ANNUAL STATISTICAL ABSTRACT OF TAMIL NADU 1991
699
R.No.25/93. ANNUAL STATISTICAL ABSTRACT OF TAMIL NADU 1991 - 92 DEPARTMENT OF STATISTICS MADRAS
-
Upload
khangminh22 -
Category
Documents
-
view
0 -
download
0
Transcript of ANNUAL STATISTICAL ABSTRACT OF TAMIL NADU 1991

R.No.25/93.
ANNUAL STATISTICAL ABSTRACTOF
TAMIL NADU
1991 - 92
DEPARTMENT OF STATISTICS MADRAS

ANNUAL STATISTICAL ABSTRACT
OF
TAMIL NADU
1 9 9 1 - 9 2
NIEPA DC
D08864
DEPARTMENT OF STATISTICS
MADRAS

LIBRARY & DOCUMENlAl lO i m National Iosntu(e of feduc;. j
PlsQoing nod AdnjiDist.at..17-B. Sri Aurobiodo Marg,N«w DeUu-110016DOC, No................ J ... J S .
«• ••• *•«

PREFACE
The current issue of the Annual Statistical Abstract of Tamil Nadu relates to the year 1991-92 and presents Administrative Statistics and data relating to Socio- Economic aspects such as Population, Agriculture, Forests, Fisheries, Industries, E l e c t r i c i t y , T r a n s p o r t and Communications, Banking, Health, Medical, Education, Prices and State Domestic Product (State Income).
The Statistical Tables are presented with a view to highlight the trends in the development of various sectors of Tamil Nadu economy.
As a compendium of essential Statistics pertaining to the State, this volume will serve as an useful source of reference to various Departments of Government especially those in charge of economic planning, research scholars, economists and others interested in the study of the Tamil Nadu economy.
With a view to avoid the time lag in releasing of this Publication this issue has been designed with DTP Process avoiding type setting and proof correction work.
The co-operation extended by various Heads of Departments and Local Bodies in supplying the data is acknowledged.
MADRAS LAL RAWNA SAILODATE : 31.3.93 COMMISSIONER OF STATISTICS.
M a
OFFICERS AND STAFF ASSOCIATED WITH THE COMPILATION OFTHIS PUBLICATION.
OVERALL GUIDANCE1. Thiru V.P. MALLIKESWARAN, M.Sc.,
Joint Director of Statistics.2. Thiru M. RAMAKRISHNAN,
Assistant Director of Statistics.
DATA PROCESSING GUIDANCEThiru K. RADHAKRISHNAN, M.Sc., M.A., Asst. Director of Statistics (EDP Manager)Thiru R. VASANTHA RAJ Senior Machine Operator
COMPILATIONThiru T.M. SIVALINGAM,Statistical Officer.Thiru R. GOPIDAS,Statistical Inspector.Thiru G. SANKARAPANI,Asst. Statistical Investigator.Thiru V.M.RAJENDRAN,Asst. Statistical Investigator.
DATA PROCESSING AND ENTRY WORK1. Tmt. G. KOMALA,
Senior Machine Operator.2. Tmt. R. SHYAMALA,
Punch Operator.3. Thiru V. SUBRAMANIAN,
Punch Operator.4. Thiru S. KANDASAMY,
Punch Operator.5. Thiru M. RAGHAVAN,
Punch Operator.6. D. GOVINDARAJAN,
Assistant Statistical Investigator.

1. SELECT ECONOMIC INDICATORS
Table CONTENTS . PageNumber
1.1 Population Growth 1
1.2 Index Numbers of Agricultural Economy 2
1.3 Index Number of Industrial Production 31.4 Index Numbers of Wholesale Prices 41.5 Consumer Price Index Numbers for Industrial 5
Workers1.6 Consumer Price Index Numbers for Urban 6
Non-Manual Employees1.7 All India Average Consumer Price Index 7
Number for Industrial Workers1.8 Consumer Price Index Numbers for Selected 8
Essential items in Rural Tamil Nadu.1.9 Consumer Price Index Numbers for selected 9
Essential Items in Urban Tamil Nadu.1.10 Index Numbers of Total Value of Exports 10
and Foreign Imports.1.11 Index Numbers of Wages paid to certain 11
categories of Agricultural Labourers.1.12 Index Numbers of Employment and Unemployment. 121.13 Index Numbers of Employment in Organised 13
Sector1.14 Index Numbers of Net State Domestic Product 14
of Tamil Nadu by Industry of Origin atCurrent Prices.
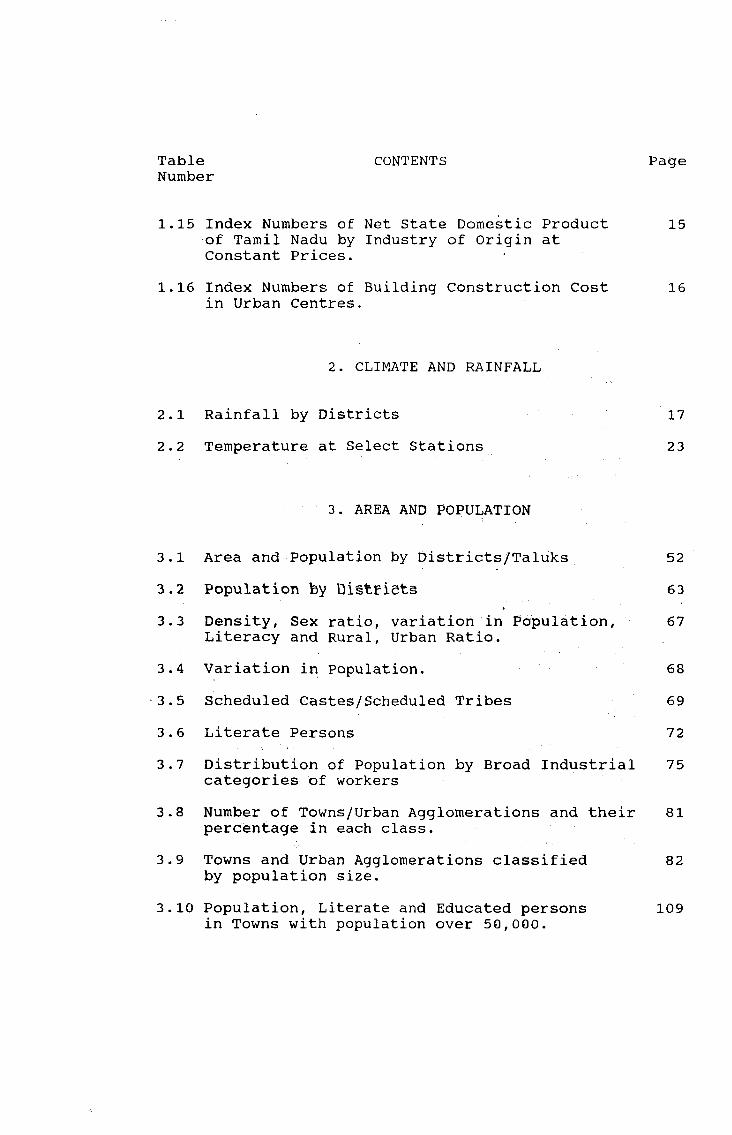
Table CONTENTS PageNumber
1.15 Index Numbers of Net State Domestic Product 15of Tamil Nadu by Industry of Origin atConstant Prices.
1.16 Index Numbers of Building Construction Cost 16in Urban Centres.
2. CLIMATE AND RAINFALL
2.1 Rainfall by Districts 172.2 Temperature at Select Stations 2 3
3. AREA AND POPULATION
3.1 Area and Population by Districts/Taluks 523.2 Population by Digtrietg 633.3 Density, Sex ratio, variation in Population, 67
Literacy and Rural, Urban Ratio.3.4 Variation in Population. 683.5 Scheduled Castes/Scheduled Tribes 693.6 Literate Persons 723.7 Distribution of Population by Broad Industrial 75
categories of workers3.8 Number of Towns/Urban Agglomerations and their 81
percentage in each class.3.9 Towns and Urban Agglomerations classified 82
by population size.3.10 Population, Literate and Educated persons 109
in Towns with population over 50,000.
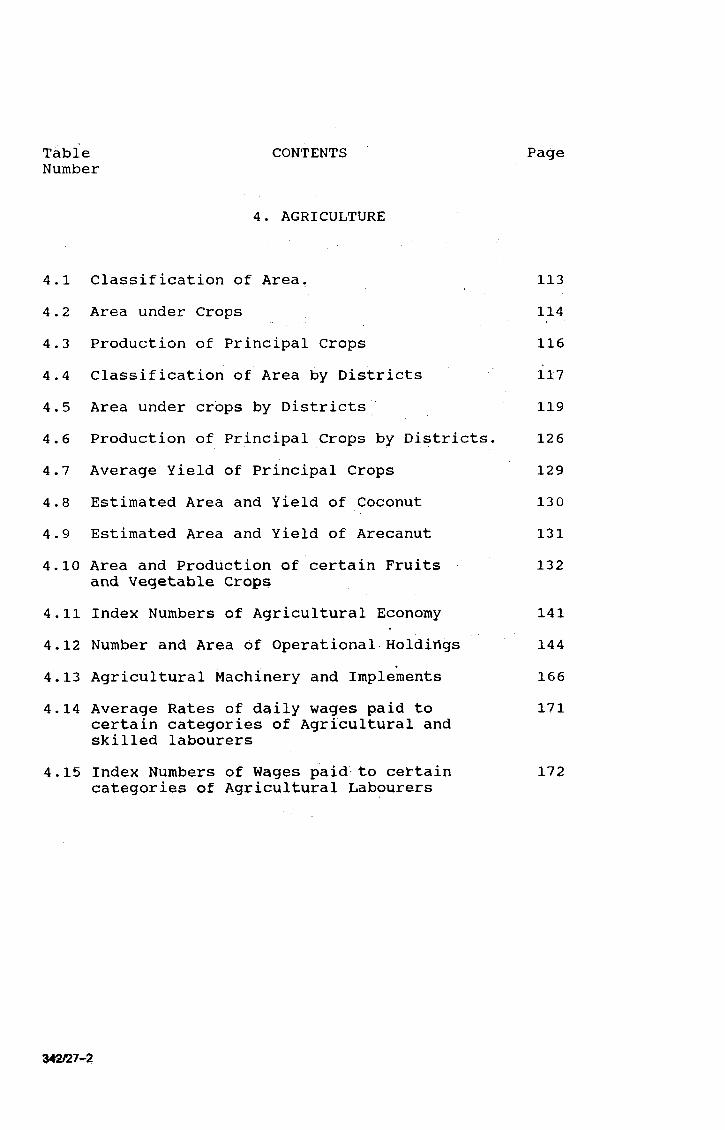
Table CONTENTS PageNumber
4. AGRICULTURE
4.1 Classification of Area, 1134.2 Area under Crops 1144.3 Production of Principal Crops 1164.4 Classification of Area by Districts 1174.5 Area under crops by Districts 1194.6 Production of Principal Crops by Districts. 1264.7 Average Yield of Principal Crops 1294.8 Estimated Area and Yield of Coconut 1304.9 Estimated Area and Yield of Arecanut 1314.10 Area and Production of certain Fruits 132
and Vegetable Crops4.11 Index Numbers of Agricultural Economy 1414.12 Number and Area of Operational Holdirtgs 1444.13 Agricultural Machinery and Implements 1664.14 Average Rates of daily wages paid to 171
certain categories of Agricultural andskilled labourers
4.15 Index Numbers of Wages paid to certain 172categories of Agricultural Labourers
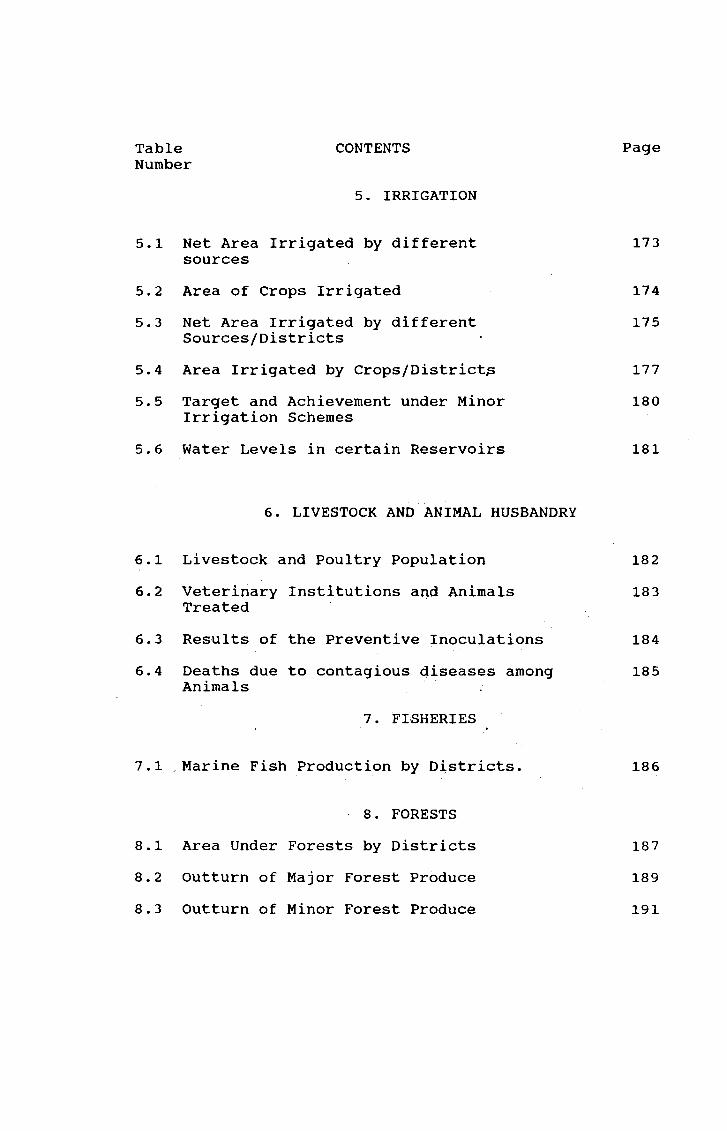
5. IRRIGATION
Table CONTENTS PageNumber
5.1 Net Area Irrigated by different 173sources
5.2 Area of Crops Irrigated 1745.3 Net Area Irrigated by different 175
Sources/Districts5.4 Area Irrigated by Crops/District^ 1775.5 Target and Achievement under Minor 18 0
Irrigation Schemes5.6 Water Levels in certain Reservoirs 181
6. LIVESTOCK AND ANIMAL HUSBANDRY
6.1 Livestock and Poultry Population 1826.2 Veterinary Institutions and Animals 183
Treated6.3 Results of the Preventive Inoculations 1846.4 Deaths due to contagious diseases among 185
Animals7. FISHERIES
7.1 Marine Fish Production by Districts. 186
8. FORESTS8.1 Area Under Forests by Districts 1878.2 Outturn of Major Forest Produce 1898.3 Outturn of Minor Forest Produce 191
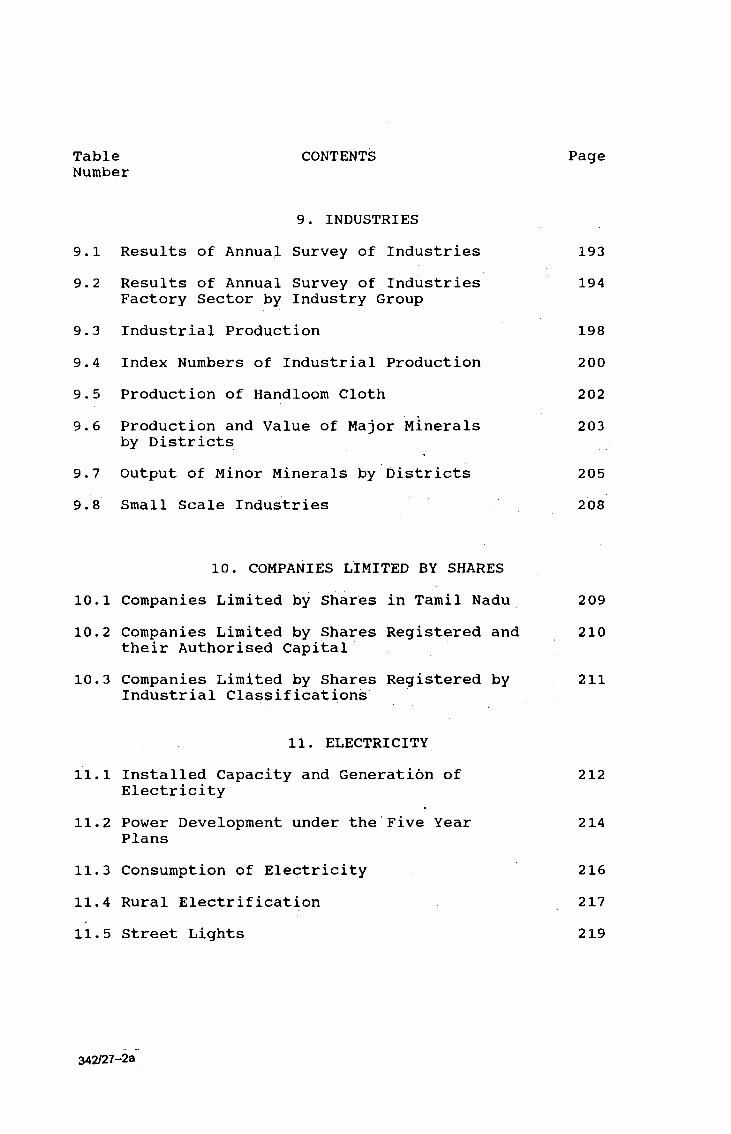
Table CONTENTS PageNumber
9. INDUSTRIES9.1 Results of Annual Survey of Industries 1939.2 Results of Annual Survey of Industries 194
Factory Sector by Industry Group9.3 Industrial Production 1989.4 Index Numbers of Industrial Production 2009.5 Production of Handloom Cloth 2029.6 Production and Value of Major Minerals 203
by Districts9.7 Output of Minor Minerals by Districts 2059.8 Small Scale Industries 208
10. COMPANIES LIMITED BY SHARES10.1 Companies Limited by Shares in Tamil Nadu 20910.2 Companies Limited by Shares Registered and 210
their Authorised Capital10.3 Companies Limited by Shares Registered by 211
Industrial Classifications
11. ELECTRICITY11.1 Installed Capacity and Generation of 212
Electricity11.2 Power Development under the Five Year 214
Plans11.3 Consumption of Electricity 21611.4 Rural Electrification 21711.5 Street Lights 219
342/27-23
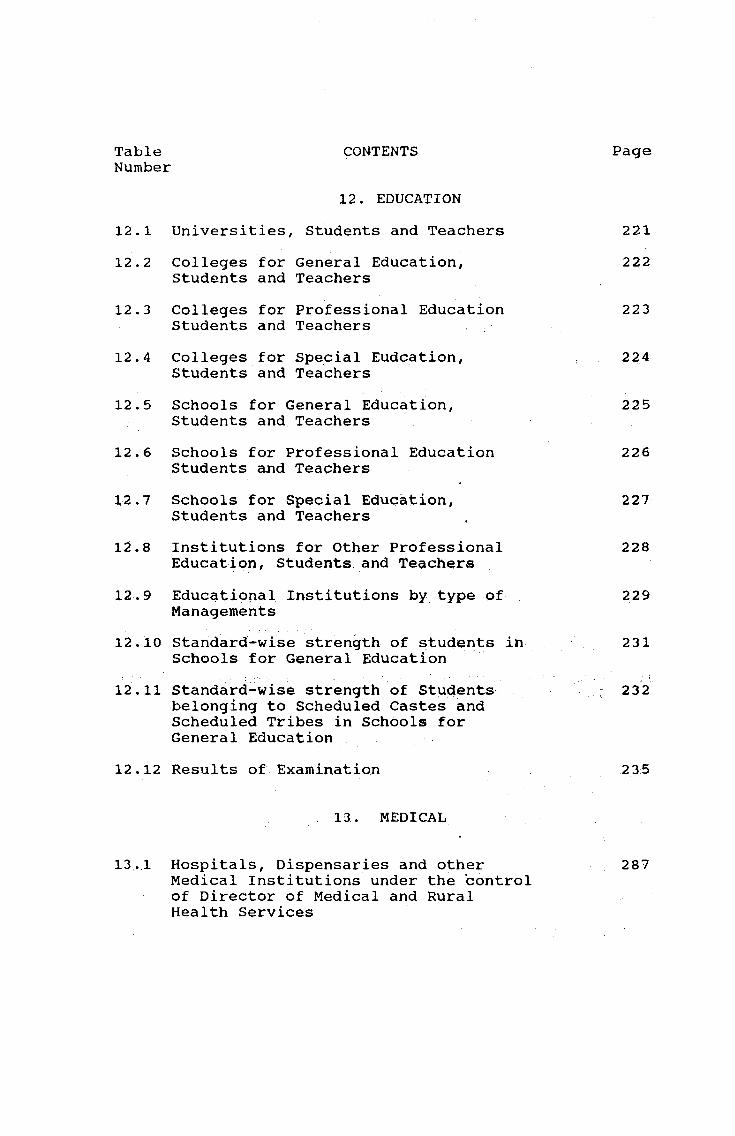
12. EDUCATION12.1 Universities, Students and Teachers 22112.2 Colleges for General Education, 222
Students and Teachers12.3 Colleges for Professional Education 223
Students and Teachers12.4 Colleges for Special Eudcation, 224
Students and Teachers12.5 Schools for General Education, 225
Students and Teachers12.6 Schools for Professional Education 226
Students and Teachers12.7 Schools for Special Education, 227
Students and Teachers12.8 Institutions for Other Professional 228
Education, Students and Teachers12.9 Educational Institutions by type of 229
Managements12.10 Standard-wise strength of students in 231
Schools for General Education12.11 Standard-wise strength of Students 232
belonging to Scheduled Castes andScheduled Tribes in Schools for General Education
12.12 Results of Examination 235
Table CONTENTS PageNumber
13. MEDICAL
13.1 Hospitals, Dispensaries and other 287Medical Institutions under the control of Director of Medical and Rural Health Services

MEDICAL Contd,13.2 Hospitals amd Dispensaries under the 289
control of Director of MedicalEducation
13.3 Health Sub-Centres under the control 290of Director of Public Health andPreventive Medicine
13.4 Primary Health Centres under the 291control of Director of PrimaryHealth Centre.
13.5 Registered Medical Personnel by 292Categories
Table CONTENTS PageNumber
14. FAMILY WELFARE14.1 Progress of Family Welfare Programme 29314.2 Progress of Family Welfare Programme 294
by Districts14.3 Family Welfare Institutions 296
15. VITAL STATISTICS15.1 Births and Deaths Registered by 297
Districts15.2 Birth and Death Rates by Districts 29915.3 Sex Ratio at Birth and Death 30015.4 Deaths and Death Rates by Districts/ 301
Causes15.5 Estimated vital Rates for India and 303
Tamil Nadu15.6 Expectation of Life at Birth 304

16. GENERAL ELECTIONS16.1 General Elections 30516.2 General Elections to Tamil Nadu 306
Legislative Assembly by Constituencies16.3 General Elections to Tamil Nadu 326
Legislative Assembly - Results at aGlance - Party-wise
16.4 General Elections to Lok-Sabha by 328Parliamentary Constituencies
16.5 General Elections to Lok-Sabha Results 332at a Glance Party-wise.
17. JUDICIAL ADMINISTRATION17.1 Number of Judicial Divisions and 333
Officers Excercising Appellate onOriginal Jurisdiction
17.2 Number and Description of Civil Suits 334Instituted
17.3 Number of Civil and Criminal Cases 336Decided
17.4 Number and Value of Civil Suits 337Instituted
17.5 Results of Civil Cases in the Courts 339of Original Jurisdiction
17.6 Appeals from Decrease and Miscellaneous 345Appeals
17.7 Results of Trials of Appeals and 349Revisions under Criminal Courts
17.8 Results of Criminal Trial in the 3 52Tribunals of Various Classes
17.9 Number of Offences Reported and Number of 356Persons Tried, Convicted and Acquitted
17.10 Persons Inflicted in Criminal Cases 393
Table CONTENTS PageNumber

18. EXCUSE AND REVENUE18.1 Revenue Receipts under State Excise 398
Duties19. POLICE
19.1 Police Force 39919.2 Persons arrested and convicted under 400
Cognizable Offences19.3 Property Stolen and Recovered . 401
20. PRISONS2 0.1 Convicts Admitted and discharged 4 022 0.2 Convicts Admitted by Nature of 403
Sentences20.3 Convicts, Admitted by Religion, Age 404
and Educational Level20.4 Mortality among Prisoners 40520.5 Physical Condition of Prisoners 406
Released20.6 Expenditure incurred on account of 407
Guarding and Maintenance of Prisoners
21. LOCAL BODIES21.1 Constitution of Municipal Bodies 40821.2 Income of the Corporation of Madras 41421.3 Expenditure of the Corporation of Madras 41521.4 Income of the Corporation of Madurai 41621.5 Expenditure of the Corporation of Madurai 41721.6 Income of the Corporation of Coimbatore : 418
Table CONTENTS PageNumber

21. LOCAL BODIES Contd.21.7 Expenditure of the Corporation of 419
Coimbatore21.8 Receipts and Expenditure of Municipalities 42021.9 Water Supply Scheme in Municipalities 424
22. COMMUNITY DEVELOPMENT22.1 Coverage of Integrated Rural Development 425
Programme22.2 Physical Achievements Under Community 426
Development Programme22.3 Radio and Television Sets Maint'ained by 427
Panchayats22.4 Panchayat Unions, Village Panchayats, 428
Town Panchayats and Town ship byDistricts
23. ADI DRAVIDAR, TRIBAL AND SOCIAL WELFARE
Table CONTENTS PageNumber
23.1 Free House Sites provided by Assignment of 430 Government Lands
23.2 Free House Sites Provided by Acquisition of 431 Lands by Adi-Dravidar and Tribal Welfare Department
24. HOUSING AND BUILDING ACTIVITY
24.1 Physical Achievements under various 432Housing Schemes •
24.2 Building Permits sanctioned for construction 433of New Buildings and Additions, Alterationsto the Existing Building in Madras City.
24.3 Building Permits Sanctioned in Local Bodies 433

24. HOUSING AND BUILDING ACTIVITY Contd.24.4 Index Numbers of Building Construction 434
Cost in Urban Centres
Table CONTENTS “ PageNumber
25. CO-OPERATION25.1 Working of Different types of Co-operative 435
Societies25.2 Loans issued by Agricultural and Non- 443
Agricultural Credit Societies classified according to purpose
25.3 Loans issued by Agricultural and 444Non-Agricultural Credit Socieitiesclassified according to value
2 5.4 Loans Overdue from Members of Agri- 44 5cultural and Non-Agricultural Credit Societies
25.5 Demand Collection and Balance of 446Principal and Interest due to Co-operative Societies
26. REGISTRATION26.1 Number of Registration Offices, 447
Registrations Aggregate value ofproperties Transferred and Revenue Receipts
27. TRANSPORT27.1 Length of Roads 45427.2 pedestrian Sub-ways in 461
Madras City27.3 Road Accidents by Districts 46227.4 Road Accidents by Type of Roads 463
342/27-3
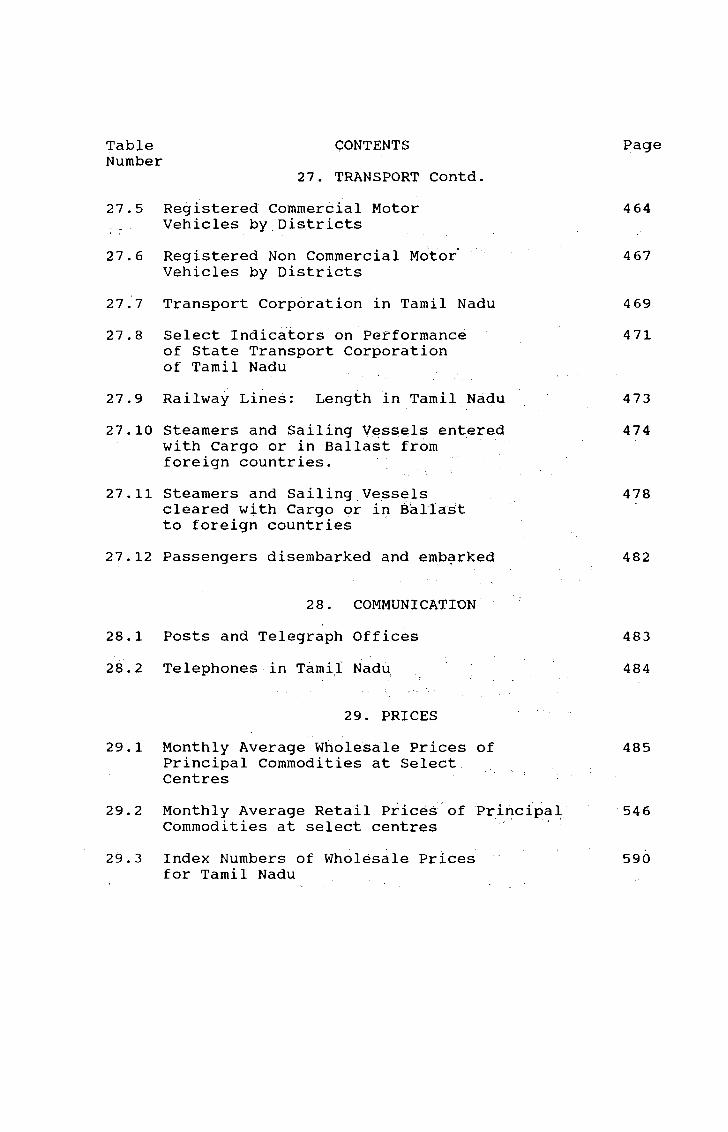
27. TRANSPORT Contd.27.5 Registered Commercial Motor 464
Vehicles by Districts27.6 Registered Non Commercial Motor 467
Vehicles by Districts27.7 Transport Corporation in Tamil Nadu 4 6927.8 Select Indicators on Performance 471
of State Transport Corporationof Tamil Nadu
2 7.9 Railway Lines: Length in Tamil Nadu 47 327.10 Steamers and Sailing Vessels entered 474
with Cargo or in Ballast fromforeign countries.
27.11 Steamers and Sailing Vessels 478cleared with Cargo or in Ballastto foreign countries
27.12 Passengers disembarked and embarked 482
Tabie CONTENTS PageNumber
28. COMMUNICATION28.1 Posts and Telegraph Offices 48328.2 Telephones in Tamil Nadu 484
29. PRICES29.1 Monthly Average Wholesale Prices of 485
Principal Commodities at SelectCentres
29.2 Monthly Average Retail Prices of Principal 546Commodities at select centres
29.3 Index Numbers of Wholesale Prices 590for Tamil Nadu

29.4 Consumer Price Index Numbers for 591Industrial Workers
29.5 Consumer Price Index Numbers for 592urban Non-Manual Employees
29.6 All India Consumer Price Index Numbers 593of Industrial Workers .
29.7 Consumer Price Index Numbers for 594selected Essential Items in RuralTamil Nadu
29.8 Consumer Price Index Numbers for 595selected essential Items in UrbanTamil Nadu
30. FOREIGN TRADE30.1 Quantum of Foreign Trade through the ports 596
of Tamil Nadu in comparison with thatof All India
30.2 Quantum of Foreign Trade through the ports 596of Tamil Nadu by Ports in terms of value
30.3 Foreign Imports by Countries in Terms of 597Quantity
30.4 Foreign Exports by countries in Terms of 598Quantity
30.5 Foreign Imports of Commodities in terms of 599value
30.6 Foreign Exports of commodities in terms 601of value
30.7 Foreign Imports of commodities by Pprts 604in terms of value
30.8 Foreign Exports of Commodities by Ports 607in terms of value
30.9 Foreign Imports from countries to the 611ports of Tamil Nadu in terms of quantity
30.10 Foreign Exports to the countries from 613 the Ports of Tamil Nadu in terms ofQuantity.
Table CONTENTS PageNumber
342/27-3a
Table CONTENTS PageNumber
31. LABOUR AND EMPLOYMENT
31.1 Registered and Working Factories 61431-2 Employment in Working Factories 61431.3 Fatal and Non-fatal Accidents in 615
Factories31.4 Working of Employment Exchanges' 61631.5 Registrations and placements through 617
Employment Exchanges by Districts31.6 Employment in Public Sector 61831.7 Employment by Industrial Divisions 61931.8 Employment in Plantations 62131.9 Average daily Earnings of Plantation 622
Labourers
32. SERVICES
32.1 Placements provided by Tamil Nadu 623Public Service Commission
32.2 Placements provided by Railway 631Recruitment Board
32.3 Placements provided by Staff Selection 633Commission
32.4 Placements provided by Banking Service 635Recruitment Board
Table CONTENTS PageNumber
33. PRINTING AND PUBLISHING
33.1 Dailies and Periodicals Published by 636Languages
34. BANKS34.1 Number of Commercial Bank Offices 63834.2 Value of Chegues cleared through Madras 639
Bankers Clearing House34.3 Deposits of Scheduled Commercial Banks 64334.4 Occupation-wise classification of out- 644
standing Credit of Scheduled CommercialBanks
34.5 Advances by Public Sector Banks towards 650Priority Sector
35. LIFE INSURENCE35.1 Life Insurence in Tamil Nadu 65235.2 Investments of Life Insurence Corporation 653
of India in Tamil Nadu
36. FIVE YEAR PLANS3 6.1 Plan Expenditure - State Schemes 654
37. STATE FINANC.E37.1 Overall Budget 65537.2 Receipts on Revenue Account by 656
Principal Heads37.3 Expenditure on Revenue Account by 658
Principal Heads37.4 Capital Budget - Receif)ts 66037.5 Capital Budget - Disbursements 661
38. STATE INCOMETable CONTENTS PageNumber
3 8.1 Nett State Domestic Product at Factor 662Cost by Industry of Origin at CurrentPrices
38.2 Nett State Domestic Product at Factor 666Cost by Industry of Origin at ConstantPrices
39. INCOME TAX
39.1 Income Tax Collections 670
40. SMALL SAVINGS40.1 Small Savings by Districts 6714 0.2 Small Savings collections by Securities 672
41. RELIGIOUS ENDOWMENTS41.1 Income from Temples by Income Ranges 67341.2 Income from Mosques by income Ranges 675
42. RECREATION42.1 Cinema Theaters. 677
*********

SELECT ECONOMIC INDICATORS1.1 Population Growth (Tamil Nadu)
SI.No. Item 1901 1911 1921 1931 1941 1951 1961 1971 1981 1991--1....... 2.................. 3...... 4..... 5...... 6...... 7.......8......9.......10......11......12--
1. Persons (in lakhs) ' 193 209 216 235 263 301 337 412 484 556
2. Deeade Variations -- +8.57 +3.47 +8.52 +11.91 +14.66 +11.85+22.30 +17.50 +14.94
3. Density (per square-Kilometre) 148 161 166 180 202 232 259 317 372 428
4. Percentage of Urban Population to TotalPopulation 13.99 14.84 15.49 17.66 19.36 24.35 26.68 30.26 32.95 34.20
5. Index of Population 100 108.6 112.3 121.9 136.4 156.4 175.0 214.0 251.4 288.1
Source : 1991 Census
• 1
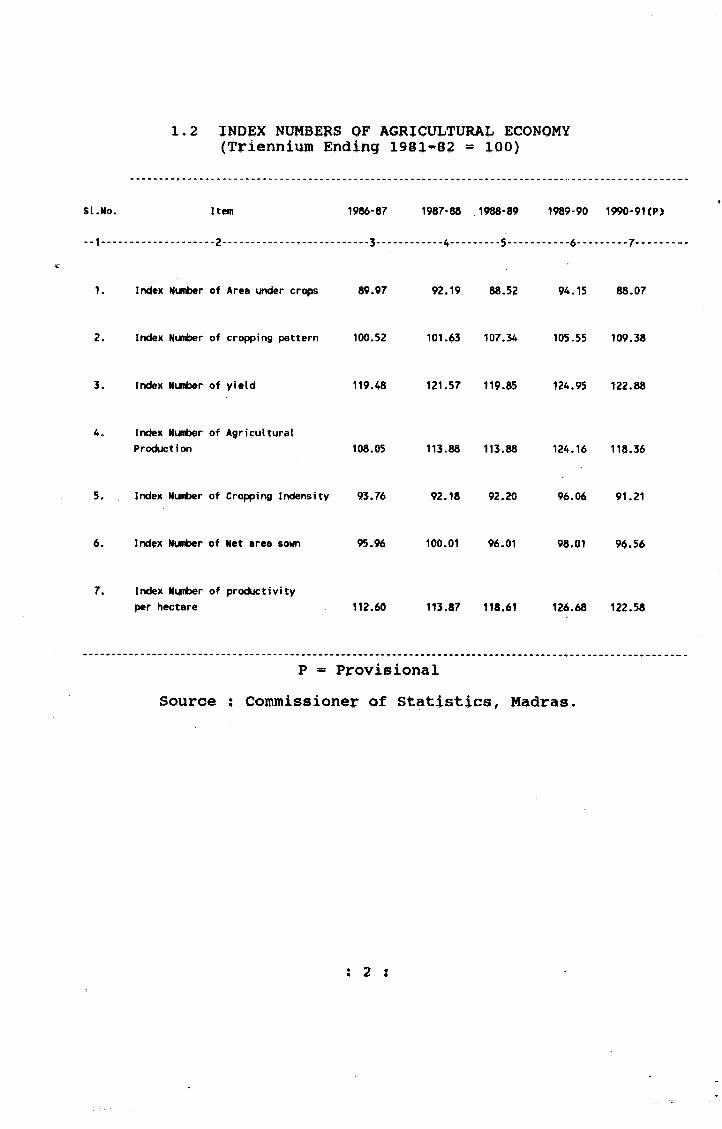
1.2 INDEX NUMBERS OF AGRICUJjTURAL ECONOMY (Triennium Ending I98l’82 = lOO)
SI.No. Item 1986-87 1987-88 1988-89 1989-90 1990-91<P)
--1---................2..........................3............4.........5-'.........6.........7......
1. Index Number of Area ynder crops 89.97 92.19 88.52 94.15 88.07
2. Index Number of cropping pattern 100.52 101.63 107.34 105.55 109.38
3. Index Number of yield 119.48 121.57 119.85 124.95 122.88
4. Index Number of AgriculturalProduction 108.05 113.88 113.88 124.16 118.36
5. Index Number of Cropping Indensity 93.76 92.18 92.20 96.06 91.21
6. Index Number of Net area sown 95.96 100.01 96.01 98.01 96.56
7. Index Number of procfcjctiyityper hectare 112.60 113.87 118.61 126.68 122.58
P « Provisional Source ; Coininissioner of Statistics, Madras.
; 2 !
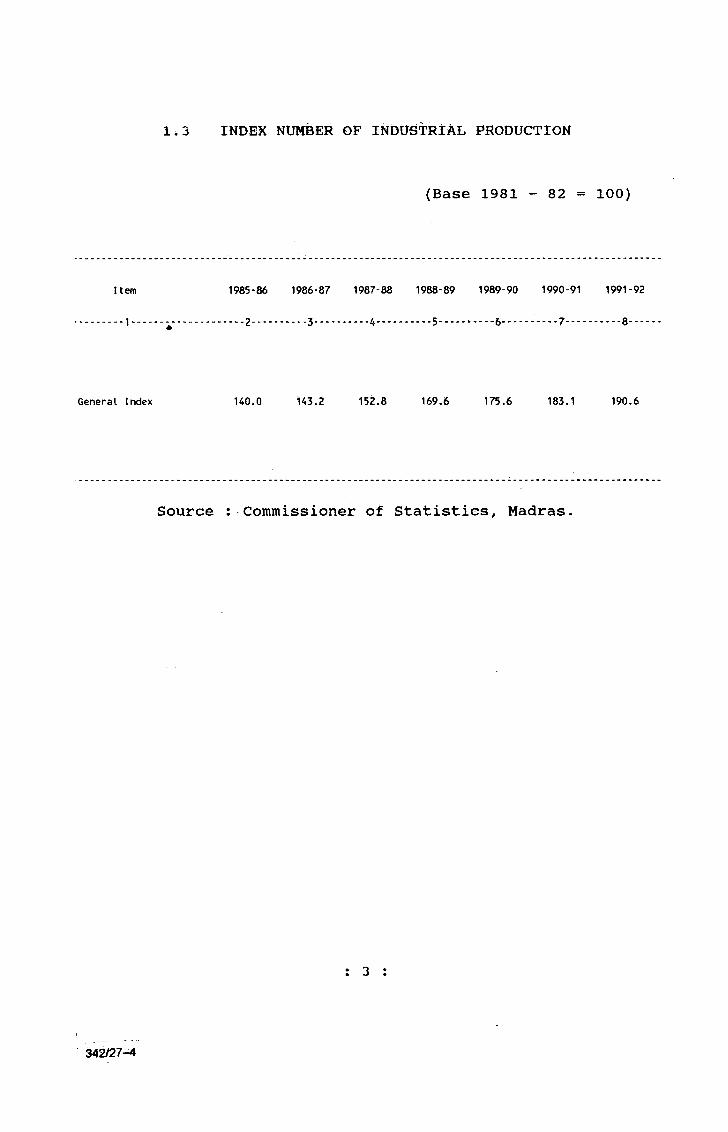
1.3 INDEX NUMBER OF INbUSTRlAL PRODUCTION
(Base 1981 - 82 = 100)
Item 1985-86 1986-87 1987-88 1988-89 1989-90 1990-91 1991-92
General Index 140.0 143.2 152.8 169.6 175.6 183.1 190.6
Source : Commissioner of Statistics, Madras.
: 3
342/27-4
(1970-71=100)
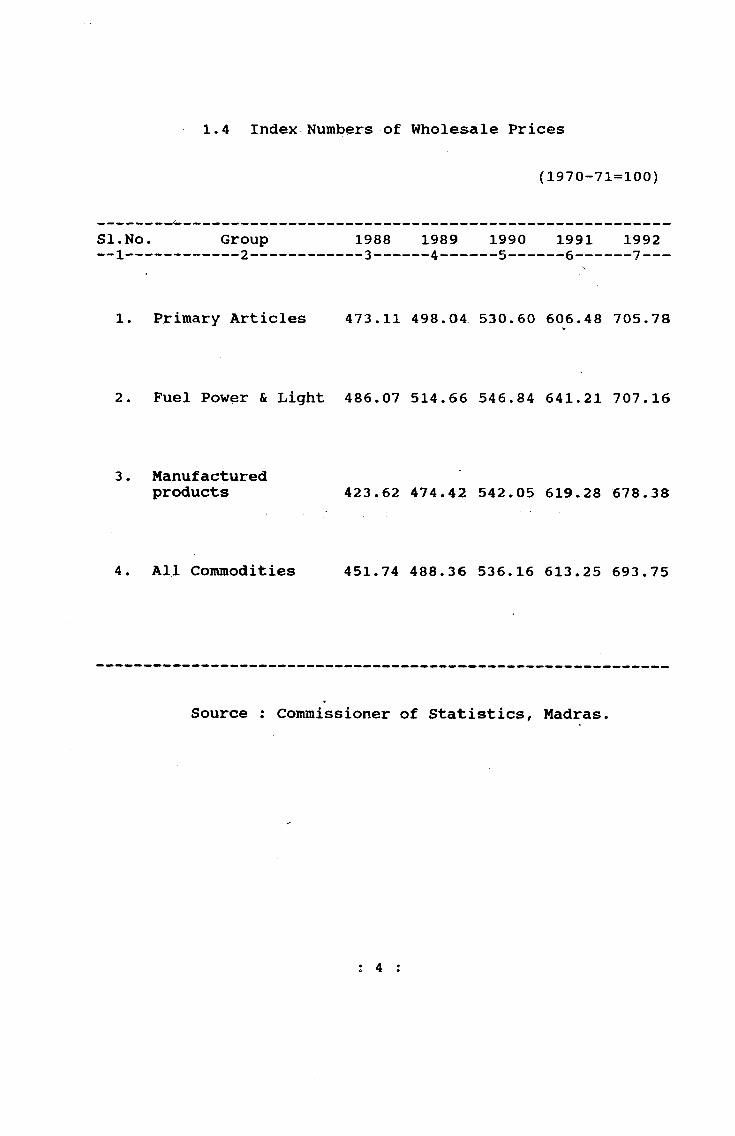
1.4 Index Numbers of Wholesale Prices
SI.No. Group 1988 1989 1990 1991 1992
1. Primary Articles 473.11 498.04 530.60 606.48 705.78
2. Fuel Power & Light 486.07 514.66 546.84 641.21 707.16
3. Manufacturedproducts 423.62 474.42 542.05 619.28 678.38
4. All Commodities 451.74 488.36 536.16 613.25 693.75
Source : Commissioner of Statistics, Madras.
4 :
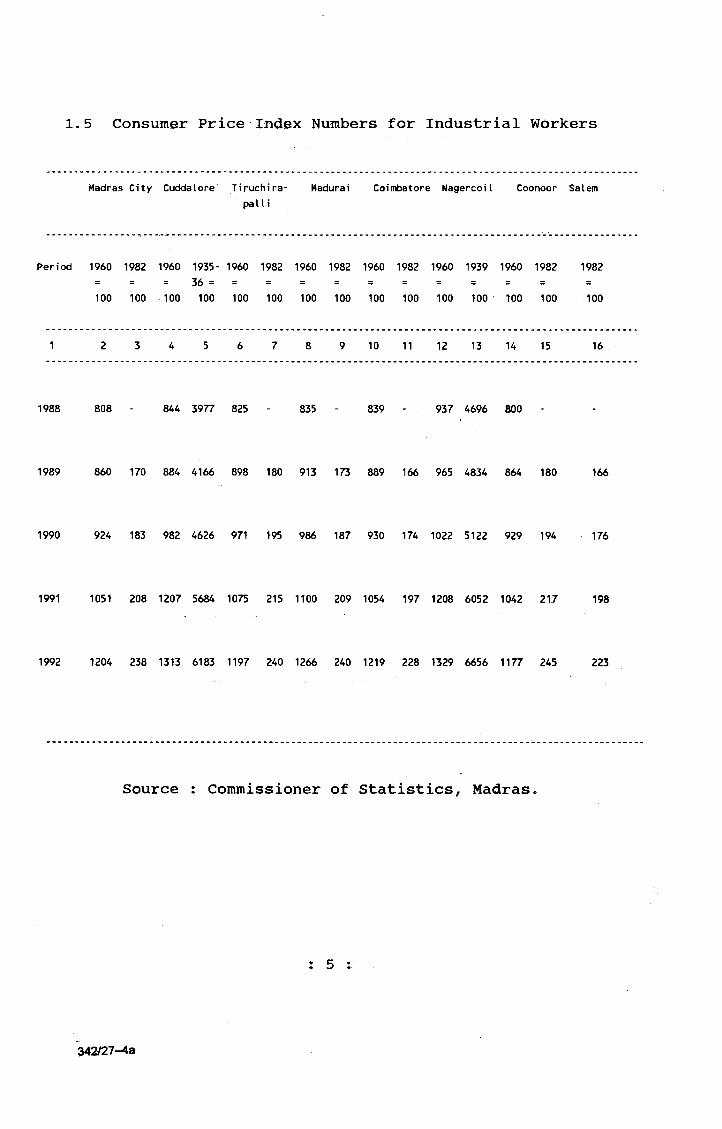
1.5 Consumer Price Index Numbers for Industrial Workers
Madras City Cuddalore Tiruchira- Madurai Coimbatore NagercoiI Coonoor Salempalli
Period 1960 1982 1960 1935- 1960 1982 1960 1982 1960 1982 1960 1939 1960 1982 1982
100 100 100 100 100 100 100 100 100 100 100 100 100 100 100
1 2 3 4 5 6 7 8 9 10 11 12 13 14 15 16
1988 808 - 844 3977 825 - 835 - 839 - 937 4696 800
1989 860 170 884 4166 898 180 913 173 889 166 965 4834 864 180 166
1990 924 183 982 4626 971 195 986 187 930 174 1022 5122 929 194 176
1991 1051 208 1207 5684 1075 215 1100 209 1054 197 1208 6052 1042 21.7 198
1992 1204 238 1313 6183 1197 240 1266 240 1219 228 1329 6656 1177 245 223
Source : Commissioner of Statistics, Madras«
: 5
342/27-43
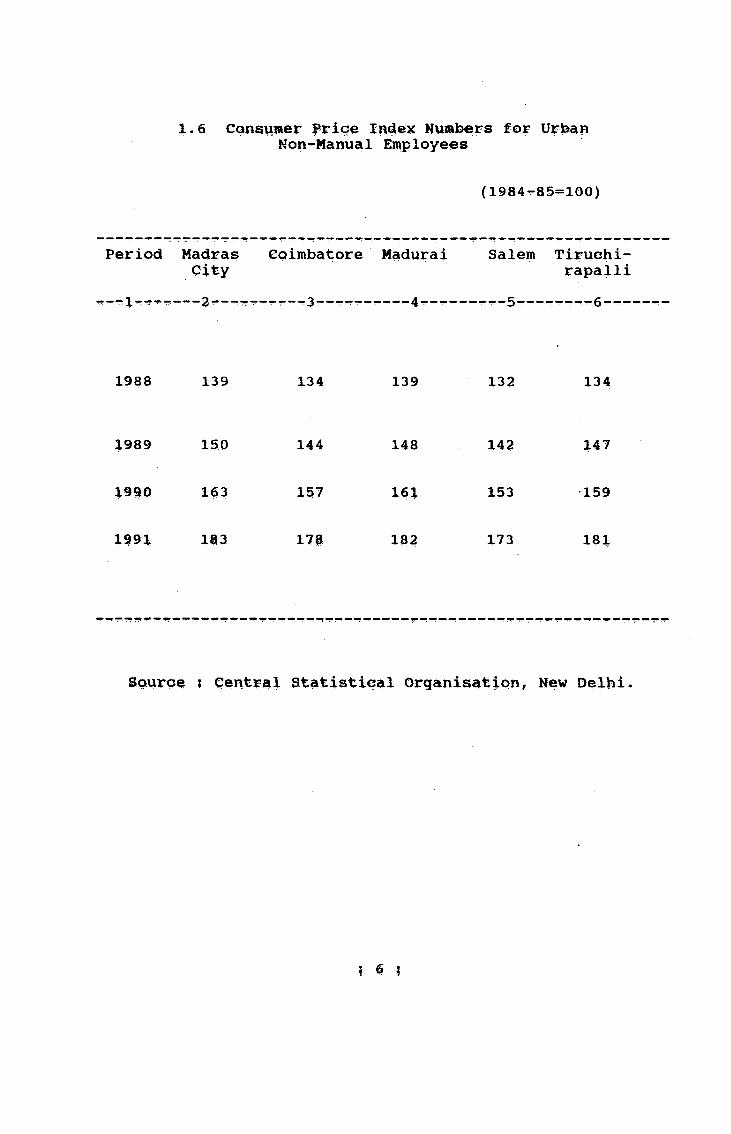
1.6 eapsv^K^er Nuiabers for UrfeanNon-Manual Employees
(1984--85=100)
Period Madras eoimbatore Madurai Salem Tiruchi-0 4 ty rapalli
1988 139 134 139 132 134
1989 150 144 148 142 147
X 9 m 163 157 161 153 159
1991 1H3 17P 182 173 181
Souro€^ I Central Statistical Organisation, New Delhi,

1.7 All Indlia Averagefor Jn^visirial Workers
(Base 1982 =
Period Index
i
1989 171
1990 186
1991 212
1992 237
Source ; p^reetQ?:^ iure^u, sijt la

1.8. Consumer Price Index Numbers for selected essentialitems in Rural Tamil Nadu.
(1970-71=100)
Period Food Fuel and Clothing Others CompositeLight Index
1988 427.97 500.12 368.18 448.67 431.19
1989 476,83 505.55 441.67 522.04 480.33
1990 491.28 520.25 514.92 537.36 498.19
1991 568.57 566.56 597.97 593.64 572.04
1992 652.98 607.58 678.47 692.53 654.55
Source : Commissioner of Statistics, Madras
: 8 :

1.9 Consumer Price Index Number for Selected essential items in Urban Tamil Nadu.
(1970-71=100)
Year Food Fuel Power Clothing Miscella- Composite and Light and neous Index
Footwear
1988 432.01 457.77 370.82 391.25 423.37
1989 460.15 481.47 432.31 435.16 455.64
1990 487.71 516.04 509.32 482.54 491.69
1991 579.80 592.91 599.47 525.20 572.27
1992 652.65 615.64 713.18 598.15 643.91
Source : Commissioner of Statistics, Madras
: 9 :
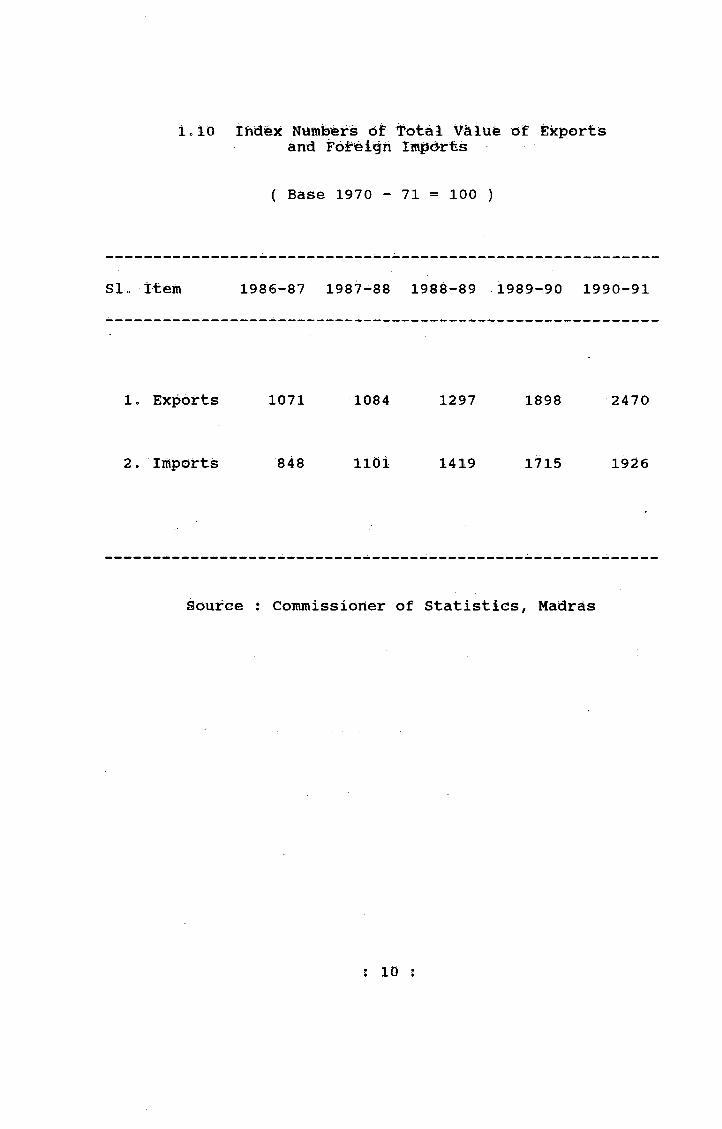
icio Ihdifex Numbers of i'dtal Valufe of Ekport-is and Fot feigri Iin|id-rts
( Base 1970 - 71 = 100 )
SIo ttem 1986-87 1987-88 1988-89 1989-90 1990-91
1. Exp6rts 1071 1084 1297 1898 2470
2. Iih{5orts 848 iidi 1419 1715 1926
source i Commissioner of Statistics, Madrds
: 10 :
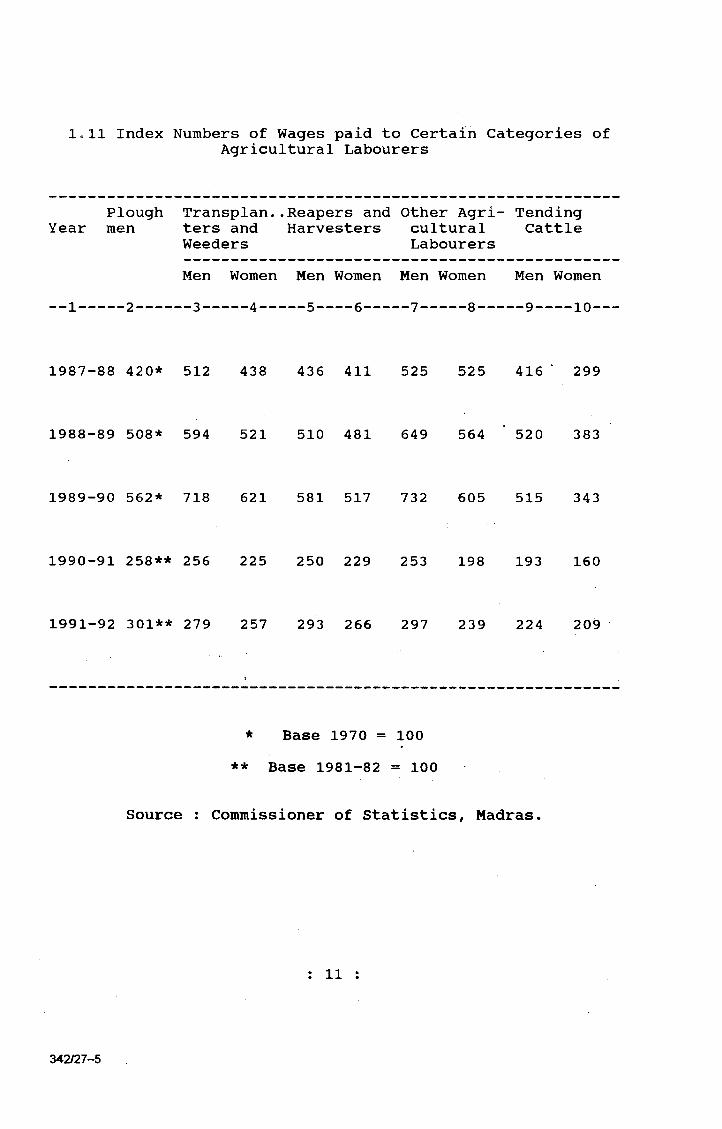
loll Index Numbers of Wages paid to Certain Categories ofAgricultural Labourers
Plough Transplan..Reapers and Other Agri- Tending Year men ters and Harvesters cultural Cattle
Weeders LabourersMen Women Men Women Men Women Men Women
— 1---------------------------------------------------------------2-3---- 4---- 5---- 6---- 7---- 8---- 9---- 10—
1987-88 420* 512 438 436 411 525 525 416 ‘ 299
1988-89 508* 594 521 510 481 649 564 520 383
1989-90 562* 718 621 581 517 732 605 515 343
1990-91 258** 256 225 250 229 253 198 193 160
1991-92 301** 279 257 293 266 297 239 224 209
* Base 1970 = 100** Base 1981-82 = 100
Source : Commissioner of Statistics, Madras
: 11
342/27-5
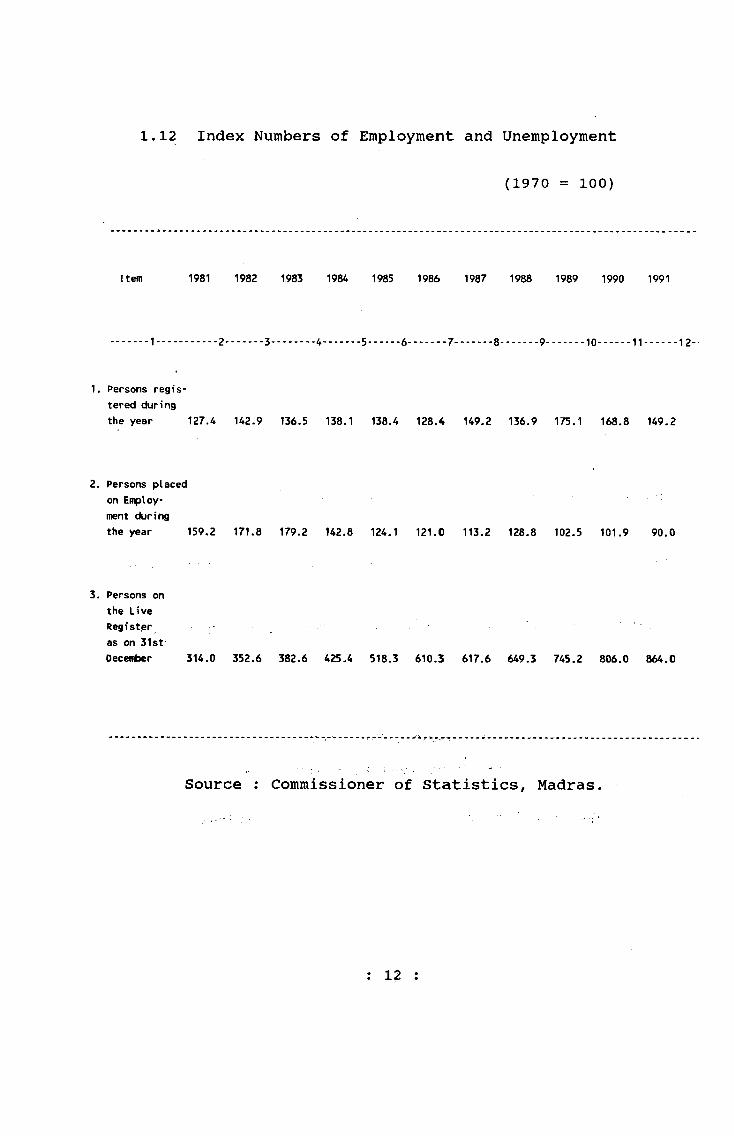
(1970 = 100)
Item 1981 1982 1983 1984 1985 1986 1987 1988 1989 1990 1991
..... 1...........2.......3........4...... 5..... 6.... --7-......8...... 9.......10......11......12-
1.12 Index Numbers of Employment and Unemployment
1. Persons registered duringthe year 127.4 142.9 136.5 138.1 138.4 128.4 149.2 136.9 175.1 168.8 149.2
2. Persons placed on Employment duringthe year 159.2 171.8 179.2 142,8 124.1 121.0 113.2 128.8 102.5 101.9 90.0
3. Persons on the Live Register as on 31stDecember 314.0 352.6 382.6 425,4 518.3 610.5 617.6 649.3 745.2 806.0 864.0
Source : Commissioner of Statistics, Madras.
: 12 :
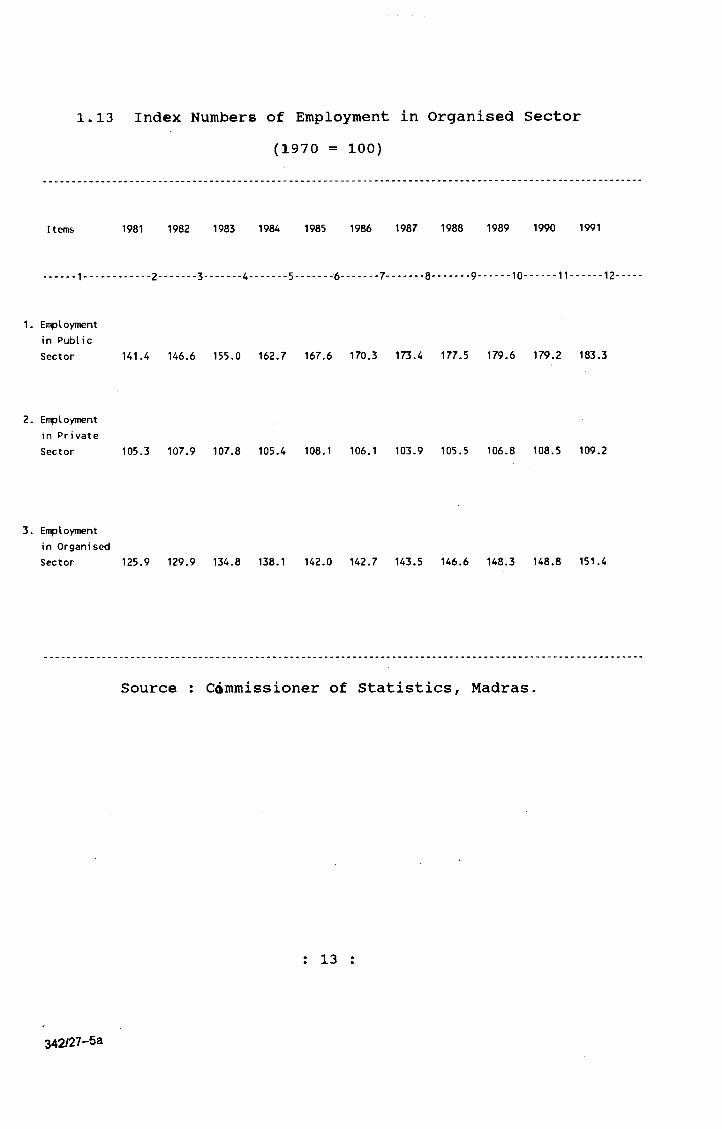
(1970 = 100)
Items 1981 1982 1983 1984 1985 1986 1987 1988 1989 1990 1991
..... 1--..........2.......3...... 4...... 5.......6...... 7.......8.......9......10......11......12-
1.13 Index Numbers of Employment in Organised Sector
1. Employment in PublicSector 141.4 146.6 155.0 162.7 167.6 170.3 173.4 177.5 179.6 179.2 183.3
2. Employment in PrivateSector 105.3 107.9 107.8 105.4 108.1 106.1 103.9 105.5 106.8 108.5 109.2
3. Employment in OrganisedSector 125.9 129.9 134.8 138.1 142.0 142.7 143.5 146.6 148.3 148.8 151.4
Source : Cdmmissioner of Statistics, Madras.
: 13
342/27-53
(Base 1980-81 = 100)
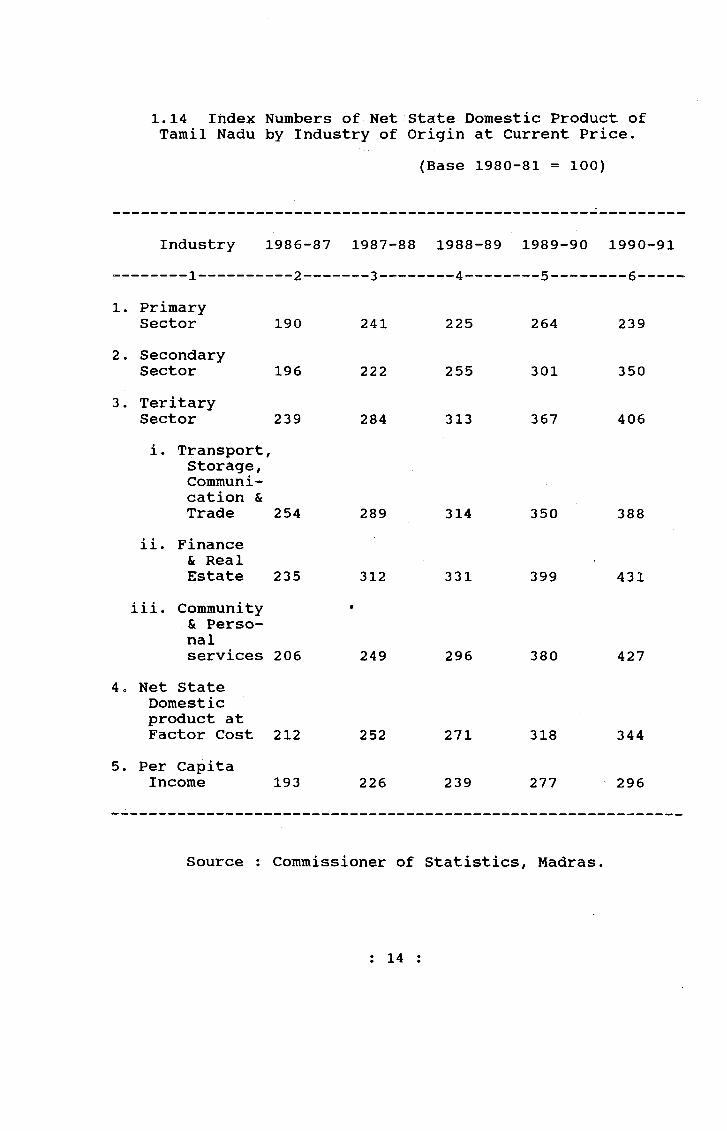
1.14 Ifidex Numbers of Net State Domestic Product ofTamil Nadu by Industry of Origin at Current Price.
Industry 1986-87 1987-88 1988-89 1989-90 1990-91
1. PrimarySector 190 241 225 264 239
2. SecondarySector 196 222 255 301 350
3. TeritarySector 239 284 313 367 406i. Transport,
Storage,Communication &Trade 254 289 314 350 388
ii. Finance & RealEstate 235 312 331 399 431
iii. Community & Personalservices 206 249 296 380 427
4 o Net State Domestic product atFactor Cost 212 252 271 318 344
5. Per CapitaIncome 193 226 239 277 296
Source : Commissioner of Statistics, Madras.
: 14 :

1.15 Index Numbers of Net State Domestic Product ofTamil Nadu Industry of Origin at Constant Prices.
(Base 1980-81 = 100)
Industry 1986-87 1987-88 1988-89 1989-90 1990-91
1. PrimarySector 176 179 179 202 186
2. SecondarySector 115 119 135 140 145
3. TeritarySector 140 155 157 167 170
i. Transport, Storage, Communication, & Trade 143 156 157 157 156
ii. Finance and RealEstate 148 172 164 173 176
iii. Community andPersonalServices
126 139 151 186 1974. Net State
Domestic Product at FactorCost 129 137 143 153 153
5. Per CapitaIncome 117 123 126 133 131
Source : Commissioner of Statistics, Madras
: 15 :
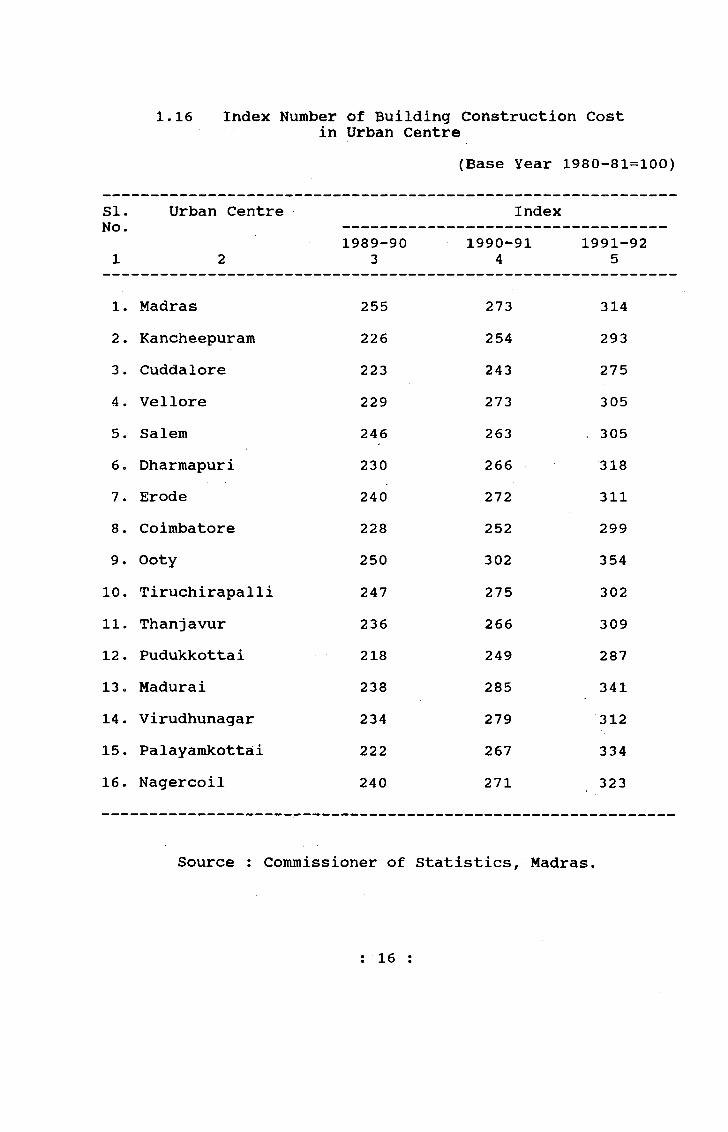
1.16 Index Numberin
of Building Construction Urban Centre
Cost
(Base Year 1980-81=100)
Si. Urban Centre No.1 2
Index1989-90
31990-91
41991-92
5
1. Madras 255 273 3142. Kancheepuram 226 254 2933. Cuddalore 223 243 2754. Vellore 229 273 3055. Salem 246 263 3056. Dharmapuri 230 266 3187. Erode 240 272 3118. Coimbatore 228 252 2999. Ooty 250 302 354
10. Tiruchirapalli 247 275 30211. Thanjavur 236 266 30912. Pudukkottai 218 249 28713. Madurai 238 285 34114. Virudhunagar 234 279 31215. Palayamkottai 222 267 33416. Nagercoil 240 271 323
Source : Commissioner of Statistics, Madras.
: 16 :
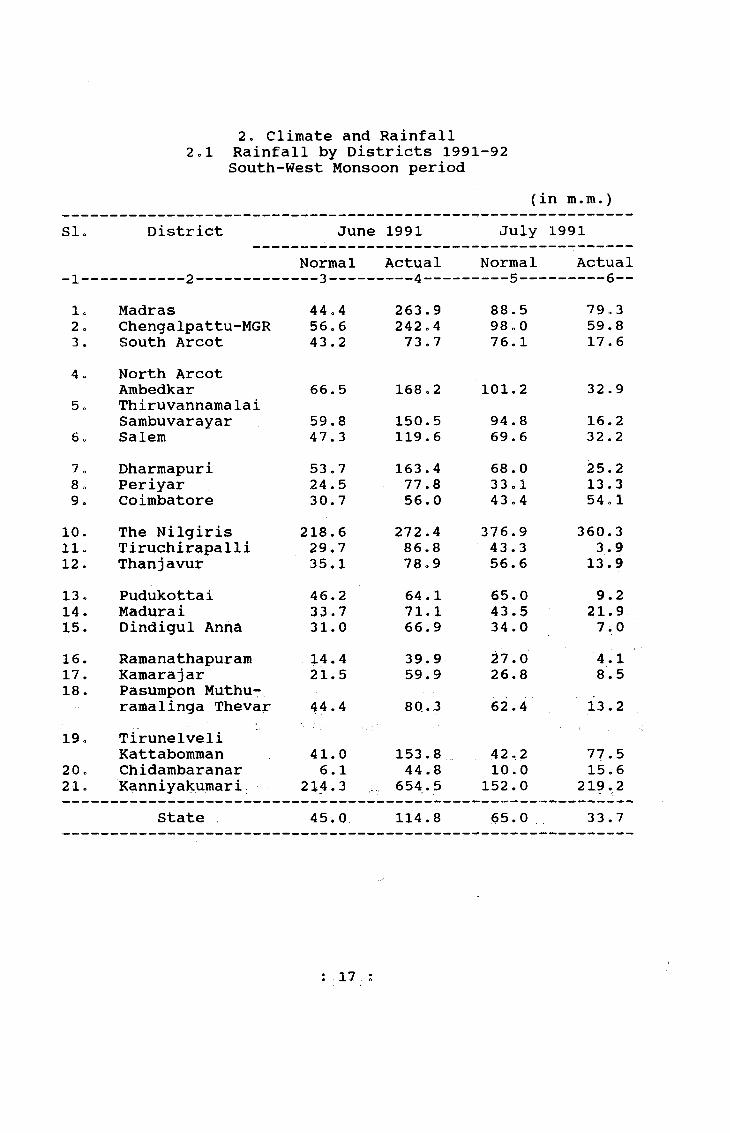
2. Climate and Rainfall 2ol Rainfall by Districts 1991-92
South-West Monsoon period(in m.m.)
S l o District June 1991 July 1 9 9 1
Normal Actual Normal Actual1 — '
l o Madras 44,4 263.9 88.5 79.32 c ChengaIpattu-MGR 56. 6 242.4 98„0 59.83 . South Arcot 43.2 73.7 76.1 17.64 . North Arcot
Ambedkar 66.5 168.2 101.2 32.95 o Thiruvannamalai
Sambuvarayar 59.8 150.5 94 .8 16.2S o Salem 47.3 119.6 69.6 32.27 „ Dharmapuri 53.7 163.4 68.0 25.2S o Periyar 24.5 77.8 33 o 1 13.39. Coimbatore 30.7 56.0 4 3 o 4 54ol
10. The Nilgiris 218.6 272.4 376.9 360.311. Tiruchirapalli 29.7 86.8 43.3 3.912. Thanjavur 35.1 78o9 56.6 13.913« Pudukottai 46.2 64.1 65.0 9.214. Madurai 33.7 71.1 43.5 21.9X 5 . Dindigul Anna 31.0 66.9 34.0 7.016. Ramanathapuram 14.4 39.9 27.0 4.117. Kamarajar 21.5 59.9 26.8 8.518. Pasumpon Muthu-
raroalinga Thevar 44.4 80.3 62.4 13 .219 o Tirunelveli
Kattabomman 41.0 153.8 42,2 77.520o Chidambaranar 6.1 44.8 10.0 15.621. Kanniyakumari 214.3 654.5 152.0 219.2
State 45.0 114.8 65.0 33.7
; 17

2.1 Cbntd.
SI. District No.
August 1991 September 1991 South West Monsoon Total
Normal Actual Normal Actual Normal Actual PercentageDeviation
1. Madras 118.1 106.7 111.6 189.0 362.6 638.9 +76.22. Chengalpattu MGR 136.7 136.7 130.7 151.4 422.0 590.3 +39.93. South Arcot 138.8 111.8 134.0 112.8 392.1 315.9 -19.4
4. North Arcot Ambedkar 134.9 148.1 146.2 149.0 448.8 498.2 +11.05. Thiruyannamalai Sambuvarayar 154.7 137.4 159.1 151.9 468.4 456.0 - 2.66. Salem 110.8 94.6 118.4 129.5 346.1 375.9 + 8.6
7. Dharmapuri 103.5 47.7 141.0 224.0 366.2 460.3 +25,78. Periyar 52.8 31.0 73.0 115.4 183.4 237.5 +29,59. Coini>atore 37.4 27.3 46.8 37.3 158.3 174.7 +10.2
10. The Nilgiris 257.8 187.8 169.0 126.8 1022.3 947.3 - 7.311. tiruchirapalli 88.7 50.7 104.8 144.9 266.5 286.3 + 7.4’12. Thanjavur 104.3 60.2 101.2 100.8 297.2 253.8 -14.6
13. Pudukkottai 113.6 49.9 117.6 99.8 342.4 223.0 -34.914. Madurai 81.3 37.3 92.3 142.8 250.8 273.1 + 8.915. Oindlgul-Anna 69.8 33.9 94.4 157.5 229.2 265.3 +15.7
16. Ramanathapuram 44.4 20.3 49.5 35.8 135.3 rob.r -26.017. Kamarajar 53.8 6.4 67.6 99.0 169.7 173.8 + 2.418. Pasunnpon Muthuranfialinga
Thevar 116.0 81.0 106.5 92.8 329.3 267.3 -18.8
19. Tirunelveli Kattabomnan 25.5 7.6 31.8 21.2 140.5 260.1 +85.120. Chidznnbaranar 18.5 0.7 25.3 44.9 59.9 106.0 +76.921. Karmiyakumari 89.1 43.6 103.7 2.9 559.1 920.3 +64.«
State 95.1 66.0 102.5 117.3 307.6 331.8 + 7.f
: 18 :
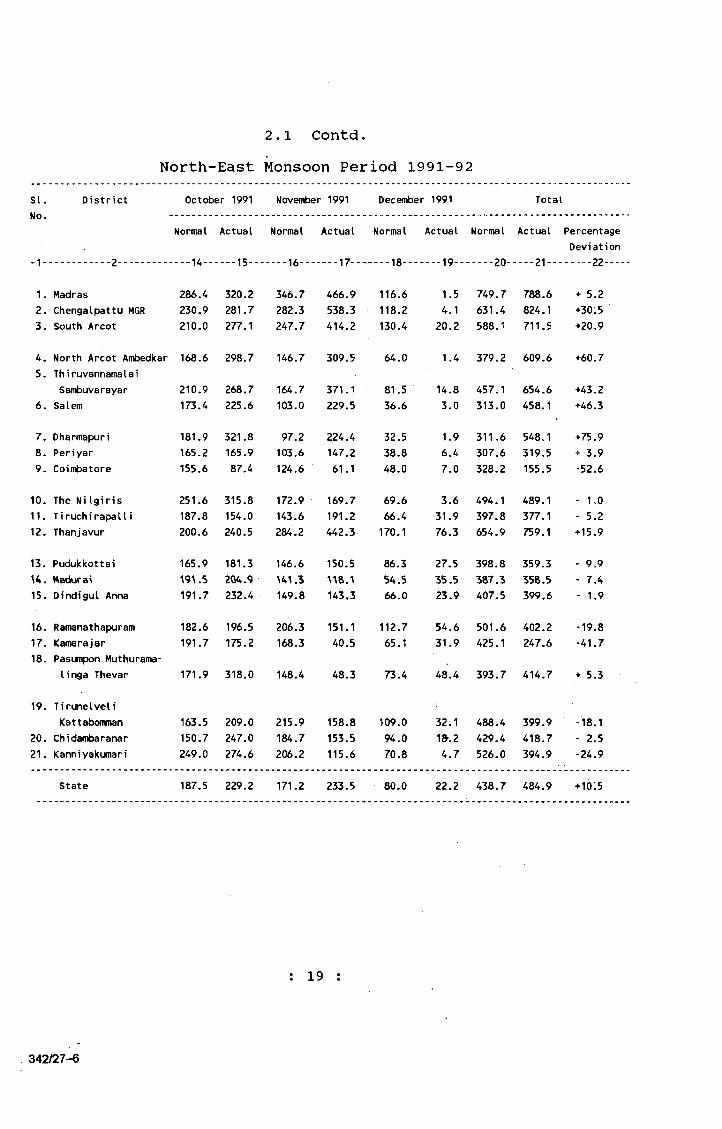
North-East Monsoon Period 1991-922.1 Contd.
SI. District October 1991 Novenfcer 1991 December 1991 Totalnuo
Normal Actual Normal Actual Normal Actual Normal Actual Percentage
---14-- ----15-- .... 16---- ---17-- ---- 18---- ---19- .... 20- --- 21---Deviation -----22....
1. Madras 286.4 320.2 346.7 466.9 116.6 1.5 749.7 788.6 + 5.22. Chengalpattu MGR 230.9 281.7 282.3 538.3 118.2 4.1 631.4 824.1 +30.53. South Arcot 210.0 277.1 247.7 414.2 130.4 20.2 588.1 711.5 +20.9
4. North Arcot Atnbedkar 168.6 298.7 146.7 309.5 64.0 1.4 379.2 609.6 +60.75. Thiruvannamalai
Sambuvarayar 210.9 268.7 164.7 371.1 81.5 14.8 457.1 654.6 +43.26. Salem 173.4 225.6 103.0 229.5 36.6 3.0 313.0 458.1 +46.3
7. Dharmapuri 181.9 321.8 97.2 224.4 32.5 1.9 311.6 548.1 +75.98. Periyar 165.2 165.9 103.6 147.2 38.8 6.4 307.6 319.5 + 3.99. Coimbatore 155.6 87.4 124.6 61.1 48.0 7.0 328.2 155.5 -52.6
10. The NiIgiris 251.6 315.8 172.9 169.7 69.6 3.6 494.1 489.1 - 1.011. Tiruchirapalli 187.8 154.0 143.6 191.2 66.4 31.9 397.8 377.1 - 5.212. Thanjavur 200.6 240.5 284.2 442.3 170.1 76.3 654.9 759.1 +15.9
13. Pudukkottai 165.9 181.3 146.6 150.5 86.3 27.5 398.8 359.3 - 9.9H . Hadura> m . s 204.9 H I .3 54.5 35.5 387.3 358.5 - 7.415. Dindigul Anna 191.7 232.4 149.8 143.3 66.0 23.9 407.5 399.6 - 1.9
16. Ramanathapuram 182.6 196.5 206.3 151.1 112.7 54.6 501.6 402.2 -19.817. Kamarajar 191.7 175.2 168.3 40.5 65.1 31.9 425.1 247,6 -41.718. Pasumpon Muthurama-
linga Thevar 171.9 318.0 148.4 48.3 73.4 48.4 393.7 414.7 + 5.3
19. Tirunelveli Kattabomman 163.5 209.0 215.9 158.8 109.0 32.1 488.4 399.9 -18.1
20. Chidambaranar 150.7 247.0 184.7 153.5 94.0 18-.2 429.4 418.7 - 2.521. Kanniyakumari 249.0 274.6 206.2 115.6 70.8 4.7 526.0 394.9 -24.9
State 187.5 229.2 171.2 233.5 80.0 22.2 438.7 484.9 +10.5
: 19
342/27-6

2.1 Contd.Winter Period
January 1992 February 1992 Totald I • U 1 d V 1 1 C VNo. Normal Actual Normal Actual Normal Actual Percentage
Deviation--23--- .... 24--- .... 25...... -26--- .... 27--- .... 28--- ....... 29----
1. Madras 34.3 12.3 8.9 0.0 43.2 12.3 -71.52. Chengalpattu MGR 28.3 11.4 7.2 0.0 35.5 11.4 -67.93. South Arcot 39.6 0.9 10.8 0.0 50.4 0.9 -98.2
4. North Arcot Ambedkar 18.0 12.0 5.2 0.0 23.3 12.0 -48.35. Thiruvannamalai Satnbuvarayar 26.4 8.3 10.1 0.0 36.5 8.3 -77.36. Salem 14.2 0.0 8.9 0.0 23.1 0.0 -100.0
7 . Dhartnapuri 11.6 1.5 7.4 0.0 19.0 1.5 -92.18. Periyar 11.6 1.7 9.9 0.0 21.5 1.7 -92.19. Coimbatore 15.8 0.1 9.8 0.0 25.6 0.1 -99.6
10. The Nilgfris 38.2 7.1 24.3 0.0 62.5 7.1 -88.611. thiruchirapalli 24.0 0.0 10.2 0.0 34.2 0.0 -100.012. Thanjavur 55.1 1.6 16.5 0.0 71.6 1.6 -97.8
13. Pudukkottai 36.2 0.8 15.8 0.0 52.0 0.8 -98.514, Madurai I Q . Z \ A ^S.6 0.0 ss.e15. Dindigul Anna 28.3 0.0 10.9 0.0 39.2 0.0 -100.0
16. Ramanathapuram 48.5 0.5 18.9 0.0 67.4 0.5 -99.217. Kamarajar 30.3 12.7 22.3 0.0 52.6 12.7 -75.818. Pasumpon Muthuramalinga Thevar 32.3 4.6 13.6 0.0 45.9 4.6 -89.9
19. Tiruhelveli Kattaboraman 58.4 4.0 32.4 0.0 90.8 4.0 -95.620. Chidambaranar 38.9 22.7 23.1 0.0 62.0 22.7 -63.421. Kanniyakumari 29.0 17.8 21.2 0.0 50.2 17.8 -64.5
State 29.0 4.1 13.2 0.0 42.2 4.1 -90.3
: 20 :
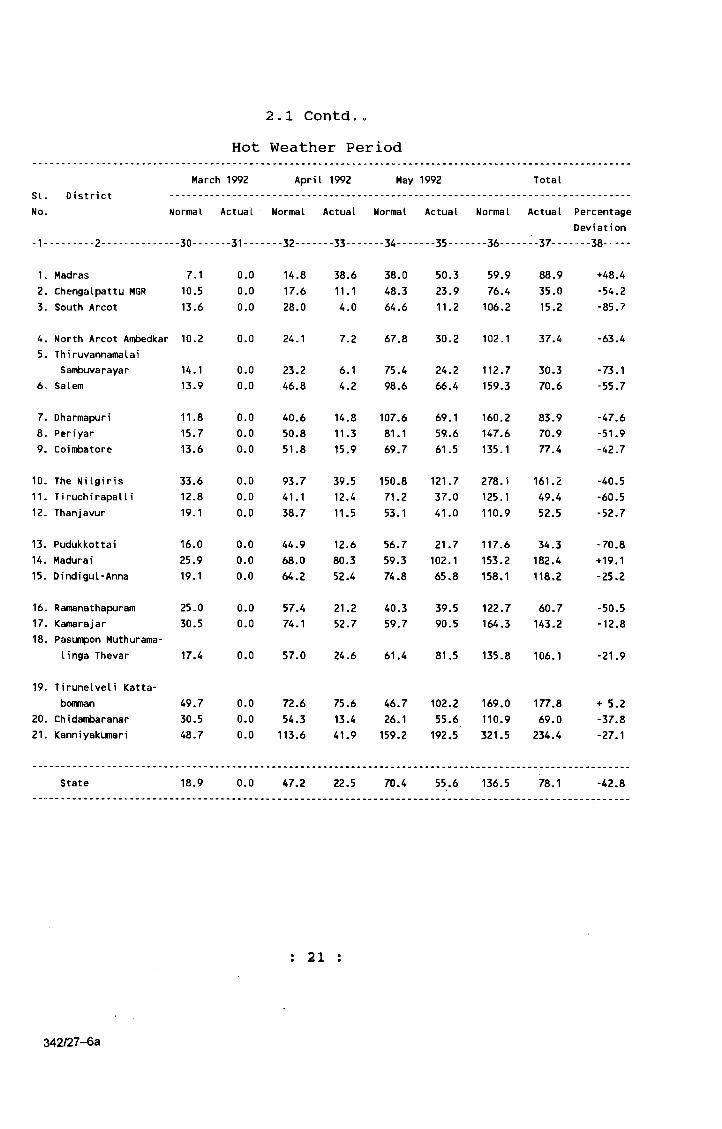
2 o1 Contd.oHot Weather Period
March 1992 April 1992 May 1992 Totalc i^ I • u 1strictNo, normal Actual Normal Actual Normal Actual Normal Actual Percentage
Deviation-1- 2 --30.... --31--- --- 32--- ---33--- ---34--- ---35--- ---36--- ----37--- --- 38--- -
1. Madras 7,1 0.0 14.8 38.6 38.0 50.3 59.9 88.9 +48.42. Chengalpattu MGR 10.5 0.0 17.6 11.1 48.3 23.9 76.4 35.0 -54.23. South Arcot 13.6 0.0 28.0 4.0 64.6 11.2 106,2 15.2 -85.7
4. North Arcot Ambedkar 10.2 0.0 24.1 7.2 67.8 30.2 102.1 37.4 -63.45. Thi ruvannamalai
Sambuvarayar 14.1 0.0 23.2 6.1 75.4 24.2 112.7 30.3 -73.16. Salem 13.9 0.0 46.8 4.2 98.6 66.4 159.3 70.6 -55.7
7. Dharmapuri 11.8 0.0 40.6 14.8 107.6 69.1 160.2 83.9 -47.68. Periyar 15.7 0.0 50.8 11.3 81.1 59.6 147.6 70.9 -51.99. Coimbatore 13.6 0.0 51.8 15.9 69.7 61.5 135.1 77.4 -42.7
10. The NiIgiris 33.6 0.0 93.7 39.5 150.8 121.7 278.1 161.2 -40.511. T i ruch i rapa11i 12.8 0.0 41.1 12.4 71.2 37.0 125.1 49.4 -60.512. Thanjavur 19.1 0.0 38.7 11.5 53.1 41.0 110.9 52.5 -52.7
13. Pudukkottai 16.0 0.0 44.9 12.6 56.7 21.7 117.6 34.3 -70.814. Madurai 25.9 0.0 68.0 80.3 59.3 102.1 153.2 182.4 +19.115. Dindigul-Anna 19.1 0.0 64.2 52.4 74.8 65.8 158.1 118,2 -25.2
16. Ramanathapuram 25.0 0.0 57.4 21.2 40.3 39.5 122.7 60.7 -50.517. Kamarajar 30.5 0.0 74.1 52.7 59.7 90.5 164.3 143.2 -12.818. Pasumpon Muthurama*
linga Thevar 17.4 0.0 57.0 24.6 61.4 81.5 135.8 106.1 -21.9
19. Tirunelveli Katta-bomman 49.7 0.0 72.6 75.6 46.7 102.2 169.0 177.8 + 5.2
20. Chidambaranar 30.5 0.0 54.3 13.4 26.1 55.6 110.9 69.0 -37.821. KanniyakUmari 48.7 0.0 113.6 41.9 159.2 192.5 321.5 234.4 -27.1
State 18.9 0.0 47.2 22.5 70.4 55.6 136.5 78.1 -42.8
: 21
342/27-6a

2.1 ContdAll Season
SI.NOo
District Normal Actual Percentage Deviation from normal
-1”— ----- ----- __2------------- ---39---- ----40--- ----- 41— —1, Madras 1215.4 1528.7 +25.82. Chengalpattu MGR 1165.3 1460.8 +25.33 . South Arcot 1136.8 1043.5 - 8.24o5o,
North Arcot Ambedkar Thiruvannamalai
953.4 1157.2 +21.4Sambuvarayar 1074.7 1149.2 + 6.9
6. Salem 841.5 904.2 + 7o57. Dharmapuri 857.0 1093.8 +27. 68e Periyar 660.1 629.6 - 4.69 c Coimbatore 647.2 407,7 -37.0lOo The Nilgiris 1857.0 1604.7 -13 . 3llo Tiruchirapalli 823. 6 712.8 -13,412. Thanjavur 1134.6 1067.0 - 5.913 o Pudukkottai 910.8 617.4 -32.214. Madurai 827.1 815.4 - 1.415. Dindigul-Anna 834.0 783.1 - 6 . 116. Ramanathapuram 827.0 563.5 -31.917.18.
KamarajarPasumpon Muthuramalinga
811.7 577.3 -28. 9Thevar 904.7 792 .7 -12.4
19. Tirunelveli Kattabomman 888.7 841.8 - 5.320. Chidambaranar 662 . 2 616.4 - 6,921. Kanniyakumari 1456.8 1567.3 + 7.6
State 925.0 898.4 - 2.8
Source : Commissioner of Statistics, Madras
: 22 :
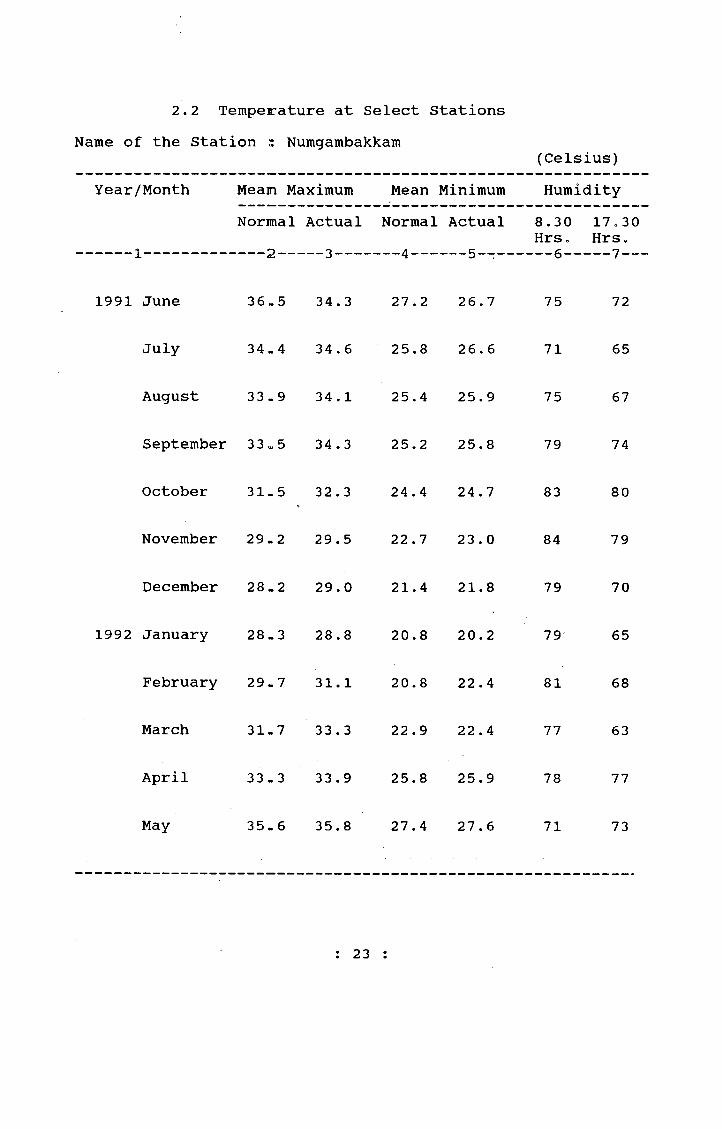
2 . 2 Tempeirature at Select Stations Name of the Station s Nuitigambakkam
(Celsius) Year/Month Mean Maximum Mean Minimum Humidity
Normal Actual Normal Actual 8.30 17o30Hrs, Hrs,
1991 June 36„5 34.3 27.2 26.7 75 72
July 34.4 34.6 25.8 26.6 71 65
August 33-9 34.1 25.4 25.9 75 67
September 33„5 34.3 25.2 25.8 79 74
October 31.5 32.3 24.4 24.7 83 80
November 29.2 29.5 22.7 23.0 84 79
December 28.2 29.0 21.4 21.8 79 70
1992 January 28.3 28.8 20.8 20.2 79 65
February 29.7 31.1 20.8 22.4 81 68
March 31.7 33.3 22.9 22.4 77 63
April 33.3 33.9 25.8 25.9 78 77
May 35.6 35.8 27.4 27.6 71 73
: 23 :

2.2 Contd
Name of the Station : Meenambakkam
1 2 3 4 5 6 7
1991 June 37.3 35.1 27. 6 26.4 76 73
July 35.2 35. 0 26.3 26.5 70 64
August 34.5 34.5 25.8 25.6 69 65
September 33.9 34.8 25.4 25. 6 77 71
October 31.8 32.6 24.4 24.5 80 77
November 29.2 29.6 22.5 22.8 83 78
December 28.2 29.0 21.0 21.5 78 66
1992 January 28.8 28.7 20.3 19.8 80 61
February 30.6 31.8 21.1 21.8 79 63
March 32.7 34.3 23.1 21.6 72 54
April 34.9 35,6 26.0 25.4 73 71
May 37.6 37.6 27.8 27.3 63 63
: 24 :
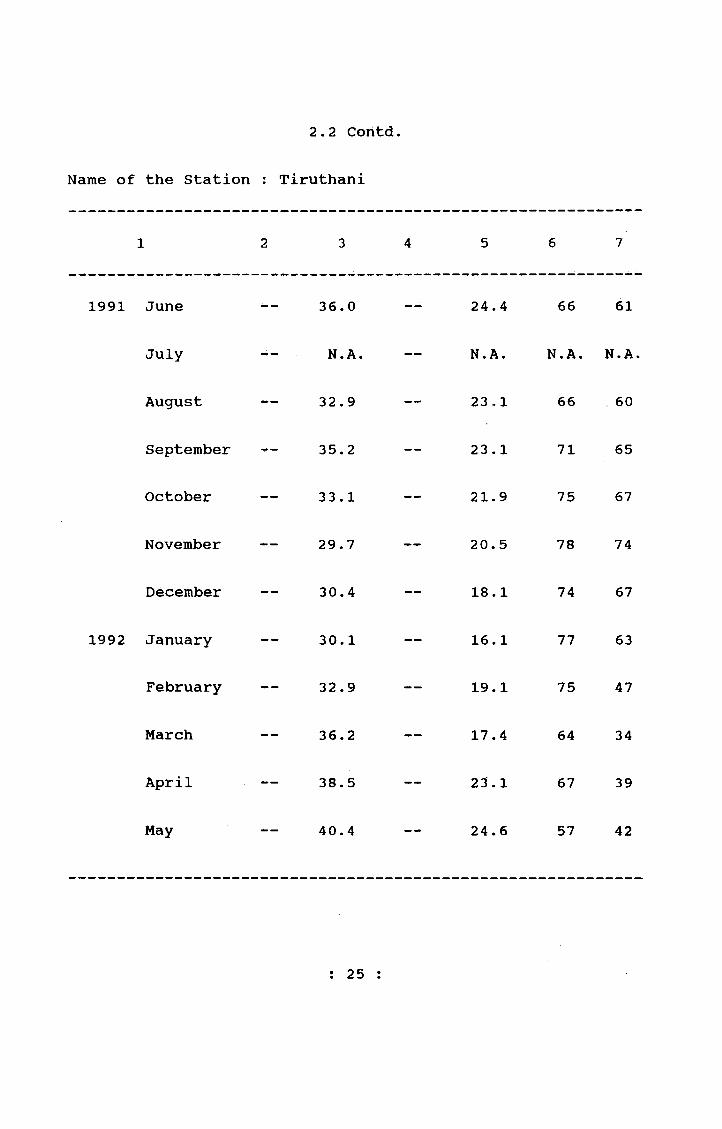
2.2 Coritd
Name of the Station : Tiruthani
1 2 3 4 5 6 7
1991 June •— 36.0 24.4 66 61
July N.A. — N.A. N.A. N.A.
August — 32.9 — 23.1 66 60
September 35.2 — 23 .1 71 65
October — 33.1 — 21.9 75 67
November — 29.7 — 20.5 78 74
December — 30.4 — 18.1 74 67
1992 January — 30.1 — 16.1 77 63
February — 32.9 — 19.1 75 47
March — 36.2 — 17.4 64 34
April — 38.5 — 23 .1 67 39
May -- 40.4 — 24.6 57 42
: 25 :

2 o 2 Cbntd
Name of the Station ; Cuddalore
1 2 3 4 5 6 7
1991 June 36.9 36.2 27.0 25.7 72 67
July 35.4 3 6.5 26.1 26.0 65 54
August 34.5 35.0 25.4 26,1 71 61
September 33.8 33.4 25.1 24*3 73 71
October 31.5 32.1 24.3 24.0 82 77
November 29.0 29.9 22.8 23.0 8S 81
December 27.9 29.0 21.5 21.5 85 75
1992 January 27o9 29.0 20.8 19.9 85 69
February 29.0 30.7 21.2 21.2 83 68
March 30.8 32.0 . 22.9 20.5 80 67
April 32.8 33.9 25.7 25.6 76 74
May 35.7 36.0 27.1 27.1 69 71
: 26 :
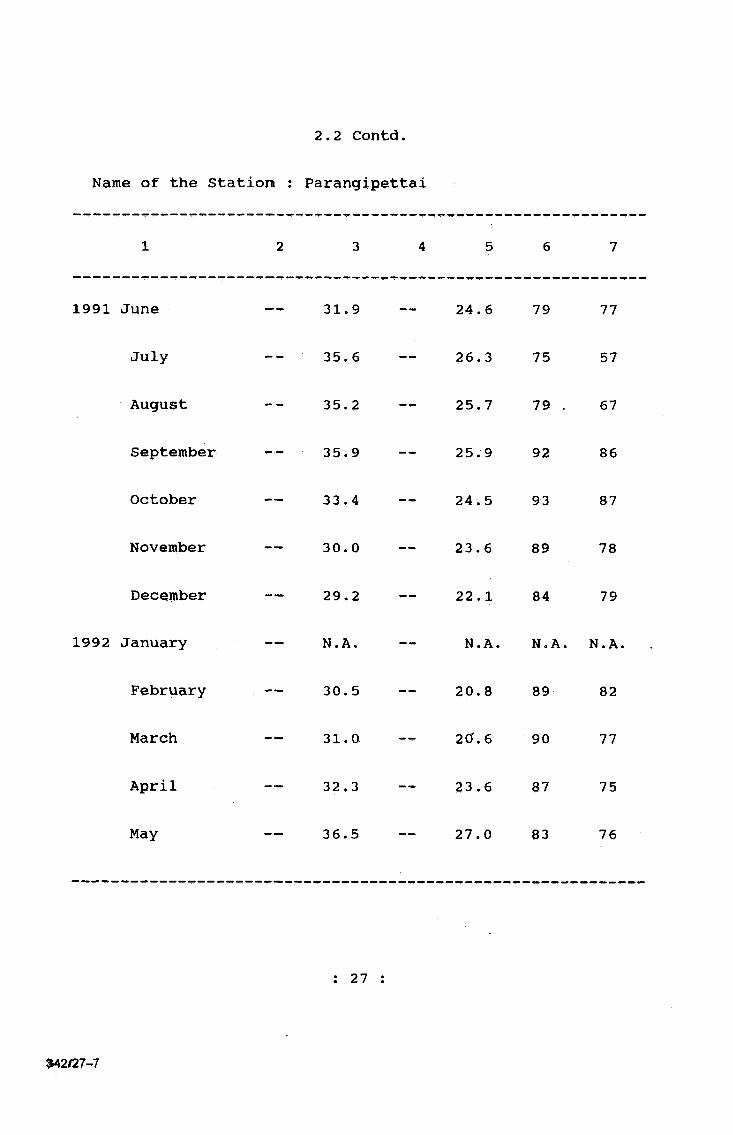
2.2 Contd.
Name of the Station : Parangipettai
1 2 3 4 5 6 7
1991 June — 31.9 — 24.6 79 77
July -- 35.6 — 26.3 75 57
August 35.2 25.7 79 . 67
September — 35.9 — 25.9 92 86
October 33.4 — 24.5 93 87
November — - 30.0 — 23.6 89 78
December — 29.2 — 22.1 84 79
1992 January — . N.A. . — N.A. N.A. N.A.
February — 30.5 — 20.8 89 82
March — 31.0 20'. 6 90 77
April — 32,3 — 23.6 87 75
May — 36.5 — 27.0 83 76
: 27
42/27-7

2.2 Contd
Name of the Station : Vellore
1 2 3 4 5 6 7
1991 June 36.0 35.6 26.3 25.9 70 59
July 34.3 34.6 25.5 25.3 68 55
August 34.1 33.6 25.0 24.4 71 59
September 33.5 34.4 24.4 24.0 76 59
October 31.8 32.3 23.7 22.6 82 66
November 29.9 28.8 20.7 20.9 89 75
December 28.1 29.0 18.7 18.9 86 57
1992 January • 28.5 29.0 18.2: 16.8 86 49
February 31.6 33.2 19.2: 20.3 83 44
March 34.5 36.4 21.4: 18.4 66 25
April 3 6.8 38.2 > 25.0) 23.9 70 37
May 38.4 38.8 26.6; 25.7 62 43
: 28 :

2.2 Contd
Name of the Station : Tirupattur
1 2 3 4 5 6 7
1991 June 34.9 ; 33.3 23.7 24.2 77 70
July 32.9 33.1 23.0 24.0 71 64
August 33 .4 33.0 22 o 9 23.4 71 59
September 32.9 33.8 22. 3 23.4 . .77 75
October 30,6 31.7 21.5 21.8 84 79
November 28.9 34.3 19.4 20.2 89 83
December 28.4 29.6 17.6 18.3 88 ■76
1992 January 29.5 30.6 17.3 15.9 94 78
February 32.5 34.8 17.5 19.4 93 83
March 35.4 38.1 19.6 18.2 90 76
April 36.5 38.9 23.1 23,6 82 67
May 36.5 38.0 24.1 24.7 65 58
: 29
342#27-7a
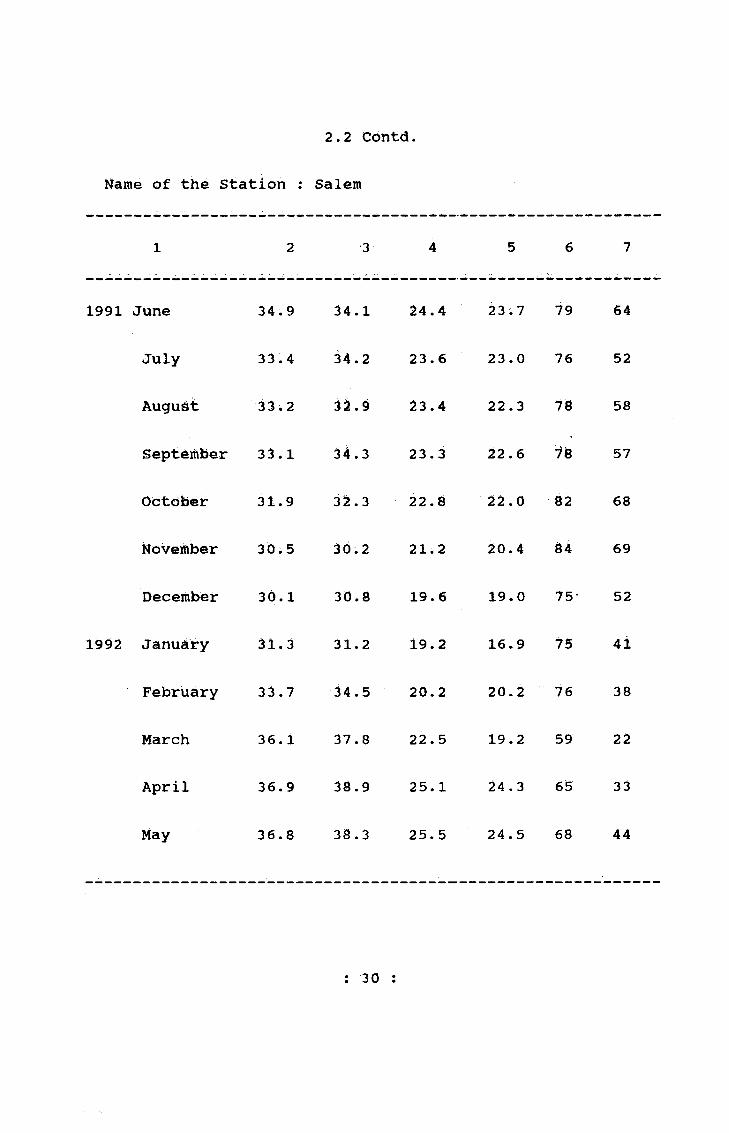
2.2 contd
Name of the Station : Salem
1 2 3 4 5 6 7
1991 June 34.9 34.1 24.4 23.7 79 64
July 33.4 34.2 23.6 23.0 76 52
August 33i2 3^.9 23.4 22.3 78 58
September 33.1 : 4.3 2 3.3 22.6 78 57
OCtOber 31.9 3^.3 22.8 22.0 ^ 2 68
November 30^5 30.2 21.2 20.4 84 69
Deceihber 30.1 30.8 19.6 19.0 73- 52
1992 Januairy 31*3 31.2 19.2 16.9 75 41
February 33.7 34.5 20.2 20.2 76 38
March 36.1 37.8 22.5 19.2 59 22
April 36.9 38.9 25.1 24.3 65 33
May 36.8 38.3 25.5 24.5 68 44
: 30 :

2.2 Contd.
Name of the Station t Mettur Daiti (RS)
1 2 3 4 5 6 7
1991 Jurie 34 .9 34.2 24.4 25.2 75 58
July 33 .4 34.0 23.6 24.9 70 50
August 33 .2 33.5 23.4 24.6 71 51
September 33 .1 33.6 23.3 23.6 69 53
October 31.9 29.6 22.8 21.4 70 59
November 30.5 30.7 21.2 22.4 78 65
December 30.x 30.7 19.6 20.9 72 50
1992 January 33.1 30.2 19.2 19.1 69 37
February 33.7 34.7 20.2 22.9 65 30
March 36.1 37.5 22.5 22.7 .53 21
April 36.9 38.7 25.1 26.4 60 29
May 36.8 38.3 25.5 26.6 63 44
: 31 :
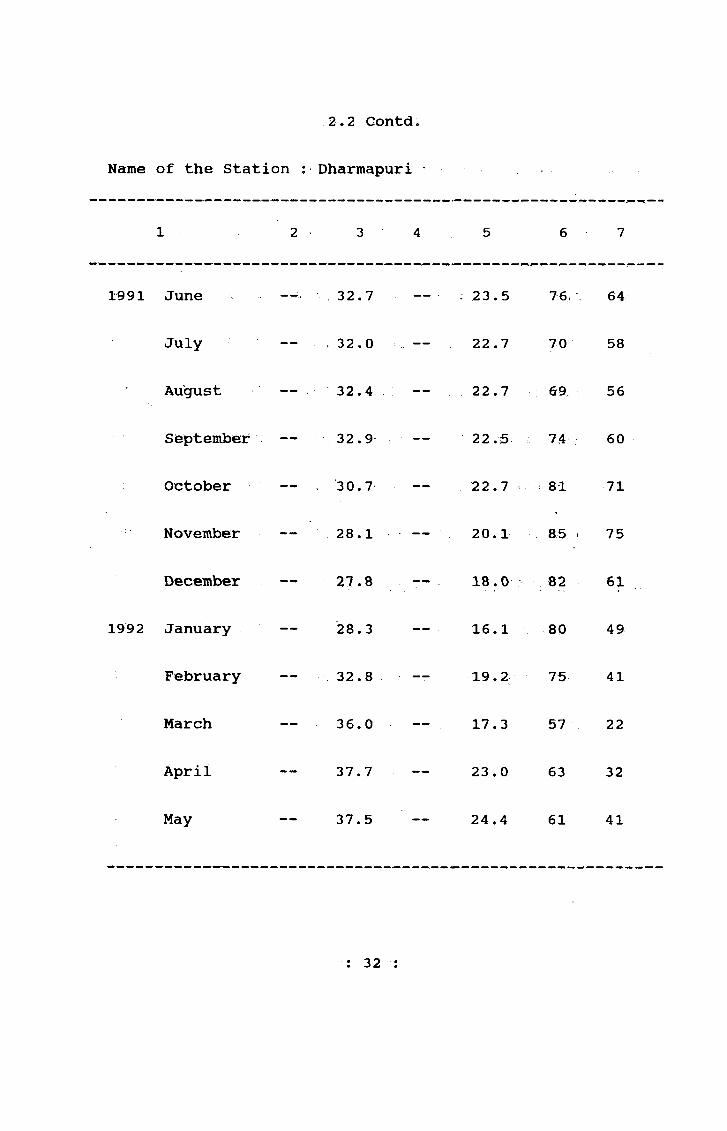
2.2 Gontd
Name of the Station ; Dharmapuri
1 2 3 4 5 6 7
1991 June — - 32.7 — : 23.5 76. 64
July . 32.0 — 22.7 70 58
August — - 32.4 . . — 22.7 69 56
Sieptember — 32.9 — ■ 22.5 74 60
October — , 30.7 . — 22.7 81 71
November — 28.1 - — ‘ 20.1 85 < 75
December — 27.8 - — . 18.0 82 61
1992 January — 28.3 , --: 16.1 80 49
February .32.8 : — 19.2 75 41
March — 36.0 -- 17.3 57 22
April — 37.7 -- 23.0 63 32
May — 37.5 ----- 24.4 61 41
: 32 :
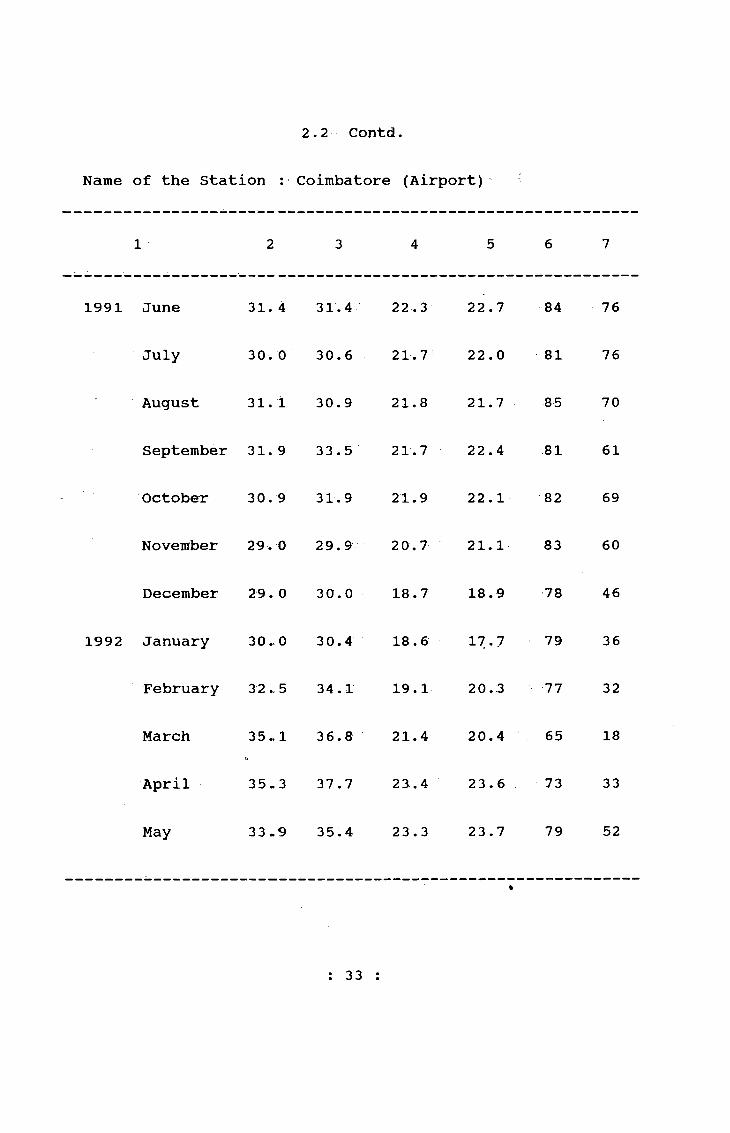
2.2 Gontd.
Name of the Station ; Coimbatore (Airport)
1 2 3 4 5 6 7
1991 June 31. 4 31.4 22.3 22.7 84 76
July 30. 0 30.6 21.7 22.0 81 76
- August 31.1 30.9 21.8 21.7 85 70
September 31.9 33.5 21.7 22.4 81 61
October 30. 9 31.9 21.9 22.1 82 69
November 29. 0 29.9 20.7 21.1 83 60
December 29. 0 30.0 18.7 18.9 78 46
1992 January 30., 0 3 0.4 18.6 17.7 79 36
February 32 .. 5 34.1 19.1 20.3 77 32
March 35 »1 36.a 21.4 20.4 65 18
April 35.3 37.7 23.4 23.6 73 33
May 33-9 35.4 23 .3 23.7 79 52
: 33 :

2.2 Contd.
Name of the Station : Udhagfainandalain
1991 ^une 18,0 18.7 11.1 12.3 87
July 16.4 1'6.6 10,9 11.2 90 85
August 17.3 17,0 10.9 11,1 90 88
September 18.2 1’9.8 10.4 10,3 83 83
= October 18.7 U8.8 10.0 10.1 87 83
November 18.9 1I9,Q 8.3 8.6 88 82
December 19.7 2 2.0 6.3 6.1 66 63
1992 January 19.9 2;2.9 5.1 5.1 47 48
February 20.6 2;2.1 6.3 5.8 77 59
March 21.9 2!5,1 8.4 8.7 31 34
April 22.1 24.1 10.2 10.1 56 53
May 21.8 22.9 11.2 10.9 73 75
: 34 :
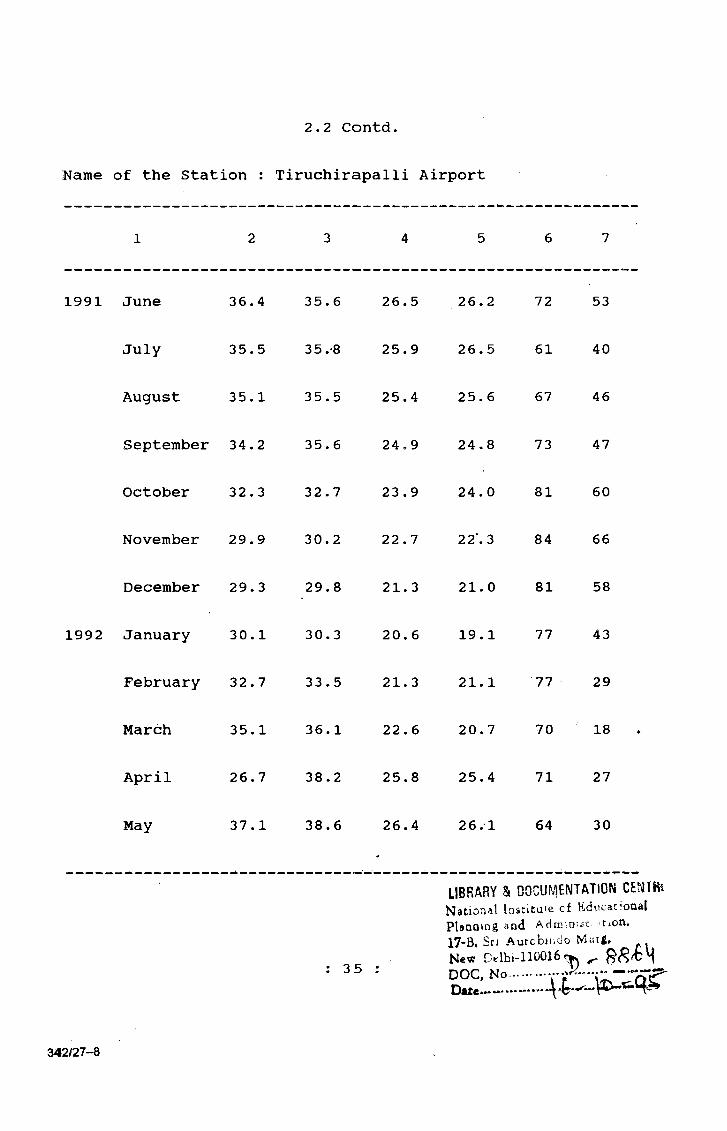
2.2 Contd.
Name of the Station : Tiruchirapalli Airport
1991 June 36.4 35.6 26.5 26.2 72 53
July 35.5 35.*8 25.9 26.5 61 40
August 35.1 35.5 25.4 25.6 67 46
September 34.2 35.6 24,9 24.8 73 47
October 32.3 32.7 23.9 24.0 81 60
November 29.9 30.2 22.7 22'. 3 84 66
December 29.3 29.8 21.3 21.0 81 58
1992 January 30.1 30.3 20.6 19.1 77 43
February 32.7 33.5 21.3 21.1 77 29
March 35.1 36.1 22.6 20.7 70 18
April 26.7 38.2 25.8 25.4 71 27
May 37.1 38.6 26.4 26.1 64 30
3 5 :
LIBRARY & DOCUiV|ENTAT!ON CEMfRi
National lascitu'e of Educatiooal
PlanQing and Adtnimst dfion.
17-B» Sri Aurobindo M ati,N«w D.lhi-1100l6r:|. ^D O C , N o ..........V p
Date-*-----
342/27-8
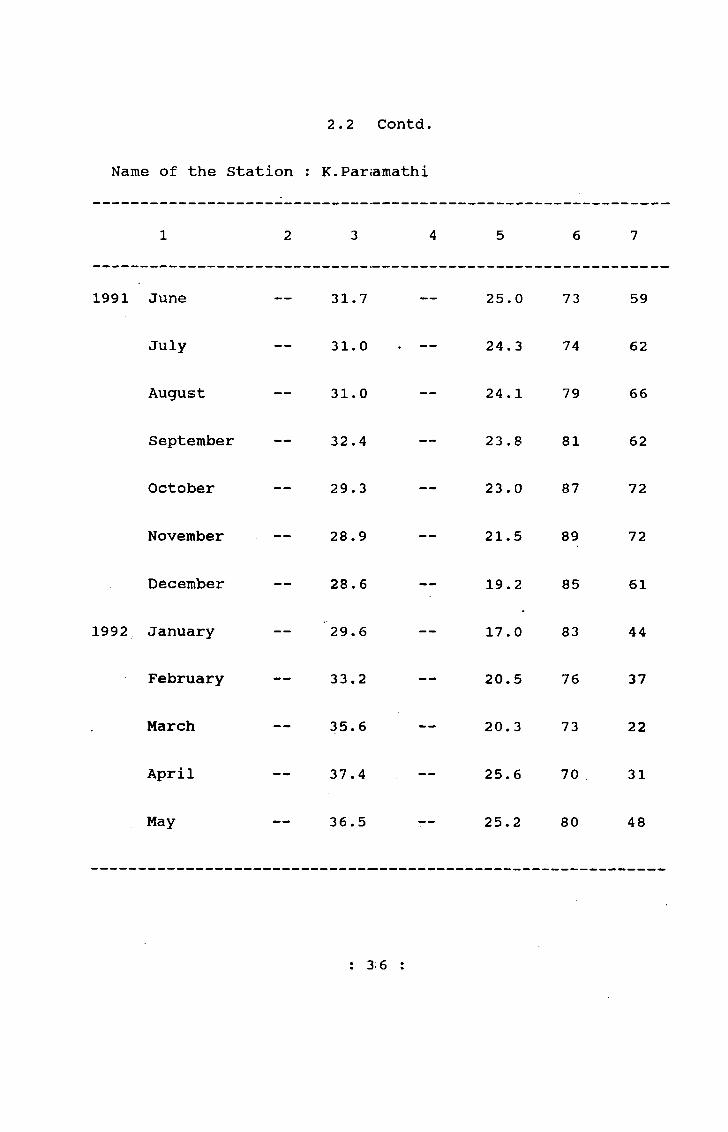
2 . 2 Contd.
Name of the Station : K.Pariamathi
1 2 3 4 5 6 7
1991 June — 31.7 — 25.0 73 59
July — 31.0 . — 24.3 74 62
August — 31.0 — 24.1 79 66
September — 32.4 — 23 .8 81 62
October — 29.3 — 23.0 87 72
November — 28.9 — 21.5 89 72
December — 28.6 — 19.2 85 61
1992 January — 29.6 — 17.0 83 44
February — 33.2 — 20.5 76 37
March — 35.6 — 20.3 73 22
April — 37.4 — 25.6 70 31
May — 36.5 25.2 80 48
: 36 :

2.2 Contd
Name of the Station ; Thanjavur
1 2 3 4 5 6 7
1991 June — 36.8 — 26.8 75 54
July — 36.3 — 26o4 65 50
August — 3 5.7t
— 25.9 74 44
September — N.A. — N.A. N.A. N.A.
October N.A. — N.A. N.A. N.Ao
November — 29.8 — 22.1 91 78
December — 29.7 21.3 88 68
1992 January — 30.4 — Ji.6 84 53
February — 33.3 — 21.5 87 50
March — 35.9 — 21.3 83 39
April — 37.9 — 26.0 84 54
May — N.A. — N.A. N.A. N.A.
: 37
342/27-8a
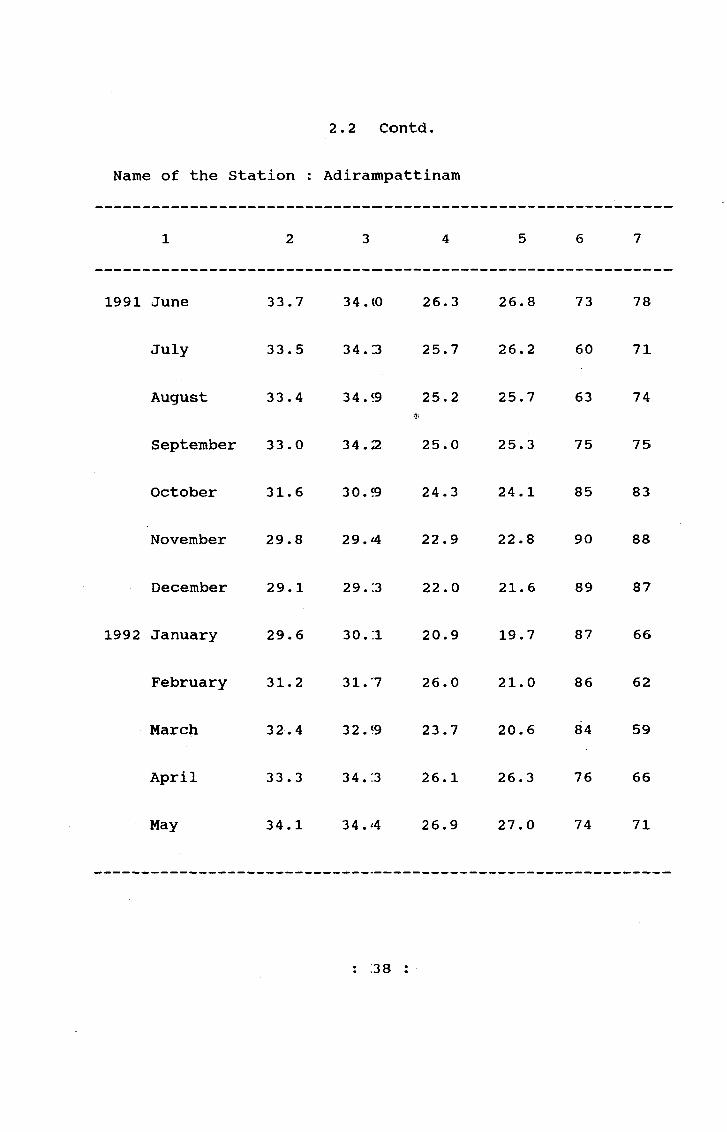
2.2 Contd.
Name of the Station ? Adiraimpattinam
1 2 3 4 5 6 7
1991 June 33.7 34.(0 26.3 26.8 73 78
July 33.5 34.3 25.7 26.2 60 71
August 33.4 34. «9 25.2m .
25.7 63 74
September 33.0 34.2 25.0 25. 3 75 75
October 31.6 30.?9 24.3 24.1 85 83
November 29.8 29.4 22.9 22.8 90 88
December 29.1 29.13 22.0 21.6 89 87
1992 January 29.6 30. :i 20.9 19.7 87 66
February 31.2 31.'7 26.0 21.0 86 62
March 32.4 32. ?9 23.7 20.6 84 59
April 33.3 34.3 26.1 26.3 76 66
May 34.1 34.4 26.9 27.0 74 71
: :38
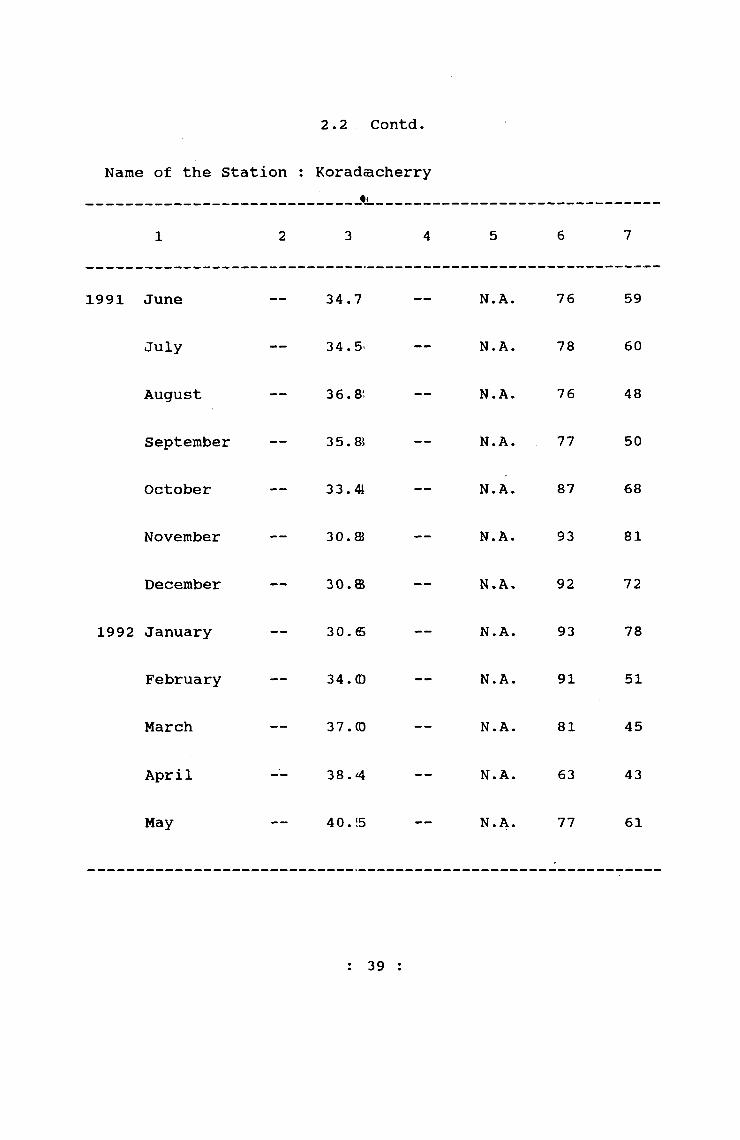
2. 2 Contd.
Name of the Station ; Koradacherry
1 2 3 4 5 6 7
1991 June — 34.7 — N.A. 76 59
July — 34.5. — N.A. 78 60
August — 36.8'. — N.A. 76 48
September — 35.8} — N.A. 77 50
October — 33.4i — N.A. 87 68
November — 30.ffi — N.A. 93 81
December — 30.® — N.A. 92 72
1992 January — 30.6 — N.A. 93 78
February — 34.® — N.A. 91 51
March — 37.(0 — N.A. 81 45
April — 38.4 — N.A. 63 43
May — 40.5 — N.A. 77 61
39 :
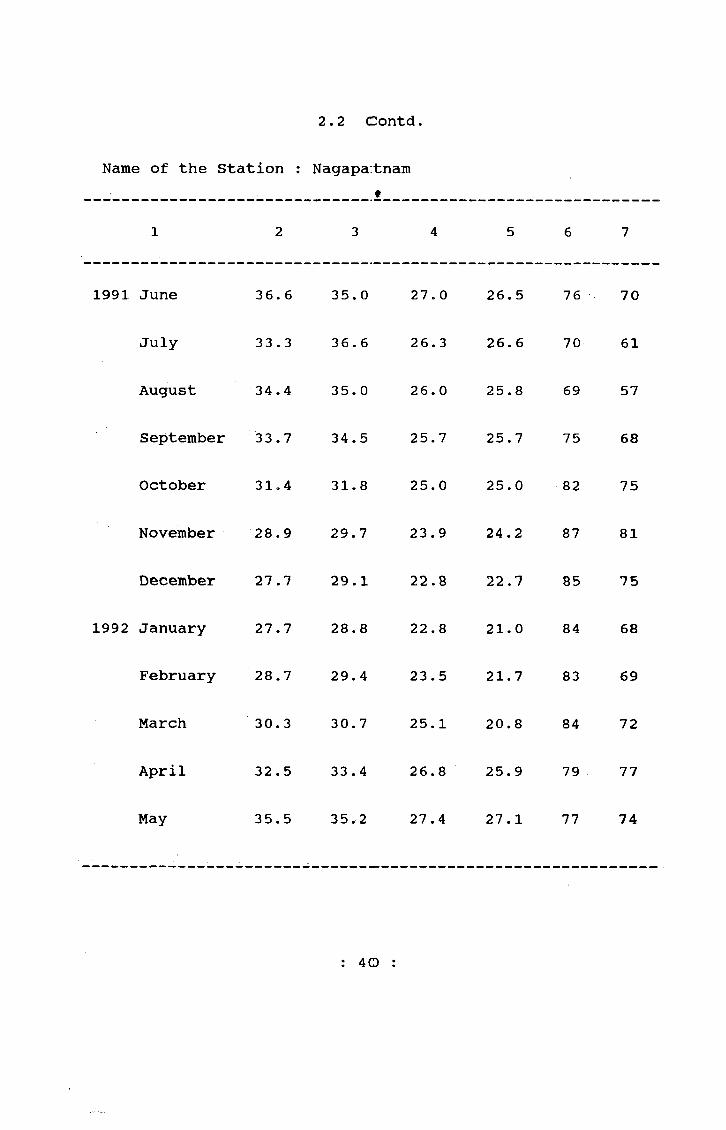
2 . 2 Contd.
Name of the Station : Nagapatnain
1 2 3 4 5 6 7
1991 June 3 6.6 35.0 27.0 26.5 76 70
July 33.3 36.6 26.3 26.6 70 61
August 34.4 35.0 26.0 25.8 69 57
September 33.7 34.5 25.7 25.7 75 68
October 31.4 31.8 25.0 25.0 82 75
November 28.9 29.7 23.9 24.2 87 81
December 27.7 29.1 22.8 22.7 85 75
1992 January 27.7 28.8 22.8 21.0 84 68
February 28.7 29.4 23.5 21.7 83 69
March 30.3 30.7 25.1 20.8 84 72
April 32.5 33.4 26.8 25.9 79 77
May 35.5 35.2 27.4 27.1 77 74
: 40 :
2.2 Contd.
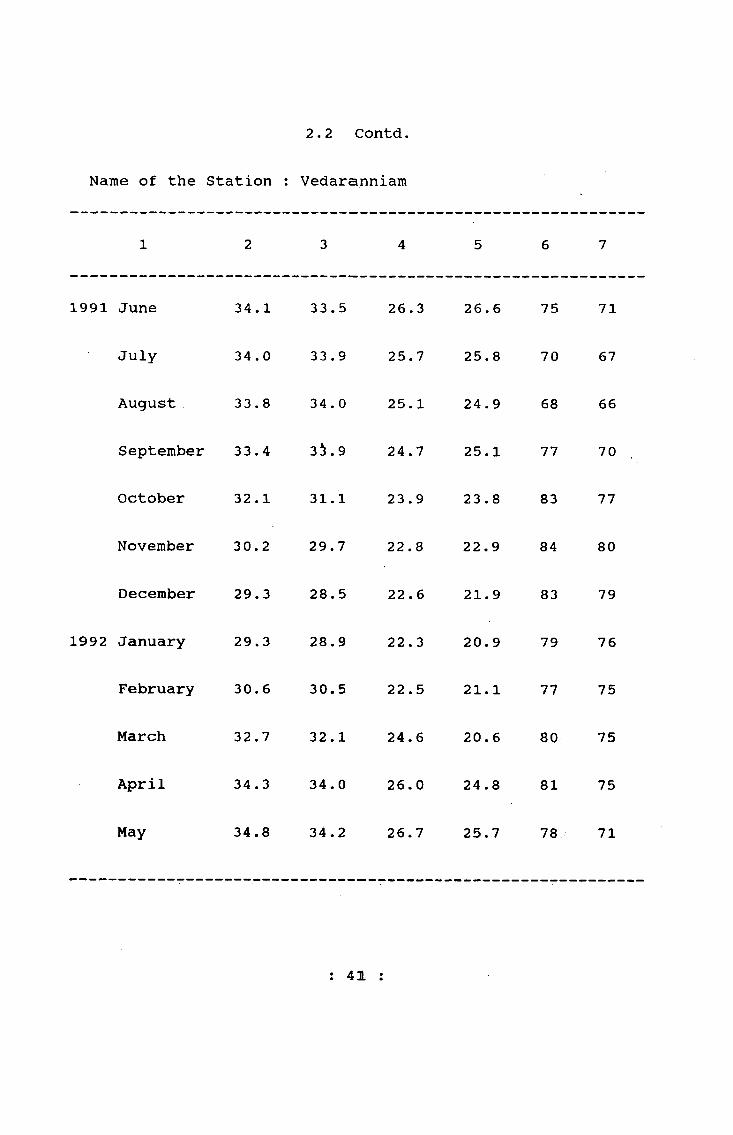
Name of the Station : Vedaranniam
1 2 3 4 5 6 7
1991 June 34.1 33.5 26.3 26.6 75 71
July 34.0 33.9 25.7 25.8 70 67
August 33 . 8 34 . 0 25.1 24.9 68 66
September 33.4 3^.9 24.7 25.1 77 70
October 32 . 1 31.1 23.9 23.8 83 77
November 30.2 29.7 22.8 22.9 84 80
December 29.3 28.5 22.6 21.9 83 79
1992 January 29.3 28.9 22.3 20.9 79 76
February 30.6 30.5 22.5 21.1 77 75
March 32.7 32.1 24.6 20.6 80 75
April 34.3 34.0 26.0 24.8 81 75
May 34.8 34.2 26.7 25.7 78 71
: 41 :
2.2 Contd.
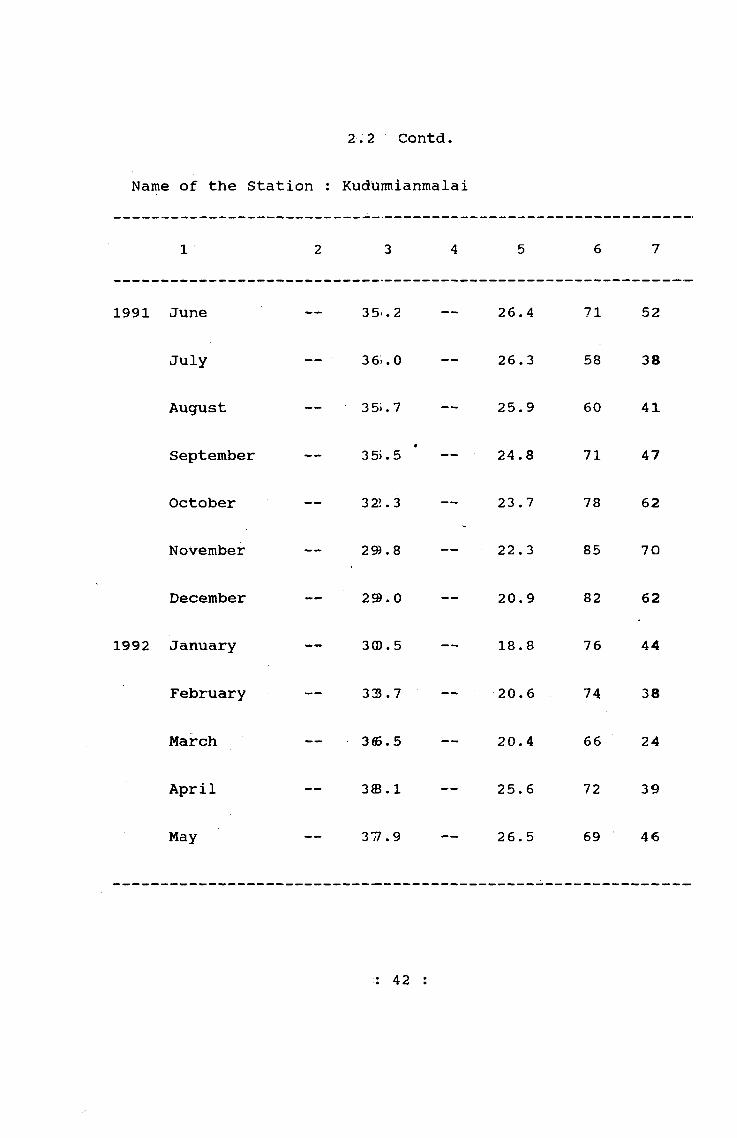
Name of the Station : Kuduimianmalai
1 2 3 4 5 6 7
1991 June — 35..2 — 26.4 71 52
July — 3 6S.0 — 26.3 58 38
August — 35>.7 — 25.9 60 41
September — 3 55.5 — 24.8 71 47
October — 32>.3 — 23 .7 78 62
November — 2^.8 — 22.3 85 70
December — 2S9.0 — - 20.9 82 62
1992 January — 30.5 — 18.8 76 44
February --- 33.7 — 20.6 74 38
March — 3©.5 — 20.4 66 24
April 3S.1 — 25.6 72 39
May — 377 .9 — 26.5 69 46
42 :
2.2 Contd.
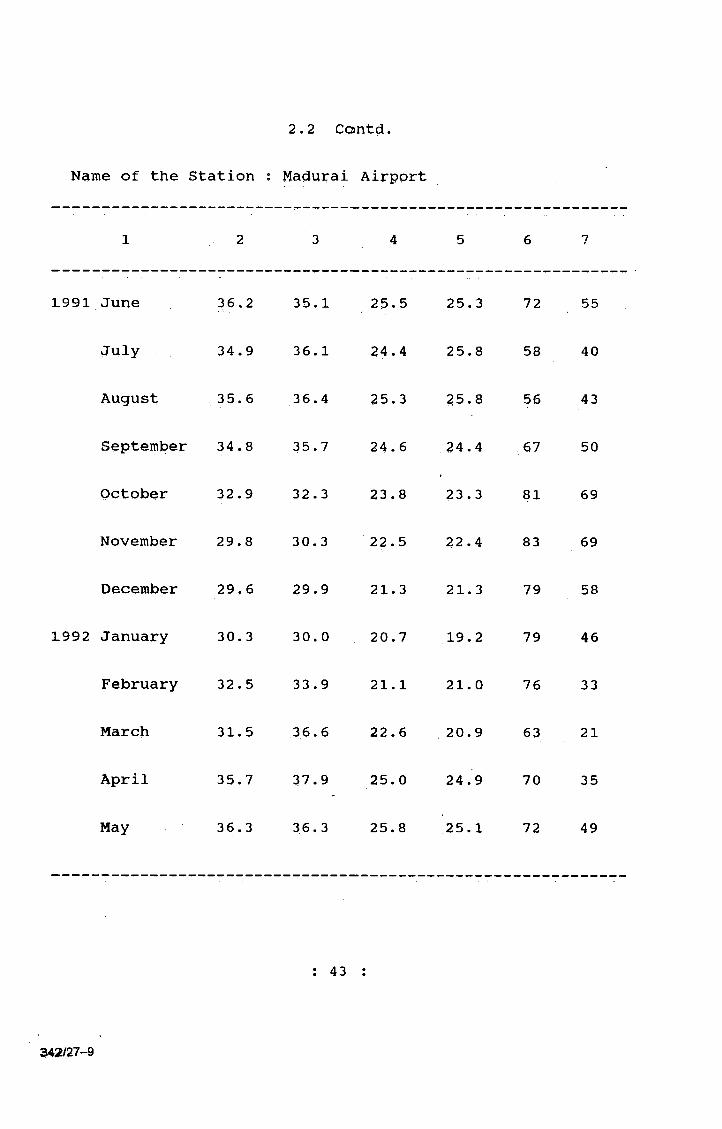
Name of the Station : Maclurai Airport
1 2 3 4 5 6 7
1991 June 36,2 35. 1 25.5 25. 3 72 55
July 34.9 36.1 24.4 25.8 58 40
August 35.6 36.4 25.3 25.8 56 43
September 34.8 35.7 24.6 24 .4 67 50
October 32.9 32.3 23.8 23.3 81 69
November 29.8 30.3 22.5 22.4 83 69
December 29,6 29.9 21.3 21.3 79 58
1992 January 30.3 30.0 20.7 19.2 79 46
February 32.5 33.9 21.1 21.0 76 33
March 31.5 36.6 22.6 20.9 63 21
April 35.7 37.9 25. 0 24.9 70 35
May 36.3 36.3 25.8 25.1 72 49
: 43
342/27-9
2 , 2 Coontd,
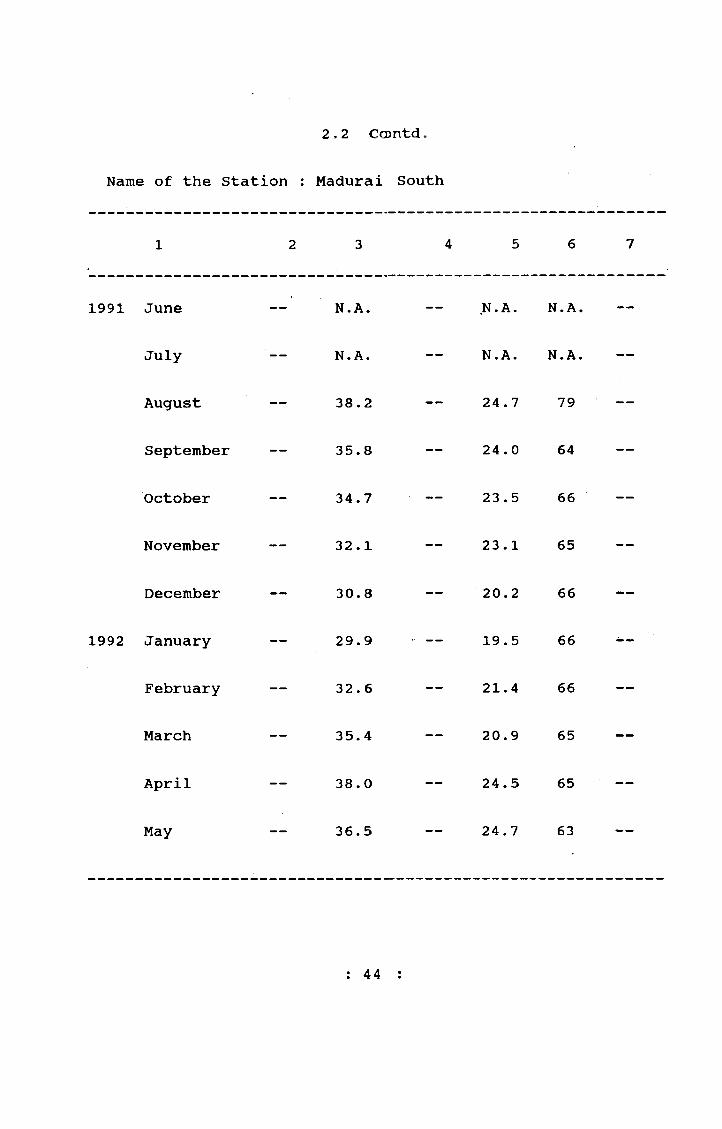
Name of the Station : Madurai South
1 2 3 4 5 6 7
1991 June — N.A. — N.A. N.A. —
July — N.A. N.A. N.A. —
August — 38.2 — 24.7 79 —
September — 35.8 — 24.0 64 —
October — 34.7 23.5 66 —
November 32.1 — 23.1 65 —
December — 30.8 — 20.2 66 —
1992 January — 29.9 — 19.5 66 —
February — 32. 6 — 21.4 66 —
March — 35.4 — 20.9 65 —
April — 38.0 — 24.5 65 —
May — 36.5 — 24.7 63 —
: 44

2.2 Contd
Name of the Station : DindLgul
1 2 3 4 5 6 7
1991 June — 33 . 5 — 23.5 71 61
July — 33.5 — 23.7 62 48
August — 33.5 — 23 . 3 64 51
September — 34.5 — 22.3 73 57
October — 31,0 — 21.4 82 75
November — 29.0 20.0 83 74
December — 28.5 18.4 77 58
1992 January — 29.8 — 16.2 71 41
February — 33.8 18.6 68 32
March — 36.4 — 19.3 63 20
April — 37.5 — 23.3 69 34
May — 36.3 — 23.8 69 45 ‘
45
342/27-9a
2.2 Contd
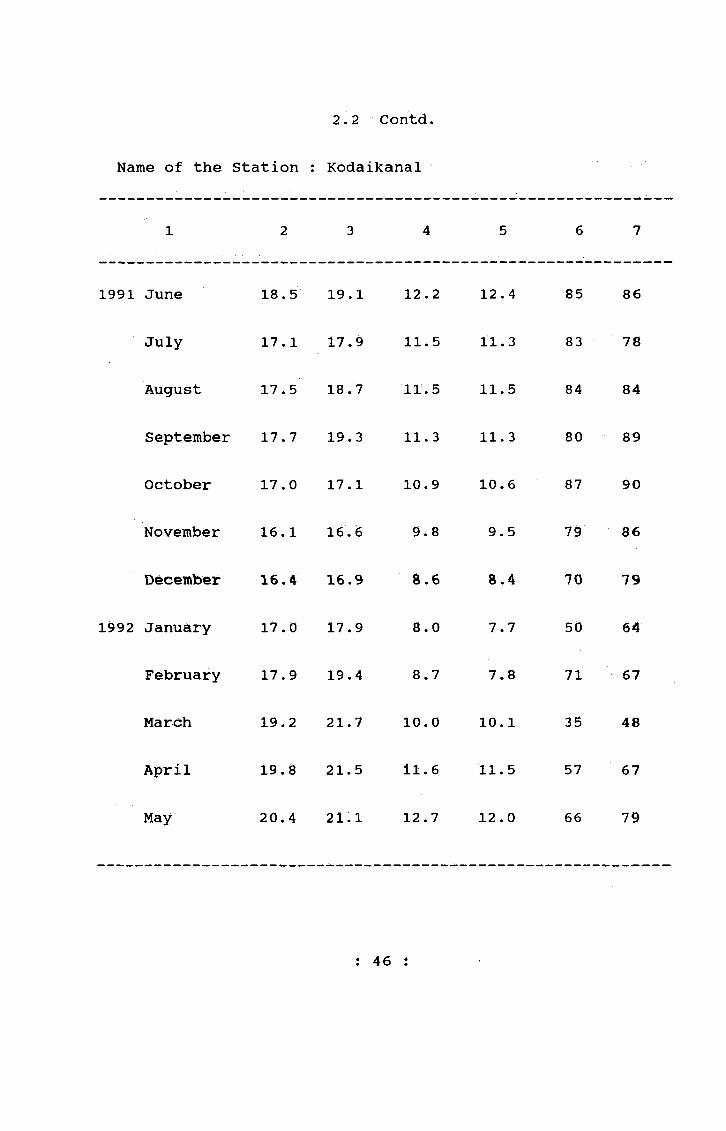
Name of the Station : Kodaikanal
1 2 3 4 5 6 7
1991 June 18.5 19.1 12.2 12.4 85 86
July 17.1 17.9 11.5 11.3 83 78
August 17.5 18.7 11.5 11.5 84 84
September 17.7 19.3 11. 3 11.3 80 89
October 17.0 17.1 10.9 10.6 87 90
November 16.1 16.6 9.8 9.5 79 86
December 16.4 16.9 8.6 8.4 70 79
1992 January 17.0 17.9 8.0 7.7 50 64
February 17.9 19.4 8.7 7.8 71 67
March 19.2 21.7 10.0 Id. 1 35 48
April 19.8 21.5 il.6 11.5 57 67
May 20.4 21.1 12.7 12.0 66 79
J 46 J
2.2 Contd
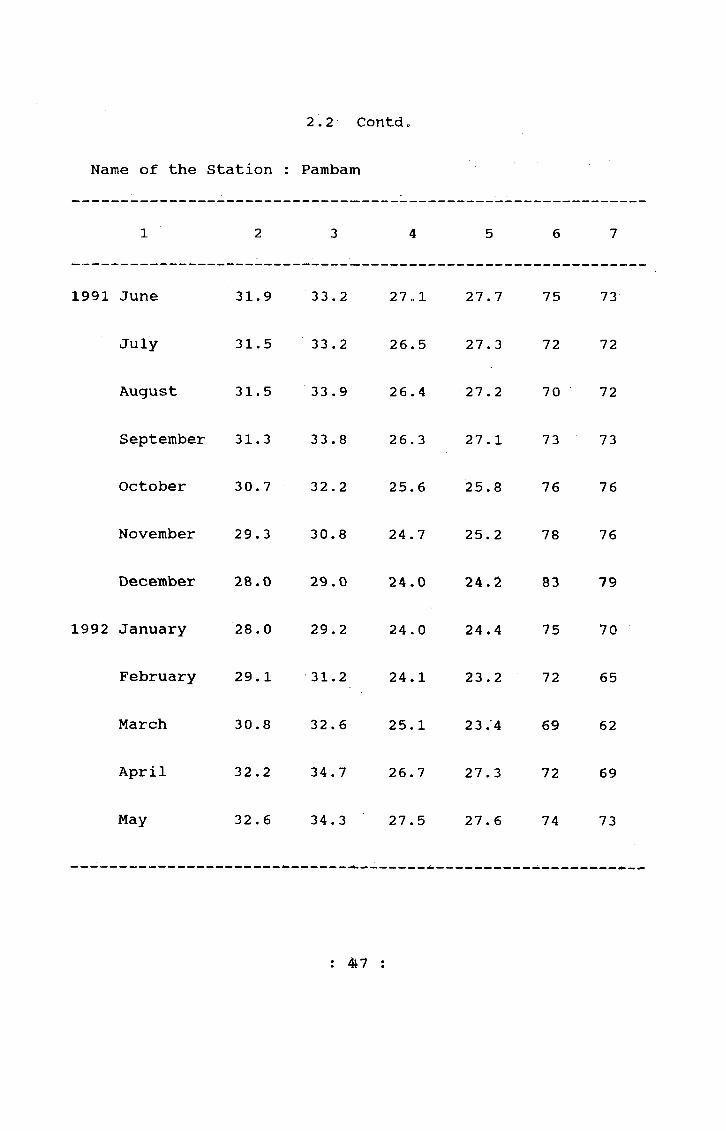
Name of the Station : Pambam
1 2 3 4 5 6 7
1991 June 31,9 33.2 27.1 27.7 75 73
July 31.5 33.2 26.5 27.3 72 72
August 31.5 33.9 26.4 27 . 2 70 72
September 31.3 33.8 26.3 27. 1 73 73
October 30.7 32.2 25.6 25.8 76 76
November 29.3 30.8 24.7 25.2 78 76
December 28.0 29.0 24.0 24.2 83 79
1992 January 28. 0 29.2 24.0 24.4 75 70
February 29.1 31.2 24.1 23.2 72 65
March 30.8 32.6 25.1 2 3.'4 69 62
April 32.2 34.7 26.7 27. 3 72 69
May 32.6 34.3 27.5 27. 6 74 73
: 47 :

2.2 Contd
Name of the Station : Tondi
1 2 3 4 5 6 7
1991 June 33.3 33.7 26.1 26.0 74 74
July 33.1 34.3 25.8 25.6 67 72
August 32.7 32 .9 25.9 25.4 66 77
September 32.8 32.5 25.6 25. 0 71 79
October 31.0 31.0 24.8 23.9 81 80
November 29.7 30.0 23.3 22.5 85 79
December 29.5 29.3 22.4 21.6 84 77
1992 January 29.2 29.8 21.9 19.6 79 73
February 29.8 29.8 22.7 21.8 77 71
March 30.7 30.6 24.9 22.1 72 68
April 32.0 32.4 26.7 25.9 73 74
May 33.3 32.9 26.7 26.0 74 76
: 4 8 :
2.2 Contd.
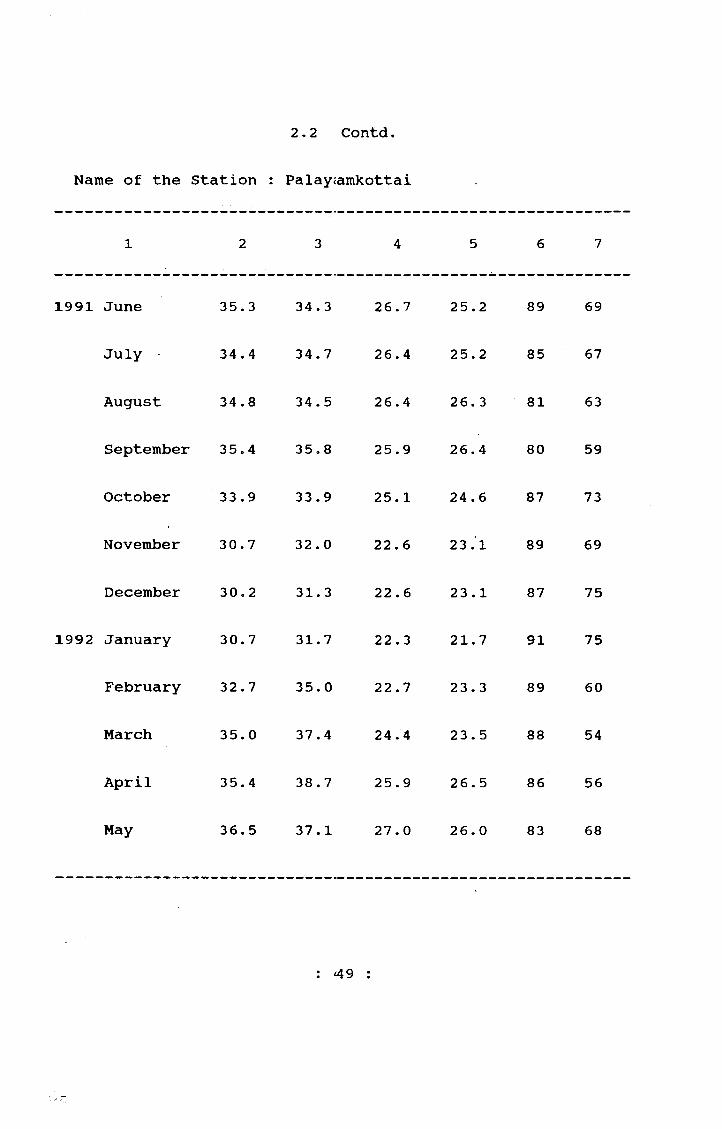
Name of the Station ; Palay<amkottai
1 2 3 4 5 6 7
1991 June 35.3 34.3 26.7 25.2 89 69
July 34.4 34.7 26.4 25.2 85 67
August 34.8 34.5 26.4 26.3 81 63
September 35,4 35,8 25.9 26.4 80 59
October 33.9 33.9 25.1 24.6 87 73
November 30.7 32.0 22.6 23 .1 89 69
December 30.2 31.3 22.6 23 .1 87 75
1992 January 3 0.7 31.7 22 .3 21.7 91 75
February 32.7 35.0 22 .7 23.3 89 60
March 35.0 37.4 24.4 23.5 88 54
April 35.4 38.7 25.9 26.5 86 56
May 36.5 37.1 27.0 26.0 83 68
: 49 :

2.3 Contd.
Name of the Station : Tuticorin Port
1 2 3 4 5 6 7
1991 June 35.5 34.0 2^. 8 215.1 76 68
July 34.4 : 35.8 .36.5 24 .7 73 63
August 34.5 3 5. 5 26. 3 25,4 65 55
September 33.9 34 , 5 26.0 24.7 67 67
OctojDer 31.9 32.0 25.1 23.4 76 73
November 29. 1 3 0.4 23.8 22.5 83 . 76
December 27.8 29.6 22.6 21.7 83 75
1992 January 27. 6 29.9 2 2.3 20.0 81 71
February 28.2 30. 6 23.0 21.3 78 68
March 27. 7 31.8 23.9 21.3 77 67
April 31.9 33 .7 26.5 24.9 74 74
May 34.3 34.1 26.9 24.3 74 73
: 50

2 . 2 Contd.
Name of the Station ; Kaniniyakumari
1 2 :3 4 5 6 7
1991 June 30.3 29 .2 24.3 24 . 6 91 86
July 29.7 29 . 0 23.8 24.'7 87 83
August 30.4 29,.8 24.0 24.6 81 80
September 30.3 31« 3 24.2 25.2 77 82
October 30.5 30.. 3 24.2 24.4 84 86
November 30.3 3 0.. 1 23.9 24 . 2 80 75
December 30.2 30.. 1 23.6 23.4 73 67
1992 January 30.6 30„8 23.3 23.2 66 62
February 31.4 31.. 0 23.6 23.5 69 67
March 32.0 32.. 0 24.9 24.4 67 67
April 32.4 33 .. 1 25.8 26.4 73 72
May 32.4 31..8 25.9 26.6 80 79
Source : Director, Regionail Metrological Centre, Madras
n 51 :
J42/27-10

AREA AND) POPULATION3el AREA AND POPULiATION BY DISTRICT/TALUKS
(1991 Census)SI, District Area TalukNo. (Sq.Km.) Total
1o Madras2. Chengal-
pattu
174 3841396
Population Rural Urban
3841396
7857 1.Gummudipoondi 14 3 5132.Ponneiri 28913 03 .UttukRottai 1280634.Tiruvallur 2965515.Tirutttani 171517 e.Pallipattu 1643107. Kancheepuram 3874508. Sripeiruinbudur 593 3859.Saidag)et 1410492
10. Chengalpet 50504411.Uttiramerur 13278712 . Madurantakam 24708213,Cheyyar 184269
Total 46535933. South Arcot
10895
139111237333128063247188137154135255199076250445177752408237111219220135174615
2565583
440251797
493633436329055
188374342940
12327409680721568269479654
2088010
1 .Gingee2.Tindiwanam3.Vanur4. Villupuram5.Tirukkoyilur 346220
:: 52 :
4878433366504393875153542570532
4109803 768630365504332296 61579153542481744 88788318018 28202

3«1 Contd,
1 2 3 4 5 6 7
6.Kallakkuri chi 652297 624403 278947. Ulundurpet-tai 273204 273204 —S.Punruti 497158 278363 2187959.Cuddalore 459540 286900 172640
10.Virudhachalam 335775 274147 6162811.Tittakudi 208099 208099 —
12.Chidambaram 397153 288049 10910413.Kattumannar-
koil 225034 225034 —
4. North ArcotAmbedkar 6077 3026432 2066718 959714
1.Arakkonam 414881 321371 935102.Walajapet 361619 244039 1175803.Gudiyattam 573488 391687 1818014 .Vellore 557816 283417 2743995 .Arcot 216051 170846 452056.Vaniyambad i 477830 309612 1682187.Tiruppatthur 424747 345746 79001
: 53
342/27-1 Oa

3 . 1 Contd.
1 2 3 4 5 6 7
5. Thiruvannamalai Sambuvarayar
6191 2042979 1800051 2429281. Cheyyar 303680 272470 312102.Vandavasi 305237 280659 245783.Arani 244316 189418 548984.Poluir 375610 352564 230465.Tiruvanna-
malai 453049 343853 1091966. Chengam 361087 361087 —
6.Salem 8649 — 3896382 2760320 1136062l.Yercaud 32500 32500 —2.0maliar 345625 315946 296793.Mettiur 320372 248362 720104. Sankari 360406 319216 4.11905. Saleim 1029230 393564 6356666.Attur 485534 422867 55667T.Rasijpuram 277330 214924 624068. Tiruchengodu 447761 253355 1944069.Namalkkal 419857 374819 45038
10. Paraimathivelurl77767 177767 —
: 54 ;

3.1 Contd.
1 2 3 4 5 6 7
7. Dharmapuri9622 2428596 2197921 230675
1.Hosur 274048 232309 417392. Denkanikata 271325 252416 189093.Krishnaglri 554297 479263 750344 .Uttangarl 205343 205343 —5.Harur 363705 343883 198226.Palakkodui 256012 240159 158537. Pennagaram 180820 180820 —8. Dharmapuri 323046 263728 59318
8. Periyar 8209 — 2320263 1746993 5732701. Satyamangfalam 267726 214229 534972 .Bhavani 374152 317140 570123.Gopichetti-
palayam 335040 286676 483644 .Perundurai 272612 237547 350655.Erode 626670 316990 3096806.Kangayam 179005 157746 212597. Dharapurain 265058 216665 48393
: 55 :
3 .1 Co)ntd.
1 2 3 4 5 6 7
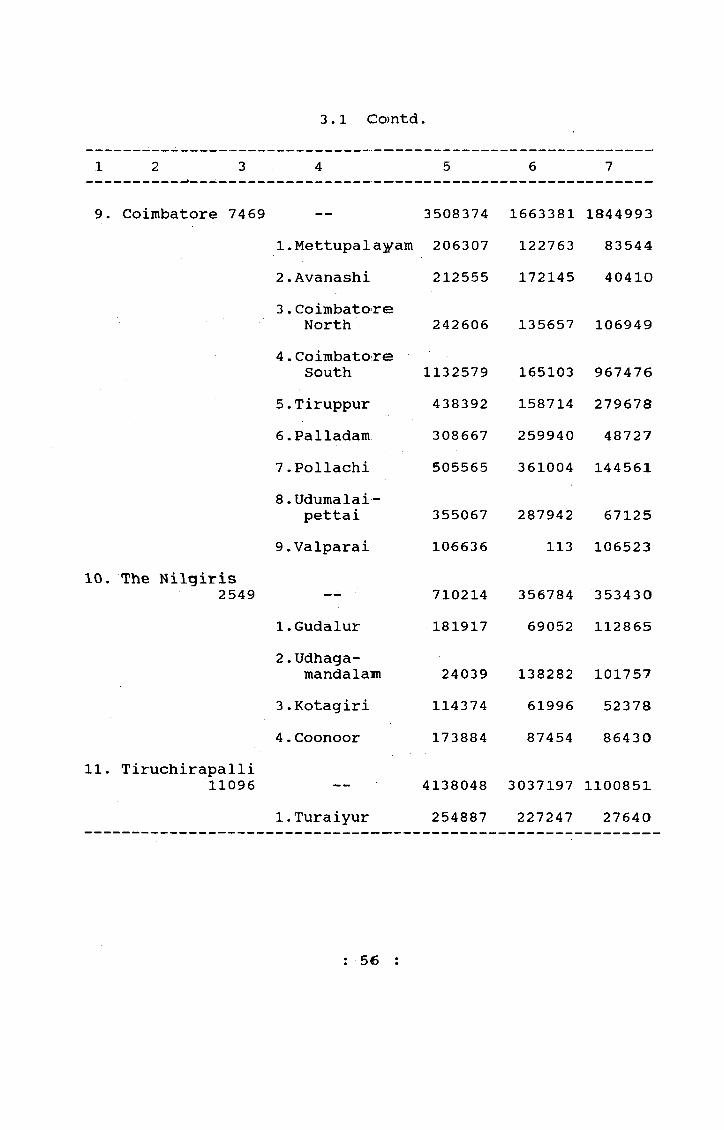
9. Coimbatore 7469 — 3508374 1663381 18449931. Mettupal ayaiti 206307 122763 835442.Avanashi 212555 172145 404103.Coimbatore
North 242606 135657 1069494.Coimbatore
South 1132579 165103 9674765.Tiruppur 438392 158714 2796786.Palladam 308667 259940 487277.Pollachi 505565 361004 1445618.Udumalai-
pettai 355067 287942 671259.Valparai 106636 113 106523
10. The Nilgiris2549 ■ 710214 356784 353430
1 .Gudalur 181917 69052 1128652.Udhaga-
mandalam 24039 138282 1017573.Kotagiri 114374 61996 523784.Coonoor 173884 87454 86430
11. Tiruchirapalli11096 — 4138048 3037197 1100851
1.Turaiyur 254887 227247 27640
: 56

3.1 Contd.
1 2 3 4 5 6 7
11. Tiruchirapalli (Contd.) 2.Perambalur 451032 424581 26451
3.Ariyalur 311709 287568 241414.Udayarpalayam 324672 3246725.Lalgudi 370906 313984 569226.Musiri 284047 231704 523437 .Karur 486563 340904 1456598 .Kulithalai 367599 343603 239969 .Tiruchira-
palLi 987241 275379 71186210 oManappairai 299392 267555 31837
12, Thanjavur 8280 4531457 3492130 10393271. Sirkazhii 259943 . 212922 470212.Tharangampadi 195751 176870 188813 .Mayiladu-
thurai 326790 237505 892854 .Thiruvadi-
marudur 192256 155680 365765.Kumbako nam 368609 205692 1629176.Papanasam 210294 182205 280897.Thiruva iyaru 172033 144927 271068. Thanjaviur 396061 194048 2020139.Valangiman 115637 91168 24469
10.Kodavasal 179157 179157 —
: 57 :

3.1 Contd.
12. Thanjavur(Contd.)11.Nannilam 20440112.Nagapattinam 22 280313.Thiruvarur 18937014.Nidamangalam 12 741815.Mannargudi 27 3608le.Orattanadu 23 260917.Tiruthurai-
poondi 21503018.Vedaranniyam 19622519.Pattukkottai 34132720.Peravurani 112135
13. Pudukkotta i4651 — 1327148
1.Kulattur 2994802.Gandarva-
kottai 717003.Pudukkotta i 1766574.Alangudi 2357085 .Thirumayam 2291086.Arantangi 1738787.Avadiyarkoil 140617
20440112305814017597951
217056221291
172876166393256620112135
9974549195294675655211318
421542983284707
1136645 190503280.272 19208
7170066508 110149
224826 10882209171 19937143551 30327140617
: 58 :

3.1 Contd.
1 2 3 4 5 6 7
14, Madurai 6565 — 3449662 1907539 15421231.Uttamapalayam 529052 315424 2136282.Periyakulam 336879 224085 1127943.Andipatti 183392 164239 191534 .Usilampatti 277902 251489 264135.Vadipatti 205283 . 205283 —6 .Melur 246828 213950 328787.Madura i North 249343 191820 575238 .Madurai
South 1154388 117085 10373039 .Thirumangalam 2 66595 224164 42431
15. Dindigul Anna 6058 — 1760601 1383580 377021
1.Palani 417195 334388 828072.Veda sandur 256232 248691 75413 .Nattam 119222 100117 191054.Dindigal 641378 436035 2053435 .Kodaikanal 98598 71175 274236 .Nilakkottai 227976 193174 34802
16. Ramanatha-puram 42 32 — 1144040 894252 249788
l.Thiruvadani 213452 194212 19240
: 59
342/27-11

3 „ 1 Contd
1 2 3 4 5 6 7
16o Ramanatha-puram (Contd.) 2.Paramakudi 223445 151124 72321
3 .Kamudi 114282 101915 123674.Mudukulattur 222000 211603 103975.Ramanatha-
puram 314339 211597 1027426.Rameswaram 56522 23801 32721
17. Kamarajar 4283 — 1565037 979333 5857041.Srivilli-
puthur 250380 781736 686442.Virudhunagar 240365 142199 981663 .Tiruchchuli 94042 94042 —
4.Aruppukkottai 282723 203747 789765.Sattur 421189 216818 2043716 .Rajapalayam 276338 140791 135547
18. Pasumpon Muthu- ramalinga Thevar 4086 1078190 787999 290191
1.Tiruppattur 230099 190902 391972 .Karaikudi 210783 99857 1109263.Devakottai 113355 75090 382654.Sivaganga 241941 203058 388835 .Manamadurai 179716 138391 413256.Ilaiyankudi 102296 80701 21595
: 60 :

3.1 Contd.
1 2 3 4 5 6 7
19. Tirunelveli Kattaboitiman
6810 2501832 1708656 7931761.Sivagiri 169138 115851 532872.Sankarankovil 318143 269297 488463.Senkottai 95550 69730 258204.Tenkasi 517792 390942 1268505 .Tirunelveli 296645 112884 1837616.Palayamkottai 269535 86427 1831087.Ambasamudram 416012 275302 1407108 .Nanguneri 186491 172858 136339.Radhapuram 232526 215365 17161
20« Chidambaranar 4621 — 1455920 856229 599691
1 .Kovilpatti 288473 176244 1122292.Vilatikulam 161347 150873 104743.Ottappidaram 109627 109627 —4 .Tuticorin 322680 47514 2751665.Srivaikuntam 195140 150862 442786.Thiruchendur 277242 139821 1374217.Sattankulam 101411 81288 20123
: 61
342/27-11a

3 o1 Contd
1 2 3 4 5 6 7
21, Kanniya- kumari 1684 1600349 1330240 270109
1oVilevankod 519140 499914 192262 .Kalkulam 533585 490011 435743 .Thovala 97802 97802 —4. Agastiswaraim 442822 242513 2 073 09
Note ; Taluk-wise Area figures are not yet received
Source : Census of India 1991
: 62

3.2 POPULATION BY DISTRICTS - 1991 CENSUS
SI. No o State/District Region Person Males Femalei
1. TAMIL NADU Total 55858946 28298975 27559971Rural 36781354 18567717 18213637Urban 19077592 9731258 9346334
1. MADRAS Total 3841396 1986278 1855118Rural — — —Urban 3841396 1986278 1855118
2. CHENGALPATTU-MGR Total 4653593 2374693 2278900Rural 2565583 1298354 1267229Urban 2088010 1076339 1011671
3. SOUTH ARCOT Total 4878433 2478944 2399489Rural 4109803 2086306 2023497Urban 768630 392638 375992
4. NORTH ARCOT - AMBEDKAR Total 3026432 1529944 1496488
Rural 2066718 1048055 1018663J
Urban 959714 481889 4778255. TIRUVANNAMALAI
SAMBUVARAYAR Total 2042979 1030052 1012927Rural 1800051 907424 892627Urban 242928 122628 120300
6. SALEM Total 3896382 2011917 1884465Rural 2760320 1429392 1330928Urban 1136062 582525 553537
•• 63 :
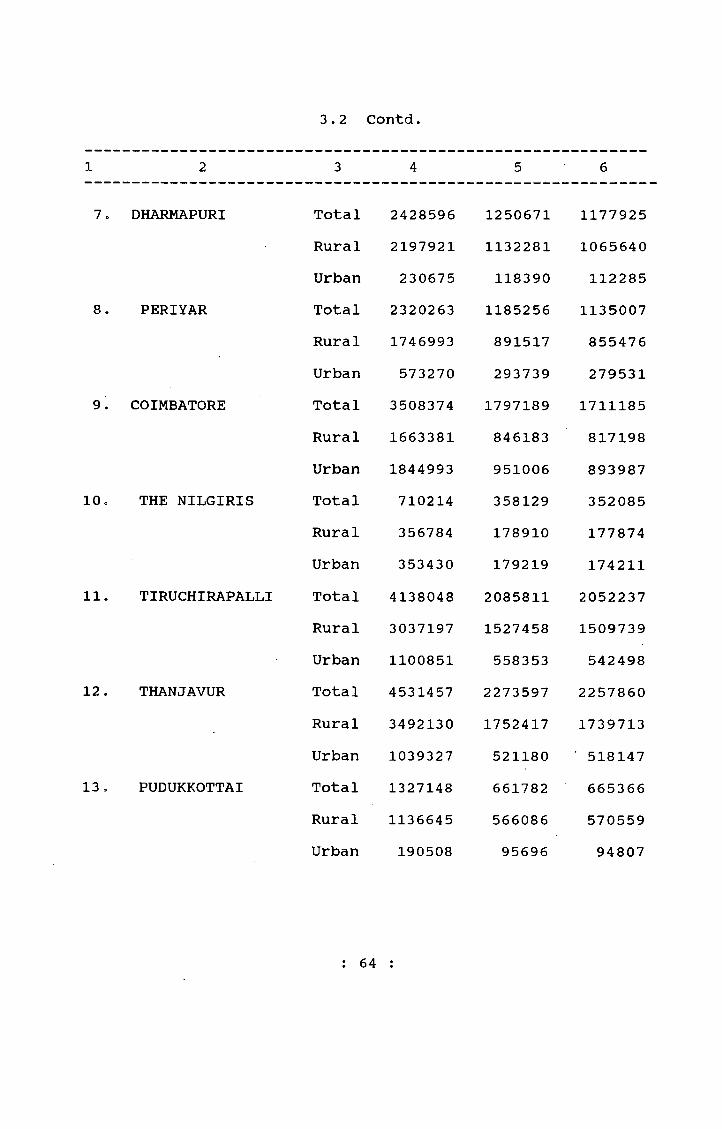
8
10,
11
12.
13
DHARMAPURI
PERIYAR
9. COIMBATORE
THE NILGIRIS
TIRUCHIRAPALLI
THANJAVUR
PUDUKKOTTAI
3 . 2 Contd.
3 4 5 6
Total 2428596 1250671 1177925Rural 2197921 1132281 1065640Urban 230675 118390 112285Total 2320263 1185256 1135007Rural 1746993 891517 855476Urban 573270 293739 279531Total 3508374 1797189 1711185Rural 1663381 846183 817198Urban 1844993 951006 893987Total 710214 358129 352085Rural 356784 178910 177874Urban 353430 179219 174211Total 4138048 2085811 2052237Rural 3037197 1527458 1509739Urban 1100851 558353 542498Total 4531457 2273597 2257860Rural 3492130 1752417 1739713Urban 1039327 521180 ‘ 518147Total 1327148 661782 665366Rural 1136645 566086 570559Urban 190508 95696 94807
: 64 :
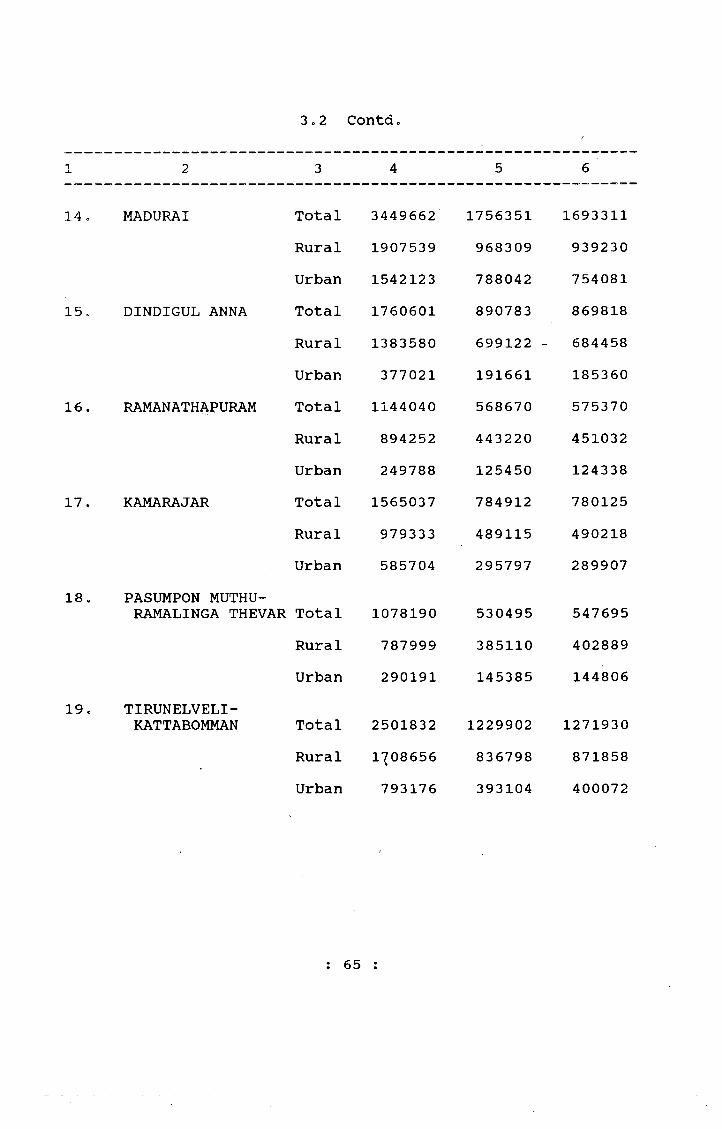
14
15
16
17
18
19
MADURAI
DINDIGUL ANNA
RAMANATHAPURAM
KAMARAJAR
PASUMPON MUTHU-
TIRUNELVELI-KATTABOMMAN
3.2 Contd c
3 4 5 6
Total 3449662 1756351 1693311Rural 1907539 968309 939230Urban 1542123 788042 754081Total 1760601 890783 869818Rural 1383580 699122 - 684458Urban 377021 191661 185360Total 1144040 568670Rural 894252 443220 451032Urban 249788 125450 124338Total 1565037 784912 780125Rural 979333 489115 490218Urban 585704 295797 289907
Total 1078190 530495 547695Rural 787999 385110 402889Urban 290191 145385 144806
Total 2501832 1229902 1271930Rural 1^08656 836798 871858Urban 793176 393104 400072
: 65 :
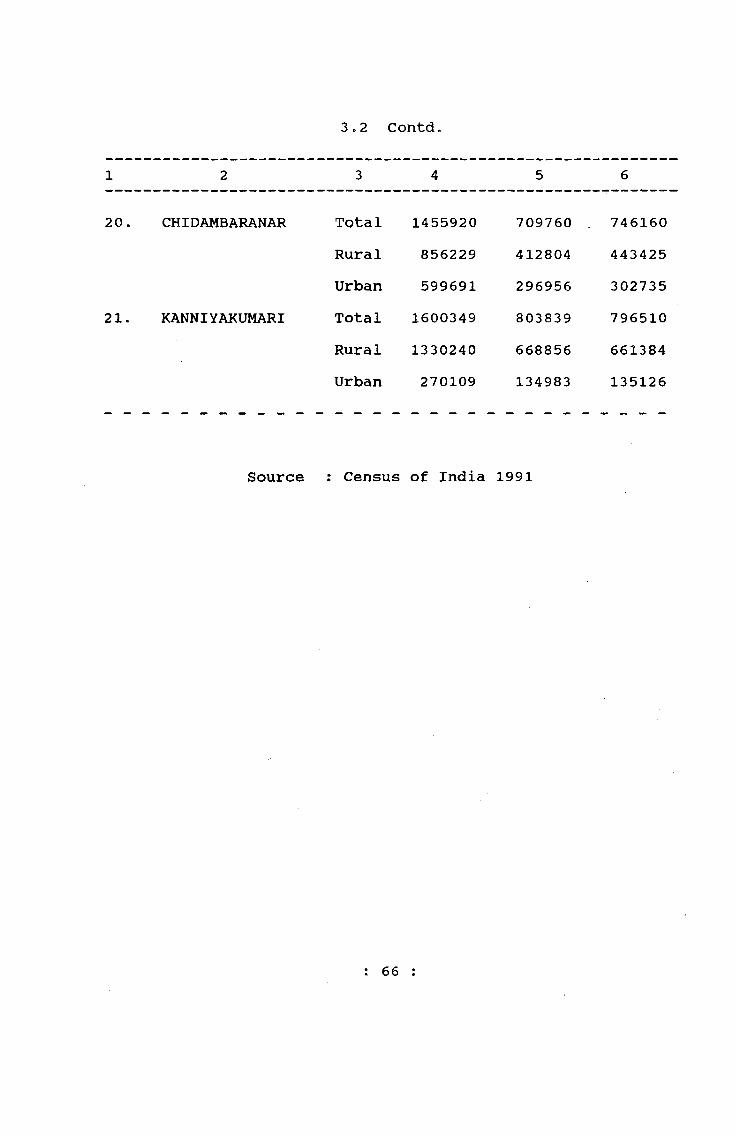
2 0. CHIDAMBARANAR
21. KANNIYAKUMARI
3o2 Contd.
3 4 5 6
Total 1455920 709760 . 746160Rural 856229 412804 443425Urban 599691 296956 302735Total 1600349 803839 796510Rural 1330240 668856 661384Urban 270109 134983 135126
Source : Census of India 1991
: 66 :

3.3 DENSITY, SEX RATIO, VARIATION IN POPULATION, LITERACY AND RURAL URBAN RATIO - 1991 CENSUS.
SI.No.
State/District No.of Females Persons per per Sq. 1000 KM. Males
LiteratesIncrease in popu- No.oflation Since 1981 Literates....................... to 1000 No. ofVariation % persons
Increase
Population
No. ofMale Female Rural Urban Liter- Literates ates
to 1 0 0 0 to 1 0 0 0
Wales Females- - - - 3 ...... 4...... 5..........6 ........7........8 .......9......10----1 1 - - - -
Tarmi I Nadu 429 974 7450869 +15.39 543 638 446 36781354 19077592
1. Madras 220772. Chengalpattu MGR 5923 . South Arcot 448
4 . North Arcot Ambedkar 4985. Tiruvannamalai
Sambuvarayar 3306 . Salem 450
7. Dharmapuri 2528= Periyar 2839 . Coimbatore 470
10. The Nilgiris 27911. T i ruch i rapa11i 37312. Thanjavur 547
13. Pudukkottai 28514. Madurai 52515. Oindigul Anna 291
16. Ramanathapuram 27017. Kamarajar 365
18. Pasumpon MuthuramalingaThevar 264
19. Tirunelveli Kattabomman 36720. Chidambaranar 31521. Kanniyakumari 950
934960968
978
983937
942957952
983984993
1005964976
1012994
1032
10341051991
257181454665
431536251801448190
80045585728467912
170335478213196153
121696224130
106004
278662105339176950
+17.24 716 773 656+28.68 569 661 473+16.10 448 556 337
+15.14 519 621 415
+14.40 449 563 333+13.^1 468 563 367
+21.61 388 480 289+12.17 481 585 372+14.65 591 682 496
+12.70 633 721 543+14.55 533 638 427+11.51 573 669 476
+14.72 497 . 618 377+16.09 575 671 476+12.54 496 604 386
+11.90 525 634 417+16.71 542 649 434
+10.90 548 665 435
+12.53 567 6 6 6 472+ 7.80 632 706 563+12.43 718 748 687
3841396
410983 768630
415 2066718 259714
1800051 2429282760320 1136062
21979211746993
230675573270
1663381 1844993
356784 3534303037197 1100851 3492130 1039327
1136645 1905031907539 1542123 1383580 377021
894252 249788979333 585704
787999 290191
1708658856229133240
793176599691270109
Source : Census of India 1991
: 67
342 27-12
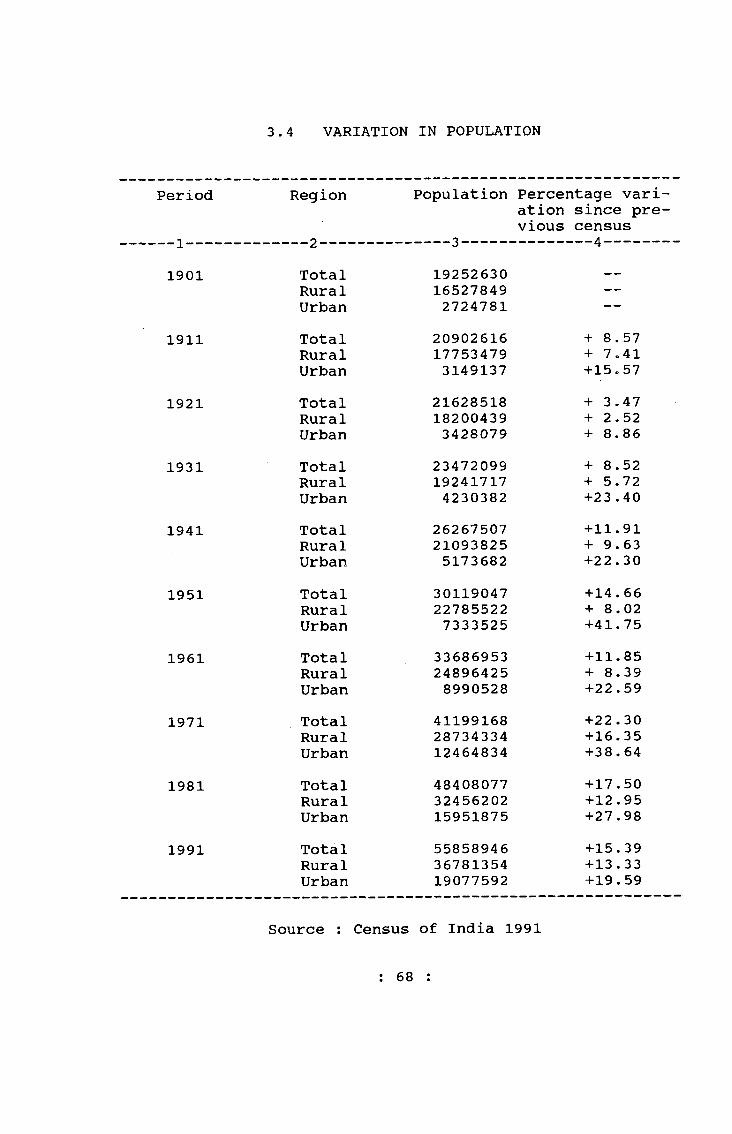
3.4 VARIATION IN POPULATION
Period Region Population Percentage variation since previous census
1901 Total 19252630 —
Rural 16527849 —Urban 2724781 —
1911 Total 20902616 + 8.57Rural 17753479 + 7.41Urban 3149137 +15»57
1921 Total 21628518 + 3.47Rural 18200439 + 2.52Urban 3428079 + 8.86
1931 Total 23472099 + 8.52Rural 19241717 + 5.72Urban 4230382 +23.40
1941 Total 26267507 +11.91Rural 21093825 + 9.63Urban 5173682 +22.30
1951 Total 30119047 +14.66Rural 22785522 + 8.02Urban 7333525 +41.75
1961 Total 33686953 +11.85Rural 24896425 + 8.39Urban 8990528 +22.59
1971 Total 41199168 +22.30Rural 28734334 +16.35Urban 12464834 +38.64
1981 Total 48408077 +17.50Rural 32456202 +12.95Urban 15951875 +27.98
1991 Total 55858946 +15.39Rural 36781354 +13.33Urban 19077592 +19.59
Source : Census of India 1991
: 68 :

3.5 SCHEDULE CASTES/SCHEDULE TRIBES 1991 CENSUS
SI,No. State/District Region Scheduled Castes Scheduled Tribes
Total Rural Urban-3-.........4........ 5----
Total Rural Urban--- 6 .........7......... 8 - -
Tamil Nadlu Persons 10712266 8428040 2284226 574194 505208 68986Males 5414599 4259370 1155229 293012 257853 35159Females 5297’667 4168670 1128997 281182 247355 33827
I. Madras
2. Chengalpattu MGR
3. South Arcot
4. Worth kvct>X J nibedWar
5. Tiruvannamalai Sambuvarayar
6. Salemi
7. Dharmapuri
PersonsMalesFemales
PersonsMalesFemales
PersonsMalesFemales
PersonsMalesFemales
PersonsMalesFemales
PersonsMalesFemales
PersonsMalesFemales
529712271549258163
1208417611S15596602
1323299673266650(333
627318 3151119 3121! 99
43835902214692169»21
6507593354.263153133
347460177876169584
-- 529712 7930 -- 7930-- 271549 4087 -- 4087
258163 3843 3843
896337 312080 57872 44998 12874452975 158840 29321 22794 6527443362 153240 28551 22204 6347
1219630 103669 58009 54999 3010620623 52643 29469 27917 1552599007 51026 28540 27082 1458
480029 147289 49857 46311 3546242149 72970 25384 23597 1786237880 74319 24473 22714 1759
413889 24501 62067 60539 1528209247 1 2 2 2 2 31791 31019 772204642 12279 30276 29520 756
536500 114259 136126 135024 1 1 0 2
277089 58337 69475 68890 585259411 55922 66651 66134 517
327814 19646 47684 46510 1174168067 9809 24760 24149 611159747 9837 22924 22361 563
: 69
342/27-12a

3,5 Contd.
1 2 3 4 5 6 7 8
8 . Penyar Persons 398123 340420 57703 19194 18037 1157Males 203386 174044 29342 9780 9187 593Females 19A737 166376 28361 9414 8850 564
9. Coimbatore Persons; 575279 338486 236793 26158 22845 3313Males 290780 171868 118912 13456 11789 1667Females 284499 166618 117881 12702 11056 1646
1 0 . The NiIgiris Persons; 214598 100805 113793 25048 17573 7475Males 107531 50448 57083 12711 8900 3811Females; 107067 50710 56710 12337 8673 3664
1 1 . T i runeIveIi Persons- 792060 678414 113646 28302 24542 3760Males 397958 340870 57088 14419 12461 1958Females 394102 337544 56558 13883 12081 1802
1 2 . Thanjavur Persons, 1095474 1007989 87485 9812 4997 4815Males 552770 508895 43875 4938 2551 2387Females; 542704 499094 43610 4874 2446 2428
13. Pudukottai Persons. 223228 206411 16817 769 416 353Males 111826 103343 8483 399 216 183Females 111402 103068 8334 370 2 0 0 170
14. Madurai Persons 503570 394599 108971 12737 6982 5755Males 255596 200064 55532 6588 3610 2978Females 247974 194535 53439 6149 3372 2777
: 70 :

3.5 Contd.
1 2 3 4 5 6 7 8
15. Dindugal Anna Persons 341703 304079 37624 9611 8039 1472Males 173098 154003 19095 4904 4123 781Females 168605 150076 18529 4607 3916 691
16. Ramanathapuram Persons 206619 186795 19824 1570 484 1086Males 103666 93733 9933 828 274 554Females 102953 93062 9891 742 2 1 0 532
17. Kamarajar Persons 288901 235852 53049 2978 1016 1962Males 145292 118800 26492 1460 509 951Females 143609 117052 26557 1518 507 1 0 1 1
18. Pasumpon Muthuramalinga Persons 172769 149776 22993 1198 341 857Thevar. Males 85130 73533 11597 608 167 441
Females 87639 76243 11396 590 174 416
19. T\runelveU (Cattabowwan Persons 447654 353056 94598 8975 5543 3432Males 218607 172129 46478 4445 2704 1741Females 229047 180927 48120 4530 2839 1691
2 0 . Chidambaranar Persons 250071 191257 58814 3174 1333 1841Males 124100 94631 29469 1567 647 920Females 125971 96626 29345 1607 6 8 6 921
2 1 . Kanniyakumari Persons 76862 65902 10960 5223 4679 544Males 38339 32859 5480 2622 2349 273Females 38523 33043 5480 2601 2330 271
Source Census of India 1991
: 71 :
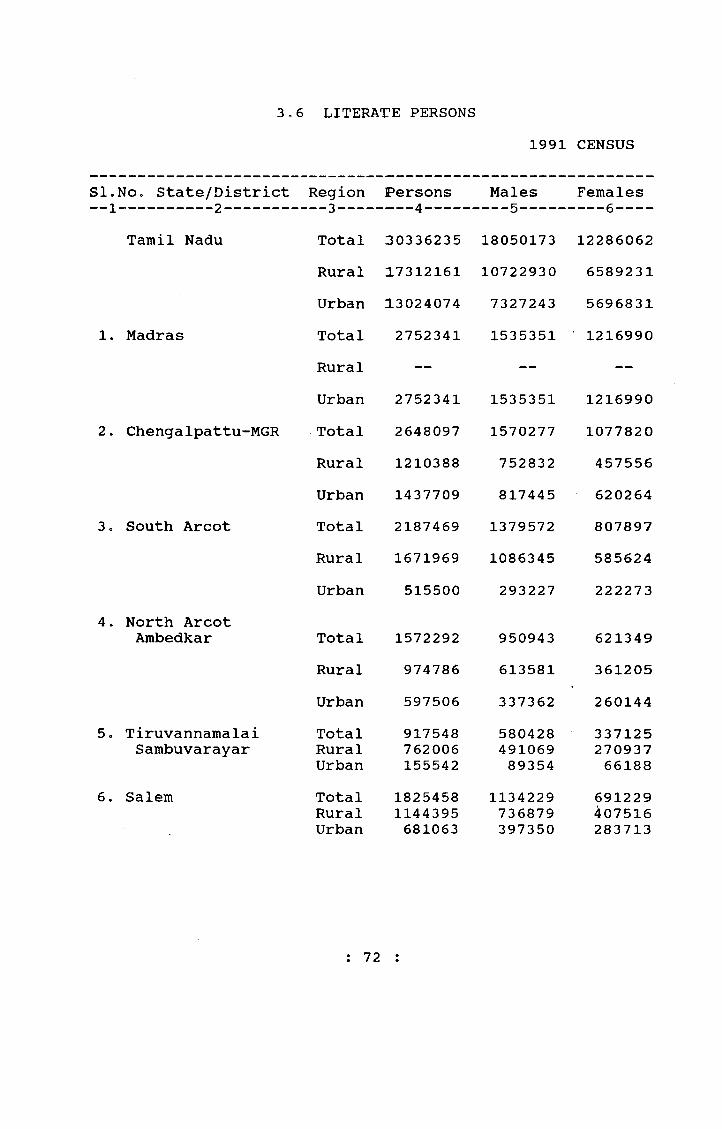
3 , 6 LITERATE PERSONS1991 CENSUS
Region Persons Males Females
Total 30336235 18050173 12286062Rural 17312161 10722930 6589231Urban 13024074 7327243 5696831Total 2752341 1535351 1216990Rural — — —Urban 2752341 1535351 1216990Total 2648097 1570277 1077820Rural 1210388 752832 457556Urban 1437709 817445 620264Total 2187469 1379572 807897Rural 1671969 1086345 585624Urban 515500 293227 222273
Total 1572292 950943 621349Rural 974786 613581 361205Urban 597506 337362 260144TotalRuralUrban
917548762006155542
58042849106989354
33712527093766188
TotalRuralUrban
18254581144395681063
1134229736879397350
691229407516283713
: 72 •«
S l . N O c State/District
Tamil Nadu
1. Madras
2. Chengalpattu-MGR
3 o South Arcot
4. North Arcot Ambedkar
5o Tiruvannamalai Sambuvarayar
6. Salem

3,6 Contd.
1 2 3 4 5 6
7 <, Dharmapuri TotalRuralUrban
941444850746140698
60051852008880430
34092628065860268
8 c Periyar TotalRuralUrban
1116896745787371109
693866479156214710
423030266631156399
9. Coimbatore TotalRuralUrban
20750238135321261491
1225782503264722518
849241310268538973
10. The Nilgiris TotalRuralUrban
449447211536237911
258247124472133775
19120087064
10413611. Tiruchirapalli Total
RuralUrban
22078461425999781847
1330527896538433989
877319529461347858
12o Thanjavur TotalRuralUrban
25950051873127716878
15202661121570393696
1074739751557323182
13„ Pudukkottai TotalRuralUrban
659597526110133487
40870033445874242
25089719165259245
14. Madurai TotalRuralUrban
1985160815346
10698141178827576796602031
806333338550467783
15. Dindugal Anna TotalRuralUrban
873499616480257019
537829392930144899
335670223550112120
16« Ramanathapuram TotalRuralUrban
600179433710166469
36044026762892812
23973916608273657
73 :
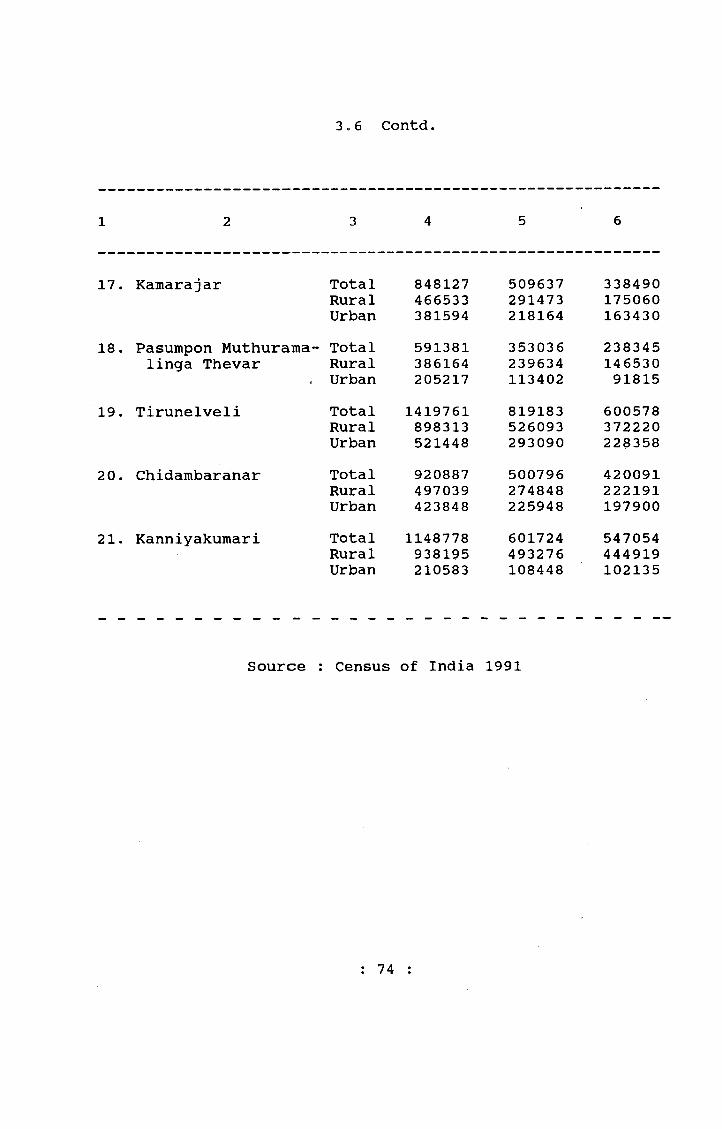
3o6 Contd.
1 2 3 4 5 6
17. Kamarajar TotalRuralUrban
848127466533381594
509637291473218164
338490175060163430
18. Pasumpon Muthuraina- linga Thevar
TotalRuralUrban
591381386164205217
353036239634113402
23834514653091815
19. Tirunelveli TotalRuralUrban
1419761898313521448
819183526093293090
600578372220228358
20. Chidambaranar TotalRuralUrban
920887497039423848
500796274848225948
420091222191197900
21. Kanniyakumari TotalRuralUrban
1148778938195210583
601724493276108448
547054444919102135
Source ; Census of India 1991
: 74 :

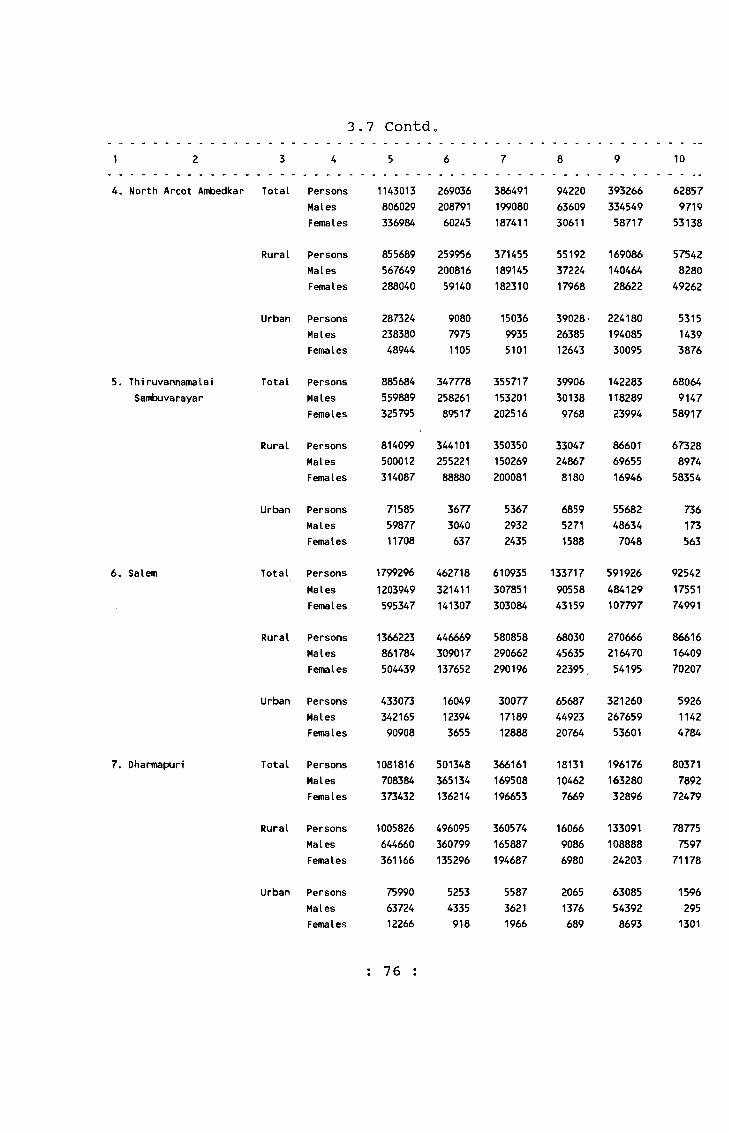
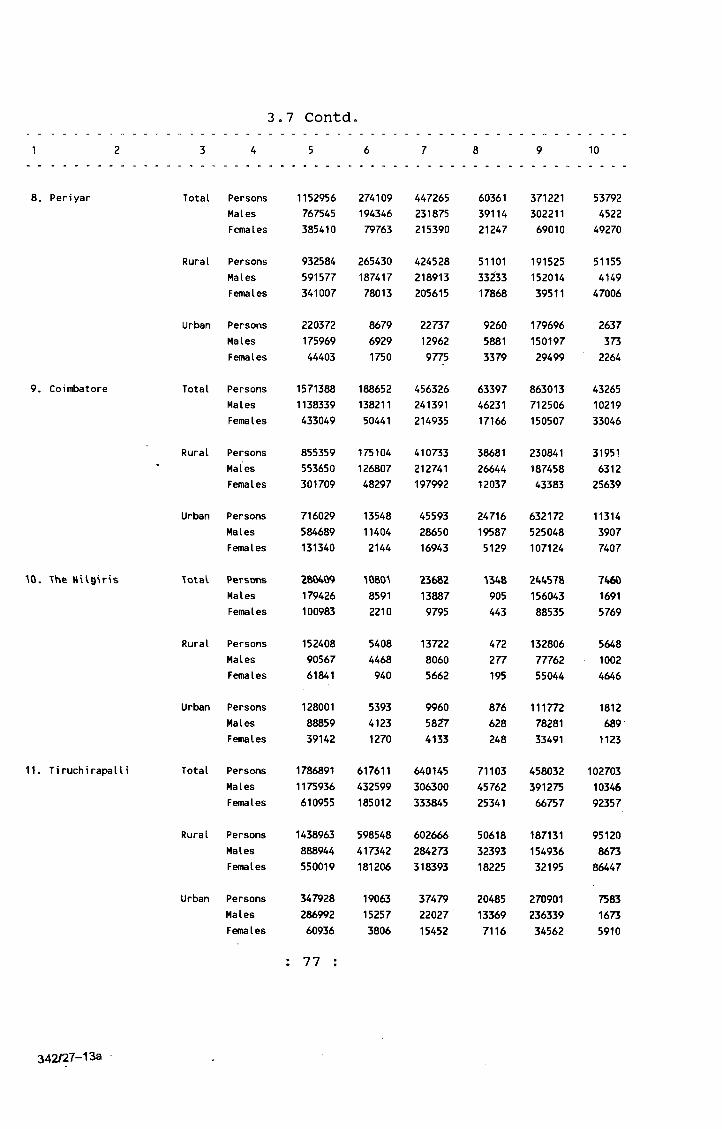
3„7 DISTRIBUTION OF POPULATION BY BROAD INDUSTRIAL CATEGORIES OF WORKERS
1991 CENSUS (P)SI.No.
State/District
-1..........2 -----Tannil Nadu
Total Culti- Agri- House- Other MarginalMain vators cultural hold Workers workersWorkers Labourers Industry
workers■ -3- - - -4........ 5 . . . . 6 ..........7 . : . .g. . . . . 9 -----10 - - -Total Persons 22971697 5729489 7846190 1069751 8326267 1583862
15756894 4190508 4092820 605288 6868278 3301527214803 1538981 3753370 464463 1457989 1253710
Region Persons Males/ Females
MalesFemales
Rural PersonsMalesFemales
16523110105560515967059
546196839924541469514
735674937885473568202
667066360181306M5
30373272414869622458
14375632857251151838
Urban PersonsMalesFemales
644858752008431247744
26752119805469467
489441304273185158
402685245107157578
52889404453409835531
14629944427101872
1. Madras Total PersonsMalesFemales
1165695995982169713
35193051468
16341139495
23062159767086
1137480975816161664
641940562363
Urban PersonsMalesFeovales
1165695995982169715
35193051468
16341139495
23062159767086
1137480975816^6^664
641940562363
2. Chengalpattu-MGR Total PersonsMalesFemales
16894171248009441408
27790221915658746
5694763138Z1255655
881356393224203
753904651100102804
942851758176704
Rural PersonsMalesFemales
1055906711878344028
25497720023054747
521208282257238951
454243153613888
23429719785536442
808931188269011
Urban PersonsMalesFemales
63351153613197380
22925189263999
482683156416704
427113239610315
51960745324566362
1339256997693
3. South Arcot Total PersonsMalesFemales
19577181340938616780
678568538059140509
865746449899415847
456693399511674
36773531898548750
17975421463158291
Rural PersonsMalesFemales
17406971153452587245
661999523417138582
837797431230406567
36036264329604
20486517237332492
15735714458
142899
Urban PersonsMalesFemales
21702118748629535
16569146421927
27949186699280
963375632070
16287014661216258
22397700515392
75
3 4 ^ 7 -1 3
3,7 Contd1 2 3 4 5 6 7 8 9 1 0
4. North Arcot Ambedkar Total PersonsMalesFemales
1143013806029336984
26903620879160245
386491199080187411
942206360930611
39326633454958717
628579719
53138
Rural PersonsMalesFemales
855689567649288040
25995620081659140
371455189145182310
551923722417968
16908614046428622
575428280
49262
Urban PersonsMalesFemales
28732423838048944
908079751105
1503699355101
39028•2638512643
22418019408530095
531514393876
5. Thiruvannamalai Sambuvarayar
Total PersonsMalesFemales
885684559889325795
34777825826189517
355717153201202516
39906301389768
14228311828923994
680649147
58917
Rural PersonsMalesFemales
814099500012314087
34410125522188880
350350150269200081
33047248678180
866016965516946
673288974
58354
Urban PersonsMalesFemales
715855987711708
36773040637
536729322435
685952711588
55682486347048
736173563
6 . Salem Total PersonsMalesFemales
17992961203949595347
462718321411141307
610935307851303084
1337179055843159
591926484129107797
925421755174991
Rural PersonsMalesFemales
1366223861784504439
446669309017137652
580858290662290196
68030 45635 22395.
27066621647054195
866161640970207
Urban PersonsMalesFemales
43307334216590908
16049123943655
300771718912888
656874492320764
32126026765953601
592611424784
7. Dharmapuri Total PersonsMalesFemales
1081816708384373432
501348365134136214
366161169508196653
18131104627669
19617616328032896
803717892
72479
Rural PersonsMalesFemales
1005826644660361166
496095360799135296
360574165887194687
1606690866980
13309110888824203
787757597
71178
Urban PersonsMalesFemales
759906372412266
52534335918
558736211966
20651376689
63085543928693
15962951301
: 76 :
4 5 6
3.7 Contd,10
8. Pen'yar
9. Coimbatore
'\0. The HUgSris
11. Tiruchirapalli
Total Persons
Males
Females
1152956767545385410
27410919434679763
447265231875215390
603613911421247
37122130221169010
53792452249270
Rural Persons
Males
Females
932584591577341007
26543018741778013
424528218913205615
5110133^3317868
19152515201439511
511554149
47006
Urban Persons
Males
Females
22037217596944403
867969291750
22737129629775
926058813379
17969615019729499
26373732264
Total PersonsMales
Females
15713881138339433049
18865213821150441
456326241391214935
633974623117166
863013712506150507
432651021933046
Rural Persons
Males
Females
855359553650301709
17510412680748297
410733212741197992
386812664412037
23084118745843383
31951631225639
Urban Persons
Males
Females
716029584689131340
13548114042144
455932865016943
24716195875129
632172525048107124
1131439077407
TotaV PersonsMales
Females
280^»09179426100983
^080‘\85912 2 1 0
23682138879795
905443
15604388535
746016915769
Rural Persons
Males
Females
1524089056761841
54084468940
1372280605662
472277195
1328067776255044
56481 0 0 2
4646
Urban Persons
Males
Females
1280018885939142
539341231270
9960582f74133
876628248
1117727828133491
18126891123
Total PersonsMales
Females
17868911175936610955
617611432599185012
640145306300333845
711034576225341
45803239127566757
1027031034692357
Rural Persons
Males
Females
1438963888944550019
598548417342181206
602666284273318393
506183239318225
18713115493632195
951208673
86447
Urban Persons
Males
Females
34792828699260936
19063152573806
374792202715452
20485133697116
27090123633934562
758316735910
77
342/27-13a

3»7 Contd.1 2 3 4 5 6 7 8 9 1 0
12c Thanjavur Total PersonsMalesFemales
17064431259989446454
37961532707452541
832773505529327244
449803216612814
44907539522053855
12929014694
114596
Rural PersonsMalesFemales
1401555998235403320
35420030336250838
794587479233315354
26332183467986
22643619729429142
1194221 2 2 2 1
107201
Urban PersonsMalesFemales
30488826175443134
25415237121703
381862629611890
18648138204828
22263919792624713
986824737395
13. Pudukkottai Total PersonsMalesFemales
516131360747155384
25102918611664913
1334406364969791
982967353094
121833 104247 ■ 17586
699095858
64051
Rural PersonsMalesFemales
462109314491147618
24780718319864609
1306346210768527
813055462584
755386364011898
688395470
63369
Urban PersonsMalesFemales
54022462567766
32222918304
280615421264
16991189510
46295406075688
1070388682
14. Madurai Total PersonsMalesFemales
16286151069122559493
25Q76117461276149
6155^7322135313412
2675718565
696985545618151367
742061064863558
Rural PersonsMalesFemales
938183548657389526
22692415507771847
552160271555280605
19787116708117
13931211035528957
661167971
58145
Urban PersonsMalesFemales
690432520465169967
23837195354302
833875058032807
255351508710448
557673435263122410
809026775413
15. Dindigul Anna Total PersonsMalesFemales
784307494671289636
20270613751665190
333673165558168115
270251558511440
22090317601244891
480718163
39908
Rural PersonsMalesFemales
658986392785266201
19704013278164259
320711157233163478
1778499297855
1234519284230609
411713756
37415
Urban PersonsMalesFemales
12532110188623435
56664735931
1296283254637
924156563585
974528317014282
690044072493
78
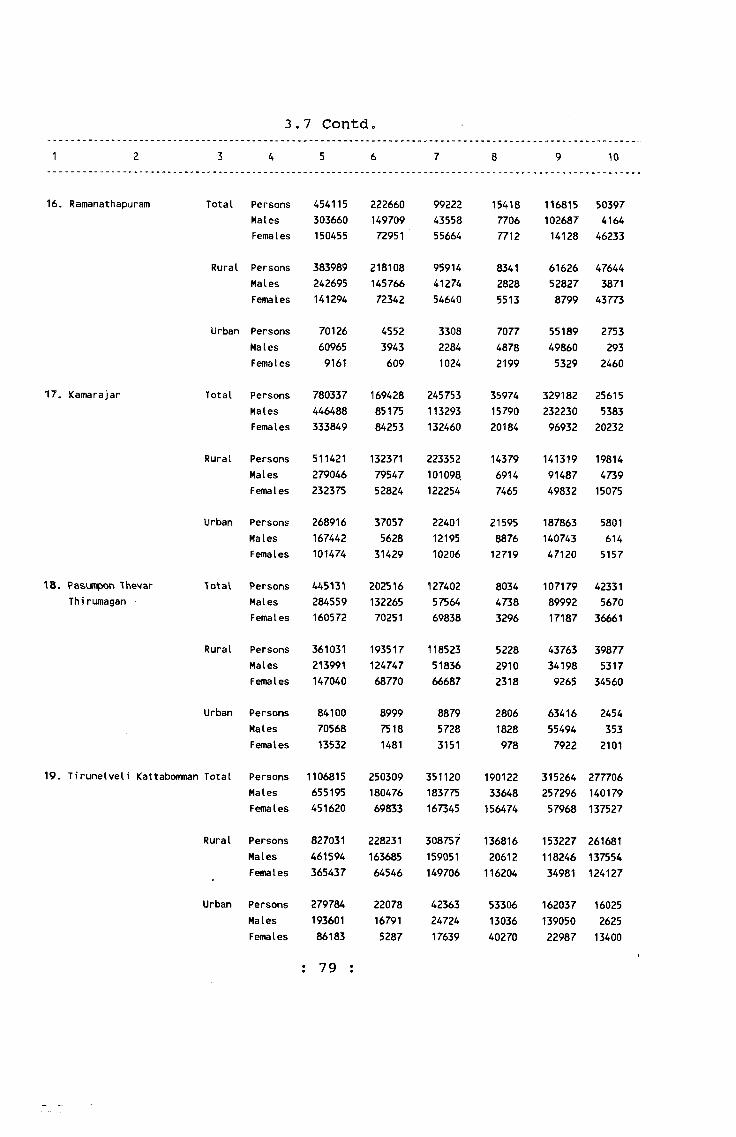
3.7 Contd.1 2 3 4 5 6 7 8 9 1 0
16. Ramanathapuram Total PersonsMalesFemales
454115303660150455
22266014970972951
992224355855664
1541877067712
11681510268714128
503974164
46233
Rural PersonsMalesFemales
383989242695141294
21810814576672342
959144127454640
834128285513
61626528278799
476443871
43773
Urban PersonsMalesFemales
70126609659161
45523943609
330822841024
707748782199
55189498605329
2753293
2460
17. Kamarajar Total PersonsMalesFemales
780337446488333849
1694288517584253
245753113293132460
359741579020184
32918223223096932
256155383
20232
Rural PersonsMalesFemales
511421279046232375
1323717954752824
223352101098122254
1437969147465
1413199148749832
19814473915075
Urban PersonsMalesFemales
268916167442101474
370575628
31429
224011219510206
21595887612719
18786314074347120
58016145157
18. PasuJBpon Thevar Thirumagan
Total PersonsMalesFemales
445131284559160572
20251613226570251
1274025756469838
803447383296
1071798999217187
423315670
36661
Rural PersonsMalesFemales
361031213991147040
19351712474768770
1185235183666687
522829102318
43763341989265
398775317
34560
Urban PersonsMalesFemales
841007056813532
899975181481
887957283151
28061828978
63416554947922
2454353
2 1 0 1
19. Tirunelveli Kattabomman Total PersonsMalesFemales
1106815655195451620
25030918047669833
351120183775167345
19012233648156474
315264 277706 257296 14017957968 137527
Rural PersonsMales
Females
827031461594365437
22823116368564546
308757159051149706
13681620612116204
153227 261681 118246 137554 34981 124127
Urban PersonsMalesFemales
27978419360186183
22078167915287
423632472417639
533061303640270
162037 16025139050 262522987 13400
79
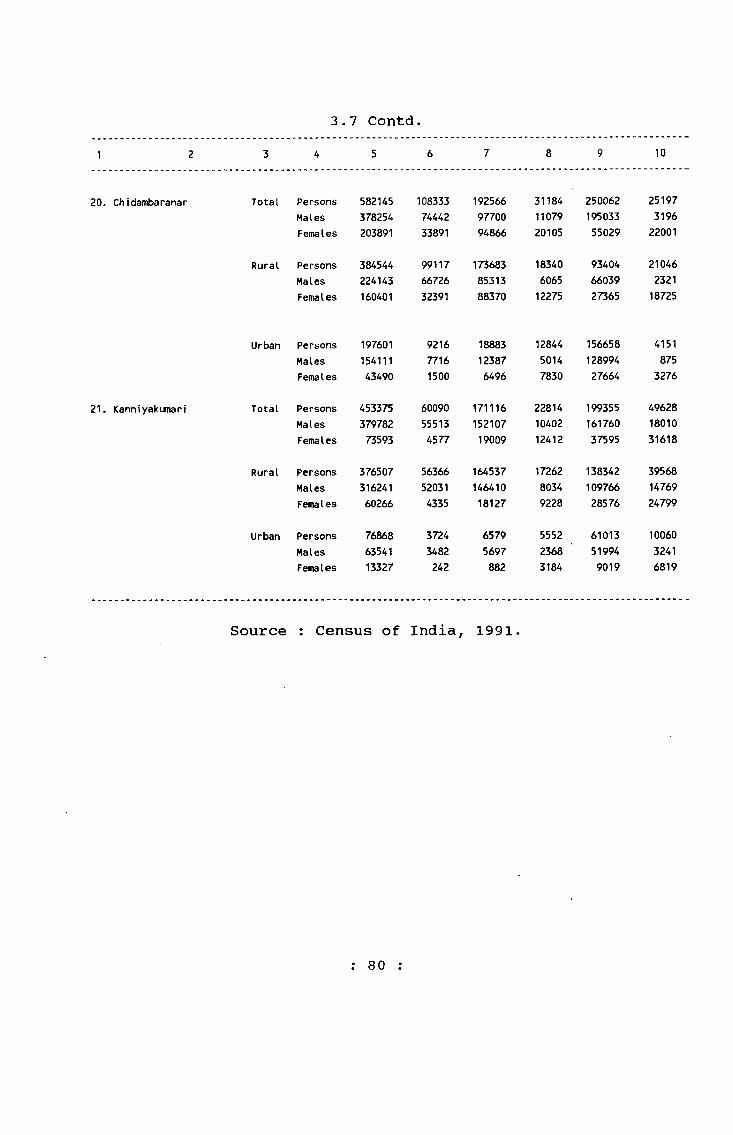
3.7 Contd.1 2 3 U 5 6 7 8 9 1 0
20. Chidambaranar Total PersonsMalesFemales
582145378254203891
1083337444233891
1925669770094866
311841107920105
25006219503355029
251973196
2 2 0 0 1
Rural PersonsMalesFemales
384544224143160401
991176672632391
1736838531388370
18340606512275
934046603927365
21046232118725
Urban PersonsMalesFemales
19760115411143490
921677161500
18883123876496
1284450147830
15665812899427664
4151875
3276
2 1 . Kanniyakumari Total PersonsMalesFemales
45337537978273593
60090555134577
17111615210719009
228141040212412
19935516176037595
496281801031618
Rural PersonsMalesFemales
37650731624160266
56366520314335
16453714641018127
1726280349228
13834210976628576
395681476924799
Urban PersonsMalesFemales
768686354113327
37243482242
65795697882
555223683184
61013519949019
1006032416819
Source : Census of India, 1991
: 80 :
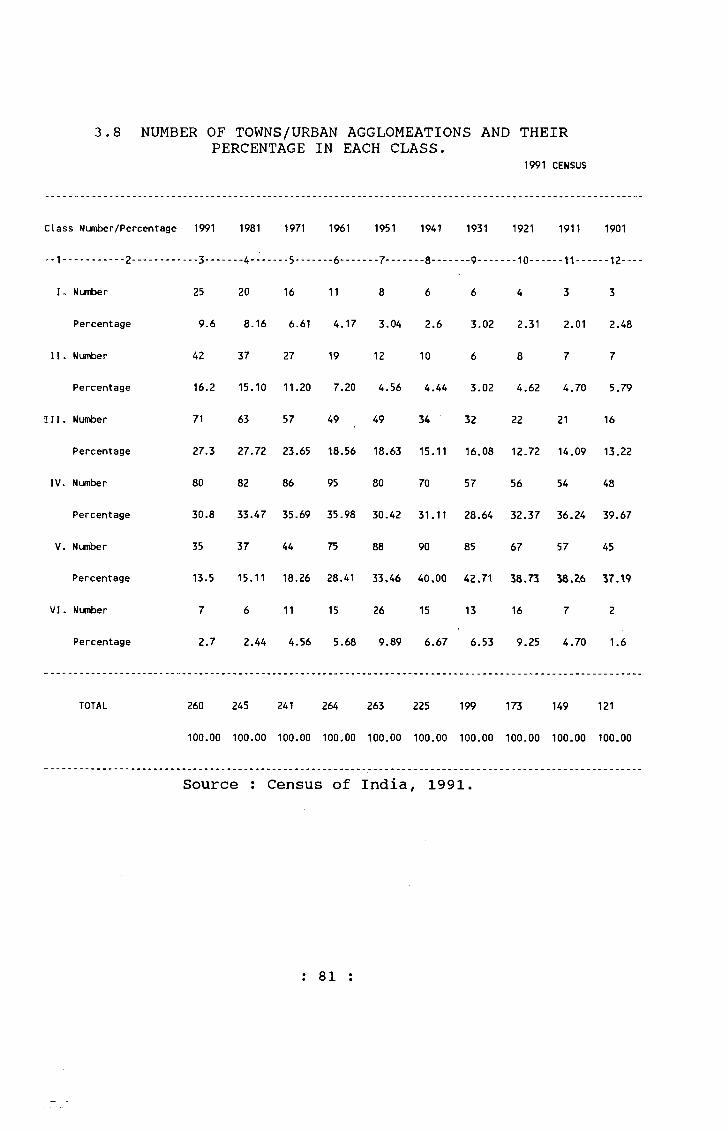
3.8 NUMBER OF TOWNS/URBAN AGGLOMEATIONS AND THEIR PERCENTAGE IN EACH CLASS.
1991 CENSUS
Class Number/Percentage
--- 2 ---------
1991 1981 1971 1961
_iL___
1951
__y._„ „
1941 1931
__o.__
1921
__in__
1911
__ 1 1 __„
1901
I. Number
_ . __
25
--4*----
2 0
_--
16
— o---
11 8
--0 ““•“
6
--V---
6
---lU---
4
• • • 1 1--
3
______
3
Percentage 9.6 8.16 6.61 4.17 3.04 2 . 6 3.02 2.31 2 . 0 1 2.48
11. Number 42 37 27 19 1 2 1 0 6 8 7 7
Percentage 16.2 15.10 1 1 . 2 0 7.20 4.56 4.44 3.02 4.62 4.70 5.79
;III. Number 71 63 57 49 49 34 32 2 2 2 1 16
Percentage 27.3 27.72 23.65 18.56 18.63 15.11 16.08 12.72 14.09 13.22
IV. Number 80 82 8 6 95 80 70 57 56 54 48
Percentage 30.8 33.47 35.69 35.98 30.42 31.11 28.64 32.37 36.24 39.67
V. Number 35 37 44 75 8 8 90 85 67 57 45
Percentage 13.5 15.11 18.26 28.41 33,46 40.00 42.71 38.73 38.Z6 37. “19
VI. Number 7 6 11 15 26 15 13 16 7 2
Percentage 2.7 2.44 4.56 5.68 9.89 6.67 6.53 9.25 4.70 1 . 6
TOTAL 260 245 241 264 263 225 199 173 149 1 2 1
1 0 0 . 0 0 1 0 0 . 0 0 1 0 0 . 0 0 1 0 0 . 0 0 1 0 0 . 0 0 1 0 0 . 0 0 1 0 0 . 0 0 1 0 0 . 0 0 1 0 0 . 0 0 1 0 0 . 0 0
Source : Census of India, 1991.
81 :
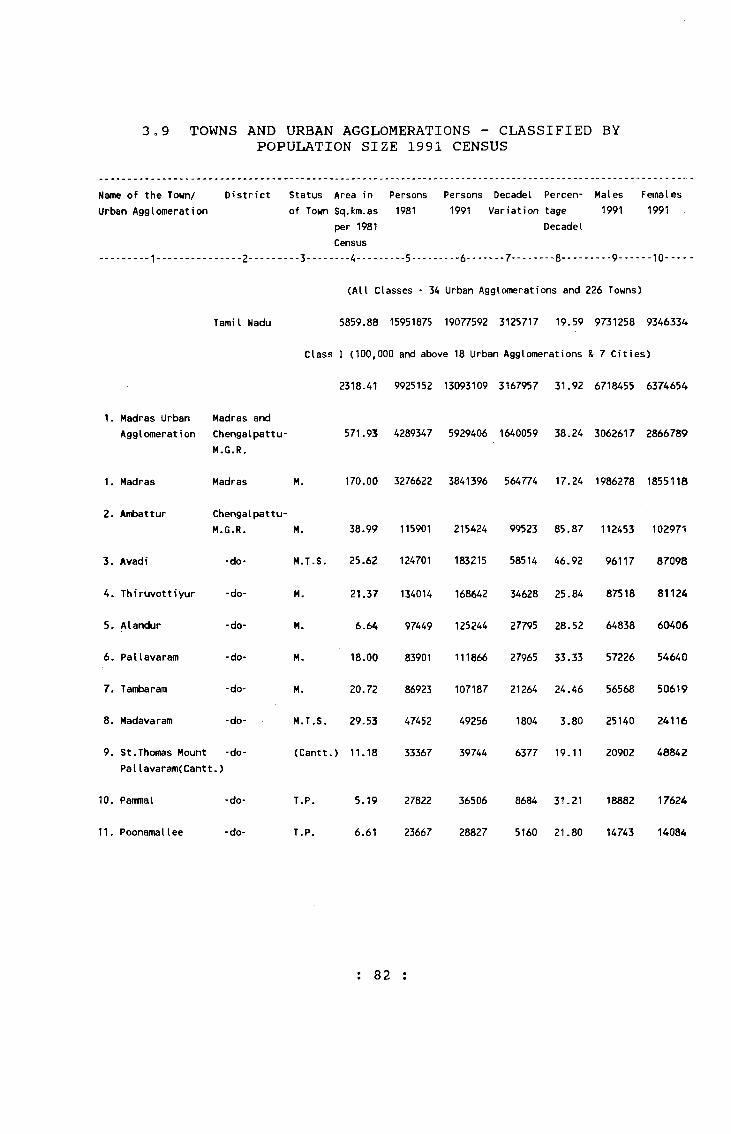
3.9 TOWNS AND URBAN AGGLOMERATIONS - CLASSIFIED BY POPULATION SIZE 1991 CENSUS
Name of the Town/ District Urban Agglomeration
Tamil Nadu
1. Madras Urban Madras and Agglomeration Chengalpattu-
M.G.R.
Madras
Chengalpattu- M.G.R.
-do-
-do-
-do-
-do-
-do-
-do-
Status Area in Persons Persons Decadel Percen- Males Females of Town Sq.km.as 1981 1991 Variation tage 1991 1991
per 1981 Decadel
Census
- - 3 ....... 4........ 5........ 6 ...... 7....... 8 ... .....9......10-----
(All Classes - 34 Urban Agglomerations and 226 Towns)
5859.88 15951875 19077592 3125717 19.59 9731258 9346334
Class I (100,000 and above 18 Urban Agglomerations & 7 Cities)
2318.41 9925152 13093109 3167957 31.92 6718455 6374654
571.93 4289347 5929406 1640059 38.24 3062617 2866789
1. Madras
2. Ambattur
3. Avadi
4. Thiruvottiyur
5. Alandur
6 . Pallavaram
7. Tambaram
8 . Madavaram
M. 170.00 3276622 3841396 564774 17.24 1986278 1855118
9. St.Thomas Mount -do- Patlavaram(Cantt.)
10. Pammal
11. Poonamallee
-do-
-do-
M. 38.99 115901 215424 99523 85.87 112453 102971
M.T.S. 25.62 124701 183215 58514 46.92 96117 87098
M.
M.
M.
M.
21.37 134014 168642 34628 25.84 87518 81124
6.64 97449 125244 27795 28.52 64838 60406
83901 111866 27965 33.33 57226 54640
86923 107187 21264 24.46 56568 50619
1804 3.80 25140 24116
18.00
20.72
M.T.S. 29.53 47452 49256
(Cantt.) 11.18 33367 39744 6377 19.11 20902 48842
T.P. 5.19 27822 36506 8684 31.21 18882 17624
T.P. 6.61 23667 28827 5160 21.80 14743 14084
: 82 :
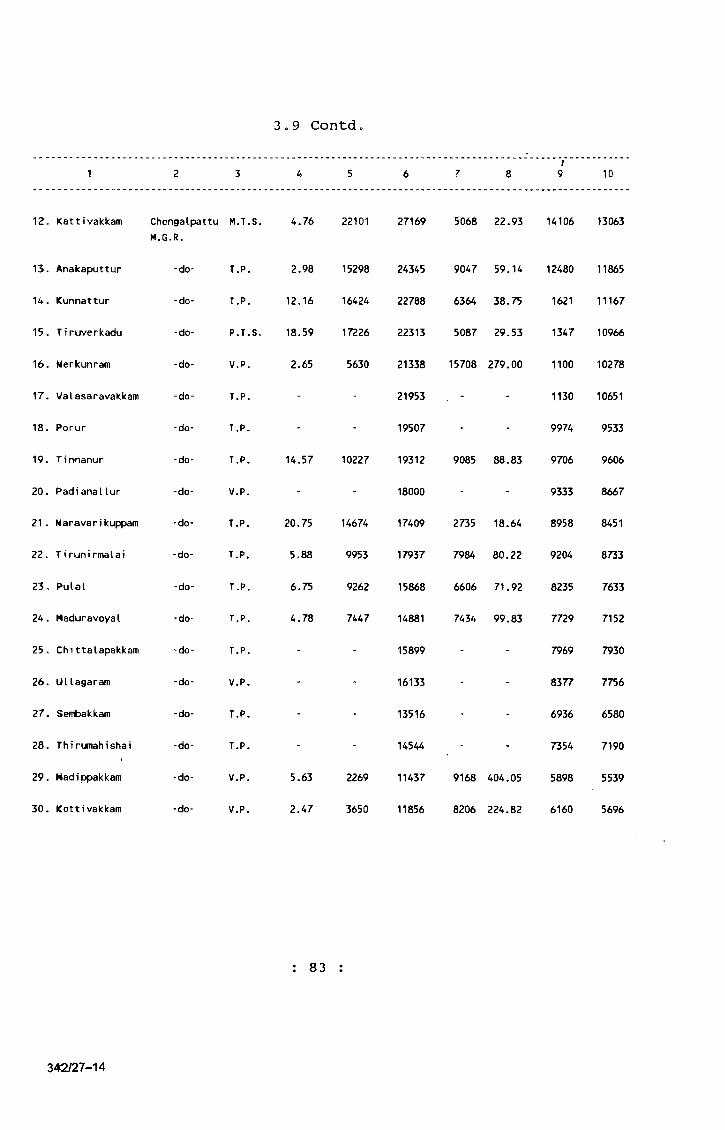
3.9 Contd
10
12,
13.
14.
15.16.
17.
18.
19.
20. 21 .
22.23.
24.
25.
26.
27.
28.
29.
30.
Kattivakkam Chengalpattu M.T.S. M.G.R.
4.76 22101 27169 5068 22.93 14106 13063
Anakaputtur
Kunnattur
T i ruverkadu
Nerkunram
Valasaravakkam
Porur
T innanur
Padianallur
Maravarikuppam
T i runi rmalai
Pulal
Maduravoyal
Chittalapakkam
Ullagaram
Sembakkam
Thi rumahishai
Madippakkam
Kottivakkam
-do-
-do-
-do-
-do-
-do-
-do-
-do-
-do-
-do-
-do-
-do-
-do-
-do-
-do-
-do-
-do-
-do-
-do-
T.P.
T.P.
P.T.S.
V.P.T.P.
T.P.
T.P.
V.P.
T.P.
T.P.
T.P.
T.P.
T.P.
V.P.
T.P.
T.P.
V.P.
V.P.
2.98
12.16
18.59
2.65
20.75
5.88
6.75
4.78
15298
16424
17226
5630
14.57 10227
14674
9953
9262
7447
5.63 2269
2.47 3650
24345
22788
22313
21338
21953
19507
19312
18000
17409
17937
15868
14881
15899
16133
13516
14544
11437
11856
9047 59.14
6364 38.75
5087 29.53
15708 279.00
9085 88.83
2735 18.64
7984 80.22
6606 71.92
7434 99.83
9168 404.05
8206 224.82
12480
1621
1347
1100
1130
9974
9706
9333
8958
9204
8235
7729
7969
8377
6936
7354
5898
6160
11865
11167
10966
10278
10651
9533
9606
8667
8451
8733
7633
7152
7930
7756
6580
7190
5539
5696
: 83
342/27-14
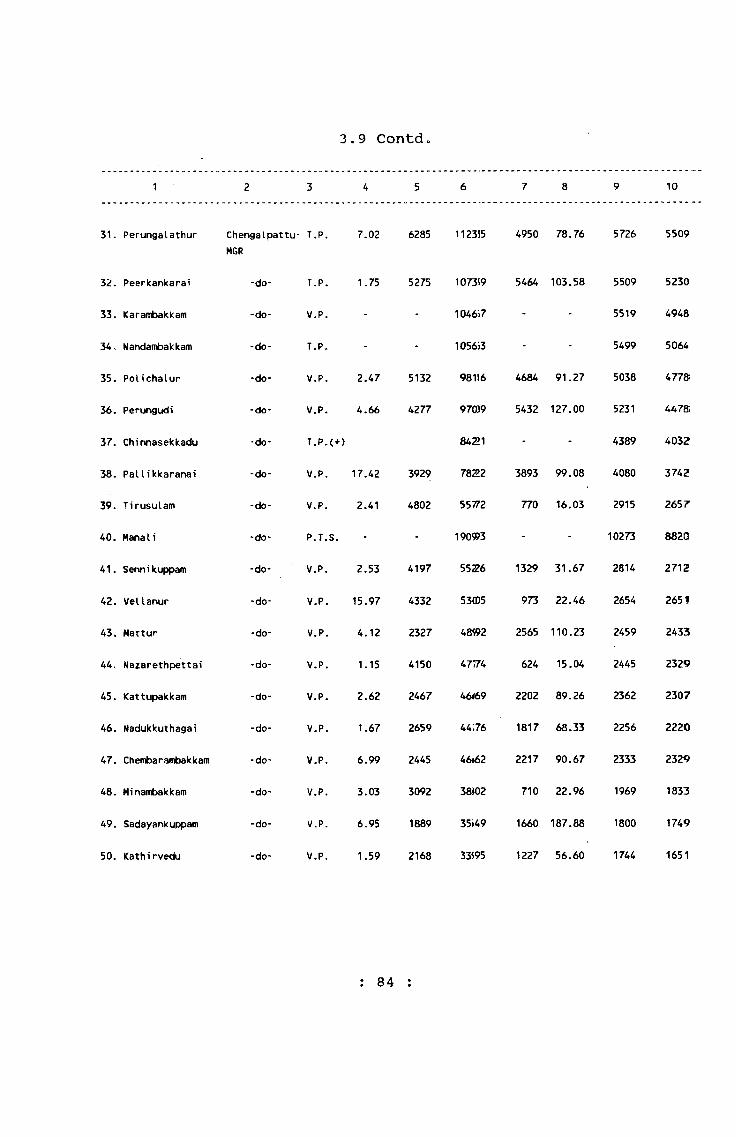
3.9 Contd.
10
31.
32.
33.
34..
35.
36.
37.
38.
39.
40.
41.
42.
43.
44.
45.
46.
47.
48.
49.
50.
Perungalathur Chengalpattu- T.P. 7.02 6285 112355 4950 78.76 5726 5509MGR
Peerkankarai
Kararrtiakkam
Nandambakkam
Polichalur
Perungudi
Chinnasekkadu
Paltikkaranai
T i rusulam
ManaIi
Sennikuppam
Vellanur
Mattur
Nazarethpettai
Kattupakkam
Nadukkuthagai
Chembarambakkam
Minambakkam
Sadayankuppam
Kathi rvedu
-do-
-do-
-do-
-do-
-do-
-do-
-do-
-do-
-do-
-do-
-do-
-do-
-do-
-do-
-do-
-do-
-do-
-do-
-do-
T.P. 1.75
V.P.T.P.
V.P. 2.47
V.P. 4.66
T.P.(+)
V.P. 17.42
V.P. 2.41
P.T.S.
V.P. 2.53
V.P. 15.97
V.P. 4.12
V.P. 1.15
V.P. 2.62
V.P. 1.67
V.P. 6.99
V.P. 3.03
V.P. 6.95
V.P. 1.59
5275
5132
4277
3929
4802
4197
4332
2327
4150
2467
2659
2445
3092
1889
2168
107359
1046i7
1056i3
98116
970)9
8421
78222
5577’2
190993
5526
53C05
48W2
47774
46169
44176
46t62
38J02
35i49
33595
5464 103.58
4684 91.27
5432 127.00
3893 99.08
770 16.03
1329 31.67
973 22.46
2565 110.23
624 15.04
2202 89.26
1817 68.33
2217 90.67
710 22.96
1660 187.88
1227 56.60
5509
5519
5499
5038
5231
4389
4080
2915
10273
2814
2654
2459
2445
2362
2256
2333
1969
1800
1744
5230
4948
5064
477®
4478
4032
3742
2657
8820
2712
2651
2433
2329
2307
2220
2329
1833
1749
1651
: 84 :

3c9 Contd.
1 10
51. Vangarasal
5 2. Kannapalayam
5 3. Soranjeri
5‘4. Varadharajapuram
55V Nemi lichen'
5 > 6 . Melmanambedu
57. MudiChur
Chengalpattu V..P.
-do- V.P.
-do-
-do-
-do-
-do-
-do-
2. Coimbatore Urban Coimbatore Agglomeration
1. Coimbatore -do-
2 . Kurichchi -do-
3. Kuniyamuttur -do-
4. KavundampaIayam -do-
5. Sulur -do-
6 . Madukkarai -do-
7. Periyanayakkan- -dope I ayam
8 . Vellalore -do-
90 Kurukkampalayam -do-
10. Saravampatti -do-
11. Perur Chettipalayam -do-
V .P.
V.P.
V .P.
V.P.
V.P.
M!.C.
T .P.
T'.P.
r.p.
jr.P. P.T.S.
TT.P.
TT.P.
W.P.TT.P.
W.P.
5.39
6.35
1.22
1.97
1.72
3.56
3.45
290.73
105.60
20.13
23.54
8.55
10.96
21.47
9.38
16.18
12.81
11.18
1791 3298 1507
2702 3283
2207 3155
2151 2529
1688 2492
2269 3284
1225 1945
581
948
378
804
1015
720
920355 1100746 181391
704514 816321 111807
418936 64796 -354140
34013 37803 3790
14554 22005 7451
17618 19715 2097
18003 18110 107
14914 18043 3129
13843 14388
12764 8447
10753
6717 9235
84,14 1610 1628
21.50 1654 1629
42.95 1596 1559
17.57 1301 1228
47.63 1269 1223
1618
964
19.71 570370 530376
44.73 1666
58.78 981
15.87 424312 392009
-0.85 33327 31469
11.14 19257 18546
51.20 11447 10558
11.90 9966 9749
0.59 9269 8841
20.98 9473 8570
-545
-4317
-3.94
-33.82
2518 37.49
7230
4296
5588
4662
7158
4151
5165
4573
: 85
342/27-143
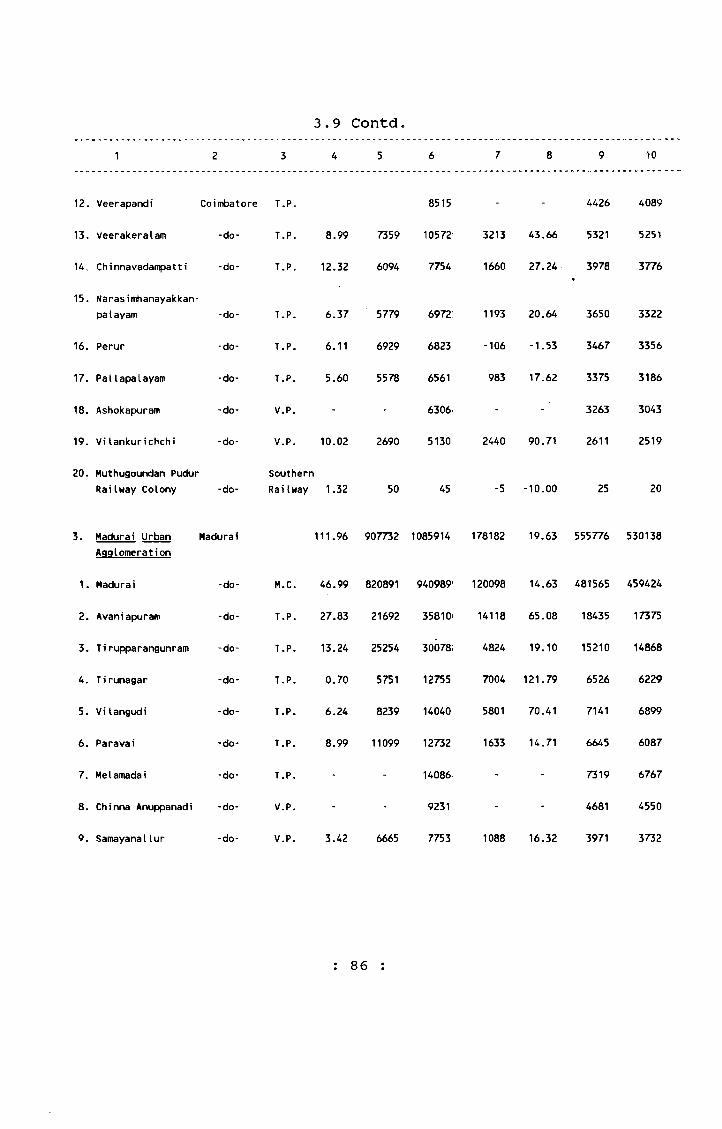
3.9 Contd.1 2 3 4 5 6 7 8 9 1 0
1 2 . Veerapandi Coimbatore T.P. 8515 - - 4426 4089
13. Veerakeralam -do- T.P. 8.99 7359 10572: 3213 43.66 5321 5251
14. Ch i nnavadampa 1 1 i -do- T.P. 12.32 6094 7754 1660 27.24 3978 3776
15. Naras i inhanayakkan- palayam -do- T.P. 6.37 5779 6972: 1193 20.64 3650 3322
16. Perur -do- T.P. 6 . 1 1 6929 6823; -106 -1.53 3467 3356
17. PaLlapalayam -do- T.P. 5.60 5578 6561 983 17.62 3375 3186
18. Ashokapuram -do- V.P. - - 6306. - 3263 3043
19. Vilankurichchi -do- V.P. 1 0 . 0 2 2690 51301 2440 90.71 2611 2519
2 0 . Muthugoundan Pudur Railway Colony -do-
Southern RaiIway 1.32 50 45 -5 -1 0 . 0 0 25 2 0
3. Madurai Urban Agglomeration
Madurai 111.96 907732 1085914 178182 19.63 555776 530138
1 . Madurai -do- M.C. 46.99 820891 940989’ 120098 14.63 487565 459424
2 . Avaniapurain -do- 27.83 21692 35810) 14118 65.08 18435 17375
3. T i rupparangunram -do- T.P. 13.24 25254 30078*. 4824 19.10 15210 14868
4. T i runagar -do- T.P. 0.70 5751 12755 7004 121.79 6526 6229
5. Vilangudi -do- T.P. 6.24 8239 14040! 5801 70.41 7141 6899
6 . Paravai -do- 8.99 11099 12732 1633 14.71 6645 6087
7. Helamadai -do- - - 14086. - - 7319 6767
8 . Chinna Anuppanadi -do- V.P. - - 9231 - - 4681 4550
9. Samayanallur -do- V.P. 3.42 6665 7753 1088 16.32 3971 3732
: 86 :
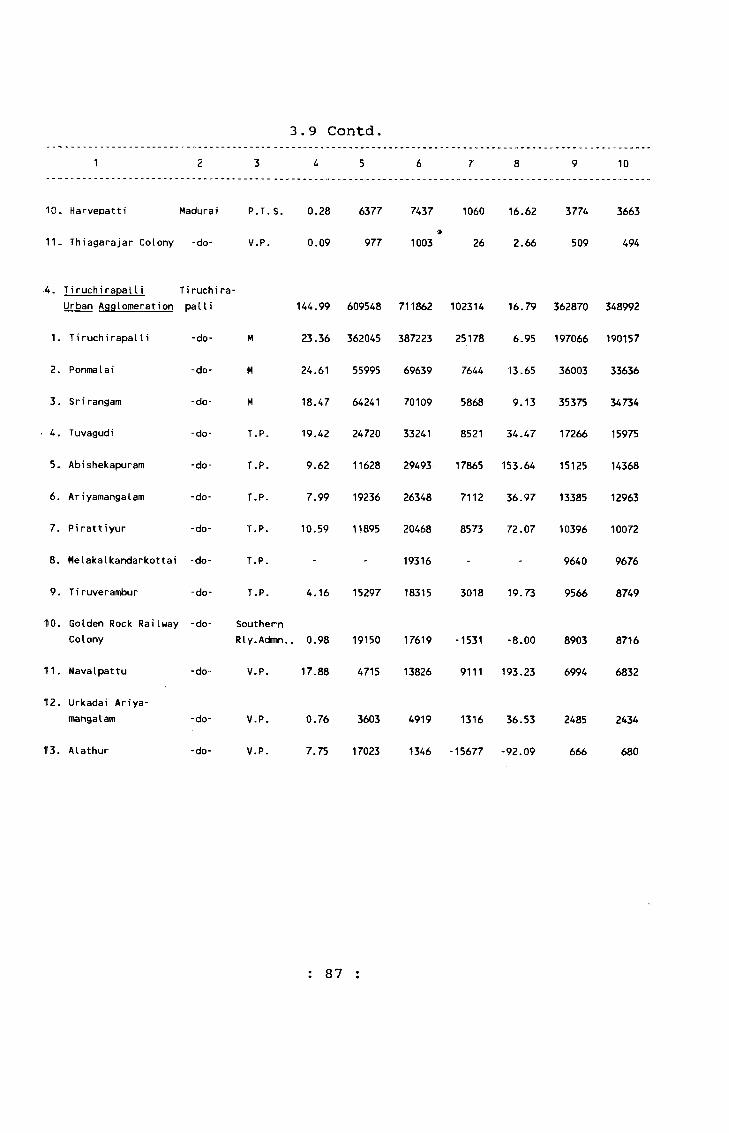
3 ^ 5
3.9 Contd1 10
10. Harvepatti Madurai
11. Thiagarajar Colony -do- V.P.
P.T.S. 0.28 6377 7437 1060 16.62 3774 3663»
0.09 977 1003 26 2 . 6 6 509 494
■4. T i ruch i rapa11i Tiruchira-Urban Agglomeration pa 11i
1 . TiruchirapalIi -do- M
2. Ponmalai -do- M
3. Srirangam -do- M
• 4. Tuvagudi -do- T.P.
5- Abishekapuram -do- T.P.
6 , Ariyamangalatn -do- T.P.
7, Pirattiyur -do- T.P.
8 . Melakalkandarkottai -do- T.P.
9. Tiruverambur -do- T.P.
HO. Golden Rock Railway -do- Southern Colony Rly.Adtmn.
HI. Navalpattu
12. Urkadai Ariya- mangalam
T3. Alathur
-do-
-do-
-do-
144.99
23.36
24.61
18.47
19.42
9.62
7.99
10.59
V.P.
V.P.
V.P.
0.98
17.88
0.76
7.75
609548
362045
55995
64241
24720
11628
19236
11895
4.16 15297
19150
4715
3603
17023
711862
387223
69639
70109
33241
29493
26348
20468
19316
18315
17619
13826
4919
1346
102314 16.79 362870 348992
25178 6.95 197066 190157
7644 13.65 36003 33636
5868 9.13 35375 34734
8521 34.47 17266 15975
17865 153.64 15125 14368
7112 36.97 13385 12963
8573 72.07 10396 10072
9640 9676
3018 19.73 9566 8749
-1531 -8.00 8903 8716
9111 193.23 6994 6832
1316 36.53 2485 2434
-15677 -92.09 6 6 6 680
: 87 :
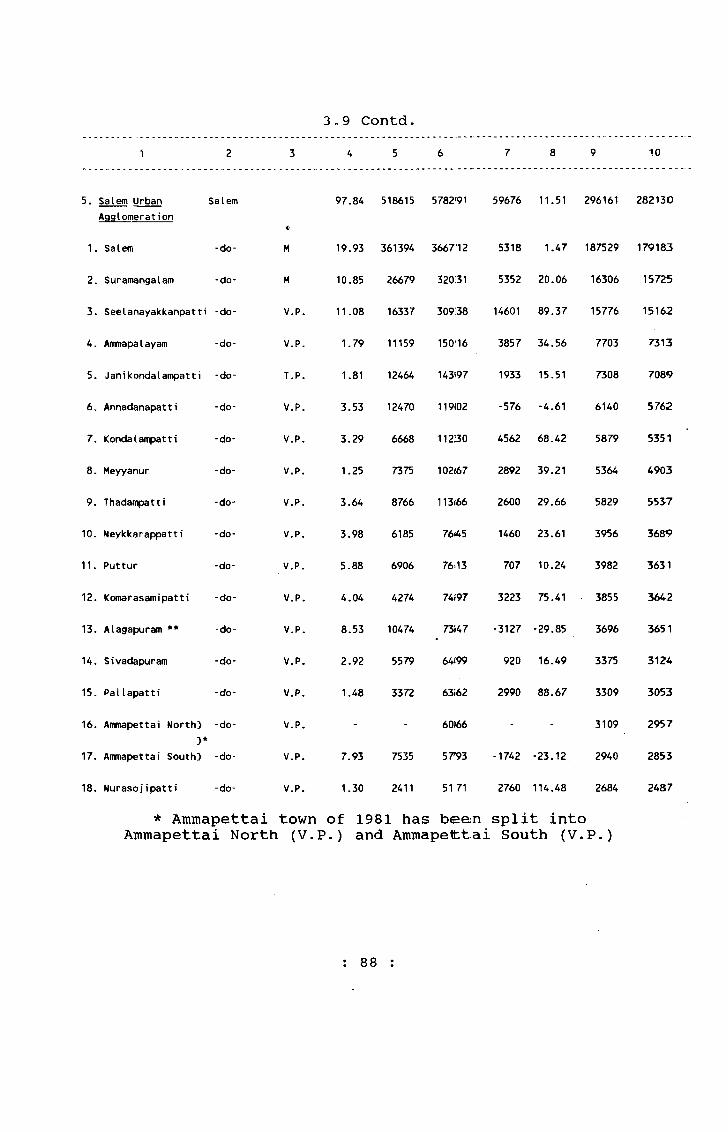
3,9 Contd.1 2 3 4 5 6 7 8 9 1 0
5. Salem Urban Agglomeration
Salem
«■
97.84 518615 5782'91 59676 11.51 296161 282130
1. Salem -do- M 19.93 361394 366712 5318 1.47 187529 179183
2c Suramangalam -do- M 10.85 26679 32031 5352 20.06 16306 15725
3. Seelanayakkanpatti -do- V.P. 11.08 16337 30938 14601 89.37 15776 15162
4. Ammapalayam -do- V.P. 1.79 11159 150-16 3857 34.56 7703 7313
5. Janikondalampatti -do- T.P. 1.81 12464 143597 1933 15.51 7308 7089
6 o Annadanapatti -do- V.P. 3.53 12470 119(02 -576 -4.61 6140 5762
7. Kondalampatti -do' V.P. 3.29 6 6 6 8 11230 4562 68.42 5879 5351
8 . Meyyanur -do- V.P. 1.25 7375 102(67 2892 39.21 5364 4903
9. Thadampatti -do- V.P. 3.64 8766 113i66 2600 29.66 5829 5537
1 0 . Neykkarappatti -do- V.P. 3.98 6185 76*45 1460 23.61 3956 3689
11. Puttur -do- V.P. 5.88 6906 76.13 707 10.24 3982 3631
1 2 . Komarasamipatti -do- V.P. 4.04 4274 74<97 3223 75.41 3855 3642
13. Alagapuram ** -do- V.P. 8.53 10474 73i47 -3127 -29.85 3696 3651
14. Sivadapuram -do- V.P. 2.92 5579 64^99 920 16.49 3375 3124
15. Pallapatti -do- V.P. 1.48 3372 63i62 2990 88.67 3309 3053
16. Amnrapettai North} >*
-do- V.P. - - 60)66 - - 3109 2957
17. Ammapettai South> -do- V.P. 7.93 7535 57^93 -1742 -23.12 2940 2853
18. Nurasojipatti -do- V.P. 1.30 2411 51 71 2760 114.48 2684 2487
* Ammapettai town of 1981 has been split into Ammapettai North (V.P.) and Ammapeltt-ai South (V.P.)
: 88 :
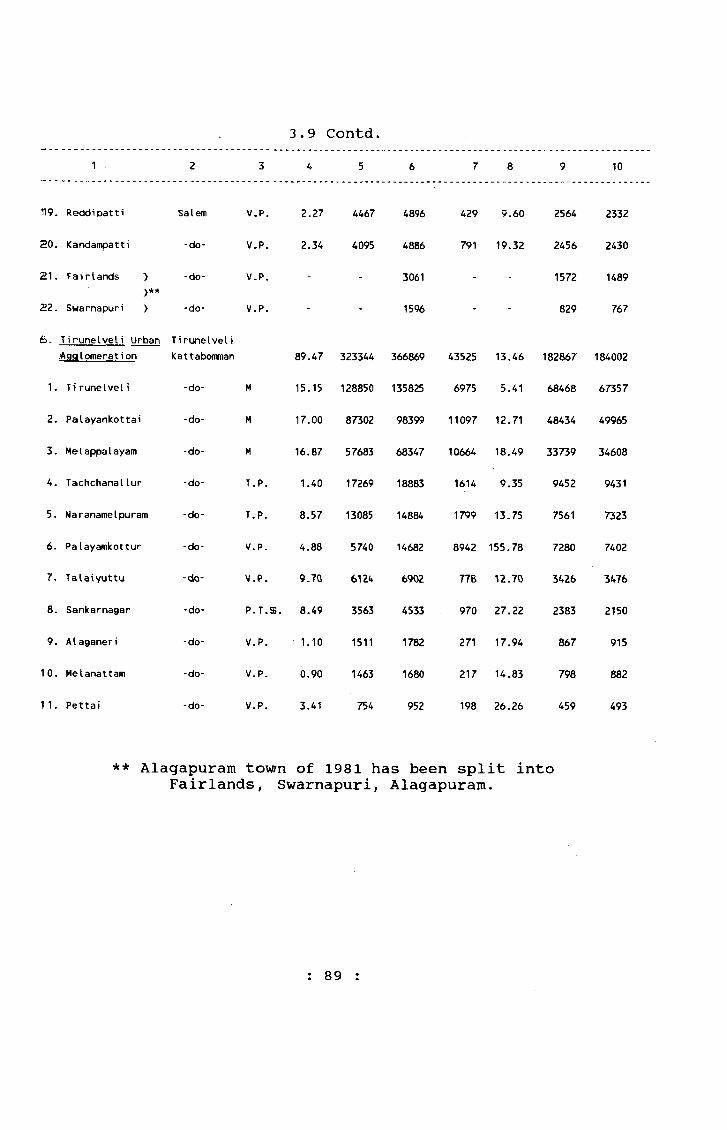
3 4 5
3.9 Contd10
119. Reddipatti Salem V.P. 2.27 4467 4896 429 9.60 2564 2332
20. Kandampatti -do- V.P. 2.34 4095 4886 791 19.32 2456 2430
21. Fairlands > -do- V.P. - - 3061 - - 1572 1489>**
22. Swarnapuri > -do- V.P. - - 1596 - - 829 767
6 . Tirunelveli Urban TirunelveliAgglomeration Kattabomman 89.47 323344 366869 43525 13.46 182867 184002
1. Tirunelveli -do- M 15.15 128850 135825 6975 5.41 68468 67357
2. Palayankottai -do- M 17.00 87302 98399 11097 12.71 48434 49965
3. Melappalayam -do- M 16.87 57683 68347 10664 18.49 33739 34608
4. Tachchanallur -do- T.P. 1.40 1 7269 18883 1 614 9.35 9452 9431
5. Naranamelpuram -do- T.P. 8.57 13085 14884 1 799 13.75 7561 7323
6 . Palayamkottur -do- V.P. 4.88 5740 14682 8942 155.78 7280 7402
7. Talaiyuttu -do- V.P. 9.70 6902 77B 12.70 5426 3476
8 . Sankarnagar -do- P.T.S. 8.49 3563 4533 970 27.22 2383 2150
9. Alaganeri -do- V.P. 1.10 1511 1782 271 17.94 867 915
10. Melanattam -do- V.P. 0.90 1463 1680 217 14.83 798 882
11. Pettai -do- V.P. 3.41 754 952 198 26.26 459 493
** Alagapuram town of 1981 has been split into Fairlands, Swarnapuri, Alagapuram.
: 89 :
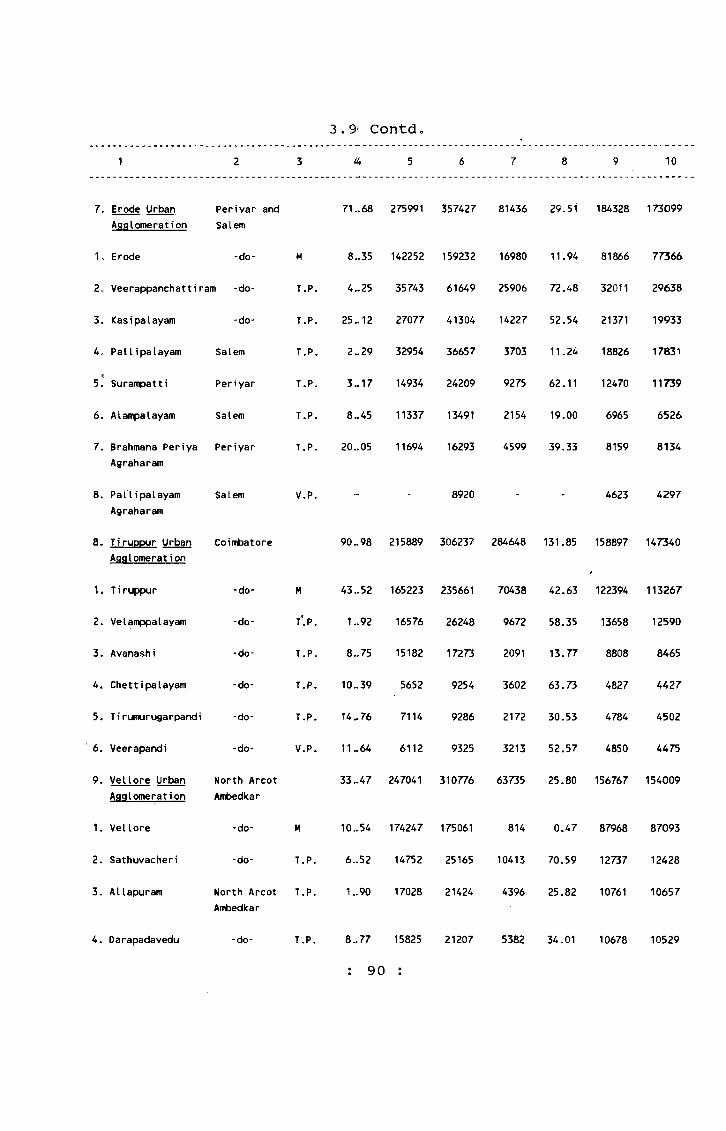
3.9' Contd3 ^ 5 10
1.2.3.
4.
s!6 .
7.
8.
Erode Urban Periyar andAgglomeration Salem
Erode -do-
Veerappanchattiram -do-
Kasipalayam -do-
Pallipalayam Salem
Surampatti Pen'yar
Alampalayam Salem
Brahmana Periya PeriyarAgraharam
PallipalayamAgraharam
Salem
Tiruppur Urban CoimbatoreAgglomeration
1.
2.
3.
4.5.
6 .
9.
1 .
2 .
3.
Tirup^r -do-
Velanppalayam -do-
Avanashi -do-
Chettipalayam -do-
Tirumurugarpandi -do-
Veerapandi -do-
Vellore Urban North ArcotAgglomeration Ambedkar
Vellore
Sathuvacheri
Allapuram
4. Oarapadavedu
-do-
-do-
North Arcot Ambedkar
-do-
MT.P.
T.P.
T.P.
T.P.
T.P.
T.P.
V.P.
Mf.P.T.P.
T.P.
T.P.
V.P.
M
T.P.
T.P.
T.P.
71 . . 6 8 275991 357427 81436 29.51 184328 173099
8 ..35 142252 159232 16980 11.94 81866 77366
4..25 35743 61649 25906 72.^8 32011 29638
25 ..12 27077 41304 14227 52.54 21371 19933
2..29 32954 36657 3703 11.24 18826 17831
3.. 17 14934 24209 9275 62.11 12470 11739
2154 19.008..45 11337 13491
20 ..05 11694 16293 4599 39.33
8920
6965 6526
8159 8134
4623 4297
90.. 98 215889 306237 284648 131.85 158897 147340
43 ..52 165223 235661 70438 42.63 122394 113267
1..92 16576 26248 9672 58.35 13658 12590
8 .. 75 15182 17273 2091 13.77 8808 8665
10..39 5652 9254 3602 63.73 4827 4627
14..76 7114 9286 2172 30.53 4784 4502
11..64 6112 9325 3213 52.57 4850 4475
33 ..47 247041 310776 63735 25.80 156767 154009
10..54 174247 175061 814 0.47 87968 87093
6..52 14752 25165 10413 70.59 12737 12428
1..90 17028 21424 4396 25.82 10761 10657
8..77 15825 21207 5382 34.01 10678 10529
: 90 :

3.9 Contd.3 4 5 10
5771
4871
4089
4385
4327
3502
3829
2128
138169
98971
12337
6704
5948
5290
2916
2464
1373
1143
1023
99820
94752
89543
5. KaIi ngur North Arcot T.P. Atnbedkar
10 .
12 .
10.
1 .
2.
3.
4.
5 .
6 .
7.
8 .
9.
10.
111.
12.
15.
Shembakkam
Torappadi
Kangayanallur
Gandhi Nagar (Katpadi Ex.)
Konavattam
Palavansathu
Vi rudambattu
-do-
-do-
-do-
-do-
-do-
-do-
-do-
T.P.
T.P.
V.P.T.P.
V.P.
V.P.
V.P.
Tuticor in Urban ChidambaranarAgglomeration
Tuticor in
Muttayyapuram^
Mappilaiurani
Attimarappatti
Mi lavittan
Tuticorin
Palayakayal
Korampallam
Mullakkadu
Ayanadaippu
-do-
-do-
-do-
-do-
-do-
-do-
-do-
-do-
-do-
-do-
Thanjavur City Thanjavur
Nagercoil Kanniyakumari M
MV.P.
V.P.
V.P.
V.P.
V.P.
V.P.
V.P.
V.P.
V.P.
M
5.10
1.61
2.71
5.75
18.79
6.74
11369
9739
7&81 9480
8869
9425 9364*
5192 6975
7883
1.32 2891 4240
138.71 2506 77 280091
13.38 1929^49 199854
18.88 24872 26005
8.71 6518 13327
5.78 6058 12201
35.73 5099 10679
22.79 466 4 5912
4925
2930 2818
19117 2271
1592 2099
29.15 184015 202013
24.27 171648 189482
1799 23.42
-61 -0.65
6905
1133
6809 104.46
6143 101.40
5580 109.43
1248 26.76
5.42
-112 -3.82
354 18.47
5598
4868
5391
4484
4637
1783 34.34 3473
4054
1349 46.66 2112
29414 11.73 141922
3.58 100883
4.56 13668
6623
6253
5389
2996
2461
1445
1128
507 31.85 1076
17998 9.78 102193
17834 10.39 94730
Dindigul Dindigul Anna M 14.01 164103 182293 8090 11.08 92750*As per publication-1991 Census. Provisional Population
Totals - Tamil Nadu supplement 15 paper-1 of 1991.: 91 :
342/27-15
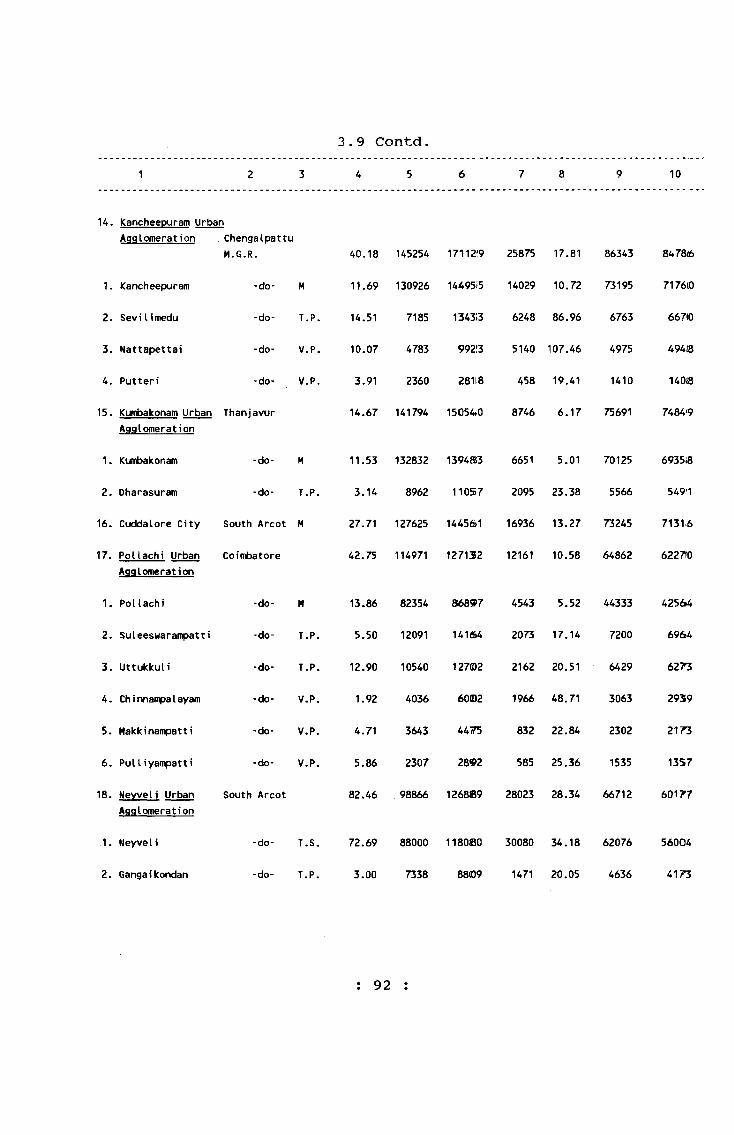
3 4 5 6
3.9 Contd.10
14.
1.
2 =3.
4.
15.
1.
2 .
16.
17.
1.
2.
3.
4.
5.
6.
18.
1.2.
Kancheepuram Urban Agglomeration Chengalpattu
Kancheepuram
SeviIimedu
Nattapettai
Putteri
M.G.R.
-do- M
-do- T.P.
-do- V.P.
-do- V.P.
Kumbakonam Urban Thanjavur Agglomeration
Kumbakonam -do- M
Dharasuram -do- T.P.
Cuddalore City South Arcot M
Pollachi Urban CoimbatoreAgglomeration
Pollachi
Suleeswarampatti
Uttukkuli
Chinnampalayam
Makkinampatti
Pulliyampatti
-do- M
-do- T.P.
-do- T.P.
-do- V.P.
-do- V.P.
-do- V.P.
Newel i Urban South Arcot Agglomeration
Neyveli
Gangaikondan
-do- T.S.
-do- T.P.
40.18 145254 1711219 25875 17.81 86343
11.69 130926 14495i5 14029 10.72 73195
14.51 7185 134313 6248 86.96 6763
10.07 4783 99Z3 5140 107.46 4975
3.91 2360 28118 458 19.41 1410
14.67 141794 15054*0 8746 6.17 75691
11.53 132832 1394S3 6651 5.01 70125
3.14 8962 11057 2095 23.38 5566
27.71 127625 144561 16936 13.27 73245
42.75 114971 127132 12161 10.58 64862
13.86 82354 86897 4543 5.52 44333
5.50 12091 14164 2073 17.14 7200
12.90 10540 12702 2162 20.51 6429
1.92 4036 6002 1966 48.71 3063
4.71 3643 44?5
5.86 2307 2892
832 22.84 2302
585 25.36 1535
82.46 98866 126889 28023 28.34 66712
8478<6
7176(0
66710
49428
14018
74849
6935i8
549’1
71316
6227?0
425&4
6964
6273
2959
217T5
1357
60177
72.69 88000 118080 30080 34.18 62076 56004
3.00 7338 8809 1471 20.05 4636 4173
; 92 :
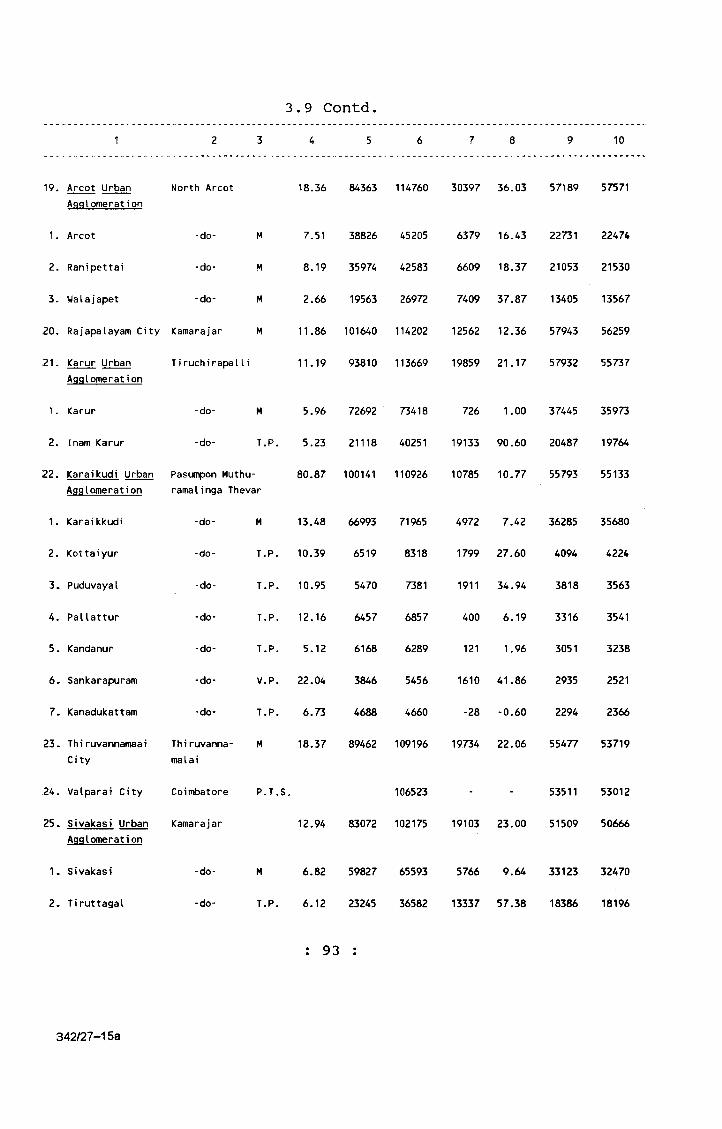
3 4 5
3 . 9 C o n td .
10
19. Arcot Urban Agglomeration
Arcot
Ranipettai
Walajapet
1.2 .
3.
20.
21.
North Arcot
-do-
-do-
-do-
2.,2 2 .
1.
2 .
3.
4.
5.
6.
7.
23.
24.
25.
Rajapalayam City Kamarajar
Karur Urban TiruchirapalliAgglomeration
Karur -do-
Inam Karur -do-
Karaikudi Urban Pasunpon Muthu- Agglomeration ramalinga Thevar
Karaikkudi
Kottaiyur
Puduvayal
Pallattur
Kandanur
Sankarapuram
Kanadukattam
Th i ruvannamaa i Th i ruvanna-City malai
Valparai City
-do- M
-do- T.P.
-do- T.P.
-do- T.P.
-do- T.P.
-do- V.P.
-do- T.P.
M
Coint)atore P.T.S =
Sivakasi Urban Kamarajar Agglomeration
2.Sivakasi
T i ruttagal
-do-
- do-
18.36 84363 114760 30397 36.03 57189 57571
M 7.51 38826 45205 6379 16.43 22731 22474
M 8.19 35974 42583 6609 18.37 21053 21530
M 2.66 19563 26972 7409 37.87 13405 13567
M 11.86 101640 114202 12562 12.36 57943 56259
11.19 93810 113669 19859 21.17 57932 55737
M 5.96 72692 73418 726 1.00 37445 35973
T.P. 5.23 21118 40251 19133 90.60 20487 19764
80.87 100141 110926 10785 10.77 55793 55133
13.48 66993 71965 4972 7.42 36285 35680
10.39 6519 8318 1799 27.60 4094 4224
10.95 5470 7381 1911 34.94 3818 3563
12.16 6457 6857 400 6.19 3316 3541
5.12 6168 6289 121 1.96 3051 3238
22.04 3846 5456 1610 41.86 2935 2521
6.73 4688 4660 -28 -0.60 2294 2366
18.37 89462 109196 19734 22.06 55477 53719
106523 - - 53511 53012
12.94 83072 102175 19103 23.00 51509 50666
M 6.82 59827 65593 5766 9.64 33123 32470
T.P. 6.12 23245 36582 13337 57.38 18386 18196
: 93 :
342/27-15a
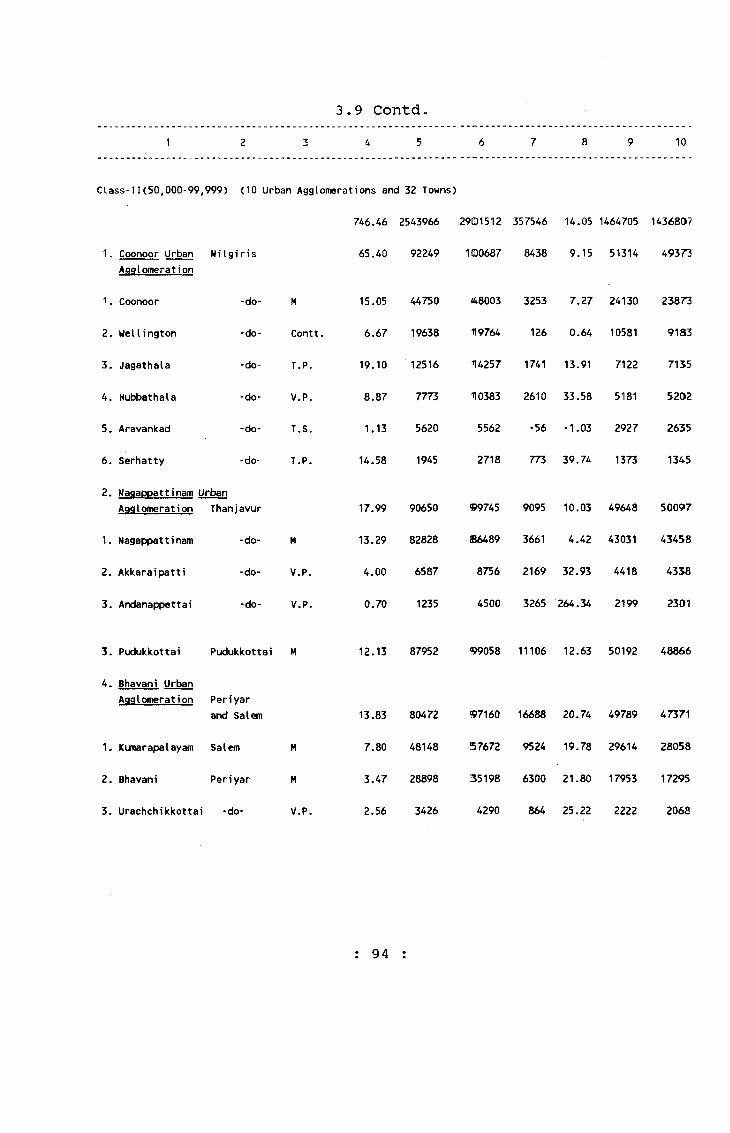
3.9 Contd.10
Class-11(50,000-99,999) (10 Urban Agglomerations and 32 Towns)
746.46 2543966 .2901512
1. Coonoor Urban NiIgi ri sAgglomeration
1o Coonoor
2. Wellington
3. Jagathala
4. Hubbathala
5. Aravankad
6 . Serhatty
-do-
-do-
-do-
-do-
-do-
-do-
2. Nagappattinam UrbanAgglomeration Thanjavur
1. Nagappattinam -do-
2. Akkaraipatti -do-
3. Andanappettai -do-
M
Contt.
T.P.
V.P.T.S.
T.P.
MV.P.
V.P.
65.40 92249 100687
15.05 44750
6.67 19638
19.10 12516
8.87 7773
1.13
14.58
4.00
0.70
5620
1945
17.99 90650
13.29 82828
6587
1235
48003
119764
14257
110383
5562
2718
99745
B6489
8756
4500
357546 14.05 1464705 1436807
8438 9.15 51314 49371
3253 7.27 24130 23873
126 0.64 10581 9183
1741 13.91 7122 7155
2610 33.58 5181 5202
-56 -1.03 2927 2635
773 39.74 1373 1345
9095 10.03 49648 50097
3661 4.42 43031 43458
2169 32.93 4418 4338
3265 264.34 2199 2301
3. Pudukkottai Pudukkottai M
4. Bhavani Urban Agglomeration Periyar
and Salem
1. Kumarapalayam Salem M
2. Bhavani Periyar M
3. Urachchikkottai -do- V.P.
12.13 87952 99058 11106 12.63 50192 48866
13.83 80472 97160 16688 20.74 49789 47371
7.80 48148 57672 9524 19.78 29614 28058
3.47 28898 35198 6300 21.80 17953 17295
2.56 3426 4290 864 25.22 2222 2068
: 94 :

3 4 5
3.9 Contd10
Vam'yambadi Urban Agglomeration North Arcot
1 .,
2 .,
3.,
4„ 6.
1 .,
2. 3.7.
8 .
9.
10.
11. 12.
1.
2.
13.
Vam'yambadi
Udayendram
Jaffrabad
Devasthanam
-do-
-do-
-do-
-do-
Gudiyattam Urban Agglomeration North Arcot
Gudiyattam
Seeyur
Chenvaali
Vi Ilupuram
Udhagamandalam
Aruppukkottai
KoviIpatti
Mayiladuthurai
PaIan1
Sivagiripatti
Ambur
-do-
-do-
-do-
-do-
-do-
-do-
-do-
Palani UrbanAgglomeration Dindigul
-do-
-do-
M
T.P.
V.P,
V.P.
MV.P,
V.P.
South Arcot M
M
V.P.
20.12 75042 92307 17265 23.00 45833 46474
8.98 59107 72428 13321 22.54 35850 36578
5.50 8674 10421 1747 20.14 5188 5233
1.44 3935 5187 1252 31.82 2652 2535
4.20 3326 4271 945 28.41 2143 2128
9.90 80674 90557 98831 12.25 45431 45126
4.79 75044 83232 8188 10.91 41739 41493
3.23 3994 5206 1212 30.35 2647 2559
1.88 1636 2119 483 29.52 1045 1074
8.29 77091 88788 11697 15.17 45501 43287
30.67 78277 81763 3486 4.45 41683 40080
14.97 72245 78976 6731 9.32 39861 39115
5.21 63964 78834 14870 23.25 39229 39605
North Arcot M Ambedkar
76837
26.60 68389 76209
6.63 64444 68907
19.97 3945 7302
18.78 66042 75911
13.84 38730 38107
7820 11.43 38689 37520
4463 6.93 34771 34136
3357 85.10 3918 3384
9869 14.94 37893 38018
14. T i ruchendur TiruchendurUrban Agglomeration
1. T i ruchendur -do- T.P.
79.77 68884 75301 6417 9.32 35544 39757
23.37 24233 27420 3187 13.15 13718 13702
: 95 :

3 4 5
3.9 Contd.
2 .
3.
15.
16.
17.
18.
1.2.
19„
20.
21.
22 .
23.
24.
25.
26.
27.
1.
2 .
28.
Kayalpattinam Tiruchchendur T.P.
Arumuganeri
Paramakkudi
Arakkonam
-do- T.P.
Ramanathapuram M
North Arcot MAmbedkar
Virudhunagar Kamarajar
Chidambaram Urban South Arcot Agglomeration
Chidambaram
Annamalai Nagar
Kadaiyanallur
Srivi11iputtur Kamarajar
Bodinayakkanur Madurai
Teni-Allinagaram -do-
Mettupalayam
T i ruchengodu
Tindivanam
Krishnagiri
Ambasamudram Urban Agglo- meration
-do-
-do-
Tirunelveli M
M M M
M M M M
Coimbatore
Salem
South Arcot
Dharmapuri
T i runeIveIi Kattabomman
MP.T.S.
Ambasamudram -do- T.P.
Kallidaikurichchi -do- T.P.
Dharmapuri Dharmapuri M
29.55
26.85
11.87
9.06
6.60
9.85
4.80
5.05
50.07
8.74
21.94
7.20
25.19
22.37
11.50
24.35
17.84
6.51
11.65
23544
21107
61149
59405
68047
62543
55920
6623
60306
59168
53018
59537
53941
56520
48335
52591
244281
23453
72321
71928:
70971
67949
58740
9209'
68819
68644
66500
66050
63479
63027
61579
60315
59661
884 3.75 10753 13675
2346 11.11 11073 12380
11172 18.27 36580 35741
12523 21.08 36500 35428
2924 4.30 35734 35237
5406 8.64 34875 33074
2550
2584
8513
7332
13032
3942
9086
5059
11980
7070
4.56
39.04
14.12
11.53
12.39
24.58
6.62
16.84
8.95
24.79
13.44
29663
5212
34453
34667
33832
34039
32373
32405
31714
30450
29082
29077
3997
34366
33977
32668
32011
31106
30622
29865
29865
30579
29761- 33893
22830 25768
4132 13.88 16581 17312
2938 12.87 12501 13267
51223 59318 8095 15.80 30202 29116
: 96 :

3 4 5
3.9 Contd.8 9 10
29. Udumalaipettai Cointoatore
30c iPattukkottai Thanjavur
311. Devarshola Urban Nilgiris Agglomeration
1, Uelliyalam
2. Devarshola
32. Mannargudi
33. Attur
34. Tenkasi
35. Tiruppattur
36. Arani
37. Chengalpattu
38. Puliyangudi
-do- r.p.
-do- r.p.
Thanjavur Ml
Salem Ml
Tirunelveli Ml
North Arcot W
T 1 r uvannama I a i M! SantHjvarayar
Chengalpattu- Ml MGR
Tirunelveli Ml Kattabomnan
39. Vridhachalam South Arcot Ml
40. Ramanathapuram Ramanathapuram Ml
Madurai Ml
South Arcot Ml
41. Kambam
42. Panruti
Class III (20.000 to 49.999)
2 Urban Agglomeration and 69 Towns
1. Thiruvarur Thanjavur
2. Vikramasingapuram Tirunelveli
3. Sankaran KoiI -do-
8.18 54852 58678 3826 6.98 29335 29343
21.17 49484 58062 8578 17.33 29443 28619
156.53 43221 57549 14328 33.15 28994 28555
95.33 25446 37787 12341 48.49 19018 18769
61.20 17775 19762 1987 11.18 9976 9786
11.24 51738 56552 4814 9.30 28771 27781
27.62 50517 55667 5150 10.19 28115 27552
25.96 49214 55189 5975 12.14 27223 27966
4.65 52441 55282 2841 5.42 28127 27155
9.74 49365 54898 5533 11.21 27717 27181
6.03 47329 54127 6798 14.36 27723 26404
42.32 43998 53287 9289 21.11 26463 26738
M
T.P
M
27.24
5.89
6.92
18.02
1316.53
11.48
, 38.84
12.40
42116
45719
50340
43042
52819
52879
52435
51394
1995779 2104713
43654 49195
49319 49834
42084 48846
10703 25.41 26998 25821
7160 15.66 26782 26097
2095 4.16 26507 25928
8352 19.40 26221 25173
108934 5.46 1078562 1026151
5541 12.69 24768 24427
515 1.04 24661 25173
6762 16.07 24532 24314
: 97 :
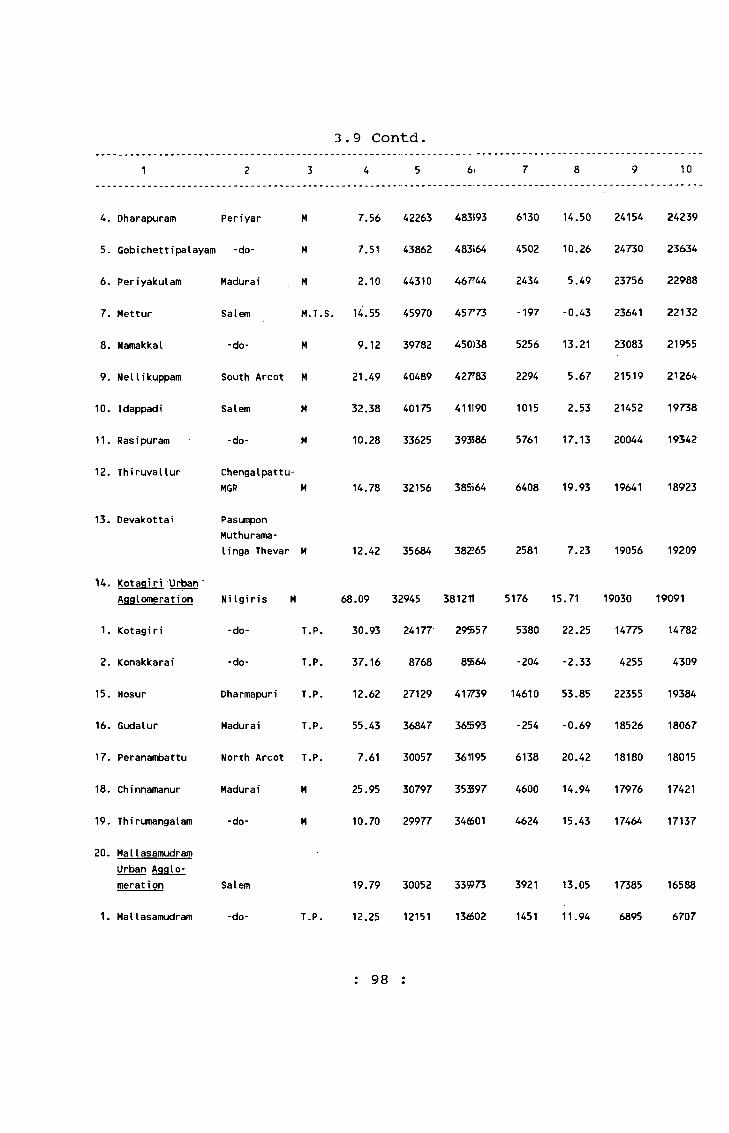
3,9 Contd. 3 4 51 10
4„
5.
6.
7.
8.
9.
10.
11.
12.
Dharapuram Pen'yar
Gobichettipalayam -do-
Pen'yakulam Madurai
Mettur
Namakkal
Nelli kuppam
Idappadi
Rasipuram
Thi ruvallur
13. Devakottai
H . Kotagiri Urban Agglomeration
1. Kotagiri
2. Konakkarai
15. Hosur
16. Gudalur
17. Peranambattu
18. Chinnamanur
19. Thirutnangalam
20. Ma11asamudram Urban Agglomeration
1. Mai Iasamudram
Salem
-do-
M
M
M
M.T.S.
M
South Arcot M
Salem M
-do- M
Chengalpattu- MGR M
Pasumpon Muthurama- linga Thevar M
Nilgiris M
-do- T.P.
-do- T.P.
Dharmapuri T.P.
Madurai T.P.
North Arcot T.P.
Madurai M
-do-
Salem
-do-
M
7.56 42263 483593
7.51 43862 483i64
2.10 44310 W 4 4
14.55 45970 457^73
9.12 39782 450)38
21.49 40489 427?’83
32.38 40175 411190
10.28 33625 393J86
6130 14.50 24154 24239
4502 10.26 24730 23634
2434 5.49 23756 22988
-197 -0.43 23641 22132
5256 13.21 23083 21955
2294 5.67 21519 21264
1015 2.53 21452 19738
5761 17.13 20044 19342
14.78 32156 385564 6408 19.93 19641 18923
T.P.
12.42 35684 382265
68.09 32945 381211
30.93 24177 29557
37.16 8768 89564
12.62 27129 417739
55.43 36847 36593
7.61 30057 361195
25.95 30797 35397
10.70 29977 34d601
19.79 30052 33973
12.25 12151 136602
2581 7.23 19056 19209
5176 15.71 19030 19091
5380 22.25 14775 14782
-204 -2.33 4255 4309
14610 53.85 22355 19384
-254 -0.69 18526 18067
6138 20.42 18180 18015
4600 14.94 17976 17421
4624 15.43 17464 17137
3921 13.05 17385 16588
1451 11.94 6895 6707
: 98 :
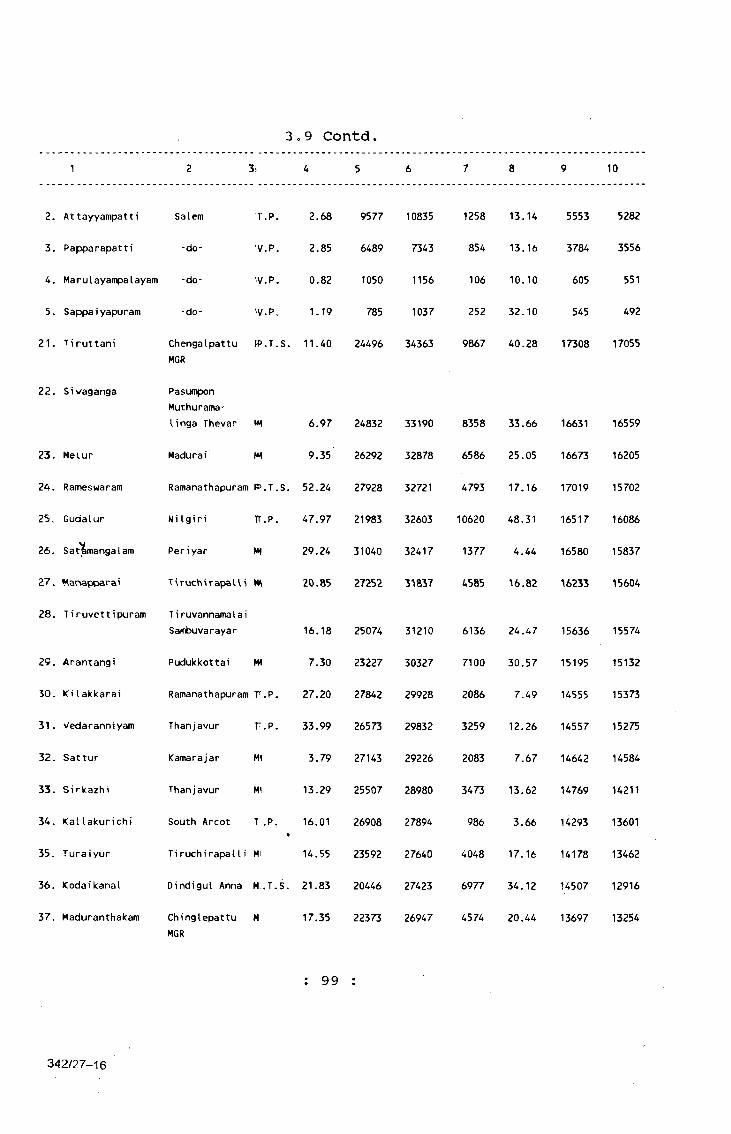
3 ; 4 5 6
3o9 Contd.8 9 10
2. Attayyampatti Salem
3. Papparapatti -do-
4. Marulayanpalayam -do-
5. Sappaiyapuram -do-
21. Tiruttani
T.P.
'V.P.
'V.P.
'V.Po
22. Sivaganga
23.
24.
25.
26.
27.
28.
29.
30.
31.
32.
33.
34.
35.
36.
37.
MeLur
Rameswaram
Gudalur
Sat^mangalam
Warxappara'
T i ruvettipuram
Arantangi
KiIakkarai
Vedaranniyam
Sattur
Si rkazhi
<allakurichi
Turaiyur
Kodai kanal
Maduranthakam
Chengalpattu fP.T.S. MGR
PasumponMuthurama'linga Thevar W
Madurai H
Ramanathapuram
N i I g i r i TT. P .
Periyar Ml
T i ruvannamalai Sambuvarayar
Pudukkottai Ml
Ramanathapuram T.P.
Thanjavur T'.P.
Kamarajar Ml
Thanjavur Ml
South Arcot T ,P.
TiruchirapalIi Mi
Dindigul Anna Ml.T.S.
Chinglepattu MMGR
2.68
2.85
0.82
1.19
11.40
6.97
9.35
52.24
47.97
29.24
20.85
16.18
7.30
27.20
33.99
3.79
13.29
16.01
14.55
21.83
17.35
9577 10835
6489 7343
1050 1156
785 1037
1258 13.14 5553 5282
854 13.16 3784 3556
24832
26292
27928
21983
31040
27252
25074
23227
27842
26573
27143
25507
26908
23592
20446
22373
33190
32878
32721
32603
32417
3‘i837
31210
30327
29928
29832
29226
28980
27894
27640
27423
26947
106 10.10
252 32.10
605
545
6136 24.47
7100 30.57
2086 7.49
3259 12.26
2083 7.67
3473 13.62
986 3.66
4048 17.16
6977 34.12
4574 20.44
15636
15195
14555
14557
14642
14769
14293
14178
14507
13697
551
492
24496 34363 9867 40,28 17308 17055
8358 33.66 16631 16559
6586 25.05 16673 16205
4793 17.16 17019 15702
10620 48.31 16517 16086
1377 4.44 16580 15837
4585 16.82 16233 15604
15574
15132
15373
15275
14584
14211
13601
13462
12916
13254
: 99 :
342/27-16
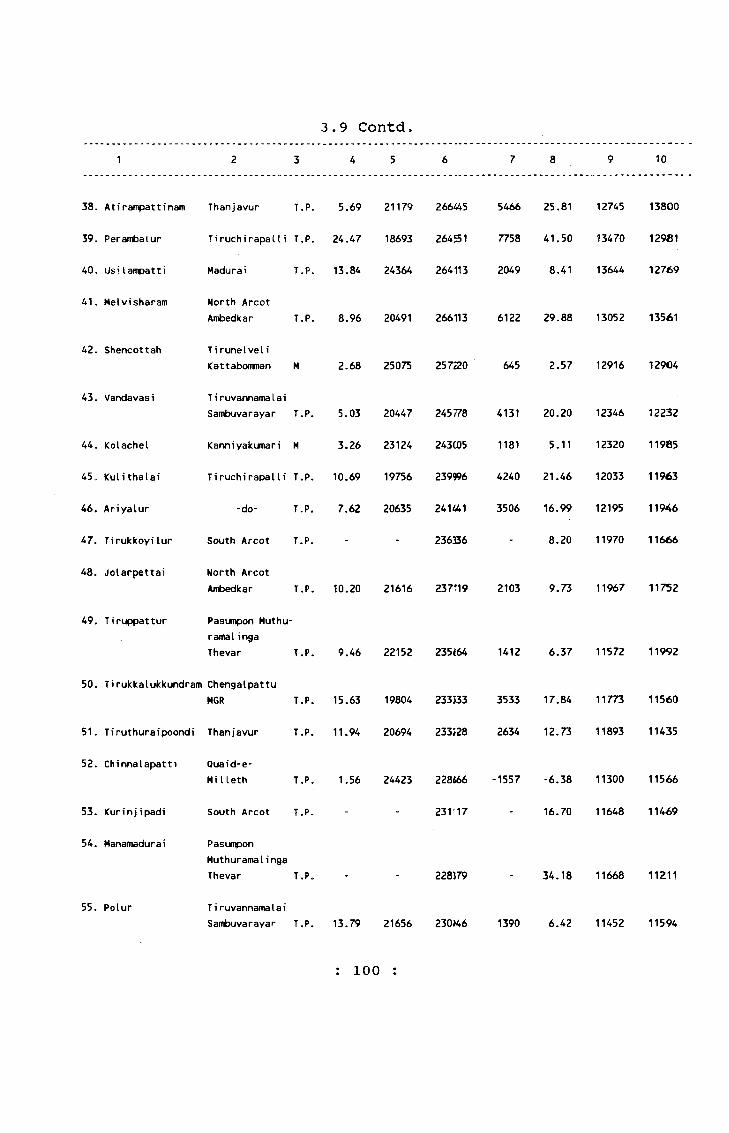
3 4 5 6
3 . 9 C o n td .
8 10
38.
39.
40.
41.
Atirampattinam Thanjavur T.P.
Perambatur TiruchirapatIi T.P.
Usilampatti
Melvisharam
42. Shencottah
43. Vandavasi
44.
45.
46.
47.
48.
Kolachel
Kuli thalai
Ariyalur
Tirukkoyilur
Jolarpettai
49. Tiruppattur
Madurai T.P.
North Arcot Ambedkar T.P.
T i runeIveI\
Kattabomman M
T i ruvannamalai Sambuvarayar T.P.
Kanniyakumari M
Tiruchirapalli T.P.
-do- T.P.
South Arcot T.P.
North Arcot Ambedkar T.P.
Pasumpon Muthu- ramalingaThevar T.P.
50.
51.
52.
53.
54.
Tirukkalukkundram ChengalpattuMGR T.P.
Tiruthuraipoondi Thanjavur T.P.
Chinnalapatti Quaid-e-MiUeth T.P.
Kurinj ipadi
Manamadurai
55. Polur
South Arcot T.P.
Pasumpon Muthuramalinga Thevar T.P.
T i ruvannamaIa i Sambuvarayar T.P.
5.69 21179 2664i5
24.47 18693 26451
13.84 24364 264113
5466 25.81 12745 13800
7758 41.50 13470 12981
2049 8.41 13644 12769
8.96 20491 266113 6122 29.88 13052 13561
2.68 25075 25720
5.03 20447 245778
3.26 23124 243C05
10.69 19756 239996
7.62 20635 2 4 m i
236B6
645 2.57 12916 12904
4131 20.20 12346 12232
1181 5.11 12320 11985
4240 21.46 12033 11963
3506 16.99 12195 11946
8.20 11970 11666
10.20 21616 237119 2103 9.73 11967 11752
9.46 22152 235<64
15.63 19804 233333
11.94 20694 233i28
1.56 24423 228466
231117
228179
13.79 21656 230146
1412 6.37 11572 11992
3533 17.84 11773 11560
2634 12.73 11893 11435
■1557 -6.38 11300 11566
16.70 11648 11469
34.18 11668 11211
1390 6.42 11452 11594
: 100 :
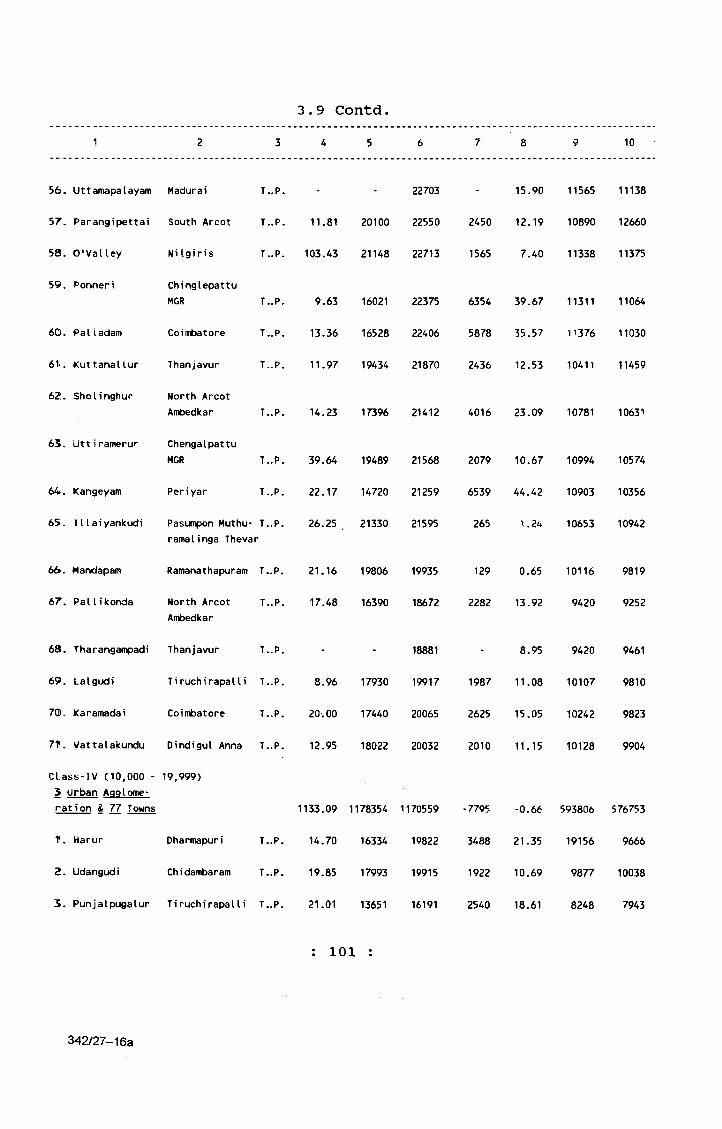
3 4 5 6
3.9 Contd.1 10
56. Uttamapalayam
5 7 . Parangipettai
58. O'Valley
59. Portneri
60. Palladam
61i. Kuttanallur
62. Sholinghur
65. Uttiramerur
64. Karrgeyam
65s. 1 1 laiyankudi
6 6 . Mandapam
67. Pallikonda
6 8 . Tharangampadi
69. Lalgudi
70. Karatnadai
71. Vattalakundu
Class-IV (10,000 - 3 Urban Agglomeration & 77 Towns
1 . Harur
2 . Udangudi
5. Punjalpugalur
Madurai
South Arcot
Ni Igiris
ChinglepattuMGR
Coiinbatore
Thanjavur
North Arcot Ambedkar
ChengalpattuMGR
Periyar
T..P. - - 22703
T..P. 11.81 20100 22550
T..P. 103.43 21148 22713
T..P, 9.63 16021 22375
T..P. 13.36 16528 22406
T..P. 11.97 19434 21870
Pasumpon Muthu- T. ramalinga Thevar
Ramanathapuram T.
North Arcot T.Ambedkar
Thanjavur T.
Tiruchirapalli T.
Coimbatore T.
Dindigul Anna T.
19,999)
15.90 11565 11138
2450 12.19 10890 12660
1565 7.40 11338 11375
6354 39.67 11311 11064
5878 35.57 11376 11030
2436 12.53 10411 11459
T..P. 14.23 17396 21412 4016 23.09 10781 10631
Dharmapuri
Chidambaram
T..P.
T..P.
Tiruchirapalli T..P.
39.64 19489 21568
22.17 14720 21259
26.25 21330 21595
21.16 19806 19935
17.48 16390 18672
18881
8.96 17930 19917
20-. 00 17440 20065
12.95 18022 20032
1133.09 1178354 1170559
14.70 16334 19822
19.85 17993 19915
21.01 13651 16191
2079 10.67 10994 10574
6539 44.42 10903 10356
265 1.24 10653 10942
129 0.65 10116 9819
2282 13.92 9420 9252
8.95 9420 9461
1987 11.08 10107 9810
2625 15.05 10242 9823
2010 11.15 101^8 9904
■7795 -0.66 593806 576753
3488 21.35 19156 9666
1922 10.69 9877 10038
2540 18.61 8248 7943
101 :
342/27-16a
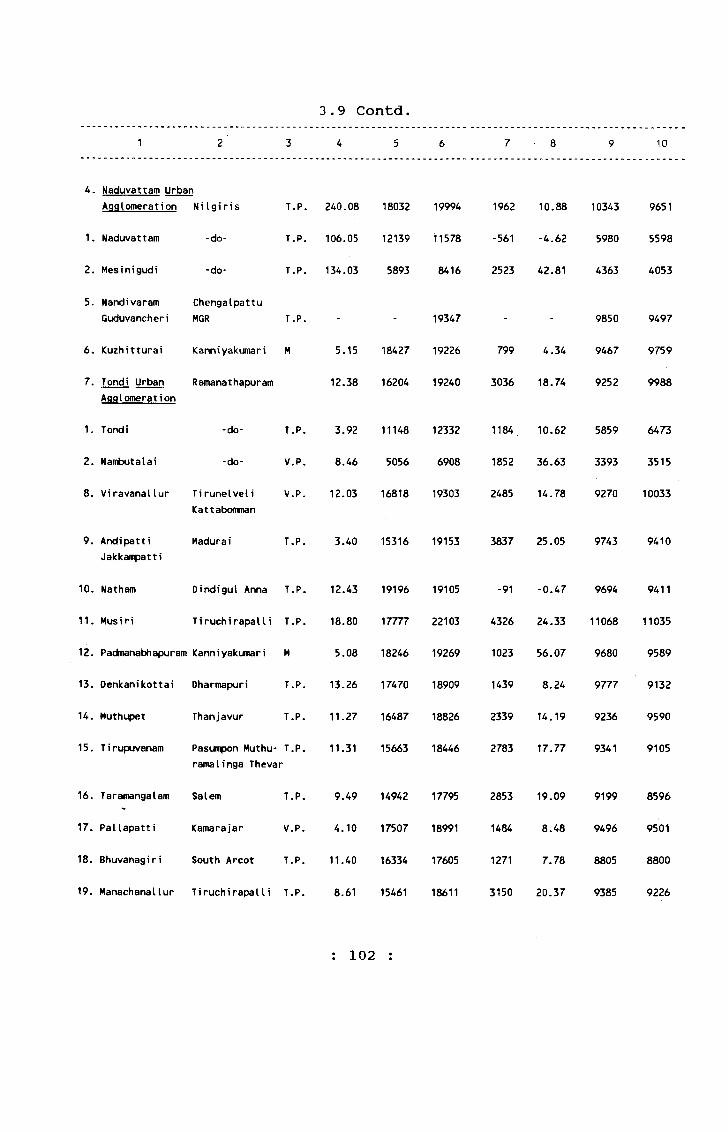
3 4 5
3.9 Contd.10
4.
1.
2.
5.
Naduvattam Urban Agglomeration N iIg i r i s
Naduvattam
Mesinigudi
-do-
-do-
Nandivaram ChengalpattuGuduvancheri MGR
6 , Kuzhitturai
7.
1.
2.
8.
9.
10.
11.
12.
13.
14.
15.
16.
17.
18.
19.
Tondi
NantMJtalai
-do-
-do-
Viravanallur Tirunelveli Kattabomman
AndipattiJakkampatti
Madurai
T.P.
T.P.
T.P.
T.P.
Kanniyakunari M
Tondi Urban Ramanathapuram Agglomeration
T.P.
V.P.
V.P.
T.P.
Natham Oindigul Anna T.P.
Musiri TiruchirapalIi T.P.
Padmanabhapuram Kanniyakumari M
Denkanikottai Oharmapuri T.P.
Muthi4 >et Thanjavur T.P.
Tirupuvanam Pasumpon Muthu- T.P.ramalinga Thevar
Taramangalam Salem T.P.
Pallapatti Kamarajar V.P.
Bhuvanagiri South Arcot T.P.
Manachanallur TiruchirapalIi T.P.
240.08 18032 19994
106.05 12139 11578
134.03 5893 8416
19347
5.15 18427 19226
12.38 16204 19240
3.92 11148 12332
8.46 5056 6908
12.03 16818 19303
3.40 15316 19153
12.43 19196 19105
18.80 17777 22103
5.08 18246 19269
13.26 17470 18909
11.27 16487 18826
11.31 15663 18446
9.49 14942 17795
4.10 17507 18991
11.40 16334 17605
8.61 15461 18611
1962 10.88 10343 9651
-561 -4.62 5980
3036 18.74 9252
-91 -0.47
4326 24.33
1023 56.07
1439 8.24
2339 14.19
2783 17,77
2853 19.09
1484 8.48
1271 7.78
3150 20.37
9694
11068
9680
9777
9236
9341
9199
9496
8805
9385
5598
2523 42.81 4363 4053
9850 9497
799 4.34 9467 9759
9988
1184. 10.62 5859 6473
1852 36.63 3393 3515
2485 14.78 9270 10033
3837 25.05 9743 9410
9411
11035
9589
9132
9590
9105
8596
9501
8800
9226
: 102 :

3,9 Contd5 4 5 10
20, Anaiyur
2"!. Arndiyur
22. Anamalai
23. Srivaikundam
24. Kanniyakumari
25. TisaiyanviIlai
26. Rosalpatti
27. Pallapatti
28. Wazarath
29. Palakkodu
30. PunjaipuIiyam- pat t i
31. Poddatturupetai
<amara]ar V.P.
Periyar T.p.
Coimbatore T.P.
Chidambaranar T.P.
Kann i yakuma r i P.T .S,
T i runelveli Kattabomman T.P.
<amarajar T.P.
Tiruchirapalli T.p.
Chidambaranar T,P.
Dharmapuri T.P.
Periyar T.P.
32.
33.
34.
35.
36 „
37.
38.
39.
40.
Papanasam
V*swanatham
Kaveripattinam
Singampuneri
Thi ruvaiyaru
Nflakkottai
Sattankulam
Amnapettai
Chennimalai
Chengalpattu-MGR
Thanjavur
Kamarajar
Dharmapuri
8.91
2.37
16.07
9.22
4.91
T.P .
T,P .
T,P ,
T.P .
Pasumpon Muthu- T.P. ramalinga Thevar
Thanjavur T.P.
Dindigul Anna T.P.
Chidambaranar T.P.
Thanjavur T.P,
Periyar T.P,
4.72
8.32
8.27
2.50
5.77
6.47
9.56
0.94
4.37
2.59
5.61
10.32
15,88
6.74
2.10
11016
14896
15575
16128
14087
8362
10725
14302
13024
12046
13128
12986
8825
13669
11901
14013
11920
13364
12902
11357
17659
17524
17429
17459
17225
17161
15957
15799
15814
15853
15075
15044
14997
14899
14719
15633
14495
14770
14270
14057
13453
6643 60.30
2628 15.00
1854 11.90
1331 8.25
3138 22.28
7595 90.83
5074 47.31
1512 10.57
2829 21.72
3029 25.15
1916 14.59
2011 15.49
6074 68.83
1050 7.63
3732 31.36
482 3.44
2850 23.91
906 6.78
1155 8.95
2096 18.46
8915
9088
8636
8423
8682
8365
8536
6314
7573
8162
7594
7620
7519
7347
7288
7928
7121
7600
6972
6885
6961
8744
8436
8793
9036
8543
8796
7421
9485
8241
7691
7481
7424
7478
7552
7431
7705
7374
7170
7298
7172
6492
: 103 :
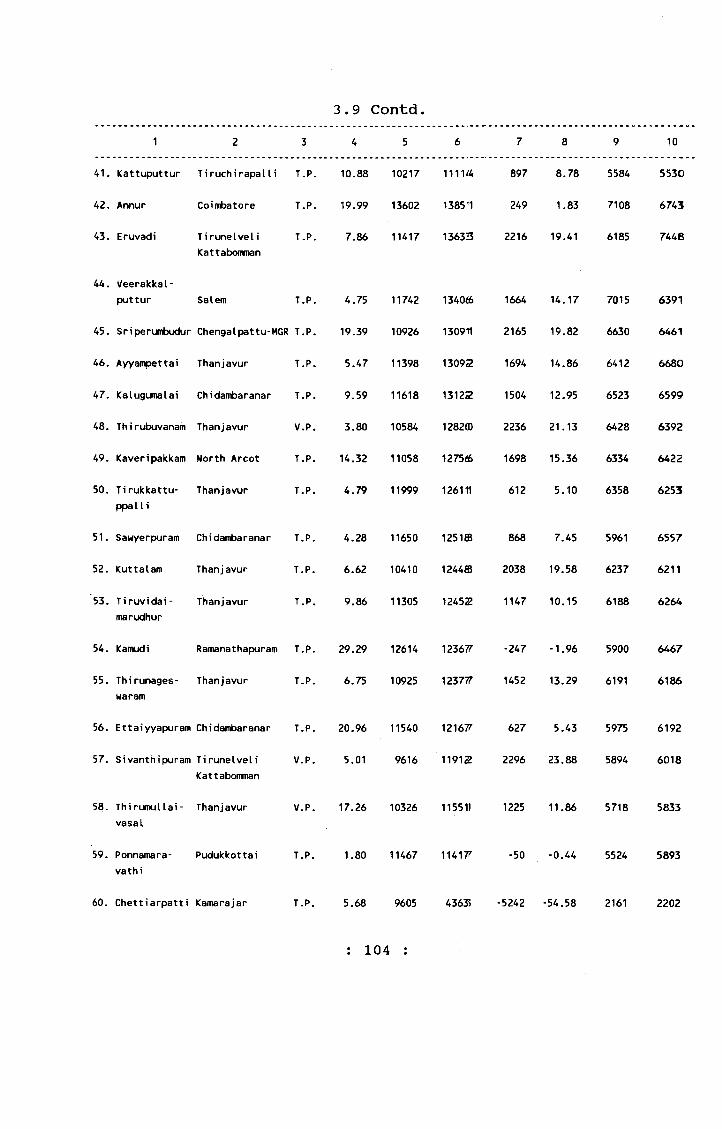
4 5 6
10.88 10217 1111^
19.99 13602 1385^1
7.86 11417 13633
3.9 Contd.1 2 3
Kattuputtur Tiruchirapalli T.P.
Annur Coimbatore T.P.
Eruvadi Tirunelveli T.P.Kattabomman
7 8
897 8.78
249 1.83
2216 19.41
1664 14.17
2165 19.82
1694 14.86
1504 12.95
2236 21.13
1698 15.36
612 5.10
9
5584
7108
6185
7015
6630
6412
6523
6428
6334
6358
10
5530
6743
7448
6391
6461
6680
6599
6392
6422
6253
41.
42.
43.
44.
45.
46.
47.
48.
49.
50.
51.
52.
53.
Veerakkal- puttur Salem
Sriperunt>udur Chengalpattu-MGR T.P
Ayyampettai Thanjavur T.P
Kalugumalai Chidambaranar T.P
Th i rubuvanam Than javur
Kaveripakkam North Arcot
Tirukkattu- Thanjavur ppalIi
54. Kamudi
55. Thirunages- Thanjavur waram
56.
57.
58.
59.
ThirumuUai- Thanjavur vasal
Ponnamara- Pudukkottai vathi
V.P.
T.P.
T.P.
Sawyerpuram Chidambaranar T.P,
Kuttalam Thanjavur T.P.
Tiruvidai- Thanjavur marudhur
Ramanathapuram T.P.
T.P.
Ettaiyyapuram Chidambaranar T.P.
Sivanthipuram Tirunelveli V.P.Kattabomnan
T.P. 4.75 11742 1340<6
19.39 10926 1309H
5.47 11398 13092
9.59 11618 13122
3.80 10584 1282ffl
14.32 11058 127566
4.79 11999 126111
4.28 11650 12518B
6.62 10410 1244®
T.P. 9.86 11305 12452
29.29 12614 12367?
6.75 10925 123777
20.96 11540 12167?
5.01 9616 11912
V.P. 17.26 10326 115511
60. Chettiarpatti Kamarajar
T.P.
T.P.
1.80 11467 114177
868 7.45 5961 6557
2038 19.58 6237 6211
1147 10.15 6188 6264
-247 -1.96 5900 6467
1452 13.29 6191 6186
627 5.43 5975 6192
2296 23.88 5894 6018
1225 11.86 5718 5833
-50 -0.44 5524 5893
5.68 9605 43635 -5242 -54.58 2161 2202
: 104 :
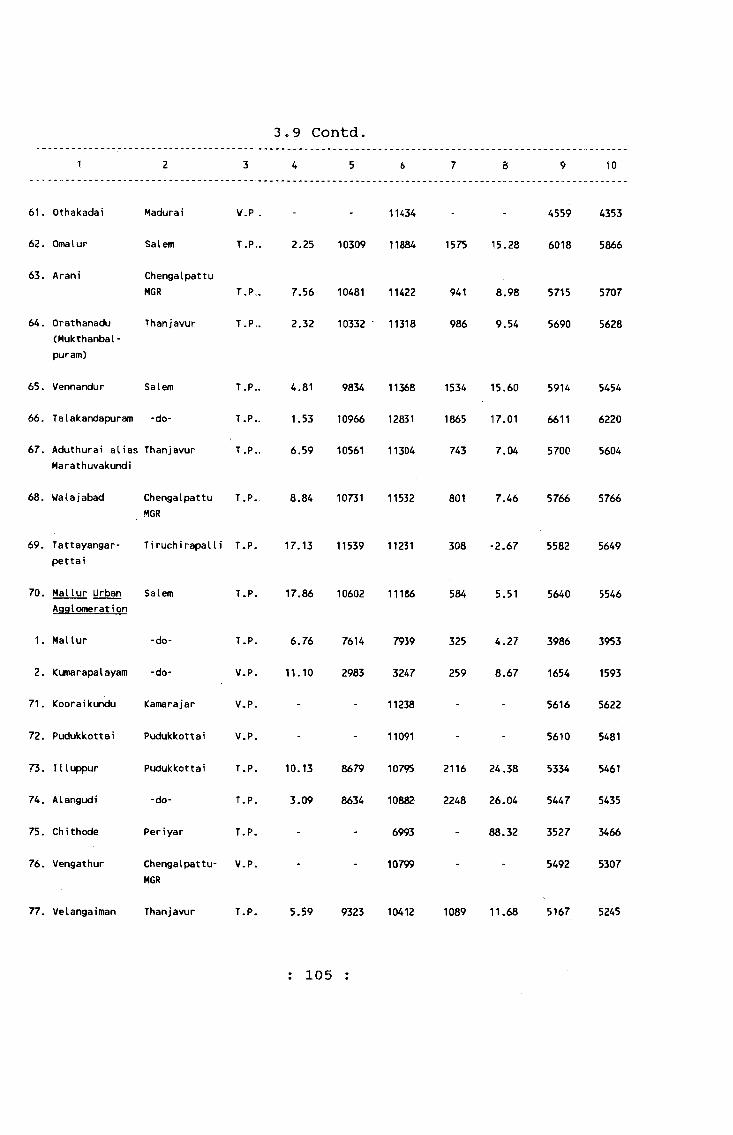
3 4 5
3.9 Contd.10
Madurai
Salem
ChengalpattuMGR
Thanjavur
61. Othakadai
62. Omalur
63. Arani
64- Orathanadu (Mukthanbal- puram)
65. Vennandur Salem
6 6 . Talakandapuram -do-
67. Aduthurai alias Thanjavur Marathuvakundi
6 8 . UaI a j abad ChengalpattuMGR
V.P
T.P.
T.P.
T.P.
T.P,
T.P.
T.P.
T.P.
1U34 4559 4353
2.25 10309 11884 1575 15.28 6018 5866
7.56 10481 11422 941 8.98 5715 5707
2.32 10332 11318 986 9.54 5690 5628
4.81 9834 11368 1534 15.60 5914 5454
1.53 10966 12831 1865 17.01 6611 6220
6.59 10561 11304 743 7.04 5700 5604
8.84 10731 11532 801 7.46 5766 5766
69.
70.
1.
2 .
71.
72.
73.
74.
75.
76.
Tattayangar-pettai
Mailur Urban Agglomeration
Mailur
Kumarapalayam
Kooraikundu
Pudukkottai
1 1 luppur
Alangudi
Ch i thode
Vengathur
Tiruchirapalli T.P. 17.13 11539 11231 308 -2.67 5582 5649
Salem
-do-
-do-
Kamarajar
Pudukkottai
Pudukkottai
-do-
Periyar
Chengalpattu-MGR
77. Velangaiman Thanjavur
T.P.
T.P.
V.P.
V.P.
V.P.
T.P.
T.P.
T.P.
V.P.
T.P.
17.86 10602 11186 584 5.51 5640 5546
6.76
11.10
10.13
3.09
7614 7939
2983 3247
11238
11091
8679 10795
8634 10882
6993
10799
325 4.27
259 8.67
2116 24,38
2248 26.04
88.32
3986
1654
5616
5610
5334
5447
3527
5492
3953
1593
5622
5481
5461
5435
3466
5307
5.59 9323 10412 1089 11.68 5167 5245
: 105 :

3 4 5
3.9 Contd.1 8 10
78. Vilattikulam Chidambaranar T.P.
79. Mudukulathur Ramanathapuram T.P.
80. Kallakudi TiruchirapalIi T.P.
Class-V (5,000 - 9,999)
(1 Urban Agglomeration 34 Towns)
1. Paramankurichi Chidambaranar V.P.
2. Cheyar Chengalpattu- V.P.MGR
3. Era I Chidambaranar T.P.
4. Sithurajapuram Kamarajar V.P,
5. Mukasipidariyur Periyar V.P.
6. Panapakkam North Arcot T.P.Ambedkar
7. Elampillai Salem T.P.
8 . Alwarthiru- Chidambaranar T.P.nagari
9. Kanakkampalayam Coimbatore V.P.
10. Pillanallur Salem T.P.
11. Kunnathur Periyar T.P.
12. Maramangalathu- Salem V.P.patti
13. Kayathar Chidambaranar T.P.
14. Puvalur Trichy T.P.
15. Mettupalayam -do- T.P.
16. Paraiyur Hadurai T.P.
16.41 8583 104774
22.76 9512 1039?7
102fiB5
302.33 282143 2621111
14.58 9135 98777
34.89 8659 96554
3.88 8862
5.71 8009
4.07 8302
6.44
8.21
10.38
7355
7805
7444
937?6
935»8
900J6
882i6
2.76 8453 884.2
868J5
844;7
84055
6183
83111
810<6
81099
7895
783®
1891 22.03 5316 5158
885 9.30 5246 5151
5248 5057
■20032 -7.10 131144 130967
742 8.12 4563 5314
995 11.49 4814 4840
514 5.80
817 10.20
103 12.41
754 10.25
90 1.15
386 5.19
4604
4762
4698
4415
4296
4253
3112
4327
4030
4028
3878
3982
4772
4656
£ ^ 3 0 8
4411
389 4.60 4521 4321
4182 4503
4151
4152
3071
3984
4076
4081
4017
3848
: 106 :
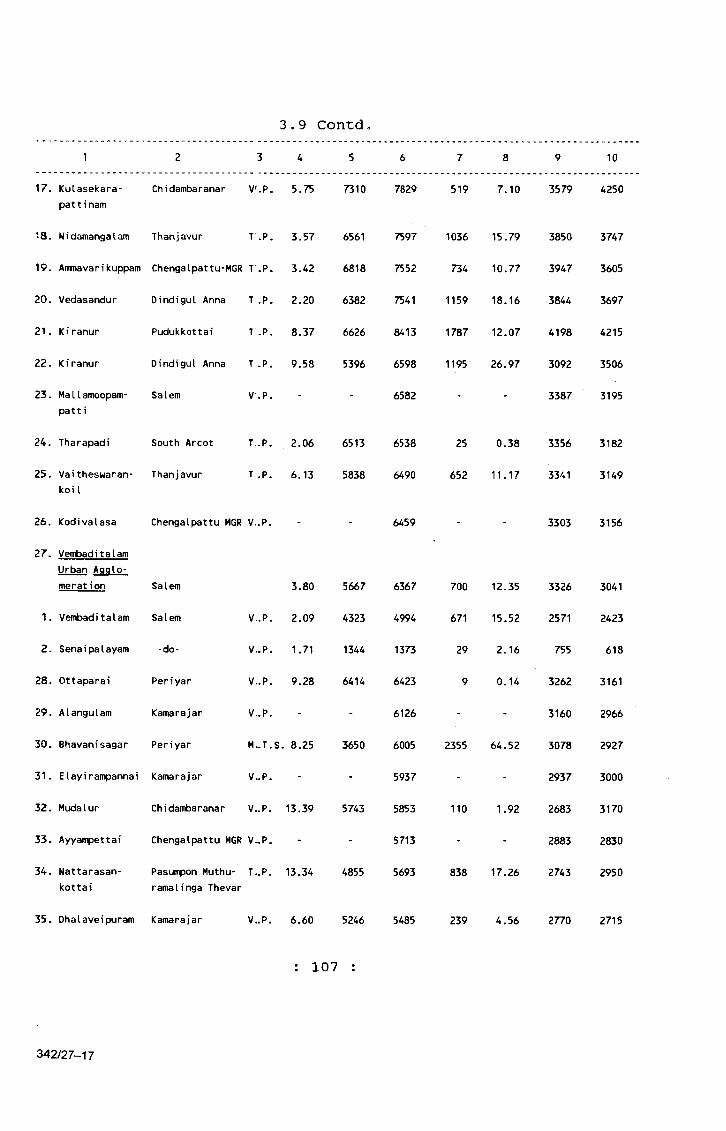
3.9 Contd 3 4 51 6
7829
7597
7552
7541
8413
6598
6582
6538
6490
6459
6367
4994
1373
6423
6126
6005
5937
5853
5713
5693
7 8 9 10
519 7.10 3579 4250
1036 15.79 3850 3747
734 10.77 3947 3605
1159 18.16 3844 3697
1787 12.07 4198 4215
1195 26.97 3092 3506
3387 3195
25 0.38 3356 3182
652 11.17 3341 3149
3303 3156
700 12.35 3326 3041
17. Kulasekara- Chidambaranar V'.P. 5.75pattinam
18. Nidamangalam Thanjavur T .P. 3.57
19. Ammavarikuppam Chengalpattu-MGR T .P. 3.42
20. Vedasandur Dindigul Anna T .P. 2.20
21. Kiranur
22. Kiranur
Pudukkottai T.P. 8.37
23. Ma11amoopam- Salempatti
Dindigul Anna T .P. 9.58
V.P.
24. Tharapadi South Arcot
25. Vaitheswaran- Thanjavur koil
T .P. 2.06
T .P. 6.13
26. Kodivalasa Chengalpattu MGR V..P.
27. VembaditalamUrban Agglomeration Salem 3.80
1. Vembaditalam Salem V..P. 2.09
2. Senaipalayam -do- V..P. 1.71
28. Ottaparai Periyar V..P. 9.28
29. Alangulam Kamarajar V..P.
30. Bhavanisagar Periyar M..T.S. 8.25
31. Elayirampannai Kamarajar V..P.
32. Mudalur Chidambaranar V..P. 13.39
33. Ayyampettai Chengalpattu MGR V..P.
34. Nattarasan- Pasumpon Muthu- T..P. 13.34kottai ramalinga Thevar
35. Dhalaveipuram Kamarajar
7310
6561
6818
6382
6626
5396
6513
5838
5667
4323
1344
6414
3650
5743
4855
V..P. 6.60 5246 5485
: 107 :
671 15.52 2571
29 2.16 755
9
2423
618
0.14 3262 3161
3160 2966
2355 64.52 3078 2927
2937 3000
110 1.92 2683 3170
2883 2830
838 17.26 2743
239
2950
4.56 2770 2715
342/27-17

3.9 Contd1 2 3 U 5 6 7 8 9 1 0
Class-VI less than 5,000
7 Towns 43.06 22481 2!96665 7174 31.91 14643 15012
1. Cuddalore P o r t
(NMA)South Arcot N.M.A. - - 49662 - - 2522 2440
2. Arakendanallur T.P.
-do- T.P. - - 45666 - - 2369 2197
3. Kodiapatti Pudukkottai V.P. 9.16 4028 44?94 466 11.57 2 2 0 0 2294
4. Padirivedu ChengalpattuMGR
V.P. - - 44C02 - - 2245 2157
5. Chatrapatti Kamarajar V.P. 0.36 4188 43663 175 4.18 2161 2 2 0 2
6 . Alagapuri Pudukkottai V.P. 4.16 3055 40226 971 31.78 1996 2030
7. iCuttalam TirunelveliKattabonman
M.T.S. 7.79 2705 28442 137 5.06 1150 1692
Source : Census of India,, 1991.
: 108 :

3.10 POPULATION, LITERATE AND EDUCATED PERSONS IN TOWNS WITH POPULATION OVER 50,000 - 1991 CENSUS.
SI.No, Name of the City/Town District Persons Literate and Educated Persons
1 . Ambattur (M) Chengalpattu-MGR 215424 158823
2. Avadi (M.T.S.) -do- 183215 135079
3„ Thiruvottiyur (M) -do- 168642 117020
4. Alandur (M) -do- 125244 96611
5. Pallavaram (M) -do- 111866 82891
6 . Tambaram (M) -do- 107187 78378
7. Coimbatore (M.C.) Coimbatore 816321 589491
8 . Wadurai (M.C.) Madurai 940989 685865
9. Tiruchirapalli (M) T i ruch i rapa11i 387283 283828
10. Ponmalai (M) -do- 69639 52391
11. Srirangam (M) -do- 70109 52185
12. Salem (M) Salem 366712 248529
13. Tirunelveli <M) Tirunelveli Kattabomman 135725 97622
14. Palayankottai <M) -do- 98399 79083
15. Melappalayam (M) -do- 68347 38268
16. Erode (M) Periyar 159232 113176
17. Tiruppur (M) Coimbatore 237661 155667
18. Vellore (M) North Arcot Ambedkar 175061 113980
19. Tuticorin <M) Chidambaranar 199854 150609
20. Thanjavur City (M) Thanjavur 202013 151959
: 109
342/27-17a
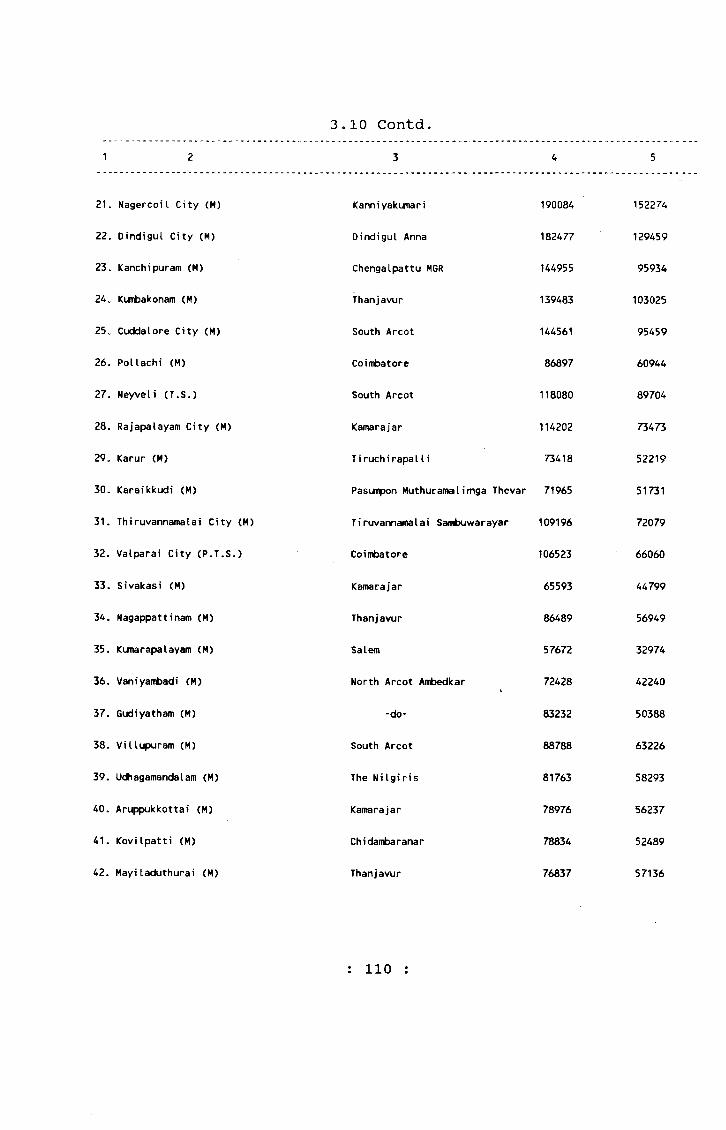
21. Nagercoil City (M)
22. Dindigul City (M)
23. Kanchipuram (M)
24. Kunt)akonam (M)
25c CucJdalore City (M)
26. PoUachi (M)
27. Neyveli (T.S.)
28. Rajapalayam City (M)
29. Karur (M)
30. Karaikkudi (M)
31. Thiruvannamalai City (M)
32. Valparai City (P.T.S.)
33. Sivakasi (M)
34. Nagappattinam (M)
35. Kumarapalayam (M)
36. Vaniyambadi (M)
37. Gudiyatham (M)
38. ViUupuram (M)
39. Udhagamandalam (M)
40. Aruppukkottai (M)
41. Kovilpatti (M)
42. Mayiladuthurai (M)
10 Contd.3 4 5
Kanniyakumari 190084 152274
Dindigul Anna 182477 129459
Chengalpattu MGR 144955 95934
Thanjavur 139483 103025
South Arcot 144561 95459
Coimbatore 86897 60944
South Arcot 118080 89704
Kamarajar 114202 73473
Tiruchirapalli 73418 52219
Pasumpon Muthuramalimga Thevar 71965 51731
Tiruvannamalai Sambuwarayar 109196 72079
Coimbatore 106523 66060
Kamarajar 65593 44799
Thanjavur 86489 56949
Salem 57672 32974
North Arcot Ambedkar 72428 42240
-do- 83232 50388
South Arcot 88788 63226
The NiIgiris 81763 58293
Kamarajar 78976 56237
Chidambaranar 78834 52489
Thanjavur 76837 57136
110 :
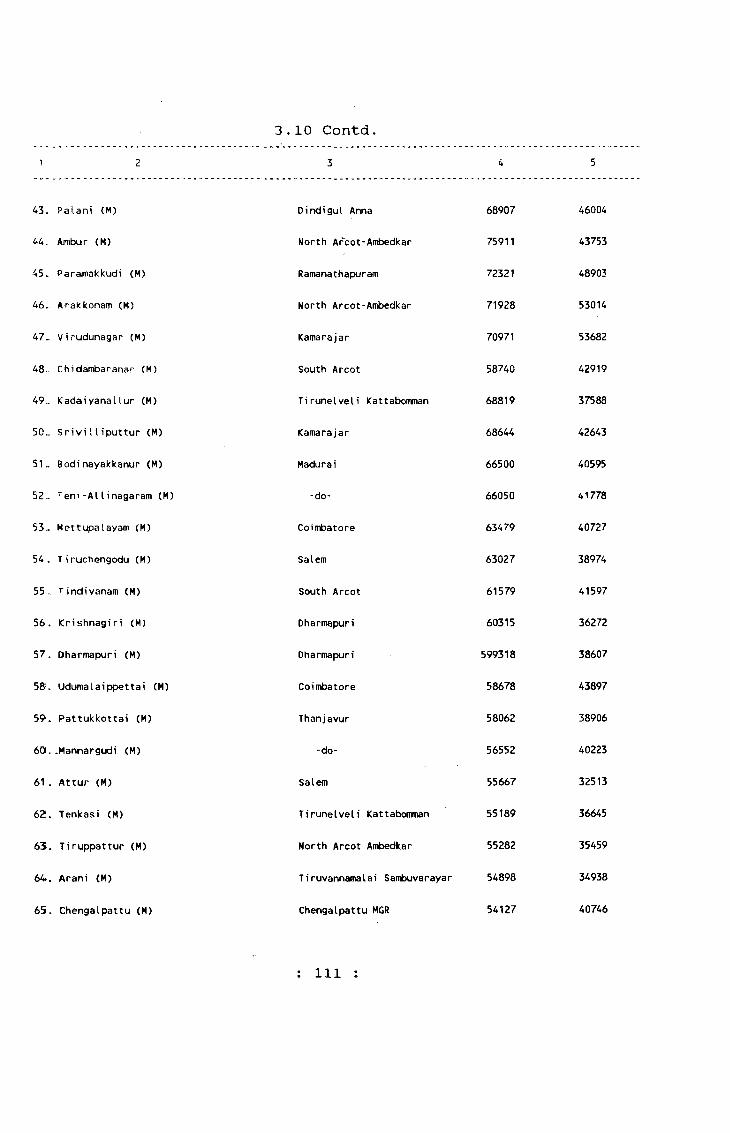
3
3.10 Contd.
43. Palani (M)
44. Ambur (M)
45.. Paramakkudi (M)
46.. Arakkonam (M)
47- Virudunagar (M)
48.. Chidambaranar (M)
49.. Kadaiyanallur (M)
50.. Srivi 11 iputtur (M)
51 „ Bodinayakkanur (M)
52.. Teni-Al linagaram (M)
53. Mettupalayam (M)
54. T 1 ruchengodu (M)
55.. Tindivanam (M)
56. Krishnagiri (M)
57. Dharmapuri (M)
55. Udumalaippettai (M)
59'. Pattukkottai (M)
60). .Mannargudi (M)
61. Attur (M)
62. Tenkasi (M)
63. Tiruppattur (M)
64t. Arani (M)
65. Chengalpattu (M)
D i nd i guI Anna 68907
North Arcot-Air4>edkar 75911
RamanathapHJram 72321
North Arcot-Ambedkar 71928
Kamarajar 70971
South Arcot 58740
Tirunelveli Kattabomman 68819
Kamarajar 68644
Madurai 66500
-do- 66050
Coimbatore 63479
Salem 63027
South Arcot 61579
Dharmapuri 60315
Dharmapuri 599318
Coimbatore 58678
Thanjavur 58062
-do- 56552
Salem 55667
Tirunelveli Kattabomman 55189
North Arcot Anfcedkar 55282
Tiruvannamalai Sambuvarayar 54898
Chengalpattu MGR 54127
46004
43753
48903
53014
53682
42919
37588
42643
40595
41778
40727
38974
41597
36272
38607
43897
38906
40223
32513
36645
35459
34938
40746
: 111 ;

3.10 Contd.1 2 3 4 5
6 6 . Puliyangudi (M) Tirunelveli Kattabomtmam 53287 25242
67. Virudhachalam (M) South Arcot 52819 33610
6 8 . Ramanathapuram (M) Ramanathapuram 52879 39115
69. Kambam (M) Madurai 52435 30776
70. Panruti <M) South Arcot 51394 30816
71. Pudukkottai (M) Pudukkottai 99058 71545
Source : Census of India - 1991
: 112 :
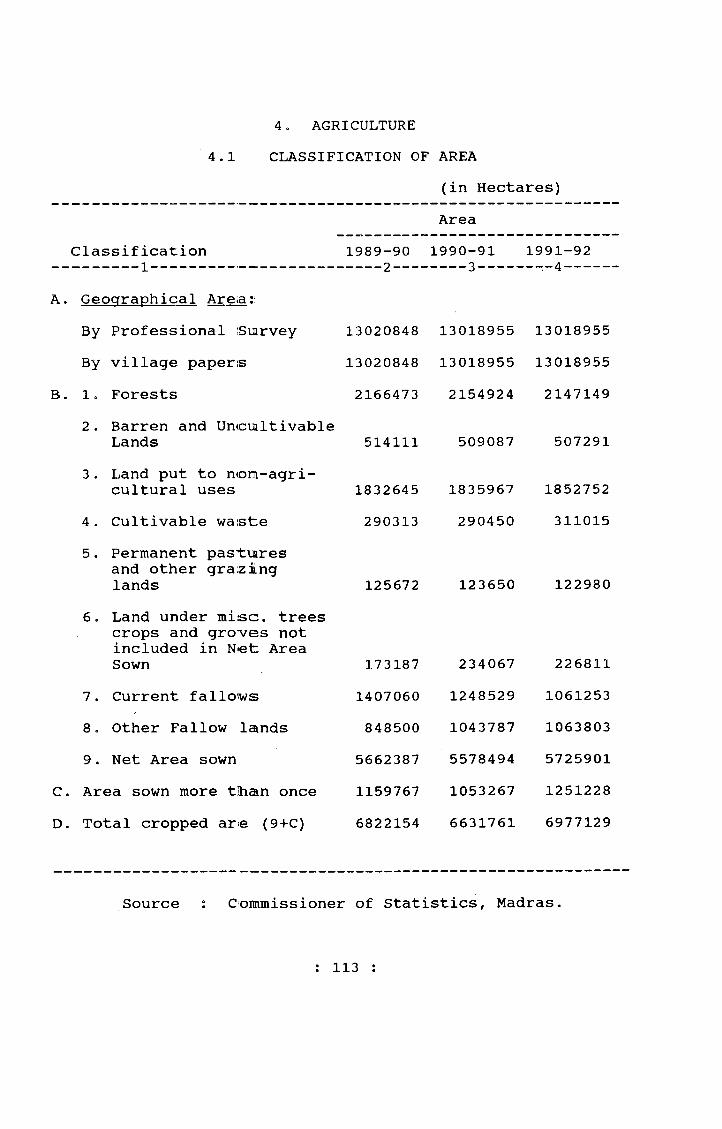
4. AGRICULTURE 4.1 CLASSIFICATION OF AREA
(in Hectares)Area
Classification 1989-90 1990-91 1991-92
A. Geoaraohical Area::By Professional Survey 13020848 13018955 13018955By village papers 13020848 13018955 13018955
B. Ic Forests 2166473 2154924 21471492 . Barren and Un<cuiltivable
Lands 514111 509087 5072913 . Land put to non-agri-
cultural uses 1832645 1835967 18527524 . Cultivable waste 290313 290450 3110155 . Permanent pas1:uires
and other grazing lands 125672 123650 122980
6. Land under misc. trees crops and groves not included in Net Area Sown 173187 234067 226811
7 . Current fallows 1407060 1248529 10612538 o Other Fallow lands 848500 1043787 10638039. Net Area sown 5662387 5578494 5725901
C. Area sown more tihan once 1159767 1053267 1251228D. Total cropped are (9+C) 6822154 6631761 6977129
Source Commissioner of Statistics, Madras
: 113 :
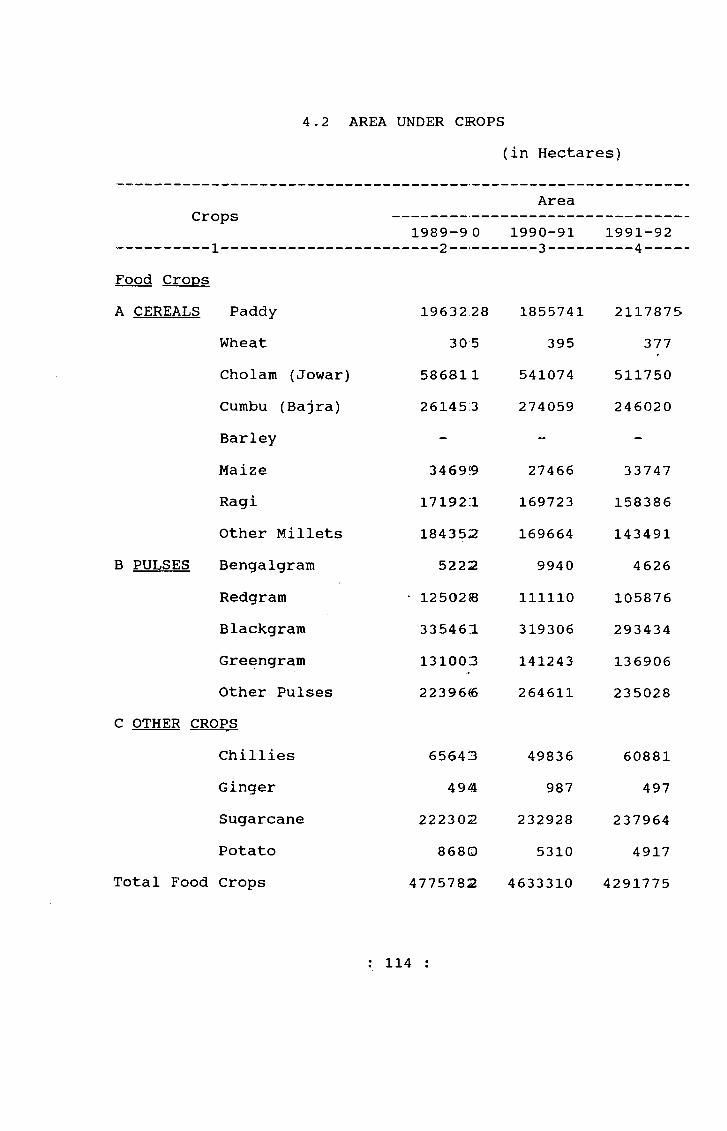
4,2 AREA UNDER CROPS(in Hectares
CropsArea
1989-9 0 1990-91 1991-92-----------1--------------------------2------ ----3— --- '-— 4---Food CroDsA CEREALS Paddy 19632 28 1855741 2117871
Wheat 30:5 395 377Cholam (Jowar) 58681 1 541074 511750Cumbu (Bajra) 261453 274059 246020Barley - ~ -Maize 3469‘9 27466 33747Ragi 17192.1 169723 158386Other Millets 18435:2 169664 143491
B PULSES Benaalaram 5222 9940 4626Redgram • 12502© 111110 105876Blackgram 33546IL 319306 293434Greengram 131003 141243 136906Other Pulses 2239666 264611 235028
C OTHER CROPSChillies 65643 49836 60881Ginger 494 987 497Sugarcane 222302 232928 237964Potato 8680 5310 4917
Total Food Crops 4775782 4633310 4291775
• 114 :
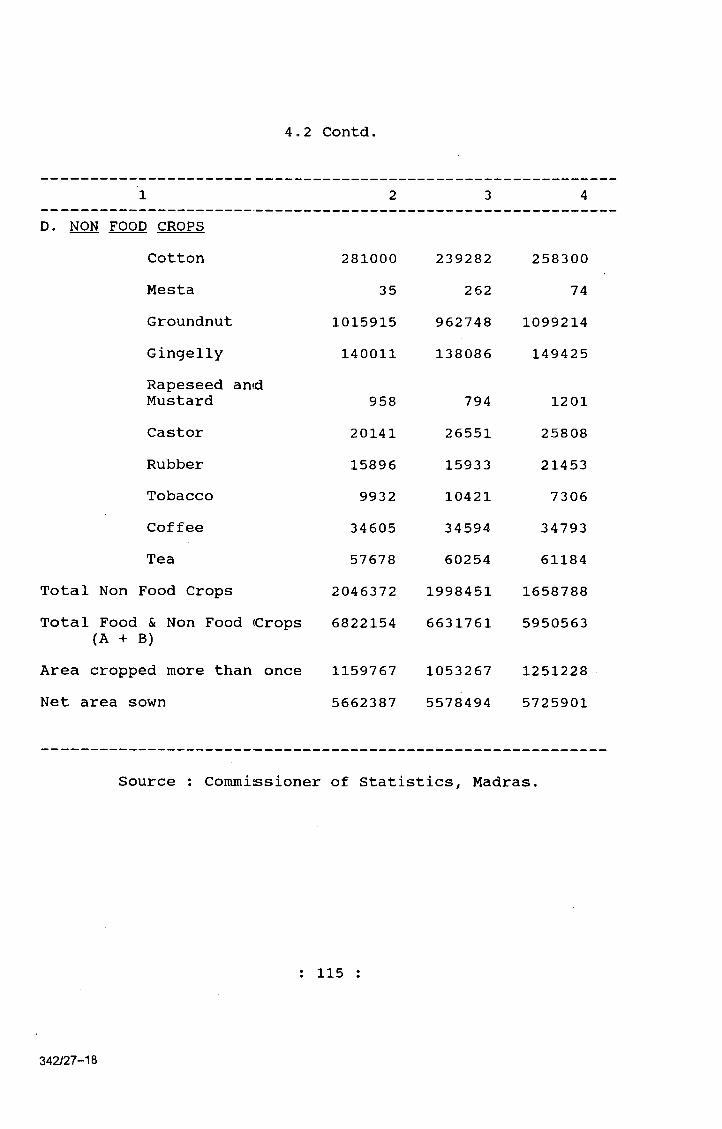
4o2 Contd.
1 2 3 4D. NON FOOD CROPS
Cotton 281000 239282 258300Mesta 35 262 74Groundnut 1015915 962748 1099214Gingelly 140011 138086 149425Rapeseed ancd Mustard 958 794 1201Castor 20141 26551 25808Rubber 15896 15933 21453Tobacco 9932 10421 7306Coffee 34605 34594 34793Tea 57678 60254 61184
Total Non Food Crops 2046372 1998451 1658788Total Food & Non Food Crops
(A + B)6822154 6631761 5950563
Area cropped more than once 1159767 1053267 1251228Net area sown 5662387 5578494 5725901
Source : Commissioner of Statistics, Madras.
: 115
342/27-18

4.3 PRODUCTION OF PRINCIPAL CROPS(IN TONNES)
Production
__________1___________________1989-9*0 1990-91 1991-92
I. Rice 60634010 5782440 65962602. Wheat 14t0 200 1803. Cholam (Jowar) 69485(0 548840 5526104o Cumbu (Bajra) 29076<0 296270 2716505. Maize 5358(0 43820 541706c Ragi 34321(0 316240 3106107. Small Millets 13905(0 147900 1284808. Bengalgram 342(0 6460 26909 o Redgram 7485(0 68500 57830
10o Blackgram 14296(0 134990 14756011. Greengram 5473(0 65400 6394012. Other Pulses 5780(0 84580 7912013. Chillies (Dry) 4607(0 30120 3434014. Sugarcane (Gur) 250689(0 2423120 271026015. Potato 15990(0 115730 11356016. Cotton (Bales of 170
lint)Kg.-/
50771(0 408710 41023017. Groundnut (Unshelled nuts) 121147(0 1179100 151762018. Gingelly 4538(0 42430 5907019 e Castor 618(0 8080 801020. Tobacco (Cured leaf) 1530(0 16040 11070
Source : Commissioner of Statistics, Madras.: 116 :
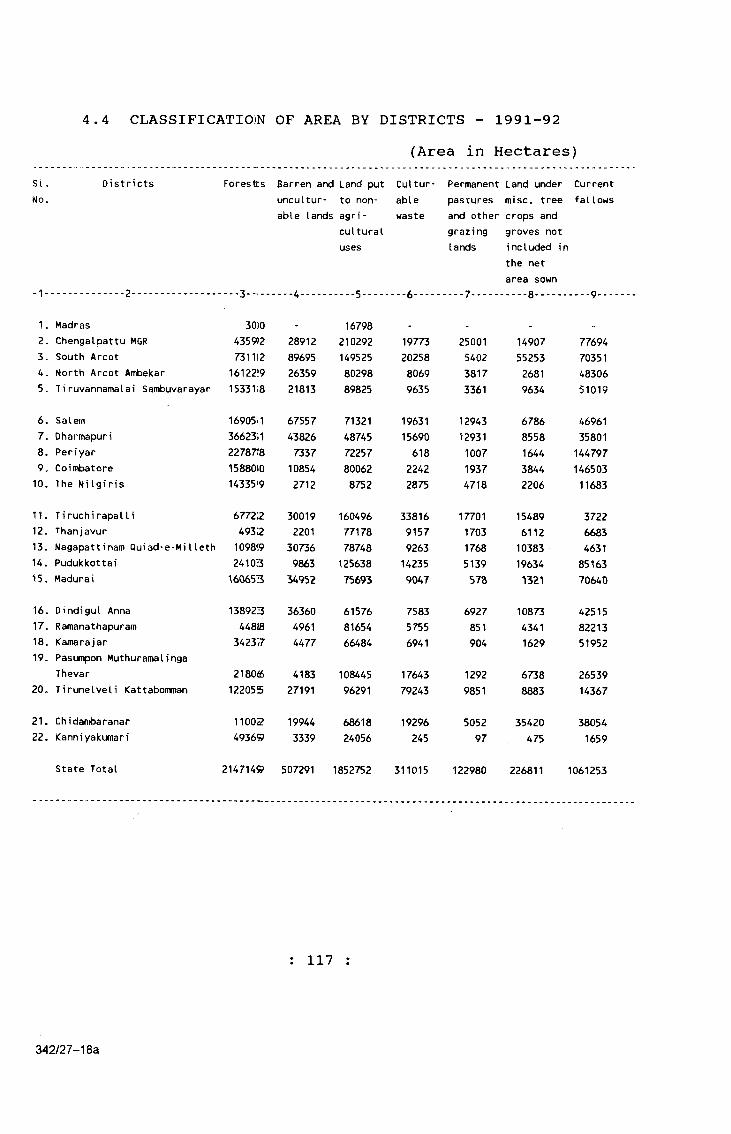
4.4 CLASSIFICATIOiN OF AREA BY DISTRICTS - 1991-92(Area in Hectares)
SI. No.
- 1-
Di stri cts Forestts Barren and Land put Cultur- Permanent Land under Current uncultur- to non- able pastures misc. tree fallowsable lands agri
cultural uses
waste and other crops and grazing groves not lands included in
the net area sown
-6 -...... 7.......... 8 ......
1. Madras 30)0 - 16798 - - .2. Chengalpattu MGR 4359?2 28912 210292 19773 25001 14907 776943. South Arcot 731112 89695 149525 20258 5402 55253 703514. North Arcot Ambekar 16122!9 26359 80298 8069 3817 2681 483065. Tiruvannamalai Sambuvarayar 15331i8 21813 89825 9635 3361 9634 51019
6 . Salem7. Dharmapuri8 . Periyar9. Coimbatore 10. The NiIgiris
16905.1 36623:1 22787f8 1588010 14335'9
67557438267337108542712
713214874572257800628752
196311569061822422875
1294312931100719374718
67868558164438442206
469613580114479714650311683
11. Tiruchirapalli 677212 30019 160496 33816 17701 15489 372212. Thanjavur 493i2 2201 77178 9157 1703 6112 668313. Nagapattinam Quiad-e-Milleth 1098^9 30736 78748 9263 1768 10383- 463114. Pudukkottai 24103 9863 125638 14235 5139 19634 8516315. Madurai 160653 34952 75693 9047 578 1321 70640
16. Dindigul Anna 138923 36360 61576 7583 6927 10873 4251517. Ramanathapuram 448ffl 4961 81654 5755 851 4341 8221318. Kamarajar 342377 4477 66484 6941 904 1629 5195219. Pasumpon Muthuramalinga
Thevar 2180<6 4183 108445 17643 1292 6738 2653920. Tirunelveli Kattabomman 122055 27191 96291 79243 9851 8883 14367
21. Chidambaranar2 2 . Kanniyakumari
1100249365?
199443339
6861824056
19296245
505297
35420475
380541659
State Total 2147149 507291 1852752 311015 122980 226811 1061253
117
342/27-18a
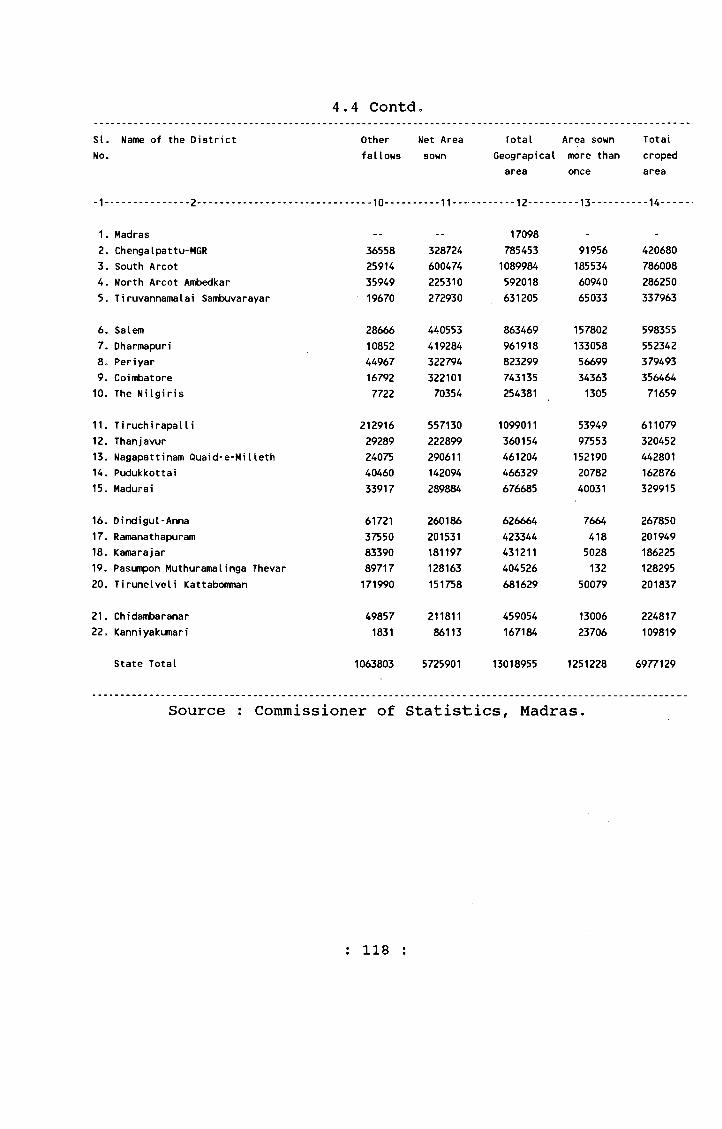
4.4 Contd51. Name of the District Other Net Area Total Area sown Total0 . fallows sown Geograpical
areamore than once
croped area
1 2 ........... 1 0... .... 11 - - - ....... 1 2 ..... --- 13....... ---14---
1. Madras - - 17098 - .
2. Chengalpattu-MGR 36558 328724 785453 91956 4206803. South Arcot 25914 600474 1089984 185534 7860084. North Arcot Atifcedkar 35949 225310 592018 60940 2862505o Tiruvannamalai Sambuvarayar 19670 272930 631205 65033 337963
6 . Salem 28666 440553 863469 157802 5983557. Dharmapuri 10852 419284 961918 133058 5523428 , Periyar 44967 322794 823299 56699 3794939. Coimbatore 16792 322101 743135 34363 35646410. The NiIgiris 7722 70354 254381 1305 71659
11. T i ruch i rapa11i 212916 557130 1099011 53949 61107912. Thanjavur 29289 222899 360154 97553 32045213. Nagapattinam Quaid-e-MiIleth 24075 290611 461204 152190 44280114. Pudukkottai 40460 142094 466329 20782 16287615. Madurai 33917 289884 676685 40031 329915
16. Dindigul-Anna 61721 260186 626664 7664 26785017. Ramanathapuram 37550 201531 423344 418 20194918. Kamarajar 83390 181197 431211 5028 18622519. Pasumpon Muthuramalinga Thevar 89717 128163 404526 132 12829520. Tirunelveli Kattabomman 171990 151758 681629 50079 201837
21. Chidambaranar 49857 211811 459054 13006 2248172 2 . Kanniyakumari 1831 86113 167184 23706 109819
State Total 1063803 5725901 13018955 1251228 6977129
Source : Commissioner of Statistics, Madras.
: 118 :
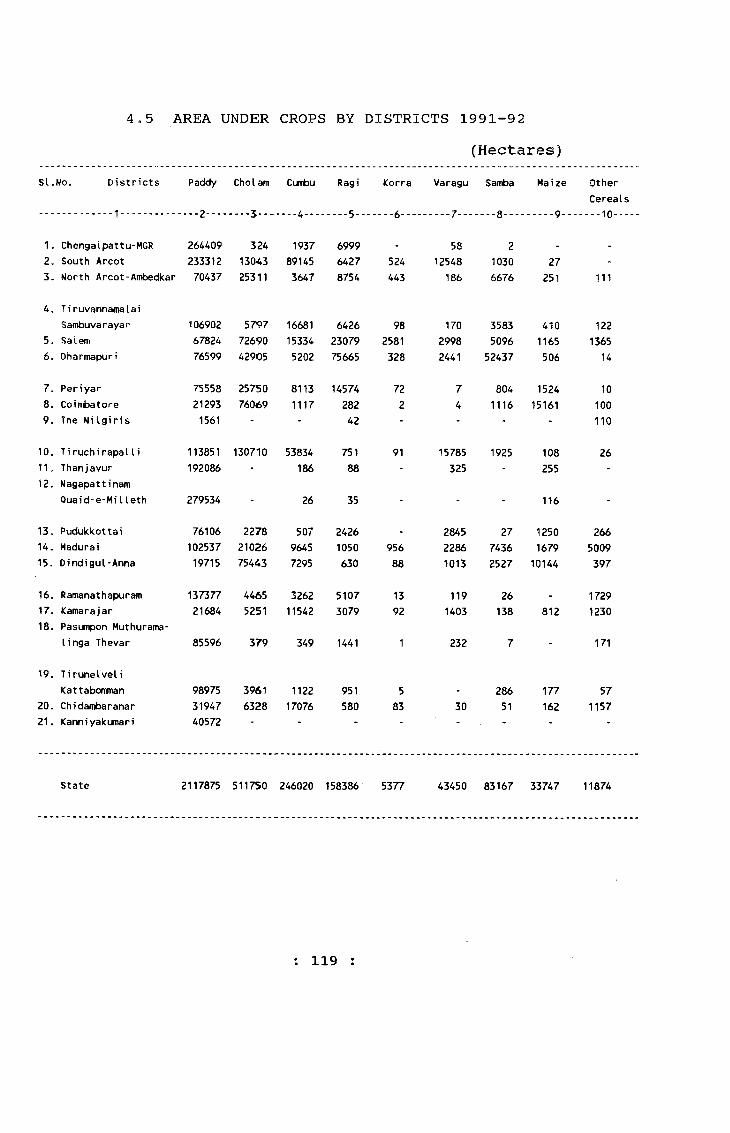
4,5 AREA UNDER CROPS BY DISTRICTS 1991-92(Hectares)
SUNo. Districts Paddy Choi am Cumbu Ragi Korra Varagu Samba Maize Other
1 ----2 ---- --- 4--- .... 5 - .... 6 --- --- 8 ---- .... 9--Cereals
.... 1 0 ....
1. Chengalpattu-MGR 264409 324 1937 6999 - 58 2 „ .
2. South Arcot 233312 13D43 89145 6427 524 12548 1030 273. North Arcot-Ambedkar 70437 25311 3647 8754 443 186 6676 251 1 1 1
4. Ii ruvannamaI a iSambuvarayar 106902 5797 16681 6426 98 170 3583 410 1 2 2
5, Salem 67824 72690 15334 23079 2581 2998 5096 1165 13656 . Oharmapuri 76599 42905 5202 75665 328 2441 52437 506 14
7. Periyar 75558 25750 8113 14574 72 7 804 1524 1 0
8 . Coimbatore 21293 76069 1117 282 2 4 1116 15161 1 0 0
9. The NiIgiris 1561 - - 42 - - - - 1 1 0
10. T i ruch i rapa11i 113851 130710 53834 751 91 15785 1925 108 2611. Thanjavur 192086 186 8 8 - 325 - 255 -1 2 . Nagapattinam
Quaid-e-MiIleth 279534 - 26 35 - - - 116 -
13. Pudukkottai 76106 2278 507 2426 2845 27 1250 26614. Madurai 102537 21026 9645 1050 956 2286 7436 1679 500915. Dindigul-Anna 19715 75443 7295 630 8 8 1013 2527 10144 397
16. Ramanathapuram 137377 4465 3262 5107 13 119 26 . 172917. Kamarajar 21684 5251 11542 3079 92 1403 138 812 123018. Pasumpon Muthurama-
linga Thevar 85596 379 349 1441 1 232 7 - 171
19. TirunelveliKattabomman 98975 3961 1 1 2 2 951 5 - 286 177 57
20. Chidambaranar 31947 6328 17076 580 83 30 51 162 11572 1 . Kanniyakumari 40572
■ ■
State 2117875 511750 246020 158386 5377 43450 83167 33747 11874
; 119 :
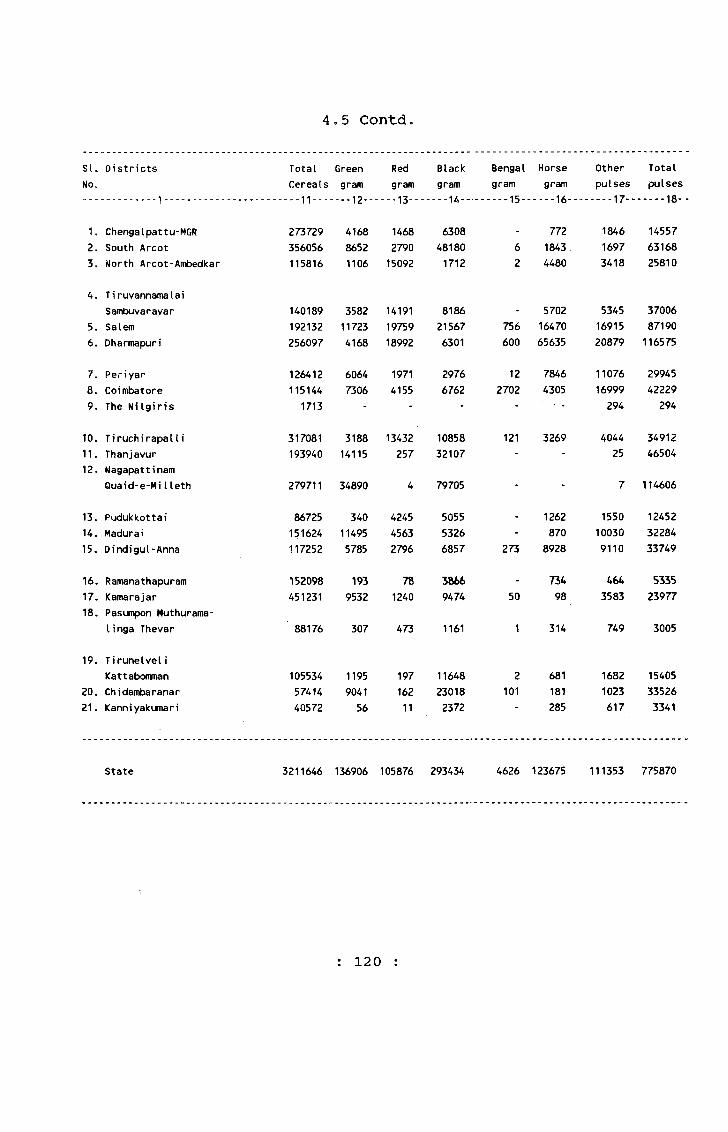
4c5 Contdo
s u Districts Total Green Red Black Bengal Horse Other TotalNo. Cereals gram gram gram gram gram pulses pulses. . . ................ .............— • •..-12-- ---■•13-- .---.1 4 .. ..... 15- .... 16--- .... 17-- .... 18- -
K Chengalpattu-MGR 273729 4168 1468 6308 - 772 1846 145572. South Arcot 356056 8652 2790 48180 6 1843. 1697 631683. North Arcot-Ambedkar 115816 1106 15092 1712 2 4480 3418 25810
4. T i ruvannamalai Sambuvarayar 140189 3582 14191 8186 5702 5345 37006
5. Salem 192132 11723 19759 21567 756 16470 16915 871906 . Oharmapuri 256097 4168 18992 6301 600 65635 20879 116575
7. Periyar 126412 6064 1971 2976 12 7846 11076 299458. Coimbatore 115144 7306 4155 6762 2702 4305 16999 422299. The NiIgiris 1713 - - - - ■ - 294 294
10. Tiruchirapalli 317081 3188 13432 10858 121 3269 4044 3491211. Than.javur 193940 14115 257 32107 - - 25 4650412. Nagapattinam
Quaid-e-MiIleth 279711 34890 4 79705 - - 7 114606
13. Pudukkottai 86725 340 4245 5055 - 1262 1550 1245214. Madurai 151624 11495 4563 5326 - 870 10030 3228415. Dindigul-Anna 117252 5785 2796 6857 273 8928 9110 33749
16. Ramanathapuram 152098 193 78 3866 - 734 464 533517. Kamarajar 451231 9532 1240 9474 50 98 3583 2397718. Pasumpon Muthurama-
linga Thevar 88176 307 473 1161 1 314 749 3005
19. Tirunelveli Kattabomman 105534 1195 197 11648 2 681 1682 15405
20. Chidambaranar 57414 9041 162 23018 101 181 1023 3352621. Kanniyakumari 40572 56 11 2372 285 617 3341
State 3211646 136906 105876 293434 4626 123675 111353 775870
: 120 :

4o5 Contd.
SI.No„
Districts Ch i I Ii es Other Condi - ments
Total Condi - ments & spices
Sugarcane
OtherSugarcrops
TotalSugarcrops
Mangoes Banana
1 . Chengalpattu-MGR ‘982 124 1106 12413 277 12690 5176 13602 . South Arcot <617 5975 6592 54513 308 54821 974 33503. North Arcot-Ambedkar <641 838 1479 19753 136 19889 7352 4403
4. T i ruvannamalai Sambuvarayar 4i87 194 681 14054 8 14062 166 1275
5. Salem 1535 4005 5540 13827 357 14184 727 20336 , Oharmapuri 1057 2084 2141 14459 1015 18474 17646 935
7 . Periyar 11103 5326 6429 14913 153 15066 133 2859 .8 . Coimbatore 1533 3767 5300 12402 69 12471 731 18259. The NiIgiris 8 4272 4280 - - - 30 316
1 0 . T i ruchi rapalIi 12272 17896 30168 20413 269 20682 1390 143881 1 . Thanjavur 96 264 360 11531 153 11684 887 40341 2 . Nagapattinam
Quaid-e-MiIleth 1182 512 694 13115 539 13654 1051 1142
13. Pudukkottai 628 240 8 6 8 1941 229 2170 275 1319U. Madurai 9J33 4423 5356 13499 334 13833 8631 338615. Oindigul-Anna 3077 4259 7336 6032 170 6202 5027 3051
16. Ramanathapuram 110)06 2080 13086 85 5807 5892 1 2 0 14417. Kamarajar 34i82 3230 6712 4714 473 5187 829 65918. Pasumpon Muthurama-
Unga Thevar 33558 361 3719 5483 7 5490 382 478
19. T i runeIveIi Kattabomnan 70)97 1751 8848 4585 1660 6245 2024 7852
2 0 . Chidambaranar 107 81 12672 23453 282 8533 8765 82 81212 1 . Kanniyakumari 6 3390 3396 2246 2246 1759 3448
State 608181 77668 138544 237964 22743 260707 55392 66378
121 :
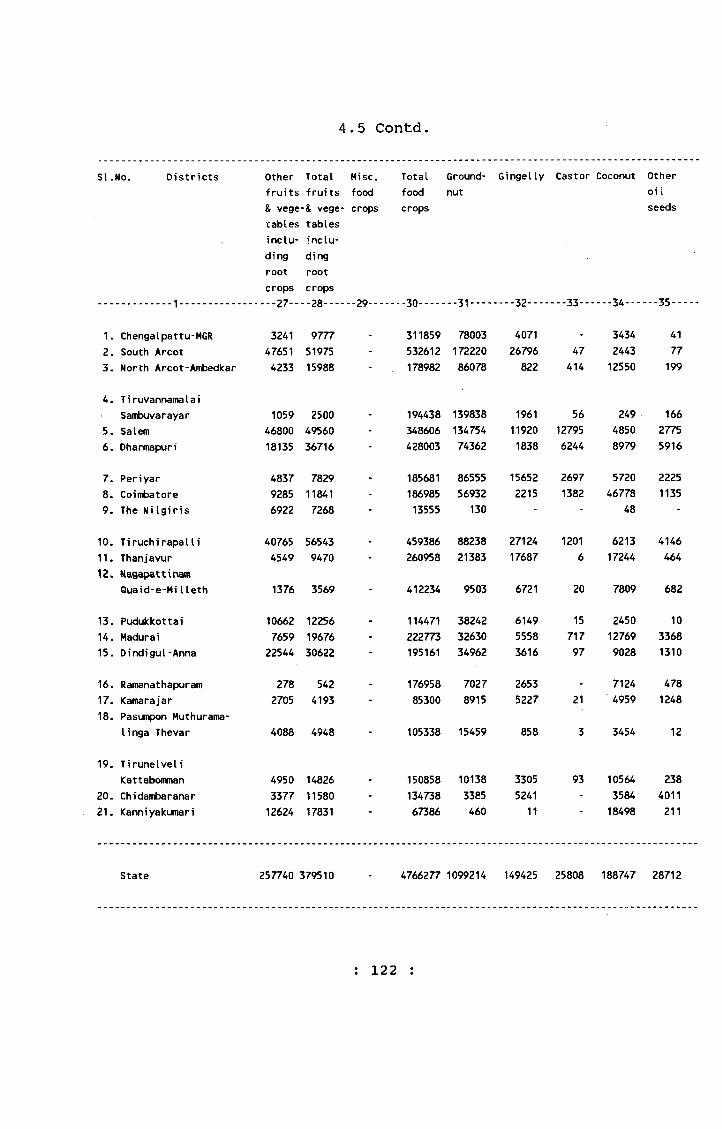
4.5 Contd.
si.No. Districts Other fruits & vege tables including root crops
Total fruits -& vegetables including root crops
Misc.foodcrops
Totalfoodcrops
Groundnut
Gingelly Castor Coconut Otheroi I seeds
1. Chengalpattu-MGR 3241 9777 311859 78003 4071 3434 412. South Arcot 47651 51975 - 532612 172220 26796 2443 773. North Arcot-Ambedkar 4233 15988 - 178982 86078 822 414 12550 199
4. TiruvannamaI aiSambuvarayar 1059 2500 - 194438 139838 1961 56 249 166
5. Salem 46800 49560 - 348606 134754 11920 12795 4850 27756 . Dharmapuri 18135 36716 - 428003 74362 1838 6244 8979 5916
7. Periyar 4837 7829 - 185681 86555 15652 2697 5720 22258 . Coimbatore 9285 11841 - 186985 56932 2215 1382 46778 11359. The Nilgiris 6922 7268 - 13555 130 - - 48 -
10. T i ruch i rapa11 i 40765 56543 . 459386 88238 27124 1 2 0 1 6213 414611. Thanjavur 4549 9470 - 260958 21383 17687 6 17244 4641 2 . Nagapattioam
Quaid-e-MiIleth 1376 3569 - 412234 9503 6721 2 0 7809 682
13. Pudukkottai 10662 12256 . 114471 38242 6149 15 2450 1 0
14. Madurai 7659 19676 - 222773 32630 5558 717 12769 336815. Dindigul-Anna 22544 30622 - 195161 34962 3616 97 9028 1310
16. Ramanathapuram 278 542 - 176958 7027 2653 - 7124 47817. Kamarajar 2705 4193 - 85300 8915 5227 2 1 4959 124818. Pasumpon Muthurama-
linga Thevar 4088 4948 - 105338 15459 858 3 3454 1 2
19. TirunelveliKattabomman 4950 14826 - 150858 10138 3305 93 10564 238
20. Chidambaranar 3377 11580 - 134738 3385 5241 - 3584 401121. Kanniyakumari 12624 17831 67386 460 11 18498 2 1 1
State 257740 379510 - 4766277 1099214 149425 25808 188747 28712
: 122 :

4,5 Contd.
SI. No. Dis.tricts Total Cotton Other Total Indigo Other Total
............ , ..........Oil seeds
......... 36.... ---37----Fiber
----38--F i ber
..... 39-- ......40----dyes
--- 41--dyes
---.-42------
1. Chengalpattu-MGR 85549 154 1 155 - - -2. South Arcot 201583 16048 25 16073 1 - 1
3. North Arcot-Ambedkar 100063 3925 8 3933 - - -
4. TiruvannamalaiSambuvarayar 142270 . 197 1 0 207 - ’ -
5, Salem 167094 19700 1 0 1 19801 85 40 1256 , Dharmapuri 97339 .10847 - 10847 - - -
7. Pen'yar 112849 6807 - 6807 - - -8 . Coimbatore 108442 16506 357 16863 - " -9. The NiIgiris 178 - - - - - -
10. T i ruch i rapa11i 126922 17758 5 17763 - - .11. Thanjavur 56784 1784 - 1784 - - -1 2 . Nagapattinam
Quaid-e-MiIleth 24735 4020 - 4020 - - -
13. Pudukkottai 46866 915 . 915 - - .14. Madurai 55042 32486 2358 34844 238 - 23815. Dindigul-Anna 149013 4041 - 4041 - - -
16. Ramanathapuram 17282 3893 - 3893 13 - 1317. Kamarajar 20370 58126 - 58126 966 - 96613. Pasumpon Muthurama-
linga Thevar 19786 789 1 2 801 - - -
19. TirunelveliKattabomman 24338 19987 2 19989 288 - 288
20. Chidambaranar 16221 40346 - 40346 3318 - 33182 1 . Kanniyakumari 19180 1 1
State 1491906 258330 2879 261209 4909 40 4949
: 123 ;
342/27-19
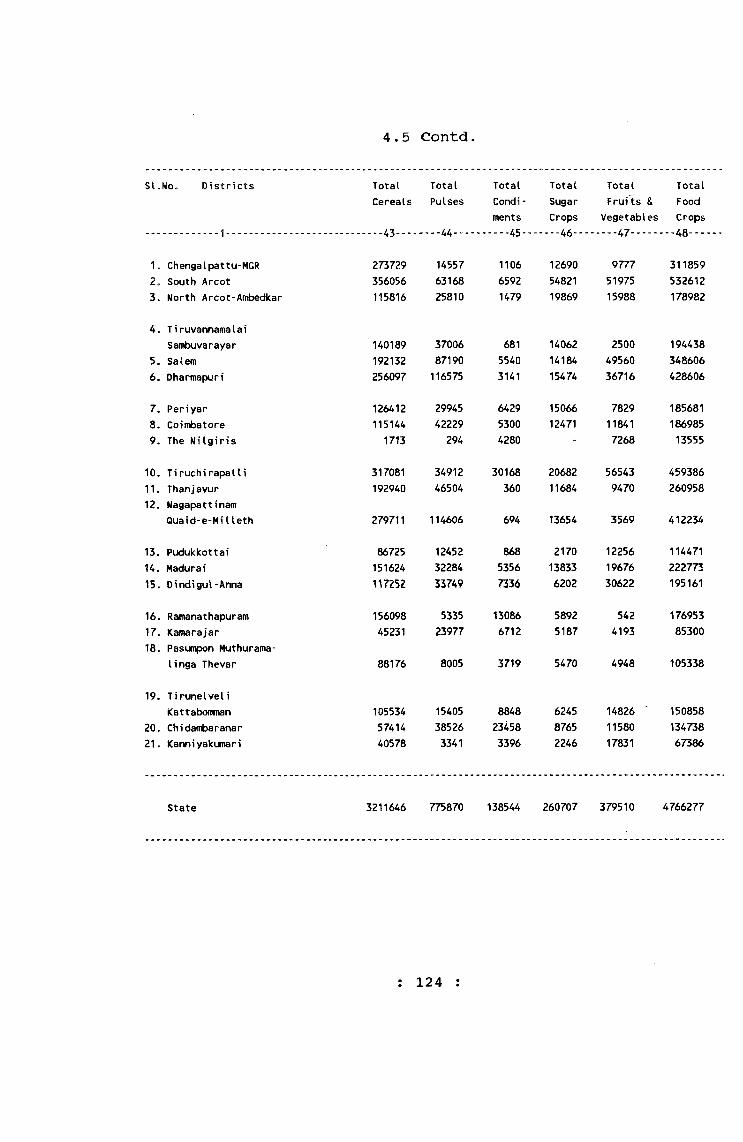
4.5 Contd
s i . No. Districts Total Total Total Total Total TotalCereals Pulses Condi - Sugar Fruits & Food
ments Crops Vegetables Crops---44--- ......... 45---....46--- .... 47......---48-....
1. Chengalpattu-MGR 273729 14557 1106 12690 9777 3118592. South Arcot 356056 63168 6592 54821 51975 5326123. North Arcot-Ambedkar 115816 25810 1479 19869 15988 178982
4. TiruvannamalaiSatnbuvarayar 140189 37006 681 14062 2500 194438
5. Salem 192132 87190 5540 14184 49560 3486066. Dharmapuri 256097 116575 3141 15474 36716 428606
7. Periyar 126412 29945 6429 15066 7829 1856818. Coimbatore 115144 42229 5300 12471 11841 1869859. The NiIgiris 1713 294 4280 - 7268 13555
10. TiruchirapalIi 317081 34912 30168 20682 56543 45938611. Thanjavur 192940 46504 360 11684 9470 26095812. Nagapattinam
Quaid-e-MiIleth 279711 114606 694 13654 3569 412234
13. Pudukkottai 86725 12452 868 2170 12256 11447114. Madurai 151624 32284 5356 13833 19676 22277315. Dindigul-Anna 1^7252 33749 7336 6202 30622 195161
16. Ramanathapuram 156098 5335 13086 5892 542 17695317. Kamarajar 45231 23977 6712 5187 4193 8530018. Pasumpon Muthurama-
linga Thevar 88176 8005 3719 5470 4948 105338
19. TirunelveliKattabomman 105534 15405 8848 6245 14826 ' 150858
20. Chidambaranar 57414 38526 23458 8765 11580 13473821. Kanniyakutnari 40578 3341 3396 2246 17831 67386
State 3211646 775870 138544 260707 379510 4766277
: 124 :
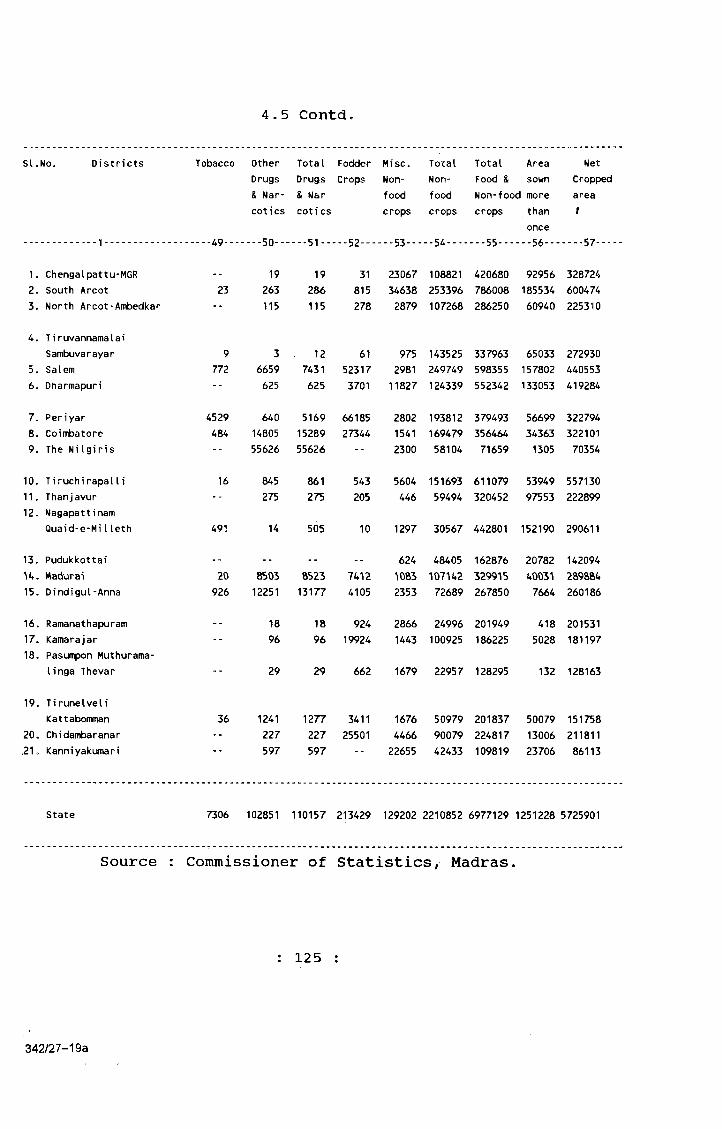
4.5 Contd
SI.No. Districts Tobacco Other Drugs & Narcotics
Total Drugs & Nar coti cs
FodderCrops
Misc.Nonfoodcrops
TotalNonfoodcrops
Total Area Food & sown Non-food more crops than
once
NetCroppedarear
..... 49--- ----50--- ---51-- ...52--- ---53--- --5 4 .--- ---55--- ---56-------57....
1. Chengalpattu-MGR -- 19 19 31 23067 108821 420680 92956 3287242. South Arcot 23 263 286 815 34638 253396 786008 185534 6004743. North Arcot-Ambedkar -- 115 115 278 2879 107268 286250 60940 225310
4. TiruvannamalaiSambuvarayar 9 3 12 61 975 143525 337963 65033 272930
5. Salem 772 6659 7431 52317 2981 249749 598355 157802 4405536. Dharmapuri -- 625 625 3701 11827 124339 552342 133053 419284
7. Periyar 4529 640 5169 66185 2802 193812 379493 56699 3227948. Coimbatore 484 14805 15289 27344 1541 169479 356464 34363 3221019. The NiIgiris -- 55626 55626 -- 2300 58104 71659 1305 70354
10. T i ruch i rapa11i 16 845 861 543 5604 151693 611079 53949 55713011. Thanjavur12. Nagapattinam
275 275 205 446 59494 320452 97553 222899
Quaid-e-MiIleth 491 14 505 10 1297 30567 442801 152190 290611
13. Pudukkottai .. -- .. . 624 48405 162876 20782 142094H . Madurai 20 8S03 8523 1083 107142 329915 40031 28988415. Dindigul-Anna 926 12251 13177 4105 2353 72689 267850 7664 260186
16. Ramanathapuram -- 18 18 924 2866 24996 201949 418 20153117. Kamarajar18. Pasumpon Muthurama-
96 96 19924 1443 100925 186225 5028 181197
linga Thevar 29 29 662 1679 22957 128295 132 128163
19, TirunelveliKattabomman 36 1241 1277 3411 1676 50979 201837 50079 151758
20. Chidatnbaranar -- 227 227 25501 4466 90079 224817 13006 211811.21. Kanniyakunari 597 597 22655 42433 109819 23706 86113
State 7306 102851 110157 213429 129202 2210852 6977129 1251228 5725901
Source : Commissioner of Statistics, Madras.
: 125
342/27-19a
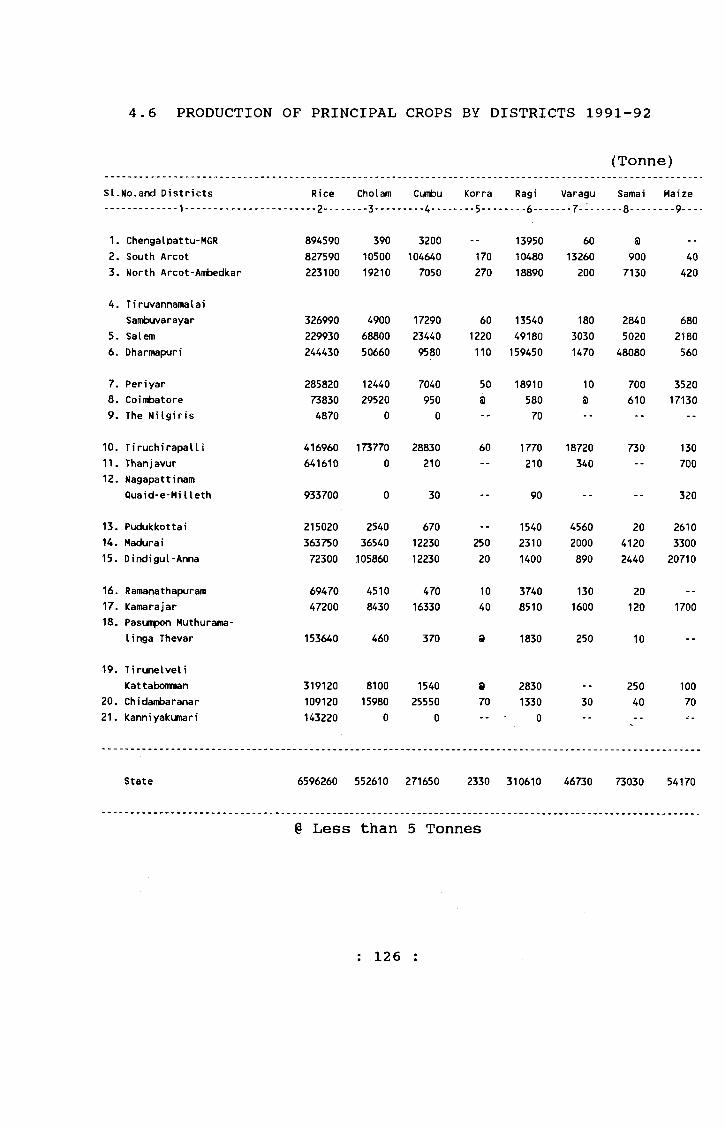
4.6 PRODUCTION OF PRINCIPAL CROPS BY DISTRICTS 1991-92
(Tonne)s i . No.and Districts Rice Cholam Cunt)u Korra Ragi Varagu Sama i Maize
..... 2---- ...... ........ ---5- - ...... 6--- ----7- ------8....... ---9-----
1. Chengalpattu-MGR 894590 390 3200 .. 13950 60 a --
2. South Arcot 827590 10500 104640 170 10480 13260 900 403. North Arcot-Ambedkar 223100 19210 7050 270 18890 200 7130 420
4. T i ruvannamaI a iSambuvarayar 326990 4900 17290 60 13540 180 2840 680
5. Salem 229930 68800 23440 1220 49180 3030 5020 21806. Dharmapuri 244430 50660 9580 110 159450 1470 48080 560
7. Periyar 285820 12440 7040 50 18910 10 700 35208. Coimbatore 73830 29520 950 a 580 a 610 171309. The NiIgiris 4870 0 0 -- 70 -- -- --
10. Tiruchirapalli 416960 173770 28830 60 1770 18720 730 13011. Thanjavur 641610 0 210 -- 210 340 -- 70012. Nagapattinam
Quaid-e-MiIleth 933700 0 30 -- 90 -- -- 320
13. Pudukkottai 215020 2540 670 1540 4560 20 261014. Madurai 363750 36540 12230 250 2310 2000 4120 330015. Dindigul-Anna 72300 105860 12230 20 1400 890 2440 20710
16. Ramanathapuram 69470 4510 470 10 3740 130 2017. Kamarajar 47200 8430 16330 40 8510 1600 120 170018. Pasumpon Muthurama-
linga Thevar 153640 460 370 a 1830 250 10 --
19. TirunelveliKattabomman 319120 8100 1540 a 2830 -- 250 100
20. Chidambaranar 109120 15980 25550 70 1330 30 40 7021. Kanniyakumari 143220 0 0 0
State 6596260 552610 271650 2330 310610 46730 73030 54170
§ Less than 5 Tonnes
: 126 :
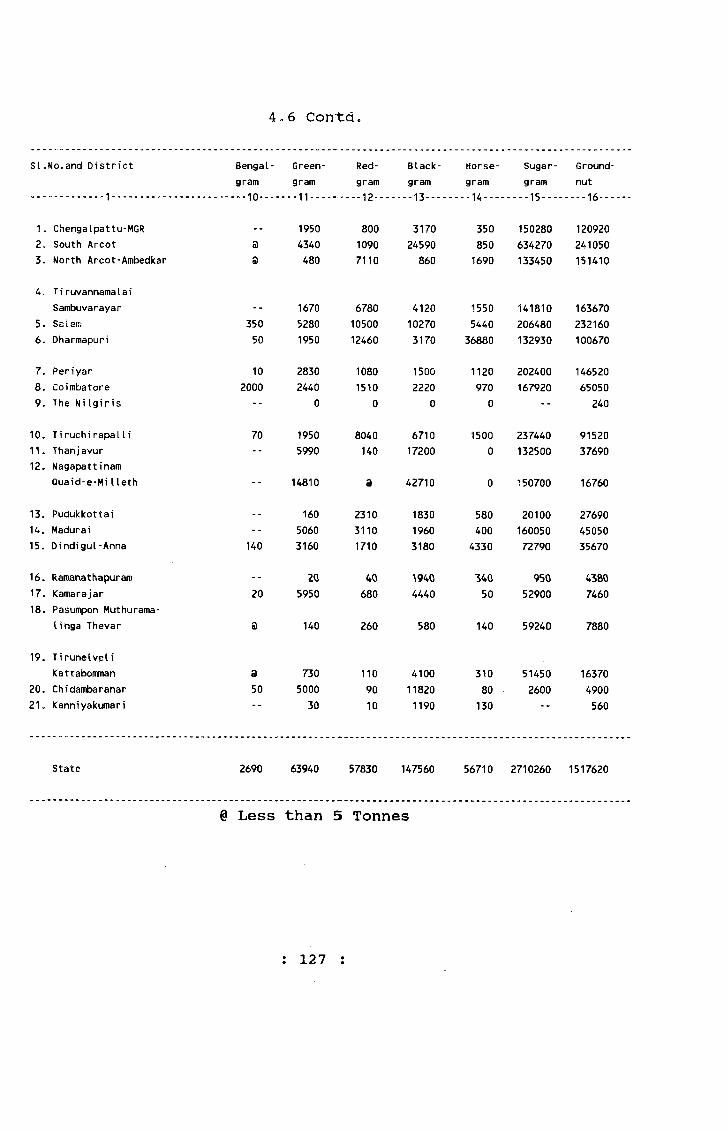
4» 6 Con“td
SI.No,and District Bengal- Green- Red- Black- Horse- Sugar- Groundgram gram gram gram gram gram nut
....10--- - - -11.... . ----12-- .... 13---- --- 14---- --”-15---- ----16.....
1. Chengalpattu-MGR .. 1950 800 3170 350 150280 1209202. South Arcot a 4340 1090 24590 850 634270 2410503. Month Arcot-Ambedkar a 480 7110 860 1690 133450 151410
4„ TiruvannamalaiSambuvarayar -- 1670 6780 4120 1550 141810 163670
5. Saletr; 350 5280 10500 10270 5440 206480 2321606. Dharmapuri 50 1950 12460 3170 36880 132930 100670
7, Periyar 10 2830 1080 1500 1120 202400 1465208, Coimbatore 2000 2440 1510 2220 970 167920 650509, The MiIgiris -- 0 0 0 0 -- 240
10. Tiruchirapalli 70 1950 8040 6710 1500 237440 9152011, Thanjavur -- 5990 140 17200 0 132500 3769012, Nagapattinam
Quaid-e-MiIleth 14810 a 42710 0 150700 16760
13. Pudukkottai -- 160 2310 1830 580 20100 2769014, Madurai -- 5060 3110 1960 400 160050 4505015. Dindigul-Anna 140 3160 1710 3180 4330 72790 35670
16, Ramanathapurara -- 20 40 1940 340 950 438017. Kamarajar 20 5950 680 4440 50 52900 746018. Pasumpon Muthurama-
linga Thevar a 140 260 580 140 59240 7880
19, TirunelveliKattabomman a 730 110 4100 310 51450 16370
20. Chidambaranar 50 5000 90 11820 80 2600 490021, Kanniyakumari 30 10 1190 130 560
State 2690 63940 57830 147560 56710 2710260 1517620
@ Less than 5 Tonnes
: 127
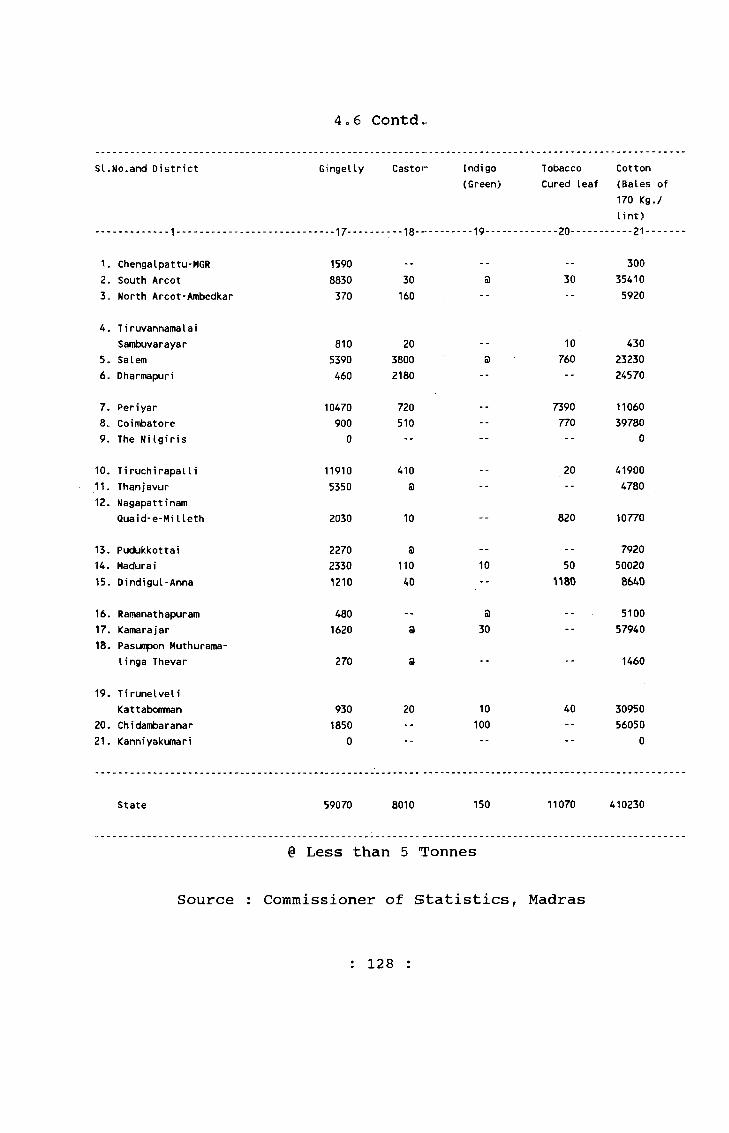
4 o 6 Contd
si.No.and District Gingelly Castor Indigo(Green)
Tobacco Cured leaf
Cotton (Bales of 170 Kg./I i nt)
............ ^ ---18--- ..... 19............. 20...... .... 21.......
1. Chengalpattu-MGR 1590 - - -- -- 3002. South Arcot 8830 30 S 30 354103. North Arcot-Ambedkar 370 160 -- -- 5920
4. TiruvannamalaiSambuvarayar 810 20 -- 10 430
5 . Salem 5390 3800 a 760 232306. Dharmapuri 460 2180 -- -- 24570
7. Periyar 10470 720 -- 7390 110608. Coimbatore 900 510 -- 770 397809. The NiIgiris 0 -- -- -- 0
10. Tiruchirapalli 11910 410 . . 20 4190011. Thanjavur12. Nagapattinam
5350 a■ ■
4780
Quaid-e-MiIleth 2030 10 -- 820 10770
13. Pudukkottai 2270 a - - 792014. Madurai 2330 110 10 50 5002015. Dindigul-Anna 1210 40 -- 1180 8640
16. Ramanathapuram 480 -- a -- 510017. Kamarajar18. Pasumpon Muthurama-
1620 s 30 57940
linga Thevar 270 a -- 1460
19. TirunelveliKattabomman 930 20 10 40 30950
20. Chidambaranar 1850 •- 100 -- 5605021. Kanniyakumari 0 0
State 59070 8010 150 11070 410230
@ Less than 5 Tonnes
Source : Commissioner of Statistics, Madras
: 128 :
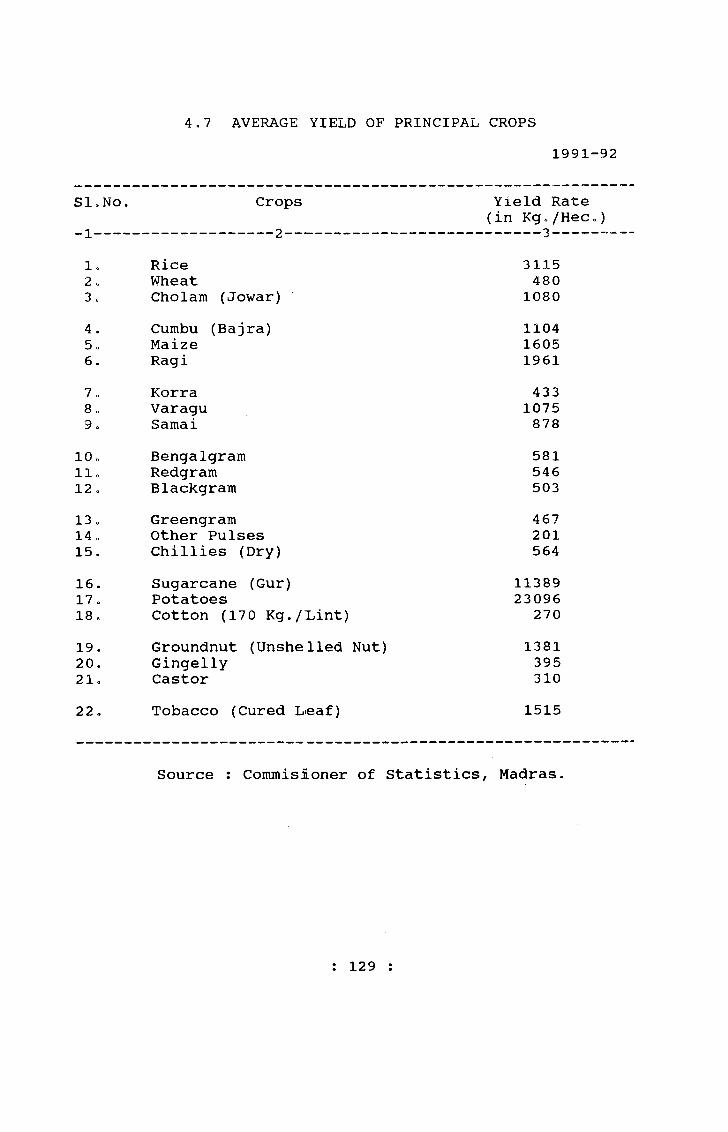
4.7 AVERAGE YIELD OF PRINCIPAL CROPS1991-92
Sl»No, Crops Yield Rate (in Kgo/HeCo)
1 ----1„ Rice 31152 o Wheat 4803 . Cholam (Jowar) 10804 . Cumbu (Bajra) 11045o Maize 16056. Ragi 19617. Korra 4338e Varagu 10759o Samai 878
lOo Bengalgram 581llo Redgram 54612 » Blackgram 50313 c Greengram 46714 o Other Pulses 20115. Chillies (Dry) 56416. Sugarcane (Gur) 1138917 o Potatoes 2309618e Cotton (170 Kg./lint) 27019. Groundnut (Unshelled Nut) 138120. Gingelly 39521o Castor 31022o Tobacco (Cured L*eaf) 1515
Source : Commisioner of Statistics, Madras.
: 129 :
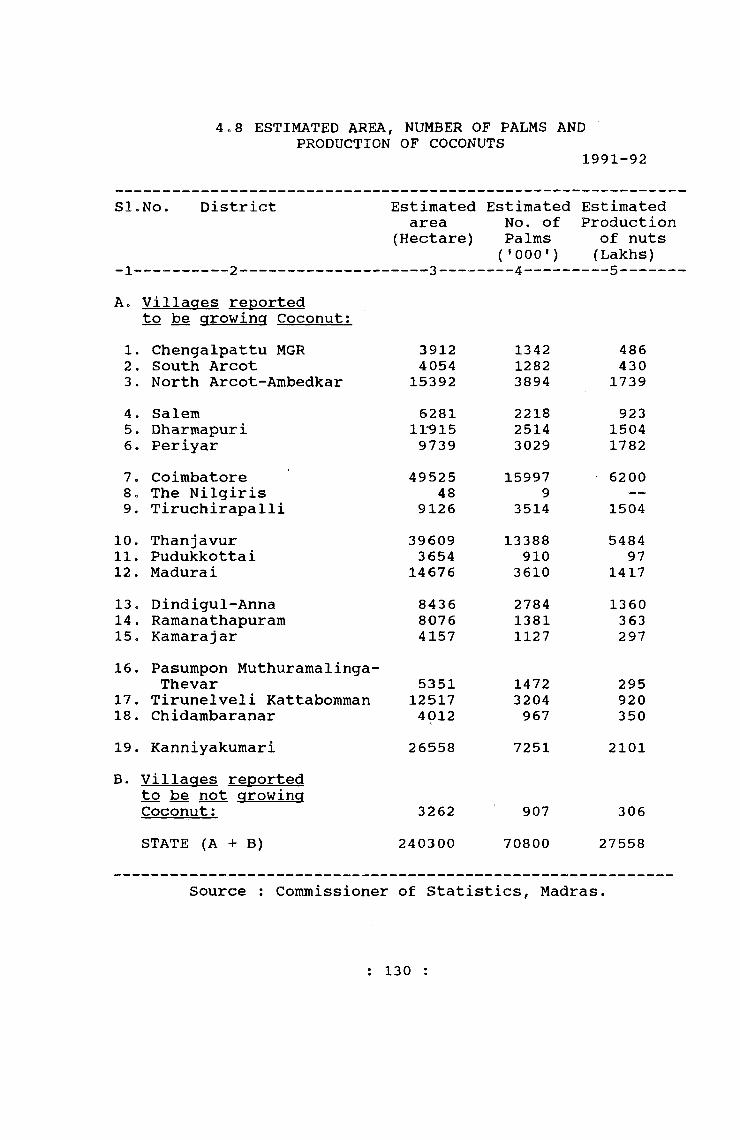
4.8 ESTIMATED AREA, NUMBER OF PALMS ANDPRODUCTION OF COCONUTS
1991-92
SI,No. District Estimated Estimated Estimatedarea No. of Production
(Hectare) Palms of nuts-I— -------- 2----------------- -----3----
('OOO') (Lakhs)
Ac Villaaes reportedto be arowina Coconut:
1. Chengalpattu MGR 3912 1342 4862. South Arcot 4054 1282 4303. North Arcot-Ambedkar 15392 3894 17394. Salem 6281 2218 9235. Dharmapuri 11-915 2514 15046. Periyar 9739 3029 17827. Coimbatore 49525 15997 62008c The Nilgiris 48 99. Tiruchirapalli 9126 3514 1504
10. Thanjavur 39609 13388 548411. Pudukkotta i 3654 910 9712. Madurai 14676 3610 141713c Dindigul-Anna 8436 2784 136014. Ramanathapuram 8076 1381 36315, Kamarajar 4157 1127 29716. Pasumpon Muthuramalinga-
Thevar 5351 1472 29517. Tirunelveli Kattabomman 12517 3204 92018. Chidambaranar 4012 967 35019. Kanniyakumari 26558 7251 2101B. Villaaes reoorted
to be not arowinaCoconut: 3262 907 306STATE (A + B) 240300 70800 27558
Source : Commissioner of Statistics, Madras.
: 130 ;
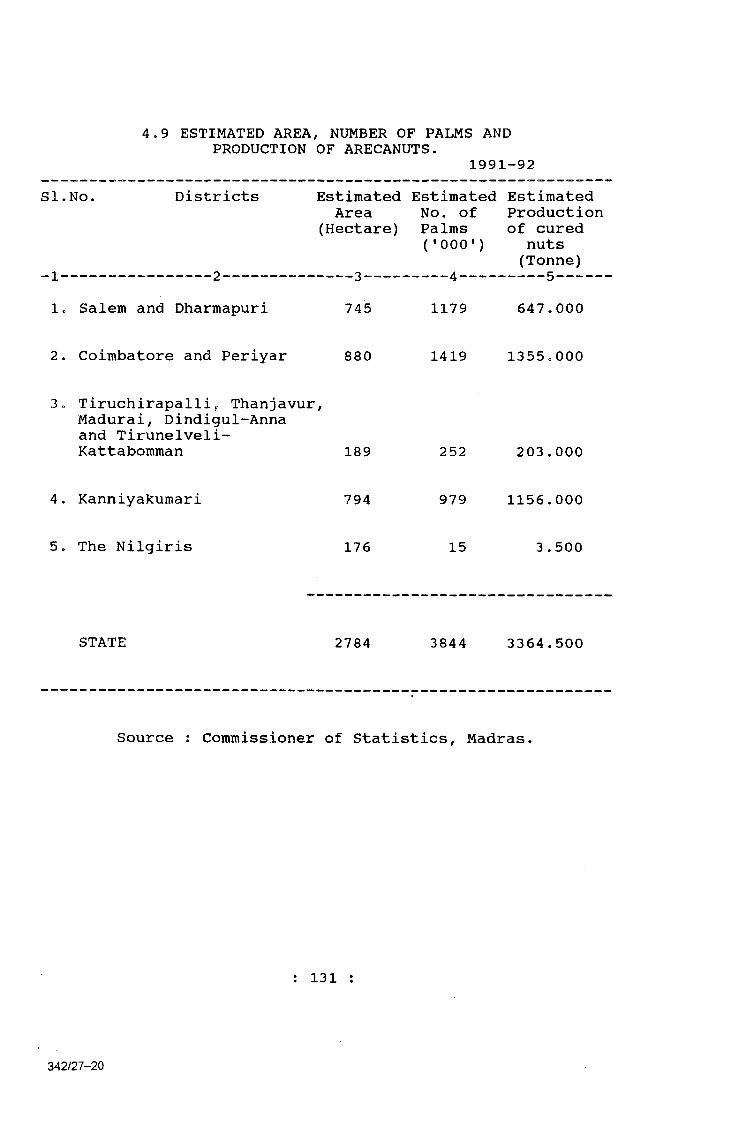
1991-92SI.No. Districts Estimated Estimated Estimated
Area No. of Production(Hectare) Palms of cured
( ' 000') nuts(Tonne)
4.9 ESTIMATED AREA, NUMBER OF PALMS ANDPRODUCTION OF ARECANUTS.
1. Salem and Dharmapuri 745 1179 647.000
2. Coimbatore and Periyar 880 1419 1355„000
3» Tiruchirapalli^ Thanjavur, Madurai, Dindigul-Anna and Tirunelveli- Kattabomman 189 252 203.000
4. Kanniyakumari 794 979 1156.000
5. The Nilgiris 176 15 3 .500
STATE 2784 3844 3364.500
Source : Commissioner of Statistics, Madras.
: 131
342/27-20
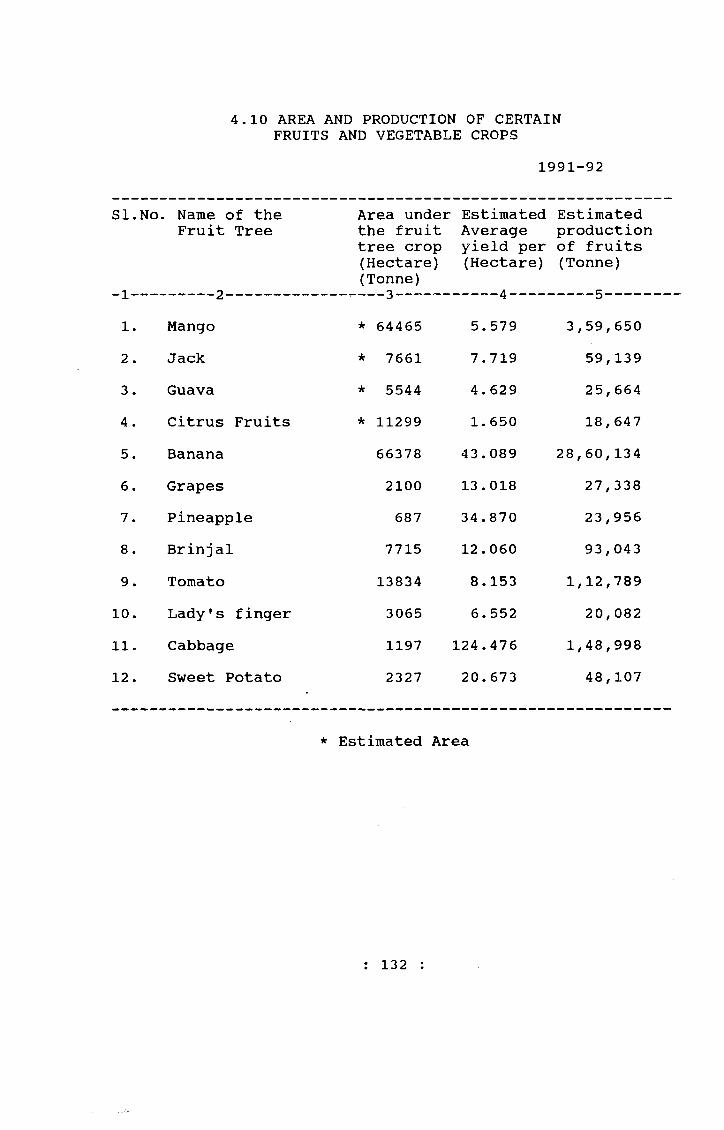
4.10 AREA AND PRODUCTION OF CERTAIN FRUITS AND VEGETABLE CROPS
1 9 9 1 - 9 2
SI.No. Name of the Fruit Tree
Area under Estimated the fruit Average tree crop yield per (Hectare) (Hectare) (Tonne)
Estimated production of fruits (Tonne)
-1— -------- 2------------------- 3— — ■--- - “-4---- ----- 5 -----1. Mango * 64465 5. 579 3,59,6502. Jack * 7661 7.719 59,1393. Guava * 5544 4.629 25,6644 . Citrus Fruits * 11299 1. 650 18,6475. Banana 66378 43.089 28,60,1346o Grapes 2100 13.018 27,3387. Pineapple 687 34.870 23,9568. Brinjal 7715 12.060 93,0439. Tomato 13834 8.153 1,12,789
10. Lady's finger 3065 6. 552 20,082llo Cabbage 1197 124.476 1,48,99812. Sweet Potato 2327 20.673 48,107
* Estimated Area
: 132 :
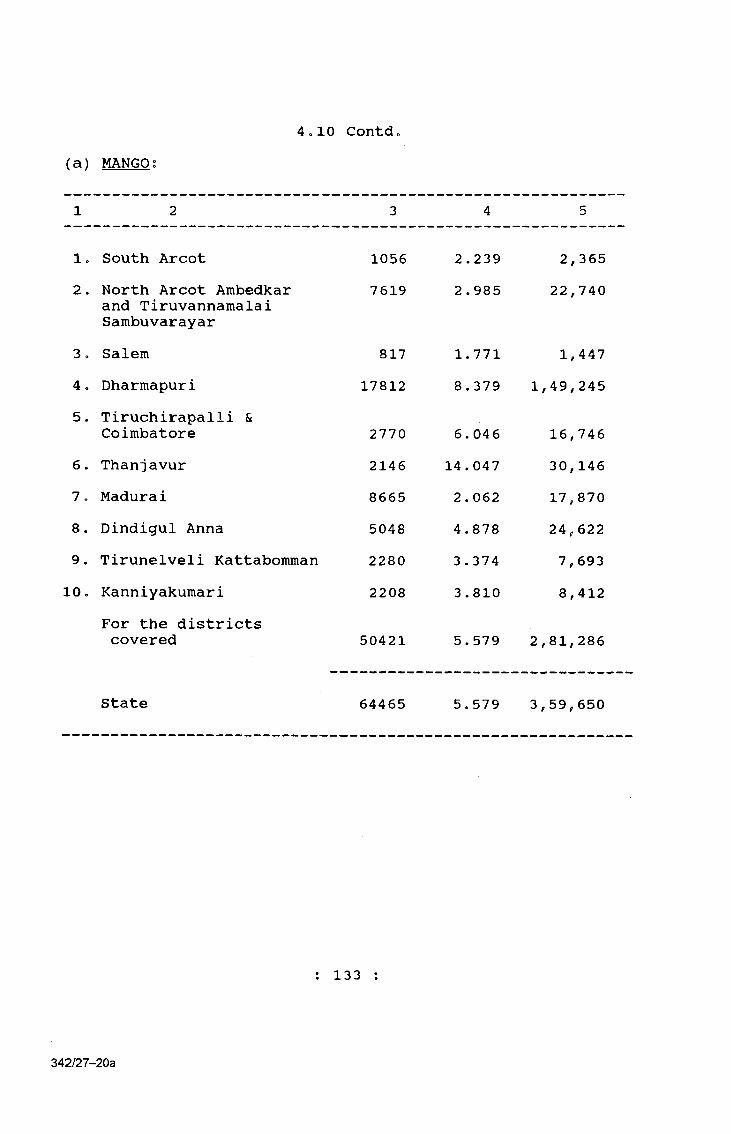
4ol0 Contd(a) MANGO;
1 2 3 4 5
1, South Arcot 1056 2.239 2,3652 . North Arcot Ambedkar
and Tiruvannamalai Sambuvarayar
7619 2.985 22,740
3 o Salem 817 1.771 1,4474. Dharmapuri 17812 8.379 1,49,2455. Tiruchirapalli &
Coimbatore 2770 6. 046 16,7466. Thanjavur 2146 14.047 30,1467 . Madurai 8665 2.062 17,8708. Dindigul Anna 5048 4.878 24,6229. Tirunelveli Kattabomman 2280 3 . 374 7, 693
10, Kanniyakumari 2208 3.810 8,412For the districts covered 50421 5.579 2,81,286
State 64465 5.579 3,59,650
: 1 3 3
342/27-20a
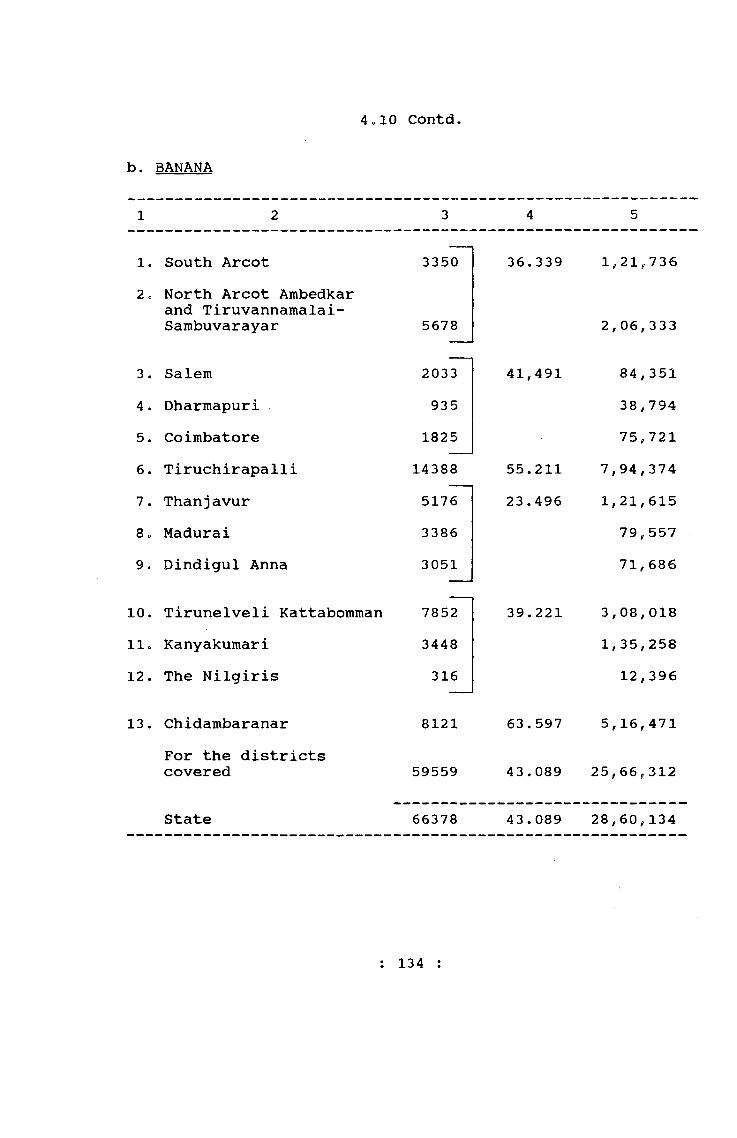
4ol0
b. BANANA
Contd.
1 2 3 4 5
1. South Arcot 3350 36.339 1,21,7362 c North Arcot Ambedkar
and Tiruvannamalai-Sambuvarayar 5678 2,06,333
3. Salem 2033 41,491 84,3514. Dharmapuri 935 38,7945. Coimbatore 1825 75,7216. Tiruchirapalli 14388 55.211 7,94,3747. Thanjavur 5176 23.496 1,21,6158o Madurai 3386 79,5579. Dindigul Anna 3051 71,686
10. Tirunelveli Kattabomman 7852 39.221 3,08,018110 Kanyakumari 3448 1,35,25812. The Nilgiris 316 12,396
13. Chidambaranar 8121 63.597 5,16,471For the districtscovered 59559 43.089 25,66,312
State 66378 43.089 28,60,134
: 134 :
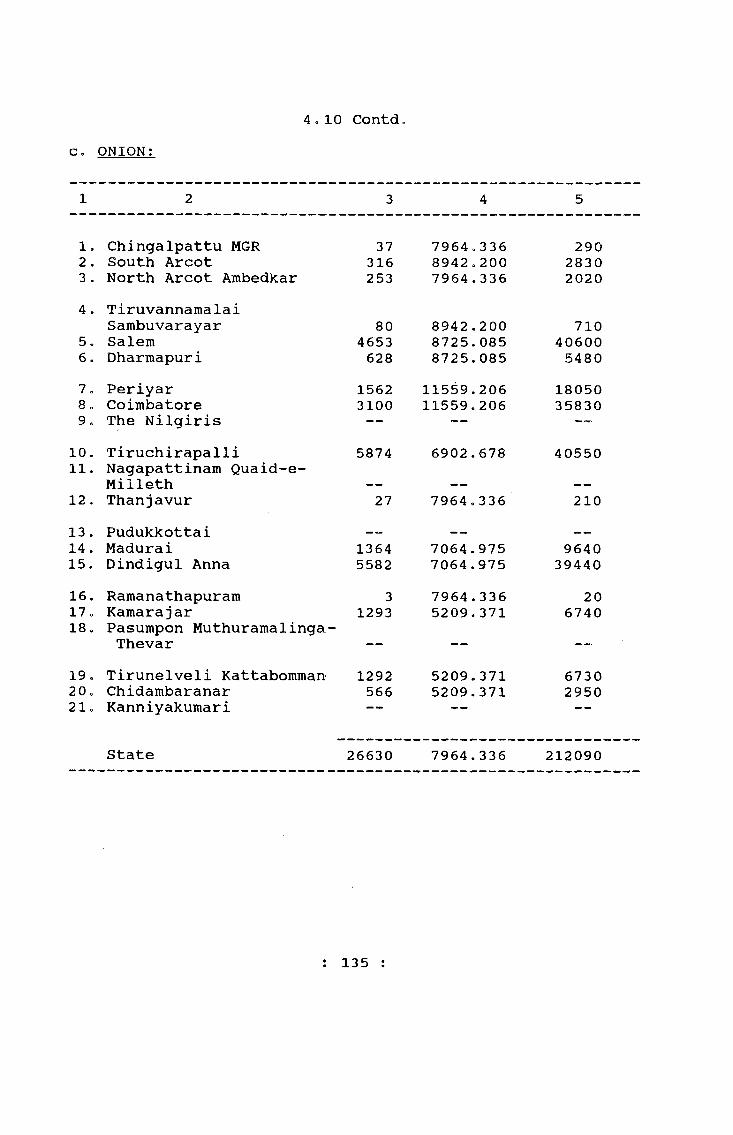
4»10 Contdc. ONION?
1 2 3 4 5
1, Chingalpattu MGR 37 7964o336 2902. South Arcot 316 8942.200 28303, North Arcot Ambedkar 253 7964.336 20204. Tiruvannamalai
Sambuvarayar 80 8942.200 7105o Salem 4653 8725.085 406006o Dharmapuri 628 8725.085 54807, Periyar 1562 11559.206 180508. Coimbatore 3100 11559.206 358309. The Nilgiris — ■—
10. Tiruchirapalli 5874 6902.678 4055011. Nagapattinam Quaid-e-
Milleth — — ,—12, Thanjavur 27 7964.336 21013. Pudukkottai _— ____ _____14. Madurai 1364 7064.975 964015. Dindigul Anna 5582 7064.975 3944016. Ramanathapuram 3 7964.336 2017o Kamarajar 1293 5209.371 674018, Pasumpon Muthuramalinga-
Thevar — —
19. Tirunelveli Kattabomman 1292 5209.371 673020 0 Chidambaranar 566 5209.371 295021o Kanniyakumari * “
State 26630 7964.336 212090
135 :

4.10 Co>ntdd. Chillies:
1 2 3 4 5
1. Chingalpattu MGR 982 859.776 8402. South Arcot 617 859.776 5303. North Arcot Ambedkar 641 859.776 5504. Tiruvannamalai
Sambuvarayar 487 859.776 4205. Salem 1535 785.887 12106. Dharmapuri 1057 785.887 8307. Periyar 1103 817.552 9008. Coimbatore 1533 817.552 12509o The Nilgiris 8 564.060 5
10. Tiruchirapalli 12272 662.014 812011o Nagapattinam Quaid-e-
Milleth 182 1217.855 22012. Thanjavur 96 1217.855 12013. Pudukkottai 628 1217.855 77014. Madurai 933 546.625 51015.■Dindigul Anna 3077 546.625 168016. Ramanathapuram 11006 350.380 386017. Kamarajar 3482 697.207 243018. Pasumpon Muthuramalinga-
Thevar 3358 697.207 234019. Tirunelveli Kattabomman 7097 433.559 308020. Chidambaranar 10781 433.559 467021. Kanniyakumari 6 564.060 5
State 60881 564.060 34340
: 136 :
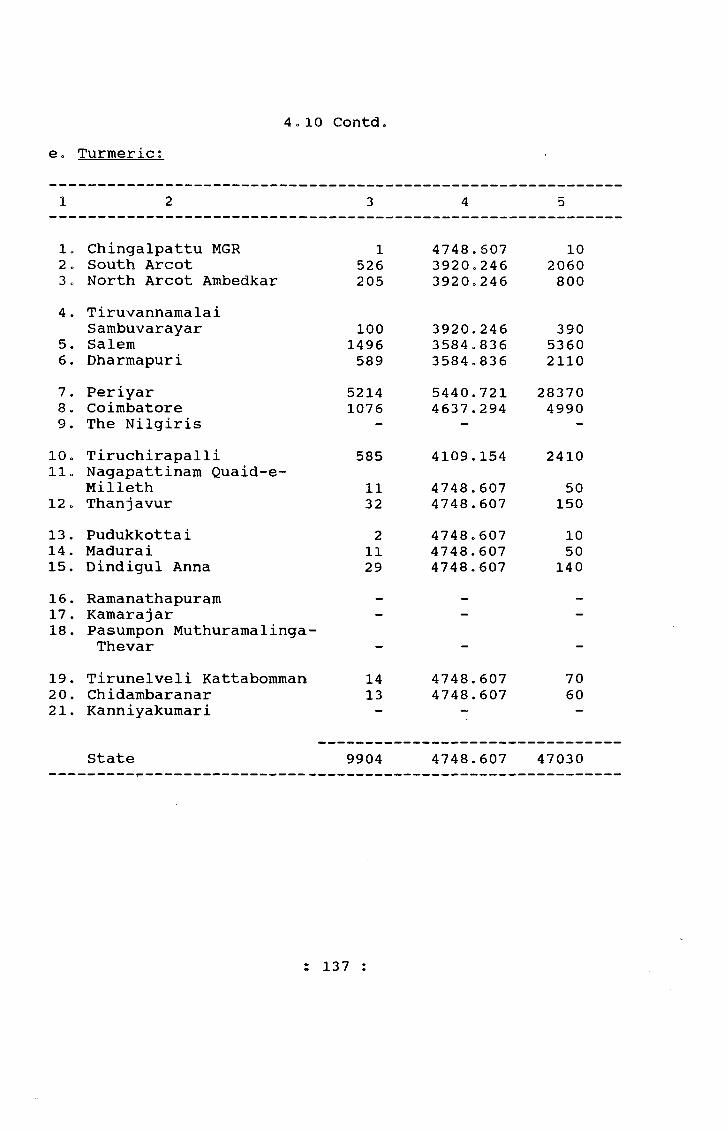
4„10 Contde„ Turmeric;
1 2 3 4 5
lo Chingalpattu MGR 1 4748.607 102 o South Arcot 526 3920.246 20603 c North Arcot Ambedkar 205 3920o246 8004. Tiruvannamalai
Sambuvarayar 100 3920.246 3905. Salem 1496 3584.836 53606. Dharmapuri 589 3584.836 21107. Periyar 5214 5440.721 283708. Coimbatore 1076 4637.294 49909. The Nilgiris - — _
10o Tiruchirapalli 585 4109.154 241011o Nagapattinam Quaid-e~
Milleth 11 4748.607 5012c Thanjavur 32 4748.607 15013. Pudukkottai 2 4748,607 1014. Madurai 11 4748.607 5015. Dindigul Anna 29 4748.607 14016. Ramanathapuram - - -
17. Kamarajar - - -
18. Pasumpon Muthuramalinga-Thevar — — —
19. Tirunelveli Kattabomman 14 4748.607 7020. Chidambaranar 13 4748.607 6021. Kanniyakumari — ~ —
State 9904 4748.607 47030
137 :

f.4.10
GinaersContd.
1 2 3 4 5
1. Chengalpattu MGR . . .2 . South Arcot - - -
3c North Arcot Ambedkar — — —
4. TiruvannamalaiSambuvarayar _
5e Salem - - —
6. Dhariiiapuri — — —
7o Periyar - - -8. Coimbatore - -9. The Nilgiris 4 60 19218.457 8840
10. Tiruchirapalli - - -11. Nagapattinam Quaid-e-
Milleth 1 19218.457 2012. Thanjavur 2 19218.457 4013 . Pudukkottai — — —14 . Madurai 1 19218.457 2015. Dindigul Anna 18 19218.457 34016. Ramanathapuram - -17. Kamarajar - — - ■18. Pasumpon Muthuramalinga-
Thevar - - -
19. Tirunelveli Kattabomman 1 19218.457 2020. Chidambaranar - - -21. Kanniyakumari 14 19218.457 270
_________ ____ ___ ___ ______ ___________State 4 97 19218.457 9550
: 138 ::
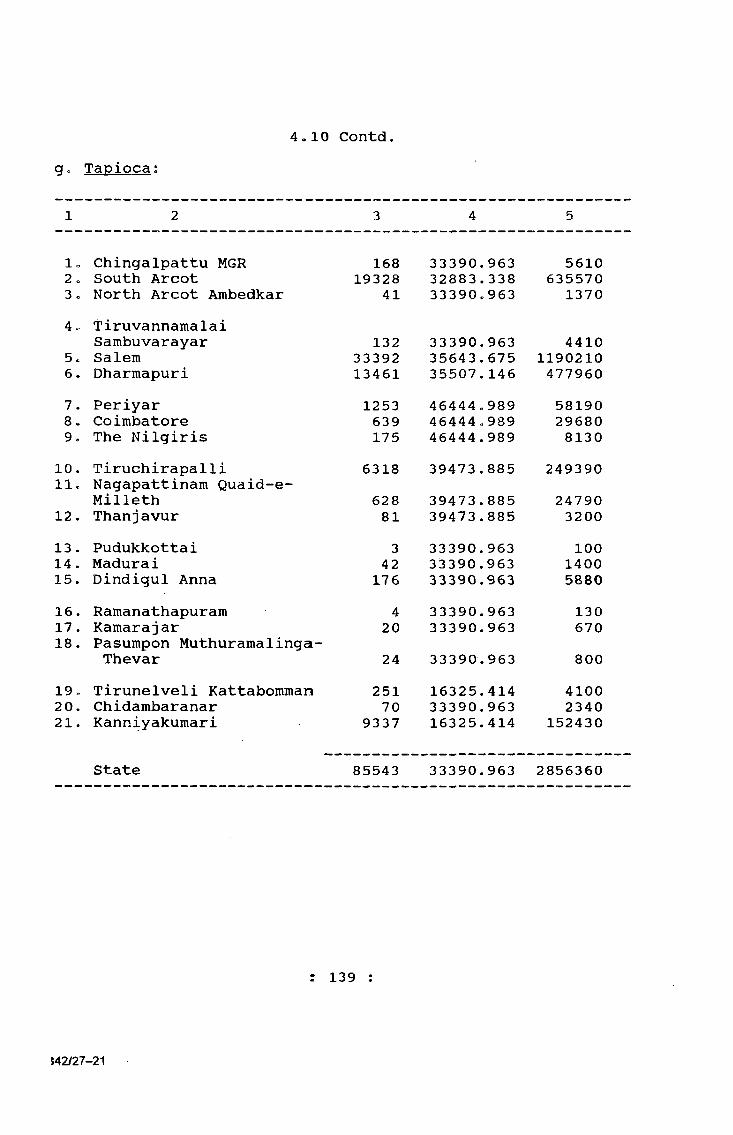
4.10 Contdgo Tapioca;
1 2 3 4 5
lo Chingalpattu MGR 168 33390.963 56102 o South Arcot 19328 32883 .338 6355703 o North Arcot Ambedkar 41 33390.963 13704c Tiruvannamalai
Sambuvarayar 132 33390.963 44105. Salem 33392 35643.675 11902106. Dharmapuri 13461 35507.146 4779607. Periyar 1253 46444,989 58190
Coimbatore 639 46444.989 296809« The Nilgiris 175 46444.989 8130
10. Tiruchirapalli 6318 39473.885 249390lie Nagapattinam Quaid-e-
Milleth 628 39473.885 2479012. Thanjavur 81 39473.885 320013. Pudukkottai 3 33390.963 10014. Madurai 42 33390.963 140015. Dindigul Anna 17 6 33390.963 588016. Ramanathapuram 4 33390.963 13017. Kamarajar 20 33390.963 67018. Pasumpon Muthuramalinga-
Thevar 24 33390.963 80019„ Tirunelveli Kattabomman 251 16325.414 410020. Chidambaranar 70 33390.963 234021. Kanniyakumari 9337 16325.414 152430
State 85543 33390.963 2856360
139
M2/27-21
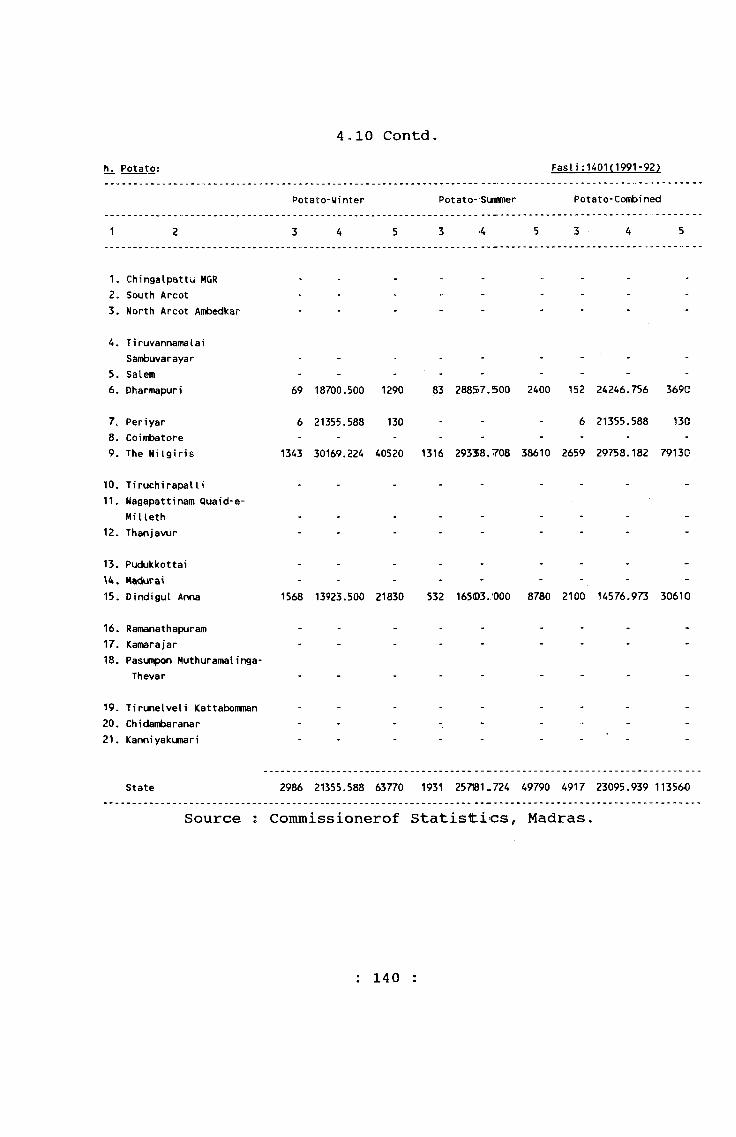
4,10 Contd.h. Potato: Fasii;U0U1991-92)
Potato-Winter Potato-:Summer Potato-Combined
1 2 3 4 5 3 5 3 4 5
1. Chingalpattu MGR .
2. South Arcot - - ~ - - - - -3. North Arcot Ambedkar - - - - - - - - -
4. T i ruvannamaI a iSarnbuvarayar - - - - - - - - -
5. Salem - - - - - - - - -6. Dharmapuri 69 18700.500 1290 83 28857.500 2400 152 24246.756 3690
7. Periyar 6 21355.588 130 - - - 6 21355.588 1308. Coimbatore - - - - - - - - -9. The NiIgiris 1343 30169.224 40520 1316 29338.708 38610 2659 29758.182 7913G
10. TiruchirapaUi - - - - - - - - -11. Nagapattinam Quaid-e-
MiIieth - - - - - - - - -12. Thanjavur - - - - - - - - -
13. Pudukkottai - - - - - - - - -
U . Hackirai - - - - - - - -15. Dindigul Anna 1568 13923.500 21830 532 165D3.000 8780 2100 14576.973 30610
16. Ramanathapuram - - - - - - - - -17. Kamarajar - - - - - - - - -18. Pasumpon Muthuramalinga-
Thevar - - - - - - - - -
19. Tirunelveli Kattabomman - - - - - - - ■- -20. Chidambaranar - - - - - - -21. Kanniyakumari
■
State 2986 21355.588 63770 1931 257181,724 49790 4917 23095.939 113560
Source ; Commissionerof Statistics, Madras.
: 140 :
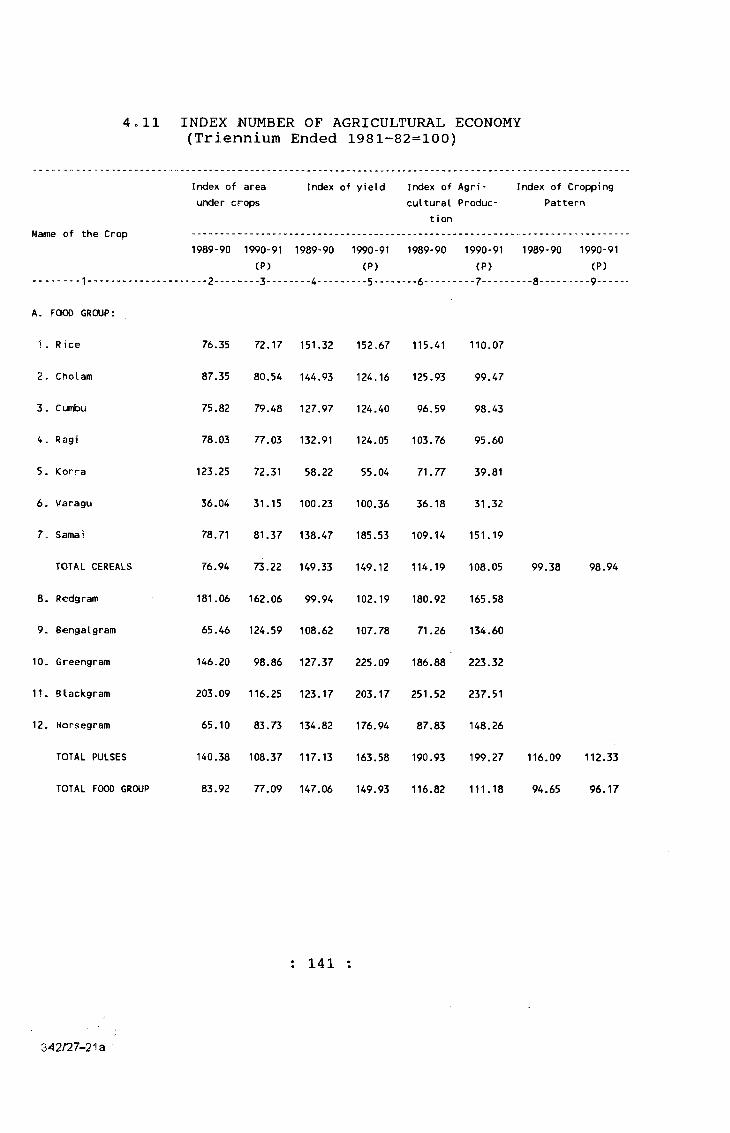
4.11 INDEX NUMBER OF AGRICULTURAL ECONOMY (Triennium Ended 1981-82=100)
Index of area Index of yield Index of Agri- Index of Croppingunder crops cultural Produc- Pattern
tionName of the Crop .... .....................-.....................-............... -.......
1989-90 1990-91 1989-90 1990-91 1989-90 1990-91 1989-90 1990-91(P) (P) (P) (P)
.... ---1-.................... 2........3........4........ 5....... 6.........7 - .......8------ -9----
A. FOOD GROUP:
1-Rice 76.35 72.17 151.32 152.67 115.41 110.07
2. Cholam 87.35 80.54 144.93 124.16 125.93 99.47
3. Cumbu 75.82 79.48 127.97 124.40 96.59 98.43
4. Ragi 78.03 77.03 132.91 124.05 103.76 95.60
5. Korra 123.25 72.31 58.22 55.04 71.77 39.81
6. Varagu 36.04 31.15 100.23 100.36 36.18 31.32
7. Samai 78.71 81.37 138.47 185.53 109.14 151.19
TOTAL CEREALS 76.94 73.22 149.33 149.12 114.19 108.05 99.38 98.94
8. Redgram 181.06 162.06 99.94 102.19 180.92 165.58
9. Bengalgram 65.46 124.59 108.62 107.78 71.26 134.60
10. Greengram 146.20 98.86 127.37 225.09 186.88 223.32
11. Blackgram 203.09 116.25 123.17 203.17 251.52 237.51
12. Horsegram 65.10 83.73 134.82 176.94 87.83 148.26
TOTAL PULSES 140.38 108.37 117.13 163.58 190.93 199.27 116.09 112.33
TOTAL FOOD GROUP 83.92 77.09 147.06 149.93 116.82 111.18 94.65 96.17
: 141
342/27-21 a
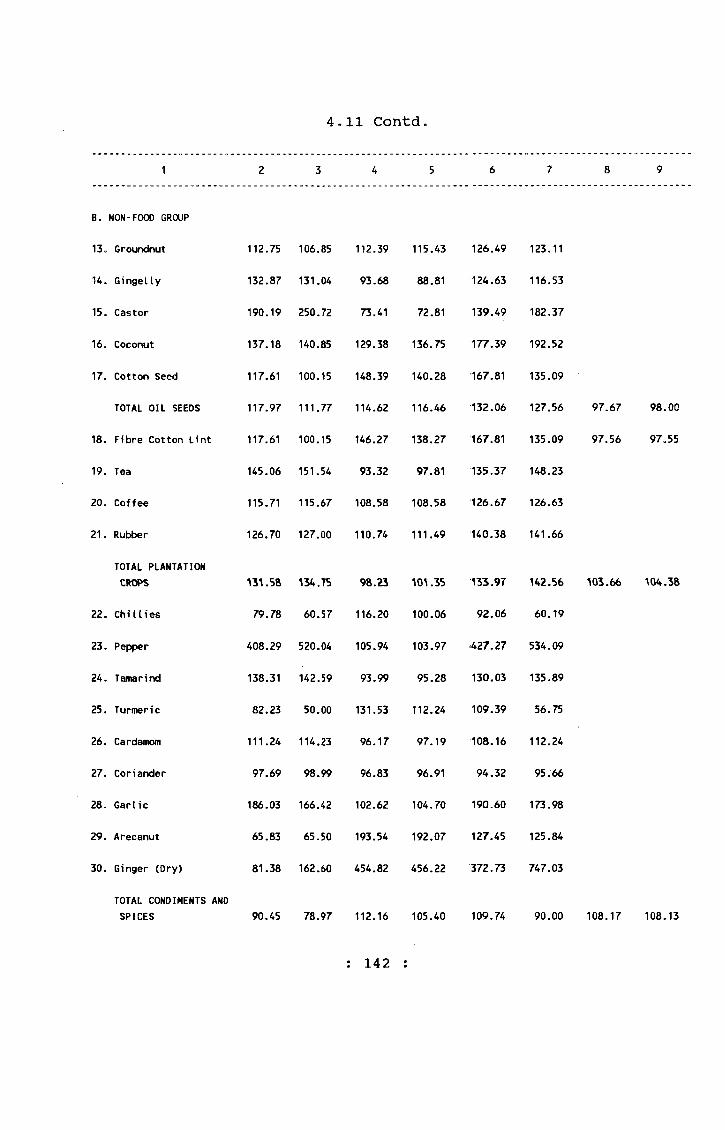
1
4,11 Contd.
B. NON-FOOD GROUP
13. Groundnut
14. Gingelly
15. Castor
16. Coconut
17. Cotton Seed
TOTAL OIL SEEDS
18. Fibre Cotton Lint
19. Tea
20. Coffee
21. Rubber
TOTAL PLANTATION CROPS
22. Chillies
23. Pepper
24. Tamarind
25. Turmeric
26. Cardamom
27. Coriander
28. Garlic
29. Arecanut
30. Ginger (Dry)
TOTAL CONDIMENTS AND SPICES
112.75 106.85
132.87 131.04
190.19 250.72
137.18 140.85
117.61 100.15
117.97 111.77
117.61 100.15
145.06 151.54
115.71 115.67
126.70 127.00
131.58 134.75
79.78 60.57
408.29 520.04
138.31 142.59
82.23 50.00
111.24 114.23
97.69 98.99
186.03 166.42
65.83 65.50
81.38 162.60
112.39 115.43 126.49 123.11
93.68 88.81 124.63 116.53
73.41 72.81 139.49 182.37
129.38 136.75 177.39 192.52
148.39 140.28 167.81 135.09
114.62 116.46 132.06 127.56 97.67 98.00
146.27 138.27 167.81 135.09 97.56 97,55
93.32 97.81 135.37 148.23
108.58 108.58 126.67 126.63
110.74 111.49 140.38 141.66
98.23 101.35 133.97 H2.56 103.66 104.38
116.20 100.06 92.06 60.19
105.94 103.97 427.27 534.09
93.99 95.28 130.03 135.89
131.53 112.24 109.39 56.75
96.17 97.19 108.16 112.24
96.83 96.91 94.32 95.66
102.62 104.70 190.60 173.98
193.54 192.07 127.45 125.84
454.82 456.22 372.73 747.03
90.45 78.97 112.16 105.40 109.74 90.00 108.17 108.13
: 142 :

4,11 Contd
1 2 3 4 5 6 7 8 9
31„ Banana 91.60 99.27 150.96 155.83 137.28 153.56
32. Citrus 133.04 94.47 16.89 20.46 23.13 19.90
33. Mangoes 144.08 149.02 44.99 37.91 64.77 56.44
3-4o Onions 117.87 106.42 92.40 84.14 108.76 89.42
35. Potatoes 83.08 50.82 197.04 225.01 167.24 116.83
36. Tapioca 139.02 140,88 126.54 119.68 175.64 168„33
37. Sweet Potato 69.32 52.66 196.55 231.52 136.24 121.91
38. Cashewnuts 125.16 127.38 99.46 99.53 125.18 127.50
TOTAL FRUITS & VEGETABLES 119.69 119.62 102.09 100.90 120.05 117.91 98.25 97.69
39. Sugarcane (Gur) 123.65 129.56 108.75 100.32 134.78 130.28
40. Tobacco (Cured Leaf) 79.26 83.16 105.37 105.28 83.63 87.68
TOTAL MISCELLANEOUS CROPS 120.76 126.54 108.71 100.37 133.93 129.56 102.03 102.03
TOTAL NON-FOOD GROUP 116.74 112.34 110.63 106.41 131.30 125.35 101.66 104.86
GENERAL 94.15 88.07 124.95 122.88 124.16 118.36 105.55 109.38
Source : Coniimissioner of Statistics, Madras.
: 143 :

4„12 NUMBER AND AREA OF OPERATIONAL HOLDINGS 1990-91 STATE s
SINo
. Size Class Number of operational holdings Area operated (in hectares)
Individual Joint Institutional Total Indf vicdual Joint Institutional Total
(1) (2) (3) (4) (5) (6) (77) (8) (9) (10)
1. Below 0.02 222210 2314 433 224957 27796 31 5 2832
2. 0.02 - 0.50 3834625 24515 3089 3862229 8927779 4685 572 898036
3. 0.50 - 1.00 1749975 9446 1489 1760910 1209858 6084 1016 1216958
MARGINAL (1+2+3) 5806810 36275 5011 5848096 21054133 10800 1593 2117826
4. 1.00 - 2.00 1267462 5680 1373 1274515 17847720 7851 1900 1794471
SMALL (4) 1267462 5680 1373 1274515 17847720 7851 1900 1794471
5. 2.00 - 3.00 426266 2405 847 429518 10326642 5758 2012 1040412
6. 3.00 - 4.00 186300 1247 540 188087 6400)37 4242 1823 646102
SEMIHEOIUM (5+6 ) 612566 3652 1387 617605 1672&79 1(iOOO 3835 ^6865U
7. 4.00 - 5.00 95746 770 371 96887 426S34 3448 1613 431395
8. 5.00 - 7.50 95864 809 542 97215 5754i99 4860 3266 583625
9. 7.50 - 10.00 32845 342 305 33492 280548 2910 2646 286104
MEDIUM (7+8+9) 224455 1921 1218 227594 1282S81 11218 7525 130.1124
10.. 10,00 - 20.00 25257 450 613 26320 3306S18 5996 8217 344831
11.. 20 and above 3895 212 695 4802 1347^00 7668 86543 228911
LARGE (10+11) 29152 662 1308 31122 4653? 18 13664 94760 573742
12. ALL SIZES 7940445 48190 10297 7998932 73105531 53533 109613 7473677
: 144 :

( 4,12 contdo)District: Madras(1> (2) (3) (4) (5) (6) (7) (8) (9) (10)
1. Below 0.02 0 0 0 0 .000 .000 .000 .000
2. 0.02 - 0.50 11 0 0 11 2.844 .000 .000 2.844
3. 0.50 - 1.00 8 0 1 9 5.655 .000 .725 6.380
MARGINAL (1+2+3) 19 0 1 20 8.499 .000 .725 9.224
4. 1.00 - 2.00 11 0 1 12 15.352 .000 1.330 16.682
SMALL (4) 11 0 1 12 15.352 .000 1.330 16.682
5. 2.00 - 3.00 2 0 3 5 4.790 .000 7.330 12.120
6. 3.00 - 4.00 4 0 0 4 13.720 .000 .000 13.720
SEMIMEDIUM (5+6) 6 0 3 9 18.510 .000 7.330 25.840
7. 4.00 - 5.00 0 0 0 0 .000 .000 .000 .000
8. 5.00 - 7.50 2 0 0 2 11.200 .000 .000 11.200
9. 7.50 - 10.00 2 0 0 2 17.795 .000 .000 17.795
MEDIUM (7+8+9) 4 0 0 4 28.995 .000 .000 28.995
10.10.00 - 20.00 0 0 0 0 .000 .000 .000 . 0 0 0
11 .20 and above 0 0 1 1 .000 .000 73.930 73.930
LARGE (10+11) 0 0 1 1 .000 .000 73.930 73.930
12.ALL SIZES 40 0 6 46 71.356 .000 83.315 154.671
145 :

( 4.12 contd.)District; Chengalpattu M.G.Ro
<1) (2) (3) (4) (5) (6) (7) (8) (9) (10)
1, Below 0.02 222210 2314 433 224957 2796 31 5 2832
1. Below 0.02 18311 824 15 19150 222.165 11.585 .200 233.950
2. 0.02 - 0.50 323423 12801 441 336665 703201.035 2413.735 55.510 72789.280
3. 0.50 - 1.00 98013 3898 191 102102 67547.310 2414.780 97.900 70059„990
MARGINAL (1+2+3) 439747 17523 647 457917 138089.510 4840.100 153.610 143083.220
4. 1.00 - 2.00 61615 1677 144 63436 851585.610 2422.830 156.850 87738.290
SMALL (4) 61615 1677 144 63436 85158).610 2422.830 156.850 87738.290
5. 2.00 - 3.00 18382 780 212 19374 44658.780 1855.770 424.950 46939.500
6. 3.00 - 4.00 7465 353 156 7974 25726.160 1195.050 483.310 27404.520
SEMIMEDIUM (5+6) 25847 1133 368 27348 70384 .940 3050.820 908.260 74344.020
7. 4.00 - 5.00 4079 204 75 4358 18137..650 910.890 310.500 19359,020
8. 5.00 - 7.50 4133 200 75 4408 24785-225 1191.440 381.205 26357.870
9. 7.50 - 10.00 1349 87 35 1471 11560-580 729.740 280.000 12570.320
MEDIUM (7+8+9) 9561 491 185 10237 54483-435 2832.070 971.705 58287.210
10.10.00 - 20.00 1079 98 71 1248 14374-295 1315.335 717.020 16406.650
11 .20 and above 201 29 47 277 7484-525 1090.075 951.280 9525.880
LARGE (10+11) 1280 127 118 1525 21858-820 2405,410 1668.300 25932.530
12.ALL SIZES 538050 20951 1462 560463 369975.315 15551.230 3858.725 389385.270
: 146 :
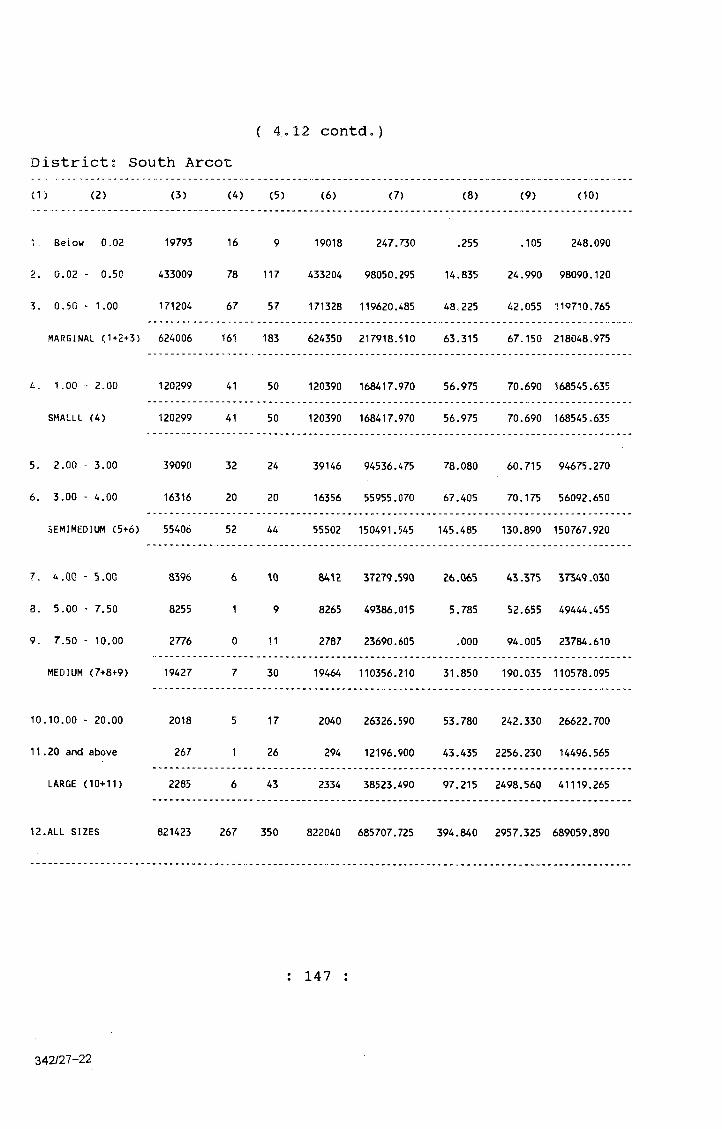
( 4.12 contdDistrict! South Arcot(1> (2) (3) (4) (5) (6) (7) (8) (9) (10)
1 = Below 0-02 19793 16 9 19018 247.730 .255 ,105 248.090
2. 0.02 - 0.50 433009 78 117 433204 98050.295 14.835 24.990 98090.120
3, 0,50 - 1.00 171204 67 57 171328 119620.485 48.225 42.055 119710„765
MARGINAL (1+2+3) 624006 161 183 624350 217918.510 63.315 67.150 218048,975
4 . 1.00 - 2.00 120299 41 50 120390 168417.970 56.975 70.690 168545.635
SMALLl (4) 120299 41 50 120390 168417.970 56.975 70.690 168545,635
5. 2.00 3.00 39090 32 24 39146 94536.475 78.080 60.715 94675.270
6. 3.00 - 4.00 16316 20 20 16356 55955.070 67.405 70.175 56092.650
SEMIMEDIUM (5+6) 55406 52 44 55502 150491.545 145.485 130.890 150767.920
7. 4.QQ - 5.0G 8396 6 8 4 U 37279.590 Z6.065 43.375 37349.030
3. 5.00 - 7.50 8255 1 9 8265 49386.015 5.785 52.655 49444.455
9. 7.50 - 10.00 2776 0 11 2787 23690.605 .000 94.005 23784.610
MEDIUM (7+8+9) 19427 7 30 19464 110356.210 31.850 190.035 110578.095
10 .10.00 - 20.00 2018 5 17 2040 26326.590 53.780 242.330 26622.700
11 .20 and above 267 1 26 294 12196.900 43.435 2256.230 14496.565
LARGE (10+11) 2285 6 43 2334 38523.490 97.215 2498.560 41119.265
12 .ALL SIZES 821423 267 350 822040 685707.725 394.840 2957.325 689059.890
: 147
342/27-22

( 4.12 contd .)District; North Arcot Ambedkar
(1) (2) (3) (4) (5) ((6) (7) (8) (9) (10)
1. Below 0.02 9776 9 14 9 7 9 9 117.935 ,130 .125 118.190
2. 0.02 - 0.50 211668 64 74 2111806 48339.695 17.225 13,915 48370.835
3. 0.50 - 1.00 86535 61 29 86625 60667.060 44.055 19.170 60730.285
MARGINAL (1+2+3) 307979 134 117 30S230 109124.690 61.410 33.210 109219.310
4. 1.00 - 2.00 58218 9 25 58252 81036.895 14.600 36.470 81087.965
SMALL (4) 58218 9 25 5S252 81036.895 14.600 36.470 81087.965
5. 2.00 - 3.00 ‘16629 2 18 16649 40052.165 4.180 44.800 40101.145
6 . 3.00 - 4.00 6331 11 7 6349 21762.065 35.810 25.865 21823.740
SEMI MEDIUM (5+6) 22960 13 25 22998 61814.230 39.990 70.665 61924.885
7 . 4.00 - 5.00 2837 18 6 2861 12602.725 78.820 25.355 12706.900
8. 5.00 - 7.50 2586 10 2 2598 15392.615 55.975 12.000 15460.590
9. 7.50 -10.00 711 3 1 715 6080.465 29.215 9.280 6118.960
MEDIUM (7+8+9) 6134 31 9 6174 34075.805 164.010 46.635 34286.450
10. 10.00 -20.00 478 3 9 490 6074.030 42.385 153.155 6269.570
11 . 20 and above 42 0 10 52 1889.795 .000 509.260 2399.055
LARGE (10+11) 520 3 19 542 7963.825 42.385 662.415 8668.625
12. ALL SIZES 395811 190 195 396196 294015.445 322.395 849.395 275187.235
: 148 :
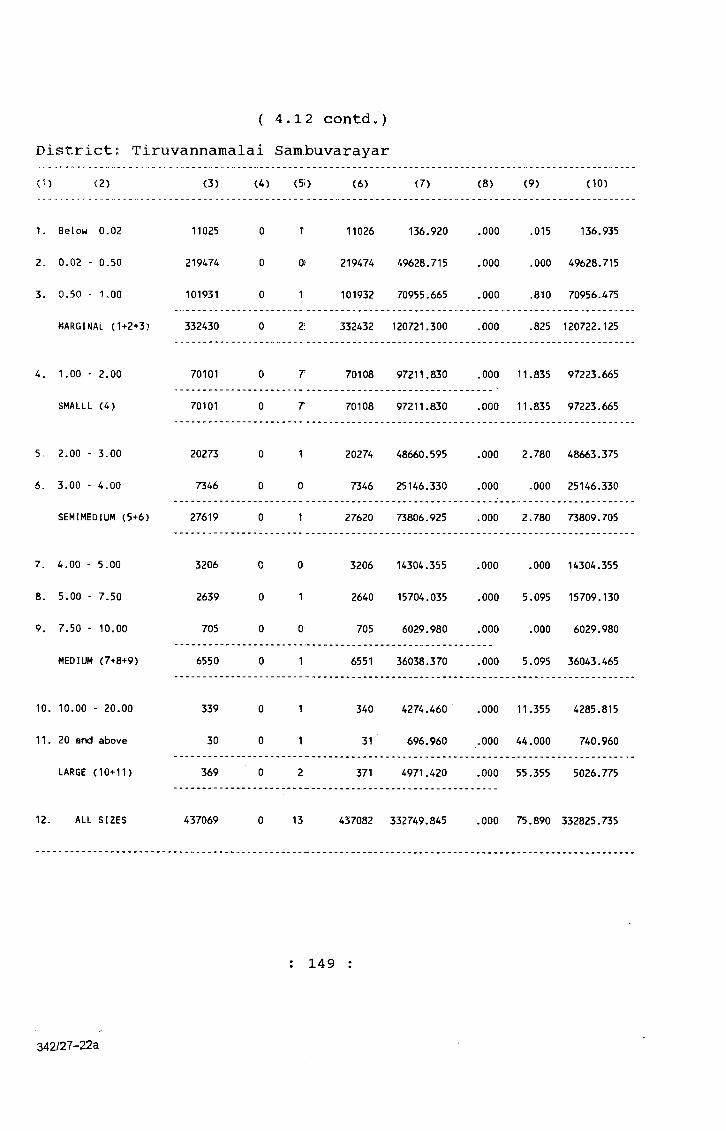
( 4.12 contd.)Districts Tiruvannamalai SambuvarayarO ) <2) <3) (4) (5i) (6) (7) (8) (9) (10)
1. Below 0.02 11025 0 1 11026 136.920 .000 .015 136.935
2. 0.02 - 0.50 219474 0 01 219474 49628.715 .000 .000 49628.715
3. 0.50 - 1.00 101931 0 1 101932 70955.665 .000 .810 70956.475
MARGINAL (1+2+3) 332430 0 2: 332432 120721.300 .000 .825 120722.125
4. 1.00 - 2.00 70101 0 T 70108 97211.830 .000 11.835 97223.665
SMALLL (4) 70101 0 T 70108 97211.830 .000 11.835 97223.665
5,. 2.00 - 3.00 20273 0 1 20274 48660.595 .000 2.780 48663.375
6. 3.00 - 4.00 7346 0 0 7346 25146.330 .000 ,000 25146.330
SEMIMEDIUM (5+6) 27619 0 1 27620 73806.925 .000 2.780 73809.705
7. 4.00 - 5.00 3206 0 0 3206 14304.355 .000 .000 14304.355
8. 5.00 - 7.50 2639 0 1 2640 15704.035 .000 5.095 15709.130
9. 7,50 - 10.00 705 0 0 705 6029.980 .000 .000 6029.980
MEDIUM (7+8+9) 6550 0 1 6551 36038.370 .000 5.095 36043.465
10. 10.00 - 20.00 339 0 1 340 4274.460 .000 11.355 4285.815
11. 20 and above 30 0 1 31 696.960 ,000 44.000 740.960
LARGE (10+11) 369 0 2 371 4971.420 .000 55.355 5026.775
12. ALL SIZES 437069 0 13 437082 332749.845 .000 75.890 332825.735
149
342/27-223
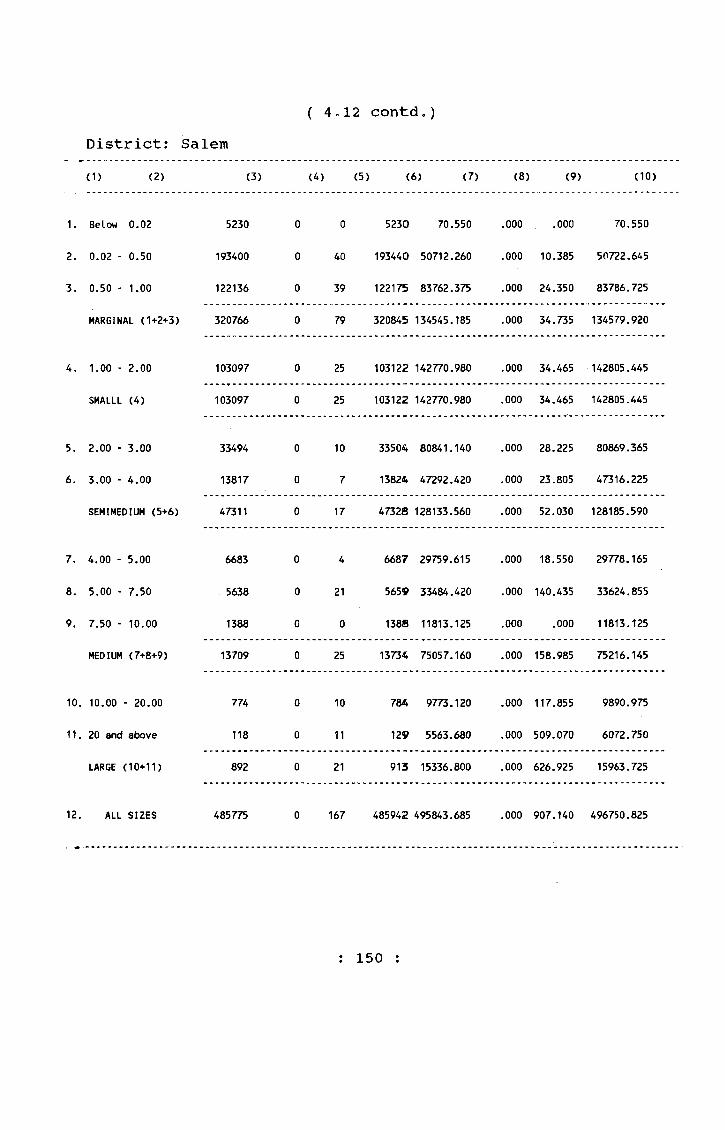
( 4.12 contd.)District: Salem(1) (2) (3) (4) (5) (6) (7) (8) (9) (10)
1. Below 0.02 5230 0 0 5230 70.550 .000 .000 70.550
2. 0.02 - 0.50 193400 0 40 193440 50712.260 .000 10.385 50722.645
3. 0.50 - 1.00 122136 0 39 122175 83762.375 .000 24.350 83786.725
MARGINAL (1+2+3) 320766 0 79 320845 134545.185 .000 34.735 134579.920
4. 1.00 - 2.00 103097 0 25 103122 142770.980 .000 34.465 142805.445
SMALLL (4) 103097 0 25 103122 142770.980 .000 34.465 142805.445
5. 2.00 - 3.00 33494 0 10 33504 80841.140 .000 28.225 80869.365
6. 3.00 - 4.00 13817 0 7 13824 47292.420 .000 23.805 47316.225
SEMIMEDIUM (5+6) 47311 0 17 47328 128133.560 .000 52.030 128185.590
7, 4.00 - 5.00 6683 0 4 6687 29759.615 .000 18.550 29778.165
8. 5.00 - 7.50 5638 0 21 5659 33484.420 .000 140.435 33624.855
9. 7.50 - 10.00 1388 0 0 1388 11813.125 .000 .000 11813.125
MEDIUM (7+8+9) 13709 0 25 13734 75057.160 .000 158.985 75216.145
10. 10.00 - 20.00 774 0 10 784 9773.120 .000 117.855 9890.975
11. 20 and above 118 0 11 129 5563.680 .000 509.070 6072.750
LARGE (10+11) 892 0 21 913 15336.800 .000 626.925 15963.725
12. ALL SIZES 485775 0 167 485942 495843.685 .000 907.140 496750.825
: 150 :

( 4ol2 contdo)Districts Dharmapuri(1) (2) (3) (4) (5) (6) (7) (3) (9) (10)
1. Below 0.02 18915 0 20 18935 233.260 .000 .230 233.490
2 . 0.02 - 0.50 178346 0 0 178346 43969.020 .000 .000 43969.020
3. 0,50 •• 1.00 114095 0 0 114095 80589.200 .000 .000 80589.200
MARGINAL (1+2+3) 311356 0 20 311376 124791.480 .000 .230 124791.710
4. 1.00 - 2.00 89337 0 0 89337 127157.700 .000 .000 127157.000
SMALLL (4) 89337 0 0 89337 127157.700 .000 .000 127157.000
5. 2.00 - 3.00 29282 0 21 29303 71228.870 .000 51.020 71279.890
6. 3.00 - 4.00 12510 0 7 12517 42881.890 .000 23.950 42905.840
SEMIMEDIUM (5+6) 41792 0 28 41820 114110.760 .000 74.970 114185.730
7. 4.00 - 5.00 6096 0 5 6101 27207.950 .000 22.040 27229.990
8. 5.00 - 7.50 5761 0 15 5776 34293.840 .000 88.220 34382.060
9. 7.50 - 10.00 1809 0 7 1816 15449.000 .000 65.110 15514.110
MEDIUM (7+8+9) 13666 0 27 13693 76950.790 .000 175.370 77126.160
10. 10.00 - 20.00 1056 0 8 1064 13731.880 .000 109.410 13841.290
11. 20 and above 120 0 8 128 3384.450 .000 415.150 3799.600
LARGE (10+11) 1176 0 16 1192 17116.330 .000 524.560 17640.890
12. ALL SIZES 457327 0 91 457418 460127.060 .000 775.130 460902.190
: 151 :
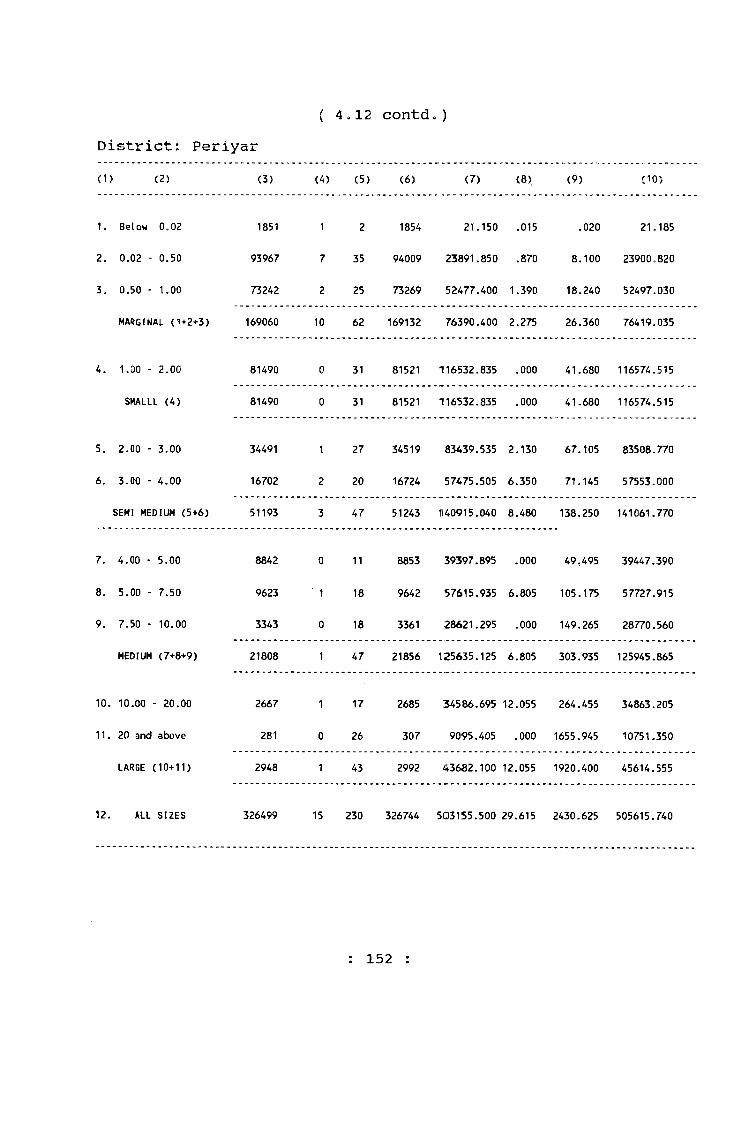
( 4 c12 contd.)District; Periyar(1) (2) (3) (4) (5) (6) (7) (8) (9) (10)
1. Below 0.02 1851 1 2 1854 21.150 .015 .020 21.185
2. 0.02 - 0.50 93967 7 35 94009 23891.850 .870 8.100 23900.820
3 = 0.50 - 1.00 73242 2 25 73269 52477.400 1.390 18.240 52497.030
MARGINAL (1+2+3) 169060 10 62 169132 76390.400 2.275 26.360 76419.035
4. 1.00 - 2.00 81490 0 31 81521 116532.835 .000 41.680 116574.515
SHALLL (4) 81490 0 31 81521 116532.835 .000 41.680 116574.515
5. 2.00 - 3.00 34491 1 27 34519 83A39.535 2.130 67.105 83508.770
6. 3.00 - 4.00 16702 2 20 16724 57475.505 6.350 71.145 57553.000
SEMI MEDIUM (5+6) 51193 3 47 51243 1140915.040 8.480 138.250 141061.770
7. 4.00 - 5.00 8842 0 11 8853 39397.895 .000 49.495 39447.390
8. 5.00 - 7.50 9623 1 18 9642 57615.935 6.805 105.175 57727.915
9. 7.50 - 10.00 3343 0 18 3361 28621.295 .000 149.265 28770.560
MEDIUM (7+8+9) 21808 1 47 21856 125635.125 6.805 303.935 125945.865
10. 10.00 - 20.00 2667 1 17 2685 34586.695 12.055 264.455 34863.205
11 . 20 and above 281 0 26 307 9095.405 .000 1655.945 10751.350
LARGE (10+11) 2948 1 43 2992 43682.100 12.055 1920.400 45614.555
12 ALL SIZES 326499 15 230 326744 503155.500 29.615 2430.625 505615.740
: 152 :
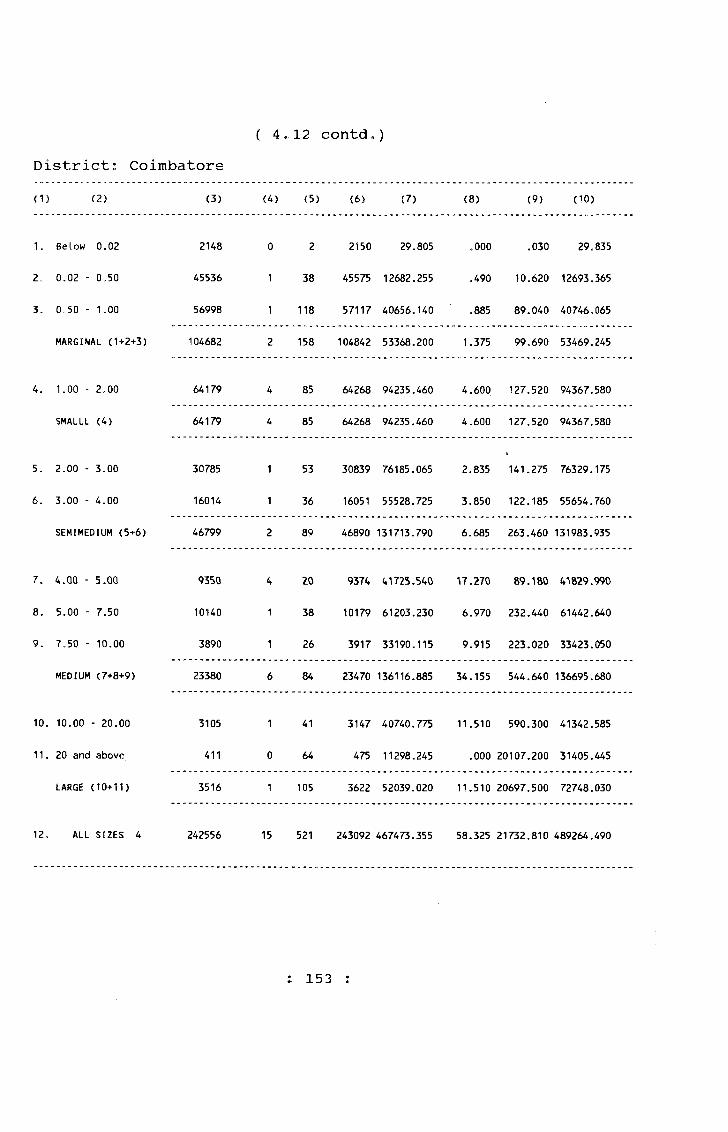
4.12 contdo)District: Coimbatore(1) (2) (3) (4) (5) (6) (7) (8) (9) (10)
1. Below 0.02 2148 0 2 2150 29.805 ,000 .030 29.835
2 = 0.02 - 0.50 45536 1 38 45575 12682.255 .490 10.620 12693.365
3. 0.50 - 1.00 56998 1 118 57117 40656.140 .885 89.040 40746.065
MARGINAL (1+2+3) 104682 2 158 104842 53368.200 1.375 99.690 53469.245
4. 1.00 - 2.00 64179 4 85 64268 94235.460 4.600 127.520 94367.580
SMALLL (4) 64179 4 85 64268 94235.460 4.600 127.520 94367.580
5. 2.00 - 3.00 30785 1 53 30839 76185.065 2.835 141.275 76329.175
6. 3.00 - 4.00 16014 1 36 16051 55528.725 3.850 122.185 55654.760
SEMIMEDIUM (5+6) 46799 2 89 46890 131713.790 6.685 263.460 131983.935
7. 4.00 - 5.00 9350 4 ZO 9374 ^*^25.540 17.270 89.180 41829.990
8. 5.00 - 7.50 10140 1 38 10179 61203.230 6.970 232.440 61442.640
9. 7,50 - 10.00 3890 1 26 3917 33190.115 9.915 223.020 33423.050
MEDIUM (7+8+9) 23380 6 84 23470 136116.885 34.155 544.640 136695.680
10. 10.00 - 20.00 3105 1 41 3147 40740.775 11.510 590.300 41342.585
11. 20 and above 411 0 64 475 11298.245 .000 20107.200 31405.445
LARGE (10+11) 3516 1 105 3622 52039.020 11.510 20697.500 72748.030
12. ALL SIZES 4 242556 15 521 243092 467473.355 58.325 21732.810 489264.490
153 :
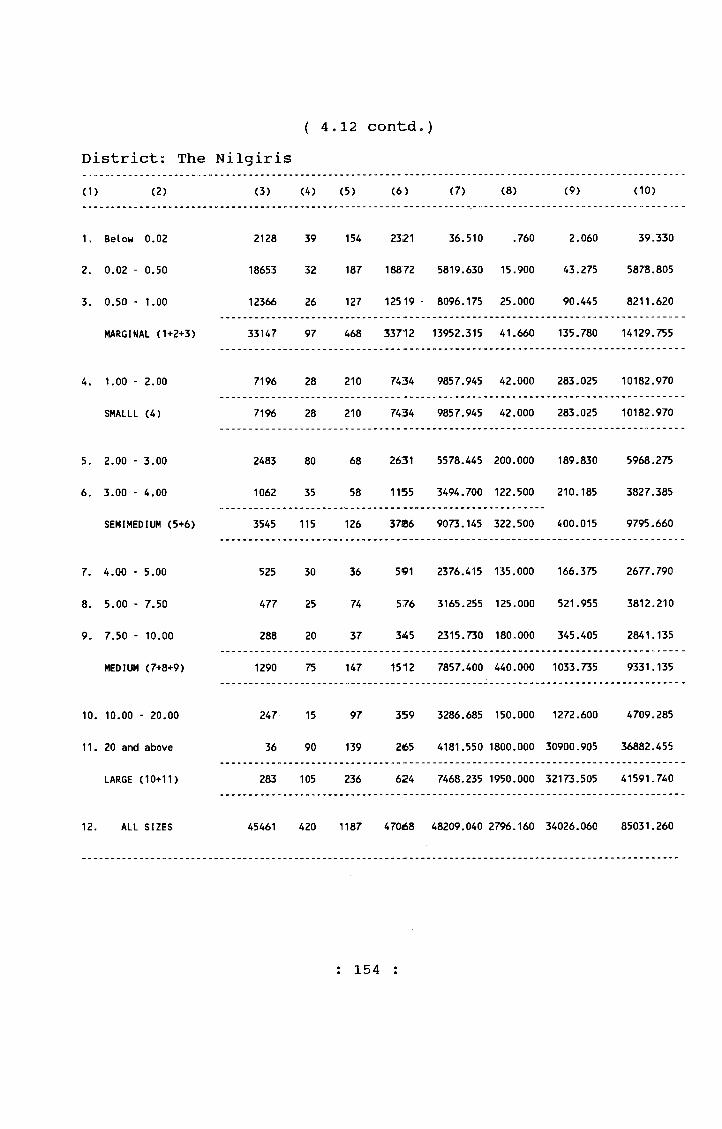
( 4,12 contd.)District; The Nilgiris(1) (2) (3) (4) (5) (6) (7) (8) (9) (10)
1. Below 0.02 2128 39 154 2321 36.510 .760 2.060 39.330
2. 0.02 - 0.50 18653 32 187 18872 5819.630 15.900 43:275 5878.805
3. 0.50 - 1.00 12366 26 127 12519 ■ 8096.175 25.000 90.445 8211.620
MARGINAL (1+2+3) 33147 97 468 33712 13952.315 41.660 135.780 14129.755
4. 1.00 - 2.00 7196 28 210 7434 9857.945 42.000 283.025 10182.970
SMALLL (4) 7196 28 210 7434 9857.945 42.000 283.025 10182.970
5. 2.00 - 3.00 2483 80 68 2631 5578.445 200.000 189.830 5968.275
6. 3.00 - 4,00 1062 35 58 1155 3494.700 122.500 210.185 3827.385
SEMIMEDIUM (5+6) 3545 115 126 37S6 9073.145 322.500 400.015 9795.660
7. 4.00 - 5.00 525 30 36 591 2376.415 135.000 166.375 2677.790
8. 5.00 - 7.50 477 25 74 576 3165.255 125.000 521.955 3812.210
9. 7.50 - 10.00 288 20 37 345 2315.730 180.000 345.405 2841.135
MEDIUM (7+8+9) 1290 75 147 1512 7857.400 440.000 1033.735 9331.135
10. 10.00 - 20.00 247 15 97 359 3286.685 150.000 1272.600 4709.285
11. 20 and above 36 90 139 265 4181.550 1800.000 30900.905 36882.455
LARGE (10+11) 283 105 236 624 7468.235 1950.000 32173.505 41591.740
12. ALL SIZES 45461 420 1187 47068 48209.040 2796.160 34026.060 85031.260
: 154 :
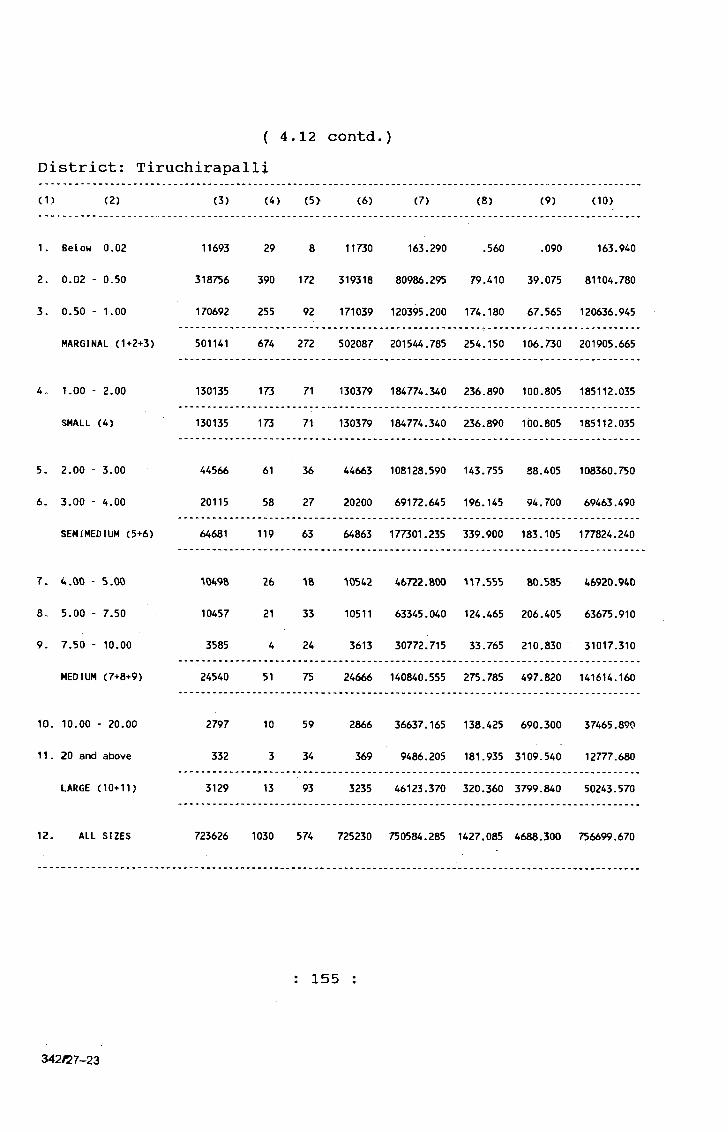
( 4.12 contd.)District: Tiruchirapalli(1) (2) (3) (4) (5> (6) (7) (8) (9) (10)
1 . Below 0.02 11693 29 8 11730 163.290 .560 ,090 163.940
2. 0.02 - 0.50 318756 390 172 319318 80986.295 79.410 39.075 81104.780
3. 0.50 - 1.00 170692 255 92 171039 120395.200 174.180 67.565 120636.945
MARGINAL (1+2+3) 501141 674 272 502087 201544.785 254.150 106.730 201905.665
4. 1.00 - 2.00 130135 173 71 130379 184774.340 236.890 100.805 185112.035
SMALL (4) 130135 173 71 130379 184774.340 236.890 100.805 185112.035
5. 2.00 - 3.00 44566 61 36 44663 108128.590 143.755 38.405 108360.750
6. 3.00 - 4.00 20115 58 27 20200 69172.645 196.145 94.700 69463.490
SEMIMEDIUM (5+6) 64681 119 63 64863 177301.235 339.900 183.105 177824.240
7. 4.00 - 5.00 10498 26 18 10542 46722.800 117.555 80.585 46920.940
8„ 5.00 - 7.50 10457 21 33 10511 63345.040 124.465 206.405 63675.910
9. 7.50 - 10.00 3585 4 24 3613 30772.715 33.765 210.830 31017.310
MEDIUM (7+8+9) 24540 51 75 24666 140840.555 275.785 497.820 141614.160
10, 10.00 - 20.00 2797 10 59 2866 36637.165 138.425 690.300 37465.890
11. 20 and above 332 3 34 369 9486.205 181.935 3109.540 12777.680
LARGE (10+11) 3129 13 93 3235 46123.370 320.360 3799.840 50243.570
12. ALL SIZES 723626 1030 574 725230 750584.285 1427.085 4688.300 756699.670
: 155
342/27-23
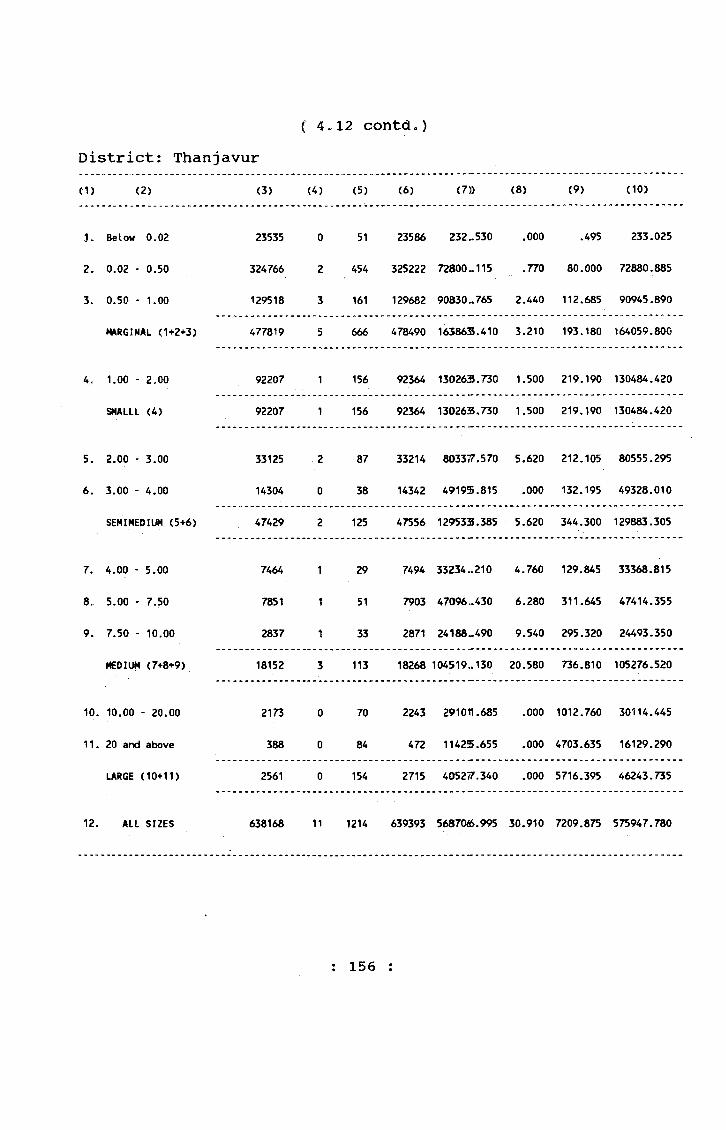
( 4«12 contd.)District; ThanjavurC D (2) (3) (4) (5) (6) (7)) (8) (9) (10)
3. Below 0.02 23535 0 51 23586 232 ..530 .000 .495 233.025
2. 0.02 - 0.50 324766 2 454 325222 72800.. 115 ,770 80.000 72880.885
3. 0.50 ' 1.00 129518 3 161 129682 90830 ..765 2.440 112.685 90945.890
MARGINAL (1+2+3) 477819 5 666 478490 165863.410 3.210 193.180 164059.800
4. 1.00 - 2.00 92207 1 156 92364 130263.730 1.500 219.190 130484.420
SMALLL (4) 92207 1 156 92364 130263.730 1.500 219,190 130484.420
5. 2.00 - 3.00 33125 2 87 33214 8033^.570 5.620 212.105 80555.295
6. 3.00 - 4.00 14304 0 38 14342 49195.815 .000 132.195 49328.010
SEMIMEDIUM (5+6) 47429 2 125 47556 129533.385 5.620 344.300 129883.305
7. 4.00 - 5.00 7464 1 29 7494 33234 ..210 4.760 129.845 33368.815
8„ 5.00 - 7.50 7851 51 7903 47096 ..430 6.280 311.645 47414.355
9. 7.50 - 10.00 2837 1 33 2871 24188 ..490 9.540 295.320 24493.350
MEDIUM (7+8+9) 18152 3 113 18268 104519.. 130 20.580 736.810 105276.520
10. 10.00 - 20.00 2173 0 70 2243 291011.685 .000 1012.760 30114.445
11. 20 and above 388 0 84 472 11425.655 .000 4703.635 16129.290
LARGE (10+11) 2561 0 154 2715 405277.340 .000 5716.395 46243.735
12. ALL SIZES 638168 11 1214 639393 568706S.995 30.910 7209.875 575947.780
: 156 :
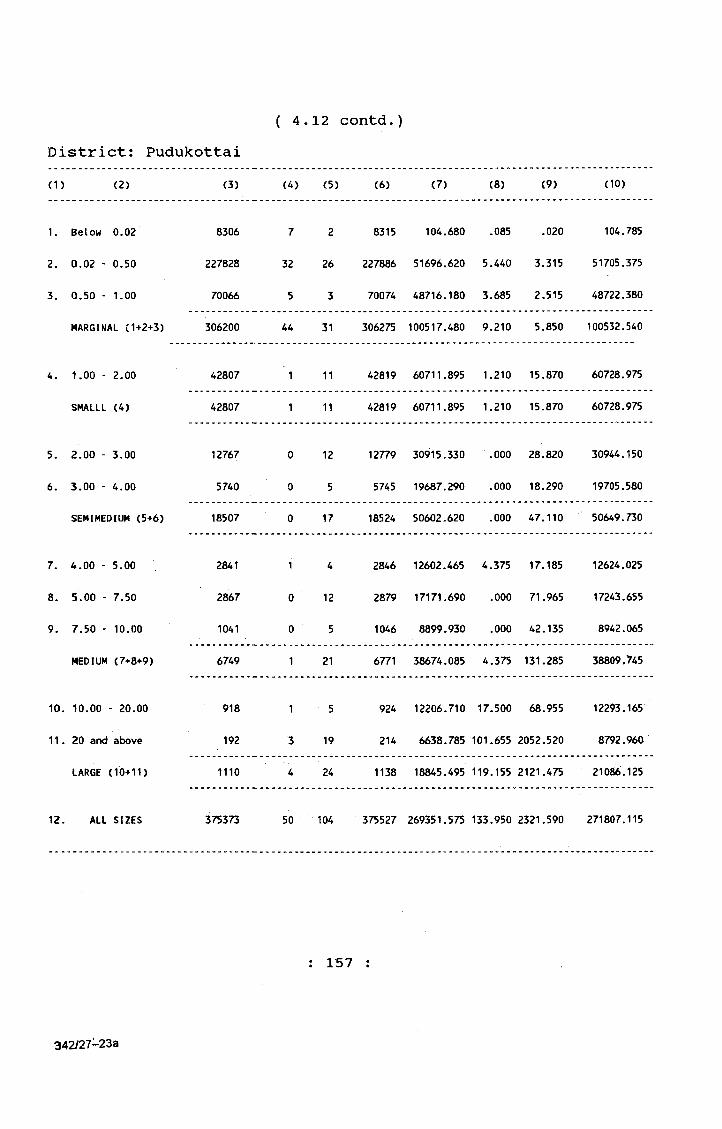
( 4.12 contd.)District: Pudukottai(1) (2) (3) (A) <5) (6) (7) (8) (9) (10)
1. Below 0.02 8306 7 2 8315 104.680 .085 .020 104.785
2. 0.02 - 0.50 227828 32 26 227886 51696.620 5.440 3.315 51705.375
3. 0.50 - 1.00 70066 5 3 70074 48716.180 3.685 2.515 48722.380
MARGINAL (1+2+3) 306200 44 31 306275 100517.480 9.210 5.850 100532.540
4. 1.00 - 2.00 42807 1 11 42819 60711.895 1.210 15.870 60728.975
SMALLL (4) 42807 1 11 42819 60711.895 1.210 15.870 60728.975
5. 2.00 - 3.00 12767 0 12 12779 30915.330 .000 28.820 30944„150
6. 3.00 - 4.00 5740 0 5 5745 19687.290 .000 18.290 19705.580
SEMIMEDIUM (5+6) 18507 0 17 18524 50602.620 .000 47.110 50649.730
7. 4.00 - 5.00 2841 1 4 2846 12602.465 4.375 17.185 12624.025
8. 5.00 - 7.50 2867 0 12 2879 17171.690 .000 71.965 17243.655
9. 7.50 - 10.00 1041 0 5 1046 8899.930 .000 42.135 8942.065
MEDIUM (7+8+9) 6749 1 21 6771 38674.085 4.375 131.285 38809.745
10. 10.00 - 20.00 918 1 5 924 12206.710 17.500 68.955 12293,165
11. 20 and above 192 3 19 214 6638.785 101.655 2052.520 8792.960
LARGE (10+11) ti io 4 24 1138 18845.495 119.155 2121.475 21086.125
12. ALL SIZES 375373 50 104 375527 269351.575 133.950 2321.590 271807.115
: 157
342/27-23a
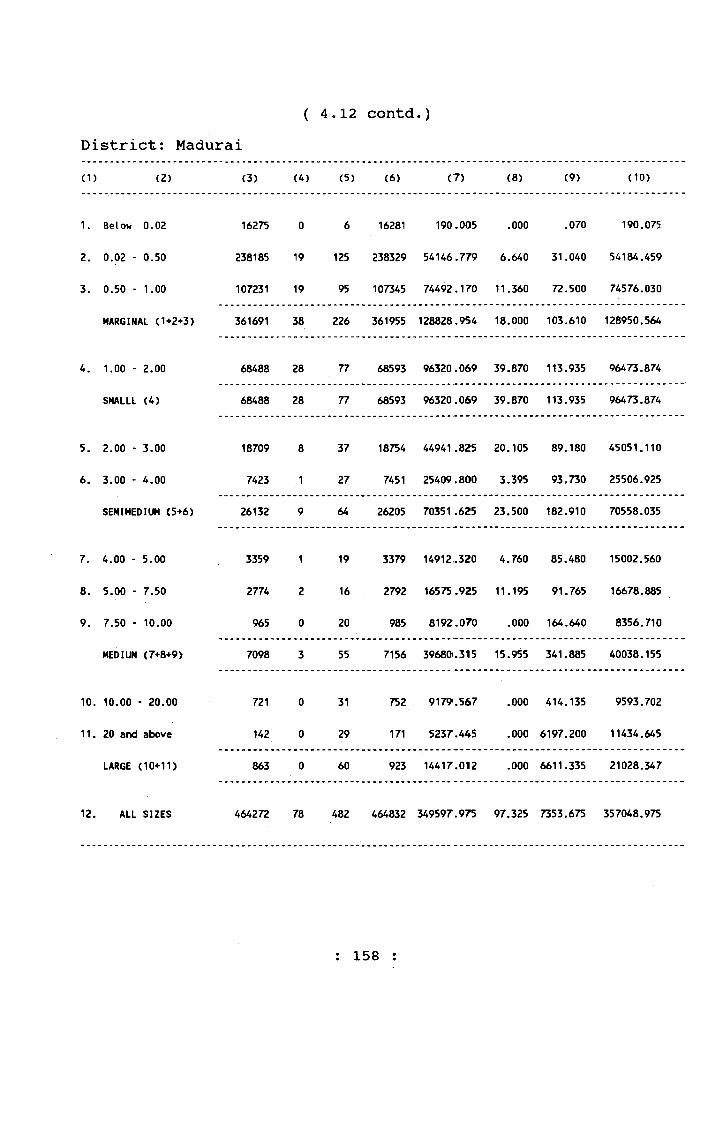
(4.12 contd.)District: Madurai(1) (2) (3) (4) (5) (6) (7) (8) (9) (10)
1. Below 0.02 16275 0 6 16281 190.005 .000 .070 190.075
2. 0.02 - 0.50 238185 19 125 238329 54146.779 6.640 31.040 54184.459
3. 0.50 - 1.00 107231 19 95 107345 74492.170 11.360 72.500 74576.030
MARGINAL (1+2+3) 361691 38 226 361955 128828.954 18.000 103.610 128950.564
4. 1.00 - 2.00 68488 28 77 68593 96320.069 39.870 113.935 96473.874
SMALLL (4) 68488 28 77 68593 96320.069 39.870 113.935 96473.874
5. 2.00 - 3.00 18709 8 37 18754 44941 .825 20.105 89.180 45051.110
6. 3.00 - 4.00 7423 1 27 7451 25409.800 3.395 93.730 25506.925
SEMIMEDIUM (5+6) 26132 9 64 26205 70351 .625 23.500 182.910 70558.035
7, 4.00 - 5.00 3359 1 19 3379 14912.320 4.760 85.480 15002.560
8. 5.00 - 7.50 2774 2 16 2792 16575.925 11.195 91.765 16678.885
9. 7.50 - 10.00 965 0 20 985 8192.070 .000 164.640 8356.710
MEDIUM (7+8+9) 7098 3 55 7156 396801.315 15.955 341.885 40038.155
10. 10.00 - 20.00 721 0 31 752 9179.567 .000 414.135 9593.702
11. 20 and above 142 0 29 171 5237.445 .000 6197.200 11434.645
LARGE (10+11) 863 0 60 923 14417.012 .000 6611.335 21028.347
12. ALL SIZES 464272 78 482 464832 349597.975 97.325 7353.675 357048,975
: 158 :
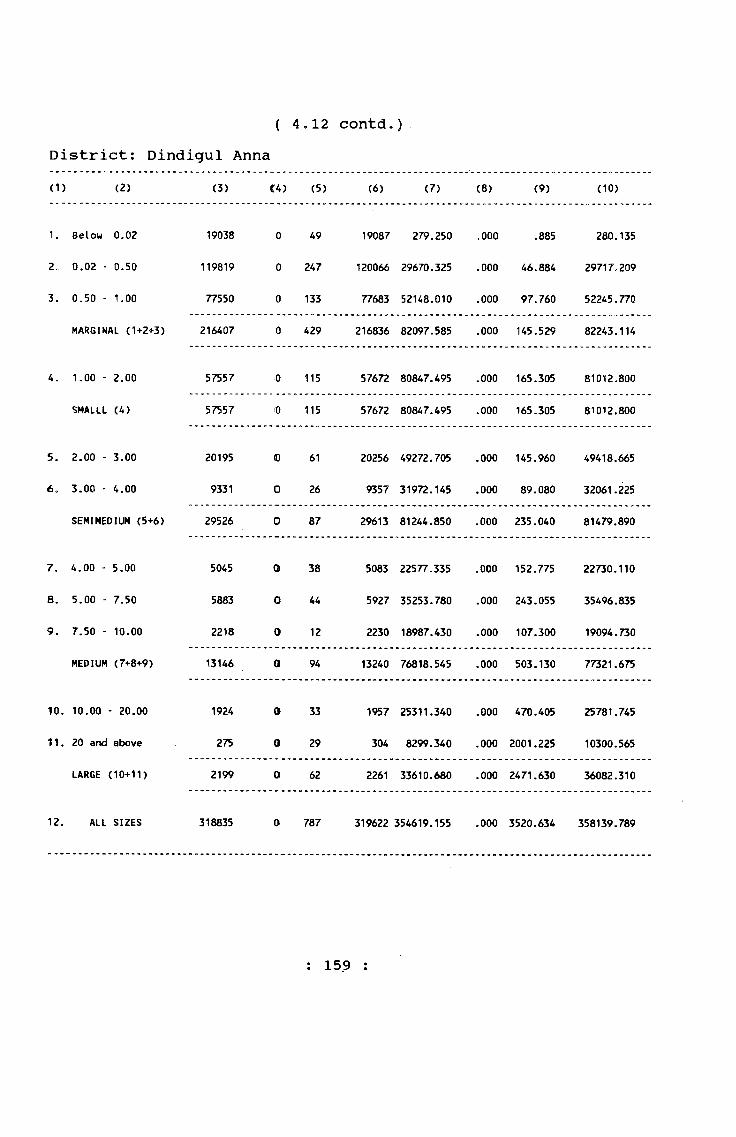
( 4.12 contd.)District: Dindigul Anna(1) (2) (3) C4) (5) (6) (7) (8) (9) (10)
1. Below 0-02 19038 0 49 19087 279.250 .000 .885 280.135
2. 0.02 - 0.50 119819 0 247 120066 29670.325 .000 46.884 29717„209
3. 0.50 - 1.00 77550 0 133 77683 52148.010 .000 97.760 52245,770
MARGINAL (1+2+3) 216407 0 429 216836 82097.585 .000 145.529 82243.114
4. 1.00 - 2.00 57557 0 115 57672 80847.495 .000 165.305 81012.800
SMALLL (4) 57557 iO 115 57672 80847.495 .000 165.305 81012.800
5. 2.00 - 3.00 20195 ID 61 20256 49272.705 .000 145.960 49418.665
6, 3.00 - 4.00 9331 0 26 9357 31972.145 .000 89.080 32061.225
SEMIMEDIUM (5+6) 29526 0 87 29613 81244.850 .000 235.040 81479.890
7. 4.00 - 5,00 5045 0 38 5083 22577.335 .000 152.775 22730.110
8. 5.00 - 7.50 5883 0 44 5927 35253.780 .000 243.055 35496.835
9. 7.50 * 10.00 2218 0 12 2230 18987.430 .000 107.300 19094.730
MEDIUM (7+8+9) 13146 0 94 13240 76818.545 .000 503.130 77321.675
10. 10.00 - 20.00 1924 0 33 1957 25311.340 .000 470.405 25781.745
11. 20 and above 275 0 29 304 8299.340 .000 2001.225 10300.565
LARGE (10+11) 2199 0 62 2261 33610.680 .000 2471.630 36082.310
12. ALL SIZES 318835 0i 787 319622 354619.155 .000 3520.634 358139.789
; 159 :
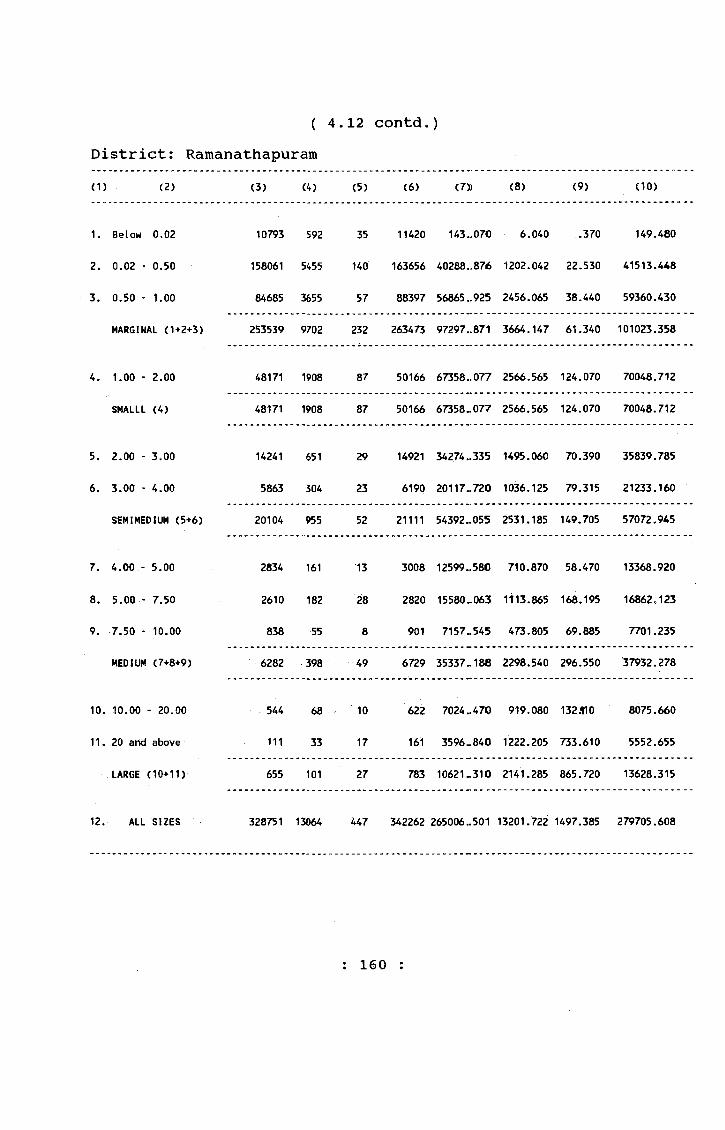
(4.12 contd.)District; Ramanathapuram(1) (2) (3) (4) (5) (6) (7)) (8) (9) (10)
1. Below 0.02 10793 592 35 11420 143 ..070 6.040 .370 149.480
2. 0.02 - 0.50 158061 5455 140 163656 40288 ..876 1202.042 22.530 41513.448
3. 0.50 - 1.00 84685 3655 57 88397 56865 ..925 2456.065 38.440 59360.430
MARGINAL <1+2+S) 253539 9702 232 263473 97297..871 3664.147 61,340 101023.358
4, 1.00 - 2.00 48171 1908 87 50166 67358 ..077 2566.565 124.070 70048.712
SMALLL (4) 48171 1908 87 50166 67358 ..077 2566.565 124.070 70048.712
5. 2.00 - 3.00 14241 651 29 14921 34274 ..335 1495.060 70.390 35839.785
6. 3.00 - 4.00 5863 304 23 6190 20117.. 720 1036.125 79.315 21233.160
SEMIMEDIUM (5+6) 20104 955 52 21111 54392 ..055 2531.185 149.705 57072.945
7. 4.00 - 5.00 2834 161 13 3008 12599 ..580 710.870 58.470 13368.920
8. 5.00 - 7.50 2610 182 28 2820 15580^063 1113.865 168.195 16862.123
9. 7.50 - 10.00 838 55 8 901 7157.. 545 473.805 69.885 7701.235
MEDIUM (7+8+9) 6282 398 49 6729 35337.. 18a 2298.540 296.550 37932.278
10. 10.00 - 20.00 544 68 10 622 7024 ..470 919.080 132.110 8075.660
11. 20 arid above 111 33 17 161 3596 ..840 1222.205 733.610 5552.655
LARGE (10+11) 655 101 27 783 10621 ..310 2141.285 865.720 13628.315
12. ALL SIZES 328751 13064 447 342262 265006..501 13201.722 1497.385 279705.608
: 160 :
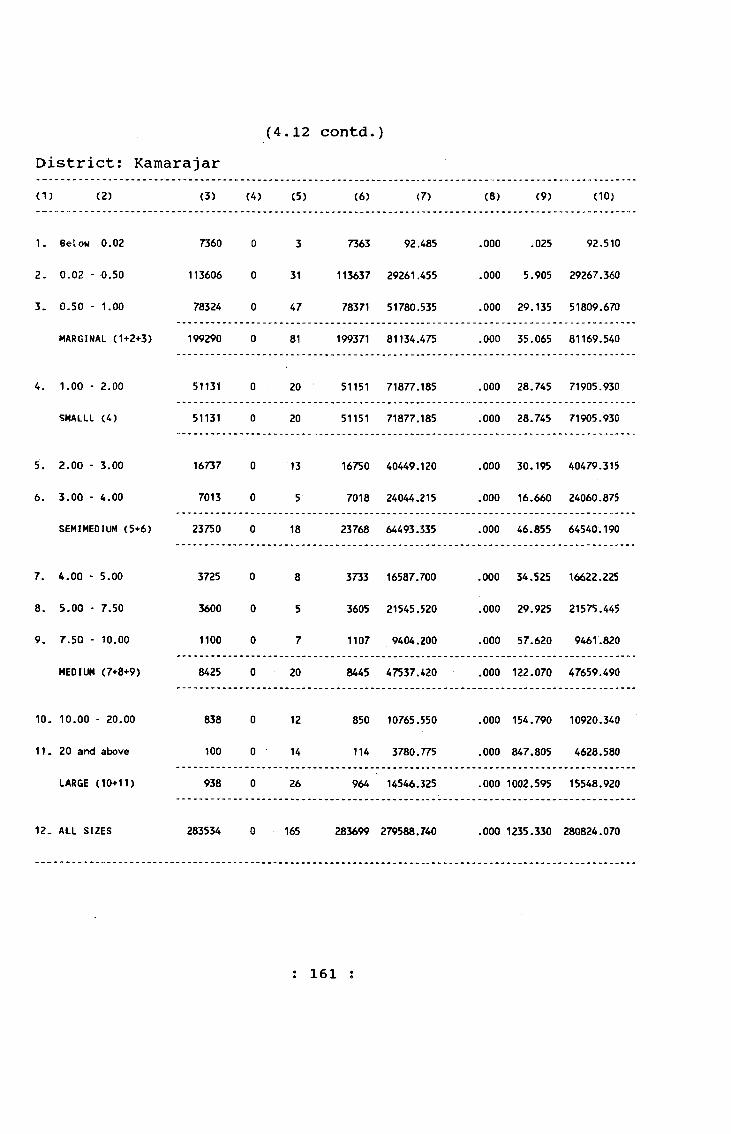
(4.12 contd.)District: Kamarajar(1) (2) (3) (4) (5) (6) (7) (8) (9) (10)
1. Below 0.02 7360 0 3 7363 92.485 .000 -025 92,510
2.. 0.02 - 0.50 113606 0 31 113637 29261.455 .000 5.905 29267.360
3. 0.50 - 1.00 78324 0 47 78371 51780.535 .000 29.135 51809.670
MARGINAL (1+2+3) 199290 0 81 199371 81134.475 .000 35.065 81169.540
4. 1.00 - 2.00 51131 0 20 51151 71877.185 .000 28.745 71905.930
SMALLL (4) 51131 0 20 51151 71877.185 .000 28.745 71905.930
5. 2.00 - 3.00 16737 0 13 16750 40449.120 .000 30.195 40479.315
6. 3.00 - 4.00 7013 0 5 7018 24044.215 .000 16.660 24060.875
SEMIMEDIUM (5+6) 23750 0 18 23768 64493.335 .000 46.855 64540.190
7. 4.00 - 5.00 3725 0 8 3733 16587.700 .000 34.525 16622.225
8. 5.00 - 7.50 3600 0 5 3605 21545.520 .000 29.925 21575.445
9. 7.50 - 10.00 1100 0 7 1107 9404.200 .000 57.620 9461.820
MEDIUM (7+8+9) 8425 0 20 8445 47537.420 .000 122.070 47659.490
10, 10.00 - 20.00 838 0 12 850 10765.550 .000 154.790 10920.340
11. 20 and above 100 0 14 114 3780,775 .000 847.805 4628.580
LARGE (10+11) 938 0 26 964 14546.325 .000 1002.595 15548.920
12. ALL SIZES 283534 0 165 283699 279588.740 .000 1235.330 280824.070
: 161
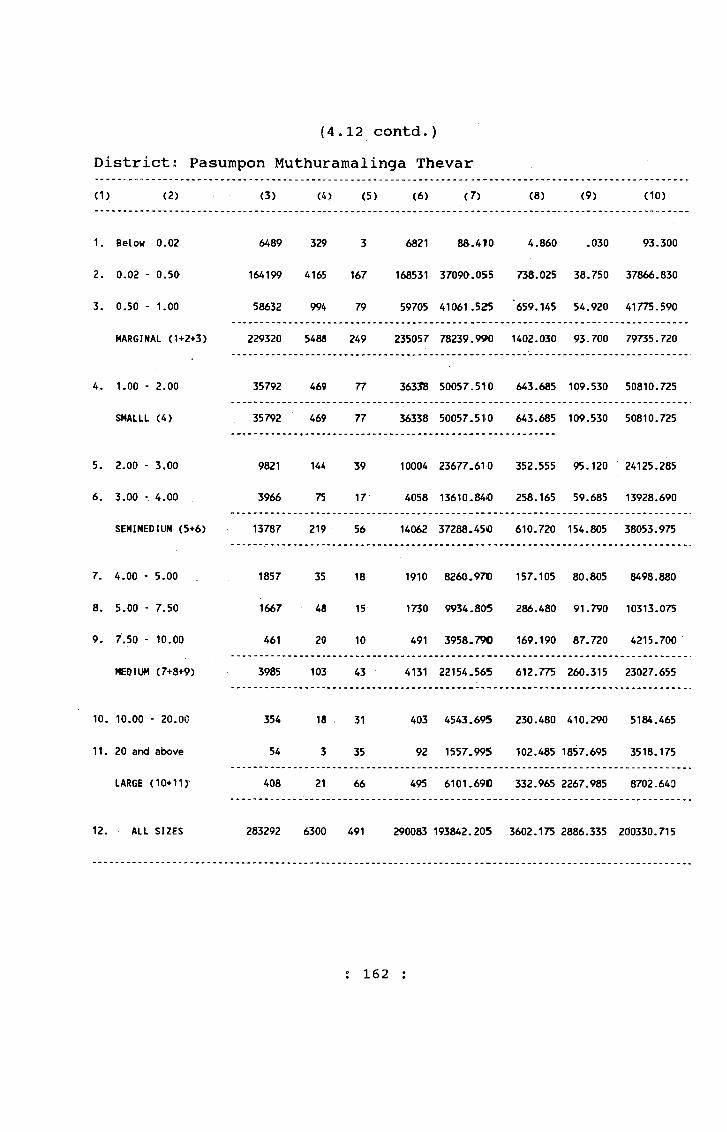
(4.12 contd.)District; Pasumpon Muthuramalinga Thevar(1) (2) (3) (4) (5) (6) (7) (8) (9) (10)
1. Below 0.02 6489 329 3 6821 88.410 4.860 .030 93.300
2. 0.02 - 0.50 164199 4165 167 168531 37090.055 738.025 38.750 37866.830
3. 0.50 - 1.00 58632 994 79 59705 41061.525 659.145 54.920 41775.590
MARGINAL (1+2+3) 229320 5488 249 235057 78239.990 1402.030 93.700 79735.720
4. 1.00 - 2.00 35792 469 77 36338 50057.510 643.685 109.530 50810.725
SMALLL (4) 35792 469 77 36338 50057.510 643.685 109.530 50810.725
5. 2.00 - 3,00 9821 144 39 10004 23677.610 352.555 95.120 24125.285
6. 3.00 ' 4.00 3966 75 17 4058 13610.84® 258.165 59.685 13928.690
SEMIMEDIUM (5+6) 13787 219 56 14062 37288.45(0 610.720 154.805 38053.975
7. 4.00 - 5.00 1857 35 18 1910 8260.97B 157.105 80.805 8498.880
8. 5.00 - 7.50 1667 48 15 1730 9934-805 286.480 91.790 10313.075
9, 7.50 - 10.00 461 20 10 491 3958.790 169.190 87.720 4215.700
MEOIUM (7+8+9) 3985 103 43 4131 22154.565 612.775 260.315 23027.655
10. 10.00 - 20.00 354 18 31 403 4543.695 230.480 410.290 5184.465
11. 20 and above 54 3 35 92 1557.995 102.485 1857.695 3518.175
LARGE (10+11)' 408 21 66 495 6101.690 332.965 2267.985 8702.640
12. ALL SIZES 283292 6300 491 290083 193842.205 3602.175 2886.335 200330.715
: 162 :
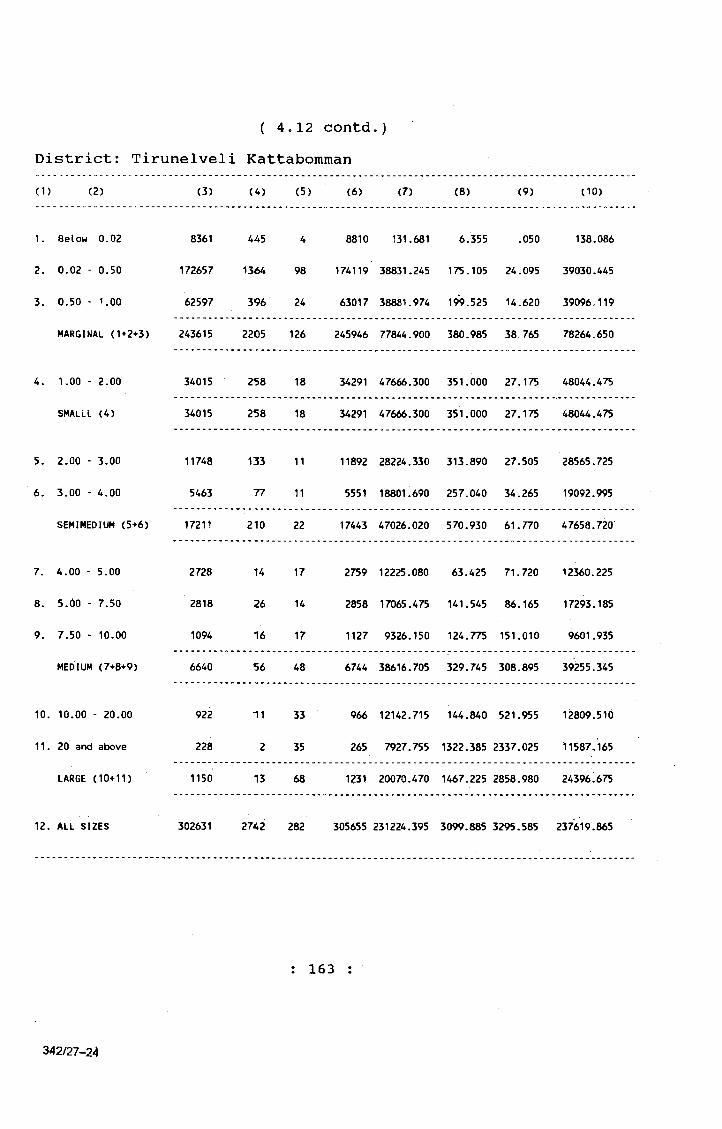
( 4.12 contd.)District: Tirunelveli Kattabomman<1> <2) (3) (4) (5) (6) (7) (8) (9) (10)
1. 8elow 0.02 8361 445 4 8810 131.681 6.355 .050 138.086
2. 0.02 - 0.50 172657 1 3 M 98 174119 38831.245 175.105 24.095 39030.445
3„ 0.50 - 1.00 62597 396 24 63017 38881.974 199.525 14.620 39096.119
MARGINAL (1+2+3) 243615 2205 126 245946 77844.900 380.985 38,765 78264.650
4. 1.00 - 2.00 34015 258 18 34291 47666.300 351.000 27.175 48044.475
SMAlLL (4) 34015 258 18 34291 47666.300 351.000 27.175 48044.475
5. 2.00 - 3.00 11748 133 11 11892 28224.330 313.890 27.505 28565.725
6. 3.00 - 4.00 5463 77 11 5551 18801.690 257.040 34.265 19092.995
SEMIMEDIUM (5+6) 17211 210 22 17443 47026.020 570.930 61.770 47658.720
7, 4.00 - 5.00 2728 14 17 2759 12225.080 63.425 71.720 12360-225
8. 5.00 - 7.50 2818 26 14 2858 17065.475 141.545 86.165 17293.185
9. 7.50 - 10.00 1094 16 17 1127 9326.150 124.775 151.010 9601.935
MEDIUM (7+8+9) 6640 56 48 6744 38616.705 329.745 308.895 39255.345
10. 10.00 - 20.00 922 11 33 966 12142.715 144.840 521.955 12809.510
11. 20 and above 228 2 35 265 7927.755 1322.385 2337.025 11587.165
LARGE (10+11) 1150 13 68 1231 20070.470 1467.225 2858.980 24396.675
12. ALL SIZES 302631 2742 282 305655 231224.395 3099.885 3295.585 237619.865
: 163
342/27-24
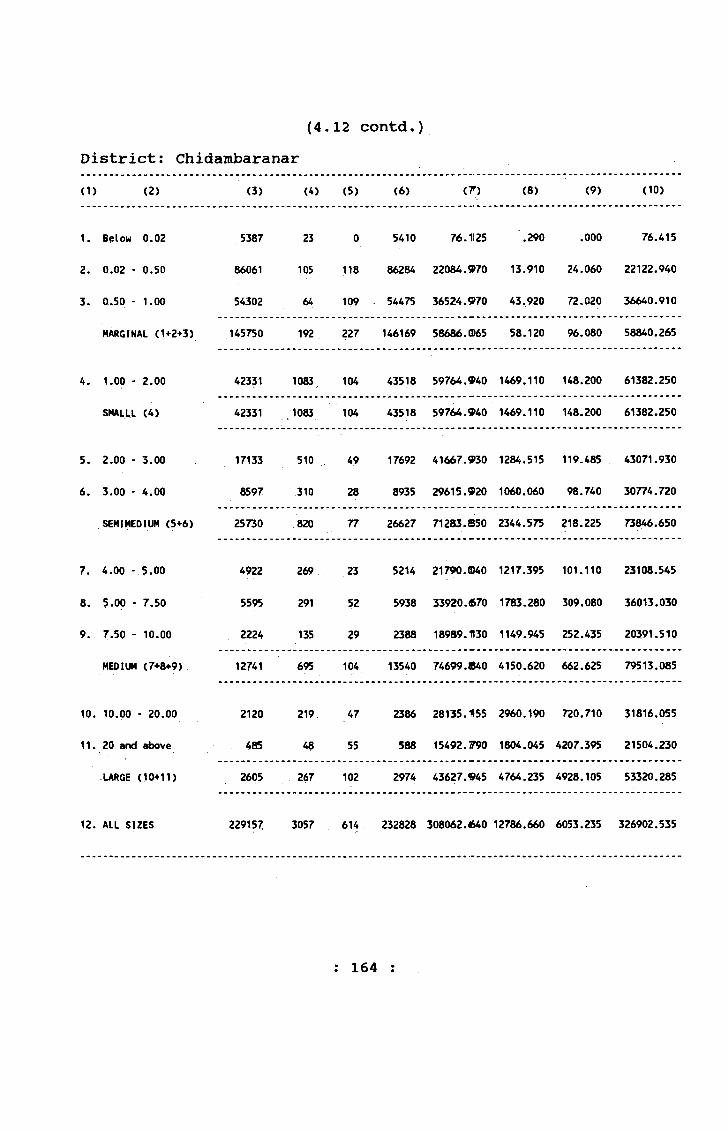
(4.12 contd.)District; Chidambaranar(1) (2) (3) (4) (5) (6) (7 ) (8) (9) (10)
1. Below 0.02 5387 23 0 5410 76.1125 .290 .000 76.415
2. 0.02 - 0.50 86061 105 n s 86284 22084.970 13.910 24.060 22122.940
3. 0.50 - 1.00 54302 64 109 54475 3652-4.970 43.920 72.020 36640.910
MARGINAL (1+2+3) 145750 192 227 146169 58686.(065 58.120 96.080 58840.265
4. 1.00 - 2.00 42331 1083 104 43518 59764.940 1469.110 148.200 61382.250
SMAUL (4) 42331 1083 104 43518 59764.940 1469.110 148.200 61382.250
5. 2.00 - 3.00 17133 510 . 49 17692 41667.930 1284.515 119.485 43071.930
6. 3.00 - 4.00 8597 310 28 8935 29615.920 1060.060 98.740 30774.720
SEMIMEDIUM (5+6) 25730 820 77 26627 71283.8550 2344.575 218.225 73846.650
7. 4.00 - 5.00 4922 269 23 5214 21790.(D40 1217.395 101.110 23108.545
8. 5.00 - 7.50 5595 291 52 5938 33920.670 1783.280 309.080 36013.030
9. 7.50 - 10.00 2224 135 29 2388 18989.1130 1149.945 252.435 20391.510
MEDIUM (7+8+9) 12741 695 104 13540 74699. S40 4150.620 662.625 79513.085
10. 10.00 - 20.00 2120 219 47 2386 28135.1155 2960.190 720.710 31816.055
11. 20 and above 485 48 55 588 15492./790 1804.045 4207.395 21504.230
-LARGE (10+11) 2605 267 102 2974 43627.945 4764.235 4928.105 53320.285
12. ALL SIZES 229157 3057 614 232828 308062.640 12786.660 6053.235 326902.535
; 164 :
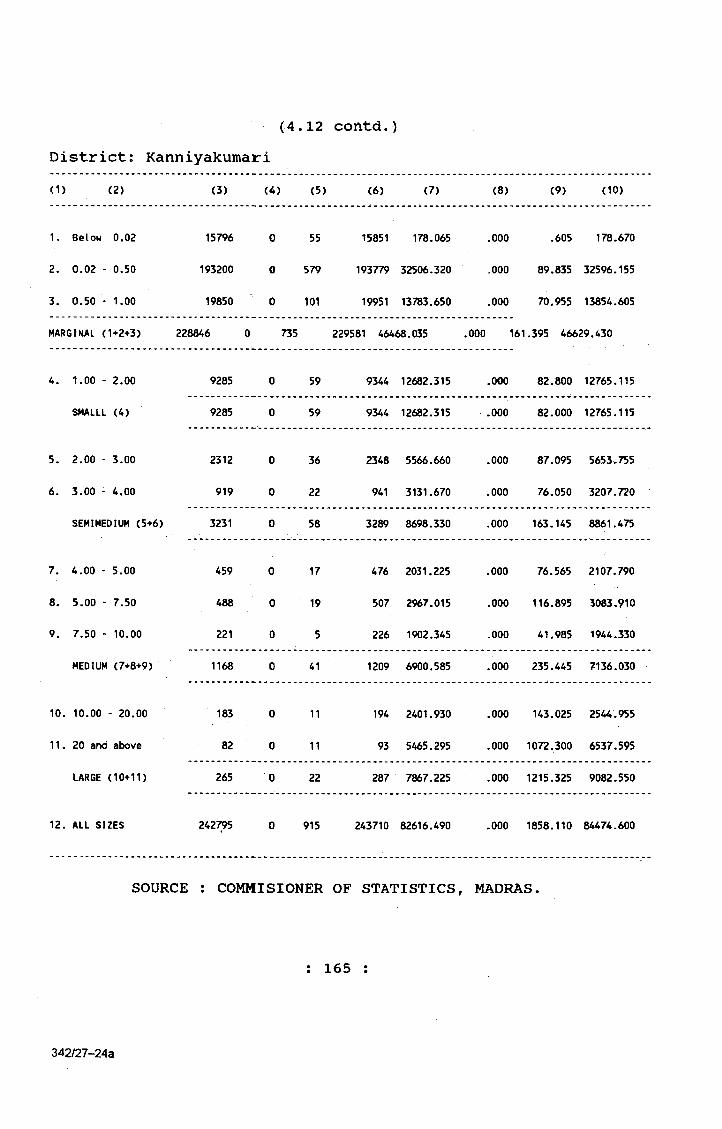
(4.12 contd.)District; Kanniyakumari<1) (2) (3) (4) (5) (6) (7) (8) (9) (10)
1. Below 0.02 15796 0 55 15851 178.065 .000 ,605 178.670
2. 0.02 - 0.50 193200 0 579 193779 32506.320 .000 89.835 32596.155
3. 0.50 - 1.00 19850 0 101 19951 13783.650 .000 70.955 13854.605
MARGtNAL (1+2+3) 228846 0 735 229581 46468.035 .000 161 .395 46629.430
4. 1.00 - 2.00 9285 0 59 9344 12682.315 .000 82.800 12765.115
SMALLL (4) 9285 0 59 9344 12682.315 .000 82.000 12765.115
5. 2.00 - 3.00 2312 0 36 2348 5566.660 .000 87.095 5653,755
6. 3.00 - 4.00 919 0 22 941 3131.670 .000 76.050 3207.720
SEMIMEDIUM (5+6) 3231 0 58 3289 8698.330 .000 163.145 8861.475
7. 4.00 - 5.00 459 0 17 476 2031.225 .000 76.565 2107.790
8. 5.00 - 7.50 488 0 19 507 2967.015 .000 116.895 3083.910
9. 7.50 - 10.00 221 0 5 226 1902.345 .000 41.985 1944.330
MEDIUM (7+8+9) 1168 0 41 1209 6900.585 .000 235.445 7136.030
10. 10.00 - 20.00 183 0 11 194 2401.930 .000 143.025 2544.955
11. 20 and above 82 0 11 93 5465.295 .000 1072.300 6537.595
LARGE (10+11) 265 0 22 287 7867.225 .000 1215.325 9082.550
12. ALL SIZES 242795 0 915 243710 82616.490 .000 1858.110 84474.600
SOURCE : COMMISIONER OF STATISTICS, MADRAS.
: 165 :
342/27-24a
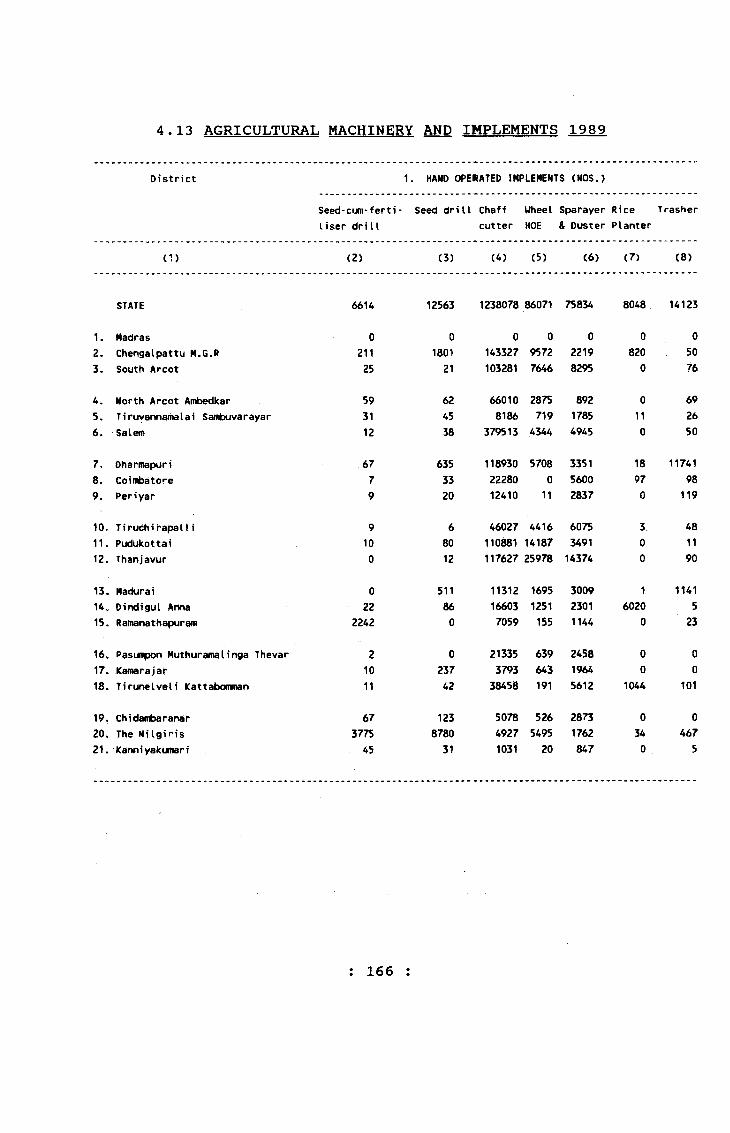
4.13 AGRICULTURAL MACHINERY AND IMPLEMENTS 1989
District 1. HAND OPERATED IMPLEMENTS (NOS.)
Seed-cum-ferti- Iiser dri11
Seed dri11 Chaff cutter
WheelHOE
Sparayer Rice & Duster Planter
Trasher
(1) (2) (3) (4) (5) (6) (7) (8)
STATE 6614 12563 1238078 86071 75834 8048 14123
1. Madras 0 0 0 0 0 0 02 . Chengalpattu M.G.R 211 1801 143327 9572 2219 820 503. South Arcot 25 21 103281 7646 8295 0 76
4. North Arcot Ambedkar 59 62 66010 2875 892 0 695. Tiruvannamalai Sambuvarayar 31 45 8186 719 1785 11 266. Salem 12 38 379513 4344 4945 0 50
7, Oharmapuri 67 635 118930 5708 3351 18 117418. Coimbatore 7 33 22280 0 5600 97 989. Periyar 9 20 12410 11 2837 0 119
10. TiruchirapalM 9 6 46027 4416 6075 3 4811. Pudukottai 10 80 110881 14187 3491 0 1112. Thanjavur 0 12 117627 25978 14374 0 90
13. Madurai 0 511 11312 1695 3009 1 114114. Dindrgul Anna 22 86 16603 1251 2301 6020 515. Ramanathapuram 2242 0 7059 155 1144 0 23
16. Pasunipon Muthuramalinga Thevar 2 0 21335 639 2458 0 017. Kamarajar 10 237 3793 643 1964 0 018. Tirunelveli Kattabomman 11 42 38458 191 5612 1044 101
19. Chidambaranar 67 123 5078 526 2873 0 020. The NiIgiris 3775 8780 4927 5495 1762 34 46721. Kanni yakumarf 45 31 1031 20 847 0 5
: 166 :
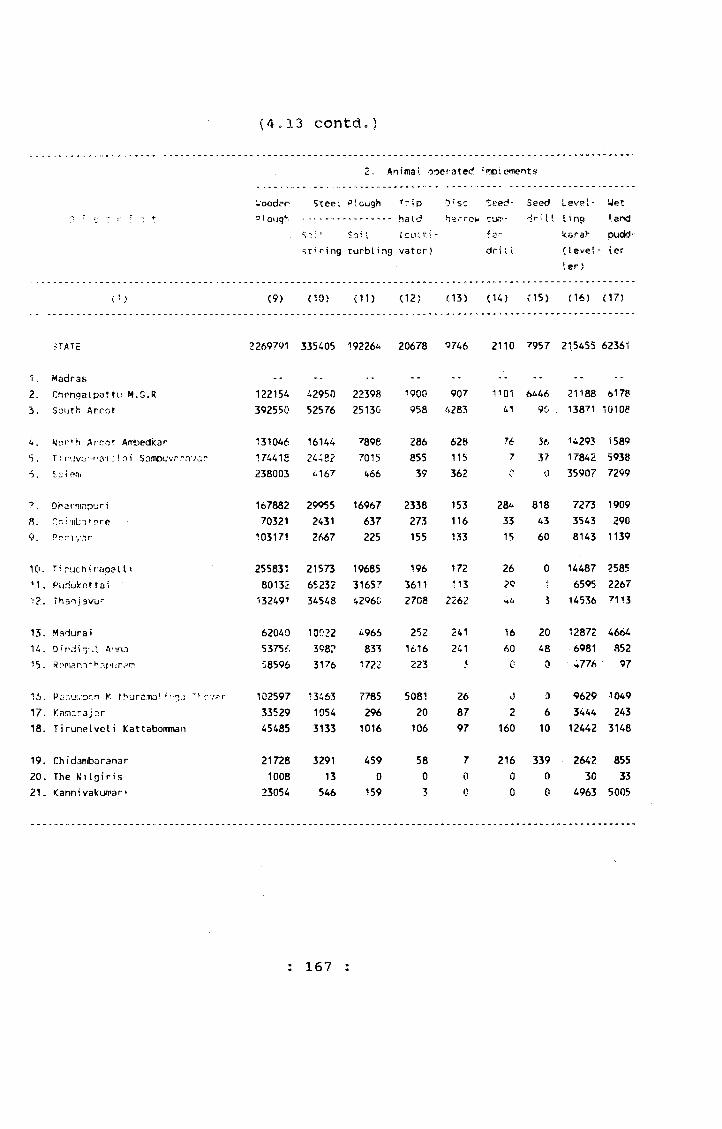
(4.13 contd
2, An i maI ooe r a t ed •mpietnents
'-ood?n Steel ?!. cugh Trip 0 i SC teed- Seed Lsvsi- Wet
0 • V i ■: t -!ough ........ ha id he .'row CUfT'- i r n ! I 5 DC) 1 and
?oil - fer ksrah pudd-
St’- ring Turbling vatcr) dri I i <level - ler
ler>
C ' > (9) (10) (11) (12) (13) (U) (15) (16) (17)
state 2269791 335405 192264 20678 9746 2110 7957 215455 62361
1. Madras
2. Chengaipattu M.G.R 12215^ 42950 22398 1900 907 1101 6446 21188 6178
3. Sourh Arcot 392550 52576 25130 958 4283 <.1 90 13871 10108
<*, Afcor Airbedkar 131046 16144 7898 286 628 76 56 U293 1589
5 , T: fjvo' 'la:!.:.! 3i Sambcvrrnvar- 174418 24;s? 7015 855 115 7 37 17842 5938
•S, Ssle.li 238003 ^167 466 39 362 <J 35907 7299
?. Dharntnpuri 167882 29955 16967 2338 153 284 818 7273 1909
fi. Hr, i:iiL;ntnre 70321 2431 637 273 116 33 43 3543 290
Pori','nr 103171 2667 225 155 133 15 60 8143 1139
10. Tiruchirapal11 255831 21573 19685 196 172 26 0 14487 2585■’1, Pvjdukottai 80132 65232 31657 3611 113 ?<3 •? 6595 2267'!2. Tha^.javu" '<32491 34548 4296C 2708 2262 5 14536 7113
1?5. Madurai 62040 10022 4966 252 241 16 20 12872 4664U . 0 iPviiA'ina 53756 3982 833 1616 241 60 48 6981 852<5. R:'’Piam*^nf'ur>fr’ 58596 3176 1722 223 '5 0 0 h 776 97
16. Pcir'.'ji.iocn K rh'jrcma! cv;=r 102597 •3463 7785 5081 26 0 0 9629 104917. Knm,-:raj::r 33529 1054 296 20 87 2 6 3444 24318. Tirunelvoli Kattabomman 45485 3133 1016 106 97 160 10 12442 3148
19. Chidambaranar 21728 3291 459 58 7 216 339 2642 85520. The MiIgiris 1008 13 0 0 0 0 0 30 3321. <annivakumar! 23054 546 159 3 0 0 0 4963 5005
: 167 :

(4.13 contd.)
D i s t r i c t
2.Animal operated implements Plant protection equipments. Engines, etc.
01 pad animal operated thresher
Animalcart
Sugar*canecrusher
Gha- Per- nies siar
wheel
Power Diesel operated engine sprayer pump- duster set
Electricpumpset
Powertiller(Agri)
(1) (18) (19) (20) (21) (22) (23) (24) (25) (26)
STATE 17098 477654 3925 2471 1727 19841 261166 866935 6802
1. Madras . -- --
2 . Chengalpattu M.G.R 577 24974 168 72 43 273 14613 43072 10893- South Arcot 2 47846 435 440 9 771 46641 128159 1048
4. North Arcot Ambedkar 166 11612 507 190 0 418 8947 73048 1035 . - T i ruvannamaI a i Sambuvarayar 48 23668 508 162 0 407 22990 88446 826. Salem 76 40915 739 244 0 2563 32969 112655 2321
7. Dharmapuri 12880 16282 217 54 1546 313 16851 42476 928. Coimbatore 187 35621 198 45 11 5144 5814 51615 3079. Periyar 1058 44550 13 70 3 2941 29540 68486 679
10. Tiruchirapalli 394 45217 439 233 28 1532 19663 75435 411, Pudukottai 149 27430 11 52 0 355 5635 25638 2212. Thanjavur 38 59620 79 329 67 691 23989 18581 234
13. Madurai 37 17099 451 35 0 427 6555 35388 20514. Oindigul Anna 0 10386 57 142 0 1718 7170 46460 4815. Ramanathapuram 59 12137 7 66 20 0 1536 1633 43
16. Pasumpon Huthurairalinga Thevar 83 14714 12 77 0 15 3766 5829 2117. Kamarajar 0 13396 63 72 0 227 1651 18367 12318. Tirunelveli KattaboMnan 221 18051 21 111 0 819 9981 23830 152
19. Chidambaranar 1123 12370 0 45 0 696 1920 9821 22720. The Nilgiris 0 59 0 0 0 455 662 99 021. Kanniyakumari 0 1107 0 33 0 76 273 2877 2
: 168 :
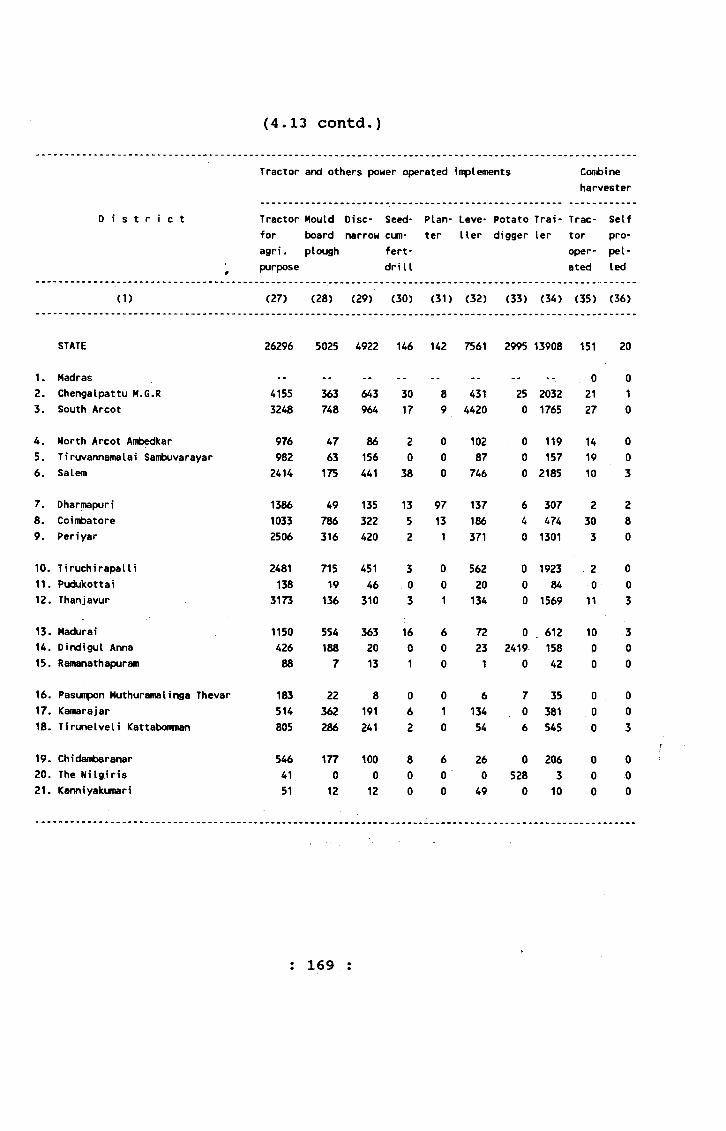
(4.13 contd.)
D i s t r i c t
Tractor and others power operated implements Coctbineharvester
Tractor Mould for board agri. plough purpose
Disc-narrow
Seed-cum-fert-drill
Planter
Leve-Uer
Potatodigger
Trailer
Tractoroperated
Selfpropelled
(1) (27) (28) (29) (30) (31) (32) (33) (34) (35) (36)
STATE 26296 5025 4922 146 142 7561 2995 13908 151 20
1. Madras 0 02. Chengalpattu M.G.R 4155 363 643 30 8 431 25 2032 21 13. South Arcot 3248 748 964 17 9 4420 0 1765 27 0
4. North Arcot Ambedkar 976 47 86 2 0 102 0 119 14 05. Tiruvannamalai Sambuvarayar 982 63 156 0 0 87 0 157 19 06. Salem 2414 175 441 38 0 746 0 2185 10 3
7. Dharmapuri 1386 49 135 13 97 137 6 307 2 28. Coimbatore 1033 786 322 5 13 186 4 474 30 89. Periyar 2506 316 420 2 1 371 0 1301 3 0
10. Tiruchirapalli 2481 715 451 3 0 562 0 1923 2 011. Pudukottai 138 19 46 0 0 20 0 84 0 012. Thanjavur 3173 136 310 3 1 134 0 1569 11 3
13. Hadurai 1150 554 363 16 6 72 0 . 612 10 314, Oindigul Anna 426 188 20 0 0 23 2419 158 0 015. Ramanathapuram 88 7 13 1 0 1 0 42 0 0
16. Pasumpon Muthuramalinga Thevar 183 22 8 0 0 6 7 35 0 017. Kamarajar 514 362 191 6 1 134 0 381 0 018. Tirunelveli Kattabonman 805 286 241 2 0 54 6 545 0 3
19. Chidambaranar 546 177 100 8 6 26 0 206 0 020. The Nilgiris 41 0 0 0 0 0 528 3 0 021. Kanniyakumari 51 12 12 0 0 49 0 10 0 0
; 169 :

(4.13 contd.)
D i s t r i c t
Power operator Thresher Equipment for Livestock & Poultry
Paddy Wheat Multi- crops
Maizeshel-ler
Chaffcutter
Sugarcanecrusher
Reaper
Incubator
Breeders
cages Feedinghopperstroughs
(1> (37) (38) (39) (40) C41) (42) (43) (44) (45) (46) (47)
STATE 790 15 201 36 506 8241 5586 261 2455 2856 70670
1. Madras 0 0 0 0 0 0 0 0 0 0 02. Chengalpattu M.G.R 15 0 0 0 168 194 418 45 23 331 3253. South Arcot 74 0 8 0 1 743 6 7 1 122 122
4. North Arcot Ambedkar 50 0 0 0 0 2277 96 5 5 42 3235. T i ruvannamaI a i Sambuva raya r 130 0 0 0 0 766 0 0 0 0 06. Salem 37 0 0 0 4 737 54 10 0 552 61530
7. Dharmapuri 21 0 6 0 3 173 2954 24 13 194 11128. Coimbatore 43 5 44 27 293 1502 6 39 2382 55 4419. Periyar 261 0 20 4 37 730 2 38 14 408 1261
10. T i ruch i rapa11i 38 0 5 0 0 252 0 19 4 4 411. Pudukottai 3 0 0 0 0 57 0 0 0 142 012. Thanjavur 44 0 0 0 0 549 0 2 3 861 4517
13. Madura i 62 2 3 0 0 129 2047 15 4 50 16414. Oindigul Anna 2 0 115 5 0 63 0 50 0 35 16415. RimM^athapjrani 1 0 0 0 0 1 0 1 1 1 1
16. Pasumpon Muthuramalinga Thevar 0 0 0 0 0 3 0 0 1 24 18417. Kamarajar 0 0 0 0 0 0 0 6 4 12 618. Tirunelveli Kattabomman 7 0 0 0 0 6 3 0 0 10 3
19. Chidambaranar 0 0 0 0 0 59 0 0 0 0 020. The NiIgiris 0 0 0 0 0 0 0 0 0 0 021. Kanniyakumari 2 0 0 0 0 0 0 0 0 13 13
Source: Fourteenth Livestock Census 1989
: 170 :
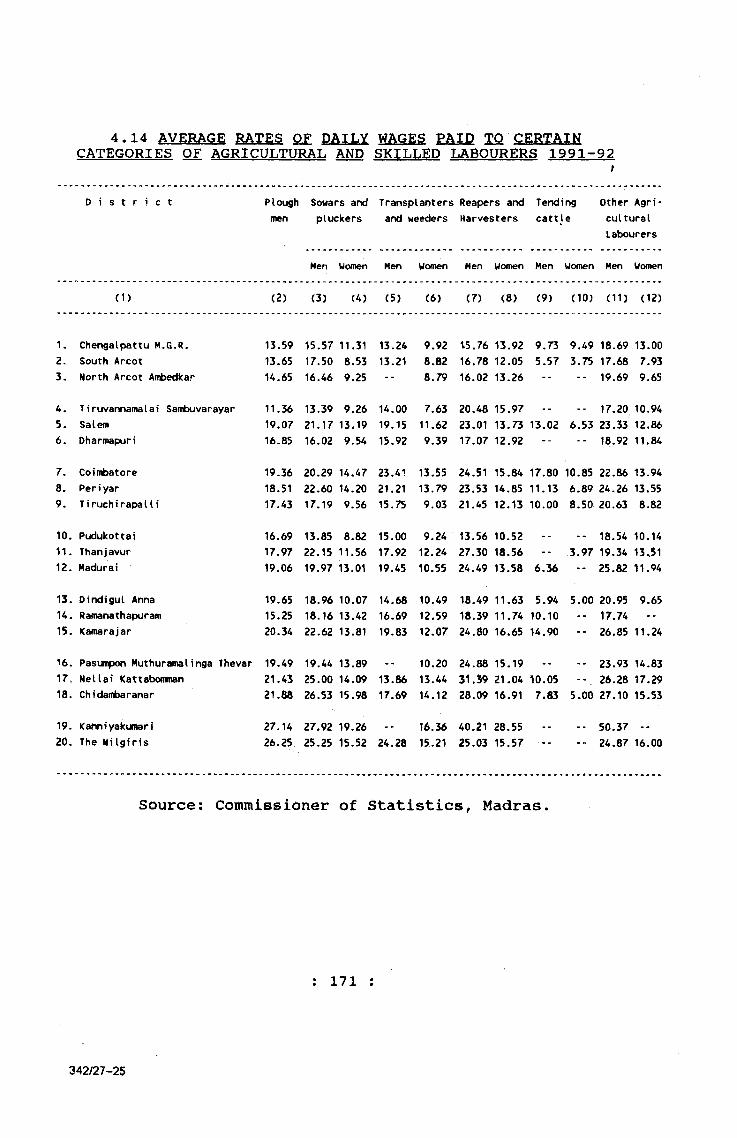
4.14 AVERAGE BATgg OF DAILY WAGES £AID XQ CERTAINCATEGORIES OF AGRICULTURAL AND SKILLED LABOURERS 1991-92
D i s t r i c t PIough men
Sowars and pluckers
Transplanters Reapers and and weeders Harvesters
Tendingcattle
Other Agricultural Labourers
Men Women Men Women Men Women Men Women Men Women
(1) (2) (3) <4) (5) (6) (7) (8) (9) (10) (11) (12)
1. Chengalpattu M.G.R. 13.59 15.57 11.31 13.24 9.92 \ 5 . 7 6 13.92 9.73 9.49 18.69 13.002. South Arcot 13.65 17.50 8.53 13.21 8.82 16.78 12.05 5.57 3.75 17.68 7.933. North Arcot Ambedkar 14.65 16.46 9.25 -- 8.79 16.02 13.26 -- -- 19.69 9.65
4. T i ruvannamaI a i Sambuvarayar 11.36 13.39 9.26 14.00 7.63 20.48 15.97 .. 17.20 10.945. Salem 19.07 21.17 13.19 19.15 11.62 23.01 13.73 13.02 6.53 23.33 12.866. Dharmapun' 16.85 16.02 9.54 15.92 9.39 17.07 12.92 -- -- 18.92 11.84
7. Coimbatore 19.36 20.29 14.47 23.41 13.55 24.51 15.84 17.80 10.85 22.86 13.948. Periyar 18.51 22.60 14.20 21.21 13.79 23.53 14.85 11.13 6.89 24.26 13.559. T i ruch i rapa11i 17.43 17.19 9.56 15.75 9.03 21.45 12.13 10.00 8.50 20.63 8.82
10. Pudukottai 16.69 13.85 8.82 15.00 9.2A 13.56 10.52 18.54 10.1411. Thanjavur 17.97 22.15 11.56 17.92 12.24 27.30 18.56 -- 3.97 19.34 13.5112. Madurai 19.06 19.97 13.01 19.45 10.55 24.49 13.58 6.36 -- 25.82 11.94
13. Oindigul Anna 19.65 18.96 10.07 14.68 10.49 18.49 11.63 5.94 5.00 20.95 9.65U . Ramanathapuram 15.25 18.16 13.42 16.69 12.59 18.39 11.74 10.10 *- 17.74 --15. Kamarajar 20.34 22.62 13.81 19.83 12.07 24.80 16.65 14.90 *- 26.85 11.24
16. Pasumpon Muthuramalinga Thevar 19.49 19.44 13.89 -- 10.20 24.88 15.19 -- 23.93 14.8317 = Nellai Kattabonman 21.43 25.00 14.09 13.86 13.44 31.39 21.04 10.05 26.28 17.2918. Chidantbaranar 21.88 26.53 15.98 17.69 14.12 28.09 16.91 7.83 5.00 27.10 15.53
19, Kahniyakumari 27.14 27.92 19.26 .. 16.36 40.21 28.55 -- 50.3720. The Nilgiris 26.25 25.25 15.52 24.28 15.21 25.03 15.57 24.87 16.00
Source: Commissioner of Statistics, Madras.
: 171
342/27-25

(Base: 1981-82 = 100)
4.15 INDEX NUMBERS OF WAGES PAID TO CERTAIN CATEGORIESOF AGRICULTURAL LABOURERS 1991-92
Year/Month Field Labourers Tending Cattle Other Agricultural Labourer
Men( 2 )
Women(3)
Men(4)
Women(5)
Men( 6 )
Women(7)( 1)
1991 July 257 240August 281 245September 295 259October 293 272November 280 283December 283 264
1992 January 290 279February 306 275March 279 259April 278 247May 317 254June 329 266
210 222 219 23 5 235 230 218 218 201 201 212 287
167167167186186208219217215216 250 312
283285292289291299301303304 310 314 298
218222228231232 238 232 229 245 262 271 256
Source: Commissioner of Statistics, Madras
: 172 :
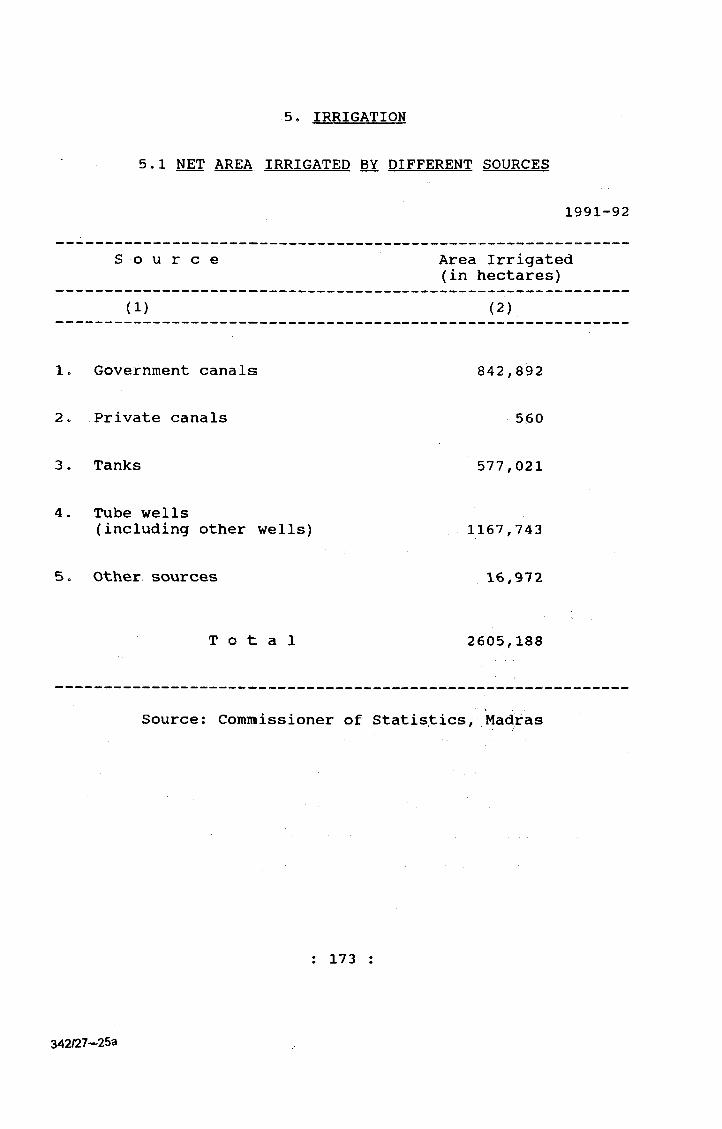
5, IRRIGATION
5.1 NET AREA IRRIGATED BY DIFFERENT SOURCES
1991-92
S o u r c e Area Irrigated(in hectares)
(1) (2)
1. Government canals 842,892
2o Private canals 560
3. Tanks 577,021
4. Tube wells(including other wells) 1167,743
5. Other sources 16,97 2
T o t a l 2605,188
Source: Commissioner of Statistics, Madras
: 173
342/27- 253
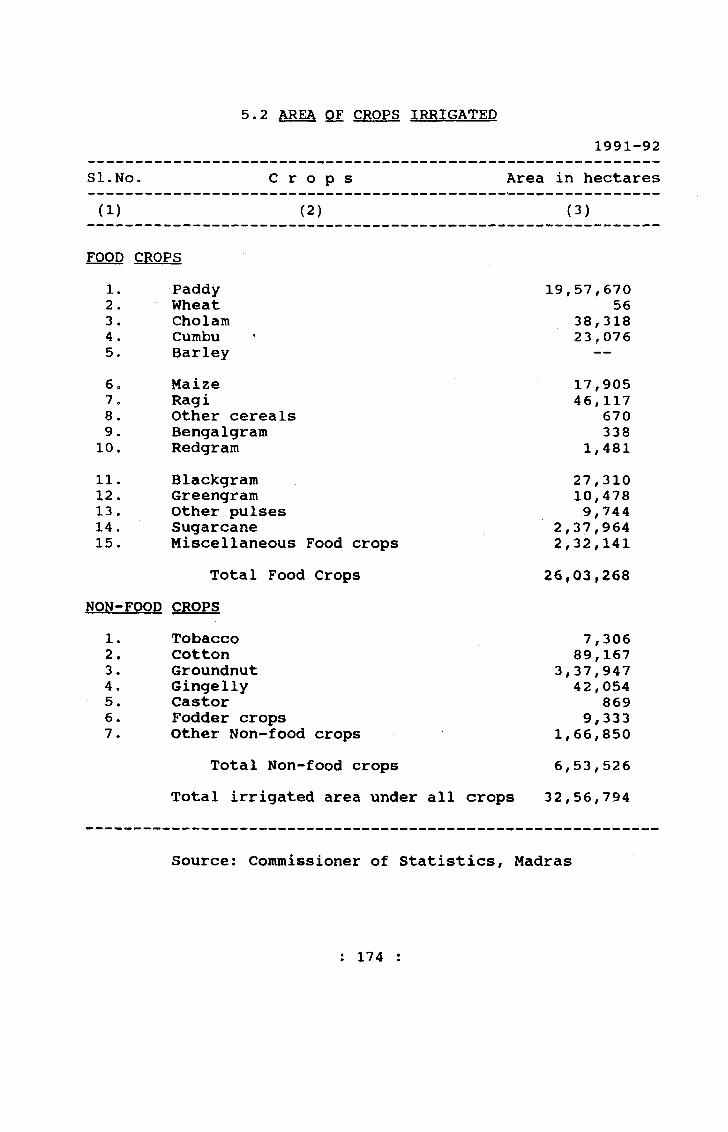
5.2 AREA OF CROPS IRRIGATED1991-92
81.No. C r o p s Area in hectares
(1) (2) (3)
FOOD CROPS1. Paddy 19,57,6702. Wheat 563. Cholam 38,3184. Cumbu 23,0765. Barley —6o Maize 17,9057o Ragi 46,1178. Other cereals 6709. Bengalgram 338
10, Redgram 1,48111. Blackgram 27,31012. Greengram 10,47813 . Other pulses 9,74414, Sugarcane 2,37,96415. Miscellaneous Food crops 2,32,141
Total Food Crops 26,03,268NON-FOOD QROPS
1. Tobacco 7,3062. Cotton 89,1673. Groundnut 3,37,9474. Gingelly 42,0545. Castor 8696. Fodder crops 9,3337. Othier Non-food crops 1,66,850
Total Non-food crops 6,53,526Total irrigated area under all crops 32,56,794
Source: Commissioner of Statistics, Madras
: 174 :

5.3 NET AREA IRRIGATED BY DIFFERENT SOURCES 1991-92(hectares)
SI.No,
District Govt. Pvt. Tanks Tube Wells Wells suppli- Other sourcescanals canals wells sole menting other ie. springs,
Irriga- sources of channels, ;tc.tion Irrigation
(13 (2) (3) (4) (5) (6) <7) (8) (9)
1. 'Chengalpattu M.G.R. A037 120711 21681 95126 17856 25122. South Arcot 59316 -- 55508 108170 76800 11393 17883. North Arcot Ambedkar 3703 -- 16681 3 78020 -- 369
4. Tiruvannamalai Sambuvarayar 2798 -- 34319 -- 83156 2605. Salem 17123 -- 4371 3630 114707 1794 19606. Dharmapuri 9690 -- 17653 -- 89657 7099 1982
7. Periyar 86892 -- 386 48098 3364 43128. Coimbatore 55623 560 2109 2261 68984 6149 1779. The NiIgiris 467 •- -- 200
10. Tiruchirapalli 74472 -- 13015 11145 71643 6001 46111. Thanjavur 172393 -- 1805 13718 3832 7828 2712. Nagapattinam Quaid-E-HiUeth 246677 -- -- 10703 832 16874 1513
13. Pudukottai 10331 54395 1153 14988 808 83H. Madurai 62025 -- 19779 1586 61474 3029 12515. Oindigul Anna 3594 *• 11038 5 57641 1305 974
16. Ramanathapurain -- 57844 468 8418 64217. Kamarajar -- 14967 5 39389 93318. Pasumpon Muthuramalinga Thevar -- -- 65216 845 13409 3985 39
19. Tirunelveli Kattabonman m m-- 47^5 Z Q
20. Chidatnbaranar 4t76 -- 48} 25 u
21. Kanniyakutnari 10621 16158 1206 3 402
STATE 842892 560 577021 175776 991967 94788 16972
; 175 :
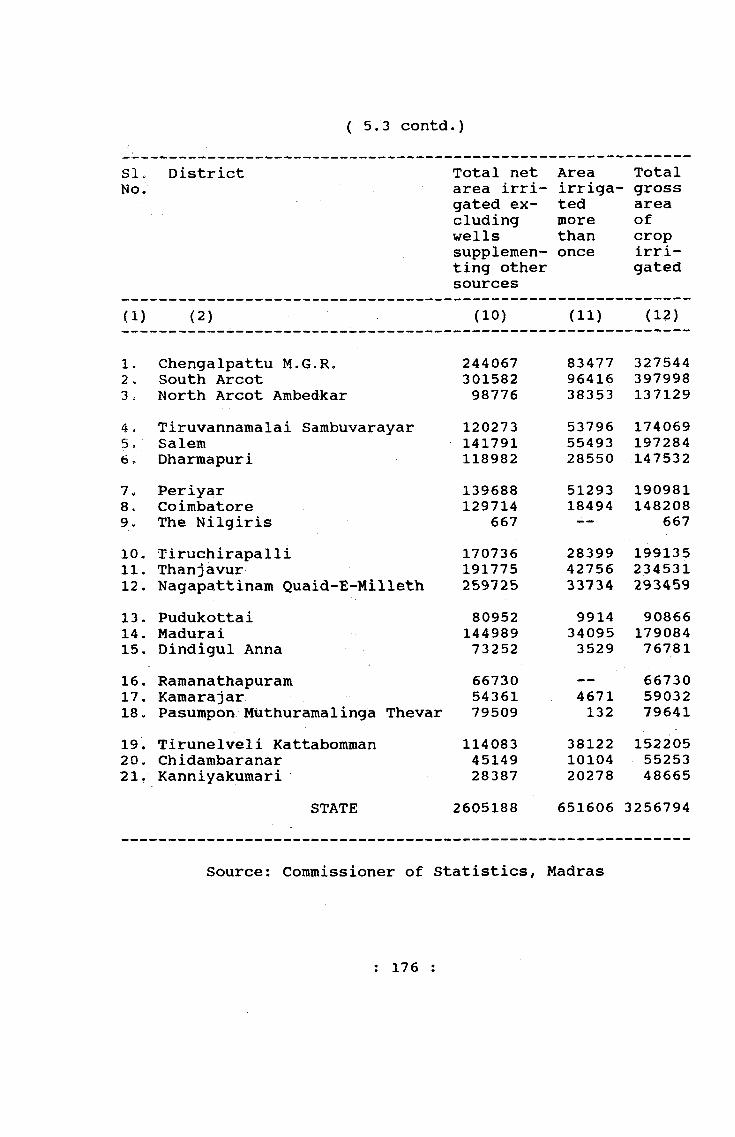
( 5.3 contd.)
SI. No.
District Total net area irrigated excluding wells supplementing other sources
Areairrigatedmorethanonce
Total - gross area ofcropirrigated
(1) (2) (10) (11) (12)
1. Chengalpattu M.G.R. 244067 83477 3275442. South Arcot 301582 96416 3979983 c North Arcot Ambedkar 98776 38353 1371294 . Tiruvannamalai Sambuvarayar 120273 53796 1740695,; Salem 141791 55493 1972846, Dharmapuri 118982 28550 1475327. Periyar 139688 51293 1909818, Coimbatore 129714 18494 1482089. The Nilgiris 667 — — 66710. Tiruchirapalli 170736 28399 19913511. Thanjavur 191775 42756 23453112. Nagapattinam Quaid-E-Milleth 269726 33734 29345913. Pudukottai 80952 9914 9086614. Madurai 144989 34095 17908415. Dindigul Anna 73252 3529 7678116. Raroanathapuram 66730 — 6673017. Kamarajar 54361 4671 5903218. Pasumpon Mtithuramalinga Thevar 79509 132 7964119. Tirunelveli Kattabomman 114083 38122 15220520. Chidambaranar 45149 10104 5525321. Kanniyakumari 28387 20278 48665
STATE 2605188 651606 3256794
Source: Commissioner of Statistics, Madras
; 176 :

5.4 AREA IRRIGATED BY CROPS/DISTRICTS - 1991-92 FOOD CROPS - CEREALS
(IN HECTARES)
SI. District No,
Paddy Wheat Choi am Cutitou Maize Ragi Othercereals
Total cc-reais
(1) (2) (3) (4) (5) (6) <7) (8) (9)
1. Chengalpattu M.G.R. .242199 66 942 3676 361 2472^42. South Arcot 229492 -- 96 2312 24 3299 119 2353423. North Arcot Ambedkar 70437 -- 28 774 251 6521 -- 780^1
4.' Tiruvannamalai Santouvarayar 106834 25 487 1366 -- 4920 1136325. Salem 67580 -- 11410 3031 903 9618 5 925476. Dharmapuri 76452 -- 197 2796 441 8938 -- 88824
7. Periyar 75466 -- 2420 592 1322 769 4 3057?8. Coimbatore 21287 21 5897 241 11852 112 135 395459. The NiIgiris 158 15S
10. Tiruchirapal. li 100727 2825 3080 3 341 45 10702111 Thanjavur 192086 -- -- 18 250 71 19242512, Nagapattinam Quaid-£-Mi Ueth 264939 -- -- 6 116 29 -- 265090
13. Pudukottai 72946 622 320 1250 1151 762891&. Madurai 102537 -- 3835 2081 563 573 13 10960215. OirxJigul Anna 19665 10 7135 2085 703 354 32 2 9 9 B A
16. Ramanathapuram 56528 -- 32 16 -- 708 69 5735317. Kamarajar 19550 382 2B28 , - 42 . 3055 210 Z 6 0 & 7
18. Pasumpon Muthuramatinga Thevar 67293 -- 81 21 •• 575 6 67976
19. Tirunelveti Kattabonvnan 98975 -- 2595 312 57 947 11 102S?720. Chidambaranar 31947 -- 210 255 128 460 30 3303G21. Kanniyakumari 40572 40572
STATE 1957670 56 38318 23076 17905 46117 1040 2084182
177 :

( 5.4 contd.)FOOD CROP PULSES
SI. District Bengal Green Red Black Other Sugarcane Other Misc, Total FoodNo. gram gram gram gram pulses crops crops
(1) (2) (11) (12) (13) (14) (15) (16) (17) (18)
1. Chengalpattu M.Q.R. 1590 430 3308 1231 12413 5332 2715482. South Arcot -- 129 33 313 182 54513 22648 3131603. North Arcot Ambedkar -- ■ 237 12 387 273 19753 10247 108920
4. Tiruvannamalai Sambuvarayar -- 657 56 1201 521 14054 2924 133045S. Salem 157 1474 49 6369 1792 13827 30544 1467596. Dharmapuri 130 222 1 286 62 14459 8439 112423
7 . Periyar -- 665 65 862 2386 14913 13980 1134448. Coimbatore 22 629 86 1761 1372 12402 14768 705859, The Nilgiris -- -- 379 537
10. Tiruchirapalli 6 444 73 2150 193 20413 34756 16505611. Thanjavur -- 5 -- 4153 -- 11531 5032 21314612. Nagapattinam Quaid-E-MiIteth -- -* -- 1586 -- 13115 2223 282014
13. Pudukottai .. 105 .. 1461 50 1941 2070 8191614. Madurai -- . 1877 545 1045 957 13499 11611 13913615. Dindigul Anna 17 284 45 857 336 6032 15498 53053
16. Ramanathapuram -- 2 1 38 20 85 4072 6157117. •- 1913 -- 731 195 4714 7583 41203
— 5483 2418 75930
19. Tirunelveii Kdttabormian 1 179 72 616 131 4585 19849 12833020. Chidambaranar 5 54 13 174 14 232 13372 4689421. Karmiyakumari * • 4026 44598
STATE 338 10478 1481 27310 9744 237964 231771 2603268
: 178 ;

( 5,4 contd.)NON-FOOD CROPS
SI.No.
District Tobacco Cotton Groundnut Gingelly Foddercrops
OtherNon-Foodcrops
TotalNon-Foodcrops
Total Food and Non- Food crops
<i) (2) (19) (20) (21) (22) (23) (24) (25) (26)
Chengalpattu M.G.R. 95 51492 2165 5 2239 55996 3275442. South Arcot 22 11467 64325 2885 13 6126 84838 3979983. North Arcot Anfcedkar -- 1091 12428 590 241 13859 28209 137129
4. TiruvannamaI ai Sambuvarayar 9 164 38654 1443 4 750 41024 1740695. Salem 773 7661 25475 8814 814 6988 50525 1972846. Dharmapuri -- 5120 10347 157 282 19203 35109 147532
7. Periiyar 4529 6507 37311 14724 5935 8531 77537 1909818. Coimbatore 484 9541 16790 704 1648 48456 77623 1482089. The NiIgiris -- 130 -- -- 130 667
10. Ii ruchirapalIi 16 3389 17853 3802 66 8953 34079 19913511. Thanjavur ' -- 1784 15777 2303 205 1316 21385 23453112. Nagapattinam Quaid-E-Mi Ueth 491 4005 5596 508 6 839 11445 293459
13. Pudukottai 709 6365 1256 620 8950 9036614. Madurai 20 13728 11756 1301 -- 13143 39948 17908415, Dindigul Anna 926 1098 10975 688 10041 23728 76781
16. Ramanathapuram 443 418 70 29 4199 5159 6673017. <amarajar -• 9158 2847 324 24 5476 17829 5903218. Pasumpon Muthuramalinga Thevar -- 440 1249 22 48 1952 3711 79641
19, Tfrunelveli Kattabomman 36 9998 6748 283 6810 23875 15220520. Chidambaranar -- 2769 1389 15 13 4173 8359 5525321. Kanniyakumari 22 4045 4067 43665
STATE 7306 89167 337947 42054 9333 167719 653526 3256794
Source: Commissioner of Statistics, Madras
: 179
342/27 6
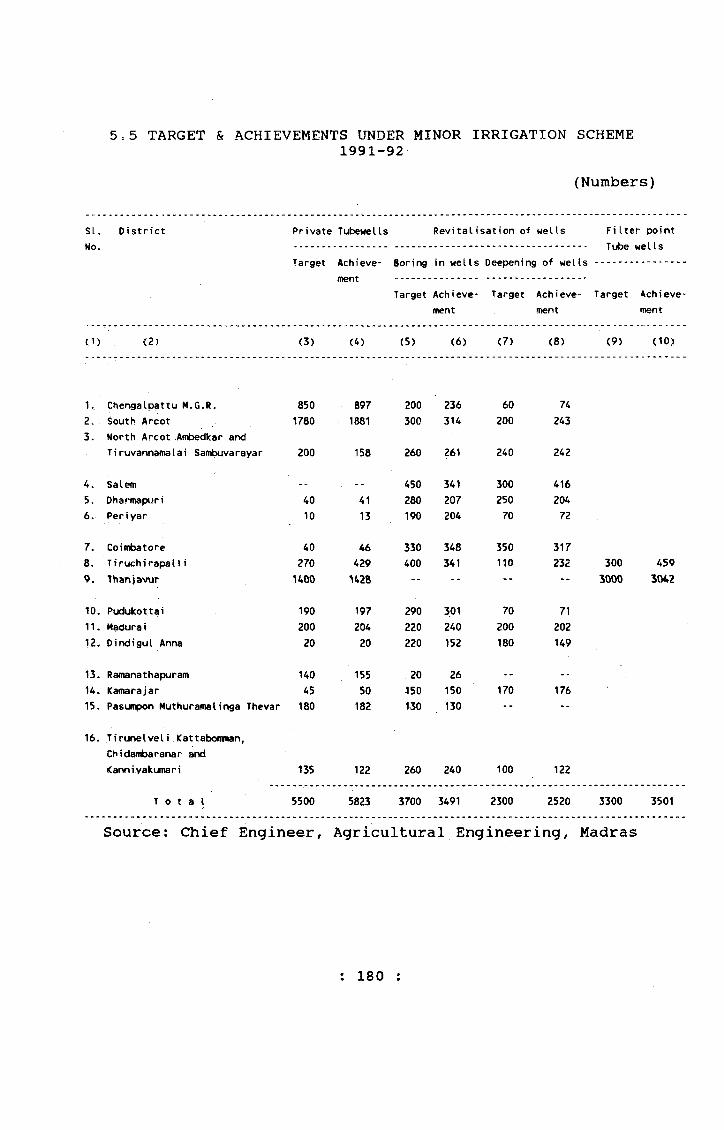
5=5 TARGET & ACHIEVEMENTS UNDER MINOR IRRIGATION SCHEME 1991-92
(Numbers)
si. District Private Tubewells Revitalisation of wells Fi Iter pointNo. Tube wells
Target Achievement
8or i ng
Target
in wells Deepening of wells .........-......
Achieve- Target Achieve- Target Achievement ment ment
(1) (2) (3) (4) (5) (6) (7) (8) (9) (10)
1, Chengalpattu M.G.R. 850 897 200 236 60 742. South Arcot 1780 1881 300 314 200 2433. North Arcot Ambedkar and
Tiruvannamalai Sambuvarayar 200 158 260 261 240 242
4. Salem 450 341 300 4165. Dharmapuri 40 41 280 207 250 2046. Periyar 10 13 190 204 70 72
7. Coimbatore 40 46 330 348 350 3178. Tiruchirapalli 270 429 400 341 110 232 300 4599. Ihanjavur H O O -- -- -- -* 3000 3042
10. Pudukottai 190 197 290 301 70 7111. Madurai 200 204 220 240 200 20212. Dindigul Anna 20 20 220 152 180 149
13. Ramanathapuram 140 155 20 26 -- --14. Kamarajar 45 50 350 150 170 17615. Pasumpon Muthuranialinga Thevar 180 182 130 130 -- --
16. Ti runelveli Kattabonman, Chidambaranar and<anniyakumari 135 122 260 240 100 122
T o t a l 5500 5823 3700 3491 2300 2520 3300 3501
Source: Chief Engineer, Agricultural Engineering, Madras
: 180 :

5„6 WATER LEVELS IN CERTAIN RESERVOIRS 1991-92SI.No.
Name of Reservoir Districts Benefitted Full Reservoir Depth (Metres)
Highest
Metres
Level
Date
Lowest
Metres
Level
Date
(1) (2) (3) (4) (5) (6) (7) (8)
1. Mettur Salem, Periyar, Thanjavur, Tiruchi-rapalli, Pudukottai, South Arcot &Nagapattinam Quaid-E-MiIleth 36.58 37.06 21.08.91 10.45 01.06,91
2. Bhavanisagar Periyar and TiruchirapalIi 32.00 26.02 24.08.91 8.67 06.05.923. Amaravathy Coimbatore and Periyar 33.53 32.65 21.08.91 8.04 14.05.92
U . Poondi Madras city (WatersupplyJ 10.06 10.06 15.11.91 2.52 04.06.915. Sathanur TiruvannamaI ai Sanixjvarayar and
South Arcot 36.27 36.27 18.12.91 16.15 11.09.91
6. Krishnagi ri Oharmapuri 15.85 15.85 31.12.91 5.00 03.06.917, Vidur South Arcot and Pondicherry 9.75 9.69 06.11.91 2.19 11.09.91
8. Qomukhi South Arcot 14.02 13.41 02.11.91 ni I 07.04.929. Manimuktha Nadhi South Arcot 10.97 10.06 16.11.91 ni I 01.06,91
10. Periyar Madurai 46.33 41.12 04.08.91 32.34 22.04.92
11. Vaigai. Madurai, Ramanathapuram andPasumpon Muthuramalinga Thevar 21.64 15.88 26.11.91 4,15 04.03.92
12. Manjalar Madurai and Dindigul Anna 17.37 16.08 11.11.91 0.61 31.03.92
13. Papanasam Tirunelveli Kattabonman andChidambaranar 45.11 44.99 19.07.91 6.73 17.05.92
U . Manimuthar Tirunelveli Kattabomman andChidambaranar 35.97 32.31 30.07.91 17.39 31.05.92
15. Pechiparai Kanniyakumari 14.63 14.14 08.07.91 1.89 01.03.9216. Perunchani Kanniyakumari 22.47 23.01 22.06.91 5.84 05.04.9217. Chittar Dam I Kanniyakumari 14.20 18.60 08.07.91 14.19 13.04.9218. Chittar Dam 11 Kanniyakumari 17.98 17.37 25.06.91 12.69 13.04.92
19- WiUington South Arcot N.A. N.A. N.A. N.A. N.A.
Source; Chief Engineer, Irrigation, Madras
: 181
342/27-263

6. LIVE STOCK AND ANIMAL HUSBANDRY6.1 LIVESTOCK AND POULTRY POPULATION - 1989
(in numbers)State/District Cattle Buffa
loesSheep Goats Pigs Horses Mlules Donkeys Camels Dogs
and Ponies
Livestock
(1) (2) (3> (4) (5) <6) (7) (8) (9) (10) (11) (12)
rAMiL NADU 9353U1 3128256 5880788 5919713 660676 6003 78 50606 9 1366950 26366220
■>. Madras 24446 28713 4832 9233 2767 114 0 72 0 14643 848202. Chengalpattu MGR 744758 337637 328948 327093 18560 211 28 1013 3 129121 18873723, South Arcot 1363455 189745 366043 638230 125508 368 0 2252 2 116151 2801754
4. North ArcotAmbedkar 498522 133081 297332 196866 13761 45 0 1941 0 57742 1199290
5. TiruvannamaI ai Sambuvarayar 606412 85449 442749 275492 31548 13 0 1193 0 71424 1514280
6. SaleiP 621930 449398 475677 601301 151388 851 0 2331 0 145266 2448142
7. Dharmapuri 518226 109551 385625 218622 18349 321 0 4948 0 80243 13358858. Periyar 365228 261029 400126 265799 23538 393 0 2077 0 86815 14250059. Coint>atore 335287 154249 153564 200829 25767 532 0 3370 0 73459 947057
10>The MUgiris 37108 5372 3670 5571 91 38 4 151 0 4608 5661311.Thanjavur 996028 291483 79120 792416 10659 481 0 829 0 155894 232691012.T i ruch i rapa11 i 853983 309499 723028 737036 121613 300 0 3212 0 131564 2880235
13.Pudukottai 526664 129969 312573 156270 9673 5 0 1178 0 64692 1201024H . Madurai 400773 151530 248364 251137 17407 249 6 1771 0 41844 111308115.Dindigul Anna 271557 118829 185354 197231 5874 1505 11 4381 4 35037 819783
16.Ramanathapuram 230086 30507 271521 154253 7757 270 29 3152 0 12273 70984817.Kamarajar 132821 65025 187186 172747 15696 241 0 2150 0 11032 58689818.Pasumpon Muthu-
ramalinga Thevar 251367 45518 350551 133339 3956 3 0 1482 0 41759 827975
19.TirunelveliKattabonwnan 280068 148229 375274 226638 27039 13 0 5849 0 33095 1096205
20.Ch i dambaranar 175905 64440 286602 299404 22248 49 0 7058 0 27238 88294421.Kanniyakumari 98517 19003 2649 60206 7477 1 0 196 0 33050 221099
Source; Fourteenth Livestock Census, 1989
; 182 :
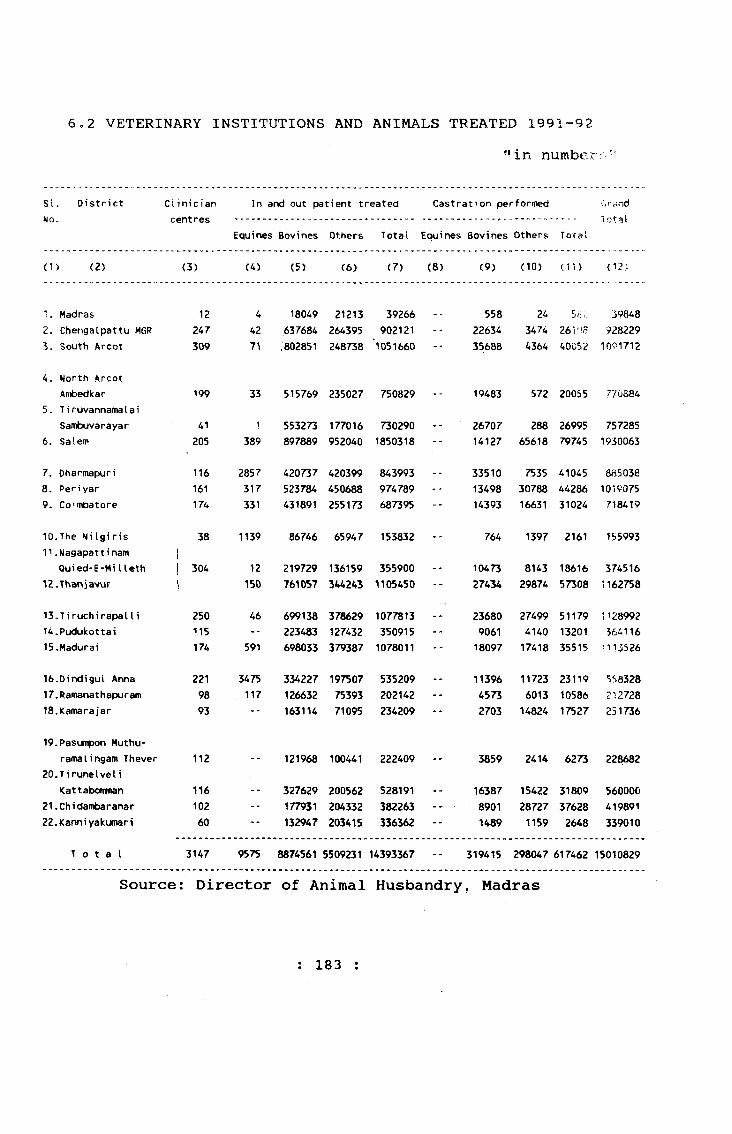
6o2 VETERINARY INSTITUTIONS AND ANIMALS TREATED 1991-92"in number;-
SI. District Clinician centres
In and out patient treated Castration performed GrandTotalNO
Equines Bovines Others Total Equines Bovines Others Total
(1) (2) <3) (4) (5) (6) (7) (8) (9) (10) (11) {125
1. Madras 12 4 18049 21213 39266 558 24 5;;: 398482. Chengalpattu MGR 247 42 637684 264395 902121 -- 22634 3474 26V15 9282295. South Arcot 309 71 .802851 248738 *1051660 -- 35688 4364 40052 1001712
4. North ArcotAmbedkar
5. Tiruvannamalai199 33 515769 235027 750829 19483 572 20055 770S84
Sambuvarayar 41 1 553273 177016 730290 -- 26707 288 26995 7572856. Salem 205 389 897889 952040 1850318 -- 14127 65618 79745 1930063
7. Oharmapuri 116 2857 420737 420399 843993 -- 33510 7535 41045 8850388. Periyar 161 317 523784 450688 974789 -- 13498 30788 44286 101V0759. Coimbatore 174 331 431891 255173 687395 -- 14393 16631 31024 718419
10,The ti<i Igi ris .Nagapattinam
3811
1139 86746 65947 153832 -- 764 1397 2161 155993
Quied-E-MiUeth i 304 12 219729 136159 355900 10473 8143 18616 374516■\2.Thanjavur 150 761057 344243 1105450 -- 27434 29874 57308 1162758
13.Ti ruchi rapalIi 250 46 699138 378629 1077813 23680 27499 51179 1128992U.Pudukottai 115 -- 223483 127432 350915 -- 9061 4140 13201 56411615,Madurai 174 591 698033 379387 1078011 -- 18097 17418 35515 1113526
16.Dindigui Anna 221 3475 334227 197507 535209 -- 11396 11723 23119 55832817.Ramanathapuram 98 117 126632 75393 202142 -- 4573 6013 10586 212728IS.Katnarajar 93 -- 163114 71095 234209 2703 14824 17527 251736
19.Pasumpon Muthu-ramalingam Thever
20.Ti runelveli112 121968 100441 222409 3859 2414 6273 2 2 ^ 2
Kattabomnan 116 -- 327629 200562 528191 -- 16387 15422 31809 56000021.Ch i dambaranar 102 -- 177931 204332 382263 .. . 8901 28727 37628 41989122.Kanniyakutnari 60 -- 132947 203415 336362 -• 1489 1159 2648 339010
T o t a l 3147 9575 8874561 5509231 14393367 -- 319415 298047 617462 15010829
Source; Director of Animal Husbandry, Madras
: 183 :
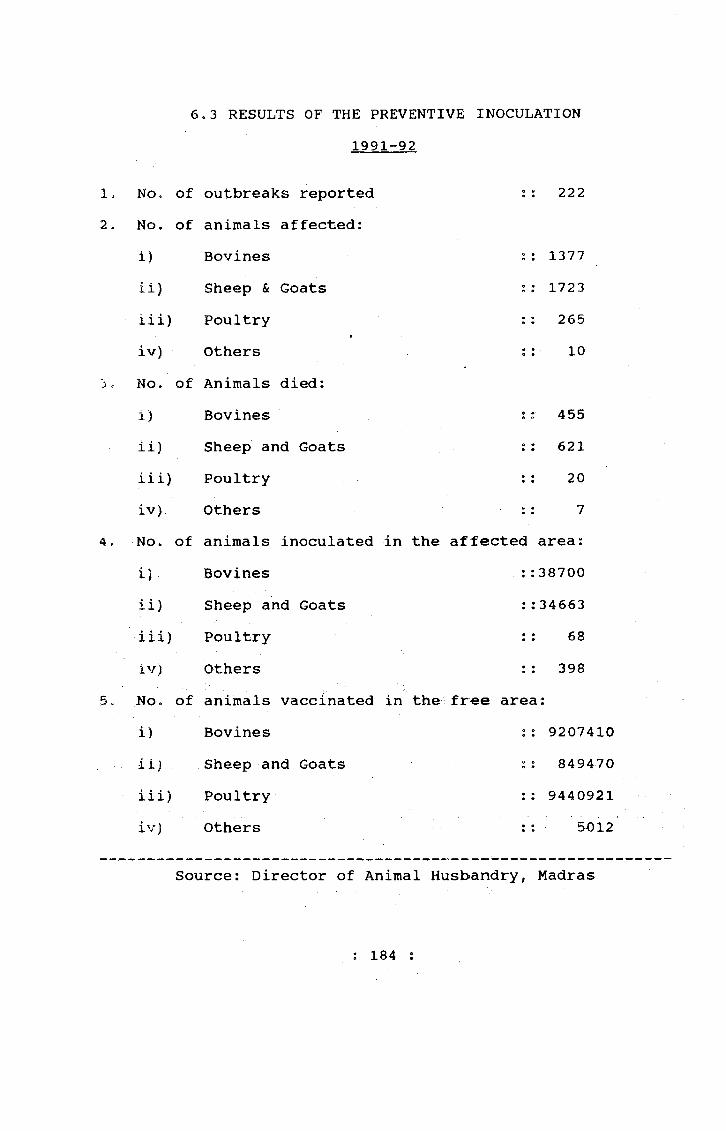
6«3 RESULTS OF THE PREVENTIVE INOCULATION1991-92
No. of outbreaks reported 9: 222No. of animals affected:
i) Bovines : 1377ii) Sheep & Goats : 1723iii) Poultry • : 265iv) Others :: 10No. of Animals died:
i) Bovines : 4 55ii) Sheep and Goats •: 621iii) Poultry •: 20iv) Others : 7No. of animals inoculated in the affected area:
i) Bovines :38700
ii) Sheep and Goats :34663iii) Poultry : 68iv) Others : 398No. of animals vaccinated in the free area:i) Bovinesii) Sheep and Goatsiii) Poultryiv) Others
9207410849470
94409215 0 1 2
Source: Director of Animal Husbandry, Madras
184 :
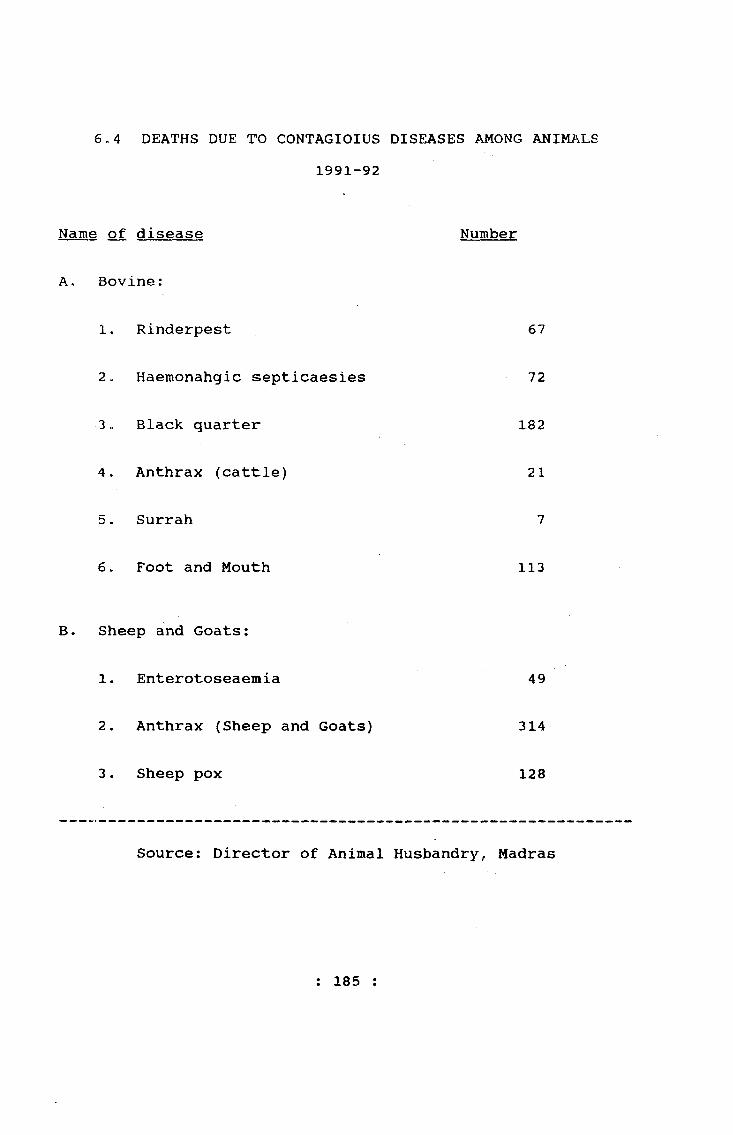
6.4 DEATHS DUE TO CONTAGIOIUS DISEASES AMONG ANIMALS1991-92
Name of disease Number
A. Bovine:
1. Rinderpest 67
2. Haemonahgic s;epticaesies 72
3o Black quarter 182
4* Anthrax (cattle) 21
5. Surrah 7
6. Foot and Mouth 113
B. Sheep and Goats:
1. Enterotoseaemia 49
2. Anthrax (Sheep and Goats) 314
3. Sheep pox 128
Source: Director of Animal Husbandry, Madras
: 185 :
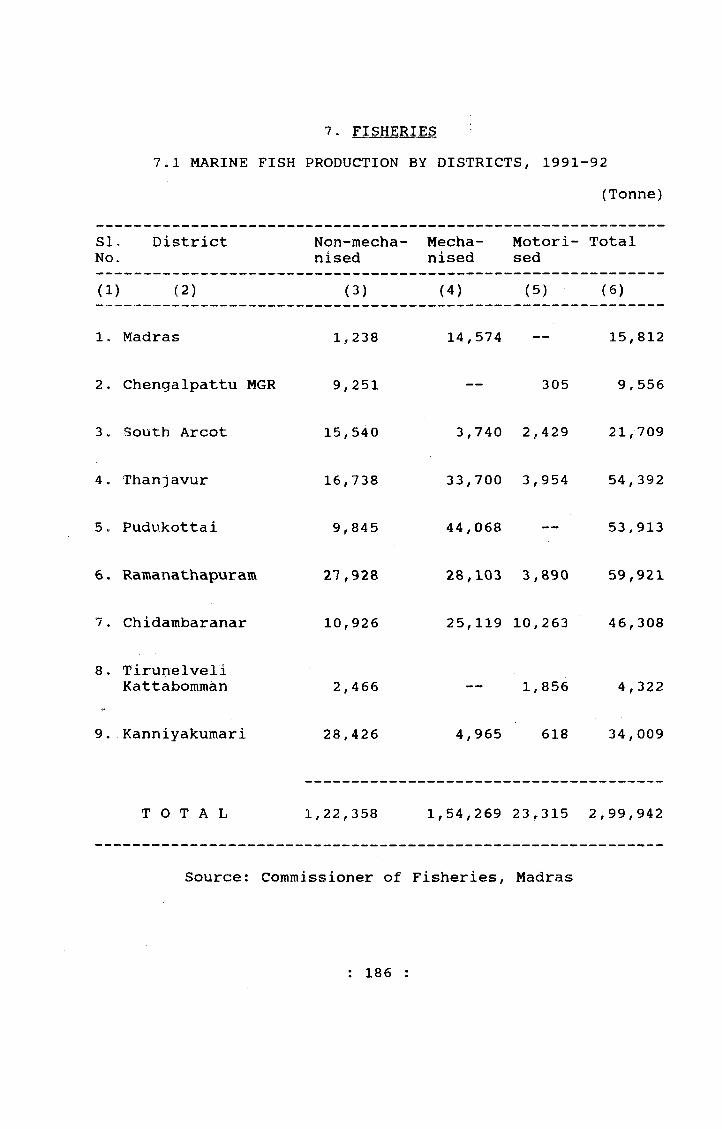
7, FISHERIES7ol MARINE FISH PRODUCTION BY DISTRICTS, 1991--92
(Tonne)
SINo
District Non-mecha-nised
Mechanised
Motorised
Total
(1) (2) (3) (4) (5) (6)
1. Madras 1, 238 14,574 — 15,812
2. Chengalpattu MGR 9,251 — 305 9, 556
3 . South Arcot 15,540 3,740 2,429 21,709
4. Thanjavur 16,738 33,700 3,954 54,392
5„ Pudukottai 9,845 44,068 — 53,913
6. Ramanathapuram 27,928 28,103 3,890 59,921
7 . Chidambaranar 10,926 25,119 10,263 46,308
8. TirunelveliKattabomman 2,466 — 1, 856 4,322
9. Kanniyakumari 28,426 4,965 618 34,009
T O T A L 1,22,3 58 1,54,269 23,315 2,99,942
Source: Commissioner of Fisheries, Madras
: 186 :
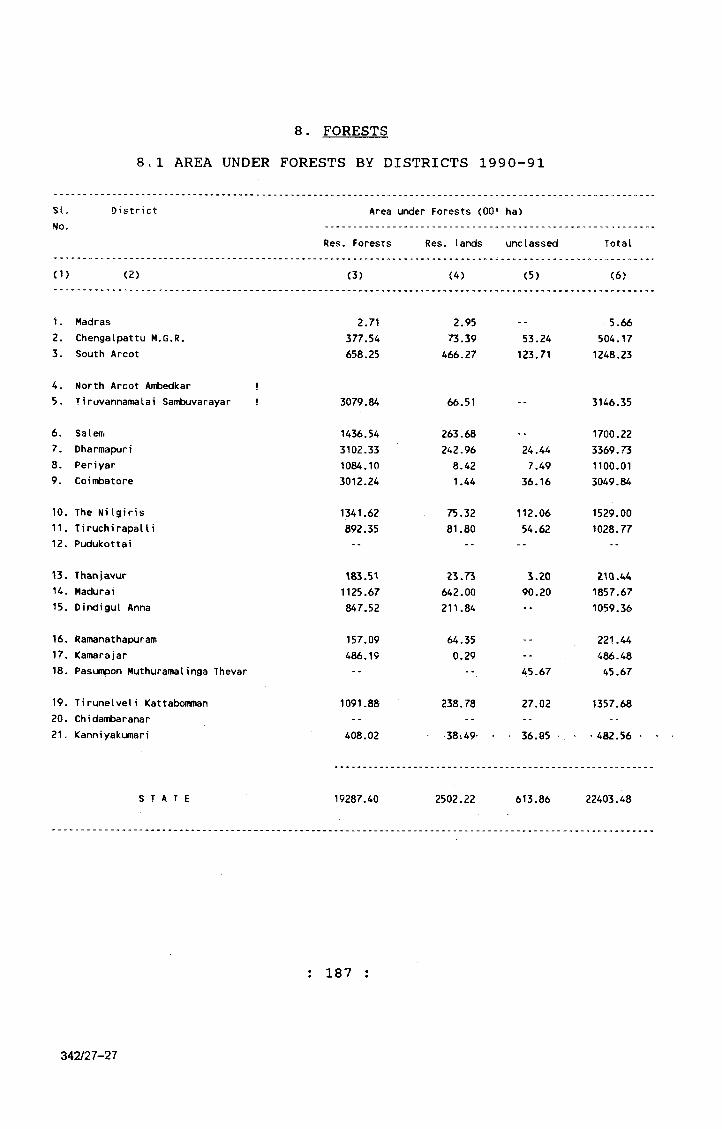
8. FORESTS8.1 AREA UNDER FORESTS BY DISTRICTS 1990-91
si. District No.
Area under Forests (00* ha)
Res. Forests Res. lands unclassed Total
(1) (2) (3) (4) (5) <6)
1. Madras 2.71 2.95 5.662. Chengalpattu M.G.R. 377.54 73.39 53.24 504.173. South Arcot 658.25 466.27 123.71 1248.23
4. North Arcot Artijedkar !5. Tiruvannamalai Sambuvarayar ! 3079.84 66.51 -- 3146.35
6. SaleiTi 1436.54 263.68 1700.227, Dharmapuri 3102.33 242.96 24.44 3369.738. Periyar 1084.10 8.42 7.49 1100.019. Coimbatore 3012.24 1.44 36.16 3049.84
10. The NiIgiris 1341.62 75.32 112.06 1529.0011. Tiruchirapalli 892.35 81.80 54.62 1028.7712. Pudukottai -- -- -- --
13. Tharvjavur 183.51 Z3.73 3.20 Z10.44H . Madurai 1125.67 642.00 90.20 1857.6715. Dindigul Anna 847.52 211.84 -- 1059.36
16. Ramanathapuram 157.09 64.35 221.4417. Kamarajar 486.19 0.29 -- 486.4818. Pasumpon Muthuramalinga Thevar -- 45.67 45.67
19. Tirunelveli Kattabomman 1091.88 238.78 27.02 1357.6820. Chidambaranar -- -- -- -V21, Kanniyakumari 408.02 .38.49- > • 36.85 • 482.56 «
s t a t e 19287.40 2502.22 613.86 22403.48
187
342/27-27
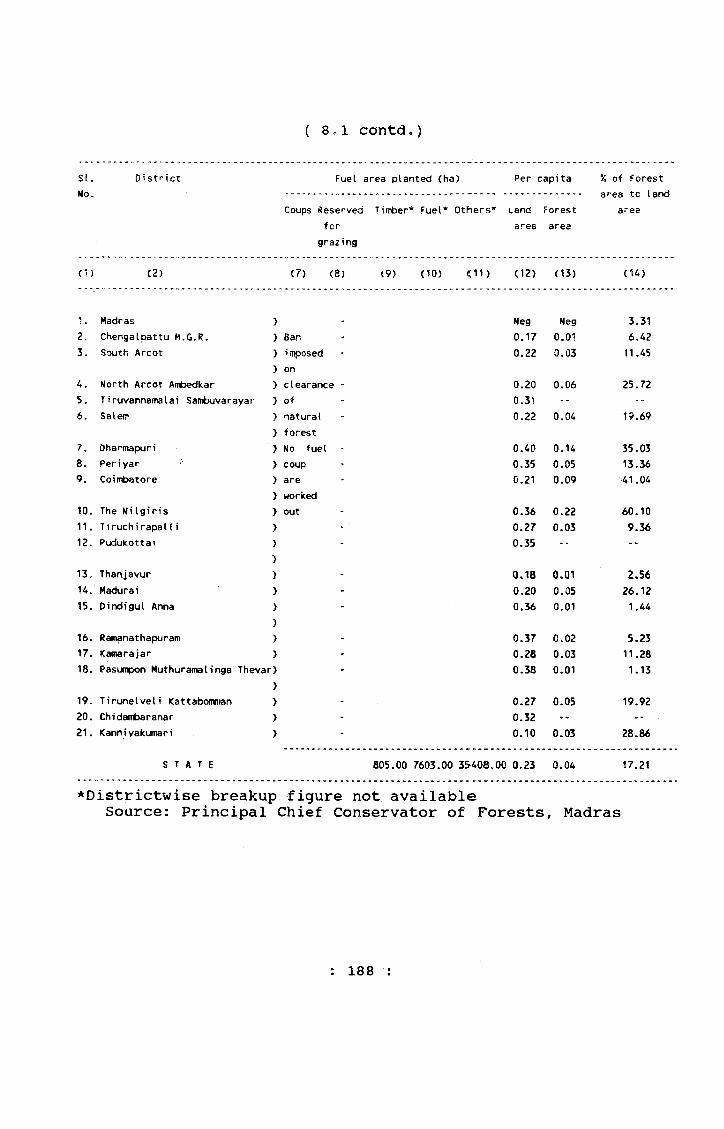
{ Sol contd.)
si. District Fuel area planted (ha) Per capita % of forestNo. area tc land
Coups Reserved Timber* Fuel* Others’' Land Forest areafor ares area
grazing
(1) (2) (7) (8) (9) (10) <11) (12) (13) (14)
1, Madras > Neg Neg 3.312. Chengalpattu M.G.R. > Ban 0.17 0.01 6.423. South Arcot > i mposed 0.22 0.03 11,45
> on4, North Arcot Airtsedkar > clearance - 0.20 0.06 25.725. Tiruvannamalai Sambuvarayar } of 0.31 -- --6. Salem > natural 0.22 0.04 19.69
> forest7. Dharmapuri > No fuel - 0.40 0.14 35,038. Periyar > coup 0.35 0.05 13.369. Coinibatore > are 0.21 0.09 41.04
> worked10. The NiIgiris > out 0.36 0.22 60.1011. Tiruchirapalli > 0.27 0.03 9.3612. Pudukottai > 0.35 -- --
13. Thanjavur/) 0,18 0.01 2.56
14/ Madurai } 0.20 0.05 26.1215. Dindigul Anna >
\
0.36 0.01 1.44
16. Rananathapuramj
> 0.37 0.02 5.2317. Kamarajar > 0.28 0.03 11.2818. Pasumpon Muthuramalinga Thevar} 0.38 0.01 1.13
19. Tirunelveli KattabonmanI
> 0.27 0.05 19.9220. Chidambaranar > 0.32 -- --21. Kanniyakumari > 0.10 0.03 28.86
s t a t e 805.00 7603.00 3S408.00 0.23 0.04 17.21
*Districtwise breakup figure not available Source: Principal Chief Conservator of Forests, Madras
188 :
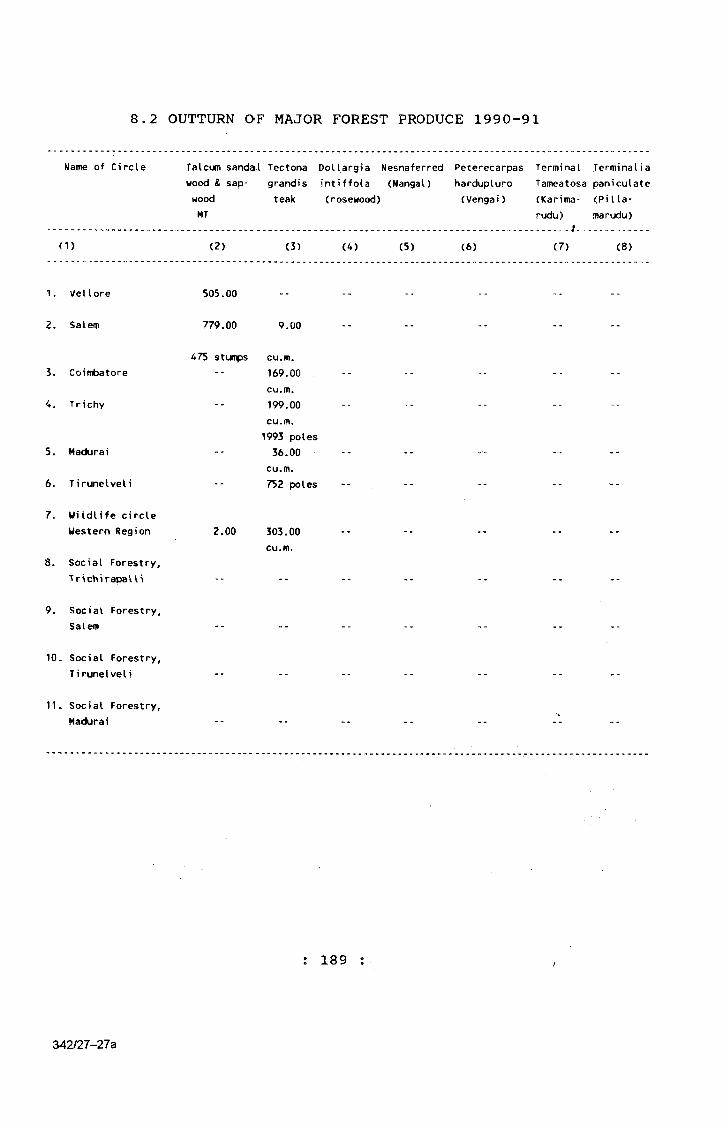
Name of Circle Talcum sandal Tectona Oollargia Nesnaferred Peterecarpas Terminal Terminaliawood & sap- grandis intiffola (Nangal) hardupluro Tameatosa paniculatewood teak (rosewood) (Vengai) (Karima- (Pilla-MT rudu) marudu)
.....-........... -................................................. ......... ....(1) (2) (3) (4) (5) (6) (7) (8)
1. Vellore 505.00
2. Salem 779.00 9.00
475 stumps cu.m.3. Coimbatore -- 169,00
cu.m.4. Trichy -- 199.00
cu.m.1993 poles
5. Madurai -- 36.00 --cu.m.
6. Tirunelveli -- 752 poles --
7. WiIdlife circleWestern Region 2.00 303.00
cu.m.8. Social Forestry,
Trict^irapaUi
9. Social Forestry,Salem
10. Social Forestry,Tirunelveli
11. Social Forestry^Madurai
8.2 OUTTURN OF MAJOR FOREST PRODUCE 1990-91
: 189
342/27-27a
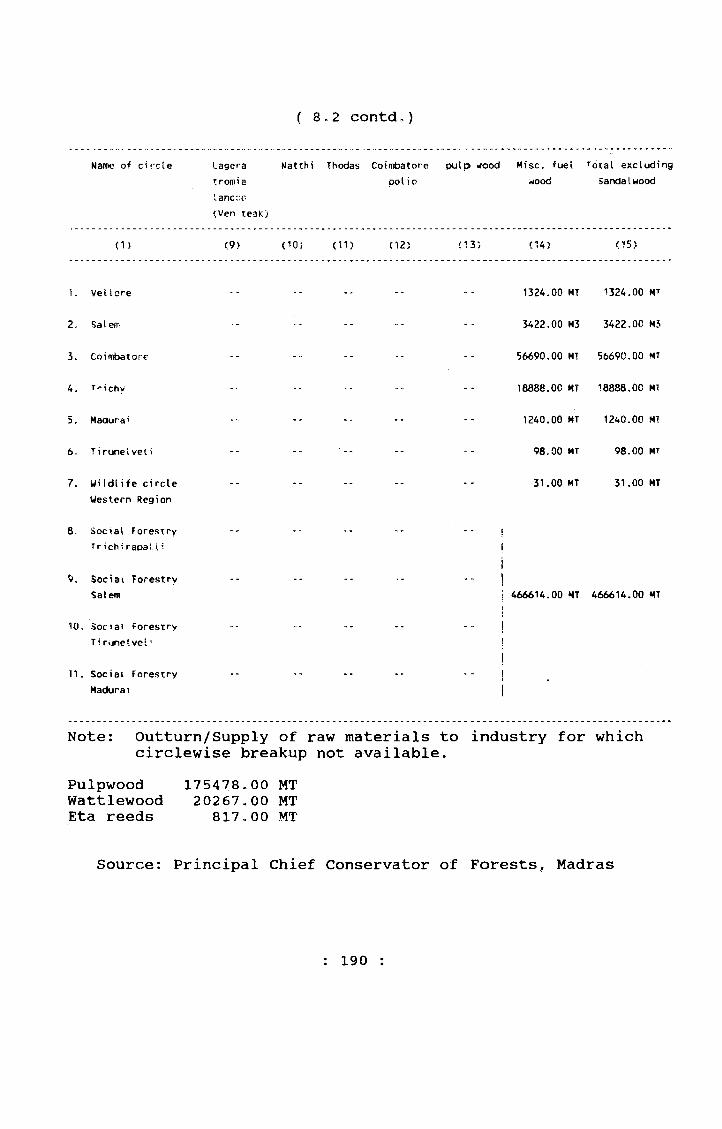
( 8»2 contdo)
Name of circle Lagera tromia lancco <Ven teak)
Natthi Thodas Coimbatore pol io
pulp wood Misc. fuel *jood
Total excluding Sandalwood
(1) <9) (10) (11) (12) <13) (14) <15)
K vet lore -- -- 1324.00 MT 1324.00 MT
2, Sa 1 etT ... -- ... 3422.00 M3 3422.00 M5
3. Coimbatore ... ... -- -- -- 56690.00 MT 56690.00 MT
4. T'-ichy ... •• ... 18888.00 MT 18888.00 MT
5, Maaura' ... -- -- 1240.00 MT 1240.00 MT
6. T i runeiveii -- -- -- 98.00 MT 98.00 MT
7. WiIdlife circle Western Region
-- -- -- -- 31.00 MT 31.00 MT
8 Social Forestry t r i ch i rapa! i
-- ~ - j ! i
Social Forestry Salem
-- -- -- ••11
466614.00 HT 466614.00 MT
10. Social Forestry Ti rijnelvel ■
-- -- -• !J1
11. Social Forestry Madurai
1*1i
'
Note: Outturn/Supply of raw materials to industry for whichcirclewise breakup not available.
Pulpwood 175478.00 MT Wattlewood 20267»00 MT Eta reeds 817,00 MT
Source: Principal Chief Conservator of Forests, Madras
: 190 :

8.3 OUTTURN OF MINOR FOREST PRODUCE - 1990-91si. Name of the Circle/ Description o i produce Produce removed or utiIised(value Rs„in 000)No. Division ............................................-
By Purchase By Govt. By By right-Group holders
(1) (2) (3) (4) (5) (6 ) (7)
Trtii!
(8)
A. CHENGALPATTU
i. Chengalpattu Cashenuts other MFp
Stone quarries
14.6 MT 580.00 1364.00
14.5 MT 580.00 1364.00
2. Cuddalore Grazing Fodder MFP
Cashew
Eucalyptus Hybrid Other MFP
54.0025.00
2011.00 MT +550.00 Nos.
0.50 MT 1.20 MT
54.0025.00 0.50 m
1.20 MT2011.00 NT +550.00 Nos
3. Kallakurichi Tamarind & other MFP 296.00 MTGallnut 51,00 MT
296.00 MT 51.00 MT
8. VELLORE CIRCLE Other MFP Gall nut Tamarind Black granites BambooEucalyptus wood F i rewood Cashew
132.36 MT162.96238.17
6523.09 MT 3306.53 178.30 300.00
621.70 MT
132.36 MT 162.96 238.17 621.70 MT
6523.09 MT 3306.55 178.30 300.00
C. SALEM CIRCLE
1. Salem TamarindGatlnutsStorema'ss '& "freeinass NelIikkai Other MFP
336.12 MT 154.45 ■ 44.60 ' 549.90 MT 406.86 MT
+6500.00 Nos.
336.12 MT 154.45- 4A.69 549.90 MT 406.86 MT
+6500.00 Nos
D. COIMBATORE CIRCLE Tamarind Gal Inut Other MFP
63.0014.00
334.00 65.00
63.0014.00
399.00
E. TRICHY CIRCLE MFP 1701.00 1701.00
: 191 :
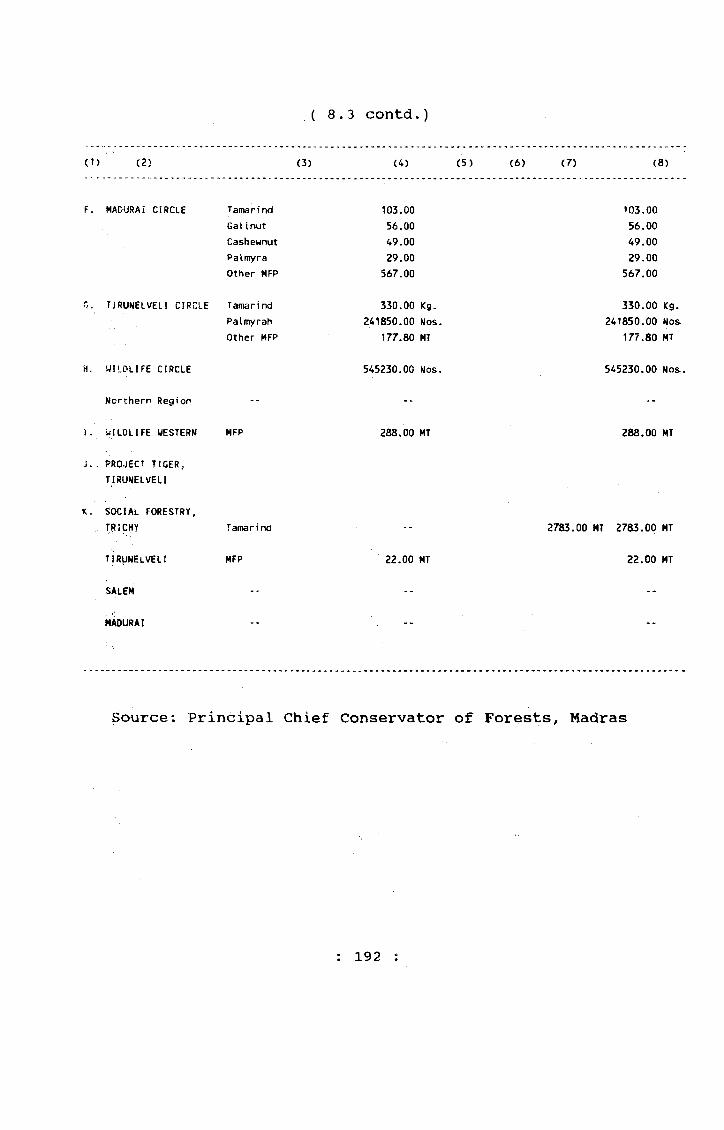
(8.3 contd.)
(1) (2) (3) (4) (5) (6) (7) (8)
f . MADURAI CIRCLE Tamarind Gal I nut Cashewnut Palmyra Other MFP
103.0056.0049.0029.00
567.00
103.0056.0049.0029.00
567.00
r • TIRUNELVELI CIRCLE Tamarind Pa Imyrah Other MFP
330.00 Kg. 241850.00 Nos.
177.80 MT
330.00 Kg. 241850.00 Nos
177.80 MT
H. WILDLIFE CIRCLE 545230.00 Nos. 545230.00 Nos-.
Northern Region -- -- --
I. WILDLIFE WESTERN MFP 288.00 MT 288.00 MT
J. ■ PROJECT TIGER, TIRUNELVELI
K. SOCIAL FORESTRY, TRICHY Tamarind -- 2783.00 MT 2783.00 MT
TIRjJNELVELI MFP 22.00 MT 22.00 MT
SALEM -- --
MADURAI
Source: Principal Chief Conservator of Forests, Madras
192 ;

9. INDUSTRIES 9.1 RESULTS OF ANNUAL SURVEY OF INDUSTRIES 1988-89
81.No.
Characteristics Units Results for all Industries
(1) (2> (3) (4)
Number of Factories Numbers 14*23 ■2 o Fixed capital Rs. in lakhs 847 172.203 . Working Capital n 382C03 ,554. Productive Capital 1229175:775. Invested Capital i« 1290092.306. Outstanding Loan n 622790.747 . Mandays Workers Worked No. in lakhs 2 5918 . Mandays Employees Worked It 32579. All Workers Numbers 72005910. All Employees m 90521811. Wages to Workers Rs. in lakhs 123872.2312. Emoluments to Employees t« 186453,0113 « Fuels consumed tt 183246.6414., Materials consumed It 1372755..9815c Industrial Services (other input) ” 195138.8416. Non-industrial Services II 1874.8317. Total Input II 1751141.6118. Products II 2083363 1419. Other Output II 168514,7820. Total Output II 2251877*9121. Depreciation .............22. Value Added II 413931.2723„ Factory Payment II 104434.8024, Net Income II 309496.49
Source: Commissioner of Statistics, Madras.
: 193 :
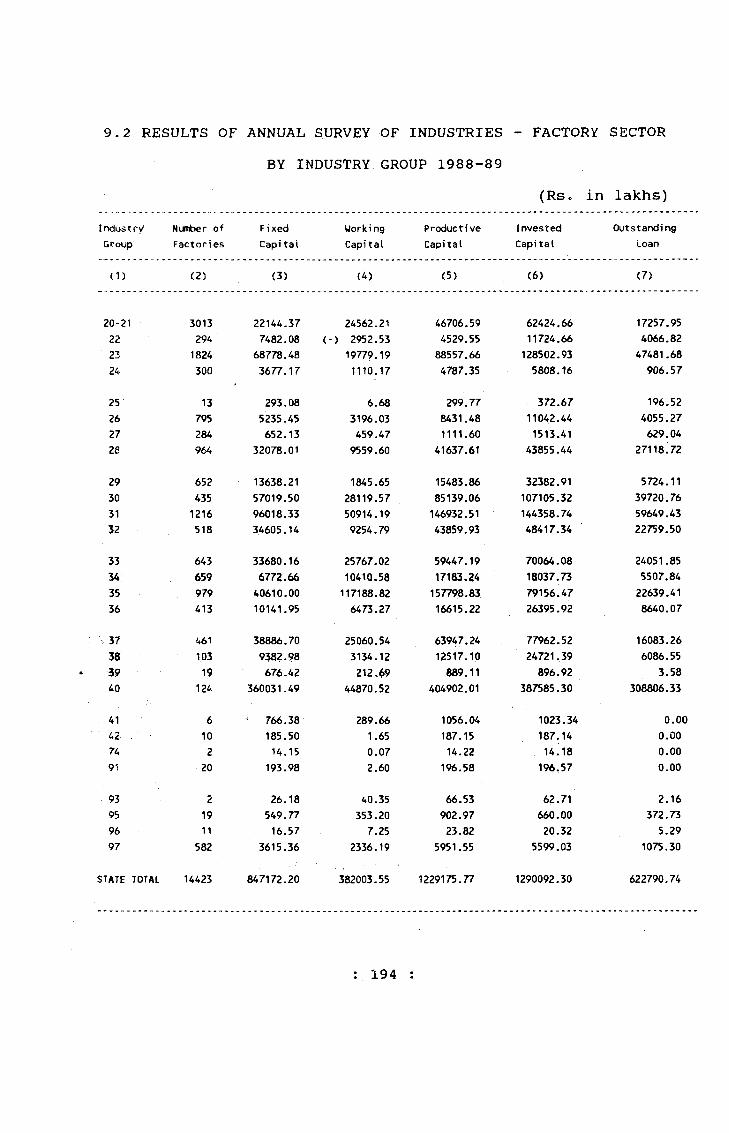
9.2 RESULTS OF ANNUAL SURVEY OF INDUSTRIES ~ FACTORY SECTORBY INDUSTRY GROUP 1988-89
(RSo in lakhs)Industry Number of Fixed Working Productive Invested OutstandingGroyp Factories Capi tai Capital Capital Capital Loan
(1) (2) (3) (4) (5) (6) (7)
20-21 3013 22144.37 24562.21 46706.59 62424,66 17257.9522 294 7482.08 <-) 2952.53 4529.55 11724.66 4066.8223 1824 68778.48 19779.19 88557.66 128502.93 47481.6824 300 3677.17 1110.17 4787.35 5808.16 906.57
25 13 293.08 6.68 299.77 372.67 196.5226 795 5235.45 3196.03 8431.48 11042.44 4055.2727 284 652.13 459.47 1111.60 1513.41 629.0428 964 32078.01 9559.60 41637.61 43855.44 27118.72
29 652 13638.21 1845.65 15483.86 32382.91 5724.1130 435 57019.50 28119.57 85139.06 107105.32 39720.7631 1216 96018.33 50914.19 146932.51 144358.74 59649.4332 518 34605.14 9254.79 43859.93 48417.34 22759.50
33 643 33680.16 25767.02 59447.19 70064.08 24051.8534 659 6772.66 10410.58 17183.24 18037.73 5507.8435 979 40610.00 117188.82 157798.83 79156.47 22639.4136 413 10141.95 6473.27 16615.22 26395.92 8640.07
37 461 38886.70 25060.54 63947.24 77962.52 16083.2638 103 93S2.?8 3134.12 12517.10 24721.39 6086.5539 1.9 676.42 212.69 889.11 896.92 3.58C O 124 360031.49 44870.52 404902.01 387585.30 308806.33
41 6 766.38 289.66 1056.04 1023.34 0.0042 10 185.50 1.65 187.15 187.14 0.0074 2 14.15 0.07 14.22 14.18 0.0091 20 193.98 2.60 196.58 196.57 0.00
93 2 26.18 40.35 66.53 62.71 2.1695 19 549.77 353.20 902.97 660.00 372.7396 11 16.57 7.25 23.82 20.32 5.2997 582 3615.36 2336.19 5951.55 5599.03 1075.30
STATE TOTAL 14423 847172.20 382003.55 1229175.77 1290092.30 622790.74
: 194 :

( 9.2 contd.)
IndustryGroup
Mandays
Workers(Klos.)
worked
Employees(Nos.)
All workers (Nos.)
All Employees (Nos.)
Wages to Workers
Emoluments to Employees
(1) (8) (9) (10) (11) (12) (13)
20-21 25885494 32543783 85691 107308 7600.28 11720.982 2 3062292 4138476 9263 11944 722.79 1339.9623 58749780 65368521 143594 158984 29305.56 34063.7924 3344623 3754953 9173 10232 1661,42 2063.61
25 78210 87104 253 281 15.53 19.4326 9840939 11327087 28664 32909 1968.09 2739.7427 1161397 1399175 3872 4748 259.56 374.9828 10771985 13871269 29804 37703 4285.66 6646.19
29 14740673 16752577 39038 44267 4263.14 5495.4630 6651438 9220936 17302 24092 4424.43 7553.8831 29844363 35701231 80824 96855 8666.98 13993.0832 8147953 10254514 23716 29317 4002.49 5809.90
33 8416889 11284903 23509 31305 4139.84 6473.8334 5316862 7022733 15174 20227 2053.13 3426.6735 16945925 24621922 47725 69566 13670,59 22042.9636 6573545 8777119 18898 25302 3572.95 6065.55
37 22255655 28628728 68316 87541 16436.52 24161.5238 1794177 2408568 4877 6544 909,21 1499.6839 407294 512460 1239 1564 260.09 366-9740 17031711 27135247 46570 74261 11730.17 24588.61
31558 46166 100 149 23.79 36.9642 100533 116937 274 321 44.62 56.3874 5864 7617 22 2,94 4.1391 ■ • ■ 118032 • 142571* • ■ 329 ' 39*5 * ^0.88 ' 68.67
93 116371 156046 286 380 80.52 110.5995 227821 318527 574 757 137.85 231.8096 84461 101614 267 302 31.28 36.9597 7405733 10072599 20711 27942 3551.92 5460.74
STATE TOTAL 259111578 325773383 720059 905218 123872.23 186453.01
: 195
342/27-28

( 9,2 contd.)
IndustpyGroup
FuelsConsuned
MaterialsConsuned
Other Input Non-Ind. Services Total Input Products
(1) C14) (15) (16) (17) (18) (19)
20-21 6923.27 186978.35 12156.61 133.87 206058.24 240489.8322 1605.47 17085.78 12657.07 30.02 31348.32 33533.1423 24814.65 209013.74 20218.90 774.03 254047.29 314848.2524 1879.56 12214.21 1208-05 7.33 15301.82 18573.14
25 7.56 233.94 18.92 0.00 260.42 214.4526 436.67 26532.04 7806.50 5.40 34775.22 38961.2327 70.08 2134.25 381.56 0.52 2585.90 2 9 3 6 . 7 9
28 8787.16 40455.37 26861.74 58.22 76104.27 65822.56
29 1196.87 79454.67 8800.70 204.21 89452.24 93295,8230 14902.83 213478.88 9407.77 58.40 237789.49 283888.2431 18308.81 105959.28 20411.80 256.52 144679.88 184401.3532 17027.82 28376.74 5407.31 46.49 50811.86 68165.61
33 12231.64 85898.00 6902.62 57.38 105032.25 119541.5234 1012.23 19934.08 3736.33 17.32 24682.63 26455.4935 4204.44 135141.04 23302.90 20.23 162648.38 197652.4736 927.51 48764.28 6035.41 85.35 55727.20 67186.77
37 3819.80 107692.14 16881.00 88.85 128392.93 151619.4438 251.78 10016.62 1794.91 12.73 12063.31 16223.2839 74.90 1313.50 27.88 0.00 1416.28 33.5740 63719.09 33462.52 9247.14 0.00 106428.74 157710.07
41 12.93 1646.51 18.63 0.00 1678.07 965.0542 162.07 75.34 3.31 0.00 240.72 60.1474 3.75 0.51 0.91 0.00 5.17 2.4591 70.82 1.76 5.00 0.00 77.58 0.00
95 45.72 56.43 14.70 0.00 116.85 122.1295 76.33 216.57 203.22 0.00 496.11 481.009 6 28.06 46.32 15.65 0.00 90.03 0.0097 644.82 6573.11 1612.30 17.96 8830.41 179.35
STATE TOTAL 183246.64 1372755.98 195138.84 1874.83 1751141.61 2083363.14
196 :
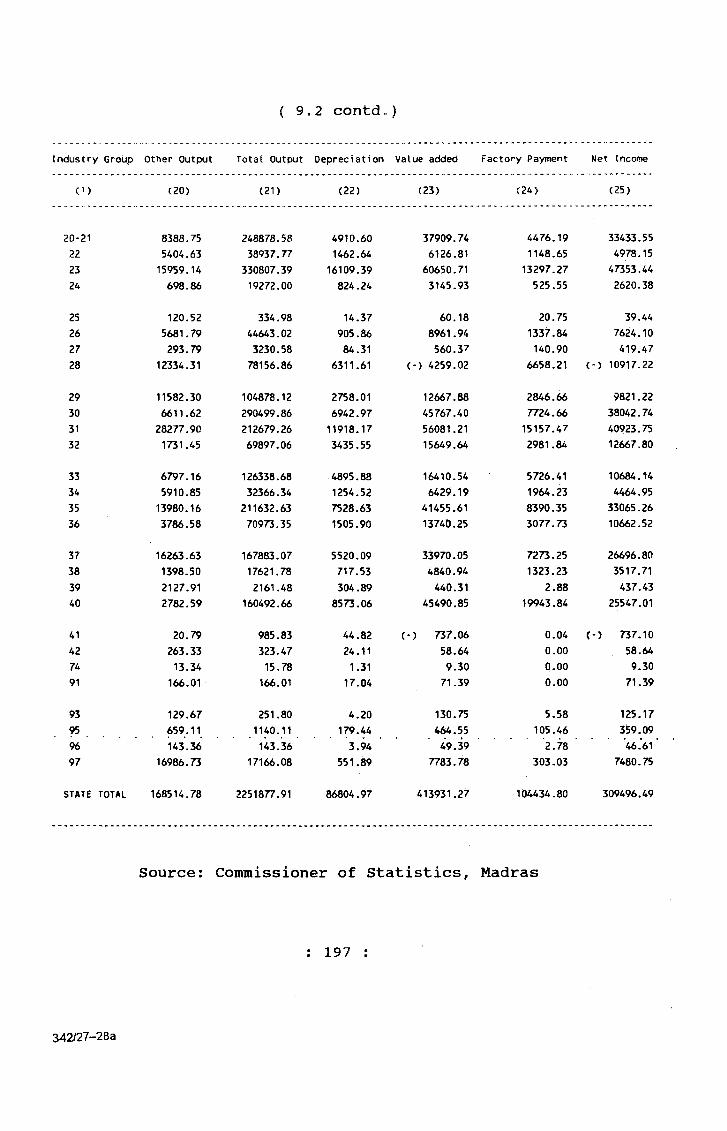
( 9.2 contd.)
Irtdustry Group Other Output Total Output Depreciation Value acided Factory Payment Net Income
(1) (20) (21) (22) (23) (24) (25)
20-21 8388.75 248878.58 4910.60 37909.74 4476.19 33433.5522 5404.63 38937.77 1462.64 6126.81 1148.65 4978,1523 15959.14 330807.39 16109.39 60650.71 13297.27 47353,4424 698.86 19272.00 824.24 3145.93 525.55 2620.38
25 120.52 334.98 14.37 60.18 20.75 39.4426 5681.79 44643.02 905.86 8961.94 1337.84 7624.1027 293.79 3230.58 84.31 560.37 140.90 419.4728 12334.31 78156.86 6311.61 (-) 4259.02 6658.21 (-) 10917.22
29 11582.30 104878.12 2758.01 12667.88 2846.66 9821.2230 6611.62 290499.86 6942.97 45767.40 7724.66 38042.7431 28277.90 212679.26 11918.17 56081.21 15157.47 40923,7532 1731.45 69897.06 3435.55 15649.64 2981.84 12667.80
33 6797.16 126338.68 4895.88 16410.54 5726.41 10684.1434 5910.85 32366.34 1254.52 6429.19 1964.23 4464.9535 13980.16 211632.63 7528.63 41455.61 8390.35 33065.2636 3786.58 70973.35 1505.90 13740.25 3077.73 10662.52
37 16263.63 167883.07 5520.09 33970.05 7273.25 26696.8038 1398.50 17621.78 717.53 4840.94 1323.23 3517.7139 2127.91 2161.48 304.89 440.31 2.88 437.4340 2782.59 160492.66 8573.06 45490.85 19943.84 25547.01
41 20.79 985.83 44.82 (-) 737.06 0.04 (-) 737.1042 263.33 323.47 24,11 58.64 0.00 58,6474 13.34 15.78 1.31 9.30 0,00 9.3091 166.01 166.01 17.04 71.39 0,00 71.39
93 129.67 251.80 4.20 130.75 5.58 125,1795 659.11 1140.11 179.44 464.55 105,46 359.0996 143.36 143.36 3.94 49.39 2,78 46.6197 16986.73 17166.08 551.89 7783.78 303,03 7480,75
STATE TOTAL 168514.78 2251877.91 86804.97 413931,27 104434.80 309496.49
Source: Commissioner of Statistics, Madras
: 197 ;
342/27-283
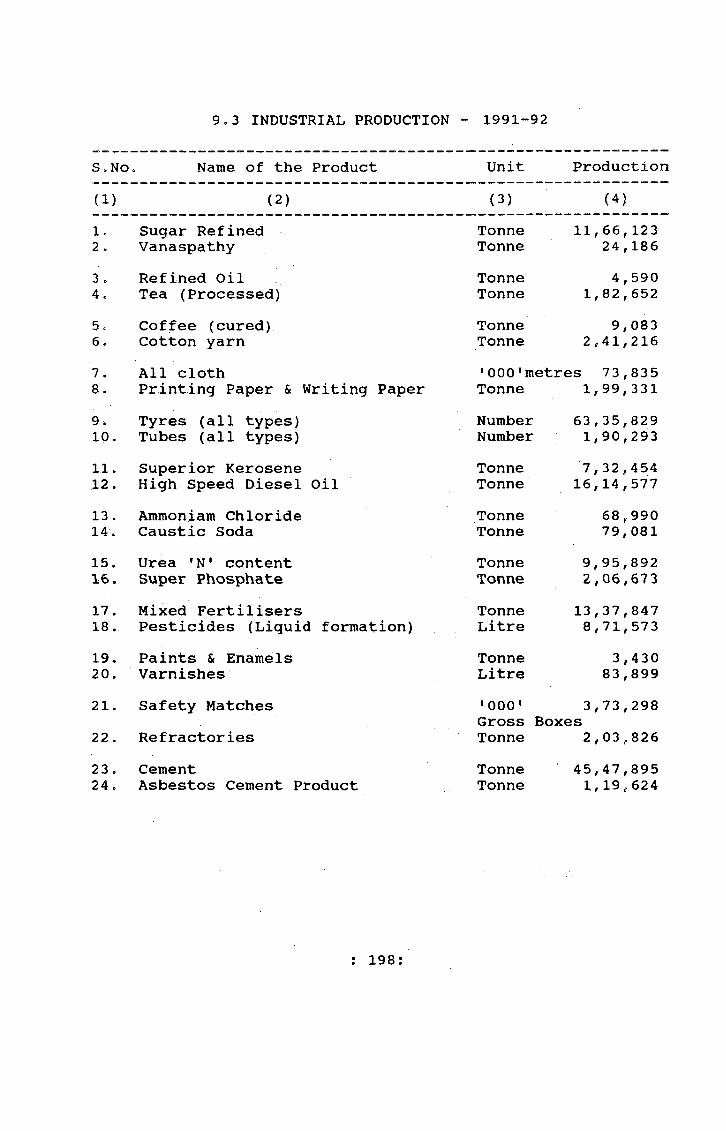
9.3 INDUSTRIAL PRODUCTION - 1991-92
S. No Name of the Product Unit Production
(1) (2) (3) (4)lo Sugar Refined Tonne 11,66,1232 . Vanaspathy Tonne 24,1863 » Refined Oil Tonne 4,5904o Tea (Processed) Tonne 1,82,6525. Coffee (cured) Tonne 9, 0836. Cotton yarn Tonne 2,41,2167. All cloth '000’metres 73,8358. Printing Paper & Writing Paper Tonne 1,99,3319. Tyres (all types) Number 63,35,82910. Tubes (all types) Number 1,90,29311. Superior Kerosene Tonne 7,32,45412. High Speed Diesel Oil Tonne 16,14,57713 . Ammoniam Chloride Tonne 68,99014. Caustic Soda Tonne 79,08115, Urea *N' content Tonne 9,95,89216. Super Phosphate Tonne 2,06,67317. Mixed Fertilisers Tonne 13,37,84718. Pesticides (Liquid formation) Litre 8,71,57319, Paints & Enamels Tonne 3,4 3020. Varnishes Litre 83,89921. Safety Matches »000' 3,73,298
Gross Boxes22. Refractories Tonne 2,03,82623o Cement Tonne 45,47,89524. Asbestos Cement Product Tonne 1,19,624
: 198:

(9.3 contd =)
(1) (2) (3) (4)
25.26.
Coated Abrasiv^es Grinding wheel
ReamTonne
40,291 4,7 13
27.28.
Bars and RodsAngles Channels & Flats
TonneTonne
1, v?7,662 :>4 j 03 4
29 „ 30.
Malleable Castings Ordinary Castings
TonneTonne
4,90352,81.3
31o 32 ,
Non-ferrious c:astings Tin Boxes containers
TonneTonne
2,062- 5 671
33 .34 .
TractorsLoaders
NumbersNumber
24,370240
35.36o
High Pressure Boilers & Fittings Diesel Engines
TonneNumber
1,14,972 86,410
37.38.
Textile Rings & Frames Power Driven Pumps
NumberNumber
24,78,122 1,91,413
39.40.
TypewritersTransformers
Number K.V.A.
35,8428,77,648
41.42.
Electric Motorrs Flash Light C^ll
Number '000' No.
1,60,055 1,71,856
43.44.
Railway Coaches Railway Wagons
NumberNumber
1,0X614-2
45 c
46.• Motor Vehicle. Chassis......... ...........
Body Building. Number . , Number
. . 21, 7.04 1,472
47.48.
Motor Cycles Bicycles
NumberNumber
1,99,26412,46,363
Source: Oommisioner of Statistics, Madras
: 199 :
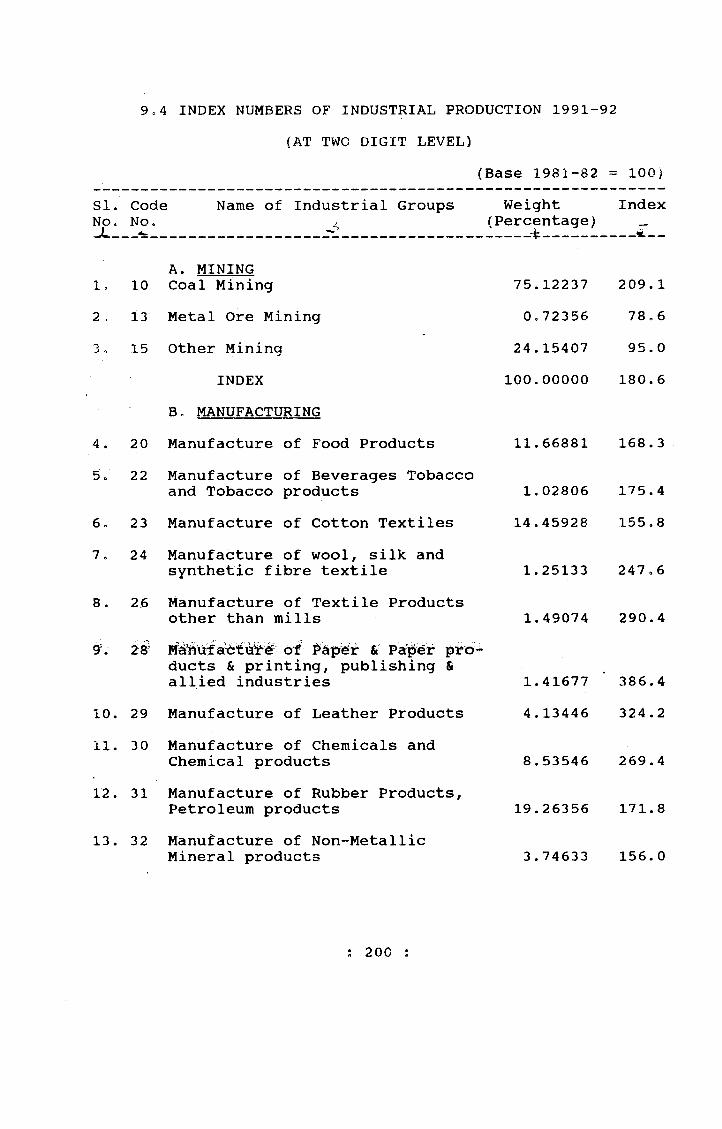
(AT TWO DIGIT LEVEL)(Base 1981-82 = 100)
Name of Industrial Groups Weight Index
9o4 INDEX NUMBERS OF INDUSTRIAL PRODUCTION 1991-92
SI. CodeNOc NOc
Weight (Percentage) ----- rt------
1 , 10 2, 133.. 15
4 . 205c 22
6. 2 37. 24
8. 26
10. 2911. 30
1 2 . 3 1
13. 32
A. MINING Coal MiningMetal Ore MiningOther Mining
INDEXB, MANUFACTURINGManufacture of Food ProductsManufacture of Beverages Tobacco and Tobacco productsManufacture of Cotton TextilesManufacture of wool, silk and synthetic fibre textileManufacture of Textile Products other than mills
of & Psr^r products & printing, publishing & allied industriesManufacture of Leather ProductsManufacture of Chemicals and Chemical productsManufacture of Rubber Products, Petroleum productsManufacture of Non-Metallic Mineral products
75.12237 0,72356
24.15407 100.00000
209. 1 7 8 o 6
95, 0 180. 6
11.66881 168.3
1.02806 175.414.45928 155.8
1.25133 247,6
1.49074 290.4
1.41677 ‘ 386.4 4.13446 324.2
8.53546 269.4
19.26356 171.8
3.74633 156.0
200 :

( 9.4 contdc)
(1) (2) (3) (4) (5)
14 . 33 Manufacture of Basic Metal and Alloy Industries 4,85032 2 2 0 „ 3
15. 34 Manufacture of Metal Products and Parts except Machinery lo 54759 155. 0
16. 35 Manufacture of Machinery, Machine Tools and Parts except Electrical Machinery 1 0 .2 5 0 0 7 171. 6
17, 36 Manufacture of Electrical Machinery Apparatus, Appliances and Supplies and Parts 3 . 9 7 5 1 1 229. 6
18 . 37 Manufactures of Transport Equipments and Parts 1 2 ,0 9 6 8 7 16S.0
19. 38 Other Manufacturing Industries 0 .2 8 5 2 4 5 2 7 .2
INDEX 1 0 0 . 0 0 0 0 0 1 9 3 .8
e. ELECTRICITY
20 . 40 Electricity 1 0 0 . poooo 15,6.5
INDEX loo.poopo 1 5 6 .5
GENERAL INDEX 1 0 0 . 0 0 0 0 0 1 9 0 . 6
Source: Goininissioner of Statistics, Madras
: 201 :
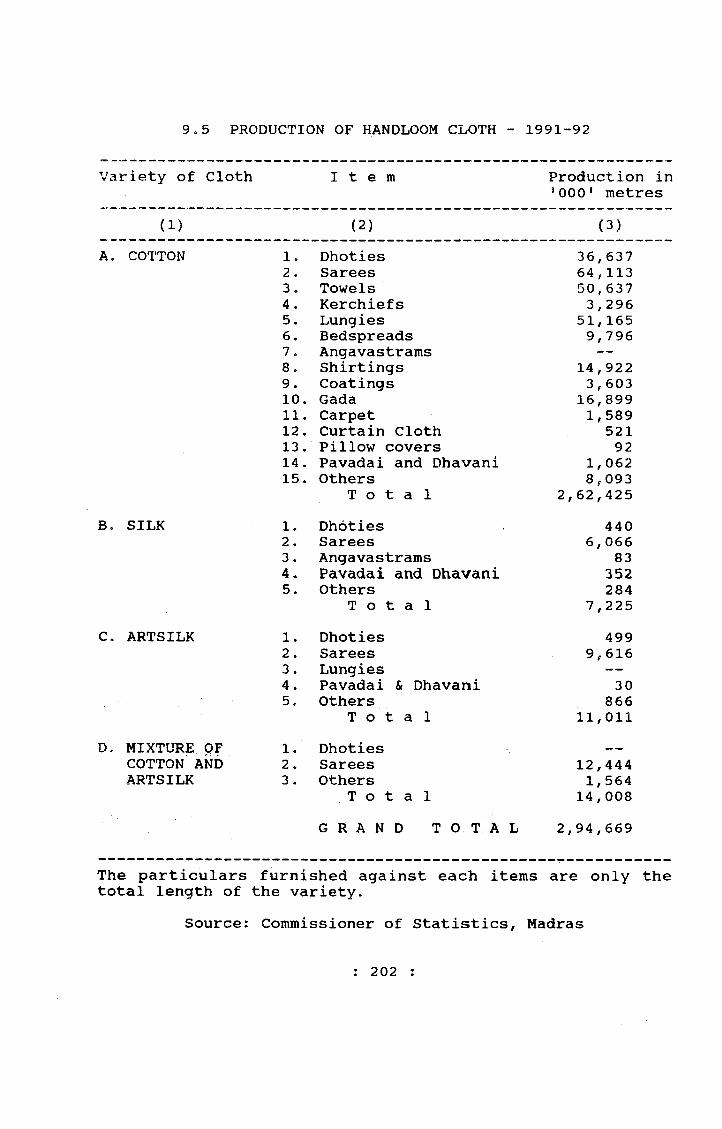
9=5 PRODUCTION OF HANDLOOM CLOTH - 1991-92
Variety of Cloth I t e m Production in *000* metres
(1) (2) (3)A. COTTON lo Dhoties 36,637
2 . Sarees 64,1133. Towels 50,6374. Kerchiefs 3,2965. Lungies 51,1656. Bedspreads 9,7967. Angavastrams -—8. Shirtings 14,9229. Coatings 3 , 60310. Gada 16,89911. Carpet 1,58912. Curtain Cloth 52113 . Pillow covers 9214. Pavadai and Dhavani 1, 06215. Others 8, 093
T o t a l 2,62,425B, SILK 1. Dhoties 440
2. Sarees 6, 0663. Angavastrams 834, Pavadai and Dhavani 3525. others 284
T o t a l 7,225C, ARTSILK 1. Dhoties 499
2. Sarees 9, 6163. Lungies —4. Pavadai & Dhavani 305e Others 866
T o t a l 11,OilD. MIXTURE OF 1. Dhoties
COTTON AND 2. Sarees 12,444ARTSILK 3 . Others 1,564
T o t a 1 14,008G R A N D T O T A L 2,94,669
The particulars furnished against each items are only the total length of the variety.
Source: Commissioner of Statistics, Madras
: 202 :
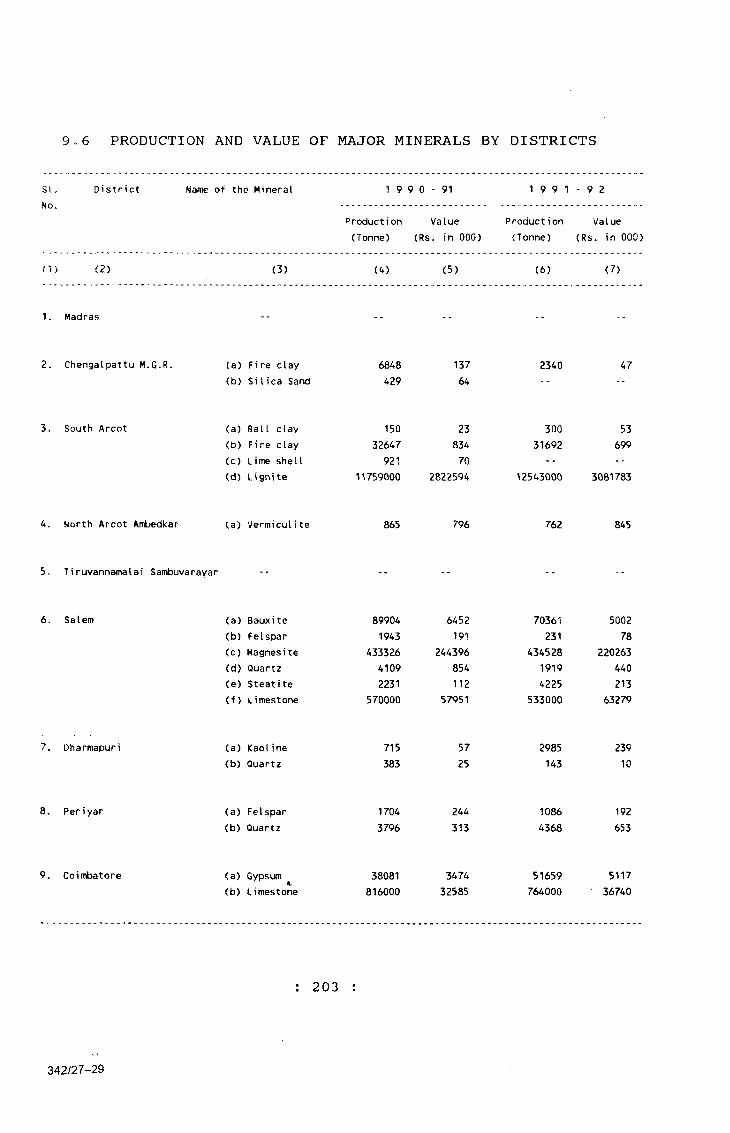
9.6 PRODUCTION AND VALUE OF MAJOR MINERALS BY DISTRICTS
St. No.
District Name of the Mineral 1 9 9 0 - 91 1 9 9 1 - 9 2
Production(Tonne)
Value (Rs. in 000)
Production(Tonne)
Value (Rs. in 000)
O ) (2) (3) (4) (5) (6) (7)
1. Madras -- -- -- --
2. Chengalpattu M.G.R. (a) Fire clay 6848 137 2340 47(b) Silica Sand 429 64
3. South Arcot (a) Ball clay 150 23 300 53(b) Fire clay 32647 834 31692 699(c) Lime shell 921 70 -- --(d) Lignite 11759000 2822594 12543000 3081783
4. North Arcot Ambedkar (a) Vermiculite 865 796 762 845
5. Tiruvannamalai Sambuvarayar -- -- -- --
6. Salem (a) Bauxite 89904 6452 70361 5002<b) Felspar 1943 191 231 78(c) Magnesite 433326 244396 434528 220263(d) Quartz 4109 854 1919 440(e) Steatite 2231 112 4225 213(f) Limestone 570000 57951 533000 63279
7. Dharmapuri (a) Kaoline 715 57 2985 239(b) Quartz 383 25 143 10
8. Periyar (a) Felspar 1704 244 1086 192(b) Quartz 3796 313 4368 653
9, Coimbatore (a) Gypsum 38081 3474 51659 5117(b) Limestone 816000 32585 764000 36740
: 2 03
342/27-29

( 9.6 contd.) (3) (4)(1) (2 ) (5) (6) (7)
10. The NiIgiris (a) Bauxite(b) Latrerite
520404044
265259
298248145
1881117
11. Tiruchirapalli (a) Felspar 1382 268 1294 285(b) Fireclay 41046 1147 12882 455(c) Gypsum 2766 342 1751 324(d) Limestone 1565000 46892 1596000 49427(e) Quartz 1333 269 4529 1114
12. Tbanjavur (a) Si Iica Sand -- -- 5955 238
13. Pudukottai -- -- -- -- --
14. Madurai (a) Graphite 3365 1010 3210 963(b) Limestone 2000 75 3000 95
15. Dindigul Anna (a) Felspar -- -- 1125 266(b) Limestone 760000 30885 1001000 41658(c) Quartz *• -- 3770 978
16. Ramanathapuram (a) Limeshell 1986 291 988 157
17. Kamarajar (a) Limestone 784000 59887 1238 79130
18. Pasumpon Muthuramalinga Thevar -- -- -- -- --
19. Tirunelveli Kattabomman (a) Garmet (Abrasive) 17421 2006 4010 602<b) Limestone 1112000 98440 1139000 114173(c) Silica Sand -- -- 1840 276
20. Chidambaranar (a) Limestone 87000 5480 107000 6735000
21. Kanniyakumari (a) Garmet (Abrasive) 2072 1607 1080 783
22. Tamil Nadu (a) Natural Gas 50 mcm 57750 161 185955(b) Petroleum(crude) 313000 699555 315000 704025
Source: Controller General, Indian Bureau of Mines, Nagpur
: 204 :

9,7 OUTPUT OF MINOR MINERALS BY DISTRICTS 1990-91
SI.No.
District
(2 )
Name of the minor Mineral
Production Value (Tonne) (Rs.in 000)
(1 ) (3) (4) (5)
Madras2. Chengalpattu}
}M.G.R. >(a) Sand 1112.0 7„00(b) Gravel 26734 . 0 140.00(c) Stone 4121.0 126„00(d) Metal 23834 . 0 1724.00(e) Chips 4439,0 259o 00
3. South Arcot (a) Sand 3335,0 M^ 28,00(b) Gravel 2095.0
14098.0 M^160.00
(c) Stone 940. 0 M^ 38.00(d) Metal 2467.0
38982.0+M^
3534.00
4. North Arcot Ambedkar
(a)(b)
SandGravel
39. 0 10228.0
2o00573,00
(c) Metal 27204.0 7520.005. Tiruvannamalai
^ambiivarayar(a)(b)
SandGravel
15. 0 10301.0
1. 00 577.00
(c) Metal 19163.0 5907.006. Salem (a) Sand 11744.0
1180.0+m 3
119.00
(b) Gravel 3897.010277.0
+m 3
97.00
(c) Metal 20103.042142.0
+m ^
1983.00
: 205 :
342 /27-293
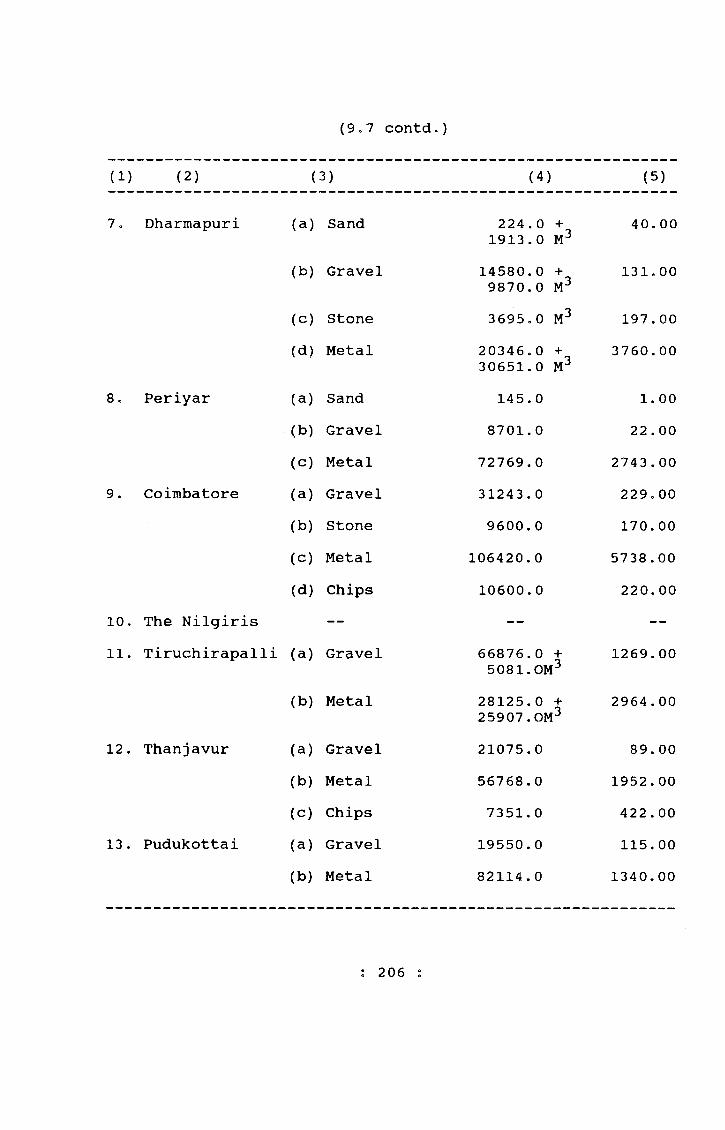
(9.7 contd.)
(1) (2) (3) (4) (5)
7« Dharmapuri (a) Sand 224.0 + 1913.0 M^
40, 00
(b) Gravel 14580.0 + 9870.0 M^
131,00
(c) Stone 3695,0 M^ 197,00(d) Metal 20346.0 +
30651.0 M^3760,00
8 . Periyar (a) Sand 145. 0 1. 00(b) Gravel 8701.0 22,00(c) Metal 72769.0 2743.00
9. Coimbatore (a) Gravel 31243.0 229o 00(b) Stone 9600.0 170.00(c) Metal 106420.0 5738.00(d) Chips 10600.0 220,00
10. The Nilgiris — — —11. Tiruchirapalli (a) Gravel 66876.0 +
5081.0M^1269.00
(b) Metal 28125.0 + 25907.OM^
2964.00
12 . Thanjavur (a) Gravel 21075.0 89. 00(b) Metal 56768.0 1952.00(c) Chips 7351.0 422.00
13. Pudukottai (a) Gravel 19550.0 115.00(b) Metal 82114.0 1340.00
206
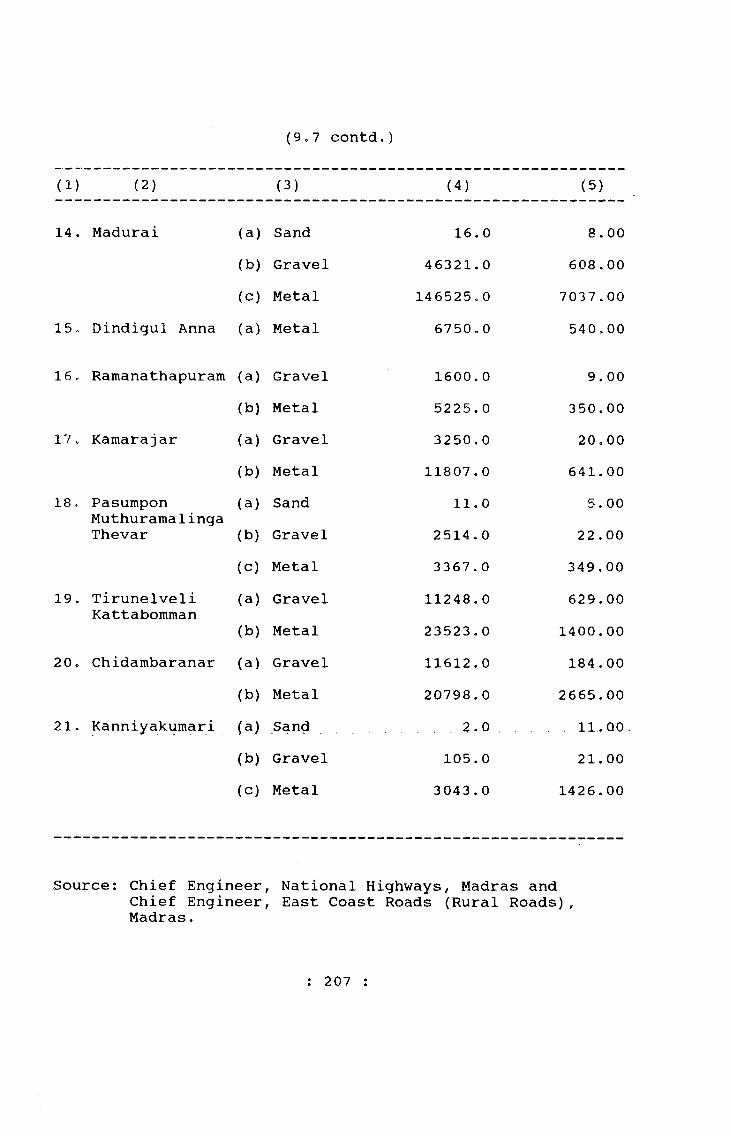
(9,7 contd.
(1) (2) (3) (4) (5)
14 . Madurai (a) Sand 16. 0 8„ 00
(b) Gravel 46321.0 608.00(c) Metal 146525e0 7037.00
15. Dindigul Anna (a) Metal 6750.0 540,00
16 » Ramanathapuram (a) Gravel 1600.0 9. 00(b) Metal 5225.0 350.00
17 « Kamarajar (a) Gravel 3250.0 20. 00(b) Metal 11807.0 641.00
18 Pasumpon (a) Sand 11.0 5. 00MuthuramalingaThevar (b) Gravel 2514.0 22 . 00
(c) Metal 3367.0 349.0019. Tirunelveli (a) Gravel 11248.0 629.00
Kattabomman(b) Metal 23523.0 1400.00
20, Chidambaranar (a) Gravel 11612.0 184.00(b) Metal 20798.0 2665.00
21. Kanniyakumari (a) Sand ....... 2.Q , , . 11.00(b) Gravel 105. 0 21. 00(c) Metal 3043.0 1426.00
Source: Chief Engineer, National Highways, Madras andChief Engineer, East Coast Roads (Rural Roads), Madras.
: 207 :

9.8 Sr^ALL SCALE INDUSTRIES 1991-92
SI.No,
IndustrialGroup
C l a s s i f i c a t i o n No. of Units
(1) (2) (3) (4)1» 20-21 Food and Food Products 186532 . 22 Beverages, Tobacco and Tobacco products 13873 o 23 Cotton Textiles 95394, 24 Wool; Silk and Synthetic Fibre Textiles 16055. 25 Jute, Hemp and Mests Products 1696. 26 Hosiery and Readymade Garments 118417. 27 Wood and Wooden Products 51988. 28 Paper and Paper Products 105429c 29 Leather and Fur Products 362710. 30 Rubber and Plastic Products 693711„ 31 Chemical and Chemical Products 1327212 . 32 Non-metallic Mineral Products 696613 . 33 Basic Metal Products 309514 . 34 Metal Products and Parts 1389915o 35 Machinery and Parts except electrical 1477416. 36 Electrical Machinery & Apparatus 599917. 37 Transport equipments and parts 500718 o 38 Other manufacturing industries 5894
T o t a l 138404
Source: Industries Commissioner and Director of Industries and Commerce, Madras.
: 208 ;
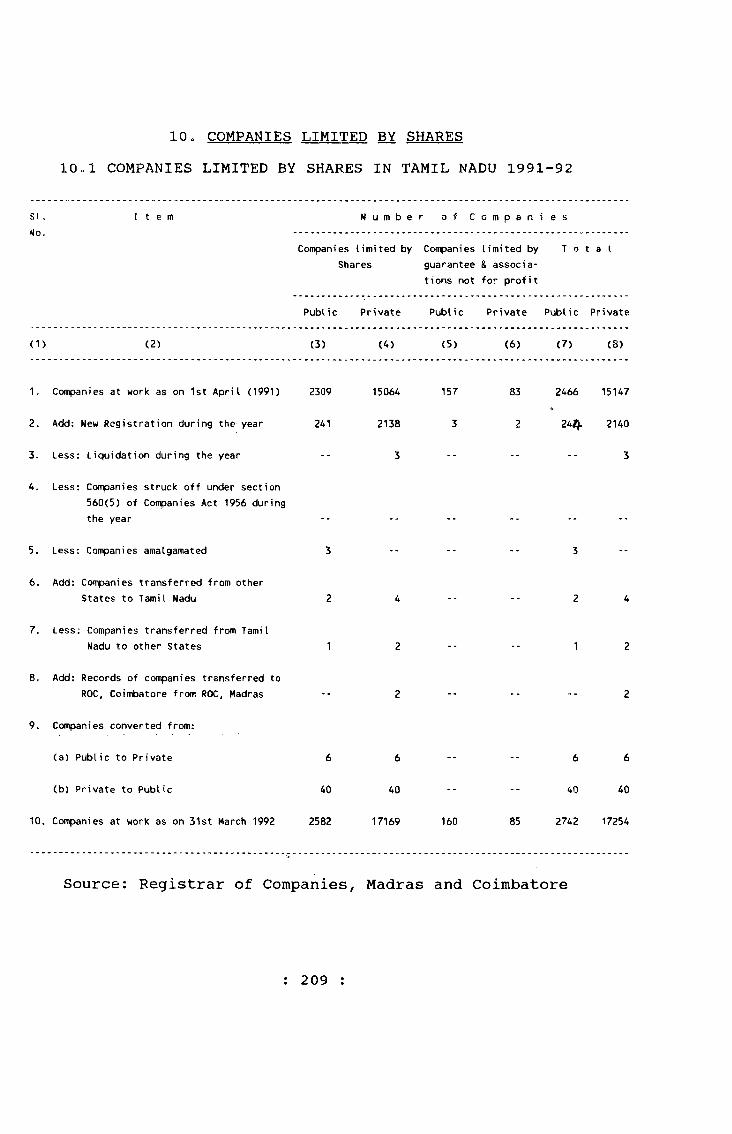
10„ COMPANIES LIMITED BY SHARES10ol COMPANIES LIMITED BY SHARES IN TAMIL NADU 1991-92
s u I t e m N u m b e r 0 f C 0 m p a n i e s
Companies limited by Shares
Companies limited by guarantee & associations not for profit
T 0 t 3 I
Public Private Public Private Public Private
(1) (2) (3) (4) (5) (6) (7) (8)
1. Companies at work as on 1st April (1991) 2309 15064 157 83 2466 15147
2. Add: New Registration during the year 241 2138 3 2 24i^ 2140
3. Less: Liquidation during the year -- 3 -- -- -- 3
4. Less: Companies struck off under section 560(5) of Companies Act 1956 during the year
5. Less: Companies amalgamated 3 -- -- -- 3 --
6. Add; Companies transferred from other States to Tamil Nadu 2 4 -- -- 2 4
7. Less: Companies transferred from Tamil Nadu to other States 1 2 -- -- 1 2
8. Add: Records of companies transferred to ROC, Coimbatore from ROC, Madras -- 2 -- -- -- 2
9. Companies converted from:
(a) Public to Private 6 6 -- -- 6 6
(b) Private to Public 40 40 -- -- 40 40
10. Companies at work as on 31st March 1992 2582 17169 160 85 2742 17254
Source; Registrar of Companies, Madras and Coimbatore
: 209 :
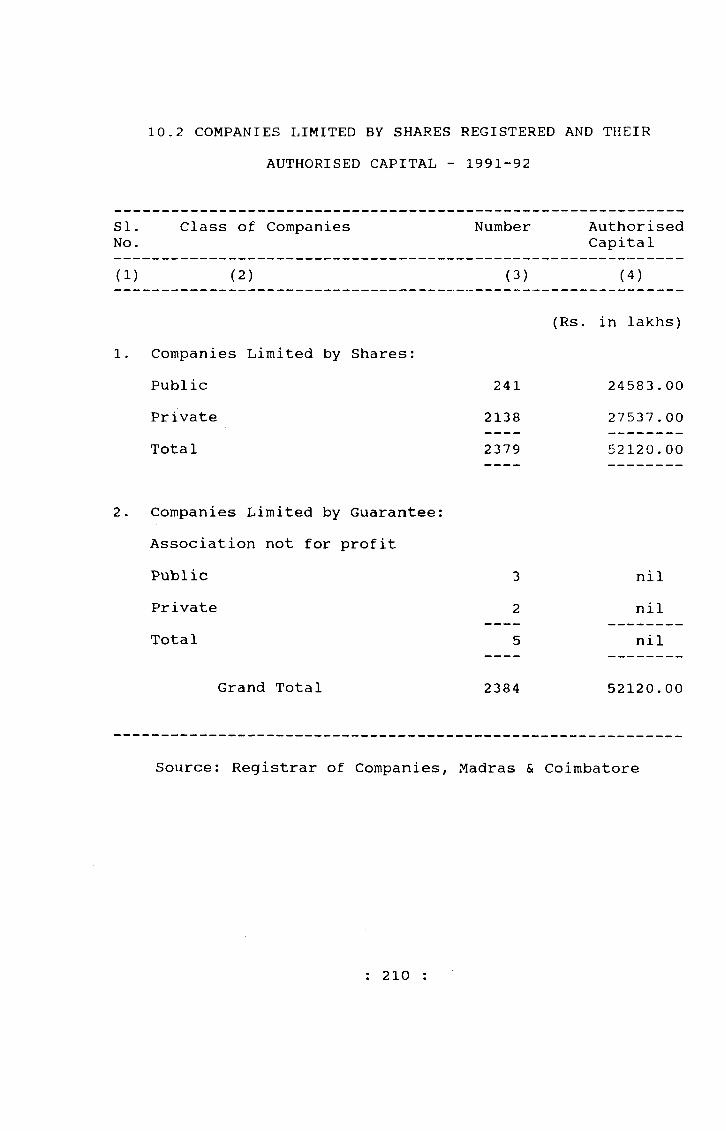
10.2 COMPANIES LIMITED BY SHARES REGISTERED AND THEIRAUTHORISED CAPITAL - 1991-92
SI, No.
Class of Companies Number AuthorisedCapital
(1) (2) (3) (4)
(Rs. in lakhs)1. Companies Limited by Shares:
Public 241 24583.00Private 2138 27537.00Total 2379 52120.00
2 . Companies Limited by Guarantee: Association not for profitPublic 3 nilPrivate 2 nilTotal 5 nil
Grand Total 2384 52120.00
Source: Registrar of Companies, Madras & Coimbatore
: 210 :
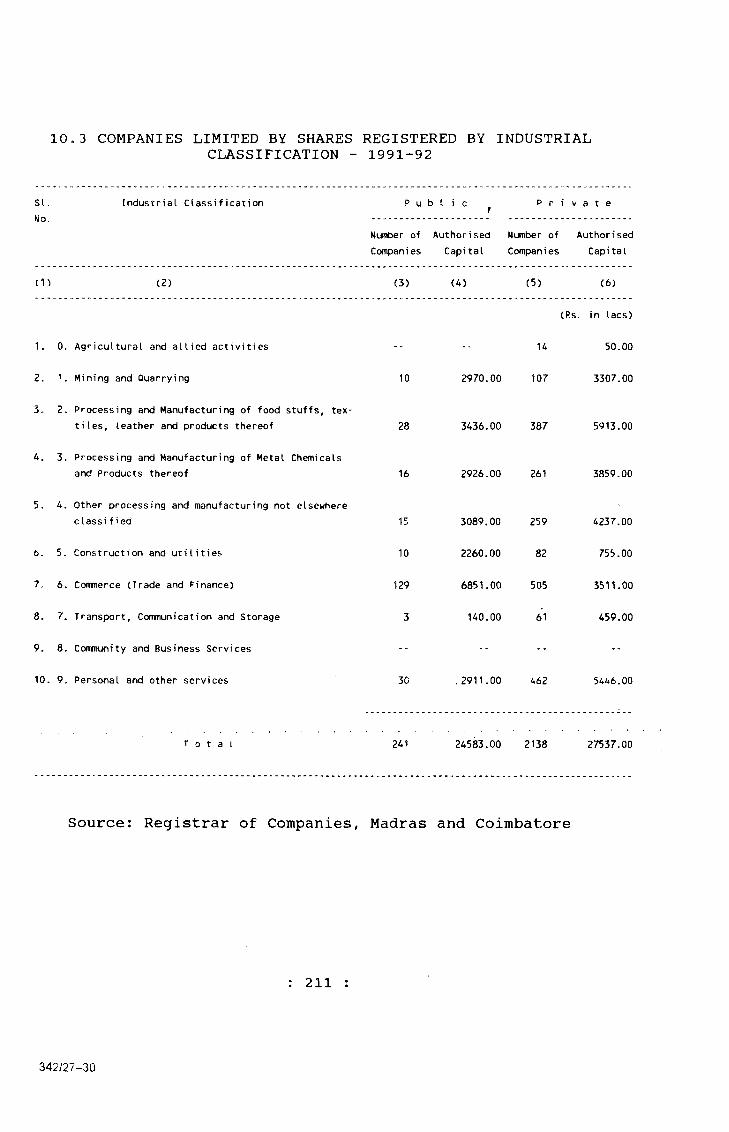
10,3 COMPANIES LIMITED BY SHARES REGISTERED BY INDUSTRIALCLASSIFICATION - 1991-92
SI.No.
(1)
Industrial Classification P u b I i c P r i v a t e
(2)
1. 0, Agricultural and allied activities
2. 1. Mining and Quarrying
3. 2. Processing and Manufacturing of food stuffs, textiles, leather and products thereof
4. 3. Processing and Manufacturing of Metal Chemicalsand Products thereof
5. i * . Other processing and manufacturing not elsewhereclassified
6. 5. Construction and utilities
7. 6. Commerce (Trade and Finance)
8. 7 . Transport, Communication and Storage
9. 8. Community and Business Services
10. 9. Personal and other services
Nudtoer of Authorised Number of AuthorisedCompanies Capital Companies Capital
(3)
10
28
16
15
10
129
3
30
(4) (5) (6)
(Rs. in lacs)
14 50.00
2970.00 107 3307.00
3436.00 387 5913.00
2926.00 261 3859.00
3089.00 259 4237.00
2260.00 82 755.00
6851.00 505 3511.00
140.00 61 459.00
.2911.00 462 5 U U 6 . 0 0
24583.00 2138 27537.00T o t a l 241
Source: Registrar of Companies, Madras and Coimbatore
: 211
342/27-30
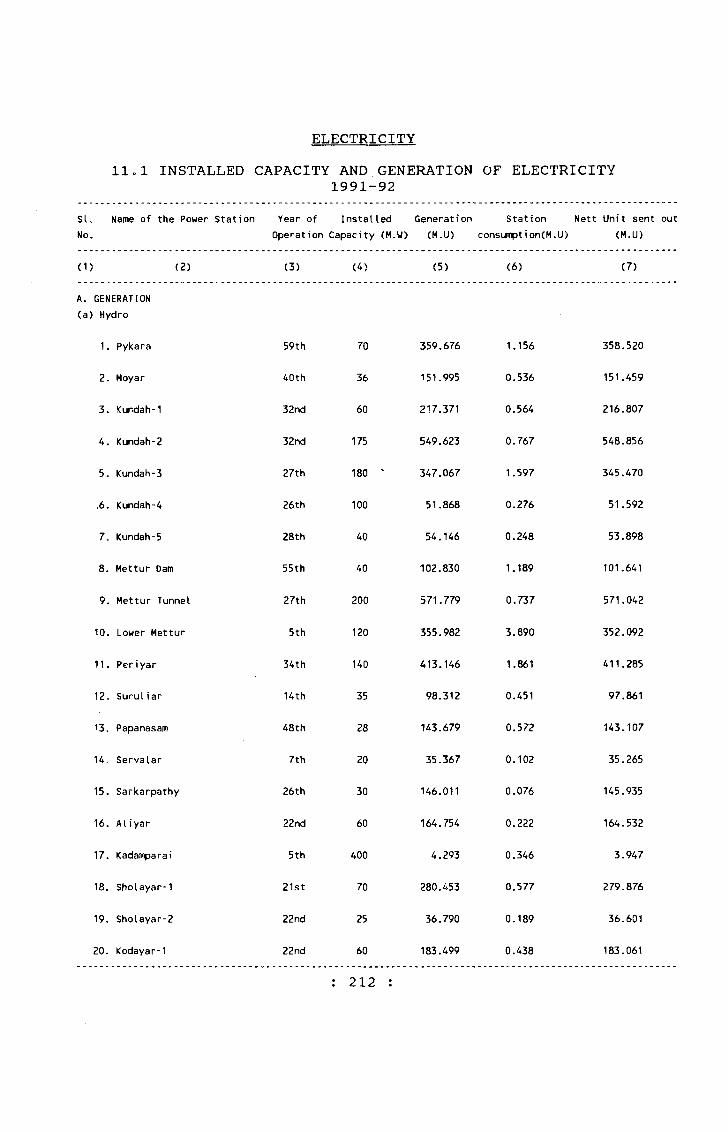
ELECTRICITYllol INSTALLED CAPACITY AND
1991-GENERATION•92
OF ELECTRICITY
S U Name of the Power Station Year of Installed No. Operation Capacity (M.W)
Generation(M.U)
Stationconsumption(M.U)
Nett Unit sent out (M.U)
(1) (2) (3) (4) (5) <6) (7)
A. GENERATION (a) Hydro
1. Pykara 59th 70 359.676 1.156 358.520
2. Moyar 40th 36 151.995 0.536 151.459
3. <undah-1 32nd 60 217.371 0.564 216.807
4. Kundah-2 32nd 175 549.623 0.767 548.856
5. Kundah-3 27th 180 347.067 1.597 345.470
.6. Kundah-4 26th 100 51.868 0.276 51.592
7= Kundah-5 28th 40 54.146 0.248 53.898
8. Mettur Dam 55th 40 102.830 1.189 101.641
9. Mettur Tunnel 27th 200 571.779 0.737 571.042
10. Lower Mettur 5th 120 355.982 3.890 352.092
11. Periyar 34th 140 413.146 1.861 411.285
12. Suruliar 14th 35 98.312 0.451 97.861
13. Papanasam 48th 28 143.679 0.572 143.107
14. Servalar 7th 20 35.367 0.102 35.265
15. Sarkarpathy 26th 30 146.011 0.076 145.935
16. Aliyar 22nd 60 164.754 0.222 164.532
17. Kadamparai 5th 400 4.293 0.346 3.947
18. Sbolayar-1 21st 70 280.453 0.577 279.876
19. Sholayar-2 22nd 25 36.790 0.189 36.601
20. Kodayar-1 22nd 60 183.499 0.438 183.061
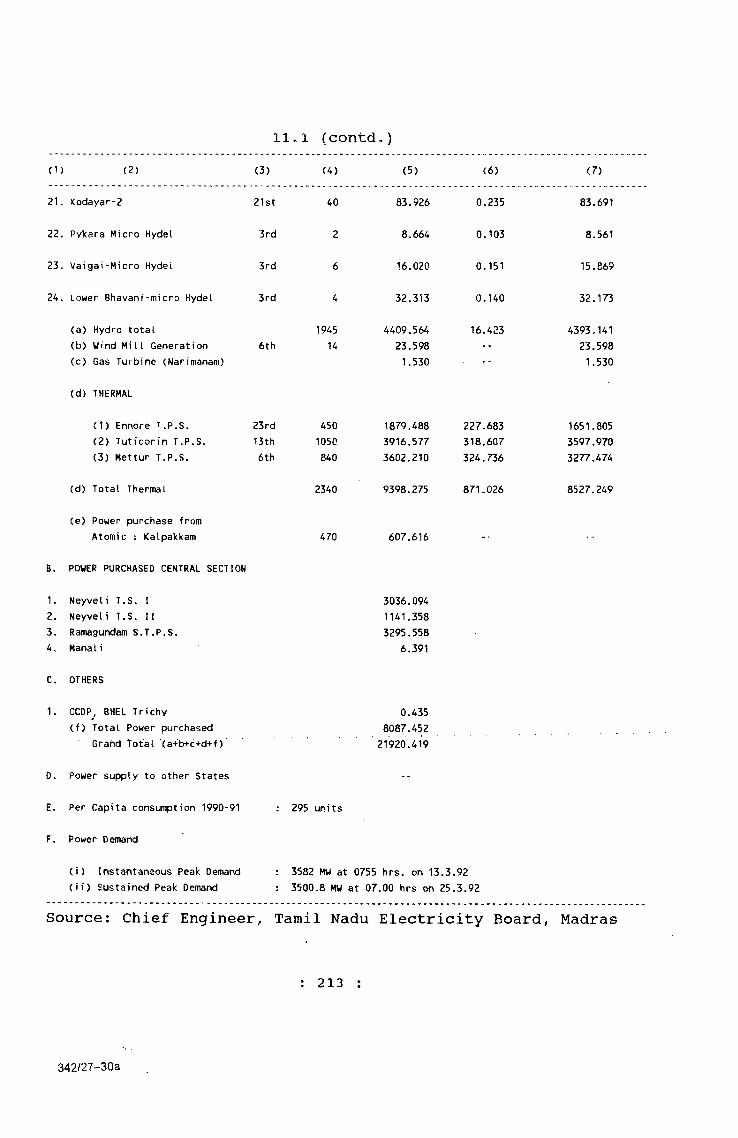
11,1 (contdo)(1) (2) (3) (4) (5) (6) (7)
21. Kodayar-2 21st 40 83.926 0.235 83.691
22. Pykara Micro Hydel 3rd 2 8.664 0.103 8.561
23. Vaigai-Micro Hydei 3rd 6 16.020 0.151 15.869
24. Lower Bhavani-micro Hydel 3rd 4 32.313 0.140 32.173
(a) Hydro total
(b) Wind Mill Generation
(c) Gas Turbine (Narimanam)6th
1945
14
4409.564
23.5981.530
16.423 4393.141
23.5981.530
(d) THERMAL
(1) Ennore T.P.S.
(2) Tuticor in T.P.S.
(3) Mettur T.P.S.
23rd
13th
6th
450
1050
840
1879.488
3916.577
3602.210
227.683318.607
324.736
1651.8053597.970
3277.474
(d) Total Thermal 2340 9398.275 871.026 8527.249
(e) Power purchase from Atomic : Kalpakkam 470 607.616 --
B. POWER PURCHASED CENTRAL SECTION
1.
2.3.
4.
Neyveli T.S. I Neyveli T.S. II Ramagundam S.T.P.S. ManaIi
3036.094
1141.3583295.558
6.391
C. OTHERS
1. CCDP, BHEL Trichy (f) Total Power purchased
Grand Total (a+b+c+d+f)
0.435
8087.452
21920.419
D. Power supply to other States --
E. Per Capita consumption 1990-91 295 units
F. Power Demand
(i) Instantaneous Peak Demand
(ii) Sustained Peak Demand ;3582 MW at 3500.8 MW
0755 hrs. on 13.3.92 at 07.00 hrs on 25.3.92
Source: Chief Engineer, Tamil Nadu Electricity Board, Madras
: 213 :
342/27-30a

11.2 POWER DEVELOPMENT UNDER THE FIVE YEAR PLAN
Sl. Description Beginning No. of 1st
Plan
1.4.51
End of 1st
Plan31.3.56
End of 11 P I an 31.3.61
End of 111Plan
31.3.66
End of Three End of IV Annual Plan Plan 31.3.69 31.3.74
(1) (2) (3) (4) (5) (6) (7) (8)
GENERATION
1, Installed capacity (M.W.) 156 256 571 1070 + 300 1070 + 400 1654 + 600
2, Peak Demand (M.W) 110 172 381
Neyveli
717
Neyveli997
Neyveli1.287
3. Generation and Purchase (M.U) 630 1,053 2,214 4,041 5,260 6,948
TRANSMISSION AND DISTRIBUTION
1. Extra High Tension and^igh Tension lines (Km) 6,936 11,479 24,194 38,806 48,336 68,737
2, Low Tension iines (Km) 5,728 13,055 35,352 73,198 1,04,977 1,97,017
3. Number of consumers (in lakhs) 2.5 4.3 7.7 13.6 18.22 27.07
4. Extra High Tension Sub-stations (Nos.) ' 31 48 70 98 146
5. High Tension Sub-stations (Nos.) 25 41 73 103 114 125
6. Distribution Transformers (Nos.) 1,591 3,773 10,004 17,360 22,842 37,453
7. Per Capita Consumption (Unit) 12 21 60 92 116 127
RURAL ELECTRIFICATION
1. Towns, Villages and Hamlets Electrified (Nos.) 1,813 3,543 10,760 22,137 31,727 61,072
2. Agricultural Pumpsets energised 14,373 32,440 1,17,695 2,56,594 4,10,119 6,81,205
3. Adidravidar colonies electrified -- ... 939 3,548 7,282 23,768
OUTLAY AND REVENUE
1. Capital outlay (Rs. in crores) 23.82 54.01 133.21 253.28 356.07 552.20
2. Gross Revenue (Rs. in crores) 3.18 5.94 15.82 34.67 50.22 114.28
: 214 :
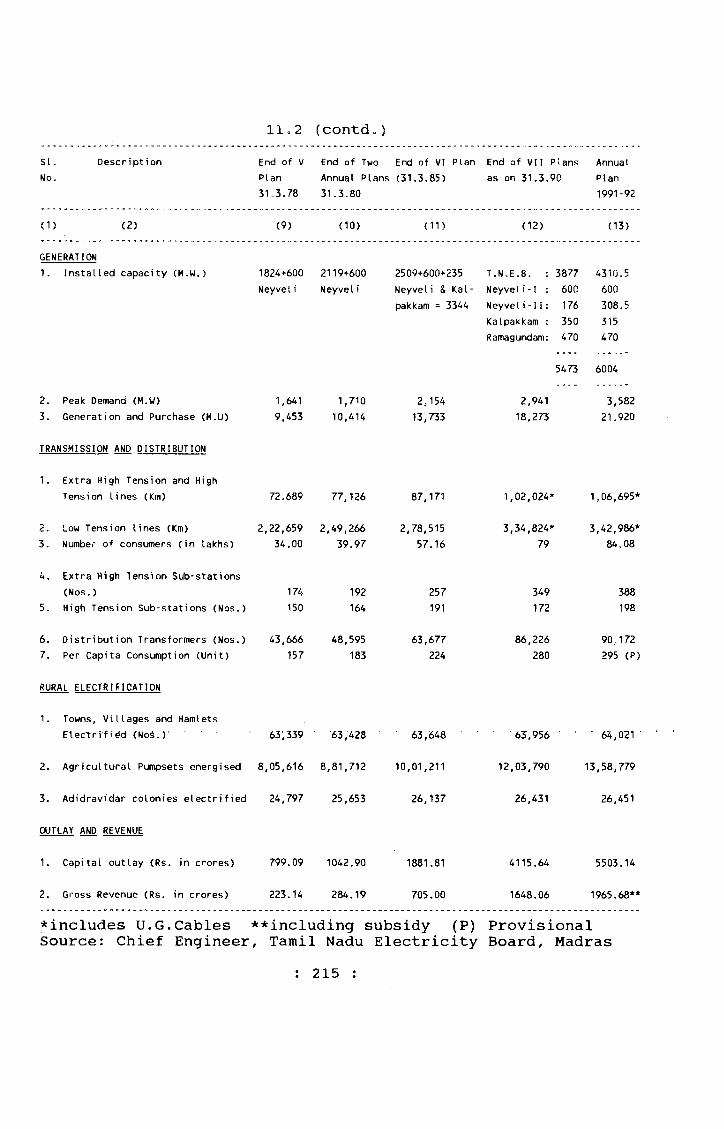
l l o 2 (contd.)si. Description
No.End of V
Plan31.3.78
End of Two Annual Plans 31.3.80
End of VI Plan (31.3.85)
End of VII Plans as on 31.3.90
Annua I
Plan1991-92
(1> (2) (9) (10) (11) (12) (13)
GENERATION
1. Installed capacity (M.W.) 1824+600 Neyveli
2119+600 Neyveli
2509+600+235 Neyveli & Kal- pakkam = 3344
T.N.E.B. : Neyveli-I : Neyveli-1i: Kalpakkam : Ramagundam:
3877
60C
176
350
470
5473
4310.5
600
308.5
315
470
6004
2. Peak Demand (M.W)
3. Generation and Purchase (M.U)
1,641
9,453
1,710
10,414
2,154
13,733
2,941
18,273
3,582 21„920
TRANSMISSION AND DISTRIBUTION
1. Extra High Tension and High Tension lines (Km) 72.689 77,126 87,171 1,02,024* 1,06,695*
2. Low Tension lines (Km)
3. Number of consumers (in lakhs)
2,22,659
34.002,49,266
39.972,78,515
57.16
3,34,824*
79
3,42,986*
84.08
4. Extra High Tension Sub-stations (Nos.)
5. High Tension Sub-stations (Nos.)
174
150192164
257
191
349
172
388
198
6. Distribution Transformers (Nos.)
7. Per Capita Consumption (Unit)
43,666
15748,595
183
63,677
224
86,226
280
90,172 295 (P)
RURAL ELECTRIFICATION
1. Towns, Villages and HamletsEtectrifi^d (NoS.)............... 63,339 ‘ -63,428 63,648 63-, 956 ■ 64,021 ■
2. Agricultural Pumpsets energised 8,05,616 8,81,712 10,01,211 12,03,790 13,58,779
3. Adidravidar colonies electrified 24,797 25,653 26,137 26,431 26,451
OUTLAY AND REVENUE
1. Capital outlay (Rs. in crores) 799.09 1042.90 1881.81 4115.64 5503.14
2. Gross Revenue (Rs. in crores) 223.14 284.19 705.00 1648.06 1965.68**
*includes U.G.Cables **including subsidy (P) Provisional Source: Chief Engineer, Tamil Nadu Electricity Board, Madras
215 :
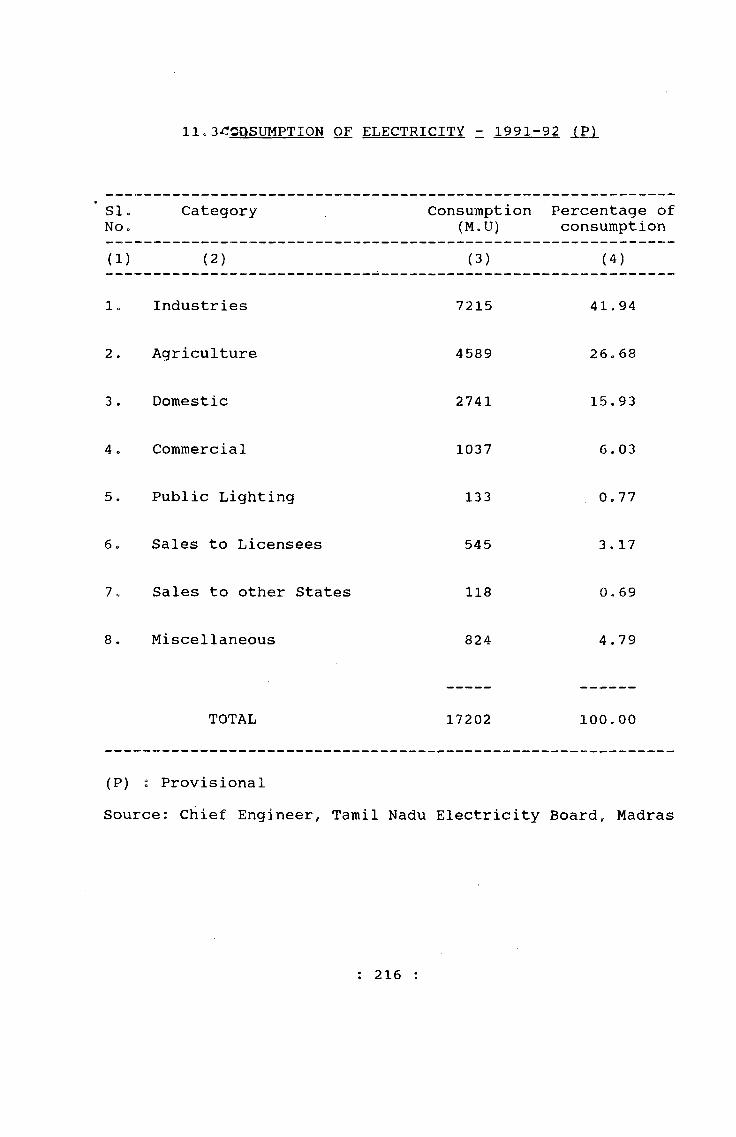
llo 3i^00SUMPTI0N OF ELECTRICITY - 1991-•92 (P)
SleNOc
Category Consumption(M.U)
Percentage of consumption
(1) (2) (3) (4)
1. Industries 7215 41. 94
2 . Agriculture 4589 26, 68
3 . Domestic 2741 15.93
4 . Commercial 1037 6. 03
5. Public Lighting 133 0,77
6o Sales to Licensees 545 3 . 17
7o Sales to other States 118 0, 69
8. Miscellaneous 824 4.79
TOTAL 17202 100.00
(P) 2 ProvisionalSource; Chief Engineer, Tamil Nadu Electricity Board, Madras
: 216 :
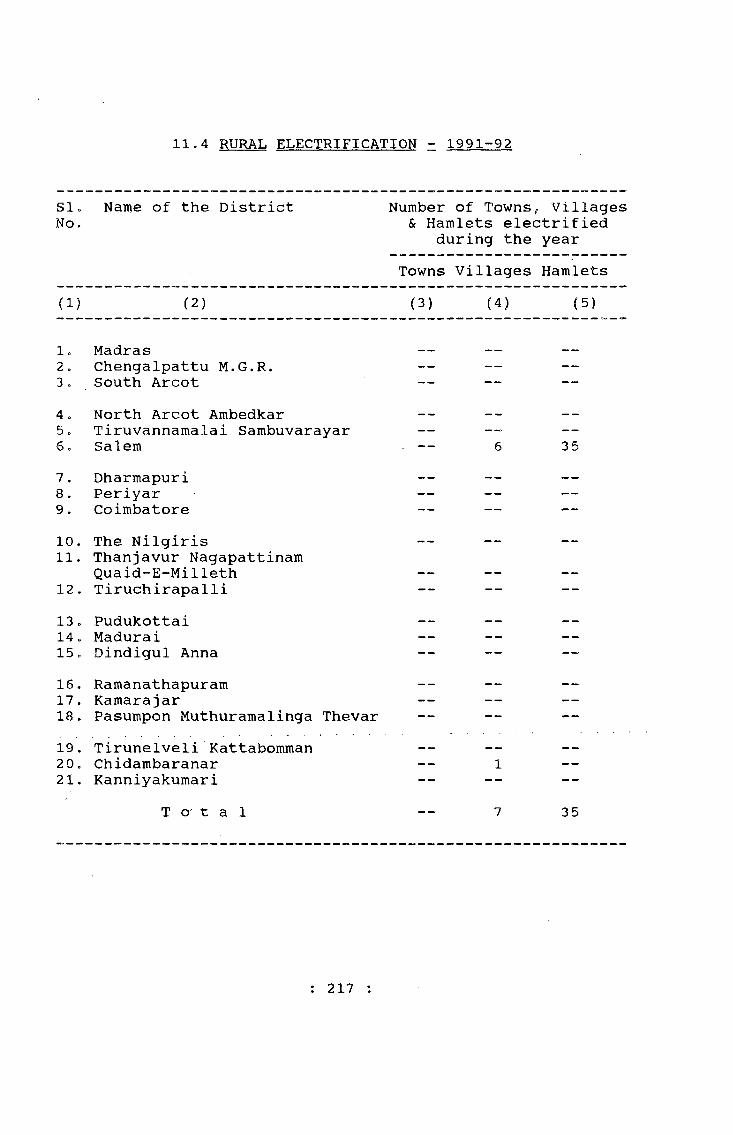
11.4 RURAL ELECTRIFICATION - 1991-92
Slo Name of the District Number of Towns VillagesNo. & Hamlets electrified
during the yearTowns Villages Hamlets
(1) (2) (3) (4) (5)
lo Madras2 » Chengalpattu M.G.R. — —3, South Arcot ■— — —
4 o North Arcot Ambedkar — . — . —
5e Tiruvannamalai Sambuvarayar —6. Salem - — 6 357 . Dharmapuri — — —
8. Periyar — — —
9. Coimbatore — — —10. The Nilgiris — — —11. Thanjavur Nagapattinam
Quaid-E-Milleth — —12 . Tiruchirapalli — — —
13 . Pudukottai — — —14 . Madurai — —15» Dindigul Anna — ■—16, Ramanathapuram — — —17 . Kamarajar — — —18. Pasumpon Muthuramalinga Thevar — — —19 . Tirunelveli Kattabomman — — —20. Chidambaranar 1 —
21. Kanniyakumari — — —
T O’ t a 1 7 35
: 217 :

11o4 (contdo)
SI „ No.
Name of the District No. of towns,villages & hamlets electrified upto the year
No. of pumpsets energised
Towns Villages
Hamlets
Duringtheyear
Upto the year
(1) (2) (6) (7) (8) (9) (10)
Ic Madras 12 , Chengalpattu M.G.R. 74 1855 2445 2675 978333 c South Arcot 14 965 1850 5795 1561914 , North Arcot Ambedkar } 32 1871 2219 1992}5 . Tiruvannamalai ! }
Sambuvarayar } 3101} 2220696. Salem 43 2286 4402 ,4 07 4 1503367 . Dharmapuri 7 1065 3510 3075 652758 e Periyar } 58 481 } 6018 2610 723049. Coimbatore } 448 } 1800 12571110„ The Nilgiris 17 43 821 35 673llo Thanjavur & Nagapattinam
Quaid-E-Milleth 31 1728 3866 2500 4494412 . Tiruchirapalli 26 894 4244 4840 11935013 . Pudukottai 7 747 2415 1340 2872614. Madurai } 1420 7338215. Dindigul Anna } 38 999 4730 1727 5860316. Ramanathapuram } 22017o Kamarajar >34 1411 5034 500 5607418 , Pasumpon Muthuramalinga}
Thevar } 50019, Tirunelveli Kattabomman} 1218 4973920. Chidambaranar >52 946 3716 486 3403621, Kanniyakumari 5 83 2490 200 3533
T o t a l 439 15822 47760 40108 1358779
Source: Superintending Engineer, Rural Electrification, Tamil Nadu Electricity Board, Madras.
: 218 :

11.5 STREET LIGHTS - 1991-92
SI. No .
Name of Electricity Distribution Circle
Street Lights energised as on 31.3.91
StreetLightsenergisedduring1991-92
Cumulative Total ason 31„3»92
(1) (2) (3) (4) (5)
1. Coimbatore/North 23,051 962 24,0132 . Coimbatore/South 29 , 978 821 30,7993 . Mettur 39,972 2, 990 42,9624 „ Periyar 45,798 2,831 48,6295. Salem 36,167 406 36,5736„ Udumalpet 17,859 451 18,310
Coimbatore Region 1,92,825 8,461 2,01,2861. Chengleput 29,583 1,402 30,9852. Kancheepuram 28,676 1,233 29,9093 . Madras/Central 1, 152 — 1, 1524 . Madras/North 21,845 799 22,6445. Madras/South 16,793 1, 344 18,137
Madras Region 98,049 4,778 1,02,8271. Ghidarabaranar 38,583 1,862 •40,445-2 . Kamarajar 32,235 1, 095 33,3303 . Kanniyakumari 36,859 1, 078 37,9374. Madurai 47,678 3 ,872 51,5505. Ramnad 57,550 2,556 60,3066. Tirunelveli Kattabomman 58,133 1, 838 59,971
: 219
342/27-31
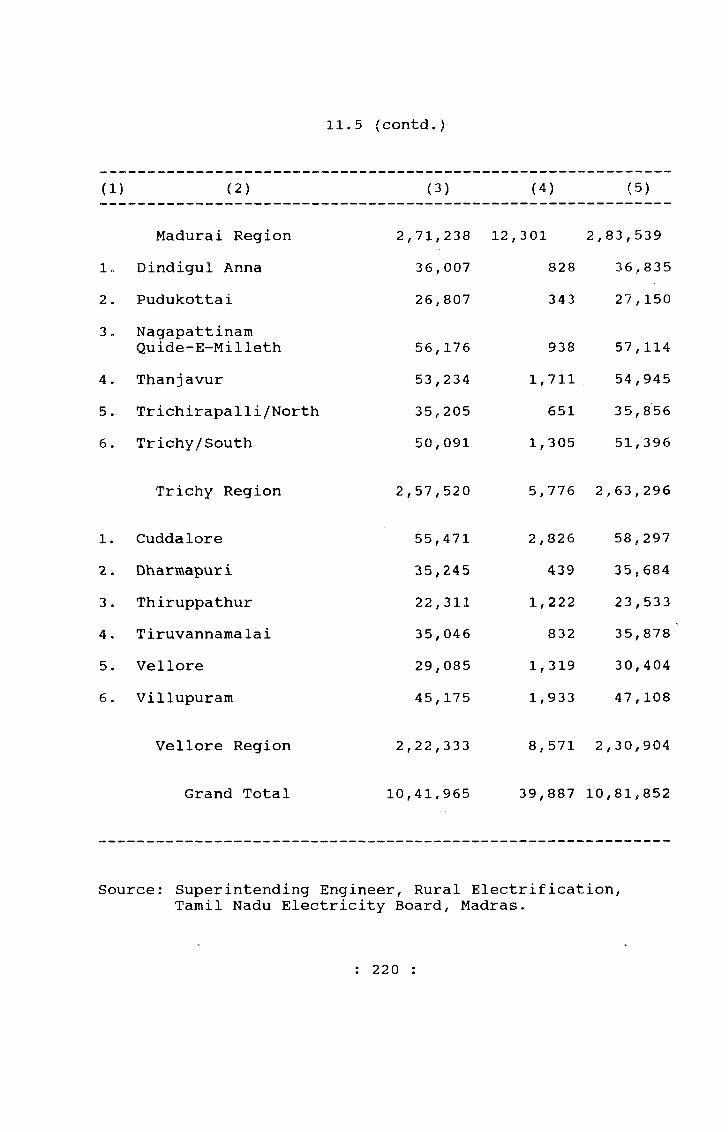
11.5 (contd.)
(1) (2) (3) (4) (5)
Madurai Region 2 ,71,238 12,301 2,83,5391. Dindigul Anna 36,007 828 36,8352. Pudukottai 26,807 343 27,1503 , Nagapattinam
Quide-E-Milleth 56,176 938 57,1144 . Thanjavur 53,234 1,711 54,9455. Trichirapalli/North 35,205 651 35,8566. Trichy/South 50,091 1,305 51,396
Trichy Region 2 ,57,520 5,776 2 , 63,296
1. Cuddalore 55,471 2,826 58,2972. Dharmapur i 35,245 439 35,6843 . Thiruppathur 22,311 1,222 23,5334. Tiruvannamalai 35,046 832 35,8785. Vellore 29,085 1, 319 30,4046. Villupuram 45,175 1,933 47,108
Vellore Region 2 ,22,333 8,571 2,30,904
Grand Total 10 ,41,965 39,887 10,81,852
Source: Superintending Engineer, Rural Electrification, Tamil Nadu Electricity Board, Madras.
: 2 2 0 :
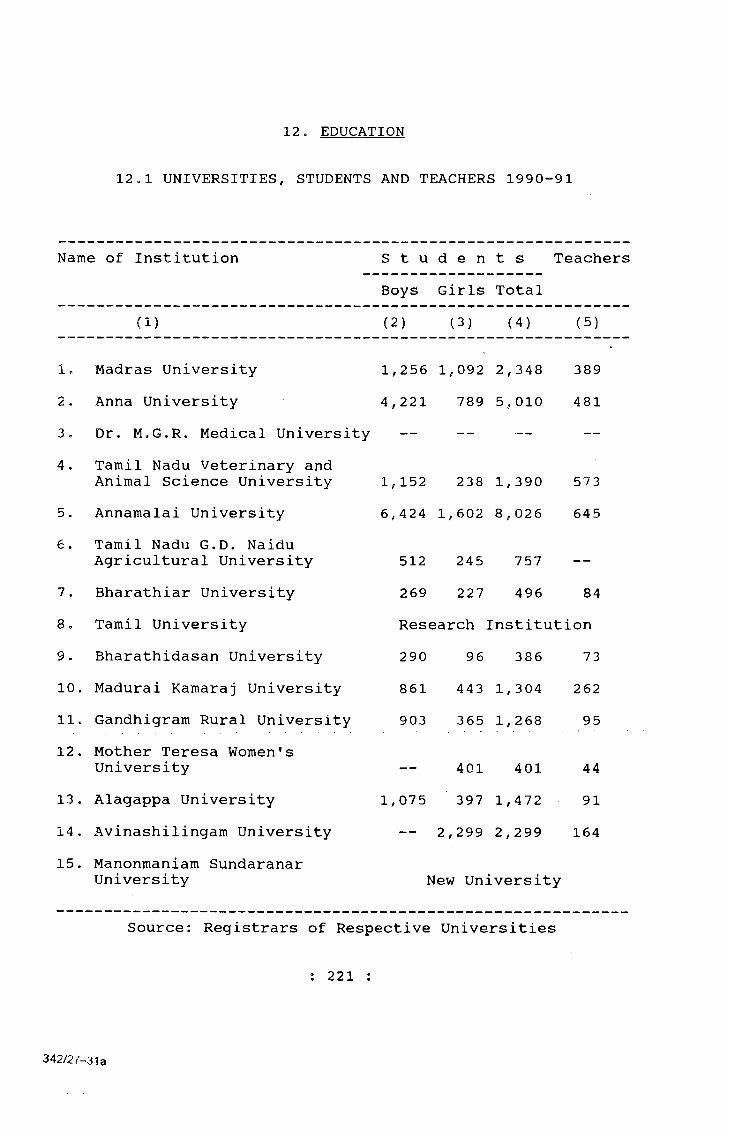
12. EDUCATION
12ol UNIVERSITIES, STUDENTS AND TEACHERS 1990-91
Name of Institution S t u d e n t s TeachersBoys Girls Total
(1) (2) (3) (4) (5)
1. Madras University 1,256 1,092 2,348 3892 . Anna University 4, 221 789 5,010 4813 c Dr. MoG.R. Medical University4 . Tamil Nadu Veterinary and
Animal Science University 1, 152 238 1,390 57 35. Annamalai University 6,424 1, 602 8, 026 6456. Tamil Nadu G.D. Naidu
Agricultural University 512 245 757 —7 . Bharathiar University 269 227 496 848 o Tamil University Research :Institution9. Bharathidasan University 290 96 386 7310. Madurai Kamaraj University 861 443 1,304 26211. Gandhigram Rural University 903 365 1,268 9512. Mother Teresa Women's
University — 401 401 4413. Alagappa University 1,075 397 1,472 9114. Avinashilingam University — 2,299 2 ,299 16415. Manonmaniam Sundaranar
University New University
Source: Registrars of Respective Universities
; 2 2 1 :
342/2 7-3 la

1990-9112»2 COLLEGES FOR GENERAL EDUCATION, STUDENTS AND TEACHERS
Name of Institution No. of insti- - tutions
S t u d e n Boys Girls
t s Total
Teachers
(1) (2) (3) (4) (5) (6)
1. GoverninentColleges 54 34,659 21,557 56,216 4, 579
2 . Aided Colleges 132 86,591 56,576 1,43,167 10,563
3 o Self FinancedColleges 29 2,494 5, 165 7, 659 596
T o t a l 215 1,23,744 83,298 2,07,042 15,738
Source: Director of Collegiate Education, Madras
: 222

12,3 COLLEGES FOR PROFESSIONAL EDUCATION,TEACHERS 1990-91
ITUDENTS AND
Name of Institution No. of S t u d e n t s Teachersins- --------------------- -titu- Boys Girls Total tion
( 1 )
1. Medical Collegesa) M.B.B.S. and P.G.
Coursesb) B.D.S. & P.G.Coursesc) Siddhad) Ayurvedhae) Unanif) Homoeopathy
2. B.Sc. Nursing3. Colleges of Engineering
Technology4„ Agricultural Colleges5. Veterinary Colleges6. Fisheries Colleges7. Law Colleges8. Teachers Training
Colleges9. Colleges for Physical
Education10»Music Colleges11.Colleges for Arts and
Crafts12.Institutions for
M.B.A. Courses13.Institutions for
M.C.A. Courses
(2) (3) (4) (5) ( 6 )
13 4,941 3,529 8,4707 693 445 1,1382 408 472 8802 137 26 1631 40 23 631 53 61 114
11 74 1,580 1,654
46 33,308 5,598 38,9067 2,193 953 3,1462 1,089 215 1,3041 63 23 866 5,897 1,030 6,927
25 1,675 2,109 3,784
556 239393 233
795626
348 30 378
600 108 708
126 73 199
3 , 114 243 81 33 9
2563
3,22930151954
146
264
•6252
51
55
Source: Respective Heads of Departments: 223 :
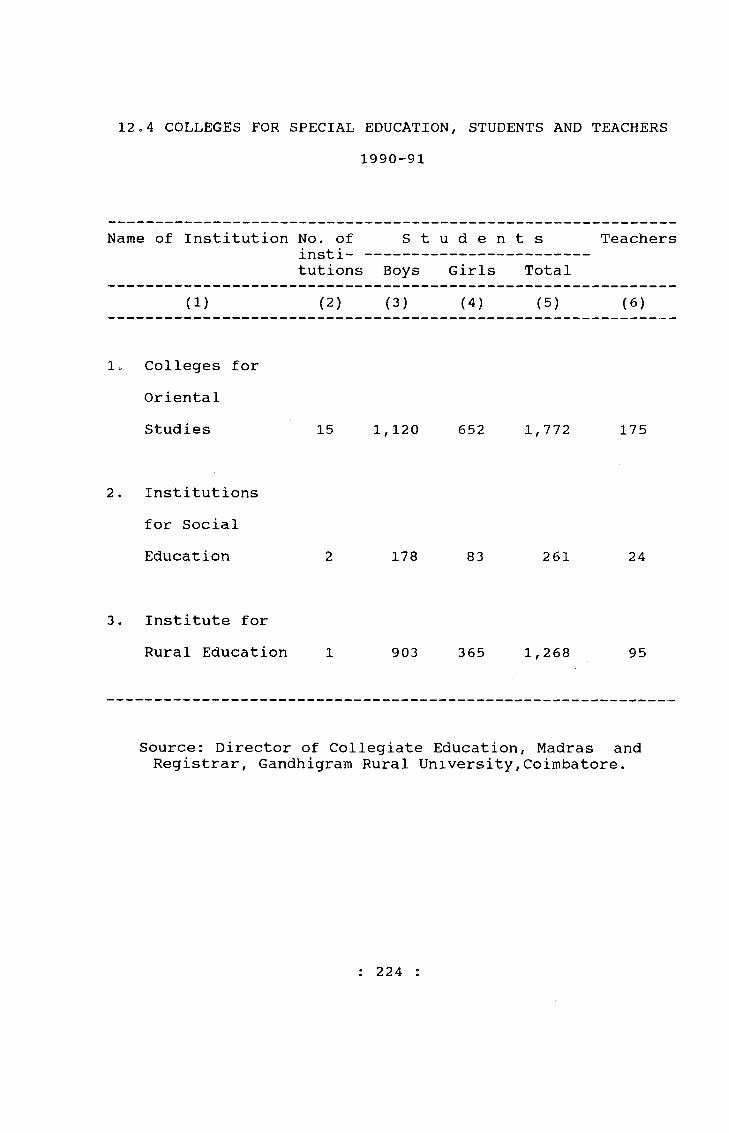
1990-9112o4 COLLEGES FOR SPECIAL EDUCATION, STUDENTS AND TEACHERS
Name of Institution No. of insti- • tutions
S t Boys
u d e n Girls
t s Total
Teachers
(1) (2) (3) (4) (5) (6)
1. Colleges for Oriental Studies 15 1, 120 652 1, 772 175
2. Institutions for Social Education 2 178 83 261 24
3. Institute for Rural Education 1 903 365 1,268 95
Source: Director of Collegiate Education, Madras and Registrar, Gandhigram Rural University,Coimbatore.
224 :

12„5 SCHOOLS FOR GENERAL EDUCATION, STUDENTS AND TEACHERS1990 -91
Name of Institution No. of institution
S t u d e n t s Teachers
Boys Girls Total
(1) (2) (3) (4) <5) (6)
1. Pre-primary Schools 23 2.742 2,846 5,588 120
2. Primary Schools 29,979 29,84,262 25,74,093 55,58,355 1,19,921
3. Middle Schools 5,624 16,58,571 13,29,549 29,88,120 65,555
4. High Schools 2,361 7,55,041 5,86,971 13,42,012 34,917
5. Anglo Indian High Schools 13 3,681 7,367 11,048 305
6. Matriculation High Schools 669 93,763 75,157 1,68,920 5,110
7. Central High Schools
a) Kendriya Vidyalayas >\J
b) Schools affiliated to Central Board of > Education >
\93 30,153 23,089 53,242 2,233
J
c) Schools affiliated to Council for Indian > School Certificate Examinations }
8. Higher Secondary Schools 1,660 13,09,038 8.63,771 21,72,809 62,780
9. Anglo Indian Higher Secondary Schools 28 20,809 16,710 37,519 1,068
10. Matriculation Higher Secondary Schools 239 71,575 60,311 1,31,886 5,122
11. Central Higher Secondary Schools
a) Kendriya Vidyalayas )\J
b) Schools affiliated to Central Board of > Secondary Education >
\81 57,981 36,815 94,796 3,846
c) Schools affiliated to Council for Indian > School Certificate Examinations >
Source: Director of School Education, Madras; 225 :
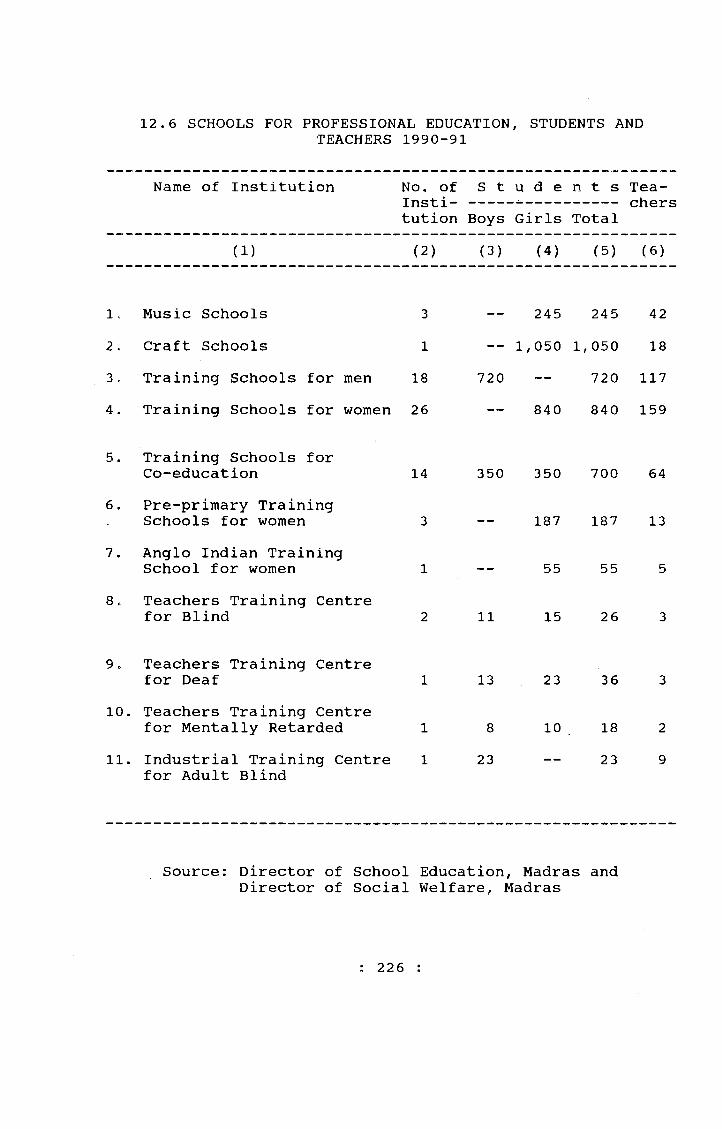
12.6 SCHOOLS FOR PROFESSIONAL EDUCATION, STUDENTS ANDTEACHERS 1990-91
Name of Institution No. of Institution
S t Boys
u d e Girls
n t s Total
Teachers
(1) (2) (3) (4) (5) (6)
lo Music Schools 3 245 245 422 „ Craft Schools 1 — 1, 050 1, 050 183 „ Training Schools for men 18 720 — 720 1174 . Training Schools for women 26 — 840 840 159
5. Training Schools for Co-education 14 350 350 700 64
6. Pre-primary Training Schools for women 3 — 187 187 13
7. Anglo Indian Training School for women 1 — 55 55 5
8 „ Teachers Training Centre for Blind 2 11 15 26 3
9. Teachers Training Centre for Deaf 1 13 23 36 3
10. Teachers Training Centre for Mentally Retarded 1 8 10 18 2
11. Industrial Training Centre for Adult Blind
1 23 23 9
Source: Director of School Education, Madras and Director of Social Welfare, Madras
226 :
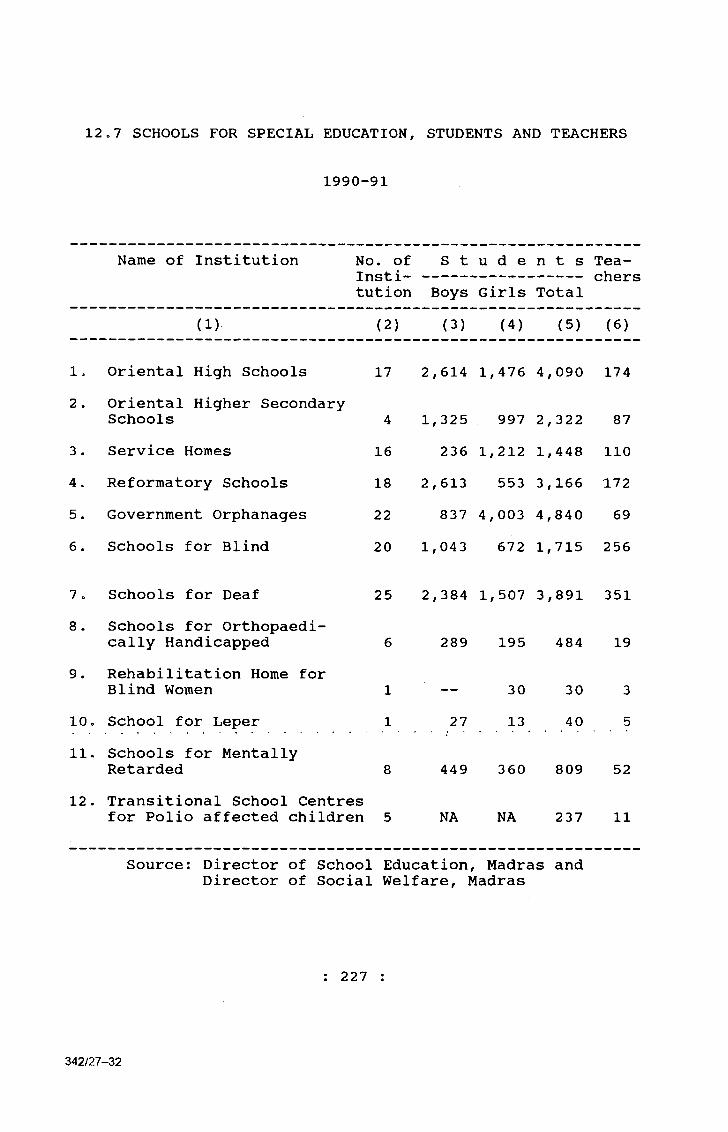
12,7 SCHOOLS FOR SPECIAL EDUCATION, STUDENTS AND TEACHERS
1990-91
Name of Institution No. of Institution
S t Boys
u d e Girls
n t s Total
Teachers
(1) (2) (3) (4) (5) (6)
lo Oriental High Schools 17 2,614 1,476 4, 090 1742 . Oriental Higher Secondary
Schools 4 1, 325 997 2, 322 873 . Service Homes 16 236 1,212 1,448 1104 . Reformatory Schools 18 2 , 613 553 3,166 1725. Government Orphanages 22 837 4,003 4,840 696. Schools for Blind 20 1,043 672 1,715 256
7 „ Schools for Deaf 25 2,384 1,507 3,891 3518 . Schools for Orthopaedi-
cally Handicapped 6 289 195 484 199 . Rehabilitation Home for
Blind Women 1 — 30 30 3lOo School for Leper 1 27 13 40 511. Schools for Mentally
Retarded 8 449 360 809 5212. Transitional School Centres
for Polio affected children 5 NA NA 237 11
Source: Director of School Education, Madras and Director of Social Welfare, Madras
: 227
342/27-32

Name of Institution No. of S t u d e n t s Tea-Insti- ---------------------- cherstution Boys Girls Total
(1) (2) (3) (4) (5) (6)^Ic Govt. Polytechnics (Men) 12 5,243 704 5,947 5402o Govto Polytechnics (Women) 4 — 1,652 1,652 1513o Private Polytechnics (Men) 100 40,266 2,663 42,929 2,9334. Private Polytechnics
(Women) 7 — 1,872 1,872 1605. Institute of Leather
Technology 1 166 — 166 126o Institute of Printing
Technology 1 143 25 168 267. Institute of Chemical
Technology 1 409 — 409 198. Institute of Textile
Technology 1 113 — 113 129c State Institute of
Commerce Education 1 124 71 195 1510.Technical Teachers
Training Institute 1 32 1 33 3711.Institute of Hotel Manage
ment, Catering Technologyand Applied Nutrition 1 266 41 307 28
12.Film and TelevisionInstitute 1 170 5 175 17
13.Technical Training Centres 2 133 72 205 2314.Industrial Schools
(Private) 175 6,520 3,000 9,520 52715.Industrial Training
InstitutesGovernment 47 8,767 1,076 9,843 2,023Private 253 13,196 604 13,800 NA
16.Institute of Architecture and Sculpture 1 134 — 134 33
Source: Respective Heads of Departments
12o8 INSTITUTIONS FOR OTHER PROFESSIONAL EDUCATION,STUDENTS AND TEACHERS 1990-91
228 :

12o9 EDUCATIONAL INSTITUTIONS BY TYPE OF MANAGEMENTS (AS ON 30TH SEPTEMBER 1991)
Type of Institution Government
MunicipalCorporation
PanchayatUnion
Aided Una i ded Total
(1) (2) (3) (4) (5) (6) (7)
A, Higher Secondary Schools: 848 68 -- 674 70 1660
State:
Boys 640 41 -- 495 61 1337
Girls 108 27 -- 179 9 323
Total 848 68 -- 674 70 1660
Anglo Indian Schools 2 -- -- 25 1 28
Matriculation Schools -- -- -- -- 239 239
Total Higher Secondary Schools (State) 850 68 -- 699 310 1927
Central:
Kendriya Vidyalaya 18 -- -- -- -- 18
C.B.S.E. -- -- -- -- 59 59
I.S.C. -- -- -- -- 4 4
Total (Central) 18 -- -- -- 63 81
Grand Total for all Higher Secondary Schools 868 68 -- 699 373 2008
: 229
342/27-32a

( 1 )
B. High Schools:
State;
Boys
Girls
Total
Anglo Indian High Schools
Matriculation High Schools
Total High Schools (State)
Central:
12.9 (contd.)
(2)
1864
1683
181
1864
6
1870
<3)
83
58
25
83
83
(4) (5) (6) (7)
370 44
33
11
44
265
105
370
7
669
1046 44
2361
2039
322
2361
13
669
3043
Kendriya Vidyalaya 7
C.B.S.E.
L.S.S. Schools
Total (Central) 7
Total High Schools State and Central 1877 83
Total High and Higher Secondary Schools 2745 151
C. Middle Schools 221 417 3055
D. Primary Schools 1479 1134 22254
Total for Middle and Primary 1700 1551 25309
52
34
86
1046 130
1745 503
1918 13
5093 19
7011 32
7
52
34
93
3136
5144
5624
29979
35603
Grand Total for all Schools 4445 1702 25309 8756 535 40747
Source: Director of Schools Edmcation: 230 :
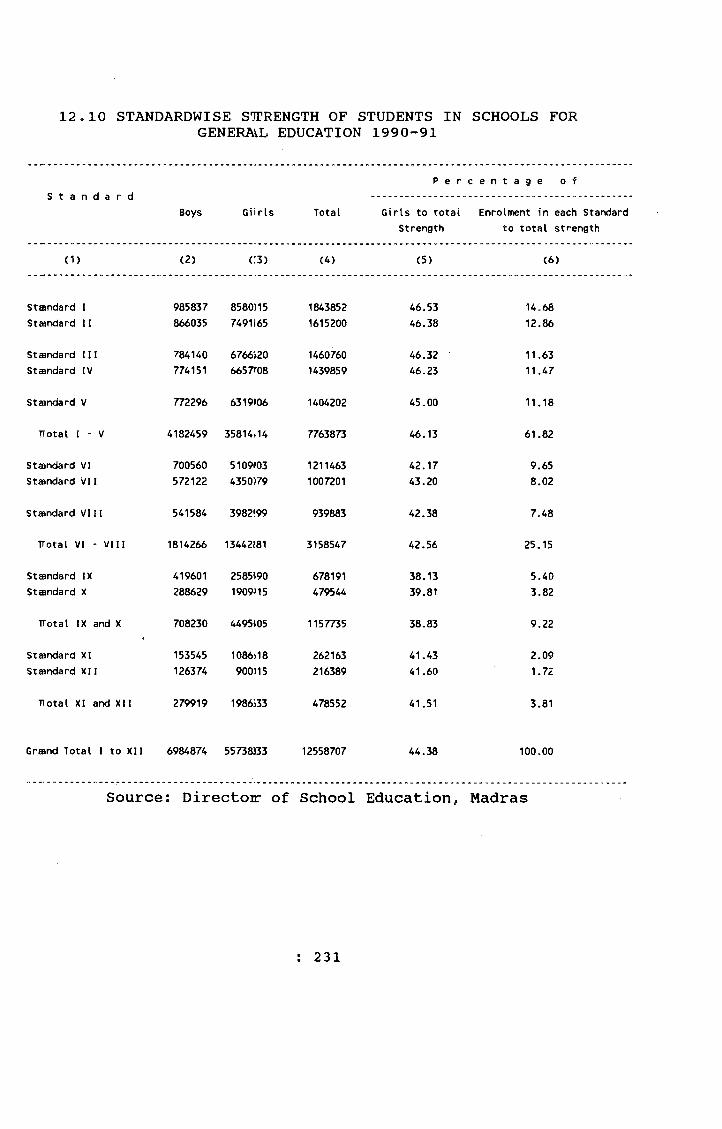
12,10 STANDARDWISE S'H’RENGTH OF STUDENTS IN SCHOOLS FORGENERAVL EDUCATION 1990-91
s t a n d a r dBoys Giirls Total
P e r
Girls to total Strength
c e n t a g e o f
Enrolment in each Standard to total strength
(1) (2) C3) (4) (5) (6)
Standard I 985837 8580)15 1843852 46.53 14,68Standard II 866035 7491165 1615200 46.38 12.86
Standard 111 784140 6766i20 1460760 46.32 11.63Standard IV 774151 6657^08 1439859 46.23 11.47
Standard V 772296 6319106 1404202 45.00 11.18
TTotal I - V 4182459 35814.14 7763873 46.13 61.82
Standard VI 700560 5109»03 1211463 42.17 9.65Standard VII 572122 4350)79 1007201 43.20 8.02
Standard VII! 541584 3982*99 939883 42.38 7.48
TTotal VI •• VIII 1814266 13442?81 3158547 42.56 25.15
Standard IX 419601 2585590 678191 38.13 5.40Standard X 288629 1909^15 479544 39.81 3.82
TTotal IX and X 708230 4495i05 1157735 38.83 9.22
Standard XI 153545 1086i18 262163 41.43 2.09Standard XII 126374 900)15 216389 41.60 1.72
Tiotal XI and XII 279919 1986S33 478552 41.51 3.81
Grand Total I to XII 6984874 55738333 12558707 44.38 100,00
Source; Directoir of School Education, Madras
; 231

12.11 STANDARDWISE STRENGTH OF STUDENTS BELONGING TOSCHEDULED CASTES & SCHEDULED TRIBES FOR 1990-91
IN SCHOOLS FOR GENERAL EDUCATION
StandardS c h e d u l e d C a s t e
Boys Girls Total % of S.C. Enrolment to total enrolment
(1) (2) (3) (4) (5)
I 198165 174546 372711 20.21II 183493 149990 333483 20.65III 162408 130642 293050 20, 06IV 156875 124041 280916 19.51V 146375 118592 264967 18.87
I - V Total 847316 697811 1545127 19.90VI 135866 94732 230598 19.30VII 102567 72493 175060 17.38VIII 97043 69851 166894 17.76
VI - VIII Total 335476 237076 572552 18. 13IX 76226 39238 115464 17.03X 48286 25978 74264 15.49
IX & X Total 124512 65216 189728 16.39XI 27127 11336 38463 14.67XII 16482 8088 24570 11. 35
XI & XII Total 43609 19424 63033 13.17I - XII Total 1350913 1019527 2370440 18.87
J 232 ;
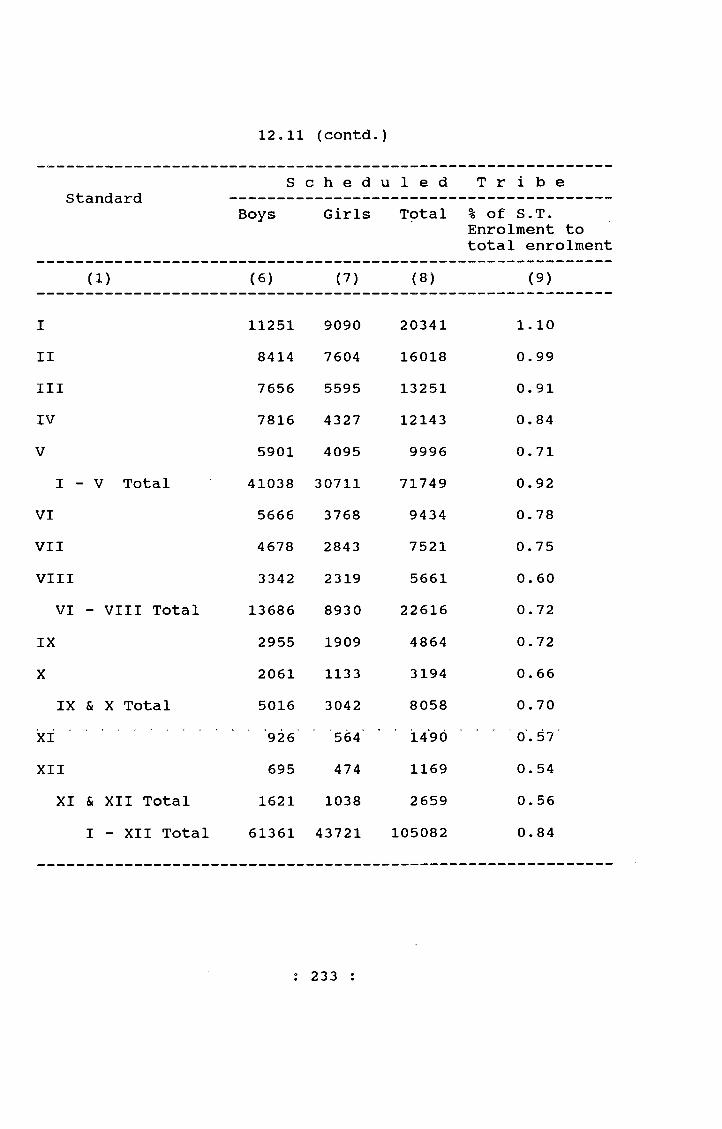
12.11 (contd. )
S c h e d u 1 e d T r i b eo UanCla jTQ
Boys Girls Tptal % of S.T. Enrolment to total enrolment
(1) (6) (7) (8) (9)
I 11251 9090 20341 1.10II 8414 7604 16018 0.99III 7656 5595 13251 0.91IV 7816 4327 12143 0.84V 5901 4095 9996 0.71
I - V Total 41038 30711 71749 0.92VI 5666 3768 9434 0.78VII 4678 2843 7521 0.75VIII 3342 2319 5661 0. 60
VI - VIII Total 13686 8930 22616 0.72IX 2955 1909 4864 0.72X 2061 1133 3194 0. 66
IX & X Total 5016 3042 8058 0.70XI 926 564 1490 0. 57XII 695 474 1169 0.54
XI & XII Total 1621 1038 2659 0. 56I - XII Total 61361 43721 105082 0.84
j 233 :
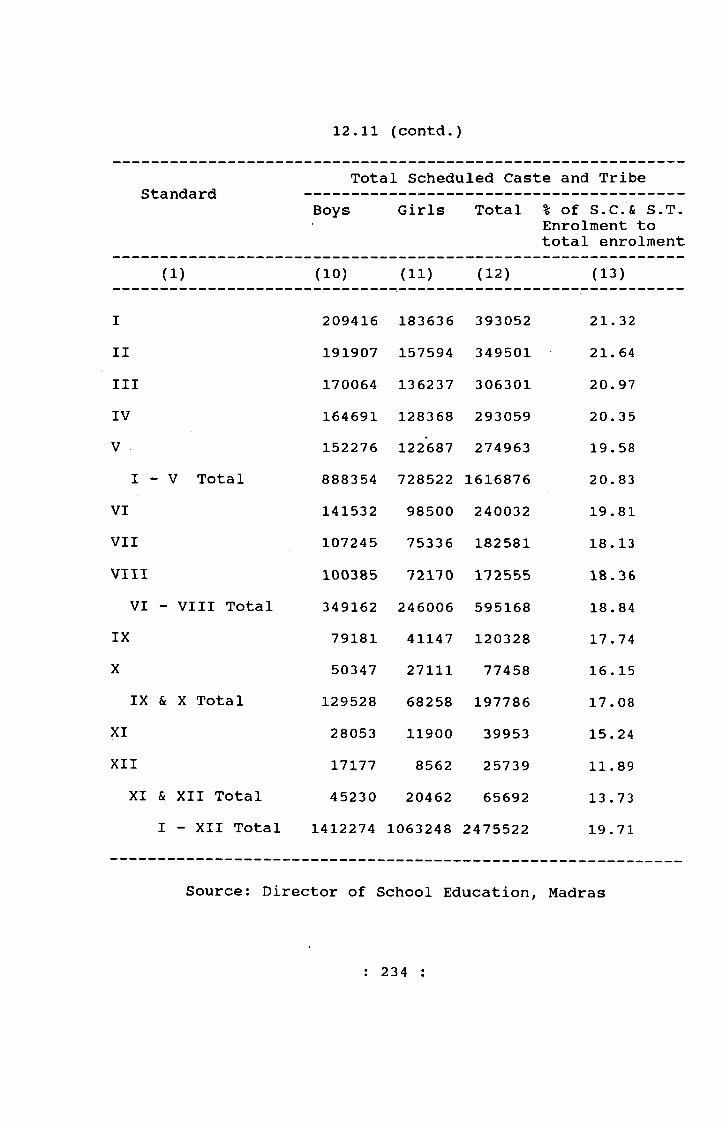
12.11 (contd.)
Total Scheduled Caste and Tribeo uoncid JTCl
Boys Girls Total % of S.C.& S.T. Enrolment to total enrolment
(1) (10) (11) (12) (13)
I 209416 183636 393052 21. 32II 191907 157594 349501 21.64III 170064 136237 306301 20.97IV 164691 128368 293059 20.35V 152276 122*687 274963 19.58
I - V Total 888354 728522 1616876 20.83VI 141532 98500 240032 19.81VII 107245 75336 182581 18.13VIII 100385 72170 172655 18.36
VI - VIII Total 349162 246006 595168 18.84IX 79181 41147 120328 17.74X 50347 27111 77458 16.15
IX & X Total 129528 68258 197786 17.08XI 28053 11900 39953 15.24XII 17177 8562 25739 11.89
XI & XII Total 45230 20462 65692 13 .73I - XII Total 1412274 1063248 2475522 19.71
Source: Director of School Education, Madras
: 234 :
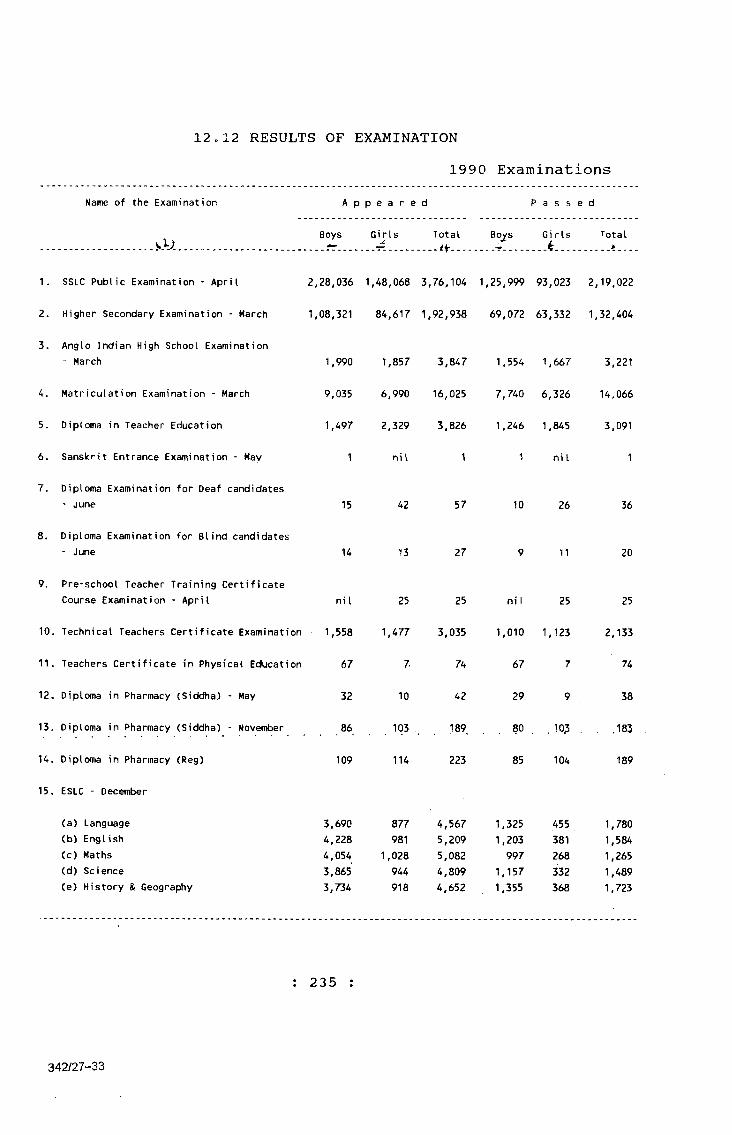
A p p e a r e d P a s s e d
Boys Girls
12.12 RESULTS OF EXAMINATION1990 Examinations
Name of the Examination
a ;Total Bo^s Girls T’otal
--4...
1. SSLC Public Examination - April
2. Higher Secondary Examination - March
3. Anglo Indian High School Examination- March
4. Matriculation Examination - March
5. Diploma in Teacher Education
6. Sanskrit Entrance Examination - May
7. Diploma Examination for Deaf candidates ' June
8. Diploma Examination for Blind candidates- June
9. Pre-school Teacher Training Certificate Course Examination - April
10. Technical Teachers Certificate Examination
11. Teachers Certificate in Physical Education
12. Diploma in Pharmacy (Siddha) - May
13. Diploma in Pharmacy (Siddha) - November
14. Diploma in Pharmacy (Reg)
15. ESLC - December
(a) Language(b) English(c) Maths(d) Science(e) History & Geography
2,28,036
1,08,321
1,990
9,035
1,497
1,48,068 3,76,104
84,617 1,92,938
1,857 3,847
6,990 16,025
1,25,999 93,023
69,072 63,332
1,554 1,667
7,740 6,326
2,329 3,826 1.246 1,845
2,19,022
1,32,404
3,221
14,066
3,091
1 ni I 1 1 ni I 1
15 42 57 10 26 36
14 13 27 9 11 20
ni I 25 25 ni I 25 25
1,558 1,477 3,035 1,010 1,123 2,133
67 7- 74 67 7 74
32 10 42 29 9 38
86 103 189 80 .10? , 183
109 114 223 85 104 189
3,690 877 4,567 1,325 455 1,7804,228 981 5,209 1,203 381 1,5844,054 1,028 5,082 997 268 1,2653,865 944 4,809 1,157 332 1,4893,734 918 4,652 1,355 368 1,723
: 235
342/27-33
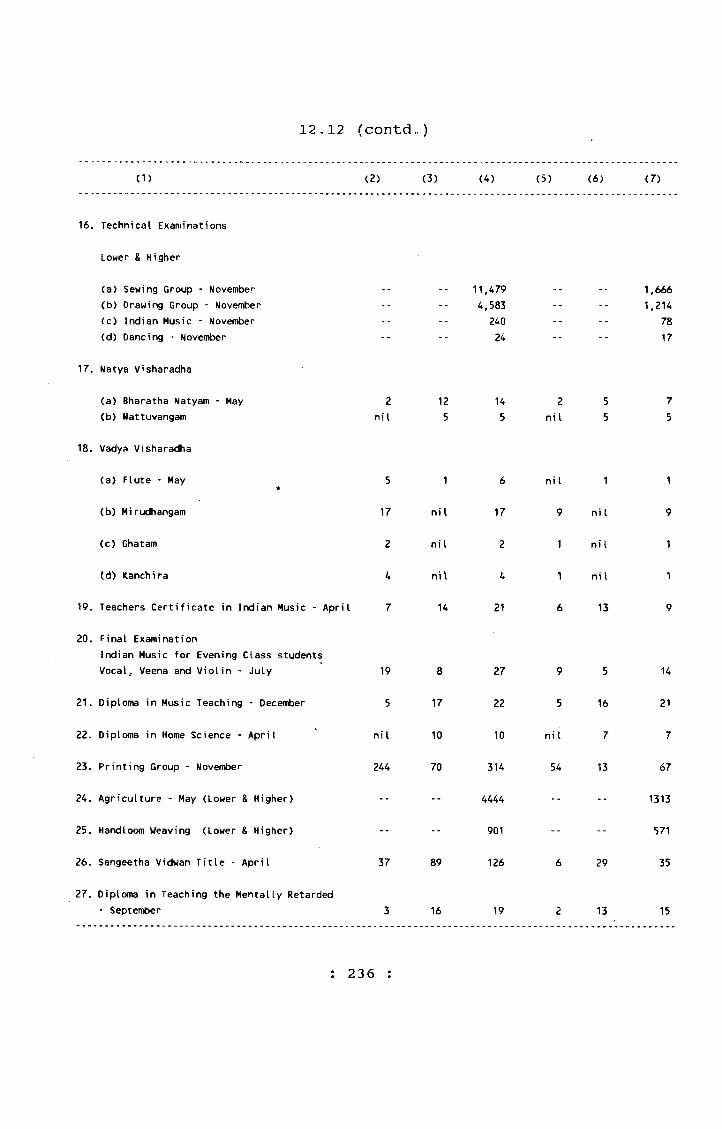
12.12 (contdo)
(1) (2) (3) (4) (5) (6) (7)
16. Technical Examinations
Lower & Higher
(a) Sewing Group - November -- 11,479 . . . 1,666(b) Drawing Group - November -- -- 4.583 -- -- 1,214<c) Indian Music - November -- -- 240 -- 78(d) Dancing - November -- -- 24 -- -- 17
17. Natya Visharadha
(a) Bharatha Natyam - May 2 12 14 2 5 7(b) Nattuvangam ni I 5 5 ni I 5 5
18, Vadya Visharadha
(a) Flute - May 5 1 6 ni I 1 1
(b) Mirudhangam 17 ni I 17 9 ni I 9
(c) Ghatam 2 ni I 2 1 ni I 1
(d> Kanchira 4 ni I 4 1 ni I 1
19. Teachers Certificate in Indian Music - April 7 14 21 6 13 9
20. Final ExaminationIndian Music for Evening Class studentsVocalj Veena and Violin - July 19 8 27 9 5 14
21. Diploma in Music Teaching - December 5 17 22 5 16 21
22. Diploma in Home Science - April ni I 10 10 ni I 7 7
23. Printing Group - November 244 70 314 54 13 67
24. Agriculture - May (Lower & Higher) -- -- 4444 -- -- 1313
25. Handloom Weaving (Lower & Higher) -- -- 901 -- -- 571
26. Sangeetha Vidwan Title - April 37 89 126 6 29 35
27. Diploma in Teaching the Mentally Retarded- September 3 16 19 2 13 15
: 236 :
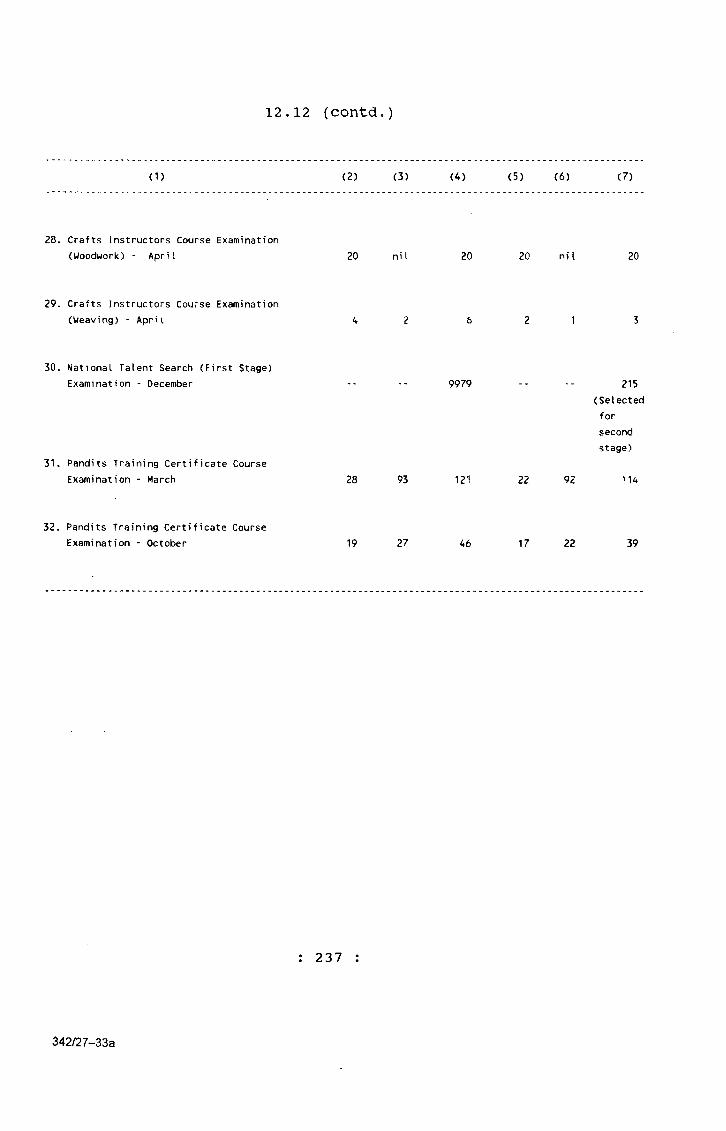
12.12 (contdo)
(1) (2) (3) (4) (5) (6) (7)
28. Crafts Instructors Course Examination (Woodwork) - April 20 ni I 20 20 ni I 20
29. Crafts Instructors Course Examination (Weaving) - April 4 2 6 2 1 3
30. National Talent Search (First Stage) Examination - December 9979 215
31. Pandits Training Certificate Course Examination - March 28 93 121 22 92
(Selectedforsecondstage)
114
32. Pandits Training Certificate Course Examination - October 19 27 46 17 22 39
: 237
342/27-33a
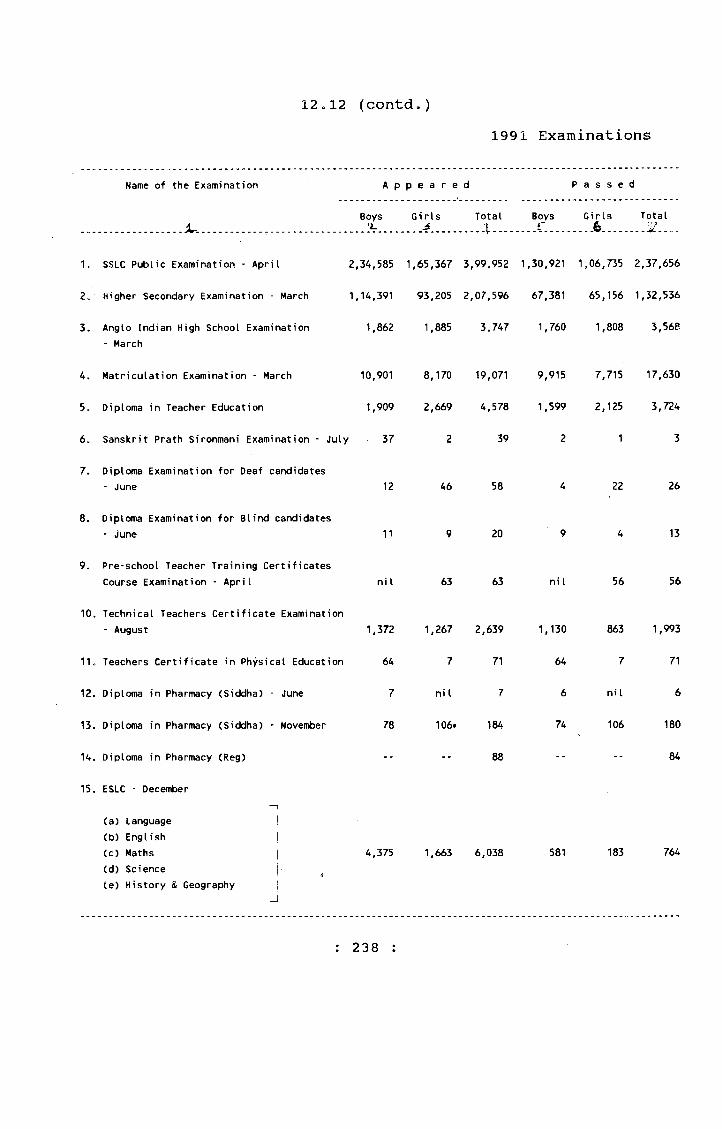
12 o12 (contd.)1991 Examinations
Name of the Examination A p p e a r e d P a s s e d
.............. J U ...........................Boys'i.
GirlsJ .
Total BoysI
Girls. J b ....
Total?
1. SSLC Public Examination - April 2.34,585 1,65,367 3,99,952 1,30,921 1,06,735 2,37,656
2. Higher Secondary Examination - March 1.14,391 93,205 2,07,596 67,381 65,156 1,32,536
3. Anglo Indian High School Examination - March
1,862 1,885 3,747 1,760 1,808 3,568
A. Matriculation Examination - March 10,901 8,170 19,071 9,915 7,715 17,630
5. Diploma in Teacher Education 1,909 2,669 4,578 1,599 2,125 3,724
6. Sanskrit Prath Sironmani Examination - July 37 2 39 2 1 3
7. Diploma Examination for Deaf candidates - June 12 46 58 4 22 26
8. Diploma Examination for Blind candidates - June 11 9 20 9 4 13
9. Pre-school Teacher Training Certificates Course Examination - April ni I 63 63 ni I 56 56
10. Technical Teachers Certificate Examination - August 1,372 1,267 2,639 1,130 863 1,993
11. Teachers Certificate in Physical Education 64 7 71 64 7 71
12. Diploma in Pharmacy (Siddha) - June 7 ni I 7 6 ni I 6
13. Diploma in Pharmacy (Siddha) - November 78 106. 184 74 106 180
14. Diploma in Pharmacy (Reg) -- -- 88 -- -- 84
15. ESLC - December— 1
(a) Language |(b) English j(c) Maths 1 4,375 1,663 6,038 581 183 764(d) Science(e) History & Geography
: 238 :

12.12 (contd.)
(1) (2) (3) (4) (5) (6) (7)
16. Technical Examinations
Lower & Higher
(a) Sewing Group - November -- -- 11,091 -- 3,577(b) Drawing Group - November -- -- 5,441 -- -- 2,088(c) Indian Music - November -- -- 534 -- -- 235(d) Dancing - November -- ... 47 -- -- 29
17„ Natya Visharadha - June(a) Bharatha Natyam ni I 13 13 ni I 9 9
18. Vadya Visharadha - June 6 Ni I 6 4 Nil k
(Flute)
19. Mirudhangam - June 6 1 7 4 1 5
20. Horsing - February 3 ni I 3 3 ni I 3
21. Teachers Certificate in Indian Music - April 2 27 29 2 27 29
22. Final ExaminationIndian Music for Evening Class studentsVocal, Veena and Violin - July 17 12 29 5 3 8
23. Diploma in Home Science - April ni I 17 17 ni I 15 15
24. Printing Group - November -- -- 378 -- -- 94
25. Agriculture - May (Lower & Higher) -- -- 6,269 -- -- 3117
26. Handloom Weaving (Lower & Higher) - May -- -- 1,213 -- -- 605
27. Sangeetha Vidwan Title - April 27 60 87 10 20 30
28. Diploma in Teaching the Mentally Retarded 5 19 24 3 16 19- September
29. National Talent Research (First Stage)Examination December 7636 245
(Selected for II Stage)
30. Pandit Training Certificate Examination- April 1991 50 72 122 49 72 121- October 1991 16 19 35 16 19 35
239

12.12 (contd.)UNIVERSITY OF MADRAS
Name of the Examination Month and Year A p p e a r e d P a s s e d
Boys Girls Total Boys Girls Total
(1) (2) (3) (4) (5) (6) (7) (8)
B.A. March 1991 3,702 2,897 6,599 1,215 1,958 3,173B.Sc. I f i 5,805 3,477 9,282 1,704 2,388 4,092B.Com. I t 3,725 2,090 5,815 1,635 1,496 3,131
M.A,. April 1991 1,409 638 2,047 431 337 768M.A. in Criminology a 4 2 6 2 1 3M.A. in Social Work I I 50 33 83 23 23 46M.A. in Communication I I 7 8 15 6 6 12
M.Com, I I 812 184 996 178 102 280M.Com„ (Business System) I I 13 20 33 2 15 17
M,SCo (Non-semester) I B 1.014 566 1,580 199 235 434M.Sc. (Semester) 11 9 18 27 7 18 25
M.C.A. (Semester) M 51 38 89 36 35 71
W.6.<k. (FuU-tiroe) I I 20 7 27 18 6 24M.S.A. (Part-time) I I 37 37 30 30
B.M.S. I I 8 3 11 8 3 11
B.P.Ed. I I - - 39 39 - - 39 39
M.P.Ed. M - - 14 14 - - 14 14
8. L i t I I 68 44 112 35 32 67
O.T. it 55 5 60 47 5 52
B.P..E.S. I I -- 17 17 -- 16 16
M.PhiI September 1990 580 536 1,116 405 433 838
B.E. April 1991 1,581 272 1,853 1,324 229 1,553
: 240 :

12,12 (contd.)
<1) (2) (3) (4) (5) (6) (7) (8)
B.L. (5 year Integrated) June 1991 233 94 327 99 66 165B.G.L„ HI 719 57 776 221 10 231
B.L. ii 590 26 616 303 21 324M.L. (Non-semester) tt 94 21 115 5 4 9
8.Ed. April 1991 365 432 797 340 406 746M.Ed. It 23 20 43 9 9 18
D.S.M. H 5 10 15 4 10 14M.L.1.S. it 18 9 27 12 9 21
Certificate Course it 60 21 81 • 59 21 80
Diploma » 22 9 31 22 9 31
P.G. Diploma ii 104 -- 104 65 -- 65
Total A 21,183 11,607 32,790 8,444 7,956 16,400
MEDICAL
D.M. Degree March-May 1991 6 6 1 1M.Ch. Degree I S 4 -- 4 4 -- 4
M.D.S. I t 2 2 2 2M.Sc. (Faculty of Medicine) I I 5 6 11 5 6 11
M.D. I I 47 12 59 10 4 14M.S. S I 25 3 28 17 1 18
P.G. Diploma I I 11 3 . - 1.4 . . .2 . . a 4B.D.S. 18 41 22 63 25 18 43
B. Pharmacy I I 28 4 32 16 2 18B.Sc. Nursing I I -- 67 67 -- 65 65
B.O.T.; B.P.T.; B.A.M.S. & B.U.M..S. » 21 14 35 15 13 28M.B.B.S. I I 380 330 710 270 265 535
Total B 570 461 1,031 367 376 743
Grand Total A + B 21,753 12,068 33,821 8,811 8,332 17,143
s 241 :

12.12 (contd.)ANNA UNIVERSITY (1990-91 EXAMINATIONS)
Name of the Examination A P
Boys
p e a r
Girls
e d
Total Boys
P a s s
Girls
e d
Total
(1) (2) <3) (4) (5) (6) <7)
A. B.E. (8 Semester)
1, Civil Engineering 9 4 13 6 4 102. Mechanical Engineering 119 3 122 116 3 119
3. Electrical & Electronics Engineering 32 27 59 29 26 554. Electronics & Communication Engineering 45 13 58 45 13 58
5. Production Engineering 8 2 10 8 2 106. Industrial Engineering 3 7 10 3 7 10
7o Computer Science & Engineering 41 14 55 40 10 508. Printing Technology 16 6 22 15 5 20
9. Mining Engineering 23 -- 23 23 -- 23
B. B.Tech. (8 Semester)
10„ Chemical Engineering 51 9 60 48 9 5711. Textile Technology 28 2 30 28 2 30
12. Leather Technology 22 -- 22 22 -- 22
C. B.Tech. (6 Semester)
13. Aeronautical Engineering 15 4 19 11 3 1414. Automobile Engineering 26 -- 26 26 -- 26
15. Electronics Engineering 39 7 46 37 7 4416. Instrumentation Engineering 48 2 50 39 2 41
17. Production Engineering 14 4 18 14 4 1818. Rubber Technology 12 -- 12 12 -- 12
D. B.Arch. (10 Semester)
19. B.Arch. 10 13 23 10 13 23
E. B.Sc. AoDlied Geology (6 Semester)
20. B.Sc. Applied Geology 7 1 8 7 1 8
: 242 :
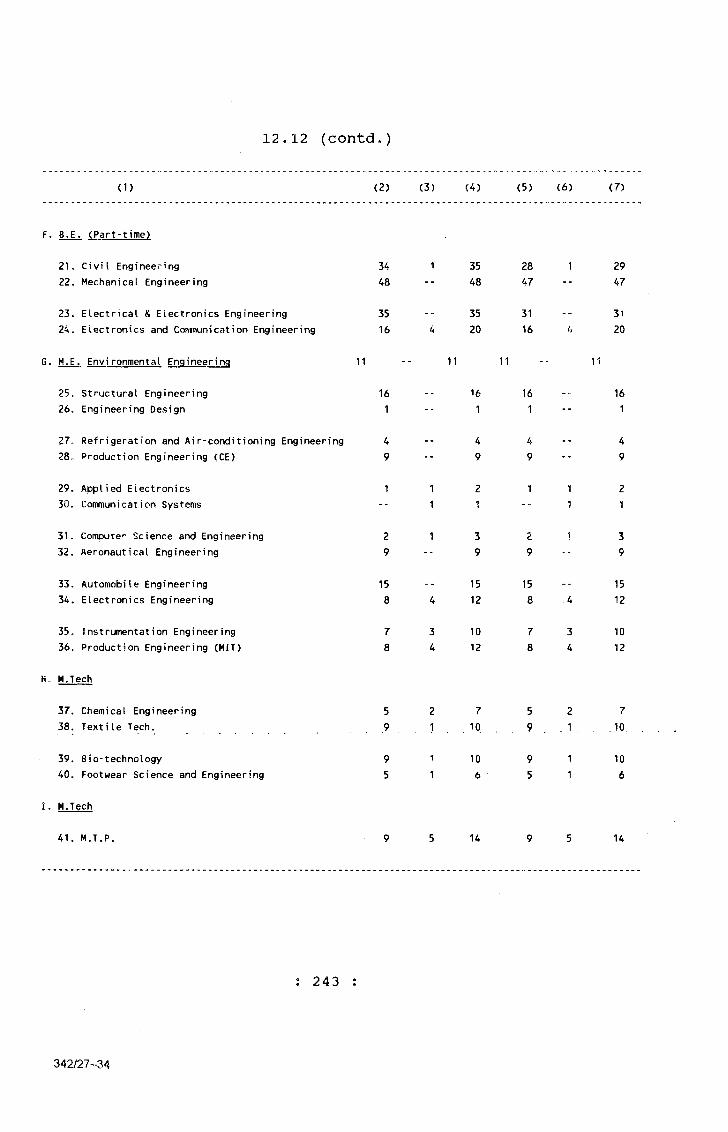
12.12 (contd,)
(1) (2) (3) (4) (5) (6) (7)
F. B.E. (Part-time)
21„ Civil Engineering 34 1 35 28 1 2922. Mechanical Engineering 48 -- 48 47 -- 47
23. Electrical & Electronics Engineering 35 35 31 - - 3124. Electronics and Communication Engineering 16 4 20 16 20
G. M.E. Environmental Engineering 11 - 11 11 11
25. Structural Engineering 16 - - 16 16 - - 1626. Engineering Design 1 -- 1 1 -- 1
27. Refrigeration and Air-conditioning Engineering 4 4 4 428. Production Engineering (CE) 9 -- 9 9 -- 9
29. Applied Electronics 1 1 2 1 1 230. Communication Systems -- 1 Tl - - 1 1
31. Computer Science and Engineering 2 1 3 2 1 332. Aeronautical Engineering 9 - - 9 9 - - 9
33. Automobile Engineering 15 - - 15 15 - - 1534. Electronics Engineering 8 4 12 8 .4 12
35. Instrumentation Engineering 7 3 10 7 3 1036. Production Engineering (MIT) 8 4 12 8 4 12
H. M.Tech
37. Chemical Engineering 5 2 7 5 2 738. Textile Tech. 9 1 10 . . 9 . 1 10
39. Bio-technology 9 1 10 9 1 1040. Footwear Science and Engineering 5 1 6 5 1 6
I. M.Tech
41. M.T.P. 9 5 14 9 5 14
: 2 4 3
342/27-34
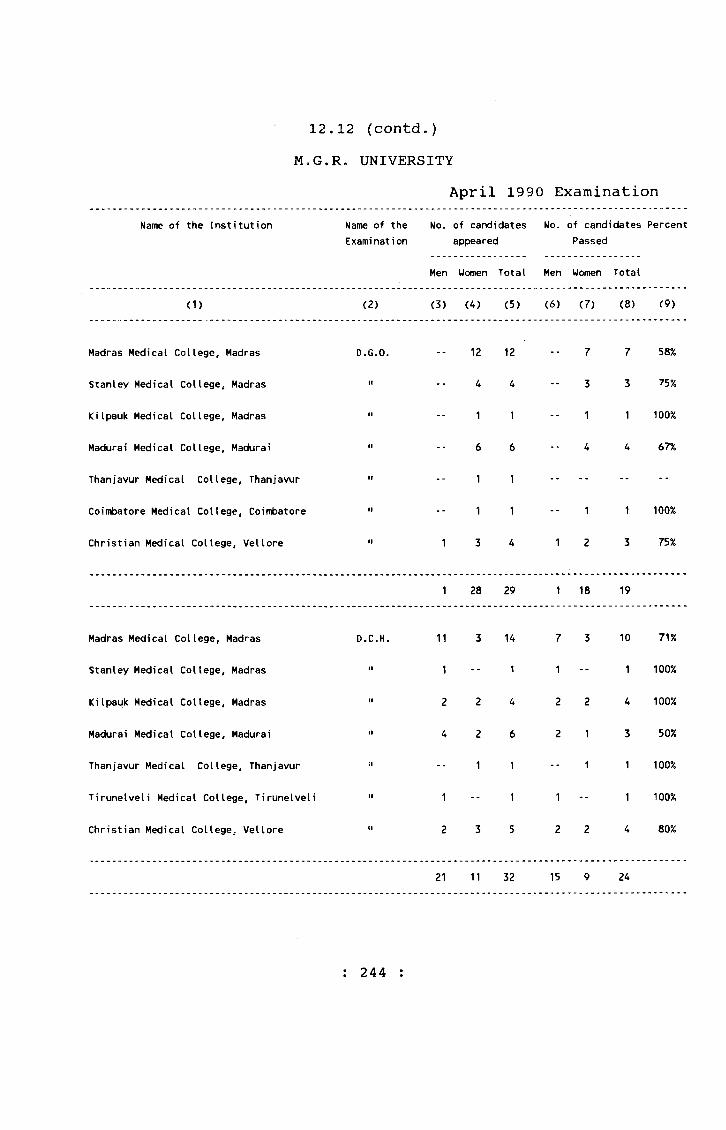
12.12 (contd,)M»G.R. UNIVERSITY
April 1990 ExaminationName of the Institution Name of the
ExaminationNo. of candidates
appearedNo. of candidates
PassedPercent
Men Women Total Men Women Total
(1) (2) (3) (4) (5) (6) <7) (8) (9)
Madras Medical College, Madras O.G.O. -- 12 12 -- 7 7 58%
Stanley Medical College, Madras ■1 -- 4 4 -- 3 3 75%
Kilpauk Medical College, Madras II -- 1 1 -- 1 1 100%
Madurai Medical College, Madurai II -- 6 6 -- 4 4 67%
Thanjavur Medical College, Thanjavur II -- 1 1 -- -- -- --
Coimbatore Medical College, Coimbatore II -- 1 1 -- 1 1 100%
Christian Medical College, Vellore II 1 3 4 1 2 3 75%
1 28 29 1 18 19
Madras Medical College, Madras D.C.H. 11 3 14 7 3 10 71%
Stanley Medical College, Madras II 1 -- 1 1 1 100%
Kilpauk Medical College, Madras II 2 2 4 2 2 4 100%
Madurai Medical College, Madurai II 4 2 6 2 1 3 50%
Thanjavur Medical College, Thanjavur ii -- 1 1 -- 1 1 100%
Tirunelveli Medical College, Tirunelveli II 1 -- 1 1 -- 1 100%
Christian Medical College, Vellore II 2 3 5 2 2 4 80%
21 11 32 15 9 24
: 244 :
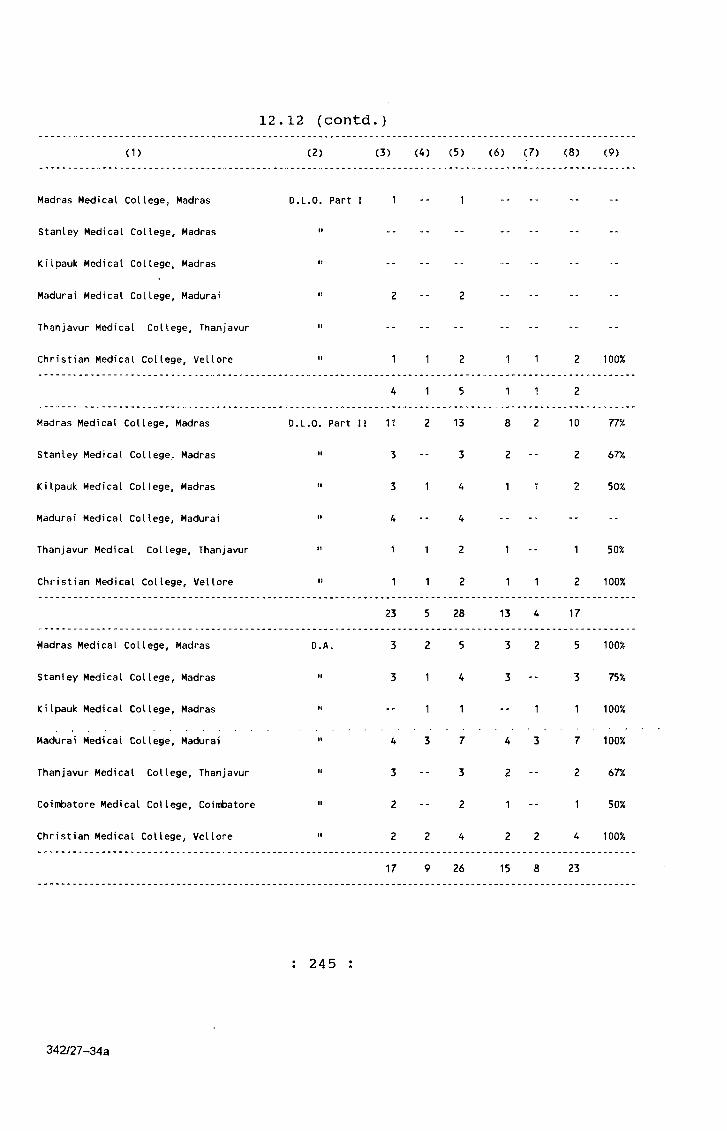
(1) (2) (3) (4) (5) (6) C7) <8) (9)
Madras Medical College, Madras D.L.O. Part I 1 -- 1
Stanley Medical College, Madras "
Kilpauk Medical College^ Madras '*
Madurai Medical College, Madurai " 2 -- 2 . . . .
Thanjavur Medical College, Thanjavur "
Christian Medical College, Vellore " 1 1 2 1 1 2 100%
4 1 5 1 1 2
Madras Medical College, Madras D.L.O. Part II 11 2 13 8 2 10 77%
Stanley Medical College, Madras " 3 -- 3 2 -- 2 67%
Kilpauk Medical College, Madras •' 3 1 4 1 1 2 50%
Madurai Medical College, Madurai '* 4 -- 4 . . . .
Thanjavur Medical College, Thanjavur ” 1 1 2 1 -- 1 50%
Christian Medical College, Vellore " 1 1 2 1 1 2 100%
23 5 28 13 4 17
Madras Medical College, Madras D.A. 3 2 5 3 2 5 100%
Stanley Medical College, Madras " 3 1 4 3 -- 3 75%
Kilpauk Medical College, Madras “ -- 1 1 -- 1 1 100%
Madurai Medical College, Madurai " 4 3 7 4 3 7 100%
Thanjavur Medical College, Thanjavur " 3 -- 3 2 -- 2 67%
Coimbatore Medical College, Coimbatore " 2 -- 2 1 -- 1 50%
Christian Medical College., Vellore " 2 2 4 2 2 4 100%
17 9 26 15 8 23
12.12 (contd.)
; 2 4 5
342/27-34a

(1) (2) (3) (4) (5) (6) (7) (8) <9)
Madras Medical College, Madras D.Orth. 6 - - 6 4 - - 4 67%
Stanley Medical College, Madras I t 3 -- 3 3 -- 3 100%
Kilpauk Medical College, Madras I I 5 - - 5 4 -- 4 80%
Madurai Medical College, Madurai I I 5 -- 5 4 -- 4 80%
Thanjavur Medical College, Thanjavur I I 1 -- 1 1 -- 1 100%
Christian Medical College, Vellore ! l 4 -- 4 3 -- 3 75%
24 24 19 - - 19
Madras Medical College, Madras 0.0. 8 5 13 3 5 8 62%
Stanley Medical College, Madras I I 4 1 5 3 1 4 80%
Madurai Medical College, Madurai I I I 1 1 2 - - 1 1 50%
Thanjavur Medical College, Thanjavur I I 1 1 2 1 1 2 100%
Christian Medical College, Vellore I I - - 2 2 - - 2 2 100%
Aravind Eye Hospital, Madurai I I 7 2 9 7 2 9 100%
Medical Research Foundation, Madras-6 I I 2 2 4 2 1 3 75%
23 14 37 16 13 29
Madras Medical College Madras D.V. 2 2
Madras Medical College, Madras D.D. 1 4 5 1 4 5 100%
Christian Medical College, Vellore I I 1 2 3 1 2 3 100%
2 6 8 2 6 8
: 246 :

(1) (2) (3) (4) (5) (6) (7) (8) (9)
Madras Medical College, Madras D.C.P. 1 5 6 .. 4 4 67%
Kilpauk Medical College, Madras II -- 1 1 -- 1 100%
Christian Medical College, Vellore II -- ■ 1 1 1 1 100%
1 7 8 6 6
Madras Medical College, Madrsui> O.T.R.D. 4 -- 4 3 -- 3 75%
Medical College, Vellore D.M.R.D. Part I 3 -- 3 3 -- 3 100%
Madras Medical College, Madras D.M.R.D. Part II 3 2 5 3 2 5 100%
Stanley Medical College, Madras II -- 2 2 -- 2 2 100%
Madurai Medical College, Madurai II 3 -- 3 3 -- 3 100%
Christian Medical College, Vellore II 2 -- 2 2 -- 2 100%
8 4 12 8 4 12
Madras Medical College, Madras D.M.R.T. Part II 1 -- 1 1 -- 1 100%
Christian Medical College, Vellore II 1 -- 1 1 -- 1 100%
2 -- 2 2 •• 2
Madras Medical College, Madras D.P.M. Part I 1 -- 1
Christian Medical College, Vellore II 3 -- ? 3 -- 3 100%
4 -- 4 3 -- 3
: 247 :
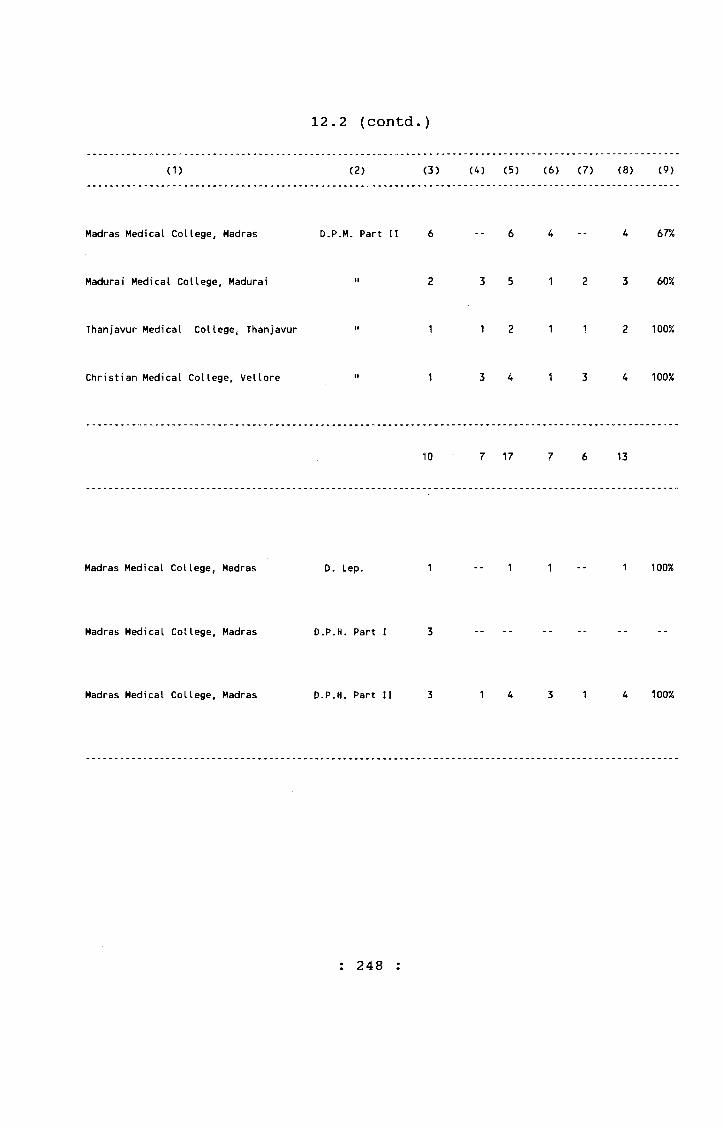
12.2 (contd.)
(1) (2) (3) (4) (5) (6) (7) (8) (9)
Madras Medical College, Madras D.P.M. Part II 6 -- 6 4 -- 4 67%
Madurai Medical College, Madurai I I 2 3 5 1 2 3 60%
Thanjavur Medical College, Thanjavur 1 8 1 1 2 1 1 2 100%
Christian Medical College, Vellore I I 1 3 4 1 3 4 100%
10 7 17 7 6 13
Madras Medical College, Madras D. Lap. 1 1 1 100%
Madras Medical College, Madras D.P.H. Part I 3
Madras Medical College, Madras D.P.H. Part II 3 1 4 3 1 4 100%
: 248 :
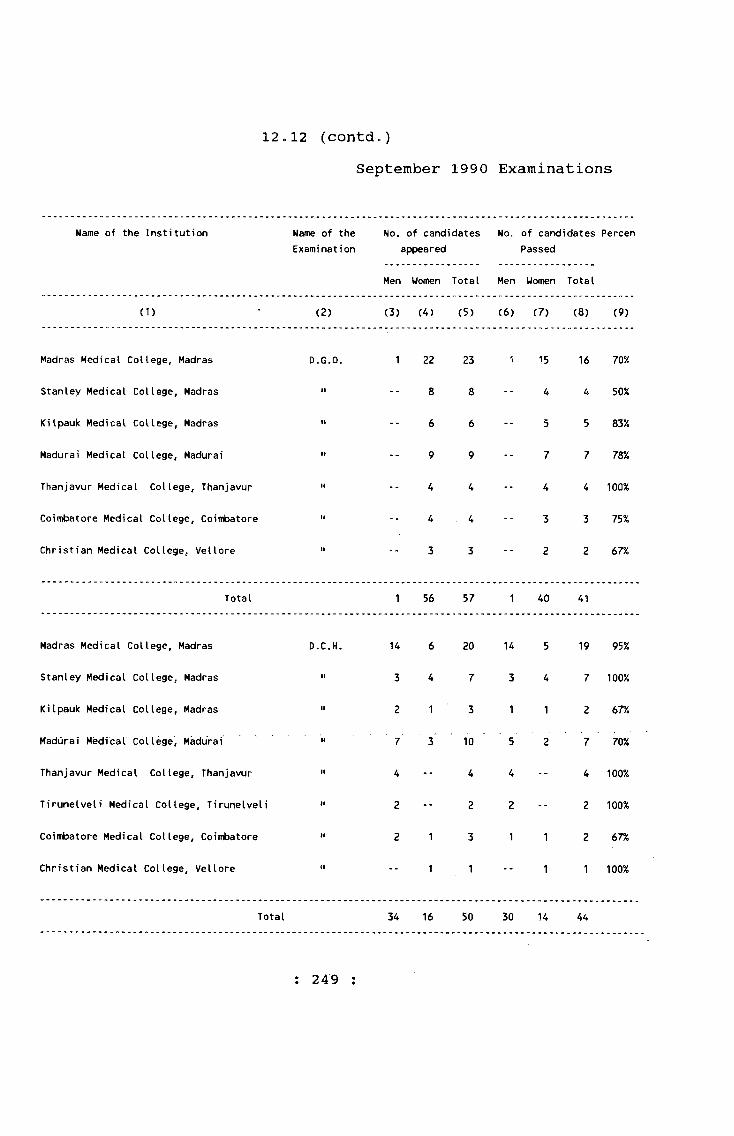
12ol2 (contdc)September 1990 Examinations
Name of the Institution Name of the Examination
No. of candidates appeared
Men Women Total
No.
Men
of candidates Passed
Women Total
Percen
(1) (2) (3) (4) (5) (6) (7) (8) (9)
Madras Medical College, Madras D.G.O. 1 22 23 1 15 16 70%
Stanley Medical College, Madras -- 8 8 -- 4 4 50%
Kilpauk Medical College, Madras « l -- 6 6 -- 5 5 83%
Madurai Medical College, Madurai I I -- 9 9 -- 7 7 78%
Thanjavur Medical College, Thanjavur I I -- 4 4 -- 4 4 100%
Coimbatore Medical College, Coimbatore I I -- 4 4 -- 3 3 75%
Christian Medical College, Vellore I I -- 3 3 -- 2 2 67%
Total 1 56 57 1 40 41
Madras Medical College, Madras D.C.H. U 6 20 14 5 19 95%
Stanley Medical College, Madras I I 3 4 7 3 4 7 100%
Kilpauk Medical College, Madras I I 2 1 3 1 1 2 e n
Madurai Medical College, Madurai I I 7 3 10 5 2 7 70%
Thanjavur Medical College, Thanjavur I I 4 -- 4 4 -- 4 100%
Tirunelveli Medical College, Tirunelveli I I 2 -- 2 2 -- 2 100%
Coimbatore Medical College, Coimbatore I I 2 1 3 1 1 2 67%
Christian Medical College, Vellore B l -- 1 1 -- 1 1 100%
Total 34 16 50 30 14 44
: 249 :

12.12 (contd,)
( 1 ) (2) (3) (4) (5) (6) (7) (8) (9)
Madras Medical College, Madras
Stanley Medical College, Madras
Kilpauk Medical College, Madras
Madurai Medical College, Madurai
Thanjavur Medical College, Thanjavur
D.L.O. Part I 13 1
2
2
13 1
1
14 12
2 2
2 2
14 9
1 1
13 93%
2 100%
2 100%
10 71%
1 100%
31 33 26 28
Madras Medical College, Madras
Kilpauk Medical College, Madras
Madurai Medical College, Madurai
Thanjavur Medical College, Thanjavur
D.L.O.(Part II) 1 1
1 1
8 4
1 1
1 100%
1 100%
4 50%
1 100%
Total 11 11 7
Madras Medical College, Madras
Stanley Medical College, Madras
Kilpauk Medical College, Madras
Madurai Medical College, Madurai
Thanjavur Medical College, Thanjavur
Coimbatore Medical College, Coimbatore
D.A. 4 3
5 1
1
5 2
4
2
4 57%
5 83%
1 100%
5 71%
4 100%
1 50%
20 27 15 20
: 250 :

12,12 (contd.)
( 1 ) ( 2 ) (3) (4) (5) (6) (7) (8) (9)
Madras Medical College, Madras
Stanley Medical College, Madras
KiIpauk Medical College, Madras
Madurai Medical College, Madurai
Thanjavur Medical College, Thanjavur
D. Orth. 4 2
1 1
3 2
1 1
2 2
2 50%
1 100%
2 67%
1 100%
2 100%
11 11
Madras Medical College, Madras D.O. 10 7 70%
Medical Research Foundation, Madras-6 II -- 1 1 1 1 100%
Stanley Medical College, Madras II 2 1 3 1 -- 1 33%
Madurai Medical College, Madurai II 2 -- 2 2 -- 2 100%
Thanjavur Medical College, Thanjavur II 2 -- 2 2 -- 2 100%
Joseph Eye Hospital, Trichy II 5 1 6 5 1 6 100%
Total 18 24 15 4 19
Madras Medical. Callege,. Madras........... , D.V. , 3 . 3 , ^ -- 2 67% .
Madras Medical College, Madras D.D. 2 1 3 1 1 2 67%
Stanley Medical College, Madras II 1 1 2 1 1 2 100%
Thanjavur Medical College, Thanjavur II 1 -- 1 1 -- 1 100%
Total 4 2 6 4 3 7
: 251
342/27-35
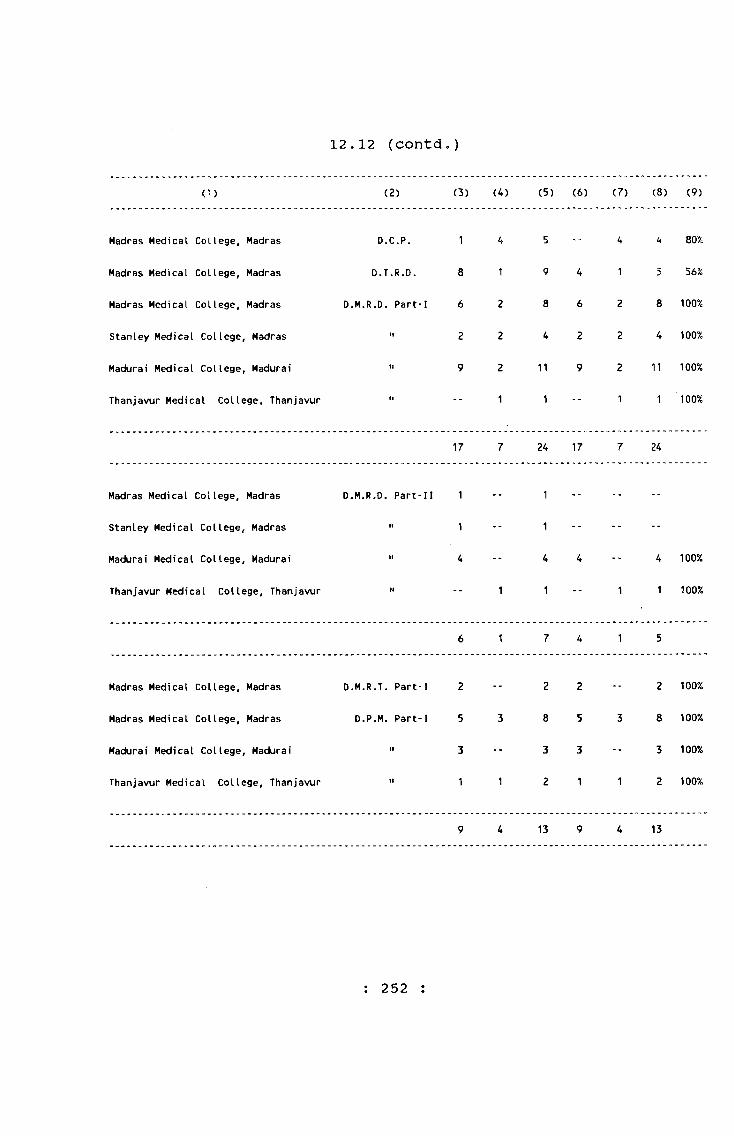
12.12 (contdo)
( 1) (2) (3) (4) (5) (6) (7) (8) (9)
Madras Medical College, Madras D.C.P. 1 4 5 -- 4 4 807c
Madras Medical College, Madras D.T.R.D. 8 1 9 4 1 5 56%
Madras Medical College, Madras D.M.R.D. Part-I 6 2 8 6 2 8 100%
Stanley Medical College, Madras II 2 2 4 2 2 4 100%
Madurai Medical College, Madurai 11 9 2 11 9 2 11 100%
Thanjavur Medical College, Thanjavur II -- 1 1 -- 1 1 100%
17 7 24 17 7 24
Madras Medical College, Madras D.M.R.D. Part-II 1 -- 1 -- -- --
Stanley Medical College, Madras II 1 -- 1 -- -- --
Madurai Medical College, Madurai II 4 -- 4 4 -- 4 100%
Thanjavur Medical College, Thanjavur II -- 1 1 -- 1 1 100%
6 1 7 4 1 5
Madras Medical College, Madras D.M.R.T. Part-I 2 -- 2 2 -- 2 100%
Madras Medical College, Madras D.P.M. Part-I 5 3 8 5 3 8 100%
Madurai Medical College, Madurai II 3 -- 3 3 -- 3 100%
Thanjavur Medical College, Thanjavur II 1 1 2 1 1 2 100%
9 4 13 9 4 13
: 252 :
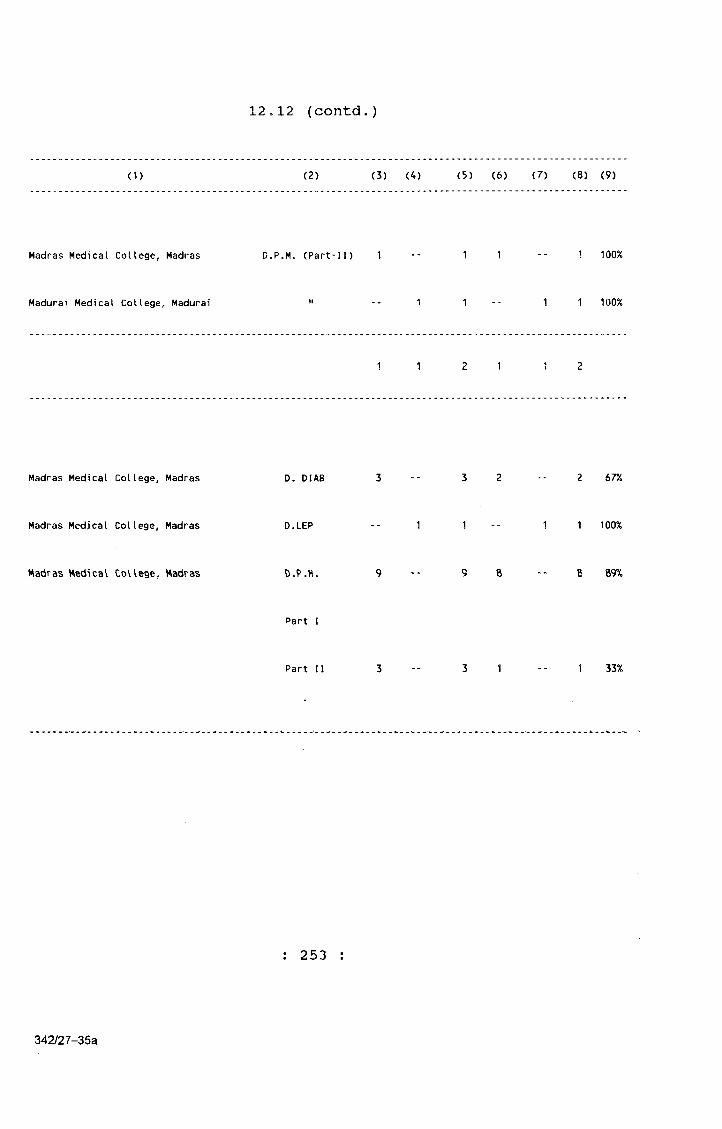
12,12 (contd.)
( 1 ) ( 2 ) (3) (4) (5) (6) (7) (8) (9)
Madras Medical College, Madras D.P.M. (Part-II) 1 1 1 1 100%
Madurai Medical College, Madurai 1 1 100%
1 1 2 1 1 2
Madras Medical College, Madras D. DIAB 3 2 2 67%
Madras Medical College, Madras D.LEP 1 1 1 1 100%
Madras MedScaV CoVVege, Madras D.P.H. 9 8
342/27-35a
Part I
Part II 1 33%
: 2 53

12.12 (contd.)December 1990 Examination
SI.No.
Name of the Institution Name of the Examination No.of candidates No,of A p p e a r e d P
candidates Percen- a s s e d tage
Men Women Total Men Women Total
(1) (2) (3) (4) (5) (6) (7) (8) (9) (10)
1. Christian Medical College, Vellore
M.Sc. (Faculty of Medicine) Preliminary 1 1 1 1 100%
2. Madurai Medical College, Madurai I.M.P. Pharmacy 2 2 4 2 1 3 75%
3. J.S.S. College, Ooty -do- 8 -- 8 8 -- 8 100%
4. Madras Dental College, Madras Part - I M.D.S. 15 5 20 13 3 16 80%
5. Madras Dental College, Madras Part - II M.D.S. 2 1 3 -- 1 1 33.3%
6. Madras Medical College, Madras 1st B. Pharmacy 8 9 17 8 7 15 88.2%
7. M.M.C., Madurai -do- 20 5 25 16 3 19 76%
8. C.L. Baid College, Madras -do- 33 7 40 13 4 17 42.5%
9. J.S.S. College, Ooty -do- 58 6 64 25 4 29 45.31%
10. K.M. College, Madurai -do- 42 5 47 16 4 20 42.55%
11. Periyar College, Trichy -do- -- 16 16 -- 9 9 56.25%
12. Ramakrishna College, Coimbatore -do- 20 11 31 10 11 21 67.74%
13. J.K.K. Natarajah College, Kumarapalayam -do- 62 2 64 24 2 26 40.62%
14. M.M.C., Madras II B. Pharmacy 7 13 20 6 9 15 75%
15. M.M.C., Madurai -do- 13 6 19 9 4 13 68.42%
16. C.L. Baid College, Madras -do- 16 5 21 9 2 11 52.3%
17. J.S.S. College, Ooty -do- 45 3 48 25 2 27 56.25%
18. K.M. College, Madurai -do- 20 4 24 13 3 16 66.6%
19. Periyar College, Trichy -do- -- 7 7 -- 4 4 57.13%
: 254 :

12,12 (contdO
(1) (2) (3) (4) (5) (6) (7) (8) (9) (10)
20. Ramakrishna College, Coimbatore II B. Pharmacy 10 11 21 6 11 17 85.7%
21. J.K.K. Natarajah Komarapalayam -do- 24 1 25 11 1 12 48%
22. Madras Dental College, Madras I. 8.D.S. 11 23 34 9 16 25 73.52%
23. Ragas Dental College, Madras -do- 21 8 29 19 7 26 89.6%
24. Saveetha Dental College, Madras -do- 10 1 11 8 1 9 81.8%
25. Balaji Dental College, Madras -do- 20 19 39 7 13 20 51.2%
26. J.K.K. Natarajah, Komarapalayam -do- 42 16 58 17 5 22 1 7 . 9 %
27. Vinayaka Dental College, Salem -do- 93 20 113 61 10 71 62.8%
28. Raja's Dental College, Vadakankulam -do- 44 21 65 15 9 24 36.9%
29. Madras Dental College, Madras II . B.D.S. 9 24 33 7 20 27 81.8%
30. Ragas Dental College, Madras -do- 7 14 21 6 14 20 95.2%
31. Saveetha Dental College, Madras -do- 17 9 26 13 7 20 76.9%
32. J.K.K. Dental College, Komarapalayam -do- 29 11 40 12 8 20 50%
33. Vinayaka Dental College, Salem -do- 48 20 68 9 6 15 22%
34. Rajas Dental College, Vadakankulam -do- 20 13 33 10 10 20 60.6%
: 255 :
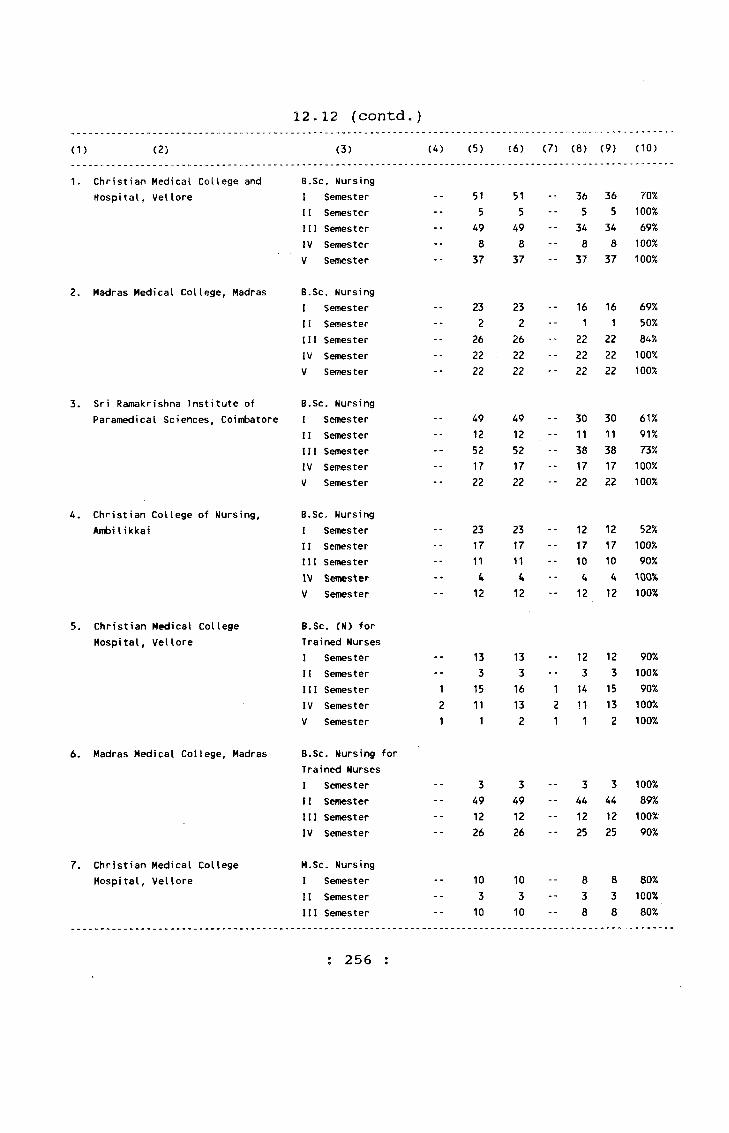
12,12 (contd.)(1) (2) (3) (4) (5) (6) (7) (8) (9) (10)
1. Christian Medical College and B.Sc. NursingHospital, Vellore I Semester -- 51 51 -- 36 36 70%
11 Semester -- 5 5 -- 5 5 100%111 Semester -- 49 49 -- 34 34 69%IV Semester -- 8 8 -- 8 8 100%V Semester -- 37 37 -- 37 37 100%
2. Madras Medical College, Madras B.Sc, NursingI Semester -- 23 23 -- 16 16 69%I! Semester -- 2 2 -- 1 1 50%111 Semester -- 26 26 22 22 84%IV Semester -- 22 22 -- 22 22 100%V Semester -- 22 22 -- 22 22 100%
3. Sri Ramakrishna Institute of B.Sc. NursingParamedical Sciences, Coimbatore I Semester -- 49 49 -- 30 30 61%
11 Semester -- 12 12 -- 11 11 91%III Semester -- 52 52 -- 38 38 73%IV Semester -- 17 17 -- 17 17 100%V Semester -- 22 22 -- 22 22 100%
4. Christian College of Nursing, B.Sc. NursingAmbiIikkai I Semester -- 23 23 -- 12 12 52%
11 Semester -- 17 17 -- 17 17 100%111 Semester -- 11 11 -- 10 10 90%IV Semester -• 4 4 -- U 4 \ m %
V Semester -- 12 12 -- 12 12 100%
5. Christian Medical College B.Sc. (N) forHospital, Vellore Trained Nurses
I Semester -- 13 13 -- 12 12 90%n Semester -- 3 3 -- 3 3 100%III Semester 1 15 16 1 14 15 90%IV Semester 2 11 13 2 11 13 100%V Semester 1 1 2 1 1 2 100%
6. Madras Medical College, Madras B.Sc. Nursing forTrained NursesI Semester -- 3 3 -- 3 3 100%II Semester -- 49 49 -- 44 44 89%III Semester -- 12 12 -- 12 12 100%IV Semester -- 26 26 -- 25 25 90%
7. Christian Medical College M.Sc. NursingHospital, Vellore I Semester -- 10 10 -- 8 8 80%
11 Semester -- 3 3 -- 3 3 100%III Semester -- 10 10 -- 8 8 80%
; 256 :

12.12 (contd.)October and December 1990 Examination
(1) (2) (3) (4) (5) (6) (7) (8) (9) (10)
1. Govt. Siddha Medical College, (a) M.D. (Siddha) 3 3 2 2 67%
Paiayamkottai <b) H. B.S.M.S. 44 53 97 34 47 81 83%
(c) I. B.S.M.S. 29 16 45 26 13 39 87%
2. Govt. Siddha Medical College, (a) II. B.S.M.S. 24 14 38 23 13 36 95%
Pa Ian! (b) I. B.S.M.S. 14 10 24 10 9 19 79%
3. Govt. Homoeo Medical College and I. B.H.M.S.
Hospital, TimmamguI am (a) Part I 9 12 21 8 11 19 90%
(b) Part II 4 7 11 4 6 10 91%
4. Govt. Unani Medical College, (a) I. B.U.M.S. 7 1 8 5 1 6 75%
Madras-106 (b) II. B.U.M.S. 2 -- 2 2 -- 2 100%
5. Ayurveda College, Coimbatore I. B.A.M.S.
(a) Part I 9 -- 9 9 -- 9 100%
(b) Part 11 18 -- 18 8 -- 8 44%
6. The Venkataramana Ayurveda I. B.A.M.S.
College, Madras (a) Part I 7 1 8 1 1 2 25%
(b) Part II 16 4 20 4 -- 4 20%
: 257 :
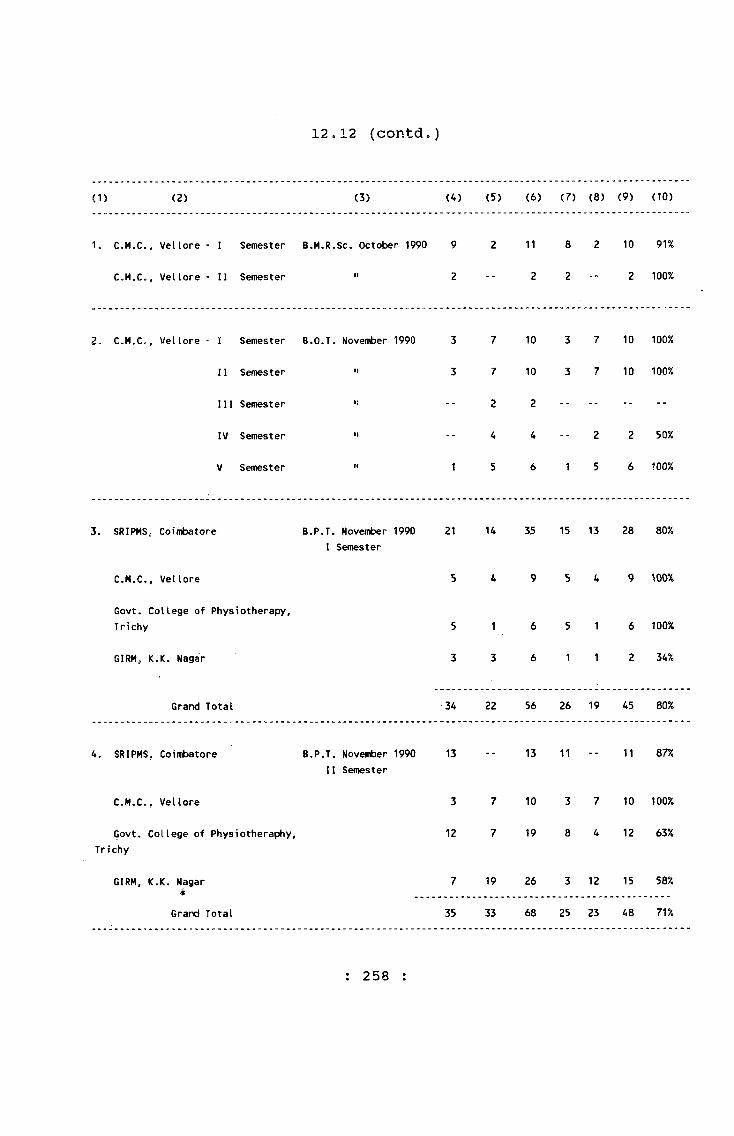
12.12 (contdo)
( 1) ( 2 ) (3) <4) (5) (6) (7) (8) (9) (10)
1. C.M.C., Vellore - I Semester B.M.R.Sc. October 1990 9 2 11 8 2 10 91%
C.M.Co, Vellore - II Semester 2 2 2 100%
2 . C.M.C,, Vellore - I Semester B.G.T. November 1990
II Semester '•
III Semester "
IV Semester •'
V Semester "
10
10
2
4
6
3 7 10 100%
3 7 10 100%
2
1 5
2 50%
6 100%
3. SRIPMS, Coimbatore B.P.T. November 19901 Semester
Govt. College of Physiotherapy, Trichy
GIRM, K.K. Nagar
21 14 35 15 13 28 80%
5 4 9 5 4 9 ^00%
5 1 6 5 1 6 100%
3 3 6 1 1 2 34%
Grand Total 34 22 56 26 19 45 80%
4. SRIPMS, Coimbatore
C.M.C., Vellore
B.P.T. November 1990II Semester
13 11 11 87%
Govt. College of Physiotheraphy, Trichy
GIRM, K.K. Nagar
Grand Total
13
3 7 10 3 7 10 100%
12 7 19 8 4 12 63%
7 19 26 3 12 15 58%
35 33 68 25 23 48 71%
: 258 :
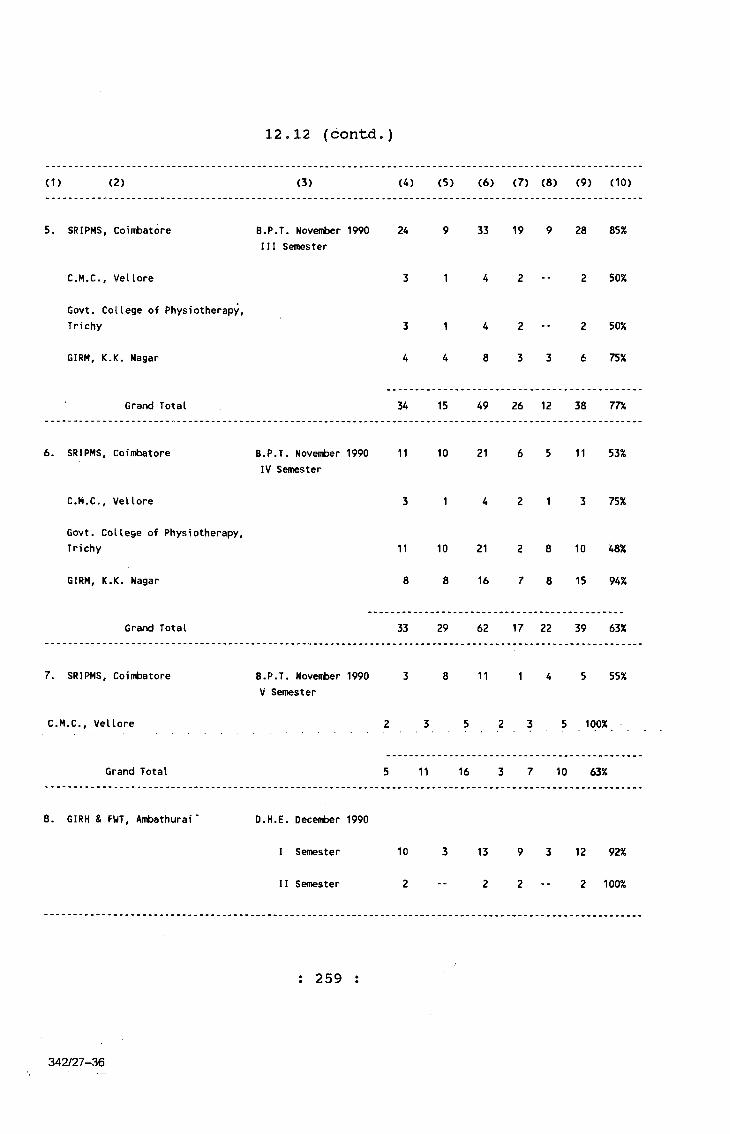
12.12 (contd.)
( 1) (2 ) (3) (4) (5) (6) (7) (8) (9) (10)
5. SRIPMS, Coirrtoatore
C.M.C., Vellore
B.P.T. November 1990 111 Semester
Govt, College of Physiotherapy, Trichy
GIRM, K.K. Nagar
Grand Total
24 9 33 19 9 28 85%
1 4 2 2 50%
1 4 2 -- 2 50%
4 8 3 3 6 75%
34 15 49 26 12 38 77%
6. SRIPMS, Coimbatore
C.M.C., Vellore
B.P.T. November 1990 IV Semester
Govt. College of Physiotherapy, Trichy
GIRM, K.K. Nagar
Grand Total
11 10 21 6 5 11 53%
3 1 4 2 1 3 75%
11 10 21 2 8 10 48%
8 8 16 7 8 15 94%
33 29 62 17 22 39 63%
7. SRIPMS, Coimbatore
C.M.C., Vellore
B.P.T. Novenfcer 1990 V Semester
8 11 1 4 5 55%
5 2 3 5 100%
Grand Total 5 11 16 3 7 10 63%
8. GIRH & FWT, Ambathurai D.H.E. December 1990
I Semester 10
II Semester 2
13 9 3 12 92%
2 2 -- 2 100%
: 259
342/27-36
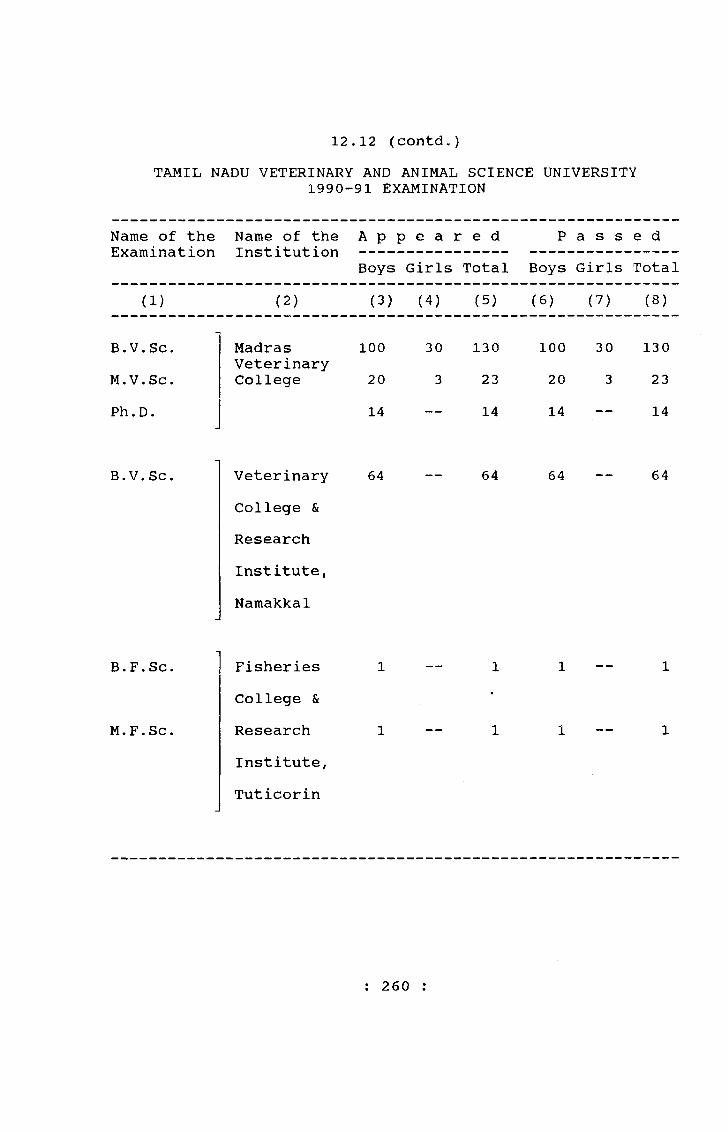
TAMIL NADU VETERINARY AND ANIMAL SCIENCE UNIVERSITY1990-91 EXAMINATION
12.12 (contd.)
Name of the Examination
Name of the Institution
A p Boys
p e aGirls
r e dTotal
PBoys
a s sGirls
e d Total
(1) (2) (3) (4) (5) (6) (7) (8)
B.V.Sc. Madras 100 30 13 0 100 30 130Veterinary
M.V.Sc. College 20 3 23 20 3 23Ph.D. 14 — 14 14 — 14
B.V.Sc Veterinary College & Research Institute, Namakkal
64 64 64 64
B.F.Sc
M.F.Sc
Fisheries College & Research Institute, Tuticorin
: 2 60 :
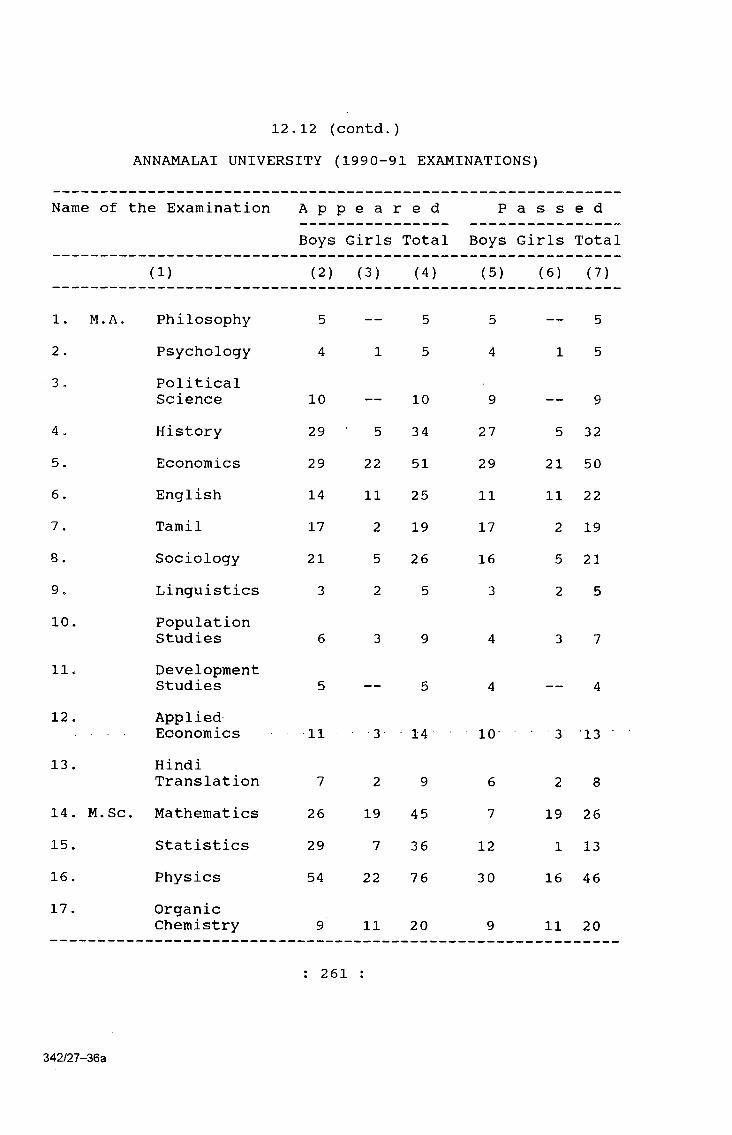
12,12 (contd.)ANNAMALAI UNIVERSITY (1990-91 EXAMINATIONS)
Name of the Examination A p p e a r e d P a s s e dBoys Girls Total Boys Girls Total
(1) (2) (3) (4) (5) (6) (V)
1. M.A. Philosophy 5 — 5 5 — 52. Psychology 4 1 5 4 1 53, Political
Science 10 — 10 9 — 94. History 29 5 34 27 5 325. Economics 29 22 51 29 21 506. English 14 11 25 11 11 227. Tamil 17 2 19 17 2 198. Sociology 21 5 26 16 5 219. Linguistics 3 2 5 3 2 510. Population
Studies 6 3 9 4 3 711. Development
Studies 5 — 5 4 — 412. Applied
Economics13. Hindi
Translation 7 2 9 6 2 814. M.Sc. Mathematics 26 19 45 7 19 2615. Statistics 29 7 36 12 1 1316. Physics 54 22 76 30 16 4617. Organic
Chemistry 9 11 20 9 11 20
: 261 :
342/27-36a
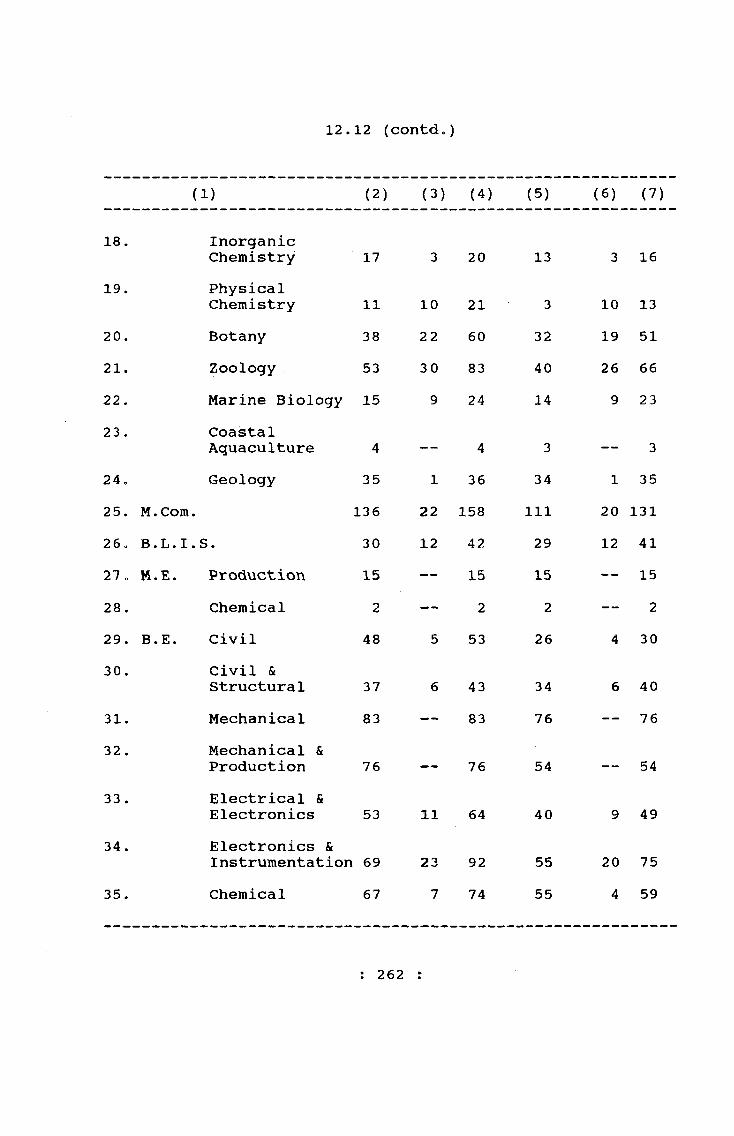
12.12 (contd.)
(1) (2) (3) (4) (5) (6) (7)
18. InorganicChemistry 17 3 20 13 3 16
19. PhysicalChemistry 11 10 21 3 10 13
20. Botany 38 22 60 32 19 5121. Zoology 53 30 83 40 26 6622. Marine Biology 15 9 24 14 9 2323 . Coastal
Aquaculture 4 — 4 3 — 324. Geology 35 1 36 34 1 3525. M.Com. 136 22 158 111 20 13126. B.L.I.S. 30 12 42 29 12 4127 . M.E. Production 15 — . 15 15 — 1528. Chemical 2 — 2 2 — 229. B.E. Civil 48 5 53 26 4 3030. Civil &
Structural 37 6 43 34 6 4031. Mechanical 83 — 83 76 — 7632. Mechanical &
Production 76 — 76 54 — 5433. Electrical &
Electronics 53 11 64 40 9 4934. Electronics &
Instrumentation 69 23 92 55 20 7535. Chemical 67 7 74 55 4 59
: 262 :
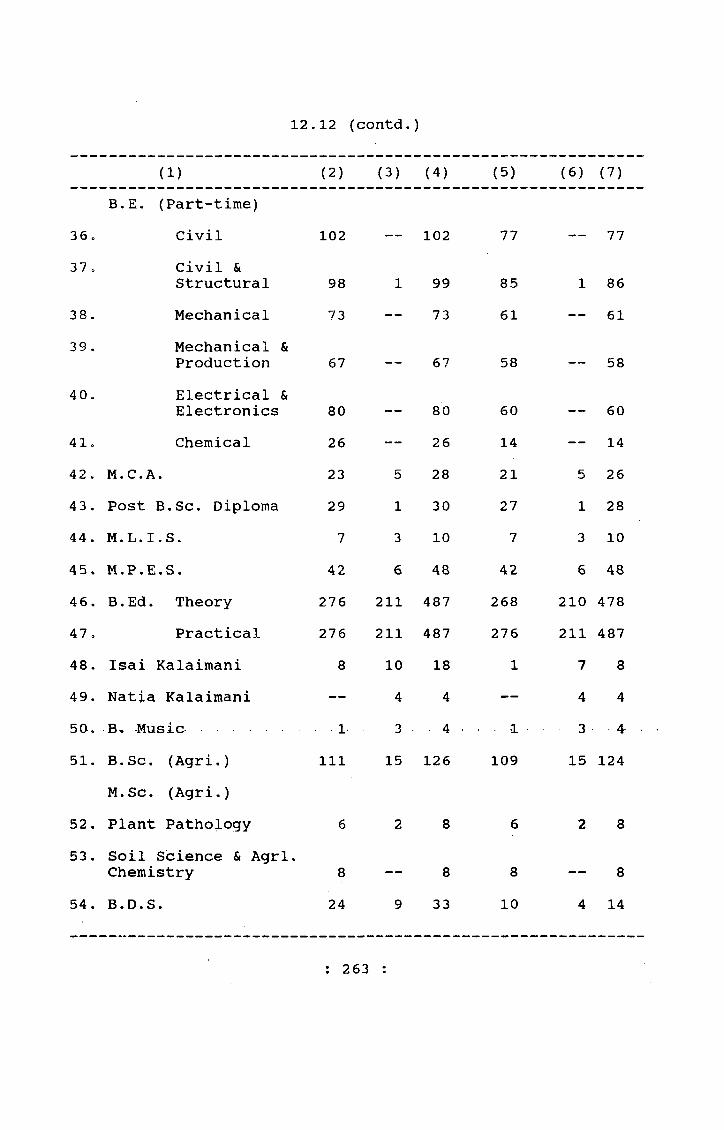
12.12 (contd.)
(1) (2) (3) (4) (5) (6) (7)B.E, (Part-time)
36« Civil 102 — 102 77 7731 o Civil &
Structural 98 1 99 85 1 8638. Mechanical 73 — 73 61 — 6139. Mechanical &
Production 67 — 67 58 — 5840. Electrical St
Electronics 80 — 80 60 — 6041. Chemical 26 — 26 14 — 1442 . M.C.A. 23 5 28 21 5 2643 . Post B.Sc. Diploma 29 1 30 27 1 2844 . M.L.I.S. 7 3 10 7 3 1045. M.P.E.S. 42 6 48 42 6 4846. B .Ed. Theory 276 211 487 268 210 47847, Practical 276 211 487 276 211 48748. Isai Kalaimani 8 10 18 1 7 849. Natia Kalaimani — 4 4 — 4 450. B, -M u s i c........... 1 -3 4 • . . 1 . 3 , . 4 .
51. B.Sc. (Agri.) M.Sc. (Agri.)
111 15 126 109 15 124
52. Plant Pathology 6 2 8 6 2 853. Soil Science & Agri.
Chemistry 8 — 8 8 — 854. B.D.S. 24 9 33 10 4 14
: 263 :

12.12 (contd.)BHARATHIAR UNIVERSITY (1990-91 Examinations)
Name of the Examination A p p e a r e d P a s s e dBoys Girls. Total Boys Girls Total
(1) (2) (3) (4) (5) (6) (V)
1. B.A.a. Tamil Literature 35 19 54 2 8 10b. Economics 210 195 405 42 116 158c. History 126 287 413 21 120 141d. English Literature 52 228 280 5 139 144e. Co-operation 42 11 53 20 4 24f . Corporate
Secretaryship 33 10 43 2 4 6g. Defence Studies 7 — 7 — — —
2. B.B.M. 78 55 133 17 47 643 o B .Com. 574 469 1043 77 225 3024o M.A.
a. Tamil 9 8 17 6 7 13b. Economics 24 14 38 10 12 22c. History 14 33 47 6 23 29d. English Literature — 38 38 — 34 34e. Social work 11 7 18 8 5 13
5. M.Sc.a. Mathematics 31 39 70 2 17 19b. Physics 38 7 45 20 6 2 6c. Chemistry 28 19 47 9 8 17d. Botany 14 29 43 6 22 28e. Zoology 33 13 46 6 12 18
: 2 64 :
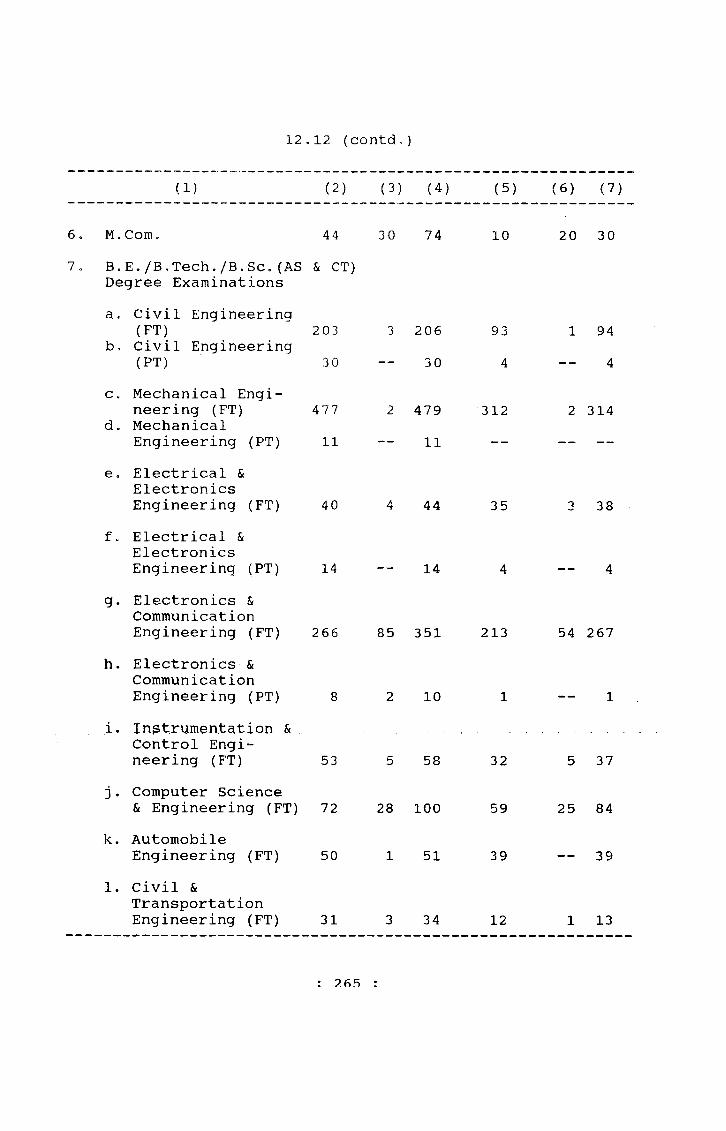
1 2 o12 fcontd
(1) (2) (3) (4) (5) (6) (7)
6. M.Conio 44 30 74 10 20 307. B,E./B,Tech,/B.Sc.(AS
Degree Examinations& CT)
a. Civil Engineerina (FT)
b. Civil Engineering (PT)
203 3 0
3 20630
934
1 944
c. Mechanical Engineering (FT)
d. Mechanical Engineering (PT)
47711
2 47911
312 2 314
e. Electrical & Electronics Engineering (FT) 40 4 44 35 3 38
f. Electrical & Electronics Engineering (PT) 14 — — 14 4 4
g. Electronics & Communication Engineering (FT) 266 85 351 213 54 267
h. Electronics & Communication Engineering (PT) 8 2 10 1 1
i. Instrumentation ft Control Engineering (FT) 53 5 58 32 5 37
j . Computer Science & Engineering (FT) 72 28 100 59 25 84
k. AutomobileEngineering (FT) 50 1 51 39 — 39
1. Civil &Transportation Engineering (FT) 31 3 34 12 1 13
2 6 5

12.12 (contd.)
(1) (2) (3) (4) (5) (6) (7)
m. B.Tech. (Chemical) (FT) 3 __ 3 ^ — __
n. B.Sc. (Applied Science (FT) 11 — 11 4 — 4
o . B.Sc. (Comp. Tech.) (FT) 1 — 1 — — —
8. a, B.Ed. November 1990 — 4 4 — 3 3b. B.Ed. April 1991 — 144 144 — 133 133
9. B.P.Ed. April 1991 89 — 89 86 — 8610. a. M.P.Ed. April 1991 25 — 25 25 . — 25
b . M .P .Ed. (Summer Course) 25 — 25 25 — 25
11. M.C.A. April 1991 10 10 20 9 8 1712. a. PGDCA December 1990 29 — 29 10 — 10
b. July 1991Regular (FT) 20 11 31 6 6 12
c. Arrear (FT) 16 — 16 4 — 4d. Arrear (PT) 1 — 1 1 — 1e. Regular (PT) 5 1 6 1 — 1
13. B.L. (3 year) a. December - 1990 86 4 90 45 1 46b. May - 1991 137 9 146 55 5 60
14. B.L. (5 year course) a. December - 1990 36 10 46 21 7 28b. May ~ 1991 48 12 60 15 4 19
: 266 :

12.12 (contd.)
(1) (2) (3) (4) (5) (6) (7)
15. M.Phil Mathematics (Part-I) June 1991 12 7 19 7 6 13a. Applied Maths 1 — 1 --b. Statistics 4 4 4 4c. Physics 7 5 12 7 3 10d. Applied Physics 1 — 1 1 — 1e. Chemistry 10 9 19 4 7 11f. Bio-chemistry — 4 4 — 4 4g. Botany 4 10 14 4 9 13h. Zoology 2 4 6 2 4 6i. Zoology Entomology — 2 2 1 1j. Genetics 3 4 7 3 4 7k. Env. Sciences
(Chemistry) 2 2 4 — 2 2lo Envi. Sciences 1 5 6 1 5 6m. Microbiology 1 1 1 — 1n. English 2 7 9 2 4 6Oo History 5 10 15 — 10 10p . Geography 1 — 1 1 — 1q. Co-operation 1 — 1 1 — 1r. Physical Education 2 — 2 2 — 2s. Psychology 4 — 4 2 — 2t. Sociology 4 3 7 4 3 7
: 267 :
342/27-37
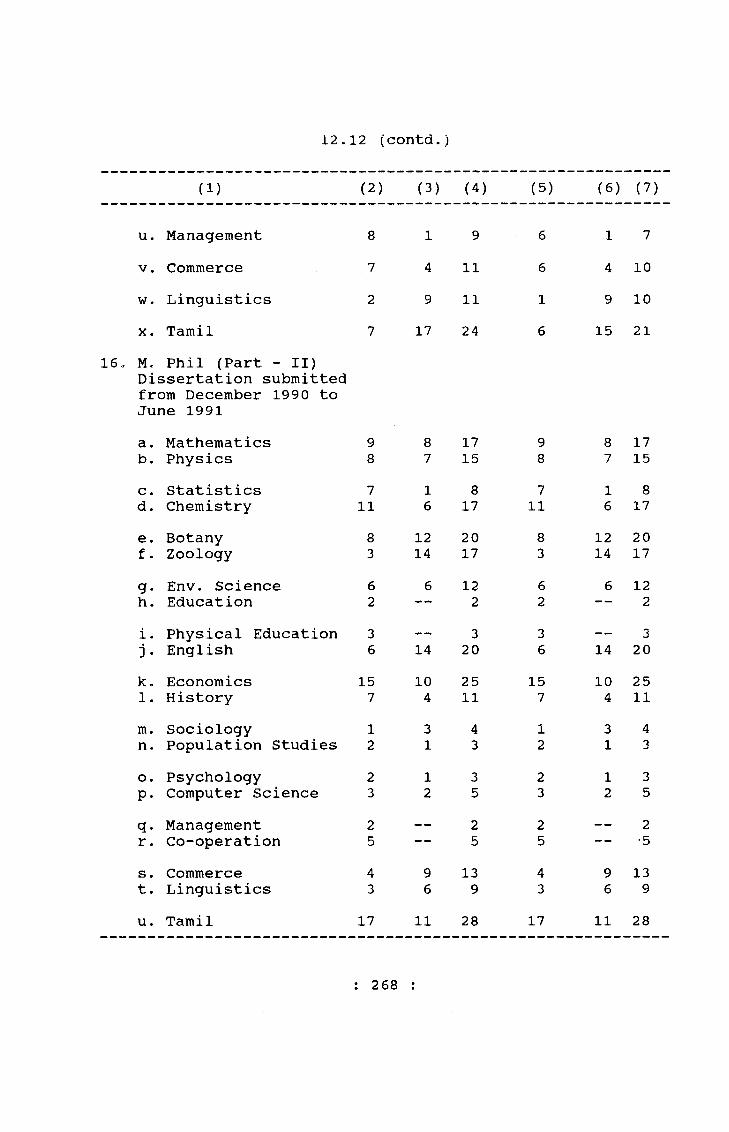
12,12 (contd.)
(1) (2) (3) (4) (5) (6) (7)
u. Management 8 1 9 6 1 7V . Commerce 7 4 11 6 4 10w. Linguistics 2 9 11 1 9 10X . Tamil 7 17 24 6 15 21
16, M. Phil (Part - II)Dissertation submitted from December 1990 to June 1991a. Mathematics 9 8 17 9 8 17b. Physics 8 7 15 8 7 15c. Statistics 7 1 8 7 1 8d. Chemistry 11 6 17 11 6 17e. Botany 8 12 20 8 12 20f. Zoology 3 14 17 3 14 17g. Env. Science 6 6 12 6 6 12h. Education 2 —— 2 2 — 2i. Physical Education 3 — 3 3 — 3j. English 6 14 20 6 14 20k. Economics 15 10 25 15 10 251. History 7 4 11 7 4 11m. Sociology 1 3 4 1 3 4n. Population Studies 2 1 3 2 1 3o. Psychology 2 1 3 2 1 3p. Computer Science 3 2 5 3 2 5q. Management 2 — 2 2 — 2r. Co-operation 5 - 5 5 --- •5s . Commerce 4 9 13 4 9 13t. Linguistics 3 6 9 3 6 9u. Tamil 17 11 28 17 11 28
: 268 :
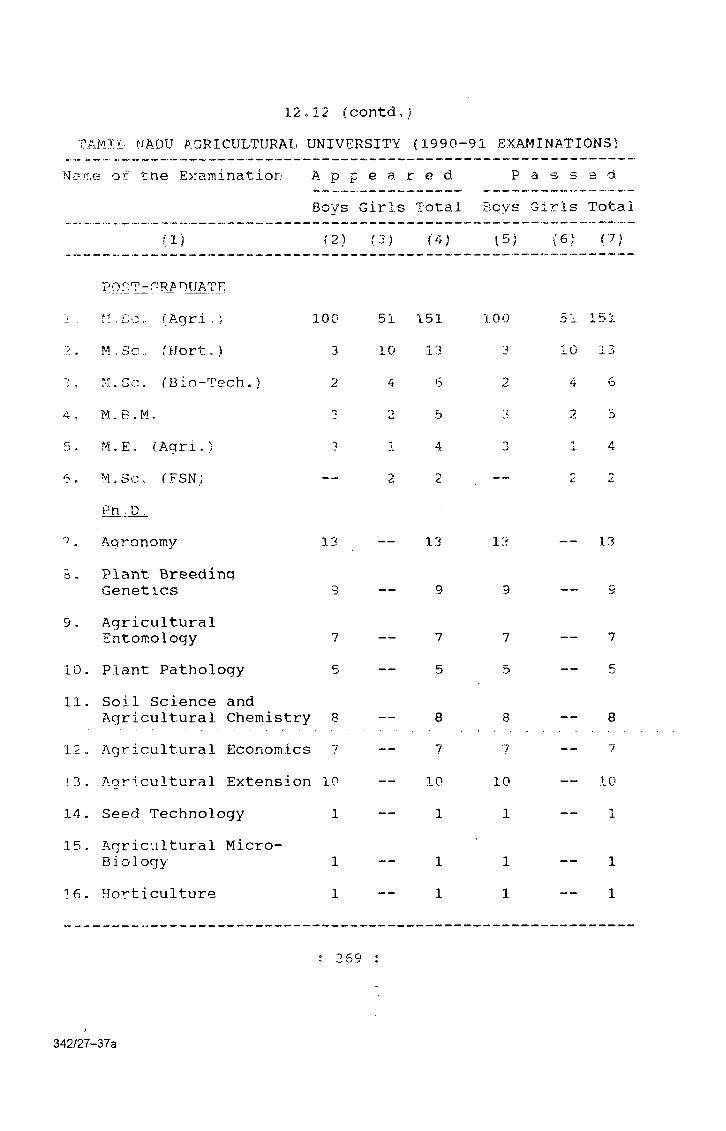
TAMIL NADU AGRICULTURAL UNIVERSITY (1990-91 EXAMINATIONS)12ol2 ( c o n t d „ )
NaxTKli of the Examination A p p e a r e d P S 3 S e dBoys Giris Total Boys Girls Total
(1) (2) (3) (4) (5) (6) \f)
Por T-r-R/anuATR fl. Sc. (Agri , ) 100 51 151 100 51 151M.SCo fHort.) 3 10 13 3 10 13
. ) • M.Gc. (Bio-Tech.) 2 4 6 2 4 64 , M . B . M. 'j 6 3 2 55 . M .E . (Agri.) 3 1 4 3 X 46 . M.Sc„ (FSN) — 2 ■C -- 2 2
1 .Ph . D ..
Agronomy 13 __ 13 13 ~ 138 . Plant Breeding
Genetics 9 — 9 9 — 99 - Agricultural
Entomology 7 — 1 7 — 710, Plant Pathology 5 — 5 5 — 511. Soil Science and
Agricultural Chemistry 8 — 8 8 — 812 o Agricultural Economics 7 — 7 1 713 , Agricultural Extension 10 — 10 10 — 1014 . Seed Technology 1 — 1 1 — 115 . Agricultural Micro-
Biology 1 — 1 1 — 116 . Horticulture 1 — 1 1 — 1
2 69 9
342/27-37a

12.12 (contd.)
AVINASHILINGAM DEEMED UNIVERSITY (1990-91 EXAMINATIONS)
Name of the Examination A p p e a r e d P a s s €! dBoys Girls Total Boys Girls Total
(1) (2) (3) (4) (5) (6) (7)
A. B.Sc. Home Science:
I Year — 573 573 — 422 422II Year 497 497 — 411 411III Year — 490 490 478 478
B. M.Sc. Home Science:
I Year — 142 142 — 133 133II Year — 129 129 — 125 125
C. Bachelor of Education — 240 240 — 224 224
D. Master of Education — 4 4 — 4 4
E. P.G. Diploma — 37 37 — 35 35
F. Master of Philosophy (M.Phil) — 30 30 — 30 30
: 270
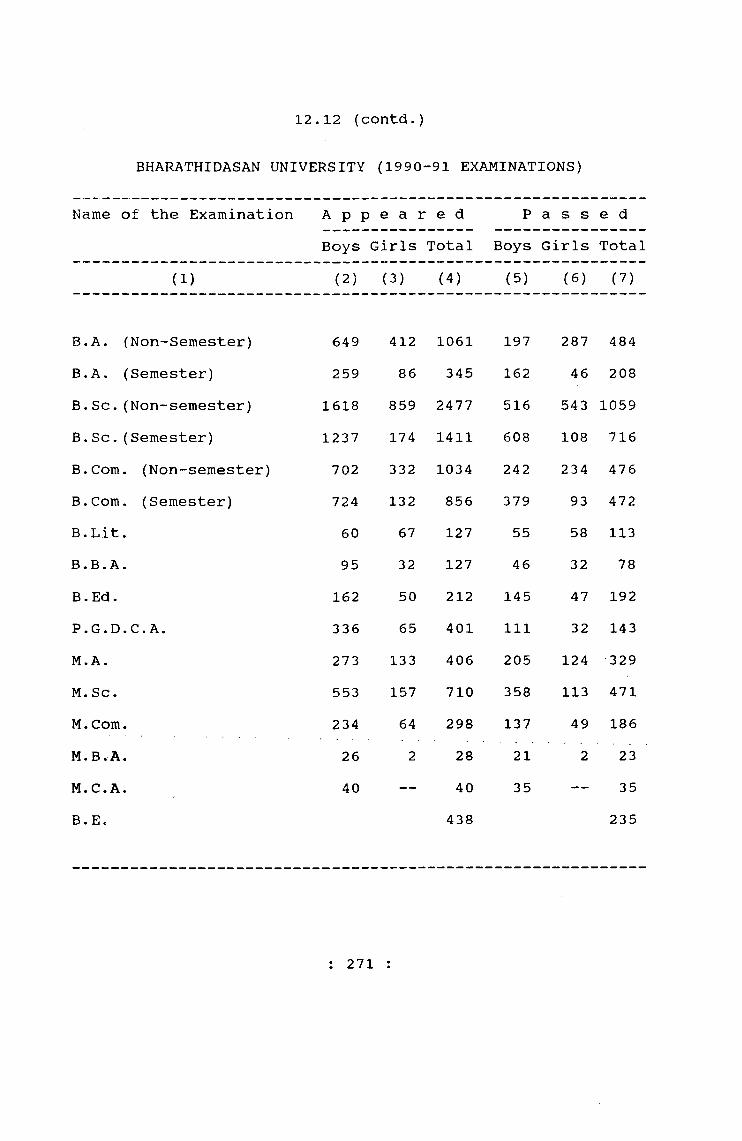
Name of the Examination A p p e a r e d P a s s e dBoys Girls Total Boys Girls Total
(1)
12.12 (contd.)
BHARATHIDASAN UNIVERSITY (1990-91 EXAMINATIONS)
B.A. (Non-Semester) B.A. (Semester)B.Sc.(Non-semester)B.Sc.(Semester)B.Com. (Non-semester) B.Com, (Semester) B.Lit.B.B.A.B.Ed.P.G.D.C.A.M . A .
M . S c .
M .Com.M.B.A. M.C.A. B.E»
(2) (3) (4) (5) (6) (7)
649 412 1061 197 287 484259 86 345 162 46 208
1618 859 2477 516 543 10591237 174 1411 608 108 716702 332 1034 242 234 476724 132 856 379 93 47260 67 127 55 58 11395 32 127 46 32 78
162 50 212 145 47 192336 65 401 111 32 143273 133 406 205 124 3 29553 157 710 358 113 471234 64 298 137 49 18626 2 28 21 2 2340 — 40 35 — 35
438 235
: 271 :

12.12 (contd.)MADURAI KAMARAJ UNIVERSITY (1990-91 EXAMINATIONS)
A p p e a ;r e d P a s s e dBoys Girls Total Boys Girls Total(2) (3) (4) (5) (6) (7)
1144 273 •1417 180 31 2111498 945 2443 319 315 634
50 85 135 7 13 2079 85 164 26 13 39
2916 1850 4766 1036 1157 21933347 1895 5242 406 448 854428 25 453 196 17 21315 4 19 10 3 13
4071 3043 7114 1810 2031 3841314 140 454 14 17 31143 67 210 101 56 157
2590 1435 4025 990 712 17022755 1181 3936 353 200 553
(1)
OPEN UNIVERSITY1. Pre-foundation2. Foundation3. OoT. Preliminary4. O.T. Final5. B.A. (Semester)6. B.A. (Non-semester)7. B.B.A. (Semester)8. B.Music (Semester)9. B.Sc. (Semester)10. B.Sc. (Non-semester)11. B.Sc. (Computer Sc.)12. B.Com. (Semester)
M.A. DEGREE COURSES (SEMESTER)
14. Tamil 60 117 177 51 111 16215. Sociology 19 11 30 17 8 2516. Social Work 30 9 39 27 9 3617. Economics 403 111 514 186 71 25718. French 1 6 7 1 5 619. Malayalam 4 2 6 4 2 6
: 272

(1) (2) (3) (4) (5) (6) (7)M.A. (NON-SEMESTER)
20„ Tamil 524 446 970 97 115 21221. English 725 524 1249 54 47 10122„ History 1671 949 2620 376 257 63323. Economics 1129 384 1513 156 88 24424, Political Science 895 168 1063 233 55 28825„ M.Com. (Non-semester) 3088 794 3882 199 78 27726o English (Private) 32 20 52 5 1 627, Gandian Thought 37 18 55 17 7 2428,. B.Ed. (Semester) 277 645 922 259 598 85729„ 3„Ed. (Non-semester) 898 1165 2063 399 531 93030. M.Ed. (Semester) 23 19 42 21 13 3431. M.Ed. (Non-semester) 870 841 1711 401 505 90632. M.P.Ed. 8 4 12 8 4 1233„ B.L.I.Sc. 28 11 39 22 10 3234o M.L.I.Sc. 6 7 13 4 3 735. B.G.L., (Non-semester). 416 49 465 73 10 8336. B.E. Civil 520 90 610 191 69 26037. B.E. Electrical and
Electronics 141 104 245 94 92 18638. B.E. Electronics and
Communication 397 122 519 249 97 34639. B.E. Mechanical 734 8 742 397 7 40440. B.E. Computer Science 289 63 352 175 55 230
12„12 (contd.)
: 273 ;
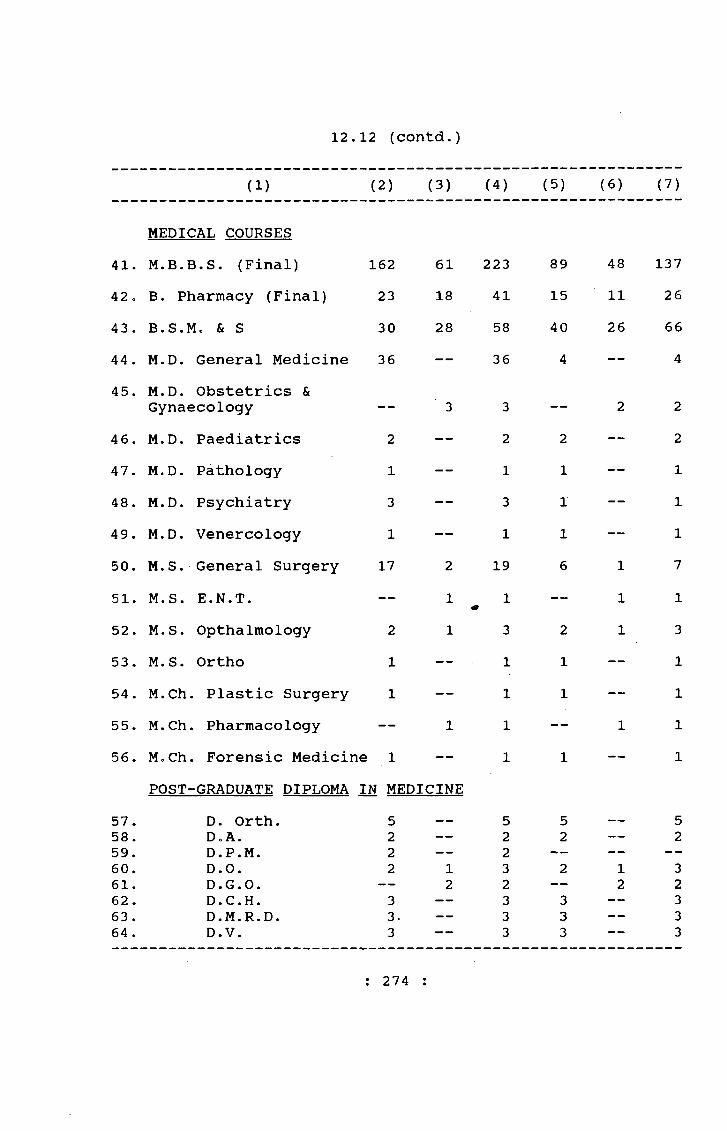
12.12 (contd.)
(1) (2) (3) (4) (5) (6) (7)
41.MEDICAL COURSES M.B.B.S. (Final) 162 61 223 89 48 137
42o B. Pharmacy (Final) 23 18 41 15 11 2643 . B.S.M. & S 30 28 58 40 26 6644. M.Dc General Medicine 36 — 36 4 — 445. M.D. Obstetrics &
Gynaecology — 3 3 — 2 246. M.D. Paediatrics 2 — 2 2 — 247. M.D. Pathology 1 — 1 1 — 148. M.D. Psychiatry 3 — 3 1 — 149. M.D. Venereology 1 — 1 1 — 150. M.S. General Surgery 17 2 19 6 1 7
51. M.S. E.N.T. — 1 1 — 1 152. M.S. Opthalmology 2 1 3 2 1 353. M.S. Ortho 1 — 1 1 — 154. M.Ch. Plastic Surgery 1 — 1 1 — 155* M.Ch. Pharmacology — 1 1 — 1 156. Mo Ch. Forensic Medicine 1 •— 1 1 — 1
57.POST-GRADUATE DIPLOMA
D. Orth.IN MEDICINE
5 5 5 558. DoA. 2 — 2 2 — 259. D.P.M. 2 — 2 — — --60. D.O. 2 1 3 2 1 361. D.G.O. — 2 2 — 2 262. D.C.H. 3 — 3 3 — 363. D.M.R.D. 3. — 3 3 — 364. D.V. 3 — 3 3 — 3
: 274 :

12.12 (contd.)
(1) (2) (3) (4) (5) (6) (7)
65oMANAGEMENT STUDIES
M.B.A. (Semester) 46 8 54 45 8 5366„ M.B.A. (Non-semester) 45 — 45 24 — 24
67 „CERTIFICATE COURSES
French 10 2 12 9 2 1168. Telugu 3 3 6 3 3 669„ Malayalam — 3 3 2 270, Sanskrit 5 3 8 1 3 471. Arabic 7 — 7 7 — 712. German 14 2 16 11 2 1373 . Rationalist Thought 18 — 18 13 — 1374 . Marxian Thought 1 — 1 1 — 175. Linguistics 1 — 176. Salesmanship 71 71 62 — 6277 o Library Science 43 16 59 41 16 5778. Office Management 6 10 16 4 6 1079. Journalism 19 10 29 15 5 2080o Russian 2 3 5 2 3 581. Library and Informa
tion Science 174 64 238 115 52 167
: 275 :342/27-38
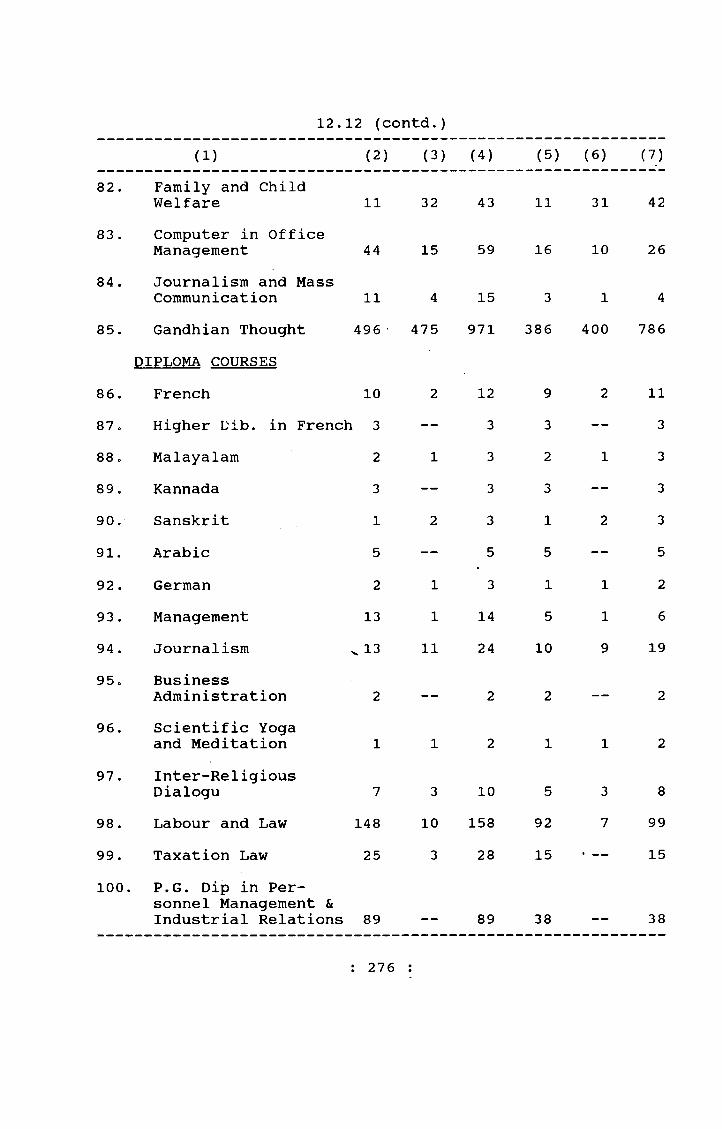
12.12 (contd.)(1) (2) (3) (4) (5) (6) (V)
82 . Family and Child Welfare 11 32 43 11 31 42
83 . Computer in Office Management 44 15 59 16 10 26
84. Journalism and Mass Communication 11 4 15 3 1 4
85. Gandhian Thought 496 • 475 971 386 400 786
86.DIPLOMA COURSES
French 10 2 12 9 2 1187o Higher Dib. in French 3 — 3 3 — 388. Malayalam 2 1 3 2 1 389. Kannada 3 — 3 3 — 390. Sanskrit 1 2 3 1 2 391. Arabic 5 — 5 5 — 592. German 2 1 3 1 1 293. Management 13 1 14 5 1 694o Journalism vl3 11 24 10 9 1995o Business
Administration 2 — 2 2 — 296. Scientific Yoga
and Meditation 1 1 2 1 1 297. Inter-Religious
Dialogu 7 3 10 5 3 898. Labour and Law 148 10 158 92 7 9999. Taxation Law 25 3 28 15 15100. P.G. Dip in Per
sonnel Management & Industrial Relations 89 __ 89 38 __ 38
: 276 :
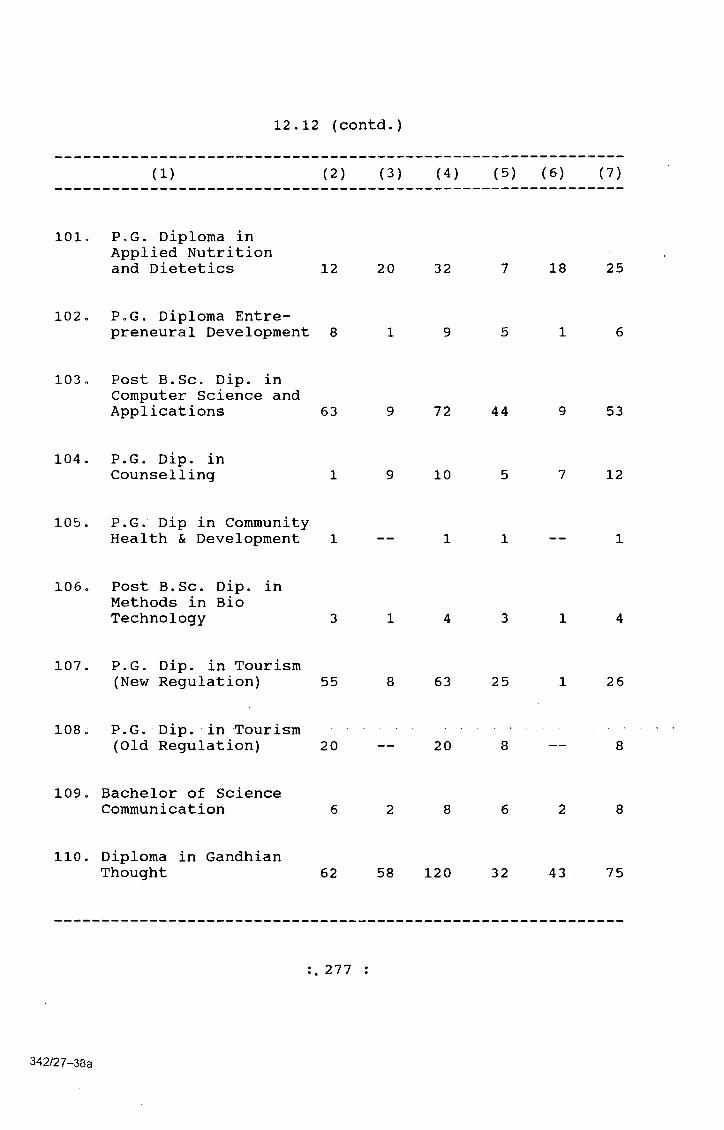
12.12 (contd.)
(1) (2) (3) (4) (5) (6) (7)
101» P.G. Diploma in Applied Nutrition and Dietetics 12 20 32 7 18 25
102 c P.G. Diploma Entre- preneural Development 8 1 9 5 1 6
103 » Post B.Sc. Dip. in Computer Science and Applications 63 9 72 44 9 53
104. P.G. Dip. in Counselling 1 9 10 5 7 12
105. P.G. Dip in Community Health & Development 1 — 1 1 1
106, Post B.Sc. Dip. in Methods in Bio Technology 3 1 4 3 1 4
107. P.G. Dip. in Tourism (New Regulation) 55 8 63 25 1 26
108. P.G. Dip. in Tourism (Old Regulation) 20 — 20 8 — 8
109. Bachelor of Science Communication 6 2 8 6 2 8
110. Diploma in Gandhian Thought 62 58 120 32 43 75
277
342/27-38a

GANDHIGRAM RURAL UNIVERITY1990-91 Examinations
12.12 (contd.)
Name of the Examination A p Boys
p e aGirls
r e dTotal
PBoys
a s sGirls
e d Total
(1) (2) (3) (4) (5) (6) (7)
lo Certificate in Sanitary Inspector's Course 42 42 39 39
2 , Diploma in Sanitary Science 3 — 3 3 — 3
3 , Diplom.a in Agriculture 48 4 52 31 4 35
4. Diploma in Khadi and Handloom Technology 24 1 25 5 — 5
5. B.A. in Co-operation 1 — 16o B.A. in Rural Indus
tries & Management 44 3 47 21 3 247. B .Cop. 35 5 40 18 2 208. Bachelor of Develop
ment Administration 38 3 41 10 2 129. B.Sc. Mathematics 17 1 18 5 — 510. B.Sc. Physics 14 10 24 6 8 1411. B .Sc. Chemistry 12 7 19 6 3 912 . B.Sc. Home Science — 24 24 — 11 1113 . P.G. Diploma in
Biogas & Renewable Energy 16 _ _ _ _ _ 16 16 — 16
14. M.A. in Rural Development 15 3 18 12 3 15
: 278 :

12.12 (contdo)
(1) (2) (3) (4) (5) (6) (V)
15. M.A. in Rural Economics & Extension Education 14 2 16 12 3 15
16. M.A. in Rural Sociology & Panchayat Raj 12 6 18 9 6 15
17 . M.A. in Co-operative Management 14 2 16 13 2 15
18 . M.A. in Tamil Literature 6 6 4 — 4
19. M.A. in Communicative English 3 10 13 2 10 12
20o M.Sc, in Applied Physics 1 9 10 1 9 10
21, M.SCo in Applied Chemistry 12 4 16 6 4 10
22 . M.Sc. in Home Science & Rural Development 15 15 15 15
23 . M.Phil in Gandhian Thought & Peace Science 10 2 12 10 2 12
24. M.Phil in Micro , Level PlanningPart-time Non- Semester Course
13 5 18 8 4 12
25. Certificate Course in Functional Hindi 15 7 22 13 4 17
26. Certificate Course in Malayalam 7 4 11 5 2 7
: 279 :
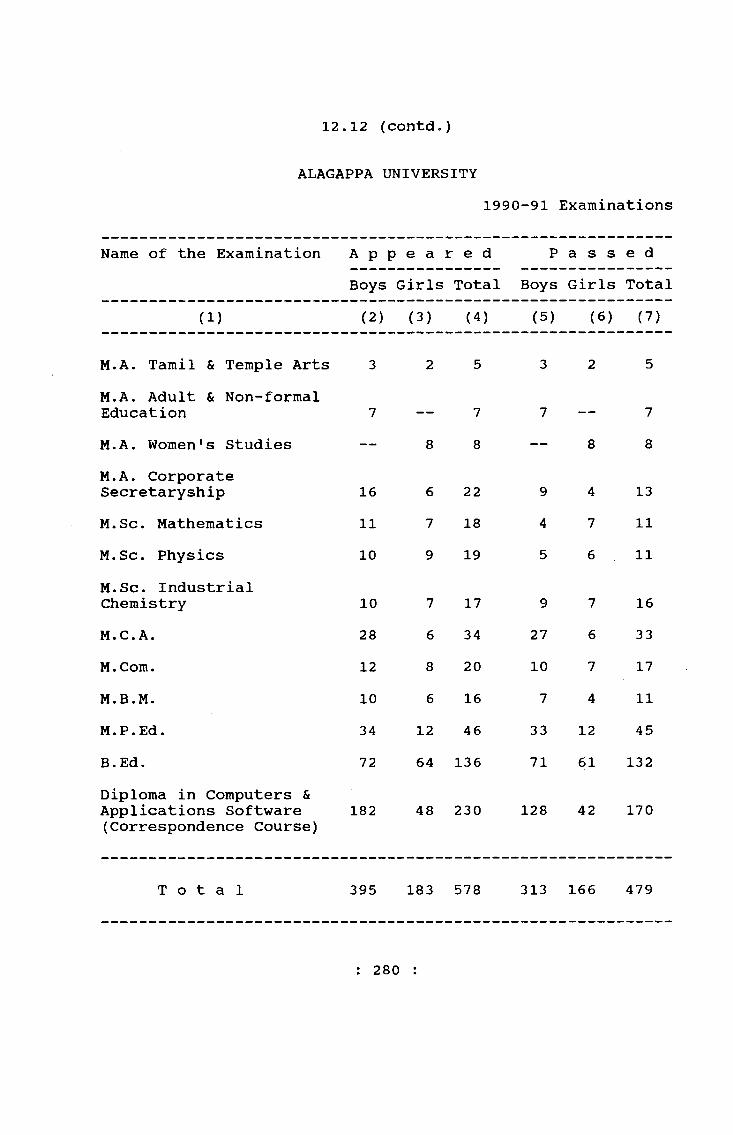
12.12 (contd,)
ALAGAPPA UNIVERSITY1990-91 Examinations
Name of the Examination A p p e a r e d P a s s e dBoys Girls Total Boys Girls Total
(1) (2) (3) (4) (5) (6) (7)
M.A. Tamil & Temple Arts 3 2 5 3 2 5M.A. Adult & Non-formal Education 7 — 7 7 -- 7M.A. Women's Studies — 8 8 — 8 8M.A. Corporate Secretaryship 16 6 22 9 4 13M.Sc. Mathematics 11 7 18 4 7 11M.Sc. Physics 10 9 19 5 6 11M.Sc. Industrial Chemistry 10 7 17 9 7 16M.C.A. 28 6 34 27 6 33M .Com. 12 8 20 10 7 17M.B.M. 10 6 16 7 4 11M.P.Ed. 34 12 46 33 12 45B.Ed. 72 64 136 71 61 132Diploma in Computers & Applications Software (Correspondence Course)
182 48 230 128 42 170
T o t a l 395 183 578 313 166 479
: 280 :
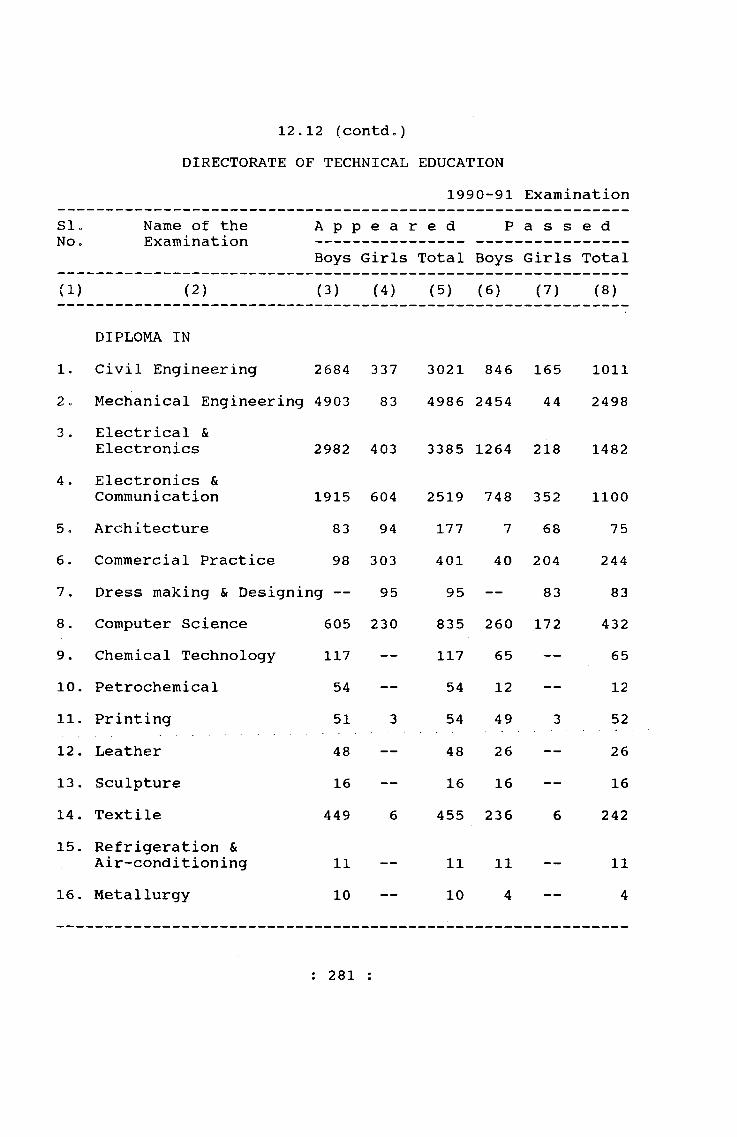
12.12 (contdo)DIRECTORATE OF TECHNICAL EDUCATION
1990-91 ExaminationSloNo.
Name of the Examination
A p p e a r e d P a s s e dBoys Girls Total Boys Girls Total
(1) (2) (3) (4) (5) (6) (7) (8)
1.DIPLOMA IN Civil Engineering 2684 337 3021 846 165 1011
2 o Mechanical Engineering 4903 83 4986 2454 44 24983 . Electrical &
Electronics 2982 403 3385 1264 218 14824 . Electronics &
Communication 1915 604 2519 748 352 11005, Architecture 83 94 177 7 68 756. Commercial Practice 98 303 401 40 204 2447. Dress making & Designing — 95 95 — 83 838 . Computer Science 605 230 835 260 172 4329. Chemical Technology 117 — 117 65 — 6510. Petrochemical 54 — 54 12 — 1211. Printing 51 3 54 49 3 5212. Leather 48 — 48 26 — 2613. Sculpture 16 — 16 16 — 1614. Textile 449 6 455 236 6 24215. Refrigeration &
Air-conditioning 11 — 11 11 — 1116. Metallurgy 10 — 10 4 — 4
: 281 :

(1) (2) (3) (4) (5) (6) (7) (8)
17„ Agriculture Engineering 24 — 24 8 — 818. Automobile Engineering 39 — 39 2 — 219. Textile Processing 59 — 59 31 — 3120. Textile Designing 26 39 65 13 33 4621. Men Made Fibre Tech. 40 — 40 25 — 2522. Marketing Management 2 0 1 21 3 — 323. B.SCc Architecture .7 — 7 7 — 724. Bo Sc. Sculpture 7 — 7 6 — 6
B.E. IN25. Civil Engineering 463 89 552 336 70 40626. Mechanical Engineering 1381 30 1411 1106 27 113327. Electrical &
Electronics Engg. 589 271 860 508 237 74528. Electronics &
12«12 (contd.)
Communication 659 208 867 565 189 75429. Computer Science 497 146 643 426 135 56130. Automobile Engg. 44 — 44 38 — 3831. Transportation Engg. 26 2 28 12 1 1332 . Metallurgy 28 1 29 25 1 2633. Production Engg. 26 — 26 24 — 2434 . B.Tech. Chemical 56 7 63 56 7 6335. Architecture 7 5 12 4 4 836. B.Sc. Computer Tech. 34 39 73 32 37 69
: 282 :
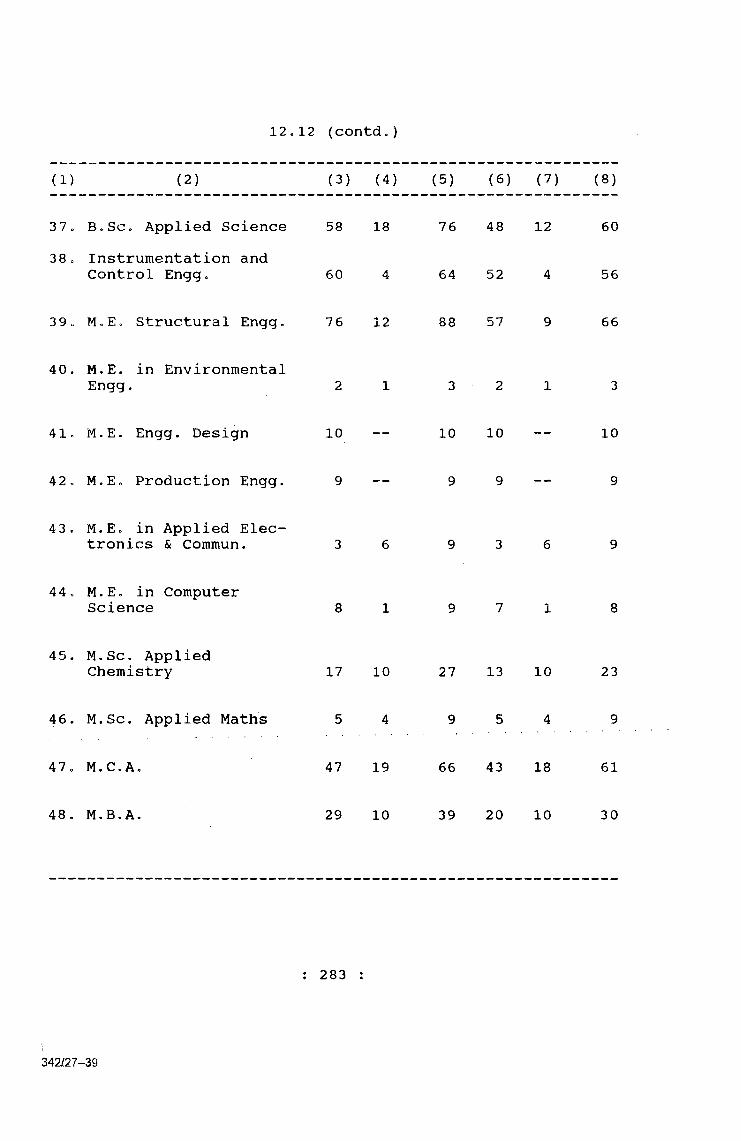
12,12 (contd.
(1) (2) (3) (4) (5) (6) (V) (8)
3 7 c B.Sc, Applied Science 58 18 76 48 12 6038o Instrumentation and
Control Engg. 60 4 64 52 4 56
39. Structural Engg, 76 12 88 5 7 9 66
40. M.E. in Environmental Engg. 2 1 3 2 1 3
41c M.E, Engg. Design 10 — 10 10 — 10
42c M.Eo Production Engg. 9 — 9 9 — 9
43. M . E c in Applied Electronics & Commun. 3 6 9 3 6 9
44„ M.E. in Computer Science 8 1 9 7 1 8
45. M.Sc. Applied Chemistry 17 10 27 13 10 23
46. M.Sc. Applied Maths 5 4 9 5 4 9
47, M.CcA. 47 19 66 43 18 61
48, M.B.A. 29 10 39 20 10 30
: 283
342/27-39

12.12 (contd,)1990-91 Examinations
Name of the Examination A p ;p e a r e d P a s s e dBoys Girls Total Boys Girls Total
(1) (2) (3) (4) (5) (6) (7)Aaricultural Colleae & Research Killikulam
Institute.
1 <• B.Sc. Agriculture 96 — 96 83 — 83Aaricultural Colleae & Research Madurai
Institute.
1, Bo Sc. Agriculture 23 76 99 14 70 842. B.Sc. Home Science 4 10 14 4 9 133c M.Sc. (Agri.) 24 40 64 20 33 53Aaricultural Enaineerina Colleae. Coimbatore
1. B.E. (Agriculture) 83 14 77 63 14 77
INDIAN INSTITUTE OF TECHNOLOGY, MADRAS1990-91 Examination
Name of the Examination A p p e a r e d P a s s e dBoys Girls Total Boys Girls Total
(1) (2) (3) (4) (5) (6) (7)
B .Tech. 263 5 268 256 5 261M.Tech. 287 6 293 287 6 293M.Sc. 26 26 52 26 26 52M.S. }
}By Research P h .D . }
6486
119
65105
: 284 :

REGIONAL ENGINEERING COLLEGE, TIRUCHIRAPALLI(Table 12,12 contd.)
1990-91 Examinations
Name of the Examination A p p e a r e d P a s s e dBoys Girls Total Boys Girls Total
(1) (2) (3) (4) (5) (6) (7)
B.E. DEGREE COURSE
1. Chemical 27 6 33 27 6 33
2, Civil 31 5 36 26 5 31
3 « Computer Science 37 5 42 36 5 41
4. E,C,E. 35 8 43 31 8 39
5. E,E.E„ 41 19 60 37 18 55
6. Mechanical 48 — 48 45 — 45
7. Metallurgy 25 1 26 22 1 23
24
9, B .Arch 7 5 12 4 4 8
10. M.B.A. 20 6 2 6 16 5 21
: 285
342/27~39a
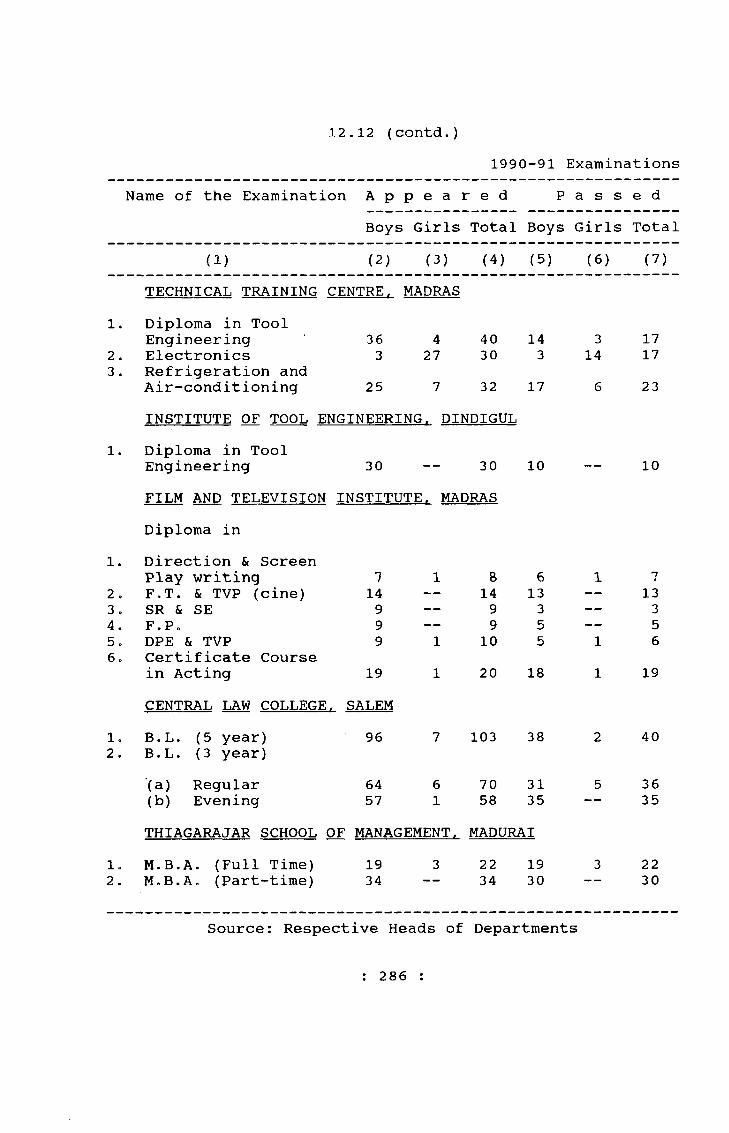
12.12 (contd.)1990-91 Examinations
Name of the Examination A p p e a r e d P a s s e dBoys Girls Total Boys Girls Total
(1) (2) (3) (4) (5) (6) (7)TECHNICAL TRAINING CENTRE. MADRAS
1. Diploma in ToolEngineering 36 4 40 14 3 17
2. Electronics 3 27 30 3 14 173. Refrigeration and
Air-conditioning 25 7 32 17 6 23INSTITUTE OF TOOL ENGINEERING. DINDIGUL
1. Diploma in ToolEngineering 30 -- 30 10 ““ “ 10FILM AND TELEVISION INSTITUTE. MADRASDiploma in
1. Direction & ScreenPlay writing 7 1 8 6 1 7
2. F.T. & TVP (cine) 14 — 14 13 — 133. SR & SE 9 — 9 3 — 34. F,P„ 9 — 9 5 — 55. DPE & TVP 9 1 10 5 1 66„ Certificate Course
in Acting 19 1 20 18 1 19CENTRAL LAW COLLEGE . SALEM
l o B.L. (5 year) 96 7 103 38 2 402. B.L. (3 year)
(a) Regular 64 6 70 31 5 36(b) Evening 57 1 58 35 -- 35THIAGARAJAR SCHOOL OF MANAGEMENT. MADURAI
l o M.B.A. (Full Time) 19 3 22 19 3 222 . M . B . A c (Part-time) 34 34 30 30
Source: Respective Heads of Departments
: 286 :
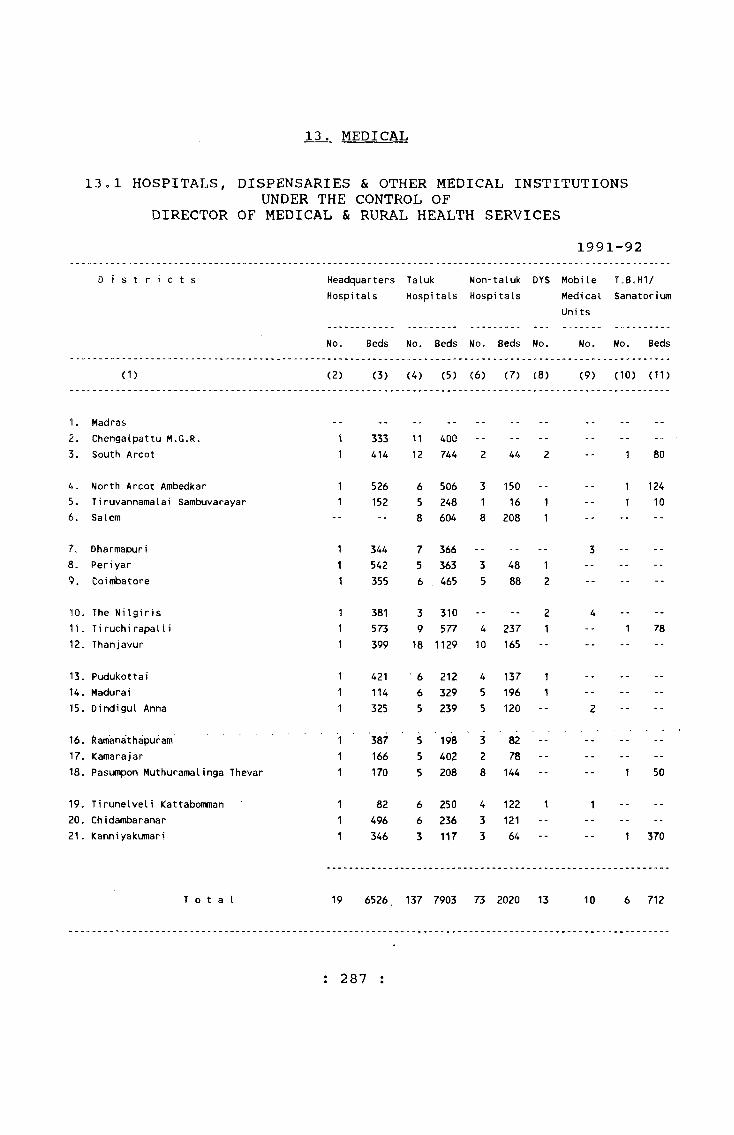
13. MEDICAL
13,1 HOSPITALS, DISPENSARIES & OTHER MEDICAL INSTITUTIONSUNDER THE CONTROL OF
DIRECTOR OF MEDICAL & RURAL HEALTH SERVICES1991-92
D i s t r i c t s Headquarters Taluk Non-taluk DYS MobileHospitals Hospitals Hospitals Medical Sanatorium
Units
No. Beds No. Beds No. Beds No. No. No. Beds
(2) (3) (4) (5) (6) (7) (8) (9) (10) (11)(1)
1. Madras2. Chengalpattu M.G.R.3. South Arcot
4. North Arcot Ambedkar 1 526 6 506 3 1505. Tiruvannamalai Sambuvarayar 1 152 5 248 1 166. Salem -- 8 604 8 208
?. Dharmapuri 1 344 7 3668. Periyar 1 542 5 3639. Coimbatore 1 355 6 465
10. The NiIgi ris 1 381 3 31011. T i ruchi rapalIi 1 573 9 57712. Thanjavur 1 399 18 1129
13. Pudukottai 1 421 • 6 212 4 13714. Madurai 1 114 6 329 5 19615. Dindigul Anna 1 325 5 239 5 120
333414
1112
400744 44
410
4888
237165
1 80
1 1241 10
1 78
16. ftam’anathapufam 1 387 5 198 3 82 -- . . -- --17. Kamarajar 1 166 5 402 2 78 -- -- -- --18. Pasumpon Muthuramalinga Thevar 1 170 5 208 8 144 -- -- 1 50
19. Tirunelveli Kattabomman 1 82 6 250 4 122 1 1 . . - -
20. Chidambaranar 1 496 6 236 3 121 -- - - - - - *
21. Kanniyakumari 1 346 3 117 3 64 1 370
T o t a l 19 6526, 137 7903 73 2020 13 10 6 712
: 287 :

13„1 (contd.)
D i s t r i c t s Leprosy Hi Lepy Centre ESI HI ESI DSY Total Doctors NursesSanatorium Units
No. Beds No. No. Beds No. No. Beds
(1) (12) (13) (14) (15) (16) (17) (18) (19) (20) (21)
1. Madras 3 1 600 36 40 600 240 1652. Chengalpattu M.G.R. 2 50 7 21 783 149 1713. South Arcot -- 11 - - 2 31 1282 186 234
4. North Arcot Ambedkar -- 3 1 50 8 23 1356 189 2505. Tiruvannamalai Sambuvarayar -- 4 -- 1 14 426 76 876. Salem 1 8 1 50 12 39 862 213 163
7. Dharmapuri -- 3 2 16 710 132 1158. Periyar -- 6 -- 2 18 953 162 1589. Coimbatore -- 6 1 540 34 55 1448 340 304
10. The MiIgiris -- 1 .. 1 12 691 91 11511. Tiruchirapalli 9 -- 9 34 1465 264 24712. Thanjavur -- 9 - - 4 42 1693 240 277
13. Pudukottai .. 3 1 16 770 106 12214. Madurai -- 7 1 209 10 31 848 181 18615. Dindigul Anna -- 3 -- 4 20 684 112 140
16. Ramanathapuram .. 3 12 667 90 10117. Kamarajar -- 3 -- 7 18 646 116 14618. Pasumpon Muthuramalinga Thevar -- 2 -- 2 19 572 81 92
19. Tirunelveli Kattabonnman -- 5 .. 8 26 454 112 9520. Chidambaranar -- 3 1 50 3 17 903 117 15521. Kanniyakumari 3 1 12 897 83 95
T o t a l 3 50 102 6 1499 147 516 18710 3280 3418
Source; Director of Medical & Rural Health Services, Madras
: 288 :
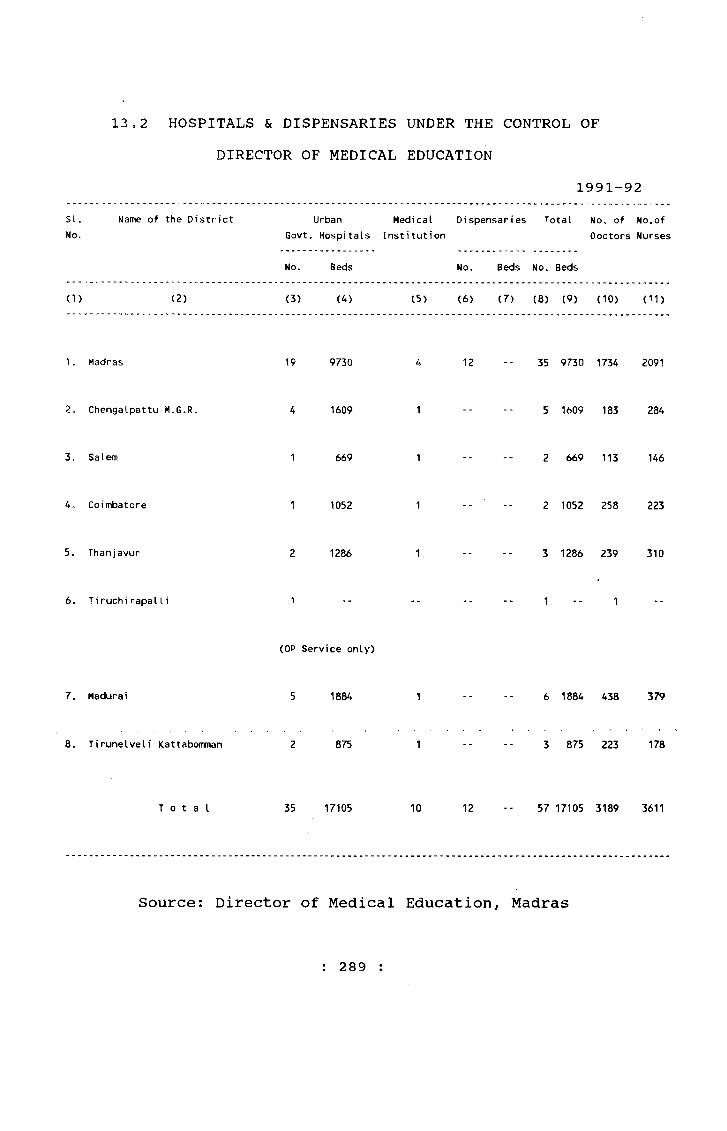
13,2 HOSPITALS & DISPENSARIES UNDER THE CONTROL OFDIRECTOR OF MEDICAL EDUCATION
1991-92s uNo„
Name of the District Urban Medical Dispensaries Total No. of No.ofGovt. Hospitals Institution Doctors Nurses
No. Beds
(3) (4)
No. Beds No. Beds
(5) (6) (7) (8) (9) (10) (11)<1) (2)
19 9730 35 9730 1734 2091
2. Chengalpattu M.G.R. 4 1609 5 1609 183 284
3. Salem 1 669 2 669 113 146
4o Coimbatore 1 1052 2 1052 258 223
5. Thanjavur 2 1286 3 1286 239 310
6. TiruchirapalIi
(OP Service only)
7. Madurai 5 1884 6 1884 438 379
8. Tirunelveli Kattabomman 875 3 875 223 178
T o t a l 35 17105 10 12 57 17105 3189 3611
Source: Director of Medical Education, Madras
: 289 :
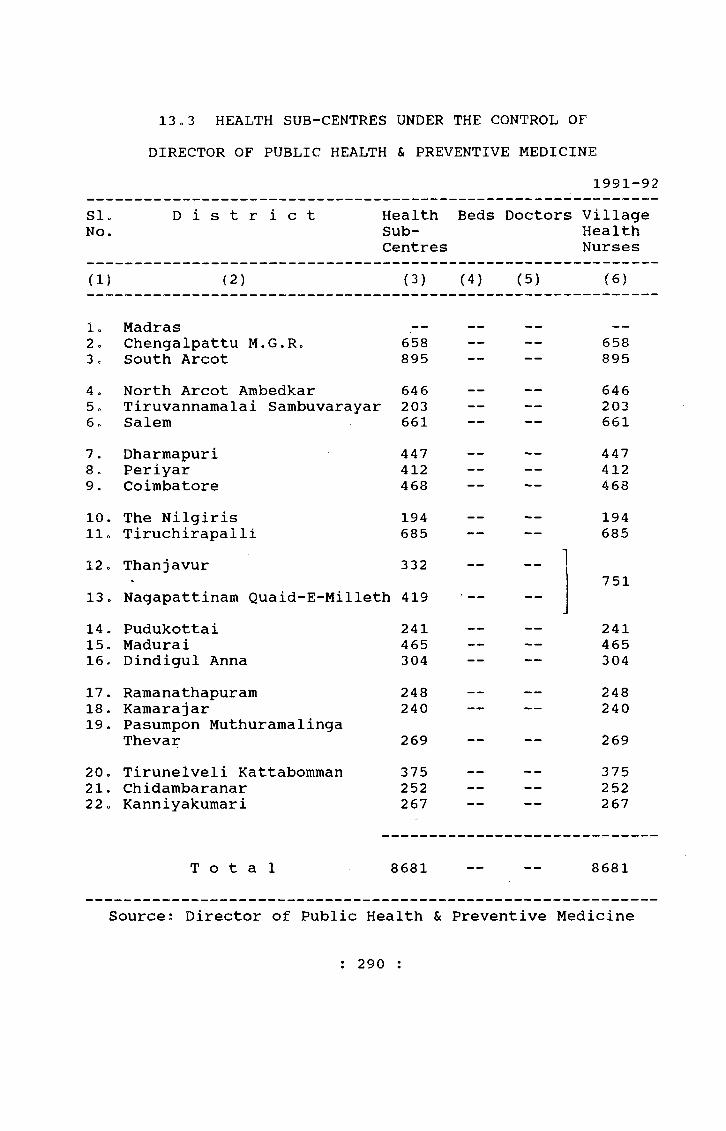
13o3 HEALTH SUB-CENTRES UNDER THE CONTROL OFDIRECTOR OF PUBLIC HEALTH & PREVENTIVE MEDICINE
1991-92SI.No.
D i s t r i c t HealthSub-Centres
Beds Doctors Village Health Nurses
(1) (2) (3) (4) (5) (6)
l o Madras2 o Chengalpattu M.G.R. 658 — — 6583 . South Arcot 895 — — 8954 . North Arcot Ambedkar 646 — — 6465 o Tiruvannamalai Sambuvarayar 203 — 2036. Salem 661 —— — 6617 . Dharmapuri 447 — — 4478. Periyar 412 — — 4129. Coimbatore 468 — — 46810. The Nilgiris 194 — — 194l l o Tiruchirapalli 685 — — 68512 o Thanjavur 332 — —
13 o Nagapattinam Quaid-E-Milleth 419 —751
14. Pudukottai 241 — — 24115, Madurai 465 — — 46516e Dindigul Anna 304 — — — 30417. Ramanathapuram 248 — — 24818. Kamarajar 240 — 24019. Pasumpon Muthuramalinga
Thevar 269 — — 26920. Tirunelveli Kattabomman 375 — — 37521. Chidambaranar 252 — — 25222o Kann iyakumar i 267 267
T o t a l 8681 — — 8681
Source: Director of Public Health & Preventive Medicine
: 290 :
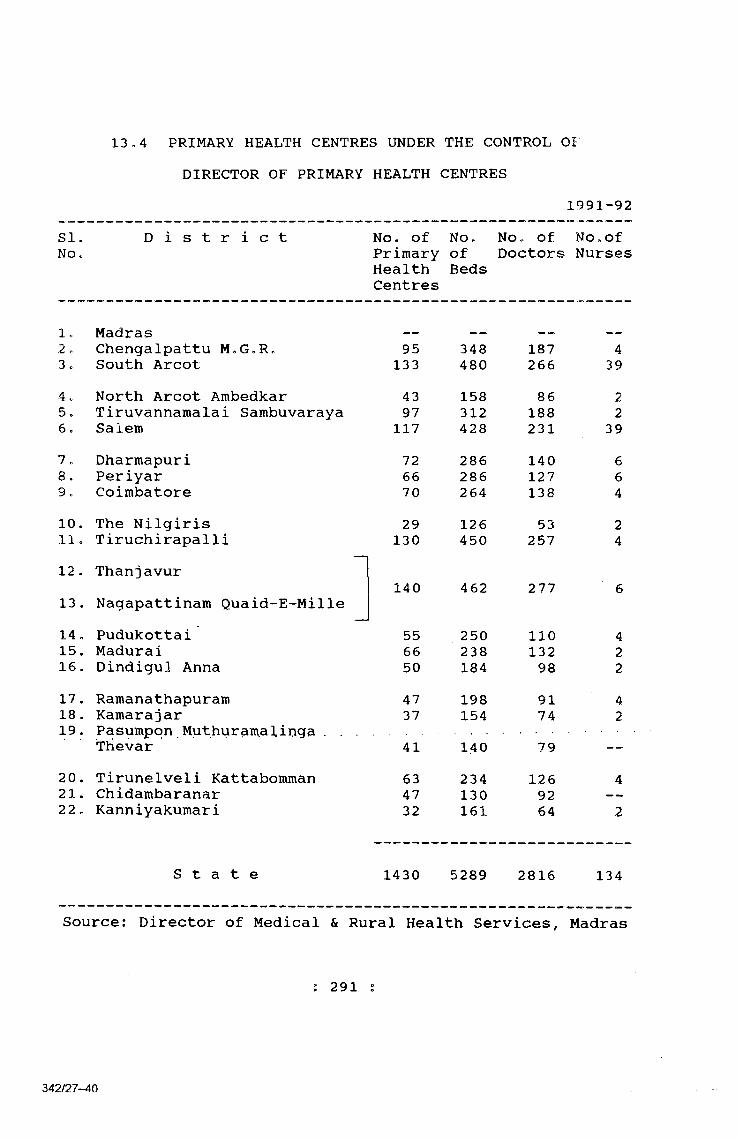
13,4 PRIMARY HEALTH CENTRES UNDER THE CONTROL OFDIRECTOR OF PRIMARY HEALTH <CENTRES
1991-92SI. D i s t r i c t No. of No. No. of No, ofNo. Primary of Doctors Nurses
Health BedsCentres
lo Madras2 o Chengalpattu M.G.R, 95 348 187 43 o South Arcot 133 480 266 394o North Arcot Ambedkar 43 158 86 25. Tiruvannamalai Sambuvaraya 97 312 188 26« Salem 117 428 231 397o Dharmapuri 72 286 140 68. Periyar 66 286 127 69c Coimbatore 70 264 138 410. The Nilgiris 29 126 53 211 . Tiruchirapalli 130 450 257 412. Thanjavur
140 462 277 613 „ Nagapattinam Quaid-E-Mille14 . Pudukottai 55 250 110 415. Madurai 66 238 132 216. Dindigul Anna 50 184 98 217. Ramanathapuram 47 198 91 418. Kamarajar 37 154 74 219. Pasumpqn Muthuramalinga . . .
Thevar 41 1.40 7920. Tirunelveli Kattabomman 63 234 126 421. Chidambaranar 47 130 92 —22 c Kanniyakumari 32 161 64 2
S t a t e 1430 5289 2816 134
Source: Director of Medical & Rural Health Services, Madras
: 291
342/27-40
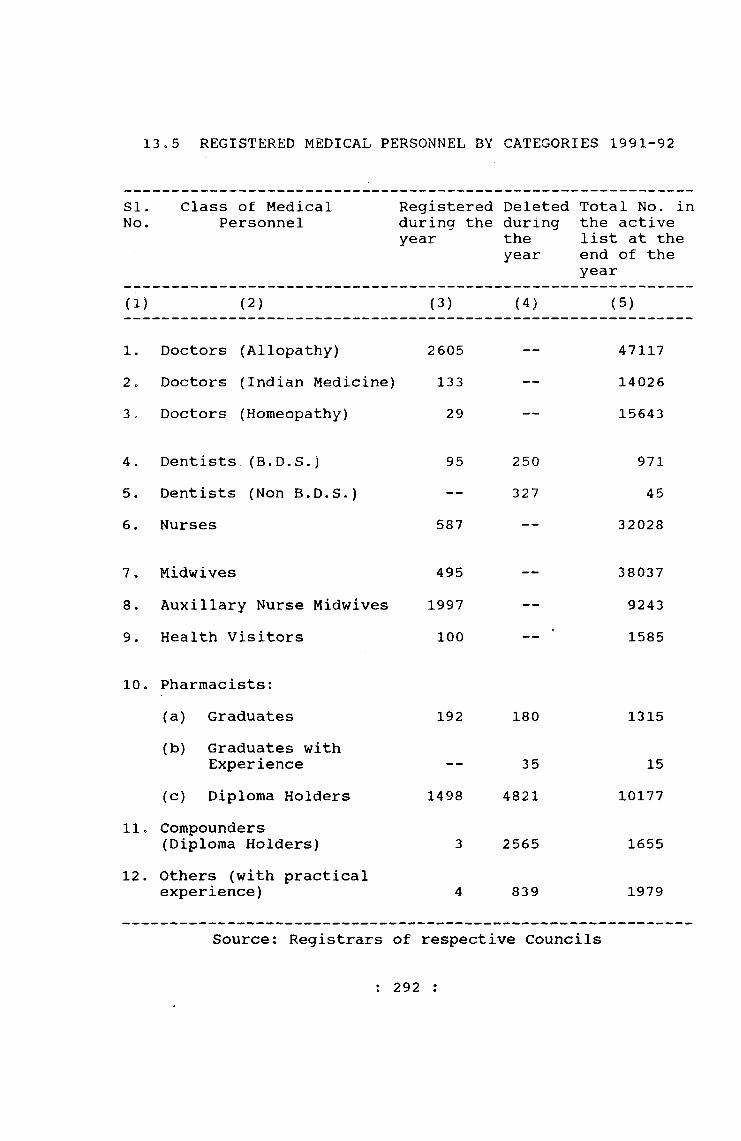
13«5 REGISTERED MEDICAL PERSONNEL BY CATEGORIES 1991-92
SI.No.
Class of Medical Personnel
Registered during the year
Deletedduringtheyear
Total No. in the active list at the end of the year
(1) (2) (3) (4) (5)
1. Doctors (Allopathy) 2605 — 471172o Doctors (Indian Medicine) 133 — 140263 , Doctors (Homeopathy) 29 — 15643
4 . Dentists (B.D.S.) 95 250 9715. Dentists (Non B.D.S.) — 327 456. Nurses 587 — 32028
7. Midwives 495 — 380378. Auxiliary Nurse Midwives 1997 — 92439. Health Visitors 100 — 1585
10. Pharmacists:(a) Graduates 192 180 1315(b) Graduates with
Experience — 35 15(c) Diploma Holders 1498 4821 10177
11. Compounders (Diploma Holders) 3 2565 1655
12. Others (with practical experience) 4 839 1979
Source: Registrars of respective Councils
: 292 :
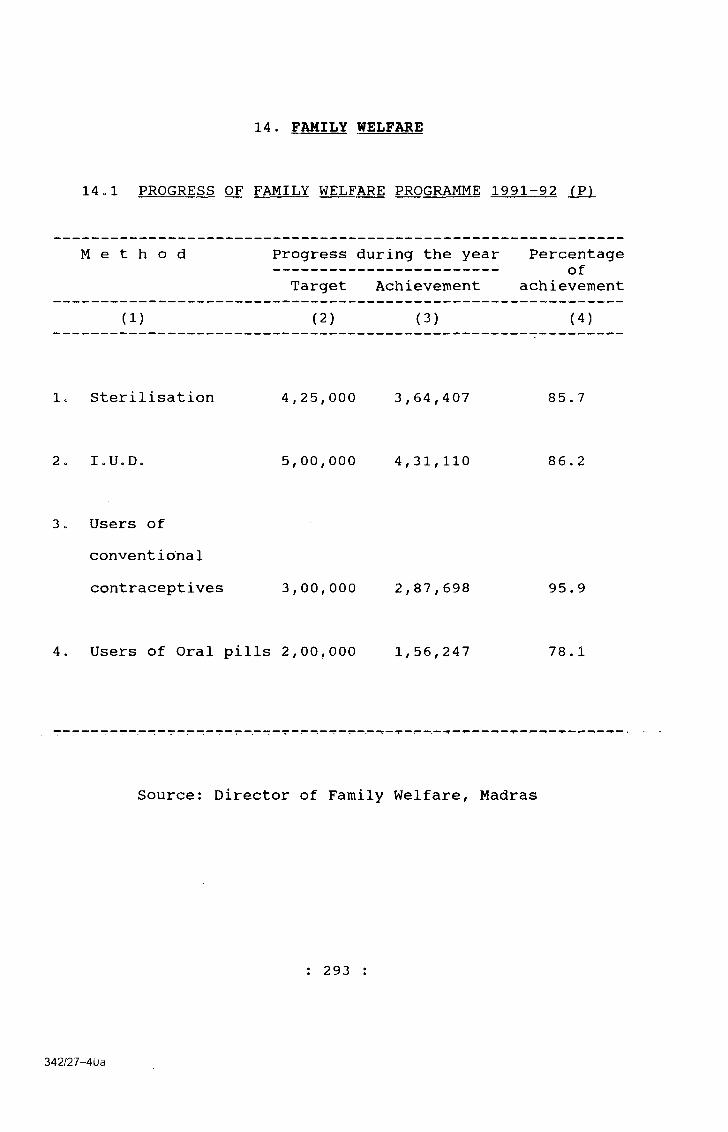
14. FAMILY WELFARE
14ol PROGRESS OF FAMILY WELFARE PROGRAMME 1991-92 (P)
M e t h o d Progress during the year Target Achievement
Percentageof
achievement
(1) (2) (3) (4)
1. Sterilisation 4,25,000 3,64,407 85.7
2. l o U . D . 5,00,000 4,31,110 8 6 . 2
3 o Users ofconventionalcontraceptives 3,00,000 2,87,698 95.9
4. Users of Oral pills 2,00,000 1,56,247 78.1
Source: Director of Family Welfare, Madras
: 293
342/27-4Ua

14,2 PROGRESS OF FAMILY WELFARE PROGRAMME BY DISTRICTS1991“92(P)
D i s t r i c tNo. of Institutions SteriIisat ion I .U.D.
Rural Urban Target Ach i evement Target Ach i evement
(1) (2) (3) (4) (5) (6) (7)
1, Madras 4 56,000 56,628 60,000 75,0132. Chengalpattu M.G.R. 95 11 27,000 22,646 33,000 25,955
3. South Arcot 134 14 37,000 30,534 42,000 42,2754. North Arcot Ambedkar 43 10 24,000 21,886 28,000 19,853
5. Thiruvannamalai Sambuvarayar 95 7 13,000 14,494 20,000 16,4466. Salem 116 11 31,000 21,699 37,000 28,051
7. Dharmapuri 72 7 18,000 15,343 20,000 14,7148. Periyar 66 8 15,000 15,058 19,000 10,880
9. Coimbatore 70 9 24,000 22,764 27,000 11,96610. The NiIgiris 29 4 4,000 4,629 4,000 4,332
11. Thanjavur 139 10 15,000 12,902 16,765 14,43512. Nagapattinam Quaid-E-MiIleth -- -- 19,000 10,556 21,235 15,946
13. TiruchirapalIi 130 11 32,000 20,163 38,000 22,93114. Pudukottai 55 8 10,000 6,256 12,000 10,197
15. Madurai 67 9 25,000 19,527 27,000 27,10716. Dindigul Anna 50 5 13,000 13,096 17,000 18,580
17. Ramanathapuram 47 5 9,000 6,157 10,000 7,67518. Kamarajar 37 5 10,000 10,005 15,000 11,401
19. Pasumpon Muthuramalinga Thevar 41 7 8,000 7,827 10,000 10,74320. Tirunelveli Kattabomman 63 11 18,000 14,981 20,000 20,562
21. Chidambaranar 47 10 7,000 7,255 12,000 12,75122. Kanniyakunari 33 5 10,000 10,001 11,000 9,297
S t a t e *1,429 171 4,,25,000 3,64,407 5,00,000 4,31,110
: 294 :

14.2 (contd.
D i s t r i c t Oral Pills users Users of conventional contraceptives
Target Achievement
Target Achievement
(1) (8) (9) (10) (11)
1. Madras 15,000 10,351 20,000 21,1822 . Chengalpattu M.G.R. 15,000 11,248 21,000 14,9003 . South Arcot 16,000 13,805 28,000 28,8844. North Arcot Ambedkar 10,000 7,795 18,000 18,8555. Thiruvannamalai
Sambuvarayar 8, 000 5,742 13,000 15,4476, Salem 15,000 10,990 24,000 24,7507 . Dharmapuri 10,000 7,994 14,000 16,1818. Periyar 7, 000 5, 147 13,000 13,3089 « Coimbatore 12,000 8, 684 18,000 14,87610, The Nilgiris 2 , 000 1, 961 3, 000 3 , 74711. Thanjavur 7, 060 6,418 11,030 10,41112. Nagapattinam
Quaid-E-Mi1leth 8,940 5,594 13,970 10,36913 . Tiruchirapalli 15,000 7, 027 24,000 12,60414. Pudukottai 5, 000 3 , 663 7, 000 5, 85215. Madurai 11,000 9,494 17,000 14,89516. Dindigul Anna 7, 000 7,222 9, 000 13,04617. Ramanathapuram 5, 000 5,416 6, 000 7, 16718 . Kamarajar 6, 000 5,848 8, 000 8, 21719. Pasumpon Muthu-
ramalinga Thevar 4,000 4,039 5, 000 5, 02620, TiruneKreli
Kattabomman 10,000 7,934 13,000 13,21421. Chidambaranar 5, 000 5, 030 7,000 7,02522. Kanniyakumari 6,000 4,847 7,000 7,741
S t a t e 2,00,000 1,56,249 3,00,000 2,87,697*including 383 main PHCs
Source: Director of Family Welfare, Madras
: 295 ;
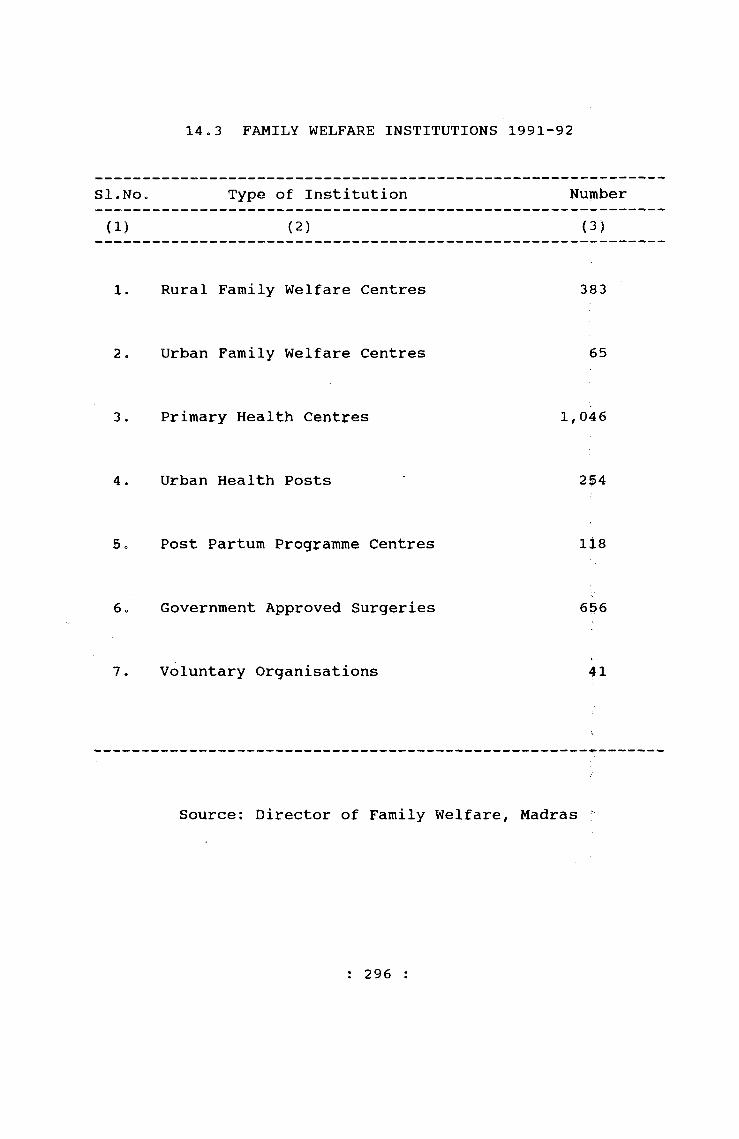
14.3 FAMILY WELFARE INSTITUTIONS 1991-92
SI.No. Type of Institution Number
(1) (2) (3)
1. Rural Family Welfare Centres 383
2. Urban Family Welfare Centres 65
3. Primary Health Centres 1,046
4. Urban Health Posts 254
5o Post Partum Programme Centres 118
6o Government Approved Surgeries 656
7. Voluntary Organisations 41
Source: Director of Family Welfare, Madras
: 296
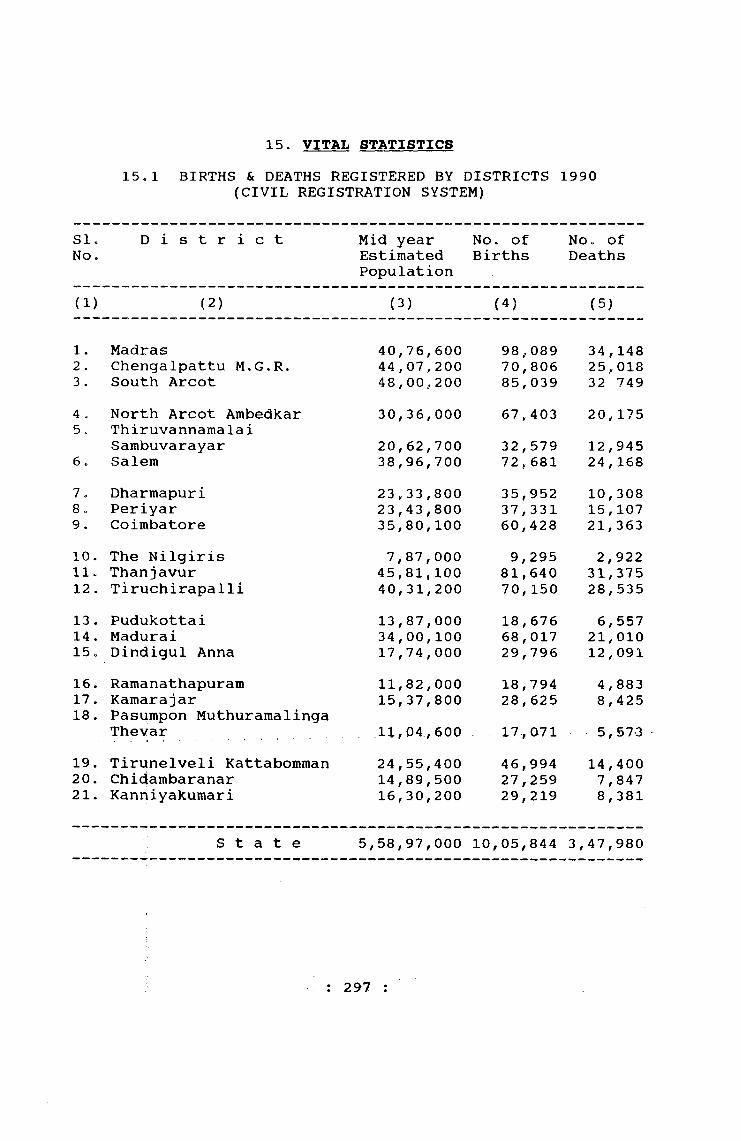
15,1 BIRTHS & DEATHS REGISTERED BY DISTRICTS 1990 (CIVIL REGISTRATION SYSTEM)
15. VITAL STATISTICS
Si,No«
D i s t r i c t Mid yearEstimatedPopulation
No. of Births
NOo of Deaths
(1) (2) (3) (4) (5)
1. Madras 40,76,600 98,089 34,1482 . Chengalpattu M.G.R. 44 , 07,200 70,806 25,0183 . South Arcot 48,00,200 85,039 32 7494 = North Arcot Ambedkar 30,36,000 67,403 20,1755. Thiruvannamalai
Sambuvarayar 20,62,700 32,579 12,9456e Salem 38,96,700 72,681 24,1687. Dharmapuri 23,33,800 35,952 10,3088 o Periyar 23,43,800 37,331 15,1079. Coimbatore 35,80,100 60,428 21,36310, The Nilgiris 7,87,000 9,295 2, 92211. Thanjavur 45,81,100 81,640 31,37512. Tiruchirapalli 40,31,200 70,150 28,53513 . Pudukottai 13,87,000 18,676 6, 55714. Madurai 34,00,100 68,017 21,01015„ Dindigul Anna 17,74,000 29,796 12,09116. Ramanathapuram 11,82,000 18,794 4,88317. Kamarajar 15,37,800 28,625 8,42518, Pasumpon Muthuramalinga
Thevar 11,04,600 17,071 5,57319. Tirunelveli Kattabomman 24,55,400 46,994 14,40020. Chidiambaranar 14,89,500 27,259 7,84721. Kann iyakumar i 16,30,200 29,219 8, 381
S t a t e 5,58,97,000 10,05,844 3,47,980
: 297 :
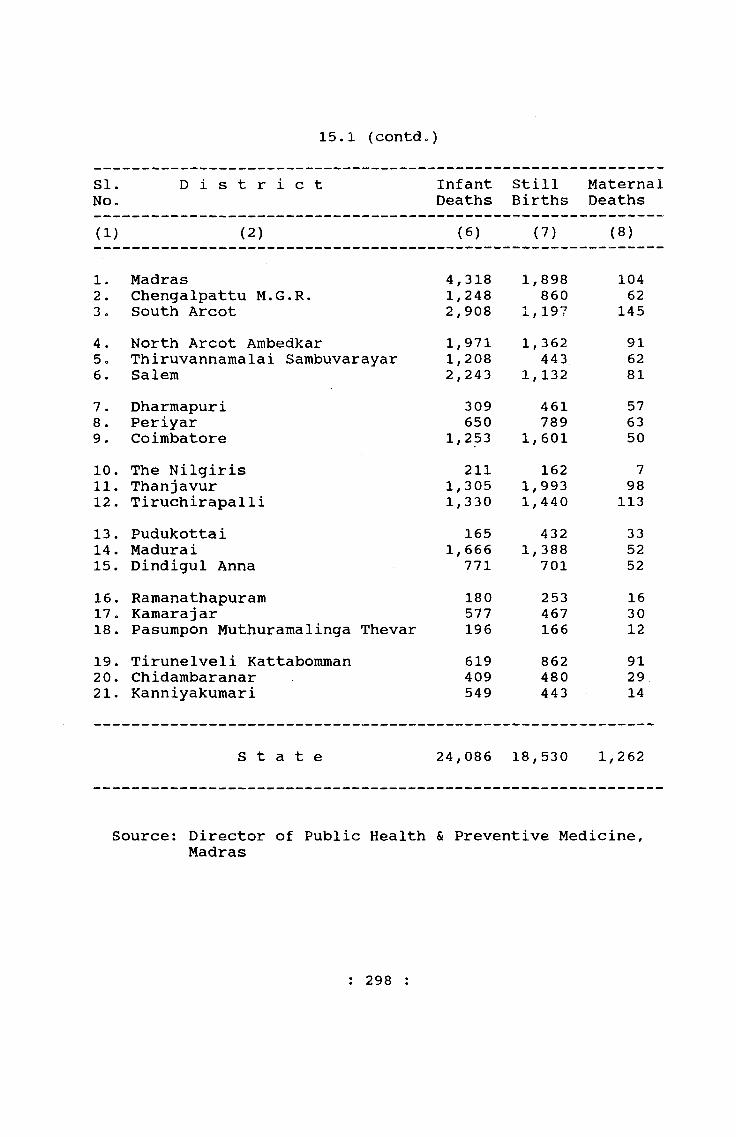
15.1 (contd»)
SI.No.
D i s t r i c t InfantDeaths
StillBirths
MaternalDeaths
(1) (2) (6) (7) (8)
1. Madras 4,318 1,898 1042 . Chengalpattu M.G.R. 1,248 860 623o South Arcot 2,908 1,197 1454. North Arcot Ambedkar 1,971 1, 362 915c Thiruvannamalai Sambuvarayar 1,208 443 626. Salem 2,243 1,132 817. Dharmapuri 309 461 578. Periyar 650 789 639. Coimbatore 1,253 1,601 5010. The Nilgiris 211 162 711. Thanjavur 1,305 1,993 9812 . Tiruchirapalli 1,330 1,440 11313. Pudukottai 165 432 3314. Madurai 1, 666 1,388 5215. Dindigul Anna 771 701 5216. Ramanathapuram 180 253 1617. Kamarajar 577 467 3018. Pasumpon Muthuramalinga Thevar 196 166 1219. Tirunelveli Kattabomman 619 862 9120. Chidambaranar 409 480 2921. Kanniyakumari 549 443 14
S t a t e 24,086 18,53 0 1,262
Source: Director of Public Health & Preventive Medicine, Madras
: 298 :

15.2 BIRTH & DEATH RATES BY DISTRICTS 1990
S U No. District
Registered Corrected for reporting Recording efficiency,
&f
Birth Rate Death Rate C.R.N.I. Birth Rate Death Rate C.R.N.I.
(1) (2) (3) (4) (5) (6) (7) (8)
1. Madras 24.06 8.38 15.68 24.06 8.38 15.682. Chengalpattu M.G.R. 16.07 5.68 10.39 21.45 8.50 12.953. South Arcot 17.72 6.82 10.90 21.71 9.38 12.33
4. North Arcot Ambedkar 22.20 6.65 15.55 28.15 9.45 18.705. Thiruvannamalai Sambuvarayar 15.79 6.28 9.51 21.41 9.55 11.866. Salem 18.65 6.20 12.45 22.23 8.29 13.94
7. Dharmapuri 15.40 4.42 10.98 19.47 6.26 13.218. Periyar 15.93 6.45 9.48 19.92 9.04 10.889. Coimbatore 16.88 5.97 10.91 21.64 8.58 13.06
10. The NiIgiris 11.81 3.71 8.10 15.76 5.56 10.2011. Thanjavur 17.82 6.85 10.97 21.38 9.22 12.16U . TiruchirapaVU 17.40 7.08 10.32 21.50 9.81 11.59
13. Pudukottai 13.47 4.73 8.74 16.18 6.37 9.8114. Madurai 20.00 6.18 13.82 24.39 8.45 15.9415. Dindigul Anna 16.80 6.82 9.98 20.48 9.32 11.16
16. Ramanathapuram 15.90 4.13 11.77 19.56 6.08 13.4817. kamarajar 18.61 5.48 13.13 24.43 8i06 16.3718.* Pasutnpon Muthuraroatinga Thevar 15.43 ■ • -5,05 • • ia.40 • *19.13' ' ' 7.01 ' T2.T2
19. Tirunelveli Kattabomnan 19.14 5.86 13.28 23.80 8.18 15.6220. Chidambaranar 18.30 5.27 13.03 23.50 7.59 15.9121. Karmiyakumari 17.92 5.14 12.78 25.00 1 8.05 16.95
t o t a l 17.99 6.23 11.76 22.40 8.70 13.70
CRNI : Crude Rate of Natural Increase ‘ . " i ■ .
Source: Director of Public Health and Preventive Medicine, ' Madras- ■ ‘
: 299 :
342/27-41

Sli Name of the District Birth Death Infant
15.3 SEX RATIO AT BIRTH & DEATH 1990(Per 100 Female)
No. Death1. Madras 100 142 1182 p Chengalpattu M*G.R. 108 160 1183 o South Arcot 113 138 1204c North Aircot Ambedkar 109 151 1225. thiruvannamalai Sambuvarayar 116 136 1206. Salem 110 150 597. Dharraapuri 119 158 858* Periyar 110 151 1219. Coimbatore 106 142 13110; The Kilgiris 102 154 9511* thanjavuir 108 144 13312. Tiruchirapalli 111 139 10313. Pudukottai 110 165 11114. Madurai 109 132 6815. Dindigul Anna 110 128 11116* Ramanathapuram 107 151 11617. Kamarajar 108 148 11218. Pasvijjfipbn Muthuramalinga Thevar 106 146 13019. Tirunelveli Kattabomman 110 140 11720. Chidattibairanar 109 144 11021. K^nniyakumari 105 140 128
Sduree: Director of Public Health & Preventive Medicine, Madras
t 300 :
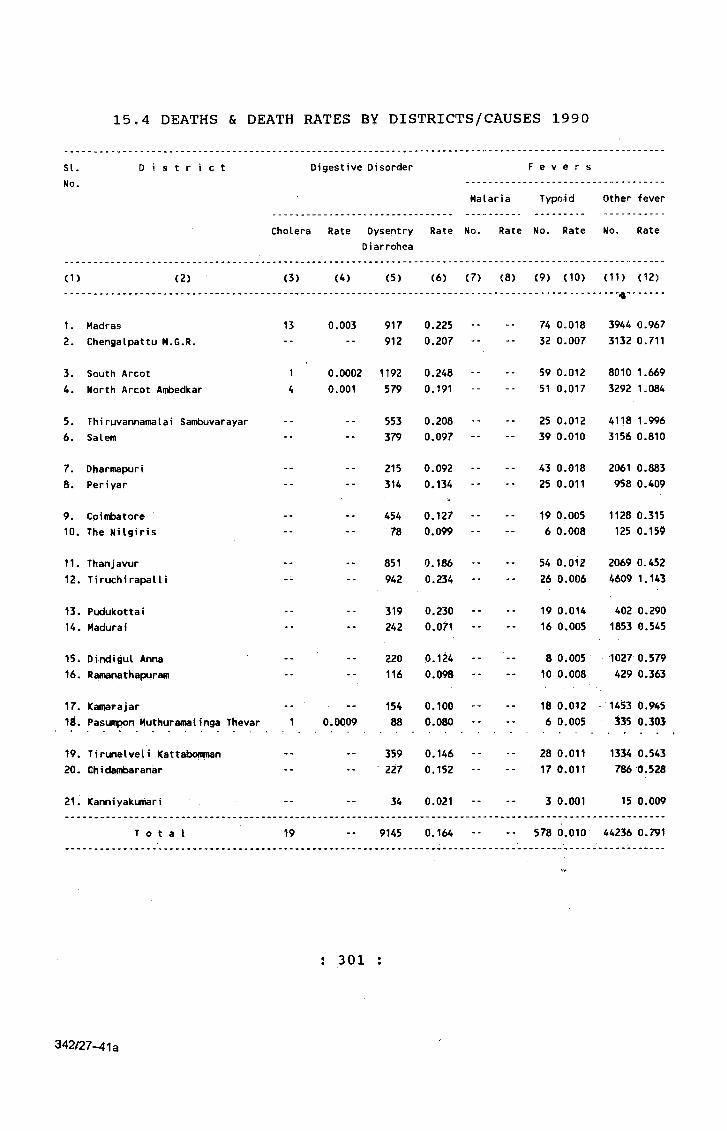
15.4 DEATHS & DEATH RATES BY DISTRICTS/CAUSES 1990
s uNo.
D i s t r i c t Digestive Disorder F e v e r s
Malaria Typoid Other fever
Cholera Rate OysentryDiarrohea
Rate No. Rate No. Rate No. Rate
(1) (2) (3) (4) (5) (6) (7) C8) (9) (10) (11) (12)
1. Madras 13 0.003 917 0.225 74 0.018
4
3944 0.9672. Chengalpattu M.G.R. -- -- 912 0.207 -- -- 32 0.007 3132 0.711
3. South Arcot 1 0.0002 1192 0.248 -- -- 59 0.012 8010 1.6694. North Arcot Ambedkar 4 0.001 579 0.191 -- 51 0.017 3292 1.084
5. Thiruvannamalai Sambuvarayar -- 553 0.208 -- -- 25 0.012 4118 1.9966. Salem -- 379 0.097 -- -- 39 0.010 3156 0.810
7. Dharmapuri -- 215 0.092 -- -- 43 0.018 2061 0.8838. Periyar -- 314 0.134 -- 25 0.011 958 0.409
9. Coimbatore -- 454 0.127 -- -- 19 0.005 1128 0.31510. The Nilgiris -- 78 0,099 -- -- 6 0.008 125 0.159
11. Thanjavur 851 0.186 54 0.012 2069 0.45212. Tiruchirapalli -- 942 0,234 -- -- 26 0.006 4609 1.143
13. Pudukottai 319 0.230 -- 19 0.014 402 0.29014. Madurai •• 242 0.071 -- -- 16 0.005 1853 0.545
15i Dindiglul Anna -- 220 0.124 -- 8 0.005 1027 0.57916. Ramanathapuram -- 116 0.098 -- -- 10 0.008 429 0.363
17. Kamarajar -- ' .. 154 0.100 -- -- 18 0.012 1453 0.94518. Pasumpon Muthuramalinga Theyar 1 0.0009 88 0.080 -- -- 6 0.005 335 0.30j
19. Tirunelveli Kattabonman -- -- 359 0.146 -- 28 0.011 1334 0.54320. Chidambaranar -- -- 227 0.152 -- -- 17 0.011 786 0.528
21. Kanniyakumari -- -- 34 0,021 -- -- 3 0.001 15 0.009
T o t a l 19 -- 9145 0.164 -- -- 578 0.010 44236 0.791
: 301
342/27-4 la
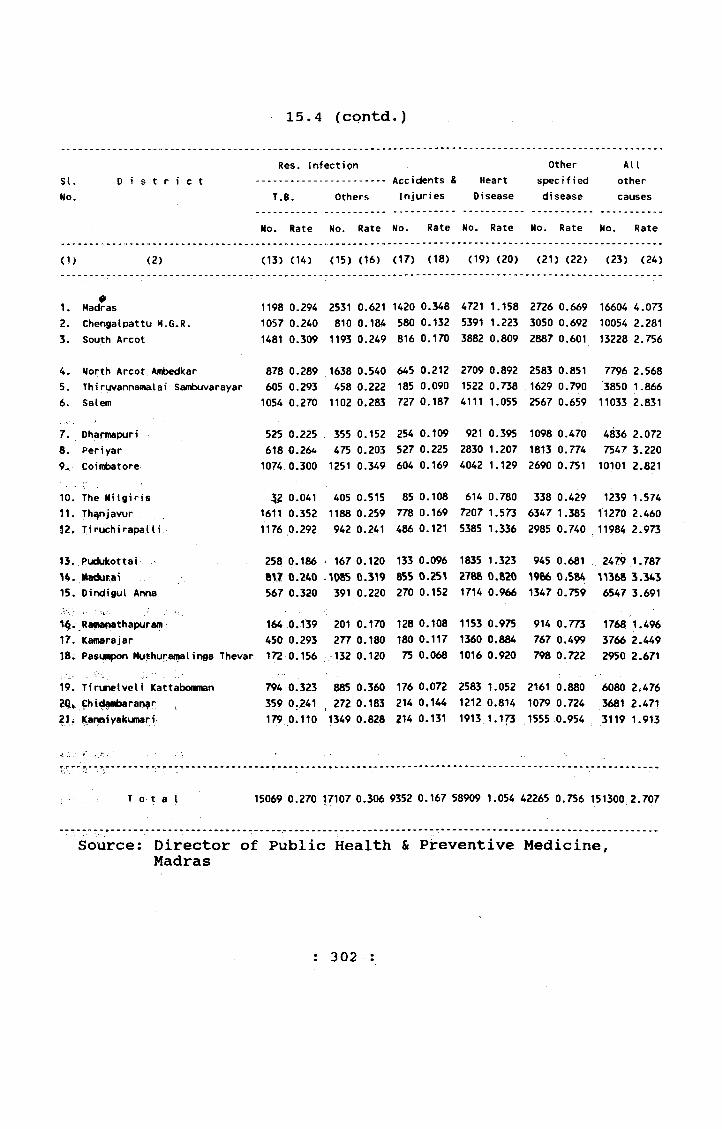
SI. D i s t r i c tNo.
15.4 (contd.)
Res. Infection Other All
T.B. Others
Accidents & Heart specified other
Injuries Disease disease causes
No. Rate No. Rate No. Rate No. Rate No. Rate No. Rate
(1) <2) (13) (14) (15) (16) (17) (18) (19) (20) (21) (22) (23) (24)
1. Madras 1198 0.294 2531 0.621 1420 0.348 4721 1.158 2726 0.669 16604 4.0732. Chengalpattu H.G.R. 1057 0.240 810 0.184 580 0.132 5391 1.223 3050 0.692 10054 2.2813. South Arcot 1481 0.309 1193 0.249 816 0.170 3882 0.809 2887 0.601 13228 2.756
4. North Arcot Ambedkar 878 0.289 1638 0.540 645 0.212 2709 0.892 2583 0.851 7796 2.5685. Th i ruvannamala i Sarabuvarayar 605 0.293 458 0.222 185 0.090 1522 0.738 1629 0.790 '3850 1.8666. Salem 1054 0.270 1102 0.283 727 0.187 4111 1.055 2567 0.659 11033 2.831
7. Dharmapuri 525 0.225 355 0.152 254 0.109 921 0.395 1098 0.470 4836 2.0728. Periyar 618 0.264 475 0.203 527 0.225 2830 1.207 1813 0.774 7547 3.2209. Coimbatore 1074 0.300 1251 0.349 604 0.169 4042 1.129 2690 0.751 10101 2.821
10. The Nilgiris 52 0.041 405 0.515 85 0.108 614 0.78011. Th^njavur 1611 0.352 1188 0.259 778 0.169 7207 1.57332. Tiruchirapalli 1176 0.292 942 0.241 486 0.121 5385 1.336
338 0.429 6347 1.385 2985 0.740
1239 1.574 11270 2.460 11984 2.973
13. Pudwkottai 258 0.186 167 0.120 133 0.096 1835 1.323Madunai 817 0.240 .1085 0.319 855 0.251 2788 0.820
15. Dindigul Anna 567 0.320 391 0.220 270 0.152 1714 0.966
1 4 Rafiaf^thapuram. 164 0.139 201 0.170 128 0.108 1153 0.97517. Kamarajar 450 0.293 277 0.180 180 0.117 1360 0.884X8;- Pasunpon Muthuran^l inga Thevar 172 0.156 ,132 0.120 75 0.068 1016 0.920
19. Tirunelveli Kattabomnan 794 0.323 885 0.360 176 0.072 2583 1.052phidfmbaran^r 359 0.241 ,272 0.183 214 0.144 1212 0.814
2Ji Kanaiyakumari 179 0.110 1349 0.828 214 0.131 1913 1.173
945 0.681 1986 0.584 1347 0.759
914 0.773 767 0.499 798 0,722
2161 0.880 1079 0.724 1555 0.954
2479 1.787 11368 3.343 6547 3.691
1768 1.496 3766 2.449 2950 2.671
6080 2.476 3681 2.471 3119 1.913
T o t a l 15069 0.270 17107 0.306 9352 0.167 58909 1.054 42265 0.756 151300 2.707
Source: Director of Public Health & Preventive Medicine, Madras
: 302 :

15,5 ESTIMATED VITAL RATES FOR INDIA & TAMIL NADU
(SAMPLE REGISTRATION SYSTEM)
Year B i r t h R a t e s D e a t h R a t e s Infant Mor taiity Rates
Tamil Nadu ! n d i a Tami I Nadu I n d i a Tamil Nadu I n d j a
R U T R U T R U T R U T R U 1 T
(1) (2) (3) (4) (5) (6) (7) (8) (9) (10) (11) (12) (13) (14)(15)(16i n7) «:i8) (19)
1982 29.2 24.9 27.7 35.5 27.6 33.8 13.4 7.4 11.2 13.1 7.4 11.9 97 51 83 114 65 105
1983 29.0 25.9 27.9 35.3 28.0 33.6 13.4 8,5 11.7 13.0 7.7 11.9 101 59 88 114 66 105
1984 28.4 27.2 28.0 35.3 59.4 33.9 11.9 8.7 10.8 13.8 8.6 12.6 90 54 78 113 66 104
1985 25.2 23.8 24.7 34,3 28.1 32.9 10.9 6.9 9.5 13.0 7.8 11.8 95 53 81 107 59 97
1986 24.1 23.1 23.8 34.2 27,1 32.6 10.7 7.1 9,5 12.2 7.6 11.1 93 54 80 105 62 96
1987 24.1 23.7 24.0 33.7 27.4 32.2 11.1 7.6 9,9 12,0 7,4 10.9 86 54 76 104 61 95
1988 23.4 21.4 22.7 33.1 26.3 31.5 10.3 7.3 9,3 12,0 7,7 11,0 84 51 74 102 62 94
1989 23.5 22.2 23.1 32.0 25.0 30.5 9.7 6.6 8.6 11.1 7,1 10.2 80 43 68 96 58 91
1990(P)
23.2 20.9 22.4 31.5 24.4 29.9 10.0 6.4 8.7 10.4 6,7 9.6 81 38 67 86 51 80
R = Rural U = Urban T .= TotalSource: Director of Public Health & Preventive Medicine,
Madras
: 303 :

15«6 EXPECTATION OF LIFE AT BIRTH
(1981 CENSUS)
Period Tamil Nadu South Zone I n d i aMale Female Male Female Male Female
(1) (2) (3) (4) (5) (6) (7)
1891 - 1901 26.21 27.13 — 23.60 23.96
1901 - 1911 25.92 27.65 22 . 59 23 „31
1911 - 1921 19.75 24.23 — 19.42 20.91
1921 - 1931 28.71 30.94 — — 26.91 26.56
1931 - 1941 35. 03 36.17 — — 32.09 31.37
1941 - 1951 36.22 27.23 — — 32.45 31.66
m m 3a. 24 41.89 40.55
1961 - 1971 47. 50 46.50 47.52 46.40 46.40 44 .70
1971 - 1981 52.50 51.90 N.A N.A. 51.40 50.20
Source: Report of the Expert Committee on Population Projection
; 304 :
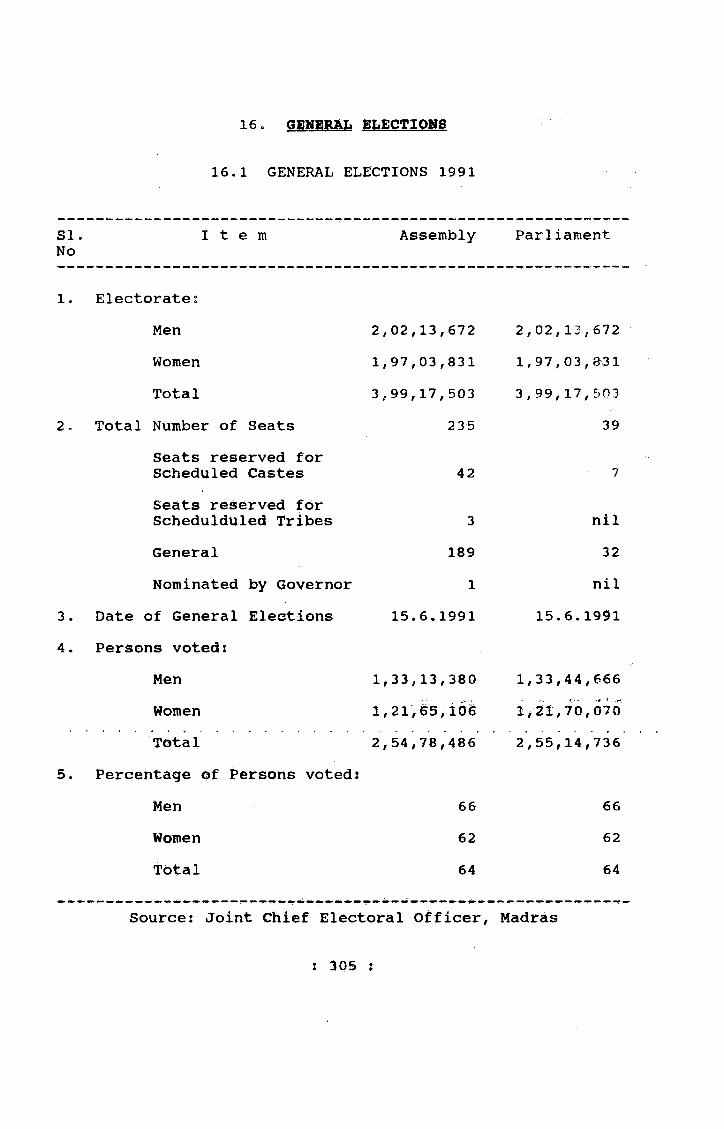
16.1 GENERAL ELECTIONS 1991
16. GENERAL ELECTIQMS
SI.No
I t e m Assembly Parliament
1. ElectoratesMen 2,02,13,672 2,02,13,672Women 1,97,03,831 l,97,03,a31Total 3,99,17,503 3,99,17,503
2 , Total Number of Seats 23 5 39Seats reserved for Scheduled Castes 42 7Seats reserved for Schedulduled Tribes 3 nilGeneral 189 32Nominated by Governor 1 nil
3 . Date of General Elections 15.6.1991 15.6.19914. Persons voted:
Men 1,33,13,380 1,33,44,666Women 1,21,65,idi i,ii,70,070Total 2,54,78,486 2,55,14,736
5. Percentage of Persons voted:Men 66 66Women 62 62Total 64 64
Source: Joint Chief Electoral Officer, Madras
: 305 :
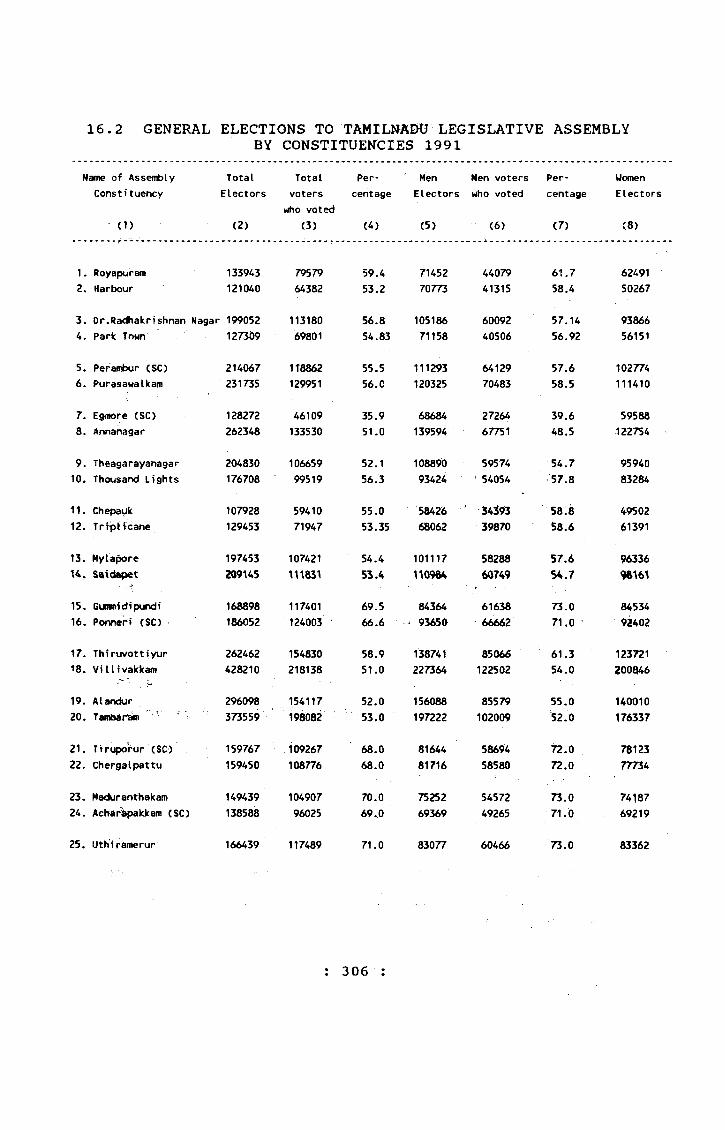
16.2 GENERAL ELECTIONS TO TAMILNWtJ LEGISLATIVE ASSEMBLYBY CONSTITUENCIES 1991
Name of Assembly Consti tuency
(1)
TotalElectors
Total voters
who voted
Per- Men Men voters Per- Womencentage Electors who voted centage Electors
(2) <3) (4) (5) (6) (7) <8)
133943 79579 59.4 71452 44079 61.7 62491121040 64382 53.2 70773 41315 58.4 50267
199052 113180 56.8 105186 60092 57.14 93866127309 69801 54.83 71158 40506 56.92 56151
214067 1T8862 55.5 111293 64129 57.6 102774231735 129951 56.0 120325 70483 58.5 111410
128272 46109 35.9 68684 27264 39.6 59588262348 133530 51.0 139594 67751 48.5 122754
204830 106659 52.1 108890 59574 54.7 95940176708 99519 56.3 93424 54054 57.8 83284
107928 59410 55,0 58426 34393 58.8 49502129453 71947 53.35 6S062 39870 58.6 61391
197453 107421 54.4 101117 58288 57.6 96336209U5 53.4 110984 60749 54.7 96^6^
168898 117401 69.5 84364 61638 73.0 84534186052 124003 66.6 9365a 66662 71.0 92402
262462 154830 58.9 138741 85066 61.3 123721428210 218138 51.0 227364 122502 54.0 200846
296098 154117 52.0 156088 85579 55.0 140010373559 198082 ' 53.0 197222 102009 52.0 176337
159767 109267 68.0 81644 58694 ^ . 0 78123159450 108776 68.0 81716 58580 72.0 n t h k
149439 104907 70.0 75252 54572 73.0 74187138588 96025 69.0 69369 49265 71.0 69219
166439 117489 71.0 83077 60466 73.0 83362
1. Royapuram2. Harbour
3. Dr.Radhakrishnan Nagar4. Parle Town
5. Perambur (SC)6. Purasawalkam
7. Egfflore (SC)8. Annanagar
9. Theagarayanagar10. Thousand Lights
11. ChepaiJk12. TripHcane
13. Myla^re U . Saiciapet
15. Gunnmidipundi16. Ponneri (SC)
17. Thiruvottiyur18. Villivakkam
19. Alandur20. Tambdr^
21. Tiirupo'rur (SC)22. Chergalpattu
23. Haduranthakam24. Achdrdpakkam (SC)
25. Uthiramerur
: 306 :
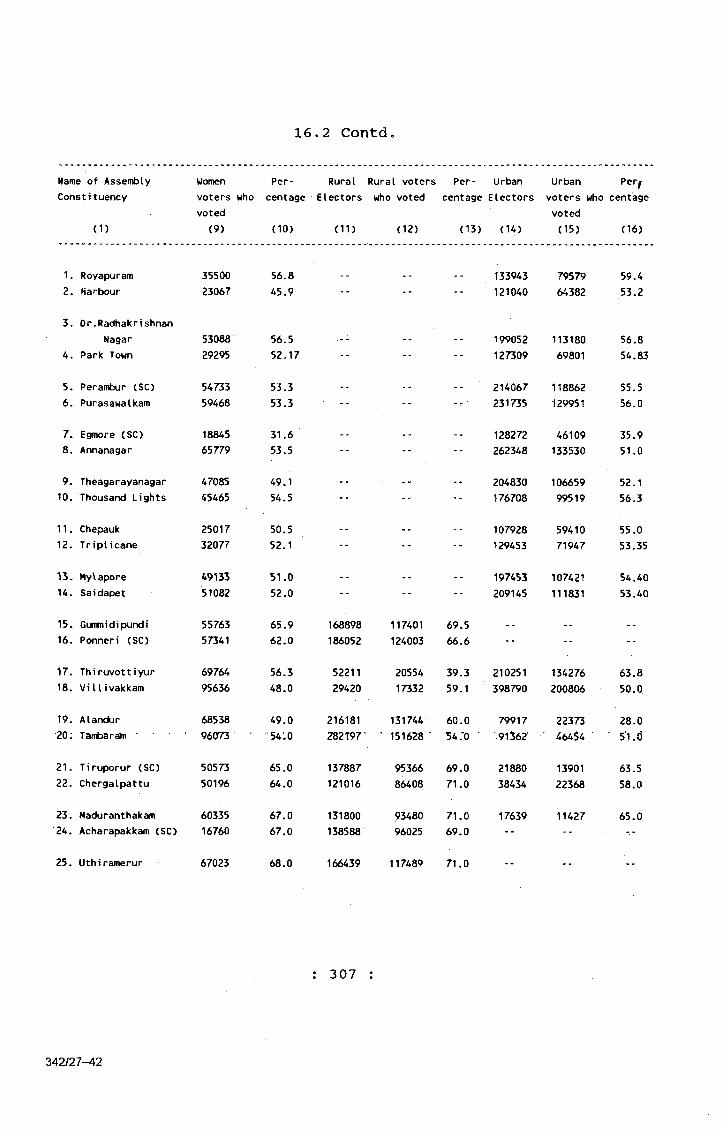
16.2 Contd.
Name of Assent Iy Constituency
(1)
Women voters who voted
(9)
Percentage
(10)
RuralElectors
(11)
Rural voters who voted
(12)
Per- Urban centage Electors
(13) (14)
Urban voters who voted (15)
Perfcentage
(16)
1. Royapuram 35500 56.8 133943 79579 59.42. Harbour 23067 45.9 -- -- -- 121040 64382 53.2
3. Or.RadhakrishnanNagar 53088 56.5 -- -- 199052 113180 56.8
4. Park Town 29295 52.17 -- -- -- 127309 69801 54.83
5, Perambur (SC) 54733 53.3 -- 214067 118862 55,56. Purasawalkam 59468 53.3 -- 231735 129951 56.0
7. Egmore (SC) 18845 31.6 - - 128272 46109 35.98. Annanagar 65779 53.5 -- -- -- 262348 133530 51.0
9. Theagarayanagar 47085 49.1 -- -- 204830 106659 52.110. Thousand Lights 45465 54.5 -- -- -- 176708 99519 56.3
11. Chepauk 25017 50.5 -- -- 107928 59410 55,012, Triplicane 32077 52.1 -- 129453 71947 53.35
■ 3. MyVapore 49133 51.0 . . 197453 107421 54.4014. Saidapet 51082 52.0 -- -- -- 209145 111831 53.40
15. Gunvnidipundi 55763 65.9 168898 117401 69.5 - - - -
16. Ponneri (SC) 57341 62.0 186052 124003 66.6 -- -- --
17. Thiruvottiyur 69764 56.3 52211 20554 39.3 210251 134276 63.818. Villivakkam 95636 48.0 29420 17332 59.1 398790 200806 50.0
19. Alandur 68538 49.0 216181 131744 60.0 79917 22373 28.020; TambaraJn • • 96073 •54'.0 282T97' • 151628 ■ ■54.*0 ■ 91362’ 46454 • 5*1.(J
21. Tiruporur (SC) 50573 65.0 137887 95366 69.0 21880 13901 63.522. Chergalpattu 50196 64.0 121016 86408 71.0 38434 22368 58.0
23. Maduranthakam 60335 67.0 131800 93480 71.0 17639 11427 65.024. Acharapakkam (SC) 16760 67.0 138588 96025 69.0 -- -- --
25. Uthiramerur 67023 68.0 166439 117489 71.0
: 307
342/27-42
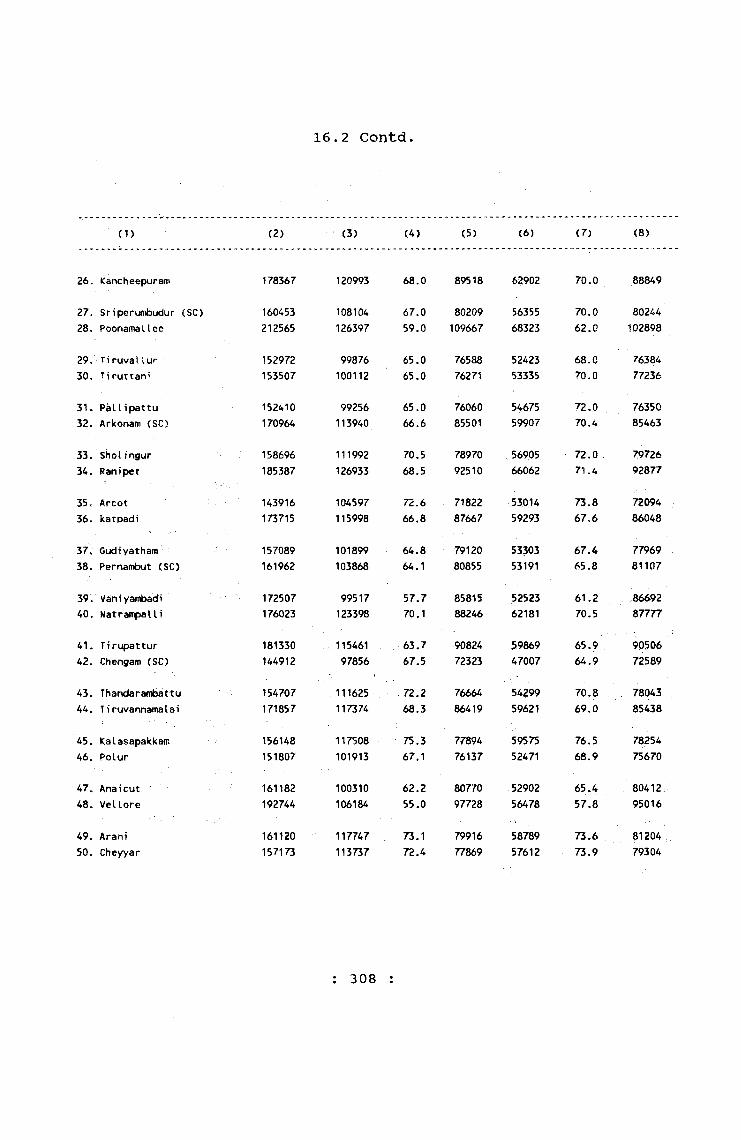
16.2 Contd.
(1) (2) (3) (4) (5) (6) (7) <8)
26. Kancheepuram 178367 120993 68.0 89518 62902 70.0 888A9
27= Sriperun*)udur (SC) 28. Poonamatlee
160453212565
108104126397
67.059.0
80209109667
5635568323
70.062.0
80244102898
29. Ti ruvallur30. Tiruttani
152972153507
99876100112
65.065.0
7658876271
5242353335
68.070.0
7638477236
31. Pal Iipattu32. Arkonam (SC)
152410170964
99256113940
65.066.6
7606085501
5467559907
72.070.4
7635085463
33. Sholfngur34. Rani pet
158696185387
111992126933
70.568.5
7897092510
5690566062
72.071.4
7972692877
35. Arcot36. katpadi
143916173715
104597115998
72.666.8
7182287667
5301459293
73.867.6
7209486048
37. (judiyatham38. Pernambut (SC)
157089161962
101899103868
64.864.1
7912080855
5330353191
67.465.8
7796981107
39. Vaniyambadv40. Natrampalli
172507176023
99517123398
57.770.1
8581588246
5252362181
61.270.5
.8669287777
41. Tirupattur42. Chengam (SC)
181330144912
11546197856
63.767.5
9082472323
5986947007
65.964.9
9050672589
43. Thandarambattu44. Tiruvannamalai
T54707171857
111625117374
72.268.3
7666486419
5429959621
70,869.0
7804385438
45. Kalasapakkam46. Polur
156148151807
117508101913
75.367.1
7789476137
5957552471
76.568.9
7825475670
47. Anaicut48. Vellore
161182192744
100310106184
62.255.0
8077097728
5290256478
65.457.8
8041295016
49. Arani50. Cheyyar
161120157173
117747113737
73.172.4
7991677869
5878957612
73.673.9
8120479304
; 308 :

16,2 Gontd.
(1) (9) (10) (11) (12) (13) (14) (15) (16)
26. Kancheepuram 58091 65.0
27. Sriperumbudur (SC) 51749 64.028. Poonamallee 58074 56.0
78139 53761 69.0
126621 86314 68.0
100228
33832212565
67232 67.Q
21790126397
64.0059.00
29. Tiruvallur30. Tiruttani
4745346777
62.060.0
124867131246
8355287634
67.067.0
2810522261
1632412478
58.0056.00
31. Pallipattu32. Arkonam (SC)
4458154033
58.063.2
135828116639
8780881870
64.070.2
1658254325
1144832070
69.0059.0
33. Sholingur34. Ranipet
5508760871
69.065.5
134488116743
9626284086
71.572.0
2420868644
1573042847
64.9062,40
35. Arcot36. katpadi
5158356705
71.565.9
93986128905
8545786091
90.966.8
4993044810
1914029907
38.366.7
37. Gudiyatham38. Pernambut (SC)
4859650677
62.362.5
94458161962
64468103868
68.2
64.162631 37431 60.3
39. Vaniyambadi40. NatrampalU
41. Tirupattur42. Chengam (SC)
43. rhandarambattu44. Tiruvannamalai
45. iCalasapakkam46. Polur
4699461217
5559250849
5732657753
57933 49442’
54.269.7
61.470.0
73.567.6
74.0 65.3'
54806176023
118236144912
15470798903
156148151807
51104123398
7680197856
11162563909
117508101913
93.270.1
64.967.5
72.264.6
75.3 67 .’l
117701
63094
72954
48413 41.1
38660 61.3
53465 73.3
47. Anaicut48. Vellore
4740849706
58.952.3
16118266815
10031037833
62.256.6 125929 68351 54.2
49. Arani50. Cheyyar
5895856125
72.670.8
105507134550
7753498791
73.573.4
5561322623
40213 72.314946 66.1
342/2 7-42a
: 309
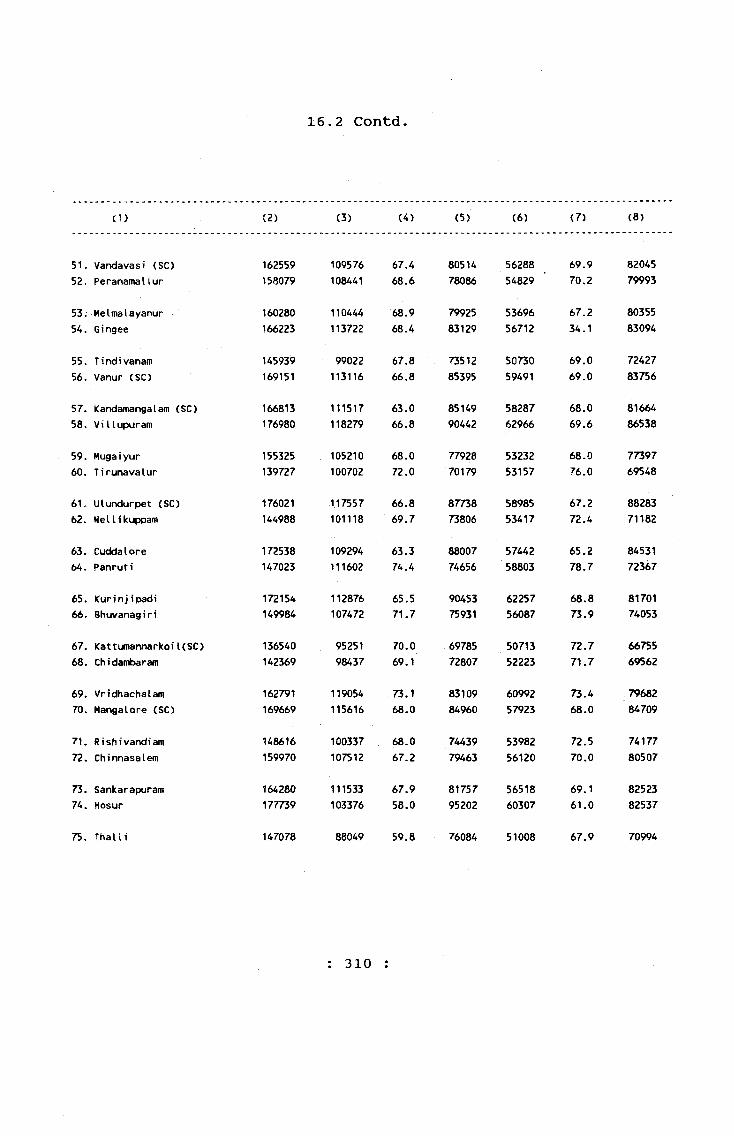
16.2 Gontd.
<i) (2) (3) (4) (5) (6) (7) (8)
51. Vandavasi (SC)52. PeranamaUur
162559158079
109576108441
67.468.6
8051478086
5628854829
69.970.2
8204579993
53. Melmalayanur54. Gingee
160280166223
110444113722
68.968.4
7992583129
5369656712
67.23A.1
8035583094
55. Tindivanam56. Vanur (SC)
145939169151
99022113116
67.866.8
^51285395
5073059491
69.069.0
7242783756
57. Kandamangalam (SC)58, VUlupuram
166813176980
111517118279
63.066.8
8514990442
5828762966
68.069.6
8166486538
59. Mugaiyur60. Tirunavalur
155325139727
105210100702
68.072.0
7792870179
5323253157
68.076.0
7739769548
61. Ulundurpet (SC)62. Nellikuppam
176021144988
117557101118
66.869.7
8773873806
5898553417
67.272.4
8828371182
63. Cuddalore64. Panruti
172538147023
109294111602
63.374.4
8800774656
5744258803
65.278.7
8453172367
65. Kurinjipadi 66r Bhuvanagiri
172154149984
112876 107472
65.571.7
9045375931
6225756087
68.873.9
8170174053
67. Kattumannarkoil(SC)68. Chidambaram
136540142369
9525198437
70.069.1
6978572807
5071352223
72.771.7
6675569562
69. Vridhachalam70. Mangalore (SC)
162791169669
119054115616
73.168.0
8310984960
6099257923
73.468.0
7968284709
71. Rishivandiam72. Chinnasalem
148616159970
100337107512
68.067.2
7443979463
5398256120
72.570.0
7417780507
73. Sankarapuram74. Hosur
164280177739
111533103376
67,958.0
8175795202
5651860307
69.161.0
8252382537
75. Thalii 147078 88049 59.8 76084 51008 67.9 70994
: 310 :
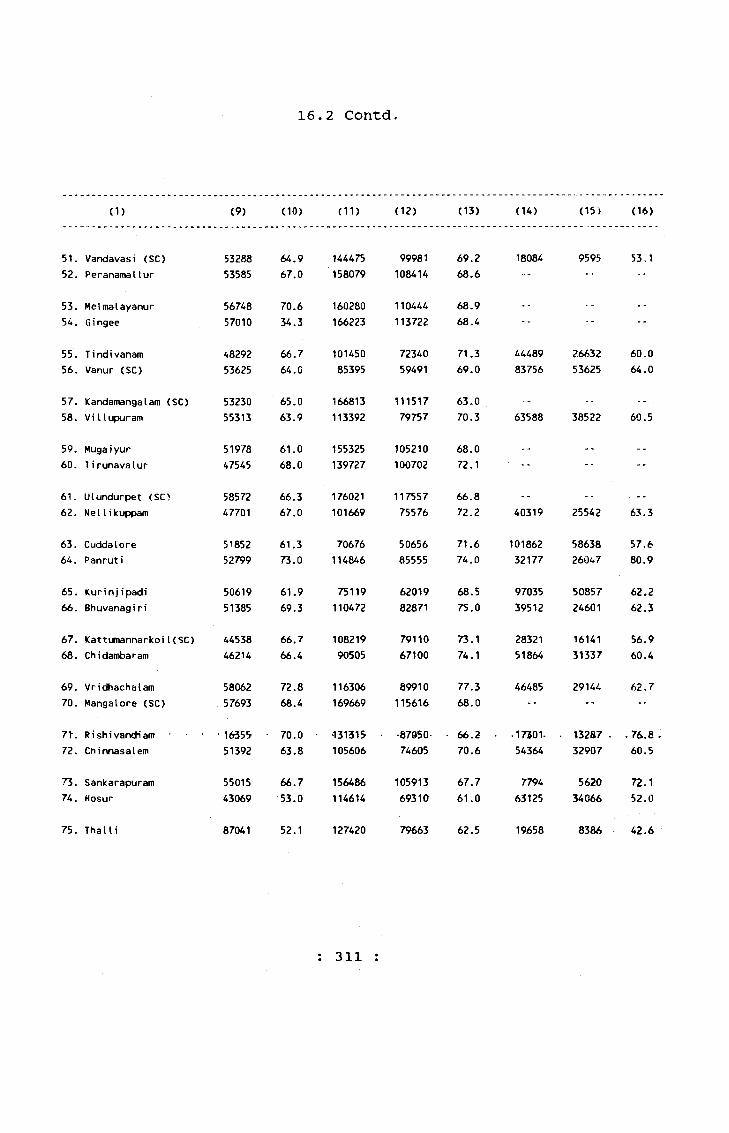
16.2 Contd.
(1) (9) (10) (11) (12) (13) (U) (15) (16)
51.52.
Vandavast (SC) Peranamallur
5328853585
64.967.0
UA475158079
999811084U
69.268.6
18084 9595 53,1
53.54.
Metmalayanur Gingee
5674857010
70.634.3
160280166223
110444113722
68.968.4
55.56.
Tindivanam Vanur (SC)
48292 66.7 101450 72340 71.3 44489 26632 60.053625 64.0 85395 59491 69.0 83756 53625 64.0
57. Kandamangalam (SC) 53230 65.0 166813 111517 63.058. Villupuram 55313 63.9 113392 79757 70.3 63588 38522 60.5
59.60.
Muga i yur T i runavalur
5197847545
61.068.0
155325139727
105210100702
68.072,1
61.62.
Ulundurpet (SO NelIikuppam
5857247701
66.367.0
176021101669
11755775576
66.872.2 40319 25542 63.3
63.64.
Cuddalore Panrut i
5185252799
61.373.0
70676114846
5065685555
71.674,0
10186232177
5863826047
57,680.9
65.66.
Kurinj ipadi Bhuvanagi ri
5061951385
61.969.3
75119110472
6201982871
68.575.0
9703539512
5085724601
62.262.3
67. KattumannarkoiUSC) 44538 66.7 108219 79110 73.1 28321 16141 56.968. Chidambaram 46214 66.4 90505 67100 74.1 51864 31337 60.4
69.70.
Vridhachalam Mangalore (SC)
5806257693
72.868.4
116306169669
89910115616
77.368.0
46485 29144 62,7
71-.72.
R i sh i vandi am Chinnasalem
1635551392
70.063.8
■13131S105606
•87050-74605
66.270.6
17301.54364
13287 . 32907
.76..S60.5
73.74.
SankarapuramHosur
5501543069
66.753.0
156486114614
10591369310
67.761.0
779463125
562034066
72.152.0
75. Thai Ii 87041 52.1 127420 79663 62.5 19658 8386 42.6
: 311 :
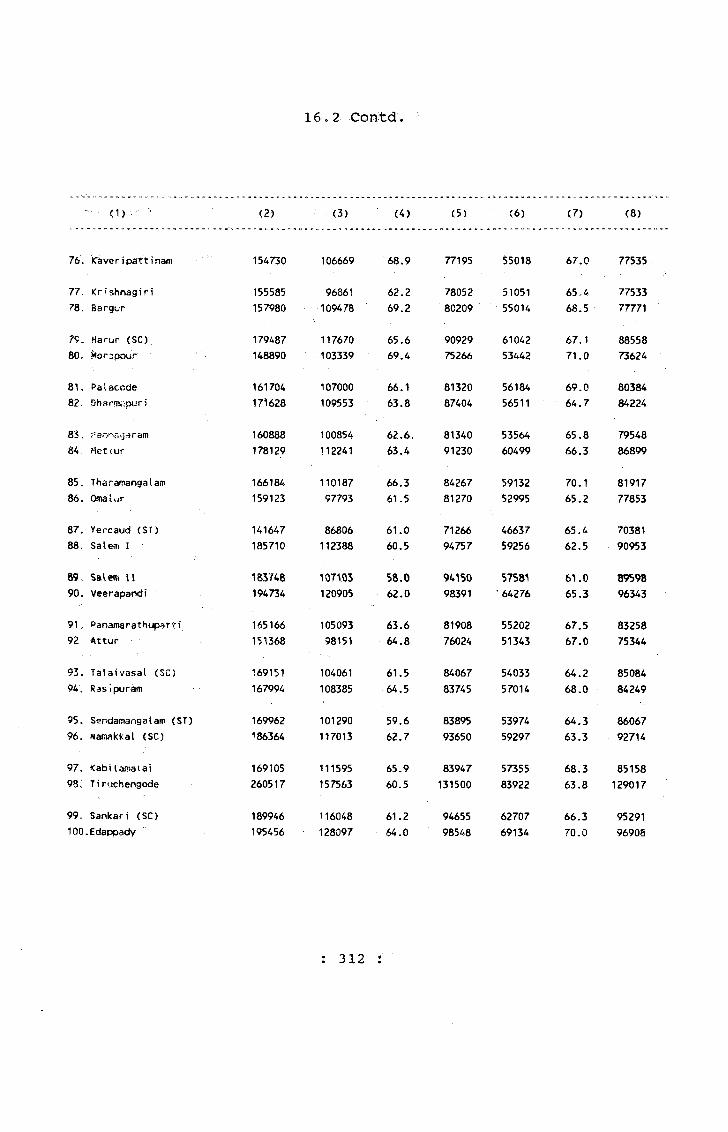
16.2 Contd.
<i) (2) (3) <4) (5) (6) (7) (8)
76, ICa ve r i pat t i nam 154730 106669 68.9 77195 55018 67.0 77535
77. Krishnagiri78. Bargur
155585157980
96861109478
62.269.2
7805280209
5105155014
65.468.5
7753377771
79. Harur (SC)80. ^orappur
179487148890
117670103339
65.669.4
9092975266
6104253442
67.1 71.0
8855873624
81. Palaccde 82.. Dhsrmapurj
161704171628
107000109553
66.163.8
8132087404
5618456511
69.064.7
8038484224
83.S4., Metiur
160888178129
100854112241
62.6.63.4
8134091230
5356460499
65.866.3
7954886899
85. Tharamangalatn86. Omalur
166184159123
11018797793
66.361.5
8426781270
5913252995
70.165.2
8191777853
87. Yercaud (ST)88. Sa I em I
141647185710
86806112388
61.060.5
7126694757
46637S9256
65.462.5
7038190953
89.. Salero II 90, Veerapandi
^83748194734
m m
12090558.062.0
9415098391
57581 • 64276
61.065.3
8959896343
91. Panamarathupatti 92- Attur
165166151368
10509398151
63.664.8
8190876024
5520251343
67.567.0
8325875344
93. Tataivasal (SC)94. Rasipur^m
169151167994
104061108385
61.564.5
8406783745
5403357014
64.268.0
8508484249
95. Sendaniangalam (ST)96. Namakkal (SC)
169962186364
101290117013
59.662.7
8389593650
5397459297
64.363.3
8606792714
97. Kabilafpaiai98. Tiruchengode
169105260517
111595157563
65.960.5
83947131500
5735583922
68.363.8
85158129017
99. Sankari (SC)100.Edappady
189946195456
116048128097
61.264.0
9465598548
6270769134
66.370.0
9529196908
: 3 1 2 :
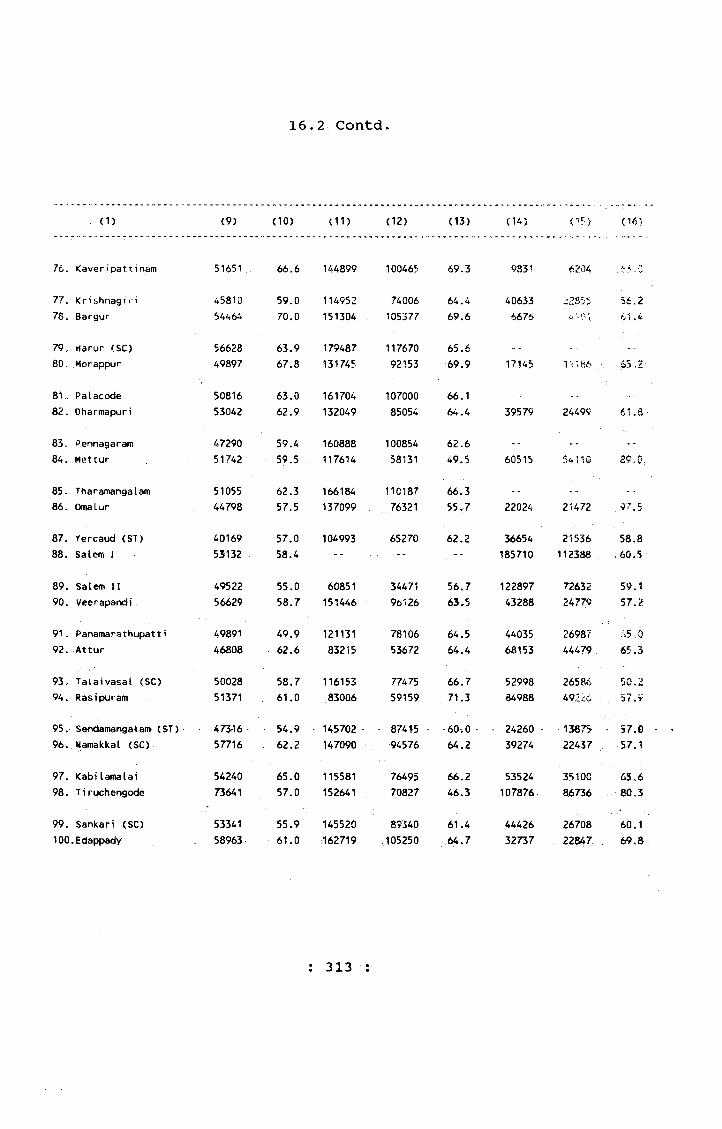
16.2 Gontd.
(1) (9) (10) ;ii) (12) :i3) (14) (1' ) <16)
76. Kaveripattinam 51651 66.6 144899 100465 69.3 9831 6204
77. Kn'shnagiri78. Bargur
h 5810 59.0 114952 74006 64.4 40633 22S5S. 56.254464 70.0 151304 105377 69.6 6676
79. riarur (SC)80. Morappur
5662849897
63.967.8
179487131745
11767092153
65.669.9 17145 65,2
81. Palacode82. Oharmapuri
5081653042
63.062.9
161704132049
10700085054
66.164.4 39579 24499 61.a
83. Pennagaram84. Mettur
4729051742
59.459.5
160888117614
10085458131
62.649.5 60515 54110 89.0
85. Tharamangalam86. Omalur
5105544798
62.357.5
166184137099
11018776321
66.355.7 22024 21472 97.5
87. Vercaud (ST)88. Salem 1
4016953132
57.058.4
104993 65270 62.2 36654185710
21536112388
58.860.5
89. Salem II90. Veerapandj
4952256629
55.058.7
60851151446
3447196126
56.763,5
12289743288
7263224779
59.157.2
91. Panamarathupatti 49891 49.9 121131 78106 64.5 44035 26987 i5,092. Attur 46808 62.6 83215 53672 64.4 68153 44479 65.3
93. Talaivasal (SC)94. Rasipuram
5002851371
58.761.0
11615383006
7747559159
66.771.5
5299884988
26586492^6
50,2 57. V
95. Sendamangaiam (ST) ■ 473-16 ■ 54.9 • 145702- ■ 87415 -60.0 ■ • 24260 -13675 • §7.096. Namakkal (SC) 57716 62.2 147090 94576 64.2 39274 22437 57.1
97. Kabilamalai98. Tiruchengode
5424073641
65.057.0
115581152641
7649570827
66.246.3
53524107876
3510086736
65.680.3
99, Sankari (SC)100.Edappady
5334158963
55.961.0
145520162719
89540,105250
61.464.7
4442632737
2670822847
60.169 .8
; 313 :
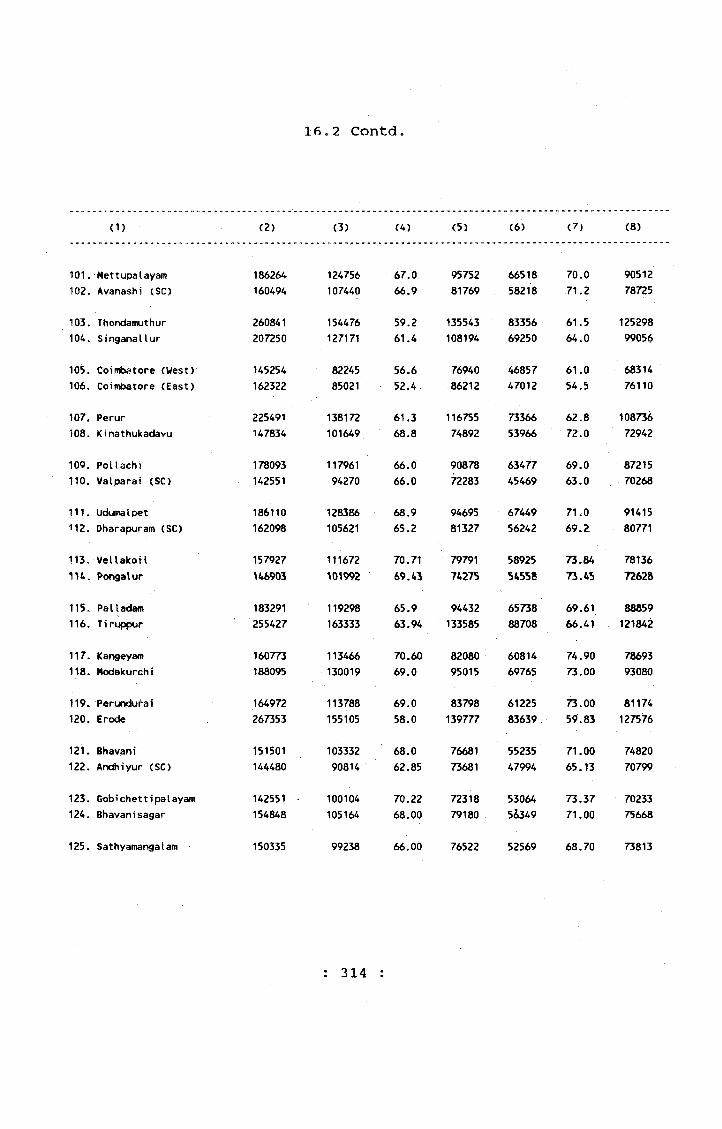
16e2 Contd.
(1) <2) (3) (4) (5) (6) ( . 7 ) (8)
101. Mettupalayam102. Avanashj (SC)
186264160494
124756107440
67.066.9
9575281769
6651858218
70.071.2
9051278725
103. Thondamuthur104. Singanallur
260841207250
154476127171
59.261.4
135543108194
8335669250
61.564.0
12529899056
105. Coimbatore (West)106. Coifltoatore (East)
145254162322
8224585021
56.652.4
7694086212
4685747012
61.054,5
6831476110
107. Perur108. Kinathukadavu
225491147834
138172101649
61.368.8
11675574892
7336653966
62.872.0
10873672942
109. PoUachi110. Valparai (SC)
178093142551
11796194270
66.066.0
9087872283
6347745469
69.063.0
8721570268
111. Udunatpet112. Dharapuram (SC)
186110162098
128386105621
68.965.2
9469581327
6744956242
71.069.2
9141580771
113. Vellakoil 1H. Pongalur
157927U5903
111672101992
70.7169.43
7979174275
5892554558
73.8473.45
7813672628
115. Palladam116. Tiruppur
183291255427
119298 163333
65,963.94
94432133585
6573888708
69.6166.41
88859121842
117, Kangey»n118. Modakurchi
160773188095
113466130019
70.6069.0
8208095015
6081469765
74.9073.00
7869393080
119. Perundurai120. Erode
164972267353
113788155105
69.058.0
83798139777
6122583639
73.0059.83
811741275^
121. Bhavani122. Andhiyur (SC)
151501144480
10333290814
68.062.85
7668173681
5523547994
71.0065.13
7482070799
123. Gobichettipalayam124. Bhavanisagar
142551154848
100104105164
70.2268.00
7231879180
530645&349
73.3771.00
7023375668
125. Sathyamahgatam 150335 99238 66.00 76522 52569 68.70 73813
: 314 :
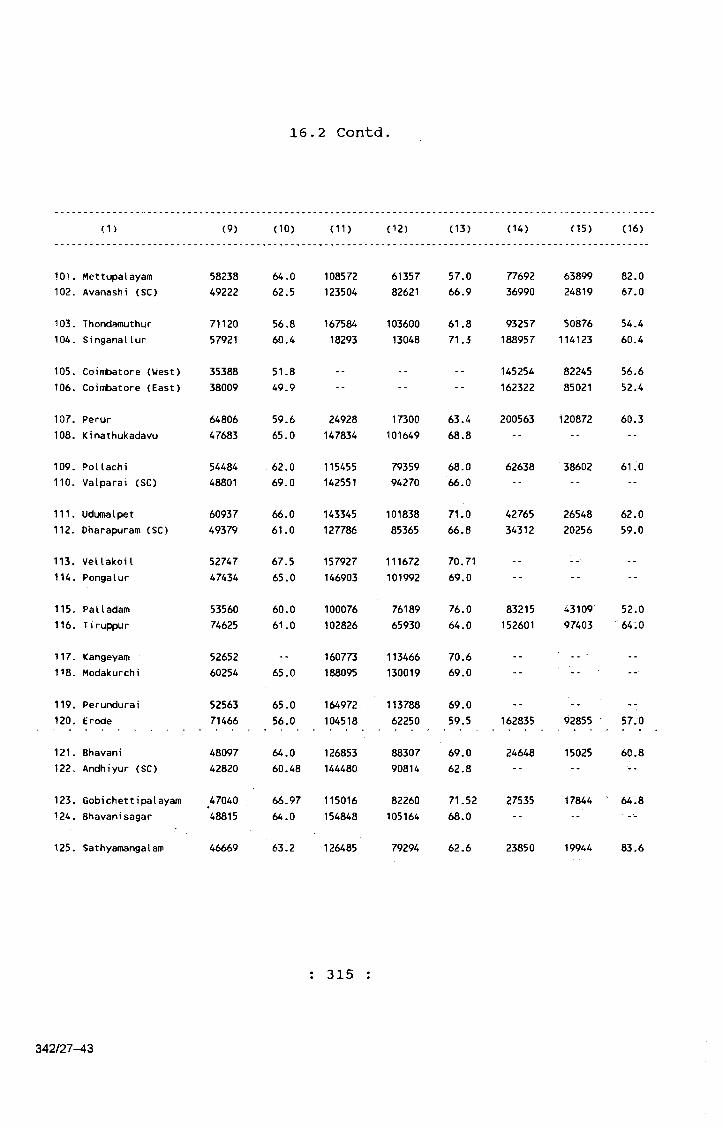
16,2 Contd.
(1) <9) (10) <11) (12) (13) (14) (15) (16)
101. Mettupalayam 58238 64,0 108572 61357 57.0 77692 63899 82.0102. Avanashi (SC) 49222 62.5 123504 82621 66.9 36990 24819 67.0
103. Thondamuthur104. Singanallur
7112057921
56.860.4
16758418293
10360013048
61.871.3
93257188957
50876114123
54.460.4
105. Coimbatore (West) 35388 51.8106. Coimbatore (East) 38009 49.9
145254162322
8224585021
56.652.4
107. Perur108. Kinathukadavu
6480647683
59.665.0
24928147834
17300101649
63.468.8
200563 120872 60.3
109. Pollachi110, Valparai (SC)
5448448801
62.069.0
115455142551
7935994270
68.066.0
62638 38602 61.0
111. Udumalpet 60937 66.0 143345 101838 71.0 42765 26548 62.0112. Dharapuram (SC) 49379 61.0 127786 85365 66.8 34312 20256 59.0
113. Vellakoil114. Pongalur
5274747434
67.565.0
157927146903
111672101992
70.7169.0
115. Palladam116. Tiruppur
5356074625
60.061.0
100076102826
7618965930
76.064.0
83215152601
4310997403
52.064.0
117. Kangeyam118. Modakurchi
5265260254 65.0
160773188095
113466130019
70.669.0
119. Perundurai120. Erode
5256371466
65.056.0
164972104518
11378862250
69.059.5 162835
24648
92855
15025
57.0
60.8121. Bhavani122. Andhiyur (SC)
4809742820
64.060.48
126853144480
8830790814
69.062.8
123. Gobichettipalayam 47040 66.97 115016 82260 71.52124. Shavanisagar 48815 64.0 154848 105164 68.0
27535 17844 64.8
125. Sathyamangalam 46669 63.2 126485 79294 62.6 23850 19944 83,6
: 315
342/27-43
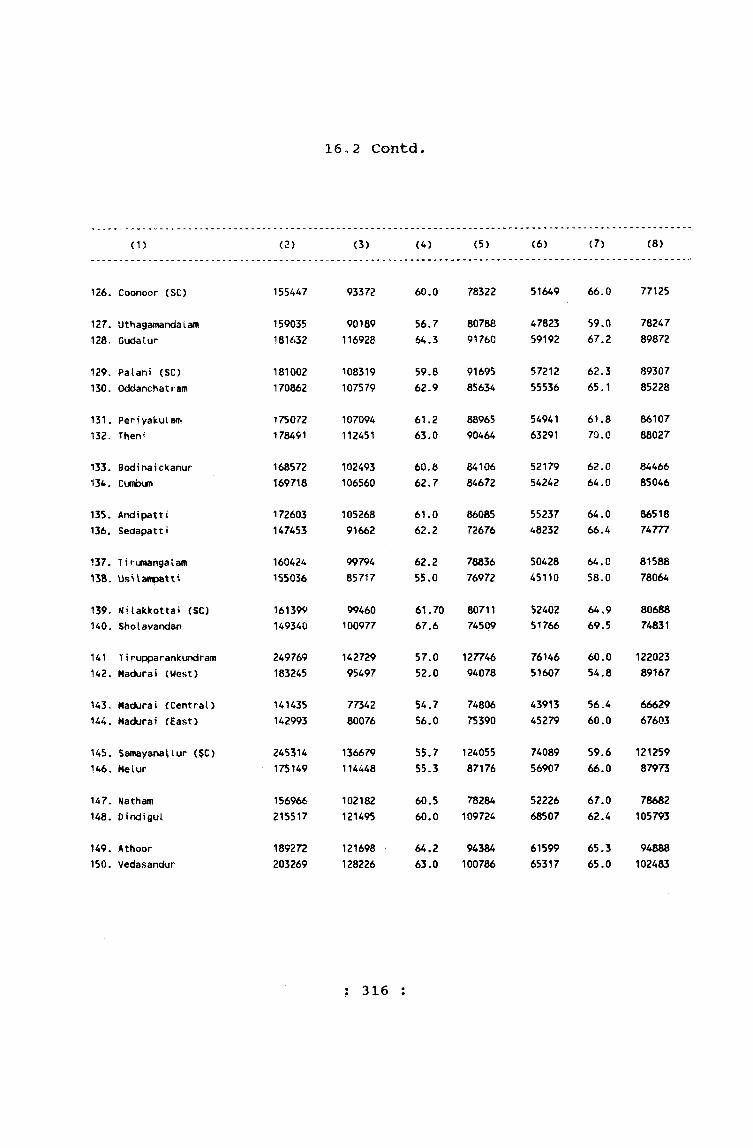
16.2 Contti.
(1) <2) (3) (4) (5) (6) (7) (8)
126. Coonoor (SC) 155447 93372 60.0 78322 51649 66.0 77125
127. Uthagamanda(.am128. Gudatur
159035181632
90189116928
56.764.3
8078891760
4782359192
59.067.2
7824789872
129. Palani (SC)130. Oddanchatram
181002170862
108319107579
59.862.9
9169585634
5721255536
62.365.1
8930785228
131. Periyakulanr!132, Thenf
175 072 178491
107094112451
61.263.0
8896590464
5494163291
61.870.0
8610788027
133. Bodinaickanur134, Cumbum
168572169718
102493106560
60.662.7
8410684672
5217954242
62.064.0
8446685046
135. Andipatti136, Sedapatti
172603147453
10526891662
61.062.2
8608572676
55237.8232
64.066.4
8651874777
137. Tirumangalam138. UsUawpatt'*
160424155036
9979485717
62.255.0
7883676972
5042845110
64.058.0
8158878064
139. »<ilakkottai (SC)140. Sholavandan
161399149340
99460100977
61.70 8071167.6 74509
5240251766
64.969.5
8068874831
141- Tirupparankundram 142. Madurai (West)
249769183245
14272995497
57.0 12774652.0 94078
7614651607
60.054.8
12202389167
143. Madurai (Central)144. Madurai (East)
141435142993
7734280076
54.756.0
7480675390
4391345279
56.460.0
6662967603
145. SantayanaUur (SC)146, Melur
245314175149
1366791U448
55.7 12405555.3 87176
7408956907
59.666.0
12125987973
147. Natham148. Oindigul
156966215517
102182121495
60.5 7828460.0 109724
5222668507
67.062.4
78682105793
149. Athoor150. Vedasandur
189272203269
121698128226
64,2 9438463.0 100786
6159965317
65.365.0
94888102483
: 316 :

342/27-43a
16.2 Contd.
(1) (9) (10) (11) (12) (13) <K) (15) (16)
126. Coonoor (SC) 41723 54.0 20190 75157 63.0 35257 18215 52.0
127. Uthagainandalam 42366 54.0 97865 58234 59.5 61170 31955 52.0128. Gudalur 57736 61.3 90914 57463 63.2 90668 59465 65.6
129. Palani (SC)130. Oddanchatram
5110752043
57.261.1
124372170862
73777107579
59.362.9
56630 34542 61.0
131. Periyakulam132. Theni
5215349160
63.656.0
91065107096
7698367471
86.563.0
8400771395
3011144980
35.063.0
133. Bodinaickanur134. Cumbum
5031452318
59.661.5
115941128363
7237581077
62.463.1
5263141355
3011825483
56.561.6
135, Andipatti136. Sedapatti
5003143430
57.058.1
158515147453
9376791662
59.362-2
14088 11501 64.0
137. T i rumangalaiT!138. Usilampatti
4936640607
60.552.0
135283155036
8562985717
63.355.0
25141 14165 56.3
139. kUatckottai CSC) 470S8 Sft.3 A60847 99297 61,7140. Sholavandan 49211 65.8 149340 100977 67.6
552 163 29.5
141. Tirupparankundram 66583 55.0142. Madurai (West) 43890 *9.2
59300 38320 65.0 190469183245
10440995497
55.052.0
143. Madurai (Central) 33429 50.2144. Madurai (East) 34797 51.0
H1435H2993
7734280076
54.7,56.0
145. Samayanallur (SC) 62590 51.7146. M e i u r .............. ^7541 • *65-.0
174504 103941 59.6153777 ■ 101596- • 166;i
70810 3273821372 ■ *12352'
46.2 6b. 0‘
147. Natham148. Oindigui
4995660988
63.057.6
15696686545
10218251621
60.559.6 128972 77874 60.3
149. Athoor150. Vedasandur
6009962909
63.361.0
189272203269
121698128226
64.263.0
: 317
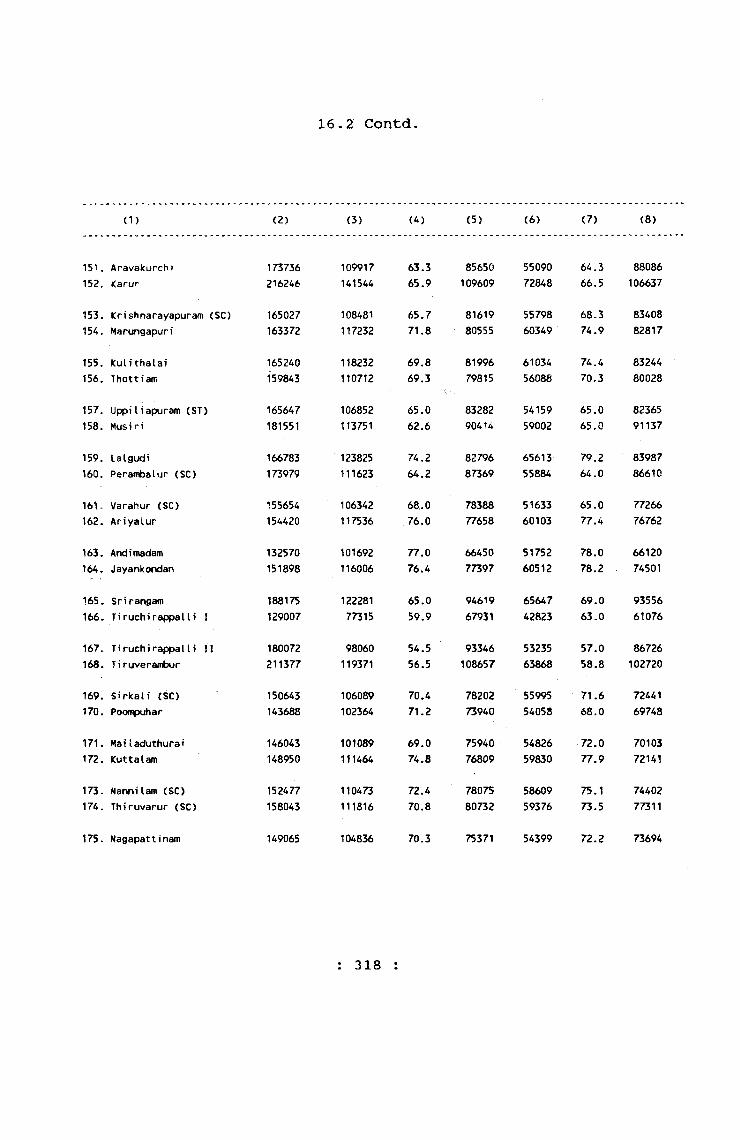
16.2 Contd.
(1) (2) (3) <^) (5) (6) (7) (8)
151.152.
AravakurchiKarur
173736216246
109917141544
63.365.9
85650109609
5509072848
64.566.5
88086106637
153. Krishnarayapuram (SC) 165027 108481 65.7 81619 55798 68.3 83408154. Marungapuri 163372 117232 71.8 80555 60349 74.9 82817
155.156.
Kuli thalai Thottiam
165240159843
118232110712
69.869.3
8199679815
6103456088
74.470.3
8324480028
157. Uppiliapuram (ST)158. Musiri
165647181551
106852113751
65.062.6
8328290414
5415959002
65.065.0
8236591137
159.160.
LalgudiPerafifcalur (SC)
166783173979
123825111623
74.264.2
8279687369
6561355884
79.264.0
8398786610
161.162.
Varahur (SC) Ariyalur
155654154420
106342117536
68.076.0
7838877658
5163360103
65.077.4
7726676762
163.164.
Andimadam Jayankondan
132570151898
101692116006
77.076.4
6645077397
5175260512
78.078.2
6612074501
165. Srirangam166. Tiruchirappalli I
188175129007
12228177315
65.059.9
9461967931
6564742823
69.063.0
9355661076
167, Tiruchirappalli 11168. Tiruverambur
180072211377
98060119371
54.556.5
93346108657
5323563868
57.058-8
86726102720
169.170.
Sirkati (iSC) Poompuhar
150643143688
106089102364
70.471.2
7820273940
5599554058
71.668.0
7244169748
171.172.
Mailaduthurai iCuttalam
146043148950
101089111464
69.074.8
7594076809
5482659830
72.077.9
7010372141
173.174.
Nannilam (SC) Thiruvarur (SC)
152477158043
110473111816
72.470.8
7807580732
5860959376
75.173.5
7440277311
175. Nagapattinam 149065 104836 70.3 75371 54399 72.2 73694
: 318 :
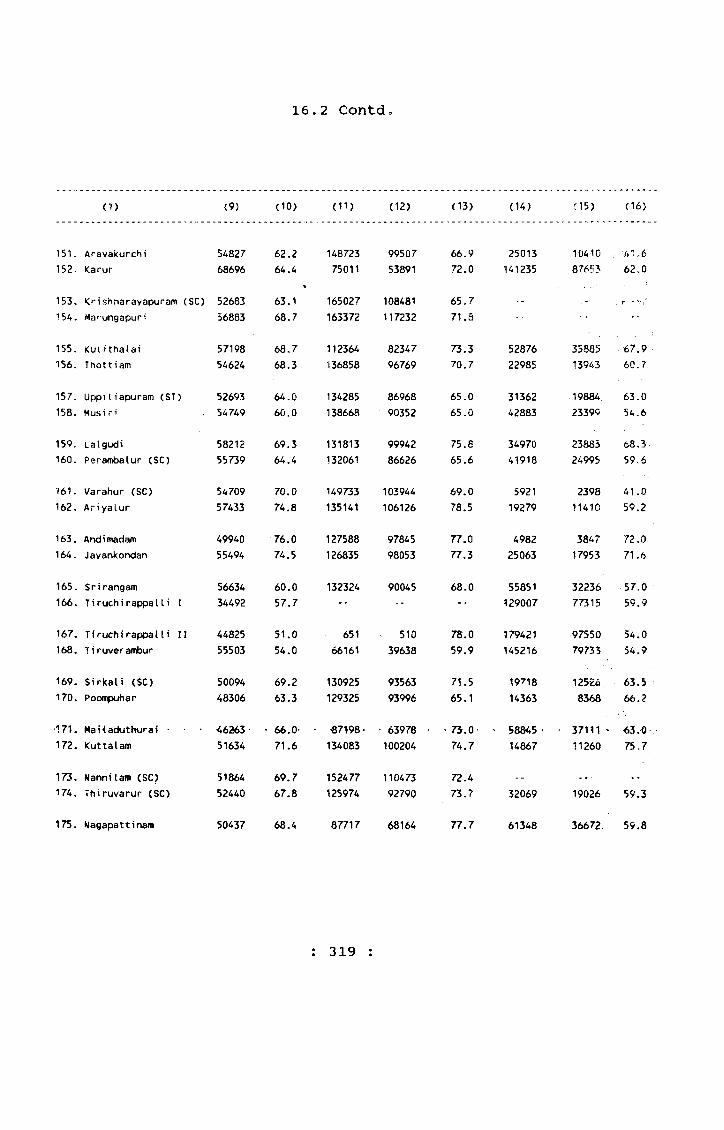
16.2 Contd
(1) {9) (10) (11) (12) (13) (U) (15) (16)
15K152,
AravakurchiKarur
5482768696
62.264.4
14872375011
9950753891
66.972.0
25013141235
10410 , 41.6 87653 62.0
153. <rishnarayapuram (SC) 52683 63.1 165027 108481 65.7154. Marungapur-; 56883 68.7 163372 117232 71.8
155.156.
Kul!thalaj Thottiam
5719854624
68.768.3
112364136858
8234796769
73.370.7
5287622985
3588513943
67.960.7
157. Uppiliapuram (ST) 52693 64.0 134285 86968 65.0 31362 19884 63.0158. Musiri . 54749 60.0 138668 90352 65.0 42883 23399 54.6
159.160.
ualgudiPerambalur (SC)
5821255739
69.364.4
131813132061
9994286626
75.865.6
3497041918
2388324995
68.3'59.6
■161.162.
Varahur (SC) Ariyalur
5470957433
70.074.8
149733135141
103944106126
69.078.5
592119279
239811410
41.059.2
163.164.
Andimadam Jayankondan
4994055494
76.074.5
127588126835
9784598053
77.077.3
498225063
384717953
72.071.6
165. Srirangam 56634 60.0166. 7iruchirappa111 I 34492 57.7
132324 90045 68.0 55851129007
3223677315
57.059.9
167. TiruchirappaUi II 44825 51.0 651 510 78.0 179421 97550 54,0168. Tiruverambur 55503 54.0 66161 39638 59.9 145216 79733 54.9
169.170.
Sirkali (SC) Poompuhar
5009448306
69.263.3
130925129325
9356393996
71.565.1
1971814363
12526,8368
63.566.2
•171.172.
MaUadtitKuraiKuttalam
<626351634
66.0-71.6
■87>98 • 134083
63976100204
73.0-74.7
5884514867
37111 ' 11260
65.075.7
173.174.
Nannilam (SC) ihiruvarur (SC)
175. Magapattinam
5186452440
69.767.8
50437 68.4
152477125974
11047392790
87717 68164
72.473.7
77.7
32069
61348
19026 59.3
36672 59,8
: 319 :

16.2 Contd
(1) (2) (3) (4) (5) (6) (7> <8)
176. Vedaranyam 141246 116520 82.5 73815 61566 83.4 67431
177. Tiruthuraipundi (SC) 161577 119460 73.9* 82657 62472 75.6 78920178. Mannargudi 159854 114547 71.6 81712 59745 73.1 78142
179,180.
PattukottaiPeravurani
166059154246
112219117227
67.676.0
8425676523
5603158402
66.576.3
8180377723
181.182.
Orathanad Th i ruvonaiP
156922161027
119319119695
76.074.3
7909880219
6011261728
75.976.9
7782480808
183.184.
ThsnjavurTniruvaiyaru
183277145334
11220599285
61.268.3
9317473823
5914652638
63.571.3
9010371511
185. Papanasam186. Valangaiman (SC)
142902129813
100463936910
70.372.2
7203866641
5228350035
72.675.1
7086463172
187. KuJ?4>akonaw188, Thiruvidsiroaruthur
160025153316
106407114371
66.575.0
8200978872
5796760042
70.776.0
7801674444
189.190.
IhirumayEwn Kolathur (SC)
172211174949
110476124191
«A.O71.0
8497086501
5169465189
60.975.4
8724188448
191.m .
Pudukottai 183488177995
126363132452
68.974.4
926678^299
6572566676
70.975.5
9082189696
193.194.
ArantangiTirupattur
191195153932
13569999063
70,964.0
9497376419
6818046126
71.760.0
9622277513
195.196.
Xaraikudi Thi ruvadahai
188714180875
113581108895
60.260.2
9422789823
5493550724
58.356.5
9448791052
197.198.
Uayangudi Sivaganga
143630157969
89890100453
62.563.6
7077778130
4362248397
61.961.9
7285379839
199, Manamadurai (SC)200. Paramakuoi (SC)
157865171075
99033101523
63.059.3
7776385181
5115850807
66.059.7
8010285894
: 320 :

16.2 Contd
(1) (9) (10) <11> (12) (13) <U) (16/
176, Vedaranyam 5A954 81.5 114352 95680 83.7 26894 201540 77,2
177. Tiruthuraipundi (SC) 56988 72.2 133967 102899 76.8 27610 16561 60.0178. Mannargudi 54802 70.1 107672 81699 75.9 52182 62.9
179.180.
PattukottaiPeravurani
5618858825
68.775.6
96060136941
71604105171
74.576.8
6999917305
4061i12056
58.069.6
'(St. 182.
Orathanad Thi ruvonam
5920757967
76.171.7
H3623152558
112035113556
78.074.4
132998469
72846139
54.772,5
183.184.
Thanjavur Thi ruvaiyaru
5305946647
58.965.2
32417118493
2398784126
74.071.0
15086026841
8821815159
58.556-5
185. Papanasam 48180 68.0 116280 83460 71.8 26622 1700? 63.9186. Valangaiman (SC) 43656 69.1 113716 83309 73.3 16097 10382 64.5
187. Kumbakonam 48440 62.0 56261 50248 89.0 103764 56159 54.0188. Thiruvidaimaruthur 54329 73.0 111974 85698 77.0 41342 28673 69.0
189.190,
Th i rumayatn Kolathur (SC)
5878259002
67.466.7
155457158355
99662n3345
64,171,6
1675416594
1081419846
64.565.4
191.192.
PudukottaiAlangudi
6063865776
60.873.3
114088177995
85375132452
74.874.4
69400 40988 59.1
193.194.
ArantangiTirupattur
6751952937
70.1 68.0
-17Q075122080
12242580004
71.9 65.0
2t12031852
m u
19059 60.0
195.196.
Karaikudi Thi ruvadanai
5864658171
62.163.9
104241154013
6504894542
62.461.4
8447326862
4853314353
57.553.4
197.198.
1layangudi S i vaganga
4626852056
58.165.2
126592135545
8218385416
61.963.0
1703822424
770715037
65.567,1
199. Manamadurai (SC) 47875 60.0 130099 82849 64.0 27766 16184 58.0200. Paramakudi (SC) 50716 50.1 119464 72661 60.8 51611 28S62 55.9
: 321 :
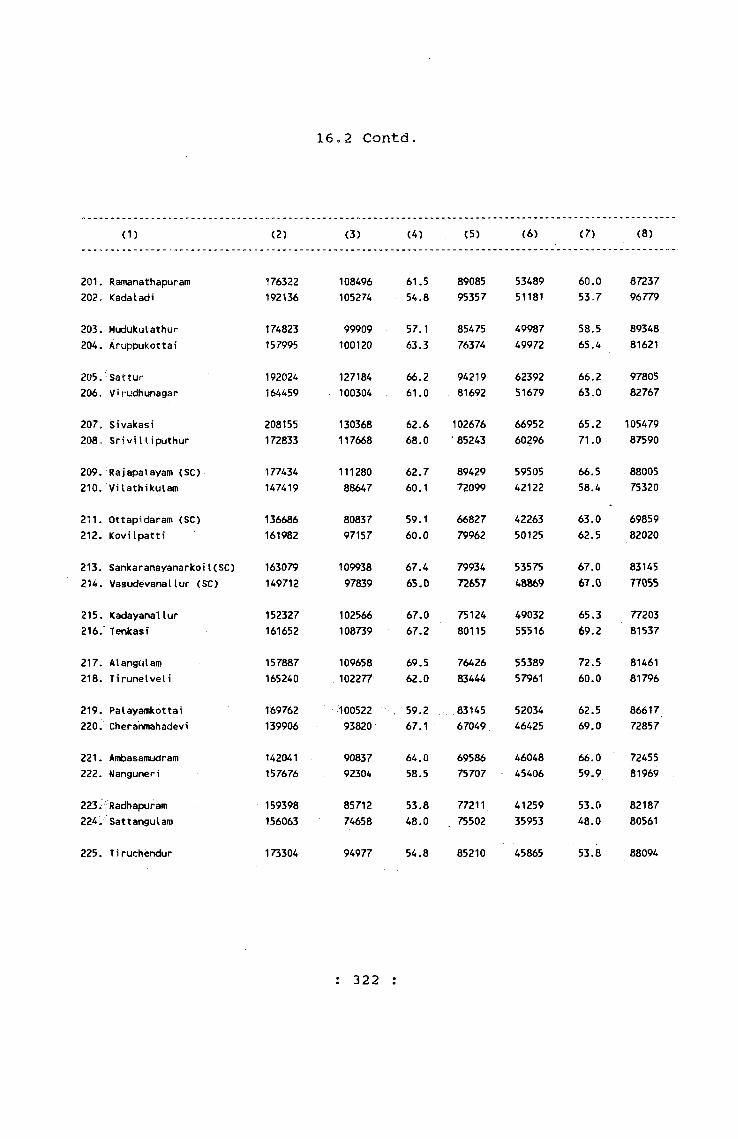
16o2 Contd.
( 1) <2 ) (3) (4) (5) (6) (7) (8)
201.202 .
RamanathapuramKadaladi
176322192136
108496105274
61.554.8
8908595357
5348951181
60.053,7
8723796779
203.204.
MudukulathurAruppukottai
174823157995
99909100120
57.163.3
8547576374
4998749972
58.565.4
8934881621
205.206.
SatturVirudhunagar
192024164459
127184100304
66.2
61.09421981692
6239251679
66.263.0
9780582767
207.208-
Sivakasi Sn'vi I liputhur
208155172833
130368117668
62.668.0
102676 ■ 85243
6695260296
65.271.0
10547987590
209. Rajapalayam (SC)210. Vilathikulam
177434147419
11128088647
62.760.1
8942972099
5950542122
66.558.4
8800575320
211. Ottapidaram (SC)212. Kovilpatti
136686161982
8083797157
59.160.0
6682779962
4226350125
63.062.5
6985982020
213. Sankaranayanarkoil(SC) 163079 109938 67.4 79934 53575 67.0 83145214. Vasudevanallur (SC) 149712 97839 65,0 72657 48869 67.0 770SS
215.216.
Kadayanallur Tenkasi
152327161652
102566108739
67.067.2
7512480115
4903255516
65.369,2
7720381537
217.218.
Alangulam T i runelveli
157887165240
109658102277
69.562.0
7642683444
5538957961
72.560.0
8146181796
219.220.
PalayamkottaiCheranmahadevi
169762139906
10052293820
59.267.1
8314567049
5203446425
62.569.0
8661772857
221.222 .
Ambasamudram Nanguner i
142041157676
9083792304
64.058.5
6958675707
4604845406
66.059.9
7245581969
223.224:
RadhapuramSattangulam
159398156063
8571274658
53.848.0
7721175502
4125935953
53.048.0
8218780561
225. Tiruchendur 173304 94977 54.8 85210 45865 53.8 88094
: 322 :

16*2 dtStttd.
(1) (9) ( 10) ( 11) (12) (13) (14) (15) (16)
201.202.
RamanathapuramKadaladi
5500754093
63.155.9
118456192136
7504105274
63 .454 .8
57866 33456 57.8
203.204.
MudukulathurAruppukottai
4992250148
41.861.4
149074157995
87414
10012058.663.3
25749 12495 48.5
205.206.
SatturVirudhunagar
6479248625
66-258.0
110491115362
7762153832
70.342.0
8153349097
<i956346472
60 .893.0
207„208.
Sivakasi Srivi11iputhur
6341657372
60.166.0
155466125329
8147385931
52.469.0
5268947504
4889531737
92.867.0
209. Rajapalayam (SC) 51775 58.8 99724 61985 62.2 77710 49295 63.4210. Vilathikulam 46525 61.8 133733 81238 60.7 13686 7409 54.1
211. Ottapidaram (SC) 38574 55.0 136686 80837 59.0212. kdvilpatti 47032 57.5 107526 64542 60.5 54456 32615 59.5
213. Sankaranayanarkoil(SC) 56363 67.8 130521 89386 68.5 32558 20552 63.1214. Vasudevanallur (SC) 48970 63.0 1tl936 74565 66.0 37776 23274 61.0
215.216.
Kadayanallur Tenkas'i
5353453223
69.365,2
62871105220
3566274409
56.770.0
8945656432
66904 74.834330 61,0
217.218.
Alangulam Tirunelveli
5426944316
66.654.0
14032870051
9705643417
69.262.0
1755995189
12602 71.858860 62.0
219.220.
PalayamkottaiCheranmahadevi
4848847395
55.965.0
5804262900
3928247482
67.671.0
11172077006
61240 54.846338 64.0
221.222.
Ambasamudram Manguner i
4478946898
62.057.2
6810599892
4673360744
68.660.8
7393657784
44104 59.631560 54,4
223.224.
Rachapur^Sattai^ulan)
225. T i ruchendur
4445338705
49112
54.048.0
55.7
159398125067
83618
8571260679
48348
53.8 49.0
57.8
30996 13979 45.0
89686 46629 52.0
323
342/27-44

16.2 Contd.
(1) (2) (3) <4) C5) (6) (7) (8)
226. Srivafkuntam
227. Tuticorin
228. Kanniyakunari
229. Nagercoii
230. Colachel
231. Padmanabhapuratn
232. Tiruvattar
233. VUavancode
234. Ki Uiyopr
U2524
208186
158543
177734
160212
143018
149139
178941
140026
84500
121943
93208
101479
89680
84888
92366
105032
80600
59.3
58.5
58.7
57.0
56.0
59.6
62.0
58.7
57.6
69911
105798
78993
90388
81769
73215
76502
91090
71613
42561
65301
49926
55535
47014
42837
48859
52759
39826
60.9
61.7
63.0
61.0
57.0
58.0
63.0
57.9
55,6
72613
102388
79550
87346
78443
69803
72637
87851
68413
: 324 :
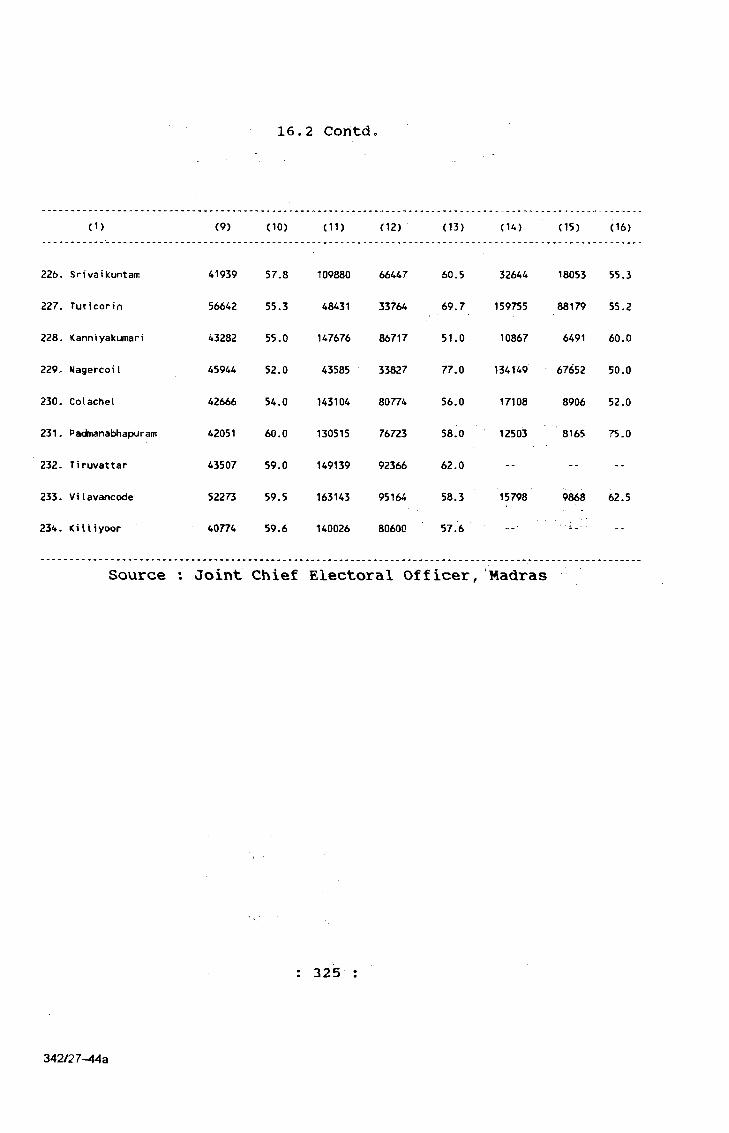
16.2 Contdc
(1) (9) ( 10) ( 11) ( 12) (13) (14) (15) (16)
226. Srivaikuntani 41939 57.8 109880 66447 60.5 32644 18053 55.3
227. Tut i con n 56642 55.3 48431 33764 69.7 159755 88179 55.2
228. Kanniyakumari 43282 55.0 147676 86717 51.0 10867 6491 60.0
229. Nagercoil 45944 52.0 43585 33827 77.0 134T49 67652 50.0
230. CoIacheI 42666 54.0 143104 80774 56.0 17108 8906 52,0
231. Padmanabhapuram 42051 60.0 130515 76723 58.0 12503 8165 75.0
232. Tiruvattar 43507 59.0 149139 92366 62.0 -- --
233. Vilavancode 52273 59.5 163143 95164 58.3 15798 9868 62.5
234. Kiliiyoor 40774 59.6 140026 80600 57.6 ■' ■ i ■
Source ; Joint Chief Electoral Officer, Madras
: 325
342/27-44a
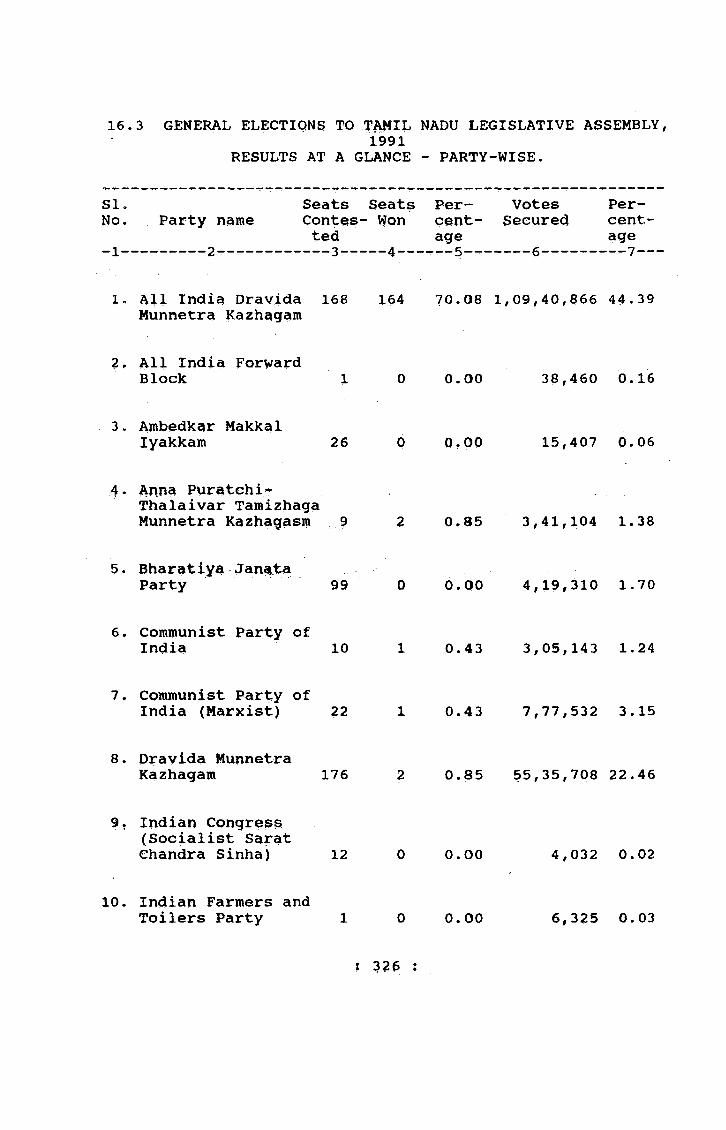
16.3 GENERAL ELECTIONS TO TAMIL NADU LEGISLATIVE ASSEMBLY,1991
RESULTS AT A GLANCE - PARTY-WISE»
Si. Seats Seats Per- Votes Per-No. Party name Contes- Won cent- Secured cent-
ted age age_1------ ----2— — — ---— 3— ---4----— 5------- 6----------7 —
M l India Dravida 168 164 70.08 1,09,40,866 44.39Munnetra Kazhagam
2, All India ForwardBlock 1 0 0.00 38,460 0.16
3. Ambedkar Makkallyakkam 26 0 0.00 15,407 0.06
4 . A n n a P u r a t c h i ^Thalaivar TamizhagaMunnetra Kazh^g^sm 9 2 0,85 3,41,104 1.38
5. Bharatiya JanataParty 99 0 0.00 4,19,310 1.70
6. Communist Party ofIndia 10 1 0.43 3,05,143 1.24
7, Communist Party ofIndia (Marxist) 22 1 0.43 7,77,532 3.15
8. Dravida MunnetraKazhagam 176 2 0.85 55,35,708 22.46
9, Indian Congress (Socialist SaratChandra Sinha) 12 0 0.00 4,032 0.02
10. Indian Farmers andToilers Party 1 0 0.00 6,325 0.03
: 326 :
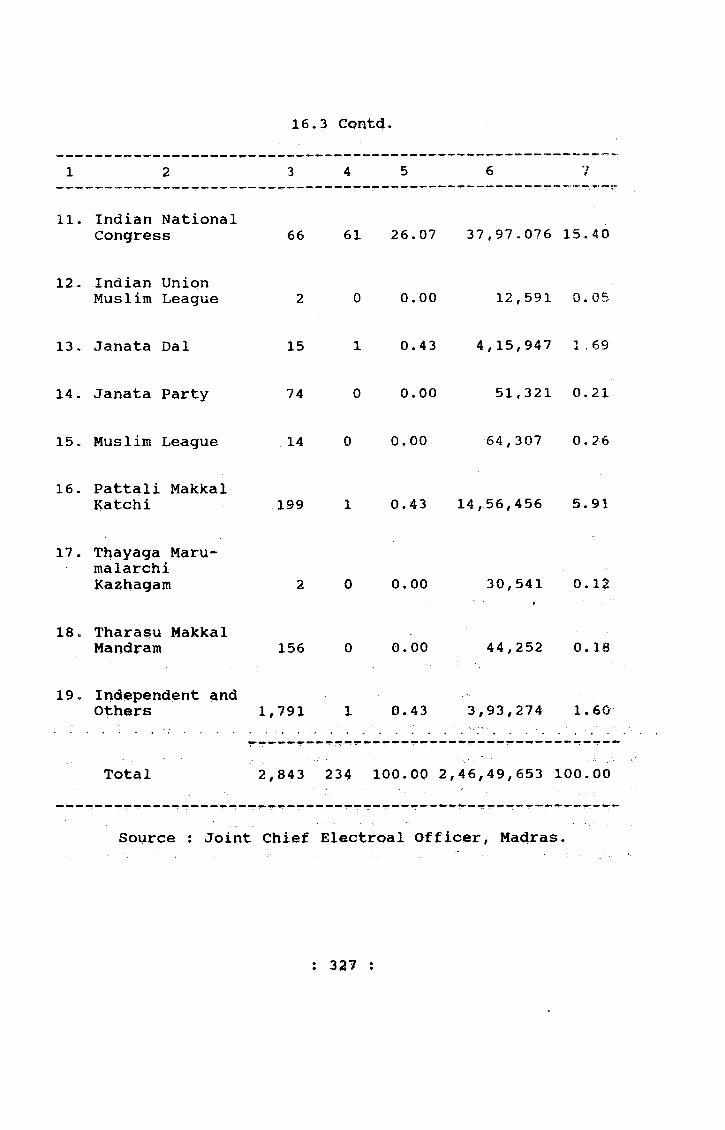
16.3 Gont(J.
1 2 3 4 5 6 7
11. Indian National Congress 66 61 26.07 37,97.076 15.4 0
12, Indian Union Muslim League 2 0 0.00 12,591 0.05
13, Janata Dal 15 1 0.43 4,15,947 1 . 69
14 . Janata Party 74 0 0,00 51,321 0.21
15. Muslim League 14 0 0.00 64,307 0. 26
16. Pattali Makkal Katchi 199 1 0.43 14,56,456 5.91
17. Thayaga Maru-malarchiKazhagam 2 0 0.00 30,541 0.12
18. Tharasu Makkal Mandram 156 0 0.00 44,252 0.18
19. Independent and Others 1,791 1 0.43 3,93,274 1. m
Total 2,843 234 100.00 2,46,49,653 100.00
Source : Joint Chief Electroal Officer, Madras.
; :
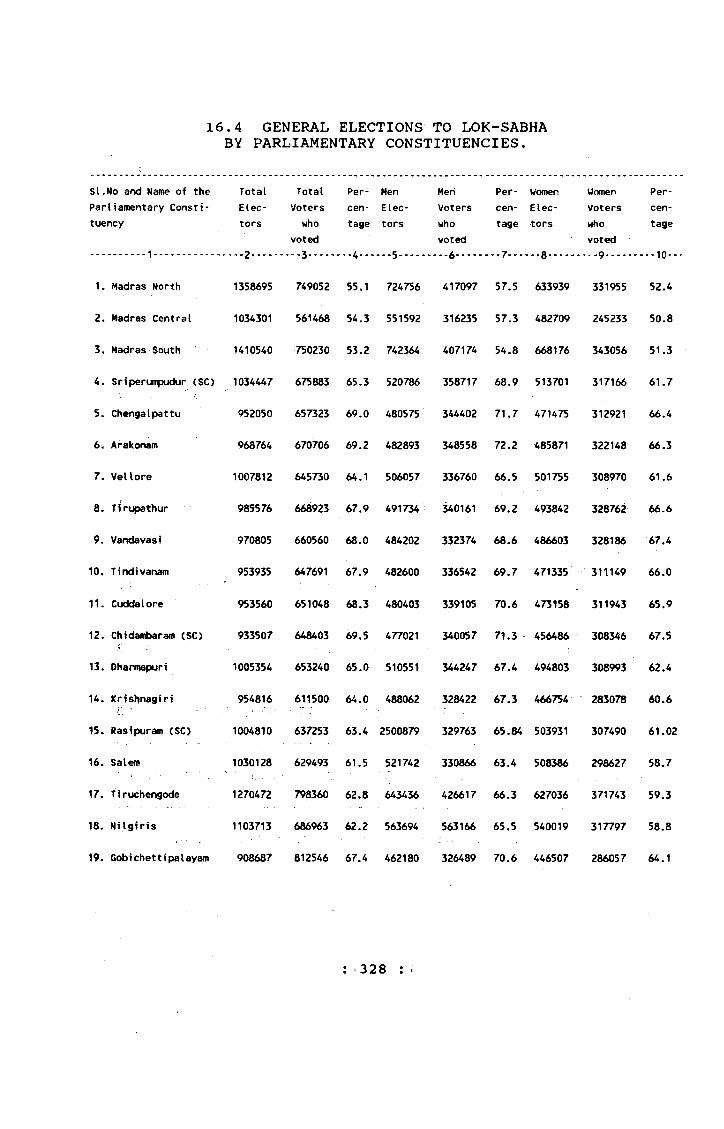
16.4 GENERAL ELECTIONS TO LOK-SABHA BY PARLIAMENTARY CONSTITUENCIES.
si.No and Name of the Total Total Per- Men Men Per- Wranen Women Per-Parliamentary Consti- Elec- Voters cen- Elec- Voters cen- Elec- Voters cen-tuency tors who tage tors who tage tors who tage
voted voted vot«J......... 1................ 2.........3....... 4..... 5.........6........7......8.........9........ 10-
1. Madras North 1358695 749052 55.1 724756 417097 57.5 633939 331955 52.4
2. Madras Central 1034301 561468 54.3 551592 316235 57.3 482709 245233 50.8
3. Madras South 1410540 750230 53.2 742364 407174 54.8 668176 343056 51.3
4. Sriperumpudur (SC) 1034447 675883 65.3 520786 358717 68.9 513701 317166 61.7
5. Chengalpattu 952050 657323 69.0 480575 344402 71.7 471475 312921 66.4
6. Arakonam 968764 670706 69.2 482893 348558 72.2 485871 322148 66.3
7. Vellore 1007812 645730 64.1 506057 336760 66.5 501755 308970 61.6
8. Tfrupathur 985576 668923 67.9 491734 340161 69.2 493842 328762 66.6
9. Vandavasl 970805 660560 68.0 484202 332374 68.6 486603 328186 67.4
10. Tindivanam 953935 647691 67.9 482600 336542 69.7 471335- 311149 66,0
11. Cuddalore 953560 651048 68.3 480403 339105 70.6 473158 311943 65.9
12. Chidambaram (SC) 933507 648403 69.5 477021 340057 71.3 456486 308346 67.5
13. Dharmapuri 1005354 653240 65.0 510551 344247 67.4 494803 308993 62.4
14. Krishnagiri 954816 611500 64.0 488062 328422 67.3 466754 285078 60.6
15. Rasipuraro (SC) 1004810 637253 63.4 2500879 329763 65.84 503931 307490 61.02
16. Salem 1030128 629493 61.5 521742 330866 63.4 508386 298627 58.7
17. Tiruchengode 1270472 798360 62.8 643436 426617 66.3 627036 371743 59.3
18. Nilgiris 1103713 686963 62.2 563694 563166 65.5 540019 317797 58.8
19. Gobichettipalayam 908687 812546 67.4 462180 326489 70.6 446507 286057 64.1
: 328 :
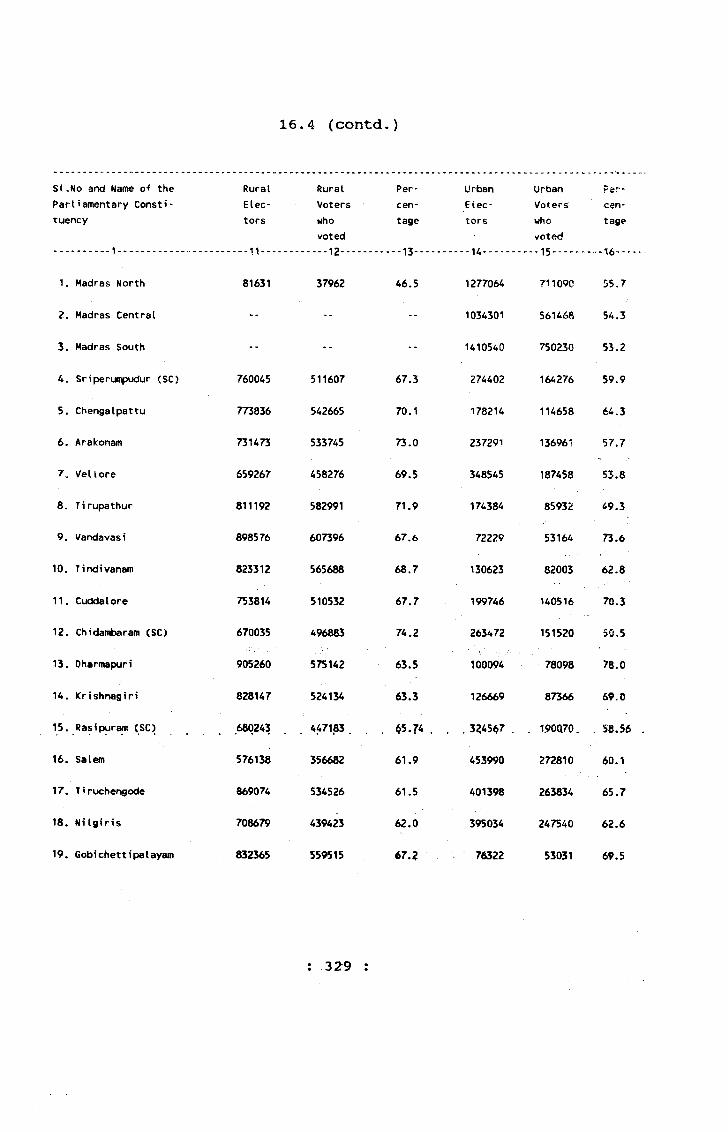
16.4 (contd.)
SI,No and Name of the RuralParliamentary Consti- Elec-tuency tors
1. Madras North 81631
2. Madras Central
3. Madras South
4. Sriperumpudur (SC) 760045
5. Chengalpattu 773836
6. Arakonam 731473
7. Vellore 659267
8. Tirupathur 811192
9. Vandavasi 898576
10. Tindivanam 823312
11. Cuddalore 753814
12. Chidambaram (SC) 670035
13. Dharmapuri 905260
14. Krishnagiri 828147
15. Rasipursm (SC) 680243
16. Salem 576138
17. Tiruchengode 869074
18. Nilgiris 708679
19. Gobichettipalayam 832365
Rural Voters who voted ---12.....
37962
Per
cen
tage
.... 13--
46.5
511607
542665
533745
458276
582991
607396
565688
510532
496883
575142
524134
447183
356682
534526
439423
55^15
67.3
70.1
73.0
69.5
71.9
67.6
68.7
67.7
74.2
63.5
63.3
< 5.74
61.9
61.5
62.0
67.?
Urban
Elec
tors
-'14..... .
1277064
1034301
1410540
274402
178214
237291
348545
174384
72229
130623
199746
263472
100094
126669
. 3245<57 .
453990
401398
395034
76522
Urban Voters who voted --15.....
711090
561468
750230
164276
114658
136961
187458
85932
53164
82003
140516
151520
78098
87366
190Q70.
272810
263834
247540
53031
per
cen
tage
55.7
54.3
55.2
59.9
64.3
57.7
55.8
49.3
73.6
62.8
70.3
50.5
73.0
69.0
. 58.56
60.1
65.7
62.6
69.5
: 329 :
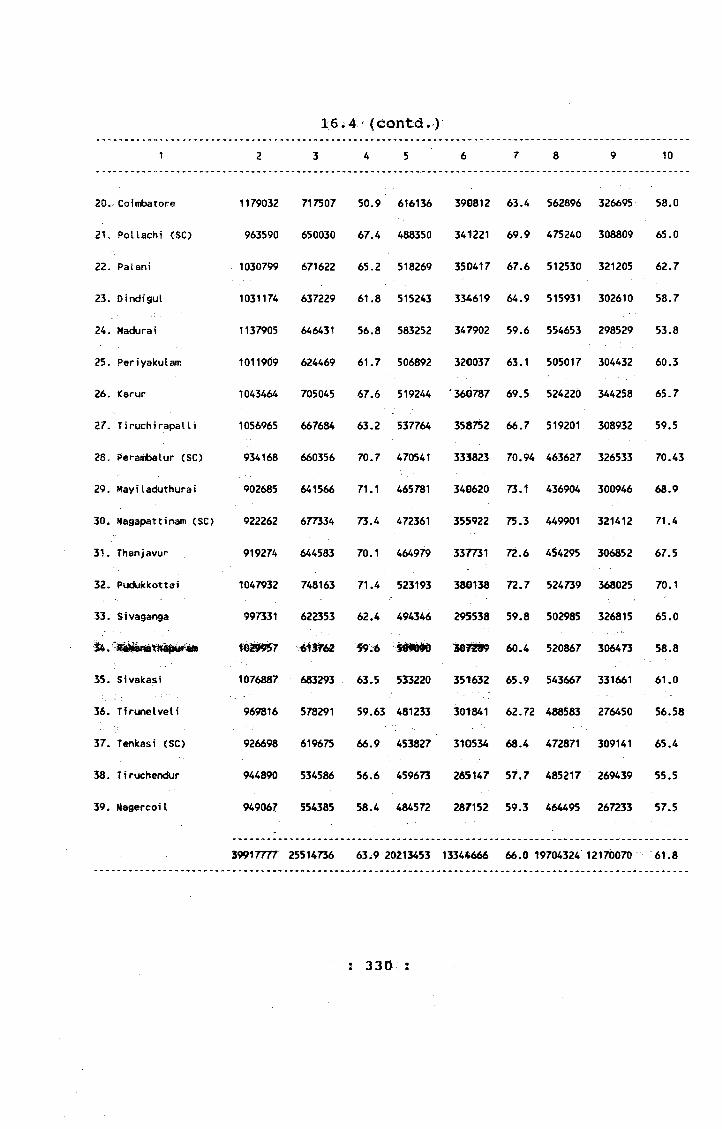
16i 4 i-(Gont^ .)
3 4 5 6 8 10
1179032
963590
1030799
1031174
1137905
1011909
1043464
1056965
934168
902685
922262
919274
1047932
997331
1076887
969816
926698
944890
949067
717507
650030
671622
637229
646431
624469
705045
667684
660356
641566
677334
644583
748163
622353
683293
578291
619675
534586
554385
50.9 616136
67.4 488350
65.2 518269
61.8 515243
56.8 5832S2
61.7 506892
67.6 519244
63.2 537764
70.7 470541
71.1 465781
73.4 472361
70.1 464979
71.4 523193
62.4 494346
S9.6
63.5 533220
59.63 481233
66.9 453827
56.6 459673
58.4 484572
390812
341221
350417
334619
347902
320037
• 360787
358752
333823
340620
355922
337731
380138
295538
351632
301841
310534
265147
287152
63.4 562896
69.9 475240
67.6 512530
64.9 515931
59.6 554653
63.1 505017
69.5 524220
66.7 519201
70.94 463627
73.1 436904
75.3 449901
72.6 454295
72.7 524739
59.8 502985
60.4 520867
65.9 543667
62.72 488583
68.4 472871
57.7 485217
59.3 464495
326695
308809
321205
302610
298529
304432
344258
308932
326533
300946
321412
306852
368025
326815
306473
331661
276450
309141
269439
267233
58.0
65.0
62.7
58.7
53.8
60.3
65.7
59.5
70.43
68.9
71.4
67.5
70.1
65.0
58.8
61.0
56.58
65.4
55.5
57.5
3991777T 25514736 63.9 20213453 13344666 66.0 19704324 12170070 6T.8
: 330 :
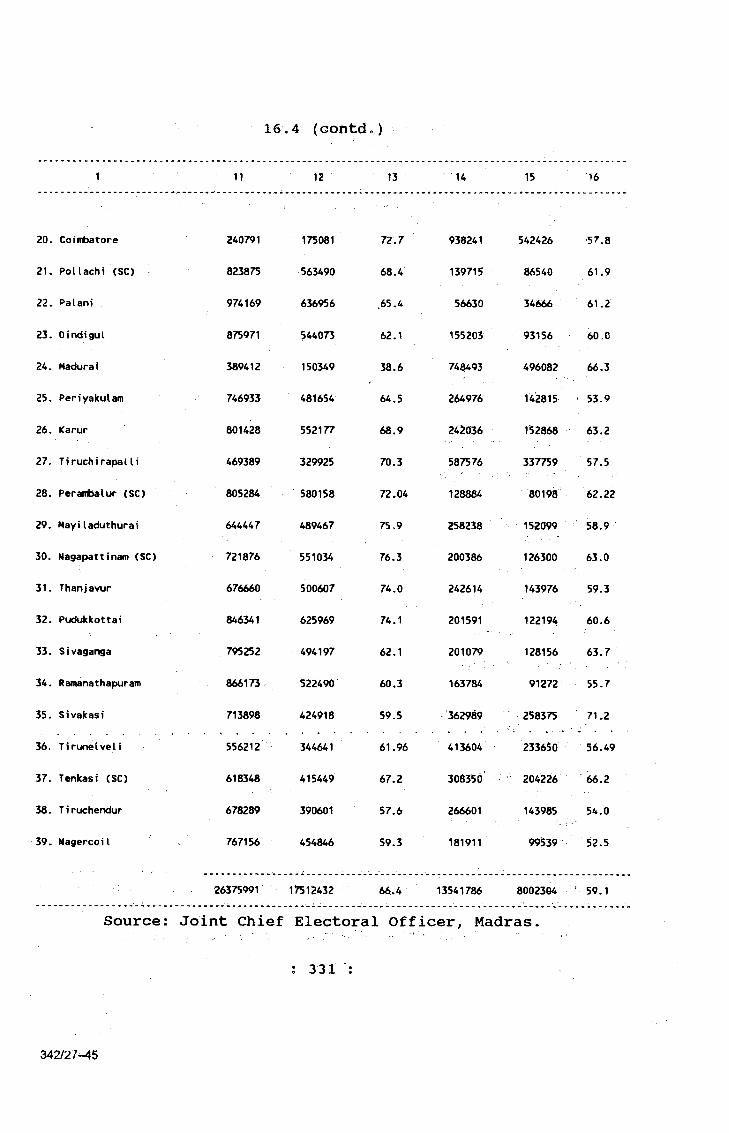
16,4 (Gontd«)
11 12 13 14 15 16
20. Cofinbatore
21. PoUachi (SC)
2 2 . PaIani
23. Oindigul
24. Madurai
25. Periyakulam
26. Karur
27c Tiruchirapalli
28. Perainbalur (SC)
29. Hayiladuthurai
30. Nagapattinam (SC)
31. Thanjavur
32. Pudukkottai
33. Sivaganga
34. Ramanathapuram
35. Sivakasi
36. Tirunelveli
37. Tenkast (SC)
38. Tiruchendur
39» Nagercoil
240791
823875
974169
875971
389412
746933
801428
469389
805284
644447
721876
676660
846341
795252
866173
713898
556212
618348
678289
767156
175081
563490
636956
544073
150349
481654
552177
329925
580158
489467
551034
500607
625969
494197
522490
424918
344641
415449
390601
454846
72.7
68.4
.65.4
62.1
38.6
64.5
68.9
70.3
72.04
75.9
76.3
74.0
74.1
62.1
60.3
59.5
61.96
67.2
57.6
59.3
938241
139715
56630
155203
748493
264976
242036
587576
128884
258238
200386
242614
201591
201079
163784
362969
413604^
30835d
266601
181911
542426
86540
34666
93156
496082
142815
152868
337759
80198
152099
126300
143976
122194
128156
91272
258375
233650
204226
143985
99539
'57.8
61.9
61.2
60.0
66.3
53.9
63.2
57.5
62.22
58.9
63.0
59.3
60.6
63.7
55.7
71.2
56.49
66.2
54.0
52.5
26375991 17512432 66>4 13541786 8002304 59.1
Source: Joint Chief Electoral Officer, Madras.
; 331 :
342/27-45

16.5 GENERAL ELECTIONS TO LOK SABHA RESULTS AT A GLANCEPARTY-WISE
SI,No.^ -1
Name of the Seats Political Contes- Party ted
Seats • Won
Percentage
VotesPolled
Percentage
X
1. All India Anna Dravida Munnetra Kazhagam
11 11 28.21 44,70,542 18.10
2. Bharatiya Janata Party 15 0 0.00 4,06,869 1.65
3. Communist Party of India 2 0 0. 00 5,03,762 2,04
4. Communist Party of India (Maxist) 3 0 0.00 6,11,358 2.48
5. Dravida Munnetra Kazhagam 29 0 0. 00 56,01,597 22.69
6. Indian National Congress 28 28 71.79 1,05,10,549 42.57
7. Janata Dal 5 0 0.00 7,18,222 2.918. Janata Party 11 0 0.00 40,819 0.179. Muslim League 4 0 0.00 97,660 0.40
10. Pattali Makkal Katchi 31 0 0.00 12,69,690 5.14
11. Tamil Nadu State Indian Union Muslim League 1 0 0.00 31,387 0.13
12 V Tharasu Makkal Mandram 29 0 0.00 52,954 0.21
13 . Independent and Others 292 0 0.00 3,76,995 1.53
Total 461 39 100.00 2,46,92,404 100.00
Source : Joint Chief Electoral Officer, Madras.: 332 :

17. JUDICIAL ADMINISTRATION:
17.1 NUMBER OF JUDICIAL DIVISIONS AND OFFICERS EXERCISING APPELLATE ON ORIGINAL JURISDICTION-1991
CIVIL CRIMINAL
Judges Number District St i pen Hono Number Nunber Sessi Other Chief Other Honoof Chief of Dis Judges diary rary of of ons Judges Judl. Magis raryCourt of tricts Sessi Dis Judges Magis tratesStates ons
Divisionstricts trates Stipen
diary
26 18 62 116 18 18 48 99 17 386
Source : Registrar, High Court, Madras.
333
342/27-45a

17.2 NUMBER AND DESCRIPTION OF CIVIL SUITS INSTITUTED 1991
TITLE
SUITS UNDER THE RENT LAW
Courts Suits for Arrears Enhance* For Pena* For ejectment All othermoney or of rent ment or lities or of the reco- suitsmoveableproperty
.... 2....
with or without ejectment
redjction of rent
compensa* very of posse- tion for ssion alone the wrongful action ^ the part of the landlord or Tenant ...... 5***.......
under the Act
COURTS IN THE DISTRICTS:
District Courts O.S.S.C.
473 1 - -
Sub Courts O.S.S.C.
976544r
16" -
6 90 2
District Munsifs' O.S. C<M^tS
S.C.
42958
y z M
109
*
16 68 20
Total 54856 126 - 22 158 22
COURTS IN THE CITY;: ; . - ■ i
City CivU Court, Kadras 6157 - • - *
Court of small causes, Madras 1846 - - - *
High Court, Madras 939 * - • -
Total 8942 - * - -
Grand Total 63798 126 - 22 158 22
: 334 :
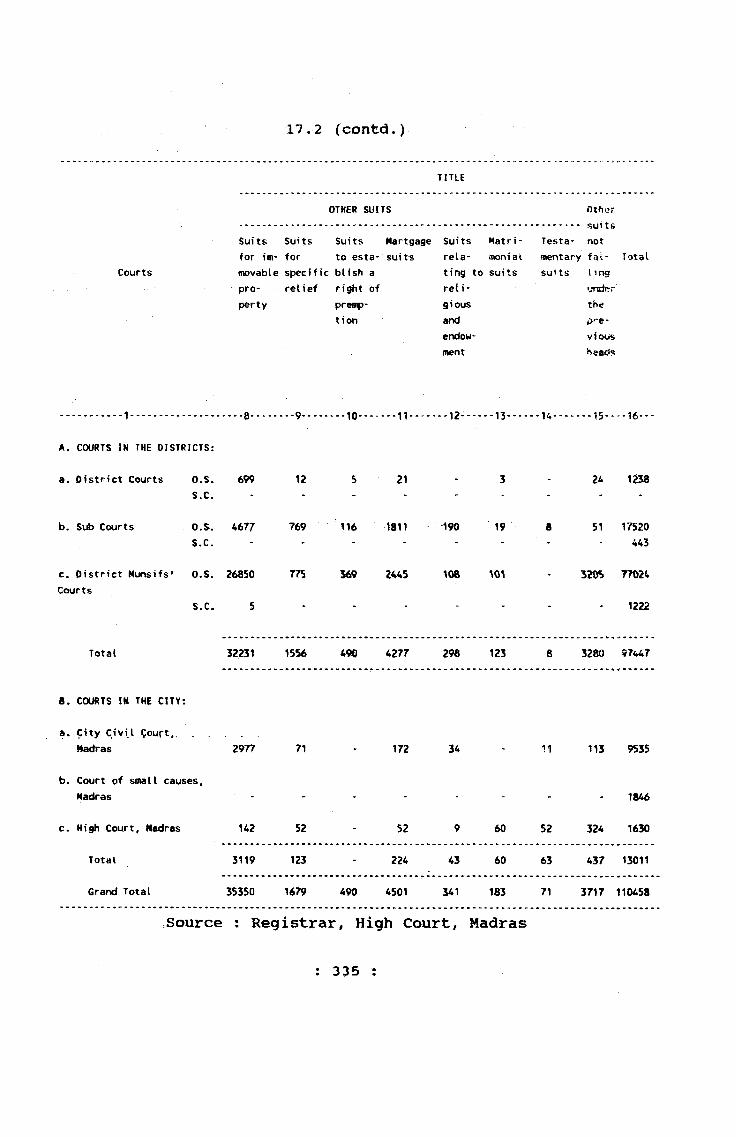
TITLE
OTHER SUITS Other........... ................................................. suitsSuits Suits Suits Martgage Suits Matri- Testa- notfor iro- for to esta- suits rela- monial nfcntary fat- Total
Courts movable specific blish a ting to suits suits lingpro- relief right of reli*perty premp'- gious the
tion and j>*'e-erwlow- vjousment heads
17.2 (contd.)
...........1.................... 8....... 9....... 10.......11^......12------13......U .......
A. COURTS IN THE DISTRICTS:
a. District Courts O.S. 699 12 5 21 - 3 - 2^ 1258S.C. - - - - . - . . -
b. Sub Courts O.S. ^677 769 116 1811 190 19 8 51 17520S.C. - - - - . . . - 4 4 3
c. District Munsifs' O.S. 26850 775 569 2445 108 - 520S 77024Courts
S.C. 5 - 1222
Total 52231 1556 490 4277 298 123 8 3280 97447
8. COURTS in THE CITY;
a. City Civil Court,..............Madras 2977 71 - 172 34 - 11 113 9535
b. Court of small causes,Madras - - - - . . . .
c. High Court, Madras 142 52 - 52 9 60 52 324 1630
Total 3119 123 - 224 43 60 63 437 13011
firand Total 35350 1679 490 4501 541 183 71 3717 110458
Source : Registrar, High Court, Madras
: 335 :
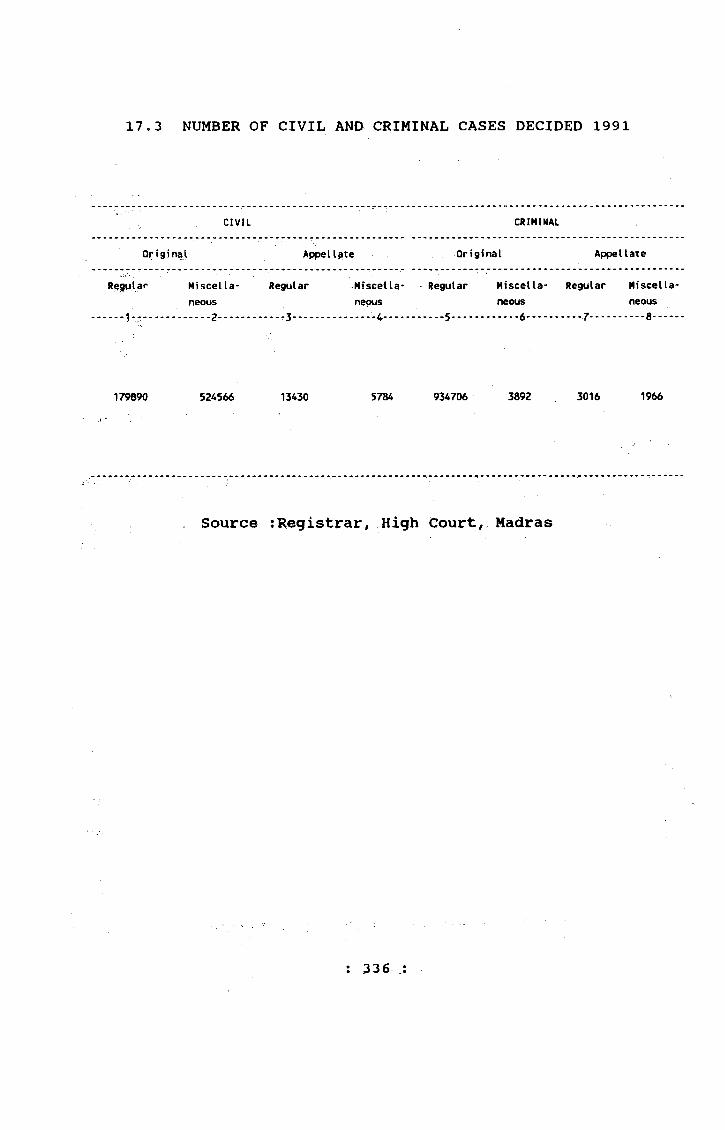
17.3 NUMBER OF CIVIL AND CRIMINAL CASES DECIDED 1991
CIVIL CRIMINAL
Original Appellate Original Appellate
Ri^9Mlar Miscella- neous
Regular Miscellaneous
Regular Miscellaneous
Regular Miscellaneous
179890 524566 13430 5784 934706 3892 3016 1966
Source :Registrar, High Court, Madras
: 336 :
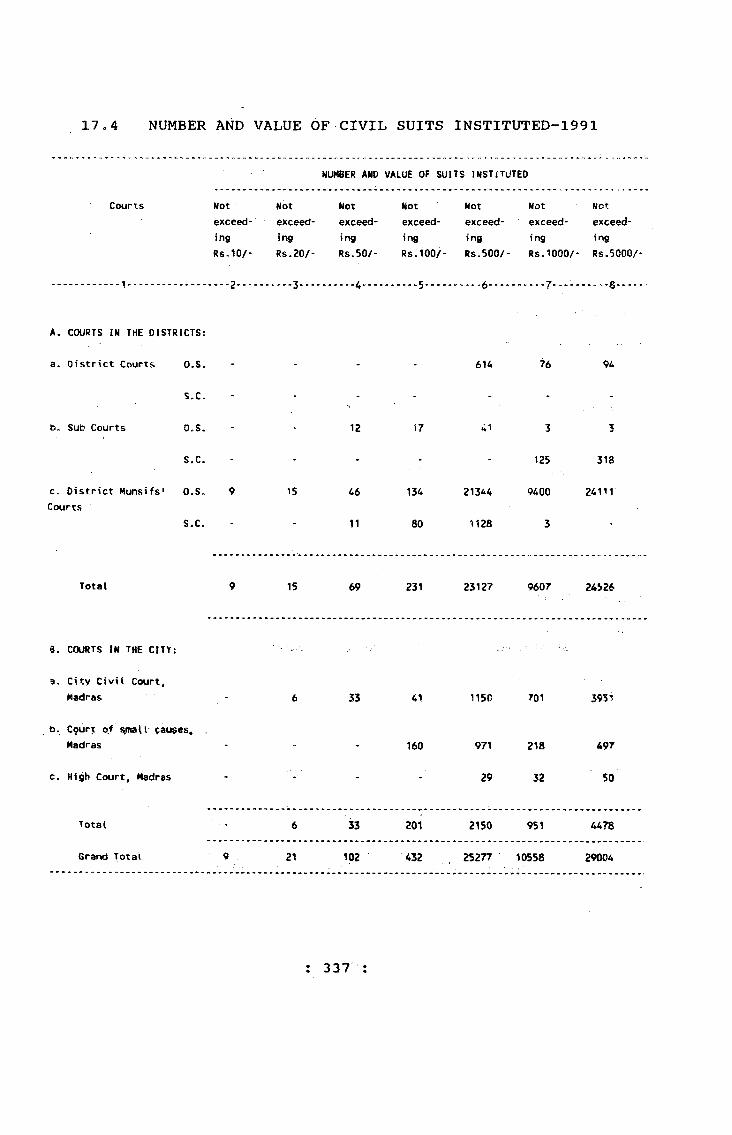
17.4 NUMBER AND VALUE OF CIVIL SUITS INSTITUTED-1991
Courts
NUMBER AND VALUE OF SUITS INSTfTUTED
NotexceedingRs.lO/-
NotexceedingRs.20/-
NotexceedingRs.50/-
NotexceedingRs.100/-
NotexceedingRs.500/-
NotexceedingRs.1000/-
NotexceedingRs.5000/-
A, COURTS IN THE DISTRICTS:
a. District Courts O.S. - - - - 614 76 94
S.C. - - - - - - -
to. Sub Courts O.S. - " 12 17 41 3 3
S.C. - - - - 125 318
c» District Munsifs' O.S. 9 15 46 134 21344 9400 24111Courts
S.C. 11 80 1128 3
Total 9 15 69 231 23127 9607 24526
8. COURTS IN THE CITY:
3. City CiviI Court,Madras - 6 53 41 1150 701 39S1
b. Court of causes^ .Madras - ■■ - 160 971 218 497
c. High Court, Madras - - - 29 32 50
Total ■ 6 33 201 2150 951 4478
Grand Totai 9 21 102 432 25277 10558 29004
: 337 :

17,4 (contd,)
Courts
...... > ----- - - 1 ----- -- ---------
A. COURTS IM THE DISTRICTS;
a. District Courts O.S.
S.C.
b. Sub Courts O.S.
S.C.
c. District Munsifs* O.S.Courts
S.C.
NtJWBER VALUE OF SUITS INSTITUTED Total... .................-...................... nuitoerNot Not Exceeding Suits value of Totalexceed- exceed- Rs.1,00,000 which can- suits value ofing ing
Rs.10,000 Rs.1,00,000
-----9.... --.-10----
52 346
14458 6541
11-
53
365 14898 2180
7Z0
not be esti- insti- suits mated in tutedmonies
....... 12-
246
13- •14-
1238 46223093.10
17520 1446082999.00
443 549150.00
77024 295096896.06
1222 64552172.00
Total 14875 21785 2953 250 97447 1852504310,16
8. COURTS IN THE CITY:
a. City Civil Court,fl55 - - 9535 129537104.20
b. Court of sntatt causes, Madras - - - - 1846 1135426.12
c. High Court, Madras 9 23 1340 147 1630 51478705.41
Total 2527 1178 1340 147 13011 182151235.73
Grand Total 17402 22963 4293 397 110458 3674655545.79
Source : Registrar, High Court, Madras.
: 3:38 :
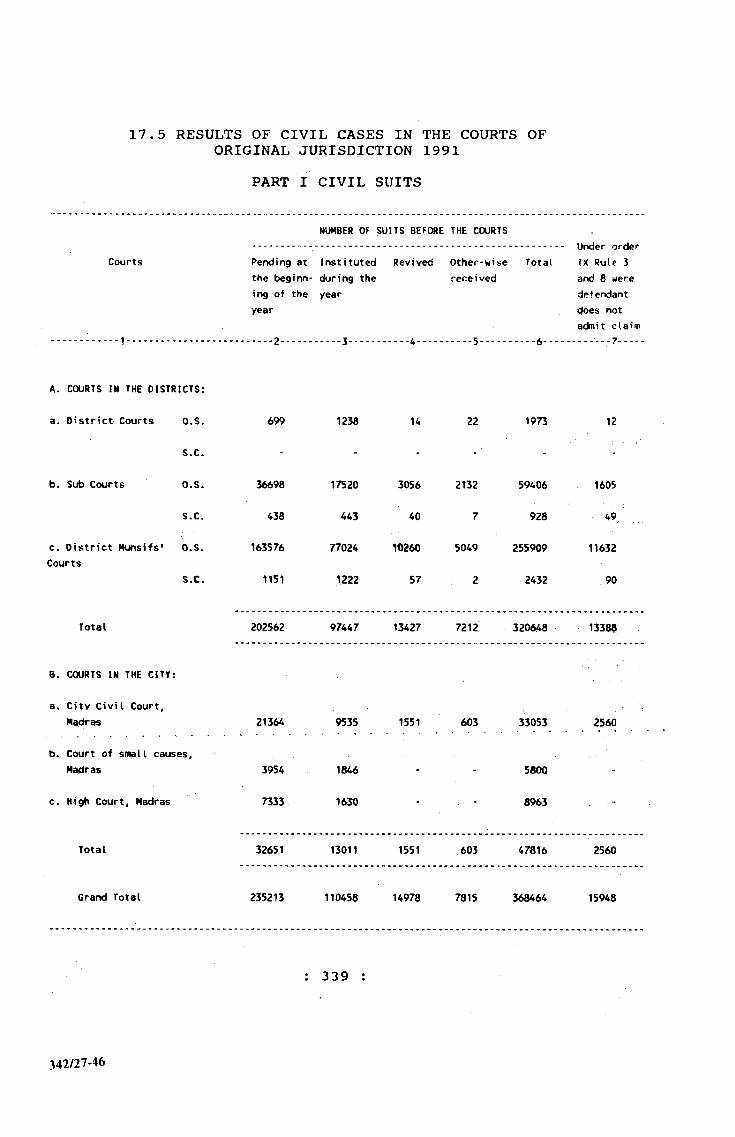
17.5 RESULTS OF CIVIL CASES IN THE COURTS OF ORIGINAL JURISDICTION 1991
PART I CIVIL SUITS
Courts
NUMBER OF SUITS BEFORE THE COURTSUnder order IX Rule 3 and 8 were defendant does not admit cla’a;
Pending at the beginning of the year
Instituted during the year
Revived Other-wisereceived
Total
A. COURTS IN the DISTRICTS:
a. District Courts O.S, 699 1238 14 22 1973 12
S.C. - - - - -
b. Sub Courts O.S. 36698 17520 3056 2132 59406 1605
S.C. 438 443 40 7 928 49
c. District Munsifs* O.S. 163576 77024 TD260 5049 255909 11632Courts
S.C. 1151 1222 57 2 2432 90
Total 202562 97447 13427 7212 320648 1338?
8. COURTS IN THE CITY;
a. City Civil Court,Madras 21364 9535 1551 603 33053 2560
b. Court of small causes.Ma<4ras 3954 1846 - - 5800 -
c. High Court, Madras 7333 1630 - . - 8963
Total 32651 13011 1551 603 47816 2560
Grand Total 235213 110458 14978 7815 368464 15948
: 339 :
342/27-46

17.5 (contd.)NUMBER OF SUITS DISPOSED OF
Courts Without trial Ex- Parte On admission of claims
Compromi sed
Number Average durat i on
Number Average Number duration
Averageduration
Number Averageduration
A. COURTS IN THE DISTRICTS:
a. District Courts O.S. 42 297 84 260 36 325 10 473
S.C. - - - - - - - ■'
b. Sub Courts O.S. 3218 841 7647 497 1302 541 587 .581
S.C. 118 387 378 380 42 337 4 270
c. District Munsifs* O.S, Courts
S.C.
16812
534
804
222
37903
754
439
173
5799
130
480
149
1366
2
1061
527
Total 20724 796 46766 446 7309 484 1969 913
B. COURTS IN THE CITY:
a. City Civil Court, Madras 2091 710 5655 460 409 470 199 472
b. Court of small causes, Madras 4130 ,679 1401 456 50 349 51 354
c. High Court, Madras 285 1005 157 1386 - - 74 1695
Total 6506 448 7213 480 459 670 324 734
Grand Total 27230 780 53979 448 7768 496 2293 204
: 340

NUMBER OF SUITS DISPOSED OF
17.5 (contd.)NUMBER OF SUITS
PENDING
Courts
A. COURTS IN THE DISTRICTS;
b. Sub Courts
Courts
Total
B. COURTS IM THE CITY;
a. City Civil Court, Madras
b. Court of small causes, Madras
c. High Court, Madras
Total
Grand Total
After full trial On reference to Arbitration
By transfer At the end of
For
more
Judgement Judgement Average for for duration plaintiff dependant ---16........ 17........18---
Nunt>er Average duration
--19...... 20---
Number Average duration
--21...... 22---
year
---23.... -24--
17 13 766 - - 1039 13 720 390
2154 684 1007 1 272 1206 82276 41002 29046
38 2 970 - - 297 125
10917 4589 1221 7 1696 4017 1495 162867 111Q47
132 29 1462 - - 27 121 734 4?2
13258 5317 1190 8 ^518 6289 20S620 H1030
1292 594 735 1 472 603 1097 19649 15656
59 18 1017 - - - 91 238
148 37 2470 8127 - 8250 7118
1499 649 895 13 9687 603 1097 27990 23012
14757 5966 1159 21 6750 6892 970 233610 164042
: 341
342/27-46a

PART II CIVIL PROCEEDINGS (MISCELLANEOUS)17.5 (contd.)
1 2 3 4 5 6 7
A. COURTS IN the DISTRICTS:
a. District Courts 8325 57165 222 989 66701 956
b. Sub Courts 93302 146965 1828 12556 254651 3223
c. District Munsifs'Courts 18A825 296284 2162 10250 493521 9007
Total 286452 500414 4212 23795 814873 13186
8. COURTS IN THE CITY:
a. City Civil Court,Madras 24609 25129 975 2 50715 a064
b. Court of small causes,Madras 14709 26835 - - 41544 -
c. High Court, Miadras - - - - - -
Total 39318 51964 975 2 92259 i O U
Gratxl Total 325770 552378 5187 23797 907132 17250
: 342 :

17.5 (contd.)
1 8 9 10 11 12 13 u 15
A. COURTS IN THE DISTRICTS:
a. District Courts 37234 42 1985 212 3420 64 479 2 2 9
b. Sub Courts 107903 134 6123 198 11902 90 3496 553
c. District Munsifs* Courts
217281 115 14569 215 15938 113 615 234
Total 362418 114 22677 209 31260 99 4590 476
B. COURTS IN THE CITY;
a. City Civil Court, Madras 12904 327 3393 268 748 328 443 322
b. Court of small causes, Madras 2257 177 24328 80 - - - -
c. High Court, Madras - - - - - - - -
Total 15161 293 27721 30 748 328 443
Grand Total 377579 123 50398 116 32008 976 5033 463
: 343 :
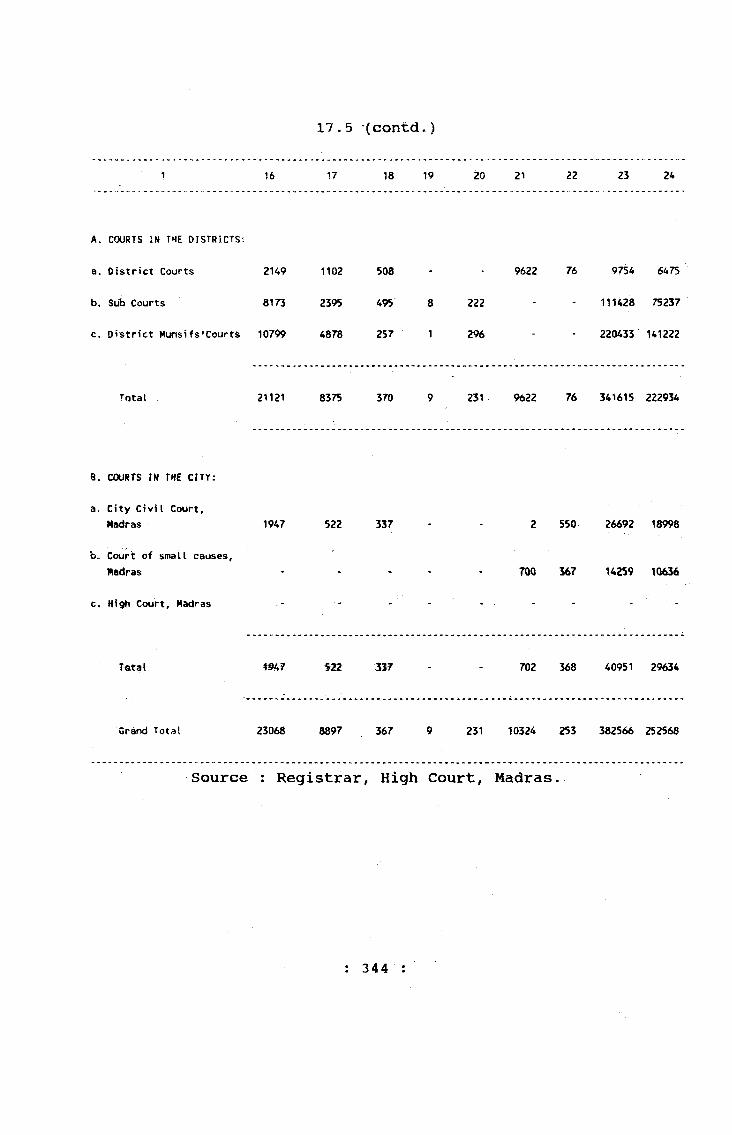
17.5 (contd.)
1 16 17 18 19 20 21 22 23 24
A. COURTS IN THE OISTRiCTSi
a. District Courts 2149 1102 508 9622 76 9754 6475
b. Sub Courts 8173 2395 495 8 222 - - 111428 75237
c. District Munsifs'Courts 10799 4878 257 1 296 - - 220433 141222
Total 21121 8375 370 9 231 9622 76 341615 222934
8. COURTS IN T H E CITY:
a. City Civil Court, Madras 1947 522 337 2 550 26692 18998
b. Court of small causes, Madras • * - • - - 700 367 14259 10636
c. High Court, Madras ■ - - - ' - - - - -
Tfital m r 522 357 - - 702 368 40951 29634
Grand Total 23068 8897 367 9 231 10324 253 382566 252568
Source ; Registrar, High Court, Madras,
: 344 :
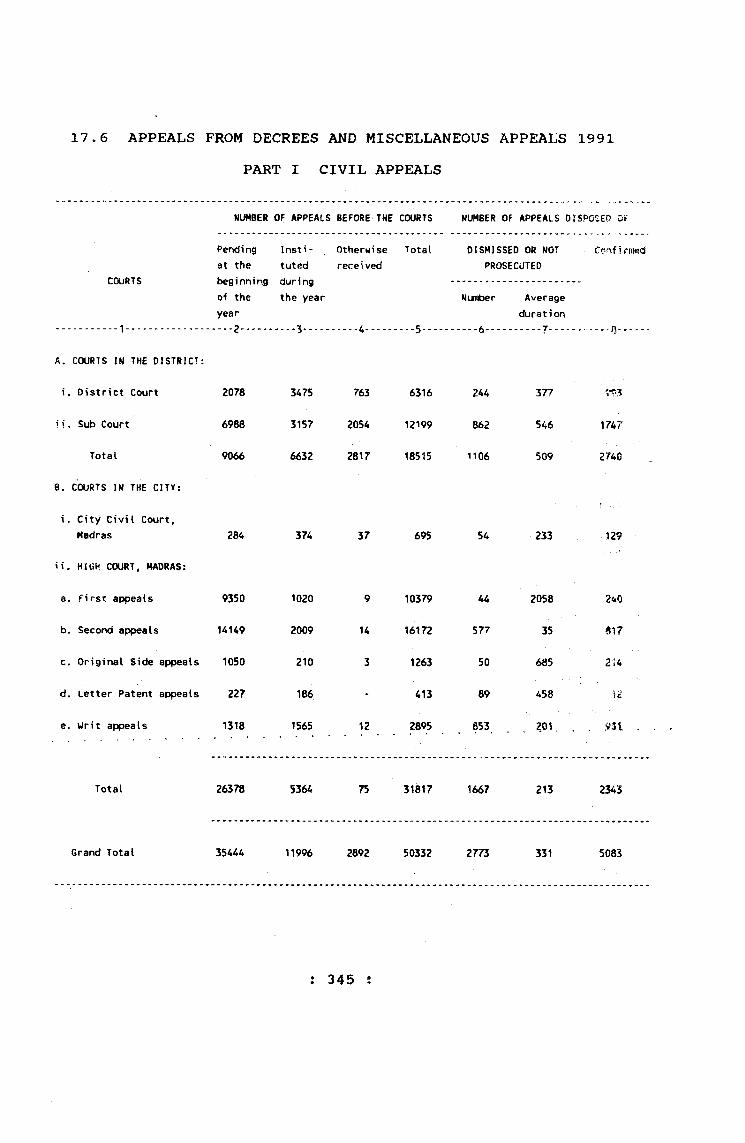
1 7 . 6 A P P E A L S F R O M D E C R E E S A N D M I S C E L L A N E O U S A P P E A L S 1 9 9 1
P A R T I C I V I L A P P E A L S
NIMBER OF APPEALS BEFORE THE COURTS NUMBER OF APPEALS 0!SPOS£C Of
COURTS
Pending at the beginning of the year
Instituted during the year
Otherwise rece i ved
Total DISMISSED OR NOT PROSECUTED
Confirmed
Number Averageduration
A. COURTS I N THE DISTRICT:
i . District Court 2078 3475 763 6316 244 377
i i. Sub Court 6988 3157 2054 12199 862 546 1747
Total 9066 6632 2817 18515 1106 509 2740
8. COURTS IN THE CITV;
i. City CiviI Court, Madras 284 374 37 695 54 233 129
ii. HIGH COURT, MADRAS:
a. first appeals 9350 1020 9 10379 44 2058 340
b. Second appeals U149 2009 14 16172 577 35 «17
c. Original Side appeals 1050 210 3 1263 50 685 214
d. Letter Patent appeals 227 186 - 413 89 458 12
e. Writ appeals 1318 1565 12 2895 853 201. . . m .
Total 26378 5364 75 31817 1667 213 2343
Grand Total 35444 11996 2892 50332 2773 331 5083
; 345 ;

NUMBER OF APPEALS DISPOSED OF BY TRANSFER NUMBER OF APPEALS...... .............................................. PENDINGModi- Rever- Remanded Average Number Average ....................fied sed for duration duration Pending For more
retrial of ap- at the than oneCOURTS peals in end of year
(Col.No. the year8,9,10 &11)
---1-------.......... 9......10........11.......12........13......- H ........15........16.....
17.6 (contd.)
A. COURTS IN THE DISTRICT
District Court
i i. s6b Court
Tdtal
B. COURTS IN THE CITY:
i. City Civil Court, M^ras
213 391
248 686
461 1077
113
295
408
278
500
419
2369 88
549 1141
2918 286
1993
7812
9805
624
3005
3629
95 73 225 336 223
it. HIGH COURT, MADRAS:
a. Ftt-st appeals 2 238 2 2798
b. S^edond appeals 1 151 17 2926
c. Original Side Appeals - 5 5 2079
d. Letter Patent appeals - 15 3 3305
e. appeals 20 64 11 1823
9853
14609
989
294
1016
8842
13123
860
197
666
Total 118 546 46 3771 27097 23911
Grand Total 579 1623 454 1742 2918 286 36902 27540
: 346 :
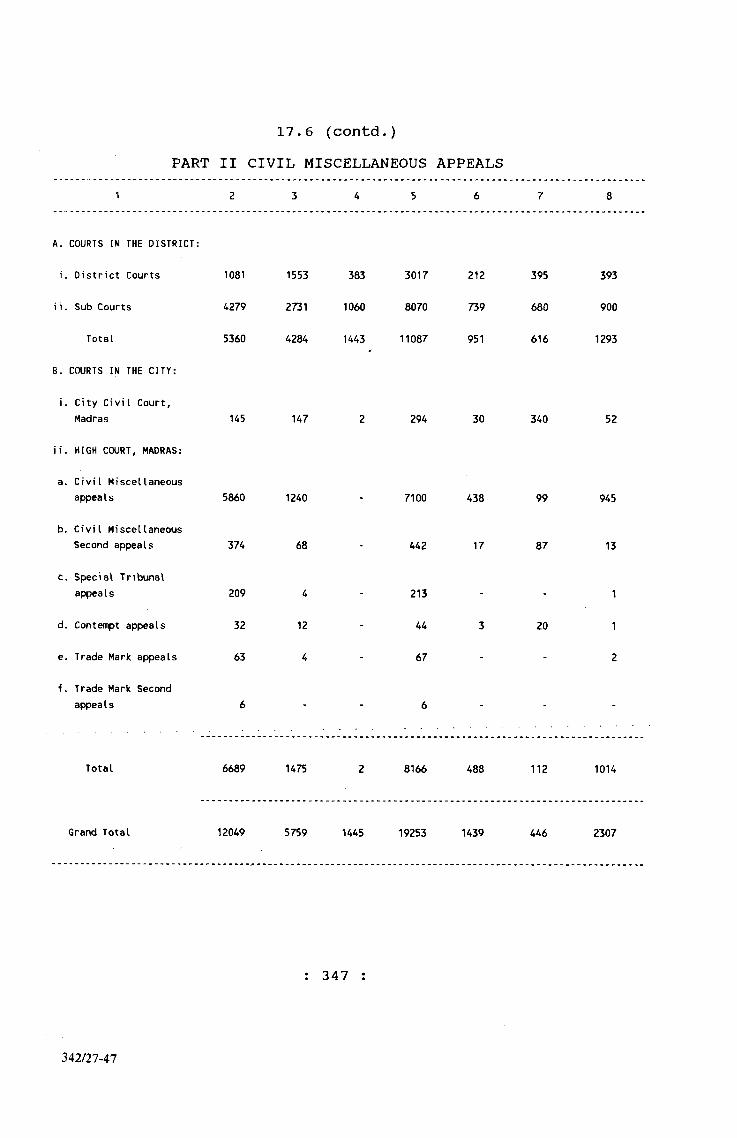
PART II CIVIL MISCELLANEOUS APPEALS17o6 (contd.)
1 2 3 4 5 6 7 8
A. COURTS IN THE DISTRICT:
i. District Courts 1081 1553 383 3017 212 395 393
i i. Sub Courts 4279 2731 1060 8070 739 680 900
Total 5360 4284 1443 11087 951 616 1293
B. COURTS IN THE CITY:
i. City CiviI Court, Madras 145 147 2 294 30 340 52
ii. HIGH COURT, MADRAS:
a. Civil Miscellaneous appeaIs 5860 1240 - 7100 438 99 945
b. Civil Miscellaneous Second appeals 374 68 - 442 17 87 13
c. Special Tribunal appeals 209 4 - 213 - - 1
d. Contempt appeals 32 12 - 44 3 20 1
e. Trade Mark appeals 63 4 - 67 - - 2
f. Trade Mark Second appeals 6 - - 6 - - -
Total 6689 1475 2 8166 488 112 1014
Grand Total 12049 5759 1445 19253 1439 446 2307
347
342/27-47
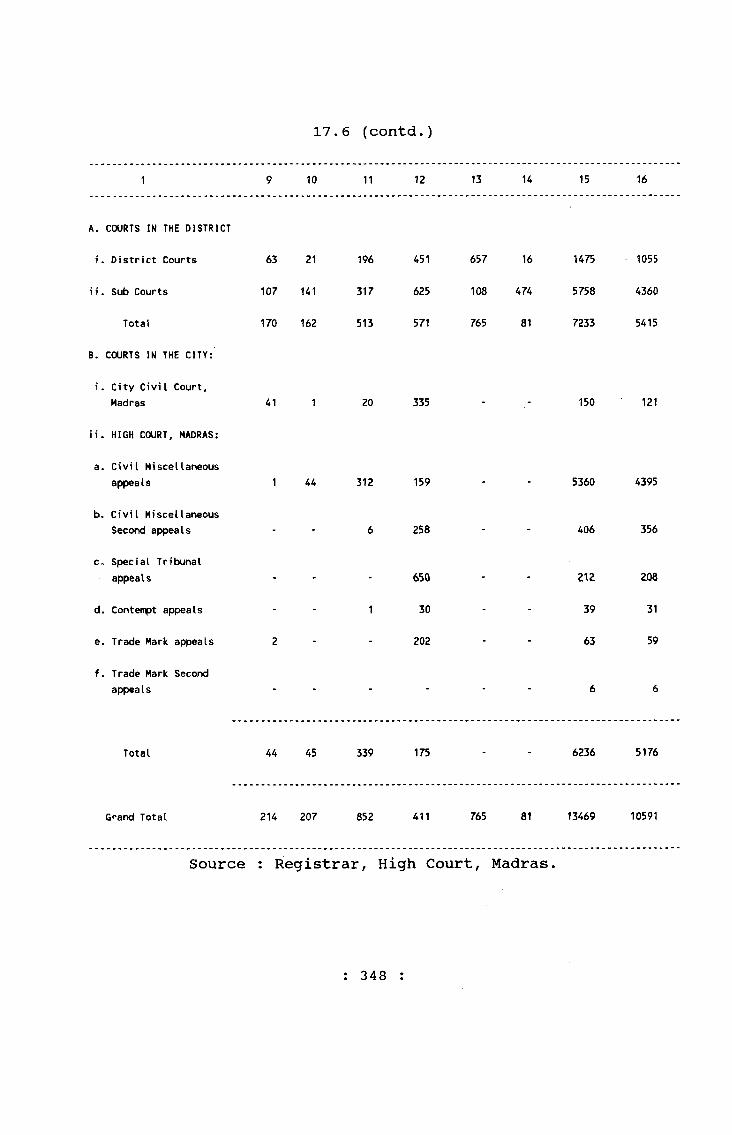
17.6 (contd.)
1 9 10 11 12 13 14 15 16
A. COURTS IN THE DISTRICT
i. District Courts 63 21 196 451 657 16 1475 1055
i i. Sub Courts 107 141 317 625 108 474 5758 4360
Total 170 162 513 571 765 81 7233 5415
B. COURTS IN THE CITY:
i. City Civil Court, Madras 41 1 20 335 150 121
ii. HIGH COJRT, MADRAS;
a. Civil Miscellaneous appeals 1 44 312 159 5360 4395
b. Civil Miscellaneous Second appeals - - 6 258 - - 406 356
c. Special Tribunal appeals - > * 650 - - Z \ Z 208
d. Contempt appeals - - 1 30 - - 39 31
e. Trade Mark appeals 2 - - 202 - - 63 59
f. Trade Mark Second appeals - - - - - - 6 6
Total 44 45 339 175 - - 6236 5176
Grand Total 214 207 852 411 765 81 13469 10591
Source : Registrar, High Court, Madras.
: 348 :
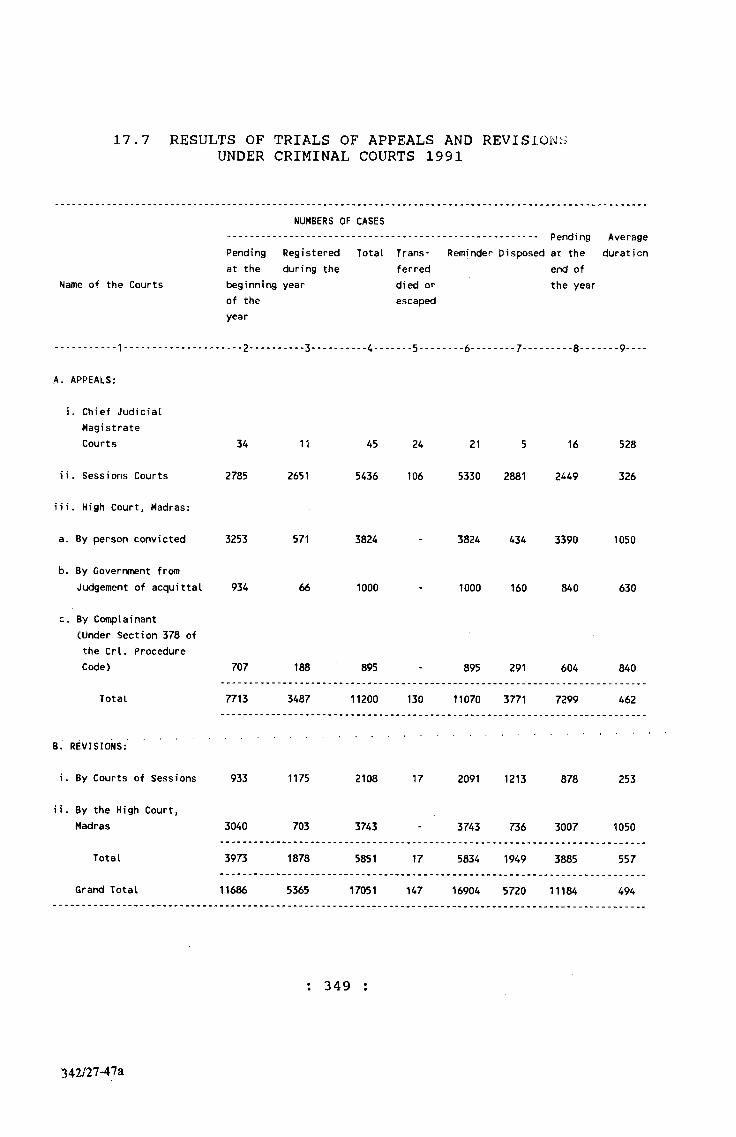
17.7 RESULTS OF TRIALS OF APPEALS AND REVISIONS UNDER CRIMINAL COURTS 1991
NUMBERS OF CASESAverageduration
Name of the Courts
Pending Registered at the during the beginning year of the year
Total Transferred died or escaped
Reminder Disposed at the end of the year
A, APPEALS:
Chief JudicialMagistrateCourts 34 11 45 24 21 5 16 528
ii. Sessions Courts 2785 2651 5436 106 5330 2881 2449 326
iii. High Court, Madras:
a. By person convicted 3253 571 3824 - 3824 434 3390 1050
b. By Government from Judgement of acquittal 934 66 1000 - 1000 160 840 630
c. By Complainant(Under Section 378 of the Crl. Procedure Code) 707 188 895 895 291 604 840
Total 7713 3487 11200 130 11070 3771 7299 462
B. REVISIONS;
i. By Courts of Sessions 933 1175 2108 17 2091 1213 878 253
ii. By the High Court, Madras 3040 703 3743 - 3743 736 3007 1050
Total 3973 1878 5851 17 5834 1949 3885 557
Grand Total 11686 5365 17051 147 16904 5720 11184 494
: 349
342/27-47a

NUMBER OF PERSONS CONCERNED IN CASES FOR REVISION
Pending Fi led Total Transferred or died or escaped
----13----
Reminders
----14---
DISPOSED OF
NAME OF THE COURTST 1 uin LHC uur iiiybegin- the yearningof theyear
.... 10....... 11---- ---12---
Appeals Sentence or appli-or order cations reduced rejected or modi
fied■---15-------16....
Sentencereversed
---17....
A. APPEALS:
1 . Chief Judicial Magistrate Courts 49 17 66 32 34 _ 4
ii. Sessions Courts 4506 4166 8672 481 8191 3 1399 1256
iii. High Court, Madras:
a. By person convicted 4036 1850 5886 - 5886 - 87 90
b. By Government from Judgement of acquittal 1062 510 1572 - 1572 - 13 114
c. By Complainant(Under Section 378 of the Crl. Procedure Code) 1070 320 1390 1390 10
Total 10723 6863 17586 513 17073 3 1509 1472
B. REVISIONS:
i. By Courts of Sessions 1503 1664 3167 21 3146 48 165 622
ii. By the High Court, Madras 5086 1725 6811 - 6811 7 75 106
Total 6589 3389 9978 21 9957 55 240 728
Grand Total 17312 10252 27564 534 27030 58 1749 2200
: 350 :

17,7 (contd . )
NUMBER OF PERSONS CONCERNED IN CASES FOR REVISION
NAME OF THE COURTSProcee- New trial dings or further quashed or enquiry in orders ordered reversed
........18................ 19.........
Sentence or order confi rmed
........ 20------
Referred to High- Court
.......21 ----
Total
.......22------
' Pending at the end of the year
.......23.......
A. APPEALS:
i. Chief Judicial Magistrate Courts 3 1 . . 8 26
ii. Sessions Courts 9 26 1617 - 4310 3881
iii. High Court, Madras:
a. By person convicted - 521 - 698 5188
b. By Government from Judgement of acquittal - 260 - 387 1185
c. By Complainant(Under Section 37a of the Crl. Procedure Code) 180 198 1192
Total 12 27 2578 - 5601 11472
B. REVISIONS:
i. By Courts of Sessions 14 113 790 22 1774 1372
ii. By the High Court, Madras 7 1120 - 1315 5496
Total 14 120 1910 22 3089 6868
Grand Total 26 147 4488 22 8690 18340
Source : Registrar, High Court, Madras •
: 351 :

17,8 RESULTS OF CRIMINAL TRIALS IN THE TRIBUNALS OF VARIOUS CLASSES-1991
NUMBER OF CASES
NAME OF THE COURTS .
Pending from last year
Insti- Received tuted or by transreceived fer or by commit-on ref- ment rence
Transferred or in which the accused died or escaped
Totalfor
disposal
Disposalof
Pending
1. Judicial Magistrate Courts 87589 608627 8660 16626 688250 596903 91347
2 . Special Judicial Magistrates for Railways. (Cases u/s.14 Crl.P.C.) 1 1904 . . 1905 1905 .
3. Chief Judicial Magistrate Courts 5017 20379 625 3922 22099 18620 3479
4. Metropolitan Magistrate Court, Madras 47096 334438 - - 381534- 314356 67178
5. Sessions Courts 4368 3664 1859 537 9354 2919 6435
6. High Court, Madras (Under Section 366 Crl.P.C.) 1 3 - - 4 3 1
Total 144072 969015 11144 21085 1103146 934706 168440
: 352 :
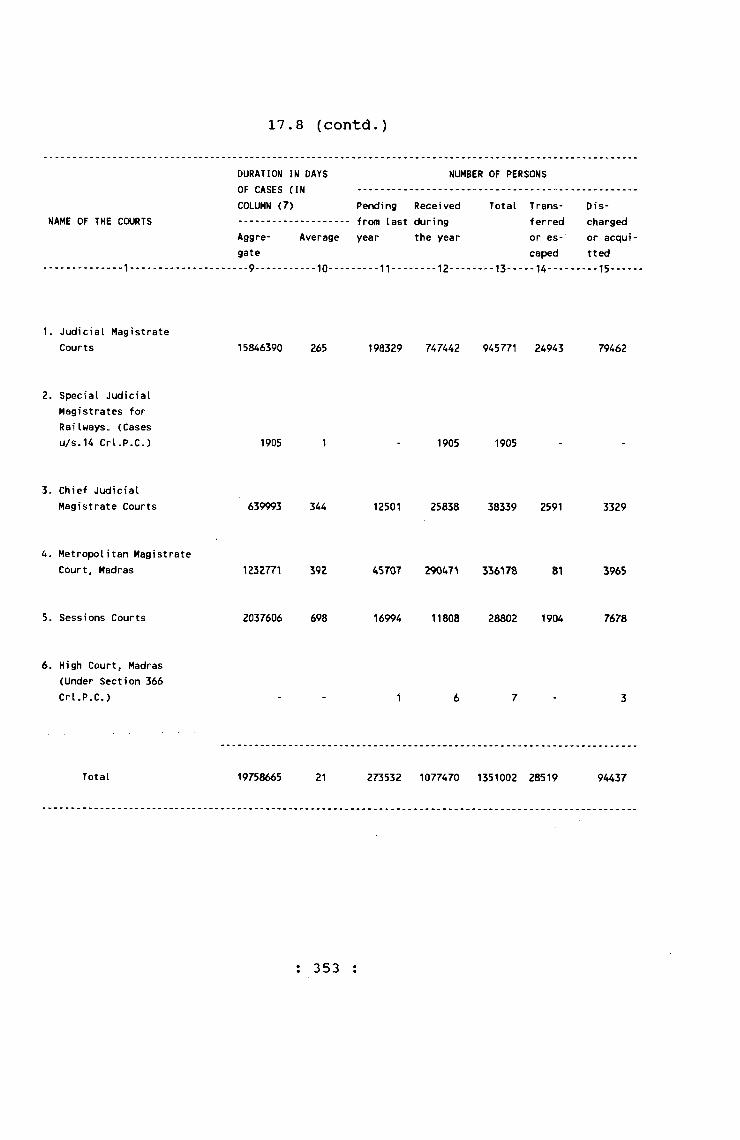
17.8 (contd.)
NAME OF THE COURTS
DURATION IN DAYS OF CASES (IN COLUMN (7)
Aggre- Average gate
NUMBER OF PERSONS
Pending Received Total Trans- • from last during ferred year the year or es
caped
Discharged or acquitted
1. Judicial Magistrate Courts 15846390 265 198329 747442 945771 24943 79462
2. Special Judicial Magistrates for Railwaysc (Cases u/s.U CrUP.C.) 1905 1 . 1905 1905
3. Chief Judicial Magistrate Courts 639993 344 12501 25838 38339 2591 3329
4. Metropolitan Magistrate Court, Madras 1232771 392 45707 336178 81 3965
5. Sessions Courts 2037606 698 16994 11808 28802 1904 7678
6. High Court, Madras (Under Section 366 Crl.P.C.) - 1 6 7 - 3
Total 19758665 21 273532 1077470 1351002 28519 94437
: 353 :

PERSONS
17„8 (contd.)
Regular Trial Summary Trial
NAME OF THE COURTS
Sen- Relea- tence sed passed after
admonition under probation of offenders Act 1958
--16.... 17---
Relea-sedon probation under probation of offenders Act 1958
---18.... 19.....20----21----
Youthful Sen-Offenders tence........... passedAdmo- Deli- nished vered
toparentetc.
Relea- Released sed after on pro- admoni- bat ion
YouthfulOffenders
Admo- Deli- nished vered
to
Total
tion under under pro- pro- bat ion parentbat ion of off- etc.of off- enders enders Act Act 19581958
--22....... 23.....24.....2S----26---
1. Judicial MagistrateCourts 105374 2051 3834 175 152 512178 11143 363 17 40 635327
2. Special Judicial Magistrates for Railways. (Cases u/s.14 Crl.P.C.) 1905 1905
3. Chief Judicial Magistrate Courts 2769 185 201 5 21 16084 989 113 20367
4. Metropolitan MagistrateCourt, Madras 297280 1976
5. Sessions Courts 1427 1
686
1
299942
1430
6. High Court, Madras (Under Section 366 Crl.P.C.)
Total 406851 4213 4722 180 173 530167 12133 476 17 40 958972
: 354 :
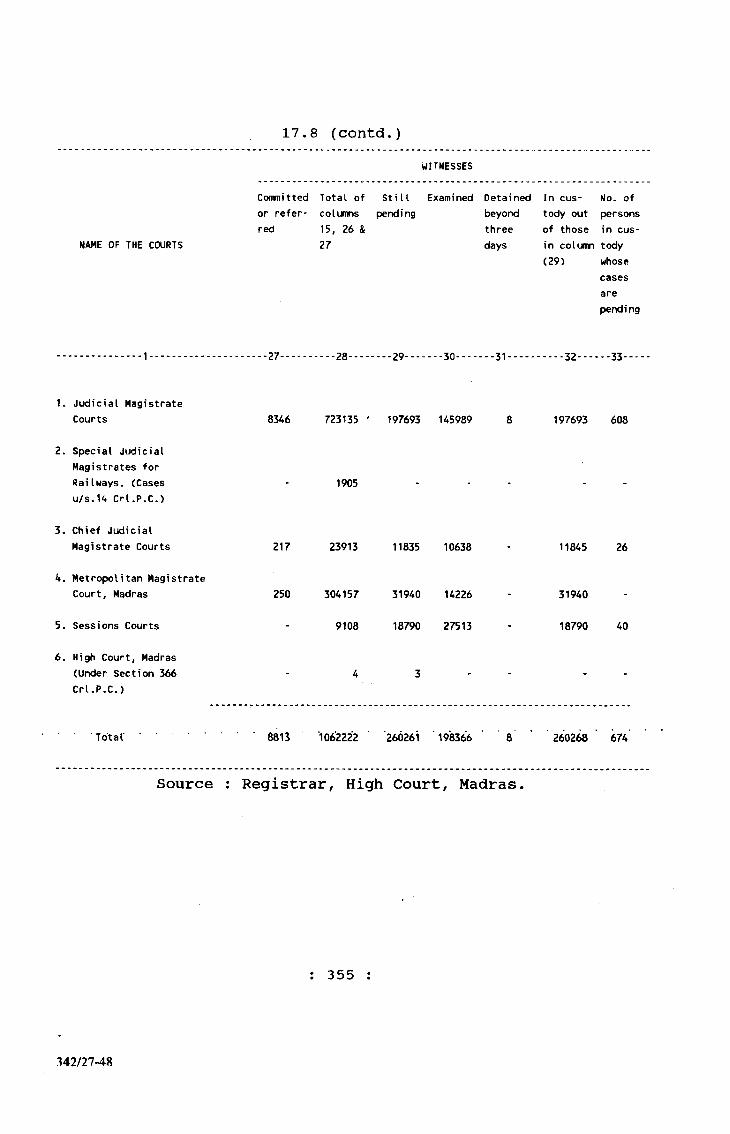
17.8 (contd.)WITNESSES
NAME OF THE COURTS
Conmitted Total of StiU Examined Detained In cus- No. ofor refer- columns pending beyond tody out personsred 15, 26 & three
27 daysof those in cus- in column tody (29) whose
cases arepending
...............1..................... 27......... 28....... 29.......30...... 31..........32......3 3 .----
1. Judicial Magistrate Courts 8346 723135 ' 197693 145989 8 197693 608
2. Special Judicial Magistrates for Railways. (Cases u/s.14 Crl.P.C.)
1905
3. Chief Judicial Magistrate Courts 217 23913 11835 10638 11845 26
4. Metropolitan Magistrate Court, Madras
5. Sessions Courts
250 304157 31940 14226
9108 18790 27513
31940
18790 40
6 . High Court, Madras (Under Section 366 Crl.P.C.)
Total' 6815 '1062222 260261 198366 260268 674
Source : Registrar, High Court, Madras
: 355
342/27-48

offences offences Complaints otherreported reported dismissed casesin, and dur i ng under foundpending the year section to befrom pre 203, Crl. falsevious Pro.Codeyear
----2 --- .... 3- — ...4 ____ - . 5 -
17.9 NUMBER OF OFFENCES REPORTED AND NUMBER OF PERSONS TRIED, CONVICTED AND ACQUITTED - 1991
NUMBER OF CASES
Cases found to be true of offences reported in
NATUR OF PROCEEDINGS pending the year section to be Previous Current Brought Pendingear year to trial at the
during end ofthe year the year
A. UNDER THE INDIAN PENAL CODE:
1. Criminal conspiracy Chapter V-AC.J.M. 6 23 - - - - - 29
Sessions 4 . . . . . . 4
2. Offefices against State Chapter VI
C.J.M. 92 7 - - 89 - 89 10
Sessions 1 1 - - 1 - 1 1
3. Offence relating to Army, Navy and Airforce etc.Chapter VII
Sessions 1 1 - - 1 1 2
4. Offences against Pidslic Tranc^iality Chapter VIIIC.J.M. 13126 10797 15 51 4774 5214 9988 13869
5. Offences relating to Public servants Chapter IX.C.J.M. 81 167 - - 73 134 207 41
: 356 :
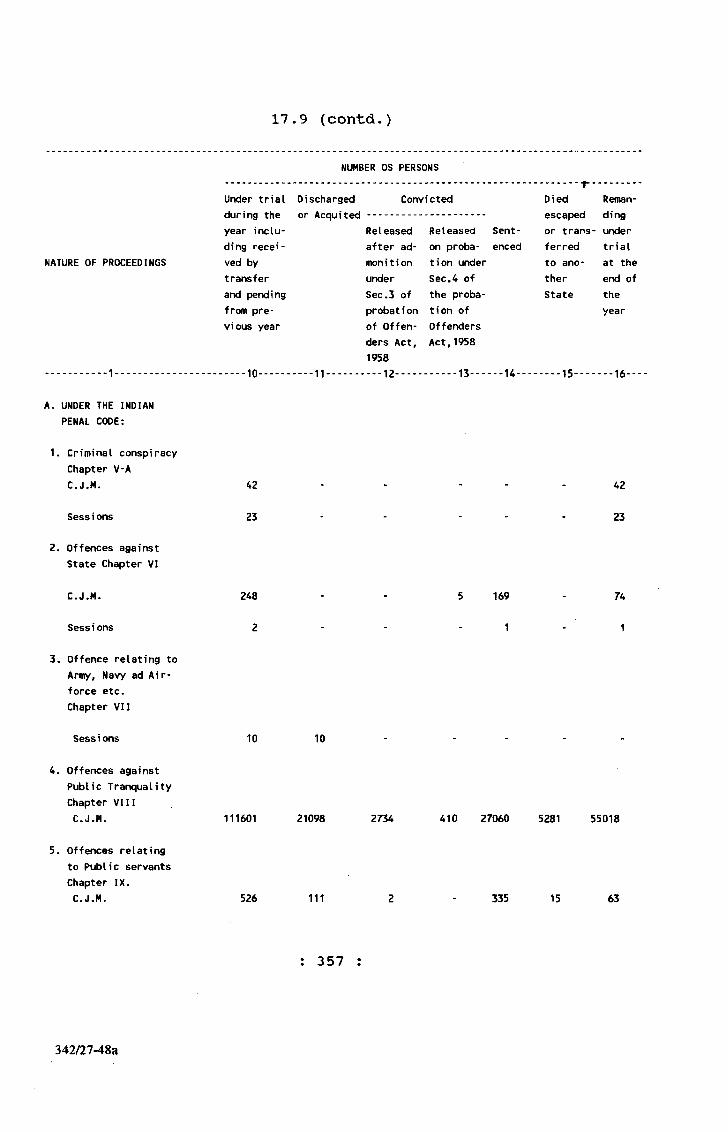
NUMBER OS PERSONS................................................ r .......Under trial Discharged Convicted Died Reman-during the or Acquited ..................... escaped dingyear inclu- Released Released Sent- or trans- underding recei- after ad- on proba- enced ferred trial
NATURE OF PROCEEDINGS ved by monition tion under to ano- at thetransfer under Sec.4 of ther end ofand pending Sec.3 of the proba- State thefrom pre- probation tion of yearvious year of Offen- Offenders
ders Act, Act,19581958
.......... 1....................... 10..........11..........12...........13......14........15.......16---
A. UNDER THE INDIAN PENAL CODE:
17.9 (contd.)
1. Criminal conspiracy Chapter V-A C.J.M.
Sessions
42
23
42
23
2. Offences against State Chapter VI
C.J.M.
Sessions
248
2
169
1
74
1
3. Offence relating to Army, Navy ad Airforce etc.Chapter VII
Sessions 10 10
4, Offences against Public Tranquality Chapter VIII C.J.M. 111601 21098 2734 410 27060 5281 55018
5. Offences relating to Public servants Chapter IX.C.J.M. 526 111 335 15 63
: 357
342/27-48a

3 4 5
17.9 (contd.)
6. Contenpt of lawful authority of Public servants
Chapter XC.J.M. 102
Sessions 7
7. False evidence and offence against public servants
Chapter XI C.J.M. 136
Sess i ons 1
8. Offences relating to coins and Government Stamp
Chapter XII C.J.M. 6
9. Offences relating to weights and measures.
Chapter XIII C.J.M.
10. Offences relating to Public Health, safety and convenienceChapter XIVC.J.M. 6438
11. Offences relating to religiousChapter XVC.J.M. 35
178
7
73
16896 125
55
4
58
135
2
35
4149 12273
190 89
6 7
93 114
1
16422 6780
50 34 42 76
; 358 :
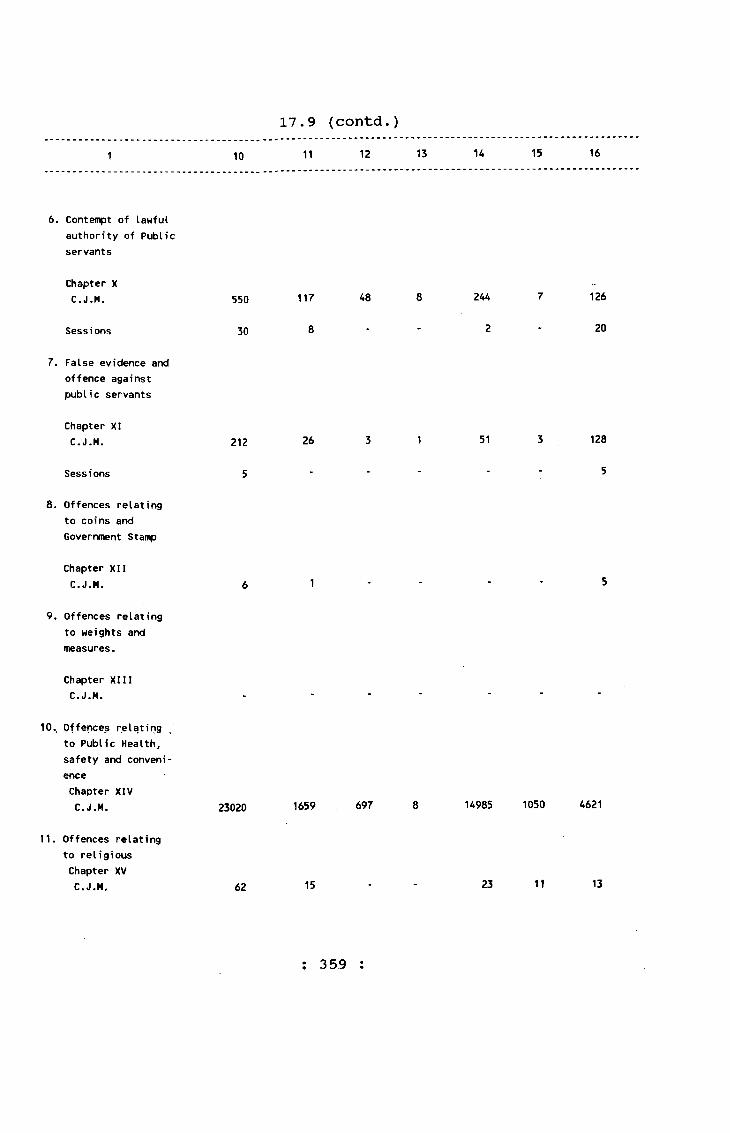
10 11 12 13
17.9 (contd.)14 15 16
6. Contefnpt of lawful authority of Public servants
Chapter X C.J.M.
Sess i ons
7 . False evidence and offence against public servants
Chapter XI C.J.M.
Sessions
8. Offences relating to coins and Government Stamp
Chapter XII C.J.M.
9. Offences relating to weights and measures.
Chapter XIII C.J.M.
550
30
212
5
117
8
26
48 244
2
51
126
20
128
5
10. Offences relating to Public Health, safety and convenienceChapter XIV C.J.M.
11. Offences relating to religiousChapter XV C.J.M.
23020 1659 697 8 14985 1050 4621
62 15 23 11 13
: 359 :
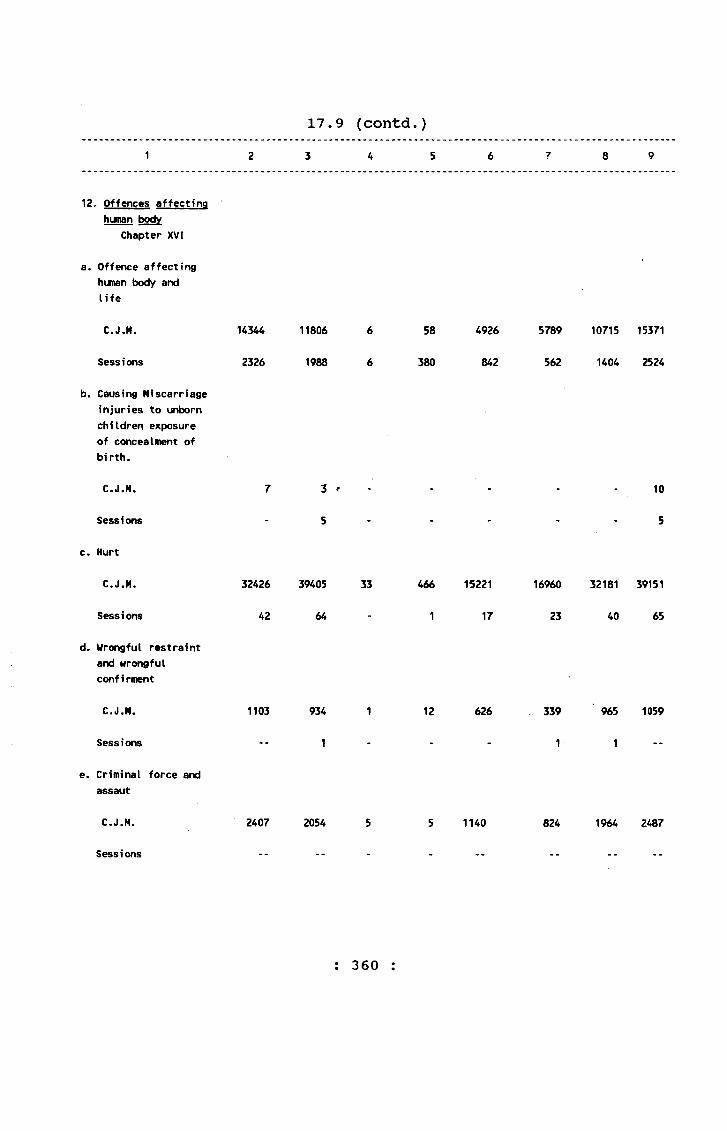
3 4 5
17.9 (contd.)
12. Offences affecting human body
Chapter XVI
a. Offence affecting human body and life
C.J.H.
Sessions
b. Causing Miscarriage injuries to unborn children exposure of concealment of birth.
C.J.H.
Sessions
c. Hurt
C.J.M.
Sessions
d. Wrongful restraint and wrongful confirment
C.J.M.
Sessions
e. Criminal force and assaut
C.J.H.
Sessions
14344 11806 6
2326 1988 6
7 3 ^ -
5
32426 39405 33
42 64 -
1103
2407
934
1
2054
58
380
12
4926
842
466 15221
1 17
626
1140
5789 10715 15371
562 1404 2524
10
5
16960 32181 39151
23 40 65
339
1
824
965 1059
1
1964 2487
: 360 :
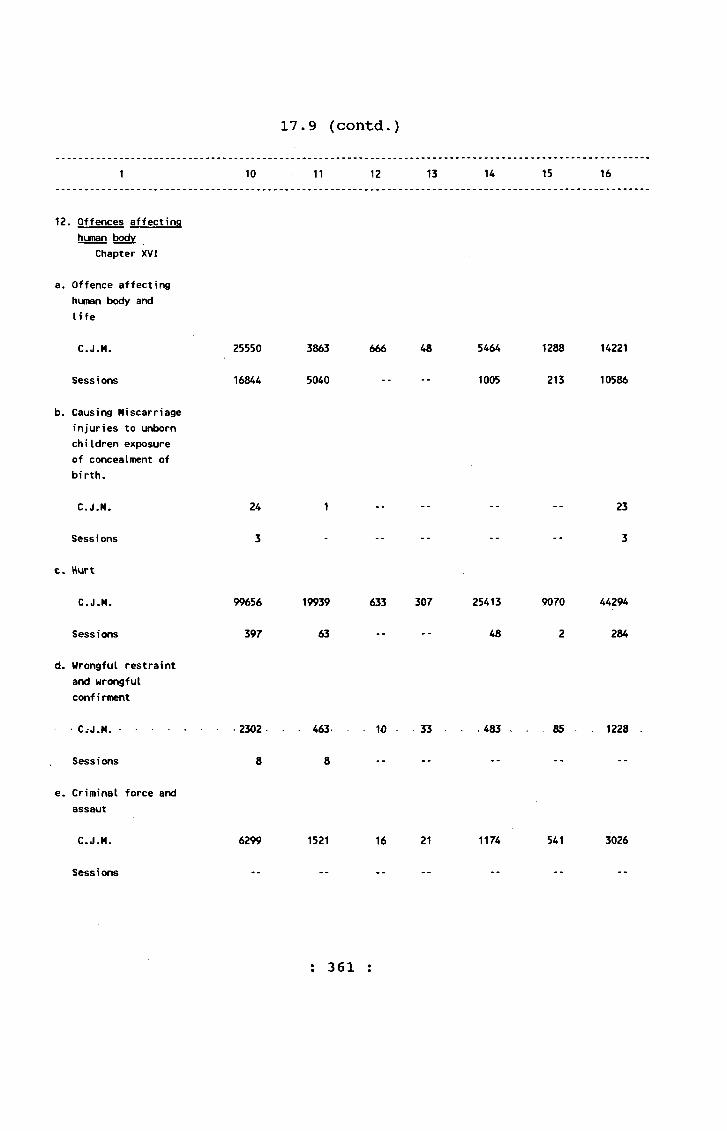
17.9 (contd.)
10 11 12 13 14 15 16
12. Offences affecting human body
Chapter XVI
a. Offence affecting human body and life
C.J.M.
Sessions
b. Causing Miscarriage injuries to unborn children exposure of concealment of bi rth.
C.J.M.
Sess i ons
c. Hurt
C.J.M.
Sess i ons
d. Wrongful restraint and wrongfulconf i rment
C.-J.M............
Sessions
e. Criminal force and assaut
C.J.M.
Sessions
25550
16844
24
3
99656
397
2302
8
6299
3863
5040
19939
63
463
8
1521
666 48
633 307
W 33
16 21
5464
1005
25413
48
483
1174
1288 14221
213 10586
23
3
9070 44294
2 284
85
541
1228
3026
: 361 :

17e9 (contd.)
1 2 3 4 5 6 7 8 9
f. Kidnapping Forcible abduction slavery and force labour
C.J.M. 385 295 14 185 142 327 339
Sessions 175 92 -- 27 40 18 58 182
g. Rape C.J.M. 82 158 2 -- 50 106 156 82
Sessions 270 170 1 25 101 39 140 274
h. Unnatural Offences
C.J.M. 1 3 2 2 2
13. Offences against Erofiertji Chapter XVII
a. Theft C.J.M. 26063 24323 8 51 11250 9441 20691 29636
b. Extoration C.J.M. 90 97 • - 41 52 93 94
c. Robbery and Decoity C.J.M. 3619 2236 7 2 1368 982 2350 3496
Sessions 497 285 1 32 128 56 184 565
d. Criminal Misappri- ation of property C.J.M. 25 6 _ 11 1 12 19
Sessions - - - -- - - -- --
e. Criminal breach of Trust C.J.M. 3937 1804 2 4 1164 345 1509 4226
Sessions 8 -- - - -- -- -- 8
: 362 :
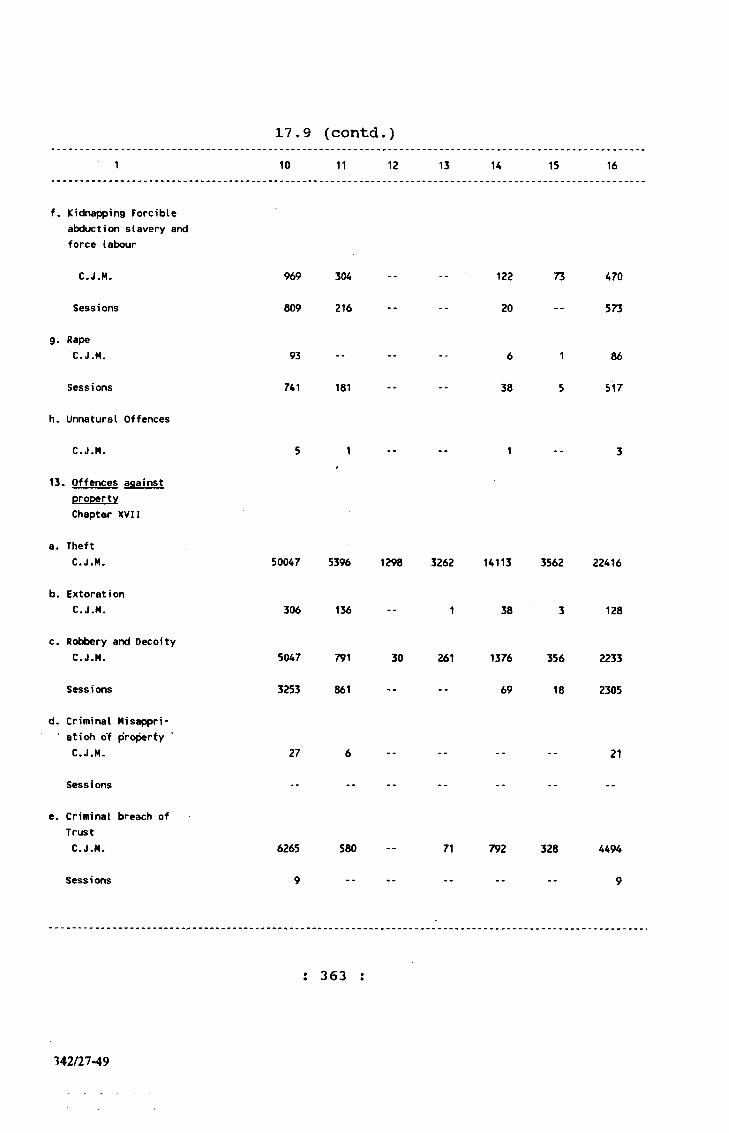
17.9 (contd.)1 10 11 12 13 14 15 16
f. Kidnapping Forcible abduction slavery and force labour
C.J.M. 969 304 -- -- 122 73 470
Sess i ons 809 216 -- -- 20 -- 573
g. Rape C.J.M. 93 -- -- -- 6 1 86
Sessions 741 181 -- -- 38 5 517
h. Unnatural Offences
C.J.M. 5 1 •- -- 1 -- 3
13. Offences against DroDertv Chapter XVII
a. Theft C.J.M. 50047 5396 1298 3262 14113 3562 22416
b. Extoration C.J.M. 306 136 -- 1 38 3 128
c. Robbery and Decoity C.J.M. 5047 791 30 261 1376 356 2233
Sessions 3253 861 -- -- 69 18 2305
d. Criminal Misappri- atioh of pVoperty C.J.M. 27 6 « - • - . . 21
Sessions -- -- •• -- -* -- --
e. Criminal breach of Trust C.J.M. 6265 580 71 792 328 4494
Sessions 9 • * 9
; 363 :
342/27-49
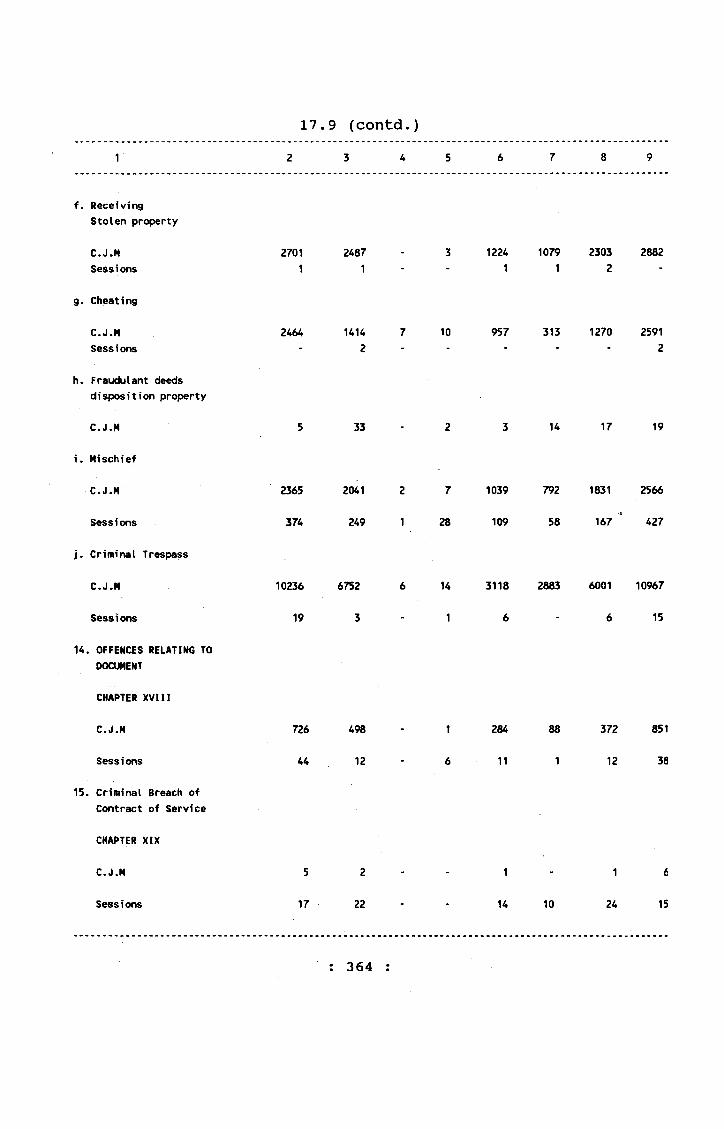
17.9 (contd.)1 2 3 4 5 6 7 8 9
f. ReceivingStolen property
C.J.M 2701 2487 3 1224 1079 2303 2882Sessions 1 1 - - 1 1 2 -
g. Cheating
C.J.M 2464 1414 7 10 957 313 1270 2591Sessions - 2 - - - - - 2
h. Fraudulant deeds disposition property
C.J.M 5 33 2 3 14 17 19
i. Mischieif
C.J.M 2365 2041 2 7 1039 792 1831 2566
Sessions 374 249 1 28 109 58 167 ’ 427
j. Criminal Trespass
C.J.M 10236 6752 6 14 3118 2883 6001 10967
Sessions 19 3 - 1 6 - 6 15
14. OFFENCES RELATING TO DOCUMENT
CHAPTER XVIII
C.J.M 726 498 1 284 88 372 851
Sessions 44 12 - 6 11 1 12 38
15. Criminal Breach of Contract of Service
CHAPTER XIX
C.J.M 5 2 1 1 6
Sessions 17 22 - - 14 10 24 15
: 364
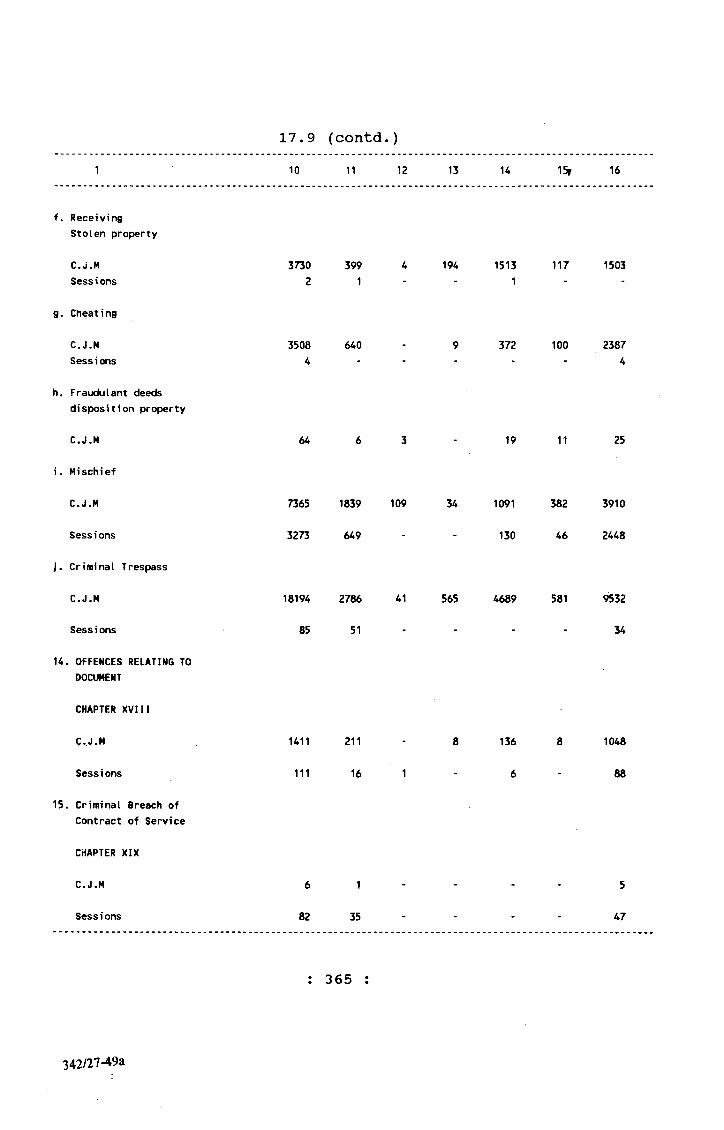
17.9 (contd.)1 10 11 12 13 14 15f 16
f. ReceivingStolen property
C. j.H 3730 399 4 194 1513 117 1503Sessions 2 1 - - 1 - -
g. Cheating
C.J.M 3508 640 9 372 100 2387Sess i ons 4 - - - * - 4
h. Fraudulant deeds disposition property
C.J.M 64 6 3 19 11 25
i. Mischief
C.J.M 7365 1839 109 34 1091 382 3910
Sessions 3273 649 - - 130 46 2448
j. Criminal Trespass
C.J.M 18194 2786 41 565 4689 581 9532
Sessions 85 51 - - - - 34
14. OFFENCES RELATING TO DOCUMENT
CHAPTER XVIII
C.J.M 1411 211 8 136 8 1048
Sessions 111 16 1 - 6 - 88
15. Criminal Breach of Contract of Service
CHAPTER XIX
C.J.M 6 1 5
Sessions 82 35 - - - - 47
: 365 :
wai-A92i
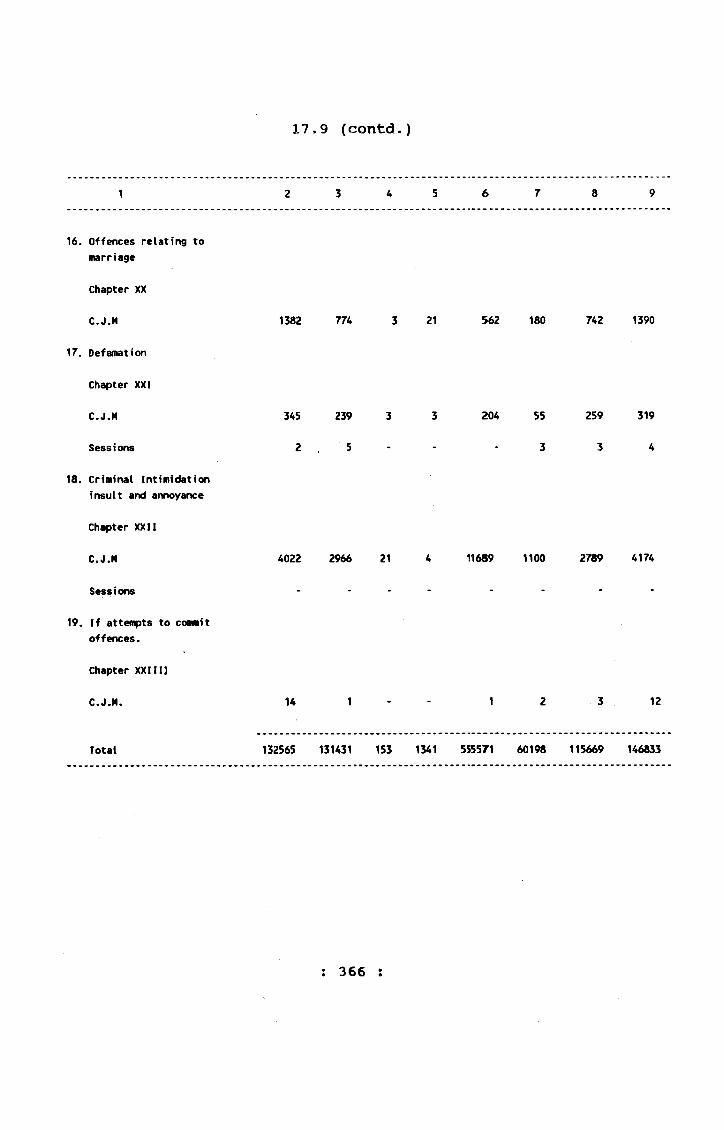
17.9 (contd.)
2 3 4 5 6 7
16. Offences relating to marriage
Chapter XX
C.J.M
17. Defamation
Chapter XXI
C.J.M
SessicNis
18. Criminal Intimidation insult and annoyance
Chapter XXII
C.J.M
Sessions
19. If attempts to commit offences.
Chapter XXIII]
C.J.M.
Total
1382 774 3 21
345 239 3 3
2 5
14
562 180 742 1390
204 55 259 319
3 3 4
4022 2966 21 4 11689 1100 2789 4174
12
132565 131431 153 1341 5S5571 60198 115669 146833
: 366 :
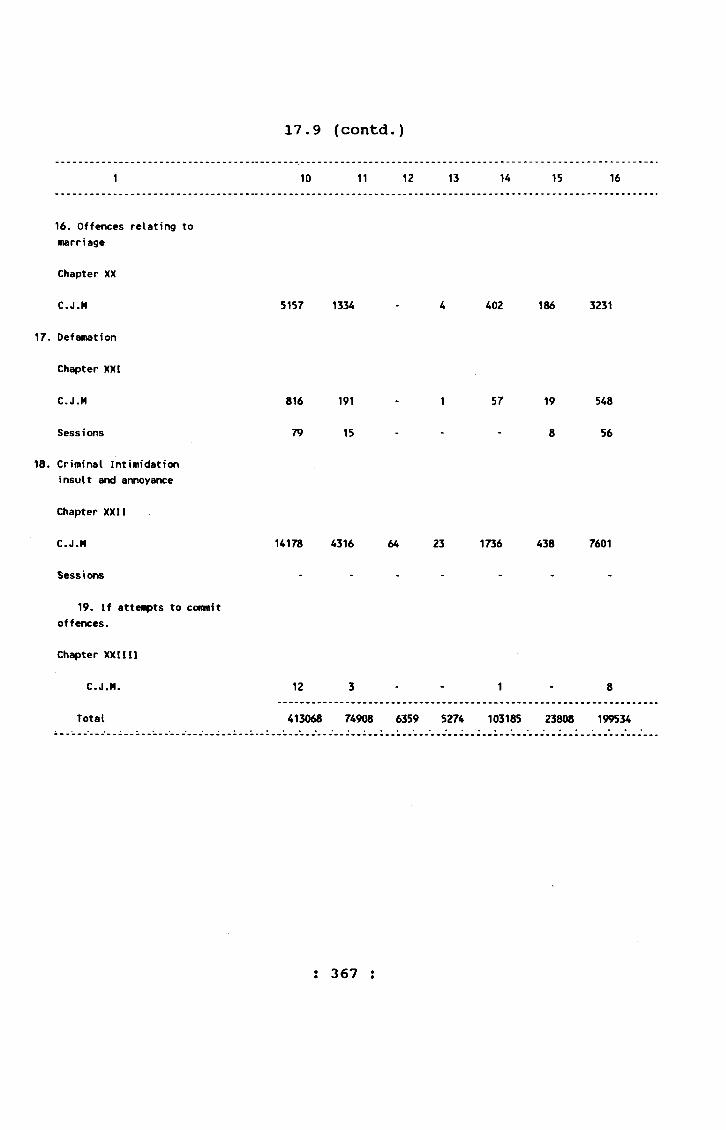
17.9 (contd.)
10 11 12 13 14 15 16
16. Offences relating to marriage
Chapter XX
C.J.H
17. Defamation
Chapter XXI
C.J.M
Sessions
18. Criminal Intimidation insult and annoyance
Chapter XXII
C.J.M
Sessi ons
19. If attempts to conmit offences.
Chapter XXI11]
C.J.M.
Total
5157 1334
816 191
79 15
12
4 402 186 3231
57 19 548
8 56
14178 4316 64 23 1736 438 7601
413068 74908 6359 5274 103185 23808 199534
: 367 :
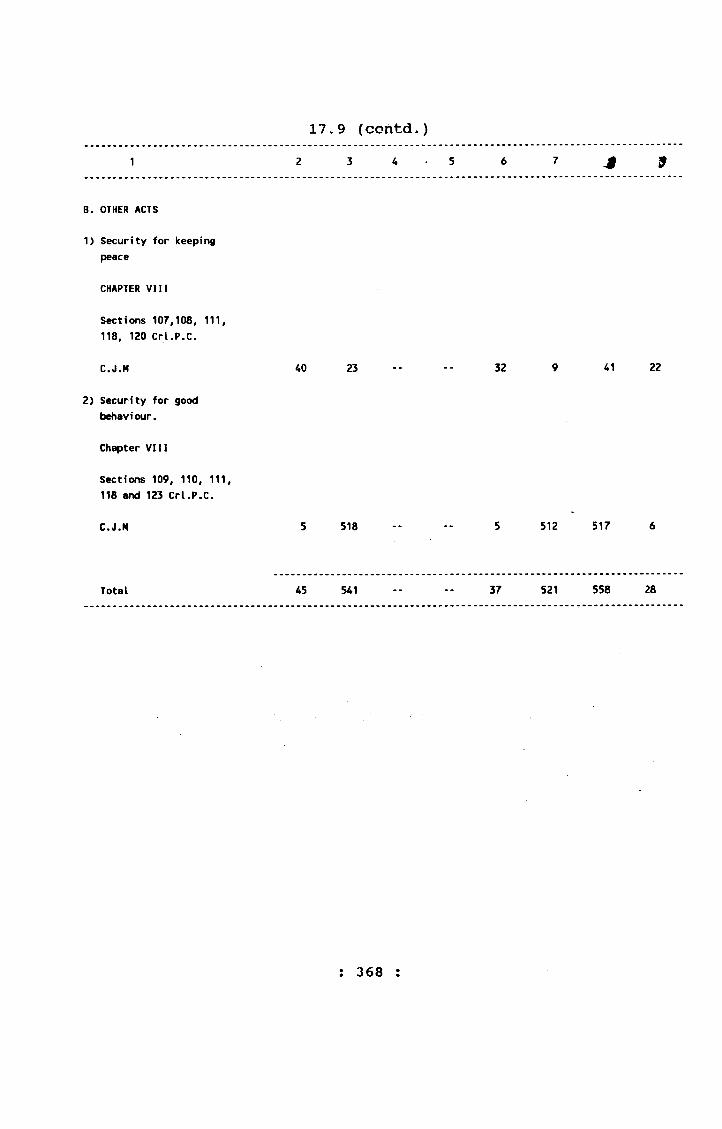
2 3 4 - 5 6 7 ^ 9
17.9 (contd.)
B. OTHER ACTS
1) Security for keeping peace
CHAPTER Vni
Sections 107,108, 111, 118, 120 Crl.P.C.
C.J.H 40 23 32 9 41 22
2) Security for good behaviour.
Chapter VIII
Sections 109, 110, 111, 118 and 123 Crl.P.C.
C.J.M 5 518 5 512 517 6
Total 45 541 37 521 558 28
: 368 :

10 11 12 13 14 15 16
17.9 (contd.)
B. OTHER ACTS
1) Security for keeping peace
CHAPTER VIII
Sections 107,108, 111, 118, 120 Crl.P.C.
C.J.M 1217 852 365
2) Security for good behaviour.
Chapter VIII
Sections 109, 110, 111, 118 and 123 Crl.P.C.
C.J.M 520 241 273
Total 1737 1093 273 371
; 369 :
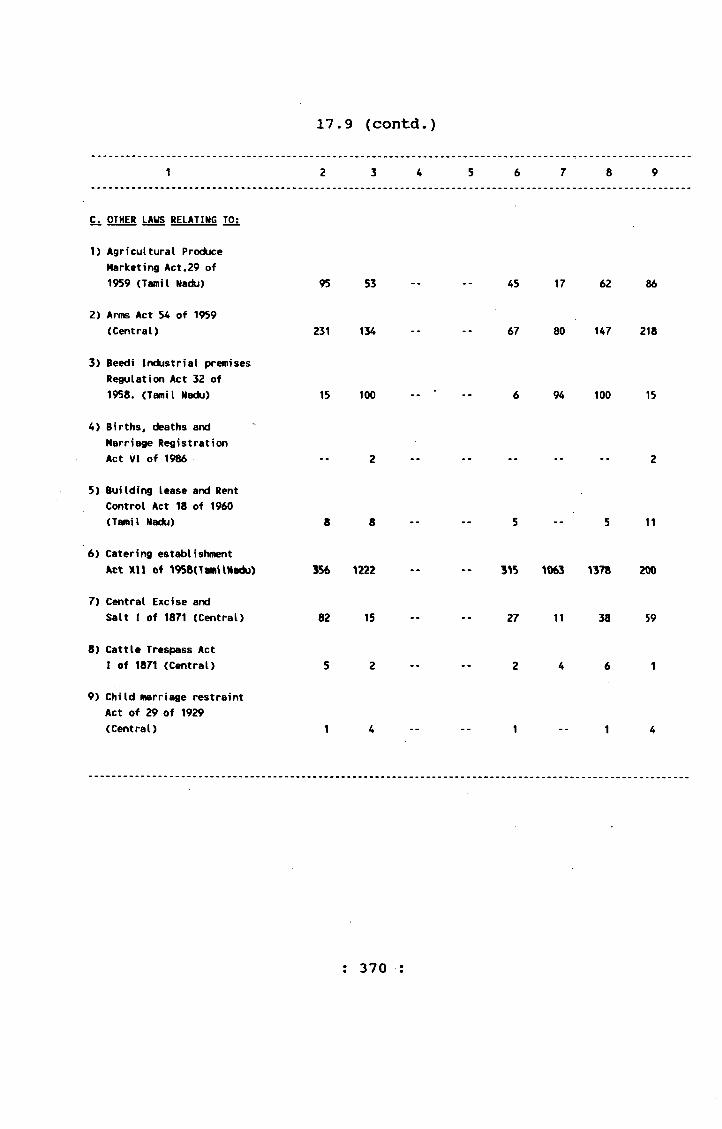
17.9 (contd.)
1 2 3 4 5 6 7 8 9
C. OTHER LAWS RELATING TO:
1) Agricultural Produce Marketing Act.29 of 1959 (Tamil Nadu) 95 53 .. .. 45 17 62 86
2) Arms Act 54 of 1959 (Central) 231 134 -- -- 67 80 147 218
3) Beedi Industrial premises Regulation Act 32 of 1958. (Tamil Nadu) 15 100 . . . 6 94 100 15
4) Births, deaths and Marriage Registration Act VI of 1986 .. 2 „ „ .. .. 2
5) Building lease and Rent Control Act 18 of 1960 (Tamil Nadu) 8 8 5 5 11
6) Catering establishment Act XII of ^9S&(TanUHadu) 356 1222 -- 315 m 3 1378 200
7) Central Excise andSalt I of 1871 (Central) 82 15 -- -- 27 11 38 59
8) Cattle Trespass Act I of 1871 (Central) 5 2 -- -- 2 4 6 1
9) Child marriage restraint Act of 29 of 1929 (Central) 1 4 -- -- 1 -- 1 4
; 370 :
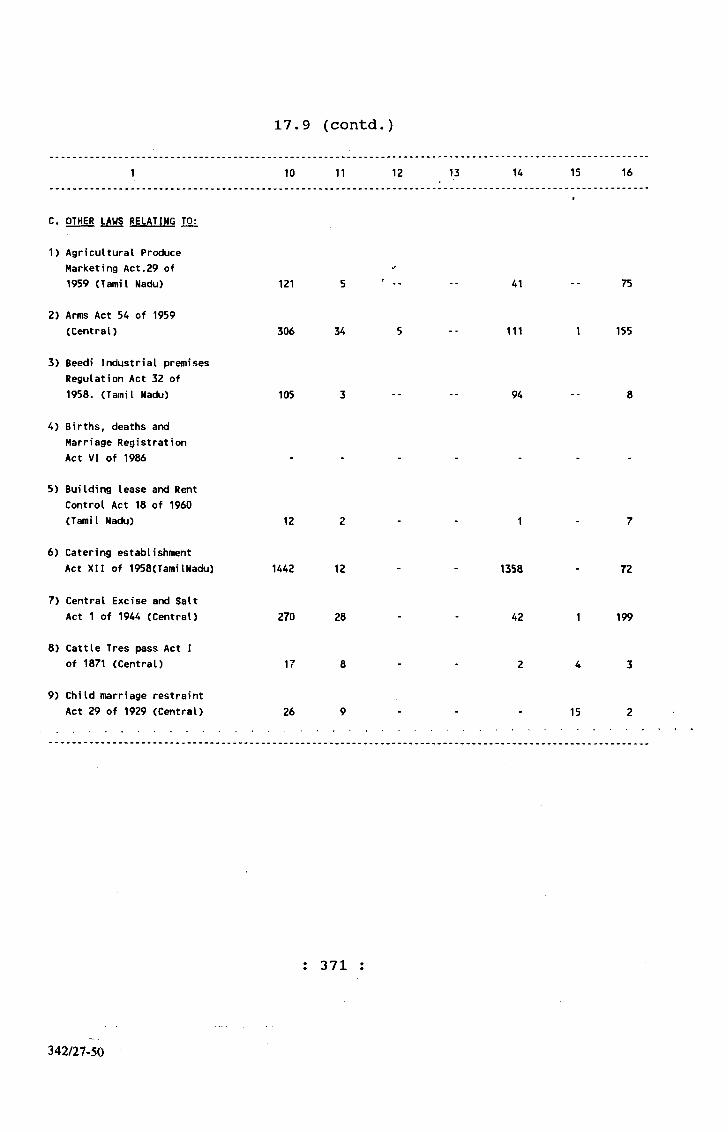
17.9 (contd.)
1 10 11 12 13 14 15 16
C. OTHER LAWS RELATING TO:
1) Agricultural Produce Marketing Act.29 of 1959 (Tamil Nadu) 121 5 t 41
1
75
2) Arms Act 54 of 1959 (Central) 306 34 5 -- 111 1 155
3) Beedi Industrial premises Regulation Act 32 of 1958. (Tamil Nadu) 105 3 94 8
4) Births, deaths and Marriage Registration Act VI of 1986 . . . . ,
5) Building lease and Rent Control Act 18 of 1960 (Tamil Nadu) 12 2 . . 1 . 7
6) Catering establishment Act XII of 1958(TamilNadu) 1442 12 - - 1358 - 72
7) Central Excise and Salt Act 1 of 1944 (Central) 270 28 - - 42 1 199
8) Cattle Tres pass Act I of 1871 (Central) 17 8 - - 2 4 3
9) Child marriage restraint Act 29 of 1929 (Central) 26 9 - - - 15 2
: 371
342/27-50
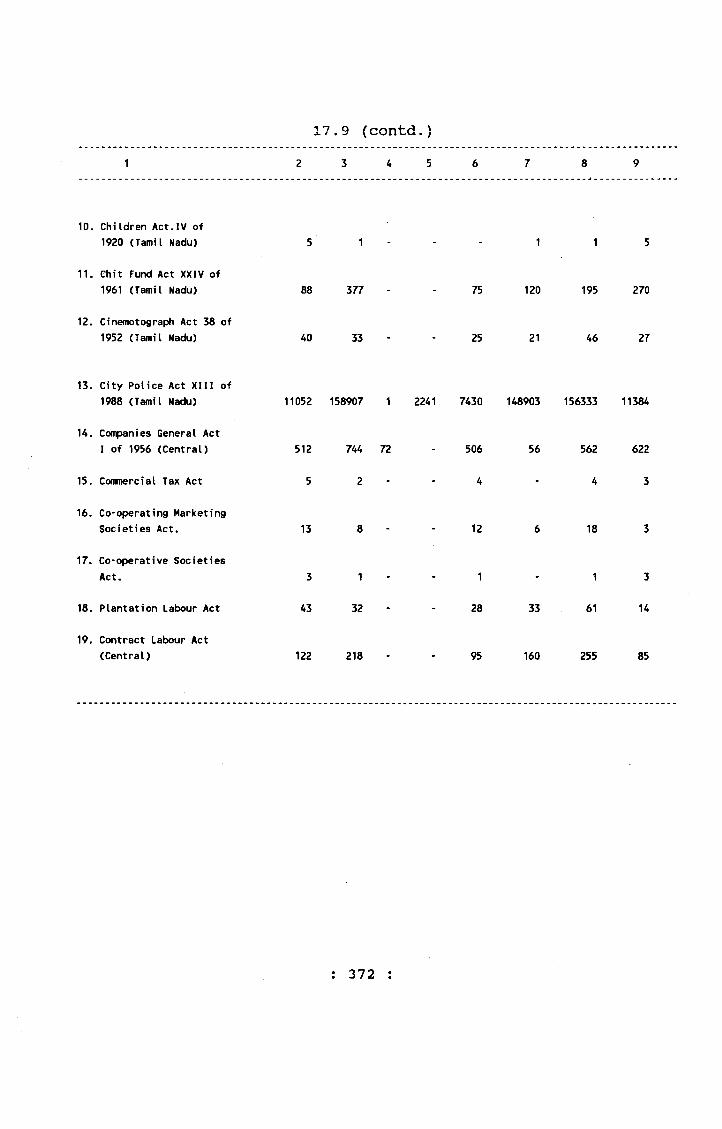
17.9 (contd.)1 2 3 4 5 6 7 8 9
10. Children Act.IV of 1920 (Tamil Nadu) 5 1 1 1 5
11. ehit Fund Act XXIV of 1961 (Tamil Nadu) 88 377 - - 75 120 195 270
12. Cinemotograph Act 38 of 1952 (Tamil Nadu) 40 33 - - 25 21 46 27
13. City Police Act XIII of 1988 (Tamil Nadu) 11052 158907 1 2241 7430 148903 156333 11384
14. Companies General Act I of 1956 (Central) 512 744 72 - 506 56 562 622
15. Commercial Tax Act 5 2 - - 4 - 4 3
16. Co-operating Marketing Societies Act. 13 8 - - 12 6 18 3
17. Co-operative Societies Act. 3 1 - - 1 - 1 3
18. Plantation Labour Act 43 32 - - 28 33 61 14
19. Contract Labour Act (Central) 122 218 - - 95 160 255 85
: 372 :

17.9 (contd.)1 10 11 12 13 14 15 16
10. Children Act.IV of 1920 (Tamil Nadu) 7 7
11. Chit Fund Act XXIV of 1961 (Tamil Nadu) 495 22 - - 180 - 293
12. Cinemotograph Act 38 of 1952 (Tamil Nadu) 81 10 - - 26 1 44
13. City Police Act XIII of 1988 (Tamil Nadu) 193475 2561 3879 106 179610 911 6408
14. Companies General Act I of 1956 (Central) 2382 133 - - 1072 44 1133
15. Commercial Tax Act 3 - - - 2 - 1
16. Co-operating Marketing Societies Act. 20 12 - - 6 - 2
17. Co-operative Societies Act. 3 - - - 1 - 2
18. Plantation Labour Act 63 5 - - 58 -
19. Contract Labour Act (Central) 269 5 - 255 - 9
: 373
342/27-50a

17.9 (contd.)1 2 3 4 5 6 7 8 9
20. Copyright Act XIV of 1957 (Central) 32 50 1 19 15 34 47
21. Corporation Act II of 1947 (Central) 150 102 - - 27 22 49 203
22. Commodities and Packages Act - 1 - - 1 1 -
23. Criminal Law Amendment Act XIV of 1908 (Central) 103 72 - - 43 18 61 114
24, Customs Act 52 of 1962 (Central) 557 416 - - 165 182 347 626
25. Dangerous Drugs Act 34 of 1947 (Tamil Nadu) 106 89 - - 51 22 73 122
26. Defence of India Rules Act 51 of 1962 (Central) - 1 - - - 1 1 -
27. Denatured spirit Methyl Alchohol Act - - - - - - - -
28. District Municipalities Act V of 1920 (Tamil Nadu) 4154 8079 - 113 3924 7225 11149 971
: 374 :

26. Defence of India Rules Act 61 of 1962 (Central)
27. Der^tured spirit Hethyl Alchohol Act
17.9 (contd.)
10 11 12 13 14 15 16
20. Copyright Act XIV of 1957 (Central) 65 16 13 36
21. Corporation Act II of 1947 (Central) 576 29 49 1 497
22. Conniodities and Packages Act 2 2
23. Criminal Law Amendment Act XIV of 1908 (Central) 454 148 12 33 261
24, Customs Act 52 of 1962 (Central) 811 32 287 27 465
25. Dangerous Drugs Act 34 of 1947 (Tamil Nadu) 142 8 54 6 74
28. District Municipalities Act V of 1920 (Tamil Nadu) 9489 459 44 8776 39 1711
; 375 :
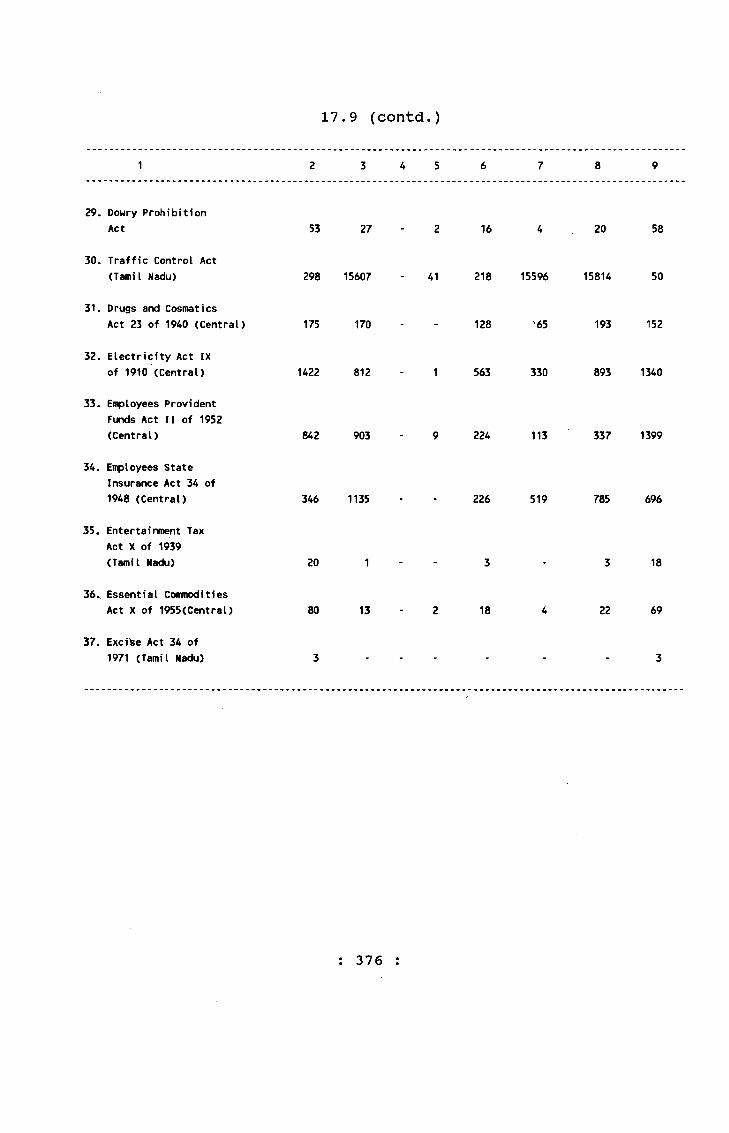
17.9 (contd.)
1 2 3 4 5 6 7 8 9
29. Dowry Prohibition Act 53 27 2 16 4 20 58
30. Traffic Control Act (Tamil Nadu) 298 15607 - 41 218 15596 15814 50
31. Drugs and CosmaticsAct 23 of 1940 (Central) 175 170 - - 128 ’65 193 152
32. Electricity Act IX of 1910 (Central) 1422 812 - 1 563 330 893 1340
33. Employees Provident Funds Act II of 1952 (Central) 842 903 9 224 113 337 1399
34. Employees StateInsurance Act 34 of 1948 (Central) 346 1135 226 519 785 696
35. Entertainment Tax Act X of 1939 (Tamil Nadu) 20 1 _ 3 3 18
36. Essential Conmodities Act X of 1955(Central) 80 13 - 2 18 4 22 69
37. Exci)se Act 34 of 1971 (Tamil Nadu) 3 - - - - - - 3
: 376 :
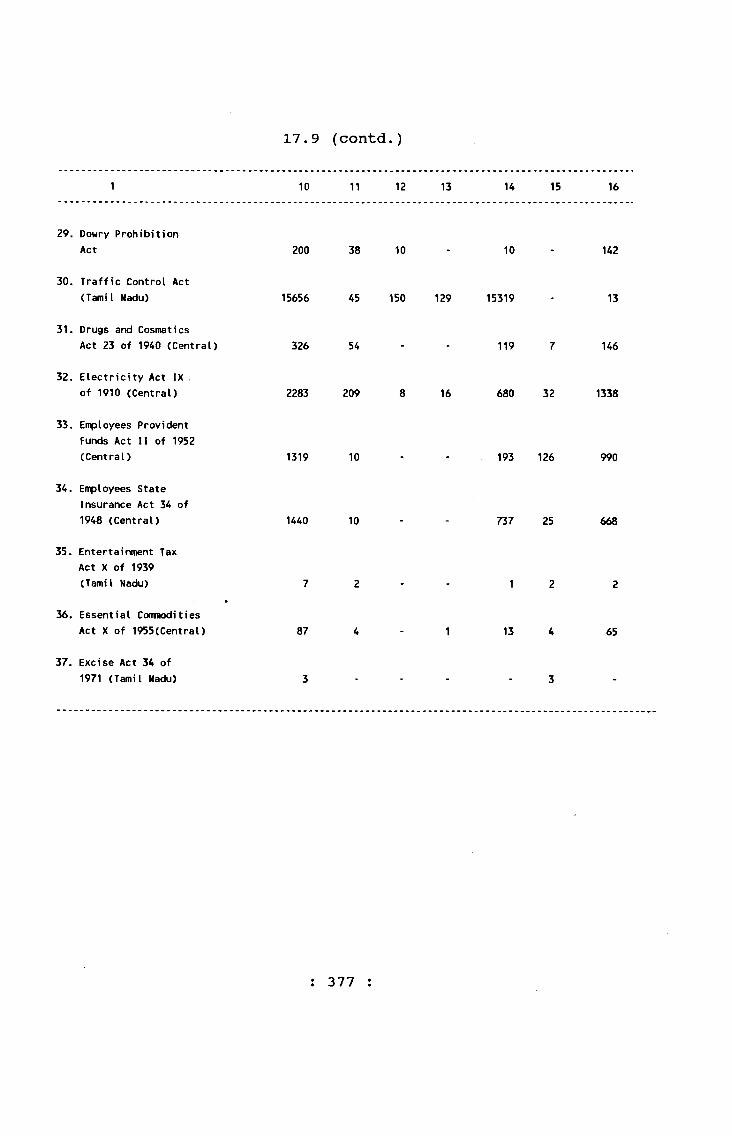
37. Excise Act 34 of 1971 (Tamil Nadu)
17.9 (contd.)
10 11 12 13 U 15 16
29. Dowry Prohibition Act 200 38 10 10 142
30. Traffic Control Act (Tamil Nadu) 15656 45 150 129 15319 13
31. Drugs and CosmaticsAct 23 of 1940 (Central) 326 54 119 7 146
32. Electricity Act IX of 1910 (Central) 2283 209 8 16 680 32 1338
33. Employees Provident Funds Act II of 1952 (Central) 1319 10 193 126 990
34. Employees StateInsurance Act 34 of 1948 (Central) 1440 10 737 25 668
35. Entertainment Tax Act X of 1939 (Tamil Nadu) 1 2
36. Essential Comnodities Act X of 1955(CentraI) 87 13 4 65
: 377 :
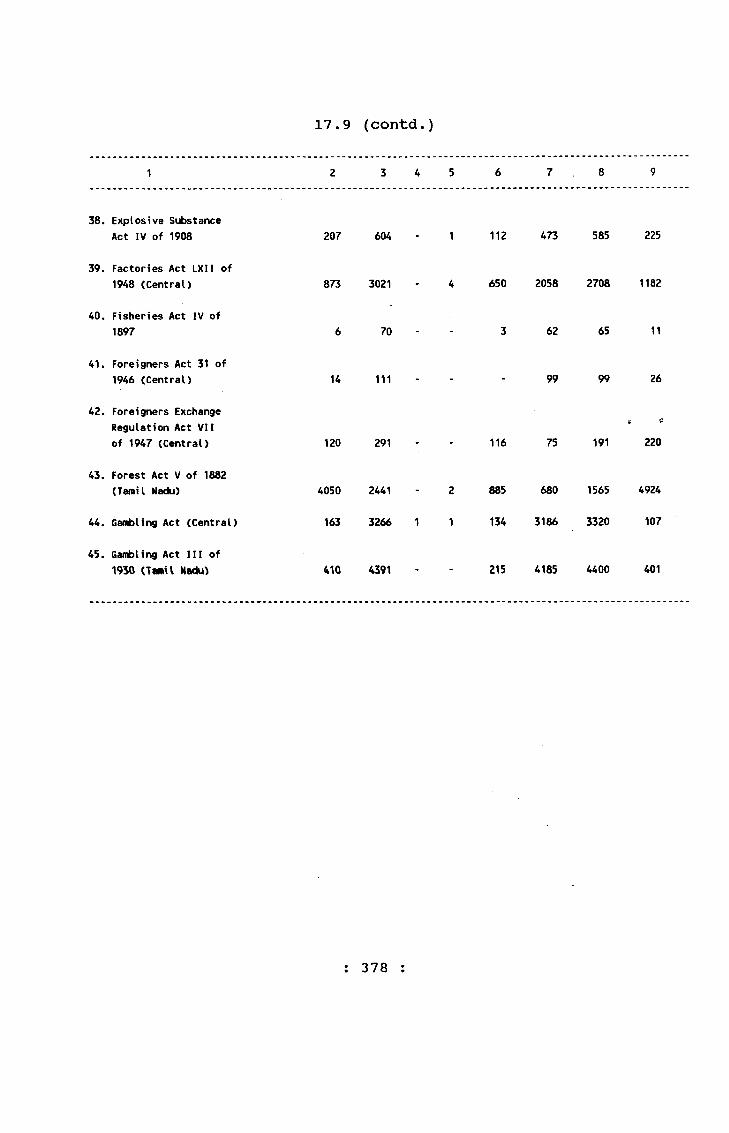
17.9 (contd.)
1 2 3 4 5 6 7 8 9
38. Explosive Substance Act IV of 1908 207 604 1 112 473 585 225
39. Factories Act LXII of 1948 (Central) 873 3021 - 4 650 2058 2708 1182
40. Fisheries Act IV of 1897 6 70 - - 3 62 65 11
41. Foreigners Act 31 of 1946 (Central) 14 111 • - - 99 99 26
42. Foreigners Exchange Regulation Act VII of 1947 (Central) 120 291 . _ 116 75 191 220
43. Forest Act V of 1882 (Tamil Nadu) 4050 2441 - 2 885 680 1565 4924
44. GcHnbling Act (Central) 163 3266 1 1 134 3186 3320 107
45. Gambling Act III of 1930 Nadu) 410 4391 - - 215 4185 4400 401
: 378 :

17.9 (contd.)
10 11 12 13 14 15 16
38. Explosive Substance Act IV of 1908
39. Factories Act LXII of 1948 (Central)
40. Fisheries Act IV of 1897
41. Foreigners Act 31 of 1946 (Central)
42. Foreigners Exchange Regulation Act VII of 1947 (Central)
43. Forest Act V of 1882 (Tamil Nadu)
44. Gambling Act (Central)
45. Gambling Act III of 1930 (Tamil Nadu)
898 149
3174 83
68
116
496 8
1 574 8 166
2301 28 762
53
103
189
13
299
5033 427 3 8 1349 48 3198
15786 294 277 - 14991 21 203
20895 174 296 2 19388 56 979
: 379
342/27-51
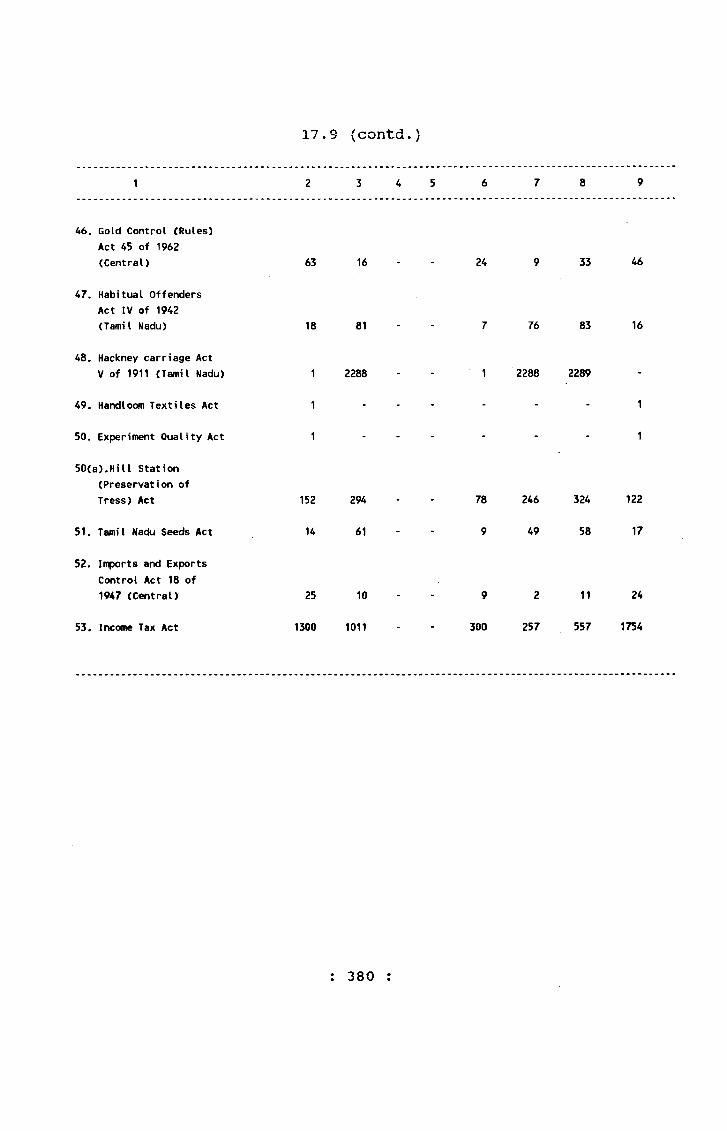
17.3 (contd.)
1 2 3 4 5 6 7 8 9
46. Gold Control (Rules) Act 45 of 1962 (Central) 63 16 24 9 33 46
47. Habitual Offenders Act IV of 1942 (Tamil Nadu) 18 81 _ _ 7 76 83 16
48. Hackney carriage Act V of 1911 (Tamil Nadu) 1 2288 - - 1 2288 2289 - .
49. Handloom Textiles Act 1 - - - - - - 1
50. Experiment Quality Act 1 - - - - - - 1
50(a).Hill Station (Preservation of Tress) Act 152 294 . 78 246 324 122
51. Tamil Nadu Seeds Act 14 61 - • 9 49 58 17
52. Imports and Exports Control Act 18 of 1947 (Central) 25 10 . . 9 2 11 24
53. Income Tax Act 1300 1011 300 257 557 1754
: 380 :

17.9 (contd.)
1 10 11 12 13 14 15 16
46. Gold Control (Rules) Act 45 of 1962
(Central) 138 26 43 1 68
47. Habitual Offenders Act IV of 1942
(Tamil Nadu) 83 76 6 1
48. Hackney carriage Act V of 1911 (Tamil Nadu) 2291 - - - 2291 • -
49. Handloom Textiles Act 1 - - - - - 1
50. Experiment Quality Act 14 - - - - - 14
50(a).Hill Station (Preservation of Tress) Act 389 9 _ 308 _ 70
51. Tamil Nadu Seeds Act 114 10 - - 84 - 20
52. Imports and Exports Control Act 18 of 1947 (Central) 60 1 17 42
53. Income Tax Act 4038 52 - - 665 18 3303
: 381
342/27-5 la
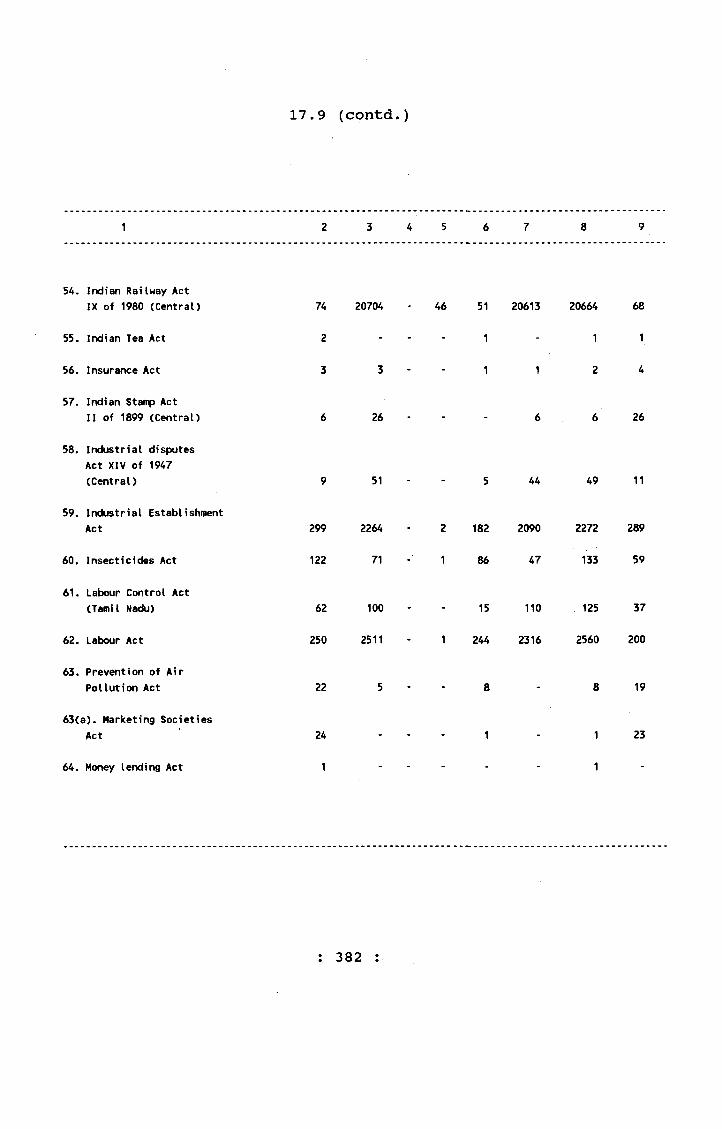
17.9 (contd.)
1 2 3 4 5 6 7 8 9
54. Indian Railway ActIX of 1980 (Central) 74 20704 - 46 51 20613 20664 68
55. Indian Tea Act 2 - - • 1 - 1 1
56. Insurance Act 3 3 - - 1 1 2 4
57. Indian Stamp ActII of 1899 (Central) 6 26 - - - 6 6 26
58. Industrial disputes Act XIV of 1947(Central) 9 51 - - 5 44 49 11
59. Industrial EstablishmentAct 299 2264 - 2 182 2090 2272 289
60. Insecticides Act 122 71 -■ 1 86 47 133 59
61. Labour Control Act(TamiI Nadu) 62 100 - - 15 110 125 37
62. Labour Act 250 2511 - 1 244 2316 2560 200
63. Prevention of AirPollution Act 22 5 - - 8 - 8 19
63(a). Marketing SocietiesAct 24 - - - 1 - 1 23
64. Money lending Act 1 1
: 382 :
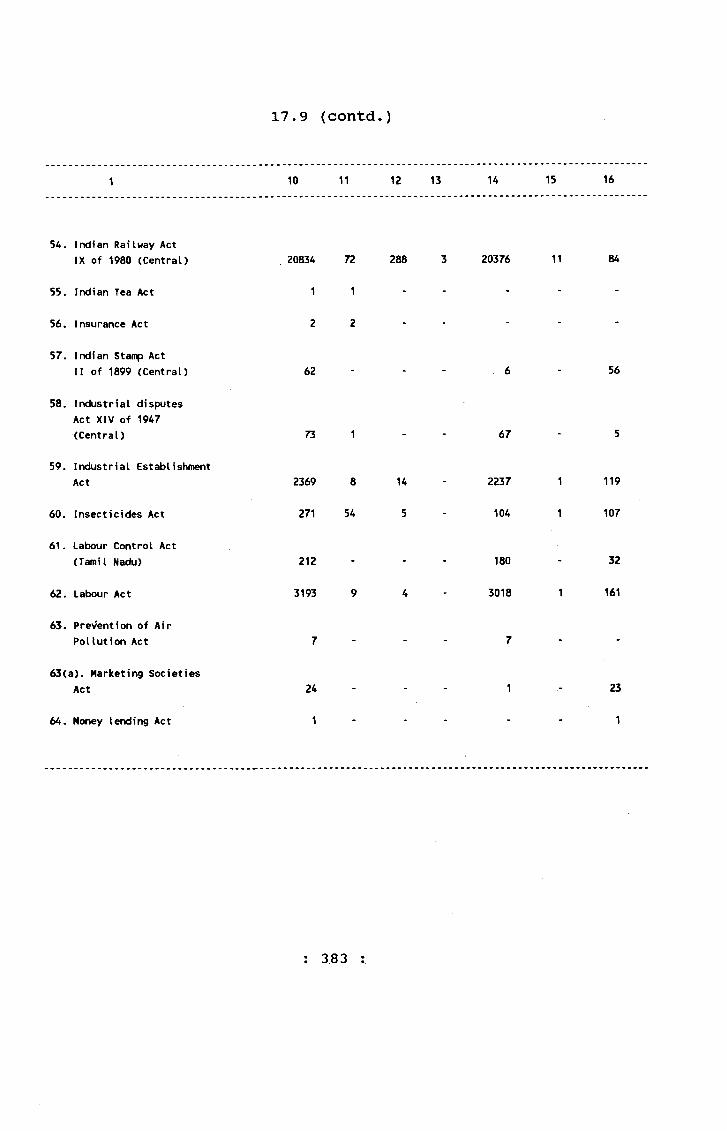
17.9 (contd.)
1 10 11 12 13 14 15 16
54. Indian Railway Act IX of 1980 (Central) 20834 72 288 3 20376 11 84
55. Indian Tea Act 1 1 - - - - -
56. Insurance Act 2 2 - - - - -
57. Indian Stamp ActII of 1899 (Central) 62 - - - 6 - 56
58. Industrial disputes Act XIV of 1947 (Central) 73 1 . . 67 - 5
59. Industrial Establishment Act 2369 8 14 - 2237 1 119
60. Insecticides Act 271 54 5 - 104 1 107
61. Labour Control Act (Tamil Nadu) 212 - - - 180 - 32
62. Labour Act 3193 9 4 - 3018 1 161
63. Prevention of Air Pollution Act 7 - - - 7 - -
63(a). Marketing Societies Act 24 - - - 1 - 23
64. Money lending Act 1 • ■
‘ '
1
; 383 :

17.9 (contd.)
1 2 3 4 5 6 7 8 9
65. Mines and Minerals(Regulation and Development) Act 67 of 1957 19 3 4 3 7 15
66. Minimum Wages Act XI of 1948 (Central) 434 1917 - 69 356 1475 1831 451
67. Motor Transport Workers Act 27 of 1961 (Central) 24 315 3 - 24 279 303 33
68. Motor Vehicles Act] IV of 1939 40362 310657 - 9789 36195 231926 268121 73109
69. Motor VehiclesTaxation Act III of 1931 (Tamil Nadu) 14 182 _ 3 182 185 11
70. Opium Act XIII of 1859 (Central) 15 10 - - 10 2 12 13
71. Provincial Insolvency Act 1 - - - - - ■- 1
72. Paddy and Rice Movement Control Order 1964 (Tamil Nadu) 4 . 1 1 3
73. Panchayat Act 35 of 1958 (Tamil Nadu) 557 2066 - 185 357 1435 1792 646
74. Passport Act XXXIV of 1920 (Central) 94 415 - - 69 311 380 139
: 384 :

17.9 (contd.)
1 10 11 12 13 14 15 16
65. Mines and Minerals(Regulation and Development) Act 67 of 1957 18 1 8 9
66. Minimum Wages Act XI of 1948 (Central) 2145 83 1 - 1780 1 280
67. Motor Transport Workers Act 27 of 1961 (Central) 301 1 3 - 287 -- 10
68. Motor Vehicles Act] IV of 1939 262348 1947 382 2 254164 28 5825
69. Motor VehiclesTaxation Act III of 1931 (Tamil Madu) 192 184 8
70. Opium Act XIII of 1859 (Central) 14 1 - - 8 1 4
71. Provincial Insolvency Act 1 - - - - - 1
72. Paddy and Rice Movement Control Order 1964 (Tamil Nadu) .
73. Panchayat Act 35 of 1958 (Tamil Nadu) 1619 182 - • 668 - ■ 169
74. Passport Act XXXIV of 1920 (Central) 520 16 - - 499 - 5
; 385 :
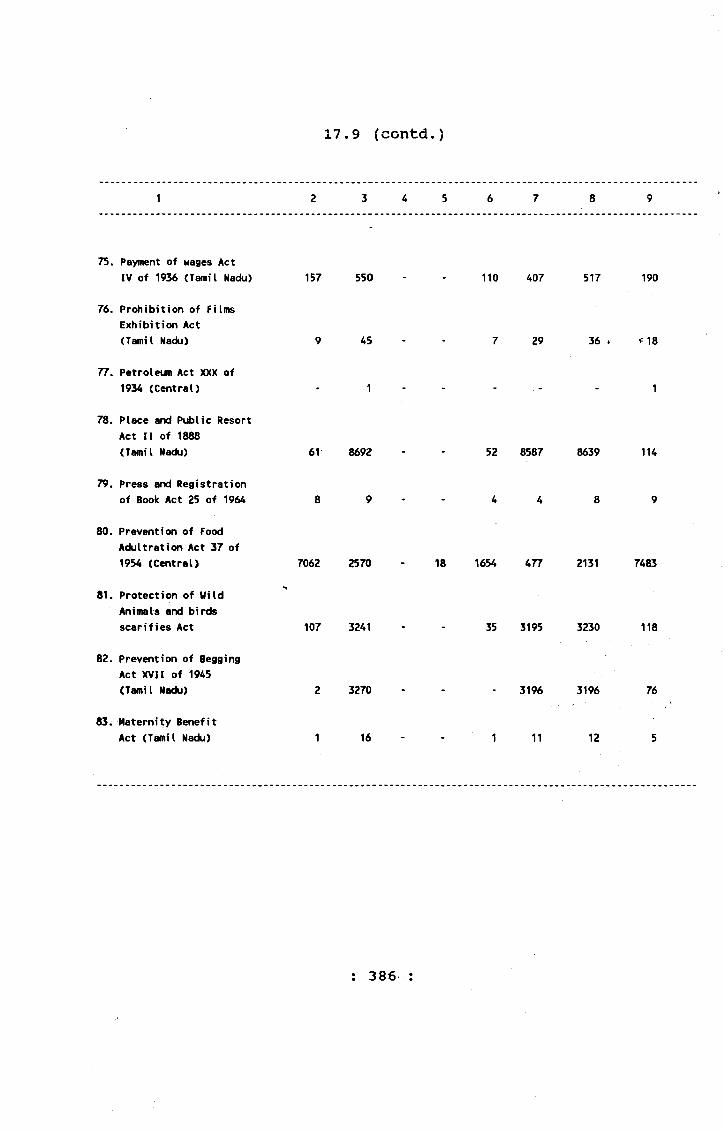
17.9 (contd.)
1 2 3 4 5 6 7 8 9
7S. Payment of wages Act IV of 1936 (Tamil Nadu) 157 550 110 407 517 190
76. Prohibition of Films Exhibition Act (Tamil Nadu) 9 45 7 29 36 .. 18
77. Petroleum Act XXX of 1934 (Central) - 1 - - - - 1
78. Place and Public Resort Act II of 1888 (Tamil Nadu) 61 8692 52 8587 8639 114
79. Press and Registration of Book Act 25 of 1964 8 9 - - 4 4 8 9
80. Prevention of Food Acfcjltration Act 37 of 1954 (Central) 7062 2570 18 1654 477 2131 7483
81. Protection of Wild Animals and birds scarifies Act 107 3241 . 35 3195 3230 118
82. Prevention of Begging Act XVII of 1945 (Tamil Nadu) 2 3270 3196 3196 76
83i Maternity Benefit Act (Tamil Nadu) 1 16 - - 1 11 12 5
386

17.9 (contd.)
1 10 11 12 13 14 15 16
75. Payment of wages ActIV of 1956 (Tamil Nadu) 516 2 486 5 23
76. Prohibition of Films Exhibition Act (Tamil Nadu) 73 17 21 35
77. Petroleum Act XXX of 1934 (Central) - 1 - - - - 1
78. Place and Public Report Act 11 of 1868 (Tamil Nadu) 8736 9 154 8537 15 21
79. Press and Registration of Book Act 25 of 1964 24 1 - - 13 - 10
80. Prevention of FoodAdultration Act 37 of 1954 (Central) 6657 731 5 2 1404 104 4411
81. Protection of Wild Animals and birds scarifies Act 3336 20 7 3222 3 84
82. Prevention of Begging Act XVII of 1945
. (Tamil Nacfej) 3271 17 248S 760
83. Maternity Benefit Act (Tamil Nadu) 13 - - - 11 - 2
: 387
342/27-52
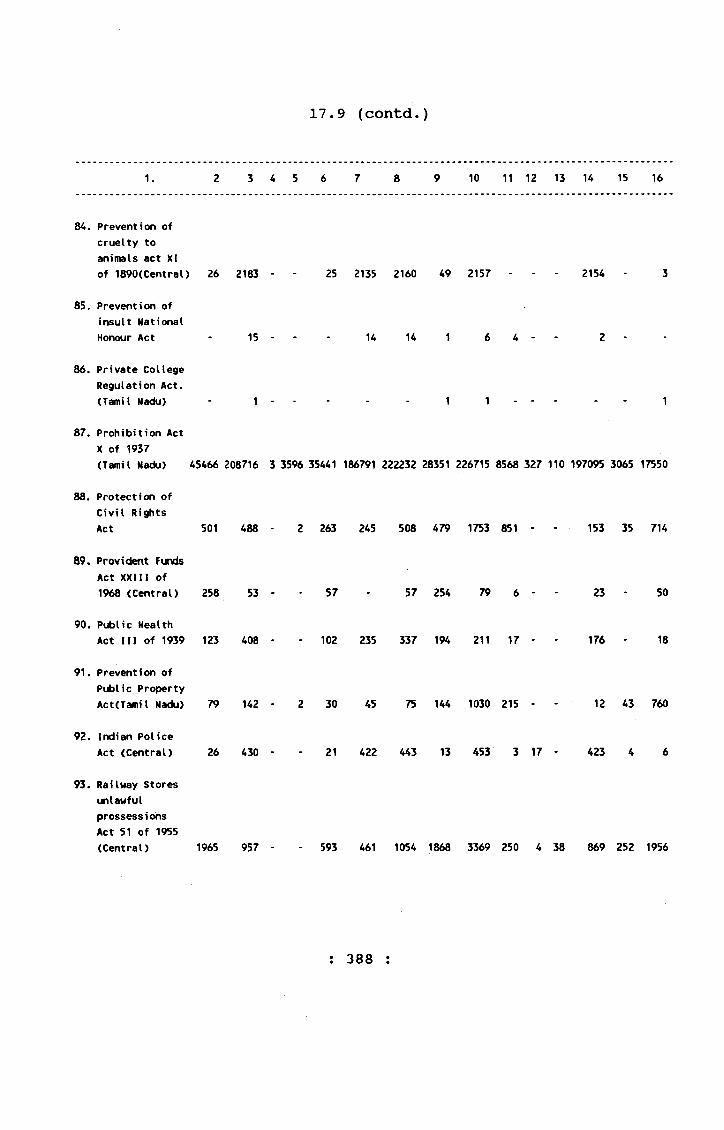
17.9 (contd.)
1, 2 3 4 5 6 7 8 9 10 11 12 13 14 15 16
84. Prevention of cruelty to animals act XIof 1890(Central) 26 2183 - - 25 2135 2160 49 2157 - - - 2154 - 3
85. Prevention of insult NationalHonour Act - 1 5 - - - 14 14 1 6 4 - - 2 -
86. Private College Regulation Act.(Tamil Nadu) - 1 - - - - - 1 1 - - - - - 1
87. Prohibition Act X of 1937(Tamil Nackj) 45466 208716 3 3596 35441 186791 222232 28351 226715 8568 327 110 197095 3065 17550
88. Protection of Civil RightsAct 501 488 - 2 263 245 508 479 1753 851 - - 153 35 714
89. PrQvi<tent Funds Act xxm of1968 (Central) 258 53 - - 57 - 57 254 79 6 - - 23 - 50
90. Public HealthAct 111 of 1939 123 408 - - 102 235 337 194 211 17 - - 176 - 18
91. Prevention of Public PropertyAct(Tamil Nadu) 79 142 - 2 30 45 75 144 1030 215 - - 12 43 760
92. Indian PoliceAct (Central) 26 430 - - 21 422 443 13 453 3 17 - 423 4 6
93. Railway Stores unlawful prossessiohs Act 51 of 1955(Central) 1965 957 - - 593 461 1054 1868 3369 250 4 38 869 252 1956
: 388 :

17.9 (contd.)
2 3 4 5 6 7 8 9 10 11 12 13 14 15 16
94. Registration of Societies Act. 1 84 23 12 49
95. Railway Protection Force Act 138 14 14 124 181 45 25 111
96. RicemiUing Industry Regulation Act 21 of 1958 (Central) 2 3 5 3 5
97, Road Traffic Rules(Tamil Nadu) 324 38598 233 38355 38588 334 38826 11 889 129 37649 * 148
98. Sandal Wood transit Rules (Tamil Nadu) 21 41
99. Shops and Establishment actXIV (TamilNadu) 3133 28084
lOO.Supressions of immoral traffic in women and girls Act 104of 1956 1627 9018
101.Textile Act
102.Tamil Nadu Exhibition of fiIm as T.V. Screen
. thorugh video, Cassettee Regulation Act
7 11 18 44 71 6 8 2 55
59 2434 25456 27890 3268 28234 88 53 5 27416 23 649
433 1286 7849 9135 1077 9610 238 178 10 8604 27 553
1 1 1
310 325 11 195 107 304 320 540 83 3 176 6 272
: 389
342/27-52a
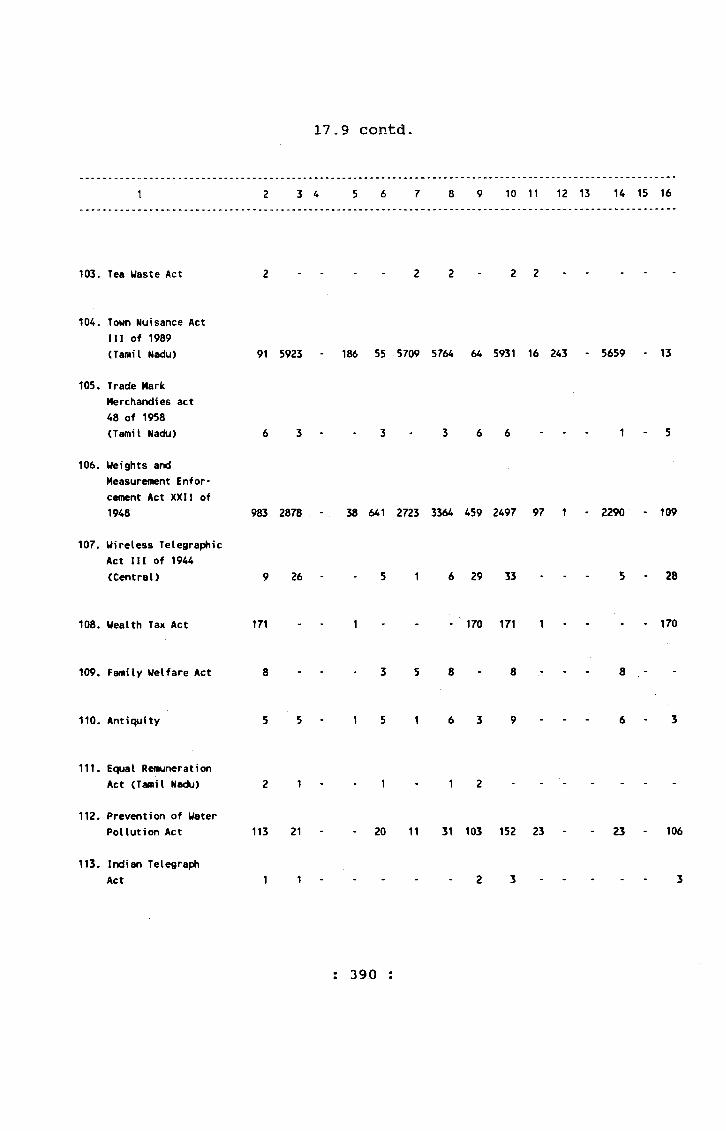
17.9 contd.
2 3 4 5 6 7 8 9 10 11 12 13 14 15 16
103. Tea Waste Act 2 - - - - 2 2 - 2 2
104. Town Nuisance ActIII of 1989(Tamil Nadu) 91 5923 - 186 55 5709 5764 64 5931 16 243 - 5659 - 13
105. Trade Mark Merchandies act 48 of 1958(Tamil Nadu) 6 3 - - 3 - 3 6 6 . . . 1 - 5
106. Weights and Measurement Enforcement Act XXI! of1948 983 2878 - 38 641 2723 3364 459 2497 97 1 - 2290 - 109
107. Wireless Telegraphic Act III of 1944(Central) 9 26 - - 5 1 6 29 33 - - - 5 - 28
108. Wealth Tax Act 171 - - 1 - - - 170 171 1 - - - - 170
109. Famil/ Welfare Act 8 - - * 3 5 8
110. Antiquity 5 5 - 1 5 1 6 3 9
111. Equal RemunerationAct (Tamil Nadu) 2 1 - - 1 - 1 2
112. Prevention of WaterPollution Act 113 21 - - 20 11 31 103 152 23 - - 23 - 106
113. Indian TelegraphAct 1 1 - - - - - 2 3 ...................... 3
: 390 :

17.9 (contd.)
2 3 A 5 6 7 8 9 10 11 12 13 14 15 16
114. Nercotic Act 936 1109 7 151 392 406 798 1089 1386 265 - - 217 37 867
115. NegotiableInstrument Act 2469 5287 5 298 1560 1035 2595 4858 4520 1377 - - 293 25 2825
116. Prevention of Public property Destruction Act. 168 346 91 149 240 274 1967 559 48 10 135 275 940
117. Standard WeightsAct 2 20 1 20 21 1 20 20
118. Market CommitteeAct. 3 12 3 12 15 15 15
119. Prize Chit and Money Circulation Act. 9 6 7 8 24 18
120. Christian Marriage Act underSection 68 - 1 1 1
121. Indiari MedicineAct 27 2 1 1 28 30 1 - 29
122. Hindu Marriage Act 6 18 6 18 21 1 - - 10 - 10
123. Choloarate Act 1 1 - 1
: 391 :
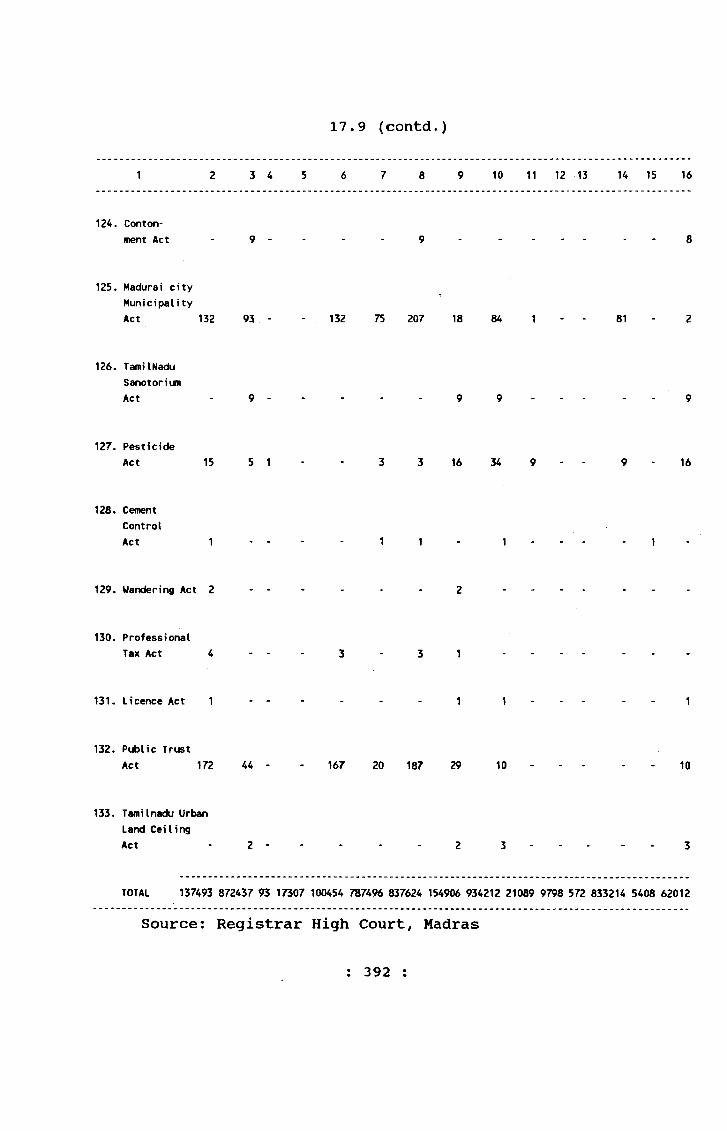
17.9 (contd.)
3 4 5 6 7 8 9 10 11 12 13 U 15 16
124. Conton- ment Act
125. Madurai city MunicipalityAct 132 93 - - 132 75 207 18 84 1 - - 81
126. TamilNadu SanotoriumAct . 9 . . . . . 9 9
127. PesticideAct 15 5 1 - - 3 3 16 34 9 - - 9 - 16
128. Cement ControlAct 1 - - - - 1 1
129. Wandering Act 2
130. ProfessionalTax Act 4 . . . 3 . 3 1
131. Licence Act 1 - - - - - - 1 1
132. Public TrustAct 172 44 - - 167 20 187 29 10 - - - • - 10
133. Tamilnadu Urban Land CeilingAct - 2 .............................2 3
TOTAL 137493 872437 93 17307 100454 787496 837624 154906 934212 21089 9798 572 833214 5408 62012
Source: Registrar High Court, Madras
: 392 ;
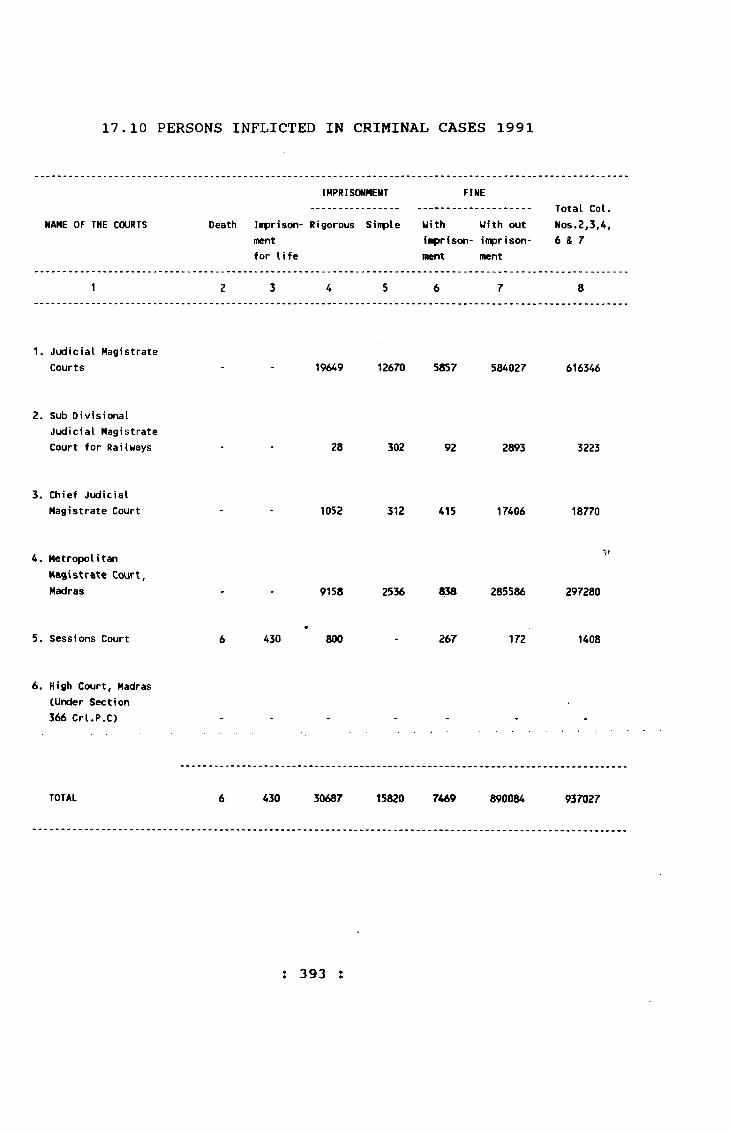
17.10 PERSONS INFLICTED IN CRIMINAL CASES 1991
NAME OF THE COURTS Death Imprisonmentfor life
IMPRISONMENT
Rigorous Simple
FINE
With With out imprison- imprisonment ment
Total Col. Nos.2,3,4, 6 & 7
1 2 3 4 5 6 7 8
1. Judicial Magistrate Courts - - 19649 12670 5857 584027 616346
2. Sub DivisionalJudicial Magistrate Court for Railways - - 28 302 92 2893 3223
3. Chief Judicial Magistrate Court - - 1052 312 415 17406 18770
4. Metropolitan Hagistrate Court, Madras - - 9158 2536 S58 285586 297280
5. Sessions Court 6 A30•
800 267 172 1408
6. High Court, Madras (Under Section 366 Crl.P.C) - - - - - -
TOTAL 6 430 30687 15820 7469 890084 937027
: 393 :
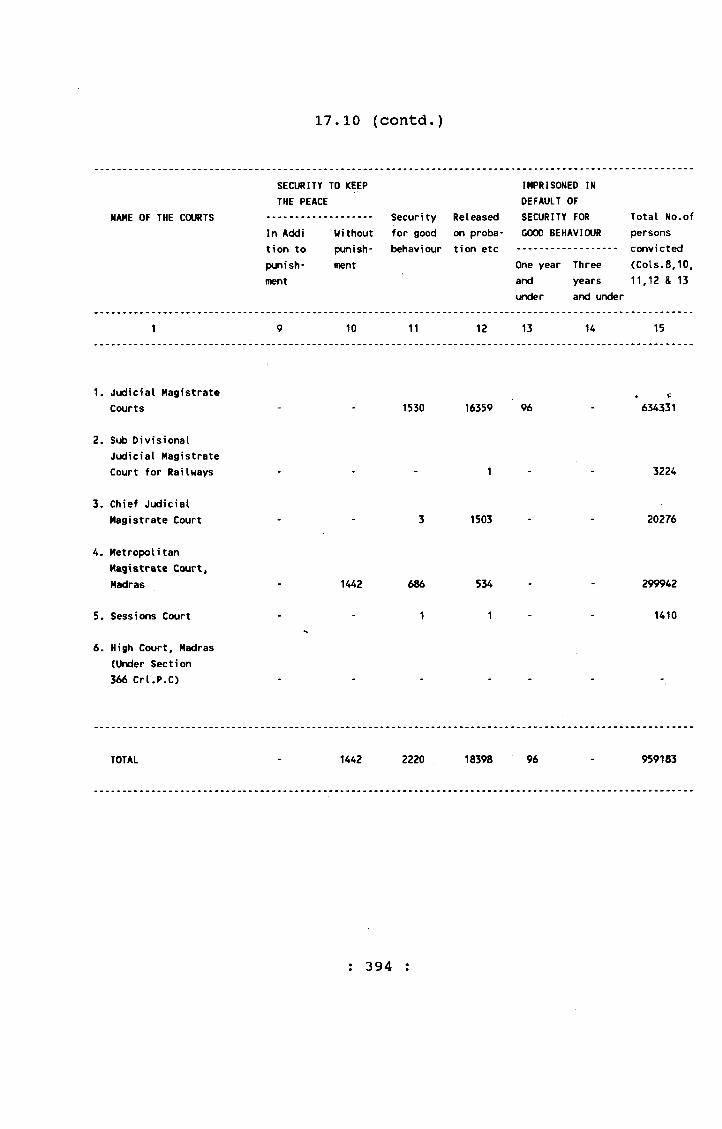
17.10 (contd.)
NAME OF THE COURTS
SECURITY THE PEACE
In Addi tion to punishment
TO KEEP
Wi thout punishment
Security for good behaviour
Released on probation etc
IMPRISONED IN DEFAULT OF SECURITY FOR GOOD BEHAVIOUR
One year Three and years under and under
Total No.of persons convicted (Cols.8,10, 11,12 & 13
1 9 10 11 12 13 14 15
1. Judicial Magistrate Courts 1530 16359 96 634331
2. Sub DivisionalJudicial Hiagistrate Court for Railways 1 3224
3. Chief Judicial Magistrate Court - - 3 1503 - 20276
4. Metropolitan Magistrate Court, Madras 14A2 686 534 299942
5. Sessions Court - - 1 1 - 1410
6. High Court, Madras (Under Section 366 Crl.P.C) - - - - -
TOTAL - U42 2220 18398 96 959183
: 394 ;
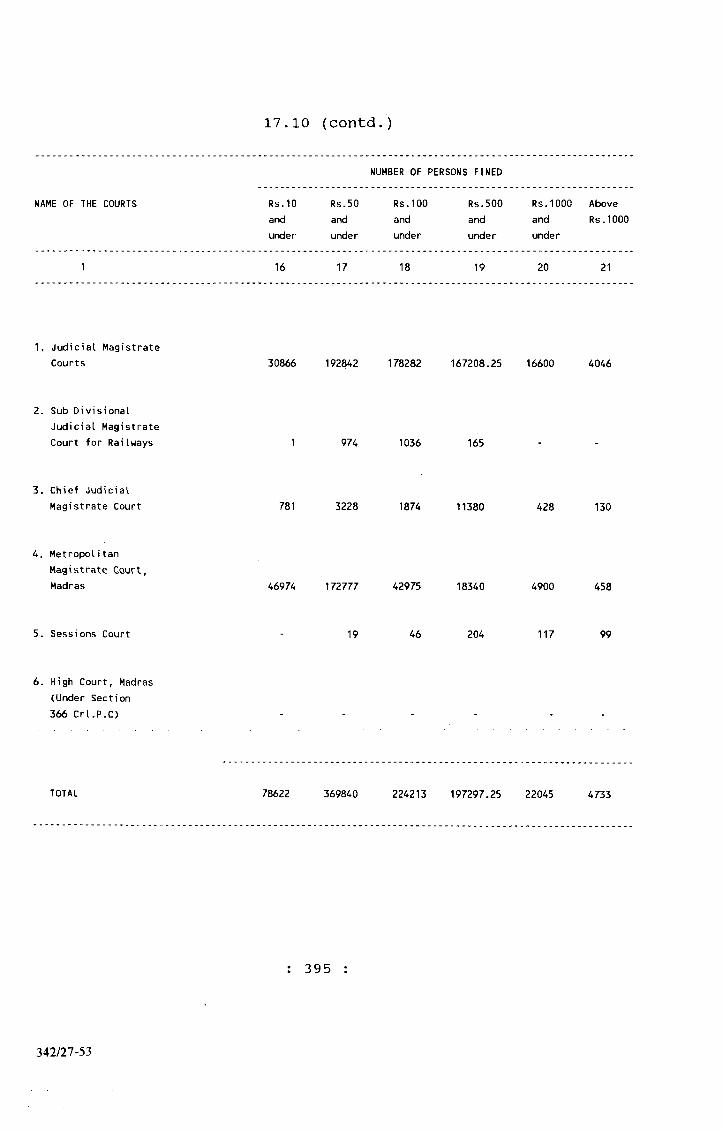
17.10 (contd.)
NUMBER OF PERSONS FINED
NAME OF THE COURTS Rs.10andunder
Rs.50andunder
Rs.lOOandunder
Rs.500andunder
Rs.1000andunder
AboveRs.1000
1 16 17 18 19 20 21
1. Judicial Magistrate Courts 30866 192842 178282 167208.25 16600 4046
2. Sub DivisionalJudicial Magistrate Court for Railways 1 974 1036 165 - -
3. Chief Judicial Magistrate Court 781 3228 1874 11380 428 130
4. MetropolitanMagistrate Court, Madras 46974 172777 42975 18340 4900 458
5. Sessions Court - 19 46 204 117 99
6. High Court, Madras (Under Section 366 Crl.P.C) - - - - - -
TOTAL 78622 369840 224213 197297.25 22045 4733
: 395 :
342/27-53
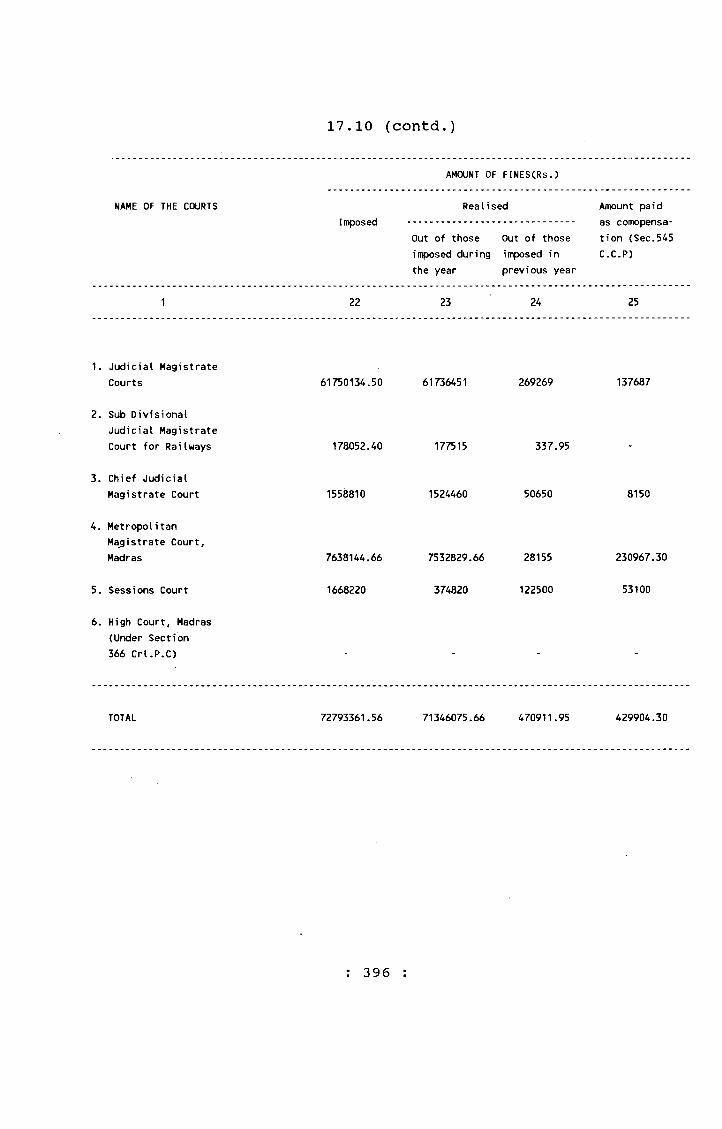
17.10 (contd.)
AMOUNT OF FINESCRs.)
NAME OF THE COURTSImposed
Realised
Out of those Out of those imposed during imposed in the year previous year
Amount paid as comopensa- tion (Sec.545 C.C.P)
1 22 23 24 25
1. Judicial Magistrate Courts 61750134.50 61736451 269269 137687
2. Sub DivisionalJudicial Magistrate Court for Railways 178052.40 177515 337.95
3. Chief Judicial Magistrate Court 1558810 1524460 50650 8150
4. Metropolitan Magistrate Court, Madras 7638144.66 7532829.66 28155 230967.30
5. Sessions Court 1668220 374820 122500 53100
6. High Court, Madras (Under Section 366 Crl.P.C) - - -
TOTAL 72793361.56 71346075.66 470911.95 429904.30
: 396 :
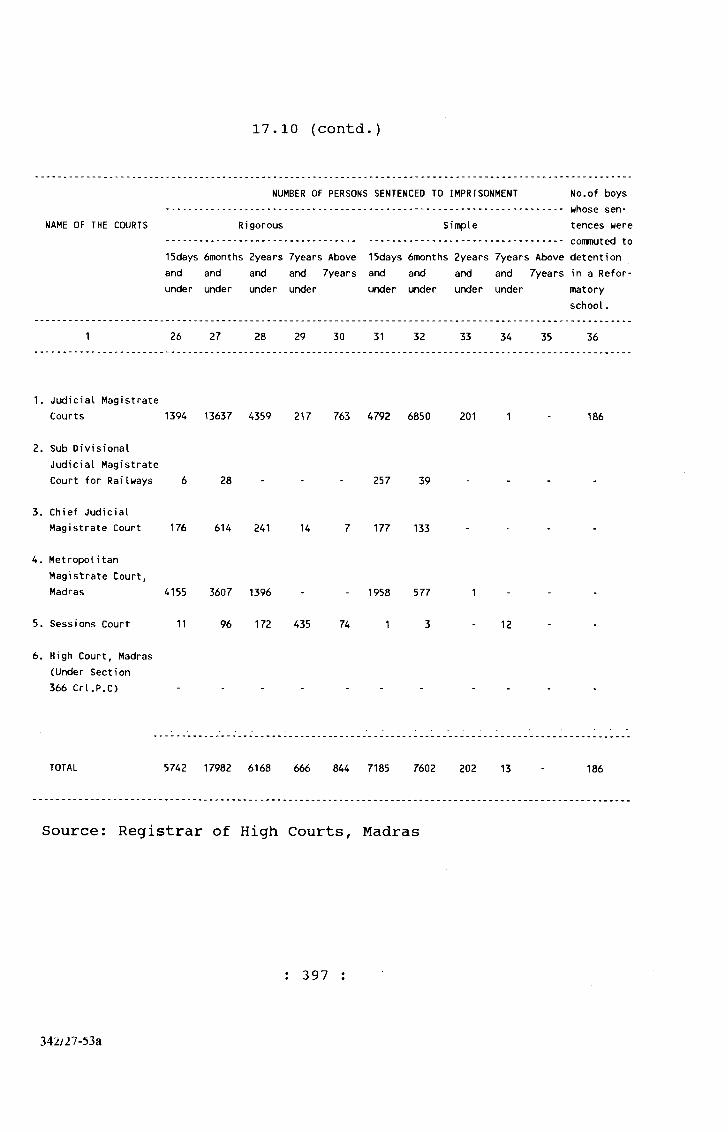
17.10 (contd.)
NUMBER OF PERSONS SENTENCED TO IMPRISONMENT No.of boys whose sentences wereNAME OF THE COURTS Rigorous Simple
15days 6months 2years and and and under under under
7yearsandunder
Above7years
15days 6n)onths 2years 7years Above detention and and and and 7years in a Refor- under under under under matory
school.
1 26 27 28 29 30 31 32 33 34 35 36
1. Judicial Magistrate Courts 1394 13637 4359 217 763 4792 6850 201 1 186
2. Sub DivisionalJudicial Magistrate Court for Railways 6 28 . . 257 39
3. Chief Judicial Magistrate Court 176 614 241 14 7 177 133 - - - -
4. Metropolitan Magistrate Court, Madras 4155 3607 1396 1958 577 1
5. Sessions Court 11 96 172 435 74 1 3 - 12 - -
6. High Court, Madras (Under Section 366 Crl.P.C) - - - - - - - - - - -
TOTAL 5742 17982 6168 666 844 7185 7602 202 13 - 186
Source: Registrar of High Courts, Madras
: 397
342/27-53a
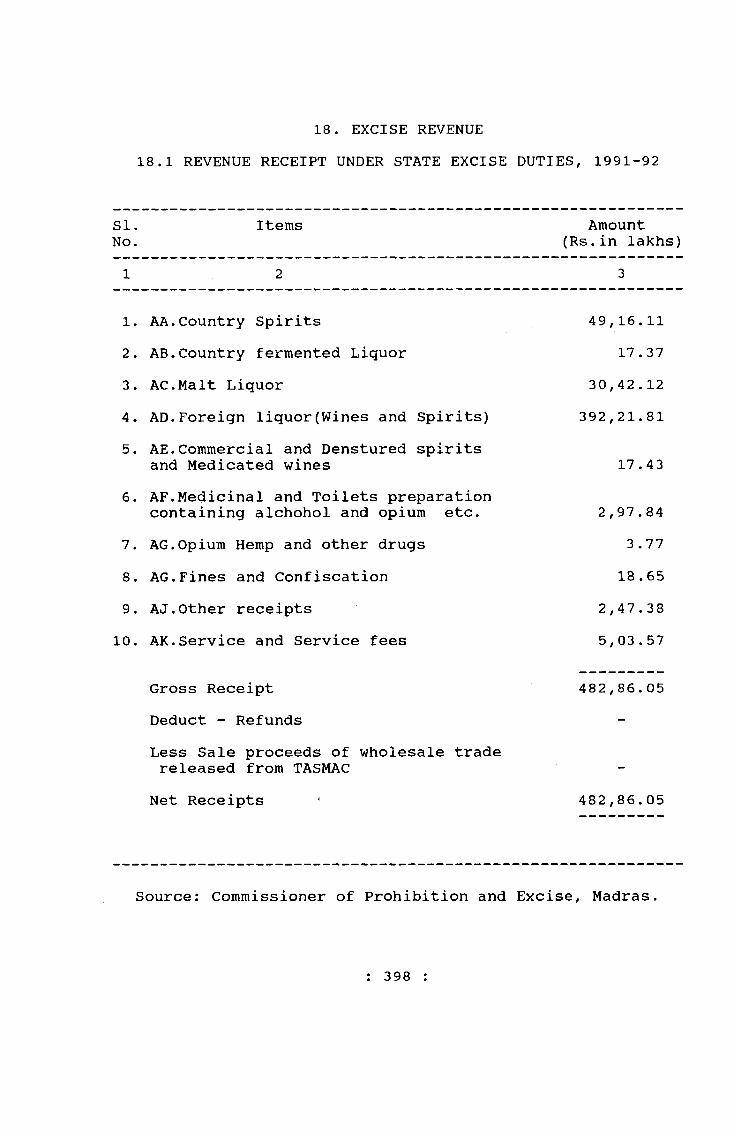
18. EXCISE REVENUE18.1 REVENUE RECEIPT UNDER STATE EXCISE DUTIES, 1991-92
SI. Items No.
Amount (Rs.in lakhs)
1 2 3
1. AA.Country Spirits 49,16.112. AB.Country fermented Liquor 17 .373. AC.Malt Liquor 30,42.124. AD.Foreign liquor(Wines and Spirits) 392,21.815. AE.Commercial and Denstured spirits
and Medicated wines 17 .436. AF.Medicinal and Toilets preparation
containing alchohol and opium etc. 2,97.847. AG.Opium Hemp and other drugs 3 . 778. AG.Fines and Confiscation 18.659. AJ.Other receipts 2,47.38
10. AK.Service and Service fees 5,03.57
Gross Receipt 482,86.05Deduct - Refunds -
Less Sale proceeds of wholesale trade released from TASMAC
Net Receipts 482,86.05
Source: Commissioner of Prohibition and Excise, Madras
: 398 :
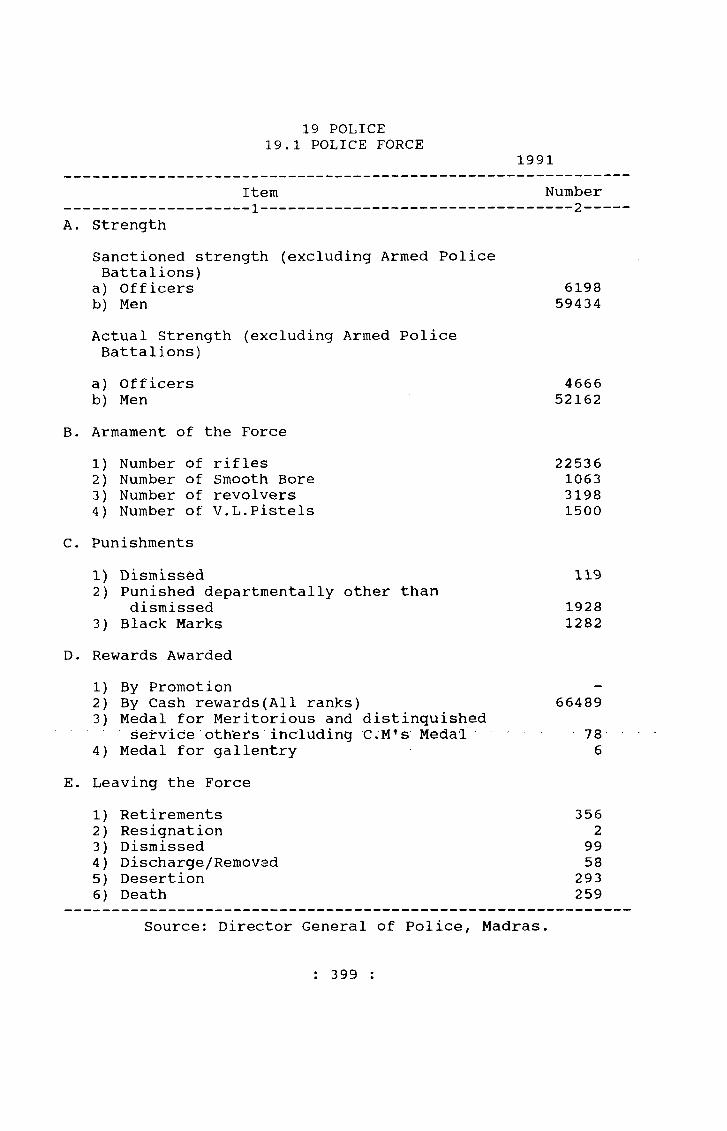
19 POLICE19.1 POLICE FORCE
1991Item Number
A. StrengthSanctioned strength (excluding Armed Police Battalions)
a) Officers 6198b) Men 59434Actual Strength (excluding Armed Police Battalions)
a) Officers 4666b) Men 52162
B. Armament of the Force1) Number of rifles 225362) Number of Smooth Bore 10633) Number of revolvers 31984) Number of V.L.Pistels 1500
C. Punishments1) Dismissed 1192) Punished departmentally other than
dismissed 19283) Black Marks 1282
D. Rewards Awarded1) By Promotion —
2) By Cash rewards(All ranks) 664893) Medal for Meritorious and distinguished
seirvice oth'eifs including C.M^s’ Medal • • 784) Medal for gallentry 6
E. Leaving the Force1) Retirements 3562) Resignation 23) Dismissed 994) Discharge/Removed 585) Desertion 2936) Death 259
Source: Director General of Police, Madras.
: 399 ;
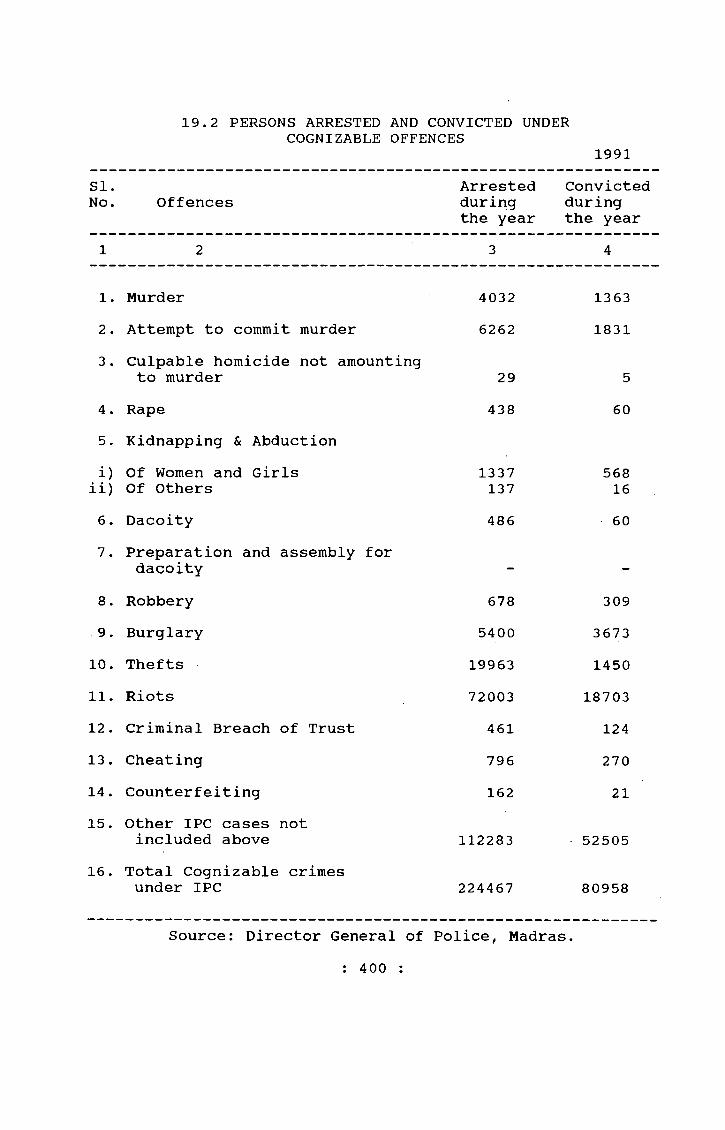
19.2 PERSONS ARRESTED AND CONVICTED UNDER COGNIZABLE OFFENCES
1991SI.No. Offences
Arrested during the year
Convicted during the year
1 2 3 4
1. Murder 4032 13632 . Attempt to commit murder 6262 18313 . Culpable homicide not amounting
to murder 29 54. Rape 438 605. Kidnapping & Abduction
i)ii)
Of Women and Girls Of Others
13 37 137
56816
6. Dacoity 486 607. Preparation and assembly for
dacoity - -8. Robbery 678 3099. Burglary 5400 3673
10. Thefts 19963 145011. Riots 72003 1870312 . Criminal Breach of Trust 461 12413. Cheating 796 27014. Counterfeiting 162 2115. Other IPC cases not
included above 112283 5250516. Total Cognizable crimes
under IPC 224467 80958
Source: Director General of Police, Madras.: 400 :

19.3 PROPERTY STOLEN AND RECOVERED1991
SI. offences No.
No.of cases in which property was stolen
No.of Cases in which property was recovered
Percentage of Amount of of cases in property which pro- stolen perty was recovered to cases in which property was stolen
Amount ofpropertyrecovered
Percentageof value ofpropertyrecoveredto value ofpropertystolen
1 2 3 4 5 6 7 8
1. Dacoity 116 56 48 31,85,093 16,88,400 53
2. Robbery 520 133 26 90,91,617 43,77,047 48
3, Burglary 8499 4248 50 4,74,96,632 1,97,08,566 41
4. Thefts 28199 20413 72 8,25,37,064 5,87,91,196 71 ■
5. Criminal Branchof Trust 558 96 17 56,25,916 15,49,630 28
6. Other kinds ofproperty offences •not included above 1584 1081 68 1,81,93,453 59,22,363 33
Total 39476 26027 66 16,61,29,775 9,20,37,202 55
Source: Director General of Police, Madras.
: 401 :

2 0 PRISONS
20.1 CONVICTS ADMITTED AND DISCHARGED 1991-92
SI.No Item Male Female Total1 2 3 4 5
1. Admitted:a. Imprisoned during the year 13,545 692 14,237
2. Discharged:a. On appeal and bail etc. 4,150 149 4,299b. Expiry of Sentence 2, 546 452 2,998c. Under remission rules" 3,279 33 3 ,312d. By order of Government 745 52 797e. Other grounds 114 22 136f. Transfer to Hospitals 774 12 786
g- Released on Parole 757 ■ 5 762h. Released on licence • • • •
i. Escaped 27 27
j • Died 14 • • 14k. Transfer to other Prisons 465 52 5171. Transfer enroute prisoners
to other prisons 219 219Total 13,090 111 13,867
Source: Inspector General of Prisons, Madras,
: 402 :
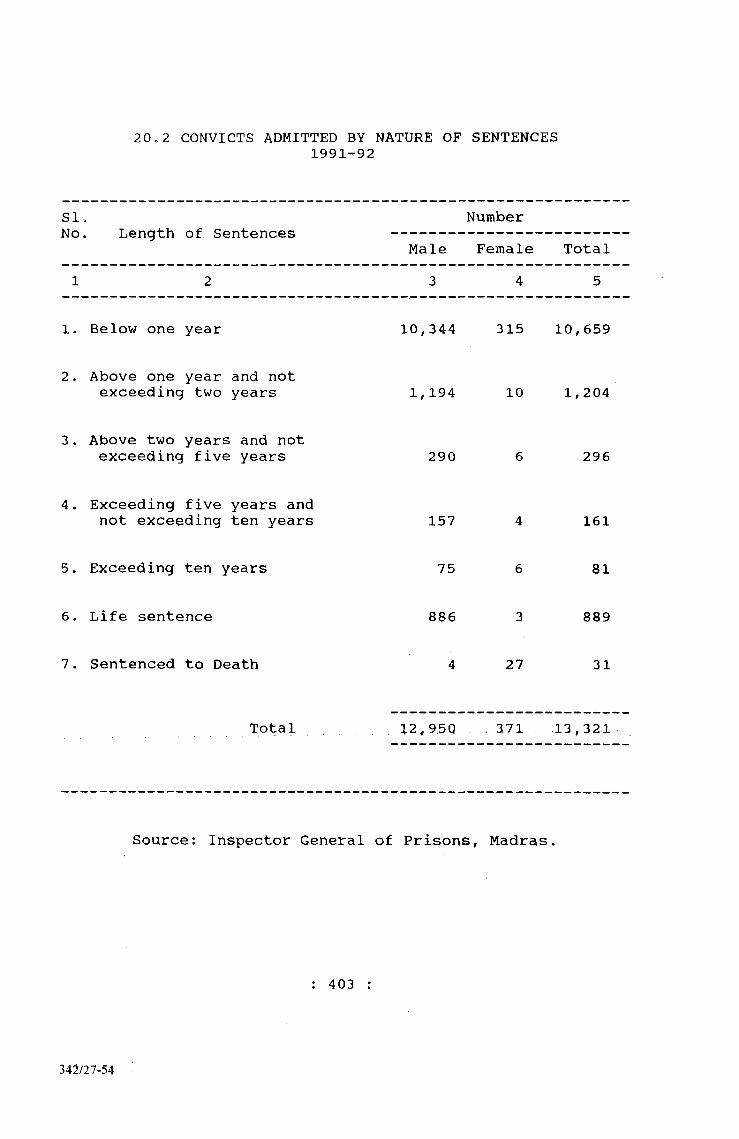
2 0.2 CONVICTS ADMITTED BY NATURE OF SENTENCES1991-92
SI.No. Length of Sentences
NumberMale Female Total
1 2 3 4 5
1. Below one year 10,344 315 10,659
2. Above one year and not exceeding two years 1,194 10 1,204
3. Above two years and not exceeding five years 290 296
4. Exceeding five years and not exceeding ten years 157 161
5. Exceeding ten years
6. Life sentence
7. Sentenced to Death
75
886
27
81
889
31
Total 12,9.50 . 371 . ,13,32.1
Source: Inspector General of Prisons, Madras.
: 403
342/27-54
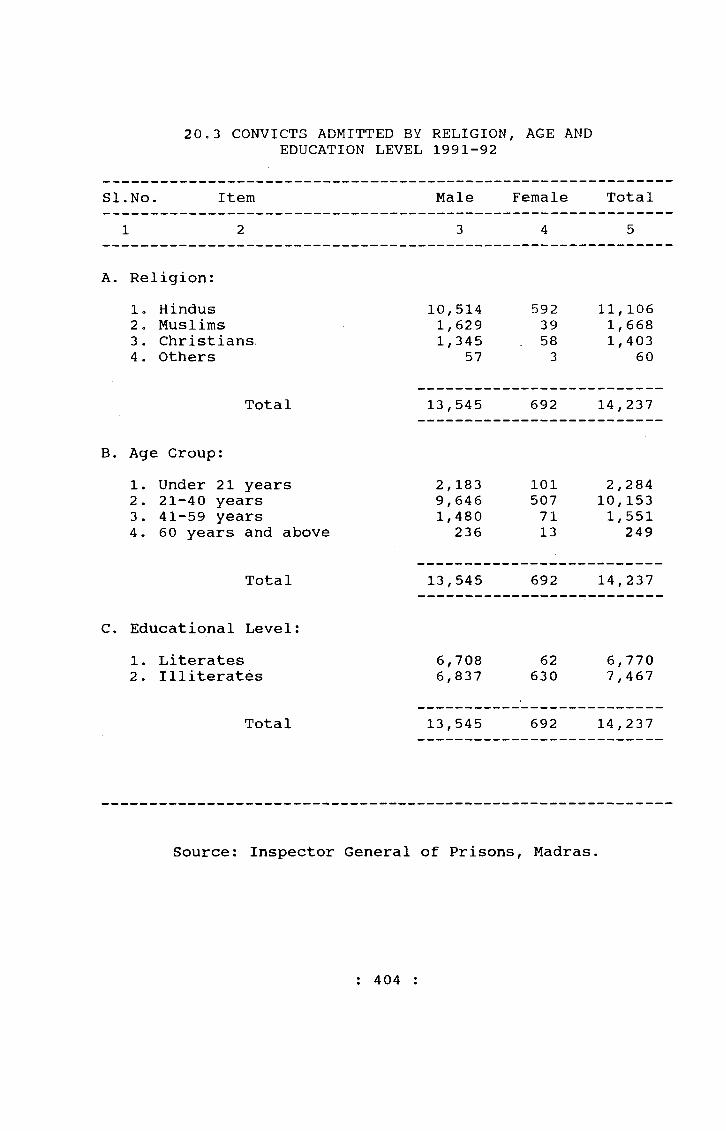
20,3 CONVICTS ADMITTED BY EDUCATION LEVEL
RELIGION1991-92
, AGE AND
SI.No. Item Male Female Total1 2 3 4 5
A. Religion:1. Hindus 10,514 592 11,1062. Muslims 1, 629 39 1, 6683 . Christians. 1, 345 58 1, 4034. Others 57 3 60
Total 13,545 692 14,237
B. Age Group:1. Under 21 years 2, 183 101 2,2842. 21-40 years 9, 646 507 10,1533. 41-59 years 1,480 71 1, 5514. 60 years and above 236 13 249
Total 13,545 692 14,237
C. Educational Level:1. Literates 6,708 62 6,7702. Illiterates 6,837 630 7,467
Total 13,545 692 14,237
Source: Inspector General of Prisons, Madras
: 404 :

2 0.4 MORTALITY AMONG PRISONERS 1991-92
SI.No. Item Male Female Total1 2 3 4 5
1. Daily Average Strength 6, 569 189 6,758
2. Number of persons admitted into Hospitals 3, 194 52 3 , 246
3. Daily Average number of sick prisoners 952 174 1, 126
4. Number of persons died in Hospitals 36 — 36
5. Number of persons died in prisons 1 — 1
Source: Inspector General of Prisons, Madras.
: 405
342/2 7-54a
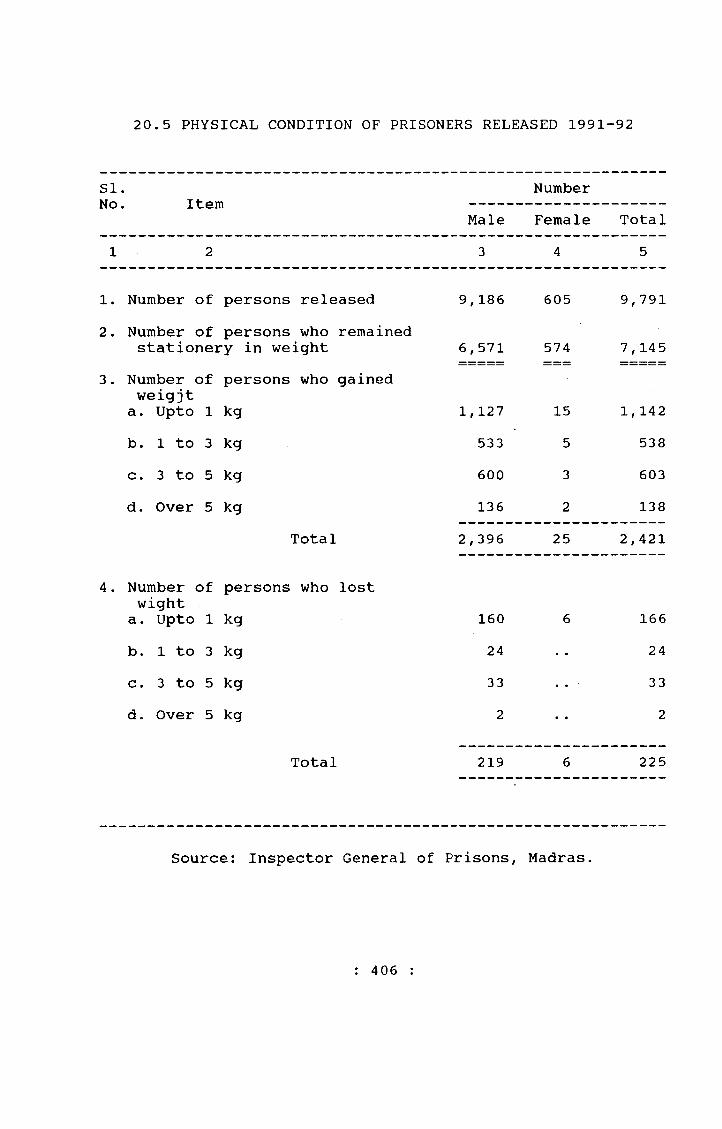
20.5 PHYSICAL CONDITION OF PRISONERS RELEASED 1991-92
SI.No. Item
MaleNumberFemale Total
1 2 3 4 5
1. Number of persons released 9,186 605 9,7912. Number of persons who remained
stationery in weight 6,571 574 7, 1453. Number of persons who gained
weigjta . Upto 1 kg 1, 127 15 1, 142b. 1 to 3 kg 533 5 538c. 3 to 5 kg 600 3 603d. Over 5 kg 136 2 138
Total 2, 396 25 2,421
4. Number of persons who lostwight
a. Upto 1 kg 160 6 166b. 1 to 3 kg 24 24c. 3 to 5 kg 33 33d . Over 5 kg 2 2
Total 219 6 225
Source: Inspector General of Prisons, Madras
: 406 :

2 0.6 EXPENITURE INCURRED ON ACCOUNT OF GUARDING AND MAINTENANCE OF PRISONERS 1991-92
SI.No. Item Amount(Rs.)1 2 3
1. Daily Average number of prisoners - 5977
2. Establishment Charges:
a. Total Cost 4,18,73,991.00b. Cost per head per year 7,005.85
3. Dietery Charges:a. Total cost 3,42,63,032.00b. Cost per head per year 5,732.47
4. Other Charges:a. Total Cost 59,28,576.00b. Cost per head per year 991.89
5. Total expenditure 8,20,65,599.00
6. Total cost per head per year 13,730.29
Source: Inspector General of Prisons, Madras.
: 407 :

21. LOCAL BODIES 21.1. Constitution of Municipal Bodies 1989-90
Grade wiseMunicipalCouncil
DistrictArea as per 1981 Census
Population as per 1981 Census
Council
Strength
1 2 3 4 5
A. Corporations1. Madras Madras 170.00 3276622 —
2. Coimbatore Coimbatore 105.60 704514 923 . Madurai Madurai 46.99 820891 65
TOTAL 322.59 4802027 157B. Municipalities (a) Special Grade1. Vellore North Arcot
Ambedkar 10. 34 174247 302 . Salem Salem 19 .93 361394 443. Pollachi Coimbatore 13 .86 82354 324. Erode Periyar 8.35 142252 365. Uthagamandalam Nilgiris 30. 67 78277 ' 326. Dindigul Dindigul Anna 14 . 01 164103 367, Thanjavur Thanjavur 29. 15 184015 368. Kumbakonam Thanjavur 11. 53 132832 369. Tiruchirapalli Thiruchirapall i 23.26 362045 44
10. Karur n 5. 96 72692 3211. Tirunelveli Tirunelveli12 . Tuticorin Chidambaranar 13 .38 192948 3613 . Nagercoil Kanniyakumari 24 . 27 171648 3614 . Tiruppur Coimbatore 43 . 52 165223 32
TOTAL 263.58 2412880 498
: 408
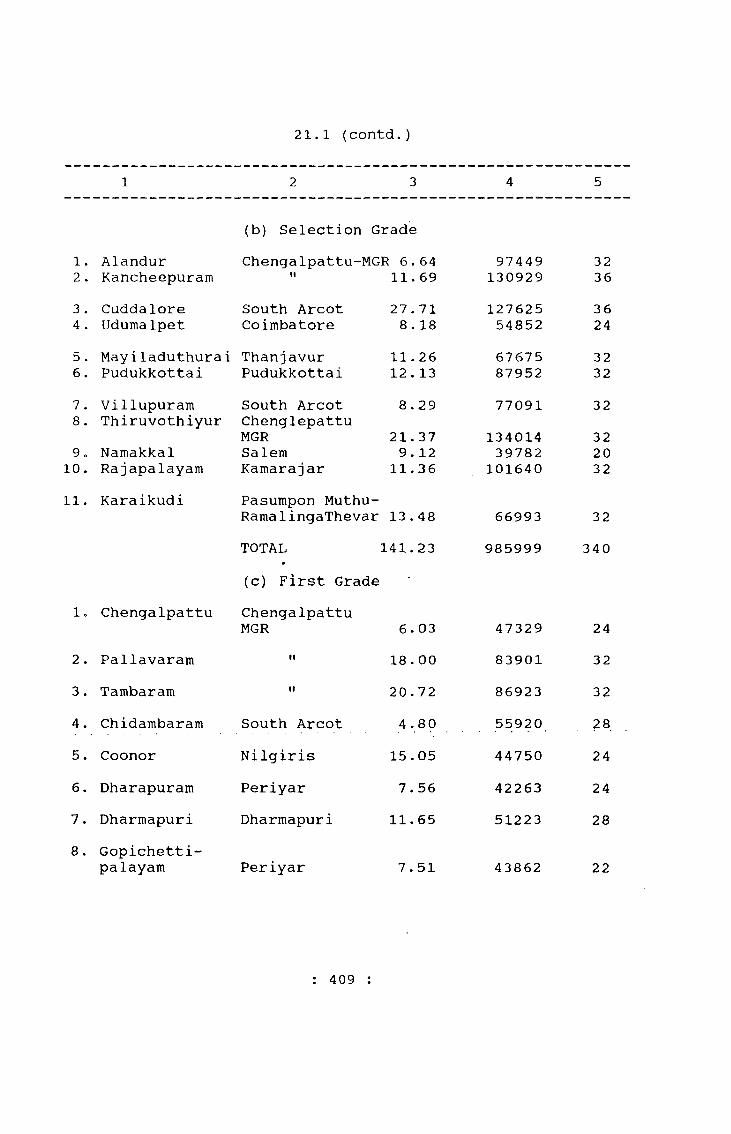
21.1 (contd.)
1 2 3 4 5
(b) Selection Grade1. Alandur Chengalpattu-MGR 6.64 97449 322 . Kancheepuram ft 11. 69 130929 363 . Cuddalore South Arcot 27. 71 127625 364 . Udumalpet Coimbatore 8 . 18 54852 245 . Mayiladuthurai Thanjavur 11. 26 67675 326. Pudukkottai Pudukkottai 12 . 13 87952 327 . Villupuram South Arcot 8.29 77091 328 . Thiruvothiyur Chenglepattu
MGR 21.37 134014 329o Namakkal Salem 9. 12 39782 2010. Rajapalayam Kamarajar 11,36 101640 3211, Karaikudi Pasumpon Muthu-
RamalingaThevar 13 . 48 66993 32TOTAL 141.23 985999 340(c) First Grade
1, Chengalpattu ChengalpattuMGR 6. 03 47329 24
2 . Pallavaram II 18 . 00 83901 323 . Tambaram II 20.72 86923 324. Chidambaram South Arcot 4 .80 55920 285. Coonor Nilgiris 15.05 44750 246. Dharapuram Periyar 7.56 42263 247. Dharmapuri Dharmapuri 11.65 51223 288. Gopichetti-
palayam Periyar 7.51 43862 22
: 409 :
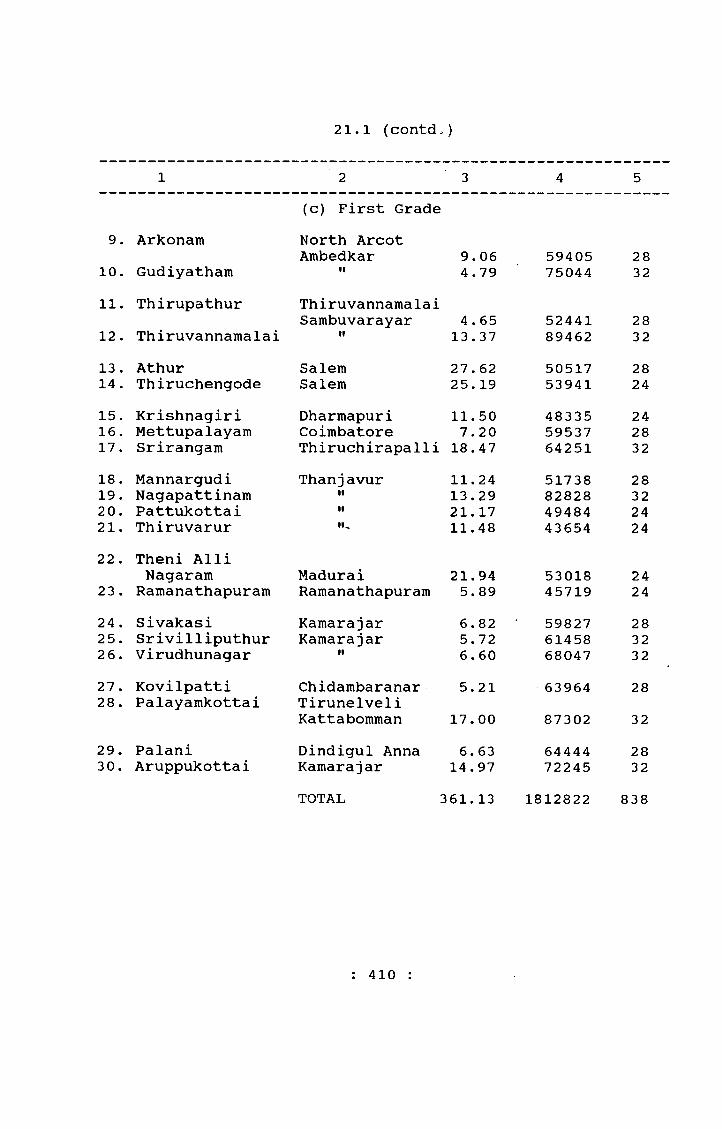
21.1 (contdO
1 2 3 4 5
9. Arkonam(c) First GradeNorth Arcot Ambedkar 9. 06 59405 28
10. Gudiyatham II 4.79 75044 3211. Thirupathur Thiruvannamalai
Sambuvarayar 4.65 52441 2812. Thiruvannamalai II 13.37 89462 3213. Athur Salem 27. 62 50517 2814. Thiruchengode Salem 25. 19 53941 2415. Krishnagiri Dharmapuri 11. 50 48335 2416. Mettupalayam Coimbatore 7.20 59537 2817. Srirangam Thiruchirapalli 18.47 64251 3218. Mannargudi Thanjavur 11.24 51738 2819. Nagapattinam II 13.29 82828 3220. Pattukottai II 21.17 49484 2421. Thiruvarur •u 11.48 43654 2422. Theni Alii
Nagaram Madurai 21.94 53018 2423. Ramanathapuram Ramanathapuram 5.89 45719 2424. Sivakasi Kamarajar 6.82 59827 2825. Srivilliputhur Kamarajar 5.72 61458 3226. Virudhunagar II 6. 60 68047 3227. Kovilpatti Chidambaranar 5.21 63964 2828. Palayamkottai Tirunelveli
Kattabomman 17.00 87302 3229. Palani Dindigul Anna 6. 63 64444 283 0. Aruppukotta i Kamarajar 14.97 72245 32
TOTAL 3 61.13 1812822 838
: 410 :
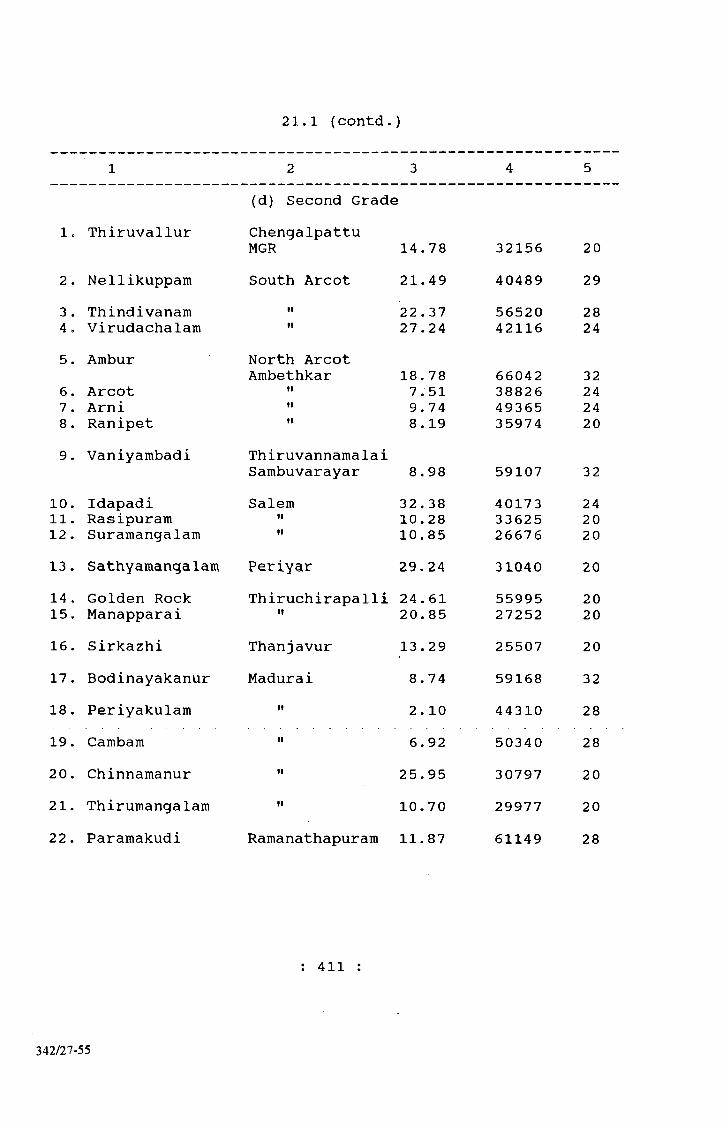
21.1 (contd.)
1 2 3 4 5
1. Thiruvallur(d) Second GradeChengalpattuMGR 14.78 32156 20
2. Nellikuppam South Arcot 21.49 40489 293. Thindivanam II 22.37 56520 284. Virudachalam II 27. 24 42116 245. Ambur North Arcot
Ambethkar 18. 78 66042 326. Arcot II 7.51 38826 247. Arni II 9.74 49365 248. Ranipet II 8.19 35974 209. Vaniyambadi Thiruvannamalai
Sambuvarayar 8.98 59107 3210. Idapadi Salem 32.38 40173 2411. Rasipuram II 10. 28 33625 2012. Suramangalam II 10.85 26676 2013. Sathyamangalam Periyar 29.24 31040 2014. Golden Rock Thiruchirapalli 24.61 55995 2015. Manapparai II 20.85 27252 2016. Sirkazhi Thanjavur 13.29 25507 2017. Bodinayakanur Madurai 8.74 59168 3218. Periyakulam II 2. 10 44310 2819. Cambam II 6.92 50340 2820. Chinnamanur II 25.95 30797 2021. Thirumangalam II 10.70 29977 2022. Paramakudi Ramanathapuram 11.87 61149 28
411
342/27-55
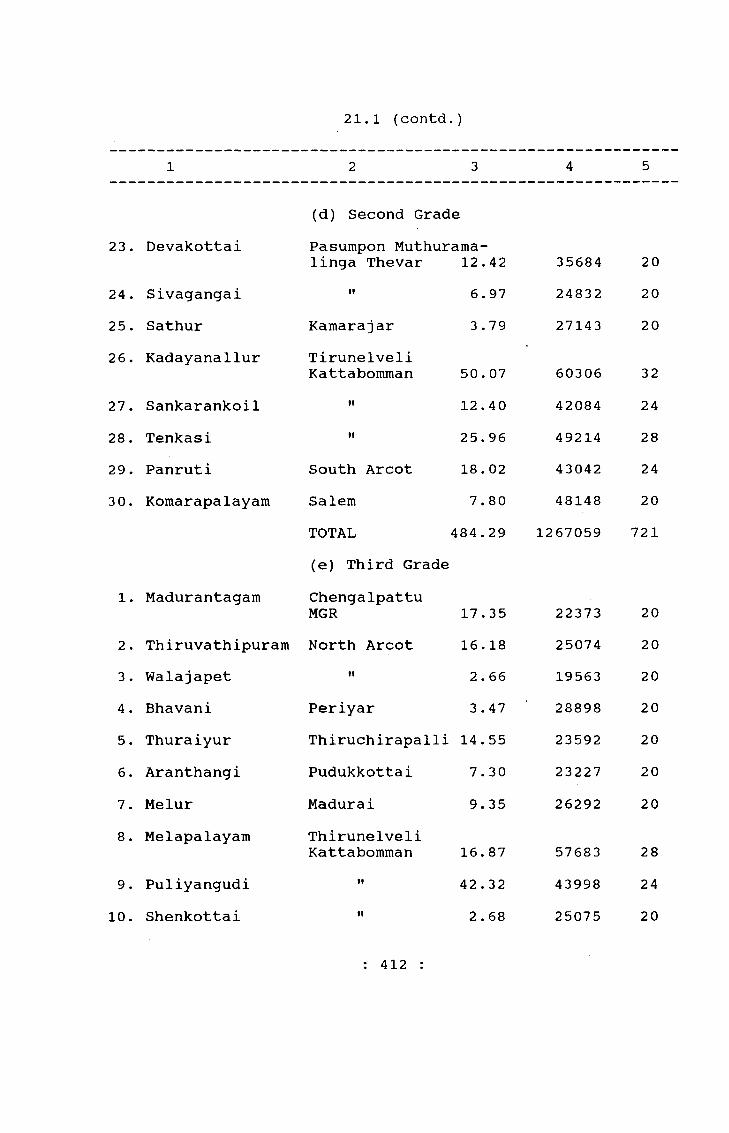
21.1 (contd.
1 2 3 4 5
(d) Second Grade23. Devakottai Pasumpon Muthurama-
linga Thevar 12.42 35684 2024. Sivagangai II 6.97 24832 2025. Sathur Kamarajar 3 .79 27143 2026. Kadayanallur Tirunelveli
Kattabomman 50. 07 60306 3227. Sankarankoil II 12.40 42084 2428. Tenkasi II 25.96 49214 2829. Panruti South Arcot 18. 02 43042 2430. Komarapalayam Salem 7.80 48148 20
TOTAL 484.29 1267059 721(e) Third Grade
1. Madurantagam ChengalpattuMGR 17.35 22373 20
2. Thiruvathipuram North Arcot 16.18 25074 203. Walajapet II 2.66 19563 204. Bhavani Periyar 3.47 28898 205. Thuraiyur Thiruchirapalli 14.55 23592 206. Aranthangi Pudukkottai 7.30 23227 207. Melur Madurai 9.35 26292 208. Melapalayam Thirunelveli
Kattabomman 16.87 57683 289. Puliyangudi II 42 .32 43998 24
10. Shenkottai II 2 . 68 25075 20
: 412 :
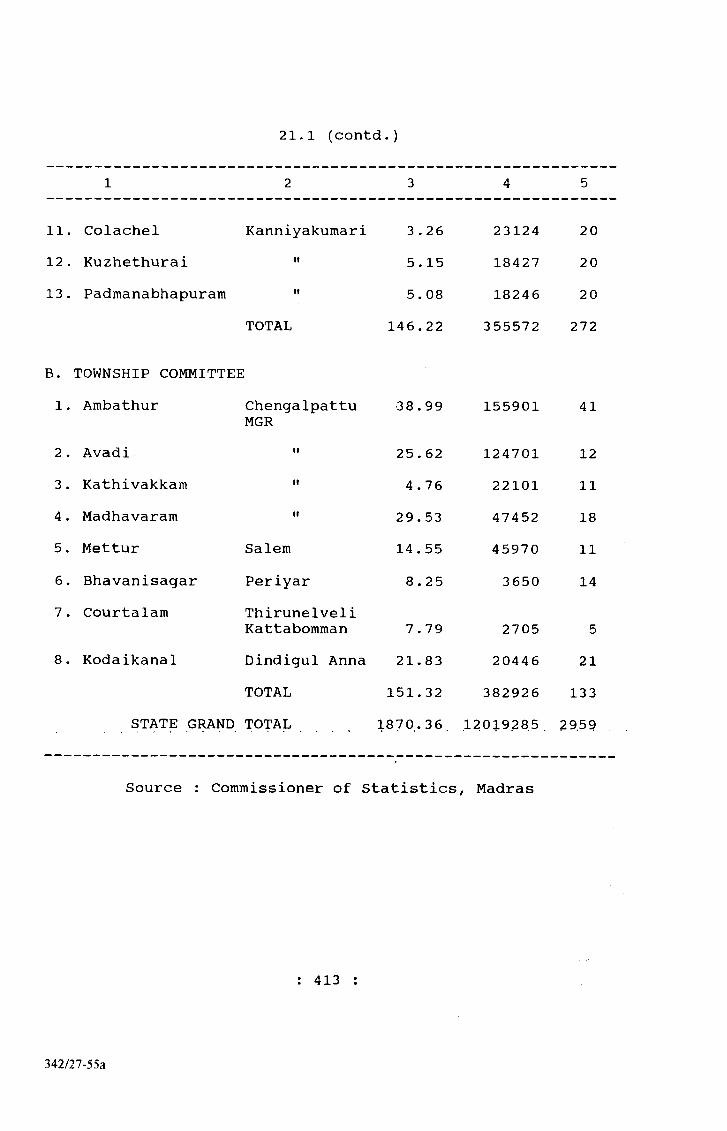
21.1 (contd.)
1 2 3 4 5
11. Colachel Kanniyakumari 3.26 23124 2012 . Kuzhethurai II 5. 15 18427 2013 . Padmanabhapuram II 5. 08 18246 20
TOTAL 146.22 355572 272
B. TOWNSHIP COMMITTEE1. Ambathur Chengalpattu
MGR3 8.99 155901 41
2 . Avadi II 25. 62 124701 123 . Kathivakkam II 4 .76 22101 114 . Madhavaram II 29 . 53 47452 185. Mettur Salem 14 . 55 45970 116. Bhavanisagar Periyar 8.25 3650 147 . Courtalam Thirunelveli
Kattabomman 7.79 2705 58. Kodaikanal Dindigul Anna 21.83 20446 21
TOTAL 151.32 382926 133STATE GRAND TOTAL 1870.36 12019285 29.59 . ,
Source : Commissioner of Statistics, Madras
: 413
342/27-55a
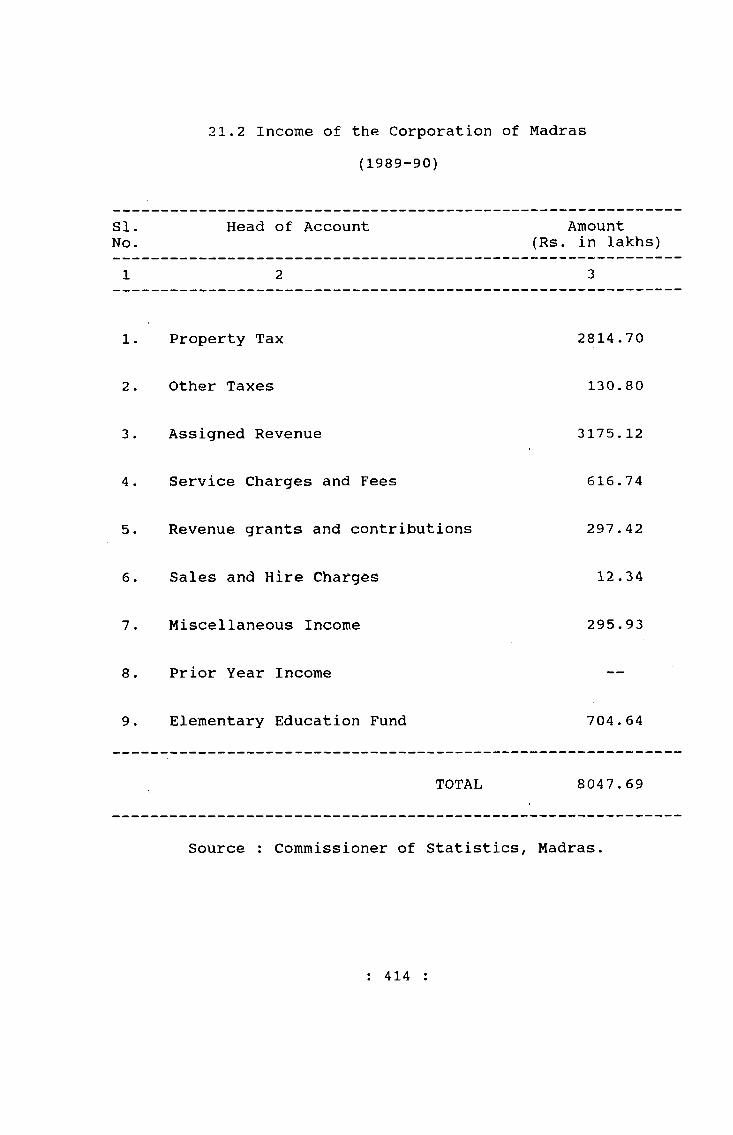
21.2 Income of the Corporation of Madras(1989-90)
SI.No.
Head of Account Amount (Rs. in lakhs)
1 2 3
1. Property Tax 2814.70
2 . Other Taxes 130.80
3 . Assigned Revenue 3175.12
4 . Service Charges and Fees 616.74
5. Revenue grants and contributions 297.42
6. Sales and Hire Charges 12.34
7. Miscellaneous Income 295.93
8. Prior Year Income —
9. Elementary Education Fund 704.64
TOTAL 8047.69
Source : Commissioner of Statistics, Madras.
: 414 :
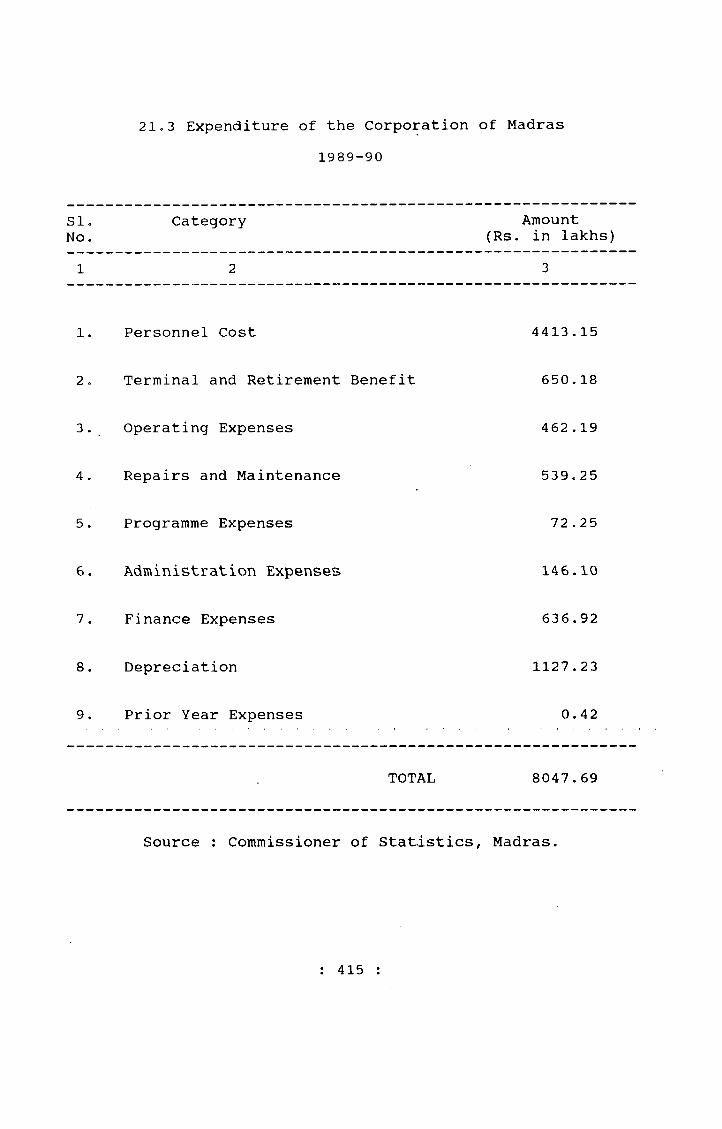
21o3 Expenditure of the Corporation1989-90
of Madras
SloNo.
Category Amount (Rs. in lakhs)
1 2 3
1. Personnel Cost 4413.15
2 c Terminal and Retirement Benefit 650.18
3 . Operating Expenses 462.19
4 . Repairs and Maintenance 539.25
5. Programme Expenses 72.25
6. Administration Expenses 146.10
7 . Finance Expenses 636.92
8. Depreciation 1127.23
9. Prior Year Expenses 0.42
TOTAL 8047.69
Source : Commissioner of Statistics, Madras.
: 415 :
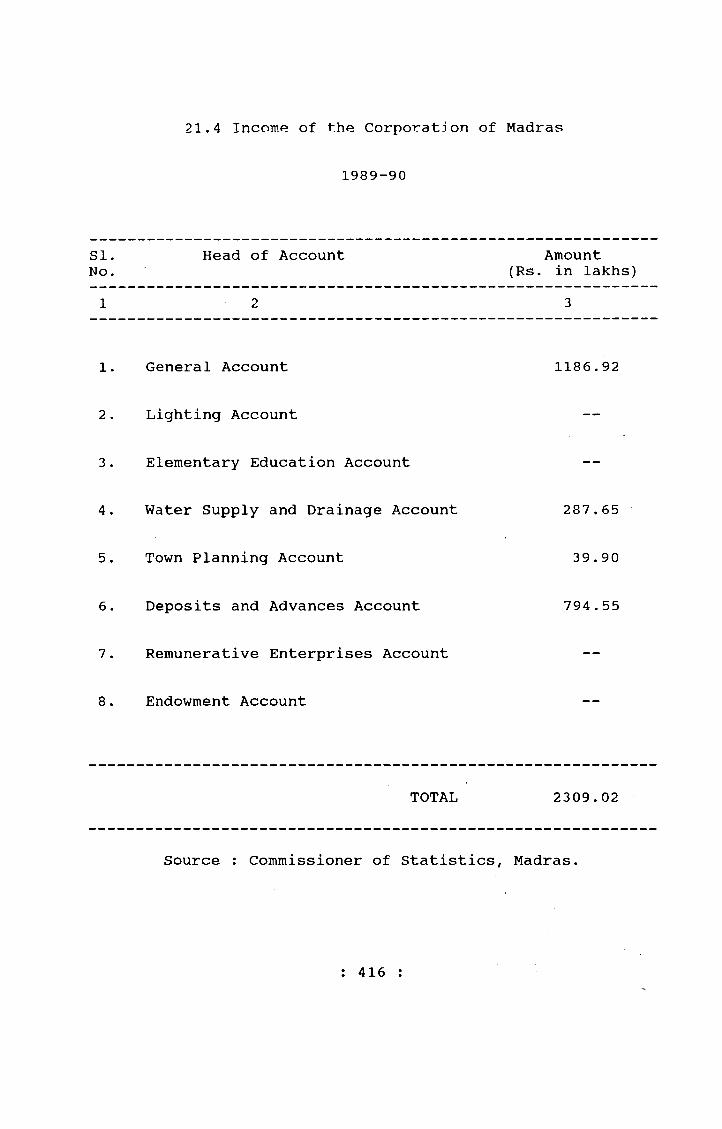
21.4 Income of the Corporation of Madras
1989-90
SI.No.
Head of Account Amount (Rs. in lakhs)
1 2 3
1. General Account 1186.92
2 . Lighting Account —
3 . Elementary Education Account —
4 . Water Supply and Drainage Account 287.65
5. Town Planning Account 39.90
6. Deposits and Advances Account 794.55
7. Remunerative Enterprises Account —
8. Endowment Account —
TOTAL 2309.02
Source : Commissioner of Statistics, Madras.
: 416 :
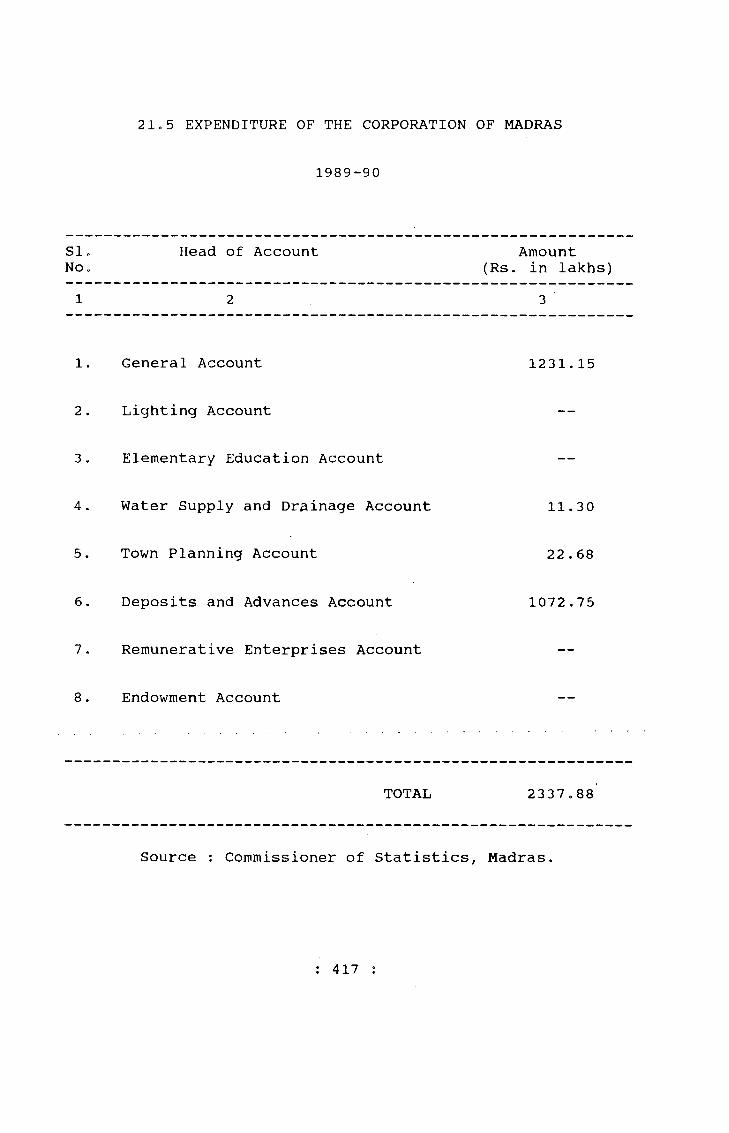
21.5 EXPENDITURE OF THE CORPORATION OF MADRAS
1989-90
SI.No„
Head of Account Amount (Rs. in lakhs)
1 2 3
1. General Account 1231,15
2 . Lighting Account —
3 . Elementary Education Account --
4 . Water Supply and Drainage Account 11.30
5. Town Planning Account 22 . 68
6. Deposits and Advances Account 1072.75
7 . Remunerative Enterprises Account --
8. Endowment Account —
TOTAL 2337,88
Source : Commissioner of Statistics, Madras.
: 417 :
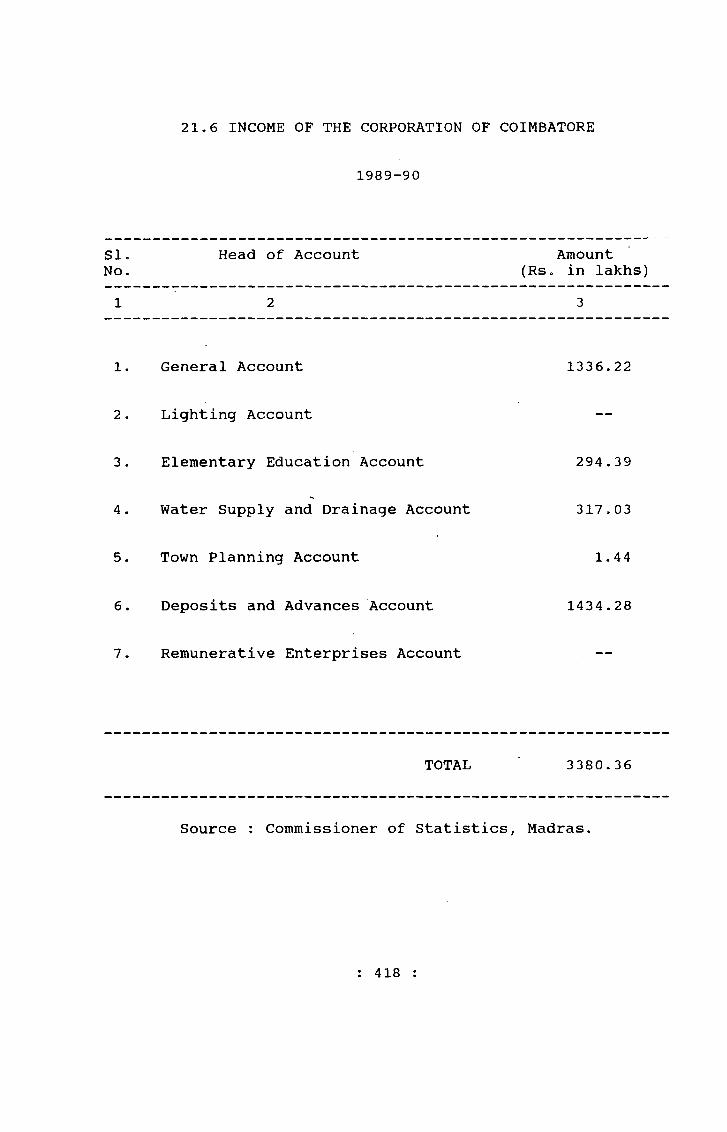
21.6 INCOME OF THE CORPORATION OF COIMBATORE
1989-90
SI.No.
Head of Account Amount (Rs„ in lakhs)
1 2 3
1. General Account 1336.22
2 . Lighting Account —
3 . Elementary Education Account 294 . 39
4. Water Supply and Drainage Account 317 . 03
5. Town Planning Account 1.44
6. Deposits and Advances Account 1434.28
7. Remunerative Enterprises Account
TOTAL 3380.36
Source : Commissioner of Statistics, Madras,
: 418 :

21.7 EXPENDITURE OF THE CORPORATION OF COIMBATORE
1989-90
SI.No.
Head of Account Amount (Rs. in lakhs)
1 2 3
1. General Account 2166.03
2 . Lighting Account 23 . 06
3 . Elementary Education Account 293.64
4. Water Supply and Drainage Account 15.86
5. Town Planning Account 313.41
6. Deposits and Advances Account 475.35
7. Remunerative Enterprises Account
TOTAL 3287.35
Source : Commissioner of Statistics, Madras.
: 419
342/27-56
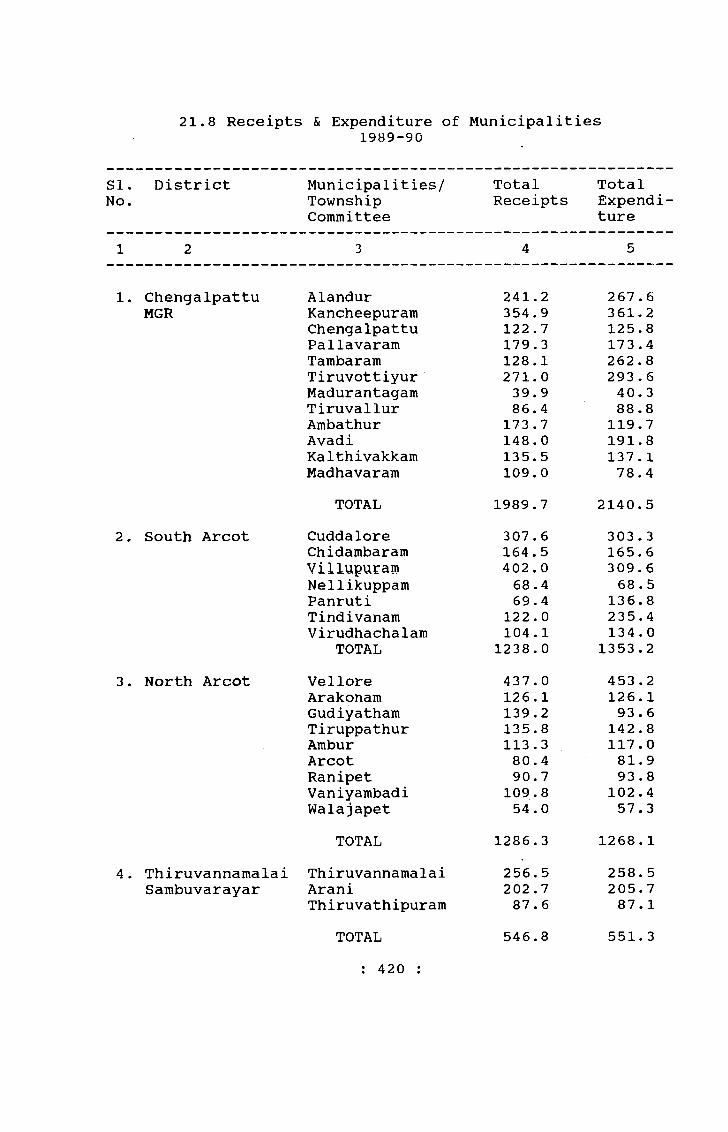
21.8 Receipts & Expenditure of Municipalities1989-90
SI. District No.
Municipalities/TownshipCommittee
TotalReceipts
TotalExpenditure
1 2 3 4 5
1. Chengalpattu Alandur 241. 2 267 . 6MGR Kancheepuram 354.9 361.2
Chengalpattu 122 .7 125.8Pallavaram 179.3 173.4Tambaram 128.1 262.8Tiruvottiyur 271.0 293 . 6Madurantagam 39.9 40. 3Tiruvallur 86.4 88.8Ambathur 173 .7 119.7Avadi 148.0 191.8Kalthivakkam 135. 5 137 .1Madhavaram 109.0 78.4
TOTAL 1989.7 2140.52. South Arcot Cuddalore 307 . 6 303 . 3
Chidambaram 164.5 165. 6Villupuram 402 . 0 309.6Nellikuppam 68.4 68.5Panruti 69.4 136.8Tindivanam 122.0 235.4Virudhachalam 104 . 1 134.0
TOTAL 1238.0 1353.23. North Arcot Vellore 437.0 453 .2
Arakonam 126.1 126.1Gudiyatham 139.2 93.6Tiruppathur 135.8 142.8Ambur 113.3 117.0Arcot 80.4 81.9Ranipet 90.7 93 .8Vaniyambadi 109.8 102.4Walajapet 54.0 57.3
TOTAL 1286.3 1268.14. Thiruvannamalai Thiruvannamalai 256.5 258.5
Sambuvarayar Arani 202 .7 205.7Thiruvathipuram 87.6 87.1
TOTAL 546.8 551. 3: 420 :

2 1 . 8 ( c o n t d , )
5. Salem SalemAthurTiruchengodeIdappadiKomarapalayamRasipuraraNamakkalSuramangalamMettur
1292.7 134 .8 132.3 72 .4
122.5 84.9
214.0 62 .8 99. 3
1232 .9134.7138.7 76.2
121.7 83 . 5
214. 1 55.5
100.8TOTAL 2215.7 2158.1
6. Dharmapuri KrishnagiriDharmapuri
110.9176.7
118.7198.1
TOTAL 287.6 316.87. Periyar Erode
DharapuramGobichettipalayamSathyamangalamBhavaniBhavanisagar
536.4150.5 157.2 142.460.28.1
462.7126.9166.5237.461.16.7
TOTAL 1054 .8 1061.38. Coimbatore Pollachi
TirupurUdumalpetMettupalayam
405.2615.8228.3165.8
421.7 581.9208.7 172.6
. TOTAL , , 1415,1 1384.99. The Nilgiris Uthagamandalam
Coonoor374.4 163 .5
258.2120.8
TOTAL 537,9 379.010. Thiruchirapalli Thiruchirapalli
KarurSrirangamGolden RockManapparaiThuraiyur
822.7437.3151.3 76.963.154.1
900.6 433.9 146.0 87.2 66. 3 54.8
TOTAL 1605.4 1688.8421
342/27-56a
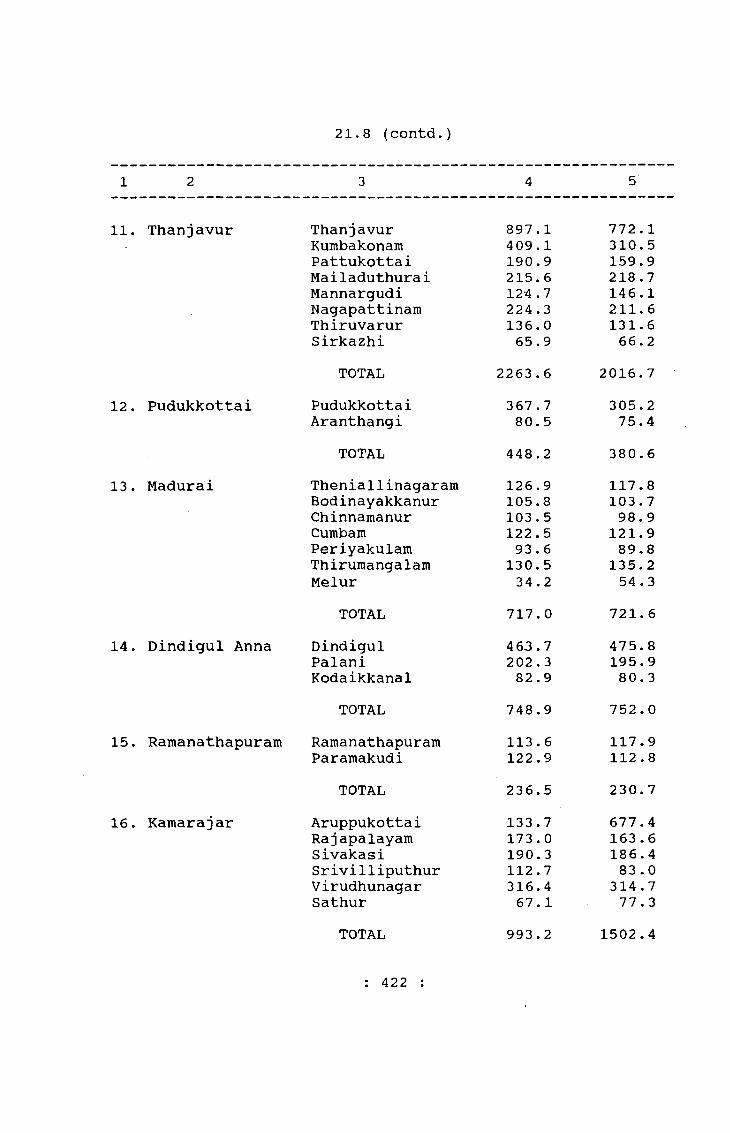
2 1 . 8 ( c o n t d . )
11. Thanjavur Thanjavur 897.1 772. 1Kumbakonam 409.1 310.5Pattukottai 190.9 159.9Mailaduthurai 215.6 218.7Mannargudi 12-4.7 146. 1Nagapattinam 224.3 211. 6Thiruvarur 136.0 131. 6Sirkazhi 65.9 66. 2
TOTAL 2263.6 2016.712. Pudukkottai Pudukkottai 367.7 305.2
Aranthangi 80.5 75.4TOTAL 448.2 380. 6
13. Madurai Theniallinagaram 126.9 117.8Bodinayakkanur 105.8 103 . 7Chinnamanur 103 .5 98. 9Cumbam 122.5 121.9Periyakulam 93 . 6 89.8Thirumangalam 130.5 135.2Melur 34.2 54.3
TOTAL 717. 0 721. 614. Dindigul Anna Dindigul 463 .7 475.8
Palani 202 . 3 195.9Kodaikkanal 82.9 80. 3
TOTAL 748.9 752.015. Ramanathapuram Ramanathapuram 113.6 117.9
Paramakudi 122.9 112.8TOTAL 236.5 230.7
16. Kamarajar Aruppukottai 133.7 677.4Rajapalayam 173.0 163 . 6Sivakasi 190. 3 186.4Srivi11iputhur 112.7 83 . 0Virudhunagar 316.4 314 .7Sathur 67.1 77 . 3
TOTAL 993.2 1502.4
: 422 ;

21.8 (contd.)
1 2 3 4 5
17. Pasumpon Muthu- Karaikudi ramalinga Thevar Devakottai
Sivaganga248.1 94 . 6 65. 3
245.4 87.8 65. 6
TOTAL 408 . 0 398.818, Tirunelveli
KattabommanTirunelveliPalayamkottaiKadayanallurSankarankoilTenkasiMelapalayamPuliyangudiShenkottahCourtalam
350. 0 219 . 3 65. 5
129.9 74 .6 78 . 0 51.1 38 . 0 74 . 3
346.8219.8 66,8
104.7 66. 6 69.2 54 .1 38. 6 82 .1
TOTAL 1080.7 1048,719. Chidambaranar Tuticorin
Kovilpatty425. 3 211. 3
424.7187.3
TOTAL 636. 6 612.020. Kanniyakumari Nagercoil
ColachelKuzhithuraiPadmanabhapuram
287.4 58.8 38.6 24 .2
248.6 48.4 41.1 24 . 0
TOTAL 409 . 0 362 . 1
Source : Commissioner of Statistics, Madras
: 423 :

21.9 Water Supply Schemes in the Municipalities1989-90
SI. Grade Wise No. Classification
Total Length pipe lines in operation in km.
Watercharges
OtherReceipts
Totalrunningchargesin theyear(Rs.inlakhs)
1 2 3 4 5 6
1.Corporation 3 2656 4998 - 5281
2.Special Grade Municipalities 14 1142 624 - 273
3.Selection Grade Municiplities 11 1233 183 - 201
4.First Grade Municipalities 30 3434 313 - 366
5.Second Grade Municipalites 30 2475 346 - 157
6.Third Grade Municipalities 13 162 26 - 25
7 .Township Committees 8 68 45 - 13
TOTAL 109 11170 6535 - 6316
Source : Commissioner of Statistics, Madras
: 424 :
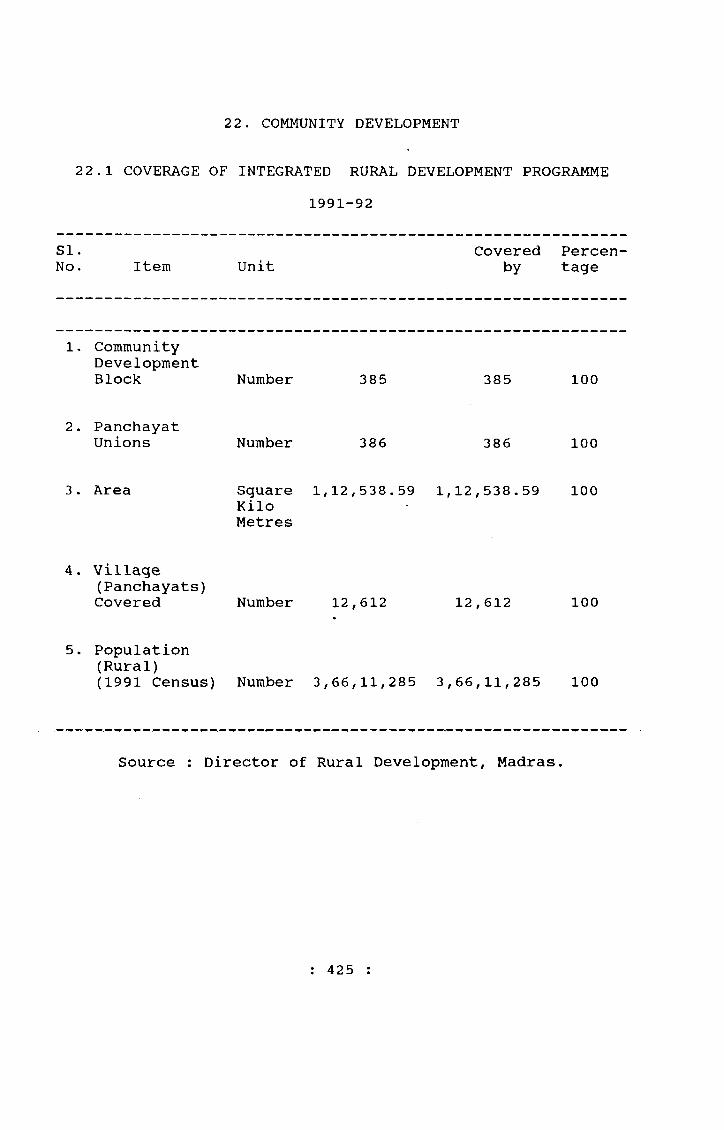
1991-92
22. C0MI4UNITY DEVELOPMENT
2 2,1 COVERAGE OF INTEGRATED RURAL DEVELOPMENT PROGRAMME
SI.No. Item Unit
Coveredby
Percentage
1, Community Development Block Number 385 385 100
2. Panchayat Unions Number 386 386 100
3. Area SquareKiloMetres
1,12,538.59 1,12,538.59 100
4. Village(Panchayats)Covered Number 12,612 12,612 100
5. Population (Rural)(1991 Census) Number 3,66,11,285 3,66,11,285 100
Source : Director of Rural Development, Madras.
: 425 :
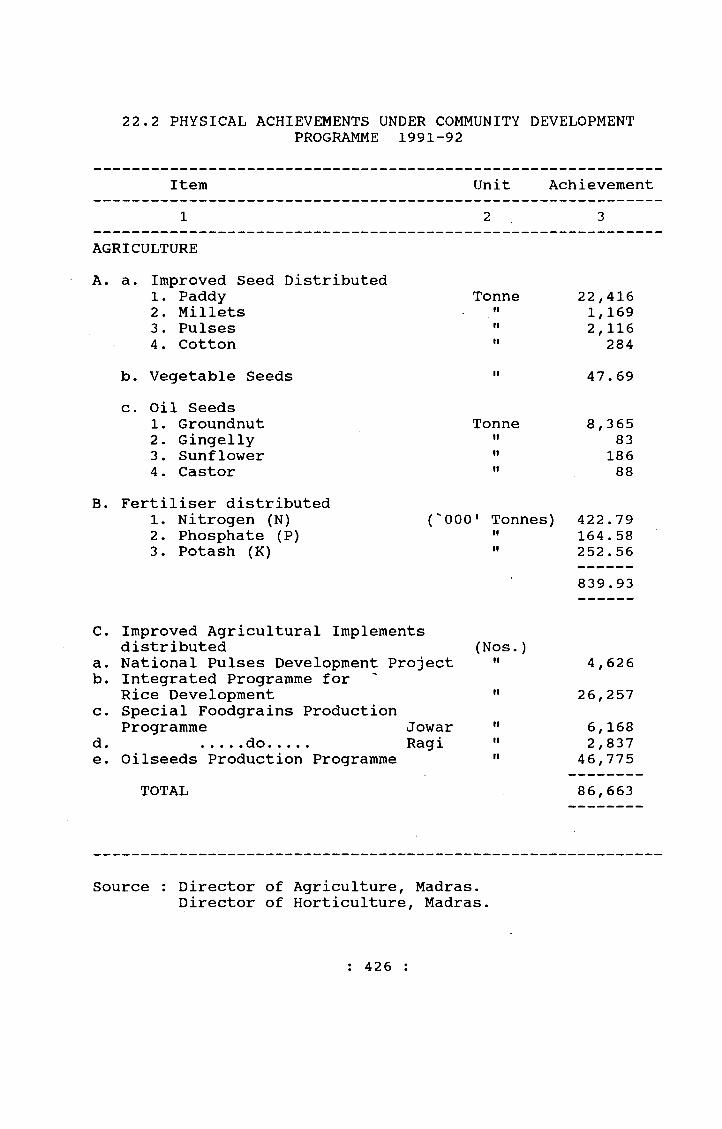
22.2 PHYSICAL ACHIEVEMENTS UNDER COMMUNITY DEVELOPMENTPROGRAMME 1991-92
Item Unit Achievement2 3
AGRICULTUREA. a. Improved Seed Distributed
1. Paddy2. Millets3. Pulses4. Cotton
b. Vegetable Seedsc. Oil Seeds
1. Groundnut2. Gingelly3. Sunflower4. Castor
B. Fertiliser distributed1. Nitrogen (N)2. Phosphate (P)3. Potash (K)
Tonne
Tonne
('000' Tonnes)II
22,4161, 1692, 116
28447.69
8, 365 83
186 88
422.79164.58252.56839.93
C. Improved Agricultural Implements distributed
a. National Pulses Development Projectb. Integrated Programme for
Rice Developmentc. Special Foodgrains Production
Programme Joward. .... do..... Ragie. Oilseeds Production Programme
TOTAL
(Nos.)II 4,626
26,2576,1682,837
46,77586,663
Source : Director of Agriculture, Madras.Director of Horticulture, Madras
: 426 :

22.3 RADIO AND TELEVISION SETS MAINTAINED BY PANCHAYATS1991-92
SI. District No.
Sets available (as on 1st April 1991)
Sets Condomned Sets Newly installed
Set31st
:s as on March 1992
Radio Television Radio Television Radio T eIev i s i on Radio Television
1 2 3 4 5 6 7 8 9 10
1. Chengalpattu-MGR 3932 2045 4 95 3928 21402. South Arcot 2603 505 - - 8 12 2611 5173. North Arcot Ambedkar 3371 442 - - 22 32 3393 474
4. ThiruvannamalaiSambuvarayar 2593 169 - - 19 22 2612 191
5. Salem 4190 825 17 2 22 82 4195 9056. Dharmapuri 2881 556 28 - 54 153 2907 709
7. Periyar 2097 1145 195 ■ 1 35 104 1937 12488. Coimbatore 1527 650 16 - 7 15 1518 6659. The NiIgiris 531 70 - - - 26 531 96
10. Thanjavur 2234 382 12 - - 15 2222 39711. Nagapattinam
Quaid-e-MiIleth 2218 44 13 - - 1 2205 4512. Thiruchirapalli 4367 1071 26 - - 38 4341 1109
13. Pudukkottai 3016 629 23 - - 5 2993 63414. Madurai 1931 806 - 1 7 - 1938 80715. Dindigul Anna 1673 802 - - - 40 1673 842
16. Ramanathapuram 1310 399 4 - - 11 1306 41017. Kamarajar 878 363 5 - - 6 873 36918. Pasumpon Muthu-
ramaling.a Thevar . . 1 2 5 2 . . . 4Q5 . . 10 . .32 . . 12.42 . . .517 *
19. TirunelveliKattabomman 1890 338 - - 35 16 1925 354
20. Chidambaranar 1205 198 16 - - - 1180 19821. Kanniyakumari 840 77 37 - - 3 803 80
TOTAL 46539 12003 406 4 209 708 46342 12707
Source : Director of Rural Development, Madras
: 427
342/27-57.
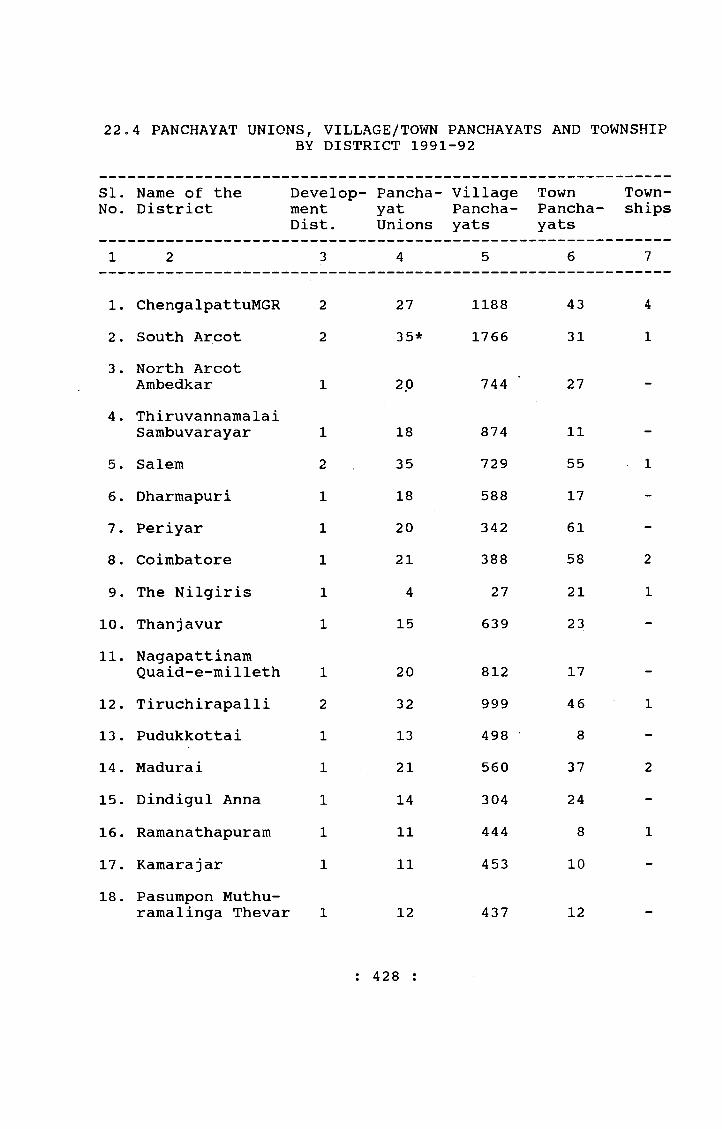
22.4 PANCHAYAT UNIONS, VILLi^GE/TOWN PANCHAYATS AND TOWNSHIPBY DISTRICT 1991-92
SI.No.
Name of the District
Development Dist.
Pancha-yatUnions
VillagePancha-yats
TownPancha-yats
Townships
1 2 3 4 5 6 7
1. ChengaIpattuMGR 2 27 1188 43 42. South Arcot 2 35* 1766 31 13 . North Arcot
Ambedkar 1 2.0 744 27 -
4. Thiruvannamalai Sambuvarayar 1 18 874 11 -
5. Salem 35 729 55 16. Dharmapuri 1 18 588 17 -
7. Periyar 1 20 342 61 -
8. Coimbatore 1 21 388 58 29. The Nilgiris 1 4 27 21 1
10. Thanjavur 1 15 639 23 -
11. NagapattinamQuaid-e-milleth 1 20 812 17 -
12. Tiruchirapalli 32 999 46 113 . Pudukkottai 1 13 498 • 8 -
14. Madurai 21 560 37 215. Dindigul Anna 1 14 304 24 -
16. Ramanathapuram 1 11 444 8 117 . Kamarajar 1 11 453 10 -
18. Pasumpon Muthu- ramalinga Thevar 1 12 437 12
: 428 :

22.4 (contd.)
1 2 3 4 5 6 7
19. ThirunelveliKattabomman 1 19 435 36 2
20. Chidambaranar 1 12 408 20 -
21. Kanniyakumari 1 9 88 66 1
TOTAL 25 386 12612 631 16
* Kalrayan Hills Blocks yet to be formedSource: Director of Rural Development, Madras.
: 429
342/27-57CX

23.1 Free house sites provided by assignment of GovernmentLands 1991-92.
23. ADI DRAVIDAR, TRIBAL AND SOCIAL WELFARE
SI.No.
District No.of Pattas issued
1 2 3
1. Madras2. Chengalpattu MGR 13,6953. South Arcot 66,9814. North Arcot Ambedkar 20,1495. Thiruvannamalai Sambuvarayar 19,2906. Salem 58,1637. Dharmapuri 15,9598. Periyar 39,2109. Coimbatore 7,327
10. The Nilgiris 35311. Thiruchirapalli 37,53612 . Thanjavur 14,21413. Pudukkottai 43,65414. Madurai 18,16215. Dindigul Anna 9,80416. Ramanathapuram 25,71217. Kamarajar 22,14818. Pasumpon Muthuramalimga Thevar 24,41919. Thirunelveli Kattabomman 21,79920. Chidambaranar 15,65021. Kanniyakumari 739
TOTAL 4,74,964
Source: Special Commissioner and Commissioner of Land Administration, Madras.
430 :

23,2 Free House Sites provided by acquisition of lands by Adi Dravidar & Tribal Welfare Department
1991-92
SI.No.
District No.of Pattas allotted
1 2 3
1. Madras2 . Chengalpattu MGR 10063 . South Arcot 75754. North Arcot Ambedkar 32425. Thiruvannamalai Sambuvarayar 23546. Salem 27867. Dharmapuri 16838. Periyar 20109 . Coimbatore 4680
10. The Nilgiris 7811. Thiruchirapalli 248412 . Thanjavur 60913. Nagapattinam Quaid-e-milleth 51714. Pudukkottai 56715. Madurai 170616. Dindigul Anna 154017. Ramanathapuram 306718. Kamarajar 105019. Pasumpon Muthu Ramalinga Thevar 18232 o: • Thrrunelveli Kattabommah ‘200321. Chidambaranar 147322 . Kanniyakumari 518
STATE 42771
Source: Director of Adi Dravidar and Tribal Welfare, Madras
: 431 :
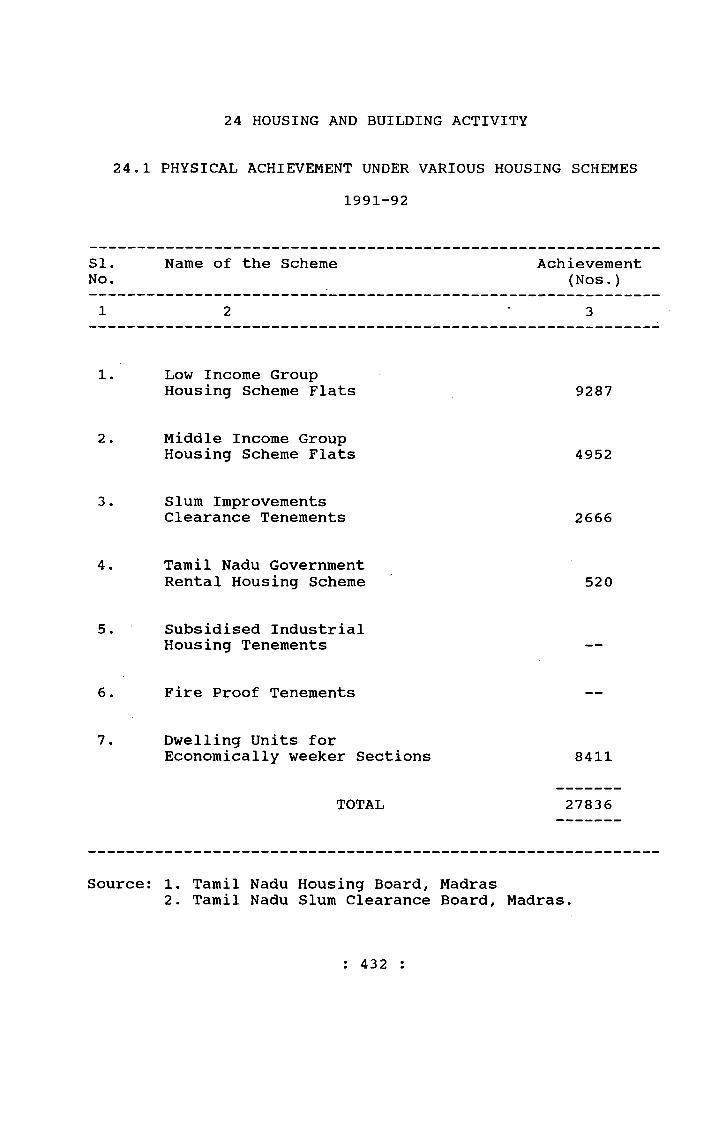
24.1 PHYSICAL ACHIEVEMENT UNDER VARIOUS HOUSING SCHEMES1991-92
24 HOUSING AND BUILDING ACTIVITY
SI.No.
Name of the Scheme Achievement (Nos.)
1 2 3
1. Low Income Group Housing Scheme Flats 9287
2. Middle Income Group Housing Scheme Flats 4952
3. Slum Improvements Clearance Tenements 2666
4. Tamil Nadu Government Rental Housing Scheme 520
5. Subsidised Industrial Housing Tenements —
6. Fire Proof Tenements —
7. Dwelling Units for Economically weeker Sections
TOTAL
8411
27836
Source: 1. Tamil Nadu Housing Board,2. Tamil Nadu Slum Clearance
: 432 :
MadrasBoard, Madras.

2 4.2 BUILDING PERMITS SANCTIONED FOR CONSTRUCTION OF NEW BUILDING AND ADDITIONS, ALTERATIONS TO THE EXISTING BUILDING
IN MADRAS CITY.
Year New BuildingsAdditions/Alterations to existing buildings
1 2 3
1990-91 2161 1816
Source: Commissioner of Statistics, Madras.6.
24.3 BUILDING PERMITS SANCTIONED IN LOCAL BODIES 1990-91
SI.No. Authority
Permits Sanctioned (Nos.)
1 2 3
1. Corporation (Madras) 39772. All Municipalities(Including
Coimbatore and Madurai Corporations) 21603
3 . Town Panchayats (having Population of 10,000 and above) 16648
TOTAL 42228
Source: Commissioner of Statistics, Madras
: 433 :
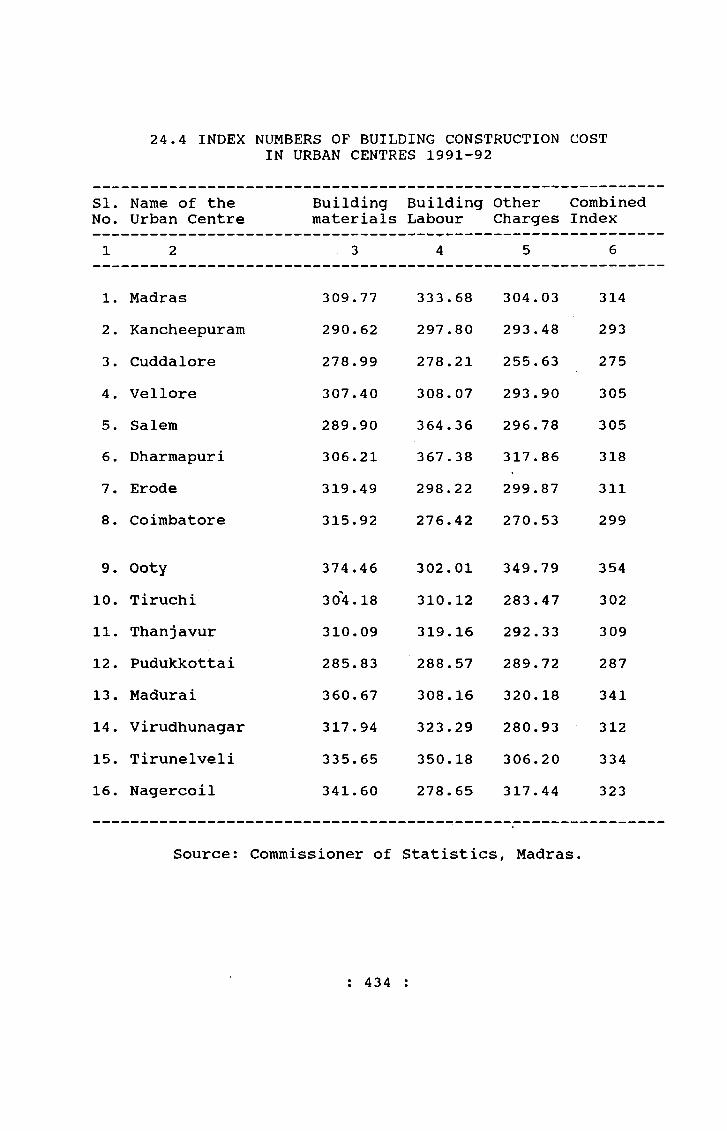
24.4 INDEX NUMBERS OF BUILDING CONSTRUCTION COSTIN URBAN CENTRES 1991-92
SI. Name of the Building Building Other CombinedNo. Urban Centre materials Labour Charges Index
1. Madras 309.77 333.68 304.03 3142. Kancheepuram 290.62 297.80 293.48 2933. Cuddalore 278.99 278.21 255.63 2754. Vellore 307.40 308.07 293.90 3055. Salem 289.90 364.36 296.78 3056. Dharmapuri 306.21 367.38 317.86 3187. Erode 319.49 298.22 299.87 3118. Coimbatore 315.92 276.42 270.53 299
9. Ooty 374.46 302.01 349.79 35410. Tiruchi 304.18 310.12 283.47 30211. Thanjavur 310.09 319.16 292.33 30912. Pudukkottai 285.83 288.57 289.72 28713. Madurai 360.67 308.16 320.18 34114. Virudhunagar 317.94 323.29 280.93 31215. Tirunelveli 335.65 350.18 306.20 33416. Nagercoil 341.60 278.65 317.44 323
Source: Commissioner of Statistics, Madras.
: 434 :
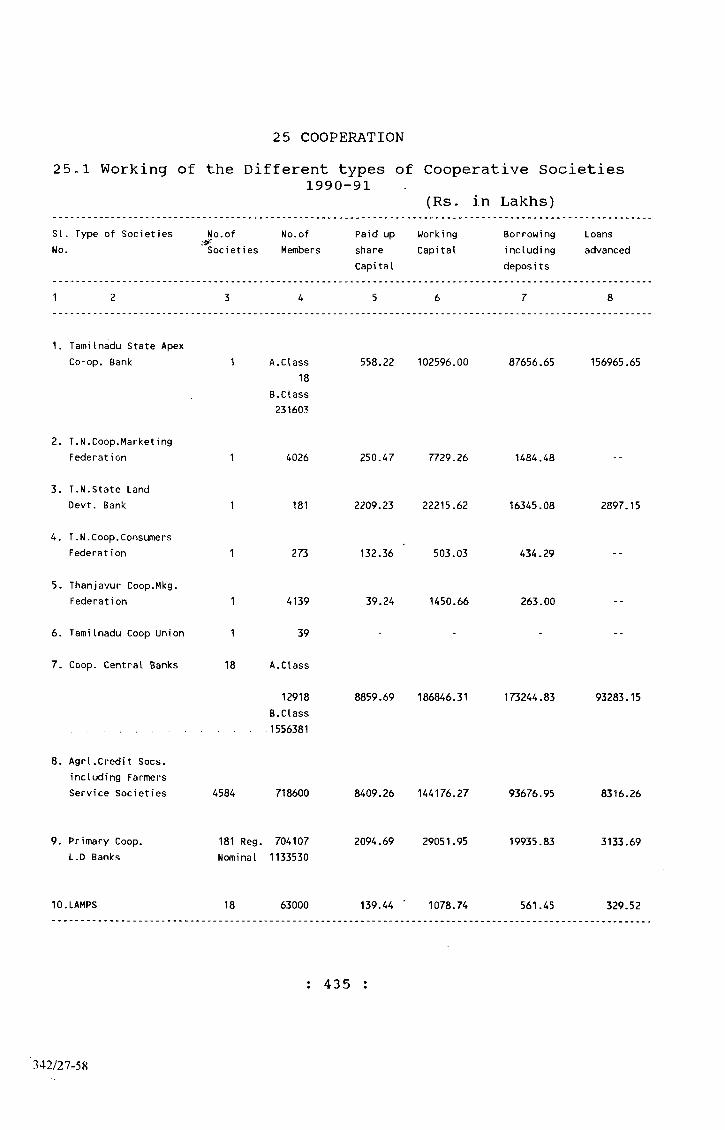
25„1 Working of the Different types of Cooperative Societies1990-91
(Rs. in Lakhs)SI. Type of Societies No.of No.of Paid up Working Borrowing LoansNo. Societies Members share Capital including advanced
Capital deposits
2 5 COOPERATION
1 8
1. Tamilnadu State Apex Co-op. Bank A.Class
18B.Class 231603
558.22 102596.00 87656.65 156965.65
2. T.N.Coop.Marketing Federation 4026 250.47 7729.26 1484.48
3. T.N.State Land Devt. Bank 181 2209.23 22215.62 16345.08 2897.15
4. T.N.Coop.Consumers Federat i on 273 132.36 503.03 434.29
5. Thanjavur Coop.Mkg.Federation 1 4139
6. Tamilnadu Coop Union 1 39
7. Coop. Central Banks 18 A.Class
39.24 1450.66 263.00
12918 B.Class 1556381
8859.69 186846.31 173244.83 93283.15
8. AgrI.Credit Socs. including Farmers Service Societies 4584 718600 8409.26 144176.27 93676.95 8316.26
9. Primary Coop. L.D Banks
181 Reg. 704107 Nominal 1133530
2094.69 29051.95 19935.83 3133.69
10.LAMPS 18 63000 139.44 ■ 1078.74 561.45 329.52
: 435 :
342/27-58

6. Tamilnadu Coop Union
25.1.(contd.)SI.No. Type of Societies
Loans Loans Value of Value of Value of No.of Value of AreaOutstand- Over due goods goods goodsing produced purchased Sold
houses houses Com- Cons- Constru- man- truced cted ded
10 11 12 13 14 15 16
1. Tamilnadu State Apex Co-op. Bank 79447.26 228.41
2. T.N.Coop.Marketing Federation 9052.57 9486.68
3. T.N.State Land Devt. Bank 20733.65 7743.28
4. T.N.Coop.Consumers Federation 306.72 296.58
5. Thanjavur Coop.Mkg. Federation 1616.37 1819.10
7. Coop. Central Banks 129952.28 30786.15
8. Agrl.Credit Socs. including Farmers Service Societies 61252.93 7354.84
9. Primary Coop. L.D Banks 15960.92 6626.34
10.LAMPS 490.00 100.54
: 436 :
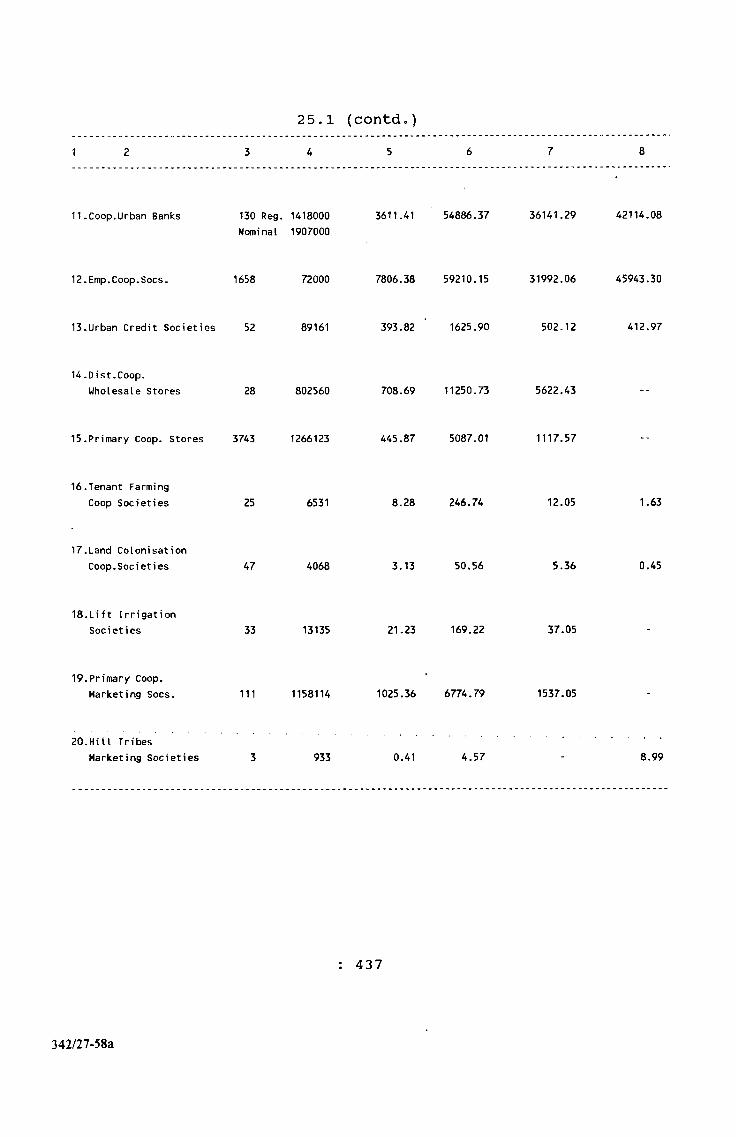
2 5.1 (contd.)1 2 3 4 5 6 7 8
11.Coop.Urban Banks 130 Reg. Nominal
14180001907000
3611.41 54886.37 36141.29 42114.08
12.Emp.Coop.Socs. 1658 72000 7806.38 59210.15 31992.06 45943.30
13.Urban Credit Societies 52 89161 393.82 1625.90 502.12 412.97
14.Dist.Coop.Wholesale Stores 28 802560 708.69 11250.73 5622.43 --
15.Primary Coop. Stores 3743 1266123 445.87 5087.01 1117.57 --
16.Tenant Farming Coop Societies 25 6531 8.28 246.74 12.05 1.63
17.Land Colonisation Coop.Societies 47 4068 3.13 50.56 5.36 0.45
18.Lift Irrigation Societies 33 13135 21.23 169.22 37.05 -
19.Primary Coop. Marketing Socs. 111 1158114 1025.36 6774.79 1537.05 -
20.H i 11 T r i besMarketing Societies 3 933 0.41 4.57 - 8.99
; 437
342/27-58a

9 10 11 12 13 U 15 16
25.1 (contd.)
11.Coop.Urban Banks 31380.93 835.38
12.Emp.Coop.Socs. 29169.45 1066.88
13.Urban Credit Societies 695.85 206.89
14.Dist.Coop.Wholesale Stores 391450.04 40129.84
15.Primary Coop. Stores 17483.79 17715.68
16.Tenant Farming Coop Societies 31.98 5.72
17.Land Colonisation Coop.Societies 8.78 5.84
18.Lift Irrigation Societies
19.Primary Coop. Marketing Socs. 239.58 35.76 15968.68 22371.26
20.Hill TribesMarketing Societies 1.41 0.33 1.68 4.25
: 438 :

25.1 (contd .)
1 2 3 4 5 6 7 8
21. Salt Manufacturers Coop.Societies 14 2610 6.91 -- 10.46 --
22. Coop. Printing Presses 17 9348 112.41 981.55 93.50 --
23. Labour Contract Coop, Societies 196 60037 39.23 336.89 70.16 27.51
24. Washerman and Laundry Coop. Societies 6 4707 0.67 11.34 0.42 --
25. Health Coop.Societies 1 379 • 2.00 6.00 -- --
26. Hair Dressers andBarbers Coop.Societies 7 725 0.26 4.95 0.58 0.42
27. Dist.Coop. Unions 18 21473 Not Applicable -- -- --
28. Coop.Training Institutes 9 2302 Not Applicable -- -- --
29. Coop,Canteen & Restaurants 69 40524 43.80 109.18 66.45 --
30. Fruit Processing Coop.Soci ety 1 544 4.96 -- -- --
439 :
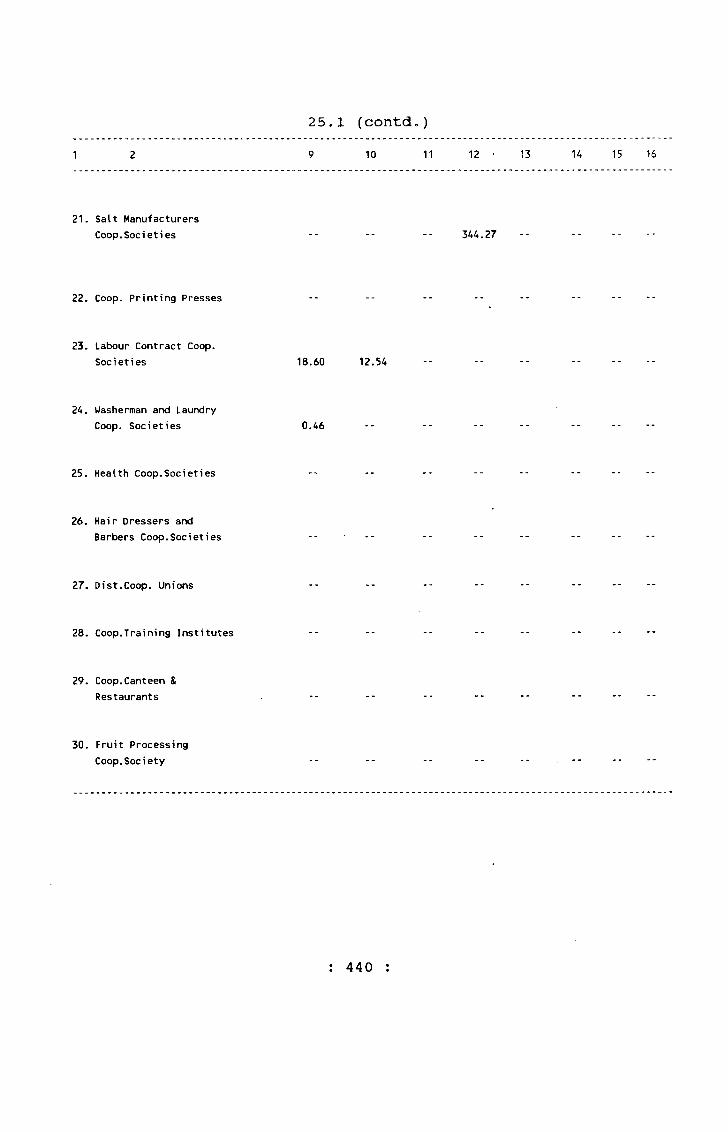
9 10 11 12 • 13 14 15 16
2 5.1 (contd.)
21. Salt ManufacturersCoop.Societies -- -- -- 344.27
22. Coop. Printing Presses
23. Labour Contract Coop.Societies 18.60 12.54
24. Washerman and LaundryCoop. Societies 0.46
25. Health Coop.Societies
26. Hair Dressers andBarbers Coop.Societies
27. DiSt.Coop. Unions
28. Coop.Training Institutes
29. Coop.Canteen & Restaurants
30. Fruit Processing Coop.Society
; 440 :
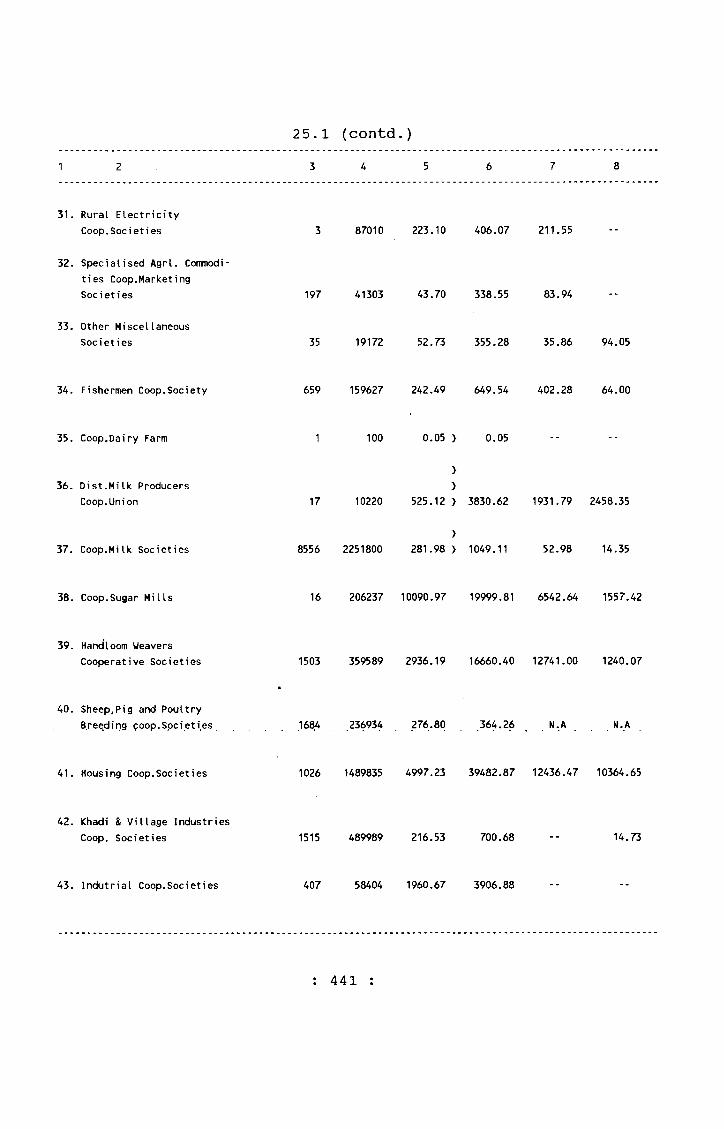
3 4 5 6 7 8
2 5.1 (contd.)
31, Rural Electricity Coop.Societies 3 87010 223.10 406.07 211.55
32. Specialised Agrl, Commodities Coop.Marketing Societies 197 41303 43.70 338.55 83.94
33. Other Miscellaneous Societies 35 19172 52.73 355.28 35.86 94.05
34. Fishermen Coop.Society 659 159627 242.49 649.54 402.28 64.00
35. Coop.Dairy Farm 1 100 0.05 > 0.05
36. Dist.Milk Producers Coop.Uni on
>
>
17 10220 525.12 > 3830.62 1931.79 2458.35
37. Coop.Mi Ik Societies 8556 2251800 281.98 > 1049.11 52.98 14.35
38. Coop.Sugar Mills 16 206237 10090.97 19999.81 6542.64 1557.42
39. Handloom WeaversCooperative Societies 1503 359589 2936.19 16660.40 12741.00 1240.07
40. Sheep,Pig and Poultry Breeding goop.Societies 1684 236934 276.80 364.26 N.A N.A
41. Housing Coop.Societies 1026 1489835 4997.23 39482.87 12436.47 10364.65
42. Khadi & Village Industries Coop. Societies 1515 489989 216.53 700.68 14.73
43. Indutrial Coop.Societies 407 58404 1960.67 3906.88
: 441 :

9 10 11
2 5.1 (contd.)12 13 14 15 16
31. Rural Electricity Coop.Societies
32. Specialised AgrI. Commodi ties Coop.Marketing Societies 100.45 33.10 108.15 107.09
33. Other Miscellaneous Societies 103.27 86.32
34. Fishermen Coop.Society 351.50 236.80 228.53 1001 145.00
35. Coop.Dairy Farm
36. Dist.Milk Producers Coop.Uni on
37, Coop.Milk Societies
2302.49 3.75 7680.71 14941.88 16212.85
33.42 24.30 7368.74 13271.80 153619.01
38. Coop.Sugar Mills 652.81 87.62 22676.81 14353.49 22030.79 849 310.79
39. Handloom WeaversCooperative Societies 2099.80 382.50 26613.79 13052.76 38695.79 4568 557.37
40. Sheep,Pidg and Poultry Breeding coop.Societies NA NA NA NA NA NA NA
41. Housing Coop.Societies 36035.88 6479.90 51343 12469.93 --
42. Khadi & Village Industries Coop. Societies 843.36 160.16 12704.08 13923.88
43. Industrial Coop.Soscieties 11109.10 13887.90
Source ; Respective Heads of Departments.: 442 :

2 5.2 LOANS ISSUED BY AGRICULTURAL AND NON-AGRICULTURAL CREDIT SOCIETIES - CLASSIFIED ACCORDING TO PURPOSE 1990-91
(Rupees in Lakhs)
A. Agricultural Credit Societies1) Short Term: 49602.21
2) Medium Term: 1329.59
Total 50931.80
B. Non-Agricultural Credit Societies
1) Short Term 13884.59
2) Medium TermTotal
33261.8247146.41
Source: Registrar of Co-operative Societies, Madras.
: 443
342/27-59

2 5.3 LOANS ISSUED BY AGRICULTURAL AND NON AGRICULTURAL CREDIT SOCIETIES CLASSIFIED ACCORDING TO VALUE 1990-91
(RS.IN LAKHS)
Agricultural Non-AgriculturalSI. Credit Societies Credit SocietiesNo. Value
Amount Percentage
Amount Percentage
1 2 3 4 5 6
1. Loans less than Rs.100/-
2. Loans exceeding RS.lOO but not exceeding Rs.3 00/
3. Loans exceeding Rs.300/- but not exceeding Rs.500/ 211.71 0.42 39.77 0.08
4. Loans exceeding Rs.500/- but not exceeding Rs.lOOO/- 1875.28 3.68 750.97 1.59
5. Loans exceeding Rs.lOOO/- but notexceeding Rs.5000'- 24561.24 48.22 13861.39 29.40
6. Loans exceeding Rs.5000/- 24283.57 47.68 32494.28 68.92
TOTAL 50931.80 100.00 47146.41 100.00
Source: Registrar of Co-operative Societies, Madras
: 444 :
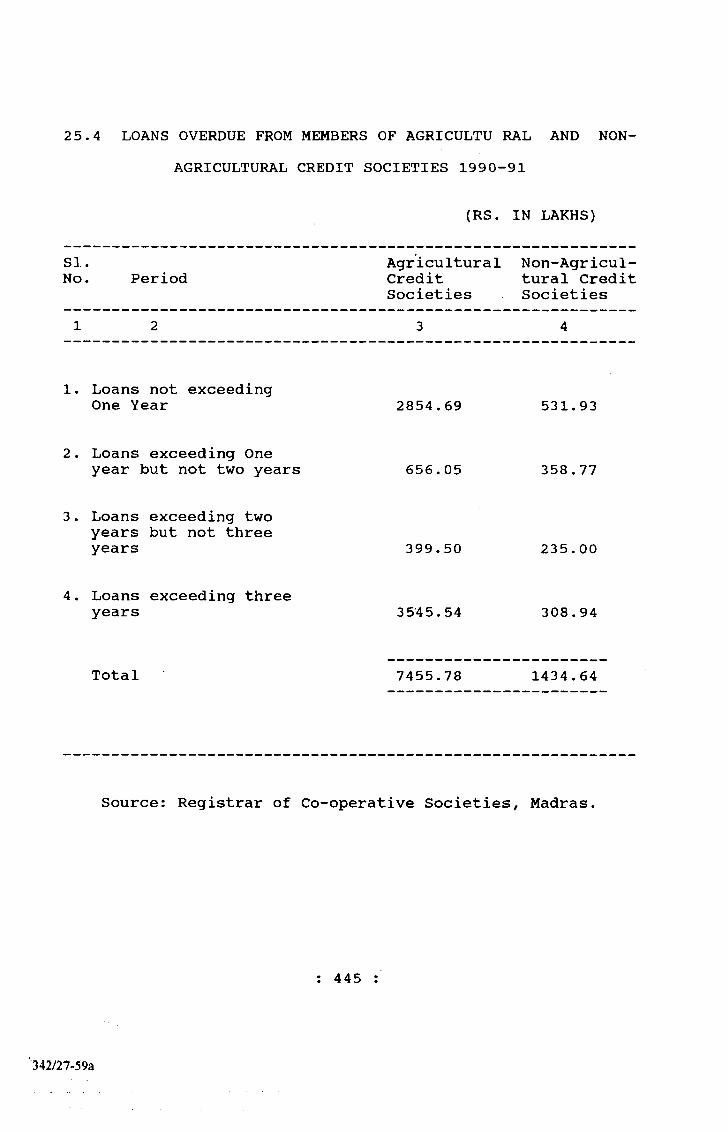
2 5.4 LOANS OVERDUE FROM MEMBERS OF AGRICULTU RAL AND NON- AGRICULTURAL CREDIT SOCIETIES 1990-91
(RS. IN LAKHS)
SI. Agricultural Non-Agricul-No. Period Credit tural Credit
Societies Societies1 2 3 4
1. Loans not exceeding One Year 2854.69 531.93
2. Loans exceeding One year but not two years 656.05 358.77
3. Loans exceeding two years but not three years 399.50 235.00
4. Loans exceeding three years 3 545.54 308.94
Total 7455.78 1434.64
Source: Registrar of Co-operative Societies, Madras.
: 445
342/27-59a
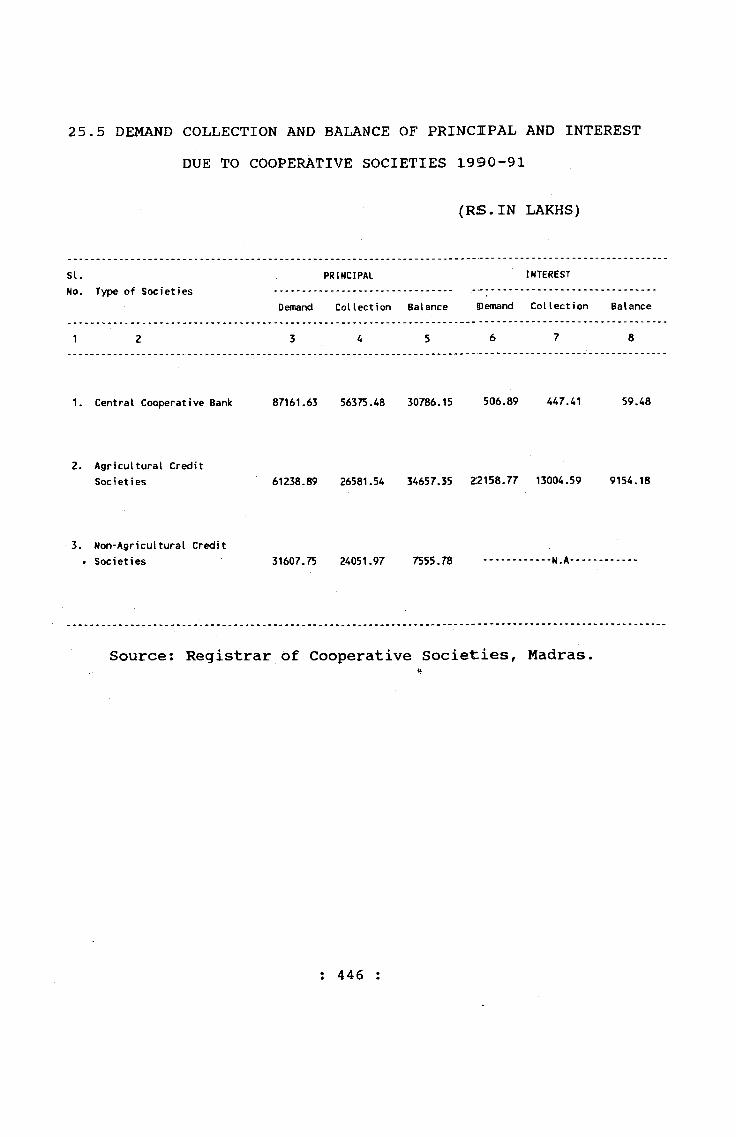
25.5 DEMAND COLLECTION AND BALANCE OF PRINCIPAL AND INTEREST DUE TO COOPERATIVE SOCIETIES 1990-91
(RS.IN LAKHS)
SI.No. Type of Societies
PRINCIPAL INTEREST
Demand Col lection Balance (Demand Col lection Balance
1 2 3 4 5 6 7 8
1. Central Cooperative Bank 87161.63 56375.48 30786.15 506.89 447.41 59.48
2. Agricultural Credit Societies 61238.89 26581.54 34657.35 22158.77 13004.59 9154.18
3. Non-Agricultural Credit Societies 31607.75 24051.97 7555.78 fi • A
Source: Registrar of Cooperative Societies, Madras.
: 446 ;
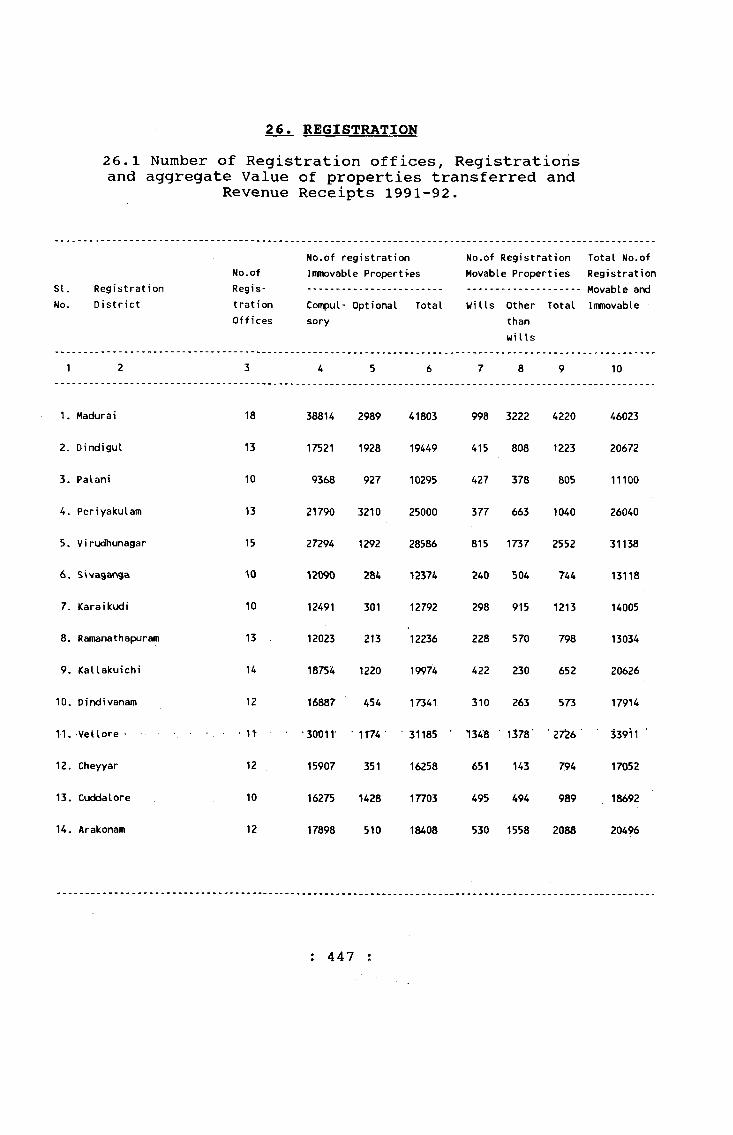
2 6.1 Number of Registration offices, Registrations and aggregate Value of properties transferred and
Revenue Receipts 1991-92.
26. REGISTRATION
SI.No.
No.of Registration Off i ces
No.of registration Inmovable Properti-es
No.of Registration Movable Properties
Total No.of Registration
rvcy 1 o L1 a L 1 ui 1District Compul
sory- Optional Total Ui lls Other
than wi I Is
TotalMovable and Inmovable
1 2 3 4 5 6 7 8 9 10
1. Madurai 18 38814 2989 41803 998 3222 4220 46023
2. Dindigul 13 17521 1928 19449 415 808 1223 20672
3. Palani 10 9368 927 10295 427 378 805 11100
4. Periyakulam 13 21790 3210 25000 377 663 1040 26040
5. Vi rudhunagar 15 27294 1292 28586 815 1737 2552 31138
6. SWagarv9a “0 12090 284 12374 240 504 744 13118
7. Karaikudi 10 12491 301 12792 298 915 1213 14005
8. Ramanathapuram 13 , 12023 213 12236 228 570 798 13034
9. Kallakuichi 18754 1220 19974 422 230 652 20626
10. Dindivanam 12 16887 454 17341 310 263 573 17914
11. •VeUore ■ • • It ■ • •30011- 1T74 ’ 31185 ' 1348 1378' ■ 27"26 * 53911 ■
12. Cheyyar 12 15907 351 16258 651 143 794 17052
13. Cuddalore 10 16275 1428 17703 495 494 989 18692
14, Arakonam 12 17898 510 18408 530 1558 2088 20496
: 447 ;

2 6 . 1 Contd •
1 2 3 4 5 6 7 8 9 10
15. Villupuram 11 16196 614 16810 383 337 720 17530
16. Chidambaram 13 16696 892 17588 436 402 838 18426
17. Tiruvannamalai 13 19997 - 19997 465 14 479 20476
18. Tirunelveli 10 11800 1423 13223 412 800 1212 14435
19. Palayamkottai 18 22354 1649 24003 512 1890 2402 26405
20. Cheranmahadevi 9 9532 1363 10895 372 647 1019 11914
21. Tenkasi 17 11800 1423 13223 485 1076 1561 14784
22. Tuticorin 16 22354 1649 24003 567 1419 1986 25989
23. Kanniyakumari 12 9532 . 1363 10895 778 1475 2253 13148
24. Marthandam 9 23772 3180 26952 352 788 1140 28092
25. Coimbatore 10 38745 1535 40280 2018 32809 34827 75107
26. Tirupur 11 31546 1143 32689 1771 1179 2950 35639
27. Erode 14 24945 1647 26592 1117 1163 2280 28872
28. Gobichettypalayam 9 10823 646 11469 649 334 983 12452
29. Ooty 5 8028 247 8275 201 312 513 8788
30. Salem 22 32918 2976 35894 1531 2197 3728 39622
31. Namakkal 17 21609 1417 23026 1033 1314 2347 25373
32. Dharmapuri 11 13801 949 14750 489 149 638 15388
33. Krishnagiri 14 21217 3217 24434 709 1110 1819 26253
: 448 :
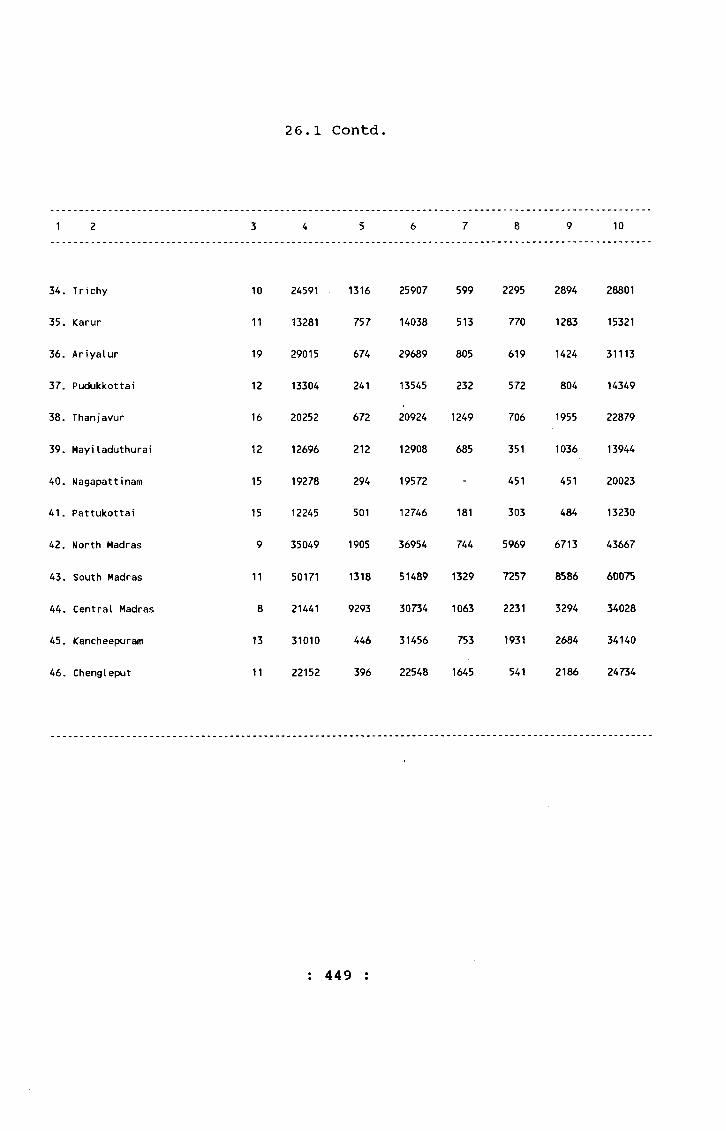
2 6.1 Contd.
10
34. Trichy
35. Karur
36. Ariyalur
37. Pudukkottai
38. Thanjavur
39. Mayiladuthurai
40. Nagapattinam
41. Pattukottai
42. North Madras
43. South Madras
44. Central Madras
45. Kancheepuram
46. Chengleput
10
11
19
12
16
12
15
15
9
11
8
13
11
24591
13281
29015
13304
20252
12696
19278
12245
35049
50171
21441
31010
22152
1316
757
674
241
672
212
294
501
1905
1318
9293
446
396
25907
14038
29689
13545
20924
12908
19572
12746
36954
51489
30734
31456
22548
599
513
805
232
1249
685
181
744
1329
1063
753
1645
2295
770
619
572
706
351
451
303
5969
7257
2231
1931
541
2894
1283
1424
804
1955
1036
451
484
6713
8586
3294
2684
2186
28801
15321
31113
14349
22879
13944
20023
13230
43667
60075
34028
34140
24734
: 449 ;
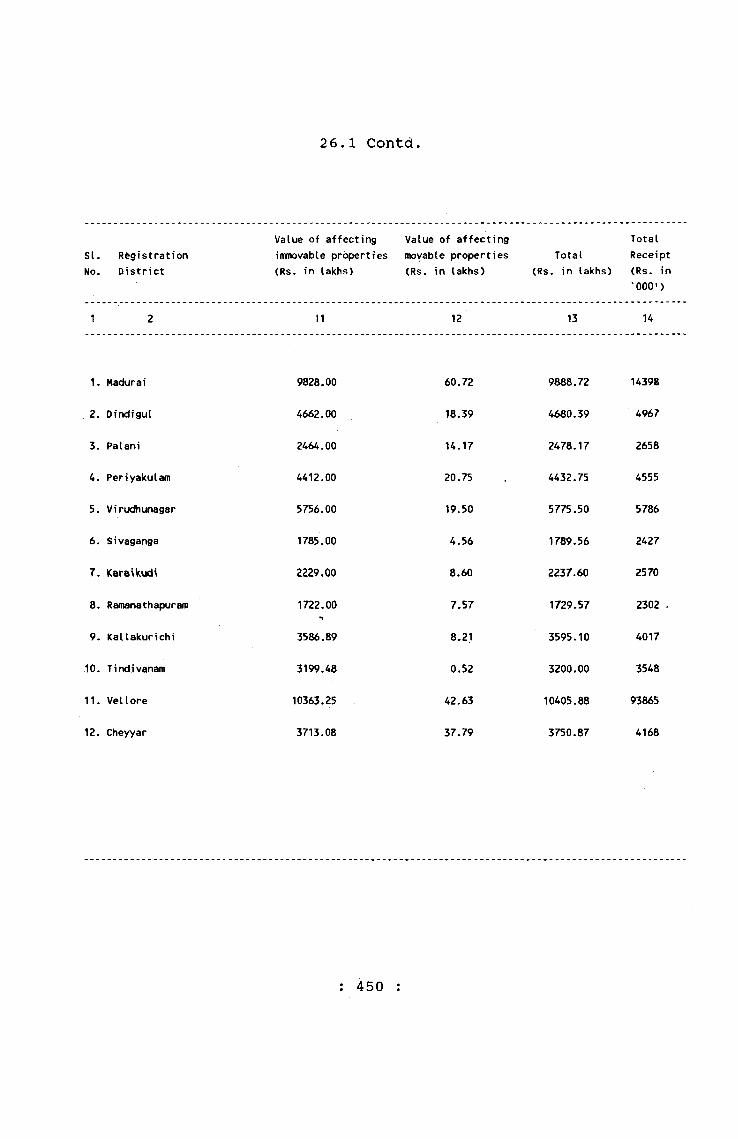
2 6.1 Contd.
si. Registration No. District
Value of affecting immovable properties (Rs. in lakhs)
Value of affecting movable properties (Rs. in lakhs)
Total (Rs. in lakhs)
Total Receipt (Rs. in 000')
1 2 11 12 13 14
1. Madurai 9828.00 60.72 9888.72 14398
2. Dindigul 4662.00 18.39 4680.39 4967
3. Palani 2464.00 14.17 2478.17 2658
4. Periyakulam 4412.00 20.75 4432.75 4555
5. Virudhunagar 5756.00 19.50 5775.50 5786
6. Sivaganga 1785.00 4.56 1789.56 2427
7. KaraAkudi 2229.00 8.60 2237.60 2570
8. Ramanathapuram 1722.00 7.57 1729.57 2302 .
9. Kallakurichi 3586.89 8.21 3595.10 4017
10. Tindivanam 3199.48 0.52 3200.00 3548
11. Vellore 10363.25 42.63 10405.88 93865
12. Cheyyar 3713.08 37.79 3750.87 4168
: 450 :
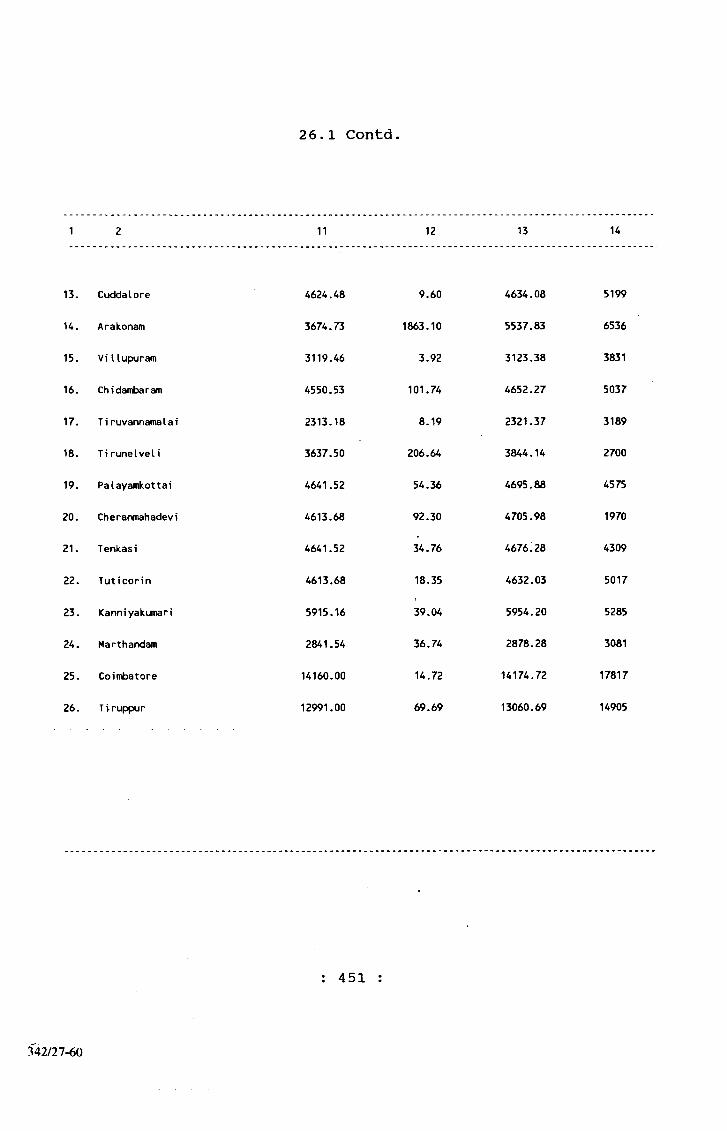
2 6.1 Contd.
11 12 13 14
13. CuckJalore
14. Arakonam
15. VUlupuram
16. Chidambaram
17. Ti ruvannatnalai
18. Tirunelveli
19. Palayamkottai
20. Cheranmahadevi
21. Tenkasi
22. Tuticorin
23. Kanniyakumari
24. Marthandam
25. Coimbatore
26. Tiruppur
4624.48
3674.73
3119.46
4550.53
2313.18
3637.50
4641.52
4613.68
4641.52
4613.68
5915.16
2841.54
14160.00
12991.00
9.60
1863.10
3.92
101.74
8.19
206.64
54.36
92.30
34.76
18,35
39.04
36.74
14.72
69.69
4634.08
5537.83
3123.38
4652.27
2321.37
3844.14
4695.88
4705.98
4676.28
4632.03
5954.20
2878.28
14174.72
13060.69
5199
6536
3831
5037
3189
2700
4575
1970
4309
5017
5285
3081
17817
14905
: 451 ;
342/27-60
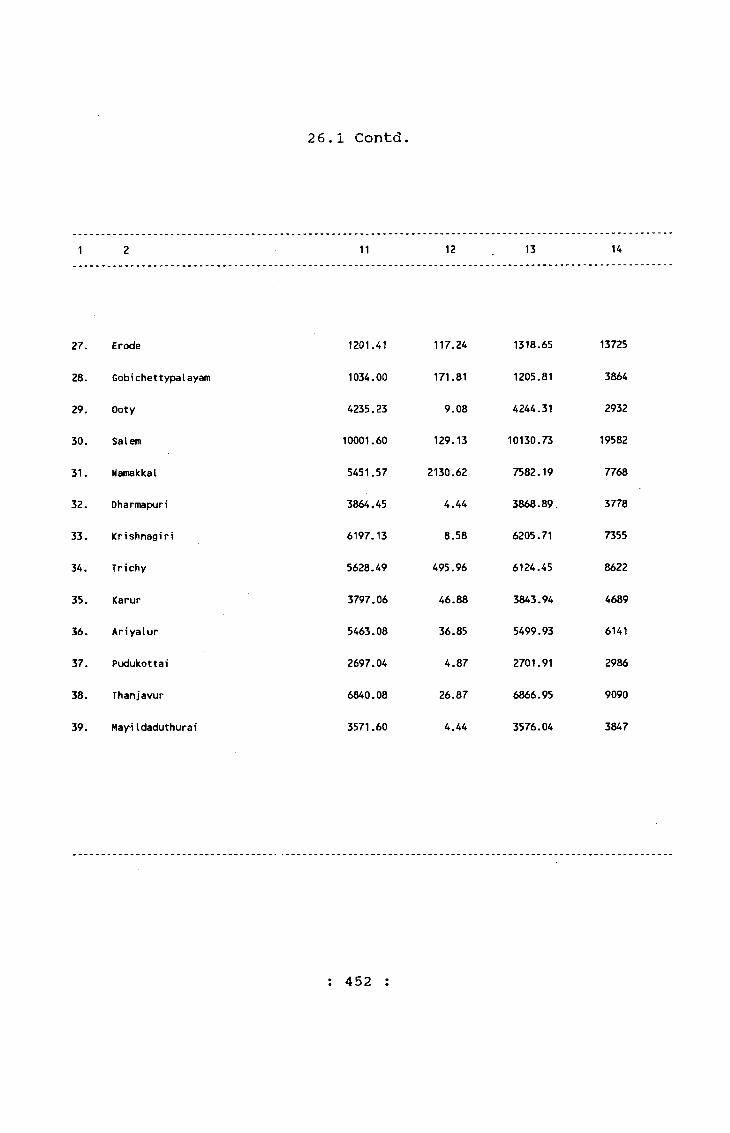
2 6.1 Contd.
11 12 13 14
27. Erode
28. Gobichettypalayam
29. Ooty
30. Salem
31. Namakkal
32. Dharmapuri
33. Krishnagiri
34. Trichy
35. Karur
36. Ariyalur
37. Pudukottai
38. Thanjavur
39. May"! Idaduthurai
1201.41
1034.00
4235.23
10001.60
5451.57
3864.45
6197.13
5628.49
3797.06
5463.08
2697.04
6840.08
3571.60
117.24
171.81
9.08
129.13
2130.62
4.44
8.58
495.96
46.88
36.85
4.87
26.87
4.44
1318.65
1205.81
4244.31
10130.73
7582.19
3868.89
6205.71
6124.45
3843.94
5499.93
2701.91
6866.95
3576.04
13725
3864
2932
19582
7768
3778
7355
8622
4689
6141
2986
9090
3847
: 452 :
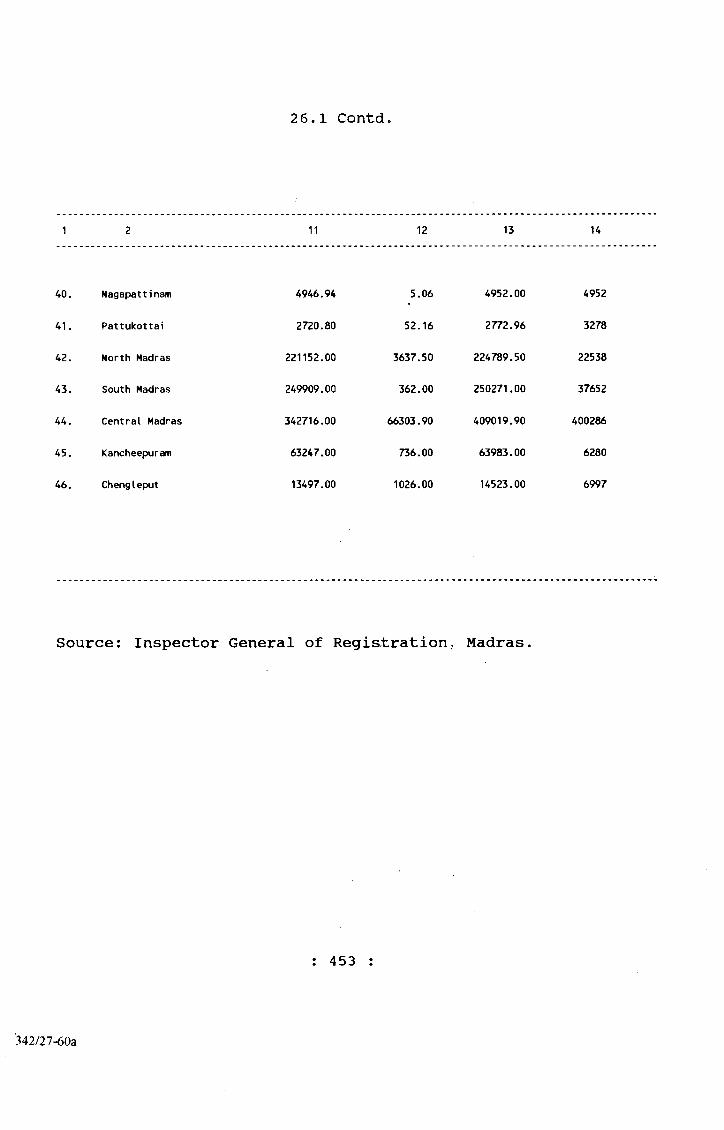
2 6.1 Contd.
11 12 13 14
40. Nagapattinam 4946.94 5.06 4952.00 4952
41. Pattukottai 2720.80 52.16 2772.96 3278
42. North Madras 221152.00 3637.50 224789.50 22538
43. South Madras 249909.00 362.00 250271.00 37652
44. Central Madras 342716.00 66303.90 409019.90 400286
45. Kancheepuram 63247.00 736.00 63983.00 6280
46. Chengleput 13497.00 1026.00 14523.00 6997
Source: Inspector General of Registration, Madras.
; 453
342/27-60a
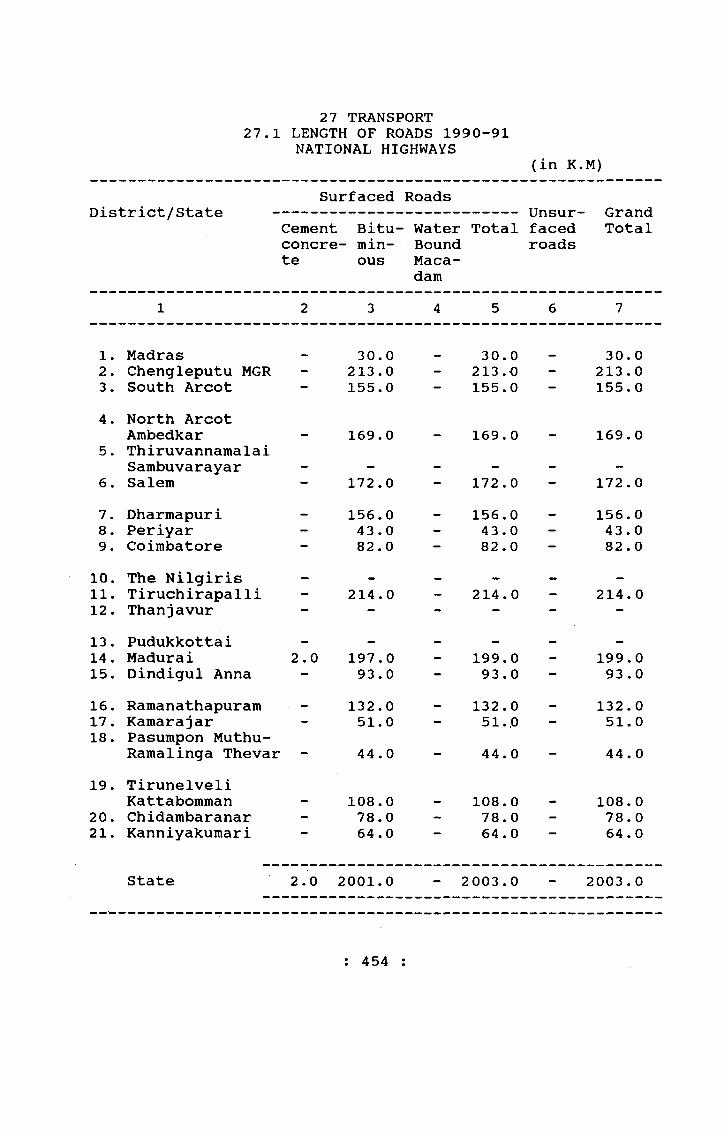
27 TRANSPORT27.1 LENGTH OF ROADS 1990-91
NATIONAL HIGHWAYS(in K.M)
District/StateSurfaced
Cement Bitu- concre- min- te ous
Roads- Water Bound Macadam
TotalUnsurfacedroads
GrandTotal
1 2 3 4 5 6 7
1. Madras 30.0 30.0 30. 02. Chengleputu MGR - 213.0 - 213.0 - 213.03. South Arcot — 155.0 — 155.0 — 155.04. North Arcot
Ambedkar - 169.0 - 169.0 - 169 . 05. Thiruvannamalai
Sambuvarayar _ _ _
6. Salem — 172.0 — 172.0 — 172 . 07. Dharmapuri - 156.0 - 156.0 — 156.08. Periyar - 43.0 - 43.0 - 43. 09. Coimbatore — 82.0 — 82.0 — 82 . 010. The Nilgiris — — — — —11. Tiruchirapalli - 214.0 - 214.0 - 214. 012. Thanjavur — — — — — —
13. Pudukkottai _ _
14. Madurai 2.0 197.0 - 199.0 - 199.015. Dindigul Anna — 93.0 — 93.0 — 93.016. Ramanathapuram . - 132.0 - 132.0 - 132.017. Kamarajar - 51.0 - 51..0 - 51.018. Pasumpon Muthu-
Ramalinga Thevar 44.0 - 44.0 - 44. 019. Tirunelveli
Kattabomman - 108.0 - 108.0 - 108. 020. Chidambaranar - 78.0 - 78.0 - 78. 021. Kanniyakumari 64.0 64.0 64 . 0
State 2.0 2001.0 - 2003.0 - 2003.0
: 454 :

27.1 Contd.
STATE HIGHWAYS
1 2 3 4 5 6 7
1. Madras2. Chengleputu
MGR 7.0 3236.0 130.0 3373.0 2.0 3375.03. South Arcot 26.0 4083.0 53 . 0 4162.0 39.0 4201,04. North Arcot
Ambedkar 4.0 1873.0 65.0 1942.0 - 1942.05. Thiruvannamalai
Sambuvarayar 2242.0 42.0 2284.0 _ 2284.06. Salem 15.0 3629.0 — 3644.0 — 3644.07. Dharmapuri — 2604.0 50.0 2654.0 — 2654.08. Periyar - 3352.0 - 3352.0 - 3352.09. Coimbatore 61.0 3130.0 73 . 0 3264.0 1.0 3265.0
10. The Nilgiris — 972.0 — 972.0 — 972 .011. Tiruchirapalli 4.0 3633 .0 142.0 3779.0 6.0 3785.012. Thanjavur 23.0 3852.0 207.0 4082.0 12.0 4094.013. Pudukkottai — 1700.0 106.0 1806.0 — 1806.014. Madurai 20.0 1972.0 20.0 2012.0 - 2012.015. Dindigul Anna 17.0 1878.0 75. 0 1970.0 12.0 1982.016. Ramanathapuram — 1239.0 151.0 1390.0 — 1390.017. Kamarajar 14.0 1406.0 67. 0 1487.0 4.0 1491.018. PasumponMuthu-
Rama1i ngaThevar 9.0 1354.0 97.0 1460.0 5.0 1465.019. Tirunelyeli
Kattabomman 4.0 2389.0 49.0 2442.0 - 2442.020. Chidambaranar - 1772.0 63.0 1785.0 - 1785.021. Kanniyakumari 11.0 1000.0 3.0 1014.0 1014.0
State 215.0 47266.0 1393.0 48874.0 81.0 48955.0
: 455 :

27.1 Contd.
CORPORATION AND MUNICIPAL ROADS
1 2 3 4 5 6 7
1. Madras2. Chengleputu
MGR3. South Arcot
34.013.646.4
1523.0673.8177.5
125.2428.2 90.8
1682.21115.6314.7
32 . 3114.941.0
1714.51230.5 355.7
4. North Arcot Ambedkar
5. Thiruvannamalai Sambuvarayar
6. Salem
70.924.3
116.9
191.995.2
329.0
48.819.576.5
311.6139. 0 522.4
24.222 . 6 44.5
335.8161.6566.9
7. Dharmapuri8. Periyar9. Coimbatore
23.2 45.797.3
40.7262.8664.7
15.7 69.1 97.6
79.6377.685*9.6
3.411.276.9
83.0388.8936.5
10. The Nilgiris11. Tiruchirapalli12. Thanjavur
11.7102.313.3
189.4261.9435.8
50.041.276.5
251.1 405.4 525.6
35.5125.0
251.1440.9650.6
13. Pudukkottai14. Madurai15. Dindigul Anna
0.8127.841.9
80.2 447.1 114.5
30.5109.530.2
111.5 684.4 186. 6
14.6 208.743.6
126.1893.1230.2
16. Ramanathapuram17. Kamarajar18. PasumponMuthu-
RamalingaThevar
6.6109.910.2
28.7155.297.1
23.1 49.352.7
58.4314.4160.0
8.831.519.3
67.2345.9179.3
19. Tirunelveli Kattabomman
20. Chidambaranar21. Kanniyakumari
117.1 35.4 49.8
128.798.0
140.592.428.415.4
338.2161.8205.7
66.2 21.8 36. 6
404.4183.6242.3
State 1099.1 6135.7 1570.6 8805.4 982 .6 9788.0
: 456 :
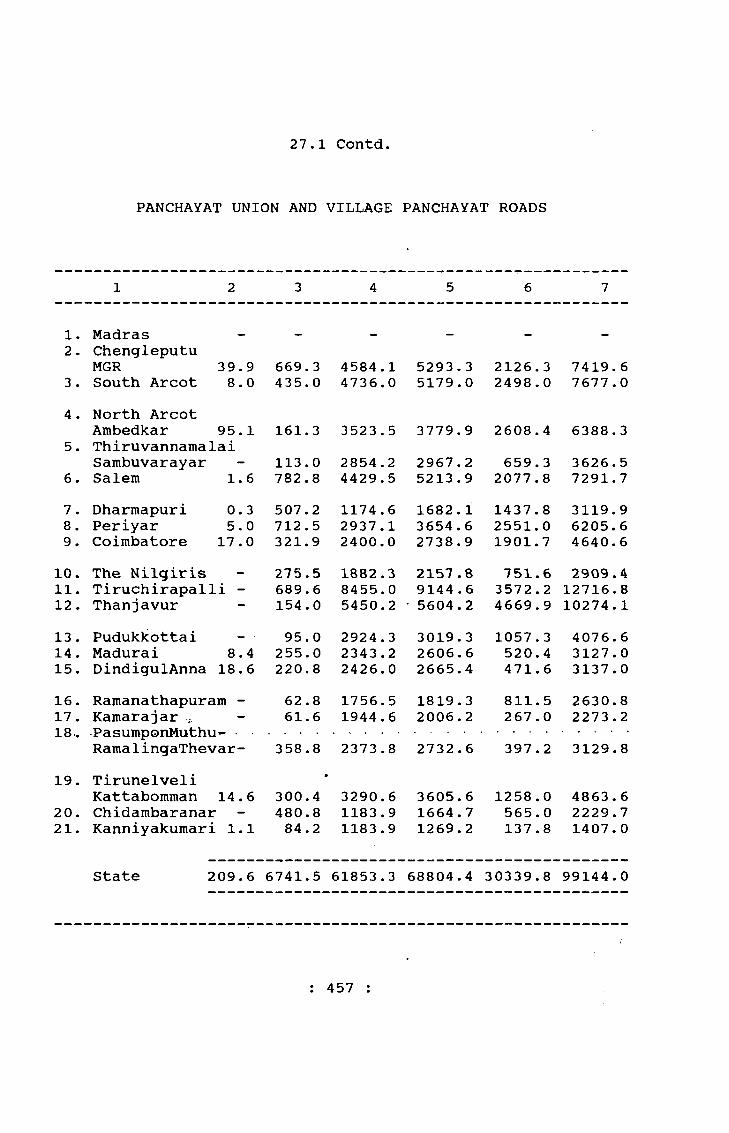
27.1 Contd.
PANCHAYAT UNION AND VILLAGE PANCHAYAT ROADS
1 2 3 4 5 6 7
1. Madras2. Chengleputu
MGR3. South Arcot
39.98.0
669.3435.0
4584.14736.0
5293 . 3 5179.0
2126.3 2498 . 0
7419.6 7677.0
4. North Arcot Ambedkar 95.1
5. Thiruvannamalai Sambuvarayar
6. Salem 1.6
161.3113.0 782 .8
3523.52854.24429.5
3779.92967.25213.9
2608.4659. 3
2077.8
6388.33626.5 7291.7
7. Dharmapuri8. Periyar9. Coimbatore
0.35.0
17.0507.2712.5321.9
1174.62937.12400.0
1682.13654.62738.9
1437.82551.01901.7
3119.96205.64640.6
10. The Nilgiris11. Tiruchirapalli -12. Thanjavur
275.5689.6 154.0
1882.38455.05450.2
2157.8 9144 .6
• 5604.2751.63572.24669.9
2909.412716.810274.1
13. Pudukkottai14. Madurai15. DindigulAnna
8.418.6
95.0255.0220.8
2924.32343.22426.0
3019.3 2606.62665.4
1057.3520.4471.6
4076.63127.03137.0
16. Ramanathapuram -17. Kamarajar18.. PasuroponMuthu^
Rama1ingaThevar-
62.861.6
358.8
1756.51944.62373.8
1819.3 2006.22732.6
811.5267.0397.2
2630.8 2273.23129.8
19. Tirunelveli Kattabomman
20. Chidambaranar21. Kanniyakumari
14.61.1
•
3 00.4 480.8 84.2
3290.61183.91183.9
3605.61664.7 1269.2
1258.0565.0137.8
4863.62229.7 1407.0
State 209.6 6741.5 61853.3 68804.4 30339.8 99144.0
: 457 :
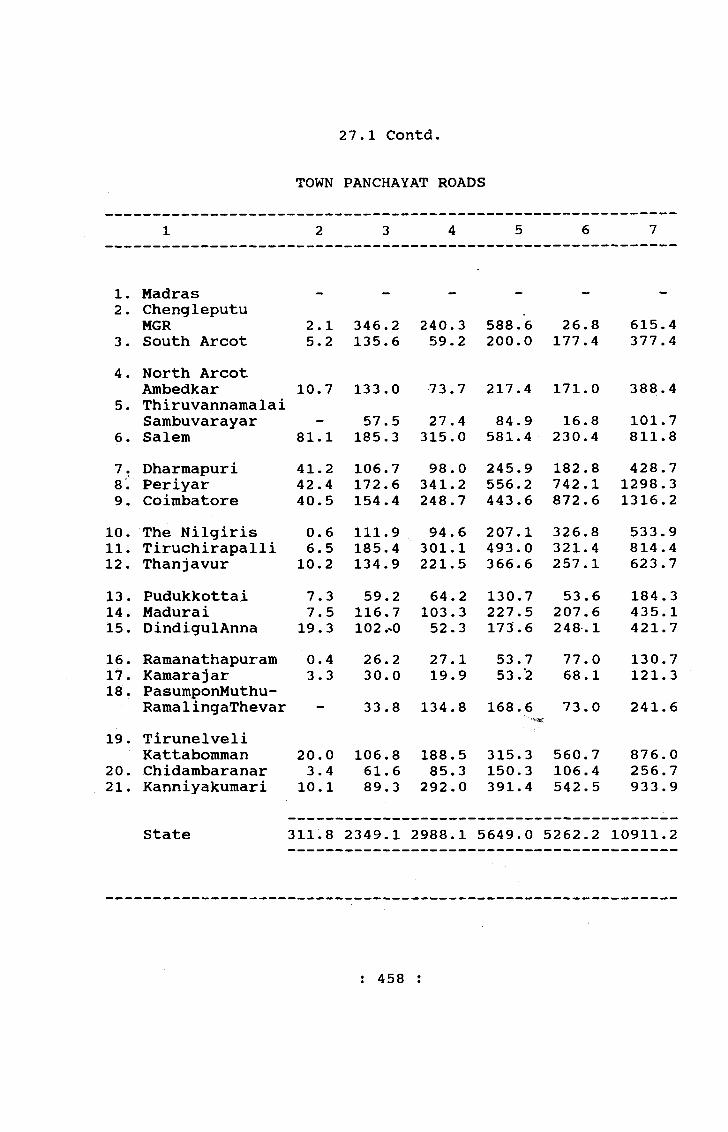
27.1 Contd.
TOWN PANCHAYAT ROADS
1 2 3 4 5 6 7
1. Madras2. Chengleputu
MGR3. South Arcot
2.1 5,2
346.2135.6
240.359.2
588.6200.0
26.8177.4
615.4377.4
4. North Arcot Ambedkar
5. Thiruvannamalai Sambuvarayar
6. Salem
10.7
81.1
133.057.5
185.3
73.727.4
315.0
217.484.9
581.4
171.016.8
230.4
388.4101.7811.8
7. Dharmapuri8. Periyar9. Coimbatore
41.242.440.5
106.7172.6154.4
98.0341.2248.7
245.9556.2443.6
182.8742.1872.6
428.71298.31316.2
10. The Nilgiris11. Tiruchirapalli12. Thanjavur
0.66.5
10.2111.9 185.4134.9
94.6301.1221.5
207.1 493.0 366.6
326.8321.4257.1
533.9814.4623.7
13. Pudukko11a i14. Madurai15. DindigulAnna
7.37.5
19.359.2
116.7102.^0
64.2 103.352.3
130.7227.5173.6
53.6 207.6 248.1
184.3435.1421.7
16. Ramanathapuram17. Kamarajar18. PasumponMuthu-
Rama1ingaThevar
0.43.3
26.230.033.8
27.1 19.9
134.8
53.7 77.0 53.‘2 68.1
168.6 73.0
130.7121.3241.6
19. Tirunelveli Kattabomman
20. Chidambaranar21. Kanniyakumari
20.03.4
10.1106.861.689.3
188.585.3
292.0315.3150.3391.4
560.7106.4542.5
876.0256.7933.9
State 311.8 2349.1 2988.1 5649.0 5262.2 10911.2
: 458 :
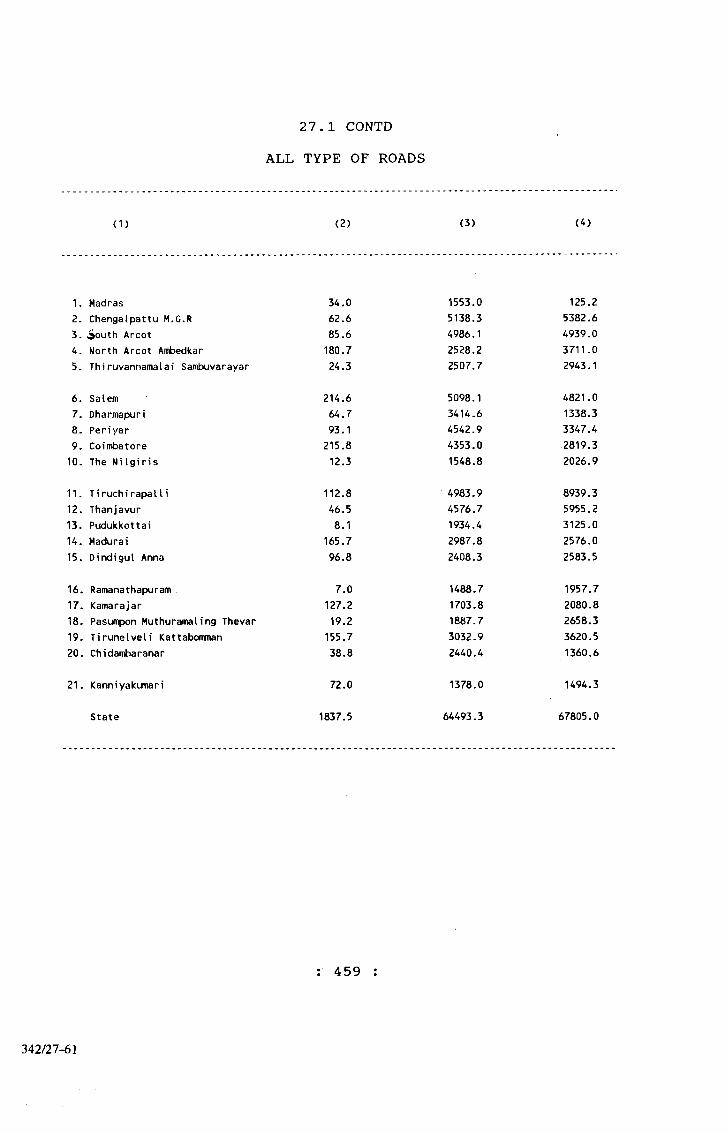
27.1 CONTDALL TYPE OF ROADS
(1) (2) (3) (4)
1. Madras 34.0 1553.0 125.22. Chengalpattu M.G.R 62.6 5138.3 5382.63. South Arcot 85.6 4986.1 4939.04. North Arcot Ambedkar 180.7 2528.2 3711.05. Thiruvannamalai Sambuvarayar 24.3 2507.7 2943.1
6. Salem 214.6 5098.1 4821.07. Dharmapuri 64.7 3414.6 1338.38. Periyar 93.1 4542.9 3347.49. Coimbatore 215.8 4353.0 2819.310. The NiIgiris 12.3 1548.8 2026.9
11. Tiruchirapalli 112.8 4983.9 8939.312. Thanjavur 46.5 4576.7 5955.213. Pudukkottai 8.1 1934.4 3125.014. Madurai 165.7 2987.8 2576.015. Dindigul Anna 96.8 2408.3 2583.5
16. Ramanathapuram 7.0 1488.7 1957.717. Kamarajar 127.2 1703.8 2080.818. Pasumpon Muthuramaling Thevar 19.2 1887.7 2658.319. Tirunelveli Kattabomman 155.7 3032.9 3620.520. Chidambaranar 38.8 2440.4 1360.6
21. Kanniyakumari 72.0 1378.0 1494.3
State 1837.5 64493.3 67805.0
: 459
3A2I21~61

27.1 CONTDALL TYPE OF ROADS
(1) (5) (6) (7)
1. Madras 1712.2 32.3 1744.52. Chengalpattu M.G.R 10583.5 2270.0 12853.53. south Arcot 10010.7 2755.4 12766.14. North Arcot Ambedkar 6419.9 2803.6 9223.55. Thiruvannamalai Sambuvarayar 5475.1 698.7 6173.8
6. Salem 10133.7 2352.7 12486.47. Dharmapuri. 4817.6 1624.0 6441.68. Periyar 7983.4 3304.3 11287.79. Coimbatore 7388.1 2852.2 10240.310. The NiIgiris 3588.0 1078.4 4666.4
11. T i ruch i rapa11i 14036.0 3935.1 17971.112. Thanjavur 10578.4 5064.0 15642.413. Pudukkottai 5067.5 1125.5 6193.014. Madurai 5729.5 936.7 6666.215. Dindigul Anna 5088.6 775.3 5863.9
16. Ran»nathapuram 3453.4 897.3 4350.717, Kamarajar 3911.8 370.6 4282.418. Pasumpon Muthuramaling Thevar 4565.2 494.5 5059.719. Ti rune I veil tCattabomman 6809.1 1884.9 8694.020. Chidambaranar 3839.8 693.2 4533.0
21. Kanniyakunnari 2944.3 716.9 3661.2
State 134135.8 36665.6 170801.4
Source : Respective Heads of Departments Note : Excluding Forest Roads
: 460 :
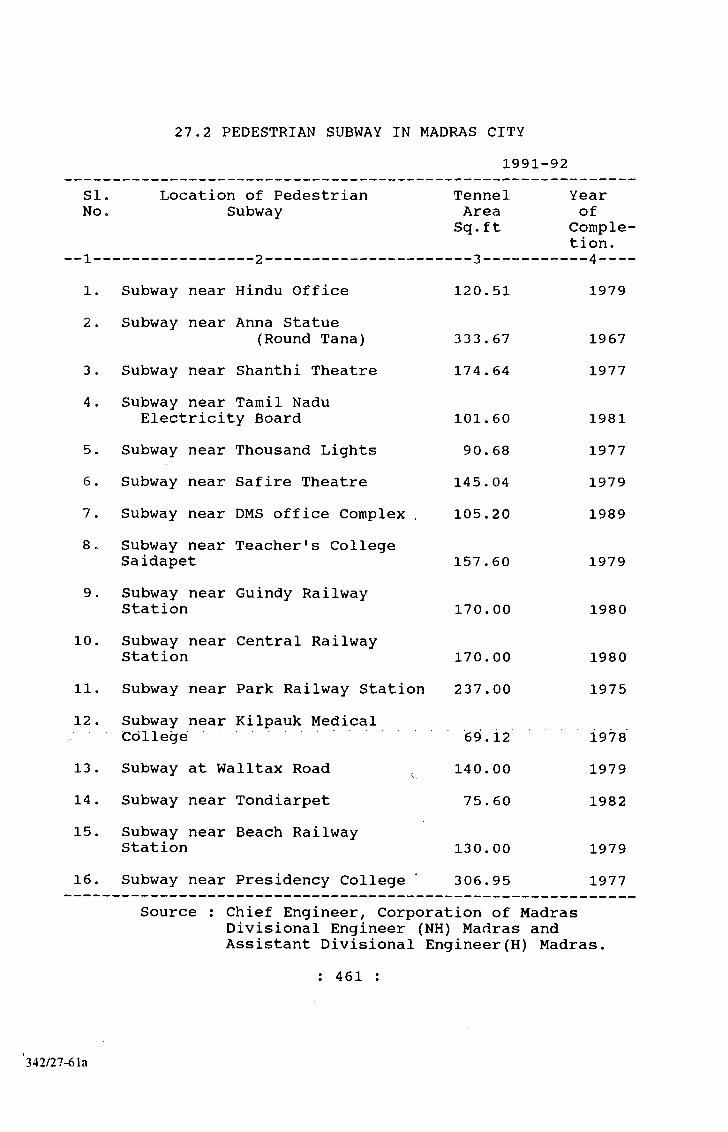
2 7.2 PEDESTRIAN SUBWAY IN MADRAS CITY1991-92
SINo
-I-
1
2
34
56
78
1 0
1 1
1 2
Location of Pedestrian TennelSubway Area
Sq.ft
Subway near Hindu Office 120.51Subway near Anna Statue
(Round Tana) 333.67Subway near Shanthi Theatre 174.64Subway near Tamil Nadu
Electricity Board 101.60Subway near Thousand Lights 90.68Subway near Safire Theatre 145.04Subway near DMS office Complex . 105.20Subway near Teacher's CollegeSaidapet 157.60Subway near Guindy RailwayStation 170.00Subway near Central RailwayStation 170.00Subway near Park Railway Station 237.00Subway near Kilpauk Medical
Yearof
Completion.
1979
19671977
1981197719791989
1979
1980
19801975
College13. Subway at Walltax Road14. Subway near Tondiarpet15. Subway near Beach Railway
Station16. Subway near Presidency College
69.12140.00 75.60
130.00 306.95
19781979 1982
19791977
Source : Chief Engineer, Corporation of Madras Divisional Engineer (NH) Madras and Assistant Divisional Engineer(H) Madras
: 461 :
342/27-6 la
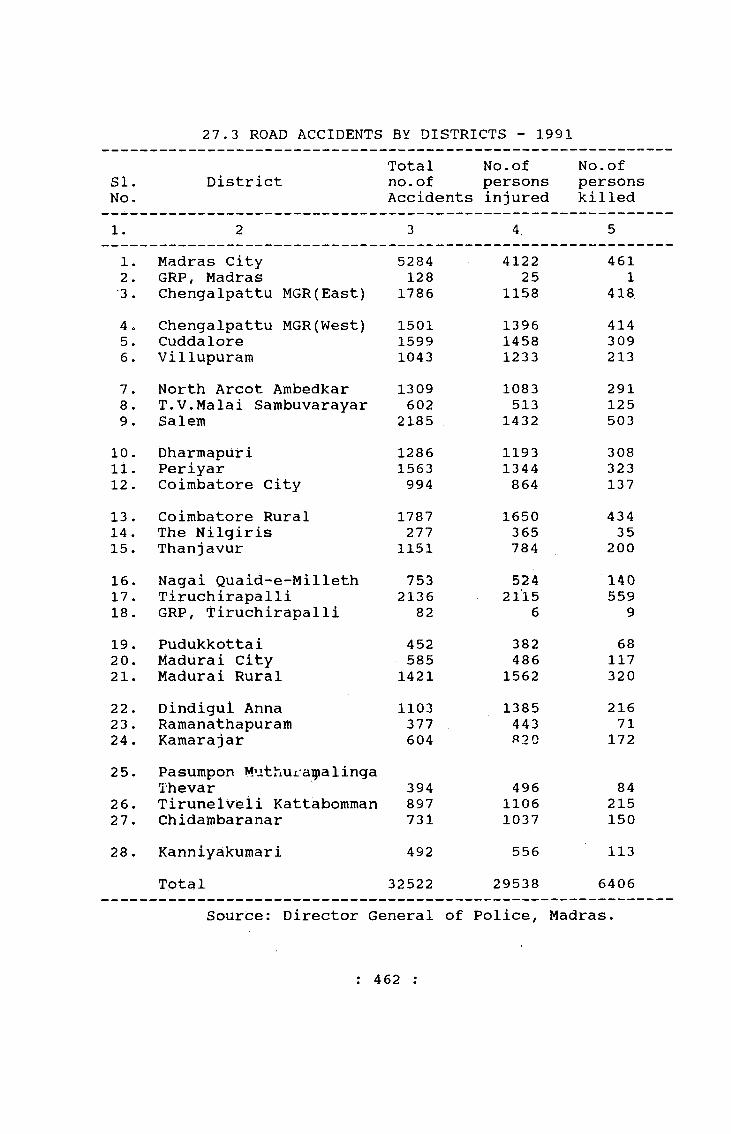
27.3 ROAD ACCIDENTS BY DISTRICTS - 1991
SI.No.
DistrictTotal no. of Accidents
No. ofpersonsinjured
No. ofpersonskilled
1. 2 3 4. 51. Madras City 5284 4122 4612. GRP, Madras 128 25 1■3 . Chengalpattu MGR(East) 1786 1158 4184 o Chengalpattu MGR(West) 1501 1396 4145. Cuddalore 1599 1458 3096. Villupuram 1043 1233 2137 . North Arcot Ambedkar 1309 1083 2918. T.V.Malai Sambuvarayar 602 513 1259. Salem 2185 1432 503
10. Dharmapuri 1286 1193 30811. Periyar 1563 1344 32312. Coimbatore City 994 864 13713. Coimbatore Rural 1787 1650 43414. The Nilgiris 277 365 3515. Thanjavur 1151 784 20016. Nagai Quaid-e-Milleth 753 524 14017. Tiruchirapalli 2136 2115 55918. GRP, Tiruchirapalli 82 6 919. Pudukkottai 452 382 6820. Madurai City 585 486 11721. Madurai Rural 1421 1562 32022. Dindigul Anna 1103 1385 21623 . Ramanathapuram 377 443 7124. Kamarajar 604 «2G 17225. Pasumpon Muthui.a|ialinga
Thevar 394 496 8426. Tirunelveli Kattabomman 897 1106 21527. Chidambaranar 731 1037 15028. Kanniyakumari 492 556 113
Total 32522 29538 6406Source: Director General of Police, Madras.
: 462 :
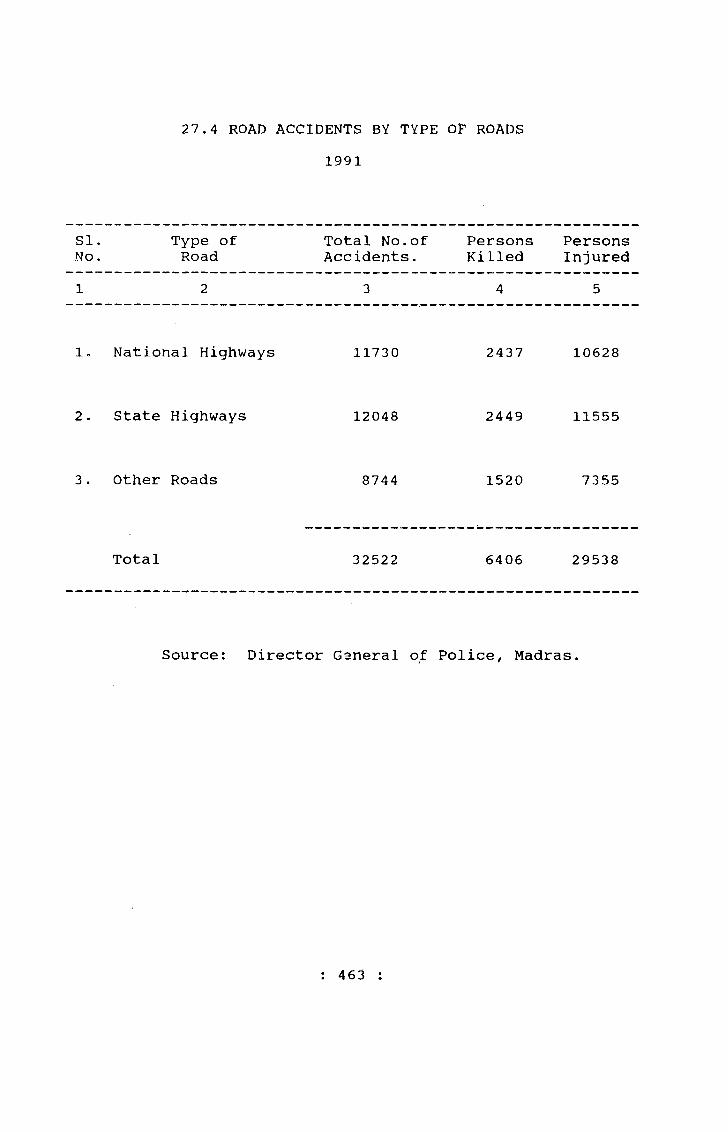
27.4 ROAD ACCIDENTS BY TYPE OF ROADS1991
81.No.
Type of Road
Total No.of Accidents.
PersonsKilled
PersonsInjured
1 2 3 4 5
1» National Highways 11730 2437 10628
2 . State Highways 12048 2449 11555
3 . Other Roads 8744 1520 7355
Total 32522 6406 29538
Source: Director General of Police, Madras.
: 463 :
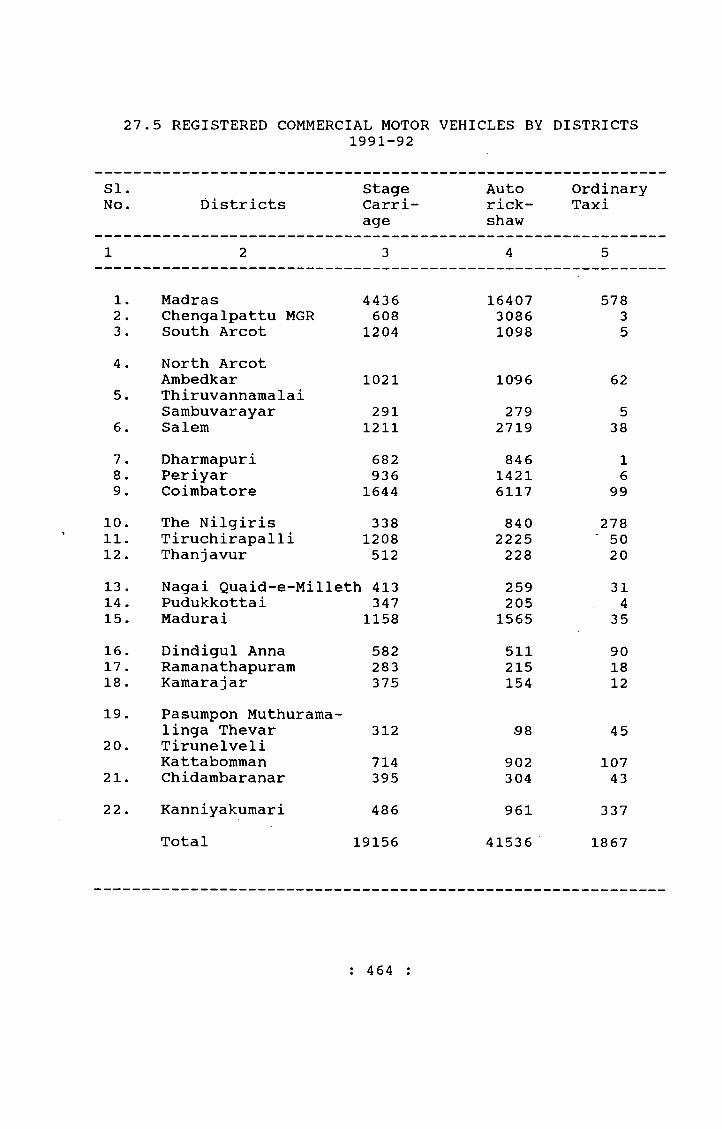
27.5 REGISTERED COMMERCIAL MOTOR VEHICLES BY DISTRICTS1991-92
SI.No. Districts
StageCarriage
Autorickshaw
OrdinaryTaxi
1 2 3 4 5
1. Madras 4436 16407 5782 . Chengalpattu MGR 608 3086 33 . South Arcot 1204 1098 54. North Arcot
Ambedkar 1021 1096 625. Thiruvannamalai
Sambuvarayar 291 279 56. Salem 1211 2719 387, Dharmapuri 682 846 18. Periyar 936 1421 69. Coimbatore 1644 6117 99
10. The Nilgiris 338 840 27811. Tiruchirapalli 1208 2225 ■ 5012. Thanjavur 512 228 2013. Nagai Quaid-e-Milleth 413 259 3114. Pudukkottai 347 205 415. Madurai 1158 1565 3516. Dindigul Anna 582 511 9017. Ramanathapuram 283 215 1818. Kamarajar 375 154 1219. Pasumpon Muthurama-
linga Thevar 312 .98 4520. Tirunelveli
Kattabomman 714 902 10721. Chidambaranar 395 304 4322. Kann iyakumar i 486 961 337
Total 19156 41536 1867
; 464 :
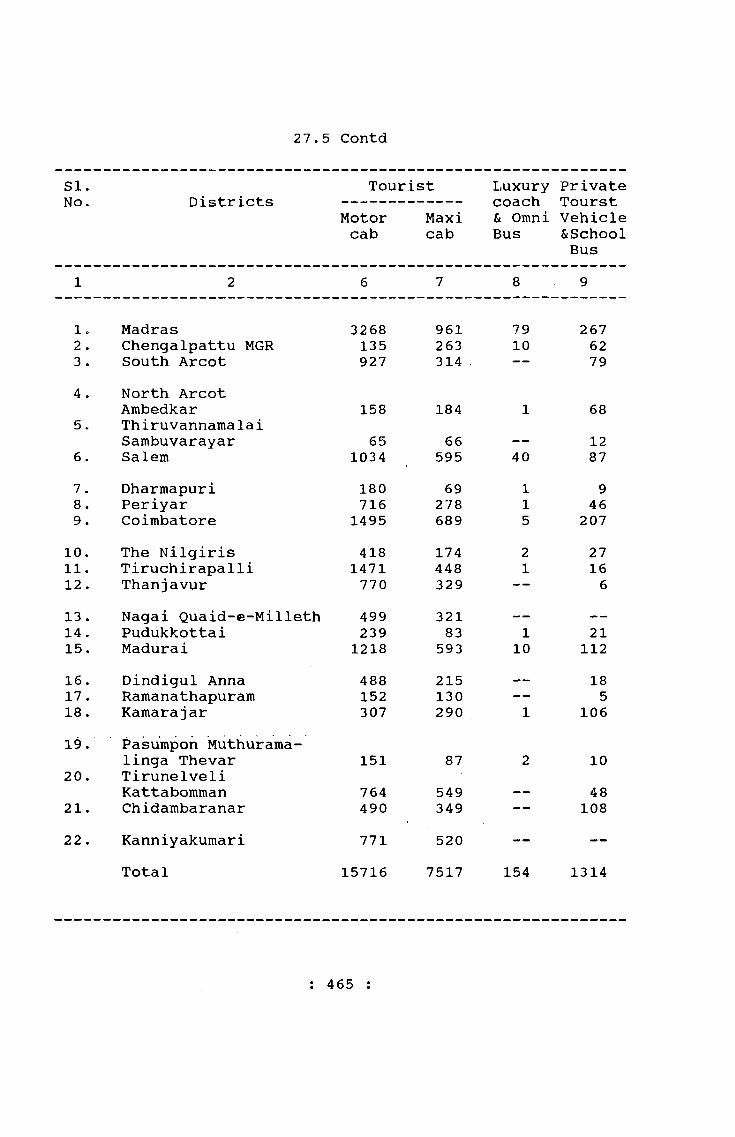
27.5 Contd
SI.No. Districts
TouristMotor Maxi cab cab
Luxury coach & Omni Bus
PrivateTourstVehicle&SchoolBus
1 2 6 7 8 9
1. Madras 3268 961 79 2672. Chengalpattu MGR 135 263 10 623 . South Arcot 927 314 — 794 , North Arcot
Ambedkar 158 184 1 685. Thiruvannamalai
Sambuvarayar 65 66 126. Salem 1034 595 40 877. Dharmapuri 180 69 1 98. Periyar 716 278 1 469. Coimbatore 1495 689 5 207
10. The Nilgiris 418 174 2 2711. Tiruchirapalli 1471 448 1 1612, Thanjavur 770 329 -- 613 . Nagai Quaid-e-Milleth 499 321 -- —14. Pudukkottai 239 83 1 2115. Madurai 1218 593 10 11216. Dindigul Anna 488 215 — 1817. Ramanathapuram 152 130 — 518. Kamarajar 307 290 1 10619. Pasumpon Muthurama-
linga Thevar 151 87 2 1020. Tirunelveli
Kattabomman 764 549 __ 4821. Chidambaranar 490 349 — 10822. Kanniyakumari 771 520 — —
Total 15716 7517 154 1314
: 465 :
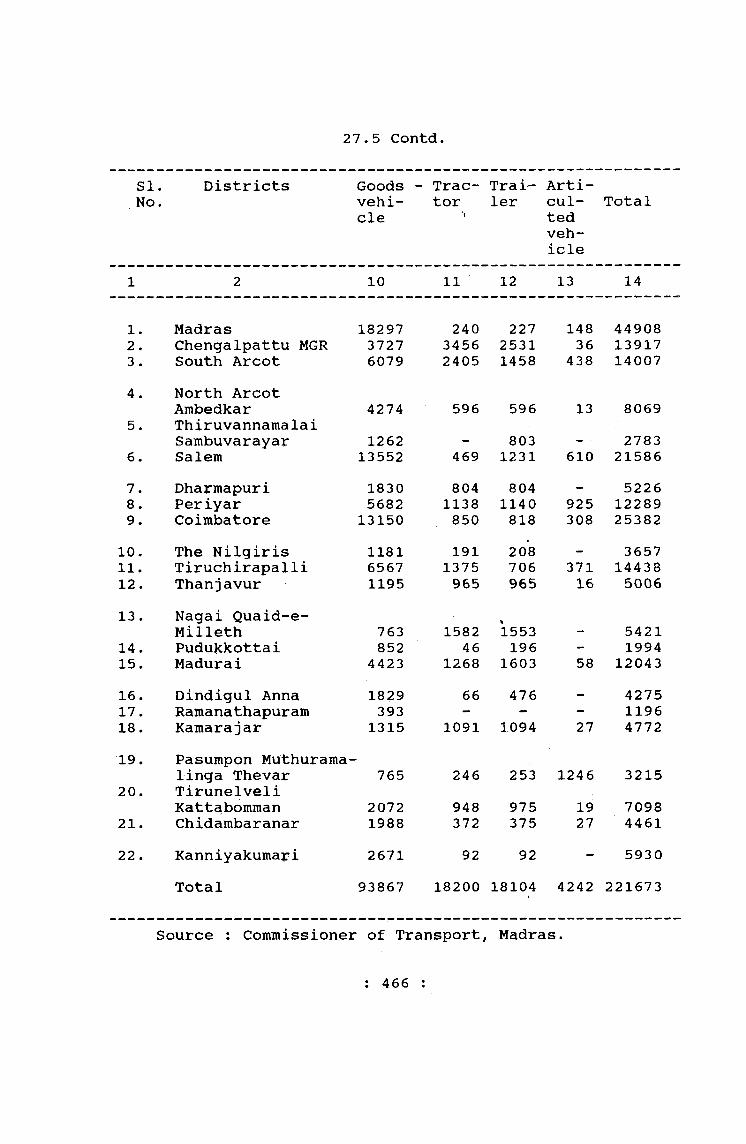
27.5 Contd.
SI.No.
Districts Goods - vehicle
Tractor
Trailer
Arti-cul-tedvehicle
Total
1 2 10 11 12 13 14
1. Madras 18297 240 227 148 449082. Chengalpattu MGR 3727 3456 2531 36 139173 . South Arcot 6079 2405 1458 438 140074. North Arcot
Ambedkar 4274 596 596 13 80695. Thiruvannamalai
Sambuvarayar 1262 803 . - 27836. Salem 13552 469 1231 610 215867. Dharmapuri 1830 804 804 - 52268. Periyar 5682 1138 1140 925 122899. Coimbatore 13150 850 818 308 25382
10. The Nilgiris 1181 191 208 365711. Tiruchirapalli 6567 1375 706 371 1443812. Thanjavur 1195 965 965 16 500613. Nagai Quaid-e-
Milleth 763 1582 1553 542114. Pudukkottai 852 46 196 - 199415. Madurai 4423 1268 1603 58 1204316. Dindigul Anna 1829 66 476 — 427517. Ramanathapuram 393 - - - 119618. Kamarajar 1315 1091 1094 27 477219. Pasumpon Muthurama-
linga Thevar 765 246 253 1246 321520. Tirunelveli
Kattabomman 2072 948 975 19 709821. Chidambaranar 1988 372 375 27 446122. Kanniyakumari 2671 92 92 - 5930
Total 93867 18200 18104 4242 221673
Source : Commissioner of Transport, Madras
: 466 :
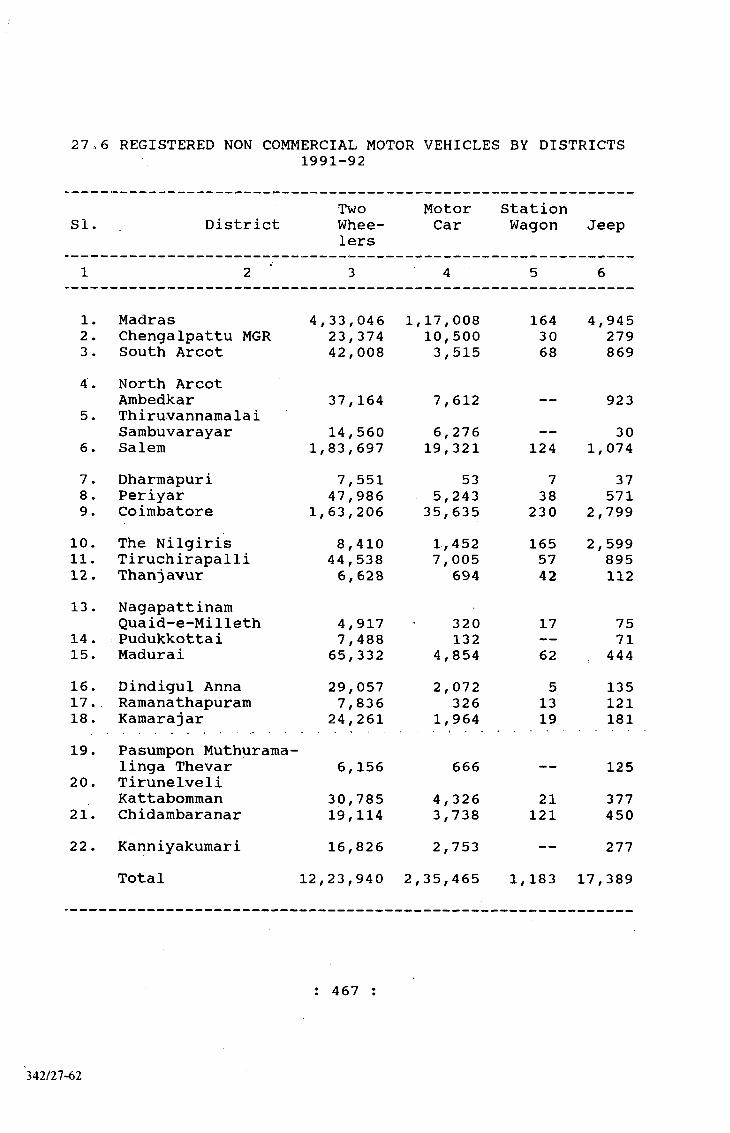
27o6 REGISTERED NON COMMERCIAL MOTOR VEHICLES BY DISTRICTS1991-92
SI. DistrictTwoWheelers
MotorCar
StationWagon Jeep
1 2 3 4 5 6
1. Madras 4 ,33,046 1,17,008 164 4 ,9452 . Chengalpattu MGR 23,374 10,500 30 2793 . South Arcot 42,008 3, 515 68 8694. North Arcot
Ambedkar 37,164 7,612 — 9235. Thiruvannamalai
Sambuvarayar 14,560 6,276 — 306. Salem 1,83,697 19,321 124 1,0747. Dharmapuri 7,551 53 7 378. Periyar 47,986 5,243 38 5719. Coimbatore 1,63,206 35,635 230 2 ,799
10. The Nilgiris 8,410 1,452 165 2 ,59911. Tiruchirapalli 44,538 7, 005 57 89512. Thanj avur 6,628 694 42 11213 . Nagapattinam
Quaid-e-Milleth 4,917 320 17 7514. Pudukkottai 7,488 132 — 7115. Madurai 65,332 4,854 62 44416. Dindigul Anna 29,057 2,072 5 13517. . Ramanathapuram 7,836 326 13 12118. Kamarajar 24,261 1,964 19 18119. Pasumpon Muthurama-
linga Thevar 6,156 666 — 12520. Tirunelveli
Kattabomman 30,785 4,326 21 37721. Chidambaranar 19,114 3,738 121 45022 . Kanniyakumari 16,826 2,753 — 277
Total 12 ,23,940 2,35,465 1,183 17 ,389
: 467

27.6 Contd.Goodsvehicles Tract(Try- ors
SI. District cycles and Others TotalNo. auto 3
wheelers & 4 wheelers
Trailers
1. Madras 4,137 554 1,039 5 ,60,8932. Chengalpattu MGR 485 370 189 35,2273. South Arcot 170 2,377 147 49,1544. North Arcot
Ambedkar 60 302 91 46,1525. Thiruvannamalai
Sambuvarayar 37 377 44 21,3246. Salem 305 2,085 620 2 ,07,2267. Dharmapuri 51 463 28 8,1908. Periyair 26 1,682 295 55,8419. Coimbatore 617 1,121 511 2 ,04,11910. The Nilgiris 140 284 288 13,33811. Tiruchirapalli 26 1,134 218 53,87312. Thanjavur 131 619 160 8, 38613. Nagapattinam
Quaid-e-Milleth 68 215 50 5,66214. Pudukkottai - 27 22 7,74015. Madurai 112 367 ' 356 71,52716. Dindigul Anna 72 108 96 31,54517. Ramanathapuram 21 68 60 8,44518. Kamarajar 66 143 121 26,75519. Pasumpon Muthurama-
linga Thevar 7 20 36 7,01020. Tirunelveli
Kattabomman 322 903 179 36,91321. Chidambaranar 97 190 101 23,81122. Kanniyakumari 21 59 60 19,996
Total 6,971 13,468 4,711 15 ,03,127Source: Commissioner of Transport, Madras.
; 468 :

27.7 TRANSPORT CORPORATIONS IN TAMIL NADU 1991-92
Si, Name of the Corporation
Year of Head forma- Quarters tion
District Fleet Covered Strength
1. Pallavan Transport Corporation 01.01.72 Madras
MadrasMetropolitanarea
2,353
2« Pandian Transport Corporation 17.01.72 Madurai
MaduraiandKamarajar Districts
1,017
3. Cheran Transport Corporation
Coimba-01.03.72 tore
CoimbatoreandThe Nilgi- risDistricts
1,373
Cholan Roadways Corporation
Anna Transport CorporationKattabommanTransportCorporation
Thanthai PeriyarTransportCorporation
01.03.72 Kumba- konam
15.02.73 Salem01.01.74 Tirunel-
veli
16.01.75 yillu- purajn
Thanjavur 752& Nagai Q.M.Dists.SalemDistrict 774Tirunelveli 761 Kattabomman &Chidambar-narDistrictsS.Arcpt & 1,066
Southern Area of Chengal- pattu M.G.R Districts
8. Thiruvalluvar Transport Corporation
01.04.80 MadrasEntire State of Tamil Nadu (Express Service)
917
: 469 ;
342/27-62a
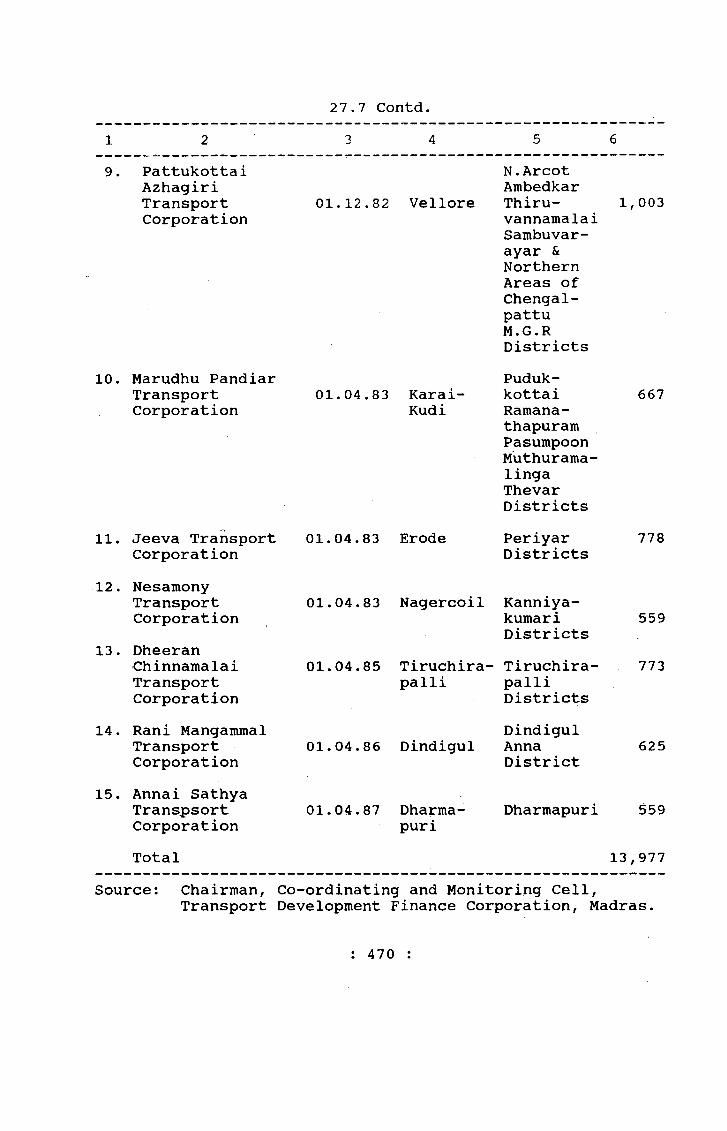
3 427,7 Contd.
9. Pattukottai Azhagiri Transport Corporation
10. Marudhu Pandiar Transport Corporation
11. Jeeva Transport Corporation
12. Nesamony Transport Corporation
13. Dheeran Chinnamalai Transport Corporation
14. Rani Mangammal Transport Corporation
15. Annai Sathya Transpsort CorporationTotal
01.12.82 Vellore
01.04.83 Karai- Kudi
01.04.83 Erode
N.ArcotAmbedkarThiru-vannamalaiSambuvar-ayar &NorthernAreas ofChengal-pattuM.G.RDistrictsPuduk-kottaiRamana-thapuramPasumpoonMuthurama-lingaThevarDistrictsPeriyarDistricts
01.04.83 Nagercoil Kanniya-kumariDistricts
01.04.85 Tiruchira- Tiruchira-palli palli
DistrictsDindigul
01.04.86 Dindigul AnnaDistrict
01.04.87 Dharma- puri
1, 003
667
778
559
773
625
Dharmapuri 559
13,977Source: Chairman, Co-ordinating and Monitoring Cell,
Transport Development Finance Corporation, Madras.
: 470 :

27o8 SELECT INDICATORS ON PERFORMANCE OF STATE TRANSPORTCORPORATION OF TAMIL NADU 1991-92
SI.No. ITEMS PTC TTC PATC PRC MPTC RMTC CTC JTC
1. Fleet Strength 2353 917 1003 1017 667 625 1373 778
2. Kilometers operated per day (in lakhs) 4.52 5.74 3.54 3.14 2.51 2.28 4.21 2.81
3. Number of Passengers carried per day (in lakhs) 35.49 1.05 7.41 13.03 5.86 5.39 16.00 7.35
4. Fleet Utilisation (%) 83.68 91.37 92.19 92.92 89.62 94.96 93.22 94.70
5. Kilometre efficiency (%) 91.88 96.12 98.69 97.53 96.21 97.23 98.69 98.04
6. Kilo Metre run per litre of diesel :
(a) City/Town 3.59 4.25 4.41 4.43 4.36 4.19 4.39(b) MofussiI -- -- 4.54 .4.36 4.42 4.40 4.41 4.46(c) Ghat/Hill -- -- 3.79 -- 3.46 3.32 --(d) Express -- 4.51 -- -- -- -- -- --(e) Overall 3.59 4.51 4.45 4.37 4.43 4.30 3.98 4.05
7. Number of routes (As on day) 480 228 624 550 440 384 840 537
8. Number of New routes Introduced during the year 25 26 22 17 9 10 39 53
9. New villages benefited during the year 59 17 50 16 23 39
10. Benefitted Villages population (in lakhs) -- 3.12 0.99 1.00 0.37 0.08 0.22 0.19
11. Staff Strength 19681 9954 7611 7612 5111 4581 10015 5717
12. Number of New buses purchased 39 208 150 133 106 100 146 121
: 471 ;
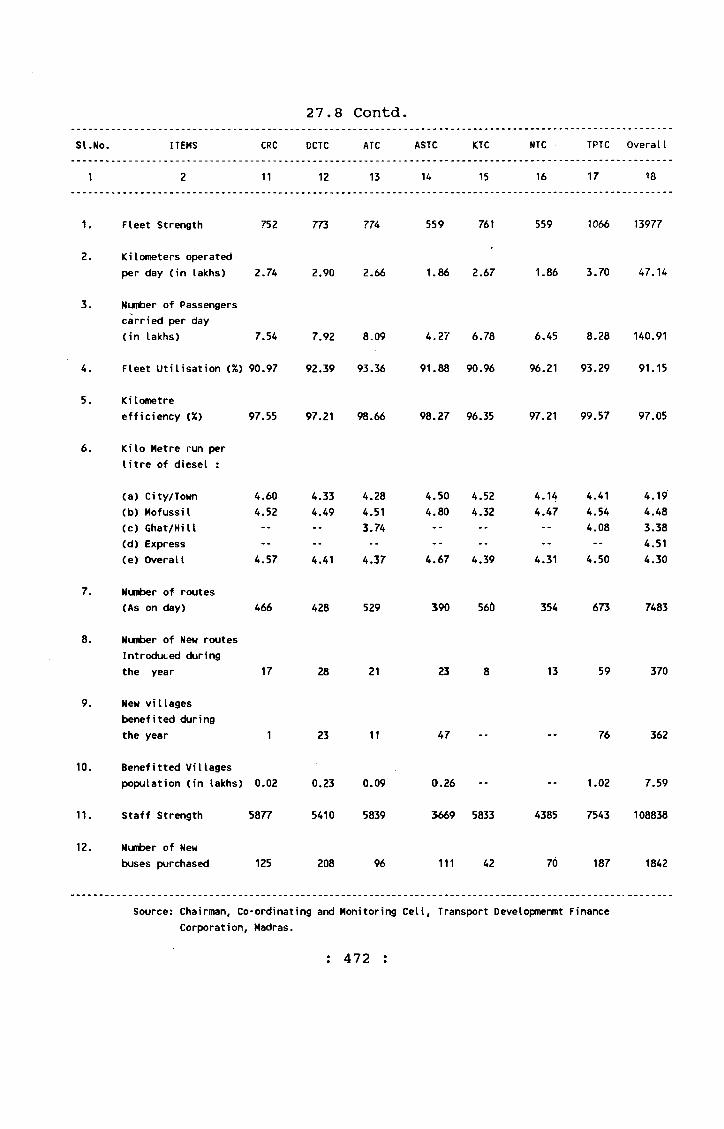
27.8 Contd.SI.No. ITEMS CRC DCTC ATC ASTC KTC NTC TPTC OveralI
1 2 11 12 13 14 15 16 17 18
1. Fleet Strength 752 773 774 559 761 559 1066 13977
2. Kilometers operated per day (in lakhs) 2.74 2.90 2.66 1.86 2.67 1.86 3.70 47.14
3. Number of Passengers carried per day (in lakhs) 7.54 7.92 8.09 4.27 6.78 6.45 8.28 140.91
4. Fleet Utilisation (%) 90.97 92.39 93.36 91.88 90.96 96.21 93.29 91.15
5. Kilometre efficiency (%) 97.55 97.21 98.66 98.27 96.35 97.21 99.57 97.05
6. Kilo Metre run per litre of diesel :
(a) City/Town 4.60 4.33 4.28 4.50 4.52 4.14 4.41 4.19(b) Mofussil 4.52 4.49 4.51 4.80 4.32 4.47 4.54 4.48(c) Ghat/Hill -- -- 3.74 -- -- -- 4.08 3.38(d) Express -- -- *- -- -- -- -- 4.51(e) Overall 4.57 4.41 4.37 4.67 4.39 4.31 4.50 4.30
7. Number of routes (As on day) 466 428 529 390 560 354 673 7483
8. Number of New routes Introduced during the year 17 28 21 23 8 13 59 370
9. New villages benefited during the year 1 23 11 47 76 362
10. Benefitted Villages population (in lakhs) 0.02 0.23 0.09 0.26 -- -- 1.02 7.59
11. Staff Strength 5877 5410 5839 3669 5833 4385 7543 108838
12. Number of New buses purchased 125 208 96 111 42 70 187 1842
Source: Chairman, Co-ordinating and Monitoring Cell, Transport Developmenmt Finance Corporation, Madras.
: 472 :
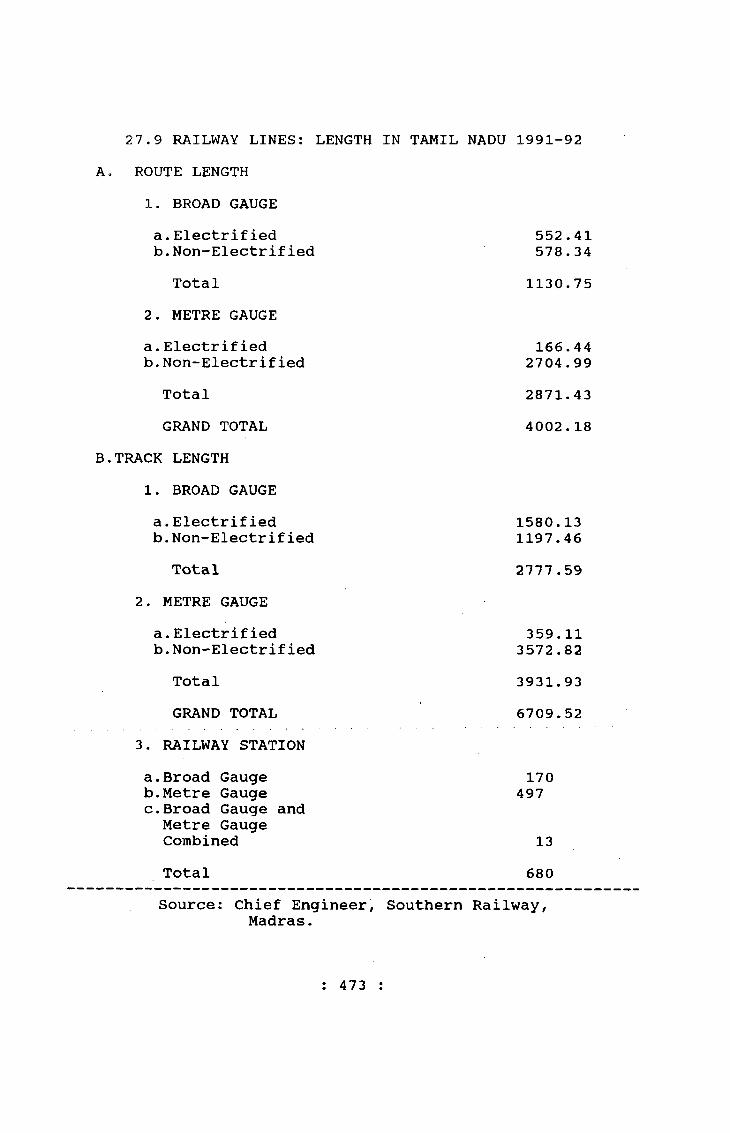
27.9 RAILWAY LINES: LENGTH IN TAMIL NADU 1991-92A , ROUTE LENGTH
1. BROAD GAUGEa .Electrifiedb.Non-Electrified
Total 2. METRE GAUGEa .Electrifiedb.Non-Electrified
TotalGRAND TOTAL
B.TRACK LENGTH1. BROAD GAUGEa.Electrifiedb.Non-Electrified
Total2. METRE GAUGE
a.Electrifiedb.Non-Electrified
TotalGRAND TOTAL
552.41 578.34
1130.75
166.442704.992871.434002.18
1580.13 1197.462777.59
359.113572.823931.936709.52
3. RAILWAY STATIONa.Broad Gaugeb.Metre Gaugec.Broad Gauge and
Metre Gauge CombinedTotal
170497
13680
Railway,Source: Chief Engineer, SouthernMadras.
: 473 :
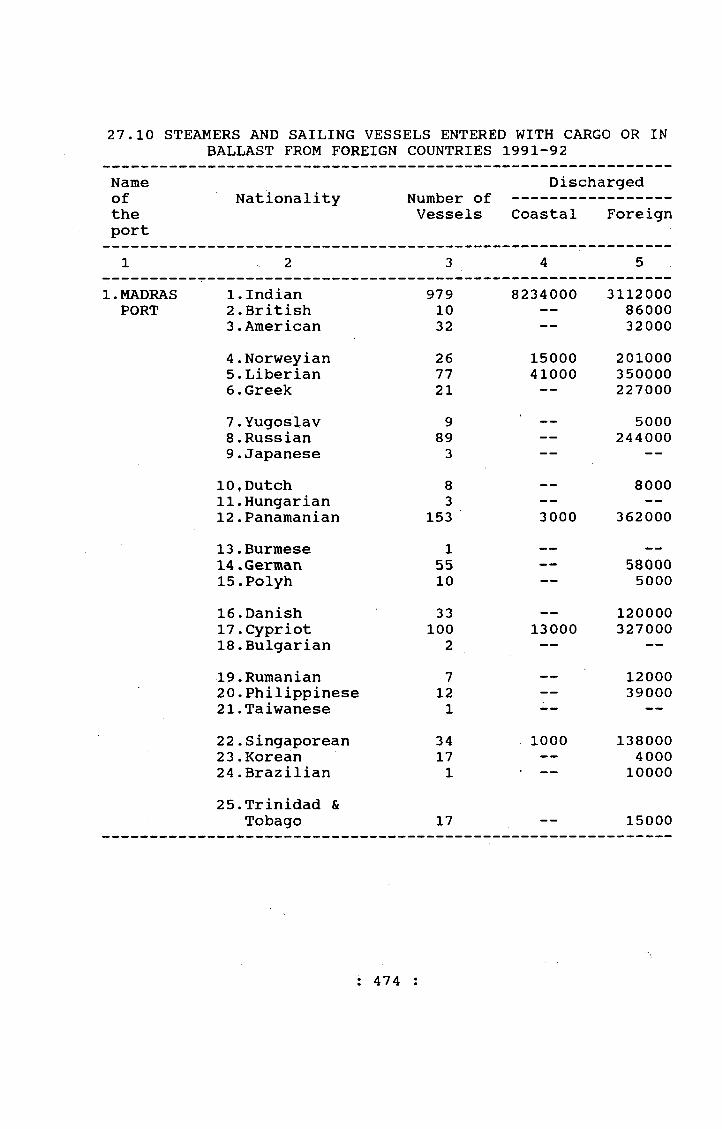
27.10 STEAMERS AND SAILING VESSELS ENTERED WITH CARGO OR INBALLAST FROM FOREIGN COUNTRIES 1991-92
Nameoftheport
Nationality Number of Vessels
Discharged Coastal Foreign
1 2 3 4 51.MADRAS 1.Indian 979 8234000 3112000
PORT 2.British 10 — 860003.American 32 — 320004 .Norweyian 26 15000 2010005.Liberian 77 41000 3500006.Greek 21 — 2270007.Yugoslav 9 — 50008 .Russian 89 — 2440009 .Japanese 3 —— ——
10,Dutch 8 — 800011.Hungarian 3 — —12.Panamanian 153 3000 36200013.Burmese 1 — —14.German 55 — 58000IS.Polyh 10 — 500016.Danish 33 — 12000017.Cypriot 100 13000 32700018.Bulgarian 2 —— —
19.Rumanian 7 — 1200020.Philippinese 12 — 3900021.Taiwanese 122.Singaporean 34 1000 13800023.Korean 17 — 400024.Brazilian25.Trinidad &
1 10000
Tobago 17 -- 15000
: 474 :

27.10 CONTD ■Nameoftheport
Nationality NumberVessels
Discharged Coastal Foreign
1 2 3 4 5
1.MADRAS 26.Bangladeshi 5 11000PORT 27.Egyption 2 — 2000
28.Kuwaiti 4 — 5900029.Maltese 38 — 8400030.Thai 19 — 100031.Malaysian 9 — 700032.U.A.R 3 — —
33.Maldivian 6 — 400034.Antigla 7 — 3500035.Saudi Arabian 3. — —36.Honduram 96 — — ^37.Chinese 23 — 300038.Sri Lankan 27 — 1800039.Bahaman 65 — 12200040.United Arab Emirate 4 — 1200041.Turkish 4 — 6600042.St.Vincent 3 — —4 3.France 1 — —44.Moroccan 8 — 8400045.Grenedian 4 — 12000
Total 2031 8307000 5875000
: 475
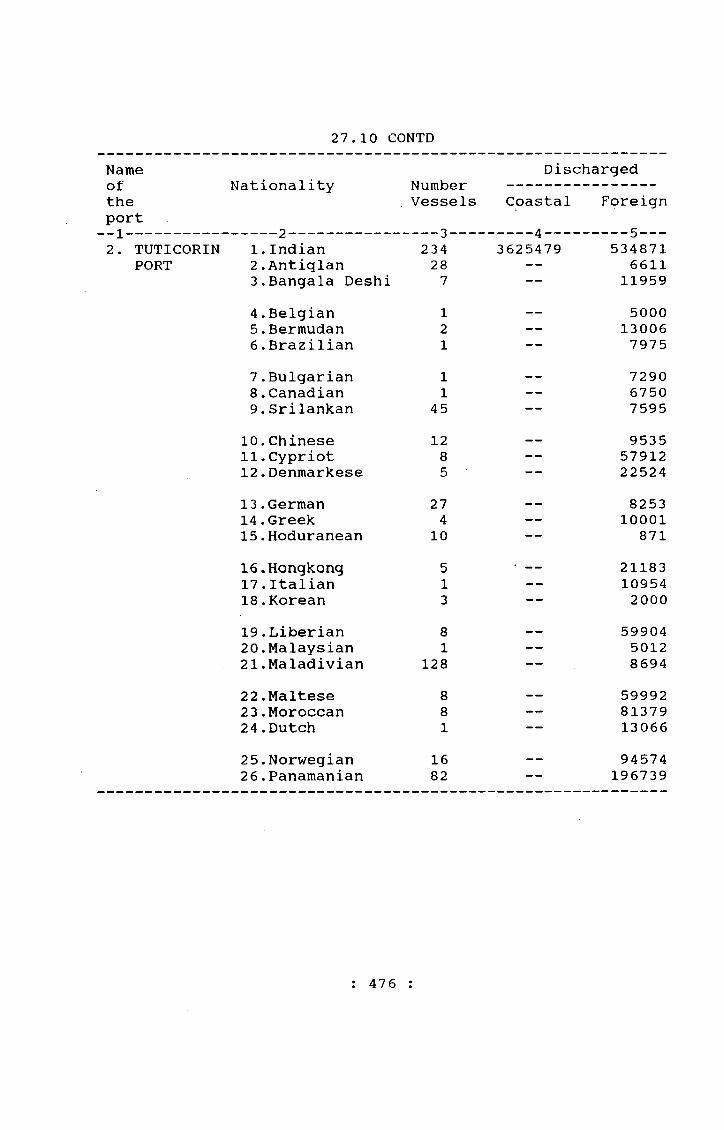
27. 10 CONTDNameof Nationality Number
Dischargedthe , Vessels Coastal Foreignport ______2____ ______ 3____ _____4_____2. TUTICORIN 1.Indian 234 3625479 534871
PORT 2.Antiqlan 28 — 66113.Bangala Deshi 7 — 119594.Belgian 1 — 50005.Bermudan 2 — 130066.Brazilian 1 — 79757.Bulgarian 1 — 72908.Canadian 1 — 67509.Srilankan 45 — 7595
10.Chinese 12 — 953511.Cypriot 8 — 5791212.Denmarkese 5 2252413.German 27 — 825314.Greek 4 — 10001IS.Hoduranean 10 — 87116.Hongkong 5 • — 2118317.Italian 1 — 1095418.Korean 3 — 200019.Liberian 8 — 5990420.Malaysian 1 — 501221.Maladivian 128 —— 869422.Maltese 8 — 599922 3.Moroccan 8 — 8137924.Dutch 1 — 1306625.Norwegian 16 — 945742 6.Panamanian 82 — 196739
: 476 :

27.10 CONTD.1 2 3 4 5
2. TUTICORIN 27.Philipian 1 — 12694PORT 28.St.Vincent 9 — 5254(contd.) 29,Singaporean 16 — 71822
30.U.A.E. 3 — 129631.Tunish 6- — 3559632.Russian 33 — 337953 3.Vanvatu 1 — 24013 4.Balvaman 24 -- 1057835.Other countries 1 — 10345
Total 741 3625479 14474313,CUDDALORE
PORT 1.Indian 54 — 326122.Liberian 1 — 252013.Cypriot 2 — 143504.Greek 1 — 226135.Malta 1 — 235876.St.Vincent 1 ' — 51427.China 1 — 4073
4.NAGA-Total 61 — 127578
PATTINAM 1.Indian 6 — 54234Total 6 — 54234
5.RAMESWARAM Nil Nil Nil Nil6.PAMBAN Nil Nil Nil Nil7.KILAKKARAI* Nil Nil Nil Nil8.COLACHEL Nil Nil Nil Nil9.KANNIYAKUMARI Nil Nil Nil Nil
lO.VALINOKKAM Nil Nil Nil Nil
*Fort closed with effect from 1-11-1991.Source: Statistical Officer, Madras Port Trust
Madras Traffic Manager,Tuticorin Port Tuticorin & State Port Officer, Madras.
: 477 :
342/27-63a
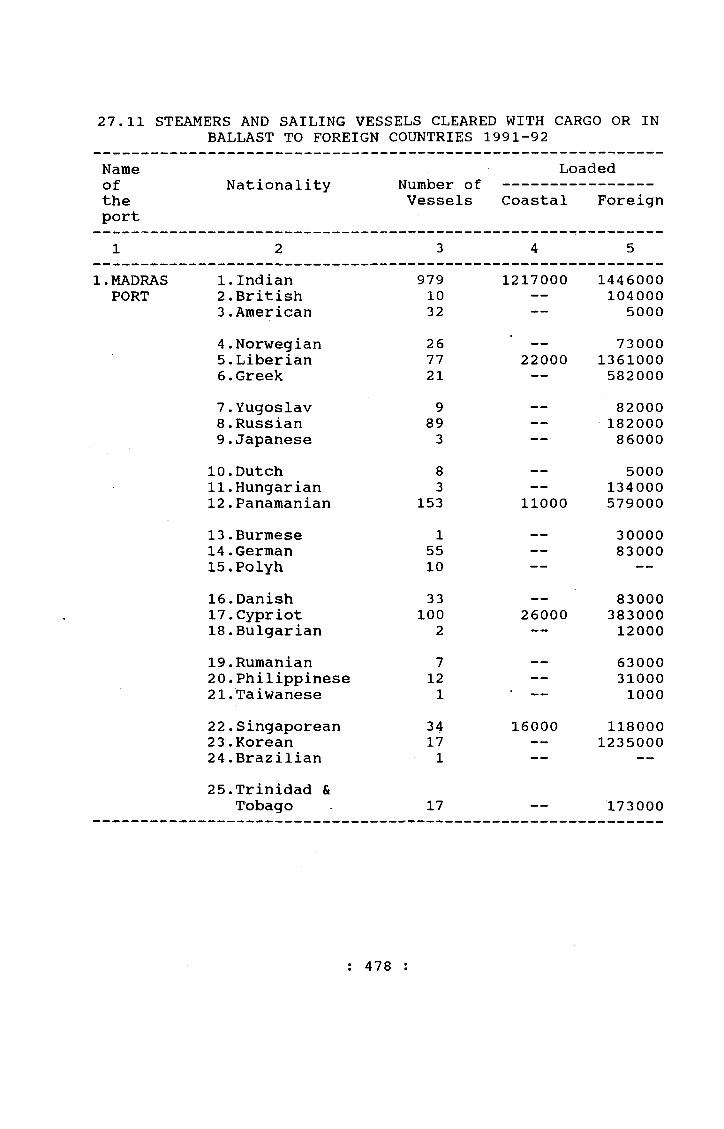
27.11 STEAMERS AND SAILING VESSELS CLEARED WITH CARGO OR INBALLAST TO FOREIGN COUNTRIES 1991-92
Nameoftheport
Nationality Number of Vessels
Loaded Coastal Foreign
1 2 3 4 51.MADRAS 1.Indian 979 1217000 1446000
PORT 2.British 10 — 1040003 .American 32 — 50004 .Norwegian 26 — 730005.Liberian 77 22000 13610006.Greek 21 — 5820007.Yugoslav 9 — 820008 .Russian 89 — . 1820009.Japanese 3 — 86000
10.Dutch 8 — 500011.Hungarian 3 — 13400012.Panamanian 153 11000 57900013.Burmese 1 —— 3000014.German 55 — 8300015,Polyh 10 --- — —
16.Danish 33 — 8300017.Cypriot 100 26000 38300018.Bulgarian 2 1200019.Rumanian 7 — 6300020.Philippinese 12 — 3100021.Taiwanese 1 100022.Singaporean 34 16000 11800023.Korean 17 — 123500024.Brazilian 1 — —
25.Trinidad &Tobago 17 — 173000
: 478 :

27.11 CONTD
Nameoftheport
Nationality NumberVessels
Loaded Coastal Foreign
1 2 3r
4 5
1.MADRAS 26.Bangladeshi 5 16000PORT 27.Egyption 2 — . —
28.Kuwaiti 4 — —29.Maltese 38 — . 810003 0.Thailand 19. — 1500031.Malaysian 9 — 700032.U.A.R 3 — 1800033.Maldivian 6 — 1300034.Antiglan 7 — 7500035.Saudi Arabian 3 — —36.Honduran 96 —37.Chinese 23 — 55400038.Sri Lankan 27 3300039.Bahaman 65 8000 1160004 0.United Arab Emirate 4 — 1700041.Turkish 4 400042.St.Vincent 3 — —
4 3.France 1 — —44.Moroccan 8 — —
45.Grenedian — , —— .Total 2031 9100000 7800000
: 479 :

27.11 CONTDNameoftheport
Nationality NumberVessels Coastal
LoadedForeign
1 2 3 4 52. TUTICORIN Ifijndian 234 17494 116237
PORT 2.Antiglan 28 — 285803.Bangla Deshi 7 — > 187624.Belgian 1 — —5.Bermudan 2 — —
6.Brazilian 1 — —7.Bulgarian 1 — —
8.Canadian 1 — --9.Srilankan 45 — 32418
10.Chinese 12 — 6512311.Cypriot 8 — 209512.Denmarkese 5 —— 132113.German 27 — 2935414.Greek 4 — 1743415.Hoduranean 10 — 1354816.Hongkongs 5 — —17.Italian 1 — —18.Korean 3 — 990719.Liberian 8 — 3281820.Malaysian 1 — —21.Maladivian 128 — 11179422.Maltese 8 2424323.Moroccan 8 — —24.Dutch 1 —— ——25.Norwegian 16 — 58452 6.Panamanian 82 — 100680
: 480 ;

27.11 CONTDNameoftheport
Nationality NumberVessels
Loaded Coastal Foreign
2. TUTICORIN 27.PhilipianPORT (contd.)
3.CUDDALORE PORT
4.NAGA- PATTINAM
5.RAMESWARAM6.PAMBAN7.KILAKKARAI*8.COLACHEL9.KANNIYAKUMARI Nil
lO.VALINOKKAM Nil
2 8.St.Vincent 2 9 .Singaporean3 0 . U . A . E .3 1.Tunish3 2 .Russian3 3 .Vanvatu3 4 .Balvaman3 5 . Other countries
Total1.Indian2 .Liberian3 .Cypriot4 .Mallese5 .St.Vincent
Total 1.Foreign
Total Nil Nil Nil Nil
19
16.36
331
241
7416012
21
6 6
2
2
NilNilNilNilNilNil
17494NilNilNilNilNilNil
NilNilNilNilNilNil
48097505870
45061
18515164
723371NilNilNilNilNilNil26822682NilNilNilNilNilNil
* Fort closed with effect from 1-11-1991.Source: Statistical Officer, Madras Port Trust, Madras
Traffic Manager, Tuticorin Port, Tuticorin State Port Officer, Madras.
481
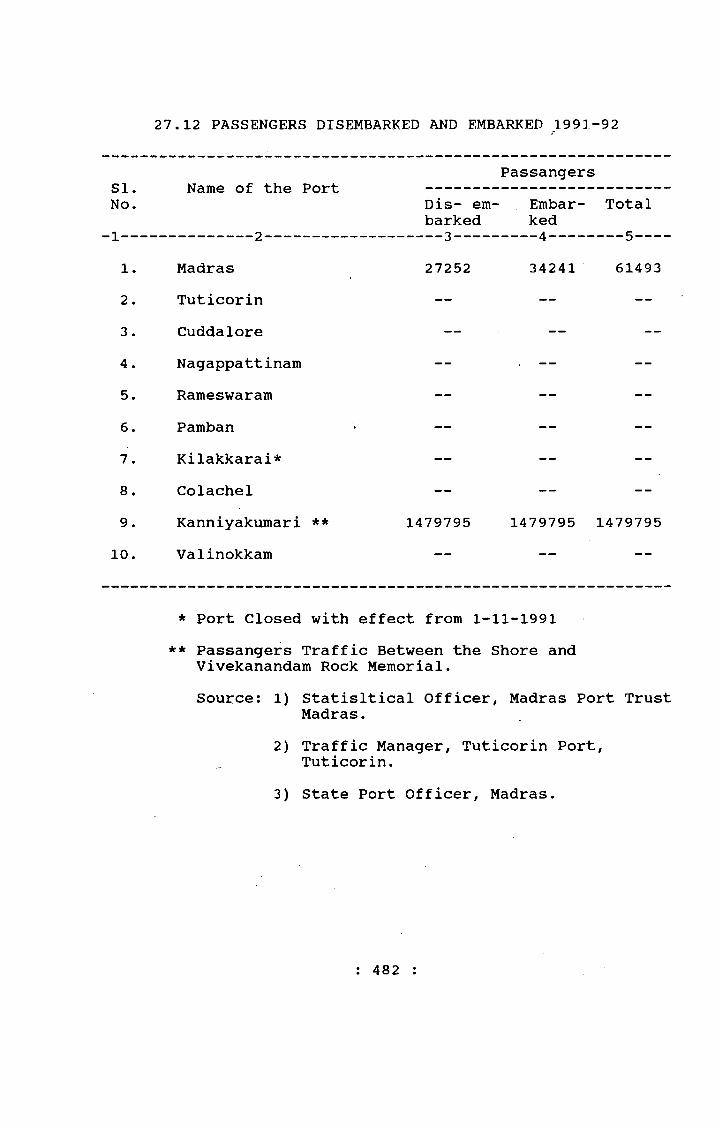
27.12 PASSENGERS DISEMBARKED AND EMBARKED 1991-92
PassangersSI.No.
-1---
Name of the PortDis- embarked
Embarked
Total
1. Madras 27252 34241 614932. Tuticorin — — —3. Cuddalore — — —
4. Nagappattinam — — —
5. Rameswaram — — —6. Pamban — —7. Kilakkarai* — — —
8. Colachel — — —9. Kanniyakumari ** 1479795 1479795 1479795
10. Valinokkam __ __
* Port Closed with effect from 1-11-1991** Passangers Traffic Between the Shore and
Vivekanandam Rock Memorial.Source: 1) Statisltical Officer, Madras Port Trust
Madras.2) Traffic Manager, Tuticorin Port,
Tuticorin.3) State Port Officer, Madras.
: 482 :
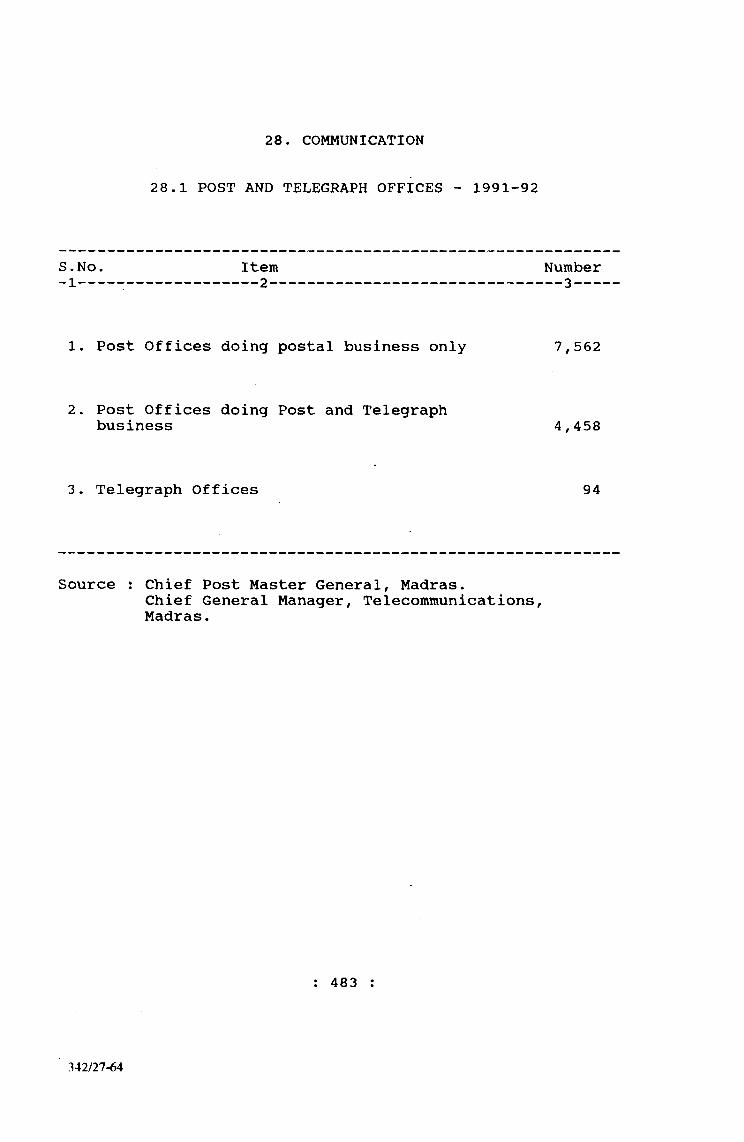
28. COMMUNICATION
28.1 POST AND TELEGRAPH OFFICES - 1991-92
S .N o . Item Number-1--------------------- 2---------------------------— ----- 3---
1. Post Offices doing postal business only 7,562
2. Post Offices doing Post and Telegraphbusiness 4,458
3. Telegraph Offices 94
Source : Chief Post Master General, Madras.Chief General Manager, Telecommunications, Madras.
; 483
342/27-64
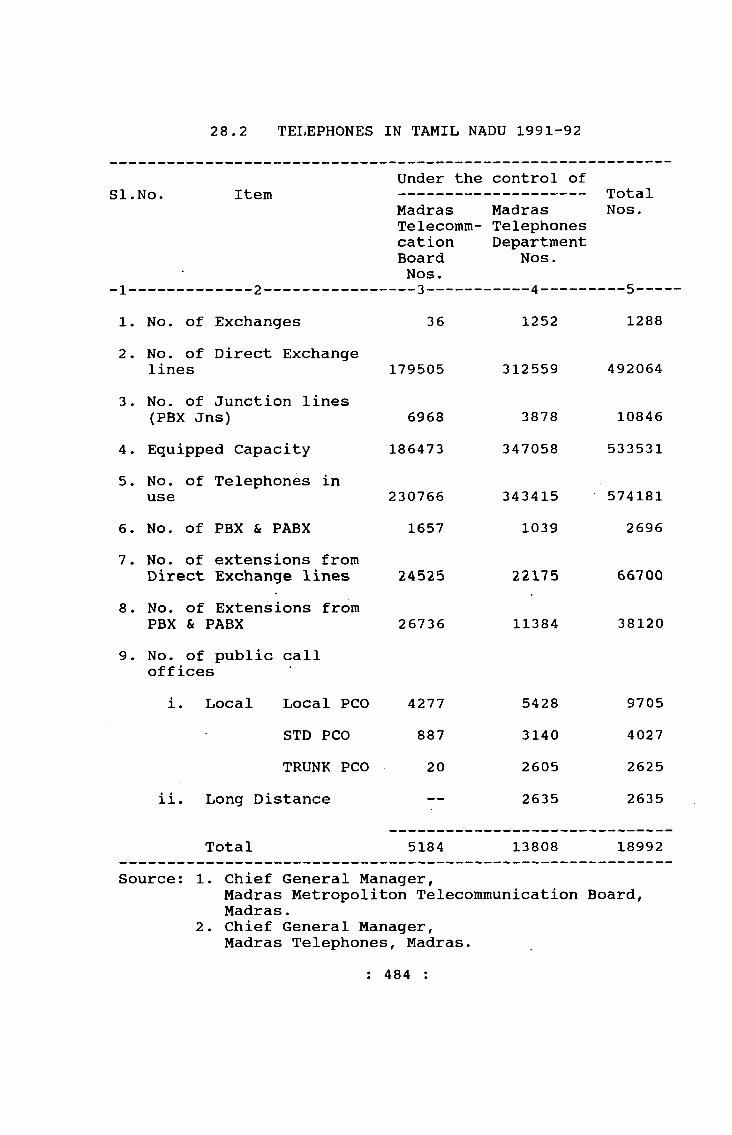
28.2 TELEPHONES IN TAMIL NADU 1991-92
SI.
1
No. ItemUnder theMadrasTelecomm-cationBoardNos.
control ofMadrasTelephonesDepartment
Nos.
TotalNos.
1. No. of Exchanges 36 1252 12882. No. of Direct Exchange
lines 179505 312559 4920643. No. of Junction lines
(PBX Jns) 6968 3878 108464. Equipped Capacity 186473 347058 5335315. No. of Telephones in
use 230766 343415 5741816. No. of PBX & PABX 1657 1039 26967. No. of extensions from
Direct Exchange lines 24526 22175 667008. No. of Extensions from
PBX & PABX 26736 11384 381209. No. of public call
officesi. Local Local PCO 4277 5428 9705
STD PCO 887 3140 4027TRUNK PCO 2 0 2605 2625
ii. Long Distance — 2635 2635
Total 5184 13808 18992Source: 1. Chief General Manager,
Madras Metropoliton Telecommunication Board, Madras.
2. Chief General Manager,Madras Telephones, Madras.
484
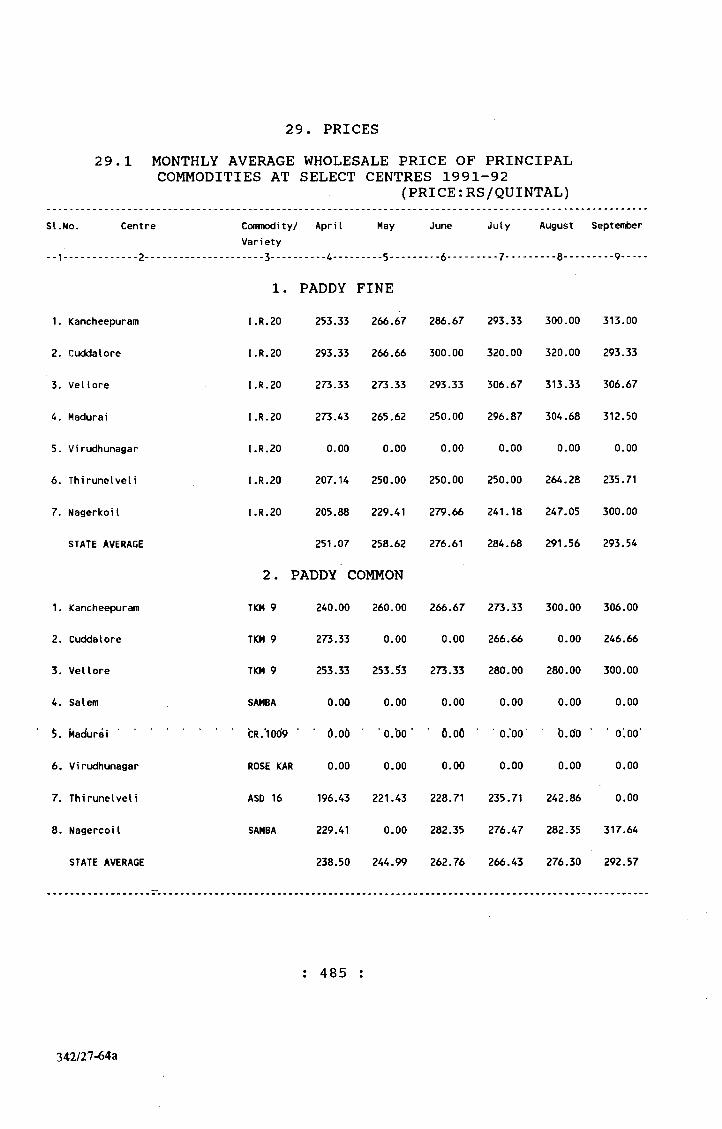
29. PRICES29.1 MONTHLY AVERAGE WHOLESALE PRICE OF PRINCIPAL
COMMODITIES AT SELECT CENTRES 1991-92(PRICE:RS/QUINTAL)
SI.No. Centre
-1........ ....2---
1. Kancheepuram
2. Cuddalore
3. Vellore
4. Madurai
5. Virudhunagar
6. Thirunelveli
7. Nagerkoil
STATE AVERAGE
1. Kancheepuram
2. Cuddalore
3. Vellore
4. Salem
5. Madurai
6. Virudhunagar
7. Thirunelveli
8. NagercoiI
STATE AVERAGE
Commodity/ April MayVariety.... 3......... 4........ 5.....
1. PADDY FINEI.R.20 253.33 266.67
I.R.20 293.33 266.66
I.R.20 273.33 273.33
I.R.20 273.43 265.62
I.R.20 0.00 0.00
I.R.20 207.14 250.00
I.R.20 205.88 229.41
251.07 258.62
2. PADDY COMMONTKM 9 240.00 260.00
TKM 9 273.33 0.00
TKM 9 253.33 253.53
SAMBA 0.00 0.00
*CR.'100‘9 * ■ d.OO ‘ 0.00’
ROSE KAR 0.00 0.00
ASD 16 196.43 221.43
SAMBA 229.41 0.00
238.50 244.99
June July August
---6........ 7.........8----
286.67 293.33 300.00
300.00 320.00 320.00
293.33 306.67 313.33
250.00 296.87 304.68
0 .00 0 .00 0.00
250.00 250.00 264.28
279.66 241.18 247.05
276.61 284.68 291.56
266.67 273.33 300.00
0.00 266.66 0.00
273.33 280.00 280.00
0.00 0.00 0.00
■ O.oO ■ ' 0 .00‘ d.oo
0.00 0.00 0.00
228.71 235.71 242.86
282.35 276.47 282.35
262.76 266.43 276.30
September
.... 9....
313.00
293.33
306,67
312.50
0.00
235.71
300.00
293.54
306.00
246.66
300.00
0.00
' ■ OlOO’
0.00
0.00
317.64
292.57
: 485
342/27-64a

29.1 Contd.
s i . No. Centre
-1........... 2---
Commodity/ Variety..... 3....
October November December
---10....... 11....... 12----
1. PADDY FINE326.67 320.00 300.00
300.00 373.33 326.66
346.67 306.67 320.00
312.50 382.81 328.12
0.00 0.00 0.00
250.00 285.71 321.43
0.00 0.00 0.00
307.17 333.70 319.24
2. PADDY COMMON333.33 306.66 346.67
0.00 0.00
300.00 293.33 320.00
0.00
0.00
0 .00 0.00 0.00
235.17 267.85 321.43
311.76 400.00 458.82
295.06 316.96 361.73
January February March AnnualAverage
----13....... 14........15........16-“-
1. Kancheepuram
2. Cuddalore
3. Vellore
4. Madurai
5. Virudhunagar
6. Thirunelveli
7. Nagerkoil
STATE AVERAGE
1. Kancheepuram
2. Cuddalore
3. Vellore
4. Salem
5. Madurai
6- Virudhunagar
7. Thirunelveli
8. Nagercoil
STATE AVERAGE
I.R.20
I.R.20
I.R.20
I.R.20
I.R.20
I.R.20
I.R.20
TKM 9
TKM 9
TKM 9
SAMBA
CR.1009
ROSE KAR
ASD 16
SAMBA
0.00 0.00
0.00 0.00
0.00
366.67 360.00 306.67 307.75
310.00 333.33 345.00 315.14
333.33 333.33 273.33 306.67
365.67 367.19 375.00 319.53
0.00 0.00 0.00 0.00
321.43 357.14 357.14 279.17
0.00 352.94 370.59 278.34
339.42 350.65 337.95 302.44
346.67 353.33 300.00 302.72
0.00 306.66 315.00 281.66
320.00 320.00 253.33 287.24
0.00 0.00 0.00 0.00
0.00 0.00 0.00 0.00
0.00 0.00 0.00 0.00
321.43 307.14 307.14 262.30
400.00 347.06 358.82 333.15
347.03 326.84 306.86 294.86
: 486 :

29.1 Contd.1 2 3 4 5 6 7 8 9
3. RICE FINE1. Madras I.R.20 425.60 459.46 486.49 520.27 547.30 547.302. Kancheepuram I.R.20 439.19 439.19 ' 479.72 479.72 493.24 506.75
3. Cuddalore I.R.20 501.26 501.26 475.94 475.94 539.24 526.284. Vellore I.R.20 494.59 494.59 521.62 493.24 513.51 506.76
5. Thi ruchi rapalIi I.R.20 500.00 0.00 0.00 0.00 540.54 554.056. Thi ruvarur I.R.20 0.00 0.00 0.00 0.00 486.49 486.49
7. Kumbakonam I.R.20 0.00 0.00 0.00 0.00 452.70 466.228. Thanjavur I.R.20 0.00 0.00 0.00 0.00 445.94 445.94
9. Nagapattinam I.R.20 0.00 0.00 0.00 0.00 472.97 0.0010. Mannargudi I.R.20 0.00 0.00 0.00 0.00 0.00 0.00
11. Madurai I.R.20 520.20 520.20 520.20 515.15 540.40 540.4012. Vi rudhunagar I.R.20 437.37 437.37 477.77 518.18 518.18 518.18
13. Thi runelveli I.R.20 444.44 454.54 479.80 479.80 464.65 469.7014. NagercoiI PONNI 439.39 449.49 439.39 459.59 454.54 464.65
STATE AVERAGE 466.90 469.51 485.12 492.74 497.67 502.73
4. RICE COMMON1. Madras ROSE KAR 390.65 398.65 425.60 466.29 506.76 506.762. Kancheepuram TKM 9 385.13 385.13 425.69 445.94 479.97 486.48
3. Cuddalore TKM 9 444.30 425.31 425.67 445.94 0.00 469.624. Chidambaram TKM 9 0.00 0.00 0.00 0.00 462.50 0.00
5. Vellore TKM 9 440.54 440,54 454.05 445.95 485.85 526.266. Salem .............. SAMBA 470.’70‘ 470.70 ■ ‘460.60 ■ 470.70 ■ 493.24 526.26'
7. Coimbatore KANCHI 0.00 0.00 0.00 486.49 493.24 520.278. Th i ruch i rapa11i CR.1009 0.00 0.00 0.00 0.00 439.18 459.45
9. Thi ruvarur CR.1009 0.00 0.00 0.00 0.00 391.89 410.9210. Kumbakonam CR.1009 0.00 0.00 0.00 0.00 398.65 405.60
: 487 :
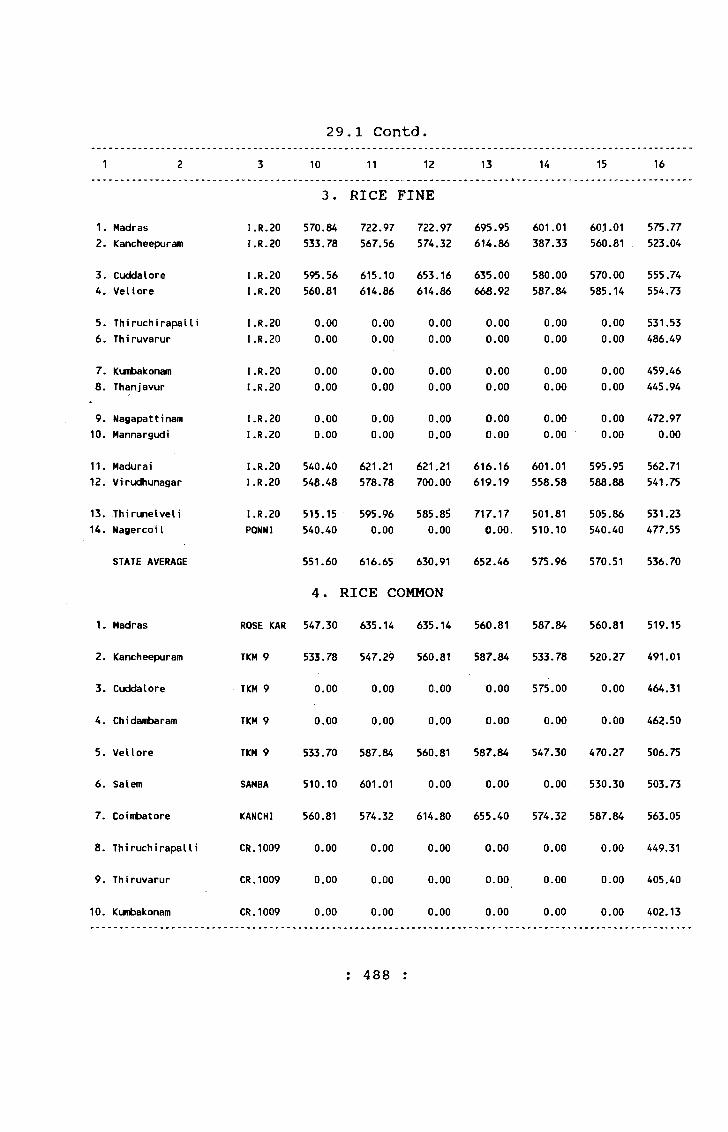
29,1 Contd.1 2 3 10 11 12 13 14 15 16
3. RICE FINE1. Madras2. Kancheepuram
I.R.20I.R.20
570.84533.78
722.97567.56
722.97574.32
695.95614.86
601.01387.33
60.1.01560.81
575.77523.04
3. Cuddalore4. Vellore
I.R.20I.R.20
595.56560.81
615.10614.86
653.16614.86
635.00668.92
580.00587.84
570.00585.14
555.74554.73
5. Thiruchirapalli6. Thiruvarur
I.R.20I.R.20
0.000.00
0.000.00
0.000.00
0.000.00
0.000.00
0.000.00
531.53486.49
7. Kumbakonam8. Thanjavur
I.R.20I.R.20
0.000.00
0.000.00
0.000.00
0.000.00
0.000.00
0.000.00
459.46 445.94
9. Nagapattinam 10. Mannargudi
I.R.20I.R.20
0.000.00
0.000.00
0.000.00
0.000.00
0.000.00
0.000.00
472.970.00
11. Madurai12. Virudhunagar
I.R.20I.R.20
540.40548.48
621.21578.78
621.21700.00
616.16619.19
601.01558.58
595.95588,88
562.71541.75
13. Thirunelveli14. Nagercoil
I.R.20PONNI
515.15540.40
595.960.00
585.8S 0.00
717.170.00.
501.81510.10
505.86540.40
531.23477.55
STATE AVERAGE 551.60 616.65 630,91 652.46 575.96 570.51 536.70
4. RICE COMMON1. Madras ROSE KAR 547.30 635.14 635.14 560.81 587.84 560.81 519.15
2. Kancheepuram TKM 9 533.78 547.29 560.81 587.84 533.78 520.27 491.01
3. Cuddalore TKM 9 0-00 0.00 0.00 0.00 575.00 0,00 464.31
4. Chidambaram TKM 9 0.00 0.00 0.00 0.00 0.00 0.00 462.50
5. Vellore TKM 9 533.70 587.84 560.81 587.84 547.30 470.27 506.75
6. Salem SAMBA 510.10 601.01 0.00 0.00 0.00 530.30 503.73
7. Coimbatore KANCHI 560.81 574.32 614.80 655.40 574.32 587.84 563.05
8. ThiruchirapalIi CR.1009 0.00 0.00 0.00 0.00 0.00 0.00 449.31
9. Thiruvarur CR.1009 0.00 0.00 0.00 0.00 0.00 0.00 405.40
10. Kumbakonam CR.1009 0.00 0.00 0.00 0.00 0.00 0.00 402.13
: 488 :

29.1 Contd.1 2 3 4 5 6 7 8 9
4. RICE COMMON CONTD.11. Thanjavur CR.1009 0.00 0.00 0.00 0.00 405.00 432.43
12. Nagapattinam CR.1009 0.00 0.00 0.00 0.00 391.89 0.00
13. Mannargudi CR.1009 0.00 0.00 0.00 0.00 385.13 0.00
14. Madurai CR.1009 0.00 0.00 0.00 0.00 0.00 0.00
15. Vi rudhunagar ROSE KAR 417.17 427.27 437.37 437.37 462.62 462.62
16. Thi runeIveIi ASD.16 404.04 419.19 434.34 434.34 414.14 500.00
17. NagerkoiI SAMBA 409.09 0.00 449.49 469.69 479.80 500.00
STATE AVERAGE 421.20 423.83 439.11 455.85 445.99 478.05
1. Madras WHITE5. WHEAT 398.99 393.94 429.29 429.29 429.29 439.39
2. Coimbatore WHITE 378.79 378.79 409.09 439.39 545.00 550.51
STATE AVERAGE 380.89 386.37 419.19 434.34 487.14 494.95
1.2.3.
KallakurichiSalemCoimbatore
CHOLAM WHITE CHOLAM WHITE CHOLAM WHITE
6. CHOLAM 280,00 300.00 253.33 278.78 287.80 292.93
320.00 278.78308.00
360.00 309.09308.00
350.00343.43297.98
350.00324.24287.80
4.5.6.
PollachiErode- . . . . T i ruppur
CHOLAM WHITE - CHOLAM «H H E ‘ CHOLAM WHITE
277.78 ■ 368.69 247.47
277.78378.79 247.47
227.27 348.48 •328.28
282.82•350.59313.13
278.00 • 350.59- 308.08
268.00 •348.48 • 323.23
7.8. 9.
ThiruchirapalliMaduraiThirunelveli
CHOLAM WHITE CHOLAM WHITE CHOLAM WHITE
265.65254.54
0.00
275.75294.94
0.00
295.95320.20
0.00
316.16284.84262.63
320.20305.05277.70
366.66294.44262.63
STATE AVERAGE 279.42 293.31 303.38 310.59 315.46 313.95
; 489 :

29.1 Contd.1 2 3 10 11 12 13 14 15 16
4. RICE COMMON CONTD.11. Thanjavur CR.1009 0.00 0.00 0.00 0.00 0.00 0.00 418.72
12. Nagapattinam CR.1009 0.00 0.00 0.00 0.00 0.00 0.00 391.89
13. Mannargudi CR.1009 0.00 0.00 0.00 0.00 0.00 0.00 385.13
14. Madurai CR.1009 0.00 0.00 0.00 0.00 0.00 0.00 0.00
15. Virudhunagar ROSE KAR 518.18 558.58 598.98 598.98 528.28 508.08 496.29
16. Thirunelveli ASD.16 494.95 545.45 0.00 676.77 520.20 535.35 488.98
17. Nagerkoil SAMBA 560.61 590.91 661.62 631.31 520.20 530.30 527.55
STATE AVERAGE 532.44 580.07 605.36 614.14 540.37 530.40 498.26
5. WHEAT
1. Madras WHITE 489.90 580.81 580.81 580.81 580.81 611.11 495.37
2. Coimbatore WHITE 0.00 Q.QQ 0.00 0.00 0.00 0.00 450.26
STATE AVERAGE 489.90 580.81 580.81 580.81 580.81 611.11 480.33
6. CHOLAM1. Kallakurichi2. Salem3. Coimbatore
CHOLAM WHITE CHOLAM WHITE CHOLAM WHITE
370.00334.34297.98
380.00343.43348.48
390.00363.63373.33
390.00 .388.88373.33
380.00393.93378.78
400.00393.93390.90
355.83333.82329.48
4. Pollachi5. Erode6. Tiruppur
CHOLAM WHITE CHOLAM WHITE CHOLAM WHITE
308.08378.79328.28
318.18398.99373.73
318.18378.79358.58
368.69429.29398.98
368.69449.49398.98
378.78500.00398.98
306.02391.41335.43
7. Thiruchirapa11i8. Madurai9. Thirunelveli
CHOLAM WHITE CHOLAM WHITE CHOLAM WHITE
366.66348.48272.73
385.85378.79218.18
416.16399.00373.74
406.06398.98373.74
395.95398.99378.78
395.95434.34378.78
350.50342.72311.00
STATE AVERAGE 333.93 349.51 374.60 391.99 393.73 408.86 340.40
: 490 :
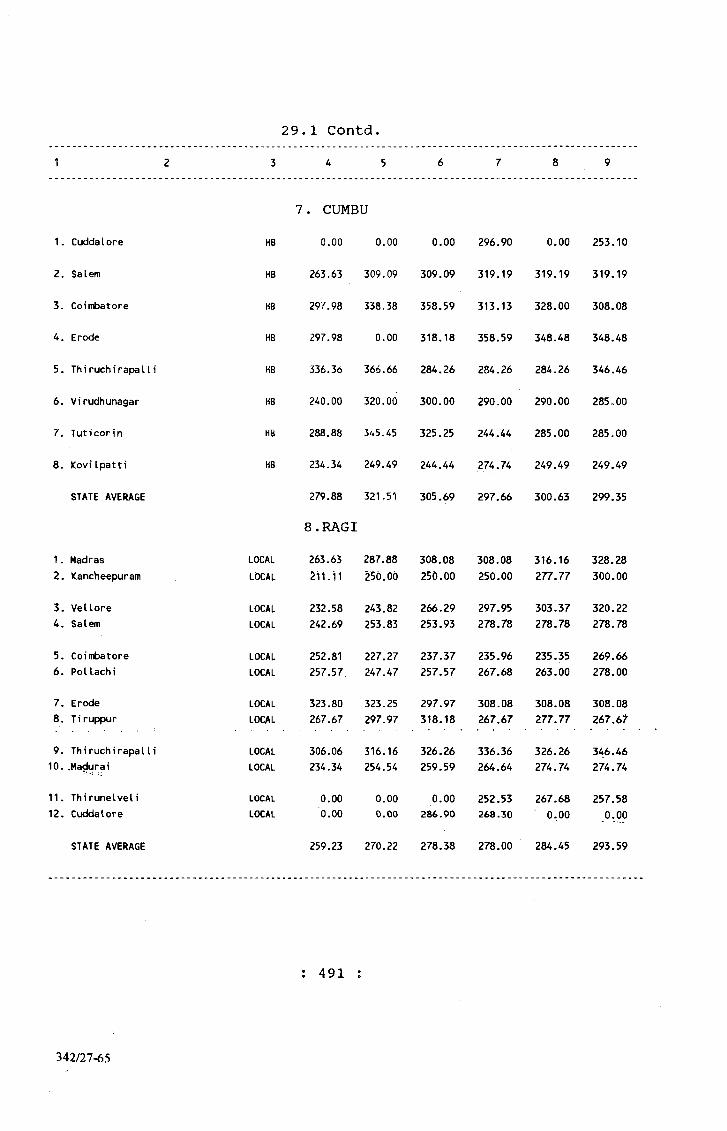
3 4 5
29.1 Contd.
1. Cuddalore
2. Salem
3. Coimbatore
4. Erode
5. ThiruchirapalM
6. Virudhunagar
7. Tuticor in
8. Kovilpatti
STATE AVERAGE
7. CUMBU HB 0.00 0.00 0.00
HB 263.63 309.09 309.09
HB 297.98 338.38 358.59
HB 297.98 0.00 318.18
HB 336.36 366.66 284.26
HB 240.00 320.00 300.00
HB 288.88 3^5.45 325.25
HB 234.34 249.49 244.44
279.88 321.51 305.69
8.RAGI
296.90 0.00 253.10
319.19 319.19 319.19
313.13 328.00 308.08
358.59 348.48 348.48
284.26 284.26 346.46
290.00 290.00 285,00
244.44 285.00 285.00
274.74 249.49 249.49
297.66 300.63 299.35
1. Madras2. Kancheepuram
LOCAL 263.63 287.88 308.08 308.08 316.16 328.28LOCAL 2ii.'l1 250.00 250.00 250.00 277.77 300.00
3. Vellore4. Salem
LOCALLOCAL
232.58 243.82242.69 253.83
266.29253.93
297.95278.78
303.37278.78
320.22278.78
5. Coimbatore6. Pollachi
LOCALLOCAL
252.81 227.27257.57 247.47
237.37257.57
235.96267.68
235.35263.00
269.66278.00
7. Erode8. Tiruppur
LOCALLOCAL
323.80 323.25267.67 297.97
297.97318.18
308.08267.67
308.08277.77
308.082 6 7 . 6 1
9. Thiruchirapal I i 10. ,Madurai
LOCALLOCAL
306.06 316.16234.34 254.54
326.26259.59
336.36264.64
326.26274.74
346.46274.74
11. Thirunelveli12. Cuddalore
LOCAL
LOCAL0.000.00
0.000.00
0.00286.90
252.53268.30
267.680.00
257.580.00
STATE AVERAGE 259.23 270.22 278.38 278.00 284.45 293.59
; 491 ;
342/27-65

29.1 Contd.10 11 12 13 14 15 16
1. CuckJalore HB 0.00
2. Salem HB 329.29
3. Coimbatore HB 318.18
4. Erode HB 348.48
5. Thiruchirapalli HB 355.55
6. Virudhunagar HB 300.00
7. Tuticor in HB 260.00
8. Kovilpatti HB 259.59
STATE AVERAGE 310.16
1. Madras2. Kancheepuram
3. Vellore4. Salem
5. Coimbatore6. Pollachi
7. Erode8. Tiruppur
11. Thirunelveli12. Cuddalore
STATE AVERAGE
7. CUMBU0 .00 0.00 0.00
348.48 418.18 434.34
348.48 373.73 353.53
338.38 398.93 398.99
355.55 316.16 421.21
350.00 340.00 375.00
320.00 325.00 348.48
0.00 325.25 0.00
343.48 356.75 388.59
8.RAGI
0.00 0.00 275.00
444.44 444.44 354.88
348.48 439.39 343.83
429.29 439.39 365.92
416.16 384.26 345.93
380.00 350.00 318.33
353.53 404.04 315.42
0.00 0.00 260.85
395.32 410.25 330.90
LOCAL 328.28 318.18 338.38 356.56 376.77 376.77 325.59LOCAL 300.00 325.00 300.00 333.33 311.11 360.00 289.03
LOCAL 303.37 275,28 342.70 353.93 331.46 351.69 301.89LOCAL 278.78 277.78 313.13 308.00 343.43 343.43 287.62
LOCAL 303.37 275.28 331.46 308.08 328.28 318.18 276.92LOCAL 282.82 277.77 282.82 338.38 348.48 363.63 288.77
LOCAL 318.18 35a.59 398.99 409.09 414.14 409.09 348.11LOCAL 297.97 297.97 277.77 378.79 378.78 365.65 307.82
9. Thiruchirapalli LOCAL 306.0610. Madurai LOCAL 297.98
345.45 370.70 406.06 416.16 436.36 353.20297.98 290.00 328.28 373.74 363.63 293.52
LOCAL 272.73 303.03 282.83 323.23 0.00 303,03 282.83LOCAL 0,00 0.00 0.00 0.00 ' 0.00 0.00 277.60
299.05 304.76 321.53 349.44 362.23 362.86 305.29
: 492 :

3 4 5
29.1 Contd.
1. Madras
2. Krishnagiri
3. Pollachi
4. Pudukottai
STATE AVERAGE
1. Dharmapuri
2, Krishnagiri
STATE AVERAGE
1. Salem
2. Nagerkoil
STATE AVERAGE
1. Madras
2, Salem
STATE AVERAGE
1. Madras2. Cuddalore-3. Vellore
4. Salem5. Coimbatore6. ThiruchirapalIi
7. Thanjavur8. Madurai9. Virudhunagar
MAIZE
MAIZE
MAIZE
MAIZE
9. MAIZE0.00 365.00
0.00 0.00
286.52 286.52
303.03 328.28
294.77 326.60
10. SAMAISAMAI
SAMAI
0.00
0.00
0.00
0.00
0.00 0.00 11. TAPIOCA
TAPIOCA 0.00 0.00
TAPIOCA 130.00
130.00 12, SAGO
SAGO
SAGO
0.00
0.00
0.00
0.00
0.00 641.50
0.00 641.5013. BENGALGRAM
BENGALGRAM 749.66 749.66BENGALGRAM. 1118.36 1118.36BENGALGRAM 1107.07 1056.56
BENGALGRAM 851.54 851.54BENGALGRAM 833.33 833.33BENGALGRAM 1002.02 1002.02
BENGALGRAMBENGALGRAM
0.00 0.00712.12 712.12
BENGALGRAM 1078.78 1078.78
398.99
0.00
0.00
368.69
383.84
0.00
0.00
0.00
0.00
130.00
130.00
675.00
617.19
646.10
819.39 • 934.69 1107.07
1006.06823.231052.52
829.89777.771043.43
409.09
0.00
0.00
0.00
409.09
0»00
0.00
0.00
0.00
130.00
130.00
0.00 375.76
0.00 0.00
0.00 348.50
0.00 323.23
0.00 349.16
0.00
0.00
0.00
0.00
0.00
0.00
0.00
0.00
150.00 160.00
150.00 160.00
700.00 951.69 0.00
647.19 0.00 669.66
673.60 951.69 669.66
804.88 745.46 791.5786S.26 ■ 880.77 1016.321106.06 1207.07 914.14
1006.06 725.84 985.85823.23 888.89 883.841002.02 901.01 870.70
0.00 850.51 871.13747.47 803.03 792.921043.43 982.82 993.93
: 493 :
342/27-65a

29.1 Contd.1 2 3 10 11 12 13 14 15 16
9. MAIZE1.2.
MadrasKrishnagiri
MAIZEMAIZE
358.590.00
409.090.00
398.990.00
398.990.00
398.990.00
424.240.00
393.770.00
3.4.
Pollachi Pudukottai
MAIZEMAIZE
358.58349.49
0.00384.85
318.18348.48
0.00383.83’
0.00398.98
0.00410.00
319.66359.89
STATE AVERAGE 355.55 396.97 355.22 391.41 398.99 417.12 365.40
1 0 . SAMAI1.2.
DharmapuriKrishnagiri
SAMAISAMAI
0.000.00
0.000.00
305.000.00
300.000.00
0.000.00
0.000.00
302.500.00
STATE AVERAGE 0.00 0.00 305.00 300.00 0.00 0.00 302.50
1 1 . TAPIOCA1.2.
Salem NagerkoiI
TAPIOCATAPIOCA
0.00160.00
0.00160.00
121.42160.00
101.42180.00
101.42180.00
0.00180.00
108.09156.36
STATE AVERAGE 160.00 160.00 140.71 140.71 140.71 180.00 146.02
12 . SAGO1.2.
MadrasSalem
SAGOSAGO
977.33730.00
949.44561.79
837.08617.97
837.08589.80
837.08626.26
837.08578.65
844.66628.01
STATE AVERAGE 853.76 755.62 727.53 713.48 731.67 707.87 730.64
13. BENGALGRAM1.2.3.
Madras Cuddalore Vellore
BENGALGRAMBENGALGRAMBENGALGRAM
740.061016.32919.19
745.46990.81919.19
745.461075.10863.64
772.471063.10919.19
758.071030.00883.84
758.071050.00888.89
765.021013.76990.99
4.5.6.
SalemCoimbatoreThiruchirapalli
BENGALGRAMBENGALGRAMBENGALGRAM
1006.00 1090.90 883.84 853.53 921.21 840.40
1060.60863.63830.30
1025.25883.83830.30
1025.25850.00880.00
1030.301005.05869.35
972.10868.81916.82
7.8. 9.
Thanjavur Madura i Virudhunagar
BENGALGRAMBENGALGRAMBENGALGRAM
850.51843.431003.03
889.67752.53750.50
0.00772.72750.50
0.000.00
801.01
858.76732.32740.40
848.45757.57750.50
856.99764.00918.09
: 494 :
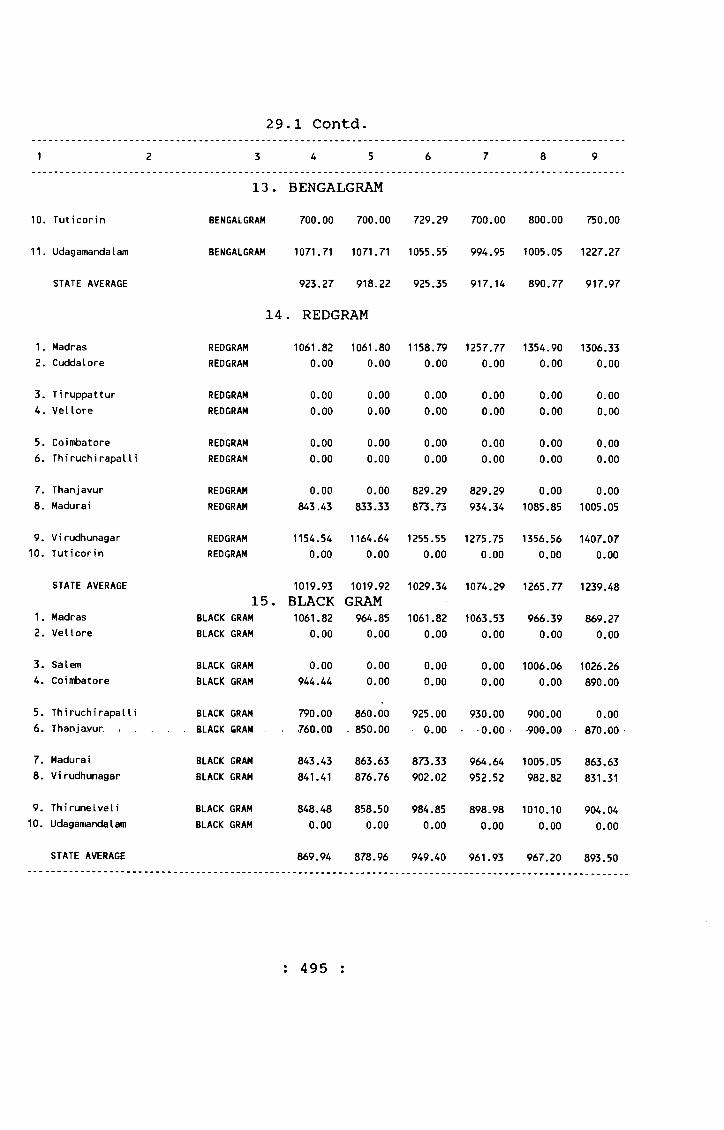
29.1 Contd.1 2 3 4 5 6 7 8 9
13. BENGALGRAM10. Tuticor in BENGALGRAM 700.00 700.00 729.29 700.00 800.00 750.00
11. Udagamandalam BENGALGRAM 1071.71 1071.71 1055.55 994.95 1005.05 1227.27
STATE AVERAGE 923.27 918.22 925.35 917.14 890.77 917.97
14 . REDGRAM1. Madras2. Cuddalore
REDGRAMREDGRAM
1061.820.00
1061.800.00
1158.790.00
1257.770.00
1354.900.00
1306.330.00
3. Tiruppattur4. Vellore
REDGRAMREDGRAM
0.000.00
0.000.00
0.000.00
0.000.00
0.000.00
0.000.00
5. Coinftbatore6. ThiruchirapalIi
REDGRAMREDGRAM
0.000.00
0.000.00
0.000.00
0.000.00
0.000.00
0.000.00
7. Thanjavur8. Madurai
REDGRAMREDGRAM
0.00843.43
0.00833.33
829.29873.73
829.29934.34
0.001085.85
0.001005.05
9. Virudhunagar 10. Tuticorin
REDGRAMREDGRAM
1154.540.00
1164.640.00
1255.550.00
1275.750.00
1356.560.00
1407.070.00
STATE AVERAGE
1. Madras2. Vellore
15.BLACK GRAM BLACK GRAM
1019.93BLACK1061.82
0.00
1019.92GRAM964.850.00
1029.34
1061.820.00
1074.29
1063.530.00
1265.77
966.390.00
1239.48
869.270.00
3. Salem4. Coimbatore
BLACK GRAM BLACK GRAM
0.00944.44
0.000.00
0.000.00
0.000.00
1006.060.00
1026.26890.00
5. ThiruchirapalIi BLACK GRAM 790.00760.00
860.00 . 850.00 .
925.00 . 0.00
930.00 - 0.00 -
900.00900.09
0.00 870.00 •
7. Madurai8. Virudhunagar
BLACK GRAM BLACK GRAM
843.43841.41
863.63876.76
873.33902.02
964.64952.52
1005.05982.82
863.63831.31
9. Thirunelveli 10. Udagamandalam
BLACK GRAM BLACK GRAM
848.480.00
858.500.00
984.850.00
898.980.00
1010.100.00
904.040.00
STATE AVERAGE 869.94 878.96 949.40 961.93 967.20 893.50
: 495 :
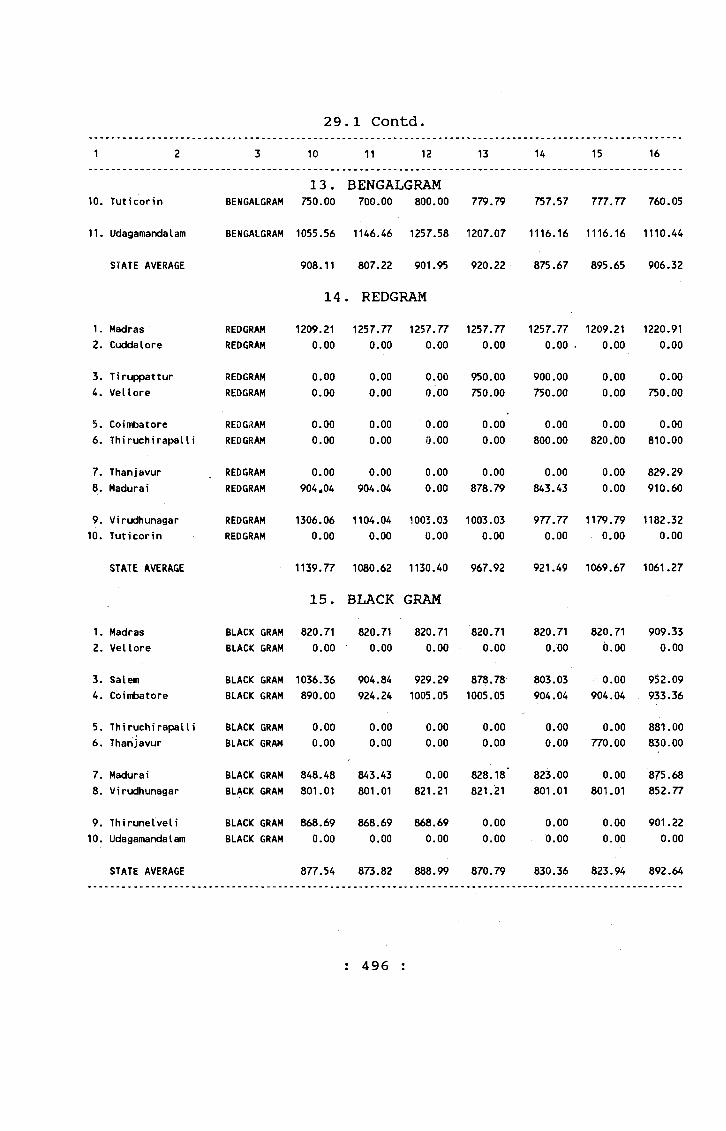
29.1 Contd.1 2 3 10 11 12 13 14 15 16
13. BENGALGRAM10. Tuticon'n BENGALGRAM 750.00 700.00 800.00 779.79 757.57 777.77 760.05
11. UdagamandaI am BENGALGRAM 1055.56 1146.46 1257.58 1207.07 1116.16 1116.16 1110.44
STATE AVERAGE 908.11 807.22 901.95 920.22 875.67 895.65 906.32
14 . REDGRAM1. Madras REDGRAM 1209.21 1257.77 1257.77 1257.77 1257.77 1209.21 1220.912. Cuddalore REDGRAM 0.00 0.00 0.00 0.00 0.00 . 0.00 0.00
3. Tiruppattur REDGRAM 0.00 0.00 0.00 950.00 900.00 0.00 0.004. Vellore REDGRAM 0.00 0.00 0.00 750.00 750.00 0.00 750.00
5. Coimbatore REDGRAM 0.00 0.00 0.00 0.00 0.00 0.00 0.006. ThiruchirapalU REDGRAM 0.00 0.00 0.00 0.00 800.00 820.00 810.00
7. Thanjavur REDGRAM 0.00 0.00 0.00 0.00 0.00 0.00 829.298. Madurai REDGRAM 904*04 904.04 0.00 878.79 843.43 0.00 910.60
9. Virudhunagar REDGRAM 1306.06 1104.04 1003.03 1003.03 977.77 1179.79 1182.3210. Tuticorin REDGRAM 0.00 0.00 0.00 0.00 0.00 0.00 0.00
STATE AVERAGE 1139.77 1080.62 1130.40 967.92 921.49 1069.67 1061.27
15. BLACK GRAM1. Madras BLACK GRAM 820.71 820.71 820.71 820.71 820.71 820.71 909.332. Vellore BLACK GRAM 0.00 0.00 0.00 0.00 0.00 6.00 0.00
3. Salem BLACK GRAM 1036.36 904.84 929.29 878.78 803.03 0.00 952.094. Coimbatore BLACK GRAM 890.00 924.24 1005.05 1005.05 904.04 904.04 933.36
5. ThiruchirapalIi BLACK GRAM 0.00 0.00 0.00 0.00 0.00 0.00 881.006. Thanjavur BLACK GRAM 0.00 0.00 0.00 0.00 0.00 770.00 830.00
7. Madurai BLACK GRAM 848.48 843.43 0.00 828.18' 823.00 0.00 875.688. Virudhunagar BLACK GRAM 801.01 801.01 821.21 821.21 801.01 801.01 852.77
9. Thirunelveli BLACK GRAM 868.69 868.69 868.69 0.00 0.00 0.00 901.2210. UdagamandaI am BLACK GRAM 0.00 0.00 0.00 0.00 0.00 0.00 0.00
STATE AVERAGE 877.54 873.82 888.99 870.79 830.36 823.94 892.64
496

29.1 Contd.1 2 3 4 5 6 7 8 9
16. GREEN GRAM1. Madras GREEN GRAM 916.36 916.36 867.88 917.83 908.12 869.272. Kancheepuram GREEN GRAM 0.00 0.00 0.00 0.00 0.00 0.00
3. Chidambaram GREEN GRAM 0.00 631.31 742.42 722.22 722.22 0.004. Vellore GREEM GRAM 0.00 0.00 0.00 0.00 0.00 1207.07
5 . Salem GREEN GRAM 834.34 958.58 985.85 1006.06 1006.06 980.006, Coimbatore GREEN GRAM 1106.06 1065.66 1005.05 1055.56 1025.25 1025.25
7. Thiruchirapalli GREEN GRAM 825.00 850.00 825.00 800.00 775.00 0.008. Kumbakonam GREEN GRAM 605.00 630.00 690.00 0.00 0.00 0.00
9. Madurai GREEN GRAM 681.81 702.02 833.33 803.03 833.33 813.1310. Virudhunagar GREEN GRAM 659.70 750.50 801.01 757.57 801.01 861.61
11. Thirunelveli GREEN GRAM 0.00 0.00 0.00 0.00 0.00 0.0012. Udagamandalam GREEN GRAM 0.00 1085.86 1085.86 1126.26 1166.67 1055.56
STATE AVERAGE 805.47 843.37 870.71 898.57 904.71 973.24
17. HORSE GRAM1. Madras HORSE GRAM 0.00 340.00 340.00 340.00 400.00 350.962. Vellore HORSE GRAM 0.00 0.00 0.00 0.00 0.00 0.00
3. Krishnagiri HORSE GRAM 330.00 330.00 0.00 360.00 360.00 360.004. Coimbatore HORSE GRAM 370.00 370.00 370.00 400.00 409.09 409.09
5. Tliiruchirapalli HORSE GRAM 0.00 0.00 0.00 0.00 0.00 0.006. Madurai HORSE GRAM 400.00 400.00 0.00 390.00 380.00 380.00
7. Thirunelveli HORSE GRAM 0.00 0.00 0.00 0.00 0.00 0.008. Udagamandalam HORSE GRAM 0.00 0.00 0.00 0.00 0.00 0.00
STATE AVERAGE 366.67 360.00 355.00 372.50 387.27 375.01
: 497 :
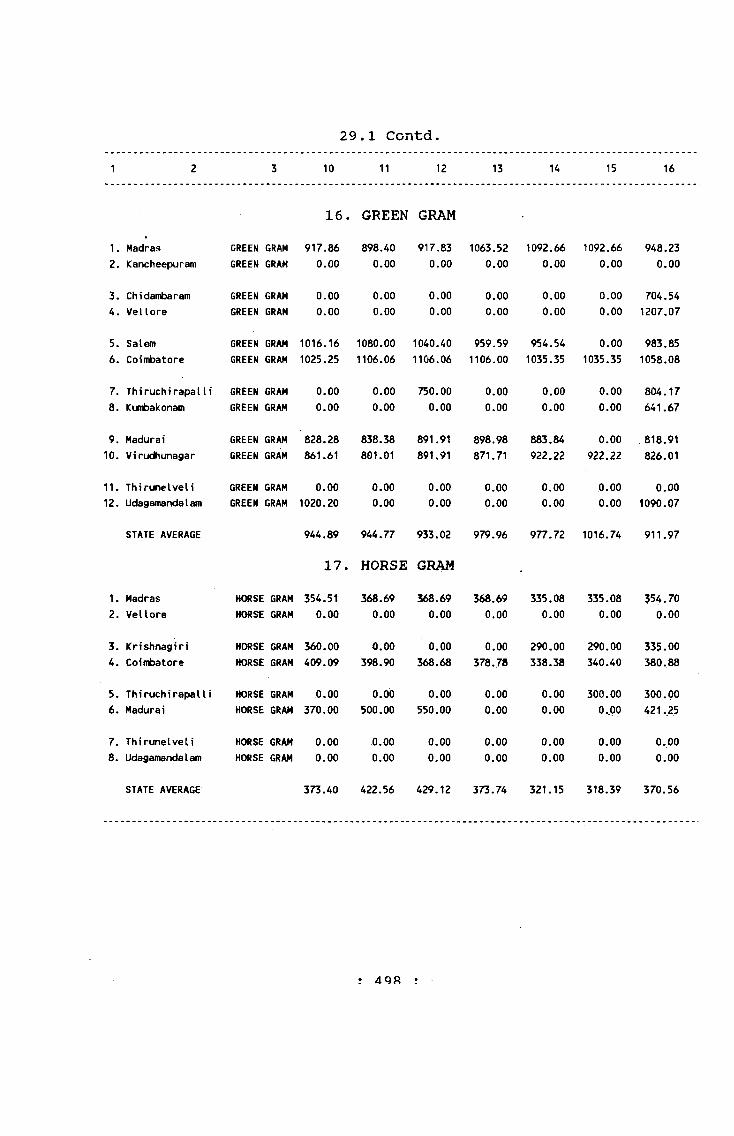
29.1 Contd.1 2 3 10 11 12 13 14 15 16
16. GREEN GRAM1. Madras GREEN GRAM 917.86 898,40 917.83 1063.52 1092.66 1092.66 948.232. Kancheepuram GREEN GRAM 0.00 0.00 0.00 0.00 0.00 0.00 0.00
3. Chidambaram GREEN GRAM 0.00 0.00 0.00 0.00 0.00 0.00 704.544. Vellore GREEN GRAM 0.00 o.oo 0.00 0.00 0.00 0.00 1207.07
5. Salem GREEN GRAM 1016.16 1080.00 1040.40 959.59 954.54 0.00 983.856. CoiniDatore GREEN GRAM 1025.25 1106.06 1106.06 1106.00 1035.35 1035.35 1058.08
7. Th i ruch i rapa11i GREEN GRAM 0.00 0.00 750.00 0.00 0.00 0.00 804.178. Kumbakonam GREEN GRAM 0.00 0.00 0.00 0.00 0.00 0.00 641.67
9. Madurai GREEN GRAM 828.28 838.38 891.91 898.98 883.84 0.00 . 818.9110. Vtrudhunagar GREEN GRAM 861.61 801.01 891.91 871.71 922.22 922.22 826.01
11. Thirunelveli GREEN GRAM 0.00 0.00 0.00 0.00 0.00 0.00 0.0012. Udagamandalam GREEN GRAM 1020.20 0.00 0.00 0.00 0.00 0.00 1090.07
STATE AVERAGE 944.89 944.77 933.02 979.96 977.72 1016.74 911.97
17. HORSE GRAM1. Madras H(»SE GRAM 354.51 368.69 368.69 368.69 335.08 335.08 354.702. Vellore HORSE GRAM 0.00 0.00 0.00 0.00 0.00 0.00 0.00
3. Krishnagiri HORSE GRAM 360.00 0.00 0.00 0.00 290.00 290.00 335.004. Coimbatore HORSE GRAM 409.09 398.90 368.68 378.78 338.38 340.40 380.88
5. Thiruchirapalli HORSE GRAM 0.00 0.00 0.00 0.00 0.00 300.00 300.006. Madurai HORSE GRAM 370.00 500.00 550.00 0.00 0.00 o.po 421.25
7. Thirunelveli HORSE GRAM 0.00 0.00 0.00 0.00 0.00 0.00 0.008. Udagamandalam HORSE GRAM 0.00 0.00 0.00 0.00 0.00 0.00 0.00
STATE AVERAGE 373.40 422.56 429.12 373.74 321.15 318.39 370.56
4Q8

29.1 Contd.
1 2 3 4 5 6 7 8 9
18. BENGALGRAM DHALL1. Madras2. Cuddalore
BENGALGRAM DHALL BENGALGRAM DHALL
785.45965.00
867.88965.00
819.39939.79
849.84975.51
888.70990.81
791.57955.10
3. Vellore4. Salem
BENGALGRAM DHALL BENGALGRAM DHALL
883.67851.54
914.28903.00
934.69934.02
892.861006.06
984.691006.06
1186.871031.31
5. Coimbatore6. ThiruchirapalIi
BENGALGRAM DHALL BENGALGRAM DHALL
863.641002.02
954.55951.51
904.04951.51
904.041062.62
954.551103.03
954.551163.63
7. Thanjavur8. Madurai
BENGALGRAM DHALL3ENGALGRAH DHALL
881.44813.13
902.06863.63
902.06883.83
902.06843,43
953.60924.24
922.68954.54
9. Virudhunagar 10. Tuticor in
3ENGALGRAM DHALL
d h a ;/.
902. Oi*
828.20
892.92901.01
902.02924.24
922.22930.00
942.42970.00
902.02900.00
11. Udagamandalani 8FNGALGRAN DHAlL 954.54 944.44 964.65 944.44 944.44 954.55
STATE AVERAGE 884.61 914.50 914.57 930.20 969.32 974.26
19. REDGRAM DHALL1. Madras2. Cuddalore
REDGRAM DHALL REDGRAM DHALL
1294.551612.12
1401.211309.09
1449.701612.12
1549.151814.14
1646.271814.14
1597.711915.15
3. Tiruppathur4. Salem
REDGRAM DHALL REDGRAM DHALL
1464.281167.67
1525.511359.59
1639.801490.90
1652.001561.61
1755.101763.63
1780.611743.43
5, Coimbatore6. ThiruchirapalIi
REDGRAM DHALL REDGRAM DHALL
1530.301587.87
1510.101537.37
1732.321582.82
1732.321668.68
1900.001759.59
1863.641709.09
7. Thanjavur8. Madurai
REDGRAM DHALL REDGRAM DHALL
1545.451510.10
1540.401520.20
1585.851560.60
1641.411631.31
1641.411813.13
1661.611833.33
9. Virudhunagar 10. Tuticor in
REDGRAM DHALL REDGRAM DHALL
1407.071592.92
1457.571608.08
1609.091772.72
1760.601800.00
18T1.112050.00
1710.101980.00
11. Udagamandalam REDGRAM DHALL 1560.61 1510.10 1611.11 1772.73 1813.13 1883.84
STATE AVERAGE 1479.36 1479.93 1604.28 1689.45 1797.05 1788.96
: 499
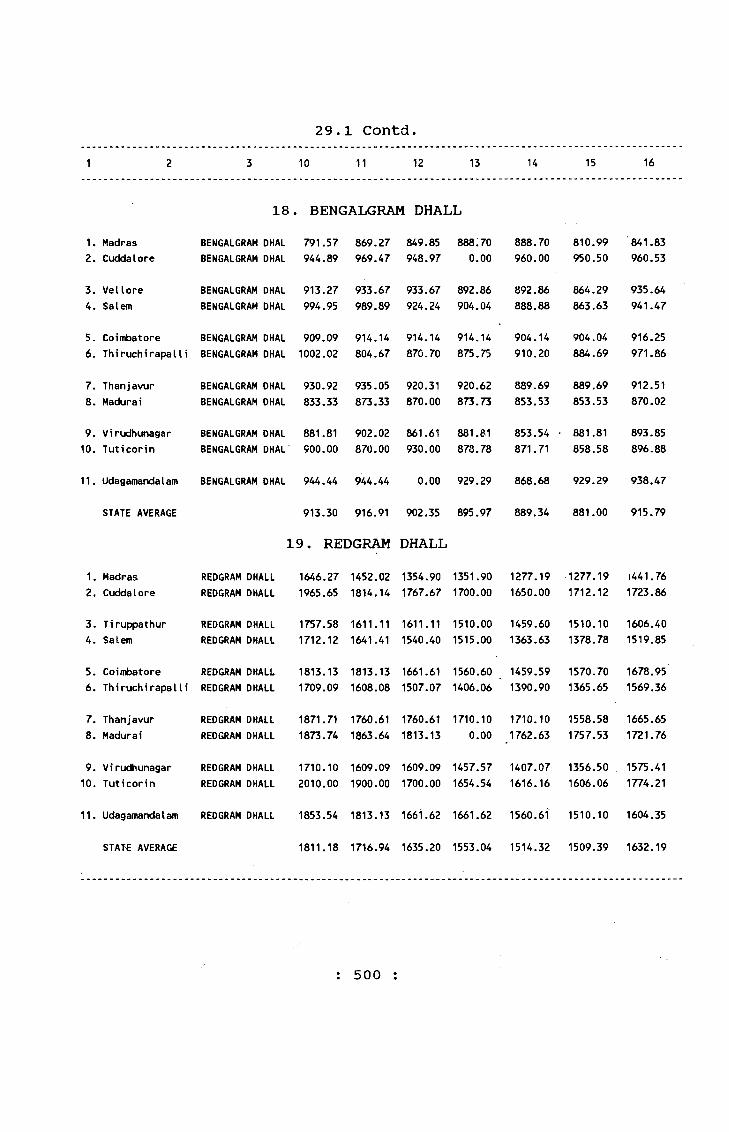
29.1 Contd.1 2 3 10 11 12 13 14 15 16
18 . BENGALGRAM DHALL1.2.
MadrasCuddalore
BENGALGRAM DHAL BENGALGRAM DHAL
791.57944.89
869.27969.47
849.85948.97
888.700.00
888.70960.00
810.99950.50
841.83960.53
3.4.
Vellore Salem
BENGALGRAM DHAL BENGALGRAM DHAL
913.27994.95
933.67989.89
933.67924.24
892.86904.04
892.86888.88
864.29863.63
935.64941.47
5.6.
CoimbatoreThiruchirapalli
BENGALGRAM DHAL BENGALGRAM DHAL
909.091002.02
914.14804.67
914.14870.70
914.14875.75
904.14910.20
904.04884.69
916.25971.86
7.8.
ThanjavurMadurai
BENGALGRAM DHAL BENGALGRAM DHAL
930.92833.33
935.05873.33
920.31870.00
920.62873.73
889.69853.53
889.69853.53
912.51870.02
9.10.
Vi rudhunagar Tuticorin
BENGALGRAM DHAL BENGALGRAM DHAL
881.81900.00
902.02 870. OOr
861.61930.00
881.81873.78
853.54871.71
■ 881.81 858.58
893.85896.88
11. Udagamandalam BENGALGRAM DHAL 944.44 944.44 0.00 929.29 868.68 929.29 938.47
STATE AVERAGE 913.30 916.91 902.35 895.97 889.34 881.00 915.79
19. REDGRAM DHALL1.2.
MadrasCuddalore
REDGRAM DHALL REDGRAM DHALL
1646.271965.65
1452.021814.14
1354.901767.67
1351.901700.00
1277.191650.00
1277.191712.12
1441.761723.86
3.4.
T i ruppathur Salem
REDGRAM DHALL REDGRAM DHALL
1757.581712.12
1611.111641.41
1611.111540.40
1510.001515.00
1459.601363.63
1510.101378.78
1606.401519.85
5.6.
CoimbatoreThiruchirapalli
REDGRAM DHALL REDGRAM DHALL
1813.131709.09
1813.131608.08
1661.611507.07
1560.601406.06
1459.591390.90
1570.701365.65
1678.951569.36
7.8.
ThanjavurMadurai
REDGRAM DHALL REDGRAM DHALL
1871.711873.74
1760.611863.64
1760.611813.13
1710.100.00
1710.101762.63
1558.581757.53
1665.651721.76
9.10.
Vi rudhunagar Tuticorin
REDGRAM DHALL REDGRAM DHALL
1710.102010.00
1609.091900.00
1609.091700.00
1457.571654.54
1407.071616.16
1356.501606.06
1575.411774.21
11. Udagamandalam REDGRAM DHALL 1853.54 1813.13 1661.62 1661.62 1560.61 1510.10 1604.35
STAT'E AVERAGE 1811.18 1716.94 1635.20 1553.04 1514.32 1509.39 1632.19
: 500 :
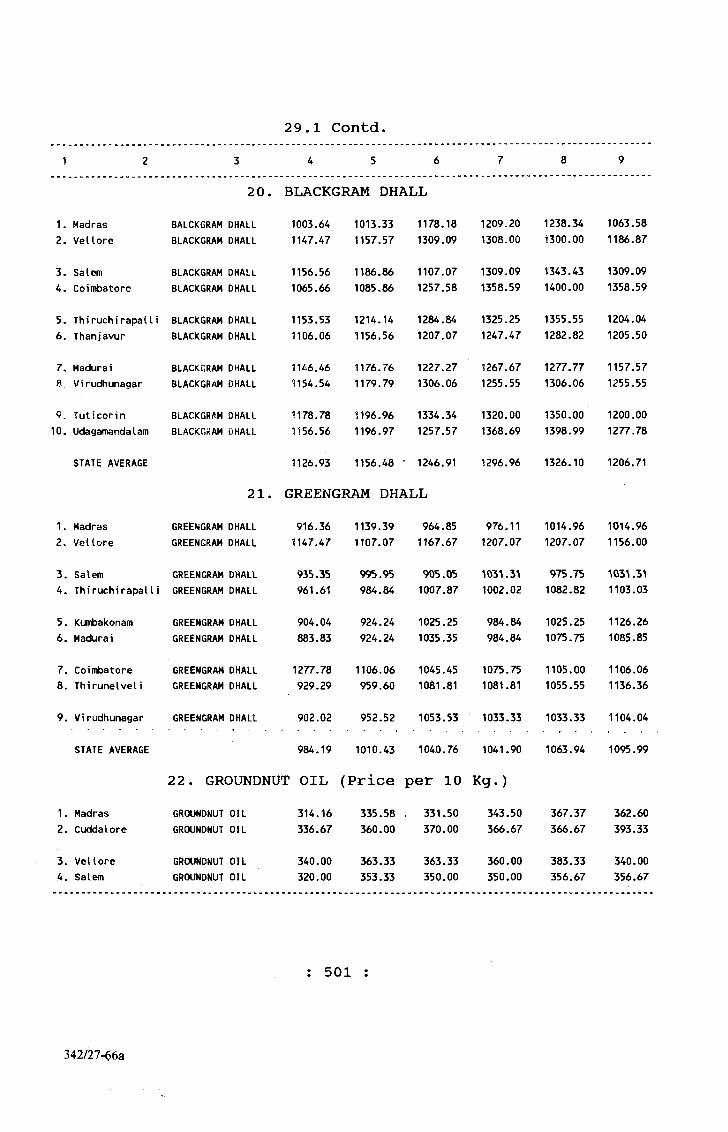
29.1 Contd.1 2 3 4 5 6 7 8 9
20. BLACKGRAM DHALL1. Madras2. Vellore
BALCKGRAM DHALL BLACKGRAM DHALL
1003.641147.47
1013.331157.57
1178.181309.09
1209.201308.00
1238.341300.00
1063.581186.87
3. Salem4. Coin*)atore
BLACKGRAM DHALl BLACKGRAM DHALL
1156.561065.66
1186.861085.86
1107.071257.58
1309.091358.59
1343.431400.00
1309.091358.59
5. ThiruchirapalIi6. Thanjavur
BLACKGRAM DHALL BLACKGRAM DHALL
1153.531106.06
1214.141156.56
1284.841207.07
1325.251247.47
1355.551282.82
1204.041205.50
7. Madurai8. Virudhunagar
BLACKGRAM DHALL BLACKGRAM DHALL
1146.461154.54
1176.761179.79
1227.271306.06
1267.671255.55
1277.771306.06
1157.571255.55
9. Tuticorin 10. UdagamandaIam
BLACKGRAM DHALL BLACKGRAM DHALL
1178.781156.56
1196.961196.97
1334.341257.57
1320.001368.69
1350.001398.99
1200,001277,78
STATE AVERAGE 1126.93 1156.48 • 1246.91 1296.96 1326.10 1206.71
21. GREENGRAM DHALL1. Madras2. Vellore
GREE>^GRAM DHALL GREENGRAM DHALL
916.361147.47
1139.391107.07
964.851167.67
976.111207.07
1014.961207.07
1014.961156.00
3. Salem4. ThiruchirapalIi
GREENGRAM DHALL GREENGRAM DHALL
935.35961.61
995.95984.84
905.051007.87
103^.3^ 1002.02
975.751082.82 1103.03
5. Kumbakonam6. Madurai
GREENGRAM DHALL GREENGRAM DHALL
904.04883.83
924.24924.24
1025.251035.35
984.84984.84
1025.251075.75
1126.261085.85
7. Coimbatore8. Thirunelveli
GREENGRAM DHALL GREENGRAM DHALL
1277.78929.29
1106.06959.60
1045.451061.81
1075.751081.81
1105.001055.55
1106.061136.36
9, Virudhunagar GREENGRAM DHALL 902.02 952.52 1053.53 1033.33 1033.33 1104.04
STATE AVERAGE 984.19 1010.43 1040.76 1041.90 1063.94 1095.99
22. GROUNDNUT OIL (Price per 10 Kg.)1. Madras2. Cuddalore
GROUNDNUT OIL GROUNDNUT OIL
314.16336.67
335.58360.00
331.50370.00
343.50366.67
367.37366.67
362.60393.33
3. Vellore A. Salem
GROUNDNUT OIL GROUNDNUT OIL
340.00320.00
363.33353.33
363.33350.00
360.00350.00
383.33356.67
340.00356.67
: 501
3Aim- e2i

29.1 Contd.1 2 3 10 11 12 13 14 15 16
1. Madras2. Vellore
BALCKGRAMBLACKGRAM
2 0DHALLDHALL
. BLACKGRAM DHALL 1014.96 1040.09 1014.96 1014.96 1111.11 1186.88 1116.16 1222.22
1014.961126.26
966.391121.21
1064.381191.75
3. Salem4. Coimbatore
BLACKGRAMBLACKGRAM
DHALLDHALL
1308.081257.58
1257.571227.27
1257.571257.57
1257.571207.07
1227.271156.56
1196.961156.56
1243.091232.41
5. Thiruchirapalli6. Thanjavur
BLACKGRAMBLACKGRAM
DHALLDHALL
1204.041200.00
1163.631205.05
1173,731154.55
1153.531205.05
1193.931184.85
1173.731154.54
1216.661192.46
7. Madurai8. Virudhunagar
BLACKGRAMBLACKGRAM
DHALLDHALL
1186.861053.53
1085.861104.04
1106.061104.04
1106.061154.54
1106.061154.54
1101.011053.53
1162.121160.85
9. Tuticorin 10. Udagamandalam
BLACKGRAMBLACKGRAM
DHALLDHALL
1190.001247.47
1180.001207.07
1200.001186.87
1204.041207.07
1161.611257.58
1171.711075.76
1223.951236.53
STATE AVERAGE 1177.36 1165.75 1157.15 1173.21 1158.36 1117.14 1192.42
2 1 . GREENGRAM DHALL1. Madras2. Vellore
GREENGRAMGREENGRAM
DHALLDHALL
1014.961111.11
1160.641191.92
1141.221277.78
1180.071257.58
•1218.921328.28
1218.921442.42
1080.111216.79
3. Salem4. ThiruchirapaVV)
GREENGRAMGREEMGRAM
DHALLDHALL
1055.55 1186.861^53.53
1212.501153.53
1222.221264.64
1242.42' 1257,571370.70
1087.651132.74
5. Kumbakonam6. Madurai
GREENGRAMGREENGRAM
DHALLDHALL
1126.261156.57
1136.361156.57
1257.571196.97
1257.571222.22
1227.271207.07
1227.271242.42
1101.851097.64
7, Coimbatore8. Thirunelveli
GREENGRAMGREENGRAM
DHALLDHALL
1106.061151.52
1227.271181.82
1297.981131.31
1247.471131.31
1328.281272.72
1328.281272.72
1187.621115.48
9. Virudhunagar GREENGRAM DHALL 1104.04 1154.54 1154.54 1235.35 1235.35 1255.55 1101.51
STATE AVERAGE 1107.72 1172.17 1202.60 1224.27 1260.57 1290.65 1124.60
22. GROUNDNUT OIL (Price per 10 Kg.)1. Madras GROUNDNUT OIL 333.97 348.28 341.13 324.42 310.11 298.18 334.23
2. Cuddalore .GROUNDNUT OIL 380.00 346.67 350.00 366.60 350.00 318.00 358.72
3. Vellore GROUNDNUT OIL 350.00 360.00 360.00 356.66* . 333.33 310.00 351.66
4. Salem GROUNDNUT OIL 353.33 343.33 336.67 336.66 328.66 306.66 341.00
: 502 :
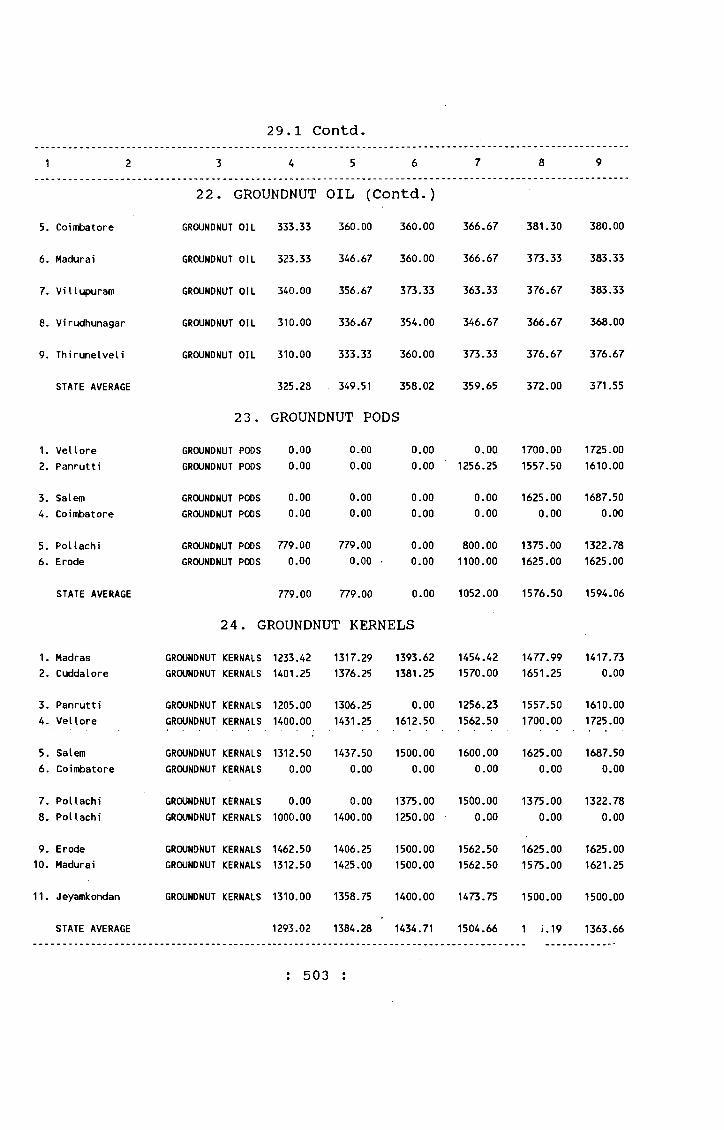
4 5
29.1 Contd.
5. Coimbatore
6. Madurai
7. Villupuram
8. Virudhunagar
9. Thirunelveli
STATE AVERAGE
1. Vellore2. Panrutti
3. Salem4. Coimbatore
5. Pollachi6. Erode
STATE AVERAGE
1. Madras2. Cuddalore
3. Panrutti4. Vellore
22. GROUNDNUT OIL (Contd.) GROUNDNUT OIL 333.33 360.00 360.00
GROUNDNUT OIL 323.33
GROUNDNUT OIL 340.00
GROUNDNUT OIL 310.00 336.67 354.00
GROUNDNUT OIL 310.00 333.33
325.23 349.51
23. GROUNDNUT PODS
346.67 360.00
356.67 373.33
360.00
358.02
366.67
366.67
363.33
346.67
373.33
359.65
381.30
373.33
376.67
366.67
376.67
372.00
380.00
383.33
383.33
368.00
376.67
371.55
GROUNDNUT PODS 0.00 0.00 0.00GROUNDNUT PODS 0.00 0.00 0.00
GROUNDNUT PODS 0.00 0.00 0.00GROUNDNUT PODS 0.00 0.00 0.00
GROUNDNUT PODS 779.00 779.00 0.00GROUNDNUT PODS 0.00 0.00 • 0.00
0.00 1700.00 1725.001256.25 1557.50 1610.00
0.00 1625.00 1687.500.00 0.00 0.00
800.00 1375.00 1322.781100.00 1625.00 1625.00
779.00 779.00 0.00 1052.00 1576.50 1594.06
24. GROUNDNUT KERNELSGROUNDNUT KERNALS 1233.42 1317.29 1393.62 1454.42 1477.99 1417.73GROUNDNUT KERNALS 1401.25 1376.25 1381.25 1570.00 1651.25 0.00
GROUNDNUT KERNALS 1205.00 1306.25 0.00 1256.23 1557.50 1610.00GROUNDNUT KERNALS 1400.00 1431.25 1612.50 1562.50 1700.00 1725.00
5. Salem6. Coimbatore
7. Pollachi8. Pollachi
9. Erode10. Madurai
11. Jeyamkondan
STATE AVERAGE
GROUNDNUT KERNALS 1312.50 1437.50 1500.00 1600.00 1625.00 1687.50GROUNDNUT KERNALS 0.00 0.00 0.00 0.00 0.00 0.00
GROUNDNUT KERNALS 0.00 0.00 1375.00 1500.00 1375.00 1322.78GROUNDNUT KERNALS 1000.00 1400.00 1250.00 0.00 0.00 0.00
GROUNDNUT KERNALS 1462.50 1406.25 1500.00 1562.50 1625.00 1625.00GROUNDNUT KERNALS 1312.50 1425.00 1500.00 1562.50 1575.00 1621.25
GROUNDNUT KERNALS 1310.00
1293.02
1358.75
1384.28
1400.00
1434.71
1473.75
1504.66
1500.00
1 i.19
1500.00
1363.66
: 503 :
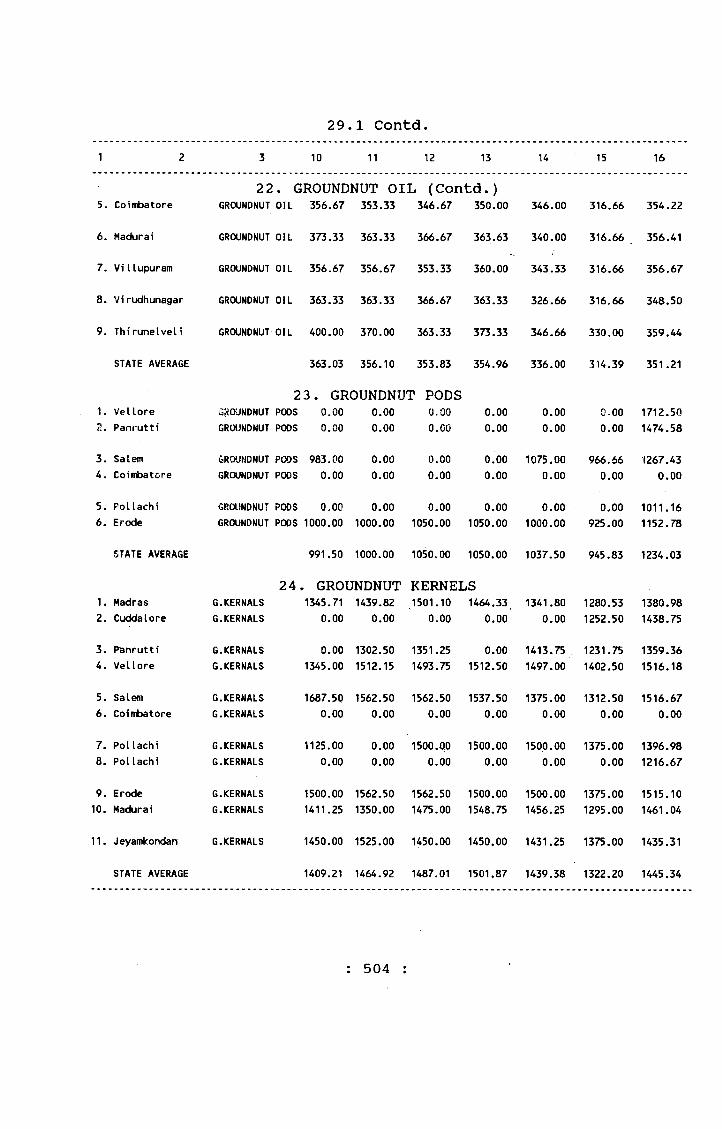
10 11 12 13
29.1 Contd.1 U 15 16
5. Coimbatore
6. Madurai
7. Villupuram
8. Virudhunagar
9. Thirunelveli
STATE AVERAGE
1. Vellore2. Panrutti
3. Salem4. Coimbatcre
5. Pollachi6. Erode
STATE AVERAGE
1. Madras2. Cuddalore
3. Panrutti4. Vellore
22. GROUNDNUT OIL (Contd.) GROUNDNUT OIL 356.67 353.33 346.67 350.00
GROUNDNUT OIL 373.33 363.33 366.67 363.63
GROUNDNUT OIL 356.67 356.67 353.33 360.00
GROUNDNUT OIL 363.33 363.33 366.67 363.33
GROUNDNUT OIL 400.00 370.00 363.33 373.33
363.03 356.10 353.83 354.96
23. GROUNDNUT PODS GROUNDNUT PODS 0.00 0.00 0.00GROUNDNUT PODS 0.00
GROUMDNUT PODS 983.00 GROUNDNUT POOS 0.00
GROUNDNUT PODS 0,00
0.00
0.000.00
0.00
0.00
0.000.00
0.00
0.000.00
0.000.00
0.00GROUNDNUT PODS 1000.00 1000.00 1050.00 1050.00
991.50 1000.00 1050.00 1050.00
24. GROUNDNUT KERNELS G.KERNALS 1345.71 1439.82 1501.10 1464.33.G.KERNALS 0.00 0.00 0.00 0.00
346.00 316.66 354.22
340.00 316.66 356.41
343.33 316.66 356.67
326.66 316.66 348.50
346.66 330.00 359.44
336.00 314.39 351.21
0.00 0.00 1712.500.00 0.00 1474.58
1075.00 966.66 1267.430.00 0.00 0.00
0.00 0.00 1011.161000.00 925.00 1152.78
1037.50 945.83 1234.03
1341.800.00
1280.531252.50
1380.981438.75
G.KERNALS 0.00 1302.50 1351.25 0.00 1413.75 1231.75 1359.36G.KERNALS 1345.00 1512.15 1493.75 1512.50 1497.00 1402.50 1516.18
5. Salem G.KERNALS 1687.50 1562.50 1562.50 1537.50 1375.00 1312.50 1516.676. Coimbatore G.KERNALS 0.00 0.00 0.00 0.00 0.00 0.00 0.00
7. Pollachi8. Pollachi
9. Erode10. Madurai
11. Jeyamkondan
STATE AVERAGE
G.KERNALS 1125.00 0.00 1500.0,0 1500.00 1500.00 1375.00 1396.98G.KERNALS 0.00 0.00 0.00 0.00 0.00 0.00 1216.67
G.KERNALS 1500.00 1562.50 1562.50 1500.00 1500.00 1375.00 1515.10G.KERNALS 1411.25 1350.00 1475.00 1548.75 1456.25 1295.00 1461.04
G.KERNALS 1450.00 1525.00 1450.00 1450.00 1431.25 1375.00 1435.31
1409.21 1464.92 1487.01 1501.87 1439.38 1322.20 1445.34
: 504 :

29.1 Contd.1 2 3 4 5 6 7 8 9
25. GINGELLY SEED1.2.3.
MadrasMadrasKancheepuram
GINGELLY SEED GINGELLY SEED GINGELLY SEED
0.001308.491312.50
0.001374.251250.00
0.001274.441250.00
0.001415.961250.00
0.001385.781437.50
0.001452.051437.50
4.5.6.
Cuddalore Vellore Salem
GINGELLY SEED GINGELLY SEED GINGELLY SEED
0.000.00
1533.33
0.000.00
1266.66
1253.750.00
1200.00
0.000.00
1266.66
0.000.00
1226.66
0.000.00
1253.33
7.8. 9.
CoimbatoreThiruchirapalliThanjavur
GINGELLY SEED GINGELLY SEED GINGELLY SEED
0.000.00
1350.00
0.001306.661150.00
0.001400.001300.00
1500.001400.001310.00
1300.001400.00
0.00
1500.000.000.00
10.11.12.
MaduraiThi runeIveliJeyamkondan
GINGELLY SEED GINGELLY SEED GINGELLY SEED
0.000.00
1338.75
0.000.00
1287.50
0.000.00
1312.50
0.000.00
1310.00
0.000.00
1445.00
0.000.00
1547.00
STATE AVERAGE 1368.61 1272.51 1284.38 1350.37 1365.82 1448.31
26 . CASTOR SEED1.2.3.
VelloreTiruppatturSalem
CASTOR SEED CASTOR SEED CASTOR SEED
0.00600.00600.00
0.00600.00586.66
0.00613.33613.33
0.00613.33640.00
0.000.00
640.00
0.000.00
660.00
STATE AVERAGE 600.00 593.33 613.33 626.66 640.00 660.00
27. COCONUT HUSKED1 (Per 1000 Nos.)1.2.3.4.
ThanjavurThanjavurCoimbatoreMarthandam
COCONUT HUSKED COCONUT HUSKED COCONUT HUSKED COCONUT HUSKED
2150.00 0.00
2 2 5 0 . 9 0
2700.00
2000.000.00
2250.002600.00
2550.002050.002000.00 2500.00
2600.002200.002500.002800.00
2800.002400.002750.003250.00
3100.002500.00 4000,00.3300.00
5.6.7.8.
NagerkoiI Gudiyatham Madras Madras
COCONUT HUSKED COCONUT HUSKED COCONUT HUSKED COCONUT HUSKED
2700.001500.002800.00 2500.00
2000.001800.002800.002500.00
2800.001800.00
0.000.00
3000.001800.00
0.00 0.00
3350.002000.00
0.003500.00'
3300.002000.00
0.003700.00
STATE AVERAGE 2371.43 2392.86 2283.33 2483.33 2864.29 3128.57
: 505 :
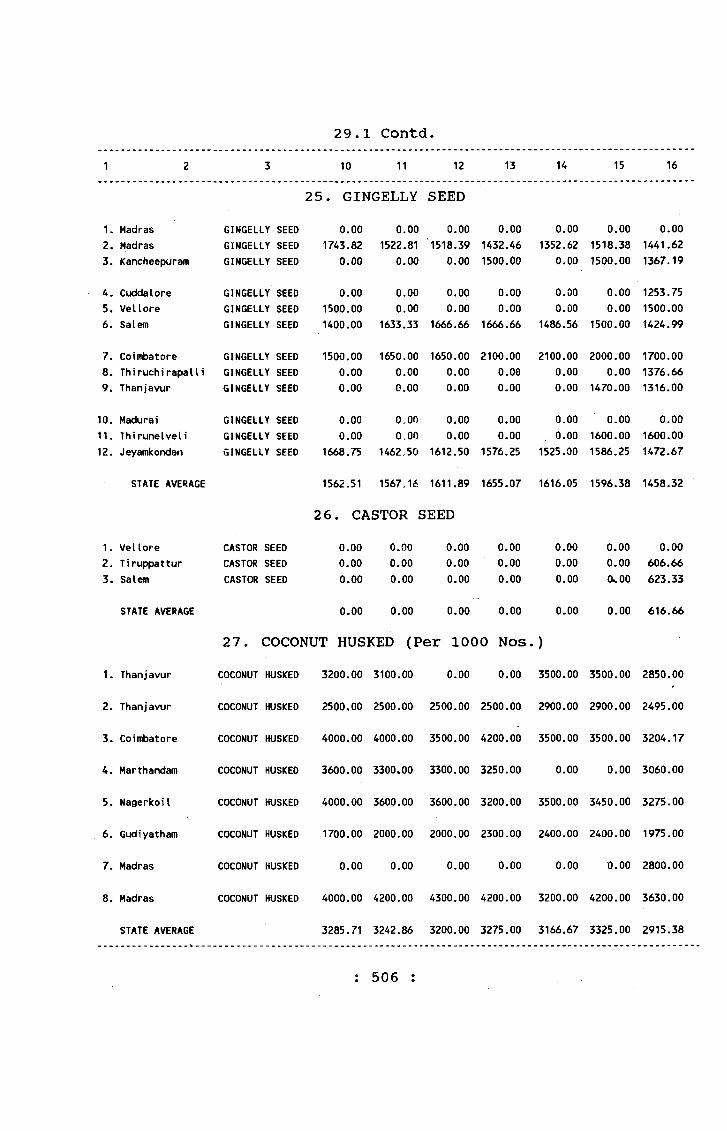
29.1 Contd.1 2 3 10 11 12 13 14 15 16
25. GINGELLY SEED1.2.3.
MadrasMadrasKancheepuram
GINGELLY SEED GINGELLY SEED GINGELLY SEED
0.001743.82
0.00
0.001522.81
0.00
0.00'1518.39
0.00
0.001432.461500.00
0.001352.62
0.00
0.001518.381500.00
0.001441.621367.19
4.5.6.
Cuddalore Vellore Salem
GINGELLY SEED GINGELLY SEED GINGELLY SEED
0.001500.001400.00
0.000.00
1633.33
0.000.00
1666.66
0.000.00
1666.66
0.000.00
1486.56
0.000.00
1500.00
1253,751500,001424,99
7.8. 9.
CoimbatoreThiruchirapalliThanjavur
GINGELLY SEED GINGELLY SEED GINGELLY SEED
1500.000.000.00
1650,000.000.00
1650.000.000.00
2100.000.000.00
2100.000.000.00
2000.000.00
1470.00
1700.00 1376.661316.00
10.11.12.
MaduraiThi runelveliJeyamkondan
GINGELLY SEED GINGELLY SEED GINGELLY SEED
0.000.00
1668.75
0,000,00
1462.50
0.000.00
1612.50
0.000.00
1576.25
0.000.00
1525.00
0.001600.001586.25
0.001600.001472.67
STATE AVERAGE 1562.51 1567.16 1611.89 1655.07 1616.05 1596,38 1458.32
26. CASTOR SEED1.2.3.
VelloreTiruf^atturSalem
CASTOR SEED CASTOR SEED CASTOR SEED
0.000.000.00
0.000.000.00
0.000.000.00
0.000.000.00
0.000.000.00
0.00 0.00 Oh 00
0,00606.66623.33
STATE AVERAGE 0.00 0.00 0.00 0.00 0.00 0.00 616.66
27. COCONUT HUSKED (Per 1000 Nos. )
1. Thanj avur COCONUT HUSKED 3200.00 3100.00 0.00 0.00 3500.00 3500.00 2850.00
2. Thanjavur COCONUT HUSKED 2500.00 2500.00 2500.00 2500.00 2900.00 2900.00 2495.00
3. Coimbatore COCONUT HUSKED 4000.00 4000.00 3500.00 4200.00 3500.00 3500,00 3204.17
4. Marthandam COCONUT HUSKED 3600.00 3300.00 3300.00 3250.00 0.00 0.00 3060.00
5. NagerkoiI COCONUT HUSKED 4000.00 3600.00 3600.00 3200.00 3500.00 3450.00 3275.00
6. Gudiyatham COCONUT HUSKED 1700.00 2000.00 2000.00 2300.00 2400.00 2400.00 1975.00
7. Madras COCONUT HUSKED 0.00 0.00 0.00 0.00 0.00 0.00 2800.00
8. Madras COCONUT HUSKED 4000.00 4200.00 4300.00 4200.00 3200.00 4200.00 3630.00
STATE AVERAGE 3285.71 3242.86 3200.00 3275.00 3166.67 3325.00 2915.38
506
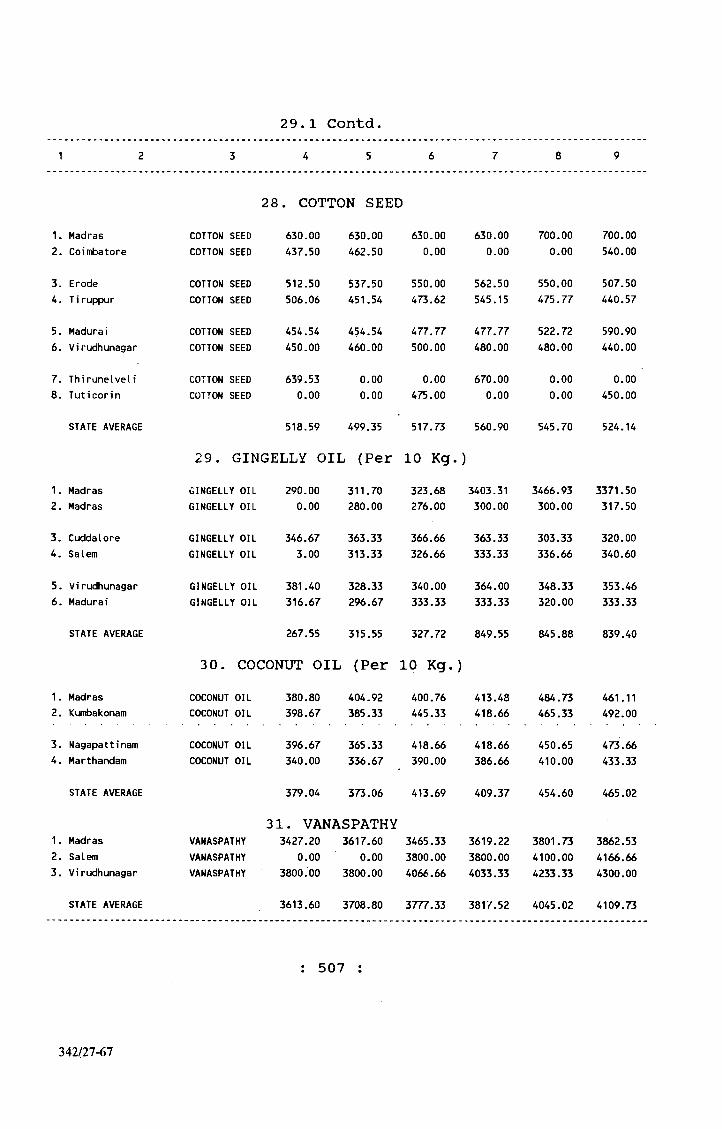
29.1 Contd.1 2 3 4 5 6 7 8 9
28. COTTON SEED1.2.
MadrasCoimbatore
COTTON SEED COTTON SEED
630.00437.50
630.00462.50
630.000.00
630.000.00
700.000.00
700.00540.00
3.4.
Erode T i ruppur
COTTON SEED COTTON SEED
512.50506.06
537.50451.54
550.00473.62
562.50545.15
550.00475.77
507.50440.57
5.6.
Madurai Vi rudhunagar
COTTON SEED COTTON SEED
454.54450.00
454.54460.00
477.77500.00
477.77480.00
522.72480.00
590.90440.00
7.8.
Thi runelveli Tuticor in
COTTON SEED COTTON SEED
639.530.00
0.000.00
0.00475.00
670.000.00
0.000.00
0.00450.00
STATE AVERAGE 518.59 499.35 517.73 560.90 545.70 524.14
29. GINGELLY OIL (Per 10 Kg. )
1.2.
MadrasMadras
GINGELLY OIL GINGELLY OIL
290.000.00
311.70280.00
323.68276.00
3403.31300.00
3466.93300.00
3371.50317.50
3.4.
CuddaloreSalem
GINGELLY OIL GINGELLY OIL
346.673.00
363.33313.33
366.66326.66
363.33333.33
303.33336.66
320.00340.60
5.6.
Vi rudhunagar Madurai
GINGELLY OIL GINGELLY OIL
381.40316.67
328.33296.67
340.00333.33
364.00333.33
348.33320.00
353.46333.33
STATE AVERAGE 267.55 315.55 327.72 849.55 845.88 839.40
30. COCONUT OIL (Per 10 Kg.)1.2.
MadrasKumbakonam
COCONUT OIL COCONUT OIL
380.80398.67
404.92385.33
400.76445.33
413.48418.66
484.73465.33
461.11492.00
3.4.
NagapattinamMarthandam
COCONUT OIL COCONUT OIL
396.67340.00
365.33336.67
418.66390.00
418.66386.66
450.65410.00
473.66433.33
STATE AVERAGE 379.04 373.06 413.69 409.37 454.60 465.02
1.2.3.
MadrasSalemVi rudhunagar
VANASPATHYVANASPATHYVANASPATHY
31. VANASPATHY 3427.20 3617.60
0.00 0.00 3800.00 3800.00
3465.333800.004066.66
3619.223800.004033.33
3801.734100.004233.33
3862.534166.664300.00
STATE AVERAGE 3613.60 3708.80 3777.33 3817.52 4045.02 4109.73
: 507 :
342/27-67

29.1 Contd.1 2 3 10 11 12 13 14 15 16
28. COTTON SEED1.2.
MadrasCoinrfDatore
COTTON SEED COTTON SEED
0.00540.00
0.00300.00
0.000.00
0.00300.00
0.000.00
0.000.00
653.33430.00
3.4.
Erode T i ruppur
COTTON SEED COTTON SEED
517.50352.42
500.00396.47
512.50506.60
587.50418.50
525.00374.54
525.00352.52
532.29441.15
5.6.
Madurai Vi rudhunagar
COTTON SEED COTTON SEED
738.64450.00
795.45440.00
795.45440.00
0.000.00
0.00400.00
0.00420.00
589.75450.91
7.8.
Thi runelveli Tuticor in
COTTON SEED COTTON SEED
0.00430.00
0.00460.00
0.00460.00
0.00460.00
0.00450.00
0.00440.00
654.76453.13
STATE AVERAGE 504.76 481.99 542.91 441.50 437.38 434.38 505.81
29. GINGELLY OIL (Per 10 Kg.)1.2.
MadrasMadras
GINGELLY OIL GINGELLY OIL
3757.70360.00
3689.60340.00
3048.60344.00
372.14-310.00
359.41290.00
362.59305.00
1963.10311.14
3.4.
CuddaloreSalem
GINGELLY OIL GINGELLY OIL
306.67376.60
353.33396.67
350.00396.66
386.66400.00
370.00373.33
320.00370.00
345.83330.57
5.6.
Virudhunagar Madura i
GINGELLY OIL GINGELLY OIL
400.33373.33
394.67366.67
398.66373.33
3 % . 00 376.66
377.00343.33
364.00326.66
370.52341.11
STATE AVERAGE 929.11 923.49 951.88 373.58 352.18 341.38 614.59
3 0. COCONUT OIL (Per 10 Kg.)1.2.
MadrasKurabakonam
COCONUT OIL COCONUT OIL
505.73545.33
543.89592.00
543.89578.67
512.09578.60
508.91565.33
454.83498.66
467.93496.99
3.4.
NagapattinamMarthandam
COCONUT OIL COCONUT OIL
545.33501.33
578.67536.67
553.33530.00
546.66456.66
543.33475.33
480.00406.66
481.50433.61
STATE AVERAGE 524.43 562.81 551.47 523.50 523.23 460.04 470.03
31. VANASPATHY1.2.3.
MadrasSalemVirudhunagar
VANASPATHYVANASPATHYVANASPATHY
3862.534300.004300.00
3923.264400.004433.33
3862.534333.334500.00
3315.074066.664500.00
3254.273933.333966.66
3436.733666.663733.33
3620.674056.664138.89
STATE AVERAGE 4154.18 4252.20 4231.95 3960.58 3718.09 3612.24 3931.80
: 508 :
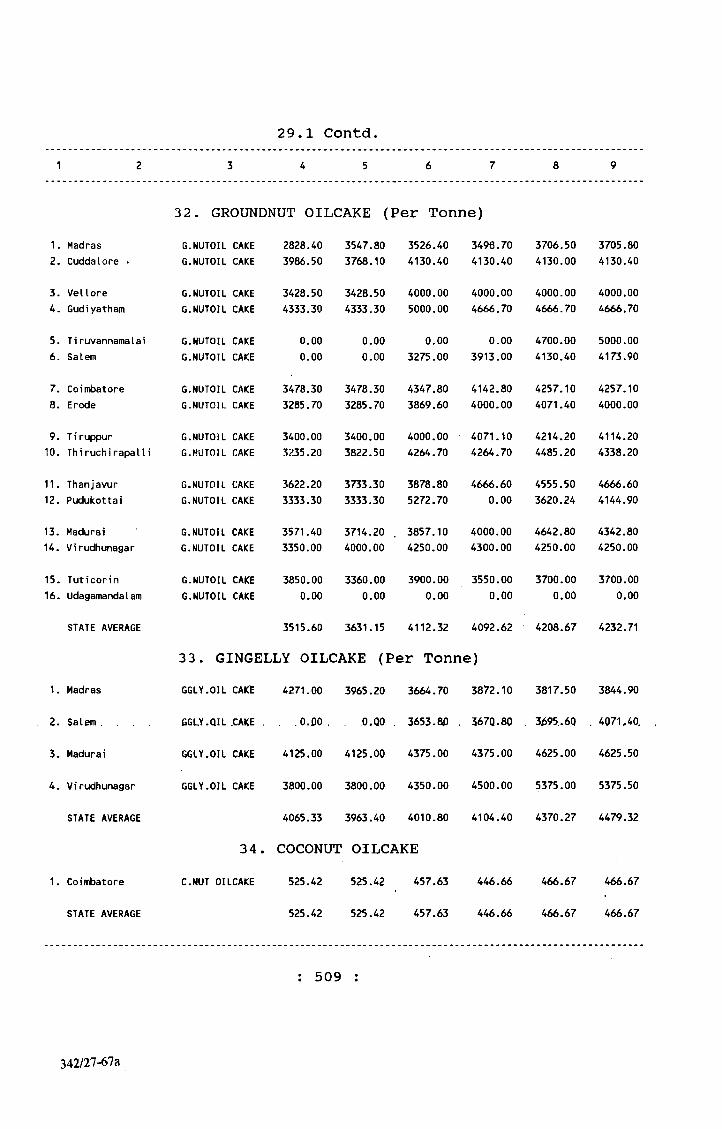
29.1 Contd.1 2 3 4 5 6 7 8 9
32. GROUNDNUT OILCAKE (Per Tonne)1.2.
Madras Cuddalore •
G.NUTOIL CAKE G.NUTOIL CAKE
2828.403986.50
3547.803768.10
3526.404130.40
3498.704130.40
3706.504130.00
3705.804130.40
3.4.
Vellore Gudiyatham
G.NUTOIL CAKE G.NUTOIL CAKE
3428.504333.30
3428.504333.30
4000.005000.00
4000.004666.70
4000.004666.70
4000.004666.70
5.6.
T i ruvannamalai Salem
G.NUTOIL CAKE G.NUTOIL CAKE
0.000.00
0.000.00
0.003275.00
0.003913.00
4700.004130.40
5000.004173.90
7.8.
Coinft)atoreErode
G.NUTOIL CAKE G.NUTOIL CAKE
3478.303285.70
3478.303285.70
4347.803869.60
4142.804000.00
4257.104071.40
4257.104000.00
9.10.
T i ruppurThi ruchi rapalIi
G.NUTOIL CAKE G.NUTOIL CAKE
3400.003235.20
3400.003822.50
4000.004264.70
4071.104264.70
4214.204485.20
4114.204338.20
11.12.
ThanjavurPudukottai
G.NUTOIL CAKE G.NUTOIL CAKE
3622.203333.30
3733.303333.30
3878.805272.70
4666.600.00
4555.503620.24
4666.604144.90
13.14.
Madurai Vi rudhunagar
G.NUTOIL CAKE G.NUTOIL CAKE
3571.403350.00
3714.204000.00
3857.104250.00
4000.004300.00
4642.804250.00
4342.804250.00
15.16.
Tuticorin UdagamandaI am
G.NUTOIL CAKE G.NUTOIL CAKE
3850.000.00
3360.000.00
3900.000.00
3550.000.00
3700.000.00
3700.000.00
STATE AVERAGE 3515.60 3631.15 4112.32 4092.62 4208.67 4232.71
33. GINGELLY OILCAKE (Per Tonne)1. Madras GGLY.OIL CAKt 4271.00 3965.20 3664.70 3872.10 3817.50 38A4.90
2. Salem . . . . GGLY.QIL .CAKE . .0.00. . O.QO 3653-80 367Q.80 , 3^95.60 . 4Q71,40.
3. Madurai GGLY.OIL CAKE 4125.00 4125.00 4375.00 4375.00 4625.00 4625.50
4. Vi rudhunagar GGLY.OIL CAKE 3800.00 3800.00 4350.00 4500.00 5375.00 5375.50
STATE AVERAGE 4065.33 3963.40 4010.80 4104.40 4370.27 4479.32
34. COCONUT OILCAKE1. Coimbatore C.NUT OILCAKE 525.42 525.42 457.63 446.66 466.67 466.67
STATE AVERAGE 525.42 525.42 457.63 446.66 466.67 466.67
: 509 :
342/27-67a

29.1 Contd.1 2 3 10 11 12 13 14 15 16
32. GROUNDNUT OILCAKE (Per Tonne)1.2.
MadrasCuddalore
G.NUTOILG.NUTOIL
CAKECAKE
3484.904201.80
3692.904202.80
3595.504202.18
3803.004202.18
4356.104202.18
1341.304202.18
3423.944124.09
3.4.
VelloreGudiyatham
G.NUTOILG.NUTOIL
CAKECAKE
3858.103333.30
3428.503500.00
3857.103750.00
4142.904583.30
4357.105083.30
4357.104500.00
3904.824368.05
5.6.
T i ruvannamalai Salem
G.NUTOILG.NUTOIL
CAKECAKE
3285.704202.80
3285.703623.10
3357.104130.40
3785.704347.80
0.004347.80
0.004130.40
3902.374027.46
7.8.
CoimbatoreErode
G.NUTOILG.NUTOIL
CAKECAKE
4257.103785.70
4000.003885.70
4142.804071.40
4457.104285.70
4714.204571.40
4857.104214.30
4199.143943.88
9.10.
T i ruppur Thiruchirapalli
G.NUTOILG.NUTOIL
CAKECAKE
4142.804411.70
3857.403970.50
4142.804191.10
4425.504705.80
4642.804705.80
4428.505147.00
4069.944295.20
11.12.
ThanjavurPudukottai
G.NUTOILG.NUTOIL
CAKECAKE
4444.404217.30
4222.204000.00
0.003710.00
4444.404144.90
4777.70,4200.00
4888.805000.00
4354.594088.79
13.14.
Madurai Vi rudhunagar
G.NUTOILG.NUTOIL
CAKECAKE
4285.704200.00
3785.903850.00
0.004150.00
4591.400.00
4714.204600.00
5000.000.00
4227.774120.00
15.16.
Tuticorin UdagamandaI am
G.NUTOILG.NUTOIL
CAKECAKE
3700.000.00
3450.000.00
3720.000.00
3480.00o.oO
3787.8u 0.00
4280.000.00
3706.480.00
STATE AVERAGE 3987.42 3783.65 3924.64 4242.83 4504.31 4334.36 4052.00
33. (SINGELLY OILCAKE (Per Tonne)1. Madras GGLY.OIL CAKE 4660.40 4738.10 4947.00 4909.30 5462.40 5669.90 4485.21
2. Salem GGLY.OIL CAKE 4275.30 5072.40 4347.80 4347.80 4347.80 4058.00 4154.07
3. Madurai GGLY.OIL CAKE 4750.00 4812.50 4750.00 5000.00 5000.00 5625.00 4682.33
4. Virudhunagar GGLY.OIL CAKE 5825.00 5687.50 5937.50 5687.50 5687.50 6785.70 5234.27
STATE AVERAGE 4877.68 5077.63 4995.57 4986.15 5124.43 5534.65 4660.05
34. COCONUT OILCAKE1. Coimbatore C.NUT OILCAKE 466.67 500.00 500.00 500.00 5666.60 5500.00 1335.14
STATE AVERAGE 466.67 500.00 500.00 500.00 5666.60 5500.00 1335.14
; 510 ;

29.1 Contd.1 2 3 4 5 6 7 8 9
1. Madras SORT 1
35. CANE GUR 555.10 627.55 627.55 600.00 650.00 600.00
2. Panrutti SORT 1 587.50 587.50 650.00 600,00 650.00 600.00
3. Kallakurichi SORT 1 373.35 426.65 426.65 453.35 426.00 420.004. Vellore SORT 1 420.00 460.00 540.00 500.00 550.00 480.00
5. Salem SORT 1 530.00 550.00 500.00 500.00 550.00 500.006. Coimbatore SORT 1 563.33 603.00 613.33 530.00 633.33 480.00
7. Erode SORT 1 493.00 575.86 551.72 517.24 517.24 472.418. ThiruchirapalIi SORT 1 527.41 575.80 559.67 511.29 479.03 446.77
9. Karur SORT 1 460.02 452.67 474.72 437.97 485.18 379.1810. Thanjavur SORT 1 540.32 556.45 669.35 637.09 637.09 540.32
11. Madurai SORT 1 580.00 610.00 620.00 550.00 620.00 500.0012. Thirunelveli SORT 1 600.00 580.00 680.00 600.00 740.00 590.00
13. Tuticorin SORT 1 640.00 600.00 670.00 600.00 650.00 550.0014. UdagamandaI am SORT 1 715.00 640.00 740.00 715.00 665.00 600.00
STATE AVERAGE 541.79 560.53 594.50 553.71 589.49 511.33
1. Madras SORT 2
36. CANE GUR 478.57 596.54 570.53 550.00 550.00 500.00
2. Panrutti SORT 2 0.00 0.00 0.00 0.00 0.00 0.003. Kallakurichi SORT 2 333.35 333.35 373.35 373.35 306.65 293.35
4. Vellore SORT 2 380.00 400.00 480.00 480.00 480.00 420.005. Salem SORT 2 400.00 420.00. . 400.00 . .400.00 >50.0.0 .375.006. Coimbatore SORT 2 516.67 496.97 530.00 496.67 516.16 446.67
7. Erode SORT 2 0.00 493.10 0.00 475.85 465.25 448.288. Thiruchirapal Ii SORT 2 350.00 366.12 350.00 479.03 0.00 0.009. K:;rur SORT 2 393.88 393.88 401.23 401.23 415.93 342.44
; 511 :

29.1 Contd.1 2 3 10 11 12 13 14 15 16
35. CANE GUR1. Madras SORT 1 550.00 700.00 475.00 525.00 450.00 425.00 565.432. Panrutti SORT 1 600.00 700.00 600.00 650.00 562.50 562.50 612.50
3. Kallakurichi SORT 1 400.00 400.00 0.00 0.00 0.00 353.33 408.814. Vellore SORT 1 500.00 550.00 400.00 400.00 350.00 400.00 462.50
5. Salem SORT 1 540.00 670.00 550.00 550.00 460.00 470.00 530.836. Coimbatore SORT 1 480.00 555.00 463.33 463.33 413.33 461.53 521.79
7. Erode SORT 1 517.24 586.20 517.24 493.10 406.89 489.66 511.488. Thiruchirapalli SORT 1 511.29 495.16 446.77 430.64 398.98 382.95 480.40
9. Karur SORT 1 393.88 467.37 500.00 505.21 458.86 458.86 456.1610, Thanjavur SORT 1 661.29 701.69 556.65 524.19 500.00 483.87 504.03
11. Madurai SORT 1 550.00 620.00 520.00 500.00 450.00 510.00 552.5012. Thirunelveli SORT 1 560.00 650.00 700.00 480.00 500.00 500.00 598.33
13. Tuticorin SORT 1 620.00 700.00 600.00 550.00 500.00 590.00 605.8314. Udagamandalam SORT 1 640.00 740.00 565.00 590.00 480.00 565.00 637.92
STME AVERAGE 557.41 609.67 530.31 512.42 456.20 475.19 540.10
36. CANE GUR1. Madras SORT 2 500.00 625.00 400.00 475.00 400.00 0.00 513.242. Panrutti SORT 2 0.00 600.00 550.00 600.00 512.50 525.00 557.503. Kallakurichi SORT 2 286.65 293.33 0.00 0.00 320.00 306.67 3^.00
4. Vellore SORT 2 320.00 400.00 360.00 350.00 300.00 320.00 390.835. Salem SORT 2 430.00 560.00 460.00 450.00 320.00 325.00 415.836. Coimbatore SORT 2 446.66 496.67 396.66 396.66 396.66 422.48 463.24
7. Erode SORT 2 482.76 568.96 482.76 465.52 389.66 448.28 472.048. ThiruchirapalIi SORT 2 300.38 0.00 350.00 333.87 0.00 0.00 373.919. Karur SORT 2 364.49 401.23 466.66 489.76 443.41 443.41 413.13
: 512 :

29.1 Contd.4 53
36 SORT 2
SORT 2
SORT 2
SORT 2
SORT 2
10. Thanjavur
11. Madurai
12. Thirunelveli
13. Tut iconin
14. Udagamandalam
STATE AVERAGE
1. Madras2. Madras
3. Cuddalore4. Vellore
5. Salem6. Coimbatore
7. Coimbatore8. ThiruchirapalIi
9. ThiruchirapalIi10. Thanjavur
11. Madurai12. Thirunelveli
13. Thirunelveli14. Tuticorin
15. Tuticorin16. Nagerkoil
17. Nagerkoil
STATE AVERAGE
PALMGURPALMGUR
PALMGURPALMGUR
PALMGURPALMGUR
PALMGURPALMGUR
PALMGURPALMGUR
PALMGURPALMGUR
PALMGUR
CANE GUR (Contd.) 475.80 508.06 556.45
540.00 570.00 580.00
560.00
600.00
665.00 590.00
560.00 660.00
580.00 640.00
474.44 485.23
37. PALM GUR
690.00
519.30
556.45
510.00
580.00
590.00
640.00
502.51
556.45
580.00
630.00
600.00
590.00
511.70
570.00 590.00 550.OO1250.00 1100.00 1100.00
0.00 0.00 0.001150.00 1150.00 800.00
720.00 700.00 700.00730.00 730.00 720.00
900.00 720.00 700.001150.00 660.00 680.00
0.00 600!00 600.001100.00 1160.00 1150.00
680.00 680.00 740.00720.00 800.00 750.00
0.00 0.00 0.00
937.69 861.43 832.14
550.00925.00
0.00850.00
700.00750.00
750.00 0.00
650.00780.00
740.00830.00
0.00
825.00
600.00900.00
0.008500.00
650.00750.00
720.00810.00
700.00780.00
700.00800.00
0.00
1372.14
459.60
450.00
570.00
530.00
540.00
447.95
PALMGUR 0.00 0.00 0.00 0.00 0.00 0.00PALMGUR 820.00 770.00 760.00 800.00 800.00 800.00
PALMGUR 900.00 900.00 900.00 900.00 900.00 900.00PALMGUR 1500.00 1500.00 1500,00 1500.00 1600.00 1600,00
540.00900.00
0.000.00
0.00750.00
720.00800.00
620.00770.00
670.00800.00
0.00
822.50
: 513 :
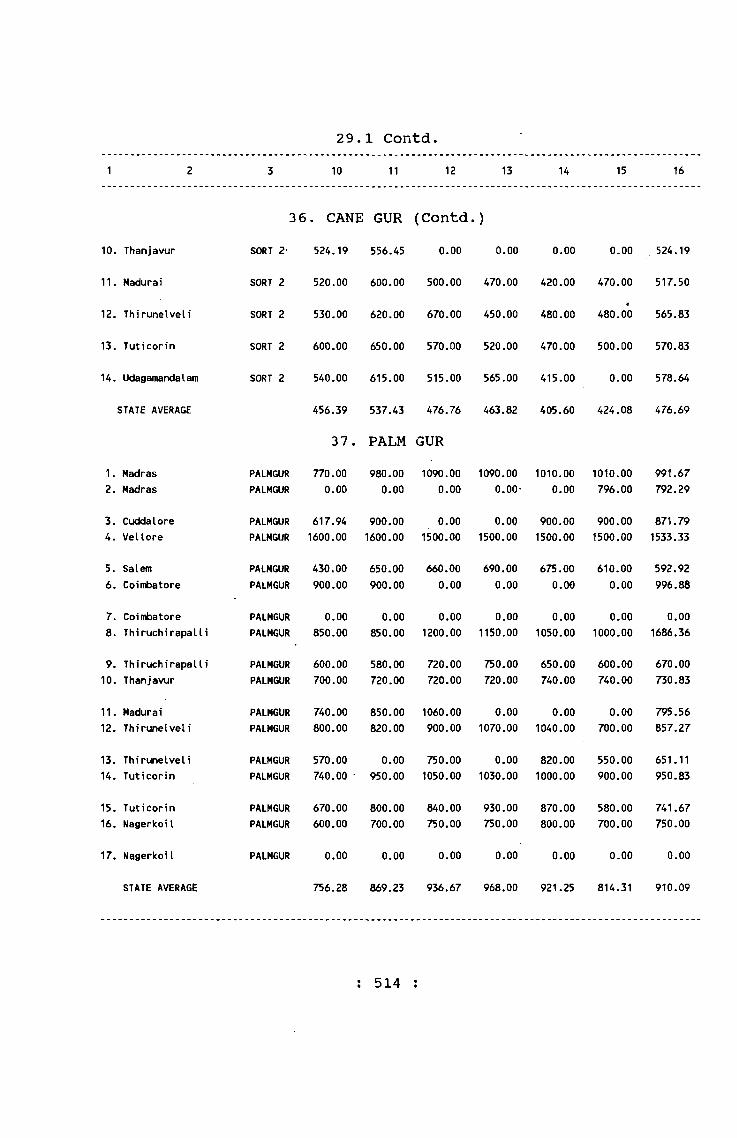
29.1 Contd.1 2 3 10 11 12 13 14 15 16
36 . CANE GUR (Contd. )
10. Thanjavur SORT 2- 524.19 556.45 0.00 0.00 0.00 0.00 524.19
11. Madurai SORT 2 520.00 600.00 500.00 470.00 420.00 470.00 517.50
12. Thirunelveli SORT 2 530.00 620.00 670.00 450.00 480.00 480.00 565.83
13. Tuticorin SORT 2 600.00 650.00 570.00 520.00 470.00 500.00 570.83
14. UdagamandaI am SORT 2 540.00 615.00 515.00 565.00 415.00 0.00 578.64
STATE AVERAGE 456.39
37.537.43
PALM476.76
GUR463.82 405.60 424.08 476.69
1. Madras2. Madras
PALMGURPALMGUR
770.000.00
980.000.00
1090.000.00
1090.000.00-
1010.000.00
1010.00796.00
991.67792.29
3. Cuddalore4. Vellore
PALMGURPALMGUR
617.941600.00
900.001600.00
0.001500.00
0.001500.00
900.001500.00
900.001500.00
871.791533.33
5. Salem6. Coimbatore
PALMGURPALMGUR
430.00900.00
650.00900.00
660.000.00
690.000.00
675.000.00
610.000.00
592.92996.88
7. Coimbatore8. Thiruchirapalli
PALMGURPALMGUR
0.00850.00
0.00850.00
0.001200.00
0.001150.00
0.001050.00
0.001000.00
0.001686.36
9. Thiruchirapalli 10. Thanjavur
PALMGURPALMGUR
600.00700.00
580.00720.00
720.00720.00
750.00720.00
650.00740.00
600.00740.00
670.00730.83
11. Madurai12. Thirunelveli
PALMGURPALMGUR
740.00800.00
850.00820.00
1060.00900.00
0.001070.00
0.001040.00
0.00700.00
795.56857.27
13. Thirunelveli14. Tuticorin
PALMGURPALMGUR
570.00740.00 ■
0.00950.00
750.001050.00
0.001030.00
820.001000.00
550.00900.00
651.11950.83
15. Tuticorin16. Nagerkoil
PALMGURPALMGUR
670.00600.00
800.00700.00
840.00750.00
930.00750.00
870.00800.00
580.00700.00
741.67750.00
17. Nagerkoil PALMGUR 0.00 0.00 0.00 0.00 0.00 0.00 0.00
STATE AVERAGE 756.28 869.23 936.67 968.00 921.25 814.31 910.09
: 514 :

1. Madras
2. Cuddalore
3. Vellore
4. ThiruchirapalIi
5. Coimbatore
f t r Madurai
?. Tuticorifi
STATE AVERAGE
1. Madras2. Madras
3. Cuddalore4. Cuddaiore
5. Coimbatore6. Coimbatore
7 . PoUachi8. PoUachi
9. ThiruchirapalIi 1^. .ThiruchirapalIi
11. Madurai12. Madurai
13. Theni14. Theni
15. Dindigul16. Dindigul
17. Virudhunagar18. Virudhunagar
SUGAR
SUGAR
SUGAR
SUGAR
SUGAR
SUGAR
SUGAR
3 8 . S U G A R
837.00 848.00
29.1 Contd.4 5
800.00
815.00
820.00
550.00
s;55.00
840.00
820.14
850.00
845.00
845.00
875.00
855.00
358.00
853.71
843.00
840.00
835.00
845.00
878.00
850.00
848.00
848.43
858.00
850.00
850.00
860.00
865.00
840.00
360.00
854.71
838.00
570.00
340.00
830.00
848.00
836.00
355.00
845.29
793.00
815.00
800.00
795.00
818.00
803.00
820.00
806.29
3 9 . C H I L L I E S
CHILLIES 1900=00 2200.00 2500.00 2800.00 <,000,00 4200.00CHILLIES 2050.00 O.OO 2900.00 3000.00 4200.00 45uG.CG
CHILLIES 2478.94 2400.00 2426.31 2742.00 0.00 4452.63CHILLIES 0.00 0.00 0.00 2478.93 2873.60 0.00
CHILLIES 2600.00 2700.00 3400.00 3000.00 3995.00 5300.00CHILLIES 2000.00 2100.00 288.00 0.00 0.00 4900.00
CHILLIES 2300.00 2800.00 3000.00 3600.00 4000.00 5500.00CHILLIES 2200.00 2500.00 2800.00 0.00 3600.00 4500.00
CHILLIES 2400.00 2200.00 2800.00 3300.00 4000.00 4600.00CHJLLIES . .1500.00. .13Q0.Q0 . J700.0D . 31OQ.O0 , 380Q.0Q . 4300..0Q
CHILLIES 2350.00 2500.00 2700.00 3100.00 4200.00 4700.00CHILLIES 1900.00 2000.00 2200.00 2600.00 3800.00 4000.00
CHILLIES 2300.00 2300.00 2900.00 0.00 4200.00 4750.00CHILLIES 2200.00 2000.00 2700.00 0.00 3800.00 4450.00
CHILLIES 2600.00 2600.00 2800.00 3200.00 3750.00 4800.00CHILLIES 2300.00 2500.00 0.00 3000.00 0.00 4500.00
CHILLIES 2300.00 2600.00 . 3100,00 3300.00 4000.00 4500.00CHILLIES 1600.00 2200.00 2800.00 3000.03 3800.00 4000.00
: 515 :
342/27-68

10 11 12
38. SUGAR763.00 768.00 783.00
790.00 830.00 775.00
747.00 765.00 785.00
760.00 760.00 790.00
783.00 795.00 875.00
775.00 780.00 805.00
775.00 785.00 790.00
770.43 783.29 800.43
39. CHILLIES
29.1 Contd.13 14 15 16
1. Madras SUGAR
2. Cuddalore SUGAR
3. Vellore SUGAR
4. Thiruchirapalli SUGAR
5. Coimbatore SUGAR
6. Madurai SUGAR
7. Tuticor in SUGAR
STATE AVERAGE
853.00 843.00 796.00 818.58
845.00' 875.00 845.00 832.00
840.00 840.00 795.00 813.08
860.00 835.00 800.00 816.67
870.00 835.00 820.00 842.67
875.00 843.00 810.00 826.25
870.00 848.48 808.00 829.79
859.00 845.64 811.71 825.59
1. Madras2. Madras
CMHLIES 3800.00 4200.00 3400.00CHILLIES 4000.00 5000.00 0.00
3200.00 3200.00 2900.00 3191.670.00 3800.00 3200.00 3627.78
3. Cvxkla\.ot)e4. Cuddalore
CHILLIESCHILLIES
4452.63 5Z4Z.000.00
Q,OQ 50QQ.Q0 4400,00 3900.00 3749.450.00 5242.00 0.00 0.00 0.00 3531.51
5. Coimbatore6. Coimbatore
CHILLIES 5300.00 5500.00 4900.00CHILLIES 4900.00 4900.00 0.00
5200.00- 4100.00 3400.00 4182.920.00 0.00 3200.00 3184.00
7. Pollachi8. Pollachi
CHILLIES 4600.00 5000.00 4600.00CHILLIES 4000.00 4700.00 . 0.00
3500.00 4100.00 3800.00 3966.670.00 3200.00 3100.00 3400.00
9. Thiruchirapalli CHILLIES10. Thiruchirapalli CHILLIES
4500.00 5000.00 0.003900.00 4900.00 0.00
0.00 3200.00 2700.00 3470.000.00 2700.00 2400.00 2960.00
11. Madurai12. Madurai
CHILLIES 4600.00 5100.00 4500.00CHILLIES 4000.00 4250.00 0.00
4000.00 3500.00 3100.00 5695.830.00 3200.00 3000.00 3095.00
13. Theni14. Theni
CHILLIES 4800.00 5000.00 0.00 4200.00 0.00 0.00 3806.25CHILLIES 4500.00 4700.00 0.00 4000.00 0.00 0.00 3543.75
15. Dindigul16. Dindigul
CHILLIES 4500.00 5250.00 0.00CHILLIES 4250.00 5000.00 0.00
4750.00 3250.00 3200.00 3700.004000.00 3000.00 3000.00 3505.56
17. Virudhunagar18. Virudhunagar
CHILLIES 4900.00 5600.00 4800.00CHILLIES 4500.00 4800.00 3800.00
4400.00 3600.00 3400.00 3875.003800.00 3000.00 3200.00 3375.00
: 516 :

29.1 Contd.1 2 3 4 5 6 7 8 9
19. Thirunelveli20. Thirunelveli
3 9CHILLIESCHILLIES
. CHILLIES Contd.2400.00 2200.00 0.002100.00 1900.00 3300.00
3400.003100.00
4000.003000.00
4400.003200.00
21. Kovilpatti22. Kovilpatti
CHILLIESCHILLIES
2300.001650.00
2700.001800.00
3000.002200.00
3300.003000.00
4000.003200.00
4600.004400.00
23. Tuticor in24. Tuticor in
CHILLIESCHILLIES
2300.001600.00
2600.00 1900.00 •
3000.000.00
3200.002600.00
4500.004000.00
5000.004500.00
25. Sankarankoil26. Sankarankoil
CHILLIESCHILLIES
2200.001900.00
0.000.00
3052.000.00
3000.000.00
0.000.00
4600.000.00
27. UdagamandaIam28, UdagamandaI am
CHILLIESCHILLIES
0.00G.OO
0.000.00
0.000.00
0.000.00
0.000.00
0.000.00
STATE AVERAGE 2137.16 2272.73 2646.01 3077.19 3843.74 4527.19
1. Madras CORIANDER40. CORIANDER 1300.00 1300.00 1300.00 1300.00 1700.00 1600.00
2. Kancheepuram CORIANDER 1217.94 1166.67 1166.67 1166.67 1397.43 1576,92
3. Vellore CORIANDER 1146.15 1120.51 1223.07 1371.79 1397.44 1576.92
4. Salem CORIANDER 940.00 0,00 890.00 1065.00 1100.00 1180.00
5. Coimbatore CORIANDER 1282.05 1282.05 1294.87 1269.23 1300.00 1487.00
6. Erode CORIANDER 1320.51 1397.44 1371.79 1320.51 1474.36 1576.92
7. Thiruchirapalli CORIANDER 1153.84 1025.64 1025.64 1025.64 1102.50 1269.23
8. Thanjavur CORIANDER 1294.87 1294.87 1217.94 1217.94 1346.15 1366.66
9. Madurai CORIANDER 1125.00 1125.00 1125.00 1125.00 1150.00 1275.00
10. Dindigal CORIANDER 1262.50 1150.00 975.00 1162.50 1375.00 1550.00
11. Thirunelveli CORIANDER 0.00 0.00 0.00 0.00 0.00 0.00
12. Tuticorin CORIANDER 998.98 1153.53 1042.42 1100.00 1300,00 1400.00
13. Kovilpatti CORIANDER 928.20 928.20 915.38 941.02 1171.79 1338.46
STATE AVERAGE 1164.17 1176.72 1128.98 1172.11 1317,89 1433.09
: 517 :
342/27-68a
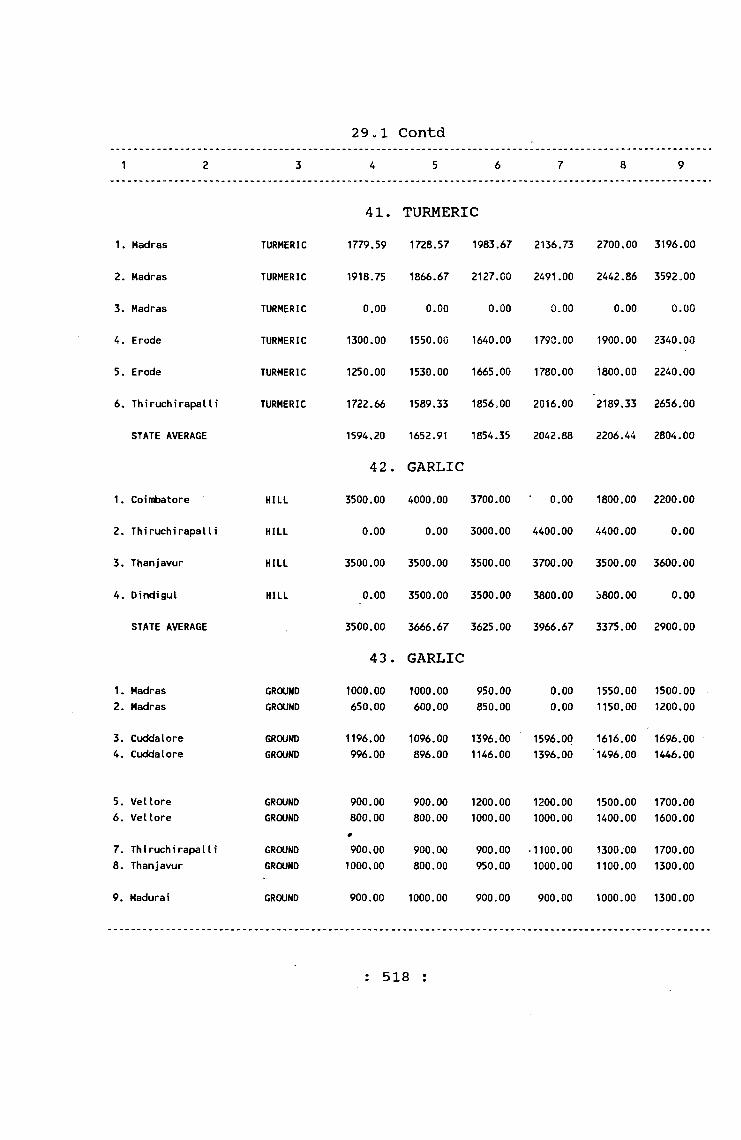
29.1 Contd4 5
1. Madras
2. Madras
3. Madras
4. Erode
5. Erode
6. Thiruchirapalli
STATE AVERAGE
1. Coimbatore
2. Thiruchirapalli
3. Thanjavur
4. Dindigul
STATE AVERAGE
1. Madras2. Madras
3. Cuddalore4. Cuddalore
TURMERIC
TURMERIC
TURMERIC
TURMERIC
TURMERIC
TURMERIC
HILL
HILL
HILL
HILL
GROUNDGROUND
GROUNDGROUND
41. TURMERIC1779.59 1728.57 1983.67 2136.73
1918.75 1866.67 2127.CO 2491.00
0.00 0.00 0.00 0.00
1300.00 1550.00 1640.00 1790.00
1250.00 1530.00 1665.00 1780.00
1722.66 1589.33 1856.00 2016.00
1594.20 1652.91 1854.35 2042.88
42. GARLIC3500.00 4000.00 3700.00 0.00
0.00 0.00 3000.00 4400.00
3500.00 3500.00 3500.00 3700.00
0.00 3500.00 3500.00 3800.00
3500.00 3666.67 3625.00 3966.67
43. GARLIC1000.00 1000.00 950.00 0.00650.00 600.00 850.00 0.00
1196.00 1096.00 1396.00 1596.00996.00 896.00 1146.00 1396.00
2700.00 3196.00
2442.86 3592.00
0.00 0.00
1900.00 2340.00
1800.00 2240.00
2189.33 2656.00
2206.44 2804.00
1800.00 2200.00
4400.00 0.00
3500.00 3600.00
3800.00 0.00
3375.00 2900.00
1550.00 1500.001150.00 1200,00
1616.00 1696.001496.00 1446.00
5. Vellore GROUND6. Vellore GROUND
7. Thiruchirapalli GROUND8. Thanjavur GROUND
9. Madurai GROUND
900.00800.00
m
900.001000.00
900.00 1200.00 1200.00 1500.00 1700.00800.00 1000.00 1000.00 1400.00 1600.00
900.00800.00
900.00 .1100.00950.00 1000.00
1300.00 1700.001100.00 1300.00
900.00 1000.00 900.00 900.00 1000.00 1300.00
: 518 :
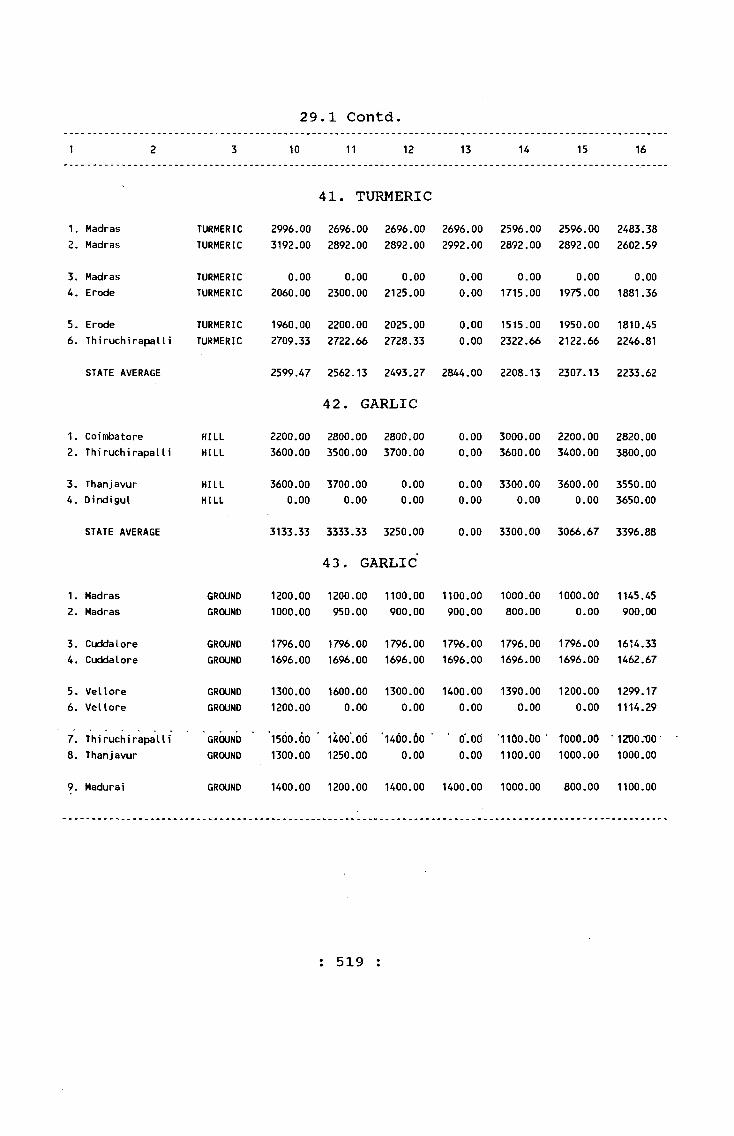
29.1 Contd.1 2 3 1 0 11 1 2 13 14 15 16
1 . Madras TURMERIC 2996.00
41. TURMERIC 2696.00 2696.00 2696.00 2596.00 2596.00 2483.38
2. Madras TURMERIC 3192.00 2892.00 2892.00 2992.00 2892.00 2892.00 2602.59
3. Madras TURMERIC 0 . 0 0 0 . 0 0 0 . 0 0 0 . 0 0 0 . 0 0 0 . 0 0 0 . 0 0
4. Erode TURMERIC 2060.00 2300.00 2125.00 0 . 0 0 1715.00 1975.00 1881.36
5. Erode TURMERIC 1960.00 2 2 0 0 . 0 0 2025.00 0 . 0 0 1515.00 1950.00 1810.456 . ThiruchirapalIi TURMERIC 2709.33 2722.66 2728.33 0 . 0 0 2322.66 2 1 2 2 . 6 6 2246.81
STATE AVERAGE 2599.47 2562.13 2493.27 2844.00 2208.13 2307.13 2233.62
1. Coimbatore HILL 2 2 0 0 . 0 0
42. GARLIC 2800.00 2800.00 0 . 0 0 3000.00 2 2 0 0 . 0 0 2820.00
2. ThiruchirapalIi HILL 3600.00 3500.00 3700.00 0 . 0 0 3600.00 3400.00 3800.00
3. Thanjavur HILL 3600.00 3700.00 0 . 0 0 0 . 0 0 3300.00 3600.00 3550.004. Dindigul HILL 0 . 0 0 0 . 0 0 0 . 0 0 0 . 0 0 0 . 0 0 0 . 0 0 3650.00
STATE AVERAGE 3133.33 3333.33 3250.00 0 . 0 0 3300.00 3066.67 3396.88
1. Madras GROUND 1 2 0 0 . 0 0
43. GARLIC 1 2 0 0 . 0 0 1 1 0 0 . 0 0 1 1 0 0 . 0 0 1 0 0 0 . 0 0 1 0 0 0 . 0 0 1145.45
2. Madras GROUND 1 0 0 0 . 0 0 950.00 900.00 900.00 800.00 0 . 0 0 900.00
3. Cuddalore GROUND 1796.00 1796.00 1796.00 1796.00 1796.00 1796.00 1614.334. Cuddalore GROUND 1696.00 1696.00 1696.00 1696.00 1696.00 1696.00 1462.67
5. Vellore GROUND 1300.00 1600.00 1300.00 1400.00 1390.00 1 2 0 0 . 0 0 1299.176 . Vellore GROUND 1 2 0 0 . 0 0 0 . 0 0 0 . 0 0 0 . 0 0 0 . 0 0 0 . 0 0 1114.29
7. ThiruchirapalIi GROUND ‘1 5 6 0 . 6 0 * 1400.00 ‘1 4 6 0 . 6 0 ■ o.otf '1100.00 • TOOO.OO ' 1200.t)0-8. Thanjavur GROUND 1300.00 1250.00 0.00 0.00 1100.00 1000.00 1000.00
9. Madurai GROUND 1400.00 1200.00 1400.00 1400.00 1000.00 800.00 1100.00
: 519 :

29.1 Contd.
1 2 3 4 5 6 7 8 9
43. GARLIC Contd.10. Them’ GROUND 594.00 594.00 696.00 794.00 994.00 894.0011. Dindigul GROUND 0.00 0.00 900.00 • 0.00 0.00 0.00
12. Thirunelveli GROUND 0.00 0.00 0.00 0.00 0.00 0.0013. Thi runeIveil GROUND 0.00 0.00 0.00 0.00 0.00 0.00
STATE AVERAGE 893.60 858.60 989.82 1123.25 1310.60 1433.60
44. TAMARIND1. Madras TAMARIND 1200.00 1200,00 1200.00 1200.00 1200.00 1200.002. Madras TAMARIND 1000.00 1000.00 1000.00 1000.00 1000.00 1000.00
3. Cuddalore TAMARIND 1096.00 1196.00 1096.00 1096.00 1096.00 1146.004. Cuddalore TAMARIND 896.00 890.00 896.00 896.00 896.00 946.00
5. Vellore TAMARIND 1300.00 1500.00 1800.00 1500.00 1600.00 1600.006. Vellore TAMARIND 1200.00 1400.00 1700.00 1400.00 1400.00 1400.00
7. Thiruchirapalli TAMARIND 1200.00 1200.00 1300.00 1400.00 1300.00 1400.008. Thiruchirapalli TAMARIND 800.00 700.00 700.00 1100.00 800.00 900.00
9. Thanjavur TAMARIND 1300.00 1300.00 1300.00 •1300.00 1300.00 1333.0010. Thanjavur TAMARIND 1000.00 1033.33 1000.00 1000.00 1000.00 1000.00
11. Madura i TAMARIND 900.00 700.00 800.00 750.00 800.00 850.0012. Madurai TAMARIND 600.00 450.00 500.00 500.00 550.00 650.00
13. Tuticorin TAMARIND 850.00 850.00 800.00 900.00 900.00 900.0014. Tuticorin TAMARIND 0.00 0.00 0.00 0.00 0.00 0.00
STATE AVERAGE 1026.31 1032.26 1084.00 1080.15 1064.77 1101.92
: 520 :
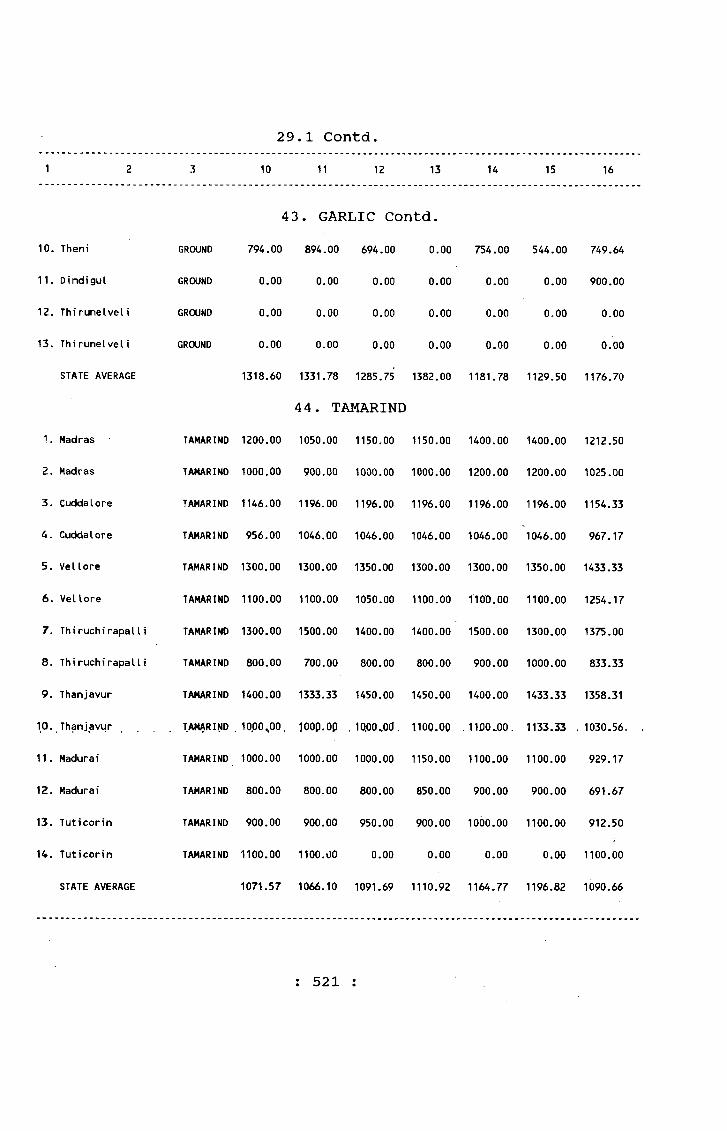
29.1 Contd.1 2 3 10 11 12 13 14 15 16
43. GARLIC Contd.10. Them' GROUND 794.00 894.00 694.00 0.00 754.00 544.00 749.64
11. Dindigul GROUND 0.00 0.00 0.00 0.00 0.00 0.00 900.00
12. Thirunelveli GROUND 0.00 0.00 0.00 0.00 0.00 0.00 0.00
13. Thirunelveli GROUND 0.00 0.00 0.00 0.00 0.00 0.00 0.00
STATE AVERAGE 1318.60 1331.78 1285.75 1382.00 1181.78 1129.50 1176.70
44. TAMARIND1. Madras TAMARIND 1200.00 1050.00 1150.00 1150.00 1400.00 1400.00 1212.50
2. Madras TAMARIND 1000.00 900.00 1000.00 1000.00 1200.00 1200.00 1025.00
3. Cuddalore TAMARIND 1146.00 1196.00 1196.00 1196.00 1196.00 1196.00 1154.33
4. Cuddalore TAMARIND 956.00 1046.00 1046.00 1046.00 1046.00 1046.00 967.17
5. Vellore TAMARIND 1300.00 1300.00 1350.00 1300.00 1300.00 1350.00 1433.33
6. Vellore TAMARIND 1100.00 1100.00 1050.00 1100.00 1100.00 1100.00 1254.17
7. ThiruchirapalIi TAMARIND 1300.00 1500.00 1400.00 1400.00 1500.00 1300.00 1375.00
8. ThiruchirapalIi TAMARIND 800.00 700.00 800.00 800.00 900.00 1000.00 833.33
9. Thanjavur TAMARIND 1400.00 1333.33 1450.00 1450.00 1400.00 1433.33 1358.31
10. Thanjavur . XAMARItJD . 1000^00. loop.Op . 1QOO.OO. 1100.00 . 11130.00. 1133.33 . 1030.56. .
11. Madurai TAMARIND 1000.00 1000.00 1000.00 1150.00 1100.00 1100.00 929.17
12. Madurai TAMARIND 800.00 800.00 800.00 850.00 900.00 900.00 691.67
13. Tuticorin TAMARIND 900.00 900.00 950.00 900.00 1000.00 1100.00 912.50
14. Tuticorin TAMARIND 1100.00 1100.00 0.00 0.00 0.00 0.00 1100.00
STATE AVERAGE 1071.57 1066.10 1091.69 1110.92 1164.77 1196.82 1090.66
: 521 :

29.1 Contd.1 2 3 4 5 6 7 8 9
45, SALT1. Madras NONIODCRTS 54.55 54.55 68.00 72.73 0.00 72.732. Thanjavur NONIODCRTS 60.00 60.00 55.00 55.00 0.00 60.00
3. Tuticorin N0N1CX)CRTS 20.00 22.00 30.00 38.00 35.00 30.004. Thi ruthuraipoondi NONIODCRTS 45.00 42.00 42.00 37.00 42.00 42.00
5. Udagamandalam NONIODCRTS 67.00 60,00 65.00 60.00 62.00 62.006. NagerkoiI NONIODCRTS 52.00 56.00 56.00 56.00 56.00 56.00
STATE AVERAGE 49.76 49,09 52.67 53.12 48.75 53.79
46. TEA
1. Madras TEA 6750.00 6594.00 6594.00 6594.00 7900.00 7900.002. Coimbatore TEA 0.00 4615.38 5400.00 8100.00 8100.00 8100.003. Cuddalore TEA 0.00 3583.33 3800.00 3500.00 3420*. 00 3700.00
STATE AVERAGE 6750.00 4930.90 5264.67 6064.67 6473.33 6566.67
47. COFFEE1. Madras PLANT A 0.00 4500.00 4200.00 4200.00 5000.00 4800.002. Mettupalayam PLANT A 0.00 4400.00 4400.00 4400.00 4400.00 4600.003. Coimbatore PLANT A 4400.00 4400.00 4400.00 4400.00 4400.00 4800.00
STATE AVERAGE 4400.00 4433.33 4333.33 4333.33 4600.00 4733.33
48. COFFEE1. Madras PEABERRY 0.00 4700.00 4700.00 4700.00 6000.00 5400.002. Mettupalayam PEABERRY 0.00 4800.00 4800.00 4800.00 4800.00 5000.003. Coimbatore PEABERRY 0.00 5000.00 5000.00 4800.00 4800.00 5200.00
STATE AVERAGE 0.00 4833.33 4833.33 .4766.67 5200.00 5200.00
: 522 :
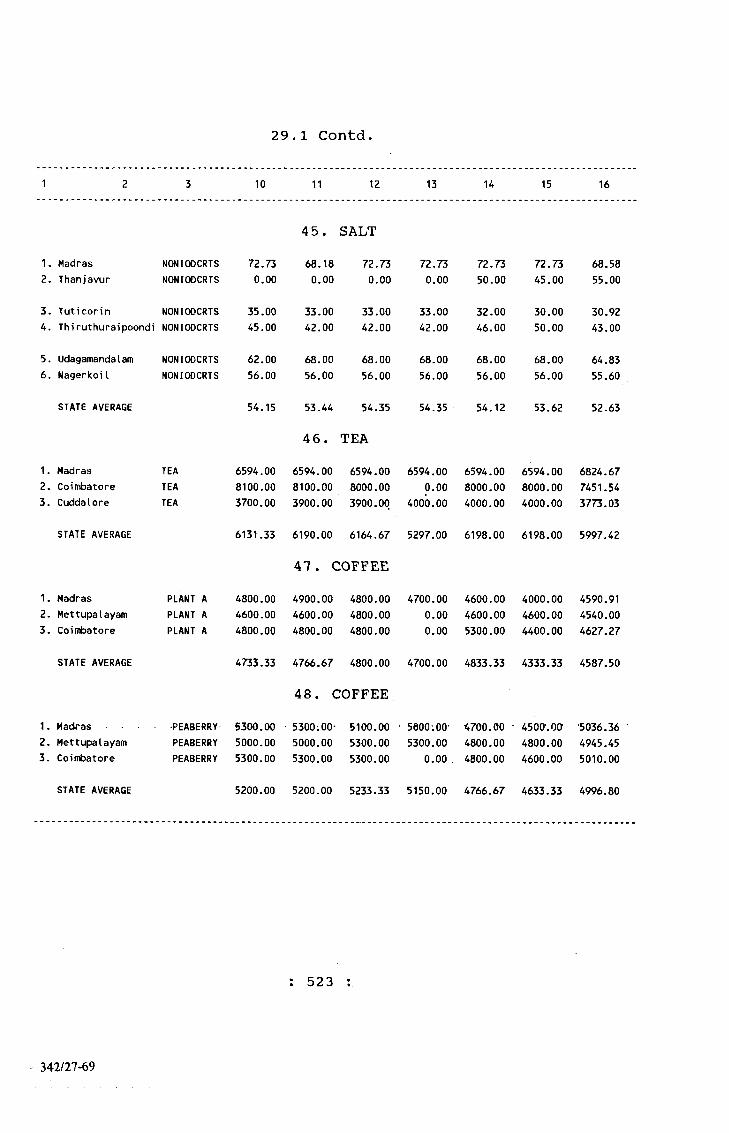
29.1 Contd.
1 2 3 10 11 12 13 14 15 16
45. SALT1. Madras2 . Thanjavur
NONIODCRTSNONIODCRTS
72.730.00
68.180.00
72.730.00
72.730.00
72.7350.00
72.7345.00
68.5855.00
3. Tuticorin4. Thiruthuraipoondi
NONIODCRTSNONIODCRTS
35.0045.00
33.0042.00
33.0042.00
33.0042.00
32.0046.00
30.0050.00
30.9243.00
5. Udagamandalam6. Nagerkoil
NONIODCRTSNONIODCRTS
62.0056.00
68.0056.00
68.0056.00
68.0056.00
68.0056.00
68.0056.00
64.8355.60
STATE AVERAGE 54.15 53.44
46.54.35
TEA54.35 54.12 53.62 52.63
1. Madras2. Coimbatore3. Cuddalore
TEATEATEA
6594.008100.00 3700.00
6594.008100.00 3900.00
6594.008000.00 3900.00
6594.00 0.00
4000.00
6594.008000.00 4000.00
6594.008000.00 4000.00
6824.677451.543773.03
STATE AVERAGE 6131.33 6190.00 6164.67 5297.00 6198.00 6198.00 5997.42
47. COFFEE1. Madras2. Mettupalayam3. Coimbatore
PLANT A PLANT A PLANT A
4800.004600.004800.00
4900.004600.004800.00
4800.004800.004800.00
4700.000.000.00
4600.004600.005300.00
4000.004600.004400.00
4590.914540.004627.27
STATE AVERAGE 4733.33 4766.67 4800.00 4700.00 4833.33 4333.33 4587.50
48. COFFEE1. Madras . . . .2. Mettupalayam3. Coimbatore
-PEABERRY'PEABERRYPEABERRY
5300.005000.005300.00
■ 5300;00-5000.005300.00
5100.005300.005300.00
• 5000-.00' 5300.00
0.00
1( 700.00 •4800.004800.00
4500-.0a4800.004600.00
•5036.36 •4945.455010.00
STATE AVERAGE 5200.00 5200.00 5233.33 5150.00 4766.67 4633.33 4996.80
: 523
342/27-69
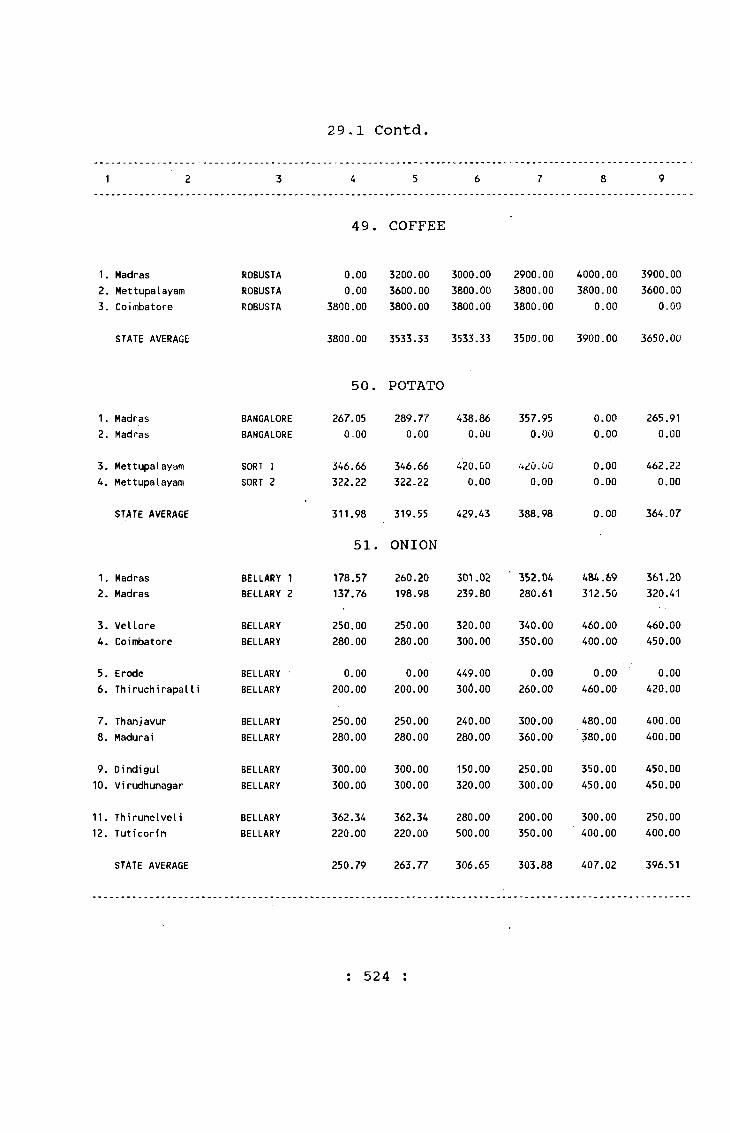
29.1 Contd.
1 2 3 4 5 6 7 8 9
4 9 . COFFEE
1. Madras ROBUSTA 0.00 3200.00 3000.00 2900.00 4000.00 3900.002. Mettupalayam ROBUSTA 0.00 3600.00 3800.00 3800.00 3800.00 3600.003. Coimbatore ROBUSTA 3800.00 3800.00 3800.00 3800.00 0.00 0.00
STATE AVERAGE 3800.00 3533.33 3533.33 3500.00 3900.00 3650.00
50. POTATO1. Madras BANGALORE 267.05 289.77 438.86 357.95 0.00 265.912. Madras BANGALORE 0.00 0.00 0.00 0.00 0.00 0.00
3. Mettupalayam SORT I 346.66 346.66 420.00 420.00 0.00 462.224. Mettupalayam SORT 2 322.22 322.22 0.00 0.00 0.00 0.00
STATE AVERAGE 311.98 319.55 429.43 388.98 0.00 364.07
51. ONION1. Madras BELLARY 1 178.57 260.20 301.02 352.04 484.69 361.202 . Madras BELLARY 2 137.76 198.98 239.80 280.61 312.50 320.41
3. Vellore BELLARY 250.00 250.00 320.00 340.00 460.00 460.004. Coimbatore BELLARY 280.00 280.00 300.00 350.00 400.00 450.00
5. Erode BELLARY ’ 0.00 0.00 449.00 0.00 0.00 0.006. Thiruchirapalli BELLARY 200.00 200.00 30(5.00 260.00 460.00 420.00
7, Thanjavur BELLARY 250.00 250.00 240.00 300.00 480.00 400.008. Madurai BELLARY 280.00 280.00 280.00 360.00 380.00 400.00
9. Dindigul BELLARY 300.00 300.00 150.00 250.00 350.00 450.0010. Virudhunagar BELLARY 300.00 300.00 320.00 300.00 450.00 450.00
11. Thirunelveli BELLARY 362.34 362.34 280.00 200.00 300.00 250.0012. Tuticor in BELLARY 220.00 220.00 500.00 350.00 400.00 400.00
STATE AVERAGE 250.79 263.77 306.65 303.88 407.02 396,51
: 524 :
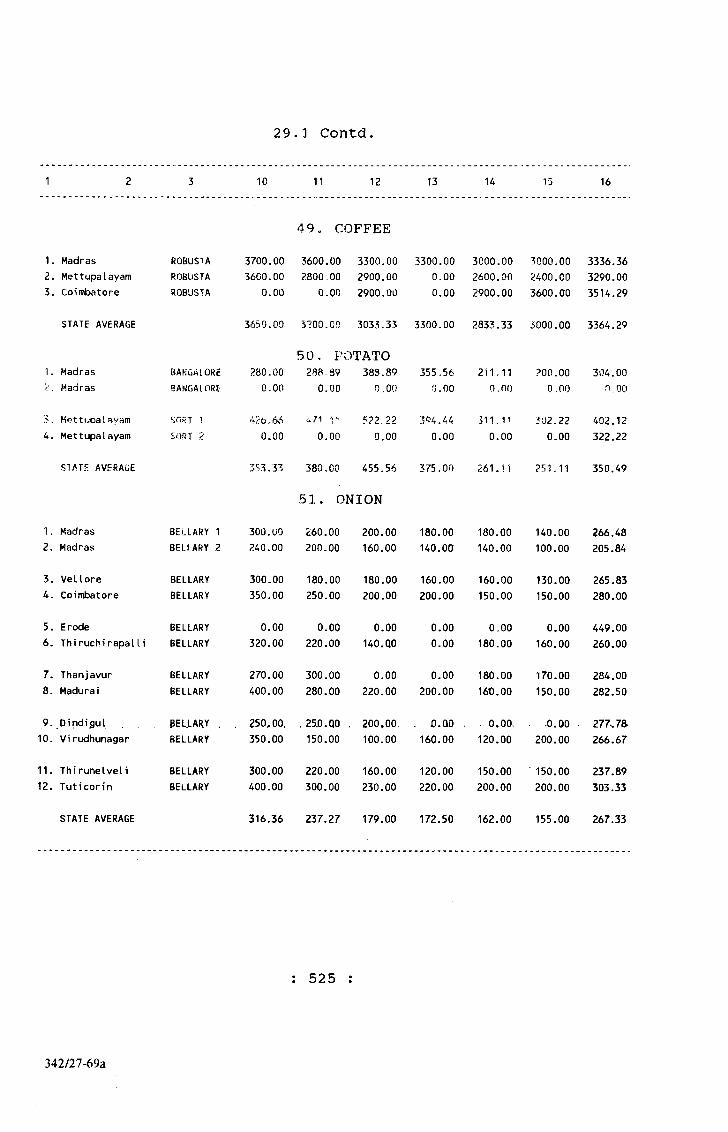
2 9.1 Contd.
1 2 3 10 11 12 13 14 15 16
49. COFFEE1. Madras2. Mettupalayam3. Coimbatore
ROBUSTAROBUSTAROBUSTA
3700.003600.00
0.00
3600.002800.00
0.00
3300.002900.002900.00
3300.000.000.00
3000.002600.00 2900.00
3000.002400.003600.00
3336,363290.003514.29
STATE AVERAGE 3650.00 3?00.00 3035.33 3300.00 2833.33 3000.00 3364.29
1. Madras ?. Madras
bangaloreBANGAIORE
280.000,00
50. POTATO288.89 388.89
0.00 0.00355,56
0.00211.11
o.no
POO.00 0 .00
304.00n.oo
3. Hettijpalayam
4, MettupalayamSOST !
SORT .?
4,?6.66
0.004 7 V 11
0.005?2.22
0.00394.44
0.00511.11
0.00302.22
0.00402.12322.22
STATE AVERAGE 353,33 380.00 455.56 375.00 261.11 251,, 11 350.49
51. ONION1. Madras2, Madras
BELLARY 1 BEUARY 2
300.00240.00
260.00200.00
200.00160.00
180.00140.00
180.00140.00
140.00100.00
266.48205.84
3. Vellore4. Coimbatore
BELLARYBELLARY
300.00350.00
180.00250.00
180.00200.00
160.00200.00
160.00150.00
130.00150.00
265.83280.00
5. Erode6. ThiruchirapalIi
BELLARYBELLARY
0.00320.00
0.00220.00
0.00 140.QO
0.000.00
0.00180.00
0.00160.00
449.00260.00
7. Thanjavur8. Madurai
BELLARYBELLARY
270.00400.00
300.00280.00
0.00220.00
0.00200.00
180.0016t).00
170.00150.00
284.00282.50
9. Dindigul 10. Virudhunagar
PELj.ARY . BELLARY
. 250,00. 350.00
. 25.0.QO 150.00
. 200.00. 100.00
. O.QO 160.00
. . 0.00. 120.00
. .0.00 .
200.00277s7& 266.67
11. Thirunelveli12. Tuticorin
BELLARYBELLARY
300.00400.00
220.00300.00
160.00,230.00
120.00220.00
150.00200.00
150.00200.00
237.89303.33
STATE AVERAGE 316.36 237.27 179.00 172.50 162.00 155.00 267.33
: 525
342/27-69a
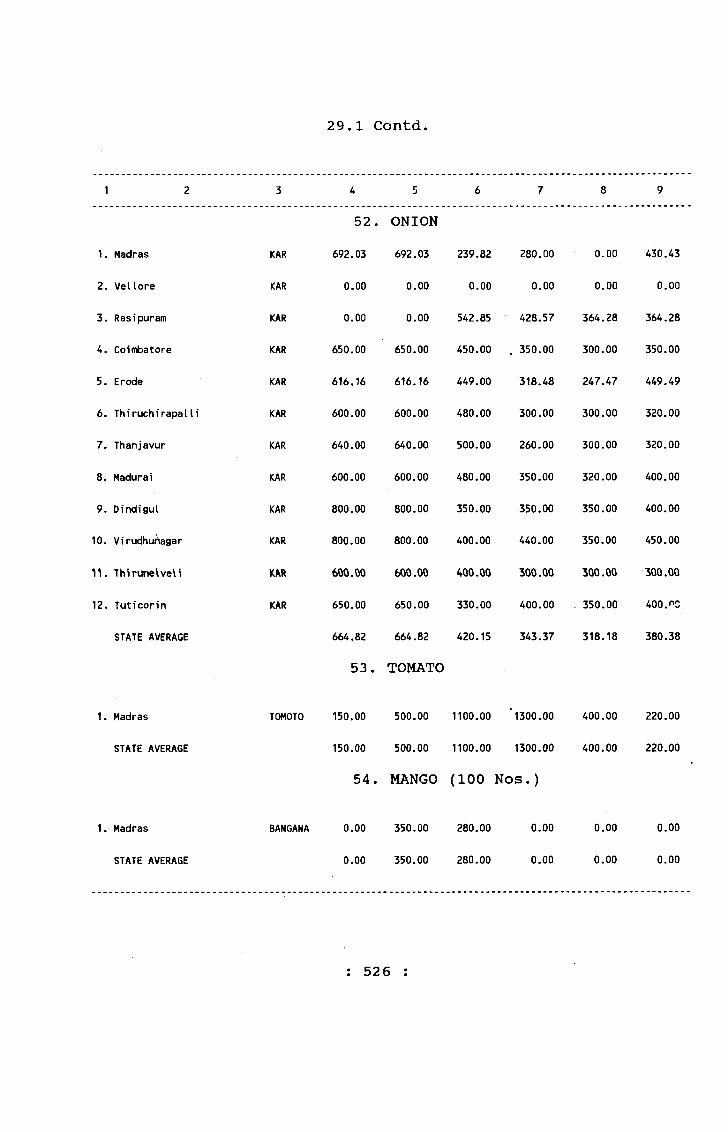
29.1 Contd,
4
52. 692.03
0.00
0.00
650.00
616.16
600.00
640.00
600.00
800.00
800.00
600.00
650.00
664.82
53.
1. Madras
2. Vellore
3. Rasipuram
4. Coimbatore
5. Erode
6. Thiruchirapalli
7. Thanjavur
8. Madurai
9. Dindigul
10. Virudhuhagar
11. Thirimelveli
12. Tuticorin
STATE AVERAGE
KAR
KAR
KAR
KAR
KAR
KAR
KAR
KAR
KAR
KAR
KAR
KAR
ONION692.03
0.00
0.00
650.00
616.16
600.00
640.00
600.00
800.00
800.00
600.00
650.00
664.82
TOMATO
239.82
0.00
542.85
450.00
449.00
480.00
500.00
480.00
350.00
400.00
400.00
330.00
420.15
280.00
0.00
428.57
350.00
318.48
300.00
260.00
350.00
350.00
440.00
300.00
400.00
343.37
0.00
0.00
364.28
300.00
247.47
300.00
300.00
320.00
350.00
350.00
300.00
350.00
318.18
430.43
0.00
364.28
350.00
449.49
320.00
320.00
400.00
400.00
450.00
300.00
400. f'O
380.38
1. Madras
STATE AVERAGE
1. Madras
STATE AVERAGE
TOMOTO 150.00 500,00 1100.00 1300.00 400.00 220.00
150.00 500.00 1100.00 1300.00 400.00 220.00
54. MANGO (100 Nos.)
BANGANA 0.00 350.00 280.00 0.00 0.00 0.00
0.00 350.00 280.00 0.00 0.00 0.00
: 526 :
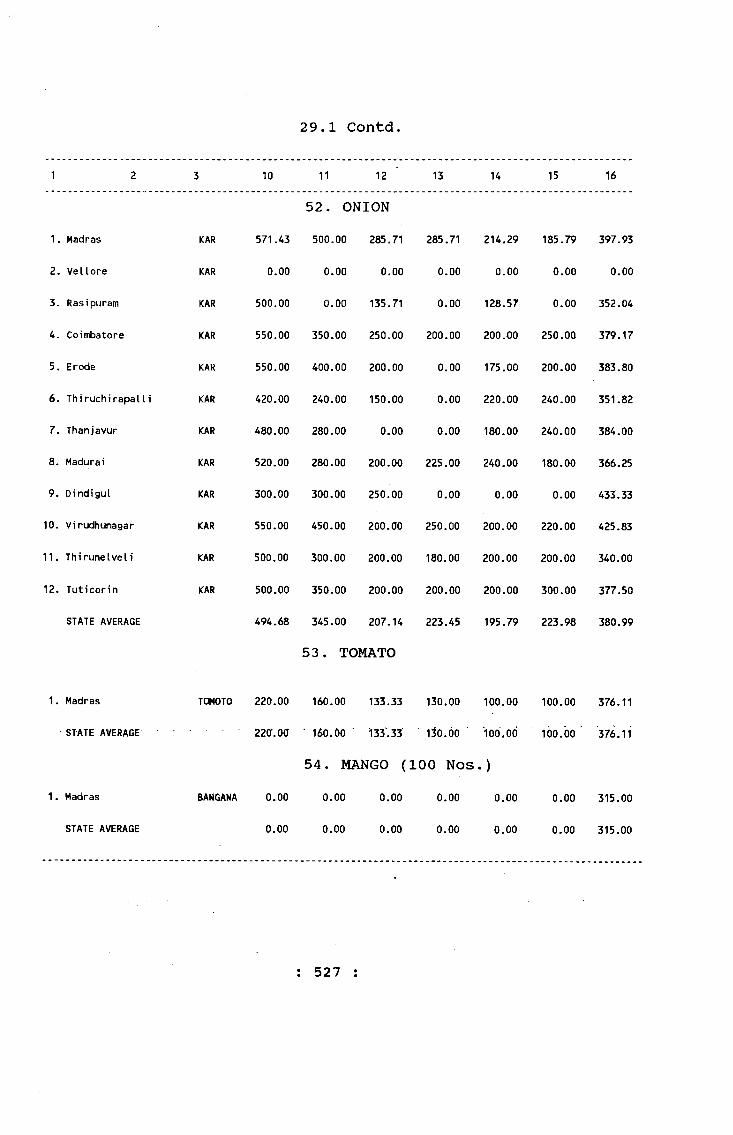
10 11 12
52. ONION 500.00 285.71
29.1 Contd.
13 14 15 16
1. Madras KAR 571.43
2. Vellore KAR 0.00
3. Rasipuram KAR 500.00
4. Coimbatore KAR 550.00
5. Erode KAR 550.00
6. Thiruchirapalli KAR 420.00
7. Thanjavur KAR 480.00
8. Madurai KAR 520.00
9. Dindigul KAR 300.00
10. Virudhunagar KAR 550.00
11. Thirune Iveil KAR 500.00
12. Tuticorin KAR 500.00
STATE AVERAGE 494.68
285.71 214.29 185.79 397.93
0.00 0.00 0.00 0 .00 0 .00 0.00
0.00 135.71 0.00 128.57 0.00 352.04
350.00 250.00 200.00 200.00 250.00 379.17
400.00 200.00 0.00 175.00 200.00 383.80
240.00 150.00 0.00 220.00 240.00 351.82
280.00 0.00 0.00 180.00 240.00 384.00
280.00 200.00 225.00 240.00 180.00 366.25
300.00 250.00 0.00 0.00 0.00 433.33
450.00 200.00 250.00 200.00 220.00 425.83
300.00 200.00 180.00 200.00 200.00 340.00
350.00 200.00 200.00 200.00 300.00 377.50
345.00 207.14 223.45 195.79 223.98 380.99
53. TOMATO
1. Madras
STATE AVERAGE
1. Madras
STATE AVERAGE
TOMOTO 220.00 160.00 133.33 130.00 100.00
2 2 0 . 0 0 160.00 ■ 133.33 ' 130.00 100.00
54. MANGO (100 Nos.) BANGANA 0.00 0.00 0.00 0.00 0.00
0.00 0,00 0.00 0.00 0.00
100.00 376.11
100.00 ' ’376.11
0.00 315,00
0,00 315,00
: 527 :

(Table 29.1 contd.)
(I) (2) (3) (4) (5) (6) (7) (8) (9)
55 . MANGO (100 Nos. )
1. Madras Peether 0.00 300.00 0.00 0.00 0.00 0.00STATE AVERAGE .00 300.00 0.00 0.00 0.00 0.00
56 . MANGO (100 Nos. )
1. Madras MaIgova 0.00 0.00 0.00 0.00 0.00 0.002. Vellore Dangana 0.00 0.00 0.00 0.00 0.00 0.00
STATE AVERAGE 0.00 0.00 0.00 0.00 0.00 0.0057« 3ANAMA
1. Madras Poovan 5" 0.00 4000.00 3500.00 3500.00 3500.00 3000,002. Madras rcovan 4" 0.00 3500.00 3000.00 3000.00 3000.00 2500.003. Kumbakonam Poovan 4" 0.00 2500.00 2500.00 2500.00 1500.00 1600.00
STATE AVERAGE .00 3333.33 3000.00 3000.00 2666.67 2366.67
58. BANANA1. Madras Green 5" 0.00 6000.00 5500.00 5500.00 4000.00 3500.002. Madras Green 4" 0.00 4000.00 4000.00 4000.00 2500.00 3000.00
STATE AVERAGE 0.00 5000.00 4750.00 4750.00 3250.00 3250.00
59. BANANA1. Madras Hi 11.Big 0.00 8000.00 7900.00 7500.00 10000.00 8000,002. Madurai Hill.Big 0.00 8000.00 9000.00 0.00 0.00 .7500.00
1. Madras Hill.Sma11 0.00 6000.00 6000.00 6000.00 8000.00 7000.00
Average 0.00 6000.00 6000.00 6000.00 8000.00 7000.00
60. SATHUKUDI (100 Nos.)1. Madras Sathukudi 3.5" 120.00 140.00 140.00 140.00 100.00 80.002. Madras Sathukudi 3" 0.00 80.00 80.00 80,00 80.00 60,00
STATE AVERAGE 120.00 110.00 110.00 110.00 70.00 70,00
: 528 :
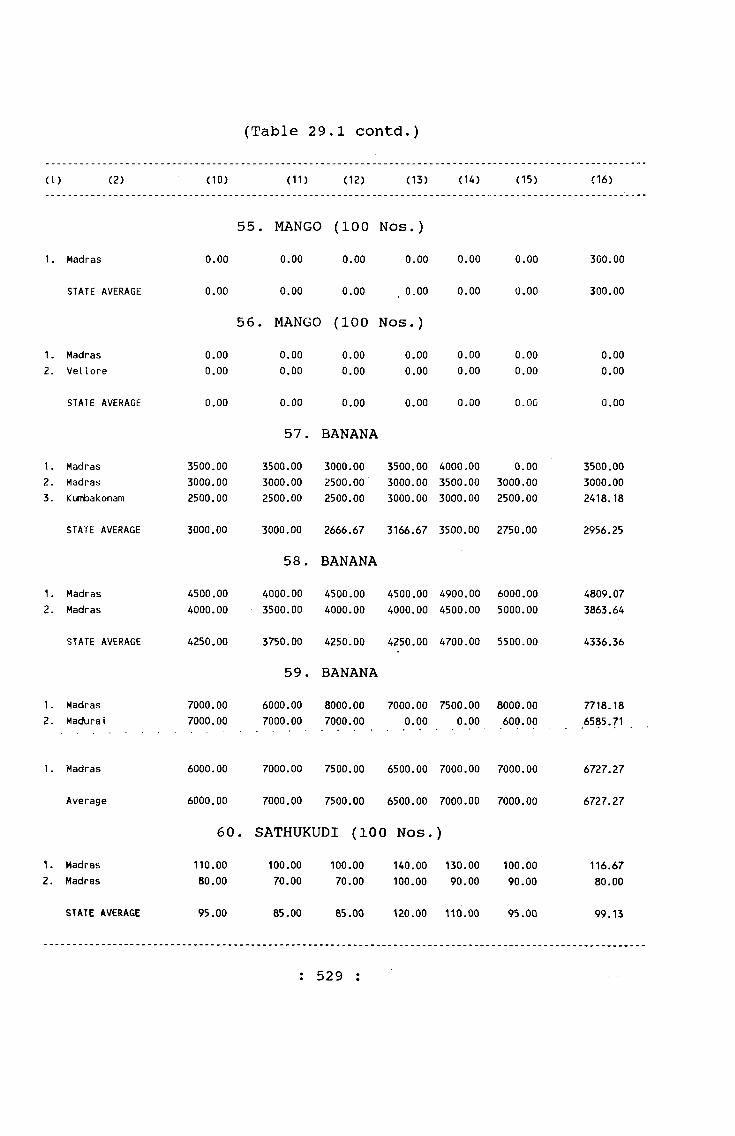
(Table 2 9.1 contd.)
(I) (2) (10) (11) (12) (13) (14) (15) (16)
55 . MANGO (100 Nos. )1. Madras 0.00 0.00 0.00 0.00 0.00 0.00 300.00
STATE AVERAGE 0.00 0.00 0.00 . 0.00 0.00 0.00 300.00
56 . MANGO1 (100 Nos.)1. Madras 0.00 0.00 0.00 0.00 0.00 0.00 0.002. Vellore 0.00 0.00 0.00 0.00 0.00 0.00 0.00
STATE AVERAGE 0.00 0.00 0.00 0.00 0.00 0.00 0.00
57. BANANA1. Madras 3500.00 3500.00 3000.00 3500.00 4000.00 0.00 3500.002. Madras 3000.00 3000.00 2500.00^ 3000.00 3500.00 3000.00 3000.003. Kumbakonam 2500.00 2500.00 2500.00 3000.00 3000.00 2500.00 2418.18
STATE AVERAGE 3000.00 3000.00 2666.67 3166.67 3500.00 2750.00 2956.25
58. BANANA1. Madras 4500.00 4000.00 4500.00 4500.00 4900.00 6000.00 4809.072. Madras 4000.00 3500.00 4000.00 4000.00 4500.00 5000.00 3863.64
STATE AVERAGE 4250.00 3750.00 4250.00 4250.00 4700.00 5500.00 4336.36
59. BANANA1. Madras 7000.00 6000.00 8000.00 7000.00 7500.00 8000.00 7718.182. Madurai 7000.00 7000.00 7000.00 0.00 0.00 600.00 6585.71
1. Madras 6000.00 7000.00 7500.00 6500.00 7000.00 7000.00 6727.27
Average 6000.00 7000.00 7500.00 6500.00 7000.00 7000.00 6727.27
60 • SATHUKUDI (100 Nos. )
1. Madras 110.00 100.00 100.00 140.00 130.00 100.00 116.672. Madras 80.00 70.00 70.00 100.00 90.00 90.00 80.00
STATE AVERAGE 95.00 85.00 85.00 120.00 110.00 95.00 99.13
: 529 :

(Table 29.1 contd.)(I) (2) (3) (4) (5) (6) (7) (8) (9)
61. CASHEWNUT1.2.
Jeyamkondan Panrutti
CashewnutCashewnut
0.001937.50
0.001937.50
0.002375.00
0.002875.00
0.003250.00
0.000.00
STATE AVERAGE 1937.50 1937.50 2375.00 2875.00 3250.00 0.00
62. ARECANUT1. Madras Pneton (Husked) 9999.90 9999.90 7899.99 9899.99 10000.00 10000.00
STATE AVERAGE 9999.90 9999.90 7899.99 9899.99 10000.00 10000.00
63 , ARECANUT1.2.
MadrasMettupalayam
RasiArecanut Rasi (Husked)
9999.995466.66
9999.995411.66
9999.995411.66
9999.996400.00
10200.005867.00
10200.005866.00
STATE AVERAGE 7733.32 7705.82 7705.82 8199.99 8033.50 8033.33
64. ARECANUTU Madras Kottai 7500.00 7500.00 7500.00 0.00 18000.00 20000.00
STATE AVERAGE 7500.00 7500.00 7500.00 0.00 18000.00 20000.00
65. ARECANUT1. Panrutti Si than 8444.44 7777.77 9999.99 7777.77 7777.77 7555.55
STATE AVERAGE 8444.44 7777.77 9999.99 7777.77 7777.77 7555.55
66. ARECANUT •
1. Panrutti Pottu 8222.22 7333.33 8444.41 7555.55 7555.55 6000.88
STATE AVERAGE 8222.22 7333.33 8444.41 7555.55 7555.55 6000.88
67. ARECANUT1.2.
MadrasPanrutti
VettaiVettai
9000.006024.70
9000.006250.00
9000.007142.85
0.006250.00
5000.005178.57
0.005133.92
STATE AVERAGE 7513.39 7625.00 8071.43 6250.00 5178.57 5133.92
: 530 :
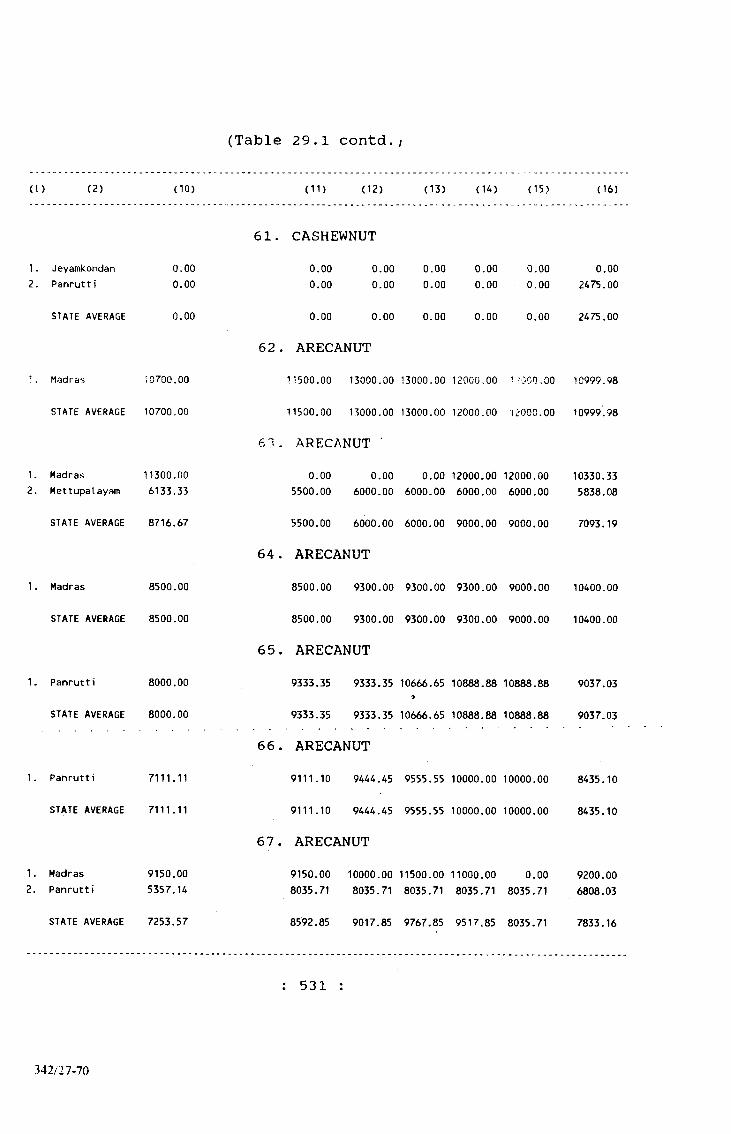
(Table 29. 1 contd. )
(I) (2) (10) (11) (12) (13) (14) (15) (16)
61. CASHEWNUT1.2.
Jeyamkondan Panrutt i
0.000.00
0.000.00
0.000.00
0.000.00
0.000.00
0.000.00
0.002475.00
STATE AVERAGE 0.00 0.00 0.00 0.00 0.00 0.00 2475.00
52 . ARECANUTi Madras 10700.00 11500.00 13000.00 13000.00 12000.00 -000,00 10999.98
STATE AVERAGE 10700.00 11500.00 13000.00 13000.00 12000.00 12000.00 10999.98
6 3 ARECANUT '1.2.
MadrasMettupalayam
11300.006133.33
0.005500.00
0.006000.00
0.006000.00
12000.006000.00
12000.006000.00
10330.335838.08
STATE AVERAGE 8716.67 5500.00 6000.00 6000.00 9000.00 9000.00 7093.19
64 . ARECANUT1. Madras 8500.00 8500.00 9300.00 9300.00 9300.00 9000.00 10400.00
STATE AVERAGE 8500.00 8500.00 9300.00 9300.00 9300.00 9000.00 10400.00
65. ARECANUT1. Panrutti 8000.00 9333.35 9333.35 10666.65 10888.88 10888.88 9037.03
STATE AVERAGE 8000.00 9333.35 9333.35 10666.65 10888,88 10888.88 9037.03
66. ARECANUT1. Panrutti 7111.11 9111.10 9444.45 9555.55 10000.00 10000.00 8435.10
STATE AVERAGE 7111.11 9111.10 9444.45 9555.55 10000.00 10000.00 8435.10
67 . ARECANUT1.2.
MadrasPanrutti
9150.005357.14
9150.008035.71
10000.008035.71
11500.008035.71
11000.008035.71
0.008035.71
9200.006808.03
STATE AVERAGE 7253.57 8592.85 9017.85 9767.85 9517.85 8035.71 7833.16
: 531 :
342/27-70
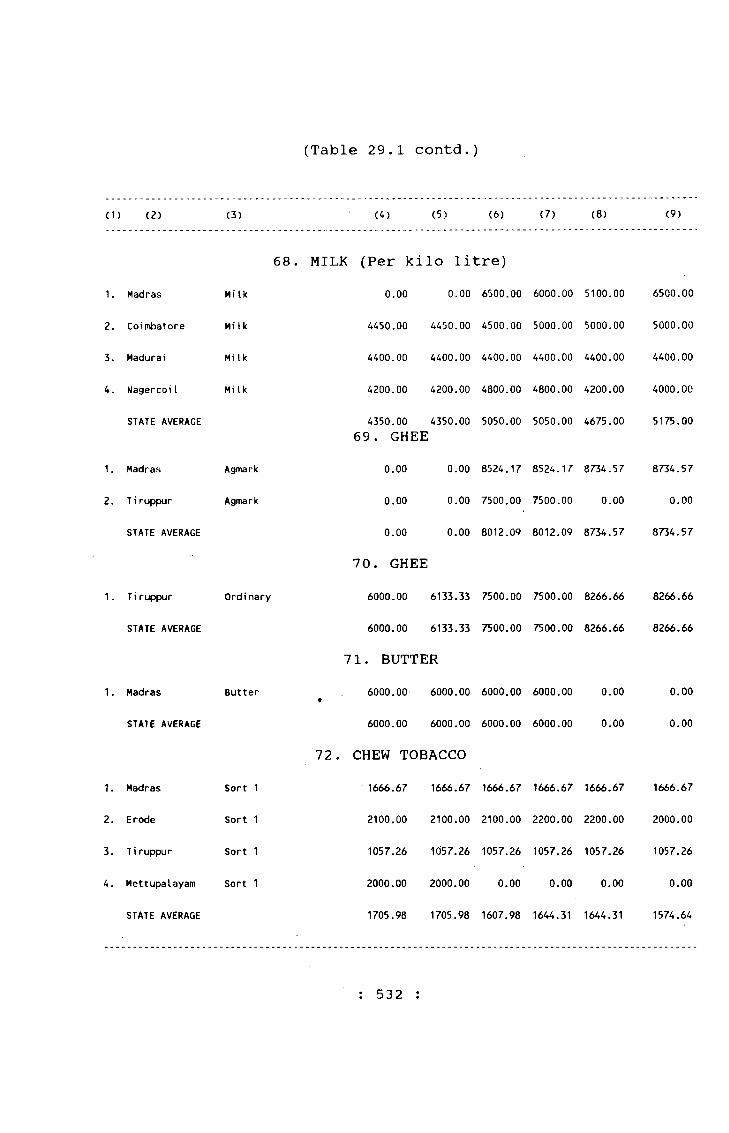
(Table 29.1 contd.)
(1) (2) (3) (4) (5) (6) (7) (8) (9)
68. MILK (Per kilo litre)1. Madras Milk 0.00 0.00 6500.00 6000.00 5100.00 6500.00
2. Coimbatore Mi Ik 4450.00 4450.00 4500.00 5000.00 5000.00 5000.00
3. Madurai Milk 4400.00 4400.00 4400.00 4400.00 4400.00 4400.00
4. NagercoiI Mi Ik 4200.00 4200.00 4800.00 4800.00 4200.00 4000.00
STATE AVERAGE 4350.00 69. GHEE
4350.00 5050.00 5050.00 4675.00 5175.00
1. Madras Agmark 0.00 0.00 8524.17 8524.17 8734.57 8734.57
2. T i ruppur Agmark 0.00 0.00 7500.00 7500.00 0.00 0.00
STATE AVERAGE 0.00 0.00 8012.09 8012.09 8734.57 8734.57
70. GHEE1. T i ruppur Ordinary 6000.00 6133.33 7500.00 7500.00 8266.66 8266.66
STATE AVERAGE 6000.00 6133.33 7500.00 7500.00 8266.66 8266.66
71. BUTTER1. Madras Butter ft 6000.00 6000.00 6000.00 6000.00 0.00 0.00
STATE AVERAGE 6000.00 6000.00 6000.00 6000.00 0.00 0.00
72 . CHEW TOBACCO1. Madras Sort 1 1666.67 1666.67 1666.67 1666.67 1666.67 1666.67
2. Erode Sort 1 2100.00 2100.00 2100.00 2200.00 2200.00 2000.00
3. T i ruppur Sort 1 1057.26 1057.26 1057.26 1057.26 1057.26 1057.26
4. Mettupalayam Sort 1 2000.00 2000.00 0.00 0.00 0.00 0.00
STATE AVERAGE 1705.98 1705.98 1607.98 1644.31 1644.31 1574.64
: 532 :
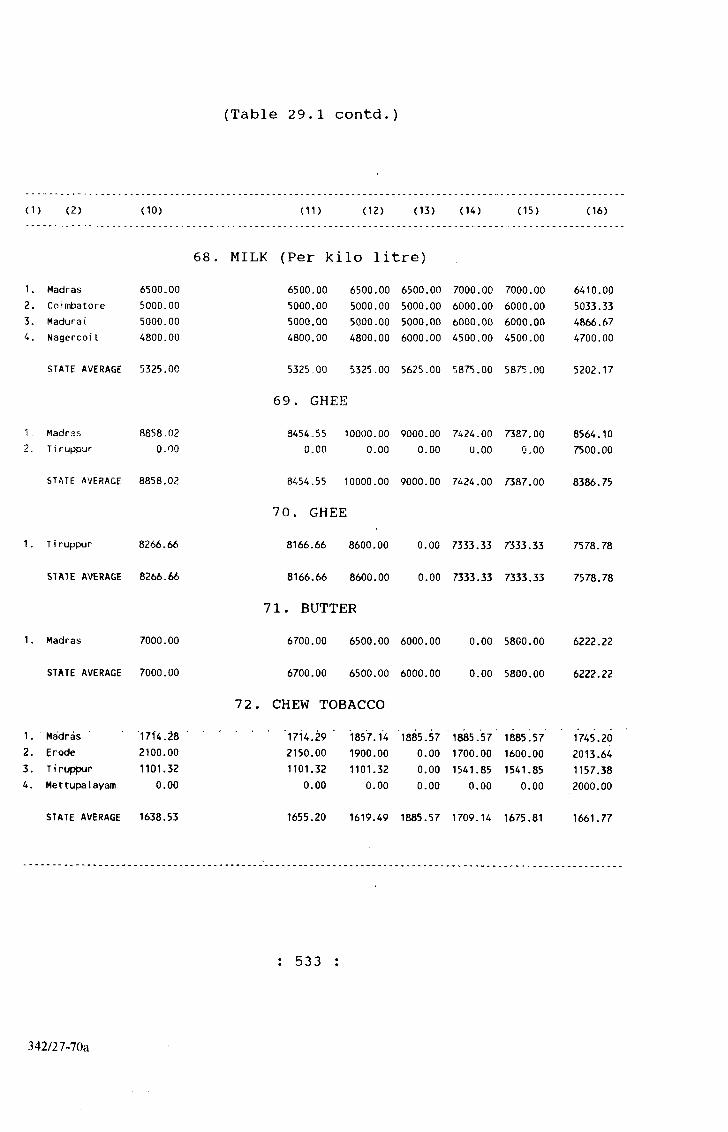
(Table 29.1 contd.)
(1) (2) (10) (11) (12) (13) (14) (15) (16)
68 . MILK (Per kilo litre)1. Madras 6500.00 6500.00 6500.00 6500.00 7000.00 7000.00 6410.002. Coinibatore 5000.00 5000.00 5000.00 5000.00 6000.00 6000.00 5033.333. Madurai 5000.00 5000.00 5000.00 5000.00 6000.00 6000.00 4866.674. NagercoiI 4800.00 4800.00 4800.00 6000.00 4500.00 4500.00 4700.00
STATE AVERAGE 5325.00 5325,00 5325.00 5625.00 5875.00 5875.00 5202.17
69. GHEE1, Madras 8858,02 3454.55 10000.00 9000.00 7424.00 7387.00 8564.102„ T i ruppur 0,00 0.00 0.00 0.00 0.00 0.00 7500.00
STATE AVERAGE 8858.02 8454.55 10000.00 9000.00 7424.00 7387.00 8386.75
70. GHEE1. T i ruppur 8266.66 8166.66 8600.00 0.00 7333.33 7333.33 7578.78
STATE AVERAGE 8265.66 8166.66 8600.00 0.00 7333.33 7333.33 7578.78
71. BUTTER1. Madras 7000.00 6700.00 6500.00 6000.00 0.00 5800.00 6222.22
STATE AVERAGE 7000.00 6700.00 6500.00 6000.00 0.00 5800.00 6222.22
72. CHEW TOBACCO1. Madras 1714.28 1714.29 1857.14 1885.57 1885.57 1885.57 1745.202. Erode 2100.00 2150.00 1900.00 0.00 1700.00 1600.00 2013.643. T i ruppur 1101.32 1101.32 1101.32 0.00 1541.85 1541.85 1157.384. Mettupalayam 0.00 0.00 0.00 0.00 0.00 0.00 2000.00
STATE AVERAGE 1638.53 1655.20 1619.49 1885.57 1709.14 1675.81 1661.77
: 533
342/2 7-70a

(Table 29.1 contd.)
(i) (2) (3) (4) (5) (6) (7) (8) (9)
1. Madras Sort 2
2. Erode Sort 2
3. Tiruppur Sort 2
4. Mettupalayam Sort 2
STATE AVERAGE
1. Madras
2. E rode
STATE AVERAGE
Sort 1
Sort 1
1. Madras Sort 2
STATE AVERAGE
1. Madras Casurina
2. Cuddalore Casurina
3. Coimbatore Casurina
4. Madurai Casurina
5. Nagercoil Casurina
STATE AVERAGE
73. CHEW TOBACCO909.09 909.09
1800.00 1800.00
991.18 991.18
0.00 0.00
1260.09 1233.42
74. CIGAR TOBACCO0.00 0.00
1200.00 1180.00
1200.00 1180.00
75. CIGAR TOBACCO0.00 0.00
0.00 0.00
76. FUEL WOOD0.00 100.00
0.00 0.00
100.00 100.00
0.00 0.00
0.00 0.00
100.00 100.00
909.09 909.09 909.09 0.00
1800.00 1600.00 1600.00 1500.00
991.18 991.18 991.18 991.18
0.00 0.00 0.00 0.00
1233.42 1166.76 1166.76 1245.59
1500.00 1800.00 1500.00 1400.00
1175.00 1000.00 1000.00 1000.00
1337.50 1400.00 1250.00 1200.00
0-00 0.00 0.00 0.00
0.00 0.00 0.00 0.00
100.00 100.00 120.00 120.00
0.00 0.00 0.00 0.00
100.00 0.00 0.00 0.00
125.00 0.00 0.00 0.00
0.00 0.00 0.00 0.00
100.33 100.00 120.00 120.00
: 534 :

(Table 29.1 contd.)
(I) (2) (10) (11) (12) (13) (14) (15) (16)
73. CHEW TOBACCO1. Madras 1057.14 1057.14 1428.57 1428.57 1428.57 1428.57 1132.102. Erode 1600.00 1650.00 1500.00 0.00 1200.00 1200.00 1568.183. T i ruppur 1031.21 1013.21 0,00 1407.68 1409.60 1076,55 991.18A. Mettupalayam 0.00 0.00 0.00 0.00 0.00 0.00 0.00
STATE AVERAGE 1229.45 1246.12 1313,93 1428.57 1346.08 1346,08 1250.97
74 . CIGAR TOBACCO1. Madras 0.00 0.00 0,00 0.00 0.00 0.00 1550.002. Erode 1200.00 1200.00 0.00 0.00 0.00 1500.00 1161.67
STATE AVERAGE 1200.00 1200.00 0.00 0.00 0.00 1500.00 1281.15
75 . CIGAR TOBACCO1. Madras Sort 2 0.00 0.00 0.00 0.00 0.00 0.00
STATE AVERAGE 0.00 0.00 0.00 0.00 0.00 0.00
76. FUEL WOOD1. Madras 112.00 itz.oo 112.00 96.00 120.00 120.00 110.182. Cuddalore 0.00 0.00 0.00 0.00 0.00 0.00 0.003. Coimbatore 0.00 0.00 128,00 0.00 0.00 0.00 107.004. Madurai 0.00 . . • O.OO . . a.OQ . 0.00 . X).QO . .0.00 . . t25,005. NagercoiI 0.00 60.00 80.00 0.00 0.00 80.00 73.33
STATE AVERAGE 112.00 86.00 106.67 96.00 120.00 100.00 104.47
: 535 :

(Table 29.1 contd.)
(I) (2) (3) (A) (5) (6) (7) (8) (9)
77. FIREWOOD1. Madras Jungle 0.00 80.00 80.00 80.00 0.00 0.002. Cuddalore Jungle 0.00 0.00 0.00 0.00 0.00 0.003. Coint)atore Jung Ie 0.00 0.00 0.00 0.00 0.00 0.004. Madurai Jungle 100.00 100.00 0.00 125.00 125.00 125.005. NagercoiI Jungle 0.00 0.00 0.00 60.00 0.00 0.00
STATE AVERAGE 100.00 90.00 80.00 88.33 125.00 125.00
7 8 . CHARCOAL1. Madras Charcoal 225.00 225.00 225.00 225.00 233.33 233.332. Madura t Charcoal 175.00 175.00 175.00 150.00 150.00 150.003. NagercoiI Charcoal 0.00 0.00 0.00 0.00 0.00 0.00
STATE AVERAGE 200.00 200.00 200.00 287.50 191.67 191.67
79. KEROSENE OIL (PER KILO LITRE)1. Madras Kerosene Oil 2481.16 2481.16 2481.16 2481.16 2431.30 2431.30
STATE AVERAGE 2481.16 2481.16 2481.16 2481.16 2431.30 2431.30
80 . RAMCO (PER BAG OF 50 KGS. ]11. Madras Cement 92.00 97.00 96.00 100.00 103.00 103.002. Coimbatore Cement 99.00 100.00 200.00 0.00 101.00 101.003. T i rune IveIi Cement 102.00 101.00 210.00 216.00 110.00 110.00
STATE AVERAGE 97.67 99.33 202.00 150.00 104.67 104.67
: 536 :

(Table 29.1 contd.)
(I) (2) (10) (11) (12) (13) (14) (15) (16)
77. FIREWOOD1. Madras 0.00 0.00 0.00 0.00 0.00 0.00 130.002. Cuddalore 0.00 0.00 0.00 0.00 0.00 0.00 0.003. Coimbatore 0.00 0.00 100.00 0.00 0.00 0.00 115.004. Madurai 125.00 125.00 125.00 0.00 100.00 100.00 115.005. NagercoiI • 0.00 0.00 0.00 0.00 0.00 0.00 60.00
STATE AVERAGE 202.50 125.00 116.50 0.00 100.00 100.00 114.88
78. CHARCOAL1. Madras 275.00 275.00 275.00 0.00 257.00 257.33 245.972. Madurai 150.00 150.00 150.00 0.00 0.00 0.00 150.333. NagercoiI 0.00 0.00 0.00 0.00 0.00 0.00 0.00
STATE AVERAGE 212.50 212.50 212.50 0.00 257.00 257.00 206.53
79 . KEROSENE OIL (PER KILO LITRE)1. Madras 2431,30 2431.30 2431.30 2431.30 2431.30 2431.30 2447.92
STATE AVERAGE 2431.30 2431.30 2431.30 2431.30 2431.30 2431.30 2447.92
80 . RAMCO (PER BAG OF 50 KGS. )
1. Madras 100.00 100.00 91.00 0.00 106.00 106.00 108.552. Coimbatore 103.00 103.00 101.00 0.00 105.00 113.00 112.603. Tirunelveli 110.00 110.00 108.00 108.00 110.00 118.00 126.08
STATE AVERAGE 104.33 104.33 100.00 100.00 107.00 112.33 116.15
: 537 :

(Table 29.1 contd.)
(I) (2) (3) (4) (5) (6) (7) (8) (9)
81. PADDY STRAW1. Pollachi Paddy Straw 65.00 65.00 65.00 65.00 65.00 65.002. T i ruchi rapalIi Paddy Straw 75.00 75.00 75.00 0.00 0.00 0.00
STATE AVERAGE 70.00 70.00 70.00 65.00 65.00 65.00
82. RICE BRAN1. Madras Rice bran 90.00 85.71 85.71 85.71 90.00 100.002. T i ruchi rapalIi Rice bran 74.00 71.43 71.43 71.43 104.16 104.16
STATE AVERAGE 82.00 78.57 78.57 78.57 97.00 102.00
83. EGG (PER 100 NOS. )
1. Madras Medium 62.00 75.00 66.00 85.00 80.00 68.002. Cuddalore Medium 64.00 60.00 65.00 70.00 65.00 65.00
3. Salem Medium 60.00 75.00 75.CO- 85.00 80.00 70.004. Krishnagiri Medium 65.00 70.00 72. 00 0.00 85.00 67.00
5. Vellore Medium 70.00 75.00 80.00 0.00, 80.00 80.006. Coimbatore Medium 63.00 80.00 68.00 80.00 70.00 72.00
7. T i ruch i rapa11i Medium 62.00 83.00 73.00 87.00 73.00 73.008. Thanjavur Medium 55.00 75.00 75.00 86.00 72.00 55.00
9. Madurai Medium 60.00 60.00 70.00 0.00 80.00 70.0010. TiruneI veil Medium 67.00 65.00 75.00 78.00 80.00 75.00
11. Udhagamandalam Medium 63.00 84.00 75.00 90.00 8o:oo 70.0012. Marthandam Medium 70.00 80.00 73.00 90.00 75.00 78.00
13. NagercoiI Medium 62.00 80.00 71.00 90.00 75.00 72.00
STATE AVERAGE 63.31 74.00 72.15 84.10 76.54 71.77
: 538 :

(Table 29.1 contd.)
(I) (2) (10) (11) (12) (13) (14) (15) (16)
81. PADDY STRAW1.2.
Pollachi T i ruchi rapalIi
80.000.00
80.000.00
80.000.00
0.000.00
0.0075.00
0.0075.00
70.0075.00
STATE AVERAGE 80.00
82 .80.00
RICE80.00
BRAN0.00 75.00 75.00 71.79
1.2.
MadrasT i ruchi rapalIi
100.00125.00
100.00104.16
100.00104.16
150.000.00
150.00104.00
130.00105.00
105.5994.45
STATE AVERAGE 112.50 102.08 102.08 150.00 127.00 117.50 100.26
1. 2.
MadrasCuddalore
83 .67.0065.00
EGG (PER78.0080.00
100 NOS. •
77.0080.00
)
85.000.00
77.0080.00
720.000.00
120.3369.40
3.4.
SalemKrishnagiri
0.0065.00
80.0070.00
80.0075.00
82.000.00
82.0085.00
75.0085.00
76.7373.90
5.6,
Vellore Coimbatore
80.0073.00
80.0085.00
75.0080.00
80.000.00
80.0090.00
80.0085.00
80.3676.91
7.8.
T i ruchi rapal11
Thanjavur Medium62.0055.00
83.0075.00
73.0075.00
87.0086.00
73.0072.00
73.0055.00
9.10..
MaduraiTirunelyeli
MediumMediutp
60.00 . ^7.Q0
60.0065.0.0
70.00 7!5.QO .
0.00 78..00 .
80.00.80,00.
70.00 . . 75..OQ
11.12.
UdhagamandalamMarthandam
Medi um Med i um
63.0070.00
84.0080.00
75.0073.00
90.0090.00
80.0075.00
70.0078.00
13. NagercoiI Medium 62.00 80.00 71.00 90.00 75.00 72.00
STATE AVERAGE 63.31 74.00 72.15 84.10 76.54 71.77
: 5 3 9 :
342/27-71

(Table 29.1 contd.)
(1) (2) (3) (4) (5) (6) (7) (8) (9)
84 . EGG (PER 1 0 0 )
1. Madras Duck 0.00 95.00 90.00 0.00 125.00 110.002. Cuddalore Duck 0.00 0.00 0.00 0.00 0.00 0.00
3. Salem Duck 0.00 0.00 0.00 0.00 0.00 0.004, Krishnagiri Duck 0.00 0.00 0.00 0.00 0.00 0.00
5. Veltore Duck 0.00 0.00 0.00. 0.00 0.00 0.006. Coint»atore Duck 150.00 150.00 150.00 0.00 90.00 90.00
7. T i ruch i rapa11i Duck 0.00 0.00 0.00 0.00 0.00 0.008. Thanjavur Duck 0.00 0.00 0.00 0.00 0.00 0.009. Madurai Duck 90.00 90.00 90.00 0.00 90.00 90.0010. T i runelveli Duck 0.00 0.00 0.00 0.00 0.00 0.00
11. UdhagamandaI am Duck 0.00 0.00 0.00 0.00 0.00 0.0012. Marthandam Duck 105.00 105.00 105.00 110.00 120.00 120.00
13. NagercoiI Duck 115.00 115.00 V5.00 118.00 115.00 115.00
STATE AVERAGE 115.00 111.00 110.00 114.00 106.00 105.00
85. TANNED COW HIDE1. Madras Tan C. Hide Dang 132.30 121.20 121.20 121.20 121.20 121.20
STATE AVERAGE 132.30 121.20 121 20. 121 20 121 20 121 20
86. TANNED COW HIDE1. Madras Tan C. Hide Expo 143.33 125.69 125.69 125.69 132.30 132.30
STATE AVERAGE 143.33 125.69 125.69 125.69 132.30 132.30
; 540 :
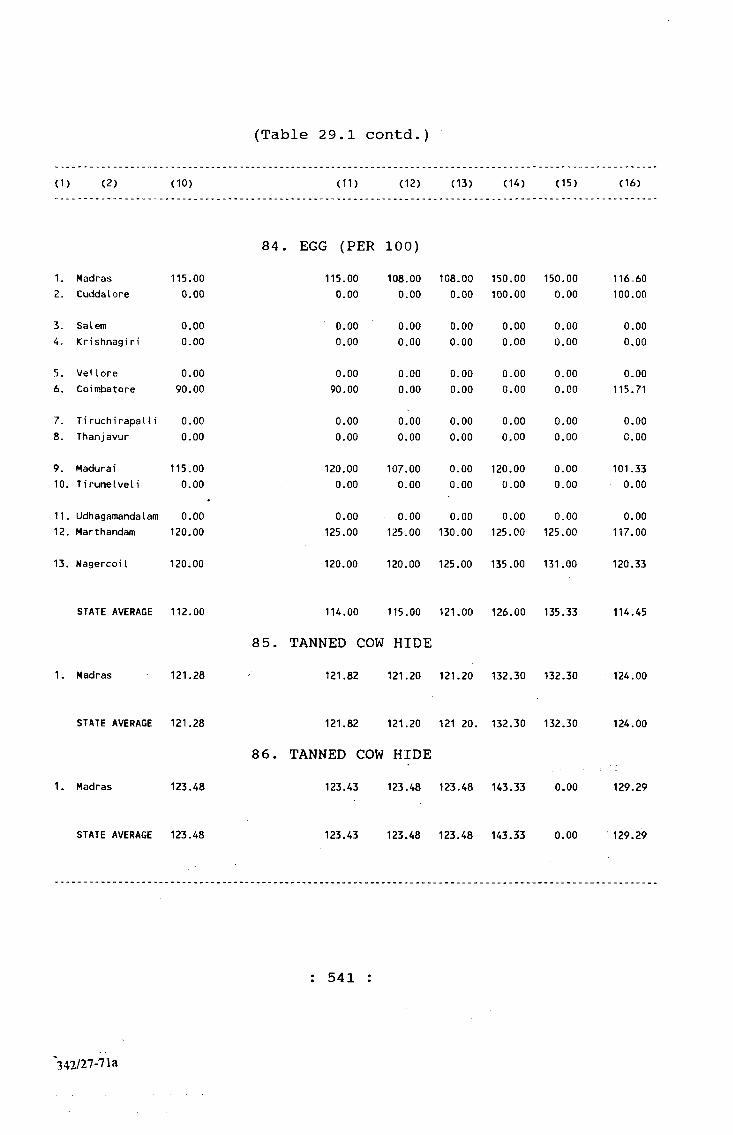
(Table 29.1 contd.)
<1) (2) (10) (11) (12) (13) (14) (15) (16)
84 . EGG (PER 1 0 0 )
1. Madras 115.00 115.00 108.00 108.00 150.00 150.00 116,602. Cuddalore 0.00 0.00 0.00 0.00 100.00 0.00 100.00
3. Salem 0.00 0.00 0.00 0.00 0.00 0,00 0.004. Krishnagiri 0.00 0.00 0.00 0.00 0.00 0,00 0.00
5. Vellore 0.00 0.00 0.00 0.00 0.00 0.00 0.006. Coimbatore 90.00 90.00 0.00 0.00 0.00 0.00 115.71
7. T i ruch i rapa11i 0.00 0.00 0.00 0.00 0.00 0,00 0.008. Thanjavur 0.00 0.00 0.00 0.00 0.00 0.00 0.00
9. Madurai 115.00 120.00 107.00 0.00 120.00 0.00 101.3310. T i rune IveIi 0.00 0.00 0.00 0.00 0.00 0.00 0.00
11. Udhagamandalam 0.00 0.00 0.00 0.00 0.00 0.00 0.0012. Marthandam 120.00 125.00 125.00 130.00 125.00 125.00 117.00
13. NagercoiI 120.00 120.00 120.00 125.00 135.00 131.00 120.33
STATE AVERAGE 112.00 114.00 115.00 121.00 126.00 135.33 114.45
85. TANNED COW HIDE1. Madras 121.28 121.82 121.20 121.20 132.30 132.30 124.00
STATE AVERAGE 121,28 121.82 121.20 121 20. 132.30 132.30 124.00
86. TANNED COW HIDE1. Madras 123.48 123.43 123.48 123.48 143.33 0.00 129.29
STATE AVERAGE 123.48 123.43 123.48 123.48 143.33 0.00 129.29
: 541 :
'342/27-71a
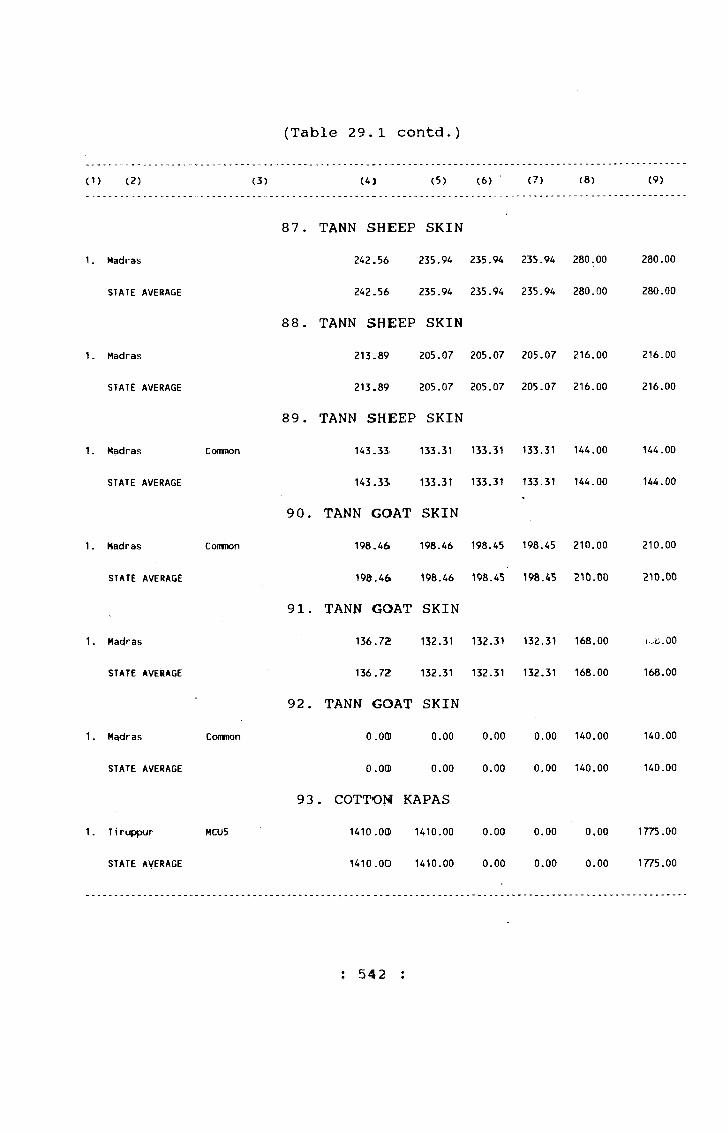
(Table 29.1 contd.)
(1) (2) (3) (4) (5) (6) (7) (8) (9)
87 . TANN SHEEP SKIN1. Madras 242.56 235.94 235.94 235.94 280.00 280.00
STATE AVERAGE 242.56 235.94 235.94 235.94 280.00 280.00
88 . TANN SHEEP SKIN1. Madras 213.89 205.07 205.07 205.07 216.00 216.00
STATE AVERAGE 213.89 205.07 205.07 205.07 216.00 216.00
89 . TANN SHEEP SKIN1. Madras CcMTmon 143.3S 133.31 133.31 133.31 144.00 144.00
STATE AVERAGE 143.33- 133.31 133.31 133.31 144.00 144.00
90, TANN GOAT SKIN1. Madras Ccmmon 198.46 198.46 198.45 198.45 210.00 210.00
STATE AVERAGE 198.46 198.46 198.45 198.45 210.00 210.00
91. TANN GOAT SKIN1. Madras 136.72 132.31 132.31 132.31 168.00 1 . 00
STATE AVERAGE 136.72 132.31 132.31 132.31 168.00 168.00
92. TANN GOAT SKIN1. Madras Conwnon 0.00 0.00 0.00 0.00 140.00 140.00
STATE AVERAGE a. 00) 0.00 0.00 0.00 140.00 140.00
93 . COTTOM KAPAS1. Tiruppur MCU5 1410.00 1410.00 0.00 0.00 0,00 1775.00
STATE AVERAGE 1410.00 1410.00 0.00 0.00 0.00 1775.00
: 542 :
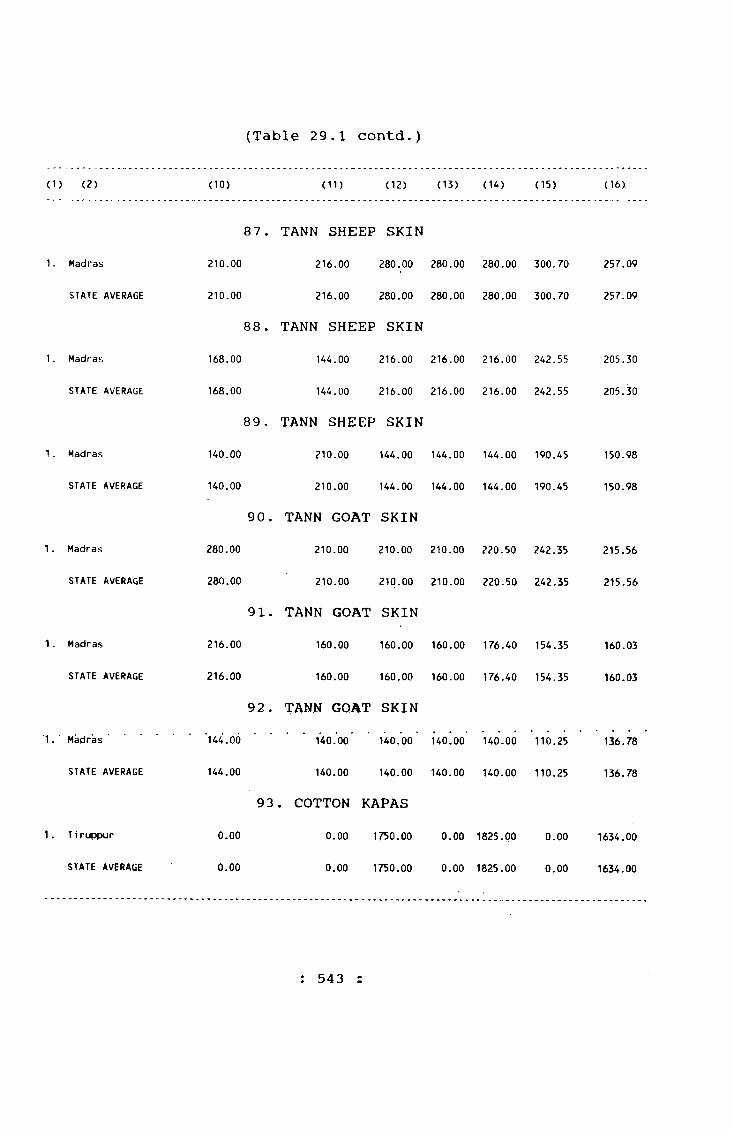
(Table 29.1 contci.)
(1) (2) (10) (11) (12) (13) (14) (15) (16)
87. TANN SHEEP SKIN1. Madras 210.00 216.00 280.00 280.00 280.00 300.70 257.09
STATE AVERAGE 210.00 216.00 280.00 280.00 280.00 300.70 257.09
88. TANN SHEEP SKIN1. Madras 168.00 144.00 216.00 216.00 216.00 242.55 205.30
STATE AVERAGE 168.00 144.00 216.00 216.00 216.00 242.55 205.30
89. TANN SHEEP SKIN1. Madras UO.OO 210.00 144.00 144.00 144.00 190.45 150.98
STATE AVERAGE 140.00 210.00 144.00 144.00 144.00 190.45 150.98
90. TANN GOAT SKIN1. Madras 280.00 210.00 210.00 210.00 220.50 242.35 215.56
STATE AVERAGE 280.00 210.00 210.00 210.00 220.50 242.35 215.56
91. TANN GOAT SKIN1. Madras 216.00 160.00 160.00 160.00 176.40 154.35 160.03
STATE AVERAGE 216.00 160.00 160.00 160.00 176.40 154.35 160.03
92. TANN GOAT SKIN'1. Madras 144.00 140.00 140.00 140.00 140.00 110.25 136.78
STATE AVERAGE 144.00 140.00 140.00 140.00 140.00 110.25 136.78
93, COTTON KAPAS1. T i ruppur 0.00 0.00 1750.00 0.00 1825.00 0.00 1634.00
STATE AVERAGE 0.00 0.00 1750.00 0.00 1825.00 0.00 1634.00
: 543 :

(Table 23,1 contd.)
(I) (2) (3) (4) (5) (6) (7) (8) (9)
94. COTTON KAP1. Salem mc45 Sort II 0.00 0.00 0.00 0,00 0.00 0.002. PoUachi I I 0.00 0.00 0.00 0.00 0.00 0.003. T i ruppur I I 0.00 1300.00 0.00 0.00 0.00 1675.004. Tuticor in I I 1300.00 1300.00 1230.00 0.00 0.00 0.00
STATE AVERAGE 1300.00 1300.00 1230.00- 0.00 0.00 1675.00
95. COTTON KAP LRA1. Vi rudhunagar Cotton kaps LRA 0.00 0.00 0.00 0.00 0.00 0.00
STATE AVERAGE 0.00 0.00 0.00 0.00 0.00 0.00
96. COTTON LINT1. Pollachi MCU5 Sort I 0.00 0.00 0.00 0.00 0.00 0.002. T i ruppur MCU5 Sort I 2949.43 2949.43 2949.43 0.00 0.00 5150.00
STATE AVERAGE 2949.43 2949.43 2949.43 0.00 0.00 5150.00
97. COTTON LINT1. T i ruppur MCU5 Sort II 2780.89 2780.89 0.00 0.00 0.00 0.00
STATE AVERAGE 2780.89 2780.89 0.00 0.00 0.00 0.00
98. COTTON LINT1. Vi rudhunagar Lashmi 0.00 0.00 0.00 0.00 0.00 3511.23
STATE AVERAGE 0.00 0.00 0.00 0.00 0.00 3511.23
99. COIR YARN1. Madras Coir yarn 0.00 0.00 0.00 0.00 0.00 0.002. Tuticorin Coir yarn 0.00 0.00 0.00 0.00 0.00 0.003. Nagercoil Coir Yarn 0.00 0.00 0.00 0.00 0.00 0.00
STATE AVERAGE 0.00 0.00 0.00 0.00 0.00 0.00
: 544 :
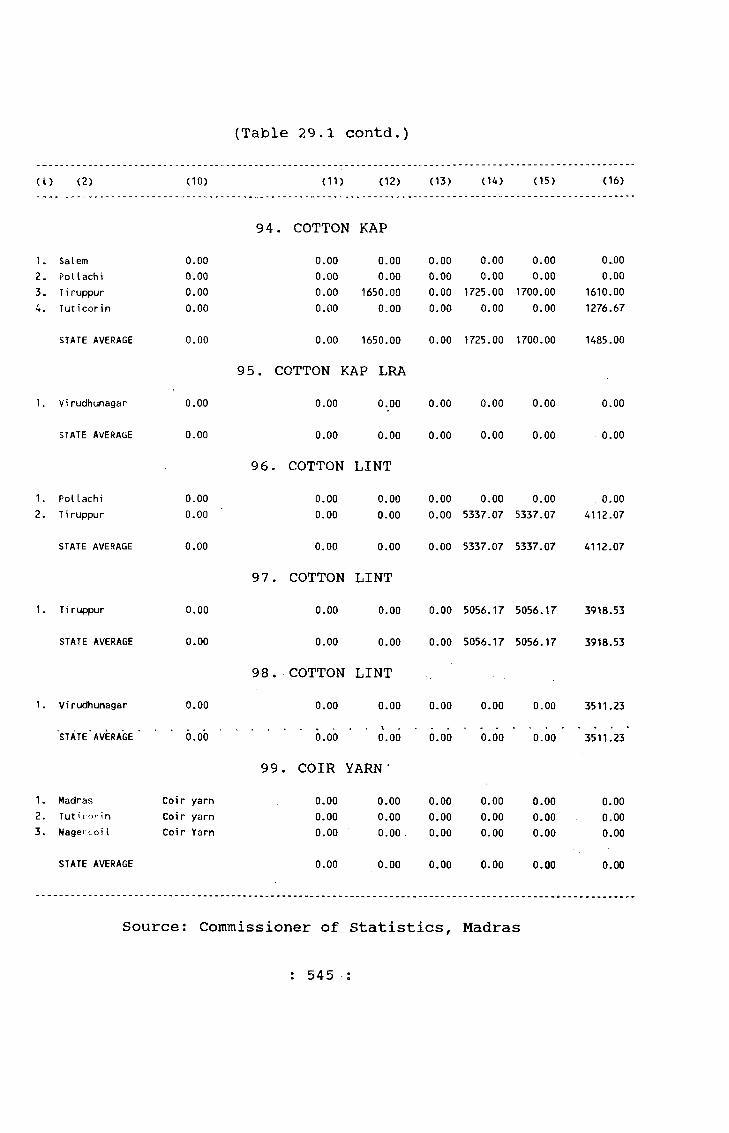
(Table 29.1 contd.)
(i) (2) (10) (11) (12) (13) (U) (15) (16)
94. COTTON KAP1. Salem 0.00 0.00 0.00 0.00 0.00 0.00 0.002. Pollachi 0.00 0.00 0.00 0.00 0.00 0.00 0.003. T i ruppur 0.00 0.00 1650.00 0.00 1725.00 1700.00 1610.004. Tuticorin 0.00 0.00 0.00 0.00 0.00 0.00 1276.67
STATE AVERAGE 0.00 0.00 1650.00 0.00 1725.00 1700.00 1485.00
95. COTTON KAP LRA1. Vi rudhunagar 0.00 0.00 0.00 0.00 0.00 0.00 0.00
STATE AVERAGE 0.00 0.00 0.00 0.00 0.00 0.00 0.00
96. COTTON LINT1. Pollachi 0.00 0.00 0.00 0.00 0.00 0.00 0.002. T i ruppur 0.00 0.00 0.00 0.00 5337.07 5337.07 4112.07
STATE AVERAGE 0.00 0.00 0.00 0.00 5337.07 5337.07 4112.07
97. COTTON LINT1. T i ruppur 0.00 0.00 0.00 0.00 5056.17 5056.17 3918.53
STATE AVERAGE 0.00 0.00 0.00 0.00 5056.17 5056.17 3918.53
98. COTTON LINT1. Vi rudhunagar 0.00 0.00 0.00 0.00 0.00 0.00 3511.23
STATE AVERAGE 0.00 0.00 0.00 0.00 0.00 0.00 3511.23
99. COIR YARN-1. Madras Coir yarn 0.00 0.00 0.00 0.00 0.00 0.002. Tut'rorin Coi r yarn 0.00 0.00 0.00 0.00 0.00 0.003. NagercoiI Coir Yarn 0.00 0.00 0.00 0.00 0.00 0.00
STATE AVERAGE 0.00 0.00 0.00 0.00 0.00 0.00
Source; Commissioner of Statistics, Madras
545 ;
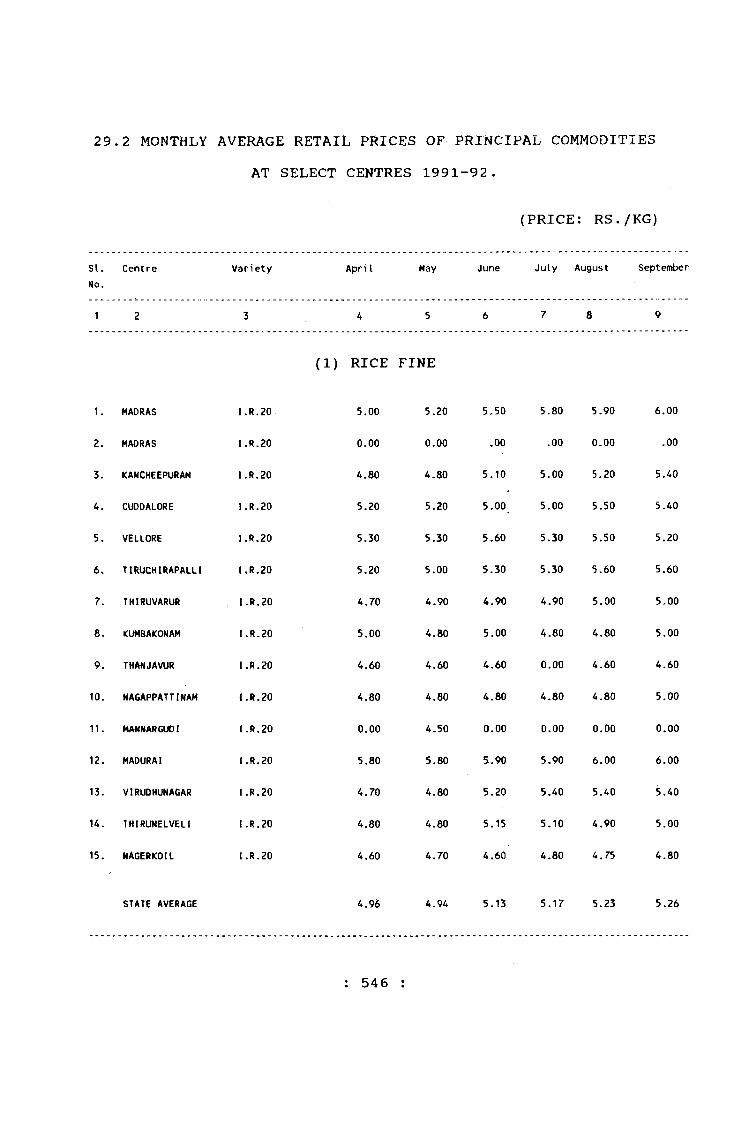
29.2 MONTHLY AVERAGE RETAIL PRICES OF PRINCIPAL COMMODITIESAT SELECT CENTRES 1991 -92 .
(PRICE : RS. /KG)
SI.No.
Centre Variety Apri I May June July August September
1 2 3 4 5 6 7 8 9
(1) RICE FINE
1. MADRAS I.R.20 5.00 5.20 5.50 5.80 5.90 6.00
2. MADRAS I.R.20 0.00 0.00 .00 .00 0.00 .00
3. KAMCHEEPURAM I.R.20 4.80 4.80 5.10 5.00 5.20 5.40
4. CUODALORE I.R.20 5.20 5.20 5.00 5.00 5.50 5.40
5. VELLORE I.R.20 5,30 5.30 5.60 5.30 5.50 5.20
6. TIRUCHIRAPALLI I.R.20 5.20 5.00 5.30 5.30 5.60 5.60
7. THIRUVARUR , I.R.20 4.70 4.90 4.90 4.90 5.00 5.00
8. ICUMBAKONAM I.R.20 5.00 4.80 5.00 4.80 4.80 5.00
9. THANJAVUR I.R.20 4.60 4.60 4.60 0.00 4.60 4.60
to. NAGAPPATTINAM I.R.20 4.80 4.80 4.80 4.80 4.80 5.00
11. MANNARGUDI I.R.20 0.00 4.50 0.00 0.00 0.00 0.00
12. MADURAI I.R.20 5.80 5.80 5.90 5.90 6.00 6.00
13. VIRUDHUNAGAR I.R.20 4.70 4.80 5.20 5.40 5.40 5.40
14. THIRUNELVELI I.R.20 4.80 4.80 5.15 5.10 4.90 5.00
15. NAGERKOIL I.R.20 4.60 4.70 4.60 4.80 4.75 4.80
STATE AVERAGE 4.96 4.94 5.13 5.17 5.23 5.26
: 54 6 :
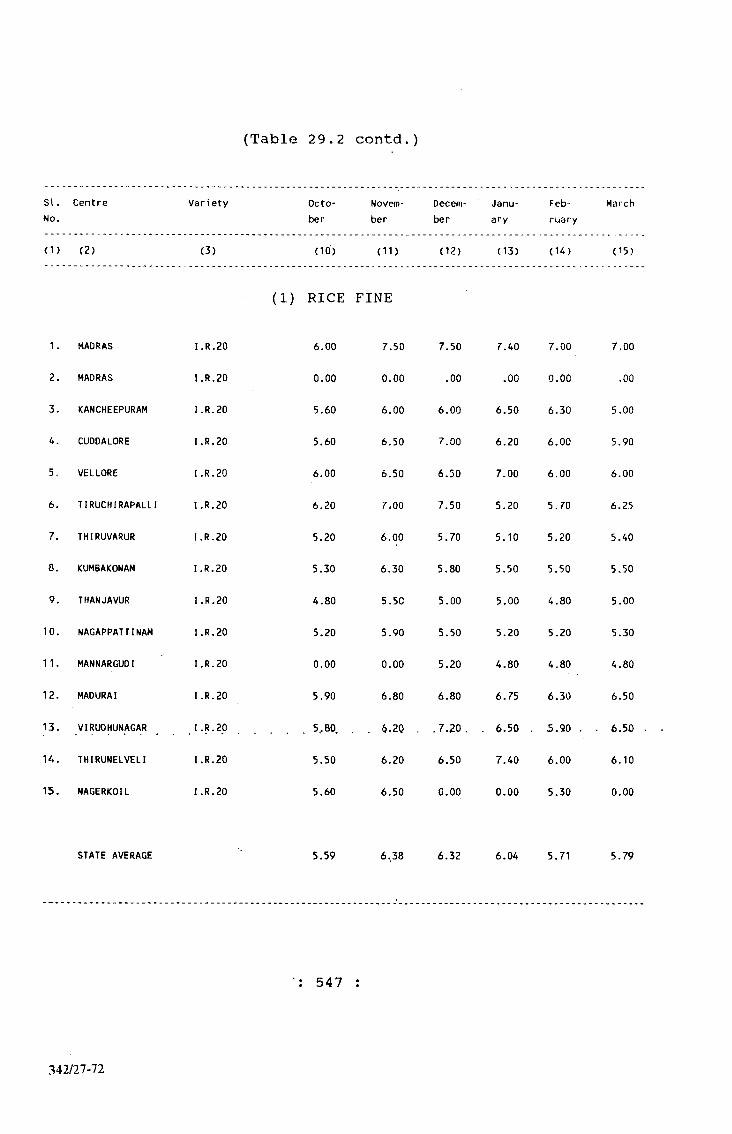
(Table 29.2 contd.)
s i . Centre No.
Variety Octo
berNovem
ber
Decem
ber
January
February
March
(1) (2) (3) (10) (11) (12) (13) (14) (15)
(1) RICE FINE
1. MADRAS I.R.20
2. MADRAS I.R.20
3. KANCHEEPURAM I.R.20
4. CUDDALORE I.R.20
5. VELLORE I.R.20
6. TIRUCHIRAPALLI I.R.20
7. THIRUVARUR I.R.20
8. KUMBAKONAM I.R.20
9. THANJAVUR I.R.20
10. NAGAPPATTINAM I.R.20
11. MANNARGUOI I.R.20
12. MADURAI I.R.20
13. VIRUDHUNAGAR .I-R-20
K . THIRUNELVELI I.R.20
15. NAGERKOIL I.R.20
6.00
0.00
5.60
5.60
6.00
6.20
5.20
5.30
4.80
5.20
0.00
5.90
5,. 80.
5.50
5.60
7.50
0.00
6.00
6.50
6.50
7.00
6.()0
6.30
5.50
5.90
0.00
6.80
^.20 .
6.20
6.50
7.50
.00
6.00
7.00
6.50
7.50
5.70
5.80
5.00
5.50
5.20
6.80
.7.20
6.50
0.00
7.40
.00
6.50
6.20
7.00
5.20
5.10
5.50
5.00
5.20
4.80
6.75
6.50 .
7.40
0.00
7.00
0.00
6.30
6.00
6.00
5.70
5.20
5.50
4.80
5.20
4.80
6.30
5.90
6.00
5.30
7.00
,00
5.00
5.90
6.00
6.25
5.40
5.50
5.00
5.30
4.80
6.50
. 6.50
6.10
0.00
STATE AVERAGE 5.59 6.38 6.32 6.04 5.71 5.79
547
342/27-72

(Table 29.2 contd.)
(1) (2) (3) (4) (5) (6) (7) (8) (9)
(2) RICE COMMON
1. MADRAS ROSE KAR
2. KANCHEEPURAM TKM-9
3 CUDDALORE TKM-9
U . CHIDAMBARAM TKM-9
5. VELLORE TKM-9
6. SALEM SAMOA
7. COIMBATORE KANCHI
8. TIRUCHIRAPALLI CR.1009
9. THIRUVARUR CR.1009
10. KUMBAKONAM CR.1009
11. THANJAVUR CR.1009
12. NAGAPPATTINAM CR.1009
13. MANNARGUDI CR.1009
14. MADURAI CR.1009
15. VIRUDHUNAGAR ROSEKAR
16. THIRUNELVELI ASD-16
17. NAGERKOIL SAMBA
4.50
4.20
4.60
4.30
4.80
5.00
0.00
4.20
4.10
4.20
4.20
4.20
3.80
0.00
4.30
4.20
4.30
4.50
4.50
4.40
4.30
4.80
5.00
0.00
4.50
4.10
4.10
4.20
4.20
4.00
0.00
4.50
4.45
4.90
4.80
4.60
0.00
4.30
5.00
5.00
0.00
4.50
4.00
4.20
4.20
4.20
3.80
0.00
4.80
4.80
4.70
5.20
4.70
0.00
0.00
4.70
4.90
5.20
4.30
4.00
4.20
0.00
4.20
3.90
0.00
4.80
4.60
4.90
5.40
5.00
0.00
4.70
5.20
5.10
5.20
4.50
4.00
4.30
4.20
4.20
4.00
0.00
5.00
4.40
5.00
5.50
6.20
0.00
4.60
5.10
5.25
5.70
4.80
4.30
4.50
4.40
4.30
4.00
0.00
5.00
4.75
5.20
STATE AVERAGE 4.33 4.43 4.49 4.58 4.68 4.91
: 548 :
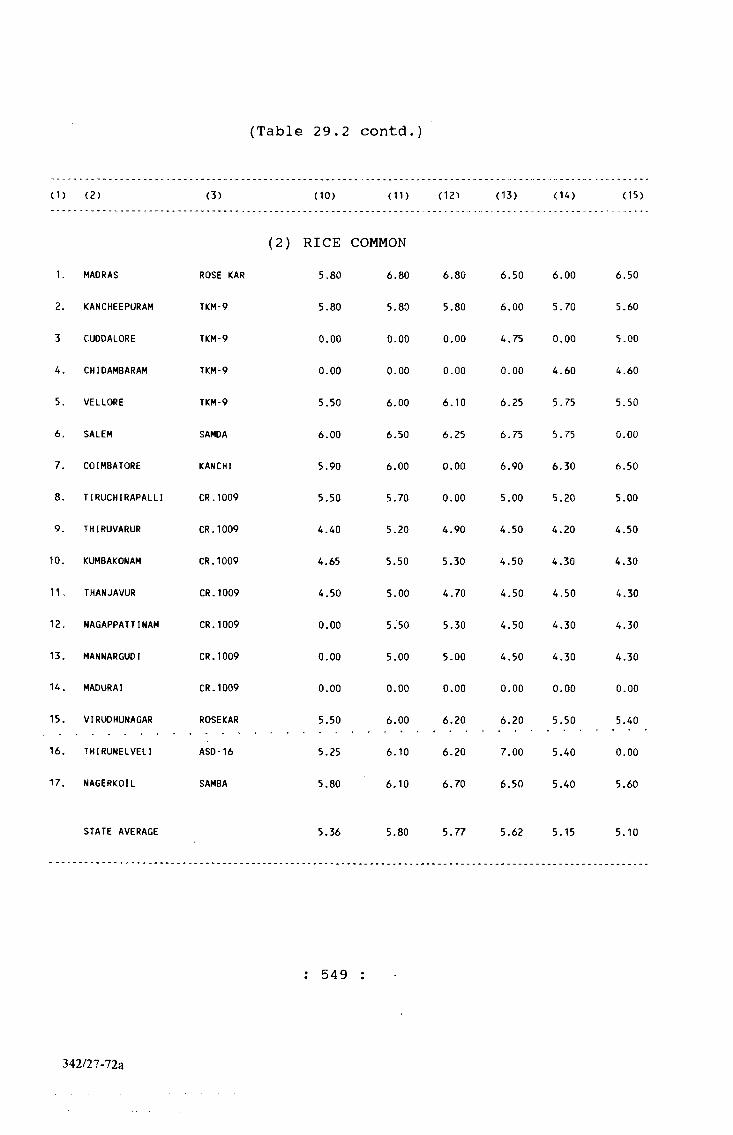
(Table 29.2 contd.
(1) (2) (3) (10) (11) (12) (13)
1. MADRAS ROSE KAR
2. KANCHEEPURAM TKM-9
3 CUDDALORE TKM-9
4. CHIDAMBARAM TKM-9
5. VELLORE TKM-9
6. SALEM SAMDA
7. COIMBATORE KANCHI
8. TIRUCHIRAPALLI CR.1009
9. THIRUVARUR CR.1009
10. KUMBAKONAM CR.1009
11, THANJAVUR CR.1009
12, NAGAPPATTINAM CR.1009
13. MANNARGUOI CR.1009
U . MADURAI CR.1009
15. VIRUDHUNAGAR ROSEKAR
(2) RICE COMMON5.80 6.80 6.80
5.80 5.80 5.80
0.00 0.00 0.00
0.00 0.00 0.00
5.50 6.00 6.10
6.00 6.50 6.25
5.90 6.00 0.00
5.50 5.70 0.00
4.40 5.20 4.90
4.65 5.50 5.30
4.50 5.00 4.70
0.00 5.'50 5.30
0.00 5.00 5.00
0.00 0.00 0.00
5.50 6.00 6.20
6.50
6.00
4.75
0.00
6.25
6.75
6.90
5.00
4.50
4.50
4.50
4.50
4.50
0.00
6.20
(14)
6.00
5.70
0.00
4.60
5.75
5.75
6.30
5.20
4.20
4.30
4.50
4.30
4.30
0.00
5.50
(15)
6.50
5.60
5.00
4.60
5.50
0.00
6.50
5.00
4.50
4.30
4.30
4.30
4.30
0.00
5.40
16. THIRUNELVELI ASD-16 5.25 6.10 6.20 7.00 5.40 0.00
17. NAGERKOIL SAMBA 5.80 6.10 6.70 6.50 5.40 5.60
STATE AVERAGE 5.36 5.80 5.77 5.62 5.15 5.10
: 549
342/27-72a

(Table 29.2 contd.)
(1) (2) (3) (4) (5) (6) (7) (8) (9)
(3) WHEAT
1. MADRAS WHEAT WHITE 4.40 4.40 5.00 5.00 5.00 5.00
STATE AVERAGE 4.40
(4) ATTA
4.40 5.00 5.00 5.00 5.00
MADRAS ATTA 3.85 3.85 3.85 4.25 5.11 5.11
STATE AVERAGE 3.85
(5) RAVA
3.85 3.85 4.25 5.11 5.11
1. MADRAS RAVA 4.80 4.80 5.16 6.00 5.56 5.56
STATE AVERAGE 4.80
(6) MAIDA
4.80 5.16 6.00 5.56 5.5^
1. MADRAS MAI DA 0.00 4.35 4.62 5.00 4.00 4.80
STATE AVERAGE 0.00 4.35 4.62 5.00 4.00 4.80
; 550 ;
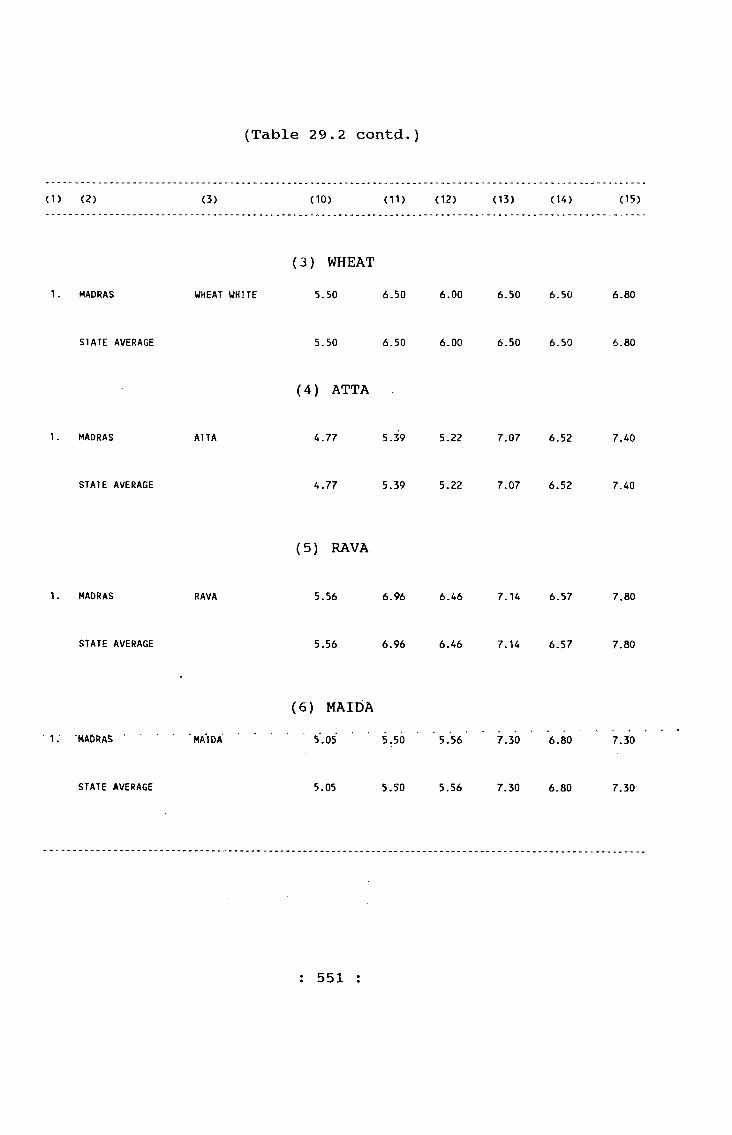
(Table 29.2 contcl.)
( 1) ( 2 ) (3) (10) (11) (12) (13) (U) (15)
1. MADRAS
(3) WHEATWHEAT WHITE 5.50 6.50 6.00 6.50 6.50 6.80
STATE AVERAGE 5.50 6.50 6.00 6.50 6.50 6.80
(4) ATTA
1. MADRAS ATTA 4.77 5.39 5.22 7.07 6.52 7.40
STATE AVERAGE 4.77 5.39 5.22 7.07 6.52 7.40
(5) RAVA
1. MADRAS RAVA 5.56 6.96 6.46 7.14 6.57 7.80
STATE AVERAGE 5.56 6.96 6.46 7.14 6.57 7.80
1. MADRAS MAI DA
(6) MAIDA5.05 ■ ■ 5.50 ‘ '5.’5 6 ‘ 7.30 6.80 7.30
STATE AVERAGE 5.05 5.50 5.56 7.30 6.80 7.30
: 551 :
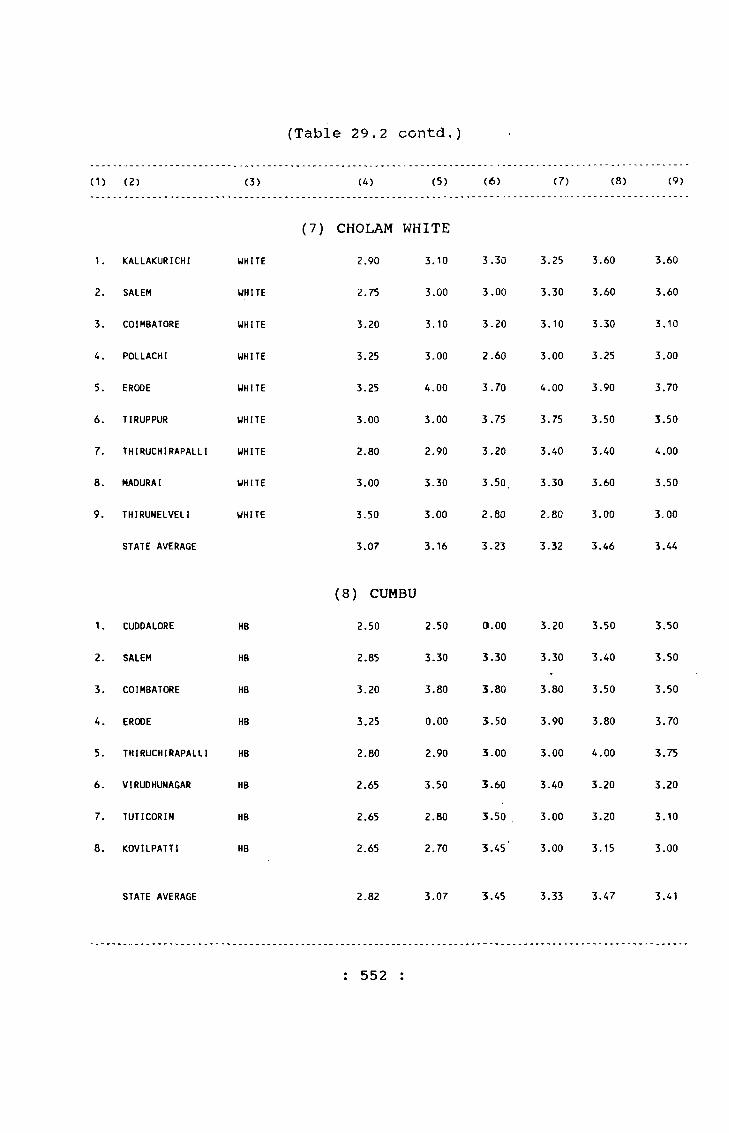
(Table 29.2 contd.)
( 1) ( 2) (3) (4) (5) (6) (7) (8) (9)
1. KALLAKURICHI WHITE
2. SALEM WHITE
3. COIMBATORE WHITE
4. POLLACHl WHITE
5. ERODE WHITE
6. TIRUPPUR WHITE
7. THIRUCHIRAPALLI WHITE
8. MADURAI WHITE
9. THIRUNELVELI WHITE
STATE AVERAGE
(7) CHOLAM WHITE2.90 3.10 3.30 3.25 3.60 3.60
2.75 3.00 3.00 3.30 3.60 3.60
3.20 3.10 3.20 3.10 3.30 3.10
3.25 3.00 2.60 3.00 3.25 3.00
3.25 4.00 3.70 4.00 3.90 3.70
3.00 3.00 3.75 3.75 3.50 3.50
2.80 2.90 3.20 3.40 3.40 4.00
3.00 3.30 3.50. 3.30 3.60 3.50
3.50 3.00 2.80 2.80 3.00 3.00
3.07 3.16 3.23 3.32 3.46 3.44
1. CUDDALORE HB
2. SALEM HB
3. COIMBATORE HB
4. ERODE HB
5. THIRUCHIRAPALLI HB
6. VIRUDHUNAGAR HB
7. TUT I COR IN HB
8. KOVILPATTI HB
(8) CUMBU2.50 2.50
2.85
3.20
3.25
2.80
2.65
2.65
2.65
3.30
3.80
0.00
2.90
3.50
2.80
2.70
0.00
5.30
3.80
3.50
3.00
3.60
3.50
3.45'
3.20
3.30
3.80
3.90
3.00
3.40
3.00
3.00
3.50
3.40
3.50
3.80
4.00
3.20
3.20
3.15
3.50
3.50
3.50
3.70
3.75
3.20
3.10
3.00
STATE AVERAGE 2.82 3.07 3.45 3.33 3.47 3.41
: 552 :
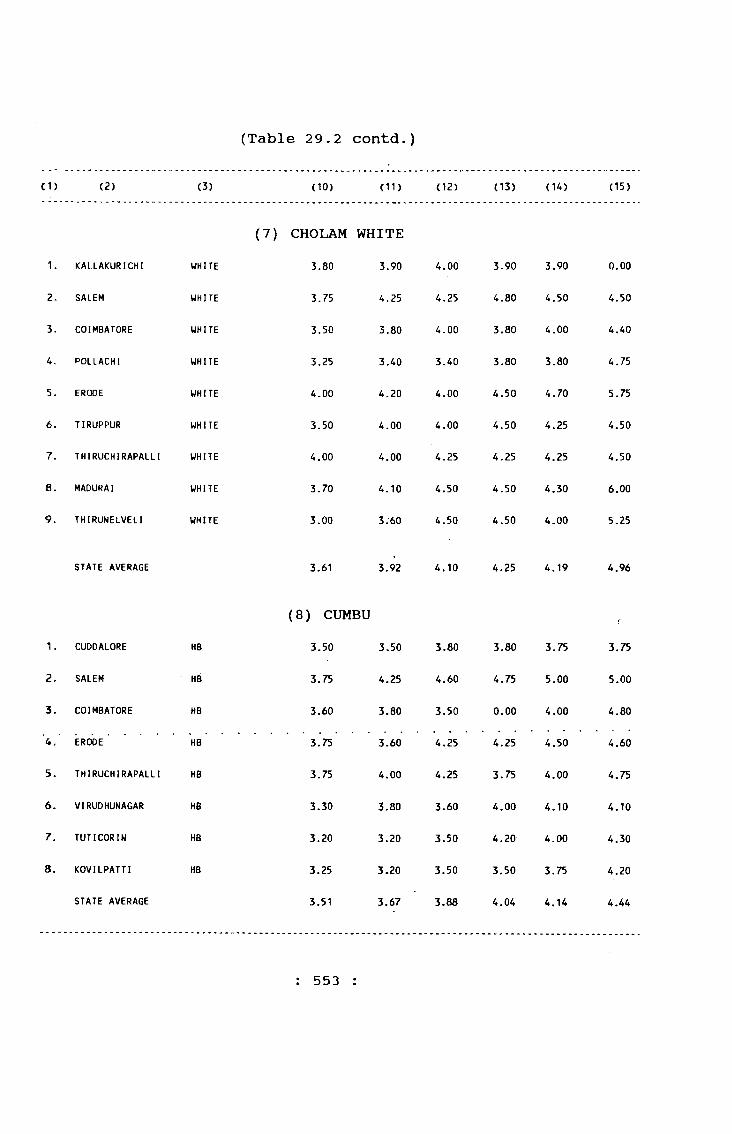
(Table 29.2 contd.)
CD (2 ) (3) ( 10) (11) (12) (13) (U) (15)
1. KALLAKURICHI WHITE
2. SALEM WHITE
3. COIMBATORE WHITE
4. POLLACHI WHITE
5. ERODE WHITE
6 . TIRUPPUR WHITE
7. THIRUCHIRAPALLI WHITE
8. MADURAI WHITE
9. THIRUNELVELI WHITE
(7) CHOLAM WHITE3.80 3.90 4.00 3.90 3.90 0.00
3.75 4.25 4.25 4.80 4.50 4.50
3.50 3.80 4.00 3.80 4.00 4.40
3.25 3.40 3.40 3.80 3.80 4.75
4.00 4.20 4.00 4.50 4.70 5.75
3.50 4.00 4.00 4.50 4.25 4.50
4.00 4.00 4.25 4.25 4.25 4.50
3.70 4.10 4.50 4.50 4.30 6.00
3.00 3;60 4.50 4.50 4.00 5.25
STATE AVERAGE 3.61 3.92 4.10 4.25 4.19 4.96
1. CUDDALORE HB
2. SALEM HB
3. COIMBATORE HB
4.‘ ERCOE HB
5. THIRUCHIRAPALLI HB
6. VIRUDHUNAGAR HB
7 . TUT I COR IN HB
8. KOVILPATTI HB
STATE AVERAGE
(8) CUMBU3.50 3.50
3.75 4.25
3.60 3.80
3.75 3.60
3.80
4.60
3.50
4.25
4.25
3.60
3.50
3.50
3.88
3.80
4.75
0.00
4.25
3.75
4.00
4.20
3.50
4.04
3.75
5.00
4.00
4.50
4.00
4.10
4.00
3.75
4.14
3.75
5.00
4.80
4.60
4.75
4.10
4.30
4.20
4.44
3.75
3.30
3.20
3.25
3.51
4.00
3.80
3.20
3.20
3.67
: 553 :
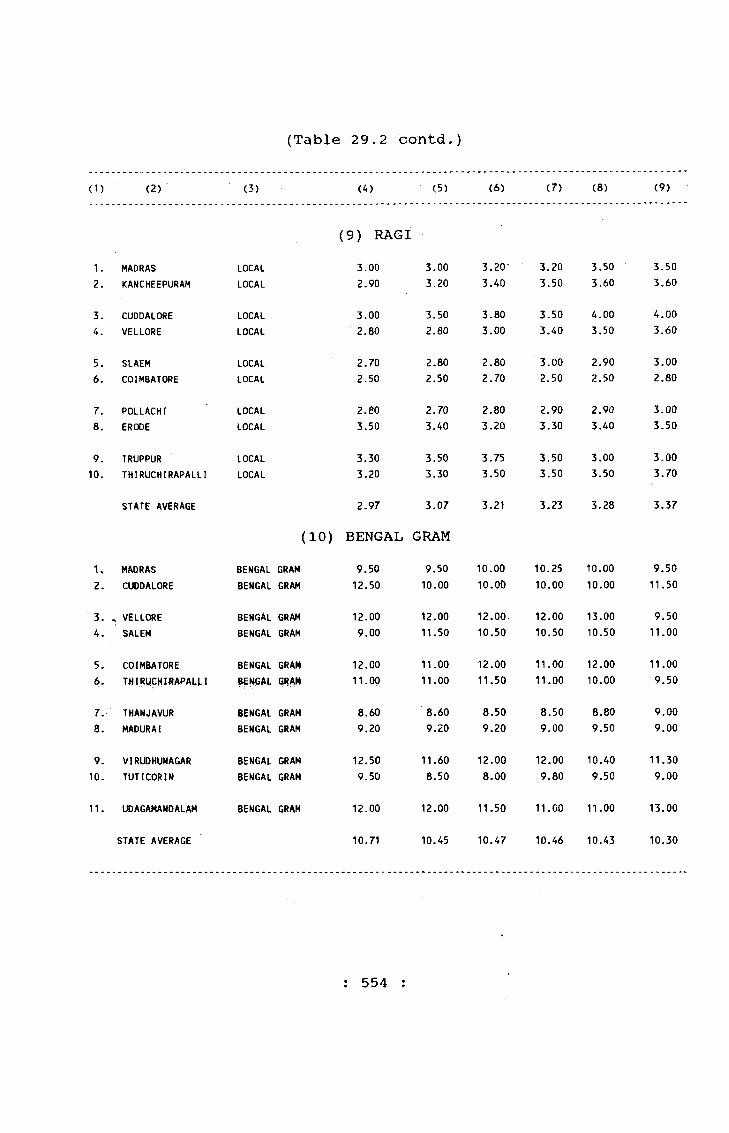
(Table 29.2 contd.)
(1) (2) ■ (3) (4) (5) (6) (7) (8) (9)
(9) RAGI1. MADRAS LOCAL 3.00 3.00 3.20- 3.20 3.50 3.502. KANCHEEPURAM LOCAL 2.90 3.20 3.40 3.50 3.60 3.60
3. CUDDALORE LOCAL 3.00 3.50 3.80 3.50 4.00 4.004. VELLORE LOCAL 2.80 2.80 3.00 3.40 3.50 3.60
5. SLAEM LOCAL 2.70 2.80 2.80 3.00 2.90 3.006. COIMBATORE LOCAL 2.50 2.50 2.70 2.50 2.50 2.80
7. POLLACHI LOCAL 2.80 2.70 2.80 2.90 2.90 3.008. ERODE LOCAL 3.50 3.40 3.20 3.30 3.40 3.50
9. TRUPPUR LOCAL 3.30 3,50 3.75 3.50 3.00 3.0010. THIRUCHIRAPALLl LOCAL 3.20 3.30 3.50 3.50 3.50 3.70
STATE AVERAGE 2.97 3.07 3.21 3.23 3.28 3.37
(10) BENGAL GRAM1. MADRAS BENGAL GRAM 9.50 9.50 10.00 10.25 10.00 9.502. CUDDALORE BENGAL GRAM 12.50 10.00 10.0{) 10.00 10.00 11.50
3. VELLORE BENGAL GRAM 12.00 12.00 12.00. 12.00 13.00 9.504. SALEM BENGAL GRAM 9.00 11.50 10.50 10.50 10.50 11.00
5. COIMBATORE BENGAL GRAM 12.00 11.00 12.00 11.00 12.00 11.006- thirughijiapalli ^MCAL GRAM 11.00 11.00 11.50 11.00 10.00 9.50
7. THANJAVUR BENGAL GRAM 8.60 8.60 8.50 8.50 8.80 9.008. MADURAI BENGAL GRAM 9.20 9.20 9.20 9.00 9.50 9.00
9. VIRUDHUNAGAR BENGAL GRAM 12.50 11.60 12.00 12.00 10.40 11.3010. TUT I COR IN BENGAL GRAM 9.50 8.50 8.00 9.80 9.50 9.00
11. UDAGAMANDALAM BENGAL GRAM 12.00 12.00 11.50 11.00 11.00 13.00
STATE AVERAGE 10.71 10.45 10.47 10.46 10.43 10.30
: 554 :
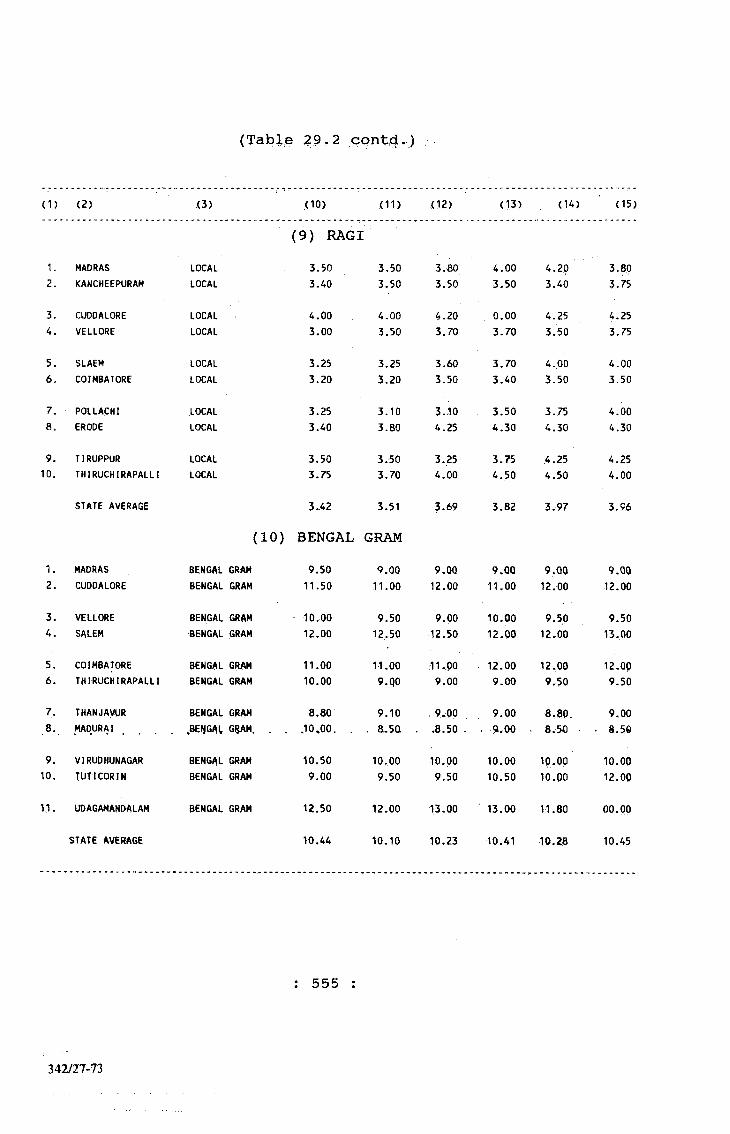
( T a b ^ e 2 9 , 2 c o n t d . )
(1) (2) (3) ,(10) -<11) (12) <13) (14) (15)
(9) R A G I
1. MADRAS LOCAL 3.50 3,50 3.60 4.00 4,20 3.802. KANCHEEPURAM LOCAL 3.40 3.50 3.50 3-50 3.40 3.75
3. CUODALORE LOCAL 4.00 4.00 4.20 0.00 4.25 4.254. VELLORE LOCAL 3.00 3.50 3.70 3.70 3.50 3.75
5. SLAEH LOCAL 3.25 3.25 3.60 3.70 4.00 4.006, COIMBATORE LOCAL 3.20 3.20 3.50 3.40 3.50 3.50
7. POiLACHI LOCAL 3.25 3.10 3.10 3.50 3.75 4,008. ERODE LOCAL 3.40 3.80 4.25 4.30 4.50 4.30
9. TIRUPPUR LOCAL 3.50 3.50 3.25 3.75 4.25 4.2510. THIRUCHIRAPALLI LOCAL 3.75 3,70 4.00 4.50 4.50 4.00
STATE AVERAGE 3.42 3.51 3.69 3.82 3,97 3.96
( 1 0 ) B E N G A L G R A M
1. MADRAS BENGAL GRAM 9.50 9.00 9.00 9.QQ 9.00 9.002. CUDDALORE BENGAL GRAM 11.50 11.00 12.00 11.00 12.00 12.00
3. VELLORE BENGAL GRAM 10.00 9.50 9.00 10.00 9-50 9.50A. SALEM BENGAL GRAM 12.00 12.50 12.50 12.00 12.00 13.00
5. COIMBATORE BENGAL GRAM 11.00 11.00 11,00 12.00 12,00 12.006. THIRUCHIRAPALLI BENGAL GRAM 10.00 9.Q0 9.00 9.00 9.50 9.50
7. THANJAVUR BENGAL GRAM 8.80 9.10 9.00 9.00 9.008. MADURAI .BEI GAt G?AM. . . .10,00. . . a.5Q ,. .8.50 . . 9.00 . 8.50 ■ . 8.56
9. VIRUDHUNAGAR BENGAL GRAM 10.50 10.00 Ip. 00 10,00 10.00 10.0010. TUT I COR I N BENGAL GRAM 9.00 9.50 9.50 10.50 10.00 12.00
1-1. UDAGAMANDALAM BENGAL GRAM 12.50 12.00 13.00 13.00 11.80 00.00
STATE AVERAGE 10.44 10.10 10.23 10.41 10.28 10.45
: 555
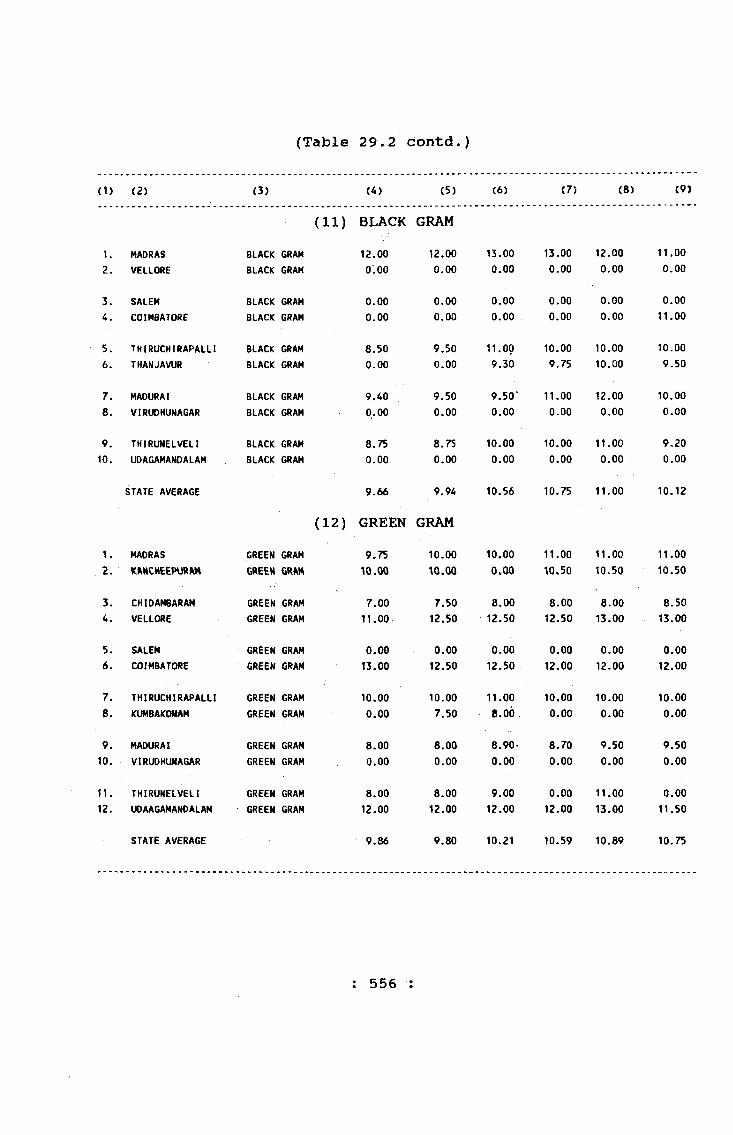
(Table 29.2 contd.)
(1) (2) (3) (4) (5) (6) (7) (8) (9)
( 1 1 ) BLACK GRAM1. MADRAS BLACK GRAM 12.00 12.00 13.00 13.00 12.00 11.002. VELLORE BLACK GRAM 0.00 0.00 0.00 0.00 0.00 0.00
3. SALEM BLACK GRAM 0.00 0.00 0.00 0.00 0.00 0.004. COIMBATORE BLACK GRAM 0.00 0.00 0.00 0.00 0.00 11.00
5. THIRUCHIRAPALL! BLACK GRAM 8.50 9.50 11.00 10.00 10.00 10.006. THANJAVUR BLACK GRAM 0.00 0.00 9.30 9.75 10.00 9.50
7. MADURAI BLACK GRAM 9.40 9.50 9.50' 11.00 12.00 10.008. VIRUDHUNAGAR BLACK GRAM 0..00 0.00 0.00 0.00 0.00 0.00
9. THIRUNELVELI BLACK GRAM 8.75 8.75 10.00 10.00 11.00 9.2010. UDAGAMANDALAM BLACK GRAM 0.00 0.00 0.00 0.00 0.00 0.00
STATE AVERAGE 9.66 9.94 10.56 10.75 11.00 10.12
(12) GREEN GRAM1. MADRAS GREEN GRAM 9.75 10.00 10.00 11.00 11.00 11,002. GREEK GRIkM 10.00 10.00 0.00 10.50 10.50 10.50
3. CHIDAMBARAM GREEN GRAM 7.00 7.50 8.00 8.00 8.00 8.504. VELLORE GREEN GRAM 11.00 12.50 12.50 12.50 13.00 13.00
5. SALEM GREEN GRAM 0.00 0.00 0.00 0.00 0.00 0.006. COIMBATORE GREEN GRAM 13.00 12.50 12.50 12.00 12.00 12.00
7. THIRUCHIRAPALLI GREEN GRAM 10.00 10.00 11.00 10.00 10.00 10.008. KLMBAKCMAM GREEN GRAM 0.00 7.50 8.00 . 0.00 0.00 0.00
9. MADURAI GREEN GRAM 8.00 8.00 8.90- 8.70 9.50 9.5010. VIRUDHUNAGAR GREEN GRAM 0.00 0.00 0.00 0.00 0.00 0.00
11. THIRUMELVELI GREEN GRAM 8.00 8.00 9.00 0.00 11.00 0.0012. UDAAGAMANDALAM GREEN GRAM 12.00 12.00 12.00 12.00 13.00 11.50
STATE AVERAGE 9.86 9.80 10.21 10.59 10.89 10.75
: 556 :
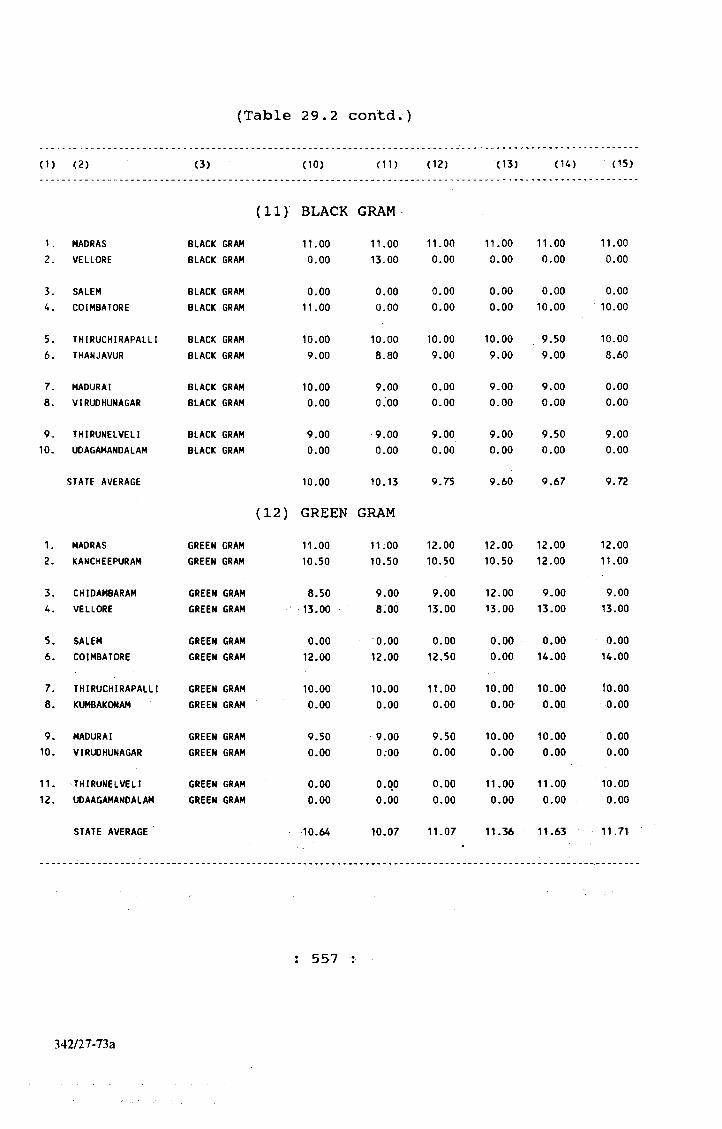
(Table 29.2 contd.)
(1) (2) (3) (10) (11) (12) (13) (14) (15)
( 1 1 ) BLACK GRAM1. MADRAS BLACK GRAM 11.00 11,00 11.00 11.00 11.00 11.002. VELLORE BLACK GRAM 0.00 13.00 0.00 0.00 0,00 0.00
3. SALEM BLACK GRAM 0.00 0.00 0.00 0.00 0.00 0.004. COIMBATORE BLACK GRAM 11.00 0.00 0.00 0.00 10.00 10.00
5. THIRUCHIRAPALLI BLACK GRAM 10.00 10.00 10.00 10.00 9.50 10.006. THANJAVUR BLACK GRAM 9.00 8.80 9.00 9.00 9.00 8.60
7. MADURAI BLACK GRAM 10.00 9.00 0,00 9.00 9.00 0.008. VIRUDHUNAGAR BLACK GRAM 0.00 O.'OO 0.00 0.00 0.00 0.00
9. THIRUNELVELI BLACK GRAM 9,00 9.00 9.00 9.00 9.50 9.0010. UDAGAMANDALAM BLACK GRAM 0.00 0.00 0.00 0.00 0.00 0.00
STATE AVERAGE 10.00 10.13 9.75 9.60 9.67 9.72
( 1 2 ) GREEN GRAM1. MADRAS GREEN GRAM 11.00 11.00 12.00 12.00 12.00 12.002. KANCHEEPURAM GREEN GRAM 10.50 10.50 10.50 10.50 12.00 11.00
3. CHIDAMBARAM GREEN GRAM 8.50 9.00 9.00 12.00 9.00 9.004. VELLORE GREEN GRAM 13.00 8.00 13.00 13.00 13.00 13.00
5. SALEM GREEN GRAM 0.00 0.00 0.00 0.00 0.00 0.006. COIMBATORE GREEN GRAM 12.00 12.00 12.50 0.00 14.00 14.00
7. THIRUCHIRAPALLI GREEN GRAM 10.00 10.00 11.00 10.00 10.00 10,008. KUMBAKONAM GREEN GRAM 0.00 0.00 0.00 0.00 0.00 0,00
9, MADURAI GREEN GRAM 9.50 9.00 9.50 10.00 10.00 0.0010. VIRUDHUNAGAR GREEN GRAM 0.00 0.00 0.00 0.00 0.00 0.00
11. THIRUNELVELI GREEN GfiAM 0.00 o.qo 0,00 11.00 11.00 10,0012, UDAAGAMANDALAM GREEN GRAM 0.00 0-00 0.00 0.00 0.00 0.00
STATE AVERAGE ' 10.64 10.07 11.07 11.36 11.63 11.71
: 557
342/2 7-73a
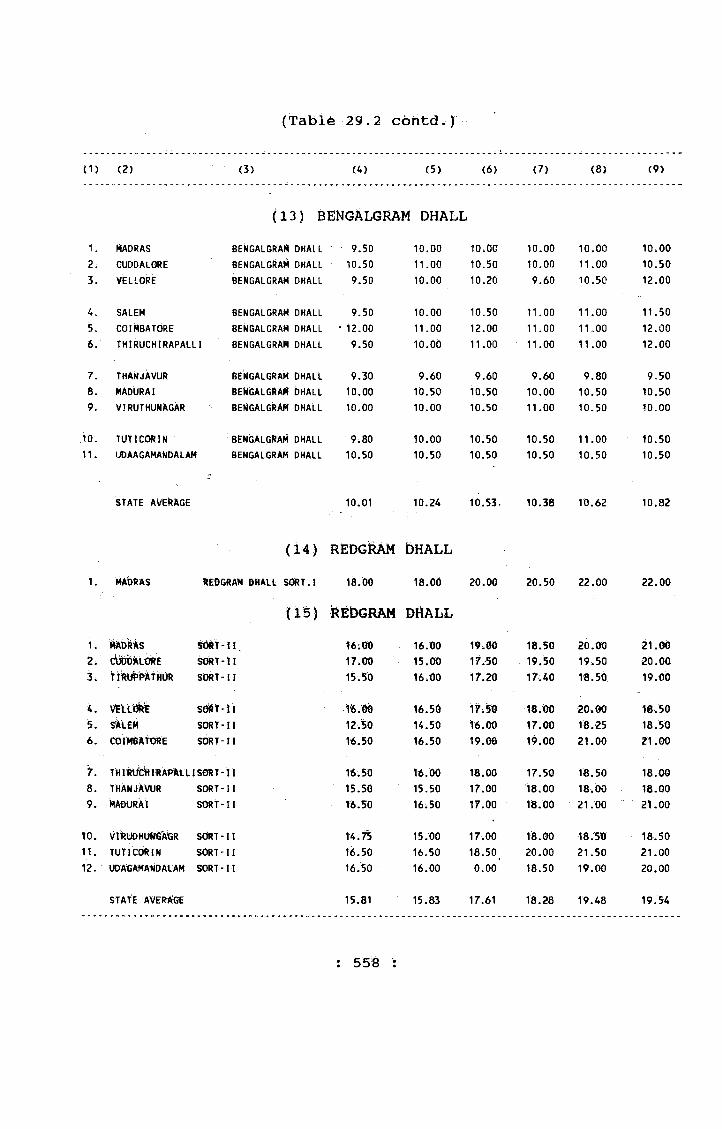
(Table 29.2 coiitd.J
t1) (2) (3) (4) (5) (6) (7) (8) (9)
(13) BENGALGRAM DHALL1. MADRAS BENGALGRAM DHALL 9.50 10.00 10.00 10,00 10.00 10.002. GUODALGRE BENGALGRAM DHALL 10.50 11.00 10.50 10.00 11.00 10,503. VELLORE ^ENGALGRAM DHALL 9.50 10.00 10.20 9.60 10.50 12.00
4. SALEM BENGALGRAM DHALL 9.50 10.00 10.50 11,00 11,00 11.505. COIMBATORE BENGALGRAM DHALL • 12.00 11.00 12.00 11.00 11.00 12.006. THIRUCHIRAPALLI BENdALGRAM OHALL 9.50 10.00 11.00 11,00 11.00 12.00
7. THAMJAVUR BENGALGRAM DHALL 9.30 9.60 9.60 9.60 9.80 9.508. MADURAI BENGALGRAM DHALL 10.00 10.50 10.50 10,00 10.50 10.509. VIRUTHUNAGAR BENGALGRAM DHALL 10.00 10.00 10,50 11.00 10.50 10.00
ID. TUT I COR IN BENGALGRAM DHALL 9.80 10.00 10.50 10,50 11.00 10,5011. UDAAGAMANDALAM BENGALGRAM DHALL 10.50 10.50 10.50 10.50 10.50 10.50
STATE AVERAGE 10.01 10.24 10.53. 10.38 10,62 10.82
(14) r e d g M m DHALLt. M dra s REDGRAM DHALL SQRT.l 18.00 18.00 20.00 20,50 22,00 22.00
US) DHALL1. iMAblAS SbRT-II, 16.00 16,00 19,00 18.50 20.00 21,002; S(»T-lI 17.00 15.00 17.50 19.50 19,50 20,00i . SORT-II 15.50 16.00 17.20 17.40 18.50 19.00
4. SQ«t-il lfe.00 16.50 17,50 18.00 20,00 16.505. S?M£M SORT-11 12.50 14.50 16,00 17.00 18,25 18,506. OOimAlORE SORT-II 16.50 16.50 19.00 19,00 21,00 21,007. T«1 Ruy«lRA1>Ait I SORT -11 16.50 16.00 18,00 17.50 18.50 18.008. THANJAVUR SORT-11 15.50 15.50 17,00 18,00 18,00 18.009; MADURAI SORT-11 T6.50 16.50 17.00 18.00 21,00 21.00TO. VlfeUOHtrtfSJ R SORT-11 14.^ 15.00 17,00 18.00 T8.50 18.5011. TUT ICOR I N SORT-11 16.50 16.50 18,50 20.00 21,50 21.0012. tJOAGAMANDALAM SORT-11 16.50 16.00 0.00 18.50 19.00 20.00
STATE AVERA<JE 15.81 15.83 17.61 18.28 19,48 19,54
: 5 m :
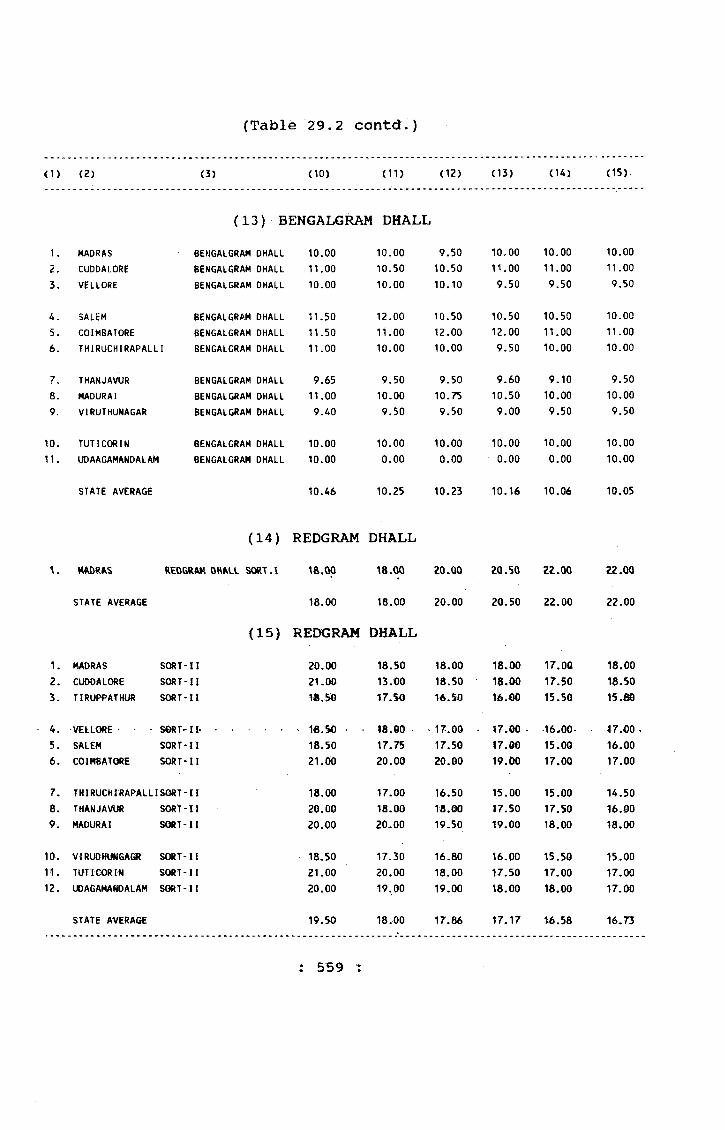
(Table 29.2 eontd.)
<1) (2) (5) (10) (11) (12) (13) (14) (15)
(13) BENGALGRAM DHALL1. MADRAS BENGALGRAM DHALL 10.00 10.00 9.50 10,00 10,00 10.002. CUDDALORE BENGALGRAM DHALL 11.00 10.50 10.50 11.00 11.00 11.003. VELLORE BENGALGRAM DHALL 10.00 10.00 10.10 9.50 9.50 9.50
4. SALEM BENGALGRAM DHALL 11.50 12.00 10.50 10.50 10.50 10.005. COIMBATORE BENGALGRAM DHALL 11.50 11.00 12,00 12.00 11.00 11,006. THIRUCHIRAPALLI BENGALGRAM DHALL 11.00 10.00 10.00 9.50 10.00 10.00
7, THANJAVUR BENGALGRAM DHALL 9.65 9.50 9.50 9.60 9.10 9.508. MADURAI BENGALGRAM DHALL 11.00 10.00 10.75 10.50 10.00 10,009.. VIRUTHUNAGAR BENGALGRAM DHALL 9.40 9.50 9.50 9.00 9.50 9.50
10. TUT 1 COR IN BENGALGRAM DHALL 10.00 10.00 10.00 10.00 10.00 10.0011. UDAAGAMANDALAM BENGALGRAM DHALL 10.00 0.00 0.00 0.00 0.00 10.00
STATE AVERAGE 10.46 10.25 10.23 10.16 10.06 10.05
(14) REDGRAM DHALLHYDRAS REOGRAiK DHALL SORT.I 18.00 18.00 20.00 20.SO 22.00 22.00
STATE AVERAGE 18.00 18.00 20.00 20.50 22.00 22.00
(15) REDGRAM DHALL1. MADRAS sa?T-f I 20.00 18.50 18-00 18.00 17,00 18.002. CUDDALOR€ SORT-II 21.00 13.00 18.50 18.00 17.50 18-503. TIRUPPATHUR SORT-n 17.50 16.50 16.00 15.50 15.80
VELLORE ■ - - SORT' 11* • . ■ , . 1«,50 • . 18.60 • • 17.00 • 17.00 . •16,00- . A7.00 .5. SALtM SORT-M 18.50 17.75 17,50 17.00 15.00 16.006. COIHBATORE SORT-II 21.00 20.00 20.00 19.00 17.00 17.00
7. THIRUCHIRAPALLISORT-H 18.00 17.00 16.50 15.00 15.00 14.508. THANJAVUR SORT-M 20.00 18,00 18.00 57.50 17.50 16.009. MADURAI SORT-II 20.00 20.00 19.50 19.00 18.00 18.00
10. VIRUDHUNSAGR SORT-M 1B.50 17.30 16.80 16.00 15.50 15.0011. TUT1 COR I N SORT-M 2U00 20.00 18.00 17.50 17.00 17.0012. UDAGAMANDALAM SORT-M 20.00 19.00 19.00 18.00 18.00 17.00
STATE AVERAGE 19.50 18.00 17.86 17.17 16.58 16.73
: 559 :
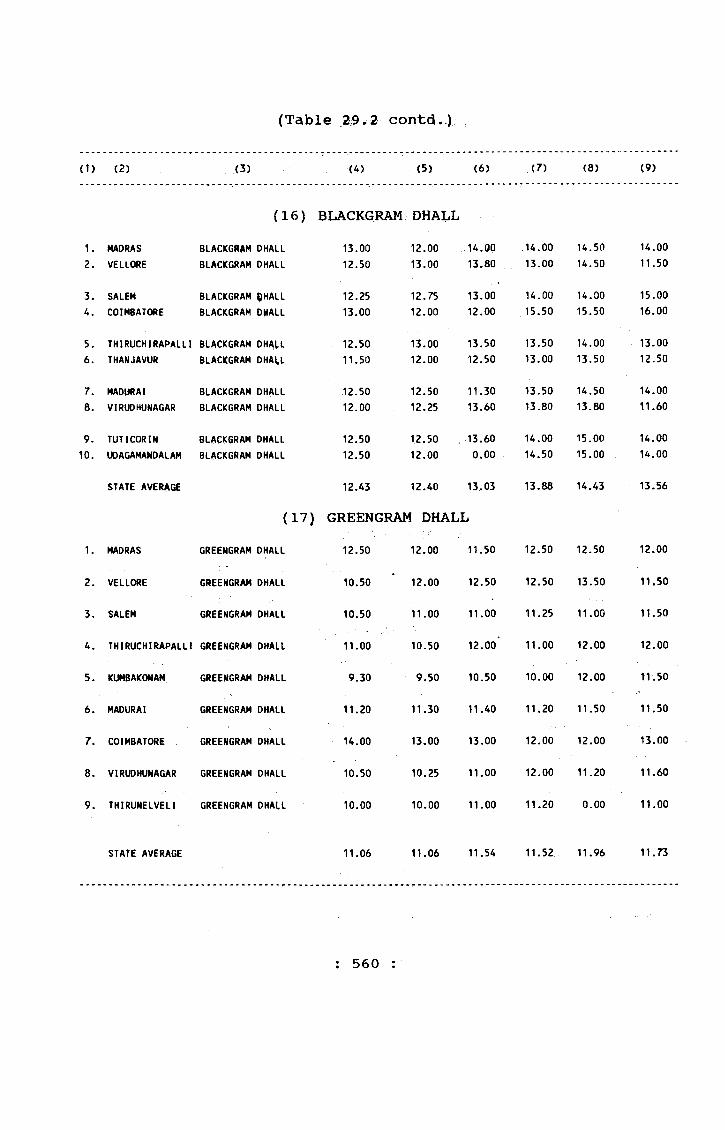
(Table 2.9. 2 contd.)
(1) (2) (3) (4) (5) (6) (7) (8) <9)
(16) BLACKGRAM DHALL1. MADRAS BLACKGRAM DHALL 13.00 12.00 14.Q0 .14.00 14.50 14.002. VELLORE BLACKGRAM DHALL 12.50 13.00 13.80 13.00 14.50 11.50
3. SALEM BLACKGRAM QHALL 12.25 12.75 13.00 14.00 14.00 15.004. COIMBATORE BLACKGRAM DMALL 13.00 12.00 12.00 15.50 15.50 16.00
5. THIRUCHIRAPALLI BLACKGRAM DHALL 12.50 13.00 13.50 13.50 14.00 13.006. THANJAVUR BLACKGRAM DHAU 11.50 12.00 12.50 13.00 13.50 12.50
7. MADURAI BLACKGRAM DHALL 12.50 12.50 11.30 13.50 14.50 14.008. VIRUDHUNAGAR BLACKGRAM DHALL 12.00 12.25 13.60 13.80 13.80 11.60
9. TUT I CORIM BLACKGRAM DHALL 12.50 12.50 13.60 14.00 15.00 14.0010. UDAGAMANDALAM BLACKGRAM DHALL 12.50 12.00 0.00 14.50 15.00 14.00
STATE AVERAGE 12.43 12.40 13,03 13.88 14.43 13.56
(17) GREENGRAM DHALL1. MADRAS GREENGRAM DHALL 12.50 12.00 11.50 12.50 12.50 12.00
2. VELLORE GREENGRAM DHALL 10.50 12.00 12.50 12.50 13.50 11.50
3. SALEM GREENGRAM DHALL 10.50 11.00 11.00 11.25 11.00 11.50
4. THIRUCHIRAPALLI GREENGRAM DHALL 11.00 10.50 12.OO' 11.00 12.00 12.00
5. KUMBAKONAM GREENGRAM DHALL 9.30 9.50 10.50 10.00 12.00 11.50
6. MADURAI GREENGRAM DHALL 11.20 11.30 11.40 11.20 11.50 11.50
7. COIMBATORE GREENGRAM DHALL 14.00 13.00 13.00 12.00 12.00 13.00
8. VIRUDHUNAGAR GREENGRAM DHALL 10.50 10.25 11.00 12.00 11.20 11.60
9. THIRUNELVELI GREENGRAM DHALL 10.00 10.00 11.00 11.20 0.00 11.00
STATE AVERAGE 11.06 11.06 11.54 11.52 11.96 11.73
: 560 :
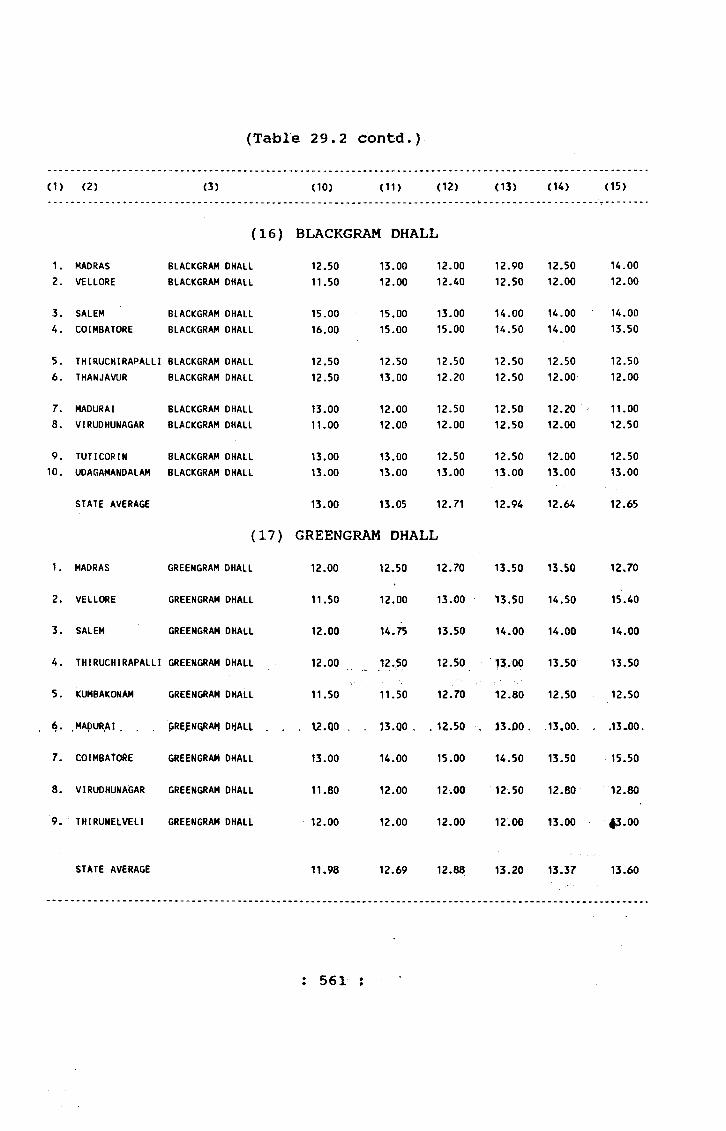
(Tab1e 29.2 contd.)
(1 ) (2 ) (3) (1 0 ) (1 1 ) (1 2 ) (13) (14) (15)
(16) BLACKGRAM DHALL1 . MADRAS BLACKGRAM OHALL 12.50 13.00 1 2 . 0 0 12.90 12.50 14.002 . VELLORE BLACKGRAM DHALL 11.50 1 2 . 0 0 12.40 12.50 1 2 . 0 0 1 2 . 0 0
3. SALEM BLACKGRAM DHALL 15.00 15.00 13.00 14.00 14.00 14.004. COIMBATORE BLACKGRAM DHALL 16.00 15.00 15.00 14.50 14.00 13.50
5. THIRUCHIRAPALLI BLACKGRAM DHALL 12.50 12.50 12.50 12.50 12.50 12.506 . THANJAVUR BLACKGRAM DHALL 12.50 13.00 1 2 . 2 0 12.50 1 2 . 0 0 1 2 . 0 0
7. MADURAI BLACKGRAM DHALL 13.00 1 2 . 0 0 12.50 12.50 1 2 . 2 0 1 1 . 0 0
8 . VIRUDHUNAGAR BLACKGRAM DHALL 1 1 . 0 0 1 2 . 0 0 1 2 . 0 0 12.50 1 2 . 0 0 12.50
9. TUT I COR IN BLACKGRAM DHALL 13.00 13.00 12.50 12.50 1 2 . 0 0 12.501 0 . UDAGAMANDALAM BLACKGRAM DHALL 13.00 13.00 13.00 13.00 13.00 13.00
STATE AVERAGE 13.00 13.05 12.71 12.94 12.64 12.65
(17) GREENGRAM DHALL1 . MADRAS GREENGRAM DHALL 1 2 . 0 0 12.50 12.70 13.50 13,50 12.70
2 . VELLORE GREENGRAM DHALL 11.50 1 2 . 0 0 13.00 13.50 14.50 15.40
3. SALEM GREENGRAM OHALL 1 2 . 0 0 14.75 13.50 14.00 14.00 14.00
4. THIRUCHIRAPALLI GREENGRAM DHALL 1 2 . 0 0 12.50 12.50 13.00 13.50 13.50
5. KUMBAKONAM GREENGRAM DHALL 11.50 11.50 12.70 12.80 12.50 12.50
6. .MApUR^AI , pRE^NQRAH DIjALi . 12.QO . . 13.00 . . 12.50 . 33.00. .13.00. . .13.00.
7. COIMBATOftE GREENGRAM OHALL 13.00 14.00 15.00 14.50 13.50 15.50
8 . VIRUDHUNAGAR GREENGRAM DHALL 11.80 1 2 . 0 0 1 2 . 0 0 12.50 12.80 12.80
9. THIRUNELVELI GREENGRAM OHALL 1 2 . 0 0 1 2 . 0 0 1 2 . 0 0 1 2 . 0 0 13.00 13.00
STATE AVERAGE 11.98 12.69 1 2 . 8 8 13.20 13.37 13.60
: 561 ;
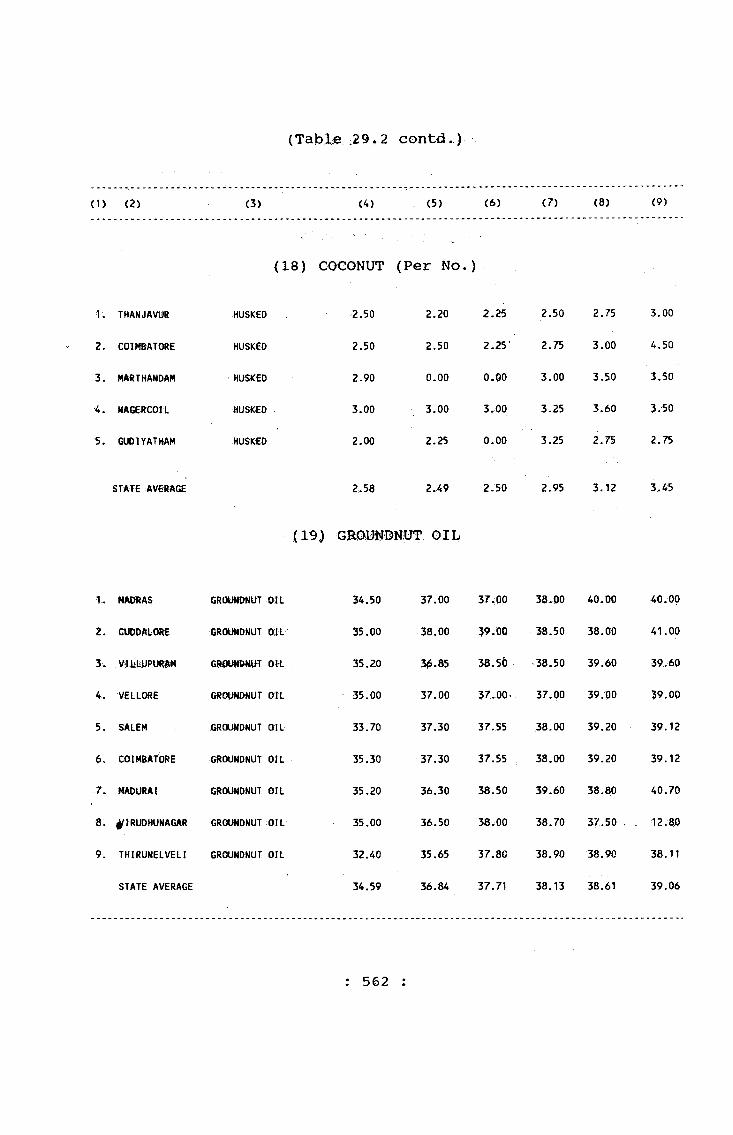
(Tab]le :29 , 2 contd.)
(1 ) (2 ) (3) (4) (5) (6 ) (7) <8 ) <9)
<18) COCONUT (Per No. )
1. THANJAVyfR HUSICED 2.50 2 . 2 0 2.25 2.50 2.75 3.00
2 . COIMBATORE HUSKED 2.50 2.50 2.25 • 2.75 3.00 4.50
3. MARTHANDAM HUSKED 2.90 0 . 0 0 0 , 0 0 3.00 3.50 3.50
4. ♦tAGE CQtlL HUSKEO 3.00 3.00 3.00 3.25 3.60 3.50
5. GUDIYATHAM HUSICED 2-00 2.25 0 . 0 0 3.25 2.75 2.75
STATE AVERAGE 2,58 2.49 2.50 2.95 3.12 3.45
(19) OIL
1 -. mtmAs GROUNWJWT OIL 34.50 37.00 37.00 38.00 40.00 40.00
2 . GODDALORE GROUNDNUT 0;1L 35 .00 38.00 39.00 38.50 38.00 41.00
3;. GWaUNWtUT OIL 35.20 36.85 38.50 38.50 39.60 39.60
4. VELLORE GROUNDNUT OIL 35.00 37.00 37.00- 37.00 39.00 39.00
5. SALEM GROUNDNUT OIL 33.70 37.30 37.55 38.00 39.20 39.12
6. COIMBATORE GROUNDNUT OIL 35.30 37.30 37.55 38.00 39.20 39.12
7. MADURAI GROUNDNUT OIL 35.20 36.30 38.50 39.60 38.80 40.70
8 . ^IRUDHUNAGAR GROUNDNUT OIL 35.00 36.50 38-00 38.70 37.50 = 12.80
9. TKIRUNELVELI GROUNDNUT OIL 32.40 35.65 37.80 38.90 38.90 38.11
STATE AVERAGE 34.59 36.84 37.71 38.13 38.61 39.06
: 562 :
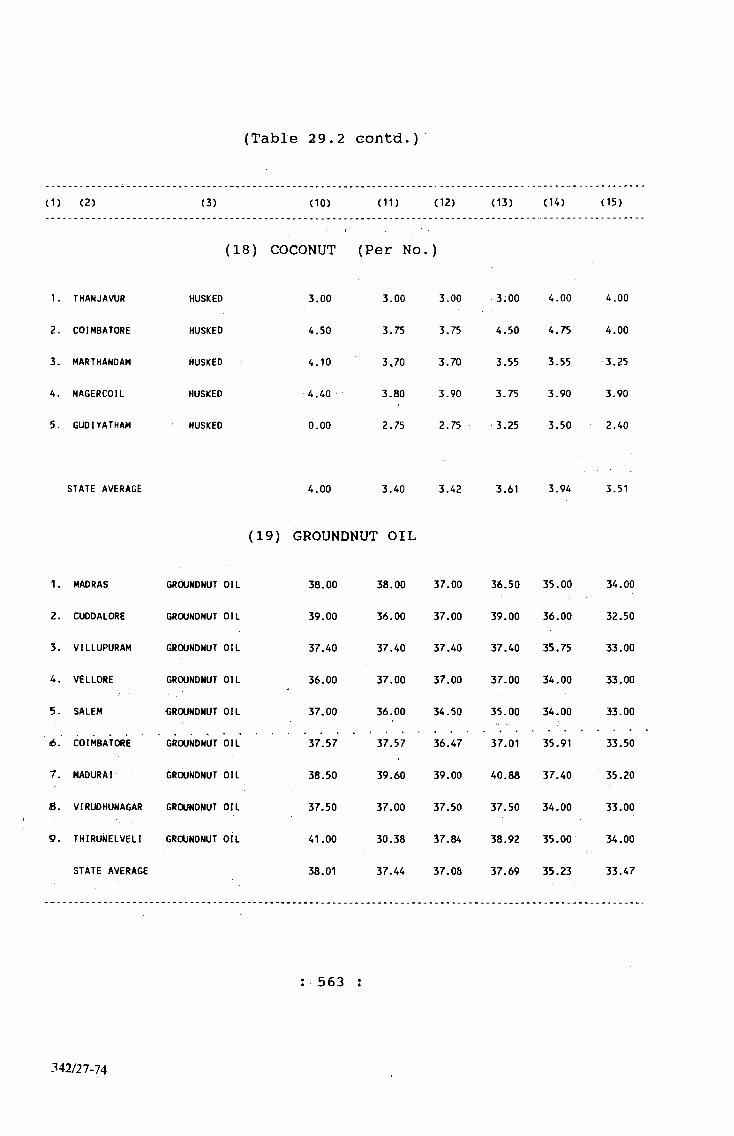
(Table 29.2 G o n t d . )
(1) (2) (3) (10) (11) (12) (13) (14) (15)
1. THANJAVUR
2. COIMBATORE
3. MARTHANDAM
4. NAGERCOIL
5. GUDIYATHAM
(18) COCONUT (Per No.)
HUSKED
HUSKED
HUSKED
HUSKED
HUSKED
3.00
4.50
4.10
4.40
0.00
3.00
3.75
3,70
3.80
2.75
3.00
3.75
3.70
3.90
2.75
3;00
4.50
3.55
3.75
3.25
4.00
4.75
3.55
3.90
3.50
4.00
4.00
3.25
3.90
2.40
STATE AVERAGE 4.00 3.40 3.42 3.61 3.94 3.51
1. MADRAS
2. CUDDALORE
3. VILLUPURAM
4. VELLORE
5. SALEM
6 . COIMBATORE
7. MADURAI
(19) GROUNDNUT OIL
GRdUNDNUT OIL
GROUNDNUT OIL
GROUNDNUT OIL
GROUNDNUT OIL
GROUNDNUT OIL
GROUNDNUT OIL
GROUNDNUT OIL
8 . VIRUDHUNAGAR GROUNDNUT OIL
9. THIRUNELVELI GROUNDNUT OIL
STATE AVERAGE
38.00
39.00
37.40
36.00
37.00
37.57
38.50
37.50
41.00
38.01
38.00
36.00
37.40
37.00
36.00
37.57
39.60
37.00
30.38
37.44
37.00
37.00
37.40
37.00
34.50
36.47
39.00
37.50
37.84
37.08
36.50
39.00
37.40
37.00
35.00
37.01
40.88
37.50
38.92
37.69
35.00
36.00
35.75
34.00
34.00
35.91
37.40
34.00
35.00
35.23
34.00
32.50
33.00
33.00
33.00
33.50
35.20
33.00
34.00
33.47
: 563 :
342/27-74
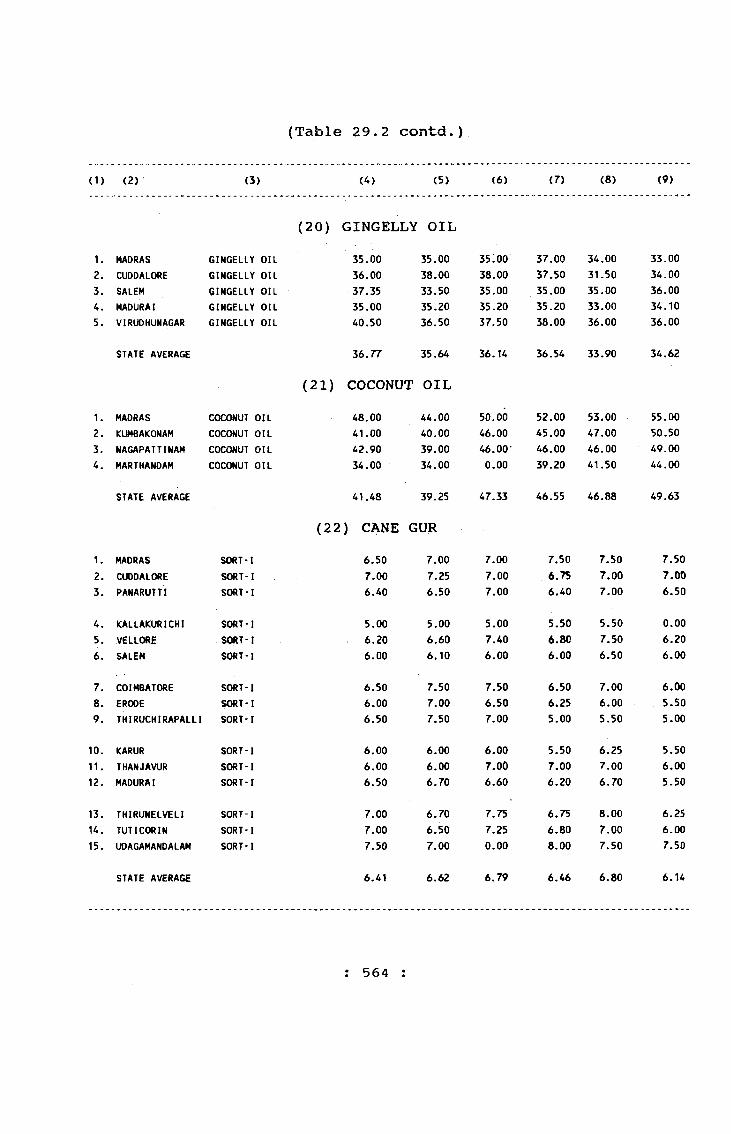
(Table 29.2 contd.)
(1 ) (2 ) (3) (4) (5) (6 ) (7) (8 ) (9)
( 2 0 ) GINGELLY OIL1 . MADRAS GINGELLY OIL 35.00 35.00 35.00 37.00 34.00 33.002 . CUDDALORE GINGELLY OIL 36.00 38.00 38.00 37.50 31.50 34.003. SALEM GINGELLY OIL 37.35 33.50 35.00 35.00 35.00 36.004. MADURAI GINGELLY OIL 35.00 35.20 35.20 35.20 33.00 34.105. VIRUDHUNAGAR GINGELLY OIL 40.50 36.50 37.50 38.00 36.00 36.00
STATE AVERAGE 36.77 35.64 36.14 36.54 33.90 34.62
( 2 1 ) COCONUT OIL1 . MADRAS COCONUT OIL 48.00 44.00 50.00 52.00 53.00 55.002 . KUMBAKONAM COCONUT OIL 41.00 40.00 46.00 45.00 47.00 50.503. NAGAPATTINAM COCONUT OIL 42.90 39.00 46.00- 46.00 46.00 49.004. MARTHANDAM COCONUT OIL 34.00 34.00 0 . 0 0 39.20 41.50 44.00
STATE AVERAGE 41.48 39.25 47.33 46.55 46.88 49.63
(22) CANE GUR1 . MADRAS SORT-I 6.50 7.00 7.00 7.50 7.50 7.502 . CUDDALORE SORT-I 7.00 7.25 7.00 6.75 7.00 7.003. PANARUTTI SORT-I 6.40 6.50 7.00 6.40 7.00 6.50
4. KALLAKURICHI SORT-1 5.00 5.00 5.00 5.50 5.50 0 . 0 0
5. VELLORE SORT-I 6 . 2 0 6.60 7.40 6.80 7.50 6 . 2 0
6 . SALEM SORT-I 6 . 0 0 6 . 1 0 6 . 0 0 6 . 0 0 6.50 6 . 0 0
7. COIMBATORE SORT-I 6.50 7.50 7.50 6.50 7.00 6 . 0 0
8 . ERODE SORT-I 6 . 0 0 7.00 6.50 6.25 6 . 0 0 5.509. THIRUCHIRAPALLI SORT-I 6.50 7.50 7.00 5.00 5.50 5.00
1 0 . KARUR SORT-I 6 . 0 0 6 . 0 0 6 . 0 0 5.50 6.25 5.501 1 . THAMJAVUR SORT-I 6 . 0 0 6 . 0 0 7.00 7.00 7.00 6 . 0 0
1 2 . MADURAI SORT-I 6.50 6.70 6.60 6 . 2 0 6.70 5.50
13. THIRUNELVELI SORT-I 7.00 6.70 7.75 6.75 8 . 0 0 6.2514. TUT I COR IN SORT-I 7.00 6.50 7.25 6.80 7.00 6 . 0 0
15. UDAGAMANDALAM SORT-1 7.50 7.00 0 . 0 0 8 . 0 0 7.50 7.50
STATE AVERAGE 6.41 6.62 6.79 6.46 6.80 6.14
: 564 :

(Table 29.2 contd.)
(1 ) (2 ) (3) (1 0 ) (1 1 ) (1 2 ) (13) (14) (15)
( 2 0 ) GINGELLY OIL1 . MADRAS GINGELLY OIL 37.00 36.00 36.00 43.00 33.00 36.002 . CUDDALORE GINGELLY OIL 32.00 37.00 44.00 39.50 41.00 35.003. SALEM GINGELLY OIL 40.00 42.00 41.50 42.00 37.00 39.004. MADURAI GINGELLY OIL 38.50 39.60 40.00 41.75 0 . 0 0 35.205. VIRUDHiniAGAR GINGELLY OIL 41.00 41.00 41.00 43.75 38.00 37.00
STATE AVERAGE 37.70 39.12 40.50 42.00 37.25 36.44
( 2 1 ) COCONUT OIL1 . MADRAS COCONUT OIL 62.00 6 6 . 0 0 65.00 60.00 59.00 57.002 . KUMBAKONAM COCONUT OIL 56.00 60.00 59.00 60.00 58.00 52.003. NAGAPATTINAM COCONUT OIL 54.00 58.00 57.00 57.00 57.00 52.004. MARTHANDAM COCONUT OIL 50.50 54.00 53.20 47.00 48.00 41.00
STATE AVERAGE 55.63 59.50 58.55 56.00 55.50 50.50
(22) CANE GUR1 . MADRAS SORT-I 6.50 7.50 7.50 7.00 6.50 6.502 . CUDDALORE SORT-1 7.00 7.00 7.00 7.00 7.00 0 . 0 0
3. PANARUTTl SORT-I 6.50 7.80 6.50 7.00 6 . 0 0 6 . 0 0
4. KALLAKURICHI SORT-I 0 . 0 0 0 . 0 0 0 . 0 0 0 . 0 0 0 . 0 0 0 . 0 0
5. VELLORE SORT-I 6.50 5.50 4.50 4.50 4.00 4.506 . SALEM SORT-1 6.25 8.25 6.50 6.50 5.00 5.50
7. COIMBATORE SORT-I 6.50 7.00 6.50 6.50 5.50 6 . 0 0
ERODE SORT-I 6 . 0 0 6.50 6 . 0 0 6 . 0 0 5.50 6 . 0 0
9. THIRUCHIRAPALLI SORT-I 6 . 0 0 6.50 5.50 5.00 4.50 4.50
1 0 . KARUR SORT-I 5.25 6 . 0 0 6 . 0 0 5.75 5.5b 5.501 1 . THANJAVUR SORT-I 7.00 7.50 6 . 0 0 5.60 5.20 5.001 2 . MADURAI SORT-I 6 . 0 0 6.60 6 . 0 0 5.80 5.25 5.50
13. THIRUNELVELI SORT-I 6.25 7.00 7.75 6 . 0 0 6 . 0 0 6 . 0 0
14. TUT I COR IN SORT-I 6.70 7.50 6.50 6 . 0 0 5.50 5.7015. UDAGAMANDALAM SORT-I 6.50 7.80 6.50 6.50 6 . 0 0 6 . 0 0
STATE AVERAGE 6.35 7.03 6.34 6.08 5.53 5.59
: 565
342/27-74a

(Table 29.2 cont4.)
(1) (2) (3) (4) (5) (6 ) (7) (8 ) (9)
(23) CANE GUR1.2.
MADRASCUDDALORE
SORT-11 SORT-11
6 . 0 0
0 . 0 0
6.500 . 0 0
6.500 .0 0 .,
7.000 . 0 0
7.000 . 0 0
7.000 . 0 0
3.A.
PANARUTTIKALLAKURICHI
SORT-11 SORT-11
0 . 0 0
4.000 . 0 0
4.000 , 0 0
4.506 .Q0
4.500 . 0 0 , .4.00
o.po0 . 0 0
5.6.
VELLORESALEM
SORT-II SORT-11
5.805.00
6 . 0 0
5.006.805.00
5.805.00
6.805.50
5.605.00
7.8 .
COIMBATOREERODE
SORT-11 SORT-11
6 . 0 0
5.006.505.50
6,750 . 0 0
6 . 0 0
0 . 0 0
6 . 0 0
5.505.50
. 5.00
9,1 0 .
THIRUCHIRAPALLIfCARUR
SORT-II SORT-11
5.005.50
5.505.50
5.505.50
0 . 0 0
5.250 . 0 0
5.75,0 . 0 0
4.75
11-12.TMANJAVURMADURAI
SORT-11 SORT-11
5.306 . 0 0
5.506.40
6.506 . 0 0
6 . 0 0
5.806 . 0 0
6.305,505.00
13.U.
THIRUNELVELl TUT I COR IN
SORT-11 SORT-11
6.256.40
6.25 . 6.40
7.257.00
6.506.50
7.506.50
6 . 0 0
5.80
15. UOAGAMANpALAM SORT-11 7.00 6.50 0 . 0 0 7.50 7.00 6 . 0 0
STATE AVER^PE 5.63 5.81 6 . 1 2 5.99 6.15 5.56
(24) SUGAR1.2.
MADRASCUDDALORE
SUGARSUGAR
8.608.30
8.708.75
8.808.60
8.808.75
8.759.00
8.308.40.
3.A.
VELLORECOIMBATORE
SUGARSUGAR
8.508.80
8.809.20
8.709.20
8.809.00
9.008.80
8.608.50
5.6.
THIRUCHIRAPALLIMADURAI
. SUGAR SUGAR
8.408.70
8.708.90
8.708.80
8.808.80
8.608.70
8.258.60
7. TUT I COR IN SUGAR 8.70 8.90 8.80 9.30 8.80 8.50
STATE AVERAGE 8.57 8.85 8.80 8.89 8.81 8.45
566 ;
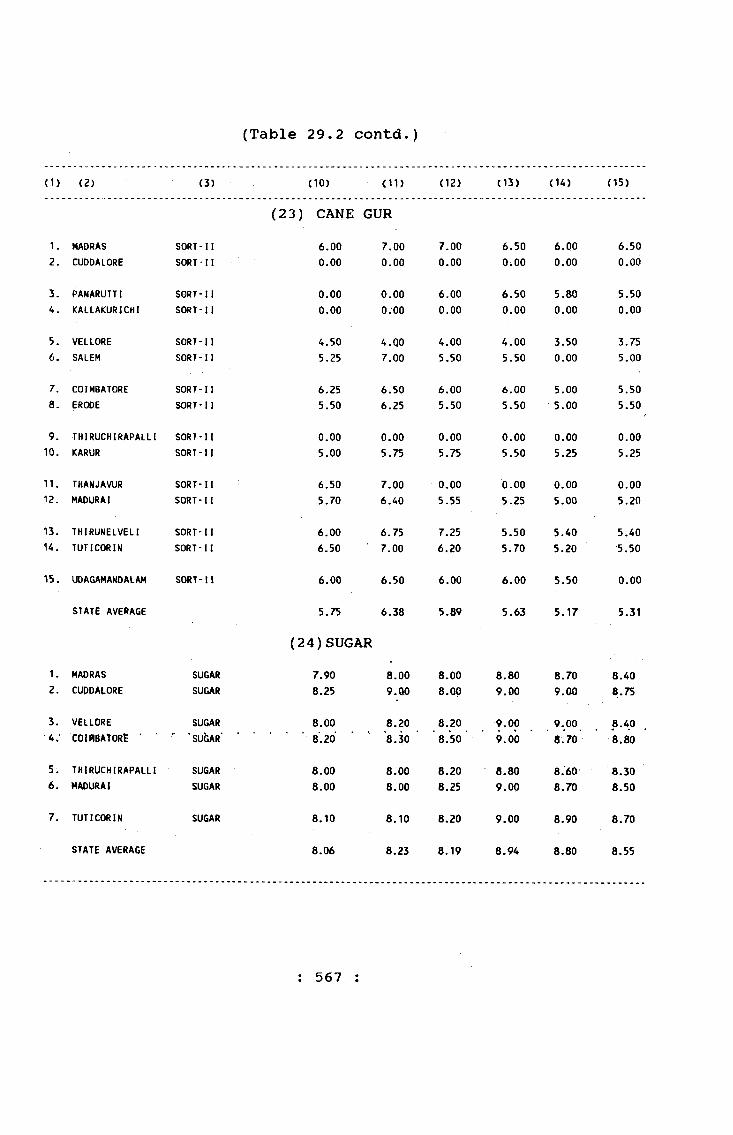
(Table 29.2 contd.)
(1 ) (2 ) (3) (1 0 ) (1 1 ) (1 2 ) (13) (14) (15)
(23) CANE GUR\. MADRAS SORT-11 6 . 0 0 7.00 7.00 6.50 6 . 0 0 6.502 . CUDOALORE SORT-11 0 . 0 0 0 . 0 0 0 . 0 0 0 . 0 0 0 . 0 0 0 . 0 0
3. PANARUTTI SORT-11 0 . 0 0 0 . 0 0 6 . 0 0 6.50 5.80 5.504. KALLAKURICHI SORT-11 0 . 0 0 0 . 0 0 0 . 0 0 0 . 0 0 0 . 0 0 0 . 0 0
5. VELLORE SORT-11 4.50 4.Q0 4.00 4.00 3.50 3.756 . SALEM SORT-11 5.25 7.00 5.50 5.50 0 . 0 0 5.00
7. COIMBATORE SORT-11 6.25 6.50 6 . 0 0 6 . 0 0 5.00 5.50a. ERODE SORT-11 5.50 6.25 5.50 5.50 5.00 5.50
9. THIRUCHIRAPALLI SORT-11 0 . 0 0 0 . 0 0 0 . 0 0 0 . 0 0 0 . 0 0 0 . 0 0
1 0 . KARUR SORT-11 5.00 5.75 5.75 5.50 5.25 5.25
1 1 . THANJAVUR SORT-11 6.50 7.00 0 . 0 0 0 . 0 0 0 . 0 0 0 . 0 0
1 2 . MADURAI SORT-11 5.70 6.40 5.55 5.25 5.00 5.20
13. THIRLINELVELI SORT'11 6 . 0 0 6.75 7.25 5.50 5.40 5.40U. TUT I COR IN SORT-11 6.50 7.00 6 . 2 0 5.70 5.20 5.50
15. UDAGAMANDALAM SORT-I! 6 . 0 0 6.50 6 . 0 0 6 . 0 0 5.50 0 . 0 0
STATE AVERAGE 5.75 6.38 5.89 5.63 5.17 5.31
(24)SUGAR1 . MADRAS SUGAR 7.90 8 . 0 0 8 . 0 0 8.80 8.70 8.402 . CUDDALORE SUGAR 8.25 9.G10 8 . 0 0 9.00 9 . 0 0 8 . ^
3. VELLORE SUGAR 8 . 0 0 8 . 2 0 8 . 2 0 9.00 9.00 8.40■ 4.- COinBATORt 'SUbAR 8 . 2 0 8.30 8.50 9.00 8.70 8.80
5. THIRUCHIRAPALLI SUGAR 8 . 0 0 8 . 0 0 8 . 2 0 8.80 8.60 8.306 . MADURAI SUGAR 8 . 0 0 8 . 0 0 8.25 9.00 8.70 8.50
7. TUT I COR IN SUGAR 8 . 1 0 8 . 1 0 8 . 2 0 9.00 8.90 8.70
STATE AVERAGE 8.06 8.23 8.19 8.94 8.80 8.55
: 567 :

(Table 29.2 contd.)
(1 ) (2 ) (3) (4) (5) (6 ) . (7) (8 ) (9)
1 . MADRAS CHILLIES
(25) CHILLIES20.00 23.00 30.00 34.00 41.00 46.00
2 . CUDDALORE CHILLIES 0 . 0 0 0 . 0 0 26.00 28.00 0 . 0 0 52.00
3. COIMBATORE CHILLIES 2 2 . 0 0 23.00 30.00 0 . 0 0 0 . 0 0 50.00
4. POLLACKI CHILLIES 2 2 . 0 0 27.00 3 0 . 0 9 36.00 40.00 48.00
5. THIRUCHIRAPALLI CHILLIES 18.00 0 . 0 0 2 0 . 0 0 33.00 41.00 45.00
6 . MADURAI CHILLIES 2 1 . 0 0 2 2 . 0 0 24.00 28.00 38,00 42.00
7. DINDIGUL CHILLIES 25.00 26.00 0 . 0 0 0 . 0 0 0 . 0 0 50.00
8 . THENI CHILLIES 2 2 . 0 0 2 2 . 0 0 29.00 30.00 40.00 50.00
9. VIRUDHUNAGAR CHILLIES 18.00 25.00 31.00 32.00 40.00 43.00
1 0 . THIRUNELVELI CHILLIES 24.00 2 1 . 0 0 37.00 33.00 35.00 45.00
1 1 , KOVILPATTI CHILLIES 19.50 2 1 . 0 0 23.00 33.00 35.00 47.00
1 2 . TUT I COR IN CHILLIES 18.00 2 1 . 0 0 0 . 0 0 33.00 43.00 49.00
13. SANKARANKOIL CHILLIES 0 . 0 0 0 . 0 0 0 . 0 0 0 . 0 0 45.00 0 . 0 0
14. UDAGAMAtWALAM CHILLIES 0 . 0 0 0 . 0 0 o.oO 0 . 0 0 0 . 0 0 0 . 0 0
15. JEYANKONDAM CHILLIES 27.00 26.00 0 .0 0 . 0 . 0 0 0 . 0 0 0 . 0 0
STATE AVERAGE 21.38 23.36 28.00 32.00 39.80 47.25
: 568 :

(Table 29.2 contd.)
< 1 ) (2 ) (3) (1 0 ) (1 1 ) (1 2 ) (13) (14) (15)
(25) CHILLIES1 . MADRAS CHILLIES 38.00 45.00 52.00 44.00 42.00 0 . 0 0
2 . CUDDALORE CHILLIES 0 . 0 0 0 . 0 0 0 . 0 0 0 . 0 0 0 . 0 0 36.00
3. COIMBATORE CHILLIES 51.00 0 . 0 0 0 . 0 0 0 . 0 0 0 . 0 0 36.00
4. POLLACHl CHILLIES 46.00 50.00 0 . 0 0 46.00 35.00 34.00
5. THIRUCHIRAPALLl CHILLIES 43.00 50.00 43.00 35.00 32.00 27.00
6 . MADURAI CHILLIES 42.00 45.00 40.00 42.00 35.00 32.00
7. DINDIGUL CHILLIES 46.00 55.00 55.00 45.00 35.00 33.00
8 . THENI CHILLIES 48.00 50.00 48.00 44.00 0 . 0 0 30.00
9. VIRUDHUNAGAR CHILLIES 47.00 50.00 40.00 38.00 32.00 34.00
1 0 . THIRUNELVELI CHILLIES 45.00 60.00 50.00 47.00 0 . 0 0 0 . 0 0
1 1 . KOVILPATTI CHILLIES 49.00 45.00 50.00 35.00 34.00 30.00
1 2 . TUT I COR IN CHILLIES 50.00 54.00 52.00 42.00 0 . 0 0 30.00
13. SANKARANKOIL CHILLIES 0 . 0 0 0 . 0 0 0 . 0 0 0 . 0 0 38.00 0 . 0 0
U . UDAGAMANDALAM CHILLIES 0 . 0 0 0 . 0 0 0 . 0 0 45.00 42.00 0 . 0 0
15. JEYANKONDAM CHILLIES 0 . 0 0 0 . 0 0 0 . 0 0 0 . 0 0 0 . 0 0 0 . 0 0
STATE AVERAGE 45.91 50.40 47.78 42.09 36.11 32.20
: 569 :

(Table 29*2 contd.)
(1) (2) (3) (4) (5) <6 ) (7) (8 ) (9)
(26) CORIANDER1. MADRAS CORIANDER 15,00 15.00 15.00 16.00 18.00 11.002. KALLAKURICHI CORIANDER 12.00 10.00 10.00 13.00 11.00 13,50
3. VELLORE CORIANDER 14.00 14.00 15.00 15.00 16.00 16.00
4. DHARMAPURl CORIANDER 15.00 13.20 14,00 14.00 15.00 15,00
5. COIMBATORE CORIANDER 15.00 15.00 15.00 15.00 15.00 16,00
6. ERODE CORIANDER 14.00 15.00 15.00 14.00 16.00 17,00
7. THIRUCHIRAPALLI CORIANDER 13.00 12.00 14.00 14.00 14.00 15.00
8 . THANJAVUR CORIANDER 13.50 13.50 13.00 13.00 14.00 15.00
9. MADURAI CORIANDER 13.50 13.00 1 3 . 0 9 14.00 14.00 15.00
10. DINDIGUL CORIANDER 13.50 12.50 15.00 13.00 14.50 16.50
11. THIRUNELVELI CORIANDER 13.00 15.00 13.00 15.00 12.00 14.00
12. TUTICORIN CORIANDER 11.50 13.00 0 . 0 0 12.50 14.00 16.00
13. ICOVILPATTl CORIANDER 11.25 11.50 11.50 12.00 14.50 15.25
STATE AVERAGE 13.40 13.28 13.46 13.88 14.46 15.02
(27) TURMERIC
1. MADRAS FINGER 18.00 17.50 21.00 23.00 25.00 33.00
2. ERODE FINGER 14.00 16.00 17.00 19.00 21.00 25.00
3. THIRUCHIRAPALLI FINGER 18.00 17.00 22.00 22.00 24.00 28.00
STATE AVERAGE 18.00 17.00 22.00 22.00 24.00 28.00
: 570 :
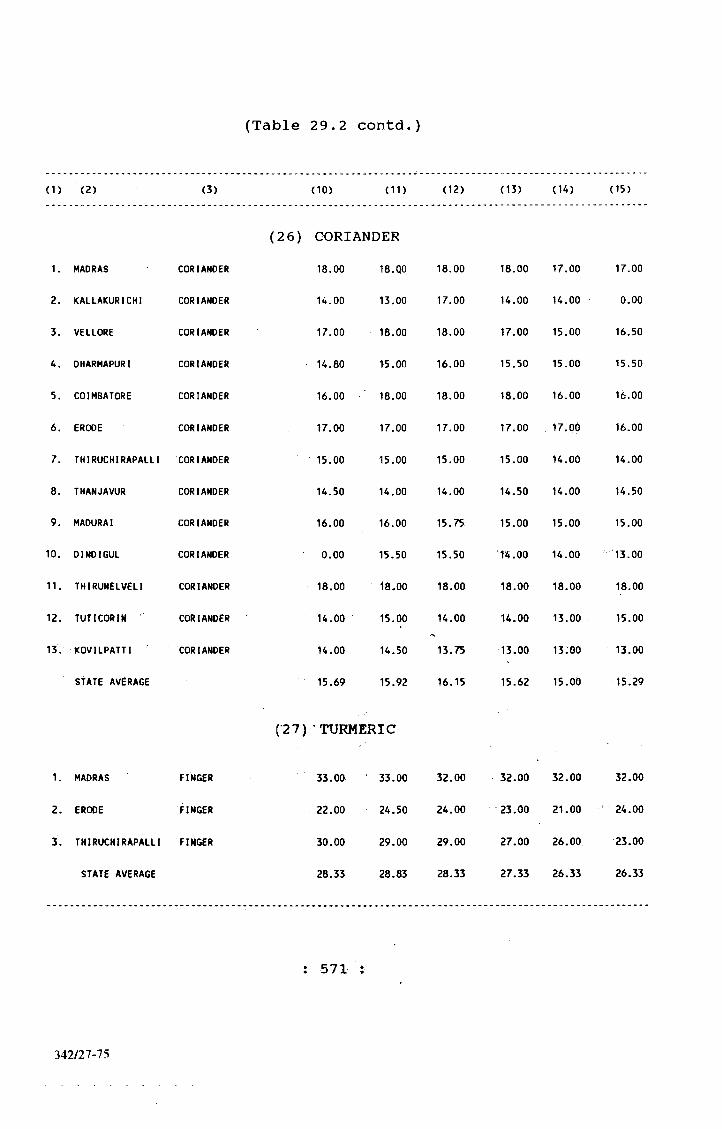
(Table 29 . 2 contd.)
(1) (2 ) (3) (1 0 ) (1 1 ) (1 2 ) (13) (14) (15)
(26) CORIANDER1. MADRAS CORIANDER 18.00 18.QO 18.00 18.00 17.00 17.00
2. KALLAKURICHI CORIANDER U.OO 13,00 17.00 14.00 14.00 0 . 0 0
3. VELLORE CORIANDER 17.00 18.00 18.00 17.00 15.00 16.50
4, DHARMAPURI CORIANDER 14.80 15.00 16.00 15.50 15.00 15.50
5. COIMBATORE CORIANDER 16.00 18.00 18.00 18.00 16.00 16.00
6. ERODE CORIANDER 17.00 17.00 17.00 17.00 17.00 16.00
7. THIRUCHIRAPALLI CORIANDER 15.00 15.00 15.00 15.00 14.00 14,00
8 . THANJAVUR CORIANDER 14.50 14.00 14.00 14.50 14.00 14.50
9. MADURAI CORIANDER 16.00 16.00 15.75 15.00 15.00 15,00
1 0 . DINDIGUL CORIANDER 0 . 0 0 15.50 15.50 n.oo 14.00 13.00
1 1 . THIRUNELVELI CORIANDER 18.00 1 8 . 0 0 18.00 18.00 18.00 18.00
1 2 . TUTICORIN CORIANDER 14.00 15.00 14.00 14.00 13.00 15.00
13. KOVILPATTI CORIANDER 14.00 14.50 13.75 13.00 i3:oo 13.00
STATE AVERAGE 15.69 15.92 16.15 15.62 15.00 15.29
(•27) 'TURMERIC
1 . MADRAS FINGER 33.00 33.00 32.00 32.00 32.00 32.00
2 . ERODE FINGER 2 2 . 0 0 24.50 24.00 23.00 2 1 . 0 0 24.00
3. THIRUCHIRAPALLI FINGER 30.00 29.00 29.00 27.00 26.00 23.00
STATE AVERAGE 28.33 28.83 28.33 27.33 26.33 26.33
: 571
342/27-75

(Table 2§.2 cohtd.)
<1) (2 ) (3) (A) (5) (6) (7) (8) (9)
(28) GARLIC1. COIMBATORE HILL 40.00 40.00 0.00 20.00 20.00 24.00
2 . THIRUCHlfeAPALLI HILL 35.00 40.00 40.00 45.00 45.00 45.00
3. THANJAVUR HILL 37.00 37.00 36.00 38.00 36.00 37.00
4. MADURAI HILL 30.00 32.00 35.00 37.00 27.00 30.00
5. DINDIGUL HILL 0.00 36.00 36.00 39.00 39.00 0.00
6. UDAQAMANbAlAM HILL 25.00 25.00 0.00 22.00 15.00 24.00
STATE AVERAGE 33.40 35.00 36.75 33.50 30.33 32.00
(29) GARLIC
1. MADRAS GROUND 12.00 12.00 0.00 12.00 13.00 13*00
2. CUDDALOfte ground 11.00 11.00 13.00 15.00 16.0b 16.00
3. VEkLORE GRbUND 10.00 11.00 12.00 12.00 17.00 18.00
4. TMIRUCrilfiAf>ALLI Qj^OUND 10.oi) 10.00 10.00 1^.00 14.00 18.00
5. tHANJAVUI^ GROUND 12.00 9.00 10.00 11.00 11.50 14.00
6. MADURAI GROUND 12;00 11.00 10.do 11.00 12.00 15.00
7. tHINi GROUND 7.50 7.50 8.SO 9.50 11.50 13.00
8. DINDIGUL GROUND 0.00 9.50 9.50 0.00 0.00 0.00
9. TKIRUNELVEL! GROUND 0.00 0.00 0.00 0.00 0.00 0.00
STATE AVERAGE 10.64 10.13 10.43 11.79 13.57 15.29
I 572 :
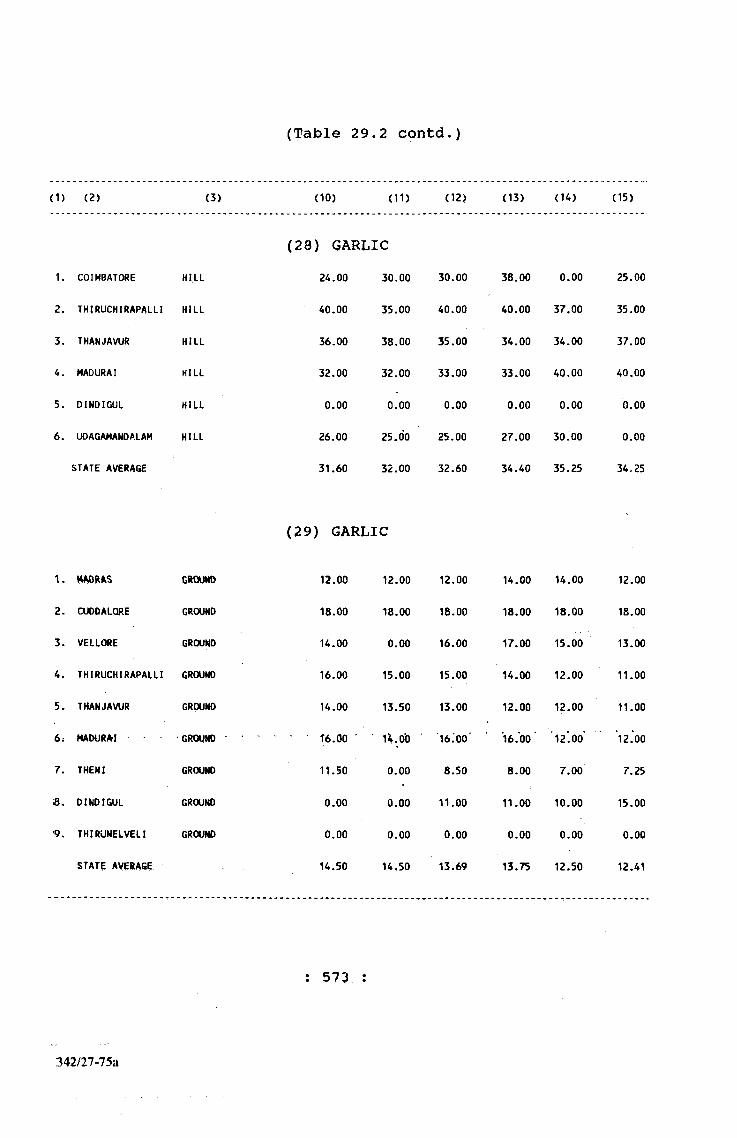
(Table 29.2 contd.)
( 1) ( 2 ) (3) ( 10) (11) (12) (13) (U) (15)
1. COIMBATORE HILL
2. THIRUCHIRAPALLI HILL
3. THANJAVUR HILL
4. MADURAI HILL
5. DINOIGUL HILL
6. UDAGAMANOALAM HILL
STATE AVERAGE
(28) GARLIC24.00 30.00
40.00
36.00
32.00
0.00
26.00
31.60
35.00
38.00
32.00
0.00
25.00
32.00
30.00
40.00
35.00
33.00
0.00
25.00
32.60
38.00 0.00
40.00 37.00
34.00 34.00
33.00 40.00
0 .00 0.00
27.00 30.00
34.40 35.25
25.00
35.00
37.00
40.00
0.00
0.00
34.25
(29) GARLIC
\. MAORfkS GROUMD
2. CUDOALQRE GROUND
3. VELLORE GROUND
4. THIRUCHIRAPALLI GROUND
5. THANJAVUR GROUND
6i MADURAI • ground
7. THEN I GROUND
a . DINOIGUL GROUND
9. THIRUNELVELl GROUND
STATE AVERAGE
12.00
18.00
14.00
16.00
14.00
T6.00 ■
11.50
0.00
0.00
14.50
12.00
18.00
0.00
15.00
13.50
iJi.0'0 ■
0.00
0.00
0.00
14.50
12.00
18.00
16.00
15.00
13.00
16.00'
8.50
11.00
0.00
13.69
14.00 14.00
18.00 18.00
17.00 15.00
14.00 12.00
12.00 12.00
'16.00' ‘ 12*00*
8.00 7.00
11.00 10.00
0.00 0.00
13.75 12.50
12.00
18.00
13.00
11.00
11.00
12.00
7.25
15,00
0.00
12.41
: 573 :
342/27-75a
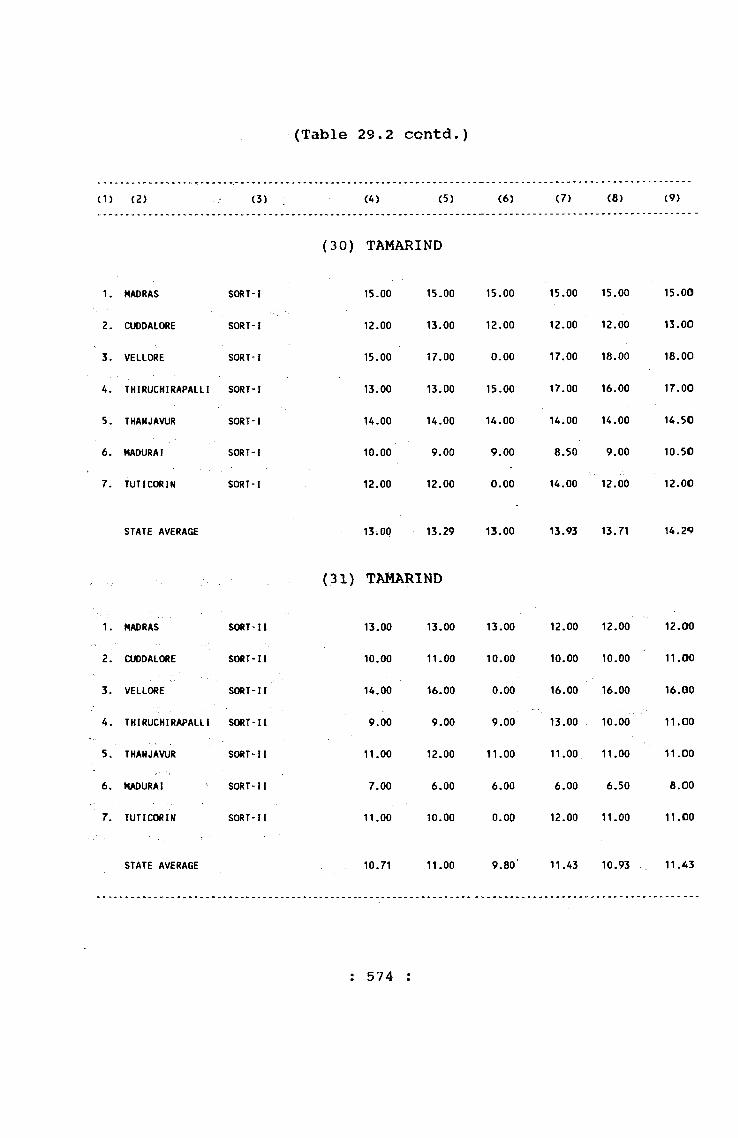
(Table 29.2 contd.)
(1> (2) (3) (A) (5) (6) C7) (8) (9)
1. MADRAS SORT-1
2. CUDDALORE SORT-I
3. VELLORE SORT-I
4. THIRUCHIRAPALLI SORT-1
5. THANJAVUR SORT-1
6. MADURAI SORT-1
7. TUTICORIN SORT-I
(30) TAMARIND
15.00
12.00
15.00
13.00
14.00
10.00
12.00
15.00
13.00
17.00
13.00
14.00
9.00
12.00
15.00
12.00
0.00
15.00
14.00
9.00
0.00
15.00
12.00
17.00
17.00
14.00
8.50
14.00
15.00
12.00
18.00
16.00
14.00
9.00
12.00
15.00
13.00
18.00
17.00
14.50
10.50
12.00
STATE AVERAGE 13.00 13.29 13.00 13.93 13.71 14.2<>
1. MADRAS SORT-11
2. CUDDALORE SORT-II
3. VELLC«E SORT-II
4. THIRUCHIRAPALLI SORT-11
5. THANJAVUR SORT-11
6. MADURAI SORT-II
7. TUTICORIN SORT-11
STATE AVERAGE
(31) TAMARIND
13.00
10.00
14.00
9.00
11.00
7.00
11.00
10.71
13.00
11.00
16.00
9.00
12.00
6.00
10.00
11.00
13.00
to .00
0.00
9.00
11.00
6.00
0.00
9.80‘
12.00 12.00
10.00 10.00
16.00 16.00
13.00 10.00
11.00 11.00
6.00 6.50
12.00 11.00
11.43 10.93
12.00
11.00
16.00
11.00
11.00
8.00
11.00
11.43
: 574 :
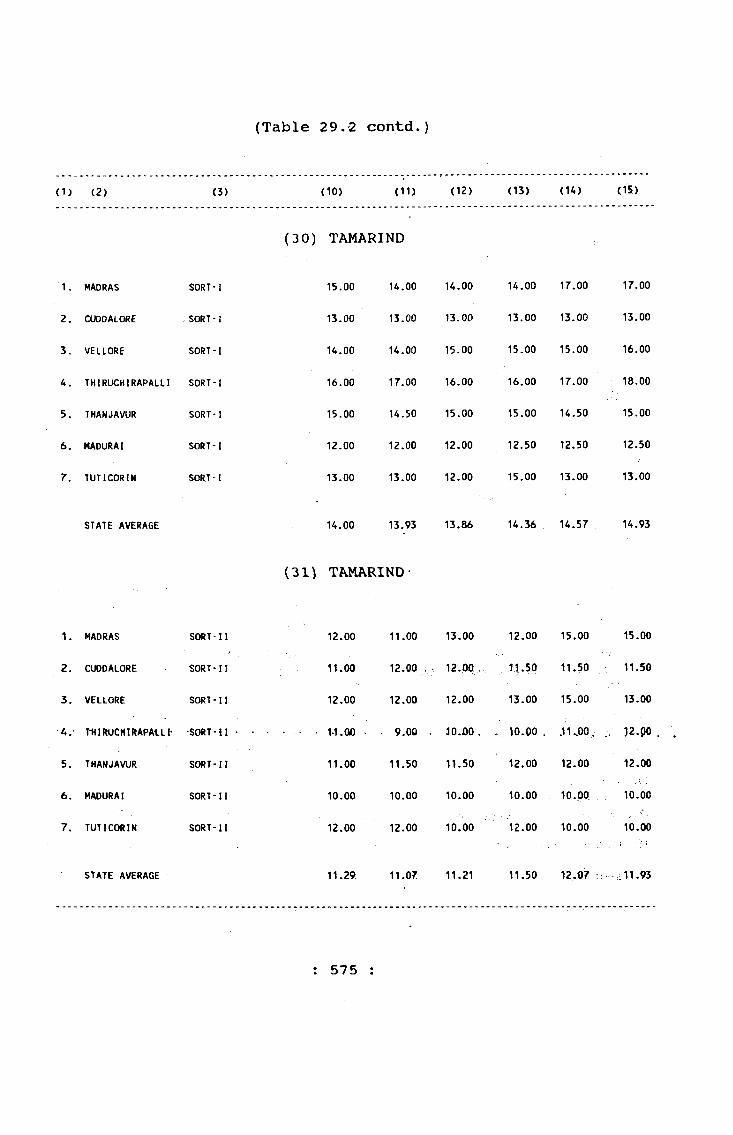
(Table 29.2 contd.
( 1) ( 2 ) (3) ( 10) (11) (12) (13) (14) (15)
1. MADRAS SORT-I
2. CUOOALORE SORT-I
3. VELLORE SORT-I
4. THIRUCHIRAPALLI SORT-I
5. THANJAVUR SORT-I
6. MADURAI SORT-I
7. TUTICORIN SORT-I
(3 0) TAMARIND
15.00
13.00
14.00
16.00
15.00
12.00
13.00
14.00
13.00
14.00
17.00
14.50
12.00
13.00
14.00
13.00
15.00
16.00
15.00
12.00
12.00
14.00
13.00
15.00
16.00
15.00
12.50
15.00
17.00
13.00
15.00
17.00
14.50
12.50
13.00
17.00
13.00
16.00
18.00
15.00
12.50
13.00
STATE AVERAGE 14.00 13.93 13.86
(31) TAMARIND
14.36 14.57 14.93
1. MADRAS SORT-
2. CUOOALORE SORT-
3. VELLORE SORT-
•A,' T-HIRUCHIRAPAtLI* SORT-
5. THANJAVUR SORT-
6. MADURAI SORT-
7. TUTICORIN SORT-
12.00
11.oa
12.00
1-1. (W .
11.00
10.00
12.00
11.00
12.00
12.00
9.00 .
11.50
10.00
12.00
13.00
12.0(1
12.00
30.00
11.50
10.00
10.00
12.00 15.00
11,50 11.50
13.00 15.00
10.00 . .11 ..00.
12.00 12.00
10.00 10.00
12.00 10.00
15.00
11.50
13.00
. 1 2 . 9 0
12.00
10.00
10.00
STATE AVERAGE 11.29 11.07 11.21 11.50 12.07 11.93
; 575 :
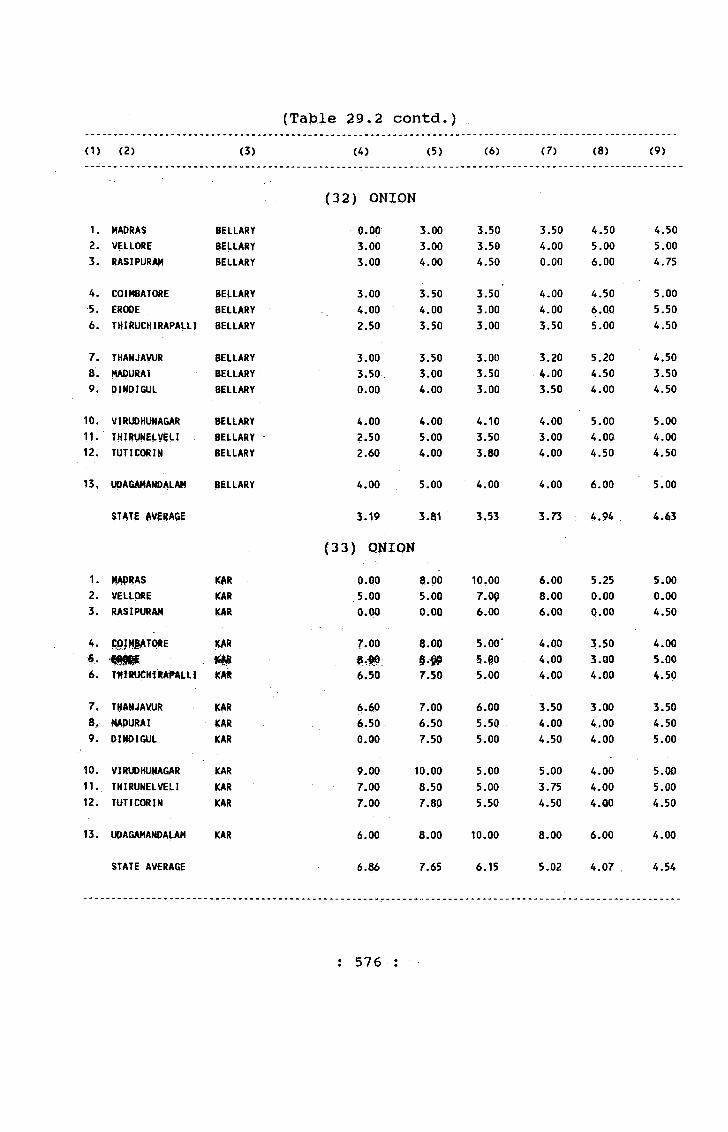
(Table 29.2 contd.)(1) (2) (3) (4) (5) (6) (7) (8) (9)
(32) ONION1. MADRAS BELLARY o.op 3.00 3.50 3.50 4.50 4.502. VELLORE BELLARY 3.00 3.00 3.50 4.00 5,00 5.003. RASIPURAM BELLARY 3.00 4.00 4.50 0.00 6.00 4.75
4. COIHBATORE BELLARY 3.00 3.50 3.50 4,00 4,50 5.005. ERODE BELLARY 4.00 4.00 3.00 4,00 6,00 5.506. THIRUCHIRAPALLI BELLARY 2.50 3.50 3.00 3,50 5,00 4.50
7. THANJAVUR BELLARY 3.00 3.50 3.00 3.20 5,20 4.508. MADURAI BELLARY 3.50 3.00 3.50 4.00 4,50 3.509. 0INDI6UL BELLARY 0.00 4.00 3.00 3.50 4.00 4,50
10. VIRUPHUNAGAR BELLARY 4.00 4.00 4.10 4.00 5.00 5.0011. THIRUNELVEU BELLARY 2.50 5.00 3.50 3.00 4.00 4,0012. TUTICORIM BELLARY 2.60 4.00 3.80 4.00 4,50 4,50
13. UOAGAHANOALAM BELLARY 4.00 5.00 4.00 4.00 6.00 5.00
5TATE AVE|?A6E 3.19 3.81 3.53 3.73 4.94 4.63
(33) QNIQN1. IfAPRAS KAR 0.00 8.00 10.00 6.00 5.25 5.002. VELLORE KAR 5.00 5.00 7.0P 8.00 0.00 0.003. RASIPURAM KAR 0.00 0.00 6.00 6.00 0.00 4.50
COIffgATORE •WR 7.00 8.00 5.00‘ 4.00 3.50 4.005.00 4,00 3.00 5.00
6* TtrfRUCHiRAW^LLl i m 6.50 7.50 5,00 4.00 4.00 4.50
7. THAHJAVUR (CAR 6.60 7.00 6.00 3.50 3.00 3.508. MADURAI KAR 6.50 6.50 5.50 4.00 4.00 4.509. DIHDIOUL KAR O.OO 7.50 5.00 4.50 4.00 5.00
10. VIRUDHl^AGAR KAR 9.00 10.00 5.00 5.00 4.00 5.0011- THIRUNELVEU KAR 7,00 8.50 5.00 3.75 4.00 5.0012. TUTieORIN KAR 7.00 7.80 5.50 4.50 4.00 4.50
13. UPAGAMANDALAM KAR 6,00 8.00 10.00 8.00 6.00 4,00
STATE AVERAGE 6 , ^ 7.65 6.15 5.02 4.07 4,54
; 576 :

(Table 29.2 coritd.)
(1) (2) (3) (10) (11) (12) (13) (14) (15)
(32) ONION1. MADRAS BELLARY 3.00 0.00 2.50 2.50 2.50 2.002. VELLORE BELLARY 3.50 2.00 2.00 2.00 2.00 1.503. RASIPURAM BELLARY 4.00 4.00 4.00 3.00 2.00 2.50
4. COIMBATORE BELLARY 4.00 3.00 2.50 2.50 2.00 2.005. ERODE BELLARY 4.00 4.00 3.00 3.00 2.50 2.506. THIRUCHIRAPALLI BELLARY 4.00 3.00 2.00 2.50 2.00 2.00
7. THANJAVUR BELLARY 3.00 3.70 3.00 2.50 2.50 2.508. MADURAI BELLARY 4.50 3.20 2.50 2.00 2.50 2.009. DINDIGUL BELLARY 4.50 3.50 3.00 3.00 2.00 2.00
10. VIRUDHUNAGAR BELLARY 5.00 2.50 1.50 2.00 1.50 2.5011. THIRUMELVELI BELLARY 3.50 3.00 2.00 2.00 2.00 2.0012. TUT I COR IN BELLARY 4.50 4.00 2.80 2.50 2.50 2.50
13. UDAGAMANDALAM BELLARY 5.00 4.00 3.00 3.00 3.00 0.00
STATE AVERAGE 4.04 3.32 2.60 2.50 2.23 2.17
(33) ONION1. MADRAS KAR 6.50 6.00 0.00 0.00 0.00 3.002. VELLORE KAR o.od 6.00 6.00 4.00 4.00 4.003. RASIPURAM KAR 6.00 6.00 2.00 2.50 1.50 2.00
4. COIMBATORE KAR 6.00 4.00 3.00 2. SO 2 M 3 M5. ERODE KAR 6 M 4.^0 5.CfO 3.CT0 Z . 6 6
6. THIRUCHIRAPALLI. m . . . . . . . 5.00 . . 3.00. . 2.50 . . 2.50 ♦ .2.50 . . 3.00
7. THANJAVUR KAR 5 . ^ 3.So 3.50 3.20 2.50 3.008. MADURAI KAR 5.50 3.20 2.50 2.50 2.50 2.259. DINDIGUL KAR 5.00 3.50 3.00 3.50 3.00 3.00
10. VIRUDHUNAGAR KAR 6.00 ' 5.00 2.50 3.00 2.50 2.5011. THIRUMELVELI KAR 6.00 4.00 2.50 3.00 2.50 2.5012. TUT I COR IN KAR 6.00 5.00 2.50 2.50 3.00 3.50
13. UDAGAMANDALAM KAR 7.00 6.00 5.00 5.00 4.00 0.00
STATE AVERAGE 5.91 4.64 3.17 3.10 2.71 2.85
; 577 ;
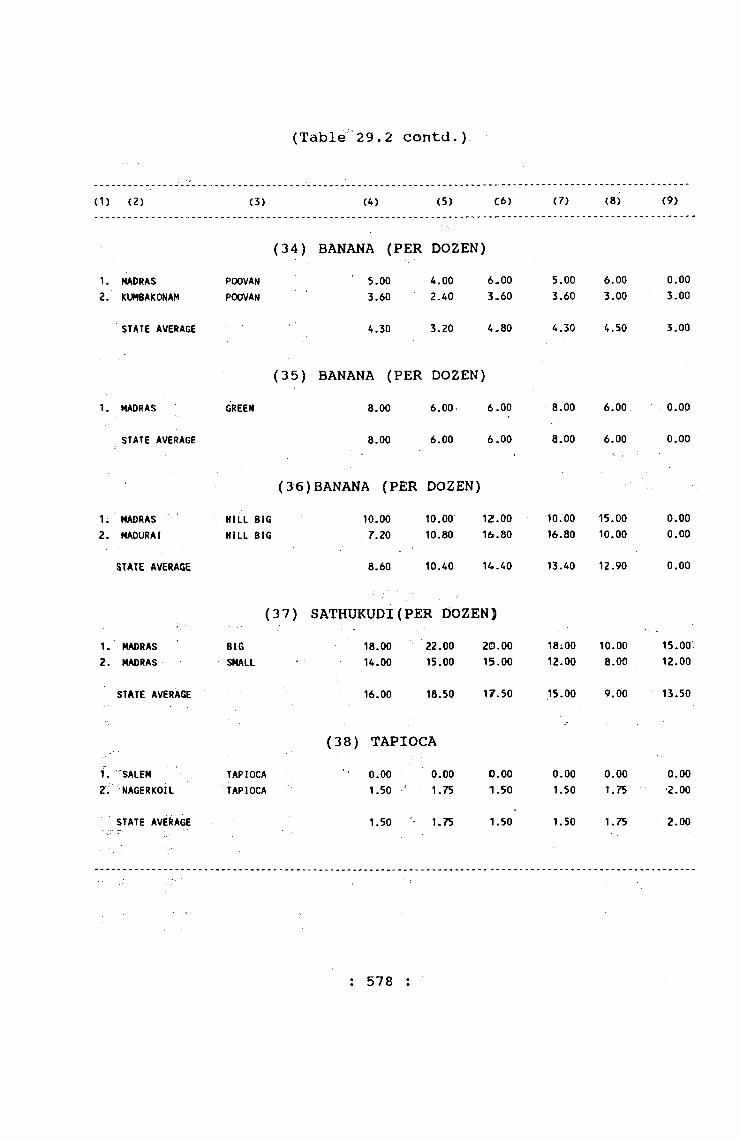
(Table 29.2 contd.)
(1) (2) (3) (4) (5) C6) (7) (8) (9)
( 3 4 ) BANANA (PER DOZEN)1. MADRAS POOVAN 5,00 4.00 6-00 5.00 6.00 0.002. KUMBAKONAM POOVAN 3.60 2.40 3.60 3.60 3.00 3.00
STATE AVERAGE 4.30 3.20 4-80 4.30 4.50 3.00
( 3 5 ) BANANA (PER DOZEN)I. MADRAS GREEN 8.00 6.00 6.00 8.00 6.00 0.00
STATE AVERAGE 8.00 6.00 6.00 8.00 6.00 0.00
(36)BANANA (PER DOZEN)1. MADRAS HILL BIG 10.00 10.00 12.00 10.00 15.00 0.002. MADURAI HILL BIG 7.20 10.80 16.80 16.80 10.00 0.00
STATE AVERAGE 8.60 10.40 14.40 13.40 12.90 0.00
( 3 7 ) SATHUKUDI(PER DOZEN)1. MADRAS Bid 18.00 22.00 20.00 18;00 10.00 15.002. MADRAS SMALL 14.00 15.00 15.00 12.00 8.00 12.00
STATE AVERAGE 16.00 18.50 17.50 15.00 9.00 13.50
(38) TAPIOCA1. SALEM TAPIOCA 0.00 0.00 0.00 0.00 0.00 0.00t v NAGERKOIL TAPIOCA 1.50 • 1.75 1.50 1.50 1.75 2.00
STATE AVERAGE 1.50 ' 1.75 1.50 1.50 1.75 2.00
: 578 :

(Table 29.2 contd.)
C D (2 ) (3) (1 0 ) (1 1 ) (1 2 ) (13) (14) (15)
(34) BANANA (PER DOZEN)1 ,2 .
MADRASKUMBAKONAM
POOVANPOOVAN
4.800 . 0 0
4.804.80
4.803.50
5.403.60
0 , 0 0
3.505.403.50
STATE AVERAGE 4.80 4.80 4.15 4.50 3.50 4.45
(35) BANANA (PER DOZEN)1 . MADRAS GREEN 6 . 0 0 ,6 . 0 0 6 . 0 0 6 . 0 0 0 . 0 0 7.20
STATE AVERAGE 6 . 0 0 6 . 0 0 6 . 0 0 6 . 0 0 0 . 0 0 7.20
(36) BANANA (PER DOZEN)1 .2 .
MADRASMADURAI
HILL BIG HILL BIG
9.600 . 0 0
1 2 . 0 0
0 . 0 0
1 2 . 0 0
10.801 2 . 0 0
0 , 0 0
o.po8.40
10.808.40
STATE AVERAGE 9.60 1 2 . 0 0 11.40 1 2 . 0 0 8.40 9.60
(37) SATHUKUDI (PER DOZEN)1 .
2 .MADRASMADRAS
BIGSMALL
15.001 2 . 0 0
18.0015.00
18.0015.00
2 1 . 0 0
18.0024.0018.00
24.0015.00
STATE AVERAGE 13.50 16.50 16.50 19.50 2 1 . 0 0 19.50
(38) TAPIOCA1 .2 .'
SALEMn a g erkoi l'
TAPIOCA TAPIOCA '
0 . 0 0
2 . 0 0
q.oo2 . 0 0
o.po2 . 0 0
,0 . 9 0 . 2 . 0 0
. 0 .0 0 .2.25
. O.po . 2.25
STATE AVERAGE 2 . 0 0 2 . 0 0 2 . 0 0 2 . 0 0 2.25 2.25
: 579
J42/27-76
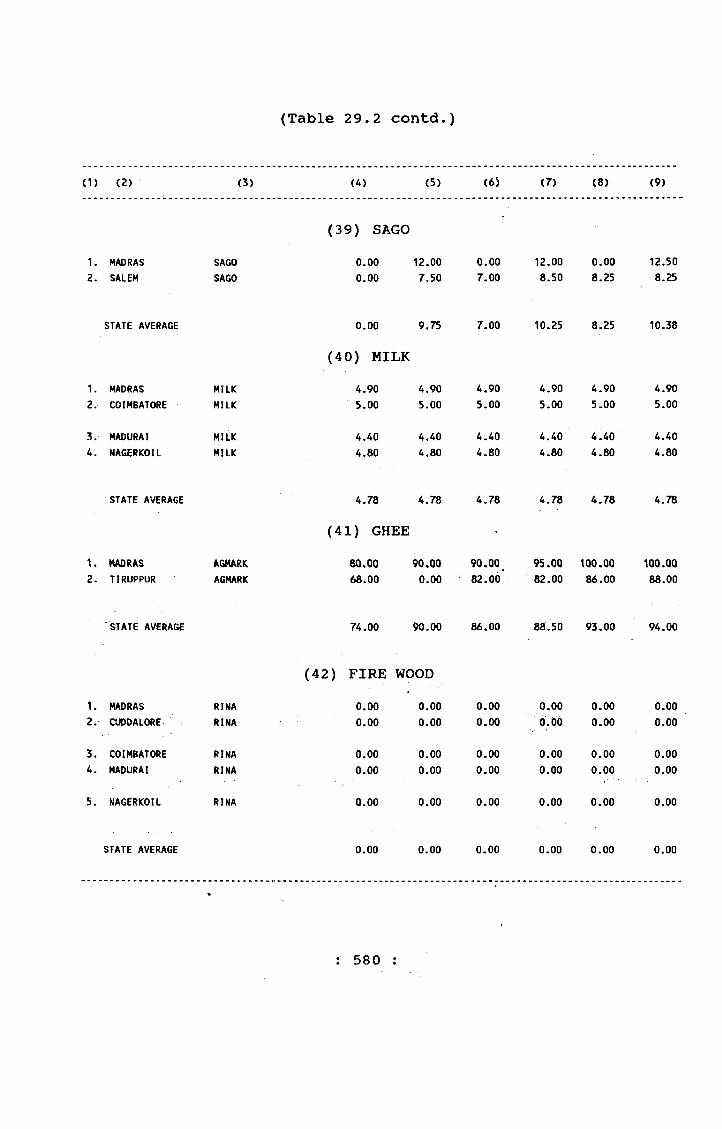
(Table 29.2 contd.)
(1) (2) (3) (4) <5) <6) (7) (8) (9)
(39) SAGO1. MADRAS SAGO 0.00 12.00 0.00 12.00 0.00 12.502. SALEM SAGO 0.00 7.50 7.00 8.50 8.25 8.25
STATE AVERAGE 0.00 9.75 7.00 10.25 8.25 10.38
(40) MILK1. MADRAS MILK 4.90 4.90 4.90 4.90 4-90 4.902. COIMBATORE MILK 5.00 5.00 5.00 5.00 5.00 5.00
3. MADURAI MILK 4.40 4.40 4.40 4.40 4.40 4.404. NAGERKOIL MILK 4.80 4.80 4.80 4.80 4.80 4.80
STATE AVERAGE 4.78 4.78 4.78 4.78 4.78 4.78
(41) GHEE •
1, MADRAS AGMARK 80.00 90.00 90.00 95.00 100.00 100.002. TIRUPPUR AGMARK 68.00 0.00 82.00 82.00 86.00 88.00
STATE AVERAGE 74.00 90.00 86.00 88.50 93.00 94.00
(42) FIREWOOD1. MADRAS RINA 0.00 0.00 0.00 0.00 0.00 0.002. CUDDALORE RINA 0.00 0.00 0.00 0.00 0.00 0.00
3. COIMBATORE RINA 0.00 0.00 0.00 0.00 0.00 0.00A. MADURAI RINA 0.00 0.00 0.00 0.00 0.00 0.00
5. NAGERKOIL RINA 0.00 0.00 0.00 0.00 0.00 0.00
STATE AVERAGE 0.00 0.00 0.00 0.00 0.00 0.00
: 580 ;

(Table 29.2 contd.)
(1) (2) (3) (10) (11) (12) (13) (14) (15)
(39) SAGO1. MADRAS SAGO 12.50 10,QO 10.00 10.00 9.00 9.002. SALEM SAGO 8.25 8.00 8.00 8.00 6.75 7.00
STATE AVERAGE 10.38 9,00 9,00 9.00 7.88 8.0.
(40) MILK1. MADRAS MILK 4.90 4.00 4,90 5.90 5.90 5.902. COIMBATORE MILK 5.00 5.00 5,00 6.00 6.00 6.00
3. MADURAI MILK 5.00 5.00 5,50 6.00 6.00 6.004. NAGERKOIL MILK 4.80 4.80 4,80 6.00 6.00 6.00
STATE AVERAGE 4.92 4.70 5.05 5.97 5.97 5.97
(41) GHEE1. MADRAS AGMARK 100.00 100.00 95.00 90,00 90.00 0.002. TIRUPPUR AGMARK 88.00 84.00 86.00 86,00 78.00 78.00
STATE AVERAGE 94.00 92.00 90.50 88.00 84.00 78.00
(42) FIRE WOOD1. MADRAS RINA 0,00 0.00 0.00 0,00 0.00 0.002. CUDDALORE RINA 0..0Q , 0,00. . o.op . . 0.00 . .0.00 - - 0.00
3. COIMBATORE RINA 0.00 0.00 0.00 0.00 0.00 0.004. MADURAI RINA 0.00 0.00 0.00 0.00 0.00 0.00
5. NAGERKOIL RINA 0.00 0.00 0.00 0.00 0.00 0,00
STATE AVERAGE 0.00 0.00 0.00 0.00 0,00 0.00
: 581
342/27-76a

(Table 29.2 contd.)
(1) (2) (3) (4) (5) (6) (7) (8) (9)
(43) FIRE WOOD1. MADRAS JUNGLE 28.00 0.00 0.00 0.00 30.00 0.002. CUDDALORE JUNGLE 0.00 0.00 0.00 0.00 0.00 0.00
3. COIMBATORE ' JUNGLE 11.00 11.00 11.00 0.00 0.00 0.004. MADURAI JUNGLE 20.00 20.00 25.00 15.80 25.00 31.25
5. NAGERKOIL JUNGLE 0.00 20.00 20.00 20.00 20.00 20.00
STATE AVERAGE 19.67 17.00 18.67 17.90 25.00 25.63
(44) CHARCOAL1. MADRAS CHARCOAL 3.25 0.00 0.00 0.00 2.65 2.002. MADURAI CHARCOAL 2.10 2.10 2.10 0.00 2.00 2.00
STATE AVERAGE 2.67 2.10 2.10 0.00 2.33 2.00
(45) KEROSENE OIL (PER LITTRE)1. MADRAS KEROSENE OIL 2.95 2.95 2.95 2.70 2.70 2.702. CUDDALORE KEROSENE OIL 0.00 3.50 0.00 3.00 0.00 0.00
3. COIMBATORE KEROSENE OIL 2.89 2.89 2.89 2.89 2.64 2.644. TIRUCHIRAPALLI KEROSENE OIL 3.04 3.04 3.04 3.04 2.79 2.79
5. MADURAI KEROSENE OIL '3.12 3.12 3.12- 3.12 0.00 0.00
STATE AVERAGE 3.00 3.10 3.00 2.95 2.71 2.71
(46) VANASPATHY1.MADRAS VANASPATHY 38.00 41.00 40 ..00 42.00 45.00 45 .002.SALEM VANASPATHY 38.00 39.50 39..50 39.50 42.00 43 .00
3.VIRUDHUNAGAR VANASPATHY 41.00 42.00 43..00 43.00 46.00 48 .00
STATE AVERAGE 39.00 40.83 40..83 41.50 44.33 45,.33
: 582 :
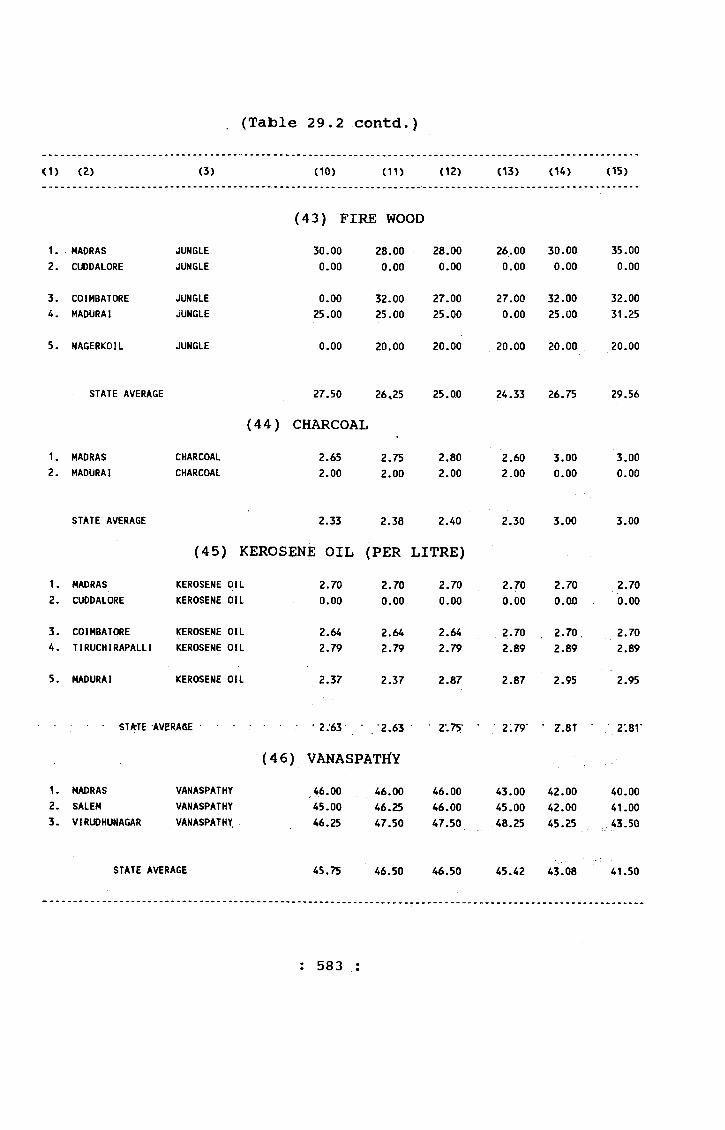
(Table 29.2 contd.)
<1) <2) (3) (10> (11) (12) (13) (14) (15)
(43) FIRE WOOD1. MADRAS JUNGLE 30.00 28.00 28.00 26.00 30.00 35.002. CUDDALORE JUNGLE 0.00 0.00 0.00 0.00 0.00 0.00
3. COIMBATORE JUNGLE 0.00 32.00 27.00 27.00 32.00 32.004. MADURAI JUNGLE 25.00 25.00 25.00 0.00 25.00 31.25
5. NAGERKOIL JUNGLE 0.00 20.00 20.00 20.00 20.00 20.00
STATE AVERAGE 27.50 26^25 25.00 24.33 26.75 29.56
(44) CHARCOAL1. MADRAS CHARCOAL 2.65 2.75 2.80 2.60 3.00 3.002. MADURAI CHARCOAL 2.00 2.00 2.00 2.00 0.00 0.00
STATE AVERAGE 2.33 2.38 2.40 2.30 3.00 3.00
(45) KEROSENE OIL (PER LITRE)1. MADRAS KEROSENE OIL 2.70 2.70 2.70 2.70 2.70 2.702. CUDDALORE KEROSENE OIL 0.00 0.00 0.00 0.00 0.00 0.00
3. COIMBATORE KEROSENE OIL 2.64 2.64 2.64 2.70 2.70 2.70U . TIRUCHIRAPALLI KEROSENE OIL 2.79 2.79 2.79 2.89 2.89 2.89
5. MADURAI KEROSENE OIL 2.37 2.37 2.87 2.87 2.95 2.95
STArTE AVERA6E • • • • ' ’ '2;63* ’2.63 2‘.75* • • 2 : 7 9 • Z.8T ■ • 2*.8r
(46) VANASPATriY1. MADRAS VANASPATHY 46.00 46.00 46.00 43.00 42.00 40.002. SALEM VANASPATHY 45.00 46.25 46.00 45.00 42.00 41.003. VIRUDHUNAGAR VANASPATHY 46.25 47.50 47.50 48.25 45.25 , 43.50
STATE AVERAGE 45.75 46.50 46.50 45.42 43.08 41.50
: 583 ;

(Table 29.2 contd.)
(1) (2) (3) (4) (5) (6) (7) (8) (9)
(47) EGG1.MADRAS LEGHRON LAR 0.75 0.90 0,80 0.95 0.90 0.75
STATE AVERAGE 0-75 0.90 0.80 0.95 0.90 0.75
(48) EGG1.MADRAS LEGHRON MED 0.70 0.85 0.75 0.90 0.80 0,702.CUDDAL0RE LEGHRON MED 0.70 0.65 0.70 0.80 0.80 0.75
3.VELLORE LEGHRON MED 0.75 0.80 0.85 0.95 0.85 0.854.SALEM LEGHRON MED 0.65 0.80 0.80 0.90 0.85 0.80
5.KRISHNAGIRI LEGHRON MED 0.70 0.85 0.80 0.90 0.85 0.806.COIMBATORE LEGHRON MED 0.65 0.85 0.75 0.85 0.75 0.75
7.THIRUCHIRAPALLI LEGHRON MED 0.65 0.85 0.75 0.90 0.75 0.758.THANJAVUR LEGHRON MED 0.60 0.85 0.80 0.85 0.75 0.70
9.MADURAI LEGHRON MED 0.65 0.65 0.75 0.85 0.75 0.7510.THIRUNELVELI LEGHRON MED 0.70 0;70 0.80 0.80 0.85 0.80
It.NAGERKOIL LEGHRON MED 0.70 0.85 0.75 0.95 0.80 0.7512.MARTHANDAM LEGHRON MED 0.75 0.85 0.75 0.95 0.80 0.80
13.UDAGAMANDALAM LEGHRON MED 0.65 0.90 0.85 1.00 0.80 0.80
STATE AVERAGE 0.68 0.80 0.78 0.89 0.80 0.77
(49) EGG1.MADRAS LEGHRON SMALL 0.65 0.70 0.80 0.85 0.75 0.65
STATE AVERAGE 0.65 0.70 0.80 0.85 0.75 0.65
(50) EGG1.MADRAS LEGHRON SMALL 0.00 0.00 0.00 • 0.00 0.00 0.70
STATE AVERAGE 0.00 0.00 0.00 0.00 0.00 0.70
: 584 :
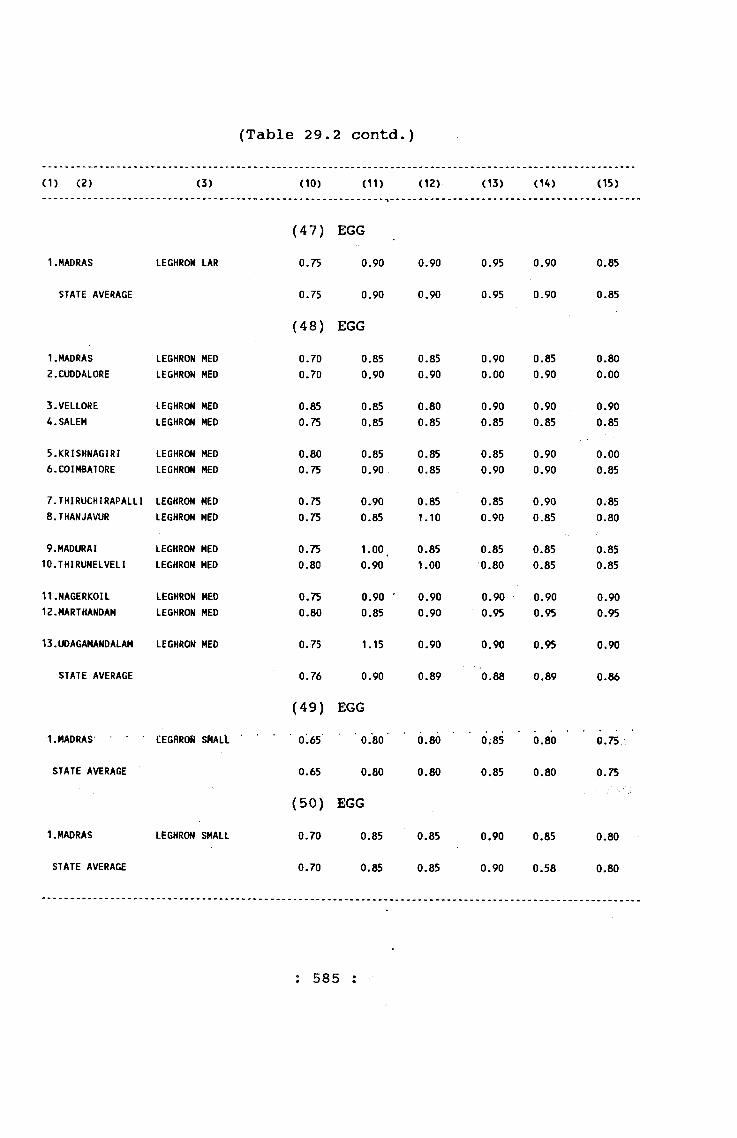
(Table 29.2 contd.)
(1) (2) (3) <10) (11) (12) (13) (14) (15)
(47) EGG1.MADRAS LEGHRON LAR 0.75 0.90 0.90 0.95 0.90 0.85
STATE AVERAGE 0.75 0.90 0.90 0.95 0.90 0.85
(48) EGG1.MADRAS LEGHRON MED 0.70 0.85 0.85 0.90 0.85 0.802.CUDDAL0RE LEGHRON MED 0.70 0.90 0.90 0.00 0.90 0.00
3.VELLORE LEGHRON MED 0.85 0.85 0.80 0.90 0.90 0.904.SALEM LEGHRON MED 0.75 0.85 0.85 0.85 0.85 0.85
5.KRISHNAG1RI LEGHRON MED 0.80 0.85 0.85 0.85 0.90 0.006.COIMBATORE LEGHRON MED 0.75 0.90 0.85 0.90 0.90 0.85
7.THIRUCHIRAPALLI LEGHRON MED 0.75 0.90 0.85 0.85 0.90 0.858.THANJAVUR LEGHRON MED 0.75 0.85 1.10 0.90 0.85 0.80
9.MADURAI LEGHRON MED 0.75 1.00, 0.85 0.85 0.85 0.85lO.THIRUNELVELI LEGHRON MED 0.80 0.90 1.00 0.80 0.85 0.85
11.NAGERK0IL LEGHRON MED 0.75 0.90 ' 0.90 0.90 0.90 0.9012.MARTHANDAM LEGHRON MED 0.80 0.85 0.90 0.95 0.95 0.95
13.UDAGAMANDALAM LEGHRON MED 0.75 1.15 0.90 0.90 0.95 0.90
STATE AVERAGE 0.76 0.90 0.89 0.88 0,89 0.86
(49) EGG1.MADRAS UEGHROR SflALl 0.65 0.80 0.80 0.85 0.80 0.75
STATE AVERAGE 0.65 0.80 0.80 0.85 0.80 0.75
(50) EGG1.MADRAS LEGHRON SMALL 0.70 0.85 0.85 0.90 0.85 0.80
STATE AVERAGE 0.70 0.85 0.85 0.90 0.58 0.80
: 585 :
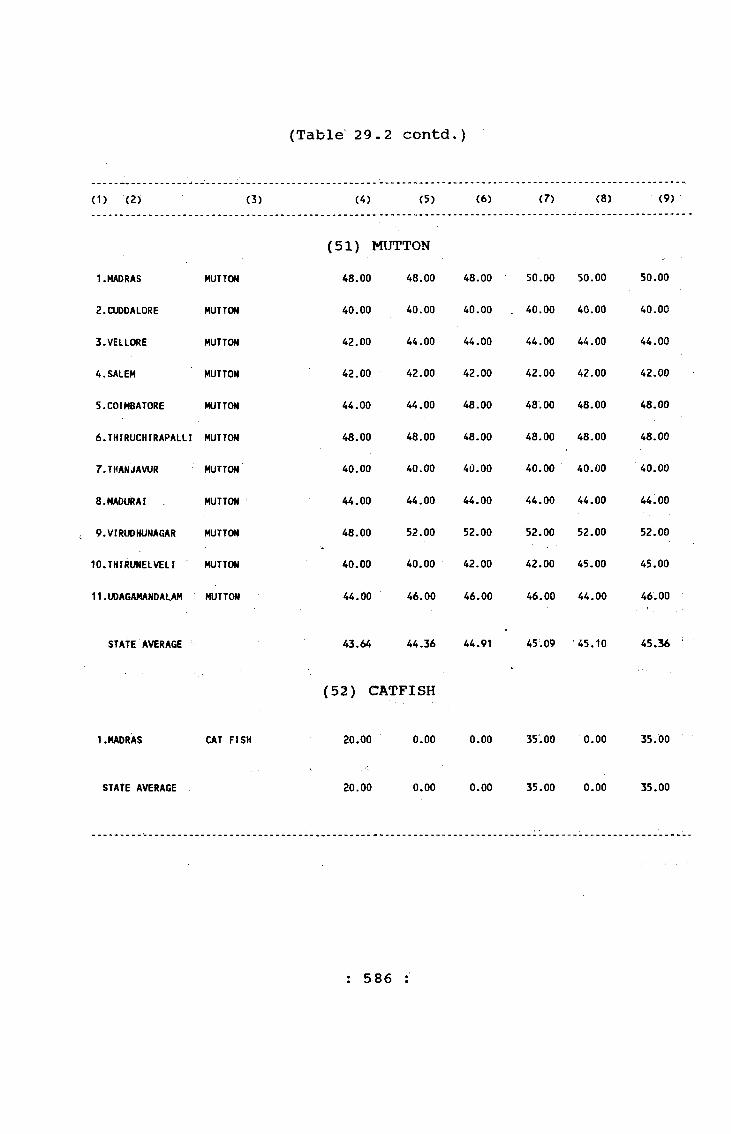
(Table 29-2 contd.)
( 1) ( 2 ) (3) (4) (5) (6 ) (7) <8) (9)
1.MADRAS MUTTON
2.CUDDAL0RE MUTTON
3.VELLORE MUTTON
4.SALEM MUTTON
5.COIMBATORE MUTTON
6.THIRUCHIRAPALLI MUTTON
7.THANJAVUR MUTTON
8.MADURAI MUTTON
9.VIRUDHUNAGAR MUTTON
10.THIRUNELVELI MUTTON
11.UDAGAMAN0ALAM MUTTON
(51) MUTTON 48.00 48.00
40.00
42.00
42.00
44.00
48.00
40.00
44.00
48.00
40.00
44.00
40.00
44.00
42.00
44.00
48.00
40.00
44.00
52.00
40.00
46.00
48.00
40.00
44.00
42.00
48.00
48.00
40.00
44.00
52.00
42.00
46.00
50.00
40.00
44.00
42.00
48.00
48.00
40.00
44.00
52.00
42.00
46.00
50.00
40.00
44.00
42.00
48.00
48.00
40.00
44.00
52.00
45.00
44.00
50.00
40.00
44.00
42.00
48.00
48.00
40.00
44.00
52.00
45.00
46.00
STATE AVERAGE
1.MADRAS CAT FISH
43.64 44.36 44.91 45.09 45.10 45.36
(52) CATFISH
20.00 0.00 0.00 35.00 0.00 35.00
STATE AVERAGE 20.00 0.00 0.00 35.00 0.00 35.00
: 586 :
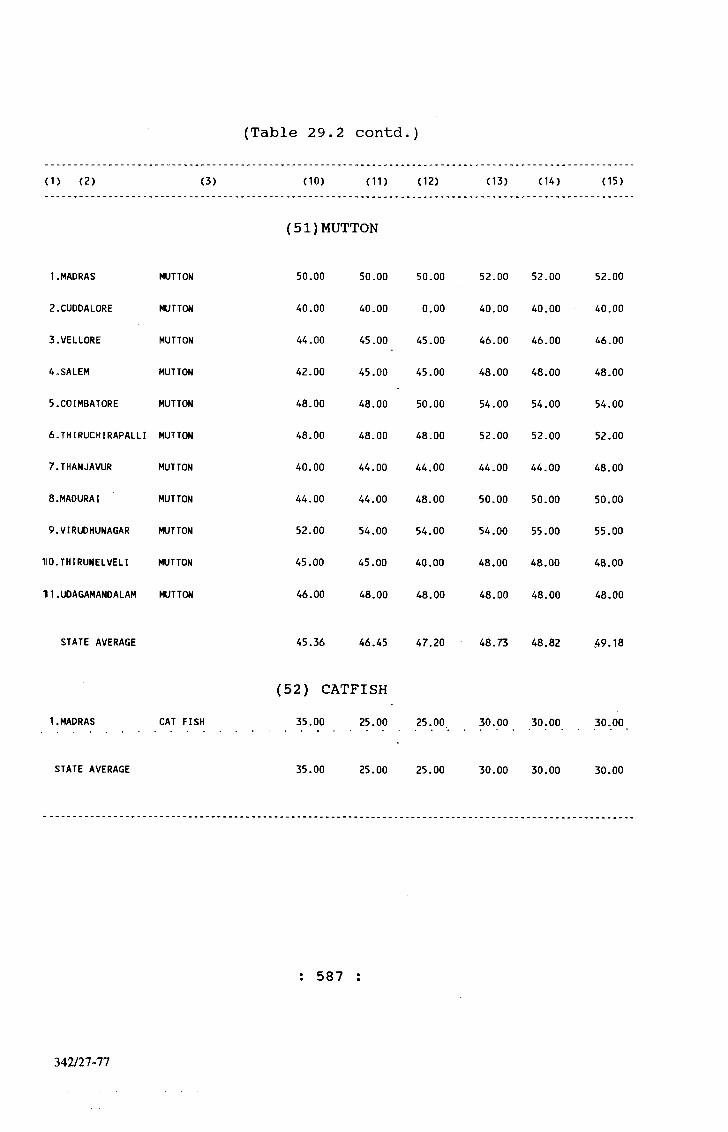
(Table 29.2 contd.)
(1) (2 ) (3) (10) ( 11 ) ( 12 ) (13) (14) (15)
(51)MUTTON
1.MADRAS MUTTON
2.CUDDAL0RE MUTTON
3.VELLORE MUTTON
4,SALEM MUTTON
5.COIMBATORE MUTTON
6.THIRUCHIRAPALLI MUTTON
7.THANJAVUR MUTTON
8.MADURA I MUTTON
9.VIRUDHUNAGAR MUTTON
110.THIRUNELVELI MUTTON
111. UDAGAMANDALAM MUTTON
50.00
40.00
44.00
42.00
48.00
48.00
40.00
44.00
52.00
45.00
46.00
50.00
40.00
45.00
45.00
48.00
48.00
44.00
44.00
54.00
45.00
48.00
50.00
0.00
45.00
45.00
50.00
48.00
44.00
48.00
54.00
40.00
48.00
52.00
40.00
46.00
48.00
54.00
52.00
44.00
50.00
54.00
48.00
48.00
52.00
40.00
46.00
48.00
54.00
52.00
44.00
50.00
55.00
48.00
48.00
52.00
40.00
46.00
48.00
54.00
52.00
48.00
50.00
55.00
48.00
48.00
STATE AVERAGE 45.36 46.45 47.20 48.73 48.82 ,49.18
1.MADRAS CAT FISH
(52) CATFISH35.00 25.00 25.00 30.00 30.00 30.00
STATE AVERAGE 35.00 25.00 25.00 30.00 30.00 30.00
: 587
342/27-77
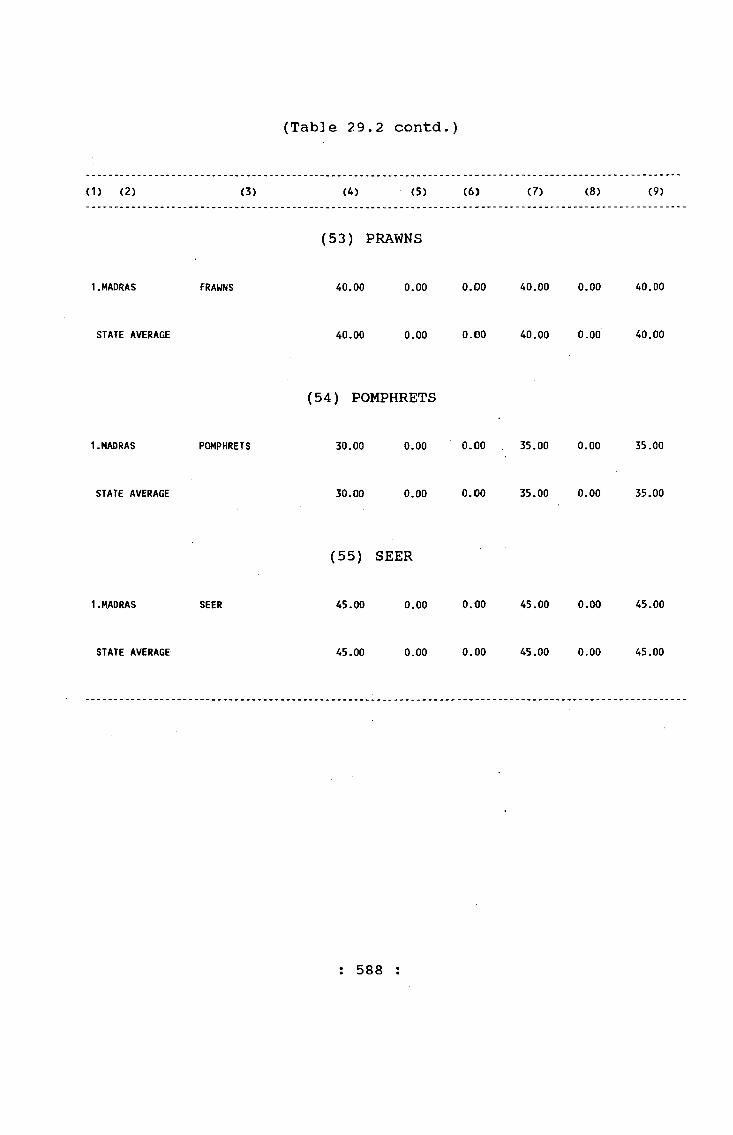
(Table 29.2 contd.)
(1) (2) (3) (4) (5) (6) (7) (8) (9)
(53) PRAWNS
1.MADRAS FRAWNS 40.00 0.00 0.00 40.00 0.00 40.00
STATE AVERAGE 40.00 0.00 0.00 40.00 0.00 40.00
(54) POMPHRETS
1.MADRAS POMPHRETS 30.00 0.00 0.00 35.00 0.00 35.00
STATE AVERAGE 30.00 0.00 0.00 35.00 0.00 35.00
(55) SEER
1.MADRAS SEER 45.00 0.00 0.00 45.00 0.00 45.00
STATE AVERAGE 45.00 0.00 0.00 45.00 0.00 45.00
: 588 :

(Table 29.2 contd.)
<1) (2) (3) (10) (11) (12) (13) (14) (15)
(53) PRAWNS
1.MADRAS FRAWNA 40.00 60.00 40.00 50.00 50.00 45.00
STATE AVERAGE 40.00 60.00 40.00 50.00 50-00 45.00
(54) POMPHRETS
1.MADRAS POMPHRETS 35.00 35.00 35.00 45.00 45.00 42.00
STATE AVERAGE 35.00 35.00 35.00 45.00 45.00 42.00
(55) SEER
1.MADRAS SEER 45.00 55.00 60.00 60.00 60.00 60.00
STATE AVERAGE 45.00 55.00 60.00 60.00 60.00 60.00
SOURCE: COMMISSIONER OF STATISTICS, MADRAS
: 589
542/27-77a
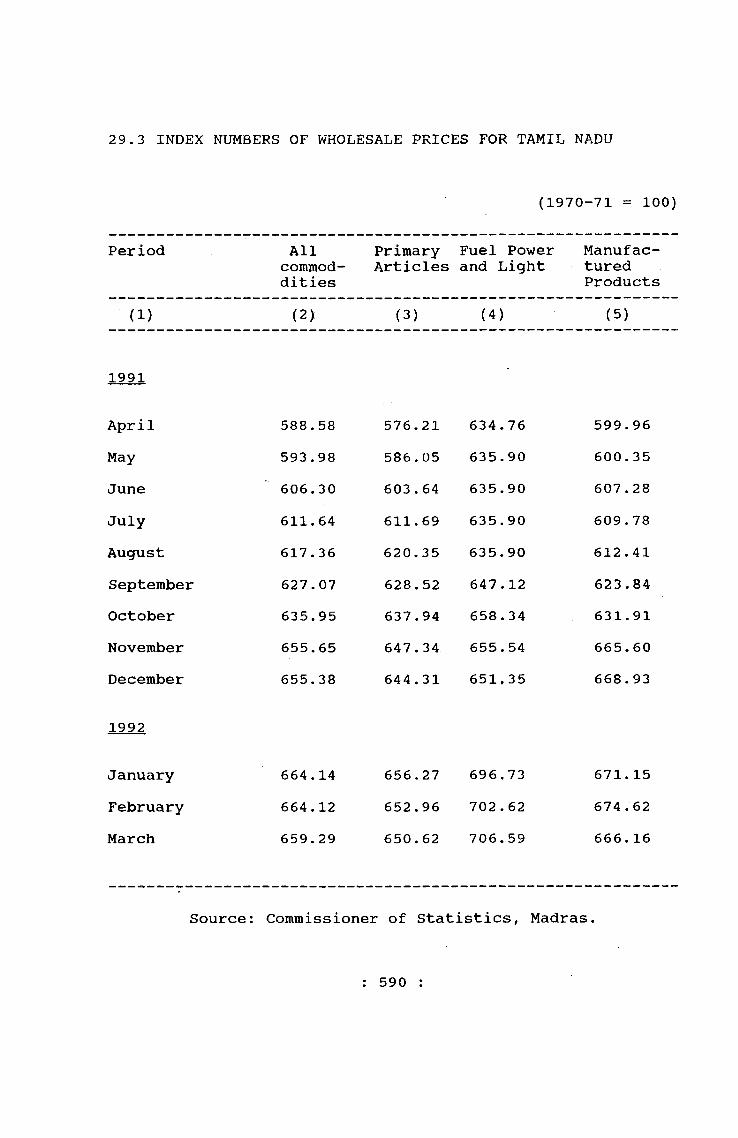
29.3 INDEX NUMBERS OF WHOLESALE PRICES FOR TAMIL NADU
(1970-71 = 100)
Period Allcornmod-dities
Primary Fuel Power Articles and Light
ManufacturedProducts
( 1) (2) (3) (4) (5)
1991
AprilMayJuneJulyAugustSeptemberOctoberNovemberDecember
588.58593.98606.30611.64 617.36 627.07 635.95655.65 655.38
576.21 586.05 603.64 611.69 620.35 628.52 637.94 647.34 644.31
634.76635.90635.90635.90635.90 647.12658.34 655.54651.35
599.96 600.35 607.28 609.78 612.41 623.84 631.91 665.60 668.93
1992
JanuaryFebruaryMarch
664.14 656.27 696.73664.12 652.96 702.62659.29 650.62 706.59
671.15 674.62666.16
Source: Commissioner of Statistics, Madras
: 590 :
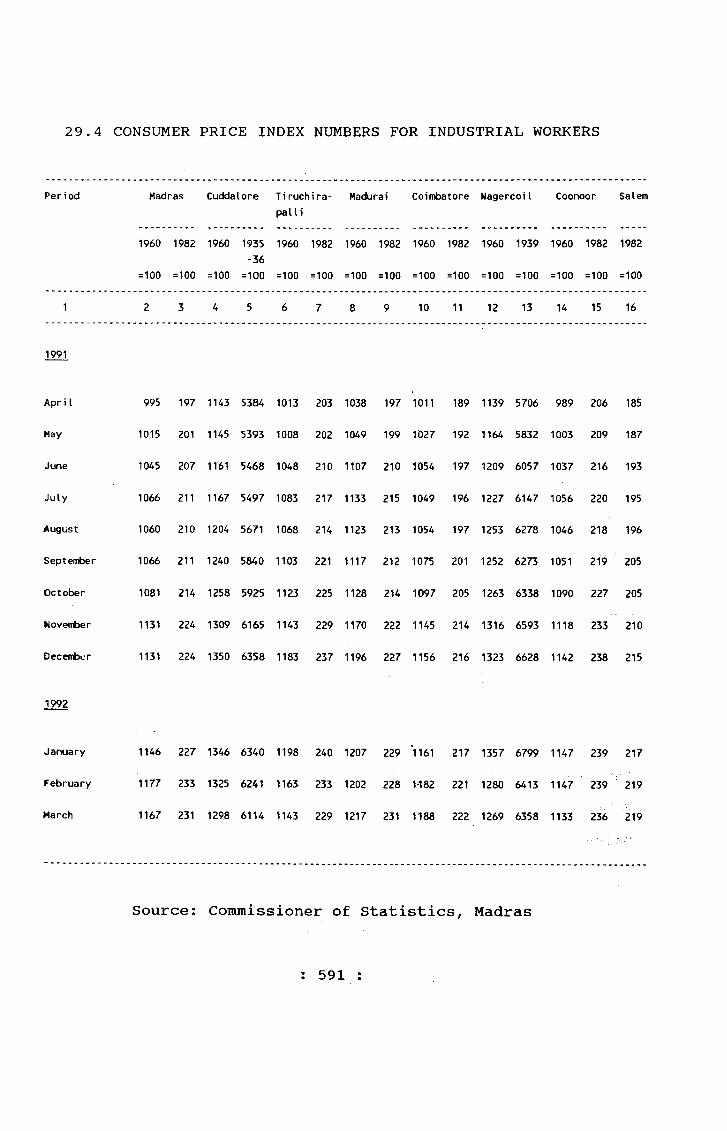
2 9.4 CONSUMER PRICE INDEX NUMBERS FOR INDUSTRIAL WORKERS
Period Madras Cuddalore T i ruchi ra- pa U i
Madurai Coimbatore NagercoiI Coonoor Salem
1960
= 100
1982
=100
1960
= 100
1935 -36
= 100
1960
=100
1982
=100
1960
=100
1982
=100
1960
= 100
1982
=100
1960
=100
1939
= 100
1960
= 100
1982
=100
1982
= 100
1 2 3 4 5 6 7 8 9 10 11 12 13 14 15 16
1991
<Apr ]■ I 995 197 1143 5384 1013 203 1038 197 1011 189 1139 5706 989 206 185
May 1015 201 1145 5393 1008 202 1049 199 1'027 192 1164 5832 1003 209 187
June 1045 207 1161 5468 1048 210 1107 210 1054 197 1209 6057 1037 216 193
July 1066 211 1167 5497 1083 217 1133 215 1049 196 1227 6147 1056 220 195
August 1060 210 1204 5671 1068 214 1123 213 1054 197 1253 6278 1046 218 196
September 1066 211 1240 5840 1103 221 1117 212 1075 201 1252 6273 1051 219 205
October 1081 214 1258 5925 1123 225 1128 214 1097 205 1263 6338 1090 227 205
November 1131 224 1309 6165 1143 229 1170 222 1145 214 1316 6593 1118 233 210
December 1131 224 1350 6358 1183 237 1196 227 1156 216 1323 6628 1142 238 215
1992
January 1146 227 1346 6340 1198 240 1207 229 1161 217 1357 6799 1147 239 217
February 1177 233 1325 6241 1163 233 1202 228 1-182 221 1280 6413 1147 239 219
March 1167 231 1298 6114 1143 229 1217 231 1188 222 1269 6358 1133 236 219
Source: Commissioner of Statistics, Madras
: 591 :
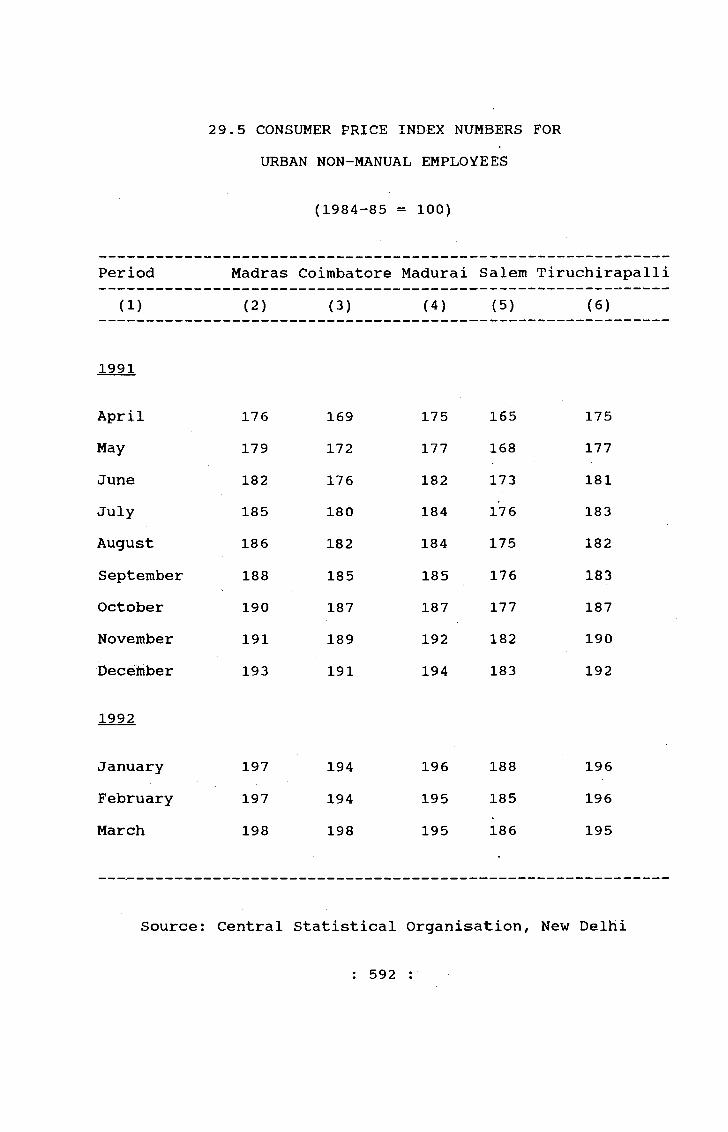
29.5 CONSUMER PRICE INDEX NUMBERS FORURBAN NON-MANUAL EMPLOYEES
(1984-85 = 100)
Period Madras Coimbatore Madurai Salem Tiruchirapalli
(1) (2) (3) (4) (5) (6)
1991
April 176 169 175 165 175May 179 172 177 168 177June 182 176 182 173 181July 185 180 184 176 183August 186 182 184 175 182September 188 185 185 176 183October 190 187 187 177 187November 191 189 192 182 190Deceinber 193 191 194 183 192
1992
January 197 194 196 188 196February 197 194 195 185 196March 198 198 195 186 195
Source: Central Statistical Organisation, New Delhi
: 592 :

2 9.6 ALL INDIA AVERAGE CONSUMER PRICE FOR INDUSTRIAL WORKERS
INDEX NUMBERS
• I n d e XP e r i o d
1960 = 100 1982 = 100
(1) (2) (3)
1991
April 996 202May 1006 204June 1030 209July 1055 214August 1070 217September 1090 221October 1099 223November 1109 225December 1109 225
1992
January 1124 228February 1129 229March 1129 229
Source: Director, Labour Bureau, Simla
: 593 :
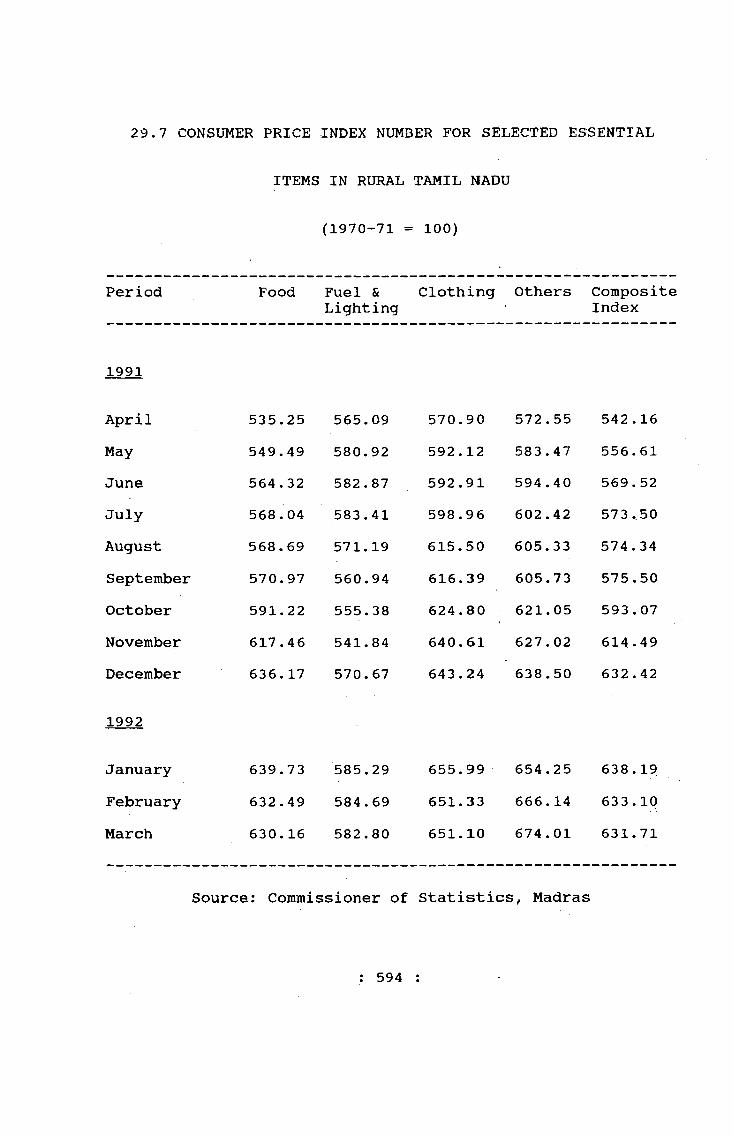
29.7 CONSUMER PRICE INDEX NUMBER FOR SELECTED ESSENTIAL
ITEMS IN RURAL
(1970-71 =
TAMIL NADU
= 100)
Period Food Fuel & Lighting
Clothing Others CompositeIndex
1991
April 535.25 565.09 570.90 572.55 542.16May 549.49 580.92 592.12 583.47 556.61June 564.32 582.87 592.91 594.40 569.52July 568.04 583.41 598.96 602.42 573.50August 568.69 571.19 615.50 605.33 574.34September 570.97 560.94 616.39 605.73 575.50October 591.22 555.38 624.80 621.05 593.07November 617.46 541.84 640.61 627.02 614.49December 636.17 570.67 643.24 638.50 632.42
1992
January 639.73 585.29 655.99 654.25 638.19February 632.49 584.69 651.33 666.14 633.10March 630.16 582.80 651.10 674.01 631.71
Source: Commissioner of Statistics, Madras
: 594 :
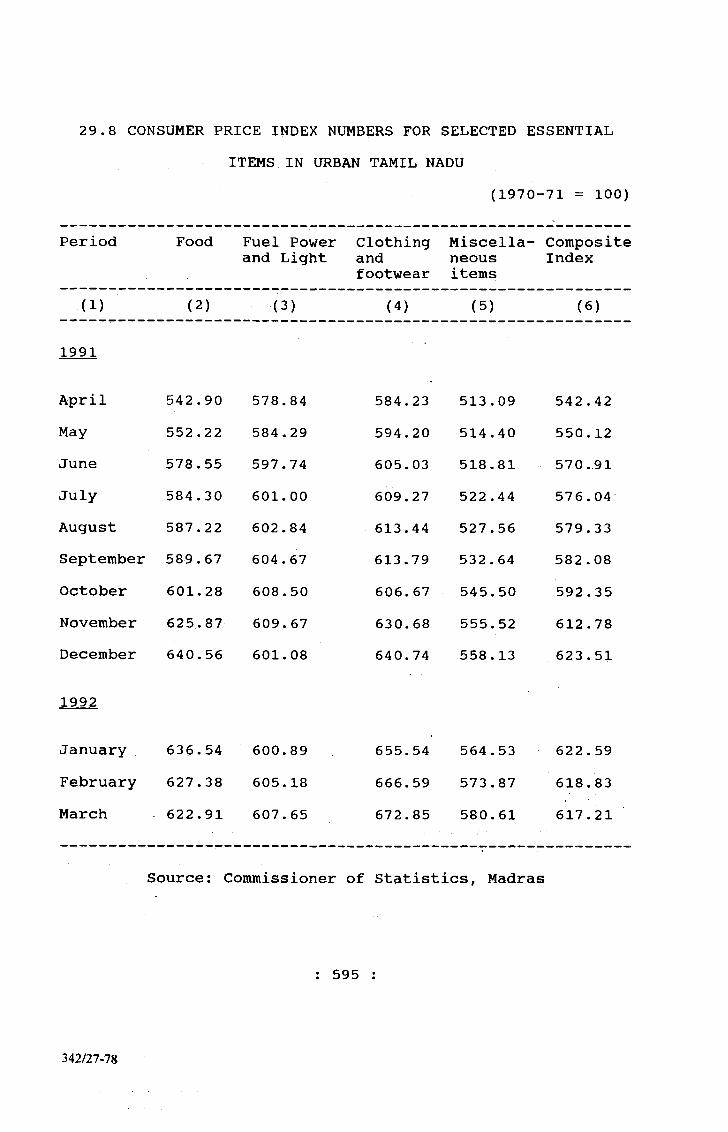
ITEMS IN URBAN TAMIL NADU29.8 CONSUMER PRICE INDEX NUMBERS FOR SELECTED ESSENTIAL
(1970--71 = 100)
Period Food Fuel Power and Light
Clothingandfootwear
Miscellaneousitems
CompositeIndex
(1) (2) (3) (4) (5) (6)
1991
April 542.90 578.84 584.23 513.09 542 .42May 552.22 584.29 594.20 514.40 550.12June 578.55 597.74 605.03 518.81 570.91July 584.30 601.00 609.27 522.44 576.04August 587.22 602.84 613.44 527.56 579.33September 589.67 604.67 613.79 532.64 582.08October 601.28 608.50 606.67 545.50 592.35November 625.87 609.67 630.68 555.52 612.78December 640.56 601.08 640.74 558.13 623.51
1992
January 636.54 600.89 655.54 564.53 622.59February 627.38 605.18 666.59 573.87 618.83March 622.91 607.65 672.85 580.61 617.21
Source: Cominissioner of Statistics, Madras
: 595
342/27-78

30.1 QUANTUM OF FOREIGN TRADE THROUGH THE PORTS OF TAMIL NADU IN COMPARISON WITH THAT OF ALL INDIA
1990-91
30. FOREIGN TRADE
SI.No. Exports/ Quantum of Percentage share Imports Foreign Trade of Foreign Trade
(Rs. in lakhs) through Tamil Nadu------------- --- ------- Ports to All IndiaTamil Nadu All India
(1) (2) (3) (4) (5)
1. Exports 4,12,993 32,55,334 132. Imports 5,22,638 43,19,286 . 12
Source: Director General of Statistics, Calcutta
Commercial intelligence and
3 0.2 QUANTAM OF FOREIGN TRADE THROUGH THE PORTS OF TAMIL NADU BY PORTS IN TERMS OF VALUE 1991
(Rs. in lakhs)SI.No. Name of the Ports Imports Exports
(1) (2) (3) (4)SEA PORTS;
1.2.3.
Madras Cuddalore Nagapatt inam
402289 (P) 6118 451
256221 (P) 514
4.5.
TuticorinColachel
55460 (P) 60154 (P)
AIRPORTS6.7.
St. Thomas Mount Tiruchirapalli
58320 960977
Total 522638 412993Source: Commissioner of Statistics, Madras
; 596 :
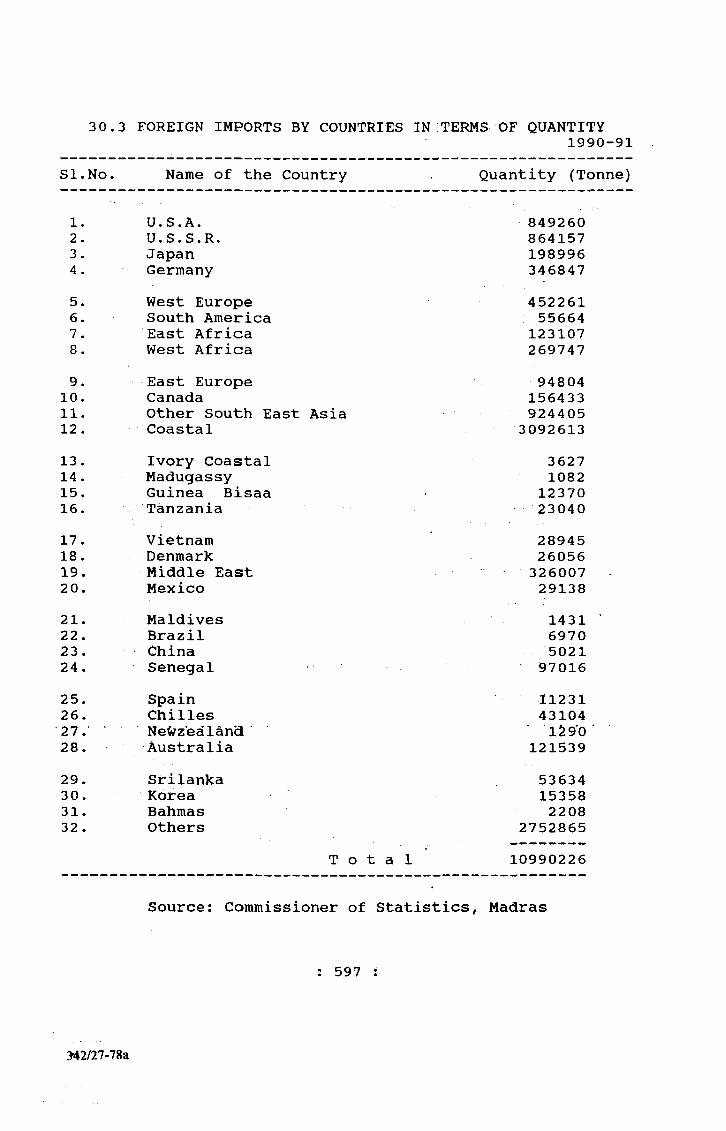
30.3 FOREIGN IMPORTS BY COUNTRIES IN TERMS OF QUANTITY1990-91
SI.No. Name of the Country Quantity (Tonne)
1. U.S.A. 8492602. U.S.S.R. 8641573 . Japan 1989964. Germany 3468475. West Europe 4522616. South America 556647. East Africa 1231078 . West Africa 2697479. East Europe 94804
10. Canada 15643311. Other South East Asia 92440512 . Coastal 309261313 . Ivory Coastal 362714 . Madugassy 108215. Guinea Bisaa 1237016. Tanzania 2304017. Vietnam 2894518. Denmark 2605619. Middle East 32600720. Mexico 2913821. Maldives 143122. Brazil 697023 . China 502124. Senegal 9701625. Spain 1123126. Chilles 4310427. Newz*ealan*d lS9‘028. Australia 12153929. Srilanka 5363430. Korea 1535831. Bahmas 220832. Others 2752865
T o t a l 10990226
Source: Commissioner of Statistics, Madras
: 597 :
342/27-78a
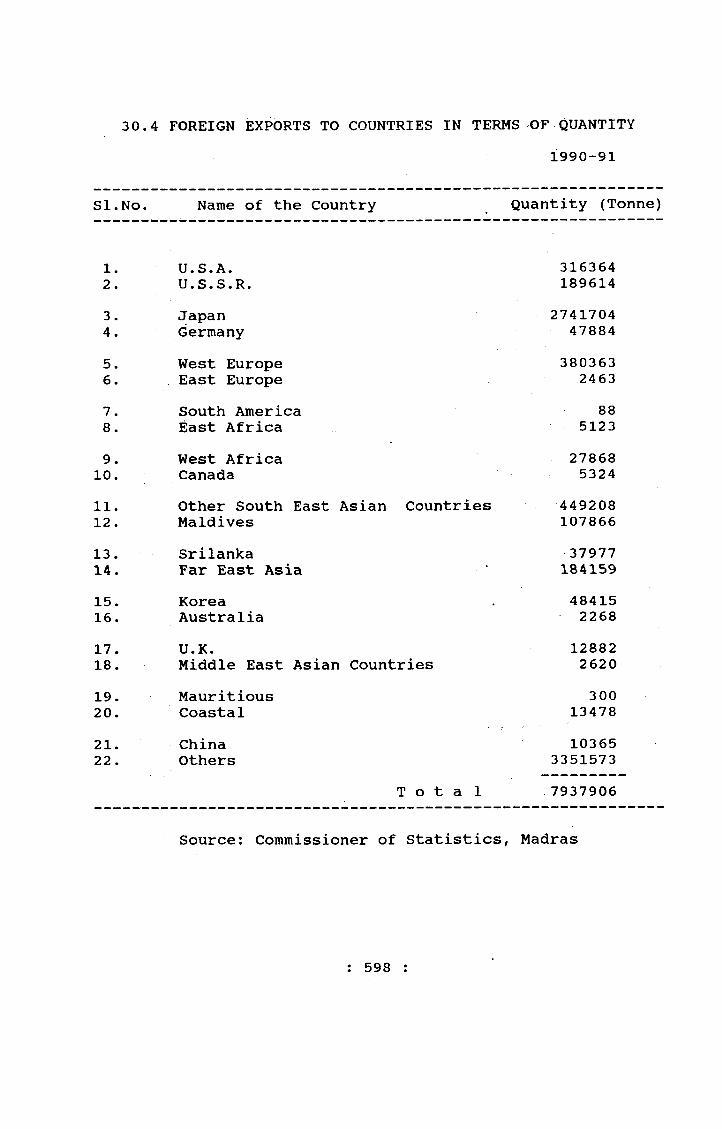
1990-9130.4 FOREIGN EXPORTS TO COUNTRIES IN TERMS OF QUANTITY
SI.No. Name of the Country Quantity (Tonne)
1. U.S.A. 3163642. U.S.S.R. 1896143. Japan 27417044. Germany 478845. West Europe 3803636. East Europe 24637. South America 888. East Africa 51239. West Africa 27868
10. Canada 532411. Other South East Asian Countries 44920812. Maldives 10786613. Srilanka 3797714. Far East Asia 18415915. Korea 4841516. Australia 226817. U.K. 1288218. Middle East Asian Countries 262019. Mauritious 30020. Coastal 1347821. China 1036522. Others 3351573
T o t a l 7937906
Source: Commissioner of Statistics, Madras
: 598 :
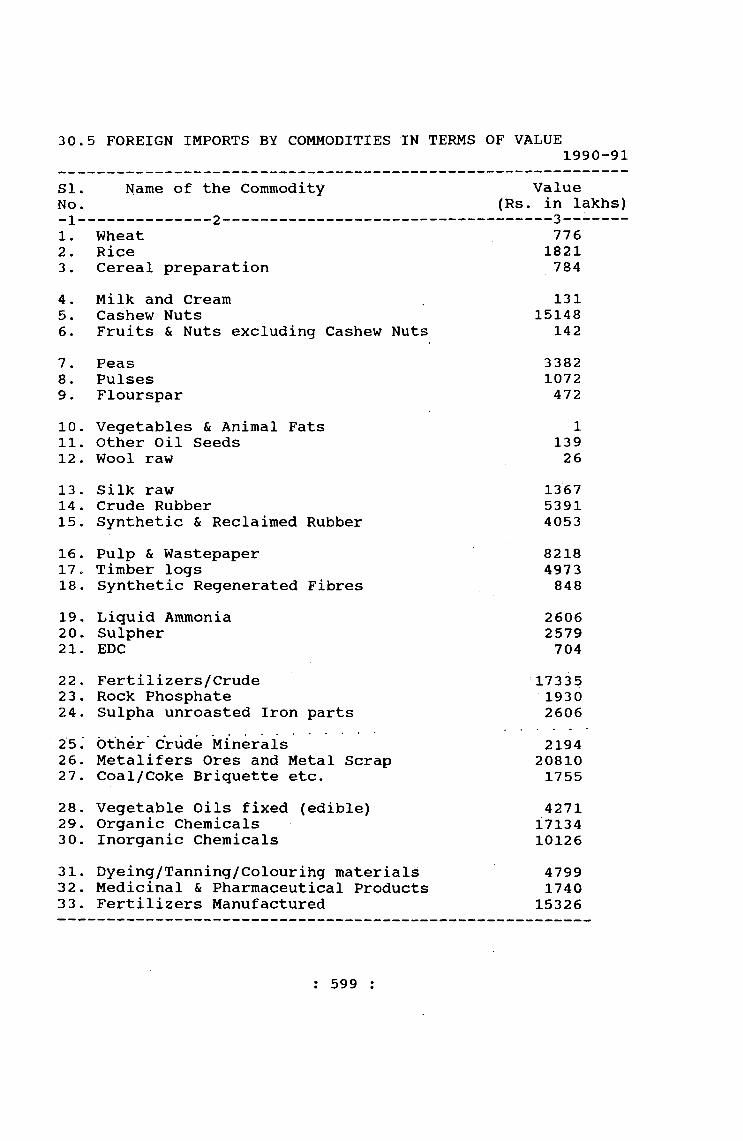
3 0.5 FOREIGN IMPORTS BY COMMODITIES IN TERMS OF VALUE1990-91
SINo-1-1.2 .3.4.5.6 .
7.8 . 9.101 11 2
1314151617181920 21
2223242526272 8 2 9 3 0313233
Name of the Commodity ---------- 2------------
Value (Rs. in lakhs)
- - - - - - - - - - - - - - - - - 3 — - - - - - - - - - - - - - -
7761821784131
15148142
33821072472
113926
13675391405382184973848
26062579704
1733519302606
WheatRiceCereal preparationMilk and Cream Cashew NutsFruits & Nuts excluding Cashew NutsPeasPulsesFloursparVegetables & Animal Fats Other Oil Seeds Wool rawSilk raw Crude RubberSynthetic & Reclaimed RubberPulp & Wastepaper Timber logsSynthetic Regenerated FibresLiquid AmmoniaSulpherEDCFert i1i z ers/CrudeRock PhosphateSulpha unroasted Iron partsOther Crude Minerals Metalifers Ores and Metal Scrap Coal/Coke Briquette etc.Vegetable Oils fixed (edible) Organic Chemicals Inorganic ChemicalsDyeing/Tanning/Colourihg materials Medicinal & Pharmaceutical Products Fertilizers Manufactured
21942081017554271
171341012647991740
15326
: 599 :
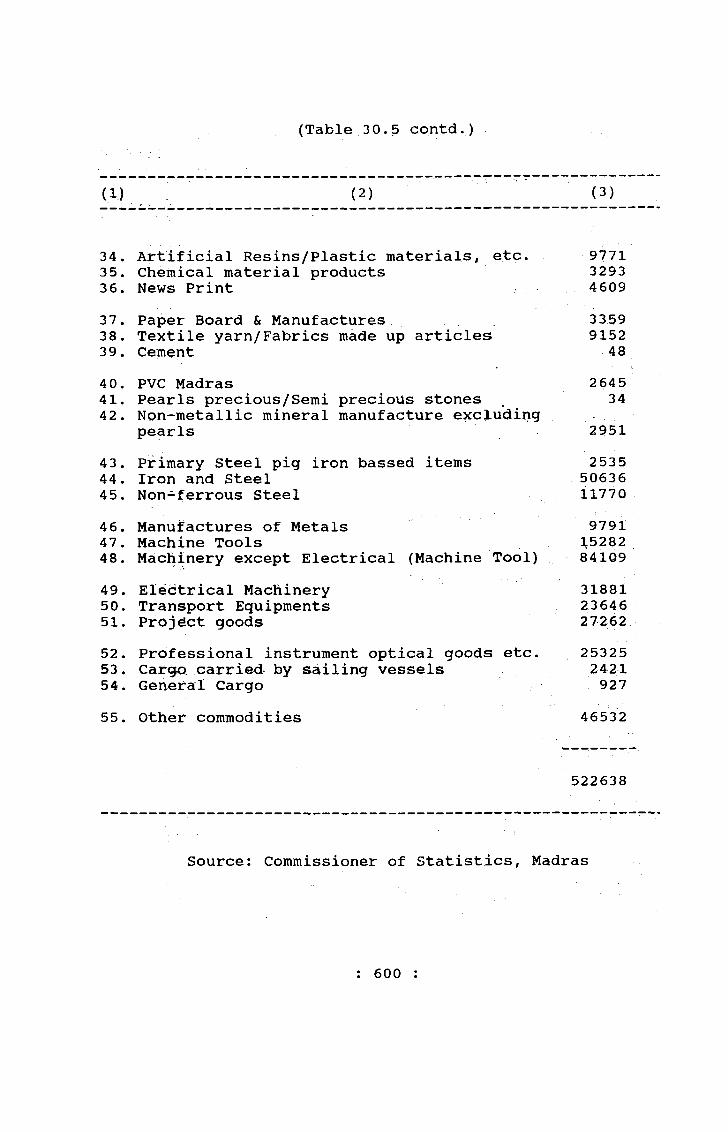
(Table 3 0.5 contd.)
(1) (2) (3)
34. Artificial Resins/Plastic materials, etc. 977135. Chemical material products 329336. News Print 460937. Paper Board & Manufactures
Textile yarn/Fabrics made up articles3 359
38. 915239. Cement 4840. PVC Madras 2 64541. Pearls precious/Semi precious stones 3442. Non-metallic mineral manufacture excluding
pearls 295143. Primary Steel pig iron bassed items 253544. Iron and Steel 5063645. Non-ferrous Steel 1177046. Manufactures of Metals 979147. Machine Tools 3,528248. Machinery except Electrical (Machine Tool) 8410949. Electrical Machinery 3188150. Transport Equipments 2364651. Project goods 2726252. Professional instrument optical goods etc. 2532553. Cargo, carried by sailing vessels 242154. General Cargo 92755. other commodities 46532
522638
Source: Commissioner of Statistics, Madras
; 600 :
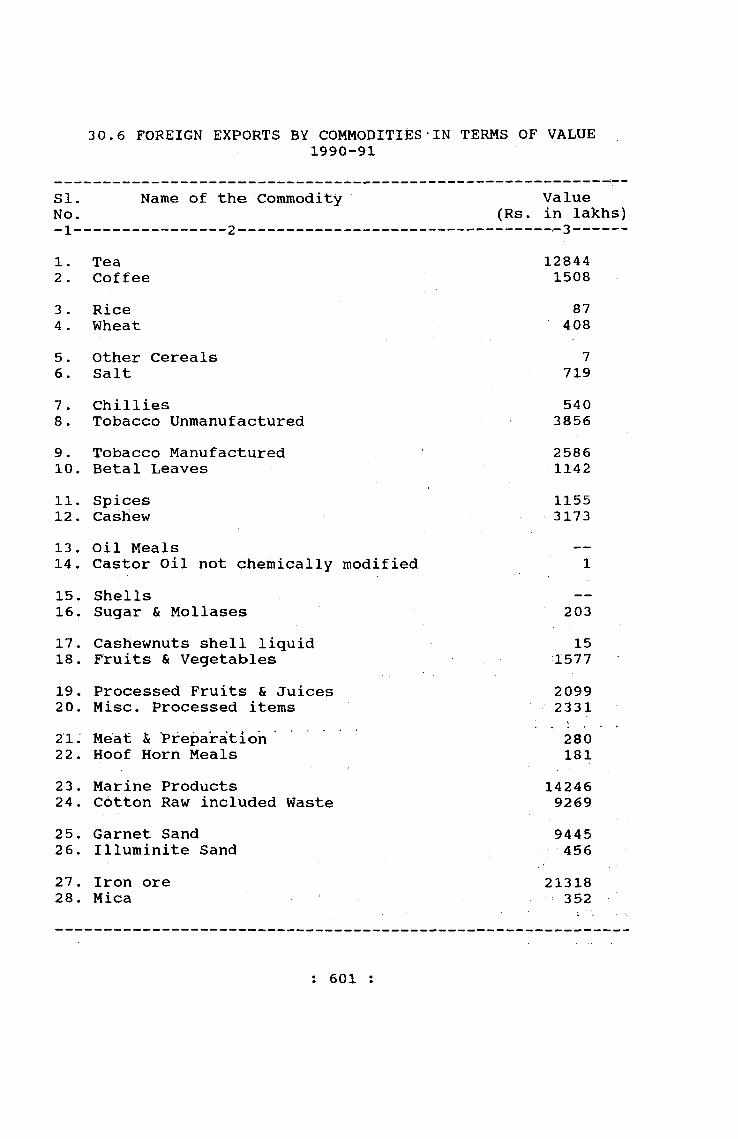
3 0.6 FOREIGN EXPORTS BY COMMODITIES•IN TERMS OF VALUE1990-91
Si.No.
Name of the Commodity Value (Rs. in lakhs)
— 1 —“ 1. Tea 128442 . Coffee 15083 . Rice 874 . Wheat 4085. Other Cereals 76. Salt 7197 . Chillies 5408 . Tobacco Unmanufactured 38569 . Tobacco Manufactured 258610. Betal Leaves 114211. Spices 115512. Cashew 317313 . Oil Meals14. Castor Oil not chemically modified 115. Shells —
16. Sugar & Mollases 20317. Cashewnuts shell liquid 1518. Fruits & Vegetables 157719. Processed Fruits & Juices 209920. Misc. Processed items 233121. Meat S( ’reparation 28022. Hoof Horn Meals 18123. Marine Products 1424624. Cbtton Raw included Waste 926925. Garnet Sand 944526. Illuminite Sand 45627 . Iron ore 2131828. Mica 352
: 601 :
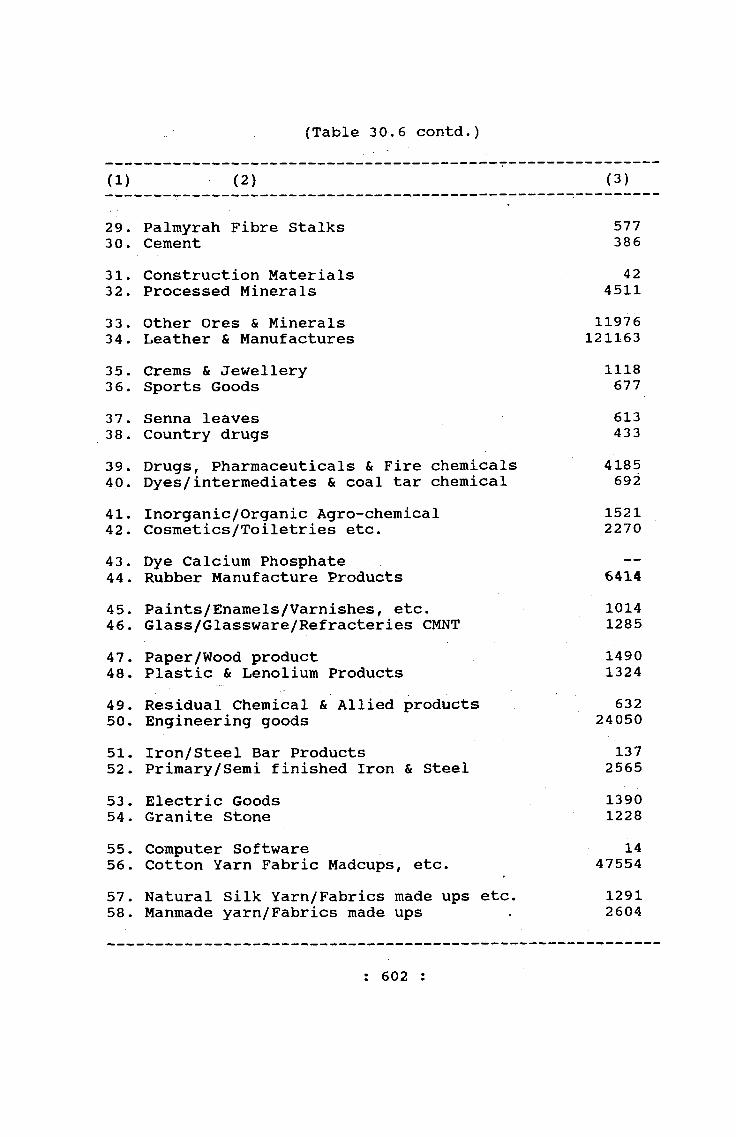
{Table 30.6 contd.)
(1) (2) (3)
29. Palmyrah Fibre Stalks 57730. Cement 38631. Construction Materials 4232. Processed Minerals 451133. Other Ores & Minerals 1197634. Leather & Manufactures 121163
35. Crems & Jewellery 111836. Sports Goods 67737. Senna leaves 61338. Country drugs 433
39. Drugs, Pharmaceuticals & Fire chemicals 418540. Dyes/intermediates & coal tar chemical 69241. Inorganic/Organic Agro-chemical 152142. Cosmetics/Toiletries etc. 227043. Dye Calcium Phosphate —
44. Rubber Manufacture Products 6414
45. Paints/Enamels/Varnishes, etc. 101446. Glass/Glassware/Refracteries CMNT 1285
47. Paper/Wood product 149048. Plastic & Lenolium Products 1324
49. Residual Chemical & Allied products 63250. Engineering goods 2405051. Iron/Steel Bar Products 13752. Primary/Semi finished Iron & Steel 2565
53. Electric Goods 139054. Granite Stone 1228
55. Computer Software 1456. Cotton Yarn Fabric Madcups, etc. 4755457. Natural Silk Yarn/Fabrics made ups etc. 129158. Manmade yarn/Fabrics made ups 2604
: 602 :

(Table 30.6 contd.)
(1) (2) (3)59, Woollen yarn/Fabrics made ups 1160. RMG Cotton including accessories 4190961. RMG man made fabrics 322?62. RMG Silk 36363 . RMG Wool 8064 . RMG & other Textile materials 588065. Coir & coir manufacturer 55566. Jute manufacture excluding floor coverings 7
67 . Floor covering of jute 568. Carpet Handmade 29869. C.P. Goods 817070. Handicrafts (excluding handmade carpets) 106571. Carpets millmade 31672. Project Goods 54373 . Frozen Cargo 156374. Cargo carried by Sailing vessels 1042475. Others 5628
T p t a 1 412B93
Source; Gomitiissioner of Statistics, Madras
: 603 ;
342/27-79

(Rs. in lakhs)3 0.7 FOREIGN IMPORTS OF COMMODITIES BY PORTS
IN TERMS OF VALUE 1990-91
SI.No.
Name of the Commodity Madras Tuticorin Naga-pattinam
Cuddalore Colachel MadrasAir
TrichyAir
Total
1 2 3 4 5 6 7 8 9 10
1. Wheat 83 693 7762. Rice 1289 532 -- -- -- 1821
3. Cereal Preparation 784 -- -- -- -- -- 7844. Milk & Cream 131 -- - - - - 131
5. Cashewnuts 2384 12764 -- . -- -- .. -- ' 151486. Fruits & Nuts excluding 142 -- -- -- -- -- 142
7.
cashewnuts
Peas 3382 33828. Pulses 1072 -- -- - - -- -- 1072
9. Flourspur -- -- -- 472 -- -- -- 47210. Vegetal^les & Animal fats 1 - - ■ * ■ 1
11. Other oil seeds 137 .. -- -- -- - 2 --12. Wool raw 26 -- -• -- 26
13. Silk raw 1322 .. -- -- 45 -- 1367U . Crude Rybber 5391 -- -- . -- -- •- , r- . 5391
15. Synthetic & Reclaimed Ruiaber 4043 10 4053
16. Pulp & Waste Paper 7275 943 -- -- -- -- -- 8218
17. Timber logs 4973 -- -- -- -- 497318. Synthetic Regenerated
F i bres 844 -- -- -- -- 4 -- 848
19. Liquid Atnnonia -- 2606 -- , -- -- 260620. Sulpher -- 2579 -- -- -- 2579
21. EDC
■
704
■
704
: 604 :

(Table 30.7 contd.)
(1) (2) (3) (4) (5) (6) (7) (8) (9) (10)
22. Fertilizers/Crude 2055 9183 451 5646 1733523. Rock Phosphate -- 1930 -- -- -- -- 1930
24. Sulpher & Unroasted Ironpyrts 2606 . . . -- -- -- -- -- 2606
25. Other Crude Minerals 2193 -- -- -- -- 1 ■ -- 2194
26. Metalifers ores & Metal scrap 20803 7 20810
27. Coal/Coke Briquettes etc. 1594 161 -- -- -- -- -- 1755
28. Vegetable Oils fixed(edible) 4271 -- -- -- • -- -- 4271 '
29. Organic Chemicals 16350 -- -- -- -- 784 -- 17134
30. Inorganic Chemicals 9970 156 1012631. Dyeing/Tanning/colouring
materials 4569 -- -- -- -- 230 -- 4799
32. Medicinal & Pharmaceutical Products 404 1336 1740
33. fertU'uers Manufactured 15326 -- -- -• , -- 15326
34. Artificial Resins/Plastic materials etc. 9453 318 9771
35. Chemical material products 3141 -- -- -- 152 •' V-' 3293
36. News print 4609 - - - - - - - - 460937. Paper Board & Manufacture 3269 -- -- -- 90 3359
38. Textile yarn/Fabrics made up article 8292' 860 9152
39. Cement 43 -- -- -- -- -- -- 48
40. Pre Madras - - 2645 - - - - . . . 264541. Pearls precious/Semi 34 34
: 605
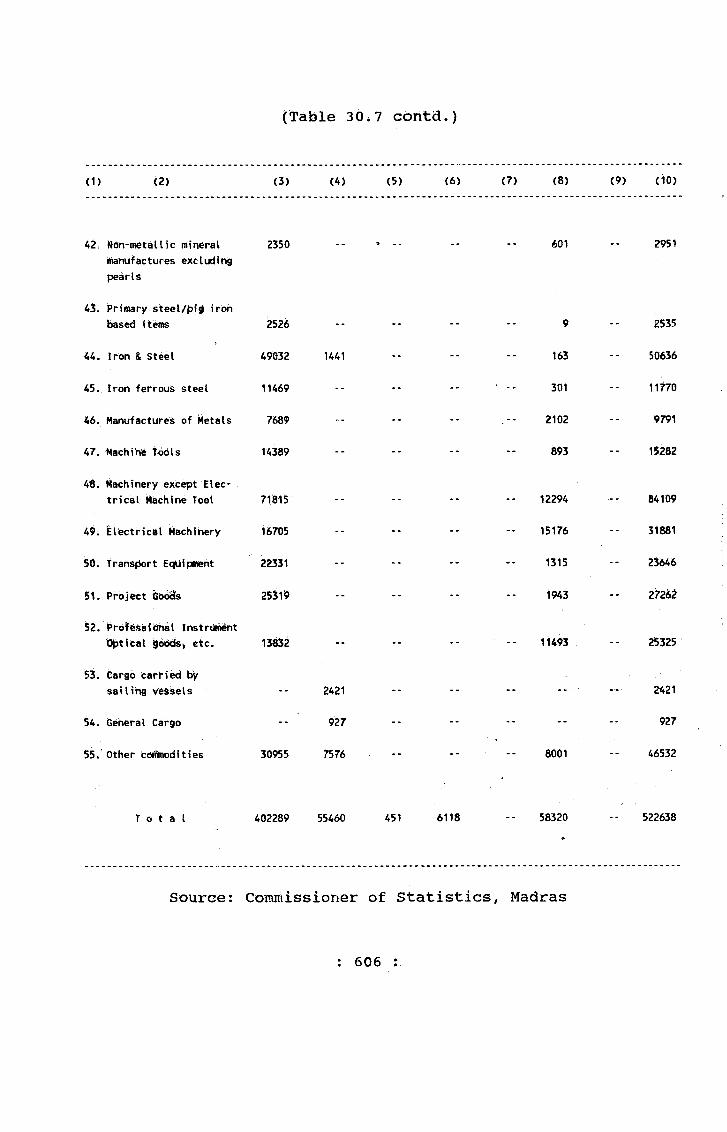
(Table 30i7 cbntd.)
(1) i z ) (3) (4) (5) (6) (7) (8) (9) (10)
42c Noh-metaUic mineral niahufactures excluding pearls
2350 -- -- -- 601 2951
43; Primary steel/pig iron based items 2526 -- -- -- -- 9 2535
44. Iron & Steel 49032 1441 - -- -- 163 50636
45. Iron ferrous steel 11469 -- -- -- • -- 301 11770
46. Hariufactures of Metals 7689 -- -- 2102 9791
47. Wachihe Tools 14389 -- -- -- -- 893 15282
48. Machinery except Electrical Machine Tool 7l8i5 -- -- -- -- 12294 84109
49i Elfectricai Machinery 16705 -- -- -- -- 15176 31881
iSii). transport EqUipm^t 22331 -- -- -- -- 1315 23646
51. Prbj^t Qoc^s 25319 •• -- -- -- 1943 272i2
52. ProHssibhal Instrtttrtent i^tical 36dds^ etc. 13832 -- -- -- -- 11493 -- 25325
53. Giargb carried by sailinig vessels -- 2421 -- •• 2421
54. General Cargo -- 927 -- -- -- -- 927
55. Other coillnodities 30955 7576 -- -- -- 8001 46532
T o t a l 402289 55460 451 6118 -- 58320 522638
Source: Commissioner of Statistics, Madras
: 606 ;
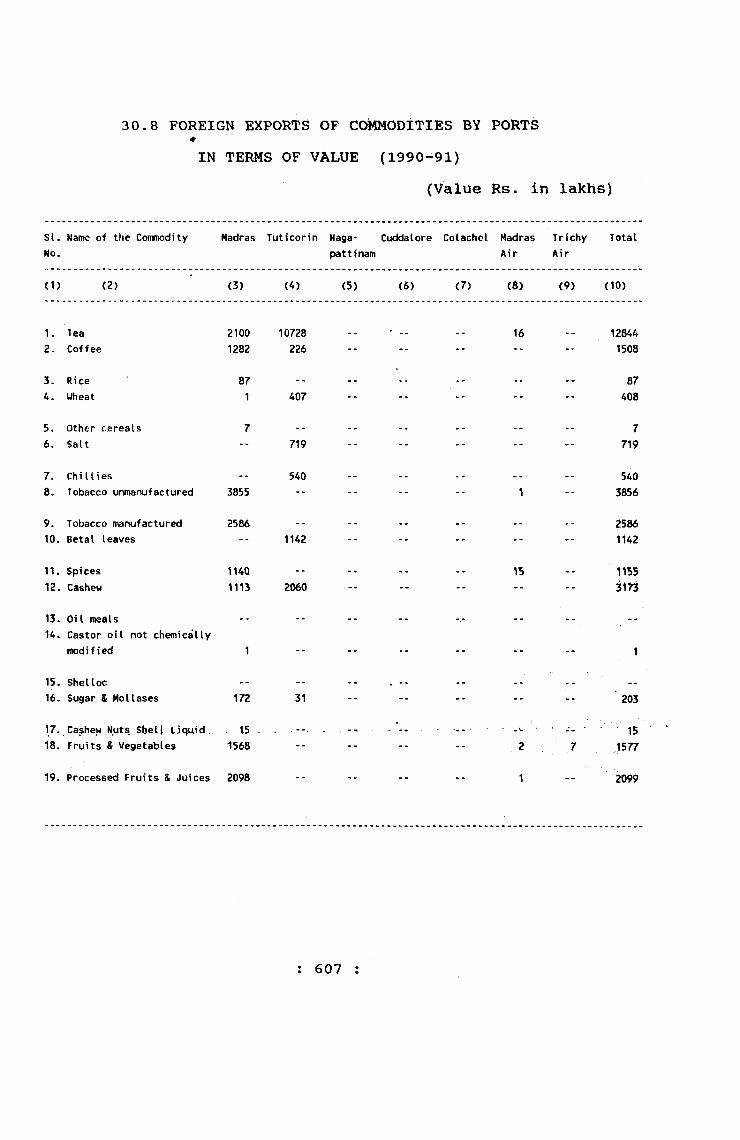
30.8 FOREIGN EXPORTS OF COMMODITIES BY PORTS *
IN TERMS OF VALUE (1990-91)(Value Rs. in lakhs)
SI. Name of the Commodity No.
Madras Tuticorin Naga-pattinam
Cuddalore ColacheI MadrasAir
T r i chy Air
Total
<1) (2) (3) (4) (5) (6) <7) (8) (9) (10)
1. Tea 2100 10728 16 128442. Coffee 1282 226 -- -- -- -• 1508
3. Rice 87 -- -- ... -- 874. Wheat 1 407 -- -- -- -- -- 408
5. Other cereals 7 -- .. .. .. -- 76. Salt -- 719 -- -- *■ -- 719
7. Chillies -- 540 -- -- -- -- 5408, Tobacco unmanufactured 3855 -- -- -- -- 1 3856
9. Tobacco manufactured 2586 -- 258610. Beta I leaves -- 1142 -- -- -- •• -- 1142
11. Spices 114Q .. 115512. Cashew 1113 2060 -- -- -- *- 3173
13. Oil meals --U . Castor oil not chemically
modified 1 -- -* -- -- -- 1
15. Shelloc -- -- -- .16. Sugar & Mollases 172 31 -- -- -- -- 203
17. Cashew Nut^ Sljell Ljquid . . 15 ■ - - ■ . ■ 1518. Fruits & Vegetables 1568 -- -- -- -- 2 7 1577
19. Processed Fruits & Juices 2098 1 2099
: 607 :
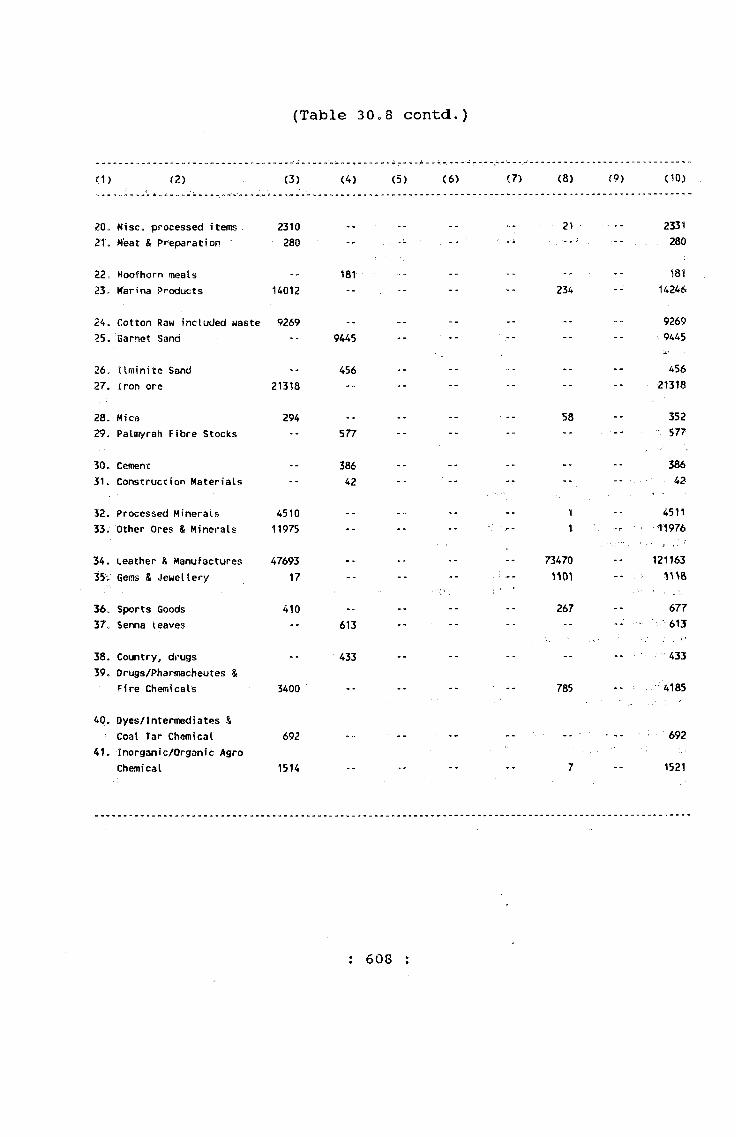
(Table 30»8 contd.)
(1) (H) (3) (4) (5) (6) (7) (8) ( 9 ) (10)
20„ Misc. processed items 2310 233121. Meat & Pr'eparation ’ 280 -- . -- . , 280
22. Hoofhorn meals 181 . . . . 18123, Warina Products 14012 ' -- ■■ , 234 -- 14246
24. Cotton Raw included waste 9269 .. -- -- -- 926925. Garnet Sand -- 9445 -- -- 9445
26, llminite Sand 456 .. -- -- -- 45627. iron ore 21318 -- -- . -- -- 21318
28. Mica 294 .. ■ -- 58 .. 35229. Palmyrah Fibre Stocks -- 577 -- -- -- -- 577
30. Cement .. 386 -- .. -- -- 38631. Construction Materials -- 42 ... - - -- 42
32. Processed Minerals 4510 .. .. -- 11 451133. Other Ores & Minerals 11975 -- -- -- t ' „ . -r ■ -• 11976
34. Leather & Manufactures 47693 - - -- -- 73470 -- 12116335- Gems & Jewellery 17 -- -- -- 1101 -- ■■ 1VV8
36= Sports Goods 410 -- -- -- 267 -- 67737. Senna leaves -- 613 -- -- 613
38. Country, drugs -- 433 . . . . - - . . . 43339, Orugs/Pharmacheutes &
Fire Chemicals 3400 -- -- -- • -- 785 -- ^ 4185
40. Dyes/Intermediates & Coal Tar Chemical 692 692
41. inorganIc/Organic Agro Chemical 1514 -- -- -- 7 -• 1521
: 608 :

(Table 3 0.8 contd.)
(1) (2) <3) (4) <5) (6) (7) (8) C9) (10)
42. Cosmetics/ToileteriesOy Ca lei urn Phosphate 2066 -- -- -- -- 204 -- 2270
43c Rubber Manufacture Products
44. Paints/Enamels/Varnishes,
6360 54 6414
etc. 1011 -- -- -- -- 3 -- 101445. Glass/Glassware/Ceramic
Refractaries/CMNT 1130 -- -- -- -- 155 -- 1285
46. Paper/Wood products 1387 -- ... 103 149047. Plastic & Linoleum Product 1245 -* -- -- 79 -- 1324
48. Residual Chemical &Allied products 365 -- -- 267 -- 632
49. Engineering Goods 22552 -- -- -- -- 1498 , — 24050
50, Iron & Steel Bar/Rod,etc. 137 -- -- -- -- -- 137
5V. Primary/Semi FinishedIron & Steel 2554 -- -- -- -- n -- 2565
52. Electric Goods 628 762 139053. Granite Stone -- 1228 -- -- -- -- 1228
54. Computer Software55. Cotton yarn/Fabric
-- -- -- • -- -- 14 -- . 14
made ups, etc. 33990 10443 -- -- 3121 47554
56. Natural Silk Yarn/, Fabrics made ups, etc. 286 . 1005 , , . . 1291
57„ Man made yarn/Fabricsmade ups 2461 -- -- -- -- 143 2604
58. RMC Cotton includingAccessories 32386 -- •; - - 9523 41909
59. Woolen yarn/Fabrics/madeups 8 3
■ ■
11
609
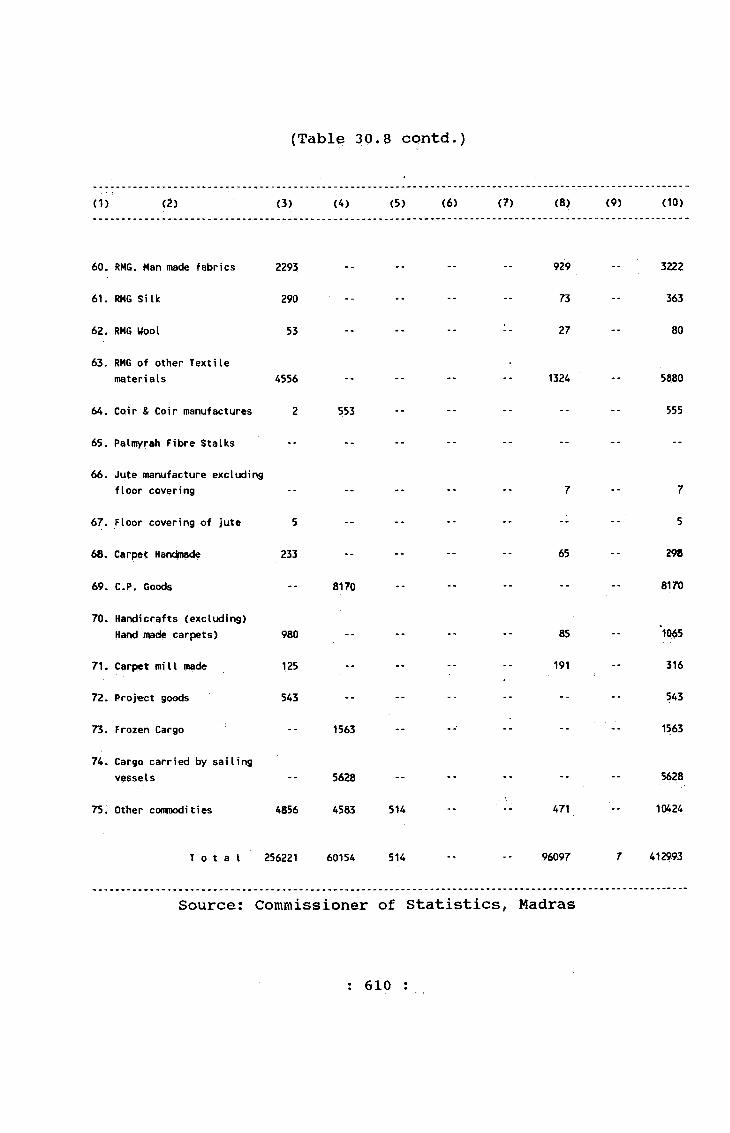
(Table 30.8 contd.)
(1) (2) (3) (4) (5) (6) (7) (8) (9) (10)
60. RMG. Man made fabrics 2293 . . 929 3222
61. RMG Silk 290 -- -- -- -- 73 -- 363
62. RMG Wool 53 -- -- -- 27 -- 80
63. RMG of other Textile materials 4556 -- -- -- -- 1324 -- 5880
64. Coir & Coir manufactures 2 553 -- -- -- -- -- 555
65. Palmyrah Fibre Stalks -- -- -- -- -- -- -- --
66. Jute manufacture excluding floor covering -- -- -- -- -- 7 -- 7
67. Floor covering of jute 5 -- -- -- -- -- -- 5
68. Carpet Hanc^nade 233 -- -- -- -- 65 -- 298
69. C.P. Goods -- 8170 -- -* -- -- •• 8170
70. Handicrafts (excluding) HaiKi made carpets) 980 -- -- -- -- 85 -- *1065
71. Carpet mill made 125 -- -- -- -- 191 -- 316
72. Project goods 543 •- -- -- -- -- -- 543
73. Frozen Cargo -- 1563 -- -- -- -- 1563
74. Cargo carried by sailing vessels *• 5628 -- -- -- -- -- 5628
75. Other coranodities 4856 4583 514 -- -- 471 -- 10424
T o t a l 256221 60154 514 -- 96097 7 412993
Source: Commissioner of Statistics, Madras
: 610 ;
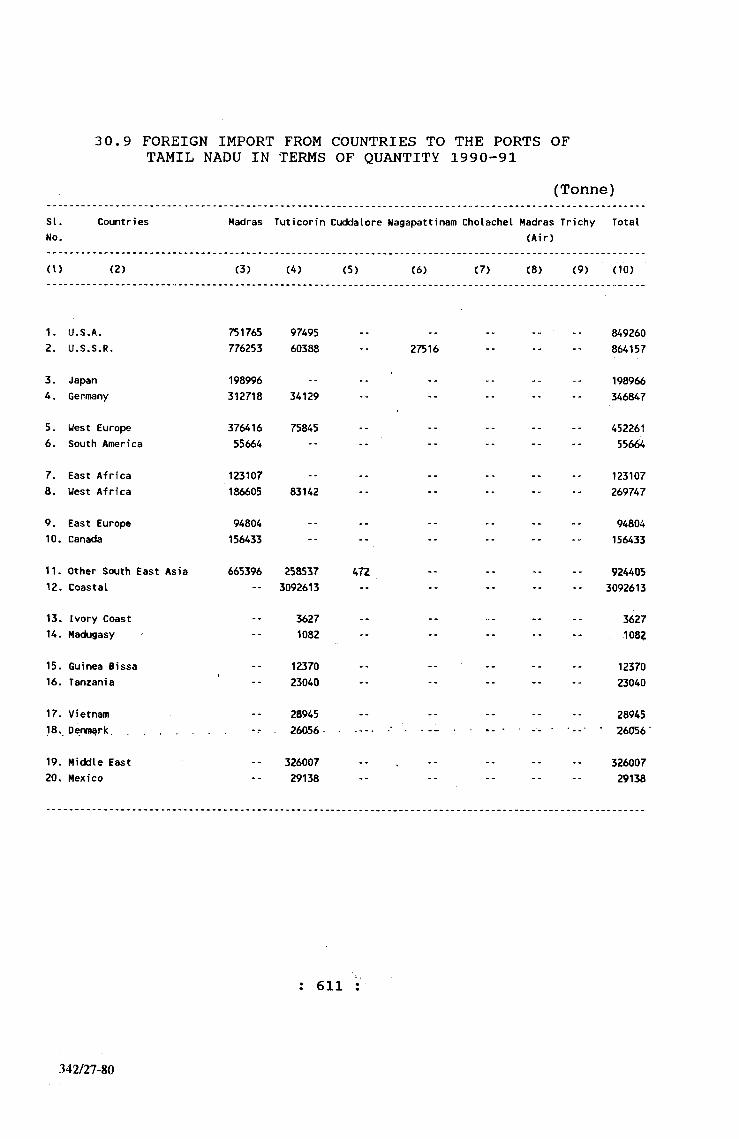
3 0.9 FOREIGN IMPORT FROM COUNTRIES TO THE PORTS OF TAMIL NADU IN TERMS OF QUANTITY 1990-91
(Tonne)SI.No.
Countries Madras Tuticorin Cuddalore Nagapattinam Cholachel Madras Trichy(Air)
Total
(I) (2) (3) (4) (5) (6) (7) (8) (9) (iO)
1. U.S.A. 751765 97495 8492602. U.S.S.R. 776253 60388 27516 -- -- -- 864157
3. Japan 198996 -- -- -- -- 1989664. Germany 312718 34129 -- -- -- -- 346847
5. West Europe 376416 75845 -- -- 4522616. South America 55664 -- -- -- -- -- 556M
7. East Africa 123107 .. -- -- 1231078. West Africa 186605 83142 -- -- -- -- 269747
9. East Europe 94804 -- -- -- .. 9480410. Canada 156433 -- -- -- -- 156433
11. Other South East Asia 665396 258537 472 -- 92440512. Coastal -- 3092613 -- -- -- -- -- 3092613
13. Ivory Coast -- 3627 . . . . 3627U . Madugasy -- 1082 -- -- -- 1082
15. Guinea Bissa -- 12370 1237016. Tanzania ' 23040 -- -- -- -- -- 23040
17. Vietnam -- 28945 -- 289451R. • 26056
19. Middle East -- 326007 32600720. Mexico 29138 29138
: 611
342/27-80

(Table 3 0.9 contd.)
(1) (2) (3) (4) (5) i6) (7) (8) (9) (10)
21. Maldives . . 1431 . . 1431
22. BraziI -- 6970 -- -- -- -- -- 6970
23. Ch i na -- 5021 -- -- -- -- -- 5021
24. Senega I -- 97016 -- -- -- -- -- 97016
25. Spain -- 11231 -- -- -- -- 11231
26. Chilly -- 43104 -- -- -- -- 43104
27. Newzealand -- 1290 -- -- -- -- -- 1290
28. Australia -- 121539 -- -- -- -- -- 121539
29. Sfi Lanka -- 53634 -- -- -- -- -- 53634
30. Korea 15358 -- -- -- -- 15358
31. Burma -- 2208 -- -- -- -- -- 2208
32. Others 2740045 -- 5646 -- -- 7174 2^52865
t o t a l 6438202 4511216 6118 27516 7174 10990226
Source: Commissioner of Statistics, Madras
: 612 :

30.10 FOREIGN EXPORTS TO THE COUNTRIES FROM THE PORTS OF TAMIL NADU IN TERMS OF QUANTITY 1990-91
(Tonnes)
Name of the country Madras Tuticorin Nagapattinam Cuddalore Colachel MadrasAir
TrichyAir
Total
(1) (2) (4) <5) (6) C7) (8) (9)
1. U.S.A. 306654 9710 3163642. U.S.S.R. 129889 59725 -- -- -- -- -- 1896143. Japan 2741704 -- -- •- . -- -- -- 2741704
4. Germany 47884 -- -- -- -- .. 478845. West Europe 303482 76881 -- -- -- -- -- 3803636. East Europe 2463 -- -- -- -- -- -- 2463
7. South America 88 .. .. -- 888. East Africa 5123 -- -- ■ -- -- -- 51239. West Africa 6309 21559 -- -- -- -- -- 27868
10. Canada 532A 532411. Other South East
Asian countries 449208 -- -- -- -- -- -- 44920812. Maldives -- 48896 -- -- -- -- 58970 107866
13. Srilanka 37977 3797714. Far East Asia 184159 -- -- 18415915. Korea -- 48415 -- -- -- -- -- 48415
16. Australia - - 2268 226817. U.K. 12882 -- -- ; -- -- 1289218. Middle East Asia « 1 -■ ' ! . ■ . *
Countries 2620 -- -- -- -- -- 2620
19. Mourjtus 300 30020. Coastal -- 13478 -- -- -- -- 1347821. China -- 10365 -- ,, -- -- 1036522. Others 3332015 -- ■ -- -- -- 19558 -- 3351573
T o t a l 7330143 518870 10365 ■ -- -- 19558 58970 7937906
Source: Cominissioner of Statistics, Madras
: 613 :
342/27 80a
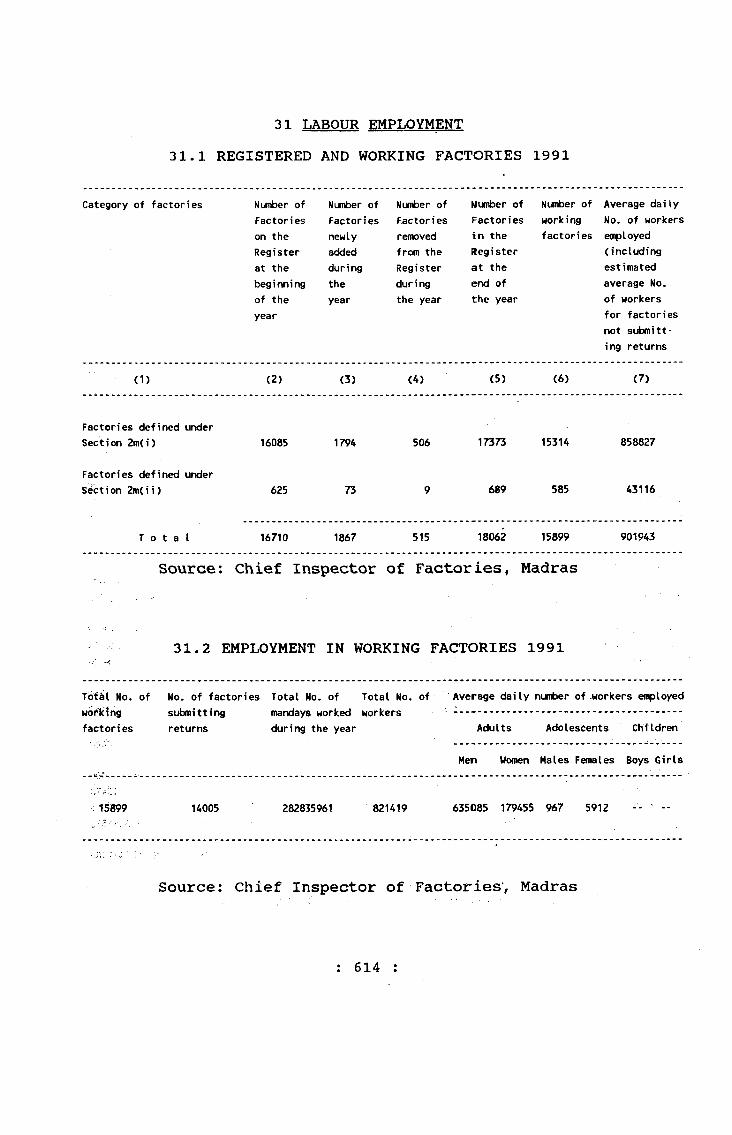
31 LABOUR EMPLOYMENT31.1 REGISTERED AND WORKING FACTORIES 1991
Category of factories Number of Number of Number of Mumber of Nunfcer of Average dailyFactories Factories Factories Factories working No. of workerson the newly removed in the factories employedRegister added from the Register (includingat the during Register at the estimatedbeginning the during end of average No.of the year the year the year of workersyear for factories
not submitting returns
(1) (2) (3) (4) (5) (6) (7)
Factories defined underSection 2m(i) 16085 1794 506 17373 15314 858827
Factories defined underSection 2m(ii) 625 73 9 689 585 43116
T o t a l 16710 1867 515 18062 15899 901943
Source; Chief Inspector of Factories, Madras
31.2 EMPLOYMENT IN WORKING FACTORIES 1991
Total No. of No. of factories Total No. of Total No. of Average daily number of workers employedwopkfng submitting matKlays worked workers ... ............................... .....factories returns during the year Adults Adolescients Children
Men Women Males Females Boys Girls
15899 14005 282835961 821419 635085 179455 967 5912 - ' --
Source: Chief Inspector of Factories', Madras
: 614 :
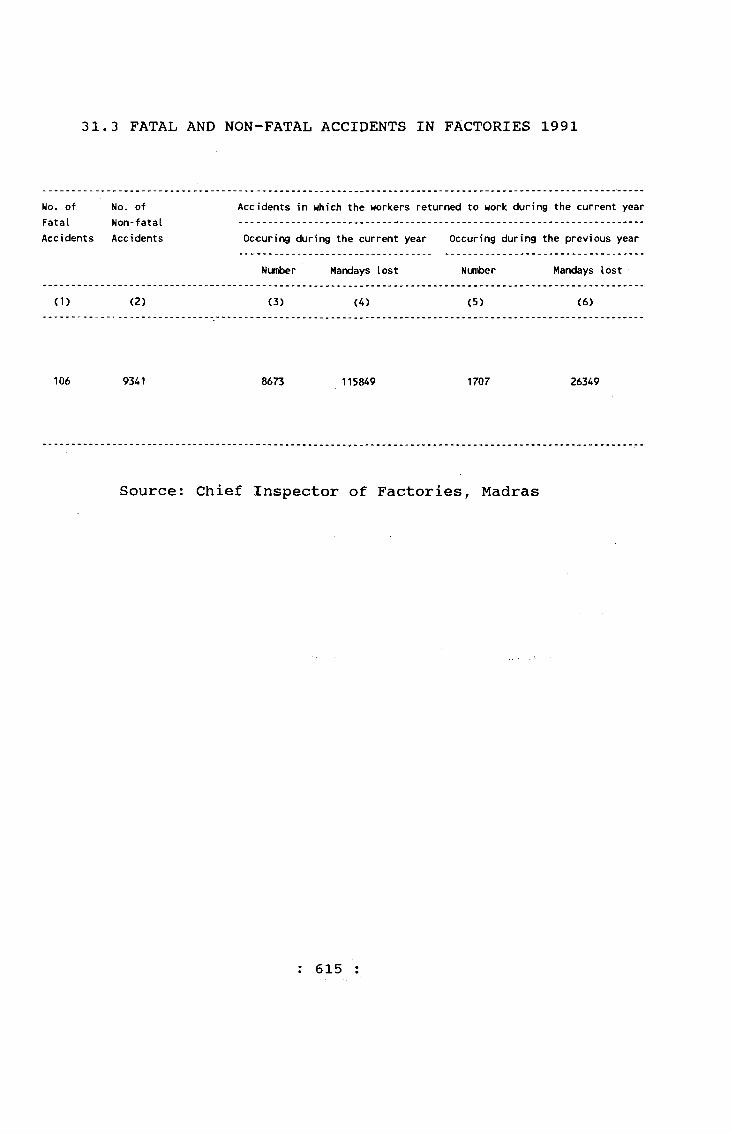
31. 3 FATAL AND NON-FATAL ACCIDENTS IN FACTORIES 1991
No. of No. of Accidents in which the workers returned to work during the current yearra Lo L Accidents
NOn TaLaiAccidents Occuring during the current year Occuring during the previous year
Number Mandays lost Number Mandays lost
(1) (2) (3) (4) (5) (6)
106 9341 8673 115849 1707 26349
Source: Chief Inspector of Factories, Madras
: 615 :

31.4 WORKING OF EMPLOYMENT EXCHANGES 1991
Type of Employment Exchanges
No. of Offices
Registration during the
year
Placemients during the
year
Number on the Live Register .at the end of
Number of vacancies notified
the year
(1) (2) C3) <4)) (5) (6)
1. District Employment Office 24 4,84,331 30,379 29,85,575 35,840
2. Sub-en^)loyment Office 5 36,726 2,056 2,06,138 1,578
3. Professional and Executive Employment Office 1 26,946 2,874 1,14,983 2,350
4. Special Employment Office for Physically handicapped, Madras 1 1,624 258 12,316 225
5. District Employment Office (Technical Personnel) 4 25,122 2,459 1,50,214 2,781
Uftivfrsity E«plo¥B»i.t
Guidance Bureau 3 •• -- -- --
T o t a l 38 5,74,749 38,026 34,69,226 42,774
Source : Director of Employment and Training, Madras
: 616 :
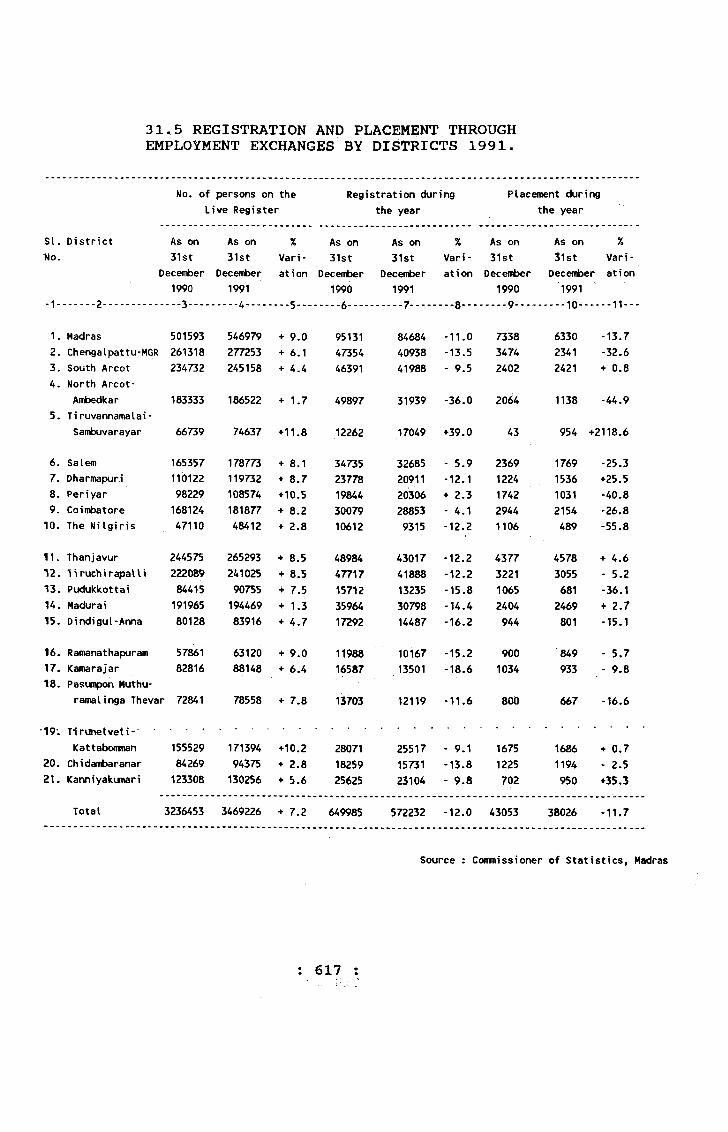
31.5 REGISTRATION AND PLACEMENT THROUGH EMPLOYMENT EXCHANGES BY DISTRICTS 1991.
No. of persons on the Live Register
Registration during the year
Placement during the year
:Sl. District As on As on % As on As on % As on As on %!No. 31st 31st Vari 31st 31st Vari - 31st 3lst Vari-
December December ation December December at ion December December at i on1990 1991 1990 1991 1990 1991
-1- 2 ....... 3 --- .... - --- 5 -- .... 6.... 7 --- 8--- .... 9---- .... 10--- ---11---
1. Madras 501593 546979 + 9.0 95131 84684 -11.0 7338 6330 -13.72. Chengalpattu-MGR 261318 277253 + 6.1 47354 40938 -13.5 3474 2341 -32.63. South Arcot 234732 245158 + 4.4 46391 41988 - 9.5 2402 2421 + 0.84. North Arcot-
Ambedkar 183333 186522 + 1.7 49897 31939 -36.0 2064 1138 -44.95. Tiruvannamalai-
SarryDuvarayar 66739 74637 + 11.8 12262 17049 +39.0 43 954 +2118.6
6. Salem 165357 178773 + 8.1 34735 32685 - 5.9 2369 1769 -25.37. Dharmapuri 110122 119732 + 8.7 23778 20911 -12.1 1224 1536 +25.58. Periyar 98229 108574 +10.5 19844 20306 + 2.3 1742 1031 -40.89, Coimbatore 168124 181877 + 8.2 30079 28853 - 4.1 2944 2154 '26.8
10. The NiIgiris 47110 48412 + 2.8 10612 9315 -12.2 1106 489 -55.8
11. Thanjavur 244575 265293 + 8.5 48984 43017 -12.2 4377 4578 + 4.6^ 2 . Tiruchirapalli 222089 241025 + 8.5 47717 41888 -12.2 3221 3055 - 5.213. Pudukkottai 84415 90755 + 7.5 15712 13235 -15.8 1065 681 -36.114. Madurai 191965 194469 + 1.3 35964 30798 -14.4 2404 2469 + 2.715. Dindigul-Anna 80128 83916 + 4.7 17292 14487 -16.2 944 801 -15.1
16. Ramanathapuram 57861 63120 + 9.0 11988 10167 -15.2 900 849 - 5.717. Kamarajar 82816 88148 + 6.4 16587 13501 -18.6 1034 933 - 9.818. Pasumpon Muthu-
ramalinga Thevar 72841 78558 + 7.8 13703 12119 -11.6 800 667 -16.6
19; TirUnelveli-'Kattabomman 155529 171394 +10.2 28071 25517 - 9.1 1675 1686 + 0.7
20. Chidambaranar 84269 94375 + 2.8 18259 15731 -13.8 1225 1194 - 2.521. Kanniyakumari 123308 130256 + 5.6 25625 23104 - 9.8 702 950 +35.3
Total 3236453 3469226 + 7.2 649985 572232 -12.0 43053 38026 -11.7
Source : Commissioner of Statistics, Madras
: 617 ;
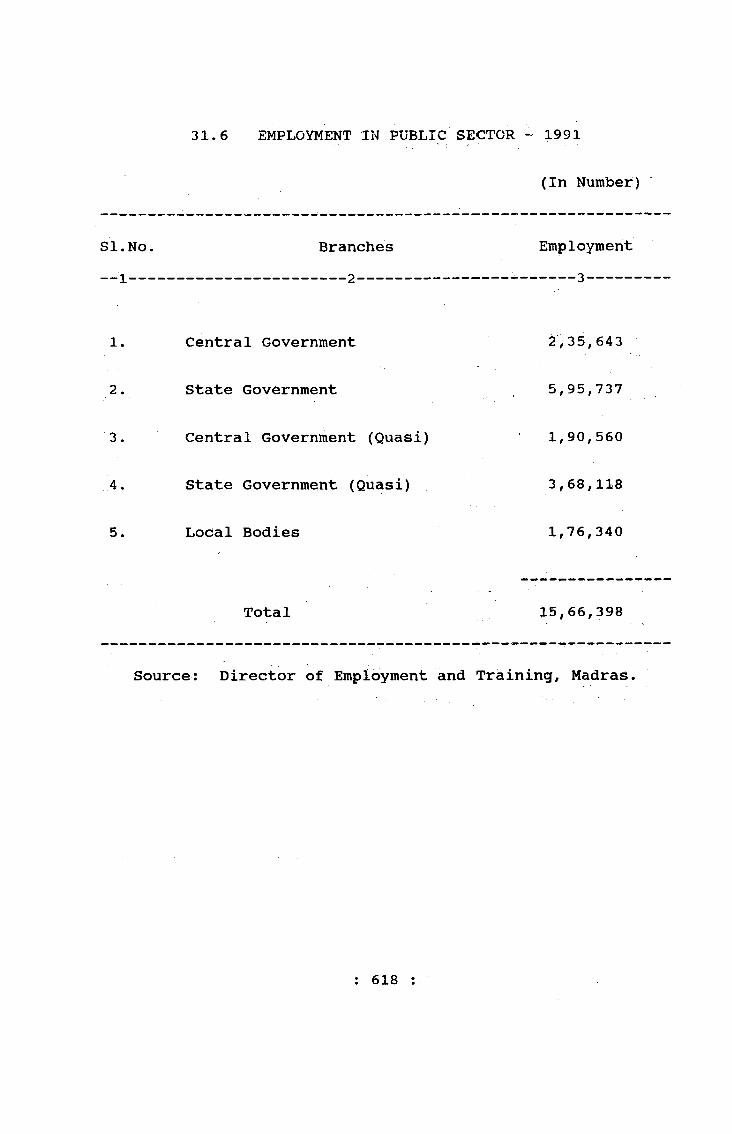
31.6 EMPLOYMENT IN PUBLIC SECTOR ~ 1991
(In Number)
SI.N o . Branches Employment
1. Central Government 2,35,643
2. State Government 5,95,737
3. Central Government (Quasi) 1,90,560
4. State Government (Quasi) 3,68,118
5. Local Bodies 1,76,340
Total 15,66,398
Source: Director of Employment and Training, Madras
: 618 :

31.7 EMPLOYMENT BY INDUSTRIAL DIVISIONS - 1991
Industrial Divisionpublic
Male Female Total
0. Agriculture, Hunting# Forestry and Fishing 23,985 2,414 26,399
1. Mining and Quarrying 28,270 2,742 31# 012
2. & 3. Manufacturing 1,12,294 5,845 1,18,139
4. Electricity, Gas and Water 78,397 3,727 82,124
5* Construction 44,840 3,834 48# 674
6. Wholesale and ketail trade, restatUrants and hotel 39,307 6, 291 45,598
7. Transport stoirage and Gdminunications 2,70,103 18,750 , 2,88,853
8. Financing> Insurance, Real Estate and Business services 1,17,503 1#34,286
9. doininunity> Social and Personal services 5,18,709 2,72^604 7,91,313
Total l2#33^40a 3,32,990 15,66#398
: 6 1 9
J42/27-81
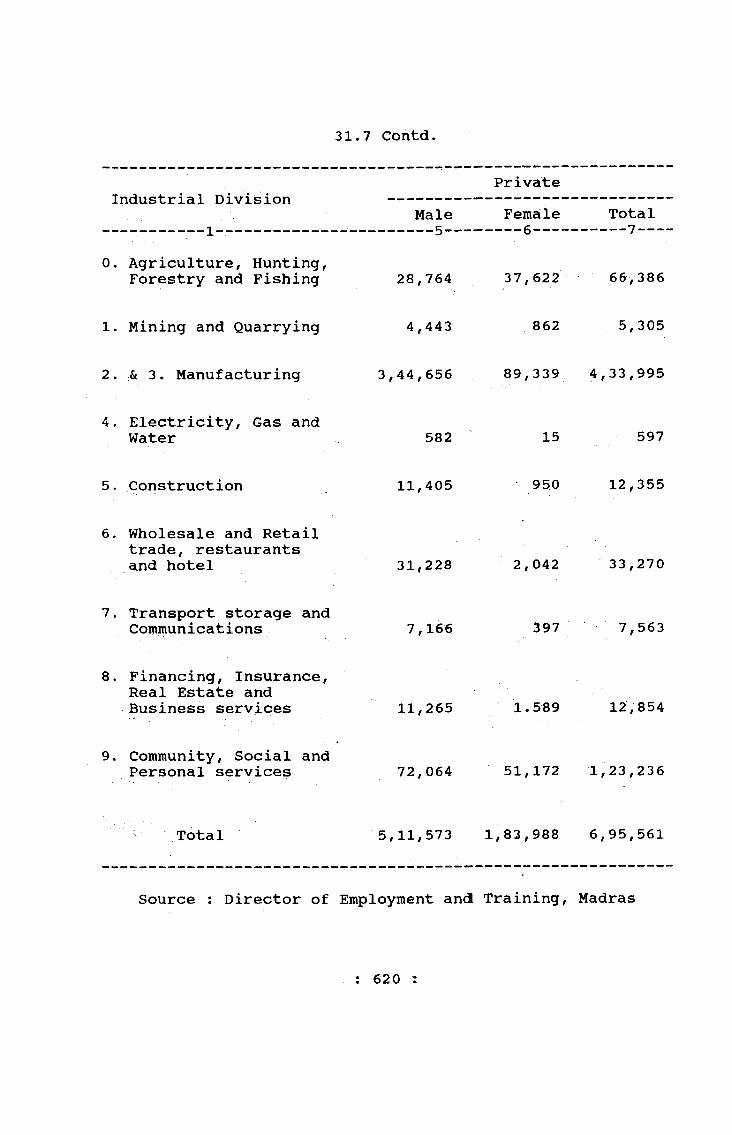
31.7 Contd.
Industrial DivisionMale
PrivateFemale Total
0. Agriculture, Hunting, Forestry and Fishing 28,764 37,622 66,386
1. Mining and Quarrying 4,443 862 5,305
2. .& 3. Manufacturing 3,44,656 89,339 4,33,995
4. Electricity, Gas and Water 582 15 597
5. Construction 11,405 950 12,355
6. Wholesale and Retail trade, restaurants and hotel 31,228 2,042 33,270
7. Transport storage and Communications 7,166 397 7,563
8. Financing, Insurance, Real Estate and Business services 11,265 1.589 12,854
9. Community, Social and Personal services 72,064 51,172 1,23,236
'■ Total 5,11,573 1,83,988 6,95,561
Source : Director of Employment and Training, Madras
: 620 :
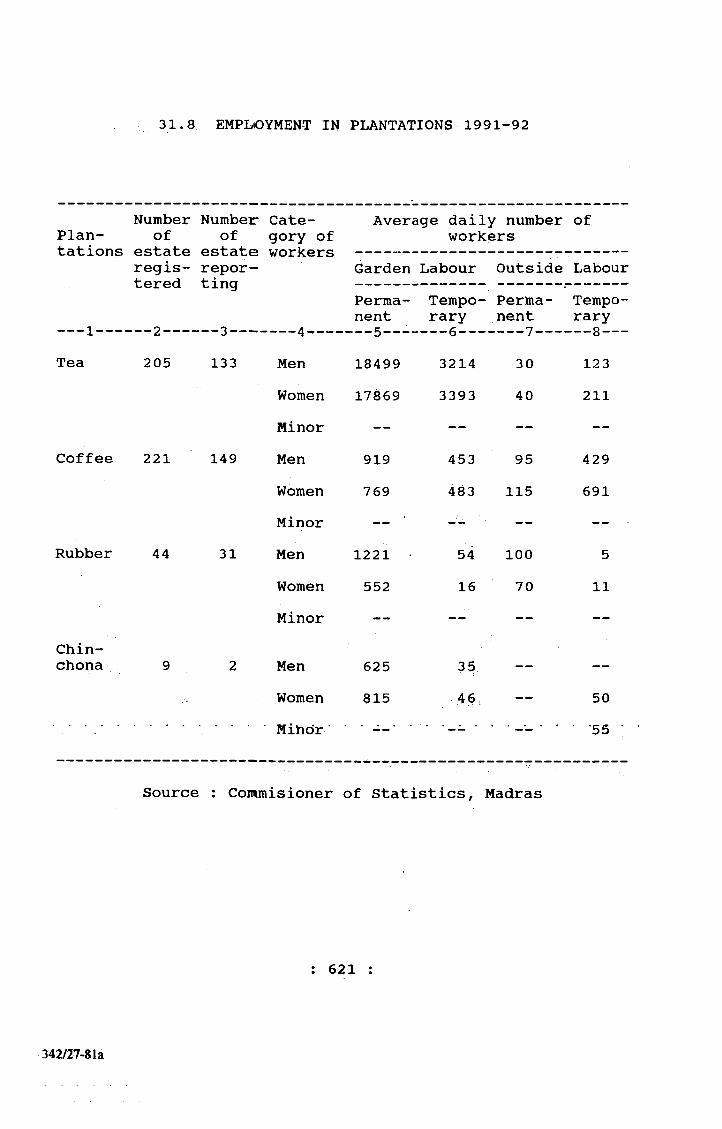
31.8 EMPLOYMENT IN PLANTATIONS 1991-92
Plantations
Numberof
estateNumbeir
ofestate
Category of workers
Average daily number workers
of
registered
reporting
Garden Labour Outside LabourPermanent
Temporary
Permanent
Temporary
Tea 205 133 Men 18499 3214 30 123Women 17869 3393 40 211Minor — — — —
Coffee 221 149 Men 919 453 95 429Women 769 483 115 691Minor — -- — — .
Rubber 44 31 Men 1221 • 54 100 5Women 552 16 70 11Minor — — — —
Chin-chona 9 2 Men 625 35 — —
Women 815 46. — 50Mihdr ’ • ■ ■ 55 * *
Source : Coimmisioner of Statistics, Madras
: 621
342/27-81a
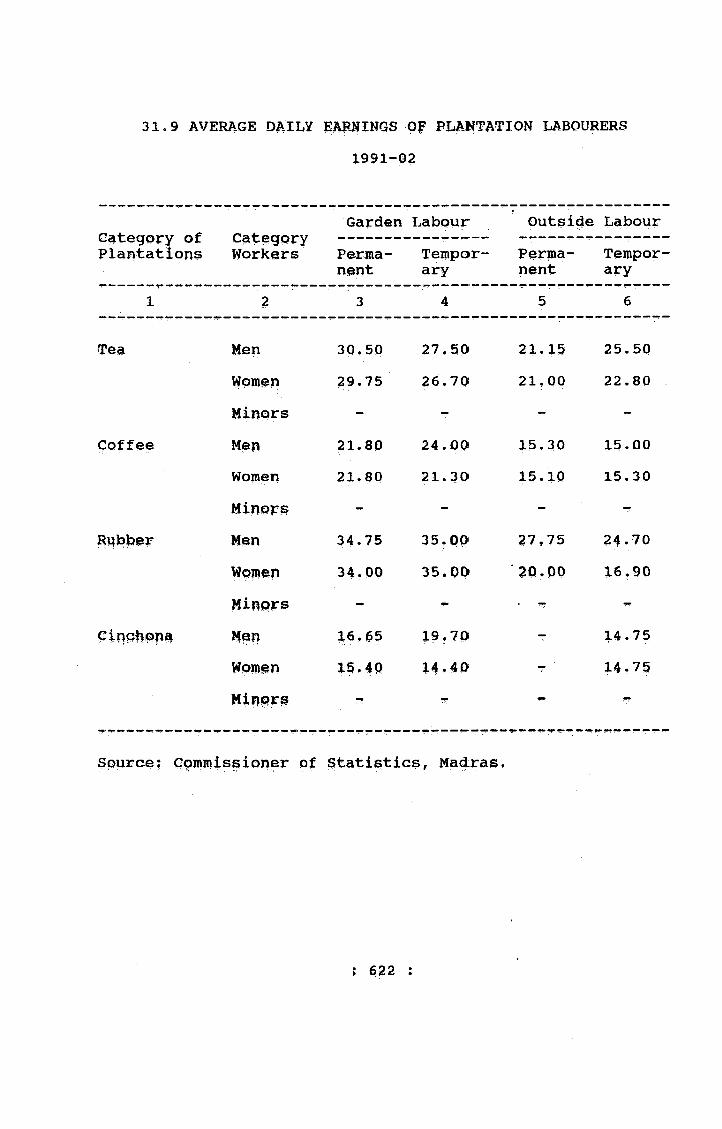
1991-0231.9 AVERAGE DAILV gAF^ING^ Of Pl^KTATIQN LABOURERS
Category of Plantations
CategoryWorkers
GardenPermanent
LabourTemporary
Outsidep^rpa-nent
LabourTemporary
1 2 3 4 5 6
T ea Men 30.50 27.50 21.15 25.50Wpin^n 29.75 26.70 21,00 22.80M in o r s - ~ - -
Coffee Men 21.80 24.00 15.30 15.00Women 21.80 21.30 15.10 15.30M in o r s - - - -
Hen 34.75 35,00 37,75 24.70
Women 34.00 35.00 ■ 20.pO 16.90
m in o rs - • T- -
c ir ic liQ n ^ ife n 19,70 - 14.75Wom^n 15.4a 14.40 r 3-4.75H i m r §
Source? Gpmmission(Br of Statistics, Madras,
? 622 :

32.x PLACEMENTS PROVIDED BY TAHI]^NADU PUBLIC SERVICE COMMISSION 199X-92.
32. ^ehvic:es
Si.No Name of the Post/ No. of qualified applicants for Service Main writiteri/orai examination
SC/ST3-—
m e /ONC-4--
BC — 5-
QC — 6-
Total — -7— r-
a. State Service:1. Assistant Director of
Co-operative Audit ~ Tamil Nadu Co-operative service
2. Special Officer (Translation) in the Department of Indian Medicine and Hoi|id- eopathy Tamil Nadu Medical Service
3. Junior Electrical Inspector, Tamil Nadu Electrical Inspectorate service
4. Veterinary Assistant Surgeon, Tamil Nadu Animal Husbandry Service
20
5. principal in the Filmand-Tfi^yifi-pn institute i of Tamil Nadu, Madras.
6. Tfchnical Officer inthe Police Radio 5Branch Tamil Nadu General Service
7. Assistant Medical Officer (Homoeppathy)Tamil Nadu Medical 14Service
17
17
IQ
41
95
81
40
12
26
10
70
133
137
63
19 80 17 I P
: @23 r

32.1 Contd.
4 ;
8. Assistant Surgeon,Tamil liladu Medical 937 316 2,, 580 577 4,410Service
9. Assistant Director of Fisheries,Tamil Nadu Fisheries 2 6 16 6 30Service
10. Post Graduate Teachers in ServiceHome in the Social 1 11 56 16 84Welfare Department.
11. Superintendent Approved Schools (Boys) - TamilNadu approved schools 18 43 104 13 178and vigilance service
12. Assistant Director ofIndustries and Commerce (Industrial Co-operatives) 25 48 115 10 198
13. Public Health Nurse,Tamil Nadu PublicHealth Service 3 2 29 8 42
14. Automobile Engineer inMotor Vehicles Maintenance Department 3 - 3 - 6Tamil Nadu GeneralService
15. Assistant Director of Statistics includingthe Assistant Director 15 - - .15of Statistics in the Education Department
16. District Munsif-cum- Judicial Magistrate,Tamil Nadu State 248 414 1,194 51 1,907Judicial Service
17. Assistant Works Manager, Tamil Nadu Stationery andPrinting Service - 4 2 - 6
: 624 :
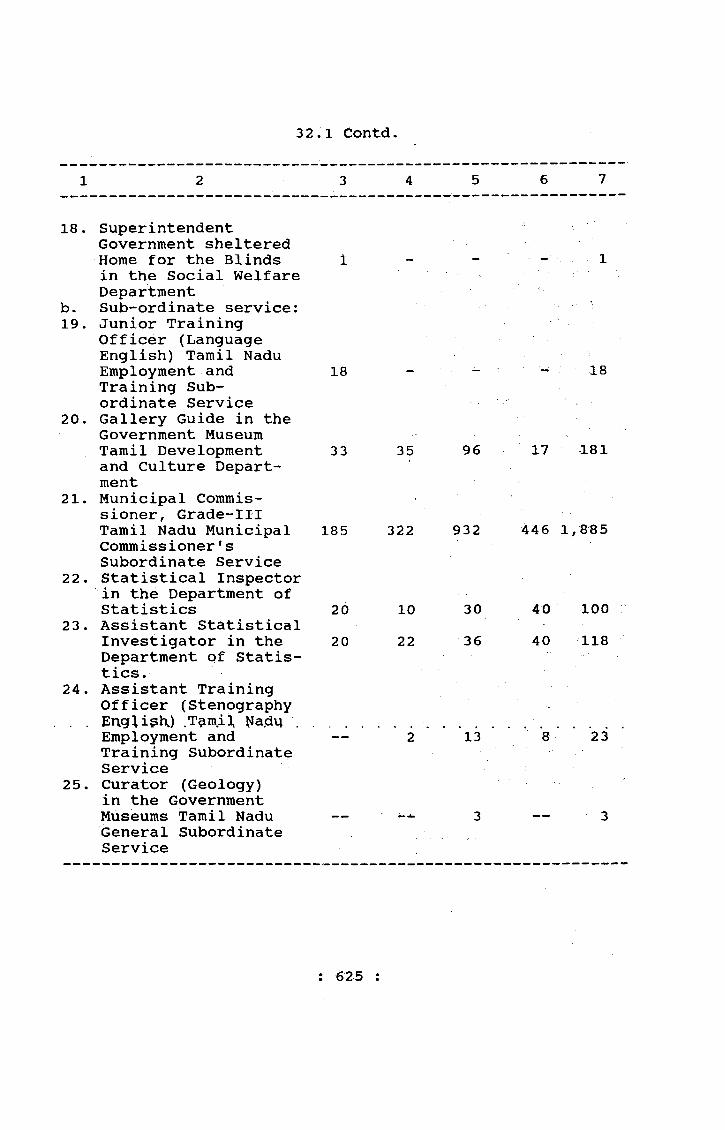
32,1 Contd.
1 2 3 4 5 6 7
18. Superintendent Government sheltered Home for the Blinds 1 1
b.19.
in the Social Welfare DepartmentSub-ordinate service: Junior Training Officer (Language English) Tamil Nadu Employment and 18 18
20.Training Subordinate Service Gallery Guide in the Government Museum Tamil Development 33 35 96 17 181
21.and Culture DepartmentMunicipal Commissioner, Grade-III Tamil Nadu Municipal 185 322 93 2 446 1,885
22 .Commissioner's Subordinate Service Statistical Inspector in the Department of Statistics 20 10 30 40 100
23. Assistant Statistical Investigator in the 20 22 36 40 118
24.Department of Statistics.Assistant Training Officer (Stenography English.) .T m il,
■ -
Employment and — 2 13 8 23
25.Training Subordinate ServiceCurator (Geology) in the Government Museums Tamil Nadu 3 3General Subordinate Service
: 625 :
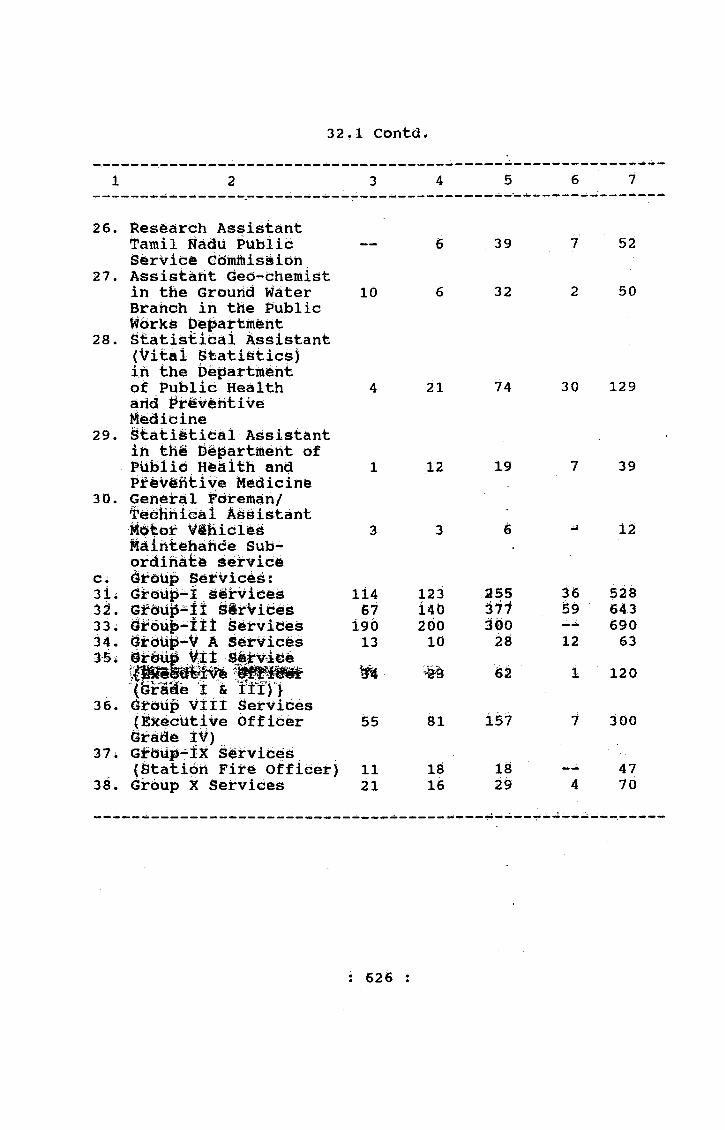
32*1 Contd.
26. Research AssistantHadii Public — 6 39 7 52
Service Gbitiihiiiidn27. Assistant Ged-clieinist
in the Ground Water 10 6 32 2 50Brahch in the i»ublic Ifbrk^ Departittent
28. Statistical Assistant (Vital gtatisticsji n t h e b fe fs a rtir tih tof Public Health 4 21 74 30 129arid i^r^v^titiveiMfeditjihe
29. Statiitieal Assistant in thi D^^artineht ofpyblid H M l t h and 1 12 19 7 39Ptev^fitive Medicirie
30. General I’oreinan/M o to if V i j i i d i ^ S 3 3 6 ^ 1 2MalMehafidd Sub^ o r d i h a t s S fe fv id ie
c ; i^ iu p S e r v i c e s :3li iirvi€:6^ 114 123 iS5 36 52831. SiifVices 67 14D 37f S9 64333; Services i90 2 0 0 3 0 0 -- 69034. ^roiip*V A S e r v ic e s 13 10 2^ 12 633§i Vlt SjB, vi€je
_ ______ ll 1% 62 i 120(^ r a d e I & i l l ) }
36. Gj^oup VIII ServiceslEkecutive Officer 55 81 157 7 300Grade iV)
37. GroupsI x ServicesfStatioh Fire Officer) 11 18 18 — 47
38. Group X Services 21 16 29 4 70
: 626 :
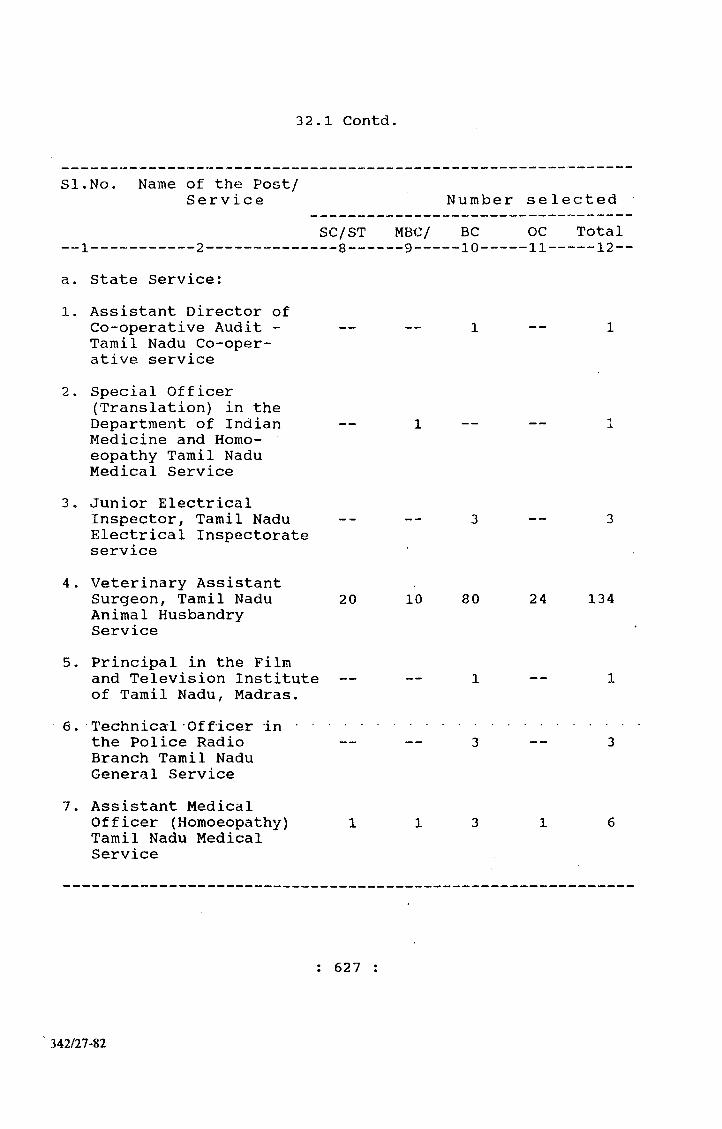
3 2 . 1 C o n t d .
SI.No. Name of the Post/S e rv i ce N u mb e r s e l e c t e d
SC/ST MBC/ BC OC Total
a. State Service:1. Assistant Director of
Co-operative Audit -- — — 1 — 1Tamil Nadu Co-operative service
2. Special Officer (Translation) in theDepartment of Indian — 1 — — 1Medicine and Homoeopathy Tamil Nadu Medical Service
3. Junior ElectricalInspector, Tamil Nadu -- — 3 — 3Electrical Inspectorateservice
4. Veterinary AssistantSurgeon, Tamil Nadu 20 10 80 24 134Animal HusbandryService
5. Principal in the Filmand Television Institute — -- 1 — 1of Tamil Nadu, Madras.Technical Officer in the Police Radio Branch Tamil Nadu General ServiceAssistant Medical Officer (Homoeopathy) Tamil Nadu Medical Service
; 6 2 7
342/27-82
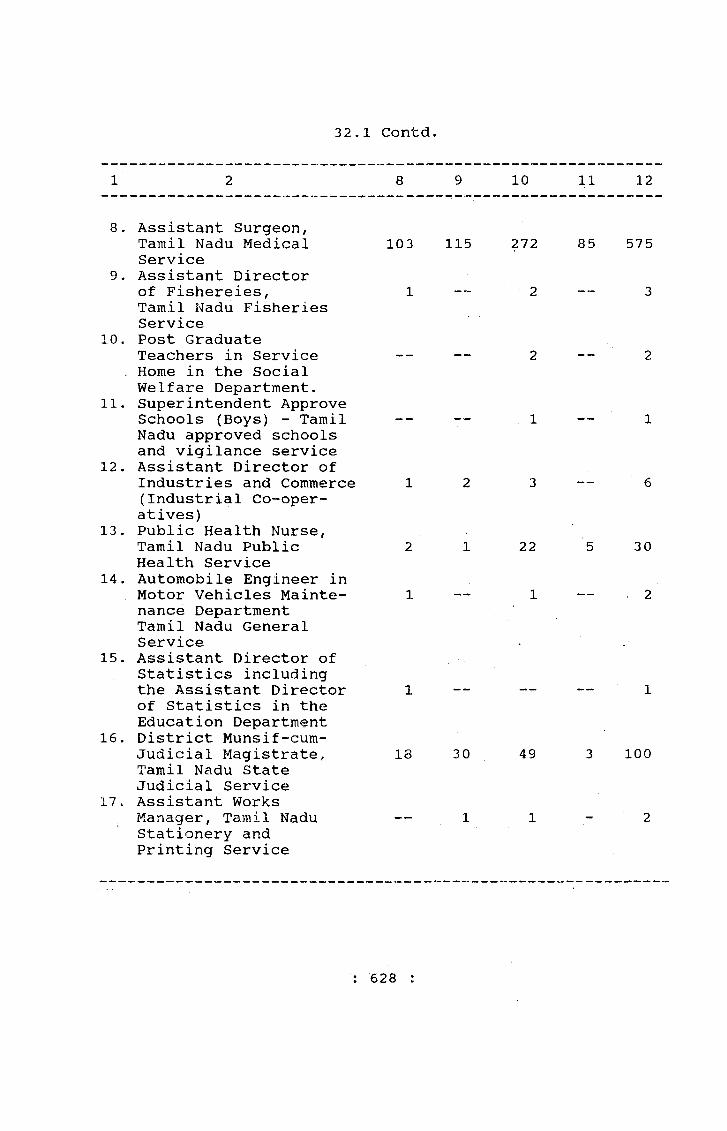
3 2 . 1 C o n t d ,
1 2 8 9 10 11 12
8. Assistant Surgeon,Tamil Nadu Medical Service
9. Assistant Director103 115 272 85 57 5
of Fishereies,Tamil Nadii Fisheries Service
10. Post Graduate
1 2 3
Teachers in Service . Home in the Social Welfare Department.
11. Superintendent Approve
2 2
Schools (Boys) - Tamil Nadu approved schools and vigilance service
12. Assistant Director of
1 1
Industries and Commerce (Industrial Co-operatives)
13. Public Health Nurse,
1 2 3 6
Tamil Nadu Public Health Service
14. Automobile Engineer in2 1 22 5 30
Motor Vehicles Maintenance Department Tamil Nadu General Service
15. Assistant Director of Statistics including
1 1 2
the Assistant Director of Statistics in the Education Department
16. District Munsif-cum-
1 1
Judicial Magistrate, Tamil Nadu State Judicial Service
17. Assistant Works
18 3 0 49 3 100
Manager, Tamil Nadu Stationery and Printing Service
1 1 2
: 6 2 8 :
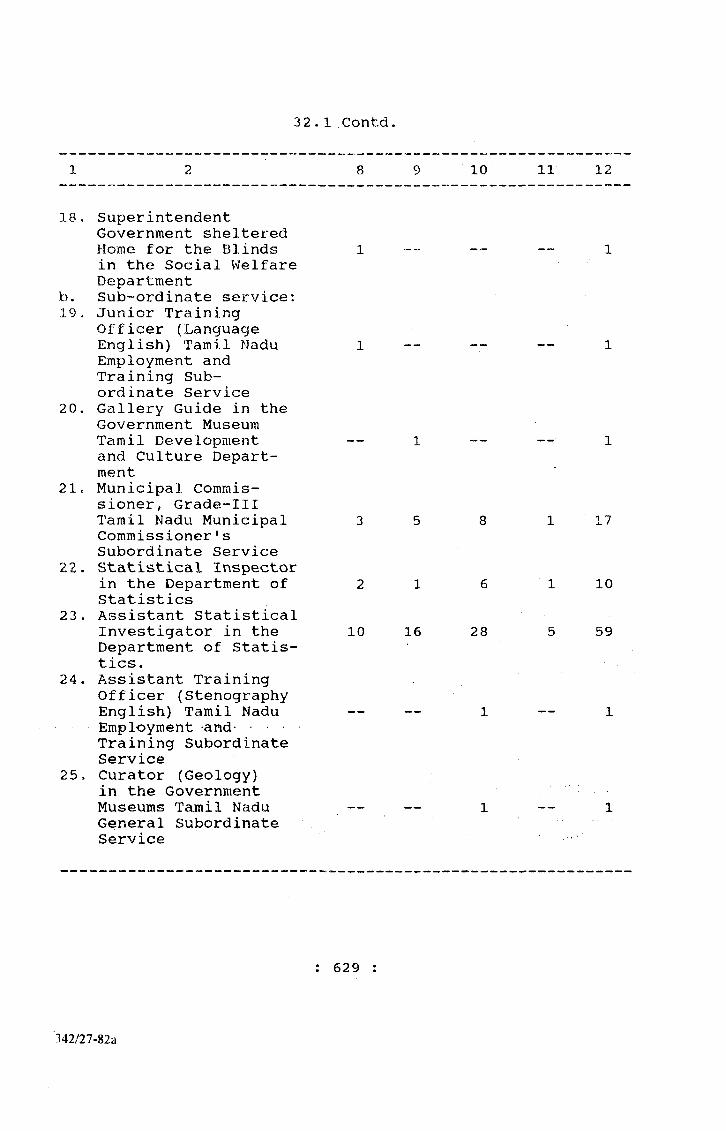
3 2 , 1 C o n t d .
10 11 12
18. Superintendent Government shelteredHome for the Blinds 1 1in the Social Welfare Department
b. Sub“ordinate service:19. Junior Training
Officer (LanguageEnglish) Tamil Nadu 1 -- — • 1Employment and Training Sub- ordinate Service
20. Gallery Guide in the Government MuseumTamil Development — 1 — — 1and Culture Department
21. Municipal Comrais- sioner, Grade-IllTamil Nadu Municipal 3 5 8 1 17Commissioner'sSubordinate Service
22. Statistical Inspectorin the Department of 2 1 6 1 10Statistics
23. Assistant StatisticalInvestigator in the 10 16 28 5 59Department of Statistics.
24. Assistant Training Officer (StenographyEnglish) Tamil Nadu ■— — 1 — 1Employment and.......Training Subordinate Service
25. Curator (Geology) in the GovernmentMuseums Tamil Nadu — — 1 — 1General SubordinateService '
: 6 2 9
342/27-82a
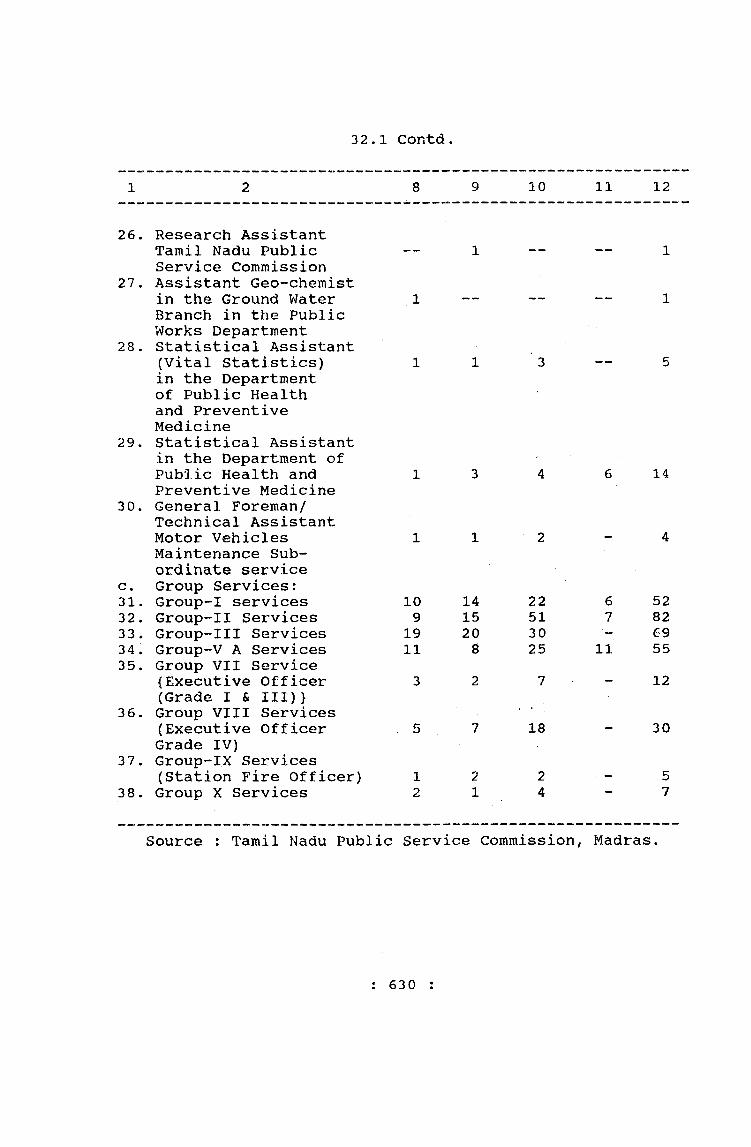
3 2 . 1 C o n t d .
1 2 8 9 10 11 12
26. Research Assistant Tamil Nadu Public 1 1Service Commission
27. Assistant Geo-chemist in the Ground V7ater 1 1Branch in the Public Works Department
28. Statistical Assistant (Vital Statistics) 1 1 3 5in the Department of Public Health and Preventive Medicine
29. Statistical Assistant in the Department of Public Health and 1 3 4 6 14Preventive Medicine
30. General Foreman/Technical Assistant Motor Vehicles 1 1 2 4Maintenance Subordinate service
c. Group Services: 31. Group“I services 10 14 22 6 5232. Group-*II Services 9 15 51 7 8233. Group-Ill Services 19 20 30 “ 6934. Group-V A Services 11 8 25 11 5535. Group VII Service
{Executive Officer 3 2 7 12(Grade I & III)}
36. Group VIII Services (Executive Officer 5 7 18 30Grade IV)
37. Group-IX Services(Station Fire Officer) 1 2 2 5
38. Group X Services 2 1 4 7
Source : Tamil Nadu Public Service Commission, Madras.
: 6 3 0 :
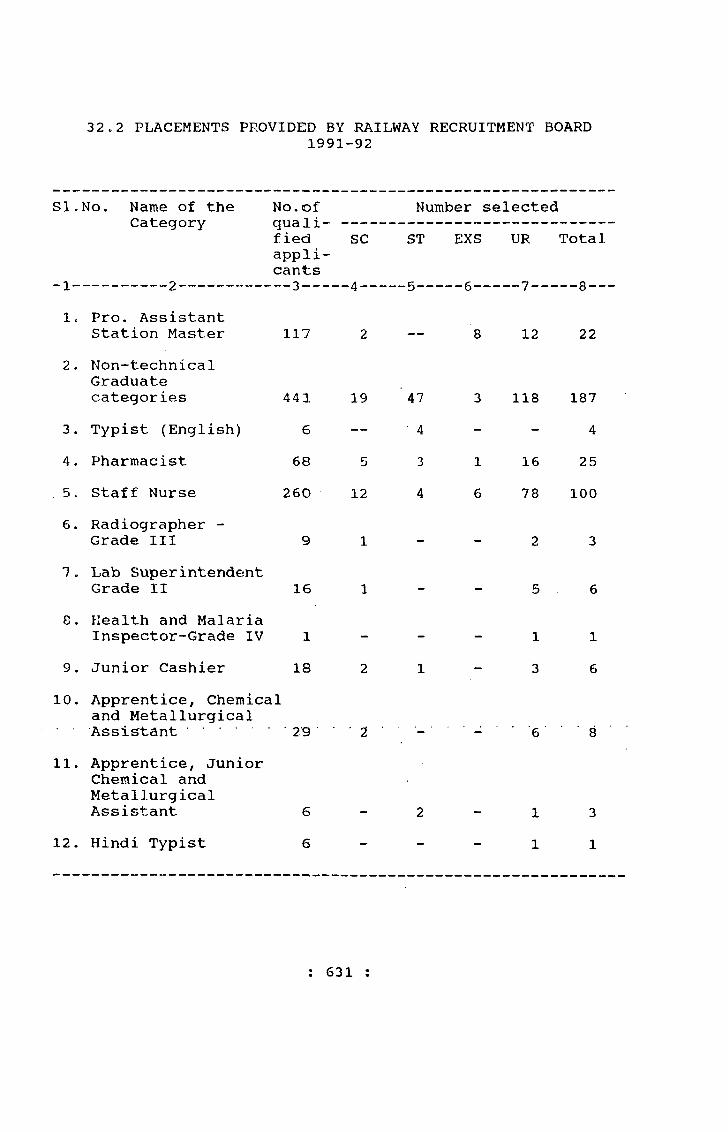
32„2 PLACEMENTS PROVIDED BY RAILWAY RECRUITMENT BOARD1991-92
SI.No. Narae of the No.of Number selectedCategory quali
fiedapplicants
SC
-4 —
ST EXS UR Total
1. Pro. Assistant Station Master 117 2 ______ 8 12 22
2. Non-technical Graduate categories 441 19 47 3 118 187
3. Typist (English) 6 — • 4 - - 44. Pharmacist 68 5 3 1 16 255. Staff Nurse 260 12 4 6 78 1006. Radiographer -
Grade III 9 1 - - 2 31 . Lab Superintendent
Grade II 16 1 - - 5 68. Health and Malaria
Inspector-Grade IV 1 - - - 1 19. Junior Cashier 18 2 1 - 3 6
10. Apprentice, Chemical and Metallurgical Assistant......... 29 2 6 8
11. Apprentice, Junior Chemical and Metallurgical Assistant 6 2 1 3
12. Hindi Typist 6 - - - 1 1
: 631 :

3 2 . 2 C o n t d .
1 2 3 4 5 6 7 8
13. Hindi Stenographer 8 . . . — 2 214, Junior Typist
(English) 154 4 2 3 19 2815. Junior Steno
grapher (English) 232 9 - “ 30 3916. Traffic
Apprentice/CommercialApprentice 14 1 4 5
17. Hindi Assistant- Grade II 18 3 1 “ 3 7Total 1403 61 64 21 201 447
Source : Railway Recruitment Board, Madras.
: 632 :
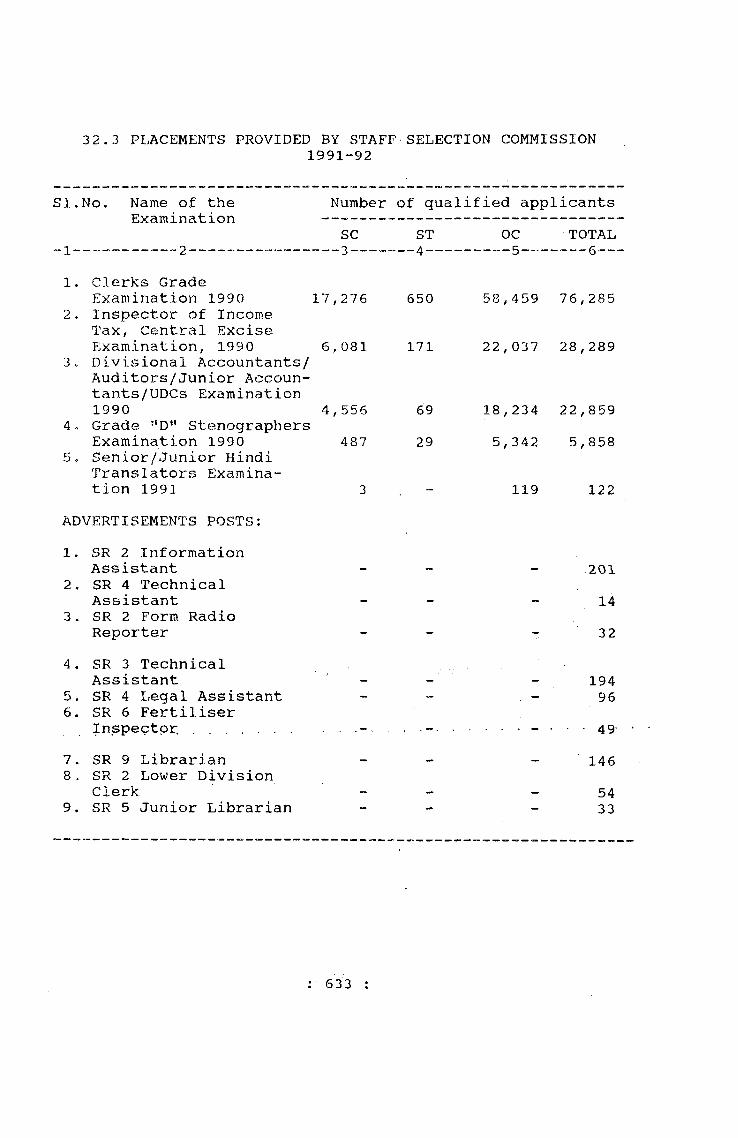
3 2.3 PLACEMENTS PROVIDED BY STAFF•SELECTION COMMISSION1991-92
SI.No. Name of the Number of qualified applicantsExamination ~ ---- ------------------------ — ^
SC ST OC TOTAL
1. Clerks GradeExamination 1990 17,276 650 58,459 76,285
2. Inspector of Income Tax, Central ExciseExamination, 1990 6,081 171 22,037 28,289
3. Divisional Accountants/Auditors/Junior Accoun- tants/UDCs Examination1990 4,556 69 18,234 22,859
4. Grade *'D'’ StenographersExamination 1990 487 29 5,342 5,858
5. Senior/Junior HindiTranslators Examination 1991 3 - 119 122
ADVERTISEMENTS POSTS:
1. SR 2 InformationAssistant - ~ - 201
2. SR 4 TechnicalAssistant - - ~ 14
3. SR 2 Form RadioReporter - - - 32
4. SR 3 TechnicalAssistant - - - 1 9 4
5. SR 4 Legal Assistant - - - 966 . SR 6 Fertiliser
Inspectpr....... .......................... . - 4 9 -
7. SR 9 Librarian - - ~ 1468 . SR 2 Lower Division
Clerk « - - 5 49. SR 5 Junior Librarian _ « _ 3 3
: 633 I

32.3 Contd
SI.No. Name of the Examination
SCNumber
STselected
OC TOTAL
1. Clerks GradeExamination 1990 42 6 60 108
2. Inspector of Income Tax, Central Excise Examination 1990 45 3 162 210
3. Divisional Accountants/ Auditors/Junior Accoun- tants/UDCs Examination 72 20 168 2601990
4. Grade "D" Stenographers Examination 1990 14 17 31
5. Senior/Junior Hindi Translators Examina- 6 6tion 1991
ADVERTISEMENTS POSTS:1. SR 2 Information
Assistant 2 1 1 42. SR 4 Technical
Assistant . 1 13, SR 2 Form Radio
Reporter — 1 14. SR 3 Technical
Assistant 1 15. SR 4 Legal Assistant - 1 16. SR 6 ’er'tiliser
Inspector 1 17. SR 9 Librarian - — 2 28, SR 2 Lower Division
Clerk 1 19. SR 5 Junior Librarian 1 1
Source : Staff Selection Commision, Madras.
: 634
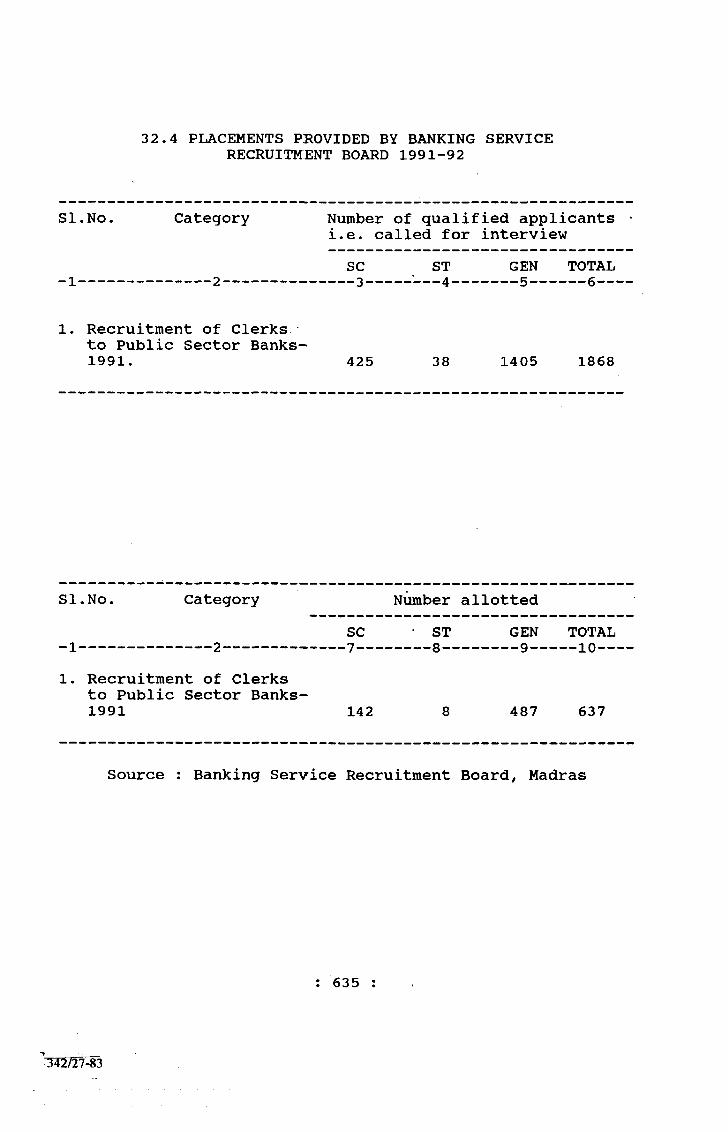
32.4 PLACEMENTS PROVIDED BY BANKING SERVICE RECRUITMENT BOARD 1991-92
Si.No. Category Number of qualified applicantsi.e. called for interview
SC ST GEN TOTAL-1--------------- 2--------------- 3----- ■---4--------5-------6 —
1. Recruitment of Clerks to Public Sector Banks-1991. 425 38 1405 1868
SI.No. Category Number allottedSC • ST GEN TOTAL
-1--------------- 2-------------- 7---------8---------9----- 10--1. Recruitment of Clerks
to Public Sector Banks-1991 142 8 487 637
Source : Banking Service Recruitment Board, Madras
: 635
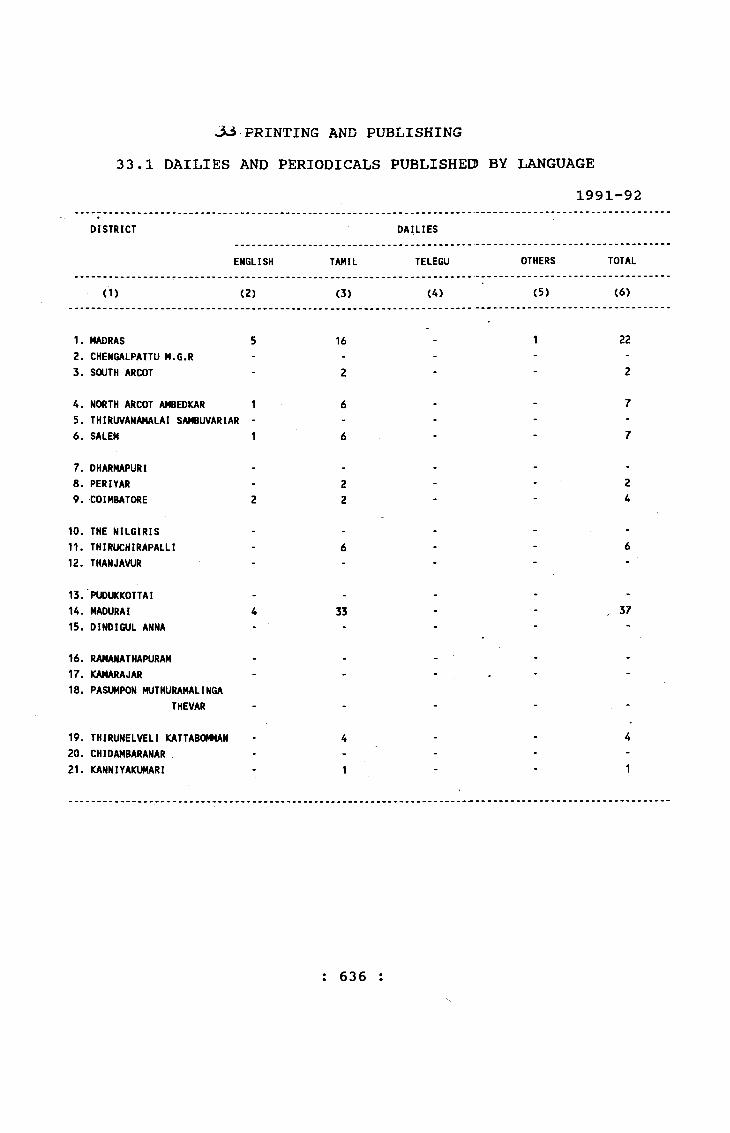
PRINTING AND PUBLISHING33.1 DAILIES AND PERIODICALS PUBLISHED BY LANGUAGE
1991-92DISTRICT DAILIES
ENGLISH TAMIL TELEGU OTHERS TOTAL
(1) (2) (3) (4) (5) (6)
1. MADRAS 5 16 1 22
2. CHENGALPATTU M.G.R - - • - -3. SOUTH ARCOT - 2 - - 2
4. NORTH ARCOT AMBEDKAR 1 6 - - 7
5. THIRUVANAMALAI SAMBUVARIAR - - - - -6. SALEM 1 6 - - 7
7. DHARMAPURI . . - - .8. PERIYAR - 2 - - 29. COIMBATORE 2 2 - - 4
10. THE NILGIRIS - - - - -11. THIRUCHIRAPALLI - 6 - - 6
12. THANJAVUR - - - - -13. PUDUKKOTTAI - . . -14. MADURAI 4 33 - - . 3715. DINOIGUL ANNA - - - - -16. RAMANATHAPURAM . . . - -17. KAMARAJAR - - - - -18. PASUHPON MUTHURAMALINGA
THEVAR - - - - -19. THIRUNELVELI KATTABOMMAN - 4 - - 420. CHIDAMBARANAR - - - - -
21. KANNIYAKUMARI 1 1
: 636 :
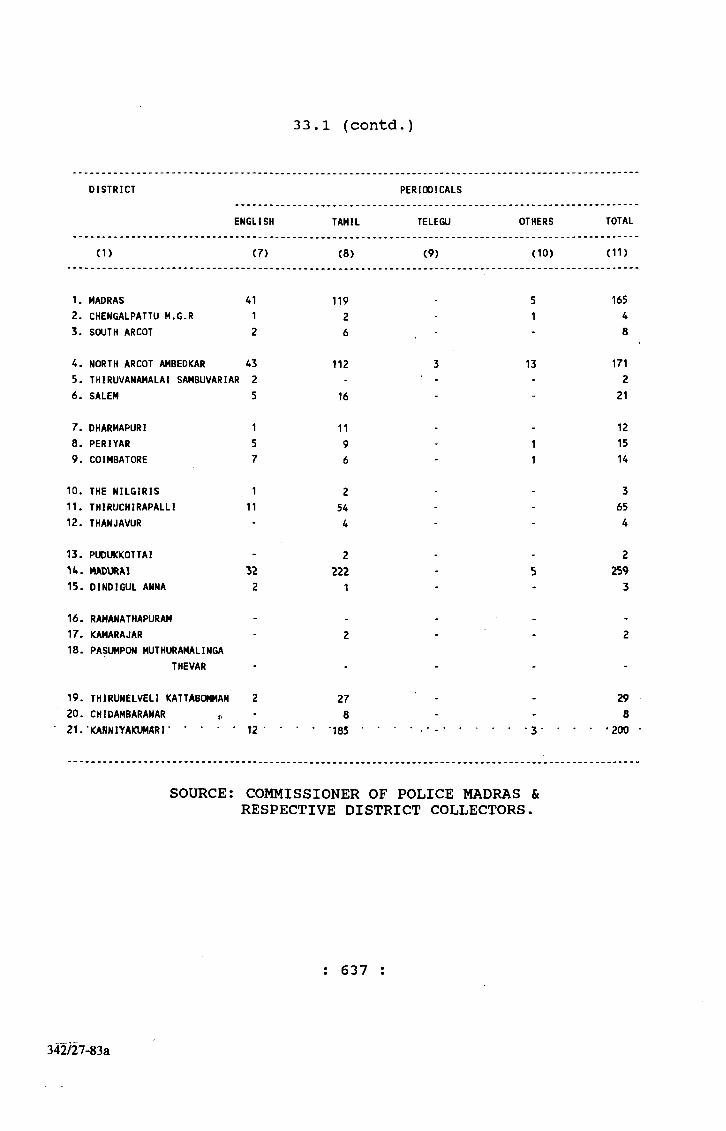
33.1 (contd.)
DISTRICT PERIODICALS
ENGLISH TAMIL TELEGU OTHERS TOTAL
(1) (7) (8) (9) (10) (11)
1. MADRAS 41 119 5 1652. CHENGALPATTU M.G.R 1 2 - 1 43. SOUTH ARCOT 2 6 - 8
4. NORTH ARCOT AMBEDKAR 43 112 3 13 1715. THIRUVANAMALAI SAMBUVARIAR 2 - ■ - - 26. SALEM 5 16 - - 21
7. DHARMAPURI 1 11 . - 128. PERIYAR 5 9 - 1 159. COIMBATORE 7 6 - 1 14
10. THE NILGIRIS 1 2 . . 311. THIRUCHIRAPALLI 11 54 - - 6512. THANJAVUR - 4 - - 4
13. PUDUKKOTTAI - 2 . - 2H . MADURAI 32 222 - 5 25915. DINDIGUL ANNA 2 1 - - 3
16. RAMANATHAPURAM - . . . -
17. KAMARAJAR - 2 - - 218. PASUMPON MUTHURAMALINGA
THEVAR - - - - -
19. THIRUNELVELI KATTABOMMAN 2 27 . 2920. CHIDAMBARANAR - 8 - - 821. XANNIYAKUMARr • • • • *200 •
SOURCE : COMMISSIONER OF POLICE MADRAS &RESPECTIVE DISTRICT COLLECTORS.
: 637
342/27-83a
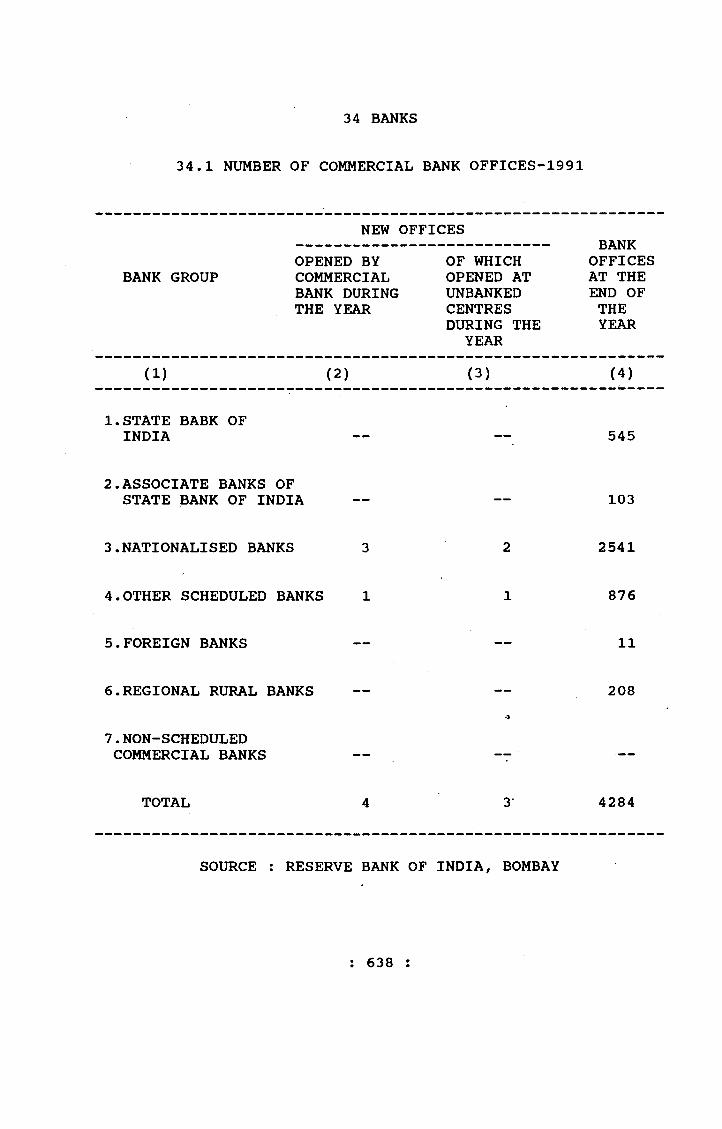
34 BANKS
34.1 NUMBER OF COMMERCIAL BANK OFFICES-1991
NEW OFFICESBANK
OFFICES AT THE END OF THE YEAR
OPENED BY BANK GROUP COMMERCIAL
BANK DURING THE YEAR
OF WHICH OPENED AT UNBANKED CENTRES DURING THE
YEAR
(1) (2) (3) (4)
1.STATE BABK OF INDIA — 545
2.ASSOCIATE BANKS OF STATE BANK OF INDIA — 103
3.NATIONALISED BANKS 3 2 2541
4.OTHER SCHEDULED BANKS 1 1 876
5.FOREIGN BANKS — 11
6.REGIONAL RURAL BANKS — 208
7.N0N-SCHEDULED COMMERCIAL BANKS -
TOTAL 4 3' 4284
SOURCE : RESERVE BANK OF INDIA, BOMBAY
: 638 :
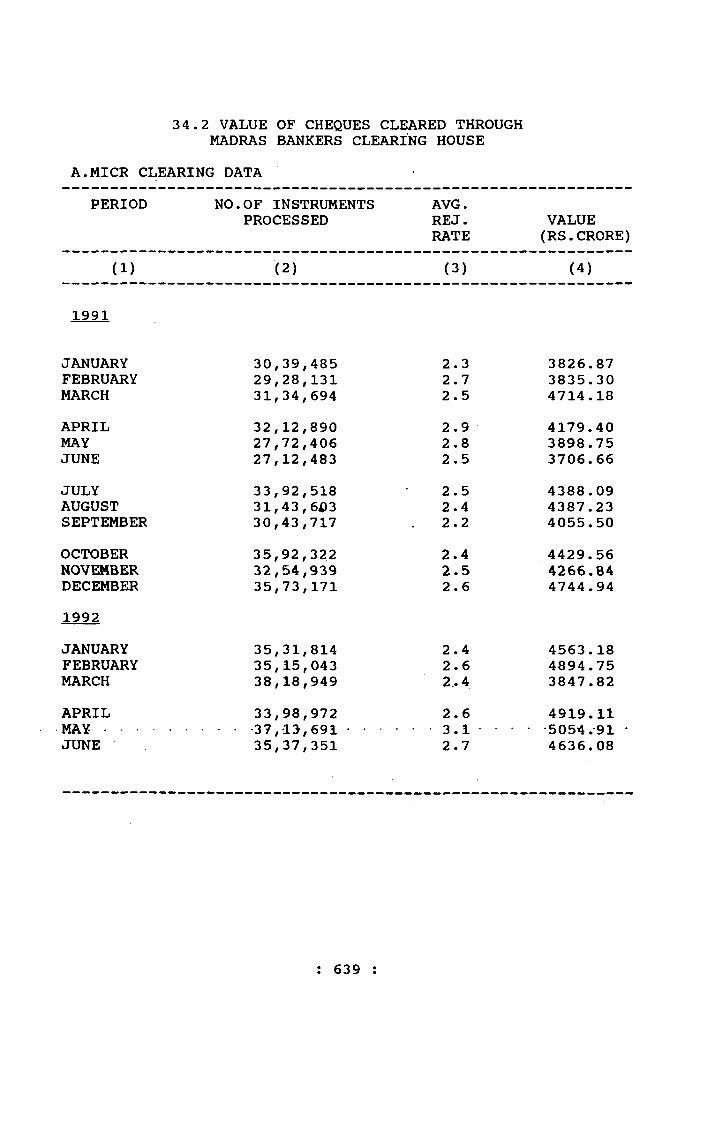
34.2 VALUE OF CHEQUES CLEARED THROUGH MADRAS BANKERS CLEARING HOUSE
A.MICR CLEARING DATAPERIOD NO.OF INSTRUMENTS
PROCESSEDAVG.REJ.RATE
VALUE(RS.CRORE)
(1) (2) (3) (4)
1991
JANUARY 30,39,485 2.3 3826.87FEBRUARY 29,28,131 2.7 3835.30MARCH 31,34,694 2.5 4714.18APRIL 32,12,890 2.9 4179.40MAY 27,72,406 2.8 3898.75JUNE 27,12,483 2.5 3706.66JULY 33,92,518 2.5 4388.09AUGUST 31,43,6X)3 2.4 4387.23SEPTEMBER 30,43,717 2.2 4055.50OCTOBER 35,92,322 2.4 4429.56NOVEMBER 32,64,939 2.5 4266.84DECEMBER 35,73,171 2.6 4744.941992JANUARY 35,31,814 2.4 4563.18FEBRUARY 35,15,043 2.6 4894.75MARCH 38,18,949 2.4 3847.82APRIL 33,98,972 2.6 4919.11MAY ........37,13,691 . 3.1 •5054.91 *JUNE 35,37,351 2.7 4636.08
: 639 :

34.2 (contd,)
B.INTERCITY CLEARING DATA
OUTWARD INWARDrCiJKXL/JJ
NO. OF ITEMS
VALUE (RS.CRORE
NO. OF ITEMS
VALUE (RS.CRORE)
(1) (5) (6) (7) (8)
1991
JANUARYFEBRUARYMARCH
14,06813,37413,725
40.79 38.14 46.96
24,46323,84024,294
51.8645.5748.51
APRILMAYJUNE
14,52211,96511,707
63.4345.44 30.46
27,54823,24622,216
70.1846.7346.69
JULYAUGUSTSEPTEMBER
13,31513,72312,414
42.8840.9635.23
26,42331,25827,466
54.8568.4255.03
OCTOBERNOVEMBERDECEMBER
15,47617,95118,961
45.1740.4445.58
33,34432,54535,220
69.1464.8576.31
1992
JANUARYFEBRUARYMARCH
18,11115,94115,404
53.74 56. 62 55.31
36,73450,57650,371
77.2999.02
100.99APRILMAYJUNE
18,03414,87714,702
55.7264.6939.44
51,09376,99450,380
150.94 132.18 111.76
: 640 :
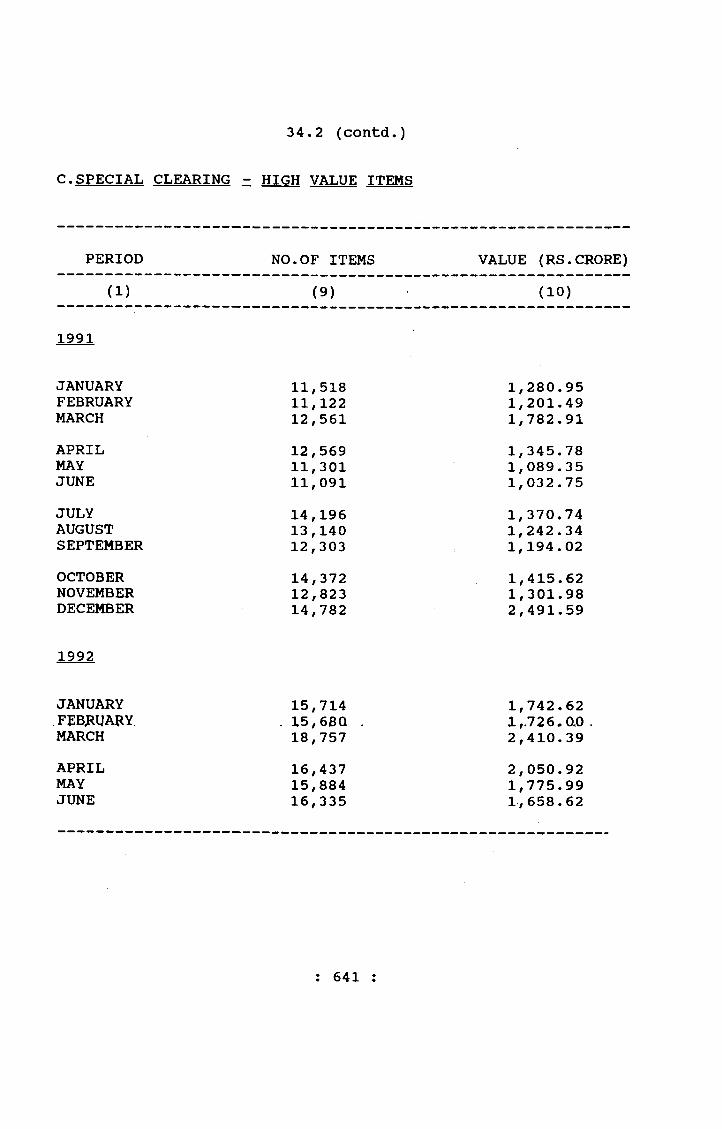
34.2 (contd.)
C.SPECIAL CLEARING - HIGH VALUE ITEMS
PERIOD NO.OF ITEMS VALUE (RS.CRORE)
(1) (9) (10)
1991
JANUARY 11,518 1,280.95FEBRUARY 11,122 1,201.49MARCH 12,561 1,782.91APRIL 12,569 1,345.78MAY 11,301 1,089.35JUNE 11,091 1,032.75JULY 14,196 1,370.74AUGUST 13,140 1,242.34SEPTEMBER 12,303 1,194.02OCTOBER 14,372 1,415.62NOVEMBER 12,823 1,301.98DECEMBER 14,782 2,491.59
1992
JANUARY 15,714 1,742.62FEBJIUAFY. . 15,68Q . 1,.726,0.0 ,MARCH 18,757 2,410.39APRIL 16,437 2,050.92MAY 15,884 1,775.99JUNE 16,335 1,658.62
: 641 :
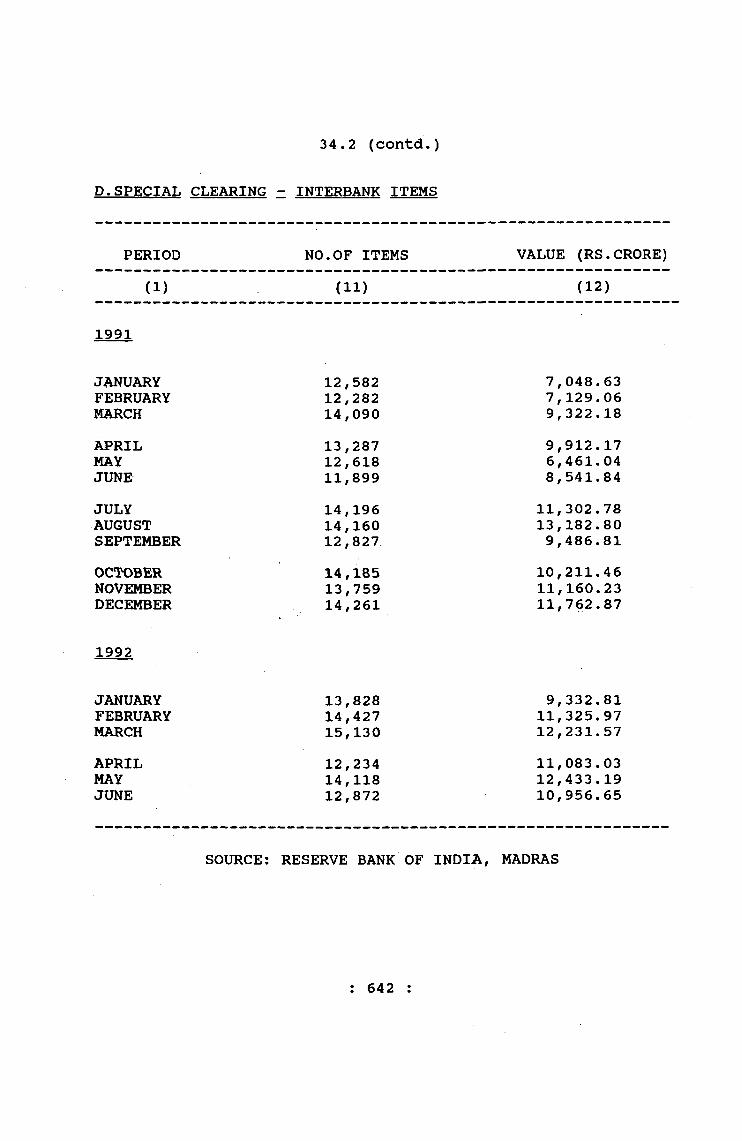
34.2 (contd.)
D.SPECIAL CLEARING - INTERBANK ITEMS
PERIOD NO.OF ITEMS VALUE (RS.CRORE)
(1) (11) (12)
1991
JANUARY 12,582 7,048.63FEBRUARY 12,282 7,129.06MARCH 14,090 9,322.18APRIL 13,287 9,912.17MAY 12,618 6,461.04JUNE 11,899 8,541.84JULY 14,196 11,302.78AUGUST 14,160 13,182.80SEPTEMBER 12,827 9,486.81OCTOBER 14,185 10,211.46NOVEMBER 13,759 11,160.23DECEMBER 14,261 11,762.87
1992
JANUARY 13,828 9,332.81FEBRUARY 14,427 11,325.97MARCH 15,130 12,231.57APRIL 12,234 11,083.03MAY 14,118 12,433.19JUNE 12,872 10,956.65
SOURCE; RESERVE BANK OF INDIA, MADRAS
: 642 :
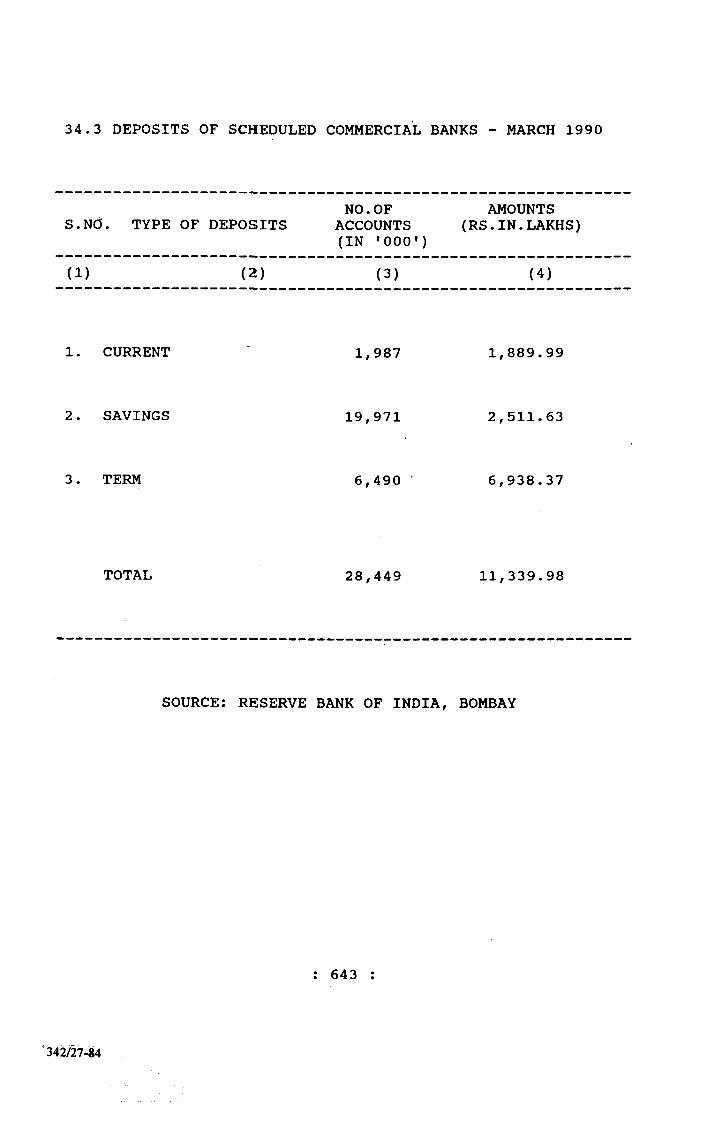
34.3 DEPOSITS OF SCHEDULED COMMERCIAL BANKS - MARCH 1990
S.Nd. TYPE OF DEPOSITSNO. OF
ACCOUNTS (IN '000')
AMOUNTS (RS.IN.LAKHS)
(1) (2) (3) (4)
1. CURRENT 1,987 1,889.99
2. SAVINGS 19,971 2,511.63
3. TERM 6,490 • 6,938.37
TOTAL 28,449 11,339.98
SOURCE: RESERVE BANK OF INDIA, BOMBAY
: 643
'342/27-lW
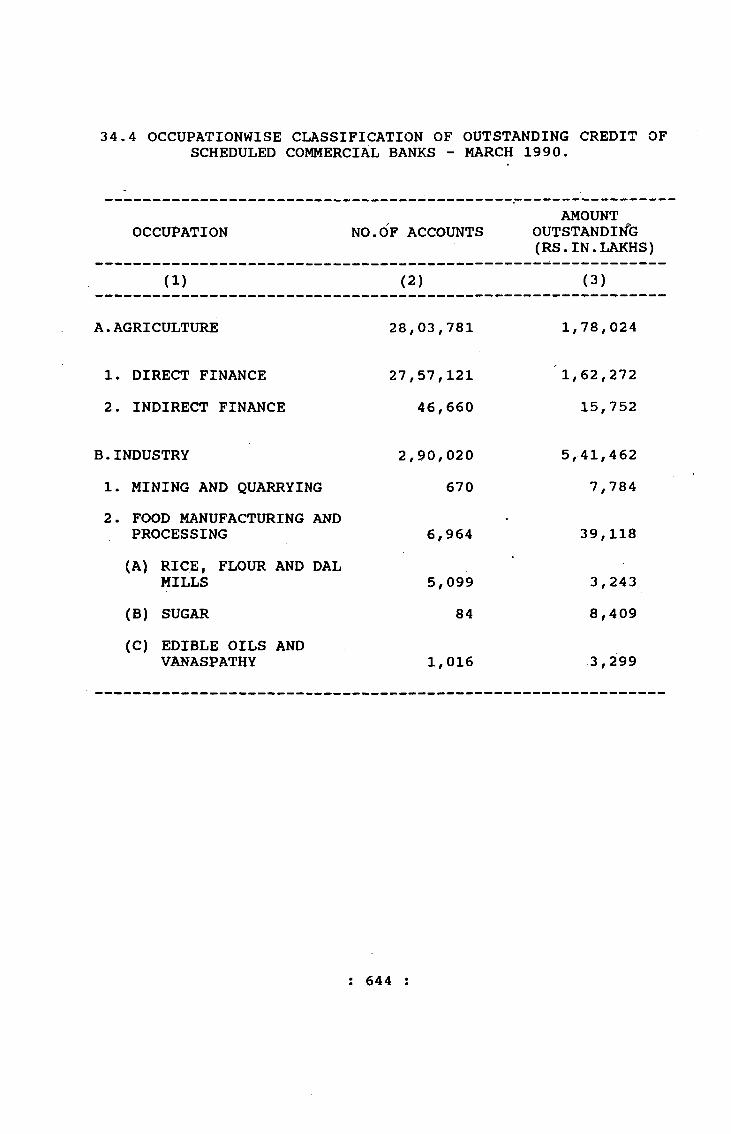
34.4 OCCUPATIONWISE CLASSIFICATION OF OUTSTANDING CREDIT OF SCHEDULED COMMERCIAL BANKS - MARCH 1990.
OCCUPATION NO.OF ACCOUNTSAMOUNT
OUTSTANDIlfG (RS.IN.LAKHS)
(1) (2) (3)
A.AGRICULTURE 28,03,781 1,78,024
1. DIRECT FINANCE 27,57,121 1,62,2722. INDIRECT FINANCE 46,660 15,752
B.INDUSTRY 2,90,020 5,41,4621. MINING AND QUARRYING 670 7,7842. FOOD MANUFACTURING AND
PROCESSING 6,964 39,118(A) RICE, FLOUR AND DAL
MILLS 5,099 3,243(B) SUGAR 84 8,409(C) EDIBLE OILS AND
VANASPATHY 1,016 3,299
: 644 :
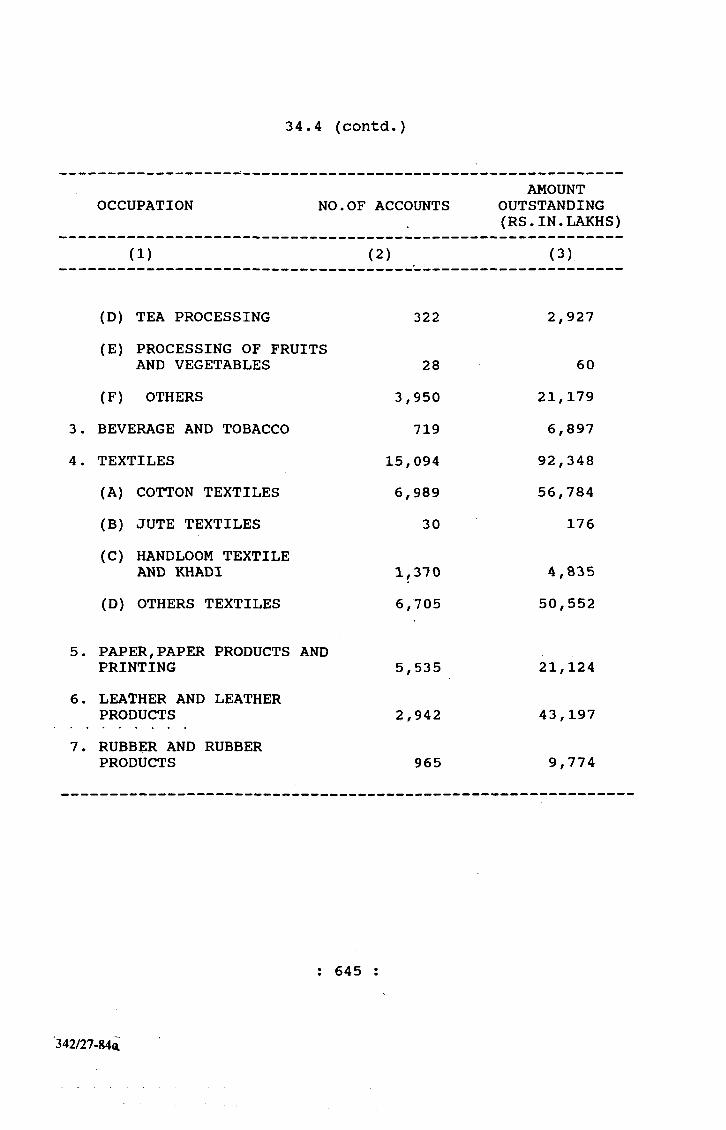
34.4 (contd.)
OCCUPATION NO.OF ACCOUNTSAMOUNT
OUTSTANDING (RS.IN.LAKHS)
(1) (2) (3)
(D) TEA PROCESSING 322 2,927(E) PROCESSING OF FRUITS
AND VEGETABLES 28 60(F) OTHERS 3,950 21,179
3. BEVERAGE AND TOBACCO 719 6,8974 . TEXTILES 15,094 92,348
(A) COTTON TEXTILES 6,989 56,784(B) JUTE TEXTILES 30 176(C) HANDLOOM TEXTILE
AND KHADI 1,370 4,835(D) OTHERS TEXTILES 6,705 50,552
5. PAPER,PAPER PRODUCTS PRINTING
AND5,535 21,124
6. LEATHER AND LEATHER PRODUCTS 2,942 43,197
7. RUBBER AND RUBBER PRODUCTS 965 9,774
: 645
342/27-84fli

34.4 (contd.)
OCCUPATION NO.OF ACCOUNTSAMOUNT
OUTSTANDING (RS.IN.LAKHS)
(1) (2) (3)
8. CHEMICALS AND CHEMICAL•
PRODUCTS 7,267 69,006(A) HEAVY INDUSTRIAL
CHEMICALS 690 12,093(B) FERTILISERS 332 29,300(C) DRUGS AND PHARMACEUTICALS SS9 7,171(D) NON-EDIBLE OILS 156 850(E) OTHERS CHEMICALS £e
CHEMICAL PRODUCTS 5,200 19,5929. PETROLEUM, COAL PRODUCTS
AND NUCLEAR FUELS 429 7,05910. MANUFACTURE OF CEMENT AND
CEMENT PRODUCTS 389 5,601
11. BASIC METAL AND METALPRODUCTS 6,796 36,258
(A) IRON AND STEEL 2,028 17,734(B) NON-FERROUS METALS 432 3,267(C) OTHER METAL PRODUCTS 4,3;36 15,257
12. ENGINEERING 9,3S74 96,544(A) HEAVEY ENGINEERING 1,442 22,960(B) LIGHT ENGINEERING 4,438 41,526(C) ELECTRICAL MACHINERY
AND GOODS 2,181 17,830(D) ELECTRONIC MACHINERY
AND GOODS 1,3113 14,27213. VEHICLES, VEHICLE PARTS
AND TRANSPORT EQUIPMENTS 2,261 46,202
: 646 :

34.4 (contd.)
OCCUPATION NO.OF ACCOUNTSAMOUNT
OUTSTANDING (RS.IN.LAKHS)
(1) (2) (3)
14. OTHER INDUSTRIES 2,28,722 49,540
15. ELECTRICITY, GAS AND WATER . 208 2, 388(A) ELECTRICITY GENERATION
AND TRANSMISSION 156 2,293(B) GAS, STEAM AND WATER
SUPPLY 47 89(C) NON-CONVENTIONFAL ENERGY 5 5
16. CONSTRUCTION 1,685 8,621C.TRANSPORT OPERATORS 56,721 29,159
: 647 :
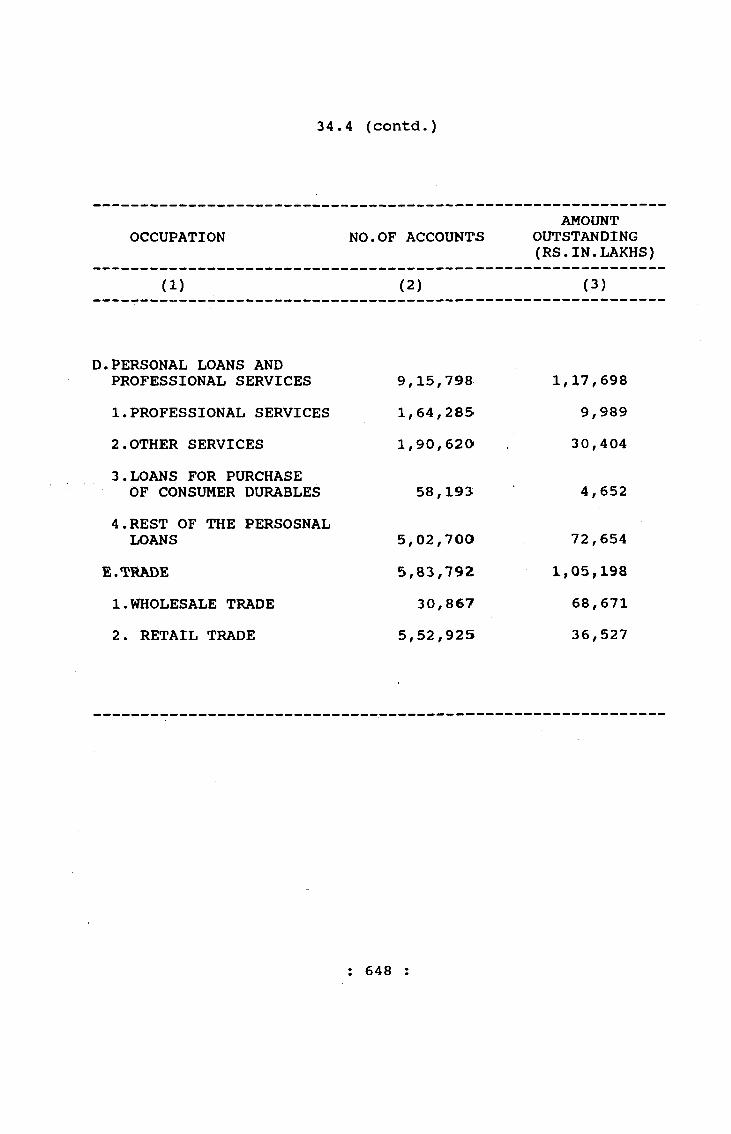
34.4 (contd.)
OCCUPATION NO.OF ACCOUNTSAMOUNT
OUTSTANDING (RS.IN.LAKHS)
(1) (2) (3)
D.PERSONAL LOANS AND PROFESSIONAL SERVICES 9,15,798 1,17,6981.PROFESSIONAL SERVICES 1,64,285 9,9892.OTHER SERVICES 1,90,620 30,4043.LOANS FOR PURCHASE
OF CONSUMER DURABLES 58,193 4,6524.REST OF THE PERSOSNAL
LOANS 5,02,700 72,654E.TRADE 5,83,792 1,05,1981.WHOLESALE TRADE 30,867 68,6712. RETAIL TRADE 5,52,925 36,527
: 648 :
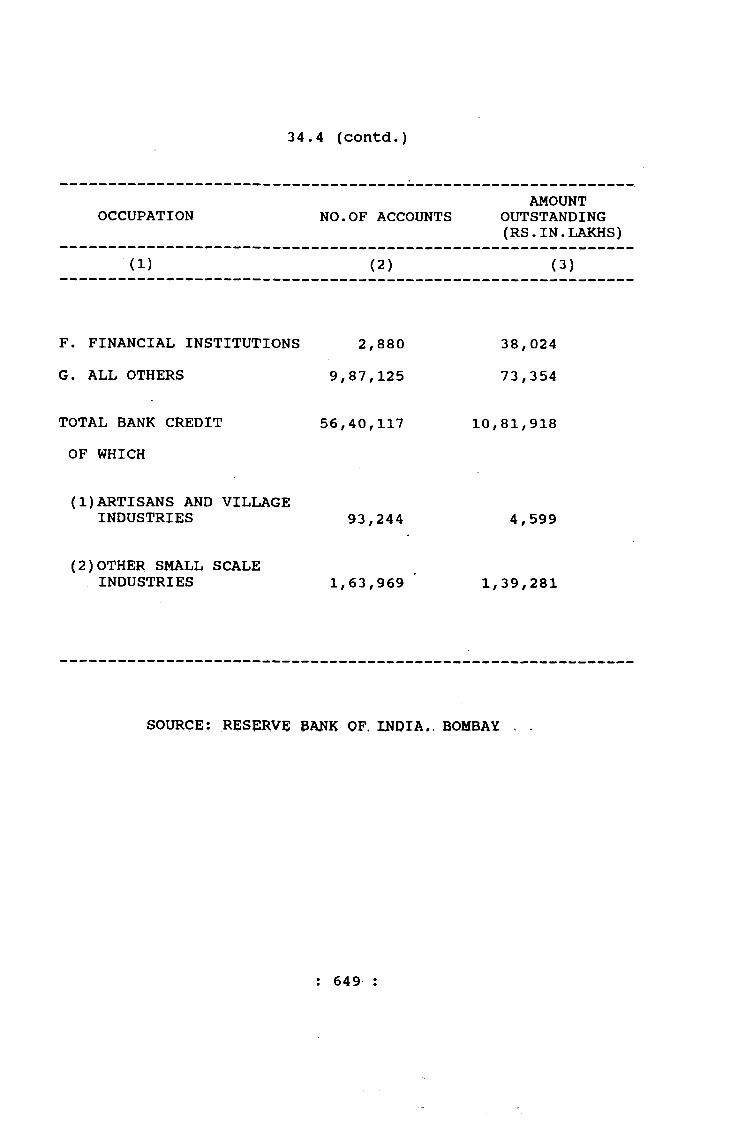
34 .4 (contd.)
OCCUPATION NO.OF ACCOUNTSAMOUNT
OUTSTANDING (RS.IN.LAKHS)
(1) (2) (3)
F. FINANCIAL INSTITUTIONS 2,880 38,024G. ALL OTHERS 9,87,125 73,354
TOTAL BANK CREDIT 56,40,117 10,81,918OF WHICH
(1)ARTISANS AND VILLAGE INDUSTRIES 93,244 4,599
(2)OTHER SMALL SCALE INDUSTRIES 1,63,969 1,39,281
SOURCE: RESERVE BANK OF. INDIA.. BOMBAY .
: 649 :
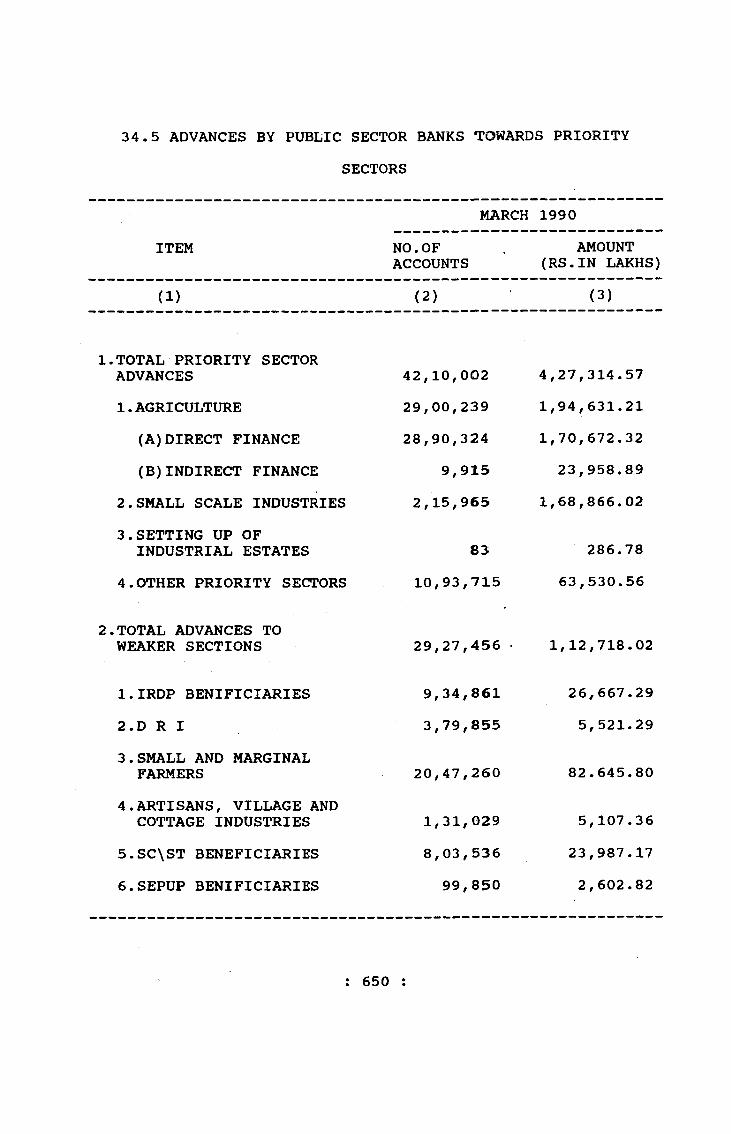
SECTORS34.5 ADVANCES BY PUBLIC SECTOR BANKS TOWARDS PRIORITY
MARCH 1990ITEM NO.OF
ACCOUNTSAMOUNT
(RS.IN LAKHS)
(1) (2) (3)
X .TOTAL PRIORITY SECTOR ADVANCES 42,10,002 4,27,314.571.AGRICULTURE 29,00,239 1,94,631.21
(A)DIRECT FINANCE 28,90,324 1,70,672.32
(B)INDIRECT FINANCE 9,915 23,958.892.SMALL SCALE INDUSTRIES 2,15,965 1,68,866.02
3.SETTING UP OFINDUSTRIAL ESTATES 83 286.78
4.OTHER PRIORITY SECTORS 10,93,715 63,530.56
2.TOTAL ADVANCES TO WEAKER SECTIONS 29,27,456 ■ 1,12,718.02
l.IRDP BENIFICIARIES 9,34,861 26,667.292.D R I 3,79,855 5,521.293.SMALL AND MARGINAL
FARMERS 20,47,260 82.645.804.ARTISANS, VILLAGE AND
COTTAGE INDUSTRIES 1,31,029 5,107.365.SC\ST BENEFICIARIES 8,03,536 23,987.176.SEPUP BENIFICIARIES 99,850 2,602.82
; 650 :

34.5 (contd.)
SEPTEMBER 1990ITEM NO. OF
ACCOUNTSAMOUNT
(RS.IN LAKHS)
(1) (2) (3)
1.TOTAL PRIORITY SECTOR ADVANCES 40,17,518 4,34,533.65
1.AGRICULTURE 26,84,159 1,90,715.42A)DIRECT FINANCEB)INDIRECT FINANCE
26,69,65914,500
1,65,236.0425,479.38
2.SMALL SCALE INDUSTRIES 2,44,112 1,80,024.123.SETTING UP OF INDUSTRIAL
ESTATES 219 60.824.OTHER PRIORITY SECTORS 10,89,028 63,733.29
2.TOTAL ADVANCES TO WEAKER SECTIONS 28,09,806 1,10,993.48
l.IRDP BENIFICIARIES 2.D R I3.SMALL AND MARGINAL ■ FARMERS . . - .
4.ARTISANS, VILLAGE AND COTTAGE INDUSTRIES
5.SC\ST BENEFICIARIES 6.SEPUP BENIFICIARIES
8,50,0003,52,757
19,46,9601,23,6747,61,9441,03,059
22,570.495,142.28
•80, 873*. 724,633.85
23,306.032,791.56
SOURCE: RESERVE BANK OF INDIA, BOMBAY
: 6 5 1
342/27-85

35. LIFE INSURANCE
35.1 LIFE INSURANCE INJTAMIL NAIDU - 1991-92
I t e m Office/Region Number/Value
(1) (2) (3)
1. Office a. Branch Offices 152b. Sub-Offices —
c. Development Centres —
2. Agents 42,710
3. Individual Businessa. Policies Issued Rural 4,00,887
Urban 4,64,272Total 8,65,159
b. Sum assured Rural 1,056.29(Rs. in crores)
Urban 1,560.51Total 2,616.80
Source: Life Insurance Corporation of India, Madras
: 652 :

3 5.2 INVESTMENT OF THE LIFE INSURANCE CORPORATION OF INDIAIN TAMIL NADU 1991-92
81.No.
I t e m A(Rs.
m o u n t in crores)
(1) (2) (3)
1. State Government Securities 21.502 . Land Development Bank Debentures 5.003. State Electricity Board - Bonds 12.004. Tamil Nadu Industrial Investment
Corporation - Bonds 53 .585. Loans to State Government for Housing
Schemes 15.796. Loans to Municipal Committees 9.397. Loans to Jilla Parishads for Rural
piped water supply schemes 19.798. Loans to Apex Co-operative Housing
Finance Society 25.009. Shares and Debentures of Companies
(including loans to Companies) 177.1310. Others 3.00
T o t a l 341.98
Source: Life Insurance Corporation of India, Madras
: 653
342/27-85a

(Rs. in lakhs)
36. FIVE YEAR PLAN
3 6.1 PLAN EXPENDITURE - STATE SCHEMES
Heads of Development 1990-91(Accounts)
7th Five Year Plan Expenditure
(1985-86 to 1989-90
1991-92(R-E.)
1992-93(B.E.)
8th Five Year Plan outlay 1992-97
(1) (2) (3) «4) (5) (6)
1. Agriculture and a llied activ it ie s 17945 64822 19436 21329 98715
2. Co-operation 475 5413 238 247 3600
3. Rural Development 7900 29265 <9700 11068 45100
4. Irrigation, Flood Control and Power 54073 211393 5!2263 55854 360000
i. Irrigation . 8191 34394 9650 9964 585001i . Power 45882 176999 42613 45890 301500
5. Industry and Minerals 11971 10969 55000
6. Transport and Communications 10077 34200 H0892 12594 70700
7. General Economic Services 206 1861 263 216 1520
8. Social and Community Services* 55805 229354 58007 61551 380965
9. General Services 1206 5039 828 1310 4400
Grand Total 159099 631764 164600 175138 1020000
*includes Science, Technology and EnvironmentSource: Plan Documents
: 654 :
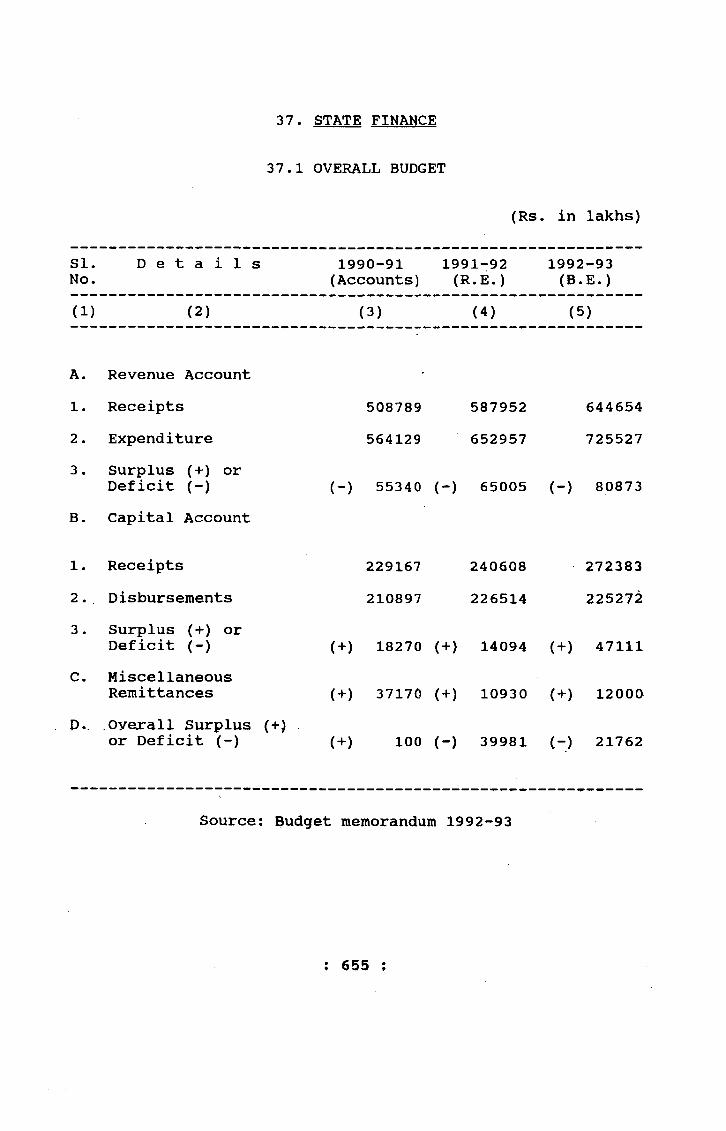
37. STATE FINANCE
37.1 OVERALL BUDGET
(Rs. in lakhs)
SI.No.
D e t a i l s 1990-91(Accounts)
1991-92(R.E.)
1992(B.
:-93E.)
(1) (2) (3) (4) (5)
A. Revenue Account1. Receipts 508789 587952 6446542. Expenditure 564129 652957 7255273. Surplus (+) or
Deficit (-) (-) 55340 (-) 65005 (-) 80873B. Capital Account
1. Receipts 229167 240608 2723832. Disbursements 210897 226514 2252723. Surplus (+) or
Deficit (-) (+) 18270 ( + ) 14094 ( + ) 47111C. Miscellaneous
Remittances (+) 37170 ( + ) 10930 ( + ) 12000D: .Overall Surplus (+) .
or Deficit (-) (+) 100 (-) 39981 (-) 21762
Source; Budget memorandum 1992-93
; 655 ;
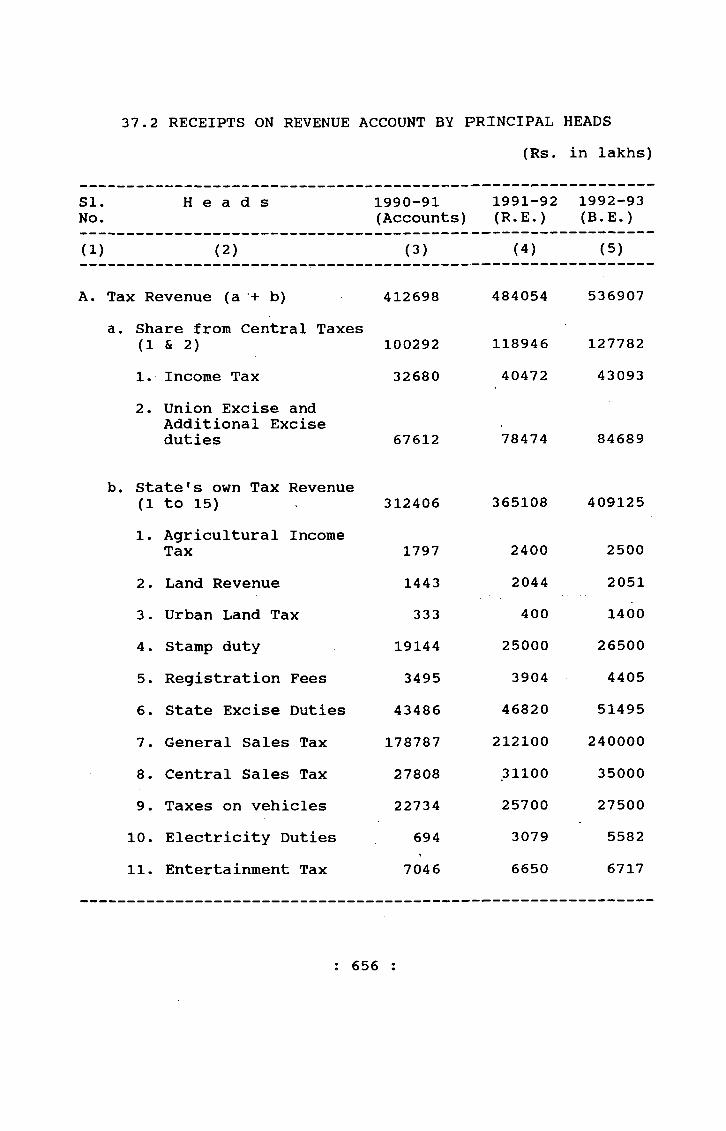
(Rs. in lakhs)37.2 RECEIPTS ON REVENUE ACCOUNT BY PRINCIPAL HEADS
SI.No.
H e a d s 1990-91(Accounts)
1991-92 (R.E.)
1992-93 (B.E.)
(1) (2) (3) (4) (5)
A. Tax Revenue (a '+ b) 412698 484054 536907a. Share from Central Taxes
(1 & 2) 100292 118946 1277821. Income Tax 32680 40472 430932. Union Excise and
Additional Excise duties 67612 78474 84689
b. State's own Tax Revenue (1 to 15) 312406 365108 409125
1. Agricultural Income Tax 1797 2400 2500
2. Land Revenue 1443 2044 20513. Urban Land Tax 333 400 14004. Stamp duty 19144 25000 265005. Registration Fees 3495 3904 44056. State Excise Duties 43486 46820 514957. General Sales Tax 178787 212100 2400008. Central Sales Tax 27808 .31100 350009. Taxes on vehicles 22734 25700 27500
10. Electricity Duties 694 3079 558211. Entertainment Tax 7046 6650 6717
; 656 :
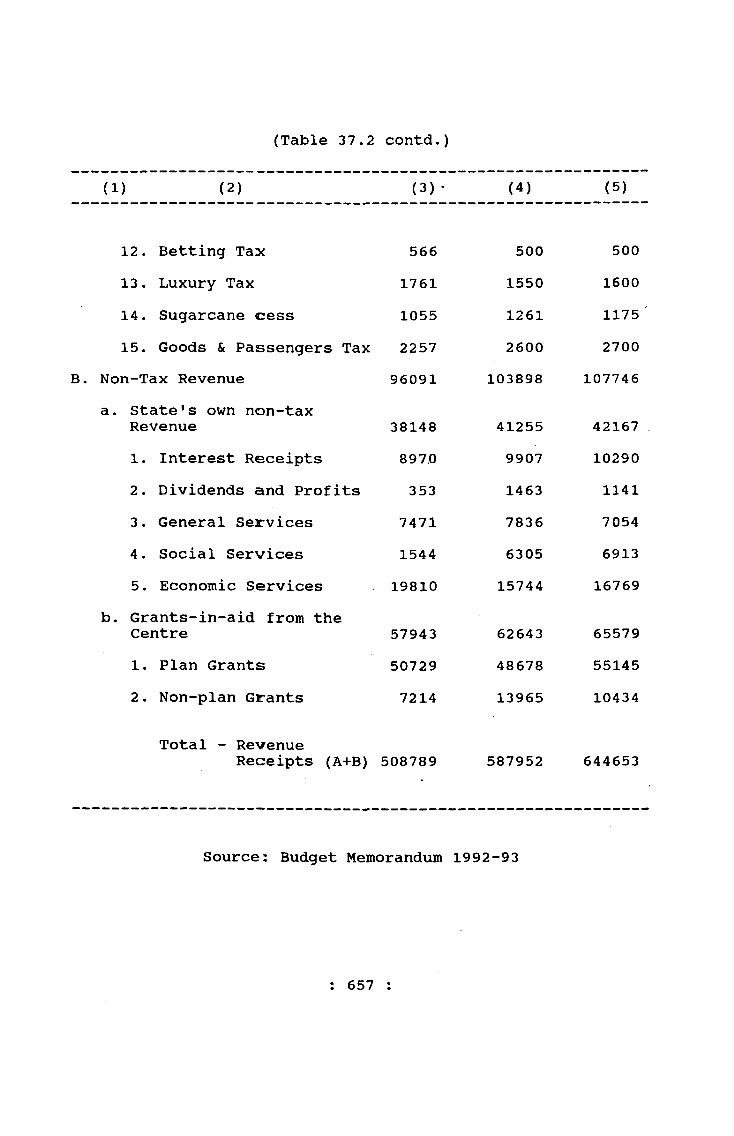
(Table 37.2 contd.)
( 1 ) ( 2 ) (3) (4) (5)
12. Betting Tax 566 500 50013. Luxury Tax 1761 1550 160014. Sugarcane cess 1055 1261 117515. Goods & Passengers Tax 2257 2600 2700
B. Non-Tax Revenue 96091 103898 107746a. State's own non-tax
Revenue 38148 41255 421671. Interest Receipts 897.0 9907 102902. Dividends and Profits 353 1463 11413. General Services 7471 7836 70544. Social Services 1544 6305 69135. Economic Services 19810 15744 16769
b. Grants-in-aid from theCentre 57943 62643 655791. Plan Grants 50729 48678 551452. Non-plan Grants 7214 13965 10434
Total - RevenueReceipts (A+B) 508789 587952 644653
Source: Budget Memorandum 1992-93
: 657 :

(Rs. in lakhs)37.3 EXPENDITURE ON REVENUE ACCOUNT BY PRINCIPAL HEADS
SI.No.
H e a d s 1990-91(Accounts)
1991-92(R.E.)
1992-93 (B.E.)
(1) (2) (3) (4) (5)
A. Development Expenditure (a+b) 407906 468323 510565a. Social Services 249191 270753 297212
1. Education 126986 132224 1482782. Art and Culture 1401 1650 18653. Medical and Public
Health 31593 34960 381634. Family Welfare 6308 7334 78635. Water Supply and
Sanitation 13933 17846 178276. Housing 2722 1428 15087. Urban Development 6946 9198 105298. Labour and Employment 4494 4477 49729. Welfare of SC, ST & OBC 13169 14680 15720
10. Social Security and Welfare 13945 14726 17822
11. Nutrition 23533 28301 3086912. Relief on account of
natural calamities 2691 2278 8713. Others 1470 1651 1709
b. Economic Services 158715 . 197570 2133531. General Economic
Services 29041 ■ 37848 53846
: 658 :

(Table 37.3 eontd.)
(1) (2) (3) (4) (5)
2. Agriculture and allied services 53306 75519 77415
3. Rural Development 32390 30463 319534. Special Area Programme 1018 1021 11205. Irrigation and Flood
Control 12298 15081 153606. Energy 4105 280 2817. Industry and Minerals 12240 17743 122958. Transport 14160 19341 208089. Science, Technology
and Environment 157 274 275B, Non-development Expenditure
(a+b) 156222 184634 214962a. General Services 145380 175872 204704
1. Organs of State 4511 6557 51192. Fiscal Services 9861 11213 121743. Debt Services 48331 64321 775744. Administration Services 46309 49432 533865. Pension and Miscell
aneous G.S. 36368 44349 56451b. Compensation and Assign
ments to L.Bs and P.R.I. 10842 8762 10258Total Revenue Expenditure 564128 652957 725527
Source: Budget Memorandum 1992-93
: 659 :
34a/27-

37.4 CAPITAL BUDGET - RECEIPTS(Rs. in lakhs)
SI.No.
H e a d s 1990-91(Accounts)
1991-92(R.E)
1992-93(R.E)
(1) (2) (3) • (4) (5)
A. Consolidated Fund 241947 254041 2824221. Public Debt incurred 229167 240608 272383
i. Internal Debt 154406 161885 174195ii. Loans and Advances
from Govt, of India 74761 78723 981882. Loans and Advances repaid
to State Government 12780 13433 10039B. Contingency Fund — — —C. Public Account 737567 694078 716610
1. Small Savings, Provident Fund, etc. 44928 45787 40119
2. Reserve Funds 12326 . 28355 298633. Deposits and Advances 261443 261849 2687274. Suspense and Miscellaneous 286145 259565 2709765. Remittances 132725 98522 106925
D. Gross Capital Receipts (A+B+C) 979514 948119 999032
Source: Budget Memorandum 1992-93
; 660 :
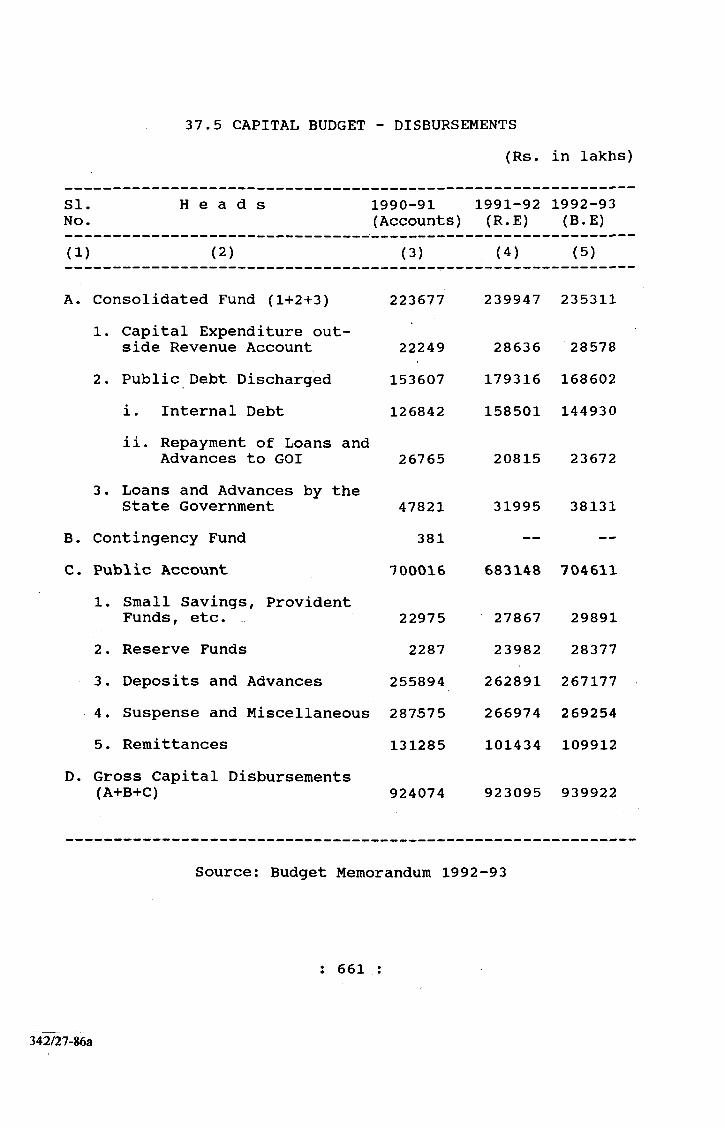
(Rs. in lakhs)37.5 CAPITAL BUDGET - DISBURSEMENTS
SI.No.
H e a d s 1990-91(Accounts)
1991-92(R.E)
1992-93(B.E)
(1) (2) (3) (4) (5)
A. Consolidated Fund (1+2+3) 223677 239947 2353111. Capital Expenditure out
side Revenue Account 22249 28636 285782. Public Debt Discharged 153607 179316 168602
i. Internal Debt 126842 158501 144930ii. Repayment of Loans and
Advances to GOI 26765 20815 236723. Loans and Advances by the
State Government 47821 31995 38131B. Contingency Fund 381 — —C. Public Account 700016 683148 704611
1. Small Savings, Provident Funds f etc. 22975 27867 29891
2. Reserve Funds 2287 23982 283773. Deposits and Advances 255894 262891 2671774. Suspense and Miscellaneous 287575 266974 2692545. Remittances 131285 101434 109912
D. Gross Capital Disbursements (A+B+C) 924074 923095 939922
Source: Budget Memorandum 1992-93
: 661
342/27-86a

38* gTH^a tllCOMfi38.1 NET STATE DOMESTIC PRODUCT AT FACTOR COST BY INDUSTRY
OF ORIGIN AT CURRENT PRICES(Rs. in lakhs)
Industry
( 1)
1980-81 1986-87 1987-88(2) (3) (4)
1. Agriculture Forestry and Fishing (1.1+1.2+1.3)1.1 Agriculture and allied
activities1.2 Forestry and Logging1.3 Fishing
2. Mining and QuarryingA. SUB-TOTAL: PRIMARY (1+2)3. Manuf actur ing (3»1+3.2)
3 * 1 Registered3.2 Unregistered
4. Electricity, Gas and Welter Supply
5. ConstructionB. SUB-TOTAL: SECONDARY
(3+4+5)
1^83,559 3,48,372 4,41,169
1,77,3191,6984,5423,503
1,87,0621,97,8991,07,907
89,992
3,38,3433,1106,9197,882
3,56,2543,86,4282,33,8021,52,626
4,31,6913,1506,3289,370
4,50,5394,25,2012,43,7261,81,475
3,140 8,640 13,74940,689 78,967 97,259
2,41,728 4,74,035 5,36,209
: 662 :
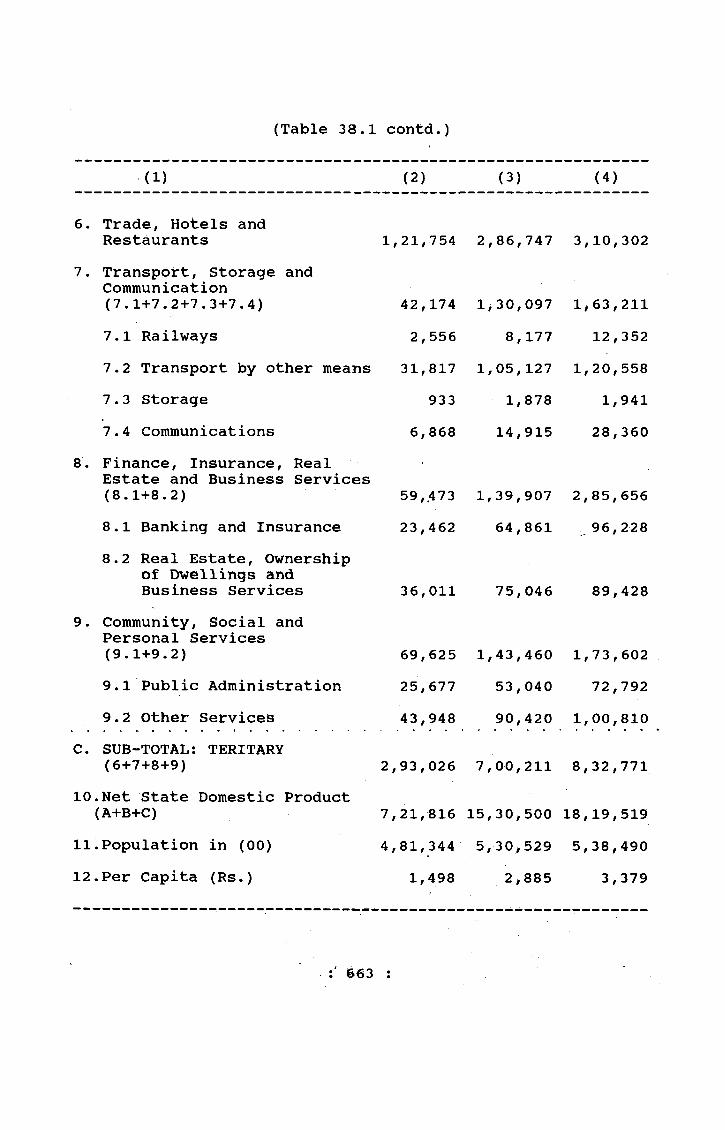
(Table 38.1 contd.)
(1) (2) (3) (4)
6. Trade, Hotels and Restaurants 1,21,754 2,86,747 3,10,302
7. Transport, storage andCommunication(7.1+7.2+7.3+7.4) 42,174 1,30,097 1,63,2117.1 Railways 2,556 8,177 12,3527.2 Transport by other means 31,817 1,05,127 1,20,5587.3 Storage 933 1,878 1,9417.4 Communications 6,868 14,915 28,360
8. Finance, Insurance, Real Estate and Business Services (8.1+8.2) 59,473 1,39,907 2,85,6568.1 Banking and Insurance 23,462 64,861 96,2288.2 Real Estate, Ownership
of Dwellings and Business Services 36,011 75,046 89,428
9. Community, Social and Personal Services (9.1+9.2) 69,625 1,43,460 1,73,6029.1 Public Administration 25,677 53,040 72,7929.2 Other Serviceis 43,948 90,420 1,00,810
C. SUB-TOTAL: TERITARY (6+7+S+9) 2,93,026 7,00,211 8,32,771
10 .Net State Domestic Product (A+B+C) 7,21,«16 15,30,500 18,19,519
11 .Population in (00) 4,81,344 5,30,529 5,38,49012 .Per Capita (Rs.) 1,498 2,885 3,379
: 663 ;

(38.1 contd.)
Industry 1988-89-----
1989-90.(R.E)
1990-91(Q.E)
(1) (5) (6) (7)
1. Agriculture Forestry and Fishing (1.1+1.2+1.3) 4,08,524 4,82,092 4,34,1291.1 Agriculture and
allied activities 3,86,732 4,59,060 4,09,4221.2 Forestry and Logging 12,890 12,553 12,1901.3 Fishing 8,912 10,479 12,517
2. Mining and Quarrying 12,044 12,440 13,694A. SUB-TOTAL: PRIMARY (1+2) 4,20,568 4,94,532 4,47,8233. Manufacturing (3.1+3.2) 4,65,989 5,54,297 6,56,443
3.1 Registered 2,80,118 3,33,202 3,^94,6053.2 Unregistered 1,85,871 2,21,095 2,61,838
4. Electricity, Gas and Water Supply 25,883 31,301 33,906
5. Construction 1,25,309 1,41,719 1,56,677B. SUB-TOTAL: SECONDARY
(3+4+5) 6,17,181 7,27,317 8,47,026
: 664 :

(1) (f') («) (f)_
6. Trade, Hotels andRestaurants 3,54,865 3,92,948 4,40,215
7. Transport, Storage and Communication(7.1+7.2+7.3+7.4) 1,60,147 1,80,013 1,95,4997.1 Railways 13,626 16,519 16,519R7.2 Transport by other
means 1,11,756 1,23,803 1,39,0267.3 Storage 2,085 2,429 2,6927.4 Communications 32,680 37,262 37,262R
8. Finance, Insurance, Real Estate and BusinessService (8.1+8.2) 1,96,939 2,37,096 2,56,0478.1 Banking and Insurance 96,228 1,26,373 1,26,373R8.2 Real Estate, Ownership
of Dwellings andBusiness Services 1,05,225 1,10,723 1,29,674
9. Community, Social and Personal Services(9.1+9.2) 2,06,280 2,64,695 2,97,4429.1 Public Administration 84,571 1,11,202 1,19,9089.2 Other Services 1,21,709 1,53,493 1,77,534
C. SUB-TOTAL: TERITARY(6+7+S+9) 9,18,231 10,74,752 11,89,203
10.Net State Domestic Product(A+B+C) 19,55,980 22,96,601 24,84,052
11.Population in (00) 5,46,186 5,53,670 5,61,00712.Per Capita (Rs.) 3,581 4,148 4,428
RE: Revised Estimates QE: Quick Estimates R: Repeated
(Table 38.1 contd.)
Source: Commissioner of Statistics, Madras
: 665 :
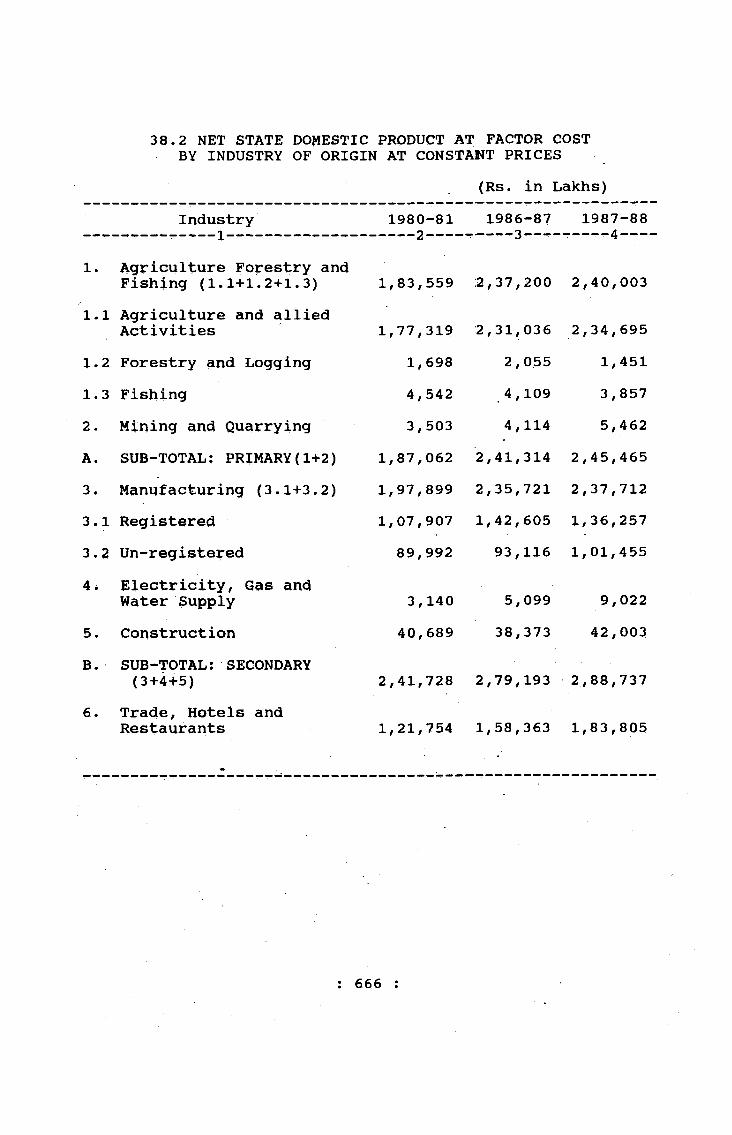
38.2 NET STATE DOMESTIC PRODUCT AT FACTOR COST BY INDUSTRY OF ORIGIN AT CONSTANT PRICES
(Rs. in Lakhs)Industry 1980-81 1986-87 1987-88
1. Agriculture Forestry and Fishing (1.1+1.2+1.3) 1,83,559 2,37,200 2,40,003
1.1 Agriculture and allied Activities 1,77,319 2,31,036 2,34,695
1.2 Forestry and Logging 1,698 2,055 1,4511.3 Fishing 4,542 4,109 3,8572. Mining and Quarrying 3,503 4,114 5,462A. SUB-TOTAL: PRIMARY(1+2) 1,87,062 2,41,314 2,45,4653. Manufacturing (3.1+3.2) 1,97,899 2,35,721 2,37,7123.1 Registered 1,07,907 1,42,605 1,36,2573.2 Un-registered 89,992 93,116 1,01,4554w Electricity, Gas and
Water Supply 3,140 5,099 9,0225. Construction 40,689 38,373 42,003B. SUB-TOTAL: SECONDARY
(3+4+5) 2,41,728 2,79,193 2,88,7376. Trade, Hotels and
Restaurants 1,21,754 1,58,363 1,83,805
: 666 :
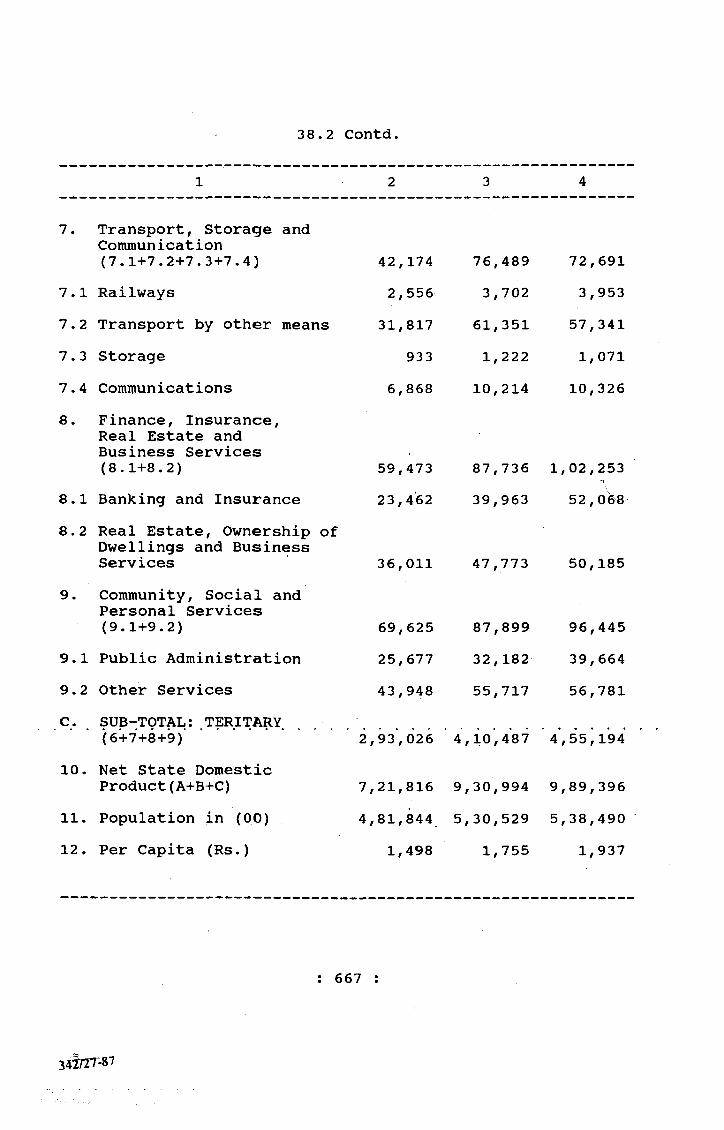
38.2 Contd.
7. Transport, Storage and Communication(7.1+7.2+7.3+7.4) 42,174 76,489 72,691
7.1 Railways 2,556 3,702 3,9537.2 Transport by other means 31,817 61,351 57,3417.3 Storage 933 1,222 1, 0717.4 Communications 6,868 10,214 10,3268. Finance, Insurance,
Real Estate and Business Services (8.1+8.2) 59,473 87,736 1,02,253•7
8.1 Banking and Insurance 23,462 39,963 52,0688.2 Real Estate, Ownership of
Dwellings and Business Services 36,011 47,773 50,185
9. Community, Social and Personal Services (9.1+9.2) 69,625 87,899 96,445
9.1 Public Administration 25,677 32,182 39,6649.2 Other Services 43,948 55,717 56,781C. SUB-TOTAL: TERITARY
(6+7+8+9) 2,93,026 4 ,10,487 4,55,19410. Net State Domestic
Product(A+B+C) 7,21,816 9 ,30,994 9,89,39611. Population in (00) 4,81,844 5 ,30,529 5,38,49012. Per Capita (Rs.) 1,498 1,755 1,937
: 667
34X/2T-87

38.2 Conltd.
Industry 1^88-89 1989-90 (R.E.)
1990-91(Q.E.)
1. Agriculture Forestry and Fishing (1.1+1.2+1.3) 2,,39,401 2,71,734 2,48,663
1.1 Agriculture and allied Activities 2„29,146 2,62,039 2,38,505
1.2 Forestry and Logging 6,359 5,738 6,1141.3 Fishing 3,896 3,957 4,0442. Mining and Quarrying 5,428 5,276 5,623A. SUB-TOTAL: PRIMARY(1+2) 2„44,829 2,77,010 2,54,2863. Manufacturing (3.1+3.2) 2„49,819 2,55,865 2,66,7383.1 Registered 1„50,173 1,53,807 1,60,3433.2 Un-registered 99,646 1,02,058 1,06,3954. Electricity, Gas and
Water Supply 15,944 19,281 20,8865. Construction 60,087 62,422 62,176B. SUB-TOTAL: SECONDARY
(3+4+5) 3^,25,850 3,37,568 3,49,8006. Trade, Hotels and
Restaurants 1„95,094 1,92,329 1,93,713
: 668
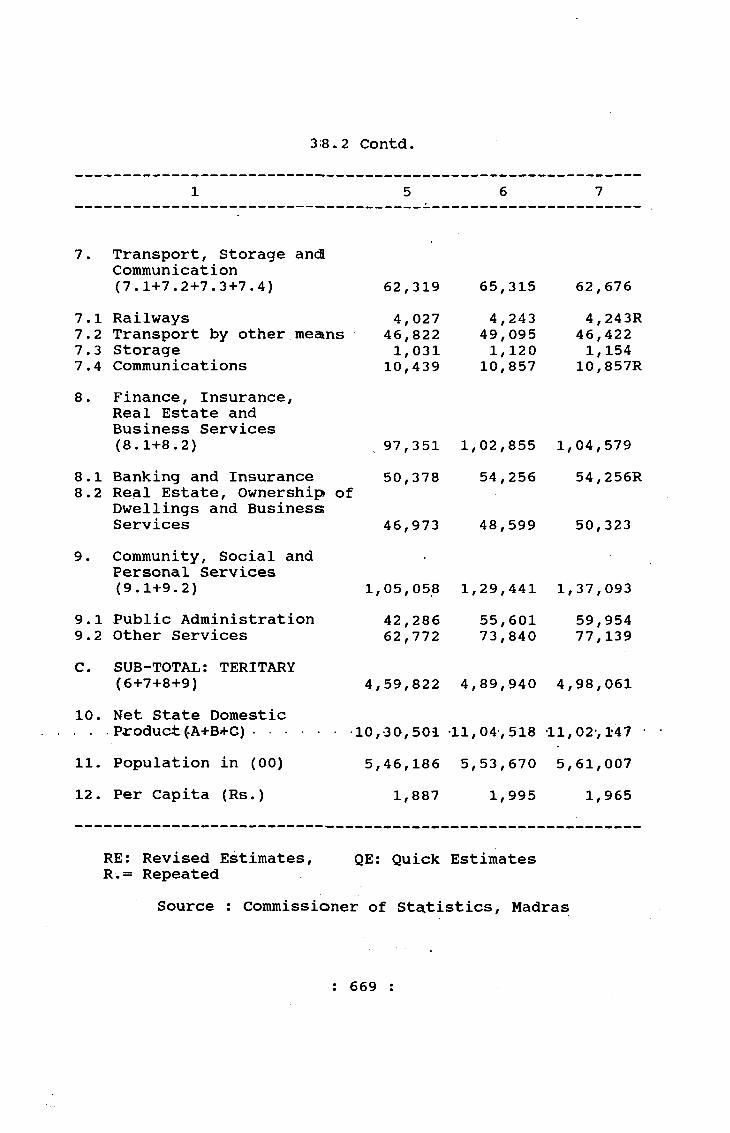
3;8.2 Contd.
1 5 6 7
7. Transport, Storage ancSCommunication(7.1+7.2+7.3+7.4) 62,319 65,315 62,676
7.17.27.37.4
RailwaysTransport by other means StorageCommunications
4,02746,8221,031
10,439
4,24349,0951,120
10,857
4,243R46,4221,154
10,857R8. Finance, Insurance,
Real Estate and Business Services (8.1+8.2) 97,351 1,02,855 1,04,579
8.18.2
Banking and Insurance Real Estate, Ownership of Dwellings and Business; Services
50,378
46,973
54,256
48,599
54,256R
50,3239. Community, Social and
Personal Services (9.1+9.2) 1,05,058 1,29,441 1,37,093
9.19.2
Public Administration Other Services
42,28662,772
55,60173,840
59,95477,139
C. SUB-TOTAL: TERITARY (6+7+8+9) 4,59,822 4,89,940 4,98,061
10. Net State Domestic . Product (.A+B+C) 10,30,501 •11,04,518 11, 02-, 147
11. Population in (00) 5,46,186 5,53,670 5,61,00712. Per Capita (Rs.) 1,887 1,995 1,965
RE: Revised Estimates, QE: Quick Estimates R.= Repeated
Source : Commissioner of Sta.tistics, Madras
: 669 :
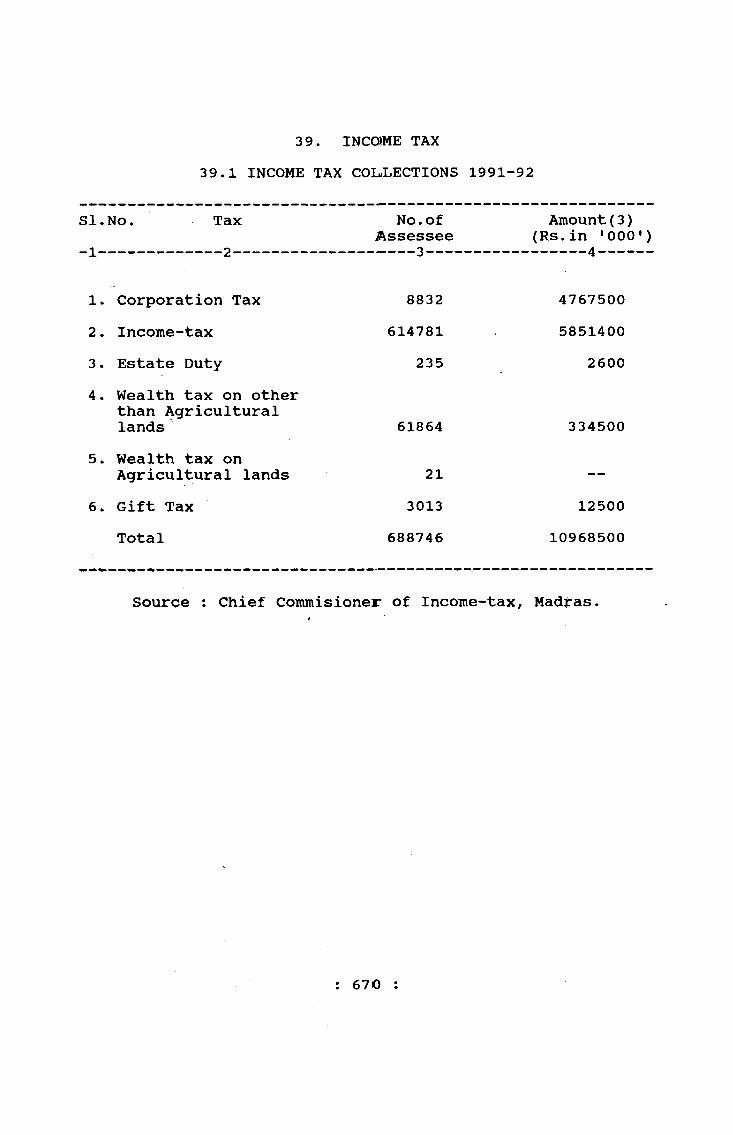
39. INCCBME TAX39.1 INCOME TAX COLLECTIONS 1991-92
SI.•1
No. Tax No. of Assessee
Amount(3) (Rs.in '000')
1. Corporation Tax 8832 47675002. Income-tax 614781 58514003. Estate Duty 235 26004. Wealth tax on other
than Agricultural lands 61864 334500
5. Wealth tax on Agricultural lands 21 —
6. Gift Tax 3013 12500Total 688746 10968500
Source : Chief Commisioner of Income-tax, Madras.
: 6 7 0 ;
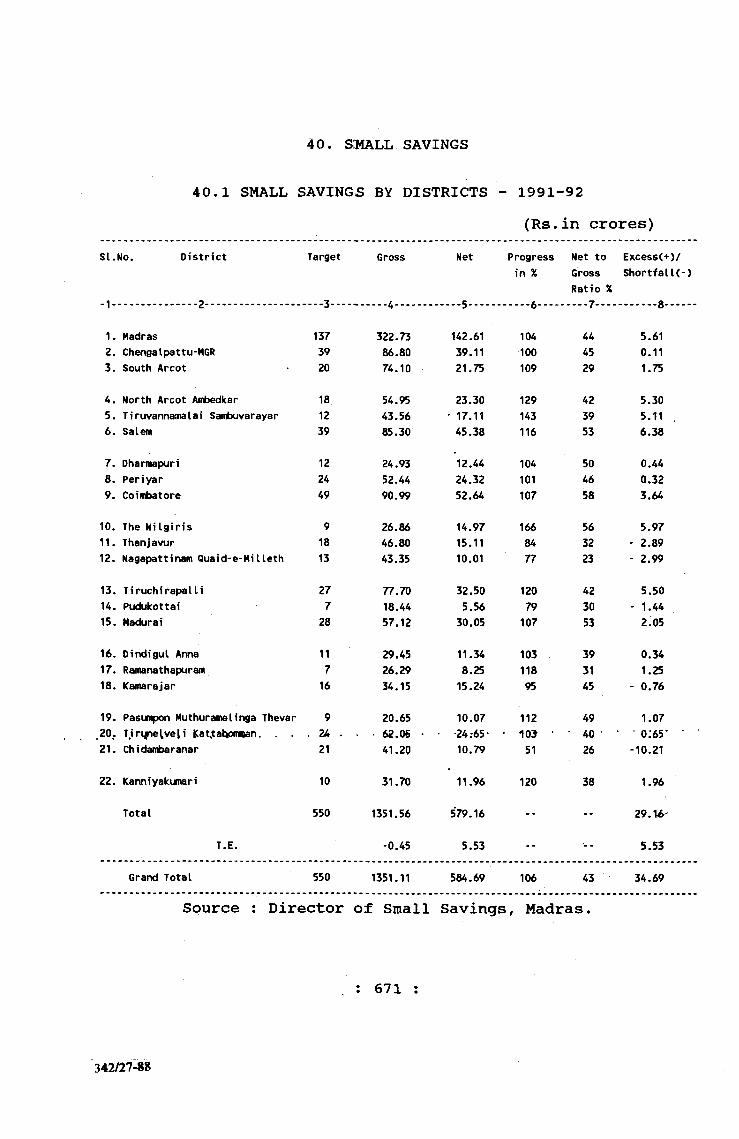
(Rs.in crores)
40. S:MALL SAVINGS
40.1 SMALL SAVINGS BY DISTRICTS - 1991-92
SI.No. D istr ic t Target Gross Net Progress Net to Excess<+)/in % Gross Shortfa ll(-)
1...... ...............2........... ............. - - - - 3 - ..........^....... ...... 5....... ...... 6.......Ratio %
- - - 7 — - ......... 8........
1. Madras 137 322.73 142.61 104 44 5.612. Chengalpattu-MGR 39 86.80 39.11 100 45 0.113. South Arcot 20 74.10 21.75 109 29 1.75
4. North Arcot Ambedkar 18 54.95 23.30 129 42 5.305. Tiruvannamalai Sambuvarayar 12 43.56 ■ 17.11 143 39 5.116. Salem 39 85.30 45.38 116 53 6.38
7. Oharmapuri 12 24.93 12.44 104 50 0.448. Periyar 24 52.44 24.32 101 46 0.329. Coimbatore 49 90.99 52.64 107 58 3.64
10. The N ilg ir is 9 26.86 14.97 166 56 5.9711. Thanjavur 18 46.80 15.11 84 32 - 2.8912. Nagapattinam Quaid-e-Hi Ueth 13 43.35 10.01 77 23 - 2.99
13. Tiruchirapalli 27 77.70 32.50 120 42 5.5014. Pudukottai 7 18.44 5.56 79 30 - 1.4415. Madurai 28 57.12 30.05 107 53 2.05
16. Oindigul Anna 11 29.45 11.34 103 39 0.3417. Ramanathapuram 7 26.29 8.25 118 31 1.2518. Kamarajar 16 34.15 15.24 95 45 - 0.76
19. Pasumpon Muthuramalinga Thevar 9 20.65 10.07 112 49 1.0720. Tirijnelveli |Catjtat|omnian. . . . 24 , 62.05 • -24:65* • 103 • • 40 * • * o:65* ■21. Chidambaranar 21 41.20 10.79 51 26 -10.21
22. Kanniyakumari 10 31.70 11.96 120 38 1.96
Total 550 1351.56 579.16 -- -- 29.1^'
T.E. -0.45 5.53 -- 5.53
Grand Total 550 1351.11 584.69 106 43 34.69
Source ; Director of Small Savings, Madras.
: 671 :
342/27-88
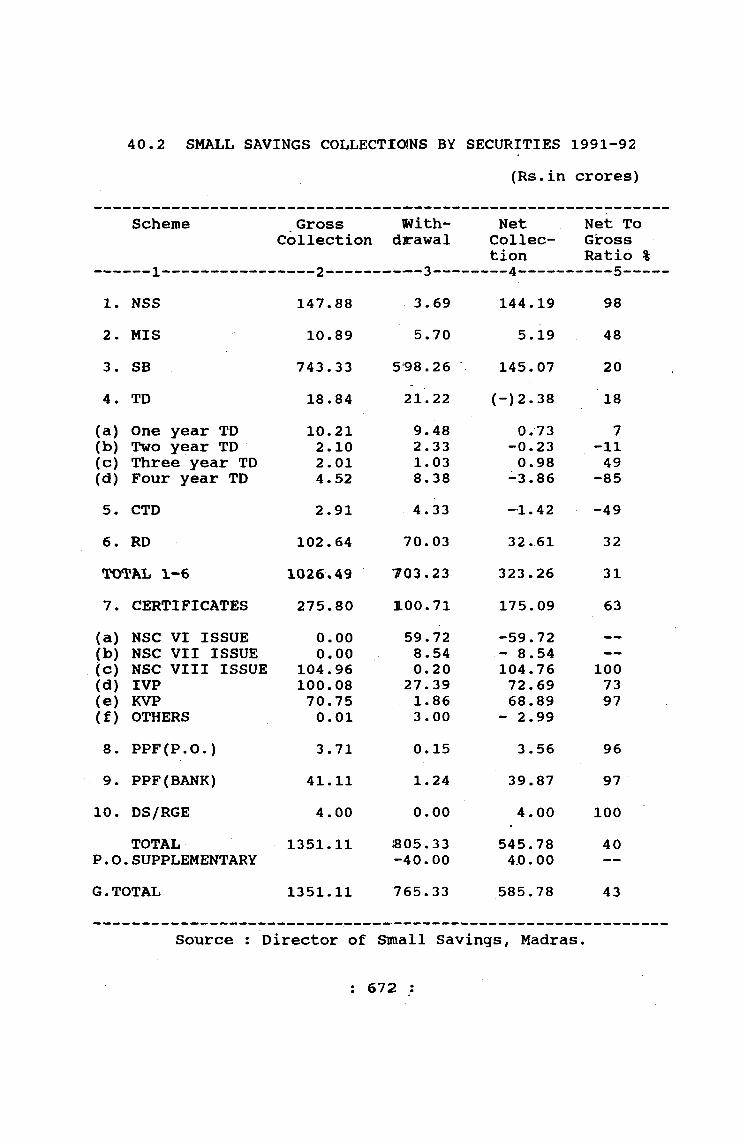
(Rs.in crores)40.2 SMALL SAVINGS COLLECTIOJNS BY SECURITIES 1991-92
Scheme GrossCollection
With-dirawal
NetCollection
Net To Gross Ratio *
--— ---1------------- ----2---- ------ 3---- ----4------ ----51. NSS 147.88 3.69 144.19 982. MIS 10.89 5.70 5.19 483. SB 743.33 598.26 145.07 204. TD 18.84 21.22 (-)2.38 18(a) One year TD 10.21 9.48 0.73 7(b) Two year TD 2.10 2.33 -0.23 -11(c) Three year TD 2.01 1.03 0.98 49(d) Four year TD 4.52 8.38 -3.86 -855. CTD 2.91 4.33 -1.42 -496. RD 102.64 70.03 32.61 32TOTAL 1-6 1026.49 703.23 323.26 317. CERTIFICATES 275.80 100.71 175.09 63
(a) NSC VI ISSUE 0.00 59.72 -59.72 —
(b) NSC VII ISSUE 0.00 8.54 - 8.54 —
(c) NSC VIII ISSUE 104.96 0.20 104.76 100(d) IVP 100.08 27.39 72.69 73(e) KVP 70.75 1.86 68.89 97(f) OTHERS 0.01 3.00 - 2.998. PPF(P.O.) 3.71 0.15 3.56 969. PPF(BANK) 41.11 1.24 39.87 97
10. DS/RGE 4.00 0.00 4.00 100TOTAL 1351.11 805.33 545.78 40
P.O .SUPPLEMENTARY -40.00 4.0.00 —G.TOTAL 1351.11 765.33 585.78 43
Source : Director of Small Savings, Madras
: 672 :
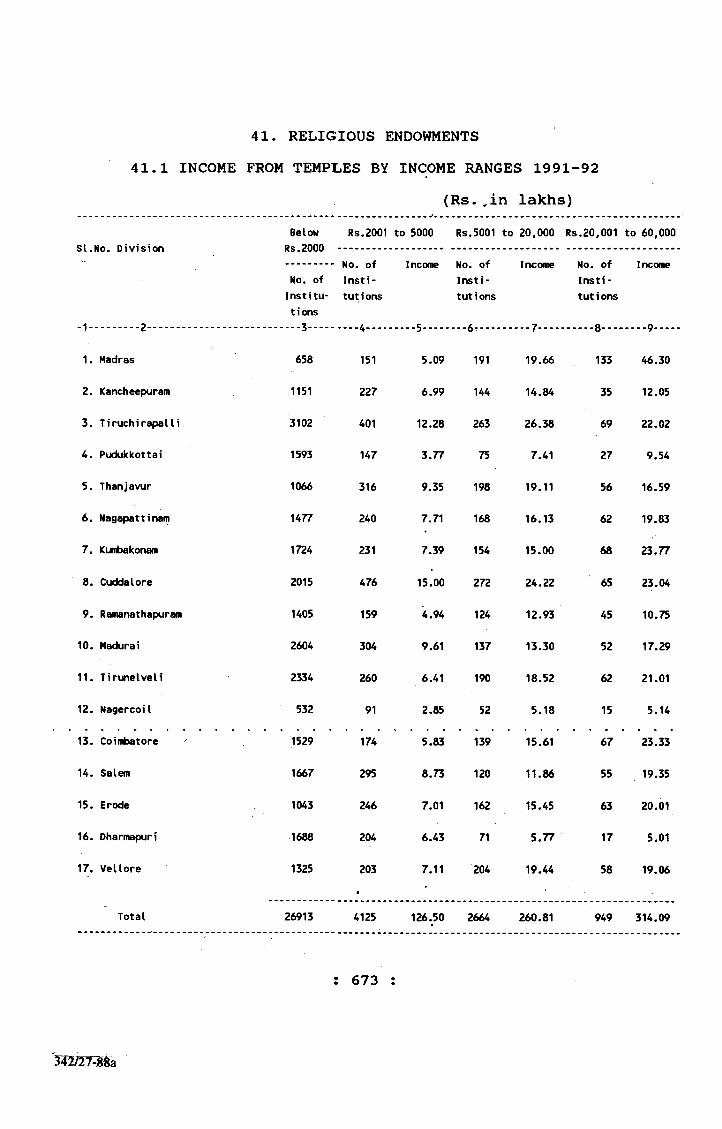
41. RELIGIOUS ENDOWMENTS41.1 INCOME FROM TEMPLES BY INCOME RANGES 1991-92
(Rs.^in lakhs)
SI.No. D ivisionBelow
Rs.2000
No. of Institu- t i ons
Rs.2001 to 5000 Rs.5001 to 20,000 Rs.20,001 to 60,000
No. ofIn s t itutions
Income No. ofIn s t itutions
Income No. ofIn s t i tutions
Income
1. Madras 658 151 5.09 191 19.66 133 46.30
2. Kancheepuram 1151 227 6.99 144 14.84 35 12.05
3. Tiruchirapalli 3102 401 12.28 263 26.38 69 22.02
4. Pudukkottai 1593 147 3.77 75 7.41 27 9.54
5. Thanjavur 1066 316 9.35 198 19.11 56 16.59
6. Nagapattinam 1477 240 7.71 168 16.13 62 19.83
7. Kumbakonam 1724 231 7.39 154 15.00 68 23.77
8. Cuddalore 2015 476 15.00 272 24.22 65 23.04
9. Ramanathapuram 1405 159 4.94 124 12.93 45 10.75
10. Hadurai 2604 304 9.61 137 13.30 52 17.29
11. T iru ie lveli 2334 260 6.41 190 18.52 62 21.01
12. Nagercoil 532 91 2.85 52 5.18 15 5.14
13. Coimbatore 1529 174 5.83 139 15.61 67 23.33
14. Salem 1667 295 8.73 120 11.86 55 19.35
15. Erode 1043 246 7.01 162 15.45 63 20.01
16. Dharmapuri 1688 204 6.43 71 5.77 17 5.01
17. Vellore 1325 203 7.11 204 19.44 58 19.06
Total 26913 4125 126.50 2664 260.81 949 314.09
673 :
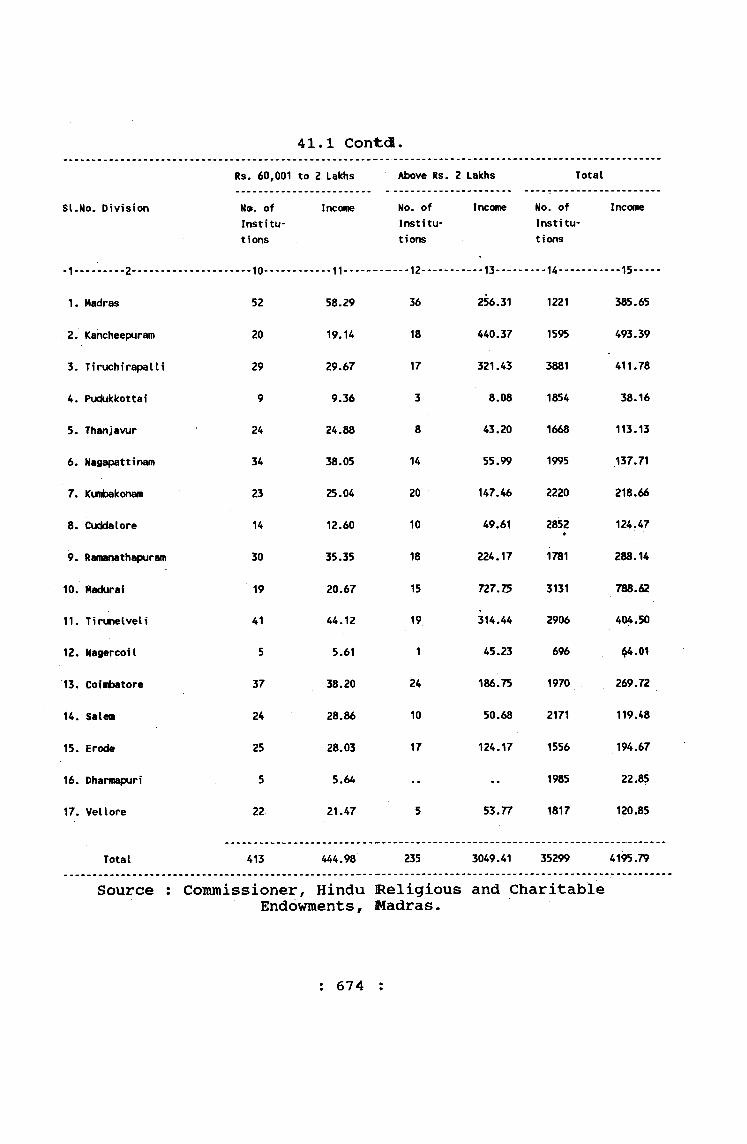
Rs. 60,001 to 2 Lakhs Above Rs. 2 Lakhs Total
SI.No. D ivision ofIn stitu tions
Income No. of In stitu tions
Income No. of In stitu tions
Income
1. Madras 52 58.29 36 256.31 1221 385.65
2. Kancheepuram 20 19.14 18 440.37 1595 493.39
3. Tiruchirapalli 29 29.67 17 321.43 3881 411.78
4. Puckikkottai 9 9.36 3 8.08 1854 38.16
5. Thanjavur 24 24.88 8 43.20 1668 113.13
6. Nagapattinam 34 38.05 14 55.99 1995 137.71
7. Kumbakon«n 23 25.04 20 147.46 2220 218.66
8. Cuddalore 14 12.60 10 49.61 2852 124.47
9. Rai)ianathapur«n 30 35.35 18 224.17 1781 288.14
10. Madurai 19 20.67 15 727.75 3131 788.6?
11. Tirunelveli 41 44.12 19 314.44 2906 404.50
12. Nagercoil 5 5.61 1 45.23 696 ^.01
13. Coimbatore 37 38.20 24 186.75 1970 269.72
14. Salem 24 28.86 10 50.68 2171 119.48
15. Erode 25 28.03 17 124.17 1556 194.67
16. Dharmapuri 5 5.64 •• •• 1985 22.85
17. Vellore 22 21.47 5 53.77 1817 120.85
Total 413 444.98 235 3049.41 35299 4195.79
Source : Commissioner, Hindu Religious and Charitable
: 674 :

(In Rs.)41.2 INCOME FROM MOSQUES BY INCOME RANGES 1991-92
si.No. Name of the
D istr ic ts
Below Rs.1000 Rs. 10101 to Rs.5000 Rs.5001 to Rs.20000 Rs.20001 to
Rs.60000
No. Income No. Income No, Income No. Income
1. Madras 164 78,921 50 2,20,827 63 4,15,929 36 11,51,899
2. Chengalpattu 230 1,89,929 21 1,02,197 19 1,02,397 1 30,197
3. North Arcot Ambedkar & TiruvannamalaiSambuvarayar 175 89.205 92 2,26,770 45 6,00,300 43 14,80,000
4. South Arcot 60 34,210 62 1,85,100 37 3,73,300 11 3,81,000
5. Salem 54 24,926 37 90,327 12 1,63,827 1 37,927
6. Oharmapuri 131 27,749 24 49,748 7 63,827 2 67,721
7. Coimbatore 148 1,04,721 28 88,127 20 2,19,747 7 2,96,921
8. Periyar 209 1,20,211 26 85,987 10 1,16,000 6 1,48,126
9. N ilg ir is -- -- 7 23,369 12 1,45,845 10 3,25,826
10. Trich irapalli 610 70,111 62 67,325 29 2,29,908 8 2,06,126
11. Thanjavur 94 67,836 164 4,96,809 115 13,46,801 50 17,57,397
12. Pudukkottai 16 8,863 20 54,594 18 97,384 5 1,62,600
13. Madurai, Oindigul ‘ Anna'Dists*. 2^7' ■49 ,'693 ‘ 86 1,93,436 26 *1,47,821 15 4,34,793
14. Ramnad, Kamaraj, P.M.D. D ists. 180 67,921 96 2,79,903 44 5,14,926 7 2,19,329
15. JirunelveliV.O.C. 629 59,786 156 3,92,625 73 7,39,782 37 12,70,156
16. Kanyakumari 100 28,126 20 49,629 12 1,04,627 7 1,41,273
: 675 :
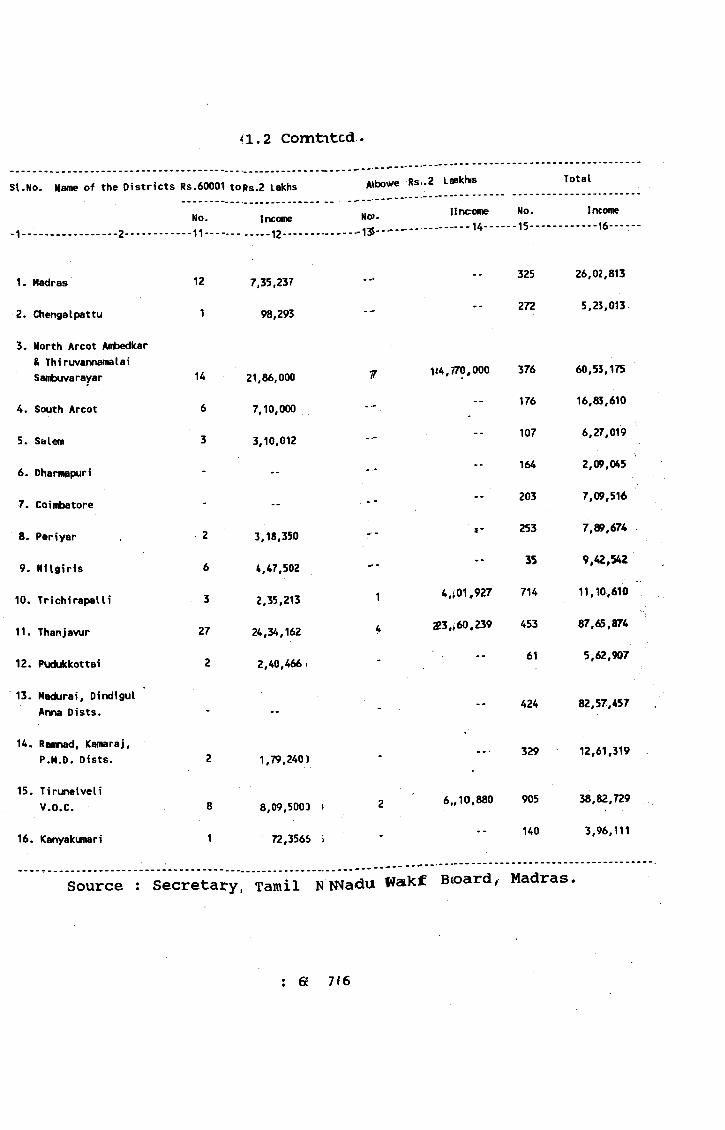
<1.2 Comtitcd .
SI.No. Name of the D istric ts Rs.60001 toRs.2 Lakhs Atbowe Rs,.2 Laakhs
" ho!..... ............n».1 - .........2........n ........12......... IS........... ..... ......... “ •
Madras 12 7,35,237 ' -
2. Chengalpattu 1 98,293 " ” 5,23,013
3. North Arcot Ambedkar& Thiruvannainalai __o ^ 1/ 7 1^4,770,000 376 60,53,175Sambuvarayar 14 21,86,000 ^
4. South Arcot 6 7,10,000 16,83,610
3,10,012 -- --< ni. - - ■■ 2,09,0456. Dharmapun - --
T n - 203 7,09,5167. Coimisatore " ■*
8 . P . r , y . r 2 3 .1 . .3 5 0 - -
9 . m i a i r i s 6 4 ,4 7 ,5 0 2 " ' ' * *
10. TMchirapaUi 3 2,35,213 ’
I t . T h a n ia v u r 2 7 2 4 ,3 4 ,1 6 2 A
1 2 . P u d u k k o tta i 2 2 ,4 0 ,4 6 6 . ■ " 5 , 6 2 . « 7
13. H«lurai, DindigulAnna D i s t s . ■ -
16. Kanyakumari 1 72,3566 > ’ " 3,96,111
Source : Secretary, Tamil N IWadu Wakf Bcoard, Madras.
: 6£ 7 ( 6

42, REC3CICBREATI0N 42.11 TTitlBiEEATRES :9Sl-92
SI.No. Type Number
1. Permanent Theatr^e~ a) A/c 128
b) Non A/c 1 3 1 8
2. Open Air Theatre 10
3. Semi Permanent Tiheatre 254
4. Touring Talkies 1068
' 2778
s o u r c e : chief E le c tr ic e a - a ll insp ector , M a d r a s .
Procesaimg %nd Priniin? atComputer Centre, Depairtment of : f SStatistics, MADRAS-600 006
ijrHAHY & DOCUMEmT'Oiy CEtim . Institute of Ed;-' s'-tjaal
p^nning-and Admuj;»c; tion. Aurobindo M i i|,
' N>w Oelhi-110016r.vX; No ........
....- - U00&864
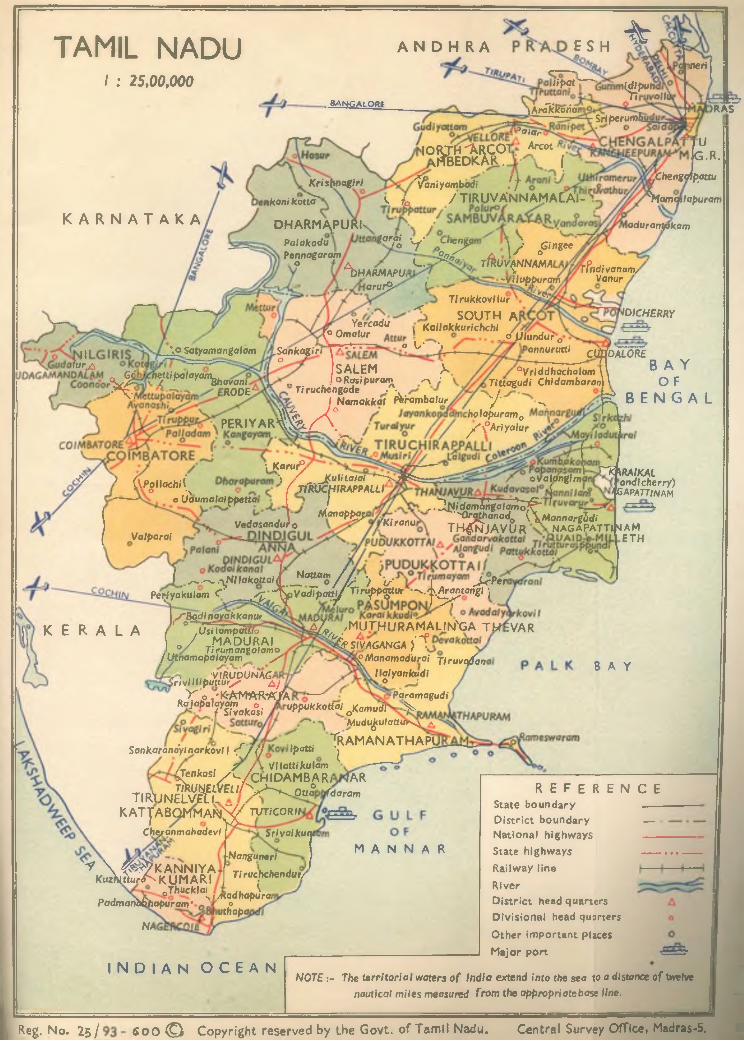
TAMIL N A D UI : 25,00,000
A N D H R A ES H %BANGALOftg
l ip a t
jArAJcoriar
il^puna l i i
SH perum l
inert
>RAS
lO l^H ^RCO Iir^EDKAR..
ikoni
K ris im a g ifi
k b t^K A R N A T A K A
^aiar Arcot
(l/a n iy a m b o d i ! f
/ T I R U V A N N A h l A C A l - '
U IG.R.
DHARMA^PURI>Palakodu
fs fo / I l K U V A N N A r
fChengdlpatw
^ a m a la p u r a m
adurantpkam
Pennagaram o ‘
i a r a { • •ro Y
^ H A R M A P U l arur^
L. C ^ A V' o®"‘“TmVA
Yercadu
I 1 t'^NNAMA i
I ■ -v« l uppvram
T l r u k k o v f l u r ^ ^ ^ 'y<
rfhd ivanam / Vanur
lilur^: > l
*.o Satyam angalam
nettipalayam „.I BhavamRODE'
,S a n k a g ino
SOUTH A ,r- _ , , K allakk u rlch ch I(o O m a lu r _ o 'j / /u n d u ?
■y. *. . o t - ' *1
^DICHERRYo
annurutti CUffDALORE°V rid d h a ch a lam
Tittag u d i C hidam baran
y- - .holaparam ^
SALEM >> . oRcfsipurom ^ ;
Tiruchengode • \/ N a m a k k a l n h a m b a lu r
nRIYAR-ikA:^ / M r
• i - / ) A n - . . — .-,f‘ ■) / K uli t a i a T ’^ ^ ^ ^ ----------o V a lan g lm
B A Y O F
^ B E N G A L
(X P g llach /l. o L
\Koru^. . /.v 'K d im
o U a u m a la i^ t t a -
Vedasanduro
ff R A P P A L U
Mmapp^ ^KiranuV a lp a ra i
,. 3 U y l d S i 5 o ^ ^'< ira ^ a n a d ^ \ \M a n n a r g Z d i
T H ^ J A V U R N A G A P A T T IN A M
KlARAIKAL on d lch erry )
4GAPATTINAM
K E R A L A
I . . NllakoUal( ^°^^/// > Vrlyaku iam <T ____^ ' ^ V a d i p o u j / T i r i ^ M u r ‘ - . . ^ ^ , ^ t a n g lPei^fyakulam
y ^dinoyakkanur .U siTom paw o
„ y MADURAITirum angolam o / U tnam apalayam ^
-■ ,„ -^ 'V IR U D U N A C > n v i l h p u i t u r ^ £ ^ f
„'ro,'K'AMARV>r/ARojo aloycini o i S ivakasi
J<Pepipoau ---Y-rp”— t*- ' i
^ ,m u t h u r a m a l in 'g a t w :var
'^^^s ivA G A N G A ) ' " f^ M a n a m a d 'u ra i T l r u v t ^ n
l la ly a n k u d lo :
uppukkotta i ^KomudltP a ^ r ta g u d i
Sankarandyl narkovf I • f / { J IpaWV ila tt ik u la m
'• Mudu^ufottUTs^ATr a m a n a th a p i
, Z / V Vilatt/KUiom ^^"'"^^XVCHIDAMBAR/
- r ov. T l k U b ! E L V E u h ^ y > ^ o t t ?
t ir\jn e lv S .lKATTABQHMAN;^ n J T ic o R if
ETH
B A Y
JAR fd aram
C hvon m ah adev i
'y \ <$^KANNIYA KuzhitturiNKUMARI
QThucklaiPadtnanhShapuram *
Srivalkuni
•Nanguneri M A N N A R
T i ruchchendur/{^^iMadhopurai
Outhapa
N/
I N D I A N O C E A N
r e f e r e n c eS ta te b o u n d a ry -------D is t r ic t b o u n d a ry — ■N a t io n a l h ig h w a y s -------S ta te h ig h w a y s -------R a ilw a y lin e
R iv e rD is t r ic t head q u a rte rs D iv is io n a l head q u a rte rs
O th e r im p o r ta n t places M a jo r p o r t
N O T E : - The te r r i to r ia l w aters o f In d ia extend Into the sea to a distance o f ttvelve nautica l m ites measured fro m the ap p ro p ria te base line. i
Reg. No. Isl 600 © Copyright reserved by the Govt, of Tamil Nadu. Central Survey Office, Madras-5. ■