STATISTICAL ABSTRACT - National Institute of Educational ...
255
STATISTICAL ABSTRACT TRIPURA 1992 ISSUED BY DIRECTORATE OF STATISTICS GOVERNMENT OF TRIPURA AGARTALA NIEPA DC D08508 PRICE Rs. 296*00
-
Upload
khangminh22 -
Category
Documents
-
view
2 -
download
0
Transcript of STATISTICAL ABSTRACT - National Institute of Educational ...

STATISTICAL ABSTRACT
TRIPURA
1992
IS S U E D B Y
DIRECTORATE OF STATISTICS GOVERNMENT OF TRIPURA
AGARTALA
NIEPA DC
D08508PRICE Rs. 296*00

-..iaA'Jrlitv Uiiv -''I Matioaa! [as t i tu te of EducacioQtit Plann-Mg s a d Adm inistration.17-B, Sri Aurobindo Marg,New Delhi-110016 ^ ^ § 5 ^ 8" DOC, N o ...... '

PREFACE
T h e‘STATISTICAL ABSTRACT—TRIPURA- 1992, which is the eighteenth issue in the seres is intended to present a comprehensive statistical picture of the Socio-Economic aspcctJof the state with available date upto 1991/1991-92.
The data presented in most of the Tables has been disaggregated at the District levels. Sources of the data have been incorporated in appropriate places.
The 4ata presented have been collected from various Departments of the state and the Centra Govt., Public sector undertakings. The Directorate of Statistics gratefully acknO\\ledges the Co-operation extended by the various Department/Organisations in bringin* out the publication.
Suggjstions for improvement o f the publication are welcome.
AGARTALA. A. K. Deb7th September 1993. Director o f Statistics.
Tripura.

STATISTICAL ABSTRACT TRIPURA-1992
CONTENTS
S E C T I O N /T A B L E
1. AREA AND POPULATION.
1.1 Area aid Rural/Urban population by sex population (Census 1991)
■ 1.2 Schediled Castes Population According to Population (Census 1991)
1.3 Schediled Tribes Population According to Population (Census 1991)1.4 Decadil variation of Population for the period from 1951-1991
1.5 Number of Villages and Towns in Tripura I98I and 1991
1.6 Villages classified by population Census- I99I1.7 PopuUtion of Cities and Towns in I 98I and I99I
1.8 All workers in Rural and Urban in 1991.
1.9 Workers and Non workers by Sex in I99I .
1.10 Workers of Main Industrial Categories in I99I.1.11 Workers by Age Group and Sex -1981
1.12 Popuhtion by Religion - 1981.
1.13 Salient Features of Population by States - 1991.
1.14 Popula:ion Projection of Tripura (1981-2001).
1.15 Literacy Rate of Tripura - 1991.
1.16 Literacy Rate of Scheduled Castes -1981.
1.17 Literacy Rate of Scheduled Tribes - 1981.
2. ENVIRONMENT STATISTICS.
1 Monthly Quinquennial Average Rainfall, 1991.
2.2 Average annual Rainfall in different Years.
2.3 Temperature recorded at Agartala (Airport)
b.
3. v it a l STATISTICS.
3.1 Estimated Annual live Birth Rate and Death Rates in Tripura.3.2 Number of Deaths by principal Causes.
4. HOUSING.
4.1 Number of census houses Classified by use according to Population Census - 1981.
4.2 Households by size number of room occupied and tenure status af houses. According to Population Census - 1981.
4.3 Number of occupied Residential houses and Persc ns per house in 1981.
4.4 Distribution of Households by Predominent Material of roof and wall of Census Houses occupied by them in Tripura.
4.5 Distribution of household by predominent Material of roof and wall o f houses occupied by them by District.
PAGE NO,
1 2 2
3
34
5
78
9
9
1115
16
17
18
19
20
21
2223
24
26
27
28
32
33
35
36
37
3g

11
4.6 Houseless and Institutional Population - 1981, 41
4.7 Number of Buildings authorise 1 for construction and buildings complited andfloor area likely to the added by type of building in the private sector at Agartala. 42
4.8 Number of dwelling in residential and non-resiJential cum-residential buildingauthorised for construction in the Private Sector at Agartala. 45
5. EDUCATION. 46
5.1' Number of Recognised Institutions by Type in Tripura. 47
5.2 Number of Education Institutions by Type in Tripura. 47
5.3 Number of Education Institutions exclusively for girls by Type in Tripura (1990-91). 48
5.4 Classification of School in Tripura (1999-91). 48
5.5. Number of Teachers Classification by Department of Tripura. 49
5.6 Number of student classified by Department in Tripura. 51
5.7 NuATiber of Scheduled Caste Student by Department in Tripura.
5.8 Numbr ofr Scheduled Tribes student by Department in Tripura. 53
5.9 Intake in Degree Courses in Engineering by Department in Tripura. 54
5.10 Expenditure Incurred on Education Institution by Type in Tripura. 54
5.11 Expenditure Incurred on Education by source in Tripura. 55
5.12 Year wise Teacher pupil Ratio by stage. 5 5
5.13 Statement showing the position of public Libraries in Tripura. 56
6 . , MASS COMMUNICATION. 57
6.1 ..Number of Newspaper and Periodicals published in Tripura. 58
6.2 Number of Printing Presses (including Govt. Press) in Tripura (By District) 58
7. HEALTH. ' 597.1 Number of Medical (Allopathic) Institutions in Tripura. 60
7.2 Number of Ayurvedic unami and Homeopathic Institutions in Tripura. 61 . >
7.3 Number of patients treated in all Types of Medical Institutions in Tripura. 62
7.4 Number of Indoor and out-door patients treated by disease in Govt.,Institutions in Tripura. 62 ~
7.5 Number of beds in all type of Medical Institutions in Tripura. 66
7.6 k-egistered Medical and para Medical Personal in Tripura. 67
8 . FAMILY WELFARE. 68
8.1 ^um bcr of Family-Welfare Clinics/Centre in Tripura. 69
8.2 Famiiy-Welfare Programmes in Tripura. 69
9. SOCIAL-WELFARE SERVICE. 70
9.1 Loans and grants disbursed to Economically weaker sections by purpose andspurse. 71
10. SOCIAL s e c u r it y AND SOCIAL DEFENCE (POLICE CRIMES AND%UDHARGHARS). 74 ^
10.1 JSiumber of Police Stations and Police Posts. 75
10.2 Strength of Civil-Police. 76 .
SECTION/TABLE PA(GEE NO.

S«tioi/Table Page No.10.3 In’idence of Crimes
1©.4 Jivenile deliquents, apprehended congnizable Crimes Juvenile deliquency. 781(0.5 Ctnvicts by age, Sox and Literacy.
11. ST4TE INCOME. gO
11.1 Stite and per capita Domestic product at Factor Cost and their Indices inTiipura. gj
111.2 N«t state Domestic product by industry of origin at Current prices. 82
Ul.3 Ntt state Domestic product by industry of origin at Constant prices. 84
11.4 Pe- Capita net state domestic product at Constant Prices. 85
12. AGRICULTURE.12.1 Laid used Classification. gg
12.2 Aisa production and average yield per hectare of important crops in different district. 90
12.3 Aiea and Average yie\d per hector of H. Y.V. crops. 9 4
12.4 Nimber of operational holdings by size group 1990-91 (Provisional). 95
12.5 Ntmber and area of holdings by tenure and by size group 1985-86. 95
12.6 Ccasumption of Cnemical Fertilizers in Tripura. 9^
12..7 - Agricultural machinery aud implements in Tripura 1987. 98
12;.8 Nimber of Plantation area and production of Tea, number of persons employed in TeaPlintation, jOO
12;.9 Ana and Production of fruits and Plantation crops in Tripura. lOi
13.. IRRIGATION. 102
13..1 ' Irrsated area by Source, IO3
13..2 Irrgated area under different crops. JO4
13..3 Gross area irrigated and gross croped area by District in Tripura (1990-91) 105
14- ANIMAL HUSBANDRY AND DAIRING. 106
14..1 Nunber of livestock and poultry. IO7
14^2 Infrastructure facilities in animal husbandry in Tripura. IO9
14-.3 Works done in Veterinary Institutions. 110
14..4 Number of Milk Plants and Milkchiling Centre and their capacity. 112
15.. FORESTRY. I I 3
15..1 Arja under Forests Classified by ownership. I I 4
15..2 Qxantity and value of major Forests produce. 115
15..3 Forest area protected from Fire and Cattle grazing. 116
I5.i4 Plantation of important specise by Forest Department. 117
15..5 Revenue from and Expenditure on Forest in Tripura. 118
16.. FISHERIES. 119
16..1 Fisheries in Tripura. 120
17.. RURAL DEVELOPMENT AND CO-OPERATION. I 2l
17.U Number of Bloek, area villages Covered and population Served. 122
Ill

IV
17.2 Government Expenditure on Rural Development by major heads. 1123 317.3 Selected Statistics of all Co-Operative Societies. B24417.4 Co-Operative Societies and banks Classified by Type. 11266
17.5 Selected Statistics of primary Agricultural credit Service Societies. 11277
17.6 Seleeted Statistics of primary non Agricultural credit Societies. 11288
17.7 Selected Statistics of primary Land Mortgage Banks. 1,29?
17-8 Selected Statistics of Central Co-Operative Banks. U300
17.9 Selected Statistics of Apex state MarketiDg Federation. 11322
17.10 Selected Statistics of Central Consun'er stores. 11333
17.11 Selected Statistics of Labour Construction Societies. 11344
17.12 Selected Statistics of Housing Co-Operative Societies. 11355
17.13 Selceted Statistics of Dairy and Milk supply Co-Opetaiive Soeieiies 1 36)17.14 Selected Statistics of Women Co-Operative Societies in Tripura. 11377
17.15 Selected Statistics of Indus'rial Co-Operative Societies in Tripura. 1388
18. MANUFACTURING. 139 •
18.1 Number of Registered Factories. 11403
18.2 Selected charaeteristie* of Factory in Tripura. 1411
18.3 Amount of grant and loans disbursed to various Industries by Khadi and village IndustriesBoard (Series). 1441
18.4 Production and Employment of Manufacturing Industries in Tripura. 1455
19. ELECTRICITY AND POWER. I 46S
19.1 Installed capacity generation and Consumption of Electricity in Tripura. 1477
19.2 Kilowat hours to ultimate consumers by publie Electricity undertaking 148J
12.3 Number of Towns and villages Electrified in Tripura. I 49)
20. TRADE. I 5O)
20.1 Inward and outward consignments of Tripura by Selected commodies by Rail pnd River duringthe year 1989—90 and 1990—91. 1511
21. TRANSPORT. 1555
21.1 Number of motor Vehicles registered by district in the state. 156S
21.2 Number of accidents by type of vehicles involved. 1577
21.3 (A) Progress of Tripura Road Transport Corporation passenger wing. 158?
21.3 (B) Progress of Tripura Road Transport Corporation goods wing. 159>
21.4 Road Length classfied by category. 160)
21.5 Railway route Length. 1611
22. MARKETING AND STORAGE. I62i
22.1 Number of Regulated market by district in Tripura, 163>
22.2 Number and Capacity of storage unit in Tripura. 1641
22.3 Number and capacity of state owned war )house in Tripura. 165>22.4 Number of Fair Price shops by owership in Tripura. 16(6
SECTION/TABLE PAGE NIO.>.

23 c o m m u n ic a t i o n . 166
2?.l Numbet of Postal Institutions. 167
24 TOURISM. 168
14.1 Number of Tourist spots and tounsts visiting them by District. 169
25. LABOUR AND EMPLOYMENT. 170
25.1 Employment in shops and commercial Establishment at Agartala. (cohered by theshops and Commercial Establishment Act. 171
25.2 Number of Registered working Factories and average daily workers Employed
(Public Sector) in the year 1989 to 1991. 172
25.3 Number of Registered Working Factories and average daily workers Factories andaverage daily workers employed (private sector) in the year ^989 to I 99I. 173
25.4 Total No. of Government Employees. 175
25.5 Number of Applicants on Live Register of Exchange according to broad Occupationgroup. 176
,25.6 Number of Applicants Placed in Employment through Employment Exchangeaccording to the nature of service. 177
25 7 Number of posts Advertised and candidates Recommended by the the state publicservice commission. 178
25.8 Industrial Injuries in Tripura in the Registered Factories. 178
25-9 Number of strikes Lockout (Industry wise) in Registered Factories in Tripura duringthe year 1988 to 1991. 179
25.1( Number of Female Workers Employed in Registered Factories and MaternityBenifit given during ihe year 1989. 181
25.1 Distribution of Trade Unions According to their Membership size in Tripura. 182
25.12 Employment in Agartala Municipality. 183
25.1; Employment in Tea Plantation. 183
26. BANKING AND INSURANCE. 184
26.1 Bank wise Branches in Tripura as on M arch‘92. 186
26.2 Banking-group and population group wise distribution of number of offices aggregatesdeposits and gross Bank credit- 187
26.3 Percentage distribution of out standing credit of Scheduled Comiiiercial Banks ofTripura by occupation. 189
26.4 Number of Polices and sum Assured Life Insurance in Tripura. 190
27. PUBLIC FINANCE.
27.1 Total Revenue of Tripura Government, 191
27.2 Expenditure met from Revenue Account of Government of Tripura. 193
27.3 Capital budget of Government of Tripura. 195
27.4 Overall Budgetory poisition. 195
27.5 Percentage distribution of Tripura Government Expenditure Functional Classification. 196
SECTION/TABLE PAGE NO.
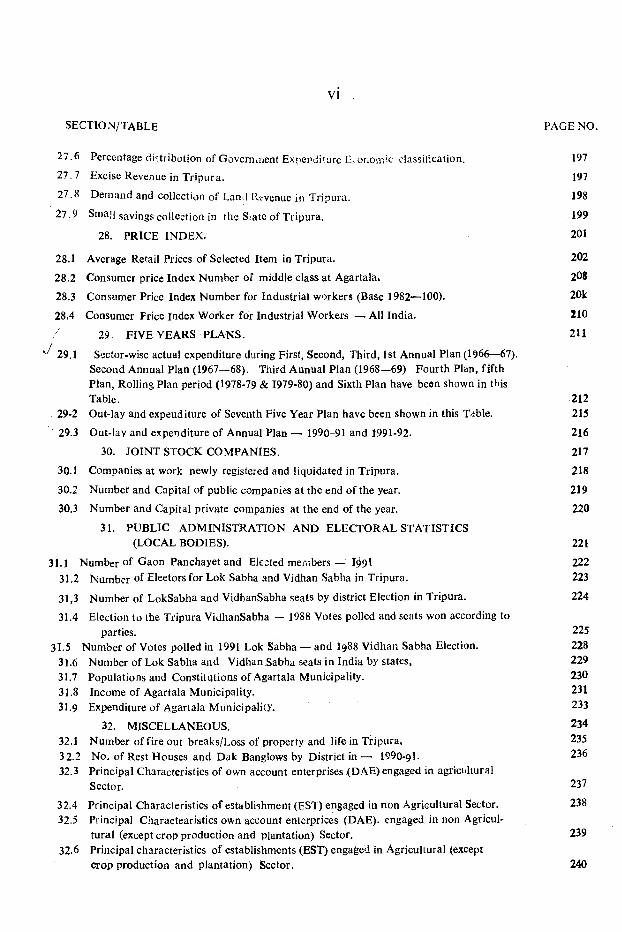
VI
SECTION/TABLE PAGE NO.
J
27.6 Percentage distribution of Governaicnt Expenditure E-onomic classification.
27.7 Excise Revenue in Tripura.
27.8 Demand and collection of Lanil Ri-venue in Tripura.
27.9 Smaji savings collection in the Siate of Tripura.
28. PRICE INDEX.
28.1 Average Retail Prices of Selected Itern in Tripura.
28.2 Consumer price Index Number ol middle class at Agartala^
28.3 Consumer Price Index Number for Industrial workers (Base 1982—100).
28.4 Consumer Price Index Worker for Industrial Workers — All India.
29. FIVE YEARS PLANS.
29.1 Sector-wise actual expenditure during First, Second, Third, 1st Annual Plan (1966—67). Second Annual Plan (1967—68). Third Annual Plan (1968—69) Fourth Plan, fifth Plan, Rolling Plan period (1978-79 & 1979-80) and Sixth Plan have been shown in this Table.
29-2 Out-lay and expeuditure of Seventh Five Year Plan have been shown in this T-ible,
' 29.3 Out-lay and expenditure of Annual Plan — 1990-91 and 1991-92.
30. JOINT STOCK COMPANIES.
30.1 Companies at work newly registered and liquidated in Tripura.
30.2 Number and Capital of public companies at the end of the year.
30.3 Number and Capital private companies at the end of the year.
31. PUBLIC ADMINISTRATION AND ELECTORAL STATISTICS(LOCAL BODIES).
31.1 Number of Gaon Panchayetand Elected mernbers — I99I31.2 Number of Eleetors for Lok Sabha and Vidhan Sabha in Tripura.
3] ,3 Number of LokSabha and VidhanSabha seats by district Election in Tripura.
31.4 Election to the Tripura VidhanSabha — 1988 Votes polled and seats won according toparties.
31.5 Number of Votes polled in 1991 Lok Sabha — and I988 Vidhan Sabha Election.31.6 Number of Lok Sabha and Vidhan Sabha seats in India by states,31.7 Populations and Constitutions of Agartala Municipality.31.8 Income of Agartala Municipality.31.9 Expenditure of Agartala Municipality.
32. MISCELLANEOUS.32.1 Number of fire out breaks/Loss of property and life in Tripura.32.2 No. of Rest Houses and Dak Banglows by District in — 1990-91.32.3 Principal Characteristics of own account enterprises (DAE) engaged in agriciiltural
Sector.32.4 Principal Characteristics of establishment (EST) engaged in non Agricultural Sector.32.5 Principal Charaetearistics own account entcrprices (DAE), engaged in non Agricul
tural (except crop production and plantation) Sector,32.6 Principal characteristics of establishments (EST) engaged in Agricultural (except
crop production and plantation) Sector.
197
197
198
,199
201
202
208
20k210
211
212215
216
217
218
219
220
221
222223
224
225 228229230231233234235236
237
238
239
240

ECONOMIC CLASSIFICATION OF POPULATION 1991 CENSUS
MOJI-WORKSRS 6 6 .8 7 %
MAIN WORKERS 2 9 .0 9 %
MMGINAL W0RKSR5 2 .0 4 %
DISTRIBUTION OF MAIN WORKERS
COMSTRUCTIOlf 1»47 %
OTHER SERVICES 2 1 ,6 7 %
TRANSPORT, STORRAGE & _ COMMUNICA- TlOIf, 2 .7 7 X
TRADE & COMMERCE
7 .6 8 %
MAJfUrACTUIIMG«» PROCESSING!, SERVICZNG & REPAIRS. 4 .9 4 %
CUI/TIVATORS 3 8 .0 9 %
AGRICULTURAL Lj^O U R S 2 3 .3 8 %

1. AREA AND POPULATION
This section deals with the population of Tripura for the period H951 to 199J asjper recommendation of Report o f the working group for the Standardiaatioii ,of “ Statistical Abstract”, All the tables have been Compiled from Census ^publication, NIC Tripura state unit.
TABLE NO-1. 1 Area and Rural/Urban population by sex population Cemus (1991)
TABLE NO-1. 2 Scheduled Caste population According to population Cecasus 1991.
TABLE NO-L 3 Scheduled Tribes population According to Population Census 1991,
TABLE NO-1. 4 Decadal variation o f population for the period 1951-;199!)..
TABLE NO-1. 5 Number of Revenue Villages and Towns in Tripura 198Land 1991.
TABLE NO-1.6 Village classified by populationin 1991 Census.
TABLE NO-1. 7 Population of Cities and Towns in 1981 and 1991.
TABLE NO-1. 8 Main Workers, Marginal Workers and Non Workers Rural and 1Uf4)an Areas in 1;991.
TABLE NO-1. 9 Workers and Non-Workers by sex in 1991.
TABLE N O -1,10 Workers by number of Main Industrial categories in 19ftl.
TABLE NO-1. 11 Workers by Age groups and sex 1981.
TABLE NO-1. 12 Population by Religion-1981.
TABLE N O -1.13 Salient Features of Population by States— 1991.
TABLE NO-I. 14 Population Projections (00) by Sex as on 1st March, 19^1-2001, Tiipura.
TABLE NO-1. 15 Literacy rate according to population Census 1991.
TABLE NO-1. 16 Literacy rate of Scheduled Caste—1981.
TABLE NO-1. 17 Literacy rate of Scheduled Tribes— 1981.

1.1 AREA AND RURAL/URBAN POPULATION BY SEX POPULATION CENSUS 1991 (POPULATION CENSUS 1991)
I. AREA AND POPULATION
District/Sub-Division
Area (Sq. Km,)
Provisional
P O P U L A T I O N
Person
Rural
Male Female Person
Urban
Male Female Person
Total
Male Female
Density per ,
Sq. Km.10 11 12
WEST TRIPURA 3033.00 977957 504619 473338 315904 160957 154947 1293861 665576 628285 427Sadar 1549.94 579112 300421 278691 267548 135959 131589 846660 436380 410280 546Khowai 1016.02 232399 118844 113555 40220 20763 19457 272619 139607 133012 268Sonamura 481.82 166446 • 85354 18092 8136 4235 3901 174582 89589 84993 362
NORTH TRIPURA 3544.00 636326 328322 308004 61004 31366 29638 697330 359688 337642 197Dharmanagar 1602.57 274071 141374 132697 25897 13259 12638 299968 154633 145335 187Kailashahar 1345.78 223320 115068 108252 30807 15856 14951 254127 130924 123203 189Kama! pur 604.91 138935 71880 67055 4300 2251 2049 143235 74131 69104 237
SOUTH TRIPURA 3909.00 721201 369588 351613 44813 23078 21735' 766014 392666 373348 196Udaipur 654.84 191434 98056 93378 18223 9276 8947 209657 107332 102325 320AMARPUR 810.63 149329 75845 73484 8550 4478 4072 157879 80323 77556 195Gandachhera 902.40 48914 25170 23744 0 0 0 48914 25170 23744 54Belonia 1013.99 217461 112125 105336 13274 6792 6482 230735 118917 111818 228Subroom 548.43 114063 58392 55671 4766 2532 2234 118829 60924 57905 217
TRIPURA 10486.00 2335484 1202529 1132955 421721 215401 206320 2757205 1417930 1339275 263
.'2Source :—1991 Census data (Nic)
SCHEDULED CASTES POPULATION ACCORDING TO POPULATION CENSUS 1991.to
District/Sub-Division
Scheduled Castes
Rural Urban Total
Scheduled - Castes as percentage
Person Male Female Person Male Female Person Male9 -
Female- iuiai
Population1 2 3 4 5 6 7 8 10 11
1. WEST TRIPURA 183,135 94232 88903 57,066 29086 27980 240,201 123318 116883 18.56Sadar 102,685 52950 49735 45,384 23067 22317 148,069 76017 72052 17.49Khowai 42,069 21565 20504 10,199 5257 4942 52,268 26822 25446 19.17Sonamura 38,381 19717 18664 1,483 762 72 i 39,864 20479 19385 22.832. NORTH TRIPURA 86,853 44659 42194 6,976 3551 3425 9,3829 48210 45619 13.46 —Dharmanagar 24,336 12484 11852 1,437 726 7111 25,773 13210 12563 8.59Kailashahar 28,265 14586 13679 5,184 2636 2548 33,449 m i l 16227 13.16Kamalour 34,252 17589 16663 355 189 166 34,607 17778 16829 24.163. SOUTH TRIPURA 109,676 56188 53488 7,410 3800 3610 117,086 59988 ■ 57098 1 5 .2 9 ^Udaipur 40,404 20610 19794 2,883 14-47 1436 43,287 22057 21230 20.65Amarpur 15,553 8038 7515 1,959 1021 938 17,512 9059 8453 11.09Gandachhara 3,983 2067 1916 3,983 2067 1916 8.14Belonia 35,381 18047 17334 1,668 '873 ■795 37,049 1«920 18129 16.06Sabroom 14,355 J426 6929 900 459 441 15,255 7885 7370 12.84TOTAL TRIPURA : 379,664 195379 1845S5 71,452 36437 35015 451,116 231516 219600 16.36
Source 1991 Census Data TN I C)

1. K r e a . a n d p o p u l a t i o n .1.3 bCHbUULED TKTBES POPULATION ACCORDING TO POPULATION CENSUS 1991.
District/ Sub-Di\ ision
1. WEST TRIPURASadarKhowaiSonamura
2. NORTH TRIPURADharmanagarKailashaharKamalpur
3. SOUTH TRIPURAUdaipurAmarpv\rGandachharaBeloniaSabroomTOTAL TRIPURA
Scheduled Tribes
Rural ^Urban Total
134,740186,732108,25219,756
195,88370,26583,60042,018
328,64151,315
112,84840,22761,46162,790
839,264
159804 154936 11,105 5750 535594754 91978 9,720 4946 477454951 53301 1,308 755 55310099 9657 77 49 28
100401 954S2 2,092 1195 89736149 34116 358 234 12442697 40903 1,601 870 73121555 20463 183 91 42
166536 162105 884 539 34525712 25603 308 167 14156834 56014 253 159 9420553 1967431375 30086 75 47 '2832062 30728 248 166 82
426741 412523 14,081 7484 6597
325,845 196,452 109,560 19,833
- 197,97570.623 85,201 42,151
^29 ,52551.623
113,10140,22761,53663,038
165554997005570610148
101596363834356721646
1670752587956993205533142232228
16029196752538549685
96379342404163420505
16245025744561081967430,11430810
Scheduled Tribes as
Percentage of Total Population
K25.18' 23.20 40.19 11.36 28.39' 23.54 33.53 29.43 43.02* 24.62 71.64 82 24 26.67 53.05
'853,345 434225 419120 30.95 __Source :—1991 Census Data (N. I. C)
1. AREA AND POPULATION.
District/Sub-Di\ ision1
1951(A)
1. WEST TRIPURA 3,23,520Sadar 2,23,416Khowai 55,560Sonamura 44,544
2. NORTH TRIPURA 1,71,541Dharmanagar 82,545Kailashahar .58,624Kanuilpur 30,372
3. SOUTH TRIPURA 1,50,646Udaipur 58,477Amarpur 28,280Gandachhara
40‘209BeloniaSabroom 23,680
1.4 DECADAL VARIATION OF POPULATION.
1961Population
1971
5,73,9933,66,0761,29,948
77,9692,93,3491,27,5481,04,126
61,6752,74,663
90,07456,365
84',82743,397
7, SI,605 4,7:,729 1,77,999 1,00,877 4,05,009 1,75,393 1,41,181
88,435 3,99,728 1,24,207
78,453
1,38'134 58,934
91815-
^7o,^526,30,9582,11,8881,33,426
5,41.2482,29,4831,90,7871,20,9785,35,5581,59,9731,13,431
1,82',S3679,318
1991
1,293,861846,660272,619174,582
697,330299,968254,127143,235766,014209,657157,87948,914
230,735118,829
Decadal Variation of Population 1951-61 1961-71 1971-81
' 2,50,473 1,42,660
74,3S8 33,425
1,21,808 45,003 45,502 31,303
1,24,017 31,597 28,0S5
44,61819.717
TOTAL ; TRIPUP.-A 6,45,707 11,42,005 15,56,342 20,53,058 2,757,205___ 4,96,298
1981-9110
1.77,612 2,24,647 3,17,6091,06,653 1,58,229 215,702
48,051 33,869 60,75122,908 32,549 41,15611.660 1,36,239 156,08247,845 54,090 70,48537,055 49,606 63,34026,760 32,543 22,257
1,25,065 1,35,830 230,45634,133 35,766 49,68422,088 34,978 93,362
55',307 44,702 47,89915,537 20,384 39,511
4,14,337 4,96,716 70-1,147
Note (A) Figures for 1951 are based on Local Tabulation on 1951. Source :—1991 Census Publication.

1 AREA AND POPULATION
1.5 NUMBER OF REVENUE VILLAGES AND TOWNS IN TRIPURA(Number)
Revenue Villages Towns
District/Sub-Division
1
WEJST TRIPURA Sadar Khowai Sonamura
NORTH TRIPURA Dharmanagar Kailashahar Kamalpur
SOUTH TRIPURA Udaipur Amarpur Gandachhara (1) Belonia Sabfoom
TOTAL : (TRIPURA) 856 864 855 856
Inhabited
1981
un-habited Total Inhabited
J991
un-habited Total
1981 1991
2. 3 4 5 6 7 8 9
278 3 281 274 274 3 10
139 2 141 135 135 1 7
77 1 78 77 77 1 2
62 62 62 62 1 I
278 2 280 260 260
100 2 102 102 102 1 1
96 96 95 95 1 2
82 82 63 63 1 1
300 3 303 321 1 322
63 1 64 63 1 64 I 1
93 2 95 55 5559 .... 59/
86 86 86 86 1 1
58 58 58 58 . 1 1
Note (1) New Sub-Division created after 1981 Census. Source 1991 Census Publication.

1. AREA ANDPOPULATIOPT ► VILLAGE CLASSIFIED BY POPULATION IN 1991 CENSUS, (Contd).
District/ Total No. Total Less than 200 200-499 500-999 1000-1999 2pog-4?9 5QQ0 and aboYgDe\elopment Block of
inhabitedvillage
Rural Num- population ber
Population
Number
Population
Num'ber
Population
Number
Population
Number
Population
Number
Population
1 2 3 4 5 6 7 8 9 10 11 12 13 14 15
WEST TRIPURA 274 977,957 6 749 14 5003 16 134,89 51 77,432 127 408,503 60 472,781Khowai Dev. Block 35 96,523 2 276 3 1131 I 793 7 9,362 17 49,302 5 35,659Teliamura Dev. Block 42 135,876 2 780 1 891 10 14,627 22 74,144 7 45,434Jirania Dev. Block 35 152,579 2 139 3 2,150 4 5,656 16 56,991 10 87,643Mohanpur Dev. Block 36 151,192 1 140 1 348 4 3,668 6 9876 12 37,315 12 99,845Bishalgarh Dev. Block 64 275,341 1 194 2 857 3 2,85? 11 17,454 25 79,095 22 174,889Melagarh Dev. Block 62 166,446 6 1887 4 3135 13 20,457 35 111,656 4 29,311
NORTH TRIPURA 260 636,326 4 646 19 6,966 37 28,234 71 102,714 108 337,166 21 160,600
Kanchanpur Dev. Block 57 104,743 2 316 9 2839 16 11,776 14 18,674 11 33,478 5 37,660
Panisagar Dev. Bloek 45 169,328 3 2,781 10 14,911 22 70,047 10 81,589
Chharaanu Dev. Block 34 86,948 1 198 1 300 5 3.673 10 13,477 14 47,379 3 21,921
Kumarghat Dev; Block 61 136,372 1 132 1 423 7 5.588 20 31,251 31 92,569 1 6,409
Salem a Dev. Block 63 138,935 8 3404 6 4,416 17 24,401 30 93,693 2 1,3021
1 2 3 4 5 6 7 8 9 10 11 12 13 14 1 5
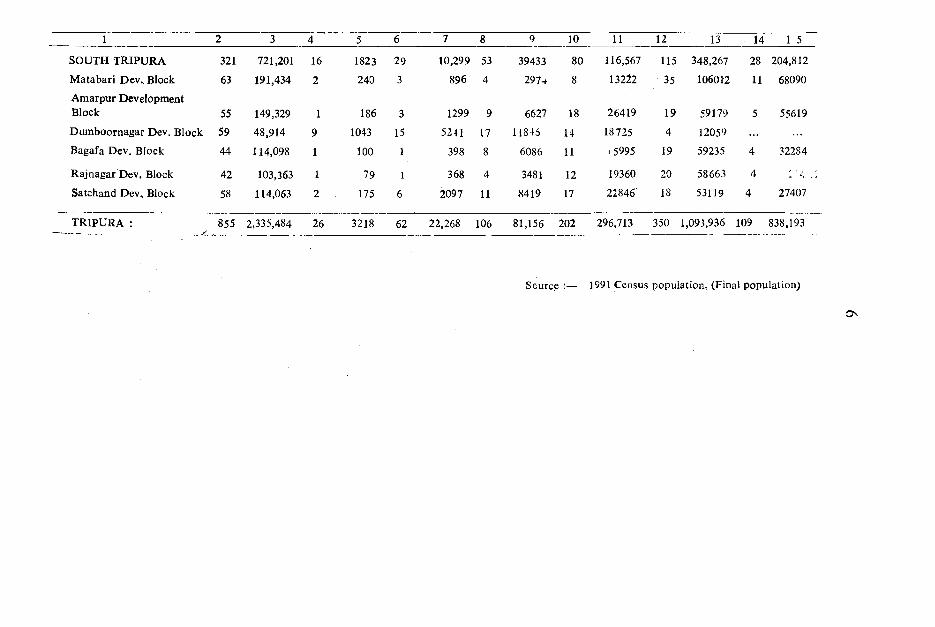
SOUTH TRIPURA 321 721,201 16 1823 29 10,299 53 39433 80 116,567 115 348.267 28 204,812
Matabari Dev.. Block 63 191,434 2 240 3 896 4 2974 8 132^2 35 106012 11 68090
Amarpur Development Block 55 149,329 1 186 3 1299 9 6627 18 26419 19 59179 5 55619Dumboornagar Dev. Block 59 48,914 9 1043 15 5241 17 11815 14 18725 4 12059
Bagafa Dev. Block 44 114,098 1 100 1 398 8 6086 11 15995 19 59235 4 32284
Rajnagar Dev. Block 42 103,363 1 79 1 368 4 3481 12 19360 20 58663 4 1 ' <
Satchand Dev. Block 58 114,063 2 175 6 2097 11 8419 17 22846' 18 53119 4 27407
TRIPURA : 855 2,335,484 26 3218 62 22,268 106 81,156 202 296,713 350 1,093,936 109 838,193
Source :— 1991 Census population, (Final population)
1. AREA AND-P&PULATION
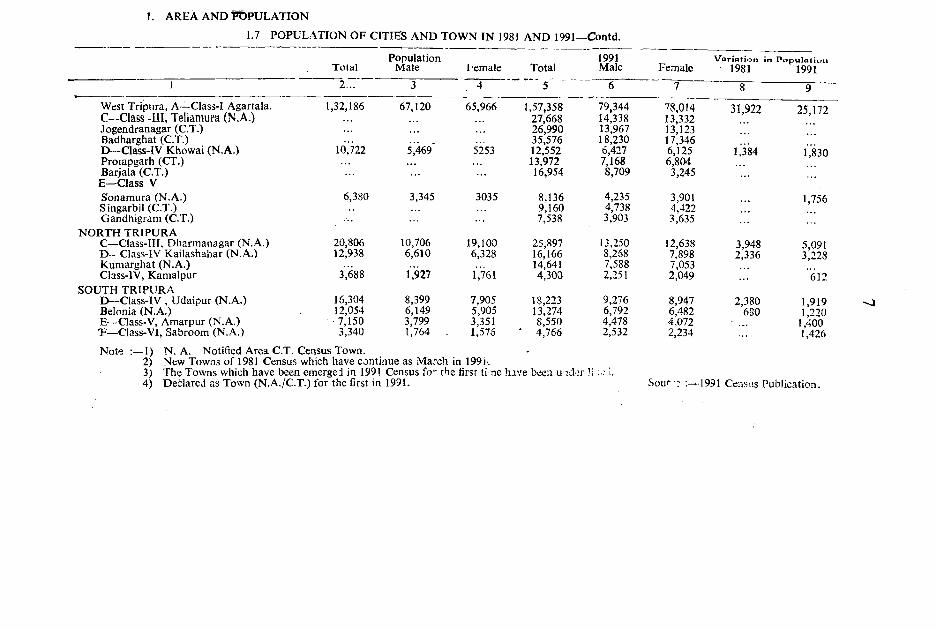
1.7 POPULATION OF CITIES AND TOWN IN 1981 AND 1991—Contd.
1
TotalPopulation
Male hemale2 ...
Total .. . ^ _
1991Male
West Tripura, A—Class-I Agartala.C—Class -III, Teliamura (N.A.)Jogendranagar (C.T.)Badharghat (C.T.)D—Class-IV Khowai (N.A.)Procapgarh (CT.)Barjala (C.T.)
E—Class V Sonamura (N.A.)Singarbil (C.T.)Gandhigram (C.T.)
NORTH TRIPURAC—Class-Ill, Dharmanagar (N.A.)D—Class-lV Kailashahar (N.A.)Kumarghat (N.A.)Class-1 V, Kama! pur
SOUTH TRIPURAD—Class-lV , Udaipur (N.A.)Belonia (N.A.)E—Class-V, Amarpur (N.A.)T —Class-VI, Sabroom (N.A.)Note ;—1) N. A. Notified Area C.T. Census Town.
2) New Towns of 1981 Census which have continue as March in 199i..3) The Towns which have been emerged in 1991 Census for the first ti ne have been u ider !;: . i.4) Declared as Town (N.A./C.T.) for the first in 1991.
Female
,32,186 67,120 65,966 1,57,358 79,344 78,01427,668 14,338 13,33226,990 13,967 13,12335,576 18,230 17,346
10,722 5 469* 5253 12,552 6,427 6,12513.972 7,168 6,80416,954 8,709 3,245
6,380 3,345 3035 8,136 4,235 3,9019,160 4,738 4,4227,538 3,903 3,635
20,806 10,706 19,100 25,897 13,250 12,63812,938 6,610 6,328 16,166 8,268 7,898
14,641 7,588 7,0533,688 1,927 1,761 4,300 2,251 2,049
16,304 8,399 7,905 18,223 9,276 8,94712,054 6,149 5,905 13,274 6,792 6,4827,150 3,799 3,351 8,550 4,478 4,0723,340 1,764 1,576 ‘ 4,766 2,532 2,234
V a r ia t io n in P o p u la tit> ii1981 1991
31,922
1,384
3,9482,336
2,380
25,172
1,830
1,756
5,0913,228
”612
1,9191,2201,4001,426
S o u f 1991 Census Publication.

Non-Workers
1. AREA AND POPULATION1.8 MAIN WORKERS. MARGINAL WORKERS & NON-WORKERS IN RURAL AND URBAN AREAS IN 199L
District/Sub-Division
1
A. WEST TRIPURA1. Sadar2. Khowai3. Sonamura
B. NORTH TRIPURA1. Dharmanagar2. Kailashahar3. Kamalpur
C. SOUTH TRIPURA1. Udaipur2. Amarpur3. Gandachhara4. Belonia5. Sabroom
TOTAL : TRIPURA
Main Workers Marginal Workers
Rural Urban
682098 119965
Total
802063
Rural
5
284400 90215 374615 16552172340 76985 249325 942768546 10915 79461 518443514 2315 45829 1941
191747 17526 209273 1657780172 7391 87563 618569863 8937 78800 526241712 1198 42910 5130
205951 12224 218175 2145056720 5117 61837 162938253 2358 40611 539718880 18880 205364054 3365 67419 809528044 1384 29428 4276
54579
Urban
1875
Total Rural
8
56454 1598807
Urban
299881
Total
10
792 17344 677005 224897 901902584 10011 997345 189979 587324198 5382 158669 29107 187776
10 1951 120991 5811 126802935 17512 428002 42543 470545278 6463 187714 18228 805942609 5871 148195 21261 16945648 5178 92093 3054 95147
148 21598 493800 32441 52674110 1639 133085 13096 14618199 5496 105679 6093 111772
2053 27981 27981"27 8122 145312 9882 155194
12 4288 81743 3370 851131898688
Source :—1991 Census Data (NIC) oo

-11 r u r u l ^ A l J U J B i t
District/Sub-Division
i.y WORKEITS AND NON-WORKERS BY SEX IN —1991.
Marginal WorkersMain Workers Non-WorkersMale
1Female Total
I. WEST TRIPURA1. Sadar2. Khowai3. Sonamura
II. NORTH TRIPURA1. Dharmanagar2. Kailashahar3. Kamalpur
I I I . SOUTH TRIPURA1. Udaipur2. Amarpur3. Gandhachara4. Belonia5. Sabroom
TOTAL : Tripura.
316919208696
6648741736
174469745436378436142
1748995045230138130035696224344
Male5
Female Total Male
5769640629129744095
3480413020150166768
4327611385104735877
104575084
3746152493257946145829
209273875637880042910
2181756183740611188806741929428
------------NumberFemale Total
9 “■ " l ^ ■
PercentageTotal
populationn
26751842426407
30611335950776
2161194359210840548
14669816949561544
14451512849214402
1943714455137184372823750
17344 10011 5382 1951
17512 6463 5871 5178
21598 1639 5496 2053 8122 4288,
345982225842
7269447446
1821587875566190372131560656686498261195761115
36022
55592036148215028279356
288387n i\% i10326657934
3106358949561946160249407949091
901902 587324 187776 i 26802 470545 205942 169456 95147
526241 146181 111772 27981
155194 35113
28.95 29.45 29.14 26.25 30.01 29.19 31.0029.9628.4829.49 25.72 38.60 20.22 24.76
666287 135776 802063 7897 48557 56454 743746 1154942 1898688 29.09
Source 1991 Census data (NIC). ~, „ 1. AREA AND POPULATION1.10 WORKERS BY NUMBER OF MAIN INDUSTRIAL CATEGORIES IN 1991.
District/Sub-Division Main workers (i-ix) Cultivators (i)Livestock, Forestry,
. . , Fishing, Hunting &Agricultural Labours Plantation Orchard
allied activities (iii)
1Male
WEST TRIPURA . Sadar Khowai . Sonamura
NORTH TRIPURA Dharmanagar Kailashahar Kamalpur
SOUTH TRIPURA Udaipur Amarpur Ganda cherra Belonia Sabroom
Female3 - -
Male Female' ■ 5
Male“ 6 “
Female Male
TRIPURA
3169192086966648741736
174469745436378436142
17489950452’30138130035696224344
666287
57696 98683 16190 6674840629 52695 10958 3495212974 25980 4068 202074093 20008 1164 10589
34804 78157 16294 3035013020 32009 6474 1232615016 31731 7329 107236768 14417 2491 7301
_ 4327,6 77710 18489 4998411385 18499 3915 1356110473 15412 5417 79395877 8678 4519 2546
10457 25619 3138 168885084 9502 1500 9050
135776 254550 50973 146082
Female-9
1756910379568315075890152727391624
1799747274156117053462598
41456
46843444703537
587423522557965
193934837780
696438
12497
1765155212588
39281504173069440174
1482
9978
VO
6094

AREA AND POPULATION1.10 WORKERS BY NUMBER OF MAIN INDUSTRIAL CATEGORIES IN 1991
District/Sub-Division
, Manufacturing, Proc- Manufacturing, proce-Mihing & Quarring ssing. Servicing & ssing. Servicing, Construction (vi)
(iv) Repairing in House Repairing in H/holdhold Industries (v) Industries (vb)
I^ale Female Male Female Male Female Male Female1 10 11 12 13 14 16 17
WEST TRIPURA 1773 33 4907 1753 1,3455 1484 6221 377Sadar 1620 30 3156 1152 12419 1092 5388 342KlWWfti 114 2 921 241 1854 241 ■646 32iSonsmura 39 I 830 360 1182 151 187 3
NORT^J, TRIPURA 353 78 1703 1034 $151 752 3492 154Djiarnianagar 102 78 697 319 3491 340 1778 82Kailasahar 19 557 573 1594 214 1260 55Kamalpur 232 449 142 1066 198 454 17
SOUTH TRIPURA 88 1 1323 664 3965 436 1466 42Udaipur 66 1 457 239 2120 253 644 24Amarpur 4 • • • 123 43 489 42 267Ganda.cherra 21 64 50 5 63 I'iBelonia 9 ... 504 250 982 98 369 6Sabroom 9 218 68 324 38 123 ...
TRIPURA 2214 112 7933 3451 25571 2672 11179 ' 573'
1. AREA AND POPULATION1.10 WORKERS BY NUMBER OF MAIN INDUSTRIAL CATEGORIES IN 1991
District/Sub-DivisionTrade a n i Commerce (vii) Transport, Storage
Communication (viii)Other Services (ix)
Male Female Male Female Male Female1 lb 19 20 21 22 23
WEST TRIPURA 33$70 835 13638 205 71940 17485Sadar 25950 622 11398 182 57674 14320Khowai 4934 149 1446 17 9682 2416Sonamura 2986 64 794 6 4584 749
NORTH. TRIPURA 14161 413 5811 82 28417 6179Dh^rmanagar 7093 163 3360 55 11335 2478Kails^sahar 4258 124 1531 14 9554 2238Kamalpur 2810 126 920 13 7528 1463
SOUTH TRIPURA 11930 412 2430 27 24064 4807Udaipur 4742 136 1296 15 8719 2001Amarpur 1739 61 281 1 3507 605Gandacherra 729 18 20 1 816 86Belonia 3441 134 633 7 7821 1379Sabroom 1279 63 200 3 3201 136
TRIPURA 59961 1660 21879 3)4 124421 28471Source :— 1991 Census Data (NIC)

a r e a a n d p o p u l a t io n .l . n DISTRIBUTION OF POPULATION AND WORKERS BY AGE GROUPS AND SEX IN 1981—Contd.
Total/Rural/Urban
TOTAL
RURAL
URBAN
AgeGroupYears
Population Main Workers
Total ' 3
Male Female Total Male
TRIPURA
Female
Total 2,053,058 1,054,846 998,212 608,589 519,291 89,2980— 14 807,900 409,613 398,287 19,796 14,107 5,689
15—19 217.565 108,927 108,638 58,978 46,096 12,88220—24 180,815 9 l j7 6 . 89,239 76,674 63,996 12,67825—29 167,974 84,942 83,032 87,293 74,044 13,24930—34 124,273 65,284 58,989 71,909 61,537 10,37235—39 118,871 63,907 54,964 71,419 6i,855 9,56440—49 175,106 93,355 81,751 104,265 90,621 13,64450—59 115,571 61,744 53,827 65,069 57,994 7,07560 + 144,730 75,358 69,372 53,155 49,016 4,139Total 1,827,490 939,558 887,932 548,066 467,866 80,2000—14 733,942 372,466 361,476 18,765 13,678 5,087
15—19 190,568 95.861 94,707 56,429 44,173 12,25620—24 156,555 79,657 76,898 70,482 58,778 11,70425—29 146,317 73,957 72,360 77,321 65,695 11,62630—34 108,232 56,555 51,6'77 62,398 53,586 8,81435—39 104,779 56,298 48,481 62,735 54,593 8,14240—49 154,160 81,479 72,681 91,390 79,261 12,12950—59 102,974 54,979 47,995 58,558 52,012 6,54660+ 129,756 68,189 61,567 49,955 46,067 3,888Total 225,568 115,288 110,280 60,523 51,425 5,0980—14 73,959 37,147 36,812 1,031 429 602
15— 19 26,9% 13,0ff5 13,931 2,5‘48 1,922 62620—24 24,261 11,290 12,341 6,193 5,218 97525—29 21,656 10,985 10,671 9,971 8,349 1,62230—34 16,041 8,729 7,312 9,511 7,953 1,55835—39 14,093. 7,610 6,483 8,684 7,262 1,42240—49 20,946 11,877 9,069 12,874 11,360 1,51450—59 12,597 6,765 5,832 6,509 5,981 52860 + 14,974 7,169 7,805 3,199 2,949 250

1. AREA AND POPULATION.1.11 DISTRIBUTION OF POPULATION AND WORKERS BY AGE GROUPS AND SEX IN 1981—Contd.
URBAN Total 0—14
15—19 20—24 25—29 30—34 35—39 40—49 5 0 -5 9 60 +
149,28848,52617,89116,12814,35910,6869,495
14,0678,3319,769
75,93424,2728,5837,9257,3015,7625,0727,8834,4694,650
73,35424,2549,3088,2037,0584,9244,4236,1843,8625,119
40,537686
1,7064,1066,7366,4505,8978,7194,3031,935
33,781265
1,2293,3875,5425,2584,8327,5833,9231,762
Total/Rural/UrbanAgeGroup(Years)
Population Main workers
Total Male Female Total Male Female1 2 3 4 5 6 7. 8
WEST TRIPURATOTAL Total 976,252 499,605 476,674 280,599 237,416 43,183
0—14 381,023 192,755 188,268 8,368 5,505 2,76315—19 106,361 52,939 53,422 25,232 19,459 5,77320—24 87,450 44,740 42,710 34,622 28,926 5,69625—29 78,945 40,251 38,694 40,409 34,153 6,25630—34 58,421 30,489 27,932 33,740 28,499 5,24135—39 55,945 29,734 26,211 33,545 28,691 4,85440—49 83,423 44,237 39,186 49,689 42,888 6,80150—59 54,901 28,939 25,962 30,479 26,909 3,5706jD+ 69,672 . 35,462 34,210 24,507 22,278 2,229
RURAL Total 826,964 423,671 403,293 240,062 203,635 36,4270—14 332,497 168,484 164,013 7,682 5,340 2,342
15—19 88,470 44,356 44,114 23,525 18,220 5,29620—24 71,322 36,815 34,507 30,516 25,539 4,97725—29 64,586 32,950 31,636 33,673 28,612 5,06130—34 47,735 24,727 23,008 27,290 23,242 4,04835—39 46,450 24,662 21,788 27,649 23,859 3,79040—49 69,356 36,355 33,001 40,970 35,305 5,66550—59 46,571 24,471 22,100 26,176 22,986 3,1906 0+ 59,903 30,812 29,091 22,573 20,517 2,056
6,756421477719
1,1941,1921,0651,136
380173

1.11 DISTRIBUTION OF POPULa T O n AND WORKERS BY AGE GROUPS AND SEX IN 1981—Contd.
T otal/Rural/Urban
TOTAL
RURAL
URBAN
TOTAL
Age PopulationGroup (Years)
Total 0—14
15—19 20—24 25—29 30—34 35—39 40—49 50—59 60 + Total 0—14
15—19 20—24 25—29 30—34 35—39 40—49 50—59 60 + Total 0—14
15—19 20-24 25—29 30—34 35—39 40—49 50—59 60 +
Total0—14
15—192 0 -2 425—2930—3435—3940—4950—5960+
Total
5,41,2482.12,996
54,81246,78944,79133,68632,80047,37030,11937,809
5,03,8162,00,664
50,51642,85241,22130,98230,46443,84727,99035,20737,432
12,334,2963,9393,5702,7042,3363,5222,1292,602
5,35,5582,13,881
56,39246,57544,23832,16730,12744,31330,551
37.249
Male~4 -
Female
NORTH TRIPURA 2,79,838 1,07,849
27,948 23,465 22,363 17,630 17,818 25,691 16,526 20,505
2,60,595 1,01,591
25,820 21,581 20,598 16,173
16.554 23,651 15,365 19,221 19,243
6,259 2,128 1,885 1,765 1,457 1,264 2,039 1,161 1,284
Main Worker
Total
2,61,410 1,63,880105,147 5,11326,864 16,37323,324 20.79922,428 23,29216,056 19,23114,982 19,57621,679 28,27313,593 17,20317,304 14,007
2,43,221 1,54,13399,073 4,95124,696 15,98321,271 19i85420,623 21,75014,809 17,71713,910 18,18120,196 26,15512,625 16,10515,986 13,42818,189 9,7476,074 163
2,168 3902,054 9461,805 1,5421,247 1,5141,072 1,3941,483 2,118
968 1,0981,318 579
SOUTH TRIPURA2,75,403 2,60,155 1,64,1101,09,008 1,04,873 6,314
28,040 28,352 17,37223,371 23,204 21,25222,328 21,910 23,59217,165 15,002 18,93716,355 13,772 18,29723,427 ■■ 20,886 26,30216,279 14,272 17,38719,391 17,858 14,640
Male
1,41,9523,907
13,19517,46519,87516,70617,21224,86615,50113,215
1,33,3463,834
12,86416,63918,53115.38216,00422,94814,47112,6668,606
73331
8271,3441,3241,2071,9181,031
549
1,39,9234,595
13,44217,60420,01616,33115,95122,867
15,58413,522
Female
21,9281,2063,1783.334 3,417 2,525 2,364 3,407 1,702
79220,787
1,1173,1193,2153,2192.335 2,177 3,207 1,634
7621,141
9059
1191981901872006730
24,1871,7193,9303,6483,5762,6062,3463,4351,803
1,1118
U)

Table No. 1.11—Contd.
RURAL
URBAN
Total 4,96,710 2,55,292 2,41,418 1,53,871 1,30,885 22,986
0—14 2,00,782 1,02,392 98,390 6,133 4,505 1,628
15—19 ' 51,582 25,625 2^897 16,920 13.079 3,841
20—24 42,381 21,261 21,120 20,112 16,600 3,512
25—29 40,510 20,499 20,191 21.899 18,553 3,346
30—34 29,516 15,655 13,861 17,391 14,960 2,431
35-39 27,864 15,081 12,783 16,904 14,729 2,475
40-^49 40,957 21,473 19,484 24,265 21,008 3,257
50—69 28,414 15.144 n ,270 16,278 14,556 1,722
60 + 34,646 18,156 16,690 13,954 12,884 1,070
Total 38,848 20,111 18,737 10,239 9,038 1,201
0—14 13.100 6,617 6,483 182 91 91
15—19 4,810 2,355 2,455 452 362 90
20—24 4,195 2,110 2,085 1,141 1,004 137
25—29 3,728 1,919 1,809 1,693 1,463 230
30-34 2,651 1,510 1,141 1,546 1,371 175
35—39 2,262 1,274 988 1,393 1,222 171
40—49 3,357 1,955 1,402 2,038 1,859 179
50-59 2,137 1,135 1,002 1,109 1,028 81
60+ 2,603 1,235 1,368 685 638 47
Note The processing of 1981 Censusdata considered of Two stages-first-hundred percent manual tabulation of the Primary Census Abstract and later on the compnter. The present Tables procession the computer were adjusted so as to conform to the earlier P. C. A. figures by applying ^uitable corrections factors. The marginal totals may therefore, not tally in all the cases
due to rouuding off.
Source Census publication series 21 (Tripura) Part—IH-A & B & Part—lV-A.

1. AREA & POPULATION.
1.12 POPULATION BY RELIGION IN 1981
District/Sub-Divison Hindus Sikhs Muslems Christian Buddhist Jains Otherreligion
Religionnot
Stated
Total
1 2 3 4 5 6 7 8 9 10
1. WEST TRIPURA 9,06,543 209 65,552 3,143 643 143 14 5 9,76,2521. Sadar 6,01,641 188 26,288 2,367 342 127 5 6,30,9582. khowai 2,09,886 21 949 748 234 16 14 2,11,8683. Sonamura 95,016 38,315 28 67 ... 1,33,426
II. NORTH TRIPURA 4,51,529 53 49,524 15,642 24,314 154 13 19 5,41,2481. Dharmanagar 1,81,915 30 27,409 8,632 11,345 120 13 19 2,29,483
2. kailashahar 1,55,664 ... 18,694 5,172 11,223 34 1,90,7873, Kamalpur 1,13,950 23 3,421 1,838 1.746 ... 1,20,978
liL SOUTH TRIPURA 4,76.146 23 23,453 6,087 29,849 5,35,5581. Udaipur 1,40,793 2 16,378 2,433 362 ... 1,59,9732. Amarpur 98,269 2,473 2,083 10,606 1,13,4313. Belonia 1,68,322 19 4,465 1,454 8,576 1,82,8364. Sabroom 68,762 2 137 112 10,305 ... ... 79,318
TOTAL 18,34,218 285 1,38,529 24,872 54,806 297 27 ■ 24 20,53,058

1.131. AREA AND POPULATION
SALIENT FEATUERS OF POPULATION BY STATES IN 1991
States/Union/Territories
Area (Sq. Km.) Provisional
Population in 1991
INDIA STATES**1. Andhra Pi adesh2. Arunachal Pradeih3. Assam4. Bihar5. Goa6. Gujrat7. Hariyana8. Himachal Pradesh9. Jammu & Kashmir
10. Karnataka11. Kerala12. Madhya Pradesh13. Maharashtra14. Manipur15. Meghalaya16. Mizoram17. Nagaland18. Orissa19. Punjab20. Rajasthan21. Sikhim22. Tamilnadu23. Tripura24. Uttar Pradesh25. West Bengal
UNION TERRITORIES1, Andaman &
Nicobar Islands2. Chandigarh3. Dadra & Nagar Haveli4. Daman & Diu5. Delhi6. Lakshadweep7. Pandicherry
32872632750458374378438
1738773702
1960244421255673
222236191791
3886344344630771322327224292108116579
15570750362
3422397096
13005810486
294411S8752
8249114491 112
148332
492
Population in 1981
NOTE
84630268866508008
8645582241432286374465
1169793413095821646364851708777718700
449772012909831866181170
VariationPopulation
1981-91
% age Female Per Population % age of % age of Variation 100% Per Sq. Km. Urban Popu- Sc. Caste1981-91 Males
1991 Census (P)
1991 lation to total
% age of Sc. Tribe to Toial
1991 Census Pop. 1991 Pop. 1991
68518469253551026
631839198968469914734
1007749340857991292261842808185987389
371357142545368052178844
5 6 7 8 9 10 11161117996 23.51 929 257 25.71 16.33 8.0112956982 24.20 973 242 26.89 15.93 6.31
232719 36.83 861 10 12.80 0.47 63.662517479 12.65 925 286 11.10 7.40 12.82
16459731 23,54 912 497 13.14 14.55 7.66162044 16.08 969 316 41.01 2.08 0.03
7223783 21.19 936 211 34.49 7.41 14.923541030 27.40 874 372 24.63 19.75890059 20.79 996 93 8.69 25.34 4.22
1731311 28.92 N.A. 35 23.83 N A . N.A.7841487 21.12 961 235 30.92 16.38 4.26
' 3644838 14002326
14.3226.84
1040932
749149
26.3923,18
9.9214.54
1.1023.27
78937187 62782818 16154369 25.73 935 257 38,69 11,09 9.271837149 1420953 416196 29.29 961 82 27,52 2.02 34.411774778 1335819 438959 32.86 947 79 18.60 0.51 85.52689756 493757 195999 39.70 924 33 46,10 0.10 94.751209546 774930 434616 56.08 890 73 17.21 87.70
31659736 26370271 5289465 20.06 972 203 13.38 16.20 22.2120281969 16788915 3493054 20.81 888 403 29.55 28.3144005990 34261862 9744128 28.44 913 129 ,22.88 17.29 12.'44
406457 316385 90072 28.47 878 57 9.10 5.92 22.3655858946 48408077 7450869 15.39 972 429 34.15 19.18 1.022757205 2053058 704147 34,30 946 263 15.30 16.36 30.95
139112287 110862013 28250274 25.48 881 473 19,84 2104 0.2168077965 54580647 13497318 24.73 917 767 27.48 2362 5.59
280661 188741 91920 48.70 820 34 26.71 9.54642015 451610 190405 42.16 793 5632 89.69 16.51138477 103676 34801 3357 953 282 8.47 1.97 78.9910186 78981 22605 28.62 972 907 46.80 3.83 1154
9420644 6220406 3200238 51.45 830 6352 89.93 19.0551707 40249 11458 28.47 944 1616 5631 93.14
807785 604471 203314 33.64 980 1642 64.00 16.25The 1991 Census was not held in Jammu & Kashmir, Total Rural and Urban
Population in cols 3 include projection for Jammu & Kashmir on 01-03-1991 made by the standing committee of exparts on population projection (Oct. 1989)The projected population figure exclude population of area under unlowful occupation of Pakistan & China where census could not be taken. However the figures of Scheduled Cast and Scheduled Tribes excludes those of Jammou Kashmir as the projected figures for Sch. Castes & Sch. Tribes are not available.
SOURCE - 1991 Census Report.
On
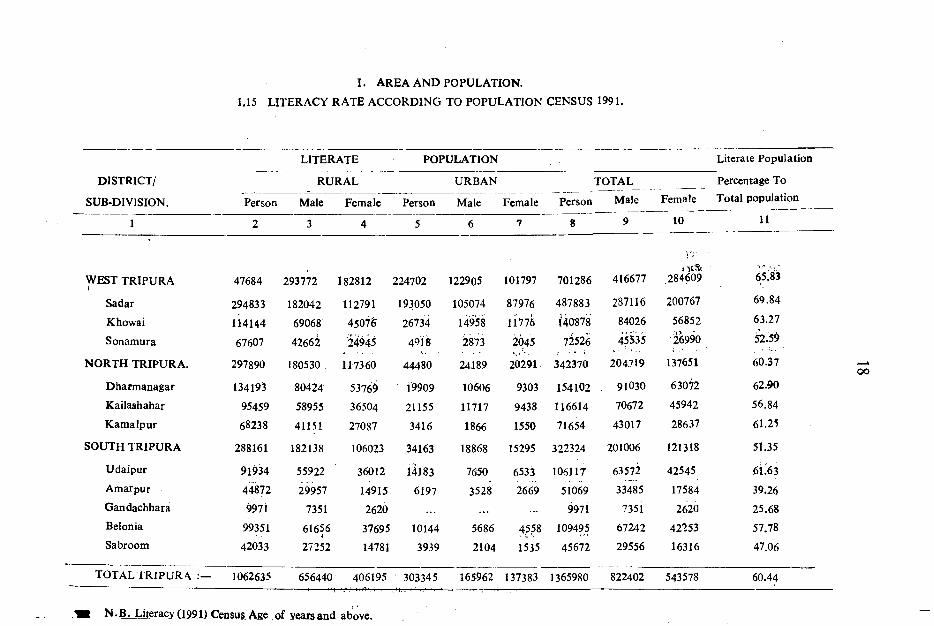
I. AREA AND POPULATION.
1.15 LITERACY RATE ACCORDING TO POPULATION CENSUS 1991.
DISTRICT/
SUB-DIVISION.
1
LITERATE
RURAL
POPULATION
URBAN
Person Male Female Person Male Female Person
8
TOTALMale
9 10
Literate Population
Percentage ToFemale Total population
11
WEST TRIPURA 47684 293772 182812 224702 122905 101797 701286 416677 284609
t o t a l TRIPUR \ 1062635 656440 406195 ' 30334 5 1 65962 1 37383 1 365980 822402 543578
65.83
Sadar 294833 182042 112791 193050 105074 87976 487883 287116 200767 69.84
Khowai 114144 69068 450T6 26734 14958 11776 t4087k 84026 56852 63.27
Sonamura 67607 42662 ^4945 4918 i m 2045 7^526 45535 ib 9 o
NORTH TRIPURA. 297890 180530 117360 44480 24189 20291 342370 204719 137651 60.37
Dharmanagar 134193 80424 537^9 19909 10606 9303 154102 91030 630)2 62.90
Kailashahar 95459 58955 36504 21155 11717 9438 116614 70672 45942 56.84
Kama Ip ur 68238 41151 27087 3416 1866 1550 71654 43017 28637 61.25
SOUTH TRIPURA 288161 182138 106023 34163 18868 15295 322324 201006 121318 51.35
Udaipur 91934 55922 36012 14183 7650 6533 106117 63572 42545 61.63Amarpur 44872 29957 14915 6197 3528 2669 51069 33485 17584 39.26Gandachhara 9971 7351 2620 ... ... ... 9971 7351 2620 25.68Belonia 99351 61656
437695 10144 5686 4.558 109495 67242 42253 57.78
Sabroom 42033 27252 14781 3939 2104 1535 45672 29556 16316 47.06
60.44
oo
N_.B. L i t e r s (1991) Census Age of jyears and above.

[. 16 LITERACY RATE OF SCHEDULED cASTgS AeCoRDING TO POPULATION CENSUS. 198).
Literate Population LiterateDistrict/Sub-Division
Rural Urban Total as-Populationpercentage
of TnfoiPersons Male Female Persons Male Female • persons Male Female Population
r 2 3 4 5 6 7 8 9 10 11
WEST TRIfURA 50,915 33,876 17,039 5,749 3,571 2,178 56,664 37,447 .
• •
19,217 34,27
Sadar 29,440 19,522 99,918 5,109 3,148 1,961 34,549 22,670, 11,879 34,89
Khowai 11,461 7,692 3,769 304 178 126 11,765 7,870 3,895 32,22
Sonamura 10,014 6,662 3,352 336 245 91 10,350 6,907 3,443 34.76
NORTH TRlPyjR-A 21,447 14,130 7,317 1,063 642 421 22,510 14,772 7,738 34,28
Dharmanagar 5,97ji 3,93? 2,040 392 244 148 6,364 4,176 2,188 35,56
Kailasha^ar 6,778 4,43? 2,33? 585 351 234 7,363 4,790 2,573 32,58
Kafljalpyr 8,697 5,759 2,938 86 4? 39 8,783 5,806 2,977 34,89
SOUTH TRIPURA 23,417 ,16,304 7,113 2,588 • 1,663 925 26,005 17,967 8,038 32,76
Udaipur 9,335 6,335 3,000 1,038 655 383 10,373 6,990 3.383 35.44
Amarpur 4,382 , 3,054 1,328 75i 475 ■ 278 5,135 3.529 1,606 35,56
Beionia 6,995 - 4,975 2,020 536 359 177 7,53i 5,334 2,197 30,04
Sabroom 2,705 1,940 .765 261 174 87 2,966 2,114 852 27-94
TRI^ViRA 95,779 — 64.310 31,469 9,400 5,876 3,524 1,05,179 70,186 34,993 33,89
VO

1. 17 LITERACY RATE OP SCHEDULED TRIBES ACCORDING TO POPULATION CENSUS. 1981.
1. AREA AND POPULATION
District/Sub-DivisionLiterate Population
Rural
Persons Male
Urban Total
Female Persons Male Female Persons Male
Literate — Percentage
of Total — Population
Female
10 11
WEST TRIPURA 69,805 50,396 19,409 5,233 2,904 2,329 75,038 53,300 21,738 30,73
Sadar 39,494 29,154 10,340 4,841 2‘653 2,188 44,335 31,807 12,528 30,13
Khowai 27,536 19,024 8,512 262 182 80 27,798 19,206 8,592 33,92
Sonamura 2,775 2.218 557 130 69 61 2,905 2,287 618 19,29
NORTH TRIPURA 30,554 22,776 7,778 456 323 133 31,010 23,099 7,911 20,97
Dharmanagar 11,535 8.506 3,029 125 92 33 11,660 8,598 3,062 23,95
Kailashahar 10,379 8,150 2,229 216 149 67 10,595 8,299 2,296 17,74
Kamalpur 8,640 6,120 2,520 115 82 33 8,755 6,202 2,553 22,19
SOUTH TRIPURA 28,311 22,919 5:392 354 269 85 28,665 23,188 5,477 14,94
Udaipur 8,288 6,128 2,160 79 60 19 8,367 6,188 2,179 21,60
Amarpur 9,937 8,429 1,508 126 102 24 10,063 8,531 1,532 13,85
Belonia 6,201 5,097 1,104 46 37 9 6,247 5,134 1,113 13,49
Sabroom 3,885 3,265 620 103 70 33 3,988 3,335 653 11,68
TRIPURA 1,28,670 96,091 32.579 6,043 3,496 2,547 1,34,713 99,587 35,126 23,07
toO
2 ENVIRONMENT STATISTICS.
Tables relating to Rainfall a Temparature are shown in the Section.
Table No 2.1 Monthly quinquinal average Rainfall (1991) data have been shown in Ta1)Ie.No, 2.1 and average annual Rainfall in different year ( By District) have been shown in table no. 2.2.
Table No-2. 3 Data on Temparature as recorded at Agartala Airport for different yeirs have been shown in Table No-2.3.

2 2
2. ENVIRONMENT STATISTICS (Claimate)
2.1 Monthly Guinquenial Average Rainfall 1991.
( in milimctres)
District January February March April May June
1 2 ' ‘ ■ '3'^ 4-v 5 ^ 6 7
West Tripura 6.9 41.4 117.4 259.2 495.0 396.4
North Tripura 4.3 31.1 96.9 297.0 538.2 443.6
South Tripura 4.1*• V *
30.S 116.5 222,1 426,6 450,1
TRIPURA 5.1 34.3 110.3 259.4 486.6 430.0r f - f r j / T d - T - ' - r r ’ ‘ o i" .
( In milimetres )
District July August September October November December. . . . . . . j i 'l Annual
1 8 9 10 11 12 13 14
West Tripura 397.8 313.8 372.1 244.9 41.0 27.9 2713.8
North Tripura 326.9 367.5 335.7 262.7 63.2 34.2 2801.J
South Tripura 668.0 388.0 320.7 285.0 59,9 23.2 2994.5
TRIPURA 464.2 356.4 342.8 264.2 54.7 ' 28.4 2836.5
Source Directorate of Agriculture. Govt. of Tripurt.

23
2.2 ENVIRONMENT STATISTICS
2.2 Average AnodaKRajnfaililn Different Year.
( I mnw^imetres)
<»4)istrii:t ^ 8 5 1986 m i 1988 1990 1991
“ 1 1 : ^ 2 3 4 5 6 ^ r 8
W est-Tripura 246.3 320.9 271.6 333.0 200.7 254.6 297.5
^ ^ o rth ' Tripura 257.0 222.8 228.8 ,3-;25.3 • 255^;;,. 337.6
I'SourbtTripura4—yn------------ ------
106.0 216.2 249-1 ’337.8A V 230‘6h A f
313.5 373.5
^^TA TE 2 3 U 253.3 250.0 ,332.0 228(8-. . 276.5 336.2
bistrict1
West Triipura
£ North ^Ijtipura
. South Xripura
s t a t e
^1991
JanuaryoMarch * April-Jnue
15.4
15.9
12.1
14.5
10
141.8
194.8 '
176.8
171.1
( In centilf»M-es )
July-Septembcr October-December11
87.7
79.3
144.5
103.8
12
-------------
5?4 ‘{
47:1 ‘m t
----- '-1^
Source Directorate of Agriculture, Govt, of Tripura.

24
e n v ir o n m e n t
2.3 Temperature Recorded at Agartala Airport. (Centrigado)
January February Match
YearHighest Lowest Highest Lowest Highest Lowest
1 2 3 4 5 6 7
1983 28.5 5.9 31.2 4.7 35.0 12.11984 26.9 6.1 32.3 6.2 37.2 11.01985 29.6 7.6 31.1 9.9 36.3 18.11986 29.0 8.0 30.7 8.9 37.4 12.C1987 29.0 7.0 33.0 9.8 36.3 13.31988 28.7 5.6 31.0 9.5 34.4 14,61989 27.6 4 1 30.2 9.0 36.0 1L 81996 M.9 7.0 31.0 11.4 37.0 12.01991 30.8 5.0 33.6 9.4 37.1 14.8
(Centrigade)
Year
April May June July
Highest Lowest Highest Lowest Highest Lowest Highest Lowest
1 8 9 10 11 12 13 14 . 15
198) 35.8 17.3 35.6 19.0 35.6 22.4 34.4 24.41984 37.6 18.7 34.3 20.0 35*.9 ■ 24.0 33.6 23.21985 35.8 19.3 35.1 19.3 34.1 22,3 32.8 23.21986 36.4 17.2 35.4 17.8 36.4 23.1 33.9 23.01987 36.9 19.3 36.4 18.2 35.3 22.7 33.5 23.61988 36.2 19.1 34.1 20.8 35.2 23.0 33.7 24.01989 36.9 19.5 36.8 21.8 36,6 21.4 34.1 23.51990 34.5 14.5 35.7 20.5 35.2 22.0 35.1 23.51991 36.9 16,6 34.1
1.
18.6 33.8 21.0 34.6 2^4

25
ENVIRONMENT
2.3 Temperature Recorded at Agartala Airport.
(Centigrade)
August September OctoberY ear ' ^
Highest Lowest Highest Lowest Highest Lowest1 16 17 18 19 20 21
198J 33.6 23.8 33.6 24.1 33.7 17.31984 34.6 24.0 33.1 21.5 33.0 19.51985 34.1 24.0 34.0 11.1 35.0 16.41986 35.7 23.7 33.5 21.2 33.4 19.21987 34.3 23.2 33.7 23.5 34.0 18.51988 34.1 24.5 34.4 22.2 38.9 18.219189 33.9 23.4 33^ 21.8 33.3 22.919>90 34.9 23.0 34.9 22.3 33.9 16.219*91 35.0 22.9 34.2 21.4 33.5 15.9
(Centigrade)
Ye:arNovember December Annual Meen
Highest Lowest Highest Lowest Highest Lowest
r 1 22 23 24 25 26 27
19813 33.2 12.5 28.2 5.5 33.2 15.8198(4 31.1 13.4 30.6 8.0 33.4 16.3198:5 32.5 11.6 29.5 8.6 33.3 17.019816 32.5 13.4 29.0 10.6 33.6 16.61987 35.1 13.2 29.6 8.4 33.9 16.7198:8 31.4 14.1 29.0 33.4' 16.3198‘9 31.2 12.3 29.2 6.9 33.3 16,51990 32.5 12.0 33.1 9.1 34.1 16.119911 29.8 11.1 29.6 6.4 33,6 15.5
SO U RC E:— Director. Meteorological Centre, Guwahati Airport, Guwahati.
3. VITAL STATISTICS.
This section presents information relating to Vital Statistics. The data have been com piled from the returns furnished by the Director o f Health Services, who is cx-oflScio Chief Registrar of birth and deaths in the State.
Table No. 3. 1. This table gives the number o f annuallive birth rates and death rates in Tripura.
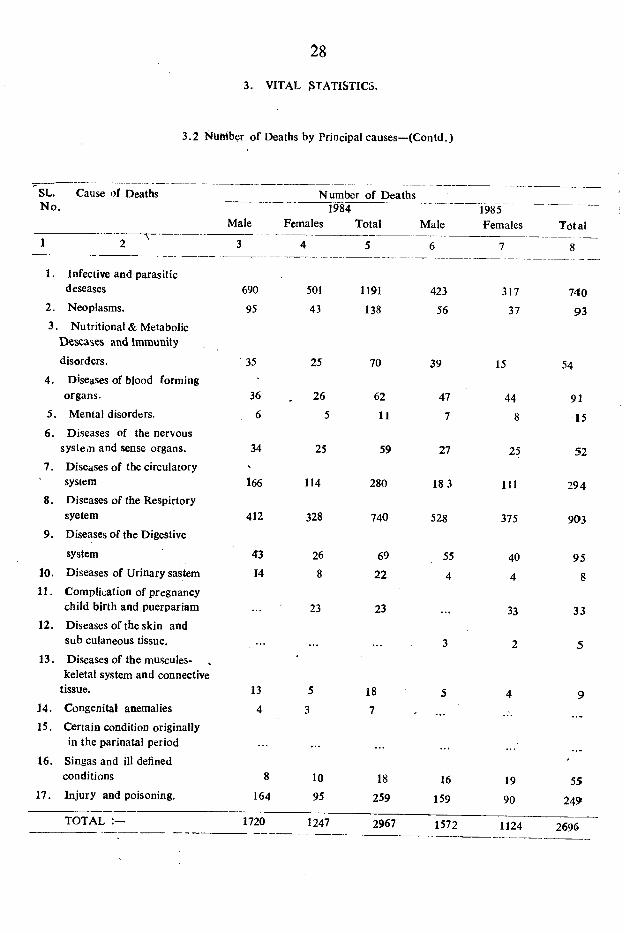
Table No. 3.2- This table gives the number of deaths by principal causes.

27
3. VITAL STATISTICS
3.1 ESTIMATED ANNUAL LIVE BIRTH RATES AND DEATH RATES IN TRIPURA
BIRTH RATE DEATH RATE
YEAR RURAL URBAN COMBINED RURAL URBAN COMBINED
1 2 3 4 5 6 7
1981 27.6 14.8 26.4 8.2 5.4 8.01982 25.1 18.5 24.4 8.0 5.7 7.71983 24.5 16.6 23.7 7.8 4.9 7.51984 27.4 19.7 26.6 9.7 7.9 9 61985 27.6 24.5 27.3 10.1 8.0 9 91986 29.1 22.4 28,5 10.5 9.2 10.31987 29.1 19.5 28.2 9.5 6.3 9.21988 27.5 17.8 26.6 8.5 4.6 8.11989 26.6 16.8 25.7 7.9 5.7 7.71990(a) ... 24.9 7.111991(a) ... 24.4 • •• ... 7.6
NOTE BIRTH & DEATH RATE SEPERATELY S O U R C E :- SAMPLE REGIST RATE ON BULLE- FOR RURAL URBAN NOT TIN (OFFICE OF THE REGISTRARAVAILABLE. GENERAL OF INDIA).
2 8
3. VITAL STATISTICS.
3.2 Nuhiber of Deaths by Principal causes—(Contd.)
SL. Cause of Deaths N o.
Number of Deaths
Male
1. Infective and parasitic deseases
2. Neoplasms.
3. Nutritional & Metabolic Deseases and Immunity
disorders.
4. Diseases of blood forming organs.
5. Mental disorders.
6 . Diseases of the nervous system and sense organs.
7. Diseases of the circulatorysystem
8. Diseases of the Respirtory syetem
9. Diseases of the Digestive
system
10. Diseases of Urinary sastem
11. Complication of pregnancy child birth and puerpariam
12. Diseases of the skin and sub culaneous tissue.
13. Diseases of the muscules- keletal system and connective
tissue.
14. Congenital anemalies15. Certain condition originally
in the parinatal period
16. Singas and ill defined conditions
17. Injury and poisoning.
TOTAL
1984Females Total
690
95
35
36
6
34
166
412
43
14
13
4
8
164
501
43
25
26
5
25
114
328
26
8
23
1720
1095
1247
1191
138
70
62
I I
59
280
740
69
22
23
18
7
18
259
2967
Male
6
423
56
39
47
7
27
18 3
528
55
4
16
159
1572
1985Females
31737
15
448
25
111
375
40
4
33
2
19
90
1124
Total
74093
54
91
15
52
294
903
95
8
33
5
55
24?
2696

29
3. VITAL STATISTICS.
3. 2. Number of deaths by principal Causes • • • •......... Contd.
SL-. Cause of Deaths
NO.No. OF DEATHS ■
1986 1987Male Females Total Male Females Total
1 2 9 lo 11 12 13 14
1. Infective and parasitic diseases. 927 713 1640 1154 738 18922 Neoplasms. 100 71 171 115 113 2283. Nutritional & Metabolic diseases
and Immvmity disorders. 40 26 66 66 34 1004. Diseases of blood forming organs. 51 64 115 102 117 2195. Mental disorders. 13 8 21 21 10 316. Diseases of the nervous system
and sense organs. 52 42 94 97 «8 1857. Diseases of the Circul ator system 285 - 153 438 234 142 3768. Diseases of the Respirtory system. 263 169 432 212 131 3439. Diseases of the Dsgestive system. 62 44 106 96 64 160
10. Disease: of Urinary system. 12 10 22 49 34 8311. Complication of pregrancy child
birth and mcerparium 21 21 63 6312. Diseases of the skin and sub
cutaneous tissue. 9 2 11 • • •
[3. Dishasesof the mesculoskeletalsystem and Comective tissne, 4 5 9
14. Congenital anemuleis15. Certain Condition originally in
the perinatal period. ... ... ...
16. iSingns and ill defined conditions. 113 65 178 23 3 2617. Injury and poisoning. 80 50 130 m 191
TOTAL:— 2011 1443 3454 2291 1666 3897

30
3. VITAL STATISTICS.
. 2 NUMBER OF DEATHS BY PRINCIPAL C A * SES—Contd.
---------------- ■ NO. OF DEATHS
SL.NO. CAUSE OF DEATHS
1988 1989
MALE FEMALES TOTAL MAI.E FEMALES TOTAL
1 2 15 16 17 18 19 20
1. Infective and parasitic diseases 1442 80S 2250 381 258 639
2. Neoplasms 73 53 126 75 39 114
3. Nutritional <6 Matabolicdiseases and Immunity disordfes 39 31 70 43 24 67
4. Diseases of Blood forming organs
5. Mental disorders
723
59
3
131
6
57
9
37
2
94
11
6 . Diseases of the nervous system and sense organs 35 34 69 35 19 54
7 , Diseases of the circulatory system 309 212 521 175 71 246
8 . Diseases of the pespirtary system
345 221 566 952 454 1406
9. Diseases of the Digestive 199 121 320 95 53 148system
10. Diseases of urinary system15 17 32 23 19 42
11, Complication of pregnancy 58 58 21 2lChild birth and puerparium
12. Disease of the skin and 4 2 6 2 ... 2sub-cutaneous tissue
13. Disease of the musculos-keleral system and connective tissue NIL NIL NIL 4 2 6
14. Congenital anematies 10 4 14 7 3 10
15. Certain condition originally in the perinatal period 11 4 15 4 2 6
16. Signs and ill defined conditions 94 46 140 159 41 200
17. Injury and poisoning 158 82 240 40 33 73
TOTAL 2809 1755 4564 2061 1078 2139

31
VITAL STATISTICS.
3 .2 Number of Deaths by Priucipal cause—concld.
» SL. NO.
1
Cause of deaths
1. In fective and parasitic diseases.
2. Neoplasms.3. Nutritional & Metabolic diseases an i
immunity disorders
4. Diseases of blood forming orgsns
5. Mental disprders.
6. Diseases of the nervous system and
sense organs.
7. Diseases of the circuletory system.
8. Diseases of of the Respirtory system.
9- Diseases of the Digestive System.
10. Diseases of Urinary System.
11. Complication of Pregnancy child brith
iand perparium.
12. Diseases of the skin and subcutaneous tissue.
13. Diseases of the musculoskeletal system and connective tissue.
14. Congenital anemalies.
15. Certain conditian orginally intthe perinatal 1 period.
16. Singns and ill-defined couditions17. Injury and poisoning.
MALE
21
554
ICO
49
85
10
65
329
865
170
18
29
10
56
1471642
NO. of deaths—1990.
FEMALES
22
337
86
30
74 ■
44
189
476
109
52
34
22
6
27
76898
TOTAL
23
891
186
79
159
18
109
518
1341
279
70
34
13
51
16
83
2232540
TOTAL 4136 2474 6610
N o te —Above data on deaths covered so for P.egistered.
Source Directorate of Health service, Tripura. AGARTALA.

32
4. HOUSING,
This section deals with the Census Houses o f Tripura as recorded in 1981 census in the statisticalTables:—
TaWe :— 4.1. Number of Census Houses classified by use according to populations Census, 1981.
Table :— 4.2, This table gives information relating to Households by size Number o f rooms occupied and tenure status o f houses according to populations Census 1981.
Table;— 4.3. This table gives Information relating to No. of occupied Residential Houses and persons per House in 1981.
Tablfe :— 4.4. Distribution of Households by predominent material of roof and wall in 1981 Census Houses occupied by them.
Table :-— 4.5. District-wise distribution of House-holds by predominent material oJf Roof and wall.
Table :— 4.6 This table gives information relating to Number of Houseless and Institutional population in 1981.
Tabler— 4.7. Data on number of Building authorised for construction and building completed with floor area in private sector at Agartala have been shown
Table No. 4.7.
Table:— 4-8. This table gives information relating to the Numbers of dwellings cum’-
residential Buildings in the private sector at Agartala.

4 .1 Number of Census House clawified by use uceording to Populatioft Ccrwu#, 1981—Cc^td.
State/District
TotalRuralUrban
TotalNumberofCensusHouses
3
Census Houses vacant at the time ofHouseListing
4
Residence Shop-cumResidence
Work shop cumResidence
includingHouseholdIndustry
Hotel, Sara is Dharamsala, Tourist
Homes and Housei Inspection Houses
Shopexcludingeating-
9
BusinesHousesand
Offices
FactoriesWork-siiopand
1 2 5 6 7 8 10 M
Total 420773 12199 365119 1331 3163 630 15390 3469 5436TRIPURA Rural 364740 9893 323867 1128 2979 460 9337 2452 3311
Urban 56033 2306 41252 203 184 170 10i7 z f e r
WEST Total 198272 5281 171464 534 1763 345 8615 , 1527 3029TRIPURA Rural 162612 3992 144689 402 1647 25i- 4706 1008 1679
Urban 35660 1289 26775 1S2-f
116 94 3909 519 1330
NORTH Total 111501 3591 96735 s u 639 , 170 3503 900 1163^TRIPURA Rural 101222 3090 89616 464 606 121 2220 659 788
Urban 10279 501 7119 52 a 49 1285 241 375
SOUTH Total 111000 3327 96920 281 761 115 3270 1042 1244TRIPURA Rural 100906 2811 89562 262 726 88 24M 785 m
Urban 10095 516 7358 19 ; 36 27 859 257 400
W

4. HOUSING
4.1 Number oF Census Houses classified by use ac-pardjflg to Popful^tion Census, 1981—Contd.
Year/District TotalRuralUrban
Restaurants Sweet shops, eatiog places
Places of Places ofEntertainment work shop& community' -gathering (Panchayat ghars)
Others
12 13 14 15 16
Total 3470 609 1516 8441
TRIPURA Rural 2641 472 1S83 6817
Urban 829 137 133 1624
WEST TRIPURA Total 1638 287 514 » 3275
Rural 1166 205 463 2404
Urban 472 82 51 871
NORTH TRIPURA Total 764 163 609 2746
Rural 577 139 562 2380
Urban 187 24 47 366
SOUTH TRIPURA Total 1068 159 393 2420
Rural 868 128 358 2033
Urban IVO 31 35 387

4. HOUSI.NG
4.2 Household by siz% Num’>sr of roons jx a p ie i and tenure status of houses according to population censM$, 1981,,
District
WESTTRIPURA
NORTHTRIPURA
SOUTHTRIPURA
STATETRIPURA
Total Total No. Average No, of household Occupied Households accupying Unioei- House- Itistj.
Rural of house No. of Total Owned Rented No. 1 2 3 4 5 6 fied No. less tuti*Urban holds. n embcis Exclusive Rooms Rooms Rooms Rooms Rooms Rooms of House coal
in the room rooms bold househousehold holds
Total
RuralUrban
Total
RuralUrban
Total
RuralUrban
Total
RuralUrban
177922
14991628006
101576
942367340
100304
924837821
379802
33663543167
177152
14937427778
100910
936817229
99702
5 920725 7630
5 377764
5 3351275 42637
147098
1303721672686731
825164215
88844
840744770
322673
29696225711
7998286055091
3816516926
8
30054 13IJOo'l 12 11052 I
14179 12
11165 123014 ...
10858 5
23
30
264
10
128482
10929119191
79302
736385664
81625
754116214
289409
25834031069
36331
306685663
16916
158271089
14783
136981085
68030
601937837
11
9023
70381985
3507
32053o2
2489
2260229
15019
125032516
12
2396
1800596
861753108
582
52656
3839
3079760
J3
192
178
14830
122
IIJ11
14 15
526 292
334 142150
131
9536
75
4332
826 489
593 280 233 218
8989
113
16
137
8354
110
1055
75
21 6411
113 322
25270
17
633
459 174
556450106527
347180
17161256460
U>
Note (l) Data in respect of col, 5 to 7 includes house’ess households but excludes institutional households. Data on only two inportant types of tcnnure shown above.
(2) col. 8 to 15 do not include houseless and institu* tional household and “ Rooms‘’ means living Room.
Natic:: ; ,.u'e of I . t:-:Planntijii ad Acar.nistraticn.17-B, Srj A jiobjiido Marg, New Delhi-110016 DOC, No
c m \.u a l
Source ;—Census of India—1^81, Publication series 21 (part—VIII of A & B)

4. HOUSING
4.3 No. of-Oceupkd Residential Houses and Persoosper in .
District Total House Hold
1. TRIPURA WEST 177922
2. TRIPURA NORTH 101576
InstitutionalHousing
Occupied Residential Housing
Rural Urban
5
633 144689
556 89616
■persons pSf Occupied Residential Census House
Total
26775 171464
7.119 96735
Rural Urban
8
Total
Ik
3. TRIPURA SOUTH 100304 527 S9562 7358 96920
TRIPURA STATE 379802 1716 323867 41252 365119
Sovirct ; 1 81 C-tnitis Pofelicatkjia bn Houselicd^ Tables ( series 21 Pai t N'lII—^A- B.)

4. HOUSING
4.4 Distribution of Households by Predominent Materials of Roof and Wall of Census House occupied by them.in Tripura.
MATERIAL OF ROOF
Material of Walls.
Totalhouseholds
Grass Leave Tiles- Corrugated Asbestos BrickReeds, Thatch Slate iron, zinc or Cement stoneWood, Mud, Shinglu other Metal Sheets &
unburnt Bricks sheets. limeor Bamboo.
Stone ConcreteRBC/RCC
All others Materials & not stated
t 2 3 4 5 6 7 8 9 10
All Materials. 42637 23515 209 14189 256 2186 45 1602 635Gass, Leave, Reedsor Bamboo. 27086 19292 7348 33 413Mud. 5667 3641 105 1785 6 ... 130Unburnt Bricks. 270 96 4 131 4 30 1 4Wood 224 26 5 184 4 ... ... ... 5Burnt Bricks 5470 146 78 2596 105 1391 19 1,113 22GS Sh««ts of others Metal sheets 1123 148 10 886 7 29 21 19 3Stone 8 ... 2 1 ... 2 3Cemeot coocretes 2580 114 6 1159 96 732 3 459 11Ail other Materials and Material not stated 209 52 1 98 ... 4 1 5 • 48
Source: 1981 Census Publication—series 21-—Tripura Part VIII—A+B

4.5 Distribution of Households by predominent Material of Roof and wall of Houses occupied by them by District—CoTitd.
WEST Tr ip u r a .
4. MOUSING
. ... ^ MATERIAL OF ROOF
Matfifial of walls TotalHouseholds
Gass leave, Reeds, thateh wood, mud, unburnt Bricks or Bamboo
Tilesslateshinglu
Corrugated Iron, Zinc or other Matal sheets
AsbestosCementSheets
BrickStone & Stone lima
Concrete/RBC/RCC
All other Materials & not stated
1 2 3 4 5 « 7 8 9 10
All Materials 27778 12862 128 10944 179 1867 30 1308 460Grass, Leave, Reeds of Bamboo, 16357 10304 5741 28 284
Mud 3928 2258 56 1490 4 ' . 120Unburnt Bricks 216 76 3 104 3 25 4 4 • ••Wood.• ‘ ■ r ■ 171 j e 2 145 4 4Burnt Bricks 4294 61 58 1881 76 1231 12 960 15G, I. Sheets or others metal sheets 951 108 5 781 6 22 15 12 2Stone. 5 1 ... 1 3Cement Concrete. 1745 16 3 743 58 588 2 330 5All other Materials' & material not stated. 111 23 1 58 1 I 27
oo

- r .—HTTUSTTVCjV
4.*) Distribution of Households by predominent Material of Roof & wall of Houses ocQHpied by them by District Contd.
NORTH TRIPURA
m a t e r ia l o f r o o f
Material of wall
. V V
TotalHouseholds
Grass Leave Reeds or Thatch^ wood Mud unburnt Bricks or Bamboo
TilesState
Shinglu
Corrugated Iron, Zinc or other
sheets
AsbestorsCementsheets
Brick Stone & Sheets
StoneConcreter b c /r c c
All other Materials & not stated
- —f---------1 , . .......... . .2 3 4 5 6 7 8 9 ' 10
All Materials 7229 5317 19 1328 51 208 9 260 37Grass, Leaves, Reeds or Bamboo 5475 4974 470 4 27Mud. 149 117 2 29 I
Unburnt Bricks 20 4 12 1 3 ...iWood ^ 34 8 1 . 25 ...Burnt Bricks 682 68 12 374 6 81 5 ' 1 3 2 4G, I. Sheets or others Metal sheets 79 19 4 41 4 3 7 1Stone 1 1 ...
Cement Concrete 718 98 ... -■ 343 38 117 ... 117 5All other Materials &
Material not stated 71 29 34 . ... 3 1 4 ...
toVO

4.5-Distribution of Households by predomineot Material of Roof & wall of Houses occupied by them by District—Contd.
SOUTH TRIPURA
4. HOUSING
m eter ial o f ro o f
Materials of walls
All Materials
Grass, Leaves Reeds or Bamboo.Mud.
Unbiirnt Bricks.Wood.
Burnt Bricks.
G. I. Sheets or others Metals Sheets.Stone
^wnent Concret,
All other Materials &Material not stated.
TotalHouse holds
2
Grass, Leave, Reeds or Thatch, Wood, Mud, Unburnt Bricks or Bamboo.
TilesStateShinglu
Corrugated Iron, Zinc or other Sheets
AsbestorsCementSheets
BrickStone
&Sheets
StoneConcreteRBC/RCC
All other Materials & Not Stated
3 4 5 6 7 8 9 10
7630 5336 62 1917 26 111 6 34 138
52541590
3419
494
40141266
162
17
47128
11372661514
341
11
23
2
79 2 21
10210
13
932
21 I 64 1 3 3 • ••
117 31
73•••
27• ••
1
1
12 1
27 ... 6 ... ... ... 21
Source :—1981 Census Publication

4. HOUSING
4.6—Hoasieless and.Institutional-Population 1981
Number of persons
District Houseless Institutional Total % age to total Population
■w- 1 . . . X i ; ■ 4 , 5-
1. Tripura West 135 9339 9494 0.97
2. Tripura North. 127 i l l ! 5849 l.OS
3. Tripura South. '147 3735 3882 0.72
State ' " 409 18,816 19,225 0.94
Source :—1981 Census Publication.

4. 7. Number of Building authorised for construction and building completed and floor area likelyto be added/added by type of building in the private scctor at Agartala..................Contd. (Floor area in Sq. Mt,)
4. HOUSING
TYPE OF SVILDINO SaoctioD
1985-86
Cdltit)letion SanctiOli
1986-87
Completion
1987-88
Sanction Complettofi
No. of Floor No. of Floor No. of Flopr No. of Floor No. of Floor No. of Floor Plans area Plans area Plaos afsk Plans area Wans area Plan area
8 40 11 12 13
i) Residential
Family (dwellings) N«v caofitrwtioa &. Additions. 529 28,300 845: 55,194 391 23,3f8 574 34,821 «I4 5S609 647 38»167
2) Residential (Others) New Construction & Additions 356 51
Non-ResldentiaU
0 Industrial i.. ... i M ■ ■ ■ ■ ... ... 2 231») Commercii! 21 999 32 1760 18 1504 19 1513 28 2127 19 1850iii) Institutional i.. i 80 2 469 1 68 4*4 1 401iv) Others i.. ... ... ... ... ... 1 87 ... ...
ALL TYPES 550 29.299 889 57,114 4 it 41533 600 36,758 543 55,823 670 40,700

4, HOUSING4.7 NUMBER OF p y itp iN G AyTHQRKgp FOR ^ N S-m U C nO N AND BUILDING COMPLETED
AND FLOOR AREA LIKELY TO BE ADDED/ADDED BY TY«S OF BUILDING IN THE PRIVATESIgCTOR A t AGARTAI.4 CONTD.
(Floor area in Sq. Mt.)
1988-89 i m - 9 0
W i-Q ^ .iy iL D lN G Sjinction Completion Sanction Completion
r - ; r ; ; r v - r , v -No. of Plans Floor area No. of Plans Floor
areaNo. of Plans Floor
areaNo. of Plans Floor
area
: ; ■- 14 15 16 17 18 19 20 21
1. ^BSipgfcJTIALPafi iiy f dwe^ hgs ) New
- CdBstruction & Additions 497 27,723 726 67,909 665 48,158 1 35.J29
Z, RESIpENTrAL- (OTHERS) "
New Construction of Additions 43 3296
3. n o n -r e sid e n t ia l
i) Industrial-
IQ 176 •••»i) Comn)ercial 16 1848 31 24T8 J2 2356 48 3891
ill) Institutional 1 78 8 569 t 1S9 3 677
iv) Others ... ... I 87 67« 50703 702 3^797
514 29649 819 74515 1356 101406 1404 79594

4.7 NUMBER OF BUILDING AUTHORISED FOR CONSTRUCTION AND BUILDING COMPLETED AND FLOORAREA LIKELY TO BE ADDFD/ADT)ED BY TYPE OF HUILDINQ IN THE PRIVATE SECTOR \T AGARTALA ..CONCLD.
(Floor area in Sq. Mt)
4. HOUSING
TYPE OF BUILDING
1990-91 1991-92
Sanction Completion Sanction Completion
No. of Plans Floor area No. of Plans Floor area No. ofPians Floor ar^ No. of Plans Floor r.ea
22 23 24 25 26 27 28 29
1. RESIDENTIAL
Family (dwellings)New Construcildb ' &Ad(^itions ,
2. RESIDENTIAL (OTHERS)
New Construction of - Additions3. NON-RESIDENTIAL
483^ 38401 959 57850 684 872 90,269
i). Industrial ... ••• 5 239 1 20 24 1,233il), Commwcial 4 2885 21 3006 16 4,264 26 1,603iii>. Institutional I-.:- • f.. 1 81 2 266 1 147|v). Others 2 87
ALL TYPE 487 41236 988 61263 703 54,967
SOURCE LOCAL SELF GOVT. DEPARTMENT AND DIRECTORATE OF STATISTICS, '
923 93,252

45
4. HOUSING.4.8. Number of dwellings in residential and non-residential - residential building authorised for’ cons-
truction in private scctor at Agartala.
St ags of construction year TYPE I Room
OF DWELLINGS 2 Room 3 Room 4 Or More
RoomsAll
Types[ 2 3 4 5 6 • - 7
PLANS SANCTIONED.a ) No of dwelling units in new
construction works. 1985-86 43 104 104 V- 192 443.1986-87 37 92 82 • ' - 123 3341987-88 , 30 124 • 108 175 437 .1988-89 ‘ 42 108 117 .. 191 4581989-90 71 136 167 241 6151990-91 47 89 128 200 464- •1991-92 53 102 191 304 650
b ) No. of additional dwellingunits created if any in additional works. 1985-86 17 27 17 ' . 23 . ,84
1986-87 14 9 15 15 531987-88 21 19 1 18 • . C771988-89 16 5 8 431989-90 ' 9 15 12 14 • 501990-91 12 3 6 8 .19199l-$2 4 6 9 12 31
WORK COMPLETED. I - ■a ) No. of dwellings uiiits in 1985-86 68 '135 - 106 214 523
new constraction works 1986-87 * 92 124 ' 122 141 4791987-88 75 165 117 215 57,1988-89 • ‘ 90 1-52 ‘ 154 ' ' 230 6261989-90 192 189 105 204 6901990-91 159 145 276 332 9121991-92 134 159 236 284 803
b ) INo of additional dwellingsunits created, if any in additional works. 1985-86 35 44 119 135 333
1986-87 27 19 15 30 911987-88 18 18 30 14 801988-89 22 27 27 40 1161989-90 10 17 17 18 621990-91 6 17 10 14 47
___ 1991-92 13 17 15 20 65
Source Local Self Govt. Deptt.Directorate of Statistics.

5. Edu«ati«ir-
46
This section deafe whfe tlift (fata crar echicatioiiat progress in respect o f InitituCioii Te»- dwr, StudeM and Oo¥t. ExpendilBTft in TfifgMraw
The follDWing Statistical tables on the Education system in Tripara are based on the Annual Educational Statistics complied by the State Education Department.
Table No * 5.1 Number o f recognised Institutions by Type in Tripura.
Table No - S2 Numbftc o f Educational Fnstilution by Type ia. Tripura.
Table N o -5 ,3 Number of Educational Institutions exclusively for Girls by Type in Tripura^
Table No - 5.4 Classification o f School in Tripura.
T a ^ No'- 5.5 NumbeF of Teacher Classified by Departmcfrt m TriptiT».
Table N o -5 .6 Number o f Student by Department in Tripura,
T a l^ N o- 5.7 Number o f SchedWed Caste Students by Derartment in Tripura,
TaWe No - R8 Number of SchecteJed Tribes Students by Di^jartmcnt in Tripura,
TaWc No - 5.9 In take Degree course in Engineering by Department in Tripura.
Tabte No- 5.10 Expenditure incurred on Educational Instftations by Type of Education i a X r ip u ia .
Table No-5.11 Expenditure incurred on Educational Institution by sourcer in Tripufa.
TafeliftNo-5,l!2 Year-wise average number o f Students and' TiKBcheir by
Tatibft No-5.13 Statement showing the position o f publift libcary in Tripura.

5. EDUCATION
(5..1 Number of Recognised Institution by type in Tripura
iy^< dria ititu tionifumber o f Instttutions
19S1-82 ^^82-83 1983-S4 ISNM SS l!>85-86 1986-S7 1^%88 1^88-89 1989-90 1990'4{T
1. General Collegif per 10,00,000population 4
2. Higher Secott«bMty S liodi|w r 1^00,000 ftop^atlon — J
3. High/Post Basic SchdiM$per 1,00,000 poptHatioii 7
4. Miiddle/SentOT Basic Sclidolper 1,00,000 population 14
5. Primary/Junior Basic Schoolper 1,00,000 population 86
4 4 4 4 4
4 4 4 , 4 4
« S 9 10 l i
14 15 16 17 18
91 89 87 83 82
9 10 i n t
5 5 5 S
$ 5 S
11 30 11
17 17 17 15
83 85 82 75Note:* Based on estimated population.
5.2 Number of Educational Institutions by type in Tripura.5. EDUCATION',
Year/District Univer- General Engineer Govt, sity college ing Law
college college
Music, Sansk Art colleg
college
1951-^1982-83 91983-84 91984-85 1 91985-86 1 91986-87 91987«88 1 l i1^8-89 1 131989-90 1 131990-9119 » -^ >
1 13
Tripura(W) 1 6Tripura(N) 3Tripura(S) ... 4
t Regional Polyte- Regional Physical chnic Pharmacy
Insti. Insti. Insti.
I.T.I. Other Higher Training Seco-
Insti. School
High/post
Middle Primary S. B. J.B.
8 9 10 11 12 13 14 15 161 3 5 72 144 294 17921 3 7 S3 156 308 19461 ... 1 7 84 180 328 m i
1 1 1 i 3 92 197 350 19611 1 1 3 4 92 239 389 18981 1 1 3 100 280 419 19271 1 i 3 126 255 419 1989I 1 1 3 6 148 280 430 20831 1 1 3 6 148 306 423 20631 I 1 3 6 148 307 427 2067
1 i 1 72 146 190 7101 ... 1 1 36 82 108 679... ... 1 2 40 79 129 678
4i
Source:- Directorate of School <& Higher Education,Gpvernment of Tripura.
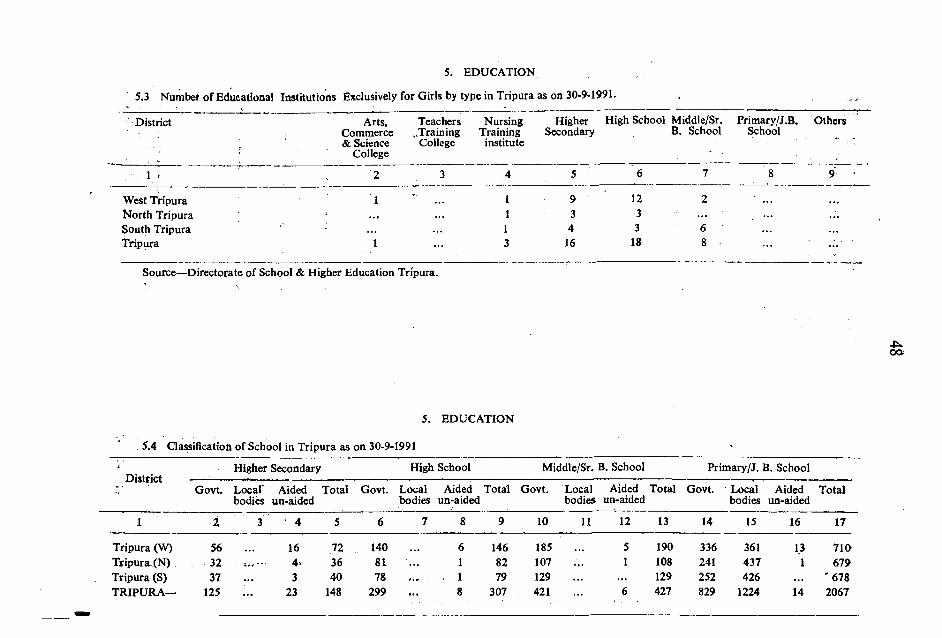
5. EDUCATION
5.3 Numbet of Educational Institutions Exclusively for Girls by type in Tripura as on 30-9-1991.
District Arts, Commerce
1 & Science ■ College
Teachers ,,Training
College
NursingTraining
institute
HigherSecondary
High School Middle/Sr. Primary/J.B.B. School School
Others
1 ' .2 3 4 5 6 7 8 9 •
West Tripura 1 - 1 9 12 2 ...North Tripura 1 3 3 ... ...South Tripura ... 1 4 3 6 ... ...Tripwa 1 ... 3 16 18 8
Source—Directorate of School 8c Higher Education Tripura.
5. EDUCATION
5.4 Qassification of School in Tripura as on 30-9-1991 •
Higher Secondary High School Middle/Sr. B. School Primary/J. B. School
Govt. Local' Aided Total Govt. Local Aided Total Govt. Local Aided Total Govt. Local Aided Totalbodies un-aided bodies un-aided bodies un-aided bodies un-aided
I 2 3 4 5 6 7 8 9 10 11 12 13 14 15 16 17
Tripura (W) 56 16 72 140 6 146 185 5 190 336 361 13 7 iaTripura-(N) 32 ............... 4. 36 8L 1 82 107 1 108 241 437 1 679Tripura (S) 37 3 40 78 ... 1 79 129 129 252 426 *678TRIPURA— 125 23 148 299 8 307 421 6 427 829 1224 14 2067
oa

5. EDUCATION5.5 Number of Teacher Classified Department in Tripura—Contd,
UniversityYear/District
I
General College Engineering College Govt. Law College Music & Art College
Men Women Total Men Women Total Men Wonien Total 2 ~ '3 4 5 6 7 8 9 10
Men Women Total " 1 1 12' 13
Men Women TotalT s “14
Note :—The figures in Parenthesis are guest decturers.
161984-85 21(42) 3(5) 24(47) 319 77 396 42 1 43 34 12 461985-86 20(42) 3(5) 23(47) 329(7) 73(2) 402(9) 37 1 38 34 12 461986-87 20 3 23 327(10) 78(1) 405(11) 42(1) 42(1) (6) (6) 34 13 471937-88 22(35) 3 25(35) 329(8) 82(1) 411(9) 41(1) 1 42(1) 4(6) 1 5(6) 34 14 481988-89 24(45) 3(9) 27(54) 431(4) 93(2) 434(6) 40(1) 1 41(1) 3(^) 1 4(4) 34 14 481989-90 31(44) 4(9) 35(53) 358(17) 108(4) 466 ;21) 37 1 38 3(4) (1) 3(5) 31 16 47
1993-91 43(44) 5(9) 48(53) 353(23) 101(7) 454(30) 38 1. 39 2(4) (1) 2(5) 32 11 431990-91 . -
Tripura (W) 43(44) 5(9) 48(53) 236(7) 74(4) 310(11) 38 1 39 2(4) (1) 2(5) 32 11 43Tripura (N) 56(4) 8 64(4) ...Tripura (S) 61(12) 19(3) 80(15) ...
5. EDUCATION 5.5 Number of Teacher Classification to Department in Tripura—Contd.
Year/Dist ictSanskrit College Resional Physical Inst. Polytechnic last. Reii'^n.J Phar.nacy Ins^ I.T.I.
Men Women Total Men Women Total Men Women Rotal Men Wo.nen Total Men Women Total
1 17 18 19 20 21 22 23 24 25 . 26 27 28 29 30 311984-85 4 1 5 4 4 30 30 3(10) ( ) 3(11) 42 2 441985-86 4 1 5 4 4 25(2) ... 25(2) 4(19) (i) 4;21) 47 2 491986-87 3 3 4 4 25(2) ... 25(2) 5(6) 5(6) 44 3 471987-88 3 3 4 4 25(2) ... 2-(’’-) 6(4) (i) 6(5) 40 3 431988-89 3 3 4 , 4 26 26 6(5) (1) 6(6) 42 3 451989-90 3 3 6 6 26 26 7(5): (I) 7(6) 53(1) 2: 55(1)1990-91 3 3 6 . . . ■ ■ 6 : . - V 21-. .6(r5)- • 1. ■ ' 6(6) 50 ■ 4 , 541990-91 Tripura (W) 3 3 ' 27- ■ ... 27 ’ 6^6)' -■ 6(6) 30' '
■ -30
Tripura (N) 6 11 2 13Tripufa (S) . . . 9 2 11
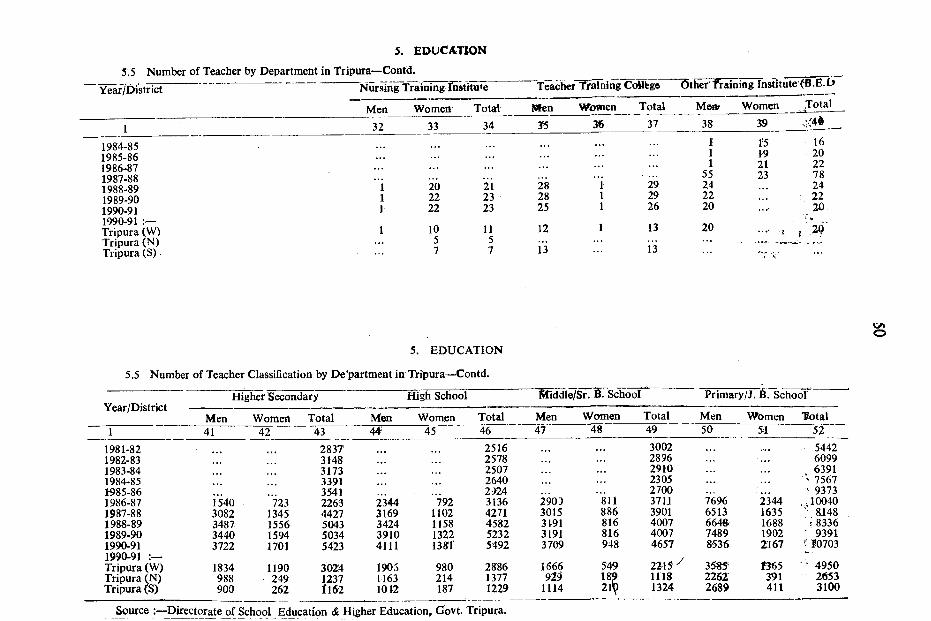
5. EDUCATION
5.5 Number of Teacher by Department in Tripura—Contd.Year/District Nursing Training Institute
Men Women
1 32
1984-851985-861986-871987-881988-891989-901990-91 1990-91 Tripura (W) Tripura (N) Tripura (S)
33Total
34
’ TeachefT?ilning CoUbge Sther’/raining Institute E
Wionien Total Mea> Women Total 36 37 38 39 __
Nfen
I11
55
1=51-92123
20 21 28 1 29 24 ...22 23 28 1 29 2222 23 25 1 26 20 ...-
10 11 12 1 13 205 5 ... ... -. ....7 7 13 13 *i* 'i| *
16202278242220
20*
5. EDUCATION
5.5 Number of Teacher Classification by De'partment in Tripura—Contd.
Higher Secondary High School ~Rriddie/&. 6. school Primary/Ji 6. School
Source Directorate of School Education & Higher Education, Govt. Tripura.
Year/DistrictMen Women Total Men Women Total Men Women Total Men Women Total
1 41 42 43 44 45 46 47 48 49 50 51 52
1981-82 2837 2516 • •• 3002 ■: 54421982-83 3148 2578 2896 60991983-84 3173 2507 2910 63911984-85 3391 2640 2305 75671985-86 3541 2924 2700 ' 93731986-87 i ‘540 ”723 2263 2344 "792 3136 2903 "811 3711 7696 2344 ,.,100401987-88 3082 1345 4427 3169 1102 4271 3015 886 3901 6513 1635 ■ 8.1481988-89 3487 1556 5043 3424 1158 4582 3191 816 4007 664ft 1688 i 83361989-90 3440 1594 5034 3910 1322 5232 3191 816 4007 7489 1902 93911990-911990-91
3722 1701 5423 4111 13»1 5492 3709 948 4657
2215^
8536 2167 ^10703
Tripura (W) 1834 1190 3024 190S 980 2886 1666 549 3585' m s ' 4950Tripura (N) 988 249 1237 1163 214 1377 929 18? 1118 2262 391 2653Tripura (S) 900 262 fl62 1012 187 1229 1114 21V 1324 2689 411 3100
o

Year/District
1
1984-851985-861986-871987-881988-891989-901990-91 1990-91 :- Tripura (W) Tripura (N) Tripura (S)
5. EDUCATION5.6 N um b« if Students by Department in Tripura.......contd.
Uni/croiiy General GoHtige
Boys Grils Total Boyas Girls Total 2 3 5 6 ■
119143148203228301312
312
6169
103148151186190
190
180212251351379487502
502
5559551651316426637164406433
4153 843
143 7
2919289425793J85312J35733217
2179479557
84788410771095119491
100139650
633213221996
Engi jw Collage G o/t. Collage
ffoys Gfrts Total Boys Gifls Total8 9 10 I f 12 __ 13
381 26 407376 39 415391 39 430 31 10 41442 40 482 31 4 35463 40 5U3 48 2 50453 41 494 28 23460 40 500 66 i'l 88
460 40 500 66 22 88
Music <feArts Collage
Boys14~
165156182165135182230
230
Girls Total15
561574355315248358422
422
16726730537480388540652
652
Year/District
5. EDUCATION5.6 Number of Students Classified by Department in Tripura...... contd.
Sanskrit Collage
Boys Girls Total
Regiona' Physical Institue
Boys Girls Total
Polytecnic Institue
Boys Girls Total
Regional Pharmacy Institue
Boys Girls Totals
Indusstrial Training Institue
1 17 18 19 20 21 22 23 24 25 26 27 28 29 30 311984-85 263 334 597 17 3 20 176 176 104 13 117 283 69 . 3521985-86 261 367 628 7 4 11 144 144 89 8 97 297 54 3511986-87 268 369 637 16 12 28 144 144 69 22 91 281 61 , 342'1987-88 270 373 643 15 3 18 140 140 75 19 94 275 64 3391988-89 273 364 637 14 1 15 135 135 82 17 99 269 67 3361989-90 276 356 632 21 8 29 147 147 72 18 90 239 8 2471990-91 270 368 638 28 12 40 173 173 92 11 103 195 47 • 2421990-91 Tripura (W) 270 368 638 173 173 92 11 103 84 .. 84Tripura (N) Tripura (S)
28 12 40::: :::
5655
2819
8474

5.6 'Numb^'r
Year'Dis'rict
1984-851985.86
5. EDUCATION of Stulents Classified by Department ia Tripura—Contd.
Nursiag Training Institute Boys Girls Total
32 33 34
Teacher Training College Other Training InstituteBoys
" 35”Girls
36Total Boys Girls
1986-871987-881988-89 217 217 2051989-90 290 290 1741990-91 208 208 1711990-91Tripura (\V) ... 127 127 ■ 68Tripi.ra(N) 40 40Tripura (S) 41 41 103
Total7 38 39 40
„ ------ ---265 265286 286306 306
169 163 332205 127 47 174174 155 45 200171 144 60 204
68 144 60 204
103
5. EDUCATION 5.6 Number of Stu lents by Department in Tripura—ContclJ.
H ijh Schooll-Ii jher Se:oiidary Year;Di;.*rict —----------------------------
41Girls
42,
Total Boys Girls
43 44 45
Total46
MiJile/Sr. B. School
Boy 3 47
(a) Boys 4 Girls brcack up are not available.Source ;—Difect.>r of School & Higher Education, Govt, of Tripura.
_Girl548
1984-85(a) 15157 269121985-86(u) . . . \ 16660 307101986-87 10107 5176 15283 24280 17253 41533 63040 43980
i987-88 9251 5135 14386 26433 18314. 44747 67390 50001I988-S9 10142 5046 15188 28124 19>76 4.U00 66312 504811989-90 11601 6885 18486 33383 23364 56747 81090 600011990-91 11312 5946 . 17283 30874 22226 53100 75508 56487
1990-91 ;~Tripura (VV) 4739 3126 " 7865 14640 11591 26231 •'37/33 ■ '29238
Tripur .a {^') 2391 1447 4338 7002 •: 5865.. 12867 . , 140 37
Tripura (S) 3712 1375 5085 9232 4770 14002 19340 13212
Total49
81444 88440
109029 117391 116795 141091 131995
6697131)72.33J52
Primary/J. B. School
Boys50
202244206469212581211179216481
1017735486959339
Girls Total
51 52
162525166242174250175442178450
350557354590364769372721386831386621394931
56195 18826845166 10003546789 106628

5. EDUCATION
5. 7 Nufflbai* of Scheduled Ca§te Studeats by Department in Tripura as on 30-9-1991.
Post Graduation Graduation Higher Secondary High School Middle/Sr. B. School Primar>/J. B. School
District -----
Boys Girls Total Boys Girls Total Boys Girls Total Boys Girls Total Boys Girls Total Boys Girls Total
1 2 3 4 5 6 7 8 9 10 11 12 13 14 15 16 17 18 19
West Tripura 22 5 27 483 244 727 559 352 911 2509 1475 3984 6344 4262 10606 20663 17201 37864
North Tripura ... ... 80 29 109 366 78 444 961 751 1712 2390 1890 4280 7844 6636 14480
South Tripura ................ 225 52 277 498 202 700 1397 806 2203 3597 2525 6122 10715 9016 19731
TRIPURA 22 5 27 788 325 1113 1423 632 2055 4867 30^2 7899 12331 8677 21008 39222 32853 72075
Source :— Director of School <5: Higher Education Tripura.
5. EDUCATION
' 5. Number of Scheduled Tribes Students by Department in Tripura as on 30.9.1991.
Post Graduation Graduation Higher Secondary High School Middle/Sr. B. School Primary/J. B. School
Boys Girls Total Boys Girls To^al Boys Girls Total Boys Girls Total Boys Girls Total1 Boys Girls Total
1 2 3 4 5 6 7 8 9 10 11 12 13 14 15 16 17 18 19
West Trip'jra 6 2 8 191 69 260 754 293 1047 4277 2351 6628 9440 6904 16344 40607 18232 588^9North Tripura ... 27 3 30 280 77 35’ 1072 6IJ 1692 3578 2087 5665 224 15 8623 H038
South Tripura ... ............... 21 ’ 23 294 41 3^5 1877 558 2435 4930 2260 7190 29455 10752 40207
TRIPURA 6 2 8 239 74 313 1328 411 1739 7226 3529 10755 17948 11251 29199 92477 37607 130084/^.
Source:— Director of School & Higher Education Tripura.

5. EDUCATION5.9 Intake in Degree Course in Engineering
by Department in Tripura.
54
Year/District Civil Mechanical Electrical Total
1 2 3 4 5
1984-85 38 7 23 681985-86 50 29 28 1071 )86-87 32 34 39 1051987-88 37 32 20 S91988-89 37 34 38 1091989-90 40 40 40 1201990-911990-91
40 40 40 120
Tripura (W) 40 40 40 120Tripura (N) ...Tripura (S)
Source :— Directorate of Higher Education, Govt, of Tripura.
5. EDUCATION5.10 Expenditure incurred on Educational Institutions hy type of Education jn Tripura
(Rs. in lakb)
Univer- Board of Research College for College Higher High ,Middle/ Primary Pre Others Total Year sity Educa- Institution General for Secondary School Sr. Basic Jr. Basic Primary Ex-
tion Education Pro- School School School penditurefessionalEducation
1 2 3 4 5 6 7 8 9 10 11 12 13
1984-85 38.82 21.62 ... 169,83 106.99 735.79 693.27 657.67 1020.89 131.46 ... 3576.34
1985-86 23.34 22.08 ... 194.10 141.46 775.01 770.41 807 46 1119.47 176.01 . 40129.351986-87 34.92 3077 ... 214.79 135.88 870.34 930.22 661 61 1569.79 195.22 ,... 46-64.54l9i!'7-88 44 93 22.79 ... 282.52 209.45 1158.92 926.64 953.55 1715.34 247.40 . .. 5561.631988-89 65.38 358.15 276.28 1440.33 1133.53 949.85 2055.15 1715.00 63.85 8057.521989-90 90.94 470 50 305.73 1970.60 1576.06 115,20 2686.18 320.74 77.36 8650.16
Source Director of School & Higher Education, Tripuira

55
5.11 Expenditure incurred on Educational Institutions by source in Tripura.
5. EDUCATION
( Rs. in lakh )
Yeav Govt, fund Local bodies fund From Fee’s From endowment Total U .G .G & Other source
1 2 3 4 5 6
1984-85 3503.08 38.02 35.24 3576.34l ‘985-86 3962.56 11.40 41.56 13.83 4029,35l!986-87 4595.58 10.51 43.72 14.74 4664.541987-88 4701.00 790,57 25.76 43.36 5561,631988-><9 7017,42 IUO.16 12.91 18.76 8179.1519)89-90 6484.01 1001.64 12,74 15.68 7947.12
Source — Director of School & Higher Education, Tripura.
5. EDUCATION
5.12 Year-wise Average Number of Students per Teacher by Stage
Year/ Primary Middle High School Higher Secondary General College UniversityDistrict Class Class Class Class Graduation Post Graduation
1 2 3 4 5 6 7
19)82-83 56 26 13 4 21 219»83*84 54 27 13 4 19 219)84-85 46 35 14 4 21 81985-86 38 33 14 5 21 919)86-87 36 29 13 7 20 111987-88 46 30 10 3 23 619)88-89 46 29 10 3 22 51989-90 41 35 11 4 21 61990-91 37 2.8 10 3 20 519*90-91Tiripura (W) 38 30 9 3 20 5Tiripura (N) 38 29 9 4 19Tripura (S) 34 25 11 4 21
Source Ditectorate of School & Higher Education, Govt, of Tripura.

56
EDUCATION
5.13 State m nt Showing the Position of Public Library in Tripura
Particulars 1985-86 1986-87 1987-88 1988-89 1989-90 1990-91 1991-92
1. Number of Libraries
i) Stationary I 1 1 21 23 23 24
ii) Mobile .. 23 23 23 23
iii) Branches 19 19 19 2 2 2 2
Total ; 20 20 20 46 48 48 49
2- Total No. of Reading25Rooms 21 21 21 23 25 25
3. No. of Books, Journals inthe Libraries.
i) Stationary 107445 109445 115445 366996 377478 380478 383510
ii) Mobile 1750 1750 1750 1750
iii) Branches 222441 226941 232941 9430 9430 9520 9630
Total :— 329^86 336386 348386 378676 399158 391748 394890
4. No. of Books, Journalsadded during the year
i) Stationary 700 800 1000 7301 1203 602 630
ii) Mobile ...
iii) Branches 3600 3800 4100 ... ... ...
Total :— 4300 4600 5100 7301 1203 602 630
5. No. of Books, Journals '
issued to the readers fromLibrary daring the year
i) Scationery 140500 150300 160000 200825 200630 202050 203750
ii) Mobile ... 1750 1750 1750 1750
iii) Branches 250906 260006 270000 212575 202389 ...
To»al 391J06 410000 430000 415150 404775 204800 205500
6. Average daily attendanceIn the reading rooms
i) Male 400 500 800 330 431 36 36
ii) Female 150 200 300 430 520 9 9
T o ta l:— 550 700 1100 760 951 45 45
7. Total Expenditure onLibraries during the year( Rji ii» l#«kh) 2.40 2 90 3.00 19.00 37.00 2.02 20.73
Source : Birchandra State Central Library, Agartala, Tripura.

57
6. MASS COMMUNICATION
Statistics on Newspapers, Periodicals and printing Press ineluding Govt. Press in Tripura (by District are presented in the following tables.
Table No. 6. 1 Number of Newspapers & PeriodicalsPublished in Tripura.
Table No. 6. 2 Information relating to number ofprinting presses including Govt.Press in Tripura (by District;.

58
Year
6, MASS COMMUNICATION.
6. 1 Number of Newspapers and periodicals in Tripura.
News Papers & Periodical by Language News Papers & periodical by periodicity.
Bengali Engltsh Manipuri Tripuri Total Daily Weekly Forth Monthly By Quarterlynightly mouthly Total
1 2 3 4 5 6 7 8 9 10 11 12 13
1982 45 2 3 1 51 12 34 5 ... ••• 51
1983 40 2 3 2 47 12 31 3 r 47
1984 36 2 3 2 43 12 27 3 1 43
1985 36 2 3 2 43 12 27 3 1 43
1986 40 2 3 4 49 12 31 4 2 49
1987 46 2 1 1 50 13 26 1 10 50
1988 47 2 1 1 51 14 26 1 10 ... 51
1989 69 1 I 2 73 13 26 1 6 27 73
1990 67 1 1 2 71 14 22 1 6 1 27 71
1991 48 2 3 3 56 15 19 4 6 1 11 56
Source ;— Director, Insformation Cultural Affairs Torism.
6. MASS COMMUNICATION
6. 2 Number of Printing Presses ( Including Govt. Press ) in Tripura ( By District )
Year Number of Printing Presses
Tripura West Tripura North Tripura South Total ( Tripura )i
3
1983 40 4 6 50
1984 45 9 6 60
1985 46 7 9 62
1986 42 6 7 55
1987 49 6 9 64
1988 62 5 11 78
1989 63 5 11 79
1990 61 7 11 79
1991 77 8 10 95
Source Offiee of the Inspector o fFactories Govt, of Tripura.

59
7. PUBLIC HEALTH.
This section presenis information relating to public health. The date have been compiled from the return furnished by the Director of health Services.
TABLE N O - 7 . 1
TABLE N O -7 . 2
TABLE N O - 7 . 3
TABLE N O - 7 . 4
TABLE NO—7. 5
TABLE NO—7. 6
This table gives the actual number of medical (Allopathic) Institutions in Tripura.
This table gives the actual number of Ayurvedic, Unani and Homeopathic Institutions in Tripura.
This table shows the number o f patients treated in all types of Govt. Institutions.
This table gives the number of Indoor outdoor patients treated by diseases of Government Institutions in Tripura.
This table shows the number of beds in medical institutions.
This Table shows the Registered Medical and para-Medical personnels in Tripura.

7. HEALTH.
7. 1 NUMBER OF MEDICAL ( ALLOPATHIC ) INSTITUTIONS IN TRIPURa :
Local Pri-Year/ Total State Self vate District Govt.
Rural Urban
Hos- P .H .C ./ Govt. Aided pital Rural
Hospital
Dispen Total Hos- P.H.C. Dispensaries pital saries
TotalPopulation served per medical (alio pathic) Institution both Rural and Urban (1)
1 2 3 4 5 6 7 8 9 10 11 12 13 14
1984-85 277 277 1 35 224 260 11 1 5 17 8125
1985-86 280 280 1 37 225 263 11 1 5 17 8038
1986-87 309 309 1 42 248 291 11 1 6 18 7526
1987-88 384 384 ... 1 54 311 366 11 1 6 18 6269
1988-89 426 426 ... 1 46+8RH 353 408 11 1 6 18 5771
1989-90 519 519 10 45 446 501 11 1 6 18 4833
1990-91 542 542 10 45 469 524 11 1 6 18 5087
1991-92 546 546 ................ 10 46 470 526 13 1 6 20 5050
1991-92
TRIPURA (W) 250 250 6 11 200 237 6 1 6 13 5175
TRIPURA (N) 159 159 ... 2 16 138 156 3 ... ... 3 4386
TRIPURA (S) 137 137 ................ 2 19 112 133 4 ... ... 4 5591
NOTE :— (I) Based on estimated population from 1984-85 to 1989-90 and on Census 1991 for 1990-91 and
SOURCE DIRECTORATE OF HEALTH SERVICE, TRIPURA.
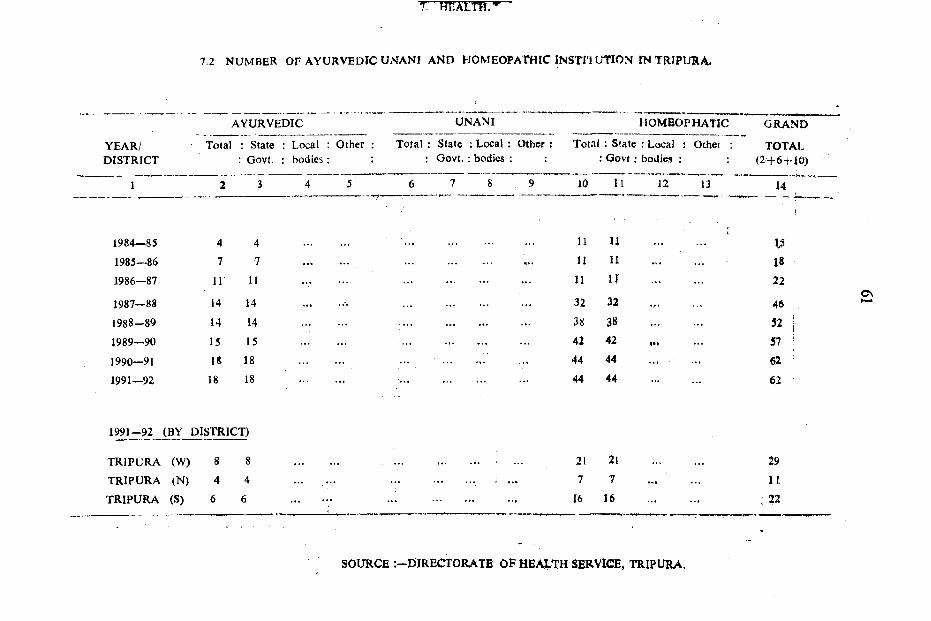
T
7.2 NUMBER OF AYURVEDIC UNANI AND HOMEOPATHIC INSTIIUTION IN TRIPURA.
YEAR/DISTRICT
AYURVEDIC UNANI MOMEOPHATIC GRAND
TOTAL(2+6 + 10)
To<a : State : : Govt. :
Local : Other : bodies: :
Total : State : Local : Other ; : Govt. : bodies : :
Total : State : Local : Other : G o v t: bodies : :
1 2 3 4 5 6 7 8 9 10 11 12 13 14
1984—85 4 4 11 a ..................
1985—86 7 7 ................ ............... U u 181986—87 11 11 ... .................. 11 11 22
1987—88 14 14 ............... 32 32 .................. 46 :
1988—89 14 • •• ............... 38 38 .................. « I-1989—90 15 15 ................ ... 42 42 57 :
1990—91 1* 18 ............... 44 44 ... ... 62 ‘
1991—92 18 18 ................ ............... 44 44 62
1991—92 (BY DISTRICT)
TRIPURA (W) 8 8 ... ..................... 21 2i .................. 29
TRIPURA (N) 4 4 ... • ... 7 7 U
t R ip u r a (S) 6 6 ... ... 16 16 ; 22
0 \
SOURCE :-EiIRECTORATE OF HEALTH SERVICE, TRIPURA.

62
7. HEALTH.7.3 NUMBER OF PATIENTS TREATED IN ALL TYPE OF GOVER^NMENT
INSni'UTIONS-
E^TITE^fTS TREATED (0
YEAR/DISTJUCT Indoor : Outdoor ; Total
1 2 3 4
1981 504307 3900440 44047471982 520774 38^4756 ' • 44055301983 505000 3900000 440500Q^984 522000 3884000 44060001985 (P) 578505 1564434 21429391986 (P) 291097 918372 12094691987 (P) 296829 883827 128C656
1988 (P) 77,885 5,72,772 6 50,6571989 (P) 47,154 275,270 3,22,4241990 (P) 1.18.870 14,05,883 15,24,753
1990 (By District)
TRIPURA (W) 61,360 6,11,9^ 6,73.339TRIPURA (N) 16,976 1,24,927 1,41,903TRIPURA (S) 40,534 6,68,977 7.09,511
NOTE :— (l) Patients treated includes new aod old patients(visit for as many days as they attented).
(2) P==Provisional. SOU RCE : — DIREC TO RATE OF HE ALT! ISERVICE, TRIPURA.
7. HEALTH.7 .4 NUMBER OF INDOOR AND OUTDOOR PATIENTS TREATED BY DISEASE
IN GOVERNMENT INSTITUTIONS IN TRIPURA............. .CONTD.
TUBERCULOSIS SYPHILIS FEVERS SMALLPOX
YEAR/DISTRICT Indoor Outdoor Indoor Outdoor Indoor Outdoor Indoor Outdooi
1 2 3 4 __5_ 6 7 ___ 8 9
1984 187 1868 ... 501 5452 79757 ... ...1985 221 1550 3 351 2847 6S63)1986 1Q9 742 2354 1055 156311987 27 ' 1204 6 533 781 119041988 24 1050 ... 97 1572 112321989 23 837 11 81 787 82051990 74 1308 34 497 5870 39844
1990 (BY DISTRICT) :
TRIPURA (W) 37 821 1 332 2478 19299 • •• ...TRIPURA (N) 28 412 24 116 1218 8422 ... ...TRIPURA (S) 9 75 9 49 2174 12123 ... ...

63
7. h e a l t h .
l A N U M BPIl OF INDOOR AND Q U T l ^ R fATiei^TnS 1 HEATED BY DISEASE IN GOVT.
INSTITUTIONS IN TRIPURA.............................. CONTD.
MALERIA LEPaO&Y CKOLERA GASTROENTERITIES
VEAR/ Ilidoor Qi|tdoofDISTRICl Patients Patients
In<|Qpr Outdoqr Indpoif OutdoorPatients Patients Patients Patients
TndoofPatients
putdpprPatients
0 10 11 12 13 14 15 16 17
1984 5275 38549 439 9011 125906m s 5\3\ 33243 461 11089 94660^986 1612 12414 141 3330 ^017891987 2174 10131 558 3745 461501988 (P) 2031 3656 303 8574 93140
1989 2415 3205 50 7532 459561990 3I5I I497Q 13 16186 ^49^5
1990 (B Y DISTRICT)
TRipU R A(W ) 357 394^
TRIPURA (N) 470 2514
TRIPURA (S) 2324 8507
IJ
2
6239
140?
8540
67618
21261
60816

64
7. HEALTH
NUMBER OF INDOOR AND OUTDOOR PATIENTS TREATED BY DISEASE INg o v e r n m e n t INSTITUTIONS IN TRIPURA......................... .. CONTD.
Ganorrhca Diptheria PotiowyeHtes Tetanus
Year/ Indoor Outdoor Indoor Outdoor Indoor Outdoor Indoor OutdoorDistriet Patients Patients Patients Patients Patients Patients Patients Patients
0
1984
1985
1986
1987
1 9 ^
1989
1990
230
50
4
45
42
76
t053
1062
701
93
362
321
424
20
92
56
*6
* 3
2
19
21
!52
47
377
353
1
4
71
22 23
38
47
ICO
72
19
14
61
24
i07
112
47
13
25
92
97
115
!5
14
1990 (BY DISTRICT)
TRIPURA (W) 23 157
TRIPURA (N) 3 27 18
10
59 12 53
TRIPURA (S) 50 240 12

65
7. HEALTH.
7 4 NUMBER OF INDOOR AND OUTDOOR PATIENTS TREATED BY DISEASE INGOVT. INSTITUTIONS IN TR IPU R A ..................................CONCLD
MEASLES WHOOPINGCOUGH TYPHOID TOTALI.
DISTRICT IndoorPatients
OutdoorPatients
IndoorPatients
OutdoorPatients
IndoorPatients
OutdoorPatients
IndoorPatients
OutdoorPatients
O 26 27 28 29 30 31 32 33
1984 1656 14291 885 12069 3213 59867 26115 3324161985 6 ^ 9567 874 6H0 804 20539 21905 236478
1986 77 4628 40 3187 273 1873 6572 144024
1987 102 2583 74 1894 192 425 7118 75848
1988 (P) 102 2478 14 1802 136 2257 12500 116406
1989 82 1390 3 542 77 502 10975 6110S
1990 228 8140 225 5946 245 3469 26134 224452
1990 (By r-istrict)
TRIPURA (WEST) 93 5333 156 5017 98 3256 9492 105798
TRIPURA (NORTH) 24
TRIPURA (SOUTH) 111
1164
1643
26
43
556
373
40
107
138
75
3273
13369
34735
83919
NOTE :— Above Patients treated includesonce for same period and in the same institution for particular disease.
SOURCE DIRECTORATE OF HEALTH SERVICE GOVERNMENT OF TRIPURA.

6 6
7. HEALTH
7.5 NUMBER OF BEDS IN MEDICAL INSTITUTIONS IN TRIPURA.
BEDS INSTALLED IN BEDS
YEAR/DISTRICT Total : Hospital Primary Health Centres R. H.
Dispensaries Rural area
IN
Urban area
195?4-85 1612 1182 418 12 455 1157
1985-S6 1750 1262 488 513 1237
1986-87 1720 1262 458 m 1237
1987-88 1810 1262 548 5 li 1231
1988-89 ' 1810 1262 548 573 l?37
1989-90 1830 1292 538 603 M il
1990-91 1830 1292 538 603 1221
1991-92 1918 1376 542 567 1351
W i-9 2 (BY D lSTR lC p
West Tripura 1134 916 218 ... 243 991
North Tripura 385 205 180' 180 205
South Tripura 399 255 144 144 255
Source ; Directorate of Health Services Tripura.

7.6 REGISTERED MEDICAL AND PARA—MEDICAL PERSONAL Ii^ TRIPURA.
67
7. HEALTH.
GRADUATE DOCTORS MIDWIVES/TRAINED DHAFS NURSE PHARMASIST
YEAR/DISTRICT
Total Male Female Population No. Population Per No. Per Doctor (a) MidwiVe (a)
Population (Allo+Hm o+Ary) Per Nurse (a) Total.
1 2 3 4 5 6 7 8 9 10
[1984-85 470 (1) 400 42 4,782 172 13,081 580 3,879T ' v / VAy
A 1 f\ 43 4,'’94 172 13,372 t 0 1 2
1986-87 504 (1) 461 38 4,663 167 14,072 590 3,9831987-88 539 496 43 3,809 167 14,419 618 3,3221988-89 540 495 45 3,802 167 15,275 675 3,042 -
1989-90 645 598 47 3,838 167 15,623 675 3,6678990-91
\^9l-92692 642 50 3,984 135 20,424 671 4,109 268781 723 58 3,350 148 18,630 586 4,705 290
1991-92 (BY DISTRICT)
WEST TRIPURA 477 431 46 2,712 88 14,703 376 3,441 147NORTH TRIPURA 146 141 5 4,776 32 21,792 101 6,904 67SOUTH TRIPURA » .......
158 151 7 4,848 . 28 27,358 109 7,028 76
NOTE :— Including licentiate Doctors.(a) Col. 5,7 & 9 :—Based on Estimated population from 1984-85 to 1989-90 and 1991 Census population for 1990-91 to 1991-92.
SOURCE DIRECTORATE OF HEALTHSERVICES. GOVT. OF TRIPURA

68
8. FAMILY WELFARE.
This section presents information relating to Family Welfare in Tripura.
Table N o ; — 8.1 This table gives information relating to the number of Family Welfare clinics/centres in Tripura.
Table No 8.2 This table gives information relating to the Family Welfare Programme in Tripura.

69
8. FAMILY WELFARE
8,1. Number of fSmily - welfare clinics/Centres in Tripura.
Year/District.
1982—831983—841984—851985—86 3986—871987—881988—891989—901990—911991—921991-92 (By District)
West - Tripura North-Tripura South Tripura
Total_ 2
394647 47 54
6669676767
212125
Rural3283536 36 43 55 57 54'5455
161821
Urban Govt, owned Other Bodies.
11111111111111
131312
534
3946474754
6668')76767
2!21
25
Source : State Faniily-Welfare Bureau, Tripura.
8, FAMILY WELFARE.
8.2 FAMILY WELFARE PROGRAMME IN TRIPURA.
Sterilisation I. U. D. Insertion C. C. Users Oral Pill User M. T. P.Year/District Target Achieve- Target Achieve
ment mentTarget Achieve
mentTarget Achieve
mentAchieve
ment10
1982-83 2,093 704 .. k NA NA NA1983-84 5,044 1,175 NA ... NA NA1984-85 7,544 990 NA NA NA
1985-86 8,917 1,032 2,287 1,304 2,2951986-87 10,786 2,139 3,923 1,911 2,8511987-88 6,764 1,748 2,999 2,291 2,898i988-89 10,000 6,722 4,0C0 1,830 8,100 2,999 2,900 2,439 1,7721989-90 9,000 7,331 4,500 2^60 4,000 4,420 2,900 2,650 2,0011990-91 11,000 8,066 2,500 1731 1,6G0 4,445 2,100 3,073 2,7521991-92 11,002 7,573 2,300 2,502 5,000 2,654, 2,300 3,527 2,997
1991—92 (By District).
Trioura West 5,166 3,705 1,080 1,226 2,348 1,068 1,080 1,678 2,035Tripura North 22,768 1,702 579 575 1,258 861 579 884 547Tripura South 3,068 2,166 641 701 1,394 725 641 965 415
Source State Family Welfare Tripura.

70
9. SOCIAL WELFARE SERVICE.
This section presents information relating to Social Welfare Service to Economically weaker section in Tripura. The data have been compiled from the returns furnished by the Directorate of Welfare for scheduIed-Tribe and Scheduled Caste.
Table No 9.1, This table show the loans and grants disbursed to Economically weaker sections by purpose & source in Tripura.
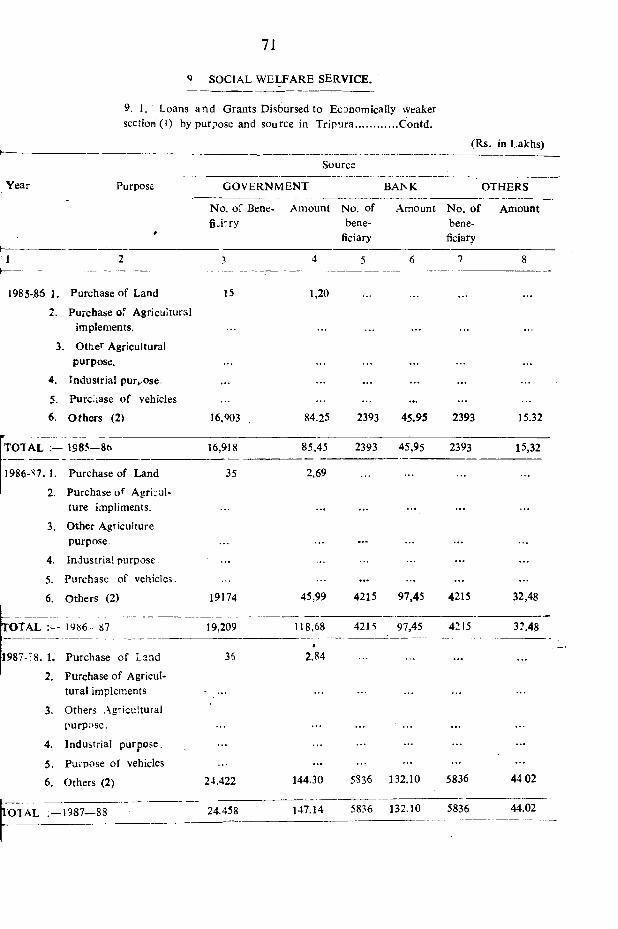
71
9 SOCIAL WELFARE SERVICE.
9. 1. Loans afld Grants Disbursed to EcDnomically weaker section (!) by purpose and source in Tripura...............Contd.
(Rs. in Lakhs)
Source
Year Purpose GOVERNMENT BANK OTHERS
#
No. of Bene- fiJrry
Amount No. of bene
ficiary
Amount No. ofbeneficiary
Amount
1 2 3 4 5 6 7 8
1985-86 ]. Purchase of Land 15 1,20
2. Purchase of Agricultural implements.
3. Othe^ Agricultural purpose. ...
4, Industrial pur»^ose. ... ... ...
5. Purchase of vehicles ...
6. Others (2) 16,903 84.25 2393 45.95 2393 15.32
TOTAL 1985-8(1 16,918 85,45 2393 45,95 2393 15,32
1986--^7. 1. Purchase of Land 35 2,69
2. Purchase of Agriculture impliments. • •• • ••
3. Other Agriculture purpose. ...
4. Industrial purpose. ■ ... ... ...
5. Purchase of vehicles. ... ... ...
6. Others (2) 19174 45,99 4215 97,45 4215 32,48
TOTAL 19S6—87 19,209 118.68 4215 97,45 4215 3:.48
1987-^8. 1. Purchase of Land 36 2,*84 • ••■ —
2. Purchase of Agricultural implements -
3. Others Agricultural purpose.
4. Industrial purpose. ...
5. Purpose of vehicles ...
6. Others (2) 24.422 144.30 5836 132.10 5836 4402
rOTAL 1987—88 24.458 147.14 5836 132.10 5836 44.02

72
Year
9. 1 LOANS AND GRANTS DISBURSED TO ECONOMICALLY WEAKER SECTION (I) BY PURPOSE AND SOURCE IN TRIPURA.—CONTD.
9. SOCIAL WELFARE SERVICE
, Purpose
Source
Government
No. of Amount Beneficiary
Bank
( Rs. in lakhs )----------------------}
Others
No. of Amount No. of Bene- Beneficiary ficiary
Amount
1988-89
1. Purchase af Land 318 11.55
2. Purpose of Agricultural implements
3. Other Agricultural Purpose
4. Industrial Purpose
5. Purchase of Vehicles6. Oiher»(2) 37,865 94.13
TOTAL 1988-89 38 183 105.68
595
595
20.69
20.69
1989-90
1. Purchase of Land 430 46.47
2. Purchase of Agricultural implement*
3. Other Agricultural purpose
4. Industrial Purpose5. Purchase of Vehicles
6. Others (2) 31.012« 180.64
TOTAL 1989-90 31.442 227.11 N.A.
62.35
62.35
20.78
N. A. 20.78
1990-91
L Purchase of Land 442. Purchase of Agricultural
implements ...3. Other Agricultural purpose4. Industrial Purpose5. Purchase of Vehicles 16. Others (2) 25.599
TOTAL 1990-91 25.644
1 1.00
1.36216.23
228.59
1924
1924
5f.95
56 95
1924
1924
13;44
13.44

73
9.1 LOANS AND GRANTS DISBURSED TO ECONOMICALLY WEAKER SECTION (1) BY PURPOSE AND SOURCE IN TRIPURA^CONTD. . .
9. SOCIAL WELFARE SERVICE
( Ra. in lakhs )
2 3 4 5 6 7
-9i
I. Purchase of Land 60 ts.oo •»* ***2, Purchase of Agricultural
implements • . .3. Other Agriculture purpose ...4. Industrial Purpose ... ... ...3. Purchase of Vehicles 15 34.40 ...6. Others (2) 36.531 547.85 980 22.28 ...
TO TA L:— 1991-92 36.591 562.85 995 56.68
NOTE :— 1. Above Covers scheduled Tribes and scheduled Caste Community only.
2. Others includes (I) Prematric Scholarships, (ii) Bording home stipend.(iii) Settlement, (iv) Rural Employment Programme,(v) Restoration assistance, (vi) Self Employment Programme, (vii) Margin money Lone.
SOURCE DIRECTORATE OF WELFARE FOR SCH. TRIBE AND SCH. CASTE IN TRIPURA.

74
10. SOCIAL SECURITY AND SOCIAL DEFENCE.
This Mctioncontaim mformation relating to Police Crime and prrsons. H ie data hav, been completed from the returns furnished by the Director General of Police Tripura.
Table No. 10.1—Number of Police Station and Police Posts.
Table No, 10.2— Strength of Civil Police.
Table No. 10.3—Incidence of Crimes.
Table No. 10.4—Juvenile delinquents, apprehended under congnizabte crunes juvcnil delinquency.
Table No-, 10.5 —Convicts by age, sex and lit€2racy.

75
10. SOCIAL SECURITY A}nD SOCIAL DEFENCE (PoLIGE, CRIME AND SUDHAR GHAR) .
10. 1 Numbca* of Police Slation and Police Posts.
(As on 31st Dec. )
Year/Distriet Police Stations Police posts/Teps Total
2 -• 4
1985 35 51 86
19Ss ; 35 61 961^87 s 40 451988 - 42 4S 90
1989 . 45 45 901990 45 53 98
1991 45 ?4 99
199! (By Distr»et)
West Tripura 16 2S 44North Tripura 14 16 30Soufh Tripura. 15 10 25
S o u rc e D ire c to r General of Police.

10. SOCIAL SECURITY AND SOCIAL DEFENCE
(POLICE, CRIMES& SUDHAR/GHAR.)
10. 2 Strength of Civil Police (SaiKtioned Strength of Police Foicc)
SL.No.
1
Item
2
1982 1983 1984 19^5 1986 1987 1983 1989 1990 1991
1. Director General of Police
2. Inspector General, Additional Generalsand Deputy Inspector Generals 5 6 6 6 7
3. Superintendents, Asstt. Superintendents and Deputy Superintendents 75 SO 80 87 95
4. Inspectors and Sub-Iuspectors Sergents and Asstt. Sub-Inspector. 630 695 713 1287 1324
5. Head Constables including Mounted Head Constables 1339 1443 1485 1298 1021
6. Constables 4602 5167 5262 5892 6050
TOTAL:— 6651 7391 7562 S570 8527
111
10
142
1507
10 11
143 143
1512 1520
12
10
144
1505
1759 1750
7351 . 7360
ON
Sonrce —Ofttec of the Diwctor General of
Police, Tripura,

77
10. SOCIAL SECURITY & SOCIAL DEFE NCE (POLICE CRIME & S UDHARGHAR)
10.3 INCIDENCE OF CRIMES.
Year/District Murder Daeoity Burglary Theft Robbery Kidna Riots Cut- pping Pable
Home -Cide
Counter Miscell- Total Fitiog aneous Cogni
za be! crimes
1 2 3 4 5 6 r 8 9 10 11 12
1982 98 198 1001 1361 175 /3 ^46 23 2111 5486
1983 111 228 1175 1471 200 39 374 1 2301 5900
1984 118 283 119S 1348 254 50 492 16 2 2273 6025
1985 150 212 955 1131 218 52 43^ 1 2309 4561
1986 127 119 748 896 135 57 36:> 1 2262 4714
1987 144 49 661 m 86 54 561 4 ... 2211 4631
1988 140 61 821 987 111 61 576 5 2758 5 520
1989 154 95 689 998 i;o 84 505 1 1 2716 5363
1990 159 93 739 1061 176 82 5 38 2 1 2801 5652
1991
(By District) 204 140 844 1108 262 80 521 2 1 2478 5640
W est Tripura 99 39 359 581 114 32 253 2 10 76 2555
North Tripura 61 47 280 251 83 31 l U ... 752 1619
So.uth Tripura 44 54 205 276 65 17 154 ... 1 650 1466
SOURCE :— Director General of Police. Tripura.

78
10.4 JUVENIL APPREHENDED UNDER COGNIZABLE CRIM E JUVENIL DELINQUENCY (NO. OF CASES REPORTED UNDER IPC COGNIZABLE CRIME HEADS).
Year/District Murder Dacoity Burglary Theft Robbery Kidna- Riots Culpp Counter Miscell Tota^pping Able Fiting aneous Cog-
Homi- nizablecide Crime
1 2 3 4 5 6 7 8 9 10 11 12
1982 20 46 98 150 21 16 163 10 • •• 5 529
1983 36 260 372 1089 113 16 424 10 21 2341
1984 12 86 105 25 10 5 125 ... 67 435
1985 6 9 18 14 5 5 42 ... 32 131
1986 ... 2 14 29 ... 2 29 125 201
1987 5 2 22 57 6 5 66 ... 15 178
1988 16 ... 24 38 78
1989 40 32 ... 59 55 186
1990 6 19 1 11 ... 216 253
1991 ... 2 • •• . . • 2
1991
(BY DISTRICT)
WEST TRIPURA
NORTH T'RIPURA
SOUTH TRIPURA
SOURCE DIRECTOR GENERAL OF POLICE
TRIPURA.

10 SOCIAL SECURITY & SOCIAL DEFENCE (f'OLlCE CRIME & SUDHa RGHAR)
10.5 Convicts by age, sex and literacy. (NUMBER)
79
Total Convicts Imprisoned Under 22 years Age of Convicts ” Education Among Convicts During the year 22 to 40 41 to 60 Above 60 Literate Iliterate
years years years
Year Male Female Total Male Female Male Female Male Female Male Female Male Female Male Female
1i—--------
2 3 4 5 6 7 8 y 10 11 12 13 14 15 161981-82 304 54 358 67 40 203 13 39 — 7 _ 222 53 94j1982-83 280 57 337 78 44 159 12 66 2 2 -- 185 51 95 611983-84 321 72 393 74 54 196 15 39 2 12 1 152 . 18 196 541984-85 223 256 V 24 105 7 35 21 5 1 130 20 93 131985-86 283 62 345 55 40 178 15 40 5 8 — 145 9 138 531986-87 298 49 347 73 26 180 22 35 1 8 — 151 19 J47 381987-88 216 26 242 242 16 139 8 32 2 3 — 122 12 94 141988-8? 458 27 485 133 • 6 265 18 50 2 10 1 164 10 294 17[989-90 471 47 51S 142 22 271 21 45 4 12 — 215 2 256 451990-91 725 57 782 280 26 366 31 73 — 6 — 360 15 365 421991-92 515 12 527 153 5 277 7 77 — 8 150 9 365 3
SOURCE OFFICE OF THE DIRECTOR g e n e r a l OF PRISON.

80
11. STATE INCOME.
Estimates of State and per capita Domestic product (New series) of Tripura is presented in
this Section.
TABLE NO —11.1 Net State Domestic Product- per capita and their Index Number (New Series in Tripura
TABLE NO— 1L2 Net State Domestic product by Industry of Original at Current prices (New Series)
TABLE N O —11.3 Net State Domestic product by Industry of original at constant Prices (New Scries).
TABLE NO—U . 4 per Capita Net Slate Do nesiic product atcoasiaat Pdccs (New scries) in Selected states and U- S. T> . of India.

STATE INCOME & PER CAPITA INCOME OF TRIPURA
THOUSAND RS. m HS
NOTE:-KmREYISED P . PROVISIONAL

11. 1 Net state Domestic Product, Per Capita and theirIndex Number (New series) in Tripura.
11. STATE INCOME
SL. NO.
1
Item
2
1980-81 1984-85 1985-86 1986-87 1987-88 1988-89(R)
1. NET STATE DOMESTIC PRODUCT (RS. IN LAKHS.)
i) A t current prices. 26780
ii) AtV 1980-81 prices. 26780
2. Per capita^Net State Domestic Product(RS).
i) At Current Prices 1323.
ii) . A t 1980^81? Prices 1323
3. Index Number of Net State DomesticProd«ct<Base : 1980-81 = 100)
i) At current Prices IQO
ii) A t- 1980-Sl Prices -------- lOO
4. Index Number of per Capita Net State Domestic Product.
i) At Current Prices (Base : 1980-81 - 100) 100
ii) At 1980-81 Prices 100
44146
30672
1962
1383
165
115
148
103
48537
31225
2108
1356
l8l
117
159102
51156
32557
2177
1385.
191
122
165
105
58862
36752
2444
1526
220
137
1^5115
76704
40012
3121
1628
286
149
236123
1989-90(P)
9
1990-91(0)
10
83506
41058
3328
1636
312
153'
252
124
96971
44444
3569
1636
362
166-
27a.124
00
R=Revjsed. P=»Prpvi§ionai Q=Quick Estimated.* Source Directorate of Statistics

11. STATE INCOME.
11.2 Net state Domestic product by Industry of origin current prices ( New series) (1980-81
. to 1988-89) ill Tripura.
SI.No.
1980*81 1984-85 1985-86 1986-87 1987^8 1988-89 (R>
8
1989-90 (P) 1990-91(0)
1 2 3 4 5 7 9 10-- /
INDUSTRY
1. Agriculture 12222 18113 18859 19794 24282 28486 32240 34637
Forestry & Loggin. 2568 3298 3659 3185 3756 3916 3247 3334
3. Fishing 515 1777 2169 2480 1798 . 2329 2814 3527
4. Mining & Quarring 3 ...
5. MANUFACTURING
51 Registered 210 607 853 879 557 .. 933 1029 1029
5.2 Un-Registered 990 2125 .2537 2603 1768 1250 1314 1323
6. Construction. 1187 1990 • 2839 2945 2546 4175 3304 4817
7. Electricity Gas & Water supply (~)576 ( - ) 1271 (—) 1467 (—)1467 (—)1905 (—)2016 ( - ) 925 (-~ ) 925
00

TRANSPORT, STORAGE AND COMMUNICATION
10
8.1. Railway8.2. Transport by other means.8.3. Storage8.4. Communication
9. Trade, Hotel & Restourant10. Banking Insurance.11. Real estate, Ownership of dwelling &
business services.12. Public Administration,13. Other Services.14. Net state Domestic Product.15. Population (,000)16. Per capita Income ( Rs. )
5 10 15 17 39 108 1 1377 909 970 1000 1174 1610 1724 1945
8 15 18 21 19 21 38 38123 197 213 386 460 501 649 784
1835 3163 3410 3515 4154 5797 6404 6972320 750 821 957 1398 1823 2091 2432
2687 3902 4227 4336 4724 6165 6904 69042215 4315 4800 5358 6260 10200 10300 133592091 4246 4614 5147. 7832 11406 12373 16794
26780 44146 48537 51156 58862 76704 83506 96971 .2024 2250 2303 2350 2408 2458 2509 27171323 1962 2108 2177 2444 3121 3328 3569
oo
Note R- Revised.P- Provisional.Q- Quick Estimates Source Directorate of Statistics, Tripura.

SL. No.
n . STATE INCOMEI t .3 Net State Domestic Product by
origin at Constant prices (New 1980-81 to 1988-89 in Tripura.
Industry of series)
(Rs. in lalchs)
INDUSTRY 1980-81 1984-85 1985-86 1936-87 1987-88 1988-89 (R) 1989-90 (P) 1990-91 (Q)
1 : 3 " 4 ‘ 5 6 7 8 9 t 10
1. AGRICULTURE. 12222 14165 14024 14764 16685 16459 16885 1670710981236
2. FORESTRY & LOGGING 2568 1643 1735 1184 1522 1128 1287
3. FISHING. 515 781 854 928 975 1014 1042
4. MINING & QUARRYING. 3 . — — — — —•“ 5. .......... MANUFACTURING.
452 4525.1 REGISTERD. 210 455 597 571 351 4525.2 U N -R EG ISTERD . 990 1090 1115 1140 1114 1174 1234 1316
19506. - CONSTRUCTION. ri87 1194' 1414 1472 1604 1419 146'7. ELECTRICITY GAS &
->V200^ (-^)925 (-)925WATER SUPPLY. (-)576^ C-)1272 (—)1463 (—)14fO':’' (-)t20a.^ (-8 ,: TRANSPORT,STORAGE
8.1AND COMMUNICATION
25 18 1 1RAILWAYS. ■ 5 5 7 ' 98.2 TRANSPORT BY OTHER
740 8'CQ 921 1096M AMBAN-g'; 377 636 630 700
8.5' STORAGE. 8 11 14 15. 12. 12: 22 22
8.4 > COMMUNICATION. 123 166 165- 172: 290 197i 184 192
9. TRADE, HOTEL &3307‘ RESTOURANT. 1835 1982' 2073’ 2115 2547* 2723^ 3010
I0,>t. BANKING & INSURANCE 3-20 588^ 598 674 1164"' 14-15 1469 1589
11. REAL ESTATE. OWNERSHIPOF DWELLING & BUSINESS
3943SERVICES. 2687 3062 3155 3245 3386 3521 394312, - PUBLIC ADMINISTRATION. 2215 3107 3216 3590 3603 5107 4573 552913. OTHER SERVICES. 2091 3059 3091 3448 3934 5711 5493 694014. NET STATE DOMESTIC
41058 44444PRODUCT. 26780 30672 31225 32557 36752 4001215. POPULATION (000) 2024 2250 2303 2350 2408 2458 250r 2717(P)16. PER CAPITA IN-COMB (Rs>. 1323 1363 1356: 1385- 1526 1628. 1636 1636
NOTE :—R—Revised. SOURCE Directorate of Statistics, Tripura.
oo4^

11. STATE INCOME.
11.4. Per capital Net state Demestic product at constant (1990'91) Prices in selected states/Union/Territedes.
SI. No. Stale/Union Territory 1580-81 19?4-85 1985-86
5..
1986-87 1987-88 1988-89(P)
(Rupees)
1989-90(Q)
1. ANDHRA PRODESH
2. ARUNACHAL PRODESH
3. ASSAM4. BIHAR
5. GOA
6. GUJRAT7. HARYANA
8. HIMACHAL PRODESH
9 JAMMU & KASHMIR
10. KARNATAKA11. KERALA
12. MADHYA PRODESH13. MAHARASTRA14. M.^NIPUR15. MEGHALAYA16. NAGALAND
1380 1505 1552 146^ 1530 1692 ...
1561 , lf'08 - 2074 2139 2184 2260 2199
1200 1457 1483 1474 1521 . 1516 1650
878 999 1007 1065 879 1042 981
3145 3313 3166 3353 3493 3582 3678
1951 2304 2048 2163 1942 2631 26292370 24S3 2778 2714 2598 ^160 3193
1698 1 592 1771 1865 1818 1921 2098
1649 1759 1807 1841 1575 1804
1596 1X34 1727 1852 l‘X)9 2072 21091494 1435 1462 1400 1413 1501 15 60
517 574 606 576 649 691 6782427 2576 2710 2644 2813 3026 32811430 1607 1661 1630 1693 1748 17021361 " 13S5 1412 1397 1485 1514 15151385 1806 1844 1889 2016 2133
oo

11.4 Per capita Net State Domestic Product at constant (1980-81) price in selected States/Union Territories-
11. STATE INCOME
SL. NO. STATE/UNION TERRITORY
-1 ' ' 2
17. Orissa
• 18. Punjab
19. Rajasthan
20- Sikkim
21. Tamil Nadu
22. Tripura
23. Uttar Pradesh
24. West Bengal25. A «& N Island
26. Delhi27. Pandicherry
28. All India Per Capita NDP.
Note Not available.(P) Provisional
(Q) Quick estimates
1980-81 1934-85 1985-86 1986-87 1987-88 1988-89(P)
1989-90(a)
3 , - 4 5 6 7 8 9
1231 1210 1390 1365 1320 1493 1557
2675 3011 3167 . 3223 3310 3421 3658
1222 1379 1338 1333 1241 1620
1571 1919 2017 2297 2678
1498 1758 1798- 1755 1621 1869 1864
1323 1363 1365 1385 1465 1562 1611
1286 1379 1404 1441 1455 1555 1572
1612 1631 1707 1755 1828 19302613 2445 2639 2644 2695 2905 2837
3843 3619 4252 4507 46013038 3062 3116 3241 3308 3245 3225
1625 1827 1858 1889 1933 2105 2169
00o^
Source :—Central Statistical Organisation Publication ‘’Estimates of State Domestic Product and Capital Formation 1991“ and Directorate of Statistics, Tripura.
• At 1970-71 Prices.

PRODUCTION OF PRINCIPAL CROPSI n T housand M .T .
600
4 5 0
3 0 0
1 5 0
0
12
9
6
3
0
1 1 0 0
75
50
25
0
I n T hou san d M.T.
600
450
100
150
0
1 2
9
6
3
0
100
75
50
25
0
8 4 -8 5 8 6 -8 7 8 8 -8 9 9 0 -9 1

87
12. AGRICUI-TyRE.
This Section presents informantion relating "to Agriculture and Tea plantation for the period from—1982—83 to 1991—92. All Table have been complied from thereport of the Directorate of Agriculture.
Table N o—12.1 this tible gives the Land utiiisatLdn according to the standared Nine fold clarification.
The defination o f the catagories of Land given here are those followed by the Govf of India.
Table NO— 12; 2 Iniormation relating to Area. Production and average yield of important crops are given in this table. The data relate to Agriculture year unless other—wise slated. -
Table NO— 12. 3 This table gives information in respect of Area and average yield o f HYV Rice and wheat.
Table NO— 12.4 These two tables deal with the Number and Area of operation holding by size groups.
Table N o—12.5. The tables are same as those followed by the Agriculture Census.
Table NO— 12.6 Information relating to consumption of chemical fartiiisers is given in this tables.
Table No— 12.7 Statistics relating to Number of Agricultural Implements and Machinery in actual use as recorded in the quin-quinnul Lives Stock Census is given in this table.
Table NO— 12. g Information relating to Number of Tea Plantation. Area and production of Tea and Number of persons employed in Plantation are shown this table.
Table NO—12.9 This table shown the Area and Production o f Fruits and Plantation crops.

Geographai Area under ^ Land not available for cultivation
- l i AOaiCULTURE
12. 1 Land Used Classificatiort by District—Contd. (Area in Hect.)
Other Un-cultivated land Excluding follow
Year/District
cal area ForestLand put to non- agriciil- • ture uses
Barren &uncultivableland
Total(4+5)
Permanent pasture &
other grazing land
Land under Misc tree crops groves not included in net Area shown
Culturablewaste
Total (7 + 8+9)
1 < 2 3 4 : 5 6 ■ 7 8 9 10
1982-83 5,69,000 1,28,200 90,400 1,100 91,500
1983-84 5,69,000 1.28,600 92,100 2,200 94,300
1984-85 • ... 5,72,000 83,620 45,380 1,28,000 n,300 74,200 2,200 88,700
1985...86 10,49,169 6,06,150 1,29,800 ... 1,29,800 12,300 72,200 2,200 «6,700
1886—87 10,49,169 6,06.150 1,30 300 1,30,300 50,369 2,100 52,469
198?-8S lv0,49,169 6,06.1'0 1,30,800 1 ,.^0,8C0 43,079 1,000 44,079
1988-89 10,49,169 6,06,150 1,31,600 1,31,600 38,802 770 39,572
1989—90 10,49,169 6,06,168 1,32,300 1,32,300 38,084 770 38,*54
1990—91 10,49,169 6,06,168 1,32,500 1,32.500 37,884 in 38,654
1990—91 ; •
Tripura (W) 2,99,682 1,05,085 60,554 60,554 977 230 1.207
Tripura (N) .^,3/,986 2,55,392 32,681 32,681 31,096 280 31,376
Tripura (S) 3,61.501 2,45,691 39,2^5 39,265 5,811 260 6,071
'
oo00

^ 12. AGRICULTURE
12. Land Used Classification by District :— Contd. (Area in hect.)
> ear/
District
Fallow
Fallow land other then current fallow
Land
Currentfallow
Total (11 + 12)
Net Area sown
Area Total cropped sown area
more than once
Per capita net area
sown
Cropping intensity (%)
1 11 12 13 14 15 16 17 18
1982—83 2,000 2.C00 4,000 2,55,000 1,77,000 4,32,000 0,12 1691983—84 1,800 4,700 6,500 2,51,500 1,64,500 4,26,000 0.11 1691984—85 1,800 7,200 9,000 2,49.000 1,41,000 3,90.000 0.11 1561985—86 1,800 1,950 3,750 2,56,000 1,67,000 4,23,000 0.11 16519. 6—87 2,500 2,750 5,250 2,55,000 1,53,200 4.08,200 0.11 1601987—88 1,200 1,500 2,700 2,65,440 1, 1,460 4,26,900 0.11 1611988—89 800 1 047 1,847 2,70.000 1 75,000 4,45,000 0.11 1651089—90 800 13,04/ 13 847 2,58,000 t .77,000 4,35,000 0.10 16 V
1990—91
1990—91 ;—800 6,047 6,847 2,65,000 1,91,000 4,56,0^ 0.10 172
Tripura (W) 220 2,986 3,206 1,29,630 95,170 2,24.800 0.10 T3Tripura (N) 300 1,507 1,807 66,730 47,270 1,14,000 0.10 171Tripura (S) 280 3,554 1,834 68.640 48 560 1,17,200 0 09 171
Source -Directorate of Agriculture
oo
Govt, of Tripura.

12.2 Area. Production and average Yierd per hectore of important crops in different district—Contd.t'Area in hect. Production in tonnes/oales and Yield in Kg, per hectors)
Year/District Area
Rice
Produc- Yield Area
Maize
Produc Yield Area
Wh^at
Produc- Yiled Area
Gram
Produc- Yield Area
Other Pulsee
Produc- \ ield
tion tion tion tion tion
1 2 3 4 5 6 7 8 9 10 11 12 13 14 15 16
1982-83 2,94,8S0 4,19,650 1,423 860 610 744 3.003 6.003 2,030 380 160 421 5.185 2,253 435
198J-84 2,78,666 3,78,597 1,359 840 640 762 3,250 5,640 1,735 503 225 447 5,305 2,315 436
19^4-85 2,66,010 3,73,010 1,402 967 713 737 2,030 3,250 1,563 413 180 4^6 5,787 2,480 429
1985-86 2,78,142 3,67,480 1,321 760 753 753 2,473 3,840 1,553 429 183 427 5,i38 , 2,334 446
1986-87 2,56,945 3,83,230 1,491 1,044 771 738 2,510 4,300 1,713 539 231 429 5,265 2,359 448
1987-«8 2,71,100 4,33,190 1,598 1,132 804 71 ) 3,150 5,100 1,619 700 360 514 7,260 3,457 476
1988-89 2,78,300 4‘57,500 1,644 1,100 800 727 3,380 6,100 1,805 500 200 400 7,700 4,200 433
1989-90 2,50,211 4,59,023 1,834 2,200 1,760 800 3,620 6,560 1,812 600 325 541 10,330 5,7lo 553
1990-91 2,74,003 5,01,342 1,330 2,300 1,550 674 3.710 6,900 1,860 690 380 551 10,240 5,804 567
1991-92 2,57,100 4,74,544 l,84i 2,030 1,240 611 2,500 4,695 1,878 701 376 536 10,234 5,834 570
l99t-92Tripura (W) 1,12,505 2,14,193 1,904 821 500 609 1,258 2,352 1,869 250 143 572 40.48 2,322 573
Tripura (N) 71,413 1,24,799 1,747 563 340 604 736 1,200 1,630 244 124 508 2,711 1,555 573
Tripura (S) 73,182 1,35,552 1,852 647 400 619 506 1,1^3 2,259 207 109 526 3.475 1,957 563
VOo

12. AGRICULTURE
12.2 Area, Production and average Yield per heetoce of important crops in differant district............Contd.
(Area in hect. Production in tonnes/bales and Yield in k.g per hectors)
Year/District Total Pulses Ground Nut Sesamum Rapeseed/Muster Total Oil Seed
17
Area Produc- Yield Area Produc- Yield Area Produc- Yield- Area Produc- Yield Area Prone- Yieid tion tion tion tion tion
18 19 20 21 22 23 24 25 26 27 28 29 30 31
1982-83 5,565 2,413 434 1,190 930 '82 2,630 950 361 3,000 1,980 660 6,824 3,863 566
1983-84 5,808 2,540 438 900 684 760 2,768 950 343 3,170 2,070 653 6,838 3,704 5
1984-85 6,200 2,660 429 995 800 804 2,580 900 349 3,120 2,130 683 6,695 3,^00 568
1685-86 5,667 2,517 444 1,023 813 795 2.683 950 354 3,130 2,160 690 6,836 3,92^ 574
1986-87 5,804 2,590 446 942 800 849 2,670 975 366 3,615 2,462 681 7,227 4,282 592
1987-83 7,960. 3,817 480 ] ,570 1,462 93^ 3.016 1,150 381 4,650 3,418 735 9,236 6,030 653
198«-89 8,200 4,400 536 1,500 1,430 953 3,400 1,350 397 5,350 4,000 736 10,250 6,780 661
1989-90 10,930 6,040 552 2,910 2,120 963 4,020 1,750 435 8,180 6,250 764 14,390 10,120 703
1990-91 10,930 6,184 566 2,151 2,200 1,022 3.960 1,770 447 8,270 6,310 763 14,"81 10,280 715
1991-92
199 1-9210.935 6,2 iO 568 1,830 1,'H64 1.018 3,730 l,4 i0 389 8,975 7,070 787 14,535 10,384 714
Tripura ( W) 4,298 2,465 573 860 913 1,061 1,080 390 361 2,925 2,265 774 4,865 3,568 733
Tripura (N) 2,955 1,679 568 634 610 *962 1,700 690 405 3,400 2,705 795 5,734 4,005 698
Tripura (S) 3,682 2,066 561 336 341 1,014 950 376 389 2,650 2,100 792 3,936 2,811 714
VO

12. AGRICULTURE
Year/
12.2 Area, Production and Average Yield per hector of Important Crops in different district .................. contd.( Area in hect, Production in tonnes/bales Yield in K. g. per hectorc )
Potato Sweet P 'tato Chillies Turmaric (Dry) Ginger
District Area Produc- Yield Area Produc- Yield Area Produc- Yield Area Produc- Yield Area Produc- Yieldtion tion tion tion tion
32 33 34 35 36 37 38 39 40 41 42 43 44 45 46
1982-83 2,562 34,200 13,349 l,45i 14,8^0 10,213 1,395 625 448 1,003 1,515 1,510 578 826 1,429
1983-84 2,500 34,698 13,879 1,460 15,340 10,507 1.413 640 453 1,080 1.620 1,500 610 867 1,4211984-85 2,625 38,400 14,629 1,416 14,755 10,420 1,527 6^5 442 1,124 1,675 1,490 648 920 1,4201985-86 2,605 36,180 13,889 1,397 13 753 9,345 1,438 677 449 1,086 1,556 1,433 693 1,167 1,6841986-87 2,538 40,220 15’847 1,400 13,012 9,294 1,485 671 452 1,148 1,676 1,460 705 1,179 1,67219S7-8 2,767 46,810 16,917 1.453 13,533 9,313 1,223 575 471 1,178 1,898 1,611 715 1,189 1,6631988-89 3,048 54,396 17.846 1,373 12,319 8,972 1,257 641 510 1,256 2,026 1,613 780 1,250 1,6031989-90 3,040 56.185 18,482 1,349 12,548 9.302 1,645 810 492 1,520 2,488 1,637 816 1,331 1,6311990-91 3,250 60,300 18,554 1,360 12,660 9,308 1,650 820 497 1,550 2,550 1,645 820 1,350 1,6461991-92
1991-92
3,475 64,200 18,474 1,350 12,400 9^185 1,470 733 498 1 , ^ 2,781 1,854 918 1,682 1,832
Tripura (W) 1,189 23,950 20,143 586 6,000 10,239 421 222 527 535 1,227 2,293 289 679 2,349Tripura (N) 1,142 19,805 17,342 468 3,899 8.331 582 327 562 540 730 1,351 336 491 1,461Tripura (S) 1,144 20,445 17,871 296 2,501 8,449 467 184 394 425 824 1,939 293 512 1,744

12. 2 Area, Production and Average Yield of Important Crops in different District .(Area in hectore, Production in tonnes/bales and Yield in K. g, per hectore.)
Tobacc Suggar (cane) Jute MestaYear/
District Area
47
Production
Yield Area
48
Production
Yield Area Production
Yield Area Production
concld.
Cotton
Yield Area Production
Yield
49 50 51 52 53 54 55 56 57 58 59 60 61
1982-83 813 287 . 353 2,073 80,000 38,591 3,750 30,500 8.13 9,100 67,200 7.38 1,420 1,502 1.061983-84 800 280 350 2,043 6^,870 32,242 3,200 20,300 6.34 9,584 59,550 6.21 1,415 1,660 1.11
1984-85 810 290 358 1,950 72,750 37,308 2,750 17,400 6.33 9,000 57,560 6.40 1,440 1,600 1,111985-86 755 265 351 l.S'H 64,850 35,948 3,070 20,500 6.6S 10,906 73,580 6.75 1,376 1,534 1.11
1986-87 710 240 338 1,840 69,430 37,734 2,745 20,478 7.46 9,320 64,180 6.89 1,147 1,600 1,39
1987-88 710 240 338 1,938 72,455 37,386 . 2,870 21,500 7.49 9,540 66,000 6.92 953 1,007 1,061988-89 600 250 417 1,900 80,500 42,368 . 2,800 22,700 8.11 7,l03 50,500 7.11 1,000 1,100 1,10
1989-90 625 255 408 2,005 87,900 43,840 2,100 16,800 8.00 4,270 3o,700 7.19 953 1,007 1,061990-91 650 260 ' 400 1.900 91,000 47,895 2,734 23,610 8.63 6,093 47,110 7.73 962 1,025 1,08
1991-91
1991-92
650 260 400 1,600 76,800 48.000 2,100 18,800 8.95 4,120 32,200 7.81 915 810 0,88
Tripura (W) 184 67 364 150 7,000 46,667 1,027 9,300 , 9.05 1,912 15,054 7.88 82, 63 0,83Tripura (N) 259 109 421 1,050 50,200 47,809 555 4,910- 8.84 961 7,5o6 7.81 600 567 0.95Tripura (S) 207 84 405 400 19,600 49,000 518 4,590 8.86 1,247 9,630 7.72 233 175 0.75
VOU>
Source Directorate of Agriculture. Govt, of Tripura

12. AGRICULTURE
12.3 Area and Average Yield per hectore of HYV.
YearDistrict
RICE WHEAT
Area (Hect) Yield (M. T.) Area (Hect)
Yield (M, T .)
Total HYV % Total HYV % Total HYV 7o Tota HYV•1
1 * 2 3 4 5 6 7 8 9 10 11 12
1984-85 266010 153090 58 1402 1S12 ii5 56^0 2680 106 li^3 1563
1985-86 278142 150031 54 1321 1586 i2i 2473 2473 Ibb 1555 1553
1986-87 256945 151674 59 1491 1806 l2l 2516 25ld 100 1713 1713
1987-88 271100 168867 62 1598 1^19 m 3i50 i i i o i6b 1 ^9 1619
1988-89 278300 226000 81 1644 1933 118 3386 3386 165 1S65 1805
1989-90 250220 187687 75 1834 2072 li3 5620 3 ^ 6 166 1812 1812
1990-9 1 274003 206955 15 1830 2033 i l l 3710 3710 166 1 8 ^ 1866
199 1-92 257100 202261 78 1846 1925 104 2506 2500 166 1880 1886
1 991-92
Tripura (W ) 112505 92328 1904 2061 108 125^ 125^ . l6<) 1869 1869
r i ) i i (N) 71413 49085 69 1747 2052 117 736 736 100 1630 1630
Tripura (S) 73182 60848 83 1852 2019 109 506 506 100 2259 2259
%13
ibbioo100
160
100100
lOO
lOO
100
100
VO
S our^ :—Directorate of Agriculture Govt, of Tripura.

12. 4PR.ICULTURE12.4. Number of operational holding by size group in Tripura (Area in hectares)
according to Agricultural Census (1990-91) (Provisional)
Area in Hec^res.
District/State Marginal (Below 1.0 hect)
Small (1.0 2.0 hect)
Semi Medium (2,0-4.0 hect)
Medium (4.0-10.0 hect)
Large (10-0 hect
atovej
Total and All categories
1 2 3 4 5 6 7
West Tripura.I) Number of holding. 93,474 31,495 9,939 1,517 77 1,36,502II) Area of holding. 37,046 50,719 25,980 7,948 8,586 1,30,279North Tripura.I) Number o f holding. 51,193 19,172 7,797 599 41 78,802Il) Area of holding. 23,735 29,060 20’188 3,163 9346 85,492
South Tripura.'i ’■ . .
I) Number of holding 7?,159 |8,550 10,696 1.455 48 1,02,908
ip Area of holding 26,312 26,371 30,429 7,245 2,248 92,605
TripuraNumber of holdidg 2,16,826 69,217 28,432 3,571 166 3,18,212
Area of holding 87.093 1,06,150 76,597 18‘356 20,180 3,08.376
v a
Souroe Agricultural Census, 199(^9K Government of Tripura. ^

12. 5 Number and Area of holdings by Tenure and by Size Group in Tricara accroding to Agricultureal Census (1985-86).
12. AGRICULTURE
(Area in hect>
Category Total Holding Total on Rent (Leaied in) Owned & self operated Other-wise operated
Number Area Number Area Number . Area Number Area
1 2 3 4 5 6 7 S 9
1. Marginal (below 1. 0 hect. ) 2,11,302 1,06,835 41,507 2,419 1,58,776 75,455 87,567 28,957
2. Small (1.0—2.0hect.) 70,442 1,14,127 18.449 2.027 56,261 81,606 31,996 30,494
3. Semi Medium
(2, 0—4.0 hect.) 27.396 74,253 7,443 696 22,504 54,734 12,177 18,823
4. Medium (4, 0—10.0 hec, ) 2,803 14.253 831 130 2,629 12,156 1,005 1,967
5. Large (10.0 hect. & above) 137 8,128 ... 121 7,236 23 892
All Categories 3,12,080 3,17,596 68,230 5,272 2,40,291 2,31,187 1,32,768 81,133
VOo \
Source Agriculture Census 1985-S6 Govt. & T ripun .

rz. AGRlCULTUHrer'
12.6 Coasumption of Chemical Fertiliapri w Tijpuro.
(In tonnes)
Years/District
1982-83
1983-84
1984-85
1985-86
1986-87
1987-881988-S91989-90
1990-91
1991-92 1991-92
Tripur* (W)
Tripura (N)
Tripura (S )
Nitrogenous(N)
16742170
2214
3295
4350
469248903857
5289
6603
2664
2197
1742
Phose-phatic (P/2 0/5)
526580
601
872
1307
2444
321018672314
2581
1101609
871
Potassic (K/2 0)
369570
502
645
984
136413501576
13921308
337
343
421
Total (N p K)
2 7 6 r3320
3317
4812
<841
8500
945098008995
104>2
4 3 ^3149
3041
SoiWc« :^D irector of A g rk iu l^ ' • Govt. ofTripuriu

12. AGRICULTURE12.7 Number of Agricultural Implement and Machinery in Tripura-1987-Co«td.
Vear/District Hand operated Equipment Equiprtient run by Animal power
Fertilizer Seed Chaft Wheel Sprayer Paddy Jatakal Wooden made Iron made Plough Three stick Diesel
seed drill drill cutter hoe and drill Plough (country' Tiller Displough machine for Harrow
duster plough) cultivator i1 2 3 4 5 6 7 8 9 10 T1 12 13
North Tripura 47 22 689 7 102 18 776 • 35,227 1,900 829 94 7
West Tripura 111 916 3,767 270 625 279 483 56,844 6,329 6,675 2,076 59
South Tripura 122 616 2,092 286 643 263 62 42,913 1,282 1,282 39
Tripura 280 1554 6,548 563 1,370 560 1,321 134,984 9,491 8,786 2,209 66
12. AGRICULTURE12.7 Number of Agricultural Implement and Machinery in Tripura.-1987-Contd.
Name of
District
0 14
North Tripura 20
West Tripura
South Tripura 1
J*ffripura 21
Eqaipment run by Animal power Seedling Preservation Instrument
Fertilizer Seed
Seed drill drilllader Puddlcr
15 16 17
4
152
4
20.824 943
32,899 85914,263 687
Corn Bullock
equipment cart
18
17
44
57
160 67,986 2,489 118
19
62
202
264
Sugar Oil cake
cane ballar
crusher
2120
97
17
124
238
Water Duster Diesel Electric
drown operated operated operated
machine pumpset pumpset pumpset
22
14
916
23 24 25
175
4e
138
112
39 22 290 11

12.7 AGRICULTURE
12.7 Number of Agricultural Implement and Machinery in Tripura-1987-Contd.
Name of the
District
Instrument run by tractor or power
Power
tillar
Tractor Mould
board
Plough
Diesel
Harrow
Fertilizer
Seed
drill
Planter Le\ eller Potato
digger
Trailer
26 27 28 29 30 31 32 33 34
North Tripura 5 5 2 631 44 1
West Tripura 11 110 8 2 92 , 2,696 1592 I,<73 4 '
South Tripura 8 3 1 255 1,303 14
Tripura 24 113 13 3 94 2,696 2,478 3.020 19
12. AGRICULTURE . 1
12.7 Number of Agricultural Implement and Machinery in Tripura-]987-Concld
Name of the Combined harvester Thrasher
District Tractor Self Paddy Wheat Multi Maize Sugarcane Seed
Propelled crop sheller crusher drill
35 36 37 38 39 40 41 42
North Tripura 1898 7 3 92 5
West Tripura 2 980 77 5 3 ... 45 1 .South Tripura ... 1050 , 2 5 2 ■ -•
Tripura 2 2878 1134 7 8 3 139 6
VOAO
Source :-Directorate of' Animal Husbandry,
Governra«jt of Tripura.

12.8 Number of Plantation Area and Production of Tea and Number 6f Persons Employed In Tea Plalitation.(AREA IN HECT,)
12—AGRICULTURE
Year/Area Growing Sub-Division
Number of Plantation
Total Planted Area as on 31st Dec. of last year.
Total Planted area at the close of the year.
Plucked area during the year.
Area Lying fallow during the year.
Area in occupation
of planter but not under tea cultivation
Total Area of the plantation.
Persons Employed_daily averageResident Out-side labour labour
(No) (No)
Manufactured
Tea(Tonnes)
1 2 3 4 5 6 7 8 9 10 11
1982 50 5260 5275 4859 571 7511 13157 5477 • 2030 3309
1983 52 5293 5234 4846 239 8073 13546 5325 2301 3507
1984 54 5175 5214 4891 185 8510 13910 5325 2526 3339
1985 55 5265 5435 4961 497 87.40 14672 5939 2535 3801'
1986 55 5362 5411 4993 460 8975 HS47 6146 2915 3283
1987 55 5458 5522 5225 716 8542 14780 6266 3328 4090
1988 53 5508 5573 5260 725 8402 14700 6673 3576 4216
.1989 55 5634 5716 5414 748 8516 17980 6629 3846 4008
1989 (By District)
Sadar 22 2139 2167 2068 76 2857 5101 2254 1095 1104
Khbwai 2 188 192 188 233 424 132 70 38Kailashahar 15 1350 1362 1271 68 2493 3923 1653 960 973
Kamalpur 5 487 490 475 4 827 1321 830 413 587
Dbarmanagar 8 1314 1334 1289 1736 3070 1602 1269 1287
Sabroom 2 149 164 123 300 296 759 118 39 19 -Belonia (1988) 1(a) 7 7 . . . 300 74 382 40 . . . • t »
Note (a) New garden, production not >et started 1989 data not reported. Source Directorate of statistici,

Year/District
1
12. AGRICULTURE12.9 Area and Production of Fruits and Plantation Crops in Tripura (Contd)
Area
Liehi
Production Area' 4 "
1982-831983-841984-851985-86 19S6-871987-881988-891989-9.0(R)1990-911991-92
37204000476255786518775288389781
1065611871
4620 46804970 47304980 46814980 47435250 48305250 43695300 48925500 49245500 49495650 4972
Mango
Production
3027039680
4204042040448004480045700407004070037150
Area
Pineapple
Productiony
Area
Orange
Production
2440266027502850
29923170326934703559
3560
1382014460
165001790019700217002450030600315003050)
3600410045004887560161326525672572557639
9
85009400
1050011900148601814019600343003550036500
10
720744776785796809829
Area in HectoreProduction in M/T
Guava
Area Production Area11 12
2240230023502350235023002200
6570680062006200630364416535658566256650
Jackfruit
Production
13170000175000171600171000171600171600180300175600175600174000
Year/District
12. AGRICULTURE12.9 Area and Production of Fruits and Plantation Crops in Tripura (Contd.)
Banana
Area Produdtion
Lemon
Area Production
Chashwanut
Area Production
Area in Hectore Production in M/T.
Coconut *
Area Production
Arecanut
Area Production
Other fruits
Area Production
1 14 15 16 17 18 19 20 21 22 23 24 251982-83 3250 18000 3130 .4600 1710 130 1840 1890 680 1045 — ■ — .
1983-84 3350 18600 3160 4640 1960 139 2300 2100 717 11391984-85 3450 19200 2750 5050 1900 130 2800 2200 1074 2150 — - —
1985-86 3458 '20200 2889 5050 2273 210 3285 2380 1104 2150 1135 16001986-87 3461 21200 3050 5050 3120 270 4131 2750 1120 2200 1194 16001987-88 3499 22000 3295 5050 4594 380 5576 3342 1162 2200 1272 If 001988-89 3528 23900 3561 5150 6419 840 7026 3480 1223 2250 1318 16501989-90 (R) 3570 24000 3792 5300 7419 930 8375 4675 1301 2300 1347 17001990-91 3587 24500 4097 5300 8919 950 9375 4700 1325 2300 1350 17001991-92 3594 25000 ^4377 5350 S952 980 10494 4850 1360 2450 1361 1710
R —Revited* Production of Coconut is (5000) Number.
Source Directorate of Horticulture, Gov(. of fripura»

102
13. IRRIGATION.
This section deals with the existing Irrigation facilities in Tripura.
Table NO. 13. 1 Irrigated area by source.
Table NO. 13. 2 Irrigated area under different Cropg.
Table NO. 13. 3 '.— Gross area Irrigated and gross Cropped area by District in Tripura (1990-91).

1990-91
134 Minor Irrigation Statistics in Tnpure (Irrigation by source)
(Area jnhect.)
Total Potential Created Cumulative at the end of year (Net) Potential utilised during the year
Year/DistrictLift
IrrigationDeepTubewell
Diversion ShallowTubewell
ArtisionWell
Smallpump
SeasonalBund
Others Total Net Gross
.
1 2 3 4 5 6 7 8 9 10 11 12
1987-88 14616 2772 (378 4S6 2815 2044 14431 1765 45277 N.A. N.A.19S8-I9 16420 2717 1846 493 3442 6630 7578 1953 41079 N.A. N.A.1989-90 17263 2817 1846 493 3977 7727 7578 1953 43654 N.A. ■ N.A.1990-91 18256 2907 2038 493 4182 7985 7578 1952 45391 32636 49571
Tfipura(W) 6185 1686 734 253 3284 3322 3645 622 19731 16470 25249Tripura (N) 6381 390 400 79 25 1888 2456 55 11674 6076 9674
Tripura (S) 5690 831 904 161 873 2775 1477 1275 13986 10090 15048
Sourec :—Publication of Minor Irrigation Flood Control Work,
Go\t. of Tripura.
OU)

Year Rice
13. IRRIGATION
13.2 Irrigation Area Under Different Crops in Tripura.(Area in hect./
Wheat TotalPulses
Sugarcane Fruits & Vegetable
Total (2 to 6)
Non-Food CropsTotal OtherOil non-foodseed crops
8
Total(S+9)
10
Note :-(a ) Including col. 9.
Total Irrigated Area under
all crops (7+10)
11
1980-81 26100 420 1000 85 8065 35670 85 345 430 36100
1981-82 27500 430 722 210 8801 37663 120 317 437 38100
1982-83 28650 430 974 230 8446 38730. 150 320 470 39200
1983-84 29450 650 1093 242 9300 40735 150 315 465 41200
1984-85 29090 415 957 230 9068 39760 150 320 470 40230
1985-86 29000 870 810 183 10087 ^0950 340 230 570 41520
1986-87 30520 390 1110 210 10815 43045 145 370 515 43560
1987-88 31725 407 1154 217 11243 44746 149 385 534 45280
1988-89 32529 510 1050 380 6200 40669 74 336 410- 41079
1989-90 33183 543 1060 401 8018 43205 455(a) — 455 43660
Source Diriict orate of Agriculture.Govt, of Tripura,
O

13.3 Districtwisc percentage of irrigated area in Tripura
Year/District
1
1985-86
1986-87
1987-88
1988-89
1989-90
1990-91 1990-»1 —
Tripura (W) Tripura (N) Tripura (S)
GrossCropped
Area
423000
408200
426900
445000
435000
464000
227000116000121000
IrrigatedArea
41520 .43560
452SO
41079
43660
45391
206761192612789
( (Area iti H ec t)
% age of irrigated
Area
9.8210.67
10.61
9.23
10.049.78
9.11
10.2810.57
O
Source Directotate of Agriculture,Govt, of Tripura.

106
14 LI?E STOCK AND VETERINARY.
Statistics on Livestock and Veterinary services are presented on this Section. Figures Itelatingto 1987 livestock Census. District wise-data so far as available from the state Animal- Husbandry Department have been showo in the following Table:—
TableNO. 14. 1 Dataregarding the number of livestock and poultry are given in the table.
TableNO;I4. 2, Infrastructure facilities in animal-Husbandry in Tripura,
■fable NO: 14.3. Works done in Veterinary Institutions in Tripura.
Table NO: 14. 4. Number of Milk Plants and Milk chilling centres and their Capacity.

14. L lV J E S rO C K A N D V E T E R IN A R Y
1 4 4 N U M B E R O F L iV E ^ T O C IC A N D P O U L T R Y (CoJitd.)
YEAR/ CATTLE BUFFA- MITHUN SHEEP GOATS HORSSS <t MULES ELEPDISTRICT CROSS
BREDINDIGENOUS
1 07’AL LObS ANDGAYAL
CROSSBRED
INDIGENOUS
TOTAL POMES KENT
1 2 3- 4 5 6 7 8 9 • 10 11 12 13
1977 5,92,201 14,215 2394 1,98,634 384 2
1982 36,041 6,44,3S5 S,SC,410 15,904 94 5293 3,43,102 1726 14 94
1987 61,479 7M, SO# 8.27,SU 16,41* ... 207 2626 2833 4,41,972 1355 1 ...1987
West Tripura 39,760 30.6,953 3,46,713 2280 58 1400 1458 1,84,653 438 1North Tripura 5,900 2,27,788 2,33,688 8954 '20 640 760 1,22,476 590South Tripura 1.5,819 2,31,36S' 2.47,187 5184 29 586 615 1,34,843 .327
O
SOURCE DIRECTORATE OF ANIMAL HUSBANDRY, GOVERNMENT OF TRIPURA.

LIVESTOCK AND VETERINARY14.1 Number of Livestock and Poultry—Condd.
YEAR/DISTRICT DONKEYS
b ~ ~ ■ J3
LIVESTOCKPIGS
GROSSBRED INDIGENOUS_ 1514
DOGSTOTAL
16 ‘ ' 17
FOWELSP O U L T I^ _
"DUCKS^
18 19
TOTAL
"20'
1977
1982 5
1987 12
1987WEST TRIPURA 1
NORTH TRIPURA 11
SOUTH TRIPURA
4,927
3,204
1.062
812
1,330
98,517
85,026
27,016
28,825
29,185
44,963 ... 5,21,244
1,03,444 I,U,394 7,95,938
88,230 1,22,721 13,97,697
28,078 5,00,54 61,55.80
29,637 31,910 36,42,58
30.515 40,757 41,78,59
1,16,197 6^65,088
],07S5f2(a)
4,72,069 1,869.766
1,82,427
1,34,933
1,54,709
7,98,007
4,99,191
5,72,568
O00-
Note (a) Including chi ken &Duklings.
Sours*:— Directorate of Animal Husbandry,Goyernn-ient of Tripura.

14. LIVE»T€>G1C AND ANIMAL HUSBANDRY
in f r a s t r u c t u r e 14.2 FACILITIES IN ANIMAL HUSBANDRY IN TRIPURA
Year/DistrictVeterinaryHospitals
Veterinarydispensaries
A. 1. Centres
Sleughterhouses
SheepswoolExtensionCentres
Cattlebreedingfarms
Poultrybreedingfarms
Pigbreedingfarms
1 2 3 4 5 6 7 8 9
1981-82 3 35 14 Nil Nil 2 3 6
1982-83 3 3.5 ,1,5 Nil Nil 2 3 6
19&3-84 3 35 15 Nil Nil 2 3 6
1984-85 4 36 15 Nil Nil 2 3 6
1985-86 4 36 15 Nil Nil 2 3 6
1986-87 4 36 15 Nil Nil 2 3 6
1987-88 , 5 35 15 Nil Nil 2 3
1988-89 9 y j 15 Nil Nil I Nil 1
1989-90 9 38 15 Nii Nil 1 1 1
1990-91 9 44 15 Nil Nil 1 1 2
1-991-92 9 44 15 Nil 1 11991-92 (By District)
West—Tripura 3 18 5 Nii Nil 1 1 1North—^Tripui^ 3 .12 ■ 5 Nil Nil Nil Nil 1
South—Tripura 3 14 5 Nil Nil Nil Nil Nil
{steurce IDirectoraie df Animal Husbandry Govt, of Tripura.
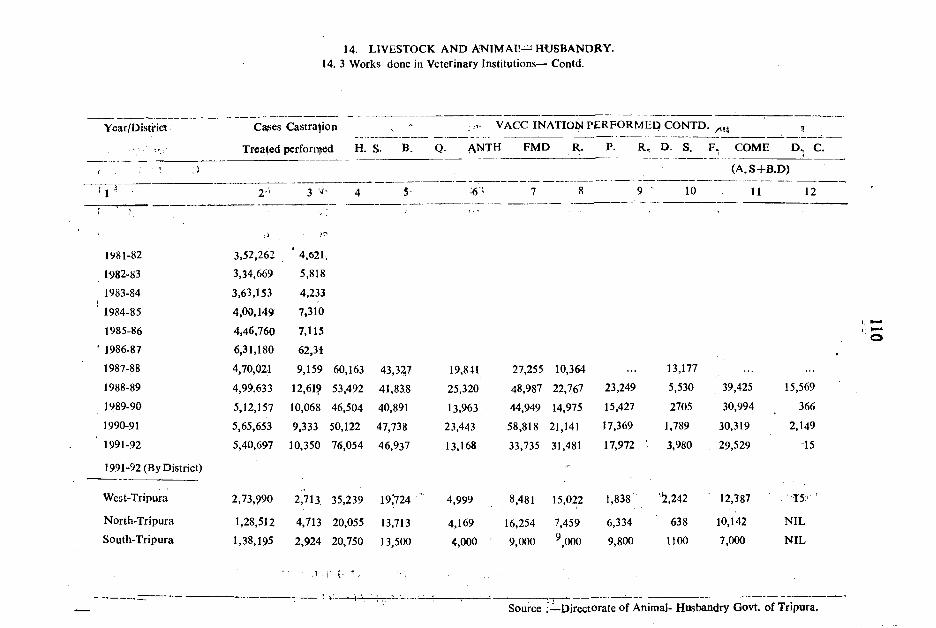
14. LIVESTOCK AND ANIMAll-ii HUSBANDRY.14, 3 Works done in Veterinary Institutions— Contd.
Year/District C ^es Castration
Treated perfornjed H.
: ; ■■■■!■ ■ : )
2'' 3 4
1981-82 3,52,262 ' 4,621.1982-83 3,34,669 5,818
1983-84 3,63,153 4,233
’ 1984-85 4,00,149 7,310
1985-86 4,46,760 7,115
■ 1986-87 6,31,180 62,31
1987-88 4,70,021 9,159 60,1631988-89 4,99.633 12,619 53,4921989-90 5,12,157 10,068 46,5041990-91 5,65,653 9,333 50,122
1991-92 5,40,697 10,350 76,054
1991-92 (By District)
West-Tripura 2,73,990 2’713, 35,239
North-Tripura 1,28,512 4,713 20,055South-Tripura 1,38,195 2,924 20,750
VACC INATIQN PERFORMED CONTD.
43,327
41,838
40,891
47,73846,937
19,'724
13,713
Q. ANTH FMD R. P. R , D. S. F. COME D, C.
19,841
25,320
13,963
23,443
13,168
4,999
4,169
4,000
27,255 10,364
48,987 22,767
44,949 14,975
58,818 21,141
33,735 31,481
8,481
16,2549,000
15,022
7,459
^.000
23,249
15,427
17,369
17,972
1,838
6,334
9,800
10
13,177
5,530
2705
1,789
3,980
'2,242
6381100
(A.S+B.D)
11
39,425
30,994
30,319
29,529
12,387
10,142
7,000
12
15,569
366
2,149
15
. ■ -T5-
NIL
NIL
■V T
Source ; —Directorate of Animal- Husbandry Govt, of Tripura.
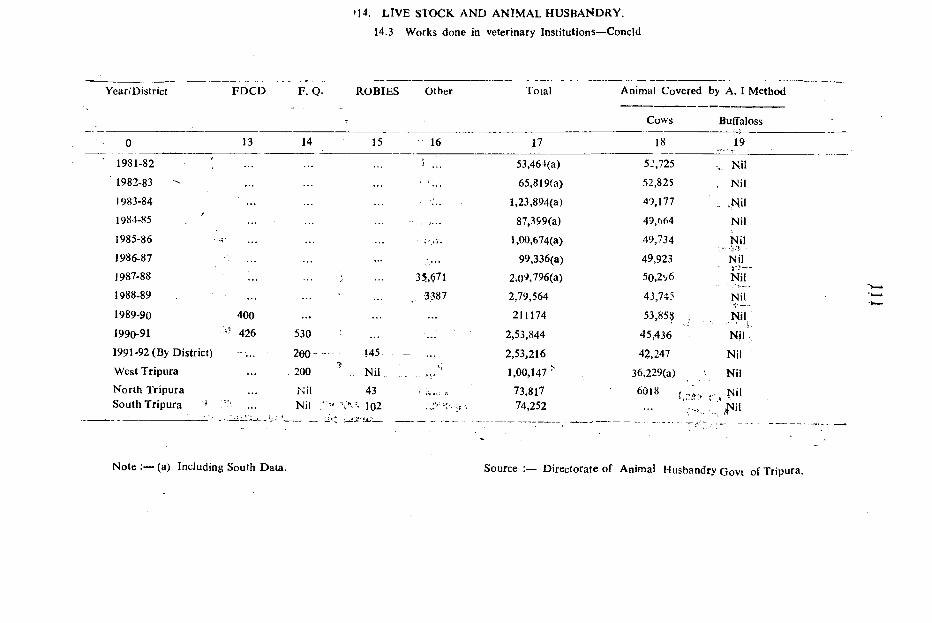
►14. LIVE STOCK AND ANIMAL HUSBAHDRY.14.3 Works done in veterinary Institutions—Concld
Year/District FDCD F. Q. ROBIES Other Total
13 14 35 16 17
Animal Covered by A. I Method
Cows
18
Buffaloss
19
1981-82 ! 53,464(a) 52,725 Nil1982-83 65,819(a) 52,825 Nil1983-84 1,23,894(a) 49,177 - .Nil1984-85 , ' 87.399(a) 49,664 Nil1985-86 -i l,00,674(a) 49,734 Nil1986-87 99,336(a) 49,923 Nil1987-88 35,671 2,0^,796(a) 50,2y6 Nil1988-89 3387 2,79,564 43,745 Nil1989-90 400 211174 53,858 Nil,1990-91 426 530 2,53,844 45/136 Nil1991-92 (By District) 260- 145 - ... 2,53,216 42,247 NilWest Tripura 200 ■ - M il. '■I 1,00,147^ 36,229(a) NilNorth Tripura Nil 43 ( ii.-; r. 73,817 l^ilSouth Tripura ’ ... Nil ]q2 74,252
Note :— (a) Including South Data. Source Directorate of Animal Husbandry Govt of Tripura.

14.4 Number of Milk Plants and Milk Chilling Centre and their capacity.
14. ANIMAL HUSBANDRY AND DAIRYING
1 Year Estimated Production of Milk
Milk Plants number Capacity
(’OOO Litres
MilkXhilliiJgnumber
1 2 3 4 5
1981-82 28.30 1 0 100 per day 2
1982.83 29.50 1 0.100 „ . 2
I983r84 31.16 1 oaoo „ 2
1984.-85 32.00 1 0.100 „
1985-86 33.40 I 0.100 „ „ a
1986-87 24.82 1 0.100 „ „ 2
1987-88 28,00 1 0.100 „ „ 2
1988-80 28.00 1 0 100 „ 2
19? 9-90 29.00 1 0.100 „ „ 2
1990-91 30.00 1 0.100 per day 2
1991-92 32.00 1 0.100 „ „ 2
Centres Capacity
(‘000 Literj)
One 0.005 Ltr. p«r day another 0.010 Ltr. per day
—do—
—do—
—do—
—do—
—do—
—do—■
—'do—'
—do—
—do—
—do—
N>
Source Directorate of Animal-Husbandry ■ Govr. of Tripura,

113
15. FO REST.
TABLE NO-15. 1 This table gives the information relating to area and forest. Area under forest is classified by types of ownerships and for the legal states. The classification of forest area given below:—•
1) State Forest;—Includes forest under the control of the Forest Department.
T A B L E N 015 .2 Information relating to produce of forestry is given in this table. Forest produce is classified as Major and total (Including timber and Firewood).
TABLENO-15. 3 This tables gives the information relating to area of Forests Protected from fire and cattle.
TABLENO-15. 4 This tablegives the Statistics regarding Plantation of important species
TABLENO-15.5 This table shows the progess Forest Revenue from and expenditure under Forest Department in Tripura.

Y ear/D istrict
1-
-State Forest
15. FORESTRY AND LOGGING
15. 1 Area under Forests Classified by “ Ownersliip’
Private Forest Total Forest % of State Fores I total foreits
(Sq . Kiiometre'i
% of Forest area to total Geographi'ral area of State/District
6
1981—82
1982—831983—841984—85
1985—861986—87
1987—881988—89
1989—90
1990—91
1990—91
Tripura (W)
Tripura (N)
Tripura (S)
5920.30
5920.30
6309.21
6299.186291.506291.67
6291.51
6291.67
6291.67
6291.67
1155.35
2650.52 2485,80
5920.235920.30
6309.21
6299.186291.50
6291.67
6291.516291.67
6291.67
6291.67
1155.35
2650.52
2485.80
100
100
100 '
100
100
100100
100
100
too
100
109
100
56.43
56.43
60.13
60.04
59.96 59-97
59.9759.97
59.97
59.97
38.57
68.29
68.76
Source :— Principal Chief Conservator of Forest -Govt, of Tripura.

15. FORESTRY AND LOGGING
15.2 Quantity and Value of Forests Product.
Year/District
Timber (cum.)
State Forest
Quantity
Firewood (M,T.)
Value
Timber
4
(Value in Lakh of Rs.)
Firewood
Total Value*
1981-82
1982—83 |983—84
1984—85
1985—861986—-87
19.87—88
1988—89
1989—90
1990—91
IS^O—91
Tripura (W) Tripura (N)
Tripura . (S)
-48999 43504
31936 45665
57202
49929
63651
49482 . 37816
25967
56508848
11469
148429190349
105883
128577
13183899026
108393
81788
58488
37539
59451807
29787
113,48 (a)
113,84 (a)
126.66(a)
234.72 (a)
279.02266.91
>75.09
408.05
353.75
262.17
66.21
80.61 •
115,35
27.17
34.01
50 44
59.21
47.21
50.S6
€4.53
2.53
23,30
123.61129.02
145.39
249.43
370.39 446.76
591.79
573.71
515.43
498.23
221.91
119.69
156.63
Note :— * All kinds of Product including in col (a) Including value of firewood.
6. Source .-—Principal Chief Conservator of Forest, Govt, of Tripura.

15. FORESTRY AND LOGGING
15.3 Forest Area Protected From Fire Cattle Grazing
Year/District
Total Forest Area
Protection Against Fire (R. F. + P. R. F.) Protection Against Grazing Area opengrazing
(Sq. Km.) Attempted Protected % of forest under fire protection to total forest area
Cost of fire conservency operation
Area closed to grazing
(Sq. Km.)
Area open to grazing through
the y5kr (Sq. Km.)
of the year
(Sq. Km.)
1 2 3 4 5 6 7 8 9
1981-82 5920.30 3862.78 3862.78 65,25 N . A. 282.11 5638.19
1982-83 5920.30 3862.78 3862.78 65.25 N. A. 295.11 5625.19
1983-84 6309.21 3862.57 3862.57 61.22 N. A. 319.84 ... 5989.37
1984-85 6299.18 3862.76 3862.76 61.32 N. A. 365.00 2436.41 349*7.77
1985-86 6291.50 3864.92 3846.92 61.14 N. A. 475.26 2444.58 3371.66
1986-87 6291.67 3847.09 3847.09 61.45 N. A. 556.61 2444.58 3290.481987-88 6291.51 3864.92 3846.92 61.14 N. A. 640.96 2444,58 3205.96
1988-89 6291.67 3847.09 3847.09 61.15. N. A. 726.82 2444.58 1703.031989-90 6291.67 3847.09 3847.09 61,15 N. A. 828.88 2444.58 3018.211990-91 6291.67 3847.09 3847.09 61,15 N. A. 916.71 2444.58 2930.381990-91
Tripura (W) 1155.35 806.47 806.47 69.80 N. A. 225.65 348.88 580.82Tripura (N) 2650.52 1677.80 1677.80 63.30 N. A. 420.49 972.72 1257.31Tripura (S) 2485.80 1362.82 1362.82 54.82 • N, A. 270.57 1122,98 1092.25
ON
Sources ;—Principal Chief Conservator of Forests, Govt,of Tripura.

Year/District
1
1981-82
1912-83
1983.941984-83
1985-861986-87
1987-881988-89
1989-90
1990-91 1990-91
Tripura (W)
Tripura (N)
Tripura (S)
15. FORESTRY & LOGO ING
15.4 Plantation of Important Specise by the Forest Department.
(Sq. Km.)
Eucalyptas Shisham Teak Kukar Mul tarry Chill Misc.
28.7640.18
48.7363.27
61,55
62.25107.02
109.87
139.71
92,01
17.00
41.81
33.20
35.9314.40
20.11
39.29
58.13
61.8430.17
29.62
13.7548.01
25.05
11.43
11.53
Total
64.6954.58
68.84102.56
119.68124.09
137.19
139.49
153.46
140.02
42.05
53.24
44.73
Source Principal Chief Conservator, Department of Forest,
Government of Tripura.

118
15. FORESTRY
15.5 Revenue from and Expenditure on Forest in Tripura
(Rs. in lakh)
Year/ i District
Total Gross Revenue from Forest under Forest Deptt.
Total Expenditure on
Forest under Forest Deptt.
Net Revenue ( f p r —) ;
1 2 3 4
1981-82 171.49 403.94 (—) 232.45
1982-83 139.19 470.96 ( - ) 331.79
1983-84 157.36 736.76 (—) 579 .40
1984-85 204.88 668,85 (—) 463.971985-86 326.34 716.81 ( - ) 390.471986-87 396.61 953.62 (—) 557.011987-88 386.15 82.04 (—) 395.89
1988-89 295.64 >93.?0 ; (~ ) 697.861989-90 247.00 )54.77 (—) 807.77
324.45 243.66 ( - ) 919.21I99O-9I : -Tripura (W) 17 2,36 521.47 , (-•) 349.11Tripura (N) 60.42 391.64 (—) 331.22Tripura (S) : 91.67 330.55 (—) 238.88
Source — Principal Chief Conservator
of Forests, Govt, of Tripura.

119
16. FISHERIES.
The section deal with Development o f Fisheries in Tripura.
— In this table data on Estimated Production. Average Price and value ispresented as suppliejj by the Directorate of Fisheries for the period from
rv r> . -* r\r\ a ^ ‘ ' t • ' . • '1982-83 to 1991-92.

16. FISHERIES.16,1 Fisheries in Tripura. Pr0d«etion/Quanti^.in Tonn^e Value Rs. in lakhs.
Year PRODUCTIONTotal
Inland Fish
(1)
Sub Sistance Fish
(2)
Valueof
Fish
2. Catch of fish by non-profiessional fisherman.
FISH (SUNDRYING)
Procfuction Curring Value
1 2 3 4 5 6 7
1982-83 8,100 810 8,910 1692.90 200 40,00
1983-84 8,500 850 9,350 1870,00 220 55,00
1984-85 10,000 lOOi) 11,000 4400,00 250 J5,001985-86 10,978 1097 12,075 2415,16 290 36.25
1986-87 11,840 150 11,990 2517.90 52 5.20
1987-88 13,842 170 14,012 3082,64 31 3.12
1988-89 16.152 259 16.411 4097.57 40 4,80
1989-90 17,874 310 18,184 4903.48 70 10.501990-91 21,100 95 21,195 5,931,75 22 3.741991-92 21,640 1604 23,244 6,973.20 11 3.96
Note 1. Excluding subsistance Fish. Source :— Directorate of Fisheries,Tripura.
K)O

1 2 1
17. RURAL DEVELOPMENT AND CO-OPERATION.
This section deals with data on Rural (Community) Development and in field o f Co-operation .
TABLE NO:— 17.1 Numbers of Block, area & Village covered and population served by District/Sub-Division have been shown in this table.
TABLE NO.:— 17.2 Data on Govt, expenditure on Rural Development programme by major heads from 1987-88 to 1990-91 have been presented.
TABLB NO:— 17.3 Selected Statistics of all societies in the field o f co-operation have been shown in table 17.3 and details o f societies by branches have been shown in tables from 17.4 to 17.15.

17. OOMMUNITY DEVELOPMENT AND CO-OPERATION
17.1 NUMBER OF BLOCKS, AREA, VILLAGES COVERED AND POPULATION SERVED
DISTRICT BLOCK FUN CnO N IN O INHABITED VILLAGES
(REVFNUE) COVERED (1991 CENSUS)
AREA IN SQ . KMS. PROVISIONAL POPULATION SERVED
(1991 CENSUS)
1 2 3 4 5
WEST TRIPURA 6 274 2982.26 1088147
Sadar 3 135 689302
Khowai 2 77 232399
Sonamura 1 62 166446
NORTH TRIPURA 5 260 3510-34 636326
Dharmanagar 2 102 274071
Kailashahar 2 95 223320
Kamalpur 1 63 138935
SOUTH TRIPURA 6 321 3894.63 721201
Udaipur 1 63 191434
Amarpur 1 55 149329
Gandachhera 1 59 48914
Belonia 2 86 217461
Sabroom 1 58 114063
TRIPURA 17 855 10387.23 24,45.674
K>ls>
SOURCE:— DIRECTORATE OF STATISTICS
GOVERNMENT OF TRIPURA

17. ^ f t A L HEVEL(»MENt AWD C6-0PERATTDN
17.2 GOVERNMENT EXPENDITURE ON RURAL DEVELOPMENT PROGRAMMES BY MAJOR HEAD
(Amount in thousand)
NAME OF MAJOR HEAD DURING THE YEAR
1987-88 1988-89 1989-90 1990-91
1 2 3 4 5
1. Block Head Quarters 15114 30326 47151 73215
2. Agriculture Development 1025 426 240 ■ 2510
3. Animal Husbandry & Fisheries 1983 59 46 368
4. Village & small Industries 209 445 832 1503
5. Amenities Programme (Drinking water supply) 1785 1242 3986 1895
6. Communication 3363 1921 3107 7709
7. Education 221 326 391 543
8. Social Education including Youth Programme 3963 5270 798 583
9. Irrigation 1728 809 3744 790
10. Land & Reclimation 809 747 201 5323
11. Health & Sanitation 79 107 490 921
12. Special Nutrition Programme 4841 4883 16375 1260813. Welfare & Backward Classes 1646 1778 1825 163814. Housing 393 3332 5765 187115. Others 42757 41009 33962 61721
TOTAL 79916 92680 118913 173198
No. of Reporting Blocks 8 9 13 14Total No. of Blocks (Including Sub-Block-I) 18 It 18 18
t o
SOURCE C. D. Unit. Directorate of Statistic*.

17. RURAL DE VELOPMENT & COOP ;
17.3 Selected Statistics of all Co-operative Societies in Tripura.
Items Unit 1981-82 1982-83 1983-84 1984-85 1985-86 1986-87 1987-88 1988-89 1989-90 1990-91
1 2 3 4 5 6 7 8 9 10 11 12
1. Societies Number 1007 1073 1127 • 1149 1199 1241 1266 1321 1351 1372
2. Membership Lakh 2.35 2.51 2.76 2.91 2.98 3.07 3.45 3.56 3.67 3.82
3. Share Capital Rs. Crores 0.47 0.47 0.79 7.09 7.16 7.22 13.03 16.02 17.73 20.38
4. Owned Fund >* 12.95 13.51 13.85 26.16 27.63 32.11 37.30
5. Working Capital ,, 30.13 25.02 29.13 44.33 44.72 45.82 95.68 109.43 119.85 137.93
6.
7.
Population *
No. of Societies per
Lakh 20.86 21.42 21.97 22.50 23.00 23.50 24.08 24.59 25.09 27.57(Census 191)
8.
akh of Population
No. of Member of all Societies per thousand
Number 48 50 51 51 52 53 53 54 54 50
9.
inhabitants „
Average Working Capital
112 117 126 129 130 131 143 145 146 139
per head of Population Rs. 145 114 133 197 194 195 397 445 478 500
to4^
* Estimated Population except 1990-91. Source :— OflSce of the Registrar, Co-operative SocietiesTripura.

s oy i>pe in iripura...conia. (N umber)
Year/District
ApexSocieties
State & Central Banks Unions
Central Land Mortgage Banks
Agricultural
Non-agri-cultural
Primary Land mortgage Banks
Marketing Sugarcanesupply
Milksupply
1 2 3 4 5 6 7 8 9 10
1981-82 ... 378 13 15
1982-83 4 1 1 372 13 13 49
1983-84 5 1 1 374 13 14 49
1984-85 7 2 1 374 14 14 50
1985-86 8 2 1 377 14 14 611986-87 8 2 1 370 14 14 70
1987-88 8 2 1 379 14 14 70
1988-89 8 2 1 382 14 14 76
1989-90 8 2 1 383 14 14 83
1990-91
1990-91
8 2 1 385 14 14 82
Jripura (W) 8 2 J 171 14 6 ... 70
Jripura (N) ... 113 4 ... 5
Tripura (S) 101 4 ... 7
to
Sourec:— OflSce of the Registrar, Co-operative SocietesTripura.

17 RURAL DEVELOPMENT & COOP
17.4 Co-operative Societies and Banks by type in Tripura............. .concld.
( Number)
Year/D ct
WeaverSocieties
ConsumerSocieties
HousingSocieties
ingSocieties
Women oci eties
Non-agriNon-credit
FisherySocieties
OtherIndustries
Others Total
1 11 12 13 14 15 16 17 18 19 20
1981-82 116 85 2 . . . 398 1007
1982-83 121 91 3 2 . . . 401 1073
1983-84 133 93 3 3 . . . . . . . . . 434 1127
1984-85 136 93 3 3 . . . - - 452 1149
1985-86 143 97 3 3 476 1199
1986-87 144 100 3 3 . . . 502 1241
1987-88 150 105 3 3 . . . 518 1267
1988-89 152 111 3 3 168 124 238 25 1321
1989-90 159 114 3 3 •V 176 127 235 29 1351
1990-91
1990—91
1^1 121 3 3 184 127 239 28 1372
Tripura (W) 107 80 3 3 119 55 149 12 800
Tripura (N) 33 23 . . . 36 25 56 9 304
Tripura (S) 21 18 . . . . . . 29 47 34 7 268
Source Office of the Registar, Co-operative Societies, Tripura.

17. RURAL DEVELOPMENT & COOP
17.5 Selected Statistics of Primary Agricultural Credit Service Societies in Tripura
1
( Rs. in lakh )
Year/ Socie- Member- Share Owned Working Deposit Borrow- Loan adva- Loan Loan out- Over dues % SocietiesDistrict ties ship capital capital Capital ing & out need during reco- standing of outstan- showro8
(No.) (Thou) standing the year vered end of year ding loan profit (No)
8 10 11 12 J3
1984-85 374 223 214 .52 505.46 1393,34 17.45 625.42 247,50 41.18 625.42 50,80% 87
1985-86 377 236 246.74 586.00 1828.35 38.18 792.33 232.63 69.29 594.62 J^.84% 96
1986-87 386 242 258.41 612.18 2263.56 42 31 916.74 365.83 87.80 872.65 €9.26% 1181987-88 379 251 311.41 868.45 2699.05 23.71 1206.70 286.85 97.27 1020.45 52,11% 87
1988-89 382 256 330.01 938.45 3092.28 21.53 1494.71 37L49 88.98 1286.2^ 51.68% 94
1989-90 383 261 345,67 1050.36 3516.37 21.52 1812.46 338.98 62.13 1568.97 58.88% 56
1990-91 385 272 373.64 1188.04 3884.63 26.82 1979.73 355 36 88.19 1793.60 73.70% 96
1990-91 : —
Tripura (W) 171 112 161.53 485.52 1439.10 7.81 752.52 123.69 46.66 681.99 72.16% 31
Tripura (N) 113 74 102.53 330.31 1078.47 6.93 535.56 102.59 7.79 472,55 72,48% 33
Tripura (S) 101 86 109.58 372.21 1367.06 12.08 691.65 129.08 33.74 639.06 76,24% 32
to--4
Source :— Office of the Registrar, Co-operativo Soci eti
Tripura.-

17. RURAL DEVELOPMENT & COOP
17.6 Selected Statistics of Primary Non-agricultural Credit Societies in Tripura.
( Rs. in Lakh )
Year/District
Societies Member ship Share No. <Thou.) capital
Ownedcapital
Workingcapital
Deposite Loan advance
Loan out Overdues as % Societies show-standing at outstanding ing profit (No)
1 2 3 4 5 6 7 8 9 10 11
1984-85 208 22 27.64 47.36 145.74 29.46 20.89 31.11 58
1985-86 234 23 66.64 108.54 436.86 11.85 11.55 22.07 7.84% 65
1986-87 246 24 70.21 113.67 498.26 12.54 14.09 25.33 8.63% 79
1987-88 250 25 81.64 147.19 417.38 12.96 10.02 25.98 27.13% 64
1988-89 256 25 91.97 161.25 445.39 15.96 11.75 27.16 33.50% 59
1989-90 270 25 100.74 170.84 428.93 13.22 16.20 30.69 45.26% 541990-91 268 26 118.95 190.74 484.01 16 17 18.09 32.32 27.38 511990-91
Tripura (W) 160 14 57.58 89.71 247.46 13.54 18.09 26.49 . 18.16% 31Tripura (N) 43 4 28.07 46.68 102.33 1.01 2.35 24.68% 6Tripura (S) 65 8 33.30 54.35 134.22 1.62 3.48 99.43% 14
00
Source Office-of the Registrar, Co :perativc SocieliesTripura.
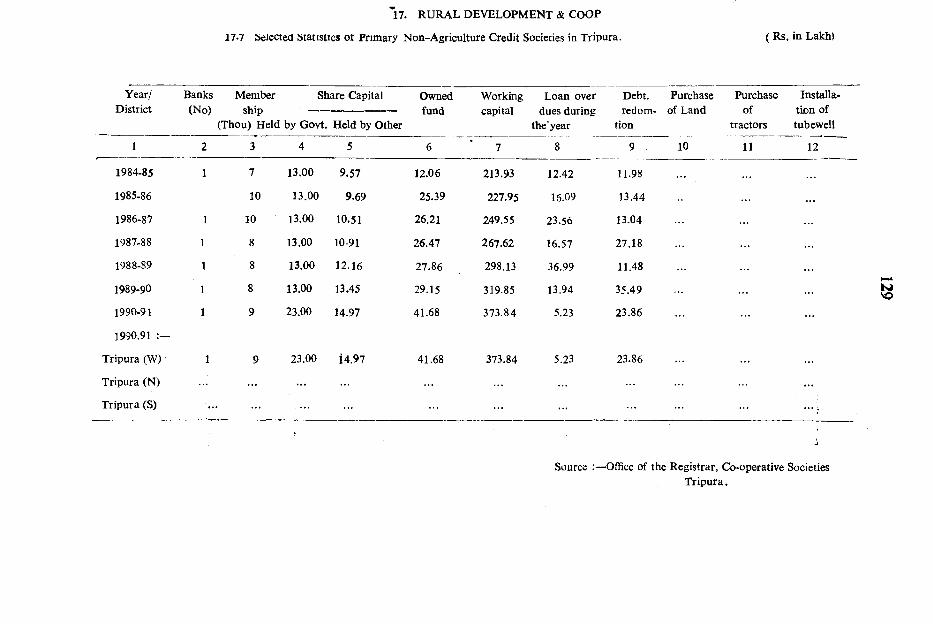
17. RURAL DEVELOPMENT & COOP
17«7 Selected statistics of Primary Non-Agriculture Credit Societies in Tripura. ( Rs. in Lakh)
Tripura (N)
Tripura (S)
Year/District
Banks(No)
Member ship
(Thou) Held
Share Capital Owned Workingcapital
Loan over dues during
the'year
Debt. Purchase redom- of Land
tion
Purchaseof
tractors
Installation of tubewellby Govt. Held by Other
l U n Q
1 2 3 4 5 6 7 8 9 10 11 12
1984-85 1 7 13.00 9.57 12.06 213.93 12.42 11.98
1985-86 10 13.00 9.69 25.39 227.95 16.09 13.44
1986-87 1 10 13.00 10.51 26.21 249.55 23.56 13.04
1987-88 1 8 13.00 10-91 26.47 2 6 7 . 6 2 16.57 27.18
1988-89 1 8 13.00 12.16 27.86 298.13 36.99 11.48 ...1989-90 1 8 13.00 13.45 29.15 319.85 13.94 35.49 ...
1990-91 1 9 23.00 14.97 41.68 373.84 5.23 23.86
1990.91
"ripura (W )' 1 9 23.00 14.97 41.68 373.84 5.23 23.86
A
Source ;—Office of the Registrar, Co-operative SocietiesTripura.
K)SO

17. RURAL DEVELOPMENT &COOP17, 7 Selected Statistics of Land Development Bank in Tripura
(Rs. in L akh)
Year/ Other land Loan recovered Over dues No. of Banks Amount of Banks showing Amount of lossDistrict improvment during the year showing profit profit loss (No.)
1 13 14 15 16 17 18 19 ___
1984-85 1242 5.56 4.60 • • • 1 17.471985-86 • • • 10.59 32.48 • • • 1 14,271986-87 • • • 11.89 • • • . . . 1 9.841987-88 • • • 12.31 29.68 1 19.581988-19 16.89 15.89 I 8.701989-90 • • • 13.89 13.94 • • • 1 12.861990-91 24.38 5-23 ‘ • • • 1 1.961990-91 . ■
Tripura (w) 24.38 5.23 • • • 1 1.96Tripura (N) • • • • • • • • • . . . . . . . . .
Tripura (S) ••• . . . . . . -
17. 8 Selected Statistics of State CO-operative Bank in Tripura (Contd.)(Rs. rn Lakh)
Year/ Banks Branches Membership Share Capital Owned Working Deposite BorrowingDistrict (No) (No) (Thou) fund Capital out
Held by Govt. Held by other standing1 2 3 X 4 5 6 7 8 9 10
1984-85 1 26 1.00 35.00 40.00 148.78 1506.36 876.49 193.611985-86 1 26 1.00 35.00 40.00 306.27 1729.18 1027.14 302.741986-87 I 26 2.00 43.41 39.96 334.64 2137.94 1183.80 340.181987-88 1 27 2.00 43.41 44.70 370.99 2467.35 1453.34 448.891988-89 1 27 3.00 43.40 48.35 379.59 3056.02 1811.47 505.201989-90 1 28 3.00 43.41 57.78 440.78 3394.71 1787.82 495.411990-91 1 29 3.00 4341 59.73 559.39 4204.35 2133.91 720.411990 Oi :Tripura (w) 1 29 300 43.41 59.73 559.39 4204.35 2133.91 720.41Tripura (N) • • • . . . ..ITripura (S) . . . . . . • • • . . . . . .

17.8. ;ed StaHstics of State Co-operative in Tripnra (Concld.)(Rs. in Lakh)
Year/District
Loan Advanced during the year
Loan outstanding ai end of the year
Overdues as % outstanding
Bank showing Profit (No.)
Profit Bank showing loss (No.)
Loss
1 11 12 13 14 15 16 17
1984—85 7363.00 496.88 82.45% 1 8.161985—86 2250.75 1646.15 44.31% 1 30.09 • • •
1986—87 2355.91 1950.89 31.53'% 1 36.05 • • •
1987—88 269.82 2390.46 15.26% 1 20.811988—89 961.18 1714.91 25.42% 1 35.57 . . .
1989—90 898.88 2123.17 24.56% 1 1.64 • • •
1990—91
1990-91 :—
941.351
1934.44 46.12% 1 62.87 . . .
Tripura (W) 941,35 1934.44 46.12% 1 62.87 ■Tripura (N) . . . . . . . . . • • • • • • • • • . . .
Tripura (S) . . . . . . . . . • • • . . . • • • . . .
Souree Oflflce of the Registrar, Co-operative Societies, Tripura.

17. RURAL DEVELOPMENT
17 .9 Selected Statstics of APEX Marketing in Tripura.(Rs. in Lakh)
Year/Distjict
Membership(Thou.)
Share Capital Ownedfund
Workingcapital
Quantity of pro-
duce(M/T)
Value of pro
duced
Business turn
over
Agrl.producemarketing
Seeddistributed
Fertilizerdistributed
Consumergoods
distributed
Profit
Held by. Held by Govt. other
1 2 3 4 5 6 7 8 9 10 11 ' 12 13 14
1984—85_ 0.123 66.69 0.27 68.83 527.32 193.18 24.36%
1985—86 0.131 69.18 0.28 92.66 1176.47 124.82 408.28 390.21 . . . 18.07 . . .
• 1986—87 0.131 73.68 0.28 106.74 1468.34 187.53 235.12 235.12 . . . 1.07
1987—88 0.131 80.18 0.28 122.01 1446.37 76.29 120.51 117.84 2.09
. 1988—89 0.131 83.18 0.28 126.54 1411.63 . . . 31.1 31.17 ...
1989—90 0.133- 87.18 • 0.28 . 131.57 1421.93 7.14 7.14
, 1990—91 0.134 101.18 0.28 147.13 1431.93 56.41 41.50 . . . 14.91 . . .
1990-91 :—
Tripura (W) '0.134 101,18 0.28 147.13 1431.93 56.41 41.50 . . . . . . 14.91 ...
Tripura (N) 0 . . . ... . . . ... ... ...
Tripura (S) . . . . . . . . . . . . . . .
Source :— Office of the Registar, Co-operative Societies, Tripura.
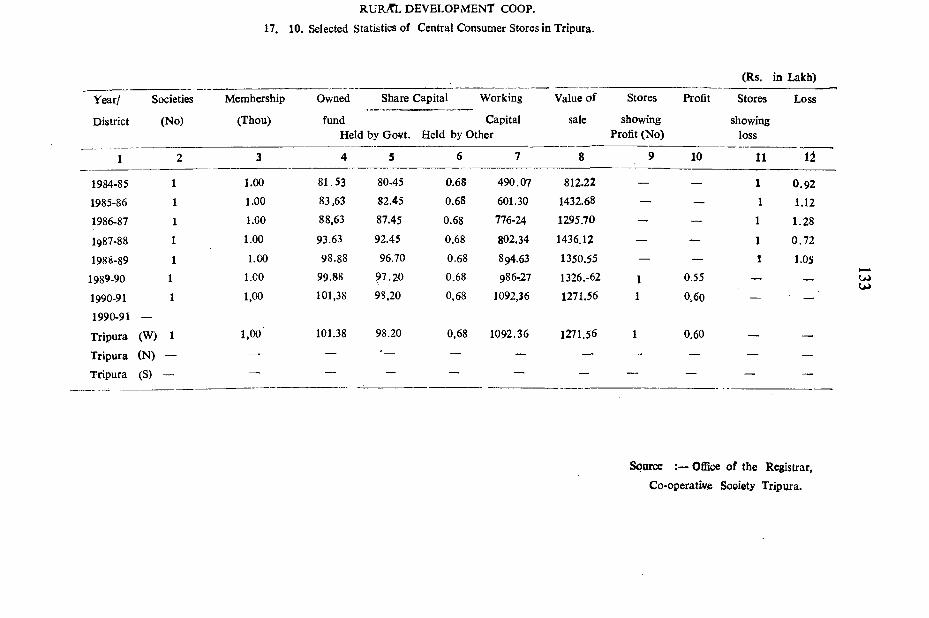
R U R ^ DEVELOPxMENT COOP.
17. 10. Selected Statistics of Central Consumer Stores in Tripura.
(Rs. in Lakh)
Year/ Societies Membership Owned Share Capital Working Value of Stores Profit Stores Loss
District (No) (Thou) fundHeld by Govt.
Capital Held by Other
sale showing Profit (No)
showingloss
1 2 3 4 5 6 7 8 9 10 11 l i
1984-85 1 1.00 81.53 80-45 0.68 490.07 812.22 — — 1 0.921985-86 1 1.00 83,63 82.45 0.68 601.30 1432.68 — — 1 1.121986-87 1 1.00 88,63 87.45 0.68 776-24 1295.70 — — 1 1.28
1987-88 1 1.00 93.63 92.45 0.68 802.34 1436.12 — — 1 0.72
198S-89 1 1.00 98.88 96.70 0.68 894.63 1350.55 — — 1 1.05
1989-90 1 1.00 99.88 97.20 0.68 986-27 1326.-62 I 0.55 — ■ —
1990-91 1 1,00 101,38 98,20 0,68 1092,36 1271.56 1 0,60 — ■ — '
1990-91 —
Tripura (W) 1 1,00 101.38 98.20 0,68 1092.36 1271.56 1 0.60 — —
Tripura (N) - — — — — — — — — —
Tripura (S) - — -- --- — -- — — — — —
u>
Scarce Office of the Registrar,
Co-operative Society Tripura.

URAL DEVELOPMENT & COOP17. 11 Selected Statistics o f Labour & Construction in Tripura
( Rs. in Lakh)
Year/District
Societies(No.)
Membership(Thousand)
Ownedfund
Workingcapital
Value of work done
Societies in profitNo.)
Profit Societies in loss(No)
Los5
1 2 3 4 5 6 7 8 9 10
1984-85 25 1.00 1.85 3.82 0.62 4 0.09 3 0.071985-86 25 1,00 2.45 4.13 1.07 4 0.12 I 0,061986-87 26 1.00 2.72 5.55 1.74 4 0.44 2 0.03
1987-88 29 2.87 7.18 6.32 5 0.97 3 0031988-89 33 1.00 3.31 8.04 6.97 5 0.50 8 0.171989-90 36 1.37 4.22 9.23 5.62 5 1.34 4 0.571990-91 36 « 5.30 10.70 5.71 5 0.49 3 0.39I99O-9I Tripura (W) 16 0.57 2.08 4.35 0.60 2 0.01 1 0.23Tripura (N) 8 0.28 1.28 3.75 5.11 1. 0.43 1 0.16Tripura (S) 12 0.54 1.94 2.60 — 2 0,05 1 0.00
■4
Source :—Office of the Registrar Co-operativeSocieties Tripura.

Year/District
17. RURAL DEVELOPMENT & COOP.
17.12 Selected Statistics of Housing Co-operative Societies in Tripura.(Rs. in Lakh)
Societies(No.)
Membership Owned Working House Constructed Societies Profit Societies Profit (Thousand) fund capital to year end (No.) in profit (No.) in loss (No.)
10
1984-85 3 0.296 0.70 1.86 ' . . . ■ 1 0.041985-86 3 0.229 1.06 3.05 1 0.061986-87 S 0,229 L30 3.15 1 0.2$
1987-88 3 0.299 1.29 3.16 . . . 1 0.101988-89 3 0.294 1.30 2.85 1 0.111989-90 3 0.294 1.38 2.99 . . . . . . 1 0.081990-91
1990-91
- 3 0,337 3.67 5.79 1 0,33 . . . . . .
Tripura (W) 3 0.337 3.67 5.79 1 0.33 "• . . .
Tripura (N) . . . « • . . . . . . . . .f
Tripura (S) . . . . . . . . . . . . . . . . . .
Source OflBcc of the Registra, Co-operative Societies, Tripura.

17. RURAL DEVELOPMENT & COOP.
17.13 Selected Statistics of Dairy & Milk supply in Tripura.(R8. in Lakh)
Year/ Societies District (No.)
Membership
(thousand)
Sharecapital
Ownedfund
Workingcapital
Loan advance during
the year
Milk & Milk products produced
Milk d milk product
sold
Societies in profit (No.)
Profit Societies in loss (No.)
Loss
1 2 3 4 5 6 7 8 9 10 11 12 13
1984-85 51 4.00 N. A. 2.10 18.25 ... 72.10 74.30 12 0.47 8 0.42
1985-86 61 4.00 N. A. 3.35 18.20 18.82 18.16 8 0.76 14 1.251986-87 70 4.00 N. A. 3.78 18.74 ... 23.85 20.04 11 0.31 13 0.69
1987-88 70 4.00 N. A. 4.05 20.24 ... 24.30 23.40 20 0.97 9 0.10
1988-89 76 4.00 N. A. 4.26 19.91 ... 25.96 26.98 16 0.63 39 0.45
1989-90 83 5.19 2.64 4.46 20-87 ... 18 0.44 14 0.43
1990-91
1990-91
82 5,00 2,641
4.28 20.68 16 0.43 13 0.29
' Tripura (W) 70 4.00 2.09 3.56 16.15 16 0.43 13 0.29
Tripura (N) 5 0.19 0.27 0.38 1.22 ... ... ...Tripura (S) 7 1.00 0,28 0,34 3.31 ... ... ... ...
0 \
Source Office of the Registrar Co-operative Societies, Tripura.

UbVELUyiVTtrSl & CUUH17. 14 Selected Statistics of Women Co-operative Societies in Tripura.
(Rs. in Lakh)
Year/Distiict
Societies(No)
Membership(Thou.)
ShareCapital
Ownedfund
WorkingCapital
Loan advance during year
Loan outstanding during „u dof year
Societies Profit in profit(N)
Societies in loss (N)
Loss
1 2 3 4 5 6 7 8 9 10 11 12
1984-85 79 4.00 2.41 2.75 3.50 • • • . . . 12 0.15 15 1.751985-86 81 4 00 2.56 8,25 14.38 8 0.16 17 0.391986-87 85 4.00 2 85 9 12 16.29 12 0.27 14 0.181987-88 85 4 00 2.91 8.52 15.17 7 0.22 14 0.671988-89 89 4 00 3.49 10.20 15.79 2 0.02 16 0.811989-90 88 4 00 4.32 11.18 16.45 . . . 7 0.15 10 0.59
1990-911990-91
Tripura (W)
89 4.00 5.08 13.74 18.65 7 0.19 9 0.37
Tripura (N)
Tripura <S) :: 89 4.00 5.08 13.74 18.65 7 0.19 9 0.37
u>
N. B. ;—Break-up of table 19.14 are not available
Source:—oflBce of the Registrar,Co-operative SocietiesTripura.

17. RURAL DEVELOPMENT & COOP.
17.15 Selected Statistics of Industrial Co-operative ia Tripura.
(Rs. in lakh)
Year Societies Membership Share Owned Working Deposite Value of Value of Societies Profit Societies Profit
District (No) (Thous.) Capital Capital Capital good pro- good in profit (N) in loss (N)duct sold
1 2 3 4 5 6 7 8 9 10 11 12 13
1984-85 331 16.00 74.44 99.47 175.48 5.26 68.36 128.66 38 1.31 67 15.98
1985-86 201 6.00 21,95 40.54 86.21 3.55 24.19 29.07 19 3.08 28 1.18
1986-87 219 7.00 23.12 42.88 99.63 4.06 28.06 34.23 22 4.07 26 0.97
1987-88 225 . 7.00 44.52 86.14 134. 17 7.91 30.10 43.37 24 1.49 31 7.87
1988-89 238 7.00 45.31 86.82 137.00 10.26 29.13 39.31 18 1.50 31 4.87
1989-90 235 7.00 53.05 90.95 N 49.33 13.12 36.93 57.61 21 2.57 30 6.821990-91
1990-91 : —239 7.00 46.51 110.48 178.00 11.40 58.02 77 37 22 5.48 28 15.89
Tripura (W) ...Tripura (N) 239 7.00 46.51 U0.48 17S.00 11.40 58.02 77.37 22 5.48 28 15.89
Tripura (S) :
u>oo
N. B. : B reakup of table No. 19.15 are not available.
Source Office o the Registrar Co-operative Socities, Govt, of Tripura.

18. MANUFACTURING
Data on Manufacturing have been presented in this section.
TABLE NO. 18.1 Number of Registered Factories and average number c>f workers employed are given in this table.
TABLE NO. 18 2 This table gives information relating to state characloristics of Factory in Tripura,
t a b l e n o . 18.3 This table gives informat on relating to the amount on graats and loans distributed to various Industries by Khadi and Village Industries Board.
t a b l e NO. 18.4 This table gives information regarding productio i anJ Employment of Manufacturing Industries in Tripura.

Year Under Sec.2m(i)
18. MANUFACTURING.
18.1 Number of Registered Factories
Under Sec. 2m(ii) Under Sec. 85. Total Factories
(a) Number of factories have come down tiue to their licences have been cancelled.
Average number of workers employed
1981 97 77 44 218 13318
1982 105 113 92 310 16664
1983 113 135 184 432 20727
1984 109 149 322 570 237281985 122 167 412 701 26905
1986 134 190 433 757 31924
1987 140 219 433 792 36541
1988 147 244 431 822 38726
1989 171 242 535 948 43331
1990 173 244 593 lOlO 44092
1991 (a) 163 172 ’647 982 36923
Source ;—Factories & Boilers Organisation,
Govt, of Tripura.

18. MANUFACTURING
18.2 Selected Characteristics of Factory in Tripura.......... con t-.
( Value figures in Rs. lakhs, mandays in thousand & others in number )
Year/ Number Industry Group (Code) of
Factory
Fixedcapi
tal
Working
capital
Investedcapital
Out standing loan
Numberof
workers
MandaysWorkers
Number of employees
Mandaysemploy
ees.
1 Total person
engaged
Wag?sto
workers
Total emulu- i ment
1 2 3 4 5 6 7 8 9 10 11 12 13
1984-85 250 1050 333 1802 1168 9983 2387 11803 2835 11996 469 6411985-86 225 1114 442 1852 1651 10586 2367 12054 2746 12247 554 7081986-87 233 2359 587 3224 1151 11726 2511 13400 2906 13591 666 8621987-88 258 2385 642 3442 580 14001 2889 15707 3290 15921 839 10891988-89 266 7699 706 8810 1527 12055 2892 13776 3376 13969 995 12761988-891, Manufacture of Food
product (20-21) 36 214 167 455 166 1377 394 1617 464 1638 55 892. Manufacture of Beverages,
Tobbaco & Tobbaco Product (22) 3 2 7 7 0 108 39 121 42 124 9 123. Manufacture of Wood & Wood
Pro. Furniture & Fixtures (27)I
5 24 3 32 16 85 26 135 40 138 11 234. Manufacture of Paper, Paper
Product, Printing, Publishing & Ai'lied Industries (28) 7 74 83 146 I 473 142 544 163 548 84 103
5. Manufacture of Rubber, Plastic, Peirolium & Coal. (30) 5 47 21 60 25 30 7 46 11 51 2 3
6‘ Manufacture of Non-metallic Mineral (32) 140 117 348 665 191 6744 1184 7340 1307 7456 249 301
7. Basic metal & alloys Industries (33) 6 17 16 42 36 69 19 92 26 98 6 8
8- Manufacture of Metal product Part cxcept machinery ,Transport equipment (34) 13 12 43 37 20 255 71 332 93 344 37 52
9. Manufacture of Electrical Machinery Appar; tus, Appli- ences. Supplies & Parts (36) 3 6 3 8 3 37 11 40 12 46 3 3
lo. O thtr Manufacturing Industries (38) 6 57 65 156 1065 1387 499 1582 56i 1586 230 284
11. Electricity (40) ^ 13 7040 l a 7046 0 805 289 1072 385 1072 181 23812. Water Works & Supply (42) 10 ,32 2 34 0 184 63 228 77 228 38 4413. Repair Services (97) 19 57 68 123 2 501 150 627 190 640 90 116
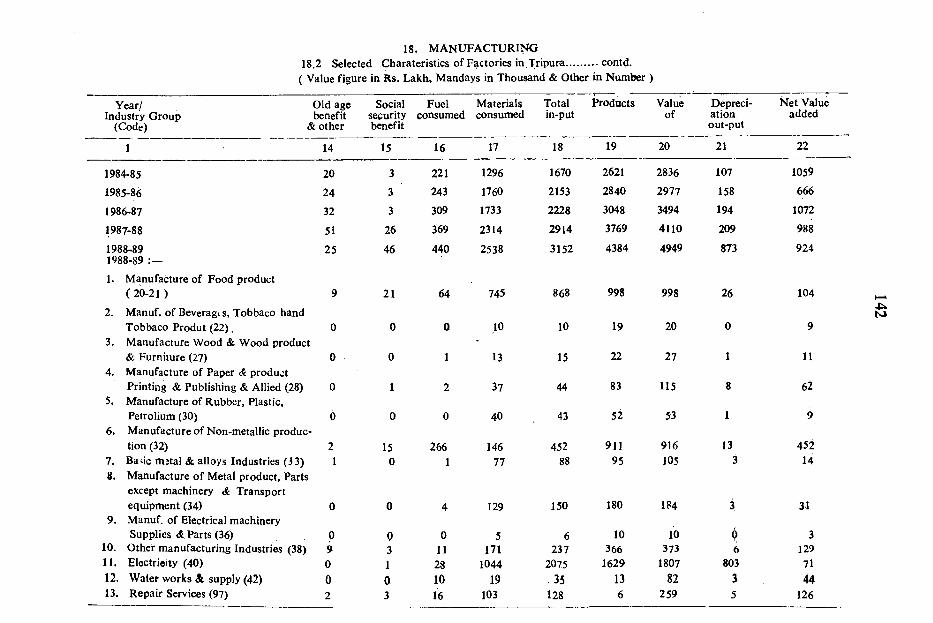
18. M A N U F A C T U R I^18.2 Selected Gharateristics of Factories in Tripura...........contd.
( Value figure in Rs. Lakh, Mandays in Thousand & Other in Number )
Year/ Industry Group
(Code)
Old age benefit
& other
Socialsecuritybenefit
Fuelconsumed
Materialsconsumed
Totalin-put
Products Valueof
Depreciationout-put
Net Value added
1 14 15 16 17 18 19 20 21 22
1984-85 20 3 221 1296 1670 2621 2836 107 1059
1985-86 24 3 243 1760 2153 2840 2977 158 666
1986-87 32 3 309 1733 2228 3048 3494 194 1072
1987-88 51 26 369 2314 2914 3769 4110 209 988
1988-891988-89
1. Manufacture of Food product
25 46 440 2538 3152 4384 4949 873 924
( 20-21 )
2. Manuf. of Beverages, Tobbaco hand
9 21 64 745 868 998 998 26 104
Tobbaco Produt (22).3. Manufacture Wood & Wood product
0 0 0 .10 10 19 20 0 9
& Furniture (27)4. Manufacture of Paper d product
0 0 1 13 15 22 27 1 11
Printing & Publishing & Allied (28) 5. Manufacture of Rubber, Plastic,
0 1 2 37 44 83 115 8 62
Petrolium (30)6. Manufacture of Non-metallic produc
0 0 0 40 43 52 53 1 9
tion (32) 2 15 266 146 452 911 916 13 4527. Ba<ic m3tal & alloys Industries (3 3)8. Manufacture of Metal product. Parts
except machinery <& Transport
1 0 1 77 88 95 105 3 14
equipment (34)9. Manuf. of Electrical machinery
0 0 4 129 150 180 184 3:
0
31
Supplies <& Parts (36) p Q 0 5 6 10 10 310. Other manufacturing Industries (38) 9 3 11 171 237 366 373 6 12911. Electricity (40) 0 1 28 1044 2075 1629 1807 803 7112. Water works & supply (42) 0 0 10 19 .35 13 82 3 4413. Repair Services (97) 2 3 16 103 128 6 259 5 126

im MANUFACTURING18.2 Selected Characteristics of Factories in Tripura...conld.
(Value figure Rs. in Lakh, Manda>s in thousand & Other in number)Year/
Industry Group (Code)
Addittion in stock ofRem Inte- Net Net fix- Gross __________________paid rest in- ed capi- fixed ca-
paid come tal for- pital for- Material Semi fini- Finished Total Physical formation mation fuel etc. shed goods goods working‘capital mation
Gross capital pro
fit
1 23 24 25 26 27 28 29 30 31 i2 33
1984-85 8 55 996 4 111 ( - ) 6 15 ( - ) 4 5 116 3321985-86 9 112 544 69 227 ( - ) 5 ( - ) 19 61 38 265 (—) 1^1r986-87 12 118 943 1382 1576 48 (—) 9 83 121 1697 461987-88 13 60 915 66 274 42 29 90 J60 435 (—) 2511988-891988-891. Manufacture of food &
14 183 726 5396 6269 28 34 49 112 6380 ( - ) 620
food product (20-21)2. Manufacture of Bevar age,
4 25 75 40 66 23 0 ( - ) 62 ( - ) 39 27 ( - ) 44
Tobbiaco & Tobbaco Prod. 3. Maunf. of wood & wood
product, furniture &
0 0 9 ( - ) 0 0 ( - ) 1 0 1 0 0 ( - ) 3
fixtures (27)4. Manuf. of paper & paper
prodt. printing publishing,
0 1 10 11 13 0 ( - ) O 1 1 14 ( - ) 14
allied Ind. (28)5. Manuf. of rubber, plastic
0 0 62 ( - ) 3 6 22 0 0 22 28 ( - ) 42
Ptitrolium & coa l pro. 30) 6. Manuf. of non-metalic,
0 4 6 ( - ) 1 0 4 0 2 6 6 2
mineral product (32) 7. Basic metal & alloys
6 28 418 9 22 10 22 105 137 159 100
industries (3^)8. Manuf. of metal product
parts except machinery &
1 4 9 0 3 ( - ) 2 ( - ) 2 3 ( - ) 1 3 ( - ) 1
transport equipment (34) 0 9. Manuf. of Electrical
machinary. Apparatus, Appli-
3 28 ( - ) 2 1 0 0 ( - ) 5 ( - ) 4 ( - ) 3 ( - ) 25
ences. Supplies A^Parts (36) 0 10. Others manufacturing
p 3 1 1 0 0 0 0 1 ( - ) 0
industries (38) 0 117 12 —3 3 3 14 4 21 24 —28411. Electricity (40)12. Waterworks &
2 0 —73 5350 6152 —3 0 0 —3 6149 —312
supply (42) 0 0 44 —3 0 0 0 0 0 0 013. Repair services (97) 0 2 l24 —4 —28 0 0 —27 —26 a
0= L ess then one unit. Source :— Annual Survey of Industries, C .S .O . Department of Statistics,
Ministry of Planning, Govt, of INDIA.
4^u>

Name of Industries
1
A. Village Industries Grant
1. Village Oil2. Village Pottery3. Cane and Bamboo4. P.C.P.I.5. Village Leather6. Cottage Match7. Gur and Khandeswari8. Pairn Gur9. Bee keeping
10. Carpentry & Blacksmithy11. Others (Lime, Gobargas,
Paper, Textile etc).
B. Village Industries Loan
L Cottage Match2. P.C.P.I.3. Leather4. Village Oil5. Carpentry <6 Blacksmity6. Village Pottery7. Candle Industry8. Service Industry9. Fiber & Textile
10. Lime Industry11. Others (Bee keeping. Paper,
K/gur. Fruit Indu. etcKHADI GRANT
18. MANUFACTURING
18, 3 Amount of Grant and Loan Disbursed to Various Industries by Khadi and Village Industries Board (Series)
1981-82 1982-83 1983-84 1984-85 1985-86 1986-87 1987-88 1988-89 1989-90 1990-91 1991-92
C.
D. KHADI LOAN
Grand Totat (A+B + C +D )
506 1037 875 1940 1960 2021 827
12 32 21 51 . . .
187 217 83 527 194 264 8828 148 153 155 276 238 5886 130 191 276 478 493 2876 62 53 31 66 41 122 2 19 67 8 . . .
25 51 84 56 78 104 8410 5 20 24 780 ’40 45 85 21 21 2170 228 226 738 819 788 270
107 • • • . . .
23 747 2167 11
• • • 315 466 • • •
. . . •AT* * * • • •
" 2 i i ♦
1(W 715 . . .
. . . 318 900
127
633
402
36
1475
21 1475
86289
75 1126
898 2837 5542
61
339
2432
75
1390
15446516
67
3737
525
902
10
334
484
10455
”4433624
16
749
45247
15044
56131
11
671
5418
247155
2251
168
912373
351030102
2723161401537588
162155
155
1390 1214 3354
12
749
lOH90
21883
132289
198
2065
21946
16
178132
"2187
235
429298
117
3229
SourceTripura Khadi & Village Industries Board,
Govt, of Tripura,

18. 4 Production and Eraplcjyffiiflt of Manufacturing Industrin
18. MANUFACTURING
Year/District
1
1987-881988-891989-90
1989-90
Tripura (W)
Tripura (N)
Tripura (S)
Number of unit
540506540
303186
51
Totalemployment
3
297714803109
16301233
226
Total investment (Rs. in Lakh)'
3SS.14
1221.12K)98.52
3U.40i m . n
535.34
Total Production (Rs. in Lakh)
923,14
1369.27il51.89
475.00212.82
464.07
r^Direct«rate of Indwstrl»8, Govt. Tripura.

This Section presents the folloffingdata regarding geoera^on and consumption of power.N« coal is {MToduced in Tr^ura. Oil is imported monthly from Asiam.
'HableN«. 19,1 Statistics regarding installed plant Capacity, total kilowatts hours s o l i to ultimate consumers are given in this tabic.
TaWe No. 19 2 This table gives information relating to consumption o f electricity for diiTerent purpose.
• ITable No. 19.3 This table gives information relating to number of towns and villages
^ectriS^ in Tripura (As on 31st March) ,
19. FUEL AND POWER

ELECTRICITY GENERATED & CONSUMED.
I n Mega Ufeits. 150 — -------------
1 2 0
60
30
"
l u i
Xlectrlclty Qener«te4 «
Electricity Consumed,
I 'I '
I
' n r
i
Iw
tttt
ega Unite,-------- 150
II
_ 1 2 0
__ 90
— 30
1 9 8 2 -8 3 8 3 -8 4 8 4 -8 5 8 5 -8 6 8 6 -8 7 8 7 -8 8 8 8 -8 9 8 9 -9 0 9 0 -9 1 9 1 -9 2

19.1 Installed Capacity, Gcneratiofl and Consumption of Electricity In Tripiira.
19.1 ELECTRICITY & POWER
YearOU
Instaled Capacity (M .U .) Hydro Gas Total
Electricity Generation (M . U.) Oil Hydro Gas Total
ElectricityPurchased
(M.U.)
Total M .U . Ultimate _ Within the State
Sold to Consuniers sold to outside State
I 2 3 4 5 6 7 8 9 10 11 12
1981-82 7.00 10.00 17.00 1.15 50.25 51.39 3.33, 37.98
1982-83 7.00 10.00 17.00 1.36 52,06 53.42 9,48. 43.11
1983-84 6.00 15.00 21.00 ,1.30 52.76 . 54,06 18.30 46.56
1984-85 6.00 15.00 21.00 , 1.58 59.00 60.58 0.30 55.141985-86 6.00 15.00 ... 21.00 1.54 65.84 67.38 0.97 64.46
1986-87 6.00 15.00 10.00 ,31.00 2.28 39.11 34.08■j
75.47 2.44 48.11
1987-88 6.00 15.00 10.00 31.00 2.20 45.60 53.00 100.80 26.03 84.14 8.17
1988-89 _ 4.85 16.00 10.00 30.85 2.00 58.68 38.05 98.93 52.51 99.67 7.77
1989-90 4.85 16.00 24,50 45.35 1.64 46.02 36.23 83.89 89.77 118.25 2.82
1990-91 4.85 16.00 24.50 45,35 1.82 56.01 78.15 135.98 52.29 127.00 4.24
1991-92 6.45 16.00 32.50 54.95 2.00 56.43 10.54 138.97 , 66.25 . 138.76 1.34
• SUurce,':--r CMSCe. jsf :tho Chief Engineer (Electrical), Tripura.

19.2 POWER TO ULTIMATE CONSUMERS BY PUBLIC ELECTMCXTY UhHQIiaerjU£fNQ>IN TRIPURA.
19. ELECTRICITY & POWER.
(IN M. U.)
YEAR TOTAL SOLD TO ULTIMATE- CONSUMERS WITHIN STATE
DOMESTIC LIGHT COMMERCIAL INDUSTRIAL PUBLIC IRRIGATION PUBLIC OTHERS (BULK- A FANS PQW ER(HIGH LIGHTING WATER AND SEWAGE SUPPLY)
VOLTAGE)
1
1981-82
1982-83
1953-84
1984^5
1985-86
1986-87
1987-88
1988-89
1989-90
1990-91
1991-92
37.98
43.11
46.56
55.14
64.46
48.11
84.14
99.67
11«.25
127.00
138.76
21.60
23.28
16.30
17.9a
20.64
, 24.67
, 256).
30.30
33.36
35.45
38.88
4.55
5.20
6.10
6.60
8.70
6.88.
11.57
13^5
14.74
15.00
16.66
5.31
5.90
8.66^
11.44
13.01
9.52
17.80
21,03
24-.47 ■
25.52
27.76
•6
1.14
1.50
1.23
1.31
1.80
2.79
2.59
3 ^
3 J )
4.16
5.28
6.35
13.53
1632
19.31
2.35
25.43.
30.19
39.53.
42M45.83
8
0.10
0.18
0.72
0,84
1.00
1.90
1.29.
1.91
2.52
5.12
5'.4f’
£
SOURCE : - O F f ICE OF THE CHIEF ENGINEER ( ELECTRICAL) GOVERNMENT OF
IRIPURA.

19.3 NUMBER OF TOWNS AND VILLAGES ELECTRIFIED IN TRIPURA (AS ON 31ST M A RCH).
19. ELECTRICITY <& POWER
TOWNS VILLAGES ^
Year Total Number of
Towns
2
Total Number of
Towns Electrified% of 1 owns
Electrified
Total Number of
Villages
Total Number of
Villages El«ctrified
% of Villages
1 Electrified
1 3 4 5 6 7
1980 -81 10 [0 100 4727 1190 25.171981-82 10 10 100 4727 1500 31.731982-83 10 10 100 4727 1705 36.071983-84 10 10 100 4727 1705 36.071984-85 10 10 100 4727 1865 39.451985-86 10 10 100 4727 2094 44.301986-87 10 10 100 4727 2147 45.991987-88 10 10 100 4727 2329 49.001988-S9 10 10 / 100 m i . 2454 51.911989-90 10 10 100 M il 2628 55.601990-91 10 10 lOo 4727 2828 59.831991-92 10 10 100 4727 3028 64.05
Source ■Officc of the -Chief Engineer
VO
( Electrical ) Government of Tiipura.
20. T R A D E
This stietfoii gives information regarding the Exports and Imports of goods by Rail & River. "
Table Nof 2C . 1 Data regarding Inward snd Outward consignment by selected commodities by Rail and River during the years 1989-90 & 1990-91.

20.1. Inward and Outword Consignments of Tripura by Selected Commodities by Rail and River During the Twelve Months Ended March — Ccntd'
151
20. TRADE
SI. No.Articles Quantity 1989-90
Inward Outward
4 5
1990-91
Inward
6
Outward
7
1. Rice in the husk Quintals
2. Rice not in thehusk „
3. Gram and G armproducts „
4. Pulses other than gram and gram products
5. Wheat
6. Wheat Flour7. Jowar ,,
8 Bajra „
9. Maize „
10- Millets „
11. Grain other Sorts „
12. Oil Seeds, Groundnut „
13. Oil Seeds, Castor
14. Oil Seeds,Cotton „
15. Oil Seeds, Limseed „
16. Rape and Mustard „
17. Til or Jingil „
18. Raw Cetton. Indian
lint
19. Raw Cotton,Foreign lint ,,
20. Kapas „
21 . Jute raw,
puceables „
660
12590
5355
18733
1505301936200
244205450
95479
17800
270
1891
14920
70
100
284
377
814
158402
1845
40188
2530
188333
3604085
12200
587110
3220^
353
62210
370
395
464
1882

152
26. t r a d e
20,1. Invyard and outward Qpn^ignments of Tripuraby Selected Commodities by Rail k River duringthe twelve moriths ?nded March — Contd.
ArticlesSI. No.
Quantiiy 1989-90 \ 1990-91
Inward Outward Inward Outward
22. Jute raw loose Quintals
23. Fruits and vegetablesfresh
24- Oil Cakes Castor25. Oil Cakes-Others „
26. Tabacoo, raw „
27. Cattle (excl. sheep&■ goats) Nos.
28. Horses, Ponies'& mules „
29. Sheep & Goats
30. Animals other Sorts „
31. Hides, raw Quintals
32. Skins, raw „
33. Hides & Skins, tanned & leather
34. Bones „35. Coal and Coke „
36. ' Lime and limestone „
37. Manganese ore
38. Iron ore,
39. Minaral oils(excl. Kerose-ne) „
40. Kerose-ne „
41. Teak wood „
42. Other timber „
2C0
1856660890
1627831217
150621
47
9S0
36710
260
240
900
2850
240
1810
619737
3233
24C0
37 621
27820
30337
2602830
7559
860
23857
408078
4218
150
12
' 927

153
20.1. TRADE.
20,1 Inward and outward consignments of Tripuraby Selected Commodities by rail and river duringthe twelve months ended March, Contd......................
SI. 1989-90 1990-91No. Articales Quantity Inward Outward Inward Outward1 2 3 4 5 6 7
43. Lac and she lac
44. Bidi leaves „
45. Sugar (exel Khandsari450 90 180
(Sugar) 28431 72588A6. Khandsari Sugar „
47, Garjaggery & Gur shakker
Gurshakker „ 47834 • • • 2699148. Malasses etc. „ 15241 60049. Salt 158,800 . . . 7997750. Tea 196 • • •
51. Ground nut Oil „ 160 . . . ■■52. Mastard Oil. „ 97524 . . . 21292 85553. Coconut Oil „ . . .
54. Castor Oil „ 14955. Ocher vegetable Oils „
56. C T. Y. Foreign „ 30 . . . «««
57. C.T. Y. Indian 1570 . . .•
• • •
58, C. P. G. Foreign „ 200 . . . . . .
59. C. P. G. Indian „ 425 . . .
60. Gunny Bags & Cloth „
61. Other Jute manufac
239 30785 26128
tured „ 570 18162. Woolen piece goods „ 290 49063. Artificial silk piece goods 30 . . . . . .

15 4
20. TRADE.
20,1. In ivard and out ward consignments of Tripura byselected commodities by rail and rever during the twelvemonths ended March, Concld.
SI. 1989-90 1990-91
NO- Articales Quantity Inward Outward Inward Outward
1 2 3 4 5 6 7
64. Cements Quintals 241863 326100
65. Bricks 9766. Tiles . . .
67. Iron and steel 87821 232 63330 250
68. Mechinery Equipments *9 13070 700 . . .
69. Glass 9i 3930 100 710 1231
70. Metal products 9y 3700 9 977 86
71. Coffee 99
72. FruitJ, dried » 30
73. Eggs. 9974. Wool, Raw 250 . . .
75. Hemp other than Cotton 99 . . .
76. Rubber Raw. 99 . . . . . . . . .
77. Myrobalans 99 . . . 220
78. Shoes (as fool wear) 99 80 . . .
Source Directorate General of Commercial Inteligence and Statistics Govt, of India, CALCUTTA.
21. TRANSPORT
Statistics on Transport presented in this section cover the in**ormation on the following.
Table No. 21.1 Data in rcspect of number of Motor Vehicles registered by District in Tripura.
Table No. 21.2 Data in respect of Ac-idents by Type of Vehicles involved in Tripura.
Table ISo. 21-3 (A) This table gives the information in respect of progress of State Roadw^ayscommercial wing (T* R. T. C)-
Table No. 21.3 (B) Progress of Tripura Road Transport Corporation good wing.
Table No. 21.4 Data in respect of Road length classified by catagory.
Table No. 21.5 Data in respect of Railway Route length in Tripura.

21, TRANSPORT.
21.1 Number of Motor vehicles registered by District in Tripura.
Year/District
Buses
, 2
PASSENGER VEHICLESCar and Passenger station Jeeps wagons
Taxis Three Two whee wheelers lers
GOODS VEHICLES
(Number)
OTHER VEHICLES
Total Four Three Total Trac- Trai Other GrandPass whee whee Goods tors lers Totalenger lers lers vehi (8-f 11+12 4-13+14>vehi & clescles above
10 11 12 13 14 15
1983-S4 625 ' 2194 638 364 105 1994 5920 3191 3191 52 668 93 99241984-85 638 2219 739 371 110 2353 6430 3244 . 3244 53 683 109 105191985-86 654 2300 120(a) 2862 7024 3325 3325 . . . 1016(a) 113651986-87 675 2364 992 413 152 3632 8228 3415 3415 63 778 131 126151987-rs 683 2515 1108 415 196 4488 9405 3542 3542 65 802 149 139631988-89 696 2602 1407 426 536 5475 11192 3653 3653 70 859 193 159671989-90 741 2678 1895 431 816 7022 13583 3924 57 3981 91 915 288 188581990-91 844 2774 2140 453 1036 8277 15524 4062 78 4140 99 944 337 210441991-92 894 2935 2210 482 1136 9754 17411 4124 83 4207 99 949 393 23059West-Tripura 781 2577 1526 351 966 8280 14481 3400 80 3480' 83 613 355 19012North-Tripura 31 160 351 58 103 713 1416 449 449 14 217 17 2113South-Tripura 82 198 333 73 67 761 1514 275 3 278 2 119 21 1934
a \
(a) Including three wheelers and taxi.------ — ----------‘ *— •»----
Source :— Office of the Assistant Transport Commissioner. Tripura,
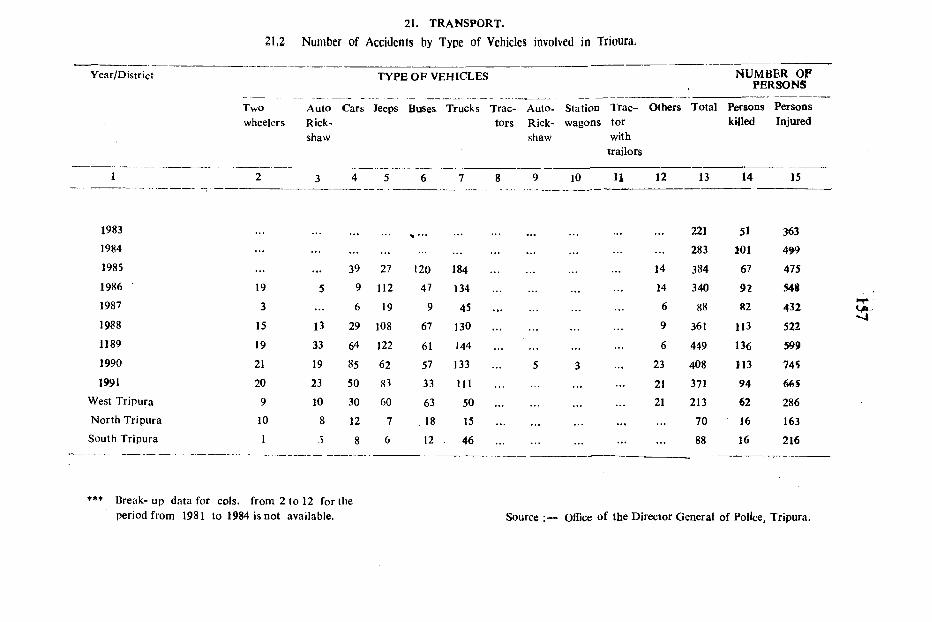
21. TRANSPORT.
21,2 Number o f Accidents by Type of Vehicles involved in Irioura.
Year/District TYPE OF VEHICLES NUMBER OF PERSONS
Twowheelers
AutoRickshaw
Cars Jeeps Buses Trucks Trac- Auto- Station tors Rick- wagons
shaw
Ira c -torwithtrailers
Others Total Personskilled
PersonsInjured
1 2 3 4 5 6 7 8 9 10 11 12 13 14 15
1983 ^ . . . 221 51 3631984 . . . . . . 283 101 4991985 . . . 39 27 120 184 14 384 67 4751986 19 5 9 112 47 134 . . . 14 340 92 5481987 3 6 19 9 45 6 88 82 4321988 15 13 29 108 67 130 . . . 9 361 113 5221189 19 33 64 122 61 144 6 449 136 5991990 21 19 85 62 57 133 5 3 23 408 113 74%1991 20 23 50 83 33 111 21 371 94 66$
West Tripura 9 10 30 60 63 50 21 213 62 286North Tripura 10 8 12 7 18 15 . . . 70 16 163South Tripura 1 . ) 8 6 12 46 88 16 216
LA-
*** Break-up data for cols, from 2 to 12 for the period from 1981 to 1984 is not available. Source ;— Office of the Director General of Police, Tripura.

21. t r a n s p o r t
21.3 (A) PROGRESS OF TRIPURA ROAD TRANSPORT CORPORATION—PASSENGERS WING.
SI. No.
1.
2.
3.4.
5,6,
7,
8, 9.
1.0,
11.
12.
13.
14.
15.
16.
17.18.
PARTICULARS
2
T -tal Fleet (As on 31st March)
No, of Routes operated Total Route
Total Gross Kilometres
Effeclive Kilometres
Avg. No. of vehicle held
Total Passenger Carried
Avg, Daily No. of Passenger Carried
No. of Bus Station (Depot)
Kilometres per litres of Fuel
Break downs
Accidents
Accidents per lakhs Kms.
No, of Staff (As on 31st March)
Daily Avg. effective Kms.
Traffic earing
Traffic earning per passengers
Operating Expenditure Excluding Dep. interest provision and other charges.
Rs.
UNIT 1985-86 1986-87 1987-88 1988-89 19<i9-9) 1990-91 1991-92
3 4 5 6 7 8 . 1 0
No 137 151 159 145 153 133 133
No 33 40 45 44 50 44 ■ 36
Kms. 2636 3176 3620 4203 4867 4194 3766
Lakhs 27.39 3496 36.76 39.23 4317 39,18 3'3.r9
Lakhs 26.88 34,34 36.22 38,38 42.22 38^1 32.42
No, 119 116 148 137 151 136 124
No. 2427647 31Q070 3523494 3800.102 3889112 3398005 2405332
No. 6652 8496 9627 10411 10655 9310 6572
No. 10 10 10 10 10 13 ' 13
Kms, 3,25 3,36 3.36 3,34 3.44 3,46 3,43
No. 1412 1971 1053 1042 1033 1392 1079
No- 14 11 22 11 26 22 20
No. 0.51 0.31 0.60 0.28 0.60 0.56 0.60
No. 739 769 773 8'24 873 8V3 895
Kms. 7363 ■ 9409 9897 10515 11568 10495 8857
in lakhs 97.00 132.00. 150.00 164.00 216.00 182.00 172.00(APP)
In Rs. 4.00 4,26 4.26 4.32 5.56 , 5.36 ■^7.15
Uioo
Lakhs f ' 173.54 221.76 243.00 301.00 425.00 375,00(P) 413^1;! '
Source ;—Tripura Road Transport Corporation.

21. TRANSPORT
21.3(B); Progress of Tripura Road Transport Corporation Goods wing
SL. NO.
1
Particulars Unit 1985-86
3 4
I9«6-87
5
1987-88 1988-89 1989-90
.8
1990-91
9
1991-92
10
K Total Fleet ( as on 31st M arch.) No. 42
2. Total Trips performed. „ 3353
3. Total gross kilomelres Lakhs, 5.90
4. Effective Kilometres. „ 5,83
5. Avg. No. of vehicle held No. 36
6. Total Goods carried M.T. 19882
7. Avg. daily effective Kms. K.M. 1598
8. Kilomitres per Litre of fuel j „ 2.90
9. Break downs No. 46
10. Accidents. ,, S
U. Accidents per Lakhs Kms. „ 1.3512. No. of staff ( ^s on 3 1st Ma^ch ) „ 157
13. Traffic earning. Rs. inLakhs. 43.20
14. Operational Expenditure (excluding depreciation interest provision^nd other charge) Lakhs, 44.07
33
33936.27
6.23
32
23057
1706
2.7933 3
0.40152
46.17
46,53
41
365^
6.72
6.7036
2:304
1830
28631
2
0.30
162
52.00
62.00
37
3372
6.05 6.02
37
2284
1650
2.74 28
NIL.
NIL,
168
60.00
64.00.
373096
5.45
5.41
37
18640
14.83
2,74
192
0,37
176
42,00
11100
373051
5,23
5.20
37
37
2702
4.76
4.73
:3i7
1985 (M.T.) 153971425
2,84.
. I9
10.19
175
48,00
66,P0(P)
1293
2.9422
NIL
NIL
150
64^70
74.26
iJiVO
P— Provisional Source ;— Tripura Road Transport Corporation,

Year NationalHighway
1983-84 198
I98a-S5 198
1985-86 1981986-87 198
1987-83 198
1988-89 198
1989-90 1981990-91 198
1991-92 198
State Highway
(Surfaced B.T).
136
136
136
136]36
136136
136
136
21. TRANSPORT.
21.4 Road length Classified by category.
P . W. D. Road
SurfacedOther P. W. D. Road
Un-surfaced
2738
2888
30903320
3613
3615
3519
37144000
2021
1971
2091
21211650
1785
1855
17001630
(Kilomiters)
Total'(4+5)
Grand Total
(2+3-f 6)
RoadLength
per 100 sq. kms.
Road Lengthper 10000
person
6 7 8 9
4759 5093 48 23
4859 5193 49 23
51&1 5515 52 24
5441 5775 55 24
5263 5597 53 24
5400 5734 55 24
5374 5708 54 23
5414 5748 55 22
5630 5964 57 22(a)
OsO
Note (a) Based on 1991 Census Population others Annual estimated population. Source : - P . W. D. Civil,
Tripura.

21.5 Railway Routei Length in the State of Tripura. (As on 31st March)
21. TRANSPORT
Year Total
1 2
1983-84 12.35
1984-85 12.351985-86 34.82
1986-87 34.821987-88 34.821988-89 . 34.821989-90 44.721990-91 44.721991-92 44.72
Broad Gauge
(in Kilometers).
Metre Gauge
12.35
12.35
34.82
34.82
34.82
34.82
44.72
44.7244.72 ON
Source Office of the Statistics Analysis Officer N- F. Railway, Maliguon.

This Section presents information relating to data on Marketing and Storage in Tripura.
Table No. 22.1 This TaHe shown number of Regulated Ma.rket by District in Tripura. Table No. 22.2 This table gives information number and capacity of Storage unit in
Tripura.Table No. 22.3 Data in raspect of number and capacity o f State owned Warehouse in
Tripura.Table No. 22.4 Data regarding number of Faif Price shops by ownership in Tripura.
22. m a r k e t i n g A N D S T O R A G E
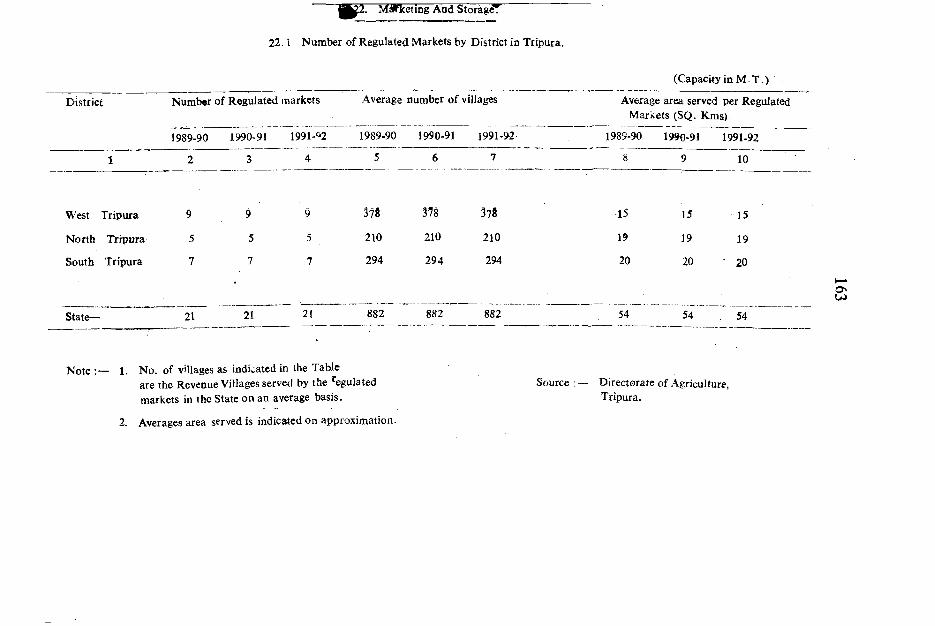
------ ^ 2 . MSTketing And StoragcT
22.1 Number of Regulated Markets by District in Tripura.
District
(Capacity in M .T .)
Number of Regulated markets Average number of villages Average area served per Regulated Markets (SQ. Kms).
1989-90 1990-91 1991-02 1989-90 1990-91 1991-92 1989-90 1990-91 1991-92
1 2 3 4 5 6 7 8 9 10
West Tripura 9 9 9 378 378 378 ■15 15 15
North Tripura 5 5 5 210 210 210 19 19 19
South Tripura 7 7 7 294 294 294 20 20 ■ 20
State— 21 21 21 882 882 882 54 54 , 54
.
Ov
Note 1. No. of villages as indicated in the Tableare the Revenue Villages served by the %gulated markets in the State on an average basis.
Source Directorate o f Agriculture,Tripura.
2. Averages area served is indicjUed on approximation.
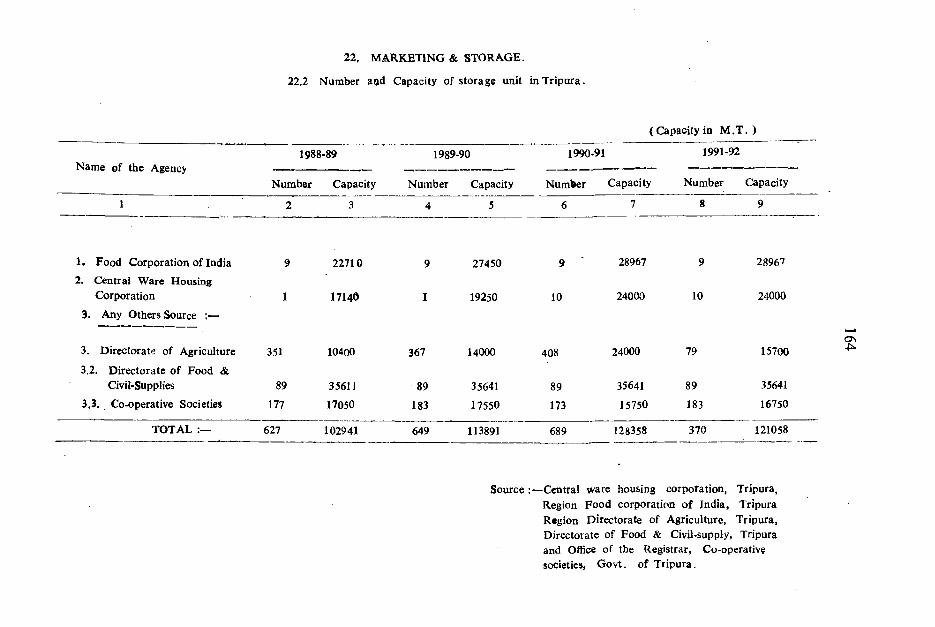
22, MARKETING & STORAGE.
22.2 Number ai|id Capacity of storage unit in Tripura.
(Capacity in M .T . )
Name of the Agency1988-89 1989-90 1990-91 1991-92
Number Capacity Number Capacity Number Capacity Number Capacity
1 2 3 4 5 6 7 8 9
1. Food Corporation of India 9 22710 9 27450 9 28967 9 28967
2. Central Ware Housing Corporation 1 17140 I 19250 10 24000 10 24000
3. Any Others Source :—
3. Directorate of Agriculture 351 10400 367 14000 408 24000 79 157003.2. Directorate of Food &
Civil-Supphes 89 35611 89 35641 89 35641 89 35641
3.3. Co-operative Societies 177 17050 183 17550 173 15750 183 16750
TOTAL 627 102941 649 113891 689 128358 370 121058
ON
Source :—Central ware housing corporation, Tripura, Region Food corporation of India, Tripura Region Directorate of Agriculture, Tripura, Directorate of Food & Civil-supply, Tripura and Office of the Registrar, Co-operative societies, Govt, of Tripura.

HI I M n I Ji^iVAVjrr22.3. NUMBER AND C A P A C IT \^ STATE OWNED WARE HOUSE IN TRIPURA
Agriculture Food & Civil Supplies Co-operative
(CAPACITYIN M.T.
All OfficesYeor/District Number
1
Capacity..... '1
1988-891989-901990-911991-921991-92(B y district) West Tripura — North Tripura —South Tripura 1
1000100010001000
1000
Number4-
Capacity
89898989283328
3564135641356413564114IQ4130788459
Number Capacity_ ^
177183173183873660
17050175501575016750
33005300
Number8'
2672732632731156989
Capacity_
53691541915239153391222541637814759
Sourcc Directorate of Agrieulturc & Food & Civil Supplies' Tripura Office, and Office of the Registrar^ Co-operative societies, Tripura.
22.4.22.4. MARKETING AND STORAGE
NUMBER OF FAIR PRICE SHOPS BY OWNERSHIP IN TRIPURA
ONUi
Rural Urban TotalYear/District Co-operative Others Total Co-perative Otheis Total Co-operative C
1 2 3 4 5 7 8
1988-89 331 687 1018 39 73 112 3701989-90 315 728 1043 41 81 122 3561990-91 ' 282 795 1077 41 87 128 3231991-921991-92 ( By District )
282 795 1077 41 87 128 323
West Tripura 110 336 446 31 53 84 141North Tripura 70 224 294 5 15 20 75South Tripura 102 235 337 5 19 24 1C7
760809882882
389239254
Total- l o
l l 30 1165 1205 1205
530314361
Source Directorate of Foo<l- & Civil Suppiles, Tn|»ura.

Statistics on Commmunication presented in this section cover the information on Fdst aBd Telegraphs offices and Telephone etc. |
Ttble No,—23.1. Data in respect of posts and Telegraphs offices and Telephone etc. are presented in this table.
23. C O M M U N IC A T IO N

—2W LOMMUNICATfUN:
23.1 NUMBER OF POSTAL INSTITUTIONS.
Note (a) Including ICTO & COS
(b) Including ICTO <fe COS
(c) Based on esttmated population except 1991-92.
Year/District
No. of post Offices
Population Served per post Office (i)
No. of Telegraph Offic38
No. of Telephone connections
No. of Public call Offices •
No. of Telephone Exchanges
1 2 3 4 5 6 • 7
1984-85 616 3,653 96 (a) 3040 85 251985.86 618 3.722 96(a) 3393 80 271986-87 617 3.809 95(a) 3606 82 281987-88 621 4,134 57(b) 3907 88 35
1988-89 651 3,821 57(b) 4078 88 351989-90 657 3,809 52 4271 88 371990.91 666 3,842 55 5391 84 , 39
1991-92 673 4,097 55 6713 84 42
1991-92 (By District).
West Tripura 166 7794 18 4528 29 • 14
North Tripura 294 2372 18 1199 30 14
South Tripra 213 3596 19 986 25 14
Soure Post and Telegraph Oflwe and Office of the District Manager, Telephone,
Tripura.
os<1

Thi* Section presents data regarding Tourism spots and Tourist Visitors in Tripura.
TaWe N o 24 1 This table given information regarding to number of Tourist spots and Tourist Visitors in Tripura.
24. TOURISM

169
ifear/Districts
24. 1 Number of Tourist spots & Tourists visiting them by District in Tripura.
24. TOURISM.
Number of Tourist spots
Number of Visitors
Foreign Indian
4
Total
1983-84
1984-85
1985-86;
1986-871987-88
1988-89
1989-90
^.990-91 1991-92
1991-92 (By District)
West Dilstrict
!ltorth District
South District
19
19
1919
19
19
19
19
19
12
2
5
130
286
422
422
4,81,7204,76,440
4.87.400 5,70,200
5.91,840
6,04,000
6.27.400
6.68.400
6,87,157
4,25,950
40,972
2,20,235
4,81,720
4.76,440
4.87,400
5,70,2005,91,840
6,04,000
6,27,530
6,68,686
6,87,527
4,26,372
40,972
20,235
Source :— Directorate of Information Cultural affairs & Tourism, Tripura.

25. LABOUR AN D EMPLOYMENT.This section contains data in respect of Industrial disputes trade Union and Employment.
Table No. 25.1 Employment in shops and commercial Establishment at Agartala.Table No. 25.2 Number of Registered working factories and average daily workers employed
( Public sector ) for the period from 1989 to 1991.Table No. 25.3 Number of Registered working factories and average daily workers employed
(private sector) for the period from 1989 to 1991.
Table N o .25-4 Total No of Government Employees.Table No- 25 5 Number o f Applications on live Register of Exchange according to bread
occupational groups.
Table No. 25.6 Number of Applicants placed in Employment through employment Exchange according to the Nature of Services.
Table No. 25.7 Number of posts Advertised and candidates Recorr.mended by the statepublic service Commission.
Table No. 25-8 Factories and Boilers Organisation Industrial Injures in Tripura in the Registered Factories.
Table No. 25,9 Number of strikes Lockout (Industries wise) in Tripura.
Table No. 25.10 Number of Female Workers employed in Registered Factories and Maternity benifit given during the year 1989.
Table No. 25.11 Distribution of Trade unions according to thetr Membershipsize in Tripura.
Table No. 25.12 Employment in Agartala Municipality.
Table No. 25.13 Employment in Tea Plantation.

25. 1 EMPLOYMENT IN SHOPS AND COMMERCL\L ESTABLISHMENT AT AGARTALA. (COVERED BY THE SHOPS AND COMMEROAL ESTABLISHMENT ACT.
5 T LABOUR AND EMPLOYMENT.
NO. OF SHOPS COMMERCIAL RESTAURANT AND ALL ESTABLISHMENT ESTABLISHMENT THEATRES
1 10
YEAR TOWN OTHERS NUMBER WORKER (a) NUMBER WORKER NUM- WOR- NUMBER WORKER AREAS. BER KER
11
1980 1 . . . 3,109 1,523 27 53 432 488 3,568 2,064
1981 1 . . . 12,534 8.218 147 540 1,150 1,654 13,831 10,412
1982 1 15,574 10,073 163 592 1,170 1,743 16,907 12,408
1983 1 18,851 12,187 179 649 1,188 1,825 20,218 14,661
1984 1 6,410 5,803 89 267 118 416 6,617 6,486
1985 1 6,925 5,925 91 267 131 437 7.181 6,629
1986 1 3,275 1.048 14 10 37 81 3,326 1,139
1987 1 3,871 1,408 29 80 59 115 3,959 1,603
1988 10 29 3,580 1,516 44 180 44 112 3,668 1,868
1989 10 29 1,142 473 06 13 15 16 1,163 502
1990 10 29 756 295 5 1 1 14 28 775 334
1991 10 29 20,828 14,539 241 1,207 338 9,920 21,407 25,666
Note Col. 2 upto 1987 data relates to Agartala only—
Col, 5: (a) INCLUDES SHOPS RUN BY OWNERS INDEPENbENTLY
SOURCE DIRECTORATE OF LABOUR.GOVERNMENT OF TRIPURA.

25.2 NUMBER OF REGISTERED WORKING FACTORIES AND AVERAGE DAILY WORKERS EMPLOYED ( PUBLIC SECTOR )
25. I.ABOUR AND EMPLOYMENT
1989 I990 Major Group of Industry as per NIC No, ofRcgd. Average No. of No. ofRegd. Average No. of — 1987. Factories Workers Emp- Factories Workers Emp
loyed loyed
No. of Regd. Factories
I 99IAverage No. of Worker - Emp
loyed
1 2 3 4 5 6 7
Major Group — 20-21 Mfg. of Food Products 3 140 4 332 6 500Major Group — 23 Mfg. of Cotton Textiles ... 2 29 4 30Major Group — 25 Mfg. of Jute & other Vegetable Fiber Textiles 1 1800 1 2000 1 2O0OMajor Group — 27 Mfg. of Wood & Wood products Furniture and Fixtures 5 73 3 145 3 82Major Group — 28 Mfg. of paper &Paper Products and Printing Publishing & Allieds Industries 2 437 2 514 2 471Major Group — 30 Mfg. of Basic Chemicals and Chemical Products 3 131 1 186 1 100Major Group — 32 Mfg. of Non-Metallic Mineral Products 13 2381 17 4470 13 3620Major Group — 33 Basic Metal and Allieds Industries 1 50Major Group — 34 Mfg. of Metal Products and Parts Except Machinery & Equipments 1 11 1 175 1 175Major Group 35 — 36 Mfg. of Machinery and Equipment other than Transport Equipments 1 15 1 17 1 19Major Group — 40 Electricity Generation, Transmission and Distribution 18 1198 16 963 16 1213Major Group — 42 Water Works and Supply 140 2188 190 1439 216 1319Major Group — 61 Whole sale Trad in Wood, Paper, Skin, Leather, and Fur, Fuel, Ceramics, Glass and Eres, and Metals 2 23 3 53Major Group —97 Repair Services 9 I92 g 481 8 474
Total 196 8566 250 10,824 275 10,056
bo
Source t — Far-torie« and Rr>ilf»rs Oronnicotion T»-;rM,ro

25.3 Number of Registered Working Factories and Average Daily Workers Employed (Private Sector).
'■T5. LABO UR A N D EM PLOYM ENT.
Major Group of Industry as per NIC—1987
1989 1990 1991
MAJOR GROUP—20-21 Mfg. of Food Products.
MAJOR GROUP—22 Mfg. of Beverages, Tobacco and Related Products
MAJOR GROUP—23 Mfg. of Cotton Textiles
MAJOR GROUP—25 Mfg. ofJute and other vegitable Fiber Textiles
MAJOR GROUP—26 Mfg. of Taxtiles Products
MAJOR GROUP—27 Mfg. of Wood & Wood Products Furniture c& Fixtures
MAJOR GROUP—28 Mfg. of Paper & Paper Products & Printing, Publishing & Allied Industries
MAJOR GROUP—30 Mfg. of Basic Chemicals & Chemical Products
No. of Reg. Factories
94
1
3
3
2
111
78
Average Daily No. ofRegd. No. of workers Factories
Emptoyed
Average Daily No. of workers
Employed
No. of Regd. Average DailyFactories No. of workers
Employed
2964
72
40
28
26
1133
679
84
110
1
2
3
1
105
81
10
2348
100
22
90
9
1010
576
84
118
1
2
4
2
94
93
15
2421
100
24
125
29
773
693
157

1
MAJOR GROUP—31 Mfg. ofRubber Plastic, Petroleum & Coal Products, Processing of Nuclear Fuels
MAJOR GROUP—32 Mfg. of Non-Metallie Mineral Products
MAJOR GROUP--33 BasicMetal & AlloyedIndustries
MAJOR GROUP—34 Mfg. ofMetal Products & Parts Except Machinery & Equipment
MAJOR GROUP—35-36 Mfg. ofMachinery & Equipment Other then Transport Equipments & Parts
MAJOR GROUP—37 Mfg. of Transport Equipments & Parts
MAJOR GROUP—38 Other Manufacturing Industries
MAJOR GROUP—61 Wholesale Trade in Wood. Paper, Skin, LeatheJ & Fur, Fuels etc.
MA70R GROUP—96 Personal SerAices
MAJOR GROUP—97 Repair Services
TOTAL :—
111
258
12
40
91
27713
105
424
55
121
752
25
1326
15
273
13
64
12
1
1
135
29584
141
571
185
17
182
14
79
67 452
34765 760 35319
2
1
1
1
75
709
139
21028
155
646
114
38
6
3
7
489
26947
Source Factories and Boilers Organisation, Trioura.

25.4 TOTAI. NO. OF GOVERNMENT EMPLOYEES.
175
25. LABOUR A N D EM PLOYM ENT.
Year No. of Employees
1954 7473
1960 9,863
1965 18,680
1974 34,288
1979 53,18276.714(a)
10821,11,026
1988
Note ;— Including Non-Government Employees Source Directorate of Statistics and(.5,729) and Contingencies. Finance Department,
Tripura.

25. 5 NUMBER OF APPLICANTS ON LIVE REGISTER OF EXCHANGE ACCORDING TO BROAD OCCUPATIONAL GROUPS.
25. LABOUR AND EMPLOYMENT.
YEARNumber of During
Registration During The Year
Number of Applicants on Live Register at the End of the Year
Number of Applicants on Live Register At The End Of The Year
Man Women Supervisory
Skilled and Clerical Semieal Skilled
Educational DomesticServices
UnskiLied
Other AllMan
CategoriesWomen
Total(11+12)
I 2 3 4 5 6 7 8 9 10 11 12 13
1982 7,456 3,331 55 9,271 935 526 14,72 25.785 40,092 52,326 25,810 78,136
1983 6,674 4,674 34 11,527 878 921 3,579 26,425 38,942 54,976 27,336 82,312
1984 9,068 3,551 92 16,077 992 1,221 5,621 28,319 40,845 62,823 30,344 93,167
1985 9,220 4,981 127 19,231 1,107 1,339 6,587 30,255 43,685 69,079 33,252 1,02,331
1986 7,357 2,824 216 3,474 343 425 346 30,279 29,686 42,833 21,936 64,769
1987 15,450 7,323 645 5,306 1,615 971 423 34,192 81,837 84,214 40,775 1,24,989
1988 18,957 9,762 734 6,413 2,123 1,179 452 40,168 94,479 98,373 47,175 1,45,5481989 12,047 6,674 820 6,767 992 1,462 612 67,301 78,768 10,4,782 51,940 1,56,7221990 10,501 5,363 786 8,883 4,040 1,239 681 52,151 1,09,012 1,13,291 63,451 1.76,7421991 11,036 6,695 980 11.002 19,972 6,481 712 76,159 76,558 12,2,250 6,96,14 1,91,864
•<1Os
SOURCE REGIONAL EMPLOYMENT EXCHANGE. GOVERNMENT OF TRIPURA, AGARTALA.

25. 6 NUMBER OF APPLICATIONS PLACED IN EMPLOYMENT THROUGH e m p l o y m e n t EXCHANGE ACCORDING TO THE NATURE OF
SERVICES.
LA«fe>UR AND EMPL(5VMENT.
NUMBER OF APPLICANTS PLACED IN THE OFFICERS CONTROLLED BY TOTAL PLACING.
1
YEAR GENERAL STATE QUASI GOVERNMENT OTHER ESTABLISHMENT MEN WOMENGOVERNMENT GOVERNMENT AND LOCAL BODIES
TOTAL
1982 65 1,508 14 45 1,201 431 1,632
1983 121 3,039 82 40 3,102 180 3,282
1984 178 3,025 71 h 2,980 331 3,311
1985 194 3,314 78 43 3,227 402 3,629
1986 46 1,252 10 7 968 347 1,315
1987 113 3,676 41 41 2,773 1,098 3,871
1988 72 1,697 49 30 1,541 307 1,843
1989 . . . 1,079 401 . . . 1,042 438 1,4801990 46 762 43 7 667 191 8581991 7 2,117 126 . . . 1,474 776 2,250
■-a
SOURCE SUB—REGIONAL EMPLOYMENT EXCHANGE,GOVERNMENT OF TRIPURA.

25. LABOUR AND EMPLOYMENT
Year
1
198619871988198919901991
25. 7 Number of Posts Advertised and State Public Service Commission.
Candidates Recommended By The
Year Post Advertised Number of Applicants Candidates Interviewed Candidates Recomn
1 2 3 4 5
1982-83 479 2,924 573 270
1983-84 325 3,821 637 248
1984-85 410 3,543 751 264
1985-86 453 4,275 820 1801986-87 335 9,078 1,178 2581987-88 805 7,815 1,173 4661988-89 389 4,355 582 18519oc9-90 726 9.210 880 2501990-^1 300 2,725 321 253
1991-92 141 6,250 436 112
Source Tripura Public Service Commission, Agartala.
25. LABOUR AND EMPLOYMENT
25. 8 Factories & Boilers Organisation Industrial Injures in Tripura in the Registered Factories.
oo
Total Average No. Of Workers Employed, Daily.
Fatal, Accident Non-Fatal, Accident Total Accidents
319243654138726433314614337003
168
128
1214
188
138
1315
Source :— Factoriers And Boilers Organisation. Tripura.

25.9 NUMBER OF STRICKES AND LOCKOUT (INDUSTRIES WISE) IN TRIPURA.
25. ■ feO U R AND EMPLOYMENT
Year
1988
1989
Name of Industry
199 0
TEA
Gins And Presses
Printing, Publishing And Allied
Number of Work Stoppages No. of Workers Involved
Strickes Lock-Outs
4
Nil
Nil
1
Nil
186
Nil
Number of Manday‘s
Lost
758
Nil
Industries Nil Nil Nil Nil
Manufacturing And Machinery Nil Nil Nil Nil
Tobacco Nil Nil Nil Nil
Bricks Nil Nil Nil NilSaw Mills Nil Nil Nil NilOthers 3 Nil 165 825All Industries 3 1 351 1,588
TEA Nil Nil Nil Nil
Gins And Presses Nil Nil Nil Nil
Priming, Publishing & Allied Industries Nil Nil Nil Nil
Manufacturing and Machinery Nil Nil Nil Nil
Tobacco Nil Nil Nil NilBricks Nil Nil Nil Nil
Saw Mills Nil Nil Nil N il
Others Nil Nil Nil NilAll Industries Nil Nil Nil NilTEA 3 Nos Nil 13. 892 Nos 14, 504 NosGins And Presses Nil Nil Nil NilPrinting, Publishing And Allied Industries Nil Nil Nil Nil
VO

1991
2 3 4 5 6
Manufacturing And Machinery Nil Nil Nil Nil
Tobacco Nil Nil Nil Nil
Bricks Nil Nil Nil Nil
Saw Mills Nil Nil Nil Nil
Others Nil Nil Nil Nil
All Industries 3 Nos Nil 13, 892 Nos 14, 504 Nos
TEA 4 Nos Nil 1, 182 3,300
Gins & Presses Nil Nil Nil Nil
Printing, Publishing And Allied Industries Nil Nil Nif Nil
Manufacturing Machinery Nil Nil Nil Nii
Tobacco Nil Nil Nil Nil
Bricks Nil Nil Nil Nil
Saw Mills Nil Nil Nil Nil
Others 3 Nos Nil 362 554
All Industries 7 Nos Nil 1.544 3,854
ooo
NOTE Name of Industry In Col. 1 May be ModifiedIf Necessary.
Source Factories And Boilers Organisation Tripura.

25.10 NU MBER OF FEMALE WORKERS EMPLOYED IN REGISTERED FACTORIES AND MATERNITY BENIFIT GIVEN DURING THE YEAR-1989.
181
25. LABOUR A N D EM PLOYM ENT
PARTICULARS. 1989.
1
1. NJo. of Factories covered by the maternity benifits etc. 379
2. NIo. of Factories nwking returns jgg
3. A.verage daily numbers of woman employed in Factories making returas 349I
4. Nco. of women who Claimed maternity benifit during the year 365. Nio. o f clairtis accepted and paid either fully of particularly 36
6. Tiotal amount of maternity benif it paid (including bonous in Rs.) 28,400
7. N(o. of cases in which women employed full maternity benifits period to confinements 36
8. A'ver age amount paid in Rs. 789
SOURCE :—FACTORIES AND BOILERS ORGANISATION,
TRIPURA.

52. LABOUR AND EMPLOYMENT25. 11 DISTRIBUTION OF TRADE UNIONS ACCORDING
TO THEIR MEMBERSHIP SIZE IN TRIPURA.
YEAR GROUP OF MEMBERSHIP TOTAL NUMBER OF UNIONS NO. OF THE TRADE UNION % AGE TO COL. (2) MEMBERSHIP
1987 Below 50
50 or about but Below 300
300 and above
TOTAL
1988 Below 50
50 or about but Below 300
300 and above
TOTAL
1989 Below 50
50 or above but Below 300
300 and above
OTAL:- ______1990 Below 50
50 or above but below 300 300 and above
TOTAL
1991 Below -50
50 or above but below 300 300 and above
TOTAL s-
SUBMITTING RETURNS
63
3325
121
14
3319
66
91
33
25
12
31
20
149 63
108
3325
23
25
166117
33
25
57
813
12
175 33
123
3325
5 _ _
22.2
100%
76%
13,2094%
80%
4105.252
41,286
46,948
405
4,181
32,017
36,603
3,3%69,7100%
3 OS
2961 35,541
38,810
6.8%39.3%
48%
258
1,820
28,851
30,929
2.43%
18.18%
4%
84
1,168
489
181 10 1,741
oo
P- A X i A H T A L A .

183
25.1225. LABOUR AND EMPLOYMENT
EMPLOYMENT IN AGARTALA MUNICIPALITY'
YEAR
19822198319841985 1986i 19877 1988i 1989' 1990) 19911
MEN
NUMBER OF WORKERS
WOMEN TOTAL
412 123 535444 133 577481 136 617521 = 521
551 139 690555 142 697579 143 622769 n o 879742 208 950791 238 1029
SOURCE :—AGARTALA MUNICIPALITY.
25. LABOUR AND EMPLOYMENT25. 13 EMPLOYMENT IN TEA PLANTATION
LABOUR EMPLOYEES (DAILY AVERAGE)
EMPLOYMENT OTHER THEN LABOUR
GRAND TOTAL TOTAL
EAR N o -OF RESIDENT OUT SIDE TOTAL ESTATED LABOUR LABOUR
SUPERVISORY
CLERICAL AND OTHER
MEDICALSTAFF
(5+9)
1 2 3 4 5__
8 9 101981 50 5,635 2,081 7,716 120 365 74 559 8,2751982 50 5,477 2,030 7,507 114 371 83 568 8,075
|l983 52 5,325 2,301 7,626 113 367 82 587 5,2131984 54 5,795 2,526 8,375 126 417 81 624 8,9991985 55 5,939 2,535 8,529 131 413 82 626 9,1551986 55 6,146 2,915 9,061 133 387 86 606 9,6671987 55 6,266 3,328 9,594 146 411 86 643 10,2371988 55 6,673 3,576 10,249 142 432 88 662 10,9111989 55 6,629 3,846 10,475 142 396 89 627 11,027
SOURCE DIRECTORATE OF STATISTICS. TRIPURA.

184
26. Banking and Insurance.
This section presents a consolidated picture of progress o f Banking and Bustncjss bythe L.I.C. in Tripura.
Table No.—26.1. This table shows Bank-wise Branches in Tripura ( as on March, 19'92 .
Table No.—26.2. Banking group and population-wise distribution of number o f 0)ffices, aggregate deposit and gross bank credit are given in this table.
Table No. 26.3. Date on percentage distribution of out-standing credit of sche;duled Commercial Banks of Tripura by occupation is presented in this tables.
Table No. 26.4 This table given number of policies and sum assured on Life Insuramce in Tripura since-1982-83 District-wise break up for the year 1991-92 has also been shown.

185
SL.NO.
Name of Banks
26, BANKING AND INSURANCE.26.1. Bank-wise Branches in Tripura. (As on March. 92)
TRIPURAWEST
DISTRICT
TRIPURANORTH
TRIPURASOUTH
TRIPURASTATE
STATTE BANK OF INDIA GROUP, 15 9 7 31
1 Sttate Bank of India, 15 9 7 31NATIIONALISED BANK GROUP I (A) 32 12 11 551. UJnited Bank of India. 18 12 11 412. Aillahabad Bank. 1 X X 13, BJank of Baroda. 2 X X 24. C'.entral Bank of India. 3 X X 35. Imdian Bank. 1 X X 16. Umion Bank of India. 1 X X 17. u r. Co. Bank. 5 X X 58. Imdian overseas Bank. 1 X X INATKONALISED BANK GROUP 11(B) 2 X X 2
1. Painjab& Sindh Bank. 1 X X 12. Viijoya Bank. 1 X X IREGI'ONAL RURAL BANK. 33 28 29 90
1. Tiripura Gramin Bank. 33 28 29 90 ,OTHER SCHEDULED COMMERCIAL BANK. X X X XCO-OPERATIVE BANK. 15 8 9 32
1. Triipura State Co-opsrative Bank.2. Trripura Co-operative Land
13 7 8 28
ft D(evelopment Bank. 1 1 1 3Agartala Co-perative Urban Bank. 1 X X 1
TOTAiL :—(ALL BANKS). 97 57 56 210
Note :— (a) Comprises 14 Banks, Nationalised in July, 1969,(b) Comprises 6 Banks Nationalised in April, 1980.
S ource Regional Office, Tripura Region,
United Bank of India.a g a r t a l a .

26. BANKING AND INSURANCE.26. 2 .Banking Group and Population Group-wise Distribution of
number of office. Aggregate Deposits and Gross Bank Credit.
(Amount in Rupees Lakhs)
YEAR/BANK GROUP RURAL SEMI- URBAN URBAN/MATROPOLITON TOTAL
Office Deposit Credit Office Deposit Ctedit Office Deposit Credit Office Deposit Credit
1 2 3 4 5 6 7 8 9 10 11 12 13
1986-(June) 92 31,28 29,51 21 16,83 12,50 23 59,11 27,84 136 107,21 69,88
1987-(September) 93 40,69 37,72 21 22,52 15,37 23 77,15 31.25 137 140,36 84,35
1988-(September) 97 46,56 43,88 23 34,83 24,61 25 94,17 35,36 145 175,56 103,85
1989-(December) 110 62,59 71,97 23 46,28 34,83 25 125,29 49,17 158 234,16 155,18
1990-(March) 110 62,73 76,99 23 45,40 35,89 25 122,43 53,52 158 230,54 166,41
l991-(March) 126 70,15 70,24 23 53,22 36,25 26 155,25 56,36 175 278,62 162,85
1992-(March)
1992 (By Bank of Group)
State Bank of India & its
129 79,55 77,51 23 58,94 38,33 26 167,75 56,85 178 306,25 172,70
AE2 ociates. 19 18,83 9.02 6 20,53 9.36 6 62,57 16,99 31 101,94 35,39
Nationalised Banks (2) 32 26,84 19,96 9 29,30 20,21 15 96.44 35,30 56 152,59 75,48
Regional Rural Banks
Other Scheduled Commercial78 33,86 48,52 8 9,11 8,74 5 8,72 4,54 91 51,70 61,82
Banks — — — — — — — — — — — —
Note L The Population Group of Centres area being revised based on 1981 Census and as such the population Group-wise
figures on some cases may not be strictly coraporable with these presented earlier.
2. Nationalised Banks comprise 14 Banks nationalised in July 1969 and 6 Banks nationalised in April, 1980.
3. The total in these statement may not exactly tally with sum of the Constituent on account of rounding of the figures.
ooo \
Source :-R. B. I. Publications Banking Statistics

187
26.3. Percentage Distribution of out-standing credit of Scheduled commercial Banks of Tripura by occupation March—1991—Contd.
26. BANKING AND INSURANCE.
(PERCENTAGE)
Si.No.
Occupation Tripura
No. of Accounts
L AGRUCULTURE.
1. Direcct Fin^ince
Indirrect Finance
IND»US!TRY.
Minimg arid Quarrying
Food Manufacturing and Processing
i) Rice IMilils, Flour Mills
j) Sugarr
:) Ediblee Oils and Vanaspati
J) Tea p)tocessing
!) Processsing of Fruits and Vegetables
^ Others?
Bever;age and Tobacco
^Textilles
) Cottain Textiles
) JUte Textiles
) Handlloom Textiles and khadi
) Otheu: Textiles
Paper,, paper Products and Printing
Leathter and Leather Products
Rubber and Rubber Produets
Chemiicals and Chemical Products
Heavy- In<Justrial Chemicals
Fertillisers
Drugss and pharmaceuticals
Non-Edible Oils
Other Chemicals and Chemicals Products
Petroleum, Coal Products & Mielcar Fuels
Manulfactures of Cement & Cement Products
46.2
45.4
0.810.3
0.1
CreditLimit
26.4
24-5
1.9
24.5
9.3
0.4
2.9
5.9
1.3
1,2
0.1
0.5
0.2
0.2
0.1
Amountcut
standing
23.2
21.8
1,426,4
9.0
0,3
3.3
5.3
2.4
2.3
0.1
0.1
0.60.2
0.2
0.1
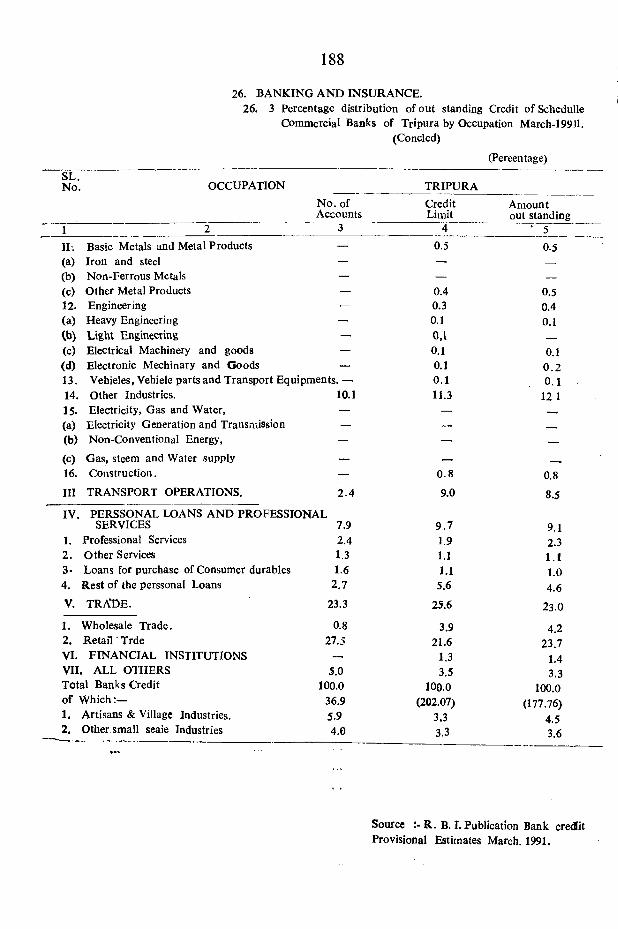
188
26. BANKING AND INSURANCE.26. 3 Percentage distribution of out standing Credit of Schedulle
Commercial Banks of Tripura by Occupation March-199]l. (Concled)
(Percentage)SL.No. OCCUPATION
No. of Accounts
111.(a)(b) (012. (a) Cb)(c)(d)13.14.15.(a)(b)
(c)16.
Ill
Basic Metals and Metal Products —Iron and steel —Non-Ferrous Metals —Other Metal Products —Engineering —Heavy Engineering —Light Engineering —Electrical Machinery and goods —Electronic Mechinary and Goods —Vehicles, Vehicle parts and Transport Equipments. —Other Industries.Electricity, Gas and Water,Electricity Generation and Transmission Non-Conventional Energy,
Gas, steem and Water supply Construction.
TRANSPORT OPERATIONS.
10.1
IV. PERSSONAL LOANS AND PROFESSIONALSERVICES
1. Professional Services2. Other Services3- Loans for purchase of Consumer durables 4. Rest of the perssonal Loans
V. t r a d e .
2.4
7.92.4 1.3 1.6
2.7
23.3
1. Wholesale Trade.2. Retail TrdeVI. FINANCIAL INSTITUTIONSVII. ALL OlHERS Total Banks Credit of W hich:—1. Artisans & Village Industries.2. Other.small seaie Industries
0.8
27.5
5.0 100.0
36.95.94.0
TRIPURACreditLimit
4“
0.5
0.40.30.10,10.10.10.1n .3
0.8
9.0
9.71.91.1 1.1
5.6
25.6
3.921.6
1.3 3.5
100.0(202.07)
3.33.3
Amount out standing
0.5
0.50.40.1
0.10.2 0.1
12 1
0.8
8.5
9.12.31.1 1.04.6
23.0
4.2 23.7
1.43.3
100.0(177.76)
4.53.6
Source R. B. I. Publication Bank credit Provisional Estimates March. 1991.

189
26.4 BANKING AND INSURANCE26. Number of Police and Sum Assured on Life Insurance
in Tripura.
Peeriod/District No. of proposal received No. of Policy issued Total sum assured (In Lakhs of Rs.)
1■ '.'5 .. : 2 . r : 3 4
1982-83 3951 3926 511,101983-84 4516 4511 598.76
' 1984^5 4961 5339 881.801985-86 5992 5906 1097.351986-87 7965 7933 1509.471987-88 9078 ■9060 2039.951988-89 13853 13794 4316.171989-90 16270 16265 5942.061990-91 18142 18020 5922.141991-92 n .a ‘ 18512 6C87.74
((19-91-92 By, District)West TriPura 8472 . 8417 . 2995.00North Tripura N .A 5042 1662.91
(South Tripui-a N .A 5053 1429.8^
N.. A- Not available. Source :—Life Insurance Corporation of . India Branch Offices, Agartala,
Dharmanagar, and Udaipur.

27. Piiblic Finance.
190
Data in respect^f Public Finance presented in this secti«on- All the Tables have beem complied from the publication “ Annual Financial Statement’” fresh and some items may nott taHy previous publication due to adjustment amalganation of Beads.
Table No. 27. 1— This table shows the actual Revenue Receipt (including GrantsHra^ldl from the centre).
Table No. 27.2— Information in respect of actual Revenu* ej^nditure have been &howm in this table.
Table No. 27.3— Data on capital'budget of Tripura have been, presented in this tabic.Table No. 27.4— This table shows the overall budgetory p*osition.
Table No. 27. 5— Percentage distribution o f State Govt. Expenditure functionkl classification in this table.
Table No. 27.^6— Percentage distribution of Govt- Expenditure'Economic €las^fiotfticmi has been shown in this table.
Table No. 27. 7— Excise Revenue in Tripura has been shown in this table.
Table No. 27. 8— This table shown the Demand and collection of Land Revenue im Tcipura.
Table No. 27. 9— Data on small Savings Collection in Tripuira have been shown in this table..

27. PUBLIC FINANCE,
27.1 Total RevcDue of Tripura OovemmeDt.
(Id Lakbs of Rupees)
1981-82 1982-83 1983-84 1984-85 l>85-86
Source of Revenue Revenue Percentage Revenue Percentage Revenue Percentage Revenue Percentage Revenue Percentageto total to total to total to total to total
Revcpmf Revenue Revenue Revenue Revenue
0 1 2 3 4 5 6 7 8 9 10
A. SHARE FROM CENTRAL TAXES 1351.21 13.98 1477.31 11.95 1678.38 11.58 1858.85 10.17 5798.53 25.07
1. Union Excise Duties 1089.00 ... 1181.53 ... J372.77 1540.19 ... 5331,07 ...
a) T^es oq locome other than Corporation Tax. 262.10 ... 292.49 302.28 317.72 466.54
b) Estate Puty 0.11 ... 3.29 ... 3.23 ... 0.64 ... 0.92 ...
B. STATE TAX REVENUE 535.18 5.54 613.34 4.96 838.58 5.78 807.84 4.42 977.13 4.23
1. Taxes on Income and Expenditure 38.89 ... 47.55 68.78 ... 90.83 ... 107.57a) Taxes on property and capital
transactions 77.88 90.84 202.33 108.04 129.15b) Taxes on Commodities and
services 418.41 .... 474.9^ ... ?67.47 608.17 ... 740.41 • ••
C. NON-TAX REVENUE 812.69 8.41 1128.35 9,12 1268.73 8.74 890.34 4.87 1165.35 5.04
1. Interest Receipts, Dividendsand profits 6.35 21.6Q 41.18 41.44 171.26 ...
a) Other Non-Tax Revenue 806.34 ... JJ06.75 ... 1227.5? 848.90 994.09 ...
GRANT IN AIDS FROM THECENTRE 6966.38 72.07 9148.54 73.97 10716.89 73.90 14713.36 ... 15185.13 65.66
TOTAL REVENUE 9665.46 100.00 lOO.pp 14502.58 100.00 18269.59 100.00 23126.14 100.00

27. PUBLIC FINANCE
27. 1 Total Revenue of Tripura Government (concld) (In lakhs of Rupees)
Source of Revenue 1986-87 1987-88 1988-89 1989-90 1990-91
Revenue percentage to total Revenue
Revenue percentage to total
Revenue
Revenue percentage to total
Revenue
Revenue percentage to total Revenue
Revenue percentage to total Revenue
0 11 12 13 • 14 15 16 17 18 19 20
A. SHARE FROM CENTRAL 8170.68 29.76 9667,07 30.77 12125.11 30,65 10306.64 24.14 15607.59 31.32TAXES
1. Union Exces Duties 5789.85 _ 8971.21 _ 11389,15 _ 9254.00 — 14364.59 —
a) Taxes on Income other than corporation tax 580.83 ___ 693.48 ___ 735.84 _ 1052.64 — 1243.00 —
b) Estate duty — — 2.38 — 0.12 — — — — —
B. STATE TAX REVENUE 1151.17 4.19 1357.44 1 4.32 1835.62 4.64 2127.90 4.98 2902.29 5.83
1. Texes on Income and expenditure 105.26 _ ,122.50 _ 197.90 _ . 193.67 — 647.96 — ■
a) Texes on property and capital transactions 150.98 _ 141.33
11_ 201.30 _ 236.25 — 291.40 —
b) Taxes on commodities and services 894.93 1093,61i ,_ r 1436.42 _ 1697.98 _ 1962.93 — ■
C. NON-TAX REVENUE 1475,94 5.38 1498,07 4.77 1568.29 3,96 1599.03 3.74 1829.11 3,67
1. Interest Receipts Dividends and profits 245.92 157,55 _ 76,60 27.65 _ 74.46 —
a) other Non-Tax Revenue 1230.02 — 1340.52 — 1491,69 — 1571.38 — 1754.65 —
B. GRANT IN AIDS FROM THE CENTRE 16652.84 60,67 18896.65 60.14 24032,88 60.75 28665.73 67.14 29488.39 59.18
TOTAL REVENUE 27450.63 100.00 31419,23 100.00 39561.90 100.00 42699,30 100.00 49827.38 100.00
VOto

27.2 Expenditure met from revenue account of Government of Tripura-—Contd.
Type of expenditure j?81-82Ex- Percentage
penditure to total expenditure
1 9 8 ^ 3Ex- Percentage
penditure to total expenditure
1983-84Ex- Percentage pen to total ex-
diture penditure
1984-85Ex- Percentage
pen- to total ex- diture penditure
i§85-86Ex- Percentage
pen- to total ex- diture penditure
0 1 2 3 4 5 6 7 8 9 10
A. General services 2177.55 23.98 3116.21 28.72 4021.32 28.69 3396.78 23.06 4575.09 23.841. Organs of state 123.50 171.17 . . . 170.10 . . . 107.12 . . . 189.65 ...2. Fiscal services 125.10 158.75 . . . 181.26 197.74 217.86 • ••3. Interest payment &
Services of debt 428.56 479.66 728.17 645.18 1108.724. Administrative services 1285.04 1776.59 22^.82 2128.94 2795,395. Pensions and
Miscellaneous 215.35 530,04 672.97 217.80 263.47General Services B. Social And Community
Services 3584.88 39.47 4152.07 38.28 5285.49 37.72 6017.17 40.85 8227.23 42.87C. Economic Services 3319.34 36.55 3579.53 33.00 4472.69 31.92 5197.99 35.28 6263-90 32,641. Agriculture & allied
services 2257.31 2374,85 2968,89 3413.06 2597.082. Rural Development . . . . . . 1205.983. Special areas programme . . . . . . . . . . . . . . . 100.394. Irrigation and flood
control 231.94 316.89 398.78 563,01 334.595. Energy . . . . . . . . . . . . . . . 660,326 . Industries <& Minerals 234.88 235.14 298.87 341.32 . . . 613,867. Transport . . . . . . . . . 429.998, Communications 263,52 . . . 306.09 366,62 429.11 . . . 74,78 • • •
9, Science, Techenology & Environment 30.51
10. Geaeral Economic Servises 331,69 . . . 346,56 . . . 439.53 451,49 . . . 216,40D. Grand-In-Aid Contribution . . . 2;i4,00 1.67 120.00 0,81 126,00 0,65
Grand Total (Gross) 9081,77 100,00 10847,81 100,00 14013,50 100,00 14732,54 100,00 19192,22 100.00
VO
Source ‘.—Finance Department’s B udp t publication ^udget Analysis u^J, pirectorate of Statistics.

27. 227. PUBLIC FINANNCE
EXPENDITURE MET FROM REVENUE ACCOUNT ON GOVERNMENT OF TRIPURA.—Concld.(In lakhs of Rs.)
1986-87 1987-88 1988-89 1989-90 1990-91
Type of Expenditure
Expenditure
Percentage to total Expenditure
Expenditure
Percentage to total- Expen- diture
Expenditure
Percentage to total- Expen- diture
Expenditure
Percsn- tage to total Expen
diture
Expenditure
Percentagetotal
Expenditure
0 11 12 13 14 15 16 17 18 19 20
A. GENERAL SERVICES 5524.57 23.66 7403 87 24.95 9801.04 25.49 11803.95 27.90 13714.17 27.361. Organs of State 234.87 356.88 422.53 598,80 563.332. Fiscal Services 250.46 312.99 480.29 487.21 530.673. Interest payment & services
of debt. 1337.47 2293.36 2075.15 2777.97 3819.124. Administrative Services 3302.16 3882.47 . . . 5935.26 6412.39 . . . 6951.885. Pension and Miscellaneous
General Services 399.61 558.17 887.81 1527.58 1849.17B. SOCIAL AND COMMUNITY
SERVICES 10100.48 43.25 12751.86 42.99 16917.55 43.98 J 8414.60 43.53 21230.06 42.35C. ECONOMIC SERVICES 7523.14 32.22 9197.93 31.01 11379.34 29.59 11722.74 27.71 14832.58 29.591. Agriculture and allied
services 3190.38 3809.23 5017,17 5276.03 6361.62 . . .
2. Rural Development 1543.37 1848.87 2056.07 1664.87 2507.983. Special areas Programme 166.80 229.13 268.40 225.11 219.224. Irrigation and flood control 446.14 . . . 688.25 579.63 587.35 1172.605. Energy 807.98 1090.76 1526.69 1762.52 2317.896. lodustries and Minerals 538,13 657.22 835.08 807.06 872.987. Transport 564.73 576.83 658.58 963.53 727.788. Communications 87.61 113.67 161.66 177.07 219.079. Sciencc, Technology & Environment 53.03 • • • 55.56 102.02 37.00 90.69 . . .
10. General Economic Services 124.97 • • • 128.41 174.04 222.20 342.75 . . .
D. GRANT-IN-AIDCONTRIBUTION 204.61 0.87 312.84 1.05 363.37 0.94 363.33 0.86 353.70 0.70
GRAND TOTAL (GROSS) 23352.80 100.00 29666.50 100.00 38461.31 100.00 42304.62 100.00 50130.51 100.00
SOURCE Finance Department’s Budget Publication &Budget Analysis Unit, Directorate of Statistics.

27. p u b l i c f in a n c e
27. 3 Capital Budget of Government of Tripura (In lakhs of Rs.)
1982—83 1983—84 1984—85 1985—86 1986—87 1987—88 1988—89 1989—90 1990—91
Heads Accounts Accounts Accounts Accounts Accounts Accounts Accounts Accounts Accounts
1 2 3 4 5 6 7 8 9 10
A. A. PUBLIC DEBT. 5792.00 2432.22 3946.08 2817.10 2952.06 4016r-. 7 10980.08 16958.15 13139.221. Internal debt. 1937.99
2. Loans and advance fromthe Central Government. 3854.01
1402.34
1029.88
2463.39
1482.69
1327.54
1489.56
1312.38
1639.68
1553.44
2463.33
7313.75
3666.33
9559.93
7398.22
6292.48
6846.74B. Loans anrd Advances
(Rccoveies) 130.78 155.10 129.75 165.86 186.52 48.12 43.61 68.48 665.90C. TOTAL CAPITAL
RECEIPTS (A+B) 5922.78 2587.32 4075.83 2982.96 3138.58 4064.89 11023.69 17026.63 13805.12D. TOTAL E X PENDITURE
AND DISBURSEMENT 5094.67 4740.49 1193.90 6929.00 6814.75 9837.62 16572.19 18412.14 15711.84E. OVERALL SURPLUS
OR DEFICIT (C—D) 828.11(+) 2153.17(-) 2881.93(+) 3946.04(-) 3676.17(-•) 5772.73(-) 5548.50(-) 1385.51(-) 1906.72
27. PUBLIC FINANCE27. 4. Overall Budgetory position
(In lakhs of Rs.)
Particulars 1982—83 1983—84 1984—85 1985—86 1986—87 1987—88 1988—89 1989—90 1990—91
r Account Account Account Account Account Account Account Acconnt Account
1 2 3 4 5 6 7 8 9 10
Surplus or Deficit on Revenue Accounts ( + )1519.73 (+)489.08 (+)3053.63 (+)3969.04 (+)4097.83 (+)1752.73 (+ )1 100.59 (+)394.68 (—>597.85Surplus or Deficit orCapital Accounts (+ ) 828.11 (—)2153.17 (—)3051.0l (_)3946.04 (—)3676,17 (—)5772.73 (—>5548.50 (—>1385,51 (_)1906.72Overal I Surplus or Deficit (Conselidated Fund. (+)2347.84 (—)1664.09 (+)602.67 (+ ) 23.00 (+ ) 421.66 (_)4929.00 (_)4447.98 (—) 990.83 (_)2504.61
VO
Souroe Budget PublicationBudget Analysis Unit,Directorate of Statistics.

27.5 Percentage Distribution of State Govt. Budget (Functional Classification)
27. PUBLIC FINANCE
(Amount in Laklis of R s.)
1985-86 1986-87 1987-88 1988-89 1989-90NAME OF HEAD Accounts Percen- Accounts Percen- Accounts Percen- Accounts Percen- Accounts Percen- Accounts Percen
tage tage tage tage tage tage
1 10 11 12
1. General Adm. External affairs. Public order & Safely, General- Research. 5004 20.60 5694 23.49 7356 24.48 9798 25.06 10824 26.37 8190
13
17.82
2. Defence. 970 0.40 208 0.86 345 1.15 421 1.08 446 1.09 513 1.12
3. Education. 5858 24.11 6318 26.07 7572 25.21 10845 27.74 9981 24.32 11642 25.33
4. Medical & Public Health. 1327 5.46 1386 5.27 1874 6.23 2342 5.99 2608 6.35 3541 7.70
5. Other Social Services. 4980 20.50 2945 12.15 1755 5.84 1970 5.04 3282 8.00 7219 15.71
6. General Adm. regulation Research Services. 328 1.35 1296 5.35 3364 11.l9 2812 7.19 2371 5.78 3088 6.72
7. Agri. Foresty, Fishery & Hunting. 2805 11.55 2436 10.05 2142 7.13 4058 10.38 4422 10.77 5809 12.64
8. Mining, Manufacturing & Construction. 782 3.22 732 3.02 1010 3.36 1200 3.07 1219 2.97 1321 2,87
9. Electricity, Gass & Stem Water (—) 925 3.81 324 I M 1185 3.94 I 84I 4.71 1336 3.26 1718 3.74
10. Transport & Communication. 1721 7.08 148 0.6l 2965 9.87 3587 9.17 4349 10.60 2845 6.I9
11. Other Economic Servises. 150 0.61 635 2.61 413 1.37 55 0.14 57 0.14
12. Other Services 318 1.31 2116 8.73 68 0.23 170 0.43 144 0.35 73 0.16
TOTAL 24295 100.00 24238 100.00 30049 100.00 39099 100.00 41039 100.00 45959 100.00
VOo^
Source :— Finance Department’s Budget Booklet andBudget Analysis Unit, Directorate of Statistics.

197
27. 6 PERCENTAGE DISTRIBUTION OF GOVERNMENT EXPENDITURE (ECONOMIC CLASSIFICATION)
27. PUBLIC FIN A N C E.
HEAD
(Amount in lakhs of Rs.)
1990-91 (Actual)
Accounts Percentage(%)
II. CONSUMPTION EXPENDITURE 22, GRANTS ii) LOCAL BODIES
iii) EDUCATIONAL INSTITUTE liii) OTHERS GRANTS 33. •OTHERS CURRENT EXPENDITURE
4t. TOTAL CURRENT EXP. (NET)5i. GROSS CAPITAL FORMATION 6 . TOTAL CAPITAL EXP. (NET)
346824628
579951
309«4705
4401587018823
78.810.5
1.32.27.0
10.7100.00
98.6
♦fOTHERS INCLUDE
i)> Interest,
ii)) Subsidies, Source Budget Analysis unitiiii) Scholarship & Stipend, Directorate of Statistics.
27. PUBLIC FINANCE
27-7 Excise Revenue Tripura(Rs. in Lakhs)
Year Amouut (All item)
1 2
1981-82 38.731982-83 51.291983-84 63.071984-85 66.081985-86 67.581986-87 87.841987-88 113.651988-89 252.941989-90 410.02
a990-9l 462,73
Source :— office of the commissioner of Excise and State Govt. Budget Publication.

27. PUBLIC FINANCb27.8 Demand and Collection of Land Revenue in Tripura (In Lakhs of Rs.)
Year Demand Collection Written off Balance
Current Arrear Total Current Arrear Total Current Arrear Total Current Arrear Total
1 2 3 4 5 6 7 8 9 10 11 12 13
1983-84 18.36 70.07 88.43 5.84 17.38 23.22 12.52 52.21 65.21
1984-85 13.95 57.57 71.50 3.16 9.47 12.63 10.77 48.10 58.87
1985-86 16.17 42.89 59.06 8.77 15.39 24.16 7,40 27.50 34.90
1986-87 17.39 38.75 56.14 12.74 17.69 30.43 4.67 21.06 25.72
1987-88 14.32 34.93 49,24 8.01 8.63 16.64 6.31 24.30 32.60
1988-89 12.01 31.39 43.40 10.13 17.07 28.01 . . . 1.87 13.52 15.39
1989-90 14.26 49.96 64.22 12.15 40.39 52.54 2.11 9.58 11.69
1990-91 27.93 45.27 73.20 27.90 37.q6 64.96 . . . 0.02 8.22 8.24
^991-92 19.83 10.96 30.79 21.47 6.93 28.40 • •• ... (+ )1 .64 4,03 2.39
oo
Source — Revenue Department

i | |p 7 . PUBLIC FINANCE.
27. 9 Small Savings Collection in the State of Tripura-Contd .................. .................. (In lakhs of Rs.)
Fear Collection under Small Savings schemes
P.O.S,B. Account R.D. Account C.T’D. Account T.D. Account S.S.C. Account P.P.E. Account old N.S.C.(II) VI and VII issue(I)
Gross Net Gross Net Gross Net Gross Net Gross Net Gross Net Gross Net
I 2 3 4 5 6 7 8 9 10 11 12 13 14 15
1982-83 (a)
1983-84 (a)1984-85 (a)
1985-86 562.12 2.64 163.01 53.23 25.09 4.28 33.77 0.49 1.30 1.19 0.10 0.10 488.84 454.411986-87 602.41 17.62 204.25 61.11 21.45 14.28 33.47 3.93 0.82 0.82 0.15 0.15 527,23 489.36
1987-88 772.82 140.31 265.59 113.28 18.33 (-)4.62 46.11 22.68 0,05 0.05 0.83 0.83 663.65 413.80
1988-89 1116.52 194,85 347.45 145.71 16.78 (-)9,45 46.40 14.13 (-)O.Ol 1.87 1.87 672,12 315.67I989- 9O 1579.03 490.13 42^.77 102.69 13.57 (-)20.55 54.20 6,48 1.28 1.23 . . . (-)356,52
1990-91 (a) 1854-01 496.53 504.42 95.86 10.05 (-)23.44 66.14 3.25 1.73 1.65 (-)428.03
1991-92 2369.99 658.65 587.88 28.21 8.43 (-)10.15 76.37 3.68 3.37 3.13 (-)422.95
1991-92 By District-
Tripura (W) 787.96 72.77 371.79 18.13 6.67 (.)9.26 55.65 (-)4.13 1.92 1.68 (-)319-47Tripura (N) 1036.03 416.39 101.14 3.47 1.38 0 0 .3 8 11.12 3.82 . . . . . . 1.45 1.45 (.) 50-43Tripura (S) 546.00 169.49 114.96 6.61 0.38 (-)0.51 9.60 4.00 . . . . . . . . . . . . (-) 53-05
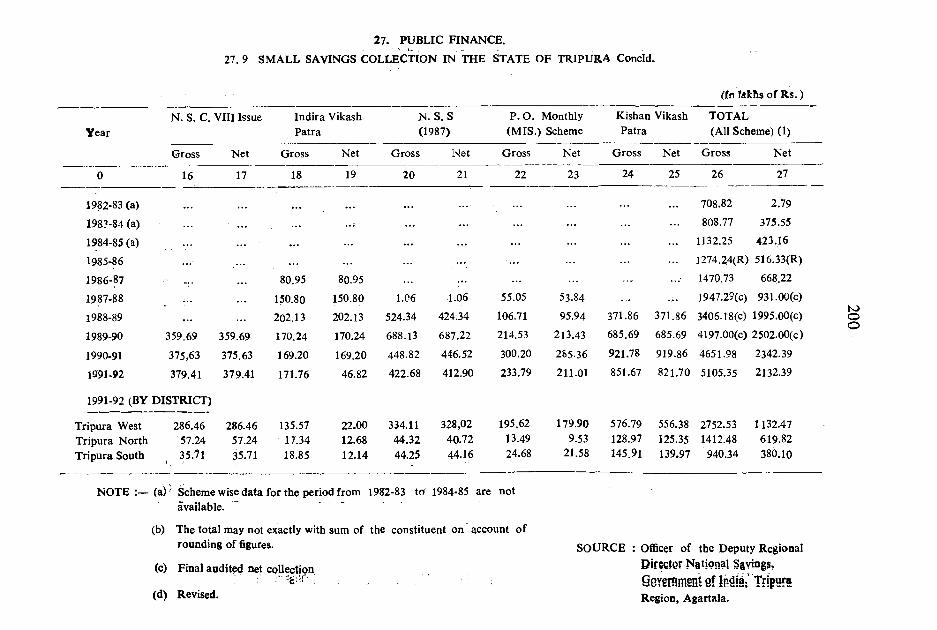
27. PUBLIC FINANCE.27. 9 SMALL SAVINGS COLLECTON IN THE STATE OF TRIPURA Concld.
{fn faklis of RS.)
YearN. S. C. VIII Issue Indira Vikash
PatraN. S .S (1987)
P .O . Monthly (MIS.) Scheme
Kishan Vikash Patra
TOTAL(All Scheme) (1)
Gross Net Gross Net Gross Net Gross Net Gross Net Gross Net
0 16 17 18 19 20 21 22 23 24 25 26 27
1982-83 (a) ... ... 708.82 2.79
198^-84 (a) .•s ... 808.77 375.55
1984-85 (a) ... ... ... 1132.25 423 J 6
1985-86 ... 1274.24(R) 516.33(R)
1986-87 80.95 80.95 1470.73 668.22
1987-88 150.80 150.80 1.06 1.06 55.05 53.84 1947.29(c) 931.00(c)
1988-89 ... 202.13 202.13 524.34 424.34 106.71 95.94 371.86 371.86 3406.18(c) 1995.00(c)
1989-90 359.69 359.69 170.24 170.24 688.13 687.22 214.53 213.43 685.69 685.69 4197.00(c) 2502.00(c)
1990-91 375,63 375.63 169.20 169.20 448.82 446.52 300.20 2S5.36 921.78 919.86 4651.98 2342.39
1991-92 379.41
1991-92 (BY DISTRICT)
379.41 171.76 46.82 422.68 412.90 233.79 211.01 851.67 821.70 5105.35 2132.39
Tripura West 286.46 286.46 135.57 22.00 334.11 328,02 195.62 179.90 576.79 556.38 2752.53 1132.47Tripura North 57.24 57.24 17.34 12.68 44.32 40.72 13.49 9.53 128.97 125.3$ 1412.48 619.82Tripura South 35.71 35.71 18.85 12.14 44.25 44.16 24.68 21.58 145.91 139.97 940.34 380.10
NOTE :— (a) Scheme wise data for the period firom 19S2-83 to" 1984-85 are not available.
(b) The total may not exactly with sum of the constituent on account of rounding of figures.
(c) Final audited net collection
(d) Revised.
SOURCE : Officer of the Deputy Regional Director National Savings,
SoYgramgnt Qt I n d l; T fIp ^ sRegion, Agartala.
K>Oo

AVERAGE RETAIL PRICES OF ESSENTIAL COMMODITIES IN TRIFLTlA In Rupees. In Rupees.
1(0
(0
7 S
4 5
3(0
1^5
(0
FOOD GRAir^S 10
J____I____ 1____ ____I____I____ \____ L
OTHERS
Meat ( H e > G o a t ^
19 8 2 1 9 6 3 19 8 4 1 9 8 5 1986 1 9 8 7 19 8 8 1989 1990 1991

This section present Price Statistics and Consumers price Index Numbers. The average
pricee in this section is sample arithraatic average.
TABJLE NO.—28.1- Average Retail prices of selected essential comodities with District- Wisftj break-up for the latest year are given in this Table.
TABJLE NO.—28.2. In this Table data in report of Consumers price Index Numbers o f Midddle; Class Employees at Agartala is shwon.
TABILE NO.—28.3. Consumer's price Index Number of Industrial Workers (Plantation workcors in Tripura) are shwon in this Table.
TABILE N O .-2 8 4. Consumers Index Number of Industrial Workers of All, India, are •hwom in this Table.
201
28. PRICES A N D INDICES.

28. PRICES AND INI>ICES.
28, 1 AVERAGE RETAIL PRICES OF SELECTED ITEM IN TRIPURA ........... ... Contd. (IN Rupees
Year/District. Food Grains And Its ProductsRice Medium Rice Coarse Rice Product
Un-boiled Per-boiled Un-boiled Per-boiled Chira-Mcdium Muri'MediumKg. Kg. Kg. Kg. Kg. Kg.
1 2 3 4 5 6 7
1982 3.60 3.38 3.22 3.06 4.81 6.26
1983 3.67 3.71 3.31 3.11 4.88 6.39
1984 4.24 3.94 3.73 3.62 5.63 7.44
1985 4.16 3.95 3.95 3.55 5.65 7.61
1986 4-59 4.34 4.01 3.83 6.06 8.45
1987 4.74 4.52 4.13 3.86 6.37 8.13
1988 5.35 5.30 4.19 4.34 7.36 9.80
1989 6.69 6.45 5.68 5.32 8.43 11.61
1990 6.75 6.48 5.52 5.27 8.23 13.76
1991 7.54 7.20 6.31 5.97 9.06 13.15
1991-(By District)
Tripura West. 7.77 7.31 6.50 5.94 9.56 13,81
Tripura North. 7.41 7.19 6.09 5.92 8.50 12.52
Tripua South. 7.44 7.11 6.34 6.05 9.12 13.12
tooK)

(In Rupees)
Year/District Fosd grains products
Wheat (atta) Contr®lled
and its
Kg.OpenMarket
Sagoosuperiorquality
Kg.
MoogSplit
mediumwithout
husk.KG.
PulsesMasurwholelarge
withouthusk.KG.
Edibleoils Gram Mustered split Oil loose
mdeium pure, without (LTR.) husk.KG.
Vanaspati vegitable ghee loose
(KG)
Ghee local purs cow's
(KG)
Orher food articles Milk Fresh cow's
L IR
7 8 9 10 11 12 13 14 15 16 17
1982 1.96 2.62 4.53 5.77 5.01 5.25 15.41 17.62 59.87 3.621983 2.24 2.62 7.06 6.11 5.01 4.76 18.95 18.39 63.73 3.961984 2.29 2.83 6.59 7.57 6.55 6.26 1939 20.35 72.30 4.351985 2.67 2.29 5.75 8.60 6.73 7.66 15.88 20.85 81.08 4.681986 N.A. 2.72 7.50 7.61 7.18 7.36 18.43 22.62 80.66 4.70
1987 2.10 2.34 7.9^ 8.13 7.26 6.92 25.74 28.18 81.08 4.411988 N.A. 3.50 7.95 11.95 8.95 9.43 26.24 30.00 102.70 5.631989 1.57 4.55 8.82 12.36 10.42 11.36 23.16 30.98 117.13 7.C31990 2.72 4.46 12.68 12.32 11.15 10.68 29.31 35.59 119.30 7.281991 3.20 5.24 12.49 13.52 13.66 11.91 37.05 44.39 127.95 7.741991 By (District)
Tripura West 3.25 5.18 12.11 13.44 13.08 11.53 36.68 44.90 128.57 8.23Tripura North 3.25 5.38 12.54 13.58 14.75 12.25 37.04 43.65 130.40 7.54Tripura South 3.12 5.17 12.84 13.53 13.16 11.95 37.45 44.63 124.88 7.54
K>O

28. PRICE AND INDICES28.1 Average Reta il Price of Selected Item in Tripura (Contd)
(Other Food Articles)
I n Rupees
Year/District Egg-Fresh Katla/ Meat PotatoDuck‘s Rahuit He-Goat Medium4 Nos. Prices Kg. Size
With-Out FreshHead Kg.
Onion Sugar Superior QualityImported Control Medium Kg.Size Fresh Kg.
Open Market Kg.
Gur Akhi Solid Medium Quality Kg.
Salt Sea Salt Curshed whUe Kg.
Dry Chillies City of Patna Superior Quality.Kg.
1 18 19 20 21 22 23 24 25 26 27
1982 3.34 24.09 18.67 2.04 2.85 3.65 5.86 4.03 0.60 14.111983 3.29 24.93 20.90 2.36 3.33 3.75 5.70 4.27 0.68 11.86
1984 3.6q 26.51 23.35 2.54 3.12 3,96 6.55 4.98 0.70 17.85
1985 4.61 34.91 29.72 2.63 3.25 4.35 7.60 5.99 0.70 18.61
1986 5.04 41.90 31.94 2.40 3.61 4.80 7.58 6.26 0/70 14.19
1987 5.09 43.10 39.80 3.45 5.48 4.65 7.49 5.73 0.82 15.10
1988 6.23 43.00 45.70 4.00 5.15 5.10 8.78 6.82 0.90 24.06
1989 7.06 50.89 58.43 3.83 4.53 5.25 10.27 8.15 0.90 25.44
1990 6.96 55.42 58.21 3.95 5.76 5.25 10.53 8.64 1.00 21.19
1991 7.66 52.09 60.74 4.77 6.74 6.47 11.08 9.14 1.15 40.59
K>
1991 (By District)
Tripura (West) 7.47
Tripura North 8.41
Tripura South 7.10
55.22 61.32 4.56 6.59 5.13 10.87 8.53 1.15 39.45
59.74 60.16 4.90 6.75 5.63 11.12 9.59 1.15 40.98
41.32 60.76 4.85 6.88 8.63 11.25 9.31 1.15 41.35

28. Prices and Indices ,28. 1 Average Retail Priccss of Selected Item In Tripura (ContD.)
Other Food Articles Fuel
Year/Dry Corriender. Turmeric Tea. Leaf Cofee, Powder Kerosin Control, Fire wood Matches Hores Dhuti Cotton Fine, Shari. Cotton
District Superior Whole,Clearkg.
Halud,SuperiorQuality
kg.
Loosekg.
Nescafee - (50 G. P.)
White (Littre) Dry, Split Supirior -
(40 kg.)
Head 50-Stich Box (1 Box)
Unbleched Power - Medium Local Loom made 114 X 9.1 (Pair)Mtr. (Pair)
0 28 29 30 31 32 33 34 35 36
1982 8.90 6.46 25.20 8.85 1.84 9.20 0.25 46.80 52.371983 8.49 11.10 30.00 9.67 1.90 10.00 0.25 47.82 52.32
1984 8.50 16.37 40.45 10-14 1.94 10.26 0.26 49.67 53.271985 8.62 18.22 40,85 10.98 2.09 1200 0.30 56.52 68.791986 10.71 16.58 40.55 12.46 2.24 13.60 0-30 58.37 72.931987 17.30 16.60 38.00 12.93 2.31 12.00 0.30 64.00 74.401988 17.00 17.70 41.67 12.05 2.25 17.60 0.34 67.80 76.50
1989 14.51 16.47 49.67 14.18 2.24 20.30 0.41 75.34 80.781990 14.62 16.37 67.86 16.61 2.36 23.66 0-41 87.80 103.461991 17.31 23.65 70.62 23.53 2.58 23.60 0.43 95.54 119.011991 (By District)
Tripura West. 16.89 22.42 70.49 24.11 2.60 24.80 0.41 97.15 119.04Tripura North 17.98 24.65 71.11 23-^8 2.65 24.40 0.43 95.15 120.85Tripura South 17.06 23.88 70.28 23.02 2.49 22.40 0.46 93.90 117.15
O

28. PRICES AND INDICATES
28-1. Average Retail Prices of Selected Items In Tripura—Contd.
Year/District Long Cloth Mediam Quality White Bleached 900 (Mtr).
Bed SheetCotton,Handloom,Med)umQuality90 'x 4 '(Picee)
CHAPPALS Lether Howai Gents Superior Ordinary Quality Design Like (Pair) Kamal of Bata (Pair)
Pencil,Medium,Lead
Pencil(Pices)
Ink, Sulekha, Blue
Black/Black 60 ml Pkt.
(Bottle)
Paper
Foolscape Elephant
(24 Sheets)
0 37 38 39 40 41 42 43
1982 6.67 24.29 32.50 14.02 8-52 3.201983 6.64 25.45 33.57 15.49 0.57 3.431984 7.10 28.55 35.37 17.00 0.64 3.77lc^85 7.88 31.86 51.92 18.69 0.79 4.331986 8.06 33.74 54.53 18.85 0.91 4.481987 7.97 34.20 55.30 19.30 0.99 4.681988 9.12 36.30 56.60 19.50 0.99 5.401989 9.25 38.16 59.59 21.25 1.12 5.511990 9.60 44-67 66.17 26.50 1.05 5.511991 13,18 44.84 70.81 26,06 1.08 5.98
1991 (By District)
Tripura West 11.28 45.k6 72.11 28.09 1.13 6.05Tripura North 17.85 43.73 70.84 28.17 1.10 5.98Tripura South 10.41 44.92 69.49 24.23 i.OO 5.92
1.93 2.02
2.39
2.59 2.95
3.02
3.02 3.25
3.93
4.31
4.77
4.05
4.10
O0 \

28. PRICES AND INDICES
28.1. AVERAGE RETAIL PRICES OF SELECTED ITEM IN TRIPURA (CONCLD) (IN RUPEES)
Chemical & Drugs Toilet Hair Oil
Year/DistrictWashing Soda I. C, I . Superior Quality
Anasin Tablet Elkeoin ( 2 T ablet) ( 6 T ablet)
Washing Shop Boll Shop No. 417 (kg.)
Toilled Lax Slanders Size 99 Cir.s ( Per Cske)
Pure Coconut Oil, (Loose) (LTR)
Razer Blade Ordinery Blade 1 (Pair)
Tooth Paste Medium size (lOOg )Per Tube Col
gate.
0 44 45 46 47 48 49 50 51
1982 4.39 0.25 1.23 7.56 2.25 1935 1.60 6.25
1983 4.82 0.39 1.26 7.35 2.32 21.29 1.71 6.49
1984 4.82 0.39 1.39 7.62 2.71 32.55 1.83 5.89
1985 6.23 0.42 1.39 8.51 3.01 33.49 1.94 7.51
1986 7.36 0.41 1.39 8.55 3.06 31.60 1.98 8.16
1987 7.48 0,43 1.30 9.2f 3.80 36.20 2.19 8.62
1988 7.34 0.44 1.43 9.40 4.73 40.00 2,47 9.30
1989 7.76 0.46 2.45 9.97 4.39 43.33 2.56 9,38
1990 8.47 0.50 0.11 8.84 4.46 48.85 4.33 9.73
1991 9.51 0.51 2.08 8.35 6.20 59.30 4.34 10.89
1991 (By District)
Tripura West 9.21 0.51 2.01 8.23 4.79 59.04 4.19 10.62
Tripura North 9.54 0.51 2.21 8.47 5.40 61.11 4.35 10.49
Tripura South 9.77 0.52 2.02 8.34 8.42 57.76 4.47 11.57
toO•'J
Source ;—Directorate of Statics.

28.2. Consumer Price Index Number of Middle Class at Agartala (Base —100 (Monthly averages or Celender Months)
28. PRICES AND INDICES.
Year/Month ITEMS
Food beverage & tobacco
Fuel and lighting
Housing Clothing bedding & Footwer
Miscellanous General Index
1 2 3 4 5 6 7
1982 508 343 399 468 386 4511983 518 351 413 495 425 4711984 590 387 455 535 459 5251985 648 453 511 571 518 5811986 721 481 554 591 573 6381987 790 525 676 655 618 7031988 862 597 740 721 671 7711989 1008 643 802 797 760 8001990 1052 645 872 923 817 93619911991 (By Month)
1138 679 981 979 887 1015
January. 1059 677 942 936 843 957February. 1055 668 942 976 859 963March. 1034 668 942 976 871 956April. 1071 685 942 976 871 974May. 1147 685 942 976 873 1012June. ll68 685 942 976 874 1022July, 1159 682 10I9 97s 887 1030August. 1134 072 IOI9 981 895 1020September. 1163 671 IOI9 98I 9O2 1035October. 1243 673 IOI9 982 920 1078November, 1206 685 IOI9 99? 924 1064December. 1222 693 IOI9 1011 929 1074
Oo
Source Director of Statistics, Tripufa.

28. 3. CflBlimer Price Index Number for Industrial W orker
in Tripura (Base :-1982= 100)
(Monthly average Calendar Month)
Month/Year 1-A FOOD 1-B pansupari Tobacco & intoxicants
II-Fuel & Light
III Housing Vl-Clothing Bedding & Footwear
V -Miscellaneous General Index
1 2 3 4 5 6 7 8
1989 195 201 153 118 169 180 1821990 209 229 165 127 191 194 1971991
1991 (By month)
232 255 171 134 206 210 217
January. 214 244 164 135 198 202 203February. 210 248 164 133 198 203 201March. 206 248 171 133 205 204 199April. 211 251 171 133 206 204 203May. 217 252 171 133 206 204 207June. 234 254 172 133 206 204 217July. 241 255 172 134 206 206 222August. 247 260 172 134 206 209 227September. 246 260 173 134 211 216 227October. 250 260 174 134 211 220 230November. 257 260 174 134 211 220 234December. 253 262 174 134 211 220 232
K>OVO
Source :-Labour Bureau, Simla.

2 1 0
28. PRICES AND INDICES
28. 4 INDEX NUMBERS OF CONSUMER PRICE (INDUSTRIAL WORKERS) ALL INDIA
(BASE : 1982=100)
Monthly averages or Calendar Month
1
FOOD
2
19891990
1991
January-1991
February- „ March „
April „
May
June „
July
August
September „ October „
November „
December „
175
191
222211
211
207
207
210
219
224230
234
236240
239
ALX INDIA CLOTHING
138
152
164
153
154 160
l62
162
164
165
166
169
170172
173
GENERAL
17118(6
21220:2
20220'1
20)2
204
20'9
21.4217
221
221322:5
22’5
Source :-Lab«r Iireau, Sinnla,

211
FIVE 'Y E A R PLAN.
isectiorn containis statistics regarding out-lay and expenditure o f Five year plan and lual plains.
eNO-2»9. 1. Sector.wise actual expenditure during First, Second, Tliird, 1st annual plan (1966-67)
tid Anniuail Plan (1967-68). Third Annual Plan (1968-69), Fourth Plan, Fifth Plan, Rol- Mai pfe¥i(Od (197 8-79 & 1979-80) and sixth Plan have been shown in this Table.-
NO 29)-2;. Out-lay and expenditure o f Seventh Five year Plan have been shown in this Table,
NO-29^. 33. Out-lay and expenditure of Annual Plans-1990-91 and 1991-92.

29. FIVE YEAR PLAN.
29.1 Expenditure under First, Second, Third, Annual Plan (1966-67, 1967-68, 1968-69), Fourth, Fifth Rolling Plan period (1978-79 & 1979-80)and Sixth Plan.
( Rs. in Lakhs )
First Plan (1951-52 to 1955-56) Second Plan (1956-57 to 1960-61) Third Plan (1961-62 to1965-66)
Sub-Head of Development Expenditure
% age to total Expenditure Expenditure % age to total Expenditure
Expenditure % age to Total Expenditure
1 2 3 4 5 6 7
I. Agriculture andAllied Services. 16.73 8.46 130.06 14.51 358.39 22.43
II. Co-operation & C. D. 28.30 14.30 15.94 1.78 2965 1.86
III. Irrigation & Power. 5.35 2.70 33.66 3.76 67.57 4.23
IV. Industries & Minerals. 5.89 2.98 42.66 4.76 73.78 4.62
V. Transport & Communication 74.00 37.40 362.48 40.45 439.55 27.52
VI. Social & Community Services 67.59 34.16 310.97 34.70 605.84 37.92
VII. Economic Services — . . . 0.33 0.04 18.84 1.18
Vni. General Services. . . . . . . 3.87 0.24
Grand T o ta l: — 197.86 100.00 896.10 1C0.00 1597.49 100.00
K>to

29. 1. Out-Lay a^d Expenditure under First, Second. Thfrd. AmnualPIan (1966-67. 1967-68 1968-69). Fourth, Fifth Rolling Plan period (11978-79 &.
iyv!^-su) ana aixin n a n .
(Rs. in Lakhs).
Head of Development First Annual Plan (1966-67)
Expenditure % age to total Expenditure
Second Annual Plan (1967 -68)
Expenditure % age to total Expenditure
Third Annual Plan (1968-69)
Expenditure % age to Total Expenditure
10 11 12 13
1. Agriculture and Allied Services.
53.55 20.31 54.38 11.94 52.18 10.60
II. Cooperation 6.87 2.61 16.38 3.60 5.76 1.17
III. Irrigation & Power 17.91 6.79 151.21 33.20 178.65 36.29
IV. Industry & Minerals 9.19 3.49 14.40 3.16 4.10 0.83
V. Transport Communication 79.68 30.22 91.76 20.15 118.32 24.04
VI. Social & Community Services 92.53 35.10 123.06 27.02 128.96 26.20
VII. Economic Services 0.51 0.19 2.05 0.45 1.92 0.39
VIII. General Services 3.39 1.29 2.21 0.48 2.34 0.48
GRAND TOTAL 263.63 100.00 455.45 100.00 492.23 100.00
JOu»

29.1. Out-Lay and Expenditure under First, Second, Third, Annual Plan (1966-67. 1967-68, 1968-69), Fourth, Fifth Rolling Plan period (1978-79, 1979-80) and Sixth Plan.
29. FIVE YEAR PLAN.
Head of Development Fourth Plan (1969-70 to 1973-74) Fifth Plan (1974-75 to 1977-78)Expenditure % age to total
ExpenditureExpenditure % age to total
Expenditure0 14 15 16 17I, Agriculture and Allied Services 644.20 18.19 1198.26 24.12
II. Cooperation 48.81 1.38 78.78 1.59III. Irrigation & Power 1021.85 28.86 1512.57 30,45IV. Industry & Minerals 64.94 1.83 347.18 6.99V. Transport & Communication 865.02 24.43 704.30 14,18VI. Social & Community Services 876.04 24.74 1106.83 22.32
VII. Economic Services 2.39 0.07 8.31 0.17VIII. General Services 17.88 0.50 9.19 0.18
GRAND TOTAL 3541.13 100.00 4967.42 1100.00
29. FIVE YEAR PLAN.
29.1. Out-lay and Expenditure under First, Second, Third, Annual Plan (1966-67,1967-68,1968-69), Fourth, Fifth Rolling Plan Period (1978-79 & 1979-80) and Sixth Plan.
(Rs. in Lakhs)
Sub-Head of Rolling Plan Period (I978 & I979-8O) Sixth Plan (I98O-85)Development Expenditure % age to total Expenditure Expenditure % age to Total Expenditure1 18 19 20 21I. Agriculture and Allied Services 1627.78 29.23 7286.02 24.89
II. Cooperation 144.60 2.60 579.10 1.98III. Irrigation & Power 967.84 17.38 7223.90 24.68IV. Industry & Menerals 255.53 4.59 1207.51 4.12V. Transport & Communication 1153.73 20.72 3724.82 12.73
VI, Social & Community Services 1314.53 23.61 8872.66 30.31VII. Economic Services 10.27 0.18 43.29 0.15
Vni. General Services 93.89 1.69 334.11 1.14GRAND TOTAL 5568.17 100.00 2927.41 100.00
K>I—*
Source State Planning Machinery.

215
29. FIVE YEAR PLAN.
29.2. Plan Out-lay and Expenditure Seventh Plan (1985-90)
Head ( ofcf Development Seventh Plan period (1985-90)
Approved Out-lay
Total Expenditure ./-Total Expenditure
1 2 3 4
ECiCCONOMIC SERVICES
1- AAgi:riC!ulture and AlliedSiSer’-vices 7410.00 11371.03 16.5
ii. R ilunal Development 2995.00 4961.44 7.2
iii. Sp>p3ccial Area Programme 3OC0 00 4631.08 6.7iv. Irlrriigation & Flood
CComtrol 4800.00 5787.79 8.4V. Eranetrgy 4800,00 8126.31 118
vi. Inndiustry & Minerals 1610.00 3o27.ll 4.4vii TtTratnsport 5200.00 7807-06 11.4
»viii Colomnmiimication 5-21 O.l
ix. Sciciefnce, Technology &Ennv/ironment 250.00 297.95 0.4
X. Ge)en€eral Economic Services 264®. 0 294. 37 0.4B. S60(CIAL SERVICES.
xi. Ecdmcation, Sport &t Ciiultture 2967.00 9067.09 13.2xii. Mdediical & Public Health 1300.00 2268.23 3.3
liii, We/atcer Supply, Housing &A Urirbfan Development. 5000.00 5798.52 8.4
Intafojririaticn & Publicity 127.CO 362.92 0.5XV. We^elffare of Sch. Castes
S»ch- Tribes and otherBj«acH<ward Classes 1432.00 1622.48 2.4
ivi. Laavcour & Labour Wel-fanre 1 9 8 . 0 0 105.54 0.2
Fvii, Soocifal Welfare &NUutirition 2197.00 2229.52 3.2
[viii. ODthier Social Services(LLeg?al Aid & Advices) 10.00 10.00 0.1
C. GBEhNERAL SERVICES.
xix. G jem eral Services 440.00 946. OK) 1.4
GRA>ND TOTAL 44000.C0 68719.65 100
Source Directorate of Planning, Tripura.

29,3 FIVE YEAR PLAN.
29.3 Plan Out-lay expenditure of Annual Plan ( 1990-91 «& 1991-9 2 ) (Rs. in Lakhs )
Head of Development ANNUAL PLAN ( 1990—91 ) ANNUAL PLAN ( 1991—92)
Approved out-lay Actual Expenditure %Total Expenditure
Approved outlay
Expenditure % total Expenditure (Provisional)
0 1 2 3 4 5 6A. ECONOMIC SERVICES.
i. Agriculture and Allied Services. 3705.00 3665.12 18.22 4434.00 4431.70 19.17ii. Rural Development 1527.00 1490.01 7.41 1620.00 1634.76 7.07
iii. Special area Programme 1674.00 1674.00 8.32 1682.00 1682.00 7.28iv. Irrigation & Flood Control 1572.00 1776.65 8.83 1900.00 1889.51 8,17V. Energy 1918.00 1922.48 9.56 2596.00 2762.08 11.95
vi. Industry & Minerals 1160.00 1096.77 5.45 1326.00 1325.24 5.73vii. Transport 1611.00 1670.71 3.30 2056.00 2075.11 8.98viil. Communication 1500.00 13.16 0.07 30.00 31.00 0.13
ix. Science, Technology & Environment 84.00 83.96 0.42 96,00 92,52 0,40X. General Economic Services 153.00 114.25 0.57 156.00 160.50 0.69
B. SOCIAL SERVICES.
xl. Education, Sport & Culture 2966.00 2937.05 14.60 2601.00 2601.65 11,26xii, Medical and Public Health 621,00 620.80 3.09 749,00 744,29 3.22xiii. Water Supply & sanitation
Housing & Urban Development 1424,00 1431.94 7,12 1577,00 1616.18 7.00xiv. Information & Publicity 146.00 145,79 0,72 167,00 162,06 0,7oXV. Welfare of Sch, Castes & Sch,
Tribes and Other Backward Classes 533.00 500,69 2,49 886,00 882,67 3,82xvi Labour & Labour Welfare 52.00 46,93 0‘23 97,00 85,45 0.37
xvii. Social Welfare & Nutrition 647.00 626,44 3,11 574,00 650.91 2.82xviii. Other Social Services (Legal Aid
Advises) 2.00 2.00 0,01 5.00 5.00 0,02
9 i. GENERAL SERVICES,xix- General Services 190.00 398.28 1.48 248.00 281.15 1,22
200UO.OO 20117.12 100.00 22800.00 23113,78 100,00
N>I— ‘
ON
Source :— Directorate of Planning, Tripura.

30. Joint Stock Companies.
Statistics relating to Joint stock companies working in Tripura.
TabHe N o. 30.1 :— Data in respect of companies at work Newly Registered aad Liiqui- datetd iin Tripura.TabUe ^^10.30.2 :—This table gives the information relating to the Number and capitail o f publiic comp^^*^s the nd of the year.
TabUe lNo.30.3 :— This table gives the information relating the Number and capitall o f Privaate: companies.
2 1 7

218
30. JOINT STOCK COMPANIES
30.1 COMPANIES AT WORK. NEWLY REGISTERED AND LIQUIDATEDIN TRIPURA.
(Rs. in crore;s)Year Ending 31st Companies at work New Registration Companies Licquidatef
M a r c o
No. Paid up Capital No. Authorised C
51 2 3 4
1982-83 19 6.2 2 0.51983-84 20 6.4 1 N1984-85 21 9.1 1 N1985-86 23 9.1 2 0-11986-87 23 11.9 . . .
1987-88 25 13.8 2 5.31988-89 28 17.0 3 0,91989-90 29 13.6 1 1.51990-91 35 23.4 1 2.0
Paid upj Capit4
N —Negligible. Source Department of Company Afffairs Govt, of India, New Delhi.

219
30 JOINT STOCK COMPANIES
30.2 Number and Capital of Public Companies at the end ofthe year,(Capital in 1000 Rupees)
ass of cojmjpamies 1981-82 1982-83 1983-84 1984-85
No. of Paid-up No. of Paid-up No. of Paid-up No. of Paid-upcompanies capital companies capital companies capital companies capital
AgricuUtuiTc aind allied Activitiees.
Mining; aind Quarriging
Processsing &. M anufacturing Ifood staff, tertile
& leathner anid Products theteoff.
Processiing& Manufacturing m:ieltals, chemicals produetts tthereof.
^rocessiing; & Manufacturing mot elsewhere specif ieed.
^nstru tc tiiou & Utilities.
Commerrce (Trade and Finances)
Transpont, Communication ancd Sitor age.
Commumityy and business lervicesj.
Personal) aind other services..
il—(All *Co)mpanies)
4144
600
1 4144 1 4144
1 1600 1 1600
2 61345
1 4800
4744 2 5744 2 5744 3 66145
iNcte—Figures are provisional Source—Department of Company Affairs Government of India, New Delhi.

30 JOINT STOCK COMPANIES
30.3 Number and capital of private Companies at the end of year
(Capital in 1,000 Rupees).
2 2 0
Class of Companies 1981-82 1982-83 1984-84 1984-8^5
No. of paid-up No. of paid-up No. of paid-uP No. of paidl-upcompanies capital companies capital companies capital companies capital
8
0. Agriculture and
allied activities, 4
1. Mining and Quarrying ...
2. Processing & Manufac
turing food staff, tertile
& leather and products
thereof. 1
3. Processing & manufac
turing metals cheoiicals
and product thereof. 1
4. Processing & manufac
turing not elsewhere
specified. 2
5. Constructions & Utilities 1
6. Commerce (Trade and
Finance) 47. Transport Communica
tion and storage. 1
8. Community and Business Service.
9. Personal and otherservice. 1
10500 5 10500 5
37300 1 37300 1
196 I 196 2
52
6069
10
52 2I
6569 4
2 1
10 2
12700 6
37300
196 2
52 2
1
6569 4
2 1
10 2
177850
196
52
77499
220
10
TOTAL (All Companies) 15 54129 17 54629 18 56829 18 2f5627
Note ; Figures are Provisional, Source Department of Company Affairs. Govt, of India, New Delhi.

221
31. Public A dm inistration & Electoral Statistics.
This section presents Electoral Statistics for Lok Sabha and Tripura Vidhan Sabha.
Tatble; N o .:— 31.1 This table gives iiiformatioii regarding to the Number of Gaon Panchayat— 1991.
Tatblej No. — 31,2 This table gives information regarding to the Number o f Electors for Lok Sabha and Vidhan Sabha in Tripura.
Tatble) N o .:— 31.3 This table shows the Number of Lok Sabha and Vidhan Sabha seats by District in Tripura.
Tatele: No.?— 31.4 Data on Election to the Tripura Vidhan Sabha 1988 votes polled and seats won according to parties.
Tabblej N o .;— 31.5 Data on Number of votes polled in the 1991 Lok Sabha and 1988 Vidhan Sabha Election in Tripura.
TabMe N o .:— 31.6 This table shows the Number of Lok Sabha and Vidhan Sabha seats'in India by state.
Tatble N o ,:— 3L7 Data on population and Constitution of Agartala Municipality.
Tabble; N o .:— 31.8 Data on income of Agartala Municipality.
Tabble; N o.:— 31.9 This table gives the information regarding to the Expenditure of Agartala Municipality.

31. PUBLIC ADMINISTRATION & ELECTORAL STATISTICS
31. 1, Number of Gaon Panchayats—1991.
2 2 2
District/Bloek. Total number of Gaon Panchayats, 1991.
within ADC area Within non-ADC area Total (Col. 2+3 )
1 2 3 4
WEST TRIPURA 125 215 340
1, Khowai 19 18 37
2, Tcliaii'jura 23 26 49
3. Mohanpur 18 22 40
4. Jirania 30 19 49
5. Jampuijala.Takarjala 15 2 17
6. Bishalgarh 13 63 76
7. Sonamura 7 65 72
NORTH TRIPURA 127 148 275
8. Panisagar 2 51 53
9. Kanchanpur 57 — 5710. Kailashahar CD
Block Kumarghat 9 61 70
11. Chaumanu 40 — 4012. Kamalpur 19 36 55
SOUTH TRIPURA 156 140 296
13. Udaipur 20 46 66
14. Am arpur 52 9 6115 Dumburnagar 26 — 2616, Bagafa 19 22 41l7. Rajnagr 3 34 3718. Sabroom 36 29 65
(TOTAL TRIPURA) 408 503 911
SOURCE—DIRECTORATE OF PANCHAYAT RAJ TRIPURA.

223
31. PUBLIC ADMINISTRATION tfi ELECTORAL SrATISTlCS31.2. Number of Electors for Loksavha and vidhan savha in Tripura.
Diistrict/Sub-Division LOKSAVHA (1) VIDHANSAVHA
1977 1980 1984 1989 1991 1972 1977 1983 1988
1 2 3 4 5 6 7 8 9 10
1. TRIPURA WEST 3,75,428 4,66,999 5,48,057 6,59,443(0) Sadar 2,45,315 2,98,760 3,57,199 4,38,763((ii)) Khowai 86,859 1,09,531 1,23,317 1,40,19
iiij) Sonamura 43,254 58,708 67,541 80,486
71. TRIPURA NORTH 2,06,244 2,48,630 2,27,903 3,14,436
((i) Kailashahar 74,424 81,141 92,109 84,949 (a>((ii) Dharmanagar 8,974 1,05,027 1,23,528 1,46.696((iii)) K am alpur 42,846 62,462 72,266 82,791
33. TRIPURA SOUTH 1,84,421 2.46,369 2,98,297 3,49,590
((i) Udaipur 51,274 74,060 91,890 1,05,802((ii) Am arpur 46,705 52,874 65,938 76,831((iii)i Belonia 59,885 83,367 97,668 1,16,720(fiv)i Sabroom 26,557 36,068 42,801 50,237
ITOTTAL TRIPURA 8,66.056 10,57,506 12,08967 15,36,550 15,61,085 7,66,093 9,61.998 11,34,257 13,23,469(a)
N>IOTrE i) Loksavha constituency covered in ail 3 (three) District of State, SOURCE,- Office of the ChiefElectoral Officer, Tripura.
a) Excluding Electors of Fatikroy Constituency, as poll was counter manded due to death of a contesting candidate.

224
31. PUBLIC AD M INISTRATIO N A N D ELECTORAL STATISTIC.31.3 Number of Lok Savha and Vidhan Savha Seats by District in Tripura*
District/ Lok Savha Sub-Division
Vidhan Savha
1977 1980 1984 1989 1991 1972 1977 1983 19>88
1 2 3 4 5 6 7 8 9 UO
1. Tripura West 30 29 29 29
i. Sadar 20 18 18 18ii. Khowai 6 7 7 7
iii. Sonan.ura 4 4 4 42. TRIPURA NORTH 16 16 16 16i, Kailashahar 6 5 5 5
ii. Dharmanagar 7 7 7 7iii. Kamalpur 3 4 4 4
3. TRIPURA SOUTH 14 15 15 15i. Udaipur 4 5 5 5ii. Amarpur 4 3 3 3
iii. Belonia 4 5 5 5iv. Sabroom 2 2 2. 2
TOTAL ( T r i p u r a ) 2 2 2 2 2 60 60 60 60
Note Lok Savha constituency covered in all Source Office of the Chief Elect(oral3 District o f State. Officer, Tripura.

225
31. PUBLIC ADMINISTRATION AND ELECTORAL STATISTICS.
31.4 Election to the Tripura vidhan Sabha, 1988 votes Polled and Seats Won According
to Parties—Contd.
Parties
c.2*c/>
s -a,s-§Qcn
Congress C. P. I. (M) T. U. J.
So>
."2
■S'S
Z D.
S.
rs15>^ -o0;S
Cj o
c/5
0 >731 “ ■S
i t
1•a■<3
• s S
cosanu10
COB0 > •a1
Oo>;o13
c
S1
So>T>••S
1Vi
1 2 3 4 5 6 7 8 9 10 11
TRIPURA WEST 5.56.447 2,17,799 39,14 15 2.79,231 50,18 13 44,097 7,93Sadar 3,65.076 1,48,465 40,67 12 1,70,597 46,73 5 34.127 9,35 1Khowai 1,19.560 34,716 29,03 1 71,913 60,15 6 9,970 8,34Sonamura 71,811 34,618 48,21 2 36,712 51,14 2
TRIPURA NORTH 2,61,589 88,352 38,78 1,24,181 47,47 8 32,089 12,27
Kailashahar 72,809 26,867 36,90 1 37.619 51,67 3 7,157 9,83
Dharmanagar 1,17,857 46,270 39,26 4 50,969 53,25 2 6,457 5,47 1Kanialpur 70,923 13,215 21,45 35,593 50,19 3 18,475 26,05 1
TRIPURA SOUTH 3,00,735 1,05,802 35.18 1,12,986 37,57 5 43,413 14.43
Udaipur 91,406 34,219 37.44 1 27,924 30,55 1 10,309 11,28. 1Amarpur 62.8 11 801 18,76 1 20,232 32,18 21,522 34.22 2Belonia 1,02,064 37,841 37,07 1 42,562 41.70 3 11,582 11,35 1Sabroom 44,380 21,941 49,44 1 22,268 50,11 1
Tripura (Total) 11,18,771 4,11,953 36,82 24 5.16.398 46,16 26 1,19,599 10,59 7

2 2 6
31. PUBLIC ADM INISTRATION A N D ELECTORAL STATISTICS
31.4 Election to the Tripura Vidhan Sabha, 1988 votes polled and Seats won according to parties—Contd.
District/
Sub-Division BJP
Parties
JNP IN D
No, of % of valid Seats No. of % of valid Seats No. of % of valid Stealsvalid votes vores polled polled
12 13
won validvotespolled
14 15
votespolled
16
won valid votes polled
17 18
votespolled
19
wvon
220
TRIPURA WEST
Sadar
Khowai
Sonamura
226
226
0.04
0.06
723
578
145
0.13
0.16
0.12
6,740
3.452
2,816
472
1.21
0.95
2.36
0.66
TRIPURA NORTH 1.148
Kailashahar
Dharmanagar
Kanialpur
516
632
0.44
0.71
0.54
186
91
95
0.07
0.12
0.13
15,633
559
13,529
1,545
5.97
0.77
11.48
2.18
TRIPURA SOUTH 260 0.09
Udaipur 163 0.17
Amarpur
Belonja 97 0.10
Sabroom
Total Tripura 1,634 0.15
229
22r
0.08
0.25
1.138 0.10
10,549
380
9,330
668
171
32,922
3,51
0.42
14.84
0.65
0.38
2.94

22 7
31. PUBLIC a d m in is t r a t io n AND ELECTORAL STATISTICS
31,• 4 Election to the Tripura Vidhan Sabha, 1988 votes polled and seats won according to parties-concld.
PartiesDisstrict/Sub-
Diwision
1
TRIIPURA WEST
Sadiar
KhoDwaiSonsamura
TRIIPURA NORTH
Kaillashahar
Dhainuanagar
Kannalpur
SOLI3TH TRIPURA
Udaiipur
Amairpuir
Belornia
Sabrcoom
I-----------------------------ITot al Tripura
RSP Forward Block CPI
No. of % of valid Seats No. of %of valid Seats No. of %of valid Seat* valid votes won valid votes won valid votes wonvotespolied
21
^8,18218,182
polled
22
6.04
19,89
18,182 1.63
23
votespolled
24
7.631
7.631
polled
25
1,37
2.09
7,631 0.68
26
votespolled
27
9,314
9.314
9,314
polled
28 29
310
9.13
0 83
Source Office of the Chief Electoral officcr, Tripura.

2 2 8
31. PUBLIC ADM IN ISl RATION AND ELECTORAL STATISl ICS
3L5, Number of votes polled in the 1991 Lok Sabha and 1988 Vidhan Sabha Election.
Lok Sabha (1991) (a) Viodan Sabha (1988)
District/Sub-Division
TotalElectors
Votespolled
Percentage
TotalElectors
Votespolled
Perceentage
1 2 3 4 5 6 7
1. TRIPURA WEST 6,59,443 5,64,739 8J5.64
i) Sadar 4,38,763 3,70,596 8^4.46ii) Khowai 1.40,194 1,21,377 m .5 8iii) Sonamura 80,486 72,766 W.41
2. TRIPURA NORTH 3,14,436 2,65,337 884.38
i) Kailashahar 84,949(b) 73,753(b) m .S 2ii) Dharmanagar 1,46,696 1,19,714 a 1.61
iii) Kamalpur 82,791 71,870 J86,81
3. TRIPURA SOUTH 3,49,590 3,04,324 ^87.05
i) Udaipur 1,05,802 92,492 : 87.42ii) -Amarpur 76,831 63,740 ; 82.96iii) Belonia 1,16,720 1.03,185 88.40iv) Sabroom 50,237 44,907 m .3 9
TOTAL TRIPURA 1561085 1050253 67.28 13,23,469(b) ll,34,400(b) i85.71
NOTE :— (a) 2 Lok Sabha constituency SOURCE :— Officer o f thiecovered in all 3 Districts Chief Electcoralof State. officer, Tripiura.
(b) Excluding Fatikroy constituency, as poll was counter manded due to death of contisting candidate.

229
31. PUBLIC ADMINISTRATION AND ELEC rORAL STATISTICS.
31.6 Number of Latest Lok Sabha &Vidhan Sabha in India by States
(As on 31—3—8
State Lok Sabha
Union Territory
O N IO N TERRITORIES
1. Andaman & N. Islands2. Chandigarh
3. Daman & Diu4. Dadra & Nagar Haveli5. Delhi6. Lakshadweep7. Pandichefry
11
543
Vidhan Sabha
1 2 3
1.2;.
Andhra Pradesh Arunachal Pradesh
422
29430
3. Assam 14 1264. Bihar 54 3245. G ujarat 26 182(5. Goa 2 207. Hariyana 10 9058. Himachal Pradesh 4 689. Jammu & Kashmir 6 76
1(0. Karnataka 28 22411. Kerala 20 14012. Madhya Pradesh 40 32013. Maharashtra 48 28814. Manipur 2 6015. Meghalaya 2 6016. Mizoram 1 4817. Nagaland 1 60Ii8. Orissa 21 14719. Punjab 13 117
2(0. Rajasthan 25 20021. Sikkim 1 32212. Tamil Nadu 39 234
23. Tripura 2 6024. Uttar Pradesh 85 425
25. West Bengal 42 294
56
30
4005
Source ;— Office of the Chief Electoral Officer. Tripura.

31. LOCAL BODIES
31.7 Population and Constitutions of Agartala Municipality.
( Rs. in Lakh )
YearPopulation
withinMunicipal(Estimated)
Member of the committe
(No)
Classifiction of members Income (Excloding balance) Incidence per head popnlation Expendi-
Official Non-official From Rates From & Taxes Others
Total Rates & Total incom T axes (excl udingextrea (Rs.) ordinary & debt, Rs.)
-dingbalance
1 2 3 4 5 6 7 8 9 10 11
1980-81 100028 10 10 13.04 100.68 113.72 13.04 113.69 123.42
1981-82 132186 10 2 8 20.30 148.39 163.69 15.38 123.25 173.17
1982-83 132186 10 2 8 27.18 161.71 188.89 20.59 142.15 148.20
1983-84 137474 13 13 12.47 233.60 246.07 9.08 204.07 166.74
1984-85 139118 13 13 9.96 208.49 218.45 7.16 208.45 210,80
1985-86 141762 13 13 11.89 288,17 300.06 8.39 300.06 267.85
1986-87 144406 13 13 13.84 306.35 320.19 9.58 315.52 290.281987-88 144406 (b) (b) (b) 11.16 332.53 343.69 7.73 213.06 251.72
1988-89 144406 (b) (b) (b) 15.19 278.35 332.53 10.52 203.27 192.76
1989-90 157358(a) (b) (b) (b) 17.35 312.41 329.76 11.03 209.56 225.78
1990-91 157358 (b) (b) (b) 21.44 399.75 421.19 13.62 267.66 242.94
1991-92 157358 (b) (b) (b) 20.51 355.16 37^67 13.03 238.74 315.07
Note :— (a) 1991 census population.
UlS MnSigipglity i§ UfldSF tbs fflaBagement of 6ovt. of Tfijjuaa. Source Agartala Municipality.

31. LOCAL BODIES
31.8 Income of Agartala Municipality
(Rs. in Lakh)
Source of Income
1
1983-84 1984-85 1985-86 1986-87 1987-88 1988-89 1989-90 1990-91 1991-92
1. Municipal Rates & Taxes :—
a. Octroi
b. Taxes on house & land
c . Lighting, water conservency ratesd. Taxes on profession, trades
c. Other rates & Taxes
Total (I)
2. Other Sources
a. Realizajion under special acts
b. Frees from edncational institute.
c. Receipts from markets slaughter, loan & rent of house & land
d. Other fees & revenuese. Grants ;—
i. Governmentii. Others
f. Others Source :—
i. Interest receipts
ii. Premium on loans
11.94
0.53
12.47
4.09
0.42
9.46
0.5011.34 13.20
0.55 0.64
2.99
8.17
4.4210.77
4.64 5.42
11.41 14.721.30 1.30
9.66 11.89 13.84 11.16 15.19 17.35 21.44
0.35 1.20
4.82 3.87 3.96 4.41 3 66 9.01 9.15
0.22 0.18 0.26 ... ... 7.18 9.60
151.67 166.31 240.32 244.82 280.35 258.90 291.44 378.66
.................................. 7.67 6.78 4.78 2.34
Total (U)
35.42 27.14 43.80 52.62 3.74 781
191.67 198.49 288.17 301.68 296.52 278.35
10
5.13
14.021.36
20.51
18.09
1179
323.991.30
312.41 399.78 355.16

1 10
3, Extraordinery Receipts and Debts
a. Sales of physical assets
b. Loans from
i) Governmentii) Others
Total (III)
4. Income of Commercial Enterprises
5- Opening Balance
ORAND TOTAL;—
42.0042.00
10.00
10.00
4.67
4.67
36.01 36.0136.01 36.01
51.55 119.83 117.25 114.31 173.98 165.40 123.75 135.80 209.79
297.62 338.28 417.31 434.50 506.51 443.34 453.51 556.99 585.46
Source :—Agar tala Muuicipalty. K>U>

JW, Local Bodies.
31.9 Expenditure of Agartala Municipalty., (Rs. in Lakh)S' — '
Head of Expenditure 1983-84 1984-85 1985-86
1
1986-87 1987-S
5 6
1988-89 1989-90 1990-91 1991-92
8
1, Current Bcpenditure
3. Extra Ordinary & Debts :—a. Payn-ent to sinking funds/
suspense account
b. Repayment of : —
10
a. Pubic Lighting & Water supply 24.15 40.03 48.81 31.69 49.23 25.75 18.49 44.01 62.18b. Drainage, Conservency & Sanitary 19.57 12.31 30.60 13.71 30.32 18,11 23.64 24.85 23.82c. Hospital, Dispensari Va^'cination . . . ••• . . . . . . . . .
d. Pnblic Institution . . . . . .
e. Miscellaneous 18.62 41.05 54.73 69.64 2.26 2.76 72.44 51.40 114.38Total :— 62.34 93.39 134.14 115.04 81.81 46.62 114.57 120.26 200.38
2. Capital Expenditure :—
a. Roads 23.10 30.13 28.96 21.45 36.53 47.40 43.49 47.71 40.03b. Others 20.35 20.80 31.14 63.14 138.55 116.59 8-56 11.23 7.96
Total 43.45 50.93 60.10 84.59 175.08 163.99 52.05 58.94 47,99
i) Government 6.80 8.02 8.16 13.21 25.24 24.61 21.49 19.71 47.40Total :— 6.80 8.02 8.16 13.21 25.24 24.61 21.49 19.71 47.40
4. Expenditure on a. Commercial Enterpriseb. Total Wages aad Salaries 54.15 56.46 65.45 77.44 81.37 116.59
5. Closing Balance 119.83 117.25 142.03 143.35 165.46 123.75 167.18 183.37 200.01Toeal (4%5) 173.98 165.71 207.48 220.79 246.8-3 240.34 135.80 2O9.79 166.43
Grand Total 286.47 328.88 409.88 433.63 528.96 475.56 491.09 592.07 661.01
toU)
Source Municipality of Agartala, Tripura west.

2 3 4
32. M iscellaneous.
This section contains information on Accident by Fire 'and some Characteristics; ofEnterprices covered by 1990 Economic census in the state of Tripura,
Table N o .;— 32.1 Data on Fire out breaks Loss property and life in Tripura have teeen presented.
Table No.;— 32.2 Number of Rest Houses and DakBanglows,
Table N o.:— 32,3 Principal characteristics own account enterprices engaged in non-Aigri- cultural sector.
Table No,:— 32.4 Principal Characteristics o f establisments engaged in non-Agric«lttural sector.
Table No.:— 32 5 Principal Characteristics of own account enterprices engaged in iiiigii- cultural sector, (excluding crop production and plantation)
Table N o .:— 32,6 Principal Characteristics of Establishments engaged in Agriculltural sector (excluding crop production and plantation)

235
32. MISCELLANEOUS
32.1 Number of Fire oul-Breaks, Loss of property and Life in Tripura.
Yearr-D)istrict Fire-out breaks Value of Property Loss (Including Spl.) (.000 Rs.) —
Cali)Affected Destroyed Saved
to Humanlife
Death Injuries
Loss in Cattle
Death
Wealth
Injuries
1 2 3 4 5 6 7 8 9
884 64371 33079 31292 16 204 88 3199877 728 55622 37116 18506 11 115 11998® 764 68824 42II0 26714 30 40 1019989) 857 71181 44192 26989 26 119 36 . . .
19990) 714 68963 44735 24228 23 388 61219991 656
19991 (By District)
3,9535 26213 13322 36 139 2 144
We'est Tripura 232 14317 10478 3839 3 6Noortlh^Tripura 191 11540 7096 4444 21 33 2 35So9Utlii Tripura 233 13678 8639 5039 12 106 103
Source :—Directorate of Fire Services,Tripura.

32. 2 NUMBER OF REST HOUSE AND DAK BANGLOWS BY DISTRICT IN TRIPURA 1990-9H
236
32. M ISCELLANEOUS
r>istrict Rev. Dak Banglows P. W. D. ins. Ban. Tribal Rest House Forest Rest House Totail
1 2
Tripura West 2 (a) 1 4 9 16
Tripura North 4 8 12 7 31
Tripura South 5 2 10 10 27
l o t a l : — 11(a) i l 26 26 74
Note :— (a) Includes Circuit House at Agartala.
Source Tripura Govt. Dairy 19922.

32.3 ECONOMIC CENSUS—1990
PRINCIPAL CHARACTERISTICS OF OWN—ACCOUNT ENTERPRISES (OAE) ENGAGED IN NON—AGRICULTURAL SECTOR.
District ToVjI Rural urban
Total No. of oae
Seasonal With power/ fuel
Withoutpremises
Owned by S.T. S.C.
Number of persons Usually working Total Male Female
1 2 3 4 5 6 7 8 9 10 11
TOTAL 27713 706 4424 6499 1438 4441 35534 32728 2806
West Tripura RURAL 17050 549 3021 3968 1.192 3068 22252 19884 2368
URBAN 10663 157 1403 2531 46 1373 13282 12844 438
TOTAL 16928 517 2662 5451 1177 2278 21167 19523 1644
North Tripura RURAL 134 ,8 438 2120 4533 1162 1942 16843 15346 1497
URBAN 3470 79 542 918 15 336 4324 4177 147
TOTAL 13863 356 2752 2719 892 2115 17405 16411 994
South Tripura RURAL 11506 319 2387 2362 891 1837 14676 13736 940
URBAN 2357 37 365 357 1 278 2729 2675 54
TOTAL 58504 1579 9838 14669 3507 8834 74106 68662 5444
State Tripura RURAL 42014 1306 7528 10863 3445 6847 53771 48966 4805
URBAN 16490 273 2310 3806 62 1987 20335 19696 639
K>
—Directorate ot Statistic TtipMia.
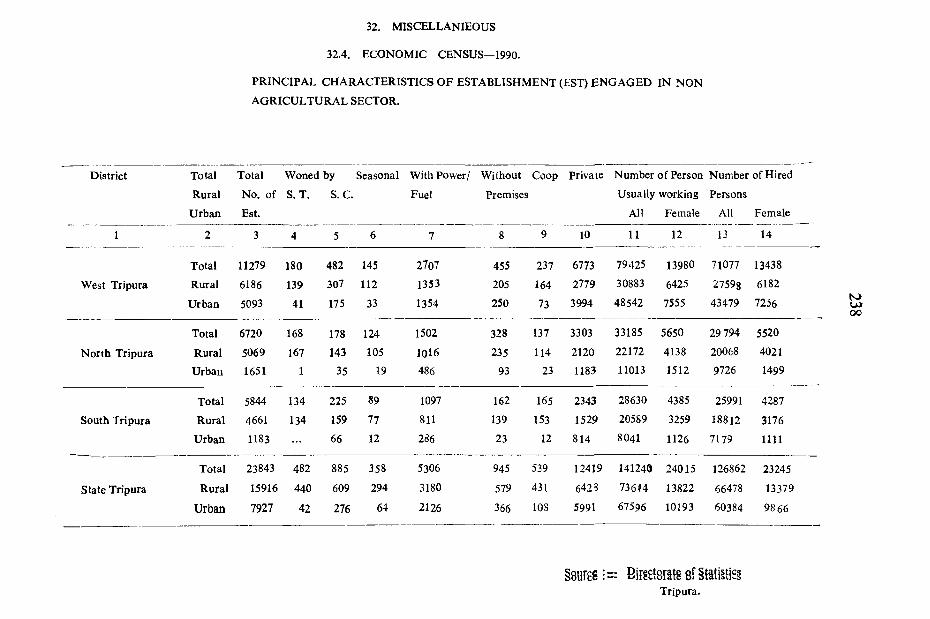
32.4. ECONOMIC CENSUS—1990.
PRINCIPAL CHARACTERISTICS OF ESTABLISHMENT (EST) ENGAGED IN NON
AGRICULTURAL SECTOR.
32. MISCELLANIEOUS
District Total Total Woned by Seasonal With Power/ Without Coop Private Number of Person Number of Hired
Rural No. of S. T. S. C. Fuel Premises Usually working Persons
Urban Est. All Female All Female
1 2 3 4 5 6 7 8 9 10 11 12 13 14
Total 11279 ISO 482 145 2707 455 237 6773 79425 13980 71077 13438
West Tripura Rural 6186 139 307 112 1353 205 164 2779 30883 6425 27598 6182
Urban 5093 41 175 33 1354 250 73 3994 48542 7555 43479 7236
Total 6720 168 178 124 1502 328 137 3303 33185 5650 29 794 5520
North Tripura Rural 5069 167 143 105 1016 235 114 2120 22172 4138 20068 4021
Urban 1651 1 35 19 486 93 23 1183 11013 1512 9726 1499
Total 5844 1,34 225 89 1097 162 165 2343 28630 4385 25991 4287
South Tripura Rural 4661 134 159 77 811 139 153 1529 20589 3259 18812 3176Urban 1183 66 12 286 23 12 814 8041 1126 7179 1111
Total 23843 482 885 358 5306 945 539 12419 141240 24015 126862 23245
State Tripura Rural 15916 440 609 294 3180 579 431 6423 736<4 13822 66478 13379
Urban 7927 42 276 64 2126 366 lOS 5991 67596 10193 60384 9866
N)u»oo
§ 8 U F £ g B iF ie ts ra tg efTripura.

MISCELLANEOUS.
32.5 ECONOMIC CENSUS—1990
rrincipai cnaracienstics own account enterprises (OAE) angaged. in agricultural (Except crop production and plantation) Sector.
District TotalRural
Urban
Total no
of OAE
Seasonal Withpower/fuel
Withoutpremises
Owned by
S T . s . c .
Total No of persons usually working
West Tripura Total
Rural
Urban
1457
1186271
179
16^
18
848
747
101
479
478
1
489
397
92
2155
1703
452
North Tripura Total 581 80 7 426 152 265 691Rural 535 68 7 388 152 236 638Urban 46 12 38 29 53
South Tripura Total 818 105 4 641 256 389 1021Rural 795 103 4 622 256 371 996
Urban 23 2 19 18 25
STATE TRIPURA Total 2856 364 17 1915 887 1143 3867Rural 2516 332 14 1757 886 1004 3337Urban 340 32 3 158 1 139 530
ts>
O
Source :— Directorate of Statistics, Tripura.

p
17-3, Sn
, ■ ■ ■ i-E-vTJi.-u u c ,:rK o a /
dm:,n , t r a n o n . nrobjrido Mura
w D tIi3 i-ijo O J6D o c , N o . . . . ...........s l i" ' ^ 5 ^ 0 % Principal characteristics of Establishments (EST) engeged in Agricultural^ • t e ....... ........production and plantation sector
32. MISCELLANEOUS.
32.6 ECONOMIC CENSUS—1990
Distri o TotalRuralUrban
Total No. of EST. S. T. S. C.
Owned by Seasonal Withpower
fuel
With out premises
Coo? Private
10
lo ta l No. persons usally working
11
Total No, of Hired persons
12
Total 109 4 9 8 36 14 2 45 542 490
West Tripura Rural 84 4 8 5 32 11 1 28 451 418
Urban 25 1 3 4 3 1 17 91 72
Total 104 6 3 12 65 13 ... 21 293 273
North Tripura Rural 98 6 3 12 61 13 21 251 231Urban 6 4 42 42
Total 101 1 11 ‘ 7 60 16 ... 20 540 512South Tripura Rural 93 1 9 6 56 14 17 510 485
Urban 8 ... 2 1 4 2 3 30 27
STATE TRIPURA Total 314 11 23 27 161 43 2 86 1375 1275Rural 275 11 20 23 149 38 1 66 1212 1134
Urban 39 3 4 12 5 1 20 163 141
K)O
NIEPA DC
'*'*"'□08508Sotifee i—Directorate of Statistics
( Economic Census U n it)

STATISTICAL ABSTRACT 1992.Errata
'o 5 9O a
01 9 " 1 — ------------- ~ ~Page : Table ? Particulars ^ine 9a Cel For ; ReadNo. 1 No. 1 • No. o No »
1 -i 2 i 3 I 4 % c I 6 s 7
4. 1.5 1981 1 0o
, *Unhabited Uninhabited
4. 1.5 1981 1 3 Unhabited Uninhabited5. 1,6 Less then — 13 2000-499 2000-49996. 1.6 RajNagar Dev.Block 6 15 Illegible 214127. 1.7 C-Class.III.Telia- — ^
mura(NA) 2 6 14338 143367. 1.7 JogendraNagar(C.T) 3 6 13967 138677. 1.7 Barjala (C.T) 7 7 3245 82457. 1.7 C-Class.III.Dharma-
Nagar (NA) 11 6 13250 132598. 1.8 Sadar 2 8 997345 3S73458.' 1'.8 DharmaNagar 6 10 805942 2559429. 1.9 Senamura 4 3 4095 4^939. 1.9 Sabroom 14 5 548 558
• 9. 1.9 Sabroom 14 6 3750 37309. 1.9 South Tripura 9 8 15606 2156069. 1.9 Sonamura 3 9 150282 1501829. 1.9 Sabr®r»m 14 10 35113 85113
. 9. 1.9 Belenia 13 11 20.2 2 29.2212. 1.11 0-14 2 7 5505 560613. 1.11 South Tripura 60+ 10 8 11118 111816. 1.13 Assam 4 4 1989684 1989684316. 1.13 Himachal Pradesh 8 11 '4.22 21.8316, 1.13 Kerala 12 .. 3 29098318 2909851816. 1.13 Daman i Diu 30 3 10186 1015618. 1.15 West Tripura 1 2 47684 47658418. 1.15 Sonamura 4 8 72526 7252518, 1.15 Belonia 13 6 5686 558618. 1.15 Sabr«"om ^ 14 9 29556 29356i n . 1.15 N,B.Literacy(1991)
Census Age of years, and above
, Age rf 7 years and above
3.2 SI.No. 3 3 4 35■ 9, 3.2 El.No.■2 2 12 115 11343. 4.7 Si,No. 1 1 20 1 65145. 4.8 Work completed
1987-88 3 7 57 57249. 5.5 1988-89 5 5 431 (4j 341(4)51. 5.6 Tripura(s) 10 6 557 55952, 5.6 1987-88 4 50 206469 20647953. 5.8 North Tripura 2 10 35 35753. 5.8 South Tripura 3 6 Nil 255, 5.11 1989-90 6 6 .7947,12 7947.1571. 9.1 1986-87 Si.No.6 6 4 45,?9 115.9976. 10.2 Total 7 7 8527 849781. 11.1 S1.N©.2 ii) 4 4 1383 136385, 11.4 Top Head line (1980-81) 1980-81 tcj 1989-9088. 12.1 1985-86 4 6 129800 12780089. 12.1 1987-88 6 15 11460 161460100. 12.8 1982 1 6 571 371101, 12.9 Nete* , - - (5000) ( ’000)109. 14.2 1987-88 7 9 Blank 6109. 14.2 1991-92 11 9 Blank 2110. 14.3 North Tripura 7 4 20,055 20, 035111. 14.3 North Tripura 13 17 73, 817 78,817125. 17.4 Top Head line Development 17.Rural De-t elopment
Sc Co-Op oc C©-Op.132. 17.9 1988-89 5 9 31,1 31.17134. 17.11 1987-88 4 3 Blank 1.00
Contd..P/2.

1 ” " T---------1- 1 4 J _ 5 J ____ 77 3 Blank 1.395 16 440 40016 22 71 (-)714 6 40188 461883 6 27820 278269 6 33 6310 6 63 336 6 2304 223046 7 2284 228487 4 622 722
12 8 Blank 80.545 6 3138.58 3130.587 2 828U1 ( + ) 828.11(-)7 3 2153.17(-) 2153.17 (-!-)7 4 2881.93 (•;') 2881.93(-)7 21 424.34 524.341 16 59,87 59.08
12 17 7-'.-54 7.4411 22 5.1'-S 5.6312 23 5.65 5.6812 35 95.15 95.571 41 8.52 0.5212 2 620.80 620.89
195.195.195.195.200.203.203.204.204.205.206. 216.220 ,
27.32 7 . 3
27.327.327.028.1 2 8 ^ 1 28.1 28.1 28.1 28.129.330.3
1999-31 1988-89 Sl.Nosil Si.N o . 4 fl.No.25 1991West Tripura SI.N o . 6 S l . N - ^ . e 1988ant in aids the Centre.
C.|T'tal Capital Re .ipts,E.Overall surplus or deficit (C-D)
1988-89 1982
l ^ r i p u r a N o r t h y P r i p u r a V J e s t
T r i p u r a N e r t h N o r t h
• ■ ':982 B . ' C i a l S e r v i c e s
^ X i i .A n 8c a l l i e d
1 .ctivities 1 2 4 2223. 31.2 L &-.©erai 3 10 14019 140194223. 31.2 M ^tipura N®rth 5 9 227903 , 287903225. 31.4 S-F nura 4 6 36712 36721225. 31.4 N-r a Tripura 5 4 38.78 33.78225. 31.4 DharmaNagar 7 7 53.25 43.25225„ 31.4 Kar.ialpur 3 3 13, 225 15, 225225. 31.4 Antarpur 11 2 628 62885225. 31,4 Esbroom 13 7 50.11 50,18225. 31.4 TCipura (Total) 14 10 10.59 10.69233 3:1.9 He;ad of Expenditure 21 1 Total(4/5) Total (4+5)233. 3 1.9 Gtfand Total 22 10 661.01 661.91