STATISTICAL HAND BOOK - National Institute of Educational ...
444
BIHAR STATISTICAL HAND BOOK m 1968 Direcotorate of Statistics and Ev^uation Government of Bihar
-
Upload
khangminh22 -
Category
Documents
-
view
0 -
download
0
Transcript of STATISTICAL HAND BOOK - National Institute of Educational ...
BIHAR
STATISTICAL HAND BOOKm
1968
Direcotorate of Statistics and Ev^uation
Government of Bihar

1 0 0s s
S I S '
D E S -
- L / /
W i 2 _
& J 9 6 % 1

P R E F A C E .
This is the eighteenth issue of the Bihar Statistical Hand Book relating to tiie year, 1968. It contains basic data on various aspects of the State’s economy and other allied matters.
2. Graphs and charts on important topics have been inserted to make the data self-explanatory.
3. The Directorate acknowledgos with thanks the co-operation and assistance received from the various departments of the State and Central Governments and other institutions.
4. Any suggestion for further improvement will be thankfully received.
K. B. SHARMu\., Director.

U e ^

INDEX
SECTION
T a b l e ? o . P ag e s .
1. A r e a an d PopuLAtioN.
1.1 Statement showing the variation of population in Bihar during 3the last sixty years.
1.2 Statement showing the area, number of towns and villages, 3population and occupied houses in towns and villages ir Bihar.
1.5 Statement showing districtwise number of subdivigions, anchals, 4police-stations and towns in Bihar.
1.4 Statement showing the number of towns classified according to 5population of 1961 and 1951 and increase or decrease in their number.
1.5 Statement showing the distiictwise number of towns in Bihar Sclassified according to population of 1961 Census.
1.6 Statement showing districtwise area, populatior, density, literacy 6-7sex ratio, etc., in Bihar according to 1961 Census.
1.7 Statement showing the-total population classified into various 8— 11livelihood classes in each district of Bihar according to 1961 Census.
1.8 Statement showing the rural population classified into various 12— 15livelihood classes in each district of Bihar according to 1961 Census.
1.9 Statement showing the urban population classified into various 16— 19livelihood classes in each district of Bihar according to 1961Census.
1.10 Statement showing the number of persons, sex ratio, etc., at 20 district hoadquarters of Bihar according to 1961 Census.
1.11 Statement showing the population of Scheduled Castes and 21 Scheculev Tribes in Bihar according to 1961 Census.
2. Cl im a t e a n d R a in f a l l .
2.1 Statement showing the. annual temperature and humidity as 24— 29 recorded in different stations of Bihar.
2.2 Statement showing the annuil rainfall in eachdistiict of Bihar. 30
2.3 Statement showing monthly and monssoonwise averagf rainfall 31in m.m. in each district of Bihar during 1968.

%%
T able NO. Paoei.
2.4 Statement showing monthly normal rainfall in each district of 32Bihar.
2.5 St9itement showing seasonwiso rainfall in Bihar . . . . 33
3. Agricultueb and Irrigation.
3.1 Statement showing classification of area of Bihar . . . . 3 -37
3.2 Statement showing districtwise classification of area of Bihar for 3 j-39the year 1967-68.
3.3 Statement showing sown area and percentage under different 40seasons in Bihar.
3.4 Statement showing the net area irrigated by different sources in 40Bihar.
3.5 Statement showing the net area irrigated by different sources in 41each district of Bihar during 1967-68.
3.5-A Statement showing the area irrigated by different sources in 42each district of Bihar during the year 1965-66.
3.6 Statement showing the areas (in thousand acres) under principal 43crops b]r complete enumeratior survey in Bihar.
3.7 Statement showing the districtwise area (in thousand acres) 43under principal crops by complete enumeration survey in Bihar during the year 1967-68,
3.8 Statement showing the outturn of principal crops by C.C.E. & 44E.E. in thousand of tons in Bihar.
/3.9 Statement showing the outturn (in thousand of tons) of principal 45
crops (by crop-cutting experiments and eye-estimation) in Bihar during 1967-68.
3.10 Statement showing average yield (in maunds per acre) of principal 46crops in Bihar (by crop-cutting experiments).
3.11 Statement showing the mileage of canals, total cajitai outlay, 47-48net revenue, net profit or loss and the araa irrigated by different canal systems owned by Government in Bihar.
3.12 Statement showing the details of operation of navigation works 49in Bihar.
3.13 Statement showing the percentage distribution of agriculture 49 labour household* with or without land according to All-India Agricultural Labour Enquiry, 1956-57.
3.14 Statement showing the percentage distribution of owned holdings 50in Bihar based on All-India Agricultural Labour Enquiry,1956-57.
I ll
3.ir> Statement showiKg tb area of waste land reclaimed in Bihar . . 50
3.16 Statement showing districtwise area of waste land reclaimed 51durirg 1967-68 in Bihar.
4. L ivesto ck St a tist ic s .
4;1 Statement showing the number of agricultural implements and 54machinery in Bihar during _1966.
4.2 Statement showing the bulls and cows (over three years) and 55-56young stock (betweer one and three year^ and under ore year) according to livestock censuses of Bihar.
4.2-A Statement showing livestock and poultry in Bihar according to 571966 CeriSus.
4.3 Statement showing districtwise livestock ard poultry in Bihar 58according to 1966 Census.
4.3-A Statement showing livestock ard poultry in Bihar according to 591966 Census.
4.4 Statement showing variation in main classes of livestock in Bihar 60according to livestock cenauaes.
4.5 Statement showing principal livestock products of Bihar according 60to livestock censuses.
4.6 Statement showing total number of different kinds of livestock 61present for sale in fairs in Bihar,
4.7 Statement showing the number of Veterinary hospitals and dis- 61pensaries and Veterinaiy doctors in Bihar.
4.8 Statement showing districtwise the number of Veterinary hos- 62pitals and dispensaries and Veterinary doctors in Bihar during the year 1966-67.
4.9 Statement showing number of livestock slaughtered in recognised 63slaughter-houses in Bihar.
4.10 Statement showing principal milk products of Bihar according 63to livestock censuses.
4.11 Statement showing average annual milk yield per animal in 64Bihar.
4.12 Statement showing the incidence of epidemic diseases amosg 64cattle ir Bihar.
5. I'oBEST Statistics.
d.l Statement showing classification of forest area (in acies) in Bihar 66
C.2 Statement showing forest tracts protected from fixe in Bihar . . 67
I'ABLE NO. P a g e s .

5.3 Statement showing the outturn of timber, fuel, Sabai grass and 68bamboos from reserved and protected forests in Bihar.
5.4 Statement showing revenue from and expenditure on forests in 68Bihar.
5.5 Statement showing the area closed and open to grazing (reserved 69'and protected forest) in Bihar.
5.6 Statement showing the production of stick lac in Bihar . . 69»5.7 Statement showing the districtwise production of stick lac in 70
Bihar during 1967-68.5.8 Statement showing employment in forest and forest industries 70
in Bihar.5.9 Statement showing districtwise employment in forest and forest 71
industries in Bihar during 1964-65.
6. M in e b a l s .
6.1 Statement showing output of minerals in Bihar . . . . 74-75
6.2 Statement showing the daily average number of workers em- 76-77ployed in different classes of mires in Bihar.
6.3 Statement showing the average weekly earning in Jharia coal- 78fields in Bihar.
6.4 Statement showing the average daily earnings of workers 79 employed in mica, copper-oro and china-clay mines in Bihar.
6.5 Statement showing the daily average earnings of workers 80employed in iron-ore, stone and lim^-stone mines in Bihar.
6.6 Statement showing the value of output (in rupees) of minerals S2-o3raised in Bihar.
6.7 Statement showing the fatal and serious accidents in and about 84-85mines regulated by the Mines Act, 1952 during the year 1968.
7. V ital St a t ist ic s .
7.1 Statement showing number of births and deaths registered, 88infant mortality and birth and death rates per 1,000 ofpopula- tion in Bihar.
7.2 Statement showing districtwise number of births and deaths 89 registered, infant mortality and birth and death rates in Biharduring 1966.
7.3 Statement showing number of deaths due to different causes 89in Bihar.
7.4 Statement showing districtwise number of deaths due to 90different causes in Bihar during 1966.
8. M e d ic a l S t a t is t ic s .
8.1 Statement showing total number of hospitals and dispensaries, 92number of hospitals having bed and number of beds therein in Bihar.
8.2 Statement showing total number of hospitals and dispensaries, 9'3number of hospitals having beds and number of beds therein in each district of Bihar during 1968.
8.3 Statement showing number of hospitals and dispensaries in exist- 94ence under different classes in Bihar at the end of the year 1968.
IVT a b l e n o . P aq h s .
8.4 Statement showing the number of doctors (allopath) registered 95by qualification and sex in Bihar.
8.5 Statement showing the number of doctors (allopath) registered 95durirg each year by qualification and sex in Bihar.
8.6 Statement showing the statistics of registered nurses, midwives, 96ard lady health visitors and trained Dais in Bihar.
9. E d u c a tio n .
9.1 Statement showing the number of institutions and number of 98— 103scholars in institutions for men and women by types in Bihar.
9.2 Statement showing the expenditure on education (by sources) 104in Bihar.
9.3 Statement showing the examination results of various examina- 106— 113tions in Bihar.
9.4 Statement showing the number of schools for general education 114-115and number of scholars in Bihar.
9.5 Statement showing the total number of scholars, number of 116-117scholars married, cost per scholar and the number of scholars residing in approved hoatela in achoola for gonei’aleducation.
9.6 Statement showing the number of teachers in dijfferent types of 118schools for general education.
9.7 Statement showing the percentage of Indian children at school to 119the total estimated male and female population in each district of Bihar during 1965-66.
9.8 Statement showing the technical institutions and number of 120— 123students passed in Bihar.
9.9 Statement showing the education of Scheduled Castes, Scheduled 124-125Tribes and other Backward Classes in Bihar.
10. Co-operative Societies.
10.1 Statement showing progress in the organisation of Co-operative 128Societies in BUiar.
10.2 Statement showing number of members, paid-up share capital, 129etc., in Bihar State Co-operative Bank Ltd.
10.3 Statement showing number of Banks, members, etc.,_of Central 130-131Co-operative Bank in Bihar.
10.4 Statement showing number of members, paid-up share capital, 132working capital and loan advanced in Bihar State Land Mortgage Bank, Patna.
T a b l i iro. P a g e s .
T a b l e n o . P a o b s .
10.5 Statement showing number of societies, etc., of Primary Agricul- L33tural Credit Societies in Bihar.
10.6 Statement showing number of societies, number of members, paid 134up capital, number of godowns, etc., of primary marketing societies in Bihar.
10.7 Statement showing Co-operative Development and Cane Market- 136 ing Union in Bihar.
10.8 Statement showing progress of Canegrowers’ Co-operative Societies 136in Bihaj:.
10.9 Statement showing Co-operative Farming Societies, their paid-up 137capital and coverage of area in Bihar.
10.10 Statement showing progress of Weavers’ Co-operative Societies, 13 ^paid-up capital, working capital, production and sale in Bihar.
11. L o cal B o d ie s .
11.1 Statement showing the number of district boards, their income, 140expenditure, road mileage and number of dispensaries maintained by them in Bihar.
11.2 Statement showing the income, expenditure, road mileage and 1 4 1 — 143number of dispensaries maintained by each district board in Bihar during 1958—60, 1960-^1 and 1961-62.
11.3 Statement showing population, income and expenditure in muni- 144cipalities of Bihar.
12 . P o l i c e a n d C rim e.
12.1 Statement showing the sanctioned strength and cost of police 146and village watch in Bihar.
12.2 Statement siiowing the strength of police and village watchmen 147in Bihar during 1967 and 1968.
12.3 Statement showing true cases of cognizable crimes in Bihar . . 148
12.4 Statement showing the number of persons tried, convicted or 149acquitted under cognizable crimes in Bihar.
12.5 Statement showing true cases of non-cognizable crimes in Bihar 149
12.6 Statement showing the number of reported cases of crimes 150investigated by the pclice, the numoer of persons arrested and evading arrest a;nd re-convictions oi oldo£Fenders in Bihar.
12.7 Statement showing the cases of property stolen and recovered in 151Bihar. '
12.8 Statement showing the number of reported cases of cognizable 152crimes investigated by the Police in Bihar during the years1967 and 1968.
vi

TiBLSNO. PAGHS.
12.9 Statement showing the number of true cases of serious crimes in 153Bihar.
1??. A d m in istr atio n of Ciy il a n d eiiiuiNAL J u stic e .
13.1 Statement showing judicial division and the number of officers 156exercising appellate or original jurisdiction in Bihar.
13.2 Statement showing districtwise judicial divisions and thenumber 157-168of officers exercising appellate or original j'urisdiction in the State of Bihar during 1967 and 1968.
13.3 Statement showing the number of cases reported, persons tried, 160convicted and acquitte^d and number of witnesses examined in Sessions and Magisterial Courts in Bihar.
13.4 Statement showing the number of cases reported, persons tried, 160-161convicted and acquitted and number of witnesses examined in Sessions and Magisterial Courts in Bihar during 1967 and 1968.
13.5 Statement showing the number and value of suits instituted in 162courts of original jurisdiction and insolvency petitions presented ill the Courts in Bihar.
13.6 Statement showing the number and value of suits instituted and 163-164applications filed for execution of decrees and amount realised by decrees in Bihar during 1967 and 1968.
14. Ja il Statistics.
14.1 Statement showing daily average number of prisoners, their 166average earning and average cost of maintenance in Bihar.
14.2 Statement showing the length of senteiices of convicts by sex 168-169admitted into Jails and Sub-Jails in Bihar.
14.3 Statement sh ow in g the classification of convicts by age, sex and 170-171literacy in various Jails of Bihar.
14.4 Statement showing the condition of the convicts released from 172various Jails of Bihar.
15. Sta te F in a n c e .
15.1 Statement showing the revenue and receipt of the State Govern- 174nent under Civil Administration.
15.2 Statement showing State Finance expenditure under Civil Ad- 176ninistration in Bihaj.
15.3 Statement showing the revenue receipt of the State Govern- 176nent under Civil Administration.
16.4 Statement showing State expenditure under Civil Administration 177 9C6 Planicg—2
v%%

vm
T a b l f n o .
15.5 Statement showing capital expenditure outside the revenue 178account relating to Bihar.
15.6 Statement showing sale and discharge under Small Savings 180-181Scheme in Bihar.
16. I ncom e-Ta x R evenue Sta t ist ic s .
16.1 Statement showing analysis of demand of income-tax and 184— 189super-tax in Bihar.
16.2 Statement showing trade, classification of business of professional 190— 194 income assessed to income-tax and super-tax in Bihar.
16.3 Statement showing classification of the income-tax demand by 195— 201grades of total income in Bihar.
16.4 Statement showing the classification of the income-tax demand 202— 205according to the class of assessee in Bihar.
t16.5 Statement showing analysis of net demand of income-tax and 206-207
super-tax in Bihar.
16.6 Statement showing analysis of net demand of income-tax and 208-209super-tax in Bihar.
17. L and BBvlistfE.
17.1 Statement showing demand and collection of land revenue in 212Bihar.
17.2 Statement showing districtwise demand and collection of rent, 213cess, miscellaneous, etc., for the year 1965-66.
17.3 Statement showing demand and collection of land revenue(rent) 214only in Bihar.
17.4 Statement showing districtwise demand and collection of rent 215only in Bihar for the year 1965-66.
17.5 Statement showing Cess on land rent in Bihar ... 21®
17.6 Statement showing districtwise demand and collection of cess in 217Bihar during the year 1965-66.
17.7 Statement showing total advances (whichinclude advance made 218during the year together with the amount outstanding from previous years) under the Land Improvement Loans Act, 1883 in Bihar.
17.8 Statement showing districtwise amount of loans outstanding iai 219Bihar during 1966-67.
17.9 Statement showing the amount of loans advanced under the 220Land Improvement Loans Act, 1883 and Agriculturists’ loans Act, 1884 during each year in Bihar.
P a g e s .

ix
Table no. Pages.
17.10 Statement showing the amount advanced in each district of Bihar under the Land Improvement Loans Act, 1883 and Agriculturists’ Loans Act, 1884 during the year 1966-67.
221
17.11 Statement showing the amount of receipt from sale of stamps judicial and non-judicial (in Bihar).
222
17.12 Statement showing the amount of receipts from sale of stamps, (judicial and non-judicial) in each district of Bihar during the year 1966-67.
18. Other State Taxes.
223
18.1 Statement showing the collection ot agricultural income-tax in Bihar.
226
18.2 Statement showing the circlewise collection of agricultural income tax in Bihar during 1968-69.
227
18.3 Statement showing the number of registered dealers and sales tax collected in Bihar.
228
18.4 Statement showing circlewise collection of sales tax in Bihar during 1968-69.
229
18.6 Statement showing the number of assessees and collection of entertainment tax in Bihar.
230
18.6 Statement showing circlewise collection of entertainment tax in Bihar during 1968-69.
231
18.7 Statement showing collection of motor spirit tax in Bihar 232
18.8 Statement showing circlewise collection of motor spirit tax in Bihar during 1968-69.
233
18.9 Statement showing the collection of transport tax in Bihar 234
18.10 Statement showing the circlewise collection of transport tax'in Bihar during 1968-69.
236
18.11 Statement showing the collection under Electricity Act of 1948 in Bihar.
236
18.12 Statement showing circlewise collection under Electricity Act of 1948 i.i Bihar durirg 1968-69.
237
18.13 Statement showing the amount of sugarcane cess realised from sugar factories in Bihar.
238
18.14 Statement showing the actual receipts from Chaukidari tax inBihar.
18.15 Statement showing the districtwise amount of receipts fromChaukidari tax in Bihar during J 968-69.
96 Planinig— 3
238
239

19. E xc ise .
Ib.l Statement showing the total net excise revenue in Bihar . . 242
11).2 Statement showing districtwise net excise revenue in Bihar during 243the year 1968-69.
19.3 Statement showing the consumption of country-spirit, opium, 24-4ganja and hha',ng per hundred of population in Bihar.
19.4 Statement sho’vwing the consumption of country-spirit, opium, 24-4ganja and hhamg in Bihar.
19.5 Statement sho^wing the districtwise consumption of country- 24 6spirit, opium, ganga and bhang in the year 1968-69 in Bihar.
19.6 Statement showing the Central excise revenue realised (Commo- 246-24,7ditywise).
2J0. R egistration Statistics .
20.1 Statement sho^wing the number of registration offices, total 25<0gross receipts income and expenditure, etc., from registration in Bihar.
20.2 Statetment slxowing tho total regiatratlon (compulsory and 25.1optional) affecjting immovable property ic Bihar.
20.3 Statement showing districtwise total (compulsory and optional) 252registration aJffecting immovable property in Bihar during 1967.
20.4 Statement showing total registration (compulsory and optional) 263affecting movjable property in Bihar.
20.5 Statement showing districtwise total (compulsory and optioral) 254registration akffecting movable property in Bihar during 1967.
20.6 Statement sho)wing number of registration and fees affecting 265wills, etc., in !Bihar.
20.7 Statement showing districtwise number of registration and fees 26*6affecting wills., etc., in Bihar during 1967.
20.8 Statement sho wing details in respect of holdings having 267 occupancy rig^hts transferred by registered deed of sale in Bihar.
20.9 Statement sho>wing the number in respect of raiyaii holdings 268having occupancy rights transferred by registered deed of sale in each distriojt of Bihar for the year 1967.
80.10 Statement showiag the number of licenses registered for fche 26'9first time duriing the year, number of licenses issued at the end of the year ajnd amount of loans advanced (with or without security) under the Bihar Money-lender’s Act in Bihar.
T a b l b n o . P a g e s .

21. T ransport Sta t ist ic s .
21.1 Statennent showing length of P.W.D. roads ditstrictwise in 262Bih»r Tip to 31st March, 1968.
21.2 Statennent showing the mileage of extra municipal roads main- 263 taineid by public authority ir Bihar.
21.3 Statennent showing progress of expenditure on roads under 264implementations of plans in Bihar.
21.4 Statennent showing number of motor vehicles andl number of 264persons holding driving licenses in Bihar.
21.5 Statement showing districtwise number of motor vehicles and 265persoms holding driving licenses in Bihar durine 19'68-69.
21.6 Statement showing the classification of Taxed Moto>r Vehicles on 266road in Bihar.
21.7 Statement showing number of different kinds of Tjaxed Motor 267Vehicles in Bihp r during 1968-69.
21.8 Statement showing fresh registration of Motor Vehicclos brought 268on road and cancellation of old vehicles taken off the road in Bihar during 1968-69.
21.9 Statement showing revenue from different types of vehicles by 268way of Motor Vehicles Tax in Bihar.
21.10 Statement showing revenue from State Motor Fees . . 269
21.11 Statement showing number of road accidents in Bilhar . , 270
21.12 Statement showing number of Motor Vehicles a«ccidents in 271each district of Bihar during the year 1968.
22. Sta tistic s r e l a t in g to P osts a n d TELEORiAPHs.
22.1 Number of post offices and letter boxes (includimgtelegraph 274-275post offices) in relation to area and population a nd number of postal articles (excluding money orders) in relation to population ir Bihar.
22.2 Classified numerical statement of permanent posffc offices and 276-277telegraph offices in Bihar.
22.3 Statement showing number and amount of naoney orders 278(inland and foreign) issued and paid in Bihar.
22.4 Statement showing the business of Post Office Sa vings Banks 280-281in Bihar.
22.5 Statement showing the business of Post Office Deftence Savings 282-283Banks in Bihar.
T a b l e n o . P a g e s .

Xlt
22.6 Statement showing the Post Office National Savings Certificate 284issued and diischarged in Bihar.
22.7 Statement showing number of broadcast receiver licenses in force 2;85in Bihar.
22.8 Statement showing the strength of the non-gazetted staff 2<85employed in the Post and Telegraph Department in Bihar.
23. I nlaind T e a d e (Rail an d R iv e e -b o k h e ).
23.1 Statement shiowing the inland (river and rail-borne) trade [of 288— 2'91Bihar (Expoirts).
23.2 Statement shiowing the inland (river and rail-borne) trade of 292— 2i95Bihar (Impoirts).
24. J o in t Stock Com panies an d B a n k s .
. 24.1 Statement showing number of companies and paid-up capital 2 98of Joint Sto(ck Companies in Bihar,
24.2 Statement sluowing number and paid-up capital of public and 2:99private companies at work in Bihar during 1968-69.
24.3 Statoment sihowing tlie debits to deposit accounts in tho 3iQ0scheduled banks ir Bihar.
24.4 Statement sihowing the distribution of offices, deposits and 301advances of scheduled banks in Bihar.
24.5 Statement sihowing the distribution of banking offices of 302scheduled aind non-scheduled and co-operative bariks by population iin Bihar.
24.6 Statement showing the number of cheq ues issued and amount 303cleared thro)ugh clearing houses at Patna, Gaya, Muzaffarpur and Ranchi..
2. ’ . T u e l and P o w er.
25.1 Statement showing the number and classification of consumers of 306electric eneirgy in Bihar.
25.2 Statement showing the classification of connected load (electric 307energy) in Bihar.
25.3 Statement showing the total installed plant capacity and 308 electricity gjenerated by ownerships and purchased in Bihar.
25.4 Statement sihowing the disposal of energy generated and pur- 309chased in Bihar.
25.5 Statement sihowing the segregation of ultimate sale of electrical 310energy in Bihar.
T a b l e k o . P a g e s .
26. F ac t o b ib s a n d L a b o u r .
Statement showing the number of shops, commercial establish- 312ments, theatres and restaurants, etc., and the number of persors employed in Bihar.
26.2 Statement showing number of factories registered, worked 313during the year and submitted returns and volume of employment in Bihar.
26.3 Statement showing district wise details of the working factories 314in Bihar during 1967.
26.4 Statement showing distribution of factories according to 316working strength in Bihar during 1967.
26.5 Statement showing number of workers employed in varying 316size of factories according to working strength in Bihar during1967.
26.6 Statement showing number of accidents reported in the factories 317of Bihar.
26.7 Statoment showing the number of cases of injuries in which 317componsation was paid and the amount of compenaatiou paid in Bihar.
26.8 Statomon+ showing the total number offem tle workers em- 318ployed, number of claims, number of miscarriages and the amount of maternity benefits paid to female workers under the Bihar Maternity Benefit Act, 1947 in Bihar.
26.9 Statement showing the number of factories and femalf workers 319employed therein under the Bihar Maternity Benefit Act,1947 in Bihar.
26.10 Statement showing the number of factories and the female 320workors employed therein dis^rictwise under the Bihar Maternity Benefit Act, 1947 during 1968.
26.11 Statoment showing number of factories subject to operation of 321the Payment of Wages Act, number of factories actually worked, number of persons employed daily and total wages paid in Bihpar.
26.12 Statoment showing the number of employment exchanges, 322number of applicants registered and number of applicants plp,ced in employment through Employment Exchanges in Bihar.
26.13 Statoment showing number of trade unions, membershij and 323firancial conditions of trade unions in Bihar.
26.14 Statoment showing stoppages, workers involved and man-days 324lost in industries in Bihar.
x%n
T a b l e n o . P a g e s .

26.15 Statement sbow’ng stoppages, workers involved and man-days 325lost in dififerert industries in Bihar during 1968.
26.16 Statement showimg number of training centres and of persons 325undergoing train ing therein (organised by Ministry of Ressettie- ment and Employment, Government of India) in Bihar.
27. Ce n s u s of MAKUFACTunmQ I n d u s t e ib s .
27.1 Statement showing census of manufacturing industries in Bihar 328-329
27.2 Statement showimg industrywise the number of factories, fixed 330-331capital, working capital, workers employed, average number of working days amd the vtlue of production according to the census of manufacturers in Biht r during 1953.
27.3 Statement showimg industrywise the number of factories, fixed 332-333capital, working capital, workers employed, average number of working days and the value of production according to the census of manufacturers in Bihar during 1954.
27.4 Statement showiJig industrywise the number of factories, fixed 334-335capital, working capital, workers employed, average number of working days aind the value of production according to the census of manufacturers in Bihar during 1955.
27.5 Statement showing industrywise the number of factories, fixed 336-33capital, working capital, workers employed, average number of working days ai.nd the value of production according to the census of manufacturers in Bihar during 1956.
27.6 Statement showing irdustrywise the number of factories, fixed 338-339capital, working capital, workers employed, average number of working days and the value of production according to the census of manu facturers in Bihar during 1957.
27.7 Statement showing industrywise the number of factories, fixed 340-341capital, working capital, workers employed, average number of working days and the value of production according to the census of manufacturers in Bihar during 1958.
27.8 Statement showing industry, groupwise number of factories re- 342— 345 gistered, factories reporting productive capital, number ofpersons employed, gross out-put, ex-factory value, value added by manufacturer during the years 1963 to 1966.
27.9 Statement showing statistics of the production of selected 346-S47industries in Bihar.
28. I n d e x N u m b e r .
28.1 Statement showing working class consumer price index number 350for different centres in Bihar.
28.2 Statement showing working class consumer price index number 350for different c-entres in Bihar during each month of the year1968.
X IV
T a b l e tso . P a g e s .

T a b l e n c . Pa o is
28.3 Statement showing consumer price index number of working 351classes for different centres in Bihar.
28.4 Statement showing consumer price index number of working 351classes for different centres in Bihar during the year 1968.
28.5 Statement showing the index number of wholesale prices of 352-353agricultural commodities in Bihar during the year 1968.
28.6 Statement showing wholesale price of essential commodities 354during the year 1968.
29. Cen su s of G o ver n m e n t E m p o l y e e s .
29.1 Statement showing the distribution of Government employees 350— 365according to basic pay-scale, gazetted (married and unmarried), non-gazetted and percentage of group totals to total employees in Bihar.
29.2 Statement showing the distribution of the Bihar Government 366-367employees by pay ranges and departments.
30. JFi e e .
30.1 Statement showing the number of outbreaks of fire, amount of 370 property destroyed and saved and deaths and injuries topersons and animals in Bihar.
30.2 Statement showing the number of outbreaks of fire, value of 370-371 property destroyed and saved and deaths and injuries topersons and animals in Bihar during the years 1967 and 1968.
31. Statistics of D isp l a c e d Pe e s o n s .
31.1 Statement showing districtwise the number of displaced persons 374in re-organised Bihar.
31.2 Statement showing the population of displaced persons by year 176— 378of arrival according to Census of Bihar, 1951.
31.3 Statement showing the population of displaced persons from 379-380West and East Pakistan to Bihar by district of their origin.
31.4 Statement showing the displaced persons classified into liveli- 382-383hood classes according to Census of Bihar, 1951.
32. P l a n S t a t is t ic s .
32 1 Statement showing the development blocks opened in each 386district of Bihar.
32.2 Statement showing the anchal-cww-development blocKsandthe 387village, area and population covered in each district of Bihar.
32.3 Statement showing the plan provision andyearwise expenditure 388of the First Five-Year Plan.
32.4 Statement showing expenditure under the major heads of 388development during the Second Five-Year Plan.
32.5 Statement showing the expenditure under sub-heads of develop- 389-390ment during the Second Five-Year Plan,
32.6 Statement showing the expenditure under major heads of de- 391velopment during the Tlird Five-Year Plan.
32.7 Statement showing the progress of Plan expenditure under 391major heads of development for the year 1962-63.
XV

XVl
T a b l e n o . P a o b s .
32.8 Statement showing tthe progress of Plan expenditure for the 392— 394period ending 31st March, 1963.
32.9 Statement showing tlhe progress of Plan expenditure under major 395heads of developmemt for the year 1963-64.
32.10 Statement showing t-he progress of Plan expenditure during the 396—398year 1963-64.
33. M isc ell an eo u s St a t ist ic s .
33.1 Statement showing fche number of presses at work, number of 400newspapers, periodicals and books, published in Bihar.
33 2 Statement showing t-he number of presses at work and number 401of newspapers and periodicals published in Bitar during the years 1962-63, 1963-64 and 1964-65.
33.3 Statement showing tbhe procurement, consumption and imports 402-403 of rationed commod.-ities in Bihar.
33.4 Statement showing tihe number of cinema houses in each district 404of Bihar during 196:8.
33.5 Statement showing tbhe number of vacancies, number ofcandi- 405 dates interviewed a-nd recommended under different categoriesby Bihar Public Seirvice Commiasioii.
33.6 Statement showing the number of sugar factories worked, 406 acreage under sugfsrcare, cane requirement, total sugarcanecrushed, quantity o f sugar manufactured, recovery of sugar and price of cane im Bihar.
33.7 Statement showing mumber of Gram Panchayats and Gram 407-408Katcharies in Bihafcr (Districtwise) during the years 1962-63 to 1967-68.
33.8 Statement showing ‘ er capita income in Bihar at current and 409constant prices.
33.9 Statement showing State Income of Bihar at current prices by 410industrial origin.
33.10 Statement showing »^tate Income of Bihar at constant prices 411by industrial origin .

NORMAL CLASSIFICATION O F LAND AREAIN
BIHAR
1. FO R EST.2 . L A N D P U T T O N O N - A G R I C O L
T U R A L USES.3. BARREN & UNCULTURABL
L AND .4. PERM ANE N T PASTURE
<1 O T H E R GRAZING LAND.
5. C U L T U R A B L E W A S T E S .
6- O T H E R F A L L O W L A N P,
7. C U R R E N T F A L L O W S ,
e. NET AREA SOWN
K. AH MED
SECTION I kiea and Population

TABLE 1.1.
STATEMENT SHOWING THE VARIATION OF POPULATION IN BIH A R DURING THE LAST SIX T Y YEARS.
Census year.
Population.
Males. Females. TotaJ.
Percentage of increase/
decrease.
1 2 3 4 5
1901 13,838,588 14,554,869 28,393,457
1911 .. 14,451,645 15,045,947 29,497,592 + 3.89
1921 .. 14,483,143 14,694,153 29,177,296 -1 .09
1931 .. 16,335,687 16,220,552 32,556,239 + 11.58
1941 .. 18,313,911 18,214.208 36,528,119 +12.20
1951 .. 19,490,560 19,293,218 38,783,778 + 6.18
1961 .. •• 23,301,449 23,154.161 46,455,610 + 19.78
* Reorganised Bihar.
SotTRCE —(i) Census of India (Paper I o f 1957).
{ii) CeaSMS of Iftdia (Paper I of 1%2).
TABLE 1.2.
STATEMENT SHOWING THE AREA, NUMBER OF TOWNS AND VILLAGES AND THE POPULATION AND OCCUPIED HOUSES IN TOWNS AND VILLAGES IN BIHAR.
Description.
1961 Census. 1951 Census.
• Towns. Villages. Total. Towns. Villages. Total.
1 2 3 4 5 6 7•
Area (in square miles) 789(a) 66,147(a) 67,196(6) 437 66,676 67.113
Number of inhabited 153 67,665* 67,818 108 67,970 68,078
Number o f occupied houses 621,354 6,264,187 6,885,541 430,775 6,342,069 6,772,844
Population 3,913,920 42,541,690 46,455,610 2,626,261 36,157,517 38,783,778
*The total number o f villages according to 1961 Census has been reported to be 77,959 out of which 67,685 areinhabited and 10,294 uninhabit/ed.
(а) Represent the area furnished by the State Survey Department.(б) Represent the area furnished by the Surveyor-General of India.
SouBOE, —(t) Census o f India (Paper I of 1957). (w) Census of India (Paper I o f 1963).

STATEMENT SHOWINO DISTRICTWISE NUMBEB OF SUBDIVISIONS, ANCHAL-CrTM-BLOCKS, POUCESTATIONS AND TOWNS IN BIHAK.
TABLE 1.3.
PistrietB.Number* of Number of Number of Number o f
Subdivisions. Ancha s-cum- Police-stationsf Towns, t BiOcks**.
Patna . .
Gaya . .
Shahabad
Saran . .
Champaran
Muzaffarpur
Darbhanga
Monghyr
Bhagalpur
Saharsa
Purnea . .
Sanftia' PargaUR®
Hazaribagh
Ranchi . .
Dbaxibad
Palamau
Singhbhum
TOTAL
5
4
4
3
2
3
3
4
2
3
4
63
4
2
3
3
28
46
41
40
36
40
44
37
21 23
38
41
42
43
10
25
32
35
39
37
30
25
26
24
34
21
16
28
43
34
33
16
21
26
10
10
9
4
9
8
6
13
5
6
8
10
109
19
5
12
58 587 488 153
♦'Directorate o f Statistics and Evaluation, Bihar,
f ♦Development Commissioner, Bihar.
fl.-G . o f Po ice, Bihair.
JCensus o f India (Paper I o f 1962).

VARIATION OF POPULATION IN BIHAR
1901.
19 I I.
19 21.
19 31.
1941.
19 51.
19 6 f.
M A L E . . .a m
F E M A L E . ■fviiiil
O. 50. lOO. 150. 2 0 0 .LAK HS OP PERSONS _______________ ^
K. AMMED

STATEMENT SHOWING NUMBER OF TOWNS CLASSIFIED ACCORDING TO POPULATION OF 1961 AND 1951 AND PERCENTAGE OF INCREASE OR DECBEASE IN THEIR NUMBER IN BIHAR.
5
TABLE 1.4.
Class.
1961. 1951.Increase or Increase or
------------------------- — ------------------------------- decrease in decrease innumber o f population
Number of Total Number o f Total towns. of class, towns, population. towns, population.
Remarks.
1 2 3 4 5 6 7 8
Class I(«) .. •• •• .. Cities with one million and above population.
Class 1(6) .. Cities with 500,000 to 999,999 population.
Class 1(c) .. 7 1,297,545 5 856,720 + 2 + 440,825 Cities with 100,000 to 499,999 population.
Class n .. 7 494,430 6 424,396 + 1 + 70,034 Towns with 50,000 to 99,999 population.
Class III .. 32 989,786 19 563,997 + 13 + 425,789 Towns with 20,000 to 49,999 population.
Class IV .. 53 743,276 37 515,575 + 16 + 227,701 Towns with 10,000 to 19,999 population.
Class V .. 46 358,847 30 223,170 + 16 + 135,677 Towns with 5,000 to 9,999 population.
Class VI .. 8 30,036 11 42,403 - 3 — 12,367 Towns with 4,999 and less population.
TOTAL 153 3,913,920 108 2,626,261 + 45 + 1,287,659
. . —Nil. SOURCE.--Census o f India 1961 (Paper I o f 1962 .)
TABLE 1.5.
STATEMENT SHOWING THE :DISTRICTWISE NUMBER OF TOWNS IN BIHAR CLASSIFIED ACCORDING TO POPULATION OF 1961 CENSUS.
Districts. Class 1(c). Class n . Class in . Class IV. Class V. Class VI. Total.
1 2 3 4 6 6 7 8
Patna 1 1 2 4 1 1 10Gaya 1 1 6 3 10Shahabad 1 3 2 3 9Saran . , 1 1 3 1 6Champ aran 2 4 2 1 9Muzafifarpur 1 1 3 1 6Darbhanga 1 2 2 1 6Mongbyr 2 5 6 1 13Bhagalpur 1 2 2 5Saharsa 3 3 6Pumoa 1 2 3 2 8Santhal Parganas 2 3 4 1 10Hazaribagb 5 2 3 10Ranchi 1 4 3 1 9Dhanbad 1 2 6 9 1 19Palamau 1 1 2 1 5Singhbhum 1 3 I 6 1 12
BIHAR 7 7 32 53 46 8 153
. . —Nil.SouBoB.—Census o f India 1961 (Paper I o f 1962).

TABLE
STATEMENT SHOWING DISTRICTWISE POPULATION, ARlEA,
6
District.
Population.
Area in --------------- -—square miles.
Persons. Males. Females.
Number o f Female per persons per 1,000 miales. square mile.
Patna
Gaya
Shahabad
Saran
Champaran
Muzaffarpur
Darbhanga
Monghj^ Bhagalpur
Saharsa
Purnea
Santhal Parganaa
Palamau
Hazaribagh
Ranchi
Dhanbad
Singhbhum
2,164
4,766
4,408
2,669
3,553
3,018
3,345
3,975
2,183
2,093
4,259
5,470
4,925
7,016
7,047
1,114
5,191
2,949.746
3,647,892
3,218,017
3,584,918
3,006,241
4,118,398
4,413,027
3,387,082
1,711,136
1,723,566
3,089,128
2,675,203
1,187,789
2,396,411
2,138,565
1,158,610
2,049,911
1,522,687
1,814,674
1,616,732
1,677,779
1,519,803
2,011,539
2,142,880
1,701,709
877,029
886,440
1,607,276
1,351,149
598,600
1,203,503
1,076,251
^646,597
1,045,801
1,427,059
1,833,218
1,601,285
1,907,139
1,486,408
2,106,859
2,270,147
1,684,373
834,107
837,126
1,481,852
1,324,054
589,189
1,192,908
1,062,314
512,013
1,004,110
1,363
765
730
1,343
846
1,365
1,319
862
784
823
725
489
241
342
303
1,040
395
937
1,010
990
1,137
978
1,047
1,059
989
951
944
922
980
984
991
987
792
960
BIHAR 67,196 46,455,610 23,301,449 23,154,161 691 994
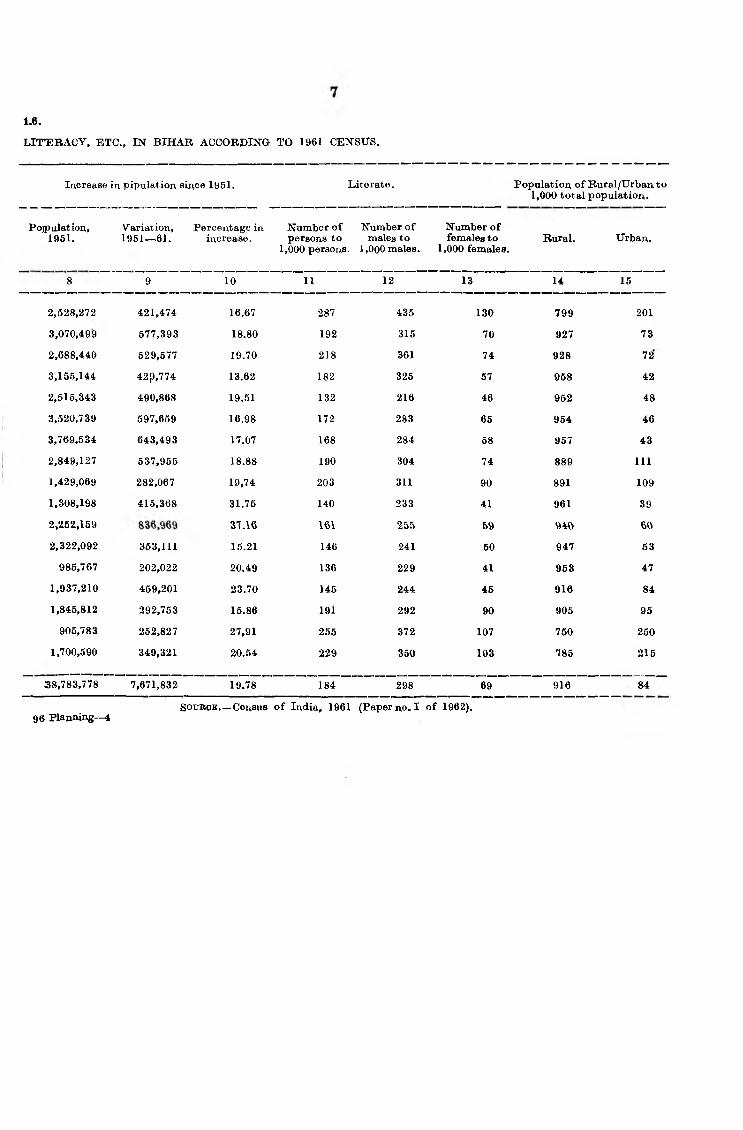
1.6.
LIT’ERACY, ETC., IN BIHAR ACCORDING TO 1961 CENSUS.
Increase in pipulation since 1951. Literate.
Pojpulation,1951.
8
Population o f Rural/Urban to 1,000 total population.
Variation, Percentage in Number o f Number o f Number o f 1951—.61. increase. persons to males to females to
1,000 persons. 1,000 males. 1,000 females.
9 10 11 12 13
Rural.
U
Urban.
15
2,528,272
3,070,499
2,688,440
3,155,144
2,515,343
3,520,739
3,769,534
2,849,127
1,429,069
1,308,198
2»252,159
2,322,092
985,767
1,937,210
1,845,812
905,783
1,700,590
421,474
577,393
529,577
42p,774
490,868
597,659
643,493
537,955
282,067
415,368
353,111
202,022
459,201
292,753
252,827
349,321
16.67
18.80
19.70
13.62
19.51
16.98
17.07
18.88
19.74
31.75
S'! .16
15.21
20.49
23.70
15.86
27,91
20.54
287
192
218
182
132
172
168
190
203
140
161
146
136
145
191
256
229
435
315
361
325
216
283
284
304
311
233
255
241
229
244
292
372
350
130
70
74
57
46
65
58
74
90
41
59 50
41
45
90
107
103
799
927
928
958
952
954
957
889
891
961
940
947
953
916
905
750
785
201
73
72
42
48
46
43
111
109
39
60 53
47
84
95
250
215
38,783,778 7,671,832 19.78 184 298 69 916 84
96 Planning—4SOTXBOB. —Census o f India, 1961 (Paper no. I o f 1962).

ITABLI
8
STATEMENT SHOWING THE TOTAL POPULATION CLASSIFIED ^INTG
Total Population. Literate and educated pearsons.
Districts. Area in square miles.
Persons. Males. Females. Males. Femiales.
Patna
Gaya
Shahabad
Saran..
Chainparan
Muzaffarpur
Darbhanga
Monghyr
Bhagalpur
Sahatsa Purnea
Santhal Pargana
Palamau
Hazaribagh
Ranchi
Dhanbad
Singhbhum
2,164
4,766
4 ,408
2,669
3,553
3,018
3,346
3,975
2,183
2,093
4,259
5,470
4,925
7,016
7,047
1,114
5,191
2,949,746
3,647,892
3,218,017
3,584,918
3,006,211
4,118,398
4,413,027
3,387,082
1,711,136
I,723,566
3,089,128
2,675,203
II,87,789
2,336,411
2,138,565
1,158,610
2,049,911
1,522,687
1,814,674
1,616,732
1,677,779
1,519,803
2,011,539
2,142,880
1,702,709
877,029
886,440
1,607,276
1,351,149
598,600
1,203,503
1,076,251
646,597
1,045,801
1,427,059
1,883,218
1,601,285
1,907,139
1,486,408
2,106,859
2,270,147
1,684,373
834,107
837126
1,481,852
l,324,u54
589,189
1,192,908
1,062,314
512,013
1,004,110
662.562
571,583
583,017
544,737
327,653
569,657
607,878
517,993
272,677
206,935
410,158
325,175
136,976
293,149
31MT*
240.563
366,281
185,020
127,646
317,748
109,342 I
68,077 I
137,399 I
131,583]
125,036 I
74,843'
34,475
87,987
66,032
24,251
53,658
95,271
54,7 IJ
103,791
BIHAR 67,196 46,455,610 23,301,449 23,154,161 6,950,967 1,596,87<

.7.
[VELIHOOD CLASSES IN
9
BIHAR ACCORDING TO 1961 CENSUS.
Total workers. As Cultivator. As Agricultural labourerIn Mining, Quarrying Live-
. stock. Forestry, Fishing, Hunting and Plantation,
Orchards and Allied activities.
Mailes. Females. Males. Females. Males. Femaleis. Males. Females.
8 9 10 11 12 13 14 15
7!98,599 310,306 346,122 104,848 156,729 139,634 11,433 2,960
976,216 618,782 528,049 245,290 220,128 214,236 18,622 3,385
862,103 332,214 449,676 129,010 154,669 126,330 24,504 5,U67
836,267 411,016 561,179 219,732 113,991 124,832 4,996 1,726
888,116 353,269 462,806 142,298 282,159 174,604 16,738 3,621
1,092,125 288,373 576,394 116,384 313,390 104,931 9,163 1,491
1,147,905 423,611 522;811 132,042 381,788 161,101 24,277 10,480
92:7,060 387,324 445,097 146,908 211,325 163,293 18,878 2,801
48.3,077 230,791 214,946 91,337 107,898 93,329 19,989 2,683
50*6,299 279,464 134,440 111 ,03% 1\2,0"2 27,998 5,859
944,460 276,018 473,966 90,793 227,102 132,570 41,976 2,268
06,075 597,191 651,652 481,787 66,427 57,969 39,659 12,159
342,047 225,298 202,588 133,965 66,859 71,32 5 17,283 2,864
687,225 473,023 418,995 366,347 52,302 67,768 76,457 14,378
639,871 565,048 464,396 482,735 32,408 35,098 18,971 7,347
401,338 164,030 118,325 109,309 12,114 12,683 143,585 23,781
616,647 443,398 309,568 308,689 57,912 72,463 27,983 7,812
12,955,409 6,279,156 6,926,057 3,435,914 2,674,239 1,844,236 541,511 110,672
Planning— 2So u r c e .— Census of India, 1961 (Paper no. I o f 1962).

TABLB
10
STATEMENT SHOWING THE TOTAL POPULATION CLASSIFIED INTO
Districts.
At household Industry.
In Manufacturing other than Household
Industry.
In CoDstraction. In Trade amd Commerce.
Males. Females. Males. Femedes. Males, Females. Males. Females.
16 17 18 19 20 21 22 23
Patna 36,996 23,659 38,146 3,048 11,847 1,434 47,648 6,952
Gaya 46,648 24,481 20,598 2,460 7,824 765 37,090 5,126
Shahabad .. 43,708 27,057 28,624 1,520 7,349 275 39,860 6,271
Saran 43,692 43,377 14,525 476 4,489 «3 26,764 5,146
Champarw.. 31,600 19,029 16,252 490 4,574 32 21,199 3,595
Muzaflarpur 56.926 41,572 12,276 286 6.816 25 31,072 6,445
Darbhanga 65,151 86,465 17,391 995 4,582 77 34,796 10,996
Monghyr 51,403 42,694 29,859 4,611 6,691 114 36,573 8,549
Bhagalpur 29,946 19,400 14,149 4,7Qft 3»48Q 161 20,530 3,025
Saharsa 17,862 12,860 5,486 1,086 2,771 30 15,529 2,634
Fumea 33,352 25,459 18,563 2,662 7,308 1,011 38,230 5,068
Santhal Parganas 41,373 26,786 10,535 1,304 2,400 69 22,171 3,020
Palamau 11,780 6,340 4,504 454 1,545 85 7,722 1,116
Hazaribagh 28,074 16,864 26,129 4,049 6,763 383 16,582 1,541
Ranohi 27,918 19,701 15,450 3,022 6449 1,141 13,920 2,092
Dhanbfibd .. 9,598 4,471 30,995 2,799 5,305 386 18,319 1,158
Singhbhom 26,931 14,727 81,314 6,532 11,151 2,958 20,482 2,728
BIHAR 602,958 454,942 385,396 40,500 99,333 9,009 448,487 74,462

i i
*1 —'ootuotd.LIVELJHOOD CLASSES IN BIHAR ACCORDING TO 1961 CENSUS.
In Tiransport, Storage and (Dommunications.
In other Services. Non-workers.
Population,1961.
Variation in population, 1951—61.
Mlales. Females. Males. Females. Males. Females.
24 25 26 27 28 29 30 31
28,691 264 120,987 27,507 724,088 1,116,759 2,62,272 421,474
16,442 70 80,815 22,969 838,458 1,314,436 3,d7,499 577,393
14,295 44 99,418 36,650 754,629 1,269,071 2,688,440 629,677
11,566 28 55,055 15,636 841,522 1,496,123 3,166,144 429,774
6,706 15 47,081 9,585 631,688 1,133,139 2,516,343 490,868
11,198 29 75,891 18,210 919,414 1,818,486 3,620,739 697,659
13,631 54 83,578 21,401 994,975 1,846,536 3,769,634 643,493
26,708 162 100,526 28,192 775,649 1,297,049 2,849,127 637,966
9,315 116 62,224 16,034 393,952 603,316 1,429,069 282,067
8,277 36 36,851 10,447 380,141 557,662 1,308,198 415,368
14 882 102 89,072 16,086 662,826 1,205,834 2,262,169 836,969
11,533 62 60,325 14,035 545,074 726,863 2,322,092 353,111
4,374 20 25,392 9,131 256,553 363,891 986,767 202,022
9,751 371 53,182 11,322 516,278 719,885 1,937,210 469,201
7,669 125 52,690 13,787 436,380 497,266 1,845,812 292,753
17,793 179 45,304 9,264 245,259 347,983 906,783 252,827
20,032 1,013 61,274 26,386 429,154 560,712 1,700,690 0 349.341
2:27,763 2,780 1,49,665 306,641 10,346,040 16,875,005 38,783,778 7,671,832
SoxmcB.—Census of India, 1961 (Paper no. I of 1962).

ITABLE
12
STATEMENT SHOWING THE RURAL POPULATION CLASSIFIED INTO
Total ropulation. Scheduled Castes. Scheduled Tribes.
Name of the districts.
Persons. Males. Females. Males. Females. Males. Feimales.
6 8
Patna
Gaya
Shahabad
Saran
Champaran
Muzaffarpur
Darbhanga
Monghyr
Bhagalpur
Saharsa
Purnea
Santhal Parganas
Palamau
Hazaribagh
Ranchi
Dhanbad
Singhbhum
BIHAR
2,355,850
3,382,794
2,986,316
3,435,002
2,860,566
3,929,573
4,222,472
3,011,883
1,524,417
1,656,139
2,903,531
2,532,251
1,131,625
2,195,227
1,936,087
868,697
1,609,260
1,195,162
1.672.194
1.491.194
1,597,657
1,440,285
1,905,263
2,040,084
1,505,592
775,110
848,831
1,499,629
1,272,824
567,913
1,092,678
964,804
470,527
800,545
1,160,688
1,710,600
1,495,122
1,837,345
1,420,281
2,024,310
2,182,388
1,506,291
749.307
807.308
1,403,902
1,259,427
563,712
1,102,549
971,283
398,170
808,715
210,654
429,199
243,778
158,643
212,108
281,891
298,964
243,675
91,499
144,240
181,444
93,908
150,071
133,895
44,278
88,645
21,086
208,554
436,114
250,311
200,860
215,322
312,076
329,399
254,760
91,391
144,179
177,637
94,902
150,555
143,687
43,984
73,637
19,308
228
228
11,036
19
1,460
1
6
23,108
32,620
3,927
59,132
508,161
112,553
134,133
627,091
61,905
454,042
194
229
10,7«6
40
1,295
23,115
31,614
3,653
58,476
509,220,i
113,6381
130,50^
646,67f|
67,40^
478,46^
42,541,690 21,140,292 21,401,398 3,027,978 3,146,676 2,029,650 2,065,171
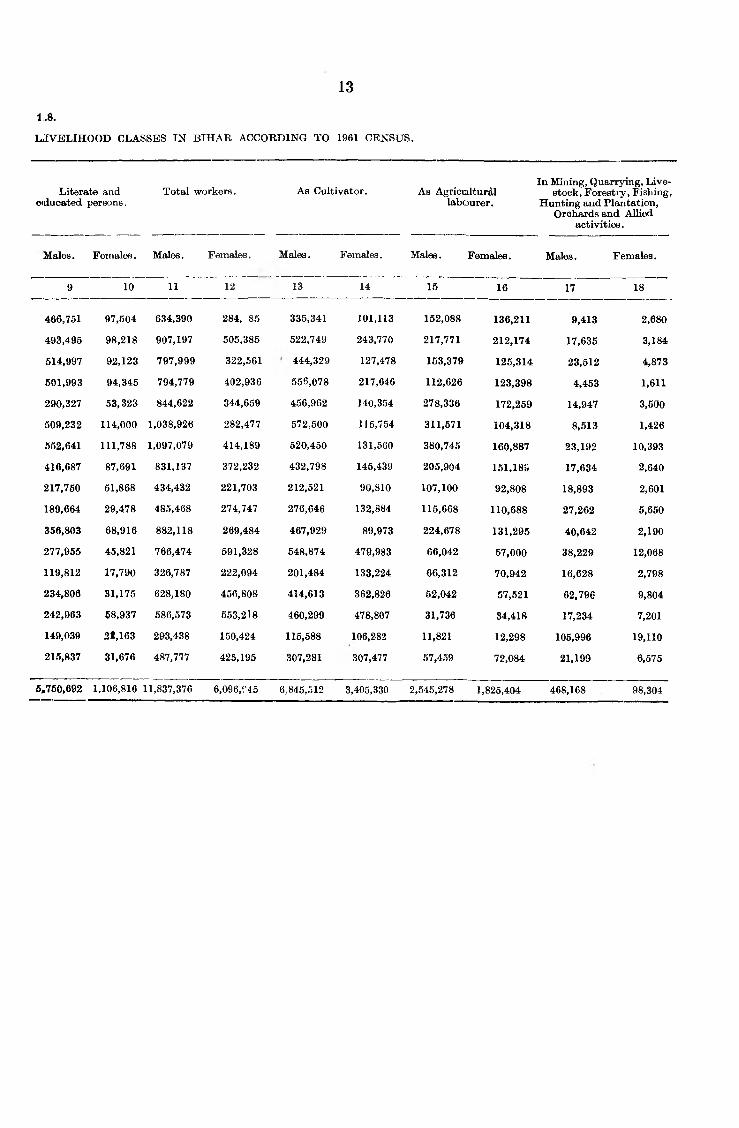
13
1 .8.LIVELIHOOD CLASSES IN BIHAR ACCORDING TO 1961 CENSUS.
Literate and eiducated persons.
Total workers. As Cultivator. As Agricmlturdl labourer.
In Mining, Quarrying, Livestock, Forestry, Fishing,
Hunting and Plantation, Orchards and Allied
activities.
Males. Females. Males. Females. Males. Females. Males. Females. Males. Females.
9 10 11 12 13 14 15 16 17 18
466,751
493,495
514,997
501,993
290,327
509,232
552,641
416,687
217,750
189,664
356,803
277,955
119,812
234,806
242,963
149,039
215,837
97,504
98,218
92,123
94,345
53,323
114,000
111,788
87,691
51,868
29,478
68,916
45,821
17,790
31,175
58,937
2t,163
31,676
634,390
907,197
797,999
794,779
844,622
1,038,926
1,097,079
831,137
434,432
485,468
882,118
766,474
326,787
628,180
586,573
293,438
487,777
284, 85
505,385
322,561
402,936
344,659
282,477
414,189
372,232
221,703
274,747
269,484
591,328
222,094
456,808
553,218
150,424
425,195
335,341
522,749
444,329
556,078
456,962
572,500
520,450
432,798
212,521
276,646
467,929
548,874
201,484
414,613
460,299
115,588
307,281
101,113
243,770
127,478
217,646
140,354
115,754
131,560
145,439
90,810
132,884
89,973
479,983
133,224
362,826
478,807
106,282
307,477
152,088
217,771
153,379
112,626
278,336
311,571
380,745
205,904
107,100
115,668
224,678
66.042
66,312
52.042
31,736
11,821
57,459
136,211
212,174
125,314
123,398
172,259
104,318
160,887
151,185
92,808
110,688
131,295
57,000
70,942
57,521
34,418
12,298
72,084
9,413
17,635
23,512
4,453
14,947
8,513
23,192
17,634
18,893
27,262
40,642
38,229
16,628
62,796
17,234
105,996
21,199
2,680
3,184
4,873
1,611
3,500
1,426
10,393
2,640
2,601
5,650
2,190
12,068
2,798
9,804
7,201
19,110
6,575
5^750,692 1,106,816 11,837,376 6,096,r45 6.-845,512 3,405,330 2,545,278 1,825,404 468,168 98,304

14
TABLE
STATEMENT SHOWING THE RURAL POPULATION CLASSIFIED INTO
f am© of the districts.
At Household Industry. In Manufacturing other than Household Industry,
In Construction,
Maies. Females. Males. Females. Males. FemaleB.
1 19 20 21 22 23 24
Patna 2S,037 19,814 14,805 1,921 6,623 1,082
Gaya 41,171 21,402 9,880 1,776 5,142 673
Shahabad 3:8,738 24,930 16,087 985 5,223 lo7
Saran 40,564 42,078 7,874 62 3,419 27
Champaran 218,667 17,873 8,776 187 3,61 29
Muzaffarpur 64,585 40,915 4,889 24 3,686 9
Darbhanga 60,606 82,972 9,448 418 3,143 28
Monghyr 43,331 38,923 11,679 3‘685 4,178 44
Bhagalpur 21,646 15,528 8,898 4,359 2,101 135
Saharsa 16,565 12,352 3,823 984 1,988 27
Pumea 29,693 24,118 8,915 2,275 5,689 951
anthal Parganas 319,230 26,057 5,243 1,051 1,400 47
Palamau 10,542 6,067 2,855 340 999 37
Hazaribagh 2.5,707 16,369 17,667 2,775 4,458 306
Ranchi 24,917 18,468 6,392 2,352 4,414 815
Dhanbad 6,917 4,052 12,242 1,710 2,525 203
Singhbhum 2.3,945 14,097 22,083 2,889 4,123 950
BIHAR 531,861 426,015 171,556 27,793 62,729 5,530

1.8.—conc Id.
LIVELIHOOD CLASSES IN BIHAR ACCORDING TO 1961 CENSUS.
15
In Trade and Commerce. In Transport, Storage andCommunications.
In o'^her «ervicies. Non-workers.
Males. Females. Males. Females. Meiles. Females. Males. Females.
26 26 27 28 29 30 31 32
22,439 4,856 10,232 26 58,412 16,782 560,772 876,203
24,961 4,172 8,664 23 59,234 18,211 764,997 1,205,215
29,349 5,366 8,787 3 78,595 33,445 693,195 1,172,56118,939 4,592 8,426 19 42,400 13,523 802,878 1,434,389
14,035 2,955 3,783 12 35,528 7,490 595,663 1,075,62220,666 4,781 6,305 16 56,211 15,234 866,337 1,741,83325,163 9,617 8,093 15 66,239 18,299 943,005 1,768,19923,442 6,938 16,161 10 76,010 23,364 674,455 1,134,05912,605 2,405 5,057 35 46,7 U 13,022 S40,6'I8 527,60412,666 2,508 1,969 33 29,481 9,621 363,363 532,56126,633 4,492 6,341 60 71,598 14,130 617,511 1,134,41815,625 2,649 5,746 2 46,085 11,871 506,350 668,0990,292 938 3,158 11 19,817 7,737 241,126 341,6189,644 1,177 5,734 311 35,619 8,719 464,498 642,7416,086 1,568 2,718 15 32,777 9,574 378,231 418,0658,164 806 7,691 112 22,494 5,901 177,089 247,7467,468 1,938 8,553 599 35,666 18,586 312,768 383,520
282,977 61,758 117,418 1,302 811,877 245,509 9,302,916 15,304,453

TABL.E
16
STATEMENT SHOWING THE URBAN POPULATION CLASSIFIED INT<0
Total Population. Scheduled Castes. Scheduled Tribes.
Name of the Districts.
Persona. Males. Females. Males. Females. Males. Females.
Patna
Gaya
Shahabad
Saran
Champaran
Muzaffarpur
Darbhanga
Monghyr
BhagalpMi
Saharsa
Pumea
Santhal Parganas
Palamau
Hazaribagh
Ranchi
Dhanbad
Singhbhum
BIHAR
593,896 327,525 266,371 29,681 25,612 644 445
265,098 142,480 122,618 15,178 14,531 73 653
231,701 125,538 106,168 11,007 9,951 212 170
149,916 80,122 69,794 5,734 5,049 13 17
145,645 79,518 66,127 5,286 4,997 53 71
188,825 106,276 82,549 9,637 9,467 31 7
190,555 102,796 87,759 9,095 9,903 5 7
375,199 197,117 178,082 18,857 18,037 260 12!7
186,719 101,919 .84,800 8,011 7,188 298 42
67,427 37,609 29,818 3,942 3,769 22 3
185,597 107,647 77,950 10,171 8,778 1,599 1,50«
142,952 78,325 64,627 6,944 6,553 3,027 2,670
56,164 30,687 25,477 3,862 3,563 1,348 1,050
201,184 110,825 90,359 12,216 10,849 3,162 2,89(4
202,478 111,447 91,031 5,006 4,131 23,577 20,170
289,91.3 176,070 113,843 25,720 18,965 4,985 4,09*0
440,651 245,256 195,395 10,610 9,921 19,035 • 18,269
,923,920 2,161,157 1,752,763 190,957 171,264 58,344 51,601

17
1.9J.
LIVELIHOOD CLASSES IN BIHAR ACCORDING TO 1951 CENSUS.
Literate and edlucated persons.
Total workers.
Males. Females. Males. Females.
195,811
T8,088
6!8,020
4:2,804
37,326
6-0,425
55,237
101,306
54,927
17,271
53,355
47,220
17,164
5S,343
71,010
91,524
150,444
10 11
87,516
29,428
25,625
14,997
14,754
23,399
19,795
37,345
22,975
4,997
19,071
20,211
6,461
22,483
36,334
32,550
72,121
164,209
69,019
64,104
41,478
43,493
53,199
50,826
95,923
48,645
20,831
62,332
39,601
15,260
59,045
53,298
107,900
128,870
12
As- Cultivator.In Mining, Quarrying,
As Agricultural labourer.Livestock, Forestry, Fishing, Hunting and
Plantation, Orchards and Allied activities.
Males.
25,821
13,397
9,653
8,060
8,610
5,896
9,422
15,092
9,088
4,717
6,534
5,863
3,204
13,215
11,830
13,606
18,203
13
Females. Males. Females. Males.
10,781
5,300
5,347
5,101
5,874
rf,894
2,361
12,299
2,425
3,441
6,037
2,778
1,404
4,382
4,097
2,737
2,287
Females.
1,200,275 490,062 1,118 033 182,211 80,545
14 15 16 17 18
3,735 4,641 3,423 2,020 280
1,520 2,357 2,062 997 201
1,532 1,290 1,016 992 184
2,086 l,36o 1,434 543 115
1,944 3,823 2,345 791 121
630 1,819 613 650 65
482 1,043 214 1,085 87
1,469 5,421 2,104 1,244 161
527 798 521 1,096 82
lv5S6 1,310 1,3S4 736 209
820 2,424 1,275 1,333 78
1,804 385 369 1,430 91
741 547 381 655 66
3,521 260 247 13,661 4,574
3,928 672 680 1,737 146
3,077 293 385 37,589 4,671
1,212 453 379 6,784 1,237
30,584 28,961 18,832 73,343 12,368
9*3 Planning— 6

TA BLE
1 «
STATEMENT SHOWING THE URBAN POPULATION CLASSIFIED INTO
Name of the Districts.
At household Industry.
Males. Females.
In Manufacturing other than Household Industry.
Males. Females.
In Construction.
Males. Females.
19 20 21 22 23 24
Patna
Gaya
Shahabad
Saran
Champaran
Muzaffarpur
Darbhanga
Monghyr
Bhagalpur
Saharsa
Pumea
Santhal Parganas
Palamau
Hazaribagh
Banchi ,
Dhanbad
Singh bhum
BIHAR
11,959
5,4/7
4,970
3,128
2,933
2,341
4,645
8,072
8,300
1,297
2,143
1,238
2,367
3,001
2,681
2,986
71,097
3,845
f3,079
2,127
1,299
1,156
657
.3,493
3,771
3,873
608
l»34l
729
278
495
1,233
419
630
28,927
23,341
10,718
12,537
6,651
7,476
7,387
7,943
18,180
5,851
1,663
9.648
6,292
1.649
8,462
9,058
18,763
59,231
213,840
1,127
684
535
414
303
262
577
926
347
102
387
253
114
1,274
670
1,089
3,643
12,707
5,224
2,682
2,126
1,070
956
2,129
1,439
2,513
1,379
783
1,619
1,000
546
1,295
2,035
2,780
7,028
36,604
3 2<92
1(08
36
3
16
49
70
26
3
60
22
48
77
326
183
2,008
.3,4 79

19
—concfd.
LIVELIHOOD CLASSES IN BIHAII ACCORDING TO 1961 CENSUS.
In Trade and Commerce. In Transport, StOr' ge ai.d‘ Communications.
in otfeaf iervicesi. Non-workers.
Males. Females. Males. Females. Males. Fetoalea. Males. Femalea.
26 26 27 28 29 80 31 32
25,209 2,096 18,459 238 62,675 10,725 163,316 240,560
12,129 954 7,778 47 ^1,581 4,768 73,461 109,221
10,511 905 5,608 41 20,8t 3 3^205 61,434 96,610
7,826 554 3,140 9 12,655 2,113 36,644 61,734
7,164 640 2,923 3 11,553 2,095 36,026 67,617
10,406 664 4,893 13 19,080 2,976 63,077 76,653
9,633 1,379 5,43] 5] 9 17,330 3,102 61.970 78,337
13,131 1,611 10,547 162 24,516 4,828 101,194 162,990
8,026 620 4,258 81 16,613 3.012 63,274 76,712
2,863 126 1,308 3 7,370 826 16,778 26,101
11.5J7 576 8,541 42 17,474 1»965 46,36 71,416
6,546 371 5,787 60 14,240 2,164 38,72 i 58,764
2,430 178 1,216 9 5,575 1,394 16,427 22,273
7,038 364 4,01 60 17,663 2,603 51,780 77,144
7,834 524 4,951 110 19,913 4,213 68,149 79,201
10,155 352 10,102 67 22,810 3,363 68,170 100,237
13,014 790 11,479 .504 25,608 78'00 116,386 177.192
165,610 12,704 110,345 1,478 337,788 61,132 1,043,124 1,670,562
S o u r c e .— Census o f India, 1961 (Paper no. I o f 1962).

2 0
TABLE 1.10.
STATEMENT SHOWING THE NUMBER OF PERSONS, SEX-RATIO, ETC., AT THE DISTRICT HEADQUARTERSOF BIHAR ACCORDING TO THE CENSUS OF 1961.
Name of District. Name of the District - Headquarter.
Total Population.
Persons. Males. Females.— Variation,
1951-61.
Female per 1,00(0
males in 19»61.
1 2 3 4 5 6 7
Patna Patna 364,594 206,050 168,544 + 81,115 7619
Gaya Gaya 151,105 82,412 68,693 + 17,405 834
Shahabad Arrah 76,766 41,748 35,018 + 12,561 8319
Saran Chapra 75,580 40,884 34,696 + 11,271 84<9
Champaran Motihari 32,620 18,675 13,945 + 8,131 747
Muzaffarpur Muzaffarpur 109,048 64,322 44,726 + 35,454 eos
Darbhanga Darbhanga 103,016 55,096 47,920 + 18,200 87(0
Monghyr Monghyr 89,768 47,700 42,068 + 15,420 882
Bhagalpur Bhagalpur 143,860 79,183 64,667 + 29,320 817
Saharsa Saharsa 14,803 8,531 6,272 + 14,803 7317
Purnea Pumea 40,602 23,903 16,699 + 15,542 6919
Santhal Parganas Dumka 18,720 10,662 8,068 + 6,138 757
Hazaribagh Hazaribagh 40,968 22,368 18,600 + 7,146 8312
Ranchi Ranchi 122,416 68,277 64,139 + 15,567 793
Dhanbad Dhanbad 46,766 28,400 18,366 + 20,376 64(6
Palamau Daltonganj 25,270 14,044 11,226 + 6,047 79!9
Singhbhum Chaibasa 22,019 12,243 9,776 + 5,545 7988
SoTTBOE.—Geneus o f India, 1961 (Paper no. I of 1962).
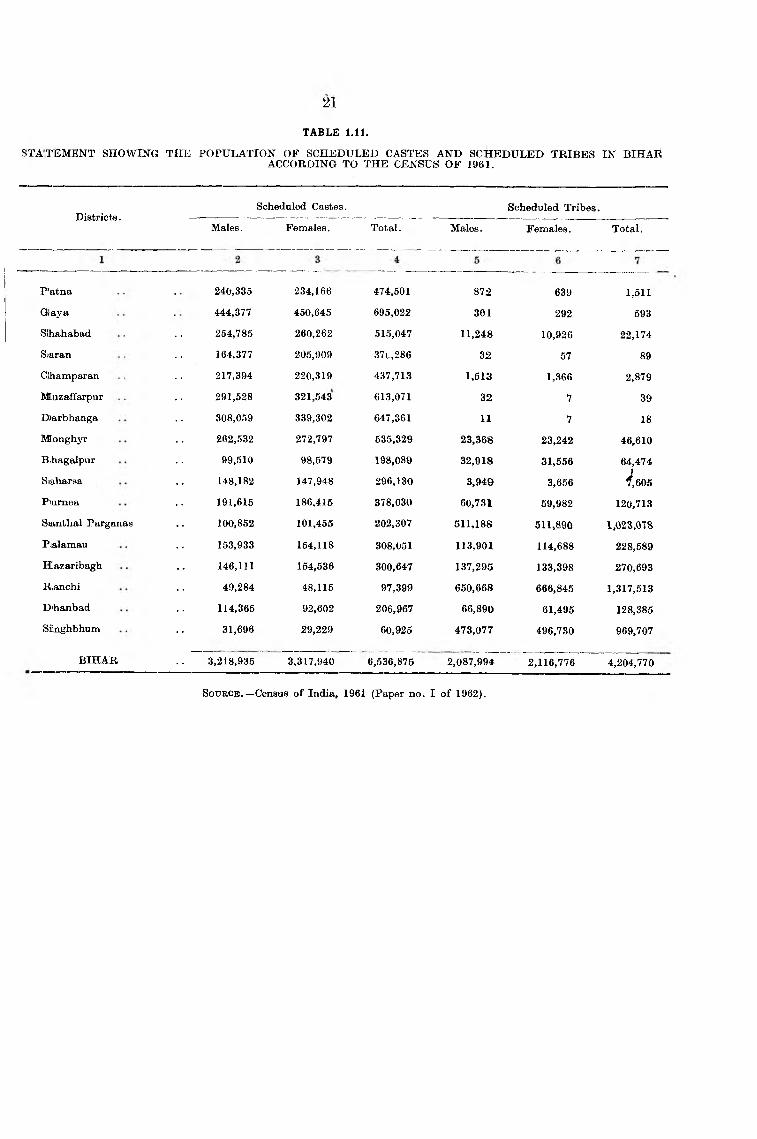
TABLE 1.11.
STATEMENT SHOWING THE POPULATION OF SCHEDULED CASTES AND SCHEDULED TRIBES IN BIHARACCORDING TO THE CENSUS OF 1961.
21
Districts.Scheduled Castes.
Males. Females. Total.
Scheduled Tribes,
Males. Females. Total.
P’atna
Graya
Slhahabad
Siaran
Ohamparan
Muzaffarpur
D)arbhanga
MTonghyr
B.hagalpur
Siaharsa
P'urnea
Sianthal Parganas
Pialamau
Hazaribagh
R,anchi
D'hanbad
Siinghbhum
BIHAR
240,335 234,166 474,501 872 639 1,511444,377 450,645 695,022 301 292 593
254,785 260,262 515,047 11,248 10,926 22,174164,377 205,909 37t,286 32 57 89217,394 220,319 437,713 1,513 1,366 2,879291,528 321,543 613,071 32 7 39308,059 339,302 647,361 11 7 18262,532 272,797 535,329 23,368 23,242 46,61099,510 98,579 198,089 32,918 31,556 64,474
148,182 147,948 296,130 3,949 3,656 */,605191,615 186,415 378,030 60,731 59,982 120,713100,852 101,455 202.307 511,188 511,890 1,023,078153,933 154,118 308,051 113,901 114,688 228,589146,111 154,536 300,647 137,295 133,398 270,69349,284 48,115 97,399 650,668 666,845 1,317,513
114,365 92,602 206,967 66,890 61,495 128,38531,696 29,229 60,925 473,077 496,730 969,707
3,218,935 3,317,940 6,536,875 2,087,994 2,116,776 4,204,770
S o u r c e .— Census o f India, 1961 (Paper no. I o f 1962).

ANNUAL AND SeASIONAL RAINFALL IN BIHAP
IN H U N D R ED
IS'
lO -
^ w
• 6 *
/•f
.H Pvi3m
1• *
y,U!
SAt
N O R M A L .r (S .W .M O N S O O N )
/ N O R M A L.
y ^ ( y e A u v t )
1l r;V
S ‘ fc* * •<>kSi
1H O T
R - P E R IO D .
/ * . H T «P E R IO D .
N . E .O N SO O N .
s.w.M O N S O O N .
I9SS J9 59*>60. 6 0 — 61. 6 I — 62. 62 — 63. — 64. 64 — 65. 65 — 6 6 , 66 — 67. 67 6 S .

SECTION II CDnate m Raintai)
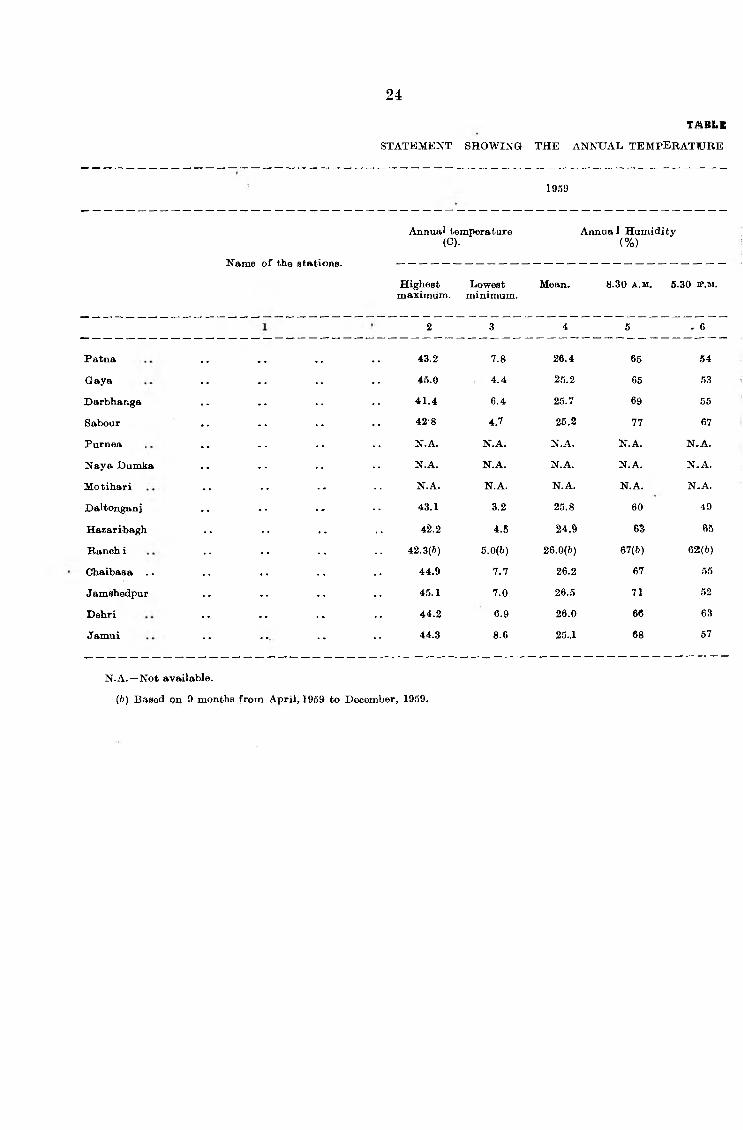
TAB Ll
STATEMENT SHOWING THE ANNUAL TEMPERATTURE
2 4
1959
Patna
Gaya
Darbhanga
Sabour
Purnea
Naya Dumka
Motihari
Daltonganj
Hazari'bagh
Ranch i
Chaibasa ..
Jamshedpur
Dehri
Jamui
Annual temperature (C).
Annua 1 Humidity (%)
Name of the stations.
Highest Lowest maximum. minimum.
Mean. 8.30 A .M . 5.30 3P.M.
2 3 4 5 . 6
43.2 7.8 26.4 65 54
46.0 4.4 25.2 65 53
41.4 6.4 25.7 69 55
42-8 4.7 25.2 77 67
N.A. N.A. N.A. N.A. N.A.
N.A. N.A. N.A. N.A. N.A.
N.A. N.A. N.A. N.A. N.A.
43.1 3.2 25.8 60 49
42.2 4.5 24.9 63 65
42.3(6) 5.0(6) 26.0(6) 67(6) 62(6)
44.9 7.7 26.2 67 55
45.1 7.0 26.5 71 52
44.2 6.9 26.0 66 63
44.3 8.6 25..1 68 57
N.A.—Not available.
(6) Based on 9 months from April, 1959 to December, 1959,

2 5
2.1.AND HUMIDITY AS RECOBDED IN DIFFERENT STATIONS IN BIHAR.
19609
Annual temperature (C).
Annual Humidity (%)•
Highestmaximum.
Lowestminimum.
Mean. 8-30 A .M . 5-30 P .M .
7 8 9 10 11
31.9 21.8 26.9 64 5132.7 20.8 26.7 64 5036.6 21.1 28.3 42 26
N.A. N.A. N.A. N.A. N.A.
29.1 14.3 21.7 75 7532.9 21.3 27.1 70 6029.7 19.9 24.8 68 6432.7 19.8 26.2 64 57
30.0 18.3 24.2 58 52
21.8 10.1 15.9 52 m
44
32.5 21.1 26.8 63 57
N.A. N.A. N.A. N.A. N.A.46.1 6.9 26.6 62 48
N.A. N.A. N.A. N.A. N.A.
SoTjBCE.—Regional MateorologicalCentre, Calcutta.
93 Planning—7

2 6
ta b l e
STATEMENT SHOWING THE ANNUAL TEMPERATURE
1961 1962
Annual temperature (C).
Annual Humidity (%)
Annual tempera ture (C).
Annual Humidity (%).
Name of stations.
Highest Lowest Mean, maximum, minimum.
8.30 A .M . 5.30p.m. Highest Lowest Mean.maximum, minimum.
8.30 A .M . 5.30 p . m .
1 12 13 14 15 16 17 18 19 20 21
Patna City . . 44.2 5.0 26.0 68 54 43.3 6.0 26.1 68 50
Patna Aerodrome 44.8 2.2 25.2 69 55 43.7 3.6 25.3 69 56
Gaya 46.2 1.4 25.3 68 54 46.5 2.9 25.5 68 54
Chapra 44.8 5.1 25.9 67 55 43.5 6.5 25.2 70 57
Motihari •• •• •• ••Darbhanga •• •• •• 41.9 5.4 24.7 68 65
Jamui 44.9 5.1 •• 75 63 44.3 3.8 25.9 75 64
Bhagalpur .. 43.3 5.2 25.5 71 62 42.3 6.8 25.9 69 60
Saboui 43.3 2.2 24.7 75 65 41.7 2.2 24.8 75 61
Forbesganj .. 41.9 5.6 25.1 76 61 40.1 5.5 24.9 76 63
Purnea 41.7 4.7 24.9 74 67 40.6 3.9 24.8 73 60
Naya Dumka 44.2 5.4 25.9 70 60 43.3 4.8 25.5 69 60
Hazaribagh 41.5 0.5 23.3 64 58 42.0 1.3 23.3 62 54
Ranchi 44.1 4.4 22.7 66 61 42.8 5.7 23.9 64 58
Ranchi (Aerodrome) 41.8 4.8 23.3 74 60 43.1 5.3 23.5 61
Daltonganj 45.0 1.8 25.1 67 61 46.1 2.2 25.9 63 50
Dhanfcad .. 44.7 4.1 25.6 66 59 44.7 8.0 25.7 65 55
Chaibasa 44.7 5.2 26.0 66 55 45.2 5.0 25.3 66 54
Jamshedpur Town 44.9 5.7 26.4 71 57 46.1 5.7 26.5 71 63
Jamshedpur (Aerodrome) 44.6 5.4 25.8 69 53 45.0 4.7 25.8 69 51
Dehri 45.3 1.8 25.9 68 54 46.1 4.8 26.2 65 51
. .Annual value not worked out due to break in figures.
SouBCE. —Regional Metorological Centre, Calcutta.

2 7
2.1.— contd.
AND HUMIDITY AS RECORDED IN DIFFERENT STATIONS IN BIHAR—contci.
1963 1964
Ann,ual temperature(C).
Annual Humidity (%)
AnAual temperature(C).
"Armual Humidity (%)
Highest Lowest maximum. * minimum.
Mean. 8.30 a .m . 5.30 P .M . Highestmaximum.
Lowestminimum.
Mean. 8.30 A .M . 5.30 » .M .
22 23 24 25 26 27 28 29 30 31
41.8 5.8 26.3 68 51 43.9 5.7 26.4 69 53
41.9 4.2 25.4 69 57 44.3 3.5 25.1 69 54
44.1 I.5 25.7 65 51 46.2 8.0 26.1 66 72
42.4 5.0 25.8 69 61\ 44.1 4.9 26.2 69 63
40.8 5.3 25.1 74 71 42.2 5.4 25.6 73 72
45.6 4.4 74 66
39.3 7.2 25.9 72 63 43.4 6.7 26.3 71 59
39.5 2.8 24.9 75 66 42.8 2.2 25.1 77 66
s r . g 5.1 24.8 76 63 40.8 3.3 24.8 77 63
39.0 4.0 24.7 75 65 42.1 2.6 24.7 76 64
40.6 5.4 25.9 71 62 43.4 5.4 26.0 70 60
39.8 3.1 2..3 65 57 •• •• ••
40.6 5.4 23.9 60 63 41.9 3.6 23.6 63 57
40.3 5.0 23.8 61 51 40.5 6.2 23.8 64 52
4S.0 7.4 26.1 64 58 44.0 7.5 65 55
43.3 26.3 66 54 44.3 5.5 26.4 69 56
44.1 5.0 26.7 69 54 44.4 6.8 27.0 68 53
42.5 5.0 26.0 69 53 44.4 6.7 26.8 65 53
44.0 6.2 26.3 66 50 45.3 64 48

2 8
TABLE
STATEMENT SHOWING THE ANNUAL TEKPERATUl^®^
1965 1966
Aimual temperature Annual Jljimidity Annual temperature Annual Humidilfcy(C). c%) (C). (%)
Name o f the stations.
J amui
Highest liowest Mean. 8.30 a .m . 5.30 p .m . Highest Lowest Mean. 8.30 a . m . 5.30 p .m maximum, minimum. maximum minimum
1 32 33 34 35 36 37 38 39 40 41
Patna City . . 45.4 6.3 26.6 66 49
Patna Aerodrome . . •• 46.6 4.8 26.1 68 49
Gaya 46.2 3.9 26.1 63 48 47.9 5.2 26.6 60 44
Chapra 44.8 8.2 26.3 68 58 4.66 7.4 26.6 65 50Motihari . . •• •• 42.4 3.2 24.3 76 68
Darbhanga 41.5 6.8 25.0 67 59 42.0 7.3 25.3 06 6445.1 4.8 28.1 73 64
Bhagalpur 43.8 8.3 26.4 68 57 44.0 7.5 26.7 67 57
Saboar . . . . 4vQ 25.3 76 67
Forbesganj 40.0 5.4 24.1 76 62 43.4 6.7 24.7 75 61
Purnea . . 43.2 4.2 24.5 74 64
Dumka 43.5 6.2 26.1 67 55 47.2 7.2 26.6 66 56
Hazaribagh.. 41.9 3.9 23.3 59 50 42.8 3.1 24.0 57 46
Ranchi .. •• 43.1 60 55
Ranchi Aerodrome .. 42.5 6.1 24.3 59 47
Daltonganj 44.0 4.2 25.4 62 48 46.2 3.4 26.4 57 43
Dhanbad .. 44.5 7.9 26.6 61 50 46.2 9.2 26.9 60 47
Chaibasa 44.4 6.1 25.9 66 54 44.5 6.5 26.6 62 50
Jamshedpur (Town) 44.3 5.6 26.5 69 51 45.1 4.9 26.1 68 52
Jamshedpur (Aerodrome) 44.4 6.4 26.2 65 51 45.5 6.3 26.7 67 53
Dehri .. 45.3 6.1 26.6 61 45 47.2 59 43
N.A.—Not available.
.. Ana’ial valae not worked oat due to break in figures*

2.i.~(Condd.
AND HUMIDITY AS RECORDED tN DIFFERENT STATIONS IN BIHAR.—concW,
29
1967 1968
Annual Temperature (C).
Annual Humidity {%)
Annual temperature (C).
Annual Humidity (%)•
Hightestmaximum.
Lowestminimum.
Mean. 8.30 A.M . 5.30 W.m. Highest.maximum.
Lowest.minimum.
Mean. 8.30 A..M. 5.30 P.M.
42 43 44 45 46 47 48 49 50 51
46i.2 5.4 26.1 68 51 45.2 6.0 26.0 70 54
44.7 25.5 65 50 45.2 4.1 28.4 69 54
45-4 3.8 26.6 62 47 45.3 3.5 25.4 68 51
45.6 6.0 26.6 66 53 45.2 G.O 25.9 69 53
42.7 . . • • • • N.A. N A. N. ■ . N.A.
42,. 4 5.9 25.3 68 63 43.5 5.4 24.9 73 65
. . . • • n .a . N.A. N A. N.A, N.a .
43.3 7.2 26.2 69 57 45.1 8.4 25.8 71 6243.5 3.0 24.7 76 76 45.0 3.0 24.6 77 60
38.3 5.3 23.3 76 63 N-A. N.A. N.A N.A . N A.38.3 4.3 24.0 76 69 42.4 2.4 23.6 75 6445.3 5.9 25.9 67 48 45.6 6.4 25.7 68 57
42.4 2.8 23.3 60 50 41.5 3.0 22.8 64 5541.4 7.5 23.7 60 49 40.8 5.3 25.8 71 62
•• N.A N.A. N.A. N,A. N.A.
45.6 25.8 59 47 44.1 2.3 25.0 61 49
45.0 8.5 26.1 63 52 45.0 7.7 25.9 62 5144.6 7.3 26.4 65 50 » A. N.A. N,A.' N.A. N A.
44.7 5.2 26.1 70 56 44.3 6.0 26.4 70 53
44.9 6.6 26.4 69 53 43.8 6.6 26.3 68 51
44.8 4.8 26.2 62 48 44.7 4.8 25.3 65 52
SoT7»CB,—Regional Meteorological Centre, CaUjutta.

3 0
TABLE 2.2.
STATEMENT SHOWING THE ANOTAL RAINFALL IN M.M. IN EACH DISTRICT OF BIHAR.
District.
1
1959
2
1960 1961 1962 1963 1964 1965 1966 1967 1968
3 4 5 6 7 8 9 10 11
1,047.9 1,289.1 1,129.8 1,176.6 1,239.5 912.7 568.1 935.9 948.6
1,022.9 1,341.5 1,023.5 983.7 1,051.2 779.0 587.8 1,021.4/ 1,013.1
924.8 940.7 820.0 958.2 1,169.6 777.0 534.6 871.8 908.2
998.5 1,190.4 991.1 1,039.5 1,153.4 822.9 563.6 943.0 956.6
1,037.5 1,030.2 1,093.5 1,255.7 1,101.9 922.2 822.9 750.2 1,064.8
1,331.0 1,137.5 1,413.6 1,210.9 1,630.7 231.2 1,144.6 1,061.4 1,212.3
1,221.5 1,007.1 1,067.4 1,185.2 1,346.4 1,162.0 636.2 1,081.2 986.5
1,229.7 1,201.7 1,161.0 1,288.3 1,182.0 1,170.9 956.2 1,074.4 1,076.2
1,204.9 1,094.1 1,183.9 1,235.0 1,315.5 1,121.6 890.0 991.8 1,084.9
1,315.5 1,247.5 1,067.1 1,506.0 1,184.8 904.1 602.2 1,022.0 1,204.6
1,359.5 1,020.4 1,085.9 1,445.3 1,145.9 1,070.4 653.6 885.1 1,317.1
1,198.2 1,130.3 1,655.6 1,626.7 1,191.3 1,075.8 1,043.8 1,134.8 962.7
1,634.1 1,382.7 1,542.4 1,652.7 1 ,498.7 1,258.3 1,031.0 1,253.1 1,901.0
1,298.3 1,308.7 1,170.2 1,389 2 1,278.6 1,082.2 1,056.4 1,088.8 1,.533.7
1,861.0 1,217.9 1,304.2 1,524.0 1,259.8 1,078.1 877.4 1,070.8 1,383.7
1,078.9 1,6.35.3 1,020.9 1,164.3 1,174.1 970.1 681.8 1,081.6 1,234.7
1,426.9 1,741.4 1,085.6 1,443.2 1,346.5 1,199.9 1,170.3 1,424.9 1,248.1
1,183.7 1,630.8 1,013.8 1,065.0 1,416.6 1,072.1 981.4 1,390.3 1,023.2
1,231.4 1,509.5 984.6 1,343.8 1,191.1 927.9 717.1 1,360.8 1,535.9
1,366.3 1,522.2 1,076.8 1,307.2 1,337.9 1,177.7 1,178.6 1,276.0 1,287.9
1,257.5 1,607.9 1,036.3 1,264.7 1,293.2 1,069.5 907.1 1,306.8 1,266.0
1,229.9 1,298.6 1,141.9 1,294.2 1,263.9 1,040.8 838.7 1,100.8 1,203.4
Patna .. . . . . 1,085.4
Gaya .. . . . • 1,208.6
Shahabad .. .. . . 1.057.2
Pataa Divisio<ii (Av.) .. . . 1,117.1
SarajTi .. . . . . 1,026.8
Cha'mparan.. •• . . 1,119.3
Muzaffarpur .. . . 937.1
Da^rbhanga .. . . 974.8
Tirhut Division (Av.) . . . . 1,014.5
Monghyr .. . . .. 1,358.8
Bhaga'lpur .. . . . . 1,459.1
Saharsa ,. .. .. 1,311.8
Purnea .. .. .. 1,403.2
Santhal Parganas . . . . 1,999.9
Bhagalpur Division (Av.) .. 1,506.6
Hazaribagh.. .. . . 1,468.6
Ranchi .. . . .. 1,463.5
Palamau .. . . . . 1,161.4
Dhaabad .. . . . . 1,655.3
Singhbhum.. .. .. 1,599.1
Chotanagpur Division (Av.) . . 1,469.6
Bihar (Av.).. . . . . 1,276.9
Year—January to December.
Av.—Average.
Source.—D irector of Statistics and Evaluation, Bih'ar,

D ISTRICT WISE ANNUAL RAINFALL O V ER YEARS IN
B I H A R
BIHAR
1964.1965.1966. 1967. 1968
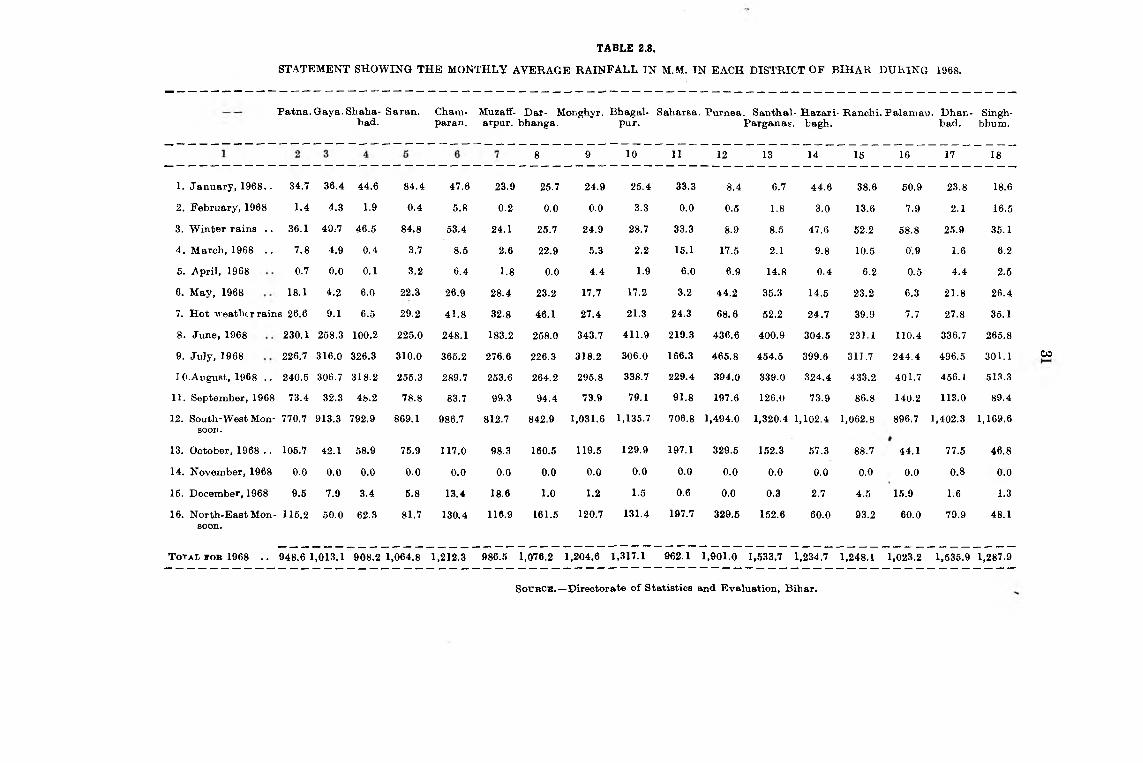
TABLE 2.8.
STATEMENT SHOWING THE MONTHLY AVERAGE RAINFALL IN M.M. IN EACH DISTRICT OF BIH AR DURING 1968.
Patna.Gaya. Shaha- Saran. Cham-bad. paran.
Muzaflf- Dar- Monghyr. Bhagal- Saharsa. Purnea. Santhal-Hazari-Ranchi. Palamau. Dhan- Singh- arpur. bhanga. pur. Parganas. bagh. bad. bhum.
8 9 10 II 12 13 14 15 16 17 18
1. January, 1968.. 34.7 36.4 44.6 84.4 47.6 23.9 25.7 24.9 25.4 33.3 8.4 6.7 44.6 38.6 50.9 23.8 18.6
2. February, 1968 1.4 4.3 1.9 0.4 5.8 0.2 0.0 0.0 3.3 0.0 0.5 1.8 3.0 13.6 7.9 2.1 16.5
3. Winter rains .. 36.1 40;7 46.5 84.8 53.4 24.1 25.7 24.9 28.7 33.3 8.9 8.5 47.6 52.2 58.8 25.9 35.14. March, 1968 .. 7.8 4.9 0.4 3.7 8.5 2.6 22.9 5.3 2.2 15.1 17.5 2.1 9.8 10.5 0.9 1.6 6.2
5. April, 1968 0.7 0.0 0.1 3.2 6.4 1.8 0.0 4.4 1.9 6.0 6.9 14.8 0.4 6.2 0.5 4.4 2.5
6. May, 1968 18.1 4.2 6.0 22.3 26.9 28.4 23.2 17.7 17.2 3.2 44.2 35.3 14.5 23.2 6.3 21.8 26.4
7. Hot weather rains 26.6 9.1 6.5 29.2 41.8 32.8 46.1 27.4 21.3 24.3 68.6 52.2 24.7 39.9 7.7 27.8 35.1
8. June, 1968 230.1 258.3 100.2 225.0 248.1 183.2 258.0 343.7 411.9 219.3 436.6 400.9 304.5 231.1 110.4 336.7 265.8
9. July, 1968 226.7 316.0 326.3 310.0 365.2 276.6 226.3 318.2 306.0 166.3 465.8 454.5 399.6 311.7 244.4 496.5 301.1
1 0.August, 1968 .. 240.5 306.7 318.2 255.3 289.7 253.6 264.2 295.8 338.7 229.4 394.0 339.0 324.4 433.2 401.7 456.1 513.3
11. September, 1968 73.4 32.3 48.2 78.8 83.7 99.3 94.4 73.9 79.1 91.8 197.6 126.0 73.9 86.8 140.2 113.0 89.4
12. South-West Monsoon.
770.7 913.3 792.9 869.1 986.7 812.7 842.9 1,031.6 1,135.7 706.8 1,494.0 1,320.4 1,102.4 1,062.8 896.7 1,402.3 1,169.6
13. October, 1968 .. 105.7 42.1 58.9 75.9 117.0 98.3 160.5 119.5 129.9 197.1 329.5 152.3 57.3 88.7 44.1 77.5 46.8
14. November, 1968 0.0 0.0 0.0 0.0 0.0 0.0 0.0 0.0 0.0 0.0 0.0 0.0 0.0 0.0 0.0 0.8 0.0
15. December, 1968 9.5 7.9 3.4 5.8 13.4 18.6 1.0 1.2 1.5 0.6 0.0 0.3 2.7 4.5 15.9 1.6 1.3
16. North-East Monsoon.
115.2 50.0 62.3 81.7 130.4 116.9 161.5 120.7 131.4 197.7 329.5 152.6 60.0 93.2 60.0 79.9 48.1
T o t a l i -o r 1968 .. 948.6 1,013.1 908.2 1,064.8 1,212.3 986.5 1,076.2 1,204.6 1,317.1 962.1 1,901.0 1,533.7 1,234.7 1,248.1 1,023.2 1,535.9 1,287.9
00
S ottbOb . — Directorate of Statistics and Evaluation, Bihar.

TABLE 2.4.
STATEMENT SHOWING MONTHLY NORMAL RAINFALL IN EACH DISTRICT OF BIH AR STATE (IN M.M.)
District. January. February. March. April. May. Jure. July.
1 2 3 4 5 6 7 8
August. September. Octoter.^ November. December. Annual.
9 10 11 12 13 14
Patna
Gaya
Sha abad
Saran
Champaran
Muzaffarpur
Darbhanga
Monghyr
Bhagalpur
Saharea
Pumea
Santhal Parganas
Hazaribagh
Ranchi
Pa’ amau
Dhanbad
Singhbhum
Bihar St^te
14.3
20.1
91.4
15.1
13.7
12.6
11.2
14.6
13.6
8.0
8.8
13.0
22.6
27.1
27.3
14.9
20.6
17.2
19.7
25.5
24.4
17.3
18.2
17.5
15.4
21.9
21.4
13.3
17.1
21.8
30.3
41.0
35.5
25.6
33.4
24.4
,7.6
12.0
. 9.5
8.7
12.6
10.8
10.9
12.3
12.5
12.0
12.4
16.7
17.7
24.0
19.5
19.8
21.8
14.4
7.9
6.9
6.6
10.1
19.5
16.1
23.8
15.9
20.8
28.8,
87.8
25.5
13.9
19.5
9.6
17.6
^8.817.1
22.2
18.3
14.7
36.0
63.9
53.5
dd.8
48.0
-*59.2
100.8
116.0
80.1
37.3
45.4
18.6
51.1
72.2
49.1
118.9
131.6
125.4
150.8
224.4
lS3.d
192.8
180.9
180.2
246.1
279.0
224.9
170.5
205.8
165.4
192.6
212.0
182.1
259.8
311.3
301.3
304.3
380.3
300.0
314.8
193.3
288.0
349.6
382.3
326.5
330.9
395.5
367.0
345.5
379.8
330.4
292.0
564.6
341.9
293.7
336.6
297.3
298.3
313.8
273.2
295.3
347.0
317.5
333.8
386.6
395.1
323.3
352.0
330.3
192.1
205.1
215.8
222.6
252.0
227.8
238.6
220.7
204.1
246.4
285.1
237.0
206.5
220.9
212.6
212.1
210.0
222.2
44.2
49.0
49.7
53.2
60.4
54.7
63.4
70.9
81.7
73.0
89.7
98.5
76.4
92.3
61.8
93.5
81.1
69.2
9.7
13.0
9.2
5.9
6.3
6.0
8.6
10.4
9.8
10.8
8.2
13.0
14.9
18.9
71.1
10.5
18.6
11.6
3.6
4.0
5.5
3.5
3.6
8.1
5.4
8.5
8.22.3
1.4
i.1
4.3
5.6
5.6
4.3
4.3
?.9
992.0
1.150.8
1.122.9
1. 121.2
1.391.5
l,188i7
1.249.9
1,206.2
1,166.2
1,385.4
1,585.3
1,877.2
1.258.1
1.482.6
1.335.1
1.310.7
1,434.6
1.271.9
COto
S o u r c e . —Deputy Director General o f OtservalorieB, Pcona-S (Climatology and Geophysics).

TABLE 2JS.
SlfA'fKStBlNT SHOWING TAB S*3 VSO 7yV’CSU Ft \[,Ci Jil. \t *
Year, South-West North-East Winter Hot GrandMonsoon. Monsoon. period. period. Total.
South-Wost Monsoon—Jtme» July, August and September. t
TiTorth-East Monsoon—October to Peoember.
Winter period—January and February.
Hot period—March, April and May.
SotTBoK.—2>ir0otorate of Statistics and Evaluation* Bihar.
1 2 3 4 6 6
1958-59 • . . 1,018.0 191.1 71.9 66.9 1^52.»
1969-60 »T« •• 925.1 253.9 2.7 88.9 1,270.6
1960-61 1,071.9 55.1 67.3 36.3 1,230.6
1961-62 1,048.0 199.5 22.1 58.7 1,328.3
1962-63 977.1 83.8 6.9 104.3 1,172.1
1963-64 1,000.6 185.2 9.9 98.9 1,300.6
1964-65 1,074.7 88.3 8.4 58.4 1,229.»
1965-66 958.7 27.8 32.4 41.1 1,060.0
1966-67 702.7 51.2 6.3 113.6 873.8
1967-68 960.9 21.6 37.4 30.6 1,050.5


m m Ilfxgrlcuiturai SlallstiGS

3 «
Y*ar.
TABILB
STATEMENT SHOWINO CLASSIFICATION OF AREA
Total area o f
the State by village
paper.
Lai^d not available for outtivatioQ.
Barren Other TotalForest. laud. Qairmazarua (ooIb . 3 to
land. 6 .
Culturable.
Permaneixt Oalturable Laud pasture and -waste other under other graz- than fallow miscella-
ing lands, lands. neous treies and groves.
1 2 3 4 5 6 7 8 9)
1068-69 4,28,23 93,66 21,26 33,78 1,48,40 6,21 22,41 ..
1059-60 4,28,23 92,87 20,53 84,06 1,47.44 6,18 23,13 » •
1960-61 4,28,23 92,87 20,87 S4,30 1,48,04 0,48 22,31 • •1961.62 4,28,23 91,65 21,01 34,73 1,47,39 6,72 13,91 4,47
1962-63 4,28,23 91,63 20,97 34,86 1,47,45 5,73 13,91 4,39
1963-64 4,28,23 91,63 19,50 86,76 1,47,88 6,31 12,94 3,9S
1964-66 • • 4,28,23 83,91 21,22 87,68 1,42,81 6,60 13,79 4,81
1066-66 • • 4,28,23 72,67 27,23 86,68 1,86,42 6,41 16,18 4,82
1966-67 •• 4,S8,23 71,46 28,63 85,82 1,86,91 6,00 14.69 4.76
1067.08 •* 4,28*23 73*06 ' 26.20 86,92 1,86,17 4,64 13,98 4,61
N-B,—Total may not tally due to rounding o f figores.
SoD9oa.—Directorate o f StatiHliioB and EveJustibn,

37
8.1.
OF BIH AR (IN THOUSANDS OF ACRES).
Waste laud. Area sown.
Other faUoTv lands.
Current Total faUow. (clos. 7
to 11 ,Net
area sowii.
Areasown Total more (cols. 13 and than 14).once.
------ Bhadaicrops.
Aghani Rabi Garma Orchard, crops. crops. crops
(excludingorchard).
10 11 12 13 14 15 16 17 18 19 20
21,00 34,12 82,74 1,96,90 76,88 2,73,78 52,57 1,31,06 82,42 5,43 2,30
20,97 34,38 83,61 1,97,18 72,92 2,70,10 53,40 1,25,28 83,87 6,24 2,81
20,84 33,08 81,71 1,98,48 75,98 2,74,46 53,12 1,30,19 83,42 6,31 2,42
20,33 30,07 74,50 2,06,33 67,75 2,74,28 54,45 1,27,18 84,93 4,42 3,30
30,22 20,34 74,59 2,06,18 67,66 2,73,84 51,88 1,29,28 83,99 5,05 3,64
28,91 18,05 69,16 2,11,19 61,84 2,73,03 50,38 1,32,57 81,32 6.24 S,62
19,26 30,91 74,27 2,11,14 56,61 2,67,65 48,66 1,33,14 77,65 4,91 8,40
23,46 37,31 86,77 2,06,04 59,84 2,65,88 47,48 1,31,28 78,36 6,21 3.65
22,72 61,66 1,08,92 1,83,41 44,64 2,27,95 48,83 1.08,76 60,45 6,34 8,67
23,46 41,77 88,36 2,04,70 64,53 66,98 1,26,02 76,62 7,08 3,64

Ti^BLK
38
STATEMENT SHOWING DISTRICTWISE CLASSIFICATION OF A R E A OF
District.
Patuft
Gaya
Shahabad
Sarau
Champarau
Mozetffarpur
Darbhanga
Monghyr
Bhagalpur ..
Baharsa
Puruea
Sautbal Farganas
Hazaribagh..
Bauohi
Palamau
Dliaabad . .
Biugbbhum..
Total
Total area o f State by
village paper. Forest.
Land not available for cultivation,. Cu]turable.
13.62
30,37
28,11
17,13
22,64
19.33
21,50
25,16
13,84
13,25
26.34
36,13
44,71
46,03
31,46
7,10
33.62
12
3,67
4,38
2,12
2,78
1,22
7
3,63
19,47
10,97
14,12
67
9,94
Perman,eAt Culturable Lian,d Barren Other Total pasture waste un^er laud. Gairmaza- (cols. 3 to and other other than misccela,
rua land. 5j. grazing fallow ueoua _land. laQds. trees an,d
gro'ves.
4.28,23
4 5 6 7 8 9
30 2,08 2,49 1 4 6
1,79 2,07 7,53 31 50 9
1,00 2;65 8,03 2 15 7
68 1,82 2,50 5 17 35
48 2,75 5,35 17 17 36
53 2,56 3,09 10 4 47
48 3,43 3,91 11 6 46
2,26 2,25 7,29 15 1,04 14
1,67 1,46 4,35 . 14 48 9
82 1,35 2,1'7 8 46 39
1,31 2,88 4,26 19 40 60
2,40 2,69 8,72 1,48 2,60 32
3,47 2,32 25,26 83 2,37 39
2,49 2,04 15,60 21 2,17 17
2,06 1,11 17,29 26 90 8
78 1,15 2,50 6 56 7
2,08 2,31 14,93 38 1,96 62
25,20 36,92 1,38,17 4,54 13,98 4,01
N ot®.—Total may not tally due to rounding up o f the figures.
SouBCB.—Directorate o f Statistics and Evaluation. Bihar.

^9
3.2.
BIHA.R FOR T a s YEAR 196 7^68 (IN’ THOUSANDS OF ACRES)
Waste land. Area Bowi\.
Other Total Netfallow Current (cols. 7 area lauds. fallow. t o l l ) . sown.
Area Total sown more area sown
than (cols. 13 OAce. and 14).
Bhadai Aghani Rabi Garma Orchard, crops. crops. crops. crops
(excludingorchard).
10 11 12 13 14 15 16 17 18 19 20
9 65 84 10,29 5,11 15,39 1,78 5,56 7,56 39 la89 3,70 5,49 17,36 5,85 23,20 1,83 12,33 8,64 34 627 1,00 1,51 18,65 9,47 28,02 1,55 11,83 13,79 51 3433 1,68 2,58 12,05 4,74 16,78 5,36 3,95 6,83 23 4138 88 1,96 15,33 5,85 21,18 4,81 8,35 7,02 60 4031 1,40 2,32 13,92 5,85 19,77 3,26 8,37 6,07 1,44 6318 1,67 2,48 15,11 4,72 19,83 3,67 9,29 5,32 90 65
1,02 2,63 4,98 12,90 2,99 15,89 3,89 4,83 6,75 26 1650 1,45 2,66 6,83 2,49 ‘1,00 4,10 3,01 11 966 1,93 3,42 7,66 4,58 12,25 3,03 4,98 2,51 1,54 19
1,09 3,10 5,38 16,70 5,15 21,85 6,77 9,89 4,35 55 293,76 5,23 13,29 13,12 2,46 15,58 2,36 12,06 1,11 3 23,13 3,88 10,60 8,85 1,83 10,68 3,94 6,20 49 3 24,86 4,33 11,74 17,79 1,76 19,56 7,58 10,67 1,07 7 172,57 4,29 8,10 6,06 1,03 7,09 2,68 2,77 1,61 3
65 93 2,27 2,35 15 2,50 37 2,05 7 12,86 3,04 8,75 9,84 50 10,34 1,09 8,81 43 2
23,46 41,77 88,36 2,04,70 64,53 2,69,23 55,98 1,26,02 76,62 7,08 3,5496 Plaaning— 8

ST^ATEMSNr SHOWING SOWN AB'EA (IN THOUSANDS OF AORBS) AND PERCENTAGE UNDER D iFFElREJftSEASONS IN BIHAR.
40
TABLE 3.8.
Year.Total area sown.
Area. Percentage,
Bhadai.
Area.
Aghani. Rabi. Garma. Orchaird.
Per- Area. Per- Area. Per- Area. Per- Area. Per- ce^tage. cen,tage. centage. centage. cej^tage.
10 11 12 13
1968-591969-601960-611961-621962-631963-641964-651965-661966-671967-68
2,73,782,70,102,74,462,74,282,73,842,73,032,67,652,65,882,27,962,69,23
63.963.144.164.063.963.8 62.562.1 63.262.9
52,5763,4053,1254,4651,8860,3848,6647,4848,8366,98
12.312.612.412.7 12.111.811.4 11.111.4 13.1
1,31,061.25.28 1,30,19 1,27,181.29.28 1,32,5V 1,33,141.31.28 1,08,76 1,26,02
30.629.230.429.930.230.9 31.130.725.429.4
82,4383,8783,4284,9383,9981,3277,5578.3660.4676,62
19.219.619.619.819.619.0
18.118.3 14.117.9
6,436,245,314,425,065,13
4,916,216,347,08
1.31.21,21.11.21.2
1.11.21.61.7
2.302.31 2,42 3,303.64 3,62 3,40 3,66 3,573.64
0.50.60.60,80.80.80.80.80.80.8
SOUBOB.— Directorate o f Statistics and Evaluation, Bihar,
TABLE 3.4,
STATEMENT SHOWING THE! NST AREA IRRIGATED B Y DIFFERENT SOURCES IN BIH AR.
( I n T h o u s a n d s o r A c b b s .)
Year. Government Private canals. canals.
Tanks. Wells. Othersources.
Total area irrigated.
1 2 3 4 5 6 7
1958-59 , , • • * • 10,70 3,64 10,24 6,81 19,51 60,90
1969-60 10,89 3,84 7,34 6,44 16,13 44,64
1960-61 • • • • 13,23 2,85 7,99 6,46 20,42 50.96
1961-62 • • • • • • 13,07 80 6,63 8,07 20,53 48,00
1962-63 . . • • • • 13,91 85 7,14 7,66 19,48 49,04
1963-64 • • • • 15,01 91 6,34 7,76 19,38 49,401964-66 . . • • • • 14,42 81 4,93 7,72 21,54 48,98
1965-66 . . • • * • 15,15 47 4,33 7,14 22,11 49,20
1966-67 . . • • • • 15,43 24 3,40 9,48 11,01 39,56
1967-68 •• 17,59 41 4,46 10,07 17,17 49,70
N o x h s , — (1) Wall iacludes tube-’wella.
(2) From 1961-62 flgarea for n et area irrigated Ikare basA givea while for prerioua yeara rMate togroaa area irrigated.
N.B.—.Tob^ doea nob tally daa to roaa<iinig of figarea.
SocsoB.—-Directorate of Stafciatica aud HvaluatioA, Bihar,

PERCENTAGE OF AREA IRRIGATED TO TOTAL AREA SOWNIN BIHAR
P E R C E N T A G E 2 0 —
lO
5—
I
K A FI L AH M E D
O - *________ I________ I________ I_______ J ________ I------------- 1-------------1_________I________ I'1958 - * 5 9 — 6 0 — 6 I ----- 6 2 ---- 63 ------- 6 4 ----- 65 ------ 66 — 6 7 ----- 6 8

0TA'(In Thousands ow Aobbb.)
41
TABLE 8'.6.
-«xrr SHOWrNTG THE NET AREA IRRIGATED B Y DIFFERENT SOURCES IN EACH DISTRICT OF” BIH AR d u r i n g 1967-63.
Patna
Gayagbahabad ..
Saran
. Cbaroparaii
Muzaffaqmr
parbhanga
Monghyr ..
Bhagalpur . .
SabarHa
’ PttfAea
Santhal Pargan.as
Hasaribagh..
Ranchi
PalaiQuu
Dhaubad . .
BiQghbhuin
Totaj.
Govern- met Privatt
canals. caaals.
1,18
2.27
7,63
2,05
2
29
83
1.27
' 76
87
11
1
16
4
1
9
33
1
17,59 40i 4,4 < 4,61 5,47
. . “ Less than thousand acres, j
N.B.—Total does not tally due to rounding o f figures.
SouBoE.—Directorate o f Statistics and Evaluation, Bihar.
96 Plaonirg— 9
17,1s
Wells.i n k s . ----------------------------------Other
Tube-wells. Other wells, sources.
Totalarea
irrigated..
4 5 6 7 8
9 1,72 46 2,20 5,65
1,14 64 91 7,96 13,25
1,01 1,27 50 95 11,36
S5 23 2,32 26 3,06
2 13 2 25 , 2,48
4 14 10 7 37
12 17 2 12 71
2 7 5 1,87 2,84
34 9 14 1,61 3,34
2 7 1 1 87; ; 1 '1 ■3 92
90 2 14 35 1,52
22 3 29 6 60
3 13 ■ 7 ‘ 40
2 . 2 28 1,84 1,70
11 2 1 15 '
14 7 12 46
49,70

TABLE 8.5.A.
STATEMENT SHOWING DISTRICTWISE AREA IRRIGATED IN EACH DISTRICT OP BIHAR DURING 196 5-e«.
42
Area irrigated by—
Diftricts.
Government State E.R.P.Sete. canals. tube-wells.
■Fotal.
Patna
Oaya
Shahabad
Saran
■Cbamparan %
lluzaffarpur .
Darbhanga
Monghyr
Bhagalpur
Saharsa
PuTnea
•Santhal Parganas
Hazaribagh
Banchi
Palamaa
Dbanbad
Singhbhum
198
352
928
1
217
10
199
137
19
15
17
28
71
1
82
17
13
9
15
11
ToTAt
17
2,138 219
271
353
1,013
18
23®
11
26
210
137
19
16
17
28
IT
2,36fl
SoTTBoB.—Chief Engineer, Irrigation, Bihar,
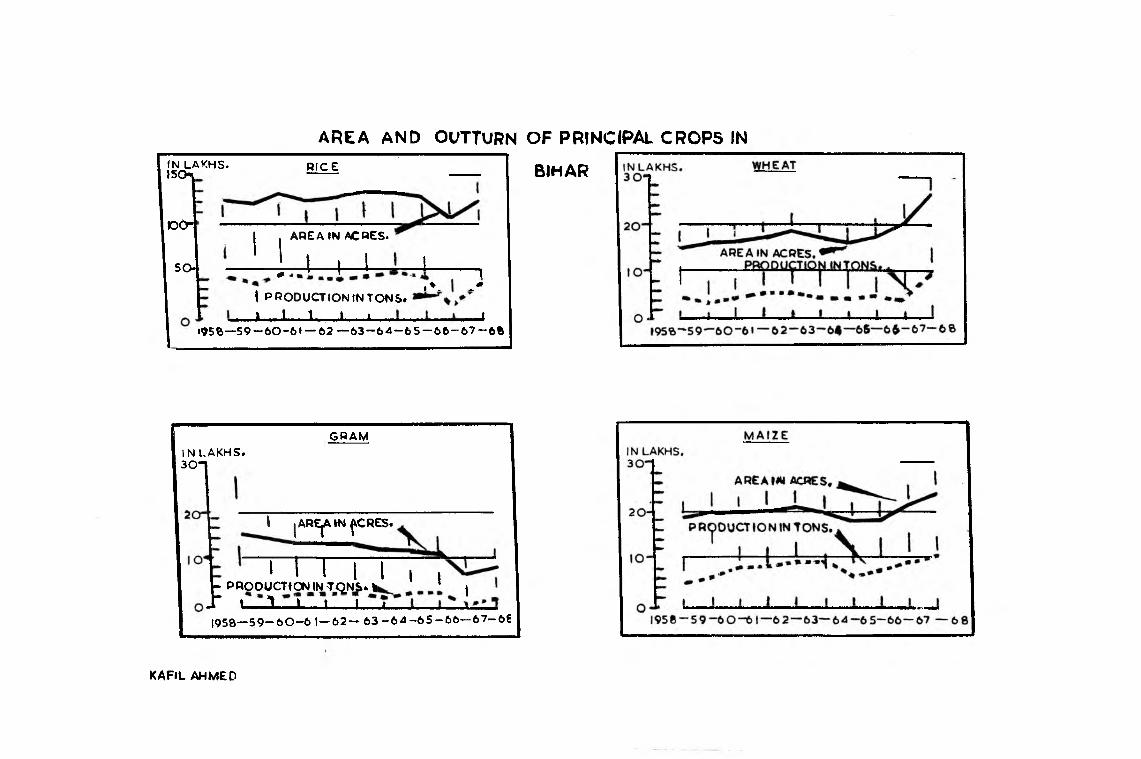
IN LAKHS. \5Ch
t o c r
AREA AND OUTTURN OF PRINCIPAL CROPS IN
BIHARRICE
AREAtN ACRES.
S O ------------- 5 — 4 -------1------ 1 .1------------- 1
. V . - *I PRODUCTION IN TONS#
J _ i ____1_____i____ I. ____t•^Sa— 5 9 - 6 0 - 6 1 — 6 2 - “ 6 3 - 6 4 - 6 5 - 6 6 - 6 7 - 6 ®
IN LAKHS. 3 0 T
GRAM
\ |A R E ^IN ^C R E S.
M i l l- PR O D U C HO NINTQ NS..I
X I— 3— I__ 1_J__ 4i I
1
1 9 5 8 - 5 9 - 6 0 - 6 1— 6 2 — 6 3 - 6 4 - 6 5 - 6 6 — 6 7 -6 6
KAFIL AHMED

43
TABLE 8.6.
SH0WI2CG THE AREA (IN THOUJ-AXPS OF ACRES) UNDER PRINCIPAL CROPS BY COMPLETE STATEJtb^> , ENUMERATION SURVEY IN BIHa R.
Year.Bice.
fAutuixmand
Winter),
Wheat. Gram. * Barley. Maize. M a R O o r . Arhar. Khesftri. Peas. Sugar- Potato. To- Jute. ChillieBf oaue. bacco.
10 11 12 13 14 15 --.f®
1858*69 .. 1,29,26 16,16 14,53 10,20 19,04 3,73 5,15 21,C0A'
1,45 4,05 1,73 40 4,55 85i.
1969-60 . . 1,23,27 16,13 14,28 10,76 19,83 3,51 5,06 22,02 1,73 4,43 1.74 45 3,99 1,0ft
1960-61 . . 1,29,57 16,10 13,39 9,72 19,89 3,71 4,61 24,02* 2,03 4,58 1,87 39 3,62
1961-62 .. 1,25,73 17,27 13,22 10,10 20,24 3,60 U 1 24,17 2,10 4,87 1,80 43 5,65
1962-63 .. 1,28,36 17,68 12,66 10,06 20,66 3,79 3,97 23,83 2,12 4.00 2,01 42 4,90
1963-64 . . 1,31,62 16,85 12,36 9,08 20,30 3,72 4,46 23,43 1,96 3,48 2,03 36 4,97 74
1964-65 .. 1,31,20 15,73 11,51 8,40 18,40 3,79 3,89 23,06 1,82 4,10 2,09 35 4.22 71
1966-66 .. 1,29,56 16,68 11,14 8,39 18,39 3,87 4,26 22,58 1,95 * 4,20 2,39 39 3,78 60
1966-67 .. 1,08,62 20,58 7,S9 8,76 21,20 2,10 3,65 8,57 1,28 3,68 2,34 34 3,97 6 »
1967-68 . . 1,27,15 26,08 8,19 8,86 24,56 3,37 4,60 14,98 I M 2,90 2,35 33 3,90 6 »
TABLES.?.
6TATEMEN1’ SHOWING THE DISTRICTWISE AREA (IN THOUSANDS OF ACRES) UNDER PRINCIPAL CROPS B Y COMPLETE ENUMERATION SURVEY IN BIHAR DURING THE YEAR 1967-68.
RiceDiatrict. (Autumn Wheat. Gram. Barley. Maize. Masoor. Arhar. Khesari. Peas. Sugar- Potato. To- Jute. Chillies*
and cane. bacco.Winter).
PatnaGayaSb^badSarau ' ..Champarautwaffarpur
«Onghyr "«agalpar Saharea .. Cornea ,, ^Parganaa * “ aribaghW h ifalaiaau~«anbad® >ghbhum
2 3 4 5 6 7 8 9 10 11 12 13 14 16
5,44 1,80 1,01 22 1,42 1,08 9 2,73 12 6 32 512,11 3,24 85 30 75 54 27 2,76 14 22 26 211,71 6,45 1,91 44 65 36 29 3,43 17 22 20 24,62 2,64 61 1,90 3,26 6 85 14 18 69 23 1 1 • »
10,64 2,44 21 1,83 1,06 52 28 69 13 94 12 208.36 1,49 18 1,30 2,23 15 33 .1 ,26 4 . 23 26 16 S 79,44 1,60 33 67 2,24 13 45 91 3 28 15 10 12 224,44 2,33 1,46 45 3,62 20 63 82 36 . 7 8 1 1 IS3,76 70 70 38 1,70 5 17 66 9 11 6 1 14,71 1,13 3 36 1,31 4 . 6 41 7 2 7 69 • •
11,04 1,60 ’ 33 52 1,15 17 10 53 7 2 21 4 28010,62 14 16 11 1,64 2 17 31 1 2 6 2 • •
6,78 13 4 4 1,60 8 1 1 6 17 t • • »11,54 8 I t 1 43 1 56 6 2 9 • •2,39 35 26 34 1,10 4 33 11 1 4 4 • •1,92 1 1 19 1 1 • • • •8,63 4 9 •• 31 •• 3 11 •• •• I • • •*
i,27,15 26,08 8,19 8,86 24,56 3,37 4,60 14,93 1,44 2,90 2,35 33 3,90 63
than thousand acres.
Total does not tally due to rounding o f figures. * ^
SoTTBoB.—Directorate o f Statistics and Evaluation, Bihar.

44
TABLE 3.8.
STATEMENT SHOWING OUTTURN OF PRINCIPAL CROPS (BY C.C.E. AND E.E.) IN THOUSANDS OF TONS IN B
PaddyYear. (Autnmn Wheat. Gram. Barley. Maize Masuor. Arhar. Khesari.
aAd. Winter).
Peas. Sugar- Potato To- Jute.*oaae. baoco.
■ 2 3 4 6 6 7 8 9 10 11 12 13 14 Is
1968-59 . . 44,17 4,31 3,11 2,49 4,68 54 1,29 4,06 29 60,55 3,99 14 12,43 Hf1969-60 . . 38,24 4,36 2,39 1,88 6,52 64 1,08 3,45 36 66,43 4,67 14 9,57 li1960-61 . . 44,69 4,36 3,19 2,01 7,82 76 1,08 4,78 39 69,27 5,62 10 8,50 It1961-62 . . 43,33 5,14 2,95 2,55 8,25 75 89 5,19 52 62,30 3,49 14 12,63 l‘ i:1962-63 . . 42,11 5,21 2,79 2,31 8,66 91 1,27 4,64 51 48,00 8,18 10 10,44 20:1963-64 . . 44,33 4,11 2,46 2,04 8,79 64 1,21 6,08 37 50,84 6,64 12 11,57 Ui1964-65 .. 48,36 4,11 2,77 1,75 5,75 86 1,37 5,21 43 67,50 7,08 11 9,09
1965-66 . . 41,91 4,70 3,29 1,79 7,45 85 1,45 5,00 45 59,49 7,76 11 8,84 1u
1966-67 .. 14,22 3,59 1,12 1,18 9,34 24 89 1,54 22 43,29 7,53 12 9,38 u
1967-68 .. 37,86 8,99 2,01 2,30 9,82 81 1,55 3,45 39 39,67 7,72 15 8,26 1)
♦Given inthouBande o f bales o f 400 lbs. each.
Novb.—Production, figures are estimated by multiplying the acreage obtained through conriplete euumeetiou suivt y •wiih averagej j^ ld obteined through ertap-cuttiiig eX|)€»i iment in tJase o f paddy,'wheat, gram and barley *iuce 1946-47 jaji MaAwJ since 1948-49, Svgarcane and Jute since 1958-59 land maize (Bhadai and Summer) since 1959-60 and through direct estimate in case of other crops.
SouBci.—Directorate o f Statistics and Evaluation, Bihar.

45
TABLE 3.9.
-.-n?MEKT {SHOWING THE ODTTUUN (IN THOUSAJJDS OF TONS) OF PRINCIPAL CROPS (BY CROP-CUTTING EXPERIMENT AND EYE ESTIMATION) IN BIHAB DTJRING 1967-68.
I
D RiceT^riots. (Autumn Wheat. Barley. Maizef. Gfam. Masoor. Arhar. Kheeari. Peas. Sugar- Potato. To-
’ and cane. baooo.Winter.)
Juto.* Chillie*.
10 11 12 13 14 16
Patn* • • 1,76 93 6 42 28 34 3 79 4 1,26 1.47 .. 2
Gaya 4,07 1,18 7 36 17 11 8 71 4 4,66 ..6 7 .... 2
gbahabad 3,43 2,02 6 24 64 9 10 73 5 2,77 1.20 . . 1
Saran 89 77 54 1,41 7 1 30 3 5 6,77 62 4 ..CSiasiparan 2,90 84 47 40 4 10 11 14 3 12,56 59 46 • •
Kxuafiarpur 1,70 46 33 71 3 3 13 26 1 2,72 ,78 .6 10 1
Darbhanga 2,39 50 r 18 1,00 6 ' 3 4.
18 19 1 3,98 .47 .3 52 4
Monghyr 1,49 88 13 1,46 39 5 24 16 11 61 .16 3 7Bhagalpur 1,39 27 10 64 23 1 7 13 2 2,59 9 1Sabaisa . . 1,20 38 11 51 1 1 3 8 2 36 14 . 1,61Pumea .. 1,97 50 13 35 6 3 6 10 2 32 40 5 5,45 ' 1S.Parganas 4,34 • 5 2 80 2 7 6 .. 13 11 3 « •Hazaribagh 2,04 3 1 63 1 - 1 43 71 . . • •Raachi .. 3,46 2 18 3 6 1 1 2 13 • • • •Palamaa 60 9 10 45 6 ■ 10 2 44 13 • • • • • •Obanbad.. 1,03 ». ... 8 .. . . • • S 1 • • • • • «Singhbhom
r3,30 1 - 19 2 - - 3 - 1 4 - -
Total 37,86 8,99 2,30 9,82 2,01 81 1,66 3,45 39 39,67 7,72 15 8,26 19
flnclading Summer Maize.
—..Lees than thousand tonfl.
in thousand baels*
Total doe B not tally due to roundinof the figures.SoxmoB.—DireotoMte of BtatiatSos a&d ETafaut^n, BShtf.

STATEMENT SHOWING AVERAGE YIELD (IN MAUNDS PER ACRE OF THE PRINGIPAL CROPS IN BIHARBY CROP CUTTING EXPERIMENT.
46
TABLE 3.10.
Year. Autumnrice.
Winterrice.
Wheat. Barley. Gram.
1 2 3 4 5 6
1958-59 . , 4.23 10.10 7.74 6.65 5.83
1959-60 . . 4.03 9.11 5.89 4.79 4.0»1
1960-61 . . . . . 5.43 10.09 7.36 5.62 6. #8
1961-62 . . 4.96 10.08 8.11 6.86 6.07
1962-63 5.41 9.52 8.02 6.25 5.99
1963-64 5.89 9.76 6.64 6.12 5.42
1964-65 6.10 10.67 7.12 6.68 6.53
1966-66 . . 6.35 9.26 7.66 5.82 8.14
1966-67 4.86 3.57 4.89 3.73 4.11
1967-68 . . •• 5.73 9.26 9.39 7.06 6.6T
SoTTaOB.—Direototftte o f Statistics and Evaluation, Bihar.

47
TABLE 8.11.
SITATEMENT SH O W IN a THE MILEAGE OF CANALS TOTAL CAPITAL OUTLAY, NET REVENUE, NET PROFIT OR LOSS AND TH E AREA IRRIGATED B Y THE DIFFERENT CANAL SYSTEM OWNED B Y GOVERNMENT.
Name o f syatem.Mileage o f canal
operation Total capita| Net revenue. Net profit + Areaincluding outlay. or loss— irrigated,
distributaries.
Sone Canal
Tribeni Canal
Dhaka Canal
Sakri Canal
Tour Canal
Sone Canal
Tribeni Canal
Dhaka Canal
Sakii Canal
Teur Canal
Sone Canal
Tribeni Canal
Dhaka Canal
Sakri Canal
Teur Canal
Sone Canal
Tribeni Canal
Dhaka Canal
-Sakri Canal
Teur Canal
Sone Canal
Tribeni Canal
Dhaka Caaal
Sakri Canal
Teur Canal
1956-57.
1,588
247
43
46
1957-58.
1,609
376
43
4S
12
1968-60.
1,609
376
43
66
12
1959-60.
2,088
376
43
56
12
1960-61
1,600
376
43
56
12
Ri.
2,68,23,344
81,58,407
6,32,773
37,69,328
2,68,23,344
81,48,407
6,32,773
2,68,23,344
81,58,407
6,32,773
37,71,976
2,68,23,344
81,48,407
6,32,773
37,74,170
2,68,23,344
81,58,407
6,32,773
37,85,085
R«.
26,53,171
1,98,370
70,833
-26,472
26,76,300
5,66,873
11,709
18,m
48,49,211
1,94,963
36,479
58,134
34,53,844
7,17,798
34,109
28,561
Rs.
+ 17,88,347
-66,400
+ 50,206
-88,767
+8,11,566
+3,02,095
-8,918
-2,27,^56
+39,84,477
-69,815
+ 15,852
-2,71,041
+25,89,110
+4,49,020
+ 13,482
-1,87,615
+ 38,13,355 +29,48,601
+7,34,904 +4,70,126
+72,423 +51,596
-77,585 -2,36,965
Rs.
639,470
140,319
14,244
12,261
676,570
160,726
16,331
24,409
4,760
6,30,696
1,62,977
13,885
38,76f
3,298
6,80,211
1,92,654
17,907
43,075
4,192
7,18,856
1,88,000
16,220
50,000
4,172

48
TABLB Z.n-6em9l4.
Name o f system.Mileage o f canal
operation Total capital Net revenue. Net profit + Area including outlay. or loss— irrigated,
distributaries.
2
1961-62
Sone Canal
Tribeni Canal
Dhaka Canal
Sakri Canal
Teur Canal
1,600 2,68,23,344 25,65,915 + 17,01,181 7,19,553
377 81,58,407 5,69,622 + 3,04,844 1,94,367
43 6,32,773 29,725 + 9,098 18,994
56 37,86,001 12,689 -1 ,46 ,846 57,370
12 .. 38,527 4,715
1962-63
Sone Canal . 1,600 2,68,23,344 + 66,98,007 + 58,33,273 7,83,624
Tribeni Canal . . . . 377 81,58,407 -1,65,623 -4 ,30 ,410 1,93,746
Dhaka Canal . . 43 6,32,773 -7 ,87 1 -28 ,4 9 8 16,144
[ Sakri Canal 56 37,86,001 + 1,28,894 — 40,044 32,020
Teur Canal 12
1963-64
. . *• 4,541
Sone Canal 1,600 2,68,23,344 + 44,75,678 + 36,10,939 8,15,204
Tribeni Canal • • 377 81,58,407 + 3,22,353 + 57,418 2,05,560
Dhaka Cafial • « 43 6,32,773 + 12,527 -8 ,1 0 0 14^384
Sakri Canal • • 56 37,86,001 -19 ,376 -1 ,88 ,014 49,000
Teur Canal •• 12
1964-65
•• 3,981
Sone Canal 1,600 2,68,23,344 + 90,70,642 + 82,05,908 8,77,298
Tribeni Canal 377 81,58,407 + 4,17,465 + 1,52,662 1,98,107
Dhaka Canal 43 6,32,773 + 10,771 -9 ,8 5 6 15,712
Sakri Canal 56 37,86,001 + 1,10,340 -77 ,369 36,480
Teur Canal 12
1965-66
4,755
Sone Canal 1,600 2,68,23,844 + 73,98,476 + 65,33,742 11,35,370
Tribeni Canal 377 81,58,407 + 3,81,408 +16,605 1,94,970
Dhaka Canal 43 6,32,778 -1 8 ,4 4 9 -39 ,0 76 16,020
Sakri Canal . . . . . . 56 37,86,001 -19 ,828 -2,07,537 36,640
Teur Canal •• •• 12 •• •• •• 3,620
•. —Not available
S otjbCb . — Chief Engineer, Irrigation Department, Bihar

TABLE 3.12
STATEMENT SHOWTNG THE DETAILS OF OPERATION OF NAVIGATION WORKS IN BIHAR.
49
Year.Leagth o f Total no. Total no.
canal open for o f boats o f boats navigation plying cargo. plying
(miles.) passengers.
Quantity o f Value cargo carried o f cargo
(tons). carried (in rupees).
Number o f Quantity o f passengers cargo carried
carried. by rafting (tons).
1 2 3 4 5 6 7 8
1955-56 213 4,522 19 41,392 43,79,000 ^ 683 30,639
1956-5? (reorganised) 213 2,276 68,282 22,547 2,006
1957-58 213 4,719 7 38,687 31,07,992 365 44,895
1)958-69 213 4,752 89 34,854 14,14,774 165 6,095
1S59-60 213 3,809 30 18,152 14,70,278 320 3,715
1960-61 214 6,118 7 48,901 17,16,921 420 22,235
1961-62 314 14,566 5 1,66,082 30,55,924 160 2,156
1962-63 214 14,394 5 1,66,485 47,08,082 1,897 12,266
1063-64 214 18,086 47 2,02,020 63,35,856 3,272
1964-65 214 18,544 94,970 28,70,593 3,503
. . —Not avaiUbl#SouaOB.—Chief Engineer, Irrigation, Bihar
TABLE 8.13
STATEMENT SHOWING PERCENTAGE DISTRIBUTION OF AGRICULTURAL LABOUR HOUSEHOLDS W ITH AND WITHOUT LAND ACCORDING TO ALL-INDIA AGRICULTURAL LABOUR ENQUIRY, 1950-51 AND 1956-67.
Period.
Percentage o f Agricultural Labour household*.
With land. Without land. Casual. Attached,
1950-51
1958-57
64.11
61.22
35.89
38.78
99.00
58.48
1.0041.52
96 Plan__ 10SouBOa.—All India Agricultural Labour Enquiry Report, 1956-57

50
TABI,E 8.14
STATEMENT SHOWING THE PERCENTAGE DISTRIBUTION OF OWNED HOLDINGS IN BIH AR BASED ONALL-INDIA AGRICULTURAL LABOUR ENQUIRY.
Grade o f holding.
Percentage o f Holdings. Percentage o f totaliarea.
1950-Cl. 1964-56. 1960-51. 1954-56=
6
Upto 1 acre
1.0 to 2.5 acres
2.5 to 6 acres
5 to 10 acres
10 to 50 acres
50 to 100 acres
Total
3L2
26.4
20.4
14.4
8.1
0.5
34.2
22.8
21.2
14.1
7.5
0.2
3.6
10.4
17.8
24.3
33.5
10.4
4.2
10.6
19.8
27.4
33.1
4,9
100.0 100.0 100.0 100.0
SotTBOB.—-All-India Agriculural Labour Enquiry Report, 1956-57
TABLE 8.15
STATEMENT SHOWING THE PROGRESS OF WASTE LAND RECLAMATION.
YearTotal area
reclaimed by tractors, (acres).*
Toted area reclaimed by manual labour
and L.I. loans, (acres.)
Total,
1969-60
1960-61
1961-62
1962-6S
1963-64
1964-65
1965-66
1966-67
1967-68
6,406.03
7,374.27
4.777.00
4.285.00
1.686.00
2,256.00
2,793.46
N.A.
939.00
8,594.80
3,563.97
6,888.00
11.449.00
3,015.00
15.645.00
16,050.72
13,084.83
12^708.65
15,000.88
10,938.24
10.665.00
15.734.00
4,701.00
17.801.00
18,844.18
13,084.8^
I3,647.6i
♦Includes tractor reclamation by State Tractor Organisation, Darbhanga
N.A.—'Not availableS o tm c E .— Deputy Director, Waste Land Reclamation, Bihar

51
TABLE 8.16
STATEMENT SHOWING THE PROGRESS MADE ON THE RECLAMATION OF WASTE LAND DURING THEYEAR, 1967-68.
District.Area
reclaimed L. I. Loans
(acres.)
Area reclaimed by
M.L. (acres).
Total(acres).
1 2 3 4
I*atna •. *
Gaya ... - ... 100.00 100.00
ShahabcMl •• • • •• 1,085.00 1,085.00
Saran •• •• •• ...
Ohamparan •• • • ••
Muzaffarpur •* •• 165.14 165.14
Darbhanga •• • • 259.85 •• 259.85
Bhagalpur - •• •• 621.10 621.10
Monghyr ... 2,283.71 2,283.71
Saharsa . . 433.10 . . 433.10
Pumeia . . •• • • ••
Santhffl.1 Pargana •• • •- *• 2,377.66 2,3'J:.66
Hazaribagh » ... •• 1,304.87 1,304.87
Ranchi . . • • •• 1,738.00 1,738.00
Palamau • • •• 856.08 856.08
Dhanbad. . • • • • 765.95 765.95
Singhbhum • • 42.50 675.69 718.19
Total •• 900.69 11,808.06 12,708.65
. . — Not available
SOTTBOE.— Deputy Director, Waste Land Reclamation, Bihar

PRINCIPAL LIVESTOCK PRODUCTIONS (LIVE STOCK CENSUS)IN BIHAR
IN L A K H M A U N D S
3 0 0
2 0 0
I O O
C O W M I L K . B U F F A L O S M ILK . T O T A L MI .KO
1961
K A F IL A H M E D .

SECTION IV Statistics of Livestoidc

54
TABLE 4.1
STATEMENT SHOWING THE NUMBER OF AGRICULTURAL IMPLEMENTS AND MACHINERY IN BiH A IDURING 1966.
Pistrici.
A o b io t t l t u s a i . I k p l e m e k t s
Wooden Iron ploughs. ploughs.
Tractors. carts. Oilengines.
Electricpumps.
Sugarcane crushers.
Power. Bullocks.
Patna 163,560 2,238 115 15*991 943 1*493 256 3,657
Gaya 291,798 2,142 128 39*276 335 2,224 252 7,268
Shahabad 261,037 10,278 312 38,663 259 1,644 308 8,.525
Saran 226,254 41,829 136 28*187 249 140 189 5,543
Ohamparan 204,374 50,830 468 55*976 169 43 66 1,135
Muzaffarpur 243,207 23,524 88 50,755 231 434 182 3,363
Darbhanga 254,364 12,895 144 60*471 243 82 193 2,796
Bhagalpur 134,130 853 87 33*971 154 41 133 1,962
TSlonghyr 186,238 5,020 136 38,615 146 111 160 1,869
Saharsa 131,808 3,976 105 32,t76 138 45 13 288
Purnea 325,426 4,061 289' 126*164 198 18 165 453
Santhal Pargana 347,236 1,467 20 78,463 191 60 98 1,476
Hazaribagh 286,817 808 50 97,828 165 164 283 5,396
Ranchi 332,297 2,456 25 15,380 88 90 29 135
Palamau 157,120 573 16 5,260 56 168 69 1,804
Dhanbtid 80,399 403 3 27*490 45 56 5 364
Singhbhum 236,912 534 11 63,342 88 41 14 147
Total 3,852,917 163,887 2*132 796,506 3,698 6,854 2,415 45,881
SoxncoB.—Superintendent o f Livestock Census o f Bihar. H 66

STATEM ENT SHOWING THE BULLS AN P COWS (OVER TH REE YEARS) AND YOtTNG STOCK (BETWEEN ONE AND TH REE Y EAR S, AND UNDER ONH) YEAR) ACCQRD-ING TO LIVESTOCKCENSUS OF BIH AR.
(Numbers).
55
t a b l e 4.2
Y ear,
1961. 1966,
1. (Catlle—
A. BULLS OVER TH REE YEARS
(i) Breeding bulls
{ii) Working bulls
(iii) Other bulls
2. ;Bui'faloes—
(i) Breeding bulls
(ii) W orking bulls
(iii) Other bulls
Total
Total . .
B . COWS OVER TH REE YEARS
1. C a t t l e -
(i) In milk
{ii) Dry . .
{iii) Not calved
(iv) For work
{v) Others
2. B uffaloes—
(i) In milk
{ii) Dry . .
(iii) Not calved
(iv) For work
(v) Others
Total
12,599
6,977,080
1,08,444
7,098,123
13,836
6,859,601
57,282
6,930,719
Total
13,239 44,758
671,814
79,881 15,446
681,866 732,018
1,633,195 1,395,120
2,200.880 2,252,988
144,210 166,251
249,449 198,721
123,863 91,690
4,351,597 41,04,770
783,147 701,643
721,398 822,177
48,637 49,536
73,926 64,784
23,350 24,545
1,650,458 1,662,685

STATEM:ENT s h o w i n g t h e b u l l s a n d c o w s (OVER THREE YEARS) AND YOUNG STOCK (BETW EEN ONE AND THREE YEARS AND UNDER ONE Y EAR ) ACCORDING TO LIVESTOCK CENSUS OF B IH A R .
(Numbers)
56
TABLE 4.2—cnncld.
Year
1961 1966
c. i:OUNG STOCK BET»VEEN ONE AND T9 REE iE A R S —
1. Total cattle
2. Total buffaloes
2,583,418
664,873
2,319,448
621,427
Total 3,248,291 2,940,875 ----- ------------------ ,j
D. y o u n g STOCK (UNDER ONE Y E A R )-
1. Total cattle'
2. Total buffaloes
2,070,948
701,036
1,801,519
638,234
Total 2,771,983 2,439,753
E. TOTAL CATTLE
TOTAL BUFFALOES
16,104,086
3,698,232
15,158,456
3,654,364
GRAND T O T A L - (TOTAL BOVINE) . . 19,802,318 18,810,820
SouKpB.— Livestocl^ Census, Bpjar, 1966
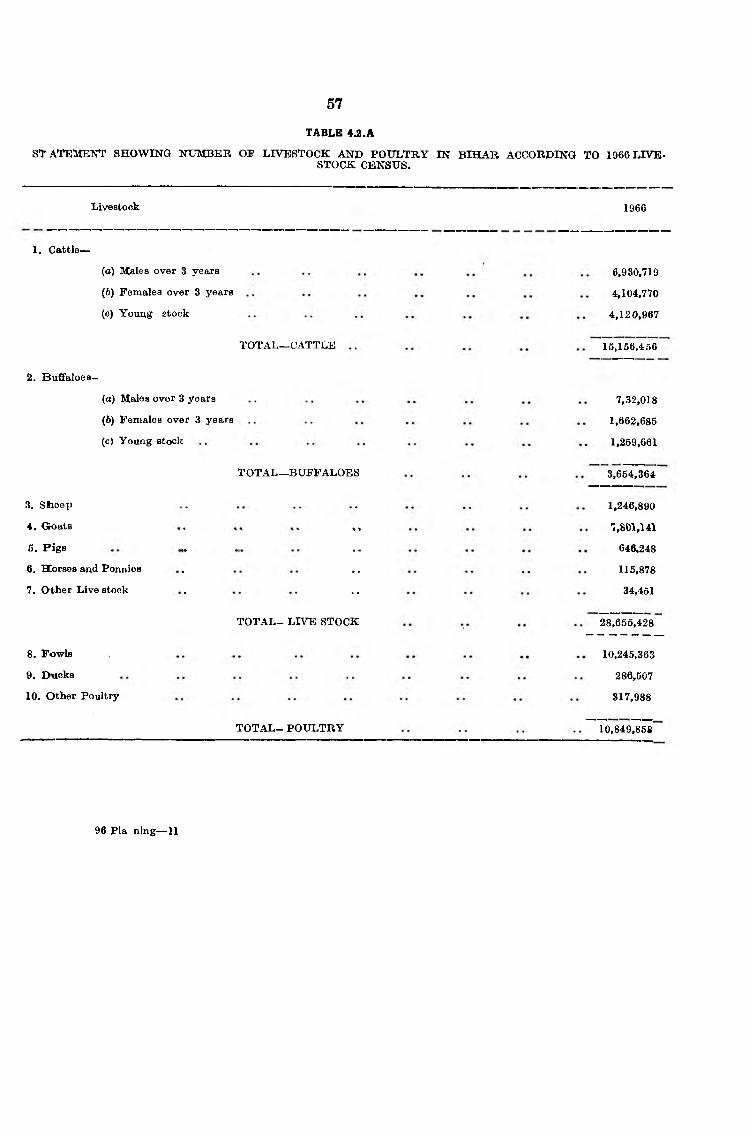
STAT e KENT s h o w i n g n u m b e r o f l i v e s t o c k a n d p o u l t r y i n B IH A R ACCORDING TO 1966 LIVESTOCK CENSUS.
57
TABLE 4.2.A
Livestock 1966
1. Cattle—
(а) Males over 3 years
(б) Females over 3 years
(c) YouAg stock
6,930,719
4,104,770
4,120,967
2. Buffaloes—
TOTAL—CATTLE
(o) Males over 3 years
(6) Females over 3 years
(c) Young stock
15,156,456
7,32,018
1,662,685
1,259,661
T O T A L -B U F F ALOES
3. Sheep
4. Goats
5. P igs
6. Horses and Pennies
7. O’ther Live stock
3,654,364
1,246,890
'7,801,141
646.248
115,878
34,451
8. Fowls
9. Ducks
10. Other Poultry
T O T A L - LIVE STOCK 28,655,428
10,245,363
286,507
317,988
T O T A L - POULTRY 10,849,858
96 Pla ning— 11

STATEMENT SHOWING DISTRIOTWISE LIVESTOCK AND POULTRY ACCORDING TO THE LIVESTOCK CENsIJS OiPBIH AR, 1966.
68
TABLE 4.3
Bulls Young He She BuffaloDistricts. an,d Cows. stock buffaloes. buffaloes. calves.
Bullocks. (calves).Sheep. Goats. Pigs. Fowles. D'ucks.
9 10 11 12
26j863 214j320 5i78868^946 525,696 11*76523jl24 217,505 7,16911>922 92,823 1*999
13,045 241»416 7*7217,437 173,916 1,677
11,117 267,071 2,127 111,094 176,759 6,08829,801 279,110 4,624
8,288 137,960 2,217 '
20,978 137,044 60,452195,673 1,432,610 48,610
91,501 1,866,343 21,02127,366 381,507 82557,081 669,068 7,81326,249 1,980,936 6,77615,763 217,270 31,835
Patna
Gaya
Shahabad . .
Sarau
Champaran.
Muzaffarpur
Darbhanga
Bhagalpur
Monghyr
Saharsa
Puraea
Santhal Par ganas.
Ran,chi
Palamau
Hazaribagh
Singhbhum
Dhanbad ..
276,158
586,684
456,961
335,286
416,202
469,446
468,075
235,500
366,481
341,576
659,033
535,519
482,692
307,876
439,302
425,535
128,493
120,551
300,678
246,660
155,465
205,036
190,833
279,987
158,717
269,038
264,445
337,267
409,803
300,783
216,893
320,479
238,389
89,746
149,664
335,932
240,275
164,424
178,292
176,950
281,703
186,250
291,024
235,902
379,811
373,541
245,870
198,115
401,767
194,572
86,875
27,020
92,584
673
524
15,549
1,960
1,336
29,879
31,176
4,369
34,050
89,609
139,930
10,528
148,070
67,732
37,029
129,139
166,329
193,419
129,852
108,511
138,084
152,823
54,198
87,897
104,439
116,662
79,699
52,938
67,602
53,381
15,852
11,860
109j702
142,115
141,766
86>073
88,433
96,852
109,523
40,675
63,980
78,589
96,940
40,072
44,130
37,917
10,314
6,455
25»056
130,820
124,785
31,253
14,670
10,862
9,605
22,349
25,871
4,040
14,224
242,
119,513
17,360
56,830
260,974
82,139
263>401
483>848
202i244
419,333
542,305
608,055
438,045
330,812
483,263
293,141
732,567
844,973
676,416
248,265
543,823
557,983
132,667
TOTAL . . 6,930,719 4,104,770 4,120,967 732,018 1,662,685 1,259,661 1,246,890 7,801,141 646,248 10,245,363 286,507
SouBcJ!.—Superintendent o f livestock Census, Bihar, 1966

59
STATEMENT SHOWING NUMBER OF LIVESTOCK AND POULTRY IN BIH A R ACCORDING TO LIVESTOCKCENSUS, 1'J66.
TABLE 4.3 A
District,
Patna
Gaya
Shahabad
Saran
Champaran, .
Muzaffarpur
Darbhanga . .
Bhagalpur . .
Monghyr
Saharsa
Puruea
Santhal Pargaua
• Hazaribagh
Ran,chi
Dhanbad
Palamau
Siinghbhum ..
Livestock.
TOTAL
1,134,021
2,311,103
1,645,501
1,352,788
1,590,538
1,709,571
1,759,363
1,075,680
1,657,027
1,350,958
2.419,787
2,846,100
2,060,851
2,154,029
591,505
1,198,616
1,797,990
Poultry.
227,423
646,179
227,774
98,328
261,937
177,466
271,871
193,119
298,503
142,389
1,508,994
1,530,721
686,563
1,901,959
263,561
382,885
2,130,196
28,655,428 10,849,858
Sou»cE,—Livestock Census 1966

STATEMENT SHOWING THE VARIATIO N IN MAIN CLASSES OF LW ESTOCK IN BIH AR ACCORDING TOLIVESTOCK CENSUS.
60
TABLE 4.4
1956. 1961. 1966.
4
Cows and Oxen— adult
Cows and Oxen— young stock
Buffaloes— adult
Buffaloes— young stock
Sheep
Goats
10,680,549 11,449,720 11,035,489
3,717,852 4,654,366 4,120,967
2,302,102 2,332,324 2,394,703
1,124,348 1,365,908 1,259,661
1,061,342 1,156,477 1,246,8«0
6,524,732 8,640,862 7,801,141
SouBcB.— liivestock Census o f Bihar
TABLE 4.5
STATEMENT SHOWING THE PRIN CIPAL LIVESTOCK PRODUCTS OF BIH AR ACCORDING TO LIVESTOCK !CENSUS.
Product 1956. 1961,
1 2 3
Cow milk . . (in lakh maonds) 293.96 240.54
Buffaloes milk (ditto) 203.24 236.40
Goat milk . . (ditto) . . , 1.93 9.25
Total milk . . (ditto) 502.13 486.19
Cattle hides . . (in lakh pieces)•
16.37 17.23
Buffaloes hides (ditto) • • 3.63 4.03
Goat skins . . (ditto) •• 16.35 2.38
Sheep skins . . (ditto) • • •• 2.94 3.25
Meat (tons) . . > • • • • 10,756* 32,033.08
W ool (lbs) 1,370.000 14,57,161.02
Fowls collected (nos.) . . 125,434,800** 170,268,608
Duck eggs collected (nos.) •• . . 22,271,000 6,220,776
•Exclusive o f the figures o f pork and fowl meat
•♦Total number o f eggs produced
SOUROB.—Livestock Census o f Bihar

STATEMENT SHOWING THE TOTAL NUMBER OF DIFFERENT KINDS OF LIVESTOCK PRESENT FOR SALEIN THE FAIRS IN BIHAR.
TABLE 4.6
Year Number o f Bulls. Bullocks, fairs.
Cows. Young Buffaloes. Goat and stock. sheep.
Others.
19518-59 109 1,740 218,754 50,548 75,387 25,581 15,415 8,698
1959-60 • • 28,115 250,063 59,453 74,807 28,521 24,012 9,01-3
196(0-61 57 4,849 258,081 76,187 80,864 43,824 38,548 7,312
1961-62 97 759 109,628 43,755 28,045 8,124 24,211 6,559
1962-63 76 540 154,386 53,488 43,474 20,105 16,078 8,245
1963-64 44 2,869 317,295 50,221 82,011 25,153 26,767 2,846
1964-65 48 1,902 681,543 64,875 99,132 31,304 31,879 15,639
1965-66 . . 67 6,570 668,644 249,740 8,520 138,058 154,417 17,366
1966-67 52 6,677 664,400 299,898 N.A. 132,749 140,372 340,907
1967-68 106 6,654 772,013 236,931 N.A. 265,612 150,677 156,426
SOUBOE. — Director, Animal Husbandry, Bihar
TABLE 4.7
STATEMENT SHOWING THE NXTMBER OF VETERIN ARY HOSPITALS AND DISPENSARIES AND VETERINARYDOCTORS IN BIHAR.
Year.
Hospitals
Number o f—
Dispensaries Total
- Number o f doctors.
1 2 3 4 5
1958-59 . . 40 344 384 347
1959-60 . . 41 471 512 469
1960-61 . . . . •. 40 579 619 573
1951-62 . . . . 40 592 632 610
1962-63 . . . . 47 585 632 611
1963-64 . . . . . . 47 585 632 632
196 4-65 . . 56 576 632 575
1965-66 . . • • • • 61 571 632 575
1966-67 . . • • » ♦ 61 571 632 608
1967-68 . . . . . . . . 61 571 632 599
SovKca.—Director, Rutb»&dryi Bihar

STATEMENT SHOWING DISTRICTWISE THE NUMBER OF VETERIN ARY HOSPITALS AND DISPENSARIES AND VETERIN ARY DOCTORS IN BIHAR DURING THE \’'EAR 1967-68.
62
t a b le 4.8
Number o f—
Name o f the district.
Hospitals. Dispensaries. Total.
2
Numbero f
doct>ors.
1 3 4 5
6 25 31 24
4 46 50 45,
4 44 48 43
3 40 43 41
3 34 37 37
4 43 47 49
3 43 46 46
2 21 23 23
3 22 25 25
4 38 42 39
4 38 42 40
7 35 42 42
4 37 41 41
3 42 45 45
2 25 27 17
2 13 15 14
3 25 28 28
Patna
Gaya
Shahabad
Saran
Champar&n
Muzaffarpur
Darbhanga
Bhagalpur
Saharsa
Monghyr . .
Purnea
Santhal Pargana
Banchi
Hazaribagh
Palamau . .
Dhanbad . .
Singhbhum
TOTAL 61 571 632 599
S o u r c e . — Director, Animal Husbandry, Bihar.

m
STATElVtENT SH O 'VIN Q TH E X'UMBER OF LIVESTOCK SLAUGHTERED I5T RECOGNISED SLAtfGEtflSaHOUSES IN BIHAR.
TABLE 4.9
Year.Bulls
Cows. aad Calves. Buffaloes. Sheep,bullocks.
Goat. Pigs, Other animals.
1 2 3 4 5 6 7 8 9
1958-59 .. 20,728 12,221 1,280 26,064 14*222 417*341
195 9-60 . . 14,541 19,960 1,102 36,830 8*797 258*923 • •
196^0-61 . . 3,938 43,180 873 32,445 70*564 653*915
1961-62 .. 894 32,460 2,170 36,967 50,968 446*801 4 4 »
1962-63 . . 15,190 35,038 12,523 440,198 » •
1963-64 .. 28,861 28,482 105,029 499,706
1964-65 . . •• 28,231 53,250 54,912 464,629 « «
1965-66 .. 28,433 32,903 54,607 385,044 • •
1966-67 . . 33,478 29,836 43,640 425,652 » •
1967-68 .. 30,947 36,545 33,491 436,152 •• • •
-Not available
S o u r c e . — Director, Animal Husbandry, Bihar
TABLE 4.10
STATEMENT SHOWING THE PRINCIPAL MILK PRODUCTS OF BIH A R ACCORDING TO LIVESTOCK CENSUS.
( I n T h o u s a n d M a u n d s )
Product
1
1956
2
1961
3
Fluitd milk . . . . . 30,170.6 25,549.7
Butter . . 131.2 93.4
Dahi • • 6,034.1 6,461.1
Khaa . 102.9 49.6
Ghe-e . . . 926.4 248.6
Chanch •• . N.A. 6,707.2
N.A.—Not available
SouROB.—Superintendent, Livestock Census o f Bihar.

TABLE 4.11
STATEMENT SHOWING THE AVERAGE ANNUAL MILK YIELD PER ANIMAL IN BIH AR.
64
Aaimal—
Cows
Buffaloes
Goats
------------------------------------ ------------------ ------------------ -------------------- --------------------------
(Old Bihar). (Reorgamised Bihar).
(In lbs.) (In lbs.) Yield. Yiel(d.
668.75 570.0
1,344.82 1,235.0
120.00 120.0
S o u B qE .— Senior Marketing Officer, Bihar
TABLE 4.12 •
STATEMENT SHOWING TH E INCIDENCE OP EPIDEMIC DISEASES AMONG CATTLE IN BIH AR.
Number o f Number o f Number o f Number o fYear outbreaks animals deaths cattle
reported. affected. recorded. innoculated.
I 2 3 4 5
1968-59 1,276 61,198 9,541 3,032,800
1969-60 3,460 30,612 9,864 5,488,783
1960-61 ' . . 4,968 151,888 7,327 2,738,760
1961-62 3,961 33,995 7,073 1,073,911
1962-63 • * •• •• •• 2,67 3 33,603 6,039 966,167
1963-64 3,466 64,508 5,628 620,404
1964-66 2,317 16,840 4,328 1,835,260
1966-66 1,964 21,357 3,329 3,287,634
1966-67 »• •• •• a. 1,676 20,800 3,093 4,674,gi5S
1967-68 947 8,817 2,126 2,247,667
S ouB O E .—. Director, Animal Husbandry, Bihar

SECTION \ Forest Statistics
96 planning—

6 6
TABLE 5.1
STATEMENT SHOWrNTG THE CLASSIFICATION OF FOREST AREA IN BIH AR
[ I n A c r e s ]
Year.
Reserved Forests.
Total.
Protected Forests.
Under direct management o f the Forest Department.
TotalUnder direct management o f the Forest Department.
Unclassed Forests.
------------------------------------- Grand Total(Cols. 2 +
Under direct 4-f- 6). Total. management
o f the Forest Department.
1 2 3 4 5 6 7 8
1958-59 9,80,301 9,80,301 64,13,587 64,13,587 8,85,152 8,85,152 82,79,040
1969-60 9,97,037 9,97,037 65,09,485 65,09,485 3,97,069 3,97,069 79,03,591
1960-61 10,12,698 10,12,698 62,63,254 62,53,254 4,33,594 4,33,594 76,99,646
1961-62 10,08,813 10,08,813 63,78,106 63,78,106 3,81,293 3,81,293 77,68,212
1962-63 10,09,914 10,09,914 63,92,371 63,92,371 3,71,665 3,71,566 77,73,8501963-64 10,09,736 10,09,736 63,89,643 63,89,643 3,71,241 3,71,241 77,70,620
1964-65 10,15,942 10,15,942 63,88,262 63,88,262 3,62,042 3,62,042 77,66,246
1966-66 11,02,720 11,02,720 72,72,000 62,72,000 2,84,800 2,84,800 76,59,6201966-67 10,78,165 10,78,165 62,07,110 62,07,110 3,16,407 3,16,407 76,01,682
1967-68 10,88,036 10,88,036 61,48,077 61,48,07? 3,09,491 3,09,491 75,45,603
SoTJBcis.-—Chief Conservator o f Forests, Bihar

TABLE 5.2
STATEM ENT SHOWING FOREST TRACTS PROTECTED FROM FIR E IN B IH A R .
[ I n A c r e s . ]
67
Year
Area attempted Area actually to be protected protected
from fire from fire(reserved and (reserved and
protected protected forest). forests).
1 2 3
19 58-69 62,04,046 60,63,035
19'59-60 •• 56,66,687 53,80,52519'60-61 •• 65,12,700 63,08,79819*61-62 •• 48,61,922 47,57,97419'62-63 •• 67,61,856 65,92,157
1903-64 •• •• 67,29,408 63,68,07 01964-65 •• •• 67,46,787 66,38,2171965-66 •• •• 57,01,760 55,76,32019616-67 •• •• 66,03,792 64,95,3591967-68 •• •• •• •• 75,45,603 74,96,450
SouBo®.— Chief Conservator o f Forests, Bihar

m
s t a t e m e n t s h o w i n g t h e OUTTUR]!^ o f t i m b e r , FUIJ-, HABAI G RAfS ANP BAMBOOS FROM RESERVEDA2^D PROTECTED FORESTS IN BIH AR.
TABLE 5.3
Year
Timber. Fuel.
In 000’ eft. In 000’ eft.
Sabai grass.
In maunds.
Bamboos.
Value in rupees.
Number in thousands.
Value ill, (1,000) rupees.
1 2 3 4 5 6 7
1958-59 73,86 2,01,65 47,266 39,975 14,677 20,77
1959-60 1,68,64 1,15,37 62,439 64,950 38,616 20,68
1960-61 1,23,58 84,04 21,031 68,304 32,975 22,12
1961-62 1,25,24 1,15,02 64,941 86,718 46,780 23,10
1962-63 1,10,24 84,07 86,903 2,13,887 41,001 26,17
1963-64 1,37,08 1,25,65 50,511 4,11,730 41,093 25.65
1964-65 1,45,34 1,02,23 1,62,673 4,69,549 40,989 30,84
1965-66 1,52,76 1,12,06 1,37,971 5,15,786 41,381 33,60
1966-67 1,18,51 1,07,80 1,06,243 3,67,672 N.A. 2S,94
1967-68 1,20,94 98,49 93,961 3,56,638 N.A. 36,47
SotTKcE.—Chief Conservator o f Forests, Bihar
TABLE 5.4
STATEMENT SHOWING TH E REVENUE FROM AND EXPENDITURE IN FORESTS IN BIH AR.
[In *000 R u p k e s . ]
Year Revenue realised Expen,ditur«
1968-59
1959-60
1960-61
1961-62
1962-63
1963-64
1964-66
1965-66
1966-67
1967-68
2 3 •
1,51,80 1,04,86
1,54,17 1,39,13
1,97,56 1,53,40
2,59,70 1,49,98
2,48,11 1,75,99
2,47,34 1,65,07
2,94,40 2,02,63
3,00,79 2,04,17
2,95,80 2,17,87
3,48,86 2,31,32

r e v e n u e f r o m a n d EXPENDtTURC ON FORESTIN BIHAR
»9S8
K A F I L A H M E D

RS. IN L A K H S
3 5 0
REVENUE ^ROM & EXPENDITURE ON FORESTS
IN BIHAR.
J -------------- 1________I________ L -I------------ 1--------------1________ I________ L
. 1 9 5 6 ---- 5 7 -----5 S ------5 9 ------6 0 ------ 6 »------- 6 2 ------ 6 3 ----- 6 4 ------ 6 5 ------ 6 6
K .A H M E D

m
STATEMENT SHOWING THE AREA CLOSED AND OPEN TO GRAZING (RESERVED AND PROTECTEDFORESTS) IN BIHAR.
[ A b e A m S q u a k e M i l e s . ]
TABLE 5.5
Year
Area closed Area open to grazing through- Area open to grazing for ato grazing out the year. part o f the year.
o f all animals---------------------------------------------- -•—------------------------------------- -thro ghout
the year. Of all O f non- Of all Of nonanimals. browi-ers only. animals. browsers only.
1 2 3 4 5 6
1958-59 1,992 5,549 1,157 185 3,447
1959-60 2,536 6,152 972 438 2,251
1960-61 3,949 4,381 812 886 2,085
1961-62 3,157 5,535 1,347 319 1,740
1962-63 2,045 7,186 1,525 155 1,291
1963-64 1,419 8,196 1,142 482 907
1964-65 1,492 7,179 1,574 1,460 428
1965-66 1,604 7,373 1,117 1,392 482
1966-67 1,688 8,637 2,085
1967-68 4,353 14,541 3,571 6,428 1,656
SoTTBOE.— Chief Conaeivator o f Forests, Bihar
TABLE 5.6
STATEMENT SHOWING THE PRODUCTION OF STICK LAC IN BIHAR
[ I n Q u i n t a l s ]
Year Production.
1961-62
1962-63
1963-64
1964-65
1965-66
1966-67
1967-68
1,81,023
2,21,146
1,56,761
89,541
1,19,995
1,50,975
2,28,982
SouBCB.—Indian Lac Cess Committee, Bihar.

70
TABLE 5.7
STATEMENT SHOWING THE DISTRICTWISE PRODUCTION OF STIK LAC (IN QUINTALS) IN felH AitDURING 1967-68.
District. Baisakhi. Jethi. Katki. Aghani(Kusmi). Total. Normal.
Santhal Parganaa
Ranchi
Singhbhum
Palamau
Hazaribagh
Gaya
Rest o f Bihar . .
Total
187
49,082
20,901
45,162
4,852
1,866
373
11,570
93
8,585
4,292
14,930
839
373
187
43,670
17,915
3,732
373
280
1,12,907
43,108
60,092
9,423
2,239
933
896
61,480
18,48a
53,598
7,927
3,696
1,60<5
1,22,423 11,570 29,299 65,690 2,28,982 1,47,685
. .— NilSoTjBCE.— Indian Lac Cess Committee, Bihar
TABLE 5.8
STATEMENT SHOWING THE EMPLOYMENT IN FOREST AND FOREST INDUSTRIES IN BIHAR
Year.
Forestry.
Management and Protection. Forest Industry Extraction. Grand Total.
Male. Female. Male. Female. Male. Female.
1 2 3 4 5 6 7
1960-61 20,53,135 10,38,258 5,72,032 2,10,977 26,25,167 12,49,235
1961-62 13,07,411 7,57,881 18,57,281 15,57,979 31,64,692 23,15,860
1962-63 18,66,798 12,56,462 33,19,065 11,95,057 51,85,863 24,51,519
1963-64 23,03,238 11,40,747 32,68,552 9,49,926 55,71,790 20,90,673
1964-65 •• 24,91,593 11,68,805 33,96,489 9,64,113 58,88,082 21,32,918
. . —^Not available
SoxTRCE.— Chief Conservator o f Forests, Bihar

71
TABLE 5.9
STATEMENT SHOWING THE DISTRICTWISE EMPLOYMENT IN FOREST AND FOREST INDUSTRIES INBIHAR DURING 1964-66.
District.
Forestry.
Managt ment and Protection, Forest Industry Extraction. Grand Total.
Male. Female. Male. Female. Male. Female.
1 2 3 4 5 6 7
Patna 10,118 3,316 10,118 3,316
Gaya 1,48,570 51,680 1,21,630 2,570 2,70,200 54,250
Shahabad 23,385 15,950 67,342 29,530 90,727 45, 480
Saran
Champaran 24,830 2,970 36,268 3,989 61,098 6,959
Muzaffarpur . . •• •• • • • •
Darbhanga •• •• ••
Monghyr 63,963 41,938 1,22,630 18,016 1,86,593 59,954
Bhagalpur 2,878 l,Q?Q 40 15 2,918 1,045
Saharsa . .
Purnea 10,587 1,100 10,587 1,109
Santhac Pargana 2,81,392 3,15,963 2,35,928 4,36,720 5,17,320 7,52,683
Hazaribagh 5,90,325 1,60,702 2,36,100 21,385 8,26,425 1,82,087
Ranchi 56,675 27,325 1,15,383 70,995 1,72,060 98,320
Palemau 6,70,980 80,982 16,13,858 90,363 22,84,838 1,71,345
Dhanbad 21,560 15,342 1,07,305 29,735 1,28,865 45,077
Singhbhum 5,86,330 4,50,507 7,40,003 2,60,795 13,26,333 7,11,302
GRAND TOTAL 24,91,593 11,68,805 33,96,489 9,64,113 58,88,082 21,32,918
r .— Nil
So u r c e .—Chief Conservator o f Forests, Bihar


SECTION VI Minerals
Planning— IS

74
t a b l e
STATEMENT SHOWING OUTPUT
Serialno.
Minerals.'
1 2
1 Coal
2 Iron-or
3 Manganese •• ••
4 Apatite •• ■ ••
5 Chromite-ore
6 Mica • •
7 Steatite
8 Slate . .
9 Limestone
10 Stone (igneous rocks)
11 Sandstone
12 Gravel
13 Fire-clay • • • •
14 China-clay, Clay and White clay
15 Asbestos
16 Kyanite •• ••
17 Copper-ore •• ••
18 Silica . .
19 Bauxite • •
20 Dolomite • •
21 Felspar •• ••
22 Quartz •• ••
23 Iron Pyrites •• • •
24 Graphite •• ••
25 Laterite ..
Units. 1959. 1960.
. . Tonnes 22,730,000 25,051,000
. . D itto 2,234,200 2,847,050
Ditto 27,438 19,180
Ditto 12,836 13,627
. . D itto 3,492 4,436
.. Kilogram 16,338 14,716
Ditto 4,375 5,066
Ditto t t
Ditto 1,753,815 2,051,000
Ditto t tDitto t tDitto t t
Ditto 77,316 66,771
Ditto 139,300 19,545$
Ditto 42 267
Ditto t 20,089
Ditto 403,711 447,882
Ditto 4,526 tDitto 76,953 106,276
Ditto t tDitto t t
Ditto t t
Ditto t t
Ditto t t
Ditto

6.1.
OF MINERALS IN BIHAR.
75
1961. 1962. 1963. 1964. 1965, 1966. 1967. 1968.
6 10 11 12 13
27,163,000
2,944,760
8,826
19,498
4,703
13,559
5,267
t
29,790,643
1,669,845
25,795
27,731
6,965
13,835
4,228
t
32,141,000
2,470,326
21,943
11,850
7,078
11,354
4,566
t
29,581,000
3,649,148
21,301
3,402
2,232
11,163
4,308
t
31,045,856
4,227,290
32,611
6,833
t15,368,197(0)
9,046
2,151
31,176,535
5,370,362
33,723
13,775
t12,678
5,992
1,457
30,559,019
5,515,133
10,487
3,331
t
10,162
4,438
1,312
32,190,451
5,774,762
23,671
264
t
9,347
2,404
1,934
2,036,227 2,213,235 2,141,008 2,140,953 236,983 2,113,219 2,077,775 2,194,899
t t t t 1,011,196 1,122,217 1,166,494 917,791
t t t t 561,068 6,891 29,004 9,969
t t t t 63,482 45,184 11,543 t58,310 83,844 111,294 87,149 131,028 141,499 130,520 118,002
132,987 139,682 83,542 t 151,776 153,835 190,728(a) 145,240(o)
90 220 347 417 297 307 380 692
27,093 49,618 32,026 33,547 37,308 63,709 49,405 64,108
423,270 492,255 474,345 472,963 467,580 480,863 458,981 475,744
12,458 6,339 42,998 21,278 14,076 20,146 20,177 28,247
153,660 215,425 275,017 337,564 315,583 371,479 399,956 412,128
3,646 4,066 8,723 4,956 12,940 23,346 14,726 15,910
257 925 115 328 2,007 4,267 4,603 2,497
t t T t t 25,169 30,634 26,718
t t t t t 422 144 16,378
t t t t t 805 358 322
•• ••/
•• •• •• 3,978 11,633
(a) Including Clay and White Clay (■}■)— Not availa'ble.
SouBCE. —(t) Chief Inspector o f Mines, Dhanbad.(n) Director General o f Mines Safety, DhanbacL

76
TABXE
STATEMENT SHOWING THE D AILY AVERAGE NUMBER OF WORKEIRS
Serial Mines. 1959. 1960.no.
1 2 3 4
1 Ckjal
2 Iron-ore
3 Manganese • • • •
4 Mica • • • •
5 Apatite • • • •
6 Chromite-oro
7 C!opper
8 Steatite . .
9 Slate
10 Limestone
11 Stone (chiefly in rock)
12 Sandstone
13 Gravel
14 Fire-clay . .
15 China-clay, Clay and "White Clay
16 Asbestos • » • *
17 Kyanite • • • «
18 Bauxite
19 Silica
20 White-clay m »
21 Dolomite • • • •
22 Felspar • • • •
23 Graphite • • • •
24 Iton Pyritea
26 Laterite • • •
26 Quartz ••
27 Phoaphatic Nodules
1.86,271 1,22,0S5
12,785 10,82:0
346 3T8
17,502 17,534
175 191
479 364
4,502 4,507
128 135
52 44
6,438 7,260
3,204 3,718
32 6
35 55
895 980
3,296 3,600
736 S07
507 617
121 236
735
. . —Not available.
(a) l&olttdi»g Whlt«>o}«y a&d Osy.

77
6.2.
EM PLOYED IN DIFFERENT CLASSES OF MINES IN BIHAR.
1962. 1963. 1964. 1965. 1966. 1967. 1968.
6 8 9 10 11 12
2,03,091
10,675
51
15,098
125
354
4,174
105
90
7,702
4,443
S47
784
3,588
59
1,110
934
282
587
246
31
174
156
42
819
2,15,935
16,914
163
14,048
538
3,929
64
71
7,634
4,022
198
92
728
3,976
60
1,148
956
224
430
143
25
184
32
69
658
251
12,708
56
11,788
245
268
3,671
33
7,563
1,077
3,796
98
1,677
1,153
525
81
13
2,07,709
12,874
101
10,331
172
60
3,772
112
7,355
848
3,288
460
1,098
1,169
274
192
39
2,02,743
11,876
233
11,168
209
12
4,081
162
78
6,798
7,100
330
144
889
250
609
1,228
12
3,252
222
30
317
220
71
2.05,100
11,235
190
11,660
270
4,098
122
80
6,642
6,567
100
951
3,297(0)
155
954
1,007
17
310
162
173
413
• •
128
1,97,969
10,645
96
10,584
153
4,041
80
75
6,801
5,288
236
34
782
2,835(a)
169
1,110
1,063
220
281
52
1.35
655
18
240
1,90,425
10,091
113
9,560
4
4,283
44
64
7,095
4,325
358
872
2,512(a)
236
1,098
1,148
296
132
31
150
684
39
243
Sotmoas.— («) Chief Inspector o f Mines, Dhanbad.
Direotor>0«&erftl of Minei Safety, Dh*nb*d«

TABLE 6.3.
STATEMENT SHOWING AVERAGE W EEKLY EARNINGS IN JHARIA COALFIELD IN BIH AR.
[Amount in Rnpees and Paise]
78
In Decembc r.
Underground. Open cast working. Surface.
Others.Mines and Others. Mines a n d ------------------- -----------
loads. loads. Men. Women.
Others. Clerical and Overall.-------------------------------- SupervisoryMen. Women. staff.
10
1959 23.51 21.69 20.33 17.66 17.80 19.75 20.23 45.06 22.73
1960 24.69 23.60 20.94 19.01 17.91 22.10 20.55 46.23 24.14
1961 23.51 23.46 21.37 18.34 19.00 21.91 20.98 44.21 23.58
1962 24.85 23.74 20.91 20.39 10.88 22.76 21.37 41.99 24.38
1963 25.73 26.12 23.72 22.25 20.12 25.12 23.47 45.51 26.25
1964 26.19 25.19 23.65 22.16 21.68 25.53 24.27 45.47 26.54
1965 30.37 30.45 28.75 28.03 26.57 28.61 27.03 46.47 30.69
1966 32.36 32.76 31.59 30.40 30.83 31.75 29.37 51.39 33.16
1967 44.81 44.88 35.90 35.87 35.69 42.35 38.41 65.11 44.52
1968 48.43 47.27 40.06 40.89 39.90 44.77 42.88 71.97 47.71
SotTROKS.— (i) Chief Inspector o f Mines, Dhanbad.
(n) Director-General o f Mines Safety, Dhanbad.

n
St a t e m e n I ’ s h o w in g t h e a v e r a g e d a i l y e a r n i n g s o f w o r k e r s e m p l o y e d i n m i c a , c o p p e r -ORE AND CHINA-CLAY MINES IN BIHAR IN DECEMBER.
(A m o u n t i n R u p e e s a n d P a i s e .)
TABLE 6.4
Below Ground. Open Cast Working. Above Ground.
Year. Overall.
Foremenand
Miningmates.
Micaworkers
andloaders.
Others.Foremen
andMiningmates.
Mines and Others,
loaders.
Clericaland
supervisorystaff.
Workers in any-
attached factory.
Others.
1 2 3 4 5 6 7 8 9 10 11
Mica.
1961 3.59 2.78 2.07 3.24 2.16 3.79 3.47 1.53 2.32 2.72
1962 3.19 2.23 2.21 3.30 1.83 3.61 3.34 1.84 2.14 2.30
1963 3.55 3.05 2.42 2.80 1.50 1.84 3.37 1
1964 3.88 2.51 2.68 3.72 2.35 2.44 3.86 '
1966 4.28 2.44 2.82 2.57 2.32 2.29 3.67
1966 3.80 2.05 2.03 4.43 1.78 1.61 2.99 1.77
1967 3.79 2.04 2.19 . . . 3.71 1.93 2.31
1968 4.24 2.33 2.53 3.11 1.58
Copper.
2.76 3.82 •• 2.22 2.61
I96I 12.06 3.76 3.76 9.20 4.16 4.07
1962 8.79 4.14 4.72 10.27 5.01 4.97 4.20
1963 10.42 3.87 4.18 10.41 1.08 3.98 4.56
1964 13.05 4.36 4.83 • • 9.46 4.30 4.74
1965 9.43 4.52 5.71 • • 8.95 6.79 5.48
1966 16.88 4.16 5.40 • • 10.69 • • 6.27 . .
1967 14.80 4.99 6.35 9.73 6.89 6.09
1968 16.37 5.29 6.03 10.32 . . 6.99 6.25
China Clay.
1961 . . 1.76 1.08 1.15 3.02 1.17 1.32 1.24
1962 . . • • 2.14 1.12 1.10 3.20 1.32 1.21 1.28
1963 2.19 L12 1.23 3.22 1.30 1.29 1.30
1964 • • • • 2.24 1.16 1.14 3.49 1.31 1.37 1.35
1965 . . • • 2.93 L15 1.74 4.04 1.34 1.12 1.43
1966 • • 2.04 1.27 1.12 3.30 • • 1.25 . .
1967 • • • • 2.57 1.30 1.17 4.04 . . 1.34 1.43^
1968 •• 2.59 1.29 1.33 3.27 •• 1.30 1.40
. . —Not available.
SOTTBOE.—Chief Inspector o f Mines, Dhanbad.

80
TABLE 6.5.
STATEMENT SHOWING THE D AILY AVERAGE EARNINGS OF W ORKERS EMPLOYED IN IRON-ORE, SITONIAND LIME-STONE MINES IN BIHAR IN DECEMBER.
(Amount m R upees and P aise).
Open Cast working. Above Gronnd.
Year. Overall.
Foremen and Mining.
Mines and Others. Loaders.
Clerical and supervisory
staff.
Workers in attached factory.
Others.
1 2 3 4 5 6 7 8
I b o n - o i i e .
1961 3.48 2.16 3.01 7.00 5.24 3.01 3.32
1962 3.39 1.36 2.62 6.21 3.49 3.24 2.86
1963 . . 4.48 1.87 3.26 2.76
1964 4.92 2.25 3.91 5.71 2.48 2.03 2.75
1965 6.36 2.52 2.76 6.13 3.99 1.77 2.81
1966 4.08 2.60 2.68 6.47 3.84 . .
1967 7.06 4.48 6.60 9.96 . . 6.77 6.54
1968 8.90 4.70 7.10
S t o n e .
13.10 •• 6.94 7.23
1961 2.42 3.06 1.73 3.17 1.50 2.37 2.26
1962 2.43 2.93 2.58 4.15 1.74 2.68 2.55
1963 . . 2.95 3.06 2.05 2.38
1964 3.46 2.99 2.67 4.40 1.75 1.90 2.33
1965 4.09 3.18 2.58 4.40 2.08 1.96 2.56
1966 3.97 2.98 2.33 4.11 . . 1.83 • •
1967 4.60 3.23 2.68 4.81 . . 2.05 2.68
1968 4.38 3.69 2.82 4.54 • • 1.97 2.62
L i m e -S t o n e .
1961 4.99 3.93 4.12 6.65 3.94 3.22 4.09
1962 4.53 3.26 3.56 6.50 4.42 3.19 3.57
1963 . . ■ . . . 4.96 3.49 4.82 4.21
1964 4.57 3.88 4.68 9.88 6.39 4.56 4.63
1965 6.74 5.09 6.26 8.50 7.20 4.84 6.33
1966 6.98 4.86 4.94 8,89 4.71 • •
1967 6.60 6.32 6.45 9.20 6.22 6.48
1968 7.36 6.37 6.13 10.14 6.22 6.58
. —Not available.
SointOB.—Chief Inspector o f Mines, Dhanbad.

TABLE 6.6.
06 Planning— 14

82
tABLE
STATEMENT SHOWING THE VALUE OF OUTPUT
Serialno.
Mineral. 1989. 1960.
1 2 3 4
1 Coal 42,72,82 49,05,66
2 Apatite •• •• . . - 3,81 4,43
3 Asbestos 8 28
4 Bauxite 7,08 9,20
5 China-clay, Clay and White Clay •• •• •• 18,65 26,96
6 Choromite 3,14 4,54
7 Copper 2,18,97 2,37,36
8 Fireclay . . . . 6,76 6,05
9 Gravel N.A. N.A.
10 Iron-ore 1,96,63 2,46,34
11 Kyanite 33,66 60,08
12 Lime-stone 91,21 1,12,18
13 Manganese . . - 4,71 6,56
14 Mica 1,68,49f 1,65,57
15 Sandstone N.A. N.A.
16 Silica (and Quartz Silica) , •• 1 N.A.
17 Slate N.A. N.A.
18 Steatite • • 22 27
19 Stone N.A. N.A.
20 Dolomite . . • •
21 Felspar •• •• . . ••
22 Graphite • • N.A. N.A.
23 Iron Pyrites • • N.A. N.A.
24 Quartz •• •• •• N.A. N.A.
25 Laterite .. ••
t Value of crude mica.N.A.—'Not available.— Available since 1961.(o) Silica only.(6) Including Clay and White Clay

83
8.6.
(IN ’ OOO RUPEES) OF MINERALS RAISED IN BIHAR.
1961. 1962. 1963. 1964. 1965. 1966. 1967. 1968.
53,87,30 62,82,29 73,81,65
5,70 7,52 3,05
16 26 45
13,73 16,14 23,60
22,75 23,64 21,24
4,76 6,80 6,71
2,29,81 2,35,11 2,27,69
5,33 7,13 10,21
N.A. N.A. N.A.
2,24,26 2,28,20 2,90,06
64,93 98,14 62,88
1,20,00 1,43,64 1,53, K
2,29 5,94 6,04
1,43,69 1,55,63 1,27,59
N.A. N.A. N.A.
2,73 2.10 11,15
N.A. N.A. N.A.
29 23 28
N.A. N.A. N.A.
29 30 69
3 6 1
N.A. N.A. N.A.
N.A. N.A. N.A.
N.A. N.A. N.A.
10 11 12
69,51,00 70,00,74 72,92,45 80,54,05 96,96,65
86 4,53 5,05 1,89 42
51 41 47 37 524
28,83 38,54 20,67 35,39 39,53
21,75 N.A. 27,6o 26,92 23,08(6)
97 N.A. N.A. N.A.
2,41,21 2,24,64 2,30,99 3,90,13 4,04,38
3,68 13,35 14,40 11,93 10,40
N.A. 2,55 3,33 43
3,72,39 4,90,69 6,26,23 8,24,91 8,41,67
62,55 77,93 1,47,51 1,29,47 1,68,86
1,56,55 1,66,18 1,72,32 2,19,27 2,84,01
7,05 10,35 7,60 2,25 5,60
1,27,26 1,65,97 1,50,48 1,34,66 1,19,73
N.A. 22,24 35 7,86 7,78
3,53 1,19(a) 6,05(a) 1,56 2,40
N.A. , 58 60 57 63
24 47 50 20 12
N.A. 67,42 60,39 50,00 48,46
39 1,21 2,11 1,34 1,54
4 32 55 49 27
N.A. 1,17 58 23 32
N.A. N.A. 25 12 14,08
N.A. N.A. 6,8o 7,58 7,87
4 23
SotTRCB.— (i) Chief Inspector of Mines, Dhanbad.(u) Director-General of Mines Safety, Dhanbad.

84
TABLB
STATEMENT SHOWING THE FATAL AND SERIOUS ACCIDENTS IN
Number o f accidents. Number o f persons killed.
Mineral field.
Fatal. Serious. Uuder-
Male.
Open working.
Male. Female.
Surface.
Male. Female.
1 2 3 4 5 6 7 8 9
Coal 103 483 92 13 2 10 1 118
Copper 3 US 2 .. 1 3
Iroxi-ore S 33 1 2 3
Lime-stone .. 2 19 1 1 • • 2
Mica 2 12 2 2
Stone 7 2 6 1 7
Bauxite 2 . . . . i
Iron-Pyrite 1 12 1 1,
Slate 1 2 2
T O T A L -B IH A R .. 122 706 96 23 S 15 1 1S&
.. -N il .

Number o f persons seriously injured. Death rate per 1,000 persons Serious injuries rate per 1,000employed. persons employed.
85
6.7.
AND ABOUT MINES REGULATED BY THE MINES ACT, 1952 IN BIH AR DURING 1968.
Unider-ground.
Male.
Open cast working
Male. Female.
Surface.
Male. Female.Total.
Underground,
Opencast
working.
Surface. Overall. Underground.
Opencast
working.
Surface. Overall.
10 11 12 13 14 15 16 17 18 19 20 21 22 23
399 34 4 69 6 • 512 0.89 0.45 0.21 0.62 3.84 1.13 1.42 2.69
129 18 147 0.63 0.89 0.70 40.82 16.03 34.32
6 4 22 1 83 0.18 0.44 0.30 1.80 5.08 3.27
17 1 1 19 0.35 0.38 2.95 1.51 2.68
9 3 12 0.27 0.21 1.22 1.42 1.26
S(a) 8(a) 8.12 0.42 1.82 0.83 0.46
2 2 8.70 1.76
12 . . 12
35.09
9.52 1.46
31.25
20.73 17.54
549 60(a) 8 U5 S T40ta) \r,< 11.48 36.54 66.61 6.11 34.16 63.98
SouBCB. —Director-General o f Mines Safety, Dhanbad.
(a) Number for calcalating rates as these relate to manager, etc.

SECTION VII Vital Statistics

TABLE 7.1.
STATEMENT SHOWING NUMBER OF BIRTHS, DEATHS, INFANT IN BIHAR.
MORTALITY AND T H E IR RATES
Year.Total
n o . o f births registered.
Total n o. of deaths
registered.
Birth Death Infant rate per 1,000 rate per 1,000
mortality. of mid-year o f mid-year population. population.
Infant mortality
rate per 1,000 live birth.
1 2 3 4 5 6 7
1957 . 597,631 332,968 37,930 14,48 8,07 63.47
1958 . 549,599 319,460 40,394 13.19 7.67 73.50
1959 . 549,278 235,587 39,327 13.05 5.60 71.60
1960 . 474,436 222,331 39,972 10.34 4.84 84,25
1961 . 458,442 229,442 39,891 9.87 4.91 87.01
1962 . 429,816 184,572 33,631 9.03 3.88 78.42
1963 . 466,098 211,112 35,180 9.63 4.36 75.48
1964 . 495,982 240,485 39,266 10.05 4.87 79.17
1965 . 522,332 285,312 36,260 29.15 16.17 69.42
1966 . 497,046 246,662 36,913 22.02 11.37 74.26
S o u r c e . —Directorate o f Statistics and Evaluation, Bihar.


NUMBER OF DEATHS DUE TO DIFFERENT CAUSES
INt h o u s a n d s .2 O —
IN BIHAR
f 5 —
ro
r957. 1 95 8 ,1 9 5 9 . 19 6 0 , 19 6J. 19 62. 19 63. |9 64, | 9 6S, | 9 66.
K A F I U A H M E D .

SHOWiNO DlSTRlCTM SE.injM SER OF BIRTHS AND DEATHS REGISTERED, XNTANT MORTA* b i r t h a n d d e a t h a n d i n f a n t m o r t a l it y r a t e s , e t c . i n BIHAR DXJRINO THE
T A B ^ 7J2.
1968-
District.Total no.
of live births
registered.
Total no. of deaths
registered.Infant
mortality.
Birth rata per 1,000 of mid-year
population.
Death rate per 1,000 o f
mid-year population.
PatnaGaya ••SbahabadSaran(ifiamparan..MuzafifarpurDarbhangaMonghyr . •Bha^pur . .SahafsaPurneaSanthaiParganaa Hazaribagh " Ranchi Falamau .. Dhaabad . . 6ingfabhum..
TOTAL
37,754 19,262 3,690 21.95 11.93 .67,786 30,098 5,461 27.26 14.6850,570 20,988 4,340 26.48 11.4831,345 14,460 1,879 21.43 10.2d31,916 16,299 2,277 21.38 10.7039,765 • 20,304 2,702 13-11 8.3«26,066 12,244 1,525 24.68 13.7841,070 23,567 3,810 21.78 13.0319,583 10,889 1,547 25.76 14.7918,850 7,241 815 16.04 «.1028,742 14,518 1,877 18.22 ■ 9.2021,668 11,310 1,220 23.32 11.3821,807 11,444 1,336 21.18 : 12.30 '26,676 15,529 1,934 21.91 11.3612,511 5,212 1,339 30.91 13.6412,810 5,622 600 21.11 7.8818,127 7,675 561 28.48 [12.08
4,97,046 2,46,662 36,913 22.02 '11.37
Souaca.—Directorate of Statistics and Evaluation, Bihar.
TABLE 7.8.
STATEMENT SHOWINa NUMBER OF DEATHS DUE TO DIFFERENT CAUSES IN BIHAR.
Year Cholera. Small-poz. ■Plague. Fever.Dysentery
andDiarrhoea.
Respiratory.
Injury. All other causes.
Total.
1 2 3 4 6 6 7 8 9 10
1957 • 10,098 6,427 77 269,839 2,153 3T1OI 3,201 39,022 332,9681958 8,689 20,626 66 246,289 2,149 2,413 2,662 39,686 319,4601959 2,670 6,343 67 73,883 2,869 3,240 2,773 45,836 236,687I960 3,067 1,866 61 160,062 4,695 4,619 4,222 43,746 222,33119«1 8,883 786 78 168,155 5,101 6,189 3,246 48,004 229,44219821 . . 760 . 861 130,476 3,341 4,226 2,690 42,229 184,6721963 2.649 8,002 141,413 4,546 4,750 3,271 46,481 211,1121964
.. 1,693 10,667 . . 163,298 4,886 6,680 2,283 52,078 240,4861985
.. 11,026 14,988 . . 176,430 6,657 5,594 3,389 69,229 285,3U*i69
.. 1,441 12,993 ... 160,526 5,137 1,390 4,383 70,792 . 246,662
aa of plague, dysentery and diarrhoea, respiratory, injury f jr the years 1957, 1958 and 1959 are provisional,
Souao*.—Directorate of Statistics and Evaluation, Bihar.16

90
TABLE 7.4.
STATEMENT SHOWING DI8TRICTWISE NUMBER OF DEATHS DUE TO DIFFERENT CAUSES T\rT TTDTXTr lAaflDURINQ 1966. B15*1
1District.
' Nxunber of deaths due to different capses
Cholera. Small-poz. Fever.Dysentery
andDiarrhoea.
Respiratory.
Injury. All other causes. Totj|_
1 2 3 4 5 6 7. , 8 9
Patna 129 1,168 9,748 413 150 419 7,235Gaya 407 960 19,931 484 105 348 7,863 30,OilShahabad .. 91 237 16,276 166 88 319 4,811 20,98tBarea 66 239 9,698 166 28 169 4,224 14,4«Champ aran.. « . . . 60 933 11,170 204 36 280 3,626 16.29JMua^affaipur 93 801 14,296 290 98 282 4,444 20,sotDarbhanga 73 646 7,392 335 97 197 3,504 12,2UMonghyr . . 72 2,081 14,337 290 60 341 6,386 23,5«Bhagalpur 68 251 6,498 260 110 222 4,480 10,g«
Baharea 46 469 6,199 106 11 145 1,276 7,241
Pumea 78 3,116 7,316 229 88 299 3,392 14,511
SantheU Parganas 73 286 7,143 285 21 155 3,347 11,11!
Hazaribagh.. 74 429 6,561 208 62 361 3,759 11,M
Rajichi 72 979 8,042 1,226 147 417 ,4,646 15,S»
Palamau 23 62 3,902 96 28 126 977 3,2Ul
Dhanbad . . ’ ' 2 4 146 2,191 173 72 164 2,862 5,69
Singhbhom.. 13 200 2,926 217 189*
170 . 3,960 7,W5
TOTAL.. 1,441 12,993 150,626 6,137 1,390 4,383 70,792 246,611
SOOBOB.—Directorate of Statistics and Evaluation, Bihar.

SECTION m Medical Stitistlcs

STATEMENT SHOWING TOTAL NUMBER OF HOSPITALS AND DISPENSARIES, NUMBER OF H0SPITAL9|HAVING BEDS AND NUMBER OF BEDS THEREIN IN BIH AR.
92
TABLE 8.1.
Year.Total Number o f
number o f hospitals Number chospitals cmd having beds,dispensebriea. beds.
1061 (a) 590 270 7,097
196S (b) . . . . . 566 270 7,178:
l»6t (o) • • • • • • . . . 582 262 6,476
1964 (d) 471 207 6,692
1960 (e) . . • • 1,006 817 9,781
1968 (e) . . . . 1,028 844 10,151
IWff(f ) . . • • . . . . 1,046 844 11,847
1968 (g) •• •• •• •• •• •• 1,058 844 2,57C
(a) Excluding Patna, Muzaffarpur, Shaharsa, Pumea, Palamau, Dhanbad and Singhbhum.
(b) Excluding Patna, Gaya, Saran, Muzaffarpxir, Saharsa, Pumea, Palamau and Dhaabad.
(e) Excluding Saran, Champaran, Darbhanga, Pumea, Hazaribagh and Singhbhum.
(d) Excluding Shahabad, Saran, Champaran, Darbhanga, Bhagalpur, Saharsa, Fume*, Banthal Parganas and Singtbhum.
(e) Excluding Saran, Champaran, Monghsrr, Pumea, Saharsa and Bhagalpur.
( /) Excluding Sarettx, Champaran, Monghyr and Singhbhum.
(g) Excluding Saran, Muzaffarpur, Monghyr and Santhal Parganas.
N.B.—^Figures from 1960 onwards are provisioiml.
^Incomplete figure.
SouBCB.—Directorate of Statistics and Evaluation, Bihar.

STATEMENT SHOWING TOTAL NUMBER OF HOSPITALS AND DISPENSAEIES, NUMBER OF HOSPITALS HAVING BEDS AND NUMBER OF BEDS THEREIN IN EACH DISTRICT OF BIHAR DURING 1968.
93
TABLE 8.2.
Districts.Number of Number o f
hospitals and hospitals dispensaries, having beds
Number o f beds.
2 3 4
76 24 398 ’
79 11 ‘ 186
66 31 510
44 11 N .R .
48 17 70
76 7 N .R .
78 9 107
65 34 N .R .
49 6 71
57 19 163
64 S
55 12 N .R .
67 49 411
30 14 131
80 42 N .R .
47 29 68
62 21 76
Patna
Gaya
ShaJiabad
Saran
O h a iD p a ra x i
Muzaffarpiir
Darbhanga
Monghjrr
Bhagalpur
8 all area
Purnea
Santhal Parganas
Ranchi
Palamau
Hazaribagh
Dhanbad
Singhbhum
TOTAL 1,033 344 2,670
N.R*— Not received.
SoTTBOB.— Directorate[of Statietics and Evaluation, Bihar.

t a t e m e n t s h o w i n q n u m b e r o f h o s p i t a l s a n d d i s p e n s a r i e s i n e x i s t e n c e u n d e r d i f f e r e n tCLASSES IN BIHAR AT THE END OF THE YEAR, 1968.
94
TABLE 8.8.
Class o f Hospitals and Dispensaries.
1
Number.
2
I. state Public . . .................................. .. 714
n . State Special . . .. 71
TTT. Bun by Local and Municipal Funda •• .. . . 168
IV. Private aided •• .. 14
V. Private non-aided—
(o) Unde» Qovemment supervision • • .. 15
(5) Not under Government supervision •• .. . . 17
VI. Railway •• .. • • SI
V n . Subsidised . . .. •• 3
TOTAL . . •• 1.033
SOUBOE. —Directorate o f Statistics and E valuation , Bihar.
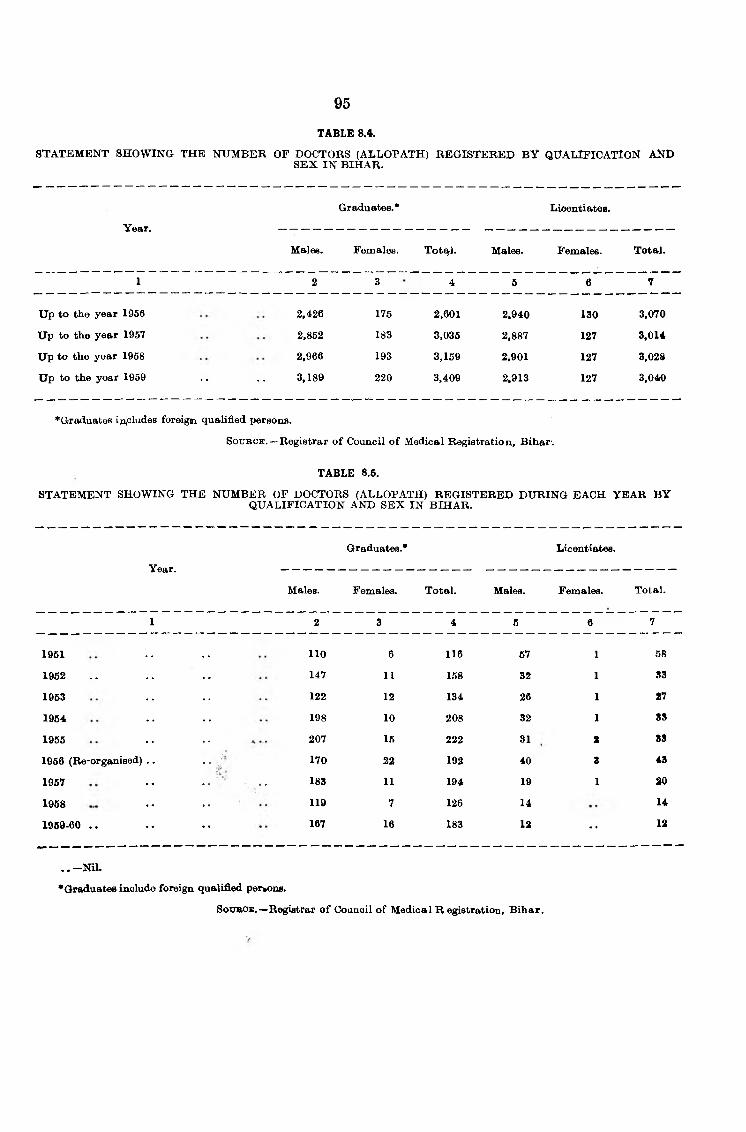
96
TABLE 8.4.
STATEMENT SHOWING THE NUMBER OF DOCTORS (ALLOPATH) REGISTERED BY QUALIFICATION ANDSEX IN BIHAR.
Graduates.* Licentiates.
Year.
Males. Females. Tot%l. Males. Females. Total.
1 2 3 4 5 6 7
Up to the year 1956 2,426 176 2,601 2,940 130 3,070
Up to the year 1967 2,852 183 3,035 2,887 127 3,014
Up to the year 1958 2,966 193 3,169 2,901 127 3,028
Up to the year 1959 . . . . 3,189
•Graduates in,cludes foreigm qualified persons.
220 3,409 2,913 127 3,040
SouBCB.—Registrar o f Council o f Medical Registration, Bihar-.
TABLE 8.5.
STATEMENT SHOWING THE NUMBER OF DOCTORS (ALLOPATH) REGISTERED DURING EACH YEAR BYQUALIFICATION AND SEX IN BIHAR.
Graduates.* Licentiates.
Year.
Males. Females. Total. Males. Females. Total.
1 2 3 4 6 6 7
1951 110 6 116 67 1 68
1962 . . . . . . 147 11 158 32 1 83
1953 122 12 134 26 1 n
1964 198 10 208 32 1 3S
1955 207 16 222 31 S 88
1966 (Re-organised) . . / 170 22 192 40 3 48
1957 . . 183 11 194 19 1 20
1968 • • • • 119 7 126 14 14
1969-60 . . 167 16 183 12 •• 12
. . - N i L
♦Graduates include foreign qualified perBons.
SoUBOB.—Registrar o f Coanoil o f Medical B egistratiou, Bihar.

^SO W m G M E STATISTICS OF REGISTERED NttRSES, MfD\VI\^ES, t-At)iES MEALTH V lS lT ok S . A U XILIA R Y NURSES AND MIDWIVES AND TRAINED DAIS IN BIHAR.
(Number)).
86
TABLE 8.6.
Year. Nurses. Midwives. T-Dais. L.H.V. A.N.M.
1 2 3 4 5 6
LW60 65 65 Nil 3 23
1961 265 133 2 2 45
1962 149 108 104 4 21
1963 123 148 45 3 41
1964 132 94 28 1 28
1965 122 89 6 8 52
1966 181 117 6 4 36
1967 ; . 140 67 3 Nil 20
1968 162 139 6 1 19
SOUBOE. — Registrar, Bihar Nurses Registration Council.

SECTION IX

98
STATEMENT SHOWIJ^G THE NUMBER OF INSTITUTIONS AKD
Typo o f Insitutions.
•1955-56.
Number of Institutions. Number
For men. For women. Men.—— , "
1 2 3 41
R bcookisbd—
Universities . . 2 2,458
•Research Institution . . . . ••
Board o f Secondary EducektionI
1CJoiiUKJSS—
Arts and Science (including Intermediate College)i
49 5 38,641 l.s«Teachers’ Training 4 1 440
Mediced and Veterinary Science 8 2,1850
Engineering and Technology 6 1,130
Agriculture and Forestry ' 2 336 ..
Commerce . . . . . . . . ; . . ... 2 2,325 ..
Law . . . . . . . . 3 934 ..
Other 3 132
T otal 78 6 48,581 1,441
iiiOKOOLs—<
Secondary . . . . . . . . 4,073 211 655,481 42,84}
Primary 26,818 2,731 1,488,257 112,95J
Nursery . . . . • 4 191
T otal 30,895 2,942 2,143,929 155,80>
Vocational ant> other Schools—
Teacher’s Training 75 13 6,834 611
Medicine 1 • • • 99 ••
Engineering . . 4 943
Technical and Industritd . . . . 28 4 2,008 343
Commerce . . 18 2,525
Agriculture . . 18 1 1,761 14
For the Handicapped . . 6 •• 194 ••
For adults . . 4,557 278 179,345 8,238
Others 454 10 16,727 220
' Total 5,161 306 210,436 9,32»
Total— R ecoqnibed . . 36,134 3,254 2,402,946 .. ..166,
Total— Unrecognised . . 905 68 45,462 , 1 2,51*
GRAND TOTAL 37,039 3,322 2,448,408
.— Not available. ♦Introduced since 1956-57.
■fNot teaching body. SOTTBOX.— Director of Public Instruction, Bihar.

99
JJ-'! [TUTI0.N« POB m e n a n d w o m e n b y t y p e s i n BIHAR.
• •
i 1956-57 (reorganised). ■ 1957-58.
Number o f Scholars. Number of Institutions. Nimiber o f Scholars.
j.{,rmen. For women. Men. Women. For men. For women. Men. Women.
7 8 9 . 10 . 11 . . 12 13
2 3,200 2 3,449
4rVt100 4 . . 98 . .
1 •• t t t •• t t
51 6 45,838 l,66o 59 6 65,032 2,026
4 1 ' 512 53 4 I 549 49
8 ' 2,446^ . . . 8 • • 2,370 . .
5 • • 1,436 5 2,220 • •
2 442 • ^ 2 519
' 2 2,342 2 2 2,474 • •
3 : ; 821 3 837
8 462 .. V. . 9 •• 555 ••
90 6 57,598 1,716 99 7 68,103 2,126
4,192 220 696,115 45,813 4,443 231 747,511 49,650
26,735 2,951 1,529,547 124,508 . 27,308 . 3,109 1,557,779 135,635
6 1 351 32 7 2 423 71
30,933 3,172 2,223,013 170,353 , 31,758 . 3,342 2,305,713 ' 185,266
74 14
•
6,793 557 73 . 16 6,267 644
1 ' . . . 90 2 . . 234 . .4 <
1,209 . . 5 . . 1,776
23 4 2,143 365 29 5 2,970 424
16 1,989 18 . 1,787 . .
18 ,( I 1,197 . 12 ; 20 • .. . 1 2,025 10
6 222 6 ’ ( ..r 219 . .
5,367 400' 220,298 14,257 . , 5,695 . • 607 v, 228,395 19,490
10 18,474 . .458 482 11 T .• 19,529 496
^ 6,972 429 252,415 15,649 6,330 639 263,202 21,064
36,995 3,607 2,535,026 187,718 38,187 3,9rf<i 2.637,01.< 208,436
828 103 42,113 3,483 /85 99 41,244 3,350
^ 37,823 3,710 2,577,144 191.201 38,972 4,087 2,678,262 211,786

1 0 0
STATEMENT SHOWING THE NUMBER OF INSTITUTIONS AND K
1968-59.
Typo o f Institutions.Number o f Institutions. N tim beT^fi;;;^^*-^
For men. For women. Men.
1 -W . 16 ■16
RKOOGIflSBa)—
Universities . . .. 2 .. 3,889 ^♦Research Instititution . . ,. • •Board o f Secondary Education •• •* •• •• t ’ t
CoLLEaBS—■ *
Arts and Science (including Intermediate College) 67 6 62,448 2,321Teacher’s Training 4 1 679 53Medical and Veterinary Science 8 2,248Engineering eind Technology 5 2,716Agriculture and Forestry 2 637Commerce . . 2 2,^80Law 3 899Others 8 •• 668
To3rA.t. 101 7 76,663 2,374
Schools—
Secondary . . •• •• 4,898 269 990,622 63,703
Primary •• •• 28,639 3,602 2,006,631 1.75,07o
Nursery •• •• 10 •• 627
Totai. •• •• 33,447 3,761 1,196,780 238,779
V0 OATIONA.L AND orHBB SOHOOIiS—
Teacher’s Training •• •• 70 17 6,288 769
Medicine • • •• 1 •• 63
Engineering . . •• 14 •• 3,020 ••
Technical and Industrial •• • • 24 6 3,869 491
Commerce . . • • •• 19 •• 2,203 ••
Agriculture . . •• •• 16 1 1,466 10
For the Handicapped . . •• •• 6 •• 238 ••
For adults . . •• •• 6,912 706 210,399 24,112
Others • • ♦ 609 12 23,166 501
Total • • . . 6^71 740 260,791 25;873
To*aj>—R eooonised • • 40,119 4,608 3,324,134 267,026
Total-IU nbbooomxsed . . • • 641' 62 44,496 2,779
' GRAND TOTAL •• •• 40,760 4,670 3,368;629 269,806
♦Introduced since 1956-57.
tN ol a teaching body.
SooBOa.—’Director of Public Instruction, Bihar.

9.1.—contd.
SCHOLARS IN I^TSTITUTIONS FOR MEN AND WOMEN B Y TYPES IN B ifiA R —con^i.
101
1959-60. 1960-61.
Number o f Institutions. Number o f Scholars. Number of Institutions. Number o f Scholars.
For men. For women. Men. Women. For men, For women. Men.1
Women.
18 19 20 21 22 23 24 25
2 2,617 4 4,8784 139
t t 1 ^ ■f
81 11 70,717 2,988 94 13 69,135 3,7754 1 593 83 4 1 559 868 2,125 11 2,4605 2,974 7 3,8842 603 3 7082 2,818 2 2,4544 1,091 4 1,4238 556 8 704
•116 12 84,089 3,071 141 14 86,344 3,861
5,297 292 1,126,985 72,989 5,616 333 1,252,870 82,774
31,510 4,091 2,283,560 216,041 33,094 4,229 2,471,628 240,463
14 1 741 49 16 2 898 103
36,821 4,384 3,411,276 289,079 38,726 4,564 3,725,296 323,340
85 23 10,223 1,663 96 26 14,379 2,481
1 152 1 159
11 3,255 12 3,719
36 18 5,370 811 31 18 6,138 983
23 2,564 .. ,24 2,687
17 1 1,529 11 19 1 1,681 10
7 381 8 370 ••
6,276 746 233,342 26,988 6,776 935 267,722 35,541
499 3 24,706 321 533 3 27,672 288
6,954 791 281,522 29,794 7,500 983 324,527 39,303
43,891 5,187 3,776,887 3,21,944 46,367 5,561 4,136,167 3,66,504
617 43 35,052 2,685 572 38 40,696 2,742
44,408 5,230 8,811,939 324,629 46,939 5,599 4,176,863 369,246

102
TABLE
STATEMENT SHOWING THE NUMBER OF INSTITUTIONS AND NUMBEK OF
1961-62. 1962-63.
Tj^pe o f Institution*.Number of Institutions. Number o f Scholars. Number of Institutions.
For men. For women, Men. Women. F ir Men. For Women.
1 26 27 28 29 30 31
R booonised—
Universities * .. 6 5,306 6•Research Institution 4 169 4Board o f Secondary Education 1 t 1
COI/T EOES—
Art and Science {including Intermediate 99 13 78,477 4,201 104 13College).
Teacher’s Training 4 1 595 101 6 1Meaical and Veterinary Science 12 2,493 357 11Engineering and Technology 7 4,555 7Agriculture and Forestry 3 818 8Commerce 2 3,001 2Law 4 1,806 4Others . . . . • 8 721 28
Total 149 14 97,941 4,659 176 14
Schools—
Secondary 6,121 360 1,284,231 92,158 6,807 490
Primary 32,952 4,435 2,599,832 254,973 36,301 4,56a
Nursery 23 4 1,246 161 30 3
Total . . .r. 39,096 4,799 3,885,309 347,292 43,138 5,058
V o c a t i o n a l a n d o t h e r S c h o o l s —
Teacher’s Training 96 25 16,566 2,865 96 26
Medicine 1 155 1
Engineering 13 4,141 26
Technical and Industrial 30 18 5,751 861 16
Commerce 27 2,899 13
Agriculture 19 1 1,783 8 19 1
For the Handicapped . . 11 406 11
For adults 6,743 1,145 250,994 35,122 5,419 916
Others 568 3 32,031 178 685 3•
Total 7,508 1,192 314,726 39,034 6,286 946
T o t a l — R e c o g n i s e d 46,753 6,005 4,297,976 390,985 49,600 6,018
T o t a l — ^Un b e c o g n i s e d 449 40 33,486 2,936 349 64
GRAND TOTAL .. 47,202 6,045 4,331,462 393,921 49,949 6,082
^Introduced since 1956-57.
tNot a teaching body.
SouKCE.— Director o f Public Instniction, Bihar.

9.1.—concW.
SCHOLARS IN INSTITUTIONS FOR MEN AND WOMEN BY TYPES IN BIHAR— concW.
103
1962-63. 1963-64. 1964-65.
Number o f Scholars. Number o f Institutions. Number of Scholars. Number o f Insttutions. Number of Scholars.
Men- Women- F.'i Men. Fur Women. Men. Women. For men For women • Men. Women.
32 33 34 35 36 37 38 39 40 41
5,382 652 6 5,504 ^60 6 5,790 800150 2 4 187 3 4 216 4
1 1
78,505 6,466 105 14 81,734 7,310 118 14 84,116 7,765
799 156 6 1 765 171 6 1 765 2122,860 ■ 54 11 3,233 507 12 3,685 5515,535 9 7 6,239 7 7 6,619 6
926 3 932 3 1,084 . ,,679 2 4,365 2 4,679
1,793 3 4 2,045 5 4 2,341 i i1,831 64 30 1,889 76 1 145
101,460 7,806 179 15 106,893 8,839 35 15 19,318 780
IJ45 119 6,03J17 52,813 1,865 137 625,580 58,636
1,421,749 2,46,017 5,328 454 9,18,019 2,28,064 5,875 500 1,007,914 261,463
2,168,438 6,74,397 34,874 4,608 22,93,940 7,31,992 38,082 4,729 2,295,788 756,232
1,227 817 30 4 1,495 721 S5 5 1,675 877
3,691,414 921,231 43,977 5,185 3,797,171 1,013,590 45.857 5,371 3,930,957 1,077,212
16,398 2,951 92 30 15,892 3,357 83 29 14,479 3,181
158 1 158 - 1 72
7,103 11 29 7,728 11 35 2 11,881 110
2,992 947 16 20 2,728 881 15 15 1,195 708
1,336 21 15 1,332 14 18 1,781 45
1,649 50 19 1 1,872 102 19 • • 1,948 77
323 48 12 324 48 12 320 51
185,691 25,968 3,689 682 1,25,402 21,250 968 217 30,744 6,612 '
40,348 883 700 2 37,458 6,377 703 3 37,245 6,729
255,998 30,879 4,573 735 1,92,894 32,040 1,853 267 99,593 17,585
3,948,872 959,916 48,729 5,935 4,096,958 1,054,469 47,745 5,653 4,049,868 1,095,577
27,415 4,294 423 36 31,342 4,578 ••
3,976,287 964,210 49,152 5,971 4,128,300 1,059,047 •• ••

104
TABLE 9.2.
STATEMENT SHOWING THE EXPENDITURE ON EDUCATION (BY SOURCES) IN BIHAR (IN RUPEES).
Year. GovernmentFonda.
Board and Municipal Fees. All other
. 8ouiTotal.
1956-56 5,56,67,211 2,«3,12,390 2,37,24,718 1,62,33,569 12,39,37,878
1956-57 (Re-organised).. 6,88,65,816 2,98,16,120 2,63,70,051 1,36,22,970 13,76,73,957
1957-58 . . • 10,72,45,376 40,74,436 2,86,25,697 1,56,40,945 15,54,86,453
1958-59 11,05,15,362 29,73,646 3,38,95,597 1,72,49,990 16,46,34,495
1959-60 12,83,51,998 44,02,971 3,73,88,021 1,70,33,502 18,71,76,492
1960-61 16,97,78,614 48,08,676 4,37,46,668 1,75,46,700 22,58,80,547
1961-62 17,18,02,694 63,72,617 4,89,87,063 2,23,10,310 24,94,72,584
1962-63 16,63,77,051 66,76,496 5,37,21,799 2,73,92,891 25,30,68,237
1963-64 18,36,21,852 67,11,292 5,86*79,926 2,96,24,128 27,75,37,198
1964-65 19,79,08,256 61,92,628 6,25,26,748 2,77,64,719 29,43,91,250
SoTmoE.— Director o f Public Instruction, Bihar.
TABLE 9.3.
96 Planning— 17

106
TABLE
STATEMENT SHOWING THE EXAMINATION RESULTS
1956-66. 1966-67.
Nature o f Examination. Number pcissed. Nmnber passed.
Men. Women. Men. Women.
1 2 3 4 5
A bts, SorENciE C o l l e g e s — ■
Doctor o f Litt. 1D octor o f Philosophy . . , , , ,D octor o f ScienceM aster o f Arts 677 59 764 46Master o f Science 151 6 186 9M.Sc. (Geology) , ,M. So. Geo., PhysicsBachelor o f Arts (Hons.) 740 49 854 48Bachelor o f Arts (Pass) 1,007 169 2,106 186Bachelor o f Science (Hons.) 121 1 140 4Bachelor o f Science (Pass) 116 8 405 9Intermediate in Arts 4,107 638 7,421 800Intermediate in Science 1,162 60 2,696 37Ph.D. (Arts) , . 5 2Ph.D. (Science) •• •• •• •• ••
CoiiUEQlS-'
Master o f Law . . . .Bachelor o f Law 435 345 3B.O.L. 463 4 422 2Master o f Commerce 129 , , 88Bachelor o f Commerce . . 415 766B.Com. (Hons.)M.B., B.S. . . 166 20 172 14M.S. , , 23 , *M.D. 62 2 12 1Other Diplomas and Certificates in Medicine . . , , 66 3Ayurvedic . .Ph.D. (Medicine) •• ••
ENGINIBBIN'CI—
Bachelor o f Civil Engineering .. 94 .. 86Bachelor o f Electrical Engineering Part I I 80 36Bachelor o f Mechanical Engineering 85 29Bachelor o f Mining and Metallurgy 46 48Licentiate of Civil Engineering 504Others •• •• •• ••
E»trOA.TlON—
M.Ed. 17 14 11 10B.E.B.T. and L.T. , , 88 53 566 72Licence, Diploma or Certificate of Teaching . . • • • •
N.A.—-Not available.
. NU.SoTjBCB.— Director of Public Instruction, Bihar.

107
».3 .
OF VARIOUS EXAMINATIONS IN BIHAR.
1967-68. 1958-69. 1959-60.
Number passed. Number passed. Number passed.
Men. Women. Men. Women. Men. Women.
6 7 8 9 10 11
3 2 ' 3
1933 86 1,320 88 1,637 114209 9 258 10 289 8
3 •• ••991 82 947 107 1,156 135 •
2,403 283 2,724 396 2,440 349137 6 162 7 15;i 10434 25 459 16 711 27
8,68/ 1,024 7,862 1,167 11,306 1,1934,076 66 3,202 96 3,7,2 148
6 4 10 1• • ' * 5 2
1319 254 2 ' N.A.
933 5 321108 112 146646 608 81239 67 7692 16 168 i5 173
9 218 268 4 70
•• •• 2 ••
137 98 13036 68 6725 PR 122
N.A. N.A. 69 631,136 34»
••1,419 36
13 9 11 16 5814 68 823 88 762 109
■■ ■■

108
STATEMENT SHOWING THE
TABLEEXAMINATION RESULTS
Nature o f examination.1960-61. 1961-62.
Number passed. Number passed.
Men. Women. Men.
12 13 14
W om en,
15
A b t s , S c ie n c e C o l l e g b s —Doctor o f Litt.Doctor o f Philosophy . .Doctor o f Science Master o f Arts Master o f Science M.Sc. (Geology)M.Sc. Geo.,Physics Bachelor o f Arts (Hons.)Bachelor o f Arts (Pass)..Bachelor o f Science (Hons.)Bachelor o f Science (Pass)Intermediate in Arts Intermediate in Science..P h .D . (Arts)Ph.D. (Science)Pre-University Arts Pre-University Science ..M .Sc. Applied Greophysica M.Sc. Applied Geology ..B .Sc. (Hons.) Applied GeopTaysics B .Sc. (Hons.) Applied Geology B.Sc. (Hons.) Petroluam Tectoology
P»o»BSSioisrAi. Co l ie Qes—Master o f Law Bachelor o f Law B .O .L .Master o f Commerce B.Com. (Hons.)B.Com.M .B.,B.S. . .M.S.M.D.Ph.D. Medicine Ph.D . Commerce Other Diplomas and Certificate in Medicine Ayurvedic . .TibbisPre-University Commerce Pre-Medical . .
Enotneebing—Bachelor o f Civil Engineering Bachelor o f Electrical Engineering.. Bachelor o f Mechanical Engineering Bachelor o f Mining and Metallurgy B .Sc. Chemical Engineering B .Sc. Production Engineering B .Sc. Textile and Communication . . Licentiate o f Civil Engineering Pre-Engineering Others . .
E ducation—M .Ed.B .E .,B .T . andL.T.Licence. Diploma or Certificate of Teewshing Dip-in-Ed. (Non-Basic)..Dip.-in-Ed, (Basic)Dip.-in-E'^. (Physical) . .Dip.-in-Ed. (Haral)Dip.-in-Ed. (Rural Education)Teachers Training (Basic)
1,771315
97
1,3843,979
338752
4,8361,188
143
14
2165
1331087321035026
246
21913213789
18
104634
59S3
14818
95540
2117
36318 1
216
8635
1,932299
1112
1,5323,625
2548411362016
2
111619
S285288113112688127
6735
18516015326
24
123994
83
27
18923
180567
152181
1
2052
9851
S o u r c e .— Director o f Public Instruction, Bihar, Patna.

109
9*8*— cofitd •
OP VARIOUS EXAMINATION IN BIHAR— con*d.
1962-63. 1963-64. 1964-65.
Number passed • Number passed. Number passed.
Men. Women. Men. Women. Men. Women.
16 17 18 19 20 21
1 5 . .
22,254 229 2,059 s i? 2,343 828
304 15 316 44 405 4416 1912 7 . ^
2,130 236 2,397 367 3,080 4204,537 594 3,746 656 5,029 713
320 28 396 28 555 20785 40 1,078 23 1,503 53
20 i 32 63 610 9 9
9,416 1,4195,689 169 , ,
, , 7 . ,19 i515 19
g 18 1719 21 2121 •• 20
2 4 5307 i 394 489 i607 10
77 98 97153 161 200681 581 577136 38 113 38 170 5864 10 54 9 88 829 4 25 2 40 4
1 5 31 , ,
22 1 41 3 33 537 1 40 2 63 2
7 7
, .834 i
188 157 238121 156 , , 178181 221 240
85 115 87• • 33 25
13 • • 10 - , ,22 '• 13 ••
' 89 •• 55
f3 2 19 6 27 11
4,269 731• • ; ; 194
•f*
25 109 125 l i i853 29 723 103
59 106 107 , .],188 is i 6,289 941
25 42 217 6,289 941
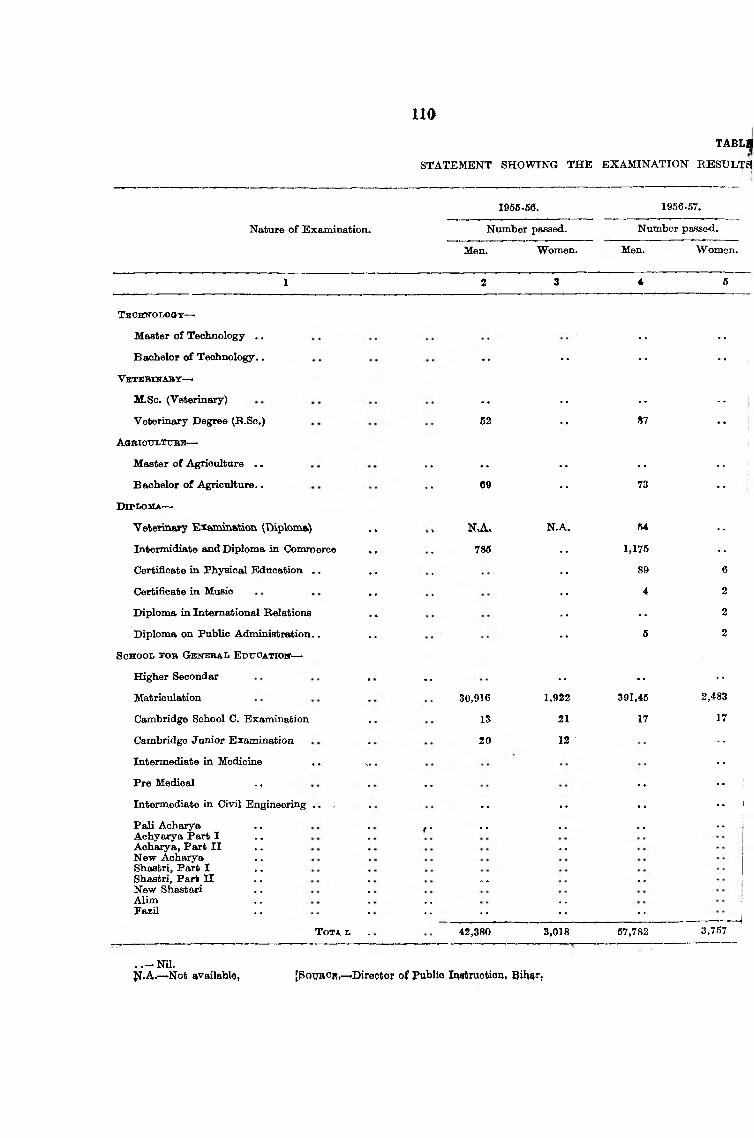
110
TABLl
STATEMENT SHOWING THE EXAMINATION RESULTS
1956-50. 1956-57.
Nature o f Examination. Nxomber passed.
Men. Women.
Number passe<i.
Men. Women.
1 2 3 4 6
TaoHNOLoaT—
Master o f Technology . . • • ••
Bachelor o f Technology.. . . •• •• ••
Vbtkbikaby—
M.Sc. (Veterinary) • • •• •• ••Veterinary Degree (B.Sc.) 52 •• 87 ••
AOBIOtrLTTJBB—•
Master o f Agriculture . . • • • • •• •• ••Bachelor o f Agriculture.. •• 69 •• 73 ••
DlPlOMA—
Yetermary E temioKbioTV (Diploma) ». NvA. N.A. 64 ••
Intermidiate «uid Diploma in C!ommerco 786 1,175 ••
Certificate in Physical Education . . 89 6
Certificate in Miisic 4 2
Diploma in International Relations • • 2
Diploma on Public Administration.. 5 2
ScHoor. b’ob Genttoai* EDirOATroir—
Higher Secondax . . .• • • ••
Matriculation 30,916 1,922 391,45 2,483
Cambridge School C. Examination 15 21 17 17
Cambridge Junior Examination 20 12 •• 1
Intermediate in Medicine , . x.. •• !
Pre Medical . , . . . . ••
Intermediate in Civil Engineering . . , . . • • • • •• 1Pali Acharya f • . . . . .. • • iAchyarya Part IAcharya, Part I I . . INew AcharyaShastri, Part IShastri, Part II s • * , 1New ShastariAlim * , .. 1Fasil •• • • •• ••
T o t a t 42,380 3,018 67,782 3,757
. . - N i l .J^.A.—Not available, [goijBOis,— Director of Publio Jaatruotiou, Bihar,

I ll
.3.—‘corucld.
i¥ VARIOUS EXAMINATION IN BlSAB^conold.
1967-58. 1958-59, 1959-60.
Number paeeed. Number passed. Number passed.
Men. Women. Men. Women. Men. Women.
6 7 8 9 10 11
•
*• *•
* • t . . .
134 140
$
179 ••
24 ' •• 32 •• 41
24 •• 148 •• 151 ••
1 , ,
l , l« 8 1,00ft 1,283 • •
75 f . . N.A. N.A. 56
1 . . N.A. N.A. 1 9
• • N.A. N.A.
3 •• N.A. N.A. 2 •A*
. .
36,522 2,678 45,624 3,265 49,960 3,775
22 20 32 21 16 30
. . • • • • N.A. N.A.
108 14 N.A. N.A. N.A. N.A.
•• •• •• ••82 •• N.A. N..A N.A. N.A.
3 •• •• . . •- •
117 S N.A. N.A. N.A. N.A.193 1 N.A. N.A. N.A. N..A
N.A. N.A. N.A. N.A.• • , , , ,
164 8 NJl. N.A. N.A. N.A.186 4 N.A. N.A. N.A. N..A
5 N.A. N.A. N.A. N.A.27 N.A. N.A. N.A. N.A.32 •• N.A. N.A. N.A. N.A.
68,131 4,384 67,697 5,273 82,539 5,997
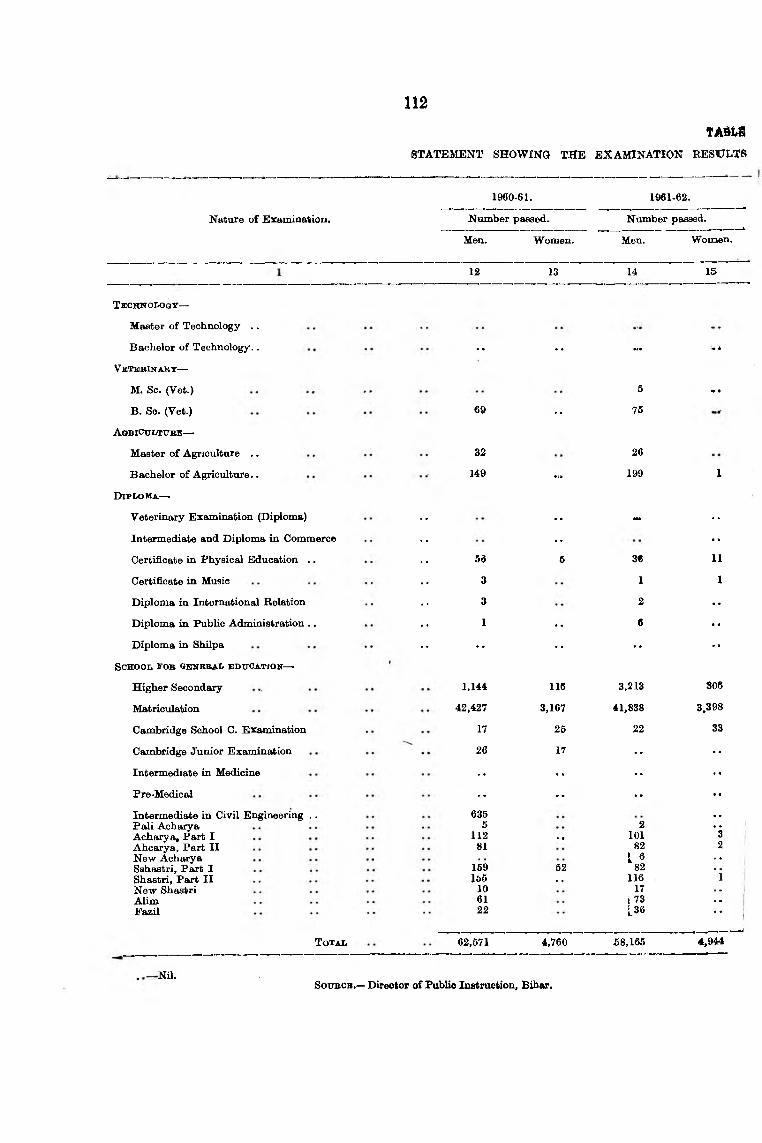
f A f t t a
STATEMENT SHOWING THE EXAM INATION RESIJLTS
112
1960-61. 1961-62.
Nature o f Examination.
Tkohnoiajqy—
Master of Technology . .
Bachelor o f Technology..
Vetbbinary—
M. Sc. (Vet.)
B. Sc. (Vet.)
A obiCttltxtbe—
Master o f Agriculture . .
Bachelor of Agriculture..
Diploma—
Veterinary Examination (Diploma)
Intermediate and Diploma in Commerce
Certificate in Physical Education ..
Certificate in Music
Diploma in International Relation
Diploma in Public Administration . .
Diploma in Shilpa
SCHOOI. I’OB ObKEBAI. EDtTCAT/OK—
Higher Secondary
Matriculation
Cambridge School C. Examination
Cambridge Junior Examination
Intermediate in Medicine
Pre-Medical
Intermediate in Civil Engineering . .Pali Acharya Acharya, Part I Ahcarya, Part II New Acharya Sshastri, Part I Shastri, Part II New Shastri Alim Fa^il
TotaIi
Number passed. Number passed. .. . LMen. Women. Men. Women.
12 13 14 15
• h •• •I* « *
5 *
69 •• 75
32 26
149 ... 199 1
. . — ••
•• ••
56 6 3« 11
3 1 1
3 2 . .
1 •• 6 ••
•• •• •• *•
1,144 116 3,213 806
42,427 3,167 41,838 3,398
17 25 22 33
26 17 •• • «
•• •• •• • •
•• •• •• • •
635 • •5 2
11281
• • 101 82
L 6159 52 82lt>5
10•• 116
1761 i7322 [36
. . ---^62,571 4,760 58,165 4,944
. NU.SotTBOH.— Director of Public Instruction, Bihar.
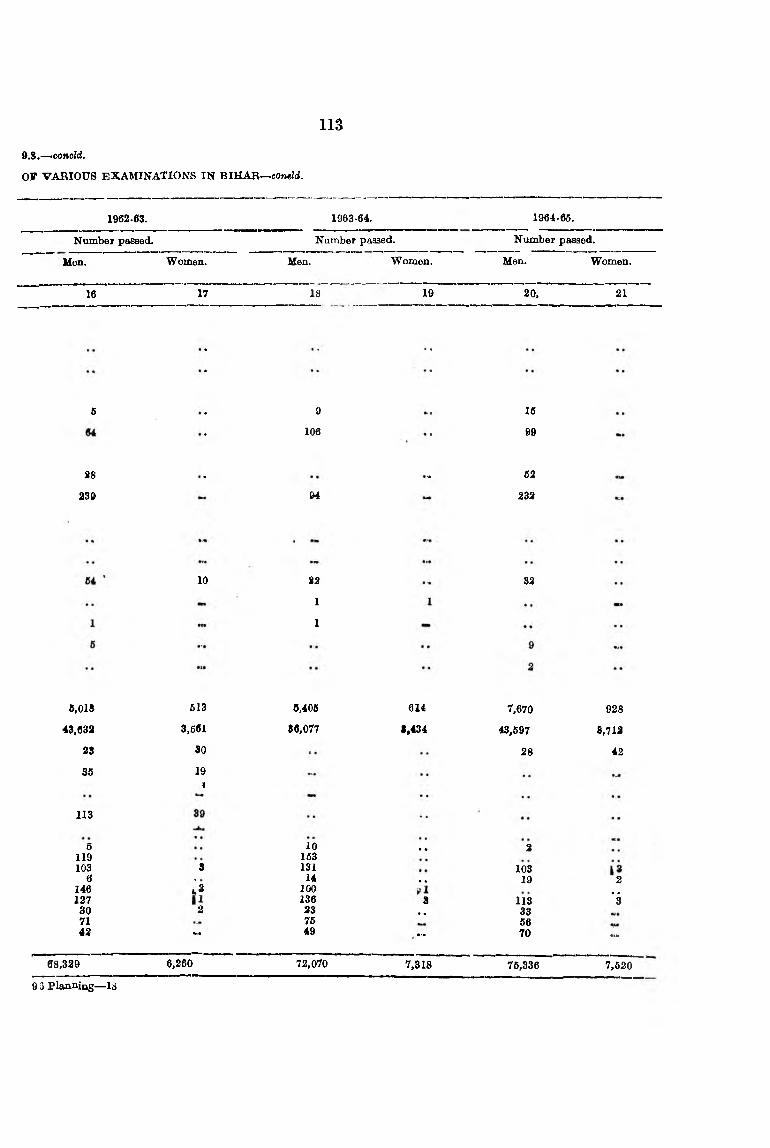
9.8.—*eoncW.
OF VARIOUS EXAMINATIONS IN BIHAR~con«W .
m
1962-63. 1963-64. 1964-65.
Number pasaed. Number passed. Nimaber passed.
lien. Women. Men. Women. Men. Women.
16 17 18 19 20. 21
6
38
230
9
106
94
IS
99
62
232
10 S3
1
1
32
6,018
43,032
2S
36
113
613
3,561
30
19I
0,405
86,077
614
S,434
7,670
43,697
28
928
8,712
42
5 10 • • 2119 153103 3 131 103
6 14 , , 19 2146 i s 100 , .127 136 3 113 330 2 23 * , 3371 76 6642 •"* 49 •r* 70
\•M
68,329 6,260 72,070 7,318 76,336 7,620
93 planning— 18

114
TABLB
STATEMENT SHOWING THE NUMBER OF SCHOOLS FOR GENERAL EDUCATION
Year.
Primary.
No. o f schools.
No. of scholars.
Junior Basic.
No. of schools.
No. o f scholars.
Middle.
No. of schools.
No. o f scholaus.
1 2 3 4 6 6 7
Fob
1955-65 25,328* 1,400,946* 1,494 87,602 2,642 312,023
1950-57 (Re-organiaed) 25.107* 1,433,356* 1,634 96,312 2,594 323,881
1957-58 26,372* 1,446,728* 1,943 112,473 2,731 849,980
1958-59 26,397* 1,860,041* 2,152 146,117 2,953 45 8,607
1959-60 29,139* 2,108,687* 2,385 176,604 3,163 636,121
1960-61 . .• 30,623* 2,286,416* 2,487 186,010 3,374 60*6,332
1961-62 32,466* 2,395,561* 2,509 2,05,517 3,739 681,956
1962-63 33,799* 2,392,813* 2,502 1,92,561 4,207 805,108
1963-64 34,439* 2,641,927* 2,435 1,95,220 4,477 881,591
1864-65 . , 36,113* 2,15’J,88'J» l,S7,92l 6,052 861,688
F o b
1955-56 2,727* 112,668* 4 285 169 24,360
1956-57 (Re-organiaed) 2,929* 123,460* 28 1,080 166 26,038
1957-68 3,047* 132,175* 64 2,431 171 28,472
1958-59 3,395* 170,212* 107 4,864 186 36,854
1959-60 3,779* 202,237* SIS 13,85S 209 43,866
1960-61 3,898* 224,858* 33S 15,708 238 51,557
1961-62 4,067* 236,786* 372 18,348 267 69,168
1962-65 4,211* 239,708* 354 17,742 368 71,226
1963-64 4,254* 249,624* 354 19,161 443 88,029
1064-65 . . 4,432* 719,077* 837 39,707 488 235,126
NU.
•Primary and Nursery.
N.A.— available.

115
9 A )
AND NUMBER OF SCHOLARS IN BIHAR.
Senior Basic.
No. of ; schools.
8
No.' o f scholars.
High. Post Beisic.
No. of schools.
No. o f scholars.
No. o f schools.
No. of scholars.
10 11 12 13
Higher Secondary.
No. of schools.
14
No. of scholars.
15
613
eii
C46
:22
759
787
6U
(33
£51
FSMIAaS!0.
7
8
8
7
9
9
9
9
II
13
82,994
85,576
89,326
127,436
139,141
152.225
159,919
105,915
175,227
146.226
1,227
1,363
1,155
1,395
1,821
1,909
1,764
1,877
2,236
26,341
903
966
1,025
1,090
1,354
1,272
1,334
1,362
1,405
1,520
46
46
52
53
74
68
74
87
90
100
258,260
281,700
300,283
334,237
448,742
382,517
394,798
400,482
409,957
419,256
‘ 17,262
18,412
20,023
19,096
27,302
20,089
21,244
22,189
23,802
34,547
15
21
23
21
21
15
15
9
5
2,204
2,958
3,508
2,350
2,937
2,405
2.495
1,674
907
152
68
8
112
N.A.
168
219
306
335
345
12
N.A.
17
19
26
29
37
4,414
67,989
N.A.
109,391
145,064
186,075
207,629
206,324
6,352
N.A.
9,067
9,914
13,220
14,334
24,087
SOUBOB. — Director of Public Instraction, Biha*.

116
TABLE 9.8
STATEMENT SHOWING THE TOTAL NUMBER OF SCHOLARS, NUMBER OF SCHOLARS MARRIED, COST PER SCHOLAR AND THE NUMBER OF SCHOLARS RESIDING IN APPROVED HOSTELS IN SCHOOLS FOR GENERAL EDUCATION IN BIH AR.
Number o f scholara. Cost per scholar in inBtitutions for-
Tewf.Males. Females. Males.
HigherTotal. Married. Total. Married. Primary. Junior Middle. Senior High. Secondary
Basic. Basic. includingMulti
purpose.
1 2 3 4 5 6 7 8 9 10 11
Rs. a. p. Rs. a. p. Rs. a. p. Rs. a. p. Rs. .a. p. Rs. a. p.
1955-66 1,949,321 7,163 350,410 885 15 7 4 18 4 2 36 6 6 73 0 4 66 10 7 . .
1950-57 (Re-organised) . 2,010,136 17,798 385,230 746 16 4 3 19 1 7 35 12 3 48 12 11 62 4 11 • •
1957-58 2,073,055 9,719 417,014 975 N.A. N.A. N.A. N.A. N.A. N .A .
Rs. Rs. Rs. Rs. Rs. Ra.
1958-591959-601960-611961-621962-631963-64 lSa4-85
2,605,8492,950,6023,232,2673,440,!2533,591,4143,797,1714,600,4S4
15,04418,33618,64117,62115,38315,821
N .A.
629,710749,753816,369891,348921,231
1,013,5904,0'I,685
1,6351,8932,1522,1481,8792,582N .A .
17.8217.9120.4218.3118.8818.8919.^1
20.9219.3021.58 18.51 17.4417.58 11.54
34.1431.0934.9830.9127.8627.7327.48
46.0045.8150.8445.0444.7644.9047.12
61.3659.4163.1567.9956.9069.5862.73
67.8073.4697.4574.3673.60 76.3363.60
TABLE 9.5—coold.
Cost per scholar in institution for—
Males— eoncld. Females.
Y ew . Post-Basio. Nursery. Primary. JuniorBasic.
Middle. SeniorBasic.
High. Post-Basic,, Nursery.Highef
Secondary includi g
Multipurpose.
I 12 13 14 15 16 17 18 19 20 21
Rs. a. p. Rs. a. p. Rs. a. p. Rs. a. p. Rs. a. p. Re. a. p. Rs. a. p. Rs. a. p. Rs. a. p. Rs. a.p.
1956-56 . . 174 14 8 112 9 9 16 3 9 16 12 7 48 9 6 49 5 5 88 2 9 •• •• ••
1956-57 (Re-opganieed).. 147 6 2 105 8 9 15 9 8 11 7 11 46 1 10 61 0 0 88 0 3 19 10 4 ••
1957-58 N.A. N .A. N.A. N.A. N.A. N .A. N .A. N.A. N .A. N .A.
Rfl. R«. Rs. Re. Rs. Rs. Rs. Rs. Rs. Rs.
1958-591959-601960-611961-621962-631963-641964-65
116.6279.1783.0061.9150.3468.98
89.47106.00132.4777.2868.3466.3974.89
21.0318.8221.4412.8419.1.120.2122.95
16.4718.5221.4413.1820.1719.4918.27
44.0545.9847.3626.6437.3533.1835.80
73.7042.8548.9914.2453.5355.6654.59
76.2081.5191.00
159.4283.7883.2279.23
26S.00
U .U159.75
19.9810.7011.3770.2867.0990.90
145.60116.86138.84107.84 13.52 13.57
152.53
N .A .—Not available. -Nil.SouBcai.— Director of Public InBtruction, Bihar.

117
TABLE 9.5—conoid.
^ (SHOWING THE TOTAL NUMBER OF SCHOLARS, NUMBER OF SCHOLARS MARRIED, COST PER SCHOLAR OF SCHOLARS RESIDING IN APPROVED HOSTELS IN SCHOOLS FOR GENERAL EDUCA-
Year-
Number o f scholars residing in approved hostels attached to institution for—
Males.
HigherPrimary. Junior Basic. Middle. Senior Basic. High. Post Basic. Secondary
(including M.P.)
^ — ; 22 23 24 25 26 27 28
J955.66 119* 3,395 548 18,432 627
1 8.67 •• 106* •• 2,886 575 22,318 574
1W7-68 80 74 2,472 496 21,534 603 172
1158-69 99 244 2,564 553 20,174 100 4,254
U59-60 256 75 1,443 • 406 16,847 110 6,221
1960-81 496 73 1,631 457 20,185 287 6,661
1961-62 667 191 2,139 994 20,237 188 8,721
1982-83 • .. 200 110 2,398 1,236 18,332 38 8,732
1963-64 320 . 1,853 17,603 35 9,043
1964-65 .. . 46 • 164 1,773 2,254 17,982 •• 9,699
TABLE 9.5—concld.
Year.
Number o f scholars residing in app-oved hostels attached to institution for—
Females.
Primary. Junior Basic.Higher
Middle. Senior Basic. High. Post Basic. Secondary(including M.P.)
" T —1 1 29 30 31 32 33 34 35
1955-66 ' 1,547 , , 1,244 . , . ,
1956-57 lo-organised) . 1,428 50 1,504
1957.58 ' 172 1,447 53 1,5631558-69 .. 1,851 48 1,443 2741159-60 • • . .. 1,617 52 1,373 , , 424
. . 1,824 61 1,855 389l**l-62 . . 2,048 50 1,942 51 5831562-63 2,038 54 1,634 254•583-84 ,. .. 2,008 94 2,151 334^•66
. . • • •• 1,139 179 1,392 •• 621
NU. ♦Primary and Nursery.
SotmoB.-—Director o f Public instruction, Bihar.

STATEMENT SHOWING THE NUMBER OF TEACHERS IN THE DIFFERENT TYPES OF SCHOOLS FOR f p wEDUCATION IN BIHAR.
I l8
TABLE 9.6 .
Primary (including Junior B asio. , Nursery),
Middle. Senior Btksio. High (including Post Ba Higher Secondary),
Year.
Total. Trained. Total Trained. Total. Trained. Total. Trained. Total. 'Trained.
1 2 3 4 5 6 7 8 9 10 11I]
1955-56>
42.872 27,307 3,183 2,356 13,388
MalSi,
4,825 3,852 3,457 10,294 3,659 142 j,
1956-6 7(Re-organi8ed) 42,243 28,144 3,321 2,561 13,210 5,650 3,851 3,524 11,122 3,884 192 n
1957-58 42,674 30,193 3,876 3,114 13,816 5,827 3,985 3,691 76,667 47,388 237^ U
1958-59 4,386 32,828 4,202 .3,539 14,832 7,233 4,434 4,087 13,903 6,228 . 150 ' a
1959-60 '47,216 34,800 4,719 3,762 16,308 8,559 4,344 4,302 15,394 6,899 153
1960-61 49,706 36,316 4,863 3,837 17,806 9,952 5,052 4,547 14,494 6,337 113 ' y
1961-62 53,382 39,236 6,115 4,042 19,603 11,676 6,181 4,676 17,636 6,537 127 i
1962-63 65,510 41,785 5,077 4,009 22,271 988 5,456 5,Q17 19,566 7,313 73 8
1963-64 . . 56,657 43,844 6,073 4,120 23,709 16,111 6,617 • 6,172 20,358 7,874 45 U
1964-65 66,929 48,688 4,381 3,551 30,295 21,760 5,78-4 5,390 23,107 9,717
1955-56 •3,586 1,064 ' 72
Female.
56 1,034 700 211 204 686 457
1956-57 (Re-organised) 3,596 1,229 70 49 1,158 752 226 220 740 492 • •
1957-58 3,753 1,450 77 64 1,217 805 235 224 6,062 3,058 2
1958-59 . . 4,104 1,756 143 98 1,314 892 253 248 868 657 1
1959-^0 4,503 1,977 118 61 1,563 1,041 247 280 961 60 • •
1960-61 • • 6,011 2,270 143 76 1,826 1,140 233 21 1,036 618 5
1961-62 5,332 2,534 222 129 1,930 1,286 277 253 1,177 644 4
1962-63 5,780 2,981 206 111 2,531 241 292 • 266 1.242 725
1963-64 6,085 2,254 249 142 2,781 319 319 28) 1,314 706
NU.
N.B .—Figaros are provisional and subject to change have not as yet been finalised.
SouBCB.— Director o f Publiclostraotion, Bibar.

6H0WING THE PERCENTAGE OF INDIAN CHILDREN AT SCHOOL TO THE TOTAL ESTIMATED MALE AND FEMALE POPULATION IN EACH DISTRICT Oi?'BIHAR DURING 1964-65,
119
TABLB 9.7.
I. •
piatriots.
Total ludian popxilation.Percentgae of Indian children
Total no. o f Indian children at at school to the total Bchool. respective population.
Male. Femskle. Total. Male. Female. Total. Male. Female. Total.''
"i 2 3 4 5 6 •7 8 9 10
pstna ,, 16,32,016 15,21,245 31,53,261 2,92,985 96,816 3,89,800 17.9I
6.4 12.3
0*^ 19,50,776 19,79,509 39,30,284 3,11,246 72,464 3,83,710 15.9 3.7 9.8
•• 17,43,160 17,35,162 34,78,312 3,17,553' 74,680/
2,92,233 18.2 4.3 11.3
I i.TOTAi ^ 63,26,951 62,30,906 1,05,61,857 9,21,784 2,43,959 11,65,743 17.3 5.7 ILO
StraQ 17,60,494 20,28,433 37,88,927 3,76,412 62,627 4,39,084 21.3 8.1 11.6
QiuapaTan 16,43,971 16,03,240 32,47,211 2,15,164 54,997 2,70,161 13.1 3.4 8.3
UtmSarpur ' 21,46,714 22,60,660 44,07,374 3,19,364 • 80,045 2,99,409 14.9 3.5 , 9.1
DKbhaBg» •• 22,86,667 24,'51,051 47,37,718 3,38,625 86,828 4,25,461 14.8 3.5 8.9
Total 78,37,8^ 83,43,384 1,61,81,230 12,49,663 2,84,542 16,34,105 15.9 3.4 9.6
Bhagalpnr . . 9.50,173 8,99,584 18,49,757 1,63,234 60,64 2,04,088 16.1 6.7 ILO
Monghyr 18,33,477 18,08,680 36,42,157 2,94,726 82,440 3,77,166 16.1 4.5 10.8
Pumea • 18,38,884 17,00,277 35,39,161 2,11,200 68,673 2,79,873 11.6 4.0 7.9
Sontal Parganos 14,36,677 14,07,602 28,48,279 2,02,674 66,619 2,69,293 14.1 4.7 9.6
SaharsR 10,00,436 9,42,688 19,43,124 1,28,754 26,591 1,54,345 12.9 2.7 7.0
T otal 70,59,647 67,58,831 1,38,18,478 9,90,588 2,94,177 12,84,765 14.0 4.4 9.3
Ranchi 11,46,315 11,32,958 22,79,273 1,81,925 79,889 2,71,814 16.7 7.1 11.9
Heoaribagh 13,14,466 13,12,676 26,27,142 1,85,496 42,424 2,27,920 14.1 3.2 8.7
Palamau 6,47,865 6,39,624 12,87,489 98,32 26,991 1,26,383 15.2 4.2 0.7
I)hanbad 7,23,671 5,64,904 12,88,575 1,02,704 34,132 1,36,836 14.2 6.0 10.0
Singhbhum •• 11,36,263 10,86,146 22,22,409 1,90,506 71,098 2,61,603 16.8 6.5 11.8
T o tal 49,68,580 47,36,308 97,04,888 7,69,022 2,54,634 10,23,656 15.6 6.4 10.6
QRAND TOTAL t h e STATE.
FOR 2,61,92,024 2,60,74,429 5,02,66,453 39,30,967 10,77,212 60,08,169 15.6 4.3 *9.9
SoiTBOa.—Director of Public Isstroction, Bihar.
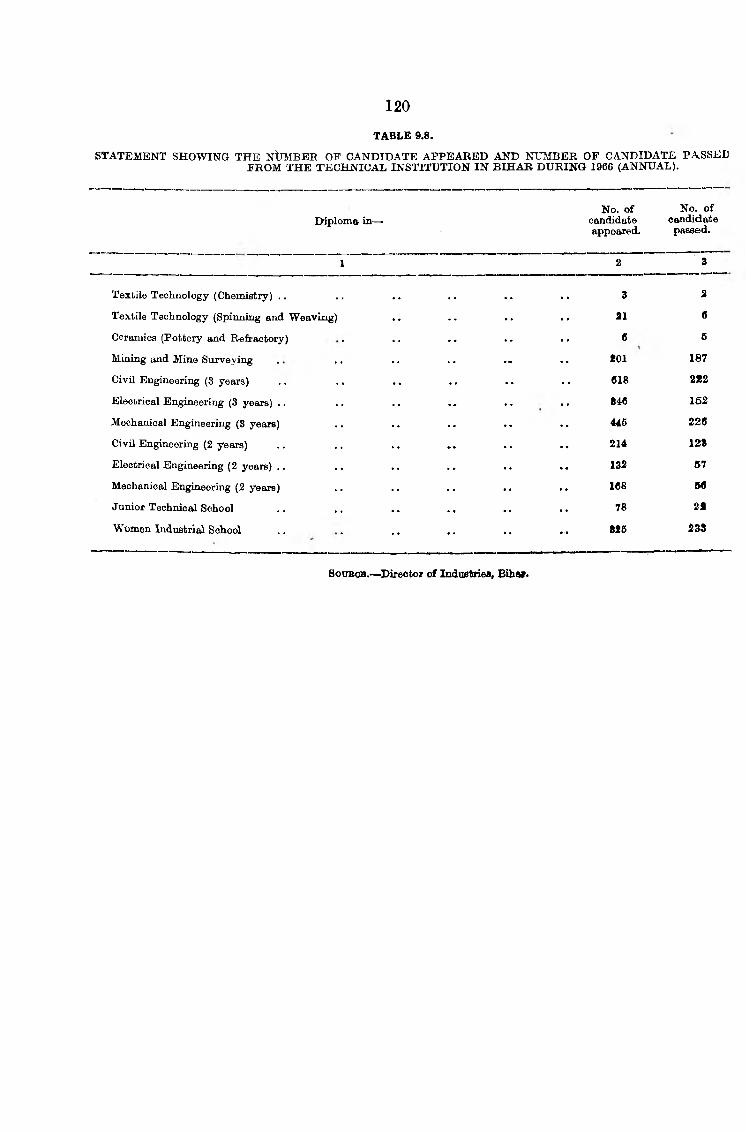
STATEMENT SHOWING THE NtTMBER OF CANDIDATE APPEARED AND NUMBER OF CANDIDATE PASSEDFROM THE TECHNICAL INSTITUTION IN BIH AR DURING 1966 (ANNUAL).
120
TABLE 9.8.
Diploma in—No. o f
candidate appeared.
No., o f candidate passed.
1 2 3
Textile Technology (Chemistry) . . . . . . 3 2
Textile Technology (Spinning and Weaving) . . 31 6
Ceramics (Pottery and Refractory) 6 6
Mining and Mine Surveying . . t o i 187
Civil Engineering (3 years) . . 618 222
Electrical Engineering (3 years) .. . . 846 152
Mechanical Engineering (3 years) . . 445 226
Civil Engineering (2 years) . . 214 128
Electrical Engineering (2 years) . . . . 132 57
Mechanical Engineering (2 years) . . 168 56
Junior Technical School . . 78 29
Women Industrial School 815 238
SoTjEcB.— Director o f InduBtries, Bihar.

m
TABLE 9.8-A.
s - s w s r “ “ >
Diploma i n -
civil EngioeeriJig (3 years)
jSJecfcrical fJngineering (3 years) . .
jjfechanical Engineering (3 years)
Civil Engineering (2 years)
Electrical Engineering (2 years)
jlech«Dicai Engineeriiig (2 years)
Textile Technology (Chemistry) . ,
Textile Technology (Spinning and Weaving)
Mining and Mine Surveying
SOXJRCK— D irecto r o f Industries, B ihar.
No- o f candidate appeared.
No. o fcandidate
passed.
3
•• • • 336 127• • 136 48■ • 159 54
107 6C73 38
*• 127 46
•• 1 Nil* • •• 15 3
5 2
in g _ i9

tAfiLfi
STATEMENT SHOWING THE NUMBER OF CANDIDATES APPEARED AND PASSED FROM
122
Mechanical. Civil. Elactri al.
Name o f the Colleges.
Appeared. Passed. Appeared. Passed. Appeared. Passed,
1 2 3 4 5 6 7
R.I.T ., Jamshedpur . . 88 72 115 64 115 85
Engineering College, Bhagalpur.. •• 64 43 •• 47
Bihar College o f Engineering, Patna 29 53 •• 27
Birla Institute o f Technology, Ranchi 96 95 62 61 78 78
B.I.T., Sindri, Dhanbad •• 83 48 •• 80
M.I.T., Muzaffarpur .. •• 33 51 •• 34
T o t a l 184 368 177 320 193 351-------——
.. Not available.
SouRcB.—Director of Induutries, Bihar.

123
9.8-B.
DIFFERENT ENGINEERING COLLEGES IN BIHAR DURING THE YEAR 1966.
Tele. Communication. Production. Mafean. Engineering. Chemical. Electrical and Commercial
Appeared. Passed. Appeared. Passed. Appeared. Passed. Appeared. Passed. Appeared. Passed.
8 9 10 11 12 13 14 15 16 17
• 47 35
9 9
• • • • 10 31 17 2
9 9 10 47 66 17 2

124
STATEMENT SHOWING NUMBER OF INSTITUTIONS AND PUPILS BELONGING TO SCHEDULED CASTE
ETC.
TAB«
Year.
Number of institutions specially
meant for pupils belonging to
Scheduled Castes, Scheduled Tribes and other Backward Community.
Numbj
Institutions meant for Scheduled Castes, Scheduled Tribes and other Backward Communities
only.
In other institutions.
Boys. Girls. Boys. Girls.
1 2 3 4 5 6
1963-54 2,005 64,168 9,520 907,625 98,418|
1954-55 2,062 65,800 9,931 1,063,465 122,0941
1955-56 2,088 68,299 10,773 1,242,974 148,659
1956-57 (Reorganised) 1,830 63,355 ,11,080 1,336,910 173,779
1957-58 1,842 68,299 12,494 1,383,846 192,472!
1958-59 1,964 79,551 17,287 1,633,448 269,633
1959-60 2,039 92,475 20,045 1,915,603 346,85ij
1960-61 2,081 75,525 18,784 2,107,845 383,14Sj
1961-62 2,091 19,150 4,677 338,262 50,49?
1962-63 2,001 95,691 25,349 ?,275,366 437,284
1963-64 . . 2,112 93,987 25,778 2,338,372 468,791^1
SOUKCB.--Director of Public Instruction, Bihar.

125
9.9.
SCHEDULED TRIBES AND BACKWARD CLASSES AND EXPENDITURE INCURRED ON SUCH INSTITUTIONS,
BIHAR.
of Pupils,
Number o f Scheduled Castes, Scheduled Tribes {ind other Backward Communities pupils getting
scholarships and stipends in all institutions.
T-
Total expenditure Annual value on institutions of scholarships, meant specially stipends and for pupils belonging
other financial to Scheduled Castes, concessions. Scheduled Tribes
and other Back-
Boys. Girls. Boys. Girls. Total.
7 8 9 10 11 12 13
Rs. Rs.
971,793 107,938 22,654 2,055 24,709 26,11,550 10,16,779
1,129,265 132,025 30,986 2,701 33,687 33,86,017 13,64,906
1,311,093 159,432 40,065 3,667 43,732 45,22,352 11,90,474
1,400,265 184,859 42^840 4,718 47,558 50,01,773 19,78,624
1,552,075 204,966 46,634 4,272 50,906 58,51,555 14,12,436
1,712,999 286,922 59,333 6,863 66,196 68,76,515 16,60,336
2,008,078 366,900 74,675 7,117 81,792 81,43,887 17,3 3,580
2,180,370 401,933 84,547 9,974 94,521 98,45,997 18,86,717
357,412 55,174 36,440 3,672 40,112 37,19,091 27,03,968
2,371,057 462,633 95,288 13,511 108,799 94,28,027 27,34,457
2,432,359 - 494,575 106,771 15,079 121,850 1,44,94,351 31,10,735


SECTION X Co-operation Statistics

TABLE 10.1.
StATEMKNT SHOWING PROGRESS IN THE ORGANISATION OF CO-OPERATIVE SOCIETIES IN BIHAR,
lJi8
—
Bihar State Co-operat ive
Bank.
Central Cane Co-operative Marketing
Bank. Unions.
OtherCentral
Societies.
Primary Agricult ural
Credit Societies.
Caaegrower’sCo-operativeSocieties.
Primary Marketing Societ ies.
1 2 3 4 5 6 7 8
At the beginning o f the First Five-Year Plan (1950-51).
1 49 61 6 8,156 5,486 Nil.
At the end o f the First Five- Year Plan (1955-56).
1 51 70 6 12,679 7,691 49
At the end o f the Second Five Year Plan (1960-61).
1 35 71 9 17,086 8,909 220
At the end o f the second year of the Third Five-Year Plan (1962-63).
1 35 72 9 18,943 9,258 234
1963-64 1 35 72 9 19,568 9,253 245
1964-65 1 28 72 9 19,338 9,253 272
1965-66 1 28 72 9 17,151 7,91.3 272
1966-67 1 28 72 9 16,500 6,330 272
1967-68 1 28 72 9 16,500 4,231 27*
FarmingCo-operativeSocieties.
SalaryEarners’ Co-operat ive
Societies.
Co-operaliveStores.
Weavers’ Fishermen’s Oilmen’s Milk Other Co-operative Co-operative Co-operative Co-o})era1 ive Societies. Societies. Societies. Societies. Societies.
Total.
9 10 11 12 13 14 15 16 17
Nil. 49 283 146 22 64 •• 408 14,731
15 134 492 499 50 115 9 539 22,400
182 202 220 1,043 156 646 82 874 29,736
280 202 272 1,062 181 987 125 4,858 36,509
299 214 394 * 1,077 219 1,043 113 4,975 37,517
301 216 508 1,157 219 1,043 113 5,118 87,648
316 216 745 1,157 234 1,096 127 7,743 37,08i
323 251 754 1,161 325 1,096 201 9,838 37,159
339 263 779 1,166 346 1,096 218 10,030 35,351
SouBCB.—Registrar, Co-operative Societies, Bihar.

STATEMENT SHOWING NUMBER OF MEMBERS, PAID-UP SHARE CAPITAL, ETC., IN BIH AR STATECO-OPERATIVE BANK LTD.
129
TABLE 10.2.
( R u p e e s in L a k h s . )
Year, Number o f members.
Paid-up share capital.
Workingcapital.
Loans advanced
during the year.
Loans recovered
during tha year.
Loans outstanding
at the en,d o f the year.
1 2 3 4 5 6 7
1950-51 146 4.15 165.82 14.31 14,57 12.16
First Five-Year Plan—
1951-52 150 4.15 158.01 15.10 17.45 19.801955-56 173 44.23 295.14 98.93 82.69 78.07
jiecond Fiv^e-Year Plan— ,1956-57 176 44.21 2,95.58 1,49.84 1,27.24 1,01.581957-58 178 44.22 3,03.01 1,52.17 1,11.45 1,25.121958-59 177 44.34 3,69.56 1,38.19 1,31.25 1,32.061959-60 177 44.56 4,18.70 1,76.39 1,61.09 1,47.371960-61 174 44.76 4,14.65 2,25.68 2,06.80 1,66.25
Third Five-Year Plan—
1961-62 158 46.15 4,41.65 3,09.43 2,70.20 2,05.481962-63 158 47.36 4,19.87 4,00.38 3,63.87 2,41.991963-64 161 57.63 5,70.77 4,74,62 4,37,82 2,78.801964-65 141 62.85 6,63.29 5,20.76 5,14.^5 2,84.981965-66 139 66.13 9,43.39 8,35.96 6,28.50 4.82.44
Fourth Five-Year Plan—
1966-67 140 68.30 1,610.27 11,21.37 5,85.95 11,43.011967-68 141 1,03,71 16,70.91 12,41.71 11,65.85 12,03.11
S o u r c e .— Registrar, Co operative Societies, Bihar.
96 P larn in j— 20

TABLES
STATEJTENT SHOWING NUMBEB OF BANKS, MEMBERS, ETC., OF
130
Year. Number o f Banks.
Number o f — i members.
Paid-up capital.
Total. Government contribution.
1 2 3 4 5
1950-51 . . . . 49 10,831 8.33 , ,
First Five-Year Plan—
1951-52 . . • • 53 10,618 8.53 • •
1955-56 . .
Second Five-Year Plan—
•• • • 51 16.520 11.01 ••
1956-57 47 17,956 15.36
1957-58 47 20,286 31.37 13.50
1958-59 47 23,215 51.72 29.00
1959-60 47 26,200 55.35 29.00
1960-61 35 30,067 74.41 44.00
Third Five-Year Pian—
1961-62 35 30,815 79.04 44.00
1962-63 35 33,079 89.50 45,50
1963-64 35 35.219 r,08.15 45.50
1964-65 28 35.219 1,21.75 45.50
1965-66 28 36.070 1.44.82 45..50
Fourth Five-Yrar Plan—
1966-67* . . . . 28 36.563 1,73.38 46.8C
1967-68 28 36,182 2,97.71 1,27.08
•Revised figures.

131
10.3.
CENTRAL CO-OPERATIVE BANKS IN BIHAR.( R u p e e s i n L a k h s . )
Reiserve. Borrowings,Loans
advanced during the
year.
Loans outstanding.
Percentage of collection to demand.
Overdues as to percentage of demand.
Cost of management. Profit or loss.
6 7 8 9 10 11 12 13
4.24 34.08 9.21 17.24 •• •• 6.64 (-)2 .0 5
4.08 47.73 13.59 22.89 - 7.26 ( - )1 .1 3
12.39 1,14.75 78.01 98.22 •• •• 2.18 ( + )1.50
16.07 1,49.82 92.32 1,24.67 48 52 2.14 ( + )0.09
17.72 2,32.91 1,51.38 1,92.31 40 60 2.90 ( + )1.49
19.65 2,50.85 1,25.79 2,05.48 46 54 26.49 ( + )1.49
22.90 2,92.03 1,71.66 2,30.73 59 41 5.03 (- )4 .2 7
26.39 3,31.07 2,27.75 2,72.82 67 33 4.61 ( + )2.30
25.(.4 3,55.59 2,83;78 3,07.02 66 34 4.77 ( + )2.41
28.75 4,22.21 3,91'.82 3,93.S8 'lO 30 8.04
32.57 5,07.53 4,92.74 4,82.25 68 32 9.06 ( + )7.46
35.76 3,28.71 5,77.98 5,25.59 71 29 10.08 ••
50.10 5,33.72 9,67.80 7,97.81 71 29 17.73 ( + )8.55
64.26 11,17.50 14,90.44 13,74.09 93 45 N .A. ( + )6.84
57.56 12,85.90 15,83.00 18,58.40 •• 40 •• ••
SOUKOE.— Registrar, Co-operative Societies, Bihar.

TABLE 10.4.
STATEMENT SHOWING NUMBER OF MEMBEES, PAID-UP SHARE CAPITAL, WORKING CAPITAL AND LOAi^ ADVANCED IN BIHAR STATE CO-OPERATIVE LAND MORTGAGE BANK LTD ., PATNA.
( R u p e e s i n L a k h s .)
132
Year. Number of members.
Paid-up share capital.
Working capital.
Loanadvanced
L 2 3 4 5
Second Five-Year Plan—
1958-59 776 . 10.24 10-27 0.45
1959-60 2,475 10.70 10.70 1.48
1960^61 4,834 11.40 11.40 2.09 ^
Third Five-Year Plan—
1961-62 6,764 13,90 13.95 6.37
1962-63 7,392 16.26 16.33 2.50 1
1963-64 8,236 16.73 19.55 9.62 i
1964-65 8,918 21.46 41.55 15.78 i
1965-66 11,365 24.09 78.24 27.51 j
Fourth Five-Year Plan—
1966-67 12,199 29.68 1,36.17 63.15 ;
1967-68 18,041* 40.50 3,13.46 2,05.10:
*It is exclusive of nominal members.
S o u r c e .— Registrar, Co-operative Societies, Bihar.

STATEMENT SHOWING NUMBER OF SOCIETIES, ETC., OF PRIM ARY AGRICULTURAL CREDIT SOCIETIESIN BIHAR.
, ( R u p e e s i n L a k h s .)
183
TABLE 10.5.
Year.Number
ofSocieties.
Numberof
members (in lakhs).
Paid -up share
capital.
Percentage Percentage Average Loans of o f rural members
advanced, villages popi.lation per covered. served. society.
Average loans
advance d per
member.
I 2 3 4 5 6 7 8 9
1950-51 8.163 2.96 20.61 L0.82 12.0 4.5 36 3.7
First Five-Year Plan—
1951-52 8,468 3.18 22.36 13.46 13.3 4.6 38 4.2
1955-56 Second Five-Year Plan—
12,681 4.18 31.15 54.99 24.8 5.0 33 1.3
1956-57 13,594 4.72 41.44 70.51 26.7 6.9 35 15
1957-58 14,636 5.54 54.67 98.54 31.2 8.0 38 18
1958-59 15.757 6.45 75.16 1,02.19 37.0 8.9 40 16
1959-60 16,223 7.31 84.27 1,31.08 50.7 10 3 45 18
1960-61 17,036 9.61 1,01.15 1,83.51 56.9 13.9 56 19
Third Five-Year Plan—
1961-62 18,394 10.66 1,22.02 2,45.60 6u.l 16.0 58 23
1962-63 18,943 11.53 1,40.80 3,29.88 63.0 17.2 61 28
1963-64 19,568 13.60 1,80.82 5,25.17 63.5 19.0 70 39
1964-6£^ 19,338 15.00 1,99.54 6,78.00 70.0 20.0 78 45
1965-66 17,151 16.50 2,47.50 10,40.00 84.0 23.0 96 63
Fourth Five-Year Plan—
1966-67 16,500 16.81 2,74.15 12,41.00 87.0 21.02 102 74
1967-68 16,500 21.50 3,59.75 15,00.00 90.0 27.0 130 70
S o u r c e .— Registrar, Co-operative Societies, Bihar.

St a t e m e n t s h o w in g n u m b e r o f s o c i e t i e s , n u m b e r o f m e m b e r s , p a i d -u p c a p i t a l , n u m b e r o fGODOWNS, e t c ., o f PRIM ARY MARKETING SOCIETIES IN BIH AR.
( R t t p e e s i n L a k h s .)
134
TABLE 10.6.
Year. Number o f Societies.
Number of members.
Paid-up share capital.
Number of godowns
, sanctioned.
Number of godowns
constructed
Number o f Marketing o f godowns Agricultural
under produce. construction.
1 2 3 4 5 6 7 8
Second Five-Year Plan—
1956-57 84 3,003 269 30 30 ••
1957-58 89 3,163 643 50 49 • • ••
1958-59 120 3,720 16.07 40 30 3 ••
1959-60 220 3,986 45.42 100 56 11 ••
1960-61 220 5,869 46.02 • • '9.46
Third Five-Year Plan—
1961-62 230 ‘ 6,307 48.62 40 1 5 23.61
1962-63 234 7,863 51.83 4 • • 29.44
1963-64 245 ' 10,707 53.32 N.A. N.A. N .A. 54.49
1964-65 272 11,680 62.00 N.A. N.A. N .A. 70.00
1966-66 272 12,950 69.11 2.72 2,36 31 92.56
Fourth Five-Year Plan—
1966-67 272 13,815 73.80 2.72 2.36 31 1,34.00
1967-68 273 14,467 77.50 2.80 2.36 31 1,80.00
S o u b c h .— Registrar, Co-operative Societies, Bihar.

135
TABLE 10.7.
STATEMENT SHOWING CO-OPERATIVE DEVELOPMENT AND CANE MARKETING UNIONS IN BIHAR.
( R u p e e s i n L a k h s .)
Year. Number o f ! Unions.
N^umber o f Paid up share members. capital.
W orking capital.
Value of goods sold.
1 2 3 4 5 6
Second Five-Year Plan—
1956-57 71 7,299 3.60 72.06 5,85,24
1957-58 70 7,478 4.92 1,10.00 4,18.11
1958-59 71 8,275 3.96 1,22.35 5,70.46
1959-60 . . 71 8,724 5.35 1,27.78 6,60.41
1960-61 . . 71 8,696 6.10 1,43.11 8,78.34
Third Five-Year Plan—
1961-62 72 9,291 6.46 1,23.32 7,70.88
1962-63 72 9,253 6.63 1,66.91 3,01.01
1963-64 . . 72 9,100 7.46 95.22 4,7.194
1964-65 72 9,114 8.68 1,07.98 9,54.58
1965-66 72 7,913 9.31 1,16.66 14,15.19
Fourth Five-Year Plan—
1966-67 . . 72 6,330 9.72 2,11.50 4,80.65
1967-68 . . 72 4,231 9.95 2,28.45 4,95.65
SotTROE.—Registrar, Co operative Societies, Bihar.

136
TABLE 10.8.
STATEMENT SHOWING PROGRESS OF CANEGROWERS CO-OPERATIVE SOCIETIES, ETC., IN BIH AR.
( R t j p e e s i n L a k h s .)
Year. Number o f Societies.
Number o f members.
Paid-up share capital.
Working capital.
Value of canemarketed
during the 5 ear.
1 2 3 4 5 6
Second Five-Year Pian—
1956-57 7,868 3,23,935 11.42 60.81 5,39.81
1957-58 8,21.5 3,24,097 14.69 65.16 4,41.19
1958-59 8,124 3,53,833 15.79 68.10 5,24.26
1959-60 8,514 3,73,564 16.42 80.24 6,78.56
1960-61 8,909 4,03,757 18.58 89.89 7,98.96
Third Five-Year Plan—
1961-62 9,291 4,13,188 19.73 84.31 8,06.73
1962-63 9,253 4,20,045 19.92 97.11 3,26.66
1963-64 9,098 4,61,943 20,82 1,09.49 4,80.56
1964-65 9,253 4,62,292 21.97 1,12.05 9,51.58
1965-66 7,913 1,59,654 23.21 1,14.97 14,15.19
Fourth Five-Year Plan -
1966-67 6,330 3,73,411 16.04 95.73 4,70.74
1967-68 4,231 3,70,564 16.04 2,43.50 4,55.96
S o u r c e .— Registrar, Co-operative Societies, Bihar.

STATEMENT SHOWING CO-OPERATIVE FARMING SOCIETIES, THEIR PAID-UP CAPITAL AND COVERAGEOF AREA IN BIHAR.
137
TABLE 10.9.
Year. Niimber of Societies.
Number of Paid-up share members. capitial.
Coverage in acres.
Areacommanded.
Area under cultivation.
First Five Y ear Plan—
1955-56
Second Five-Year Plan—
1956-57
1957-58
1958-59
1959-60
1960-61
Third Five-Year Plan—
1961-62
1962-63
1963-64
1964-65
1965-66
f'ourth Five-Year Plan—
1966-67
1967-68
15
19
53
91
182
260
280
m
301
316
323
339
374
458
746
1,541
2,115
4,530
6,753
8,687
9,304
10,421
11,136
11,336
11,742
1,06,637
I,6i6,9l81
1,6:9,944
1,79,0(00
1,9:3,0(00
2,16,6112
2,54t,26i7
2,65,80)2
4 31 00(0
5,21,16(0
6,01,00(0
6,09,000)
6,13„000)
a,i96
4,323
4,709
1?,445
18,453
28,805
28^814
28.916
28.916
27,626
27,658
1,832
2,575
4,143
8,012
13,258
17,623
20,936
21,873
22,703
23,170
23,415
96 Planning-—21

St a t e m e n t s h o w i n g p r o g r e s s o f w e a v e r s * c o -o p e r a t i v e s o c ie t i e s , p a i d -u p c a p i t a l w o r k in g CAPITAL, p r o d u c t i o n AND SALE IN BIH AR.
( R u p e e s i n L a k h s .)
138
TABLE 10.10.
Year. Nuinber of societies.
Number of members.
Paid-up share capital.
Workingcapital.
Production Sale.
1 2 3 4 5 6 7
1950-61 145 13,181 2.85 6.71 20.32 21.14
First Five-Yea? Plftn—
1951-52 • • 149) 13,095 2.94 5.53 35.17 42.45
1955-56 •• 488 88,123 9.95 21.59 147.37 141.79
Second Five-Year Plan—
1956-57 787 1,06,421 10.41 53.67 3,59.33 2,52.44
1957-58 . . 989 1,30,670 15.39 76.85 5,98.85 5,89.21
1958-59 • • 1,021 1,31,508 17.10 86.21 4,17.08 4.22.25
1959-60 . . 1,031 1,31,478 17,16 86.50 2,09.48 2,23.42
1960-61 1,043 1,31,917 17.16 93.27 2,29.48 2,30.22
Third Five-"year Plan—
1961-62 . . 1,043 1,41,195 21.97 96.95 2,03.14 2,11.53
1962-63 • • 1,062 1,42,205 22.14 98.43 2,80.24 2,36.57
1963-64 •• 1,077 1,43,103 24.59 1,03.50 3,38.44 3,22.25
1964-65 •• 1,157 1,46,355 24.91 1,05.03 3,41.69 3,38.54
1965-66 • • 1,161 1,46,365 25.60 1,06.25 3,50.00 3,46.0
Fourth Five-Year Plan—
1966-67 • • 1,161 1,46,500 27.00 1,15.00 3,60.00 3,63.00
1967-68 ^ •I* . . . - - ••

SECTION XI Local Bodies
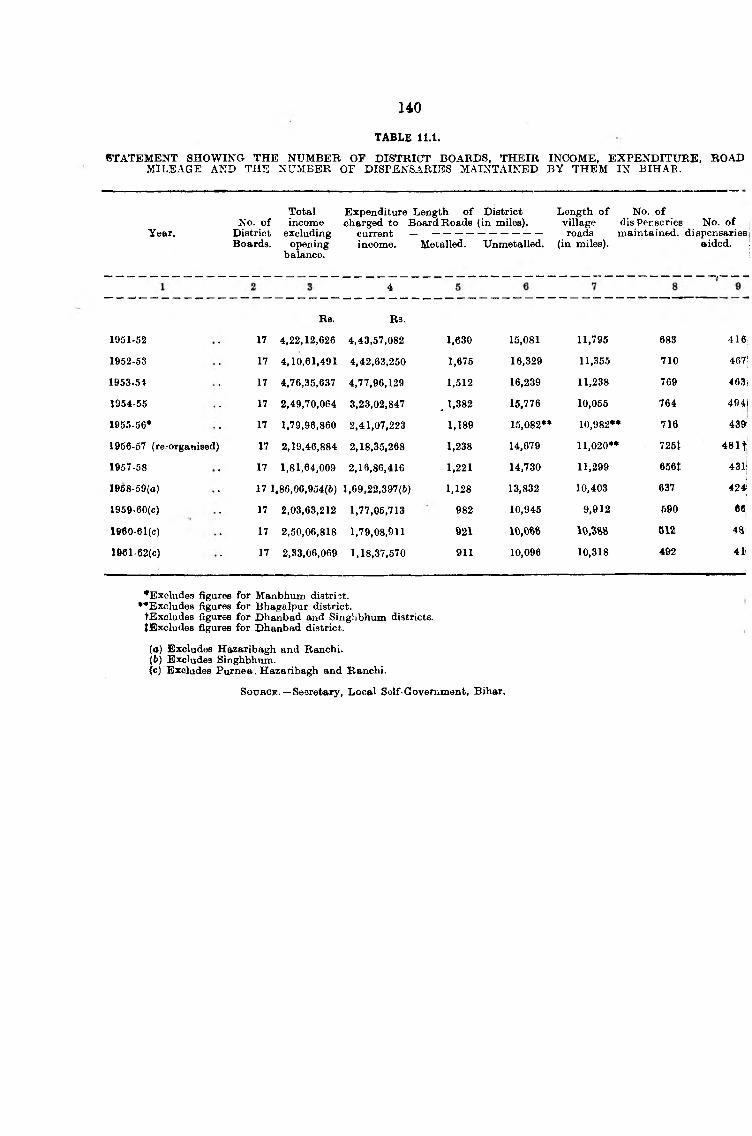
TABLE 11.1.
STATEMENT SHOWING THE NUMBER OF DISTRICT BOARDS, TH EIR INCOME, EXPENDITURE, ROADMILEAGE AND THE NUMBER OF DISPENSARIES MAINTAINED BY THEM IN BIHAR.
u o
Total Expenditure Length o f District Length o f No. o fNo. o f income charged to Board Roads (in miles). village dis Per.series No. o f
Year. District excluding current ---------------------------------------- roads maintained, dispensariesBoards. opening income. Metalled. Unmetalled, (in miles). aided,
balance.
R b.
4
Rs.
1951-52 17 4,22,12,626 4,43,57,082 1,630 15,081 11,795 683 4161
1952-53 17 4,10,61,491 4,42,63,250 1,675 16,329 11,355 710 467S
1953-5i 17 4,76,35,637 4,77,96,129 1,512 16,239 11,238 769 463]
1954-55 17 2,49,70,064 3,23,02,847 1,382 15,776 10,055 764 49 4|
1955-56* 17 1,79,96,860 2,41,07,223 1,189 15,082** 10,982** 716 439|
1956-57 (re-organised) 17 2,19,46,884 2,18,35,268 1,238 14,679 11,020** 725t 48 I t
1957-58 17 1,81,64,009 2,16,86,416 1,221 14,730 11,299 656t 43l!j1968-59(0) 17 1,86,06,954(6) 1,69,22,397(&) 1,128 13,832 10,403 637 424
1959-60(c) 17 2,03,63,212 1,77,05,713 982 10,945 9,912 590 e«!
1960-61(c) 17 2,50,06,818 1,79,08,911 921 10,066 10.S8S S12 48i
1961-62(c) 17 2,33,06,069 1,18,37,570 911 10,096 10,318 492 411
•Excludes figures for Manbhum distri3t.•^Excludes figures for Bhagalpur district.
tExcludes figures for D h a n b a d and Singhbhum districts.{Excludes figures for Dhanbad district.
(o) Excludes Hazaribagh and Ranchi.(6) Excludes Singhbhum.(c) Excludes Purnea. Hazaribagh and Ranchi.
SOUBOE. —Secretary, Local Self-Government, Bihar.

TABLE 11.2.
STATEMENT SHOWING THE INCOME, EXPENDITURE, HOAD MILEAGE AND NUMBER OF DISPENSARIESMAINTAINED BY EACH DISTRICT BOARD DURING 1961-62 IN BIHAR.
141
District.Total income Expenditure Length o f roads (in miles). Length o f Number o f Number o f
excluding charged t o ----------------------------------------- village dispensaries dispenBariesopening current Metalled. Unmetalled. roads maintained. aided, balance. income. (in miles).
Patna
Gaya
Shahabad
Saran
Champaran
Muzaffarpur
Darbhanga
Monghyr
Bhagalpur
Purnea
Santhal Parganas
Saharsa
Hazaribagh
Ranchi
Palamau
Dhanbad
Singhbhum
TOTAL BIHAR
Rs.
22,24,373
29,00,898
20,28,586
21,61,397
14,36,314
16,38,147
17,41,070
18,23,917
9,71,424
N.A.
14,89,263
13,56,056
N.A.
N.A.
5,06,969
23,28,944
6,98,711
Rs.
17,49,593
21,96,461
17,96,099
14,10,442
9,26,779
12,36,677
15,19,777
12,78,747
6,16,392
N.A.
17,41,797
9,31,087
N.A.
N.A.
4,59,218
16,25,846
6,48,655
62
128
112
107
41
76
82
94
10
N.A.
30
14
N.A.
N.A.
30
87
38
292
695
600
672
1,016
967
1,899
1,909
859
N.A.
652
799
N.A.
N.A.
253
124
259
890
785
913
1,942
1,716
911
1,642
156
N.A.
N.A,
879
13
N.A.
N.A.
27
144
300
65
81
58
21
51
31
27
25
16
N.A.
15
35
N.A.
N.A.
18
21
28
1
1
1
5
3
IS
N.A.
N.A.
7
N.A.
N.A.
10
2,33,06,069 1,81,37,570 911 10,096 9,380 492 41
.. -N il .
N.A.—Not available.SOXTBOB.—Local Self-Government, Bihar.
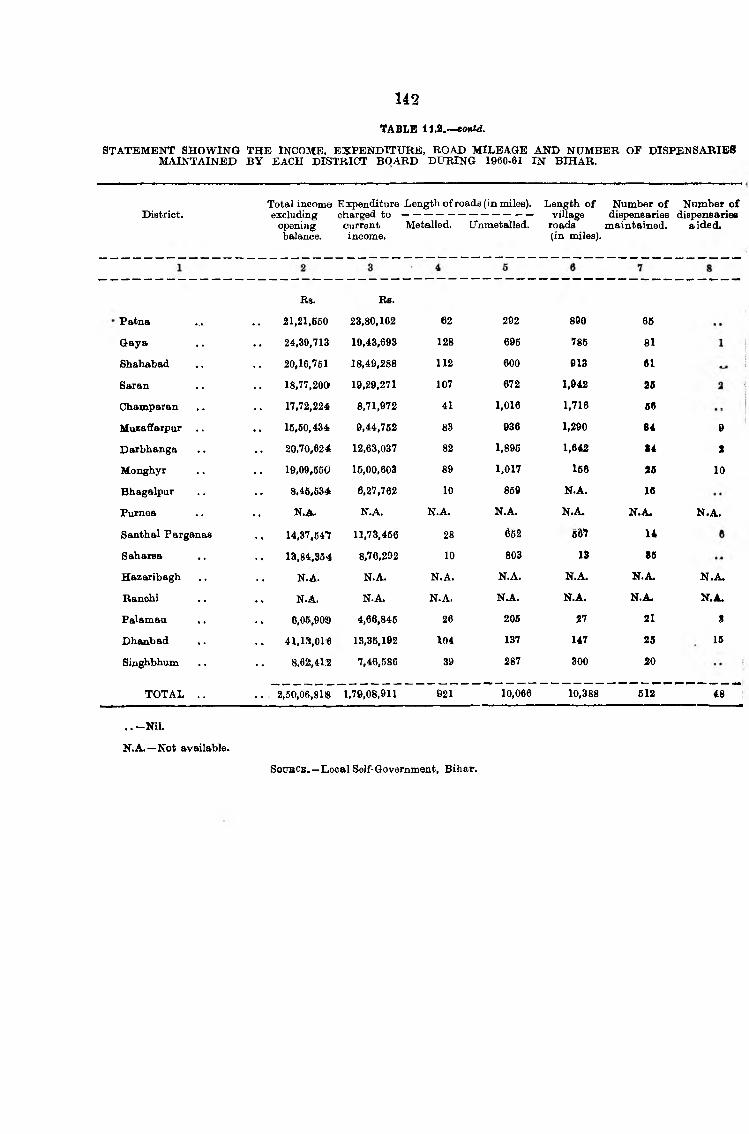
Totalincome Expenditure Length o f roads (in miles). Length o f Number o f Number o fDistrict. excluding charged t o ---------------------------------------- village diapenearies dispensaries
opening current Metalled. Unmetalled. roads maintained. aided,balance. income. (in miles).
142
TABLE 11.2.—conW.
STATEMENT SHOWING THE INCOME, EXPENDITURE, ROAD MILEAGE AND NUMBER OF DISPENSARIESMAINTAINED BY EACH DISTRICT BOARD DURING 1960-61 IN BIHAR.
Patna
Gaya
Shahabad
Saran
Champaran
Musaffarpur
Darbhanga
Monghyr
Bhagalpur
Purnea
Santhal Parganas
Saharsa
Hazaribagh
Ranohi
Palamau
Dhonbad
Singhbhum
TOTAL
Rs.
21,21,560
24,39,713
20,16,761
18,77,20a
17,72,224
15,50,434
20,70,624
19,09,550
8,46,634
N.A.
U,37,64’7
13,84,354
N.A.
N.A.
6,05,90(9
41,131,016
8,62,41.'2
Rs.
23,80,162
19,43,693
18,49,288
19,29,271
8,71,972
9,44,752
12,63,037
16,00,603
6,27,762
N.A.
11,73,456
8,76,292
N.A.
N.A.
4,66,845
13,36,192
7,46,586
62
128
112
107
41
83
82
89
10
N.A.
28
10
N,A.
N.A.
26
104
39
292
695
600
672
1,016
936
1,895
1,017
859
N.A.
652
803
N.A.
N.A.
205
137
287
800
786
013
1,942
1,716
1,290
1,642
166
N.A.
N.A.
607
13
N.A.
N.A.
27
147
300
66
81
61
26
66
84
U
36
16
N.A.
14
86
N.A.
N.A.
21
25
20
9
i
10
N.A.
N.A.
N.A.8
16
2,50,06.,818 1,79,08,911 921 10,066 10,388 512 48
. . -N il.
N.A.—Not available.
SouBCB.—Local Self-Government, Bihar.

143
TABLE l l i . - condd.
STATEMENT SHOWING THE INCOME, EXPENDITURE, ROAD MILEAGE AND NUMBER OF DISPENSARIESMAINTAINED BY EACH DISTRICT BOARD DURING 1959 60 IN BTHxlR.
District.Total income Expea diture Length of roads (in mile-e). Length o f Number o f Number o f
excluding charged t o ----------------------------------------opening current Metalled. Unmetialled. balance.
2
village dispensaries dispensariea roads maintained. aided.
income. (in miles).
3 4 6 6 7 8
Rs.
18,02,100 67 3:98 890 74 6
22,25,989 137 714 769 99 1
17,41,616 111 598 915 63
17,96,233 127 747 1,942 31 3
9,20.888 41 1,0.67 1,716 66 . .
13,38,027 90 1,003 912 48 16
11,37,206 83 1,981 1,643 89 4
13,08,487 83 1,103 160 28 9
7,21,260 12 895 N.A. 24 ..i?.A. N.A. N.A.
8,26,209 66 8i52 478 13 6
9,71,322 6 972 13 36 . .
N.A. N.A. N.A. N.A. N.A. N.A.
N.A. N.A. N.A. N.A. N.A. N.A.
4,73,666 26 201 27 27 7
18,99,351 104 137 147 24 15
6,44,361 39 287 300 23 ••
[,77,05,713 982 10,946 9,912 690 66
Patna
Gaya
Shahabad
Saran
ChaxDparan
Ifuzaffarpur
Darbhanga
Monghyr
Bhagalpvur
Par&ea
Santhal ParganM
Saharsa
Hazaribagh
Bazicbi
Palamau
Dhanbad
Singhbhum
TOTAL
Rs.
1,82,276
24,20,310
20,82,658
19,46,491
14,62,932
16,27,173
17.69.858
13,93,098
11,60,206
N.A.
20,78,844
12.36.858
N.A.
N.A.
6,78,106
14,67,544
9,86,759
N.A.—Not available.Soxmoa.—Local Self-Goverjunent, Bihar.

141
STATEMENT SHOWING POPULATION, INCOME AND EXPENDITURE IN THE MUNICIPALITIES OF BIHAR.
TABLE 11.3.
Year.Number of,
municipalities and notified
area committees.
PopulationwithinMunicipal
limits.
Total income excluding opening
balance.
Totalexpenditure.
Percentage o f expenditure on education to total income.
1 2 3 4
Rs.
5
Rs.
6
1962-63 . . 90 2,449,898 2,48,59,065 2,63,30,974 N.A.
1963-64 . . 90 1,919,929 2,35,46,128 12,25,98,930 N.A.
N .A.—Not available.
S o u r c e .—Local Self-Qovemmont Department, Government o f Bihar.


TOTAL STRENGTH OF POLtCE& NUMBER OF CASESIN BIHAR
K A F A I L A H ME D.

SECTION XII Police and Crime
96 Plan— 22

146
TABLE 12.1,
STATEMENT SHOWING THE SANCTIONED STRENGTH AND COST OF POLICE AND VILLAGE WATCHMENIN BIHAR.
Year.Number Number Total Total Total Total cost
o f o fpolice- out-posts. o f police o f
stations. (Inspector Militaryto Police.
Constable)
strength strength strength o f Police.o f
Chaukidars.
Total cost o f Military
Police.
Estimated value o f
annual emolu
ments o f Chaukidars.
Number o f Police who can read and
write (exclud
ing officers).
1 2 3 4 5 6 7 8 * 9 10
Rs. Rs. Rs.
1959 519 309 20,940 4,862 N.A. 4,51,65,763 N.A. N.A. 131(a)
1960 520 339 21,008 4,862 N.A. 5,03,04,762 61,59,887 N.A. 25
1961 522 339 21,112 4,862 N.A. 5,87,47,418 67,77,900 N.A. All
1962 560 333 21,412 4,862 38,006 6,10,00,000 83,97,587 182.87 All
1963 560 333 21,465 6,142 38,006 6,05,54,415 182.87 All
1964 560 333 22,258 7,894 37,986 7,49,77,532 l,53,30,711t 191.60 All
1965 588 406 22,258 8,950 38,029 8,36,74,826 1,83,59,218 191.60 All
1966 588 406 22,258 8,950 38,029 7,67,12,609 N.A. N.A. All
1967 588 406 22,891 9,799 N.A. 7,71,33,000 N.A. Is.A. All
1968 588 406 22,891 9,799 N.A. 12,70,15,734 N.A. N.A. All
(a) Stands for number o f men in the force who caimot read or write.
(t) Financial Year, 1964-65.
N .A .—Not available. Sotthce—Inspector-General o f Police, Bihar.

147
TABLE 12.2.
S TATEMENT SHOWING THE STRENGTH OF POLICE AND VILLAGE WATCHMEN IN BIHAR DURING THEYEAR 1967 and 1968.
District.Number o f
police-stations.Number o f out-posts.
Total strength o f Police
(Inspector to constable).
Number o f man in the
force who can not read and
write.
Proportion o f police to population.
1 2 3 4 5 6
Patna 37 66 2,428 *
Gaya 43 26 1,480 *
Shahabad 38 23 1,422 * « •
Saran 35 21 1,247 *• •
Champaran.. 29 15 823 * • •
Muzaffarpur 30 22 1,110 *
Darbhanga 35 22 1,184
Monghyr 35 35 1,314 ♦
Bhagalpur 22 20 1,022 *
Saharsa 18 17 549 *
Purnea 32 20 1,201 « • •
Santhal Parganas 43 13 1,230 • • •
Hazaribagh 34 29 1,082 * • •
Ranchi 44 26 1,126 *• »
Palamau 22 6 514 • •
Dhanbad .. 17 17 878 * • •
Singhbhum 28 9 687 * • •
Jamshedpur 5 15 737 >•>• •
E. Railways 2C 3 779 * • •
N. E. Railways 15 1 629 *
C. I. D. 875 * • •
P.T.C. . . 41 * • •
C. T. S. • • 118 « • •
Wireless • • 359
L -G .’s andD .L G .’s staff • • • • 56 * • •
Headquarters Staff . . •• •• * • •
T o t a l •• 588 406 22,891 * ••
* —All can read and write.
. . —Not available.
S o u b c e ,— Inspector-General of Police, Bihar.

TABLE 12.3.
STATEMENT OF TRUE CASES OF COGNIZABLE CRIMES IN BIHAR.
148
True cases.Total number Total
Year. of cases ---------------------------------------------------------------------------------------------------------- Magistrate’sreported casesduring Discharged Not detected Magistrate’s Total convicted,
the year. Corvicted. or or appre- true cases. true cases,acquitted. bended.
1959 . . 55,777 6,097 9,666 29,889 5,660 1,07,089 5,028
1960 66,061 10,735 11,351 31,203 13,237 68,722 13,237
1961 64,290 10,787 10,676 31,006 17,476 71,963 17,746
1962 58,587 5,558 7,054 29,629 11,318 58,991 1,939
1963 60,970 5,693 10,665 33,084 12,179 63,675 1,135
1964 66,258 5,621 10,202 36,439 8,863 63,386 632
1965 64,832 5,602 10,167 31,914 8,859 58,439 629
1966 69,388 5,870 7,346 35,761 11,501 56,988 909
1967 86,120 5,913 7,711 43,872
1968 79,899 6,434 6,570 39,810
Notf.—Total o f the true cases reported under column 7 includes the figures relating to the luimber o f cases in which investigation was refused, the figures o f which is not reported in this table.
. —Not available.S ource.—'Inspector-Generiil of Police Bihar.

NUMBEP OF CASES PEPOPTED » PERSONS TRIEDIN BIHAP
NUBER IN
B-H'USS AIN


I^TATEMEKT SHOWING THE NUMBER OF PERSONS TRIED, CONVICTED OR ACQUITTED UNDER COGNI-ZABLE CRIMES IN BIHAR.
149
TABLE 12.4.
Year.No. o f persons
tried (total o f columns 3 and 4).
Police cases.
Number of persons
convicted.
Magistrate's cases.
Number o f persons
acquitted or discharged.
Number o f persons
convicted.
Number o f persons
acquitted or discharged.
1959 58,449 19,708 38,741 8,311 16,529
1960 56,562 20,293 36,269 6,588 16,671
1961 57,363 20,044 37,319 11,943 24,402
1962 53,588 12,588 41,000 3,595 18,086
1963 52,604 13,908 38,696 3,012 16,648
1964 50,221 13,175 37,046 1,503 16,871
1965 50,578 13,160 37,418 1,969 14,018
1966 56,764 14,208 42,556 2,991 15,746
1967 54,363 13,690 40,673
1968 51,645 15.,591 S6,ft54
S o u r c e . —Inspector-General o f Police, Bihar.
TABLE 12.5.
STATEMENT OF TRUE CASES OF NON-COGNIZABLE CRIMES IN BIHAR.
Year. Total numbero f cases reported.
Number o f cases.
Discharged Ended in after trial. conviction.
Number o f persons.
Acquitted or Convicted, discharged.
1 2 3 4 5 6
1957 84,777 15,935 49,338 56,425 64,406
1958 91,479 21,574 55,703 75,654 77,284
1959 96,497 16,921 55,589 64,374 80,542
1960 1,01,104 22,700 61,005 76,461 80,370
1961 1,16,570 23,539 63,531 88,533 81,931
1962 1,17,330 27,368 66,636 91,066 99,061
1963 r. 1,40,277 33,640 75,619 1,02,122 98,654
1964 1,11,984 30,317 67,910 96,370 94,985
1965 ■ . . 87,938 20,396 52,105 81,899 67,456
1966 1,10,019 45,033 36,565 91,352 54,001
SotjbCe . —Inspector-General of Police, Bihar.

STATEMENT SHOWING THE NUMBER OF REPORTED CASES OF CRIMES INVESTIGATED BY THE POLICE, THE NUMBER OF PERSONS ARRESTED AND EVADING ARREST AND RE-CONVICTIONS OF OLD OFFENDERS IN BIHAR.
150
TABLE 12.6.
Year.
Number of Number of Number ofNumber of persons persons personscogn,izable arrested evading convicted
crimes by the police arrest at the for offenceinvestigated during the close of the against
by police. year under year property,cogriizable under cogni-
crimes. zable crimes.
Number of persoi^s
with previous convicticwi judicially
proved.
Percentage o f persons
with previous conviction
to persons con,victed.
1 2 3 4 5 6 7
1959 . . 59,658 77,432 2,673 * * *
1960 . . . . 62,870 80,792 2,209 7,872 N.A. *
1961 . . 63,374 77,681 1,834 8,131 N.A. *
1962 . 61,501 68,379 2,187 5,420 N.A. N.A.
1963 . . 65,201 73,475 4,670 6,283 N.A. N.A.
1964 .. 71,454 86,335 1,723 5,847 206 3.5
1965 .. 67,540 91,223 1,762 6,317 182 2.9
1966 . . 76,329 95,922 2,508 8,829 N.A. N.A,
1967 . . 78,461 1,02,585 3,145 5,974 N.A. N.A.
1968 . . 74,008 1,02,394 3,033 6,501 N.A. N.A.
N .A .—Not available.
S o u r c e . — Inspector General o f Police, Bihar.

TABLE 12.7.
STATEMENT SHOWING THE CASES OF PROPERTY STOLEN AND RECOVERED IN BIHAR.
151
Percentage o fNumber o f cases Number o f cases Percentage o f Amount o f peroperty Amount o f property value recovered
o f stolen property. o f recovery. cases o f recovery. stolen. recovered. to total value o fproperty stolen.
Year.
Cogniz- Non-cog- Cogniz- Non-cog- Cogniz- Non-cog- Cogiiiz- Non-cog- abJe. nizable. able, nizalbe. able, nizalbe. able. nizalbe.
Cogniz- Non-cog- Cogniz- Nqn-cog- able. nizable. able. nizabe.
1 2 3 4 5 6 7 8 9 10 11 12 13
Rs. Rs. Rs. Rs.
1959.. 30,075 34 2,766 9.2 85,62,258 2,787 3,04,323 3.6
KI60. . 29,825 57 2,678 8.9 87,97,271 7,472 3,32,309 3.7
1961.. 30,331 578 2,974 11 9.8 1.90 78,52,161 14,463 3,17,132 706 4.03 4.88
1962.. 28,467 306 2,905 7 10.20 2.29 82,77,779 42,285 4,41,694 1,477 5.33 3.49
1963.. 31,853 125 2,853 13 8.96 10.40 1,22,15,858 14,560 4,00,798 1,413 3.28 9.701964. . 31,694 102 3,240 1 10.22 0.98 92,97,297 4,380 8,06,533 75 8.67 1.71
1965. . 32,631 183 2,610 5 8.00 2.73 1,29,30,723 5,157 10,25,348 357 7.93 6.921966 33,136 41 3,419 10.32 1,72,52,237 4,446 27,57,187 15.98
1967.. 40,936 113 4,569 11.1 2,44,85,022 5,394 7,70,756 3.1
1968. . 40,260 159 4,472 70 11.1 44.2 5,06,09,835 6,291 68,37,042 13.1 . .
—Not available.
SOUBOB. —Inspector-General o f Police, Bihar,

STATEMENT SHOWING THE NUMBER OF REPORTED CASES OF COGNIZABLE CRIME INVESTIGATED B'5lTHE POLICE IN BIHAR DURING THE YEAR 1967 and 1968. i
152
TABLE 12.8.
District.
Number o f cognizable crimes investigated
by the police
1967. 1968.
1 2 3
Patna . . 7,990 8,410 ;
Gaya 4,761 4,735
Shahabad 6,100 5,226
Saran 4,295 3,695
Champaran 3,252 2,982
Muzaffarpiir 4,484 4,505
Darbhanga 4,972 4,326
Bhagalpur 3,292 3,108
Monghyr . . 5,737 5,672
Saharsa 2,727 2,538
Purnea 4,150 3,588
Santhal Parganas 3,652 2,914
Ranchi 5,038 4,772
Hazaribagh 4,175 3,860
Palamau . . 1,947 1,660
Dhaubad . . 4,182 4,114
Singhbhum 2,189 1,726
Jamshedpur 1,686 2,139
N.E. Railways 1,641 1,416
E. & S. E. Railways ..
TOTAL
2,262
78,532
2,622
74,008
S o t jr c -e . — Inspector-General of Police, Bihar.

153t a b l e 13.9
STATEMENT SHOWING THE NUMBER OF TRUE CASES OF SERIOUS CRIMES IN BIHAR.
Year. Rioting. Murder. Culpablehomitjide.
Administering
Btupefyingdrngg.
Dacoity. Robbery. House- Theft breaking, (ordinary).
Theft(cattle.)
Receivingstolen
property.
1 2 3 4 5 6 7 8 9 10 11
i1959 3,331 762 165 72 1,120 560 17,187 19,020 819 825
1960 3,557 744 190 46 773 526 17,163 19,295 606 907
1961 3,619 792 181 97 703 474 16,737 18,764 478 752
1962 4,033 820 172 69 634 473 16,392 18,602 744 666
1963 4,471 915 163 67 642 544 18,648 20,636 544 716
1964 5,882 1,031 168 67 856 660 22,367 19,435 737 909
1966 6,093 1,058 192 82 892 664 20,691 19,867 577 739
1966 6,469 1,072 185 175 1,012 689 21,533 21,692 830 849
1967 8,282 1,367 245 104 1,752 1,080 24,725 27,055 823 1,392
1968 8,048 1,282 225 147 1,580 978 21,210 24,580 642 1,409
SouB C K . —Inspector-General o f Police, Bihar.
96 Planni g—23


SECTION XIII Administration of Civil ud Griminai Justice
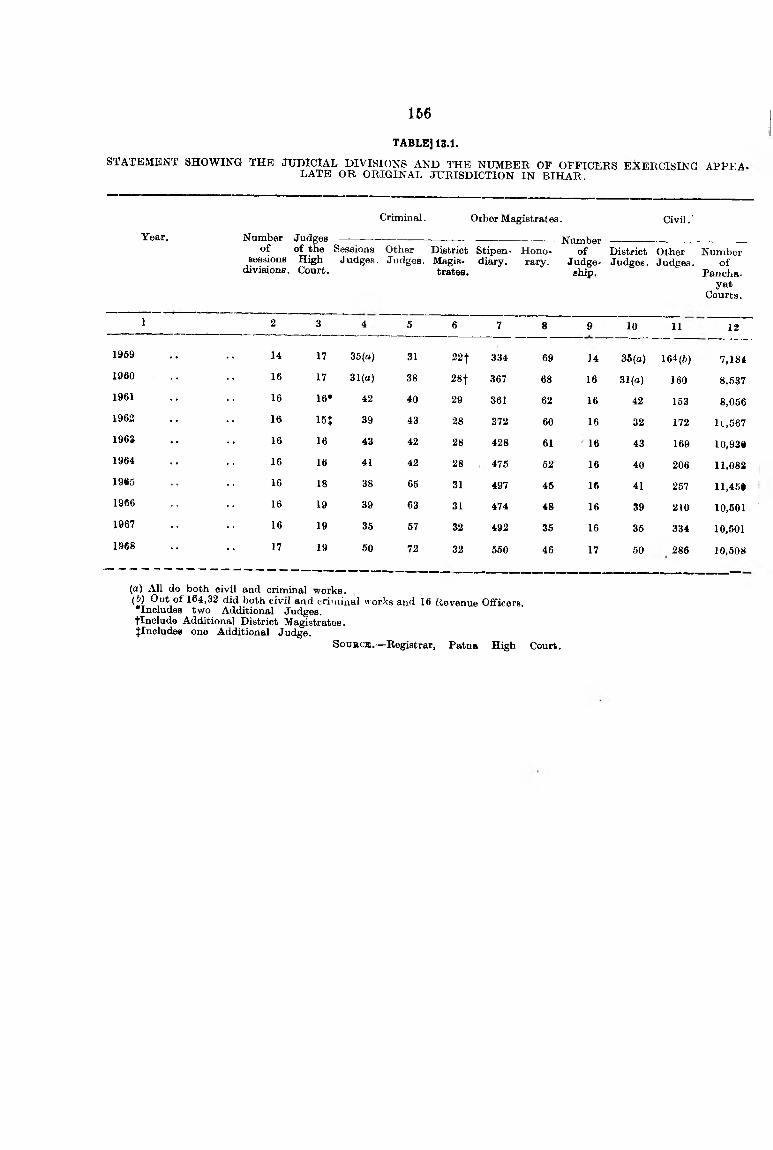
m
TABLE] 13.1.
STATEMENT SHOWING THE JUDICIAL DIVISIONS AND THE NUMBER OF OFFICERS EXERCISING APPEA-LATE OB ORIGINAL JURISDICTION IN BIHAR.
Year.
Criminal. Other Magistrates. Civil.'Number J u d g e s ------------- ---------- ---------- -— ------------------------
o f o f the Sessions Other District Stipen- Hono-sessions High Judges. Judges. Magis- diary,
divisions. Court. trates.rary.
N u m b e r-----------------------------------------o f District Other Number
Judge- Judges. Judges. o f ship. Pancha-
yat Courts.
1 2 3 4 5 6 7 8 9 10 11 12
1959 14 17 35(a) 31 22f 334 69 14 36(0) 164(fc) 7,1841960 16 17 31(a) 38 28t 367 68 16 31(a) 160 8,6371961 16 16* 42 40 29 361 62 16 42 153 8,0561962 16 15J 39 43 28 372 60 16 32 172 ll,5671963 16 16 43 42 28 428 61 16 43 169 10,93«1964 16 16 41 42 28 475 52 16 40 206 11,0821965 16 18 38 65 31 497 45 16 41 257 11,45#1966 16 19 39 63 31 474 48 16 39 210 10,5011967 16 19 36 67 32 492 35 16 35 334 10,6011968 17 19 50 72 32 550 46 17 50 286 10,608
(a) All do both civil and criminal works.(b) Out o f 164,32 did both civil and criminal works and 16 Revenue Officers. •Includes two Additional Judges.tlnclude Additional District Magistrates, jincludes one Additional Judge.
SouRCK.—Registrar, Patna High Court.

157
TABLE 13.2.
STA*tEMENT SHOWING DISTRICTWISE JUDICIAL DIVISIONS AND THE NUMBER OF OFPICERS EXERCISINGAPPELLATE OR ORIGINAL JURISDICTION IN THE STATE OF BIHAR DURING 1967.
No. o f session
division.
Judges of the High
Courts
Criminal. Other Magistrate.No. of Judge ship.
Civil.No. o f
Panchayat Courts.
Name of district.Sessions
JudgesOtherJudg-es.
DistrictMagis
trate.
Stipendiary.
Honorary.
District Judges.
OtherJudges.
1 2 3 4 5 6 7 8 9 10 11 12
Patna 1 19 4 8 2 38 4 1 4 37 518
Gaya 1 2 5 2 42 1 1 2 29 844
Shahabad 1 2 7 2 35 3 1 2 32 812
Saran 1 2 6 2 25 4 1 2 24 799
Champaran.. 1 1 2 2 16 1 1 1 15 676
Muzaffarpur 1 1 4 2 29 7 1 1 25 673
Darbhanga . . 1 2 5 1 32 4 1 2 24 843
Monghyr 1 5 3 2 42 1 1 5 24 708
Bhagalpur 1 3 4 4 36 8 1 3 26 846
Santhal Parganas I 1 4 2 37 1 1 15 731
Parnea 1 3 3 2 29 1 1 3 18 621
Hazaribagh 1 2 2 1 29 1 2 15 700
Ranchi 1 3 2 2 23 1 3 11 712
Palamau .. 1 1 2 19 1 1 9 344
Dhanbad 1 1 1 2 28 1 1 1 16 203
Singhbhum 1 2 1 2 32 •• 1 2 14 471
Total 16 19 35 57 32 492 35 16 35 334 10,501
. —N ot available.
S o u r c e .— Registrar, Patna High Court.
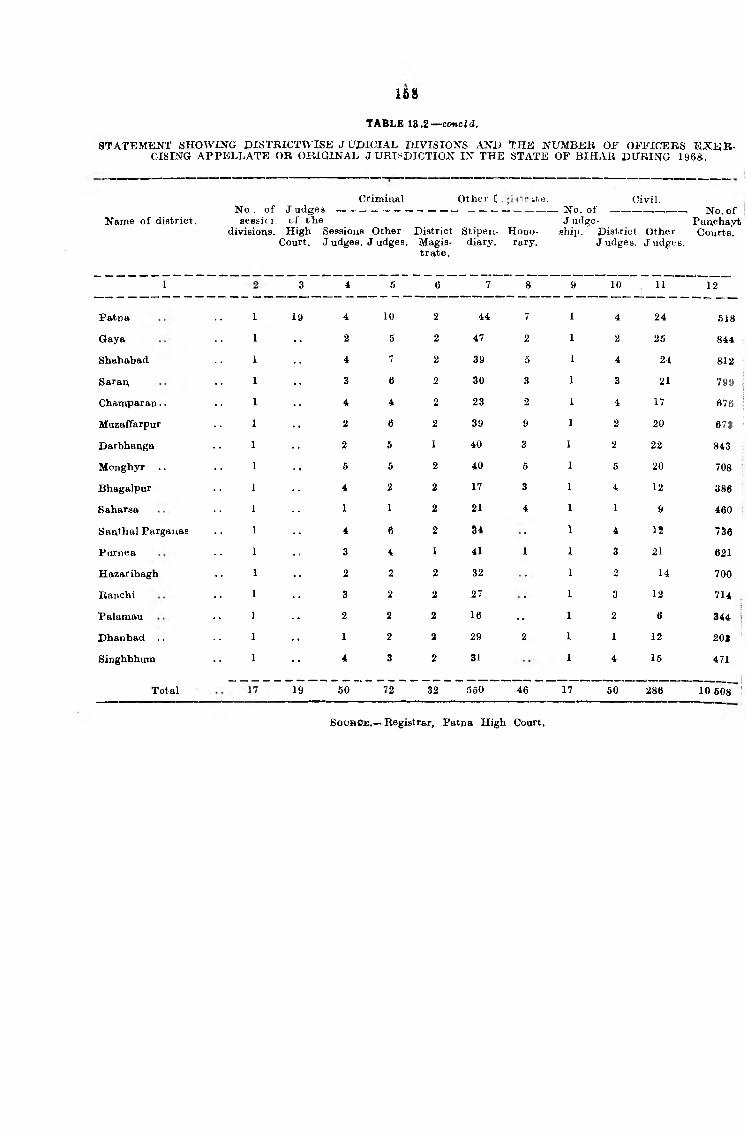
STATEMENT SHOWING DISTRICTWISE JU DICIAL DIVISIONS AND THE NUMBER OF OFFICERS E X E R CISING APPELLATE OR ORIGINAL J URI,'^DICTION IN THE STATE OF BIH AR DURING 1968.
l U
TABLE 13.2 —concld.
CrimiAal Other I , vte. Civil.N o . o f J u d g e s ------------------------------------- ------------------------------No. o f ------------------------- N o .o fseesifi. c f tlie Judge- Panchayt
divisions. High Sessions Other District Stipen,- Hono- shijj. District Other Courts. Court. J udges. J udges, Magis- diary. rary. J udges. J udges.
trate.
Name o f district.
1 3
19
4 5 6 7 8 9 10 11 12
4 10 2 44 7 1 4 24 518
2 5 2 47 2 1 2 25 844
4 7 2 39 5 1 4 24 812
3 6 2 30 3 1 3 21 799
4 4 2 23 2 1 4 17 076
2 6 2 39 9 1 2 20 673
2 6 1 40 3 1 2 22 843
5 5 2 40 5 1 5 20 708
4 2 2 17 3 1 4 12 386
1 1 2 21 4 1 1 9 460
4 6 2 34 1 4 12 736
3 4 1 41 1 1 3 21 621
2 2 2 32 1 2 14 700
3 2 2 27 1 3 12 714
2 2 2 16 • • 1 2 6 344
1 2 2 29 2 1 1 12 203
4 3 2 31 1 4 15 471
60 72 32 550 46 17 50 286 10 508
Patna
Gaya
Shahabad
Saran
Champaran..
Muzaffarpur
Darbhanga
Monghyr ..
Bhagalpur
Saharsa
Santhal Pargauae
Purnea
Hazaribagh
Ranchi
Palamau
Dhanbad ..
Singhbhuna
Total 19
S o t jb O e .-> Registrar, Patna High Court.

STATEMENT SHOWING THE NUMBER OF CASES REPORTED PERSONS TRIED CONVICTED AND ACQUITTED AND NUMBER OF WITNESSES EXAM IN ED IN SESSIONS AND MAGISTERIAL COURTS IN BIH AR.
159
t a b l e 13.3
Number o f cases. Number o f persons.Number o f
witnesses exam ined,
Year.
Under trial Pendingincluding Acquitted trial At At
Reported Returned Brought those"-)i-a of Ojivl^.tod. Died, at the Sessions Magistratesas true. to trial. previous discharged. end o f Coa’i-’ ts. Courts,
year. the year.
1 2 3 4 5 6 7 8 9 10 11
1959 .. 1,90,049 1,19,052 1,36,316 4,00,901 1,45,817 1,04,020 1,241 1,49,823 27,750 2,61,957
I960 1,75,473 1,20,291 1,32,124 4,48,367 1,61,466 1,10,240 1,328 1,75,333 25,597 2,69,938
1961 . . 1,84,966 1,14,889 1,47,505 4,87,243 1,73,063 1,12,622 1,225 2,00,333 29,992 2,78,054
1962 1,99,782 1,45,983 1,69,285 5,41,008 1,88,358 1,21,885 962 2,29,803 28,849 2,73,195
1963 1,95,194 1,78,700 1,94,263 6,17,269 2,06,440 1,38,971 983 2,70,875 28,848 3,09,674
1964 1,56,249 1,66,246 1,70,743 6,71,511 2,22,542 1,19,389 1,955 3,27,625 28,136 3,07,838
1965 1,69,026 1,49,890 1,74,217 6,94,324 2,34,883 1,19,579 1,768 3,38,094 27,658 3,04,799
1966 .. 1,53,923 1,25,466 1,66,713 7,35,598 2,19,852 1,05,994 2,029 4,07,723 28,194 2,98,203
1967 U65,036 I ,25>6I8 1,T4,-251 T,S4,456 ‘ 5,47 4 2,30": 4,"8,614 •22,241 2,84,910
1968 1,91,499 1,17,725 1,63,108 8,86,266 2,32,962 1 05,052 4,377 5,43,875 21,017 2,09,758
SOUBCB.--Registrar, Patna High Court.

TABLE 13.4.
STATEMENT SHOWING THE NUMBER OF CASES REPORTED .PERSONS TRIED, CO.NVICTED AND ACQUITTED AND NUMBER OF WITNESSES EXAM INED IN SESSIONS AND MAGISTERIAL COURTS DURING 19«7.
150
Number o f cases. Number o f persons.Number of
witnesses examined.
Name o f ju'lgeshiiDs.
Accepted Brought Acquitted Reported, as to or Convicted,
true. trial. discharged.
At AtSessions Magistrates’
Courts. Courts,
iPatna 10,248 12,771 13,957 9,7T4 10,6.2 2,568 22,619
Gaya 12,012 13,074 14,469 22,713 11,194 1,381 22,351
Shahabad 12,302 12,800 14,835 18,925 7,996 1,539 21,855
Saran 11,321 5,953 23,406 12,37] 5,846 1,454 16,141
Champaran 9,682 2,383 6,962 14,568 3,545 547 13,807
Muzaffarpur 14,081 8,174 11,399 20,712 4,217 1,435 20,678
Darbhanga 10,367 8,238 9,950 17,591 4,222 1,494 28,888
Monghyr 20,298 4,230 14,549 13,758 12,220 2,255 22,48?
Bhagalpuf . . 3,303 3,396 3,452 8,200 2,794 993 13,241
Saharsa 3,904 3,056 4,986 11,928 1,228 453 9,130
Pufnea 5,314 5,864 6,446 13,061 3,298 1,596 13,573
Santhal Parganas .. 8,399 11,141 8,203 12,539 5,740 ],400 20,485
Hazaribagh 9,834 16,043 9,955 11,632 6,709 1,166 18,223
Ranchi 9,708 6,535 9,652 7,412 4,677 1,782 11,454
Palamau 5,208 3,353 3,538 6,399 2,118 568 10,434
Dhanbad 9,986 5,617 8,845 3,338 4,106 502 8,083
Singhbhum 8,469 2,990 9,648 3,030 4,942 1,108. 11,461
TotAt ., 1,65,036 1,25,618 1,74,251 2,08,0f;l 95,474 22,241 2,84,910
SOTJBOE,— Registrar, Patna High Coirt,

161
TABLE 18.4—concW.
-r.urPVT SHOWING THE IJXTMBER OF CASES REPORTED, PERSONS TRIED. CONVICTED AOT) ArOTTTTTTrT |TAJ^^2;^BER o f WITNESSES EXAJTINED IN SESSIONS AND MAGISTERIAL COURTS DURING 196
Kftni* of iudg93hipi
Number o f cases. Number o f persons. Number o f witnesses examined.
Reported.Accepted Brought
as totrue. trial.
Acquitted Ator Convicted, Sessions
discharged. Courts,At
MagistratesCourts.
6 8
Gs.va
Sbababad
Sarau
Chaa'paran
MtO!affar[>ur
Darbhanga
Moagh\T
Blu alpur
Saharsa
Purnea
Ssnthal Parganas
Hazaribagh
Ranchi
Palamau
Dhaubad
Siaghbhum
T o t a l
16,742
9,512
15,273
9,960
12,340
18,520,
14,947
21,221
3,131
5,915
6,720
11,037
13,756
9,606
4,459
11,682
6,678
14,942
12,962
8,343
9,220
4,555
2,287
9,976
3,984
2,515
3,404
5,371
6,433
13,252
7,593
4,037
2,730
6,119
15,160
9,068
11,788
6,531
9,023
13,156
12,068
16,896
3,456
5,409
6,562
10,625
13,067
9,542
4,297
7,020
9,440
11,725
30,547
24,501
11,929
15,636
24,098
26,117
12,273
4,970
13,207
12,570
12,958
10,282
8,490
6,242
3,496
3,921
11,633
8.789
11,877
7,181
3,935
4,893
4,980
13,495
2,325
1,383
3,477
4,696
6,380
5.790
1,899
6,275
6,044
1,672
1,276
2,070
842
1,389
1,406
1,292
1,452
916'
287
1,244
2,134
784
1,831
401
662
1,359
1,91,499 1,17,725 1,63,108 2,32,962 1,05,052
22,051
22,353
21,553
19,317
16,196
19,575
21,892
20,246
10,968
8,206
11,597
16,445
15,722
15,600
7,801
7,482
12,754
21,017 2,69,7 5 8
SOUBOB.—Registrar, Patna High Court.
Pl»ning>-_24

STATEMENT SHOWING THE N m rB E R AND VALUE OF SUITS INSTITUTED IN COURTS OF O R IG lN ij JURISDICTION AND INSOLVENCY PETITIONS PRESENTED IN THE COURTS IN BIH AR.
162
TABLE 13.5.
Year. Total no.o f suits
inst ituted.
Number o f insolvent petitions presented by debtors.
Total value
o f suits. Under arrest or imprison
ment.
Not un<ier arrest or
imprisonment.
Involventpetitions
presentedby
creditors.
Numbei adjudged;
be insolve^ during thi
year.
1 2 3 4 5 6 7
1959 49,855
w
Rs,
8,04,73,524 3 135 112 182
1980 44,366 48,12,32,846 4 152 105 79
1961 46,589 9,81,27,499 7 198 181 134
1962 43,978 8,88,22,522 1 199 128 194
1963 43,013 9,98,20,265 6 180 222 205
1964 • • 85,455 12,31,74,040 134 428 133
1965 • • 43,772 11,55,14,273 131 55 31
1966 • • 43,520 13,06,’:2,0'75 1 110 15 36
1967 • • 43,045 15,38,76,310 100 18 22
1968 •• 47,192 15,99,96,810 1 105 16 15
SouBCE.—Registrar, Patna High Court.

;STATElVrBNT SHOWING THE NUMBEB AND VALUE OF SUITS INSTITUTED AND APPLICATIONS FILED ' FOR EXECUTION OF DECREES AND AMOUNT REALISED B Y DECREES IN BIH AR DURING 1967.
163
TABLE 13.6.
Name of J udgeshipa.Tota]
number of suits
instituted.
Total value o f suits.
Total number o f
applications filed for
execution of decrees.
Amountrealised
bydecrees.
Patna
Gaya
Shahabad
Saran,
Champaran
Muzaffarpur
Darbhanga
Bhagalpur
Monghyr
P\iTfn,6a
Santhal Parganas
Ranchi
Hazaribagh
Palamau
Singhbhum
Dhanbad
T o t a l
SOUBCE
Rs. Rs,
2,795 2,03,61,109 826 5,72,8192,299 67,89,326 476 4,46,5583,572 1,24,29,084 1,367 6,16,5733,823 2,04,82,651 994 4,01,4052,290 1,13,23,848 625 2,92,5512,572 97,72,065 878 3,62,7073,928 2,39,88,498 576 2,49,1223,146 91,92,047 695 4,09,1071,918 1,07,97,568 621 3,46,895
4,598 57,57,943 1,286 5,15,0931,250 19,13,219 177 52,7572,485 76,75,509 252 1,10,1553,209 40,00,076 292 85,392
479 7,51,760 99 17,8083,377 46,83,254 1,020 5,85,0811,304 39,58,353 363 4,59,371
43,045 15,38,76,310 10,547 55,23,394
— Registrar, Patna High Court.
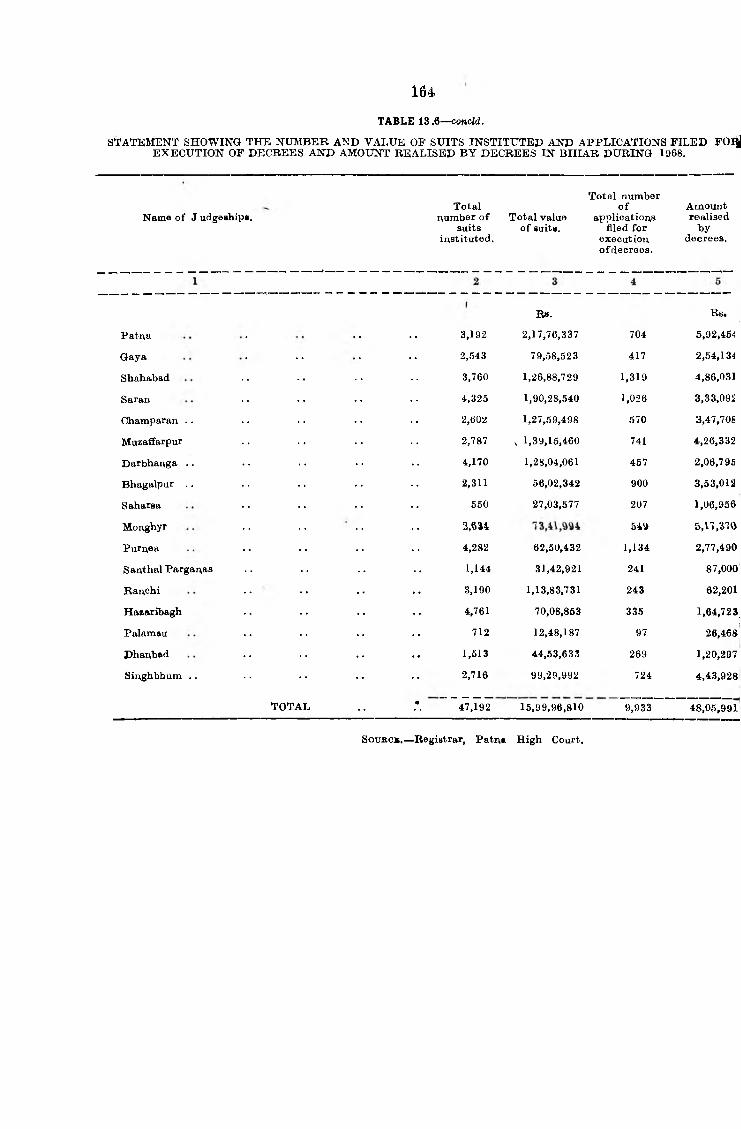
STATEMENT SHOWING THE NUMBER AND VALtTE OF SUITS INSTITUTED AND APPLICATIONS FILED FOqj EXECUTION OF DECREES AND AMOUNT REALISED B Y DECREES IN BIH AR DURING 1968.
164TABLE 18.6—concld.
N am e o f J udgeahipa.Total
number o f suits
instituted.
Total value o f suits.
Total number o f
applications filed for
execution ofdecreea.
Amountrealised
i>ydecrees.
Patna
Gaya
Shahabad
Saran
Champaran • •
Muzaffarpur
Darbhanga . .
Bhagalpur ..
Saharsa
MongM**
Purnea
Santhal Parganaa
Ranchi
Hazaribagh
Palamau
Dhanbad
Singbbhum . .
TOTAL
Rs. Rs.
3,192 2,17,76,337 704 5,92,454
2,543 79,58,523 417 2,54,134
3,760 1,26,88,729 1,319 4,86,031
4,325 1,90,28,540 1,026 3,33,092
2,602 1,27,59,498 570 3,47,708
2,787 , 1,39,15,460 741 4,26,332
4,170 1,28,04,061 457 2,06,795
2,311 56,02,342 900 3,53,012
550 27,03,577 207 1,06,956
2,6»4 54^ 5,n ,S70
4,282 62,50,432 1,134 2,77,490
1,144 31,42,921 241 87,000
3,190 1,13,83,731 243 62,201
4,761 70,08,853 335 1,64,723
712 12,48,187 97 26,468
1,513 44,53,633 269 1,20,297
2,716 99,29,992 724 4,43,928
47,192 15,99,96,810 9,933 48,05,991
SouBC*.—Registrar, Patna High Court.

SECTION XIV JaH Statlstles

STATEMENT SHOWING THE DAILY AVERAGE NUMBER OF PRISONERS, THEIR AVERAGE EARNINGSAND AVERAGE COST OF MAINTENANCE IN BIH AR.
l68
TABLE 14.1.
Year.Daily average
number of prisoners.
Dietary charges Average cost per head o f maintencnce
(excluding civil per head (inprisoners) . cludi 1 g dietary
charges).
Average cash earning
per head.
Average net Deat’i rate per cost per head mile (thousand
to Government o f average (col. 4 minus strength),
col. 5).
1 2 3 4 5 6 7
Rs. a. p. Rs. a, p. Rs. "a. p. Rs. a, p.
1953 17,292 239 9 0 456 3 1 63 11 0 392 8 1 7.32
195.4 16,960 232 8 0 454 11 0 (— )10 2 8 464 13 8 5.01
1955 18,175 182 10 1 408 14 8 27 0 0 381 14 8 3.52
1956 16,972 205 14 6 450 5 4 42 13 6 407 8 1 4.00
Rs, Rs. Rs. Rs.
1957 17,450 229.63 650.25 93.25 511.92 3.03
1958 22,574 240.77 584.02 52.98 531.04 8.46
1959 21,078 226,13 465.76 79.35 386.41 7.16
1960 19,679 250.69 498,78 22.94 475.84 6.78
1961 19,882 259.56 562.08 72,41 489.67 5.93
1962 20,459 250.15 516.34 72,93 443.41 4.44
Note.—The figures in col, 2 relate to convict, under trial, civil and security prisoners.
S ou B C K .— Inspector-General o f Prisons, Bihar.

TABLE 14,2*

TABLE
STATEMENT SHOWING THE LENGTH OF SENTENCES OF
168
Not e’iceeding month.
oneAbove one montH and not exceeding
six months.
Above six months and not exceeding
one year.
Above one year and not exceeding
five years.
Above and not
ten
five years exceeding
years.
Males. Females. Males. Females. Males. Females. Males. Females. Males. Females.
1 2 3 4 5 6 7 8 9 10 11
1955 10,102 429 11,702 420 3,943 34 3,071 15 542 3
1956 13,183 547 13,241 435 3,550 14 2,098 22 503(Re-organised).
1957 14,417 737 12,511 344 3,216 14 1,754 14 681 1
1958 22,280 1,348 16,732 501 4,088 28 2,252 14 697 . .
1959 21,139 778 15,803 432 4,083 16 2,285 11 731 3
1960 18,842 690 12,803 635 3,520 6 2,164 4 558 7
1961 14,637 663 12,633 382 3,278 46 2,377 27 766 4
1962* 12,019 489 13,308 365 3,178 50 2,585 74 851 9
1963* 13,772 650 12,168 388 3,194 32 2,699 34 733 5
1964* 11,120 318 7,749 317 3,059 122 2,772 11 664 3
NU.•^Provisional.
SouR''E.—Directorate o f Statistics and Evaluation, Bihar,
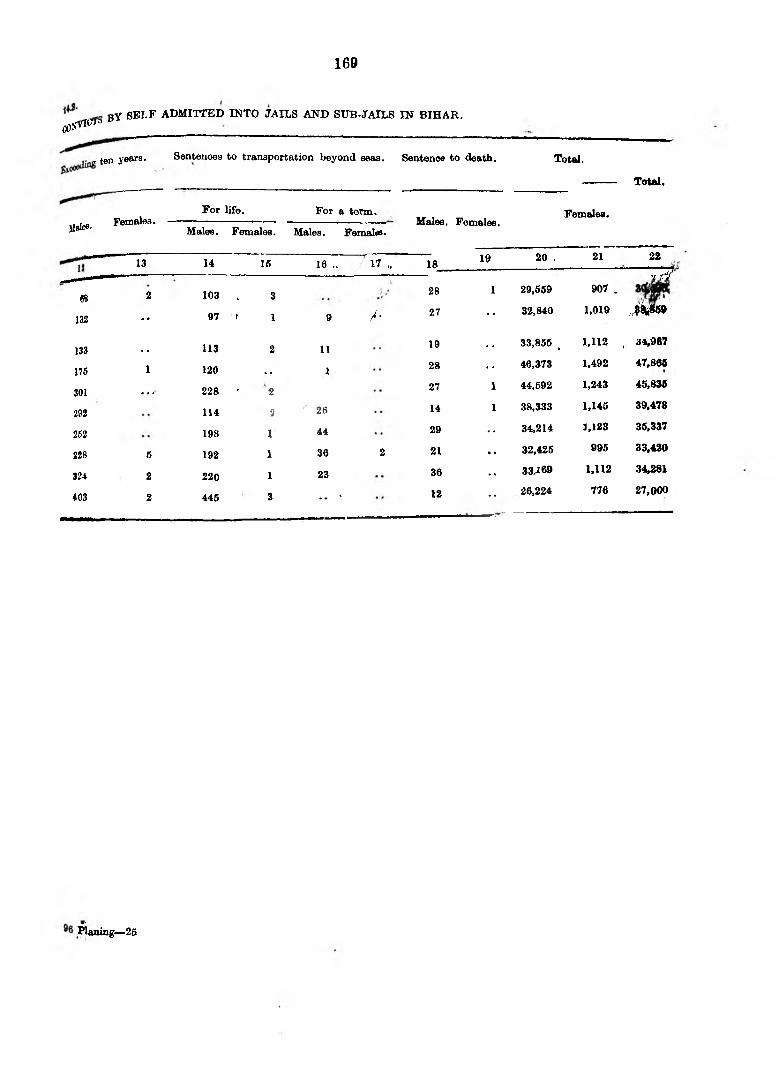
169
co>T?y SELF ADMITTED INTO JAILS AND SUB-JAILS IN BIHAR..'fllTJO I'
- ten years. Sentenoea to transportation beyond seas. Sentence to death. Total.
jlalee-Females.
For life. For a term.
Males. Females. Males. Female*Males. Feoaales.
Females.
Total.
13 14 15 16 .. 17 „ 18 19 20 , 21 22J?
65 2 103 . 3 28 1 29,559 907 .*/ ?TV
132 •• 97 I 1 9 /- 27 •• 32,840 1,019 j m 9
133 .. 113 2 11 19 •• 33,855 , 1,112 , 34,967
176 1 120 .. 1 28 •• 46,373 1,492 47,865
301 • • f 228 ' 2 27 1 44,592 1,243 45,835
292 114 2 26 14 1 38,333 1,145 39,478
252 198 1 44 29 •• 34,214 1.123 35,337
228 5 192 1 36 2 21 . . 32,425 995 33,420
324 2 220 1 23 36 • • 33^69 1,112 34,281
403 2 445 3 • • ' 12 • • 26,224 776 27,000
Waning— 25

170
STATEMENT SHOWINQ THE CLASSlFiCAtt,
'nJoT
Year.der 16. 16—1^ 19-21. 22—30. -
Mfiles. Femait,.
t r r
19W
IfiiM (Reorganised).
1987
1958
i k r ..
. . —Nil.*—^ProvisionaL
Males. Female^ Males. Females. Males. Females. Males. t
2 3 ' - 5 6 7 8 9 10
1.052 8 2,213 4,613 83 11,464 S14 7,096937 3 2,261 l& 4,813 104 11,372 872 7,935
1,084 18 2,018 3. \3,972 64 12,617 886 9,1021,282 3 3,226 17 ^71 69 17,831 464 12,669
748 4 2,428 16 4,8k 46 16,744 428. 13,1331,317 4 2,696 12 6,007 66 13,402 278 10,031
761 •• 2,489 12 4,619 11,762 416. 8,9642 2,226 7 3,967 44 11,834 239 9,096
4^ 5 1,702 28 6,206 43 18,720 531 6,6666^0 “ ■, •• 1,604 6 6,194 187 8,013 179 6,114
SOOT<«.-D i«o»o«te of Er.tartio.^ B ih ». P « » .
381
<Sl
««
«-
26

171
AOE, SEX AND LITBRACY IN VARIOUS JAILS_____________
IN BIHAR.
Above 60. Total—Age-groupa. Literates. Illiterates.
Males-
12
Females- Male*. Femiles. Malee. Females. Total. Males. Females. Males. Females*
13 14 16 16 17 18 19 • 20 21 23
8.331 103 800 1 39 29,569 907 30,466 8.216 20 21,344 887
3.09* 188 1,938I®"" 32,840 1,019 33,869 8,217 27 24,623 ■ : 993
4,16« 317 906 60 33,856 1,112 34,967 • 8,843 37 26,012
6.16* 280 1,U»1 71 46,373 1,492 47,865 12,642 26 33,831 r 1,467
6 fi6 aio 1,396 1 60 44,592 1,243 45,835 10,374 19 34,268 1 ^ 4
i,729 268 1^61 88.333 1,146 39,478 8,094 20 30,239 1,126
4,478 ' 201 1.261 ^66 34,214 1,123 36,337 7,686 33 26,628 1,090
4,033 184 1,176 id 32,426 996 33,420 6,648 60 26,877 ■ 936
3,716 111 796 10 33,169 1,112 34,281 6,064 8 27,106 ■ 1,104
3,789 197 971 4 26,224 776 ' 27,000 6,916 7 19,309 769

TABLI
STATEMBirr SHOWING THE CONDITION OF THE CONVICTS RELEASED FROM VARIOUS JAILS IN BIHAR.
Year.
Number Number Numbero f o f who had
couvicts prisoners ^eitheradmitted released lost norduring during gained
the year, the year, weight.
Number o f prisoners who had gained weight. Number o f prisoners who had lost weight.
Up to From From Over 1 lb. 1 Ibi to 5 lbs. to 10 lbs.
5 lbs. 10 lbs.
Total. Up to From From Over 11b. 1 Ib to 6 lbs to 10 lbs.
5 lbs. 10 lbs.
Total.
1 2 3 4 6 6 7 8 9 10 11 12 13 14
1»55 30,466 21,470 8,053 4,244 6,448 2,249 271 12,212 647 485 128 45 1,205
1956 (Re organised) 33,859 24,544 9,165 6,302 5,429 1,803 642 14,176 661 426 96 21 1,203
1967 34,967 36,481 22,366 5,802 4,876 1,443 527 12,648 821 427 155 64 1,467
1958 47,865 33,790 16,094 7,686 6,582 1,584 601 16,453 629 367 185 62 1,243
1959 45,835 46,487 27,923 6,974 6,820 2,319* 196 16,909 966 369 218 76 1,656
m o : : 39(678 39,540 26,865 4.836 4,407 1,562! 609 11,414 613 479 91 78 1,261
1»61* »0,0en 3t).bb4 2'l.ft4.2 3.676 3,659 1,4899 763 9,587 809 313 142 71 1,335
1 0 6 2 ^ •• 33,420 31,936 20,432 4,698 3,405 1,261 819 10,183 764 314 159 94 1,3211963» •• 34,281 — UULLS— ----- tt;285 3,984 1,887 864 12,020 470 313 79 42
1964* . . 27,000 19,216 5,833 4 , 8 3 ^ 1,374 538 12,083 593 467 186 66 1,300
♦ Provisional.
SoxtBcE.—D irectorate o f Statistics and Evalualici 3 ih ar.

SECTIOK XV State FinanM

STATEMENT SHOWING THE REVENUE RECEIPT AND DEBT OS' 'THE STATE GOVERNMJiNT FROM THEDIFFERENT SOURCES OF REFEMUE.
( I n T h o u s a n d o f R x j p ib s .)
174
TABLE 15.1.
Heads. 1961-62. 1962-63. 1963-64. 1964-65. 1965-66. 1966-67, 1967-68,
6
REVENUE,
Sales Tax . .
Estate I>uty .. .,
UniOtt Excise Duties
Taxes on Income other than Corporation Tax.
Land Revenue
State fiiOise .. . ,
Stamps . ,
Forest
Regi-^iCfation
Receipts under Motor Vehioles Act.
Other Ta:s:es and Duties
Total Pc acvpal Heads
Irrigation net receipts
Multi-purpose River Schemes
Debt serv ces
Civil Administration
Civil Works and miscellaneous public improvements.
Receipts from Electricity Schemes.
Transport and Communication
Miscellaneous
Contribution and miscellaneous adjustments between Union and State Government.
Extraordinary item
Total Revenue
Surplus Deficit (— )
DEBT.
11,34,34
40»04
6,21,41
9,74,36
9,11,2o
6,30,60
3,82,71
2,59,69
82,87
13,59
1,68,80
52,19,64
— 6,07
46,72
7,93,95
90,46
1,33,28
16,98,99
3,57
l2,44,8i
39,39
11,65,91
9,35,02
15,41,34
6,37,20
3,63,35
2,48,11
85,78
17,09
2.05.82
64,83,82
1,34,49
2,25,41
8,66,70
52,42
1
1,98
1,97,27
13.71.82
2,77
16,74,85
44.91
13,01,73
10,31,76
12,51,88
6 ,76,81
4,53,83
2,47,25
1,08,23
20,56
3,42,01
71,53,82
1,18,60
2,09
3,60,37
8,99,95
77,18
48
32
1,19,69
12.61.91
5,61
79,8t,u4 93,36,69 1,00,00,02
17,62,88
69,85
12,0s,09»
11,74,63!
12,06,70
6,935,94
5,19„62
2,94,40
5l,19),95
177,68
ft,28!,68
7 ,93^42
2:,01 43
1,93,28
10,97,41
83,03
1,70
4,57,34
15,07,<65
3,S3
1,11,39,19
21,42,52 26,65,02 34,54,45
71,46 79,00 8
14,11,87 20,72,46 17,32,80
11,71,40 12,56,85 15,9943
12,04,88 5,46,05 3,23,54
8,17,54 9,15,76 10,76,69
6,00,76 6,46,85 6,88,75
3,04,89 2,93,58 3,38,25
1,36,32 1,53,45 1,64,03
20,47 25,46 33,07
5,47.49 6a0,49
84,29,60 92,64,97 10,08,273
1,94,68 1,29,67 1,91,83
2,25 31,90 46,01
2,84,52 4,63,16 5,91,38
13,46,31 11,54,80 13,18,09
83,11 74,75 75,76
33 7
2,66 15 1,67
1,54,66 1,68.89 2,68,22
22,70,42 21,00,26 29,31,46
19,66 6,72 37,63
1,27,87,87 1,33,95,59 1,66,43,74
Public Debt 48,29,93 83,73,64 99,07,60 79,03,76 1,51,24,82 2,19,64,29 3,62,17,71
Unfunded Debt . . 2,23,63 2,54,46 2,95,57 3,39,9*5 3,90,41 3,64,13 8,51,19
Deposits and Advances 60,10,76 70,51,24 90,40,33 1,55,48,9»8 J.72,07,99 1,41,86,85 1,32,50,18
I^ans and advances by the 1,41,|0 5,00,36 2,60,96 2,67,9t3 3,38,73 4,61,68 16,50,81■ ‘State Government.
Remitttmcea 64,27,95 49,68,49 53,83,72 61,22,42 68,34,17 87,10,21 90,23,11
^Coiiti^ency Fund 4,33 5 19,19 11 26,88 45,00 1,00
Openinj^baltmce . . , - 3,49,19 - 10,10,45 - 2,08,68 4-5,44,66 ■+■2,94,90 +3,87,07 — 1,61,66
GR\ND TOTAL 2,42,42,85 2,94,74,48 3,46,98,71 4,18,67,00 5,30,05,77 5,94.94,82 7,62,76,18
Soxraos.—'Finance Department, Government of Bihiax.

TABLE 15.2.
STATEMENT SHOWING THE STATE FINANCE DISBURSEMENT UNDER THE PRINCIPAL HEADS.
( I n T h o u s a s t d s o f R u p e e s .)
175
Heads. 1961-62. 1962-63. 1963-64. 1964-65. 1965-66. 1966-67. 1967-68.
EXPEN DITU RE.
Sales Tax
Taxes on income other than Corporation Tax.
Leoid Revenue
State Excise
Stamps
Forest
Registration Fees
Charges on account o f Motor Vehicles Act.
Other Taxes and Duties
Total Principal Heads
Revenue account o f Irrigation Navigabion.Utc.
Multi-purpose River Scheme ..
Debt Services
Civil Administration
Civil Works and miscellaneous public improvements.
Electricity Scheme
Miscellaneous
Extraordinary items(Aviation)
Contributions and Miscellaneous Adjustm ent..
Capital expenditure within the revenue account.
Total expenditure on revenue ikccount.
Capital expenditure outside the revenue account.DEBT.
22,82 23,5i 24,93 29,15 84,36 36,03 42,78
75 78 84 97 1,15 1,20 1,43
4,30,70 3,56,78 4,60,43 4,25,10 5,16,14 4,83,48 4,71,40
38,78 38,81 39,98 44,38 48,73 49,06 66,55
11,65 9,92 12,81 13,80 15,18 8,67 17,69
1,32,75 1,21,03 1,25,27 1,31,28 1,47,88 1,59,85 1,62,48
19,58 20,89 21,49 24,75 27,43 34,36 37,77
5,81 6,21 5,95 6,47 7,15 7,09 8,59
8,02 8,33 8,66 10,20 11,87 12,73 15,41
6,70,86 5,86,30 7,00,36 6,86,10 8,09,89 7,92,47 8,14,10
84,88 2,30,49 1,97,67 2,38,31 2,93,63 3,18,11 3,67,12
3,52 2,32 3,20 5,02 3,84 2,80,76 2,81,18
6,62,86 9,89,94 11,82,16 10,10,36 26,18,56 21,66,45 25,05,10
57,21,41 55,24,60 60,11,01 62,17,12 72,84,69 85,09,36 89,68,47
4,67,18 4,51,53 2,20,84 3,82,78 8,38,08 12,06,39 9,47,03
4,77 5,69 --10,48 — 5,36 — 64 — 18,34 84
4,86,46 5,38,71 4,07,14 4,58,83 4,99,01 14,43,18 31,10,96
. . 16,98 16,70 8,05 21,50 10,43 12,57
1 24 4,77 1,50,46 39,64 40,59
1,60 1,94 3,39 1,55 1,52 1,25 2,49
81,03,54 83,48,50 87,32,23 90,07,53 1,25,20,54 1,47,49.59 1,70,50,44
34,99,84 35,39,48 32,27,46 33,07,30 50,68,99 29,81,32 49,06,74
Public Debt 16,18,74 40,99,68 53,68,13 38,99,06 84,21,21 1,40,18,14 2,53,01,02
Unfunded Debt . . 84,67 1,00,28 1,02,09 1,20,95 1,34,64 1,79,95 2,33,92
Deposits and Advances 53,85,72 69,07,93 95,69,18 1,62,25,61 1,63,37,90 1,42,17,56 1,33,89,16
Loans and advances by the State Government.
9,51,90 10,38,66 15,86,23 26,92,72 28,06,05 43,13,40 64,43,11
Remittances 57,08,84 56,33,64 55,67,67 62,91,50 73,24,91 91,95,12 92,51,06
Contige cy Fund 5 14,99 1,06 27,44 4,41 1,30 90,29
Closing balanoe M (-)10,10,45 (— )2,08,68 ( + )5,44,66 {-f)2,94.90 ( - f ) 3,87,07. ( - )1,61,56 (— )3,89>56
g r a n d t o t a l 2,42,42,85 2,94,74,48 3,46,98,71 4,18,67,00 5,30,05,77 5,94,94,82 7,6f,76,18
. Not available. SotTBOB.— Fineknce Department, Government o f Bihar.

table 15.8.STATEMENT SHOWING THE REVENUE RECEIPT OF THE STATE GOVERNMENT TINDER CIVIL ADMINISTRATION.
(Ik T h o t t s a it d s ow R u p e e s .)
Heads. 1968-59. 1959-60. 1960-61. 1961-62. 1962-63. 1963-64. 1964-65. 1965-66. 1966-67. 1967-68.
1 2 3 4 5 6 7 8 9 10 11
Genera] A 1 ai ustration . . . , , ,Admiijistration o f j ustice 14.77 18,85 22.00 21,53 29,73 30,55 26,25 29,13 25,31 29,57
J ails and Convict Settlements 14,99 19,80 21,13 21,11 22,77 17,10 '22,59 26,29 14,78 8,80
Police 15,08 20,26 27,66 19,75 19,86 32,22 37,90 76,06 76,63 46,55
Scientific Dapartment •• ••
Education 1,35,40 2,59,55 ?,92,62 28,86 58,22 51,92 59,71 38,62 63,42 40,78
Medical 83,13 40,64 1,12,22 40,31 30,06 29,58 41,74 45,55 52,19 48,36
Public Health , . 89,51 1,21,76 1,55,28 1,41,36 34,01 23,10 53,83 27,55 63,96 73,00
Agriculture 1,89,00 1,97,67 1,83,24 65,73 64,57 74,38 73,75 96,47 1,98,55 3,62,55
Rural Development* 2,93,45 1,09,96 1,55,87 2,32,37 4,02,43 4,56,55 6,64,02 6,19,43
Veterinary 25,89 28,58 27,92 15,45 20,39 19,30 20,91 23,99 17,94 23,88
Co-operation 1,39,33 1,89,66 2,06,64 1,36,40 2,02,20 2,02,41 1,91,06 2,69,91 11,13 5,41
In'itistries and Supplies 2,14,68 2,78,64 2,14,62 1,60,47 1,67,08 1,07,04 1,57,10 2,56,79 85,67 47,32
Aviation . . . . .
Miscellaneous Department 20,64 44,19 88,46 33,02 61,94 79,98 10,14 11,40 12,30 12,44
TOTAL 9,42,42 12,19,60 16,45,14 7,93,95 8,66,70 8,99,95 10,97,41 13,46,31 11,54,«0 13,18,08
► Including OommuiUty D a v e lo p m e A t, N.E.S. Local D®v-elopmeAt Works an,d Miscellaneous Social Development Works.
• •—Not mentioned in the civil budget estinaate.
SouBCE.—Finance Department, Qovemjcnent o f Bihar.PI _ning -2 6

f A B U 1B.4.
STATEMENT SHOWING THE STATE EXPENDITUBE T7NDER CIVIL ADMINISTRATION IN BIHAR.
( I n T hottsakds o» R u w sbs .)
Heads.
1
1958-59. 1959-60. 1960-61. 1961-62. 1962-63. 1963-64. 1964-65. 1965-66. 1966-67. 1967-68.
10 11
General Administration 4,22,01 4,99,07 5,47,16 3,16,26 3,25,45 3,38,68 4,13,80 4,18,46 4,26,59 5,74,05
Administration o f Justice 1,04,49 1,06,88 1,12,18 1,21,00 1,22,97 1,30,92 1,41,88 1,56,29 1,60,38 1,97,16
Jaile and Convict Settlement* 1,19,39 1,21,46 1,34,84 1,33,17 1,35,84 1,45,07 1,71,28 1,76,87 1,86,35 2,30,22
Police 3 4,70.89 5,01,90 5,67,10 6,06,08 6,29,59 6,62,72 8,08,72 8,94,25 9,54,39 10,90,23
Scientific Department 1,13 1,57 7,54 6,67 6,83 8,95 22,07 36,46 20,64 25,40
Education 9,38,57 11,42,55 13,25,54 15,06,77 15,32,85 15,70,86 17,52,88 19,19,75 22,05,72 26,55,15
Hedical 2,35,13 3,04,58 3,31,50 3,59,35 3,41,67 4,12,23 4,78,76 5,33,52 6,07,54 7,66,06
Public Health . . . . 2,80,12 2,79,38 3,21,09 4,07,38 3,41,68 4,30,81 2,22,73 3,49,40 3,88,54 1,20,20
Agriculture 3,24,79 3,75,84 4,11,08 4,30,87 3,80,18 4,66,46 4,64,43 6,63,05 16,91,79 13,37,18
Rural Development* •• 7,27,25 10,39,41 9,33,94 6,38,54 12,11,08 14,00,08 12,12,87 12,81,93
Veterintkry 93,05 1,27,38 1,46,14 1,52,53 1,53,47 1,61,85 1,92,29 2,63,40 2,27,35 2,61,28
Co-operation 1,66,93 2,63,81 2,86,76 3,41,81 3,87,55 4,04,67 1,22,91 1,35,46 1,36,06 2,00,31
InduBtries and Supplies 1,87,46 2,32,83 2,26,25 2,10,10 1,88,69 2,56,08 2,13,34 2,88,26 1,50,65 1,48,71
Aviation . . • • 1,04 1,33 •• •• •• •• •• • •
Miscellajneoue Department 42,20 51,28 68,25 61 73 75 95 95 1,12 1,13
Parliament and State Legislji?- tures.
•• •• •• •• 48,49 1,40,37 79,47
TOTAL 34,05,20 40,09,86 52,02,7 56,32,00 54,81,44 66,28,59 62,17,12 72,84,69 85,09,36 89,68,46
-aOD
— •Including Community Development, N.E.S., Local Development Works , Labour and Employment and other Social Development Works.
—Not mentioned in the report

STATEMENT SHOWING THE CAPITAL EXPENDITURE OUTSIDE THE REVENUE ACCOUNT RELATING TO BiH AR.
( I n T h o u s a n d s R u p e e s .)
Heads. 1968.69. 1969-60. 1960-61. 1961-62. 1962-63. 1963-64. 1964-65. 1966-66. 1966-67. 1967-68.
1 2 8 4 6 6 7 8 9 10 11
Capital account o f Navigation, Embankment and Drainage works.
7,14,89 8,24,29 9,49,36 18,26,14 18,80,73 20,91,26 22,11,88 26,19,48 32,61,96 28,6e,6«
Capital account o f civil works and miscellaneouB public
i mprovement.
12,80,64 13,62,87 8,67,36 18,13,77 13,82,43 10,69,96 12,01,66 14,76,76 13,86,67 12,38,93>
Capital account o f electricity schemes.
• • 14,90,91 •• •• •• •• ••
Miscellaneous capital account 1,62,28 3,13,22 2,67,28 (-)1 ,40 ,07 2,76,32 76,24 (-)1 ,06 ,14 9,72, 6 (-)16,67,20 8,17,16
TOTAL 21,47,81 24,90,38 36,64,89 34.99,84 36,39,48 32,27,46 33,07,30 50,68,99 29,81,32 49,06,74
Not mentioned in the Budget report.
(a) Including compensation paid for Zamindari Abolition, Public Health, Industrial and Water Transport Development.
SoxtbOb ,—F inance Department, Bibar.

180
fABLE
STATEIMENT SHOWING SALSS AND DISCHARGE
National Defence Oertificate. Defence Deposit Ceirtifiicatte. Poet Office Savings Bank.
f WIUU..
GrossSales.
Discharge. NetSales.
GrossSales.
Disdhaxge. NeetRleeB.
GrossDeposit.
Withdrawal. Net Deposit.
1 2 3 4 5 6 7 8 9 10
1963-64 . . 6,95,12 13,82 6,81,30 33,2i0 15,20 118,010 24,10,10 20,45,44 3,64,66
1964-65 6,83,10 13,43 6,69,67 l,40,6i3 9,21 l,331,4t2 26,79,77 22,48,74 4,31,03
1965-66 6,62,31 66,83 4,95,48 16,74 16,13 651 34,29,93 27,39,81 6,90,12
1966-67 6,38,22 62,72 4,75,50 14,19 12,16 2,0)3 38,03,48 32,81,25 6,22,23
1967-68 6,62,52 2,08,62 4,53,90 12,00 13,70 —770 38,43,33 35,94,33 2,49,00
1968-69 6,73,72 2,10,70 4,63,02 21,17 10,91 110,26 40,11,68 40,81,69 — 70,01
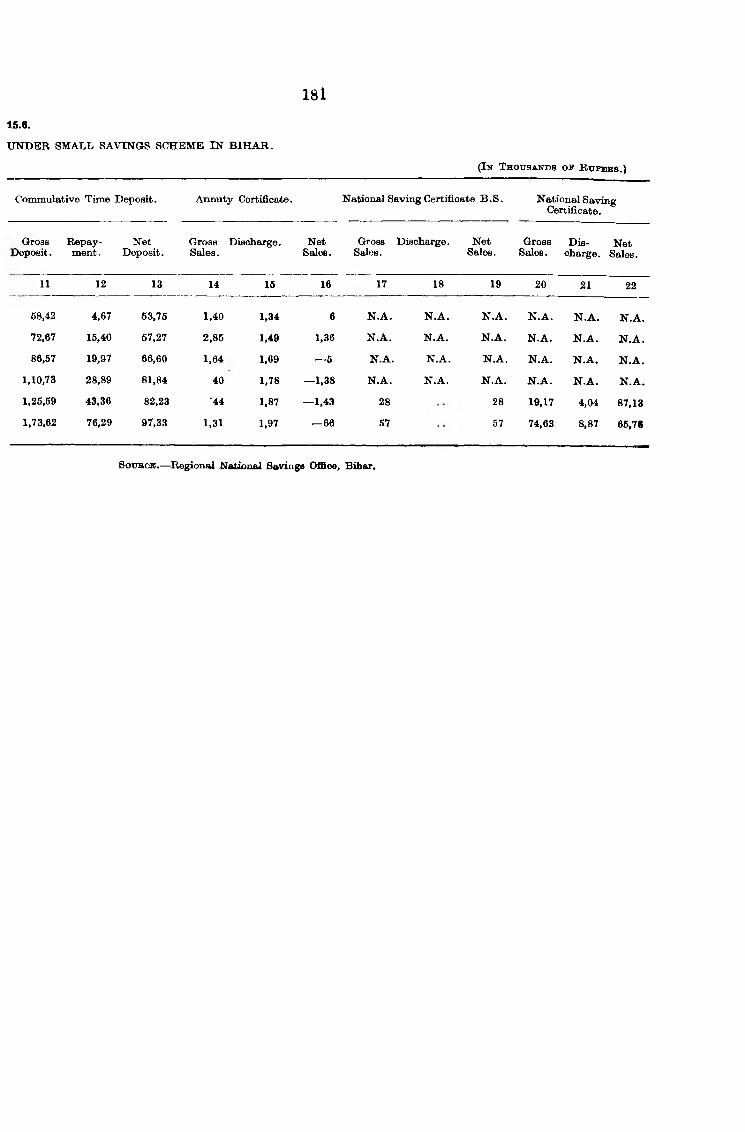
15.8.
UNDER SMALL SAVINGS SCHEME IN BIHAB.
181
(In T h ottsa n d s o v R u p e e s .)
Coimnulative Time Deposit. Annuty Certificate. National Saving Certificate B . S . National SavingCertificate.
Gross Deposit.
Repayment.
NetDeposit.
GrossSales.
Discharge. NetSales.
GrossSales.
Discharge. NetSales.
GrossSales.
Dis*charge.
NetSales.
11 12 13 14 15 16 17 18 19 20 21 22
68,42 4,67 53,75 1,40 1,34 6 N.A. N.A. N.A . N .A. N .A . N .A .
72,67 15,40 57,27 2,85 1,49 1,36 N.A. N .A. N .A. N .A. N .A . N .A .
86,57 19,97 66,60 1,64 1,69 — 5 N.A. N.A. N.A. N.A. N .A . N .A .
1,10,73 28,89 81,84 40 1,78 — 1,38 N.A. N .A. N .A. N .A. N .A . N .A .
1,25,59 43,36 82,23 '44 1,87 — 1,43 28 28 19,17 4,04 87,13
1,73,62 76,29 97,33 1,31 1,97 — 66 57 57 74,63 8,87 65,78
SOUKOE.— Regional National Savinga Offioe, Bihar.

SECTION XYl Ineome-Tu Reienue Stitlstln.

184.TABLE
STATEMENT SHOWING ANALYSIS OF DEMAND OF
AoCOBDING to THS! OIUASS
Serial Classification. 1955-56.no. Number o f
assessees.Income. Income-tax.
- • ■ — "•! Super-tax.
I 2 3 4 6 6
Rs. Rs. Ra.
1 Saiariet—
(a) Gk>vemment—
(♦) Central Government emoluments .. 100 19,02,033 2,01,010 66,452
{♦») Other Government salaries 2,265 2,04,41,945 13,06,065 1,28,752
(6) Others 6,272 4,74,72,274 28,27,246 6,63,616
2 IrUereat on Seeuritiea—
(a) Government o f India and Local Government—
(*) Tax-free 3L 1,20,338 23,292 26,116
(♦*) Taxed 274 10,66,791 2,28,164 2,89,468
(6) Local Authorities and compameB S3 1,62,825 31,672 24,451
8 Property 4,832 60,66,740 6,33,890 3,17,496
4 Bnmness and professions 9,046 11,11,80,552 1,30,93,043 88,32,637
5 Share o f profit from unr^istered firm (taxed) 162 11,99,716 1,44;634 10,064
6 Share o f profit from association o f persons (taxed) • 7 29,164 1,490
7 Partnership profit from registered firms 18 1,31,046 12,387 31
8 Other Sources—
(a) Dividends . . 809 47,67,384 9,24,775 10,50,746
(6) Interest or other sums received under deduction o f tax.
(c) Others
63
1,609
2,91,692
60,32,381
60,296
8,78,278
1,08,066
6,48,230
9 Accruing capital gains •• •• ••
10 Income aoermng or arising abroad—
(o) Assessed on remittance basis . . . . 6 41,610 6,069 399
(fc) Assessed on arising basis—
(♦) Business, profession or vocation 9 85,902 17,643 19,296
(« ) Others 4 62,619 10,099 9,797
11 Unclasfflfied demand made on account o f revisions, rectifications, etc.
N .A. N.A. N.A.^ N .A .
T o t a l 25,489 20,10,15,911 2,03,99,932 1,20,85,5001
. NU.
N.A.—Not available.
SOXTBOB.—All-India Income-tax Revenue StatieticB.

185
OB' IN O O M B A S S E S S E D .
16.1.
TNOOME-TAX AND SUPER-TAX IN BIHAR.
1956-57. 1957-58.
Nami er o f Income. Income-tax. Super-tax. Number o f Income. Incom e-tax. Super-tax.assessees. • assessees.
7 8A
9 1(? 11 12 13 14W
Rs. R0. Rs. (Rs. ’000). (Rs. ’ 000). (Rb. ’000)*
44 3,30,162 22,706 9,053 228 22,40 1.66 29
1,488 1,27,59,878 9,36,486 1,91,239 2,087 1,91,05 13,32 216
6,»C5 5,71,18,291 43,92,417 7,09,856 9,486 8,26,32 62,12 13,96
10 13,992 1,419 444 21 26 • * 8
2fl8 10,88,252 2,34,666 8,12,784 284 20,48 4,80 0,69
18 1,34,557 28,351 26,411 61 5,53 1,42 1,39
6,412 68,06,864 7,23,391 3,69,240 6,110 87,09 10,00 0,03
10,7 14 15,82,86,890 1,95,78,91;9 1,73,73,724 12,761 18,93,86 2,26,76 2,07,86
2»6 19,33,439 2,55,862 16,419 256 16,26* 1,60* 11*
17 1,15,016 12,978 258 729t l,52,00t 20,66t 9,36t19 1,72,262 20,400 •• •• •• -
8H2 55,24,291 10,50,471 13,05,214 1,014 75,79 16,61 21,10
iVl 1,28,349 18,765 16,218 52 1,96 36 23
58,78,484 7,66,206 5,12,228 1,767 76,38 12,22 12,96
*!♦ •• •• •• 2 17 2 ...
6 84,779 8,103 1,706 13 2,35 49 03
2 61,642 3,631 1,957 4 2,49 63 77
7 75,777 12,160 10,256 3 1,03 14 2
NJL N.A. N.A. N.A. N.A. ■ N.A. N.A. N.A.
27,8S!9 25,05,12,862 2,80,66,933 2,08,56,996 34,873 33,75,42 3,70,63 2,84,69
Inclusiv«t serial nos. 5 and 7.
Share o f profit from registered firms (taxed).
8otTRos«<^All Indicti itiboih6>taic ikeVe&ue iStktietice.
Xn fitvirM fbr f^ia Mi09i«tien of i erio&f (tfticti!) Ineludcd in thktt tf frctn tsretiturcd

186
STATEMENT SHOWING THE ANALYSIS OP
ACCOKDIn Qop
’ ^OTas,
Serialno.
Clfissifioatiob.Number o f assessees;
1958-59.
Income. Income-tax.
•..Super-tai"
1 2 15 16 17 is '" '
1 Salaries—
(a) Qovemment —
Rs.(’000). Rs. ( ’000) * Re. (’000) Rfi- COOO)
(») Central Government emoluments 197 14,65 84 17{« ) Other Government salaries 1,041 39,34 5,61 86
(b) Others 10,822 6,81,92 51,04 io.«2 JTniererf on Seouritiea—
(a) Government of India and Local Government—
•
(♦) Tax-free 47 19 2 ,,
(♦♦) Taxed . . . . • ...................... 243 12,53 2,95 4,52
(6) Local authorities and companies 49 3,03 53 32
3 property 6,913 71,24 6,46 3,82
Business and professions 14,282 16,22,04 1,32,69 78,22
6r Share of profit from unregistered firm (taxed) 186 9,80 66 2
6 Share of profit from association of per80ns(taxed) 834 1,72,87 22,79 10,25
7 Partnerduf ofit fifom registered firms • • ••
8 Other sources—
j (a) Dividends 962 63,85 11,87 14,0)
(b) Interest or other sums received under deduction o f tax.
39 4,71 1,03 1,72
(c) Others 2,052 63,74 11,87 11,66
9 Aceuring capital gains 2 1,05 9,38 ••
10 Income accruing or arising abroad. .
(o) Assessed on remittance basis , . 1 12 24 ••
(6) Assessed on' arising basis—7(«) Business, profession or vocation 7 1.19 11
[ii) Others 3 5 1 ••
11 Unclassified demand made on account* o f revisions, rectifications, etc.
N.A. N.A. N.A. N.A.
TOTAL . . 36,660 28,13,48 2,45,69 I,35.8«
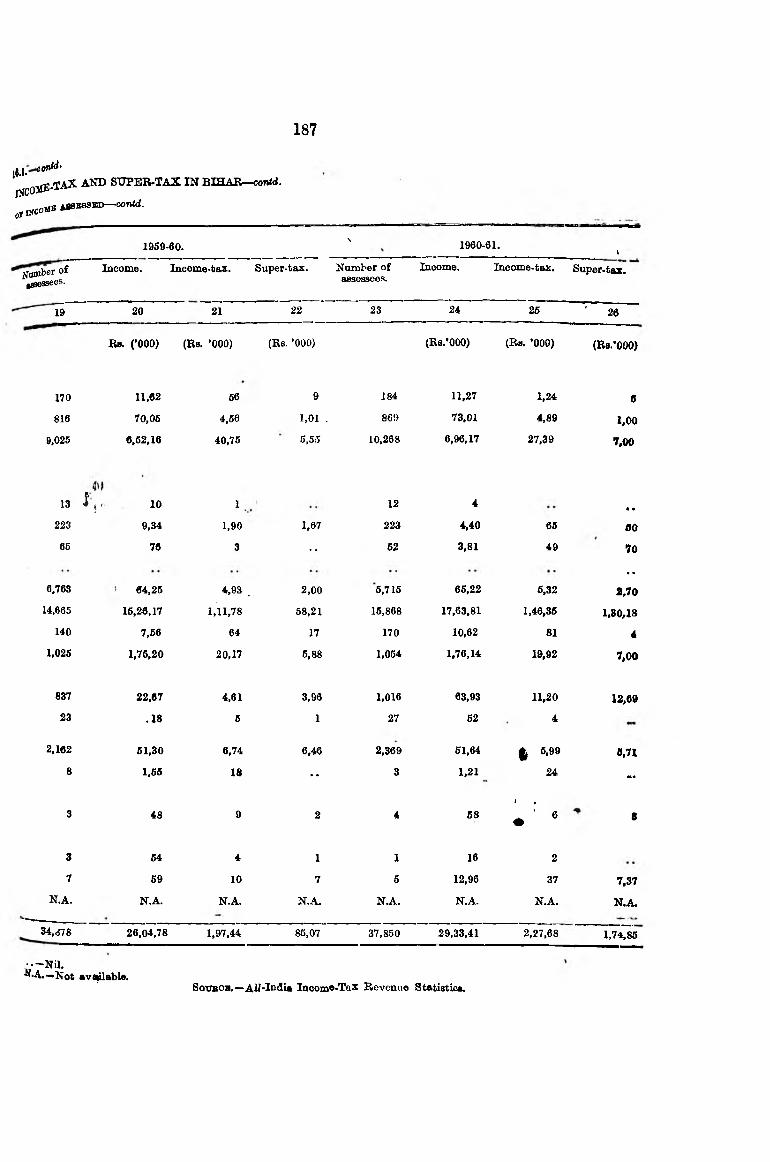
187
jB,l. ioiM'
INCOJIE
QliSCO^
.TAX AND SUPER.TAX IN BIHAR—con<<i.
^BSSBD— contd.
1969-60.\ 1960-61. I
jfafljber ofjBsessees.
Income. Income-tax. Super-tax. Number o f assessees.
Income. Income-tax. Super-tax.
19 20 21 22 23 24 25 ' 26
Rs. (’000) (Rs. ’ 000) (Rs. ’ 000) (Rs.’ 000) (Rs. ’ 000) (R8.’000)
170 11,62 66 9 184 11,27 1,24 0816 70,05 4,56 1,01 . 86{> 73,01 4,89 1,00
9,025 6,52,16 40,75 5,55 10,268 6,96,17 27,39 7,00
13 i y 10 1 12 4 « •223 9,34 1,90 1,67 223 4,40 66 0065 76 3 •• 62 3,81 49 70
6,763 64,25 4,93 . 2,00 5,715 65,22 6,32
• •
2,7014,665 15,26,17 1,11,78 58,21 15,868 17,63,81 1,46,35 1,80,18
140 7,66 64 17 170 10,62 81 41,025 1,75,20 20,17 5,88 1,054 1,76,14 19,92 7,00
837 22,67 4,61 3,96 1,016 63,93 11,20 12,6923 .18 6 1 27 52 4
2,162 61,30 6,74 6,46 2,369 61,64 ^ 6,99 0,718 1,65 18 •• 3 1,21 24 «»•
3 48 9 2 4 681 ,
« ■ « 8
3 64 4 1 1 16 2
7 69 10 7 6 12,96 37 7,37N.A. N.A. N.A. N.A. N j . N.A. N.A. N.A.
34,<i78 26,04,78 1,97,44 85,07 37,850 29,33,41 2,27,68 1,74,86
••-Nil.^•A.—Not avliable.
Soxmca.—Aii-I°<lia Inoozno-Taz Kovcnue Statistioa.

tABLfi
STATEMENT SHOWING THE ANALYSIS OF DEMAND OF
A c c o r d i n g t o t h e c l a s s
188
DIflAaifiAfliiinn.1961-62.
no. Number of as^essees.
Income. i saesscd.
Total tax.
1 2 27 28 29
1 Salarita—
(a) Qovemment>—
(•) Central Govenunent emoluments .. 429 26,09 1,77(m) Other Government salaries 1,173 92,96 6,90
(6) Others . . . . 11,836 7,81,86 60,98
2 Iwtmreat on SeeuriHea— I
(a) Qovemment of India and Looal Gk>r«mment—
(t) Tax'free • • 18 10 2
(w) Taxed .. 192 7,36 4,68 ;
(b) LoocJ authorities and companies .. 31 76 14
% Property 6,088 66,60 8,31
4 Business and professions .. 16,826 18,64,60 2,93,34
5 Share o f profit in registered firm (taxed) .. 1,164 2,16,08 36,84
6 Shsfe of profit from association of persons (taxed) . . . 183 11,60 1,107 Partnership profit from registered firms .. • • . . . . .
8 Other sources—
(a) Dividends .. 1,140 76,38 86,90(6) Interest on other sums received under deduction o f tax
(o) Others . . . . 2,617 77,21 21,87
9 Accruing capital aains . . 13 6,24 1,68
10 Income a4scruing~or arising abroad—
(a) Assessed on remittance basis . . . . 3 82 24
(6) Assessed on {urising basis—
(«) Business profession or vocation .. •• • • . .(u) Others .. • • • • •• i
11 Unclassified demand made on account o f revision, rectifications, etc. •• •• ••
TOTAL—ALL CLASS OF INCOME ASSESSED .. 41,717 32,16,63 4,62,67 j
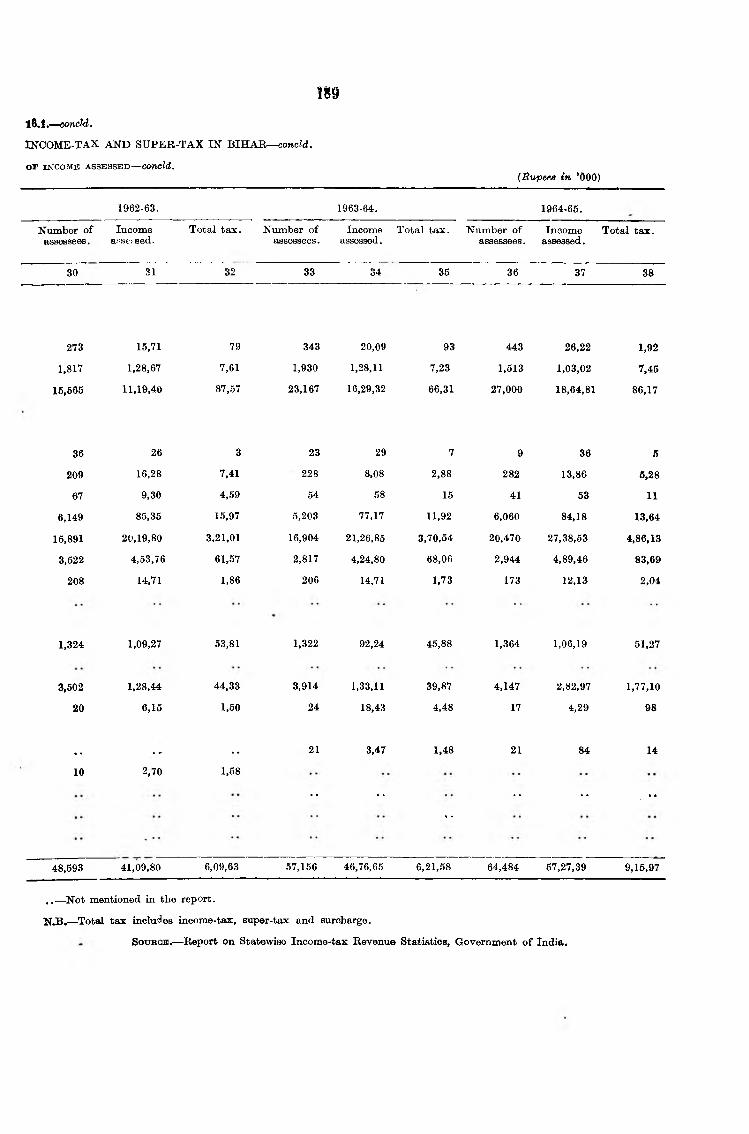
189iAA.—conctd.
INCOME-TAX AND SUPER-TAX IN BIHAR— concZd.
OS’ INCOM E ASSESSED— concld.{Rupees in *000)
1962-63. 1963-64. 1964-65.
Number of assessees.
Incomeasse.-sed.
Total tax. Number of assessees.
Income assessed.
Total tax. Number of assessees.
Incomeassessed.
Total tax.
30 31 32 33 34 35 36 37 38
273 15,71 79 343 20,09 93 443 26,22 1,92
1,817 1,28,67 7,61 1,930 1,28,11 7,23 1,513 1,03,02 7,45
15,665 11,19,40 87,57 23,167 16,29,32 66,31 27,000 18,64,81 86,17
36 26 3 23 29 7 9 36 5
209 16,28 7,41 228 8,08 2,88 282 13,86 6,28
67 9,30 4,59 54 58 15 41 53 11
6,149 85,35 15,97 5,203 77,17 11,92 6,060 84,18 13,64
15,891 20,19,80 3,21,01 16,904 21,26,85 3,70,54 20.470 27,38,53 4,86,13
3,522 4,53,76 61,57 2,817 4,24,80 68,06 2,944 4,89,46 83,69
208 14,71 1,86 206 14,71 1,73 173 12,13 2,04
1,324 1,09,27 53,81 1,322 92,24 45,88 1,364 1,06,19 61,27
3,502 1,28,44 44,33 3,914 1,33,11 39,87 4,147 2,82,97 1,77,10
20 6,15 1,50 24 18,43 4,48 17 4,29 98
. . • •' , , 21 3,47 1,48 21 84 14
10 2,70 1,58
•• ••
••
•• ■ •• ••
48,593 41,09,80 6,09,63 57,156 46,76,65 6,21,58 64,484 57,27,39 9,15,97
...—^Not mentioned in the report.
N.B.—Total tax includes income-tax, super-tax and siircharge.
SOUBOB}.— Report on Statewise Income-tax Revenue Statistics, Government o f India.

1 § 0
TABLE 16.2.
STATEMENT SHOWING TH3 TRADE CLASSIFICATION OF BUSINESS AND PROFESSIONAL INCOME ASSESSEDTO INCOME-TAX AND STJPER-TAX IN BIHAR.
Classification. Number ofassessees.
Income. Income-tax. Super-tax.
1 2 3 4 5
1955-56.Rs. Rs. Rs.
Forestry, mining and quarrying 300 2,60,74,853 50,23,341 48,94,428
Other primarj’ industries and manufactures o f foodstuffs (including beverages and narcotics).
233 39,84,387 5,76,184 4,63,473
Processing and manufactures of textile and leather and products thereof.
159 28,12,887 3,94,640 2,24,325
Processing and manufactures o f metals and chemicals and products thereof.
152 17,44,315 2,00,986 1,20,738
Processing and manufactures not elsewhere specified 162 17,95,776 1,75,854 1,05,356
Construction and utilities . . 655 91,11,013 11,17,559 6,90,525
Commerce, transport and communications 5,196 5,15,04,746 40,26,114 10,69,324
Finance 261 55,55,453 10,61,725 10,8",631
Services not ©Isevfhere specified l>423 85,97,122 5,16,640 1,80,737
TOTAL— 1955-56 9,046 11,11,80,552 1,30,93,043 88,32,537
1956-57.
Forestry, mining and quarrying 1,016 3,72,93,674 68,42,236 96,04,985
Other primary industries and manufactures of food stuffs (including beverages and narcotics).
364 88,69,989 14,92,613 13,75,436
Processing and manufactures o f textile and leather and products thereof.
115 14,06,677 1,41,544 7,751
Processing and manufactures o f metals and chemicals and products thereof. '
206 24,62,195 '•,24,364 1,27,501
Processing and manufactures not elsewhere specified 222 81,31,394 16,00,009 17,00,464
Construction and utilities .. 796 1,08,36,240 10,74,705 4,75,382
Commerce, transport and communications 6,207 7,68,57,743 72,21,611 35,91,487
Finance 219 25,00,723 3,49,434 1,80,491
Services not elsewhere specified 1,589 99,28,295 6,32,403 2,40,328
TOTAL— 1956-57 10,734 15,82,86,890 1,95,78,919 1,73,73,724

191TABLE 10.2.—con<rf.
STATEMENT SHOWING THE TRADE CLASSIFICATION OF BUSINESS AND PROFESSIONAL INCOME ASSESSEDTO INCOME-TAX AND SUPER-TAX IN BIHAR.
Classification. Nimiber of assessees.
Income. Income-tax. Super-tax.
1 2 4 6
Rs. Rs. Rs.
1967-58.
Forestry, mining and quarrying 1,108 40,846 3,100 10,342
Primary industries and manufactures of food-stuffs (including beverages and narcotics).
383 3,321 1,270 1,356
Processing and manufactures of textile and leather and produces thereof.
82 307 83 74
Processing and manufactures o f metals and chemicals and products thereof.
220 2,450 203 110
Processing and manufactures o f cement, rubber, paper and other mineral products.
293 6,957 1,235 1,766
Construction and utilities .. 333 14,931 1,651 1.146
Commerce, transport and communications 7,940 95,496 7,392 2,7o6
Finance 282 10,228 2,068 2,438
Professions \ ,m 9,349 567 260
TOTAL— 1957-58 12,761 1,89,385 22,574 20,780
1958-59.
Forestry, mining and quarrying 729 18,346 2.271 1,910
Primeiry industries and manufactures o f food stuffs (including beverages and narcotics).
295 9,550 1,564 1,634
Processing and manufactures of textile and leather and products thereof.
193 1,600 83 14
Processing and majiufactures of metals and chemicals and products thereof.
199 3,537 593 788
Processing and manufactures o f cement, rubber, paper and other mineral products.
224 1,937 122 62
Construction and utilities .. 815 13,936 1,389 863Commerce, transport and communications 10,069 1,051 6,190 1,795Finance 191 3,591 656 606Professions 1,567 8,554 436 161
T O T A L - 1958-59 14;282 1,62,202 13,204 7,822

192
TABLE 16.2.—contd.
STATEMENT SHOWING THE TRADE CLASSIFICATION OF BUSINESS AND PROFESSIONAL INCOME ASSESSEDTO INCOME-TAX AND SUPER-TAX IN BIHAR^con<d.
Olaasification. Number of assessees.
Income. Income-tax. Super-tax.
1 2 3 4 6
Rs. Rs. Re.
1959-60.
Forestry, mining eaid quarrying 533 13,261 1,622 1,398
Primeiry industries and manufactures o f food-stuffs (including beverages and narcotics).
292 3,321 265 116
Processing and manufactures o f textiles and leather and products thereof.
114 1,545 300 400
Processing and manufactures o f metals and chemicals and products thereof.
171 8,829 423 423
Processing and manufactures o f cement, rubber, paper and other mineral products.
207 5,951 1,116 1,224
Construction and utilities . . . . . . . . . 733 9,866 819 349
Commerce, transport and communications 10,974 1,06,563 6,150 1,696
Finance 184 2,002 230 177
Professions 1,467 7,279 273 38
T O T A I^ 1959-60 14,665 1,52,617 11,198 6,821
1960-61.
Forestry, mining and quarrying 437 11,971 1,351 1,051
Primary industries and processing and manufactures o f food-stuffs (including beverages and narcotics).
266 10,362 1,854 2,854
Processing nad manufactures o f textile and leather and products thereof.
89 654 21 ••
Processing and manufactures o f metals and chemiceils twid products thereof.
191 2,010 174 167
Processing emd manufactures o f cement, rubber, paper and other mineral products.
173 11,148 2,540 4,113
Construction and utilities . . . . 511 6,604 430 100
Commerce, transport and communication 12,507 1,20,680 6,936 2,682
Finance 211 5,250 1,064 2,113
Professions 1,483 7,702 265 32
T O T A I^ 1960-61 15,868 1,76,381 14,635 13,018
N.B.—Amount in thousand rupees from 1957-58,
SoTTBCiE.— All India Income-tax Revenue Statistics;

193
TABLE 16.2.—contd.
STATEMENT SHOWING THE TRADE CLASSIFICATION OF BUSINESS AND PROFESSIONAL INCOME ASSESSEDTO INCOME-TAX AND SUPER-TAX IN BIHAR—conid.
Classification.1961-62. 1962-63.
Number o f assessees.
Income. Total-tax. Number o f aesessees.
Income. Total-tax.
I 2 3 4 5 6 7
Forestry, mining and quarrying 740 21,25 24,24 667 2,12,27 66,22
Other primary industries, processing and mtuiufe^ture o f food-stuff (including beverages and narcotics).
271 26,11 1,22 333 70,89 24,14
Processing and manufacture o f textile and leather £md products thereof.
124 12,97 2,90 182 20,09 1,24
Processing eind manufacture o f metals and chemicala tmd products thereof.
318 42,76 2,02 314 37,48 8,63
Processing and manufacture o f cement, rubber, paper and minertil products.
257 47,88 21,08 310 34,60 •,12
Construction and utilities » 932 1,02,22 7,47 90« 1,08,07 8,02
Commerce, transport and commimication .. 12,347 12,70,14 M 4,39 11,614 14,22,77 2,20,22
Fintmce 165 34,68 18,38 311 26,44 6,71
Profession 1,588 96,34 7,84 1,366 77,38 6,00
TOTAL 16,742 22,06,27 2,19,54 16,893 20,09,89 3,28,20
9G PLmping-—28

TABLE 1 .2.'—conoid.
STATEMENT SHOWING THE TRADE CLASSIFICATION OP BUSINESS AND PROFESSIONAL INCOME ASSESSEDTO INCOME-TAX AND SUPER-TAX IN BIHAR~eo«cW*
( R u f b e s in ’ 000)
194
Classification.1963-64. 1964-65.
Number ofassessees.
Incomeassessed.
Total tax. Number o f assessees.
Incomeassessed.
Total tax.
1 8 9 10 11 12 13
Forestry, mining and quarrying 773 3,24,01 96,93 699 1,75,98 32,75
Other primary industries, processing and manufacture of food-stuflf (including
beverages and narcotics).
317 69,32 19,96 362 2,48,87• />
1,01,02
Processing and manufacture of textile and leather and products thereof.
103 7,40 23 101 7,93 67
Processing and manufacture of metals and chemicals and products thereof.
270 34,66 6,16 ^ 0 1.06,42 42,14
Processing and manufacture of cement, rubber, paper and mineral products.
355 1,98,67 1,05,61 33? 1.13,54 35,93
Oonstruction and utilities 620 1,08,18 14,16 486 1,09,22 12,81
Conunerce, transport and communication . . 12,223 12,28,93 96,47 15,891 18,21,08 2,37,42
Finance 427 68,54 25,01 879 55,05'Kv:;; :* ‘ 16,60
Profession 1,816 97,14 7,02 1,960 1,00,44 6,79
TOTAL 16,904 21,26,85 3,70,54 20,i70 27,38,53 4,86,13
Total tax includes iitcome-tas, super-tax and surcharge.
fiotraoa.—AU*2&dift fUvMUt SUfiiitiMk

1^ 6
fABLB 16^.STATEMENT SHOWINQ THE CLASSIFICATION OF INCOME-TAX DEMAND BY GRADES OF TOTAL INCOMB
IN BIHAR.
Scr'alno.
Grades o f total inoome.
1965-56.
TotalNo. of income
assessees. assessed.
All classes o f assessees.
Demand payable.
Income-tax. Super-tax. Surcharge. Total.
6 8
1 Bel9«»4,2QD2 4,201— 6,000
8 5,001--7,600 ..
4 7,601—8,400
6 8.401—10,000
6 10,001— 12,000
7 12,001—15,000
8 15,001—20.000
9 20,001—25,000. .,<i.10 25,001—30,000
11 30,001—35,000
12 35,001—40,000
13 40,001—45,000
14 45,001—60,000
16 50,001—56,000
10 55,001—60,000
17 60,001—65,000
18 65,001—70,000
1 9 ' 70^001—76,000.. i i.
20 75,001—80,000
21 80,001—85,0M
22 . 85,001—90,00023 90,001—96,00024 95,001—1,00,000 25. 1,^00,001-1,60,000 26 1,60,001^2,00,000 27 2,00,001—3,00,000 28. 3,00,001—4,00,000 29 4,00,001—5,00*000 80 Over 6,00,000
TV>t a l
369
3,998
4,633
1,320
2,287
1,511
941
1,067
488
296
166
100
100
66
36
26
16
13
12
12
10
669
12107649
Ra.
11,26,507
1,80,17,982
2,88,26,705
1,04,23,569
2,05,99,149
1,68,85,043
1,29,95,177
18,33,18,350
1,08,60,600
80,58,988
63,80,601
37,49,111
42,46,390
31,42,056
18,98,001
14,45,603
9,99,953
8,74,487
8,66,264
9,21,017
8,21,106
5,32,102 5,52,099 8,89,337
14,74, 093 17,37,351 17,16,860 19,98,810 18,13,729
1,91,05,820
Rs.
39,594
3,01,458
8.16.359
3,37,490
7,15,878I
9,76,563
8,10,936
16,86,691
11,83,713
10,33,987
8,13,408
6,02,509
7,62,052
5,52,927
3,49,180
2.64.095
2,04,820
1,76,762
1,79,683
1,76,182
1.69.096
1,13,7461,18,7751,93,2643,32,0784.14.360 3,91,157 4,88,548 4,46,518
44,68,328
Rs.
13,468
1,590
13,885
7,566
22,140
10,578
10,189
1,17,497
63,295
1,57,763
2,58,448
2,50,298
3,61,369
3,02,969
2,28,153
1,96,803
1,68,270
1,49,234
1,55,711
1,74,019
1,63,830
1,27,9951,30,3682,19,3334,56,4075,78,7833,75,1834,49,3993,11,734
37,93,737
Rs.
797
130
11.130
12,658
28,116
38,023
33,485
81,297
71,041
69,910
65,769
40,947
61,682
43,043
28,440
22,296
17,427
16,161
15,567
16,805
15,936
11,31711,71717,08338,68947,07630.131 32,959 22,672
2,94,033
Rs.
63,8S9
3,03,178
8,40.374
8,67,614
7,66.134
10,26,164
8,64,610
17.84,486
13,08,049
12,61.660
11,27,616
8,93,764
11,75,002
9,98,929
6,06,773
4,88,194
3,80.617
3,42,167
3,60,961
3.67,066
3,48.861
2,63.0582,60,8504,29,6808,27,174
10,40,2197,96,4718,70,9077,80,924
85,56,098
17,635 20,02,86,770 1,90,18,157 92,49,994 11,76,186 2,94,44,337
iDoom e*^ Revenue Statiatios.

196
TABLE 16.ar—conW.
STATEMENT SHOWINa CASSIFICATION OF INCOME-TAX DEMAND BY GRADES OF TOTAL INCOME INBIHAB— contd.
1066-67. All classes of tissessees.
no.OradoB of total income.
1 Below 4,200 . .
2 4,201--6,000
» fi,001—7»«00
4 7,601—8,400
6 8,401—10,000
0 10,001—12,000
7 12,001—16,000
8 15,001—20,000
9 20,001—26,000
10 26,001-30,000
11 80,001—36,000
la *6,001—40,000
13 40,001-46,000
14 46,001—60,000
16 60,001—66,000
1C 66,001—60,000
17 60,001—06,000
18 66,001—70,000
19 70,001—76,000
20 76,001—80,000
2 1 80,001—85,00022 85,001—90,00023 90,001—95,00024 95,001—1,00,00025 1,00,001- 1,20,000 28 1,20,001- 1,50,00027 1,50,001 — 2,00,00028 2,00,001—3,00,00029 3,00,001—4,00,00030 4,00,001—5,00,00031 Ove** 6,00,000,.
Total
Demand payable.Ko. of Total income •
aasessees. assessed.Income-tax. Super-tax. Surcharge. Total.
Rb. Rs. Rs. Rs. R«.222 6,32,672 37,830 22,823 1,846 62,499
4,070 1,82,66,684 3.09,641 6,149 339 3,15,1296,431 3,42,21,898 10,16,622 6,493 13,206 10,36,3211,101 89,06,144 3,81,285 2,728 18,607 4,02,6201,999 1,81,77,836 6,68,690 24,132 26,164 7,17,8761,816 2,10,62,969 12,49,869 20,738 48,146 [13,18,7431,028 1,40,03,818 8,77,767 12,281 33,693 9,23,6311,358 2,36,11,810 22,78,908 14,777 1,03,522 23,97,207
677 1,60,01,241 16,54,982 1,01,646 84,608 18,41,236365 97,01,801 13,04,149 2,46,629 78,783 16,29,661264 82,06,018 10,80,129 3,72,057 80,363 16,32,649129 48,14,441 8,10,012 3,19,492 63,626 11,83,030122 61,69,363 6,23,762 2,93,712 44,881 9,62,34689 41,96,806 6,22,353 3,11,837 38,076 9,72,26668 30,33,408 3,98,366 2,61,962 30,832 6,81,16042 42,08,765 3,20,896 2,34,029 27,112 6,82,03638 23,78,846 4,14,761 2,67,737 29,111 7,11,60925 16,89,478 1,96,678 1,63,893 13,658 3,74,02922 16,94,283 2,00,740 1,66,196 18,126 3,86,06017 13,15,186 2,10,301 1,91,202 17,372 4,18,8762218
88
1814
78 2 2
10
- 18,17,853 15,70,239 7,47,445 7,77,288
19,39,878 18,40,525 11,17,117 20,40,364
6,29,243 9,07,994
3,82,78,196
2,76,9633,32,4511,28,9041,33,3532,44,0572,09,4311,73,7244.61.9351.42.935
2,24,897 93,64,971
2,62,6943,25,6131,44,3131,53,6692,68,9142,71,5272,26,8846,93,3121,87,5962,74,499
76,69,716
25,32033,64012,86313,39819,40217,20516,49248,76914,26920,690
6,12,824
^6,64,977 66,91,704
2,86,080 3,00,420 6,32,373 4,98,133 4,17,109
11,94,016 3,44,8001 5,20,086 1
1.76,47,51118,970 26,00,27,497 2,63,40,121 1,35,08,249 14,95,531 4,13,43, 901
--------------- -jSOTTBOB.—All-India Inoome-tax Revenue Statistics.

( I k T H o tJ S A K D S O FB T TPE E S.)
19?
¥ABLE 16.3—eonid.
^ATEMEN'T s h o w in g c l a s s if ic a t i o n o f INCOME-TAX DEMAND BY GRADES OF TOTAL ll^COJktE liCBIHAR—contd.
1957-58. All classes o f aBsessees.
S»rlal Grades of total income,AO .
Demand payable.
aaseBsees. a s s e s B e d .Income-tax. Buper-tax. Surcharge. Total.
2 3 4 5 6 7 8
1 Below 3,000 .. 279 4,31 20 10 1 31
2 3,001-5,000 5,322 2,27,19 3.51 17 1 3,69
3 5,001- 10,000 10,671 7,53, 12 20,77 48 56 21,81
4 10,001- 15,000 4,063 4,95,36 32,41 37 1,46 34,24
5 15,001-20,000 1,789 3,08,72 24,38 82 1,39 26,59
6 20,001—50,000 2,276 6,80,37 91,34 27,85 6,71 1,25,90
7 50,001 — 1,00,000 431 2,92,27 38,00 32,94 3,87 74,81
8 1,00,001—2,00,000 96 1,24,64 16,61 19,68 1,85 38,04
9 2,00,001 — 5,00,000 34 97,80 20,39 23,80 1,79 45,44
10 Over 5,00,000. . 16 3,67,49 09,53 1,03,02 7,15 2,08,70
T o t a l 24,977 33,51,27 3,47,04 2,08,69 23,80 5,79,53
SOTTBOB.— All-India Income-tax Revenue S t a t is t i c s .

(In IH O U S A l’ I ) S OF BTTPBS8
TABLE 16.8-con«(2.
StAT^EMEN’T SHOWmO CLASSIFICATION OF INCGOStE-TAX DEMAND BY GRADES OF ToTa L INCOMEBIH AR—cont (2.
1958-59. All classes o f asaessees.
Serial Qrades of total income. ----- ------------ ----------- -no.
Demand payable.
No. of assessees.
Total income— aaseas«d.
Inoorme-tax. Super-tax, Sorcharge. Total.
1 2 3 4 6 6 7 8
Rs. Rs. Bs. Rs.
1 Below 3,000 449 6,21 11 8 14
2 3,001-5,000 10,406 4,04,74 8,97 12 2 8,51
3 5,001-10,000 8,890 6,31,09 19,21 24 86 20,31
4 10,001-15,000 9,534 4,26,97 26,98 23 1,68 28,79
6 15,001-20,000 1,297 2,23,66 18,04 0 1,10 10,23
6 20,001-50,000 1,814 6,39,42 69,61 20,43 6,70 96,74
7 50,001-1,00,000 360 2,42,53 28,09 23,61 3,47 65,71
8 1,00,001-2,00,000 ■ 81 1,08,45 14,43 14,20 1,66 30,29
9 2,00,001—5,00,000 29 82,37 13,80 12,83 1,66 22,18
10 Over 5,00,000 10 1,39,61- 34,41 89,66 2,76 76,82
Totai. 26,869 28,04,04 2,33,05 1,11,44 18,69 3,63,18
SotTBOB.—All-India Income-tax Revenue Statistics.

199
TABLE 16.3- corUd.i STATEMENT SHOWING CLASSIFICATION OF INCOME-TAtfC DEMAND BY GRADEJS OF TOTAL INCOKE IN
BIHAR-co»5d.
(Ik H O U SAND S OF k u p e e s .)
Serial Grades of total income.
No. of asseBsees.
1959-60.
Grossincome.- - j
Qrpss4 a x .
1960-61.
No. o f Gross assesses B. income.
Grosstax.
1 9 10 11 12 13 14
I Below— 3,000 529
Rs.
13,85
Rs.
6,75 6,46
Rs.
12,85
Rs.
24
2 3,001- 5,000 .. 83,767 3,19,52 5,52 8,801•3,63,84 2,94
3 5,001- 10,000 14,387 7,07,14 21,61 11,563 8,06,47 17,58
4 10,001—15,000 5,550 4,60,03 32,34 3,416 4,12,81 20,55
6 15,001—20,000 2,023 2,08,40 25,20 1,292 2,20,69 19,02
6 20,001—50.000 2,602 3,78,89 65,34 1,391 3,72,85 62,78
7 60,001—1,00,000 918 3,39,02 69,88 638 3,60,69 62,92
8 1,00,001—2,00,000 59 52,89 14,24 62 83,06 21,94
9 2,00,001—5,00,000 35 32,05 13,89 22 63,72 20,90
10 Over 5,00,000 18 92,99 52,39 10 2,35,22 1,30,91
Total 34,888 26,04,78 2,97,16 27,841 29,32,20 3,69,78

(In THOtrSAJSTDS OB' KTTPEB8.)
2 0 0
TABLE 16.J—conctd.
STATEIVIENT SHOWING CLASSIFICATION OF INCOME-TAX DEMAND BY GRADES OF TOTAL INCOME INBIHAR.—contd.
Serialno,
Grades o f total in.come, -----------
Niimbero f
assessees.
1961-62.
Grossiuoomeassessed.
1962-63.
Total-teur.Nimiber Gross
o f incomeassessees.
Total-tax.
1 15 16 18 19 20
Rs. Rs. Rs. Rs.
1 Below— 3,000 1,013 3,01 12 141 3,46 16
2 3,001- 6,000 9,796 4,27,63 4,02 12,130 4,98,66 2,60
8 6,001- 10,000 12,671 8,74,46 22,78 16,520 10,78,10 33,92
4 10,001-16,000 3,642 4,31,62 23,96 3,833 4,68,65 26,56
5 15,001—20,000 1,441 2,48,02 21,62 1,726 2,97,41 25,83
6 20,001—40,000 1,647 4,36,72 74,03 2,184 6,01,45 83,20
7 40,001—1,00,000 681 4,00,61 64,65 872 4,99,86 92,88 ;
8 1,00,001—2,00,000 78 1,08,84 28,23 109 1,49,69 61,62
9 2,00,001—6,000,000 26 79,37 37,66 17 48,48 19,80
10 Over 6,00,000.. - 11 1,97,261
1,03,53 18 4,22,83 2,35,88
T O T A t 31,005 32,07,52 3,80,68 36,553 40,68,39 6,71,33
SoT7Sk:n.—Report on Stateyrise lopom e-tax Revenue Statisticp, Gcveriiiiient o f India,

( I n t h o u s a n d s o p r u p e e s ) .
2 0 1
TABLE 16.3— concld,
STATEMENT SHOWINQ CLASSIFICATION OF INCOME-TAX DEMAND B Y GRADES OF TOTAL INCOME INBIHAR—concld.
'Serial no.
Grades of total Income.
1963-64. 1964-65.
Number Gross Number Grosso f income Total-tax. o f income Total-tax.
assessees. assessed. assessees.
1 2 21 22 23 24 25 26
Rs. Rs. Rs. Rs..
1 Belcw— 3,000 28 31 13 26 24 11
2 3,001— 5,000 15,311 6,28,61 2,64 18,343 7,57,12 6,32
3 5,001— 10,000 19,669 13,78,82 23,89 22,550 15,50,76 38,96
4 10,0»)1— 15,000 4,670 5,68,14 27,91 5,184 6,39,98 37,90
5 15,001-20,000 1,789 3,09,53 28,11 1,980 3,42,25 33,06
6 20,001— 40,000 2,240 6.13,47 80,08 2,569 7,15,20 98,467 40,0«1— 1,00,000 756 4,30,11 79,55 1,007 5,71,69 1,09,828 1,00;)01— 2,00,000 113 1,55,33 52,88 93 1,32,42 ' 37,80
9 2,00,001— 5,00,000 36 1,07,92 51,66 43 1,26,59 41,43
10 Over 5,00,001 •• 12 3,47,75 1,78,15 26 8,75,73 4,82,70
T o t a l 44,624 45,40,02 5,25,00 51,821 57,11,98 8,86,56
SouRca.—Report on Statewise Income-tax Revenue Statistics, Government o f India.
98 Planning—2o

202
TABLE
STATEMENT SHOWING THE CLASSIFICATION OF THE INCOME-TAX
1955-56.
Serialno.
Class of ass0s<*ee.
Income-taxNumber of Total income includirg tax
assessees. assessed. deductedat source.
1 2 3 4 5
Rs. Rs. R s.
I Indivd 'als— Salaries earners 7,190 5,53,85,024 29,30,273
II Individuals—Salaries earners with income from other sources 1,458 2,01,19,240 30,31,893
III Individuals—All other sources 4,794 4,76,65,655 62,95,989
IV Hindu undivided families— All sources 3,015 4,16,18,893 51,94,985
V Unregistered firms and other associations of persons— All sources 940 1,15,50,478 16,76,852
VI Companies and other concerns assessable at company rate 138 2,39,47,480 1,03,14,345
T o t a t . 17,535 20,22,86,780 2,94,44,337
N o t e . — Figures since 1937-58 are in of Thousand rupees.
• This also includes the figures for registered firms.
SouKCE.— All-India Incom e-tax P.evenue Statistics.

t A .—comtd.
pjcJMAND ACCORDING TO THE CLASS OF ASSESSEE IN BIHAR.
203
1956-57, 1957-58. 1958-59.
Incom e-tax Income-tax Income-taxNo. o f
ussessees.Total income
assessed.including tax deducted at
source.
No. o f assessees.
Total income including tax assessed. deducted at
source.
No. o f assesses.
Total income including tax assessed. deducted at
source.
6 7 8 9 10 11 12 13 14
Rs. Rs. Rs. ‘000 Rs. ‘000 Rs. ‘000 R. . ‘000
«,981 5,64,54,737 39,61,306 10,130 8,47,84 56,50 9,971 6,07,07 46,76
1.4J7 2,11,48,510 40,07,962 1,661 2,89,04 65,72 2,072 2,92,44 67,13
S.STl 6,07,37,667 77,66,271 7,241 7,84,41 1,05,89 8,614 8,31,65 93,89
3,365 4,83,72,198 59,17,871 4,373 6,43,04 1,00,88 4,706 5,48,29 59,93
1„204* 2,38,13,521* 19,49,908* 1,399* 3,77,79* 26,08* 1,416* 3,74,39* 23,10*
112 3,95,00,864 1,77,40,583 173 4,09,16 2,24,50 90 1,50,20 72,37
IS.Q^O 25,00,27,497 4,13,43,901 24,977 33,51,27 5,79,57 26,869 28,04,04 3,63,18

204TABLE
STATEMENT SHOWING THE CLASSIFICATION OF INCOME-TAX
1961-62.
Serialno.
Class o f assessee.
Numbero f
assesBoes.
Totalincome.
Totaltax.
1 2 15 16
Rs. ‘ 000
17
Rs. “ 000
I Individuals — salary earners 13,381 9,67,92 67,14
II Individuals—salary earners with income from other sources 11,088 10,55,24 1,23,11
n i Individuals—All other sources . . , . . .
IV Hindu undivided families A1. sources 4,966 5,35,86 48,94|
V Un-registered firm and other associations o f persons—All sources .. 1,467 4,02,46 18,23
VI Companies and other -concerns assessed at company rate 82 2,36,05 1,23,16ii
T o t a l 31,004 31,97,53 3,80,58

1 6.4.—conc^d.
DEMAND ACCORDING TO THE CLASS OP ASSESSEE IN BIH AR-concZd.
205
1962-63. 1963-64. 1964-65.
Number Total Total Number Total Total Number Total Totalo f income. Tax. o f income. tax. of income. tax.
assessees. assessees. assessees.
18 19 20 21 22 23 24 25 26
Rs. ‘000 Rs. ‘000 Rs. ‘ 000 Rs. ‘000 Rs. ‘ 000 Rs. ‘ 000
17,626 13,79,11 1,27,83 25,414 18,92,20 1,02,59 28,928 22,46,83 2,50,85
12,067 11,45,22 1,23,14 12,786 12,04,38 14,865 15,677 14,38,85 1,67,62
4,942 5,36,76 56,09 4,632 4,96,82 53,89 5,224 5,75,67 68,34
1,031 1,13,01 23,08 843 93,03 13,87 801 1,22,54 34,88
939 8,90,94 2,41,55 949* 8,59,79* 2,12,00* 1,191 13,28,09 3,64,87
36,605 40,65,04 5,71,69 44,624 45,46,22 5,31,00 51,821 57,11,98 8,86,56
^Including Registered firms.
S o u r c e . —Report on Statewise Income-tax Revenue Statistics, Government of India.
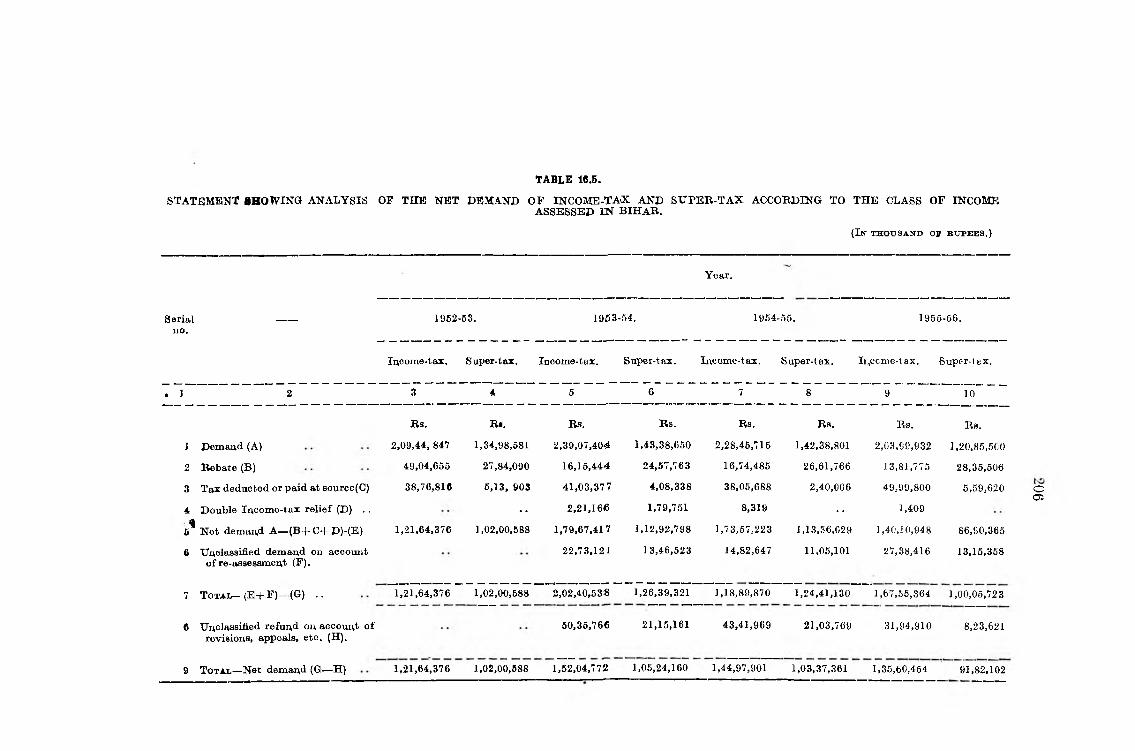
s t a t e m e n t SHOW IN a ANALYSIS OF THE NET DEMAND OF INCOME-TAX AND SU P E B -T A X ACCORDING TO THE CLASS OF INCOMEASSESSED IN BIHAR.
( I n t h o u s a n d o f r u p e e s .)
Year.
TABLE 16.5.
Serialno.
1952-53. 1963-54. 1954-55. 1955-56.
Income-tax. Super-tax. Income-tax. Super-tax. lucome-tax. Super-tax. Ir^ccnie-tax. Super-1 £X.
. 1 2 3 4 5 6 7 8 9 10
Rs. R«. Rs. Rs. Rs. Rs. Rs. Rs.
1 Demand (A) 2,09,44, 847 1,34,98,581 2,39,07,404 1,43,38,650 2,28,45,715 1,42,38,801 2,03,99,932 1,20,85,500
2 Rebate (B) 49,04,656 27,84,090 16,15,444 24,57,763 16,74,485 26,61,766 13,81,775 28,35,506
3 Tax deducted or paid at 8ource(C) 38,76,816 5,13, 908 41,03,377 4,08,338 38,05,688 2,40,006 49,99,800 5,59,620
4 Double Income-tax relief (D) . . •• 2,21,166 1,79,751 8,319 •• 1,409
5’ Net demand A — (B + C -f D)-(E) 1,21,64,376 1,02,00,588 1,79,67,417 1,12,92,798 1,73,57,223 1,13,36,029 1,40,10,948 86,90,365
6 UAclassified demand on accoxint o f re-asaessment (F).
22,73,121 13,46,523 14,82,647 11,05,101 27,38,416 13,15,358
7 T o t a l - (E -fF ) (G) . . 1,21,64,376 1,02,00,588 2,02,40,53S 1,26,39,321 1,18,89,870 1,24,41,130 1,67,55,364 1,00,05,723
6 Unclassified refund on accoun,t o f revisions, appeals, etc. (H).
50,35,766 21,15,161 43,41,969 21,03,769 31,94,910 8,23,621
9 T o t a l —Net demand (G—H) 1,21,64,376 1,02,00,588 1,52,04,772 1,05,24,160 1,44,97,901 1,03,37,361 1,35,60,454 91,82,102
oo ;

TABLE 16.5—conc?d.
ASSESSED IN BIKAB, - concld.( I n t h o u s a n d s o p e t t p e b s .)
s t a t e m e n t s h o w in g a n a l y s i s o f t h e n e t d e m a n d o f INCOME-TAX AND SUPER-TAX ACCORDING TO THE CLASS OF INCOME-
Year.
1956-57. 1957-58. 1958-69. 1959-60. 1960-61.
Serialno.
Income-tax. Super-te^x. Income-tax.
Supertax.
Income-tax.
Supertax.
Income-tax.
Supertax.
Income-tax.
Supertax.
1 2 11 12 13 14 15 16 17 \ 18 19 20
Rs. Rs.
1 Demand (A) 2,80,66,935 2,08,56,996 3,70,63 2,84,59 2,45,69 1,35,86 1,97,44 85,07 2,27,68 1,74,85
2 Rebate (B) 17,26,812 73,48,747 23,55 75,90 12,40 24,42 8,89 20,47 8,84 52,60
3 Tax deducted or paid at source (C) . . 58,15, 945 6,77,854 85,55 11,54 68,35 7,88 61,77 4,31 43,63 5,02
4 Double Income-tax relief (D) , . 9,217 99 68 • 2
5 Jfat demand A —(B-f-C+D ) — (E) 2,0544,959 1,28,30,395 2,60,54 1,96,47 1,63,54 1,03,56 1,36,75 60,29 1,75,21 1,17,28
6 I/nolassified demand on account o f r®faps0ssment (F).
1,54,438 31,79 18,01 14,72 11,24 7,20 5,60 7,01 2,70
7 T o T A t -{E -fF )— (G) 2,06,69,397 1,28,30,395 2,92,33 2,14,48 1,78,26 1,14,80 1,43,96 65,89 1,82,22 1,19,93
8 Unolassified refund on account o f reyisiona, appeals, etc.(H).
60,30 38,85 28,74 16,24 22,59 10,75 24,10 16,39
9 T »tai-—Net dem*nd (G —H) 2,06,69,397 1,28,30,395 2,32,03 1,75,63 1,49,52 98,56 1,21,37 55,14 i»58,12 1,03,54
bOo-a
N .B .—Amoyint in thousand rupees from 1957-58.
SoTJRCB.— Income-tax Revenue Statistics.
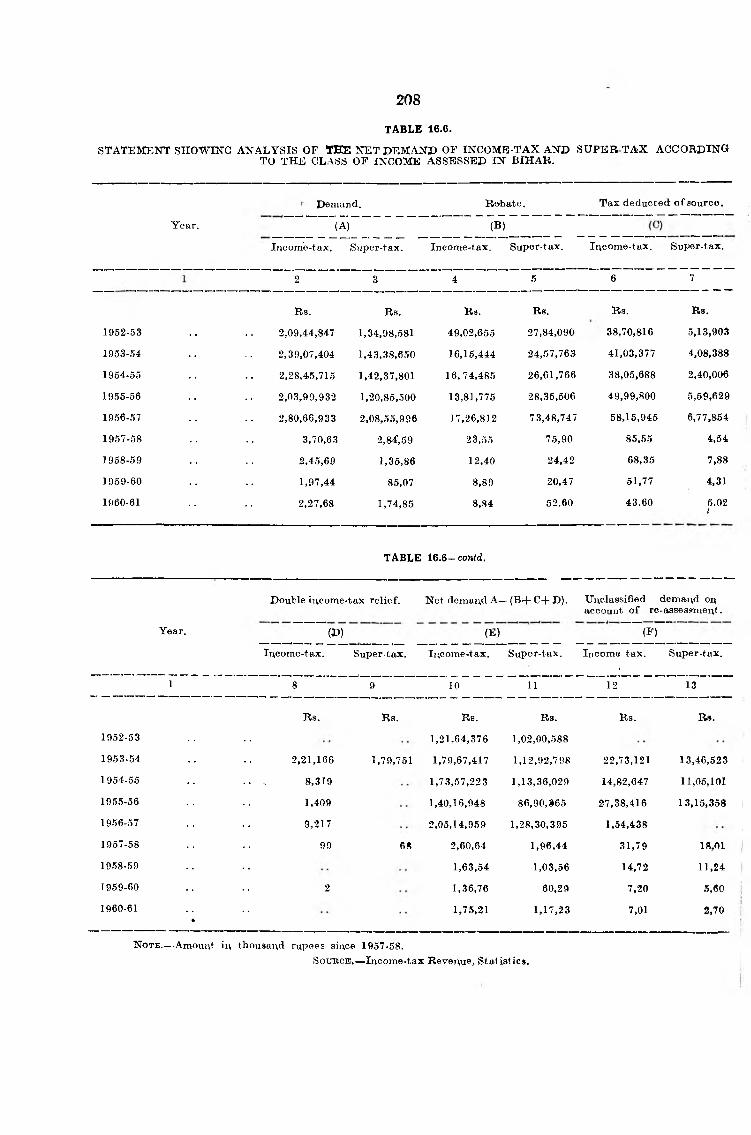
208TABLE 16.6.
STATEMENT SHOWHSTG ANALYSIS OF THE NET DEMAND OF INCOME-TAX AND SUPER TAX ACCORDINGTO THE CLASS OF INCOME ASSESSED IN BIHAR.
Year.
Demand.
"(A)
Rebate.
7 b )
Tax deducted o f source. - -
Licom’e-tax. Super-tax.
2 3
Income-tax. Super-tax,
4 5
Income-tax. Super-tax.
6 7
Rs. Rs. Rs. Rs. Rs. Rs.
1952-53 2,09,44,847 1,34,98,581 49,02,655 27,84,090 38,70,816 5,13,903
1953-54 2,39,07,404 1,43,38,650 16,15,444 24,57,763 41,03,377 4,08,388
1954-55 2,28,45,715 1,42,37,801 16,74,485 26,61,766 38,05,688 2,40,006
1955-56 2,03,99,932 1,20,85,500 13,81,775 28,35,506 49,99,800 5,59,629
1956-57 2,80,66,933 2,08,55,996 17,26,812 73,48,747 58,15,945 6,77,854
1957-58 3,70,63 2,8f,59 23,55 75,90 85,55 4,54
1958-59 2,45,69 1,35,86 12,40 24,42 68,35 7,88
1959-60 1,97,44 85,07 8,89 20,47 51,77 4,31
1960-61 2,27,68 1,74,85 8,84 52.60 43.60 5.02)
TABLE 16.6— contd.
Double income-tax relief. Net demand A— (B + C -f D). Unclassified demand onaccount o f re-assessment.
Year. (I>) (E) (F)
Income-tax. Super-tax. Income-tax. Super-tax. Income tax. 1
Super-tax.
1 8 9 10 11 12 13
Rs. Rs. Rs. Rs. Rs. Rs.
1952-53 1,21,64,376 1,02,00,588
1953-54 2,21,166 1,79,751 1,79,67,417 1,12,92,798 22,73,121 13,46,523
1954-55 .. , 8,319 1,73,57,223 1,13,36,029 14,82,647 11,05,101
1955-56 1,409 1,40,16,948 86,90,»65 27,38,416 13,15,358
1956-57 9,217 2,05,14,959 1,28,30,395 1,54,438
1957-58 99 6S 2,60,64 1,96,44 31,79 18,01
1958-59 1,63,54 1,03,56 14,72 11,24
1959-60 2 1,36,76 60,29 7,20 5,60
1960-61•
1,75,21 1,17,23 7,01 2,70
Note.—Amount in thousand rupees since 1957-58.SoUKCB.—Income-tax Revenue, Statistics.

209TABLE 16.6 —cowcZd.
Total (K +F ).Unclassified refun,d on
account o f revisions, 3, etc.
Year. (G) (H)
Total net deman,d(G—H).
(I)
Income-tax. Super-tax.
U 15
lACome-tax, Super-tax.
16 17
Income-tax. Super-tax.
18 19
Rs. Rs. Rs. Rs. Rs. Rs.
1952-53 1,21,64,376 10,20,588 1,21,64,376 1,02,00,588
1953-54 . , 2,02,40,538 1,26,39,321 50,35,'66 21,15,161 1,52,04,772 1,05,24,160
1954-55 1,18,39,870 1,25,41,130 43,41,699 21,03,769 1,44,97,901 1,03,37,361
1955-56 1,67,55,364 1,00,05,723 31,94,910 8,23,621 1,35,60,454 91,82,102
1956-57 2,06,69,397 1,28,30,395 2,06,69,397 1,28,30,935
1957-58 29,233 21,448 6,030 3,885 23,203 41,563
1958-59 17,826 11,480 2,874 1,624 14,952 9,836
1959-60 14,396 6,589 2,259 1,075 12,137 5,5141960-'61 18,222 11,993 2,410 1,639 15,812 10,354
Note.—Amount in thousand rupees since 1957-58.
^OTTROE,—tlncorae-taX^Revenue Statistics.
96 Flaming— 30


SECTION XVil Laid Reyeoue

STATEMENT SHOWING DEMAND AND COLLECTION OF LAND REVENUE (LAND RENT, CESS, EDUCATIONCESS, ETC.) IN BIH AR.
2 1 2
TABLE 17.1.
Demand. Collection.
Year.
Arrear. Current. Total. Arrear. Current. Total.
Rs. Rs. Rs. Rs. Rs. Rs.
1956-57 2,96,24,048 6,11,45,132 9,07,69,180 1,60,83,391 4,25,10,928 5,85,94,319
1957-58 4,01,37,842 6,64,08,646 10,65,46,488 1,69,76,709 3,58,34,671 5,28,11,380
1958-59 6,16,27,107 7,09,28,907 13,25,56,014 3,84,98,946 4,82,05,235 8,67,04,181
1959-60 5,94,98,736 7,59,85,190 13,54,83,926 3,19,95,070 5,00,04,324 8,19,99,394
1960-61 - .. 7,74,07,177 8,39,02,769 16,13,09,946 4,32,62,124 5,63,99,394 9,96,61,518
1961-62 7,59,21,214 8,76,50,375 16,35,71,589 3,71,75,017 5,42,15,022 9,13,90,039
1962-63 9,12,48,470 9,00,25,620 18,12,74,090 6,09,50,506 6,70,45,146 12,59,95,652
1963-64 .6,97,15,934 9,36,15,080 16,33,31,014 4,31,79,070 7,09,87,963 11,41,67,032
1964-65 5,22,88,566 9,52,86,163 14,75,74,729 3,28,41,322 7,53,39,267 10,81,80,589
1965-66 •• •• •• 13,92,87,136 •• 10,76,03,006
SoOTCB.— Revenue Department, Govemmjent of Bihar.

213
TABLE 17.2.
STATEMENT SHOWING TOTAL DEMAND AND COLLECTION OF RENT, CESS, EDUCATION CESS, MISCELLANEOUS, ETC., FOR THE YEAR 1965-66.
District. Totaldemand.
Total.collection.
Patna
Gaya
Shahaubad
Saran
Champ aran . .
Muzaffarpur . .
Darbhanga
Bhagalpiir
Monghij'-r
Purnea
Saharsia
Santh'al Parganaa
Ranchi
Hazarilaagh . .
Palamau
Dhanbad
Singhbhun
Total
Rs.
1,39,99,481
2,08,12,723
1,23,17,858
92,15,851
84,45,582
96,30,538
1,53,46,790
49,13,112
1,05,14,929
1,30,14,614
65,77,695
39,45,982
24,28,328
30,21,873
23,87,420
7,11,814
20,02,546
Rs.
1,15,37,051
1,59,86,842
94,73,090
82,15,265
58,49,793
87,22,160
97,08,073
42,42,234
80,13,646
81,55,081
39,31,076
35,60,331
23,73,926
29,33,812
22,98,782
6,87,822
18,21,092
13,92,87,136 10,76,02,096
S o u r c e .— Revenue Department, Government of Bihar.

TABLE 17.3.
STATEMENT SHOWING DEMAND AND COLLECTION OF LAND REVENUE (RENT ONLY) IN B lH A il.
^14
District.
Arreax.
Demand.
Current. TotaL Arrear.
Collection,
Current. Total.
1 2 3 4 5 6 7
Rs. Rs. Rs. Rs. Rs. Rs.
1956-57 2,58,97,635 5,15,78,019 7,74,75,654 1,46,74,676 3,49,90,024 4,96,64,700
1957-58 3,49,69,842 5,63,22,465 9,12,92,307 1,55,37,840 3,00,58,201 4,55,96,041
1958-59 5,43,91,597 6,00*90,772 1,44,82,369 3,55,17,107 4,13,72,763 7,68,89,870
1959-60 . . 5,20,41,494 6,31,81,979 11,52,23,473 2,93,95,659 4,03,87,383 6,97,83,042
1960-61 6, 7,69,770 6,76,59,203 13,34,28,973 3,81,32,052 3,45,61,189 8,26,93,241
1961-62 6,40,79,770 7,08,51,143 13,49,30,913 3,29,96,477 4,23,50,254 7,53,51,731
1962-63 7,72,05,460 7,27,55,032 1 ,99,60,492 5,35.58,562 5,31,84,784 10,67,43,346
-1963-64 5,81,99,320 7,58,23,620 13,40,22,940 3,76,31,236 5,63j06,562 9,39,37,798
1964-65 4,28,12,132 7,62,17,364 11,99,29,396 2,83,93,807 6,00,48,956 8,84, 2,763
1965-66 3,51,21,900 7,66,35,609 11,17,57,509 2,38,53,084 6,27,90,878 8,06,43,962
SOTTRCE.— Revenue Department, Government of Bihar.

215
ta ble 17.4.
DISTRICTWISE COLLECTION OF REKT (ONLY) FOR THE YEAR
Demand. Collection.D istrict.
Arrear. Current. Total. Arrear. Currnet. Total.
6
Patna
G»y»
Ssran
Qinmparait
3ur
Darbbanga
Monghyr
Pumea
Ssnthal Parganas
Etharaa
Eanchi
Hmribagh
Sn^bhum
slsfflau
Clianbad
Total
Rs.
36,38,350
59,99,121
20,18,912
17*:63,9U3
21,26,718
14,20,582
54,38,340
11,34,056
. 28,02,239
41,02,417
4,86,428
27,89,812
2,18,772
3,78,303
2,31,603
4,75,526
36,818
Rs.
81,50,259
1,19,50,238
84,69,693
59,20,037
39,93,740
61,82,033
72,35,480
27,64,755
57,83,378
53,03.388
22,13,915
24,34,332
16,26,006
19,63,108
11,21,855
13,12,159
5,01,233
R s.
1,17,88,609
1,79,49,359
1,01,88,605
76,92,940
61.20.458
76,03,615
1,26,73,820
38,98,811
85,85,617
94,65,805
27,00,343
52,24,144
18,44,778
23,41,411
13.53.458
17,87,685
5,38,051
Rs.
28,42,862
38,30,973
16,07,069
9,68,201
10,14,695
11,79,173
33,28,275
10,98,662
22,56,759
24,57,140
3,12,216
16,84,256
2,20,218
3,66,187
1,90,573
4,60,075
35,750
Rs.
69,89,225
99,21,533
62,36,408
59,33,220
30,57,632
58,19,876
47,81,444
23,34,809
44,43,888
34,36,696
20,55,'588
14,70,048
15,88,243
19,10,138
10,40,895
12,90,149
4,84,088
Rs.
98,32,087k1,37,52,506
78,43,477
69,01,421
40,72,327
69,99,049
81,09,719
34,30,171
67,00,647
58,93,835
23,67,804
31,54,304
18,08,461
22,76,326
12,31,468
17,50,223
5,19,838
____ 7^6,35,609 11,17,57,509 2,38,53,084 6,27,90.878 8,66,43,?62
SouBPE.-Revenue Department, Government of Bih^r,

216
t a b l e 17.5.
STATEMENT SHOWING CESS ON LAND RENT IN BIHAR.
Year.
Arrear.
Demand.
Current.
Collection.
Total. Arrear. Current. Total.
1 2 3 4 5 6 7
Rs. Rs. Rs. Rs. Rs. Rs.
1956-57 74,29,800 37,89,434 62,19,234 11,06,204 24,15,766 35,21,970
1957-58 28,85,675 39,50,939 68,36,614 10,49,648 18,83,607 29,33,255
1958-59 44,23,208 42,17,912 86,41,120 24,99,566 26,18,331 31,17,807
1959-60 43,67,031 44,26,991 87,94,022 20,91,128 27,29,305 48,20,486
1960-61 51,51,023 45,79,570 97,30,593 26,26,686 28,71,851 5,40,637
1961-62 • • 49,81,123 47,55,189 97,36,312 21.66,715 26,92,857 48,59,572
1962-63 • * 60,56,714 48,82,738 1,09,39,452 36,69,619 34,10,419 70,80,038
1963-64 • • 45,69,429 49,99,329 95,68,758 26,18,311 35,97,652 62,15,963
1964-65 • • 34,34,704 50,34,982 84,69,686 19,53,164 38,17,265 75,70,429
1965-66* • • 29,60,937 50,76,084 80,27,021 16,69,560 40,22,672 56,92,232
*provisional.SoTTBCE.—Revenue Department, Government of Bihar.

217
TABLE 17.6
SHOWING DISTRICTWISE DEMAND AND COLLECTION OF CESS IN BIHAR DURING THEy e a r 1906-66.
District.
patn*
o»y*ghahabfcd
gtfsn
(jiamparan . . ,
3(0affarpur
Darbbangs
Bbagalpur
Honghyr
Pomea
Sa&thal Parganas . .
Sabarsa
Raoobi
Hwaribagh
Ptlamaa
Dhaobad
Demand. OoUeotioti.
Arrear.
Total
2
Ra.
2,79,724
4,70,125
1,60,430
1,43,411
2,45,335
1,21,429
4,86,811
88,542
3,68,231
3,08,667
32,356
3,40,438
16,194
26,617
41,788
3,641
18,298
Current. Total. Azrear. Current.
29,50,937
6
Rs.
5,41,603
7,77,828
5,53,189
3,65,605
2,62,919
3,90,711
4,90,980
1,97,876
3,99,641
3,31,135
1,23,450
1,83,510
1,34,393
1,23,069
82,565
39,081
78,630
Rs.
8,21,327
12,47,953
7,13,619
5,09,016
6,08,254
5,12,140
9,77,791
2,86,418
6,67,773
6,39,802
1,66,815
4,23,948
1,60,687
1,49,686
1,24,343
41,623
96,928
Ra,
2,00,754
2,80,889
1,13,761
76,172
31,474
96,589
3,24,982
81,293
1,74,108
1,44,120
20,288
1,28,992t
15,270
24,764
' 38,929
3,423
14,762
Rs.
4,43,311
6,36,604
4,06,288
3,63,547
1,97,640
3,60,163
3,09,873
1,62,617
2,87.268
2,14,497
1,08,826
1,06,690
1,30,627
1,18.966
78.039
87,260
70,788
TotaL
60,76,084 80,27,021 16,69,660
Rs.
6,44.065
9,17.493
5.20.089
4.29.719
2,29.014
4,66,742
6,34,854
2,43.910
4,61,366
8,68,617
1,29.114
2,36,682
1.45,797
1,43.719
1.16.968
89,683
86.660
40.32,672 66,92,232
SointcB.—Eevenue Department. Govenunent of Bibwr,

218
TABLE 17.7.
STATEMENT SHOWING TOTAL ADVANCES (WHICH INCLUDE ADVANCES MADE DURING THE Y E A R TOGETHER WITH THE AMOUNT OUTSTANDING FROM PREVIOUS YEARS) UNDER THE LAND IMPROVE- MENT LOANS ACT, 1883 AND AGRICULTURISTS’ LOANS ACT, 1884 IN BIH AR.
Year.Under Land Under Agri-Improvement culturists’Loans Act, Loans Act,
1883. 1884.
1958.59
1959*60
1960-61
1961-62
1962-63
1963-64
1964-65
1965-66
1966-67
1967-68
Rs.
2,21,05,866
1,47,42,514
1,45,43,750
1,82,71,511
85,51,884(a)
1,77,37,109
1,73,25,882
1,68,70,412
1,76,82,452
1,84,74,739
Rs.
19,20,20,091
12,10,20,709
14,04,66,754
13,96,29,014
9,70,42,002(6)
11,95,61,974
12,37,80,223
11,71,54,499
12,51,12,821
15,53,98,537
(а) Excluding Champaran, Muzaffarpur, Saharsa, Pumea and Hazaribagh.
(б) Excluding Champaran, Muzaffarpur, Saharsa and Hazaribagh.
SotrEoB.—Board o f Revenue, Bihar.

STATETVTRNT SHOWING DISTRICTWISE
TABLE 17.8.
AMOUNT OF LOANS OUTSTANDING IN BIH AR DtJRlN^^ YEAftd 1966-67 AND 1967-68.
1966-67. 1967-68.W
Agriculturists’ Loans. Land Improvement Loan. Agriculturi sts’ Loans. Leind Improvement Loan.
District.
Principal. Interest. Principal. Interest. Principal. Interest. Principal. Interest.
1 2 3 4 5 6 7 8 9
Rs. Rs. Rs, Rs. Rs. Rs. Rs. Bs.
Patna 25,32,998 19,73,700 63,632 • 56,476 25,32,997 19,73,700 6,36.320 66,476
Gaya 16,79,921 6,93,173 3,32,120 1,89,124 16,79,921 6,93,173 2,32,130 1,89,124
Shahabad 7,12,205 9,16,951 1,02,090 2,32,2G4 *1,69,53,462 13,90,009 1,29,662 79,396
Saran 11,70,043 34,05,366 39,890 38,308 11,70,043 34,05,366 39,890 38,308
Champaran 58,44,027 39,33,170 1,34,848 1,25,044 58,44,027 39,33,170 1,34,848 1,25,044
Muzaffarpur 39,00,176 36,04,204 2,17,985 73,623 39,00,176 36,04,204 2,17,985 73,623
Darbhanga 2,26,65,292 62,15,308 4,94,293 ivs'i.sn 2,15,\0,'T6^ 1,25,23,610 6,67,969 2,04,166
Bhagalpur 39,41,645 25,01,964 7,24,498 6,94,351 39,41,545 25,01,964 7,24,498 6,94,361
Monghyr 1,32,37,365 65,26,529 5,24,773 2,43,778 1,32,37,365 65,26,629 6,24,773 2,43,778
Saharsa 94,05,175 76,13,995 35,78,865 35,43,182 94,02,230 81,99,607 35,72,976 37,66,666
Purnea •• 30,05,627 68,33,463 1,06,266 1,96,185 33.05,629 39,76,323 1,94,764 2,32,906
Santhai Farganas 17,35,758 18,09,921 26,69,535 12,31,661 1,35,000 18,09,921 26,69,536 12,31,661
Hscaxibagh 13,95,735 9,58,172 3,08,498 1,30,632 87,10,247 16,27,803 3,13,590 1,48,641
Bemchi 11,13,382 6,00,431 3,07,479 2,11,151 37,19,061 6,31,441 2,28,156 1,46,091
Palamau 18,79,606 8,69,690 71,746' 58,285 19,10,967 9,77,641 82,723 66,684
Dhanbad 5,51,606 3,33,590 2,60,038 2,03,905 16,56,477 2,88,072 2,44,448 1,73,889
' Singhbhum •• 9,66,197 5,86,536 2,64,027 1,97,284 13,35,307 3,90,881 2,24,421 1,67,181
Total •• 7,67,36,658 4,98,76,163 1,01,00,582 75,81,870 10,09,45,223 6,44,63,314 1,08,37,768 76,36,971
SouBCS.—Board of Revenue, Bihar.

2 2 0
S tA f^ iiE N T S H O \ ^ a l?ri:E AH^OUNT O f LOANS ADVANCED m S E iR 'f f lE LAtJD ilM PROVEMENl’ LOAi^l^ AC?T, 1883 AND AGRICULTURIST LOANS ACT, 1884 DURING EACH Y EAR IN BIH AR.
¥AiLE 17.9.
Yeat*Land
Agriculturists Improvement Loan. Loan.
1960-61
1961-62
1962-63
1963-64
1964-66
1966-66
1966-67
1967-68*
Rs.
49,64,678
86,10,378
26,47,001
14,67,532
33,24,093
4,15,04,659
9,10,03,109
10,33,03,715
K b .
2,48,931
2,17,738
2,33,962
1,78,293
1,42,808
15,09,103
1,16,84,948
1,07,28,239
*Exoluding Champoran and Sabarsa.
SouBCV.— Board o f Revenue, Bihar.

221
TABLE 17.10.
feT’A T E M fikt SHOW mG I'HE A k o W ji* OF LOANS ADVANCED 11 felH AB btrH lNG 1966-6^ A ^ b
1966-67. 1967-68.
Land LandAgriculturistB Improvement AgrictiltnristB Improvement
Loan, L oan . Loan. Loan.
Patna
Gaya
Shahabad
Saraoi
Champaram
MuzafiTeuqpurI
Darbhanga
Bhagalpur
Monghyr
Saharsa
PumeA
Santhel Parganas
HazeuibAgh
Banohi
Palamau
Dhanbad
Singhbhum
Total
Rs. Rs. Rs. Rs.
20,63,880 72,930 20,53,330 72,930
19,10,828 2,68,260 19,10,823 2,68,260
0,17,421 1,62,314 34,11,988 1,08,369
36,25,898 80,603 36,26,898 80,603
62,21,682 1,75,294 62,21,682 1,75,294
46,14,20o 2,45,036 46,14,200 2,46,030
2,88,80,600 6,59,910 2,86,97,821 6,53,964
41,16,436 7,36,734 41,16,436 7,36,734
1,38,94,547 5,64,457 1,38,94,647 6,64,457
96,44,470 36,69,767 94,98,973 35,80,337
49,73,632 2,16,478 50,96,102 2,13,542
21,60,377 2^,86,386 21,60,377 26,86,385
10,69,071 0,65,548 69,88,349 3,36,667
19,61,046 5,50,169 14,36,870 2,72,257
19,68,936 85,424 66,51,624 84,154
0,08,768 6,17,224 10,10,678 2,62,690
14,81,872 3,43,365 15,16,017 3,38,500
9,10,03,109 1,10,84,948 10,33,03,715 1,07,28,239
SO^OB.— Board of Revenue, Bihar,

TABLE 17 .ll.
S t o B M E ir r SHOWING THE AMOUNT OF BALE OF STAM ts (JTTPiOtAl A S b
1960-61
1961-62
1962-63
1963-64
1964-65
1965-66
1966,-67
1967-68
iTear.
Amount o€ recoipts (in
Judicial. Non-Judicial.
™Peee),
Total.
— -------------1
2 3 4
1958-59
1959-60
. .
B8.
1,08,96,463
1,27,61,009
Bs.
1,61,24,817
2,47,44,417
Rs.
2,70,21,280
3.75,05,426
1,19,74,234
1,25,39,492
1,23,03,767
1,29,23,937
4,93,12,402
4,83,94,167
5,07,09,236
6,28,41,830
A*.JBj.—Figures fbl- 1960-61 to 19Q3-64 oot avftilable.
S o o E ^ .—Board o f Bevenue, Bihar.
6,12,86,638
6,09,33,659
6,30,13,003
6,57,65.768

4 -oRftrNT SHOWING THE AMOUNT OF RECEIPT (DISTRICTWISE) FROM SALE OP STAMPS (JUDICIAL NON-JUDICIAL )IN BIH AR DURING THE YEARS 1966-67 AND 1967-68.
223
TABLE 17.12.
Districts.
1966-67. 1987-68.
Atuount o f receipts (in rupees).
Jadiciai. Nob.judicia}. Total. Judicial. Non-jndicjal. Total.
__ _____ _______________ ____________ _ - - ____________ £ ---- ------------- ---------1---------------------------. .. ___ ______ _____ .2 3 4 6 6 7
Rs. Rs. Ra. Rs. R b. Rs.
Paina 16,03,324 , 78,21,986 94,26,309 16,37,743 86,85,649 1,02.23.392
Onya 7,84,201 33,08,267 40,92,468 7,75,121 36,24,067 43,99,188
gfaahabad ;3 ,71,764 39,86,794 63,67,558 13,14,307 42,38,429 55,62,736
Saran 9.14,423 30,18,785 39,33,^08 9,80,341 32,41,098 42,21,439
(SiftTnparao 6^85,252 19,58,147 25,43.399 6,95.981 23,49,627 30,45,508
Muxftffarpur 9,53,228 40,30,670 49,83,898 10 ,66,273 47,38,805 58,04,078
Darbhanga 8,83,288 85,16,491 43,98,779 10,11,239 94,43,711 44,64,960
llonghyr 6,88,785 22,67,133 29,45,918 7,02,964 24.21,749 31,24,703
Bbagalpur 6,62,960 21^99,504 27,62,464 N.R. N.R. N.R.
Pumea 7,63,797 26,48,177 84.01,974 8,85,478 34,99,246 43,84,724
Santbal Farganas ,. 6,25,732 12,39,982 17,65,714 6,42,620 13,50.453 19,92,973
Soharsa 3,66,070 8,22,073 11,88,143 3,89,369 13,18,470 17,07,839
Eazaribagh 6,12,300 26,93,688 32,05,988 6,52,333 29,85,966 35,38,298
Ranchi 4,84,436 36,62,630 40,36,966 6,40,112 35,50,257 41,90,369
Pftlamaa 1,71,943 9,67,428 11,29,371 1.81,871 6,06,034 7,86,905
Dbanbad 6,05,636 38,35,060 43,40,696 5,84,770 d9.03,336 44,88,106
fii&ghbhoiD , . 6,46,’/28 28,64,522 35,11,250 8,64,626 29.86,034 38,50,560
Total •• 1.23,03,767 5,07.09,236 3,06,13,003 1,29»23,938 ff.28,41,830 6.67.66,768
N.R,—Not reported.
BoTnKW.- Bourd of BeTease*


SEGTIIW XVIII Biliar State Tam .
|06 Planning— 32

226
TABLE 18.1.
STATEMENT. SHOWING THE COLLECTION OF AGRICULTURAL INCOME-TAX IN BIHAfe.
Years.
1959-60
1960-61
1961-62
1962-63
1963-64
1964-65
1965-66
1966-67
1967-68
1968-69
N.A.~Not available.
Figures since corrected by the Commissioner pf Commercial^Taxea, Bihar.
SouKCB.—Commissioner of Commercial Taxes, Bihar.
Number of agaessees.
Taxcollected.
Ri.
6,046 26,27,939
5,766 §4,26,243
N.A. 02,84,369
N.A. 48,03,657
N.A. 41,93,612
N.A. 23,74,968
N.A. 26,17,481
N.A. 14,51,246
N.A. 17,19,150
N.A. 14,28,042

227
TABLE 18,2.
STATEMENr SHOWING THE CIBCLEWISE COIyLECTION OF AGRICULTURE INCOME-TAX IN BIHAR DURING1908-69.
Gird*. Tax collected.
1 2
Rs.
Patna City . . • •
Patna Circle .. . . 22,859
Patna (Urban).. • •
Gaya •• • • 35,460
Shahabad • • . . 1,14,753
Muzaffarpur •• • • • • 84,200
Darbhanga 1,44,345
S aran 72,579
Champaran . . 3,98,609
Bhagalpur • • •• 48,943
Saharsa . . 22,633
Monghyr . . 3,0/,087
ISiTnea . . 33,198
Santhal Parganas 61,874
Ranchi . . . . 25,565
Hazaribagh . . 13,530
Palamau 37,329
SinghbhuOT . . 820
Dhanbad 1,833
Central Circle . .
Giridih 2,425
Chaibasa
Total •• •• 14,28,042
So u r c e ,— Commissioner of Commercial Taxes, Bihar

228
TABLE 18.3.
STATEMENT SHOWING THE NUMBER OF REGISTERED DEALERS AND SALES-TAX COLLECTED IN BIHAR
Year. No. o f registered Tax collected dealers. (in rupees).
1959-60
1960-61
1961-62
1962-63
1963-64
1964-65
1965-66
1966-67
1967-68
1968-69
26,418 4,85,31,564
21,720 6,65,82,896
N.A. 7,44,43,428
N .A. 7,94,96,593
N.A. 9,75,24,822
N.A. 10,65,45,945
N.A. 13,72,32,049
N .A. 15,82,87,861
N.A. 19,77,99,131
N.A. 19,97,93,043
N. A.— Not available.
Figures since corrected by the Commissioner o f Commercial Taxes, Bihar.
SouRCB.— Commissioner o f Commercial Ta^es, Bihar,

229
TABLE 18.4.
STATEMENT SHOWING CIRCLEWISE COLLECTION OF SALES TAX IN BIHAR DURING 1968-(
Circle.Tax collected
(in rupees).
Patna city
Patna Circle
Patna Urban
Gaya
Shahabacl
Mnzaffarpur
Darbhanga
Saran
Champaran
Bhagalpur
Saharaa
Monghyr
Purnea
Santhal Parganas
Ranchi
Hazaribagh
Palamau
Singhbhum
Dhanbad
Central Circle
Supply and Commerce Department
Food Corporation of India
Giridih
Chaibasa
Total
78,41,804
29,34,647
S,23,84,343
43,07,884
1,40,05,917
81,81,914
47,72,997
S4,65,643
27,4i,827
89,62,777
18.00.056
84,88,876
75,04,999
88,54,994
86,82,266
63,36,680
20,80,608
3,01,92,485
2,39,57,326
88.00.249
76,41,882
25,64,869
22.00.143
10,27,357
19,97,93,043
SOTJBOB.—ComioisBioner of Commercial Taxes, Bihar,

230
TABLE 18.5.
STATEMENT SHOWING THE NUMBER OP ASSESSEES AND COLLECTION OF ENTERTAINMENT TA X INBIHAR.
Year. Number o f Collection assessees. (in rupees)
1959-60
1960-61
1961-62
1962-63
1963-64
1964-65
1965-66
1966-67
1967-68
1968-69
170
185
N.A.
152
N.A.
N.A.
N.A.
N .A.
N.A.
N .A.
55,92,873
62,56,616
71,21,691
77,58,341
1,08,39,791
1,15,49,385
1,24,11,525
1,32,71,342
1,33,52,245
1 ,59,84,670
N.A.—Not available.
SOUROB,—Commissioner o f Commercial Taxes, Bihar.

TABLE 18.6.
STATEMENT SHOWING THE CIRCLE WISE COLLECTION OF ENTERTAINMENT TAX IN THE STATE bFBIHAR DURING 1968-69.
C rcle.Tax collected (in rupees).
Patna Circle
Patna Urban
Gaya
Shahabad
Muzaffarpur
Darbhanga
Saran
Champaran
Bhagalpur
Saharsa
Monghyr
Parnea
Santhal T arganas
Ranchi
Hazaribagh
Palamaa
Singhbhum
Dhanbad
Central Circle
Patna City
Giridih
Chaibasa
Total
4,15,714
18,37,300
7,01,179
8,01,930
10,11,713
8,11,557
3,51,912
4,26,492
5,96,652
69,135
7,83,027
10,12,858
12,57,888
4,54,196
1,30,140
18,54,838
21,77,939
1,64,584
4,01,959
2,62,926
1,59,34,670
SotTKOB.— CoBnmissioner of Ccirinaercial Taxes, Bihar.
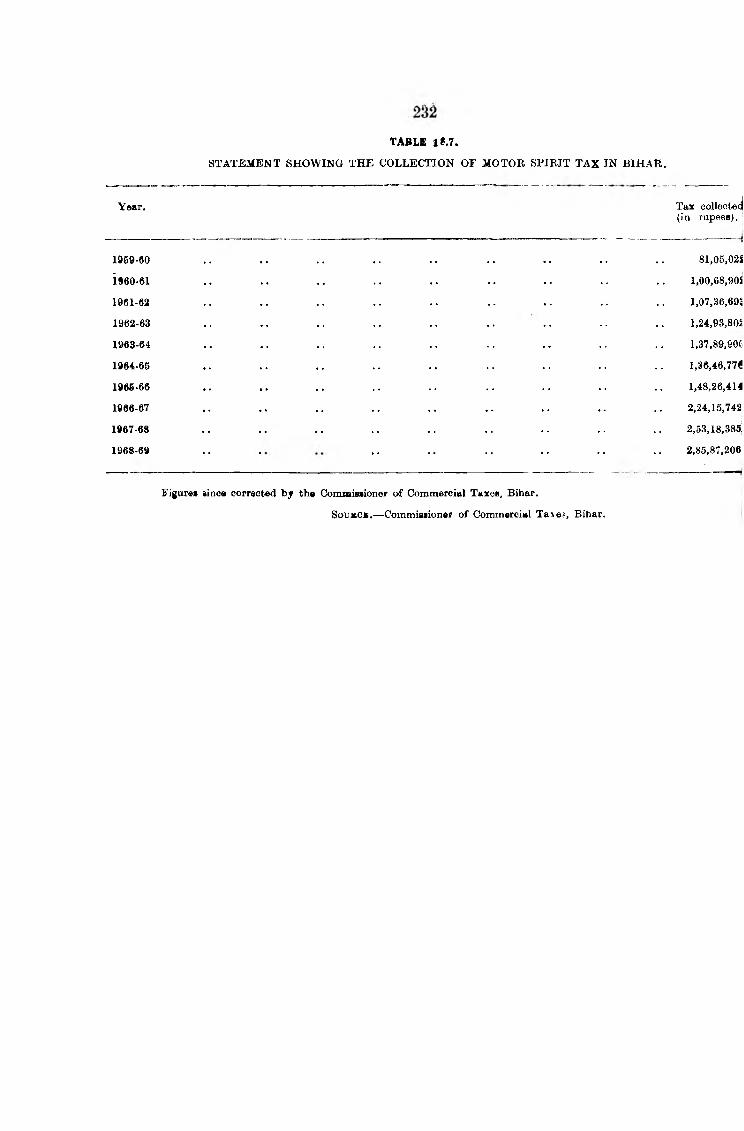
Year.
s t a t e m e n t s h o w i n g t h e c o l l e c t i o n o f m o t o r s p i r i t t a x i n BIH AR.
TABLE 1?.7.
Tax collected (in rupees).
1959-60
i§60-61
1961-62
1962-63
1963-64
1964-65
1965-66
1966-67
1967-68
1968-69
Figures sinca corrected by th® ComnaiBsioner o f Commercial Taxes, Bihar.
Sous.o».— Commisaioner of Commercial Taie^, Bihar.
81,05,025
1,00,68,90S
1,07,36,691
1,24,93,805
1,37,89,90f
1,36,46,77^
1,48,26,414
2,24,15,742
2,53,18,38^
2,85,87,206

233
TABLE 18.8.
^VTEMENT SHOWING THE (CIRCLEWISE) COLLECTION OF MOTOR SPIRIT TAX IN BIHAR DURING1968-69.
Tax collected (in rupees).
!na Cir/*,lo • • , , . , • • 19,614
ina Urban • • • • • • • • • • • • 2,78,66,911
• • • • • • • • • • • • 49,515
ihabad • • . . ♦ • • • • • • « 38,848
zaffarpur • • • • • • •• •• •• • • • • 22,043
rbhanga •• • • • • • • • • • • • • 73,805
pRn. • • • • •• • • • • • • • • .• * 89,811
amparan • • •• •• •• •• • • 41,995
agalpur •• •• • • • « 9,182
flarsa •• •• • • • • • • 7,041
nghyr •• •• • • •• ••Tnea .• • • • • • • • • 77,670
athal Parga ' ap . . • • •• •• • • 643
nchi •• • • 11,551
.zaribagh • • • • 29,945
lamau • • •• •• •• •• •• • • 18,422
ighbhum • * • • 12,242
anbad • • • • • • 1,92,346
ntral Circle . . • • • • • •
itna City • • •• • • • • •• • •
ridih • • • • •• • • •• • • 22,425
aibasa •• •• •• •• •• •• •• 3,197
Total •• 2,85,87,206
SOUBOH.— Commissioner of Commercial Taxes, Bihar.
96 Planning— 33

234
Year.
1959-60
1960-61
1961-62
1962-63
1963-64
1964-65
1965-66
1966-67
1967-68
1968-69
TABLE 18.9.
STATEMENT SHOWING THE COLLECTION OF TRANSPOBT T A X IN BIHAR.
Figures since corrected by the Commissioner, Commercial Taxes, Bihar.
SoTTBCE.—Commissioner o f Commercial Taxes, Bihar.
Tax collected (in rupees).
46,40,025
35,29,318
33,86,317
57,75,415
98,94,877
95,72,157
1,13,35,040
1,39,17,426
1,46,94,086
90,12,216

235
TABLE 18.10.
STATEMENT SHOWING THE COLLECTION OF TRANSPORT T A X (CIRCLEWISE) IN BIH AR DURING 1968-69.
Circle. Tax collected (in rupees).
Patna Circle
Patna Urban
Gaya
Shahabad
Muzaffarpur
Darbhanga
Saran
•Champaran
Bhagalpur
Saharsa
Monghyr
Purnea
Santhal Parganas
Ranchi
teazaribagh
Palamau
Binghbhum
3hanbad
*atna City
Jiridih
/haibasa
Jnter-State Tnick Owners
Total
2,63,316
2,49,569
2,46,677
6,73,296
8,18,986
1,19,232
4,68,606
2,94,412
3,21,406
73,610
2,66,367
3,99,683
4,69,363
8,89,695
3,76,408
2,96,387
6,97,017
6,29,760
2,40,426
1,43,060
1,07,835
9,89,440
90,12,216
SOUBOE.—'Commissioner o f Commercial Taxes, Bihar.

236
TABLE 18.11.
STATEMENT SHOWING THE COLLECTION UNDER ELECTKICITY ACT OF 1948 IN BIHAR.
Year. Tax collect^ (in rupees)^
1959-60 • • • •
----- ----------------—,
46,62,0f
1960-61 50,42,2(
1961-62 56,80,01
1962-63 67,62,91
1963-64 1,17,74,3
1964-65 \ 2,98,70,8
1965-66 3,38,05,6
1966-67 3,41,08,f
1967-68 3,97,21,(
1968-69 •• 4,03,12,:
Figures since corrected by the Commissioner o f Commercial Taxes, Bihar, |Fatna.
SouBCB.—Commissioner of Commercial Ttbxes, Bihar.

237
TABL] 18.12.
STATEMENT SHOWING THE COLLECTION (CIRCLEWISE) UNDER ELECTRICITY ACT OF 1948 IN BIHARDURING 1968-69.
Circle.
Patna Circle
Patna Urban
Gaya
Shahabad
Muzaffarpur
Darbhanga
Saran
Champaran
Bhagalpur
Saharsa
Monghyr
Purnea
Santhal Parganas
BancYii
Hazaxibagh
Palamau
Singhbhum
Dhanbad
Central Circle
Giridih
Chaibasa
Bihar Electricity Board
Total
Tax collected (in rupees).
27,91,083
• f * *9,84,351
29,05,492
7,41,470
5,84,356
4,76,879
10,43,595
4,78,843
7,75,011
9,51,250
3,49,807
4,21,577
25,94,681
17,28,820
6,12,444
1,05,98,070
1,00,26,948
12,11,61b
11,36,052
4,03,12,348
Squrob.—Commissioner of Commercial Taxes, Bihar.

238
TABLE 18.13.
STATEMENT SHOWING THE AMOUNT OF CESS REALISED FROM SUGAR FACTORIES IN BIHAR.
Year, Cess realised (In laklis of Rupees).
1958-591959-601960-611961-621962-631963-641964-651965-66*1966-67*1967-68*
1,46.781,50.02
83.701,06.33
60.9692.46
1,67.552,01.831,09.45
79.29
Figures since corrected by the Cane Commissioner, Bihar,’"'-^Realisable,
Soui Ce;. — Cane Commissioner, Bihar,
TABLE 18.14.
STATEMENT SHOWING ACTUAL RECEIPTS FROM THE CHAUKIDARI REVENUE IN BIHAR.
Year. Tax collected (in Rupees).
1959-60
1960-61
1961-62
1962-63
1963-64
1964-65
1965-66
1966-67
1967-68
1968-69
19,65,306(a)
11,90,676(6)
25,54,606(c)
26,35,984(d)
24,74,774(e)
23,42,387(/)
24,29,489(gr)
21,42,377(;»)
21,04,851(«)
21,85,613(i)
(а) Excluding Gaya, Shahabad, Muzaffarpur, Darbhanga and Champaran.(б) Excluding Gaya, Shahabad, Muzaffarpur, Darbhanga, Champaran, Saran, Monghyr and Santhal Pargauas.(c) Excluding Patna, Darbhanga and Santhal Parganas.(d) Excluding Patna and Darbhanga.(e) Excluding Patna and Darbhanga.(f) Excluding Patna, Darbhanga and Muzaffarpur.{g) Excluding Patna, Darbhanga, Muzaffarpur and Palamau.(A) Excluding Patna, Muzaffarpur and Darbhanga.(i) Excluding Patna, Muzaffarpur, Darbhanga and Saharsa.{j) Excluding Patna, Muzaffarpur and Darbhanga.
SoubOb.—Directorate of Statistics and Evaluation, Bihar.

239
TABLE 18.15.
PTATEMENT SHOWIXG DISTBICTWISE THE AMOUNT OF RECEIPT FROM CHAUKIDARI REVENUE INBIHAR DURING THE YEAR 1968-69.
District.
b--------------------Patna
Gaya
3h ahabad
MuzafiEarpur
^arbhanga
?aran »Dhamparan
^hagalpur
laharsa
longhyr
^urnea
anthal Parganaa
lanohi
'azaribagh
ilamau
banbad
nghbhum
Tax collected (in Rupees).
Total
N.A.
1,53,064
3,07,157
N.A.
N.A.
4,30,116
45,665
95,210
77,589
1,74,550
2,82,171
91,295
1,38,761
1,87,505
59,827
1,04,189
38,514
21,85,613
N .A .—Not available.
So^7B0B.—Directorate of Statistics and Evaluation, Bihar.


SECTION XIX Excise Statistics
96 planning— 34

242
TABLE 19.1.
STATEMENT SHOWING THE TOTAL NLT EXCISE REVENUE IN BTEAR.
Year.
. -... . ' .
Net revenue | (in rupees).
1969-60 5,44,28,493]
1960-61 5,78,96,89oi11961-62 6,30,59,535j
1962-63 6,37,20,071;
1963-64 6,76,81,185,
1964-65 7,15,91,859:
1965-66 8,17,53,478,|
1966-67 8,90,12,03611967-68 10,57,04,321'
i968-69 •• . . 11,02,59,15c1
S o u r c e . — E cise Commissioner, Bihar.
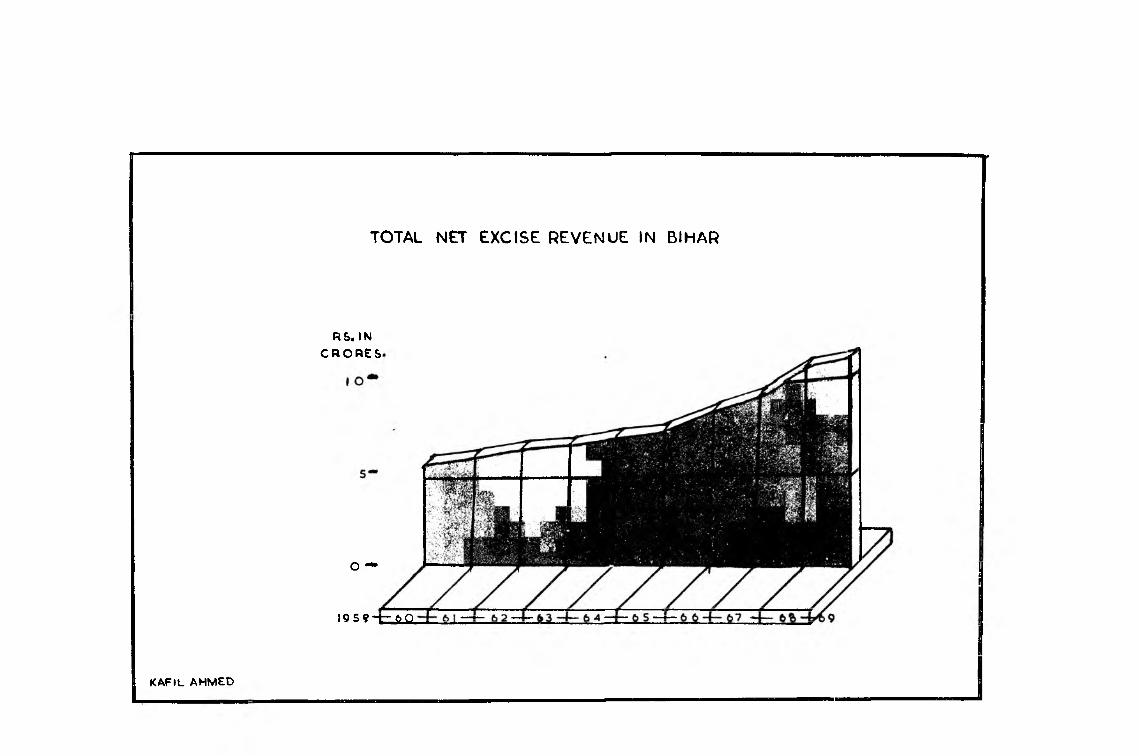
TOTAL NCT EXCISE REVENUE IN BIHAR
R & .INC R O R E S
O —
l 9 S ? - t ! Z S
KAFIL AHMED

243
TABLE 19.2.
^STATEMENT SHOWING DISTRICTWISE NET EXCISE REVENUE IN BIH A R DURING THE YEAR 1968-69.
Name of District. Net revenue, (in rupees).
Patna . . 1,36,45,802
Gaya . . •• 84,44,026
Shahabad •• 65,15,447
Saran •• 65,52,118
Champaran •• 53,03,205
Muzaffarpur 48,00,072
Darbhanga •• 38,23,428
^Mo ghyr 50,89,245
Bhagalpur 15,31,975
Saharsa •• 7,84,660iI Purnea 37,41,190
Santal Parganas 57,00,775
Hazaribiagh I.'1,13,38,503
Ranchi 1,18,68,178
Palamani 31,17,262
Dhanbad 90,21,300
Singhbhum
T o t a l
74,79,194
10,87,56,380
This, is E elusive of Inter-State Adjustment (of Rs. 18,02,770) m d after refunds (Rs. 3,00,000).
SouKCE,— Commissioner of Excise, Bihar.

244
TABLE 19.3.
STATEMENT SHOWING THE CONSUMPTION 01' COUNTRY SPIRIT, O PIU M , OANJA AND BHANG PER HUNDREDPOPULATION IN BIHAR.
Year.Country spirit Opium Oanja Bhang
(ingaUons) (K .G .). (K .G .). (K.G.).(Distillery Area).
1960-61
1961-62
1962-63
1963-64
1964-65
1965-66
1966-67
1967-68
1968-69
4.79
4.17
17.3
18.2
20.4
21.6
22.3
27.3
26.6
.00016
.00012
.00009
.00009
.00001
.00007
.0000006
.00009
.00008
.067
.036
.028
.022
.024
.026
.024
.043
.049
.036
.028
.026
.023
.026
.029
.018
.023
.02^
N o t e .— Since 1962-63 in K .G . and Litre in places o f seers and gallons.
SoTJRCK.— Commissioner of Excise, Bihar.
TABLE 19.4.
STATEMENT SHOVITLNG THE CONSUMPTION OF SPIRIT, OPIUM, GANJA AND BHANG m BIH AR.
Year. Country spirit Opium Ganja Bhang.(in L . P. gallons). (K .G .) (K .G .). (K .G.).
6
1960-61
1961-62.
1962-63
1963-64
1964-65
1966-66
1966-67
1967-68
1968-69
18.60.554.1
19,38.180.8
80.41.273.2
84.93.883.2
94,78,142.0
1,00,66,135.0
1.03.65.873.5
1.27.03.248.5
1,23,88,610.0
67
55,511
43,490
43.408
48.028
35,696
28.555
41.575
35.800
26,253
17,786.809
12,596.482
10.333.500
11.462.500
12.391.500
11,180.000
20,317.000
22.087.500
14,17
13,til8.2S
12,022.05
10,998.0C
12,187.0(
11,874.0(
8,349.0<
10,575.5(
10,467.01
SoxTBCS.—CommiBsioner of Excise, Bihar.

245
TABLE 19.5.
STATEMENT SHOWING DISTRICTWISE CONSUMPTIOK OF COUNTRY SPIRIT, OPIUM, QANJA AND BH AN QIN BIHAR DURING 1968-69.
Patn,a
Gaya
Shahabad
Saran
Champaran
Muzaffarpur . .
Darbhanga
MoAghyr
Bhagal pur
Saharaa
Pumea
Santhal Parganas
Hazaribagb . .
Ranchi
Palamau
Dhanbad
Singhbhum . .
District.
Totax
Country spirit (in L.P. Litres).
Opium
Kilogram).
Ganja(in
Kilogram).
Bhang(iA
Kilogram).
2 3 4 5
. . 14,86,664.5 1.000 544.000 408.000
. . 9,16,616.0 768.000 895.000
. . 7,46,847.5 1,153.550 1,117.000
. . 5,79,684.0 0.491 1,025.000 132.000
. . 5,64,350.0 479.050 63.000
. . 2,89,059.5 0.466 1,053.000 192.000
. . 2,27,717.5 8.000 700.000 68.000
. . 5,34,942.0 1.000 1,454.000 156.000
. . 1,37,425.0 775.000 160.000
66,742.0 1,337.000 9.000
. . 4,50,812.0 12.000 3,239.600 136.000
. . 7,56,974.0 0.466 1,375.500 403.000
.. 18,82,383.0 4.455 1,662.900 1,143.000
.. 17,07,361.5 5.000 1,791.000 1,302.000
. . 3,66,571.5 463.500 929.000
. . 10,01,311.0 2.000 1,753.400 1,139.000
. . 6,74,259.0 0.922 2,513.000 2,215.GC0
. . 1,23,88,610.0 35.800 22,087.500 10,467.000
..N il.SoTJBcB.—Commissioner of JlxciBe, Bihai.

246TABLE 19.6.
STATEM EN T S H O W IN G C E N T R A L E X C IS E R E V E N U E R E A L IS E D (C 0M :V I0D ITYW ISB )
(In T h o u s a n d s o f R u p e k s . )
Names o f coromodities. 1961-62. 1962-63. 1963-64. 1964-64. 1966-66. 1966-67. 1967-68. 1968-69.
Tobacco
V .N .E . Oil
Sugar{IT.I‘ .)
Paints and varnishes
P .P . medicin.es
Steel ingots
Cotton yarn
8. Cement
9. Cigarettes
10. Vegetable products
11. Woollen yarns
12. Caustic soda
13. Staple fabrics
14. Silver . .
15. Soap . .
16. W .R . sets
17. Aluminium
18. Pig iron
19. I .e . Engine
20. Copper and cop per alloys
21. Loose tea
22. Glass and glassware
23. Motor spirit
24. Woollen fabrics
2 3 4 5 6 7 8 9
3,39,19 3,60,69 4,08,03 4,56,55 4,57,89 6,44,27 5,84.02
12,64 10,76 23 8 13 3
6,65,78 8,54,81 6,34,38 • 7,47,13 9 ,94,26 8,27,09 4,74,95
• 80 3 ,17 ‘ 9,58 12,16 -5 ,62 6,36 3,01
90 1,07 67 86 9o 90 1,12
6,52 ,63 2,25,95 27 2,73 4,85 5,92 30,46
56 73 70 61 48 1,03 2,18
3,25,57 3,H1,28 4,45,34 4,56,95 3,61,14 4,69,25 1,31,78
1,37,42 1,69,56 2,30 2,39,27 2,86,59 6,00,74 42,57,33
17,26 22,79 41,84 27,89 21,62 13 30,89
24 65 87 64 60 48 44
2,18 2,20 2,31 2,53 2,45 1,91 1,16
32 1
38 24 26 35
27 75 1,37 1,09 84 54 98
r ,i8 91 1,28 1,74 5,61 99 2
14 1,10 1,03 65 82 55 2
8,28 8,11 9,85 29,76 35,71 25,58 30,41
1,37 1,41 2,67 4,94 5,31 5,66 13,17
24,59 39,21 66,84 65.10 1,81,66 1,66,29 1,84.51
7 20 9 8 5 7 9
26,66
89
68
41,30
10,10
61
■. 30,45
6,23
. 72
26,24
3,44,46
1,06
26,94
6,70,07
1,24
25. China and procelain ware 51 60 73 1,96 3,69 3,46 " 2,16
26. Package tea 1 1 1 2 1 1 ••
27, Footwear •• 12,63 17,03 15,97 18,86 ••
28. Tin plate •1,38,07 1,39,12 1,48,64 1,44,95 1,01,03 1,75,83 1,48,06
29. Paper . . 1,52,55 1,87,83 2,16,66 2,18,25 2,20,78 •• 2,78 ,84 1,88,48
30. Motor vehicles 3,67,25 3,75,81 4,96,05 6,55,32 7,48,29 •• 8,46,78 10,77,25
3 1. Electric bulbs 4,47 6,54 9,07 6,72 5 .62 6 ,12 5,80
32. Match . . 1,84 H9 28 79 26 13 15
37,32
4,25 ,54
1,43
34,44
2,86,63
1,40

TABLE 19.6-con«Znf,
STATEMENT SHOWING CENTRAL EXCISE REVENUE REALISED (COMMODITYWISE).
( I n T h o u s a n d s o p R u p e e s ) .
247
Name o f commodities. 1961-62. 1962-63. 1963-64. 1964-65. 1965-66. 1966-67. 1967-68. 1968-69.
1 2 3 4 5 6 7 8 9
33. Cotton fabrics 2,81 1,85 3,50 1,95 2,77 66 95
34. Khandsari sugar . . 10 34 97 86 1,21 96
35. Cosmetic toilet * *
36. Jute, Manufacture 34,38 37,87 38,04 30,45 42,86 60,80
37. Asbestos cement Products 6,46 7,73 9,64 9,92 9,30 9,08
38. Gasses .. 55,77 71,34
39. Electric battery 4 6 4 5 14 72
40. Iron and steel product 8,39,80 12,82,25 16,63,44 23,60,20 23,11,15 21,93,26
41. Plywood 47 20 2 3 5 2
42. Electric wire and cable 56,57 61,88 77,38 62,00 56,55 78,37
43. Acid 11,08 13,39 6,20 5,26 3,25 3,82
44. Power alcohol 19 2
45. Refrigerator A.C. appliances . . 2 18 18 12 3
46. Sodium solicat© 31 4,69 6,44 5,36 4,63
47. Diesel oU (N.O.S.) . . 20,66 1,39,82 2,81,05 3,25,01
48. Refined diesel oil . . 3,34,74 9,60,68 11,85,84 7,68,63
49. Rubber product •• 9 6 • • *
60. Petroleum Product (N.O.S.) , . •• 7 94 44,24 82,49
61. Furnace oil 2,56 71,96 . . 1,68,69 1,81,60
62. Kerosene oil 20,42 2,00,08 2,92,53 1,72,62
63. Zinc •• • • , 2 . . • •
64. Lead . . 4,19 10,72 16,35
66. Cotton fabric (Power loom) •• •• •• •• 40 95
T o t a l 29,00,24 38,71,96 40,33,80* 56,50,84 79,99,40 •• 87,47,37 1,13,79,79
•Less thaa thousand.
...N ot available.
SotnaoB.—Collector of Central E3Ecise, Bihar.


SECTION XX Registratiofl Statisties.
66 Planning—35

250
TABLE 20.1.STATEMENT SHOWING THE NUMBER OF REGISTRATION OFFICE, TOTAL GROSS RECEIPTS, INCOME
AND EXPENDITURE, ETC. FROM RETISTRATION IN BIHAR.
Year.Number o f Total Total Total Refunds Totalregistration. Fees. Receipts. Gros*. Expenditure. and net
drawbacks. income.
Rs. Rs. Rs. Rs. Rs.
1958 . . 114 67,94,691 8,16,827 66,11,618 16,09,160 1,630 61,00,728
1069 . . 114 69,63,103 9,84,613 69,47,736 16,84,066 1,689 62,61,992
1960 . . 114 66,22,796 10,98,222 76,21,018 17,01,893 866 69,18,269
m i . . 114 70,16,621 11,96,344 82,12,866 17,71,684 928 64,40,263
looa . . 114 67,14,917 11,23,666 78,38,482 21,59,186 1,396 66,77,900
1963 . . 114 84,34,213 17,13,787 1,01,48,000 20,30,917 1,209 81,15,874
1964 . . 114 98,49,287 14,96,573 1,13,45,861 23,62,993 30,788 89,52,080
1965 . . 114 1,16,17,361 16,08,222 1,31,25,683 26,87,960 1,793 1,05,36,884
1966 . . 114 1,30,31,177 18,71,128 1,49,02,305 26,65,187 2,969 1,22,44,169
1967 . . 114 1,36,21,837 20,37,858 1,66,69,696 39,75,658 1,835 1,16,82,302
•Piotleiuml.
Boubob.—lospeotot.Qeneral of Begistrati<m« Bihar.

251
TABLE 20.2.
STATEMENT SHOWING TOTAL REGISTRATION (COMPrLSORY AND PROPERTY IN BIHAR.
OPTIONAL) AFFECTING IMMOVABLE
Number
Year. Aggregatevalue.
Fees.
Oompulsory. Optional. Total.
1 2 3 4 5 6
Rs. Rs.1958 9,57,450 2,202 9,59,652 48,07,35,372 59,40,227
1959 9,25,962 1,649 9,27,611 90,26,42,588- 58,91,737
1960 8,28,921 N.A. 8,28,921 51,05,23,446 67,13,780
1961 9,84,459 1,868 9,86,327 62,61,04,125 69,31,739
1962 . . . 8,86,143 1,726 8,87,869 58,39,32,603 66,35,537
1963 8,99,658 2,303 9,01,961 64,85,42,467 91,35,249
1964 9,36,576 N .A . 9,36,676 67,97,67,673 97,56,543
1965 10,30,365 N.A. 10,30,365 80,93,75,250 1,11,74,446
1966 10,44,407 30 10,44,437 99,22,32,598 1,28,80,049
11,11,652 315 11,11,967 1,01,99,11,435 1,21,28,289
N.A.— Not available.
•Provimonal.
SouaOB.—Inspeotor-Qeneral of Begistrstion, Bihar.

s t a t e m e n t s h o w in g DISTRICTWISE t o t a l (COMPULSORY AND OPTIONAL) REGISTRATION AFFECTINGIMMOVABLE PIlOP:aRTY IN BIHAR DLTIING THE YEAR, 1967.
252
TABLE 20.3.
District.
Number.
Compulsory. Optional. Total.
Aggregatevalue.
Fees.
I 2 3 4 5 6
R% Ra.Patna • • 77,832 77,832 11,62,77,882 12,61,919
Gaya . . , . 78,681 78,681 6,80,48,857 9,60,330
Shahabad . . 72,006 72,005 10,46,92,322 10,85,602
Saran 1,08,816 1,08,816 10,75,77,936 13,27,779
Champaran 82,576 .. 92,575 9,39,55,108 11,95,509
Muzaffarpur 1,18,125 • • 1,18,125
Darbhanga 1,49,708 1,49,708 11,77,30,120 16,65,407
Monghyr 84,8^ 84,846 8,76,21,844 10,48,021
Bhagsilpur . . 43,509 43,509 5,09,67,642 5,93,843
Saharsa 57,000 • • 57,000 3,90,12,357 6,01,972
Pumea 82,459 82,459 7,03,35,003 8,65,819
Santhal Parganas 25>05l 283 25,334 1,77,86,660 2,36,618
Hazaribagh 45,888 45,888 8,44,02,964 4,37,218
Ranchi 20,665 20,555 2,60,02,088 2,72,516
Palamau 11,645 11,645 73,46,004 96,647
Dhanbad . . 26,449 32 26,481 2,00,38,531 2,64,714
Singhbhum.. •• •• 16,508 •• 16,508 1,82,16,117 2,24,375
T o t a l . . •• 11,11,652 315 11,11,967 1,01,99,11,435 1,21,28,289
. .■—Not available.
SotTBiOa.—Inspector-General of Registration, Bihar.

STATEMENT SHOWING TOTAL REGISTRATION (COMPULSORY AND OPTIONAL) AFFECTING MOVABLEPROPERTY IN BIHAR.
253
TABLE 20.4.
Year.
Number of Registration.
Compulsory. Optional. Total.
Aggregatevalue.
Fees.
1 2 3 4 6 6
1958
V
86 14,352 14,438
Rs.
88,76,435
Rs.
48,856
1959 6 17,349 17,355 89,75,471 44,246
1960 9J50 13,501 22,651 1,12,64,457 1,92,844
1961 4 12,174 12,178 77,33,647 50,114
1962 • • 7 10,545 10,552 60,66,438 ' 43,958
1963 • « 4 11,466 11,470 62,93,991 62,912
1964 • • 6 10,722 10,727 60,71,558 67,188
1965 • • 5 12,387 12,392 1,21,22,680 98,342
1966 • • 4 14,105 14,109 1,20,72,082 94,114
1967 •• I 14,260 14,261 \,43,63,m %,110
•Provisional.
SouRCB.—Inspector -General of Registration, Bihar.

254
TABLE 20.5. ,
STATEMENT SHOWING DISTRICTWISE TOTAL (COMPULSORY AND OPTIONAL) REGISTRATIONMOVABLE PROPERTY IN BIHAR DURING THE YEAR, 1967.
District.
Number.
Compulsory. Optional.
-------Aggregatevalue.
Total.
Patna
GayaBhahabad . .
Saran
Muzaffarpur
Champaran
Darbhanga
Monghyr
BhagcJpur . .
Saharsa
Pumea
Bantbal Parganas
Hasaribagh..
Ranchi
Pi^amau
DhanbcMl . .
Binghbhxun..
T o t a Zi
1,094
785
1,640
1,176
395
441
47«
4S7
lOS
984
t.709
704
480
401
ISO
496
1,094
444
786
1,540
1,176
895
441
476
4S7
tos
984
#,769
704
480
401
•36
497
Rs.
80,77,144
1,62,871
8,80,267
21,33,063
21,68,162
1,16,974
2,93,909
2,80,712
1,67,863
1,63,719
13,43,090
*22,03,346
4,23,393
6,69,666
96,760
1,66,389
1.67,990
Ri.
14,260 14,261 1,43,63,177
Souxci.—Inipeotor-Qeaeral of B«girtra(ion, Bihar.

555
t a b l e 20.6.
STATEMJil^T SHOWINQ TOTAL REGISTRATION AFFEUTING WILLS, ETC., IN BIHAR.
Year. Number. Fees.
1 2 3
B b.
196»• • • • • • • • 1,894 27,813
• • • • • • 1,811 27,118
15«0 •• • • • • • • * 1,931 2,93,702
1/1 • • • • • • ' 2,282 34,031
0 • • • • • • • • 2,289 34,623
0 • • • • • • « • 2,290 46,051\
19J4* • • • • • • • • 2,204 60,126
m * - • « • • • • 2,263 61,881
\ m • • • • • • • • 2,461 87,014
0 - - •• .. .. 2,401 64,443
^Tisionnl.
SOXTBOB.—Z&q>ector.G«n«Ml of Begistntion, Bibiv.

556
TABLE 20.7.
STATEMENT SHOWING DISTRICTWISE TOTAL NUMBER OF REGISTRATION AND FEES AFFECTING WILLS,ETC., IN BIHAR DURING 1967.
District. \ Number. Fees.
1 2 S
Rs.
Patna • • • • • • 184 4,281
Oaya •• •• •• • • •• 116 2,730
Shahabad . . •• - • • • • 272 6,119
Saran - •• •• • • •• 294 6,470
Cbamparan . . • • •• •• • • 115 2,699
Mnzaffarpur - •• - •• • • , •• 330 7,392
Darbhanga . . •• • •’a - • 282 6,553
Monghyr • • •• •• » - 164 3,810
Bhagalpur • • •• •• • • •• 64 1,600
Purnea - - - - - 108 2,472
Samthal Farganas •• •• •• - - 224 4,979
BEiharsa - - - • « - 60 1,297
Hazaribagb . . • • - - - - - 67 1,634
Ranchi - - - - - - 39 881
Pelamau - - - - - - 8 197
Dhanbad • X* — - - - — 20 449:
Singhbhum . . •a* - - ... - - - 64 1,186
T o t a l - 2,401 54^443
SotmoB.—Znspeotot'Oeneral of Registration, Bihar.

STATEIVTENT SHOW W G DETAILS EST RESPECT OF RATyATT HOLDrN"GS HAVESTG OCCUPAITCY RIGHTS TRANSFERRED B Y REGISTERED DEEDS OF SALE I?T BIH AR.
257TABLE 2 0.8.
Y «»r .Ent r*. I n P a b t .
Area Annual rent Area Annual rentNumber, transferred payable to Consideration Number. transferred payable to Consideration
(in acres). landlord, mon®y. {in acres). landlord. money.
1 2 3 4 5 6 7 8 9
Rs. Rs. Rs. Rs.
1958 51,495 41,712.75 1,43,202 3,69,77,914 3,89,687 210,449.74 8,77,729 25,11,94,627
1989 61,330 60,104.71 1,60,062 4,15,54,651 4,65,143 288,761.96 8,13,927 37,00,50,409
t> 1980 70,044 62,141,90 1,47,986 3,89,67,928 4,64,990 266.090.48 7,30,511 25,15,05,278
1961 73,982 62,486.00 1,49,608 4,02,28.591 4,73,734 259,491.00 8,60,337 26,42,16,217
1902 61,823 63,164.26 1,61,986 3,54,51,308 4,28,015 273,774.52 7,89,853 27,28,64,168
1963 62,421 50,868.32 1,38,718 3,71,16,877 4,39,534 232,832.53 10,29,617 27,33,51,049
1964<* 60,784 45,007.88 95,973 3,99,85,586 4,80,790 235,146.60 7,71,960 33,56,81,777
1965* 75,842 68,331.32 1,51,413 4,76,31,470 5,42,762 341,799.39 ' 15,71.897 86,06,04,849
1966 57,313 45,190.00 1,31,909 5,19,88,875 5,33,767 2,89,430 8,70,553 45,44,56,519
1 64,960 36,033 1,19,251 3,12,’/2,1 ST 5.32,’7"4 2,52,48& 7,44,064 47,44,85,605
•Provisional.
SoUBoB.—Inapector-General of Registration, Bihar.
96 Planning— 3^

258
q't a T’-P’MT TCT s h o w ij t g t h e n u m b e e i n r e s p e c t o f r a i y a t i h o l d i n g s h a v i n g o c c u p a n c y r i g h t s^ S s7 e BR ED B Y M « S T E B E D I )B E D S 0 F S A L E I N E A C H » I S T B I C T 0 F B I H A B d c b i n g t h e y e a e
1967.
TABLE 2 0.9.
ErrTiBB. I n P a b t .
District.
AreaNumber, transfarred
(in acres).
Annualrent
payable Consideration to mon®y.
landlord.
Annual Area rent
Number, transferred payable Consideration (in acres). to money,
landlord.
Patna 221 117Rs.1,425 3,51,981 29,432 10,464
Rs. Rs. ? 88,767 6,21,44,820 :
Gaya 2,611 1,678 9,222 16,49,785 35,437 19,344 79,291 2,56,91,535
Shahabad 5,144 2,925 12,673 51,84,461 16,408 9,074 48,688 2,01,07,035
Saran 1,078 539 1,674 11,81,631 33,459 8,355 34,629 3,66,76,260
Champaran 1,828 1,766 8,267 42,02,716 48,548 22,310 47,889 5,23,09,548
Muzaffarpur 1,956 328 3,533 7,78,081 63,558 20,701 80,720 5,19,56,474
Darbhanga 4,713 1,758 6,831 11,788 95,781 34,168 1,30,024 7,21,16,092
Mongbyr 10,530 6,015 33,722 1,39,609 26,833 12,685 53,142 1,83,39,026
Bhagalpur 2,168 1,461 7,108 35,18,421 15,185 7,985 29,707 1,84,01,040
Saharsa 3,728 2,743 8,777 7,46,044 35,240 22,387 38,190 2,45,57,345
Purnea 20,831 14,109 25,671 1,34,59,546 33,973 20,801 33,283 25,81,407 ^
Santhal Parganaa 146 ' 323 282 2,454 8,699 11,068 10,225 1,66,00,820 i
39,498 25,038 30,892 3,04,27,540 :Hazaribagh * *
Ranchi 12 48 27 18,440 12,622 10,204 12,714 1,46,62,199 !
Palamau 4 2,223 39 27,800 6,794 5,547 8,861 41,72,238
18,891 7,762 10,034 1,32,58,287Dhanbad • •
12,416 4,595 7,008 1,04,83,839Singbbhum • •
T otal 54,960 36,033 1,19,251 3,12,72,757 5,32,774 2,52,488 7,44,064 47,44,85,506
.—Nil.SotntcE.— 'Inspector-General of Registration, Bihar.

STATEMENT SECW3KG K t'M BER OF LICENSES BEGI&TERED FOR THE FIRST TIME DURING THE YEAR, TOTAL NUKBER OF LICENSES ISSUED AT THE END OF THE YEAR AND Am MOI NT OF LOANS ADVANCED (WITH OR WITHOUT SECURITY) UlTDER THE BIHAR MONEY
LENDERS ACT.
TABLE 20.10.
Year.
No. o f licenses registered for
the first time during the year.
No. o f licenses in force at the end o f the year.
Urban. Rural. Urban. Rural.
Amount o f loans advanced.
with security.
In Urban Areas.
In Rural Areas,
W i hout security.
Total. In Urban Areas.
In Rural Areas.
Total.- Total (Cols.8+11).
10 11 12
Rs. Rs. Rs. Rs. Rs. Rs. Rs.
1964-56 1,253 3,090 8,503 14,687 1,78,21,908 6,84,25,513 8,62,47,421 22,99,478 33,75,376 56,74,854 9,19,22,275
1955-56 1,347 3,522 9,333 16,509 2,09,44,743 7,89,56,997 9,99,01,740 23,13,037 63,36,439 86,48,476 10,85,51,216
1956-57 (Reorgaiased) 1,306 3,416 9,793 18,455 ^,45,26,647 6,75,20,020 9,20,46,667 20,85,158 36,67,747 67,52,905 9,77,99,572
1967-58 1,772 4,219 12,766 25,086 2,54,12,434 8,51,75,227 11,06,87,661 23,16,712 36,41,069 69,56,771 11,76,44,432
l958-5» 1,990 4,704 13,129 28,801 6,63,84,680 5,20,17,783 11,84,02,463 29,85,192 33,29,904 63,15,096 12,47,17,559
1959-60 . . 1,988 4,704 12,129 28,801 6,72,85,680 8,87,l5,7o4 13,60,01,384 29,85,192 38,04,832 67,90,024 14,27,21,408
1964.65* . . 3,218 8,713 49,383 18,282 7,10,74,443 7,68,51,817 14,79,26,2^0 50,83,681 44,96,708 96,80,389 16,75,06,649
1965.66* 3,077 9,536 19,980 46,558 6,56,58,858 8,05,37,057 14,61,95,916 11,70,097 33,21,500 65,91,697 16,17,87,512
1966-07 17,814 45,499 2,636 9,833 6,58,56,856 8,18,73,342 14,77,30,198 12,16,597 44,19,505 66,36,102 15,33,66,300
1967.06 4,629 13,399 25,517 74,316 27,28,54,964 13,99,42,862 61,27,97,826 3,53,00,414 1,53,87,713 5,06,88,127 56,34,85,£5S
too»CO
♦Provisional.
N »B -—Figures from 1960-61 to 1963-64 not available.
S o u b o e . — Inspeotor-General o f Registration, Bihar,


SECTION XXI T im p o r t S l a M e s

262 TABLE 21.1
STATEMENT SHOWING LENGTH OF P.W.D. ROADS DISTRICTWISE UP TO END OF 31ST MARCH, 1968.
District.
Patna
Gaya
Shahabad .
Saran
Champarajd
Muzaffarpur
Darbhanga
Monghyr
Bhagalpur
Purnea
Saharsa
Santhal Farganas
Ranchi
H azaribagh
Palamau
Dhanbad
Singhbhnm
Mileage o f P.W.D. Eoads.
Metalled. Unmetalled. Total.
T o t a l — (B i b a b )
449
526
477
493
433
432
439
458
283
399
259
669
696
585
382
227
336
120
100
193
82
67
132
218
137
87
144
57
61
52
157
102
49
117
569
626
670
575
500
564
657
595
370
343
319
639
648
742
484
276
453
7,343 1,875 9,218
SoxjKCB.— Chief Engineer (Roads and Buildings), Bihar, Patna.

STATEMENT SHOWING THE MILEAGE OF E X TR A MUNICIPAL ROADS MAINTAINED B Y PUBLIC AU TH ORITIES (AS ON 31ST M ABCH 01 j!.ACH YEAR).
263
TABLE 21.2
Year.
Bituminous. Concrete.
P.W.D. Local TotaL P.W.D. Local TotaJ.and Bodies. and Bodies.
M.E.S. M.E.S.
Total modem surface (Cols. 4 + 7).
Water Bound Macadam.
P.W .D. Local and Bodies.
M.E.S.
Total------ -— surfaced
Macadam Total. (Cols. 8 + 11).
1959196019611962196319641965196619671968
2 3 4 5 6 7 8 9 10 11 12
4,252 528 4,780 8 1 9 4,789 463 1,740 2,203 6,9924,534 440 4,974 8 11 119 4,993 474 735 1,209 6,2024,991 4,991 4,991 309 309 5,3005,585 0,585 5,585 220 220 5,8065,955 5,955 5,955 125 125 6,0806,056 6,056 6,056 289 289 6,346
6,962 6,962 6,962 211• •
2 l i 7,1737,052 7,052 7,052 221 221 7,2737,122 7,122 7,122 231 231 7,353
Lower Types.
Year.
-------------------------- ----------------- Totalunsurfaced Total
Natural soil unmotorable. (unmetalled (P.W.D. Total Grand or inferior and (Local Total.
------ ------- --------- -— —.—— _ — --------------------—.—,— types) M.E.S.). Bodies).P.W.D. Local Total. P.W.D. Local Total. P.W.D. Local Total. roads
Artificially admixed Natural soil motorable granular material, etc. in fair weather,
or natural soil.
andM.E.S.
Bodies. andM.E.S.
Bodies. andM.E.S.
Bodlies. (CoJs. 15 + 18 + 21).
1 13 14 15 16 17 18 19 20 21 22 23 24 25
1959 .. 1,815 18,253 20,068 6,713 6,713 26,781 6,538 27,235 33,773
1960 . . • • 1,942 18,588 20,530 7, <002 7,002 27,532 6,958 26,776 33,734
1961 . . • • 2,346 2,346 2,346 7,646 7,646
1962 . . • • 2,133 2,133 2,133 7,938 7,938
1963 . . • • 2,162 2,162 2,162 8,242 8,242
1964 .. • • 2,240 2,240 2,240 8,585 8,586
1966 . . • • • • • «
1966 . . • • • • 1,936 1,936 1,936 9,109 9,109
1967 . . • • • • 1,935 1,935 1,935 9,208 9,208
1968 . . • « * • 1,865 •• 1,865 •• 1,865 9,218 9,218
. . —Not available.
Note.—•These statistics for extra-municipal roads, that is, roads outside the area or jurisdiction of a municipality, towB or city corporation} or the like urban body
SoimcE.— Chief Engineer (Roads end Buildinge), Bihar,

264
TABLE 21.3,
STATEMENT SHOWINa PROGRESS OF EXPENDITURES ON ROADS UNDER IMPLEMENTATIONS OF PLANSIN BIHAR.
(Rttpees In LaiKhs. )
Y e w . Expenditureactual.
1958-69
1959-60
1960-61
1961-62
1962-63
1963-64
1964-65
1966-66
1966-67
1967-68
265.66
297.49
246.56
234.28
324.87
312.45
302.01
299.74
187.47
•.— Not available.SOTTBCB.—Chief Engineer (Roads and Buildings), Bihar.
TABLE at ASTATEMENT SHOWING NUMBER OF MOTOR VEHICLES AND NUMBER OF PERSONS HOLDING DRIVING
LICENCES IN BIHAR.
Year.Number o f
motor vehicles on road.
Number o f persons holding driving
licences.
Number of professional
drivers.
Number o f persons
authorised 1,0 drive public
Bercvice vehicles.
1 2 3 4 6
1959-60 • • • • • 23,614 6,900 4,073 1,181
1960-61 • • • • • 25,120 19,959 11,536 1,629
1961-62 • • • • • 26,637 20,842 13,072 837
1962-63 • • • • • 34,770 14,210 9,484 1,201
1963-64 • • • • • 36,736 20,697 12,686 1,381
1964-65 • • • • • 40,977 24,052 14,128 1,026
1965-66 • • • • • 43,878 19,289 10,617 1,295
1966-67 • • • • • 60,035 26,342 13,761 1,147
1967-68 • • • • • 57,908 29,777 14,907 1,339
1968-69 . . 63,664 24,883 12,243 1,263
SoTTBCB.—-State Transport Commissioner, Bihar.

265
TABLE 21.5.
.STATEMENT SHOWING DISTRICTWISE NUMBER OF MOTOR VEHICLES AND PERSONS HOLDING DRIVINGLICENCES IN BIHAR DURD^G 1968-69.
District.Number o f
motor vehicles, on road.
Number o f persons holding driving
licences.
Number of professional
drivers.
Number o f persons
authorised to drive
public service vehicles.
1 2 3 4 5
Patna . . . . 8,519 3,219 1,180 68
iOaya T • •• 1,826 1,059 662 40
Shahabad . . •• 3,994 1,345 997 184
Muzaffarpur . . . . 2,942 1,994 1,337
Baran . . •• 1,580 786 694 160
Champaran . . •• 2,181 781 279 26
Darbhanga . . •• 1,635 208 88
Bhagalpur . . •• 989 761 408 4
Saharsa . . • • 519 422 302 16
|4onghyr . . •• ,9 4 2 871 690 6
^ m e a . . % % \ ,m 749 362 6
anthal Parganas . . • • 1,718 .667 442 ...
lanchi . . . . 7,819 3,321 98 120
lazaribagh . . . 3,609 1,839 1,218 172
’alamau » . . • • 1,027 614 81 6
^hanbad . . . . 10,673 2,846 2,038 145
inghbhum (Excluding Jamshedpur) •• 1,142 611 403 7
amshedpur ^ »-• • • • • 10,747 3,091 1,164 305
Total •• 63,564 24,883 12,243 1,263
NU.96 P.a -ning— 37 SotmoB.— State x’ronsport Commissioner, Bihar.

m
TABLE 21.6.
STATEMENT SHOWING THE CLASSIFICATION OF TAXED MOTOR VEHICLES ON ROAD IN BiHAli.
Year and date. Motorcycles.
Trucks. Motor ca 8.
Buses.Private
cars,jeeps,etc.
Others, Total.
1■ I I I -1 V- J - .. 1 .
2 3 4 5 6 7
31st March, 1960 2,983 7,263 742 1,842 9,915 869 23,614
31st March, 1961 . . . ; 3,386 7,76u 708 1,881 10,395 984 25,120
31st March, 1962 4,000 7,550 785 1,894 11,407 901 26,537
31st March, 1963 5,163 12,114 1,011 2,331 12,862 1,289 34,770
31st Majch, 1964 6,326 11,582 1,013 2,418 14,129 1,263 36,736
31st March, 1965 7,310 12,432 896 2,453 16,206 1,681 40,977
31st March, 1966 8,923* 12,024 1,115 2,830 16,984 2,002 43,878
31st March, 1967 12,377* 11,532 l,368(a) 3,071 19,650 2,037 60,035
31st March, 1968 14828* 13,293 1,943(0) 3,384 21,735 2,725 67,908
31st March, 1969 17,170* 14,390 2.330(a) 3,894 22,467 3,313 63,564
♦Including Scooters.(a) Including 3 wheelers taxis.
S o u r c e .— S t a t e Transport Conunissioner, Bihar.

STATEMENT SHOWING DISTRICTWISE NUMBER OF DIFFERENT KINDS OF MOTOR VEHICLES IN BIHAR DURING 1968-69 (INCLUDES TAXED, TAX EXEMPT, AND VEHICLES TEMPORARILY WITHDRAWN
f FROM USE).
267
TABLE 21.7.
Districts.Motor Motor
cycles and Trucks, cabs and Buses, scooters. 3 wheeler
taxis.
Privatecars and Others. Total,
jeeps.
Patna
Gaya
ShEihabad
Muzaffarpur
Saran . . . .
Champaran
Darbhanga
Bhagalpur
Saharsa . .
Monghyr . .
Pumea
Santhal Parganas
Ranchi
Hazaribagh
Palamau . .
Dhanbad . .
Singhbhum (Excluding Jamshedpur)
Jamshedpur
T o T A t
2,287
177
422
553
156
482
437
143
109
131
236
418
2,648
429
109
2,470
102
5,861
1,224
519
1,183
729
293
418
163
227
129
268
620
301
1,501
741
457
3,818
658
1,141
342
106
58
218
141
5
74
42
4
99
32
56
304
151
4
333
361
327
226
489
645
224
107
88
93
9
122
184
194
317
243
66
314
53
193
4,023
609
1,465
553
741
815
842
471
224
304
456
707
2,785
1,547
353
3,308
289
2,975
316
189
377
244
25
354
31
13
44
18
174
42
264
498
38
430
40
216
8,519
1,826
3,994
2,942
1,580
2,181
1,635
989
519
942
1,702
1,718
7,819
3,609
1,027
10,673
1,142
10,747
17,170 14,390 2,330 3,894 22,467 3,313 63,564
. .— Nil.S o u r c e ;— State Transport Commissioner, Bihar.

268
TABLE 21.8.
STATEMENT SHOWING FRESH REGISTRATION OF MOTOR VEHICLES BROUGHT ON ROAD AND CANCEL LATION OF OLD VEHICLES TAKEN OF THE ROAD IN BIH AR DURING THE Y EAR 1968-69.
Particulars.
Motorcycles.
Privatecars. Jeeps.
Contract carriages,
(taxi).
State Goods vehicles Miscella- carriagea trucks £uid neous.
(buses). vans.
Total.
New. Can- New. Can- New. Can- New. Can- New. Can- New. Can- New. Can- New. Can-i celled. celled. celled. ■ celled. celled. celled. celled, celled.i
6 8 9 10 11 12 13 14 15 16 17
New vehicles . . 2,882 13 1,471 20 537 1 217 . . 330 . . 1,697 12 1,167 2 8,301 48*
Old vehicles . . 136 . . 9 . . 21 .................................................... 87 . . 1 . . 254
fT o t a l . . 3,018 13 1,480 20 558 1 217 . . 330 . . 1,784 12 1,168 2 8,555 48
. . —Nil.SoxnicK— State Transport Commissioner, Bihar.
TABLE 21.9.
STATEMENT SHOWING REVENUE FROM DIFFERENT TYPES OF VEHICLES B Y W AY OF MOTOR VEHICLE^TAX 1 5 BIHAR.
( I k H u n d r e d o f R u p e e s . )
Yeair.Other
Motor Private Motor public Goods Miscella- cycles. cars. cabs. service vehicles, neous.
vehicles.
Total.
6 8
1959-60
1960-61
1961-62
1962-63
1963-64
1964-65
1965-66I • *- I
1966-67
1968-69
7,39
8,00
9,86
12,08
14,52
30,88
37,75
42,26
43,44
46,63
87,17
98,79
1,09,63
1,20,69
1,24,62
1,95,53
2,24,25
2 31,09
2,39,24
2,50,91
9,37
11,14
12,73
14,51
20,06
24,11
30,83
36,61
48,46
79,56
1,39,74
1,43,58
1,82,00
2,08,83
2,74,12
3,49,99
4,34,48
4,64,10
4,76,87
4,88,51
2,89,24
3,51,83
4,66,78
5,85,44
9,84,82
11,35,26
14,68,19
11,98,03
12,53,86
14,35,58
9.28
9,90
1,076
1,555
2,197
3,946
6,444
7,694*
8,487*
8,361*
6,42,
6,23,S
7,91,1
9,67,
14,40,
17,76,
22,39,
20,49,
^1,46
23,84
♦Including penalty.
NtBi—Total may not tally dua to rounding off figures .
SbaftoB.—StataTaaap orb O^naniiaaioaer, Bihairt

TABLI a i.M .
•TATHMBNT SHOWING REVBKTJE FROM STATE MOTOR FEES.
(In L a k h s o f R tjI ’e e s .)
269
Toar.
luue ftnd renewal o f driving licenses, issue of duplicate Miscellaneous. Ueenaes and test of
competence to drive.
Total.
1 s 3 4
i950-60 , . . , . . 0.77 10.29 11.06
1900-61 2.14 12.59 14.73ioei-62 • • 2.56 13.82 16.37
1962-ftS . . i.70 18.16 19.86
1063-64 ... ♦ •• « « t.05 19.96 23.01
1964-66 ■a ^ >• •' 1.40 16.76 20.16
1965-66 — • • «- 2.16 20.69 22.85
1966-67 . . t.61 24.27 27.78*
1967.68 • m' « •* •.81 31.73 35.54
1968.69 - •• • 4 « 4 S.19 40.61 48.70
*B«vaniMi fignxm.
iSotAios.—State Tr<uu|>ort C<w»iwioiier, Bibiirt
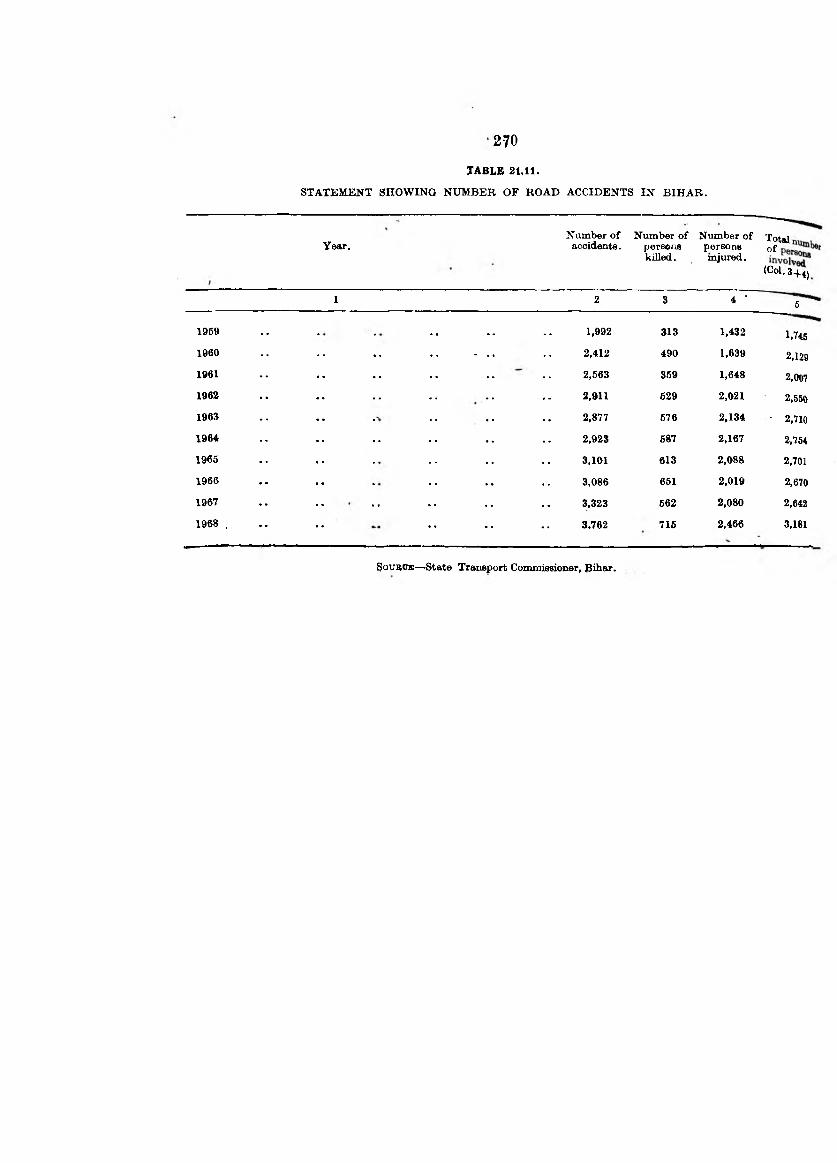
270
TABLE 21.11.
STATEMENT SHOWING NUMBER OF ROAD ACCIDENTS IN BIHAR.
Year.Number of Number of Number of Total accidents. persons persons of
killed. , mjuxed.(Col. 3+4)
1 2 3 4 • 5
1959 •• •• • 1,992 313 1,432 1.7451960 • • •• - . . 2,412 490 1,639 2.1291961 • • « • •• 2,563 359 1,648 2,0071962 • • • • • • 2,911 529 2,021 2.5501963 • • • • • • 2,877 576 2,134 • 2,7101964 • « « • • • • • 2,923 587 2,167 2,7541965 • • • • • • 3,101 613 2,088 2,701
1966 • • • • 3,086 651 2,019 2,6701967 • • . . . . • • 3,323 562 2,080 2,642
1968 . • • • • 3,762 715 2,466 3,181
SotTQOE—State Transport Commissioner, Biheir.

N'l SHOWING NUMBER OF ROAD ACCIDENTS IN EACH DISTRICT OF BIH AR DURING THE YEAR196a.
2 7 i
TABLE 21.12.
District.Number o f Number o f Number o f
accidents. persons persons killed. injured.
I^ h b h u m (excluding Jamshedpur) . .
|famdiedpur
T o t a l
457 115 342270 63 202177 70 163176 60 130153 46 69162 24 128139 27 101218 13 158
171 18 87
43 10 33110 30 74
129 16 82
340 59 218
301 47 234
63 6 63
482 64 70
184 28 135
188 29 177
3,762 716 2,466
SOTJBCB.— State Transport Commissioner, Bihar.


SECTION XXII Statistics relating to Posts and Telegraplis

m
t ABl e I
StfAffiMfiNT' Sd:OW lsra K tfM BElt OB' POST OFFICES AND LETTER B02tES (INCLUDING TELEGRAPHS ~ (EXCLUDING MONEY ORDER'S) IN
------------ 1963-64. 1964-66. 1966-66.
1 2 3 4
1. Area io square xuilea • • • 70,330 70,330I
70,330 *
2» Population . . . . . . ... 40,226,947 40,226,947 40,226,947
3. Literate population 4,921,634 4,921,634 4,921,634
4. One Post OfiQoe serves—
(a) Square miles ^ 16 14 12.8
(6) Population — 8,868 8,079 7,312
(c) Literate popula^n 1,084 968 896
6. One Letter Box serves—
(a) Square miles ~ ••• • 9 8.3 7.3
(6) Population • • • 6,041 4,762 4.687
(e) Literate population — . . ' 617 681 666
6. Number o f postal artioles per head of—
(a) Population ^ . . 4.6 4.8 6.3
(6) Literate populakion . . 36.7 39.3 43.3
NoTx.—Ststistios for 1961-62 to 1969-60 based eta 1961 Ceosus.
Statiatios for 1960^1 based on provisional figureg o f 1961 Cen«uB and for 1961-62 based on figures of 1961 Ceneus.
Sodbob.—Report on the working oi

27622.1.
POST OFFICES) IN RELATION TO AREA AND POPULATION AND NUIMEER OF lO ST A L ARTICLES RELATION TO POPULATION IN BIH AR.
1956-67. 1957-58. 1958-59. 1959-60. 1960-61. 1961-62. 1962-63.
5 6 7 8 9 10 11
70,330 70,330 70,330 70,330 67,198 67,196 67,19640,225,947 40,225,947 40,225,947 40,225,947 46,467,042 46,456,610 46,456,6104,921,634 4,921,634 4,921,634 4,921,634 8,470,426 8,647,845 8,647,846
12.6 12.1 11.7 11.2 1Q.6 10.3 10.07,181 6,915 6,717 6,509 7,298 7,134 6,886
879 846 882 784 1,331 1,313 1,267
7.2 6.8 6.7 6.4 5.9 8.3 5.7
4,112 3,912 3,826 3,667 4,106 4,032 3,911503 479 468 447 748 742 720
6.7 6.8 «.2 6.8 6.10 6.42 7.87
46.9 47.6 60.9 66.0 34.11 34.88 40.07
|di*n Posts «ad Telegraphs Department.

S7€TABLE
8TATE3«tENT SHOWING CLASSIFIED NmiEKICAL STATEMENT OF
91st March 31st March 1954. 1955.
1. Number o f Post Offices—
(а) Head offices
(б) Sab-offices . . . . .•
(c) Branch offices
(d) Total
(e) tTrbau
( / ) Rural
2. Number o f Post Offices with restricted functionB—
(o) Number o f delivery offices
(6) Number o f mouey.order oflBces
(c) Number o f Savings Bank offices . .
5. Number o f combined. Receiving and Telegraph Offices—
(o> Head offices
(6) Sub-offices . .
(e) Branch offixses
(<2) Total
(e) Postal Receiving offices
( /) Departmental Telegraph offices
4. Number o f record sorting and Transit offices and seotionB—
(а) Record offices . . .» « ,
(б) Sorting and Transit offices
(c) Sorting and Transit sections
6. Number o f Letter Boxes and Rural delivery staff—
(а) Letter Boxes—
(*) Urban
(*i) Rural -
(m ) Total . . ... ~
(б) Rural delivery staff
20
400
1,907
2.39g
260
2.137
106
Nil
1,476
14
818
1
333
1,220
8
24
22
02
1,176
4,060
6,831
2,224
20
489
2,229
2,738
208
2,470
106
Nil
1.812
14
338
3
366
1,340
7
16
18
88
1,240
6,012
0,201
3,361
0& working of;

27722.2 .
PERMANENT POSTS AND TELEGRAPHS OFFICES IN BIHAR.
31st March 1956.
31st March 31st March 1957. 1958.
31st March 1959.
31st March 1960.
31st March 1961.
31st March 1962.
10
31st March 1963.
11
20
480
2,696
3,196
306
2,899
21
510
2,669
3,200
237
2,963
21
517
2,664
3,202
244
2,958
21
557
2,675
3,253
252
9,001
21
565
2,811
3,397
242
8,155
20
564
2,964
3,548
245
3,303
20
603
3,208
3,831
264
3,567
20
644
3,667
4,331
309
4,022
109
Nil
2,047
108
Nil
2,28«
113
Nil
2,257
111
Nil
2,153
118
Nil
2,223
122
Nil
2,253
137
Nil
2,184
146
Nil
2,949
14
124
467
1,323
7
15
W l
85
467
1,323
7
15
Vll
87
479
69
8
15
415
97
527
69
8
14
4\\
104
529
65
8
13
S95
106
514
73
18
406
108
527
73
11
12
419
93
624
77
d
23
29
61
25
34
57
25
88
57
25
88
57
35
104
75
37
97
61
28
28
63
28
28
69
1,454
6,107
6,561
2,344
1,463
5,918
7,381
2,402
],512
6,155
7,667
2,362
1,533
6,245
7,778
2,612
1,509
6.613
8,122
2.613
1,593
6,903
8,496
2,766
1,616
7,224
8,840
3,064
1,683
7,779
9,462
3,385
Posta and Telegraphs Department.

STATKMENT SHOW m G NUMBER AND AMOUNT OF MONEY-ORDERS (INL AND AND FOREIGN) ISSUED ANDPAID IN BIHAR.
179
t a b l e 22.8.
luland money-orders issued and paid in, India. Foreign (including Indiar, States) money- orders issued and paid iu India.
Year.
NU.
Number. Amount (in Rs.) Number, Amount (in Rs.)
Issued. Paid. Issued. Paid. Issued. Paid. Issued. Paid.
1 2 3 4 5 6 7 8 9
1958-59 5,318,706 6,786,489 24,67.32,498 29,60,89.388 7,081 2.84,386
1959-60 5,374,672 6,417,710 26,18.71,267 30,27,24,462 5,286 1,72,431
1960-61 5,274,080 6,309,653 27.08,42.880 31,36,56,954 4.929 1,62,707
1961-62 5,399,692 6,443,446 28,91,62,997 33,68,37.536 12 1.846 655 67.340
1962-63 5,543,105 6,674,382 30,29,40,723 35,76,63,480 65 784 5,817 54,760
1963-64 6,004,338 7,212,082 32,04,58,593 38,92,71,432 498 V 41.418
1964-65 5,798,356 7,403,152 33,24,03,652 42,66,32,554 520 •• 31,672
1965-66 5,425,921 6,979,919 34,62,95,243 44,12,91,927 316 27,716
1966-67 5,438,992 7,001,200 36,86,10,722 48,25,93,607 51*J •• 64,459
SOUBOK.—Director o f Audit and Accounts, Posts and Telegraphs, Calcutta.
TABLE 22A.

280
tA B tlSTATEMENT SHOWING THE BUSINESS
1
1953-64.
2
Savings.
1964-55
3
1. Number o f Head Banks 20 20
2. Number o f Sub-Banks
3. Number o f Accounts—
808 926
(o) At the beginning o f the year 3,15,700 3,28,407
(f>) Opened during the year .. 74,737 68,873
(c) Closed during the year . , 64,030 26,623
(d) At the end o f the year .. 3,26,407 3,69,657
4. Opening Balance (Rs.) 16,43,06,677 17,89,83,767
5. Deposits (Rs.) 10,92,88,300 11,27,73,146
6. Interest fRs.) 32,42,929 34,43,621
7. Total (Bs.) 27,68,36,906 29,52,00,438
8. Withdrawals (Rs.) 9,78,53,139 9,26,46,334
9. Balance (Rs.) 17,89,83,767 20,26,54,099
10. Average number o f depositors per Bank 396.6 890.8
11. Average balance in each Bank (Rs.) 21,747.72 2,16,222.1
12. Average balance at the credit o f depositor (Rs.) . . 648.3 648.3
8oxr»o*.— wotking of
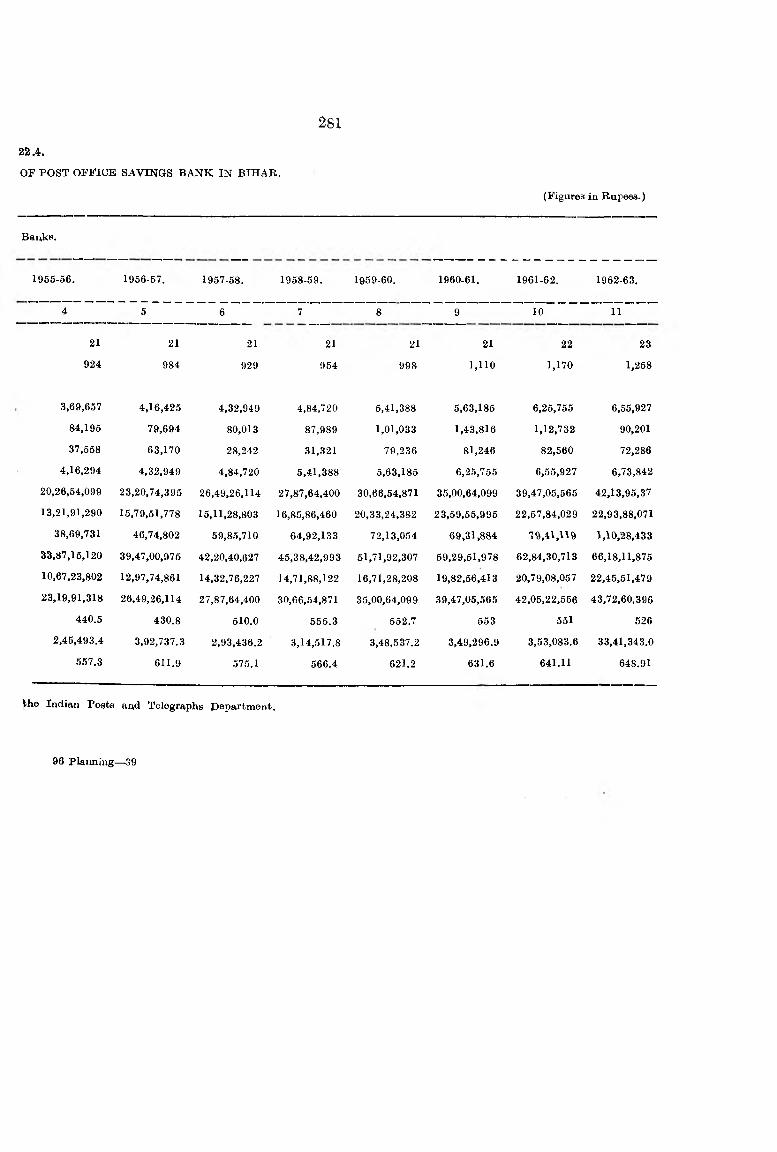
281
22.4.
OF POST OFFICE SAVINGS BANK IN BIHAR.
(Figures in Rupees.)
BaAks.
1955-56. 1956-57. 1957-58. 1958-59. 1959-60. 1960-61. 1961-62. 1962-63.
4 5 6 7 8 9 10 11
21 21 21 21 21 21 22 23
924 984 929 954 998 1,110 1,170 1,258
3,69,657 4,16,425 4,32,949 4,84,720 5,41,388 5,63,185 6,25,755 6,55,927
84,195 79,694 80,013 87,989 1,01,033 1,43,816 1,12,732 90,201
37,558 63,170 28,242 31,321 79,236 81,246 82,560 72,286
4,16,294 4,32,949 4,84,720 5,41,388 5,63,185 6,25,755 6,55,927 6,73,842
20,26,54,099 23,20,74,395 26,49,26,114 27,87,64,400 30,66,54,871 35,00,64,099 39,47,05,565 42,13,95,37
13,21,91,290 15,79,51,778 15,11,28,803 16,85,86,460 20,33,24,382 23,59,55,995 22,57,84,029 22,93,88,071
38,69,731 46,74,802 59,85,710 64,92,133 72,13,054 69,31,884 70,41,119 1,10,28,433
33,87,15,120 39,47,00,975 42,20,40,627 45,38,42,993 51,71,92,307 59,29,51,978 62,84,30,713 66,18,11,875
10,67,23,802 12,97,74,861 14,32,76,227 14,71,88,122 16,71,28,208 19,82,56,413 20,79,08,057 22,45,51,479
23,19,91,318 26,49,26,114 27,87,64,400 30,66,54,871 35,00,64,099 39,47,05,565 42,05,22,556 43,72,60,396
440.5 430.8 510.0 555.3 552.7 553 551 526
2,45,493.4 3,92,737.3 2,93,436.2 3,14,517.8 3,48,537.2 3,49,296.9 3,53,083.6 33,41,343.0
557.3 611.9 575.1 566.4 621.2 631.6 641.11 648.91
^he Indian Posts and Telegraphs Department.
96 Planning— 39

282
TA6LE
STATEMENT SHOWIN<j THE POST OFFICE
'Defence Savings Ban> .
1958-59. 1959-60.
1 2 3
1. Number of Head Banks . . . . . . 18 is
2. Number of Sub Bank ?
3. Nuojber of Accoonts• •
(a) At the beginning o f the year 77,788 77,639
(^) Opened during the year ••
(c) Closed during the year 149 lf)5
(d) At fche end o f the year . . . . 77,639 77,483
A. Opening Balarsc® (Rs.) 7,lfi,081 7,08,787
6. Deposits (Rs.) . .
6. Interest (Rs.) t i
7. Total (Rs.) 7,15,081 7,08,787
8. Withdrawals (Rs.) . . 5, "'47
9. Balance (Rs.) 7,08,787 7,03,240
10. Average num’.j''r o f depositors per Bank 4.313 4,304
11. Average balance in each Bank ^Rs.) 39,377 39,069
12. Average balance at the credit o f each depositor (R p.) 9.2P. 9.r8
. . -N i i .
No interest is accruable in Defence Saving Bank accounts on and from 1st August 1947.
N.A.—No* available.
SouBCK.—(♦) Report on the working o f the Tndian Post and Telegraphs Department,
(it) Dirtceor, Audit and Acoouni, Posts aud Telegraph. Calcutta,

283
22.R.
DEFENOF. SAVINGS BANK IN BIHAR.
J^efence S a . ings Bauk.
1960-61. 1961-62. 1962-63. 1963-64. 1964-65. 1965-66. 1966.67.
4 5 6 7 8 9 10
18 18 23 23 23 23 23
•• •• •• m * III
77,483 77,456 77,220 77,?I8 77,198 77,189 77,188
1 N.A. . .
28 N. rV 2 20 9 6 2
n,4r^6 77,220 77,218 77,198 77,189 77,183 77,181
7,03,240 7,0!,944 6,96,634 6,95,994 6,95,674 6,95,500 6,95,09/5
76 • •
t t t t t t t
7,03,315, 7,01,944 6,98,634 6,95,994 6,95,674 6,95,500 6,95,098
1,371 1,266 2,640 330 174 402 36
7,0 J,944 6,98,634 6,95,994 6,95,674 6,95,500 6,9.5,01)8 6,95,062
4,303 4,20o 3,357 3,356 3,356 3,356 3,35U
38,997 38,813 30,261 30,247 30,239 30,222 30,220
9.00 9.0'S 9.01 9.01 9.0’ 9.00 9.00
SOTTRCU. —Director, Audit Rnd Account, Potts ai d T«i«graph», Calcutta.
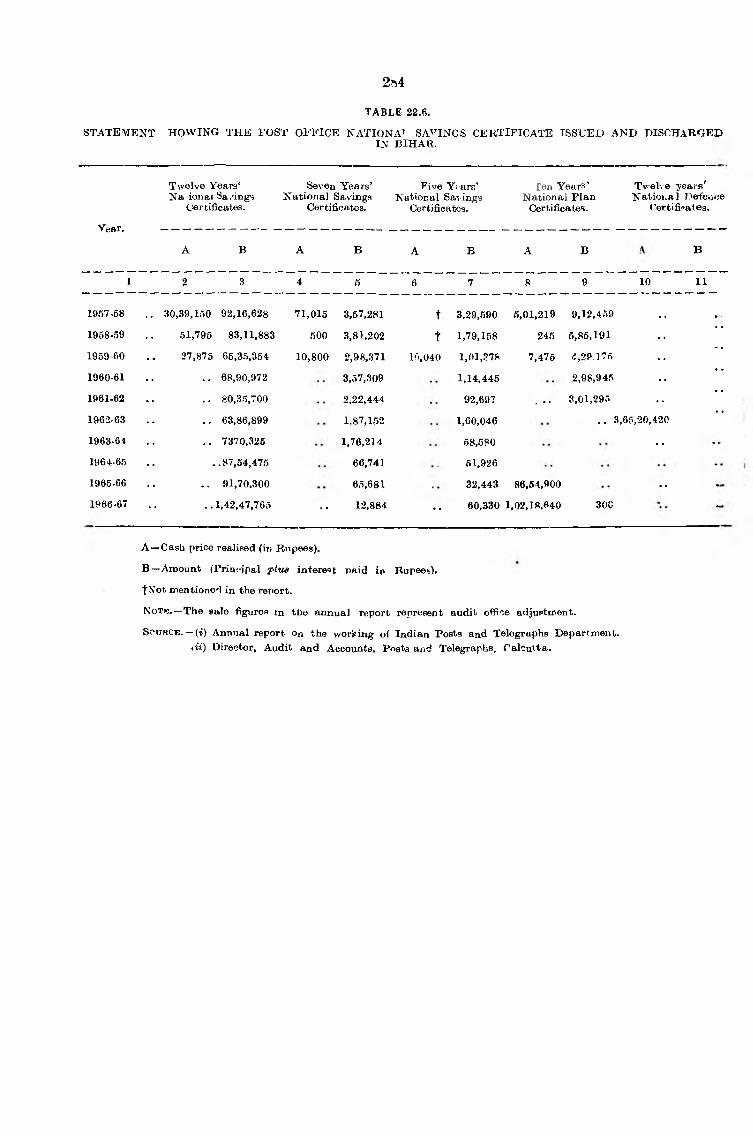
2 b i
t a b l e 22.6.
STATEMENT HOW ING THE POST OFFICE NATIONAL SAVINGS CERTIFICATE ISSUED AND DISCHARGEDIN BIHAR.
Twelve Years* Na ionaiSa/ings
Certificates.
Seven Years’ National Savings
Certificates.
Five Years’ National Savings
Certificates.
Ten Years' National Flan
Certificates.
T^^elve years' National Defeii-ie
^'ertificates.
Year.
A B A B A B A B B
1 2 3 4 5 6 7 8 9 10 11
1957-58 30,39,150 92,16,628 71,015 3,57,281 t 3.29,590 5,01,219 9,12,459
1958-59 51,795 83,11,883 500 3,81,202 t 1,79,158 245 5,85,191
1959 60 27,875 65,35,354 10,800 2,98,371 i ‘:.,040 1,01,?7S 7,475 C,29.375
1960-61 . . 68,90,972 3,57,.309 1,14,445 2,98,945
1961-62 . . 80,35,700 2,22,444 92,697 . .• 3,01,295
1962-63 . . 63,86,899 1,87,152 1,60,046 . . 3,65,20,420
1963-64 . . 7370,325 1,76,214 58,580 ..
1964-65 . .87,54,475 66,741 51,926
1965-66 . . 91,70.300 6.5,681 32,443 86,54,900 • •
1966-67 ..1,42,47,765 •• 12,884 •• 60,330 1,02,18.640 30C
A —Cash price realised (in Rupees).
B —Amount (rriu;fipal plus interest paid io Rupees).
tNot mentioned in the report.
NoTic.—The sale figures m the annual report represent audit oflRce adjuptixient.
S o u r c e .— ( i ) Annual report on the working of Indian P o s ts and Telegraphs Department. tii) Director, Audit and Accounts, Posts and Telegraphs, Calcutta.


TABLE 22.7.
s t a t e m e n t RHOWIjSTG n u m b e r o f b r o a d c a s t r e c e i v e r l i c e n c e m FORCE IX B IH A R .
285
At the end o f the year. Number o f licences.
19591960196119621963196419651966 196’’ 1968
74,93984,22095,015
1,18,7881,37,7441,74,0822,02,5642,40,4892,55,0452,81,131
S o u r c e . — Post Master-General, Bihar Circle, Patna.
T^BLE 22 .8 .
STATEMENT SHOWING THE STRENGTH OF TH E NON-GAZETTED STAFF EM PLOYED IN THE POSTS ANDTELEGRAPHS DEPARTMENT IN BIH AR CIRCLE,
Number o f employees employed in—
As it stands on 31st March, during the year.
Post office 8. Telegraphengineering.
Telegraph Telephone* Total, traffic. and wireless, etc.
6
1953
1954
1955
1956
1957
1958
1959
1960
1961
1962
648
749
779
1,650
870
912
993
1,951
2,041
613
685
783
1,052
1,093
711
4,228(6)
1,178(6)
2,363
2,713
221
227
251
471
537
557
1,016
393
508
685
3
5
216
244
406
363
487
499
10,157
10,114
11,827
14,415
14,210
13,993
35,108
16,777
13.804
14.805
♦Includes workshop (T. Transport Services, Postal Life Insurance, Telephone Automatisation).
, . —Not available.
(а) Includes R.M.S. and Telephones.
(б) Includes Telephone.
S o u r c e . —Anr^ual Report on the Working o f the Posts and Telegraphs Departm,ent,

SECTION XXIII Mand Trade (Rail and River Borne)

^88
TABLE
STATEMENT SHOWING THE INLAND (RIVER AND
Ex
Units. 1959-60. 1960-61(a)
3 4 5
Animals (Livestock) Cattle (excluding sheep and goat) Nos. 65,717 73,028
Horses, ponies and mules 99 141 66
Sheep and goats 99 60,049 13,349
Others f f 95,091 106,755
Bones Bones Mds. 274,038 125,802
Cement Cement 9f 18,481,542 540,355
Coal and coke . . Coal and coke 99 325,433,303 153,711,965
Coffee Coffee 99 11 7
Cotton twist and yarn Foreign 99
Indian 99 1,037 791
Cotton piece goods Foreign (in bales) 99 ••
Foreign (in boxes) 99 ••
Indian (in bales) 99 3,530 7,180
Indian (in boxes) 99
Dyes and tans .. Myrobalans 99 12,554 2,986
Fruits, dried Fruits, dried .. »• • 99 7,155 6,154
Glass Glass 99 345,987 169,959
Grain, pulses and flour Pulses (other than gram products) . . 99 1,883,748 555,937
Oram and Gram products 99 341,355 62,935
Maize 99 20,417 2,982
J owar and Bajra 99 14,755 2,936
Millets other than J owar and Bajra 99 ••
Rice in the husk 99 119,900 16,869
Rice not in the husk 99 502,132 40,589
"Wheat 99 31,361 66,901
Wheat flour 99 3,303 1,817
Other sorts . . 99 129,437 17,934
Hemp, Indian and other . . Fibres (excluding jute) , . „ 28,554 9,808(6)
Hides, raw Hides, raw 99 412,735 157,725
Bricks Bricks •• Nos. •• ••
. . — Nil.
(а) Figures since 1961 in metric units.
(б) Excluding Cotton and Jute.

TRAD® OP BtSAA.I
1961*62(a).
6
1962-63(0). 1963-64(0). 1964-66(0).
9
1966-66(0). 1966-67(0).
10 i i
1967-68(0).
12
1968.69(0).
13
68*746 62*277 48*369 86*112 364,254 222,209 73,934 49.65144 32 180 23 117 164 163 28
31*786 22,217 6*266 3*449 7,821 8,654 1,186 908114,146 114,910 162,727 120,468 28,702 24,198 58,146 316,773103,226 103,886 98,168 97,473 3,972 1,195 173,485 117,854
4,986,432 6,677,998 6,268,128 297,623 2,027,192 1,411,720 6,845,290 6,933,908146,335,803 163,961,685 167,182,113 139,658,213 32,914,900 40,529,082 199,733,628 781,387,505
1 10 429 487 1,871 16 1,47610 •• •• 338 1,747 , 992 224 432
936 1,641 4,761 6,009 44,910 44,923 8.098 2.707• • • • •• 1 747 70 123 281
10,470 3,082 4,092 515.963 620,226 4.412 3.169
1,858 1,229 3,180 5,806 7,970 7,625 6.880•i*
4.0686,432 2,667 2,093 1,136 17,328 14,425 4,182 4.178
172,307 192,085 168,927 124,930 44,879 45,731 236,115 254,660665,276 624,347 508,594 1,272,163 414,983 446,814 30,679 519,091103.082 121,423 239,601 414,126 201,423 239,428 6,281 20.792
4,612 13,800 23,572 34,844 130,850 1,386,640 11,067 45,2832,163 3,603 2,039 2,229 1,664 1,303,178 247 194.042
• • •• •• 6 13,269 1,485,814 1,357 36.0069,442 19,405 44,736 11,840 13,000 22,949 2,369 2.991
27,989 20,450 112,906 36,727 362,438 146,585 25,116 356.301110,543 215,668 662,669 307,017 6,197,442 8,665,879 14,875 144.316
22,481 70,049 46,220 11,692 10,327 338,367 1,270 41.85625,407 81,206 66,126 95,391 146,941 1,624,686 22,623 784.699
7,948(6) 1,182(6) 10,028(6) 6,564(6) 323(6) 1,014(6) 6,382 4.944133,778 205,683 128,386 118,907 30,008 40,277 182,030 150.636
• • •• 612,166 619,832
96 Planning— 40

S90
TABLfi
STATElMtENi’ SHOW INa Vh E litLAITD (RIVER A lt jj
’ E3f
Uuits. 1959-60. 1960.01(0).
4 5
Skins, raw Skin.8, raw . . . . Mds. 32,183 8,097
Hides and skins tanned and leather.
J ute, raw
Hides an,d skins, tann^< and leather
Loose . .
99
99
16,390
1,034,705
9,551
19,081
Pucca bales • • 99 8,514,057 2,081,259
Qtmny bags and cloth . . Gunny bags and cloth •• 99 1,129,143 330,805
Iron and steel Iron and steel, bars and others •• 99 23,957,871 9,899,941
Lao an,d shellac Lac and shellac . . •• •• 99 7,804 977
Mtinganese ores Manganese ores •• 99 5,220,479 2,171,843
Oil*oakes Oil-oakes •• 99 1,541,803 202,305
OUs Kerosene •• • • 99 148,194 75,174
Vegetable oils Coconut •• • • 99 5,842 2,033
Castor •• • • 99 13,073 3,155
Groundnut • • 99 3,104 2,313
Others • • • • 99 31,39S 19,42a
OilM«da . . Castor • • 99 433,433 143,151
Cotton • • 99 39,337 11,028
Groundnufcs 99 9,885 10,513
Linseed • • 99 904,579 28,589
Rape and mustard • • 99 333,754 149,983
Til • • 99 40,089 12,328
Ghee Ghee . . • • • • 99 30,517 10,803
Salt Salt • • •• 99 100,325 53,397
Rubber, raw Rubber • • • • 99 • • 1
Sugar Sugar . . •• 99 4,145,290 1,425,407
Khandsari sugar . . • • 99 507 1,431
Gur, rab, molasses, etc. . . 99 774,289 373,743
Tea . Tea . . • • • • 99 3,943 6,905
Tobacco, raw Tobacco, raw •• 99 1,105,158 98,238
"Wood and timber Teak
Other tim ber
• •
• •
99
99
582
4,370,106
467
1,532,005
W ool, raw "Wool, raw •• • • 99 8,481 5,348
Tiles Tiles •• Nos. . .
Lime and lime-stones . . Lime and lime*ston e •• •• Mds. •• ••
(a) Ia,dioates the metric oait. Sotraoii.— Accounts relating to the Inlau4
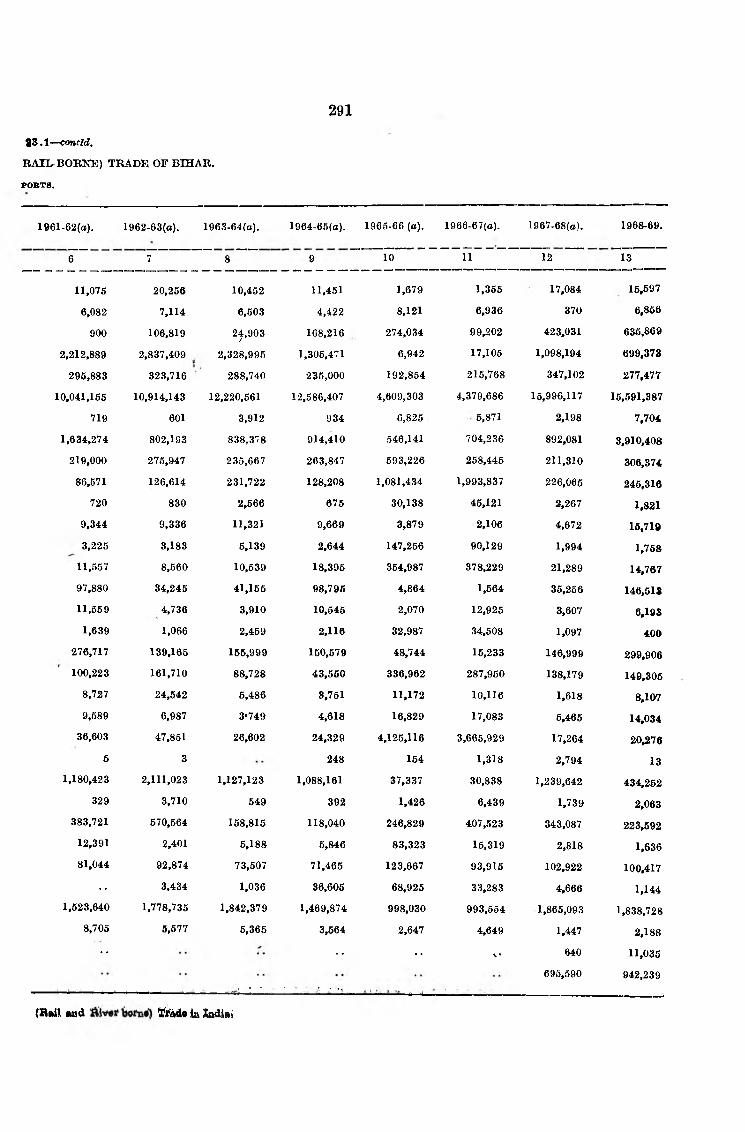
29188 .1— concld.
R A IL B0R3STE) TRADE OF BIHAR.
PO R T S.
1961.62(a). 1962-63(0). 1963-64(a).
7 86
11,076
6,082
900
2,212,889
296,883
10,041,155
719
1,634,274
219,000
86,571
720
9,344
3,225
1964-65(0). 1966-66 (0 ). l966-67(o). l967-68(o). 1968-69.
9 10 11 12 13
20,256
7,114
106,819
2,837,409
323,716
10,914,143
601
802,193
275,947
126,614
830
9,336
3,183
10,452
6,503
24,903/2,328,995
288,740
12,220,561
3,912
838,378
235,667
231,722
2,566
11,321
5,139
11,451
4,422
168,216
1,305,471
236,000
12,586,407
934
914,410
263,847
128,208
676
9,669
2,644
1,679
8,121
274,034
6,942
192,854
4,609,303
6,825
546,141
593,226
1,081,434
30,138
3,879
147,256
1,356
6,936
99,202
17,106
215,768
4,379,686
6,871
704,236
268,446
1,993,837
46,121
2,106
90,129
17,084
370
423,031
1,098,194
347,102
15,996,117
2,198
892,081
211,310
226,066
2,267
4,672
1,994
15.597
6,866
635.869
699.373
277,477
16,591,387
7,704
3,910,408
306.374
246,316
1,821
15,719
1,76811,557 8,560 10,539 18,396 364,987 378,229 21,289 14,76797,880 34,245 41,156 98,796 4,864 1,564 35,256 146,51811,559 4,736 3,910 10,545 2,070 12,925 3,607 6,193
1,639 1,066 2,469 2,116 32,987 34,508 1,097 400276,717 139,165 155,999 150,579 48,744 15,233 146,999 299,906100,223 161,710 88,728 43,560 336,962 287,950 138,179 149,306
8,727 24,642 5,486 3,751 11,172 10,116 1,618 8,1079,589 6,987 3*749 4,618 16,829 17,083 5,466 14,034
36,603 47,851 26,602 24,329 4,125,116 3,665,929 17,264 20,2766 3 248 154 1,318 2,794 13
1,180,423 2,111,023 1,127,123 1,088,161 37,337 30,838 1,239,642 434,252329 3,710 649 392 1,426 6,439 1,739 2,063
383,721 670,564 158,815 118,040 246,829 407,523 343,087 223,59212,391 2,401 6,188 6,846 83,323 15,319 2,818 1,63681,044 92,874 73,507 71,465 123,667 93,916 102,922 100,417
•• 3,434 1,036 36,606 68,925 33,283 4,666 1,1441,523,640 1,778,735 1,842,379 1,469,874 998,030 993,554 1,865,093 1,838,728
8,706 5,577 5,365 3,564 2,647 4,649 1,447 2,188
•• •• •• i* 640 11,035
,/ -- " ■ ' • > 7 ..695,590 942,239
(BaiH Asd H 'fe d i ia Sodlai

292
TABLE
STATEMEKT SHOWING THE INLAND (RAIL AND
Im
— ------ Units. 1969-60. 1960-61(0).
1 2 s 4 6
Animals (Live stock) . . Cattle excluding sheep and goats . . . . Noa. 62,768 '84,752Horses, ponies an,d mules • • 99 1 101Sheep and goats . . * * 99 2,334 6,968Others . . • • 99 8,278 8,438
Bon.es Bones . . . . Mda. 28 958Cement Cement . . • • 99 607,868 306,773Coal and coke . . Coal and coke . . 99 34,642336 74,072,252Coffee . . Coffee — 99 439 62
Cotton twist and yarn . . Foreign . . . . . .
Indian . . . . 111,972 34,970
Cotton piece goods . . Foreign (in, bales) . . . . .•
Foreign (in boxes) . . . . . .
In ^ an (in Tbales) . . . . 1,053,845 403,151
Indian (in boxes; . . . . • • 6,281
Dyes and tans MyTobalai\s •• Bldfl. 4,904 64,810
Tniits . . Fruits, dried . . ** 89,734 27,577
Glass Glass . . 99 71,228 503,630
Grain, pulse and flour . . Pulses (other than gram and Gram Products) 9,798,866 574,246
Gram and Gran Products 99 1,837,913 669,998Maize . . • • 99 1,351,970 274,246
J owar and Bajra . . 99 80,146 26,026
Millets other than J owax and Bazra 99
Rice in husk . . • • 99 40,756 20,881
Rice not in husk . . • • 99 520,036 730,160
Wheat . . • • 99 7,205,379 4,846,464
Wheat flour . . • • 99 266,930 107,49f
Other sorts .. 99 762,997 227,246
Hemp . . Hemp, Indian and other fibres (excludiz^g jute) „ 8,702 5,607
Hides, raw . . , . Hides, raw . . • • »» 15,040 9,341
Bricks . . Bricks . . . . Noo.
I- - — >. .
. NU.(a) Indioatea the metric ixuit; •Figures incomplete*

S8,a.
rORTS,
BIVER-BORNE) TRADE OF BIHAR.
m
1961-62(a). 1962-63(0). l963-64(a). 1964-65(a). l965-66(a). 1966-67(o). 1967-68 1968-69.
6 7 8 9 10 11 12 13
61,814 66,107 65,559 141,208 64,331 98.198 54,874 59,926
111 41 54 56 41 229 221
6,431 1,232 4,715 8,060 2,598 6,155 2,991 1,951
12,790 7,513* 9,925 9,350 46,894* 69.085* 8,107 4,607
930 223 240 266 1^1,324 129,094 2,950 3,683
886,765 1,187,108 1,026,717 1,406,312 7,587,564 7,438,516 3,364,356 1,396,695
14,208,311 14,669,739 17,448,948 18,168,051 162,371,696 208,291,687 34,997,800 85,977,217
117 137 207 725 84 62 830 1,451
279 347 73 3,112 812
38,279 35,214 26,342 25,238 1,292 20,277 41,648 32,596
•• •• 867 515 8 666 229
•• . . . . *• ••
34,970 381,345 308,280 . 849,898 7,795 4,360 931,795 329,776
•• •• . .5,660 5,689 6,628 6,848 4,434 2,841 6,956 4,969
40,933 47,672 32,678 85,213 2,554 2,969 14,261 9,816
29,578 24,778 24,845 20,188 157,658 228,088 41,762 48,048
653,610 573,755 418,319 214,010 858,209 743,080 685,007 389,786
530,085 468,607 487,773 150,006 35,100 16,196 487,196 700,726
367.196 441,770 474,753 148,133 1,153 1,170 246,438 887,560
13,877 9,778 18,105 3,855 632 661 1,065,292 18,587
... . . 1 16 575 4,370,403 436,713
14,182 15,731 6,834 15,305 19,959 6,981 438,402 47,149
486,488 528,944 419,440 400,670 116,108 109,928 425,628 194,786
3,275, 568 3,244,536 4,257,687 4,187,765 8,233 M 6 8 12,093,122 4,612,657
844,957 498,511 450,064 82,979 1,867 1,381 528,698 57,289
254,749 182,695 124,055 34,032 88,886 287,943 3,769,795 320,386
9,927 2,720 3,376 5,187 4,257 1,619 1,785 68]
11,866 19,228 25,295 26,239 122,437 135,975 26,152 • 28,030
•• ••— - ..........,i
632,206 459,322

TABLE
STATEMENT SHOWING THE INLAND (EAIL A N !
Im
TTn,its. 1959-69.
Skins . . ■ Skins, raw .. Mds. 501 109
Hides an,d skins.taiwied Hides and skins, tanned and leather 2,782 1,729and leather.
J ute, raw Loose . . . . . . • • f9 ]0,170 1,116
Pucca bales .. . . • • 9f 16,997 73
Gmmy bags and cloth . . Gunny bags and cloth . . .. • • 9f 477,507 176,039
Iron and steel , . . . Iron and steel, bars and others * • 99 4,245,187 2,340,240
Lac and shellac . . Lac and shellac .. 66,360 16,713
Manganese ores . . Manganese ores .. 26«,912
Oil-cakes / . Oil-cakes 655,521 25,896
Oil . . . . Kerosen« 3,844,425 1,488,943
Vegetable oil . . Coconut/ • • 99 94,309 88,676 i
Castor • • »* 9,292 68%
Groundnut . . 300,401 169,188
Others . . 445,228 322,548
OJleeeds . . Castor 846 572
' Cotton 488 140
Groundi^ut 99 64,830 17,468
Linseed • • f» 105,486 77,5ia
R ape and mustard 223,131 159,534
T il . . • * 99 5,773 3,833
Ghee . . Ghee . , ' . . • • 99 2,655 800
Salt . . Salt . . . . . . . . • * 99 6,351,481 2,881,135
Rubber . . Rubber, raw 1,853 69^
Sugar ., . . Sugar .. 237,985 23,21S
Khandsari sugar .. • • 99 3,966 2,03^
Gur, tab, molasses, etc. • • 99 400,775 198,171
Tea . . Tea • • 9f 7,253 6,16j
Tobacco . . Tobacco, raw 33,664 65,67:
W ood and timber . , Teak • • 99 23,722 8,17
Other t imber • • 99 1,080,323 530,2S
W ool, ra\T .. W ool, raw • • 99 2,686 1,42
Lime and Lime-ston® Lime and lime-sfcone .. • • 99
^iles . . . . Tiles .. . . ' . . Nos.\.
...—m i

|S8 •—csojtc cZ.
^IVER-BORNE) TRADE OF BlttAIi.
I ranT».
lBBl-62(a , 1962-63(0). 1963-64(o).
6 7 8
1964-65(0). 1965-66(0).
10
1966-67(0). 1967-68
9 11 12
121
2,533
1,830
4,074
156,132
2,942,894
890
119,912
230,089
1,353,338
42,517
804
95,555
235,578
2,174
308
15,417
56,864
185,958
8,824
985
2,684,294
248
106,381
3,404
233,386
3,267
60,546
8,847
526,926
1,409
433
1,824
27
2,116
158,874
3,244,225
1,140
444,284
243,423
1,417,863
43,153
4,474
736,677
228,824
266
517
17,675
57,186
177,309
2,684
1,968
3,239,291
316,425
581
248,115
2,573
45,040
4,895
784,876
1,529
328
1,439
850
891
120,735
2,743,720
2,040
770,851
262,077
1,457,915
70,697
470
129,066
214,535
528
339
16,452
42,144
238,807
3,790
1,400
2,614,627
80,244
903
92,765
3,056
42,251
6,156
482,768
1,706
789
2,196
2,811
4,551
136,939
3,620,278
3,862
278,557
198,500
972,388
37,673
936
106,636
194,110
630
1,385
26,250
38,510
144,327
3,427
10,209
2,010,023
870
38,422
5,447
86,827
3,666
65,138
41,035
666,247
2,445
18,634
745
681,895
1,263,423
354,519
16,343,528
998
905,901
271,206
340,573
2,013
11,710
4,169.
31,658
48,189
4,080
2,143
275,269
107,431
5,947
8,140
14,558
1,693,186
30,247
439,732
1,570
73,948
11,826
2,151,806
644
18,381
64
1,336,325
951,672
327,145
16,443,049
3,846
46,342
345,285
525,768
486
8,931
2,824
20,738
54,084
5,189
26,285
257,617
143,827
3,749
11,509
19,274
457
1,505,757
2,316
580,947
1,336
108,990
2,286
1,832,260
1,882
2,447
6,320
4,066
4,412
169,067
3,770,232
6,100
1,179,622
298,499
767,513
32,783
897
168,785
387,116
651
8,229
119,931
19,678
184,746
13,676
1,876
4,060,638
522
102,394
4,887
229,679
5,524
103,325
34,796
741,878
2,947
12,498,202
11,009
1968-6^
13
^28
9,354
37,162
7,866
218,161
4,429,324
6,266
788,114
287,931
1,116,876
43,222
2,082
140,541
339,714
11,501
1,150
86,595
31.533
153,047
7,328
2,142
4,629,147
436
297,347
13,762
107,183
6,666
109,502
31.533
824,798
2,017
7,792,296
10,280
OCTROB.—A.cooun,ta ralatiag to tha Inland (Rail an,d aixd River-Borae) Trade of Indian


SiGTION XXiV Jolit Stock Companies and Banks

I' ^ABLS
298
STATEMENT SHOWINd THE NUMBER OP OOI^ANIES AND PAID-UP CAPITAL OF JOINT STOCK COMPANIESIN BIHAR.
Year. Total number o f oompanies.
Paid-upoapitaL
I969r00
1860^61
1961,42
1962.68
1963«64
1964^6
1966-66
1966^7
1967<48
1968-69
2 3
Bs.
382 3,40,49,92,016
366 3,31,76,38,387
331 3,47,88,14,616
336 4,70,66,46,874
336 6,76,69,51,064
341 6,77,72,98,880
360 6,91,44,63,424
360 7,20,31,78,069
372 7,32,66,69,772
386 7,76,22,76,969
SouBOB.—^3Re0utr«jrof Company L av Adminutration, Bihar.
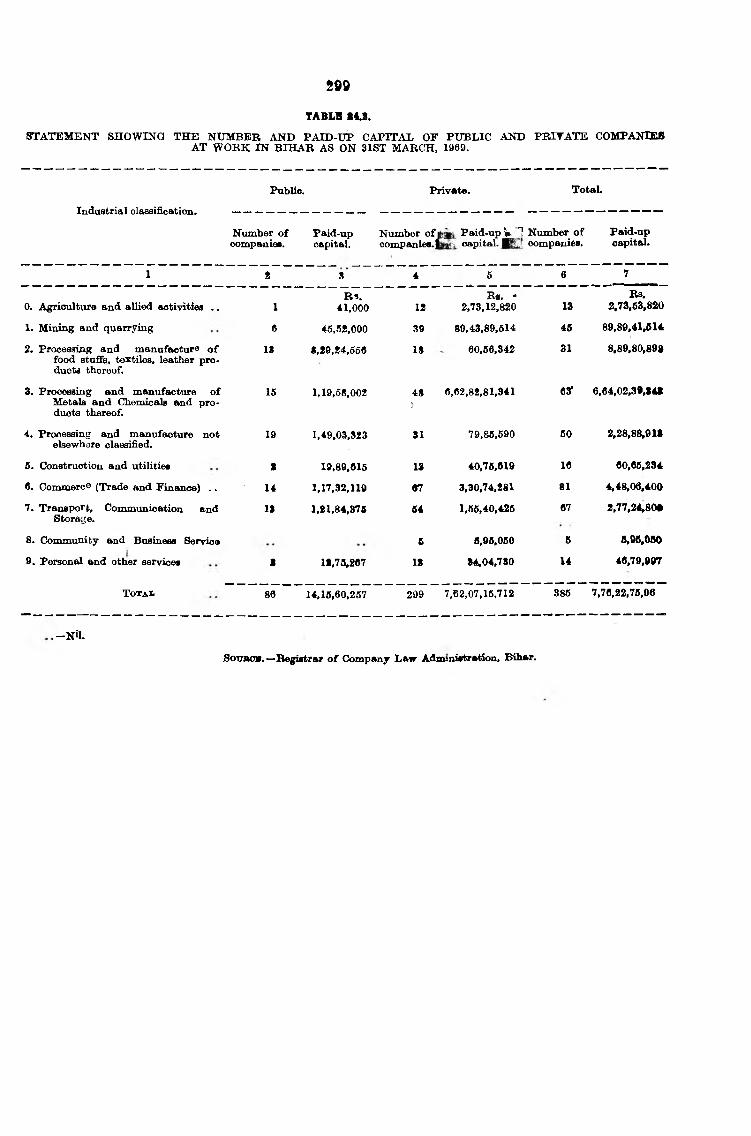
m
TABLE 84.8.
STATEMENT SHOWING THE NUMBER AND PAID-UP CAPITAL OF PUBLIC AND PRITATE COMPANIESAT W ORK IN BIH AR AS ON 31ST MARCH, 1969.
PubUc. Private. Total.
Industrial classification.
Niunber o f companie*.
Paid-upcapital.
Number ofj companies.]
Paid-up k 1 Number o f capital, companies.
Paid-upcapital.
1 8 S 4 6 6 7
0. Agrioultiire and allied activities . . IR 9 .
41,000 12Rs. ■ '*
2,73,12,820 13Bs.
2,73,53,820
1. Mining and quarrying 6 46,52,000 39 89,43,89,514 46 89,89,41,514
2. Processing and manufacture o f food stuffs, textiles, leather pro- duota thereof.
13 S,29,24,556 IS 60,66,342 31 8,89,80,898
3. Processing and manufcKjture o f Metala and Chemicals and products thereof.
16 1,19,58,002 4St
6,62,82,81,341 63' 6,64,02,39,848
4. Processing and manufacture not elsewhere classified.
19 1,49,03,323 SI 79,86,590 60 2,28,88,918
6. Construction and utilities S 19,89,616 IS 40,76,619 16 60,66,294
6. Commerce (Trade and Finance) . . 14 1,17,32,110 87 3,30,74,281 81 4,48,06,400
7. Transport, Communication end Storage.
It 1,21,84,376 54 1,66,40,426 67 2,77,24.80#
8. Community and Business Service 5 6,96,060 5 6,96,0509. Personal and other service! S 18,78,267 18 84.04,730 14 46,79,807
T o t a x . 86 14,16,60,257 299 7,62,07,16,712 386 7,76,22,76,96
, -N U .
SOTTBO.—Begiatrar o f Compsnj L»w Adiruni»te*tioii, Bihar.

TABLl lU .
STATEMENT SHOWING THE DEBITS TO DEPOSIT ACCOUNTS WTTH SCHEDULED BANKS IN BIHAR.
Amount In crores of rupees.
Number o f olBcet
»t the end of the year.
Tear. Numbero f ——----------
reporting
banks.
Deposits as at the end o f December. Total o f debits.
Total 'T'otalof Total o fo f Total Jovom- business
Fixed Sav- Cur- Govern- o f Fixed Savings Ourrent ment andErist- Report- depo- ings rent ment business Grand deposit depsbit deposit and indivi-ingg. ings, aits, depo- depo-end quasi- and total, accotunts. acco- accounts, quafti- duals.
sita, sits, Go' ern- i '’ ivi- unte, G"'?er^«ment duals. ment
bodies. bodies.
TotalTotal o f
o f creditGrand ! appro- out-
total. ved stand- credit
and/or
Rate o f turnover o f current
deposits. *
ing O faf=! at business Over-
over- the end and alldraft o f the indivi- rate.
11 ■ its. year, dua p.
1 2 3 4 5 6 7 8 9 10 111 12 13 14 15 16 17 18 19 20
1966 . . 11 124 112 7.3 7.8 12.2 1.5 25.8 27.3 1.3.6 6.6 299.3 8.6 310.8 319.4 14.6 12.6 24.4 23.31967 . . 11 132 33 6.7 4.9 8.9 2.2 18.3 20.5 13.0 4.3 197.9 6.7 209.7 215.4 60.3 6.3 27.7 23.81968 . . 11 127 26 7.6 3.6 4.3 0.7 14.8 , 16.6 16.8 6.3 191.5
(76.2)23.3 265.1
(76.2)288.4
• (76.2)69.6 3.5 24.1 22.5
1969 . . 12 154 31 9.0 5.3 8.8 2.8 20.3 23.1 21.4 6.3 164.1(32.8)
16.1(0.1)
164.8(32.7)
180.9(32.8)
110.8 4.4 21.9 19.5
1960 . . 11 160 30 6.7 4.6 11.1 3.9 17.6 21.4 £.‘4.6 6.7 203.0(37.8)
27.0 206.3(37.8)
233.3(37.8)
127.4(0) 4.3 22.6 20.8
1961 . . 13 178 29 8.7 5.8 5.6 1.0 19.1 20.1 17.6 6.7 184.6(44.7)
15.9(1.3)
191.9(43.4)
207.8(44.7)
160.4(a) 6.3 26.9 28.41962 . . 21 180 163 16.4 14.1 19.2 6.6 40.6 49.7 S0.2 15.7 396.7 56.8 372.8 442.6 87.7 24.7 49.3 22.91968 . . 21 188 178 21.6 17.6 25.8 10.4 49.9 66.0 . 34.8 20.7 616.1 94.6 456.7 571,6 44.7 J9.1 64.6 24.71964 . . 21 201 197 23.2 23.5 25.9 6.3 69.6 72.6 56.2 30.7 782.8 163.4 688.3 869.3 38.7 30.1 69.9 37.61966 . . 13 213 193 27.7 26.4 25.8 7.3 67.8 79.9 83.8 36.2 735.9 213.2 651.6 805.9 39.8 34.9 68.6 32.8
*Total o f Debits current to accounts f^r twelve months divided by the monthly average o f curr^t deposits fcr the year.The overall rate o f turnover is arrived at by dividing debits to current accounts and cash credits and overdrafts by the average outstanding of current
accounts and effective cash credit and overdraft limits from the ear 1962.(a) This represents 12 nftnths total o f approved limits of cash cre^t and/or overdrafts as at the end o f > ach month from January to December, I860. Figures in brackets are debits to cash credit and overdrafts from 1958 onwards they are excluded from deposits and also from the calculation erf the
rate o f turnover of current deposits.
SccTRCBi. — (1) Reserve Bank o f India Bulletin, 1956 (June), and 1968 (February).(2) Director, Banking Division, Reserve Bank o f I nida, Bombay.
O

SOI
TABLB S4r.4.
STATEMENT SHOWlNa THE DISTRIBUTION OF OFFICES, DEPOSITS AND ADTANCES OF SCHEDULEDBANKS IN BIHAR.
(IiT Lakhs o r Rtjfbes.)Number o f Number o f —----- ----------------------------
banks officea.operating. Deposits, t Advances.
1 8 8 4 5
30th December, 19591 . . 18 164 44,06 15,13
30th December, 1960 11 160 30,04 19,64
31st December, 1961 1* 178 56,34 24,19
31st Deoem'-er, 1962 18 182 •3,79 27,42
31st December, 1963 18 189 69,76 27,06
S 1st December, 1964 . . u £01 83,33 24,66
l is t December, 1966 . . . . . , 14 £18 96,60 34,61
ils t December, 1966 16 226 1,11,70 40,89
81st December, 1967 15 246 1,37,48 38,51
81st December, 1968 . . . . ^ 10 267 1,63,81 47,36(a)
Administrative, seasonal, temporary and non«banklng offices have been excluded,
tinclude inter-bank deposits.
JFigiires are as on the last Friday o f the year and relate to 09 Banks in 1969.
(a) Including Bills.
SOXJBOK.— (») Annual Report on the Trend and Progress o f Banking in India.
(m) Director, Bcmking Division, Reserve Bank o f India, Bombay,

302TABLE 24.5.
STATEMENT SHOWING THE DISTRIBUTION OF BANKING OFFICES OF SCHEDULED AND NON-SCHEDULEDBY POPULATION OF BIHAR.
Populaiioa.1Q59. I960. 1961. 1962. 1963.
Number Number Number Number Number Number Number Number Number Number o f o f of o f of o f o f o f o f o f
place*, banking place*, banking plaoei. bankiag places, banking places, banking officeB. oflBlces. officei. offices. offices.
1 1i 8 4 6 6 7 8 9 10 11
Unclassified ii 26 16 16 8 10 1 2 5 3
Below 6,000 •• 6 7 6 7 •• •• 1 1 1 1
8,000 to 10,000 S 6 3 6 11 14 16 18 16 13
10,000 to 25,000 26 66 26 43 25 34 28 39 28 39
26,000 to 50,000 13 38 13 29 21 44 23 62 22 5t j
60,000 to 75,000 •• 1 f 2 6 . . . .
)- 6 33 6 27 <76,000 to 1,00,000 •• J I * 14 4 i4 4
1,00,000 and over 6 43 6 39 7 56 7 66 7 60
T o t a » 81 208 73 167 78 178 79 182 82 189!
Fopalation.1064. 1066. 1966. 1967. 1968.
Number Number Number Number Number Number Number Number Number Numbt o f of o f o f . o f of o f of o f o f
places, bemking places, banking places, banking places, banking places, banking offices. offices. offices. offices. office«i
1 12 13 14 15 16 17 18 19 20 21
UnelcMisified K - ) l ( - ) 4 ( - ) 4(— ) 7(2) 7(2) 8 ( - ) 8 ( - ) 6(8) 6(8)
Below 6,000 3(1) 4(1) 8(1) 4(1) 5(1) e<i) 4(1) 6(1) 7(1) 9(i)
6,000 to 10,000 16(7) 19(7) 17(6) 20(6) 17(6) 21(6) 2%(7) 25(7) 25(7) 29(7)
10,000 to 26,000 . . 31(17) 42(17) 35(1)7 60(17) 36(18) 60(16) 42(20) 57(20) 43(23) 65(24
26,000 to 60,000 . . 25(16) 67(16) 23(16) 66(15) 24(17) 67(17) 23(17) 59(17) 24(17) 64(18!
60,000 to 75,000 l ( - ) K - ) K - ) K - ) l ( - ) l ( - ) K— ) 2 ( - ) K— ) 2(—
76,000 to 1,00,000 4(4) 4(4) 4(4) 14(4) 4(4) 14(4) 4(4) 15(4) 4(4) 16(6
1,00,000 and over 7(7) 66(11) 7(7) 66(11) 7(7) 71(9) 7(7) 75(10) 7(7) 78(10
T o t a l . . 88(52) 203(56) 94(50) 214(54) 100(53) 227(55) 111(56) 247(59) 116(67) 257C5
N .B .— The unbrtioketed figures are for Scheduled and Non-Soheduled banks and tire as at the end o f December, while the bracketed figures are for Co-operative Beuik* and are as at the end o f Jime.
SousciB.— (i) Annnal Report on the Trend and Progress o f Banking in India.(it) Director, Banking Division, Reserve Bank o f India, Bombay.
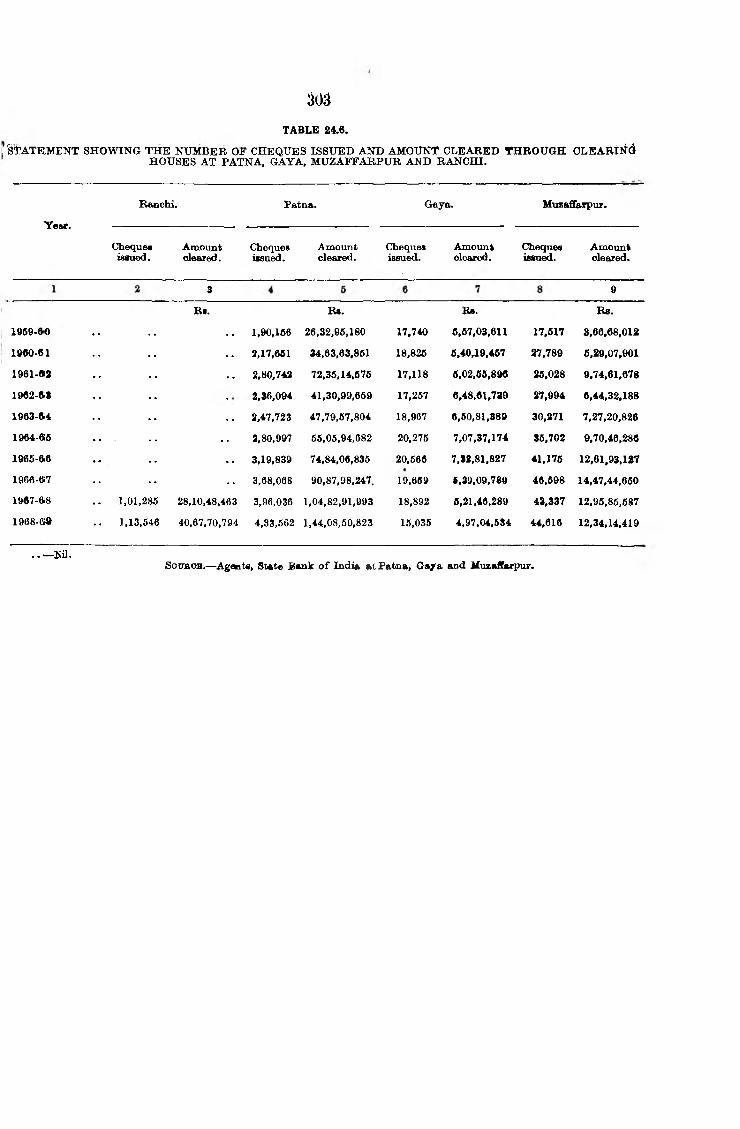
0^
1 St a t e m e n t s h o w i n g t h e n u m b e r o f c h e q u e s i s s u e d a n d a m o u n t c l e a r e d t h r o u g h cL E A R ii^ dHOUSES AT PATNA, GAYA, MUZAFFARPUR AND RANCHI.
TABLE 24.6.
Year.
Ranchi.
Chequesissued.
Amountcleared.
Patna.
Chequesissued.
Amountcleeired.
Gaya.
Chequesissued.
Amountcleared.
Muzaffarpiir.
Chequesifisn^.
Amountcleared.
3 9
Rs. Rs. B«. Rs.1969-60 . . . . . . 1,90,166 26,32,^96,180 17.740 6,67,03,611 17.617 3,66,68,012
1960-61 . . . . . . 3,17,661 34,63,63.861 18,826 6,40,19,467 27,789 6,29,07,901
1961-»3 . . . . . . 2,80,742 72,36,14,676 17,118 6,02,66,896 26.028 9.74,61,678
1962-6S . . . . 2,36,094 41,30,99,659 17,257 6,48,61,739 27,994 6,44,32,188
1963-6i4 . . . . . . 2,47,723 47,79,67,804 18,967 6,50,81,889 30,271 7,27,20,826
1964-6J6 . . . . . . 2,80,997 56,05,94,682 20,275 7,07,37,174 36,702 9,70,46,286
1965-6.6 . . , . . . 3,19,839 74,84,06,835 20,566 7,32,81,827 41,176 12,61,93,1«7
1966-617 . . . . . . 3,68,068 90,87,98,247. 19,669 *,39,09,789 46,698 14,47,44,660
19«7-6i8 . . 1,01,285 28,10,48,463 3,96,036 1,04,82,91,993 18,892 6,21,46,289 43,337 12,96,85,687
1968-6& .. 1,13,546 40,67,70,794 4,33,562 1,44,08,50,823 15,035 4,97,04,534 44,616 12,34,14,419
------ Kil.SouBCS.—Agmts, State Sank o f India at Patna, G aja and Muzaflarpur.


SECTION XXV Fuel and Powir
90 Planning^^

306
TABLE 25.1.
s t a t e m e n t s h o w i n g t h e n u m b e r a n d c l a s s if i c a t i o n o f c o n s u m e r s o f e l e c t r i c e n e r g y ]BIHAR.
Year.
Segregation o f Number o f Consumers. Total Number of Consumersj
Domestic or resi- Commercial light dential light and and small small power. power.
Industrial powers
including electric trac
tion and public water
works.
Public lighting.
Irrigation.
a .c . D.C. A.C. D.C. A.C. D.C. A.C. D.C. A.C. D.C. Total.
1 2 3 4 5 6 7 8 9 10 11 12 13 14
1958-69 76,519 6,416 5,710 1,738 3,776 185 81 4 1,355 3 87,441 8,346 95,787j
1959-60 86,513 4,564 9,821 1,483 4,426 134 94 2 1,333 3 102,187 6,186 108,373j
1960-61 120,194 4,529 21,680 1,259 5,975 116 160 3 3,347 1 151,356 5,908 157,264J
1961-62 154,533 4,443 21,686 1,259 6,104 117 228 3 5,358 1 187,908 5,823 193,73li
1962-63 162,525 4,254^ 21,685 1,330 6,419 108 228 3 5,405 1 196,262 5,696 201,95S
1963-64 168,073 1,752 52,368 92 10,860 71 7,609 2 5,238 1 244,148 1,918 246,066
1964-65 176,159 1,974 64,939 532 n . m 61 'J,6U 1 6,486 1 2>569 271,34^
1965-66 182,382 903 95,821 99 16,131 50 5,097 1 10,660 1 310,091 1,054 311,145
1966-67 203,446 583 106,134 249 18,792 40 5,098 10,822 1 344,292 873 345,165!
1967-68 206,970 537 107,701 231 19,269 41 5,098 •• 10,900 I 349,938 800 350,738
NU.S cuH C E .— (?■) Public Electricity S u p p ly , All-India Statistics (General Review).
(n) Since 1960-61, Director, Central Water and Power Commission (Power Wing), Simla.

307
TABLS 25.2.
STATEMENT SHOWING THE NUMBER AND CLASSIFICATION OF CONNECTED LOAD (ELECTRIC ENERGY)IN BIHAR.
Year.Segregation o f connected I.oad in K.W. Total connected in K.W.
Domestic or reaideneial light and smallpower.
Commercial light and
small power.
Indusrtial row®rs
including electric
traction and public water,
works.
Publiclighting.
Irrigation,
A.C. D.C. A.C. D.C. A.C. D.C. A.C. D.C. A.C. D.C.A.U. IJ.U. KjtrmiiO
Total.
1 2 3 4 5 6 7 8 9 10 11 12 13 14
1957-58 36,002 3,454 6,252 1,295 168.180 1,739 609 45 6,713 4 217,756 6,537 224,293
1958-59 44,173 3,280 6,142 1,222 201,671 1,688 819 45 8,671 5 261,476 6,240 267,716
1959-60 49,239 2,378 7,615 848 236, L31 1,492 944 30 7,884 5 301,813 4,753 306,566
1960-61 65,190 2,581 18,216 589 365,324 860 1,162 24 17,312 4 467,204 4,058 471,262
1961-62 82,139 2,527 19,918 589 327,629 893 1,524 30 26,725 4 456,935 4,043 460,978
1962-63 89,502 2,154 18,918 633 337,273 914 1,527 25 27,101 4 474,321 3,730 478,051
1963-64 100,276 742 63,890 132 445,586 457 4,768 12 22,231 4 636,751 1,347 638,098
1964-65 103,598 2,091 65,904 2,681 535,308 369 4,953 1 22,110 4 731,873 5,146 737,019
1965-66 99,585 S72 SO, 406 ” 4 382,281 456 2,655 2 42,443 4 607,376 908 608,284
1966-67 109,678 222 84,518\ 140 4.52,363 400 2,682 42,594 4 591,835 766 692,601
1967-68* . . ..
*Not availabla.___ Nil.
SoT7B0E.~(t) Public Electricity Supply, All-India Statistics (G«nera] Rev iew).(ii) Since 1960-61 Director, Central Water and Power Commission (Power Wir g), Simla.

STATEMENT SHOWING THE TOTAL INSTALLED PLANT CAPACITY AND ELECTRICITY GENERATED BY OWNERSHIP AND PURCHASED INBIH AR.
TABLE 25.S.
Year.
Capacity K .W .
PowerGovern- Corpora- Compa- Total,
ment. tion. nies.
Total K .W .H . generated.
Govern- Manici- ment palities
(millions), (millions).
PowerCorporation
(millians).
Companies
(millions).Total
(millions).
K .W .H . purchased (millions).
From non
electric utilities.
Fromelectricutilities
inadjoining States.
Total available electric
energy in K .W .H . (millions) (cols. lo4- 11 + 12).
1 2 3 4 5 6 7 8 9 10 11 12 13
1958-59 16,769t 176,500 32,973 226,242 31.316 1,048.150 132.545 1,262.011 22.666 2.911 1,287.588
1959-60 18,784t 216,500 32,529 267,813 31.995 1,240.861 129.648 1,402.504 14,727 11.055 1,428.286
1960-61* 19,127| 299,000 32,766 350,893 29.406 1,422.275 125.152 1,595,833 28,789 35.000 1,660.622
1961-62* 21,360t 299,000 33,766 354,126 32.769 1,358.066 129.206 1,520.041 39.700 27.150 1,586.891
1962-63 15,805 299,000 34,336 349,141 33.92T 1,612.315 113.2.30 1,759.472 13.340 85.700 1,858.512
1963-64 46,778 299,000 34,696 380,474 50.560 1,901.468 125.738 2,077.766 35.943 263.960 2,375.669
1964-66 44,108 439,000 34,396 517,504 99.030 2,132.703 116.734 2,348.467 16.87-T 273.895 2,639.238
1965-66 59,538 579,000 33,756 672,294 102.642 3,019.638 104.589 3,226.869 0.813 112.722 3,340.404
1966-67 107,843 579,000 31,841 718,694 316.394 3,146.888 102.972 3,565.254 3.387 39.333 3,607.974
1967-68 158,646t 30,841 189,487 684.193 95.109 779.302 3.048 1,195.291 1,977.641
COO00
♦Includes plant installed in Municipal tindertakings. ^Figure relates to Board.
SouBcB.— (i) Public Electricity Supply, All-India Statistics (General Review).(ii) Director, Central Water and Power Commission (Power Wing), Simla.

309
TABLE 25.4.
8TATEMENT SHOWING THE TOTAL DISPOSAL OF ENERGY GENERATED AND PfJRCHASED IN BIHAR,.
Year.
K.W-H. sold within the State (nJllions.)
By undertaking with own generationB.
Direct Toto own distributing Total,
consumers, licensees.
By die- Total tributing K.W .H. licenses sold to
to consumers consumers. (Cols. 2 +
5).
K.W.H. K.W.H. K.W.H. Grandsoldin used for lost and Totalbulk to power un- (Cols. 6other station accounted lo 9).
States auxiliaries for (millions), (millions). (milUo/js).
1 2 3 4 5 6 7 8 9 10
1958-59 587.960 438.200 75.438 185.990 1,287.588
1959-60 770.819 370.000 85.179 213.388 1,428.286
1960-61 700.127 573.915 1,274.042 190.078 889.205 457.839 98.629 214.949 1,660.622
1961-62 699.746 742.644 1,509.390 204.946 971.692 224.368 92.396 298.435^ 1,586.891
1962-63 .. 1,077.938 113.199 1,198.137 201.921 1,279.859 251.246 129.121 193.286 1,858.512
1963-64 .. 1,282.958 162.390 1,445.348 245.206 1,528.164 490.272 156.338 200.895 2,375.669
1964-65 .. 1,489.783 167.728 1,657.511 253.106 1,742.889 479.498 192.973 22:1.878 2,639.238
1965-66 .. 1,172.138 1,932.547 889.304 300.661 217.892 3,340.404
2,121.S8(> 2.557 S30.501 28O.Q30 3,607.974
1967-68 . . •• 1,424.477 1?7.387 76.160 349.617 1,997.641
. . - N i l .
S o u r c e . — (t) Public Electricity Supply, AlMndia Statistics (General Review).
(u) Director, Central Water and Pow^r Commission (Power WirgK Simla.

310
TABLE 25.5.
STATEMENT SHOWING THE SEGREGATION 01 SALES OP ELECTRICAL ENERGY IN BIHAR.
Year.Total
sold to ultimate
consumers K.W.H. (millions).
DomSgticHeat
andSmallPower.
DomesticLight
andFans.
Segregation Total
Com- Commercial mercial Heat and Light and
Small Fans. Power.
K.W .H. sold in millions.
Industria l Indus- Public
Power, trial Lighting Low and Power Medium High V oltage. V oltage.
Electric . Traction,
Irrigation.
Publicwater worKs and
sewerage pun pmg.
1 2 3 4 5 6 7 8 9 10 11 12
1958-59 .. 587.960 5.322 39.502 2.341 17.304 42.656 451.415 3.462 13.490 12.468 :
1959-60 .. 770.819 8.507 46.705 3.581 19.527 61.563 590.233 4.216 22.008 14.479 1
1960-61 889.205 5.023 39.289 5.129 24.701 58.913 717.482 3.647 4.528 18.255 12.238 1
1961-62 . . 971.692 5.487 42.004 8.429 17.044 55.718 746.174 3.984 61.598 18.462 12.791 1
1962-63 . . 1,279.859 6.534 52.172 7.764 32.843 76.4.53 927.385 4.725 130.835 19.998 21.150
1963-64 .. 1,527.664 4.497 56.286 9.921 35.597 86.679 1,133.176 4.912 153.146 19.453 23.997 j
1964-65 .. 1,742.889 5.003 61.220 6.351 43.862 93.264 1.212.181 4.918 268.054 22.349 2P.68T ■
1965-66 .. 1,932.547 9.022 53.071 14.010 55.344 100.419 1,296.732 4,804 343.085 29.325 27.635
1966 67 .. 2,121.886 11.157 53.481 13.880 70.733 106.553 1,393.522 4.867 388.411 49.249 30.034 )
1967-68 .. 2,195.397 71.298 * S2.498 t 126.427 1,459.927 4.905 349.997 61.050 31.803 I1
. . -N il .
♦This is inoluded in c lumn 3.
tThis is include in column 5.
S o u r c e . — ( i ) Public Electricity Supply, All-India Statistics (General Review).
(ii) Director, Central Water and Power Comnriission (Power Wing), Simla,

SECTION XXVI Factories ind Labour

s t a t e m e n t s h o w i n g t h e N rM B l.I l OF SHOPS. COMMERCIAL ESTABLISHMENTS, THEATRES ANB RESTAURANTS, e TC., AND THE NUMBER OF PERSONS EMPLOYED IN BIHAR.
312
t a b l e 26.1.
Year.
Shops. CommercialEstabliabments.
Cinema. Restaurants. Total,
No. o f , No. o f No. o f No. o f No. ofNumber. persons Number, persons Number, persons Number. persons Number. personB
employed. employed. employed. employed employed.
1 2 3 4 5 6 7 8 9 10 11
1960 18,182 15,414 1,045 18,455 49 1,047 1,224 3,099 20,500 38,015
1961 25,145 25,990 1,511 6,553 46 896 1,556 3,221 28,258 36,660
1962 25,665 22,017 1,321 10,533 49 787 1,515 3,517 28,550 36,854
1963 7,476 17,157 1,061 10,971 •54 981 975 3,555 9,566 32,664
1964 8,186 16,828 433 13,179 44 742 1,168 5,127 9,831 35,876
1965 7,385 13,275 703 11,338 42 712 782 3,348 8,912 28,673
1966 7,219 16,606 809 6,686 48 775 856 4,800 8,932 28,867
1967 7,227 15,280 905 9,930 56 857 867 6,022 9,055 32,089
1968 9,110 23,746 717 5,385 ^ 66 1,096 1,560 7,002 11,453 37,229
N.B .—The figures relate to the establishments registered under the Bihar Shops and Establishments Act, 1953,
SOCTBCE. —Commissioner o f Labour, Bihar.

STATEMENT SHOWING THE NUMBER OF FACTORIES REGISTERED . W ORKED DXTRTNG THE Y EAR AND'SUBMITTED RETURNS AND VOLUME OF EMPLOYMENT IN BIHAR.
Average number o f workers employed daily.No. o f No. o f No. o f Average ----------------------------------------------------------------------------- --------------------
Year. factories factories factories uumber Adult. Adoles’ ents. Children. Total.registered, worked submitting o f --------------------------------------------------- -------------------- -------(Cols. 6 to
during returns. workii',g 11).the year. days. Male. Female. Male. Female, Kal( . Fem -l®.
313
TABLE 26.2.
1 2 3 4 5 6 7 8 9 10 11 12
1959 6,177 5,544 5,484 289 176 112 9,459 582 6 492 9 186,060
1960 6,822 5,504 5,453 291 178.676 8,841 395 4 392 Nil 188,308'
1961 7,456 6,053 6 026 297 181,366 8,819 543 9 407 Nil 191,144
1962 8,452 6,927 6 910 294 191,821 9,944 815 72 357 7 203,016
1963 •• N .' . 8,182 8.148 243 203,361 10,046 699 18 365 Nil 214,4891964 •• 11,140 9,407 9.401 299 217,"^47 10,287 503 20 310 2 228,8691965 •• 12,359 10,685 10,554 N.A. 227,674 10,061 569 30 305 1 238,0401966 •• 13,383 11,598 11,667 306 226,915 9,362 576 29 295 1 237,1781967 14,136 12,369 12 364 302 240,611 9,789 694 14 109 251,2181968 15,345 13,430 13,406 329 247,137 9,490 748 19 100 257,494
. .— Nil.
N .R — N t Reported.
96 Planning— 43S ouB C E .— Chief Inspector of Factofiep, Bihar.
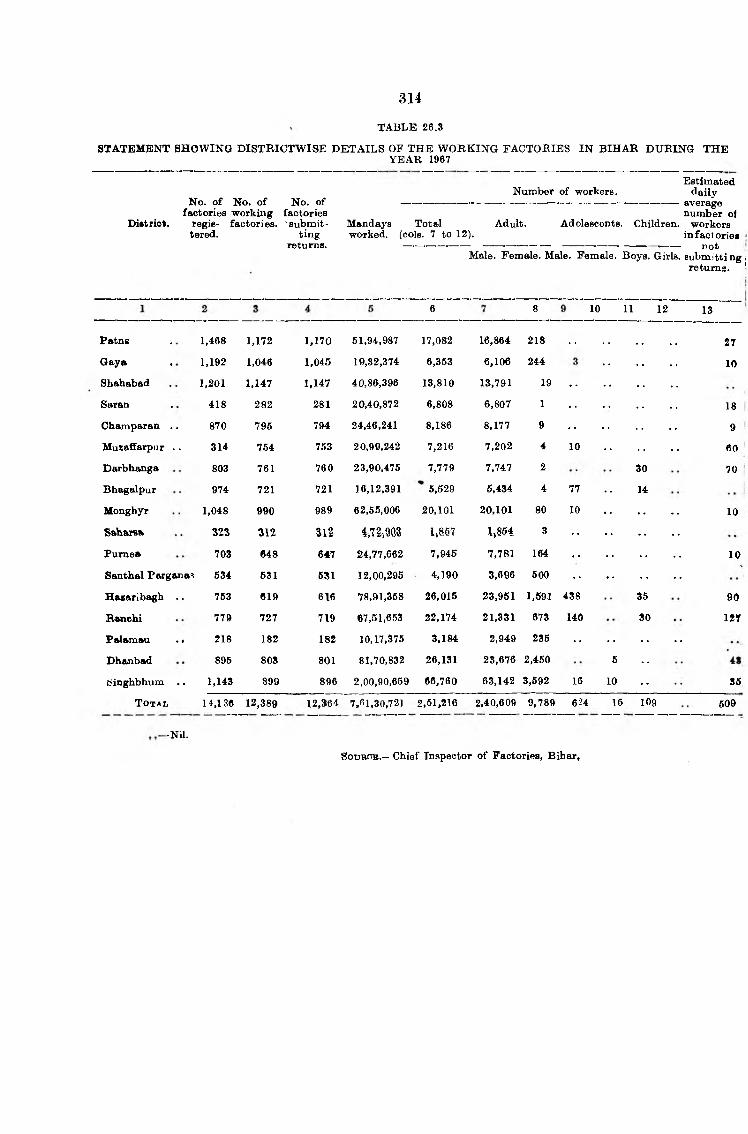
314
TABLE 26.3
STATEMENT SHOWING DISTRICTW ISE DETAILS OF THE W ORKING FACTORIES IN BIHAR DURING THEYEAR 1967
No. o f No. o f No. of factories working factories
Diatrict. regie- factories. ' submit- tered. ting
returns.
Number of workers.
Mandays Total worked, (cols. 7 to 12).
Estimated d a ily
-—.—------- ------- ------- -—..—— averagenimiber of
Adolescents. Children, workers infactories
-------not
Adult.
Male. Female. Male. Female. Boys. Girls, submitting ireturns. '
6 8 10 11 12 13
Patng
Gaya
Shahabad
Saran
1,468
1,192
1,201
418
1,172
1,046
1,147
282
1,170
1,045
1,147
281
51,94,987
19,32,374
40,86,396
20,40,872
17,082
6,353
13,810
6,808
16,864 218
6,106 244
13,791
6,807
19
1
27
10
18
Champaran . . 870 795 794 24,46,241 8,186 8,177 9 9
Muaaffarpur . . 314 754 753 20,99,242 7,216 7,202 4 10 60
Darbhanga 803 761 760 23,90,475 7,779 7,747 2 30 70
Bhagalpur 974 721 721 16,12,391 6,529 6,434 4 77 •• 14
Monghyr 1,048 990 989 62,56,006 20,101 20,101 80 10 10
SaliaTsa 323 312 312 i,7S-,903 1,867 l,864_ 3
Purnea 703 648 647 24,77,662 7,945 7,781 164 10
Santhal Pargana^ 634 631 631 12,00,295 4,190 3,696 600
Hazaribagh . . 753 619 616 78,91,368 26,015 23,951 1,591 438 35 90
Ranchi 779 727 719 67,51,653 22,174 21,331 673 140 SO 12Y
Palamau .« 218 182 182 10,17,375 3,184 2,949 285
Dhanbad 896 SOS 801 81,70,832 26,131 23,676 2,450 5 . .
cSinghbhum . . 1,143 899 896 2,00,90,659 66,760 63,142 3,592 16 10 . . S5
T o t a l 14,136 12,389 12,364 7,fil,30,721 2,51,216 2,40,609 9,789 624 16 109 509
-Nil.
iSouROB.— Chief Inspector o f Factories, Bihar,

316
TABLE 26.4.
»StA tE M E N T SHOWING DISTRIBUTION OF FACTORIES ACCORDING TO W ORKING STRENGTH IN BIHAR.DURING THE Y E A R ]967.
Industries.Working atrength.
than0
10— 19. 20— 49. 60— 99. 100- 499. 500- 999. 1,000-4,999.
2 3 4 5 6 7 8— — ------------------
60 65 7 •• •• •• ••
r,849 209 .151 22 33
I 2 6 1«
•• ••
4 26 48 11 •• 1
27 30 13 3 4 3 2
4 6 1 •• 2 ••
60S 114 10 7 1
17 16 6 1 •• ••
1 2 8 2 1 •• 1
418 73 21 6 1 ••
1 3 •• 1
34 1 1 •• •• ••
32 62 17 4 8 •• 1
13 5 6 11 1 1
35 96 181 98 63 9 6
28 13 17 2 9 6
234 87 64 17 6 2 1
293 60 44 23 18 6 1
29 10 6 6 S 1 1
251 43 41 20 7 1 1
149 22 15 5 1
130 62 34 4 7 2
3 9 13 6 • •
6,000.
9* 1
0.1
20.
21.
22.
^3.
24.
25.
26.
27.
28.
29«
30.
81.
32.
83.
►)4.
i5.
J6.
?8.
19.
>2.
13.
U.
i rocess edlied to Agriculture (gins and process).
Food except beverage
Beverage
Tobacco
Textiles
Footwetir, other wearing apparel and made up textile goods.
W ood and cork except furniture
Furniture and fixture
Paper and paper product
Printing and publishing and allied industries.
Leather and leather products . .
Rubber and rubber products
Chemical and chemical products
Products o f petroleum and coal
Non-metallic mineral products (except products o f petroleum and coal).
Basia Metal Industries
Metal products (except machi- nery and transport equipment).
Machinery (except Electrical Machinery).
Electrical Machinery, apparatus, appliances and supplies.
Transport equipment
Miscellaneous industries
Elect^rical gas and steam
Water and sanitary services . .
Recreation industries
Person^ service (laundries, dyeing and cleaning).
T o t a l
75
10,177
-Nil
1,096 721 2o7 168 83
•Figures include the factori«i under sections 2m(t), 2wi(«) and 36,
SOTJBCB.— Chief Inspector o f Faotori**, Bihar.
20

3 1 6
TABLE 26.5.
STATEMENT SHOWING NUMBER OF W ORKERS EMPLOYED IN VARYING SIZE OF FACTORIES ACCORDINGTO W ORKING STRENGTH IN BIHAR DURING 1967.
Industries.*Working strength.
Less than 10.
10— 19. 20--49 . 50— 99. 100 499. 600— 999. 1,000—4,999.
Over5,000.
2 3 4 6 6 7 • 8 9
271 975 170
26,947 2,826 4,325 1,370 10,194 2,778
3 28 187 53 .
16 337 1,419 705 1,441
140 432 574 241 838 1,781 4,354 .
43 149 70 1,820 .
2,503 1,438 536 437 112 .
' 91 198 143 82
5 33 68 166 158 3,020 .
2,060 935 674 264 1,127 628 •
3 93 510 .
0.1
2u.
21.
22.
23.
24.
25.
26.
27.
28.
29.
30.
31.
32.
33.
34.
36.
36.
37.
38.
39.
61.
62.
83.
84.
. Process allied to agriculture (gins and process.)
Food except 1 everage
Beverage
Tobacco
Textiles
Footwear, other wearing apparel and made up textile goods.
Wood and cork e cept furniture
Furniture and fixture
Paper and paper product
Printing and publishing and allied industries.
Leather and leather products
Rubber and rubber products
Chemical and chemical products
Products of petroleum and coal
Non-met£kUic mineral products (except products o f petro* leum and coal).
Basia Metal Industries
Metal product (except machinery and transport equipment).
Machinery except electrical
Electrical machinery apparatus, appliances and supplies.
Transport equipment
Miscellaneous Ihdustries
Electrical gas and steam
Water and sanitary service . .
Recreation industries
Personal service (laundries, 305dyeing and cleaning).
T o t a l .. • . 37,957
91 30
. . — Nil.
•Figures includes the factories under sections 2m(t), 2m{ii) and 86.
SO URCE.— Chief Inspector o f Factories, Bihar.
135 \1 T4
251 1,368 742 240 952 1,290 5,124
68 66 153 3,459 870 1,092
177 1,342 5,452 6,765 11,524 6,301 5,750 ••
116 196 528 120 2,452 14,168 20,762
l,u04 1,225 1,887 1,069 1,351 1,102 1,779
1,250 793 1,441 1,641 3,996 3,626 1,494 24,025
134 147 193 471 1,003 540 2,184
1,216 601 1,578 1,378 2,067 605 1,375 10,100
684 293 417 317 116
665 696 579 263 2,275 1,600
23 113 364 307
14,192 21,402 16,033 41,714 21,960 37,947 60,011

3 lt
TABLE 26.6.
STATEMENT SHOWING NUMBER OF ACCIDENTS REPORTED IN THE FACTORIES OF BIH AR.
N u m b b b s o p A c c i d e n t s R b p o k t b d .
Year.
Fatal. Non-Fatal. Total.
1959196019611962196319641965196619671968
31 8,264 8,29531 8,426 8,45624 9,713 . 9,73725 9,927 9,95243 9,091 9,13426 8,990 9,01626 8,921 8,94733 7,937 7,97036 6,996 7,03228 6,650 6,678
S o u r c e . — Chief Inspector o f Factories, Bihar.
TABLE 26.?.
STATEMENT SHOWING THE NUMBER OF OASES OF INJURIES IN WHICH COMPENSATION WAS PAIDAND AMOUNT OF COMPENSATION P A ID 1 5 BIH AK.
No. o f cases o f injuries in respect of which final Amount o f compensation paid compensation was paid during the jear. (in Rupees).
Year.Deaths. Permanent Temporary Total. Deaths. Permanent Temporary Total,
disablement, disablement. disablement, disablement.
1 2 3 4 5 6 7 8 9
1959 122 243 2,362 2,727 2,97,600 1,59,088 63,728 5,20,416
1960 122 655 7,017 7,794 3,09,051 1,95,034 5,79,284 10,83,369
1961 137 572 10,104 10,813 2,98,933 2,14,852 6,49,256 11,63,041
1962 174 403 6,790 7,367 3,40,311 2,37,986 2,70,811 8,49,108
1963 141 162 10,325 10,628 4,15,449 1,47,502 3,93,030 9,55,981
1964 92 194 9,105 9,391 4,58,845 2, 6,077 6,13,114 13,18,036
1965 168 210 9,958 10,336 10,92,447 3,78,583 6,30,557 21,01,587
1966 136 328 9,071 9,535 7,23,490 2,88,351 6,55,491 16,67,332
1967 157 178 6,647 6,982 8,48,613 2,77,568 5,81,939 17,08,120
1968 218 86 2,836 3,140 12,19,475 1,98,744 1,85,738 16,03,957
SOTTBOH.— Commissioner o f Labour, Bihar.

St a t e m e n t s h o w in g t h e t o t a l n u m b e r o f f e m a l e w o r k e r s e m p l o y e d , n u m b e r o f c l a im s ,NUMBER OF MISCARRLAGES AND THE AMOUNT OF MATERNITY BENEFITS PAID TO FEMALE WORKERS UNDER TH i: BIHAR M ATERNITY BENEFIT ACT, 1947 IN BIHAR.
318
TABLE 26.8
Year.
Total number o f
Total number o f
female workersfemale workers excluding
employed childrenin all covered under
factories. the Maternity Benefit Act.
Number o f claims
accepted.
Number of miscarriages.
Amount o f Maternity
Benefit paid to workers.
• 1 2 3 4 5 6
Rs.
Id69 • • • • • 9,474 9,465 728 33 91,320
1960 « • • • * 8,845 8,845 589 25 94,518
1961 • « • • • 8,828 8,828 423 30 81,127(a)
1962 • • • 10,023 10,016 455 22 89,532(6)
1963 • • • • * 10,064 8,252 303 23 69,285
1964 • • • • • 10,243 10,243 281 30 82,995(c)
1965 • • • • • 10,091 10,091 291 16 75,820
1966 • * • • • 9,347 9,347 280 13 83,954
1967 • • • • * 9,787 9,787 261 7 79,883
1968 •• 9,473 9,473 201 8 71,890
(o) This amount includes Rs. 5,265.86 paid in respect of 53 cases o f the previous 3'ears which were accepted but were not paid due to non-resumption o f their duties during the same year.
(6) This amount includes Rs. 8,594.96 paid in respect o f 1961 which W3re accepted but not paid.
(e) This amount includes Rs. 10,555.23 paid in respect of 56 cases of the previous years, which were accepted but were not paid due to non-resumption of their duties during the same year.
SouRCB.—Chief Inspector of Factories, Bihar.

319
TABLE 26.9
STATEMENT SHOWING THE NTBIBER OF FACTORIES AND FEMALE W ORKERS EMPLOYED THEREINUNDER THE BIHAR MATERNITY BENEFIT ACT, 1947 IN BIH AR.
Year.Number of
Number of female workers factories. omployed.
1959
1950
1961
19»2
1963
1964
1965
1966
1967
1968
288 9,465
311 8,845 •
357 8,828
435 10,016
349 8,252
403 10,243
451 10,091
415 9,347
422 9,789
425 9,473
S o u r c e , —Chief Inspector of Factories, Bihar.

STATEMEITT SHOWING NUMBER OF 5’ACTORIES EMPLOYING FEMALE WORKERS AND THE NUMBER OF FEMALE WORKERS EMPLOYED THEREIN DISTRICTWISE UNDER THE BIHAR MATERNITY BENEFIT ACT., 1947 IN BIH AR.
320
TABLE 26.10
District.1968
Number of factories
employing female
workers.
Number o f female workers
employed.
Patna
Gaya
Shahabad
Saran
Champaran
Muzaffaxpur
Darbhanga
Monghyr
BhagtJpur
Purnea
Saharsa
Santhal Parganas
Hazaribagh
Ranchi
Palamau
Dhanbad
Singhbhum . .
T o t a l
30
19
3
3
2
5
1
8
4
U
26
78
55
28
47
102
425
185
261
15
9
14
13
2
68
89
159
428
1,746
693
253
2,021
3,517
9,473
, . - N U .S o u r c e :.— Chief Inspector of Factories, Bihar.

Jt a t e m e n t s h o w i n g n u m b e r o f f a c t o r i e s s u b j e c t t o o p e r a t i o n o f t h e p a y m e n t o f w a g e s: ACT, NUMBER OF FACTORIES ACTUALLY W ORKED, NUMBER OF PERSONS EMPLOYED D AILY AND
TO TAL WAGES PAID IN BIHAR.
321
TABLE 26.11
Year.Number of
factories subject to operation of the Payment of Wages Act
at the end of the year.
Number of factories worked
during the year.
Average number o f persons employed
daily.
Total wages paid molusive o f money
value o f concessions and cash benefits including deduction under
olauses (a) to ( /) o f Bub-fleo-
tion (2) o f section 7 o f the
Payment of Wages Act.
1959
1960
1961
1962
1963
1964
966
966
967
968
2 3 4 6
1,875 1,617 1,63,233
Bs.
23,93,68.634
1,981 1,537 1,62,125 25,39,54,328
2,026(6) 1,476 1,62,248 25,55,36,010
2,191(6) 1,660 1,77,933* 28,50,01,8211
1,808 1,796 1,79,548 29,11,98,847
11,145(c) 9,884 2,22,733 33,26,04,153
12,364 10,563 2,23,964 38,92,69,196
13,388(c) 11,578 2,26,711 41,24,93,529
14.142(a) 12,359 2,35,143 45,03,83,991
15,351(a) 13,410 2,36.678 49,62,42,737
Incl des 22 Railway Factories and 6 Defence establishments from which returns w e not collected by Factory Inspector.
k) Includes 21 Railway Factories and 4 Defence establishments from which returns are not collected by Factory Inspector.
») Includes 22 Railway Factoriea and 5 Defence establishments from which returns are not collected b y the Factory Inspector.
♦This gives figures o f persons employed getting less than Rs. 400 per month.
■j-Thi* is the total o f wages paid to such employee getting less than Rs. 400 per month. I f all the employees w ill.be taken the figure would be higher.
P la -.— 44SOUBOB.— Chief Inspector o f Factories, Bihar.

STATEMENT SHOWING. THE NUM BER OF EMPLOYMENT EXCHANGES, NUMBER OF APPLICANTS REGISTERED, NUMBER OF APPLICANTS PLACED IN EMPLOYMENT THROUGH EMPLOYM, NT EXCHANGES IN BIH AR.
322
TABLE 26.12
Year.
Number of employment
exchanges f nctioning
during the year.
Number o f apphcants
registered (including re-registra
tion).
Number of applicants placed in
employment.
Number o f applicants
on live register
at the end of the year.
Vacancies noticed
during the year.
1 2 3 4 6 6
1069 24 1,48,862 10,331 84,377 26,102
1900 24 1,64,655 9,587 1,16,469 26,091
1961 24 2,36,697 20,898 1,27,136 40,024
1962 24f 2,62,470 26,328 1,80,037 47,732 j1963 26| 2,60,932 3z,574 1,79,029 49,106
1964 - . . . . 25j 2,25,739 33,219 1,62,471 54,637 1
1965 25 2,44,870 49,466 1,82,662 73,726
1966 26 2,59,941 32,056 2,16,088 50,560 ' I !
1967 23 2,89,359 23,118 2,40,256 39,422 1
1068 26 S,08,06'J 2»67»QIQ 39,006
•flncludes2 CampsE. C. S under S .R .R ., Dhanbad.■[■Includes 2 Camps E. E., Sindri &nd Kumardhubi under S. R. E , Dhanbad
SoxTBCs.—State Director of National Employment Sonrice, Bihar.
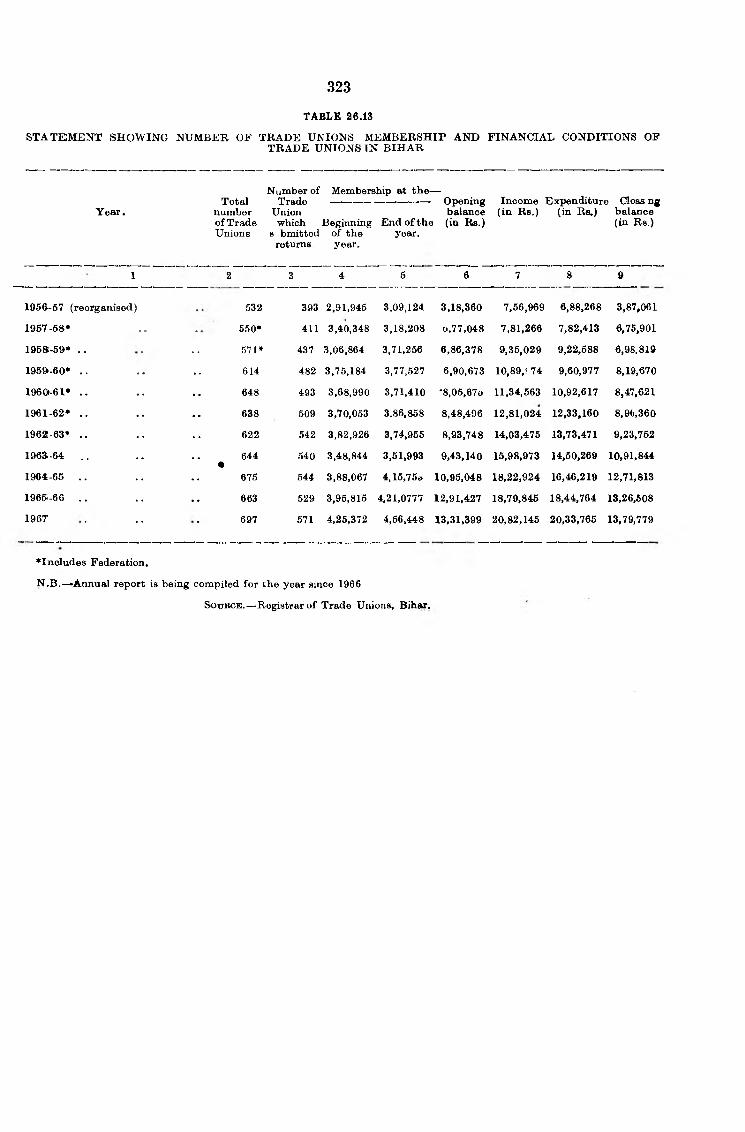
323TABLE 26.13
STATEM ENT SHOWING NUMBER OF TRADE UNIONS MEMBERSHIP AND FINANCIAL CONDITIONS OFTRADE UNIONS TN BIH AR
Year.Total
number of Trade Unions
Number of Membership at the—Trade —■■—•—---------- -—------- Opening Income Expenditure Closs ng
Union balance (in Rs,) (in Rs.) balancewhich Beginning End o f the (in Rs.) (in Rs.)
s bmitted of the returns year.
year.
1 2 3 4 5 6 7 8 9
1956-57 (reorganised) 532 393 2,91,945 3,09,124 3,18,360 7,56,969 6,88,268 3,87,061
1967-58* . . . 550* 411 3.40,348 3,18.208 0,77,048 7,81,266 7,82,413 6,76,901
1958-59* . . 571* 437 3,06,864 3,71,256 6,86,378 9,35,029 9,22,588 6,98,819
1959»-60* . . 614 482 3,75,184 3,77,527 6,90,673 10,89,' 74 9,60,977 8,19,670
1960-61* . . 648 493 3,68,990 3,71,410 *8,05,670 11,34,563 10,92,617 8,47,621
1961-62* . . 638 509 3,70,053 3.86,858 8,48,496 12,81,024 12,33,160 8,96,360
1962-63* .. 622 542 3,82,926 3,74,955 8,93,748 14,03,475 13,73,471 9,23,752
1963.-64 .. 644% 540 3,48,844 3,51.993 9,43,140 15,98,973 14,50,269 10,91,844
1964-65 . . 675 544 3,88,067 4,15.75o 10,95,048 18,22,924 16,46,219 12,71,813
1965.-66 .. 663 529 3,95,815 4,21,0777 12,91,427 18,79,845 18,44,764 13,26,608
196T 697 571 4,25,372 4,56,448 13,31,399 20,82,145 20,33,765 13,79,779
♦Includes Federation.
N .B .— Annual report is being compiled for the year since 1966
S o t j k o e .— Registrar o f Trade Unions, Bihar,

STATEMENT SHOWING STOPPAlGES, W ORKERS INVOLVED AJ^D MANDAYS LOST IN DIFFEREINTINDUSTRIES IN BIHAR.
324
TABLE 26 14
Number of Number o f Number <Year. stoppages. workers mandayi^
involved. lost.
1 2 3 4
1969 . . • • • • 57 17,877 76,120
1960 .. • • • • 58 20,239 1,64,768
1961 .. • • • • • ■ 86 11,438 62,491
1962 . . • • • • 38 10,617 39,032
1963 .. • • • • 21 10,585 61,863
1964 . . • • • • • • • * 37 43,216 3,88,033
1966 . . • • • • • • • • • • 33 9,827 1,25,220
1986 . . • • • • • • • • • • 61 30,229 2,24,899
1967 . . • • • • • • • • 67 46,545 7,70,852
1968 .. •• •• •• •• • 89 24,088 1,18,268
SoxTBc®.— ^Commissioner o f Labour, |6ihar.

325
TABLE 26.15
STATEMENT SHOWING STOPPAGES, WORKERS INVOLVED AN D MANDAYS LOST IN DIFFERENTINDUSTRIES IN BIHAR DURING 1968.
Industries.Nvimber o f Number o f Number of stoppages. workers mandays
involved. lost.
Textile
^Engineering
IMiscellaneous 84
1,408
22,680
19,262
99,016
Total 89 24,088 1,18,268
-N i l SouBcB.— Cpinmigsioner o f Labour, Efihax.
TABLE 26.16
STATEMENT SHOWING NUMBER OF TRAINING CENTRES AND NUMBER OF PERSONS UNDERGOING TRAINING THEREIN (ORGANISED B Y MINISTRY OF RESETTLEMENT AND EMPLOYMENT, GOVERNMENT
OF INDIA), IN BIHAR.
year. No. o f Centre.
No o f persons undergoing training.
Nonengineering.
Others. Total.
1 2 3 4 5
1959 • • .14 91 2,759 2,8501960 • • 19 98 3,645 3,743
1961 • • • 20 80 4,354 4,434
1962 • • • 22 66 5,273 5,3391963 19 54 6,270 6,3241964 19 58 6,354 6,412
1966 29 45 9,297 9,342
1966 29 60 13,006 13,0661967 - 29 37 9,518 9,5551968 - . . 29 12 9,396 9,408
SOT7BOE.— Indian'..Labour Journal.


SECTION XXVII Gensas 6f Manutacturins Indastries

328
TABLE 27.1
STATEMENT SHOWING CENSUS OF MANUFACTURING IN33USTRIES IN THE STATE OF BIHAR.
Productive capital employad.Numberof
Number fa c to r ie s ------------------------------------------------------------Year. o f from
factories whichin returriswere Fixed,
existence, received.
Nj:ab3r o f parsons employed.
Working.Persoi^
Total. Workers, other than workers.
Total.
1 2 3 4 5 6 7 8 9
Rs. Rs. Rs.
1953 410 374 50,27,88,358 45,88,41.076 96,16,29,434 88,770 22,251 1,11,021
1954 350 331 51,88,33,372 44,16,49,310 96,05,32,682 88,': 85 22,422 1,11,207
1955 y 346 343 62,10,39,591 50,57,09,450 1,12,67,49,041 92,415 24,040 1,^,455
1956 347 344 73,99,02,984 53,39,95,639 1,27,38,98,623 98,912 24,039 1,22,951
1957 350 341 97,99,09,321 53,51,34,176 1,51,60,43,497 1,01,043 24,544 1,25,587
1958 364 351 1,49,08,63,814 60,02,30,834 2,09,40,94,648 1,00,262 25,320 1,25,582
1960 257 241 1,97,97,39,235 57,45,73,439 2,55,43,12,674 1,33,(96 32,762 1,65,858
1962 305 298 2,91,00,82,000 70,85,27,000 2,89,86,09,000 1,51,547* 34,118 1,85,665
1963 318 307 2,44,97,85,000 89,06,94,000 3,34,04,79,000 1,60,719 34,998 1,95,707
TABLE2 7.1—cw«£«.
Year.
Wages paid to
workers.
Wages and Salaries.
S alaries an d wages paid to persons Non-cash
other than benefits, workers.
materials and Total. chemicals
consumed.
Cost o f fuel, etc. consumed.
1 10 11 12 13 14 15
Rs. Rs. Rs. Rs. Rs. Rs.
1953 42,48,24,875 4,59,91,554 1,04,97,883 18,13,14,312 45,49,(8,£46* 8,68,30,48s-)-
1954 12,63,80,615 4,73,31,199 1,57,68,637 18,94,70,451 53,84,28,11 8* 9,13,79,22Ct
1955 18,41,54,446 5,11,77,179 1,79,12,701 20,32,44,326 61,91,80, 8,64,7 9,’:': 81
1956 14,08,23,226 5,51,05,685 1,83,02,898 21,42,31,309 66,£(,1 2,J£7* 9,53,5C,8C(t1957 14,57,78,561 5,78,76,167 2,69,43,162 22,45,97,890 63,C8,4S,43”,* 12,21,74,495-j-
1958 14,98,62,354 6,05^00,545 2,29,40,314 23,33,03,213 68,58,81,2£2 83,26,£2,r.9
1960 24,18,10,032 9,88,24,798 4,11,46,245 38,17,81,075 1,26,65,20,033 22,02,15 168
1962 29,22,22,000 11,37,58,000 4,20,67,000 44,80,47,600 1,63,11,24,000 2,6,64,64,000
1963 33,21,26,000 12,41,22,000 5,27,11,000 50,89,59,000 1,69,44,13,000 32,37,50,000
♦Includes the value o f semi-finished products or finished parts manufactured earliei but c c i .a n ft c’ uiii^ iLt y€*r.
•^Includes cost o f transport o f materials fuels etc. to factory.

329
TABLE 27.1— coticid.
Products and by-produota.
Value o f Ex-faotorywork done Total cost valufOf Value o f
Tear. Depreciation. forindustry including products work done forby other Depreciatiou and customers,
concern. (Cols. 14 tol7). by-products.
Total.Value
adde d by manufacturera.
1 16 17 19 20 21 23
Bs. R3. lirf. Rs. Bs. Bs. B i.
1053 3,85,42,542 26,2 7,')9;- 58,29,18,669 96 ,009 ,2 03 71,92,587 96,79,31,863 38,50,13,134
1964 4,16,40,332 26,75,587 67,41,23,347 1,07,91,26,191 86,71,314 1,08,77,96,506 41,36,73,158
1966 6,09,03,310 24,63,3c 6 75,90,] 6,8£-_ 1,2’ ,2 ,45,391 53,27,951 1,21,74,73,342 45,84,56,520
1966 6,17,30,324 28,14,587 82,49,87,862 1,35,67,39,554 74,09,719 1,36,41,49,273 53,91,61,411
1967 8,40,22,166 33,-i2,703 H4,;'3,82,801 I,35,62,07,U«0 U 3,36,202 1,36,75,43,292 62,40,08,607
1958 13,38,56,366 36,29,456 1,65,23,69,837 1,45,76,78,701 1,23,96,478 1,47,00,75,179 48,35,69,630
1960 . . 16,11,11,326 19,68,69,874 1,84,47,06,390 2,35,73,61,005 7,82,92,435 2,44,96,84,511 60,49,78,121
1962 22,62,69,000 14,49,54,000 2,26,78,15,CCO 3,02,61,2f.,0C0 6,19,38,000 3,11,14,82,000 84,36,67,000
l963 21,44,92,000 14,68,27,000 2,37,94,82,000 3,17,58,83,000 7,60,09,000 3,27,58,90,000 89,84,08,000
SOVBOB.— Ce&sus of Mauofactarers.
96 Plann ng 45

330
STATEMENT SHOWING THE INDUSTBY-WISE NUMBER OF FACTORIES, F IX E D CAPITAL WORKING CAPITTHE v a l u e OF PRODUCTION ACCORDING TO THE CEN
Number ofNumber of factories
(/i) Includes the figure for Andhra, U.P., Bihar, M.P., Punjab, Delhi, Qrisffa and Saurashtra. (6) Includes the figures for Andhra, Bihar, M.P., and Orissa.(c) Includ b the figures for Bihar, Orissa, PEPSU and Assam.(d) Includes the figures for Bombay, Bihar and M.P.(e) Includes the figures for Bihar, PEPSU, Assam and Eutoh.(/) Inoludet tho ^ures for Madras, Bihar And Saarashtra.
Induatries. registered factories
in existODce.
from which return^ were
reoeived.
Fixedcapital.
Workincapiti
1 'i 3 4
B i.
Wheat flooY . . 13 18 17,65,316 I9,02,i
Bioe ooilling - - 127 120 73,06.903 88,22,
Biscuit-making a.« • « e 6 14,89,635 21,66,
Sugar *. • • •• • • IS 28 2,76,76,400 7.12,12,
Qu? *. ^ .• - . . t 8 1,02,317 50,i
Distilleries and breweriai (including Power Alcohol maaufactaring) 0 6 24,00,363 18,09,1
Edible Hydogenated oils (o) - • • •• 13(1) 13(1) 3,46,68,344 2,12,71;
Soap (£>) •• •• •• 4(1) i(l)2 4,09,851 2,00/
Tanning («) • • *• •• 0(1) 6(1) 0,84,488 16,16,
Cement •• •• •• 5 6 8,02,00,191 1,77,62*
Vegetable o ill . . •• • • • • 60,27,138 4B,7&,
Glass and glasswaresf •• • • •• 10 0 1,00,22,287 28,76;
Oeramiot •• •• •• 0 8 1,02,60,146 66,76,
Plywood and tea-chest (<l) •• • • U D 4(1) 22,79,628 12,08<
Pap9r and paper board ... . . • • 76,24,421 47,01,
Cotton Textile* (») •• • • •• m 6(2) 99,60,786 86.63,
Woollen Textiles (•) •• • • •• 4(1) 4(1) 68,01,679 28.16,
Jute Textiles (y) •• •• •• 7(3) 5(1) 63,47,225 l,27,19j
CbemioaLi . . . • • • - “ 14 18 81,70,16,046 8,66,78
Aluminium, Copper and Brass •• •• • • fl 4 1,66,66,220 4,22,63
Iron and Steel Smelting • • •• •• 4 4 13,60,37,309 22,72,14
Bicycles (ft) •• •• •• 8(1) 8(1) 1.08,06,616 37,51,
Eleotrio Lamp (») - •• •• 4(1) 4(1) 84,67,988 29,69
General Engineering and Electrical Engineering . . 97 92 1,81,03,662 2,24,44

331
isON S EM PLOYED, AVERAGE NUMBER OF WORKING DAYS, SALARIES AND WAGES PAID ANDMANUFACTURES IN BIH A R DURING THE Y E A R 1963.
tal number Average number Total Balaries, Valu© o f factory Total value o ft o f o f wages o f Total valua products Value addedDergons wor'ting and other materials o f and bymployed days. te ie fits consumed, products. by-nroducts manufacture*,jerday. paid. (ex-factory.).
8 9 10 11 12
474
0,047
824
27,620
56
427
8,867
118
43B
4,121
1.953
2,228
6,801
658
1,010
8,798
9,822
0,224
C.493
3,774
|7,U07
794
833
10,456
243
153
215
75
130
224
N.A.
N.A.
242
355
236
263
316
N.A.
273
295
23*?
285
325
310
320
300
302
269
B a.
4,08,525
21,14,802
3,82,004
1,76,13,230
27,212
4,30,073
41,01,292
66,406
8,69,950
69,62,220
13,00,608
15,59,919
82,65,686
4,42,546
14,20,735
33,17,814
7,64,165
89,01,546
1,04,63,309
60,68,024
10,80,14,291
6,83,180
12,36,377
1,28,94,730
Bs.
1,29,28,914
6,82,12,557
21,39,998
7,34,36,471
2,28,629
15,47,036
13,51,76,748
7,54,993
81,02,448
2,31,66,188
3,25,90,077
87,48,096
43,52,522
7,02,587
1,24,19,733
1,04,29,542
49,83,600
2,11,61,821
2,98,86,702
4,30,28,609
13,35,63,745
66,64,090
22,78,720
1,11,54,931
Bs.
1,22,05,568
6,84,43,576
N.A.
10,83,36,177
2,50,407
33,39,217
16,56,72,200
9,56,971
40,57,063
N.A.
2,84,97,606
68,68,888
N.A.
11,63,199
N.A.
1,76,63,427
69,85,621
N.A.
0,01,92,041
N.A.
42,73,54,685
N.A.
N.A.
N.A.
Bs.
1,37,30,195
5,90,87,519
80,64,732
10,85,47,682
2,66,063
33,01,267
16,23,19,149
10,16,680
40,51,*I92
6,63,29,082
3,68,69,522
55,58,721
1,71,84,152
11,63,199
1,67,67,562
1,83,09,435
69,95,709
3,12,53,666
9,33,71,623
6,65,00,484
45,09,44,310
1,05,05,147
48,83,276
N.A.
B a.
6,21,628
1,71,400
7,21,715
3,08,69,628
20,226
11,66,390
2,28,15,829
2,16,712
,39,654
2,10,26,657
19,94,747
2,80,499
99,17,058
2,71,232
12,23,198
64,11,863
16,07,883
83,36,344
3,47,69,072
70,46,091
25,40,86,619
14,31,766
20,2 9,f04
1,75,14,460
(g) Includes the figures for U.P., M.P. and Bihar.(h) Includes the figures for Madras, Bihar anci Delhi.(») Ij^olndfts tho figures for Bom bay, U P ,, and Bihar.
'Excludes production o f soap in factories which produce soap as a secondary product or by r-rof^uct,Figures reported in (♦) columnp 2 and 3 stand tor Bihar State, figures under column 7 relate to Bihar orJy,
N .A .-N o t avaUftble.

332
TABLE
STATEMENT SHOWING INDUSTRY-WISE THE NUMBER OP FACTORIES, FIXED CAPITAL, WORKINGAND THE VALUE 01’ PKODUCTIGN ACCOEDING TO THE CENSUS
InduBtriei.
Number o f Numberj o f factories registered from which factories returns
in existence. were received.
Fixedcapital.
Workingcapital.
Wheat flour
Rioo millin,g
Biscuit-making
Sugar
Distilleries and breweries (including Power Alcohol Minufacturing]
Edible hydrogenated oils (a) ..
Soap {h)
Tanning (?)
Cement
Vegetable oils
Glass and glassvrares
C3ramics
Plywood and tea-chest (d)
Paper and paper-board (e)
Ootton Textiles ( /) . .
Woollen textiles (jjr)
Jute textiles {h) . .
Chemicals
Aluminium, Copper and Brass . .
Iron and Steel Smelting •. . . . •
Bicycles (*)
Electric lamp (j) • •
General EngiAeering and Electrical Engineering
Rs. R«.
4 4 12,03,210 15,19,819
123 104 70,53,042 1,10,88,468
5 5 11,85,920 15,95,000
31 30 3,01,21,462 29,14,42,285
6 6 22,71,619 1,82,065
11(1) 11(1) 2,86,94,836 2,08,29,737
7(1) 6(1) 1,01,09,266 96,90,232
6(1) 6(1) 17,71,484 21,36,571
& 5 3,03,92,610 1,65,64,952
47 43 54,87,279 61,60,798
4 4 1,07,84,321 29,20,191
9 9 1,06,39,810 76,59,608
6(1) 4(1) 48,52,900 22,65,361
10(2) 10(2) 6,19,02,018 34,91,365
2(2) 2(2) 86,68,363 82,24,901
4(1) 3(1) 80,35,780 46,08,404
1(3) 1(3) 93,07,447 49,63,843
14 14 20,35,96,499 23,88,88,328
4 3 1,72,05,980 2,73,78,227
4 4 15,91,08,167 20,38,34,497
10(1) 10(1) 43,74,069 8,58,286
4(1) 4(1) 87,80,611 39,71,058
80 77 1,97,04,113 2,17,76,711
(«) Includes the figures for Madras, Andhra, Bihar, Madhya Pradesh, Punjab, Delhi, Orissa and Saurashtra.(b) Includes the figures for Andhra, Bihar, Midhya Pradesh, Delhi, Orissa, Travancore-Cochin.(c) Includes the figures for Bihar, Mysore, Orissn, PEP.^U, S lurashtra and Assam.(d) Includes the figures for Bombay, Bihar, Mysore and Madhva Pradesh.(e) Includes the figures for Madras, Andhra, Bihar, Mysore, Madhya Pradesh, Punjab, Orissa, Saurashtra and
Travancore-Cochin.(/) Includes the figures for Bihar, PEPSU and AsBam.

333
ilP ITA L, PERSONS EM PLOYED, AVERAGE NUMBER OF WORKUra nAV«s <3at Arenac, aatxxlND o f MANtTFACTURERS IN BIH A R DURING THE Y EAR I9M SALARIES AND WAGES PAID
Total t ntiniber of
persons employed
per day.
Average uumbar o f working
days.
Total salaries and
wages and otherbenefits
paid.
Value at factory
o f a ■'■’i'll i conaumed.
TotalV llU3 o f
products.
Total value of
products and ]jy-products (ex-faotory).
Value added by
manufacturers.
8 10 11 12
ts o
6,153
310
27,151
366
3.254
740
602
1,883
1,474
6,792
666
9,676
3,701
I,578
S,95I
6,484
3,889
36,616
666
1,080
II,092
212
174
223
124
227
1,687(122)
1,449
1,444(242)
GO
231
176
332
614
2,634(363)
540(295)
607(303)
305(299)
316
443
321
282(299)
903(303)
288
Rs.
8,10,860
21,53,230
3,29,280
2,02,32,019
4,42,812
42,72,908
10,96,127
7,10,907
6Q,51»572
12,56,282
13,76,706
86,66,463
6,71,197
1,26,57,277
36,29,783
13,36,166
38,34,481
1,23,81,162
63,71,261
10,84,91,867
6,22,946
16,19,346
14,15,893
Rs.
I,11,96,911
51,47,297
24,91,333
13,80,26,918
14,31,336
II,61,82,733
1,19,47,713
38,08,032
2,30,56,951
8,54,08,413
31,68,939
46,68,562
16,40,206
6,18,86,283
1,17,78,646
61,72,377
89,89,370
4,02,63,396
4,52,01,630
13,19,08,123
14,25,399
29,38,623
1,62,26,076
Rs.
12,70,243
6,18,27,604
N.A.
6,60,616
29,29,444
69,89,227
1,44,39,967
48,31,712
8,06,76,398
67,57,682
N.A.
26,16,898
N.A.
1,91,37,300
88,11,234
N.A.
9,29,81,027
N.A.
42,49,66,802
N.A.
N.A.
N.A.
Rs.
1,16,99,234
6,26,93,369
31,44,915
18,74,76,302
28,83,641
12,78,26,972
1,62,82,601
48,06,386
6.23.41.041
3,73,62,066
46,04,389
1,89,01,843
26,13,686
10,61,40,384
1,98,39,726
85,66,743
1,33,27,446
9,32,22,647
7.36.84.041
45,29,09,134
30,12,047
66,90,685
3,87,09,494
Rs.
2,71,358
3,83,488
4,63,610
4,42,73,704
9,51,981
69,50,711
36,16,660
9,03,654
2,69,27,161
8,05,412
10,43,096
1,16,62,364
5,49,"03
4,12,62,261
69,42,176
13.17,488
34,95,838
2,45,26,260
2,31,83,744
25,05,73,756
14,19,424
27,18,628
1,87,58,166
(g) Includes the figures for Bihar, Mysore and Saurashtra.(h) Includes the figures for Bihar and Madhya Pradesh.(i) Includes the figures for Bihar, Delhi and Rajasthan.(J) Includes the figures for Bombay, Uttar Pradesh, Bihar and Mysore.N.B.__Figures under brackets stand for Bihar State.N .A.—Not available.

334
TABLl
STATEMENT SHOWING INDUSTRY-WISE THE NUM BER OP FACTORIES, F IX E D CAPITAL, WORKING CAPITAL,VAL.UE OF PROi>UCnON ACCORDING TO THE CENSUS OF
InduetrieB.
Number o f Number o f factories registered from which
factories returns were in ezistenoe. received.
Fixedcapital.
Workingcapital.
Wheat flour
Rice milling
Bisouit*making
Sugar
Distilleriea and breweries (including Poorer Alcohol cnaaufacturing)
Edible hydrogenated oil (o) . .
Tanning (6)
Cement
Vegetable oils ..
Glass and Glasswarea
Ceramics
Plywood and tea-chest (c)
Paper and paper board (d) .......................
Cotton textiles («) . .
Woollen textiles ( /) . . . .
Jute textiles (g) ..
Chemicals ..
ATiiTnininm, Copper and Brass
Iron and Steel SmeHing
Bicycles {h)
Electric lamps {*) ..
General Engineering and Electrical Engineering
2 8 4 6
Rs. Ite.
6 0 12,76,070 20,00,643
114 114 68,66,633 76,32,110
6 8 11,33,672 13,77,711
SI 31 3,33,70,620 13,48,23,216
7 7 22,44,692 13,32,468
U 14 3,12,77,432 1,82,22,666
7 7 19,16,847 20,37,627
S 0 4,94,89,806 1,87,19,274
49 48 61,08,927 69,70,037
S 6 1,06,37,436 28,44,471
10 10 1,11,96,691 77,60,611
6 6 48,17,390 23,36,778
12t 11 6,91,64,864 6,12,03,048
S S 84,20,687 74,07.478
6 0 82,92,462 40,64,628
4 4 34,04,098 48,22,842
16 10 22,06,27,176 3,61,00,694
4 4 1.79,27,265 9,06,63,849
4 4 21,79,13,016 21,67,61,652
5 6 96,66,877 74,92,663
6 6 83,26,170 46,30,115
77 76 1.98,66,296 2,47,06,371
Jlncludes one in Vindhya Pradesh from which ruo return was received-*Combined figures o f products and by-products.(c) Includes Madras, Andhra, Bihar, Punjab and Delhi.(6) Includes Bihar, Mysore, Punjab, Orissa and Assam.(c) Includes Bihar, M.P. and Kerala.Id) Includes Madras, Andhra, Bihar,Mysore, Pumjab, Orissa and Kerala.

335
27.1PERSONS EMPLOYED, AVERAGE NUMBER OF WORKING D AYS, SALARIES AKD WAGES PAID AND THEMANUFACTURERS IN BIH AR DURING THE Y EAR 1955.
Total number of
persons employed
per day.
Average number of
working days.
Total salaries and
wages and other benefits
paid.
Value at factory
o f materials consumed.
Totalvalue of products.
Totai value o f
products and by-products (ex-factory).
Value added by
manufacturers.
8 10 i l 12
808
4,652
802
£8,011
369
3,640
830
4,368
1,880
1,552
fi,753
078
9,956
2,985
1,741
4,004
9,017
8,965
87,051
1,020 . 1,166
12,049
185
169
270
159
265
249
288
304
283
241
832
240
308
266
279
288
810
801
321
287
301
280
B b.
8,42,018
18,05,337
3,08,840
2,37,54,111
4,15,051
48,33,218
7,71,971
73,70,856
12,97,277
13,37,890
85.49,034
6,92,565
1,31,54,613
33,51,141
12,96,276
39,85,904
1,51,10,058
78,10,108
11,21,45,114
12,48,534
18,12,045
1,59,48,101
Bs.
1,06,31,518
4,03,90,682
22,26,2^3
17,53,03,594
14,12,135
11,44,67,281
53,33,686
2,32,14,573
3,22,56,921
28,96,391
48,76,089
23,27,605
5,43,94,306
09,75,188
68,91,598
1,09,26,408
6,65,31,007
6,50,10,310
14,71,26,161
97,80,297
32,36,902
1,83,69,611
Bfl.
1,01,12,364
4,29,84,857
33,39,945*
23,46,75,382
38,07,640
12,48,90,956
61,55,737
6,02,55,120*
2,88,83,536
69,09,381
1,99,43,872*
60,76,839*
12,15,55,497*
1,80,07,643
85,01,722
1,65,46,294*
10,41,84,722
10,36,59,625*
44,92,65,164
1,57,93,928*
77,35,803*
N.R.
B i.
1,13,77,005
4,38,03,828
33,36,373
23,49,09,276
37,52,391
12,99,09,990
61,24,926
5,78,75,633
3,57,54,395
57,42,869
1,99,43,872
60,57,939
12,02,28,673
1,87,33,270
82,58,669
1,65,46,294
10,45,66,728
10,28,25,625
48,26,00,448
1,54,98,770
75,42,061
4,32,28,845
Bi.
i ,80,648
26,96,088
9,38,689
5,39,47,010
17,61,670
99,00,060
5,92,694
2,15,54,894
22,43,561
15,42,821
1,22,39,156
23,06,116
5,18,40,015
76,80,771
16,12,577
47,60,818
2,42,57,210
. 3,40,62,831
26,20,16,759
48,85,344
32,66,544
2,44,73,851
( ) Includes the figures for Bihar, PEPSU, Assam and Kutch.(j) Includes the figures for Bihar, Mysore and Saurashtra.{g) Includes the figures for Bihar and Madhya Pradesh.(h) Includes the figures for Maoras, Bihar, Mysore and Rajasthan.t) Includes the figures for Bombay, Uttar Pradesh, Bihar, Punjab and Mysore.
N .R .—Not reported.
Sottbob.—Census o f Manufaotuven.

TABLfl
STATEMENT 6H 0W IN 0 INDUSTBYT-WISE NUMBER OF FACTORIES, F IX E D CAPITAL, W ORKING CAPITAI^THE VALUE OF PRODUCTION ACCORDING TO CENSUS OF
Indu8trieB.
Number o f registered
factories in exietence.
Number o f factories
from which returns were
received.
Fixed capital. Workingcapital.
Wheat flour . . . . . . . .
Rice milling . . . . •»
Biscuit-making
Sugar
Distilleries and breweries (including pow er Alcohol) . .
Vegetable oil (excluding edible hydrogenated oil)
Edible hydrogenated oil (a)
Tanning (6)
Cement
Glass ajid Glassware
Ceramics
Plywood and tea-chest (e)
Paper and paper board (d) . .
Matches (f)
Cotton Textiles (f) . . . . .
Woollen Textiles (g)
Jute Textiles (A) . .
Chemicals
Iron and Steel . . . . . •
Electric lamps {%) . .
General Engineering and electrical ea{gineering
8
l ie6
30
7
40
7
7
7
4
10
12
9
10
5
5
4
14
47
75
7
116
6
SO
7
46
7
7
7
3
10
11
0
9
3
t
4
14
4
7
76
Ba.
16,64.943
77,86,690
12,66.848
3,76,54,525
24,15,753
47,49,587
1,31,86,033
18,56,154
6,84,13,533
7.04,04,516
1,39,13,606
33,59,212
10,32,11.608
53,36,090
23,32,561
18,01,717
34,02,682
21.19,99,096
80,18.95,933
87,20,777
2,28,18,649
B f,
24,90,01 OJ
94,63,207
19,59,27®
14,32,61,6691
18,56,480
69,58,10^
1,40,81,187
21,10,166
2,45,67,68(
33,18,03&i
84,16,7041I
14,09,901
4,92,68,22^
64.84,64^
11,92,67^
41.30,40^
6,60,21,170
2,33,94,19^
22,80,86,121
46.72,70(j
2,86,03,14^
•Combined figures for products anid by-products.(а) Includes the figures for Madiras, Andhra, Mysore, Madhya Pradesh, Punjab, Delhi and Sauraflhtreu(б) Includes the figures for Bihair, Mysore, Orissa, PEPSU, Saurtushtra and Assam.(c) Includes the figures for Bom bay, Bihar, Mysore and Madhya Pradesh.(d) Includes the figures for Madras, Andhra, Bihar, Madhya Pradesh, Punjab, Oriasa, Saurashtxa, Travancore-cochi
and Mysore.

337
27.5.
^EKSO'NS EMPLOYED, AVERAGE NUMBER OF W ORKING DAYS, ETC., iMANUFACTURERS IN BIH AR ANDMANUFACTURERS IN BIH AR DURING THE Y E A R 1956.
T otal number o f
persons employed
per day.
fi47
5,105
381
28,367
400
1,569
1,965
648
Average number o f workirg
days.
Total salaries,
wages and other benefits
paid.
Value at factory
o f materials consumed.
Total value o f products.
Total value o f
products and by-pioducts.
(eic-factcry).
ID 11
235
171
237
143
228
216
312
286
Rs.
4,91,117
20,13,236
3,01,886
2,93,74,718
4,48,121
10,10,012
32,99,261
8,32,709
Rs.
1,95,84,432
6,44,846
17,60,638
17,19,25,553
26,67,699
2,85,52,609
10,88,11,092
54,05,050
Rs-
I,84,42,68J8
6,81,59,434
27,88,36.5*
21,53,59,50)2
39,10,96!8
2,46,38,34t6
II,26,37,29)0
65,41,06;3
6,929 320 79,47,539 4,00,49,829 7,34,47,87 6*
1,174 342 13,13,230 42,69,408 66,63,19)8
6,228 336 98,64,106 83,75,975 2,33,97,6772*
1,320 277 8,87,196 38,29,541 82,19,073
11,698 323 1,76,51,660 7,35,21,900 13,26,29,1319*
3,095 255 60,34,446 79,87,029 2,00,26,38;4»
838 267 6,43,993 15,89,181 25,12,61-6
1,819 338 14,67,608 1,32,35,111 1,77,18,9658
7,436 300 71,60,705 2,28,23,274 3,29,37,421
9,626 303 1,69,23,636 4,18,83,477 10,83,76,45i0
35,917 S18 11,45,65,804 21,75,54,092 62,92,27,249
1,243 303 21,03,066 58,99,682 1,04,871*
12,562 285 1,72,15,751 2,60,92,726 N.A»
(c) Includes Andhra, U.P., Bihar, Delhi, Rajasthan, Assam and Kerala.
Rs.
2,06,04,368
5,95,58,422
27,82,908
21,55,16,304
38,84,763
2,97,49,245
11,51,94,127
64,87,185
6,90,42,216
64,47,360
2,33,97,672
78,12,071
13,10,41,902
1,95,30,204
25,67,154
1,79,61,569
3,29,37,421
11,74,92,904
56,42,97,155
1,03,17,706
4,85,75,954
Value added by
manufacturers
12
Rs.
9,33,234
39,37,338
9,20,621
4,07,36,594
11,08,103
9,76,410
62,87,233
9,38,513
2,31,30,279
15,10,178
1,42,04,216
37,77,115
4,82,41,709
1,11,64,674
8,44,748
45,49,185
99,07,182
6,87,38,810
31,91,10,821
36,75,033
3,82,10,822
(/) Xncludes Bihar and Assam.(g) Includes West Bengal and Bihar. iji) Includes Bihar uad M.P.(•) Includes Bombay, Madras. U.P., Bihar, Mysore and Punjab.
xnI . N o t availible.SoxmoH.—'Census of manufacturers.
96 Plann ng— 46

338
STATEMENT SHOWING INDUSTRY-W ISE NUMBER OF FACTORIES, FIX E D CAPITAL, WORKINQCENSUS OF MANUFACTURERS IN
TABLE
Particulars.Number o f registered fa toriea.
Number o f factories
from which return received.
Fixed capital. Workingcapital.
Wheat flour
Rice milling . . . .
Biscuit making
Sugar
Distilleries and breweries (including Power A lcohol)..
Tegetable oil (excluding edible hydrogenated oil)
Edible hydrogenated oil (a)
Tanning (&)
Cement
Glass and Glassware
Ceramics
Plywood tea-chest (c)
Paper-Board (d)
Matches (e)
Cotton textile ( /)
Woollen textile (g) . .
Jute textile (h)
Chemicals
Iron and Steel
Electric lamp (♦)
General Engineering and Electrical Engineering
Rs. Rs.
7 7 17,26,518 18,75,158
116 111 65,92,904 80,55,332
3 3 11,55,757 15,44,346
30 30 3,95,26,870 11,72,39,876
7 . 7 22,64,564 17,61,878
60 46 45,99,084 45,53,100
11 11 1,85,75,674 2,31,69,516
8 8 18,87,887 30,16,461
7 7 7,46,04,796 3,21,00,469
4 4 1,44,66,713 58,30,661
10 10 1,59,72,753 84,78,753
11 10 3,69,313 27,37,19
0 9 12,20,15,092 4,30,20,206
14 11 1,04,03,912 1,30,074
3 3 21,92,287 7.39,756
30 26 1,04,60,553 2,90,93,354
4 4 34,35,671 66,42,732
12 12 20,61,78,034 4,25,03,250
6 5 51,69,11,412 21,00,75,821
7 6 51,13,087 43,16,194
80 80 2,54,86,694 3,26,44,529

359
27.6
, CAPITAL, PERSONS EMPLOYED. AVERAGE NUMBER OF W ORKING DAYS, ETC., ACCORDING TO THE^BIHAR DURING THE Y EAR 1957.
Total number o f persons employed
per day.
Average number o f
working days.
Total salaries, wages
and other benefits
paid.
Value o f factories, fuel, etc., consumed.
Total value c f products.
Total value o f product
and by-products.
Value added by manufacturers.
8 10 11 12
623
6,176
261
27,539
305
I,479
2,603
799
5,754
2,670
6,653
1,371
12,870
7,35,465
996
6,615
7,418
9,850
38,259
1,285
II,357
230
148
278
116
243
211
289
297
347
250
325
301
323
253
252
294
285
315
318
303
277
Be.
4,69,131
19,21,8 f6
2,94,831
2,10,16,143
5,05,330
9,40,329
41,61,347
10,96,869
86,20,716
18,48,102
1,16,14,532
10,73,322
2,04,59,193
98,12,624
8,34,617
74,94,656
67,88,804
1,83,38,816
12,08,13,366
19,57,707
1,71,87,654
Rfl.
6,45,73,246
6,73,59,668
19,66,817
14,12,64,034
27,18,129
2,48,54,993
15,56,04,187
64,07,425
4,61,23,497
57,19,366
99,50,663
45,91,118
8,65,29,145
1,63,43,103
28,25,497
5,13,39,249
2,11,72,726
4,65,13,228
24,68,11,973
68,99,409
2,77,02,656
R b.
1,36,40,794*
G,08,13,569*
31,13,136*
19,63,72,998*
40,30.563*
2 ,i6 ,10,903
15,96,01,860*
78,29,357*
2,52,89,192*
92,08,199
2,89,92,834*
I,04,96,168
15,10,81,678*
35,95,598
38,63,41*
6,83,80,201
2,98,29,561
II,07,53,996
58,81,43,471
94,51,628
N.A.
Rs.
6,63,68,570
6,12,88,200
38,13,130
19,68,24,399
40,30,563
2,63,87,995
16,30,60,502
78,05,284
7,35,78,785
89,61,600
2,89,73,848
99,89,837
14,92,89,110
3,54,06,156
39,31,025
6,80,27,486
2,98,29,561
11,07,55,315
58,86,39,133
93,24,718
5,53,25,714
Rs.
14,01,663
36.75.583
10,54,601
5,27,43,242
11,60,384
12,58,835
59,74,520
12,81,118
2,14,91,727
23,22,038
1,78,30,701
52,15,991
5,18,60,649
1,93,42,662
9,86,087
1,61,89,395
84.47.583
4,79,49,829
29,37,76,412
31,23,343
2,58,24,683
(o) Includes Madras, Andhia, Bihar, Punjab and Delhi.(&) Includes Bihar, Mysore, Pimjab, Orissa and Assam.(c) Includes Bihar, M.P. and Kerala.{d) Includes Madras, Andhia, Bihar, Mysore, Punjab, Orissa and Kerala,(e) Includes Andhra, U.P., Bihar, Delhi, Rajasthan, Assam and Kerala. ( /) Includes Bihar and Assam.(gf) Includes West Bangal and Bihar.(h) Includes Bihar and M.P.(*) Includes Bombay, Madres, U.P., Bihar, Mysore and Punjab.
•Combined figures ofproduots and by-producta.N.A.—.N ot available.
SotTBcB.—Censui o f Manufacturer*.

346
TABLE
STATEMENT SHOWING THE INDUSTRY-W ISE NLM BER OP FACTORIES, F IX E D , CAPITAL, W0RKI3SGCAPITAL, MANUFACTURERS IN BIH AR
Paftioulare.
Number o f Number o f factories registered from whicb
factoriea. returns received.
Fixedcapital.
W orking capital.
Wheat flour " j'‘H
Bice milling
Biscuit making . .
Sugar
Distilleries and Breweries (including Power Alcohol)
Vegetable oil (excluding edible hydrogenated)
Edible hydrogenated oil (a)
Planning (6)
Cement ».
Qlfi^ aud Qlaaaware
Ceramics * •
Plywood and tea-chest (c)
Paper Board (d)
Matches (e)
Cotton textile (/)
f Woollen textile (( )
Jute textile (h)
Chemicals . .
Iron ftnd Steel
Electric lamp (»)
General Engineering and Electrical Engineering
2 8 4 5
Bs. R b.
9 9 17,73,109 19,45,998
111 107 64,57,171 64,19,372
6 6 13,16,687 15,43,791
SO 80 8,98,03,872 10,56,45,916
7 7 19,09,426 18,74,897
62 47 44,76,799 48,37,651
10 7 1,28,60,402 1,98,00,600
& 7 19,96,573 33,74,570
7 7 9,01,32,591 3,74,57,431
4 4 1,66,49,968 80,03,351
14 12 1,77,06,729 89,13,506
12 12 40,97,582 27,76,186
» 3 3,53,02,785 1,25,00,264
14 7 58,47,055 57,38,972
27 24 3,77,51,120 2,47,59,516
11 23 1,19,89,497 2,92,25,808
t 3 60,08,963 1,07,37,219
13 13 20,41,04,495 5,17,37,642
6 6 1,00,62,80,888 26,27,69,474
6 5 53,98,062 46,43,156
87 85 2,81,02,841 3,85,94,814
(a) Includes Madras, Andhra, Bihar, Punjab and Delhi.(b) Includes Bihar, Mysore, Punjab, Orissa and Assam.(c) Includes Bihar, M.P. and Kerala.(d) Includes Madras, Andhra^ Bihar, Mysore, Punjab, Orissa a^d Keralft. (#) Includes Andhra, U-P., Bihar, Delhi, Rajasthan, Assam egad Kerala.

S41
87.7
PERSONS EMPLOYED, AVERAGE NUMBER OF W ORKING DAYS, ETC., ACCORDING TO THE CENSUS OF DUTRING t h e y e a r 1958.
Total niimber o f
persons employed
per day.
Average number o f working
days.
Total salaries,
wage and other
benefis paid.
Value o f factories, fuel, etc.,
consumed.
Total value o f product.
Total value o f
products and
by-products.
Value addedby
manufacturers.
8 9 10 11 12
611
4,ll79
826
17,706
t70
1,514
2,228
766
0,044
1,835
7,868
1,685
2,465
2,906
11,576
627
7,967
10,176
86,968
1,339
11,203
240
121
278
129
236
220
312
803
362
a w
321
305
343
269
270
271
284
801
S94
803
279
R b.
6,46,503
12,61,306
3,39,222
2,33,69,888
4,03,975
23,21)6
40,53,849
11,00,597
99,64,170
32,68,326
1,36,13,531
14,75,399
40,48,443
56,63,077
1,19,19,542
85,74,412
86,53,587
1,83,24,874
1)2,02,89,379
21.87,234
1,78,58,827
R b.
2,24,81,723
3,30,77,506
2,93,895
16,09,82,396
28,77,232
2,52,81,042
13,61,79,939
79,63,718
5,47,30,326
91,90,674
1,28,63,982
63,34,428
4,95,22,209
88,34,063
4,37,90,491
5,32,03,998
1,67,88,586
6,08,46,071
26,85,69,993
57,64,406
2,87,07,074
Rs.
1,29,81,394
3,51,87,547
3,02,070
21,98,94,680
39,99,736
2,^9,09,505
14,57,63,665
95,34,475*
19,36,61,952*
1,67,44,336
3,64,13,262*
1,16,82,568
7,65,49,982
2,90,54,792*
6,15,88,074
7,20,30,120
2,34,96,103*
12,01,41,404
56,48,75,757
94,10,586
N.A.
Rs.
2,40,20,869
3,58,45,598
33,02,070
22,07,50,365
39,99,736
2,69,14,636
14,65,44,003
95,61,700
8,86,78,745
1,57,39,036
3,64,13,202
1,11,24,698
7,66,49,982
2,85,11,858
6,06,05,907
7,22,25,095
2,34,96,103
12,20,00,919
69,35,45,720
92,84,709
5,77,72,109
R b.
14,48,493
24,63,747
9,02,486
3,69,31,837
9,92,086
13,42,734
94,44,194
14,61,646
26,45,289
66,3A,026
2,22,37,670
45,44,024
2,38,31,270
1>,92,59,684
1.44.05.275
1,82,67,781
66,04,536
4.63.49.276
22,87,72,151
32,03,097
2,68,87,614
( /) Includes Bihar and Assam.(ff) Includes West Bengal and Bihar.(h) Includes Bihar and M.P.(t) Includes Bombay, Madras, U.P., Bihar, Mysore and Punjab.
•Combined figures o f products and by-products.N .A .— Not available.
SauEOB.—Census Manufacturer*.

U 2
TABLE
STATEMENT SHOWING THE INDUSTRY-& ROUP-WISE NUMBER OF FACTORIES REGISTERED, FACTORYVALUE AND VALUE ADDED BY MANUTACTUREF-S
Serial Industry Group (Group level).Number o f Factories Registered,
no.
1 2
1963.
3
1964.
4
1966.
6
1966.
0
1 205 Grain mills . . 26 29 85 83
2 207 Sugar and Gur ... 83 32 « 83 83
3 209 Miscellaneous food preparations M • • • 0 8 11 8
4 231 Spiiming, weaving, etc. . . 8 0 10 10
5 251 Saw mills etc. . . 3
fi 259 Cork and wood products . . . . 8
7 260 Furniture and fixtures . . 3 3 8
8 271 Paper and paper products . . . . 4 4 4 4
9 280 Printing, publishing, etc. . . . . 10 10 11 11
10 311 Basic industrial Chemicals, etc. . . 10 10 10 10
11 3L9 Misoellaneous Chemicals 4 8 9 0
12 321 Petroleum refineries .« %
13 329 Misoellaneous products o f Petroleum and Coal . . 9 11 11 11
11 331 Structural clay products . . . . 24 86 96 2B
15 332 Glass and Glass products . . 7 8 8 9
16 333 Pottery, China and earthenware . . 4 0 6 5
17 334 Cement (hydraulic) . . 7 7 7 7
18 339 Non-metallic mineral products . . 44 61 47 40
19 341 Iron and steel . . 96 88 41 88
342 Non-ferrous metals . . 4 4 6 0
21 350 Metal products except machinery And transport 7 7 8 0
22equipment.
860 Machinery except electrlcftl . . t4 98 80 SO
23 370 Electrical machinery etc. . . • • • • 4 7 6 7
24 381 Ship building and repairing . . 8 8 3 8
25 382 Rail-road equipments . . 5 4 4 4
^6 383 Motor vehicles—manufacture o f . . • « » • 4 -
27 384 Motor vehicles— repair o f . . 11 11 19 13
28 385 Motor cycles and Bicyclee . . . . - - 8 • •
29 511 Electric light and power . . • • • • 1« 17 38 87
30 Other Industry Groups* 17 19 14 19
TOTAL . . 318 348 381 386
. . —Nil.FiKureB for 1966 are provisionaL
f Relates to industry groups 206, 208, 2J11, 220, 232, 241, 243, 291, 383 and 885 toth in 1963 snd 1S64 and IBdlfttea to Industry groups 202, 206, 3B08, 211, 220, 232, 241, 243 and 201 both in 1966 and 1966 an d 263,

31H
27.8
REPORTING PRODUCTIVE CAPITAL, NUMBER OF PERSONS EM PLOYED, GROSS OTjTPUT EX-FACTCEYDURING THE YEARS 1963, 1964, 1965 AND 1966.
NumbeP o f f^tories reporting. Productive capital in (Rs. ’ 000).
1963. 1964. 1965. 1966. 1963. 1964. - 1965. 1966.
7 8 9 10 11 12 13 14
26 29 35 33 80,24 98,81 1,05,39 1,16,41
S3 82 33 32 9,42,70 11,34,58 14,74,11 16,72,67
9 7 11 8 1,24,91 1,08,1 1,00,49 1,64,71
8 8 10 10 1,45,30 1,62,34 2,00,62 2,38,09
S . . ' 18,30
. . S • • 5,33
S 3 s . . 4,10 4,09 3,73 ♦ .
4 4 4 4 6,58,13 6,78,71 6,31,19 6,42,93
10 10 11 11 1,26,89 1,15,30 1,06,86 1,20,17
10 10 10 10 39,73,56 38,72,87 32,82,66 34,28,33
4 8 9 9 20,74 34,35 47,99
• • 3 . . 46,93,77
8 10 11 11 8,52,16 18,51,62 17,i 1,46 17,21,92
24 84 25 24 3,93,07 6,73,29 7,30,04 7,28,84
T 8 8 8 3,02,79 3,51,94 3,40,58 2,33,46
4 6 5 5 1,31,81 1,42,75 1,72,84 1,80,02
7 7 7 7 11,69,18 10,85,45 11,06,80 11,10,13
90 45 47 46 2,50,43 2,53,39 1,98,14 2,31,64
25 27 40 36 1,74,29,90 1,70,78,35 1,86,31,47 1,60,93,05
4 S 5 6 7,76,25 8,57,98 9,14,24 10,03,40
T 7 6 6 1,22,06 1,66,67 2,55,96 2,89,82
21 87 S9 28 2,99,50 29,39,38 37,02,80 50,12,46
4 7 6 7 8,57,46 8,99,97 10,38,79 11,36,79
S S 1 3 6,70 6,36 6,04 5,47
4 S 4 4 6,39,93 4,84,64 6,92,97 7,79,10
. . 4 — • • 28,31,28
11 11 IS 12 20,27 19,15 10,48 8,67
. . t . . 60,87
16 16 2S 87 19,48,13 10,29,07 1,17,09,90 1,42,13,80
16 19 14 19 21,28,58 29,02,82 49,45,71 77,74,27
307 333 380 382 3,34,04,79 3,09,51,98 5,50,21,71 6,16,51,58
252 and 259 in 1963 and 202, 261 and 399 in 1964.259 and 321 in 1966 and 251, 260. 383. 385 and 399 in 1966.
IBoxmoB.» Annual Borrey of InduitriM.

344TABLE
STA.TEMENT SHOWING THE INDUSTRY aROU P-W ISE NUMBEB OF FACTORIES REGISTERED, FACTORYVALUE AND VALUE ADDED BY MANUFACTURERS
Serial Industry group (Group level), no. 1963.
Number o f persons employed.
1964. 1965. 1966.
1 2 15 16 17
I 205 Grain mills 1,689 2,170 1,787 1,931
2 207 Sugar and Gur 15,492 15,777 18,567 18,847
3 209 Miscellaneous food preparations 1,300 714 1,082 775
4 231 Spinning, weaving etc. 8,668 7,222 7,181 5,014
fi 251 Sa\r mills etc. 206 • •
6 259 Cork and wood products . . . . . . 22T
7 260 Furniture and fixtures 14« 157 I l l •-
8 271 Paper and paper product* . . 4,001 6,000 4,786 4,511
9 280 Printing, publishing, etc. . . 2»762 1,630 2,651 2,725
10 811 Basic industrial chemicals, etc. 7,864 8,281 9,519 0 / t S
\\ 319 MisceYlftiieouB cbemie&ls m 1,089 1,011 90S
12 321 Petroleum refineries . . • • . . 1,083
13 329 Miscellaneous products o f petroleum »n d coal 2,967 8,644 S»988 4,397
14 331 Structural clay products 0,238 8,970 8,017 8,174
16 332 Glass and glass products . . 1,821 8,824 1,484 2,063
16 333 Pottery, China and earthenware 476 617 784 74(0
17 334 Cement (hydraulic) 5,621 6,698 1,885 6,694
18 339 Non-metallic mijieral prodAta 8,118 8,108 7,801 7,87»
19 341 Iron and steel , . 47,498 80,106 50,598 60,164
20 342 Non-ferrous metals S,881 9,008 1,197 8,180
21 850 Metal products except machinery »n d equipment.
transport 938 1,182 1,116 1,28*7
22 360 Machilnary except electrical 4,718 7,492 10,121 11,188
23 370 Electrical machinery etc. . . 4,987 8,076 4,747 4,8510
24 381 Ship building and repairiitig 613 669 686 60)6
26 382 Rail-road equipments 16,181 18,886 15,694 13,5119
28 383 Motor vehicles— manufacture o f •• 20,2g4
27 384 Motor vehicles— repair o { . . 1,804 1,808 1,441 1,401
28 385 Motor cycles and Bicycles , . •• 400
29 611 Electric light and poirer . . 18,781 21,167 21,760 2S,1315
30 Other Industry groups* 24,118 24,420 8,876 86,0311
TOTAL 1,96,707 2,02,097 2,12,020 2,10,644
____NiLFigures for 1966 are provisional.Relates to Industry Groups 206, 208, 211, Relates to Industry Groups 202, 206, 2’08,
220, 232, 211, 930.
241, 243, 291, 382, 241, 243
, 888 and 885 And 291 both
both in 1963 in U66akid
and 1964 and 1966 and 261,

345
27.8-““ coftC d.
REPORTING PRODUCTIVE CAPITAL, NUMBER OF PERSONS EM PLOYED, GROSS OUTPUT E X - FACTORY DURING THE YEARS 1963, 1964, 1966 AND 1966.
Gross output ex-faotory (value—Rs-. ’ 0^0). Value added by manufacture^ (Rs. ’ 000).
1963. 1964. 1966. 1966. m r 1964. • 1966. 1966.
19 20 21 22 23 S4 16 26
6,79,90 7,48,35 4,67,08 C,52,24 32,26 58,16 31,26 40,19
13,96,88 22,56,97 36,17 26 14,71,89 3,10,46 6,56,89 7,10,99 6,31,18
3,60,74 2,98,57 4,98,26 4,62,38 41 72 88,86 46,87 64.24
4,13,11 *,78,79 4 26,W 4,4«,78 1,00,06 1,00,18 1,01,76 80.81
. . >1,12 . . . . i.71 ••
11,62 • • . . 4,11
4,41 6,19 5.84 • • 1,97 2,84 1,80 • •
9,18,06 9,16,69 9,87,36 7,91,68 2,10,93 1,46,14 2.15,84 1,07,41
1,20.98 2,27,04 2.51,,94 2,26,90 93,96 89,41 93.46 66,19
21,78,44 13,65,00 85.02,16 86.17,84 4,70,70 0,t7,02 8,18,M 7,99,89
73,21 98,19 1,29,16 1,62,26 35.34 17,77 29,36 41,74
16,11,79 • • » • . . s , i2 ,n
18,54,95 17,22,81 19,47,54 16,82,67 S.83,66 2,i0,49 1,78,61 2,88,11
4,65,37 4,20,22 6,85,83 6,08,21 2,24,18 1,85,38 1,91,03 1,84,45
1,53,14 2,40,13 2,12,68 2,79,86 68,92 68,46 52,95 85,69
11,30 27,29 34,46 50,99 ( )13.81 8,69 9.11 10,79
13,24,54 13,40,53 15,27,93 17,42,98 8,18,98 1,76,05 3,08,19 4,43,13
3,97,86 6,92,24 6,89.71 7,33,88 1,28,72 1,88,65 1,30,94 1,41,29
1,18,98,12 1,32,61,W 1,44.41.19 1,53,70,28 81,69,18 41,80,59 45,49,48 46,67,15
8,88,41 9,71,11 10,50,41 12,20,87 8,30,26 3,82,68 8,95,79 4,65,91
1,26,91 1,95,56 1,40,41 1,97,41 18,94 66,92 63,115 74,18
4,02,94 6,72,06 9,82.44 19.92,54 1,67,80 1,01,32 4,07,61 1,49,70
11,77,71 12,47,79 13.60,08 14,47,69 4,68,43 8,67,98 8,36,76 4,59,80
15,20 17,95 16,70 16,19 9,18 9,97 12,19 11,96
8,85,99 7,14,08 9,66,91 9,08.09 8,17,41 8,44.00 8,83,70 4,38,02
79,48,06 . . 19,83,17 . .
48,38 57,68 59,33 59,59 20,94 26,47 24,94 24,16
. . . . 13,22 1,83 .•
15,05,98 15,42,67 16,69,81 19,29,24 6,33,47 4,76,16 2,86,68 4,50,11
57,45,40 72,37,77 21,12,41 1,03,69,60 16,34,38 16,93,47 4,85,09 25,32,66
3,27,52,50 8.76,54,25 4,46,35,79 4,92,80,62 89,68,10 1,04,36,87 1,18,62,37 1,25,79,16
252 aud 259 in 1963 and 202, 251 and 899 in 1964.S59 and 821 in 1965 aud 251, 260, 383, 385 and 898 in 1900.
Sovsoi.—Azinuftl Surrey of IndortviM.96 Plan— 47

TABLB
STATEMENT SHOWING THE VOLUME OF PRODUCTION IN
Industries. 1957. 1958. 1959.
1 • 2 3 4
Coal (Tons) 21,444,016 22,164,497 22,738,683
Iron-ore (in thousand tone) • • 2,272 3,234
Sugar* 316.831 279,471 315,307
Tea (a) (in thousand Kgs.) 626(0) •• . . .
Vegetable oil (Vanaspati) (in quintals) . . ' •• 81,904 99,319
Cotton Textile (in thousand Kgs.) 839 993 662
Cloth (in thousand metres) 4.683 4.449 3,964
Cement (Tons) . . 1.115,061 1,285.583 1»405,391
Refractions (Tons) . . 216,255 241,020 236,233
Iron and Steel (Pig-iron) ( thousand to»s) 1.005.6 1.026.9 1,471.2
Direct casting (thousand tons) 114.5 73.7 44.7
Iron and Steel (Ferro-alloys) (thouaandl toms) 2.4 19.4 15.0
Steel ingots and metal for casting (!jho»usaaid tons) 1.106.7 1,144.3 1.481.6
Iron and Steel (semi-finished Steel) (thousiancl tons) 950.1 1,058.5 1,444.5
Iron and Steel (finished steel) (thousacid tiona) 671.5 601.1 703.6
Electricity generated (in million K.W .M .) 951.213 1,233.465 1,362.647
. ••—Not available.
♦Annual figure relates to crop jfear ((Navembai to October).
(а) In respect o f Black tea only.
(б) From September, 1962 onwards figutre are indaded in thosB o f pig-iron.

27.9
SELECTED INDUSTRIES IN BIH AB.
347
I960. 1961. 1962. 1963. 1964. 1965.
10
25,051,390 27,162,957 29,835.080 32,144,336 29,580,522 31,006,861
2,847 2,94o 3,106 3,466 8,632 4,124
828,824 385,446 858,482 169,962 238,842 391,580
40(a) 65(a) 60(0) 61(a) 67(0) ••
99,990 110,660 105,300 118,387 77,020 112,476
582 13,101 1,467 1,674 1,731 2,369
4,238 3,649 2,335 694 860 1,601
1,534,812 1,421,830 1,603,951 1,663,086 1,069,277 1,627,930
246,946 229,898 253,396 250,630 229,612 £63,414
1,601.6 1,608.4 1,824.6 1,880.3 1,865.3 1,956.3
35.2 41.5 32.6 (b) (6) ••
22.9 . . . . •• ••
1,684.8 1,620.4 1,768.7 1,894.6 l»0I3.2 1,969.0
1,584.3 876.3 433.9 472 4 461.1 458.3
971.3 865.4 1,068.6 1,157.7 1,203.6 1,293.7
1,703.636 1,785.802 1,920.589 2,082.622 2,744.304 2,993.758
SotracE.—Statistice of Production in Selected Industries in India, July, 1966 and 1966.


SECTION m mindH Rynilir
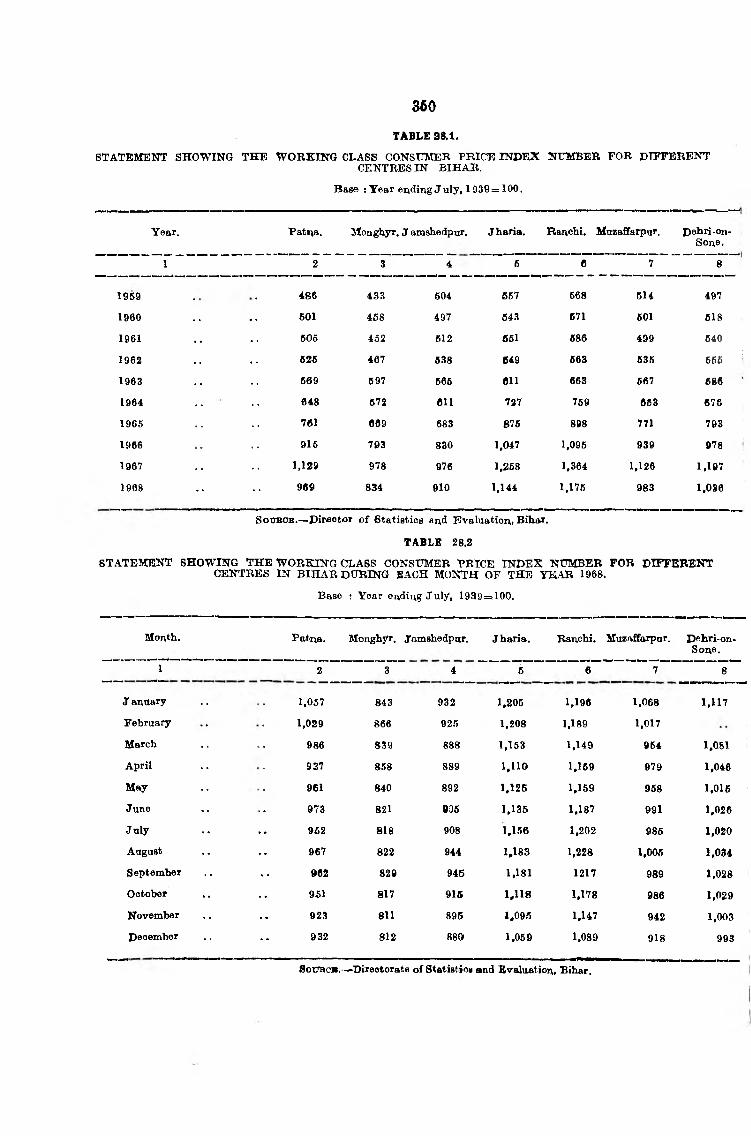
m
Base : Year ending Ju ly , 1939=100.
TABLE 38.1.
STATEMENT SHOWING TH E W ORKING CLASS CONSTtMER PRICE IN D EX NUMBER FOR rUFFERENTCENTRES IN BIHA R.
Year. Patna. Monghjrr. J amshedpnr. Jharia, Ranchi. Mazaffarpur. Dehri-on-Sone.
1 2 3 4 6 6 7 8
1959 486 433 604 657 568 614 497
1960 601 468 497 643 671 601 618
1961 605 452 612 651 686 499 640
1962 626 467 638 649 663 636 665
1963 669 697 665 Oil 663 667 686
1964 048 672 611 727 759 653 676
1965 781 069 683 876 898 771 793
1966 915 703 830 1,047 1,095 939 978
1967 1,129 978 976 1,258 1,364 1,126 1,197
1968 96fl 834 910 1,144 1,176 983 1,036
SOITBOB.— Pirector o f Btatifltics and Evaluation, Bihar.
TABLE 28.2
STATEMENT SHOWING TH E W ORKING CLASS CONSTTMER 'PRICE IN D EX NTm BER FOR DIFFERENT CENTRES IN BIH AR DtTRING EACH MONTH OF THE YEAR 1968.
Base : Year ending July, 1939=100.
Month. I*atr^a. Monghyr. Jamshedpur. Jharia. Ranchi. Muzaffarpur. Dehri-on-Sone,
1 2 3 4 6 6 7 8
J anttary 1,057 843 932 1,205 1,196 1,068 1,117
February 1,029 866 925 1,208 1,189 1,017
March 986 839 888 1,153 1,149 954 1,081
April 937 858 889 1,110 1,169 979 1,046
May 961 840 892 1,125 1,159 958 1,016
J une 973 821 035 1,135 1,187 991 1,026
July 962 818 908 1,156 1,202 985 1,020
August 967 822 944 1,183 1,228 1,006 1,034September 962 829 945 1,181 1217 989 1,028October 951 817 915 1,118 1,178 986 1,029
November 923 811 895 1,095 1,147 942 1,003December 932 812 880 1,059 1,089 918 993
SotJBc*. —Dixeotorate o f Statistics and Evaluation, Bihar.

361
TABLE 28.8.
STATBMBNr SHOW INa THE CONSUMER PRICE IN D E X NUMBER FOR W ORKING CLASSES FOR DIFPERFNTCENTRES IN BIHAR. A
Base : 1949 = 100
Year. J amshedpur, J haria.
. . — Not available.
Monghyr Deliri-on arid
Sone. Jamalpur.1 2 3 4 6
1959 •• •• 126 108 100 971960 •• - - 120 106 106 1001961 •• •• •• •• 123 105 109 991962 - - - •• 129 108 111 1031963 - •• - . . 118
1964 •• •• - - - — 135
1965 •• 160
1966 • • . 2011967 •• •• •• •• 251
1968 . . - 213
SoyiRCS.—IjabonT Bureau, Governmeiit o f India.
TABLE 2 8.4.
STATEMENT SHOWING THE CONSUMER PRICE IN D EX NUMBER OF WORKING CLASSES FOR DIFFERPVT CENTRES IN BIH AR DURING EACH MONTH OF THE YEAR, 1968.
Base : 1949 = 100.
Houth.
J auuary . .
February
March «.
April .
\Iay •
Juive
July
August
fieptember
October . .
Novem ber..
*^9oember
Jamshedpur. J haria.
2 3
Monghyr Dehri-ou- ar;d
Sone. J amalpur.
. . — Not available.
4
223
220
212
209
212
215
212
210
217
217
208
197
Source— Labur Bureau, Goveminent o f India.

352
Base
STATEMENT SHOWING THE IN D EX NUMBERS OF AORICULTUBAL
TABLfl
’URAl ]
Name o f commodities.
Weights.
J aiuuary. February.
March. April.
price
May.
Relative.
Juiie. July. August. September.
October.
November.
December.
1 2 3 4 6 6 7 8 9 10 11 12 13 14
1. Fool> 95.91 • • . . . . .. . .
(0) Cereals 67.28 •• •• •• •• •• •• •• •• . . . . • •
Bice coarse • • 66.30 219.59 217.91 207.43 204.81 213.26 223.82 220.02 217.48 209.04 191.09 174.96 162.01
Wheat .. 5.39 187.93 196.19 179.12 148.89 147.98 157.97 171.58 182.71 184.29 185.66 172.90 174.01
Barley • • 1.85 262.45 268.20 236.02 181.99 167.05 175.48 182.76 174.33 164.75 153.26 151.65 128.8]
Maize 3.74 230.71 240.71 215.15 176.00 203.57 220.36 210.71 191.43 188.57 171.48 159.86 152. ij
(ft) Gram and Pulses.
Qram
12.50
3.71 301.84 291.34 236.22 194.75 182.68 170.61 170.60 174.85 190.81 188.19 169.03H
I59.6i
Arhar 2.08 379.87 415.48 332.38 408.36 403.61 212.73 208.93 223.17 223.17 223.17 223.17 225.6
Masoor 1.24 311.92 369.69 300.37 197.78 2 n .4 i m M W M 251.S5 261.09 252.77 IS2.81 2Ql,a
Khesari 5.47 288.87 332.80 227.64 163.74 186.63 162.41 167.73 181.68 194.36 178.38 171.09 157.T
(c) Vegetables •• 1.32 .. • • •• •• .
potatoes •• 1.26 147.90 152.67 121.30 198.00 217.66 260.97 267.18 254.77 190.84 209.92 151.43 238.S
Onion •• 0.06 179.26 192.07 115.24 140.85 76.82 76.82 89.63 163.65 266.08 448.14 484.38 276.4
(d) Ghee •• 10.69 213.20 212.00 206.82 207.21 209.61 209.61 209.91 210.80 226.27 227.57 224.50 223.4
(•) Sugarcane 1.96 152.67 152.67 152.67 152.67 162.67 152.61 152.67 162.67 152.67 152.67 152.67 152.€
{ /) Others 2.27 * « .. • • •• •• -
ChiUies •• 1.12 151.17 141,72 161.17 160.62 151.17 151.17 147.72 141.72 188.02 188.02 179.46 179.A
Turmeric . . 1.15 415.97 416.97 4^ .97 699.00 605.93 604.65 415.97 687.99 1,,028.07 1,053.80 1,053.40 979.2
1. N o n -F ood • • 4.09 • • • • . . . . • • • • • • •• ••
(a) Tobacco • • 0.77 254.66 264.66 254.66 262.38 262.88 262.38 262.38 262.38 262.88 274.13 273.25 282.S
(6) Industrial raw material.
Jute
8.32
0.93 895.70 396.70 395.77 895.70
• «
896.70 570.93 612.86 705.91 709.33 812.16 913.53 913.(
Cotton . . 0.04 141.07 141.07 141.07 141.07 142.83 142.83 141.07 141.07 175.45 175.45 176.28 176.!
Lac 0.71 168.42 189.47 1S9.47 189.47 189.47 101.05 102.74 1,03.58 90.95 85.89 136.84 94.1
Rape an<l mustard seed.
Linseed
0.88
0.71
287.87
308.57
349.36
281.22
253.44
250.16
276.69
239.42
282.28
384.93
271.10
203.82
268.31
216.72
299.05
236.07
338.15
263.16
229.79
266.25
324.20
258.00
816.'
256.;
Castor seed . . 0.05 215.19 215.29 1»5.48 215.29 322.93 172.28 163.39 166.08 178.96 181.38 177.61 182.1
G ^ era l %idex 100 •• •• •• •• •• •• •• •• •• I
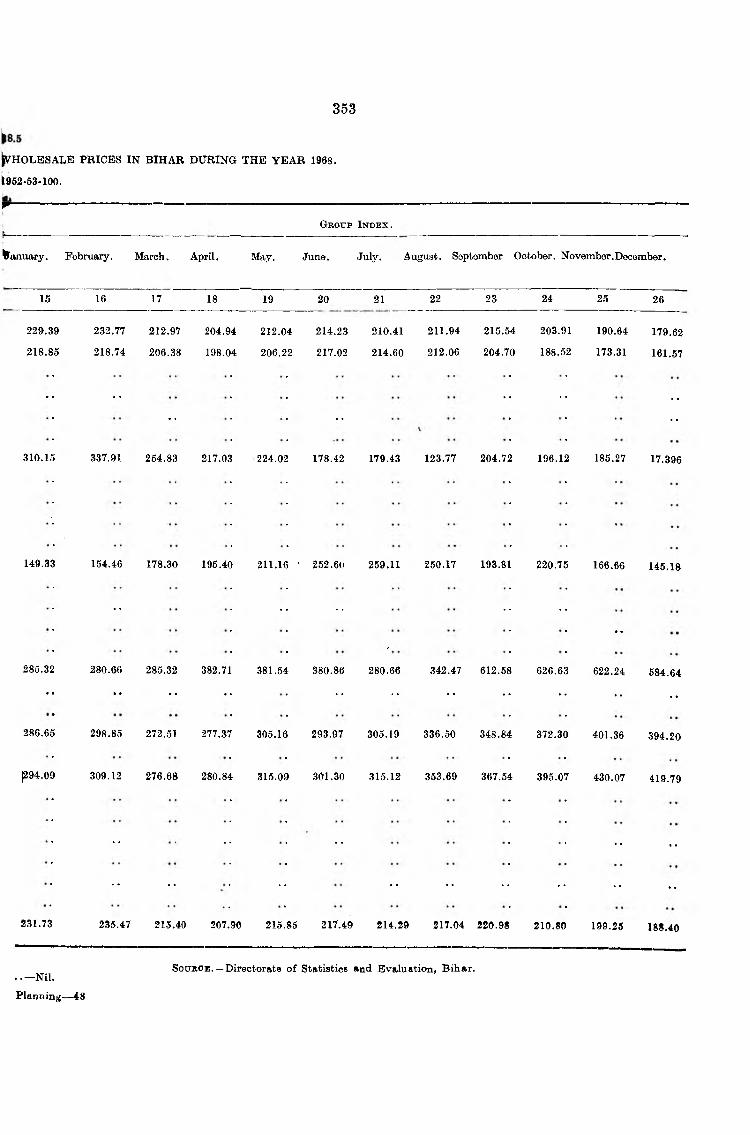
353
Wh o l e s a l e p r i c e s i n b i h a r d u r i n g t h e y e a r i 96s .
^952-53-100.
r -------------------------------------------
G r o u p I n d e x .L
January. February. March. April. May. June. July. August. September October. November .December.
15 16 17 18 19 20 21 22 23 24 25 26
229.39
218.85
232.77
218.74
212.97
206.38
204.94
198.04
212.04
206.22
214.23
217.02
210.41
214.60
211.94
212.06
215.54
204.70
203.91
188.52
190.64
173.31
179.62
161.57
• • • •, , , ,
• * • •;;
310.15 337.91 254.83 217.03 224.02 178.42 179.43 123.77 204.72 196.12 185.27 17.396
149.33 154.46 178.30 195.40 211.16 • 252.6U 259.11 250.17 193.81 220.75 166.66 145.18
• • • • • • • • • •, ,
285.32 280.66 285.32 382.71 381.54 380.86
/
280.66 342.47 612.58 626.63 622.24 584.64
•• •• •• •• •• •• •• •• •• •• ••
286.65 298.85 272.51 277.37 305.16 293.97 305.19 336.50 348.84 372.30 401.36 394.20
|294.09 309.12 276.68 280.84 315.09 301.30 315.12 353.69 367.54 395.07 430.07 419.79
•• •• •• •• ••
1 •• •• •• •• •• •• •• •• . .
231.73 235.47 215.40 207.90 215.85 217.49 214.29 217.04 220.9S 210.80 199.25 I8S.40
. . —Nil.
Planning— 48
SoubOb . —Directorate o f Statistics and Evaluation, Bihar.
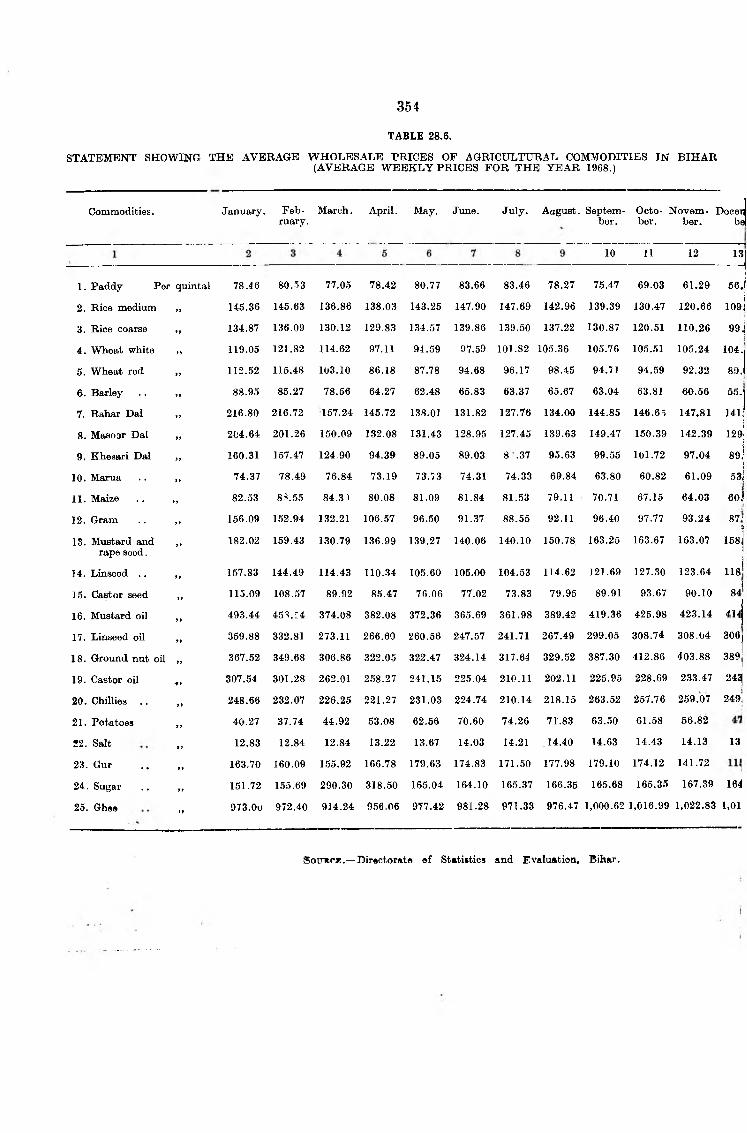
STATEMENT SHOWING THE AVERAGE WHOLESALE PRICES OF AGRICULTURAL COMMODITIES IN BIHAR(AVERAGE W EEKLY PRICES FOR THE YEAR 1968.)
354
TABLE 28.6.
Commodities. January. Feb- March. April. May. Jtme. July. Aogust. Septem- Octo- Novem- Decen ruary. ber. ber. ber. be
10 11 12 13
1. Paddy Per quintal 78.46 80.53 77.05 78.42 80.77 83.66 83.46 78.27 75.47 69.03 61.29 56.
2. Rice medium „ 145.36 145.63 136.86 138.03 143.25 147.90 147.69 142.96 139.39 130.47 120.66 109j
3. Rice coarse „ 134.87 136.09 130.12 129.83 134.57 139.86 139.50 137.22 130.87 120.51 110.26 99.j
4. Wheat white ,, 119.05 121.82 114.62 97.11 94.59 97.59 101.82 105.36 105.76 105.51 105.24 104.
5. Wheat red ,, 112.52 115.48 103.10 86.18 87.78 94.68 96.17 98.45 94.71 94.59 92.32 89.
6. Barley . . ,, 88.95 85.27 78.56 64.27 62.48 65.83 63.37 65.67 63.04 63.81 60.56 55.'
7. RaJiar Dal „ 216.80 216.72 157.24 145.72 138.01 131.82 127.76 134.00 144.85 146.65 147.81 141,
8. Masoor Dal ,, 204.64 201.26 150.09 132.08 131.43 128.95 127.45 139.63 149.47 150.39 142.39 129
9. Khesari Dal „ 160.31 157.47 124.90 94.39 89.05 89.03 8 .37 95.63 99.55 101.72 97.04 89i
10. Marua . . ,, 74.37 78.49 76.84 73.19 73.73 74.31 74.33 69.84 63.80 60.82 61.09 53,i11. Maize . . ,, 82.53 8S.55 84.3) 80.08 81.09 81.84 81.53 79.11 70.71 67.15 64.03 601
12. Gram . . „ 156.09 152.94 132.21 106.57 96.50 91.37 88.55 92.11 96.40 97.77 93.24 87'!;13. Mustard and ,,
rape seed.182.02 159.43 130.79 136.99 139.27 140.06 140.10 150.78 163.25 163.67 163.07 168,
14. Linseed . . ,, 157.83 144.49 114.43 110.34 105.60 105.00 104.53 114.62 121.69 127.30 123.64 118
15. Castor seed ,, 115.09 108.57 89.92 85.47 76.06 77.02 73.83 79.95 89.91 93.67 90.10 84
16. Mustard oil ,, 493.44 45S.:4 374.08 382.08 372.36 365.69 361.98 389.42 419.36 425.98 423.14 414
17. Linseed oil „ 359.88 332.81 273.11 266.60 260.56 247.57 241.71 267.49 299.05 308.74 308.04 306
18. Ground nut oil „ 367.52 349.68 306.86 322.05 322.47 324.14 317.64 329.52 387.30 412.86 403.88 389 119. Castor oil „ 307.54 301.28 262.01 258.27 241.15 225.04 210.11 202.11 225.95 228.69 233.47 243|
20. Chillies .. ,, 248.66 232.07 226.25 221.27 231.03 224.74 210.14 218.15 263.52 257.76 259.07 249j
21. Potatoes „ 40.27 37.74 44.92 53.08 62.56 70.60 74.26 71.83 63.50 61.58 56.82
22. Salt 12.83 12.84 12.84 13.22 13.67 14.03 14.21 14.40 14.63 14.43 14.13 13
23. Gur . . „ 163.70 160.09 155.92 166.78 179.63 174.83 171.50 177.98 179.10 174.12 141.72
24. Sugar .. ,, 151.72 155.69 290.30 318.50 165.04 164.10 165.37 166.35 165.68 165.35 167.39 164
25. Gh«® 973.00 972.40 914.24 956.06 977.42 981.28 971.33 976.47 1,000.62 1,016.99 1,022.83 1,01
SotTRri:.—Directorate o f Statistics and Evaluation, Bihar.

SECTION XXIX Census of Governinent Employees

356
TABLE
s t a t e m e n t s h o w in g t h e d i s t r i b u t i o n o f g o v e r n m e n t e m p l o y e e s a c c o r d i n g t o b a s i c p a y -TO t o t a l e m p l o y e e s
Basic pay ranges.
1st June 1962.
Gazetted.
Non-gazetted.
Married.
Total(Gazetted
and
Percentage ot Group Total
to TotalUnmarried. Non-gazetted). Employees.
6
Below 51
51 or above but below 101
101 or above but below 151
151 or above but below 201
201 or above but below 251
251 or above but below 301
301 or above but below 351
351 or above but below 501
501 or above but below 751
751 or above but below 1,001
1.001 or above but below 1,501
1,501 or above but below 2,001
2.001 or above but below 2,151
2,151 or above but below 3,001
3.001 or above
Total— (Employees)
60,619
15,823
4,595
1,050
533
122
34
37
103
999
327
374
367
376
128
76
23
11
25
14
31
11
3
5
2
3
3
60,619
5,833
4,595
1,161
1,563
460
411
409
378
131
79 1
.3
11 .
25
14 \
70.72
18.47
5.36
1.35
1.82
0.54
0.48
0.48
0.45
0.15
0.13
82,823 2,823 66 85,712 100.00
. . —Nil.

357
29.1.
SCALE, GAZETTED (MARRIED AND UNMARRIED), NON-GAZETTED AND PERCENTAGE OF GROUP TOTAL IN BIHAR.
1st June, 1953.
gazetted. Total Percentage ofNon-gazetted.------------- —------------------------------- (Gazetted Group total
Married. Unmarried. and to TotalNon gazetted). Employees.
Basic pay ranges.
10 11
69,794
17,701
'5,166
1,171
289
133
49
51
1
202
851
345
338
326
261
120
69
25
5
17
13
16
30
IB
8
7
2
3
1
69,794
17,701
6,166
1,389
1,170
505
395
384
264
123
70
25
5
17
13 J
71.94
18.24
5.32
132
1.00
0.52
0.43
0.40
0.27
0.13
0.13
94,355 2,581 85 97,021 100.00
Below 51.
51 or above but below 101.
101 or above but below 151.
151 or above but below 201.
201 or above but below 251.
251 or above but below 301.
301 or above but below 351.
S5l OT above but below 501.
501 or above but below 751.
751 or above but below 1,001.
1.001 or above but below 1,501.
1,501 or above but below 2,001.
2.001 or above but below 2,151.
2,151 or above but below S,001.
3.001 or above.
Total— (Employees).

358
TABLE
1st June, 1954.
STATEMENT SHOWING THE DISTRIBUTION OF GOVERNMENT EMPLOYEES ACCORDING TO BASIC PAY-T O T JT A L EMPLOYEES
Sasi* pay Non-gazetted.Gazetted.
Married. Unmarried.
Total(Gazetted
and
Percentage o f Group Total to Total
Non-gazetted). Employees.
1 12 13 14 15 16
Bslow B1 71,724 71,724 73.84
61 or above but below 101 17,587 17,587 18.10
101 or above but below 151 . . . . 3,935 3,935 4.05
161 or above but below 201 . . S60 246 28 1,229 1.27
301 or above but below 251 . . •• 368 579 41 988 1.02
261 or above but below 301 . . •• 150 354 17 521 0.54
101 or above but below 351 . . •• 44 291 10 345 0.35
361 or above but below 501 . . •• 50 269 13 332 0.34
601 or abov® but below 751 • • • • 225 2 227 0.28
761 or above but below 1,001 114 1 115 0.12
1,001 or above but below 1,501 76 1 77 0.08
1,501 or above but below 2,001 •• 19 1 20 ■1
J,001 or above but below 2,151
351 or above but below 3,001
5
17
5
170.06
3,001 or above •• •• 13 •• 13 J1
Total— (Employees) . . 94,818 2,208 109 97,135 100.00
. .—Nil,

369
2 9 .i.~ *ontd.
SCALE* g a z e t t e d (M ARRIED AND UNMARRIED). NON-GAZETTED AND PERCENTAGE OF GROUP TOTAL I^ B iH AH -conW .
1st Jun6, 1956,,
Gazetted. T ota l Percentage ofNOft-gazetted.------------ ----------------------------------(Gazetted Groii p Total
Married. Unmarried. and to Total(Noa-Gazetted). Employees.
Bftsic p »y ranges.
17 18 19 20 21 1
85,020 85,020 72.38 Below 5 1 .
22,948 •• 22,948 19.54 51 or above but below lO l.
4,817 4,817 4.10 101 or above but below l 5 l .1,144 349 33 1,526 1.30 151 or above but below 201.
430 698 42 1,170 0.99 201 or above but below 251.165 .435 16 616 0.52 251 or above but below 301.46 299 9 354 0.30 301 or above but below 351.54 .371 11 436 0.37 351 or above but below 501.
• • 288 3 291 0.25 501 or abovei but balo’w T51.• • 136 1 137 0.12 751 or above but below 1,001.
89 r 90 0.08 1,001 or above but below l,5 0 l.21 3 23 'I (Employees) 1,501 or above but below 2,661
8 • • 80.05
2,001 or a^bove but below 2,1-61.
16 16 2 ,1 51 or above but below 3,001.14 • • 14 3,001 or above.
1,14,624 ' 2,724 118 1,17,466 100.00 Total

360TABLE
STATEMENT SHOWING THE DTSTRIBUTTON OF GOVERNMENT EMPLOYEES ACCORDING TO BASIC PAY-TO TOTAL EMPTO\EES
Basio p%y ranges.
1st June, ]956.
Gazetted. T ota l Percentage o fN on-gazetted.-----------------------------------------------(Gazetted Group Total
Married. Unmarried. Total and to TotalNon gazetted). Employees.
22 23 24 25 26 27
Below 51
51 or above but below 101 . .
101 or above but below 1.11
151 or above but below 201
201 or above but below 251
251 or above but below 301
301 or above but below 351
351 or above but below 501
501 or above but below 751
751 or above but below l,OlOl
1.001 or above but below 1,501
1,501 or above but below 2,001
2.001 or above but below 2,151
2,151 or above but below 3,001
3.001 or above . .
Total . .
89,833
28,821
6,460
1,920
548
188
98
68
1.27,936
348
977
600
322
509
413
162
111
32
5
10
15
3,504
23
59
28
11
17
11
2
1
162
381
1,036
628
633
526
424
164
112
32
5
10
.1,6
3,666
89,833
28,821
6,460
2,301
1,584
816
431
594
424
164
112
32
5
10
15 J
1,31,602
68.26
21.90
4.91
1.75
1.20
0.62
0.38
0.45
0.32
0.12
0.09
0-05
100.00

361J.i.— contd.
AMirTWMABKIED). NOK-QAZETTED AKD PEKOEIrtAOE OP GTioup To t a l
t1st June, 1957.
Nongazetted.
Married.
Gazetted.
Unmarried. Total
T ota l Percentage o f ■ (GajZetted Group Total
aind Non- to Totalga?;etted). Employees.
28 29 30, 31 32 33
35,843 • • 35,843 26.7057,066 •• • • 57,065 42.5127,125 •• 27,125 20.21
6,93g . . 6,938 5.162,159 250 25 275 2,344 1.31
748 805 59 864 1,612 1.202,18 868 17 703 921 0.69302 422 14 436 738 9.56
S9 658 16 574 643 0.48• • 515 10 525 525 0.89- 212 4 216 216 0.16
117 1 21 31 120 ... 8 8 1
8 0.05•• 19 19 1
... 19 » • 14 14 J
1,30,467 3,626 146 3,772 1,14,239 100.00
96 Planning—49

362
tABLiiAfEltfiNT SHOWIKQ THE DISTRIBUTION! OP GOVEBNMEOT EMPLOYEES ACCGRDtNG TO BASIC PAY
TO TOTAL EMPIOYBES
Basio pay range*.
1st Julia, 1958.
Non- Gazetted. Total Percentage o fG azetted .----------------------------------------------------------- - Gazetted Group Total
Married. Unmarrjed. T otal and Non- to Totalgazetted. Employees.
34 35 36 37 38 39
B elov Bi. 30
30 or above but below 51 . .
61 or above but below 101 . .
101 or above but below 161
161 or above but below 201
201 or above but below 251
361 or above but below 301
301 or above but below 361
361 or above but below 601
601 or a bove but below 761
761 or above but below 1,001
1.001 or above but below 1,601
1,601 or above but below 2,001
2.001 or above but below 2 ,l6 l
2,161 or above but below 3,001
3.001 or above
Total— (Employees)
38,544
57,663
31,223
7,822
2.865
655
424
378
94
268
1,035
713
486
620
686
230
137
20
8
16
17
0
86
24
14
20
11
6
1
298
1,121
737
409
640
607
236
138
20
8
16
17
38,544
67,663
81,223
7,822
3,163
1,776
1,161
877
734
697
236
138
30
t
16
17
26.77
40.06
21.69
6.43
2.20
1.2S
0.81
0.61
0.60
0.42
0.17
0.09
0.01
0.01
0.01
1,39,668 4,135 192 4,327 1,43,996 100.00

SCALE, GAZETTED M ARRIED AND UNMARRIED . NON-GAZETTED AND PERCENTAGE OF GROUP TOTAL IN BIH AR-con</i.
363
29.1—'Contd.
Non-gaietted.
1st ,fune, 1959.
Ga7<etted.
Married. Unmarried. Total.
Tota Percentage o f Gazetted Group Total and Non- to Total gazetted. Employees.*
Basic pay ranges.
40 41 42 43 44 45
48,218
60,448
38,763
9,842
3,641
842
348
146
114
1
1,62,663
48,218 28.78 Below Rs. 30,
60,448 36.09 30 or above but beolw 61 .
38.763 23.14 51 or above but below 101-
9,842 5.83 101 or alDOve but below 151.
232 6 238 3,879 2.32 l5 l or above but below 201:.
1,504 111 1,816 2,457 1.47 201 or above but below 251.
633 20 645 991 0.58 251 or above but below 301.
630 24 664 800 0-48 301 or above but below 361.
874 18 892 1,006 0.60 361 or above but below 60l.
060 7 667 658 0.40 501 or above but below 761.
2, 6 8 239 239 0.14 751 or above but be’ow 1,001.
129 2 131 131 0.08 1,001 or above but below 1,501.
288 . . 26 26 0.02 1,601 or above but below 2,001.
9 9 9 . . 2,001 or above but below 2,151.
13 . . 13 13 0.01 2,151 or above but below 3,001.
16 . . 16 15 0.01 3,001 or above.
4,951 191 5,142 1,67,505 100.00 T ota l— (E S ployees).

364
TABLE's t a t e m e n t s h o w in g t h e DISTRIBUTION OF GOVERNMENT EMPLOYEES ACCORDING TO BASIC PAY-
TO TOTAL EMPLOYFjiS
Basic pay ranges.
31st March, 1960.
Gazetted, Total Percentage o f Group Totals
to Total Employees.
Married. Unmarried. andnon-Gazetted).
1 2 3 4 6 6
Below Rs. 30 • • 60,329 50,329 29.47
31 or above but below 61 69,847 59,847 35.04
51 or above but below 101 38,776 38,776 22.71
101 or above but below 161 . 10,566 10,565 6.18
161 or above but below 201 . 4,046 242 16 4,303 2.52
201 or above but below 261 . 1,016 1,039 35 2,089 1.22
261 or above but below 301 . 409 1,704 11 2,124 1.24
301 or above but below 351 . 186 421 14 621 0.36
351 or above but below 601 ► 176 808 15 999 0.69
501 or above but below 761 - 1 681 5 687 0.40
761 or above but below 1,001 . . 245 246 245 0.14
1,001 or above but below 1,601 . . 149 1 150 0.09
1,601 or above but below 2,001 . . 26 •• 26 0.02
2,001 or above but below 2,151 .. 5 •• 6 0.00
2,161 or above but below 3,00i • • I< •• 16 0.01
3,001 or above • 17 •• 17 0.01
Total • 1,65,340 6,363 3 a 1,70,789 100.00
rr

365
29.1.— c#ncW.
SCALE, GAZETTED (MARRIED AND UNMARRIED), NON-GAZETTED AND PERCENTAGE OF GROUP TCTAL IN BIHAR.— concW.
31st March. 196J*.
Gazetted. Total Percentage o fNbn-gaietted.--------------------------------- -------------- (Gazetted Group Totals Basic pay ranges.
Married. Unmarried. and to Totalnon-Gaz6tted). Employees.
7 8 9 10 11
63,673 . . . . 53,673 28.39 Below Rs. 30.
68,225 . . . . 68,225 36.09 31 or above bv£t below
41,971 . . . . , 41,971 22.20 61 or above but below lOt.
12,400 6 . . 12,405 6.56 101 or above btit below I5 l.
4,866 285 9 5,160 2.73 151 or above but below 201.
1,147 2,281 36 3,464 1.83 201 or above biit below 251.
449 636 11 1,096 0.58 251 or above but below 301.
267 479 17 763 0.40 301 or above but below 351.
226 907 p 1,145 0.61 351 or abdve fcut below 501.
662 6 658 0.35 501 or above but below 751.
250 2 252 0,13 751 or above but beldw 1,001.
157 . . 157 0.08 1,001 or above but below 1,501.
26 1 27 0.02 1,501 or above but below 2,001.
16 . . 16 * 0,01 2,001 or above but below 2,151.
14 14 0.01 2,151 or above but below 3,001.
18 . . 18 0.01 3,001 or above.
1,83,223 5,726 95 1,89,044 100.00 Total.
SoxJECB.— Directorate of Statistics and Evaluation, Bihar,

360
TABLE
STATEMENT SHOWING THE DISTRIBUTION 05' THE BTHAB GOVEBNME^^^ EMPLOYEES
Basic pay.PoliticalAppoiij fc- Revenue. Finance. Health,
meat.
Legislative Law. Develop- Coun«il Educa-
ment. and tion.Assembly.
Below Bfl. 30 1,232 12,489 1,638 7,165 2,171 14,012 91 2,740
80 or above but below 61 28,499 9,120 440 2,444 2,133 10,159 19 1,002
61 or above but below 101 4,268 6,933 1,299 1,924 1,816 11,195 78 6,513
101 or above but below l6 l 1,356 882 650 476 374 3,198 23 2,32B
151 or above but below 201 1,022 310 330 200 72 1,445 15 694
201 or above but below 251 296 239 171 1,240 100 769 16 151
251 or above but below 301 163 66 62 23 13 340 12 89
301 or above but below 361 102 68 64 17 19 227 9 77
351 or above but below 601 169 71 34 82 100 298 20 163
501 or above but below 761 86 24 22 12 84 160 3 147 f
751 or above but below 1,001 37 37 21 14 70 1 30
1,001 or above but below 1,601 . 16 12 6 40 19 2 18
1,601 or above but below 2,001 . 1 3 6 2 3 • • 2
2,001 or above but below 2,161 . 4 • • . . 2 • • • •
2,151 or above but below 3,001 . 7 2 . . . . 2 • •
S,001 or above •• 1 •• •• •• •• •• ,
Total . . 37,148 30,267 4,631 13,583 6,938 41,889 289 1L\954
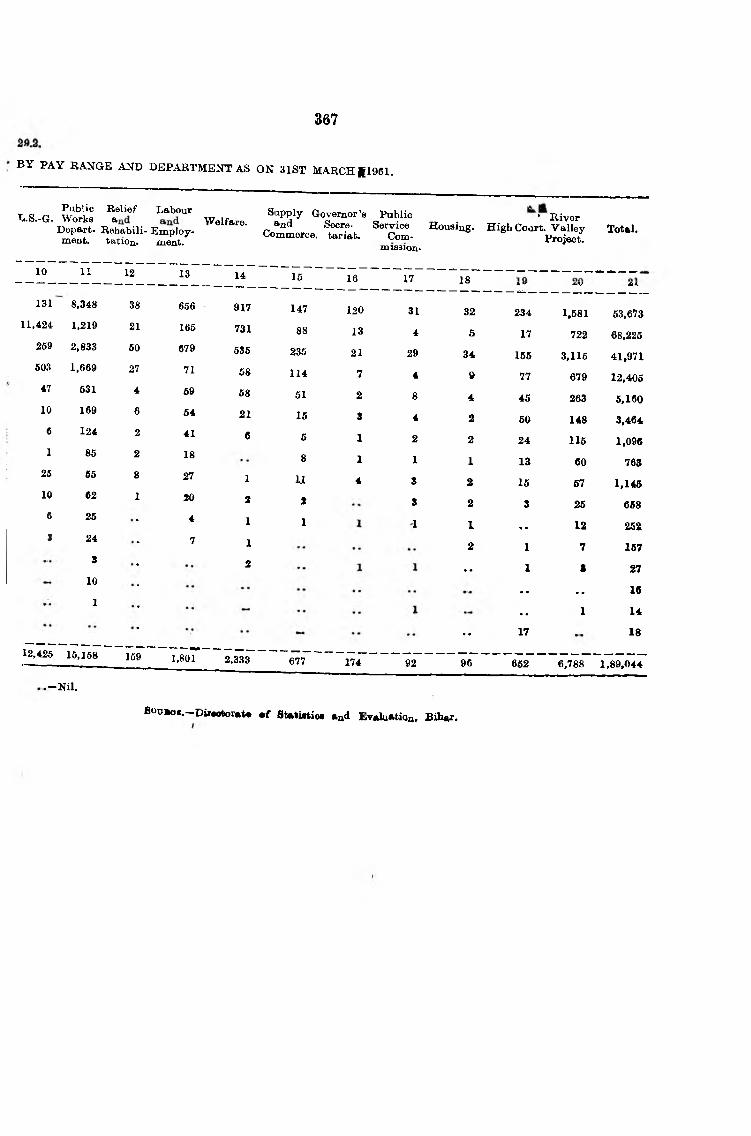
367
B Y PAY RANGE ANB DEPARTMENT AS ON 31ST MARCH J|196l.
Public T .S.-G. Works
Department.
Supply Governor’s PublicRelief LabourRe^hahiU Welfare. a^d Secre- Service Housiug.Rehabih-Em ploy. Commerce, tariat. Com-tation. ment.u lAiouu. mission*
* River High Coart. Valley
Project.Total.
10 11 12 13 14 16 16 17 18
32 234 1,581 53*6735 17 722 68,226
34 156 3,116 41,971
9 77 679 12,405
4 46 263 6,160
2 60 148 3,464
2 24 115 1,096
1 13 60 763
2 16 57 1,146
2 3 26 658
I % ♦ 12 252
2 1 7 167
• • 1 S 27
• • • • 16
. . 1 14
•• 17 18
131
11,424
259
603
47
10
6
1
26
10
6
t
8,348
1,219
2,833
1,669
631
169
124
86
66
62
26
24
3
10
1
38
21
60
27
4
6
2
2
8
1
656
165
679
71
69
64
41
18
27
20
4
7
917
731
536
68
68
21
6
1
2
1
1
2
147
88
235
114
51
16
6
8
u
3
1
120
13
21
7
2
3
1
1
4
31
4
29
4
8
4
2
1
5
3
1
12,425 16,168 159 i^goi 2,333 677 174 92 96 662 6,788 1,89,044
.-N il .
fiou»o*.-D i»*otor*t* * f St*li«tio« *nd Ev*lu*tiOft, Bih*r.


SECTION XXX F Iri Stitistles
06 P la n .-6O

W ATEMENT SHOWING THE NUMBER OF OUTBREAKS OF FIRE, AMOUNT OF PROPERTY DESTROYED AND SAVED AND DEATHS AND INJURIES TO PERSONS AND ANIMALS IN BIHAR.
370
TABLE 80.i.
Year.Number o f outbreaks o f fire.
Amoimt o f property
destroyed (in rupees).
Amount of property saved
(in rupees).
Number o f deaths and injuries to
persons.
Number o f deaths and injuries to
. animals.
Number of viUage
fire.
1 2 3 4 6 6 7
lOSO1980IM l1968190S19041986198019671968
369490486446869613707869743640
13,61,63816,96,27012,61,19019,36,8787,77,162
13,63,6786,48,31,8481,06,66,239
72,32,90148,37,718
80,94,2601,06,00,160
66,07,9861,01,49,4694,00,17,6301.38.26.126 3,26,61,5602.06.16.126 4,66,66,836 2,24,03,660
4(46)11(18)9(18)
10(19)10(13)16(17)18(39)20(32)27(37)14(22)
61(6)27(4)
28 (..)17(3)6 (..)66(3)60(2)68(2)
64(11)129(3)
16213791
1412 il263224171
. .—Nil.Yigorea under bracket! atand for number o f injoriea. Vigurea of 1966 Reviaed.
SovBoa.— State Fire Officer, Bibar.
TABLE 80.2.
■TATEMENT SHOWING THE NUMBER OF OUTBREAKS OF FIRE, AMOUNT OF PROPERTY DESTROYED AN D SAVED AND DEATHS AND INJURIES TO PERSONS AND ANIMALS IN BIHAR DURING 1967.
Centre.Number o f
outbreaks o f fire.
Amount o f property destroyed
(in rupeea).
Amount o f property saved
(in rupeea).
Number o f deaths and injuries to persons.
Number o f deaths and
injiuries to animals.
Nimiber o f village fire.
1 3 3 4 6 6 7
Patna 146 16,66,218 84,43,300 ..(16) m ) 23
Oaya 97 1,68,266 S,60,900 61
Bhagalpur » 4,47,777 7,68,676 m 80
Jamahedpur 43 16,88,622 3,67,06,326 1
MuaafEarpur 130 16,78,808 39,69,690 7(22) 67(8) 61
Dhanbad 68 1,12,810 9,03,400 14
Katihar 26 3,29,697 24,82,176 8
Banehi 41 6,06,486 13,94,816 4 (..) ..(3 ) 4
Patxta City 46 3,24,312 8,76,431 7
Jfonghyv 86 1,40,740 2,46,086 M ..) 10
Bagoaarai 40 2,30,280 9,41,400 6 (..) 26
Total 743 72,32,901 4,66,66,836 27(37) 224
. .—Nil.7ifvrcf in bracket* •taod for the ca«e of injuriea.
fiovmoB.—6t«t« Fir* OfBew,

371
TABLE 80.—aonold
TATEMENT SHOWINQ TH E NUMBER OF OUTBREAKS OF FIRE, AMOUNT OF PROPERTY DESTROYED AND SAVED AND DEATHS A.VD INJURIES TO PERSONS AND ANIMALS IN BIH AR DURING 1968.
Centra.
N\imber of outbreak*
of fire.
Amount of property
destroyed (in rupees).
Amount o f property
saved (in rupees).
Number o f deaths and
injuries to persons.
Ntunber o f deaths and injuries to animals.
Number of village fire.
1 2 3 4 6 6 7
Patina 126 4,96,710 23,81,226 1(3) 3(1) 11Oaya • • 93 1,67,660 6,46,360 . - ( . - ) 82
Bhagalpur •• 08 4,76,197 11,66,010 ..(2 ) 36
Jaznahedpur . . • « 44 41,187 1,08,46,460 - ( - ) 1Musafihrpur • • 122 13.34,643 19,99,176 1(7) 4(2) 44
Dhanbad 40 1,31,636 9,26,160 1(8) 16Katiihar 21 2,74,766 1,79,060 2 ( ..) 101(.») 6Banohi 80 6,02,636 . 13,71,826 7(2) 4
Patina City — . 11 61,910 9,47,100 . . ( . . ) 4
Monghyr 28 3,87,426 6,96,860 1 (..) 4 (..) 6
Begnaarai 33 8,63,060 13,64,476 1 (..) 17 (..) 22
Total •• 640 48,37,718 2,24,03,660 14(22) 129(3) 171
. . — Nil. Pigoye* in braoketa stand for the case o f injiirie*.
SOTTBCta.— State Fir* 0£Qo«r, Bihar.


SECTIOI mi Stitlstlcs Q( Displaceil Persons

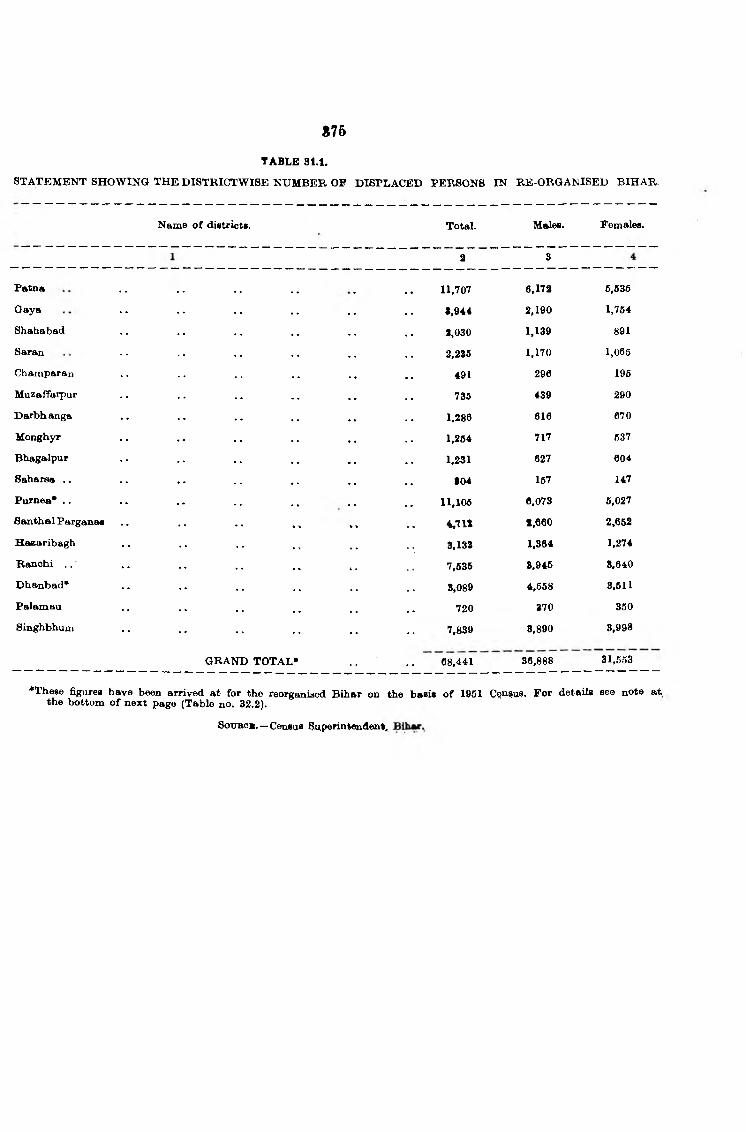
S76
TABLE 31.1.
STATEMENT SHOWING THE DISTRICTWISE NUMBER OP DISPLACED PERSONS IN RE-ORGANISED BIHAR.
Name o f districts. Total.
2
Moles.
3
FemaleB.
Patna
Gaya
Shahabad
Saran
Champaran
Muzaffarpur
Darbhanga
Monghyr
Bhagalpur
Saharsa . .
Purnea* . .
Santhal Parganas
Hazaribagh
Ranohi . .
Dhanbad*
Palamau
Singhbhum
GRAND TOTAL*
11,707 6,172 6,536
S.944 2,190 1,764
9,030 1,139 891
2,235 1,170 1,066
491 296 196
785 439 290
1.286 616 670
1,204 717 537
1,231 627 604
804 167 147
11,106 6,073 5,027
4.711 t,6Q0 2,652
3,133 1,364 1,274
7,535 8,945 3,640
3,089 4,668 3,511
720 370 350
7,839 3,890 3,998
68,441 36,888 31,563
♦These figures have been arrived at for the reorganised Bihar on the basis o f 1961 C^n^us, For details see note at the bottom o f next page (Table no. 32.2).
SotnBOB.—Census Superintendent,

376
TABLE
STATEMENT SHOWING THE POPULATION OF DISPLACED
Displaced persons from ‘ 'Weht Pakistan” .
STATE,Division
andDistriot.
Total Population.1946. 1947. 1948.
Persons. Male. Female. Male. Female. Male. Female. Male. Female.
1 2 8 4 6 6 7 8 9 10
BIH AR . . 78,603(08.441)
39,624(36,888)
8,879(31,653)
389 198 6,636 6,682 1,899 1,376
P a t s a DiviBiow 17,681 9,601 8,180 220 142 2,631 1,883 727 464
Patna 11,707 6,172 6,636 220 142 1,311 988 673 374
Oaya 3.944 2,190 1,764 •• 886 633 6
Shahabad 2.030 8.139 891 •• •• 434 362 149 90
T ib h u t D ivisiok 4,7*7 2,621 2,226 6 2 707 536 204 12S
Saran 2,236 1,170 1,066 •• 90 68 42 14
Champaran.. 4dl 296 196 •• •• 136 69 69 16
Muzaffarpur 736 439 296 1 •• 212 118 36 88
Darbhanga 1,286 616 670 4 2 270 301 68 66
BHAaAUtm Divistoir . . 23,026 12,613 10,413 11 419 379 328 168
Monghyr .. 1.264 717 637 •• •• 170 104 72 29
Bhagalpur . . 1,231 627 604 •• 132 169 190 68
Saharaa 304 167 147 •• 20 22 26 26
Purnea* 16,526(11,106),
8,462(6,078)
7,073(6,627)
2 •• 46 44 27 17
Santhal Pargeuaas 4,712 2,660 2,062 9 •• 61 40 13 29
C h o t a k a g I’ u b D i v Is i o w 28,049 14,989 13,060 163 64 2,778 2,884 640 120
Hazaribagh.. 3,138 1,864 1,274 14 1 192 222 104 73
Ranchi 7,686 1,946 3,640 47 8 861 630 122 96
Purulia** .. 8,464(Nil)
613(Nil)
841(Nil)
•• •• 23 30 17 87
Dhanbad .. 7,207 i8,069)
4,307(4,668)
2,950(3,611)
37 24 630 670 174 166
Palamaa 726 370 366 136 177 17 26
Singhbhum.. 7,889 3,890 3,999 66 21 1,046 1,266 206 224
. - —Nil.Figures under braoketa show the position after re-organisation o f State under Transfer o f Territories Act, 1956.
*Due to the re-orgftnisation o f State, 4,426 East Pakistan displskced persons o f Purnea district have been transferred to West Bengal.
•♦With the re-org£uaisation o f State Purulia ceased to be a district o f JHhar, hence out o f its total displaced persojus (1,454), 642 consisting o f 122 West Pakistan displaced persons and 520 East Pakistan displaced persons have been transferred to West Bengal, while the rest have been added to the population o f the present district o f Dh*nb»d.
SouBoa.—Belief auad Bebabilitation Department, Bihar.

377
^tl.2.PERSONS BY YEAB OF ABRIVAL ACCORDING TO CENSUS OF BIHAR, 1©M.
Displaced persons from “ West Pakistoa* • Displaced Ipersona ,from “ East Pakistan’ ’ .
1049. 1950. 1951 Date o f return not stated.
1946. 1947.
Hale. Female. Male. Female. Male. Female. Male. Female. Male. Female. Male. Female.
11 12 13 14 15 16 17 18 19 20 21 22
729 263 641 643 16 19 64 87 1,734 1,083 9,022 7,678
260 120 478 482 S 16 298 261 1,60S 944
B83 190 122 147 s 16 • • 298 S49 1,896 865
. . S66 S86 • • • • •• S 102 187
t • • • • • • • • • • •• •• 104 892
Ot fiO 22 19 • • • • 04 87 11 13 823 831
69 12 .. S • • • • • • • • S 1 28 27
4 19 11 8 • • • • .. - • • S 87 18
6 S t 4 • • . . 04 87 • • 1 41 62
14 7 8 4 • • .. . . 8 8 216 234
186 19 4 16 8 4 .. . . 710 427 2,785 2,321
IT 2 1 8 • • . . . . 8 306 252
111 6 • • •• •• • • • • - •• •• 96 184
4 1 .. . . • • . . - . . . . 53 ‘ 36
•8 1 2 8 8 4 468 267 1,245 1,098
IS 7 1 . . 242 162 1,085 761
S16 74 187 76 9 » • 716 872 4,313 4,082
22 SB 10 8 ' •• . . . . . . 24 17 834 621
11 29 82 26 7 .. 109 106 420 461
12 1 •• S •• • • •• •• 17 40 238 166
BO 6 46 S7 - • w •• •• 468 126 1,639 1,247
• • • • • • . . . . . . 90 83
n o 16 60 17 S •• •• 107 84 1,097 1,30096 Flan__51

378
TABLE 81.2.— eoneld.
STATEMENT SHOWING THE POPULATION OF DISPLACED PERSONS BY YEAR OF ARRIVAL ACCORDINGTO CENSUS OF BIHAR, 1951—cone d.
STATE,Division
andDietrict.
Displaced persons from *‘East Pakistan".
1948. 1949. 1960. 1951. Date of retttm not stated.
Male. Female. Mide. Female. Mole. Female. Male. Female. Male. FemaU
1 23 24 25 26 27 28 29 30 31 32
BIHAR 6,961 4,911 8,297 2,552 8,03« 9,251 312 307
Patna Division 1.020 488 448 229 1,838 3,212
Patna 758 386 402 229 856 2,520 ..Gaya 48 62 46 • • 747 686 .• *
Shahabad .. 214 40 .. 23.5 7 .•Tikhut Division 166 132 239 847 676 616 83 20
Saran 75 79 218 306 64,6 666 • •Champaran., 23 16 8 22 9 24
MmttSaTpuT 2% e 11 4 21 14 8S 20
Darbhanga .. 36 81 2 16 ... 13 • •BhaoalfubDivision.
3,108 2,550 1,863 1,446 2,960 2,826 237 258 ••
Monghyr .. 127 111 17 6 0 17 ••Bbagalpor .. 78 144 18 34 •• •• •• ..
Saharsa 46 60 9 10 •* •• •• •• ..
Pumea 2,288 1,619 1,^80 1,168 2,785 2,697 218 250 ..
Santhal Par- ganas.
669 626 43d 228 219 211 19 8 ..
C h o t a n a g p t j b
d i v i s i o n .2,677 1,741 747 680 2,568 2,598 42 29 ..
Hazaribagh.. 491 206 71 68 87 49 5 2 ..
Ranchi 438 294 192 76 1,673 1,888 32 25 . .
Purulia . . 188 264 67 46 6ft 66 1 . .
Dhanbad . . 640 398 218 173 311 219 5 1
Palamaa 108 48 6 89 12 •• •• . .
Binghbhmn.. 612 637 203 173 402 364 •• . .
Bottbob .— Census Superintendent, Bibar.

mTABLE a iS .
STATEMENT SHOWINQ THE POPULATION OF DISPLACED PERSONS FROM WEST AND EAST PAKISTAN TOBIHAR BY DISTRICT OF THEIR ORIGIN.
District o f origin.
1
WEST PAKISTAN.
Persons. Male. Female.
2 3 4
Jhar ParkarUpper Sind FrontierSanghor
Hazra
Karanohi ..
Sarkhana .. Nawabshah SukkurBelnoh Frontier Tract Ounidaspur Dadn
Hyderabad
Thong
Maltan MosafiFargarh
Dera Oazikhan Attook
ISainwali Montgomery
Lyolpur Qajarat Shahapore ..
Jhelom Rawalpindi..Lahore Sialkot Gujranwala
Bheikhpura
Mardan Peaha^rot . .
KohfttBaxmu *.
0 6 • •
J70 31 130
87 34 13
105 60 46
699 370 223
301 308 88
60 27 32
018 687 831
11 8 8
181 74 107
20 0 30
840 128 218704 674 120
244 167 87
73 63 20
000 467 632
36 17 18
71 84 87
188 77 61
221 82 139
2.446 1,396 1,060
131 40 91
477 277 200
1,048 611 637
3,266 1,631 1,634
1,386 727 668
836 623 812170 163 26
72 7 66
200 148 148
44 18 86
183 126 66

TABLE' R1.8.-coijcItf.STATEMENT SHOWING TH E POPULATION OF DISPMJ::D PERSONS FROM WEST AND EAST PAKISTAN TO
B Ih A h b y DISTRICT OF TH EIR O R IG IN con eW .
380
District of origin. persons. Male. remal
T O T A L -E A S T PAKISTAN
GRAND T O T A L -(E A S T AND WEST PAKISTAN)
I 2 3
Dera Ismallkhan • • • • 562 296i
2el
Quetta Pisbin • • • • 76 34 i
Sibi / •• • • 6 6
Ealat • • • • • • • • • • • • • 14 14
Karan • • • • • • • • • • • a 2 •Babawalpur •• 267 144 l i
Khairpur . . . . • • • • It 6
District not atated *• • • • • 1,666 1,018 64
TOTAL-W EST PAKISTAN
EAST P A K IfiT ^ .
• • 18,379 10,262 8,i;!
Nadia • • • • • • • • . . 1,890 1.16Q 71
lestoi »• .. • • 1,061 607 4i
Khuina S,676 1,495 l,a
Noakhali . . • • • • * • • • • k 2.213 1,220 ft
Chittagong .. • • • • • • • • 3,263 1,394 9
Bylhet • • • • * • •• •• 253 141 1
Bogra ». • • •• 504 240
Pal»na .. • • * * * * • • •• 1,448 048 8
Malada *. *1 • • • * • » • • • 559 310 a
Dacca •t • * * * * • • . . 11,899 6,289 5,6
Mymensingh * • • • • * * • •• 5,907 8,238 2,fl
Faridpu* . . • • • * • • • • •• 4,268 2,175
BakarganJ . . m • • • * * • • • • 5,816 2,874 2,9
Tippera . . * • • • 2,072 1,129
Bajshai • • • • • • • • 1,015 565 4
Ectft Dinajpur • • •• 6,416 1,128
/alpaiguri . . • • •• 528 228
Rangpu* . • • • • • 1,655 1,030
District not stated . . • • • • 2,788 1,473 >•1
05,124
73,503
29,362
89,624
26,1
83,
Boxrsoa.—Ceniua Superintendent, Bib«r.

TABLE 31.4.

mfi
TABLi
8TATBMBNT SHOWING THE POPULATION OF DISPLACED PERSONa
Agricultural Liyelihood Glaaees.
STATE,Divibiok
andDistriot.
Total.I n m IV
Caltivation of land wholly or mainly owned and
their dependants.
Cultivation of land wholly or mainly owned and
their dependants.
Cultivati labourers a
their dependant
JlflPNon-cultivating owners of land agriculture rent receivers
and their dependants.
TrtalClasses.
Peraont. Male. Pemale.s.
Male. Female. 1Male. Female. Male. Female. Male. Female. Persons.
1 2 3 4 6 6 7 8 9 10 11 12 13
BIHAR 78«608 89.884 83,879 lp718 1.687 1*718 1.480 1,617 1,181 190 148 9.528Patjta Dxvibiov 17,681 0,601 8,180 36 36 17 28 12 11 14 8 106
Patna 11,707 6,172 6,636 6 11 16 24 .. .. 60
Oaya 8,944 2.190 1.764 81 24 2 4 12 11 14 8 101
Shahabad 2,030 1,139 891 • • .. .. . . . . .. . .Tibhvt Dxtisiov 4.747 2,621 2,226 87 89 6 10 13 6 1 118
8 »a n 2,236 1.170 1.066 .. . . . . . . . . . . . .
Champatan 491 m m . . . . . . . . h 6 .. 10
Muiaffarpuv 735 439 296 18 13 .. 6 1 8 4 .. 40
Darbhanga 1,280 616 670 19 26 .. • • 6 2 1 07D m
•ION.. 29.020 12,613 10.418 1.410 1,368 1,676 1.887 1.816 1.147 161 188 8,694
Ifonghyv 1,204 717 537 19 13 70 69 71 40 42 16 849
Bhagalpuv 1,231 627 604 .. . . . . . . .. • « . .
flahana/ 304 157 147 • • .. . . . . .. . . . . . .Purnea 15,825 8.452 7,073 1.348 1,304 1.601 1.314 1,239 1.103 74 64 8.047
Banthal Parganas 4,712 2.660 2,062 43 61 6 4 6 4 46 62 209
OROSAKAOnrBDzvzuoir.
28.049 14,989 13,060 236 196 20 9 180 10 9 6 664
Baaaribagh 3.138 1,864 1,274 102 81 10 .. 138 9 2 880Raoebi 7.685 8,946 3,640 64 64 .. • • .. . . • • • • 168
Poralia 1.464 613 841 22 • • .. 16 7 .. 44
Dbanbad 7,267 4,307 2,960 85 86 8 .. 16 7 .. 1 98
Falamao 726 870 366 .. . . • . . 8 • • 8
Binghbhom 7.880 8.890 8.999 22 14 1 9 8 1 • • 8 78

38S
• 1.4.
OUkSSIFIED INTO LIVELIHOOD CLASSES ACCORDING TO CENSUS OF BIHAR, 198L
L--------------------------—--------
A ^ooltnral
«NoD*agricultnral Livelihood Oassea.
1 Total n on*agrioaltaralclasses.
V VI V II v m
Prodnotlon other than eoltivation.
Commerce. Transport. Other Bouroeaand miscellaneous
sources.
Male. Female. Male. Female. Male. Female. Male. Female. Male. Female. Persons. Male. Female.
14 16 16 17 18 19 20 21 22 23 24 26 26
9,188 4,890 4,182 82.49 8,004 6,558 8,464 2,800 18,888 16,882 63,975 84,486 89,460
70 11 877 286 2,286 1,941 1,137 937 6.624 4,939 17,626 9,422 8,108
fO 86 108 141 1,630 1,448 644 434 3,780 3,477 11,662 6,161 6,600
•0 41 40 26 336 247 810 176 1,646 1.262 3,843 2,131 1,711
•» • 110 110 820 246 882 827 298 199 2,030 1,139 801
08 00 108 88 841 602 114 28 1,406 1,449 4,636 2,468 2,167
. . 01 i& Ufi 26 VI 968 914 2,336 1,170 1,066
6 0 18 16 189 107 6 3 76 64 481 291 190
It S3 7 8 220 167 26 3 163 96 690 416 274
18 81 11 16 804 242 68 6 208 376 1,229 691 6384,«0i 1,084 1,080 989 2,260 1,771 826 670 3.939 3,009 14,430 8,061 6,879
101 188 7 14 89 18 220 198 249 169 916 6,161 899
• • . . 108 107 186 118 68 63 231 226 1,231 627 604
•• • • 4 4 98 96 . . .• 60 48 304 167 1474.103 8,786 063 470 1,401 1.096 802 249 1,934 1,474 7,478 4,190 8,288
08 111 269 234 682 446 246 170 1,466 1,092 4,503 2,662 1.941444 320 2.011 1,940 2,628 2.244 1,388 1,166 7, 18 7,486 27,386 14,646 12,840
1S2 83 876 266 374 244 128 70 736 622 2,803 1,612 1,19104 64 202 166 617 432 46 31 3,127 2,968 7,477 3.891 8,68644 •• 16 16 147 269 224 333 183 234 1,410 669 841#4 44 1,068 639 872 491 849 605 1,464 1,171 7,169 4.263 8,90698 •• 66 61 42 77 2 268 218 723 367 8663T 39 886 821 676 741 140 12 ^ 2,161 2,272 7,813 3,86» 8,060
8ovboi.->Censtis Superintendent, Bihar.


R S . I NC R O R E S .
4 0 0 ------
PR OVISION AND EXPENDCTURE UNDER M A J O R HEADS O F
D E V E L O P M E N T S DURING PLAN P E R I O D S
IN B H A R
2 0 0 —
SOCIAL SERVICE.^
t r a n s p o r t 1 c o m m u n i c a t i o n -'
R Y ( M I N I N G . _i r r i g a t i o n t p o w "
AGRI C U L T U R E ^ . D * 8 C 0 . 0 pe\ a - TOTA L e x p e n d i t u r e . * T l V E .\ 'yPLAN P R O V I S I O N - | l OO - __________ ___
SECTION XXXII Plan Statistics
96 Plan.— 62

386
TABLE 32.1.
STATEMENT SHOWING DEVELOPMENT BLOCKS OPENED IN EACH DISTRICT OF BIHAR.
District.
Blocks opened.
Tafget 1952. 1963. 1964. 1955. 1956. 1957. 1968. 1969. I960. 1961. 1962. 1963. Total.
8 9 10 11 12 13 14 16
Patna
Gaya
Shahabad
Saran
Champaran
Muzaffarpur
Darbhanga
Monghyr
Bhagalpur
Saharsa
Purnea
Santhal Parganaa
Heizaribagh
Banchi
Palamau
Dhanbad
Siagbbhum
TOTAL
28
46
41
40
36
40
44
39
21
21
38
41
42
38
25
10
25
1
7
8
5
2
6
2
6
4
3
3
4
4
2
2
1
7
6
8
6
6
4
6
2
2
5
3
5
6
5
S 3
4
6
6
6
0
6
4
6
5
3
6
6
6
6
3
1
4
1
4
2
2
2
3
4
1
1
2
%
3
3
3
1
1
4
3
3
5
4
4
2
2
1
5
3
4
3
2
575 16 17 36 76 78 23 35 46
t
5
4
4
3
5
4
5
2
2
3
4
4
3
3
1
3
68
5
6
10
4
4
5
6
4
2
3
4
6
6
5
3
2
3
74
28
46
41
40
36
40
44
39
21
21
88
41
42
38
25
10
25
87 576
.—Nil.
Source.—Development Commissioner, Bihar.

387TABLE 32.2.
STATEMENT SHOWING THE ANCHAL-(7(7M-DEVELOPMENT BLOCK AND THE VILLAGE AREA, POPULATIONCOVERED IN EACH DISTRICT OF BIHAR.
No. o f Anchal-c««»-Develop- Average area Average no. Average
Total rural Total no. Total rural ment Block in sq, K.M. o f village population in area (in sq. o f population, finally fixed in per unit per unit thousand
K.M.) villages. consultation block. block. per unitwith District block,commissions
and officers.
District,
Patna 6,319.3 2,335 23,55,850 28 190 83 84
Gaya 12,157.8 6,236 33,82,794 46 264 136 74
Shahabad 11,288.7 4,767 29,86,316 41 275 116 73
Saran C,894.8 4,425 34,35,002 40 172 111 86
Champaran 9,030.5 2,642 28,60,666 36 261 73 79
Mu*a£farpur 7.742.S 4,147 89,29,573 40 194 104 98
Darbhanga 8,664.9 8,148 42,23,472 44 197 71 96
Bhagalpur 5,438.5 2,489 15,24,417 21 269 119 73
8aharsa 8,377.7 1,195 16,56,139 21 256 57 79
Monghyr 9,997.5 3,464 30,11,883 89 266 89 77
Santhal Parganan 14,118.8 10,068 26,33,261 41 344 246 62
Purnea 10,771.6 8,687 29,03,531 88 283 97 76
Ranohi 18,058.8 8,858 19,36,087 88 475 102 51
HaKEiribagh 17,917.4 ' 0,162 21,96,227 42 427 147 52
PaLamau 12,661.7 3,194 11,31,625 25 606 128 45
Singhbhum 13,182.8 4,401 16,09,260 25 527 176 64
Dhanbad 2,708.4 1,462 8,68,697 10 271 146 87
TOTAL 171,320.5 67,665 4,25,41,690 575 298 118 74
Source.— (<) Development Commissioner, Bihar.
{it) Census o f India, 1961, Volume IV (Bihar).

STATEMENT SHOWING THE PLAN PROVISION AND Y EAB W ISE EXPENDITURE Oil' THE FIRST tlV E -Y E A RPLAN.
( R t t p e e s i n L a k h s . )
388
TABLE 32.3.
Naire of the Section. PlanProvisi'-n,1951-56.
1951-52. 1952-53.
Expenditure.
1953-54. 1954-55. 1955-56.Total. Per-
ceutage.
1 2 3 4 5 6 7 8 9
1. Agriculture Programme 15,17.4 3,61.3 1,71.9 1,61.5 2,79.7 4,96.5 14,70.9 69.9
2. C.n. and Co-operation 1,63.7 18.0 24.0 28.7 35.7 56.2 1,62.6 99.3
3. Irrigation and Power 22,21.0 2,59.0 2,98.0 2,60.3 4,56.0 9,67.0 22,40.5 100.9
*. Industry and Mining 1,36,3 6.9 13.7 H .l 36.3 32.8 1,03.8 76.2
5. Transno^'t and Communication . 10,00.0 2,02.1 2,02.4 1,04.4 1,82.0 3,67.9 10,48.8 148.9
6. Social Servi'^e? 17,il.0 3,36.0 2.55.9 3,32.2 4,67.2 7,27.7 21,19.0 121.7
7. Miscellaneous? •• L82.0 •• •• •• 1,82.0 ••
TOTAL 67,79.1 13,65.3 9,65.9 9,01.2 14,56.9 26,33.3 73,:>' .6 10«.0
S o u r c e . — First F ive-Year Plau Review.
TABLE 82.4.
STATEMENT SHOWING EXPENDITURE UNDER TH E M AJOR HEADS OF DEVELOPMENT DURING IH ESECOND TIVE-YTSAR PLAN.
( R t j p e b s I ” L a k h s . )
Heads o f Detrelopment.‘ Plan Total Per-
Provibion, Actual, Actual, Actual, Actual, Actual, expenditore, certaae 1956-61. 1956-57. 1957-58. 1958-59. 1959-60. 1960-61. 1956-61. col. 8 "'to
col, 2.
1 2 3 4 5 6 7 8 9
1. Agrioaltaral and Commutvity Development.
49,90.86 6,68.18 9,01,10 10,74.59 13,13.70 14,57.68 54,20.25 108.61
2. Irrigation and Power 69,43.67 8,85.79 10,22.06 10,64.7<j 14,46.46 14,93.37 58,12,46 97.8
3. Industry 11,66.86 1,00.07 1,52.88 1,')8.62 2,23.16 2,12.56 8,47.30 72.?.
4, Tran’port and ComrP’inication . 15,85.54 3,27.08 2,47.24 2,53.17 3,23.25 3,69.10 15,19.84 95.9
5. Social Servfce? 52,39.83 5,?9.57 5,16.47 6,9?.21 10.70.68 12,75.92 41,27.78 78.8
8. Miacellaneous 9f».?3 9.04 13.60 15.05 14.58 17.64 70.91 74.5
GRAND t o t a l . . 1,90,21.99 25,19.73 28,93.28 32,61.43 42,96.83 48,26.27 1,77,97.-4 «3.6
SOTTKOE.-Sepr>nd Five-YeaT Plan, 1956—61 (Review).

TAfiLE 82.!?.
STATEM ENr SHO'tViNO THE EXPENDITURE UNDER SUB-HEADS OF DEVELOPMENT DTJRTNO THE SECONDF r^ E -Y S A R PLAN.
389
( R f p e e s i n L a k h . )
Codeno.
He^d o f development.
Planprovision ---------------
afteradjutstment. Actual,
1956-57.
Expenditure.
Actual,1957-58.
Actual,1958-59.
Actual,1959-60,
Aot.iaUj1960-61.
Total Percentage expen- o f col. diture, 9 to 1956-61. col. 3.
10
1 AGRICULTURE AND COMMUNITY D EVE IO P- MEN r.
49,90.86 6,68.18 9,01.10 10,74.59 12,18.70 14,57.65 64,20.25 108.5
1.1 A gricult lira 1 Prod^jction 11,95.35 1,30.08 2,54.14 2,40.61 3,24.50 3,20.68 12,70.98. 106.3
1.2 Minor Irrigation 3,99.91 l,8l..55 1,52.?4 1,65.11 1,50.7^ 1,66.63 8.16.30 204.1
1.3 Soil Conservation 2,01.93 18.13 21.63 31.81 35.30 41.57 1 48.44 73.5
1.4 Marketing 9.19 0.40 0.71 0.74 0.97 Ll-J 3.»7 42 1
1.5 Anitr>a1 Hostandry 5,18.34 32.29 59.65 90.46 1.38.01 3,67..f 4 70.3
1.6 Dairying ftiid Milk Supply 47.07 0.22 4.11 2.24 9.85 24.61 41.03 87.2
\.7 'oregfc 2,70.60 24.60 25.26 28.30 47.4? 54.55 1,80.09 66.6
1.8 Fisheries 54.24 3.86 5.54 6.19 7.76 6.86 30.15 55.6
1.9 r.P . and N .E .S... 17,45.38 2,25.00 3,35.92 79.06 5,39.19 6,21.59 22,00.76 126.1
2.0 - Co operatioE, 3,58.87 41.10 42.84 43.88 89.33 47.16 2,<?7.3I 74.5
2.1 Par.cbayat 1 90.00 8.05 11.58 17.00 22.15 35.00 9.3.78 49.4
3 IRRIGATION AND POWER.
59,43.67 8,85.79 10,22.06 10,64.73 13,46.46 14,93.36 58.12.46 07.8
3.1 Major and Medium Irrigation Project.
32,58.50 3,03.03 4,24.36 4,82.21 5,72.11 9,16.82 26,98.53 82.8
3.2 Power Project . . 26,85.17 5,82.76 5,97.90 5,8.3.57 7,74.35 5,76.55 31,13.93 116.0
4 INDUSTRY . . 11,66.88 1,00.07 1,52.88 1,58.63 2,23.16 2,12.56 3,47.30 72.5
4.1 Major and Medium Industries 1,58.88 22.44 26.72 1,00.08 72.02 2,21.26 130.3
4.2 Indasterial Estates and Town- 10,07.98 1,00.07 1,30.44 1,31.91 1,2?.08 1,40.54 6,26.04 62.1ships and Village and Small- scales Industries,
5 TRANSPORT AND COMMUNICATION.
15,85.54 3,27.08 2,47.24 2,53.17 3,23.25 3,69.10 15,19.e4 95.9
5.1 Road 14,66.79 3,27.08 2,43.43 2,49.99 3,17.95 3,41.10 14,79.55 100.9
5.2 Road T rarsport.. 1,18.75 3.81 3.18 5.30 28.00 40.29 33.9
6.1 Education 22,83.08 2,08.36 2,44.78 3,03.00 4,96.55 6,40.33 18,93.02 32.9
6.2 Health 16,18.21 2,18.58 1,81.26 2,24.08 3,21.67 3,64.32 13.09.91 80.9

(R u p e e s in L a k h s .)
390
TABLE 32.5— concld.
STATEMENT SHOWING THE EXPENDITURE UNDER SUB-HEADS OF DEVELOPMENT DURING THE SECONDFIVE-YEAR PLAN— concZd.
Codeno.
Head o f Development.Plan
provision ■ (after adjustment).
Actual,1956-57.
Expenditure.
Acitual, Actual, 19577-58. 1968-69.
Actual1959-60.,
Actual1960-61.
Total Percentage expenditure, o f col, 9
1956-61. to ool. 3.
1 2 3 4 5 6 7 8 9 10
6.3 Hoasing 5,95.13 45.48 53.34 66.70 1,08.96 1,08.56' 2,83.04 64.4
6.4 Labour W elfare.. 1,37.48 9.43 9.83 19.31 27.12 33.99 99.68 72.6
6.5 Welfeire o f Scheduled Tribes, Scheduled Castes and Backward Classes.
6,43.36 47.39 66.. 49 80.47 1,12.24 1,23.62 4,30.71 79.2
6.6 Social Welfare . . 62.57 0.33 0i.70 1.65 3.66 5.20 11.43 18.3
6 TO TAL-SO C IAL SERVICES 52,39.83 5,29.57 5,66. 40 6,96.21 10,70.68 12,76.92 41,27.78 *78.8
7 ALL OTHER ACTIVITIES 95.23 9.04 13.60 16.05 14.63 17.64 70.91 74.5
7.1 Publicity and Propaganda 43.37 6.51 5.62 7.18 7.04 8.02 86.97 82.9
7.2 Statistics 51.86 2.53 T.98 7.87 7.54 9.62 33.94 65.4
g r a n d TOTAL 1,90,21.99 25,19.76 28,98.27 82,81.42 42,96.63 43,23.27 .1,77,07.52 98,6
S Q u r c b . — Second, F ive-Year Plan, 1956— 61 (Review).

TABLE 32.6.
STATEMENT SHOWING BX;PENDITURE UNDER T H E MAJOR HEADS OF DEVELOPMENT DURING THETH IRD F IV E -Y E A R PLAN.
( R t j p b e s I n L a k h s . )
301
Heads o f Development.Plan
provision,1961-66.
Actuals,1961-62.
Actuals,1S62-63.
Actuals.1963-64.
Anticipated Plan Total Percent- expendi- provision, anticipated age o f
ture. 1965-66. expenditure col. 8 to 1964-65. 1961-66. col. 2.
1 2 3 4 5 6 7 8 9
1. Agricultural Programme 41,38.61 6,00.05 5,66.26 7,23.04 8,80.79 10,65.00 38,35.14 92.7
2. C.D. and Co-operation •• 41,10.00 6,52.57 5,37.43 5,10.34 6,63.89 7,45.00 31,09.23 75.57
3. Irrigation • • 70,57.10 14,29.28 15,60.27 14,36.54 17,23.39 13,67.00 75,16.48 107.4
4. Power 70,62.00 8,26.65 12,46.83 15,66.76 22,21.18 23,81.00 82,42.42 116.7
6. Industries and Mining • • 14,03.00 1,77.92 1,84.63 1,09.13 2,29.80 2,67.00 9,68.48 69.0
6. Transport and Communication 21,40.00 3,35.69 2,80.42 3,54.27 3,58.57 3,71.00 16,99.95 79.4
7. S>ocial Services 76,75.49 10,06.18 10,45.36 9,94.70 12,52.82 15,36.00 58,35.07 76.9
8. Miscellaneous •• 1,18.18 8.18 6.97 8.59 20.34 26.00 70.08 59.3
GRAND TOAL •• 3,37,04.38 50,36.52 54,28.17 57,03.37 73,50.78 77,58.00 3,12,76.85 92.8
S o u t iO E .— Bihar Third rive-Y ear Plan (Axmual Plan, 1965-66).
t a b l e 32.7.
STATEMENT SHOWING THE PROGRESS OF PLANT ElXPENDlTURE UNDER MAJOR HEADS OF DEVELOPMENT FOR TH E Y E A R 1962-63.
(Rs. O K L a k h b )
Serialno.
Head o f Development.Plan
Provision,1961-66.
Expenditureduring
1961-62.
Planprovision,1962-63.
Expenditure, Percentage 1962-63. o f col. 6 to Remarks,
col. 5.
1 2 3 4 6 6 7 8
1 Agriculture Programme . : 41,33.61 6,00.05 7,27.21 5,66.26 77.9
2 Co-operative, Community Development and Panchayat.
41,10.00 6,52.57 6,16.50 5,37.43 87.2
3 Irrigation and Flood Control 70,57.10 14,29.28 17,32.25 15,60.27 90.1
4 Power 70,62.00 8,26.65 13,05.00 12,46.83 95.5
6 Industries and Mining 14,03.00 1,77.92 2,08.65 1,84.63 103.8
6 Transport and Communication 21,40.00 3,35.69 3,44.50 2,80.42 83.5
7 Social Service 76,75,49 10,60.18 13,51.76 10,40.36 . .
8 Misoellaneoua . . 1,18.18 8.18 17.73 6.97 103.9
g r a n d TOTAL 3,37,04.38 50,36.52 63,03.70 54,28.17 107.8
SOUBCH.—Bihar Third Five-Year Plan (Annual Plan, 1965-66).

39^
TABLE 32.8.
STATEMENT SHOWING THE PROGRESS OF PLAN EXPENDITURE;THE 3IST MARCH, 1963.
FOR THE PERIOD ENDING
( R u p e e s in L a k h s ) .
tieads o f Development.
1
Flan Actuals, PlanProvision, 1961-62. Provisions,1961— 66. 1962-63.
Actuals, Percentage 1962-63. o f col. 5 to Remarks,
col. 4.
3 6
1. AGRICULTURAL PRODUCTION
(i) Agriculture DepaFtment
(it) Finance Department . .
(in ) Cane Department
(iv) Forest Department
(v) Revenue Department . .
(а) W.L.R*
(б) Consolidation o f Holding
(c) Survey and Settlement
2. MINOR IRRIGATION
(») Agriculture Department
(»i) iTiigatioa Departmeat
(m ) Co-operative Department
3. ANIMAL HUSBANDRY . .
4. D A IR Y AND M ILK SUPPLY
(i) Animal Husbandry Department
(it) Co-operative Department
6. FOREST
6. SOIL CONSERVATION . .
(*) Agriculture Department
(ii) Forest Departmejit
(Hi) Revenue Department . .
(iv) Kosi Department
7. FISHERIES
(*) Agriculture Depaxtmont
(ii) Co-operative Department
(Mi) Damodar Valley Corporation
8. WAREHOUSING AND MARKETING
(») Agriculture Department
(ii) Co-operative Department
TOTAL—AGRICULTURE PROGRAMME
9. C.D. DEPARTMENT
10. CO-OPERATIVE DEPARTMENT
17.70.61
15,36.56
10.35
1,88.00
12.70
23.00
3.00
20.00
8,38.91
5,35.95
3,00.00
2.96
4.68.00
2.11.61
2.10.00
1.61
2.95.00
4.15.04
1.30.04
95.00
1.65.00
25.00
89.44
71.78
9.66
8.00
50.00
30.00
20.00
41,38.61
35,00.00
6.18.00
2,41.02
l,83.t)4
19.21
1.16
37.61
1.55
4.63
31.43
1,40.84
94.67
46.17
70.96
17.19
17.19
45.88
75.08
27.88
16.53
30.67
6.62
6.62
2.46
2.46
6,001.05
5,94.67
55.59
3,50.25
2,71.19
1.66
30.12
2.03
86.50
42.00
4.50
40.00
1,25.60
65.00
60.00
0.60
70.20
34.14
31.42
0.32
48.72
78.78
16.00
18.53
3.00
13.42
11.45
1.97
8.50
4.50
4.00
7,27.21
5,25.00
77.70
2,15.73
1,70.27
0.11
8.40
1.47
34.98
0.41
4.06
30.51
1,36.83
80.93
55.90
74.95
20.60
20.60
55.59
52.32
12.08
17.47
22.77
7.59
7.59
2.65
2.65
5,66.28
5,04.16
32.54
61.6
62.8
6.6
37.9
72.4
46.2
9.8
90.2
76.5
108.9
98.1
106.8
64.9
65.6
114.1
66.4
75.5
94.3
56.6
66.3
31.2
68.9
77.9
96.0
41.9
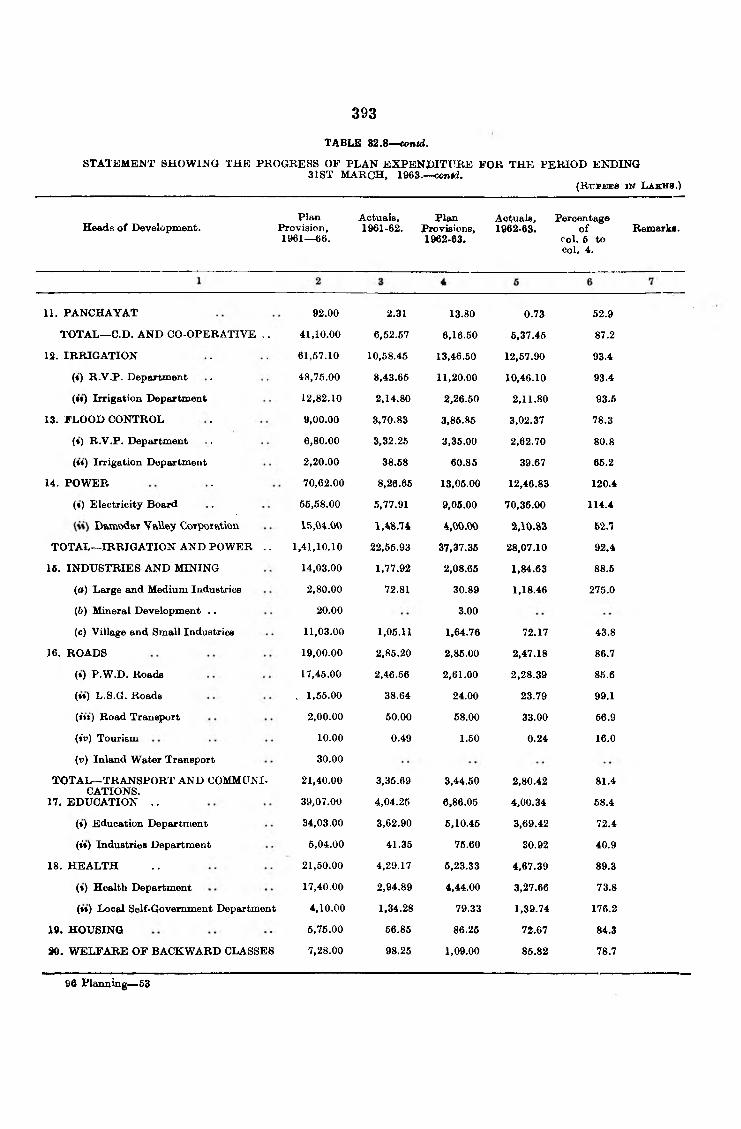
s t a t e m e n t s h o w i n q t h e p r o g r e s s o f p l a n e x p e n d i t x t r e f o r t h e p e r i o d e n d i n g31ST m a r c h , 1963.—confd.
393
TABLS B2,8—<ontd.
( R u p e e s i n L a k h b .)
Heads o f Devel6pment.Plan
Provision,1961—66.
Actuals,1961-62.
PlanProviBions,1962-63.
Actuals,1962-63.
Percentageo f
Col. 6 to col. 4.
Remarka.
11. p a n c h a y a t 92.00 2.31 13.80 0.73 52.9
t o t a l — C.D. AND CO-OPERATIVE .. 41,10.00 6,52.57 6,16.50 6,37.46 87.2
12. IRRIGATION 61,57.10 10,58.45 13,46.50 12,57.90 93.4
(*) R.V.P. Department 48,75.00 8,43.65 11,20.00 10,46.10 93.4
(it) Irrigation Department 12,82.10 2,14.80 2,26.50 2,11.80 93.6
13. FLOOD CONTROL 9,00.00 3,70.83 3,86.85 3,02.37 78.3
(*) R.V.P. Department 6,80.00 3,32.25 3,36.00 2,62.70 80.8
(♦») Irrigation Department 2,20.00 38.68 60.86 39.67 66.2
14. POWER 70,62.00 8,26.66 13,06.00 12,46.83 120.4
(♦) Electricity Board 56,58.00 5,77.91 9,06.00 70,36.00 114.4
Deiraod&T VaUey Ckjrpoiation 15,04.00 1,4S.14 4,00.00 2,10.83 52.7
TOTAL—IRRIGATION AND POWER . . 1,41,10.10 22,55.93 37,37.36 28,07.10 92.4
16. INDUSTRIES AND MINING 14,03.00 1,77.92 2,08.65 1,84.63 88.6
(o) Large and Medium Industries 2,80.00 72.81 30.89 1,18.46 275.0
(&) Mineral Development . . 20.00 3.00
(c) Village and Small Industries 11,03.00 1,05.11 1,64.76 72.17 43.8
16. ROADS 19,00.00 2,85.20 2,85.00 2,47.18 86.7
(») P.W.D. Roads 17,45.00 2,46.56 2,61.00 2,28.39 85.6
(«*) L.S.G. Roads > 1,55.00 38.64 24.00 23.79 99.1
(in) Road Transport 2,00.00 50.00 68.00 33.00 56.9
(iv) Tourism 10.00 0.49 1.50 0.24 16.0
(v) Inland Water Transport 30.00
TOTAL—TRANSPORT AND COMMUNI- 21,40.00 3,35.69 3,44.50 2,80.42 81.4CATIONS.
17. EDUCATION . . 39,07.00 4,04.25 6,86.05 4,00.34 58.4
(») Education Department 34,03.00 3,62.90 6,10.45 3,69.42 72.4
(it) Industries Department 5,04.00 41.35 76.60 30.92 40.9
18. HEALTH . . 21,50.00 4,29.17 6,23.33 4,67.39 89.3
(t) Health Department 17,40.00 2,94.89 4,44.00 3,27.66 73.8
(**) Local Self-Government Department 4,10.00 1,34.28 79.33 1,39.74 176.2
19. HOUSING 6,75.00 66.86 86.26 72.67 84.3
30. W ELFARE OF BACKWARD CLASSES 7,28.00 98.26 1,09.00 85.82 78.7
96 Plaiming~53

mTABLE 32.8—concZd.
fetX^TEMENT SHOWING THE PBOGRESS OF PLAN EXPENDITURE FOR THE PERIOD31ST MARCH 1963—concZd.
(RTTPBES in LAkHSj)
Heads o f Development.Plan
Provision,1961— 66.
Actuals,1961-62. Provision,
1962-63.
i- Actuals, ^ 1962-63.
iPercentage o f col. 6 to Remarks 4 col. 4.
.........1 2 3 4 6 « 7
21. SOCIAL WELFARE 35.23 2.43 6.09 2.86 66.2
(♦) S.S.W.A. Board 3.30 1.72 l i o 2.26 107.6
(♦t) Jail Department 14.35 0.71 2.66 0.60 22.^
(Hi) Health Department . , 1.00 0.16 •• i(iv) Education Department 2.60 0.18 • • ••
(tf) Unallocated 14.09 • • •• • •
22. PUBLIC CO-OPERATION 0.25 0.04 0.19 47.6
23. LABOUR AND LABOUR W ELFARE 2,80.00 16.24 42.00 16,09 38.4
(t) Labour Department 71.60 6.21 10.74 4.33 40.8
(tt) Industries Department (Craftsman Training Scheme).
2,08.40 10.03 31.26 11.76 »7.6
TOTAL— SOCIAL SERVICES 76,76.49 10,06.19 18,61.76 10,46.56 77.S
24. PUBLICITY . . 60.00 3,03 7.60 2.42 32.2
J6. STATISTICS . . 18.18 2.73 0.36 13.2
26. LOCAL BODIES 60.00 6.16 7.60 4.19 66.9
TOTAI^MISCELLANE OUS 1,18.18 8.18 17.73 6.97 39.3
GRAND TOTAL 3,27,04.38 30,36.63 63,03.76 64,28.17 86.1
SoxmoE.— ^Bihar Third Five-Year Plan (Annual Plan, 1866-66.)

ST A T E M E N T SHOWING THE PROGRESS OF PLAN EXPEN DITU RE UNDER MAJOR HEADS OF DEVELOPMENT FOR THE Y E A R 1963-64.
( Rr-PEEs IN Lakhs, i
395
TABLE 32.9.
Heads o f Development.Plan Expenditure Expenditure Plan Expenditure Percentage of
Provision, during during provision, during «;o’ . 7 to Remarks.1961— 66. 1961-62. 1962-63. 1963-64. 1963-64. col- 6.
1 2 3 4 6 6 7 8
1. Agriculture Programme . . 41,38.61 6,00.05 5,66.26 8,27.30 7,23.04 87.4
2. Co-operative, Community Development and Panchayat.
41,10.00 6,25.57 5,37.43 4,57.00 5,10.34 111.7
3. Irrigation and Flood Control 70,57.10 14,29.28 15,60.27 12,12.00 14,36.54 11S.5
4. Power / 70,62.00 8,26.65 12,46.83 15,50.00 15,66.76 lO Ll
6. Industries and Mining 14,03.00 1,77.92 1,84.63 1,74.00 1,09.13 62.7
6. Transport and Communication 41,40.00 3,35.69 2,80.42 2,90.50 3,54.27 56.4
7. Social Service 7,76,76.49 10,06.18 10,45.36 10.25.00 9,94.70 97.0
8. Miscellaneous 11,18.18 8.18 6.97 10.40 8.59 82.6
GRAND TOTAL 3,37,04.38 60,36.52 5,54,28.17 65,46.20 57,03.37 102.8
8o\I»Cit.—Bihar Third Five-Year Plan, (Annual Plan, 1965-66,).

396
TABLE 32.10.
STATEMENT SHOWING THE PROGRESiS OF PLAN EXPEN DITU RE DURING THE YEAR, 1963-64.
( R u p e e s i n L a k h s . )
PlauHead o f Development. Provison,
1961— 66.
Acliu&ls,19101-62.
Actuals,1962-63.
PlanProvision,1963-64.
Actuals,1963-64.
Percentageo f col. C to Remarks,
col. 5.
1 2 3 4 6 6 7 8
1. AGRICULTURAL PRODUCTION.
17,70.61 2,41.02 2,16.73 3,37.80 2,52.90 74.9
(♦) Agriculture Depeirtment 16,36.56 1,83.04 1,70.27 2,82.00 2,06.59 72.9
( t t ) Finance Department . . lo .as -• 0 .1 1 0.30 0.26 86.6
(wt) Cane Department 1 , 8 8 .0 0 19.21 8-40 16.00 10.69 71.3
(tv) Forest Department 12.70 1.16 L47 2 .0 0 1.62 81.0
(«) Land Development 23.00 37.61 34.98 33.50 34.83 104.0
2. MINOR IRRIGATION .. 8,38.91 1,40.84 1,36.83 3,01.00 2,63.83 87.6
(t) Agriculture Department 6,35.96 94.67 80.93 1,81.00 1,48.08 81.8
(»♦) Irrigation Department 3,00.00 46.17 66.90 1 ,2 0 .0 0 1,16.75 96.4
(Hi) Co-operative Department 2.96 • • 1 .0 0
3. ANIMAL H trSBAN teABY.. 4,68.00 70.96 74.96 48.00 72.70 151.4
4. D A IR Y AND MILK SUPPLY 2,11.61 17.19 20.60 30.00 24.21 80.7
( i ) Animal Husbandry D epartment.
2 ,1 0 . 0 0 17.19 20.60 29.76 25.21 81.4
(t») Co-operative Department 1.61 0.24
«. FOREST 2,96.00 46.88 66.69 40.00 4 LOO 1 0 2 .6
6. SOIL CONSERVATION .. 4,16.04 76.08 62.32 .56.60 56.16 1 0 1 .2
(») Agriculture Department 1,30.04 27.88 12.08 16.00 22.26 139.1
(it) Forest Department 96.00 16.53 14.47 17.00 16.86 99.2
(tit) Kosi Department 26.00
(tv) Revenue Department 1 ,6 6 .0 0 30.67 22.77 22.50 17.03 75.7
7. FISHERIES . . 89.44 6.62 7.69 1 0 .0 0 8.67 86.7
(t) Agriculture Department 71.78 6.62 7.69 8.60 8.67 1 0 0 .8
(tt) Co-operative Department 9.66 1.40 • -
(ttt) Damodar Valley Corporation.
8.00 •• -• •• •• ••
8. WAREHOUSING AND MARKETING.
60.00 2.46 2 .6 6 6 .0 0 3.49 69.8
(t) Agricult re Department 30.00 2.46 2.65 3.00 3.49 116.3
(ii) Co- perative Department 20.00 2 .0 0 . .
TOTAL— AGRICULTURE P.tiU GRAMME.
361 6,00.06 6,66.26 8,27.30 7,23.04 87.4
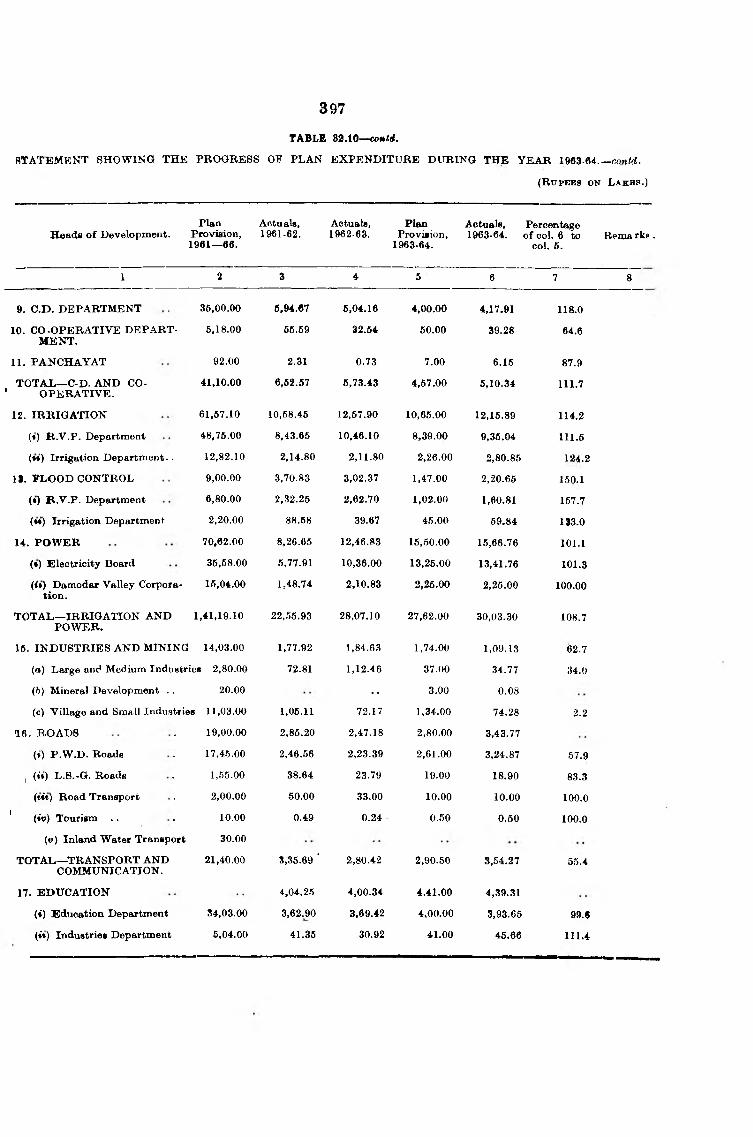
397TABLE 32.10—ooM«j.
BTATEMRNT SHOWING THE PROGRESS OF PLAN EXPENDITURE DITRTNG THE Y EAR 1963-64.—con<(£.
( R u p e e s o n L a k h s .)
Heads o f Development.Plan
Provision,1961—86.
Actuals,1961-62.
Actuals,1962-63.
PlanProviaion,
1963-64.
Actuals,1963-64.
Percentageo f col. 6 to Reroa rks .
col. 6.
1 2 3 4 5 6 7 8
9. C.D. DEPARTMENT 35,00.00 6,94.67 6,04.16 4,00.00 4,17.91 118.0
10. CO-OPERATIVE DEPARTMENT.
6,18.00 66.69 32.64 60.00 39.28 64.6
11. PANCHAYAT 92.00 2.31 0.73 7.00 6.15 87.9
TOTAJ.— C-D. AND CO- ' OPERATIVE.
41,10.00 6,62.67 6,73.43 4,57.00 5,10.34 111.7
12. IRRIGATION 61,57.10 10,68.45 12,57.90 10,65.00 12,15.89 114.2
(») R .V .P . Department 48,76.00 8,43.66 10,46.10 8,39.00 9,36.04 111.5
(♦♦) Irrigation Departm ent.. 12,82.10 2,14.80 2,11.80 2,26.00 2,80.85 124.2
IJ. FLOOD CONTROL 9,00.00 3,70.83 3,02.37 1,47.00 2,20.65 150.1
(*) R .V .P. Department 6,80.00 2,32.25 2,62.70 1,02.00 1,60.81 157.7
(**) Irrifi'ation Department 2,20.00 88.68 39.67 45.00 69.84 133.0
14. POW ER 70,62.00 8,26.65 12,46.83 15,50.00 15,66.76 101.1
(*) Electricity Board 35,58.00 5,77.91 10,36.00 13,26.00 13,41.76 101.3
(<•) Damodttf Valley Corporation.
15,04.00 1,48.74 2,10.83 2,26.00 2,26.00 100.00
TO TAL—IRRIGATION AND POW ER.
1,41,19.10 22,55.93 28,07.10 27,62.00 30,03.30 108.7
18. INDUSTRIES AND MINING 14,03.00 1,77.92 1,84.63 1,74.00 1,09.13 62.7
(a) Large and Medium Industries 2,80.00 72.81 1,12.46 37.00 34.77 34.0
{h) Mineral Development . . 20.00 •• 3.00 0.08
(c) Village and Small Industries 11,03.00 1,06.11 72.17 1,34.00 74.28 2.2
16. ROADS 19,00.00 2,85.20 2,47.18 2,80.00 3,43.77
(») P .W .D. Roads 17,45.00 2,46.56 2,23.39 2,61.00 3,24.87 57.9
1 (it) L.S.-G. Roads 1,55.00 38.64 23.79 19.00 18.90 83.3
(tit) Road Transport 2,00.00 50.00 33.00 10.00 10.00 100.0
' (it>) Tourism .. 10.00 0.49 0.24 0.50 0.50 100.0
(v) Inland Water Transport 30.00
TOTAL—TRANSPORT AND COMMUNICATION.
21,40.00 8,35.69 * 2,80.42 2,90.50 3,54.27 55.4
17. EDUCATION 4,04.25 4,00.34 4.41.00 4,39.31
(i) Education Department 34,03.00 3,62.90 3,69.42 4,00.00 3,93.65 99.6
(it) Industries Department 5,04.00 41.35 30.92 41.00 45.66 111.4

398TABIE S2.W.--cnncli.
STATEMENT SHOWING THE PROGRESS OF PLAN EXPENDITURE DURING THE YEAR 1963-64— cowcZc?.
( R u p e e s i k L a m p . )
Heads o f Development.Plan
Provision,1961— 66.
Actuals,1961-62.
Actuals,1962-63.
Plan Prov ision, 1963-64.
Actuals,1963-64.
Percentage o f col. 6 to eol. 5.
Remarks.
1 2 3 4 5 6 7 8
18. HEALTH 21,50.00 4,29.17 4,67.39 4,50.63 4,10.57 91.1
(•) Health Department 17,40.00 2,94.89 3,27.65 3,59.12 34,27.33 91.1
(u) Local Self-Government Department.
4,10.00 1,34.28 1,39.74 91.50 83.24 91.0
19. HOUSING . . 6,75.00 66.86 72.67 30.00 44.99 140.9
JO. WELFARE OF BACKW ARD CLASSES.
7,28.00 98.26 86.82 80.00 81.08 101.4
J l. SOCTAT, WELFARE 35.49 2.43 2.86 3.00 4.26 141.6
(*) S.S.W.A. Board 3.30 1.72 2.26 1.50 3.42 228.0
(H) Jail Department 14.35 0.71 0.60 1.50 0.83 66.3
(«m) Health Department . . 1.00
(iv) Education BepaTtmeni 2.60 V \ • •
( v ) Unallocated 14.09
22. PUBLIC CO-OPERATION 0.26 0.19 0.38 0.38 100.0
23. LABOUR AND LABOUR WELFARE.
2.80.0 15.24 16.09 20.00 14.12 70.6
(•) Labotir Department 71.60 6.21 4.33 5.00 2.30 46.0
(»i) IndustrieB Department 2,80.40 10.03 11.76 15.00 11.82 78.8
TOTAL—SOCIAL SERVICES 76,76.49 10,06.19 10,45.36 10,26.00 9,94.70 97.0
24. PUBLICITY . . 50.0 3.03 2.42 5.00 3.19 63.8
26. STATISTICS . . 18.18 0.36 0.40 0.40 100.0
26. LOCAL BODIES 50.00 5.15 4.19 5.00 5.00 100.0
TOTAL—MISCELLANEOUS 1,18.18 8.18 6.97 10.40 8.69 82.6
GRAND TOTAL 3,37,04.38 60,36.63 54,28.17 55,46.20 57,03.37 102.8
SouBOB.—Bihar Third Five-Year Plan (Annual Plan, 1965-66).
SEGTiON XXXIII Miscellaneous Statistics

400
TABLE 38.1.
STATEMENT SHOWING NUMBER OF PRESSES AT WORK AND NUMBER OF NEWSPAPERS, PERIODICALSAND BOOKS PUBLISHED IN BIHAR.
Year.Number of
presses at work.
Number of newspapers
and periodicals published.
Number o f Number o f books published books pub- in English or lished inany other European language.
Hindi or £iny other
Indian language.
1 2 3 4 5
1955-66 . . 414 211 41 120(6)
1956-57** (Re-organised) 367 194 22 163(c)
1957-58 . . 382 174 27 152(d)
1958-59t . . 237 119 12 94
1959-60* . . 323 106 9 65
1900-61 . . 394 154 46 130
1961-62ft . . . . 409 137 44 82
1962-63(0) . . . . 261 94 18 20
1963.64(e) . . . . 505 171 34 70
1964-65(/) . . • . 213 96 18 26
**Excludes Champaran.
fExcluding Patna District.
*Excluding Patna and Bamchi District.8.
'f^Excluding Patna, Bhagalpur and Sahansa.
(o) Excluding Patna, Shahabad. Champajm, Muzaffarpur, Bhagalpur, Saharsa and Palamau. |
(6) In the year 1955-56, M l ofl20booifci, 4 books were published in Hindi and English both.
(e) In the year 1956-57, out o f 163 books, 11 books were published in Hindi, English and Urdu.
(d) In the year 1957-58, out o f 152 books, 3 b o o k s , were published in Hindi, 8 in English, 4 in Maithili, 9 in Urdt», 3 ia Bengali and 6 in Sauiskrit.
(«) Excluding Shcihabad, Champaran, MmzafFarpur, Bhagalpur, Saharsa and Palamau.
( /) Excluding Patna, Shahabad, Sa.r{ini, Ohampareui, Muzaffarpur, Darbhanga, Bheigalpur and Saharsa.
SotTBOS.—Political Dtepajrtment (Special Section), Government of Bihar.

401TABLE 38.2.
STTATEMENT SHOWING NUMBER OF PRESSES AT WORK AND NUMBER OF NEWSPAPERS AND PERIODICALS PUBLISHED IN BIHAR.
District
Number o f books published.
Number o f Presses at Number o f Newspapers work. and Periodicals.
In English or any In Hindi or aoiy other ------ ---- other European language. Indian language.
1962-63 1963-64 1964-65 1962-63 1963-64 1964-65
1962-63. 1963-64. 1964-65. 1962-63. 1963-64. 1964-65. _ N
9 10 11 12 13
Paitna N.A. 230 N.A. N.A. 63 N.A. N.A. 16 N.A. N.A. 47 N.A.
Gmya 10 11 11 N.A. 1 2 N.A. N.A. 2 1
Shtahabad N.A. N.A. N.A. N.A. N.A. N.A. N.A. N.A. N.A. N.A. N.A. N.A.
Sairan 24 25 N.A. 3 4 N.A. N.A. • • N.A. N.A. 1 N.A.
Chtamparan N.A. N.A. N.A. N.A. N.A. N.A. N .A . N.A. N.A. N.A* N.A. N.A.
Mmza£farpur N.A. N.A. N.A. N.A. N.A. N.A. N.A. N.A. N.A. N.A. N-A. N.A..
Dairbhanga 60 54 N.A. 12 12 N.A. N.A. N.A.
Mojnghyr 30 30 30 2 3 4 N.A. N.A. it.A . i?.A . N.A.
Bhtagalpur N.A. N.A. N.A. N.A. N.A. N.A. N.A. N.A. N.A. N.A. N.A. N.A.
Puimea 12 15 17 5 10 10 4
Samthal Parganas 15 15 15 9 9 9 8 S 8
Saluarsa N.A. N.A. N.A. N.A. N.A. N.A. N.A. N.A. N.A. N.A. N.A. N.A.
Reunchi 30 31 31 30 30 30 18 18 18 12 12 12
Hanaribagh 13 14 17 1 1 2
Paltamau N.A. N.A. 7 N.A. N.A. 2 N.A. N.A. N.A. N.A.
Dhombad 32 33 34 18 21 18 . .
Sinfghbhiim 45 47 51 14 17 19 •• •• •• •• •• * •
'TOTAL 261 505 213 94 171 96 18 34 18 20 70 25
. . .— Nil.•ILanguage not known. M .A.— Not available.
96Plan.~54SOTTBOB.—Political Department (Special Section), Government of Bihar.

402
TABLE
STATEMENT SHOWING THE PROCUREMENT, CONSUMPTION
Crop ye&r».
In terms o f rice.
P r o c u r e m e n t .
Wheat. Gram. Maize. Rice.
Consump-
Wheat. Gram.
1 2 3 4 6 6 7 8
1959 . . 21,408 Nil Nil Nil 32,084 1,92,963 18,407
1960 . . Nil Nil Nil Nil 66,784 2,55,355 Nil
1961 . . Nil Nil Nil Nil 66,337 2,86,889 3,69,399
1962*.. Nil Nil Nil Nil 42,177 1,93,023 541|
1963*.. Nil Nil Nil Nil 42,277 1,99,910 5
1964*.. 8,712 Nil 244 Nil 55,098 4,20,416 ••
1965*.. 26,853 Nil Nil Nil 70,982 4,03,077 ••1966*.. 88,833 Nil Nil Nil n ,i8 s 3,31,019 ••19p7 . . 3,740 Nil Nil Nil 38,604 6,00,353 ••1968 .. 41,549 •• •• . j 16,694 2,31,089 ••
*In metric tons
. . — Not available
SoTTftcB.—Supply »nd Commerce Department, Bihnr.

403
SS.8.
AND) IMPORTS OF RATIONED COMMODITIES IN BIHAR.(In Tons.)
tiom. Imports.
lla iie . Barley. MiUet. Others. Rice. Wheat. Gram. Maize. Beirley. Millet. Others.
9 10 11 12 13 14 15 16 17 18 19
Nil Nil Nil Nil 6,471 1,62,141 Nil Nil Nil Nil
Nil Nil Nil Nil 77,244 3,22,446 Nil Nil Nil Nil • •
Nil Nil Nil Nil 77,214 2,98,463 Nil N il Nil Nil • •
Nil Nil Nil Nil 45,578 2,10,990 Nil Nil Nil Nil • •
NU Nil Nil Nil 39,299 2,35,093 Nil NU Nil Nil • •
62,121 4,00,868 . . . . ■ • •
• • 2,641 68,107 4,03,373 . . . . 3,236
ne,482 1,04,703 4,800 3,36,209 . .. 18,254 . . 1,31,267
US.IOI 6,33,496 4,635 6,35,684 19,215 6,66,676
n 2,098 1,28,646 337 2,27,969 2,844 1,10,06*

404
TABLE as.4.
STATEMENT SHOWING NUMBER OF CINEMA HOUSES IN EACH DISTRICT OF BIHAR ^tlR lN G ijiSg.
Diiine*. Numbw.
Patna
Gaya
Shahabad
Saran
CSlamparan
Miuaffarpnr
Darbhanga
Monghyr
Bhagalpur
Sahfuna
Pnrnea
Santhal Pargana«
HaEaribagh . .
Baaohi
Palamau
Dhanbad
Singbbhum . .
TOTAL
16
8
11
10
12
9
IS
10
6
6
11
7
11
8
4
IS
14
170
SotTBOB.— Directorate of Statistics and Evaluation, Bihar.
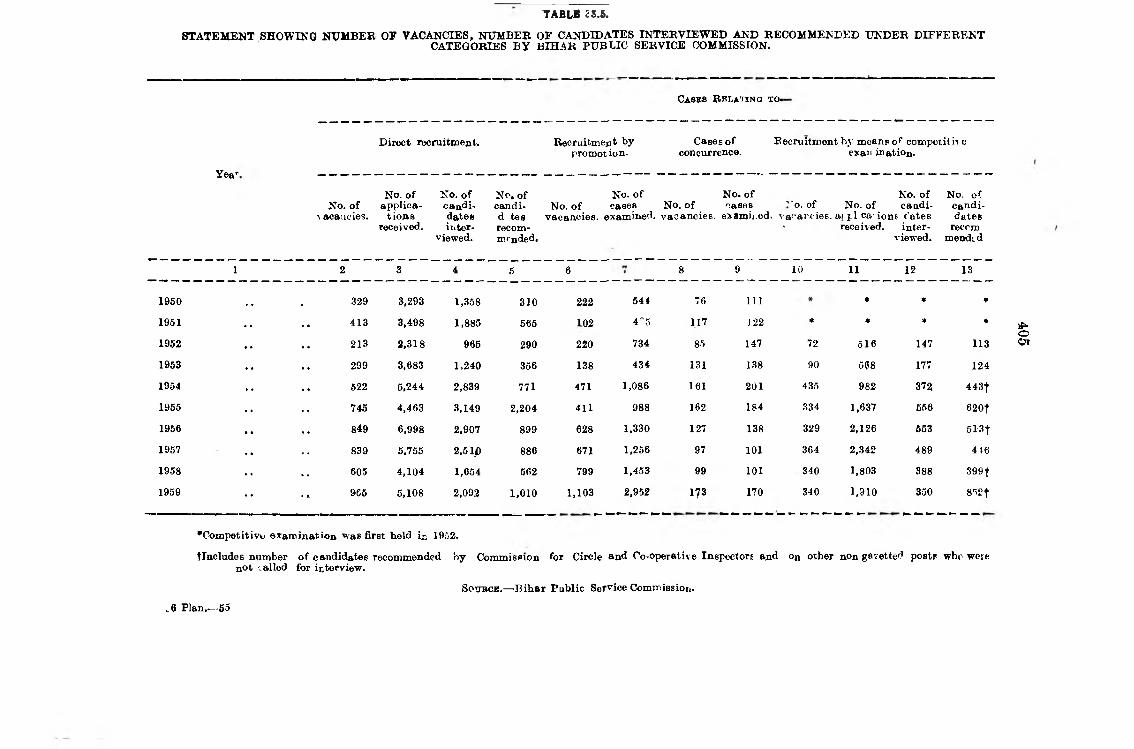
STATEMENT SHOWING NUMBER OF VACANCIES, NUMBER OF CANDIDATES INTERVIEW ED AND RECOMMENDED UNDER DIFFERENTCATEGORIES B Y BIH AR PUBLIC SERVICE COMMISSION.
TABLB 8S.5.
Casbs R e l a t i n g t o «
Direct recruitment. Recruitmejit by promot ion.
Cases o f concurrence.
Recruitiaaent by meanpoP competitiA e exan ination.
Yea'
No. o f No. o f applica-
Aacaiicies. tioAs received.
No. o f candidate s ititer-
viewed.
No, o f No. o f No. o f No. o f No. o fcandi- No. o f cases No. o f cases '*o. o f No. o f caadi- candi-d tea vacancies. examiiAed. vacancies, examii.ed. va<^arcieE. ai pi ca 'ions c’ ates datesrecom- ' received. inter- reccmmraded. viewed, mended
1 2 3 4 5 6 8 9 10 11 12 13
1950 329 3,293 1,358 310 222 544 76 111 • * *
1951 413 3,498 1,885 565 102 4''5 117 122 « « « *
1952 213 2,318 965 290 220 734 85 147 72 516 147 113
1953 299 3,683 1,240 356 138 434 131 138 90 5(J8 177 124
1954 522 5,244 2,839 771 471 1,086 161 201 435 982 372 443t
1955 745 4,463 3,149 2,204 411 988 162 184 334 1,637 556 620t
1956 849 6,998 2,907 899 628 1,330 127 138 329 2,126 553 513t
1957 839 5,755 2,5 ip 886 671 1,256 97 101 364 2,342 489 446
1958 605 4,104 1,654 562 799 1,453 99 101 340 1,803 388 399t
1959 965 5,108 2,092 1,010 1,103 2,952 173 170 340 1,910 350 8'">2t
•Competitive ©yaminatiou was first held i i 1952.
tlncludes number o f candidates recommended by Commispxon for Circle ajid Co-operative Inspectort ajid on other non gai’etted postr who wore n O t tailed for itterview.
SouBCB.— Bihar Public Service Commission.
1#oOx
.6 Plan.— 55

STATEMENT SHOWING THE NUMBER OF SUGAR FACTORIES W ORKED, ACREAGE UNDER SUGARCANE, CANE REQUIREMENT, TOTAL SUGARCANE CRUSHED, QUANTITY OF SUGAR MANUFACTURED, RECOVERY OF SUGAR AND PRICE OF CANE IN BIH AR.
TABLE 23.?.
Number o f Area sugar under
Ye"r§ factories cane (inworked, lakh acres).
Cane Total canerequirement crushed(in lakh (in lakh
ton es). tonnes).
Total quantity
o f sugar
manufactured,
(in l6kkh) tonnes).
Recovery Percentage Percentage Number of o f sugar in o f cane o f gate cane working percentage, crushed to to the total days,
cane canerequirement. crushed.
Price o f cai*e per maund.
Factory Outside gate. the
factory
1 2 3 4 5 6 7 8 9 10 11 12
1958-69(0) 28 4.66 9.01 8.64 84.32 9.78 96.00 66.00 124 1.44 1.31
1959-60(0) 28 3.78* 9.01 9.38 88.70 9.46 104.11 65.00 130 U59 1.50
1960-61 28 4.78 33.99 41.75 3.86 9.23 122.83 66.00 156 1.62
1961-62 28 4.78 33.99 39.29 3.59 9.11 115.59 69.00 149 1.62
1962-63 28 3.32 38.15 17.50 1.70 9.74 45.87 68.00 68 1.62 -
1963-64 28 3.26 38.15 S3.g§ 2.3§ 10.02 62.10 71.00 89 2:00
1964-65 29 5.27 41.00 41.42 3.91 9.43 108.57 67.00 147
1965-66 29 5.80 41.00 39.80 3.71 9.32 143 ••
1966-67 29 4.14 37.15 21.72 2.11 9.72 71
1967-68 27 2.80 37.15 15.55 1.47 9.45 •• 59
OOi.
•Reserved area only.(a) Figures are in lakh mds. . . —Not available.
SouBcE.— Cane CommisBioner, Bihar.

I TA.BLB 88.7.
St a t e m e n t s h o w i n g d i s t r i c t w i s e n u m b e r o f g r a m p a n c h a y a t s a n d g r a m k a c h a h a r i i nt BIH AR DU RIN G THE YEAR
407
Districts.
1962-63. im -6 4 . 1964-65.
No. o f Gram Pan
chayats.
No. of Gram Kachahari.
No. o f Gram Pan
chayats collecting
revenue.
N o. o fGramPan-cHiayata.
No. of Gram Kachahari.
No. o f Gram
Panchayats
collecting revenue.
No. o f Gram Panchayats.
No. of Gram Kachahari.
No. of Gram
Panchayats
collecting revenue.
1t2 3 4 5 6 7 8 9 10
Patna 564 564 396 568 549 432 567 552 459
»Gays 910 910 260 N.A. N.A. N.A. N.A. N.A. N.A.
8hahab«d 818 818 529 817 805 600 819 810 580
‘ 8aran 821 821 714 N.A. N.A. N.A. N.A. N.A. N.A.
Champaraii 678 678 579 N.A. N.A. N.A. 681 653 612
Muzaffakrpur 751 761 484 751 738 482 764 754 482
Darbhamga 865 865 627 N.A. N.A. N.A. N.A. N.A. N.A.
Bhagalpur 376 376 274 372 371 300 378 371 300
Monghyr , . TS6 1X5 ZiM N .A. N.A. N.A. 696 696 346
Purnea 635 635 425 629 473 N.A. 630 617 427
Saharsa 408 408 219 N.A. N.A. N.A. 427 427 244
kkhthal Parganas 666 666 354 666 666 378 666 666 378
Eiazaribagh 699 699 516 700 681 578 700 700 578
Ranchi 705 705 377 712 606 643 712 709 641
Palumau .. 344 344 299 344 344 302 344 344 302
Dhanbad .. 203 203 172 203 203 182 203 203 101
Singhbhum 474 474 271 474 474 302 472 471 sot
s t a t e TO'J a l . 10,652 10,652 6,803 6,236 5,910 4,199 8,054 7,973 5,751

408
TABLE 38.7— concld.
STATEMENT SHOWING DISTBICTWISE NUMBER OF GUAM PANCHAYATS AND GRAM KAC'HAHARI INBIHAR DURING THE YEAR.— concW.
1965-66. 1966-67. 1967-68.
Districts.No. o f Gram Pan-
chayats.
No. o f Gram
Kacha- hari.
No. o f Gram Pan-
chayats collecting revenue.
No. o f No. ofGram GramPan- Kacha-
chayatB. hari.
No. of Gram Pan-
chayatB. collecting revenue.
No. o f Gram Pftp- chayatg.
No. o f Gram
Kacha- hari.
No. o f j Gram;
Pan- [ chayaUl
collecting revenue^
10
Patna 583 N.A. N.A. 578 N.A. N.A. 678 N.A.
Gaya 907 907 411 909 N.A. N.A. 908 888
Shahabad 824 814 580 822 810 509 822 N.A.
Saran 810 794 735 823 N.A. N.A. 822 N.A.
Champaxan 681 663 612 498 485 418 675 N.A.
Muzaffarpur 764 754 482 770 763 322 768 N.A.
Deurbhanga 874 N.A. N.A. 874 N.A. N.A. 876 N.A.
Bhagalpur 373 373 160 386 374 103 387 386
Monghyr . . 708 708 212 741 N.A. N.A. 708 708
Pumea 631 630 362 631 630 526 6S2 623
Saharsa 462 427 147 464 464 N.A. 465 461
Santhal Parganas 730 687 331 731 731 256 731 679
Hazaribagh 700 700 563 703 699 594 702 N.A.
Ranchi 712 712 641 718 N.A. N.A. 718 N.A.
Palamau . . 344 344 302 344 344 N.A. 344 844
Dhembad .« 203 203 187 203 203 159 203 203
Singhbhum ^ 472 472 299 472 N.A. N.A. 472 N.A.
s t a t e TOTAL .. 10,778 9,178 6,024 10,667 5,493 2,886 10,811 4,292
N.A.
N.A.
N.A.
N.A.
N.A.
N.A.
N.A^
N.A.«
N.A.
n .a J
N.A.
N.A.
N.A.
N.Ai
N.A^
N.A '
N.Aj
N.A.—Not available.
SoujiCB.— Director, Panclaayati Raj, Bihar.

400
TABLV S8iTATBMENT SHOWING PER CAPITA INCOME IN BIHAR AT CURRENT AND CONSTANT PRICES.
Year.At current lAt 1948-49
Prices. Constant Prices.
1 # 2 3
iOflO-61 • 5 • • 205.44 198.34
I90i.es • • • • ♦ •• 212.42 201.41
496S.0I . . • -9. 221.99 203.96
^ . i. 244.68 205.65
iM4-0S . V <• • •' '• «• 283.04 210.40
•• ♦ •’ ♦ •% 322.64 201.95
. .V ‘ . *■ • • i 293.94 170.31
loer-es* . . •• . . . 398.68 195.82

TABLE 33.9.
STATEME2SIT SHOWING STATE INCOME OF BIH AB AT CUKBENT PRICES B Y INDUSTRIAL ORIGIN.
( I n Cb o b e s o f E ttpee*.^
1960-61. 1961-62. 1962-63. 1963-64. 1964-65. 1966-66. 1966-67. 1967-68.*
1 2 3 4 5 6 7 8 9
410
1. AGRICULTURE AND ALLIED ACTIVITIES—
(rit) Agriculture . . 4,01 A6 4,18.29 4,15.88 4,84.81 6,17.62 7,37.08 5,23.39 8,64.56
(6) Animal Husbandry 1,04.05 1,10.08 1,14.09 1,36.58 1,56.08 1,68.79 1,91.84 1,78.21
(c) Forestry 6.91 9.76 9.50 12.04 14.51 16.13 18.18 20.45
(d) Fisheries 12.03 13.48 15.10 16.94 16.12 21.75 22.55 25.08
Stjb-Totai. . . 5,30.454
2. MINING AND MANUFACTURING
5,51.61 5,54.57 6,50.37 8,04.33 9,41.75 7,55.96
f
10,88.30
AND SMALL ENTERPRISES—
(a) Electricity Gas 0.43 2.62 4.44 5.33 4.76 2.86 2.86 4.63
(6) Mining 45.75 51.23 62.16 67.93 65.78 73.11 76.90 83.82
(•) Factory Establishnjent . . 64.42 69.40 87.75 91.34 96.62 12,1.34 1,23.18 1.24.20
(4) Small enterprise* 26.57 31.34 37.68 45.03 55.62 67.81 83.82 1,06.16
(«) Construction . . 7.87 8.14 8.55 8.98 10.37 11.54 13.08 17.70
Sub-Total . . 1,45.04 1,62.73 2,00.61 2.18.61 2,33.15 2,76.66 2,99.79 3,S6.51
3. COMMERCE, TRANSPORT AND CO MMUNIC ATION—
(a) Communication 2.94 3.23 3.75 3.90 4.24 4.76 5.71 6.39
.6) RaiW ayt 37.01 39.55 44.54 50.16 53.87 59.18 58.01 61.95
(e) Bankintrsnd Iniiirance . . 10.50 10.52 10.54 10.56 12.60 15.03 17.94 21.40
(d) Other Commerce 79.09 81.76 85.90 90.18 1,04.22 1,15.93 1,30.89 1,84.31
(e) Other Transport 9.38 9.70 10.19 10.70 12.36 13.76 15.53 31.61
Sttb-Total
4. OTHER SE R V IC E S-
1,38.92 1,44.76 1,54.92 1,65.50 1,87.29 2,08.66 2,28.08 3,05.56
(o' Water Supply and Sanitary 0.52 0.60 0.69 0.78 0.81 0.96 1.05 1.11Services
(b) Profession, Domestic Services 57.99 59.94 62.95 66.12 76.35 84.99 95.96 1.49.61and Liberal Arts.
(t) Public Authorities 25.08 24.71 24.66 24.45 28.67 33.85 36.79 51.87
(d) House Property 37.34 38.95 46.94 47.88 54.17 60.88 70.67 81.67
(«) Educatiojn 12.79 14.03 16.05 17.18 18.79 21.18 23.65 27.32
Sttb-Total 1,33.72 1,38.23 1,51.29 1,56.39 1,78.79 12,01.86 2,28.12 3,14,42
NET DOMESTIC PRODUCT AT FACTOR COST.
9,48.13 9.97.33 10,61.39 11,90.87 14.03..56 16,28.93 15,11.95 20,44.79
Somtoaf- DireotoratQ of Stfttiatiioi and Eva'uatiou* Bihar.

TABLE 33.10.
S fA fE M E N T SHOWING STATE INCOME OF BIH AR AT CONSTANT PRICES B Y iN D U STniAL ORlGiN.
( I n C e o b e s o f R u p e e s .)
411
1960-61. 1961-62. 1962-63. 1963J-64. 1964-66. 1965-66.* 1966-67. 1967-68.*
1 2 3 4 5 6 7 8 9
i . AGRICULTURE AND ALLIED ACTIVITIES—
(o) Agriculture . , * * 4,53.28 4,63.10 4,52.30 4,6i8.32 4,85. ir> 4,36.14 2,78.26 4,30.89
{b) Animal Husbandry . . 1,04.81 1,08.54 1,12.30 l,n6.74 1,21.64 1,24.05 1,22.56 90.34
(c) Forestry 1.17 1.61 1.33 1.59 1.74 1,79 1.80 1.83
(d> PisherieB 11.18 11.39 11.60 H1.81 12.03 12.25 12.48 12.48
Sub - T o t a l . . 5,70.44 5,84.64 5,77.53 5,98.46 6,20.56 5,74.23 4,15.10 5,35.54
2. MINING AND MANUFACTURING AND SMALL ENTERPRISES—
(o) Minintt 32.13 35.87 48.11 41125 40.27 43.63 43.92 42.74
fft) Factory Establishment . . 58.48 62.19 , 75.14 76.77 82.48 89.08 91.36 92.12
(•) SmallEnterprisee 24.22 27.48 30.68 34.22 38.14 42.58 47.48 62.94
(d\ Con»tT\iCt\on . . 6.-1 6.99 1.12 7.25 1.S9 7.53 7.6ft
fc> Electricity 0.43 0.48 0.51 0.58 0.63 0.66 0.76 1.22
Sub - T o t a l 1,22.01 1,32.89 1,60.92 1,59.94 1,,68.77 1,83.34 1,91.05 1,95.68
*, COMMERCE, TRANSPORT AND COMMUNICATION—
(f) Communication 1.69 1.60 1.69 1.79 1.81 1.75 1.65 1.69
(ft) Railwaya 32.75 33.85 34.98 316.15 41,67 44.25 47.03 49.96
(o) Banking and Inturance . . 7.48 7.95 8.45 8.98 9.54 10.14 10.77 11.44
{4) Other Commerce 67.28 68.51 69.77 7 1.05 72.36 73.70 75.06 76.46
{«) Other Transport 7.94 8.09 9.24 8.39 8.54 8.70 8.86 9.03
Sub - T o t a l \ 1,17.04 1,20.00 1,23.13 1,26.36 1,33.92 1,38.54 1,43.37 1,48.47
4. OTHER SERVICES—
(o) Education 8.75 9.04 9.05 19.14 15.49 17.53 15.99 16.32
(ft) Professions, Domeptic Service and Liberal Arts.
(e) Public Authoritiep
45.38
17.25
46.22
18.57
47.06
20.02
47.93
21.53
48.81
23.21
49.71
25.07
50.63
25.68
16.67
36.18
(d) House Property 33.06 33.71 36.29 3'7.29 37.98 38.85 39.75 40.66
(e> Water Supply and Sanitary Service*.
0.52 0.57 0.62 (0.68 0.72 0.74 0.78 0.80
S u b - T o t a l . . 1,04.96 1,08.11 1,13.04 1,16.57 1,20.06 1,23.84 1,26.54 1,46.64
N E T DOMESTIC PRODUCT AT FACTOR COST.
9,14.45 9,45.64 9,75.13 10„01.33 10,43.31 10,19.96 8,76.06 10,26.28
•Provisional.SOUBOB.—^Directorate o f StatisticBand Evaluatinoir Bihar.
Y E T \ f? ; jB.S.P. (Planning)— 9 6 - M.G.— 500— 3-9-1971 G. Pd. and others. '
OF