District Statistical Hand Book, Ganjam, 2018
158
-
Upload
khangminh22 -
Category
Documents
-
view
5 -
download
0
Transcript of District Statistical Hand Book, Ganjam, 2018
GOVERNMENT OF ODISHA
DISTRICT STATISTICAL HAND BOOK
GANJAM
2018
DIRECTORATE OF ECONOMICS AND STATISTICS, ODISHA
ARTHANITI ‘O’ PARISANKHYAN BHAWAN
HEADS OF DEPARTMENT CAMPUS, BHUBANESWAR
PIN-751001
Email : [email protected]/[email protected]
Website : desorissa.nic.in [Price : Rs.25.00]
ସଙ୍କର୍ଷଣ ସାହୁ, ଭା.ପ.ସେ ଅର୍ଥନୀତି ଓ ପରିସଂଖ୍ୟାନ ଭବନ
ନସିଦେଶକ Arthaniti ‘O’ Parisankhyan Bhawan
ଅର୍େନୀତ ିଓ ପରେିଂଖ୍ୟାନ HOD Campus, Unit-V
Sankarsana Sahoo, ISS Bhubaneswar -751005, Odisha
Director Phone : 0674 -2391295 Economics & Statistics e-mail : [email protected]
Foreword
I am very glad to know that the Publication Division of Directorate of Economics &
Statistics (DES) has brought out District Statistical Hand Book-2018. This book contains key
statistical data on various socio-economic aspects of the District and will help as a reference
book for the Policy Planners, Administrators, Researchers and Academicians. The present issue
has been enriched with inclusions like various health programmes, activities of the SHGs,
programmes under ICDS and employment generated under MGNREGS in different blocks of
the District.
I would like to express my thanks to Dr. Bijaya Bhusan Nanda, Joint Director, DE&S,
Bhubaneswar for his valuable inputs and express my thanks to the officers and staff of
Publication Division of DES for their efforts in bringing out this publication.
I also express my thanks to the Deputy Director (P&S) and his staff of DPMU, Ganjam
for their tireless efforts in compilation of this valuable Hand Book for the District.
Bhubaneswar (S. Sahoo) May, 2020
Dr. Bijaya Bhusan Nanda, O.S. & E.S.(I)
Joint Director Directorate of Economics & Statistics Odisha, Bhubaneswar
Preface
The District Statistical Hand Book, Ganjam’ 2018 is a step forward for evidence based
planning with compilation of sub-district level information. It furnishes block-wise statistics on
Area & Population, Agriculture, Co-operation, Forest, Fisheries, Live Stock & Animal
Husbandry, Industry & Mining, Power, Transport & Communication, Education, Health and
Family Welfare, Banking, Revenue, Police, Crime and Judiciary, Labour & Employment, Public
Distribution, Local Bodies, Election, Women & Child Welfare Programme, Poverty Alleviation
Programme, Disaster Statistics etc. Besides, the publication provides district wise information
on selected indicators which helps to access the relative position of the district in the State.
This publication will be a handy guide to the line Departments at the district and State
level for sectoral and decentralized planning. This will also carter to the district and block level
data requirement for Non-Government Organizations working in the field.
I acknowledge with thanks the valuable help and co-operation of various Government
offices of Ganjam District as well as at the State level, which have made available the required
data for publication of this issue. The effort of the entire DPMU team comprising of Deputy
Director (P&S), Ganjam and his staff is highly appreciated for bringing out this valuable Hand
Book for the District.
I sincerely acknowledge the guidance of Sri S. Sahoo, ISS, Director, DE&S for enriching
this publication with his valuable technical inputs and insights.
Diligence and contribution of the Officer and Staff of Publication Division and
Computer Centre for bring out the publication are praiseworthy.
. Bhubaneswar
May, 2020 (Bijaya Bhusan Nanda)

Table No. SUBJECT PAGE
( 1 ) ( 2 ) ( 3 )
Socio-Economic Profile : Ganjam … 1
Administrative set up … 4
I. POSITION OF DISTRICT IN THE STATE
1.01 Geographical Area … 5
1.02 District wise Population with SC & ST and their Percentage to total Population
of Odisha as per 2011 Census… 6
1.03 Population by Sex, Density & Growth rate … 7
1.04 District-wise Sex Ratio among all category, SC & ST by
residence as per 2011 Census… 8
1.05 District-wise Population by Religion as per 2011 Census … 9
1.06 District-wise Literacy rate, 2011 Census … 10
1.07 Child Population in the Age Group 0-6 in different district of Odisha as per 2011
Census… 11
1.08 Age-wise Population with Rural and Urban of the district as per 2011 Census … 12
1.09 Decadal Variation in Population since 1901 of the district … 13
1.10 District wise Disabled Population by type of Disability as per 2011 Census … 14
II. AREA AND POPULATION
2.01 Geographical Area, Households and Number of Census Villages in different
Blocks and ULBs of the district.… 15
2.02 Total Population, SC and ST Population by Sex in different Blocks and ULBs of
the district.… 17
2.03 Total number of Main Workers, Marginal Workers and Non-Workers by Sex in
different Blocks and Urban areas of the district.… 21
2.04 Classification of Workers ( Main + Marginal ) in different Blocks and Urban
areas of the district. … 25
III. CLIMATE
3.01 Month-wise Rainfall in different Rain gauge Stations in the District. … 27
3.02 Month-wise Temperature and Relative Humidity of the district. … 29
CONTENTS
1
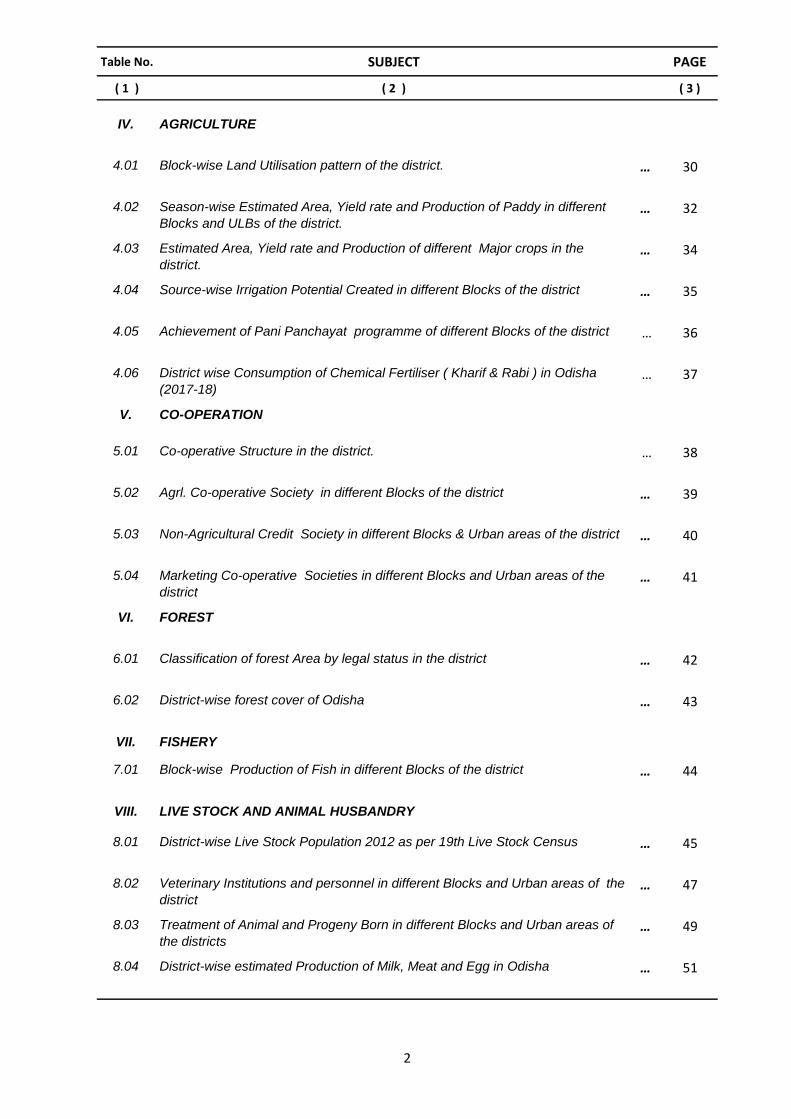
Table No. SUBJECT PAGE
( 1 ) ( 2 ) ( 3 )
IV. AGRICULTURE
4.01 Block-wise Land Utilisation pattern of the district. … 30
4.02 Season-wise Estimated Area, Yield rate and Production of Paddy in different
Blocks and ULBs of the district.… 32
4.03 Estimated Area, Yield rate and Production of different Major crops in the
district.… 34
4.04 Source-wise Irrigation Potential Created in different Blocks of the district … 35
4.05 Achievement of Pani Panchayat programme of different Blocks of the district … 36
4.06 District wise Consumption of Chemical Fertiliser ( Kharif & Rabi ) in Odisha
(2017-18)… 37
V. CO-OPERATION
5.01 Co-operative Structure in the district. … 38
5.02 Agrl. Co-operative Society in different Blocks of the district … 39
5.03 Non-Agricultural Credit Society in different Blocks & Urban areas of the district … 40
5.04 Marketing Co-operative Societies in different Blocks and Urban areas of the
district… 41
VI. FOREST
6.01 Classification of forest Area by legal status in the district … 42
6.02 District-wise forest cover of Odisha … 43
VII. FISHERY
7.01 Block-wise Production of Fish in different Blocks of the district … 44
VIII. LIVE STOCK AND ANIMAL HUSBANDRY
8.01 District-wise Live Stock Population 2012 as per 19th Live Stock Census … 45
8.02 Veterinary Institutions and personnel in different Blocks and Urban areas of the
district… 47
8.03 Treatment of Animal and Progeny Born in different Blocks and Urban areas of
the districts… 49
8.04 District-wise estimated Production of Milk, Meat and Egg in Odisha … 51
2

Table No. SUBJECT PAGE
( 1 ) ( 2 ) ( 3 )
IX. INDUSTRY AND MINING
9.01 Details of Small Scale, Cottage & Handloom Activities of Small Scale,
Handicrafts & Cottage and Handloom Industries in the district… 54
9.02 Mining Activities in Odisha, 2017-18 … 55
X. POWER
10.01 Villages Electrified in Odisha at the end of the year 2017-18 … 61
XI. TRANSPORT AND COMMUNICATION
11.01 Postal Net-work different Block and ULBs of the district. … 62
11.02 Distance of Sub Divisional Hqrs / Block Hqrs / Main Hats ( Market) from District
Hqrs of the district … 64
11.03 Motor Vehicles Registered & M.V On Road in the district. … 65
11.04 Length of different categories of Roads in the Districts. … 66
11.05 Important Tourist Spots of the district. … 67
XII. EDUCATION
12.01 Education in Rural / Urban areas of the District. … 71
12.02 No. of Primary Schools, Teachers and Students in different Block and Urban
area of the district… 72
12.03 No. of Up-primary Schools, Teachers and Students in different Block and Urban
area of the district… 76
12.04 No. of Secondary Schools, Teachers and Students in different Block and Urban
area of the district… 80
12.05 No. of Colleges for General education, Lecturers and Students in different
Block and Urban area of the districts.… 84
12.06 Literacy rate in different Blocks and Urban areas of the district. … 88
XIII HEALTH AND FAMILY WELFARE
13.01 Health care infrastructures (Allopathic) in different Blocks and Urban areas of
the district… 90
13.02 Ayush infrastructures ( Homoeopathic) , Patients treated in different blocks and
urban areas of the district… 94
13.03 Ayush infrastructures ( Ayurvedic / Uanani ) Patients treated in different Blocks
and Urban areas of the district.… 95
13.04 Family welfare, Maternity and Child health programmes of the district. … 96
13.05 Number of Births, Deaths and Infant Deaths registered in the district. … 97
13.06 Health Control Programmes in the districts. … 98
13.07 Availability of Portable Drinking Water facilities in different Blocks of the district
(2017-18)… 100
13.08 District wise Rural Habitation as on 01. 04. 2018 … 101
3
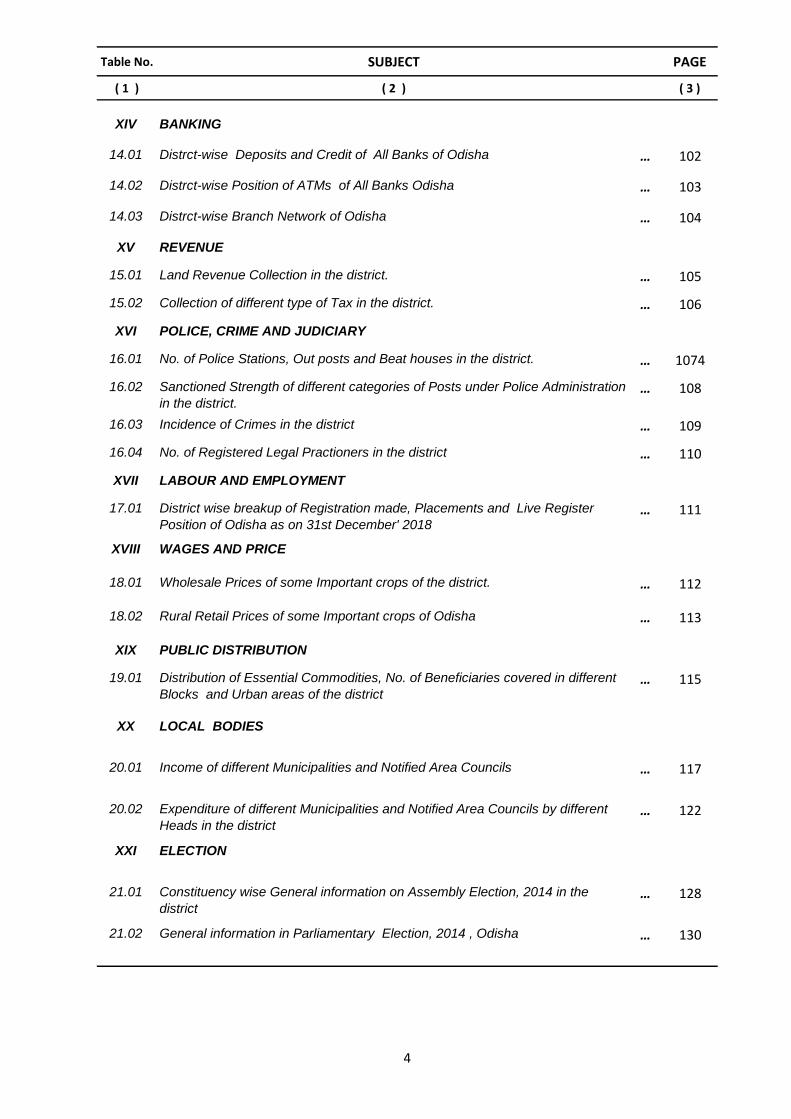
Table No. SUBJECT PAGE
( 1 ) ( 2 ) ( 3 )
XIV BANKING
14.01 Distrct-wise Deposits and Credit of All Banks of Odisha … 102
14.02 Distrct-wise Position of ATMs of All Banks Odisha … 103
14.03 Distrct-wise Branch Network of Odisha … 104
XV REVENUE
15.01 Land Revenue Collection in the district. … 105
15.02 Collection of different type of Tax in the district. … 106
XVI POLICE, CRIME AND JUDICIARY
16.01 No. of Police Stations, Out posts and Beat houses in the district. … 1074
16.02 Sanctioned Strength of different categories of Posts under Police Administration
in the district.… 108
16.03 Incidence of Crimes in the district … 109
16.04 No. of Registered Legal Practioners in the district … 110
XVII LABOUR AND EMPLOYMENT
17.01 District wise breakup of Registration made, Placements and Live Register
Position of Odisha as on 31st December' 2018… 111
XVIII WAGES AND PRICE
18.01 Wholesale Prices of some Important crops of the district. … 112
18.02 Rural Retail Prices of some Important crops of Odisha … 113
XIX PUBLIC DISTRIBUTION
19.01 Distribution of Essential Commodities, No. of Beneficiaries covered in different
Blocks and Urban areas of the district… 115
XX LOCAL BODIES
20.01 Income of different Municipalities and Notified Area Councils … 117
20.02 Expenditure of different Municipalities and Notified Area Councils by different
Heads in the district… 122
XXI ELECTION
21.01 Constituency wise General information on Assembly Election, 2014 in the
district… 128
21.02 General information in Parliamentary Election, 2014 , Odisha … 130
4
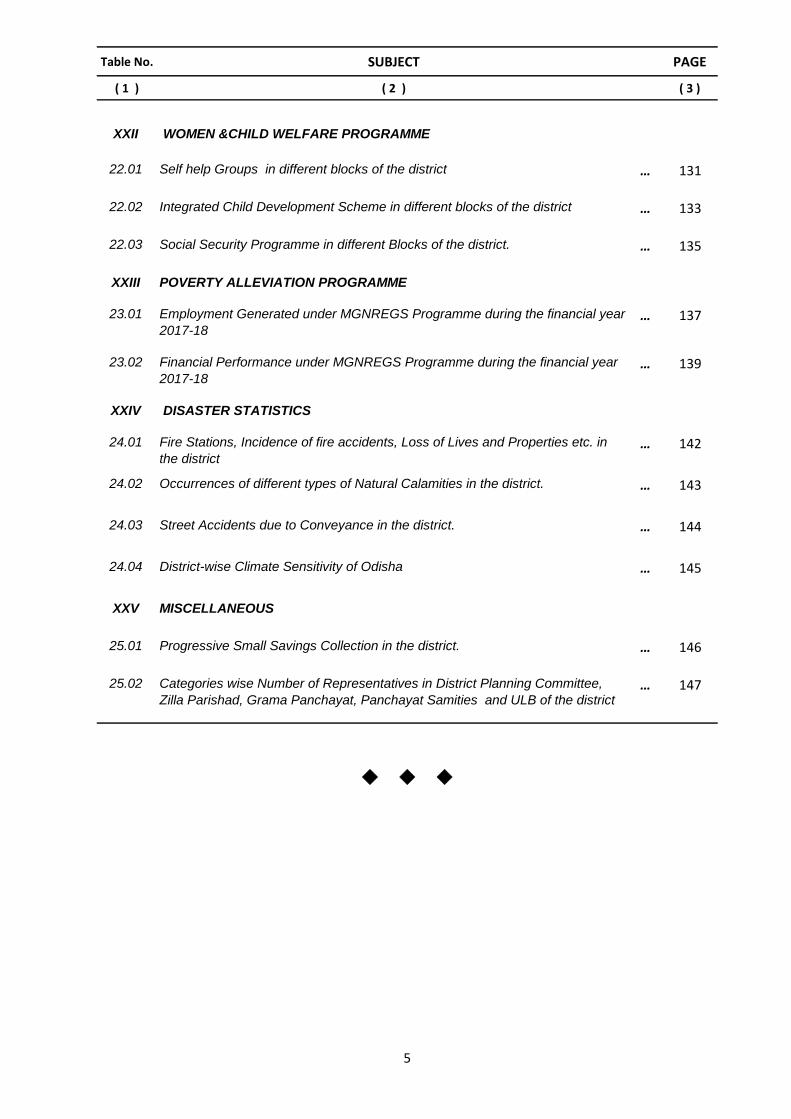
Table No. SUBJECT PAGE
( 1 ) ( 2 ) ( 3 )
XXII WOMEN &CHILD WELFARE PROGRAMME
22.01 Self help Groups in different blocks of the district … 131
22.02 Integrated Child Development Scheme in different blocks of the district … 133
22.03 Social Security Programme in different Blocks of the district. … 135
XXIII POVERTY ALLEVIATION PROGRAMME
23.01 Employment Generated under MGNREGS Programme during the financial year
2017-18… 137
23.02 Financial Performance under MGNREGS Programme during the financial year
2017-18… 139
XXIV DISASTER STATISTICS
24.01 Fire Stations, Incidence of fire accidents, Loss of Lives and Properties etc. in
the district… 142
24.02 Occurrences of different types of Natural Calamities in the district. … 143
24.03 Street Accidents due to Conveyance in the district. … 144
24.04 District-wise Climate Sensitivity of Odisha … 145
XXV MISCELLANEOUS
25.01 Progressive Small Savings Collection in the district. … 146
25.02 Categories wise Number of Representatives in District Planning Committee,
Zilla Parishad, Grama Panchayat, Panchayat Samities and ULB of the district… 147
u u u
5
1
SOCIO ECONOMIC PROFILE: GANJAM
1. Location: Ganjam district is one of the south-east located districts in Odisha. It lies between
84o9’ to 85o11’ east longitude and between 19o0’ to 20o17’ north latitude. It is bounded by
the Nayagarh district in north, Gajapati district in south, Puri & Khurda district in the east and
Kandhamala district in the west.
2. Area and Population: The district has an area of 8206 sq. kms and 35.29 lakhs of
population as per 2011 census. The district accounts for 5.27 percent of the state territory
and shares 8.41 percent of the state population. The density of population of the district is
430 per sq. kms as against 270 person per sq.km of the state. It has 3195 villages (including
412 un-inhabited villages) covering 22 blocks 23 Tahasils and 3 Subdivisions. As per 2011
census the schedule caste population is 688235 (19.50%) and schedule tribe population
118928 (3.37%). The literacy percentage of the district covers 71.1 against 72.9 of the state.
3. Climate: The climate condition of the district is generally hot with high humidity during April
to May and cold during December to January. The monsoon generally breaks during the
month of June, Annual rainfall of the district was 1373.1 m.m in 2018 which is higher than
the normal rainfall (1276.2 m.m).
4. Agriculture: During the year 2017-18, the net area sown was 195 thousand hectares
against 4474 thousand hectares of the state. The production of paddy was 4889209
quintals, 6342 quintals maize, 2859 quintals ragi, 118397 quintals mung, 15650 quintals biri,
1623 quintals kulthi, 1599 quintals till, 18984 quintals groundnuts, 5 quintals mustard, and
481 quintals potatoes and 133945 quintals sugarcane. During 2017-18, the total fertilizers
used in Ganjam district is about 36169 MT with a breakage of 26128 MT nitrogenous, 6215
MT phosphatic and 3826 MT pottasic and the consumption of fertilizer per hectare is 69.80
Kg.
5. Irrigation: By the end of June 2017-18, it is reported by Deputy Director Agriculture,
Ganjam, Berhampur that the total irrigation potential created during Kharif and Rabi are
204166 hectares and 31403 hectares respectively through major / medium irrigation
projects in the district.
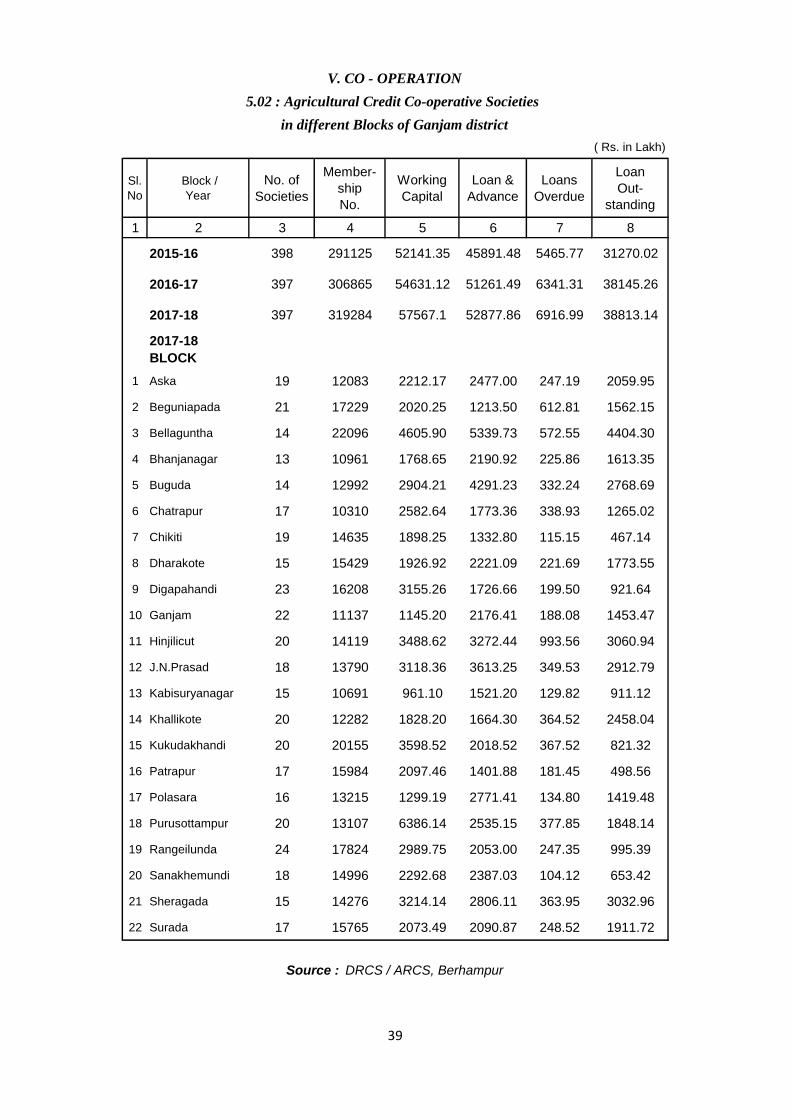
6. Co-operation: The district has 397 agricultural Co-operative societies with a membership of
319284. The loan advances is to the tune of Rs. 52877.86 lakh and loan outstanding stood
at Rs. 38813.14 lakhs as of 2017-18. The agricultural credit Co-operative societies as more
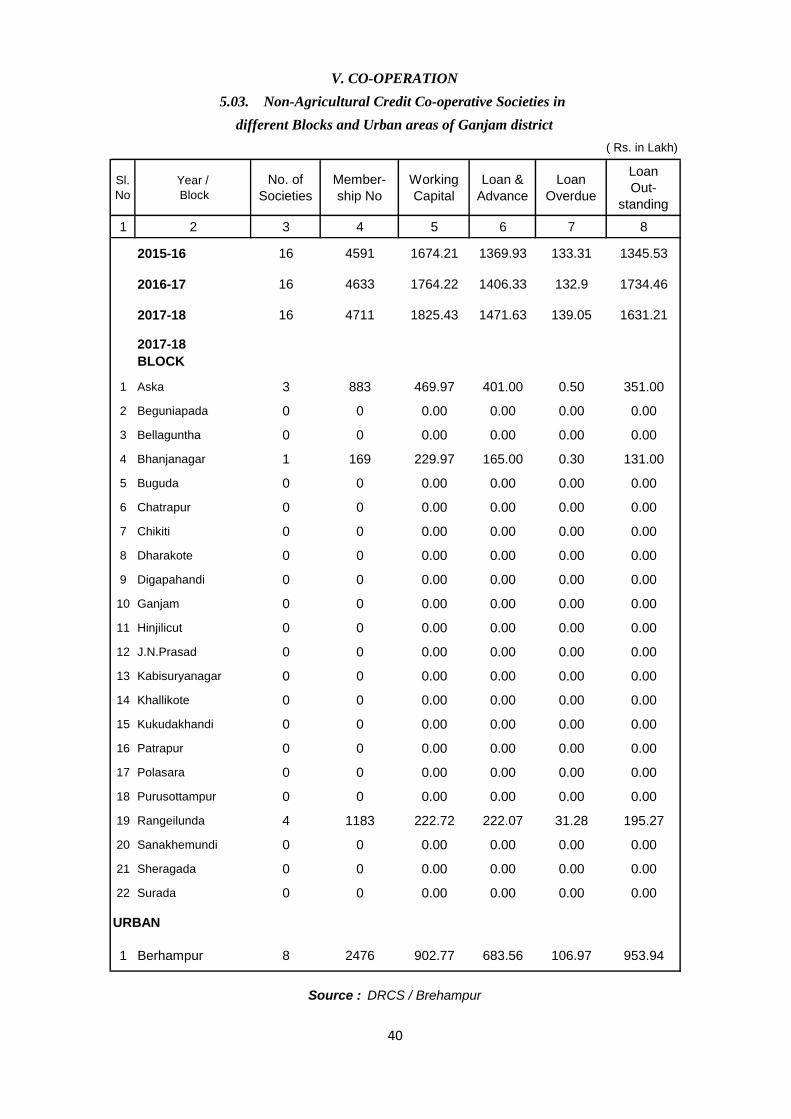
or less evenly distributed across the 22 Blocks of the district. Besides that are 16 non-
agricultural credit Co-operative Societies in the district of which 8 are in different blocks and
8 are Berhampur Municipalities.
2
7. Forest: District of Ganjam has abundant of Forest area that contributed 38.39% of the total
geographical area of the district.
8. Veterinary Services During 2017-18, Milk production is 123.61 thousand MT, production of
eggs is 5086.86 lakhs nos. and production of meat is 9.92 thousand MT in this district.
During 2017-18, 38 nos. of Hospitals and Dispensaries, 259 nos. of Livestock Aid centers
and 263 Artificial Insemination Centers, 51 nos. of VAS & Additional VAS were functioning
in the district.
9. Industry and Mining: During the year 2017-18, 2799 nos. of small scale industries have
established with total capital investment of about Rs. 6647.74 lakhs with 6696 nos. of
Employment generated in Ganjam district. Besides various kinds of handicraft works have
been developed by the skilled workers and artisans of the district.
10. Power: During the year 2017-18, villages so far electrified as on 30.03.2018 is 2753 which
constitutes 98.9 % to the total villages of the district.
11. Transport & Communication: During 2017-18, 327.45 Kms. of National Highways, 491.87
Kms. of state highways, 91.36 Kms. Major district roads, 877 Kms of other district roads,
5526.82 kms of Inter-village road, 2936.84 kms of Intra-village road, 2989.39 Kms of village
roads and 501.50 Kms of forest roads are operating in the district.
12. Education: There were 2328 nos. of primary schools, 1342 nos. of Up-primary schools, 715
nos. of secondary schools and 119 nos. of general colleges in the district during 2017-18.
Besides, there are 11 nos. of polytechnic school and 9 nos. of engineering colleges in the
district during year 2017-18 to impart technical education. The teacher pupil ratio in the
primary, upper primary, Secondary School stood at 43, 7.8 and 17 respectively.
13. Health: The medical facilities are provided by different agencies like Govt., Private
individuals and voluntary organizations in the district. There were 4 no. DHH, 30 nos. CHC,
97 nos. PHC of the Allopathic medical institutions including 460 nos. of Sub Centre in the
district during the year 2017-18. There were 44 nos. of Homoeopathic dispensaries and 49
nos. of Ayurvedic dispensaries in the district during the year 2017-18.
14. Banking: As on December, 2018, there were 423 nos. of All Banks having 18386.41 crore
rupees deposit and 6970.71 crore rupees credit in the district. The district has banking
branches network of 423 out of which 92 (4.38%) were in the urban area, 132 (32.5%) in
semi-urban area and 199 (63.12%) in rural areas. The total number of ATMs in the district
stood at 535.
3
15. Collection of Land Revenue: The total collection of land revenue in the district for 2017-
18 was Rs. 1845.01 lakh. The total collection of Tax in the district during 2017-18 was
Rs. 11466.17 Lakh.
16. Poverty Alleviation Programme: In the district total no. of Job card issued was 4.89 Lakh
and total no. of person days generated was 96.70 lakh during the year 2017-18.
17. Disaster Scenario: In terms of Disaster activity the district in graded as slight zone for wind
& cyclone, high risk zone for flood, very high risk zone for drought, moderate risk zone for
earthquake & high risk zone for accident.
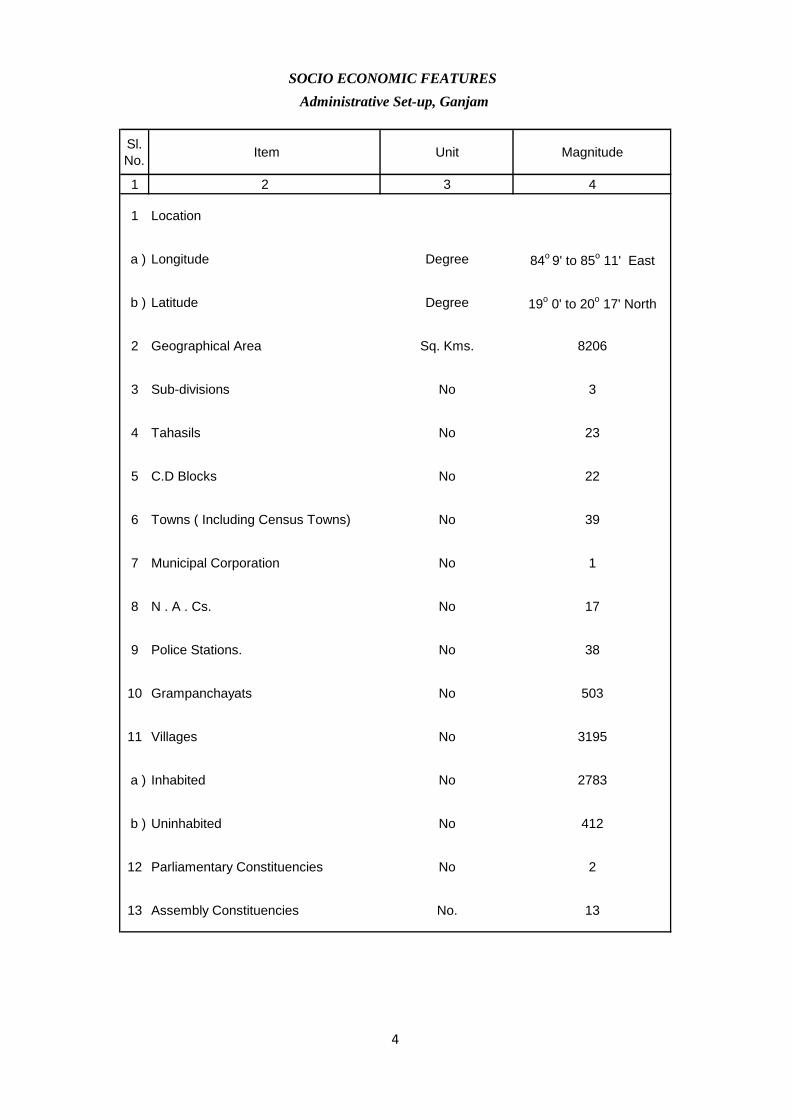
Sl.
No. Item Unit Magnitude
1 2 3 4
1 Location
a ) Longitude Degree 84o
9' to 85o 11' East
b ) Latitude Degree 19o 0' to 20
o 17' North
2 Geographical Area Sq. Kms. 8206
3 Sub-divisions No 3
4 Tahasils No 23
5 C.D Blocks No 22
6 Towns ( Including Census Towns) No 39
7 Municipal Corporation No 1
8 N . A . Cs. No 17
9 Police Stations. No 38
10 Grampanchayats No 503
11 Villages No 3195
a ) Inhabited No 2783
b ) Uninhabited No 412
12 Parliamentary Constituencies No 2
13 Assembly Constituencies No. 13
SOCIO ECONOMIC FEATURES
Administrative Set-up, Ganjam
4
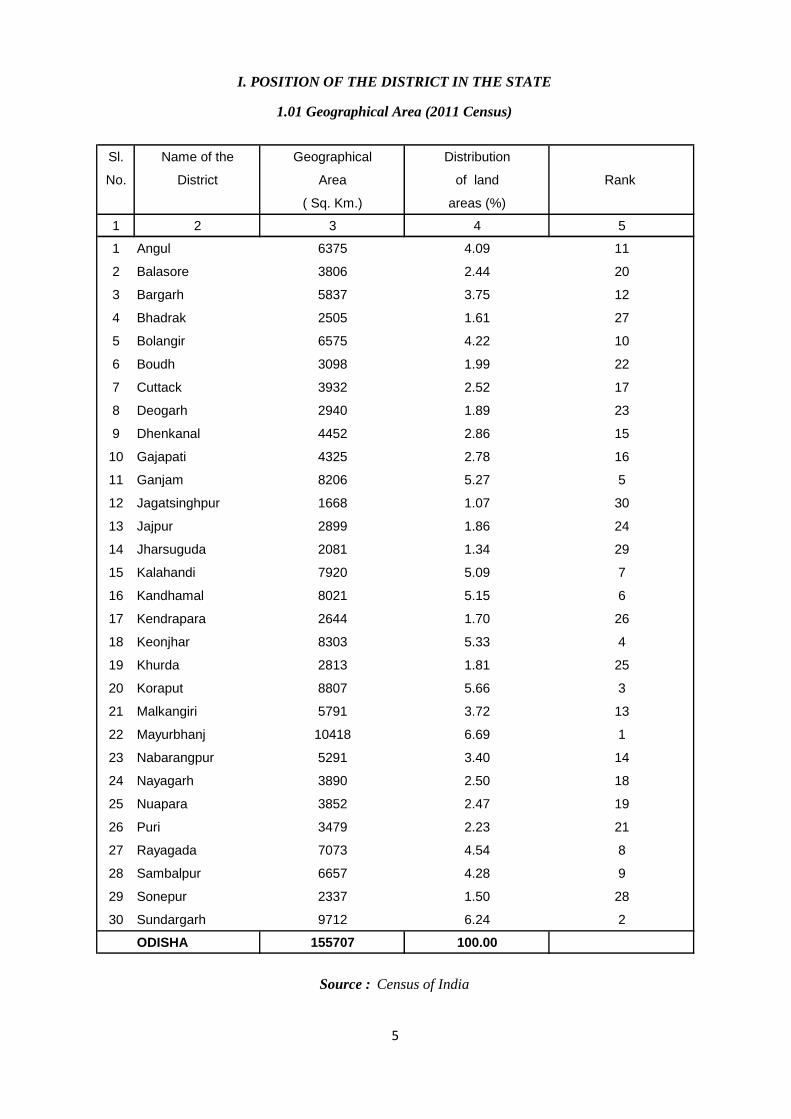
Sl. Name of the Geographical Distribution
No. District Area of land Rank
( Sq. Km.) areas (%)
1 2 3 4 5
1 Angul 6375 4.09 11
2 Balasore 3806 2.44 20
3 Bargarh 5837 3.75 12
4 Bhadrak 2505 1.61 27
5 Bolangir 6575 4.22 10
6 Boudh 3098 1.99 22
7 Cuttack 3932 2.52 17
8 Deogarh 2940 1.89 23
9 Dhenkanal 4452 2.86 15
10 Gajapati 4325 2.78 16
11 Ganjam 8206 5.27 5
12 Jagatsinghpur 1668 1.07 30
13 Jajpur 2899 1.86 24
14 Jharsuguda 2081 1.34 29
15 Kalahandi 7920 5.09 7
16 Kandhamal 8021 5.15 6
17 Kendrapara 2644 1.70 26
18 Keonjhar 8303 5.33 4
19 Khurda 2813 1.81 25
20 Koraput 8807 5.66 3
21 Malkangiri 5791 3.72 13
22 Mayurbhanj 10418 6.69 1
23 Nabarangpur 5291 3.40 14
24 Nayagarh 3890 2.50 18
25 Nuapara 3852 2.47 19
26 Puri 3479 2.23 21
27 Rayagada 7073 4.54 8
28 Sambalpur 6657 4.28 9
29 Sonepur 2337 1.50 28
30 Sundargarh 9712 6.24 2
ODISHA 155707 100.00
I. POSITION OF THE DISTRICT IN THE STATE
1.01 Geographical Area (2011 Census)
Source : Census of India
5
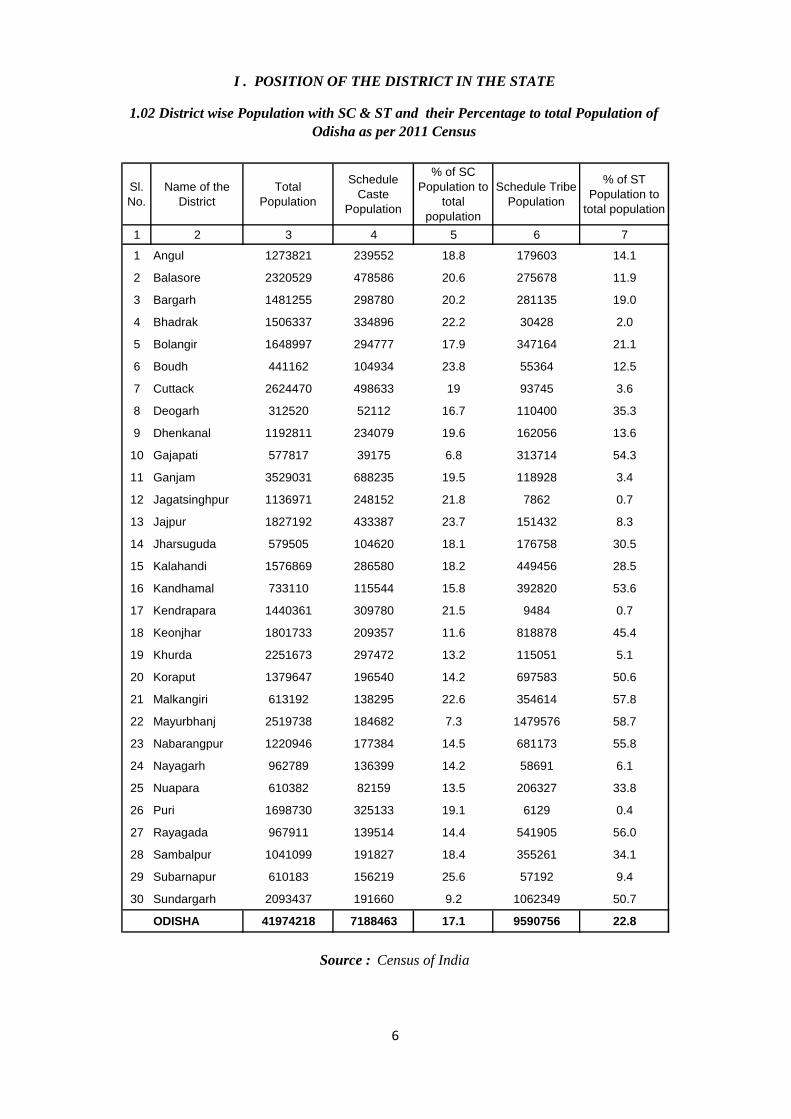
Sl.
No.
Name of the
District
Total
Population
Schedule
Caste
Population
% of SC
Population to
total
population
Schedule Tribe
Population
% of ST
Population to
total population
1 2 3 4 5 6 7
1 Angul 1273821 239552 18.8 179603 14.1
2 Balasore 2320529 478586 20.6 275678 11.9
3 Bargarh 1481255 298780 20.2 281135 19.0
4 Bhadrak 1506337 334896 22.2 30428 2.0
5 Bolangir 1648997 294777 17.9 347164 21.1
6 Boudh 441162 104934 23.8 55364 12.5
7 Cuttack 2624470 498633 19 93745 3.6
8 Deogarh 312520 52112 16.7 110400 35.3
9 Dhenkanal 1192811 234079 19.6 162056 13.6
10 Gajapati 577817 39175 6.8 313714 54.3
11 Ganjam 3529031 688235 19.5 118928 3.4
12 Jagatsinghpur 1136971 248152 21.8 7862 0.7
13 Jajpur 1827192 433387 23.7 151432 8.3
14 Jharsuguda 579505 104620 18.1 176758 30.5
15 Kalahandi 1576869 286580 18.2 449456 28.5
16 Kandhamal 733110 115544 15.8 392820 53.6
17 Kendrapara 1440361 309780 21.5 9484 0.7
18 Keonjhar 1801733 209357 11.6 818878 45.4
19 Khurda 2251673 297472 13.2 115051 5.1
20 Koraput 1379647 196540 14.2 697583 50.6
21 Malkangiri 613192 138295 22.6 354614 57.8
22 Mayurbhanj 2519738 184682 7.3 1479576 58.7
23 Nabarangpur 1220946 177384 14.5 681173 55.8
24 Nayagarh 962789 136399 14.2 58691 6.1
25 Nuapara 610382 82159 13.5 206327 33.8
26 Puri 1698730 325133 19.1 6129 0.4
27 Rayagada 967911 139514 14.4 541905 56.0
28 Sambalpur 1041099 191827 18.4 355261 34.1
29 Subarnapur 610183 156219 25.6 57192 9.4
30 Sundargarh 2093437 191660 9.2 1062349 50.7
ODISHA 41974218 7188463 17.1 9590756 22.8
I . POSITION OF THE DISTRICT IN THE STATE
1.02 District wise Population with SC & ST and their Percentage to total Population of
Odisha as per 2011 Census
Source : Census of India
6
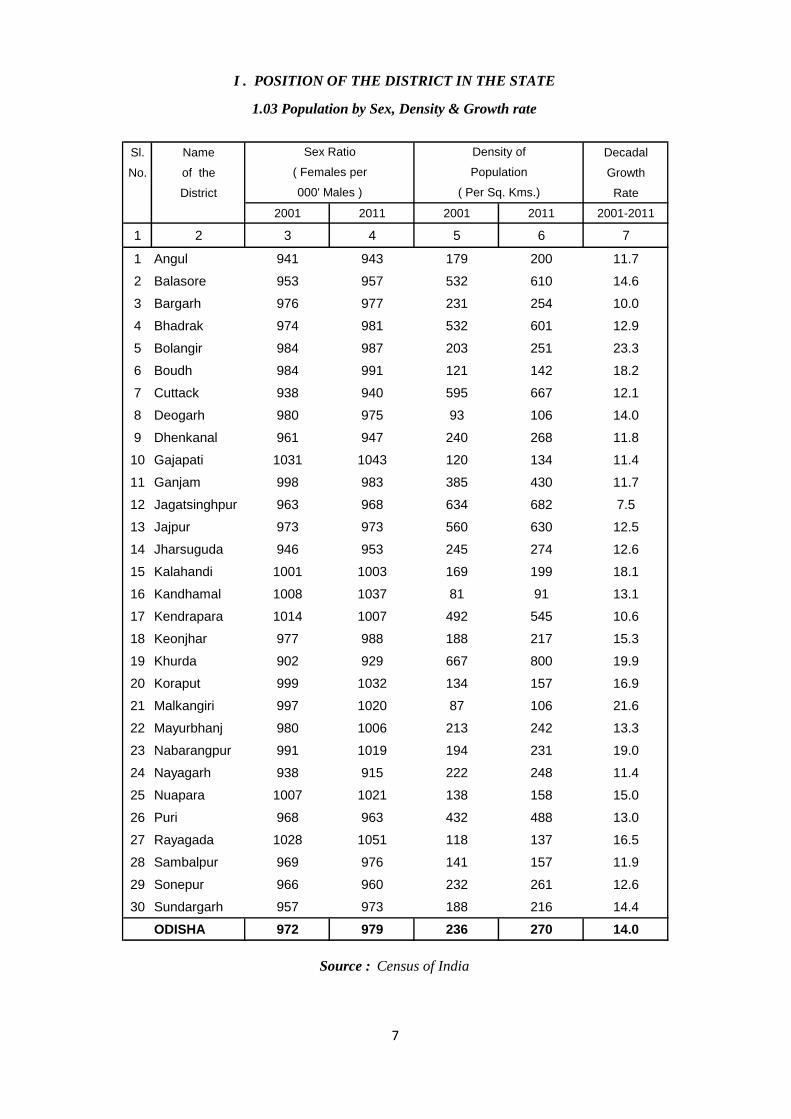
Sl. Name Decadal
No. of the Growth
District Rate
2001 2011 2001 2011 2001-2011
1 2 3 4 5 6 7
1 Angul 941 943 179 200 11.7
2 Balasore 953 957 532 610 14.6
3 Bargarh 976 977 231 254 10.0
4 Bhadrak 974 981 532 601 12.9
5 Bolangir 984 987 203 251 23.3
6 Boudh 984 991 121 142 18.2
7 Cuttack 938 940 595 667 12.1
8 Deogarh 980 975 93 106 14.0
9 Dhenkanal 961 947 240 268 11.8
10 Gajapati 1031 1043 120 134 11.4
11 Ganjam 998 983 385 430 11.7
12 Jagatsinghpur 963 968 634 682 7.5
13 Jajpur 973 973 560 630 12.5
14 Jharsuguda 946 953 245 274 12.6
15 Kalahandi 1001 1003 169 199 18.1
16 Kandhamal 1008 1037 81 91 13.1
17 Kendrapara 1014 1007 492 545 10.6
18 Keonjhar 977 988 188 217 15.3
19 Khurda 902 929 667 800 19.9
20 Koraput 999 1032 134 157 16.9
21 Malkangiri 997 1020 87 106 21.6
22 Mayurbhanj 980 1006 213 242 13.3
23 Nabarangpur 991 1019 194 231 19.0
24 Nayagarh 938 915 222 248 11.4
25 Nuapara 1007 1021 138 158 15.0
26 Puri 968 963 432 488 13.0
27 Rayagada 1028 1051 118 137 16.5
28 Sambalpur 969 976 141 157 11.9
29 Sonepur 966 960 232 261 12.6
30 Sundargarh 957 973 188 216 14.4
ODISHA 972 979 236 270 14.0
000' Males ) ( Per Sq. Kms.)
Source : Census of India
I . POSITION OF THE DISTRICT IN THE STATE
1.03 Population by Sex, Density & Growth rate
Sex Ratio Density of
( Females per Population
7
Sl Name of
No District Total Rural Urban Total Rural Urban Total Rural Urban
1 2 3 4 5 6 7 8 9 10 11
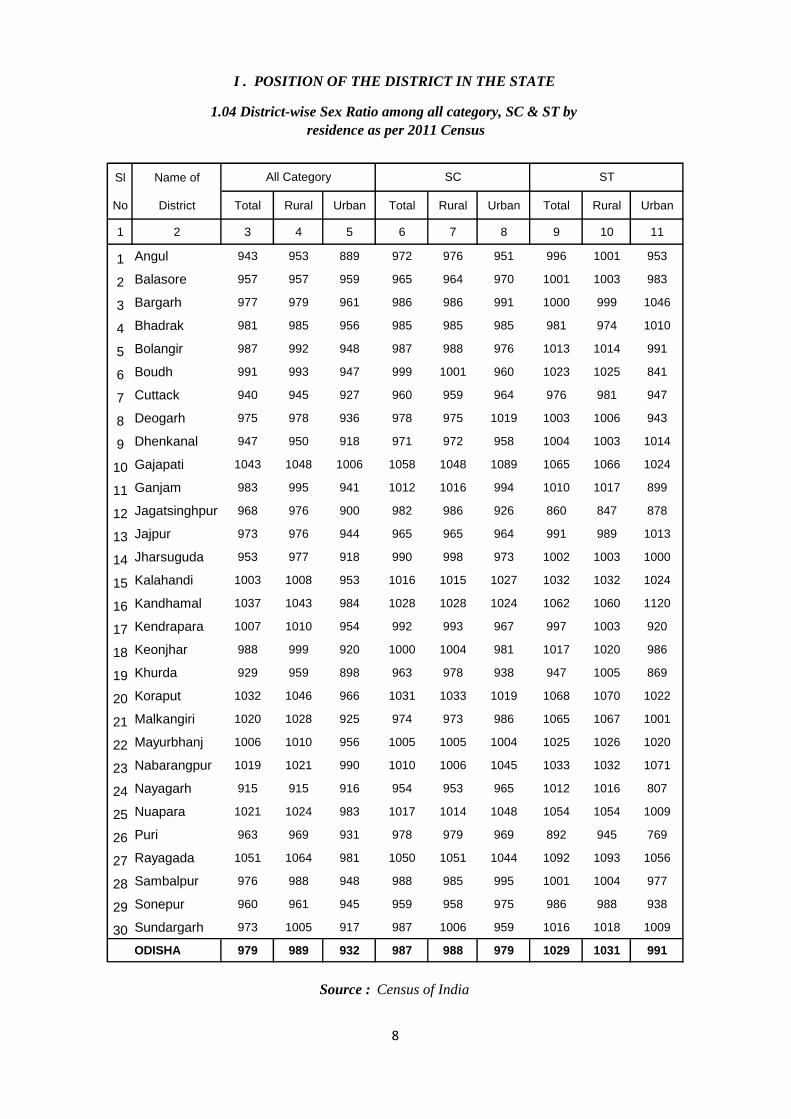
1 Angul 943 953 889 972 976 951 996 1001 953
2 Balasore 957 957 959 965 964 970 1001 1003 983
3 Bargarh 977 979 961 986 986 991 1000 999 1046
4 Bhadrak 981 985 956 985 985 985 981 974 1010
5 Bolangir 987 992 948 987 988 976 1013 1014 991
6 Boudh 991 993 947 999 1001 960 1023 1025 841
7 Cuttack 940 945 927 960 959 964 976 981 947
8 Deogarh 975 978 936 978 975 1019 1003 1006 943
9 Dhenkanal 947 950 918 971 972 958 1004 1003 1014
10 Gajapati 1043 1048 1006 1058 1048 1089 1065 1066 1024
11 Ganjam 983 995 941 1012 1016 994 1010 1017 899
12 Jagatsinghpur 968 976 900 982 986 926 860 847 878
13 Jajpur 973 976 944 965 965 964 991 989 1013
14 Jharsuguda 953 977 918 990 998 973 1002 1003 1000
15 Kalahandi 1003 1008 953 1016 1015 1027 1032 1032 1024
16 Kandhamal 1037 1043 984 1028 1028 1024 1062 1060 1120
17 Kendrapara 1007 1010 954 992 993 967 997 1003 920
18 Keonjhar 988 999 920 1000 1004 981 1017 1020 986
19 Khurda 929 959 898 963 978 938 947 1005 869
20 Koraput 1032 1046 966 1031 1033 1019 1068 1070 1022
21 Malkangiri 1020 1028 925 974 973 986 1065 1067 1001
22 Mayurbhanj 1006 1010 956 1005 1005 1004 1025 1026 1020
23 Nabarangpur 1019 1021 990 1010 1006 1045 1033 1032 1071
24 Nayagarh 915 915 916 954 953 965 1012 1016 807
25 Nuapara 1021 1024 983 1017 1014 1048 1054 1054 1009
26 Puri 963 969 931 978 979 969 892 945 769
27 Rayagada 1051 1064 981 1050 1051 1044 1092 1093 1056
28 Sambalpur 976 988 948 988 985 995 1001 1004 977
29 Sonepur 960 961 945 959 958 975 986 988 938
30 Sundargarh 973 1005 917 987 1006 959 1016 1018 1009
ODISHA 979 989 932 987 988 979 1029 1031 991
Source : Census of India
I . POSITION OF THE DISTRICT IN THE STATE
1.04 District-wise Sex Ratio among all category, SC & ST by
residence as per 2011 Census
All Category SC ST
8
Sl
No
Name of the
DistrictHindu Muslim Christian Sikh Buddhist Jain Other
1 2 3 4 5 6 7 8 9
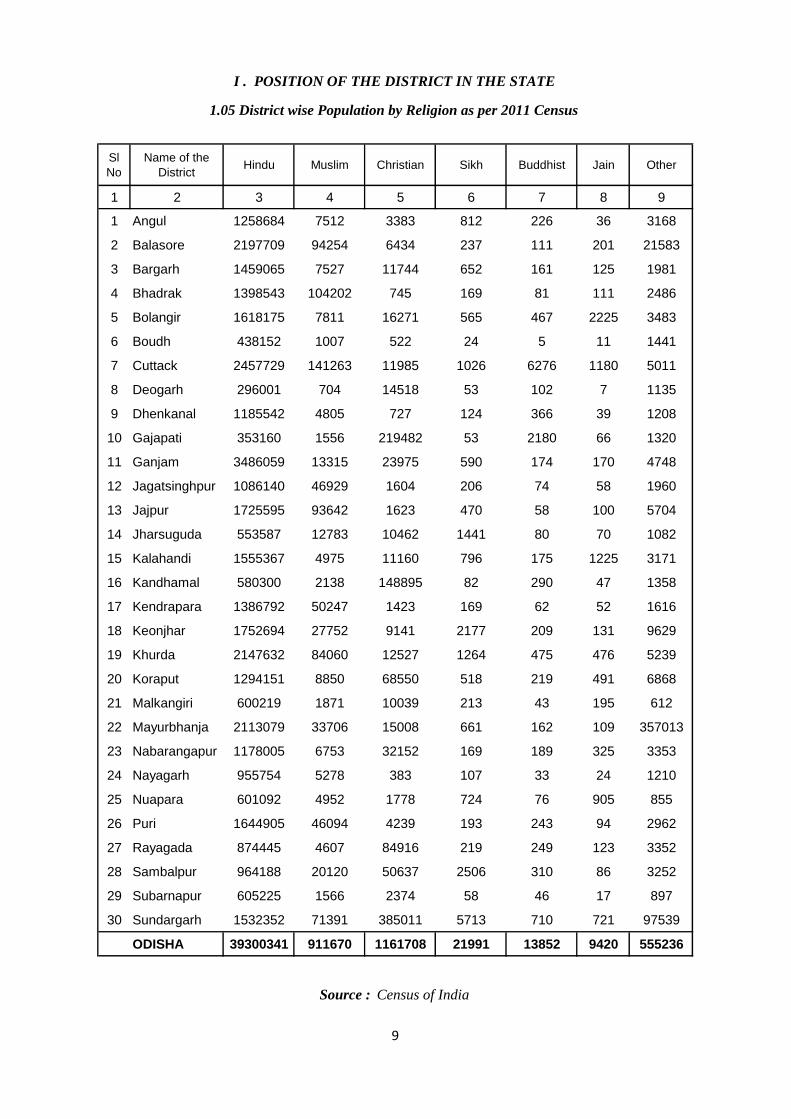
1 Angul 1258684 7512 3383 812 226 36 3168
2 Balasore 2197709 94254 6434 237 111 201 21583
3 Bargarh 1459065 7527 11744 652 161 125 1981
4 Bhadrak 1398543 104202 745 169 81 111 2486
5 Bolangir 1618175 7811 16271 565 467 2225 3483
6 Boudh 438152 1007 522 24 5 11 1441
7 Cuttack 2457729 141263 11985 1026 6276 1180 5011
8 Deogarh 296001 704 14518 53 102 7 1135
9 Dhenkanal 1185542 4805 727 124 366 39 1208
10 Gajapati 353160 1556 219482 53 2180 66 1320
11 Ganjam 3486059 13315 23975 590 174 170 4748
12 Jagatsinghpur 1086140 46929 1604 206 74 58 1960
13 Jajpur 1725595 93642 1623 470 58 100 5704
14 Jharsuguda 553587 12783 10462 1441 80 70 1082
15 Kalahandi 1555367 4975 11160 796 175 1225 3171
16 Kandhamal 580300 2138 148895 82 290 47 1358
17 Kendrapara 1386792 50247 1423 169 62 52 1616
18 Keonjhar 1752694 27752 9141 2177 209 131 9629
19 Khurda 2147632 84060 12527 1264 475 476 5239
20 Koraput 1294151 8850 68550 518 219 491 6868
21 Malkangiri 600219 1871 10039 213 43 195 612
22 Mayurbhanja 2113079 33706 15008 661 162 109 357013
23 Nabarangapur 1178005 6753 32152 169 189 325 3353
24 Nayagarh 955754 5278 383 107 33 24 1210
25 Nuapara 601092 4952 1778 724 76 905 855
26 Puri 1644905 46094 4239 193 243 94 2962
27 Rayagada 874445 4607 84916 219 249 123 3352
28 Sambalpur 964188 20120 50637 2506 310 86 3252
29 Subarnapur 605225 1566 2374 58 46 17 897
30 Sundargarh 1532352 71391 385011 5713 710 721 97539
ODISHA 39300341 911670 1161708 21991 13852 9420 555236
I . POSITION OF THE DISTRICT IN THE STATE
1.05 District wise Population by Religion as per 2011 Census
Source : Census of India
9
Sl. Name of the
No. District Total Male Female Total Male Female Total Male Female
1 2 3 4 5 6 7 8 9 10 11
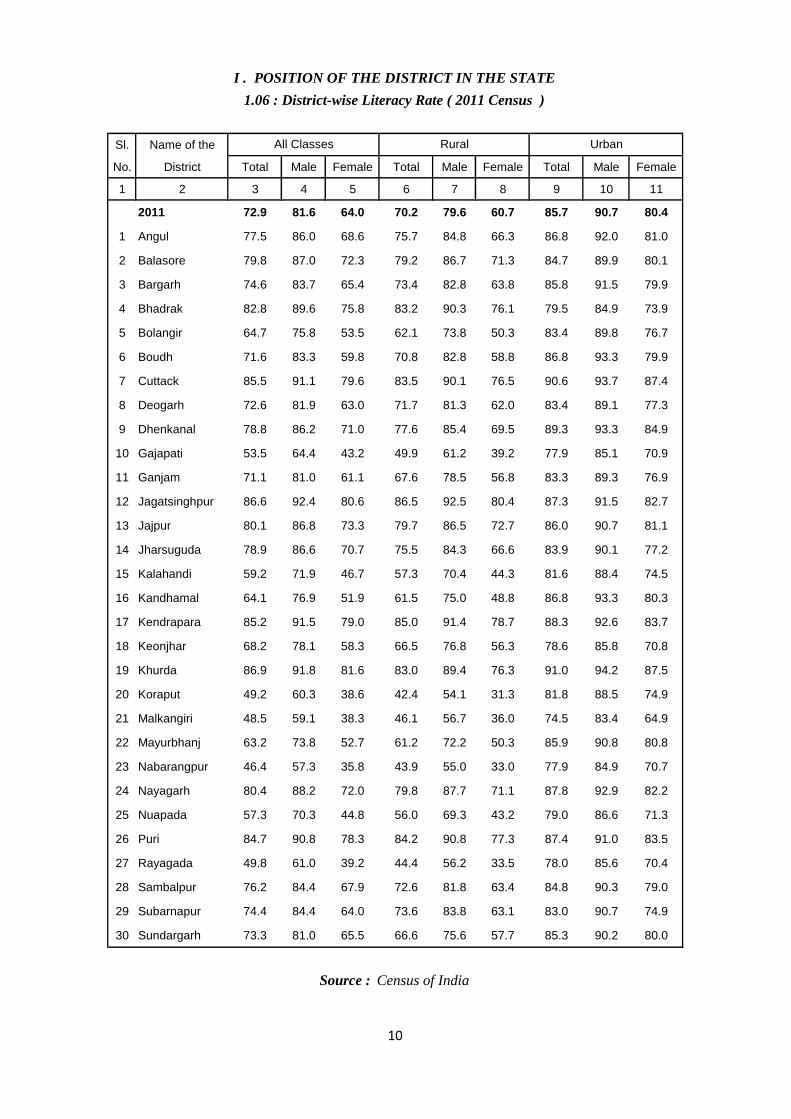
2011 72.9 81.6 64.0 70.2 79.6 60.7 85.7 90.7 80.4
1 Angul 77.5 86.0 68.6 75.7 84.8 66.3 86.8 92.0 81.0
2 Balasore 79.8 87.0 72.3 79.2 86.7 71.3 84.7 89.9 80.1
3 Bargarh 74.6 83.7 65.4 73.4 82.8 63.8 85.8 91.5 79.9
4 Bhadrak 82.8 89.6 75.8 83.2 90.3 76.1 79.5 84.9 73.9
5 Bolangir 64.7 75.8 53.5 62.1 73.8 50.3 83.4 89.8 76.7
6 Boudh 71.6 83.3 59.8 70.8 82.8 58.8 86.8 93.3 79.9
7 Cuttack 85.5 91.1 79.6 83.5 90.1 76.5 90.6 93.7 87.4
8 Deogarh 72.6 81.9 63.0 71.7 81.3 62.0 83.4 89.1 77.3
9 Dhenkanal 78.8 86.2 71.0 77.6 85.4 69.5 89.3 93.3 84.9
10 Gajapati 53.5 64.4 43.2 49.9 61.2 39.2 77.9 85.1 70.9
11 Ganjam 71.1 81.0 61.1 67.6 78.5 56.8 83.3 89.3 76.9
12 Jagatsinghpur 86.6 92.4 80.6 86.5 92.5 80.4 87.3 91.5 82.7
13 Jajpur 80.1 86.8 73.3 79.7 86.5 72.7 86.0 90.7 81.1
14 Jharsuguda 78.9 86.6 70.7 75.5 84.3 66.6 83.9 90.1 77.2
15 Kalahandi 59.2 71.9 46.7 57.3 70.4 44.3 81.6 88.4 74.5
16 Kandhamal 64.1 76.9 51.9 61.5 75.0 48.8 86.8 93.3 80.3
17 Kendrapara 85.2 91.5 79.0 85.0 91.4 78.7 88.3 92.6 83.7
18 Keonjhar 68.2 78.1 58.3 66.5 76.8 56.3 78.6 85.8 70.8
19 Khurda 86.9 91.8 81.6 83.0 89.4 76.3 91.0 94.2 87.5
20 Koraput 49.2 60.3 38.6 42.4 54.1 31.3 81.8 88.5 74.9
21 Malkangiri 48.5 59.1 38.3 46.1 56.7 36.0 74.5 83.4 64.9
22 Mayurbhanj 63.2 73.8 52.7 61.2 72.2 50.3 85.9 90.8 80.8
23 Nabarangpur 46.4 57.3 35.8 43.9 55.0 33.0 77.9 84.9 70.7
24 Nayagarh 80.4 88.2 72.0 79.8 87.7 71.1 87.8 92.9 82.2
25 Nuapada 57.3 70.3 44.8 56.0 69.3 43.2 79.0 86.6 71.3
26 Puri 84.7 90.8 78.3 84.2 90.8 77.3 87.4 91.0 83.5
27 Rayagada 49.8 61.0 39.2 44.4 56.2 33.5 78.0 85.6 70.4
28 Sambalpur 76.2 84.4 67.9 72.6 81.8 63.4 84.8 90.3 79.0
29 Subarnapur 74.4 84.4 64.0 73.6 83.8 63.1 83.0 90.7 74.9
30 Sundargarh 73.3 81.0 65.5 66.6 75.6 57.7 85.3 90.2 80.0
Source : Census of India
I . POSITION OF THE DISTRICT IN THE STATE
1.06 : District-wise Literacy Rate ( 2011 Census )
All Classes Rural Urban
10
Sl. Name of the
No. District Total Male Female Male Female Male Female
1 2 3 4 5 7 8 10 11
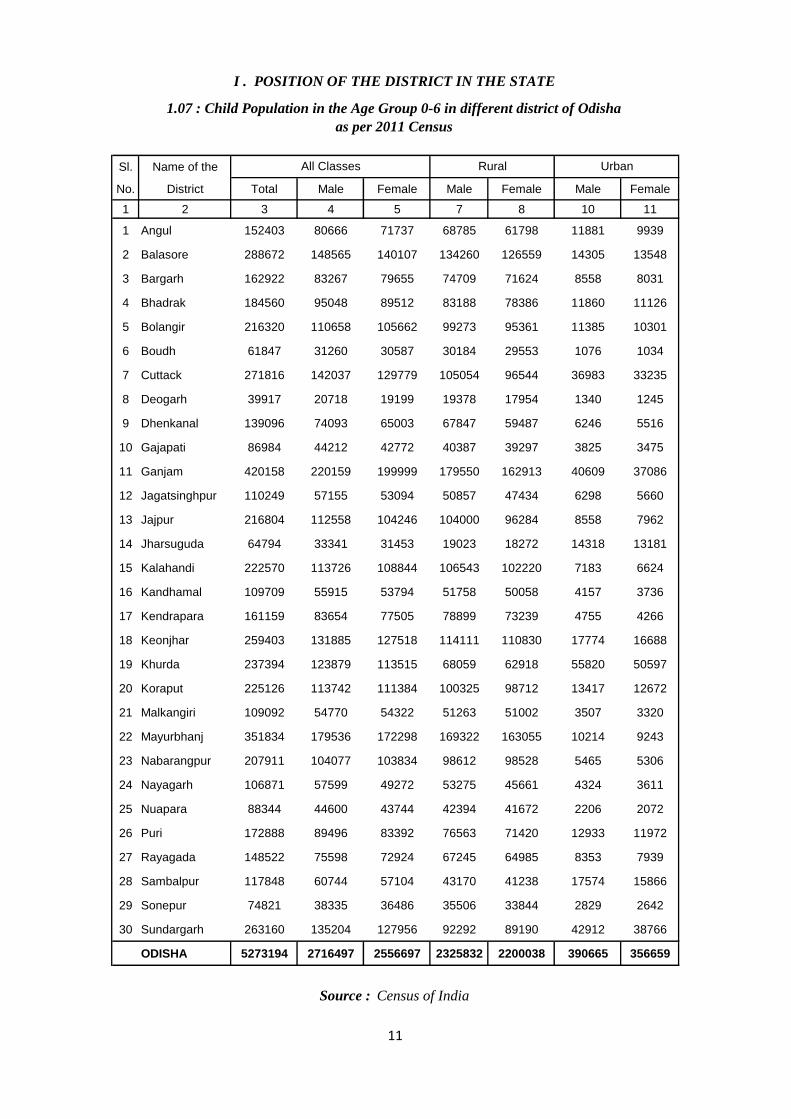
1 Angul 152403 80666 71737 68785 61798 11881 9939
2 Balasore 288672 148565 140107 134260 126559 14305 13548
3 Bargarh 162922 83267 79655 74709 71624 8558 8031
4 Bhadrak 184560 95048 89512 83188 78386 11860 11126
5 Bolangir 216320 110658 105662 99273 95361 11385 10301
6 Boudh 61847 31260 30587 30184 29553 1076 1034
7 Cuttack 271816 142037 129779 105054 96544 36983 33235
8 Deogarh 39917 20718 19199 19378 17954 1340 1245
9 Dhenkanal 139096 74093 65003 67847 59487 6246 5516
10 Gajapati 86984 44212 42772 40387 39297 3825 3475
11 Ganjam 420158 220159 199999 179550 162913 40609 37086
12 Jagatsinghpur 110249 57155 53094 50857 47434 6298 5660
13 Jajpur 216804 112558 104246 104000 96284 8558 7962
14 Jharsuguda 64794 33341 31453 19023 18272 14318 13181
15 Kalahandi 222570 113726 108844 106543 102220 7183 6624
16 Kandhamal 109709 55915 53794 51758 50058 4157 3736
17 Kendrapara 161159 83654 77505 78899 73239 4755 4266
18 Keonjhar 259403 131885 127518 114111 110830 17774 16688
19 Khurda 237394 123879 113515 68059 62918 55820 50597
20 Koraput 225126 113742 111384 100325 98712 13417 12672
21 Malkangiri 109092 54770 54322 51263 51002 3507 3320
22 Mayurbhanj 351834 179536 172298 169322 163055 10214 9243
23 Nabarangpur 207911 104077 103834 98612 98528 5465 5306
24 Nayagarh 106871 57599 49272 53275 45661 4324 3611
25 Nuapara 88344 44600 43744 42394 41672 2206 2072
26 Puri 172888 89496 83392 76563 71420 12933 11972
27 Rayagada 148522 75598 72924 67245 64985 8353 7939
28 Sambalpur 117848 60744 57104 43170 41238 17574 15866
29 Sonepur 74821 38335 36486 35506 33844 2829 2642
30 Sundargarh 263160 135204 127956 92292 89190 42912 38766
ODISHA 5273194 2716497 2556697 2325832 2200038 390665 356659
Source : Census of India
I . POSITION OF THE DISTRICT IN THE STATE
1.07 : Child Population in the Age Group 0-6 in different district of Odisha
as per 2011 Census
All Classes Rural Urban
11
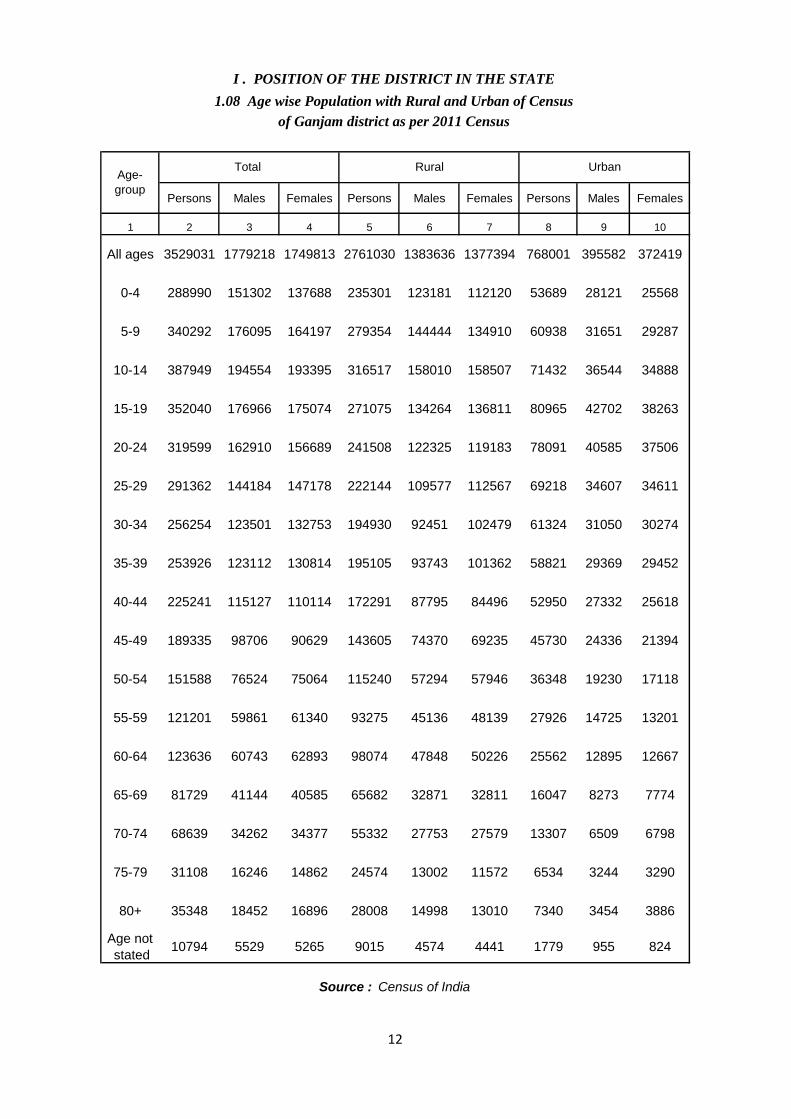
Persons Males Females Persons Males Females Persons Males Females
1 2 3 4 5 6 7 8 9 10
All ages 3529031 1779218 1749813 2761030 1383636 1377394 768001 395582 372419
0-4 288990 151302 137688 235301 123181 112120 53689 28121 25568
5-9 340292 176095 164197 279354 144444 134910 60938 31651 29287
10-14 387949 194554 193395 316517 158010 158507 71432 36544 34888
15-19 352040 176966 175074 271075 134264 136811 80965 42702 38263
20-24 319599 162910 156689 241508 122325 119183 78091 40585 37506
25-29 291362 144184 147178 222144 109577 112567 69218 34607 34611
30-34 256254 123501 132753 194930 92451 102479 61324 31050 30274
35-39 253926 123112 130814 195105 93743 101362 58821 29369 29452
40-44 225241 115127 110114 172291 87795 84496 52950 27332 25618
45-49 189335 98706 90629 143605 74370 69235 45730 24336 21394
50-54 151588 76524 75064 115240 57294 57946 36348 19230 17118
55-59 121201 59861 61340 93275 45136 48139 27926 14725 13201
60-64 123636 60743 62893 98074 47848 50226 25562 12895 12667
65-69 81729 41144 40585 65682 32871 32811 16047 8273 7774
70-74 68639 34262 34377 55332 27753 27579 13307 6509 6798
75-79 31108 16246 14862 24574 13002 11572 6534 3244 3290
80+ 35348 18452 16896 28008 14998 13010 7340 3454 3886
Age not
stated10794 5529 5265 9015 4574 4441 1779 955 824
Source : Census of India
I . POSITION OF THE DISTRICT IN THE STATE
1.08 Age wise Population with Rural and Urban of Census
Age-
group
Total Rural Urban
of Ganjam district as per 2011 Census
12

Census
Year
Persons Males Females
Absolute Percentage
1 2 3 4 5 6
1901 9,57,123 - - 4,51,592 5,05,531
1911 10,64,172 +1,07,049 +11.18 4,92,889 5,71,283
1921 10,29,623 -34,549 -3.25 4,63,149 5,66,474
1931 11,65,908 +1,36,285 +13.24 5,32,234 6,33,674
1941 13,08,056 +1,42,148 +12.19 6,03,031 7,05,025
1951 13,61,831 +53,775 +4.11 6,40,184 7,21,647
1961 15,87,461 +2,25,630 +16.57 7,58,688 8,28,773
1971 19,44,844 +3,57,383 +22.51 9,50,879 9,93,965
1981 22,67,628 +3,22,784 +16.60 11,15,643 11,51,985
1991 27,04,056 +4,36,428 +19.25 13,48,042 13,56,014
2001 31,60,635 +4,56,579 +16.88 15,81,986 15,78,649
2011 35,29,031 +3,68,396 +11.66 17,79,218 17,49,813
I . POSITION OF THE DISTRICT IN THE STATE
1.09 Decadal Variation in Population since 1901 of
Ganjam district as per 2011 Census
Variation since the preceding
census
Source : Census of India
13
Sl.
No.
Name of the
District
In
Seeing
In
Hearing
In
Speech
In
Movement
Mental
Retardation
Mental
Illness
Any
Other
Multiple
Disability
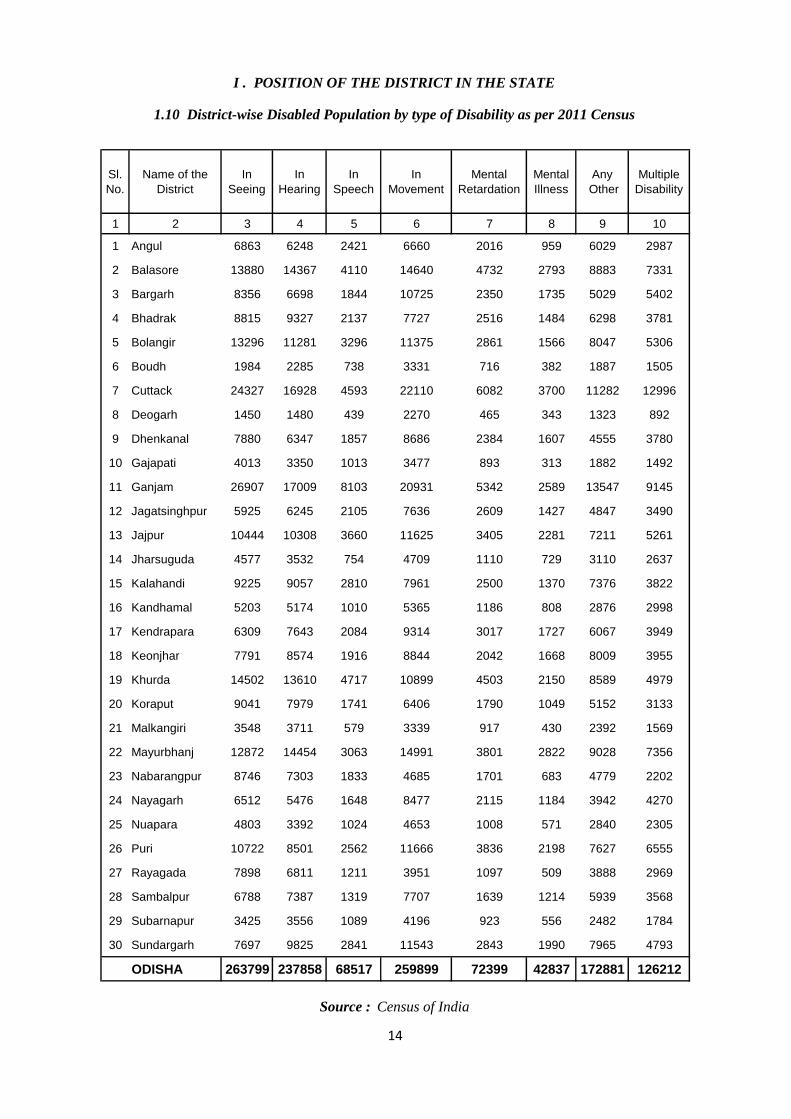
1 2 3 4 5 6 7 8 9 10
1 Angul 6863 6248 2421 6660 2016 959 6029 2987
2 Balasore 13880 14367 4110 14640 4732 2793 8883 7331
3 Bargarh 8356 6698 1844 10725 2350 1735 5029 5402
4 Bhadrak 8815 9327 2137 7727 2516 1484 6298 3781
5 Bolangir 13296 11281 3296 11375 2861 1566 8047 5306
6 Boudh 1984 2285 738 3331 716 382 1887 1505
7 Cuttack 24327 16928 4593 22110 6082 3700 11282 12996
8 Deogarh 1450 1480 439 2270 465 343 1323 892
9 Dhenkanal 7880 6347 1857 8686 2384 1607 4555 3780
10 Gajapati 4013 3350 1013 3477 893 313 1882 1492
11 Ganjam 26907 17009 8103 20931 5342 2589 13547 9145
12 Jagatsinghpur 5925 6245 2105 7636 2609 1427 4847 3490
13 Jajpur 10444 10308 3660 11625 3405 2281 7211 5261
14 Jharsuguda 4577 3532 754 4709 1110 729 3110 2637
15 Kalahandi 9225 9057 2810 7961 2500 1370 7376 3822
16 Kandhamal 5203 5174 1010 5365 1186 808 2876 2998
17 Kendrapara 6309 7643 2084 9314 3017 1727 6067 3949
18 Keonjhar 7791 8574 1916 8844 2042 1668 8009 3955
19 Khurda 14502 13610 4717 10899 4503 2150 8589 4979
20 Koraput 9041 7979 1741 6406 1790 1049 5152 3133
21 Malkangiri 3548 3711 579 3339 917 430 2392 1569
22 Mayurbhanj 12872 14454 3063 14991 3801 2822 9028 7356
23 Nabarangpur 8746 7303 1833 4685 1701 683 4779 2202
24 Nayagarh 6512 5476 1648 8477 2115 1184 3942 4270
25 Nuapara 4803 3392 1024 4653 1008 571 2840 2305
26 Puri 10722 8501 2562 11666 3836 2198 7627 6555
27 Rayagada 7898 6811 1211 3951 1097 509 3888 2969
28 Sambalpur 6788 7387 1319 7707 1639 1214 5939 3568
29 Subarnapur 3425 3556 1089 4196 923 556 2482 1784
30 Sundargarh 7697 9825 2841 11543 2843 1990 7965 4793
ODISHA 263799 237858 68517 259899 72399 42837 172881 126212
I . POSITION OF THE DISTRICT IN THE STATE
1.10 District-wise Disabled Population by type of Disability as per 2011 Census
Source : Census of India
14
InhabitedUn-
inhabitedTotal
1 2 3 4 5 6 7
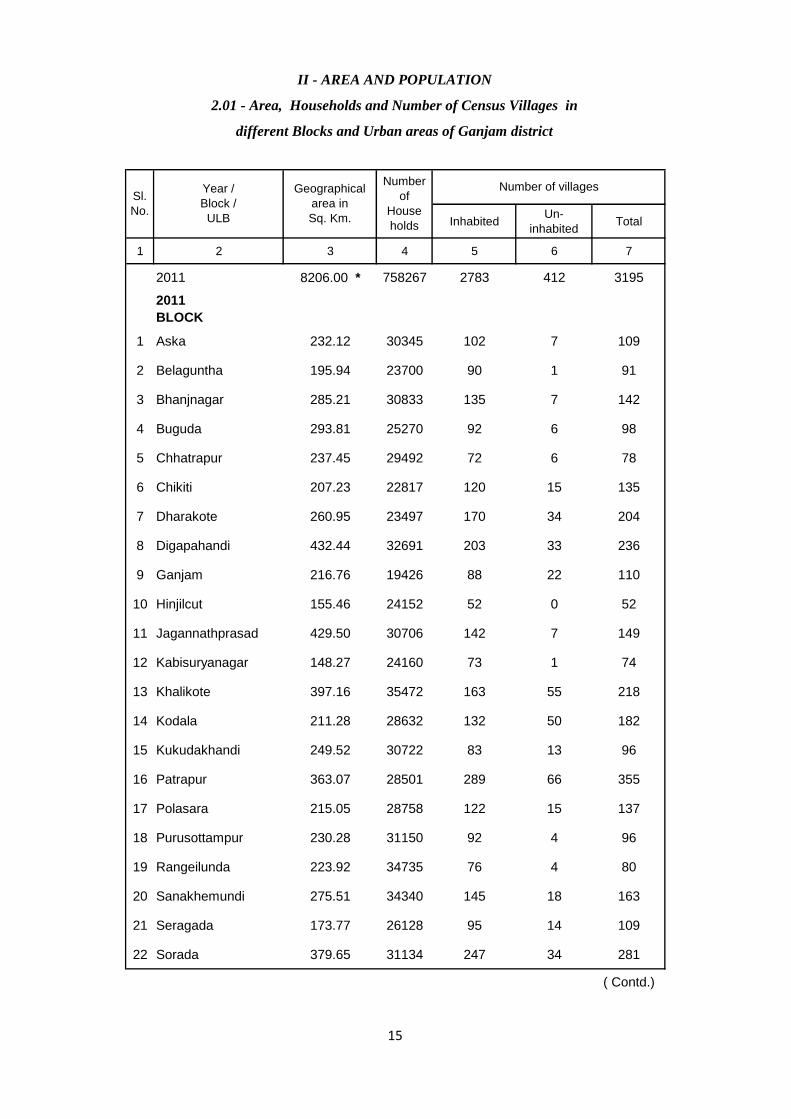
2011 8206.00 * 758267 2783 412 3195
2011
BLOCK
1 Aska 232.12 30345 102 7 109
2 Belaguntha 195.94 23700 90 1 91
3 Bhanjnagar 285.21 30833 135 7 142
4 Buguda 293.81 25270 92 6 98
5 Chhatrapur 237.45 29492 72 6 78
6 Chikiti 207.23 22817 120 15 135
7 Dharakote 260.95 23497 170 34 204
8 Digapahandi 432.44 32691 203 33 236
9 Ganjam 216.76 19426 88 22 110
10 Hinjilcut 155.46 24152 52 0 52
11 Jagannathprasad 429.50 30706 142 7 149
12 Kabisuryanagar 148.27 24160 73 1 74
13 Khalikote 397.16 35472 163 55 218
14 Kodala 211.28 28632 132 50 182
15 Kukudakhandi 249.52 30722 83 13 96
16 Patrapur 363.07 28501 289 66 355
17 Polasara 215.05 28758 122 15 137
18 Purusottampur 230.28 31150 92 4 96
19 Rangeilunda 223.92 34735 76 4 80
20 Sanakhemundi 275.51 34340 145 18 163
21 Seragada 173.77 26128 95 14 109
22 Sorada 379.65 31134 247 34 281
( Contd.)
II - AREA AND POPULATION
2.01 - Area, Households and Number of Census Villages in
different Blocks and Urban areas of Ganjam district
Sl.
No.
Year /
Block /
ULB
Geographical
area in
Sq. Km.
Number
of
House
holds
Number of villages
15

InhabitedUn-
inhabitedTotal
1 2 3 4 5 6 7
URBAN
1 Aska (N) 5.31 4581 - - -
2 Belaguntha (N) 5.18 2317 - - -
3 Berhampur (M.Corp) 79.80 74720 - - -
4 Bhanjanagar (N) 6.06 4546 - - -
5 Buguda (N) 7.45 3179 - - -
6 Chhatrapur (N) 4.40 4841 - - -
7 Chikiti (N) 6.48 2465 - - -
8 Digapahandi (N) 10.22 2955 - - -
9 Ganjam (N) 9.12 2523 - - -
10 Gopalpur (N) 2.56 1480 - - -
11 Hinjili (N) 11.81 5189 - - -
12 Kabisuryanagar (N) 18.13 3562 - - -
13 Khalikote (N) 28.49 2769 - - -
14 Kodala (N) 12.09 2802 - - -
15 Polasara (N) 11.81 4806 - - -
16 Purusottampur (N) 34.89 3224 - - -
17 Rambha (N) 7.77 2495 - - -
18 Sorada (N) 4.92 3152 - - -
* : District total is not additive
Source : Census of India
II - AREA AND POPULATION
2.01 - Area, Number of Households and Census Villages in
different Blocks and Urban areas of Ganjam district ( Concld..)
Sl.
No.
Year /
Block /
ULB
Geographical
area in
Sq. Km.
Number
of
House
holds
Number of villages
16
Males Females Total Males Females Total
1 2 3 4 5 6 7 8
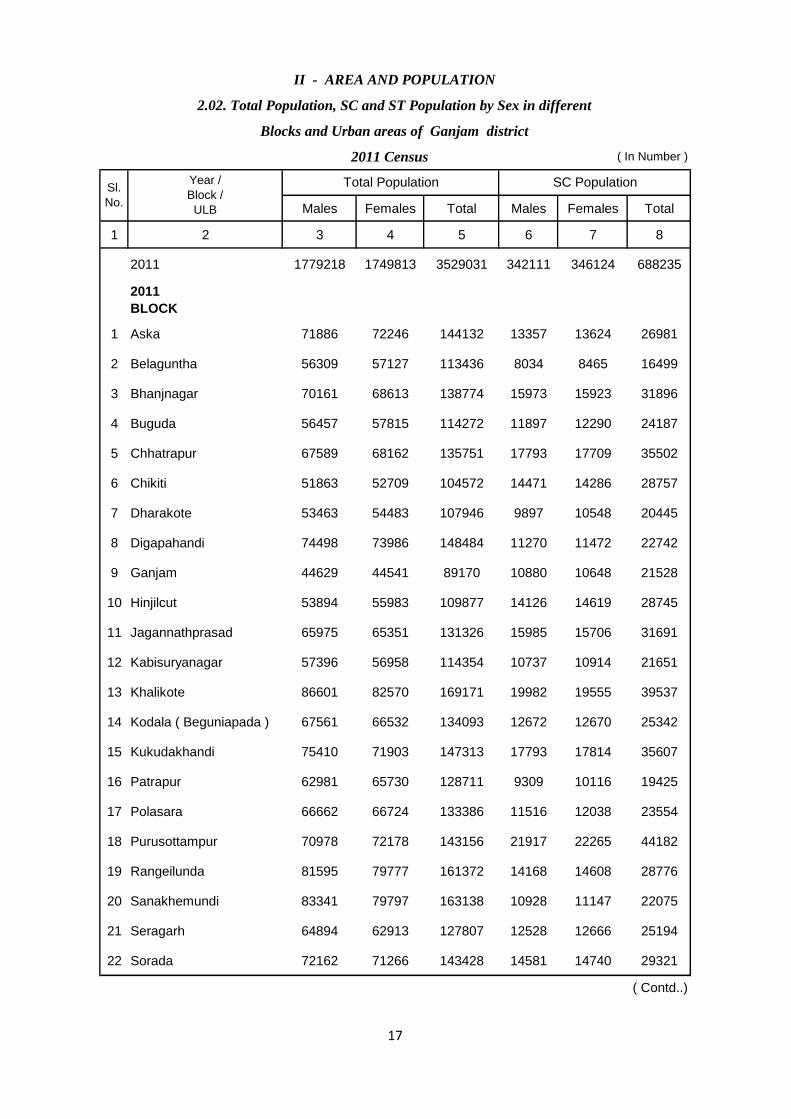
2011 1779218 1749813 3529031 342111 346124 688235
2011
BLOCK
1 Aska 71886 72246 144132 13357 13624 26981
2 Belaguntha 56309 57127 113436 8034 8465 16499
3 Bhanjnagar 70161 68613 138774 15973 15923 31896
4 Buguda 56457 57815 114272 11897 12290 24187
5 Chhatrapur 67589 68162 135751 17793 17709 35502
6 Chikiti 51863 52709 104572 14471 14286 28757
7 Dharakote 53463 54483 107946 9897 10548 20445
8 Digapahandi 74498 73986 148484 11270 11472 22742
9 Ganjam 44629 44541 89170 10880 10648 21528
10 Hinjilcut 53894 55983 109877 14126 14619 28745
11 Jagannathprasad 65975 65351 131326 15985 15706 31691
12 Kabisuryanagar 57396 56958 114354 10737 10914 21651
13 Khalikote 86601 82570 169171 19982 19555 39537
14 Kodala ( Beguniapada ) 67561 66532 134093 12672 12670 25342
15 Kukudakhandi 75410 71903 147313 17793 17814 35607
16 Patrapur 62981 65730 128711 9309 10116 19425
17 Polasara 66662 66724 133386 11516 12038 23554
18 Purusottampur 70978 72178 143156 21917 22265 44182
19 Rangeilunda 81595 79777 161372 14168 14608 28776
20 Sanakhemundi 83341 79797 163138 10928 11147 22075
21 Seragarh 64894 62913 127807 12528 12666 25194
22 Sorada 72162 71266 143428 14581 14740 29321
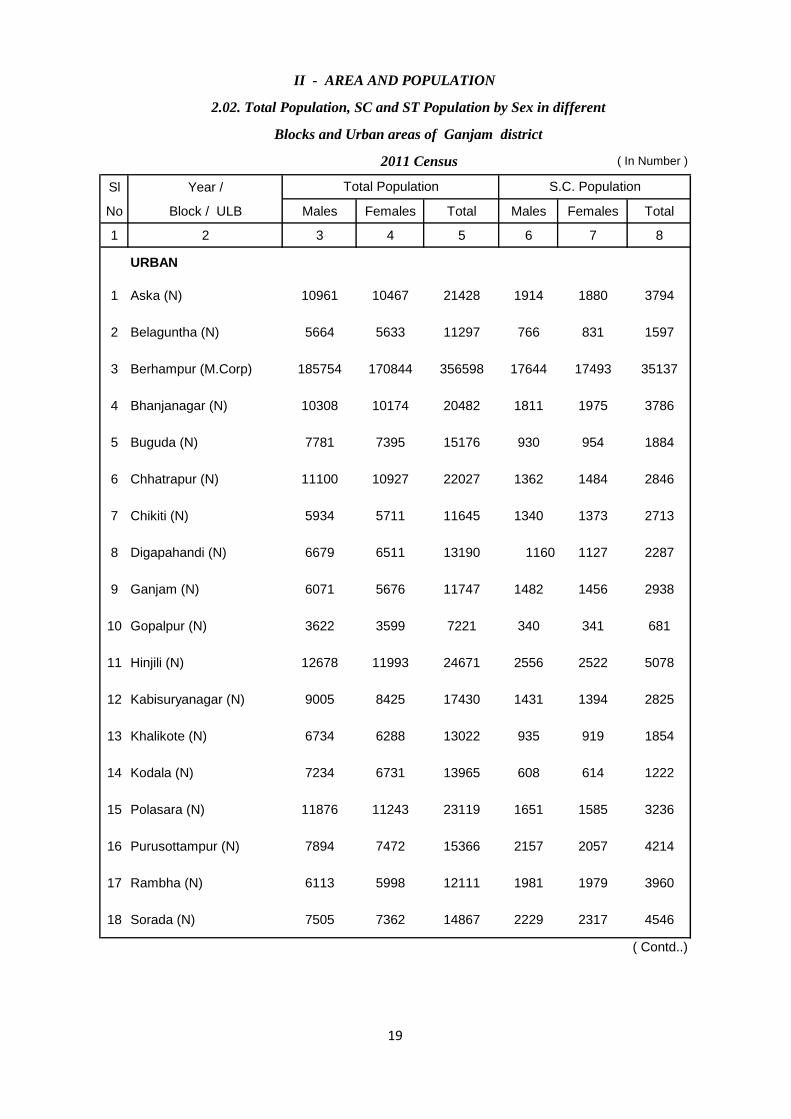
II - AREA AND POPULATION
2.02. Total Population, SC and ST Population by Sex in different
Blocks and Urban areas of Ganjam district
2011 Census ( In Number )
Sl.
No.
Year /
Block /
ULB
Total Population SC Population
( Contd..)
17

( In Number )
Males Females Total
1 2 9 10 11
2011 59172 59756 118928
2011
BLOCK
1 Aska 456 496 952
2 Belaguntha 338 325 663
3 Bhanjnagar 6164 6164 12328
4 Buguda 1033 1062 2095
5 Chhatrapur 264 254 518
6 Chikiti 1568 1678 3246
7 Dharakote 4335 4510 8845
8 Digapahandi 4858 4994 9852
9 Ganjam 269 183 452
10 Hinjilcut 43 48 91
11 Jagannathprasad 3585 3563 7148
12 Kabisuryanagar 178 188 366
13 Khalikote 2883 3207 6090
14 Kodala ( Beguniapada ) 2487 2394 4881
15 Kukudakhandi 3486 3559 7045
16 Patrapur 8938 8992 17930
17 Polasara 1869 1957 3826
18 Purusottampur 123 129 252
19 Rangeilunda 460 267 727
20 Sanakhemundi 3729 3906 7635
21 Seragarh 582 613 1195
22 Sorada 8515 8596 17111
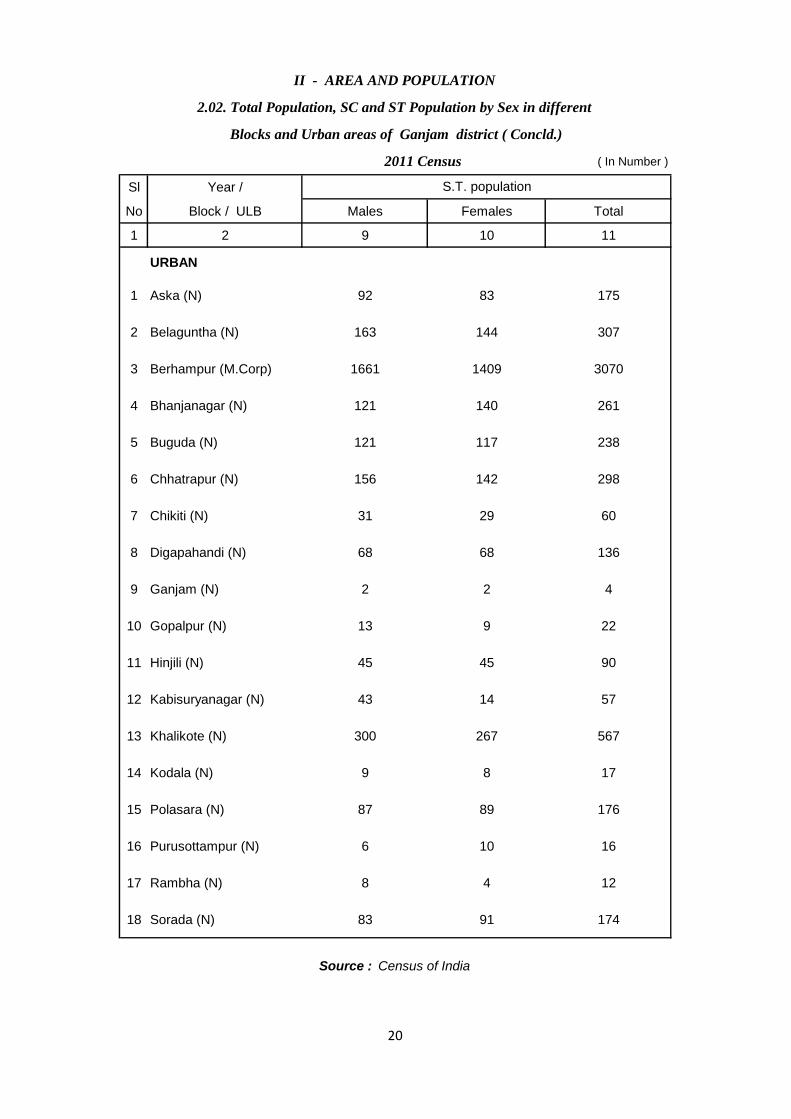
II - AREA AND POPULATION
2.02. Total Population, SC and ST Population by Sex in different
Blocks and Urban areas of Ganjam district
2011 Census
Sl.
No.
Year /
Block /
ULB
ST Population
( Contd..)
18
Sl Year /
No Block / ULB Males Females Total Males Females Total
1 2 3 4 5 6 7 8
URBAN
1 Aska (N) 10961 10467 21428 1914 1880 3794
2 Belaguntha (N) 5664 5633 11297 766 831 1597
3 Berhampur (M.Corp) 185754 170844 356598 17644 17493 35137
4 Bhanjanagar (N) 10308 10174 20482 1811 1975 3786
5 Buguda (N) 7781 7395 15176 930 954 1884
6 Chhatrapur (N) 11100 10927 22027 1362 1484 2846
7 Chikiti (N) 5934 5711 11645 1340 1373 2713
8 Digapahandi (N) 6679 6511 13190 1160 1127 2287
9 Ganjam (N) 6071 5676 11747 1482 1456 2938
10 Gopalpur (N) 3622 3599 7221 340 341 681
11 Hinjili (N) 12678 11993 24671 2556 2522 5078
12 Kabisuryanagar (N) 9005 8425 17430 1431 1394 2825
13 Khalikote (N) 6734 6288 13022 935 919 1854
14 Kodala (N) 7234 6731 13965 608 614 1222
15 Polasara (N) 11876 11243 23119 1651 1585 3236
16 Purusottampur (N) 7894 7472 15366 2157 2057 4214
17 Rambha (N) 6113 5998 12111 1981 1979 3960
18 Sorada (N) 7505 7362 14867 2229 2317 4546
II - AREA AND POPULATION
2.02. Total Population, SC and ST Population by Sex in different
( Contd..)
Blocks and Urban areas of Ganjam district
2011 Census ( In Number )
Total Population S.C. Population
19
( In Number )
Sl Year /
No Block / ULB Males Females Total
1 2 9 10 11
URBAN
1 Aska (N) 92 83 175
2 Belaguntha (N) 163 144 307
3 Berhampur (M.Corp) 1661 1409 3070
4 Bhanjanagar (N) 121 140 261
5 Buguda (N) 121 117 238
6 Chhatrapur (N) 156 142 298
7 Chikiti (N) 31 29 60
8 Digapahandi (N) 68 68 136
9 Ganjam (N) 2 2 4
10 Gopalpur (N) 13 9 22
11 Hinjili (N) 45 45 90
12 Kabisuryanagar (N) 43 14 57
13 Khalikote (N) 300 267 567
14 Kodala (N) 9 8 17
15 Polasara (N) 87 89 176
16 Purusottampur (N) 6 10 16
17 Rambha (N) 8 4 12
18 Sorada (N) 83 91 174
II - AREA AND POPULATION
2.02. Total Population, SC and ST Population by Sex in different
Source : Census of India
Blocks and Urban areas of Ganjam district ( Concld.)
2011 Census
S.T. population
20
Males Females Total Males Females Total
1 2 3 4 5 6 7 8
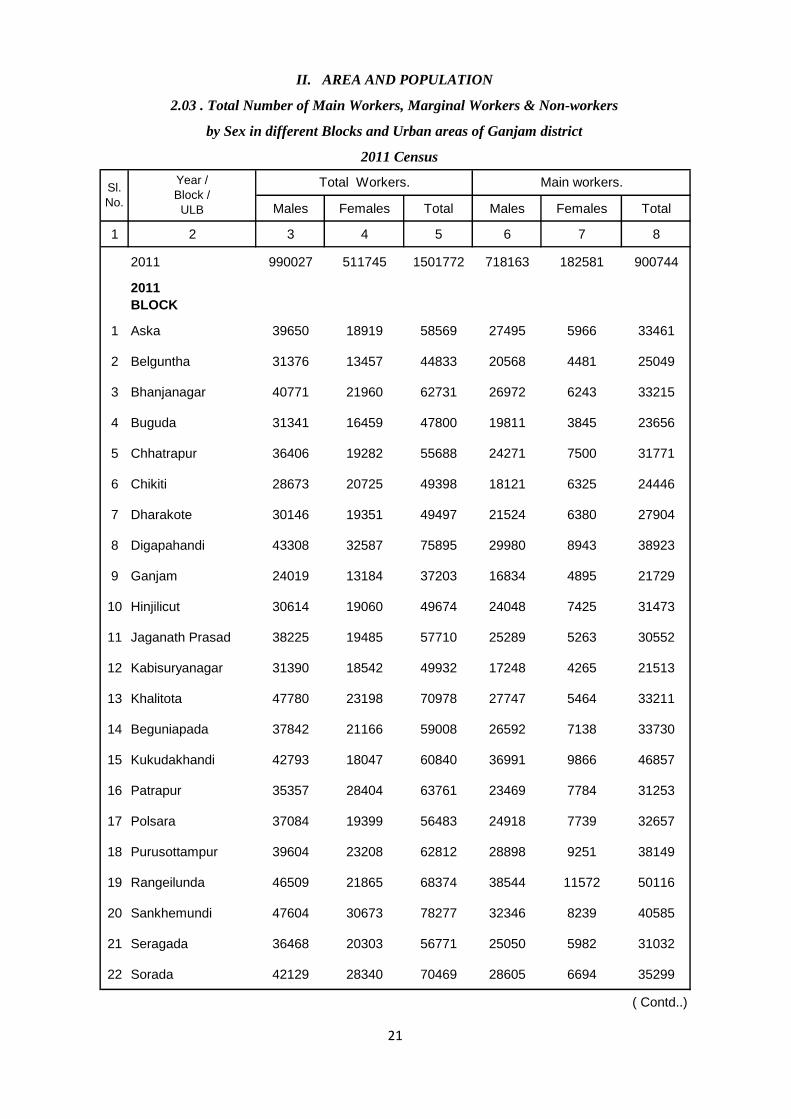
2011 990027 511745 1501772 718163 182581 900744
2011
BLOCK
1 Aska 39650 18919 58569 27495 5966 33461
2 Belguntha 31376 13457 44833 20568 4481 25049
3 Bhanjanagar 40771 21960 62731 26972 6243 33215
4 Buguda 31341 16459 47800 19811 3845 23656
5 Chhatrapur 36406 19282 55688 24271 7500 31771
6 Chikiti 28673 20725 49398 18121 6325 24446
7 Dharakote 30146 19351 49497 21524 6380 27904
8 Digapahandi 43308 32587 75895 29980 8943 38923
9 Ganjam 24019 13184 37203 16834 4895 21729
10 Hinjilicut 30614 19060 49674 24048 7425 31473
11 Jaganath Prasad 38225 19485 57710 25289 5263 30552
12 Kabisuryanagar 31390 18542 49932 17248 4265 21513
13 Khalitota 47780 23198 70978 27747 5464 33211
14 Beguniapada 37842 21166 59008 26592 7138 33730
15 Kukudakhandi 42793 18047 60840 36991 9866 46857
16 Patrapur 35357 28404 63761 23469 7784 31253
17 Polsara 37084 19399 56483 24918 7739 32657
18 Purusottampur 39604 23208 62812 28898 9251 38149
19 Rangeilunda 46509 21865 68374 38544 11572 50116
20 Sankhemundi 47604 30673 78277 32346 8239 40585
21 Seragada 36468 20303 56771 25050 5982 31032
22 Sorada 42129 28340 70469 28605 6694 35299
( Contd..)
II. AREA AND POPULATION
2.03 . Total Number of Main Workers, Marginal Workers & Non-workers
by Sex in different Blocks and Urban areas of Ganjam district
2011 Census
Sl.
No.
Year /
Block /
ULB
Total Workers. Main workers.
21

Males Females Total Males Females Total
1 2 9 10 11 12 13 14
2011 271864 329164 601028 789191 1238068 2027259
2011
BLOCK
1 Aska 12155 12953 25108 32236 53327 85563
2 Belguntha 10808 8976 19784 24933 43670 68603
3 Bhanjanagar 13799 15717 29516 29390 46653 76043
4 Buguda 11530 12614 24144 25116 41356 66472
5 Chhatrapur 12135 11782 23917 31183 48880 80063
6 Chikiti 10552 14400 24952 23190 31984 55174
7 Dharakote 8622 12971 21593 23317 35132 58449
8 Digapahandi 13328 23644 36972 31190 41399 72589
9 Ganjam 7185 8289 15474 20610 31357 51967
10 Hinjilicut 6566 11635 18201 23280 36923 60203
11 Jaganath Prasad 12936 14222 27158 27750 45866 73616
12 Kabisuryanagar 14142 14277 28419 26006 38416 64422
13 Khalitota 20033 17734 37767 38821 59372 98193
14 Beguniapada 11250 14028 25278 29719 45366 75085
15 Kukudakhandi 5802 8181 13983 32617 53856 86473
16 Patrapur 11888 20620 32508 27624 37326 64950
17 Polsara 12166 11660 23826 29578 47325 76903
18 Purusottampur 10706 13957 24663 31374 48970 80344
19 Rangeilunda 7965 10293 18258 35086 57912 92998
20 Sankhemundi 15258 22434 37692 35737 49124 84861
21 Seragada 11418 14321 25739 28426 42610 71036
22 Sorada 13524 21646 35170 30033 42926 72959
( Contd..)
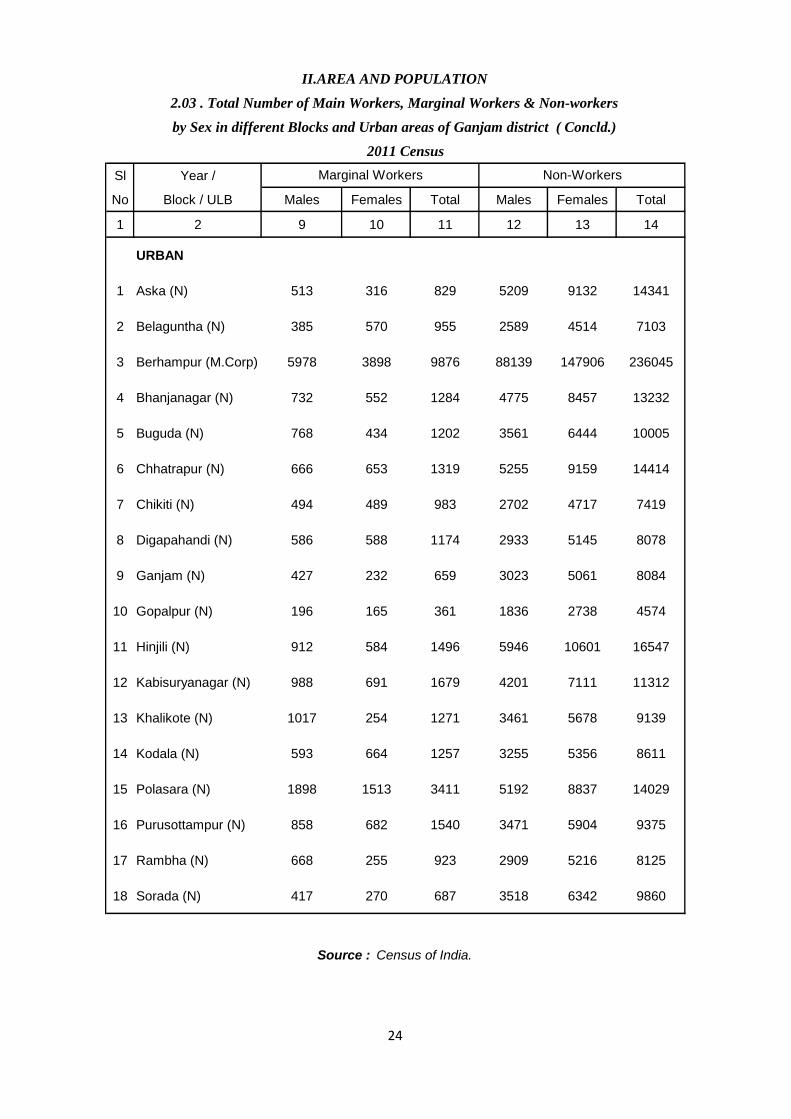
II.AREA AND POPULATION
2.03 . Total Number of Main Workers, Marginal Workers & Non-workers
by Sex in different Blocks and Urban areas of Ganjam district ( Contd..)
2011 Census
Sl.
No.
Year /
Block /
ULB
Marginal Workers Non- workers
22

Sl Year /
No Block / ULB Males Females Total Males Females Total
1 2 3 4 5 6 7 8
URBAN
1 Aska (N) 5752 1335 7087 5239 1019 6258
2 Belaguntha (N) 3075 1119 4194 2690 549 3239
3 Berhampur (M.Corp) 97615 22938 120553 91637 19040 110677
4 Bhanjanagar (N) 5533 1717 7250 4801 1165 5966
5 Buguda (N) 4220 951 5171 3452 517 3969
6 Chhatrapur (N) 5845 1768 7613 5179 1115 6294
7 Chikiti (N) 3232 994 4226 2738 505 3243
8 Digapahandi (N) 3746 1366 5112 3160 778 3938
9 Ganjam (N) 3048 615 3663 2621 383 3004
10 Gopalpur (N) 1786 861 2647 1590 696 2286
11 Hinjili (N) 6732 1392 8124 5820 808 6628
12 Kabisuryanagar (N) 4804 1314 6118 3816 623 4439
13 Khalikote (N) 3273 610 3883 2256 356 2612
14 Kodala (N) 3979 1375 5354 3386 711 4097
15 Polasara (N) 6684 2406 9090 4786 893 5679
16 Purusottampur (N) 4423 1568 5991 3565 886 4451
17 Rambha (N) 3204 782 3986 2536 527 3063
18 Sorada (N) 3987 1020 5007 3570 750 4320
( Contd..)
II. AREA AND POPULATION
2.03 . Total Number of Main Workers, Marginal Workers & Non-workers
by Sex in different Blocks and Urban areas of Ganjam district ( Contd..)
2011 Census
Total Workers. Main workers.
23
Sl Year /
No Block / ULB Males Females Total Males Females Total
1 2 9 10 11 12 13 14
URBAN
1 Aska (N) 513 316 829 5209 9132 14341
2 Belaguntha (N) 385 570 955 2589 4514 7103
3 Berhampur (M.Corp) 5978 3898 9876 88139 147906 236045
4 Bhanjanagar (N) 732 552 1284 4775 8457 13232
5 Buguda (N) 768 434 1202 3561 6444 10005
6 Chhatrapur (N) 666 653 1319 5255 9159 14414
7 Chikiti (N) 494 489 983 2702 4717 7419
8 Digapahandi (N) 586 588 1174 2933 5145 8078
9 Ganjam (N) 427 232 659 3023 5061 8084
10 Gopalpur (N) 196 165 361 1836 2738 4574
11 Hinjili (N) 912 584 1496 5946 10601 16547
12 Kabisuryanagar (N) 988 691 1679 4201 7111 11312
13 Khalikote (N) 1017 254 1271 3461 5678 9139
14 Kodala (N) 593 664 1257 3255 5356 8611
15 Polasara (N) 1898 1513 3411 5192 8837 14029
16 Purusottampur (N) 858 682 1540 3471 5904 9375
17 Rambha (N) 668 255 923 2909 5216 8125
18 Sorada (N) 417 270 687 3518 6342 9860
Source : Census of India.
II.AREA AND POPULATION
2.03 . Total Number of Main Workers, Marginal Workers & Non-workers
by Sex in different Blocks and Urban areas of Ganjam district ( Concld.)
2011 Census
Marginal Workers Non-Workers
24

CultivatorAgricultural
worker
Worker in
household
Industry
Other
Worker
1 2 3 4 5 6 7
2011 1501772 284943 565448 56274 595107
2011
BLOCK
1 Aska 58569 12454 20560 2987 22568
2 Belaguntha 44833 10289 16426 2184 15934
3 Bhanjnagar 62731 11186 26561 2671 22313
4 Buguda 47800 10498 19264 2023 16015
5 Chhatrapur 55688 8355 18572 1552 27209
6 Chikiti 49398 7576 19850 1575 20397
7 Dharakote 49497 13214 23286 1635 11362
8 Digapahandi 75895 18050 42219 2092 13534
9 Ganjam 37203 10508 12282 1051 13362
10 Hinjilcut 49674 11058 22526 1364 14726
11 Jagannathprasad 57710 14065 25912 2191 15542
12 Kabisuryanagar 49932 8764 25413 2045 13710
13 Khalikote 70978 15705 33585 2229 19459
14 Kodala 59008 14241 27236 1612 15919
15 Kukudakhandi 60840 7667 15838 2157 35178
16 Patrapur 63761 13679 33646 1769 14667
17 Polasara 56483 13657 24564 2273 15989
18 Purusottampur 62812 16232 28038 2368 16174
19 Rangeilunda 68374 8640 15156 1849 42729
20 Sanakhemundi 78277 18505 41707 2223 15842
21 Seragada 56771 14280 25898 3401 13192
22 Sorada 70469 19444 33630 2593 14802
( Contd.)
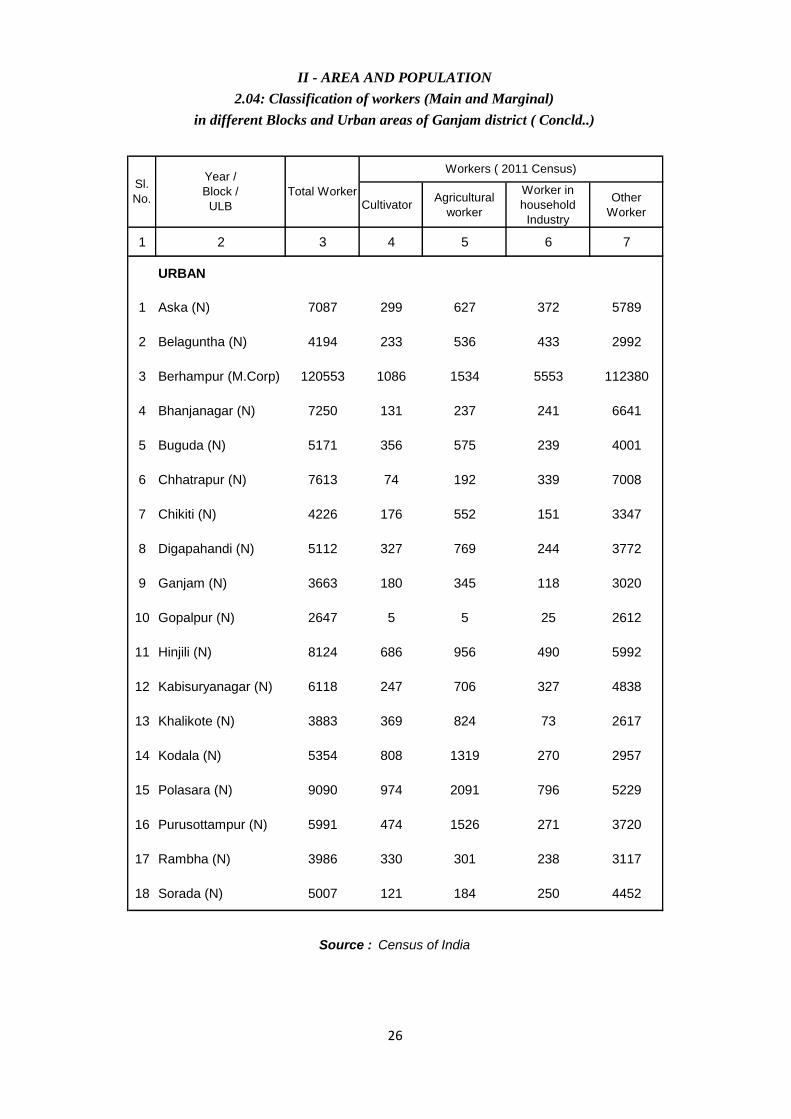
II - AREA AND POPULATION
2.04: Classification of workers ( Main and Marginal )
different Blocks and Urban areas of Ganjam district
Sl.
No.
Year /
Block /
ULB
Total
Worker
Workers ( 2011 Census)
25
CultivatorAgricultural
worker
Worker in
household
Industry
Other
Worker
1 2 3 4 5 6 7
URBAN
1 Aska (N) 7087 299 627 372 5789
2 Belaguntha (N) 4194 233 536 433 2992
3 Berhampur (M.Corp) 120553 1086 1534 5553 112380
4 Bhanjanagar (N) 7250 131 237 241 6641
5 Buguda (N) 5171 356 575 239 4001
6 Chhatrapur (N) 7613 74 192 339 7008
7 Chikiti (N) 4226 176 552 151 3347
8 Digapahandi (N) 5112 327 769 244 3772
9 Ganjam (N) 3663 180 345 118 3020
10 Gopalpur (N) 2647 5 5 25 2612
11 Hinjili (N) 8124 686 956 490 5992
12 Kabisuryanagar (N) 6118 247 706 327 4838
13 Khalikote (N) 3883 369 824 73 2617
14 Kodala (N) 5354 808 1319 270 2957
15 Polasara (N) 9090 974 2091 796 5229
16 Purusottampur (N) 5991 474 1526 271 3720
17 Rambha (N) 3986 330 301 238 3117
18 Sorada (N) 5007 121 184 250 4452
Source : Census of India
II - AREA AND POPULATION
2.04: Classification of workers (Main and Marginal)
in different Blocks and Urban areas of Ganjam district ( Concld..)
Sl.
No.
Year /
Block /
ULB
Total Worker
Workers ( 2011 Census)
26
2 3 4 5 6 7
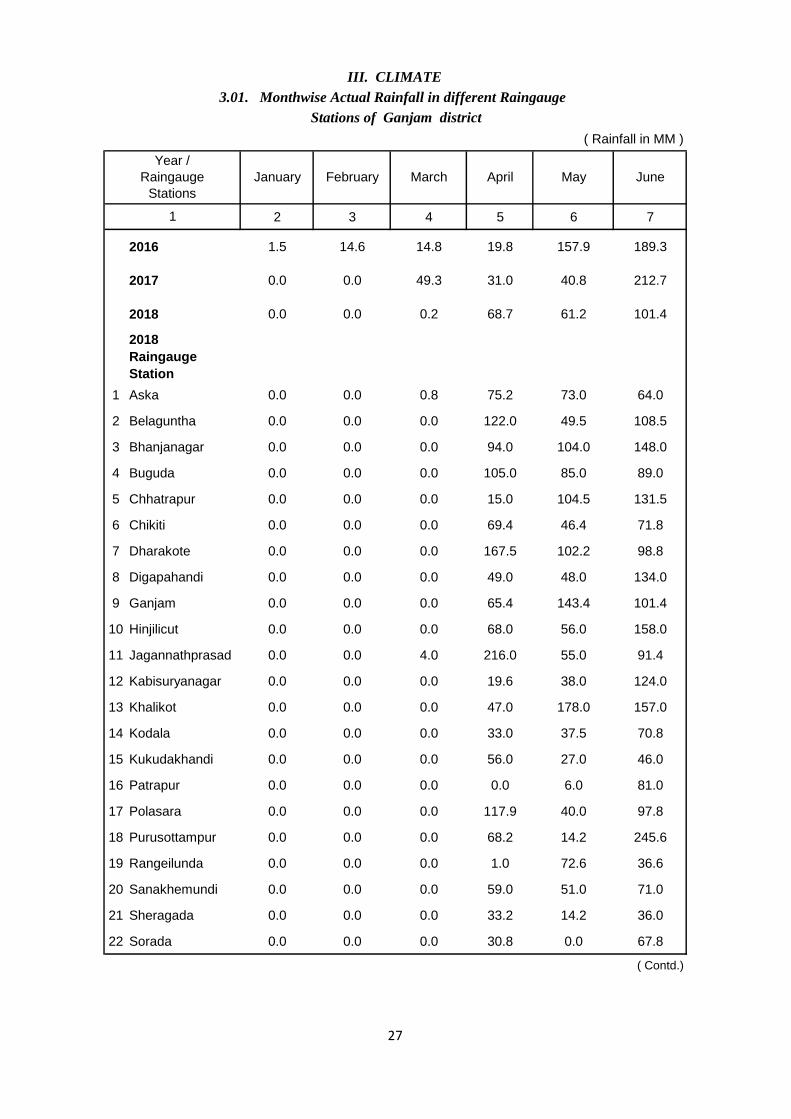
2016 1.5 14.6 14.8 19.8 157.9 189.3
2017 0.0 0.0 49.3 31.0 40.8 212.7
2018 0.0 0.0 0.2 68.7 61.2 101.4
2018
Raingauge
Station
1 Aska 0.0 0.0 0.8 75.2 73.0 64.0
2 Belaguntha 0.0 0.0 0.0 122.0 49.5 108.5
3 Bhanjanagar 0.0 0.0 0.0 94.0 104.0 148.0
4 Buguda 0.0 0.0 0.0 105.0 85.0 89.0
5 Chhatrapur 0.0 0.0 0.0 15.0 104.5 131.5
6 Chikiti 0.0 0.0 0.0 69.4 46.4 71.8
7 Dharakote 0.0 0.0 0.0 167.5 102.2 98.8
8 Digapahandi 0.0 0.0 0.0 49.0 48.0 134.0
9 Ganjam 0.0 0.0 0.0 65.4 143.4 101.4
10 Hinjilicut 0.0 0.0 0.0 68.0 56.0 158.0
11 Jagannathprasad 0.0 0.0 4.0 216.0 55.0 91.4
12 Kabisuryanagar 0.0 0.0 0.0 19.6 38.0 124.0
13 Khalikot 0.0 0.0 0.0 47.0 178.0 157.0
14 Kodala 0.0 0.0 0.0 33.0 37.5 70.8
15 Kukudakhandi 0.0 0.0 0.0 56.0 27.0 46.0
16 Patrapur 0.0 0.0 0.0 0.0 6.0 81.0
17 Polasara 0.0 0.0 0.0 117.9 40.0 97.8
18 Purusottampur 0.0 0.0 0.0 68.2 14.2 245.6
19 Rangeilunda 0.0 0.0 0.0 1.0 72.6 36.6
20 Sanakhemundi 0.0 0.0 0.0 59.0 51.0 71.0
21 Sheragada 0.0 0.0 0.0 33.2 14.2 36.0
22 Sorada 0.0 0.0 0.0 30.8 0.0 67.8
( Contd.)
III. CLIMATE
3.01. Monthwise Actual Rainfall in different Raingauge
Stations of Ganjam district
( Rainfall in MM )
Year /
Raingauge
Stations
January February March April May June
1
27
8 9 10 11 12 13 13
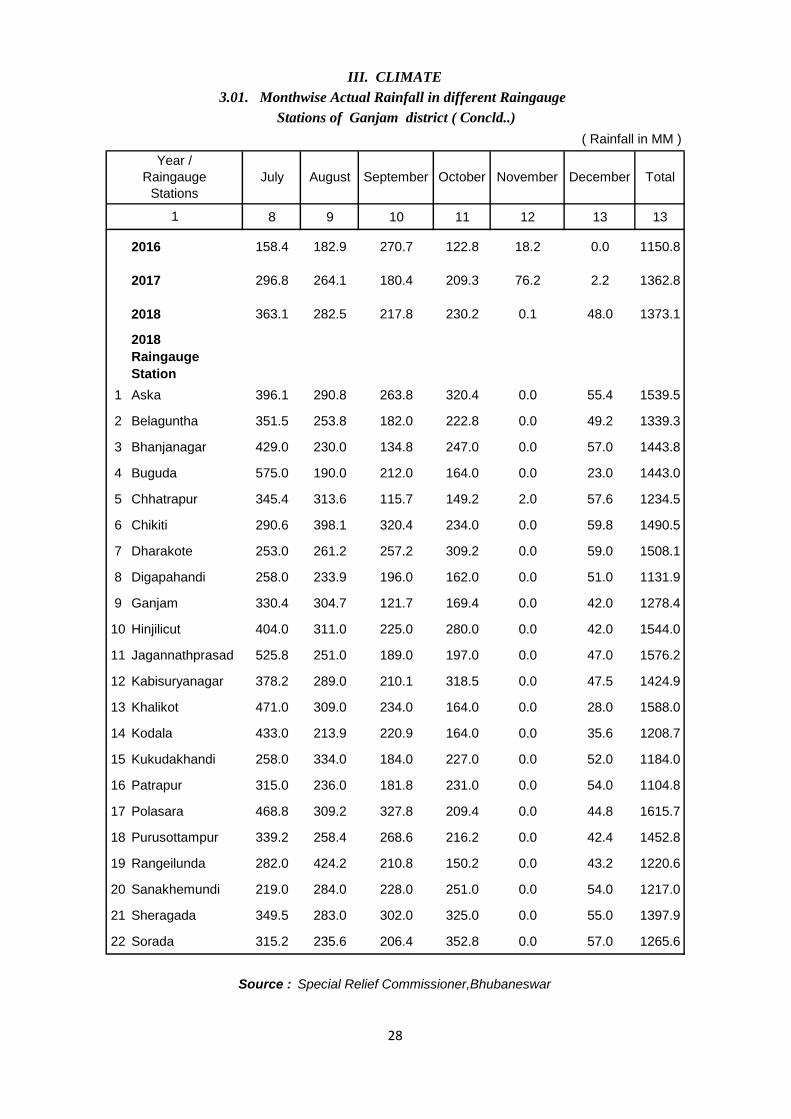
2016 158.4 182.9 270.7 122.8 18.2 0.0 1150.8
2017 296.8 264.1 180.4 209.3 76.2 2.2 1362.8
2018 363.1 282.5 217.8 230.2 0.1 48.0 1373.1
2018
Raingauge
Station
1 Aska 396.1 290.8 263.8 320.4 0.0 55.4 1539.5
2 Belaguntha 351.5 253.8 182.0 222.8 0.0 49.2 1339.3
3 Bhanjanagar 429.0 230.0 134.8 247.0 0.0 57.0 1443.8
4 Buguda 575.0 190.0 212.0 164.0 0.0 23.0 1443.0
5 Chhatrapur 345.4 313.6 115.7 149.2 2.0 57.6 1234.5
6 Chikiti 290.6 398.1 320.4 234.0 0.0 59.8 1490.5
7 Dharakote 253.0 261.2 257.2 309.2 0.0 59.0 1508.1
8 Digapahandi 258.0 233.9 196.0 162.0 0.0 51.0 1131.9
9 Ganjam 330.4 304.7 121.7 169.4 0.0 42.0 1278.4
10 Hinjilicut 404.0 311.0 225.0 280.0 0.0 42.0 1544.0
11 Jagannathprasad 525.8 251.0 189.0 197.0 0.0 47.0 1576.2
12 Kabisuryanagar 378.2 289.0 210.1 318.5 0.0 47.5 1424.9
13 Khalikot 471.0 309.0 234.0 164.0 0.0 28.0 1588.0
14 Kodala 433.0 213.9 220.9 164.0 0.0 35.6 1208.7
15 Kukudakhandi 258.0 334.0 184.0 227.0 0.0 52.0 1184.0
16 Patrapur 315.0 236.0 181.8 231.0 0.0 54.0 1104.8
17 Polasara 468.8 309.2 327.8 209.4 0.0 44.8 1615.7
18 Purusottampur 339.2 258.4 268.6 216.2 0.0 42.4 1452.8
19 Rangeilunda 282.0 424.2 210.8 150.2 0.0 43.2 1220.6
20 Sanakhemundi 219.0 284.0 228.0 251.0 0.0 54.0 1217.0
21 Sheragada 349.5 283.0 302.0 325.0 0.0 55.0 1397.9
22 Sorada 315.2 235.6 206.4 352.8 0.0 57.0 1265.6
III. CLIMATE
3.01. Monthwise Actual Rainfall in different Raingauge
Stations of Ganjam district ( Concld..)
( Rainfall in MM )
Year /
Raingauge
Stations
Total
1
Source : Special Relief Commissioner,Bhubaneswar
July August September October November December
28
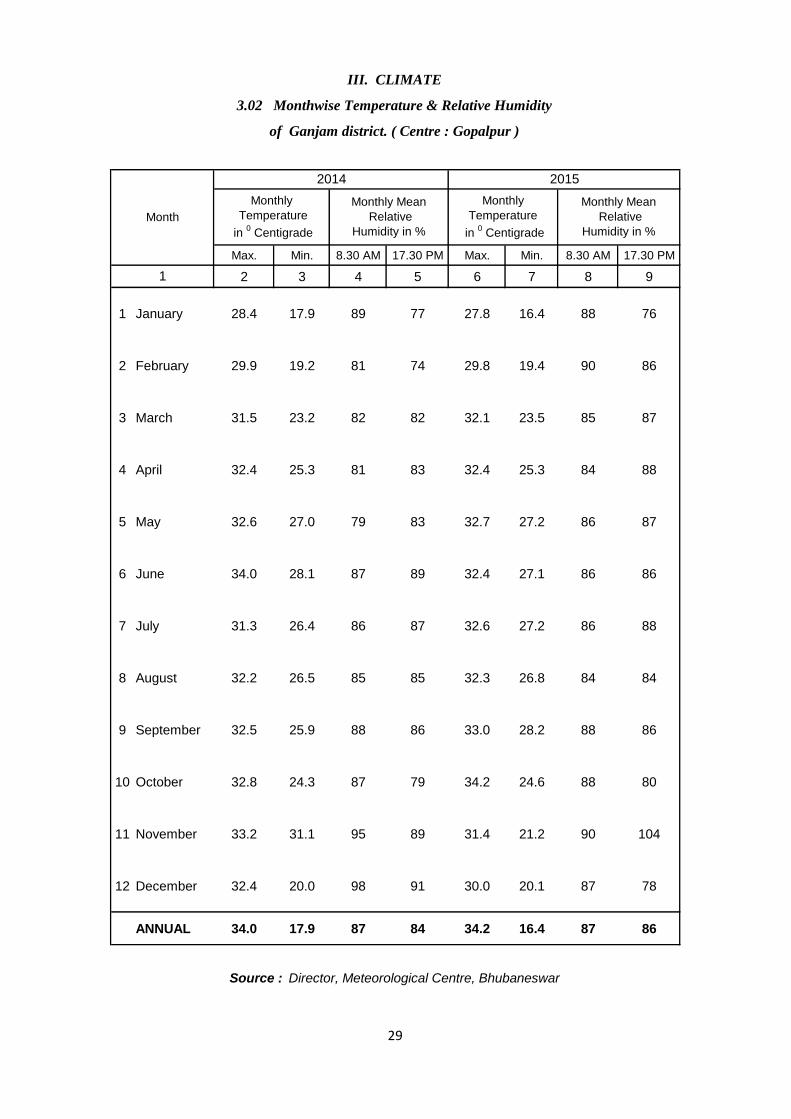
Max. Min. 8.30 AM 17.30 PM Max. Min. 8.30 AM 17.30 PM
2 3 4 5 6 7 8 9
1 January 28.4 17.9 89 77 27.8 16.4 88 76
2 February 29.9 19.2 81 74 29.8 19.4 90 86
3 March 31.5 23.2 82 82 32.1 23.5 85 87
4 April 32.4 25.3 81 83 32.4 25.3 84 88
5 May 32.6 27.0 79 83 32.7 27.2 86 87
6 June 34.0 28.1 87 89 32.4 27.1 86 86
7 July 31.3 26.4 86 87 32.6 27.2 86 88
8 August 32.2 26.5 85 85 32.3 26.8 84 84
9 September 32.5 25.9 88 86 33.0 28.2 88 86
10 October 32.8 24.3 87 79 34.2 24.6 88 80
11 November 33.2 31.1 95 89 31.4 21.2 90 104
12 December 32.4 20.0 98 91 30.0 20.1 87 78
ANNUAL 34.0 17.9 87 84 34.2 16.4 87 86
Monthly Mean
Relative
Humidity in %
1
Source : Director, Meteorological Centre, Bhubaneswar
III. CLIMATE
3.02 Monthwise Temperature & Relative Humidity
of Ganjam district. ( Centre : Gopalpur )
Month
2014 2015
Monthly
Temperature
in 0 Centigrade
Monthly Mean
Relative
Humidity in %
Monthly
Temperature
in 0 Centigrade
29
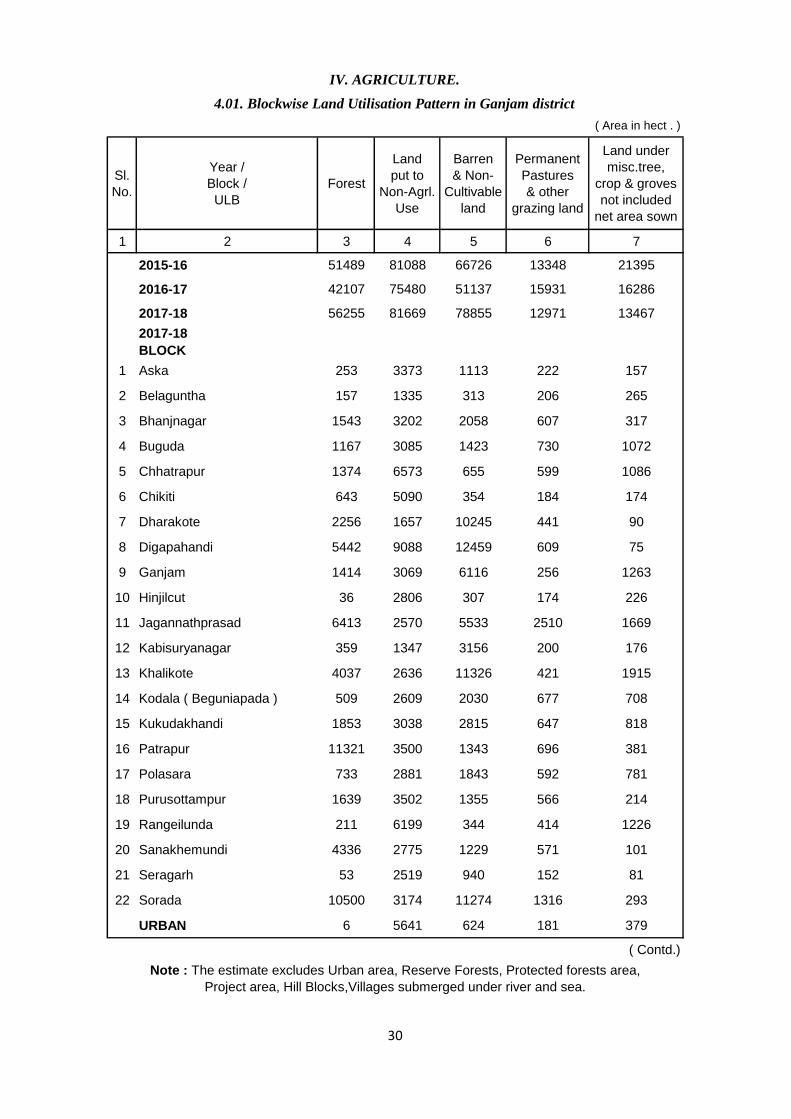
Sl.
No.
Year /
Block /
ULB
Forest
Land
put to
Non-Agrl.
Use
Barren
& Non-
Cultivable
land
Permanent
Pastures
& other
grazing land
Land under
misc.tree,
crop & groves
not included
net area sown
1 2 3 4 5 6 7
2015-16 51489 81088 66726 13348 21395
2016-17 42107 75480 51137 15931 16286
2017-18 56255 81669 78855 12971 13467
2017-18
BLOCK
1 Aska 253 3373 1113 222 157
2 Belaguntha 157 1335 313 206 265
3 Bhanjnagar 1543 3202 2058 607 317
4 Buguda 1167 3085 1423 730 1072
5 Chhatrapur 1374 6573 655 599 1086
6 Chikiti 643 5090 354 184 174
7 Dharakote 2256 1657 10245 441 90
8 Digapahandi 5442 9088 12459 609 75
9 Ganjam 1414 3069 6116 256 1263
10 Hinjilcut 36 2806 307 174 226
11 Jagannathprasad 6413 2570 5533 2510 1669
12 Kabisuryanagar 359 1347 3156 200 176
13 Khalikote 4037 2636 11326 421 1915
14 Kodala ( Beguniapada ) 509 2609 2030 677 708
15 Kukudakhandi 1853 3038 2815 647 818
16 Patrapur 11321 3500 1343 696 381
17 Polasara 733 2881 1843 592 781
18 Purusottampur 1639 3502 1355 566 214
19 Rangeilunda 211 6199 344 414 1226
20 Sanakhemundi 4336 2775 1229 571 101
21 Seragarh 53 2519 940 152 81
22 Sorada 10500 3174 11274 1316 293
URBAN 6 5641 624 181 379
( Contd.)
( Area in hect . )
Note : The estimate excludes Urban area, Reserve Forests, Protected forests area,
Project area, Hill Blocks,Villages submerged under river and sea.
IV. AGRICULTURE.
4.01. Blockwise Land Utilisation Pattern in Ganjam district
30
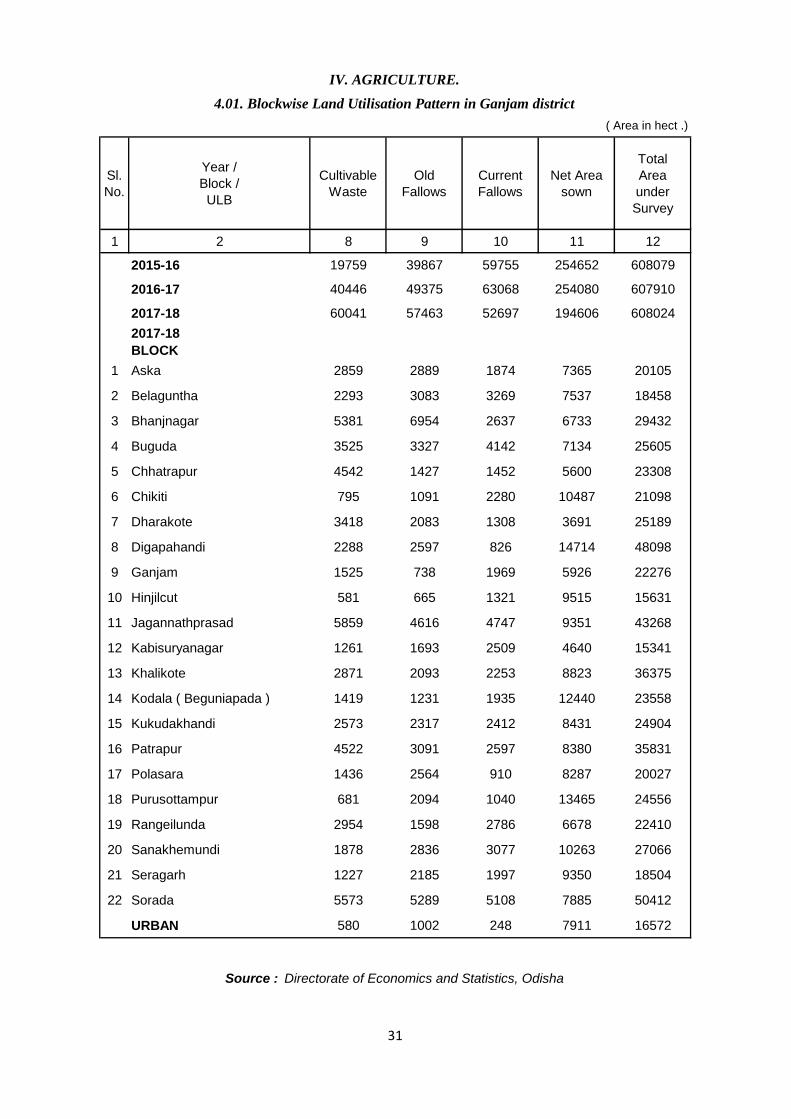
Sl.
No.
Year /
Block /
ULB
Cultivable
Waste
Old
Fallows
Current
Fallows
Net Area
sown
Total
Area
under
Survey
1 2 8 9 10 11 12
2015-16 19759 39867 59755 254652 608079
2016-17 40446 49375 63068 254080 607910
2017-18 60041 57463 52697 194606 608024
2017-18
BLOCK
1 Aska 2859 2889 1874 7365 20105
2 Belaguntha 2293 3083 3269 7537 18458
3 Bhanjnagar 5381 6954 2637 6733 29432
4 Buguda 3525 3327 4142 7134 25605
5 Chhatrapur 4542 1427 1452 5600 23308
6 Chikiti 795 1091 2280 10487 21098
7 Dharakote 3418 2083 1308 3691 25189
8 Digapahandi 2288 2597 826 14714 48098
9 Ganjam 1525 738 1969 5926 22276
10 Hinjilcut 581 665 1321 9515 15631
11 Jagannathprasad 5859 4616 4747 9351 43268
12 Kabisuryanagar 1261 1693 2509 4640 15341
13 Khalikote 2871 2093 2253 8823 36375
14 Kodala ( Beguniapada ) 1419 1231 1935 12440 23558
15 Kukudakhandi 2573 2317 2412 8431 24904
16 Patrapur 4522 3091 2597 8380 35831
17 Polasara 1436 2564 910 8287 20027
18 Purusottampur 681 2094 1040 13465 24556
19 Rangeilunda 2954 1598 2786 6678 22410
20 Sanakhemundi 1878 2836 3077 10263 27066
21 Seragarh 1227 2185 1997 9350 18504
22 Sorada 5573 5289 5108 7885 50412
URBAN 580 1002 248 7911 16572
( Area in hect .)
Source : Directorate of Economics and Statistics, Odisha
IV. AGRICULTURE.
4.01. Blockwise Land Utilisation Pattern in Ganjam district
31
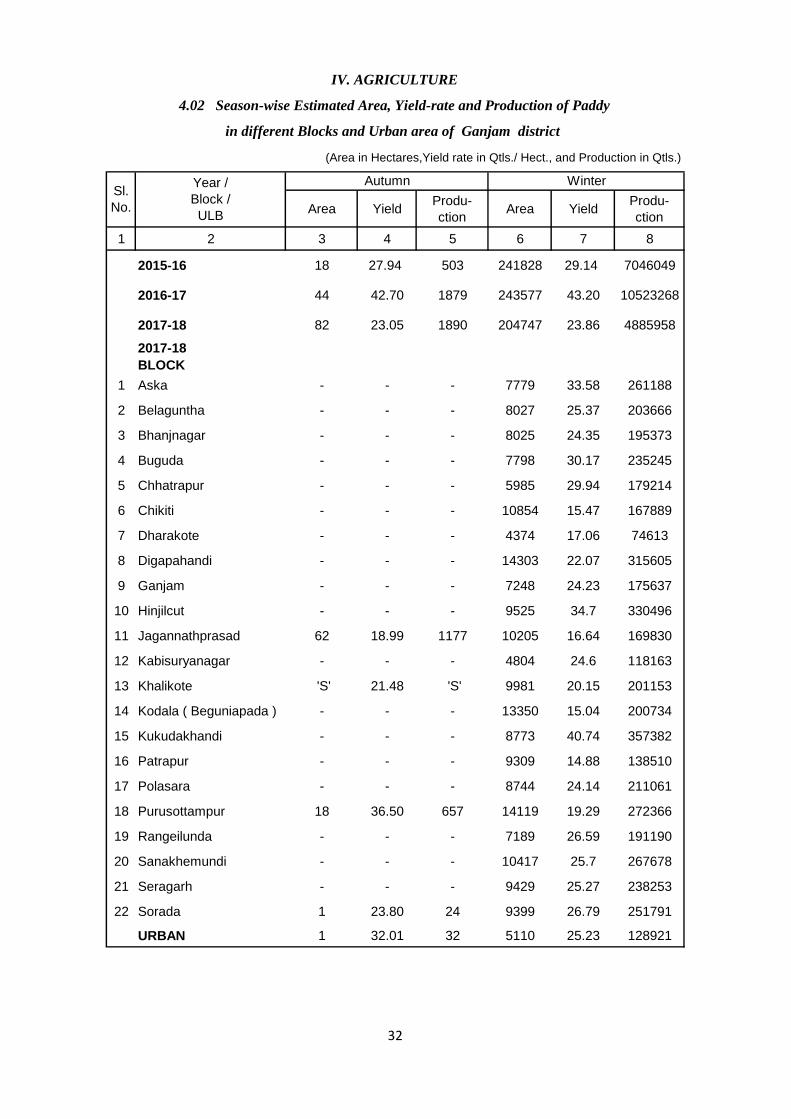
Area YieldProdu-
ctionArea Yield
Produ-
ction
1 2 3 4 5 6 7 8
2015-16 18 27.94 503 241828 29.14 7046049
2016-17 44 42.70 1879 243577 43.20 10523268
2017-18 82 23.05 1890 204747 23.86 4885958
2017-18
BLOCK
1 Aska - - - 7779 33.58 261188
2 Belaguntha - - - 8027 25.37 203666
3 Bhanjnagar - - - 8025 24.35 195373
4 Buguda - - - 7798 30.17 235245
5 Chhatrapur - - - 5985 29.94 179214
6 Chikiti - - - 10854 15.47 167889
7 Dharakote - - - 4374 17.06 74613
8 Digapahandi - - - 14303 22.07 315605
9 Ganjam - - - 7248 24.23 175637
10 Hinjilcut - - - 9525 34.7 330496
11 Jagannathprasad 62 18.99 1177 10205 16.64 169830
12 Kabisuryanagar - - - 4804 24.6 118163
13 Khalikote 'S' 21.48 'S' 9981 20.15 201153
14 Kodala ( Beguniapada ) - - - 13350 15.04 200734
15 Kukudakhandi - - - 8773 40.74 357382
16 Patrapur - - - 9309 14.88 138510
17 Polasara - - - 8744 24.14 211061
18 Purusottampur 18 36.50 657 14119 19.29 272366
19 Rangeilunda - - - 7189 26.59 191190
20 Sanakhemundi - - - 10417 25.7 267678
21 Seragarh - - - 9429 25.27 238253
22 Sorada 1 23.80 24 9399 26.79 251791
URBAN 1 32.01 32 5110 25.23 128921
IV. AGRICULTURE
4.02 Season-wise Estimated Area, Yield-rate and Production of Paddy
in different Blocks and Urban area of Ganjam district
(Area in Hectares,Yield rate in Qtls./ Hect., and Production in Qtls.)
Sl.
No.
Year /
Block /
ULB
Autumn Winter
32
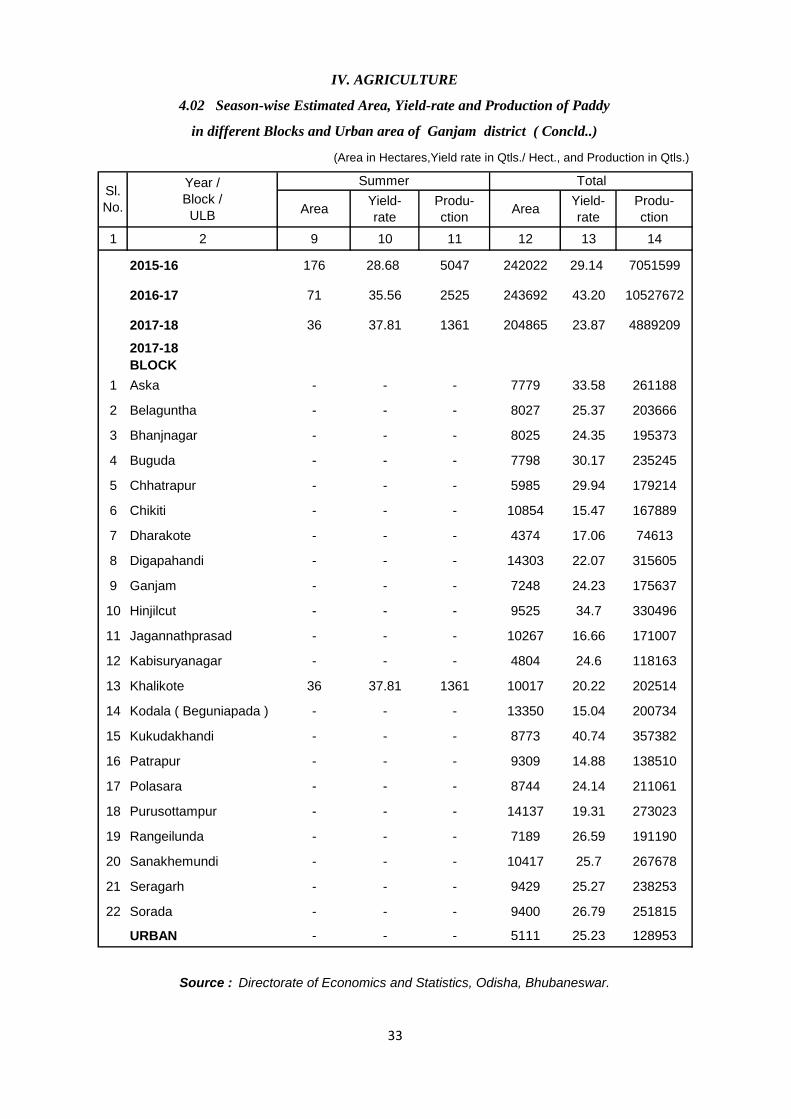
AreaYield-
rate
Produ-
ctionArea
Yield-
rate
Produ-
ction
1 2 9 10 11 12 13 14
2015-16 176 28.68 5047 242022 29.14 7051599
2016-17 71 35.56 2525 243692 43.20 10527672
2017-18 36 37.81 1361 204865 23.87 4889209
2017-18
BLOCK
1 Aska - - - 7779 33.58 261188
2 Belaguntha - - - 8027 25.37 203666
3 Bhanjnagar - - - 8025 24.35 195373
4 Buguda - - - 7798 30.17 235245
5 Chhatrapur - - - 5985 29.94 179214
6 Chikiti - - - 10854 15.47 167889
7 Dharakote - - - 4374 17.06 74613
8 Digapahandi - - - 14303 22.07 315605
9 Ganjam - - - 7248 24.23 175637
10 Hinjilcut - - - 9525 34.7 330496
11 Jagannathprasad - - - 10267 16.66 171007
12 Kabisuryanagar - - - 4804 24.6 118163
13 Khalikote 36 37.81 1361 10017 20.22 202514
14 Kodala ( Beguniapada ) - - - 13350 15.04 200734
15 Kukudakhandi - - - 8773 40.74 357382
16 Patrapur - - - 9309 14.88 138510
17 Polasara - - - 8744 24.14 211061
18 Purusottampur - - - 14137 19.31 273023
19 Rangeilunda - - - 7189 26.59 191190
20 Sanakhemundi - - - 10417 25.7 267678
21 Seragarh - - - 9429 25.27 238253
22 Sorada - - - 9400 26.79 251815
URBAN - - - 5111 25.23 128953
IV. AGRICULTURE
4.02 Season-wise Estimated Area, Yield-rate and Production of Paddy
in different Blocks and Urban area of Ganjam district ( Concld..)
Source : Directorate of Economics and Statistics, Odisha, Bhubaneswar.
(Area in Hectares,Yield rate in Qtls./ Hect., and Production in Qtls.)
Sl.
No.
Year /
Block /
ULB
Summer Total
33
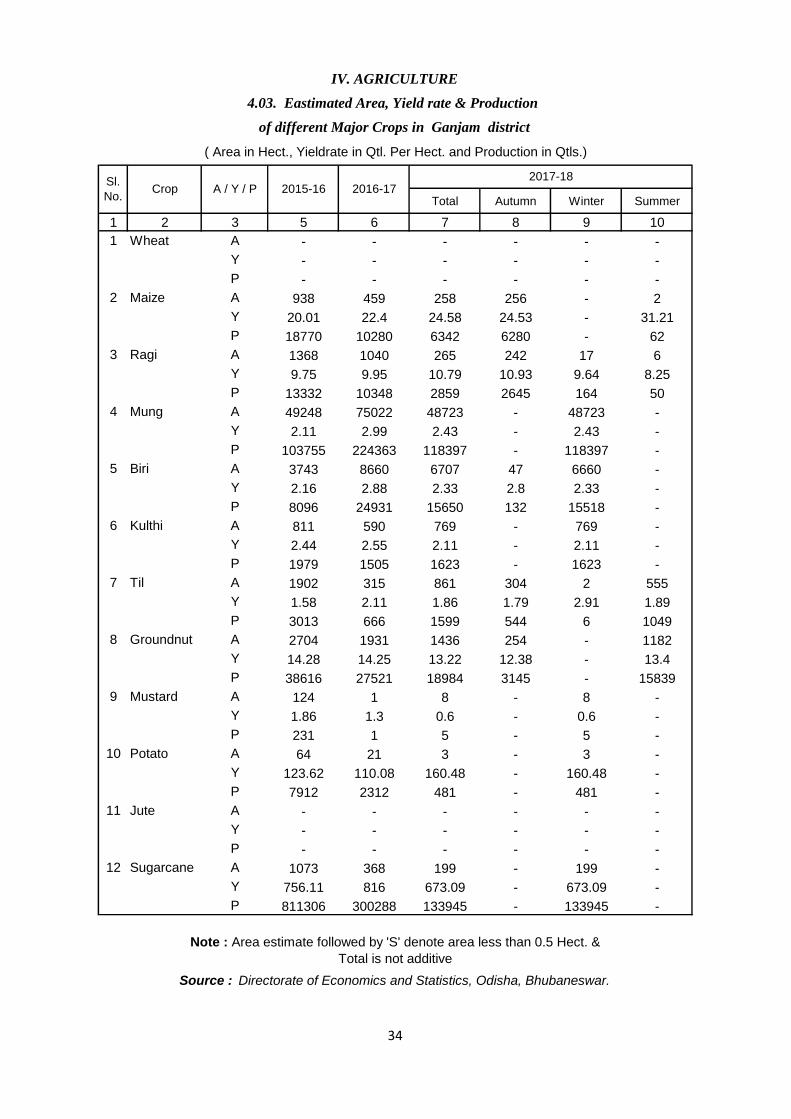
Total Autumn Winter Summer
1 2 3 5 6 7 8 9 10
1 Wheat A - - - - - -
Y - - - - - -
P - - - - - -
2 Maize A 938 459 258 256 - 2
Y 20.01 22.4 24.58 24.53 - 31.21
P 18770 10280 6342 6280 - 62
3 Ragi A 1368 1040 265 242 17 6
Y 9.75 9.95 10.79 10.93 9.64 8.25
P 13332 10348 2859 2645 164 50
4 Mung A 49248 75022 48723 - 48723 -
Y 2.11 2.99 2.43 - 2.43 -
P 103755 224363 118397 - 118397 -
5 Biri A 3743 8660 6707 47 6660 -
Y 2.16 2.88 2.33 2.8 2.33 -
P 8096 24931 15650 132 15518 -
6 Kulthi A 811 590 769 - 769 -
Y 2.44 2.55 2.11 - 2.11 -
P 1979 1505 1623 - 1623 -
7 Til A 1902 315 861 304 2 555
Y 1.58 2.11 1.86 1.79 2.91 1.89
P 3013 666 1599 544 6 1049
8 Groundnut A 2704 1931 1436 254 - 1182
Y 14.28 14.25 13.22 12.38 - 13.4
P 38616 27521 18984 3145 - 15839
9 Mustard A 124 1 8 - 8 -
Y 1.86 1.3 0.6 - 0.6 -
P 231 1 5 - 5 -
10 Potato A 64 21 3 - 3 -
Y 123.62 110.08 160.48 - 160.48 -
P 7912 2312 481 - 481 -
11 Jute A - - - - - -
Y - - - - - -
P - - - - - -
12 Sugarcane A 1073 368 199 - 199 -
Y 756.11 816 673.09 - 673.09 -
P 811306 300288 133945 - 133945 -
IV. AGRICULTURE
4.03. Eastimated Area, Yield rate & Production
of different Major Crops in Ganjam district
( Area in Hect., Yieldrate in Qtl. Per Hect. and Production in Qtls.)
2017-18
Note : Area estimate followed by 'S' denote area less than 0.5 Hect. &
Total is not additive
Source : Directorate of Economics and Statistics, Odisha, Bhubaneswar.
Sl.
No.Crop A / Y / P 2015-16 2016-17
34
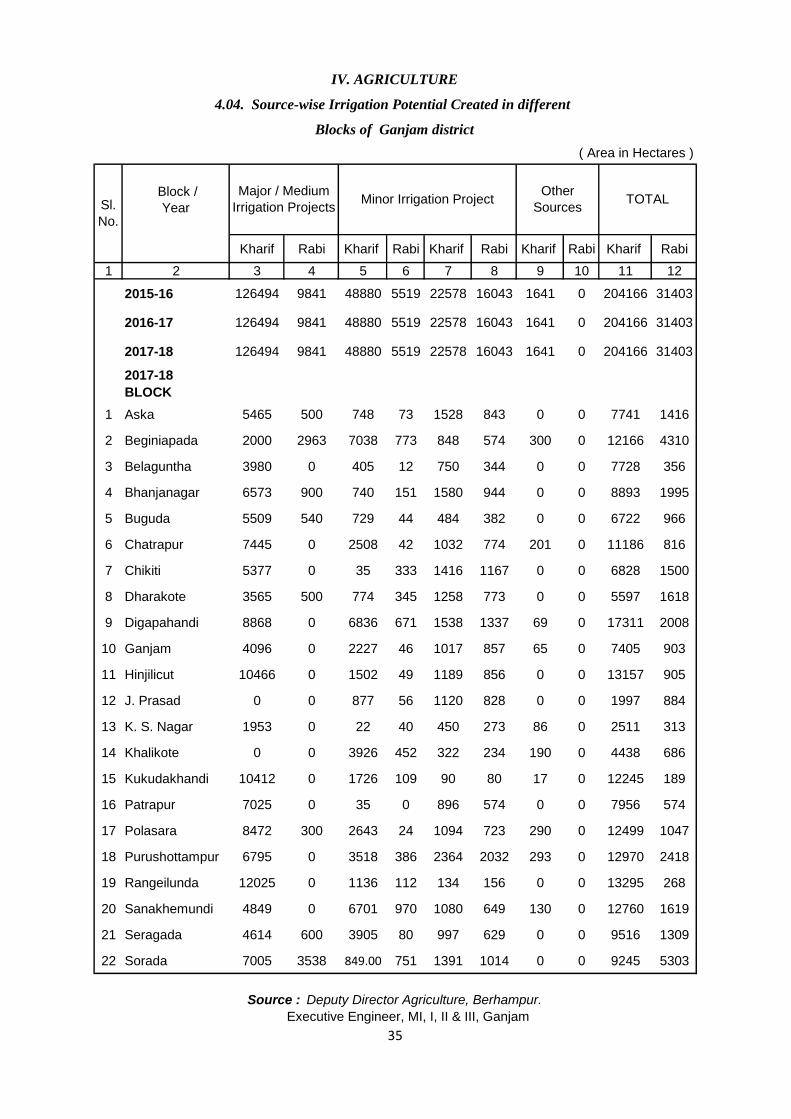
Block /
Year
Kharif Rabi Kharif Rabi Kharif Rabi Kharif Rabi Kharif Rabi
1 2 3 4 5 6 7 8 9 10 11 12
2015-16 126494 9841 48880 5519 22578 16043 1641 0 204166 31403
2016-17 126494 9841 48880 5519 22578 16043 1641 0 204166 31403
2017-18 126494 9841 48880 5519 22578 16043 1641 0 204166 31403
2017-18
BLOCK
1 Aska 5465 500 748 73 1528 843 0 0 7741 1416
2 Beginiapada 2000 2963 7038 773 848 574 300 0 12166 4310
3 Belaguntha 3980 0 405 12 750 344 0 0 7728 356
4 Bhanjanagar 6573 900 740 151 1580 944 0 0 8893 1995
5 Buguda 5509 540 729 44 484 382 0 0 6722 966
6 Chatrapur 7445 0 2508 42 1032 774 201 0 11186 816
7 Chikiti 5377 0 35 333 1416 1167 0 0 6828 1500
8 Dharakote 3565 500 774 345 1258 773 0 0 5597 1618
9 Digapahandi 8868 0 6836 671 1538 1337 69 0 17311 2008
10 Ganjam 4096 0 2227 46 1017 857 65 0 7405 903
11 Hinjilicut 10466 0 1502 49 1189 856 0 0 13157 905
12 J. Prasad 0 0 877 56 1120 828 0 0 1997 884
13 K. S. Nagar 1953 0 22 40 450 273 86 0 2511 313
14 Khalikote 0 0 3926 452 322 234 190 0 4438 686
15 Kukudakhandi 10412 0 1726 109 90 80 17 0 12245 189
16 Patrapur 7025 0 35 0 896 574 0 0 7956 574
17 Polasara 8472 300 2643 24 1094 723 290 0 12499 1047
18 Purushottampur 6795 0 3518 386 2364 2032 293 0 12970 2418
19 Rangeilunda 12025 0 1136 112 134 156 0 0 13295 268
20 Sanakhemundi 4849 0 6701 970 1080 649 130 0 12760 1619
21 Seragada 4614 600 3905 80 997 629 0 0 9516 1309
22 Sorada 7005 3538 849.00 751 1391 1014 0 0 9245 5303
Executive Engineer, MI, I, II & III, Ganjam
Source : Deputy Director Agriculture, Berhampur.
IV. AGRICULTURE
4.04. Source-wise Irrigation Potential Created in different
Blocks of Ganjam district
Major / Medium
Irrigation ProjectsMinor Irrigation Project
Other
SourcesTOTAL
( Area in Hectares )
Sl.
No.
35
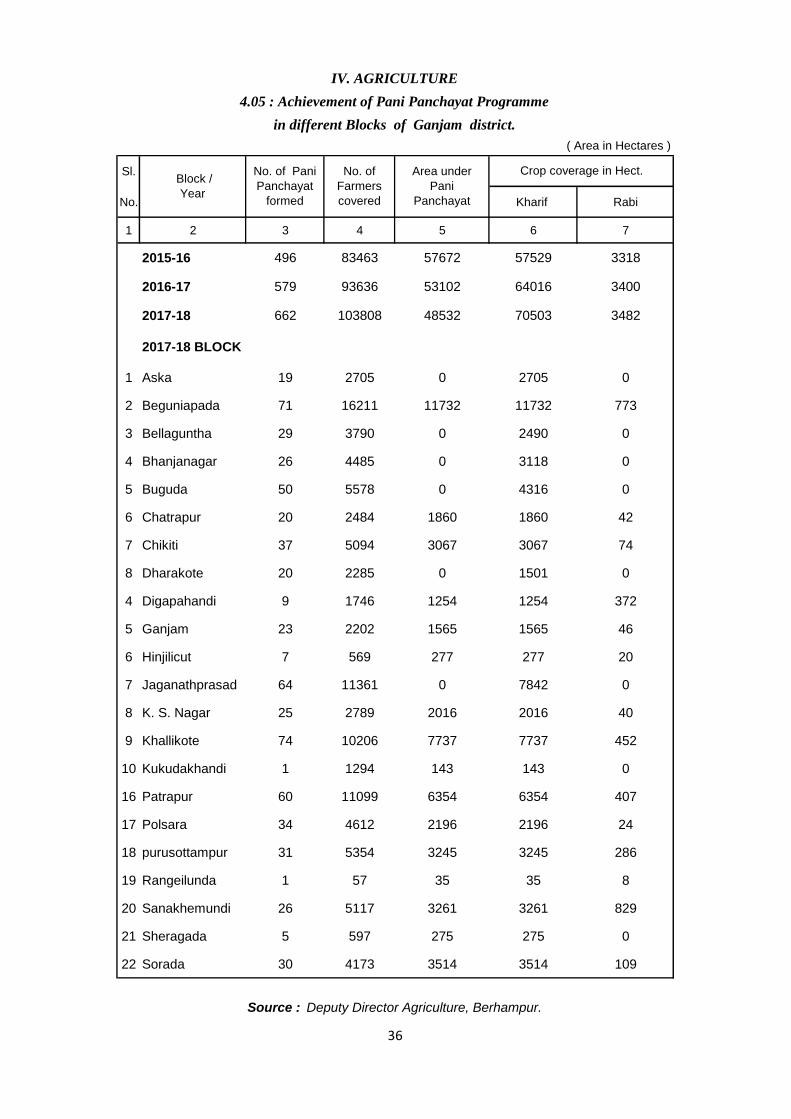
Sl.
No. Kharif Rabi
1 2 3 4 5 6 7
2015-16 496 83463 57672 57529 3318
2016-17 579 93636 53102 64016 3400
2017-18 662 103808 48532 70503 3482
2017-18 BLOCK
1 Aska 19 2705 0 2705 0
2 Beguniapada 71 16211 11732 11732 773
3 Bellaguntha 29 3790 0 2490 0
4 Bhanjanagar 26 4485 0 3118 0
5 Buguda 50 5578 0 4316 0
6 Chatrapur 20 2484 1860 1860 42
7 Chikiti 37 5094 3067 3067 74
8 Dharakote 20 2285 0 1501 0
4 Digapahandi 9 1746 1254 1254 372
5 Ganjam 23 2202 1565 1565 46
6 Hinjilicut 7 569 277 277 20
7 Jaganathprasad 64 11361 0 7842 0
8 K. S. Nagar 25 2789 2016 2016 40
9 Khallikote 74 10206 7737 7737 452
10 Kukudakhandi 1 1294 143 143 0
16 Patrapur 60 11099 6354 6354 407
17 Polsara 34 4612 2196 2196 24
18 purusottampur 31 5354 3245 3245 286
19 Rangeilunda 1 57 35 35 8
20 Sanakhemundi 26 5117 3261 3261 829
21 Sheragada 5 597 275 275 0
22 Sorada 30 4173 3514 3514 109
Source : Deputy Director Agriculture, Berhampur.
IV. AGRICULTURE
4.05 : Achievement of Pani Panchayat Programme
in different Blocks of Ganjam district.
( Area in Hectares )
Block /
Year
No. of Pani
Panchayat
formed
No. of
Farmers
covered
Area under
Pani
Panchayat
Crop coverage in Hect.
36

Sl Name Nitrogenous Phosphatic Potasic Total Total Fertiliser
No of the (N) (P) (K) (N+P+K) Crop area Consumption
District ( M.T) ( M.T) ( M.T) ( M.T) (in'000 Hect.) (Kg/Hect.)
1 2 3 4 5 6 7 8
1 Angul 4354 2025 853 7232 284.11 25.45
2 Balasore 20829 11777 7350 39956 286.11 139.65
3 Baragarh 33222 15695 8353 57270 437.67 130.85
4 Bhadrak 10506 6833 3313 20652 206.23 100.14
5 Bolangir 16191 5270 2940 24401 415.70 58.70
6 Boudh 3599 1015 559 5173 131.10 39.46
7 Cuttack 12664 3309 1894 17867 243.33 73.43
8 Deogarh 2093 1091 460 3644 105.76 34.46
9 Dhenkanal 3421 1537 799 5757 204.47 28.16
10 Gajapati 3575 1167 243 4985 117.95 42.26
11 Ganjam 26128 6215 3826 36169 518.21 69.80
12 Jagatsinghpur 6110 3909 2025 12044 176.90 68.08
13 Jajpur 11011 4896 3513 19420 214.92 90.36
14 Jharsuguda 3372 1401 722 5495 81.68 67.27
15 Kalahandi 20439 8764 4499 33702 538.07 62.63
16 Kandhamal 1321 676 316 2313 144.09 16.05
17 Kendrapara 4625 2556 679 7860 229.35 34.27
18 Keonjhar 9185 3701 1725 14611 377.21 38.73
19 Khordha 7398 2893 2198 12489 163.85 76.22
20 Koraput 9106 4233 2518 15857 335.05 47.33
21 Malkangiri 7355 2881 921 11157 185.11 60.27
22 Mayurbhanj 13234 4866 2406 20506 467.01 43.91
23 Nabarangpur 26515 7369 4614 38498 254.90 151.03
24 Nayagarh 5684 2307 1184 9175 206.26 44.48
25 Nuapada 5691 2394 904 8989 263.21 34.15
26 Puri 9882 3854 3343 17079 193.46 88.28
27 Rayagada 10204 3632 1532 15368 221.93 69.25
28 Sambalpur 19822 8803 4323 32948 248.71 132.48
29 Subarnapur 6103 2703 1718 10524 214.56 49.05
30 Sundargarh 11410 12594 1781 25785 352.24 73.20
ODISHA 325049 140366 71511 536926 7819.15 68.67
IV. AGRICULTURE
4.06 : District wise Consumption of Chemical Fertiliser
( Kharif & Rabi ) in Odisha (2017-18)
Source : Directorate of Agriculture & Food Production, Odisha, BBSR
37
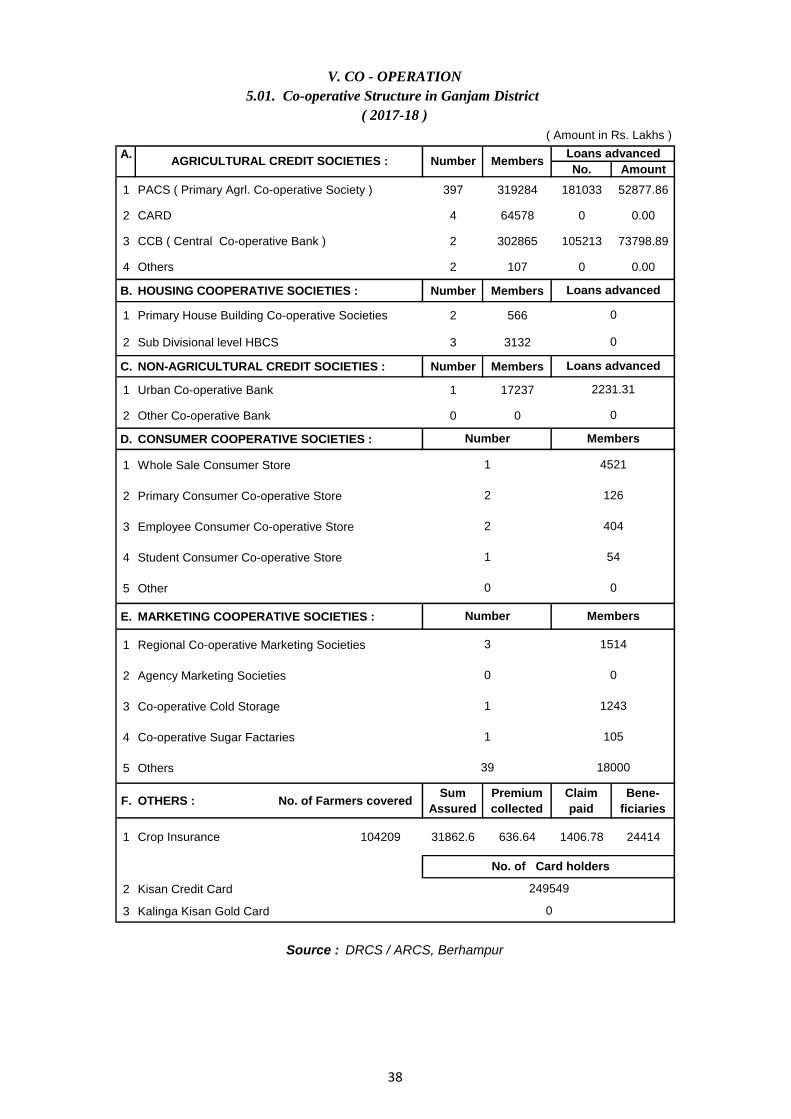
A.
No. Amount
1 PACS ( Primary Agrl. Co-operative Society ) 397 319284 181033 52877.86
2 CARD 4 64578 0 0.00
3 CCB ( Central Co-operative Bank ) 2 302865 105213 73798.89
4 Others 2 107 0 0.00
B. HOUSING COOPERATIVE SOCIETIES : Number Members
1 Primary House Building Co-operative Societies 2 566
2 Sub Divisional level HBCS 3 3132
C. NON-AGRICULTURAL CREDIT SOCIETIES : Number Members
1 Urban Co-operative Bank 1 17237
2 Other Co-operative Bank 0 0
D. CONSUMER COOPERATIVE SOCIETIES :
1 Whole Sale Consumer Store
2 Primary Consumer Co-operative Store
3 Employee Consumer Co-operative Store
4 Student Consumer Co-operative Store
5 Other
E. MARKETING COOPERATIVE SOCIETIES :
1 Regional Co-operative Marketing Societies
2 Agency Marketing Societies
3 Co-operative Cold Storage
4 Co-operative Sugar Factaries
5 Others
F. OTHERS : No. of Farmers coveredSum
Assured
Premium
collected
Claim
paid
Bene-
ficiaries
1 Crop Insurance 104209 31862.6 636.64 1406.78 24414
2 Kisan Credit Card
3 Kalinga Kisan Gold Card
Source : DRCS / ARCS, Berhampur
39 18000
No. of Card holders
249549
0
0 0
1 1243
1 105
0 0
Number Members
3 1514
2 126
2 404
1 54
0
Number Members
1 4521
Loans advanced
0
0
Loans advanced
2231.31
V. CO - OPERATION
5.01. Co-operative Structure in Ganjam District
( 2017-18 )
AGRICULTURAL CREDIT SOCIETIES : Number MembersLoans advanced
( Amount in Rs. Lakhs )
38
Sl.
No
Block /
Year
No. of
Societies
Member-
ship
No.
Working
Capital
Loan &
Advance
Loans
Overdue
Loan
Out-
standing
1 2 3 4 5 6 7 8
2015-16 398 291125 52141.35 45891.48 5465.77 31270.02
2016-17 397 306865 54631.12 51261.49 6341.31 38145.26
2017-18 397 319284 57567.1 52877.86 6916.99 38813.14
2017-18
BLOCK
1 Aska 19 12083 2212.17 2477.00 247.19 2059.95
2 Beguniapada 21 17229 2020.25 1213.50 612.81 1562.15
3 Bellaguntha 14 22096 4605.90 5339.73 572.55 4404.30
4 Bhanjanagar 13 10961 1768.65 2190.92 225.86 1613.35
5 Buguda 14 12992 2904.21 4291.23 332.24 2768.69
6 Chatrapur 17 10310 2582.64 1773.36 338.93 1265.02
7 Chikiti 19 14635 1898.25 1332.80 115.15 467.14
8 Dharakote 15 15429 1926.92 2221.09 221.69 1773.55
9 Digapahandi 23 16208 3155.26 1726.66 199.50 921.64
10 Ganjam 22 11137 1145.20 2176.41 188.08 1453.47
11 Hinjilicut 20 14119 3488.62 3272.44 993.56 3060.94
12 J.N.Prasad 18 13790 3118.36 3613.25 349.53 2912.79
13 Kabisuryanagar 15 10691 961.10 1521.20 129.82 911.12
14 Khallikote 20 12282 1828.20 1664.30 364.52 2458.04
15 Kukudakhandi 20 20155 3598.52 2018.52 367.52 821.32
16 Patrapur 17 15984 2097.46 1401.88 181.45 498.56
17 Polasara 16 13215 1299.19 2771.41 134.80 1419.48
18 Purusottampur 20 13107 6386.14 2535.15 377.85 1848.14
19 Rangeilunda 24 17824 2989.75 2053.00 247.35 995.39
20 Sanakhemundi 18 14996 2292.68 2387.03 104.12 653.42
21 Sheragada 15 14276 3214.14 2806.11 363.95 3032.96
22 Surada 17 15765 2073.49 2090.87 248.52 1911.72
Source : DRCS / ARCS, Berhampur
V. CO - OPERATION
5.02 : Agricultural Credit Co-operative Societies
in different Blocks of Ganjam district
( Rs. in Lakh)
39
Sl.
No
Year /
Block
No. of
Societies
Member-
ship No
Working
Capital
Loan &
Advance
Loan
Overdue
Loan
Out-
standing
1 2 3 4 5 6 7 8
2015-16 16 4591 1674.21 1369.93 133.31 1345.53
2016-17 16 4633 1764.22 1406.33 132.9 1734.46
2017-18 16 4711 1825.43 1471.63 139.05 1631.21
2017-18
BLOCK
1 Aska 3 883 469.97 401.00 0.50 351.00
2 Beguniapada 0 0 0.00 0.00 0.00 0.00
3 Bellaguntha 0 0 0.00 0.00 0.00 0.00
4 Bhanjanagar 1 169 229.97 165.00 0.30 131.00
5 Buguda 0 0 0.00 0.00 0.00 0.00
6 Chatrapur 0 0 0.00 0.00 0.00 0.00
7 Chikiti 0 0 0.00 0.00 0.00 0.00
8 Dharakote 0 0 0.00 0.00 0.00 0.00
9 Digapahandi 0 0 0.00 0.00 0.00 0.00
10 Ganjam 0 0 0.00 0.00 0.00 0.00
11 Hinjilicut 0 0 0.00 0.00 0.00 0.00
12 J.N.Prasad 0 0 0.00 0.00 0.00 0.00
13 Kabisuryanagar 0 0 0.00 0.00 0.00 0.00
14 Khallikote 0 0 0.00 0.00 0.00 0.00
15 Kukudakhandi 0 0 0.00 0.00 0.00 0.00
16 Patrapur 0 0 0.00 0.00 0.00 0.00
17 Polasara 0 0 0.00 0.00 0.00 0.00
18 Purusottampur 0 0 0.00 0.00 0.00 0.00
19 Rangeilunda 4 1183 222.72 222.07 31.28 195.27
20 Sanakhemundi 0 0 0.00 0.00 0.00 0.00
21 Sheragada 0 0 0.00 0.00 0.00 0.00
22 Surada 0 0 0.00 0.00 0.00 0.00
URBAN
1 Berhampur 8 2476 902.77 683.56 106.97 953.94
different Blocks and Urban areas of Ganjam district
Source : DRCS / Brehampur
V. CO-OPERATION
( Rs. in Lakh)
5.03. Non-Agricultural Credit Co-operative Societies in
40
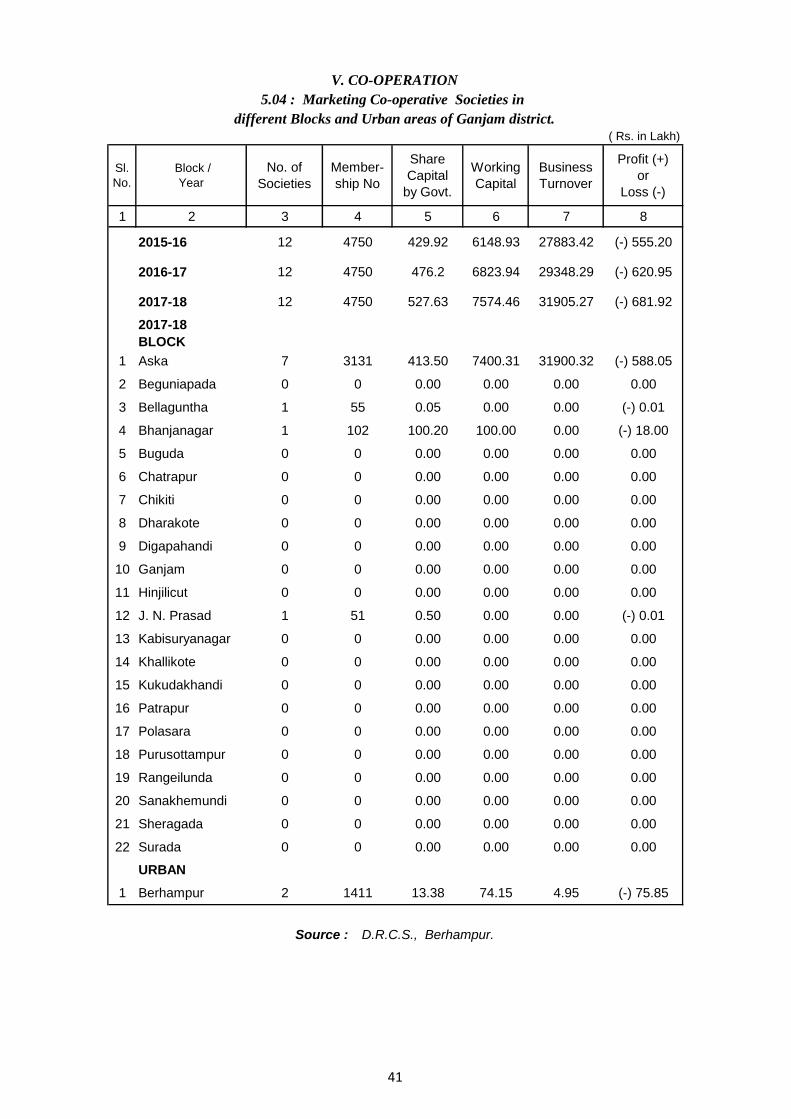
Sl.
No.
Block /
Year
No. of
Societies
Member-
ship No
Share
Capital
by Govt.
Working
Capital
Business
Turnover
Profit (+)
or
Loss (-)
1 2 3 4 5 6 7 8
2015-16 12 4750 429.92 6148.93 27883.42 (-) 555.20
2016-17 12 4750 476.2 6823.94 29348.29 (-) 620.95
2017-18 12 4750 527.63 7574.46 31905.27 (-) 681.92
2017-18
BLOCK
1 Aska 7 3131 413.50 7400.31 31900.32 (-) 588.05
2 Beguniapada 0 0 0.00 0.00 0.00 0.00
3 Bellaguntha 1 55 0.05 0.00 0.00 (-) 0.01
4 Bhanjanagar 1 102 100.20 100.00 0.00 (-) 18.00
5 Buguda 0 0 0.00 0.00 0.00 0.00
6 Chatrapur 0 0 0.00 0.00 0.00 0.00
7 Chikiti 0 0 0.00 0.00 0.00 0.00
8 Dharakote 0 0 0.00 0.00 0.00 0.00
9 Digapahandi 0 0 0.00 0.00 0.00 0.00
10 Ganjam 0 0 0.00 0.00 0.00 0.00
11 Hinjilicut 0 0 0.00 0.00 0.00 0.00
12 J. N. Prasad 1 51 0.50 0.00 0.00 (-) 0.01
13 Kabisuryanagar 0 0 0.00 0.00 0.00 0.00
14 Khallikote 0 0 0.00 0.00 0.00 0.00
15 Kukudakhandi 0 0 0.00 0.00 0.00 0.00
16 Patrapur 0 0 0.00 0.00 0.00 0.00
17 Polasara 0 0 0.00 0.00 0.00 0.00
18 Purusottampur 0 0 0.00 0.00 0.00 0.00
19 Rangeilunda 0 0 0.00 0.00 0.00 0.00
20 Sanakhemundi 0 0 0.00 0.00 0.00 0.00
21 Sheragada 0 0 0.00 0.00 0.00 0.00
22 Surada 0 0 0.00 0.00 0.00 0.00
URBAN
1 Berhampur 2 1411 13.38 74.15 4.95 (-) 75.85
Source : D.R.C.S., Berhampur.
V. CO-OPERATION
5.04 : Marketing Co-operative Societies in
different Blocks and Urban areas of Ganjam district.
( Rs. in Lakh)
41

Sl.
No.Classification of Forest Area in Sq. Kms.
1 2 3
1 Reserve Forests 1485.69
2 Demarcated Protected Forests 143.54
3 Un-demarcated Forests 1167.36
4 Un Classified Forests 0.86
5 Other Forests 352.45
6 Total Forest Area 3149.90
7 Total Geograpical Area 8206
8 % of Forest area to Geographical Area 38.39
VI. FOREST
6.01. Classification of Forest Area by Legal Status in
Ganjam district as on 31. 03. 2017
Source : Principal Chief Conservator of Forests, Odisha.
42
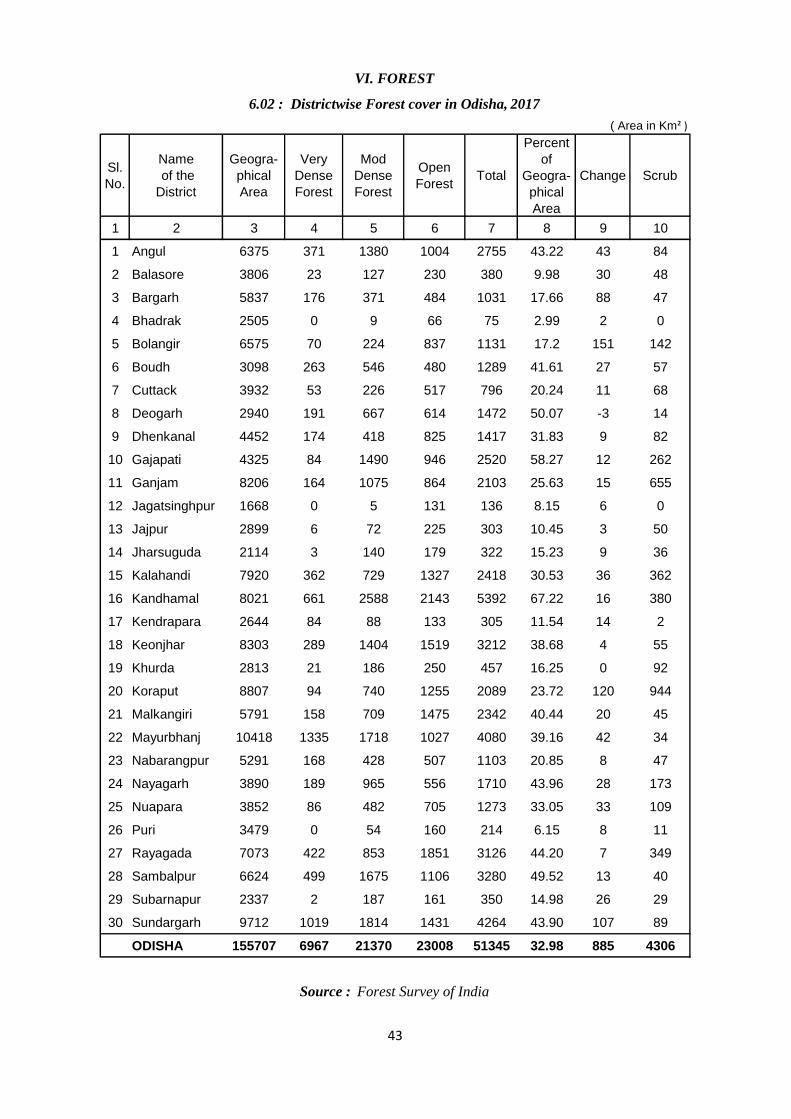
Sl.
No.
Name
of the
District
Geogra-
phical
Area
Very
Dense
Forest
Mod
Dense
Forest
Open
ForestTotal
Percent
of
Geogra-
phical
Area
Change Scrub
1 2 3 4 5 6 7 8 9 10
1 Angul 6375 371 1380 1004 2755 43.22 43 84
2 Balasore 3806 23 127 230 380 9.98 30 48
3 Bargarh 5837 176 371 484 1031 17.66 88 47
4 Bhadrak 2505 0 9 66 75 2.99 2 0
5 Bolangir 6575 70 224 837 1131 17.2 151 142
6 Boudh 3098 263 546 480 1289 41.61 27 57
7 Cuttack 3932 53 226 517 796 20.24 11 68
8 Deogarh 2940 191 667 614 1472 50.07 -3 14
9 Dhenkanal 4452 174 418 825 1417 31.83 9 82
10 Gajapati 4325 84 1490 946 2520 58.27 12 262
11 Ganjam 8206 164 1075 864 2103 25.63 15 655
12 Jagatsinghpur 1668 0 5 131 136 8.15 6 0
13 Jajpur 2899 6 72 225 303 10.45 3 50
14 Jharsuguda 2114 3 140 179 322 15.23 9 36
15 Kalahandi 7920 362 729 1327 2418 30.53 36 362
16 Kandhamal 8021 661 2588 2143 5392 67.22 16 380
17 Kendrapara 2644 84 88 133 305 11.54 14 2
18 Keonjhar 8303 289 1404 1519 3212 38.68 4 55
19 Khurda 2813 21 186 250 457 16.25 0 92
20 Koraput 8807 94 740 1255 2089 23.72 120 944
21 Malkangiri 5791 158 709 1475 2342 40.44 20 45
22 Mayurbhanj 10418 1335 1718 1027 4080 39.16 42 34
23 Nabarangpur 5291 168 428 507 1103 20.85 8 47
24 Nayagarh 3890 189 965 556 1710 43.96 28 173
25 Nuapara 3852 86 482 705 1273 33.05 33 109
26 Puri 3479 0 54 160 214 6.15 8 11
27 Rayagada 7073 422 853 1851 3126 44.20 7 349
28 Sambalpur 6624 499 1675 1106 3280 49.52 13 40
29 Subarnapur 2337 2 187 161 350 14.98 26 29
30 Sundargarh 9712 1019 1814 1431 4264 43.90 107 89
ODISHA 155707 6967 21370 23008 51345 32.98 885 4306
VI. FOREST
6.02 : Districtwise Forest cover in Odisha, 2017
( Area in Km² )
Source : Forest Survey of India
43
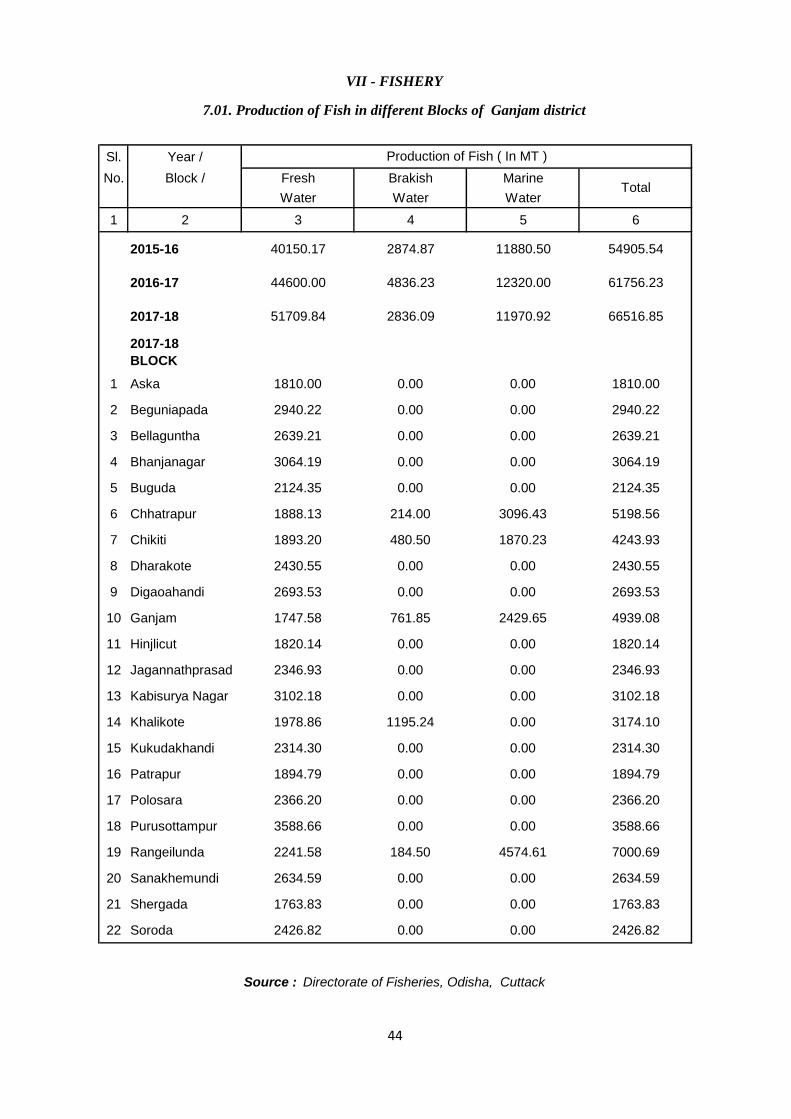
Sl. Year /
No. Block / Fresh Brakish Marine
Water Water Water
1 2 3 4 5 6
2015-16 40150.17 2874.87 11880.50 54905.54
2016-17 44600.00 4836.23 12320.00 61756.23
2017-18 51709.84 2836.09 11970.92 66516.85
2017-18
BLOCK
1 Aska 1810.00 0.00 0.00 1810.00
2 Beguniapada 2940.22 0.00 0.00 2940.22
3 Bellaguntha 2639.21 0.00 0.00 2639.21
4 Bhanjanagar 3064.19 0.00 0.00 3064.19
5 Buguda 2124.35 0.00 0.00 2124.35
6 Chhatrapur 1888.13 214.00 3096.43 5198.56
7 Chikiti 1893.20 480.50 1870.23 4243.93
8 Dharakote 2430.55 0.00 0.00 2430.55
9 Digaoahandi 2693.53 0.00 0.00 2693.53
10 Ganjam 1747.58 761.85 2429.65 4939.08
11 Hinjlicut 1820.14 0.00 0.00 1820.14
12 Jagannathprasad 2346.93 0.00 0.00 2346.93
13 Kabisurya Nagar 3102.18 0.00 0.00 3102.18
14 Khalikote 1978.86 1195.24 0.00 3174.10
15 Kukudakhandi 2314.30 0.00 0.00 2314.30
16 Patrapur 1894.79 0.00 0.00 1894.79
17 Polosara 2366.20 0.00 0.00 2366.20
18 Purusottampur 3588.66 0.00 0.00 3588.66
19 Rangeilunda 2241.58 184.50 4574.61 7000.69
20 Sanakhemundi 2634.59 0.00 0.00 2634.59
21 Shergada 1763.83 0.00 0.00 1763.83
22 Soroda 2426.82 0.00 0.00 2426.82
VII - FISHERY
7.01. Production of Fish in different Blocks of Ganjam district
Production of Fish ( In MT )
Source : Directorate of Fisheries, Odisha, Cuttack
Total
44
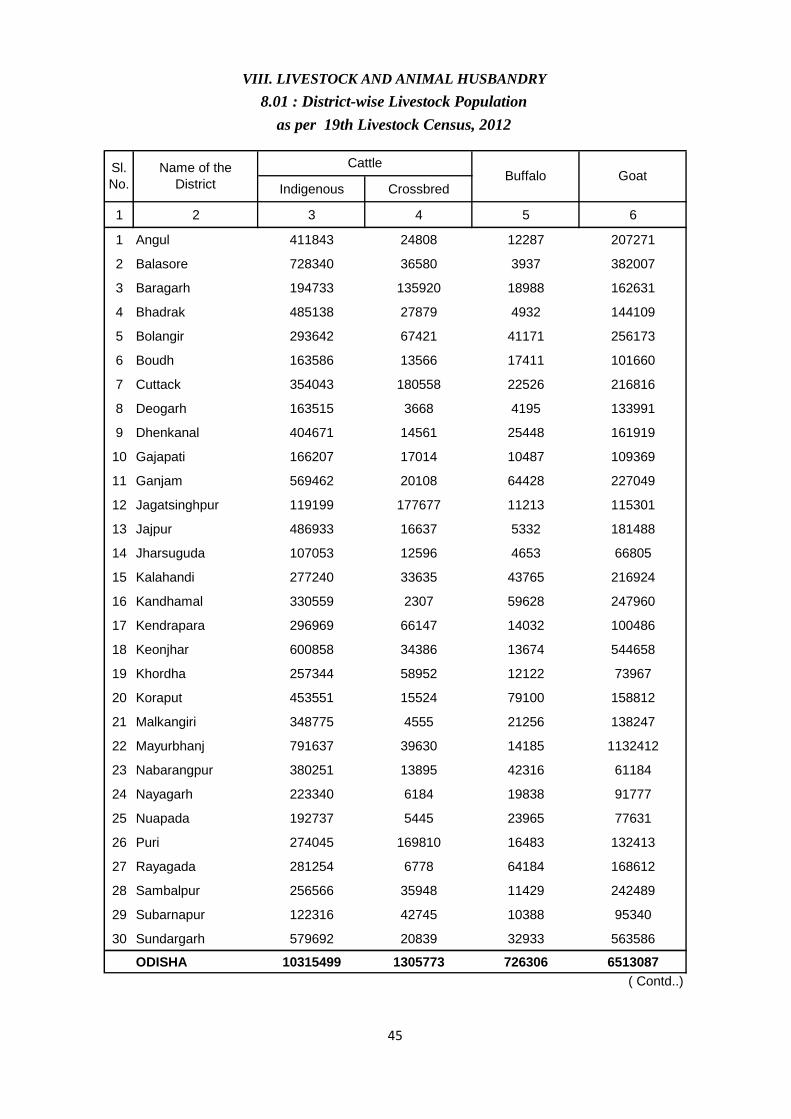
Indigenous Crossbred
1 2 3 4 5 6
1 Angul 411843 24808 12287 207271
2 Balasore 728340 36580 3937 382007
3 Baragarh 194733 135920 18988 162631
4 Bhadrak 485138 27879 4932 144109
5 Bolangir 293642 67421 41171 256173
6 Boudh 163586 13566 17411 101660
7 Cuttack 354043 180558 22526 216816
8 Deogarh 163515 3668 4195 133991
9 Dhenkanal 404671 14561 25448 161919
10 Gajapati 166207 17014 10487 109369
11 Ganjam 569462 20108 64428 227049
12 Jagatsinghpur 119199 177677 11213 115301
13 Jajpur 486933 16637 5332 181488
14 Jharsuguda 107053 12596 4653 66805
15 Kalahandi 277240 33635 43765 216924
16 Kandhamal 330559 2307 59628 247960
17 Kendrapara 296969 66147 14032 100486
18 Keonjhar 600858 34386 13674 544658
19 Khordha 257344 58952 12122 73967
20 Koraput 453551 15524 79100 158812
21 Malkangiri 348775 4555 21256 138247
22 Mayurbhanj 791637 39630 14185 1132412
23 Nabarangpur 380251 13895 42316 61184
24 Nayagarh 223340 6184 19838 91777
25 Nuapada 192737 5445 23965 77631
26 Puri 274045 169810 16483 132413
27 Rayagada 281254 6778 64184 168612
28 Sambalpur 256566 35948 11429 242489
29 Subarnapur 122316 42745 10388 95340
30 Sundargarh 579692 20839 32933 563586
ODISHA 10315499 1305773 726306 6513087
( Contd..)
Sl.
No.
Name of the
District
CattleBuffalo Goat
VIII. LIVESTOCK AND ANIMAL HUSBANDRY
8.01 : District-wise Livestock Population
as per 19th Livestock Census, 2012
45
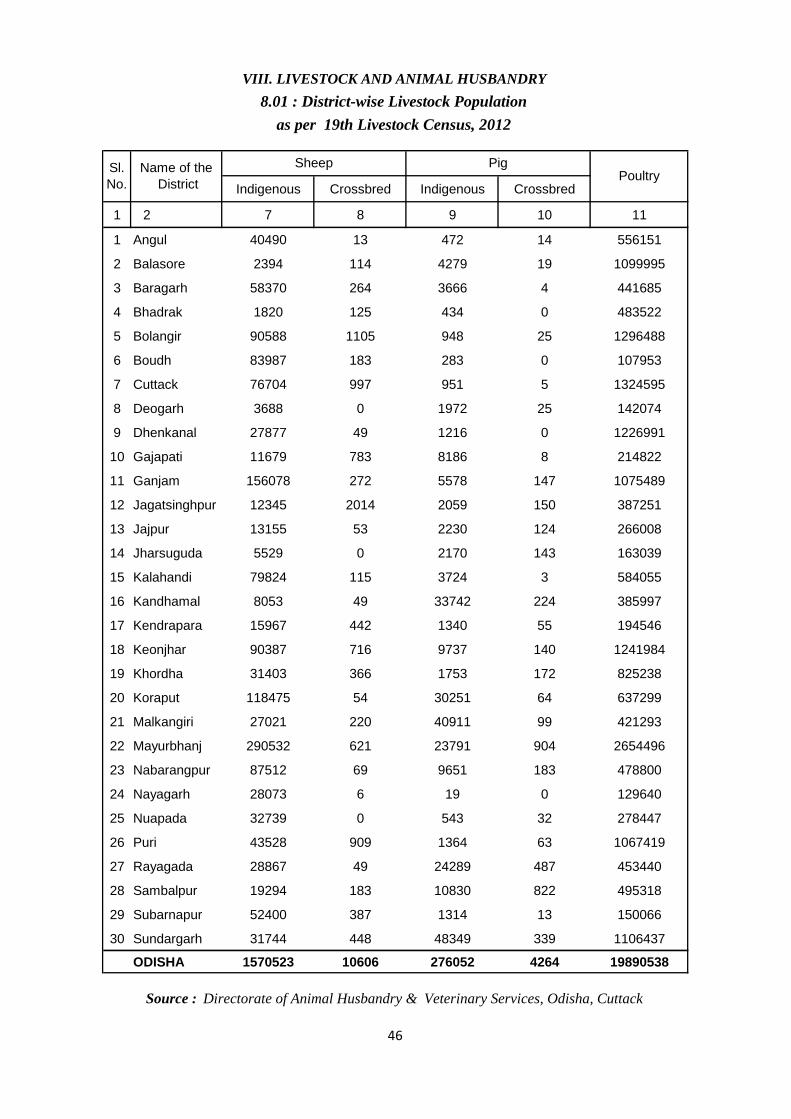
Indigenous Crossbred Indigenous Crossbred
1 2 7 8 9 10 11
1 Angul 40490 13 472 14 556151
2 Balasore 2394 114 4279 19 1099995
3 Baragarh 58370 264 3666 4 441685
4 Bhadrak 1820 125 434 0 483522
5 Bolangir 90588 1105 948 25 1296488
6 Boudh 83987 183 283 0 107953
7 Cuttack 76704 997 951 5 1324595
8 Deogarh 3688 0 1972 25 142074
9 Dhenkanal 27877 49 1216 0 1226991
10 Gajapati 11679 783 8186 8 214822
11 Ganjam 156078 272 5578 147 1075489
12 Jagatsinghpur 12345 2014 2059 150 387251
13 Jajpur 13155 53 2230 124 266008
14 Jharsuguda 5529 0 2170 143 163039
15 Kalahandi 79824 115 3724 3 584055
16 Kandhamal 8053 49 33742 224 385997
17 Kendrapara 15967 442 1340 55 194546
18 Keonjhar 90387 716 9737 140 1241984
19 Khordha 31403 366 1753 172 825238
20 Koraput 118475 54 30251 64 637299
21 Malkangiri 27021 220 40911 99 421293
22 Mayurbhanj 290532 621 23791 904 2654496
23 Nabarangpur 87512 69 9651 183 478800
24 Nayagarh 28073 6 19 0 129640
25 Nuapada 32739 0 543 32 278447
26 Puri 43528 909 1364 63 1067419
27 Rayagada 28867 49 24289 487 453440
28 Sambalpur 19294 183 10830 822 495318
29 Subarnapur 52400 387 1314 13 150066
30 Sundargarh 31744 448 48349 339 1106437
ODISHA 1570523 10606 276052 4264 19890538
Source : Directorate of Animal Husbandry & Veterinary Services, Odisha, Cuttack
Sl.
No.
Name of the
District
Sheep PigPoultry
VIII. LIVESTOCK AND ANIMAL HUSBANDRY
8.01 : District-wise Livestock Population
as per 19th Livestock Census, 2012
46
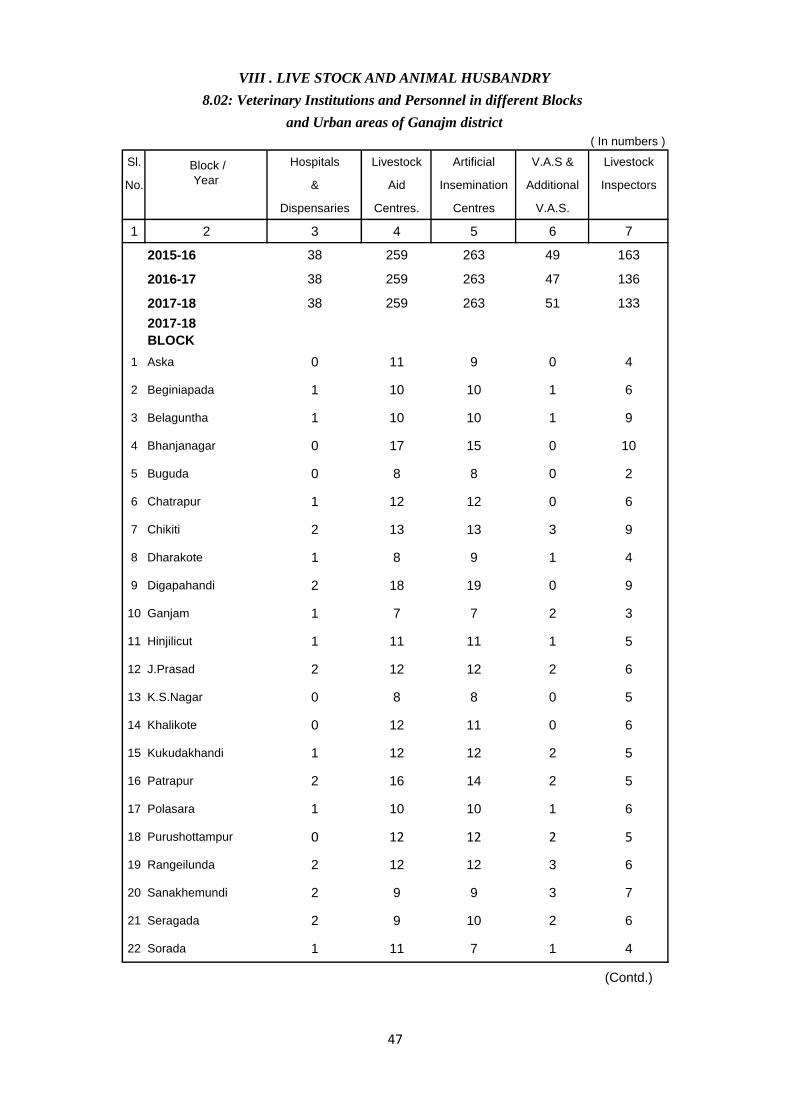
Sl. Hospitals Livestock Artificial V.A.S & Livestock
No. & Aid Insemination Additional Inspectors
Dispensaries Centres. Centres V.A.S.
1 2 3 4 5 6 7
2015-16 38 259 263 49 163
2016-17 38 259 263 47 136
2017-18 38 259 263 51 133
2017-18
BLOCK
1 Aska 0 11 9 0 4
2 Beginiapada 1 10 10 1 6
3 Belaguntha 1 10 10 1 9
4 Bhanjanagar 0 17 15 0 10
5 Buguda 0 8 8 0 2
6 Chatrapur 1 12 12 0 6
7 Chikiti 2 13 13 3 9
8 Dharakote 1 8 9 1 4
9 Digapahandi 2 18 19 0 9
10 Ganjam 1 7 7 2 3
11 Hinjilicut 1 11 11 1 5
12 J.Prasad 2 12 12 2 6
13 K.S.Nagar 0 8 8 0 5
14 Khalikote 0 12 11 0 6
15 Kukudakhandi 1 12 12 2 5
16 Patrapur 2 16 14 2 5
17 Polasara 1 10 10 1 6
18 Purushottampur 0 12 12 2 5
19 Rangeilunda 2 12 12 3 6
20 Sanakhemundi 2 9 9 3 7
21 Seragada 2 9 10 2 6
22 Sorada 1 11 7 1 4
(Contd.)
VIII . LIVE STOCK AND ANIMAL HUSBANDRY
8.02: Veterinary Institutions and Personnel in different Blocks
and Urban areas of Ganajm district
( In numbers )
Block /
Year
47
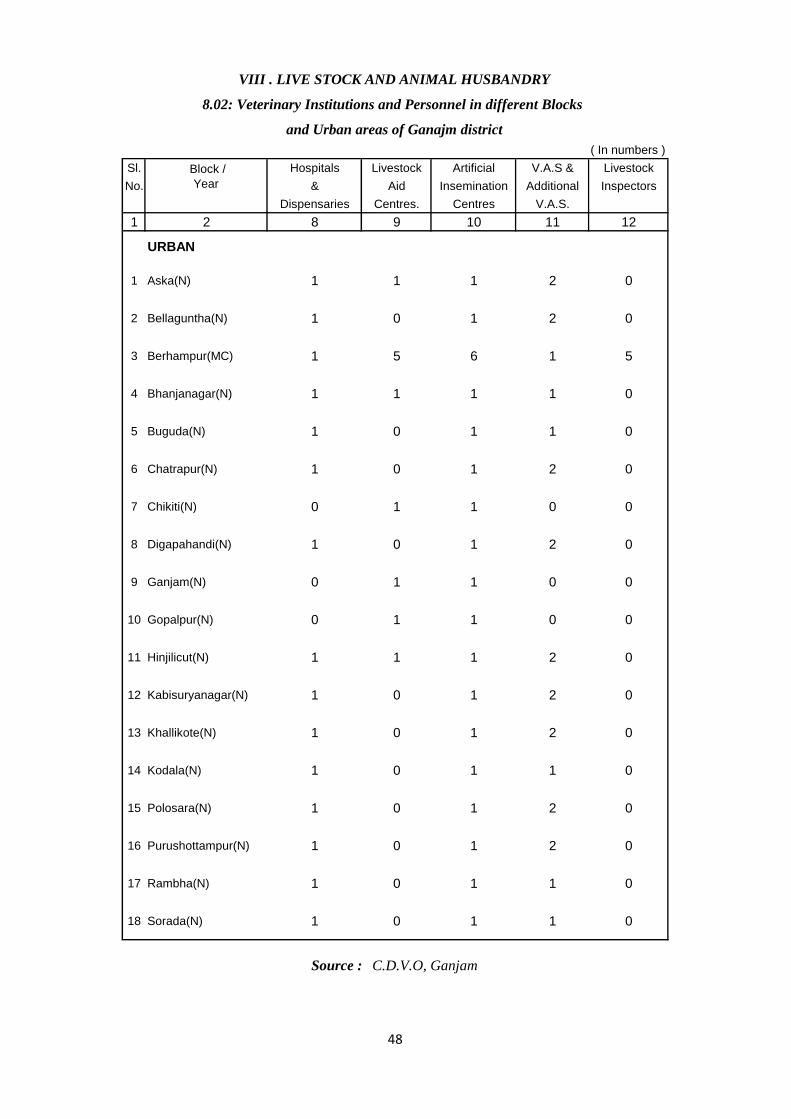
Sl. Hospitals Livestock Artificial V.A.S & Livestock
No. & Aid Insemination Additional Inspectors
Dispensaries Centres. Centres V.A.S.
1 2 8 9 10 11 12
URBAN
1 Aska(N) 1 1 1 2 0
2 Bellaguntha(N) 1 0 1 2 0
3 Berhampur(MC) 1 5 6 1 5
4 Bhanjanagar(N) 1 1 1 1 0
5 Buguda(N) 1 0 1 1 0
6 Chatrapur(N) 1 0 1 2 0
7 Chikiti(N) 0 1 1 0 0
8 Digapahandi(N) 1 0 1 2 0
9 Ganjam(N) 0 1 1 0 0
10 Gopalpur(N) 0 1 1 0 0
11 Hinjilicut(N) 1 1 1 2 0
12 Kabisuryanagar(N) 1 0 1 2 0
13 Khallikote(N) 1 0 1 2 0
14 Kodala(N) 1 0 1 1 0
15 Polosara(N) 1 0 1 2 0
16 Purushottampur(N) 1 0 1 2 0
17 Rambha(N) 1 0 1 1 0
18 Sorada(N) 1 0 1 1 0
Source : C.D.V.O, Ganjam
Block /
Year
VIII . LIVE STOCK AND ANIMAL HUSBANDRY
8.02: Veterinary Institutions and Personnel in different Blocks
and Urban areas of Ganajm district
( In numbers )
48
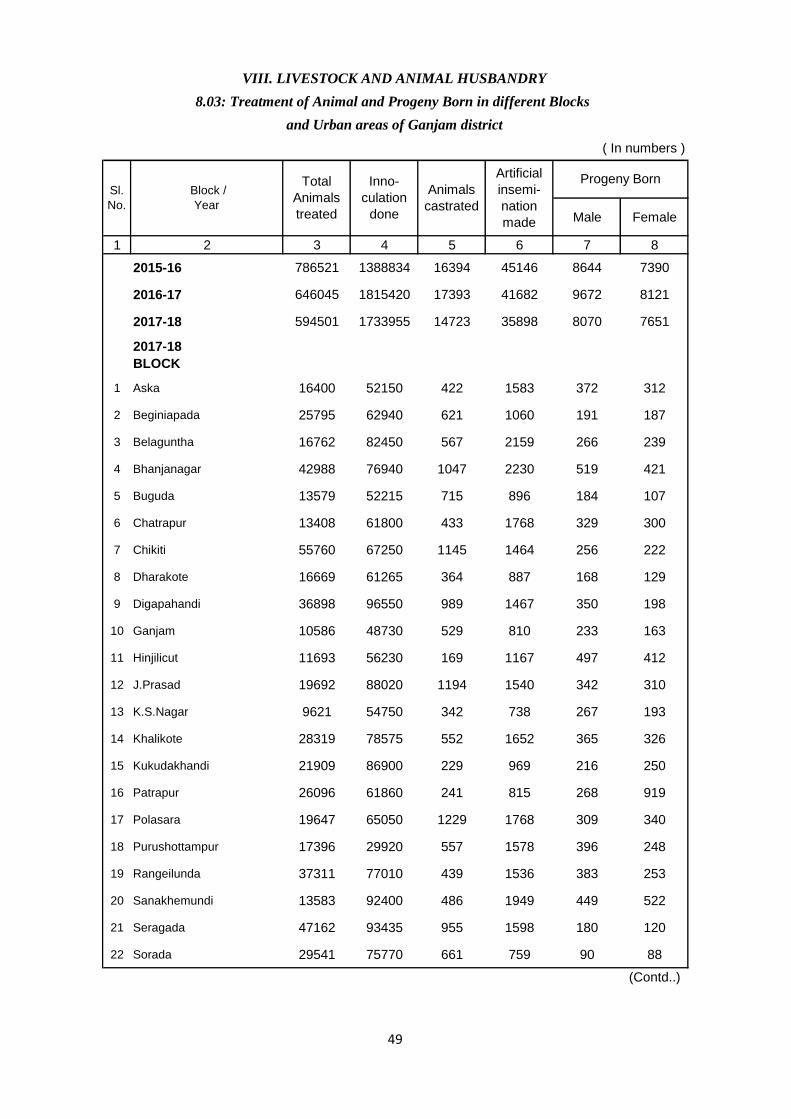
Male Female
1 2 3 4 5 6 7 8
2015-16 786521 1388834 16394 45146 8644 7390
2016-17 646045 1815420 17393 41682 9672 8121
2017-18 594501 1733955 14723 35898 8070 7651
2017-18
BLOCK
1 Aska 16400 52150 422 1583 372 312
2 Beginiapada 25795 62940 621 1060 191 187
3 Belaguntha 16762 82450 567 2159 266 239
4 Bhanjanagar 42988 76940 1047 2230 519 421
5 Buguda 13579 52215 715 896 184 107
6 Chatrapur 13408 61800 433 1768 329 300
7 Chikiti 55760 67250 1145 1464 256 222
8 Dharakote 16669 61265 364 887 168 129
9 Digapahandi 36898 96550 989 1467 350 198
10 Ganjam 10586 48730 529 810 233 163
11 Hinjilicut 11693 56230 169 1167 497 412
12 J.Prasad 19692 88020 1194 1540 342 310
13 K.S.Nagar 9621 54750 342 738 267 193
14 Khalikote 28319 78575 552 1652 365 326
15 Kukudakhandi 21909 86900 229 969 216 250
16 Patrapur 26096 61860 241 815 268 919
17 Polasara 19647 65050 1229 1768 309 340
18 Purushottampur 17396 29920 557 1578 396 248
19 Rangeilunda 37311 77010 439 1536 383 253
20 Sanakhemundi 13583 92400 486 1949 449 522
21 Seragada 47162 93435 955 1598 180 120
22 Sorada 29541 75770 661 759 90 88
(Contd..)
VIII. LIVESTOCK AND ANIMAL HUSBANDRY
8.03: Treatment of Animal and Progeny Born in different Blocks
and Urban areas of Ganjam district
( In numbers )
Block /
Year
Total
Animals
treated
Inno-
culation
done
Animals
castrated
Artificial
insemi-
nation
made
Progeny BornSl.
No.
49
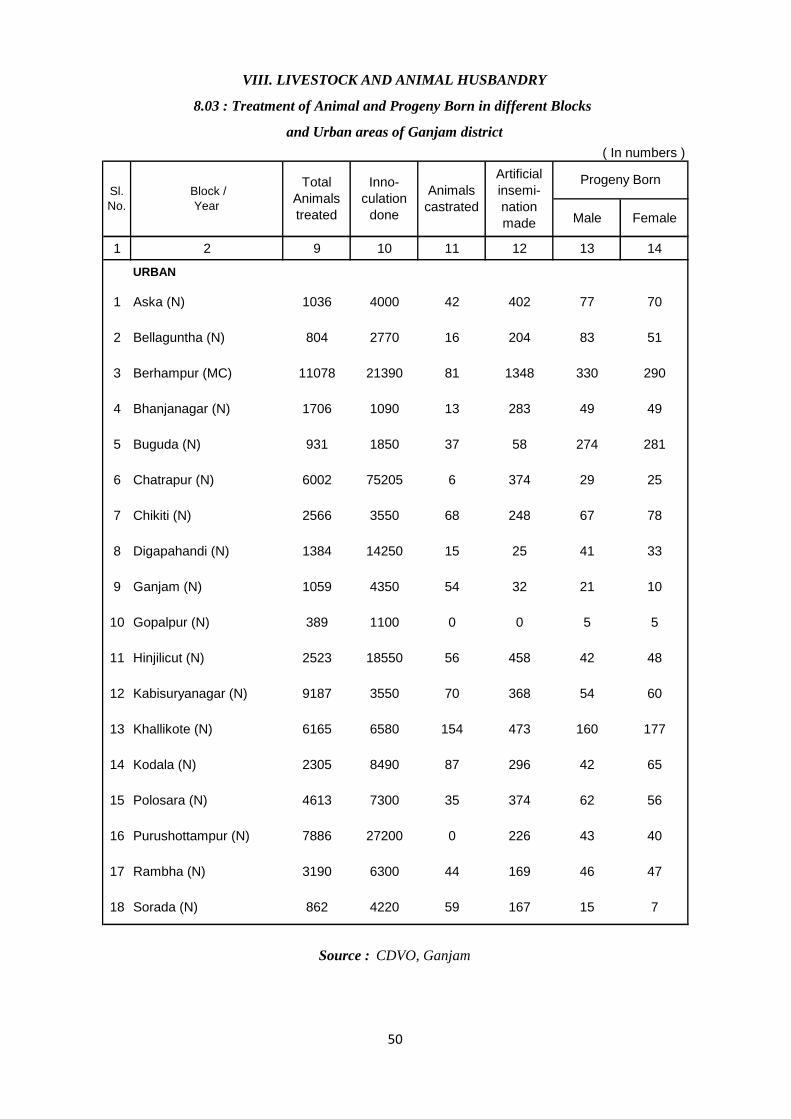
Male Female
1 2 9 10 11 12 13 14
URBAN
1 Aska (N) 1036 4000 42 402 77 70
2 Bellaguntha (N) 804 2770 16 204 83 51
3 Berhampur (MC) 11078 21390 81 1348 330 290
4 Bhanjanagar (N) 1706 1090 13 283 49 49
5 Buguda (N) 931 1850 37 58 274 281
6 Chatrapur (N) 6002 75205 6 374 29 25
7 Chikiti (N) 2566 3550 68 248 67 78
8 Digapahandi (N) 1384 14250 15 25 41 33
9 Ganjam (N) 1059 4350 54 32 21 10
10 Gopalpur (N) 389 1100 0 0 5 5
11 Hinjilicut (N) 2523 18550 56 458 42 48
12 Kabisuryanagar (N) 9187 3550 70 368 54 60
13 Khallikote (N) 6165 6580 154 473 160 177
14 Kodala (N) 2305 8490 87 296 42 65
15 Polosara (N) 4613 7300 35 374 62 56
16 Purushottampur (N) 7886 27200 0 226 43 40
17 Rambha (N) 3190 6300 44 169 46 47
18 Sorada (N) 862 4220 59 167 15 7
Source : CDVO, Ganjam
Sl.
No.
Block /
Year
Total
Animals
treated
Inno-
culation
done
Animals
castrated
Artificial
insemi-
nation
made
Progeny Born
VIII. LIVESTOCK AND ANIMAL HUSBANDRY
8.03 : Treatment of Animal and Progeny Born in different Blocks
and Urban areas of Ganjam district
( In numbers )
50
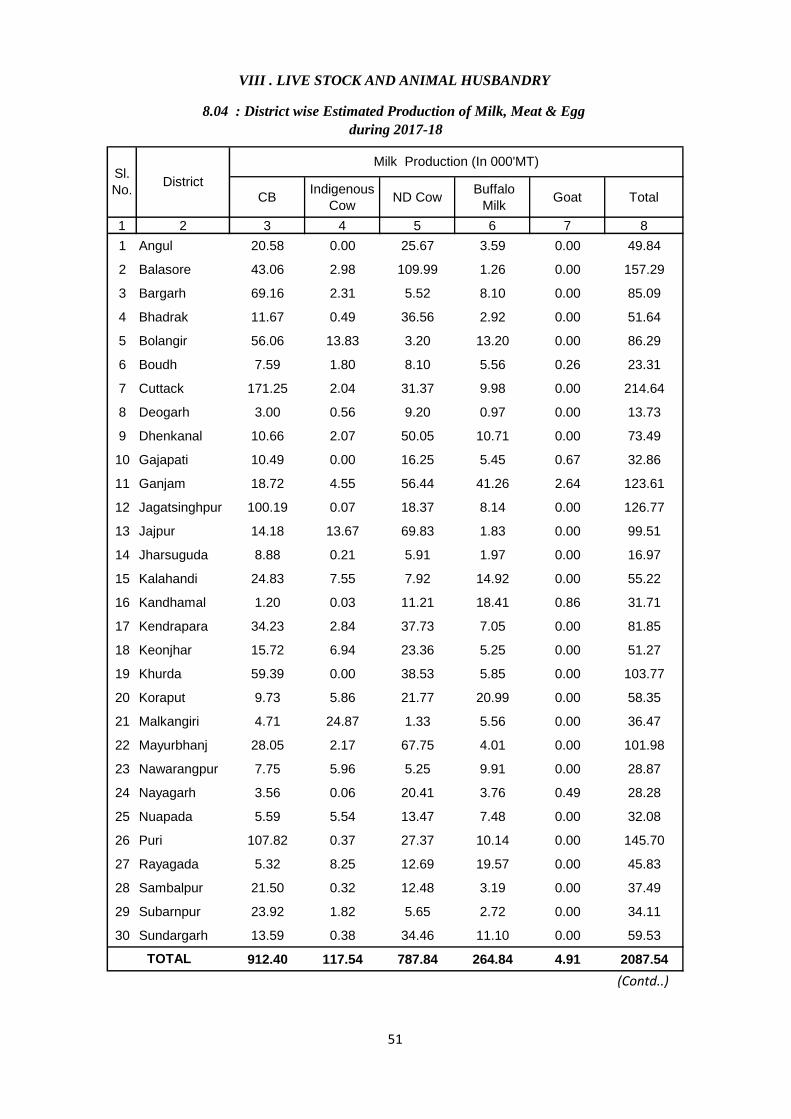
CBIndigenous
CowND Cow
Buffalo
MilkGoat Total
1 2 3 4 5 6 7 8
1 Angul 20.58 0.00 25.67 3.59 0.00 49.84
2 Balasore 43.06 2.98 109.99 1.26 0.00 157.29
3 Bargarh 69.16 2.31 5.52 8.10 0.00 85.09
4 Bhadrak 11.67 0.49 36.56 2.92 0.00 51.64
5 Bolangir 56.06 13.83 3.20 13.20 0.00 86.29
6 Boudh 7.59 1.80 8.10 5.56 0.26 23.31
7 Cuttack 171.25 2.04 31.37 9.98 0.00 214.64
8 Deogarh 3.00 0.56 9.20 0.97 0.00 13.73
9 Dhenkanal 10.66 2.07 50.05 10.71 0.00 73.49
10 Gajapati 10.49 0.00 16.25 5.45 0.67 32.86
11 Ganjam 18.72 4.55 56.44 41.26 2.64 123.61
12 Jagatsinghpur 100.19 0.07 18.37 8.14 0.00 126.77
13 Jajpur 14.18 13.67 69.83 1.83 0.00 99.51
14 Jharsuguda 8.88 0.21 5.91 1.97 0.00 16.97
15 Kalahandi 24.83 7.55 7.92 14.92 0.00 55.22
16 Kandhamal 1.20 0.03 11.21 18.41 0.86 31.71
17 Kendrapara 34.23 2.84 37.73 7.05 0.00 81.85
18 Keonjhar 15.72 6.94 23.36 5.25 0.00 51.27
19 Khurda 59.39 0.00 38.53 5.85 0.00 103.77
20 Koraput 9.73 5.86 21.77 20.99 0.00 58.35
21 Malkangiri 4.71 24.87 1.33 5.56 0.00 36.47
22 Mayurbhanj 28.05 2.17 67.75 4.01 0.00 101.98
23 Nawarangpur 7.75 5.96 5.25 9.91 0.00 28.87
24 Nayagarh 3.56 0.06 20.41 3.76 0.49 28.28
25 Nuapada 5.59 5.54 13.47 7.48 0.00 32.08
26 Puri 107.82 0.37 27.37 10.14 0.00 145.70
27 Rayagada 5.32 8.25 12.69 19.57 0.00 45.83
28 Sambalpur 21.50 0.32 12.48 3.19 0.00 37.49
29 Subarnpur 23.92 1.82 5.65 2.72 0.00 34.11
30 Sundargarh 13.59 0.38 34.46 11.10 0.00 59.53
912.40 117.54 787.84 264.84 4.91 2087.54
(Contd..)
VIII . LIVE STOCK AND ANIMAL HUSBANDRY
8.04 : District wise Estimated Production of Milk, Meat & Egg
during 2017-18
TOTAL
Sl.
No.District
Milk Production (In 000'MT)
51
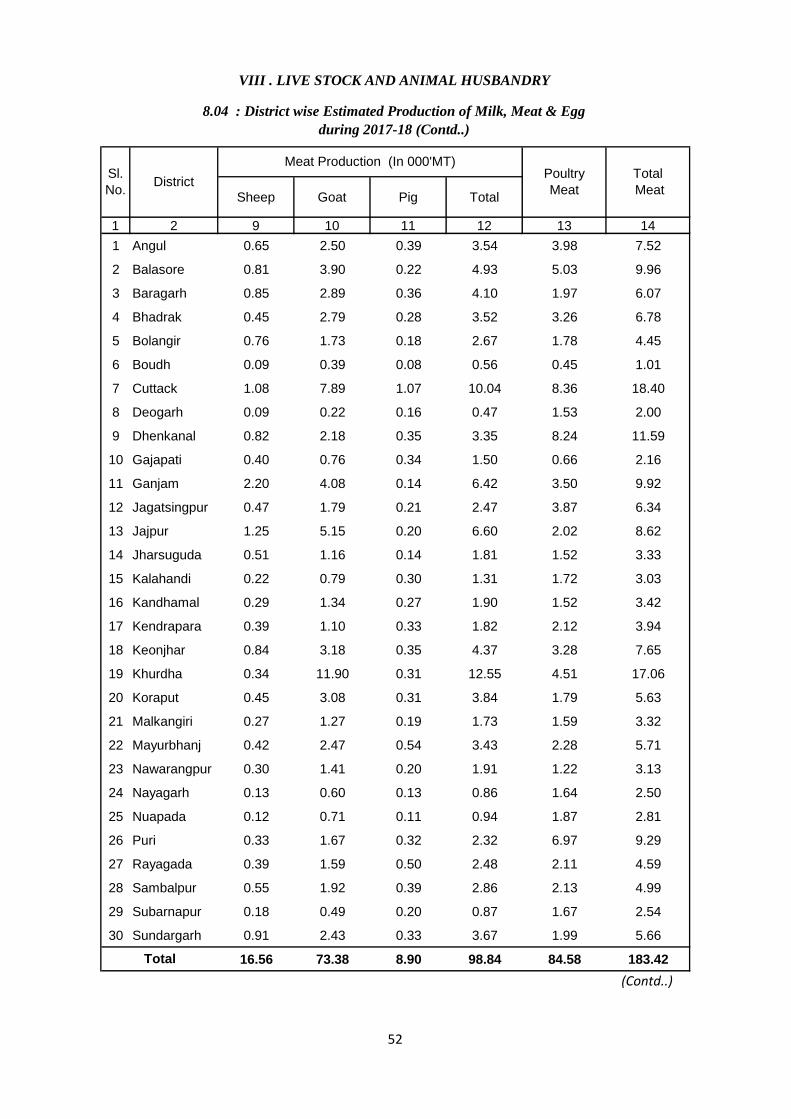
Sheep Goat Pig Total
1 2 9 10 11 12 13 14
1 Angul 0.65 2.50 0.39 3.54 3.98 7.52
2 Balasore 0.81 3.90 0.22 4.93 5.03 9.96
3 Baragarh 0.85 2.89 0.36 4.10 1.97 6.07
4 Bhadrak 0.45 2.79 0.28 3.52 3.26 6.78
5 Bolangir 0.76 1.73 0.18 2.67 1.78 4.45
6 Boudh 0.09 0.39 0.08 0.56 0.45 1.01
7 Cuttack 1.08 7.89 1.07 10.04 8.36 18.40
8 Deogarh 0.09 0.22 0.16 0.47 1.53 2.00
9 Dhenkanal 0.82 2.18 0.35 3.35 8.24 11.59
10 Gajapati 0.40 0.76 0.34 1.50 0.66 2.16
11 Ganjam 2.20 4.08 0.14 6.42 3.50 9.92
12 Jagatsingpur 0.47 1.79 0.21 2.47 3.87 6.34
13 Jajpur 1.25 5.15 0.20 6.60 2.02 8.62
14 Jharsuguda 0.51 1.16 0.14 1.81 1.52 3.33
15 Kalahandi 0.22 0.79 0.30 1.31 1.72 3.03
16 Kandhamal 0.29 1.34 0.27 1.90 1.52 3.42
17 Kendrapara 0.39 1.10 0.33 1.82 2.12 3.94
18 Keonjhar 0.84 3.18 0.35 4.37 3.28 7.65
19 Khurdha 0.34 11.90 0.31 12.55 4.51 17.06
20 Koraput 0.45 3.08 0.31 3.84 1.79 5.63
21 Malkangiri 0.27 1.27 0.19 1.73 1.59 3.32
22 Mayurbhanj 0.42 2.47 0.54 3.43 2.28 5.71
23 Nawarangpur 0.30 1.41 0.20 1.91 1.22 3.13
24 Nayagarh 0.13 0.60 0.13 0.86 1.64 2.50
25 Nuapada 0.12 0.71 0.11 0.94 1.87 2.81
26 Puri 0.33 1.67 0.32 2.32 6.97 9.29
27 Rayagada 0.39 1.59 0.50 2.48 2.11 4.59
28 Sambalpur 0.55 1.92 0.39 2.86 2.13 4.99
29 Subarnapur 0.18 0.49 0.20 0.87 1.67 2.54
30 Sundargarh 0.91 2.43 0.33 3.67 1.99 5.66
16.56 73.38 8.90 98.84 84.58 183.42
(Contd..)
VIII . LIVE STOCK AND ANIMAL HUSBANDRY
8.04 : District wise Estimated Production of Milk, Meat & Egg
during 2017-18 (Contd..)
Total
Sl.
No.District
Meat Production (In 000'MT)Poultry
Meat
Total
Meat
52
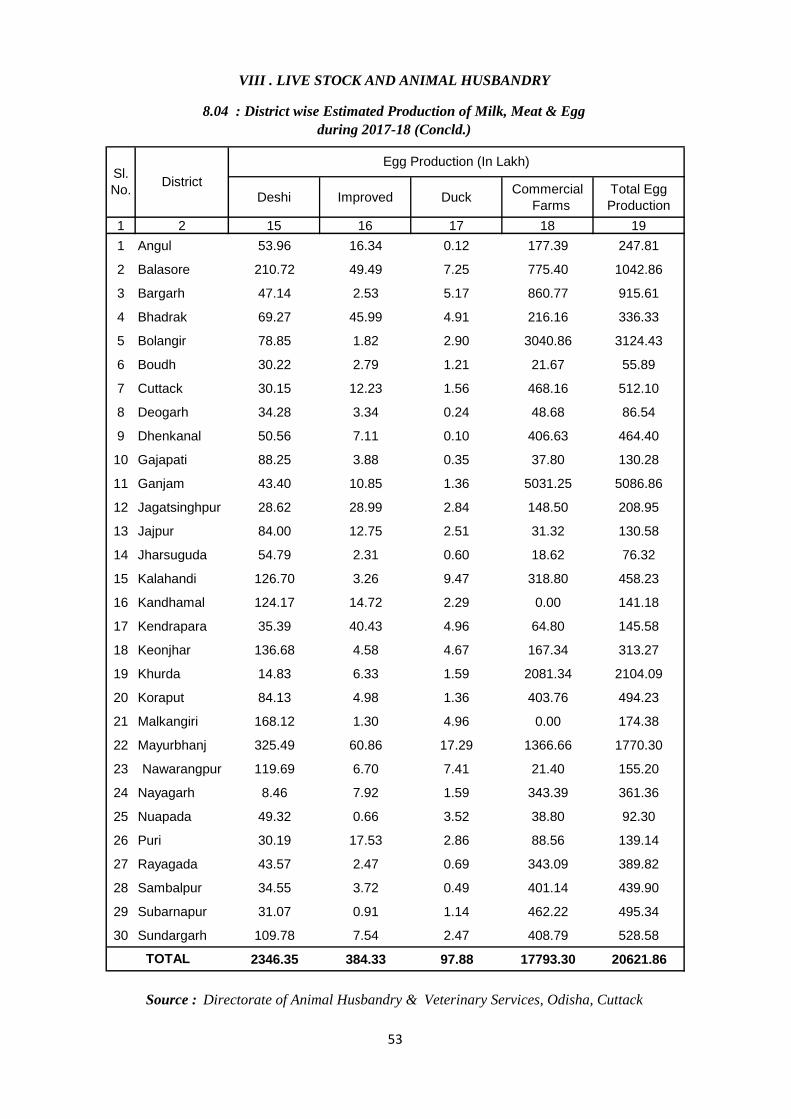
Deshi Improved DuckCommercial
Farms
Total Egg
Production
1 2 15 16 17 18 19
1 Angul 53.96 16.34 0.12 177.39 247.81
2 Balasore 210.72 49.49 7.25 775.40 1042.86
3 Bargarh 47.14 2.53 5.17 860.77 915.61
4 Bhadrak 69.27 45.99 4.91 216.16 336.33
5 Bolangir 78.85 1.82 2.90 3040.86 3124.43
6 Boudh 30.22 2.79 1.21 21.67 55.89
7 Cuttack 30.15 12.23 1.56 468.16 512.10
8 Deogarh 34.28 3.34 0.24 48.68 86.54
9 Dhenkanal 50.56 7.11 0.10 406.63 464.40
10 Gajapati 88.25 3.88 0.35 37.80 130.28
11 Ganjam 43.40 10.85 1.36 5031.25 5086.86
12 Jagatsinghpur 28.62 28.99 2.84 148.50 208.95
13 Jajpur 84.00 12.75 2.51 31.32 130.58
14 Jharsuguda 54.79 2.31 0.60 18.62 76.32
15 Kalahandi 126.70 3.26 9.47 318.80 458.23
16 Kandhamal 124.17 14.72 2.29 0.00 141.18
17 Kendrapara 35.39 40.43 4.96 64.80 145.58
18 Keonjhar 136.68 4.58 4.67 167.34 313.27
19 Khurda 14.83 6.33 1.59 2081.34 2104.09
20 Koraput 84.13 4.98 1.36 403.76 494.23
21 Malkangiri 168.12 1.30 4.96 0.00 174.38
22 Mayurbhanj 325.49 60.86 17.29 1366.66 1770.30
23 Nawarangpur 119.69 6.70 7.41 21.40 155.20
24 Nayagarh 8.46 7.92 1.59 343.39 361.36
25 Nuapada 49.32 0.66 3.52 38.80 92.30
26 Puri 30.19 17.53 2.86 88.56 139.14
27 Rayagada 43.57 2.47 0.69 343.09 389.82
28 Sambalpur 34.55 3.72 0.49 401.14 439.90
29 Subarnapur 31.07 0.91 1.14 462.22 495.34
30 Sundargarh 109.78 7.54 2.47 408.79 528.58
2346.35 384.33 97.88 17793.30 20621.86
VIII . LIVE STOCK AND ANIMAL HUSBANDRY
8.04 : District wise Estimated Production of Milk, Meat & Egg
during 2017-18 (Concld.)
TOTAL
Source : Directorate of Animal Husbandry & Veterinary Services, Odisha, Cuttack
Sl.
No.District
Egg Production (In Lakh)
53
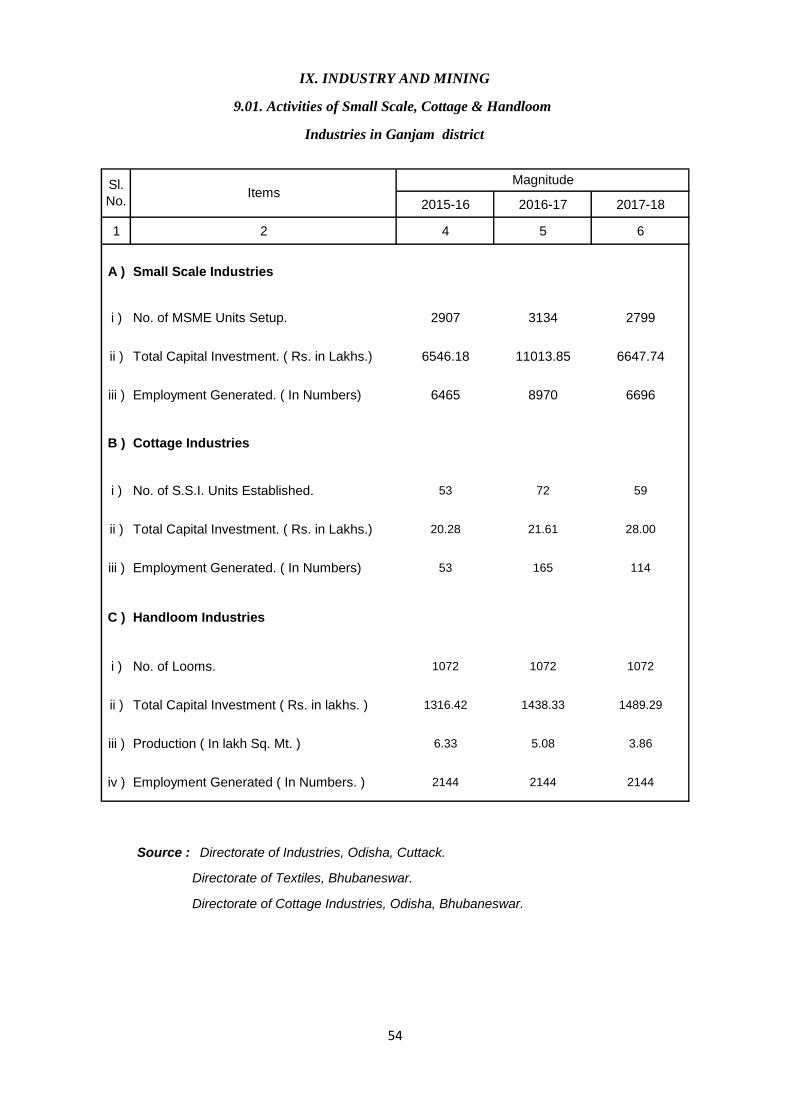
2015-16 2016-17 2017-18
1 2 4 5 6
A ) Small Scale Industries
i ) No. of MSME Units Setup. 2907 3134 2799
ii ) Total Capital Investment. ( Rs. in Lakhs.) 6546.18 11013.85 6647.74
iii ) Employment Generated. ( In Numbers) 6465 8970 6696
B ) Cottage Industries
i ) No. of S.S.I. Units Established. 53 72 59
ii ) Total Capital Investment. ( Rs. in Lakhs.) 20.28 21.61 28.00
iii ) Employment Generated. ( In Numbers) 53 165 114
C ) Handloom Industries
i ) No. of Looms. 1072 1072 1072
ii ) Total Capital Investment ( Rs. in lakhs. ) 1316.42 1438.33 1489.29
iii ) Production ( In lakh Sq. Mt. ) 6.33 5.08 3.86
iv ) Employment Generated ( In Numbers. ) 2144 2144 2144
Source : Directorate of Industries, Odisha, Cuttack.
Directorate of Textiles, Bhubaneswar.
Directorate of Cottage Industries, Odisha, Bhubaneswar.
IX. INDUSTRY AND MINING
9.01. Activities of Small Scale, Cottage & Handloom
Industries in Ganjam district
Sl.
No.Items
Magnitude
54
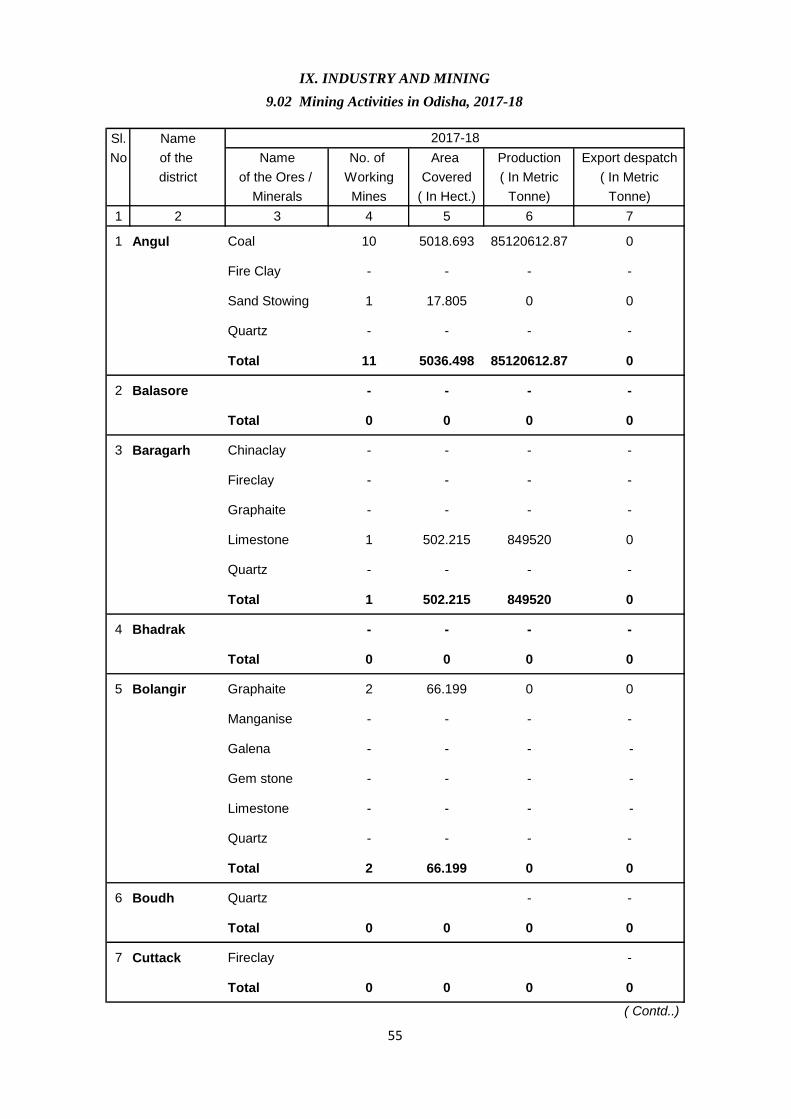
Sl. Name
No of the Name No. of Area Production Export despatch
district of the Ores / Working Covered ( In Metric ( In Metric
Minerals Mines ( In Hect.) Tonne) Tonne)
1 2 3 4 5 6 7
1 Angul Coal 10 5018.693 85120612.87 0
Fire Clay - - - -
Sand Stowing 1 17.805 0 0
Quartz - - - -
Total 11 5036.498 85120612.87 0
2 Balasore - - - -
Total 0 0 0 0
3 Baragarh Chinaclay - - - -
Fireclay - - - -
Graphaite - - - -
Limestone 1 502.215 849520 0
Quartz - - - -
Total 1 502.215 849520 0
4 Bhadrak - - - -
Total 0 0 0 0
5 Bolangir Graphaite 2 66.199 0 0
Manganise - - - -
Galena - - - -
Gem stone - - - -
Limestone - - - -
Quartz - - - -
Total 2 66.199 0 0
6 Boudh Quartz - -
Total 0 0 0 0
7 Cuttack Fireclay -
Total 0 0 0 0
( Contd..)
IX. INDUSTRY AND MINING
9.02 Mining Activities in Odisha, 2017-18
2017-18
55
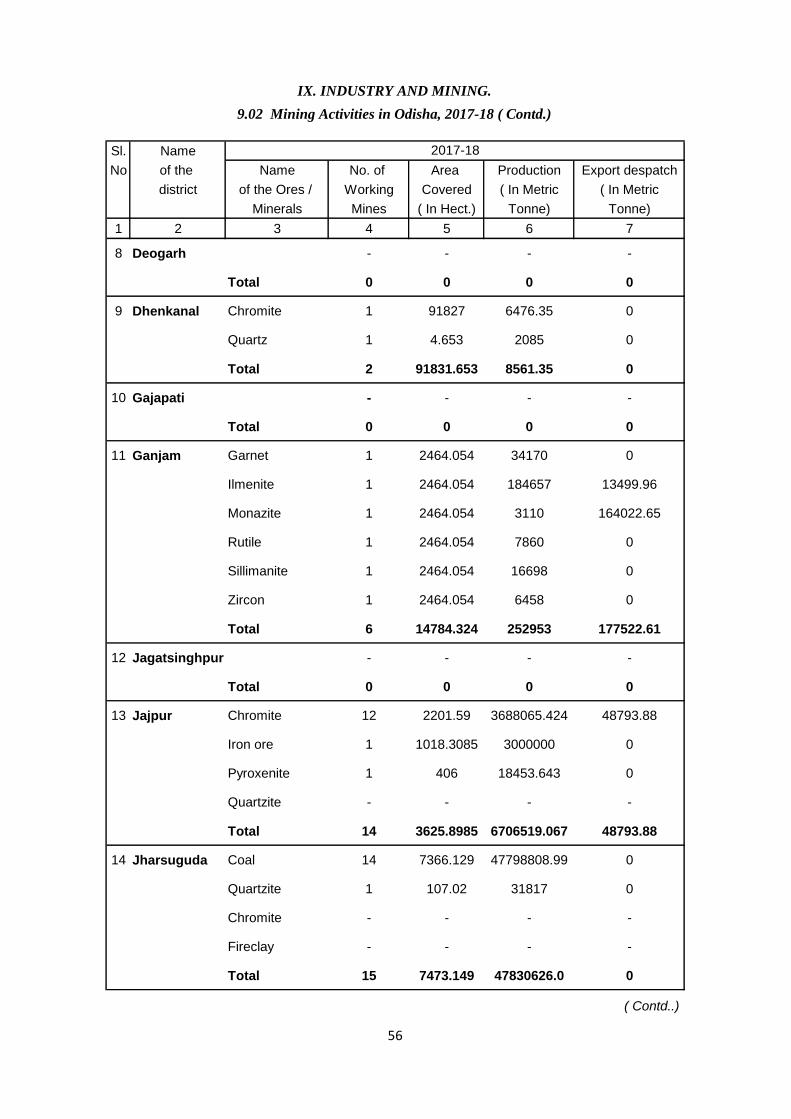
Sl. Name
No of the Name No. of Area Production Export despatch
district of the Ores / Working Covered ( In Metric ( In Metric
Minerals Mines ( In Hect.) Tonne) Tonne)
1 2 3 4 5 6 7
8 Deogarh - - - -
Total 0 0 0 0
9 Dhenkanal Chromite 1 91827 6476.35 0
Quartz 1 4.653 2085 0
Total 2 91831.653 8561.35 0
10 Gajapati - - - -
Total 0 0 0 0
11 Ganjam Garnet 1 2464.054 34170 0
Ilmenite 1 2464.054 184657 13499.96
Monazite 1 2464.054 3110 164022.65
Rutile 1 2464.054 7860 0
Sillimanite 1 2464.054 16698 0
Zircon 1 2464.054 6458 0
Total 6 14784.324 252953 177522.61
12 Jagatsinghpur - - - -
Total 0 0 0 0
13 Jajpur Chromite 12 2201.59 3688065.424 48793.88
Iron ore 1 1018.3085 3000000 0
Pyroxenite 1 406 18453.643 0
Quartzite - - - -
Total 14 3625.8985 6706519.067 48793.88
14 Jharsuguda Coal 14 7366.129 47798808.99 0
Quartzite 1 107.02 31817 0
Chromite - - - -
Fireclay - - - -
Total 15 7473.149 47830626.0 0
( Contd..)
IX. INDUSTRY AND MINING.
9.02 Mining Activities in Odisha, 2017-18 ( Contd.)
2017-18
56
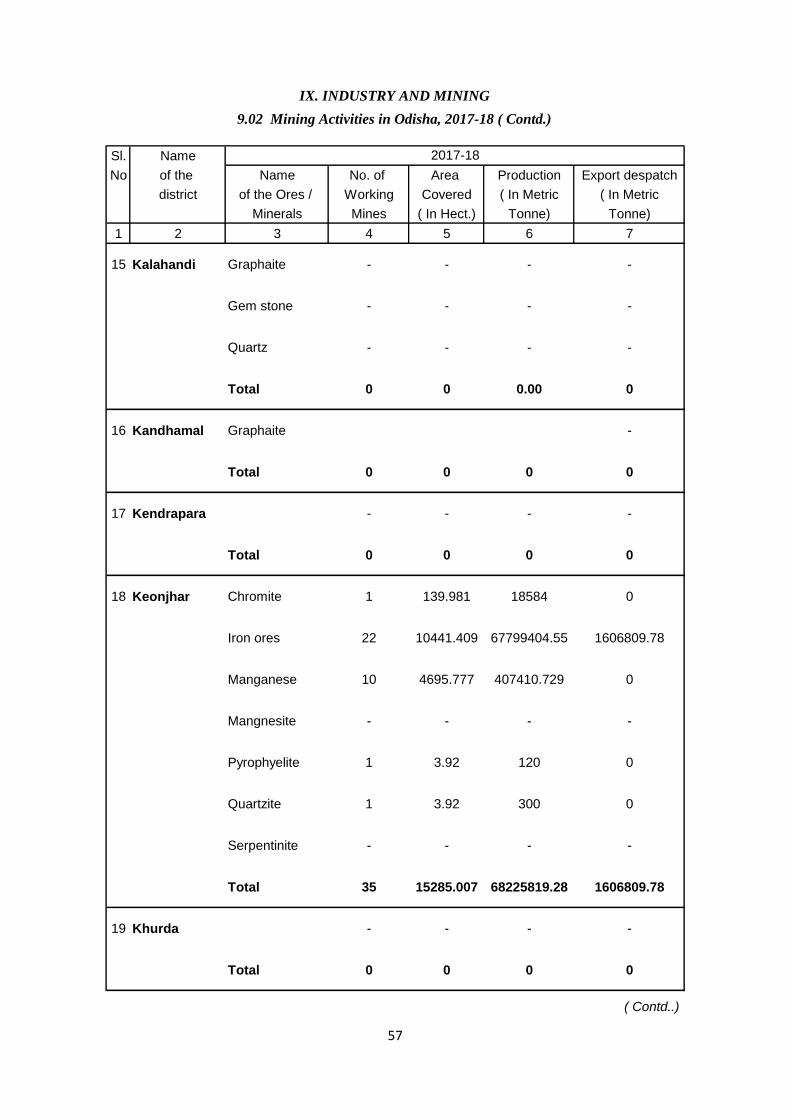
Sl. Name
No of the Name No. of Area Production Export despatch
district of the Ores / Working Covered ( In Metric ( In Metric
Minerals Mines ( In Hect.) Tonne) Tonne)
1 2 3 4 5 6 7
15 Kalahandi Graphaite - - - -
Gem stone - - - -
Quartz - - - -
Total 0 0 0.00 0
16 Kandhamal Graphaite -
Total 0 0 0 0
17 Kendrapara - - - -
Total 0 0 0 0
18 Keonjhar Chromite 1 139.981 18584 0
Iron ores 22 10441.409 67799404.55 1606809.78
Manganese 10 4695.777 407410.729 0
Mangnesite - - - -
Pyrophyelite 1 3.92 120 0
Quartzite 1 3.92 300 0
Serpentinite - - - -
Total 35 15285.007 68225819.28 1606809.78
19 Khurda - - - -
Total 0 0 0 0
( Contd..)
IX. INDUSTRY AND MINING
9.02 Mining Activities in Odisha, 2017-18 ( Contd.)
2017-18
57
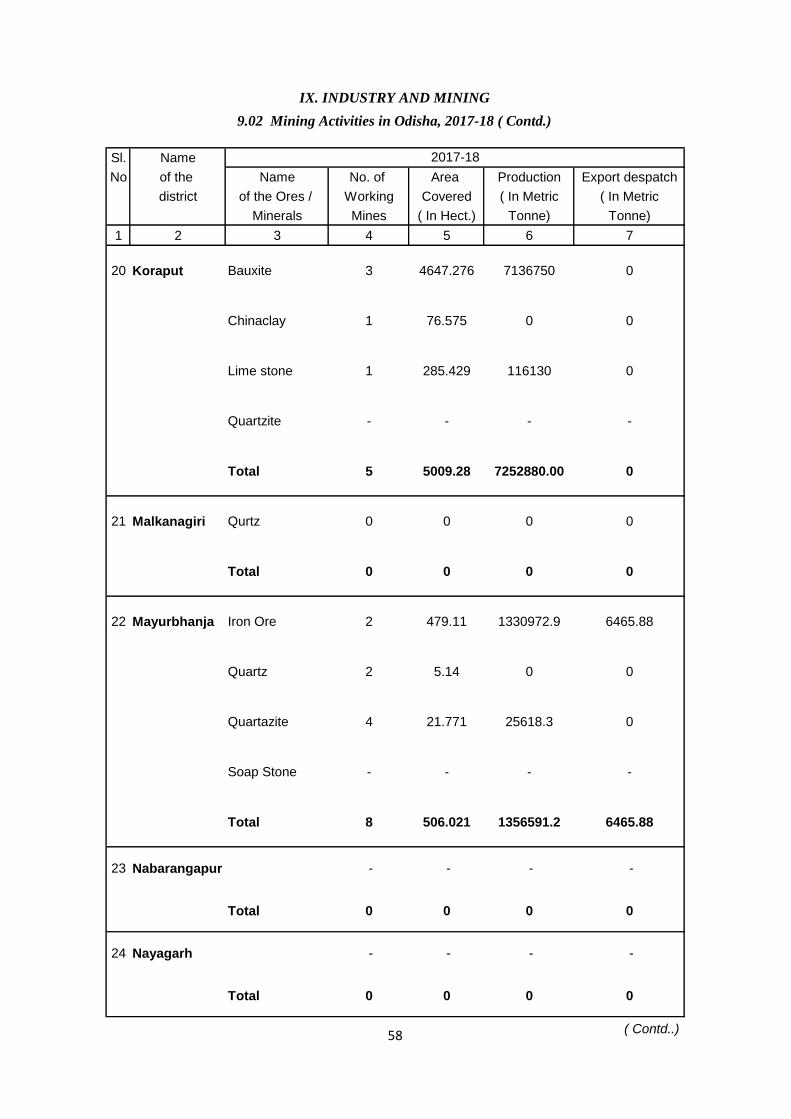
Sl. Name
No of the Name No. of Area Production Export despatch
district of the Ores / Working Covered ( In Metric ( In Metric
Minerals Mines ( In Hect.) Tonne) Tonne)
1 2 3 4 5 6 7
20 Koraput Bauxite 3 4647.276 7136750 0
Chinaclay 1 76.575 0 0
Lime stone 1 285.429 116130 0
Quartzite - - - -
Total 5 5009.28 7252880.00 0
21 Malkanagiri Qurtz 0 0 0 0
Total 0 0 0 0
22 Mayurbhanja Iron Ore 2 479.11 1330972.9 6465.88
Quartz 2 5.14 0 0
Quartazite 4 21.771 25618.3 0
Soap Stone - - - -
Total 8 506.021 1356591.2 6465.88
23 Nabarangapur - - - -
Total 0 0 0 0
24 Nayagarh - - - -
Total 0 0 0 0
( Contd..)
2017-18
IX. INDUSTRY AND MINING
9.02 Mining Activities in Odisha, 2017-18 ( Contd.)
58
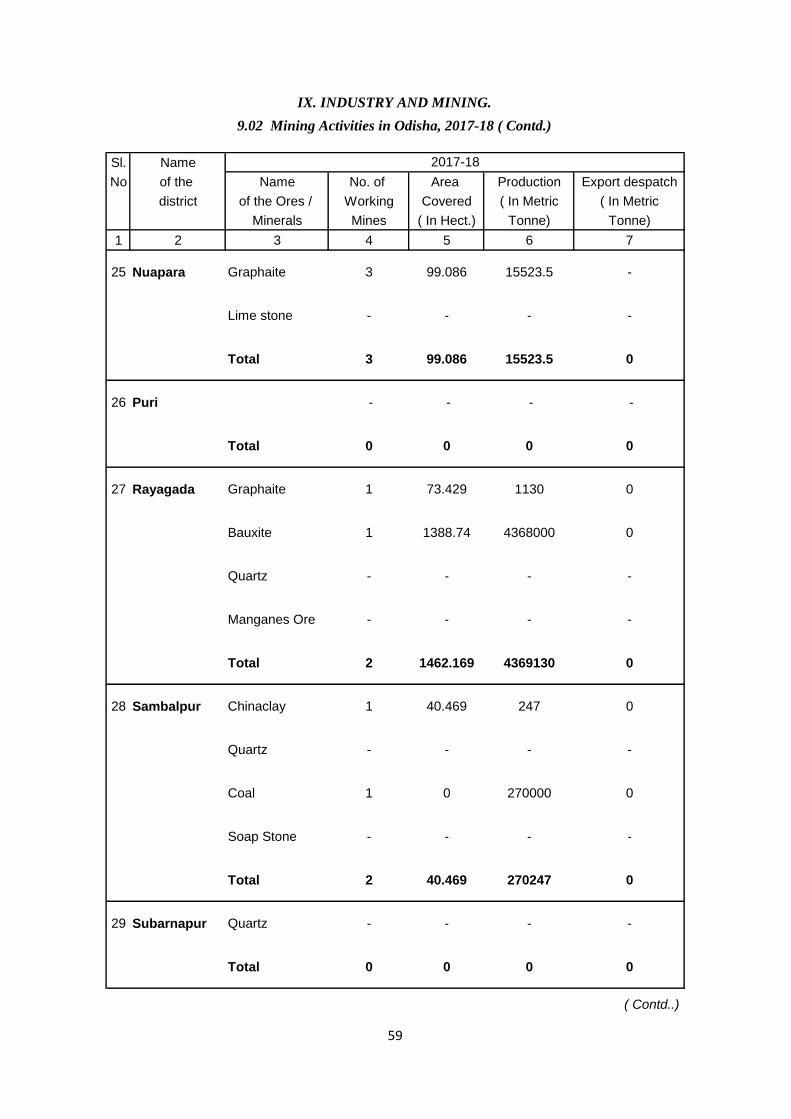
Sl. Name
No of the Name No. of Area Production Export despatch
district of the Ores / Working Covered ( In Metric ( In Metric
Minerals Mines ( In Hect.) Tonne) Tonne)
1 2 3 4 5 6 7
25 Nuapara Graphaite 3 99.086 15523.5 -
Lime stone - - - -
Total 3 99.086 15523.5 0
26 Puri - - - -
Total 0 0 0 0
27 Rayagada Graphaite 1 73.429 1130 0
Bauxite 1 1388.74 4368000 0
Quartz - - - -
Manganes Ore - - - -
Total 2 1462.169 4369130 0
28 Sambalpur Chinaclay 1 40.469 247 0
Quartz - - - -
Coal 1 0 270000 0
Soap Stone - - - -
Total 2 40.469 270247 0
29 Subarnapur Quartz - - - -
Total 0 0 0 0
( Contd..)
IX. INDUSTRY AND MINING.
9.02 Mining Activities in Odisha, 2017-18 ( Contd.)
2017-18
59
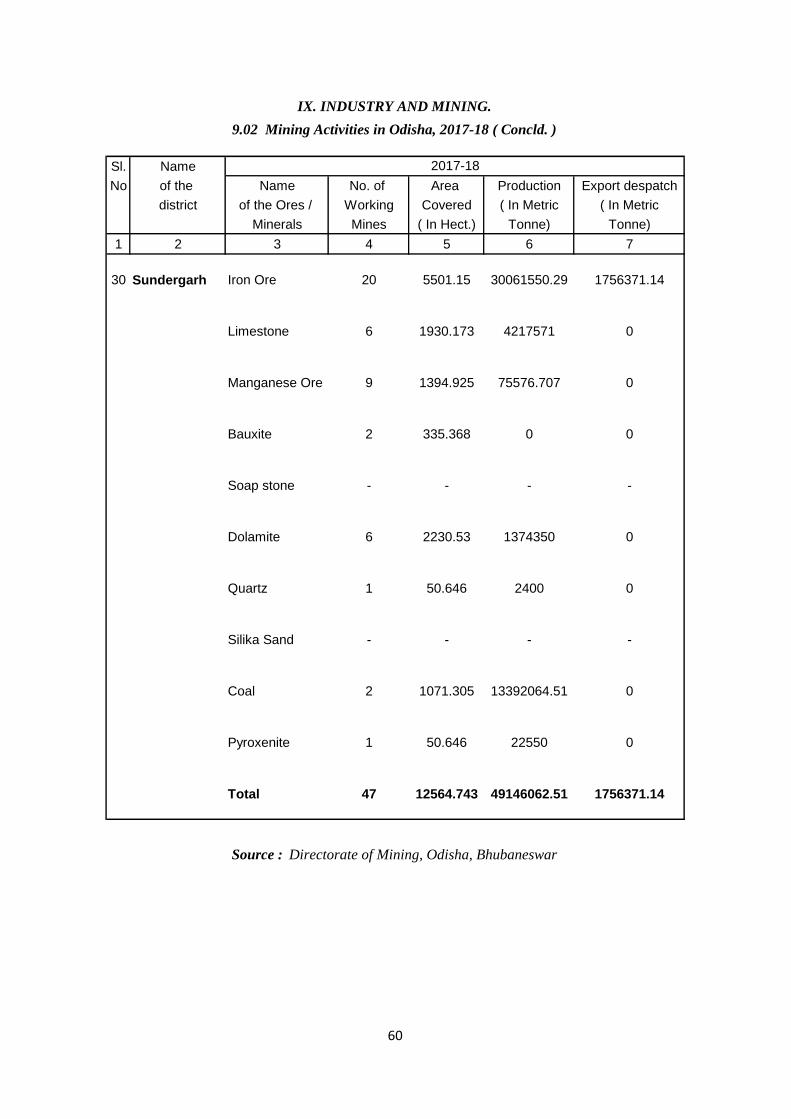
Sl. Name
No of the Name No. of Area Production Export despatch
district of the Ores / Working Covered ( In Metric ( In Metric
Minerals Mines ( In Hect.) Tonne) Tonne)
1 2 3 4 5 6 7
30 Sundergarh Iron Ore 20 5501.15 30061550.29 1756371.14
Limestone 6 1930.173 4217571 0
Manganese Ore 9 1394.925 75576.707 0
Bauxite 2 335.368 0 0
Soap stone - - - -
Dolamite 6 2230.53 1374350 0
Quartz 1 50.646 2400 0
Silika Sand - - - -
Coal 2 1071.305 13392064.51 0
Pyroxenite 1 50.646 22550 0
Total 47 12564.743 49146062.51 1756371.14
Source : Directorate of Mining, Odisha, Bhubaneswar
IX. INDUSTRY AND MINING.
9.02 Mining Activities in Odisha, 2017-18 ( Concld. )
2017-18
60

Sl. Name of the Total Village declared Balance Number % of
No. District Inhabited Electrified of Un-electrified Villages
Villages as on Villages Electrified
(2011 Census) 31.03.18 31.03.18
1 2 3 4 5 6
1 Angul 1654 1652 2 99.9
2 Balasore 2635 2633 2 99.9
3 Baragarh 1179 1179 0 100.0
4 Bhadrak 1250 1242 8 99.4
5 Bolangir 1751 1751 0 100.0
6 Boudh 1117 1101 16 98.6
7 Cuttack 1856 1852 4 99.8
8 Deogarh 718 706 12 98.3
9 Dhenkanal 1081 1081 0 100.0
10 Gajapati 1499 1382 117 92.2
11 Ganjam 2783 2753 30 98.9
12 Jagatsinghpur 1223 1223 0 100.0
13 Jajpur 1598 1598 0 100.0
14 Jharsuguda 347 347 0 100.0
15 Kalahandi 2116 2047 69 96.7
16 Kandhamal 2417 2017 400 83.5
17 Kendrapara 1415 1385 30 97.9
18 Keonjhar 2064 2059 5 99.8
19 Khurda 1356 1356 0 100.0
20 Koraput 1941 1383 558 71.3
21 Malkangiri 995 898 97 90.3
22 Mayurbhanj 3751 3644 107 97.1
23 Nabarangpur 868 820 48 94.5
24 Nayagarh 1541 1534 7 99.5
25 Nuapada 656 656 0 100.0
26 Puri 1600 1576 24 98.5
27 Rayagada 2468 2220 248 90.0
28 Sambalpur 1229 1229 0 100.0
29 Subarnapur 856 856 0 100.0
30 Sundargarh 1713 1713 0 100.0
TOTAL 47677 45893 1784 96.3
X. POWER.
10.01 Villages Electrified in Odisha at the end of the Year 2017-18
Source : EIC, (ELECY)-CUM-PCEI, ODISHA
61
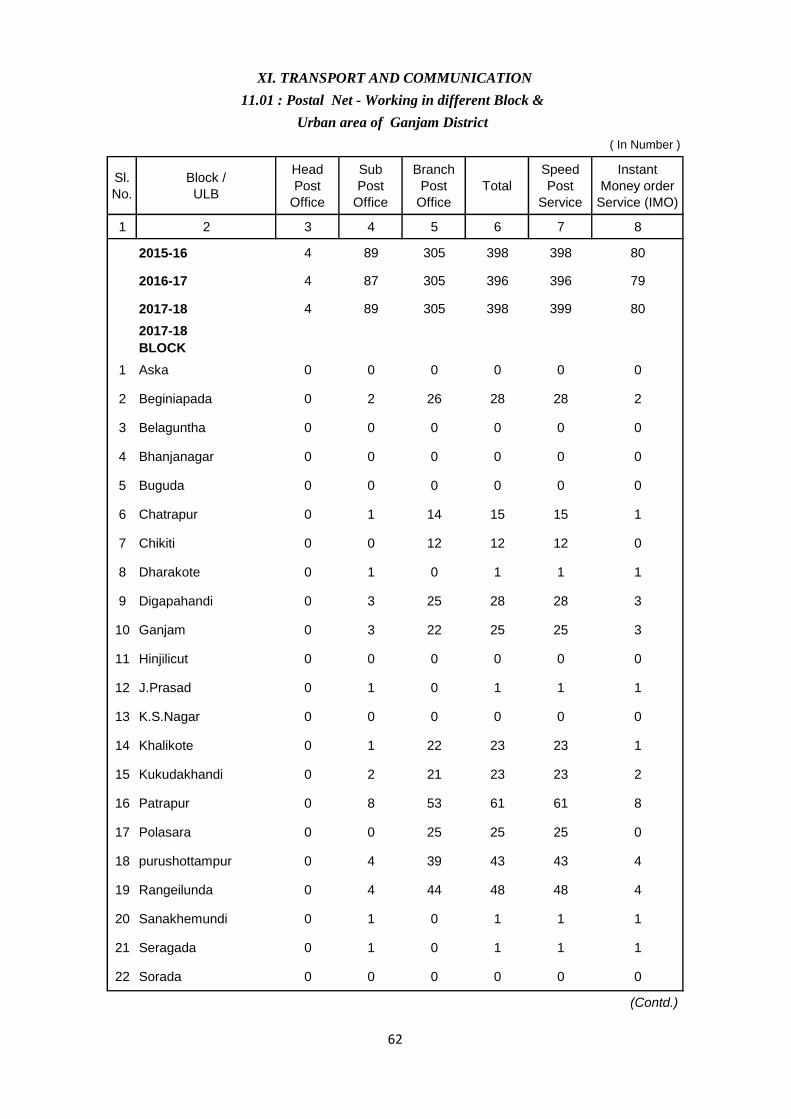
Sl.
No.
Block /
ULB
Head
Post
Office
Sub
Post
Office
Branch
Post
Office
Total
Speed
Post
Service
Instant
Money order
Service (IMO)
1 2 3 4 5 6 7 8
2015-16 4 89 305 398 398 80
2016-17 4 87 305 396 396 79
2017-18 4 89 305 398 399 80
2017-18
BLOCK
1 Aska 0 0 0 0 0 0
2 Beginiapada 0 2 26 28 28 2
3 Belaguntha 0 0 0 0 0 0
4 Bhanjanagar 0 0 0 0 0 0
5 Buguda 0 0 0 0 0 0
6 Chatrapur 0 1 14 15 15 1
7 Chikiti 0 0 12 12 12 0
8 Dharakote 0 1 0 1 1 1
9 Digapahandi 0 3 25 28 28 3
10 Ganjam 0 3 22 25 25 3
11 Hinjilicut 0 0 0 0 0 0
12 J.Prasad 0 1 0 1 1 1
13 K.S.Nagar 0 0 0 0 0 0
14 Khalikote 0 1 22 23 23 1
15 Kukudakhandi 0 2 21 23 23 2
16 Patrapur 0 8 53 61 61 8
17 Polasara 0 0 25 25 25 0
18 purushottampur 0 4 39 43 43 4
19 Rangeilunda 0 4 44 48 48 4
20 Sanakhemundi 0 1 0 1 1 1
21 Seragada 0 1 0 1 1 1
22 Sorada 0 0 0 0 0 0
(Contd.)
XI. TRANSPORT AND COMMUNICATION
11.01 : Postal Net - Working in different Block &
Urban area of Ganjam District
( In Number )
62
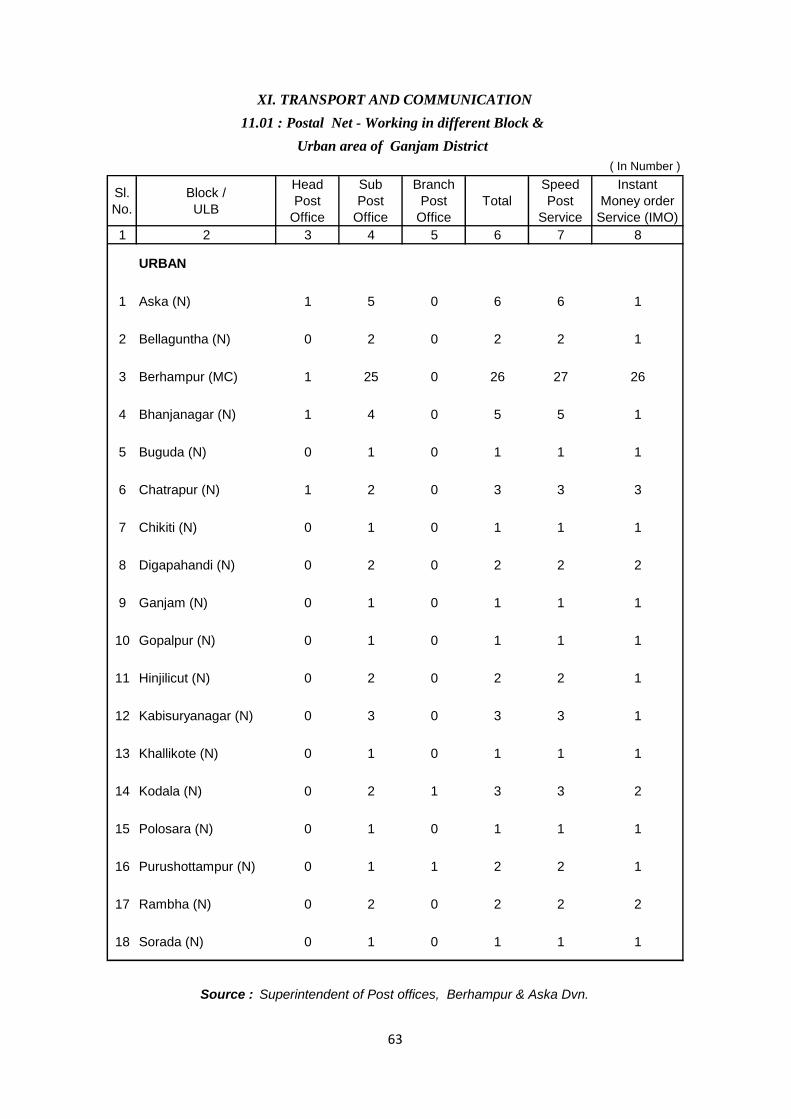
Sl.
No.
Block /
ULB
Head
Post
Office
Sub
Post
Office
Branch
Post
Office
Total
Speed
Post
Service
Instant
Money order
Service (IMO)
1 2 3 4 5 6 7 8
URBAN
1 Aska (N) 1 5 0 6 6 1
2 Bellaguntha (N) 0 2 0 2 2 1
3 Berhampur (MC) 1 25 0 26 27 26
4 Bhanjanagar (N) 1 4 0 5 5 1
5 Buguda (N) 0 1 0 1 1 1
6 Chatrapur (N) 1 2 0 3 3 3
7 Chikiti (N) 0 1 0 1 1 1
8 Digapahandi (N) 0 2 0 2 2 2
9 Ganjam (N) 0 1 0 1 1 1
10 Gopalpur (N) 0 1 0 1 1 1
11 Hinjilicut (N) 0 2 0 2 2 1
12 Kabisuryanagar (N) 0 3 0 3 3 1
13 Khallikote (N) 0 1 0 1 1 1
14 Kodala (N) 0 2 1 3 3 2
15 Polosara (N) 0 1 0 1 1 1
16 Purushottampur (N) 0 1 1 2 2 1
17 Rambha (N) 0 2 0 2 2 2
18 Sorada (N) 0 1 0 1 1 1
Source : Superintendent of Post offices, Berhampur & Aska Dvn.
XI. TRANSPORT AND COMMUNICATION
11.01 : Postal Net - Working in different Block &
Urban area of Ganjam District
( In Number )
63
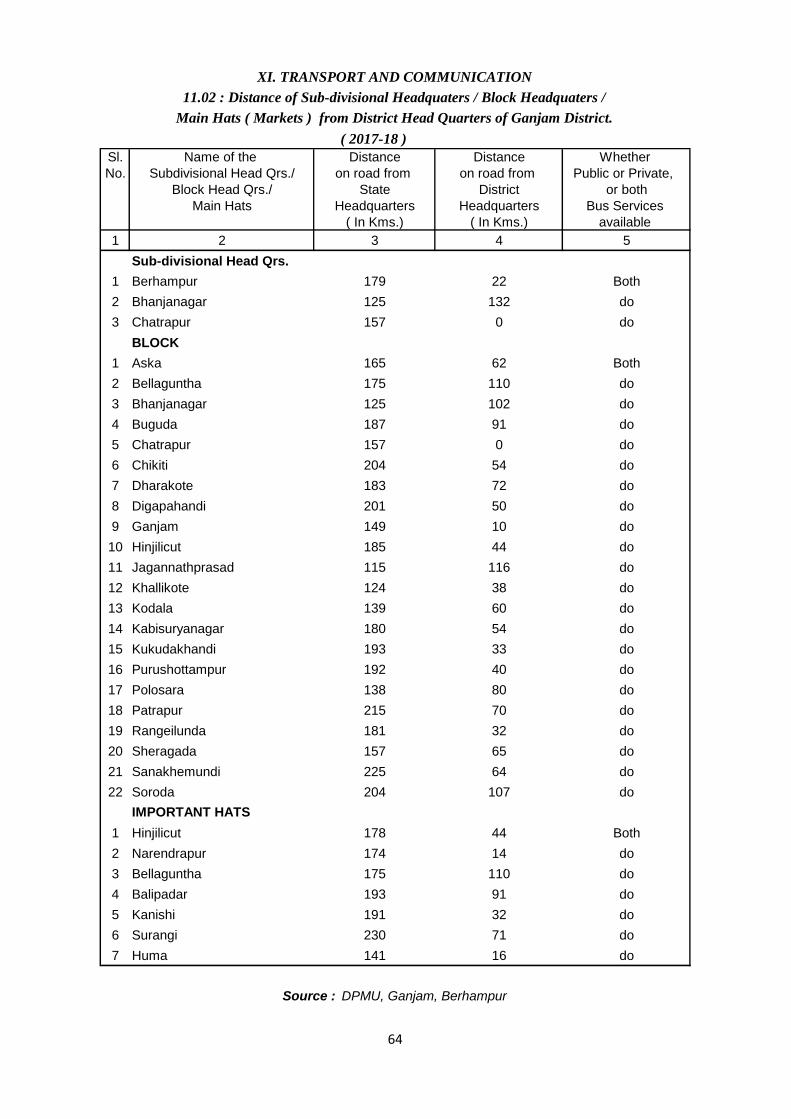
( 2017-18 )
Sl. Name of the Distance Distance Whether
No. Subdivisional Head Qrs./ on road from on road from Public or Private,
Block Head Qrs./ State District or both
Main Hats Headquarters Headquarters Bus Services
( In Kms.) ( In Kms.) available
1 2 3 4 5
Sub-divisional Head Qrs.
1 Berhampur 179 22 Both
2 Bhanjanagar 125 132 do
3 Chatrapur 157 0 do
BLOCK
1 Aska 165 62 Both
2 Bellaguntha 175 110 do
3 Bhanjanagar 125 102 do
4 Buguda 187 91 do
5 Chatrapur 157 0 do
6 Chikiti 204 54 do
7 Dharakote 183 72 do
8 Digapahandi 201 50 do
9 Ganjam 149 10 do
10 Hinjilicut 185 44 do
11 Jagannathprasad 115 116 do
12 Khallikote 124 38 do
13 Kodala 139 60 do
14 Kabisuryanagar 180 54 do
15 Kukudakhandi 193 33 do
16 Purushottampur 192 40 do
17 Polosara 138 80 do
18 Patrapur 215 70 do
19 Rangeilunda 181 32 do
20 Sheragada 157 65 do
21 Sanakhemundi 225 64 do
22 Soroda 204 107 do
1 Hinjilicut 178 44 Both
2 Narendrapur 174 14 do
3 Bellaguntha 175 110 do
4 Balipadar 193 91 do
5 Kanishi 191 32 do
6 Surangi 230 71 do
7 Huma 141 16 do
IMPORTANT HATS
Source : DPMU, Ganjam, Berhampur
XI. TRANSPORT AND COMMUNICATION
11.02 : Distance of Sub-divisional Headquaters / Block Headquaters /
Main Hats ( Markets ) from District Head Quarters of Ganjam District.
64
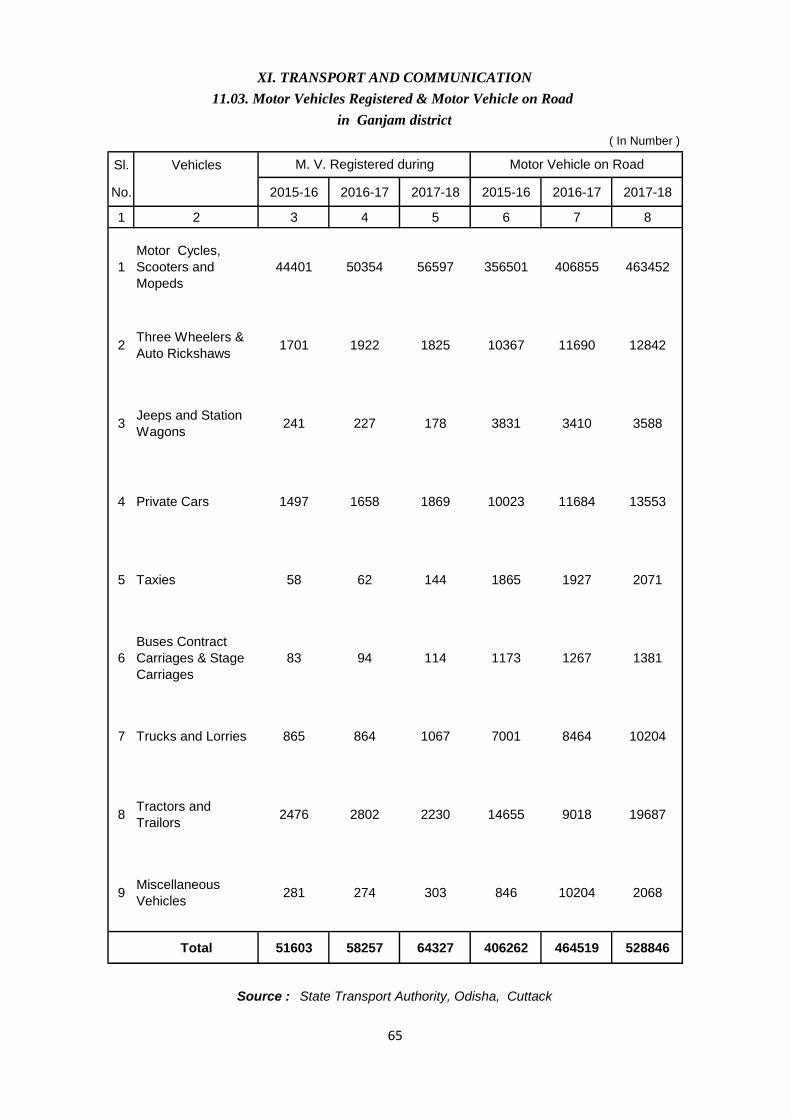
Sl. Vehicles
No. 2015-16 2016-17 2017-18 2015-16 2016-17 2017-18
1 2 3 4 5 6 7 8
1
Motor Cycles,
Scooters and
Mopeds
44401 50354 56597 356501 406855 463452
2Three Wheelers &
Auto Rickshaws1701 1922 1825 10367 11690 12842
3Jeeps and Station
Wagons241 227 178 3831 3410 3588
4 Private Cars 1497 1658 1869 10023 11684 13553
5 Taxies 58 62 144 1865 1927 2071
6
Buses Contract
Carriages & Stage
Carriages
83 94 114 1173 1267 1381
7 Trucks and Lorries 865 864 1067 7001 8464 10204
8Tractors and
Trailors2476 2802 2230 14655 9018 19687
9Miscellaneous
Vehicles281 274 303 846 10204 2068
Total 51603 58257 64327 406262 464519 528846
Source : State Transport Authority, Odisha, Cuttack
XI. TRANSPORT AND COMMUNICATION
11.03. Motor Vehicles Registered & Motor Vehicle on Road
in Ganjam district
( In Number )
M. V. Registered during Motor Vehicle on Road
65
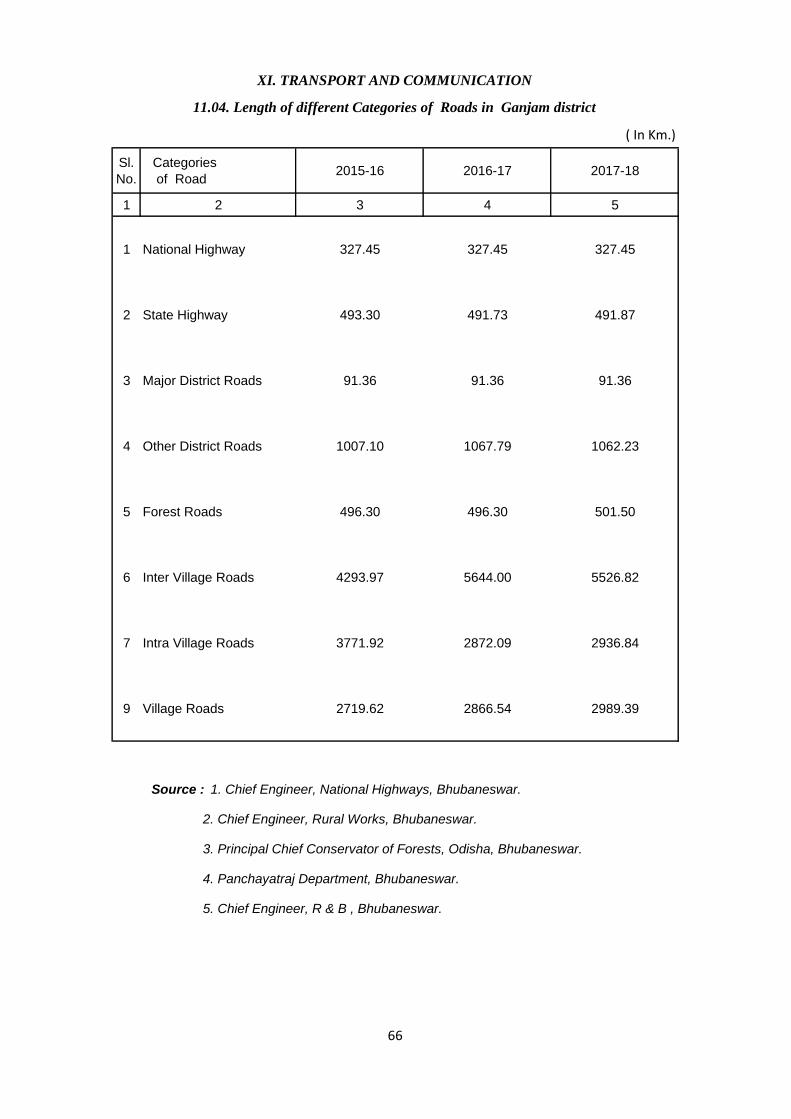
( In Km.)
Sl.
No.
Categories
of Road2015-16 2016-17 2017-18
1 2 3 4 5
1 National Highway 327.45 327.45 327.45
2 State Highway 493.30 491.73 491.87
3 Major District Roads 91.36 91.36 91.36
4 Other District Roads 1007.10 1067.79 1062.23
5 Forest Roads 496.30 496.30 501.50
6 Inter Village Roads 4293.97 5644.00 5526.82
7 Intra Village Roads 3771.92 2872.09 2936.84
9 Village Roads 2719.62 2866.54 2989.39
5. Chief Engineer, R & B , Bhubaneswar.
XI. TRANSPORT AND COMMUNICATION
11.04. Length of different Categories of Roads in Ganjam district
Source : 1. Chief Engineer, National Highways, Bhubaneswar.
2. Chief Engineer, Rural Works, Bhubaneswar.
3. Principal Chief Conservator of Forests, Odisha, Bhubaneswar.
4. Panchayatraj Department, Bhubaneswar.
66
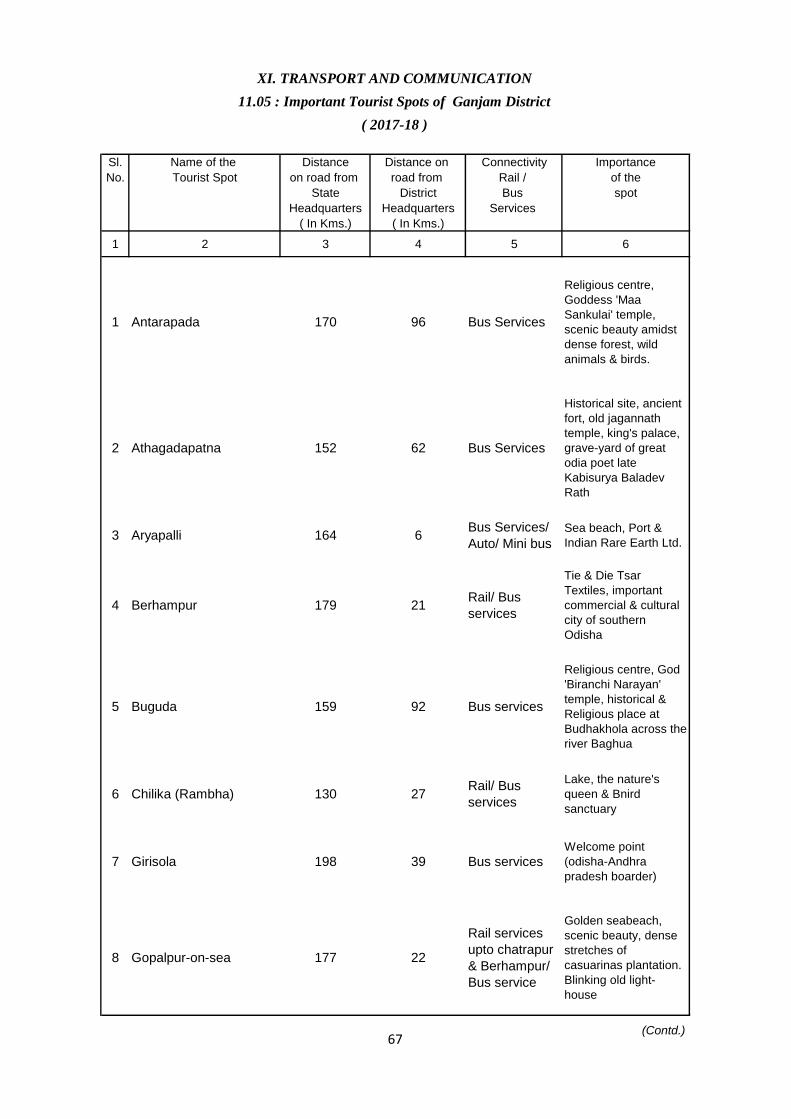
Sl. Name of the Distance Distance on Connectivity Importance
No. Tourist Spot on road from road from Rail / of the
State District Bus spot
Headquarters Headquarters Services
( In Kms.) ( In Kms.)
1 2 3 4 5 6
1 Antarapada 170 96 Bus Services
Religious centre,
Goddess 'Maa
Sankulai' temple,
scenic beauty amidst
dense forest, wild
animals & birds.
2 Athagadapatna 152 62 Bus Services
Historical site, ancient
fort, old jagannath
temple, king's palace,
grave-yard of great
odia poet late
Kabisurya Baladev
Rath
3 Aryapalli 164 6Bus Services/
Auto/ Mini bus
Sea beach, Port &
Indian Rare Earth Ltd.
4 Berhampur 179 21Rail/ Bus
services
Tie & Die Tsar
Textiles, important
commercial & cultural
city of southern
Odisha
5 Buguda 159 92 Bus services
Religious centre, God
'Biranchi Narayan'
temple, historical &
Religious place at
Budhakhola across the
river Baghua
6 Chilika (Rambha) 130 27Rail/ Bus
services
Lake, the nature's
queen & Bnird
sanctuary
7 Girisola 198 39 Bus servicesWelcome point
(odisha-Andhra
pradesh boarder)
8 Gopalpur-on-sea 177 22
Rail services
upto chatrapur
& Berhampur/
Bus service
Golden seabeach,
scenic beauty, dense
stretches of
casuarinas plantation.
Blinking old light-
house
(Contd.)
XI. TRANSPORT AND COMMUNICATION
11.05 : Important Tourist Spots of Ganjam District
( 2017-18 )
67
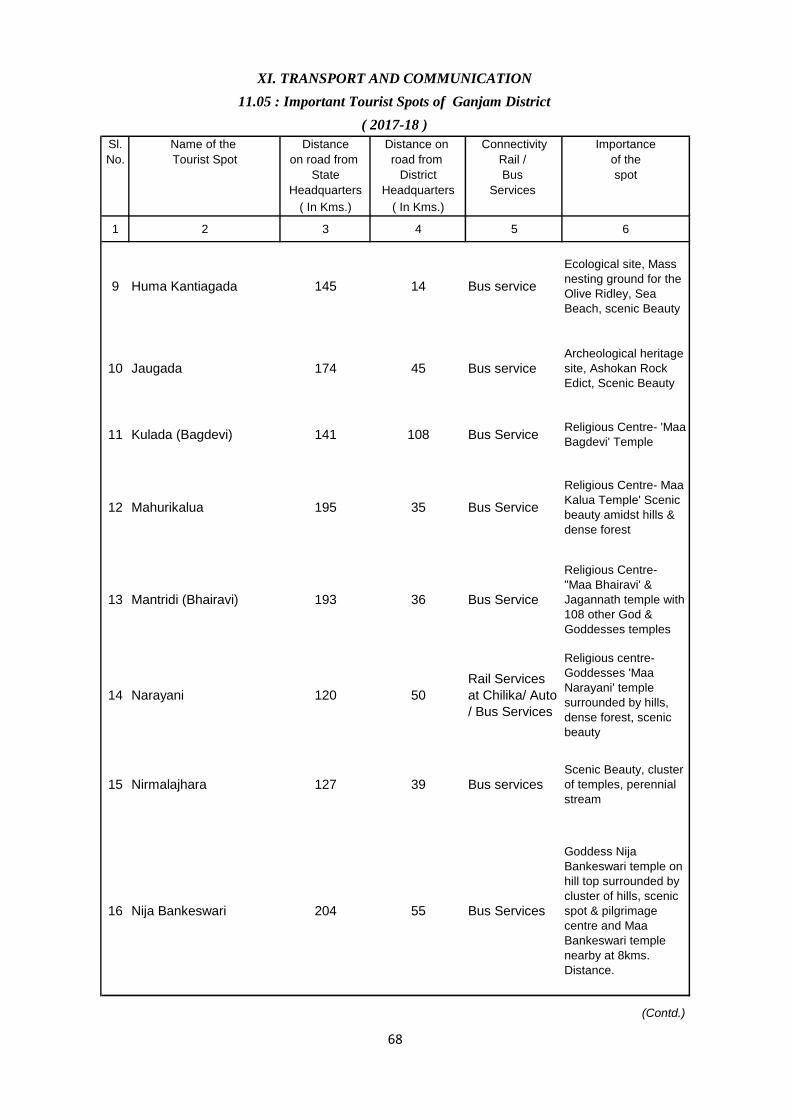
Sl. Name of the Distance Distance on Connectivity Importance
No. Tourist Spot on road from road from Rail / of the
State District Bus spot
Headquarters Headquarters Services
( In Kms.) ( In Kms.)
1 2 3 4 5 6
9 Huma Kantiagada 145 14 Bus service
Ecological site, Mass
nesting ground for the
Olive Ridley, Sea
Beach, scenic Beauty
10 Jaugada 174 45 Bus serviceArcheological heritage
site, Ashokan Rock
Edict, Scenic Beauty
11 Kulada (Bagdevi) 141 108 Bus ServiceReligious Centre- 'Maa
Bagdevi' Temple
12 Mahurikalua 195 35 Bus Service
Religious Centre- Maa
Kalua Temple' Scenic
beauty amidst hills &
dense forest
13 Mantridi (Bhairavi) 193 36 Bus Service
Religious Centre-
"Maa Bhairavi' &
Jagannath temple with
108 other God &
Goddesses temples
14 Narayani 120 50
Rail Services
at Chilika/ Auto
/ Bus Services
Religious centre-
Goddesses 'Maa
Narayani' temple
surrounded by hills,
dense forest, scenic
beauty
15 Nirmalajhara 127 39 Bus servicesScenic Beauty, cluster
of temples, perennial
stream
16 Nija Bankeswari 204 55 Bus Services
Goddess Nija
Bankeswari temple on
hill top surrounded by
cluster of hills, scenic
spot & pilgrimage
centre and Maa
Bankeswari temple
nearby at 8kms.
Distance.
(Contd.)
XI. TRANSPORT AND COMMUNICATION
11.05 : Important Tourist Spots of Ganjam District
( 2017-18 )
68

Sl. Name of the Distance Distance on Connectivity Importance
No. Tourist Spot on road from road from Rail / of the
State District Bus spot
Headquarters Headquarters Services
( In Kms.) ( In Kms.)
1 2 3 4 5 6
17 Pati Sonapur 206 47 Bus services
Sea Beach across the
river 'Bahuda', scenic
beauty, ideal for
boating
18 Potagada 146 10 Bus servicesFort on the bank of
river 'Rushikulya'
19 Taptapani 223 72 Bus servicesScenic Spot & hot
Spring
20 Taratarini 175 33 Bus Services
Religious centre-
Goddesses 'Maa
Taratarini' temple on
hill top
21 Humuri Tampara 156 4
Rail services at
chatrapur/ Bus/
Auto services
Scenic Beauty,
cruising by paddle
boats & water
scooters/ Boat Club
22Ghodahada dam &
Ujjaleswar228 75
Rail services
up to
Berhampur/
Bus services
Religious centre &
Scenic Spot- Siva
Temple
Special Attraction
1Bhanjanagar Dam & Biju
Patnaik Children's Park
260 Via
Berhampur
101 Via
BerhampurBus services
Dam site, scenic
beauty, Children's
Park having toy trains
and boating facility,
Herbal Garden, Lotus
Pond, Snacks Bar,
Arch Bridge, Science
Park
2 Mahurigada 191 34
Bus services
upto
Berhampur/
Auto/ Hired
Taxi services
Cluster temples, Big
ponds, scenic beauty
with wild animals/birds
XI. TRANSPORT AND COMMUNICATION
11.05 : Important Tourist Spots of Ganjam District
( 2017-18 )
69
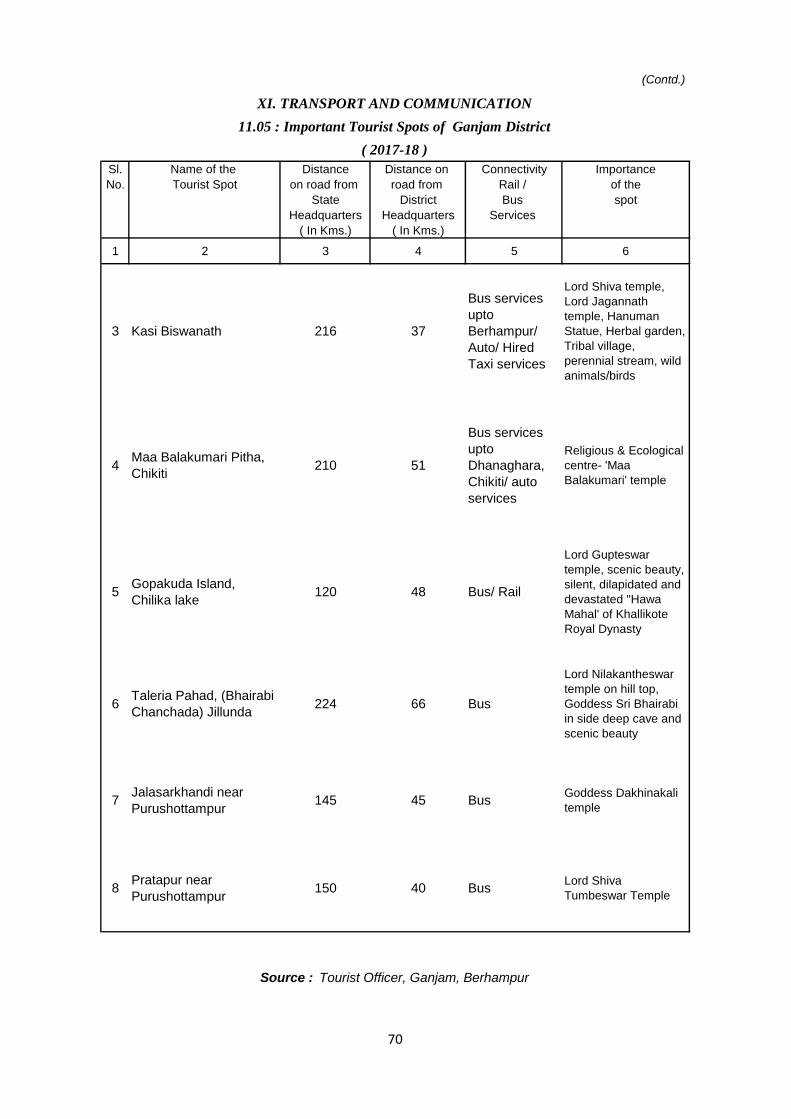
(Contd.)
Sl. Name of the Distance Distance on Connectivity Importance
No. Tourist Spot on road from road from Rail / of the
State District Bus spot
Headquarters Headquarters Services
( In Kms.) ( In Kms.)
1 2 3 4 5 6
3 Kasi Biswanath 216 37
Bus services
upto
Berhampur/
Auto/ Hired
Taxi services
Lord Shiva temple,
Lord Jagannath
temple, Hanuman
Statue, Herbal garden,
Tribal village,
perennial stream, wild
animals/birds
4Maa Balakumari Pitha,
Chikiti210 51
Bus services
upto
Dhanaghara,
Chikiti/ auto
services
Religious & Ecological
centre- 'Maa
Balakumari' temple
5Gopakuda Island,
Chilika lake120 48 Bus/ Rail
Lord Gupteswar
temple, scenic beauty,
silent, dilapidated and
devastated "Hawa
Mahal' of Khallikote
Royal Dynasty
6Taleria Pahad, (Bhairabi
Chanchada) Jillunda224 66 Bus
Lord Nilakantheswar
temple on hill top,
Goddess Sri Bhairabi
in side deep cave and
scenic beauty
7Jalasarkhandi near
Purushottampur145 45 Bus
Goddess Dakhinakali
temple
8Pratapur near
Purushottampur150 40 Bus
Lord Shiva
Tumbeswar Temple
Source : Tourist Officer, Ganjam, Berhampur
XI. TRANSPORT AND COMMUNICATION
11.05 : Important Tourist Spots of Ganjam District
( 2017-18 )
70

1 2 3 4 5
1 Primary 2328 6499 281085
2 Up-Primary 1342 10525 175814
3 Secondary 715 6732 111451
4Colleges
( Gen. Education )119 1712 77499
5Colleges
( Diploma )11 119 2490
6Colleges
( Tech. Degree )9 133 2064
NB : 1. Primary-I-V,
2. Up-Primary-VI-VII &I-VII,
3. Secondary-VIII-X,VI-X,I-X,
4 College( gen)
Source : Dist Project Coordinator, OPEPA / Circle Inspector of Schools /
Dist Inspector of Schools / Block Development Officer
5. Govt. includes school / colleges of Central / State Govt.,Tribal Deptt., Local bodies,Kendriya
Vidyalayas, Novodaya Vidyalayas,Sainika School, Project School etc.Private colleges / Schools
consist of Private Aided /Un-aided, Private Mgt. College (Diploma & Degree) includes
engineering, polytechnic, computer science, management, pharmacy, nursing etc
Schools / Colleges Teachers / Lecturers Enrollment
XII.EDUCATION
12.01. Education in Rural / Urban Odisha of Ganjam District
( 2017-18 )
Sl.
No.
Categories
of School /
Colleges
71
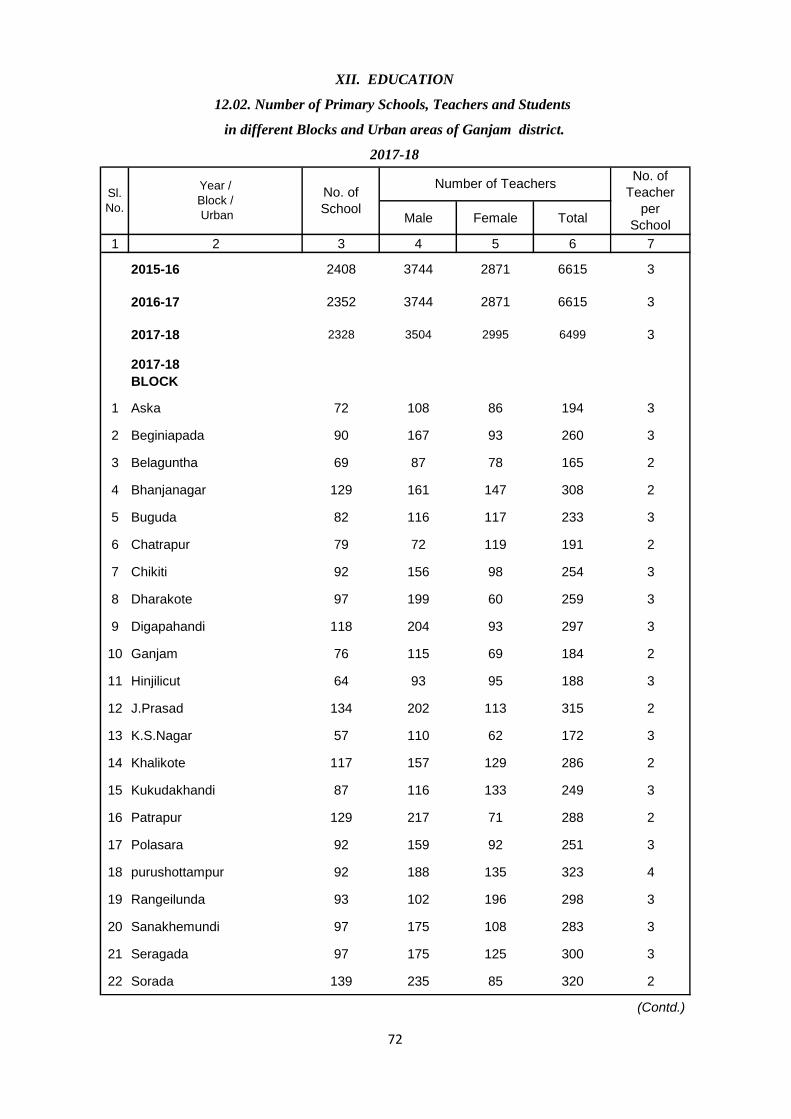
Male Female Total
1 2 3 4 5 6 7
2015-16 2408 3744 2871 6615 3
2016-17 2352 3744 2871 6615 3
2017-18 2328 3504 2995 6499 3
2017-18
BLOCK
1 Aska 72 108 86 194 3
2 Beginiapada 90 167 93 260 3
3 Belaguntha 69 87 78 165 2
4 Bhanjanagar 129 161 147 308 2
5 Buguda 82 116 117 233 3
6 Chatrapur 79 72 119 191 2
7 Chikiti 92 156 98 254 3
8 Dharakote 97 199 60 259 3
9 Digapahandi 118 204 93 297 3
10 Ganjam 76 115 69 184 2
11 Hinjilicut 64 93 95 188 3
12 J.Prasad 134 202 113 315 2
13 K.S.Nagar 57 110 62 172 3
14 Khalikote 117 157 129 286 2
15 Kukudakhandi 87 116 133 249 3
16 Patrapur 129 217 71 288 2
17 Polasara 92 159 92 251 3
18 purushottampur 92 188 135 323 4
19 Rangeilunda 93 102 196 298 3
20 Sanakhemundi 97 175 108 283 3
21 Seragada 97 175 125 300 3
22 Sorada 139 235 85 320 2
(Contd.)
2017-18
Number of TeachersNo. of
Teacher
per
School
Sl.
No.
Year /
Block /
Urban
No. of
School
XII. EDUCATION
12.02. Number of Primary Schools, Teachers and Students
in different Blocks and Urban areas of Ganjam district.
72
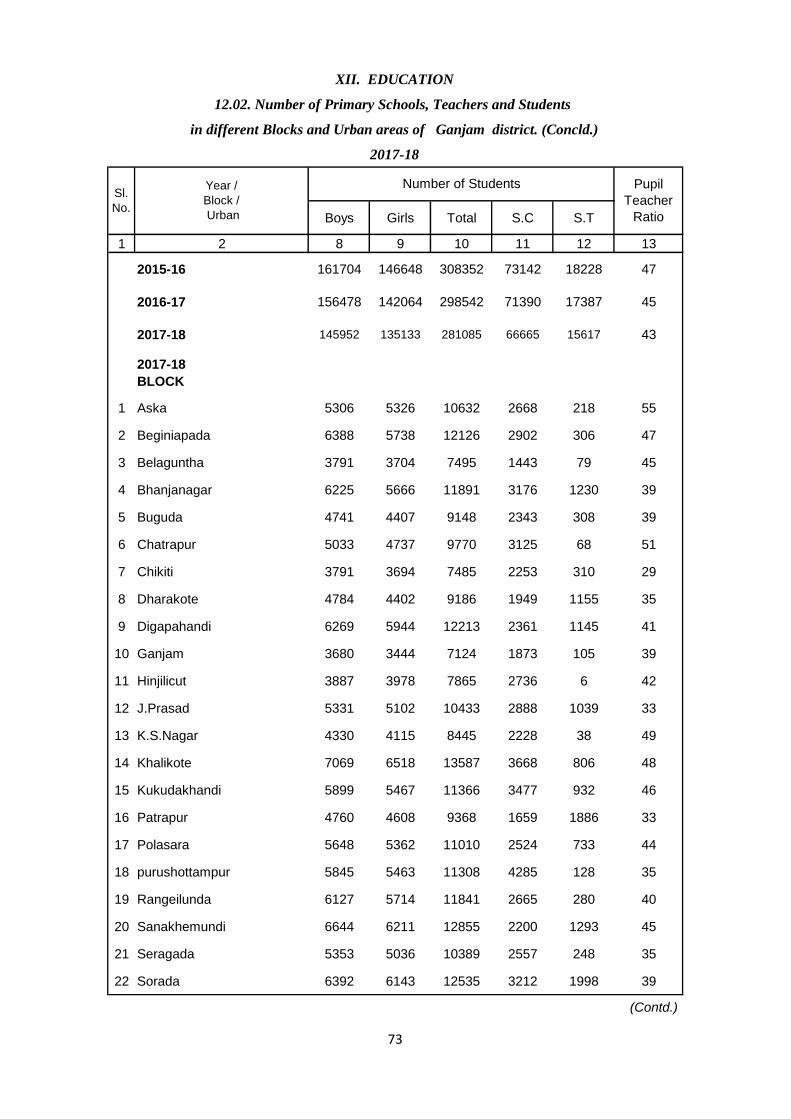
Boys Girls Total S.C S.T
1 2 8 9 10 11 12 13
2015-16 161704 146648 308352 73142 18228 47
2016-17 156478 142064 298542 71390 17387 45
2017-18 145952 135133 281085 66665 15617 43
2017-18
BLOCK
1 Aska 5306 5326 10632 2668 218 55
2 Beginiapada 6388 5738 12126 2902 306 47
3 Belaguntha 3791 3704 7495 1443 79 45
4 Bhanjanagar 6225 5666 11891 3176 1230 39
5 Buguda 4741 4407 9148 2343 308 39
6 Chatrapur 5033 4737 9770 3125 68 51
7 Chikiti 3791 3694 7485 2253 310 29
8 Dharakote 4784 4402 9186 1949 1155 35
9 Digapahandi 6269 5944 12213 2361 1145 41
10 Ganjam 3680 3444 7124 1873 105 39
11 Hinjilicut 3887 3978 7865 2736 6 42
12 J.Prasad 5331 5102 10433 2888 1039 33
13 K.S.Nagar 4330 4115 8445 2228 38 49
14 Khalikote 7069 6518 13587 3668 806 48
15 Kukudakhandi 5899 5467 11366 3477 932 46
16 Patrapur 4760 4608 9368 1659 1886 33
17 Polasara 5648 5362 11010 2524 733 44
18 purushottampur 5845 5463 11308 4285 128 35
19 Rangeilunda 6127 5714 11841 2665 280 40
20 Sanakhemundi 6644 6211 12855 2200 1293 45
21 Seragada 5353 5036 10389 2557 248 35
22 Sorada 6392 6143 12535 3212 1998 39
(Contd.)
Year /
Block /
Urban
2017-18
Number of Students Pupil
Teacher
Ratio
Sl.
No.
XII. EDUCATION
12.02. Number of Primary Schools, Teachers and Students
in different Blocks and Urban areas of Ganjam district. (Concld.)
73
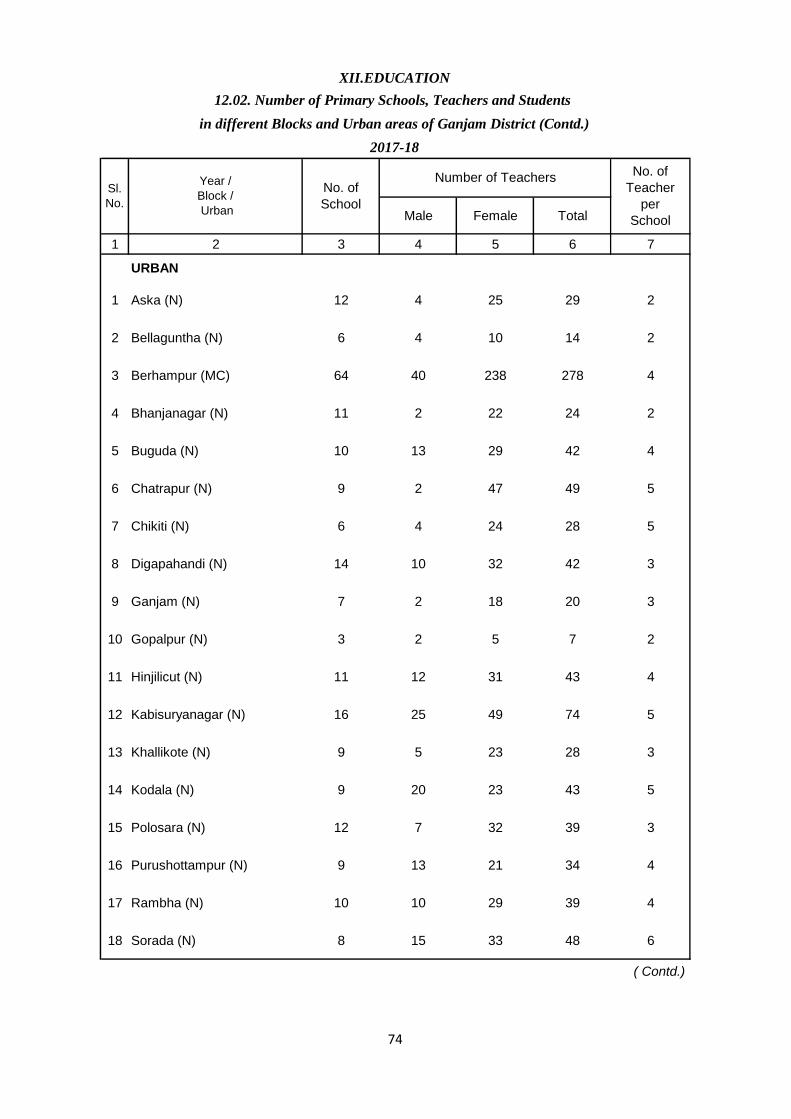
Male Female Total
1 2 3 4 5 6 7
URBAN
1 Aska (N) 12 4 25 29 2
2 Bellaguntha (N) 6 4 10 14 2
3 Berhampur (MC) 64 40 238 278 4
4 Bhanjanagar (N) 11 2 22 24 2
5 Buguda (N) 10 13 29 42 4
6 Chatrapur (N) 9 2 47 49 5
7 Chikiti (N) 6 4 24 28 5
8 Digapahandi (N) 14 10 32 42 3
9 Ganjam (N) 7 2 18 20 3
10 Gopalpur (N) 3 2 5 7 2
11 Hinjilicut (N) 11 12 31 43 4
12 Kabisuryanagar (N) 16 25 49 74 5
13 Khallikote (N) 9 5 23 28 3
14 Kodala (N) 9 20 23 43 5
15 Polosara (N) 12 7 32 39 3
16 Purushottampur (N) 9 13 21 34 4
17 Rambha (N) 10 10 29 39 4
18 Sorada (N) 8 15 33 48 6
( Contd.)
XII.EDUCATION
12.02. Number of Primary Schools, Teachers and Students
in different Blocks and Urban areas of Ganjam District (Contd.)
2017-18
Sl.
No.
Year /
Block /
Urban
No. of
School
Number of TeachersNo. of
Teacher
per
School
74
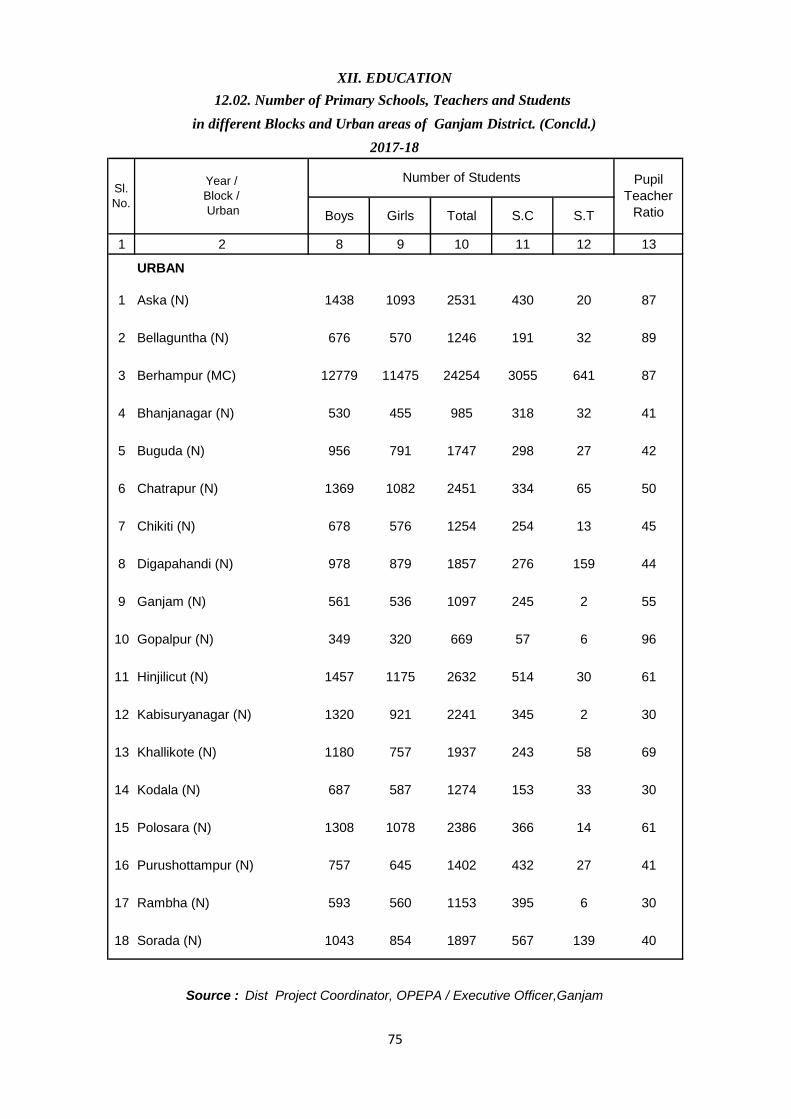
Boys Girls Total S.C S.T
1 2 8 9 10 11 12 13
URBAN
1 Aska (N) 1438 1093 2531 430 20 87
2 Bellaguntha (N) 676 570 1246 191 32 89
3 Berhampur (MC) 12779 11475 24254 3055 641 87
4 Bhanjanagar (N) 530 455 985 318 32 41
5 Buguda (N) 956 791 1747 298 27 42
6 Chatrapur (N) 1369 1082 2451 334 65 50
7 Chikiti (N) 678 576 1254 254 13 45
8 Digapahandi (N) 978 879 1857 276 159 44
9 Ganjam (N) 561 536 1097 245 2 55
10 Gopalpur (N) 349 320 669 57 6 96
11 Hinjilicut (N) 1457 1175 2632 514 30 61
12 Kabisuryanagar (N) 1320 921 2241 345 2 30
13 Khallikote (N) 1180 757 1937 243 58 69
14 Kodala (N) 687 587 1274 153 33 30
15 Polosara (N) 1308 1078 2386 366 14 61
16 Purushottampur (N) 757 645 1402 432 27 41
17 Rambha (N) 593 560 1153 395 6 30
18 Sorada (N) 1043 854 1897 567 139 40
XII. EDUCATION
12.02. Number of Primary Schools, Teachers and Students
in different Blocks and Urban areas of Ganjam District. (Concld.)
Source : Dist Project Coordinator, OPEPA / Executive Officer,Ganjam
2017-18
Sl.
No.
Year /
Block /
Urban
Number of Students Pupil
Teacher
Ratio
75
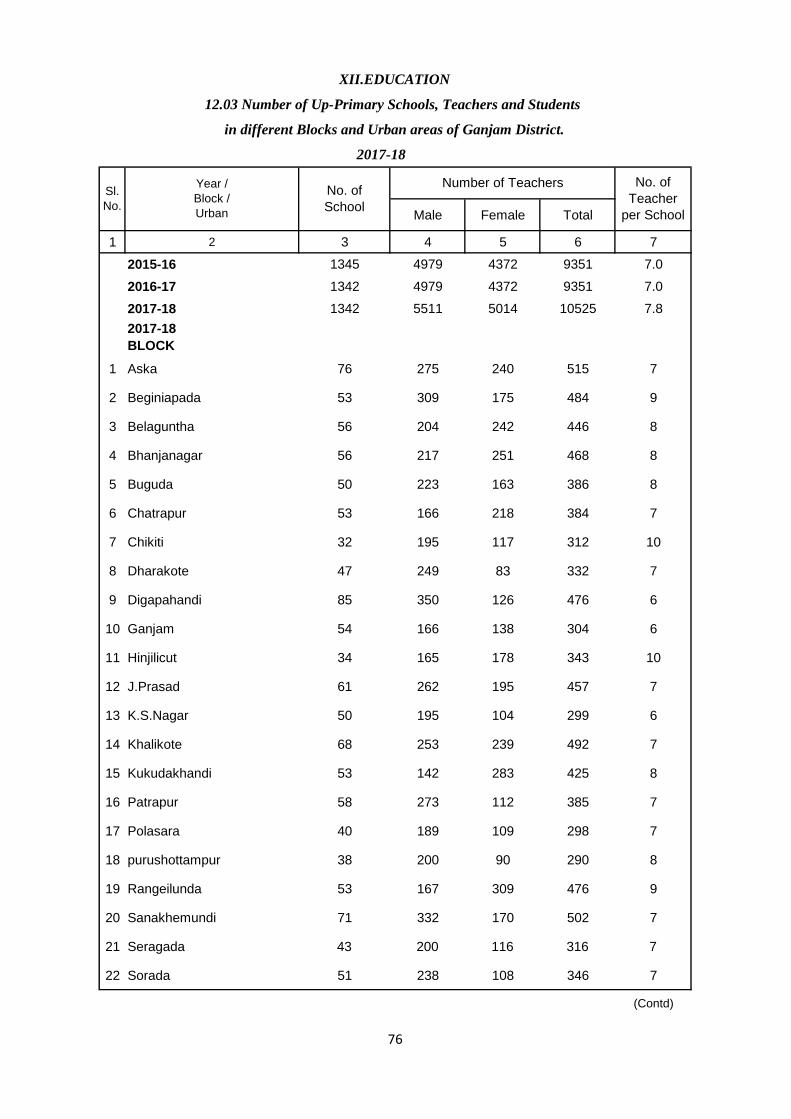
Male Female Total
1 2 3 4 5 6 7
2015-16 1345 4979 4372 9351 7.0
2016-17 1342 4979 4372 9351 7.0
2017-18 1342 5511 5014 10525 7.8
2017-18
BLOCK
1 Aska 76 275 240 515 7
2 Beginiapada 53 309 175 484 9
3 Belaguntha 56 204 242 446 8
4 Bhanjanagar 56 217 251 468 8
5 Buguda 50 223 163 386 8
6 Chatrapur 53 166 218 384 7
7 Chikiti 32 195 117 312 10
8 Dharakote 47 249 83 332 7
9 Digapahandi 85 350 126 476 6
10 Ganjam 54 166 138 304 6
11 Hinjilicut 34 165 178 343 10
12 J.Prasad 61 262 195 457 7
13 K.S.Nagar 50 195 104 299 6
14 Khalikote 68 253 239 492 7
15 Kukudakhandi 53 142 283 425 8
16 Patrapur 58 273 112 385 7
17 Polasara 40 189 109 298 7
18 purushottampur 38 200 90 290 8
19 Rangeilunda 53 167 309 476 9
20 Sanakhemundi 71 332 170 502 7
21 Seragada 43 200 116 316 7
22 Sorada 51 238 108 346 7
(Contd)
Sl.
No.
No. of
School
XII.EDUCATION
12.03 Number of Up-Primary Schools, Teachers and Students
Year /
Block /
Urban
in different Blocks and Urban areas of Ganjam District.
Number of Teachers No. of
Teacher
per School
2017-18
76
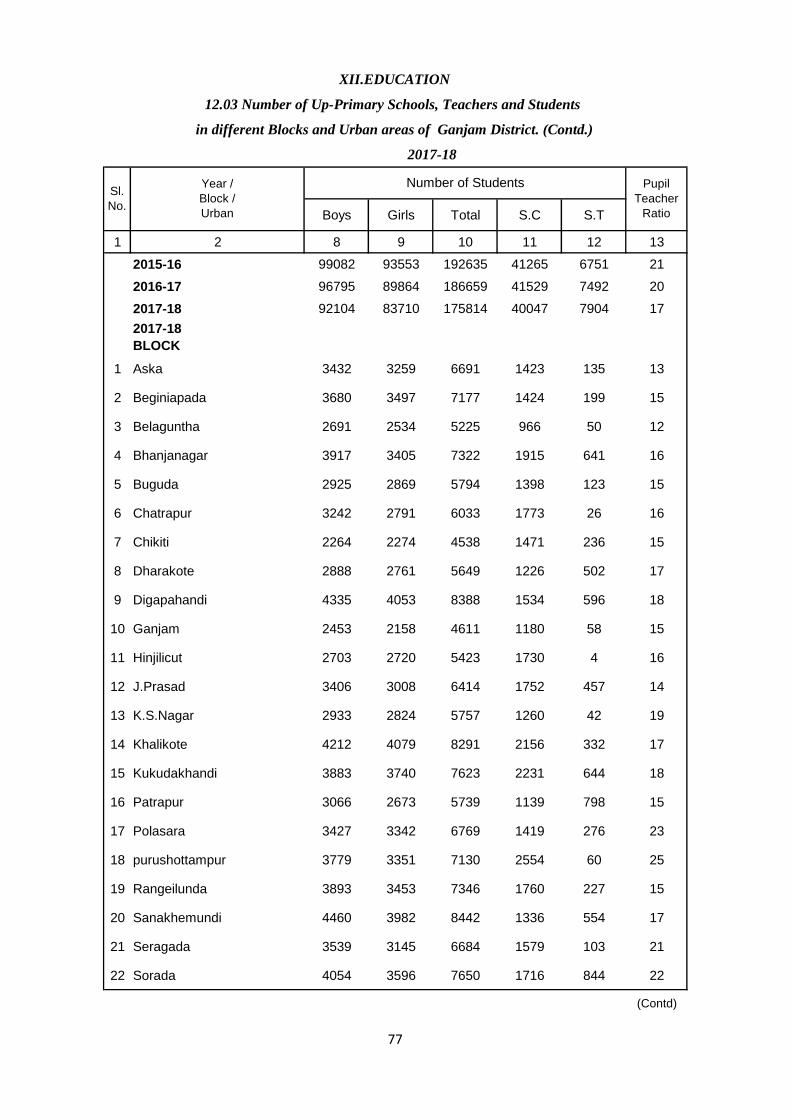
Boys Girls Total S.C S.T
1 2 8 9 10 11 12 13
2015-16 99082 93553 192635 41265 6751 21
2016-17 96795 89864 186659 41529 7492 20
2017-18 92104 83710 175814 40047 7904 17
2017-18
BLOCK
1 Aska 3432 3259 6691 1423 135 13
2 Beginiapada 3680 3497 7177 1424 199 15
3 Belaguntha 2691 2534 5225 966 50 12
4 Bhanjanagar 3917 3405 7322 1915 641 16
5 Buguda 2925 2869 5794 1398 123 15
6 Chatrapur 3242 2791 6033 1773 26 16
7 Chikiti 2264 2274 4538 1471 236 15
8 Dharakote 2888 2761 5649 1226 502 17
9 Digapahandi 4335 4053 8388 1534 596 18
10 Ganjam 2453 2158 4611 1180 58 15
11 Hinjilicut 2703 2720 5423 1730 4 16
12 J.Prasad 3406 3008 6414 1752 457 14
13 K.S.Nagar 2933 2824 5757 1260 42 19
14 Khalikote 4212 4079 8291 2156 332 17
15 Kukudakhandi 3883 3740 7623 2231 644 18
16 Patrapur 3066 2673 5739 1139 798 15
17 Polasara 3427 3342 6769 1419 276 23
18 purushottampur 3779 3351 7130 2554 60 25
19 Rangeilunda 3893 3453 7346 1760 227 15
20 Sanakhemundi 4460 3982 8442 1336 554 17
21 Seragada 3539 3145 6684 1579 103 21
22 Sorada 4054 3596 7650 1716 844 22
(Contd)
Pupil
Teacher
Ratio
XII.EDUCATION
12.03 Number of Up-Primary Schools, Teachers and Students
Year /
Block /
Urban
Sl.
No.
in different Blocks and Urban areas of Ganjam District. (Contd.)
2017-18
Number of Students
77
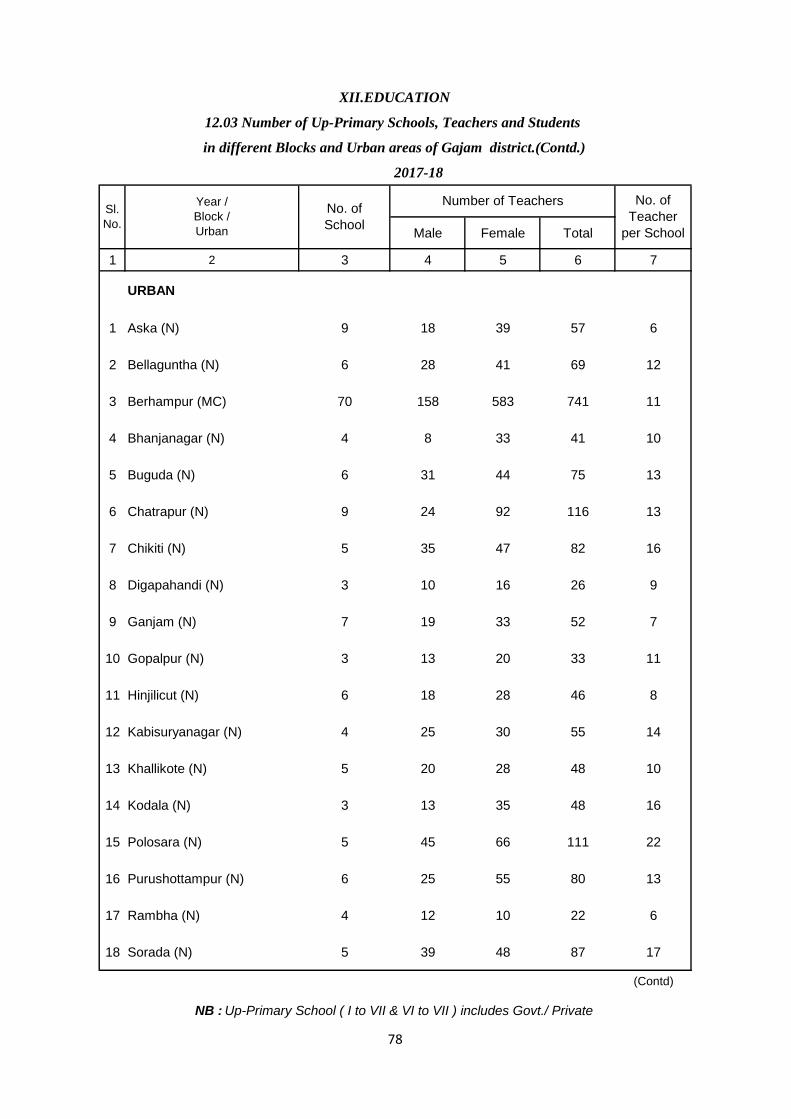
Male Female Total
1 2 3 4 5 6 7
URBAN
1 Aska (N) 9 18 39 57 6
2 Bellaguntha (N) 6 28 41 69 12
3 Berhampur (MC) 70 158 583 741 11
4 Bhanjanagar (N) 4 8 33 41 10
5 Buguda (N) 6 31 44 75 13
6 Chatrapur (N) 9 24 92 116 13
7 Chikiti (N) 5 35 47 82 16
8 Digapahandi (N) 3 10 16 26 9
9 Ganjam (N) 7 19 33 52 7
10 Gopalpur (N) 3 13 20 33 11
11 Hinjilicut (N) 6 18 28 46 8
12 Kabisuryanagar (N) 4 25 30 55 14
13 Khallikote (N) 5 20 28 48 10
14 Kodala (N) 3 13 35 48 16
15 Polosara (N) 5 45 66 111 22
16 Purushottampur (N) 6 25 55 80 13
17 Rambha (N) 4 12 10 22 6
18 Sorada (N) 5 39 48 87 17
(Contd)
2017-18
XII.EDUCATION
NB : Up-Primary School ( I to VII & VI to VII ) includes Govt./ Private
12.03 Number of Up-Primary Schools, Teachers and Students
in different Blocks and Urban areas of Gajam district.(Contd.)
Sl.
No.
Year /
Block /
Urban
No. of
School
Number of Teachers No. of
Teacher
per School
78
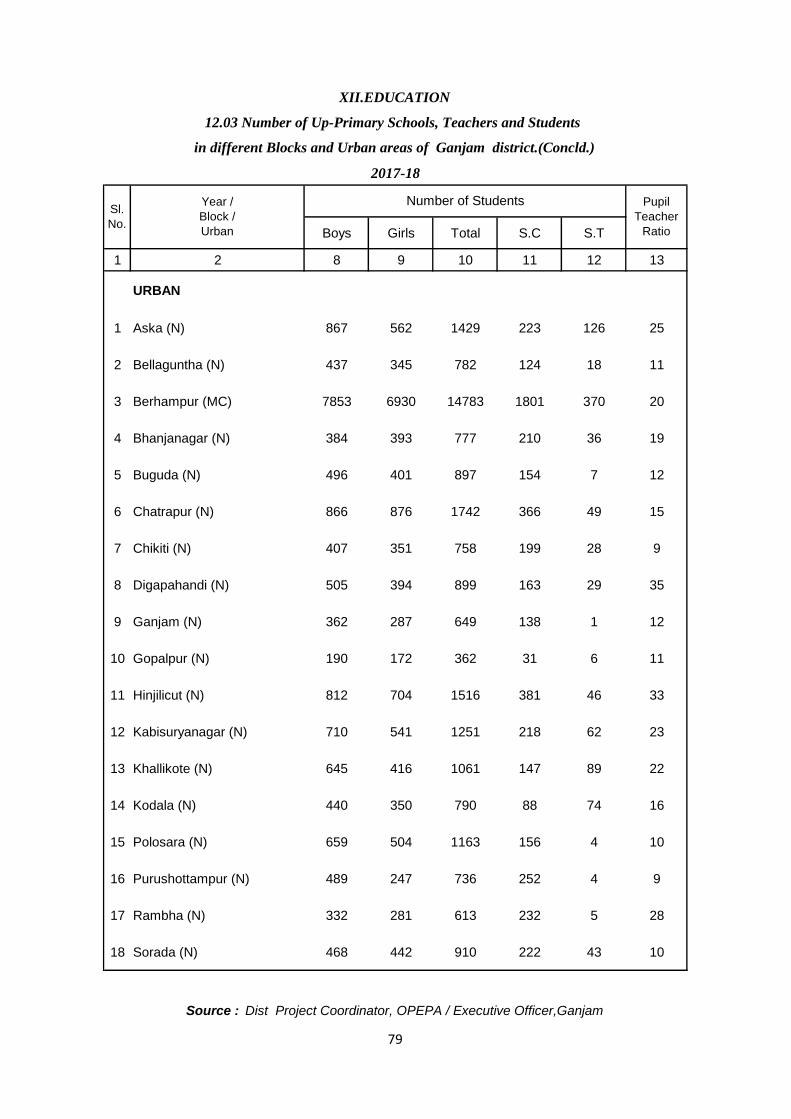
2017-18
Boys Girls Total S.C S.T
1 2 8 9 10 11 12 13
URBAN
1 Aska (N) 867 562 1429 223 126 25
2 Bellaguntha (N) 437 345 782 124 18 11
3 Berhampur (MC) 7853 6930 14783 1801 370 20
4 Bhanjanagar (N) 384 393 777 210 36 19
5 Buguda (N) 496 401 897 154 7 12
6 Chatrapur (N) 866 876 1742 366 49 15
7 Chikiti (N) 407 351 758 199 28 9
8 Digapahandi (N) 505 394 899 163 29 35
9 Ganjam (N) 362 287 649 138 1 12
10 Gopalpur (N) 190 172 362 31 6 11
11 Hinjilicut (N) 812 704 1516 381 46 33
12 Kabisuryanagar (N) 710 541 1251 218 62 23
13 Khallikote (N) 645 416 1061 147 89 22
14 Kodala (N) 440 350 790 88 74 16
15 Polosara (N) 659 504 1163 156 4 10
16 Purushottampur (N) 489 247 736 252 4 9
17 Rambha (N) 332 281 613 232 5 28
18 Sorada (N) 468 442 910 222 43 10
Sl.
No.
Year /
Block /
Urban
Number of Students Pupil
Teacher
Ratio
XII.EDUCATION
Source : Dist Project Coordinator, OPEPA / Executive Officer,Ganjam
12.03 Number of Up-Primary Schools, Teachers and Students
in different Blocks and Urban areas of Ganjam district.(Concld.)
79
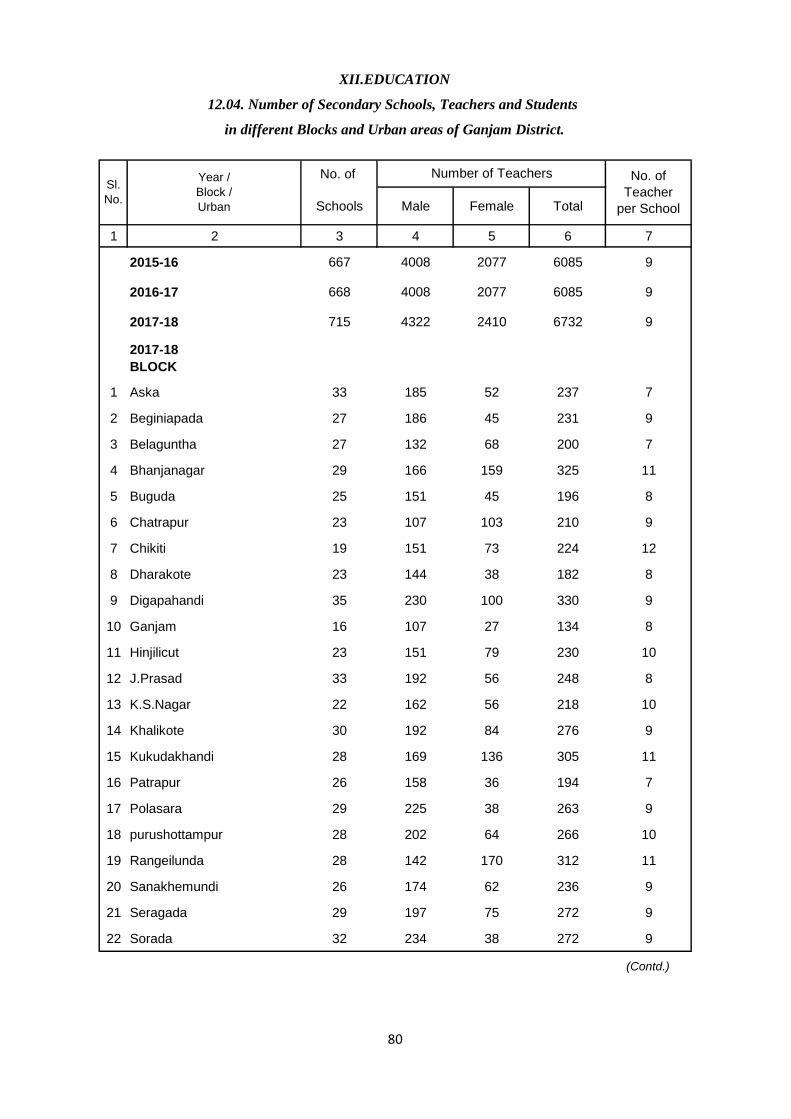
No. of
Schools Male Female Total
1 2 3 4 5 6 7
2015-16 667 4008 2077 6085 9
2016-17 668 4008 2077 6085 9
2017-18 715 4322 2410 6732 9
2017-18
BLOCK
1 Aska 33 185 52 237 7
2 Beginiapada 27 186 45 231 9
3 Belaguntha 27 132 68 200 7
4 Bhanjanagar 29 166 159 325 11
5 Buguda 25 151 45 196 8
6 Chatrapur 23 107 103 210 9
7 Chikiti 19 151 73 224 12
8 Dharakote 23 144 38 182 8
9 Digapahandi 35 230 100 330 9
10 Ganjam 16 107 27 134 8
11 Hinjilicut 23 151 79 230 10
12 J.Prasad 33 192 56 248 8
13 K.S.Nagar 22 162 56 218 10
14 Khalikote 30 192 84 276 9
15 Kukudakhandi 28 169 136 305 11
16 Patrapur 26 158 36 194 7
17 Polasara 29 225 38 263 9
18 purushottampur 28 202 64 266 10
19 Rangeilunda 28 142 170 312 11
20 Sanakhemundi 26 174 62 236 9
21 Seragada 29 197 75 272 9
22 Sorada 32 234 38 272 9
(Contd.)
Sl.
No.
Year /
Block /
Urban
Number of Teachers No. of
Teacher
per School
XII.EDUCATION
12.04. Number of Secondary Schools, Teachers and Students
in different Blocks and Urban areas of Ganjam District.
80
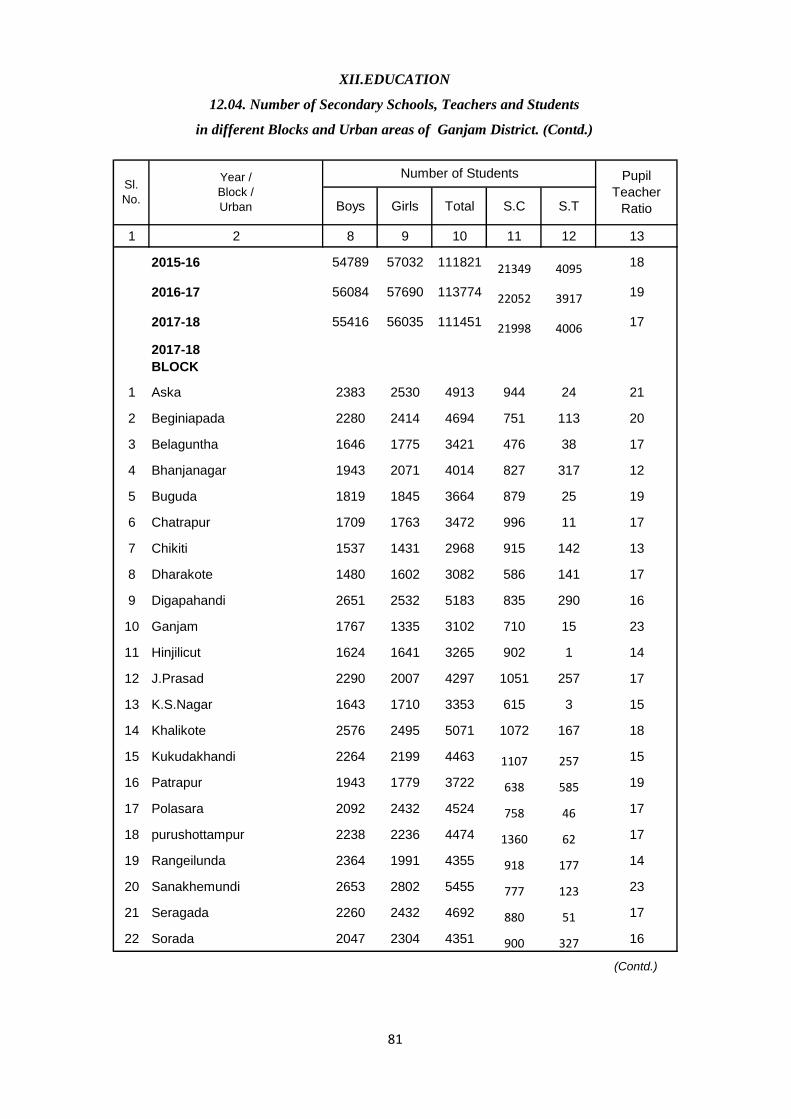
Boys Girls Total S.C S.T
1 2 8 9 10 11 12 13
2015-16 54789 57032 111821 21349 4095 18
2016-17 56084 57690 113774 22052 3917 19
2017-18 55416 56035 111451 21998 4006 17
2017-18
BLOCK
1 Aska 2383 2530 4913 944 24 21
2 Beginiapada 2280 2414 4694 751 113 20
3 Belaguntha 1646 1775 3421 476 38 17
4 Bhanjanagar 1943 2071 4014 827 317 12
5 Buguda 1819 1845 3664 879 25 19
6 Chatrapur 1709 1763 3472 996 11 17
7 Chikiti 1537 1431 2968 915 142 13
8 Dharakote 1480 1602 3082 586 141 17
9 Digapahandi 2651 2532 5183 835 290 16
10 Ganjam 1767 1335 3102 710 15 23
11 Hinjilicut 1624 1641 3265 902 1 14
12 J.Prasad 2290 2007 4297 1051 257 17
13 K.S.Nagar 1643 1710 3353 615 3 15
14 Khalikote 2576 2495 5071 1072 167 18
15 Kukudakhandi 2264 2199 4463 1107 257 15
16 Patrapur 1943 1779 3722 638 585 19
17 Polasara 2092 2432 4524 758 46 17
18 purushottampur 2238 2236 4474 1360 62 17
19 Rangeilunda 2364 1991 4355 918 177 14
20 Sanakhemundi 2653 2802 5455 777 123 23
21 Seragada 2260 2432 4692 880 51 17
22 Sorada 2047 2304 4351 900 327 16
(Contd.)
Pupil
Teacher
Ratio
Sl.
No.
Number of StudentsYear /
Block /
Urban
XII.EDUCATION
12.04. Number of Secondary Schools, Teachers and Students
in different Blocks and Urban areas of Ganjam District. (Contd.)
81
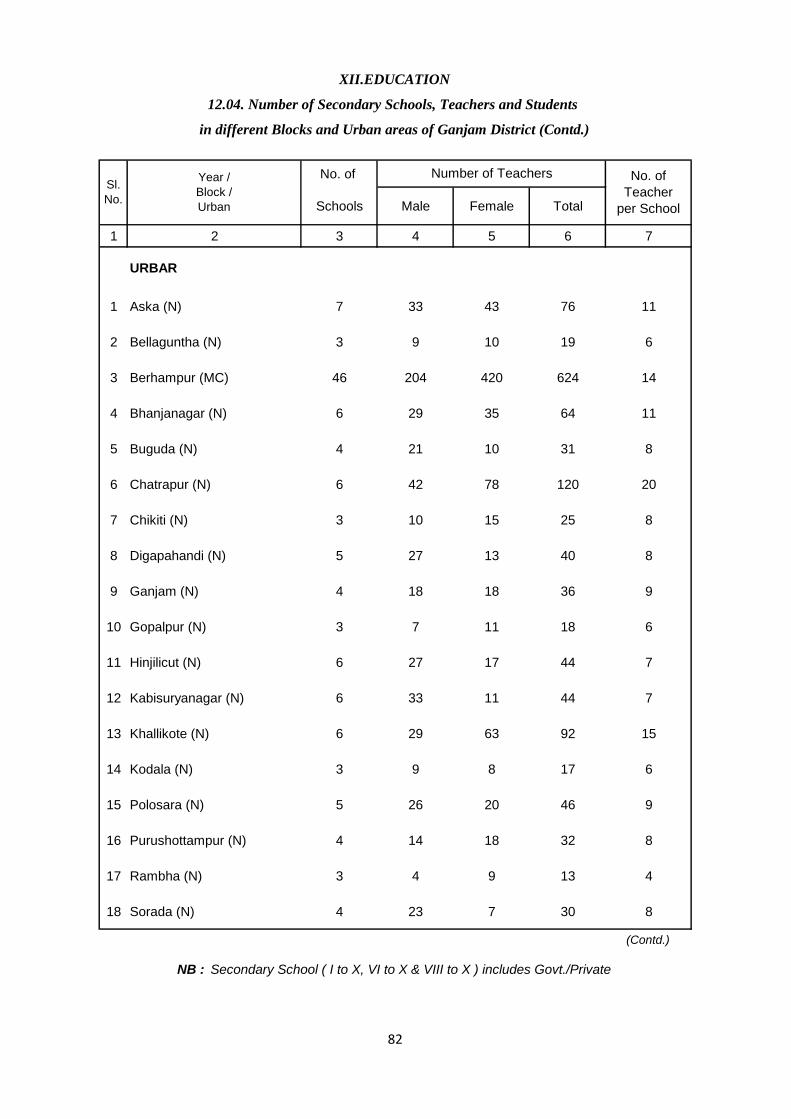
No. of
Schools Male Female Total
1 2 3 4 5 6 7
URBAR
1 Aska (N) 7 33 43 76 11
2 Bellaguntha (N) 3 9 10 19 6
3 Berhampur (MC) 46 204 420 624 14
4 Bhanjanagar (N) 6 29 35 64 11
5 Buguda (N) 4 21 10 31 8
6 Chatrapur (N) 6 42 78 120 20
7 Chikiti (N) 3 10 15 25 8
8 Digapahandi (N) 5 27 13 40 8
9 Ganjam (N) 4 18 18 36 9
10 Gopalpur (N) 3 7 11 18 6
11 Hinjilicut (N) 6 27 17 44 7
12 Kabisuryanagar (N) 6 33 11 44 7
13 Khallikote (N) 6 29 63 92 15
14 Kodala (N) 3 9 8 17 6
15 Polosara (N) 5 26 20 46 9
16 Purushottampur (N) 4 14 18 32 8
17 Rambha (N) 3 4 9 13 4
18 Sorada (N) 4 23 7 30 8
(Contd.)
Sl.
No.
Year /
Block /
Urban
Number of Teachers No. of
Teacher
per School
NB : Secondary School ( I to X, VI to X & VIII to X ) includes Govt./Private
XII.EDUCATION
12.04. Number of Secondary Schools, Teachers and Students
in different Blocks and Urban areas of Ganjam District (Contd.)
82
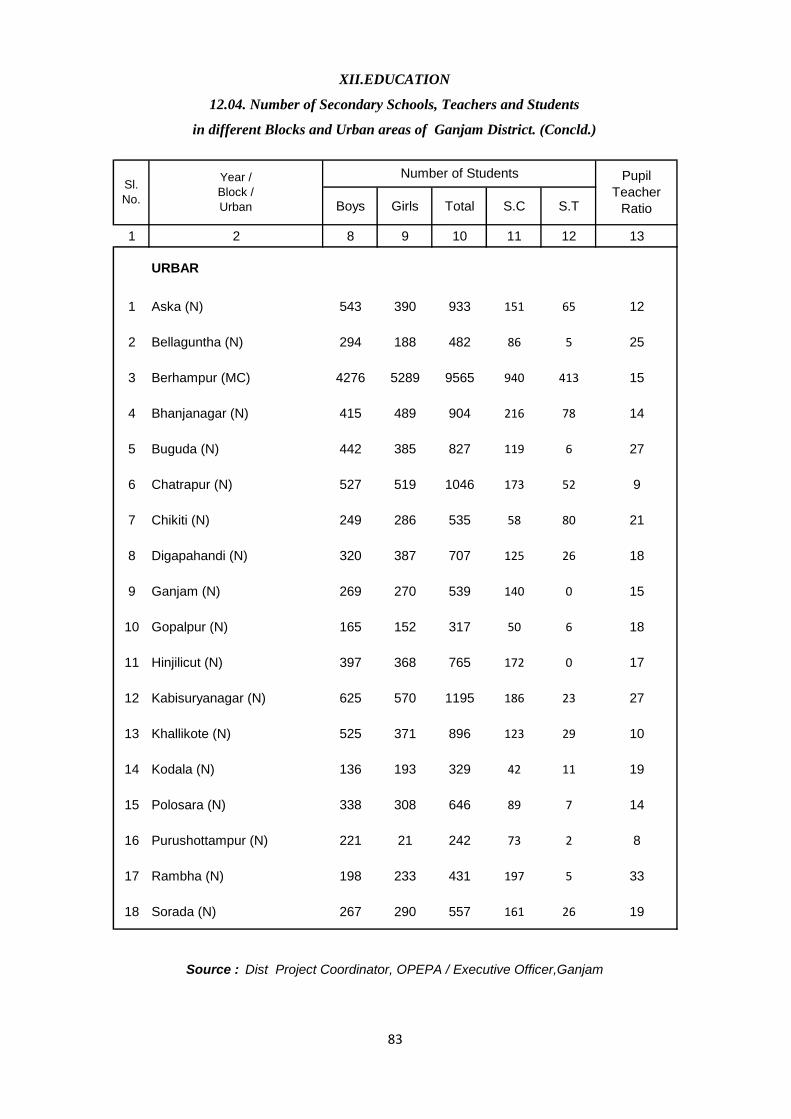
Boys Girls Total S.C S.T
1 2 8 9 10 11 12 13
URBAR
1 Aska (N) 543 390 933 151 65 12
2 Bellaguntha (N) 294 188 482 86 5 25
3 Berhampur (MC) 4276 5289 9565 940 413 15
4 Bhanjanagar (N) 415 489 904 216 78 14
5 Buguda (N) 442 385 827 119 6 27
6 Chatrapur (N) 527 519 1046 173 52 9
7 Chikiti (N) 249 286 535 58 80 21
8 Digapahandi (N) 320 387 707 125 26 18
9 Ganjam (N) 269 270 539 140 0 15
10 Gopalpur (N) 165 152 317 50 6 18
11 Hinjilicut (N) 397 368 765 172 0 17
12 Kabisuryanagar (N) 625 570 1195 186 23 27
13 Khallikote (N) 525 371 896 123 29 10
14 Kodala (N) 136 193 329 42 11 19
15 Polosara (N) 338 308 646 89 7 14
16 Purushottampur (N) 221 21 242 73 2 8
17 Rambha (N) 198 233 431 197 5 33
18 Sorada (N) 267 290 557 161 26 19
Year /
Block /
Urban
Number of Students Pupil
Teacher
Ratio
Sl.
No.
Source : Dist Project Coordinator, OPEPA / Executive Officer,Ganjam
XII.EDUCATION
12.04. Number of Secondary Schools, Teachers and Students
in different Blocks and Urban areas of Ganjam District. (Concld.)
83

Male Female Total
1 2 3 4 5 6 7
2015-16 110 1245 421 1666 15
2016-17 119 1122 521 1643 14
2017-18 119 1062 650 1712 14
2017-18
BLOCK
1 Aska 3 24 12 36 12
2 Beginiapada 2 13 5 18 9
3 Belaguntha 3 20 7 27 9
4 Bhanjanagar 2 8 2 10 5
5 Buguda 2 34 9 43 22
6 Chatrapur 3 56 33 89 30
7 Chikiti 3 32 21 53 18
8 Dharakote 2 15 12 27 14
9 Digapahandi 2 15 10 25 13
10 Ganjam 3 23 2 25 8
11 Hinjilicut 4 12 9 21 5
12 J.Prasad 2 14 2 16 8
13 K.S.Nagar 1 13 5 18 18
14 Khalikote 2 28 14 42 21
15 Kukudakhandi 3 39 23 62 21
16 Patrapur 2 37 13 50 25
17 Polasara 1 20 9 29 29
18 purushottampur 1 11 13 24 24
19 Rangeilunda 6 68 44 112 19
20 Sanakhemundi 2 31 13 44 22
21 Seragada 2 30 14 44 22
22 Sorada 1 6 8 14 14
(Contd.)
XII.EDUCATION
12.05. Number of Colleges for General Education, Lecturers and
in different Blocks and Urban areas of Ganjam District.
Sl.
No
.
Year /
Block /
Urban
No. of
Colleges
Number of Lecturers No. of
Teacher
per
College
84
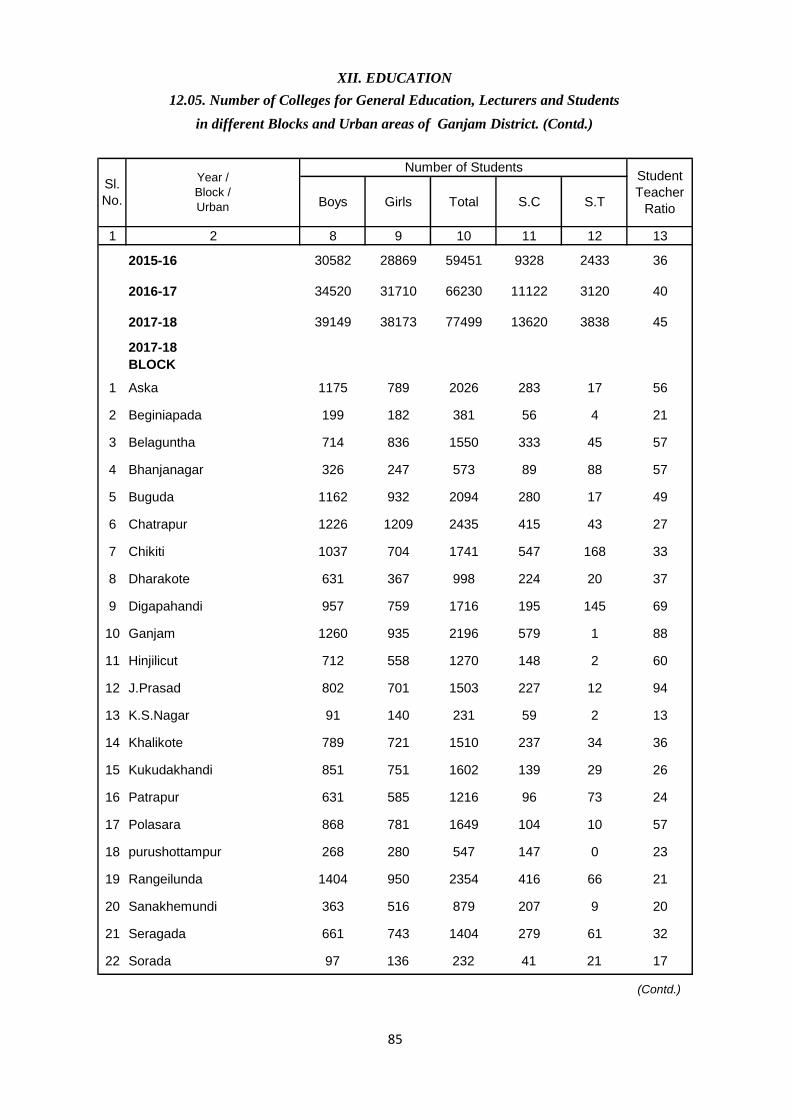
Boys Girls Total S.C S.T
1 2 8 9 10 11 12 13
2015-16 30582 28869 59451 9328 2433 36
2016-17 34520 31710 66230 11122 3120 40
2017-18 39149 38173 77499 13620 3838 45
2017-18
BLOCK
1 Aska 1175 789 2026 283 17 56
2 Beginiapada 199 182 381 56 4 21
3 Belaguntha 714 836 1550 333 45 57
4 Bhanjanagar 326 247 573 89 88 57
5 Buguda 1162 932 2094 280 17 49
6 Chatrapur 1226 1209 2435 415 43 27
7 Chikiti 1037 704 1741 547 168 33
8 Dharakote 631 367 998 224 20 37
9 Digapahandi 957 759 1716 195 145 69
10 Ganjam 1260 935 2196 579 1 88
11 Hinjilicut 712 558 1270 148 2 60
12 J.Prasad 802 701 1503 227 12 94
13 K.S.Nagar 91 140 231 59 2 13
14 Khalikote 789 721 1510 237 34 36
15 Kukudakhandi 851 751 1602 139 29 26
16 Patrapur 631 585 1216 96 73 24
17 Polasara 868 781 1649 104 10 57
18 purushottampur 268 280 547 147 0 23
19 Rangeilunda 1404 950 2354 416 66 21
20 Sanakhemundi 363 516 879 207 9 20
21 Seragada 661 743 1404 279 61 32
22 Sorada 97 136 232 41 21 17
(Contd.)
XII. EDUCATION
12.05. Number of Colleges for General Education, Lecturers and Students
in different Blocks and Urban areas of Ganjam District. (Contd.)
Sl.
No.
Year /
Block /
Urban
Number of StudentsStudent
Teacher
Ratio
85
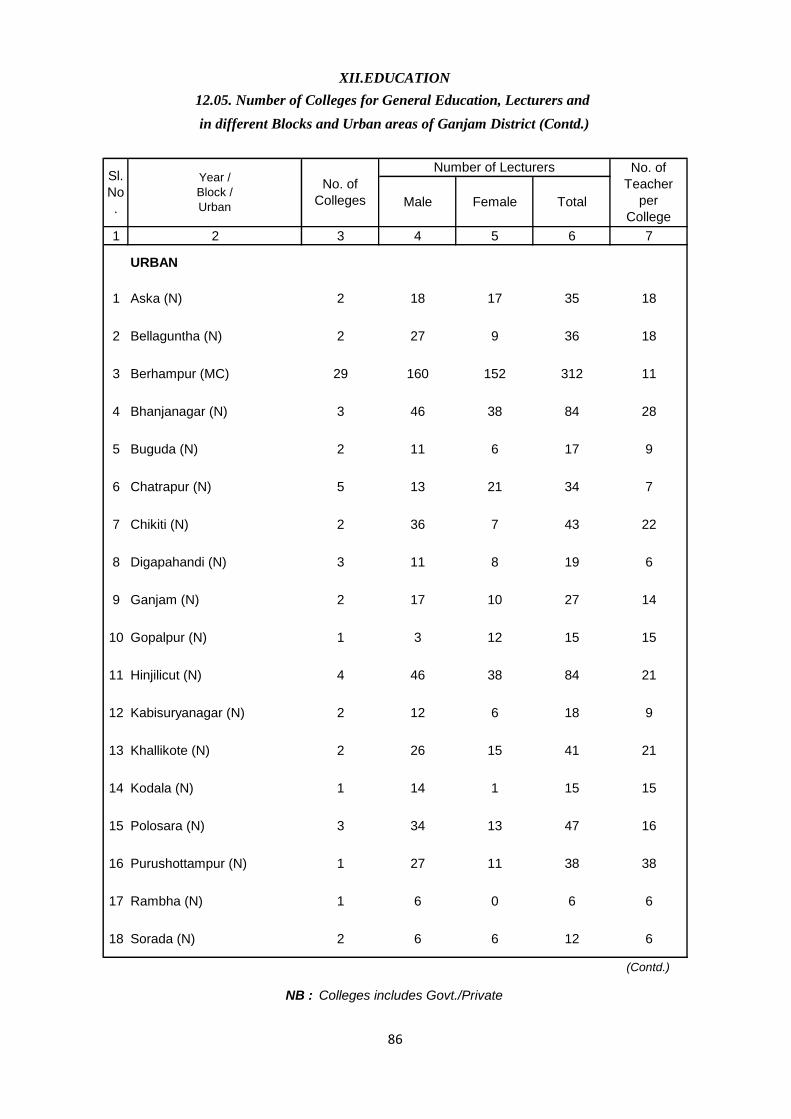
Male Female Total
1 2 3 4 5 6 7
URBAN
1 Aska (N) 2 18 17 35 18
2 Bellaguntha (N) 2 27 9 36 18
3 Berhampur (MC) 29 160 152 312 11
4 Bhanjanagar (N) 3 46 38 84 28
5 Buguda (N) 2 11 6 17 9
6 Chatrapur (N) 5 13 21 34 7
7 Chikiti (N) 2 36 7 43 22
8 Digapahandi (N) 3 11 8 19 6
9 Ganjam (N) 2 17 10 27 14
10 Gopalpur (N) 1 3 12 15 15
11 Hinjilicut (N) 4 46 38 84 21
12 Kabisuryanagar (N) 2 12 6 18 9
13 Khallikote (N) 2 26 15 41 21
14 Kodala (N) 1 14 1 15 15
15 Polosara (N) 3 34 13 47 16
16 Purushottampur (N) 1 27 11 38 38
17 Rambha (N) 1 6 0 6 6
18 Sorada (N) 2 6 6 12 6
(Contd.)
NB : Colleges includes Govt./Private
XII.EDUCATION
12.05. Number of Colleges for General Education, Lecturers and
in different Blocks and Urban areas of Ganjam District (Contd.)
Sl.
No
.
Year /
Block /
Urban
No. of
Colleges
Number of Lecturers No. of
Teacher
per
College
86
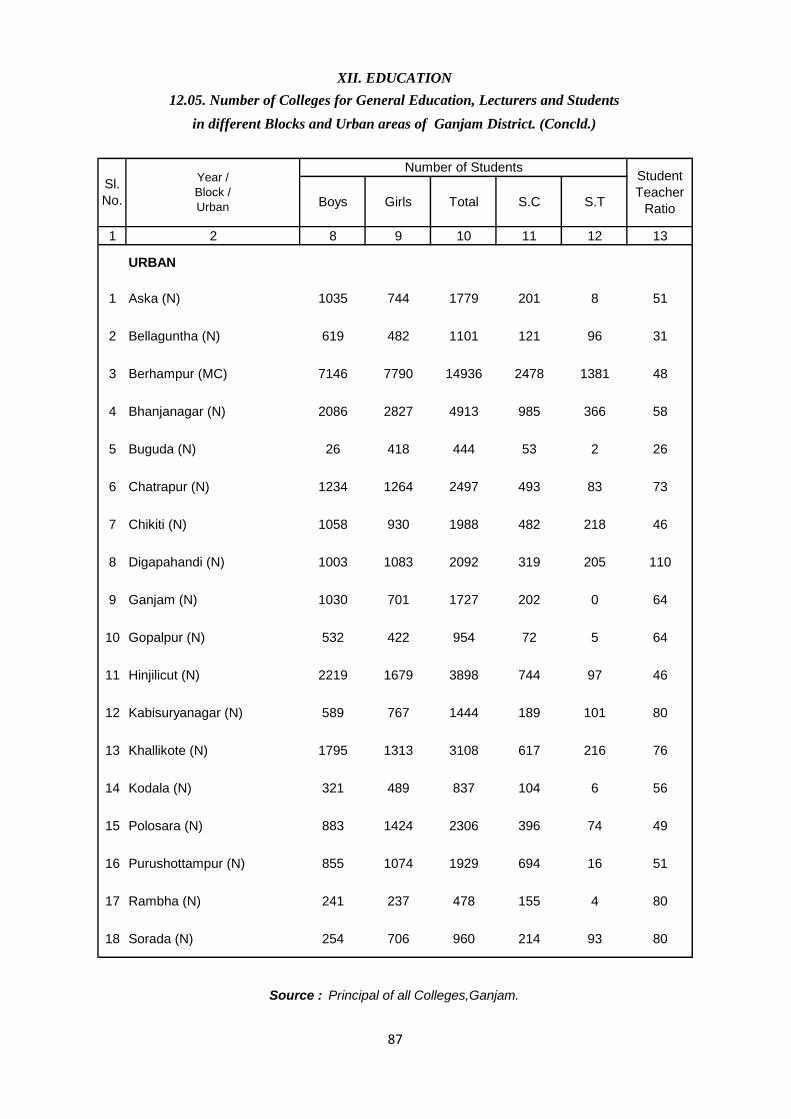
Boys Girls Total S.C S.T
1 2 8 9 10 11 12 13
URBAN
1 Aska (N) 1035 744 1779 201 8 51
2 Bellaguntha (N) 619 482 1101 121 96 31
3 Berhampur (MC) 7146 7790 14936 2478 1381 48
4 Bhanjanagar (N) 2086 2827 4913 985 366 58
5 Buguda (N) 26 418 444 53 2 26
6 Chatrapur (N) 1234 1264 2497 493 83 73
7 Chikiti (N) 1058 930 1988 482 218 46
8 Digapahandi (N) 1003 1083 2092 319 205 110
9 Ganjam (N) 1030 701 1727 202 0 64
10 Gopalpur (N) 532 422 954 72 5 64
11 Hinjilicut (N) 2219 1679 3898 744 97 46
12 Kabisuryanagar (N) 589 767 1444 189 101 80
13 Khallikote (N) 1795 1313 3108 617 216 76
14 Kodala (N) 321 489 837 104 6 56
15 Polosara (N) 883 1424 2306 396 74 49
16 Purushottampur (N) 855 1074 1929 694 16 51
17 Rambha (N) 241 237 478 155 4 80
18 Sorada (N) 254 706 960 214 93 80
Source : Principal of all Colleges,Ganjam.
XII. EDUCATION
12.05. Number of Colleges for General Education, Lecturers and Students
in different Blocks and Urban areas of Ganjam District. (Concld.)
Sl.
No.
Year /
Block /
Urban
Number of StudentsStudent
Teacher
Ratio
87
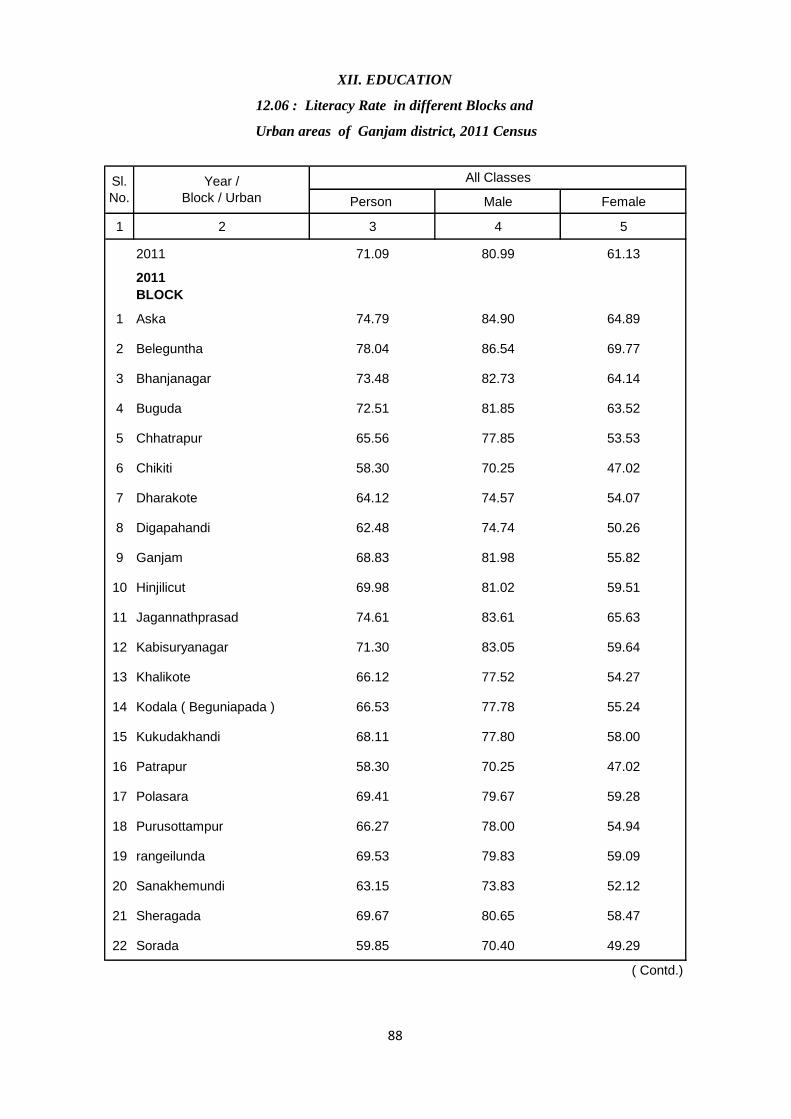
Person Male Female
1 2 3 4 5
2011 71.09 80.99 61.13
2011
BLOCK
1 Aska 74.79 84.90 64.89
2 Beleguntha 78.04 86.54 69.77
3 Bhanjanagar 73.48 82.73 64.14
4 Buguda 72.51 81.85 63.52
5 Chhatrapur 65.56 77.85 53.53
6 Chikiti 58.30 70.25 47.02
7 Dharakote 64.12 74.57 54.07
8 Digapahandi 62.48 74.74 50.26
9 Ganjam 68.83 81.98 55.82
10 Hinjilicut 69.98 81.02 59.51
11 Jagannathprasad 74.61 83.61 65.63
12 Kabisuryanagar 71.30 83.05 59.64
13 Khalikote 66.12 77.52 54.27
14 Kodala ( Beguniapada ) 66.53 77.78 55.24
15 Kukudakhandi 68.11 77.80 58.00
16 Patrapur 58.30 70.25 47.02
17 Polasara 69.41 79.67 59.28
18 Purusottampur 66.27 78.00 54.94
19 rangeilunda 69.53 79.83 59.09
20 Sanakhemundi 63.15 73.83 52.12
21 Sheragada 69.67 80.65 58.47
22 Sorada 59.85 70.40 49.29
( Contd.)
XII. EDUCATION
12.06 : Literacy Rate in different Blocks and
Urban areas of Ganjam district, 2011 Census
Sl.
No.
Year /
Block / Urban
All Classes
88
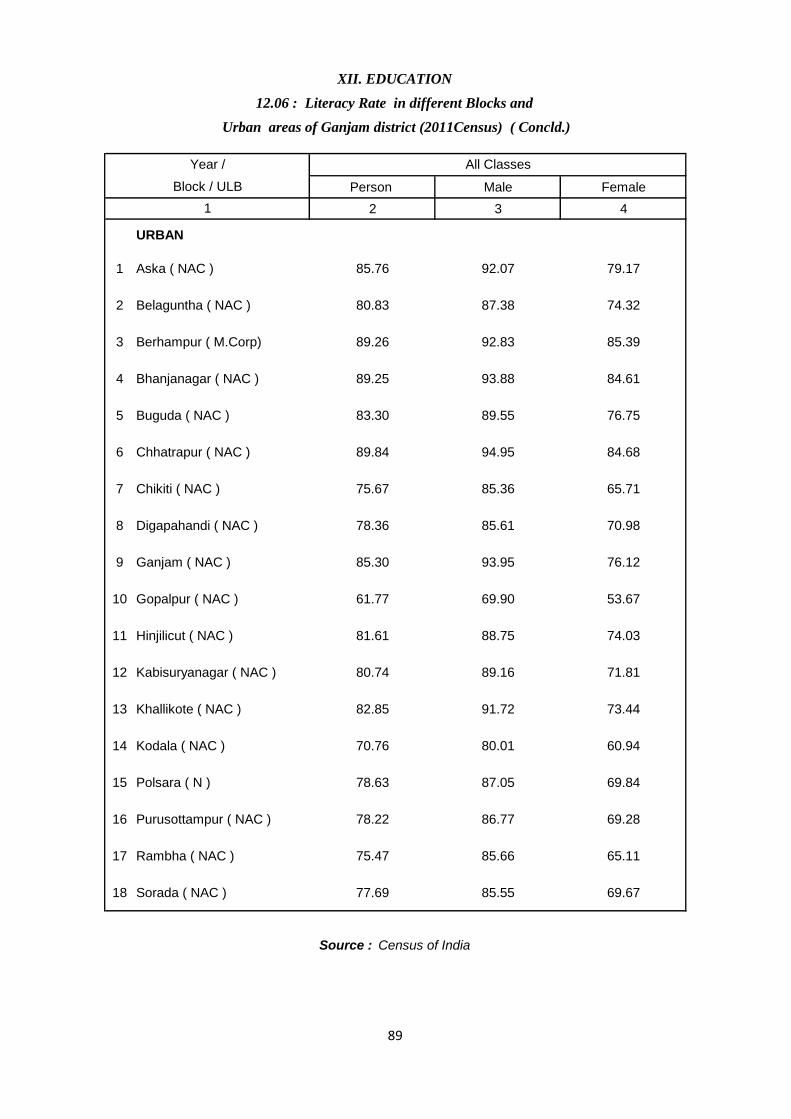
Person Male Female
2 3 4
URBAN
1 Aska ( NAC ) 85.76 92.07 79.17
2 Belaguntha ( NAC ) 80.83 87.38 74.32
3 Berhampur ( M.Corp) 89.26 92.83 85.39
4 Bhanjanagar ( NAC ) 89.25 93.88 84.61
5 Buguda ( NAC ) 83.30 89.55 76.75
6 Chhatrapur ( NAC ) 89.84 94.95 84.68
7 Chikiti ( NAC ) 75.67 85.36 65.71
8 Digapahandi ( NAC ) 78.36 85.61 70.98
9 Ganjam ( NAC ) 85.30 93.95 76.12
10 Gopalpur ( NAC ) 61.77 69.90 53.67
11 Hinjilicut ( NAC ) 81.61 88.75 74.03
12 Kabisuryanagar ( NAC ) 80.74 89.16 71.81
13 Khallikote ( NAC ) 82.85 91.72 73.44
14 Kodala ( NAC ) 70.76 80.01 60.94
15 Polsara ( N ) 78.63 87.05 69.84
16 Purusottampur ( NAC ) 78.22 86.77 69.28
17 Rambha ( NAC ) 75.47 85.66 65.11
18 Sorada ( NAC ) 77.69 85.55 69.67
1
Source : Census of India
XII. EDUCATION
12.06 : Literacy Rate in different Blocks and
Urban areas of Ganjam district (2011Census) ( Concld.)
Year / All Classes
Block / ULB
89

Sl.
No.
Year /
Block /
Urban
Govt
Medical
Colleges /
Hospitals
Community
Health
Centre
Primary
Health
Centre
(Old/New)/
UGPHC/
Other
Hospital
Sub
Centres
Private
Hospitals/
Nursing
Homes/
Medical
College
Hospitals
1 2 3 4 5 6 7
2015-16 4 30 90 460 NA
2016-17 4 30 90 460 NA
2017-18 4 30 97 460 NA
2017-18
BLOCK
1 Aska 0 1 3 23 NA
2 Beguniapada 0 1 2 22 NA
3 Bellaguntha 0 1 3 20 NA
4 Bhanjanagar 0 1 4 21 NA
5 Buguda 0 0 4 19 NA
6 Chatrapur 0 1 3 20 NA
7 Chikiti 0 1 5 17 NA
8 Dharakote 0 1 4 17 NA
9 Digapahandi 0 1 6 27 NA
10 Ganjam 0 1 2 15 NA
11 Hinjilicut 0 1 3 19 NA
12 Jagannathprasad 0 1 4 23 NA
13 Kabisuryanagar 0 0 2 17 NA
14 Khallikote 0 0 4 24 NA
15 Kukudakhandi 0 1 4 20 NA
16 Patrapur 0 1 7 23 NA
17 Polasara 0 0 4 22 NA
18 Purushottampur 0 1 4 25 NA
19 Rangeilunda 0 1 3 21 NA
20 Sanakhemundi 0 1 6 25 NA
21 Seragada 0 1 5 19 NA
22 Soroda 0 1 5 21 NA
(Contd.)
XIII. HEALTH & FAMILY WELFARE
13.01. Health Care infrastructures( Allopathic)
in different Blocks and Urban areas of Ganjam District.
90
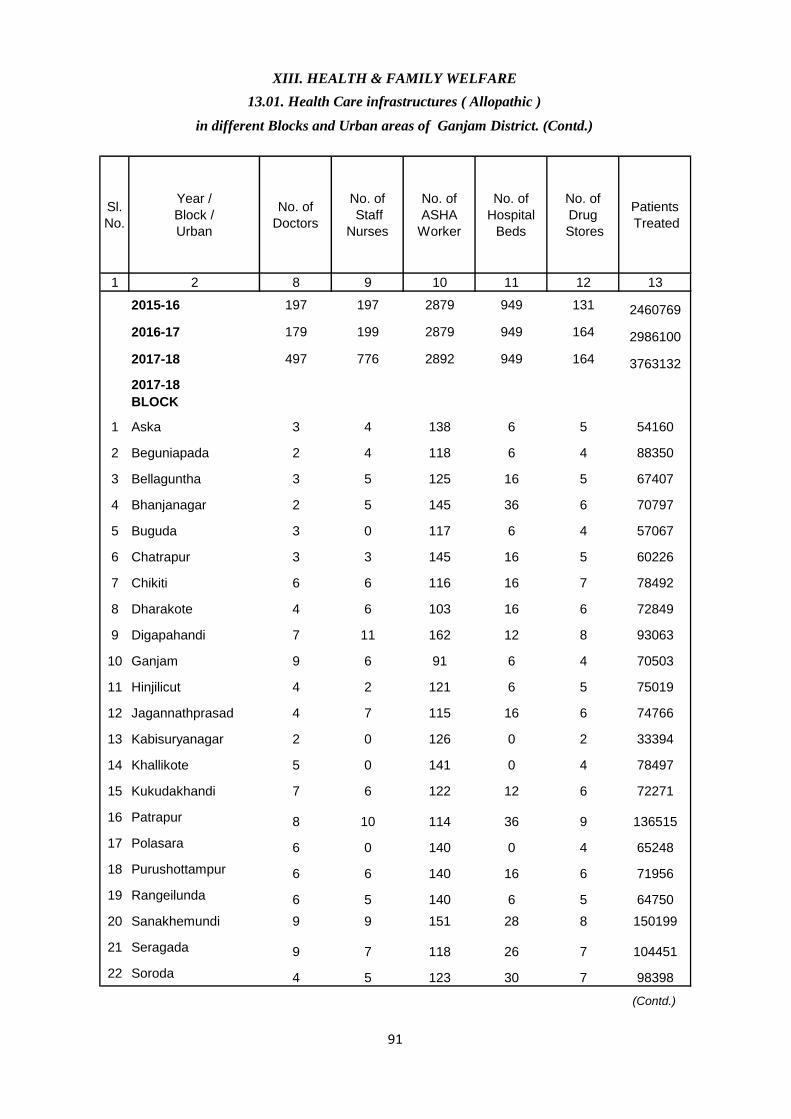
Sl.
No.
Year /
Block /
Urban
No. of
Doctors
No. of
Staff
Nurses
No. of
ASHA
Worker
No. of
Hospital
Beds
No. of
Drug
Stores
Patients
Treated
1 2 8 9 10 11 12 13
2015-16 197 197 2879 949 131 2460769
2016-17 179 199 2879 949 164 2986100
2017-18 497 776 2892 949 164 3763132
2017-18
BLOCK
1 Aska 3 4 138 6 5 54160
2 Beguniapada 2 4 118 6 4 88350
3 Bellaguntha 3 5 125 16 5 67407
4 Bhanjanagar 2 5 145 36 6 70797
5 Buguda 3 0 117 6 4 57067
6 Chatrapur 3 3 145 16 5 60226
7 Chikiti 6 6 116 16 7 78492
8 Dharakote 4 6 103 16 6 72849
9 Digapahandi 7 11 162 12 8 93063
10 Ganjam 9 6 91 6 4 70503
11 Hinjilicut 4 2 121 6 5 75019
12 Jagannathprasad 4 7 115 16 6 74766
13 Kabisuryanagar 2 0 126 0 2 33394
14 Khallikote 5 0 141 0 4 78497
15 Kukudakhandi 7 6 122 12 6 72271
16 Patrapur 8 10 114 36 9 136515
17 Polasara 6 0 140 0 4 65248
18 Purushottampur 6 6 140 16 6 71956
19 Rangeilunda 6 5 140 6 5 64750
20 Sanakhemundi 9 9 151 28 8 150199
21 Seragada 9 7 118 26 7 104451
22 Soroda 4 5 123 30 7 98398
(Contd.)
XIII. HEALTH & FAMILY WELFARE
13.01. Health Care infrastructures ( Allopathic )
in different Blocks and Urban areas of Ganjam District. (Contd.)
91
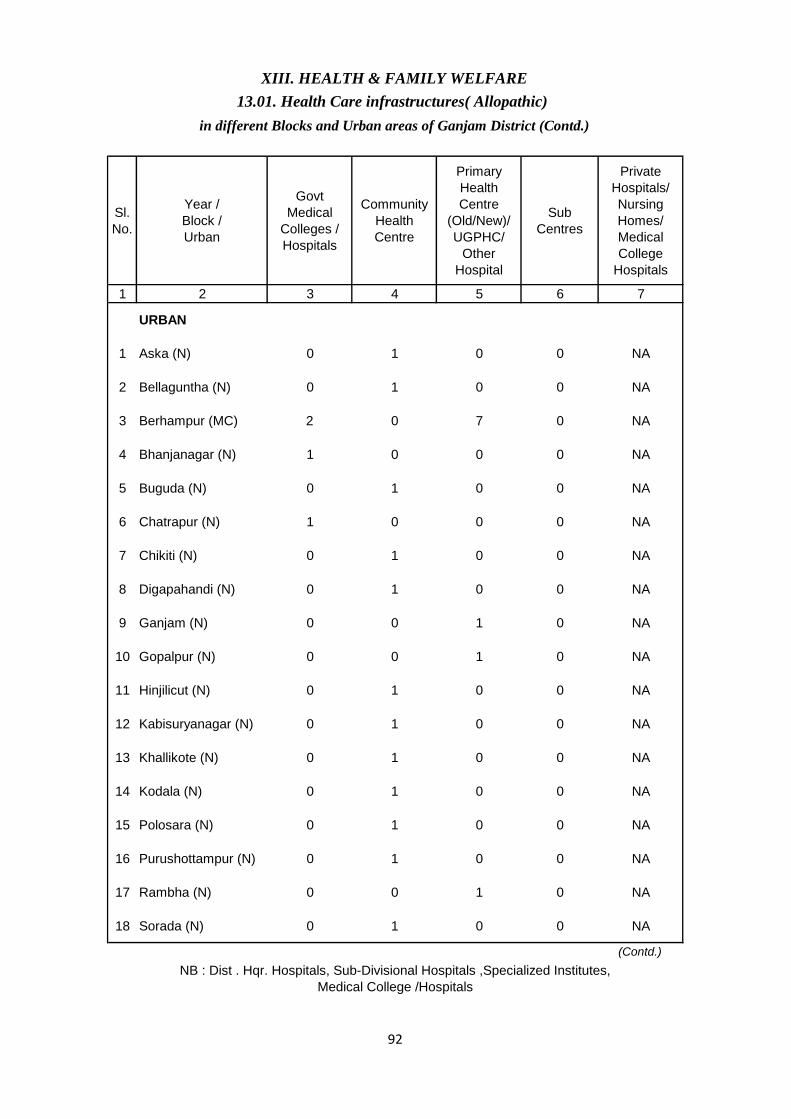
Sl.
No.
Year /
Block /
Urban
Govt
Medical
Colleges /
Hospitals
Community
Health
Centre
Primary
Health
Centre
(Old/New)/
UGPHC/
Other
Hospital
Sub
Centres
Private
Hospitals/
Nursing
Homes/
Medical
College
Hospitals
1 2 3 4 5 6 7
URBAN
1 Aska (N) 0 1 0 0 NA
2 Bellaguntha (N) 0 1 0 0 NA
3 Berhampur (MC) 2 0 7 0 NA
4 Bhanjanagar (N) 1 0 0 0 NA
5 Buguda (N) 0 1 0 0 NA
6 Chatrapur (N) 1 0 0 0 NA
7 Chikiti (N) 0 1 0 0 NA
8 Digapahandi (N) 0 1 0 0 NA
9 Ganjam (N) 0 0 1 0 NA
10 Gopalpur (N) 0 0 1 0 NA
11 Hinjilicut (N) 0 1 0 0 NA
12 Kabisuryanagar (N) 0 1 0 0 NA
13 Khallikote (N) 0 1 0 0 NA
14 Kodala (N) 0 1 0 0 NA
15 Polosara (N) 0 1 0 0 NA
16 Purushottampur (N) 0 1 0 0 NA
17 Rambha (N) 0 0 1 0 NA
18 Sorada (N) 0 1 0 0 NA
(Contd.)
in different Blocks and Urban areas of Ganjam District (Contd.)
NB : Dist . Hqr. Hospitals, Sub-Divisional Hospitals ,Specialized Institutes,
Medical College /Hospitals
XIII. HEALTH & FAMILY WELFARE
13.01. Health Care infrastructures( Allopathic)
92
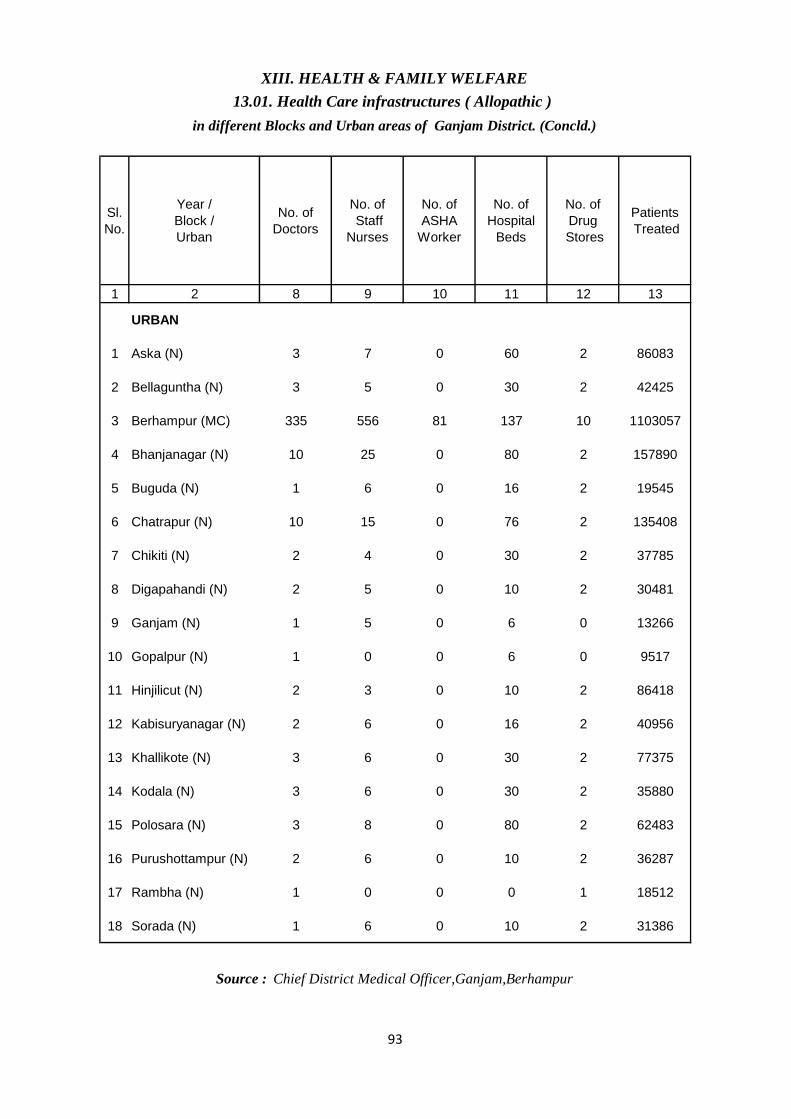
Sl.
No.
Year /
Block /
Urban
No. of
Doctors
No. of
Staff
Nurses
No. of
ASHA
Worker
No. of
Hospital
Beds
No. of
Drug
Stores
Patients
Treated
1 2 8 9 10 11 12 13
URBAN
1 Aska (N) 3 7 0 60 2 86083
2 Bellaguntha (N) 3 5 0 30 2 42425
3 Berhampur (MC) 335 556 81 137 10 1103057
4 Bhanjanagar (N) 10 25 0 80 2 157890
5 Buguda (N) 1 6 0 16 2 19545
6 Chatrapur (N) 10 15 0 76 2 135408
7 Chikiti (N) 2 4 0 30 2 37785
8 Digapahandi (N) 2 5 0 10 2 30481
9 Ganjam (N) 1 5 0 6 0 13266
10 Gopalpur (N) 1 0 0 6 0 9517
11 Hinjilicut (N) 2 3 0 10 2 86418
12 Kabisuryanagar (N) 2 6 0 16 2 40956
13 Khallikote (N) 3 6 0 30 2 77375
14 Kodala (N) 3 6 0 30 2 35880
15 Polosara (N) 3 8 0 80 2 62483
16 Purushottampur (N) 2 6 0 10 2 36287
17 Rambha (N) 1 0 0 0 1 18512
18 Sorada (N) 1 6 0 10 2 31386
in different Blocks and Urban areas of Ganjam District. (Concld.)
Source : Chief District Medical Officer,Ganjam,Berhampur
XIII. HEALTH & FAMILY WELFARE
13.01. Health Care infrastructures ( Allopathic )
93
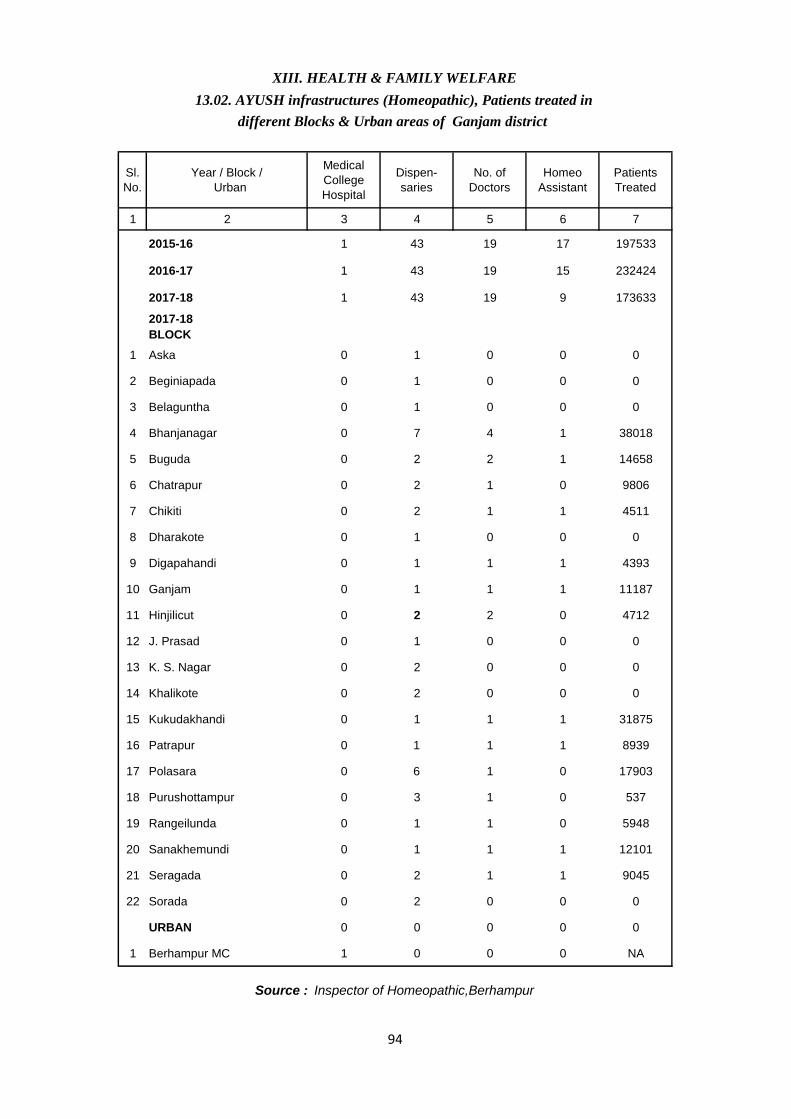
Sl.
No.
Year / Block /
Urban
Medical
College
Hospital
Dispen-
saries
No. of
Doctors
Homeo
Assistant
Patients
Treated
1 2 3 4 5 6 7
2015-16 1 43 19 17 197533
2016-17 1 43 19 15 232424
2017-18 1 43 19 9 173633
2017-18
BLOCK
1 Aska 0 1 0 0 0
2 Beginiapada 0 1 0 0 0
3 Belaguntha 0 1 0 0 0
4 Bhanjanagar 0 7 4 1 38018
5 Buguda 0 2 2 1 14658
6 Chatrapur 0 2 1 0 9806
7 Chikiti 0 2 1 1 4511
8 Dharakote 0 1 0 0 0
9 Digapahandi 0 1 1 1 4393
10 Ganjam 0 1 1 1 11187
11 Hinjilicut 0 2 2 0 4712
12 J. Prasad 0 1 0 0 0
13 K. S. Nagar 0 2 0 0 0
14 Khalikote 0 2 0 0 0
15 Kukudakhandi 0 1 1 1 31875
16 Patrapur 0 1 1 1 8939
17 Polasara 0 6 1 0 17903
18 Purushottampur 0 3 1 0 537
19 Rangeilunda 0 1 1 0 5948
20 Sanakhemundi 0 1 1 1 12101
21 Seragada 0 2 1 1 9045
22 Sorada 0 2 0 0 0
URBAN 0 0 0 0 0
1 Berhampur MC 1 0 0 0 NA
Source : Inspector of Homeopathic,Berhampur
XIII. HEALTH & FAMILY WELFARE
13.02. AYUSH infrastructures (Homeopathic), Patients treated in
different Blocks & Urban areas of Ganjam district
94
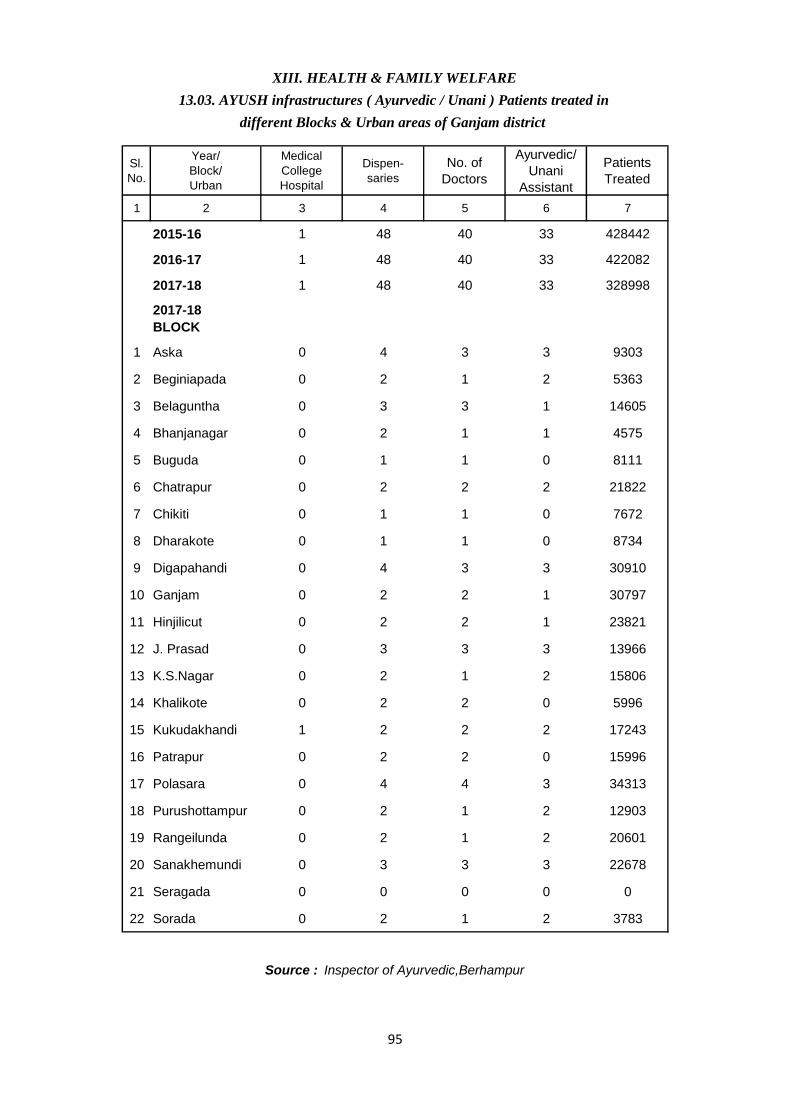
Sl.
No.
Year/
Block/
Urban
Medical
College
Hospital
Dispen-
saries
No. of
Doctors
Ayurvedic/
Unani
Assistant
Patients
Treated
1 2 3 4 5 6 7
2015-16 1 48 40 33 428442
2016-17 1 48 40 33 422082
2017-18 1 48 40 33 328998
2017-18
BLOCK
1 Aska 0 4 3 3 9303
2 Beginiapada 0 2 1 2 5363
3 Belaguntha 0 3 3 1 14605
4 Bhanjanagar 0 2 1 1 4575
5 Buguda 0 1 1 0 8111
6 Chatrapur 0 2 2 2 21822
7 Chikiti 0 1 1 0 7672
8 Dharakote 0 1 1 0 8734
9 Digapahandi 0 4 3 3 30910
10 Ganjam 0 2 2 1 30797
11 Hinjilicut 0 2 2 1 23821
12 J. Prasad 0 3 3 3 13966
13 K.S.Nagar 0 2 1 2 15806
14 Khalikote 0 2 2 0 5996
15 Kukudakhandi 1 2 2 2 17243
16 Patrapur 0 2 2 0 15996
17 Polasara 0 4 4 3 34313
18 Purushottampur 0 2 1 2 12903
19 Rangeilunda 0 2 1 2 20601
20 Sanakhemundi 0 3 3 3 22678
21 Seragada 0 0 0 0 0
22 Sorada 0 2 1 2 3783
Source : Inspector of Ayurvedic,Berhampur
different Blocks & Urban areas of Ganjam district
13.03. AYUSH infrastructures ( Ayurvedic / Unani ) Patients treated in
XIII. HEALTH & FAMILY WELFARE
95
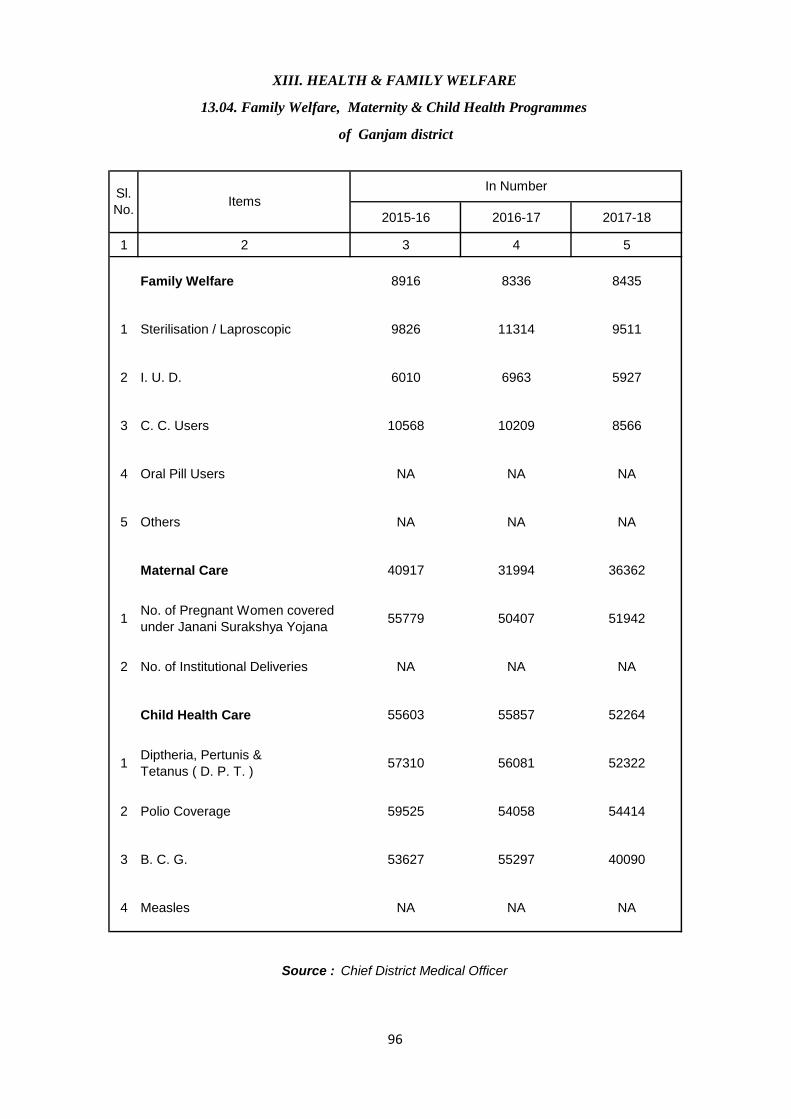
2015-16 2016-17 2017-18
1 2 3 4 5
Family Welfare 8916 8336 8435
1 Sterilisation / Laproscopic 9826 11314 9511
2 I. U. D. 6010 6963 5927
3 C. C. Users 10568 10209 8566
4 Oral Pill Users NA NA NA
5 Others NA NA NA
Maternal Care 40917 31994 36362
1No. of Pregnant Women covered
under Janani Surakshya Yojana 55779 50407 51942
2 No. of Institutional Deliveries NA NA NA
Child Health Care 55603 55857 52264
1Diptheria, Pertunis &
Tetanus ( D. P. T. )57310 56081 52322
2 Polio Coverage 59525 54058 54414
3 B. C. G. 53627 55297 40090
4 Measles NA NA NA
Source : Chief District Medical Officer
XIII. HEALTH & FAMILY WELFARE
13.04. Family Welfare, Maternity & Child Health Programmes
of Ganjam district
Sl.
No.Items
In Number
96
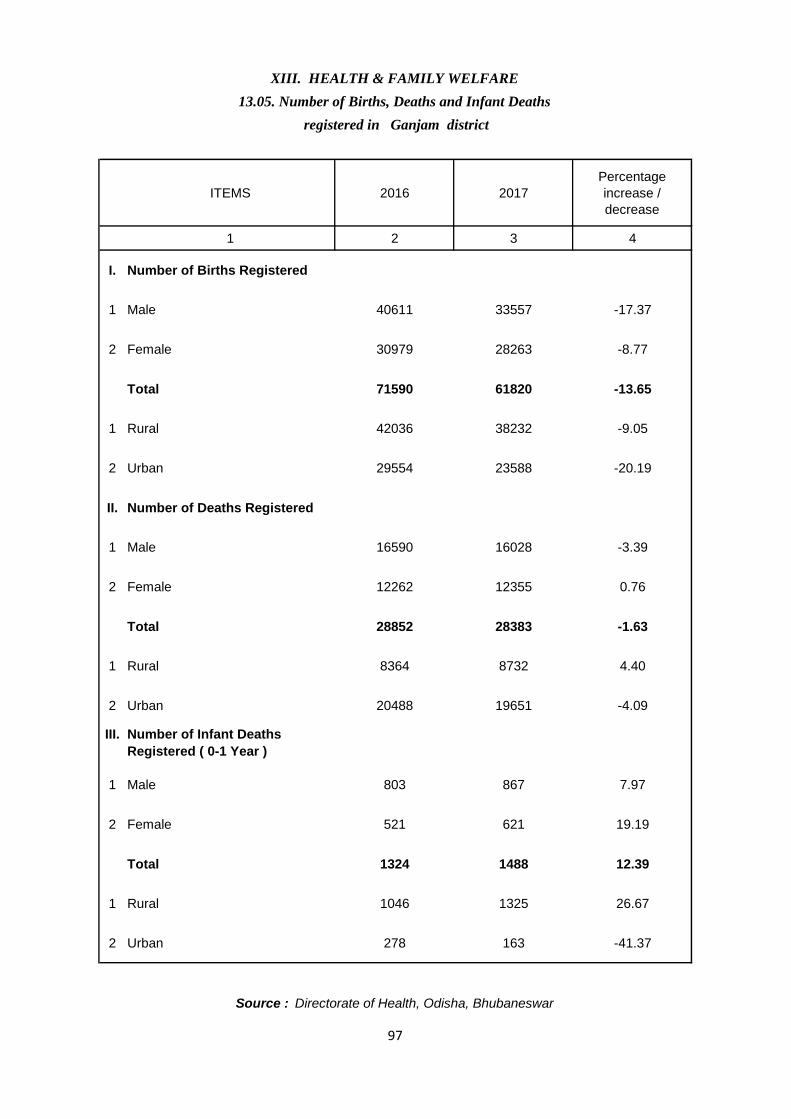
ITEMS 2016 2017
Percentage
increase /
decrease
1 2 3 4
I. Number of Births Registered
1 Male 40611 33557 -17.37
2 Female 30979 28263 -8.77
Total 71590 61820 -13.65
1 Rural 42036 38232 -9.05
2 Urban 29554 23588 -20.19
II. Number of Deaths Registered
1 Male 16590 16028 -3.39
2 Female 12262 12355 0.76
Total 28852 28383 -1.63
1 Rural 8364 8732 4.40
2 Urban 20488 19651 -4.09
III. Number of Infant Deaths
Registered ( 0-1 Year )
1 Male 803 867 7.97
2 Female 521 621 19.19
Total 1324 1488 12.39
1 Rural 1046 1325 26.67
2 Urban 278 163 -41.37
XIII. HEALTH & FAMILY WELFARE
13.05. Number of Births, Deaths and Infant Deaths
registered in Ganjam district
Source : Directorate of Health, Odisha, Bhubaneswar
97

Pv Pf
1 2 3 4 5 6 7 8 9
1 Angul 496 151 0 459 368 1260 1260
2 Balasore 42 65 0 184 116 1766 1766
3 Bargarh 415 268 0 729 753 1341 1341
4 Bhadrak 19 79 0 174 148 808 808
5 Bolangir 352 243 0 781 832 1734 1734
6 Boudh 164 88 0 249 243 222 222
7 Cuttack 41 76 0 247 167 4924 4924
8 Deogarh 125 43 0 87 73 317 317
9 Dhenkanal 165 79 0 715 728 1035 1035
10 Gajapati 3356 769 0 33 15 1248 1248
11 Ganjam 7138 2001 1 731 669 4826 4826
12 Jagatsinghpur 14 34 0 48 47 384 384
13 Jajpur 189 86 0 342 265 1207 1207
14 Jharsuguda 122 85 1 279 303 666 666
15 Kalahandi 7290 1406 0 588 493 1567 1567
16 Kandhamal 3577 1122 0 53 31 942 942
17 Kendrapara 9 31 0 66 60 536 536
18 Keonjhar 2111 739 0 338 186 2514 2514
19 Khurda 210 122 0 263 203 3757 3757
20 Koraput 6139 664 0 264 227 1990 1990
21 Malkangiri 8519 814 0 29 14 913 913
22 Mayurbhanja 1263 963 0 718 641 5310 5310
23 Nabarangapur 2780 400 0 346 288 1157 1157
24 Nayagarh 372 124 0 95 114 1275 1275
25 Nuapara 458 149 0 255 231 1064 1064
26 Puri 25 64 0 144 102 943 943
27 Rayagada 4547 581 0 82 25 1656 1656
28 Sambalpur 178 108 0 316 275 2328 2328
29 Subarnapur 255 157 0 369 342 378 378
30 Sundargarh 3632 768 1 592 467 2904 2904
ODISHA 54003 12279 3 9576 8426 50972 50972
( Contd.)
Cases
Treated
XIII. HEALTH & FAMILY WELFARE
13.06 : Health Control Programmes of the districts
Sl.
No.
Name
of the
District
MALARIA
( 2018 )
LEPROSY
(2017-18)
TUBERCULOSIS
( 2018 )
Malaria Positive No. of
Deaths
Cases
Found
Cases
Treated
Cases
Found
98
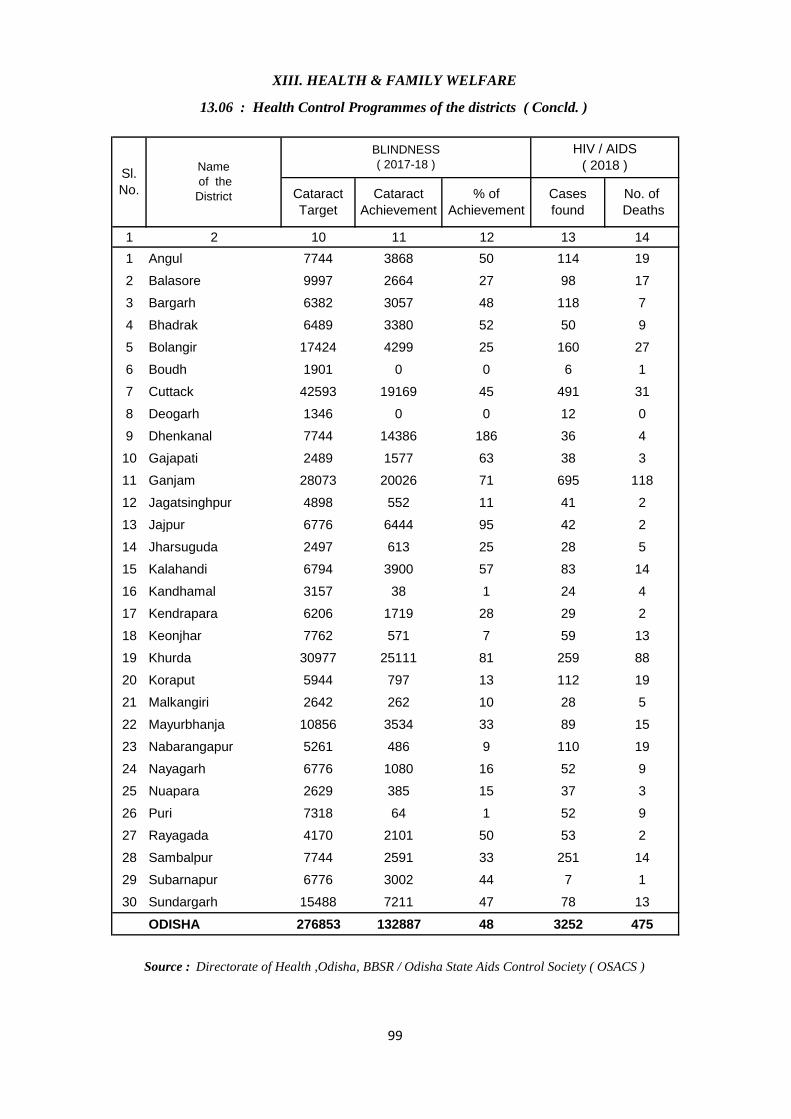
1 2 10 11 12 13 14
1 Angul 7744 3868 50 114 19
2 Balasore 9997 2664 27 98 17
3 Bargarh 6382 3057 48 118 7
4 Bhadrak 6489 3380 52 50 9
5 Bolangir 17424 4299 25 160 27
6 Boudh 1901 0 0 6 1
7 Cuttack 42593 19169 45 491 31
8 Deogarh 1346 0 0 12 0
9 Dhenkanal 7744 14386 186 36 4
10 Gajapati 2489 1577 63 38 3
11 Ganjam 28073 20026 71 695 118
12 Jagatsinghpur 4898 552 11 41 2
13 Jajpur 6776 6444 95 42 2
14 Jharsuguda 2497 613 25 28 5
15 Kalahandi 6794 3900 57 83 14
16 Kandhamal 3157 38 1 24 4
17 Kendrapara 6206 1719 28 29 2
18 Keonjhar 7762 571 7 59 13
19 Khurda 30977 25111 81 259 88
20 Koraput 5944 797 13 112 19
21 Malkangiri 2642 262 10 28 5
22 Mayurbhanja 10856 3534 33 89 15
23 Nabarangapur 5261 486 9 110 19
24 Nayagarh 6776 1080 16 52 9
25 Nuapara 2629 385 15 37 3
26 Puri 7318 64 1 52 9
27 Rayagada 4170 2101 50 53 2
28 Sambalpur 7744 2591 33 251 14
29 Subarnapur 6776 3002 44 7 1
30 Sundargarh 15488 7211 47 78 13
ODISHA 276853 132887 48 3252 475
Source : Directorate of Health ,Odisha, BBSR / Odisha State Aids Control Society ( OSACS )
Sl.
No.
Name
of the
District
BLINDNESS
( 2017-18 )
HIV / AIDS
( 2018 )
Cataract
Target
Cataract
Achievement
% of
Achievement
Cases
found
No. of
Deaths
XIII. HEALTH & FAMILY WELFARE
13.06 : Health Control Programmes of the districts ( Concld. )
99

Sl.
No.
Year /
Block
No. of
Villages/
hamlets
No. of
Villages
covered
with Rural
drinking Water
Supply Prog
( Out of Col.3 )
No. of
working
Tube
Wells
No. of
working
Sanitary
Wells
No. of
Piped
Water
Projects
1 2 3 4 5 6 7
2015-16 2797 2075 26348 367 1284
2016-17 2797 2090 27173 367 1332
2017-18 2797 2114 29730 360 1407
2017-18
BLOCK
1 Aska 102 102 3338 7 61
2 Beginiapada 133 133 1303 18 50
3 Belaguntha 91 91 1111 4 34
4 Bhanjanagar 136 136 1597 29 59
5 Buguda 93 93 1190 2 38
6 Chatrapur 71 42 1083 0 69
7 Chikiti 126 72 973 0 49
8 Dharakote 167 167 1093 39 54
9 Digapahandi 205 87 1451 36 100
10 Ganjam 104 65 763 0 84
11 Hinjilicut 52 51 1235 0 56
12 Jaganath Prasad 145 145 1902 22 113
13 K.S.Nagar 74 74 961 4 46
14 Khalikote 79 57 1197 0 80
15 Kukudakhandi 148 58 1290 5 66
16 Patrapur 295 73 1174 36 56
17 Polasara 125 125 1234 16 49
18 Purushottampur 247 247 1451 116 51
19 Rangeilunda 79 78 1470 2 121
20 Sanakhemundi 138 56 1309 24 46
21 Seragada 94 69 1340 0 68
22 Sorada 93 93 1265 0 57
Source : EE, RWSS, Berhampur and Bhanjanagar
13.07. Availability of Potable Drinking Water facilities
in different Blocks of Ganjam district ( 2017-18 )
XIII. HEALTH & FAMILY WELFARE
100
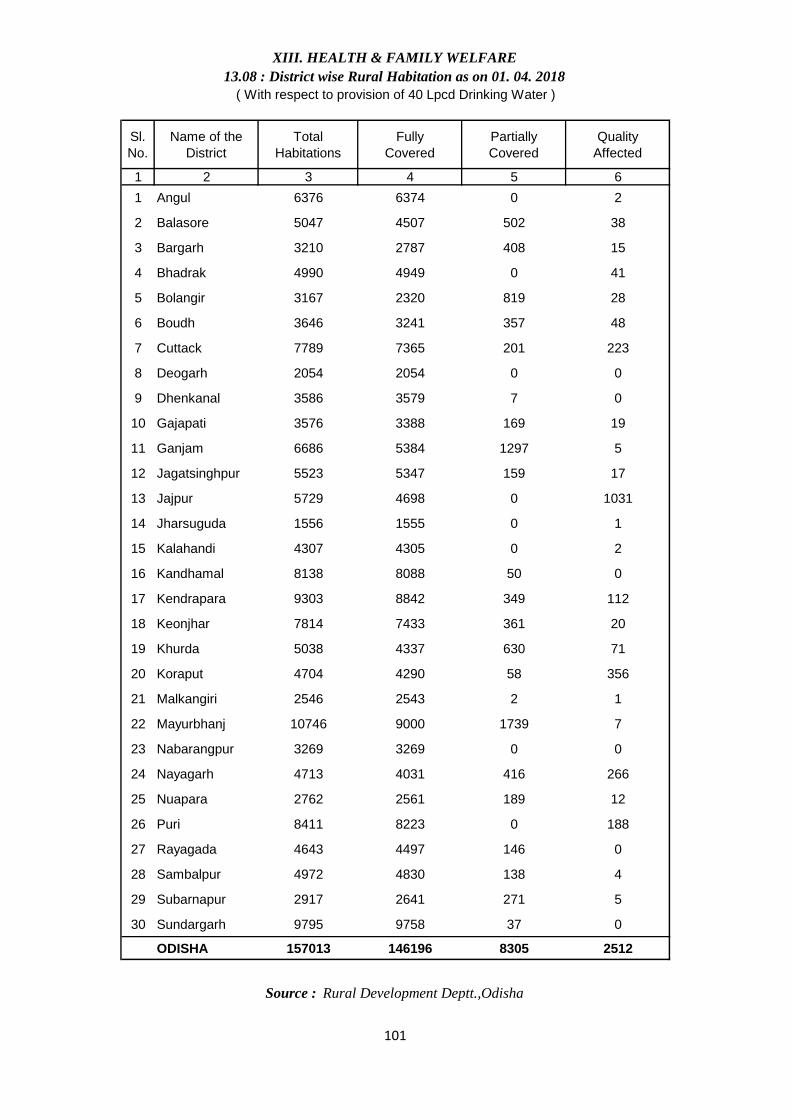
Sl.
No.
Name of the
District
Total
Habitations
Fully
Covered
Partially
Covered
Quality
Affected
1 2 3 4 5 6
1 Angul 6376 6374 0 2
2 Balasore 5047 4507 502 38
3 Bargarh 3210 2787 408 15
4 Bhadrak 4990 4949 0 41
5 Bolangir 3167 2320 819 28
6 Boudh 3646 3241 357 48
7 Cuttack 7789 7365 201 223
8 Deogarh 2054 2054 0 0
9 Dhenkanal 3586 3579 7 0
10 Gajapati 3576 3388 169 19
11 Ganjam 6686 5384 1297 5
12 Jagatsinghpur 5523 5347 159 17
13 Jajpur 5729 4698 0 1031
14 Jharsuguda 1556 1555 0 1
15 Kalahandi 4307 4305 0 2
16 Kandhamal 8138 8088 50 0
17 Kendrapara 9303 8842 349 112
18 Keonjhar 7814 7433 361 20
19 Khurda 5038 4337 630 71
20 Koraput 4704 4290 58 356
21 Malkangiri 2546 2543 2 1
22 Mayurbhanj 10746 9000 1739 7
23 Nabarangpur 3269 3269 0 0
24 Nayagarh 4713 4031 416 266
25 Nuapara 2762 2561 189 12
26 Puri 8411 8223 0 188
27 Rayagada 4643 4497 146 0
28 Sambalpur 4972 4830 138 4
29 Subarnapur 2917 2641 271 5
30 Sundargarh 9795 9758 37 0
ODISHA 157013 146196 8305 2512
XIII. HEALTH & FAMILY WELFARE
13.08 : District wise Rural Habitation as on 01. 04. 2018
( With respect to provision of 40 Lpcd Drinking Water )
Source : Rural Development Deptt.,Odisha
101
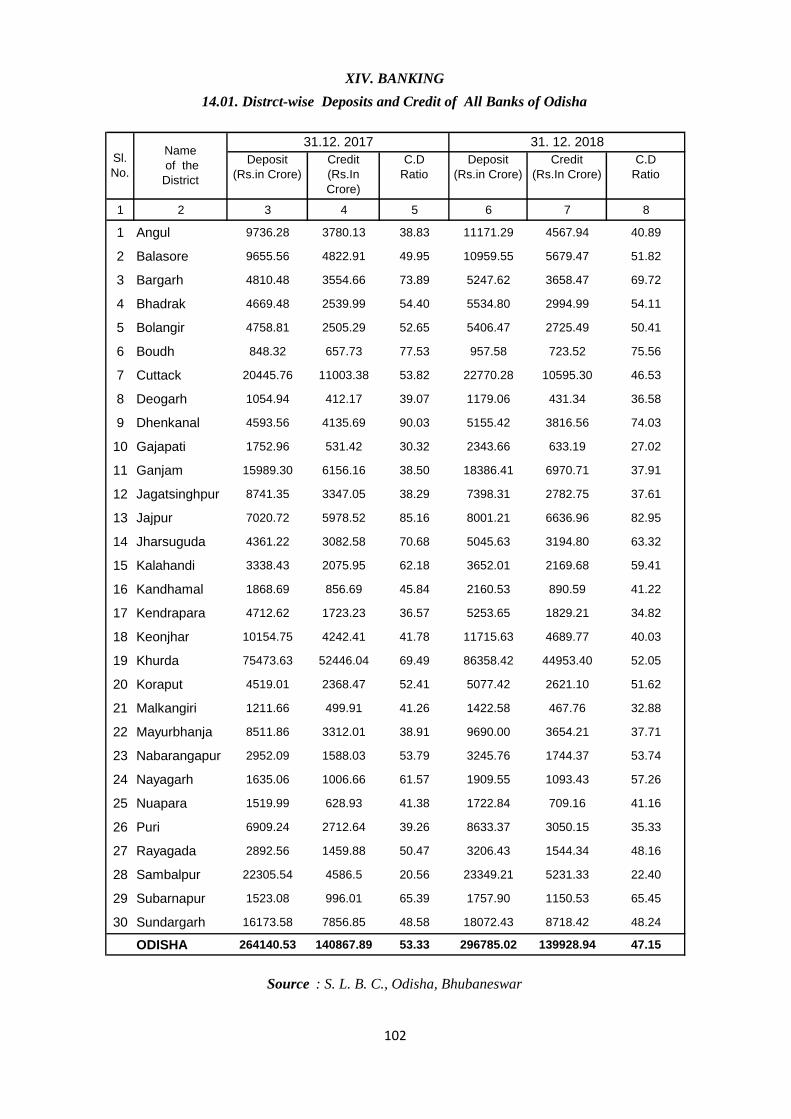
Deposit
(Rs.in Crore)
Credit
(Rs.In
Crore)
C.D
Ratio
Deposit
(Rs.in Crore)
Credit
(Rs.In Crore)
C.D
Ratio
1 2 3 4 5 6 7 8
1 Angul 9736.28 3780.13 38.83 11171.29 4567.94 40.89
2 Balasore 9655.56 4822.91 49.95 10959.55 5679.47 51.82
3 Bargarh 4810.48 3554.66 73.89 5247.62 3658.47 69.72
4 Bhadrak 4669.48 2539.99 54.40 5534.80 2994.99 54.11
5 Bolangir 4758.81 2505.29 52.65 5406.47 2725.49 50.41
6 Boudh 848.32 657.73 77.53 957.58 723.52 75.56
7 Cuttack 20445.76 11003.38 53.82 22770.28 10595.30 46.53
8 Deogarh 1054.94 412.17 39.07 1179.06 431.34 36.58
9 Dhenkanal 4593.56 4135.69 90.03 5155.42 3816.56 74.03
10 Gajapati 1752.96 531.42 30.32 2343.66 633.19 27.02
11 Ganjam 15989.30 6156.16 38.50 18386.41 6970.71 37.91
12 Jagatsinghpur 8741.35 3347.05 38.29 7398.31 2782.75 37.61
13 Jajpur 7020.72 5978.52 85.16 8001.21 6636.96 82.95
14 Jharsuguda 4361.22 3082.58 70.68 5045.63 3194.80 63.32
15 Kalahandi 3338.43 2075.95 62.18 3652.01 2169.68 59.41
16 Kandhamal 1868.69 856.69 45.84 2160.53 890.59 41.22
17 Kendrapara 4712.62 1723.23 36.57 5253.65 1829.21 34.82
18 Keonjhar 10154.75 4242.41 41.78 11715.63 4689.77 40.03
19 Khurda 75473.63 52446.04 69.49 86358.42 44953.40 52.05
20 Koraput 4519.01 2368.47 52.41 5077.42 2621.10 51.62
21 Malkangiri 1211.66 499.91 41.26 1422.58 467.76 32.88
22 Mayurbhanja 8511.86 3312.01 38.91 9690.00 3654.21 37.71
23 Nabarangapur 2952.09 1588.03 53.79 3245.76 1744.37 53.74
24 Nayagarh 1635.06 1006.66 61.57 1909.55 1093.43 57.26
25 Nuapara 1519.99 628.93 41.38 1722.84 709.16 41.16
26 Puri 6909.24 2712.64 39.26 8633.37 3050.15 35.33
27 Rayagada 2892.56 1459.88 50.47 3206.43 1544.34 48.16
28 Sambalpur 22305.54 4586.5 20.56 23349.21 5231.33 22.40
29 Subarnapur 1523.08 996.01 65.39 1757.90 1150.53 65.45
30 Sundargarh 16173.58 7856.85 48.58 18072.43 8718.42 48.24
ODISHA 264140.53 140867.89 53.33 296785.02 139928.94 47.15
Source : S. L. B. C., Odisha, Bhubaneswar
XIV. BANKING
14.01. Distrct-wise Deposits and Credit of All Banks of Odisha
Sl.
No.
Name
of the
District
31.12. 2017 31. 12. 2018
102
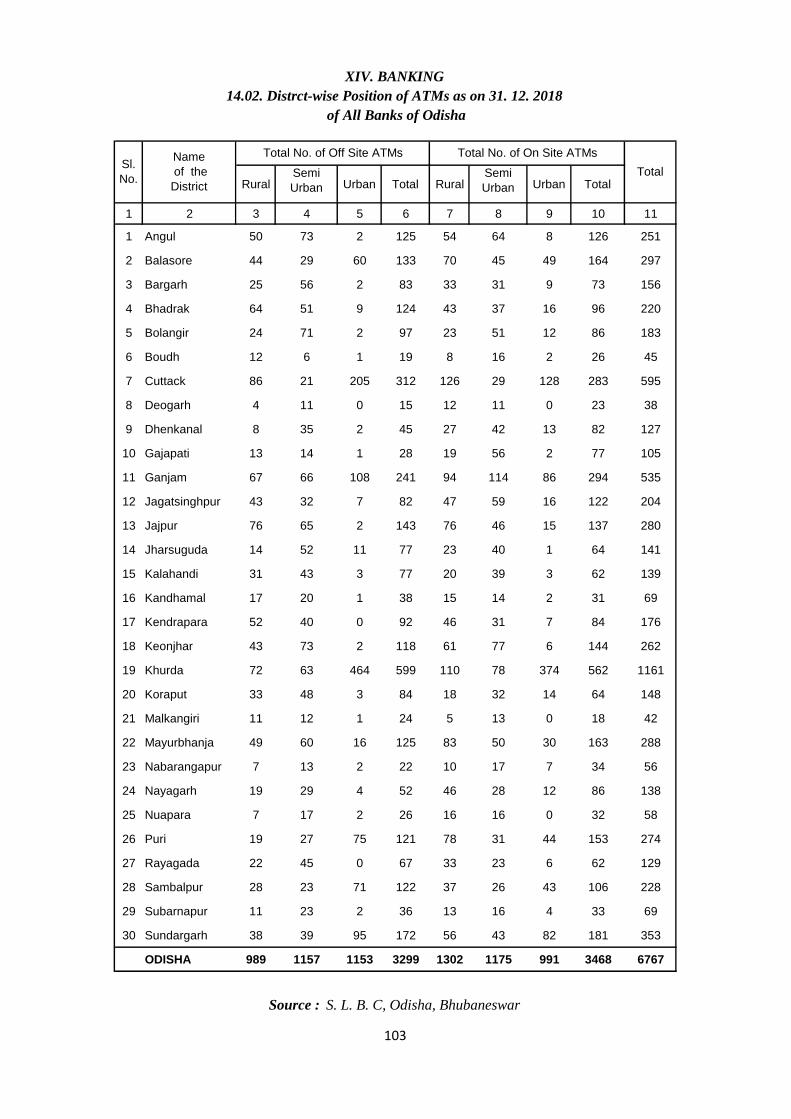
RuralSemi
Urban Urban Total RuralSemi
Urban Urban Total
1 2 3 4 5 6 7 8 9 10 11
1 Angul 50 73 2 125 54 64 8 126 251
2 Balasore 44 29 60 133 70 45 49 164 297
3 Bargarh 25 56 2 83 33 31 9 73 156
4 Bhadrak 64 51 9 124 43 37 16 96 220
5 Bolangir 24 71 2 97 23 51 12 86 183
6 Boudh 12 6 1 19 8 16 2 26 45
7 Cuttack 86 21 205 312 126 29 128 283 595
8 Deogarh 4 11 0 15 12 11 0 23 38
9 Dhenkanal 8 35 2 45 27 42 13 82 127
10 Gajapati 13 14 1 28 19 56 2 77 105
11 Ganjam 67 66 108 241 94 114 86 294 535
12 Jagatsinghpur 43 32 7 82 47 59 16 122 204
13 Jajpur 76 65 2 143 76 46 15 137 280
14 Jharsuguda 14 52 11 77 23 40 1 64 141
15 Kalahandi 31 43 3 77 20 39 3 62 139
16 Kandhamal 17 20 1 38 15 14 2 31 69
17 Kendrapara 52 40 0 92 46 31 7 84 176
18 Keonjhar 43 73 2 118 61 77 6 144 262
19 Khurda 72 63 464 599 110 78 374 562 1161
20 Koraput 33 48 3 84 18 32 14 64 148
21 Malkangiri 11 12 1 24 5 13 0 18 42
22 Mayurbhanja 49 60 16 125 83 50 30 163 288
23 Nabarangapur 7 13 2 22 10 17 7 34 56
24 Nayagarh 19 29 4 52 46 28 12 86 138
25 Nuapara 7 17 2 26 16 16 0 32 58
26 Puri 19 27 75 121 78 31 44 153 274
27 Rayagada 22 45 0 67 33 23 6 62 129
28 Sambalpur 28 23 71 122 37 26 43 106 228
29 Subarnapur 11 23 2 36 13 16 4 33 69
30 Sundargarh 38 39 95 172 56 43 82 181 353
ODISHA 989 1157 1153 3299 1302 1175 991 3468 6767
Source : S. L. B. C, Odisha, Bhubaneswar
XIV. BANKING
14.02. Distrct-wise Position of ATMs as on 31. 12. 2018
of All Banks of Odisha
Sl.
No.
Name
of the
District
Total No. of Off Site ATMs Total No. of On Site ATMs
Total
103
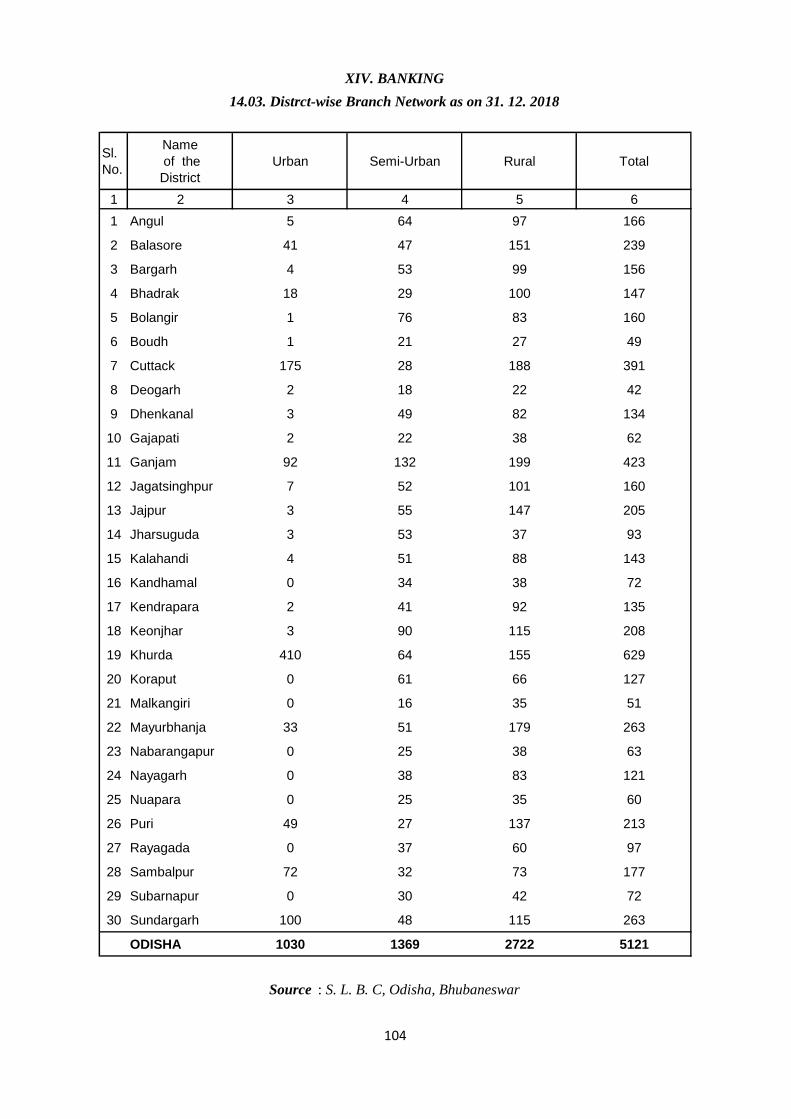
Sl.
No.
Name
of the
District
Urban Semi-Urban Rural Total
1 2 3 4 5 6
1 Angul 5 64 97 166
2 Balasore 41 47 151 239
3 Bargarh 4 53 99 156
4 Bhadrak 18 29 100 147
5 Bolangir 1 76 83 160
6 Boudh 1 21 27 49
7 Cuttack 175 28 188 391
8 Deogarh 2 18 22 42
9 Dhenkanal 3 49 82 134
10 Gajapati 2 22 38 62
11 Ganjam 92 132 199 423
12 Jagatsinghpur 7 52 101 160
13 Jajpur 3 55 147 205
14 Jharsuguda 3 53 37 93
15 Kalahandi 4 51 88 143
16 Kandhamal 0 34 38 72
17 Kendrapara 2 41 92 135
18 Keonjhar 3 90 115 208
19 Khurda 410 64 155 629
20 Koraput 0 61 66 127
21 Malkangiri 0 16 35 51
22 Mayurbhanja 33 51 179 263
23 Nabarangapur 0 25 38 63
24 Nayagarh 0 38 83 121
25 Nuapara 0 25 35 60
26 Puri 49 27 137 213
27 Rayagada 0 37 60 97
28 Sambalpur 72 32 73 177
29 Subarnapur 0 30 42 72
30 Sundargarh 100 48 115 263
ODISHA 1030 1369 2722 5121
XIV. BANKING
14.03. Distrct-wise Branch Network as on 31. 12. 2018
Source : S. L. B. C, Odisha, Bhubaneswar
104
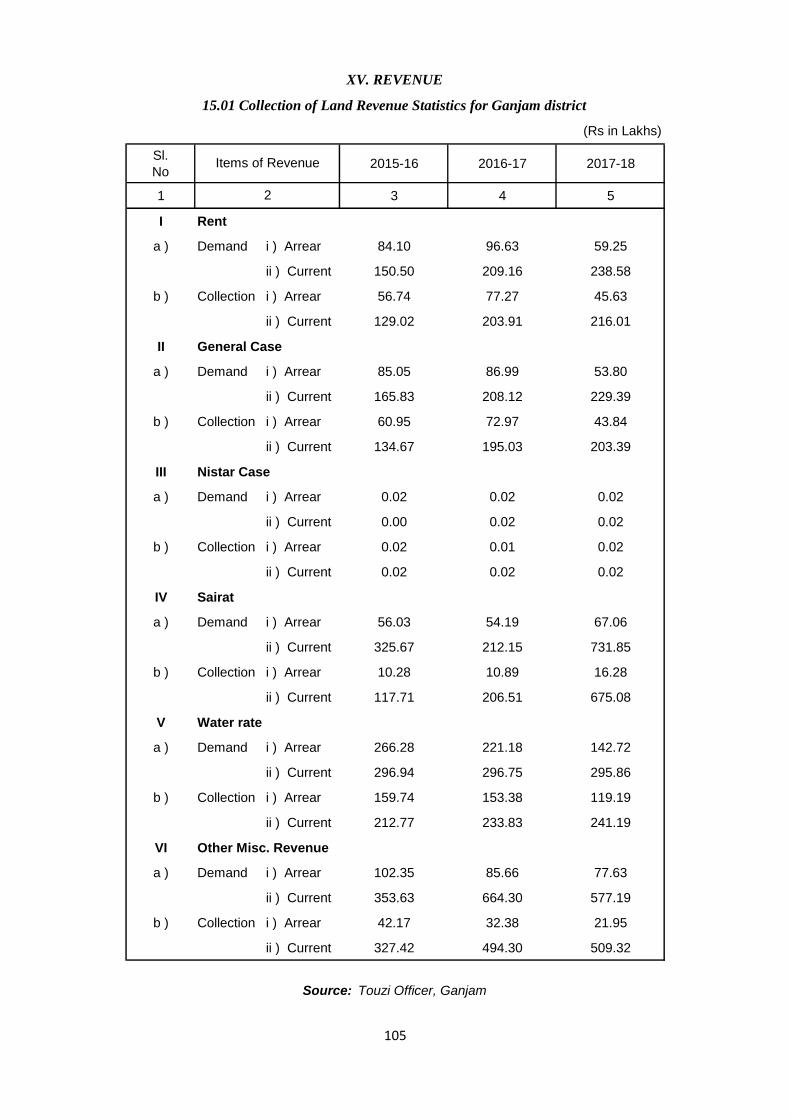
Sl.
No2015-16 2016-17 2017-18
1 3 4 5
I Rent
a ) Demand i ) Arrear 84.10 96.63 59.25
ii ) Current 150.50 209.16 238.58
b ) Collection i ) Arrear 56.74 77.27 45.63
ii ) Current 129.02 203.91 216.01
II General Case
a ) Demand i ) Arrear 85.05 86.99 53.80
ii ) Current 165.83 208.12 229.39
b ) Collection i ) Arrear 60.95 72.97 43.84
ii ) Current 134.67 195.03 203.39
III Nistar Case
a ) Demand i ) Arrear 0.02 0.02 0.02
ii ) Current 0.00 0.02 0.02
b ) Collection i ) Arrear 0.02 0.01 0.02
ii ) Current 0.02 0.02 0.02
IV Sairat
a ) Demand i ) Arrear 56.03 54.19 67.06
ii ) Current 325.67 212.15 731.85
b ) Collection i ) Arrear 10.28 10.89 16.28
ii ) Current 117.71 206.51 675.08
V Water rate
a ) Demand i ) Arrear 266.28 221.18 142.72
ii ) Current 296.94 296.75 295.86
b ) Collection i ) Arrear 159.74 153.38 119.19
ii ) Current 212.77 233.83 241.19
VI Other Misc. Revenue
a ) Demand i ) Arrear 102.35 85.66 77.63
ii ) Current 353.63 664.30 577.19
b ) Collection i ) Arrear 42.17 32.38 21.95
ii ) Current 327.42 494.30 509.32
Source: Touzi Officer, Ganjam
XV. REVENUE
15.01 Collection of Land Revenue Statistics for Ganjam district
(Rs in Lakhs)
Items of Revenue
2
105
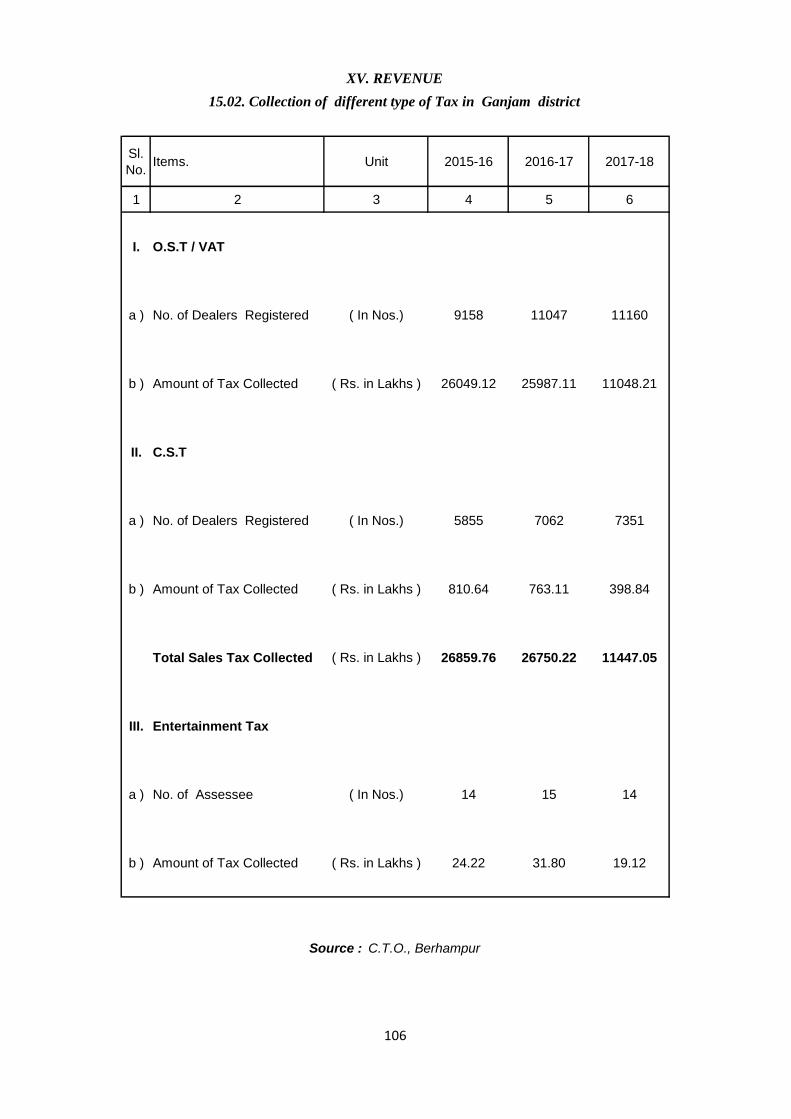
Sl.
No.Items. Unit 2015-16 2016-17 2017-18
1 2 3 4 5 6
I. O.S.T / VAT
a ) No. of Dealers Registered ( In Nos.) 9158 11047 11160
b ) Amount of Tax Collected ( Rs. in Lakhs ) 26049.12 25987.11 11048.21
II. C.S.T
a ) No. of Dealers Registered ( In Nos.) 5855 7062 7351
b ) Amount of Tax Collected ( Rs. in Lakhs ) 810.64 763.11 398.84
Total Sales Tax Collected ( Rs. in Lakhs ) 26859.76 26750.22 11447.05
III. Entertainment Tax
a ) No. of Assessee ( In Nos.) 14 15 14
b ) Amount of Tax Collected ( Rs. in Lakhs ) 24.22 31.80 19.12
Source : C.T.O., Berhampur
XV. REVENUE
15.02. Collection of different type of Tax in Ganjam district
106
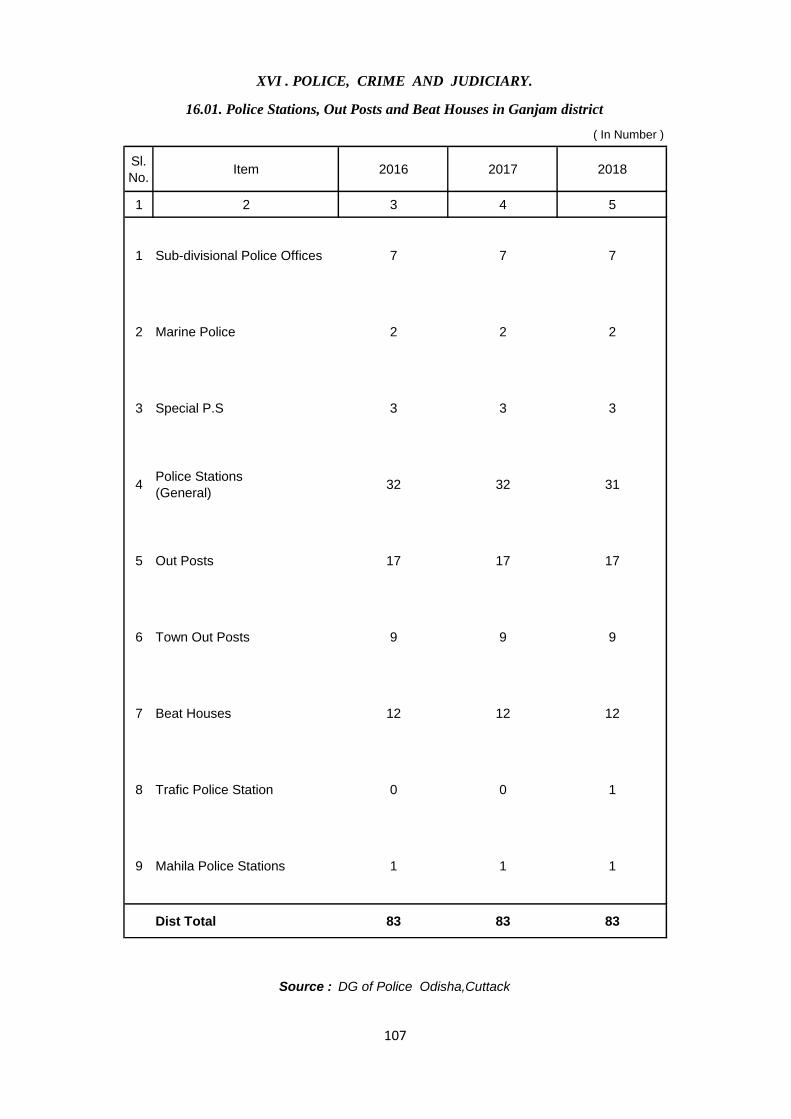
Sl.
No.Item 2016 2017 2018
1 2 3 4 5
1 Sub-divisional Police Offices 7 7 7
2 Marine Police 2 2 2
3 Special P.S 3 3 3
4Police Stations
(General)32 32 31
5 Out Posts 17 17 17
6 Town Out Posts 9 9 9
7 Beat Houses 12 12 12
8 Trafic Police Station 0 0 1
9 Mahila Police Stations 1 1 1
Dist Total 83 83 83
XVI . POLICE, CRIME AND JUDICIARY.
16.01. Police Stations, Out Posts and Beat Houses in Ganjam district
( In Number )
Source : DG of Police Odisha,Cuttack
107
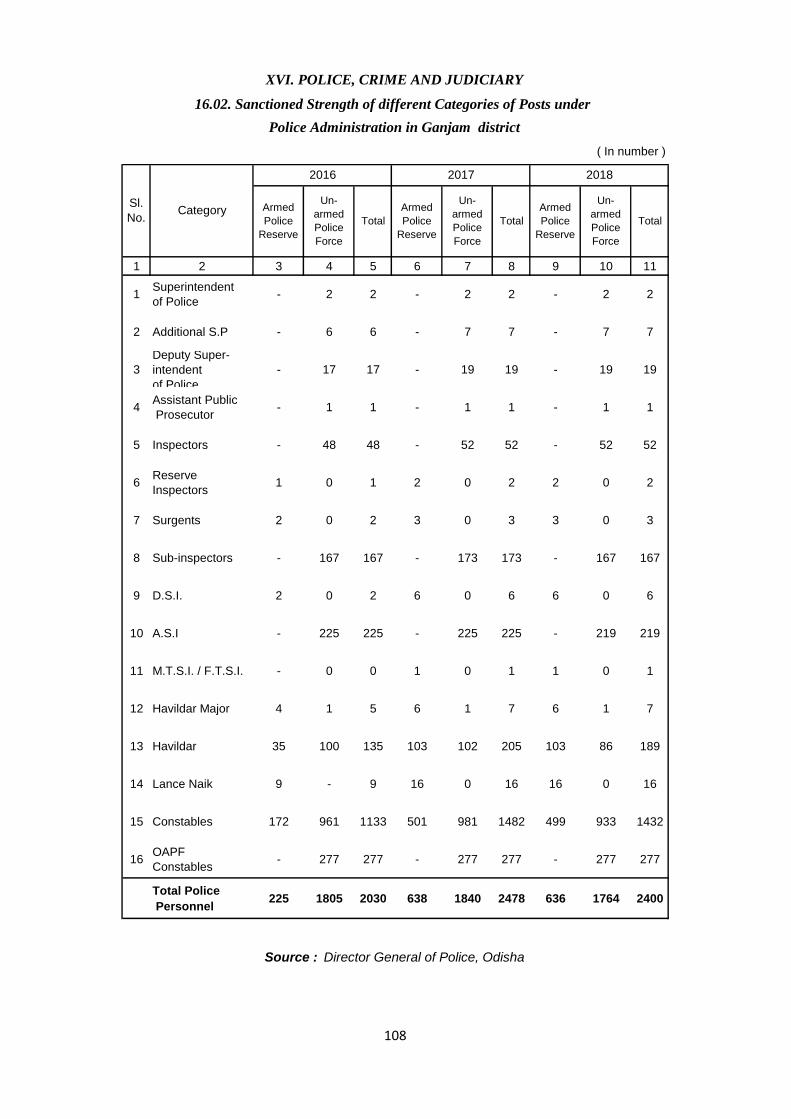
1 2 3 4 5 6 7 8 9 10 11
1Superintendent
of Police- 2 2 - 2 2 - 2 2
2 Additional S.P - 6 6 - 7 7 - 7 7
3
Deputy Super-
intendent
of Police
- 17 17 - 19 19 - 19 19
4Assistant Public
Prosecutor- 1 1 - 1 1 - 1 1
5 Inspectors - 48 48 - 52 52 - 52 52
6Reserve
Inspectors1 0 1 2 0 2 2 0 2
7 Surgents 2 0 2 3 0 3 3 0 3
8 Sub-inspectors - 167 167 - 173 173 - 167 167
9 D.S.I. 2 0 2 6 0 6 6 0 6
10 A.S.I - 225 225 - 225 225 - 219 219
11 M.T.S.I. / F.T.S.I. - 0 0 1 0 1 1 0 1
12 Havildar Major 4 1 5 6 1 7 6 1 7
13 Havildar 35 100 135 103 102 205 103 86 189
14 Lance Naik 9 - 9 16 0 16 16 0 16
15 Constables 172 961 1133 501 981 1482 499 933 1432
16OAPF
Constables- 277 277 - 277 277 - 277 277
Total Police
Personnel225 1805 2030 638 1840 2478 636 1764 2400
Armed
Police
Reserve
Un-
armed
Police
Force
Total
Source : Director General of Police, Odisha
2018
Armed
Police
Reserve
Un-
armed
Police
Force
Total
Armed
Police
Reserve
Un-
armed
Police
Force
Total
Sl.
No.Category
2016 2017
XVI. POLICE, CRIME AND JUDICIARY
16.02. Sanctioned Strength of different Categories of Posts under
Police Administration in Ganjam district
( In number )
108
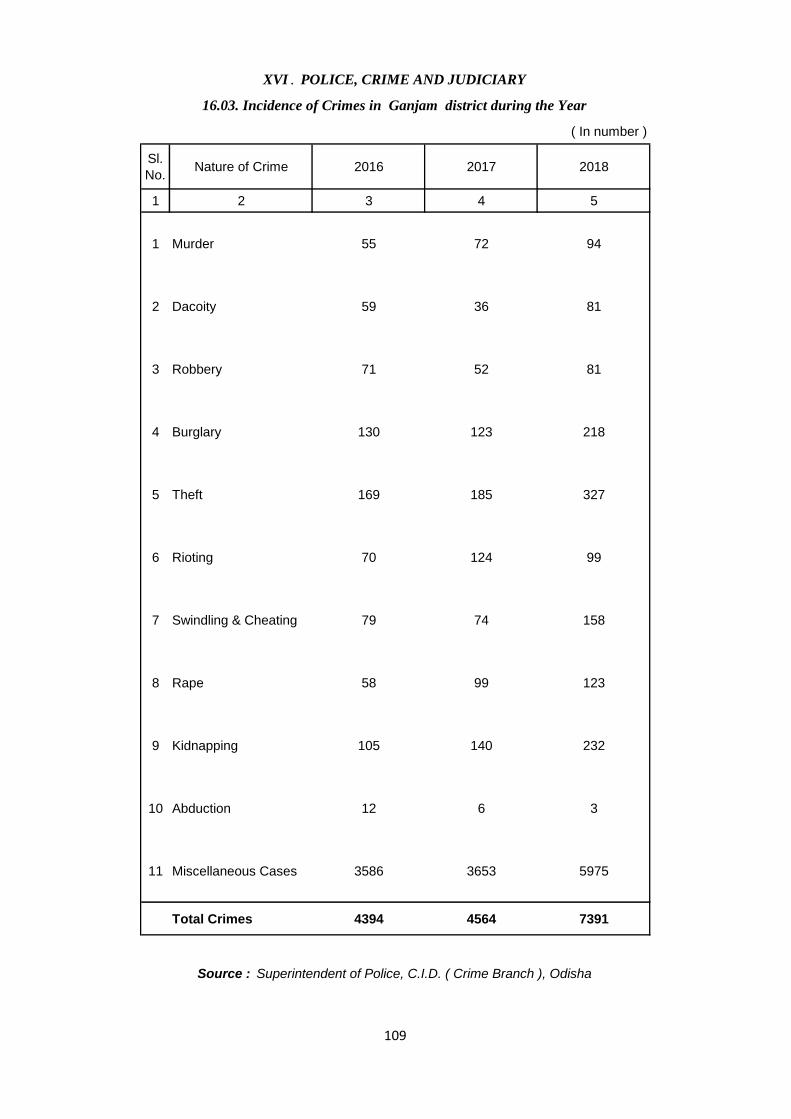
( In number )
Sl.
No.Nature of Crime 2016 2017 2018
1 2 3 4 5
1 Murder 55 72 94
2 Dacoity 59 36 81
3 Robbery 71 52 81
4 Burglary 130 123 218
5 Theft 169 185 327
6 Rioting 70 124 99
7 Swindling & Cheating 79 74 158
8 Rape 58 99 123
9 Kidnapping 105 140 232
10 Abduction 12 6 3
11 Miscellaneous Cases 3586 3653 5975
Total Crimes 4394 4564 7391
Source : Superintendent of Police, C.I.D. ( Crime Branch ), Odisha
XVI . POLICE, CRIME AND JUDICIARY
16.03. Incidence of Crimes in Ganjam district during the Year
109
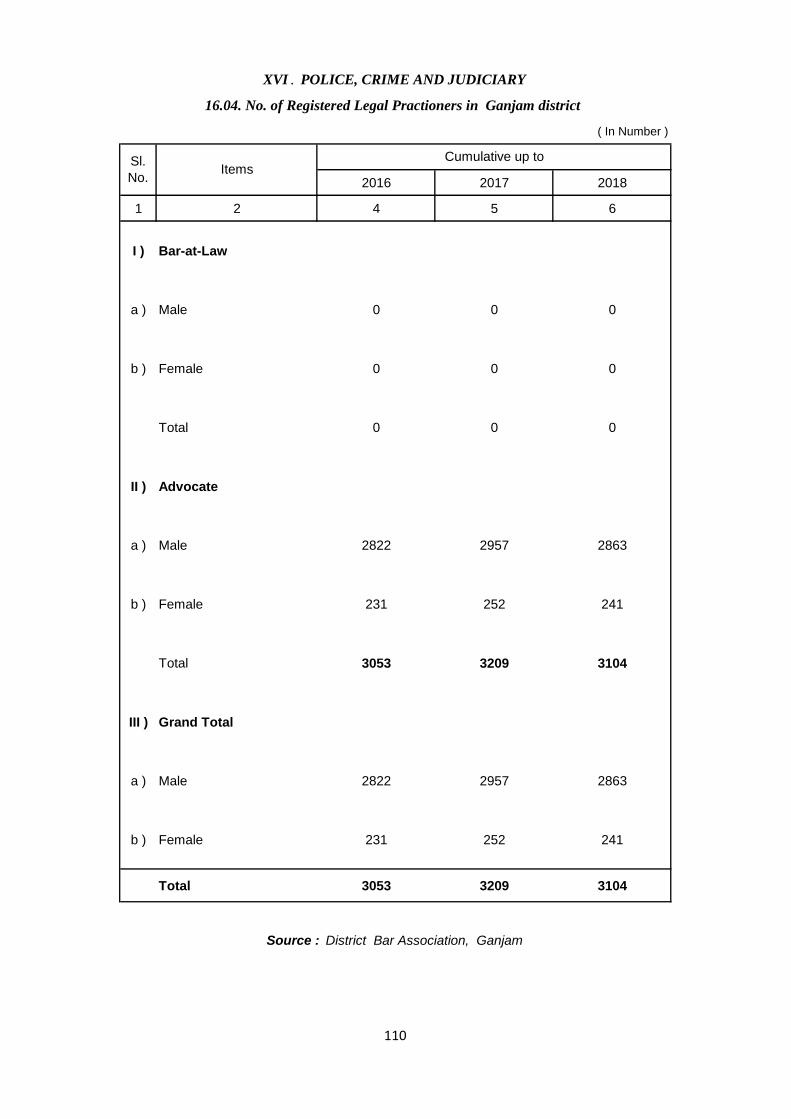
( In Number )
2016 2017 2018
1 2 4 5 6
I ) Bar-at-Law
a ) Male 0 0 0
b ) Female 0 0 0
Total 0 0 0
II ) Advocate
a ) Male 2822 2957 2863
b ) Female 231 252 241
Total 3053 3209 3104
III ) Grand Total
a ) Male 2822 2957 2863
b ) Female 231 252 241
Total 3053 3209 3104
XVI . POLICE, CRIME AND JUDICIARY
16.04. No. of Registered Legal Practioners in Ganjam district
Cumulative up to
Source : District Bar Association, Ganjam
Sl.
No.Items
110
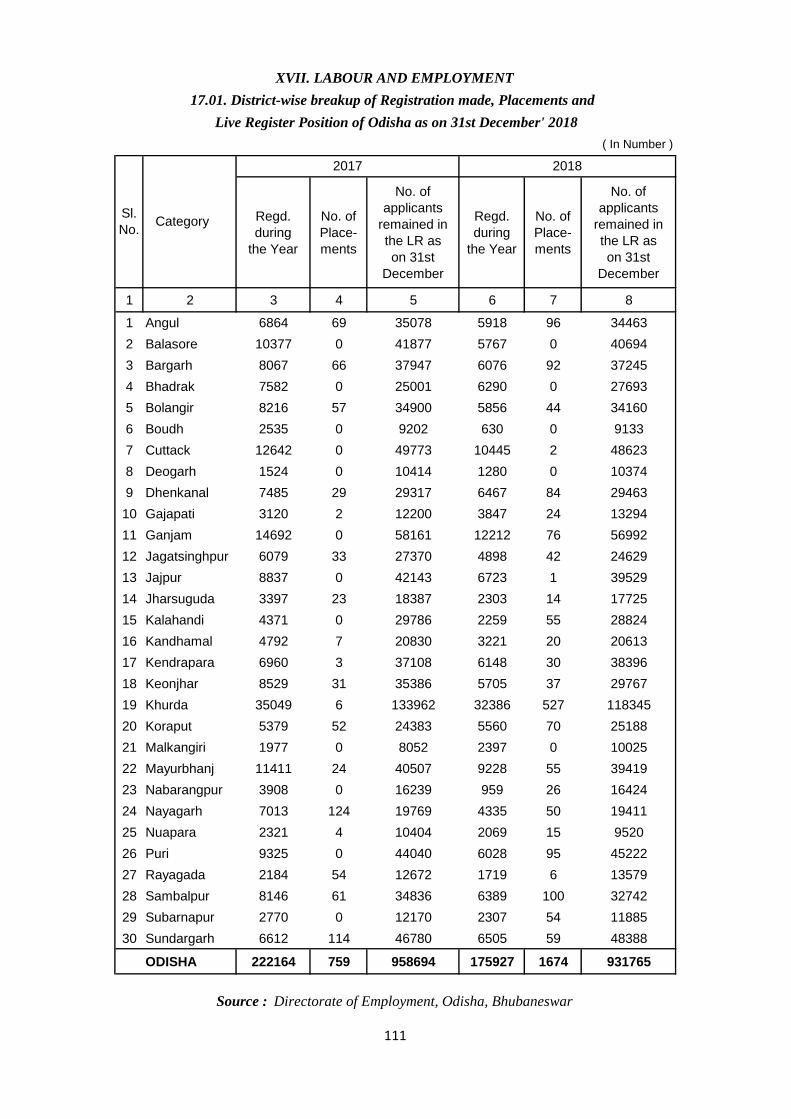
Regd.
during
the Year
No. of
Place-
ments
No. of
applicants
remained in
the LR as
on 31st
December
Regd.
during
the Year
No. of
Place-
ments
No. of
applicants
remained in
the LR as
on 31st
December
1 2 3 4 5 6 7 8
1 Angul 6864 69 35078 5918 96 34463
2 Balasore 10377 0 41877 5767 0 40694
3 Bargarh 8067 66 37947 6076 92 37245
4 Bhadrak 7582 0 25001 6290 0 27693
5 Bolangir 8216 57 34900 5856 44 34160
6 Boudh 2535 0 9202 630 0 9133
7 Cuttack 12642 0 49773 10445 2 48623
8 Deogarh 1524 0 10414 1280 0 10374
9 Dhenkanal 7485 29 29317 6467 84 29463
10 Gajapati 3120 2 12200 3847 24 13294
11 Ganjam 14692 0 58161 12212 76 56992
12 Jagatsinghpur 6079 33 27370 4898 42 24629
13 Jajpur 8837 0 42143 6723 1 39529
14 Jharsuguda 3397 23 18387 2303 14 17725
15 Kalahandi 4371 0 29786 2259 55 28824
16 Kandhamal 4792 7 20830 3221 20 20613
17 Kendrapara 6960 3 37108 6148 30 38396
18 Keonjhar 8529 31 35386 5705 37 29767
19 Khurda 35049 6 133962 32386 527 118345
20 Koraput 5379 52 24383 5560 70 25188
21 Malkangiri 1977 0 8052 2397 0 10025
22 Mayurbhanj 11411 24 40507 9228 55 39419
23 Nabarangpur 3908 0 16239 959 26 16424
24 Nayagarh 7013 124 19769 4335 50 19411
25 Nuapara 2321 4 10404 2069 15 9520
26 Puri 9325 0 44040 6028 95 45222
27 Rayagada 2184 54 12672 1719 6 13579
28 Sambalpur 8146 61 34836 6389 100 32742
29 Subarnapur 2770 0 12170 2307 54 11885
30 Sundargarh 6612 114 46780 6505 59 48388
ODISHA 222164 759 958694 175927 1674 931765
Source : Directorate of Employment, Odisha, Bhubaneswar
XVII. LABOUR AND EMPLOYMENT
17.01. District-wise breakup of Registration made, Placements and
Live Register Position of Odisha as on 31st December' 2018
( In Number )
Sl.
No.Category
2017 2018
111
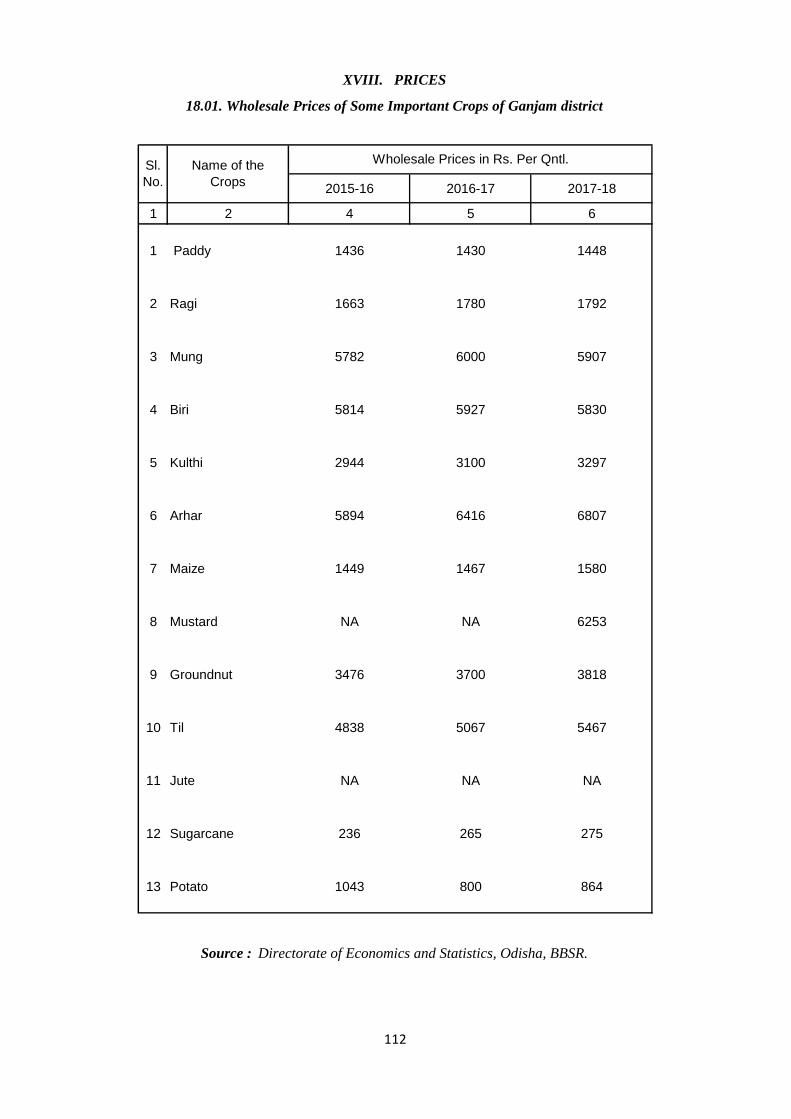
2015-16 2016-17 2017-18
1 2 4 5 6
1 Paddy 1436 1430 1448
2 Ragi 1663 1780 1792
3 Mung 5782 6000 5907
4 Biri 5814 5927 5830
5 Kulthi 2944 3100 3297
6 Arhar 5894 6416 6807
7 Maize 1449 1467 1580
8 Mustard NA NA 6253
9 Groundnut 3476 3700 3818
10 Til 4838 5067 5467
11 Jute NA NA NA
12 Sugarcane 236 265 275
13 Potato 1043 800 864
XVIII. PRICES
18.01. Wholesale Prices of Some Important Crops of Ganjam district
Wholesale Prices in Rs. Per Qntl.
Source : Directorate of Economics and Statistics, Odisha, BBSR.
Sl.
No.
Name of the
Crops
112
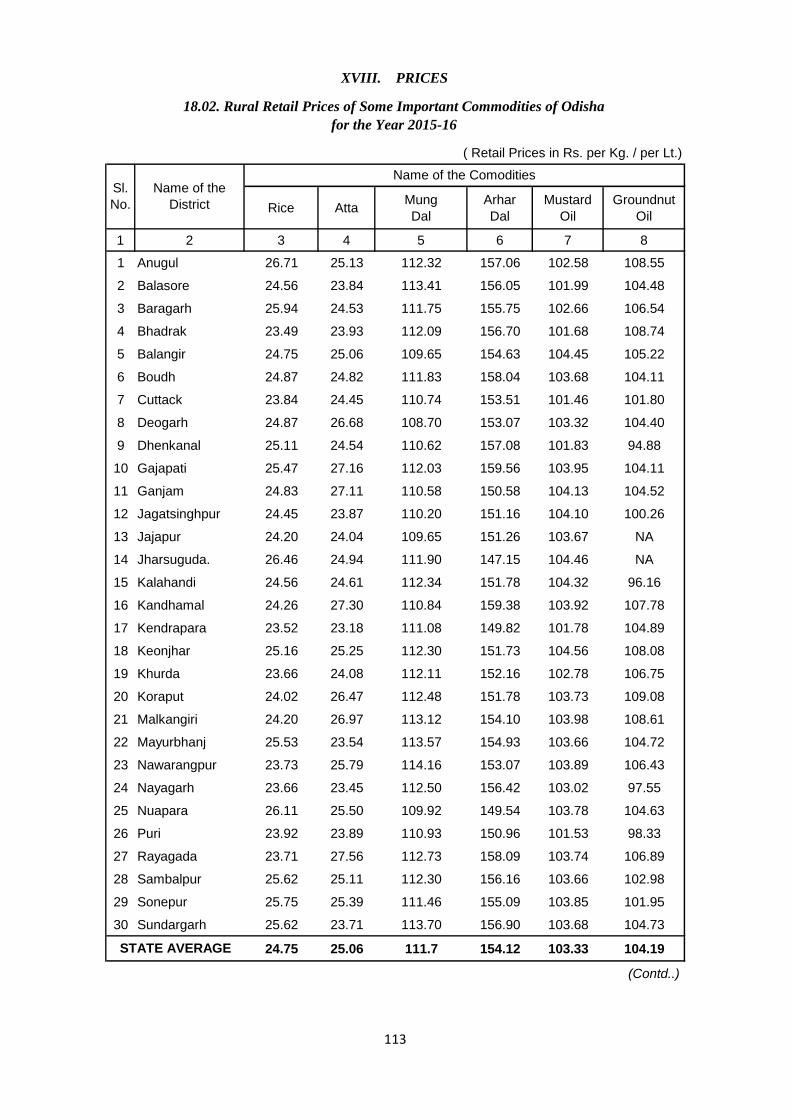
Rice AttaMung
Dal
Arhar
Dal
Mustard
Oil
Groundnut
Oil
1 2 3 4 5 6 7 8
1 Anugul 26.71 25.13 112.32 157.06 102.58 108.55
2 Balasore 24.56 23.84 113.41 156.05 101.99 104.48
3 Baragarh 25.94 24.53 111.75 155.75 102.66 106.54
4 Bhadrak 23.49 23.93 112.09 156.70 101.68 108.74
5 Balangir 24.75 25.06 109.65 154.63 104.45 105.22
6 Boudh 24.87 24.82 111.83 158.04 103.68 104.11
7 Cuttack 23.84 24.45 110.74 153.51 101.46 101.80
8 Deogarh 24.87 26.68 108.70 153.07 103.32 104.40
9 Dhenkanal 25.11 24.54 110.62 157.08 101.83 94.88
10 Gajapati 25.47 27.16 112.03 159.56 103.95 104.11
11 Ganjam 24.83 27.11 110.58 150.58 104.13 104.52
12 Jagatsinghpur 24.45 23.87 110.20 151.16 104.10 100.26
13 Jajapur 24.20 24.04 109.65 151.26 103.67 NA
14 Jharsuguda. 26.46 24.94 111.90 147.15 104.46 NA
15 Kalahandi 24.56 24.61 112.34 151.78 104.32 96.16
16 Kandhamal 24.26 27.30 110.84 159.38 103.92 107.78
17 Kendrapara 23.52 23.18 111.08 149.82 101.78 104.89
18 Keonjhar 25.16 25.25 112.30 151.73 104.56 108.08
19 Khurda 23.66 24.08 112.11 152.16 102.78 106.75
20 Koraput 24.02 26.47 112.48 151.78 103.73 109.08
21 Malkangiri 24.20 26.97 113.12 154.10 103.98 108.61
22 Mayurbhanj 25.53 23.54 113.57 154.93 103.66 104.72
23 Nawarangpur 23.73 25.79 114.16 153.07 103.89 106.43
24 Nayagarh 23.66 23.45 112.50 156.42 103.02 97.55
25 Nuapara 26.11 25.50 109.92 149.54 103.78 104.63
26 Puri 23.92 23.89 110.93 150.96 101.53 98.33
27 Rayagada 23.71 27.56 112.73 158.09 103.74 106.89
28 Sambalpur 25.62 25.11 112.30 156.16 103.66 102.98
29 Sonepur 25.75 25.39 111.46 155.09 103.85 101.95
30 Sundargarh 25.62 23.71 113.70 156.90 103.68 104.73
24.75 25.06 111.7 154.12 103.33 104.19
(Contd..)
XVIII. PRICES
18.02. Rural Retail Prices of Some Important Commodities of Odisha
for the Year 2015-16
( Retail Prices in Rs. per Kg. / per Lt.)
STATE AVERAGE
Sl.
No.
Name of the
District
Name of the Comodities
113
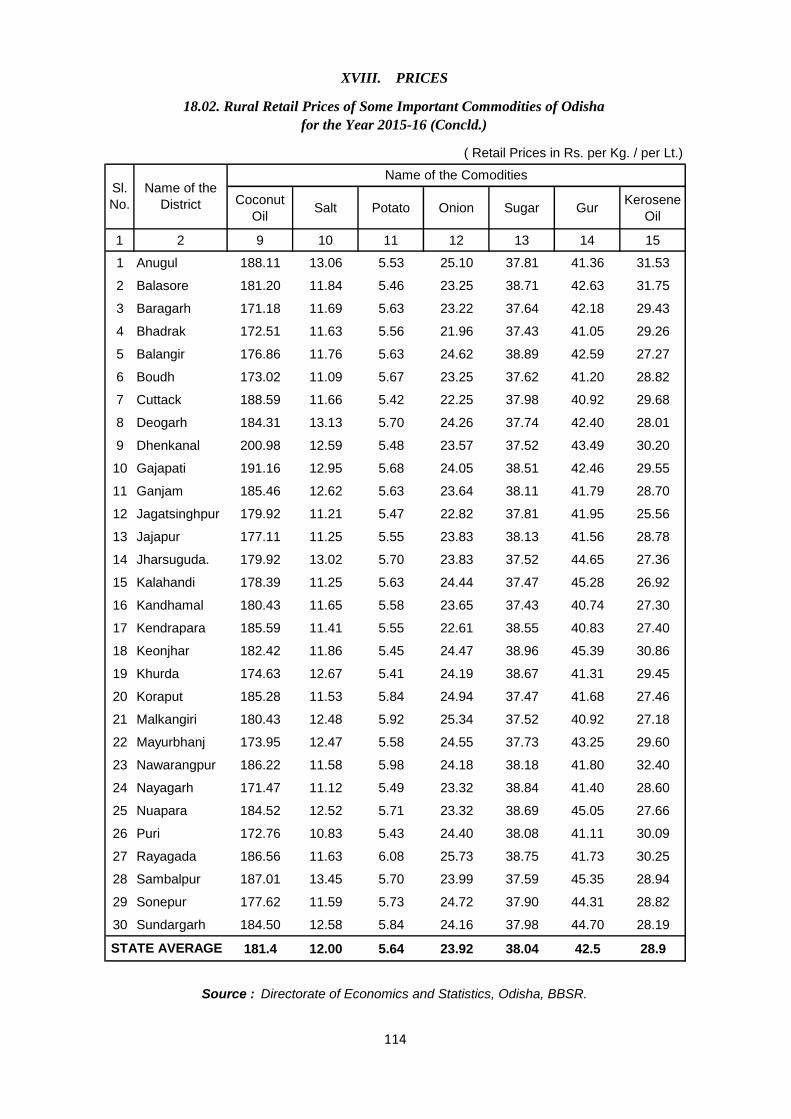
Coconut
OilSalt Potato Onion Sugar Gur
Kerosene
Oil
1 2 9 10 11 12 13 14 15
1 Anugul 188.11 13.06 5.53 25.10 37.81 41.36 31.53
2 Balasore 181.20 11.84 5.46 23.25 38.71 42.63 31.75
3 Baragarh 171.18 11.69 5.63 23.22 37.64 42.18 29.43
4 Bhadrak 172.51 11.63 5.56 21.96 37.43 41.05 29.26
5 Balangir 176.86 11.76 5.63 24.62 38.89 42.59 27.27
6 Boudh 173.02 11.09 5.67 23.25 37.62 41.20 28.82
7 Cuttack 188.59 11.66 5.42 22.25 37.98 40.92 29.68
8 Deogarh 184.31 13.13 5.70 24.26 37.74 42.40 28.01
9 Dhenkanal 200.98 12.59 5.48 23.57 37.52 43.49 30.20
10 Gajapati 191.16 12.95 5.68 24.05 38.51 42.46 29.55
11 Ganjam 185.46 12.62 5.63 23.64 38.11 41.79 28.70
12 Jagatsinghpur 179.92 11.21 5.47 22.82 37.81 41.95 25.56
13 Jajapur 177.11 11.25 5.55 23.83 38.13 41.56 28.78
14 Jharsuguda. 179.92 13.02 5.70 23.83 37.52 44.65 27.36
15 Kalahandi 178.39 11.25 5.63 24.44 37.47 45.28 26.92
16 Kandhamal 180.43 11.65 5.58 23.65 37.43 40.74 27.30
17 Kendrapara 185.59 11.41 5.55 22.61 38.55 40.83 27.40
18 Keonjhar 182.42 11.86 5.45 24.47 38.96 45.39 30.86
19 Khurda 174.63 12.67 5.41 24.19 38.67 41.31 29.45
20 Koraput 185.28 11.53 5.84 24.94 37.47 41.68 27.46
21 Malkangiri 180.43 12.48 5.92 25.34 37.52 40.92 27.18
22 Mayurbhanj 173.95 12.47 5.58 24.55 37.73 43.25 29.60
23 Nawarangpur 186.22 11.58 5.98 24.18 38.18 41.80 32.40
24 Nayagarh 171.47 11.12 5.49 23.32 38.84 41.40 28.60
25 Nuapara 184.52 12.52 5.71 23.32 38.69 45.05 27.66
26 Puri 172.76 10.83 5.43 24.40 38.08 41.11 30.09
27 Rayagada 186.56 11.63 6.08 25.73 38.75 41.73 30.25
28 Sambalpur 187.01 13.45 5.70 23.99 37.59 45.35 28.94
29 Sonepur 177.62 11.59 5.73 24.72 37.90 44.31 28.82
30 Sundargarh 184.50 12.58 5.84 24.16 37.98 44.70 28.19
181.4 12.00 5.64 23.92 38.04 42.5 28.9
XVIII. PRICES
18.02. Rural Retail Prices of Some Important Commodities of Odisha
for the Year 2015-16 (Concld.)
( Retail Prices in Rs. per Kg. / per Lt.)
STATE AVERAGE
Source : Directorate of Economics and Statistics, Odisha, BBSR.
Sl.
No.
Name of the
District
Name of the Comodities
114
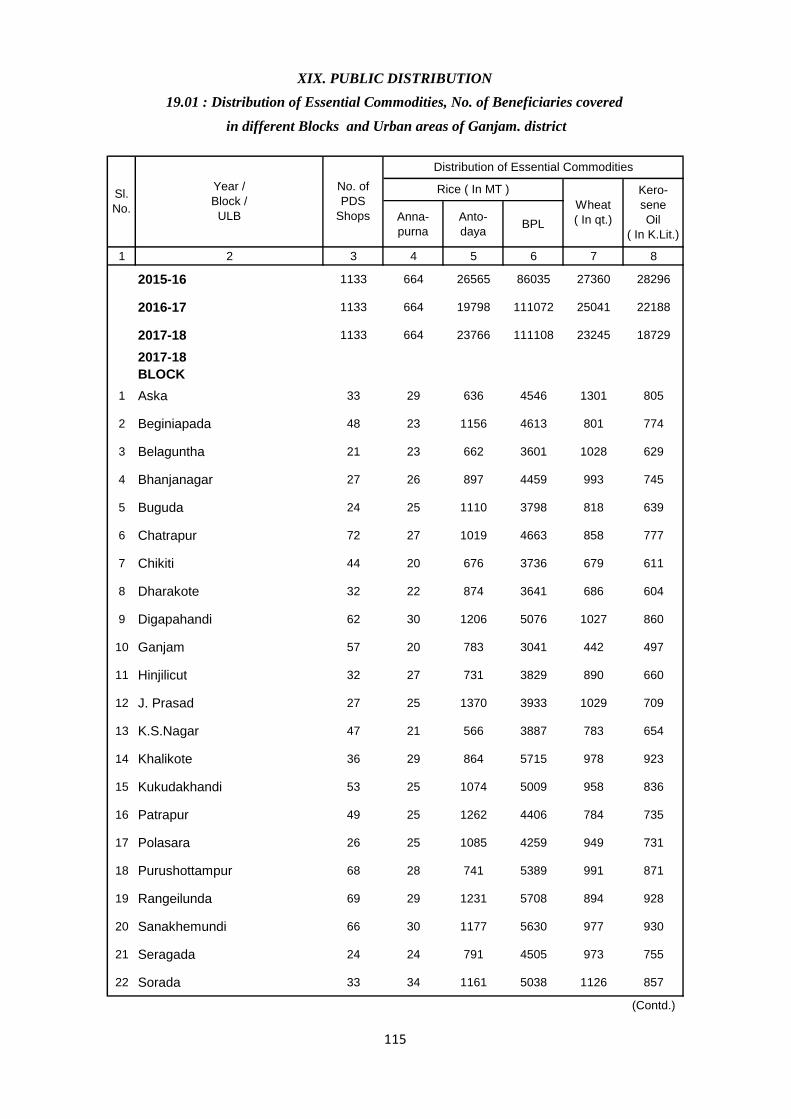
Anna-
purna
Anto-
dayaBPL
1 2 3 4 5 6 7 8
2015-16 1133 664 26565 86035 27360 28296
2016-17 1133 664 19798 111072 25041 22188
2017-18 1133 664 23766 111108 23245 18729
2017-18
BLOCK
1 Aska 33 29 636 4546 1301 805
2 Beginiapada 48 23 1156 4613 801 774
3 Belaguntha 21 23 662 3601 1028 629
4 Bhanjanagar 27 26 897 4459 993 745
5 Buguda 24 25 1110 3798 818 639
6 Chatrapur 72 27 1019 4663 858 777
7 Chikiti 44 20 676 3736 679 611
8 Dharakote 32 22 874 3641 686 604
9 Digapahandi 62 30 1206 5076 1027 860
10 Ganjam 57 20 783 3041 442 497
11 Hinjilicut 32 27 731 3829 890 660
12 J. Prasad 27 25 1370 3933 1029 709
13 K.S.Nagar 47 21 566 3887 783 654
14 Khalikote 36 29 864 5715 978 923
15 Kukudakhandi 53 25 1074 5009 958 836
16 Patrapur 49 25 1262 4406 784 735
17 Polasara 26 25 1085 4259 949 731
18 Purushottampur 68 28 741 5389 991 871
19 Rangeilunda 69 29 1231 5708 894 928
20 Sanakhemundi 66 30 1177 5630 977 930
21 Seragada 24 24 791 4505 973 755
22 Sorada 33 34 1161 5038 1126 857
(Contd.)
XIX. PUBLIC DISTRIBUTION
19.01 : Distribution of Essential Commodities, No. of Beneficiaries covered
in different Blocks and Urban areas of Ganjam. district
Distribution of Essential Commodities
Kero-
sene
Oil
( In K.Lit.)
Sl.
No.
Year /
Block /
ULB
No. of
PDS
Shops
Rice ( In MT )
Wheat
( In qt.)
115
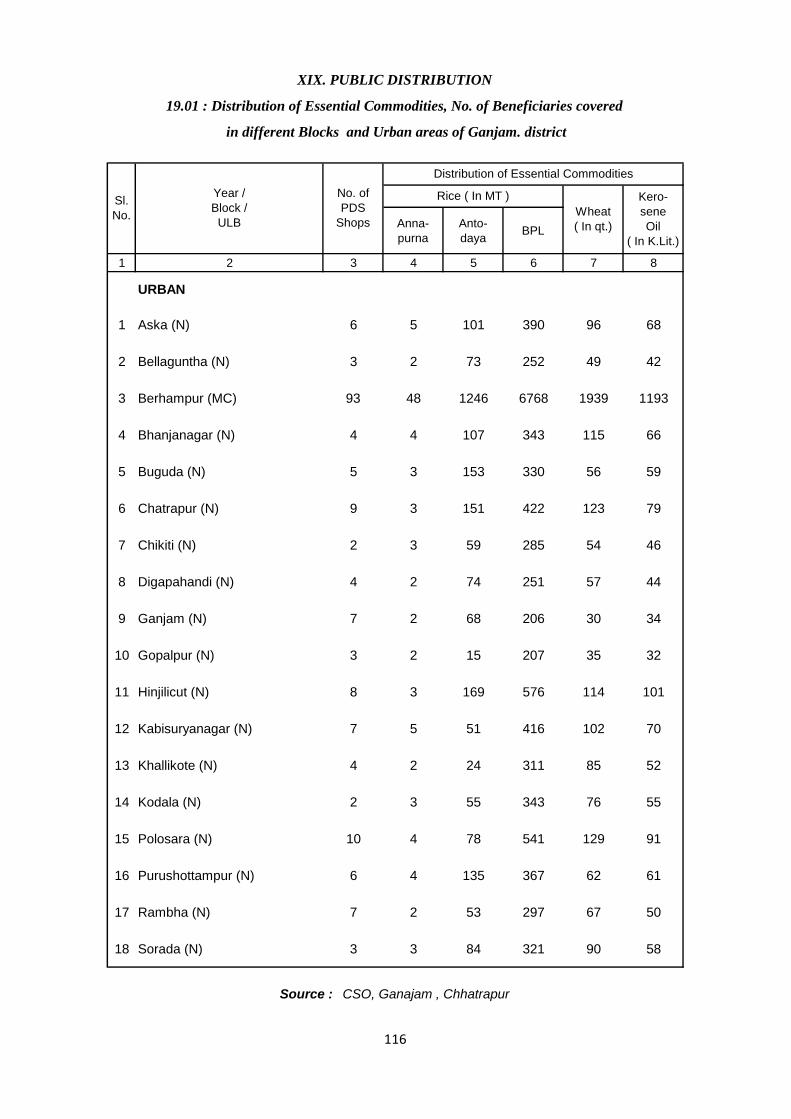
Anna-
purna
Anto-
dayaBPL
1 2 3 4 5 6 7 8
URBAN
1 Aska (N) 6 5 101 390 96 68
2 Bellaguntha (N) 3 2 73 252 49 42
3 Berhampur (MC) 93 48 1246 6768 1939 1193
4 Bhanjanagar (N) 4 4 107 343 115 66
5 Buguda (N) 5 3 153 330 56 59
6 Chatrapur (N) 9 3 151 422 123 79
7 Chikiti (N) 2 3 59 285 54 46
8 Digapahandi (N) 4 2 74 251 57 44
9 Ganjam (N) 7 2 68 206 30 34
10 Gopalpur (N) 3 2 15 207 35 32
11 Hinjilicut (N) 8 3 169 576 114 101
12 Kabisuryanagar (N) 7 5 51 416 102 70
13 Khallikote (N) 4 2 24 311 85 52
14 Kodala (N) 2 3 55 343 76 55
15 Polosara (N) 10 4 78 541 129 91
16 Purushottampur (N) 6 4 135 367 62 61
17 Rambha (N) 7 2 53 297 67 50
18 Sorada (N) 3 3 84 321 90 58
Source : CSO, Ganajam , Chhatrapur
XIX. PUBLIC DISTRIBUTION
19.01 : Distribution of Essential Commodities, No. of Beneficiaries covered
in different Blocks and Urban areas of Ganjam. district
Sl.
No.
Year /
Block /
ULB
No. of
PDS
Shops
Distribution of Essential Commodities
Rice ( In MT )
Wheat
( In qt.)
Kero-
sene
Oil
( In K.Lit.)
116
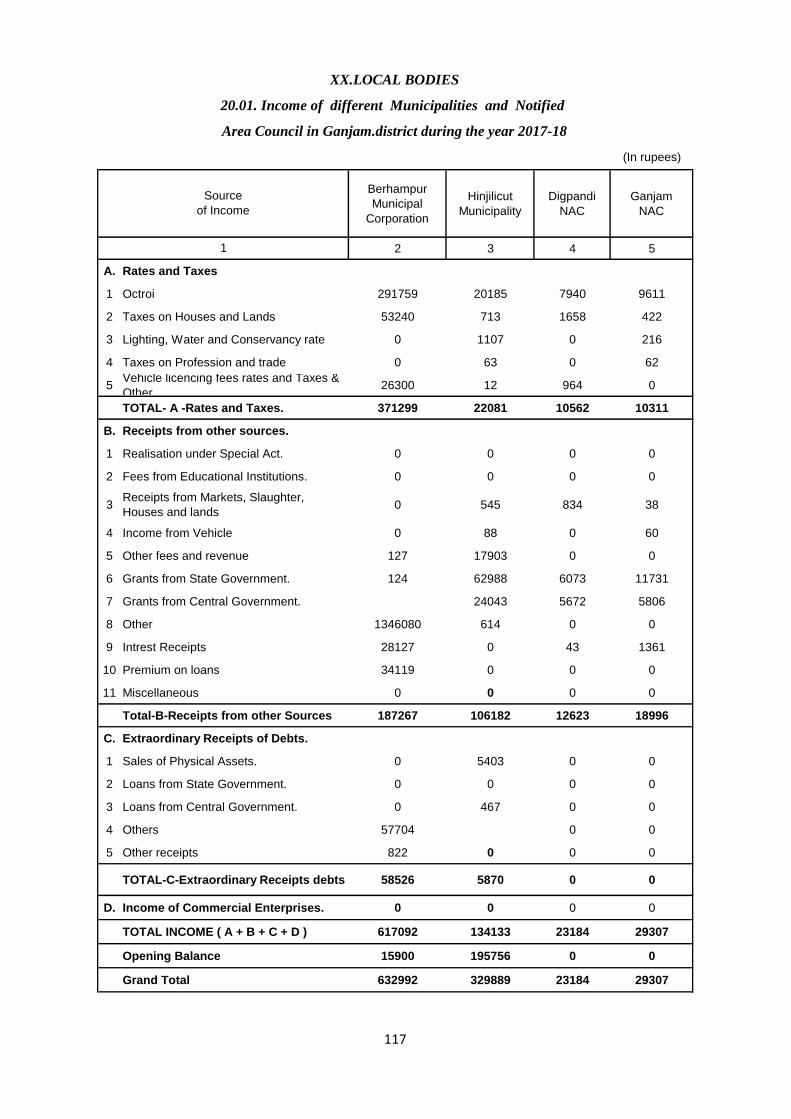
(In rupees)
Berhampur
Municipal
Corporation
Hinjilicut
Municipality
Digpandi
NAC
Ganjam
NAC
2 3 4 5
A. Rates and Taxes
1 Octroi 291759 20185 7940 9611
2 Taxes on Houses and Lands 53240 713 1658 422
3 Lighting, Water and Conservancy rate 0 1107 0 216
4 Taxes on Profession and trade 0 63 0 62
5Vehicle licencing fees rates and Taxes &
Other26300 12 964 0
TOTAL- A -Rates and Taxes. 371299 22081 10562 10311
B. Receipts from other sources.
1 Realisation under Special Act. 0 0 0 0
2 Fees from Educational Institutions. 0 0 0 0
3Receipts from Markets, Slaughter,
Houses and lands0 545 834 38
4 Income from Vehicle 0 88 0 60
5 Other fees and revenue 127 17903 0 0
6 Grants from State Government. 124 62988 6073 11731
7 Grants from Central Government. 24043 5672 5806
8 Other 1346080 614 0 0
9 Intrest Receipts 28127 0 43 1361
10 Premium on loans 34119 0 0 0
11 Miscellaneous 0 0 0 0
Total-B-Receipts from other Sources 187267 106182 12623 18996
C. Extraordinary Receipts of Debts.
1 Sales of Physical Assets. 0 5403 0 0
2 Loans from State Government. 0 0 0 0
3 Loans from Central Government. 0 467 0 0
4 Others 57704 0 0
5 Other receipts 822 0 0 0
TOTAL-C-Extraordinary Receipts debts 58526 5870 0 0
D. Income of Commercial Enterprises. 0 0 0 0
TOTAL INCOME ( A + B + C + D ) 617092 134133 23184 29307
Opening Balance 15900 195756 0 0
Grand Total 632992 329889 23184 29307
1
XX.LOCAL BODIES
20.01. Income of different Municipalities and Notified
Area Council in Ganjam.district during the year 2017-18
Source
of Income
117
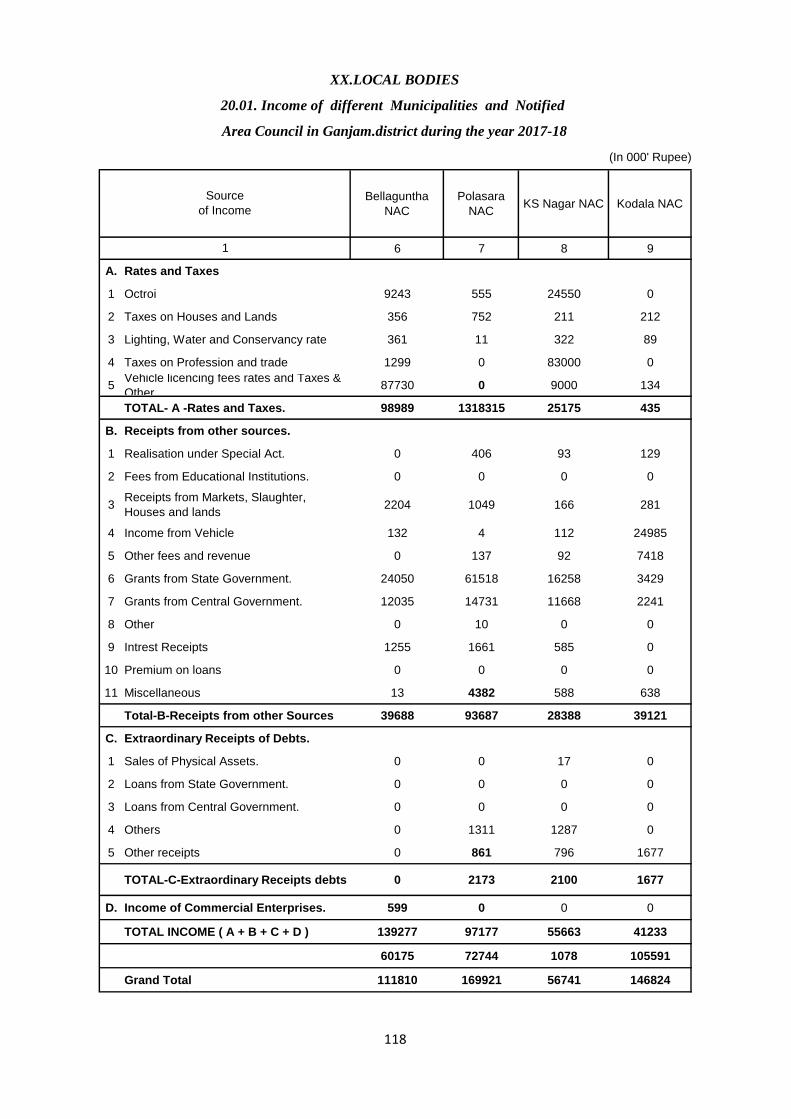
(In 000' Rupee)
Bellaguntha
NAC
Polasara
NACKS Nagar NAC Kodala NAC
6 7 8 9
A. Rates and Taxes
1 Octroi 9243 555 24550 0
2 Taxes on Houses and Lands 356 752 211 212
3 Lighting, Water and Conservancy rate 361 11 322 89
4 Taxes on Profession and trade 1299 0 83000 0
5Vehicle licencing fees rates and Taxes &
Other87730 0 9000 134
TOTAL- A -Rates and Taxes. 98989 1318315 25175 435
B. Receipts from other sources.
1 Realisation under Special Act. 0 406 93 129
2 Fees from Educational Institutions. 0 0 0 0
3Receipts from Markets, Slaughter,
Houses and lands2204 1049 166 281
4 Income from Vehicle 132 4 112 24985
5 Other fees and revenue 0 137 92 7418
6 Grants from State Government. 24050 61518 16258 3429
7 Grants from Central Government. 12035 14731 11668 2241
8 Other 0 10 0 0
9 Intrest Receipts 1255 1661 585 0
10 Premium on loans 0 0 0 0
11 Miscellaneous 13 4382 588 638
Total-B-Receipts from other Sources 39688 93687 28388 39121
C. Extraordinary Receipts of Debts.
1 Sales of Physical Assets. 0 0 17 0
2 Loans from State Government. 0 0 0 0
3 Loans from Central Government. 0 0 0 0
4 Others 0 1311 1287 0
5 Other receipts 0 861 796 1677
TOTAL-C-Extraordinary Receipts debts 0 2173 2100 1677
D. Income of Commercial Enterprises. 599 0 0 0
TOTAL INCOME ( A + B + C + D ) 139277 97177 55663 41233
60175 72744 1078 105591
Grand Total 111810 169921 56741 146824
Source
of Income
Area Council in Ganjam.district during the year 2017-18
XX.LOCAL BODIES
20.01. Income of different Municipalities and Notified
1
118

(In 000' Rupee) (In 000' Rupee)
Bhanjanagar
NACGopalpur NAC Chikiti NAC Rambha NAC
10 11 12 13
A. Rates and Taxes
1 Octroi 16758 264 0 9909
2 Taxes on Houses and Lands 493 577 378 89
3 Lighting, Water and Conservancy rate 591 79 689 250
4 Taxes on Profession and trade 35 0 777 330
5Vehicle licencing fees rates and Taxes &
Other492 0 159 73
TOTAL- A -Rates and Taxes. 18369 920 2002 10652
B. Receipts from other sources.
1 Realisation under Special Act. 0 0 0 77
2 Fees from Educational Institutions. 0 0 0 0
3Receipts from Markets, Slaughter,
Houses and lands2562 1 568 m
4 Income from Vehicle 0 0 0 240
5 Other fees and revenue 1055 2094 0 52
6 Grants from State Government. 41094 26881 40853 5637
7 Grants from Central Government. 0 4622 13783 6475
8 Other 0 3208 0 218
9 Intrest Receipts 1861 1346 0 1860
10 Premium on loans 0 0 0 0
11 Miscellaneous 0 0 12287 45366
Total-B-Receipts from other Sources 46573 38152 67492 59924
C. Extraordinary Receipts of Debts.
1 Sales of Physical Assets. 0 0 0 0
2 Loans from State Government. 0 0 0 0
3 Loans from Central Government. 0 0 0 0
4 Others 0 0 0 182
5 Other receipts 0 1776 1164 653
TOTAL-C-Extraordinary Receipts debts 0 1776 1164 835
D. Income of Commercial Enterprises. 0 0 0 0
TOTAL INCOME ( A + B + C + D ) 64942 40848 70658 71411
Opening Balance 149486 44912 33039 113962
Grand Total 214428 85760 103697 185373
Source
of Income
XX.LOCAL BODIES
20.01. Income of different Municipalities and Notified
1
Area Council in Ganjam.district during the year 2017-18
119
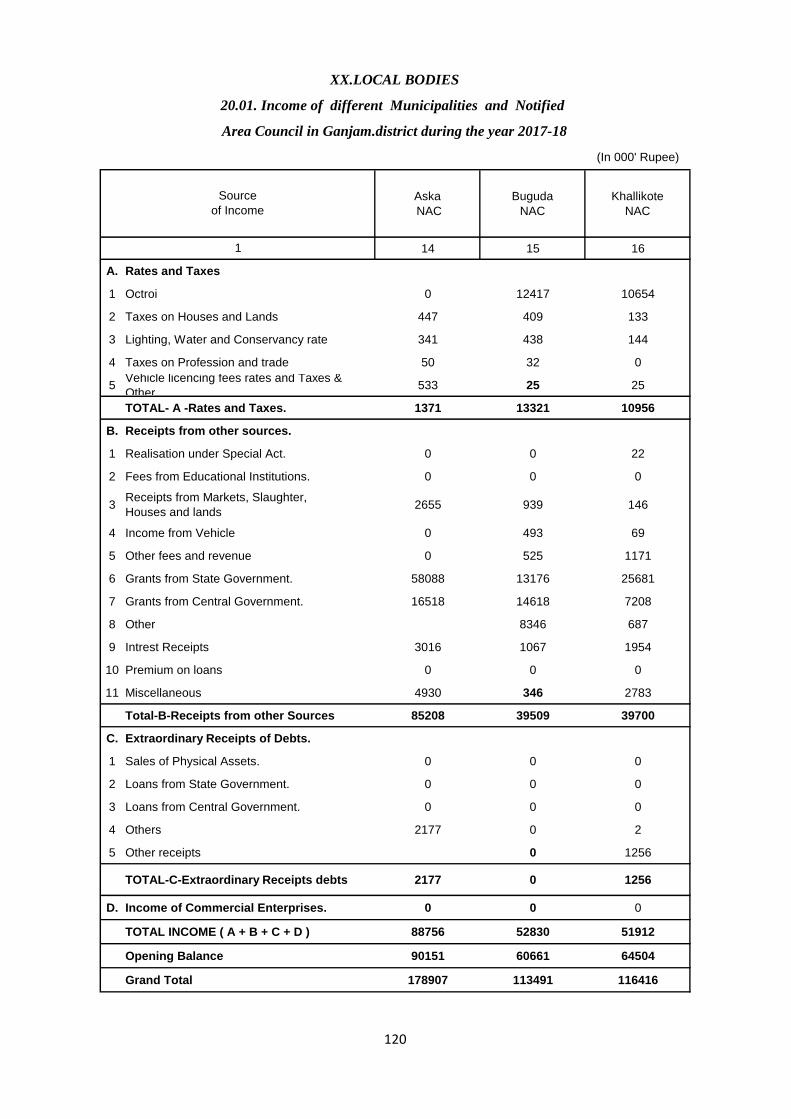
(In 000' Rupee)
Aska
NAC
Buguda
NAC
Khallikote
NAC
14 15 16
A. Rates and Taxes
1 Octroi 0 12417 10654
2 Taxes on Houses and Lands 447 409 133
3 Lighting, Water and Conservancy rate 341 438 144
4 Taxes on Profession and trade 50 32 0
5Vehicle licencing fees rates and Taxes &
Other533 25 25
TOTAL- A -Rates and Taxes. 1371 13321 10956
B. Receipts from other sources.
1 Realisation under Special Act. 0 0 22
2 Fees from Educational Institutions. 0 0 0
3Receipts from Markets, Slaughter,
Houses and lands2655 939 146
4 Income from Vehicle 0 493 69
5 Other fees and revenue 0 525 1171
6 Grants from State Government. 58088 13176 25681
7 Grants from Central Government. 16518 14618 7208
8 Other 8346 687
9 Intrest Receipts 3016 1067 1954
10 Premium on loans 0 0 0
11 Miscellaneous 4930 346 2783
Total-B-Receipts from other Sources 85208 39509 39700
C. Extraordinary Receipts of Debts.
1 Sales of Physical Assets. 0 0 0
2 Loans from State Government. 0 0 0
3 Loans from Central Government. 0 0 0
4 Others 2177 0 2
5 Other receipts 0 1256
TOTAL-C-Extraordinary Receipts debts 2177 0 1256
D. Income of Commercial Enterprises. 0 0 0
TOTAL INCOME ( A + B + C + D ) 88756 52830 51912
Opening Balance 90151 60661 64504
Grand Total 178907 113491 116416
Source
of Income
XX.LOCAL BODIES
20.01. Income of different Municipalities and Notified
Area Council in Ganjam.district during the year 2017-18
1
120
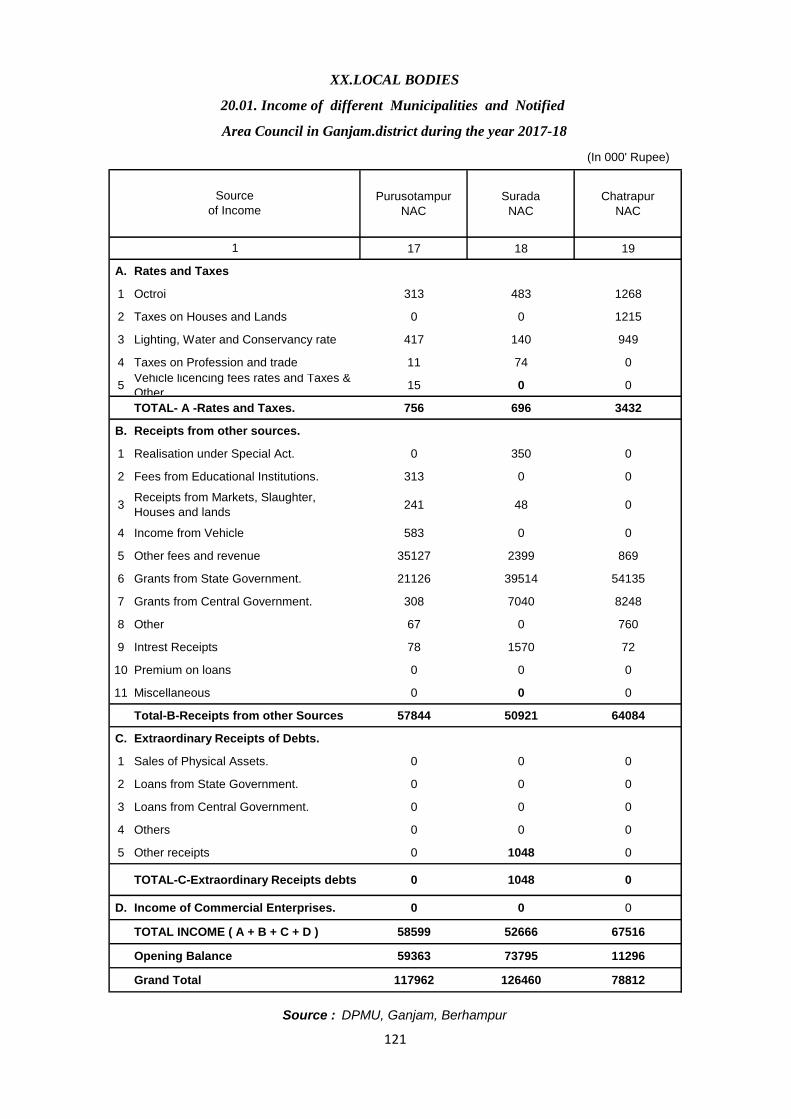
(In 000' Rupee)
Purusotampur
NAC
Surada
NAC
Chatrapur
NAC
17 18 19
A. Rates and Taxes
1 Octroi 313 483 1268
2 Taxes on Houses and Lands 0 0 1215
3 Lighting, Water and Conservancy rate 417 140 949
4 Taxes on Profession and trade 11 74 0
5Vehicle licencing fees rates and Taxes &
Other15 0 0
TOTAL- A -Rates and Taxes. 756 696 3432
B. Receipts from other sources.
1 Realisation under Special Act. 0 350 0
2 Fees from Educational Institutions. 313 0 0
3Receipts from Markets, Slaughter,
Houses and lands241 48 0
4 Income from Vehicle 583 0 0
5 Other fees and revenue 35127 2399 869
6 Grants from State Government. 21126 39514 54135
7 Grants from Central Government. 308 7040 8248
8 Other 67 0 760
9 Intrest Receipts 78 1570 72
10 Premium on loans 0 0 0
11 Miscellaneous 0 0 0
Total-B-Receipts from other Sources 57844 50921 64084
C. Extraordinary Receipts of Debts.
1 Sales of Physical Assets. 0 0 0
2 Loans from State Government. 0 0 0
3 Loans from Central Government. 0 0 0
4 Others 0 0 0
5 Other receipts 0 1048 0
TOTAL-C-Extraordinary Receipts debts 0 1048 0
D. Income of Commercial Enterprises. 0 0 0
TOTAL INCOME ( A + B + C + D ) 58599 52666 67516
Opening Balance 59363 73795 11296
Grand Total 117962 126460 78812
Source
of Income
Area Council in Ganjam.district during the year 2017-18
Source : DPMU, Ganjam, Berhampur
XX.LOCAL BODIES
20.01. Income of different Municipalities and Notified
1
121

(In 000' Rupee)
Berhampur
Municipal
Corporation
Hinjilicut
Municipality
Digpandi
NAC
Ganjam
NAC
2 3 4 5
A. Current Expenditure
1 Public Lighting and Water supply 39680 1784 1950 0
2 Drainage, Conservancy and Sanitation 119884 0 1458 332
3 Hospitals, Dispensaries and Vaccination 1943 0 0 0
4 Public Institution. 9208 0 0 0
5 Miscellaneous 11805 14144 0 0
TOTAL- A 182521 15928 3408 332
B. Capital Expenditure
1 Road / Bridge 8928 75799 0 3472
2 Buildings 5932 3644 36 1749
3 Vehicles 17861 2007 0 0
4 Machinary and Equipments 75 0 0 0
5 Others 2425 11323 0 185
Total-B 35221 92773 36 5406
C. Extraordinary Expenditure & debts.
1 Payment to Sinking Fund Suspence accounts 375570 0 0 0
2 Repayment of loans ( i ) Govt. 0 0 0 0
( ii )
Others 0 1845 0 0
3 Investment deposits 0 0 0 0
4 Loan / Advance given 35849 436 0 0
TOTAL-C 411419 2281 0 0
D. Expenditure of Commericial Enterprises 0 0 0 0
TOTAL Expenditure ( A + B + C + D ) 629161 110982 3444 5738
Closing Balance 3831 218907 19740 23569
Grand Total 632992 329889 23184 29307
(Contd.)
1
Source
of Income
XX.LOCAL BODIES
20.02. Expenditure of different Municipalities and Notified Area Council
by different Heads in Ganjam district, during the Year 2017-18
122
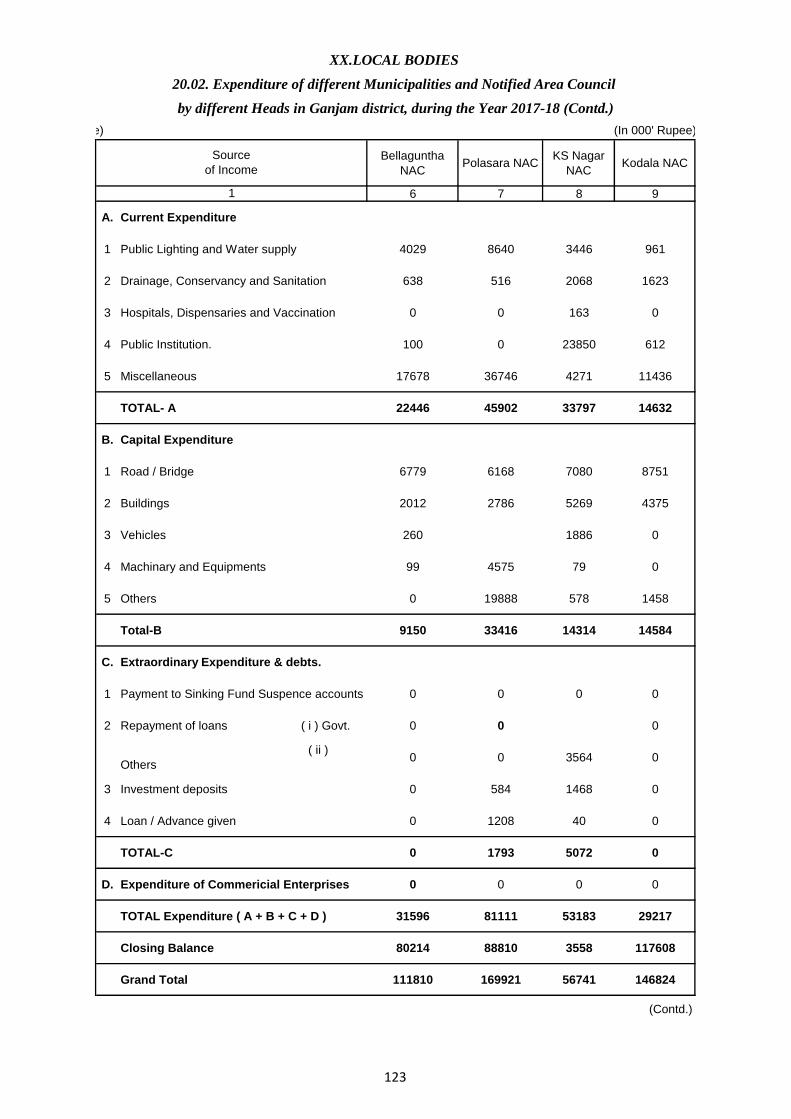
(In 000' Rupee) (In 000' Rupee)
Bellaguntha
NACPolasara NAC
KS Nagar
NACKodala NAC
6 7 8 9
A. Current Expenditure
1 Public Lighting and Water supply 4029 8640 3446 961
2 Drainage, Conservancy and Sanitation 638 516 2068 1623
3 Hospitals, Dispensaries and Vaccination 0 0 163 0
4 Public Institution. 100 0 23850 612
5 Miscellaneous 17678 36746 4271 11436
TOTAL- A 22446 45902 33797 14632
B. Capital Expenditure
1 Road / Bridge 6779 6168 7080 8751
2 Buildings 2012 2786 5269 4375
3 Vehicles 260 1886 0
4 Machinary and Equipments 99 4575 79 0
5 Others 0 19888 578 1458
Total-B 9150 33416 14314 14584
C. Extraordinary Expenditure & debts.
1 Payment to Sinking Fund Suspence accounts 0 0 0 0
2 Repayment of loans ( i ) Govt. 0 0 0
( ii )
Others 0 0 3564 0
3 Investment deposits 0 584 1468 0
4 Loan / Advance given 0 1208 40 0
TOTAL-C 0 1793 5072 0
D. Expenditure of Commericial Enterprises 0 0 0 0
TOTAL Expenditure ( A + B + C + D ) 31596 81111 53183 29217
Closing Balance 80214 88810 3558 117608
Grand Total 111810 169921 56741 146824
(Contd.)
Source
of Income
1
XX.LOCAL BODIES
20.02. Expenditure of different Municipalities and Notified Area Council
by different Heads in Ganjam district, during the Year 2017-18 (Contd.)
123
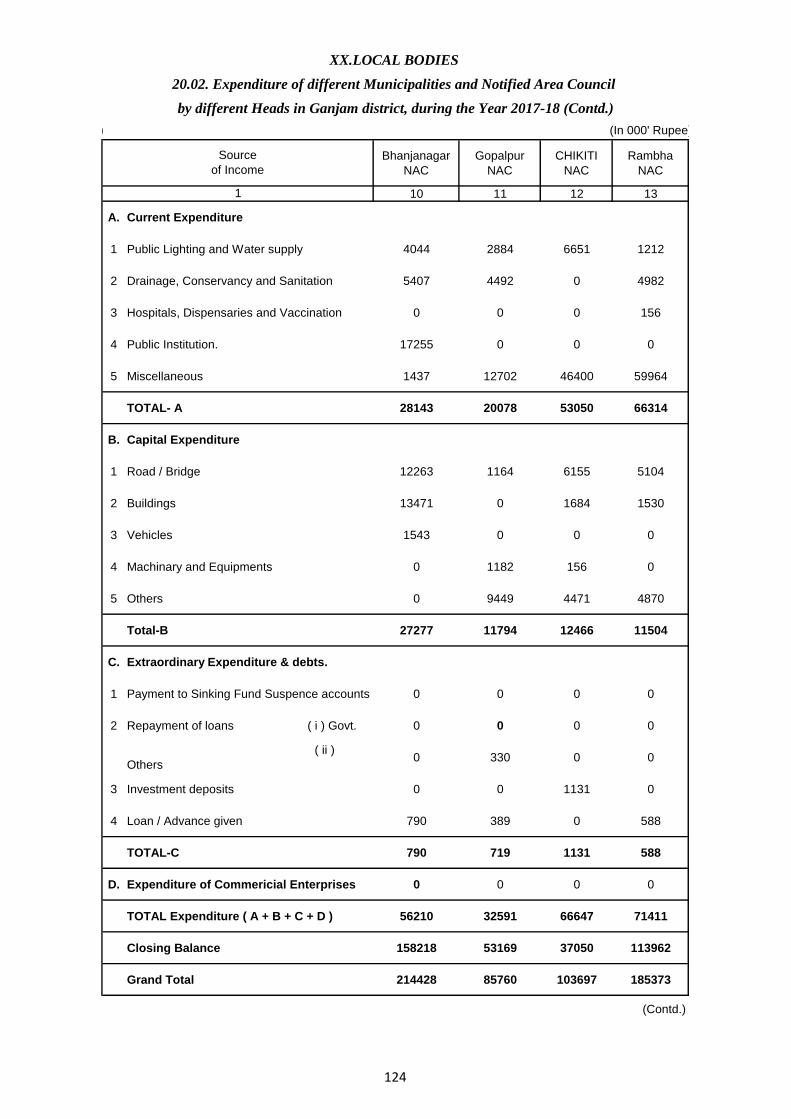
(In 000' Rupee) (In 000' Rupee)
Bhanjanagar
NAC
Gopalpur
NAC
CHIKITI
NAC
Rambha
NAC
10 11 12 13
A. Current Expenditure
1 Public Lighting and Water supply 4044 2884 6651 1212
2 Drainage, Conservancy and Sanitation 5407 4492 0 4982
3 Hospitals, Dispensaries and Vaccination 0 0 0 156
4 Public Institution. 17255 0 0 0
5 Miscellaneous 1437 12702 46400 59964
TOTAL- A 28143 20078 53050 66314
B. Capital Expenditure
1 Road / Bridge 12263 1164 6155 5104
2 Buildings 13471 0 1684 1530
3 Vehicles 1543 0 0 0
4 Machinary and Equipments 0 1182 156 0
5 Others 0 9449 4471 4870
Total-B 27277 11794 12466 11504
C. Extraordinary Expenditure & debts.
1 Payment to Sinking Fund Suspence accounts 0 0 0 0
2 Repayment of loans ( i ) Govt. 0 0 0 0
( ii )
Others 0 330 0 0
3 Investment deposits 0 0 1131 0
4 Loan / Advance given 790 389 0 588
TOTAL-C 790 719 1131 588
D. Expenditure of Commericial Enterprises 0 0 0 0
TOTAL Expenditure ( A + B + C + D ) 56210 32591 66647 71411
Closing Balance 158218 53169 37050 113962
Grand Total 214428 85760 103697 185373
(Contd.)
XX.LOCAL BODIES
20.02. Expenditure of different Municipalities and Notified Area Council
by different Heads in Ganjam district, during the Year 2017-18 (Contd.)
Source
of Income
1
124
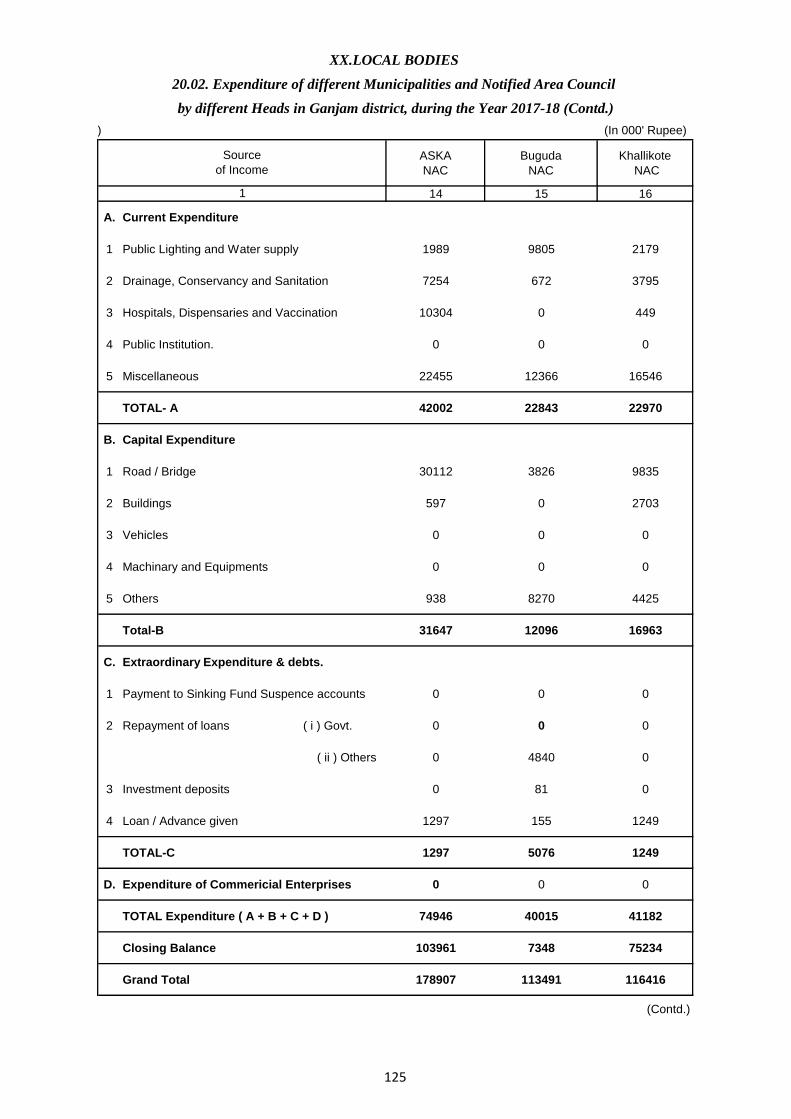
(In 000' Rupee) (In 000' Rupee)
ASKA
NAC
Buguda
NAC
Khallikote
NAC
14 15 16
A. Current Expenditure
1 Public Lighting and Water supply 1989 9805 2179
2 Drainage, Conservancy and Sanitation 7254 672 3795
3 Hospitals, Dispensaries and Vaccination 10304 0 449
4 Public Institution. 0 0 0
5 Miscellaneous 22455 12366 16546
TOTAL- A 42002 22843 22970
B. Capital Expenditure
1 Road / Bridge 30112 3826 9835
2 Buildings 597 0 2703
3 Vehicles 0 0 0
4 Machinary and Equipments 0 0 0
5 Others 938 8270 4425
Total-B 31647 12096 16963
C. Extraordinary Expenditure & debts.
1 Payment to Sinking Fund Suspence accounts 0 0 0
2 Repayment of loans ( i ) Govt. 0 0 0
( ii ) Others 0 4840 0
3 Investment deposits 0 81 0
4 Loan / Advance given 1297 155 1249
TOTAL-C 1297 5076 1249
D. Expenditure of Commericial Enterprises 0 0 0
TOTAL Expenditure ( A + B + C + D ) 74946 40015 41182
Closing Balance 103961 7348 75234
Grand Total 178907 113491 116416
(Contd.)
Source
of Income
1
XX.LOCAL BODIES
20.02. Expenditure of different Municipalities and Notified Area Council
by different Heads in Ganjam district, during the Year 2017-18 (Contd.)
125

(In 000' Rupee)
Purusotampur
NAC
Surada
NAC
Chatrapur
NAC
17 18 19
A. Current Expenditure
1 Public Lighting and Water supply 0 4695 4620
2 Drainage, Conservancy and Sanitation 313 4717 2036
3 Hospitals, Dispensaries and Vaccination 417 0 0
4 Public Institution. 11 10 367
5 Miscellaneous 15 5368 19628
TOTAL- A 756 14790 26651
B. Capital Expenditure
1 Road / Bridge 1138 8652 20189
2 Buildings 35127 0 10056
3 Vehicles 21126 0 0
4 Machinary and Equipments 308 0 0
5 Others 145 14246 0
Total-B 57844 22897 30245
C. Extraordinary Expenditure & debts.
1 Payment to Sinking Fund Suspence accounts 0 0 0
2 Repayment of loans ( i ) Govt. 0 0 0
( ii ) Others 0 0 0
3 Investment deposits 0 0 0
4 Loan / Advance given 0 1006 0
TOTAL-C 0 1006 0
D. Expenditure of Commericial Enterprises 0 0 0
TOTAL Expenditure ( A + B + C + D ) 58600 38694 56896
Closing Balance 59363 87767 21916
Grand Total 117962 126460 78812
Source
of Income
1
Source : DPMU, Ganjam, Berhampur
XX.LOCAL BODIES
20.02. Expenditure of different Municipalities and Notified Area Council
by different Heads in Ganjam district, during the Year 2017-18 (Concld.)
126
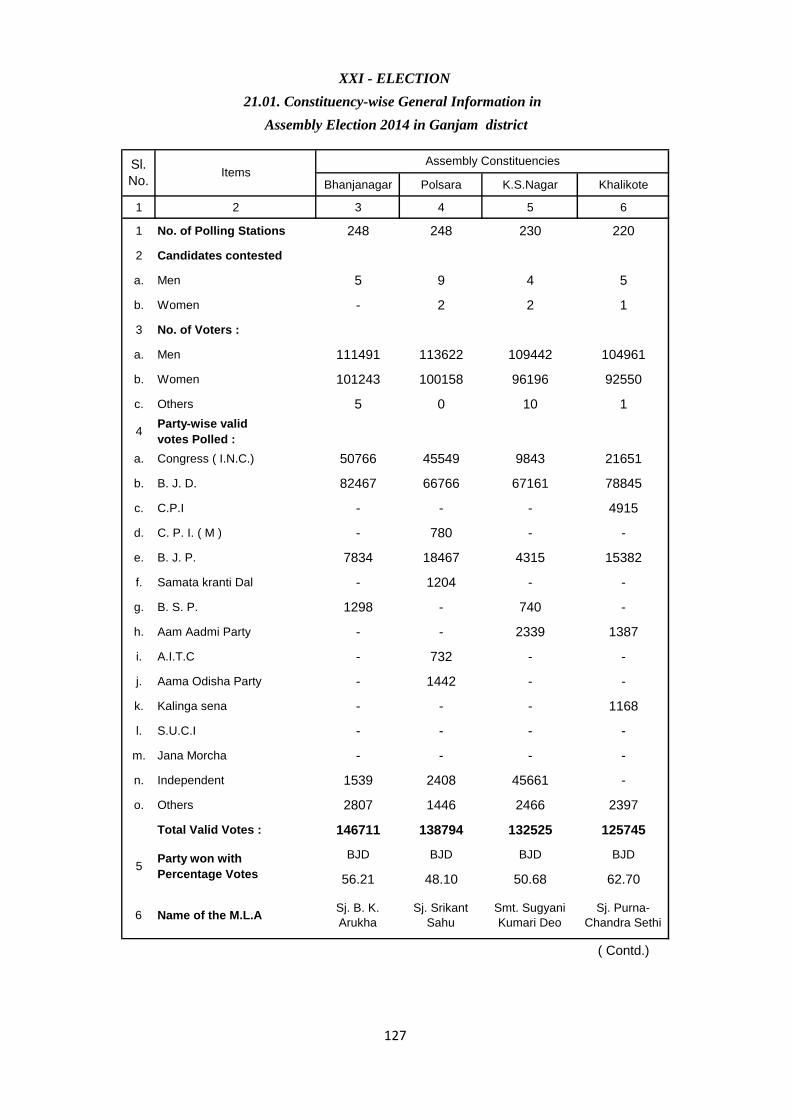
Bhanjanagar Polsara K.S.Nagar Khalikote
1 2 3 4 5 6
1 No. of Polling Stations 248 248 230 220
2 Candidates contested
a. Men 5 9 4 5
b. Women - 2 2 1
3 No. of Voters :
a. Men 111491 113622 109442 104961
b. Women 101243 100158 96196 92550
c. Others 5 0 10 1
4Party-wise valid
votes Polled :
a. Congress ( I.N.C.) 50766 45549 9843 21651
b. B. J. D. 82467 66766 67161 78845
c. C.P.I - - - 4915
d. C. P. I. ( M ) - 780 - -
e. B. J. P. 7834 18467 4315 15382
f. Samata kranti Dal - 1204 - -
g. B. S. P. 1298 - 740 -
h. Aam Aadmi Party - - 2339 1387
i. A.I.T.C - 732 - -
j. Aama Odisha Party - 1442 - -
k. Kalinga sena - - - 1168
l. S.U.C.I - - - -
m. Jana Morcha - - - -
n. Independent 1539 2408 45661 -
o. Others 2807 1446 2466 2397
Total Valid Votes : 146711 138794 132525 125745
BJD BJD BJD BJD
56.21 48.10 50.68 62.70
6 Name of the M.L.ASj. B. K.
Arukha
Sj. Srikant
Sahu
Smt. Sugyani
Kumari Deo
Sj. Purna-
Chandra Sethi
( Contd.)
XXI - ELECTION
21.01. Constituency-wise General Information in
Assembly Election 2014 in Ganjam district
Sl.
No.Items
Assembly Constituencies
5Party won with
Percentage Votes
127
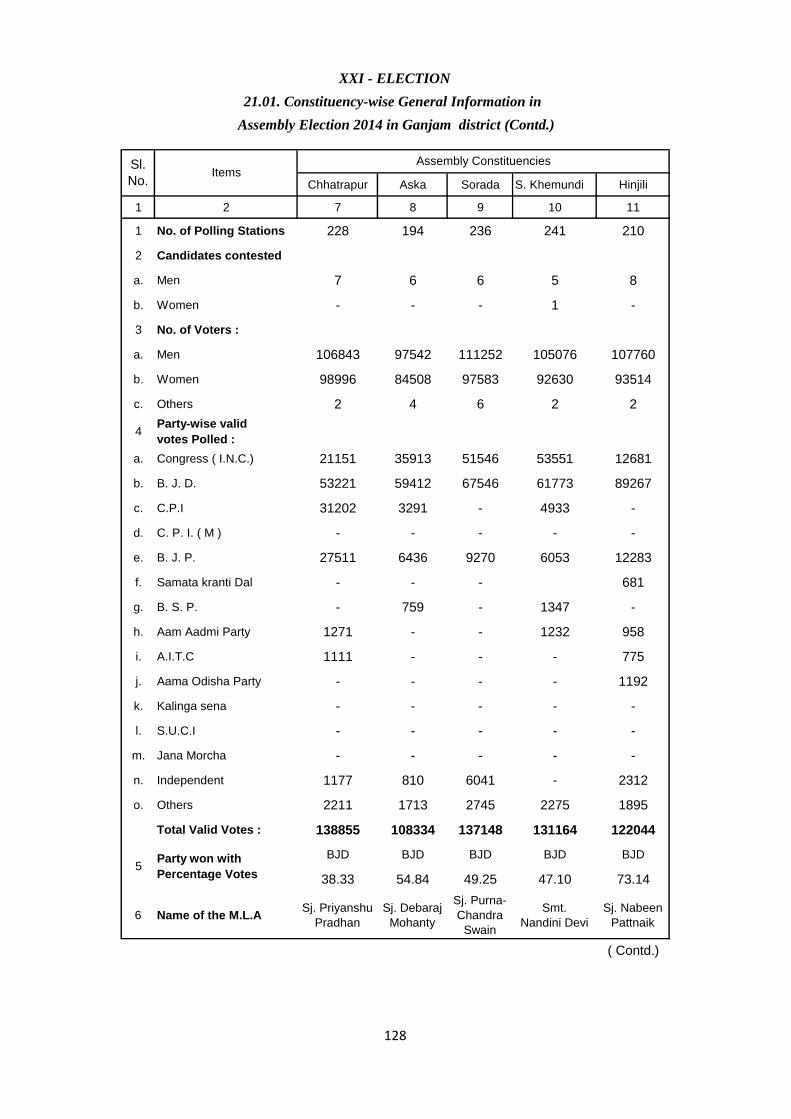
Chhatrapur Aska Sorada S. Khemundi Hinjili
1 2 7 8 9 10 11
1 No. of Polling Stations 228 194 236 241 210
2 Candidates contested
a. Men 7 6 6 5 8
b. Women - - - 1 -
3 No. of Voters :
a. Men 106843 97542 111252 105076 107760
b. Women 98996 84508 97583 92630 93514
c. Others 2 4 6 2 2
4Party-wise valid
votes Polled :
a. Congress ( I.N.C.) 21151 35913 51546 53551 12681
b. B. J. D. 53221 59412 67546 61773 89267
c. C.P.I 31202 3291 - 4933 -
d. C. P. I. ( M ) - - - - -
e. B. J. P. 27511 6436 9270 6053 12283
f. Samata kranti Dal - - - 681
g. B. S. P. - 759 - 1347 -
h. Aam Aadmi Party 1271 - - 1232 958
i. A.I.T.C 1111 - - - 775
j. Aama Odisha Party - - - - 1192
k. Kalinga sena - - - - -
l. S.U.C.I - - - - -
m. Jana Morcha - - - - -
n. Independent 1177 810 6041 - 2312
o. Others 2211 1713 2745 2275 1895
Total Valid Votes : 138855 108334 137148 131164 122044
BJD BJD BJD BJD BJD
38.33 54.84 49.25 47.10 73.14
6 Name of the M.L.ASj. Priyanshu
Pradhan
Sj. Debaraj
Mohanty
Sj. Purna-
Chandra
Swain
Smt.
Nandini Devi
Sj. Nabeen
Pattnaik
( Contd.)
XXI - ELECTION
21.01. Constituency-wise General Information in
Assembly Election 2014 in Ganjam district (Contd.)
Sl.
No.Items
Assembly Constituencies
5Party won with
Percentage Votes
128
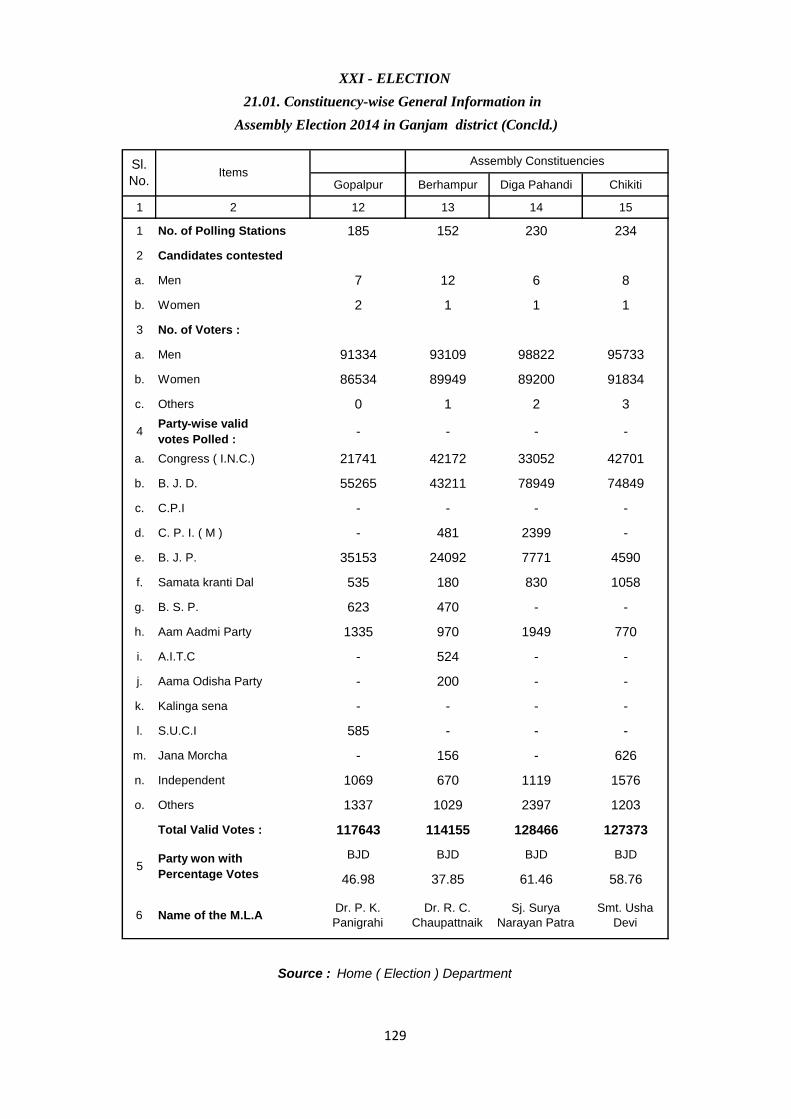
Gopalpur Berhampur Diga Pahandi Chikiti
1 2 12 13 14 15
1 No. of Polling Stations 185 152 230 234
2 Candidates contested
a. Men 7 12 6 8
b. Women 2 1 1 1
3 No. of Voters :
a. Men 91334 93109 98822 95733
b. Women 86534 89949 89200 91834
c. Others 0 1 2 3
4Party-wise valid
votes Polled :- - - -
a. Congress ( I.N.C.) 21741 42172 33052 42701
b. B. J. D. 55265 43211 78949 74849
c. C.P.I - - - -
d. C. P. I. ( M ) - 481 2399 -
e. B. J. P. 35153 24092 7771 4590
f. Samata kranti Dal 535 180 830 1058
g. B. S. P. 623 470 - -
h. Aam Aadmi Party 1335 970 1949 770
i. A.I.T.C - 524 - -
j. Aama Odisha Party - 200 - -
k. Kalinga sena - - - -
l. S.U.C.I 585 - - -
m. Jana Morcha - 156 - 626
n. Independent 1069 670 1119 1576
o. Others 1337 1029 2397 1203
Total Valid Votes : 117643 114155 128466 127373
BJD BJD BJD BJD
46.98 37.85 61.46 58.76
6 Name of the M.L.ADr. P. K.
Panigrahi
Dr. R. C.
Chaupattnaik
Sj. Surya
Narayan Patra
Smt. Usha
Devi
XXI - ELECTION
21.01. Constituency-wise General Information in
Assembly Election 2014 in Ganjam district (Concld.)
Sl.
No.
Source : Home ( Election ) Department
ItemsAssembly Constituencies
5Party won with
Percentage Votes
129

Name of the No. of Total Name
Parliamentary Polling valid of Elected
Constituencies Stations Male Female Votes Won % of Votes M.P
1 2 3 4 5 6 7 8 9
1 Baragarh 1595 8 0 383230 BJD 34.12 Sj. Prabhas Kumar Singh
2Sundargarh
(S.T)1454 10 2 340508 BJP 33.69 Sj. Juel Oram
3 Sambalpur 1401 10 1 358618 BJD 36.43Sj. Nagendra Kumar
Pradhan
4Keonjhar
(S.T)1646 6 2 434471 BJD 40.09
Smt. Sakuntala
Laguri
5Mayurbhanj
(S.T)1622 8 1 383779 BJD 36.43
Sj. Rama Chandra
Hansda
6 Balasore 1464 9 1 433768 BJD 41.33 Sj. Rabindra Kumar Jena
7 Bhadrak (S.C) 1542 8 0 502338 BJD 46.46 Sj. Arjun Charan Sethi
8 Jajpur (S.C) 1399 8 1 541349 BJD 55.22 Smt. Rita Tarai
9 Dhenkanal 1375 11 1 453277 BJD 43.50 Sj. Tathagata Satpathy
10 Bolangir 1887 6 2 453519 BJD 38.75Sj. Kalikesh Narayan
Singh Deo
11 Kalahandi 1732 15 0 370871 BJD 33.19 Sj. Arka Keshari Deo
12Nabarangpur
(S.T)1457 7 0 373887 BJD 36.58 Sj. Balabhadra Majhi
13 Kandhamal 1288 7 1 421458 BJD 50.21Sj. Hemendra
Chandra Singh
14 Cuttack 1319 8 2 526085 BJD 53.76 Sj. Bhartruhari Mahatab
15 Kendrapara 1664 7 0 601574 BJD 52.72 Sj. Baijayanta Panda
16Jagatsinghpur
(S.C)1711 6 1 624492 BJD 55.17 Sj. Kulamani Samal
17 Puri 1524 6 1 523161 BJD 50.33 Sj. Pinaki Mishra
18 Bhubaneswar 1306 10 1 439252 BJD 49.25Sj. Prasanna Kumar
Patasani
19 Aska 1390 9 0 541473 BJD 60.41 Sj. Ladu Kishore Swain
20 Berhampur 1325 11 0 398107 BJD 43.97 Sj. Sidhanta Mohapatra
21 Koraput (S.T) 1516 9 0 395109 BJD 39.93 Sj. Jhina Hikaka
Source : Home ( Election ) Department
XXI : ELECTION
21.02. : General Information in Parliamentary Election 2014
Sl.
No.
Contesting Name of the
Candidates Political Party
130
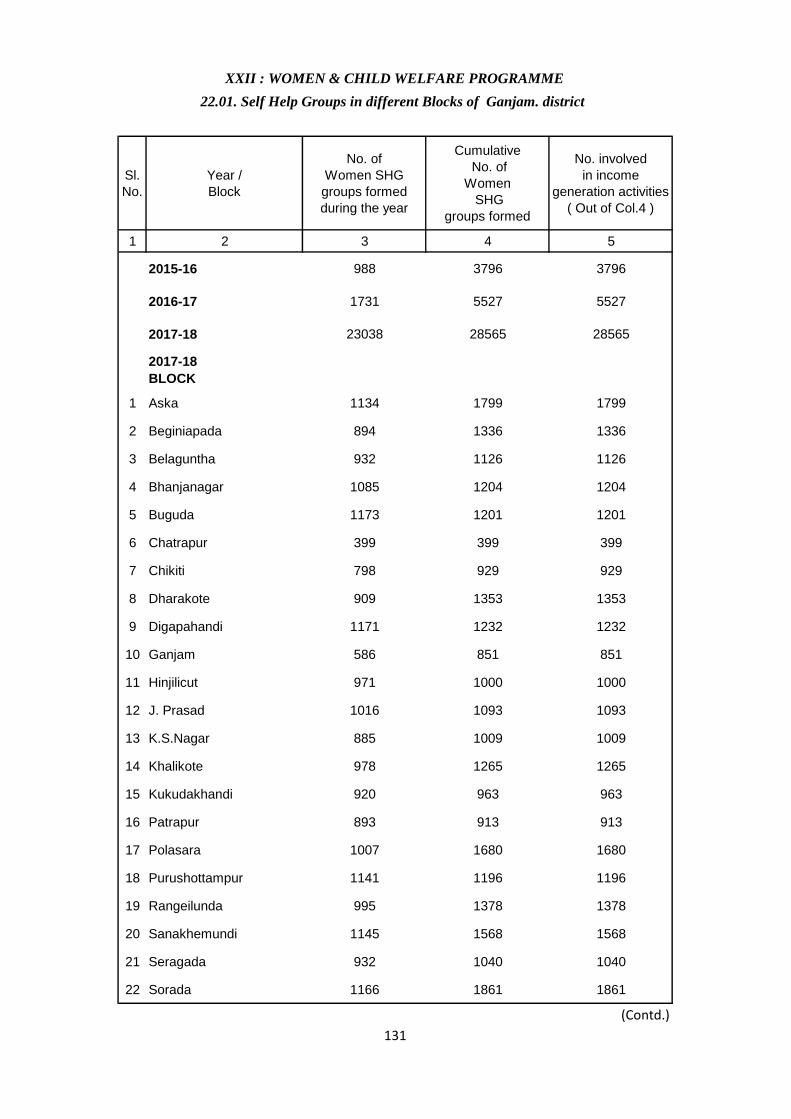
Sl.
No.
Year /
Block
No. of
Women SHG
groups formed
during the year
Cumulative
No. of
Women
SHG
groups formed
No. involved
in income
generation activities
( Out of Col.4 )
1 2 3 4 5
2015-16 988 3796 3796
2016-17 1731 5527 5527
2017-18 23038 28565 28565
2017-18
BLOCK
1 Aska 1134 1799 1799
2 Beginiapada 894 1336 1336
3 Belaguntha 932 1126 1126
4 Bhanjanagar 1085 1204 1204
5 Buguda 1173 1201 1201
6 Chatrapur 399 399 399
7 Chikiti 798 929 929
8 Dharakote 909 1353 1353
9 Digapahandi 1171 1232 1232
10 Ganjam 586 851 851
11 Hinjilicut 971 1000 1000
12 J. Prasad 1016 1093 1093
13 K.S.Nagar 885 1009 1009
14 Khalikote 978 1265 1265
15 Kukudakhandi 920 963 963
16 Patrapur 893 913 913
17 Polasara 1007 1680 1680
18 Purushottampur 1141 1196 1196
19 Rangeilunda 995 1378 1378
20 Sanakhemundi 1145 1568 1568
21 Seragada 932 1040 1040
22 Sorada 1166 1861 1861
(Contd.)
XXII : WOMEN & CHILD WELFARE PROGRAMME
22.01. Self Help Groups in different Blocks of Ganjam. district
131

Sl.
No.
Year /
Block
No. of
Women SHG
groups formed
during the year
Cumulative
No. of
Women
SHG
groups formed
No involved
in income
generation activities
( Out of Col.4 )
1 2 3 4 5
URBAN
1 Aska (N) 130 130 130
2 Bellaguntha (N) 56 56 56
3 Berhampur (MC) 1036 1216 1216
4 Bhanjanagar (N) 106 106 106
5 Buguda (N) 91 91 91
6 Chatrapur (N) 39 39 39
7 Chikiti (N) 33 33 33
8 Digapahandi (N) 96 96 96
9 Ganjam (N) 18 31 31
10 Gopalpur (N) 33 42 42
11 Hinjilicut (N) 48 48 48
12 Kabisuryanagar (N) 35 35 35
13 Khallikote (N) 84 84 84
14 Kodala (N) 0 0 0
15 Polosara (N) 81 81 81
16 Purushottampur (N) 0 0 0
17 Rambha (N) 19 38 38
18 Sorada (N) 3 43 43
XXII : WOMEN & CHILD WELFARE PROGRAMME
22.01. Self Help Groups in different Blocks of Ganjam. district
Source : Dist Social Welfare Officer,Ganjam
132
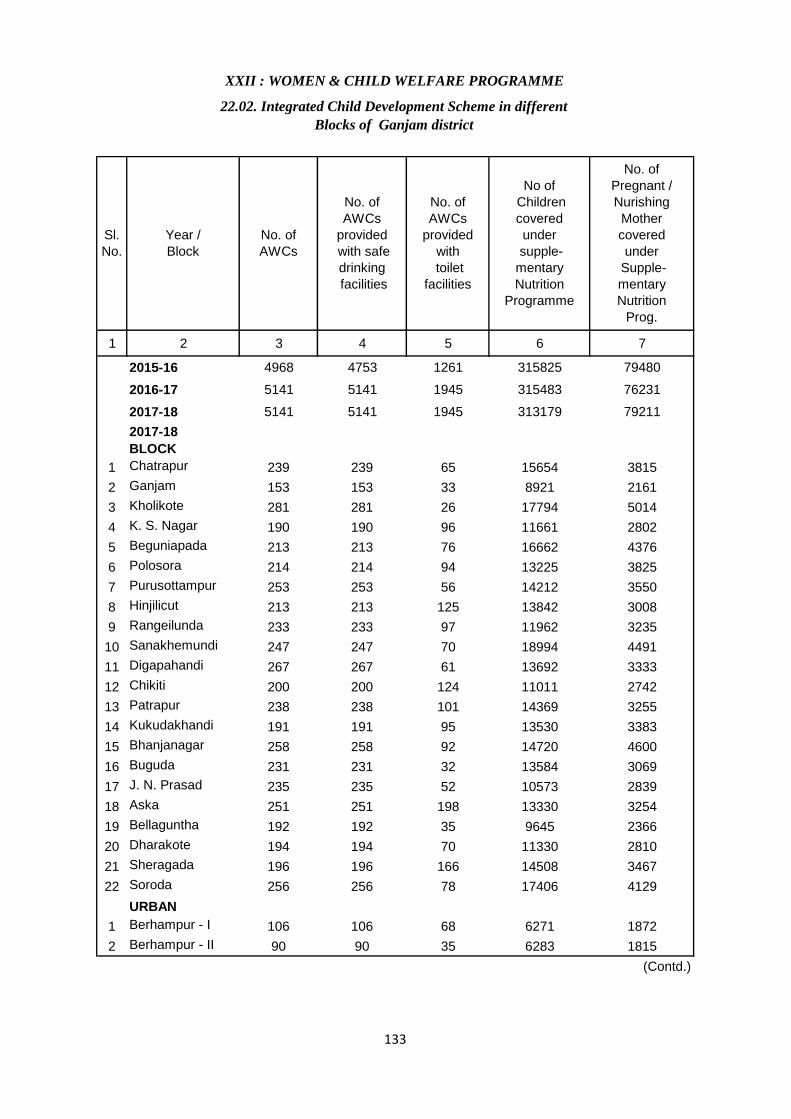
1 2 3 4 5 6 7
2015-16 4968 4753 1261 315825 79480
2016-17 5141 5141 1945 315483 76231
2017-18 5141 5141 1945 313179 79211
2017-18
BLOCK
1 Chatrapur 239 239 65 15654 3815
2 Ganjam 153 153 33 8921 2161
3 Kholikote 281 281 26 17794 5014
4 K. S. Nagar 190 190 96 11661 2802
5 Beguniapada 213 213 76 16662 4376
6 Polosora 214 214 94 13225 3825
7 Purusottampur 253 253 56 14212 3550
8 Hinjilicut 213 213 125 13842 3008
9 Rangeilunda 233 233 97 11962 3235
10 Sanakhemundi 247 247 70 18994 4491
11 Digapahandi 267 267 61 13692 3333
12 Chikiti 200 200 124 11011 2742
13 Patrapur 238 238 101 14369 3255
14 Kukudakhandi 191 191 95 13530 3383
15 Bhanjanagar 258 258 92 14720 4600
16 Buguda 231 231 32 13584 3069
17 J. N. Prasad 235 235 52 10573 2839
18 Aska 251 251 198 13330 3254
19 Bellaguntha 192 192 35 9645 2366
20 Dharakote 194 194 70 11330 2810
21 Sheragada 196 196 166 14508 3467
22 Soroda 256 256 78 17406 4129
URBAN
1 Berhampur - I 106 106 68 6271 1872
2 Berhampur - II 90 90 35 6283 1815
(Contd.)
XXII : WOMEN & CHILD WELFARE PROGRAMME
22.02. Integrated Child Development Scheme in different
Blocks of Ganjam district
Sl.
No.
Year /
Block
No. of
AWCs
No. of
AWCs
provided
with safe
drinking
facilities
No. of
AWCs
provided
with
toilet
facilities
No of
Children
covered
under
supple-
mentary
Nutrition
Programme
No. of
Pregnant /
Nurishing
Mother
covered
under
Supple-
mentary
Nutrition
Prog.
133
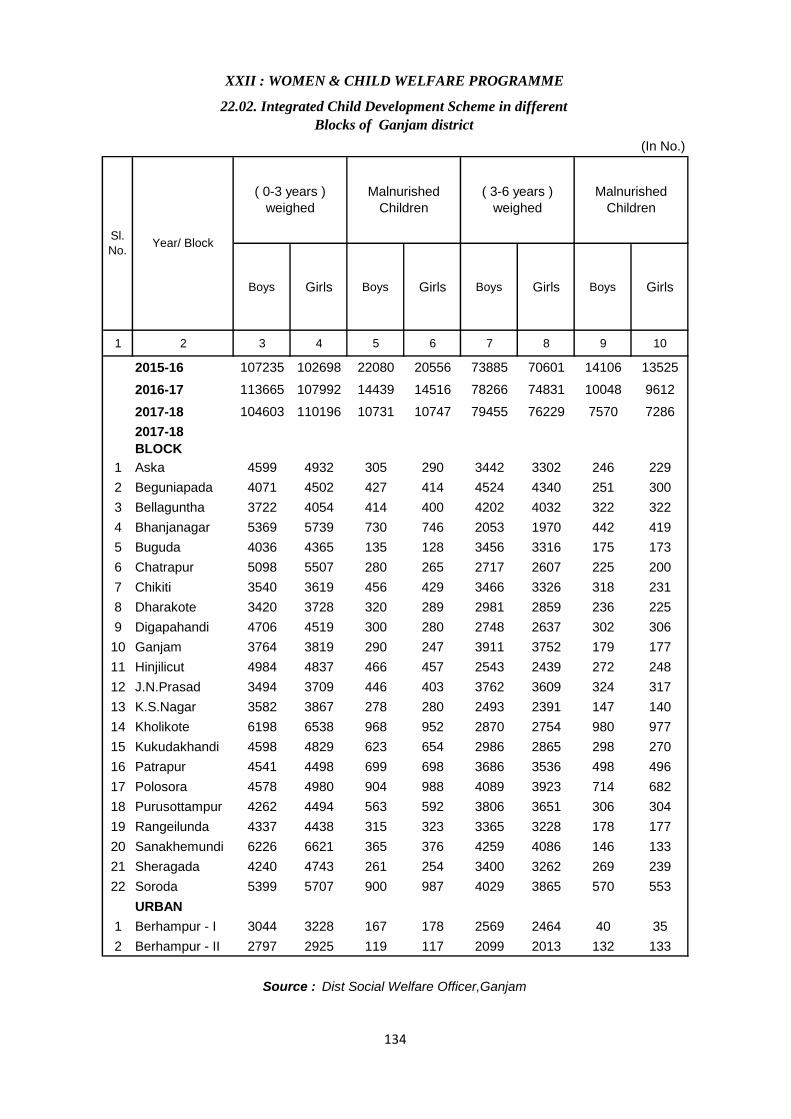
Boys Girls Boys Girls Boys Girls Boys Girls
1 2 3 4 5 6 7 8 9 10
2015-16 107235 102698 22080 20556 73885 70601 14106 13525
2016-17 113665 107992 14439 14516 78266 74831 10048 9612
2017-18 104603 110196 10731 10747 79455 76229 7570 7286
2017-18
BLOCK
1 Aska 4599 4932 305 290 3442 3302 246 229
2 Beguniapada 4071 4502 427 414 4524 4340 251 300
3 Bellaguntha 3722 4054 414 400 4202 4032 322 322
4 Bhanjanagar 5369 5739 730 746 2053 1970 442 419
5 Buguda 4036 4365 135 128 3456 3316 175 173
6 Chatrapur 5098 5507 280 265 2717 2607 225 200
7 Chikiti 3540 3619 456 429 3466 3326 318 231
8 Dharakote 3420 3728 320 289 2981 2859 236 225
9 Digapahandi 4706 4519 300 280 2748 2637 302 306
10 Ganjam 3764 3819 290 247 3911 3752 179 177
11 Hinjilicut 4984 4837 466 457 2543 2439 272 248
12 J.N.Prasad 3494 3709 446 403 3762 3609 324 317
13 K.S.Nagar 3582 3867 278 280 2493 2391 147 140
14 Kholikote 6198 6538 968 952 2870 2754 980 977
15 Kukudakhandi 4598 4829 623 654 2986 2865 298 270
16 Patrapur 4541 4498 699 698 3686 3536 498 496
17 Polosora 4578 4980 904 988 4089 3923 714 682
18 Purusottampur 4262 4494 563 592 3806 3651 306 304
19 Rangeilunda 4337 4438 315 323 3365 3228 178 177
20 Sanakhemundi 6226 6621 365 376 4259 4086 146 133
21 Sheragada 4240 4743 261 254 3400 3262 269 239
22 Soroda 5399 5707 900 987 4029 3865 570 553
URBAN
1 Berhampur - I 3044 3228 167 178 2569 2464 40 35
2 Berhampur - II 2797 2925 119 117 2099 2013 132 133
Source : Dist Social Welfare Officer,Ganjam
XXII : WOMEN & CHILD WELFARE PROGRAMME
22.02. Integrated Child Development Scheme in different
Blocks of Ganjam district
(In No.)
Sl.
No.Year/ Block
( 0-3 years )
weighed
Malnurished
Children
( 3-6 years )
weighed
Malnurished
Children
134
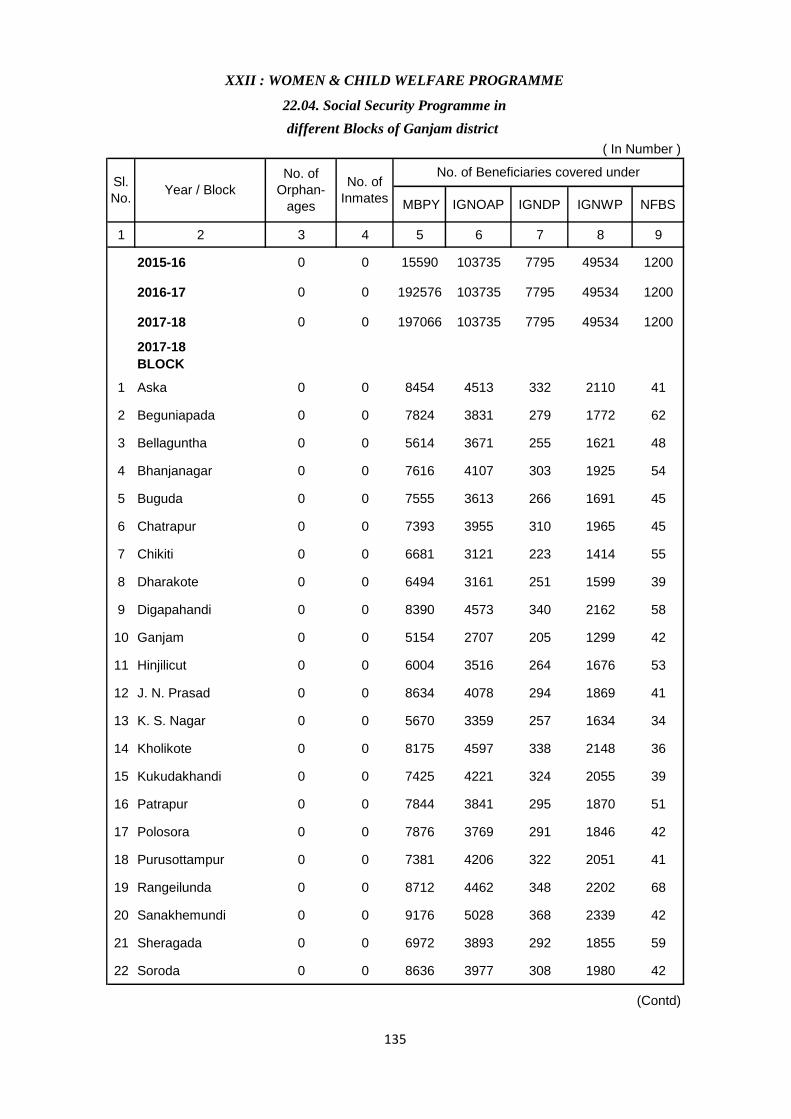
MBPY IGNOAP IGNDP IGNWP NFBS
1 2 3 4 5 6 7 8 9
2015-16 0 0 15590 103735 7795 49534 1200
2016-17 0 0 192576 103735 7795 49534 1200
2017-18 0 0 197066 103735 7795 49534 1200
2017-18
BLOCK
1 Aska 0 0 8454 4513 332 2110 41
2 Beguniapada 0 0 7824 3831 279 1772 62
3 Bellaguntha 0 0 5614 3671 255 1621 48
4 Bhanjanagar 0 0 7616 4107 303 1925 54
5 Buguda 0 0 7555 3613 266 1691 45
6 Chatrapur 0 0 7393 3955 310 1965 45
7 Chikiti 0 0 6681 3121 223 1414 55
8 Dharakote 0 0 6494 3161 251 1599 39
9 Digapahandi 0 0 8390 4573 340 2162 58
10 Ganjam 0 0 5154 2707 205 1299 42
11 Hinjilicut 0 0 6004 3516 264 1676 53
12 J. N. Prasad 0 0 8634 4078 294 1869 41
13 K. S. Nagar 0 0 5670 3359 257 1634 34
14 Kholikote 0 0 8175 4597 338 2148 36
15 Kukudakhandi 0 0 7425 4221 324 2055 39
16 Patrapur 0 0 7844 3841 295 1870 51
17 Polosora 0 0 7876 3769 291 1846 42
18 Purusottampur 0 0 7381 4206 322 2051 41
19 Rangeilunda 0 0 8712 4462 348 2202 68
20 Sanakhemundi 0 0 9176 5028 368 2339 42
21 Sheragada 0 0 6972 3893 292 1855 59
22 Soroda 0 0 8636 3977 308 1980 42
(Contd)
( In Number )
XXII : WOMEN & CHILD WELFARE PROGRAMME
22.04. Social Security Programme in
different Blocks of Ganjam district
Sl.
No.Year / Block
No. of
Orphan-
ages
No. of
Inmates
No. of Beneficiaries covered under
135
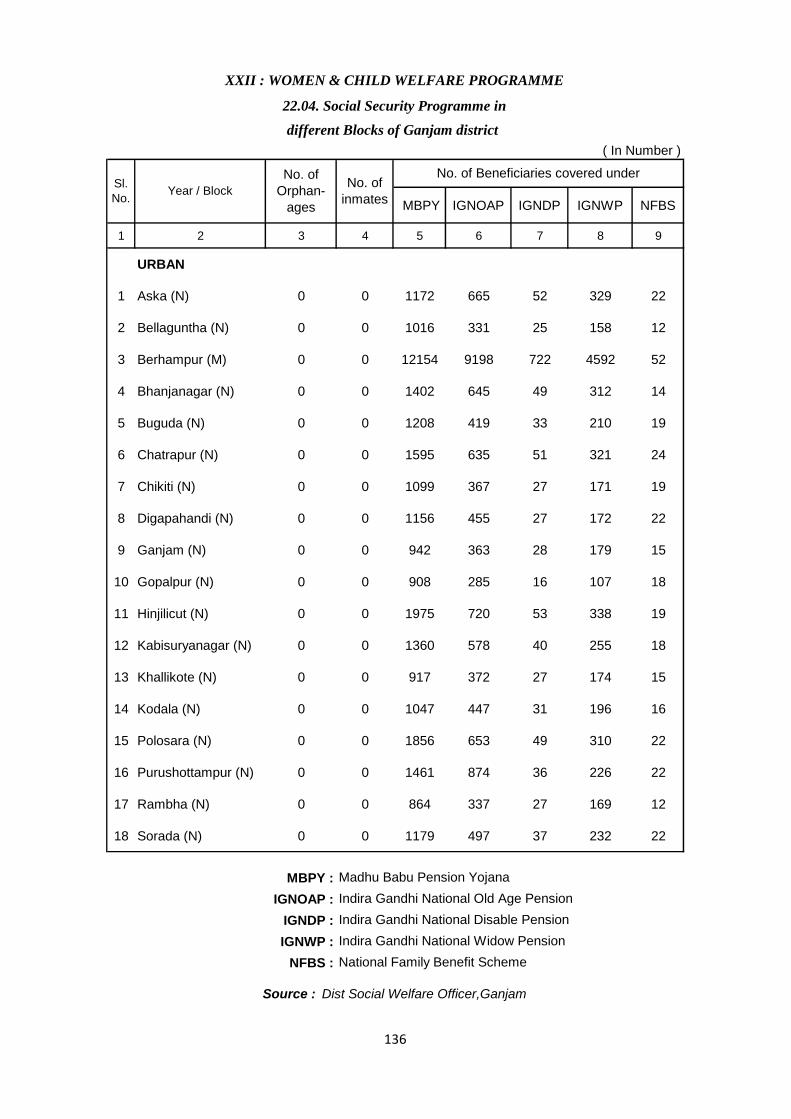
MBPY IGNOAP IGNDP IGNWP NFBS
1 2 3 4 5 6 7 8 9
URBAN
1 Aska (N) 0 0 1172 665 52 329 22
2 Bellaguntha (N) 0 0 1016 331 25 158 12
3 Berhampur (M) 0 0 12154 9198 722 4592 52
4 Bhanjanagar (N) 0 0 1402 645 49 312 14
5 Buguda (N) 0 0 1208 419 33 210 19
6 Chatrapur (N) 0 0 1595 635 51 321 24
7 Chikiti (N) 0 0 1099 367 27 171 19
8 Digapahandi (N) 0 0 1156 455 27 172 22
9 Ganjam (N) 0 0 942 363 28 179 15
10 Gopalpur (N) 0 0 908 285 16 107 18
11 Hinjilicut (N) 0 0 1975 720 53 338 19
12 Kabisuryanagar (N) 0 0 1360 578 40 255 18
13 Khallikote (N) 0 0 917 372 27 174 15
14 Kodala (N) 0 0 1047 447 31 196 16
15 Polosara (N) 0 0 1856 653 49 310 22
16 Purushottampur (N) 0 0 1461 874 36 226 22
17 Rambha (N) 0 0 864 337 27 169 12
18 Sorada (N) 0 0 1179 497 37 232 22
MBPY :
IGNOAP :
IGNDP :
IGNWP :
NFBS :
XXII : WOMEN & CHILD WELFARE PROGRAMME
Source : Dist Social Welfare Officer,Ganjam
Madhu Babu Pension Yojana
Indira Gandhi National Old Age Pension
Indira Gandhi National Disable Pension
Indira Gandhi National Widow Pension
National Family Benefit Scheme
No. of
inmates
No. of Beneficiaries covered under
( In Number )
22.04. Social Security Programme in
different Blocks of Ganjam district
Sl.
No.Year / Block
No. of
Orphan-
ages
136
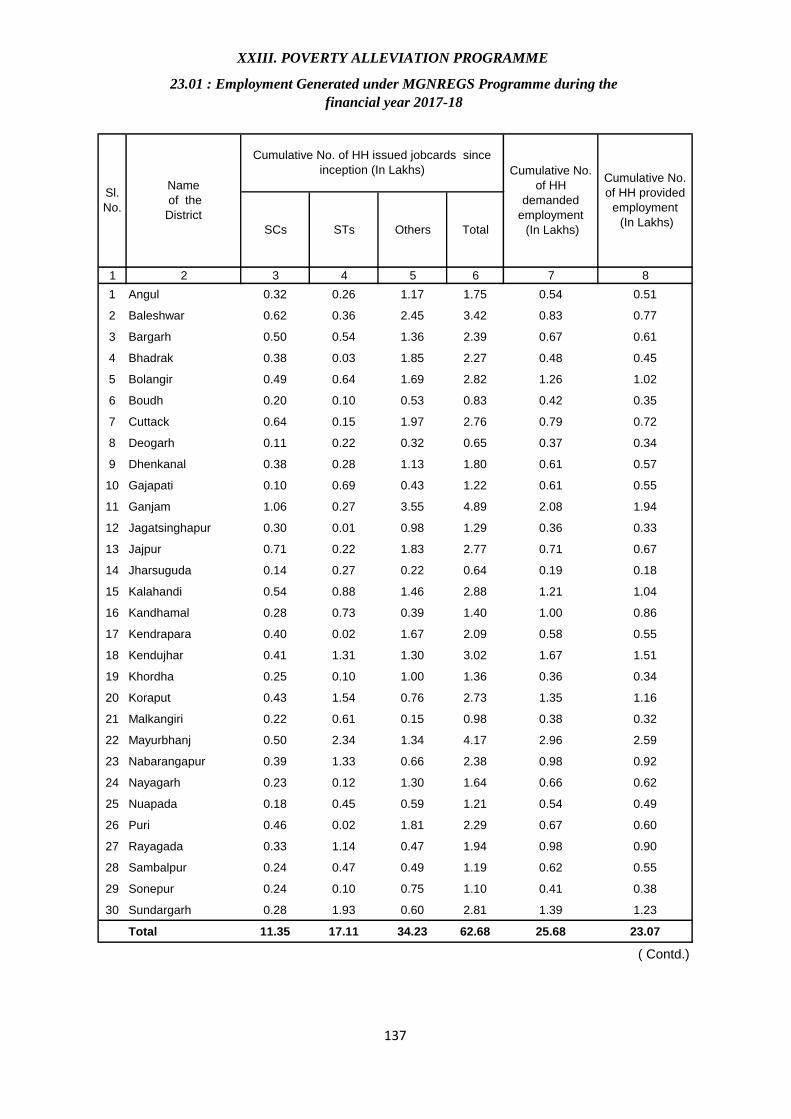
SCs STs Others Total
1 2 3 4 5 6 7 8
1 Angul 0.32 0.26 1.17 1.75 0.54 0.51
2 Baleshwar 0.62 0.36 2.45 3.42 0.83 0.77
3 Bargarh 0.50 0.54 1.36 2.39 0.67 0.61
4 Bhadrak 0.38 0.03 1.85 2.27 0.48 0.45
5 Bolangir 0.49 0.64 1.69 2.82 1.26 1.02
6 Boudh 0.20 0.10 0.53 0.83 0.42 0.35
7 Cuttack 0.64 0.15 1.97 2.76 0.79 0.72
8 Deogarh 0.11 0.22 0.32 0.65 0.37 0.34
9 Dhenkanal 0.38 0.28 1.13 1.80 0.61 0.57
10 Gajapati 0.10 0.69 0.43 1.22 0.61 0.55
11 Ganjam 1.06 0.27 3.55 4.89 2.08 1.94
12 Jagatsinghapur 0.30 0.01 0.98 1.29 0.36 0.33
13 Jajpur 0.71 0.22 1.83 2.77 0.71 0.67
14 Jharsuguda 0.14 0.27 0.22 0.64 0.19 0.18
15 Kalahandi 0.54 0.88 1.46 2.88 1.21 1.04
16 Kandhamal 0.28 0.73 0.39 1.40 1.00 0.86
17 Kendrapara 0.40 0.02 1.67 2.09 0.58 0.55
18 Kendujhar 0.41 1.31 1.30 3.02 1.67 1.51
19 Khordha 0.25 0.10 1.00 1.36 0.36 0.34
20 Koraput 0.43 1.54 0.76 2.73 1.35 1.16
21 Malkangiri 0.22 0.61 0.15 0.98 0.38 0.32
22 Mayurbhanj 0.50 2.34 1.34 4.17 2.96 2.59
23 Nabarangapur 0.39 1.33 0.66 2.38 0.98 0.92
24 Nayagarh 0.23 0.12 1.30 1.64 0.66 0.62
25 Nuapada 0.18 0.45 0.59 1.21 0.54 0.49
26 Puri 0.46 0.02 1.81 2.29 0.67 0.60
27 Rayagada 0.33 1.14 0.47 1.94 0.98 0.90
28 Sambalpur 0.24 0.47 0.49 1.19 0.62 0.55
29 Sonepur 0.24 0.10 0.75 1.10 0.41 0.38
30 Sundargarh 0.28 1.93 0.60 2.81 1.39 1.23
Total 11.35 17.11 34.23 62.68 25.68 23.07
( Contd.)
XXIII. POVERTY ALLEVIATION PROGRAMME
23.01 : Employment Generated under MGNREGS Programme during the
financial year 2017-18
Sl.
No.
Name
of the
District
Cumulative No. of HH issued jobcards since
inception (In Lakhs) Cumulative No.
of HH
demanded
employment
(In Lakhs)
Cumulative No.
of HH provided
employment
(In Lakhs)
137
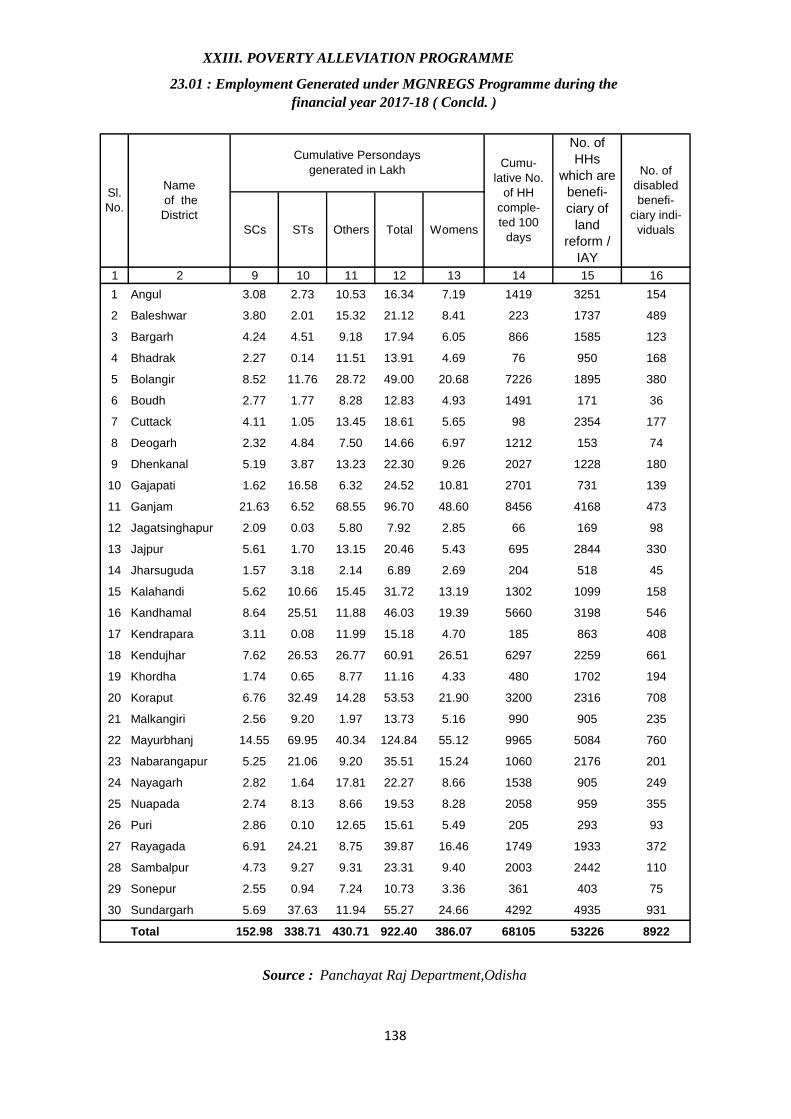
SCs STs Others Total Womens
1 2 9 10 11 12 13 14 15 16
1 Angul 3.08 2.73 10.53 16.34 7.19 1419 3251 154
2 Baleshwar 3.80 2.01 15.32 21.12 8.41 223 1737 489
3 Bargarh 4.24 4.51 9.18 17.94 6.05 866 1585 123
4 Bhadrak 2.27 0.14 11.51 13.91 4.69 76 950 168
5 Bolangir 8.52 11.76 28.72 49.00 20.68 7226 1895 380
6 Boudh 2.77 1.77 8.28 12.83 4.93 1491 171 36
7 Cuttack 4.11 1.05 13.45 18.61 5.65 98 2354 177
8 Deogarh 2.32 4.84 7.50 14.66 6.97 1212 153 74
9 Dhenkanal 5.19 3.87 13.23 22.30 9.26 2027 1228 180
10 Gajapati 1.62 16.58 6.32 24.52 10.81 2701 731 139
11 Ganjam 21.63 6.52 68.55 96.70 48.60 8456 4168 473
12 Jagatsinghapur 2.09 0.03 5.80 7.92 2.85 66 169 98
13 Jajpur 5.61 1.70 13.15 20.46 5.43 695 2844 330
14 Jharsuguda 1.57 3.18 2.14 6.89 2.69 204 518 45
15 Kalahandi 5.62 10.66 15.45 31.72 13.19 1302 1099 158
16 Kandhamal 8.64 25.51 11.88 46.03 19.39 5660 3198 546
17 Kendrapara 3.11 0.08 11.99 15.18 4.70 185 863 408
18 Kendujhar 7.62 26.53 26.77 60.91 26.51 6297 2259 661
19 Khordha 1.74 0.65 8.77 11.16 4.33 480 1702 194
20 Koraput 6.76 32.49 14.28 53.53 21.90 3200 2316 708
21 Malkangiri 2.56 9.20 1.97 13.73 5.16 990 905 235
22 Mayurbhanj 14.55 69.95 40.34 124.84 55.12 9965 5084 760
23 Nabarangapur 5.25 21.06 9.20 35.51 15.24 1060 2176 201
24 Nayagarh 2.82 1.64 17.81 22.27 8.66 1538 905 249
25 Nuapada 2.74 8.13 8.66 19.53 8.28 2058 959 355
26 Puri 2.86 0.10 12.65 15.61 5.49 205 293 93
27 Rayagada 6.91 24.21 8.75 39.87 16.46 1749 1933 372
28 Sambalpur 4.73 9.27 9.31 23.31 9.40 2003 2442 110
29 Sonepur 2.55 0.94 7.24 10.73 3.36 361 403 75
30 Sundargarh 5.69 37.63 11.94 55.27 24.66 4292 4935 931
Total 152.98 338.71 430.71 922.40 386.07 68105 53226 8922
Source : Panchayat Raj Department,Odisha
XXIII. POVERTY ALLEVIATION PROGRAMME
23.01 : Employment Generated under MGNREGS Programme during the
financial year 2017-18 ( Concld. )
Sl.
No.
Name
of the
District
Cumulative Persondays
generated in LakhCumu-
lative No.
of HH
comple-
ted 100
days
No. of
HHs
which are
benefi-
ciary of
land
reform /
IAY
No. of
disabled
benefi-
ciary indi-
viduals
138

1 2 3 4 5 6 7 8 9
1 Angul 124.04 0.00 0.00 0.00 0.00 4333.79 0.05
2 Baleshwar 75.90 0.00 0.00 0.00 0.00 5465.44 0
3 Bargarh -35.65 0.00 0.00 0.00 0.00 4814.60 3
4 Bhadrak 92.22 0.00 0.00 0.00 0.00 3204.37 0
5 Bolangir -542.80 0.00 0.00 0.00 0.00 12905.18 0
6 Boudh -19.87 0.00 0.00 0.00 0.00 3341.01 0
7 Cuttack -4.20 0.00 0.00 0.00 0.00 4667.15 31.20
8 Deogarh -127.92 0.00 0.00 0.00 0.00 4099.20 0
9 Dhenkanal 114.74 0.00 0.00 0.00 0.00 6015.16 0
10 Gajapati 119.36 0.00 0.00 0.00 0.00 7001.70 0
11 Ganjam 179.39 0.00 0.00 0.00 0.00 26142.95 0
12 Jagatsinghapur 2.39 0.00 0.00 0.00 0.00 1995.72 0
13 Jajpur -43.58 0.00 0.00 0.00 0.00 5258.30 0
14 Jharsuguda 47.11 0.00 0.00 0.00 0.00 1990.81 0
15 Kalahandi -161.87 0.00 0.00 0.00 0.00 8391.16 0
16 Kandhamal 105.02 0.00 0.00 0.00 0.00 11455.50 0
17 Kendrapara 137.58 0.00 0.00 0.00 0.00 3828.78 0
18 Kendujhar -979.66 0.00 0.00 0.00 0.00 17521.41 0
19 Khordha 16.06 0.00 0.00 0.00 0.00 2961.52 0
20 Koraput -90.52 0.00 0.00 0.00 0.00 17639.98 0
21 Malkangiri 641.88 0.00 0.00 0.00 0.00 3953.94 214.68
22 Mayurbhanj 570.78 0.00 0.00 0.00 0.00 35900.20 0
23 Nabarangapur -468.33 0.00 0.00 0.00 0.00 9277.18 0
24 Nayagarh 128.44 0.00 0.00 0.00 0.00 5683.16 0
25 Nuapada 527.10 0.00 0.00 0.00 0.00 5290.52 0
26 Puri 41.52 0.00 0.00 0.00 0.00 3951.00 0
27 Rayagada -512.07 0.00 0.00 0.00 0.00 10526.54 0
28 Sambalpur 182.57 0.00 0.00 0.00 0.00 6668.64 0
29 Sonepur 229.19 0.00 0.00 0.00 0.00 3028.06 0
30 Sundargarh 240.89 0.00 0.00 0.00 0.00 15310.04 0
Total 589.71 0.00 0.00 0.00 0.00 252623.01 248.93
XXIII. POVERTY ALLEVIATION PROGRAMME
23.02 : Financial Performance under MGNREGS
during the financial year 2017-18
( Rs. In Lakh)
Sl.
No.
Name
of the
District
Audited
O. B.
Rel. of Last Yr, recieved
in current Yr
Release of
current
year
Total
ReleaseEFMS Misc.
Centre State
( Contd.)
139

1 2 10 11 12 13 14 15
1 Angul 0 4457.88 3122.17 45.90 962.18 4.31
2 Baleshwar 0 5541.34 3926.95 64.18 1131.29 7.07
3 Bargarh 0 4781.95 3495.88 87.60 969.14 3.72
4 Bhadrak 0 3296.59 2500.44 16.98 496.90 0.52
5 Bolangir 0 12362.38 9438.96 208.83 2642.72 10.47
6 Boudh 0 3321.14 2224.43 27.58 888.49 6.00
7 Cuttack 0 4694.15 3360.46 78.69 892.21 1.52
8 Deogarh 0 3971.28 2983.63 31.38 934.50 0.64
9 Dhenkanal 0 6129.90 4224.06 91.80 1353.29 10.29
10 Gajapati 0 7121.06 4478.23 42.97 2214.70 1.42
11 Ganjam 0 26322.34 16795.97 294.64 7641.30 2.41
12 Jagatsinghapur 0 1998.11 1409.31 60.06 406.58 3.70
13 Jajpur 0 5214.72 3788.66 83.34 1099.54 8.03
14 Jharsuguda 0 2037.92 1387.50 45.10 424.98 9.03
15 Kalahandi 0 8229.29 5941.54 219.31 1834.19 15.89
16 Kandhamal 0 11560.52 9126.94 168.67 1642.69 23.80
17 Kendrapara 0 3966.36 2759.81 62.10 763.30 4.67
18 Kendujhar 0 16541.75 11156.03 148.66 5574.66 75.40
19 Khordha 0 2977.58 2078.71 44.58 688.20 4.08
20 Koraput 0 17549.46 10439.88 71.51 6139.55 70.69
21 Malkangiri 139.58 4670.92 2897.54 20.82 743.97 1.77
22 Mayurbhanj 0 36470.98 24041.96 219.09 10245.20 49.58
23 Nabarangapur 0 8808.85 6916.32 55.19 1805.14 4.12
24 Nayagarh 0 5811.60 4188.28 81.75 1141.14 8.69
25 Nuapada 0 5817.62 3997.82 70.60 1024.11 7.46
26 Puri 0 3992.52 2949.50 76.66 679.44 6.25
27 Rayagada 0 10014.47 7437.73 80.58 2595.57 16.16
28 Sambalpur 0 6851.21 4433.13 133.34 1825.17 15.77
29 Sonepur 0 3257.25 1977.16 81.82 804.41 3.00
30 Sundargarh 0 15550.93 10630.67 325.39 3673.70 14.66
Total 139.58 253322.07 174109.67 3039.12 63238.28 391.10
XXIII. POVERTY ALLEVIATION PROGRAMME
23.02 : Financial Performance under MGNREGS
during the financial year 2017-18 (Contd.)
( Rs. In Lakh)
Sl.
No.
Name
of the
District
Refund to
State
(Borrowed
Fund)
TFA On
Unskilled
Wage
On Semi-
Skilled
and
Skilled
Wage
On
Material
Cumulative Expenditure
( Contd.)
Tax
Paid
140
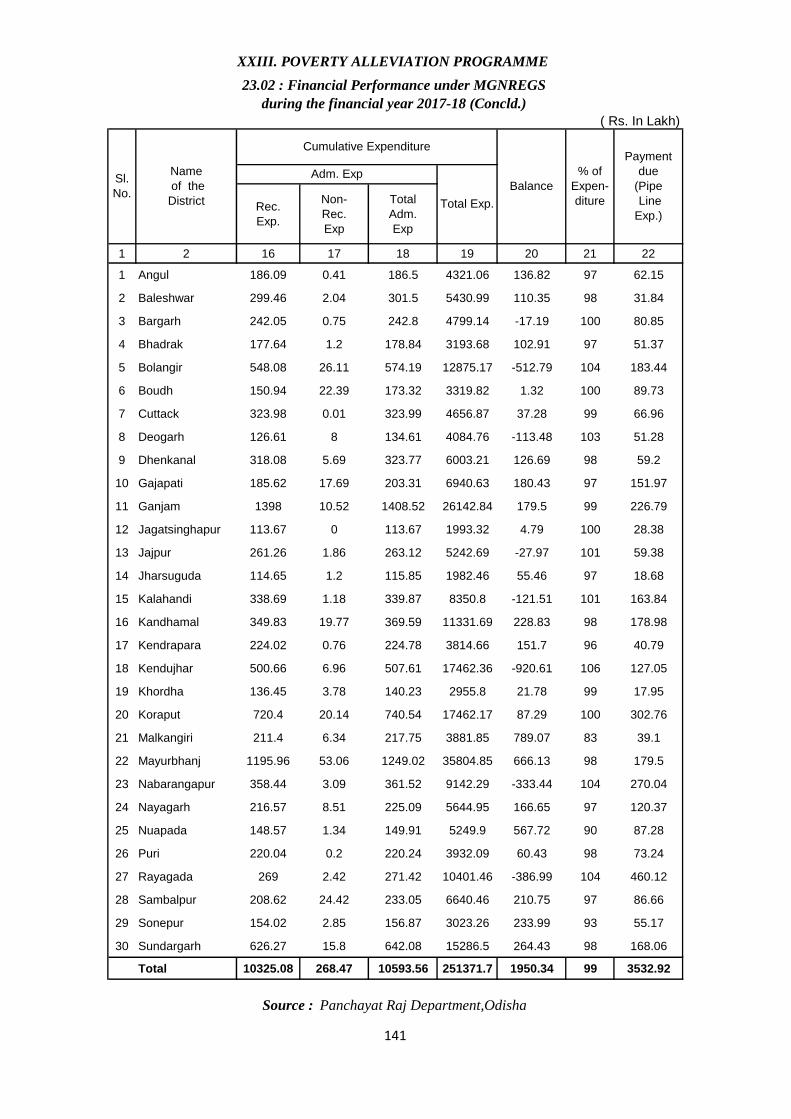
Rec.
Exp.
Non-
Rec.
Exp
Total
Adm.
Exp
1 2 16 17 18 19 20 21 22
1 Angul 186.09 0.41 186.5 4321.06 136.82 97 62.15
2 Baleshwar 299.46 2.04 301.5 5430.99 110.35 98 31.84
3 Bargarh 242.05 0.75 242.8 4799.14 -17.19 100 80.85
4 Bhadrak 177.64 1.2 178.84 3193.68 102.91 97 51.37
5 Bolangir 548.08 26.11 574.19 12875.17 -512.79 104 183.44
6 Boudh 150.94 22.39 173.32 3319.82 1.32 100 89.73
7 Cuttack 323.98 0.01 323.99 4656.87 37.28 99 66.96
8 Deogarh 126.61 8 134.61 4084.76 -113.48 103 51.28
9 Dhenkanal 318.08 5.69 323.77 6003.21 126.69 98 59.2
10 Gajapati 185.62 17.69 203.31 6940.63 180.43 97 151.97
11 Ganjam 1398 10.52 1408.52 26142.84 179.5 99 226.79
12 Jagatsinghapur 113.67 0 113.67 1993.32 4.79 100 28.38
13 Jajpur 261.26 1.86 263.12 5242.69 -27.97 101 59.38
14 Jharsuguda 114.65 1.2 115.85 1982.46 55.46 97 18.68
15 Kalahandi 338.69 1.18 339.87 8350.8 -121.51 101 163.84
16 Kandhamal 349.83 19.77 369.59 11331.69 228.83 98 178.98
17 Kendrapara 224.02 0.76 224.78 3814.66 151.7 96 40.79
18 Kendujhar 500.66 6.96 507.61 17462.36 -920.61 106 127.05
19 Khordha 136.45 3.78 140.23 2955.8 21.78 99 17.95
20 Koraput 720.4 20.14 740.54 17462.17 87.29 100 302.76
21 Malkangiri 211.4 6.34 217.75 3881.85 789.07 83 39.1
22 Mayurbhanj 1195.96 53.06 1249.02 35804.85 666.13 98 179.5
23 Nabarangapur 358.44 3.09 361.52 9142.29 -333.44 104 270.04
24 Nayagarh 216.57 8.51 225.09 5644.95 166.65 97 120.37
25 Nuapada 148.57 1.34 149.91 5249.9 567.72 90 87.28
26 Puri 220.04 0.2 220.24 3932.09 60.43 98 73.24
27 Rayagada 269 2.42 271.42 10401.46 -386.99 104 460.12
28 Sambalpur 208.62 24.42 233.05 6640.46 210.75 97 86.66
29 Sonepur 154.02 2.85 156.87 3023.26 233.99 93 55.17
30 Sundargarh 626.27 15.8 642.08 15286.5 264.43 98 168.06
Total 10325.08 268.47 10593.56 251371.7 1950.34 99 3532.92
XXIII. POVERTY ALLEVIATION PROGRAMME
23.02 : Financial Performance under MGNREGS
during the financial year 2017-18 (Concld.)
( Rs. In Lakh)
Total Exp.
Adm. Exp
Source : Panchayat Raj Department,Odisha
Sl.
No.
Name
of the
District
Cumulative Expenditure
Balance
% of
Expen-
diture
Payment
due
(Pipe
Line
Exp.)
141

Items Unit 2016 2017 2018
1 2 3 4 5
1 Fire Stations No 23 23 23
2 Fire Call attended
a ) Serious No 2 1 1
b ) Major No 23 17 32
c ) Mediam & Small No 1912 1629 1621
d ) Falls No 19 11 9
Total No 1956 1658 1663
3 Resue Call attended
a ) In Fire Accident 584 723 778
b ) In Other Accident 445 506 577
Total No 1029 1229 1355
4 Lives losts
i ) In Fire Accident
a ) Human No 3 1 1
b ) Cattle No 77 6 20
ii ) In other Accident
a ) Human No 60 62 69
b ) Cattle No 13 20 15
5 Lives saved
i ) In Fire Accident
a ) Human No 21 10 40
b ) Cattle No 52 8 23
ii ) In other Accident
a ) Human No 849 816 1048
b ) Cattle No 392 406 436
6 Persons injured
a ) In Fire Accident No 2 17 12
b ) In Other Accident No 418 265 207
Total No 420 282 219
7Total Properties saved in
Fire and other AccidentRs.in lakh 2141.565 2034.7 2107.33
8Total Properties lost in
Fire and other AccidentRs.in lakh 502.361 452.81 1116.52
XXIV - DISASTER STATISTICS
24.01 Fire Stations, Incidence of Fire Accidents, Loss of lives
and Properties etc. in Ganjam district
Source : Fire officer, Odisha,
142
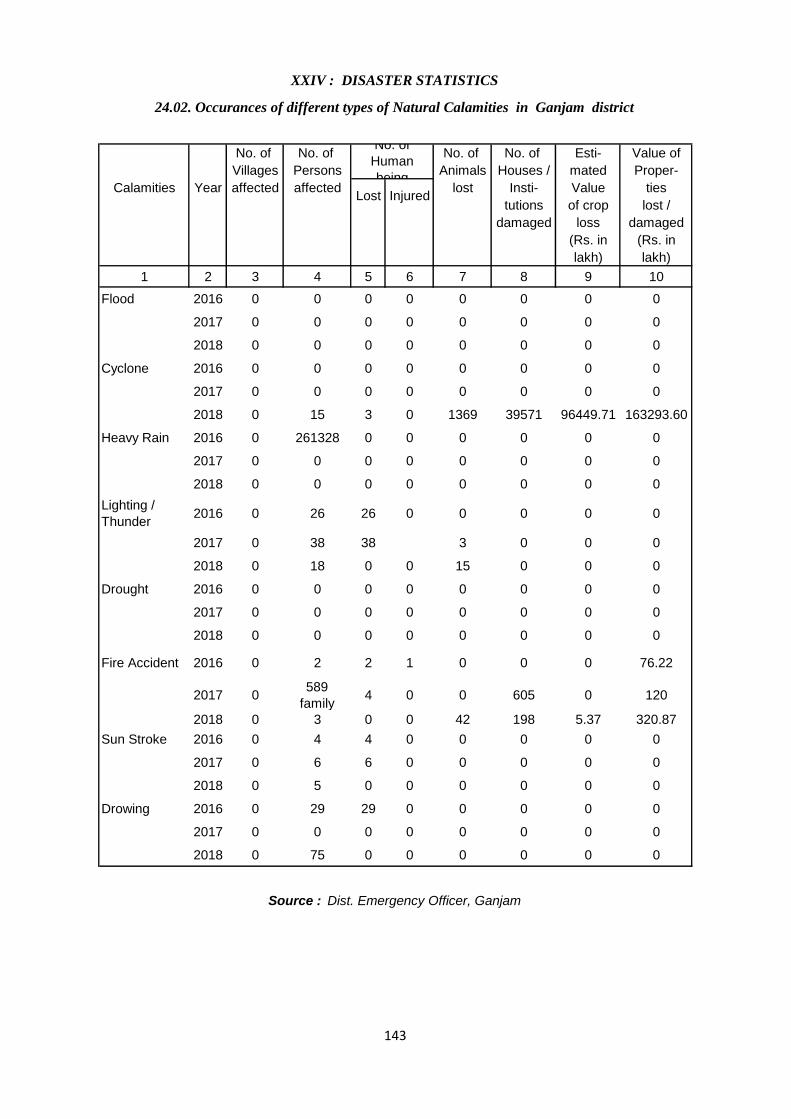
No. of No. of No. of No. of Esti- Value of
Villages Persons Animals Houses / mated Proper-
Calamities Year affected affected lost Insti- Value ties
tutions of crop lost /
damaged loss damaged
(Rs. in (Rs. in
lakh) lakh)
1 2 3 4 5 6 7 8 9 10
Flood 2016 0 0 0 0 0 0 0 0
2017 0 0 0 0 0 0 0 0
2018 0 0 0 0 0 0 0 0
Cyclone 2016 0 0 0 0 0 0 0 0
2017 0 0 0 0 0 0 0 0
2018 0 15 3 0 1369 39571 96449.71 163293.60
Heavy Rain 2016 0 261328 0 0 0 0 0 0
2017 0 0 0 0 0 0 0 0
2018 0 0 0 0 0 0 0 0
Lighting /
Thunder2016 0 26 26 0 0 0 0 0
2017 0 38 38 3 0 0 0
2018 0 18 0 0 15 0 0 0
Drought 2016 0 0 0 0 0 0 0 0
2017 0 0 0 0 0 0 0 0
2018 0 0 0 0 0 0 0 0
Fire Accident 2016 0 2 2 1 0 0 0 76.22
2017 0589
family4 0 0 605 0 120
2018 0 3 0 0 42 198 5.37 320.87
Sun Stroke 2016 0 4 4 0 0 0 0 0
2017 0 6 6 0 0 0 0 0
2018 0 5 0 0 0 0 0 0
Drowing 2016 0 29 29 0 0 0 0 0
2017 0 0 0 0 0 0 0 0
2018 0 75 0 0 0 0 0 0
Source : Dist. Emergency Officer, Ganjam
XXIV : DISASTER STATISTICS
24.02. Occurances of different types of Natural Calamities in Ganjam district
No. of
Human
being
Lost Injured
143
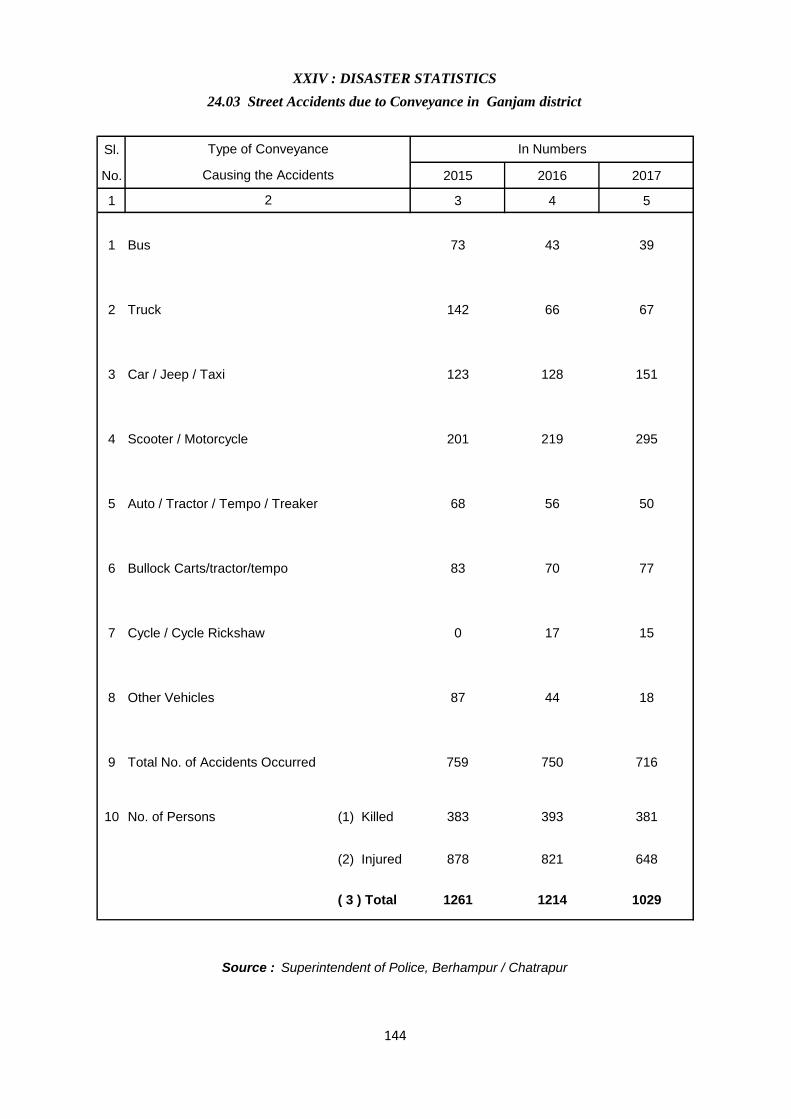
Sl.
No. 2015 2016 2017
1 3 4 5
1 Bus 73 43 39
2 Truck 142 66 67
3 Car / Jeep / Taxi 123 128 151
4 Scooter / Motorcycle 201 219 295
5 Auto / Tractor / Tempo / Treaker 68 56 50
6 Bullock Carts/tractor/tempo 83 70 77
7 Cycle / Cycle Rickshaw 0 17 15
8 Other Vehicles 87 44 18
9 Total No. of Accidents Occurred 759 750 716
10 No. of Persons (1) Killed 383 393 381
(2) Injured 878 821 648
( 3 ) Total 1261 1214 1029
Source : Superintendent of Police, Berhampur / Chatrapur
XXIV : DISASTER STATISTICS
24.03 Street Accidents due to Conveyance in Ganjam district
Type of Conveyance
Causing the Accidents
2
In Numbers
144

Sl.
No.
Hazards
Districts
Wind &
CycloneFlood Drought Earthquake Accidents
1 2 3 4 5 6 7
1 Angul 3 2 2 1,2 1
2 Balasore 1 1 3 1,2 1
3 Bargarh 3 1,2 1 1,2,3 1
4 Bhadrak 1 1 3 2 1
5 Bolangir 3 2 1 3 2
6 Boudh 3 2 3 2,3 2
7 Cuttack 1,2 1,2 2 1,2 1
8 Deogarh 3 2 1 1,2 2
9 Dhenkanal 1,3 2 2 1,2 1
10 Gajapati 1,2 2 3 2,3 1
11 Ganjam 1,2 1,2 3 2,3 1
12 Jagatsinghpur 1 1,2 3 1 2
13 Jajpur 1 1,2 2 1,2 2
14 Jharsuguda 4 2 1 1,2 1
15 Kalahandi 3,4 2 1 3 2
16 Kandhamal 4 2 3 3 2
17 Kendrapara 1 1,2 3 1 2
18 Keonjhar 1,2,3 2 2 2,3 1
19 Khurda 1 2 3 1,2 1
20 Koraput 2,4 1,2 2 3 2
21 Malkangiri 2,4 1,2 2 3 2
22 Mayurbhanj 1,2 2 3 1,2,3 2
23 Nabarangpur 4 2 1 3 2
24 Nayagarh 2 2 3 2,3 1
25 Nuapara 3 2 1 3 2
26 Puri 1 1,2 3 1 1
27 Rayagada 2,4 2 2 3 2
28 Sambalpur 3,4 1,2 1 1,2 1
29 Subarnapur 3 2 1 1,2 2
30 Sundargarh 3,4 2 1 1,2 1
EARTHQUAKE : 1=Moderate Damage Zone , 2=Less Damage Zone , 3=Very low Damage Zone
ACCIDENTS : 1=Major Accident Prone Areas , 2=Minor Accident Prone Areas ,
Source : Odisha Climate Change Action Plan Cell , OSDMA
XXIV- DISASTER STATISTICS
24.04 : Districtwise Climate Sensitivity of Odisha
WIND & CYCLONE : 1 = Very High risk Zone , 2= High Risk Zone , 3= Moderate Risk Zone ,
4 = Slight Zone
FLOOD : 1=Liable to get flooded , 2 = Protected areas ,
DROUGHT : 1=Very High risk Zone , 2= High Risk Zone , 3= Moderate Risk Zone , 4= Slight Zone
145
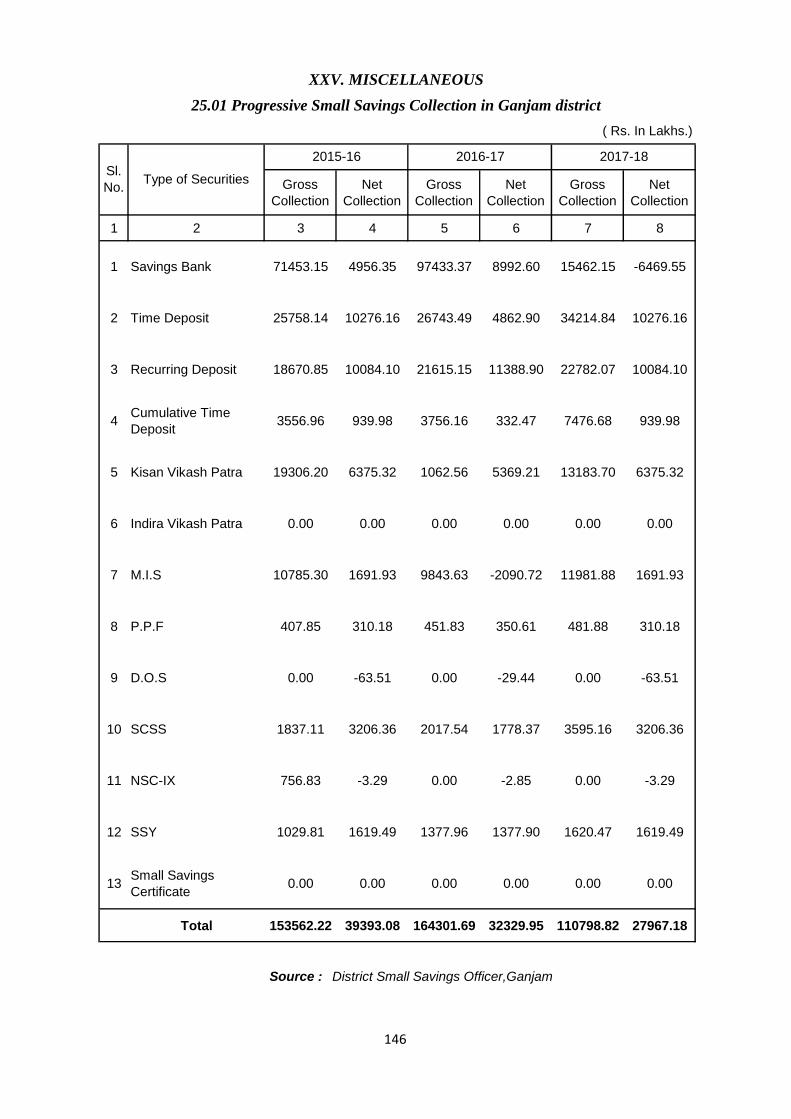
Gross
Collection
Net
Collection
Gross
Collection
Net
Collection
Gross
Collection
Net
Collection
1 2 3 4 5 6 7 8
1 Savings Bank 71453.15 4956.35 97433.37 8992.60 15462.15 -6469.55
2 Time Deposit 25758.14 10276.16 26743.49 4862.90 34214.84 10276.16
3 Recurring Deposit 18670.85 10084.10 21615.15 11388.90 22782.07 10084.10
4Cumulative Time
Deposit3556.96 939.98 3756.16 332.47 7476.68 939.98
5 Kisan Vikash Patra 19306.20 6375.32 1062.56 5369.21 13183.70 6375.32
6 Indira Vikash Patra 0.00 0.00 0.00 0.00 0.00 0.00
7 M.I.S 10785.30 1691.93 9843.63 -2090.72 11981.88 1691.93
8 P.P.F 407.85 310.18 451.83 350.61 481.88 310.18
9 D.O.S 0.00 -63.51 0.00 -29.44 0.00 -63.51
10 SCSS 1837.11 3206.36 2017.54 1778.37 3595.16 3206.36
11 NSC-IX 756.83 -3.29 0.00 -2.85 0.00 -3.29
12 SSY 1029.81 1619.49 1377.96 1377.90 1620.47 1619.49
13Small Savings
Certificate0.00 0.00 0.00 0.00 0.00 0.00
Total 153562.22 39393.08 164301.69 32329.95 110798.82 27967.18
Source : District Small Savings Officer,Ganjam
XXV. MISCELLANEOUS
25.01 Progressive Small Savings Collection in Ganjam district
( Rs. In Lakhs.)
Sl.
No.Type of Securities
2015-16 2016-17 2017-18
146
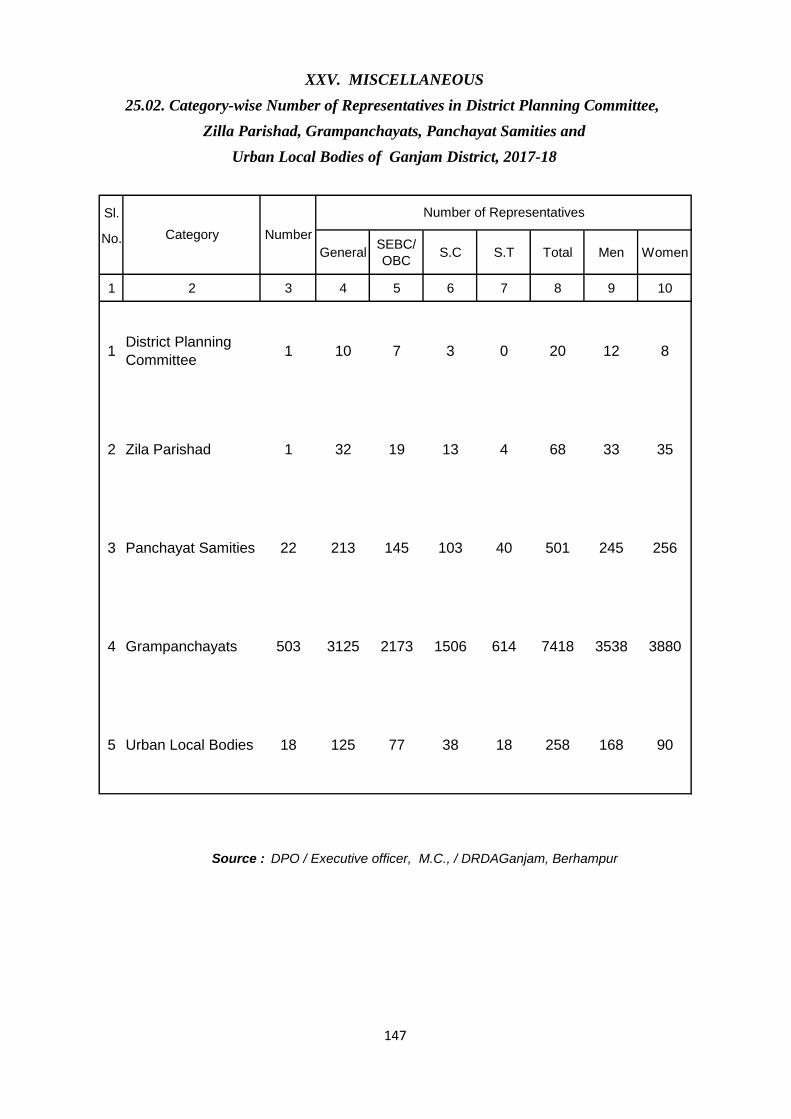
Sl.
No.General
SEBC/
OBCS.C S.T Total Men Women
1 2 3 4 5 6 7 8 9 10
1District Planning
Committee1 10 7 3 0 20 12 8
2 Zila Parishad 1 32 19 13 4 68 33 35
3 Panchayat Samities 22 213 145 103 40 501 245 256
4 Grampanchayats 503 3125 2173 1506 614 7418 3538 3880
5 Urban Local Bodies 18 125 77 38 18 258 168 90
Source : DPO / Executive officer, M.C., / DRDAGanjam, Berhampur
XXV. MISCELLANEOUS
25.02. Category-wise Number of Representatives in District Planning Committee,
Zilla Parishad, Grampanchayats, Panchayat Samities and
Urban Local Bodies of Ganjam District, 2017-18
Category Number
Number of Representatives
147
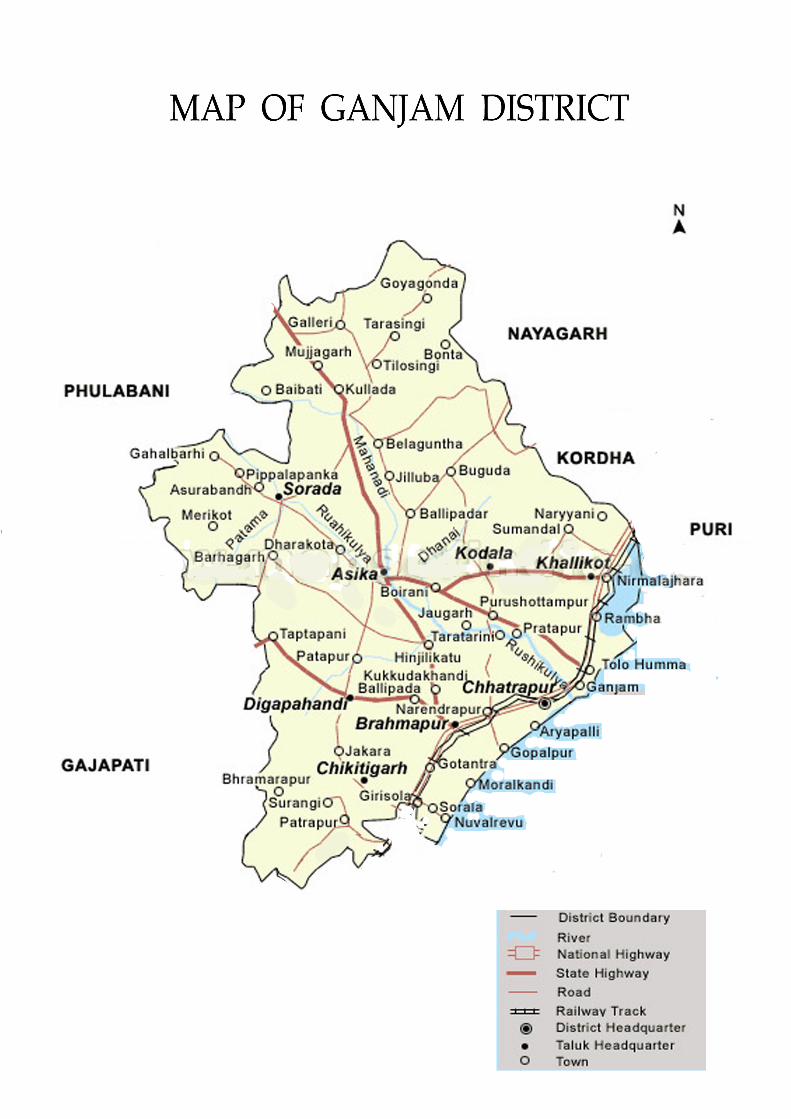
For Improvement and Suggestion Contact
Sri S. Sahoo, ISS
Director,
Economics and Statistics, Odisha
Arthaniti ‘O’ Parisankhyan Bhawan
Heads of Department Building Campus
Bhubaneswar – 751001
Phone : 0674-2391295, FAX-0674-2391897
Mob : 9868214276
Email : [email protected] / [email protected]
Website : www.desorissa.nic.in
Processed at
Computer Centre, Directorate of Economics and Statistics,
Odisha, Bhubaneswar