voltage stabilizer (75 kva) - (ganjam rice mill cluster)
40
DETAILED PROJECT REPORT ON VOLTAGE STABILIZER (75 KVA) (GANJAM RICE MILL CLUSTER) Bureau of Energy Efficiency Prepared By Reviewed By
-
Upload
khangminh22 -
Category
Documents
-
view
2 -
download
0
Transcript of voltage stabilizer (75 kva) - (ganjam rice mill cluster)

DETAILED PROJECT REPORT
ON
VOLTAGE STABILIZER (75 KVA)
(GANJAM RICE MILL CLUSTER)
Bureau of Energy Efficiency
Prepared By
Reviewed By

VOLTAGE STABILIZERS FOR RICE MILL (75 KVA)
GANJAM RICE MILLS CLUSTER

BEE, 2010
Detailed Project Report on Voltage Stabilizer
Rice Mill SME Cluster, Ganjam, Orissa (India)
New Delhi: Bureau of Energy Efficiency;
Detail Project Report No.: Ganjam/Ricemills/PC/01
For more information
Bureau of Energy Efficiency (BEE)
(Ministry of Power, Government of India)
4th Floor, Sewa Bhawan
R. K. Puram, New Delhi – 110066
Telephone +91-11-26179699
Fax+91-11-26178352
Websites: www.bee-india.nic.in
Email: [email protected]/ [email protected]

Acknowledgement
We are sincerely thankful to the Bureau of Energy Efficiency, Ministry of Power, for giving
us the opportunity to implement the BEE SME project in “Ganjam Rice Cluster, Ganjam”.
We express our sincere gratitude to all concerned officials for their support and guidance
during the conduct of this exercise.
Dr. Ajay Mathur, Director General, BEE
Smt. Abha Shukla, Secretary, BEE
Shri Jitendra Sood, Energy Economist, BEE
Shri Pawan Kumar Tiwari, Advisor (SME), BEE
Shri Rajeev Yadav, Project Economist, BEE
Zenith Energy Services Pvt. Ltd. (ZESPL) is also thankful to Shri Purna Chandra Sahu,
President, Shri Santhosh Kumar Sahu, Secretary, Ganjam District Rice Mill Owners
Association, Berhampur and to Shri Bibudatta Panigrahi, M/s Aanjeneya Modern Rice Mill
for their valuable inputs, co-operation, support and identification of the units for energy use
and technology audit studies and facilitating the implementation of BEE SME program in
Ganjam Rice Cluster.
We take this opportunity to express our appreciation for the excellent support provided by
Rice Unit Owners, Local Service Providers, and Equipment Suppliers for their active
involvement and their valuable inputs in making the program successful and in completion
of the Detailed Project Report (DPR).
ZESPL is also thankful to all the SME owners, plant in charges and all workers of the SME
units for their support during the energy use and technology audit studies and in
implementation of the project objectives.
Zenith Energy Services Private Ltd.
Hyderabad

Contents
List of Annexure vii
List of Tables vii
List of Figures viii
List of Abbreviation viii
Executive summary ix
About BEE’S SME program xi
1 INTRODUCTION ........................................................................................................1
1.1 Brief Introduction about cluster ...................................................................................1
1.1.1 Production process .....................................................................................................1
1.2 Energy performance in existing situation ....................................................................4
1.2.1 Electricity consumption of a typical unit in the cluster ..................................................4
1.2.2 Average production by a typical unit in the cluster ......................................................4
1.2.3 Specific Energy Consumption .....................................................................................4
1.3 Existing technology/equipment ...................................................................................4
1.3.1 Description of existing technology ...............................................................................4
1.4 Establishing the baseline for the equipment to be changed ........................................5
1.4.1 Electricity consumption ...............................................................................................5
1.4.2 Operating efficiency of the existing system .................................................................5
1.5 Barriers for adoption of new and energy efficient technology / equipment ...................6
1.5.1 Technological Barriers ................................................................................................6
1.5.2 Financial Barrier ..........................................................................................................6
1.5.3 Skilled manpower .......................................................................................................6
1.5.4 Other barrier(s) ...........................................................................................................6
2. EQUIPMENT OPTION FOR ENERGY EFFICIENCY IMPROVEMENT ......................7
2.1 Detailed description of technology/equipment selected ...............................................7
2.1.1 Description of technology ............................................................................................7

2.1.2 Technology /Equipment specifications ........................................................................7
2.1.3 Justification of the technology selected & its suitability................................................8
2.1.4 Superiority over existing technology/equipment ..........................................................8
2.1.5 Availability of the proposed technology/equipment ......................................................8
2.1.6 Source of technology/equipment for the project ............................................................8
2.1.7 Service/technology providers ......................................................................................9
2.1.8 Terms of sales of the suppliers, etc. ............................................................................9
2.1.9 Process down time during implementation ..................................................................9
2.2 Life cycle assessment and risks analysis ....................................................................9
2.3 Suitable unit/plant size the identified equipment..........................................................9
3. ECONOMIC BENEFITS OF NEW ENERGY EFFICIENT TECHNOLOGY ............... 10
3.1 Technical benefits ..................................................................................................... 10
3.1.1 Fuel Saving ............................................................................................................... 10
3.1.2 Electricity savings ..................................................................................................... 10
3.1.2 Improvement in product quality ................................................................................. 10
3.1.3 Increase in production............................................................................................... 10
3.1.4 Reduction in raw material consumption .................................................................... 10
3.1.5 Reduction in other losses .......................................................................................... 10
3.2 Monetary benefits ..................................................................................................... 10
3.3 Social benefits .......................................................................................................... 10
3.3.1 Improvement in working environment in the plant ..................................................... 10
3.3.2 Improvement in skill set of workers ........................................................................... 11
3.4 Environmental benefits ............................................................................................. 11
3.4.1 Reduction in effluent generation ............................................................................... 11
3.4.2 Reduction in GHG emission such as CO2, NOx, etc ................................................. 11
3.4.3 Reduction in other emissions like SOx ...................................................................... 11

4. INSTALLATION OF NEW ENERGY EFFICIENT EQUIPMENT ............................... 12
4.1 Cost of equipment implementation ............................................................................ 12
4.1.1 Cost of equipments ................................................................................................... 12
4.1.2 Other costs ............................................................................................................... 12
4.2 Arrangement of funds ............................................................................................... 12
4.2.1 Entrepreneur’s contribution ....................................................................................... 12
4.2.2 Loan amount ............................................................................................................. 12
4.2.3 Terms & conditions of loan ....................................................................................... 12
4.3 Financial indicators ................................................................................................... 12
4.3.1 Cash flow analysis .................................................................................................... 12
4.3.2 Simple payback period .............................................................................................. 13
4.3.3 Net Present Value (NPV) .......................................................................................... 13
4.3.4 Internal rate of return (IRR) ....................................................................................... 13
4.3.5 Return on investment (ROI) ...................................................................................... 13
4.4 Sensitivity analysis in realistic, pessimistic and optimistic scenarios ......................... 13
4.5 Procurement and implementation schedule .............................................................. 13

vii
List of Annexure
Annexure 1: Energy audit and base line establishment .......................................................... 14
Annexure 2: Process flow diagram ......................................................................................... 15
Annexure 3: Detail technical assessment report ..................................................................... 16
Annexure 4 Technical design ................................................................................................. 17
Annexure 5: Detailed Financial Calculations & Analysis ......................................................... 18
Annexure 7: Details of technology/equipment and service providers ...................................... 23
Annexure 8: Quotations or Techno-Commercial Bids ............................................................. 24
List of Table
Table 1.1: Energy consumption of a typical unit (M/s Sri Ganesh Rice Mill) .............................. 4
Table 1.2: Specific energy consumption for a typical unit (M/s Sri Ganesh Rice Mill) ................ 4
Table 1.3: Electricity consumption in three different units .......................................................... 5
Table 2.1: Proposed voltage stabilizer specifications................................................................. 7
Table 4.1: Project cost ............................................................................................................. 12
Table 4.2: Sensitivity analysis ................................................................................................. 13

viii
List of Figures
Figure 1: General Process Flowchart of a Typical Rice Mill Unit ………………….…….…3
Lists of Abbreviations
BEE - Bureau of Energy Efficiency
DPR - Detailed Project Report
DSCR - Debt Service Coverage Ratio
GHG - Green House Gases
HP - Horse Power
IRR - Internal Rate of Return
MSME - Micro Small and Medium Enterprises
MoP - Ministry of Power
MoMSME - Ministry of Micro Small and Medium Enterprises
NPV - Net Present Value
ROI - Return On Investment
SIDBI - Small Industrial Development Bank of India
TPH - Ton Per Hour

ix
EXECUTIVE SUMMARY
Zenith Energy Services Pvt. Ltd is executing BEE-SME program in Ganjam Rice Mills
Cluster, supported by Bureau of Energy Efficiency (BEE) with an overall objective of
improving the energy efficiency in cluster units.
Paddy is one of the major crops cultivated in the eastern states especially in the state of
Orissa. The Rice comes out of milling of paddy. Hence rice milling is an important activity
in the state. There are about 250 rice mills in Ganjam rice mills cluster covering
Berhampur, Hinjilicut, Bhanjanagar, and Ganjam areas. The major Energy forms used in
the cluster is electricity. Electricity is used for driving the prime movers of elevators,
Chaluni, separator, paddy cleaners, Rubber Sheller, and whiteners/cones, drives and for
lighting. The cost of energy as a percentage of end product cost (Rice) cost varies
anywhere between of 1% to 1.5%.
Based on detailed energy audits conducted in various units of the cluster, the voltage
supply is measured to be only 297 volts to 350 volts. About 30% of the units are facing
acute low voltage problem due to overloading of electricity board distribution transformers.
Due to low voltage, the current drawn by the motors is high due to low voltage and the
windings are overheated and the frequent failure of the motors is evidenced. Further, due
to low voltage the power consumption of the motors is high.
Voltage stabilizers are an effective solution to voltage fluctuation problems. They are
designed to current a wide range of Input Fluctuations to maintain specified output voltage.
Installation of proposed technology i.e. voltage stabilizer of 75 KVA capacity would lead to
save about 9503 kWh of electricity per year.
The DPR highlights the details of the study conducted for assessing the potential for
installation of voltage stabilizer in various unit of cluster, possible electricity savings and its
monetary benefit, availability of the technologies/design, local service providers, technical
features and proposed equipment specifications, various barriers in implementation,
environmental aspects, estimated GHG reductions, capital cost, financial analysis, and
schedule of Project Implementation.
This bankable DPR also found eligible for subsidy scheme of MoMSME for “Technology
and Quality Upgradation Support to Micro, Small and Medium Enterprises” under “National
Manufacturing and Competitiveness Programme”. The key indicators of the DPR including
the Project cost, debt equity ratio, monetary benefit and other necessary parameters are
given in table:

x
S.No Particular Unit Value
1 Project cost ` (In lakh) 1.05
2 Electricity saving kWh/annum 9503
3 Monetary benefit ` (In lakh) 0.40
4 Debit equity ratio Ratio 3:1
5 Simple payback period Years 2.63
6 NPV ` (In lakh) 0.40
7 IRR %age 20.79
8 ROI %age 24.68
9 DSCR Ratio 1.51
10 Process down time Days 2
11 CO2 reduction Ton /year 7
The projected profitability and cash flow statements indicate that the proposed
project implementation in the cluster units will be financially viable and technically
feasible solution for the cluster.

xi
ABOUT BEE’S SME PROGRAM
Bureau of Energy Efficiency (BEE) is implementing a BEE-SME Programme to improve
the energy performance in 29 selected SMEs clusters. Ganjam Rice Mills Cluster is one of
them. The BEE’s SME Programme intends to enhance the energy efficiency awareness by
funding/subsidizing need based studies in SME clusters and giving energy conservation
recommendations. For addressing the specific problems of these SMEs and enhancing
energy efficiency in the clusters, BEE will be focusing on energy efficiency, energy
conservation and technology up-gradation through studies and pilot projects in these
SMEs clusters.
Major activities in the BEE -SME program are furnished below:
Activity 1: Energy use and technology audit
The energy use technology studies would provide information on technology status, best
operating practices, gaps in skills and knowledge on energy conservation opportunities,
energy saving potential and new energy efficient technologies, etc for each of the sub
sector in SMEs.
Activity 2: Capacity building of stake holders in cluster on energy efficiency
In most of the cases SME entrepreneurs are dependent on the locally available
technologies, service providers for various reasons. To address this issue BEE has also
undertaken capacity building of local service providers and entrepreneurs/ Managers of
SMEs on energy efficiency improvement in their units as well as clusters. The local service
providers will be trained in order to be able to provide the local services in setting up of
energy efficiency projects in the clusters
Activity 3: Implementation of energy efficiency measures
To implement the technology up-gradation project in the clusters, BEE has proposed to
prepare the technology based detailed project reports (DPRs) for a minimum of five
technologies in three capacities for each technology.
Activity 4: Facilitation of innovative financing mechanisms for implementation of
energy efficiency projects
The objective of this activity is to facilitate the uptake of energy efficiency measures
through innovative financing mechanisms without creating market distortion

Voltage Stabilizer 75 KVA
1
1 INTRODUCTION
1.1 Brief Introduction about cluster
Paddy is one of the major crops cultivated in the eastern states especially in the state of
Orissa. The Rice comes out of milling of paddy. Hence rice milling is an important activity
in the state. There are about 250 rice mills in Ganjam rice mills cluster covering
Berhampur, Hinjilicut, Bhanjanagar, and Ganjam areas. The major Energy forms used in
the cluster is grid electricity. Electricity is used for driving the prime movers of elevators,
Chaluni, separator, paddy cleaners, Rubber Sheller, and whiteners/cones, drives and for
lighting. The cost of energy as a percentage of end product cost (Rice) cost varies
anywhere between 1% and 1.5%.
1.1.1 Production process
Pre-Cleaner/ Paddy Cleaner
Paddy cleaner is a most essential equipment in a rice mill and separates all the impurities
like dust, straw, sand, clay and heavy particles of even and uneven sizes from paddy
before the paddy is processed. The clean paddy sent to the rubber roll sheller to process
further. The advantages with the paddy cleaner are it increases the life of rubber rollers
and the percentage of oil in bran.
The function of the dust blower is to remove the dust from paddy through the pipeline
connected to the paddy cleaner. This equipment is recommended for installation in
conventional rice mills, also to get the same advantages as of modern rice mills. If this are
not removed prior to shelling the efficiency of the rubber Sheller and the milling recovery is
reduced.
The pre-cleaners separate three groups of materials:
The first separation is done by scalping or removing the objects that are larger than
the grain. Either a flat oscillating screen or a rotary drum screen that allows the
grain to pass through but retains straw.
The second separation retains the grains but allows broken grains, small stones
and weed seeds to pass through. Aspirator is installed to remove the dust and light
empty grains

Voltage Stabilizer 75 KVA
2
Rubber Sheller
The objective of a hulling/de husking operation is to remove the husk from the paddy grain
with a minimum of damage to the bran layer and, if possible, without breaking the brown
rice grain. Since, the structure of the paddy grain makes it necessary to apply friction to
the grain surface to remove the husk; it leads to breaking of some of the rice.
The paddy is fed into the center of the machine through a small hopper. A vertically
adjustable cylindrical sleeve regulates the capacity and equal distribution of the paddy
over the entire surface of the rotating disc, paddy is forced between the two discs ( rubber
Sheller)and as a result of pressure and friction most of the paddy is de husked (hulled),
where husk and brown rice are separated.
Separator
The output from the huller is a mixture of brown rice, husk, broken paddy etc. The huller
aspirator removes the lighter material such as husk, bran and very small broken rice. The
remainder passes onto the paddy separator where the unshelled paddy rice is separated
from the brown rice. The amount of paddy present depends on the efficiency of the
husker, and normally less than 10%. Paddy separators work by making use of the
differences in specific gravity, buoyancy, and size between paddy and brown rice. Paddy
rice has a lower specific gravity, higher buoyancy, and is physically bigger, longer and
wider than brown rice
The compartment type of paddy separator uses the difference in specific gravity and the
buoyancy to separate paddy and brown rice. When paddy and brown rice move over an
inclined plane, they move at different speeds depending on their specific gravity, their
shape and contact area, smoothness of inclined surface and the co-efficient of sliding
friction. Brown grains are smaller, heavier, rounder, and smoother and will slide faster than
paddy grains. The processing capacity of the compartment separator is dependent on the
compartment area. For a 1.5 ton/hr capacity rice mill, a 45-compartment separator made
up of 15 compartments on each of three decks is used.
Whitening and Polishing
In the process of whitening, the skin and bran layer of the brown rice are removed. During
polishing of the whitened rice, the bran particles still sticking to the surface of the rice are
removed and the surface of the rice is slightly polished to give it a glazed appearance. For
further whitening if required as per the market demand or for export market, the polished
rice is further processed in the silky machine for additional polishing.

Voltage Stabilizer 75 KVA
3
Electricity Rubber Sheller
Separator
Whiteners/Cones
Paddy Cleaner
Paddy
Pre Cleaner
Rice Grader
Packing
Rice grader
After polishing, the white rice is separated into head rice and, large and small broken rice
by a sifter. Head rice is normally classified as kernels, which are 75-80% or more of a
whole kernel. The sifter is made up of a series of oscillating or cylindrical screens through
which the rice passes. The output from the bottom screen is the very fine broken tips and
is called the “brewers”.
Elevators
The elevator used at different stages of rice milling for transferring paddy, brown rice and
white rice during the milling process
Figure 1.1: General Process Flowchart of a rice mill is furnished below.

Voltage Stabilizer 75 KVA
4
1.2 Energy performance in existing situation
1.2.1 Electricity consumption of a typical unit in the cluster
The main source of energy for a typical rice milling unit in the cluster is electricity and is
used for driving the prime movers of common drive shaft motor and in individual drive
system like elevators, Chaluni, separator, paddy cleaners, Rubber Sheller, and
whiteners/cones, drives and for lighting. The energy consumption of a typical rice
production unit in the cluster is furnished in Table 1.1 below:
Table 1.1: Energy consumption of a typical unit (M/s Sri Ganesh Rice Mill)
S.No. Details Unit Value
1 Electricity Consumption MWh/annum 95
2 Production (Rice) tonne/annum 6720
1.2.2 Average production by a typical unit in the cluster
The average production in a year in a typical rice production unit is 6720 tonne per annum.
1.2.3 Specific Energy Consumption
The major source of energy for paddy processing is electricity and the specific electricity
consumption per ton of processing for a typical unit of having 2.0 TPH capacity is
furnished in Table 1.2 below:
Table 1.2: Specific energy consumption for a typical unit (M/s Sri Ganesh Rice Mill)
1.3 Existing technology/equipment
1.3.1 Description of existing technology
The main energy source for the cluster rice mill units is electricity. The electricity is
supplied the state electricity board through common distribution transformers. Based on
detailed energy audits conducted in various units of the cluster, the voltage supply is
measured to be only 297 volts to 350 volts. About 30% of the units are facing acute low
S. No. Type of energy Units Specific Energy Consumption
1 Electricity kWh/ton of production 14.1

Voltage Stabilizer 75 KVA
5
voltage problem due to overloading of electricity board distribution transformers. Due to
low voltage, the current drawn by the motors is high due to low voltage and the windings
are overheated and the frequent failure of the motors is evidenced. Further, due to low
voltage the power consumption of the motors is high.
As the connected load of these rice mills is low, the power is supplied through common
distribution transformers and the distribution transformers installed by electricity board is of
lower capacity than the demand and hence the transformers are overloaded leading to low
voltage supply.
1.4 Establishing the baseline for the equipment to be changed
1.4.1 Electricity consumption
The electricity consumption of typical units having 2/1.5 TPH paddy processing capacity
where low voltage problem is furnished below in Table 1.3 below:
Table 1.3: Electricity consumption in three different units
S. No Name of the unit
Production capacity
(TPH)
No of (hours/
day)
No of (days
/annum)
Average electricity
consumption (kWh/months)
Actual Power consumption (kWh/annum)
1 M/s Sri Ganesh Rice Mill 2 14 340 7916 95,000
2 M/s Ganesh Rice Mill
1.5 10 220 2750 33,000
1.4.2 Operating efficiency of the existing system
The detailed energy audits studies had been undertaken in various units of the cluster to
evaluate quality of power supply in cluster units. Based on the studies undertaken, the
units are facing low voltage problem due to overloading of electricity board distribution
transformer. The voltage supply in the cluster is poor and is varying anywhere between
270 to 350 volts against requirement of 415 Volts plus 10% variation. Due to low voltage,
the current drawn by the motors is increased and hence I2R losses increases (no load and
load losses). Further, due to over drawl of current, the motor windings gets heated up and
frequent burning of the motors is common and hence drops in efficiency.

Voltage Stabilizer 75 KVA
6
The production loss is also evident due to frequent failures of the motors and due to
voltage supply, only partial equipments are operated leading to low loading of the motors
hence drop in efficiency.
The above are the factors of lowering of the efficiency of the systems and hence more
power consumption.
1.5 Barriers for adoption of new and energy efficient technology / equipment
1.5.1 Technological Barriers
The major technical barriers that prevented the implementation of the new voltage
stabilizer in the cluster are:
The major technical barrier that prevented the implementation of the voltage
stabilizers/transformers in the cluster is due Lack of technical knowledge and its
losses and lack of technical manpower
Lack of technical knowledge and its losses
1.5.2 Financial Barrier
The installation of voltage stabilizers requires high initial investment. Hence, many
of the owners don’t show interest for implementation and operating the equipments
even at low voltage.
Lack of financial strength of the rice mill owners to invest for the technologies
Further, the lack of awareness of the monetary losses due to the absence of
voltage stabilizers is also one of the major factors for implementing the technology
Energy Efficiency Financing Schemes such as SIDBI’s, if focused on the cluster, will play
a catalytic role in implementation of identified energy conservation projects & technologies.
The cluster has significant potential for implementing voltage stabilizer in the cluster
1.5.3 Skilled manpower
Not applicable
1.5.4 Other barrier(s)
Information on the energy efficient technologies is not available among cluster unit
owners.

Voltage Stabilizer 75 KVA
7
2. EQUIPMENT OPTION FOR ENERGY EFFICIENCY IMPROVEMENT
2.1 Detailed description of technology/equipment selected
2.1.1 Description of technology
The project activity is installation of voltage stabilizers and Stabilizer is the Automatic
Voltage regulator. It regulates the output power. It produces the output 230 V ± 1%
(Variable 5%) or 415 ± 1% (Variable 5%) or as per customer demand for the appliances.
Voltage stabilizers are an effective solution to voltage fluctuation problems. They are
designed to current a wide range of Input Fluctuations to maintain specified output voltage.
The output voltage waveform is completely distortion free and the regulation is unaffected
by the load power factor.
Voltage stabilizer should have the high voltage protection. If the Input is going beyond the
limit and Output is going beyond the limit in worst cases. The stabilizer should sense Input
and Output condition and cutoff the output supply of the stabilizer. So In this way stabilizer
protects the connected appliances.
2.1.2 Technology /Equipment specifications
The detailed specifications of voltage stabilizer of 75 kVA are furnished in Table 2.1 below:
Table 2.1: Proposed voltage stabilizer specifications
S. No. Parameter Details
1 Input 340 V to 480 V AC OR As per customer demand
2 Output 415 ± 1% (Variable 5%) OR As per customer demand
3 Capacity Upto 100 KVA
4 Regulation Better than ± 1%
5 Winding Copper wound
6 Duty cycle Continuous
7 Frequency 47 – 53 Hz
8 Waveform distortion Nil
9 Power factor Nil
10 Ambient 0 to 45° C Max

Voltage Stabilizer 75 KVA
8
S. No. Parameter Details
11 Environment Designed for indoor tropical use
12 Mounting Free on wheel
Further detail technical specification is given at Annexure 7.
2.1.3 Justification of the technology selected & its suitability
As discussed in previous sections, about 30% of the units are facing low voltage problem
due to overloading of electricity board distribution transformers. Due to low voltage,
frequent failures, the frequent failure of motors is very common in the units, further the
current drawn by the motors is high due to low voltage and power consumption also
increases.
Voltage stabilizers are an effective solution to voltage fluctuation problems and will reduce
motor failures and also optimize power consumption. They are designed to current a wide
range of Input Fluctuations to maintain specified output voltage. The output voltage
waveform is completely distortion free and the regulation is unaffected by the load power
factor.
Based on facts, the installation of voltage supply for the cluster units is a viable option for
reducing motors burnt and also reducing power consumption
2.1.4 Superiority over existing technology/equipment
The following are the superior features of voltage stabilizers.
Power saving
Improves life of the equipment
Reduces frequent burning of the motors
Uses isolation shielding to suppress the harmonics to give quality power
Reduces maintenance cost
2.1.5 Availability of the proposed technology/equipment
The voltage stabilizers suppliers are available at Bhubaneshwar, Vishakhapatnam and
Vijaywada. The details of the suppliers are provided in Annexure 6.
2.1.6 Source of technology/equipment for the project
The source of the technology is indigenous and is locally available.

Voltage Stabilizer 75 KVA
9
2.1.7 Service/technology providers
Details of service providers had been furnished in Annexure 5.
2.1.8 Terms of sales of the suppliers, etc.
The terms and conditions of the equipment supplier for supply of the voltage stabilizer are
given at annexure 7.
2.1.9 Process down time during implementation
The process down time for installation of voltage stabilizer is considered at two days for
installation of providing electrical connections to the panel and main feeder.
2.2 Life cycle assessment and risks analysis
The life of the voltage stabilizer is considered at 15 years. There is no risk involved in
installation of voltage stabilizers.
2.3 Suitable unit/plant size the identified equipment
Based on total connected load and actual operating at full load, the capacity of the voltage
stabilizer is suitable for unit having 2.0 TPH production capacity.
Voltage Stabilizer 75 KVA
10
3. ECONOMIC BENEFITS OF NEW ENERGY EFFICIENT TECHNOLOGY
3.1 Technical benefits
3.1.1 Fuel Saving
No fuel saving is envisaged due to proposed technology
3.1.2 Electricity savings
The installation of voltage stabilizer reduces the power consumption of the unit. The power
savings due to installation of project activity is estimated at 9,503 kWh per annum. Detail
of saving calculation is shown in Annexure 3.
3.1.2 Improvement in product quality
There will be no significant change in the product quality due to the installation of voltage
stabilizer.
3.1.3 Increase in production
The installation of voltage stabilizer increases the production capacity due to reduction in
frequent breakdowns of the machines due to voltage fluctuations and motor burnt and
hence there may improvement in production.
3.1.4 Reduction in raw material consumption
Not Applicable
3.1.5 Reduction in other losses
Not applicable.
3.2 Monetary benefits
The monetary benefit due to installation of voltage stabilizer is estimated at ` 0.40 lakh per
annum due to reduction in electricity consumption. Details of monetary saving are given in
Annexure3.
3.3 Social benefits
3.3.1 Improvement in working environment in the plant
As installation of voltage stabilizer will reduce frequent breakdowns and motor burnings
and hence working environment may improve.

Voltage Stabilizer 75 KVA
11
3.3.2 Improvement in skill set of workers
The technology selected for the implementation is new and energy efficient. The
technology implemented will create awareness among the workforce and improves skills
of the workers.
3.4 Environmental benefits
3.4.1 Reduction in effluent generation
Not applicable
3.4.2 Reduction in GHG emission such as CO2, NOx, etc
The major GHG emission reduction source is CO2. The technology will reduce grid
electricity consumption and emission reductions are estimated at 9 tons of CO2 per annum
due to implementation of the project activity.
3.4.3 Reduction in other emissions like SOx
No significant impact on SOx emissions.

Voltage Stabilizer 75 KVA
12
4. INSTALLATION OF NEW ENERGY EFFICIENT EQUIPMENT
4.1 Cost of equipment implementation
4.1.1 Cost of equipments
The total cost for voltage stabilizer is estimated ` 1.00 lakh (after discussion with
technology vendor and considering the discount) as per the quotation provided in
Annexure 8.
4.1.2 Other costs
Cost included in cabling modification and commissioning is ` 0.05 lakh. Detail of project
cost is furnished in Table 4.1 below:
Table 4.1: Project cost
S.No Particular Unit Value
1 Voltage stabilizer ` in lakh 1.00
2 Cabling, Shaft , Modifications, Commissioning etc ` in lakh 0.05
3 Total Investment ` in lakh 1.05
4.2 Arrangement of funds
4.2.1 Entrepreneur’s contribution
The entrepreneur’s contribution is 25% of total project cost, which works out at ` 0.26 lakh.
4.2.2 Loan amount
The term loan is 75% of the total project cost, which is ` 0.79 lakh.
4.2.3 Terms & conditions of loan
The interest rate is considered at 10.0% which is prevailing interest rate of SIDBI for
energy efficiency related projects. The loan tenure is 5 years and the moratorium period is
6 months.
4.3 Financial indicators
4.3.1 Cash flow analysis
Considering the above discussed assumptions, the net cash accruals starting with ` 0.24
lakh in the first year operation and increases to ` 1.00 lakh at the end of eighth year.

Voltage Stabilizer 75 KVA
13
4.3.2 Simple payback period
The total project cost of the proposed technology is ` 1.05 lakh and monetary savings due
to reduction in electricity consumption is ` 0.40 lakh and the simple payback period work
out to be 2.63 years.
4.3.3 Net Present Value (NPV)
The Net present value of the investment at 10.0% interest rate works out to be ` 0.40 lakh.
4.3.4 Internal rate of return (IRR)
The after tax Internal Rate of Return of the project works out to be 20.79%. Thus the
project is financially viable.
4.3.5 Return on investment (ROI)
The average return on investment of the project activity works out at 24.68%.
4.4 Sensitivity analysis in realistic, pessimistic and optimistic scenarios
A sensitivity analysis has been worked out to ascertain how the project financials would
behave in different situations like there is an increase in power savings or decrease. For
the purpose of sensitive analysis, two scenarios are considered are.
Increase in power savings by 5%
Decrease in power savings by 5%
In each scenario, other inputs are assumed as constant. The financial indicators in each of
the above situation are indicated along with standard indicators.
Table 4.2: Sensitivity analysis
Particulars IRR %
NPV ` in lakh
ROI %
DSCR
Normal 20.79 0.40 24.68 1.51
5% increase in power savings 22.75 0.47 25.01 1.58
5% decrease in power savings 18.78 0.32 24.30 1.43
4.5 Procurement and implementation schedule
The project is expected to be completed in 4 weeks from the date of release of purchase
order. The detailed schedule of project implementation is furnished in Annexure 6.

Voltage Stabilizer 75 KVA
14
Annexure 1: Energy audit and base line establishment
M/s Jagates hwara Rice Mill
S.No. Particulars Unit Value
1 Voltage measured Volts (V1) Volt 360
2 Current measured Amps (I 1) Amp 22.4
3 Resistance R Ohm 16.07
4 Power factor -- 0.67
5 power loss kW (P1) kW 8.06
6 New voltage (V2) Volt 415
7 New current Amps ( I 2) Amp 19.43
8 power loss kW (P2 kW 6.07
9 Net power losses reduced per hr (P) kWh 2.00
M/s Ganesh Rice Mill
S.No. Particulars Unit Value
1 Voltage measured Volts (V1) Volt 360
2 Current measured Amps (I 1) Amp 30.5
3 Resistance R Ohm 11.80
4 power loss kW (P1) kW 10.98
5 New voltage (V2) Volt 415
6 New current Amps ( I 2) Amp 26.46
6 power loss kW (P2 kW 8.26
7 Net power losses reduced per hr (P) kWh 2.72

Voltage Stabilizer 75 KVA
15
Electricity Rubber Sheller
Separator
Whiteners/Cones
Paddy Cleaner
Paddy
Pre Cleaner
Rice Grader
Packing
Annexure 2: Process flow diagram
Process flow diagram is same even after implementation of proposed technology.

Voltage Stabilizer 75 KVA
16
Annexure 3: Detail technical assessment report
S.No. Particulars Unit Value
1 Voltage measured Volts (V1) Volt 360
2 Current measured Amps (I 1) Amp 22.4
3 Resistance R Ohm 16.07
4 Power factor -- 0.67
5 Power loss kW (P1) kW 8.06
6 New improved voltage (V2) Volt 415
7 New current Amps ( I 2) Amp 19.43
8 power loss kW (P2) kW 6.07
9 Net power losses reduced per hr kWh 2.00
10 Total operating hours Hr 14
11 Total operating days days 340
12 Total power saving kWh 9503
13 Cost of electricity ` /kWh 4.2
14 Monetary savings per annum `(In lakh) 0.40
15 Investment required `(In lakh) 1.05
16 Payback period Years 2.63

Voltage Stabilizer 75 KVA
17
Annexure 4 Technical design

Voltage Stabilizer 75 KVA
18
Annexure 5: Detailed Financial Calculations & Analysis
Assumption
Name of the Technology VOLTAGE STABLIZER
Rated Capacity 75 KVA
Details Unit Value Basis
Installed Capacity KVA 75
No of working days Days 340
No of operating hours Hrs 14
Proposed Investment
Equipment cost ` (in lakh) 1.00
Cabling, Civil works and Modification ` (in lakh) 0.05
Total Investment ` (in lakh) 1.05
Financing pattern
Own Funds (Equity) ` (in lakh) 0.26
Loan Funds (Term Loan) ` (in lakh) 0.79
Loan Tenure years 5 Assumed
Moratorium Period Months 6 Assumed
Repayment Period Months 66 Assumed
Interest Rate %age 10.00% SIDBI Lending rate
Estimation of Costs
O & M Costs % on Plant & Equip 4.00 Feasibility Study
Annual Escalation %age 5.00 Feasibility Study
Estimation of Revenue
Power saving kWh/year 9503
Cost `/kWh 4.2
St. line Depn. %age 5.28 Indian Companies Act
IT Depreciation i.e. WDV %age 80.00 Income Tax Rules
Income Tax rate %age 33.99 Income Tax
Estimation of Interest on Term Loan ` (in lakh)
Years Opening Balance Repayment Closing Balance Interest
1 0.79 0.03 0.76 0.09
2 0.76 0.06 0.70 0.07
3 0.70 0.11 0.59 0.07
4 0.59 0.24 0.35 0.05
5 0.35 0.28 0.07 0.02
6 0.07 0.07 0.00 0.00
0.79

Voltage Stabilizer 75 KVA
19
WDV Depreciation ` (in lakh)
Particulars / years 1 2
Plant and Machinery
Cost 1.05 0.21
Depreciation 0.84 0.17
WDV 0.21 0.04
Projected Profitability ` (in lakh)
Particulars / Years 1 2 3 4 5 6 7 8
Fuel savings 0.40 0.40 0.40 0.40 0.40 0.40 0.40 0.40
Total Revenue (A) 0.40 0.40 0.40 0.40 0.40 0.40 0.40 0.40
Expenses
O & M Expenses 0.04 0.04 0.05 0.05 0.05 0.05 0.06 0.06
Total Expenses (B) 0.04 0.04 0.05 0.05 0.05 0.05 0.06 0.06
PBDIT (A)-(B) 0.36 0.35 0.35 0.35 0.35 0.35 0.34 0.34
Interest 0.09 0.07 0.07 0.05 0.02 0.00 - -
PBDT 0.27 0.28 0.29 0.30 0.32 0.34 0.34 0.34
Depreciation 0.06 0.06 0.06 0.06 0.06 0.06 0.06 0.06
PBT 0.21 0.23 0.23 0.25 0.27 0.29 0.29 0.28
Income tax - 0.04 0.10 0.10 0.11 0.12 0.12 0.12
Profit after tax (PAT) 0.21 0.19 0.13 0.14 0.16 0.17 0.17 0.17
Computation of Tax ` (in lakh)
Particulars / Years 1 2 3 4 5 6 7 8
Profit before tax 0.21 0.23 0.23 0.25 0.27 0.29 0.29 0.28
Add: Book depreciation 0.06 0.06 0.06 0.06 0.06 0.06 0.06 0.06
Less: WDV depreciation 0.84 0.17 - - - - - -
Taxable profit (0.57) 0.11 0.29 0.30 0.32 0.34 0.34 0.34
Income Tax - 0.04 0.10 0.10 0.11 0.12 0.12 0.12
Projected Balance Sheet ` (in lakh)
Particulars / Years 1 2 3 4 5 6 7 8
Liabilities
Share Capital (D) 0.26 0.26 0.26 0.26 0.26 0.26 0.26 0.26
Reserves & Surplus (E) 0.21 0.40 0.53 0.67 0.83 1.00 1.17 1.34
Term Loans (F) 0.76 0.70 0.59 0.35 0.07 0.00 0.00 0.00
Total Liabilities (D)+(E)+(F) 1.23 1.36 1.39 1.29 1.17 1.27 1.44 1.61
Assets 1 2 3 4 5 6 7 8
Gross Fixed Assets 1.05 1.05 1.05 1.05 1.05 1.05 1.05 1.05
Less Accm. Depreciation 0.06 0.11 0.17 0.22 0.28 0.33 0.39 0.44
Net Fixed Assets 0.99 0.94 0.88 0.83 0.77 0.72 0.66 0.61
Cash & Bank Balance 0.24 0.42 0.50 0.46 0.39 0.55 0.78 1.00
TOTAL ASSETS 1.23 1.36 1.39 1.29 1.17 1.27 1.44 1.61
Net Worth 0.47 0.66 0.79 0.94 1.10 1.27 1.44 1.61
Debt Equity Ratio 2.89 2.66 2.26 1.34 0.28 0.01 0.01 0.01

Voltage Stabilizer 75 KVA
20
Projected Cash Flow ` (In lakh)
Particulars / Years 0 1 2 3 4 5 6 7 8
Sources
Share Capital 0.26 - - - - - - - -
Term Loan 0.79
Profit After tax 0.21 0.19 0.13 0.14 0.16 0.17 0.17 0.17
Depreciation 0.06 0.06 0.06 0.06 0.06 0.06 0.06 0.06
Total Sources 1.05 0.27 0.24 0.19 0.20 0.21 0.23 0.23 0.22
Application
Capital Expenditure 1.05
Repayment Of Loan - 0.03 0.06 0.11 0.24 0.28 0.07 - -
Total Application 1.05 0.03 0.06 0.11 0.24 0.28 0.07 - -
Net Surplus - 0.24 0.18 0.08 (0.04) (0.07) 0.16 0.23 0.22
Add: Opening Balance - - 0.24 0.42 0.50 0.46 0.39 0.55 0.78
Closing Balance - 0.24 0.42 0.50 0.46 0.39 0.55 0.78 1.00
IRR
` (in lakh) Particulars / months 0 1 2 3 4 5 6 7 8
Profit after Tax 0.21 0.19 0.13 0.14 0.16 0.17 0.17 0.17
Depreciation 0.06 0.06 0.06 0.06 0.06 0.06 0.06 0.06
Interest on Term Loan 0.09 0.07 0.07 0.05 0.02 0.00 - -
Cash outflow (1.05) - - - - - - - -
Net Cash flow (1.05) 0.36 0.32 0.26 0.25 0.24 0.23 0.23 0.22
IRR 20.79%
NPV 0.40
Break Even Point ` (in lakh)
Particulars / Years 1 2 3 4 5 6 7 8
Variable Expenses
Oper. & Maintenance Exp (75%) 0.03 0.03 0.03 0.04 0.04 0.04 0.04 0.04
Sub Total(G) 0.03 0.03 0.03 0.04 0.04 0.04 0.04 0.04
Fixed Expenses
Oper. & Maintenance Exp (25%) 0.01 0.01 0.01 0.01 0.01 0.01 0.01 0.01
Interest on Term Loan 0.09 0.07 0.07 0.05 0.02 0.00 0.00 0.00
Depreciation (H) 0.06 0.06 0.06 0.06 0.06 0.06 0.06 0.06
Sub Total (I) 0.16 0.14 0.13 0.12 0.09 0.07 0.07 0.07
Sales (J) 0.40 0.40 0.40 0.40 0.40 0.40 0.40 0.40
Contribution (K) 0.37 0.37 0.36 0.36 0.36 0.36 0.36 0.35
Break Even Point (L= G/I) 42.83% 38.10% 36.65% 31.96% 25.61% 19.85% 19.48% 19.79%
Cash Break Even {(I)-(H)} 27.75% 22.96% 21.44% 16.67% 10.24% 4.40% 3.94% 4.16%
Break Even Sales (J)*(L) 0.17 0.15 0.15 0.13 0.10 0.08 0.08 0.08

Voltage Stabilizer 75 KVA
21
Return on Investment
` (In lakh) Particulars / Years 1 2 3 4 5 6 7 8 Total
Net Profit Before Taxes 0.21 0.23 0.23 0.25 0.27 0.29 0.29 0.28 2.04
Net Worth 0.47 0.66 0.79 0.94 1.10 1.27 1.44 1.61 8.27
24.68%
Debt Service Coverage Ratio
` (In lakh)
Particulars / Years 1 2 3 4 5 6 7 8 Total
Cash Inflow
Profit after Tax 0.21 0.19 0.13 0.14 0.16 0.17 0.17 0.17 1.00
Depreciation 0.06 0.06 0.06 0.06 0.06 0.06 0.06 0.06 0.33
Interest on Term Loan 0.09 0.07 0.07 0.05 0.02 0.00 0.00 0.00 0.31
Total (M) 0.36 0.32 0.26 0.25 0.24 0.23 0.23 0.22 1.64
DEBT
Interest on Term Loan 0.09 0.07 0.07 0.05 0.02 0.00 0.00 0.00 0.31
Repayment of Term Loan 0.03 0.06 0.11 0.24 0.28 0.07 0.00 0.00 0.79
Total (N) 0.12 0.13 0.17 0.29 0.30 0.07 0.00 0.00 1.09
2.94 2.38 1.49 0.86 0.78 3.16 0 0 1.51
Average DSCR (M/N) 1.51

Voltage Stabilizer 75 KVA
22
Annexure 6: Details of procurement and Implementation plan
Project Implementation Schedule
S. No Activity Weeks
1 2 3 4
1 Placement of Orders for voltage stabilizer
2 Supply of voltage stabilizer
3 Installation of the voltage stabilizerr and cabling
4 Trial runs
Process down time
The process down time for installation of voltage stabilizer is considered at two days for
installation of providing electrical connections to the panel and main feeder.
Voltage Stabilizer 75 KVA
23
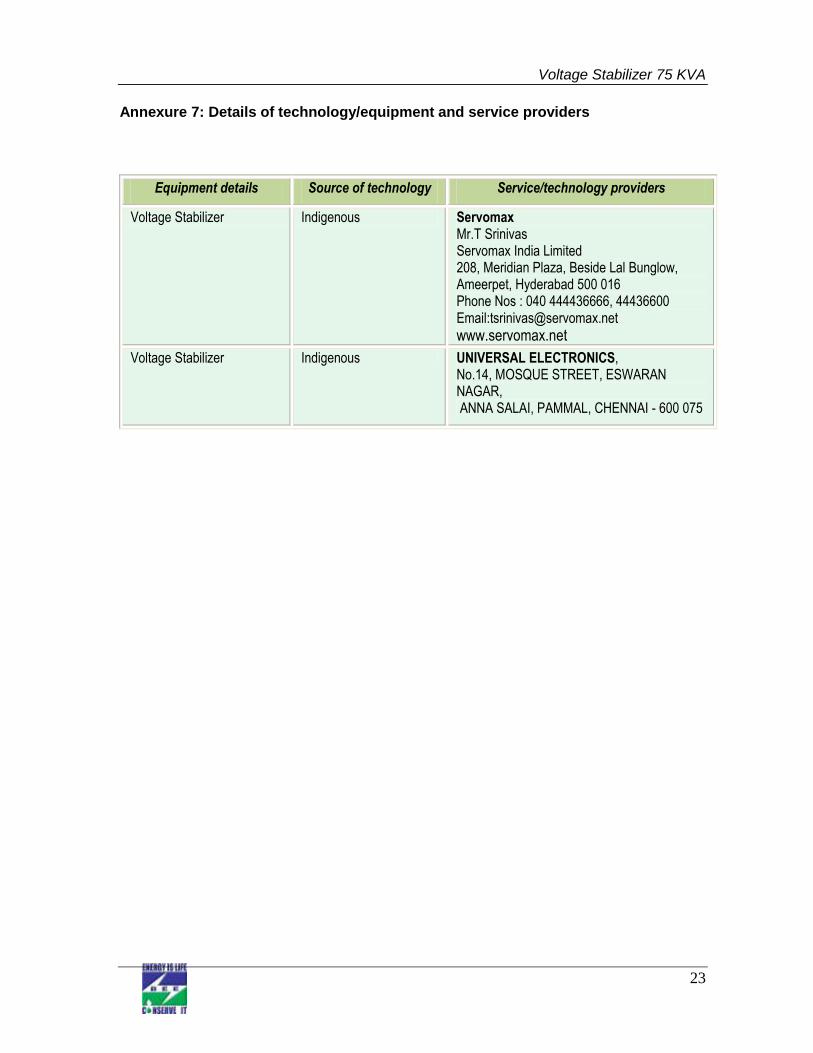
Annexure 7: Details of technology/equipment and service providers
Equipment details Source of technology Service/technology providers
Voltage Stabilizer Indigenous Servomax Mr.T Srinivas Servomax India Limited 208, Meridian Plaza, Beside Lal Bunglow, Ameerpet, Hyderabad 500 016 Phone Nos : 040 444436666, 44436600 Email:[email protected]
www.servomax.net
Voltage Stabilizer Indigenous UNIVERSAL ELECTRONICS, No.14, MOSQUE STREET, ESWARAN NAGAR, ANNA SALAI, PAMMAL, CHENNAI - 600 075

Voltage Stabilizer 75 KVA
24
Annexure 8: Quotations or Techno-Commercial Bids

Voltage Stabilizer 75 KVA
25

Voltage Stabilizer 75 KVA
26

Voltage Stabilizer 75 KVA
27

Bureau of Energy Efficiency (BEE) (Ministry of Power, Government of India) 4th Floor, Sewa Bhawan, R. K. Puram, New Delhi – 110066 Ph.: +91 – 11 – 26179699 (5 Lines), Fax: +91 – 11 – 26178352
Websites: www.bee-india.nic.in, www.energymanagertraining.com
Zenith Energy Services Pvt. Ltd 10-5-6/B, My Home Plaza, Masab Tank HYDERABAD, AP 500 028 Phone: 040 23376630, 31, Fax No.040 23322517
Website: www.zenithenergy.com
India SME Technology Services Ltd DFC Building, Plot No.37-38, D-Block, Pankha Road, Institutional Area, Janakpuri, New Delhi-110058 Tel: +91-11-28525534, Fax: +91-11-28525535 Website: www.techsmall.com