Chemical characteristics of oils from naked and husk seeds ofCucurbita pepo L
Upload
khangminh22Category
view
3download
0
i
The Use of Rice Husk Ash (RHA) as Stabilizer in
Compressed Earth Block (CEB) for Affordable
Houses
Thesis Submitted in fulfilment of the requirement of Cardiff University
for the Award of Doctor of Philosophy
Candidate: Adedamola Ojerinde
Supervisor: Dr Vicki Stevenson
Dr Eshrar Latif
Date of submission: 20-04-2020

ii
iii
Abstract
Shelter is a basic human need for comfort and safety; however, Nigeria has a housing
deficit of 17 million units. Modern construction materials are not affordable for most
earners and have a significant environmental impact.
This research investigates the suitability of substituting locally available rice husk ash
(RHA) for up to 50% cement stabiliser in compressed earth blocks (CEB) over three
different curing times. CEBs with up to 30% RHA substitution were produced with enough
compressive strength for load-bearing use in 2 and 3 storey buildings. They also met
initial hygrothermal requirements.
Data from the mechanical and hygrothermal investigation were utilised in hygrothermal
simulations for normal (eg bedroom, living room) and high relative humidity spaces (eg
kitchen, bathroom) to establish likely issues with condensation (interstitial or surface) or
mould growth on interior wall, which could affect occupant comfort and safety, or impair
structure durability. Simulation was based on the tropical Savannah climate in Nigeria for
full cavity and partially insulated cavity wall structures for CEB with up to 30% RHA
substitution. 20% was the highest RHA substitution CEBs achieving acceptable results.
In a full cavity wall structure, it was less likely to suffer condensation or mould (than in
partial insulated cavity) but would benefit from treatment with a moisture retarding material
if used in a high humidity space.
Thermal simulation of a free-running building indicated that thermal comfort with 20%
RHA substitution CEBs achieved similar hours at 90% satisfaction as a concrete wall, so
replacement would not lead to disadvantage for occupants.
In comparison to a typical concrete mixture (1 part cement, 2 parts sand, 4 parts
aggregate) which contains 14% cement (dry mix), the 20% RHA substitution CEB had 8%
cement (dry mix). This is a substantial reduction in a material which has high cost and
environmental impact.
iv
Acknowledgements
I would like to thank the following people who have supported me during the period of the
research:
My supervisor’s Dr Vicki Stevenson and Dr Eshrar Latif for their enthusiasm for the project,
for their support, encouragement, and patience.
I would like to thankful to Welsh school of Architecture and School of Chemistry, Cardiff
University, Covenant University and Federal Ilaro Polytechnic.
I would also like to thank Mr Odion, the sculptor that allowed me to use his furnace for
combusting Rice husk. Mr Gbadamosi Ibrahim Abiodun and Mr Mathew Oladele Bamidele
for building the thermal box required for the thermal test.
I would like to appreciate my parent, friends, Prof Dibu Ojerinde, Dr Raheem Oloyo and my
husband for the unconditional support throughout duration of the research.
v
Table of Contents
Contents Abstract ....................................................................................................................... iiiii
Acknowledgements .....................................................................................................iviii
Table of Contents ........................................................................................................ viv
List of Tables ............................................................................................................. ixviii
List of Figures ......................................................................................................... xivxiii
Nomenclature ........................................................................................................... xxxix
1. Introduction ................................................................................................................ 1
1.1. Background ........................................................................................................ 1
1.2. Aim of the Study. ................................................................................................ 3
1.3. Research objectives ........................................................................................... 3
1.4. Scope and focus ................................................................................................. 3
1.5. Dissertation overview .......................................................................................... 3
2. Introduction ................................................................................................................ 5
2.1. Housing in Nigeria – Types, Demand Challenge and Supply Strategies ............. 5
2.2. Traditional and Modern Architecture and Types of Housing in Nigeria ................ 8
2.2.1. Northern Nigeria traditional architecture ........................................................................... 9
2.2.2. Southern Nigeria traditional architecture ........................................................................ 11
2.2.3. Integration of Modern architecture in Nigeria housing styles ................................. 12
2.2.4. Housing Demand and Supply Strategies Challenges in Nigeria ............................... 13
2.3. Building element requirements and passive design strategies .......................... 17
2.3.1. Climate and Passive design strategies ................................................................................ 17
2.4. External wall material options and their properties ............................................ 21
2.4.1. Fired bricks .................................................................................................................................... 21
2.4.2. Blockwork....................................................................................................................................... 25
2.4.3. Earth ................................................................................................................................................. 27
2.4.4. Stonework ...................................................................................................................................... 30
2.4.5. Summary ......................................................................................................................................... 31
2.5. CEB (Compressed earth block) ........................................................................ 32

vi
2.6. Stabilizers ......................................................................................................... 35
2.6.1. Pozzolans – Definition, Functions and Mode of Action, Classification, and
Characterization .............................................................................................................................................. 36
2.6.2. Rice husk ash ................................................................................................................................. 38
2.6.3. Sugar Bagasse Ash (SBA) .......................................................................................................... 42
2.6.4. Palm Oil Fuel Ash (POFA) ......................................................................................................... 46
2.6.5. Geo-polymer Concrete ............................................................................................................... 49
2.6.6. Comparison of agricultural pozzolans ................................................................................ 50
2.7. Mechanical and Hygrothermal Properties .......................................................... 50
2.7.1. Mechanical Properties of building materials ................................................................... 50
2.7.2. Hygrothermal properties of building materials ............................................................. 51
2.7.3. Indoor Air Quality ....................................................................................................................... 54
2.8. Design principles for buildings in Nigeria ........................................................... 63
2.8.1. Possible walls system used for construction with compressed earth blocks. ... 64
2.9. Summary of literature findings ........................................................................... 67
3 Research Methodology ............................................................................................. 71
3.1 Research Framework ............................................................................................. 71
3.2 Production of CEBs and testing of the component materials ............................. 73
3.2.1 Raw material collection preparation and test ................................................................. 73
3.2.2 Compressed Earth Block (CEBs) production ................................................................... 82
3.3 Compressed earth blocks (CEBs) testing .......................................................... 87
3.3.1 Bulk density of Compressed earth block ........................................................................... 87
3.3.2 Compressive strength of Compressed earth block ........................................................ 88
3.3.3 Water absorption Capacity of compressed earth block............................................... 91
3.3.4 Water absorption coefficient of compressed earth block ........................................... 92
3.3.5 Water vapour transmission .................................................................................................... 95
3.3.6 Moisture absorption ................................................................................................................... 98
3.3.7 Moisture buffering ....................................................................................................................100
3.3.8 Thermal conductivity ...............................................................................................................102
3.4 Simulation of Wall System ............................................................................... 107
vii
3.4.1 Modelling for interstitial condensation and assessing risk of mould growth
development on selected CEB compositions ..................................................................................... 107
3.4.2 Simulation for thermal comfort performance ............................................................... 110
4. Laboratory Test Results ..........................................................................................113
4.1Testing of raw materials used for CEB production. ................................................113
4.1.1 Atterberg limit test for laterite soil ............................................................................................ 113
4.1.2 Phase identification of silica in RHA ..................................................................114
4.2 Mechanical and Hygrothermal properties of the Experimental CEBs ....................116
4.2.1 Bulk density of experimental CEBs ............................................................................................ 116
4.2.2 Compressive strength of experimental CEBs ......................................................................... 120
4.2.3 Water Absorption Capacity of experimental CEBs .............................................................. 125
4.2.4 Water Absorption coefficient of Compressed Earth Blocks ............................................. 129
4.2.5 Water Vapour Transmission of Compressed Earth Blocks .............................................. 137
4.2.6 Moisture absorption of Compressed Earth Blocks .............................................................. 141
4.2.7 Moisture Buffering of Compressed Earth Blocks ................................................................. 144
4.2.8 Thermal Conductivity of Compressed Earth Blocks ........................................................... 145
5. Simulation Results ..................................................................................................148
5.1. Hygrothermal behaviour of Wall system...........................................................148
5.1.1. Boundaries of Simulation ....................................................................................................... 148
5.1.2. Temperature Simulation results ......................................................................................... 155
5.1.3. Relative humidity Simulation results ................................................................................ 159
5.1.4. Moisture content Simulation results ................................................................................. 163
5.1.5. Mould Growth on interior wall - Simulation results ................................................... 168
5.1.6. Total water content Simulation results ............................................................................ 171
5.1.7. Summary of Hygrothermal behaviour of wall system ............................................... 174
5.2. Simulation of Thermal Comfort Performance ...................................................174
5.2.1. Adaptive comfort for a tropical savanna climate (ASHRAE 55-2010) ................ 177
5.2.2. Comparison of hours in thermal comfort ........................................................................ 177
6. Discussion ..............................................................................................................179
6.1. Raw materials for CEBs ...................................................................................179
6.1.1. Laterite soil .................................................................................................................................. 179

viii
6.1.2. Amorphous Silica in RHA .......................................................................................................180
6.2. CEBs for residential buildings .......................................................................... 181
6.2.1. Mechanical Properties .............................................................................................................182
6.2.2. Hygrothermal Properties .......................................................................................................186
6.3. Mould growth and interstitial condensation simulation ..................................... 192
6.4. Thermal comfort simulation ............................................................................. 196
7 Conclusion and contribution to knowledge .................................................................. 197
7.1 Introduction ..................................................................................................... 197
7.1.1 Aim and objectives ............................................................................................................................198
7.2 Conclusions ......................................................................................................... 198
7.2.1 Mechanical property of compressed earth blocks ...............................................................199
7.2.2 Hygrothermal properties of compressed earth blocks ......................................................200
7.2.3 Indoor air quality ...............................................................................................................................201
7.2.4 Thermal Comfort ................................................................................................................................202
7.3 Contribution to knowledge .................................................................................... 202
7.3.1 Limitation of research ......................................................................................................................204
7.3.2 Further research ................................................................................................................................204
7.4 Summary ............................................................................................................. 204
8 Reference ................................................................................................................... 206
SOFTWARE TOOLS ..................................................................................................... 221
Publication ..................................................................................................................... 222

ix
List of Tables
Page
Table 2.1 Population of the top cities of Nigeria 6
Table 2.2 Income of Government workers in Nigeria 8
Table 2.3 Number of housing unit/ net hectare provided by different types
of houses
16
Table 2.4 Comparing compressed earth blocks with other masonry 32
Table 2.5 Stages for compressed earth blocks production 34
Table 2.6 Types of presses used for Compressed earth blocks (CEBs)
Production
35
Table 2.7 Chemical composition (% by weight) of RHA sample 39
Table 2.8 Chemical and physical properties of sugar bagasse ash (SBA) 43
Table 2.9 Comparison of the properties of agricultural waste ash pozzolan
material and ordinary Portland cement
50
Table
2.10
Moisture generated by different household activities in residential
buildings
55
Table
2.11
typical moisture generated in areas with normal and high relative
humidity in a typical Nigeria house generated from Table 2.10
56
Table
2.12
Substrate class for mould growth 60
Table
2.13
Mould index on building materials 60
Table 3.1 Casagrande test requirements 79
Table 3.2 Physical characteristics of experimental CEBs 84
Table
3.3a
Composition of mix for CEBs- Solid 85
Table
3.3b
Composition of mix for CEBs- Hollow 86
Table 3.4 Maximum permissible error/ repeatability of compressive test 89
x
Table 3.5 Condition of CEBs in a laboratory 90
Table 3.6 WUFI Bio traffic light indicators 110
Table 4.1 Properties of Laterite sample used for making the experimental
CEB
113
Table 4.2 Description of the unified soil classification with laterite
classification highlighted
114
Table 4.3 Percentage amorphous silica contents of experimental rice husk
ash (RHA) samples at different combustion times
116
Table 4.4 Bulk density of solid CEBs produced with varying partial
replacement of OPC with RHA
117
Table 4.5 Bulk density of hollow CEBs produced with varying partial
replacement of OPC with RHA
118
Table 4.6 Effect of RHA inclusion and curing duration on the bulk density of
solid CEBs
119
Table 4.7 Effect of RHA inclusion and curing duration on the bulk density of
hollow CEBs
120
Table 4.8 Compressive strength of solid CEBs produced with varying
partial replacement of OPC with RHA
121
Table 4.9 Compressive strength of hollow CEBs produced with varying
partial replacement of OPC with RHA
122
Table
4.10
Effect of RHA inclusion and curing duration on the compressive
strength of experimental solid CEBs
123
Table
4.11
Effect of RHA inclusion and curing duration on the compressive
strength of experimental hollow CEBs
124
Table
4.12
Water absorption capacity of solid CEBs produced with varying
partial replacement of OPC with RHA
126
Table
4.13
Water absorption capacity of hollow CEBs produced with varying
partial replacement of OPC with RHA
127
Table
4.14
Water absorption capacity of solid CEBs with varying RHA levels
cured for 14, 21 and 28 days
128
xi
Table
4.15
Water absorption capacity of hollow CEBs with varying RHA
levels cured for 14, 21 and 28 days
129
Table
4.16
Water Absorption Coefficient for sample S/0 RHA 130
Table
4.17
Water Absorption Coefficient for sample S/0.2 RHA 131
Table
4.18
Water Absorption Coefficient for sample S/0.4 RHA 132
Table
4.19
Water Absorption Coefficient for sample S/0.6 RHA 133
Table
4.20
Water Absorption Coefficient for sample S/0.8 RHA 134
Table
4.21
Water Absorption Coefficient for sample S/1 RHA 135
Table
4.22
Water absorption coefficient of experimental solid CEB at
different RHA inclusion level
136
Table
4.23
Changes in water contents in CEB at varying levels of RHA
inclusion (water vapour transmission)
137
Table
4.24
Hygroscopic properties of CEB at various RHA inclusion 141
Table
4.25
Changes in moisture contents in CEB at varying levels of RHA
inclusion (moisture absorption)
142
Table
4.26
Influence of stabilization on moisture buffering value of CEBs 145
Table
4.29
Thermal Conductivity of CEBs masonry wall with varying RHA
content
147
Table 5.1 Properties Summary of CEB materials included in simulation
study
149
Table 5.2 Properties of experimental CEB used for simulation study 151
Table 5.3 External condition for simulation 152
Table 5.4 External boundary condition of wall 153

xii
Table 5.5 Distance of wall with varying Positions on wall 155
Table 5.6 Summary of parameter simulated on WUFI Pro 155
Table 5.7 Temperature of Wall section EP at areas with normal internal
relative humidity
156
Table 5.8 Temperature of Wall section EP at areas with high relative
internal humidity
157
Table 5.9 Temperature of Wall section NP at areas with normal internal
relative humidity
158
Table
5.10
Temperature of Wall section NP at areas with high internal
relative humidity
159
Table
5.11
Relative humidity of Wall section EP at areas with normal internal
relative humidity
161
Table
5.12
Relative humidity of Wall section EP at areas with high internal
relative humidity
161
Table
5.13
Relative humidity of Wall section NP at areas with normal internal
relative humidity
162
Table
5.14
Relative humidity of Wall section NP at areas with high internal
relative humidity
163
Table
5.15
Moisture content of Wall section EP at areas with normal internal
relative humidity
165
Table
5.16
Moisture content of Wall section EP at areas with high internal
relative humidity
166
Table
5.17
Moisture content of Wall section NP at areas with normal internal
relative humidity
167
Table
5.18
Moisture content of Wall section NP at areas with high internal
relative humidity
168
Table
5.19
Building use, proportion of OPC replacement with RHA, mould
growth and WUFI code
172
Table
5.20
Average Climatic data of Lagos, Nigeria (2000-2009) 176

xiii
Table
5.21
Adaptive comfort using natural ventilation 178
Table
5.22
Time not achieving thermal comfort over 1 year - using Adaptive
comfort model at 90% and 80%
178
Table 6.1 Required CEB compressive strength for wall structures 184
Table 6.2 Correlation coeeficient (r) matrix for solid CEBs 186
Table 6.3 Correlation coeeficient (r) matrix for hollow CEBs 187
Table 6.4 Suitability of solid CEBs for application based on mechanical
properties
191
Table 6.5 Suitability of hollow CEBs for application based on mechanical
properties
192
Table 6.6 Suitability of solid CEBs for application based on hygrothermal
properties
193
Table 6.7 Suitability of solid CEBs for application based on results from
mould growth and interstitial condensation simulation
196
Table 7.1 %RHA compositions which meet required CEB compressive
strength for wall structures
201

xiv
List of Figures
Page
Figure 2.1 Layout of Northern living quarters showing separation of men
and women
10
Figure 2.2 Ornamentation of building Façade in Northern House 11
Figure 2.3 Type 2 Rooming house- Southern Nigeria 12
Figure 2.4 Modern residential houses in Nigeria 13
Figure 2.5 Present and future Köppen- Geiger climate maps at 1 km
resolution of Nigeria
18
Figure 2.6 Nigeria max temperature for dry and rain season climate data
(Am, Aw, BWh, BSh) superimposed on bioclimatic template
20
Figure 2.7 Brick production process 23
Figure 2.8 Damages to concrete wall 27
Figure 2.9 Traditional earth building techniques 29
Figure 2.10 Classification of moisture buffering values 53
Figure 2.11 Range of temperature and relative humidity for mould
germination
59
Figure 2.12 Limiting growth curves for mould growth categories 61
Figure 2.13 Solid wall with external insulation with low resistance finish 65
Figure 2.14 Solid wall with external insulation with high vapour resistance
finish
65
Figure 2.15 Solid wall with internal insulation 66
Figure 2.16 Masonry wall with wall cavity, external insulation 66
Figure 2.17 Masonry wall with cavity- insulation partial filling the cavity 67
Figure 3.1 Theoretical framework for providing affordable and sustainable
residential house
73
Figure 3.2 Green outline highlighting the location of Ogun state on the
map
75
xv
Figure 3.3 Map of Ogun state and location of site, location and distance of
material to site
75
Figure 3.4 Liquid limit device 78
Figure 3.5 Material mix before moulding and CEBs mould 84
Figure 3.6 Samples of experimental solid CEBs produced in this study 87
Figure 3.7 Samples of experimental hollow CEBs produced in this study 87
Figure 3.8 Image of compressive strength test on CEB 89
Figure 3.9 Section of water absorption coefficient test set up 94
Figure 3.10 Change of mass per area vs square root of immersion time -
This represents a sample which did not develop water on the
top surface even after the longest immersion time
94
Figure 3.11 Change of mass per area vs square root of immersion time -
This represents a sample which developed water on the top
surface
94
Figure 3.12 Section of Water vapor transmission setup 98
Figure 3.13 Section of Moisture Absorption setup 99
Figure 3.14 Section of Moisture buffering setup 102
Figure 3.15 Section of in-situ thermal test with CEB blocks exposed to
laboratory environment
104
Figure 3.16 Elevation of in-situ thermal test with CEB blocks exposed to
laboratory environment
104
Figure 3.17 External view of the in-situ thermal test 105
Figure 3.18 Internal view of the in-situ thermal test 105
Figure 3.19 Heat flux sensor and thermistor 106
Figure 3.20 Data logger 106
Figure 4.1 80% SiO2(xrd analysis software) – Method 1 115
Figure 4.2 96% SiO2(xrd analysis software) – Method 2 115
Figure 4.3 Effects of RHA inclusion on bulk density of experimental solid
CEBs
119
xvi
Figure 4.4 Effects of RHA inclusion on bulk density of experimental hollow
CEBs
120
Figure 4.5 Effects of RHA inclusion on compressive strength of
experimental solid CEBs
123
Figure 4.6 Effects of RHA inclusion on compressive strength of
experimental hollow CEBs
125
Figure 4.7 Effects of RHA inclusion on water absorption capacity of
experimental solid CEBs
128
Figure 4.8 Effects of RHA inclusion on water absorption capacity of
experimental hollow CEBs
129
Figure 4.9 Water content change over surface area and square root of
time in 24 hrs (control, S/0 RHA)
131
Figure 4.10 Water content change over surface area and square root of
time in 24 hrs (CEBs, S/0.2 RHA)
132
Figure 4.11 Water content change over surface area and square root of
time in 24 hrs (CEBs, S/0.4 RHA)
133
Figure 4.12 Water content change over surface area and square root of
time in 24 hrs (CEBs, S/0.6 RHA)
134
Figure 4.13 Water content change over surface area and square root of
time in 24 hrs (CEBs, S/0.8 RHA)
135
Figure 4.14 Water content change over surface area and square root of
time in 24 hrs (control, S/1 RHA)
136
Figure 4.15 Change in mositure content in CEBs at 10% RHA (S/0.2 RHA)
inclusion
138
Figure 4.16 Change in mositure content in CEBs at 20% RHA (S/0.4 RHA)
inclusion
138
Figure 4.17 Change in mositure content in CEBs at 30% RHA (S/0.6 RHA)
inclusion
139
Figure 4.18 Change in mositure content in CEBs at 40% RHA (S/0.8 RHA)
inclusion
139
Figure 4.19 Change in mositure content in CEBs at 50% RHA (S/1 RHA)
inclusion
140
xvii
Figure 4.20 Equilibrium moisture content curve for CEBs with 0% RHA (S/0
RHA)
142
Figure 4.21 Equilibrium moisture content curve for CEBs with 10% RHA
(S/0.2 RHA)
143
Figure 4.22 Equilibrium moisture content curve for CEBs with 20% RHA
(S/0.4 RHA)
143
Figure 4.23 Equilibrium moisture content curve for CEBs with 40% RHA
(S/0.8 RHA)
144
Figure 4.24 Compressed earth block stabilized with OPC (control) 146
Figure 4.25 10% RHA partially replaced OPC in compressed earth blocks 146
Figure 4.26 20% RHA partially replace OPC in compressed earth blocks 146
Figure 4.27 50% RHA partially replaced OPC in compressed earth blocks 147
Figure 4.28 Thermal condcutivity for masonry CEBs stabilized with RHA 147
Figure 5.1 Masonry wall section EP 150
Figure 5.2 Masonry wall section NP (No external plaster 151
Figure 5.3 Driving rain direction 152
Figure 5.4 Point of reference (PR) through Wall section EP 154
Figure 5.5 Point of reference (PR) through Wall section NP 154
Figure 5.6 Temperature of wall section EP for areas with normal internal
humidity
157
Figure 5.7 Temperature of wall section EP for areas with high internal
humidity
158
Figure 5.8 Temperature of wall section NP for areas with normal internal
humidity
159
Figure 5.9 Temperature of wall section NP for areas with high internal
humidity
160
Figure 5.10 Relative humidity of wall section EP for areas with normal
internal humidity
161
Figure 5.11 Relative humidity of wall section EP for areas with high internal
humidity
162
xviii
Figure 5.12 Relative humidity of wall section NP for areas with normal
internal humidity
163
Figure 5.13 Relative humidity of wall section NP for areas with high internal
humidity
164
Figure 5.14 Moisture content of wall section EP for areas with normal
internal humidity
165
Figure 5.15 Moisture content of wall section EP for areas with high internal
humidity
166
Figure 5.16 Moisture content of wall section NP for areas with normal
internal humidity
168
Figure 5.17 Moisture content of wall section NP for areas with high internal
humidity
169
Figure 5.18 Mould growth on interior wall surface EP for areas with normal
internal humidity
170
Figure 5.19 Mould growth on interior wall surface EP for areas with high
internal humidity
170
Figure 5.20 Mould growth on interior wall surface NP for areas with normal
internal humidity
171
Figure 5.21 Mould growth on interior wall surface NP for areas with high
internal humidity
171
Figure 5.22 Total water content in wall section EP in area with high relative
humidity for 1 year
173
Figure 5.23 Total water content in wall section NP in area with high relative
humidity for 1 year
173
Figure 5.24 Total water content in wall section EP in area with normal
relative humidity for 3 years
174
Figure 5.25 Total water content in wall section NP in area with normal
relative humidity for 3 years
174
Figure 5.26 Annual temperature and relative humidity of Lagos, Nigeria 175
Figure 5.27 Wind direction and wind speed using wind rose 177
Figure 5.28 Annual rainfall of Lagos, Nigeria 177

xix
Figure 6.1 Chat of unified soil classification 181
xx
Nomenclature
A area (m2)
Am Köppen-Geiger climate classification for Monsoon climate
Aw Köppen-Geiger climate classification for Tropical Savannah climate
bm moisture effusivity for moisture buffering test (kg/[m2.Pa.s]1/2)
BSh Köppen-Geiger climate classification for Warm Semi-Arid climate
BWh Köppen-Geiger climate classification for Warm desert climate
CEB Compressed Earth Block
d mean thickness of specimen (m)
d relative humidity difference EP External Plaster EPS Expanded polystyrene fb compressive strength (N/mm2) FHA Federal Housing Authority (Nigeria)
g density of water vapour flow rate (kg/m2.s)
G water vapour flow rate through specimen (kg/s)
Gt accumulated moisture uptake
GHG Greenhouse Gases
k thermal conductivity (W/m.K)
L length (mm)
Lp plasticity index (numerical difference between liquid limit and plastic limit)
LS longitudinal shrinkage of the soil (mm)
m mass (g)
mr reference mass (g)
MBV moisture buffer value (kg/m2.%RH)
N/A not acceptable
NAFDAC National Agency for Food and Drug Administration (Nigeria)

xxi
NBRRI Nigerian Building and Road Research Institute
NP No External Plaster
OPC Ordinary Portland Cement
p vapour pressure
ps saturation vapour pressure (Pa)
PR point of reference
PVC Poly Vinyl Chloride
q quantity of heat passing through a unit area (W/m2)
Q quantity of heat passing through sample (W)
RD gas constant of water vapour = 462 N.m/kg.K (BS, EN ISO 12572:2016)
RH Relative Humidity
RHA Rice Husk Ash
S suitable
SD standard deviation
t time (s)
tp period (s)
T temperature (oC)
u moisture content (kg/kg)
wl liquid limit (water content at which soil passes from the liquid to the plastic
state)
wp plastic limit (water content at which a specimen ceases to be plastic when
dried further)
V volume (m3)
W water content
WAC water absorption coefficient (kg/[m2.s1/2])
WAR water absorption rate
WWR window wall ratio
xxii
Z water vapour resistance, this is the reciprocal of the water vapour
permeance (m2.s.Pa/kg)
Greek Symbols
water vapour permeability (kg/[m.s.Pa])
p water vapour permeability (kg/[m.s.Pa])
relative humidity
relative humidity
water vapour resistance factor
temperature (oC)
density (kg/m3)

1
1. Introduction
_______________________________________________________________________
1.1. Background
Shelter is a basic need for humans (Sekhar C & Nayak, 2018). Essentially, it provides
comfort and safety for the occupants. Quality housing enhances the health and wellbeing
of humans. Design and construction details and service life of the building determines the
house quality. Consequently, the construction industry has undergone changes in
response to changes in the environment, lifestyle of the people, increase in population, cost
of construction and other factors. The construction industry has contributed to the increased
greenhouse gas (GHGs) emissions which are associated with global climate change.
Globally, 24% of the raw materials are used in the construction industry; while the residential
and commercial buildings use 32% of total energy and account for over 30% of green gas
emissions worldwide (Tettey et al, 2017). In this context, it has been reported that cement
is the most widely used man-made material and is the source of about 8% of the world’s
CO2 emissions (Rogers, 2018).
However, the building industry has failed to reduce the housing deficit in Nigeria. The
need to provide low cost houses in Nigeria cannot be over emphasized. Indeed, it was
reported that the country’s housing deficit grew from 5 million units in 1991 to 17 million
units in 2017. Lagos alone, the country’s commercial nerve centre, has an estimated
housing shortage of 5 million units. Unfortunately, about 62% of Nigerians live below the
international poverty line (UNDP, 2015), which makes it difficult for them to afford
contemporary housing of the types prevalent in the developed countries. Over 90% of
low-income earners cannot afford decent accommodation even if they saved 100% of
their income for 10 years (Emmanuel, 2012). Doing that will be contravening the
recommendation that affordable house rental cost or mortgage repayment should not
exceed 30% of household income (including bills). In Nigeria the rental expenditure
annually in cities amount to $216 whereas the average income of 90% of Nigerians is
about $113 or $31 for more than 75% Nigerians (Olanrewaju et al, 2016). Also,
Government’s efforts at solving the problem of housing shortage proved futile because it
ended in providing unaffordable houses.
It is noticed that construction materials accounts for 60% of the total cost of building
construction, hence the use of cheaper and available suitable alternative materials could
contribute to housing sustainability in future. The Nigeria Building and Road Research
Institute (NBRRI) and Federal Housing Authority (FHA) in a collaborative investigation
noted that cost of building construction was reduced by at least 40% with the use of local
2
materials. In this regard, use of earth material in building construction may find useful
application in the context of Nigeria (Olotuah, 2002). While the use of earth material may
be of considerable value in low-rise building, it may be necessary to improve the strength
and durability of such construction materials if they will be used in the construction of multi
dwelling unit.
Several workers have confirmed that compressed earth block (CEB), an earth material,
can be stabilized to improve on its mechanical properties (Donkor & Obonyo, 2015;
Taallah & Guettala, 2016). The use of several agricultural waste products including rice
husk ash (Antiohos et al, 2014), waste sugarcane bagasse (Kazmi et al, 2016b), palm oil
fuel ash (Karim et al, 2013) sawdust or wood ash (Chowdhury et al, 2015), etc. as
stabilizing agents has been reported in other building materials.
The current study is interested in the use of rice husk ash (RHA) as a stabilizing agent in
CEB because of the huge investment of the Federal Government of Nigeria in rice
production in furtherance of the shift of the economy from being dependent on the crude
oil to agriculture. Consequently, the waste generation from rice processing industry
would increase; and it should therefore be reused to avoid environmental pollution it
would cause when not properly disposed.
Cost of cement has been of concern in the provision of sustainable housing. The material
is used as a binding agent in compressed earth block moulding. Sourcing an acceptable
alternative low-cost binding agent will significantly reduce cost of providing housing. RHA,
like other sustainable pozzolans could serve useful application here (Kumar & Gupta,
2016). (Kazmi et al, 2016b) suggested that addition of RHA in fired brick manufacturing
could lead towards sustainable and economical construction. A pozzolan is a siliceous or
a combination of siliceous and aluminous materials. Independently, it possesses little or
no cementing property, but in a finely divided form - and in the presence of moisture – it
will chemically react with calcium hydroxide to form compounds possessing cementitious
properties (Mehta et al, 1996). This suggests that the stabilizing strength of RHA in earth
blocks will depend on the geochemical composition of the earth material used. The
geochemical composition of the soil will vary according to the nature and mineral
composition originating rock.
Apart from reducing cost, RHA’s utilization in construction will displace the use of cement
in the construction industry thereby reducing environmental pollution. Also, it has lower
embodied energy compared to cement hence its use will save energy cost (Mithra, 2015).
RHA being a product of agricultural production will raise the farmers’ income. It will be
worthwhile to see the possibility of replacing cement with RHA in CEB.
It is noteworthy to add that this study is a contribution to the academic literature on
CEB/RHA as opposed to the less formal work or less rigorous academic work on
3
CEB/RHA. Although informal work has been reviewed, the findings of such work are not
included in this study. This study focuses on the determination of suitability of CEB/RHA
for wall construction in tropical savannah climate of Nigeria as a means of reducing
building construction cost in the poor country for low-income earners.
1.2. Aim of the Study.
To investigate the provision of low cost, sustainable wall construction material in Nigeria
by focusing on CEBs stabilized using pozzolanic agricultural waste.
1.3. Research objectives
The objectives of the study are to:
1. Investigate the proportions of laterite, RHA, OPC and sharp sand needed to
produce RHA CEBs for walls in the tropical Nigeria.
2. Evaluate the mechanical and hygrothermal properties of the resulting CEBs and
analyse them against wall construction requirements; and
3. Simulate the hygrothermal and thermal properties to evaluate indoor air quality
and thermal comfort.
1.4. Scope and focus
This work is focused on establishing the suitability of RHA to reduce the use of cement for
stabilising CEBs utilising lateritic earth for low-rise affordable housing in Nigeria. There
may be potential for the findings to apply to areas with similar climate and soil type with
rice agriculture.
1.5. Dissertation overview
Chapter 1 (Introduction) gives the background of the study, definition of problem the
research sought to address; provides the justification for the study, and the research
objectives. In addition, focus and scope of the work is given in this section.
Chapter 2 (Literature Review) gives a critical evaluation of the research problem, current
materials used for masonry wall construction, and sustainable and affordable design
principles required for the Nigeria’s climate. It shows critical analysis of the available
pozzolans in the country, and most suitable mechanical and hygrothermal property for the
climate selected by studying suitable material characteristics to be used to address the
research problem in the form of review of literature.
Chapter 3 (Methodology) gives the detailed description of materials, design of the
research procedure (i.e. experimental design), experimental procedures of laboratory
tests, and statistical treatment to which the data obtained from the research was
subjected. The detailed simulation process required for the materials tested based on the
characteristics of the laboratory test.
4
Chapter 4 (Laboratory Results) reports the results from the various laboratory tests
performed on RHA, laterite and experimental CEBs. The key mechanical and
hygrothermal properties of the compressed earth block masonry unit as represented by
statistical analysis carried out are highlighted.
Chapter 5 (Simulation Results) reports the results from simulation using WUFI PRO 5.3,
WUFI Bio and Design Builder 5.5. The simulation results were analysed to evaluate
indoor air quality and thermal comfort for the occupants of the residential house.
Chapter 6 (Discussion) presents the principles and relationships indicated by the results.
It points out exceptions or any lack of correlation and defines unsettled points. Finally, it
shows how the results and interpretations agree (or contrast) with the existing body of
knowledge. Discussion of the theoretical implication of the research results and possible
practical application is given in this section, also.
Chapter 7 (Conclusion & Recommendations on future research work) states the
research problem, briefly summarises work done, and the highlights of results obtained.
Finally, the conclusion drawn from the results are highlighted in this section. Also,
recommendations on future research work are made.

5
2. Introduction _______________________________________________________________________
The large deficit of residential houses requires that the research concentrate on affordable
and sustainable building material for wall. The literature review explains a mean to achieve
wall material using local material with agricultural pozzolans to partially replace Ordinary
Portland cement by stabilizing earth material.
An investigation of the cause that led to the large deficit of residential house is reviewed in
this chapter. This process involves studying the urban population in each urban town, the
income of government worker at each level and to understand that the low-income earner
reason they cannot afford a safe house. The review aims to study a sustainable and
affordable wall material to reduce the cost of superstructure, as materials cost about 60%
of the whole building. The chapter investigates the traditional and modern means houses
to improve on the conditions of the people by studying the design strategy for the climate
to ensure comfort. The common wall material used in Nigeria was then studied, it was then
established to use local material to reduce cost and improve sustainability of the material.
The earth material was stabilized to ensure adequate mechanical and hygrothermal
property. The most frequently used stabilizing material is the ordinary Portland cement
(OPC), a review of some agricultural pozzolan was then studied to partially replace OPC.
The design approach to be used for masonry unit for wall was studied to ensure a means
to ensure indoor air quality and thermal comfort.
2.1. Housing in Nigeria – Types, Demand Challenge and Supply Strategies
The increase in urbanisation has changed the distribution of people across the world. Since
2018, over 55% of the world population live in cities and the proportion continues to
increase. together with China, India and Nigeria the urban population accounts for 35% of
the world urban population and Nigeria is projected to have additional growth of 189 million
by 2050 (UN, 2018). The growing urban population has led to infrastructure problems and
housing shortages, with over 863 million people globally, living in slums and informal
settlements (Gan et al, 2017).
Meeting housing demand in Nigeria is yet to be realized. Energy and infrastructure are
inadequate to meet the nations demand, yet the cement industry dominates the
construction industry. Before the monopolization of cement in construction industry, most
traditional homes in Nigeria were built with earth, which requires low cost and were self-
built. The old traditional types are disappearing because of increasing modernization or
urbanization. Urbanization affects the social relation, economic standard, life cycle energy
consumption, and climate and environmental change.

6
The rate of population migration from rural to urban areas in Nigeria has continued to
increase for some decades. For instance, in the early 1950s, there were 56 cities in the
country with 10.6% total population. By 1963 it increased to 19.1%, by 1985 increased to
24.5% of total population and in 2019 the city population increased to 48%.
The statistics shown in Table 2.1. illustrates the population densities in cities across
Nigeria. The cities with highest population density may need affordable housing unit to be
increased vertically (medium rise buildings) in direction rather than horizontal direction
(low rise buildings).
Table 2.1. Population of the top cities of Nigeria
Cities Population Area
(km2)
Density
(population/km2)
Tropical savanna climate
Lagos 9,000,000 1425 6,316
Ibadan 3,565,108 466 7,650
Kaduna 1,582,102 153 10,341
Benin 1,125,058 228 4,934
Zaria 975,153 88 11,081
Jos 816,824 70 11,668
Tropical monsoon climate
Port
Harcourt 1,148,065 158 7,266
Abia 897,562 91 9,863
Warm semi-arid climate (Bsh)
Kano 3,626,068 1965 1,845
Warm desert climate (BWh)
Maiduguri 1,112,449 155 7,177
©World population review (Worldometer, 2019)
The population of top 10 cities have been divided according to the climate in the country,
from the observation 6 of the cities are located at the tropical savanna climate. The
proposed affordable and sustainable design for wall material will be for the growing housing
deficits.
This rise in population in cities has also led to acute shortage of dwelling units which
resulted in overcrowding, high rent, poor urban living, low infrastructure services and high

7
crime rate. Public housing provision in the country has continued to lag behind the housing
demand (Ugochukwu & Chioma, 2015). The authors attributed the lag to the following
reasons:
a. Absence of proper monitoring and evaluation of public housing policies;
b. Lack of access to land and other housing inputs;
c. Cost of imported material; and
d. Failure to generate tangible and sustainable housing production, particularly
for low-income earners.
In a bid to find solution to housing deficit in the country, the Nigeria Building and Road
Research Institute collaborated with Federal Housing Authority to compare the cost of using
local materials (earth) with conventional materials (Fired earth bricks, and Sandcrete
blocks) for the provision of affordable homes. The rule of thumb states that for a house to
be affordable for low income earners, the cost shouldn’t be more than 30% of the house
income (Adabre et al, 2020). The cost of constructing a terraced single storey building with
local and conventional materials was calculated to be $2717 and $14493, respectively, the
US dollars have been used instead of local currency to ensure applicability internationally.
In addition, the authors affirmed material constitutes about 60% of the total cost (Olotuah,
2002) and using local material can bring the total cost to approximately 50%.
The Nigeria’s housing deficit was estimated at 16-17 million units as at 2015. Also, it was
estimated that it would cost approximately $97,223,000,000 to fund 14 million units, an
average cost of $ 6944.50 per housing unit. Meanwhile, Salary Grade Level government
workers shown in Table 2.2 revealed that workers at the Director Level could comfortably
afford a 25-year mortgage to buy a property costing $13194.55, whereas a more typical
graduate post (Levels 8 to 9) would proportionately only be able to afford a mortgage on
$2368 – significantly lower than the projected cost (Ugochukwu & Chioma, 2015).
Government workers in the Director status on Salary Grade Level 17 are in the top workers
in the Public Service and are in the minority. Most of the workforce earn less, could not
afford to pay mortgage and thus needing affordable housing. Consequently, the current
research has focused on reducing cost building construction using cheaper and locally
available materials to provide affordable housing.

8
Table 2.2. Income of Government Workers in Nigeria
Salary Grade Salary per
month ($)
Per year ($) Affordable 25 yrs.
mortgage ($)
Level 01 52.50 474
Level 02 514
Level 03 552.68
Level 04 (School leaver) 56.25 606.37-661.01
Level 05 693.22
Level 06 (Officers) 73.20-112.80 860.24-1325.59
Level 07 (Diploma
certificate holder)
117.42 1409.02 1253.51
Level 08 220.34 2662.25
Level 13-14 3261 2913.54-3194.27
Level 15 – 17 1235.95 14831.42 13194.55
©Federal civil service commission salary structure (Chizoba, 2019; Gberevbie, 2010)
2.2. Traditional and Modern Architecture and Types of Housing in Nigeria Traditional architecture has been an inspiration for innovation in socio-economically
sustainable design and environmental planning especially in residential housing. The
techniques have resolved some climatic and environmental problems caused by the
modern construction. The design has harmonized nature and the built environment by
providing a comfortable living environment. It can be defined as the unconscious realization
and embodiment of the society with requirement for the people in nature. Traditional
architecture has successfully maximized the natural terrain potentials (natural occurring
materials, architecture design considering the climate conditions etc.) in its design and
method of construction (Alabsi et al, 2016). The techniques used in some of the traditional
architecture are currently used in present day passive designs, zero carbon energy design,
low carbon design, and more.
In developing countries, it can be seen with modernization of the construction sector the
traditional knowledge that previously underpinned climate responsive vernacular design is
rapidly declining. Modern design pays little attention to local materials and traditional
method of construction. Vernacular architecture provides strong local content both in
traditions, materiality, building skills and methods. Traditional architecture buildings are

9
built with material within 360 m of their location due to the cost and difficulty of transporting
over long distance. Local materials selected are reflective on local climate and leads to
significant saving of embodied energy (Alabsi et al, 2016; Kırbaş & Hızlı, 2016).
Construction with earth material is increasing due to the environmental awareness. It is
estimated that two billion people are living in earth dwellings and 10% of the world heritage
buildings have earth structures. Earth material has an advantage of being infinitely
recyclable (without stabilizing), requiring minimum technology and no intensive energy for
production, it is inexpensive and can generally be sourced around the site saving the impact
and cost of transportation. It also performs well hydrothermally due to its relatively low
thermal conductivity, large thermal and hydric mass and strong breathability (easy water
transport). These factors ensure good comfort, remarkably small-embodied energy and
light environmental impact. In addition to providing dwelling, it has the potential of solving
the production of affordable housing. It is labour intensive compared to fired-clay bricks
(Abd Rashid & Yusoff, 2015; Darko et al, 2017; Van Damme & Houben, 2017).
The demand for sustainable construction at low cost is growing as a process of resolving
social, economic and environmental issues.
2.2.1. Northern Nigeria traditional architecture
The Hausa-Fulani’s who essentially are nomads predominantly inhabit the northern Nigeria.
They are mainly Muslims and their Islamic faith accommodates the polygamous family
system. The northern Nigeria architecture, therefore, has reflected the culture, climate,
social/ economic status and materials in the region as indicated below.
a. Culture: The Islamic faith encourages segregation of female and male (Figure 2.1).
They are also engaged in ornamentation and agriculture, which reflects on the façade
of the buildings (Figure 2.2).
b. Climate: Northern Nigeria has the vegetation of the equatorial desert characterised by
little rainfall and extreme temperature difference between the day and night-time; and
bright sunshine, hot and dry air during the daytime and during the night-time extremely
cold. The wind direction is mainly from the North–eastern (Sahara Desert) and some
from South-western (Atlantic Ocean) and average speed of 2-3m/s. The average
ground temperature is about 29-30oC annually, relative humidity has an average of 12-
29% from Oct-May and 45-59% from June-Sept (Meteonorm 7.2).
The traditional approach to achieving an adequate comfort level in a residential house
is to incorporate a shaded courtyard, open interior, opposite openings to allow cross
ventilation, flat roof (lightly coloured to reflect heat), and window overhangs to provide
shading and minimize glazing at the west facing facade. Enough north glazing is
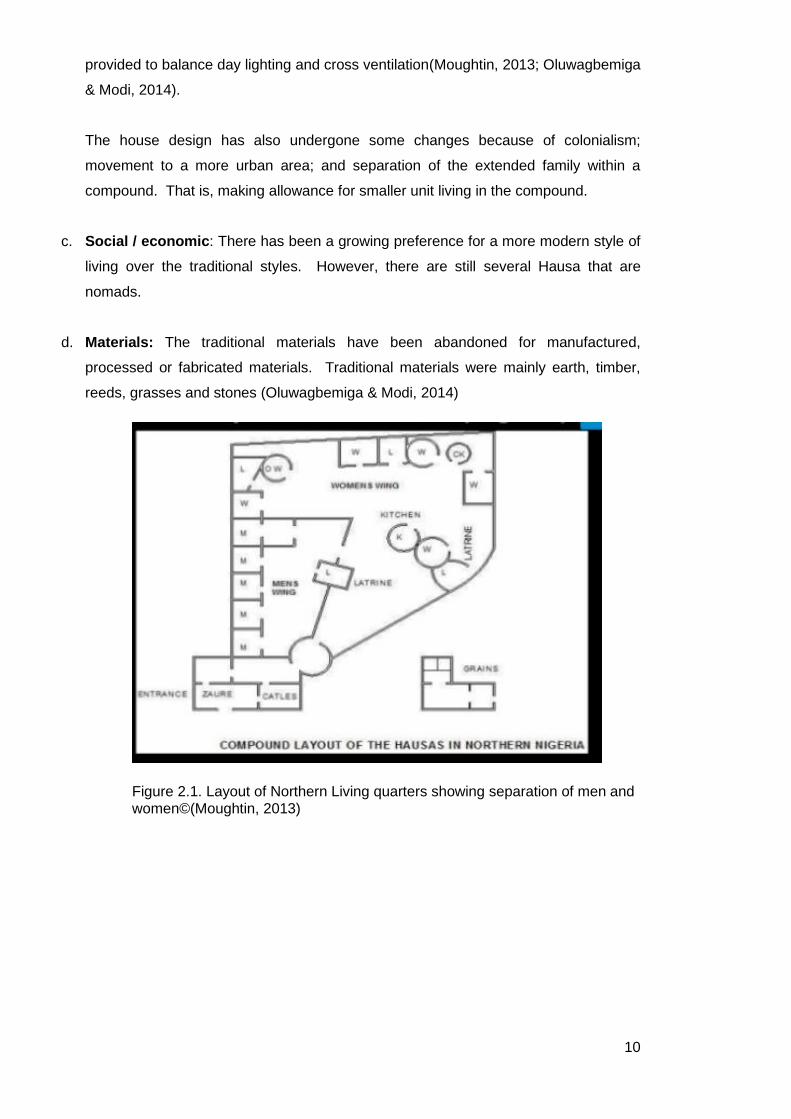
10
provided to balance day lighting and cross ventilation(Moughtin, 2013; Oluwagbemiga
& Modi, 2014).
The house design has also undergone some changes because of colonialism;
movement to a more urban area; and separation of the extended family within a
compound. That is, making allowance for smaller unit living in the compound.
c. Social / economic: There has been a growing preference for a more modern style of
living over the traditional styles. However, there are still several Hausa that are
nomads.
d. Materials: The traditional materials have been abandoned for manufactured,
processed or fabricated materials. Traditional materials were mainly earth, timber,
reeds, grasses and stones (Oluwagbemiga & Modi, 2014)
Figure 2.1. Layout of Northern Living quarters showing separation of men and women©(Moughtin, 2013)

11
Figure 2.2. Ornamentation of building Facade in Northern House ©Wikipedia, Hausa people.
2.2.2. Southern Nigeria traditional architecture
The Yoruba people are the predominant ethnic group inhabiting the south-western part of
Nigeria. The architecture of the region is influenced as described below:
a. Climate: The region records average 26-28oC temperature and 75-90% relative
humidity annually, and predominant rainfalls. (Meteonorm and Climate consultant).
b. Design Approach: Architecture style of the Yoruba people is a courtyard, cuboid or
rectangular form of compound. The rooms are rectangular and arranged in a linear
pattern. The household leader has his room at the front of the house to provide a form
of security, boys rooms are at the corner. The wall surface is made of courses of mud
mixed with vegetative material such as straw and adhesives. The ceiling made of palm
fronds or split bamboo. Mud is then placed on the palm fronds to use as a decking
material. Construction takes place during dry season to accelerate curing. The
bedrooms and storage areas have small windows to allow light and air, providing a
comfortable living environment. The veranda is opened to allow light and air, while
shading openings. The cooking activity is performed outside (Adedokun, 2014).
There are two house types that characterise the southern region of Nigeria as depict below:
i. The first house type is built around one or more courtyards. The type of family system
within determines the form of the house. The compound has an open plan with a single
entrance, rooms facing the courtyard.
ii. The second house type is a new concept that became popular in 1930s when the
earning from coca, palm oil and other agricultural produce made people travel for work
purposes. The house has no compound and has a central corridor with series of
unconnected rooms (rooming house). The wall construction of this type of house was
compressed earth blocks, some of which were used without stabilization. The design

12
was to provide housing rental accommodation at reasonable cost for the immigrants
from rural to urban area (Okeyinka, 2015).
The second house type of Yoruba architecture (rooming style) is depicted in Figure 2.3.
The building has a raised ground level with a solid concrete foundation to prevent water
or moisture from penetrating into the interior of the building. Furthermore, it has a
veranda that the occupant uses as a sit out area. There is a long corridor with rooms
along the building.
Figure 2.3. Type 2 rooming house - Southern Nigeria © (Adedamola Ojerinde,2018)
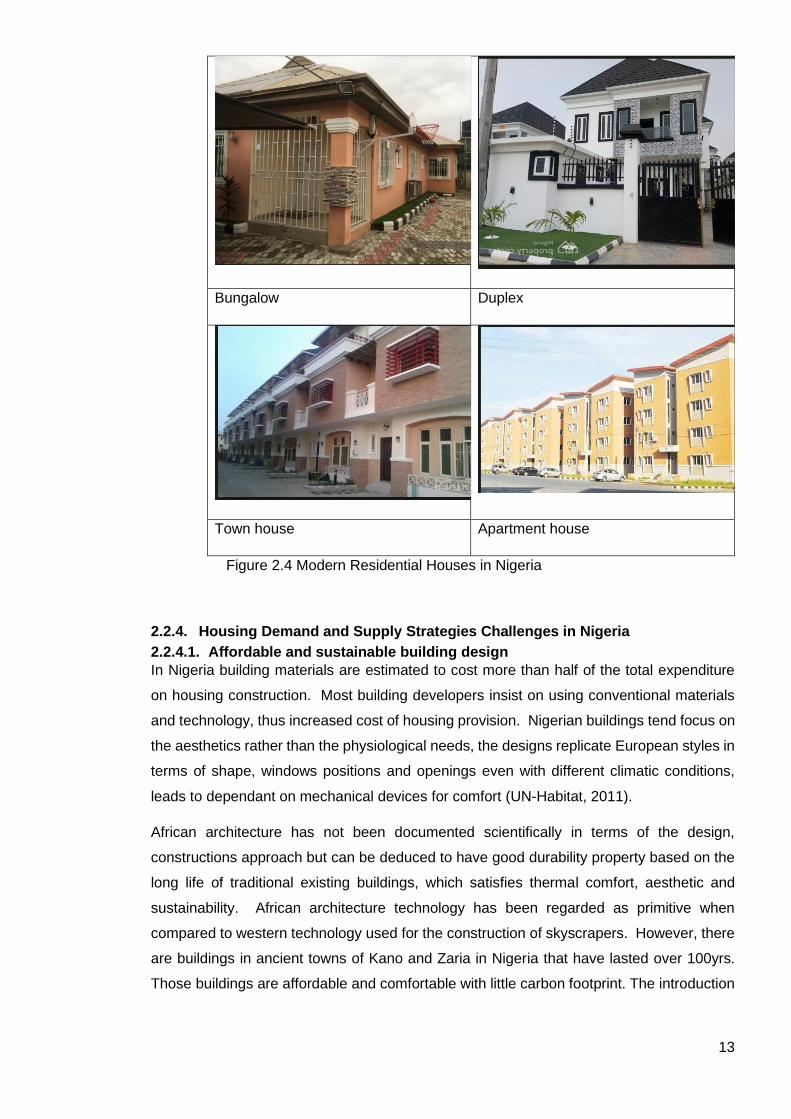
2.2.3. Integration of Modern architecture in Nigeria housing styles
The houses that integrate modern architecture in Nigeria are dependent on the income of
the household. Some of the houses are privately built to architectural taste and
requirements, while some developers construct houses in private gated estates. Low-
income earners mainly live in government provided houses or rent from private developers.
Contrary to the traditional architecture of Nigeria, these modern houses are not designed
with relation to the microclimate. The difference between the houses in the northern and
southern Nigeria in modern architecture is mainly the size of the building. The same type
of materials and design strategies are commonly used. Figure 2.4 shows the samples of
integrated modern architecture in Nigeria.
13
Bungalow Duplex
Town house Apartment house
Figure 2.4 Modern Residential Houses in Nigeria
2.2.4. Housing Demand and Supply Strategies Challenges in Nigeria
2.2.4.1. Affordable and sustainable building design
In Nigeria building materials are estimated to cost more than half of the total expenditure
on housing construction. Most building developers insist on using conventional materials
and technology, thus increased cost of housing provision. Nigerian buildings tend focus on
the aesthetics rather than the physiological needs, the designs replicate European styles in
terms of shape, windows positions and openings even with different climatic conditions,
leads to dependant on mechanical devices for comfort (UN-Habitat, 2011).
African architecture has not been documented scientifically in terms of the design,
constructions approach but can be deduced to have good durability property based on the
long life of traditional existing buildings, which satisfies thermal comfort, aesthetic and
sustainability. African architecture technology has been regarded as primitive when
compared to western technology used for the construction of skyscrapers. However, there
are buildings in ancient towns of Kano and Zaria in Nigeria that have lasted over 100yrs.
Those buildings are affordable and comfortable with little carbon footprint. The introduction
14
of modern technology has relegated traditional component (Akadiri, 2015; Ugochukwu &
Chioma, 2015).
Affordable construction has been identified as requiring low embodied energy. Operation
Energy consumption has increased in the recent years as a result of fast urbanization,
continuous industrialization and improved living standards. Understanding the concept of
affordable construction is predicated on understanding of the terminologies: embodied
energy; life cycle energy; operating energy; affordable housing; and sustainability
(environmental and social). The terms are defined as follows:
a. Embodied energy: It has been defined as the sum of primary energy consumed in
constructing a building using construction materials, products and processes along with
related transportation, administration and services. Life cycle energy is the sum of
embodied energy, operational energy and decommission energy (Cabeza et al, 2013;
Dixit, 2017).
b. Operating energy: It is the energy expended in maintaining the inside environment
through process such as heating and cooling, lighting and operating appliances
(Cabeza et al, 2013).
c. Affordable housing: usually refers to housing for people whose income is not enough
to have access to appropriate houses at market value. It is important to include
economical sustainability factors in order for the low-income earner to afford the house
proposed. It therefore means considering the initial and future cost, transport cost and
energy bill (Gan et al, 2017).
Sustainability is generally elaborated as a development that satisfies the needs of the
current generation and not at the cost of compromising future generation (Aste et al,
2017; Gan et al, 2017).
d. Environmental sustainability considers energy efficiency, water efficiency, effective
utilization of resources, efficient water management, comfortable and healthy
environment, reduction of footprint to minimize the biodiversity loss, climate change
and mitigation of greenhouse gas emission. (Aste et al, 2017; Gan et al, 2017; Walsh
et al, 2017). Selection of a wall material that is environmentally sustainable and doesn’t
compromise the economic sustainability such as local earth material is best.
e. Social sustainability is another important factor in sustainability. It emphasizes the
equal distribution and consumption of housing resource with special attentions to
horizontal equity and vertical equity. Vertical equity refers to equal treatment of people
in unequal position, horizontal in equal treatment of people in equal positions (Aste et
al, 2017; Gan et al, 2017; Walsh et al, 2017).
Reduction of building energy consumption will require a radical change in building design
procedure. A well designed building can support the local based economy by using on site
material as well as local labour forces (Aste et al, 2017). Unfortunately, too, there is

15
infrastructure deficit in Nigeria. The infrastructure including energy is inadequate for the
growing population that live in the urban areas. Almost all Nigerian home has to provide
water (borehole unit), generate electricity and construct drainages around their compounds.
(Ugochukwu & Chioma, 2015) identified the following challenges encountered in the
delivery of affordable houses in Nigeria:
a. Poor promotion of security tenure: Government would have to provide incentives
that encourages families to invest in their homes and communities.
b. Inadequate supply of affordable land: Scarcity of land has led to escalation of land
prices, overcrowding of existing sites, illegal invasion of vacant land, and growth of
squatter settlement.
c. Poor infrastructure and services: It make procurement of infrastructure by
individuals difficult and unaffordable because it is very costly
d. Utilization of local building materials and technologies: The use of conventional
materials has led to reduction of skilled artisans for traditional construction and
disappearance of the buildings.
The Nigerian Government has gone through different phases since the independence of
the country in 1960. Although several of the administrations have committed to providing
housing for the general public, relatively small numbers of houses have been built
(Olayiwola et al, 2005) and are summarized below:
a. Colonial period (1800-1960): The Government made no effort to provide houses to
rent for the general public
b. Post-independence period (1962-68): The Government planned to provide 24000
housing units, however, only 500 houses were provided before the civil war in 1967
c. The second National Development Plan (1970-1974): The Government only
provided 90 staff quarters and 4 blocks of flats for the Ministry of External Affairs
d. The third National Development Plan (1975-1980): The Federal Government
planned to build 200,000 housing unit in 5 years. Less than one-eighth of the houses
were built.
e. The fourth plan period (1981-1985): The Federal Government committed to building
200,000 housing units. However, a military coup occurred in 1986.
f. Post fourth plan period (1986-1998): The mass housing scheme was terminated
until 1991. In 1994-95 121,000 housing units were to be constructed for all income
groups. Unfortunately, the project was not completed due to the following reasons:
i. Problems from site acquisition
ii. Exorbitant contractual procedures
iii. Inflation of labor cost
16
iv. Budget reduction and improper phasing of the infrastructure and housing
construction
v. A slow rate of construction
vi. Lack of material choice
vii. Inadequate building and construction technology
g. Democracy 1999 till 2005: The Government completed 500 housing units in Abuja.
In addition, partnered with private investor developers to provide 1,127 units in Abuja
and Port Harcourt. Furthermore, construction resumed at previously abandoned
sites in Lagos.
h. Current 2005-2019: the government established a mortgage payment that requires
30% of the cost as down payment for a 10-year load. The cost is not affordable for
most government workers (Wallace and Adeleke 2019).
2.2.4.2. Vertical vs Horizontal buildings
Residential buildings can be categorized into high rise buildings (more than 10 storeys);
medium rise buildings (3-6 storeys); and low-rise buildings (1-2 storeys). The present high-
rise building evolved as a result of technology, utilities and services including stair way shaft,
elevator shafts, air conditioning system, communication system, electrical power, water
supply and gas system (Craighead, 2009).
Construction of high-rise building demand a huge capital, requires massive energy and
mechanical services, which increase the cost of running the building. Tall buildings
accommodate many people on a smaller area of land than low rise building for the same
number of units. High rise buildings create open land that can be used for communal
facilities such as libraries, sport areas and parks (Craighead, 2009).
There is shortfall in energy generation in Nigeria, hence the country is unable to meet the
energy needs of the urban cities. Although high rise buildings, could be the fastest route to
solving the housing deficit problem, they require more energy for mechanical services so
will not be of use here.
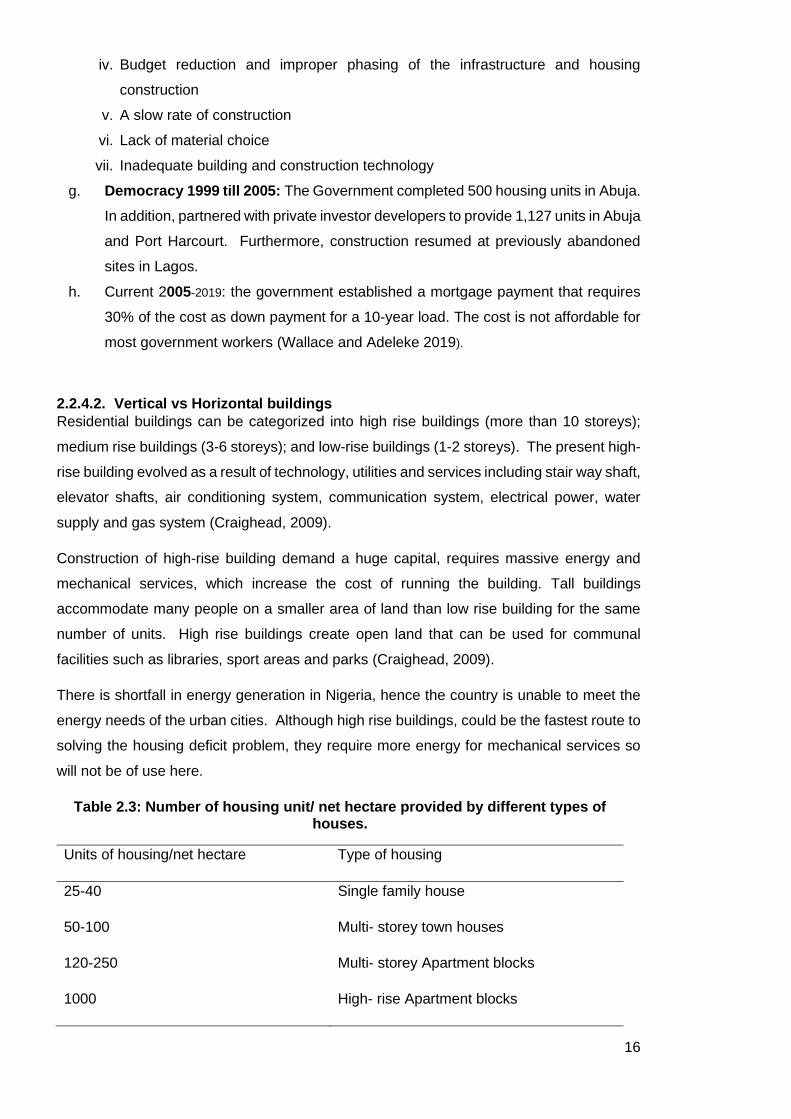
Table 2.3: Number of housing unit/ net hectare provided by different types of houses.
Units of housing/net hectare Type of housing
25-40 Single family house
50-100 Multi- storey town houses
120-250 Multi- storey Apartment blocks
1000 High- rise Apartment blocks
17
Table 2.3 shows the number of houses in a single hectare depending on its vertical
measurement. Low rise can accommodate a smaller number of families which might not be
adequate for a dense urban city. The shortage of houses in Nigeria is about 16-17 million
units - providing low rise buildings will create a large urban spread, which would reduce the
natural vegetation and energy efficiency of the towns that is required for vertical
transportation in such buildings. Land is a scarce commodity in urban city, Arable land area
is constantly threatened by urban spread. Low rise housing does not ensure adequate
utilization of this resource for sustainable housing (Adabre et al, 2020).
From the foregoing, medium rise (3-6 storeys) buildings appear to solve the housing deficit
in the country as they accommodate more people, reduce the urban spread, and do not
require particularly high energy for vertical transport. The reason medium rise buildings up
to 4 floors are suitable to provide house in a dense city and to manage the scare land
available in the city.
2.3. Building element requirements and passive design strategies
2.3.1. Climate and Passive design strategies
As described, A building is to perform the function of regulating the internal thermal comfort
in response to the external climate condition. High quality building construction is not only
question of aesthetics, but also, it is a question of function, construction, economy, ecology
and the wellbeing of the users (Hall et al, 2012). Thermal comfort is subjective but can be
expressed as the condition of mind where the occupant experiences satisfaction (Taylor et
al, 2008). Improving sustainable materials in order to improve its durability property in order
to encourage the use in the construction industry is paramount in order to mitigate the
adverse effect of other building materials. The construction industry worldwide is
encouraged to use materials, designs and construction methods that improve the energy
performance of buildings especially as the industry accounts for 40-50% world energy
consumption (Xiao et al, 2018). Developing countries are growing and would therefore
require a further increase in energy use. To avoid the energy requirement (and occupant
expenditure) of heating and cooling services, passive design strategies should be employed
(Ashour et al, 2015).
The temperature and relative humidity of the space affects the level of comfort for the users.
To ensure the correct passive design strategy, weather data can be super imposed on a
bioclimatic chart showing passive strategy options (an example is shown in Figure 2.6).
The application of passive design strategies in finding solution to housing deficit and
provision of sustainable houses for the low-income mass of Nigeria population would
require knowledge of the geographical location, soil and climate of the country. Nigeria, a
18
West African country is on Latitude 4-13oN and Longitude 2-14oE. It covers 923000km2
land area. The topography is mostly flat in the south and some elevated areas and
mountains in the northern part of the country (World, 2020). The lowest elevation is 0m
near the Atlantic Ocean in the south and highest elevated area of 2419m at the north-
eastern part of the country.
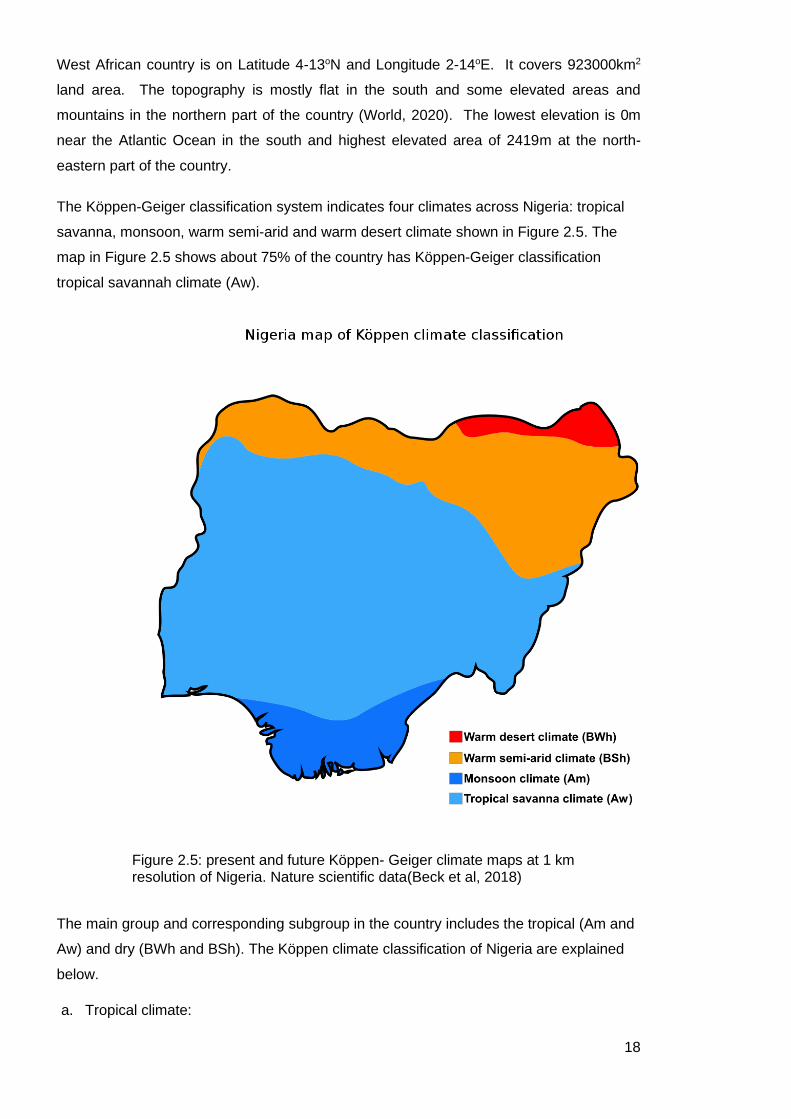
The Köppen-Geiger classification system indicates four climates across Nigeria: tropical
savanna, monsoon, warm semi-arid and warm desert climate shown in Figure 2.5. The
map in Figure 2.5 shows about 75% of the country has Köppen-Geiger classification
tropical savannah climate (Aw).
Figure 2.5: present and future Köppen- Geiger climate maps at 1 km resolution of Nigeria. Nature scientific data(Beck et al, 2018)
The main group and corresponding subgroup in the country includes the tropical (Am and
Aw) and dry (BWh and BSh). The Köppen climate classification of Nigeria are explained
below.
a. Tropical climate:
19
▪ Monsoon climate (Am): This region has short dry season. The driest month has
less than 60mm rain, the average monthly maximum is 380mm and minimum is
20mm. The maximum temperature in this region is 28-33oC, minimum
temperature 18oC. The relative humidity of the area is 58-80%.
▪ Tropical savanna climate (Aw): the driest month experiences less than 60mm
rainfall, the rainy season starts around April to October. The mean temperature
28-32oC with its peak in February and March (Fasona et al, 2013). The relative
humidity is about 80-85%.
b. Dry climate:
▪ Warm desert climate (BWh): the climate experiences long hot summers, warm
transitional season and short , mild chilly winters with mean temperature of equal
or greater than 18oC (Wang et al, 2019), The relative humidity is about 15-65%.
▪ Warm semi- arid climate (BSh): most of the area experiences less than 500mm
rainfall annually(Engelbrecht & Engelbrecht, 2016), the maximum temperature
ranges from 30-36oC . The relative humidity is about 25-80% annually.

20
Figure 2.6. Nigeria max temperature for dry and rainy seasons climate data (Am, Aw, BWh, BSh) superimposed on bioclimatic template (Givoni, 1992; Roshan et al, 2019). NB: The comfort band is based on Givoni’s work which applies to developed countries
The chart in Figure. 2.6 indicates the appropriate passive strategy for dry and rainy seasons
of each climate (based on mean data):
i. Monsoon climate (Am): the position of monsoon climate on figure 2.6 shows that the
passive design strategy required for this area is natural ventilation.
ii. Tropical savannah climate (Aw): the position on figure 2.6 shows that it requires
natural ventilation for its user to achieve thermal comfort wet season. The use of air
conditioning and conventional dehumidification is indicated for the other season, but
Aw Am
BS
h
BWh

21
it should be noted that the comfort band on figure 2.6 is not based on an acclimatized
population. The comfort band is higher in this region.
iii. Warm desert climate (BWh): the design for thermal comfort to be achieve is shading,
thermal mass with night ventilation and evaporative cooling.
iv. Warm semi- arid climate (BSh): the design for thermal comfort to be achieved is
buildings with high thermal mass and evaporative cooling.
Most of the country falls in the tropical savannah climate (Aw) and monsoon climate (Am)
which require shading and natural ventilation. Natural ventilation is adequate when
maximum temperature is approximately 34 oC, average 32 oC, wind speed 1.5 m/s and
relative humidity between 30-90% (Khambadkone & Jain, 2017). Natural ventilation can be
accomplished by façade openings, solar chimney, wind catcher and atrium.
The northern part of the country warm desert climate (BWh) and warm semi-arid climate
(BSh) require shading and high thermal mass (in combination with night ventilation for the
warm desert climate area. Earth blocks can be used as a thermal mass material.
The comfort band based on the mean temperature for Nigeria with 80% comfort is
approximately 23-30 oC and for 90% 24-29 oC (Toe et al, 2010). Adaptable comfort level of
approximately 80% can be achieve at air speed 0.1-0.2 m/s. Air speed of about 1 m/s for
temperature above comfort limit of 30 oC can provide adaptable comfort level. ASHRAE
Standard 55-2013, comfort level can be expanded by 2-3 oC when air movement is 1-1.5
m/s for air temperature and relative humidity boundary is 90% (Khambadkone & Jain, 2017).
2.4. External wall material options and their properties The wall, in addition to isolating the interior condition from the exterior condition, act as a
structural support for the load imposed by any suspended floor and roof. Walls can function
as load bearing, bracing or non-load bearing element in a building. Load bearing walls
transfer force to the foundation by itself, whereas bracing walls (also known as shear walls)
resist wind loads and any horizontal impact loads that are encountered. Non-load bearing
wall can be classified as walls that provide enclosure, which needs to transfer its load or
force to the load bearing walls, which in turn is transferred to the foundation. Load bearing
walls and non-load bearing walls protects external element at the same time giving room
for openings within them to provide light and ventilation depending on the requirement
(Berge, 2000). Material options for the construction of external walls and their properties for
low cost housing in Nigeria are reviewed in the following sections 2.4.1.-2.4.4 with a
summary in 2.4.5.
2.4.1. Fired bricks
Clay is a widely available raw material, which can be used to produce bricks.
Characteristically, it is suitable for brick because it could be moulded and shaped, it has

22
enough tensile strength to keep its shape and it fuses together when exposed to adequate
temperature. Clay occurs in the forms of surface clay, shales and fireclays. Surface clay
are found close to the surface of the earth, shales are clays that have been subjected to
high pressure and have become hard and fireclays are found at deeper levels. The most
important characteristic is its ability to withstand high temperatures. Clay is a complex
material but mainly composes of silica and alumina with varying quantity of metallic oxides
and other ingredients. Clay can be divided into two main types. That is, calcareous clay
(has 15% calcium carbonate and burns to yellowish colour), and Non-Calcareous clay
(contains silicate of alumina, with feldspar and iron oxide 2-10%, with burning colour of red,
buff or salmon)(Lyons, 2014).
Brick can be classified according to use:
- Common bricks have acceptable strength, water absorption durability, thermal and
moisture movement. They are cheap to produce but have poor appearance.
- Facing bricks are more expensive, have better appearance and are better to use in
exposed area. They have similar performance to common bricks.
- Engineering bricks are stronger than common or facing brick. They have low moisture
absorption but are more expensive than common bricks. They are used where
enhanced strength and low porosity is needed (Lyons, 2014).
The manufacture of clay brick can be done through three stages: excavation and
preparation of the raw material; forming the shape required; and drying and firing. The
process is illustrated in Figure 2.7 and explained below:
i. Excavation of clay: Mined material is checked for impurities before use to determine
the active soluble salts content of masonry (Lyons, 2014). It quarried crushed,
screened to remove stone and other debris, mixed with water and then passed through
a pug mill to produce uniform clay of high plasticity (Charlett, 2013).
ii. Forming the shape: Shaping is made manually or by using machine. If done
manually, the lump of clay is put into wooden mould that have been lined with sand or
sawdust which have relatively irregular shaped and dimension. The machine or
alternative clay is formed through a die and cut and shape into dimensions needed by
stretched wires. Clay needed to be moderately stiff (Lyons, 2014).
iii. Drying and firing bricks: Firing temperature is usually around 900oC. The bricks are
dried prior firing otherwise they will crack when exposed to high temperature within the
kiln. Finally, bricks are cooled by incoming air needed for combustion. (Charlett, 2013;
Lyons, 2014).
iv. Manufacture of calcium silicate: It is manufactured with sand, flint mixed with quick
lime or hydrated lime and water in protein to proportion of 10 parts sand or flint to 1-
part quick lime or hydrated lime mixed with pressed steel in mould and then autoclaved
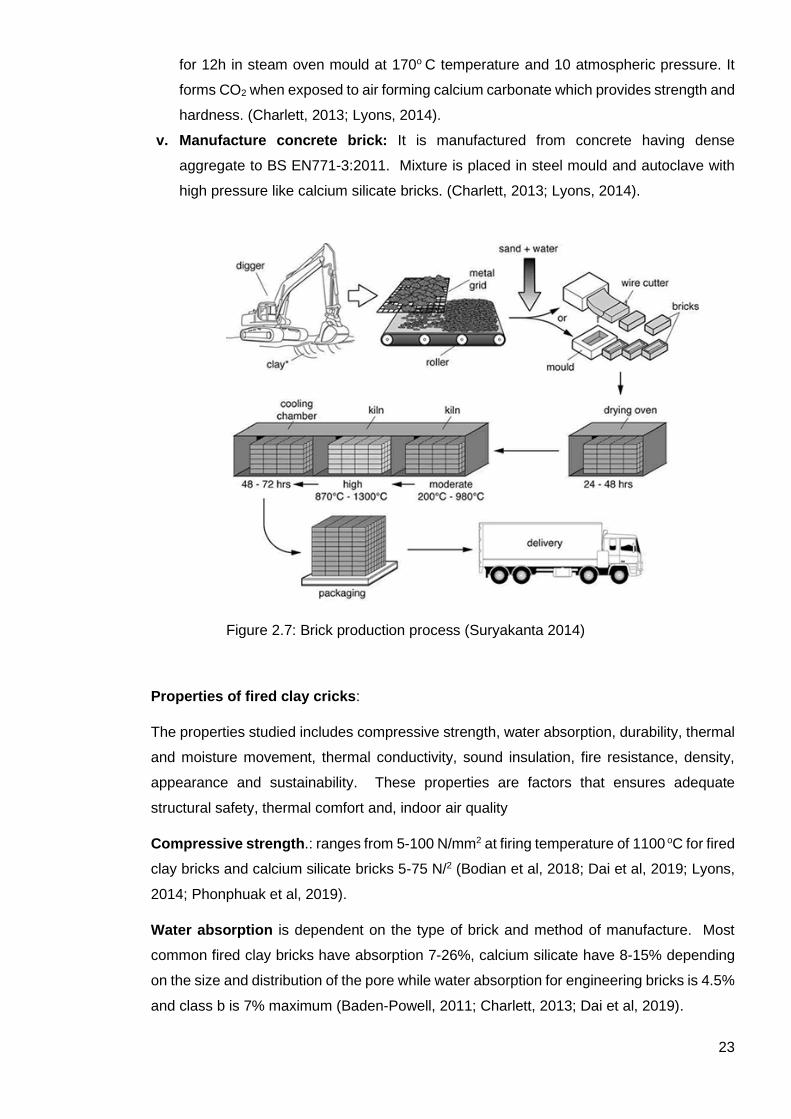
23
for 12h in steam oven mould at 170o C temperature and 10 atmospheric pressure. It
forms CO2 when exposed to air forming calcium carbonate which provides strength and
hardness. (Charlett, 2013; Lyons, 2014).
v. Manufacture concrete brick: It is manufactured from concrete having dense
aggregate to BS EN771-3:2011. Mixture is placed in steel mould and autoclave with
high pressure like calcium silicate bricks. (Charlett, 2013; Lyons, 2014).
Figure 2.7: Brick production process (Suryakanta 2014)
Properties of fired clay cricks:
The properties studied includes compressive strength, water absorption, durability, thermal
and moisture movement, thermal conductivity, sound insulation, fire resistance, density,
appearance and sustainability. These properties are factors that ensures adequate
structural safety, thermal comfort and, indoor air quality
Compressive strength.: ranges from 5-100 N/mm2 at firing temperature of 1100 oC for fired
clay bricks and calcium silicate bricks 5-75 N/2 (Bodian et al, 2018; Dai et al, 2019; Lyons,
2014; Phonphuak et al, 2019).
Water absorption is dependent on the type of brick and method of manufacture. Most
common fired clay bricks have absorption 7-26%, calcium silicate have 8-15% depending
on the size and distribution of the pore while water absorption for engineering bricks is 4.5%
and class b is 7% maximum (Baden-Powell, 2011; Charlett, 2013; Dai et al, 2019).

24
Durability is affected by the water absorption of the brick, but clay is mainly affected by
soluble salt, which could cause staining or efflorescent. Unburnt brick is less durable than
fired brick. Engineering clay bricks have the best durability. Calcium silicate and concrete
bricks are not affected by soluble salt like clay brick (Charlett, 2013).
Thermal and moisture movement: moisture movement is negligible in burnt bricks, but
thermal movement is 0.3mm/m. It is advisable therefore to incorporate 10mm expansion
joint protected by plastic sealant for every 12m wall not broken by door or window. Moisture
movement is higher in calcium silicate and concrete bricks, so it is recommended to have
10 mm expansion joint at every unbroken 7m wall.
Thermal conductivity of fired clay bricks depend on the density and position, but typically
ranges from 0.43 to 1.4 W/m.K and calcium silicate (0.6-1.3 W/m.K) with thickness of 100-
102.5 mm (Charlett, 2013; Engineering, 2002; Lyons, 2014).
Sound insulation: Most bricks have good sound reduction values ranging from 44 to 57dB
(Binici et al, 2009; Charlett, 2013; Hegger, 2006).
Fire resistance: The resistance of clay bricks has fired resistance up to 1-4 hrs. Calcium
silicate provides resistance up to 3 hrs. Concrete bricks have high resistance also (Charlett,
2013).
Density: The density of bricks varies from 1600 to 2100 kg/m3 (Ashby, 2013).
Appearance: Clay is usually faced with sand or colouring of natural pigment of clay.
Calcium silicate is usually off white or pale pink in colour, smooth finish but textured can be
available. Concrete has slightly rougher surface and can be available in smooth rustic or
weathered finish (Charlett, 2013; Hegger, 2006).
Sustainability: The recycle fraction in current supply 15-20% (Ashby, 2013). During the
production of clay bricks, the emission of carbon dioxide and other pollutant like sulphur
dioxide is emitted to the environment and embodied energy for bricks is approximately 200-
220 KgCO2/ tonne(SFGB, 2011; Torgal & Said, 2011). Well-constructed clay bricks have
long life span (50+ years) (Maia de Souza et al, 2016; Thomas & Ding, 2018; Udawattha &
Halwatura, 2017) and low maintenance. The use of Portland cement requires high level of
technology and skill for production.
In summary, brickwork has the advantage of being: locally sourced; able to withstand high
temperature in case of fire outbreaks; amenable to different product sizes and finishes, and
can be made for different uses (i.e. Engineering, decorative and regular use). However, it
has drawbacks because it requires more energy, high technology would require this
material high cost for production of low-cost housing with the material.

25
2.4.2. Blockwork
Blocks are made from either clay or concrete. Clay blocks are available in three width
variation of 62.5, 75 or 150 mm wide. The 62.5mm and 75mm thick blocks are used for
non-load bearing application (Charlett, 2013).
Concrete blocks are made from dense, lightweight or aerated concrete. Lightweight or
aerated concrete is used for internal leaves of cavity walls or internal partitions; it has good
thermal expansion, sound insulation as a result of the air voids within (Kalpana & Mohith,
2020). The size ranges from 370 to 590mm length, 140 to 290mm height and 60 to 250mm
thick. Concrete blocks are made from a mixture of Portland cement and aggregates. It can
be designed to be hollow, cellular, sound absorbing, insulating or solid blocks.
Blocks have unique characteristics including:
i. Light weight compares to bricks
ii. Are comparatively cheap to produce and lay, giving economical walls compared to
brickwork
iii. Have better thermal resistance than brick
iv. Accept nails and screws more readily than brickwork
v. Can be supplied with a keyed or textured surface for the application of plastered
rendered finish (Charlett, 2013)
Manufacture of concrete block has mixture of cement, appropriate aggregate and water.
The mixture is put into a steel mould compacted by pressure or vibration, demoulded
immediately and left to cure either naturally or artificially. Aerated blocks are made from
sand, pulverised fuel ash, cement and aluminium powder. Like most concrete products,
concrete blocks shrink as they cure.
Properties of the blocks:
Compressive strength: The minimum compressive strength for clay block is 1.4 N/mm2
for non-load bearing and 2.8 N/mm2 for load bearing. The compressive strength for dense
concrete blocks over 75 mm thickness ranges from 2.8 to 35.0 N/mm2 and light weight or
aerated 5.5-45N/mm2. (Charlett, 2013; Gyurkó et al, 2019)
Water absorption: Due to the pores, blocks have higher water absorption than bricks.
Dense concrete is better for below ground level since it has lower porosity than light-weight
blocks. Aerated concrete is more porous, and this should be considered when designing to
minimize the absorption rate (Charlett, 2013).
Durability: it has good resistance to freeze/ thaw condition beyond DPC level but
compressive strength lower than 7 N/mm2 should not beyond DPC( damp proof course )
level(Lyons, 2014).

26
Thermal and moisture movement: They are like brick but can be bad for aerated concrete
blocks if exposed to damping prior to laying which leads to cracking from drying shrinkage
(Charlett, 2013).
Thermal conductivity: higher porosity leads to improved thermal resistance. Thermal
conductivity for concrete block ranges from 0.7 to 1.8 W/m. K for dense block, 1.0-1.8 W/m.
K for light-weight clay blocks. The low thermal values make it suitable for inner leaf cavity
walls (Ashby, 2013; Charlett, 2013; Engineering Toolbox, 2002).
Fire resistance: Block is slightly less resistant to fire than clay brick. A 100mm block has
2 h resistance to its load bearing and 4h if it is non-load bearing (Charlett, 2013; Stowell,
2020).
Density: aerated blocks have density of 400-1500 kg/m3 and dense blocks are closer to
2050-2300 kg/m3 (Charlett, 2013; Lyons, 2014; Goodhew, 2016).
Appearance: Clay blocks have grooved surfaces to provide a surface for rendering. Dense
and high strength concrete tend to be slightly rough textured which makes it good for
application of finishes. Aerated blocks have smooth finish (Charlett, 2013).
Sustainability: the major environmental impacts of concrete blocks relates to the carbon
emissions of cement which is attributed with 5-7% of the total CO2 emitted worldwide and
embodied energy of the material is approximately 143-375 Kg CO2/ tonne (Alsubari et al,
2016; Liu et al, 2017; SFGB, 2011; Torgal & Said, 2011). However, the blocks often make
use of recycled aggregates such a fly ash and foamed granulated blast furnace slag. The
lightweight and aerated concrete blocks have reduced transportation energy in comparison
with dense blocks (Charlett, 2013).
Concrete can be affected by cracking, spalling or by efflorescence (Figure 2.8). Spall is
caused by a problem in the mix, water or mechanical damage, while efflorescence is caused
by accumulation of salts on the surface. Unpainted block can be cleaned with low-pressure
water and non-ionic detergent. Limiting the moisture movement within the wall by installing
flashing, coping and using appropriated barriers can prevent the problem of efflorescence.
Limiting the movement of the walls, by using concrete with limit shrinkage or reinforcement,
can prevent the problem of cracking. Spall can be repaired by patching a mix like the
concrete blocks (Jester & Tomlan, 2014).
The advantages of using blockwork for wall are listed below:
i. it is produced in a range of sizes,
ii. it can be used for both load bearing and non-load bearing walls in construction,
iii. production is cheaper compared to brickwork
iv. It has good thermal resistance and good sound insulation
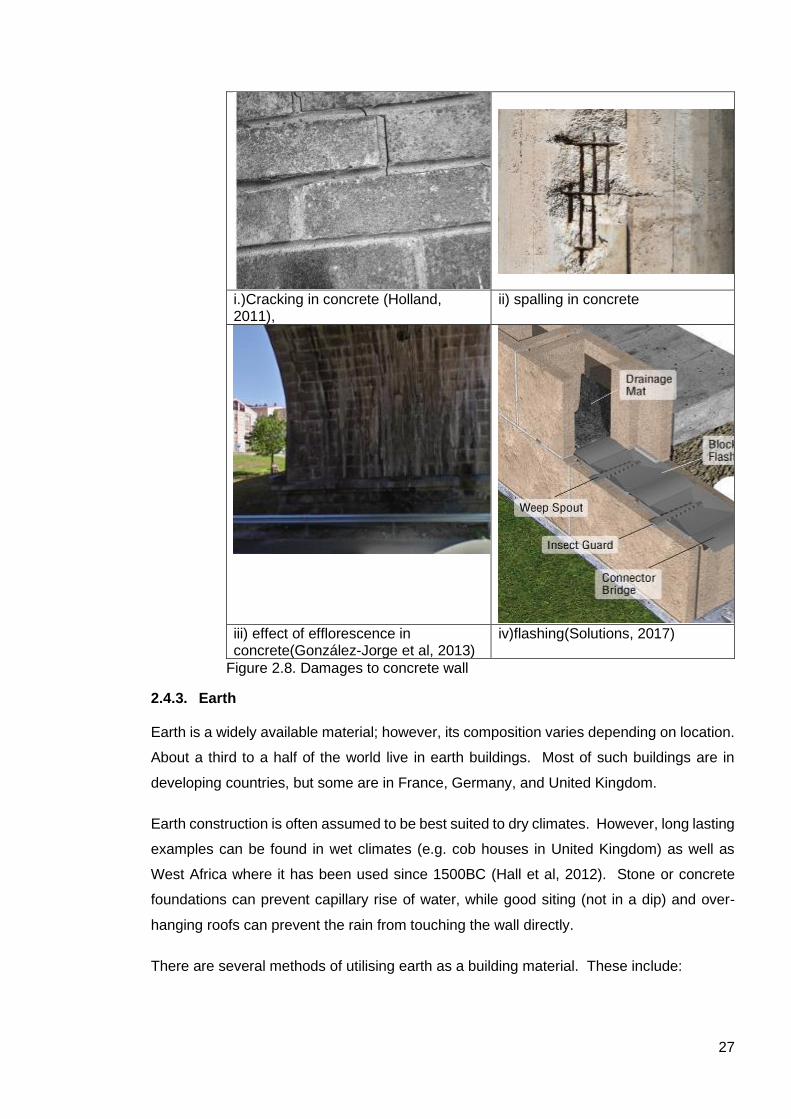
27
i.)Cracking in concrete (Holland, 2011),
ii) spalling in concrete
iii) effect of efflorescence in concrete(González-Jorge et al, 2013)
iv)flashing(Solutions, 2017)
Figure 2.8. Damages to concrete wall
2.4.3. Earth
Earth is a widely available material; however, its composition varies depending on location.
About a third to a half of the world live in earth buildings. Most of such buildings are in
developing countries, but some are in France, Germany, and United Kingdom.
Earth construction is often assumed to be best suited to dry climates. However, long lasting
examples can be found in wet climates (e.g. cob houses in United Kingdom) as well as
West Africa where it has been used since 1500BC (Hall et al, 2012). Stone or concrete
foundations can prevent capillary rise of water, while good siting (not in a dip) and over-
hanging roofs can prevent the rain from touching the wall directly.
There are several methods of utilising earth as a building material. These include:
28
Wattle and Daub: Straw and earth are pressed in a relatively light woven lattice of wooden
strips, sometimes simple boughs, the lattice is connected to a stronger vertical or incline
wooden frame (Van Damme & Houben, 2017). The image shown in Fig 2.9 (I).
Cob: uses the same straw mix as for wattle and daub but without any support for formwork,
which allows a free shaped wall. The moist earth (cob) mixture is lightly tamped into place
to form monolithic walls (Hall et al, 2012). The image shown in Fig 2.9(ii).
Adobe brick: can be made from earth with a clay content between 10-30% and earth
containing 5-40% and no particles larger than 15mm. Straw is added to reduce shrinkage
with a small amount of water to make the earth workable. The blocks are pressed in a
mould, then removed and placed to dry for two weeks in a place protected from rain
(McHenry, 1984). Adobe is commonly used for single and two storey houses, but it has
been used for construction of 10-storey building (Pacheco-Torgal, 2015). Example in Fig
2.9 (iii).
Rammed earth: requires a formwork for the wall. Damp earth is poured into the form and
tamped to compact the earth (McHenry, 1984). Rammed earth is better for lower clay
levels than adobe blocks (higher clay levels increase likelihood of cracking during drying)
and coarse particles can be included (Van Damme & Houben, 2017). Stabilizing agents
such as Portland cement may be added to provide moisture proofing or additional strengths
quality (McHenry, 1984). The formwork can be removed before the wall has fully dried (Hall
et al, 2012). Rammed earth is more appropriate for humid climates than adobe (McHenry,
1984). Example in Fig 2.9 (iv).
Earth loaves: freshly hand formed earth loaves are laid like the brick construction, but only
four courses are completed in a day. Stick reinforcements are introduced at every third
course. After it is dried for 6 weeks the earth is strong enough to support the roof. This
technique can be used for internal and external walls with load and non-loadbearing function
(Berge, 2000). This technique was further developed in Germany to become the Earth
Strand which was more suitable to the locally available earth. A brick extruding machine
was used to compress and extrude a tube of 8-16cm in diameter (Berge, 2000).
Earth filled hoses are suitable for clay free earth – even for pure sand with no binding
properties. The filled sacks are piled up within a light timber framework (Berge, 2000).
Compressed Earth Blocks (CEBs): The use of compacted stabilized blocks was seen
after the 1940s. Paul Ramirez developed the CINVA-RAM press in 1952. Social houses
were built with stabilized blocks of up to 3 storeys (Hall et al, 2012). Further details will be
presented in Section 2.3.

29
-
i) Wattle and Daub- lowimpact.org ii) Cob-
www.buildsomethingbeautiful.com
iii) Adobe- Santa Fe - Adobe Building is
a photograph by Frank Romeo iv) Rammed Earth- Materials: Rammed
Earth, Paul Downton 2013
Figure 2.9. Traditional earth building techniques
Properties of earth construction:
Compressive strength: un-stabilized earth can have compressive strength of 0.7-5 N /mm2, but higher once stabilized. The lower strength requires thicker walls to be built (Hall et al, 2012; Zak et al, 2016)
Water absorption: earth is an excellent regulator of humidity (Hall et al, 2012)
Thermal and moisture movement: the movement of rain on wall surface doesn’t have
erosive effect above 25mm/m (Torgal & Said, 2011).
Thermal conductivity: dry earth has a thermal conductivity of 1.5 W /m. K, like dense brick
and dense concrete. The thermal performance of earth can be improved by adding fibres
(Berge, 2000; Engineering Toolbox, 2002).
Sound insulation: the sound insulation of earth structure is 51 to 53dB (Binici et al, 2009).
Fire resistance: earth structures are considered fireproof (Hall et al, 2012)
Density: dry density ranges from 1450-2400 (Steve, 2016; Torgal & Said, 2011)

30
Appearance: the appearance varies from rough surface to smooth clean surface based on
the images in Figure 2.9
Sustainability: earth is a low pollution material. When the building is no longer required, it
can be reverted to earth (unless it has been stabilised). The replacement of concrete
blocks by 5% with earth blocks will reduce the CO2 emission by approximately 10000
tonnes. The embodied energy for this material is about 22 Kg CO2/ tonne (Torgal & Said,
2011).
There is little documentation of methods for formal earth building construction and structural
performance in construction codes is scanty. The use of earth for construction depends on
constraints of mining, resource delivery and processing, access to labour force, quality
control and approve building plans. However, it helps with local job creation and economic
growth as well as low production and maintenance costs (Krosnowski, 2011). The material
required for earth construction is locally available but the skills for construction have not
been passed to the new generation as the material has been ignored for modern material
as a result of social stigma attached to earth buildings as it is often used by the poorest in
the community.
2.4.4. Stonework
Stone is one of the oldest building materials known to man, it was a dominant building
material until the 20th century and is preferred for construction of permanent buildings.
The extraction of stone is more labour intensive, which could not compete with the growing
industrialization of construction despite having a lower energy consumption compared to
bricks and concrete.
The process of removing stone from earth is known as quarrying; drilling and splitting the
stone can remove it. The method varies depending on the thickness of the stone. Holes
can be drilled on the face at right angles, wedges are driving to the holes in order to divide
the rock, the rocks are large and can be divided into pieces and shape required, the stone
can be finished with planar finish, carbon finish, rubbed finish and different machine finishes.
The building industry today uses stone to face building with exterior made of steel or
concrete frames (Hegger, 2006; Lyons, 2014).
Rock can be classified into igneous (e.g. granite) sedimentary (e.g. limestone / travertine,
sandstone) or metamorphic (e.g. marble, slate, serpentine). Stones used for construction
can be classified into commercial forms, which are rubble (fieldstone), dimension (cut
stone), flagstone (flat slabs), and crushed stone. Rubble stone are used the way it is found
in the field, dimension stones are cut to suitable sizes, flag stones are cut to 12.7mm and
up and crushed stone are cut in sizes varying from 9.5 to 152mm. Crushed stone is
31
commonly used for aggregate in concrete or levelling for loose foundation(Richardson,
2001).
Properties of stone construction:
Compressive strength: varies depending on stone type. E.g. Sandstone and limestone
2.1 N/ mm2, slate 3.5 N /mm2, granite 4.8 N /mm2 (Engineering Toolbox, 2008)
Water absorption: ranges from 1-7% (Fockenberg, 1991)
Thermal and moisture movement: the thermal expansion oranges from 0.0032-0.044%
(Hackman & Kessler, 1950)
Thermal conductivity: 1.7-6.0 W /m. K (Charlett, 2013; Engineering, 2002).
Density: 2240-2650 kg m-3 (Baden-Powell, 2011; Charlett, 2013; Charlotte, 2011).
Appearance: colour, grain, porosity and texture are important to the appearance and vary
between stone types
Sustainability: The recycling fraction in the current supply is 1-2% (Ashby, 2013). The
embodied energy for stonework is 64-84 Kg CO2 /tonne (SFGB, 2011). Stonework material
is available in Nigeria but requires high energy for extraction and processing for construction
use; these factors increases the cost of houses and reduces the potential for the purpose
of affordable houses in the country.
2.4.5. Summary
The review on conventional material used for wall construction in Nigeria on requirement all
of the materials described above can be considered (assuming earth materials are
stabilized). With this basic requirement met, the decision on material choice is based on
appearance, material availability and cost implications for the resulting building
construction. The summary of the materials characteristics of wall material characteristics
is shown in Table 2.4
The use of stonework, brickwork, blockwork require significant energy for production, the
amount available in the country is inadequate. For these reasons, stabilised CEBs have
been chosen as the most suitable wall material for affordable and sustainable residential
building.
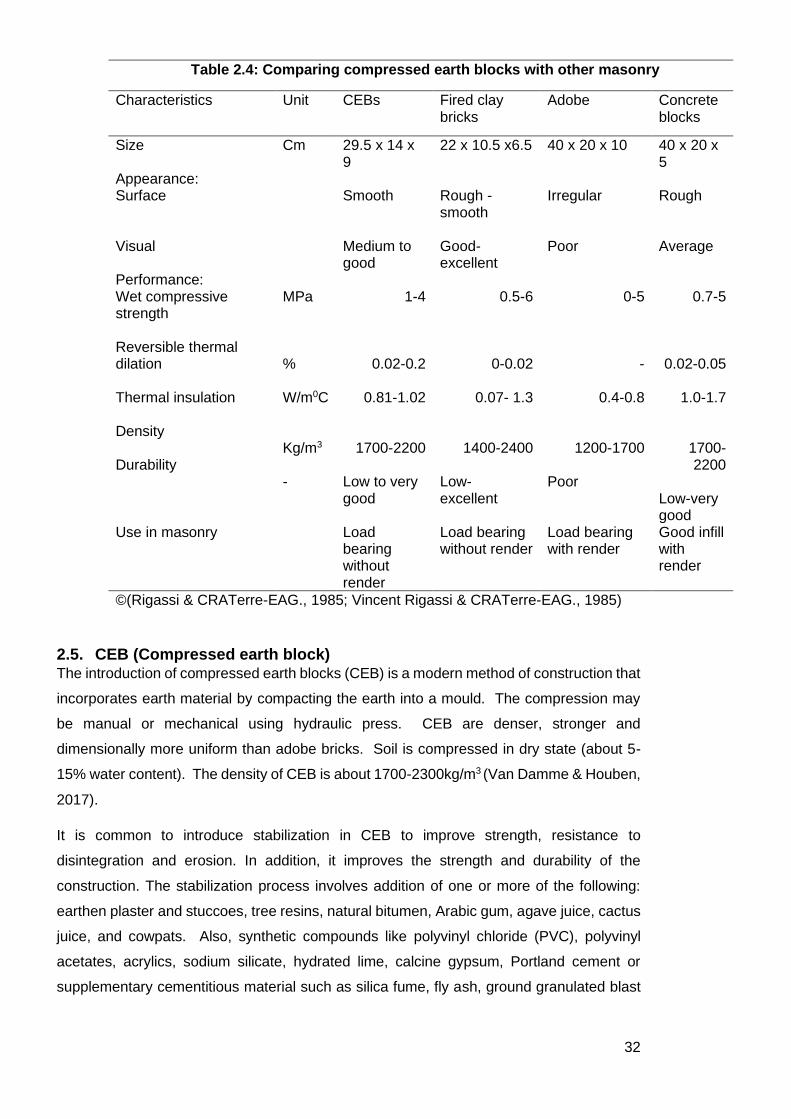
32
2.5. CEB (Compressed earth block) The introduction of compressed earth blocks (CEB) is a modern method of construction that
incorporates earth material by compacting the earth into a mould. The compression may
be manual or mechanical using hydraulic press. CEB are denser, stronger and
dimensionally more uniform than adobe bricks. Soil is compressed in dry state (about 5-
15% water content). The density of CEB is about 1700-2300kg/m3 (Van Damme & Houben,
2017).
It is common to introduce stabilization in CEB to improve strength, resistance to
disintegration and erosion. In addition, it improves the strength and durability of the
construction. The stabilization process involves addition of one or more of the following:
earthen plaster and stuccoes, tree resins, natural bitumen, Arabic gum, agave juice, cactus
juice, and cowpats. Also, synthetic compounds like polyvinyl chloride (PVC), polyvinyl
acetates, acrylics, sodium silicate, hydrated lime, calcine gypsum, Portland cement or
supplementary cementitious material such as silica fume, fly ash, ground granulated blast
Table 2.4: Comparing compressed earth blocks with other masonry
Characteristics Unit CEBs Fired clay bricks
Adobe Concrete blocks
Size Cm 29.5 x 14 x 9
22 x 10.5 x6.5 40 x 20 x 10 40 x 20 x 5
Appearance: Surface Visual
Smooth Medium to good
Rough - smooth Good- excellent
Irregular Poor
Rough Average
Performance: Wet compressive strength Reversible thermal dilation Thermal insulation Density Durability
MPa % W/m0C Kg/m3 -
1-4
0.02-0.2
0.81-1.02
1700-2200 Low to very good
0.5-6
0-0.02
0.07- 1.3
1400-2400 Low- excellent
0-5
-
0.4-0.8
1200-1700 Poor
0.7-5
0.02-0.05
1.0-1.7
1700-2200
Low-very good
Use in masonry Load bearing without render
Load bearing without render
Load bearing with render
Good infill with render
©(Rigassi & CRATerre-EAG., 1985; Vincent Rigassi & CRATerre-EAG., 1985)
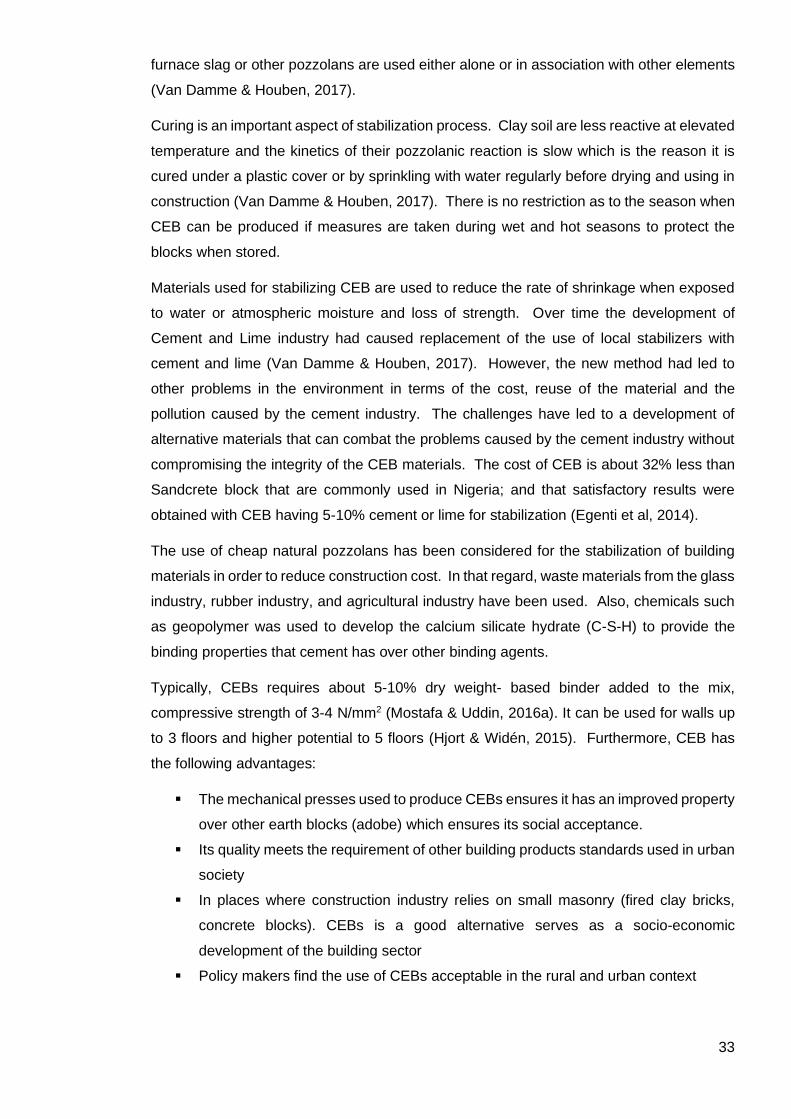
33
furnace slag or other pozzolans are used either alone or in association with other elements
(Van Damme & Houben, 2017).
Curing is an important aspect of stabilization process. Clay soil are less reactive at elevated
temperature and the kinetics of their pozzolanic reaction is slow which is the reason it is
cured under a plastic cover or by sprinkling with water regularly before drying and using in
construction (Van Damme & Houben, 2017). There is no restriction as to the season when
CEB can be produced if measures are taken during wet and hot seasons to protect the
blocks when stored.
Materials used for stabilizing CEB are used to reduce the rate of shrinkage when exposed
to water or atmospheric moisture and loss of strength. Over time the development of
Cement and Lime industry had caused replacement of the use of local stabilizers with
cement and lime (Van Damme & Houben, 2017). However, the new method had led to
other problems in the environment in terms of the cost, reuse of the material and the
pollution caused by the cement industry. The challenges have led to a development of
alternative materials that can combat the problems caused by the cement industry without
compromising the integrity of the CEB materials. The cost of CEB is about 32% less than
Sandcrete block that are commonly used in Nigeria; and that satisfactory results were
obtained with CEB having 5-10% cement or lime for stabilization (Egenti et al, 2014).
The use of cheap natural pozzolans has been considered for the stabilization of building
materials in order to reduce construction cost. In that regard, waste materials from the glass
industry, rubber industry, and agricultural industry have been used. Also, chemicals such
as geopolymer was used to develop the calcium silicate hydrate (C-S-H) to provide the
binding properties that cement has over other binding agents.
Typically, CEBs requires about 5-10% dry weight- based binder added to the mix,
compressive strength of 3-4 N/mm2 (Mostafa & Uddin, 2016a). It can be used for walls up
to 3 floors and higher potential to 5 floors (Hjort & Widén, 2015). Furthermore, CEB has
the following advantages:
▪ The mechanical presses used to produce CEBs ensures it has an improved property
over other earth blocks (adobe) which ensures its social acceptance.
▪ Its quality meets the requirement of other building products standards used in urban
society
▪ In places where construction industry relies on small masonry (fired clay bricks,
concrete blocks). CEBs is a good alternative serves as a socio-economic
development of the building sector
▪ Policy makers find the use of CEBs acceptable in the rural and urban context
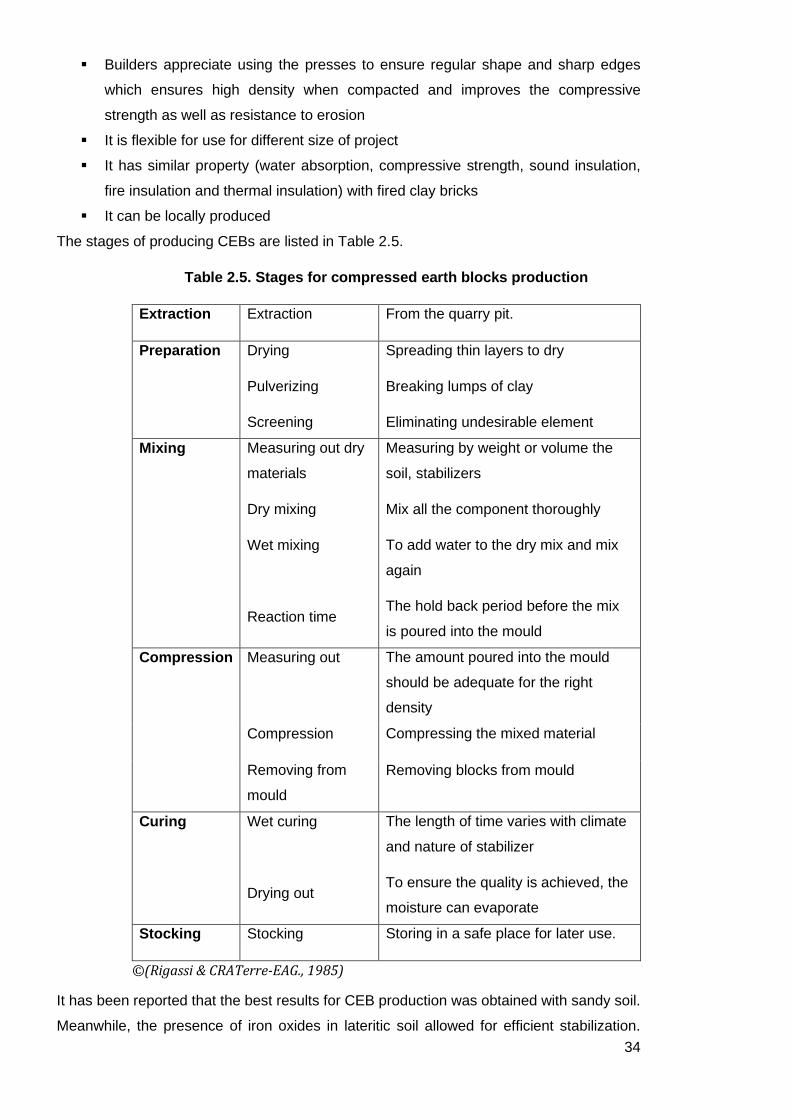
34
▪ Builders appreciate using the presses to ensure regular shape and sharp edges
which ensures high density when compacted and improves the compressive
strength as well as resistance to erosion
▪ It is flexible for use for different size of project
▪ It has similar property (water absorption, compressive strength, sound insulation,
fire insulation and thermal insulation) with fired clay bricks
▪ It can be locally produced
The stages of producing CEBs are listed in Table 2.5.
Table 2.5. Stages for compressed earth blocks production
Extraction Extraction From the quarry pit.
Preparation Drying
Pulverizing
Screening
Spreading thin layers to dry
Breaking lumps of clay
Eliminating undesirable element
Mixing
Measuring out dry
materials
Dry mixing
Wet mixing
Reaction time
Measuring by weight or volume the
soil, stabilizers
Mix all the component thoroughly
To add water to the dry mix and mix
again
The hold back period before the mix
is poured into the mould
Compression Measuring out The amount poured into the mould
should be adequate for the right
density
Compression Compressing the mixed material
Removing from
mould
Removing blocks from mould
Curing Wet curing
Drying out
The length of time varies with climate
and nature of stabilizer
To ensure the quality is achieved, the
moisture can evaporate
Stocking Stocking Storing in a safe place for later use.
©(Rigassi & CRATerre-EAG., 1985)
It has been reported that the best results for CEB production was obtained with sandy soil.
Meanwhile, the presence of iron oxides in lateritic soil allowed for efficient stabilization.
35
Also, soil must be free of organic matter before use for CEB production. Water with salt
and in particular sulphate should be avoided to achieve the best CEB (Rigassi & CRATerre-
EAG., 1985)
Table 2.6 shows the different presses that are available to produce CEB. It also highlights
the average blocks that can be produced and the cost of production.
Table 2.6: Types of presses used for Compressed earth blocks (CEBs) production
Manual ¼
Motorized
½
Motorized
¾
Motorized
Motorized Automatic
Number of
blocks daily
600-
1000
1200-
1500
1200-
1500
1500-
2000
1500-
2500
5000-
6000
Number of
labourers
9-10 11-13 10-12 9-11
8-10 8-10
Investment
on
equipment
2,000 10,000 14,500 23,000 46,000 83,000
Infrastructure
(excluding
land)
2250 4150 4150 4500 10,000
38,000
Total blocks
produced
4250 14,150 18,650 27,500 56,000 121,000
(Rigassi & CRATerre-EAG., 1985)
2.6. Stabilizers Stabilization has been defined as the controlled modification of texture, structure and/or
physio-mechanical properties of the soil. It can be in the form of physical, mechanical or
chemical modification, and its main objectives are listed below:
- Improves mechanical properties: dry and wet compressive strength
- Reduce porosity and variation in volume when exposed to moisture: swelling and
shrinkages with moisture content
- Improving ability to withstand weathering by wind and rain. It reduces abrasion and
increases waterproofing property.
- Stabilization can increase the cost of building material by 30-50%
- Therefore, the object of a stabilizer is to: reduce the volume between the particles (i.e.
porosity); block the void which cannot be eliminated (i.e. permeability); and improves
binding links between particles (i.e. mechanical strength).

36
Stabilization can be achieved in any of the following forms:
- Mechanical stabilization: its inexpensive, it involves the mixture of two or more soil
types to get the required grade (sand and gravel). Adding sand or gravel to the mixture
can improve soil with high content of clay. Densification of soil through compaction
(Hall et al, 2012; Pacheco-Torgal, 2015)
- Stabilization by compaction: loose soil is compacted to be denser. It imposes
strength, reduces porosity, etc. - modifies physical soil texture by firing, freezing or
electro-osmosis (Hall et al, 2012; Pacheco-Torgal, 2015).
- Stabilization by additives: Modifies soil through mixing with chemical additives such
as lime, cement (4-10%) (Hall et al, 2012; Pacheco-Torgal, 2015). It helps control
excessive shrinkage that causes cracks in blocks. Ordinary Portland cement is the
most used stabilizer. Its content ranges from 5-10%. The formation of CSH gel in the
mixture of soil, cement and water establishes insoluble bonds and binds the sand and
the silt particles.
However, demerits of stabilizers are listed below:
- Raw materials cost increase (particularly for cement)
- The stabilizer might not be available in some countries, so more cost is incurred from
transportation
- The process of mixing and construction can be more complex
- The stabilization process might significantly affect the environment.
- The material used for stabilization might cause burns to skin, eyes (cement, lime,
chemical addictive)
- Stabilization can prevent the material from being recycled at end of use.
2.6.1. Pozzolans – Definition, Functions and Mode of Action, Classification, and
Characterization
A pozzolan is defined as a ‘a siliceous or siliceous and aluminous material, which in itself
possesses little or no cementitious value but will, in finely divided form and in the presence
of moisture, chemically reacts with calcium hydroxide to form compounds possessing
cementitious properties’ (Malhotra & Mehta, 1996). It can be explained that pozzolanic
material will not react to form cementitious material alone but will react with Portland
cement.
Generally amorphous silica reacts with calcium hydroxide much more rapidly than silica in
crystalized form. Also, fine pozzolanic particles with higher surface areas reacts much more
rapidly than larger particles.
37
Natural pozzolans may be classified into two principal classes. First, those derived from
volcanic rocks in which the amorphous content is produced by glass fusion and second,
those derived from rocks or earth from which the silica constituents contain opal, either from
precipitation of silica or from the remains of organisms.
Some agricultural wastes have pozzolanic properties, i.e. they have little or no cementitious
value but react with calcium hydroxide in presence of moisture to form compounds with
cementitious properties. Such materials can be substituted for a proportion of Portland
cement.
Pozzolans are a variety of materials or classes of materials, which may differ from one
another in both their chemical and physical composition and their effect on the properties
of mortars and concrete. There are three classification of pozzolans ASTM C618-19
includes class N, F and C. Class N is naturally occurring from diatomaceous earth, volcanic
ashes, class F is the fly ash gotten from burning bituminous coal and class C is fly ash that
is produced from burning lignite coal. The minimum percentage of SiO2, AL2O3 and Fe2O3
for class N. F AND C is 70,70 and 50 respectively. Agricultural pozzolan falls under the
classification N.
Fineness and grain size of materials are determined using Automatic Blaine Machine and
Malvern Matersizer, respectively. The amorphous or crystalize phase of material are
determined with X- RAY diffraction. Chemical composition is determined by X RAY
Fluorescence (XRF) test. The morphological view and shape of the particles of the material
are examined using Scanning Electron Microscopy (SEM) analysis (Bahurudeen &
Santhanam, 2015; Cordeiro et al, 2009a; Sore et al, 2016; Sturm et al, 2016).
The loss of ignition is also another important test used in inorganic analytical chemistry,
particularly in the analysis of materials. It involves heating a material, allowing the volatile
substance to escape until its mass stops to change. This is helpful because the
replacement of pozzolans is specified or calculated with the volume of the material to
replace Portland cement in the mix.
The fineness modulus is an empirical factor obtained by adding the cumulative percentage
of aggregate retained on each of the standard sieves. It is generally used to determine how
coarse or fine the aggregate is, and it affects the water- cement ratio, workability, shrinkage
and creep of concrete (Aprianti et al, 2015). Creep and shrinkage occur in concrete when
concrete is loaded, the structure undergoes elastic and inelastic deformation. Aggregate
play an important role. The water demand and workability are affected by the particle size
distribution, particle packing effect and voids present in the solid system.
Rice husk ash, Sugar Bagasse Ash, and Palm Oil Fuel Ash; like other sustainable
pozzolans could serve useful application here. The binding and stabilizing strengths of the

38
three agricultural waste materials in the production of concrete, building blocks, and mortar
will depend on the geo-chemical composition of the aggregates used. The geo-chemical
composition of the aggregates will vary per the nature and mineral composition of the
originating rock.
Furthermore, successful replacement of cement with RHA, SBA, and POFA will provide a
solution to management of agricultural waste, environmental pollution and financial
sustainability (Aprianti et al, 2015; Chong et al, 2015).
The pozzolanic properties of Rice Husk Ash (RHA), Sugar Bagasse Ash (SBA), and Palm
Oil Fuel Ash (POFA) are studied in detail in sections 2.6.2 – 2.6.4. The information will
facilitate more understanding of the binding qualities and their use in the construction
industry.
Rice husk ash, sugar bagasse ash and palm oil fuel ash have high silica content in
amorphous form, which makes it useful as pozzolans. The following agricultural wastes are
studied because they are common crops grown in Nigeria.
The cost and environmental hazards of cement production have been described earlier.
Sourcing acceptable alternative low cost and environmentally friendly binding agent will
significantly reduce cost of providing housing and the cost environmental pollution
management.
2.6.2. Rice husk ash
2.6.2.1. Availability of Rice Husk Ash (RHA)
Rice Production for 2015 was 472.09 x 10 9 kg, year and for 2016 it is 483.26 x 10 9 kg. It
is estimated million tonnes could represent an increase of 11.17 million tonnes or a 2.37%
in rice production around the globe (Knoema, 2020). Rice husk (RH) is the by-product
from rice milling industries. Rice husk ash is obtained after the combustion of rice husk.
For every tonne of rice produced worldwide; about 20% mass of rice husk is obtained. and
out of that 15-25 % rice husk ash. The RHA estimated to be produced in the year 2016 will
be 14.5- 24.16 x 10 9 kg globally (Heung Fai et al, 2011; Kazmi et al, 2016b; Sturm et al,
2016; Xu et al, 2012). Rice is grown in 11 out of 36 states in the country, eight of the states
are in the tropical savannah climate and three are located at the monsoon climate. The
states in the tropical climate are Kaduna, Jos, FCT (Abuja), Niger, Ekiti, Lagos, Ebonyi,
Benue and the monsoon climate state includes Akwa-Ibom, Rivers and Bayelsa. It is
estimated that Nigeria produced 4.9 million tonnes of rice in the year 2019 (Knoema, 2020)
2.6.2.2. Properties of Rice Husk Ash (RHA)
The chemical composition of RHA is largely dependent on the type of paddy, soil type and
condition, geographical conditions, combustion temperature, and cooling method. RHA
pozzolan is prepared by burning rice husk at a controlled temperature ranging from 600-
800oC, and cooled uniformly to maintain amorphous silica content of 77-95% before

39
grinding into specified particle size (Alsubari et al, 2016; Chiang et al, 2009; Ganesan et al,
2008; Sore et al, 2016), particle size 5-10μm (Alsubari et al, 2016). The silica in RHA exist
in amorphous state but becomes crystallised when burnt at a temperature higher than 600-
800oC for a few minutes or 500oC for a longer period (Ganesan et al, 2008; Nehdi et al,
2003; Sturm et al, 2016).
The chemical activity of amorphous silica in RHA to produce the required filling effect in
structures to increase compressive strength and reduce water permeability is dependent
on the surface area of RHA (Givi et al, 2010). Also the fineness of the RHA influences the
rate of reaction, increase in concrete strength, water-cement ratio, workability, shrinkage
and creep of concrete (Aprianti et al, 2015). The RHA particle ranges from 5 to 10μm with
a very high surface area of more than 250 m2/g due to the porous nature of RHA (Aprianti
et al, 2015; Van Tuan et al, 2011). RHA has 2.11 specific gravity, and a modulus of rupture
ranging from 0.67-1.49 MPa (Kazmi et al, 2016a). Its colour ranges from whitish grey to
black depending on the source of the raw material, method of incineration, and time and
burning temperature (Aprianti et al, 2015). The amount of silicon dioxide (SiO2), iron oxide
(Fe2 O3), aluminium oxide (Al 2O3) in the ash should be greater than 70%, and the Loss of
Ignition (LOI) should not be less than 12%, as mentioned in ASTM C618 requirement
(Aprianti et al, 2015). Variations in the chemical composition of RHA in different countries
are shown in Table 2.7.
Table 2.7: Chemical composition (% by weight) of RHA sample
Constituents Malaysia Brazil Netherlands Kenya
Silica (SiO2) 93.1 92.9 86.9 75.8
Alumina (Al2O3) 0.21 0.18 0.86 1.15
Iron Oxide (Fe2O3) 0.21 0.43 0.73 0.86
Calcium Oxide (CaO) 0.41 1.03 1.4 3.25
Potassium Oxide (K2O) 2.31 0.72 2.46 1.5
Magnesium Oxide (MgO) 1.59 0.35 0.57 0.23
Sodium Oxide (Na2O) - 0.02 0.11 0.35
Sulfur Oxide (SO3 - 0.01 - -
Loss of Ignition (LOI) 0.36 - 5.14 10.2
SiO2+Fe2O3+Al2O3 93.52 93.51 88.47 77.81
*Abubakar et al., 2010

40
2.6.2.3. Rice Husk Ash as Pozzolan
Cook (1986) reported that highly reactive pozzolans such as rice husk ash can reduce the
size of voids in hydrated cement paste, thus making them almost impenetrable to water and
chloride ions even at early days of curing (Cook, 1986).
The silica in RHA reacts with Ca (OH)2 produced from cement in the presence of water as
shown below to produce Calcium-Silicate-Hydrate (C-S-H) gel
n SiO2 + n Ca (OH)2 + H2O → n CaSiO + nH2O
The formation of secondary Calcium-Silicate-Hydrate (C-S-H) gel was obtained; the
presence of this gel is what makes the possibility of the silica (SiO2) present in RHA and
calcium hydroxide (Ca (OH)2) in hydrating cement to bind. RHA has been tested for its
pozzolanic properties and was recommended as a supplementary cementitious material
(SCM).
2.6.2.4 Effect of RHA on mechanical properties of concrete and fired clay bricks
There is a little of literature reporting the effect of RHA on OPC replacement of CEBs. The
literature documenting the effect of RHA on OPC replacement in concrete and fired bricks
was analysed as an indicator of potential effects.
The standard compressive strength of concrete combined with or without RHA, is within
range for conventional concrete (15-45 MPa) with a density of about 2400 kg/m3. (Aprianti
et al, 2015) showed the possibility of increasing compressive strength after curing concrete
for 7days and 28 days to approximately 55MPa and 72MPa, respectively.
The presence of 30%RHA in concrete mix has been noticed to improve concrete’s
mechanical and durability properties by producing C-S-H gel that filled the large and
continuous pores within the concrete. It increased compression strength, improved the
microstructure of the paste making it more homogenous and denser, and finally enhanced
its resistance to water and chloride penetration to prevent the possibility of corrosion
(Ganesan et al, 2008; Givi et al, 2010).
By replacing OPC by 10% with RHA, the compressive strength increased from the control,
but it starts to decrease at 20% and 30% by 7.89% and 26.32%. The concrete was grade
range of M25 and M35 ((Takhelmayan et al, 2014; Rama et al, 2015). Another group of
researchers observed that at 15% replacement the compressive strength was maximum
(Ganesan et al, 2008; Salas et al, 2009). (Tsado et al, 2014) produced concrete of grade
M25-M35 by replacing OPC with RHA, the compressive strength decreased from control at
33.62MPa to 30.58, 26.51, and 17.68MPa when replaced with RHA at 10, 20 and 30%,
respectively. Rao et al. (2014) achieved grade M30 by replacing OPC with RHA at 5-12.5%.
(Rama et al, 2015; Ramezanianpour et al, 2009) replaced 5-20% and 7-15% OPC,
respectively with RHA to make concrete grade of M45 and M40. Keertana and Gobhiga
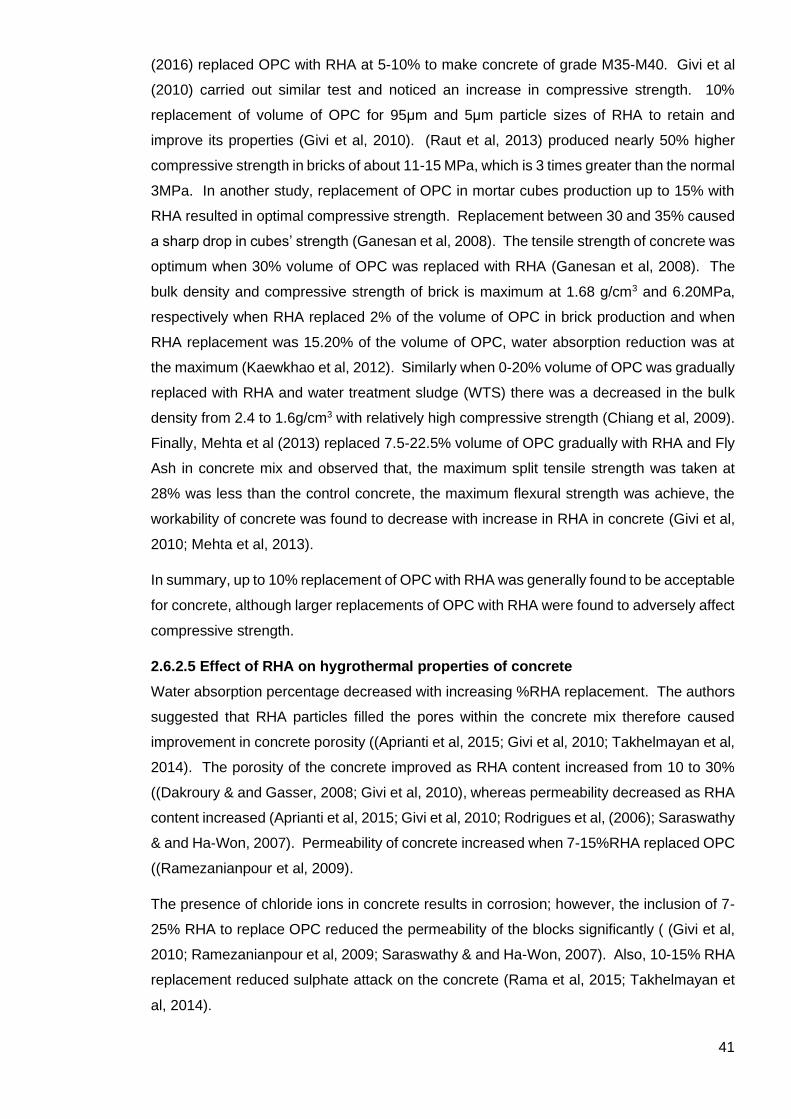
41
(2016) replaced OPC with RHA at 5-10% to make concrete of grade M35-M40. Givi et al
(2010) carried out similar test and noticed an increase in compressive strength. 10%
replacement of volume of OPC for 95μm and 5μm particle sizes of RHA to retain and
improve its properties (Givi et al, 2010). (Raut et al, 2013) produced nearly 50% higher
compressive strength in bricks of about 11-15 MPa, which is 3 times greater than the normal
3MPa. In another study, replacement of OPC in mortar cubes production up to 15% with
RHA resulted in optimal compressive strength. Replacement between 30 and 35% caused
a sharp drop in cubes’ strength (Ganesan et al, 2008). The tensile strength of concrete was
optimum when 30% volume of OPC was replaced with RHA (Ganesan et al, 2008). The
bulk density and compressive strength of brick is maximum at 1.68 g/cm3 and 6.20MPa,
respectively when RHA replaced 2% of the volume of OPC in brick production and when
RHA replacement was 15.20% of the volume of OPC, water absorption reduction was at
the maximum (Kaewkhao et al, 2012). Similarly when 0-20% volume of OPC was gradually
replaced with RHA and water treatment sludge (WTS) there was a decreased in the bulk
density from 2.4 to 1.6g/cm3 with relatively high compressive strength (Chiang et al, 2009).
Finally, Mehta et al (2013) replaced 7.5-22.5% volume of OPC gradually with RHA and Fly
Ash in concrete mix and observed that, the maximum split tensile strength was taken at
28% was less than the control concrete, the maximum flexural strength was achieve, the
workability of concrete was found to decrease with increase in RHA in concrete (Givi et al,
2010; Mehta et al, 2013).
In summary, up to 10% replacement of OPC with RHA was generally found to be acceptable
for concrete, although larger replacements of OPC with RHA were found to adversely affect
compressive strength.
2.6.2.5 Effect of RHA on hygrothermal properties of concrete
Water absorption percentage decreased with increasing %RHA replacement. The authors
suggested that RHA particles filled the pores within the concrete mix therefore caused
improvement in concrete porosity ((Aprianti et al, 2015; Givi et al, 2010; Takhelmayan et al,
2014). The porosity of the concrete improved as RHA content increased from 10 to 30%
((Dakroury & and Gasser, 2008; Givi et al, 2010), whereas permeability decreased as RHA
content increased (Aprianti et al, 2015; Givi et al, 2010; Rodrigues et al, (2006); Saraswathy
& and Ha-Won, 2007). Permeability of concrete increased when 7-15%RHA replaced OPC
((Ramezanianpour et al, 2009).
The presence of chloride ions in concrete results in corrosion; however, the inclusion of 7-
25% RHA to replace OPC reduced the permeability of the blocks significantly ( (Givi et al,
2010; Ramezanianpour et al, 2009; Saraswathy & and Ha-Won, 2007). Also, 10-15% RHA
replacement reduced sulphate attack on the concrete (Rama et al, 2015; Takhelmayan et
al, 2014).
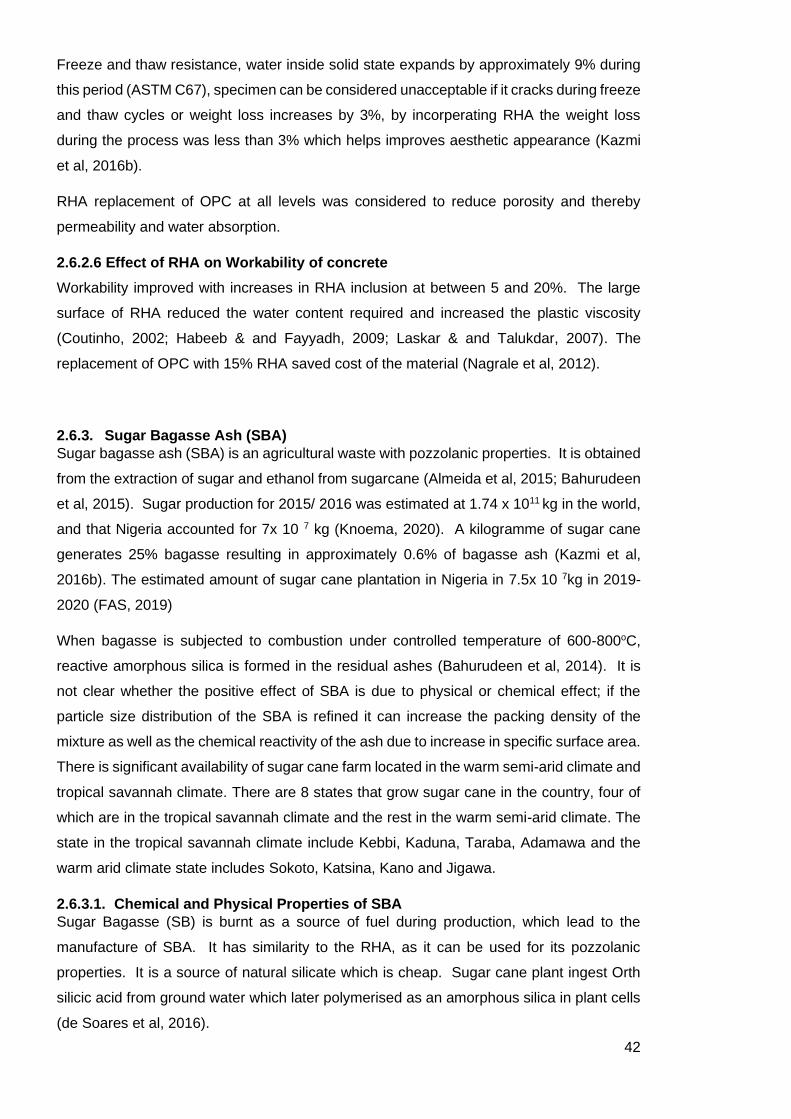
42
Freeze and thaw resistance, water inside solid state expands by approximately 9% during
this period (ASTM C67), specimen can be considered unacceptable if it cracks during freeze
and thaw cycles or weight loss increases by 3%, by incorperating RHA the weight loss
during the process was less than 3% which helps improves aesthetic appearance (Kazmi
et al, 2016b).
RHA replacement of OPC at all levels was considered to reduce porosity and thereby
permeability and water absorption.
2.6.2.6 Effect of RHA on Workability of concrete
Workability improved with increases in RHA inclusion at between 5 and 20%. The large
surface of RHA reduced the water content required and increased the plastic viscosity
(Coutinho, 2002; Habeeb & and Fayyadh, 2009; Laskar & and Talukdar, 2007). The
replacement of OPC with 15% RHA saved cost of the material (Nagrale et al, 2012).
2.6.3. Sugar Bagasse Ash (SBA)
Sugar bagasse ash (SBA) is an agricultural waste with pozzolanic properties. It is obtained
from the extraction of sugar and ethanol from sugarcane (Almeida et al, 2015; Bahurudeen
et al, 2015). Sugar production for 2015/ 2016 was estimated at 1.74 x 10¹¹ kg in the world,
and that Nigeria accounted for 7x 10 7 kg (Knoema, 2020). A kilogramme of sugar cane
generates 25% bagasse resulting in approximately 0.6% of bagasse ash (Kazmi et al,
2016b). The estimated amount of sugar cane plantation in Nigeria in 7.5x 10 7kg in 2019-
2020 (FAS, 2019)
When bagasse is subjected to combustion under controlled temperature of 600-800oC,
reactive amorphous silica is formed in the residual ashes (Bahurudeen et al, 2014). It is
not clear whether the positive effect of SBA is due to physical or chemical effect; if the
particle size distribution of the SBA is refined it can increase the packing density of the
mixture as well as the chemical reactivity of the ash due to increase in specific surface area.
There is significant availability of sugar cane farm located in the warm semi-arid climate and
tropical savannah climate. There are 8 states that grow sugar cane in the country, four of
which are in the tropical savannah climate and the rest in the warm semi-arid climate. The
state in the tropical savannah climate include Kebbi, Kaduna, Taraba, Adamawa and the
warm arid climate state includes Sokoto, Katsina, Kano and Jigawa.
2.6.3.1. Chemical and Physical Properties of SBA
Sugar Bagasse (SB) is burnt as a source of fuel during production, which lead to the
manufacture of SBA. It has similarity to the RHA, as it can be used for its pozzolanic
properties. It is a source of natural silicate which is cheap. Sugar cane plant ingest Orth
silicic acid from ground water which later polymerised as an amorphous silica in plant cells
(de Soares et al, 2016).

43
Table 2.6. shows the chemical and physical characteristics of SBA. The ash has two main
constituents of oxides of silica and aluminium. Its specific gravity is lower compared to
clay, which is 2.24 (Kazmi et al, 2016b). Increase in specific surface area is directly
responsible for the kinetics of their pozzolanic reactions. The application of an ultra-finely
ground SBA produced by vibratory grinding allowed the production of high-performance
concrete with the same mechanical response up to 20% replacement as concrete prepared
solely using Portland cement. The reaction improved the fresh state and resistance to
penetration of chloride ions in concrete (Cordeiro et al, 2009b). Particle size of SBA are
analysed with the Malvern Matersizer following Blaine fineness as determined according to
ASTM C204 (Cordeiro et al, 2008). The compressive strength of SBA mortar is inversely
proportional to the SBA particle size (Cordeiro et al, 2008).
Table 2.8: Chemical and physical properties of sugar bagasse ash (SBA)
Chemical Composition (% by
mass):
SiO2 60.0 – 65.3
Al2O3 4.7 – 9.1
Fe2O3 3.1 – 5.5
MgO 1.1 – 2.9
CaO 4.0 – 10.5
Na2O 0.3 – 0.9
K2O 1.4 – 2.0
SO3 0.1 – 0.2
Physical Properties:
Particle size distribution (µm) 66.9 – 107.9
Specific gravity 1.9 – 2.4
Specific surface area (cm2/g) 274.0 – 943.0
Loss of Ignition, LOI (% by mass) 15.3 – 19.6
SBA is considered as non-plastic (not clay like) and non-cohesive material. The weight per
unit area when replacing clay with SBA and RHA in the manufacture of bricks is 15% and
4% lighter, respectively. These phenomena affected the weight of bricks produced with SBA
and RHA such that their densities 258.6kg/m3 and 550.54 kg/m3, respectively and were
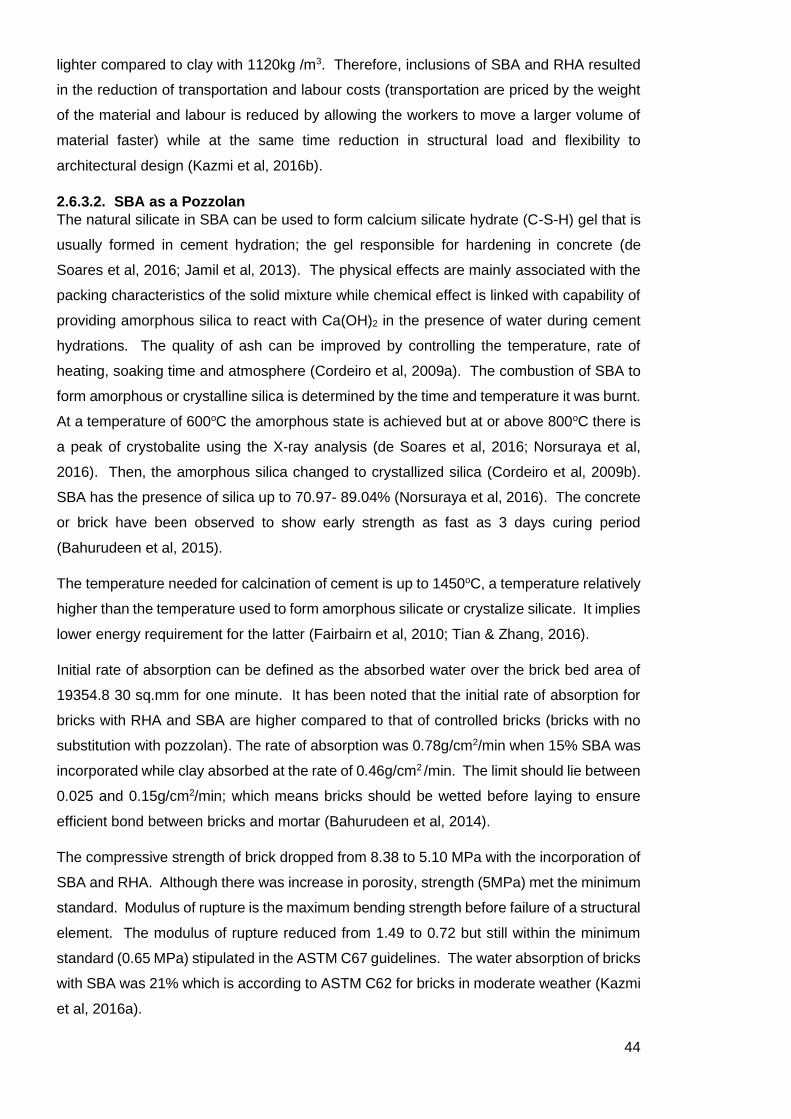
44
lighter compared to clay with 1120kg /m3. Therefore, inclusions of SBA and RHA resulted
in the reduction of transportation and labour costs (transportation are priced by the weight
of the material and labour is reduced by allowing the workers to move a larger volume of
material faster) while at the same time reduction in structural load and flexibility to
architectural design (Kazmi et al, 2016b).
2.6.3.2. SBA as a Pozzolan
The natural silicate in SBA can be used to form calcium silicate hydrate (C-S-H) gel that is
usually formed in cement hydration; the gel responsible for hardening in concrete (de
Soares et al, 2016; Jamil et al, 2013). The physical effects are mainly associated with the
packing characteristics of the solid mixture while chemical effect is linked with capability of
providing amorphous silica to react with Ca(OH)2 in the presence of water during cement
hydrations. The quality of ash can be improved by controlling the temperature, rate of
heating, soaking time and atmosphere (Cordeiro et al, 2009a). The combustion of SBA to
form amorphous or crystalline silica is determined by the time and temperature it was burnt.
At a temperature of 600oC the amorphous state is achieved but at or above 800oC there is
a peak of crystobalite using the X-ray analysis (de Soares et al, 2016; Norsuraya et al,
2016). Then, the amorphous silica changed to crystallized silica (Cordeiro et al, 2009b).
SBA has the presence of silica up to 70.97- 89.04% (Norsuraya et al, 2016). The concrete
or brick have been observed to show early strength as fast as 3 days curing period
(Bahurudeen et al, 2015).
The temperature needed for calcination of cement is up to 1450oC, a temperature relatively
higher than the temperature used to form amorphous silicate or crystalize silicate. It implies
lower energy requirement for the latter (Fairbairn et al, 2010; Tian & Zhang, 2016).
Initial rate of absorption can be defined as the absorbed water over the brick bed area of
19354.8 30 sq.mm for one minute. It has been noted that the initial rate of absorption for
bricks with RHA and SBA are higher compared to that of controlled bricks (bricks with no
substitution with pozzolan). The rate of absorption was 0.78g/cm2/min when 15% SBA was
incorporated while clay absorbed at the rate of 0.46g/cm2 /min. The limit should lie between
0.025 and 0.15g/cm2/min; which means bricks should be wetted before laying to ensure
efficient bond between bricks and mortar (Bahurudeen et al, 2014).
The compressive strength of brick dropped from 8.38 to 5.10 MPa with the incorporation of
SBA and RHA. Although there was increase in porosity, strength (5MPa) met the minimum
standard. Modulus of rupture is the maximum bending strength before failure of a structural
element. The modulus of rupture reduced from 1.49 to 0.72 but still within the minimum
standard (0.65 MPa) stipulated in the ASTM C67 guidelines. The water absorption of bricks
with SBA was 21% which is according to ASTM C62 for bricks in moderate weather (Kazmi
et al, 2016a).
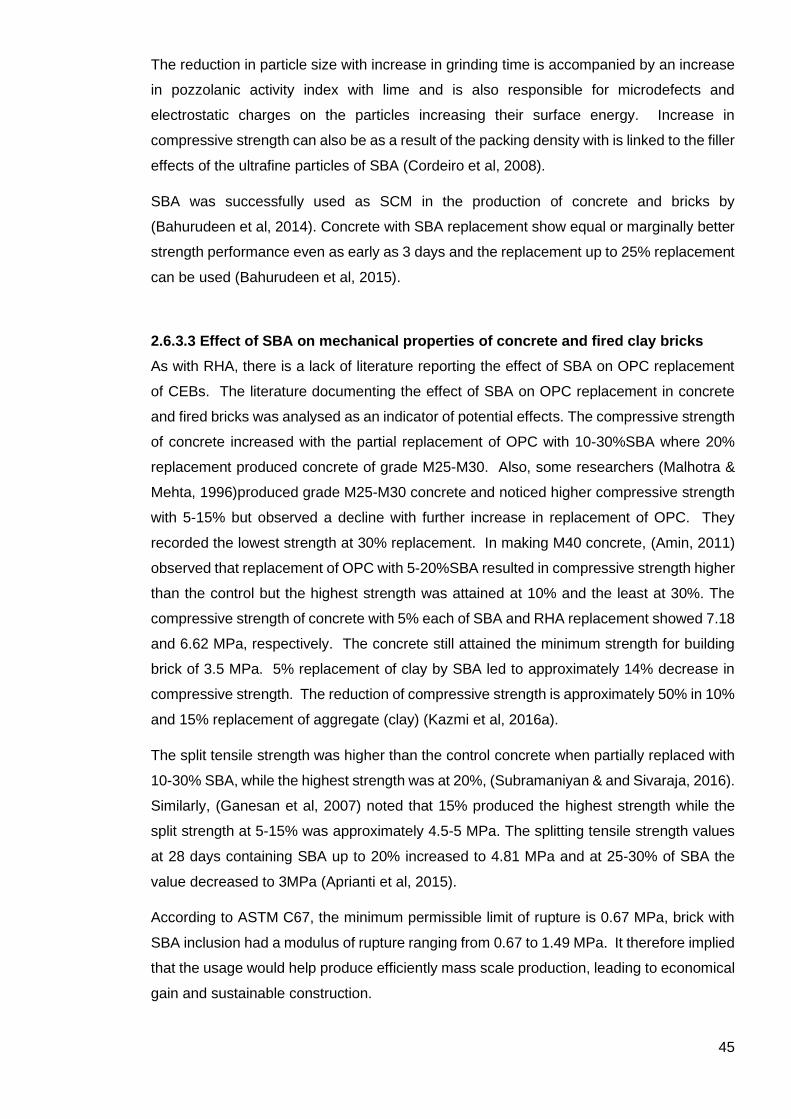
45
The reduction in particle size with increase in grinding time is accompanied by an increase
in pozzolanic activity index with lime and is also responsible for microdefects and
electrostatic charges on the particles increasing their surface energy. Increase in
compressive strength can also be as a result of the packing density with is linked to the filler
effects of the ultrafine particles of SBA (Cordeiro et al, 2008).
SBA was successfully used as SCM in the production of concrete and bricks by
(Bahurudeen et al, 2014). Concrete with SBA replacement show equal or marginally better
strength performance even as early as 3 days and the replacement up to 25% replacement
can be used (Bahurudeen et al, 2015).
2.6.3.3 Effect of SBA on mechanical properties of concrete and fired clay bricks
As with RHA, there is a lack of literature reporting the effect of SBA on OPC replacement
of CEBs. The literature documenting the effect of SBA on OPC replacement in concrete
and fired bricks was analysed as an indicator of potential effects. The compressive strength
of concrete increased with the partial replacement of OPC with 10-30%SBA where 20%
replacement produced concrete of grade M25-M30. Also, some researchers (Malhotra &
Mehta, 1996)produced grade M25-M30 concrete and noticed higher compressive strength
with 5-15% but observed a decline with further increase in replacement of OPC. They
recorded the lowest strength at 30% replacement. In making M40 concrete, (Amin, 2011)
observed that replacement of OPC with 5-20%SBA resulted in compressive strength higher
than the control but the highest strength was attained at 10% and the least at 30%. The
compressive strength of concrete with 5% each of SBA and RHA replacement showed 7.18
and 6.62 MPa, respectively. The concrete still attained the minimum strength for building
brick of 3.5 MPa. 5% replacement of clay by SBA led to approximately 14% decrease in
compressive strength. The reduction of compressive strength is approximately 50% in 10%
and 15% replacement of aggregate (clay) (Kazmi et al, 2016a).
The split tensile strength was higher than the control concrete when partially replaced with
10-30% SBA, while the highest strength was at 20%, (Subramaniyan & and Sivaraja, 2016).
Similarly, (Ganesan et al, 2007) noted that 15% produced the highest strength while the
split strength at 5-15% was approximately 4.5-5 MPa. The splitting tensile strength values
at 28 days containing SBA up to 20% increased to 4.81 MPa and at 25-30% of SBA the
value decreased to 3MPa (Aprianti et al, 2015).
According to ASTM C67, the minimum permissible limit of rupture is 0.67 MPa, brick with
SBA inclusion had a modulus of rupture ranging from 0.67 to 1.49 MPa. It therefore implied
that the usage would help produce efficiently mass scale production, leading to economical
gain and sustainable construction.
46
2.6.3.4 Effect of SBA on hygrothermal properties of concrete and fired clay bricks
SBA inclusion remarkably affected water absorption coefficient where 5-20% caused
reduction while it was the reverse at 30% replacement (Ganesan et al, 2007). Permeability
of chloride ion reduced as OPC was replaced with 10-40%SBA, it was lowest at 20%-25%
after curing for 28 days (Amin, 2011; Ganesan et al, 2007; Subramaniyan & and Sivaraja,
2016). The sorptivity of concrete was tested when OPC was partially replace with SBA at
10-40%, it was lower than that of control and lowest at 10% and 15% (Ganesan et al, 2007;
Subramaniyan & and Sivaraja, 2016).
(Almeida et al, 2015) suggested that the substitution of natural sand with SBA up to 30%
could lead to improvement of maintenance properties, micropore clogging and durability of
the mortar in comparison with control mix. The workers added the increased chloride
penetration resistance could be as a result of the physical and chemical effects of SBA.
The durability and porosity of bricks, which can affect the mechanical property, was
improved with inclusion of SBA (Almeida et al, 2015; Fairbairn et al, 2010). It can therefore
be best utilized in places where insulation and heat transfer resistance are required.
Water absorption also affects the durability of bricks, in corperating SBA showed that the
rate of absorption was less than 21%, according to ASTM C62, water absorption should
not be more than 17% for severe weather resistance and 22% for moderate weather
resistance which means it can be used in places with moderate weather condition i.e.
Nigeria. (Kazmi et al, 2016b). It was also observed by increasing temperature of firing of
fired clay bricks from 900 to 1000 o C, absorption reduces from 40% to 2%.
Efflorescence is considered as an aesthetic problem. Inclusion of SBA can lead to improved
aesthetic behaviour of masonry construction.
Sulphate attacks reduces the compressive strength, incorperating SBA improves resistance
against sulphate attack by 5% (Kazmi et al, 2016b).
2.6.3.5 The effect of SBA on workability of concrete
The workability of concrete increased as OPC was replaced with 10-40%SBA
(Subramaniyan & and Sivaraja, 2016). Workability increased from 5 to 10% and then
declined thereafter as SBA content increased further.
2.6.4. Palm Oil Fuel Ash (POFA)
The high productivity of oil palm is concentrated at the tropical zone, located 10o to the north
or south of the equator, which Nigeria falls within. Global palm oil production in 2015 was
5.3379 x10¹⁰Kg. The estimate for 2016 was 5.8513 x 10¹⁰Kg, which represented an
increase of 5.125 x10⁹Kg or 9.6% (Knoema, 2020). It was estimated that Nigeria would
produce 8.799 x10⁸Kg, palm residue amounting to 15% shell and 85% fibre. Furthermore,
47
the residue would lead to 5% ash by weight of solid waste. The availability of palm oil fuel
ash is located 6 states that are in tropical savannah climate, and monsoon climate. There
are three state that have palm oil in the tropical savannah climate which includes Enugu,
Ogun and Oyo. The monsoon climate state includes Imo, Cross-river and Rivers state.
Tangchrapat et al. (2009) defined palm oil fuel ash (POFA) as an agricultural waste formed
when palm oil residue is burnt at 800-1000oC to produce steam for electricity in biomass
thermal power (Alsubari et al, 2016; Tangchirapat et al, 2009).
2.6.4.1. Manufacture and properties of POFA
POFA is dried initially in oven at 105 ± 5oC for 24h; the combustion process is at a
temperature of 700-1000oC and sieved (1.18mm opening) to remove impurities. The
different sizes of POFA are based on the specific gravity original size (OP), medium size
(MP) and small size (SP) was 1.89, 2.36 and 2.43, respectively. It shows that the grinding
process does not just improve the fineness but also the specific gravity. The ash has
different colours ranging from greyish in colour and becomes darker as there is increase in
unburned carbon. POFA has content of silica amounting to 59.6-66.9%, the loss of ignition
(LOI) detected is 8.25% which is higher than the maximum value of 6% stipulated in ASTM
C618 which will affect the correct proportion of volume replacement of OPC in the mix
(Alsubari et al, 2016; Aprianti et al, 2015).
The specific gravity of ordinary POFA ranges from 1.89 -2.43 and that of ground POFA
ranges from 2.05 to 2.78 (Antiohos et al, 2014). Sata et al 2004 and Tangchirapat et al
2009 found that by grinding process, the pozzolanic reactivity of POFA increased in
response to the increased fineness of POFA. Based on ASTM C618 the strength activity
index which is an indirect method of measuring pozzolanic activity specifies the minimum
strength index for fly ash as 75% (Khankhaje et al, 2016). Unground POFA have shown to
have larger size, which makes its highly porous compared to ground POFA. Fly ash
concrete requires less water compared to POFA concrete to achieve the required slump
because of its spherical shaped particles and the solid texture of fly ash. Increasing water
in the mix lowers the pH value of concrete and increases the distance between cement
hydration products resulting in delay or decrease in the hydration activities of the cement
particle. It also decreases the setting time as the fineness increased (Khankhaje et al,
2016).
Fire resistance is an important issue in buildings; in concrete, it must preserve its structural
actions for prescribed timespan. The mass loss of concrete containing 20% POFA was
lower than control concrete under fire test conditions (Khankhaje et al, 2016).
2.6.4.2. Pozzolanic Reaction of POFA
The increase of pozzolan replacement and fineness will cause a reduction in the Ca(OH)2
content, while improving the sulphate resistance in concrete. The pozzolanic reaction

48
shows that POFA is slow at the early stage and increased at a later stage. The reaction
also confirmed that faster reaction of finer particles. The median size particles (10μm)
utilized in high strength concrete had compressive strength ranging 60-66 MPa with 20%
replacement of OPC at 28 days with total binder 550-560 kg/m3. The increase in fineness
will reduce the expansion and loss in the compressive strength of concrete(Jaturapitakkul
et al, 2011).
POFA chemical and physical properties are similar to fly ash, which attracted its use as
cement substitute in concrete (Khankhaje et al, 2016).
2.6.4.3 Effect of POFA on mechanical properties of concrete and mortar
By grinding treated POFA (TPOFA) and subjecting it to heat treatment, the compressive
strength of concrete will increase because of the finer particles. Tay (1990) discovered that
the drying shrinkage of POFA concrete containing 10% POFA was the same as the OPC
control mix (Tay, 1990).
Particles containing 10μm POFA showed a reduced expansion compared to control mix
and mortar containing 45μm POFA, this is because 10μm hasten the pozzolanic reactivity
forms secondary C-S-H gel in a short time. It can also serve as a favourable pozzolan
replacing part of Portland cement in producing mortar that exhibits a low carbonation depth
and a high strength (Khankhaje et al, 2016).
Replacing up to 30% of OPC with POFA performed adequately but higher proportions
caused significant reduction of compressive strength (Aprianti et al, 2015).
(Khankhaje et al, 2016) observed that compressive strength of concrete that contains 20%
ground POFA was like OPC concrete. However, increasing the ground POFA content
lowered compressive strength because of high water demand. Sumadi and Hussin (1995)
reported that inclusion of 20% ground POFA produced durable concrete that was like OPC
concrete.
Abdullah et al (2006) suggested that replacing 10-35% of cement with POFA is likely
producing aerated concrete. Hussin and Abdullah (2009) demonstrated that 30% of OPC
replacement with POFA was able to produce an aerated concrete panel exhibiting strength
equivalent to that of an aerated concrete with 100% cement (Khankhaje et al, 2016).
(Jaturapitakkul et al, 2011) investigated the use of POFA to replace 10-40% cement and
noted the compressive strength of mortar varied from 0.1MPa to 4.5 MPa at 7 days and 2.5
MPa to 22.5 MPa at 90 days. Also, concrete samples with 20% and 30% POFA showed
compressive strength of 59 and 60 MPa, respectively. (Jaturapitakkul et al, 2011).

49
2.6.3.4 Effect of POFA on hygrothermal properties of concrete and fired clay bricks
The incorporation of POFA improves mortar’s resistance to chloride penetration. This is
because of pozzolanic reactivity, the reduced Ca(OH)2 and the improved permeability of the
mortar. These researches (Khalid et al, 2016) observed that the higher the fineness levels
of POFA, the faster the pozzolanic reaction for formation of extra C-S-H gel thus creating
denser concrete and enabling it to exhibit better resistance to chloride attack and the longer
the curing days (Khankhaje et al, 2016).
2.6.3.5 The effect of POFA on workability of concrete
Literature revealed that replacing up to 30% of OPC with POFA performed adequately but
higher proportions caused significant reduction of workability. While for self-compacting
concrete, studies showed improvement on workability, enhanced concrete characteristics,
decrease cost and saved energy due to POFA inclusion. This is beneficiary to sustainable
construction method (Aprianti et al, 2015).
2.6.5. Geo-polymer Concrete
Replacing cement with geo-polymer as a stabilizing agent in concrete could prove
economical. In addition, it alleviates environmental pollution caused by cement and
aggregate production. Indeed, Gartner (2004) reported that geo-polymer could reduce CO2
emissions in the atmosphere cause by cement and aggregate industries by approximately
80%. It is a friendlier alternative to stabilizing bricks during raining periods. It involves using
amorphous silica (SiO2), alumina (Al2O3), and alkali hydrate. The mixture of alkaline hydrate
(NaOH) with water and amorphous silicate produces the same gel (C-S-H) made when
cement mixes with water.
It could also be another way to make use of RHA, SBA and POFA because the alkali silicate
geo-polymer manufacture could be made from the agricultural wastes (Ariffin et al. 2011).
The mixture of pulverised fuel ash (PFA) and POFA completely replaced the combination
of sodium silicate and sodium hydroxide solution in the manufacture of geo-polymer
concrete. A ratio of 70:30 PFA: POFA achieved the highest compressive strength of
25MPa. The compressive strength also increased with the longer the curing time
(Khankhaje et al, 2016)
Karim et al (2013) made a non-cement composite binder (NCB) using slag from cement
manufacture, POFA, and RHA with NAOH as the activator. The combination of 42% slag,
28% POFA and 30% RHA with 5% NaOH at 28days achieved the highest compressive
strength of 40.68 MPa and flexural strength of 6.57 MPa. (Khankhaje et al, 2016)
Geo-polymer concrete showed better structural stability than OPC concrete after exposure
to 800oC. Surface cracks appeared at temperature between 600 and 800oC for geo-
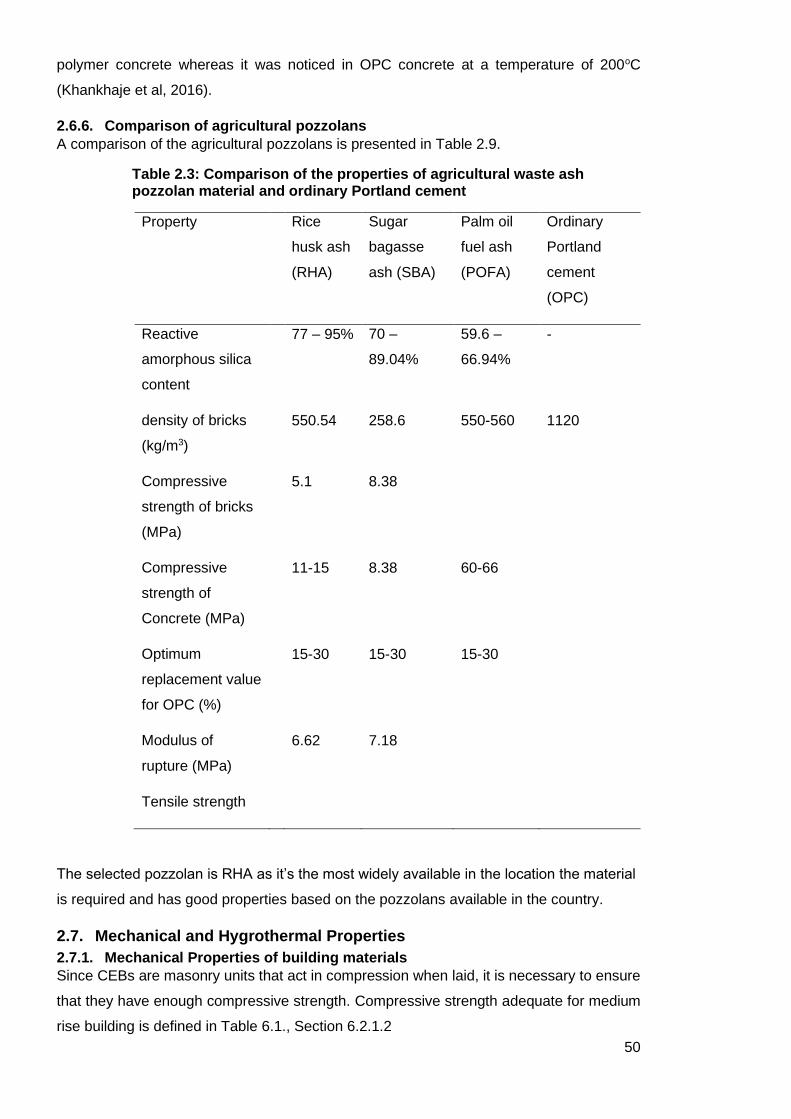
50
polymer concrete whereas it was noticed in OPC concrete at a temperature of 200oC
(Khankhaje et al, 2016).
2.6.6. Comparison of agricultural pozzolans
A comparison of the agricultural pozzolans is presented in Table 2.9.
Table 2.3: Comparison of the properties of agricultural waste ash pozzolan material and ordinary Portland cement
Property Rice
husk ash
(RHA)
Sugar
bagasse
ash (SBA)
Palm oil
fuel ash
(POFA)
Ordinary
Portland
cement
(OPC)
Reactive
amorphous silica
content
77 – 95% 70 –
89.04%
59.6 –
66.94%
-
density of bricks
(kg/m3)
550.54 258.6 550-560 1120
Compressive
strength of bricks
(MPa)
5.1 8.38
Compressive
strength of
Concrete (MPa)
11-15 8.38 60-66
Optimum
replacement value
for OPC (%)
15-30 15-30 15-30
Modulus of
rupture (MPa)
6.62 7.18
Tensile strength
The selected pozzolan is RHA as it’s the most widely available in the location the material
is required and has good properties based on the pozzolans available in the country.
2.7. Mechanical and Hygrothermal Properties
2.7.1. Mechanical Properties of building materials
Since CEBs are masonry units that act in compression when laid, it is necessary to ensure
that they have enough compressive strength. Compressive strength adequate for medium
rise building is defined in Table 6.1., Section 6.2.1.2

51
2.7.2. Hygrothermal properties of building materials
Moisture affects the building energy efficiency, the service life, the indoor climate and the
air quality. Durability properties affect the life span of the material and the building
(Mukhopadhyaya et al 2002). Lowering permeability of materials can cause improvement
in the durability of the materials through reduction of moisture, sulphate ions, chloride ions,
carbon dioxide and other harmful substances. The absence of moisture in the building
materials will prevent crystallization and recrystallization of ions in building materials as it
would not be transported from the atmosphere or ground to the materials (Al-Naddaf 2018).
Natural pozzolans have lowered permeability in building materials. The replacement of
10% cement with fine pozzolan caused reduction in sorptivity (Sicakova et al. 2017).
In the tropical climate, building materials used for external purpose are subjected to
extremely high temperature, high relative humidity and heavy rainfall. Materials used under
such conditions will change in mass if they allow moisture into their membranes. The
phenomenon had been the reason for testing the water absorption coefficient of
compressed earth blocks. Additionally, it helps to understand how the blocks will perform.
2.7.2.1. Water absorption coefficient and Moisture absorption
Moisture has long been a cause of problem in building structure. This phenomenon results
in decay, deterioration, unhealthy environment, inadequate comfort level in the interior of
the building, structural and durability problems in building. Water enters the building
material through direct rainwater contact on the wall surface, ground water rising, moisture
in the atmosphere, etc. (Sicakova et al. 2017; Al-Naddaf 2018; Feng and Janssen 2018).
The rise of ground water is known as capillary rise through permeable wall structure causing
the material to be damp. Building materials can retain a little water or moisture in the
structure and still perform adequately. However, the presence of water becomes a problem
when it becomes more than the material can accommodate to maintain comfort and
structural purpose. The knowledge of water or moisture movement in materials is important
for durability, design use of the material. Capillarity water absorption is related to water
sorptivity defined as the tendency of material to absorb or desorb water by capillarity
(Karagiannis et al. 2016; Sicakova et al. 2017). Water absorption coefficient is the mass of
water absorbed by a test specimen per face area and per square root of time, it can be
determined by weighing the samples at different times (Janetti and Wagner 2017; Al-Naddaf
2018). It can occur when capillary movement is caused by the difference between fluids
surface capillary pressure and its gravity pressure which causes fluid movement until
balance is reached (Sicakova et al. 2017). Water absorption coefficient governs liquid
movement into a material (Mukhopadhyaya et al 2002).
52
Water absorption coefficient required for CEBs unit is discussed in section 6.2.2.1 and
moisture absorption is discussed in section 6.2.2.3
2.7.2.2. Water vapour transmission
The process of vapor transportation is the movement of water vapor in the opposite direction
from higher vapor in the atmosphere through the material surface to a lower vapor
atmosphere. Water vapor transport in porous building material have negative effect on the
service life of a building (Kočí et al, 2011). Water vapor resistant factor indicates the degree
to which moisture transfers from the external surface to the internal surface, it can be
expressed as the capacity of a material to let vapor pass or to block vapor from passing
through (Ducoulombier & Lafhaj, 2017; Zhao & Plagge, 2015). The rate of water vapor flow
is measured by using the wet/dry cup method. This method is called a CUP method as it
utilizes a cup with desiccant (dry) or distilled water/saturated salt (wet) sealed with one side
of the material and the cup is placed in a climatic chamber (Maillard & Aubert, 2014; Zhao
& Plagge, 2015). It measures the vapor diffusion through a unit area of the material at a unit
time under controlled temperature and relative humidity. The change in mass of the sample
against the time is then used to determine the water vapor flow rate (G) (Zhao & Plagge,
2015). The ability of a porous material to retard vapor diffusion can be described as vapor
diffusion resistance factor (μ) which indicates how much vapors can diffuse through the
material (Maillard & Aubert, 2014; Zhao & Plagge, 2015).
Water vapor transmission required masonry unit such as CEBs in section 6.2.2.2
2.7.2.3. Moisture buffering
Earth is a reusable and environmentally friendly material that can exchange moisture
effectively with the environment. The hydrothermal properties of building materials as be
observed to influence indoor comfort level of building users. Materials with good moisture
storage abilities on the other hand can absorb water vapour from the environment when the
Relative Humidity (R.H) increases and released water vapour when the R.H decreases in
order to maintain a more stable indoor comfort level (Zhang et al., 2018). Earth materials
have a large moisture capacity compared to fired clay bricks and concrete (Zhang et al.,
2018). The ability of a material to properly absorb or release moisture from its body plays
a significant role in the risk of biological growth on the surface of the material (i.e. mould
growth on wall surface).
Moisture buffering performance is the ability of the space to regulate relative humidity level
daily or seasonally. The moisture buffering value is the amount of water that is transported
in and out of a material per open space during a certain period when it’s subjected to
variation in R.H of the surrounding air. The effect of moisture buffering on the compressed
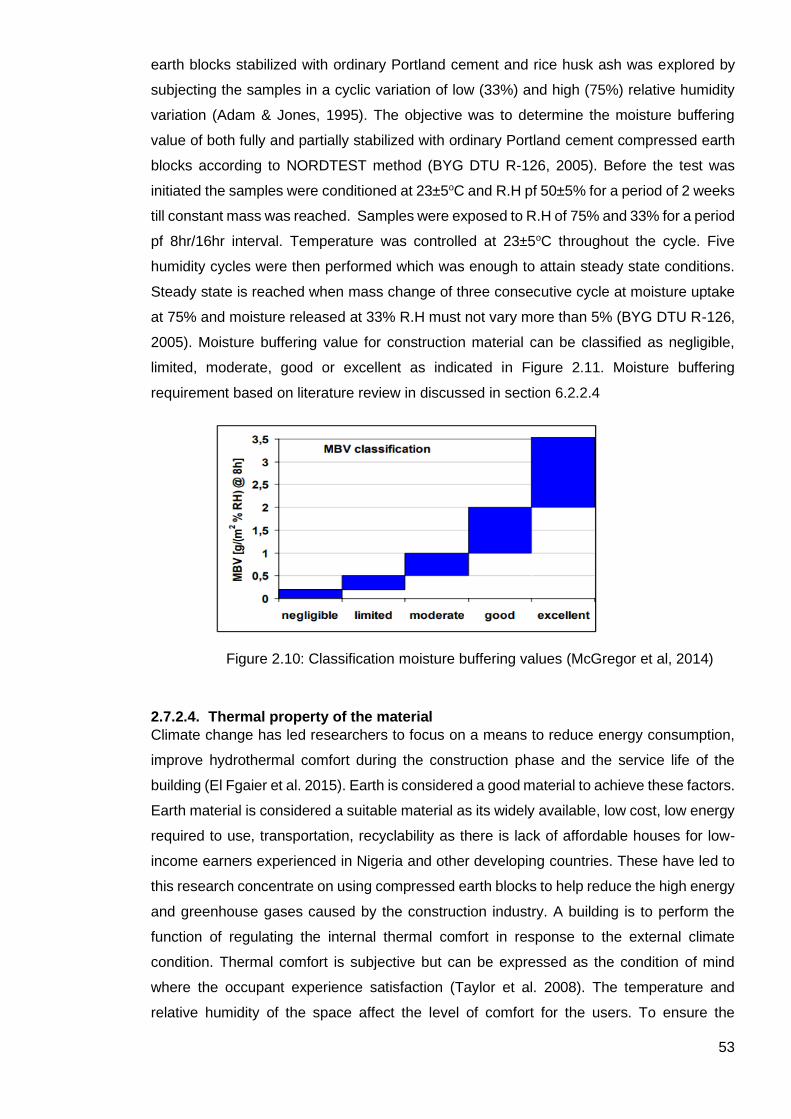
53
earth blocks stabilized with ordinary Portland cement and rice husk ash was explored by
subjecting the samples in a cyclic variation of low (33%) and high (75%) relative humidity
variation (Adam & Jones, 1995). The objective was to determine the moisture buffering
value of both fully and partially stabilized with ordinary Portland cement compressed earth
blocks according to NORDTEST method (BYG DTU R-126, 2005). Before the test was
initiated the samples were conditioned at 23±5oC and R.H pf 50±5% for a period of 2 weeks
till constant mass was reached. Samples were exposed to R.H of 75% and 33% for a period
pf 8hr/16hr interval. Temperature was controlled at 23±5oC throughout the cycle. Five
humidity cycles were then performed which was enough to attain steady state conditions.
Steady state is reached when mass change of three consecutive cycle at moisture uptake
at 75% and moisture released at 33% R.H must not vary more than 5% (BYG DTU R-126,
2005). Moisture buffering value for construction material can be classified as negligible,
limited, moderate, good or excellent as indicated in Figure 2.11. Moisture buffering
requirement based on literature review in discussed in section 6.2.2.4
Figure 2.10: Classification moisture buffering values (McGregor et al, 2014)
2.7.2.4. Thermal property of the material
Climate change has led researchers to focus on a means to reduce energy consumption,
improve hydrothermal comfort during the construction phase and the service life of the
building (El Fgaier et al. 2015). Earth is considered a good material to achieve these factors.
Earth material is considered a suitable material as its widely available, low cost, low energy
required to use, transportation, recyclability as there is lack of affordable houses for low-
income earners experienced in Nigeria and other developing countries. These have led to
this research concentrate on using compressed earth blocks to help reduce the high energy
and greenhouse gases caused by the construction industry. A building is to perform the
function of regulating the internal thermal comfort in response to the external climate
condition. Thermal comfort is subjective but can be expressed as the condition of mind
where the occupant experience satisfaction (Taylor et al. 2008). The temperature and
relative humidity of the space affect the level of comfort for the users. To ensure the

54
sustainable thermal comfort building the thermal performance criteria has increased from
the norm where high heating and cooling services are required to achieve comfort for users
(Ashour et al. 2015).
Thermal conductivity required for masonry unit such as CEBs is discussed in section
6.2.2.5.
2.7.3. Indoor Air Quality
Indoor air quality is one of the most serious elements for the health of the building’s
occupants (Nguyen et al. 2017). For example, high moisture in the building can cause,
hydration of absorbed inorganic salt, dampness of material, presence of organic growth on
the wall surface (mold, algae, fungi etc.) and loss of insulation properties within the internal
spaces (Kočí et al. 2011; Ducoulombier and Lafhaj 2017; Nguyen et al. 2017). Moisture
transfer in a building occurs mainly through water vapor and liquid transport under actions
of capillary forces (Ducoulombier and Lafhaj 2017). When the indoor air temperature is
higher than the outdoor temperature, water vapor diffusion occurs (Ducoulombier and
Lafhaj 2017). When relative humidity increases, the moisture in the atmosphere increases
and more adsorption occurs, as a result, the pores are covered with a film of water, the
adhesive holding the water particle from moving into the internal space decreases, some
become mobile and initial surface diffusion occurs (Ducoulombier and Lafhaj 2017).
Moisture causes dampness, deterioration to the fabric, corrosion to metals in building and
mould, rot, and decay within the building structure. Moistures can cause an adverse
reduction in thermal resistance of the materials within the structure and increases the risk
of mould and interstitial condensation. Initial moisture in building can be from construction,
moisture can also be introduced to building fabric as a result of occupants and their activities
i.e., bathing, cooking, indoor swimming pool, industries, food factories generate large
moisture (Zemitis et al. 2016; BS 5250:2011+A1:2016). The different activities in a
residential house generates different moisture in the space. It can be shown in the table
below.
There is a high risk of mould growth on the external fabric of a building when the relative
humidity is above 70% for a long period of time, the risk can be reduced by increasing
temperature, or decreasing vapour pressure or a combination of the two factors. Moisture
can also be introduced into the building structure from sources such as follows.
a. Water used in construction: masonry structure, concrete, plastering of the walls etc.
b. Ground water seeping in from walls and floors in contact with the ground.
c. Flooding:
d. Precipitation: Rain fall been a major factor in the southern part of Nigeria.
e. Spillage or leaks
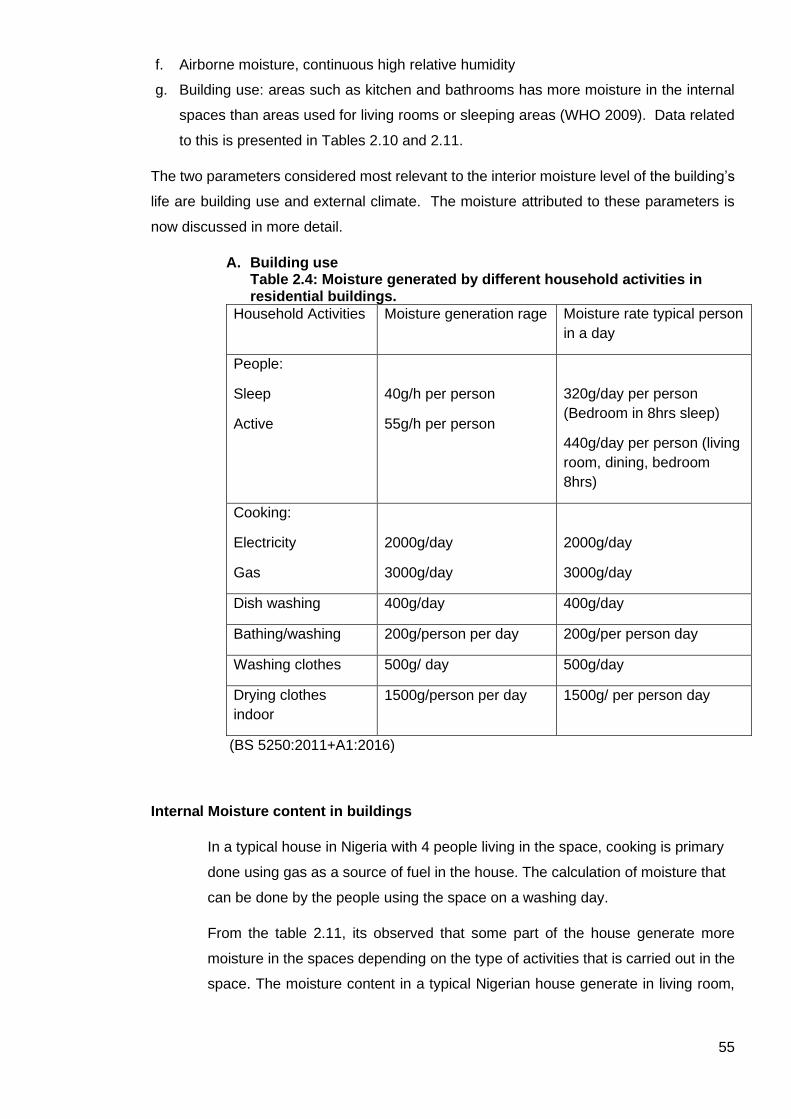
55
f. Airborne moisture, continuous high relative humidity
g. Building use: areas such as kitchen and bathrooms has more moisture in the internal
spaces than areas used for living rooms or sleeping areas (WHO 2009). Data related
to this is presented in Tables 2.10 and 2.11.
The two parameters considered most relevant to the interior moisture level of the building’s
life are building use and external climate. The moisture attributed to these parameters is
now discussed in more detail.
A. Building use Table 2.4: Moisture generated by different household activities in residential buildings.
Household Activities Moisture generation rage Moisture rate typical person
in a day
People:
Sleep
Active
40g/h per person
55g/h per person
320g/day per person
(Bedroom in 8hrs sleep)
440g/day per person (living
room, dining, bedroom
8hrs)
Cooking:
Electricity
Gas
2000g/day
3000g/day
2000g/day
3000g/day
Dish washing 400g/day 400g/day
Bathing/washing 200g/person per day 200g/per person day
Washing clothes 500g/ day 500g/day
Drying clothes
indoor
1500g/person per day 1500g/ per person day
(BS 5250:2011+A1:2016)
Internal Moisture content in buildings
In a typical house in Nigeria with 4 people living in the space, cooking is primary
done using gas as a source of fuel in the house. The calculation of moisture that
can be done by the people using the space on a washing day.
From the table 2.11, its observed that some part of the house generate more
moisture in the spaces depending on the type of activities that is carried out in the
space. The moisture content in a typical Nigerian house generate in living room,

56
bedroom and dining room combine is less or about the same as a place like kitchen
alone in one day.
Table 2.5: Typical moisture generated in areas with normal and high relative humidity in a typical house generated from table 2.10
Interior spaces Moisture content rate
Normal relative humidity areas
Bedroom
Living room, dining room
Total moisture content normal relative humidity
1280g/day
1760g/ day
3040g/gay
High relative humidity areas
Kitchen:
Cooking
Dish washing
Total kitchen moisture content
3000g/day
400g/day
3400g/day
Bathroom:
Bathing
Washing cloth
Drying cloth
Total bathroom moisture content
800g/day
500g/day
1500g/day
2800g/day
Total moisture content high relative humidity 6200g/day
2. external climate- (Rainfall or precipitation rate of building location)
Rain fall is natural climatic factor that occurs in the Southern part of Nigeria regular
with high driving force. The driving rain direction intensity on the building structure
can be influenced by factors such as mentioned below:
1. Location of the building
Köppen-Geiger climate location: Nigeria contains four climate types – monsoon
climate (Am) in part of the coast, tropical savannah climate (Aw) across most of the
country, warm semi-arid arid (BSh) and warm desert climate (BWh) in the northernmost
part.
Nigeria has a mix of urban and rural areas. Urban areas are characterised with a high
population density supported by high-rise buildings and proximity of surrounding
buildings to one another. Rural areas have less population density, more open areas
which could have green areas for farming, grazing for animals or just open green areas

57
for wild animals to live. This work focuses on building in city that are sheltered by
surrounding buildings. Building located in urban areas are more likely to be sheltered
by other buildings, thereby reducing driving rain intensity compared to buildings in rural
areas.
2. Orientation of the wall: the wall facing the predominant rain direction is likely to be more
exposed to rain or moisture on its surface than other walls in other direction. So, walls
in that direction should be treated to ensure the rainwater or moisture does not remain
on it for a long period of time.
3. Degree of the shelter: walls can be subjected to low slope roof, high slow roof or
subjected to high rain runoff. In the southern rain areas of Nigeria that experiences high
rainfall, the use of walls that area subjected to high rain runoff is to be avoided as much
as possible but if it cannot be avoided should ensure the material of the wall is not
easily damage by presence of moisture or treated adequately. The use of high slope
roof is the most adequate to remove rain load from the building easily, especially when
considering the use of earth material that has high affinity to water absorption when
exposed.
2.7.3.1. Mould growth in buildings
Dampness on the surface of the wall can lead to biological growth or material degradation
when not adequately removed. Dampness can cause mould growth and interstitial
condensation. Dampness may occur in new and old building. In existing building when
poorly, insulated spaces lead to low internal surface temperature and in new building airtight
envelope with bad ventilation management may lead to high internal relative humidity
(Fantucci et al. 2017). Mould is likely to occur in spaces with high relative humidity, poor or
no ventilation and cold surfaces. Structural damage, water damage, rising damp, leaks can
also promote mould growth in a building surface (Hurraß et al. 2017). Mould is used to
describe fungi which is visible or invisible to the human eye. Mould spreads and reproduces
spores. It grows on different surfaces such as paper, cardboard, masonry, plastics etc.
Indoor mould is a major health issue such as allergy respiratory diseases, asthma, allergic
rhinitis, hypersensitivity pneumonitis (HP), exogenous allergic alveolitis (EAA). Promoting
respiratory infections (e.g. bronchitis) have been proven to be caused by exposure to mould
(Hurraß et al. 2017). It is also suspected to cause rheumatism, arthritis, sarcoidosis, cancer,
neurotoxic effects, atopic eczema, chronic obstructive pulmonary disease (Hurraß et al.
2017).
Mould can reduce the quality of a building fabric. Mould in building also causes negative
effect on the physiological, visual hazard and health risk to the users of the space
(Marincioni and Altamirano-Medina 2017). Mould may release volatile organic compounds
(VOCs) which can lead to sick building syndrome (Sadovský and Koronthályová 2017).
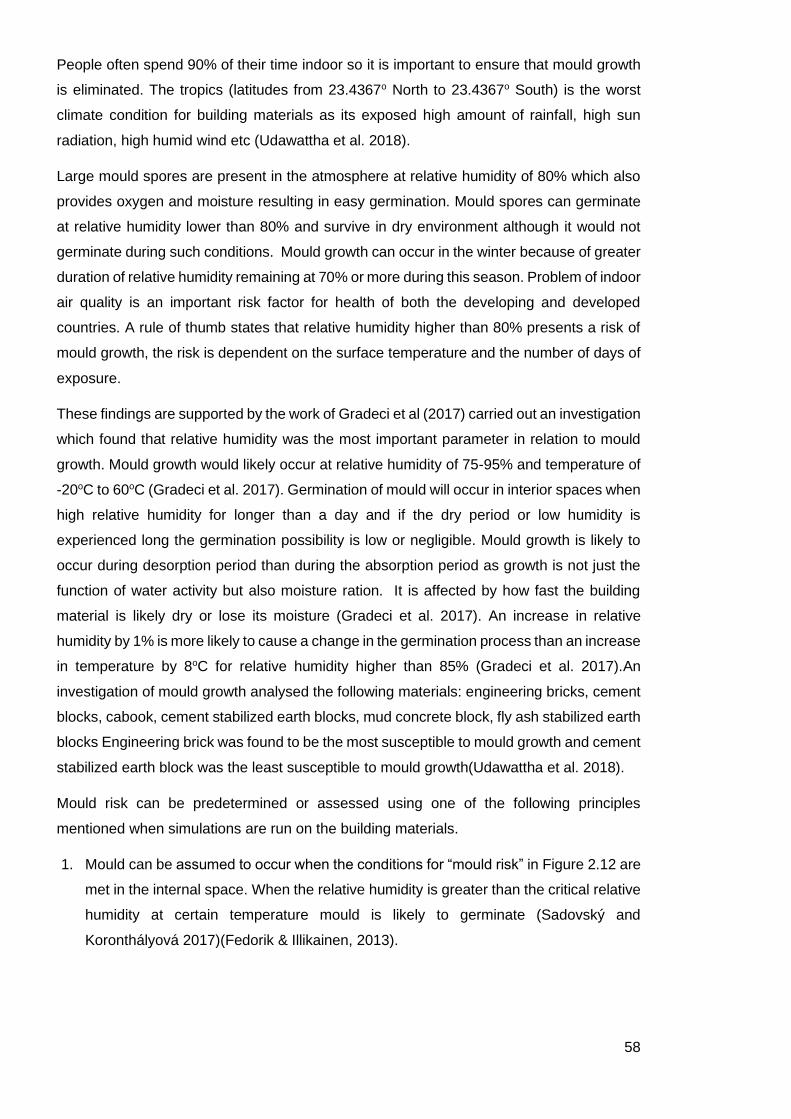
58
People often spend 90% of their time indoor so it is important to ensure that mould growth
is eliminated. The tropics (latitudes from 23.4367o North to 23.4367o South) is the worst
climate condition for building materials as its exposed high amount of rainfall, high sun
radiation, high humid wind etc (Udawattha et al. 2018).
Large mould spores are present in the atmosphere at relative humidity of 80% which also
provides oxygen and moisture resulting in easy germination. Mould spores can germinate
at relative humidity lower than 80% and survive in dry environment although it would not
germinate during such conditions. Mould growth can occur in the winter because of greater
duration of relative humidity remaining at 70% or more during this season. Problem of indoor
air quality is an important risk factor for health of both the developing and developed
countries. A rule of thumb states that relative humidity higher than 80% presents a risk of
mould growth, the risk is dependent on the surface temperature and the number of days of
exposure.
These findings are supported by the work of Gradeci et al (2017) carried out an investigation
which found that relative humidity was the most important parameter in relation to mould
growth. Mould growth would likely occur at relative humidity of 75-95% and temperature of
-20oC to 60oC (Gradeci et al. 2017). Germination of mould will occur in interior spaces when
high relative humidity for longer than a day and if the dry period or low humidity is
experienced long the germination possibility is low or negligible. Mould growth is likely to
occur during desorption period than during the absorption period as growth is not just the
function of water activity but also moisture ration. It is affected by how fast the building
material is likely dry or lose its moisture (Gradeci et al. 2017). An increase in relative
humidity by 1% is more likely to cause a change in the germination process than an increase
in temperature by 8oC for relative humidity higher than 85% (Gradeci et al. 2017).An
investigation of mould growth analysed the following materials: engineering bricks, cement
blocks, cabook, cement stabilized earth blocks, mud concrete block, fly ash stabilized earth
blocks Engineering brick was found to be the most susceptible to mould growth and cement
stabilized earth block was the least susceptible to mould growth(Udawattha et al. 2018).
Mould risk can be predetermined or assessed using one of the following principles
mentioned when simulations are run on the building materials.
1. Mould can be assumed to occur when the conditions for “mould risk” in Figure 2.12 are
met in the internal space. When the relative humidity is greater than the critical relative
humidity at certain temperature mould is likely to germinate (Sadovský and
Koronthályová 2017)(Fedorik & Illikainen, 2013).

59
Figure 2.11: Range of temperature and relative humidity for mould germination.(Fedorik & Illikainen, 2013)
- The critical relative humidity varies for temperature from ≥ 0oC < 20oC. the
relative humidity at each point needs to be mathematically calculated using the
formula below
RHcrit=−0.00267T3+0.161T3+3.13T+100
- The critical relative humidity for temperature ≥ 20oC ≤ 50oC is 80%.
2. buildings require that 30 day moving average of relative humidity to be below 80% for
the surface and temperature should be between 5-40oC, this is more severe than the
ISO standard (BS EN ISO 13788:2012) used for interior surface that states.
- For 7 days duration moving average relative humidity should be below 98%
- For 24 hours (1 day) moving average relative humidity should be below 100%,
- If the relative humidity on the surface passes 100%, condensation has occurred,
(Fantucci et al. 2017)
3. Mould prediction can be done some using simulation software (e.g., WUFI Pro). Inputs
for the simulation software include the internal temperature, moisture, substrate of the
material and exposure time. The substrate class of different building are be described
in Table 2.12.
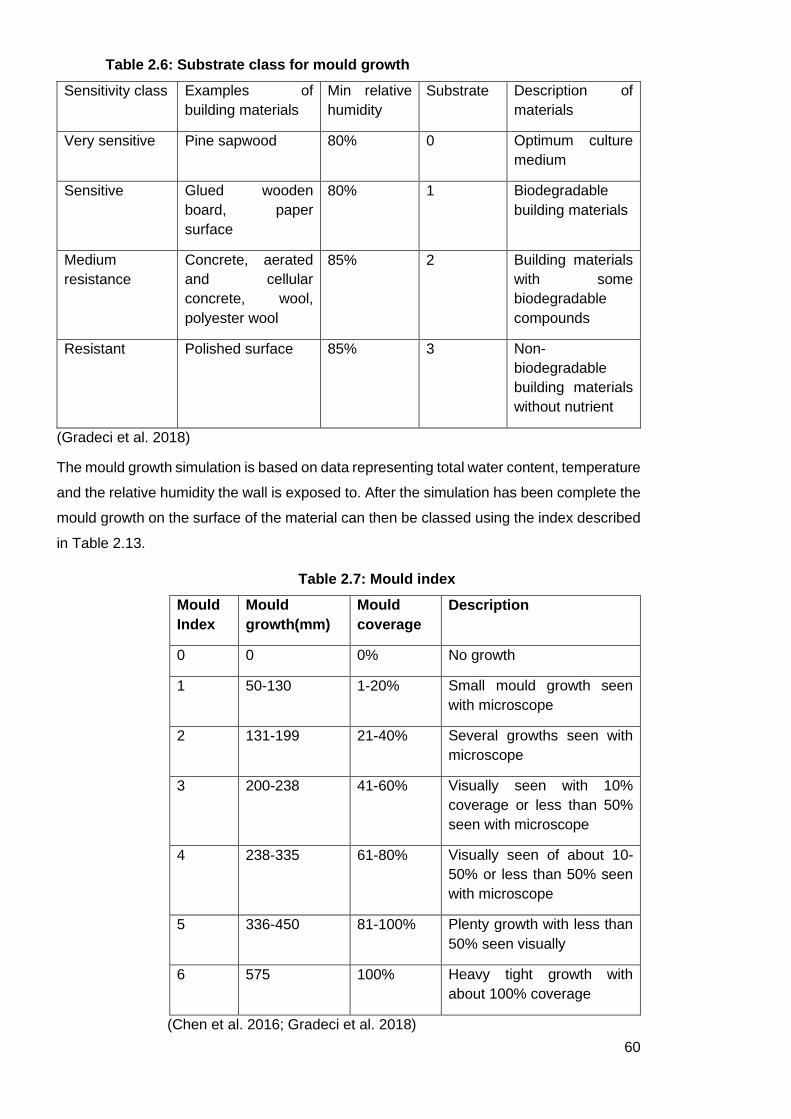
60
Table 2.6: Substrate class for mould growth
Sensitivity class Examples of
building materials
Min relative
humidity
Substrate Description of
materials
Very sensitive Pine sapwood 80% 0 Optimum culture
medium
Sensitive Glued wooden
board, paper
surface
80% 1 Biodegradable
building materials
Medium
resistance
Concrete, aerated
and cellular
concrete, wool,
polyester wool
85% 2 Building materials
with some
biodegradable
compounds
Resistant Polished surface 85% 3 Non-
biodegradable
building materials
without nutrient
(Gradeci et al. 2018)
The mould growth simulation is based on data representing total water content, temperature
and the relative humidity the wall is exposed to. After the simulation has been complete the
mould growth on the surface of the material can then be classed using the index described
in Table 2.13.
Table 2.7: Mould index
Mould
Index
Mould
growth(mm)
Mould
coverage
Description
0 0 0% No growth
1 50-130 1-20% Small mould growth seen
with microscope
2 131-199 21-40% Several growths seen with
microscope
3 200-238 41-60% Visually seen with 10%
coverage or less than 50%
seen with microscope
4 238-335 61-80% Visually seen of about 10-
50% or less than 50% seen
with microscope
5 336-450 81-100% Plenty growth with less than
50% seen visually
6 575 100% Heavy tight growth with
about 100% coverage
(Chen et al. 2016; Gradeci et al. 2018)

61
Mould growth prediction would be checked using the WUFI Pro checking the relative
humidity and temperature within the building structure and in the building for a year and
WUFI bio mould index would also be analysed to accurately predict the indoor air quality of
the building using the selected material.
Figure 2.12: Limiting growth curves for mould growth categories (Clarke et al, 1999)
Xerophilic organism can grow with low moisture content and hydrophilic organisms
needs high moisture content to germinate. The figure shows that the increase in
relative humidity which means increase in moisture content agrees with the
hydrophilic and xerophilic characteristics of mould organism.
2.7.3.2. Condensation
Condensation can occur in building in two forms – condensation on the surface of the
building material and interstitial condensation. Both are described below.
1. Condensation on the surface of the building material
Surface condensation occurs when humid air cooled to its dewpoint meets cold non-
absorbent surface such as glass (Fantucci et al. 2017). The surface condensation is
affected by two factors that includes the temperature and vapour pressure of the air.
Temperature of the surface of building material can be affected by; time rate of heating in
the building, ventilation rate, thermal property of the surface finish of the building fabric,
62
external temperature. The building material in Nigeria climate is to be exposed to external
climatic factors which cannot be change, thermal property of building material is gotten from
the thermal conductivity rate. The ventilation rate is the factor that can be adjusted to meet
the need of the people and the building. It can be through natural or HVAC system. To
achieve affordable and sustainable building, the natural means of ventilation is the most
adequate.
Vapour pressure of the building can be influence by, water vapour production within the
building space, ventilation rates, moisture content of the outdoor air, ability of building to
absorb or desorb water content (moisture buffering effect) (BS, 5250:2011+A1:2016). The
different spaces in the building have different vapour pressure. The moisture production in
the building spaces differ based on the use of the space which is discussed in Table 2.10
and 2.11.
2. Interstitial condensation
Interstitial condensation occurs within the building material when water vapour moving
through it meets material that is at a temperature and relative humidity below the dew point
of the vapour. In the winter, interior of building is warmer, and air contains more moisture
than the external side of the building. In spring, autumn as well as summer, surface
temperature might be lower in the external side, the external surface of south facing walls
may be wet by driving rain and can be heated by sun causing when the moisture can dry.
Interstitial condensation can lead to staining, odours, deterioration of fabric and loss of
thermal performance.
Relative humidity of interior air, air tightness of the vapour barrier and the temperature are
all import factors to study in order to prevent interstitial condensation in building structure.
The indoor environment can be improved by controlling the external climate that is allowed
into the space. It can be controlled by altering the building form and adjusting the orientation
of the building in relation to the topography, prevailing winds, sun light, and shadows caused
from surrounding buildings or obstructions (BS 5250:2011+A1:2016).
The interior space can be improved by improving the air tightness in wall cavities to reduce
hygrothermal risk. Relative humidity of interior air can also be reduced by providing
adequate source of ventilation. Increasing the ventilation alone cannot reduce hygrothermal
risk but in tandem with an increase in temperature and or increasing air tightness can also
improve the risk in buildings.
Interstitial condensation can occur easily in areas of the house such as;
▪ Corners of the rooms, mostly external walls
▪ Lintels and windowsills
▪ Behind the furniture placed against external walls

63
▪ Internal part of the building facing the driving the driving rain direction (BS
5250:2011+A1:2016).
To prevent interstitial condensation on building structure the following should be followed
according to BS EN ISO 13788: 2012
a. Coldest month should not have internal relative humidity above 80%
b. Any interstitial condensation that occurs during the winter should be evaporated during
the summer period.
c. The risk of degradation of material should be assessed in terms of the level of
condensation which might occur.
It is necessary to consider the conditions which facilitate interstitial condensation in the
context of the human comfort level which lies between 45-70% relative humidity at 18-24oC.
There is little gap between human comfort level and conditions which encourage mould
growth. Therefore, when relative humidity exceeds 70%, it important to remove excess
moisture from the space by providing ventilation or dehumidification source (BS
5250:2011+A1:2016). Natural Ventilation allows air pressure to move across the building
envelop as a result of the internal and external temperature difference together with wind
forces. Dehumidification is a mechanical process of removing moisture from the building.
The external climate allows the building structure such as wall component to be exposed to
solar gain, night sky radiation and exposed position.
- Exposure to solar gain: the building structure increases temperature which promotes
rapid drying of any condensation that nay have occurred.
- Night sky radiation: the external surface of the building cools easily at night which
means interstitial condensation can occur on the internal surface easily and can then
be easily evaporated during the daytime to reduce condensation on the building fabric.
(BS 5250:2011+A1:2016).
- Exposed position: (BS 5250:2011+A1:2016). In an urban city, some areas of the
building are exposed to external climate and the other part of the building can be
sheltered. The exposed area has high wind speed and driving wind that cools the
external surface of the building and cools the internal areas closest. (BS
5250:2011+A1:2016).
2.8. Design principles for buildings in Nigeria Nigeria is in the tropics where heating of interior spaces is not needed to achieve comfort
for the users, however there are several approaches that are appropriate for the region.
The interior climate in Nigeria can also be controlled by using one of the following
approaches:
64
1. Ventilation: constant flow of air allows internal relative humidity (moisture in the air) to
remain between 40-70% to ensure comfort and reduce mould risk. Ventilation is also
used to remove unwanted smells and pollutants from a space (BS
5250:2011+A1:2016). This is usually achieved by natural ventilation. The rate of
ventilation depends on the size of the openings/vents, driving force of air which can
create wind pressure and buoyancy from temperature difference can also cause stack
effects. Wind pressure is dependent on the wind speed and direction. Natural ventilation
in a house can be achieved through different means such as single sided ventilation,
cross ventilation, wind tower, stack system, atrium ventilation. The southern climate of
Nigeria commonly uses cross ventilation and places that can’t be cross ventilated use
single sided ventilation. The northern climate of Nigeria commonly uses the wind tower
system
2. Insulation: building insulation can raise the surface temperature of the building (BS
5250:2011+A1:2016).
3. Places with high relative humidity such as kitchen and bathroom can control the
moisture content by doing one or a combination of the following:
a. keeps the internal doors for kitchen closed and leave the windows opened while
cooking.
b. keeps the doors closed while bathing and open the windows after bathing or
showering.
c. uses an electric fan till the mist in the air clears in the space.
d. if condensation has occurred on the surface it can be mopped dry.
The current research concentrates on using compressed earth blocks for the construction
of affordable and sustainable walls. The different wall system is to be studied to under the
most suitable for Nigerian climate. Solid walls include stonework, brickwork, blockwork,
earthwork or concrete. The thermal mass property allows change in temperature to respond
to change in air temperature slowly and of moisture change to some degree.
2.8.1. Possible walls system used for construction with compressed earth blocks.
There are different wall types that be used in construction earth walls in Nigeria. Each is
described below in relation to their risk of interstitial condensation and mould risk. The wall
design is studied to understand the best principle that should be applied in a place with
tropical savanna climate, with high relative humidity and high temperature to prevent
moisture build up in the building structure.
1. Solid masonry wall- external insulation with low pressure resistance finish is illustrated
in Figure 2.13 (internal finish on right). Insulation can be applied to new and old

65
buildings. External insulation when applied reduces the risk of thermal bridges and risk
of water penetration. There is no calculation needed for mould growth and interstitial
condensation (BS, 5250:2011+A1:2016).
Figure 2.13: Solid wall with external insulation with low resistance finish, (BS, 5250:2011+A1:2016)
2. Solid masonry wall- external insulation with high vapour resistance finish is illustrated
in Figure 2.14 (internal finish on right) A ventilated cavity is present between the
insulation and the finish. The risk of mould growth should be calculated following the
principles of BS EN ISO 13788(BS, 5250:2011+A1:2016).
Figure 2.8: Solid wall with external insulation with high vapour resistance finish, (BS, 5250:2011+A1:2016)

66
3. Solid wall- internal insulation is illustrated in Figure 2.15 (internal finish on right). the
risk of moisture risk on the wall is calculated using BS EN 15026: 2007(BS,
5250:2011+A1:2016; BS EN, 15026:2007)
Figure 2.9: Solid wall with internal insulation, (BS, 5250:2011+A1:2016)
4. Masonry wall with cavity- External insulation is illustrated in Figure 2.16 (internal finish
on right). The use of external insulation might be necessary for improving thermal
performance. There is a risk of interstitial condensation when the building is heated;
however, a Nigerian building does not get heated as it has warm climate all through the
year, therefore no calculation is needed for mould growth and interstitial condensation.
(BS, 5250:2011+A1:2016)
Figure 2.10: Masonry wall with cavity, external insulation (BS, 5250:2011+A1:2016)

67
Cavity is to prevent rainwater to the interior of the house. Rainwater may penetrate the
external skin of the structure if it’s not adequately constructed but the cavity will reduce
the chances of it going through the inner skin and entering the interior space. The use
of these wall system seems to be a very good for the climate in Nigeria that is
considered. (BS, 5250:2011+A1:2016)
5. Masonry wall with cavity- internal insulation: The insulation could fully or partially fill the
cavity. The introduction of insulation in the cavity might reduce the primary purpose of
the cavity of reducing rainwater. The risk of interstitial condensation depends on the
heating regime of the interior space and the type of thermal mass material used in the
inner leaf. There is a higher risk of interstitial condensation when a higher density is
combined with a heating regime. Nigeria house doesn’t have any heating regime
throughout the year. The use of fully insulated cavity will not be advisable to use in the
country as the external wall is required to keep the large driving rain fall from coming
into the internal space (BS, 5250:2011+A1:2016). The risk of moisture is calculated
using BS EN 13788, (BS EN, 13788:2012)
Figure 2.11:Masonry wall with cavity- insulation partial filling the cavity(BS, 5250:2011+A1:2016)
2.9. Summary of literature findings There is significant housing deficit caused by several factors mentioned by (Ugochukwu &
Chioma, 2015). Key factors are lack of land and cost of materials.
Medium rise housing appear to be the optimum compromise between low rise housing
(significant land use) and high rise housing (significant energy use particularly for vertical
transport) (Craighead, 2009). Medium multi-story (3-5 storeys) houses were found to have
the best compromise between minimising land use and minimising energy consumption –
68
particularly for vertical transport. The quality of the building design strategy for passive
environment is to be analysed used simulation too design builder to ensure maximum
adaptable comfortable interior environment.
(Olotuah, 2002) found that using local materials could reduce the overall cost by 50%.
Traditional architecture responds to local culture, climate, and materials (Alabsi et al, 2016;
Kırbaş & Hızlı, 2016). The traditional architecture tends to use local material and passive
design strategies that are important to the climate such as shading ventilations and thermal
mass in the north and in the south roof with wide slope, raised building and cross
ventilations. Whereas the modern residential building uses materials that focuses on the
aesthetic and international designs strategies not suitable for the climate. This modern
design raises the building materials and increases the energy required for the operation and
construction of the building. The need to provide affordable houses should be reconciled
consideration to the environment - this research aims to solve the problem of
accommodation while minimising problems to the environment.
The building material was the focus to reduce the cost of building material and energy use
of building. The requirement of the building material required needs to be affordable,
minimise environmental impact, structurally appropriate, conducive to thermal comfort and
good indoor air quality and avoid social stigmatisation.
The present research concentrates on materials used for wall construction for residential
building. The materials most used are blockworks, fired clay bricks, stonework and earth
blocks. Blocks and fired bricks– not affordable and have significant environmental impact.
Stone has fewer environmental impacts than bricks and blocks, but there is not a sufficient
local resource, which requires importing and expense. (Ashby, 2013) (Charlett, 2013).
Earth is labour intensive and has many environmental benefits in construction and in use
(Abd Rashid & Yusoff, 2015; Darko et al, 2017; Van Damme & Houben, 2017). However,
in some forms (particularly adobe blocks) it is associated with poor quality construction and
social stigmatisation. This can be addressed using CEBs which have a different
appearance, but more importantly have appropriate strength and durability if incorporated
in a sympathetic design which protects the blocks from driving rains common in Nigeria.
However, using the lateritic earth available in Nigeria it requires stabilisation. Cement is
currently used, but this has associated costs and environmental impacts. Ashes from
agricultural waste (rice husk, sugar bagasse and palm oil fuel) have been researched as
cement substitutes in blocks, bricks and mortar applications. These sources have
particularly been chosen for their availability in Nigeria. The impact on mechanical
properties of a range of cement substitute proportions have been analysed for these three
materials (Almeida et al, 2015; Ganesan et al, 2008; Givi et al, 2010) (Khankhaje et al,
2016). The waste product considered were rice husk ash, sugar bagasse ash, and palm oil
69
fuel ash. Rice husk ash is deemed to be the most suitable agricultural waste as it’s widely
available in the country, particularly in the Tropical savannah climate which dominates
Nigeria.
The reason for abandonment includes factors such as strength, durability, social
stigmatization. The current research would aim to improve factors mentioned.
Hygrothermal properties are important to ensure the CEBs will have the expected durability
and will not have adverse impacts on indoor air quality (eg mould formation)
(Mukhopadhyaya et al 2002) (Nguyen et al. 2017). Equally the impact of CEBs on thermal
comfort (RH, temperature and surface condensation) (Fantucci et al. 2017) (BS
5250:2011+A1:2016) are important considerations for occupant acceptance, particularly
given previous stigmatisation of earth-based housing.
The quality of residential material using local soil as the main constituent of construction,
while utilizing agricultural waste ash for partial stabilization in the country for sustainable
and comfortable environment can be determined by two criteria. The quality of the material
for the type of building required and the potential design strategies required.
The quality of material can be analysed by checking the mechanical and hygrothermal
property of the material in a laboratory. The mechanical strength is to ensure that material
can carry the load it will be exposed to from dead load, live load of users, external load etc.
the mechanical strength for compressed earth blocks to be analysed includes compressive
strength and bulk density of the material.
The hygrothermal properties relate to indoor air quality and are also required to ensure the
comfort of the users in the space. The tests required includes water absorption coefficient,
moisture absorption test, water vapour transmission, moisture buffering test and thermal
conductivity test. Improvement of the property of the material would also mean the reduction
of energy required to keep the user of the space comfortable. To analyse the hygrothermal
property of the material in depth, hygrothermal simulation based on the laboratory results
is required.
The parameters affecting hygrothermal and thermal performance were identified such as
building location in relation to climate and surrounding buildings, orientation, shelter from
rain (ie roof), moisture from indoor activities. The assessment criteria for mould growth risk
were defined (Sadovský and Koronthályová 2017) (Fedorik & Illikainen, 2013), (ISO
13788:2012 (Gradeci et al. 2018)
Potential wall structures which can incorporate CEBs are considered in relation to potential
interstitial condensation and mould growth. The most suitable wall design for tropical
savanna climate (Aw) in Nigeria is the option of masonry wall with cavity to prevent driving

70
rain from going into the inner skin of the wall. The wall could be having full cavity or partially
filled cavity with insulation.
This literature review has revealed a lack of research on CEBs with RHA as a cement
substitute and its effect on the resulting hygrothermal properties and impact on indoor air
quality and thermal comfort of the resulting building. It has also revealed little data on the
mechanical properties of CEBs with RHA as a cement substitute.
71
3 Research Methodology
_______________________________________________________________________
This chapter describes the activities carried out at various stages of the research project in
order to achieve the objectives of the study. Section 3.1 describes the relevant research
strategies used from the inception to the conclusion of the research. Section 3.2 describes
the processes adopted in this research for production and testing of materials used for
manufacturing CEBs, and the production of the experimental CEBs. Section 3.3 describes
the tests carried out on the CEBs to ascertain their mechanical, physical and durability
properties. Section 3.4 describes the simulation to test the hygrothermal performance of
the wall material. Section 3.5 describes the method applied to develop the building design
optimised for CEBs in the local climate and to compare the thermal comfort arising from
using CEBs versus concrete blocks.
3.1 Research Framework
The current study concentrates on a means to provide affordable and sustainable
residential houses for low-income earners in Nigeria. The construction techniques,
materials and design process are to ensure that the construction process has less
negative impact on the earth for present and next generation. Figure 3.1 illustrates the
theoretical framework adopted in the study for providing affordable and sustainable
residential houses using compressed earth blocks partially stabilized with rice husk ash.
The steps employed to achieve the required material property is described in this section.
1. Provision of affordable and sustainable residential houses: there have been
different research methods carried out across the globe to ensure affordable and
sustainable buildings in areas such as the design method, construction methods,
building materials used for building construction, policy of the industry, and some
other methods. This research focused on providing affordable and sustainable
material for wall construction. The use of locally available material using simple
methods for production and material that does not adversely affect the
environment for this generation and future generation to come.
2. Compressed earth block: it is a traditional masonry material technique that
requires the use of the local soil, it can be stabilized to improve it is mechanical
and hygrothermal property and requires minimal energy and simple methods for
production.
3. Raw materials: the local soil of the area is laterite. Laterite is major material
required for production of compressed earth blocks. It has high content of clay and
this causes moulded material to have high tendency to shrink and cause cracking
when dried. The characteristics of shrinkage and cracking can be resolved by
reducing the clay content and stabilizing the soil. To reduce the clay content ratio,
72
there would be addition of sandy soil to the mix and to stabilize the soil, ordinary
Portland cement and rice husk ash would be mixed in varying ratio. Rice husk ash
would be prepared according to achieve the require amorphous silica content.
4. Production of CEBs: The material laterite, sandy soil, ordinary Portland cement
and rice husk are mixed in varying ratio. The laterite soil and sand soil mix ratio
remain a constant ratio, while the ordinary Portland cement is gradually reduced
and replaced with rice husk ash. There are two types of blocks produced which
included the solid and hollow blocks. The blocks are cured for a duration of 14, 21
and 28 days.
5. Evaluation of mechanical and hygrothermal properties of CEBs: the varying ratio of
the blocks are laboratory tested in to ensure the blocks meet the required
mechanical property required for the building type. Blocks that meet the required
mechanical test are further tested to ensure it meets the hygrothermal property
required for masonry unit. The most suitable CEB mixes are selected for further
evaluation.
6. Evaluation of hygrothermal behaviour of wall structure (mould growth) and thermal
comfort: the property of wall material is analysed using numerical simulations. The
hygrothermal behaviour of the wall for mould growth was analysed using WUFI
and the thermal comfort level of the wall was analysed using Design Builder. Four
sets of mix ratio are selected from the laboratory test as the most suitable to
proceed for further evaluation, the properties from the laboratory test are then
inputted to WUFI to analyse the hygrothermal behaviour of the wall structure in the
selected climate. The best mix ratio based on the studied conditions are selected
for further test to ensure thermal performance of the wall meets the requirement.
The use of simulation for this aspect was chosen rather than in situ measurement
techniques because of time and cost constraint of the research. The simulation of
the wall material is based on weather data from previous decade and assumed
conditions, while in situ measurement would have been based on real condition of
the place at the time.

73
Figure 3.1, Theoretical framework for providing affordable and sustainable residential
houses
3.2 Production of CEBs and testing of the component materials
3.2.1 Raw material collection preparation and test
This section describes in detail the process used to obtain the raw materials, test them and
manufacture CEBs from them. The main material used for construction was earth material
(laterite). The selection of soil for engineering purpose (CEBs) required several steps before
it was deemed appropriate. The following characteristic was used to determine the soil
selection in accordance to British standard (BS, EN ISO 14688-1:2018; EN ISO 14688-
2:2018). The characteristic of the soil was appropriate for sustainable construction:
a. the soil must be natural to the area
b. the soil should not have organic matter
c. the soil particle had to be smaller than 63mm.
d. the soil had to stick together when wet and moulded
e. coarse soil could have sand
1. PROVISION OF AFFORDALE AND SUSTAINABLE RESIDENTIAL
HOUSES
2. USING COMPRESSED EARTH BLOCKS (CEBS)
3. RAW MATERIAL
(Material collection, preparation and Testing)
4. PRODUCTION OF CEBS
(Determination of pressing techniques, dimension, and mix ratio)
5. EVALUATION OF THE MECHANICAL AND HYGROTHERMAL
PROPERTIES OF THE MASONRY UNIT (CEBs)
(Test to determine compressive strength, thermal conductivity,
moisture absorption, and water vapour transmission)
6. USE OF CEBs IN RESIDENTIAL HOUSING DESIGN TO EVALUTE THE
POSSIBILITY OF PASSIVE DESIGN IMPLEMENTATION
(Design and evaluation of passive building using Design Builder
and WUFI)
74
f. fine soil could include silt and clay soil
3.2.1.1 Raw material collection
The materials used to produce the experimental CEBs include laterite (clay), sharp sand,
Ordinary Portland Cement (OPC), rice husk ash, and water. All the materials were sourced
locally, the exact locations are indicated in the following information.
a. Soil Type: Combinations of clay soil, silt, sand or gravel are commonly used to produce
CEBs. To improve binding due to poor soil type, stabilizers are used to enhance the
property of soil type available (Mostafa, 2016). Laterite (clay) soil is rich in iron oxide,
silica, alumina which can be gotten from weathering of rocks with colour generally red,
yellow and brown. It is the predominant soil in Nigeria (Adam & Agib, 2001; Mostafa &
Uddin, 2016b) and was extracted in Ogun state as shown in Figures 3.2 and 3.3.
Laterite has poor workability, low shear strength, high compressibility and poor bearing
capacity as a result of the property of clay. Stabilization will reduce soil compressibility,
improve workability and soil drainage characteristic. Production usually requires
stabilizer such as lime, cement, straw, bitumen and pozzolans. Attempts are being
made to avoid cement due to its environmental impact. The large proportion of clay
causes excessive shrinkage; and therefore, requires an addition of sand to make it
suitable for CEB. A small test sample of laterite soil and stabiliser was first test without
the addition of sand, the compressive strength was poor so further test was not
conducted for this batch. For this study, laterite was therefore combined with sharp
sand to achieve soil with an appropriate ratio of components to form bricks.
The laterite was taken from an excavation site close to CEB production site (Ilaro) along
the Oja-Odan road, Ilaro, Ogun State, Nigeria. Sharp sand was collected from a local
stream along the Oja-Odan road, Illaro, Ogun State, Nigeria. Samples of the laterite
and sharp sand were collected to carry out standard procedure test to determine
Atterberg limits, and porosity.
b. Cement: The 42.5 grade Dangote Ordinary Portland Cement (OPC) brand
manufacture in Ogun state (location shown in Figure 3.3) is popularly used for building
construction in Nigeria and was purchase from a retailer along Oja-Odan Road, Ilaro
Ogun State, Nigeria for the stabilisation of laterite in this research.
c. Rice Husk: The rice husk was obtained from a rice milling factory along Lagos -
Abeokuta Expressway, Ogun State (location shown in Figure 3.3). This was used to
make rice husk ash for the stabilisation of laterite in this research.
d. Water: Potable water from a borehole at the production site was used to mix the
material after batching.

75
Figure 3.2: green outline highlighting the location of Ogun state on the map. (d-maps.com,
2020)
Figure 3.3: Map of Ogun state and location of site, location and distance of materials to site.
76
3.2.1.2 Raw material preparation
Each material required preparation before being used to produce CEBs. The preparation
process for each material is described in this section.
a. Soil Type: The excavated soil was air dried on a flat surface, pulverised and passed
through sieve. Laterite was sieved with a minimum and maximum sieve mesh size of
0.063mm and 63mm respectively to ensure the appropriate grain were attained
(Akinwunmi et al 2019). Similarly, the sharp sand was subjected to sieving through
mesh size between 2mm and 0.425mm to attain the appropriate grain sizes (Mostafa,
2016). The sieved soil was spread across a large surface area where they were air
dried for a week.
b. Rice Husk Ash (RHA): The rice husk was charred before subjected to combustion for
a period of 3 – 4hrs at temperatures of 550-700oC in a furnace to obtain Rice Husk Ash
(RHA). The treatment was to ensure the RHA retains its high amorphous silica content
(Alsubari et al, 2016; Chiang et al, 2009; Ganesan et al, 2008; Sore et al, 2016). The
process of carrying out the burning of the rice husk ash was challenging, as a large
combusting device to burn the rice husk at the required temperature wasn’t available.
i. At Covenant University the combustion furnace was damaged and the part that was
to be fixed wasn’t available in the country, so it was to be ship into the school from
the buyer. The only combustion furnace available was too small to burn the amount
that would be required for the partially replacement needed in the soil mix.
ii. There was also an enquiry of the device at Nigeria Building and Road Research
Institute Nigeria (NBRRI) but the furnace available to burn at controlled temperature
was damaged and the other furnaORDIce did not have enough temperature control.
iii. There was an enquiry of the furnace at National Agency for Food and Drug
Administration (NAFDAC), the furnace available was small and can only burn 50 g
of rice husk at a time per day as the furnace would take a few hours to cool down
before another batch can be put in to burn.
Finally, the burning process of rice husk ash had to be done with a private sculptor that had
a large furnace. The burning process took about three weeks to be completed as the
furnace had to be cooled for 36 hours after each batch before it could be removed from the
furnace.
3.2.1.3 Raw material testing - Earth
The principal purpose of testing soil is to understand the soil behaviour in terms of its
compressibility, strength and permeability. The soil behaviour can then be predicted based
on the characteristics of the soil particle size, shrinkage property, soil composition, soil bulk
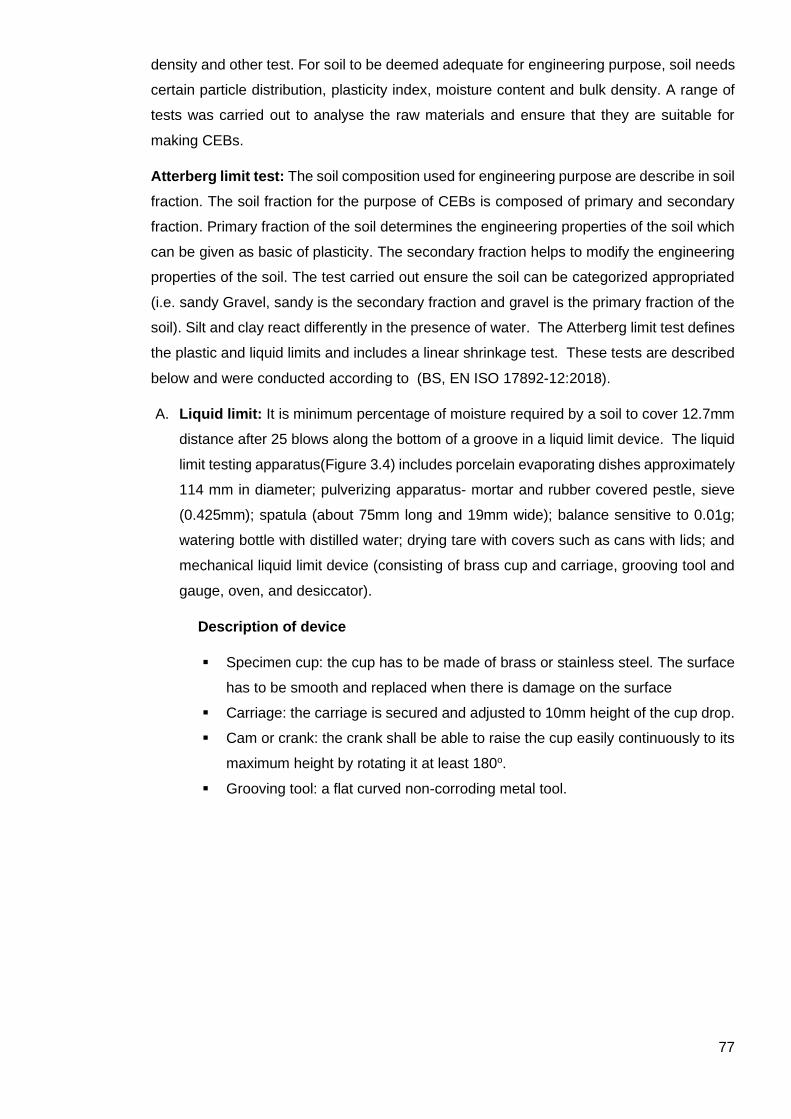
77
density and other test. For soil to be deemed adequate for engineering purpose, soil needs
certain particle distribution, plasticity index, moisture content and bulk density. A range of
tests was carried out to analyse the raw materials and ensure that they are suitable for
making CEBs.
Atterberg limit test: The soil composition used for engineering purpose are describe in soil
fraction. The soil fraction for the purpose of CEBs is composed of primary and secondary
fraction. Primary fraction of the soil determines the engineering properties of the soil which
can be given as basic of plasticity. The secondary fraction helps to modify the engineering
properties of the soil. The test carried out ensure the soil can be categorized appropriated
(i.e. sandy Gravel, sandy is the secondary fraction and gravel is the primary fraction of the
soil). Silt and clay react differently in the presence of water. The Atterberg limit test defines
the plastic and liquid limits and includes a linear shrinkage test. These tests are described
below and were conducted according to (BS, EN ISO 17892-12:2018).
A. Liquid limit: It is minimum percentage of moisture required by a soil to cover 12.7mm
distance after 25 blows along the bottom of a groove in a liquid limit device. The liquid
limit testing apparatus(Figure 3.4) includes porcelain evaporating dishes approximately
114 mm in diameter; pulverizing apparatus- mortar and rubber covered pestle, sieve
(0.425mm); spatula (about 75mm long and 19mm wide); balance sensitive to 0.01g;
watering bottle with distilled water; drying tare with covers such as cans with lids; and
mechanical liquid limit device (consisting of brass cup and carriage, grooving tool and
gauge, oven, and desiccator).
Description of device
▪ Specimen cup: the cup has to be made of brass or stainless steel. The surface
has to be smooth and replaced when there is damage on the surface
▪ Carriage: the carriage is secured and adjusted to 10mm height of the cup drop.
▪ Cam or crank: the crank shall be able to raise the cup easily continuously to its
maximum height by rotating it at least 180o.
▪ Grooving tool: a flat curved non-corroding metal tool.
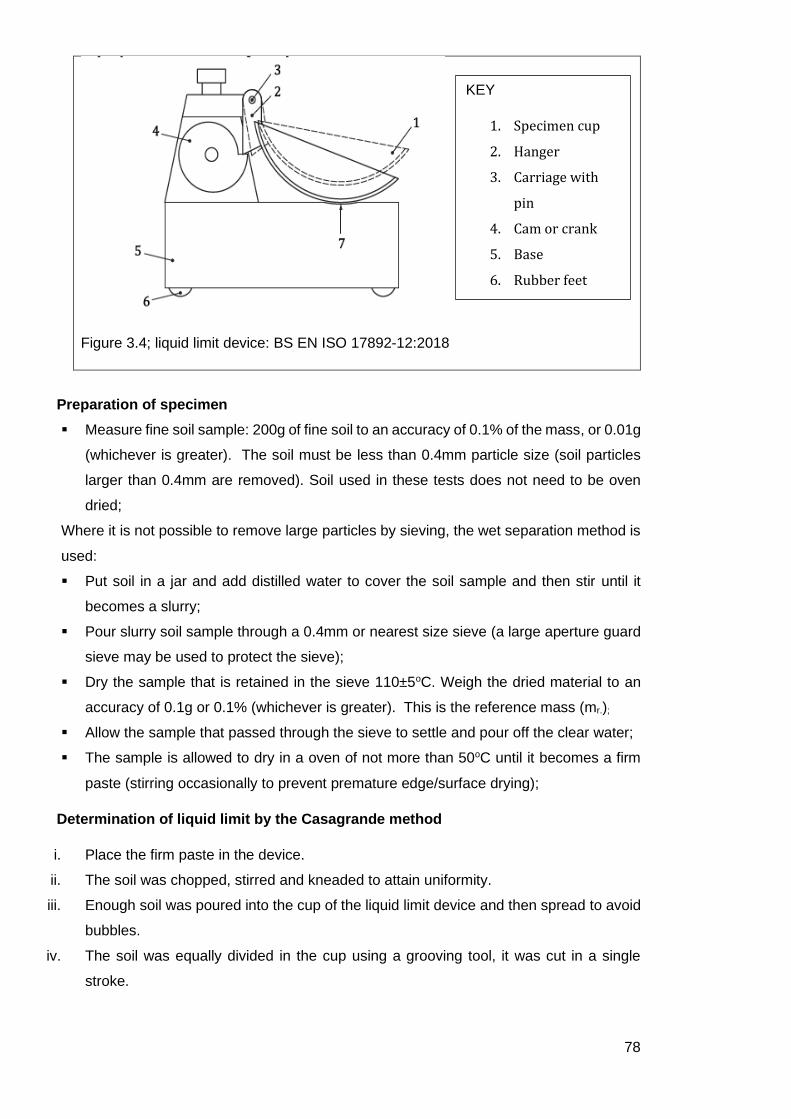
78
Figure 3.4; liquid limit device: BS EN ISO 17892-12:2018
Preparation of specimen
▪ Measure fine soil sample: 200g of fine soil to an accuracy of 0.1% of the mass, or 0.01g
(whichever is greater). The soil must be less than 0.4mm particle size (soil particles
larger than 0.4mm are removed). Soil used in these tests does not need to be oven
dried;
Where it is not possible to remove large particles by sieving, the wet separation method is
used:
▪ Put soil in a jar and add distilled water to cover the soil sample and then stir until it
becomes a slurry;
▪ Pour slurry soil sample through a 0.4mm or nearest size sieve (a large aperture guard
sieve may be used to protect the sieve);
▪ Dry the sample that is retained in the sieve 110±5oC. Weigh the dried material to an
accuracy of 0.1g or 0.1% (whichever is greater). This is the reference mass (mr.);
▪ Allow the sample that passed through the sieve to settle and pour off the clear water;
▪ The sample is allowed to dry in a oven of not more than 50oC until it becomes a firm
paste (stirring occasionally to prevent premature edge/surface drying);
Determination of liquid limit by the Casagrande method
i. Place the firm paste in the device.
ii. The soil was chopped, stirred and kneaded to attain uniformity.
iii. Enough soil was poured into the cup of the liquid limit device and then spread to avoid
bubbles.
iv. The soil was equally divided in the cup using a grooving tool, it was cut in a single
stroke.
KEY
1. Specimen cup
2. Hanger
3. Carriage with
pin
4. Cam or crank
5. Base
6. Rubber feet
7. Point of contact
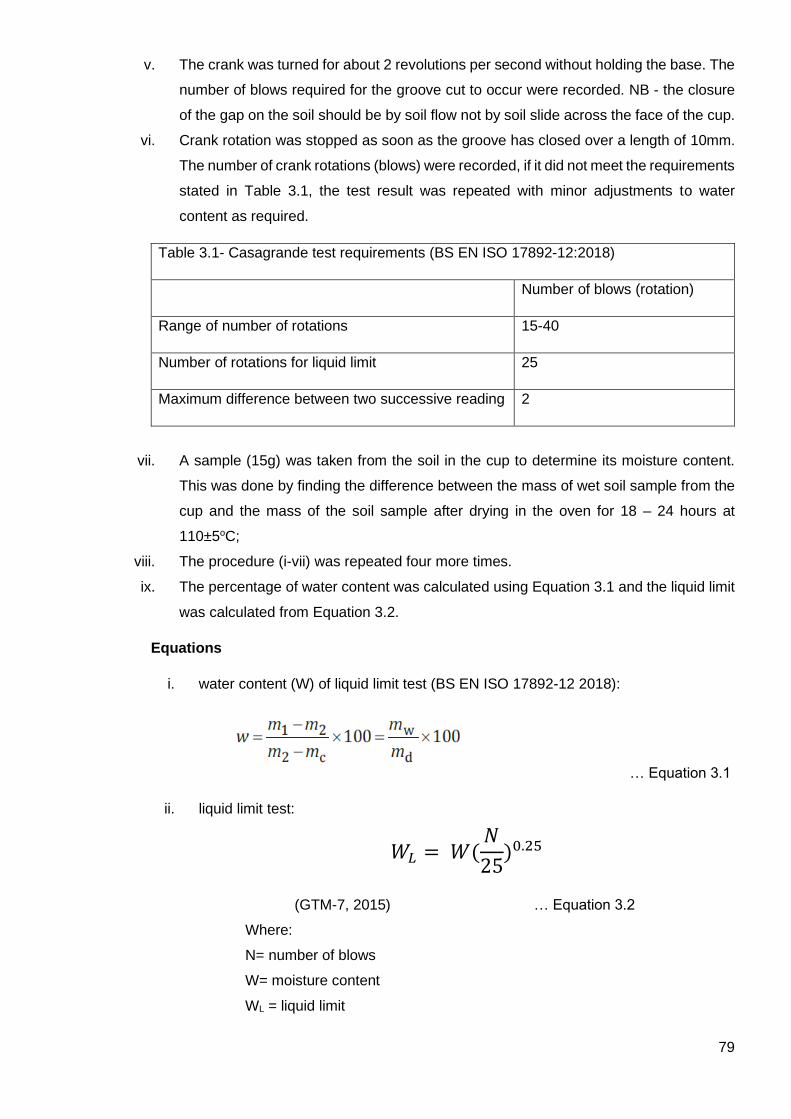
79
v. The crank was turned for about 2 revolutions per second without holding the base. The
number of blows required for the groove cut to occur were recorded. NB - the closure
of the gap on the soil should be by soil flow not by soil slide across the face of the cup.
vi. Crank rotation was stopped as soon as the groove has closed over a length of 10mm.
The number of crank rotations (blows) were recorded, if it did not meet the requirements
stated in Table 3.1, the test result was repeated with minor adjustments to water
content as required.
Table 3.1- Casagrande test requirements (BS EN ISO 17892-12:2018)
Number of blows (rotation)
Range of number of rotations 15-40
Number of rotations for liquid limit 25
Maximum difference between two successive reading 2
vii. A sample (15g) was taken from the soil in the cup to determine its moisture content.
This was done by finding the difference between the mass of wet soil sample from the
cup and the mass of the soil sample after drying in the oven for 18 – 24 hours at
110±5oC;
viii. The procedure (i-vii) was repeated four more times.
ix. The percentage of water content was calculated using Equation 3.1 and the liquid limit
was calculated from Equation 3.2.
Equations
i. water content (W) of liquid limit test (BS EN ISO 17892-12 2018):
… Equation 3.1
ii. liquid limit test:
𝑊𝐿 = 𝑊(𝑁
25)0.25
(GTM-7, 2015) … Equation 3.2
Where:
N= number of blows
W= moisture content
WL = liquid limit

80
B. Plastic limit: It is the moisture content in the soil between the plastic and semi-solid
state of the soil. It is measured by rolling a 3mm stick soil sample on glass surface until
it begins to crumble,
Apparatus
▪ Mixing plate: it’s a smooth, flat, clean surface used to roll the threads. It’s usually
made of glass of about 100mm thick with square dimension of 300mm.
▪ Rod or gauge: it’s a rod of 3mm to 3.5mm or a gauge with opening equal to be
used to check the size of thread made.
Determination of plastic limit
i. the remainder of the sample from the liquid limit test machine was
retrieved.
ii. take 15g to 20g of the retrieved soil sample and plate on the mixing
plate.
iii. allow the paste to dry partially until it has reached plastic state.
iv. mould the sample into a ball and roll into an ellipsoidal shape.
v. divide the portion into three.
vi. each portion should be rolled into ellipsoidal shape of 6mm first.
vii. the ellipsoidal shape was rolled into a uniform thread of 3mm diameter
through the length.
viii. the thread was broken into 6 pieces and squeezed back together into a
uniform rod.
ix. place the pieces into a suitable container and place a lid on it.
x. repeat step 4-9 until the thread crumbles and the soil can no longer be
rolled into a thread.
xi. the moisture content of the crumbled soil was determined by finding the
difference between the mass of the wet crumbled soil sample from the
cup and the mass of the crumbled soil sample after drying in the oven
for 18 – 24 hours at 110±5oC and calculate using Equation 3.3;
xii. the percentage plastic limit was calculated using Equation 3.4.
Equations
▪ Moisture content for plastic limit test
𝑚𝑜𝑖𝑠𝑡𝑢𝑟𝑒 𝑐𝑜𝑛𝑡𝑒𝑛𝑡(𝑊𝑃) =𝑚𝑎𝑠𝑠 𝑜𝑓 𝑤𝑎𝑡𝑒𝑟
𝑤𝑒𝑖𝑔ℎ𝑡 𝑜𝑓 𝑑𝑟𝑦 𝑠𝑜𝑖𝑙𝑥100(GTM-7, 2015) Equation 3.3
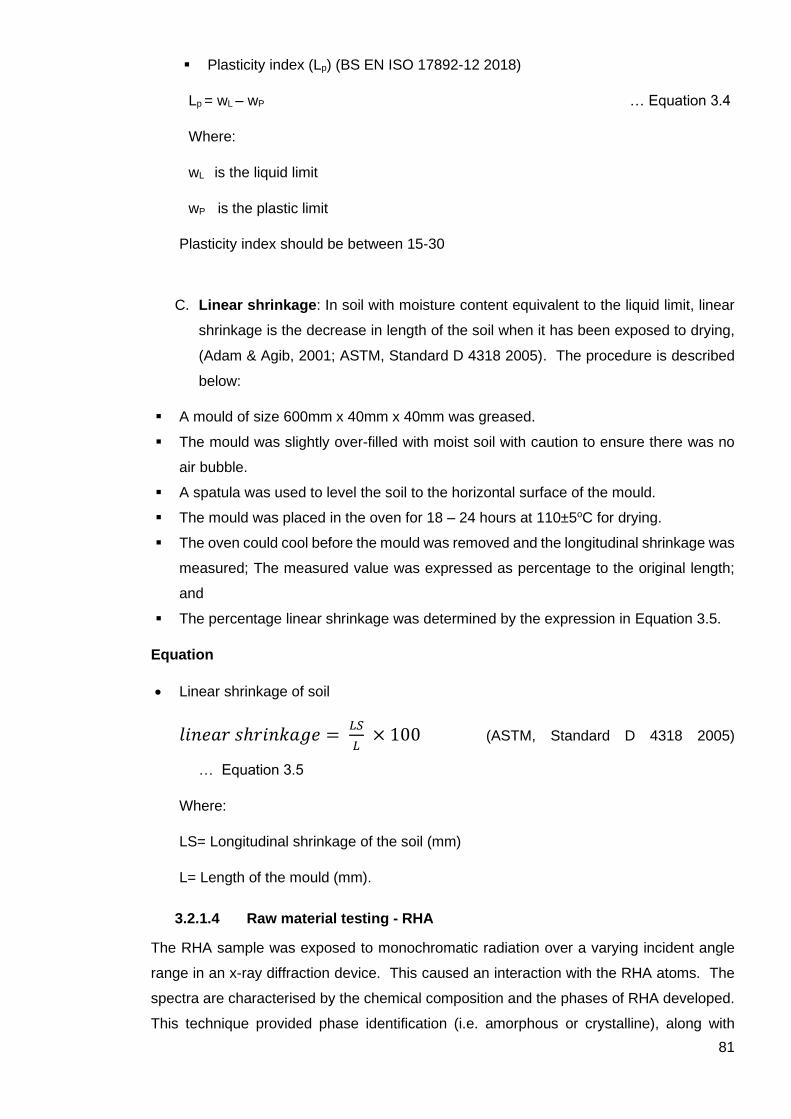
81
▪ Plasticity index (Lp) (BS EN ISO 17892-12 2018)
Lp = wL – wP … Equation 3.4
Where:
wL is the liquid limit
wP is the plastic limit
Plasticity index should be between 15-30
C. Linear shrinkage: In soil with moisture content equivalent to the liquid limit, linear
shrinkage is the decrease in length of the soil when it has been exposed to drying,
(Adam & Agib, 2001; ASTM, Standard D 4318 2005). The procedure is described
below:
▪ A mould of size 600mm x 40mm x 40mm was greased.
▪ The mould was slightly over-filled with moist soil with caution to ensure there was no
air bubble.
▪ A spatula was used to level the soil to the horizontal surface of the mould.
▪ The mould was placed in the oven for 18 – 24 hours at 110±5oC for drying.
▪ The oven could cool before the mould was removed and the longitudinal shrinkage was
measured; The measured value was expressed as percentage to the original length;
and
▪ The percentage linear shrinkage was determined by the expression in Equation 3.5.
Equation
• Linear shrinkage of soil
𝑙𝑖𝑛𝑒𝑎𝑟 𝑠ℎ𝑟𝑖𝑛𝑘𝑎𝑔𝑒 = 𝐿𝑆
𝐿 × 100 (ASTM, Standard D 4318 2005)
… Equation 3.5
Where:
LS= Longitudinal shrinkage of the soil (mm)
L= Length of the mould (mm).
3.2.1.4 Raw material testing - RHA
The RHA sample was exposed to monochromatic radiation over a varying incident angle
range in an x-ray diffraction device. This caused an interaction with the RHA atoms. The
spectra are characterised by the chemical composition and the phases of RHA developed.
This technique provided phase identification (i.e. amorphous or crystalline), along with

82
phase quantification, percentage crystallinity, crystallite size and unit cell. The x-ray
diffraction device at Cardiff University can collect high resolution data at low temperature to
systems that can probe structures up to 9000C under 10 different atmospheres of reactive
gases.
The RHA samples were obtained using two different methods in order to establish which
was the most suitable for high amorphous silica content
Method 1
The rice husk ash used for the test was gotten form Abeokuta, Ogun state. The rice husk
was first charred to remove the moisture and organisms from the waste using a local
burning method in a local mud pot. The colour of the husk changed from cream to black
and the husk reduced to about half its size in mass. The charred husk was then combusted
in a furnace for about 2-3 hrs at temperature ranging from 550-780oC. The furnace was left
to cool for about 24 hrs before the RHA was brought out of the furnace. The colour of the
resulting rice husk ash was whitish grey colour.
Method 2
The rice husk was combusted directly in the furnace for 21/2 hrs- 4hrs. The colour of the rice
husk changed from cream to whitish grey. The furnace was fed with the same quantity of
husk used in ‘method 1’, the burning of the hush took a long time and cost more because
the mass of the husk has not been reduced from the charring step which removes moisture
and organisms. The second method was introduced to reduce the time of production
process.
3.2.2 Compressed Earth Block (CEBs) production
Compressed earth block (CEB) is produced by mechanical compaction. Besides being
made locally by semi-skilled labour. CEB has possibility of attaining adequate thermal and
acoustic properties. It requires less energy compared to bricks and concrete thus making it
affordable and at the same time sustainable (Sekhar C & Nayak, 2018). The study serves
dual purposes. Reduction of construction cost through reduction of the quantity of OPC
and substitution with cheaper waste product, RHA. In CEB, the environmental impact of
producing OPC is major and the cost of production and purchasing is a concern in the
production of a sustainable and affordable building walls.
3.2.2.1 CEB Mix ratios
The cement content used was in accordance with the recommended ratio for the wet climate
(Sekhar and Nayak, 2018). All the blocks required for one mix ratio was made in one single
mix to ensure the same mix was achieved was made for each individual block within a
batch.

83
Six different mix ratios were used to produce 162 solid and 108 hollow CEBs to test the
best mixture ratio. The solid CEBs are to be used for exterior and load bearing walls, as
these walls will be exposed to environmental climate and structural loads. The production
of hollow blocks was used to reduce the raw material needed to make interior walls as these
are not exposed to environmental climate and are not load bearing. The mix ratio variables
included Laterite, Sharp Sand, OPC, RHA and Water. Each mix ratio was grouped and
labelled accordingly. The control mixes for solid CEBs adopted ratio 11:7:2 for Laterite,
Sharp Sand and OPC. While the hollow CEBs adopted ratio 13:5:2 for Laterite, Sharp Sand
and OPC. The mix ratio for hollow CEBs differed from the solid because the formation of
the hollow block required more laterite.
The experimental CEBs were intended to explore the replacement of OPC with RHA. For
this reason, the proportions of laterite and sharp sand were identical to the control mix. The
OPC component was replaced with 10%, 20%, 30%, 40% and 50% of RHA respectively for
both block shapes – this is detailed in Table 3.3.
3.2.2.2 Production of solid and hollow CEBs
For each CEB mix, the respective proportions of laterite, sharp sand, ordinary Portland
cement and Rice Husk Ash, were measured and mixed thoroughly with a shovel in order to
achieve homogenous mixtures as shown in Figure 3.5. Thereafter, the respective mixes
were each filled in (290 × 140 × 95) mm mould, placed in the mortar interlocking press (also
illustrated in Figure 3.5) to produce solid and hollow CEBs. Consequently, two types of
CEB (i.e. solid and hollow) of the specifications shown in Table 3.2 were produced.
The manual production method was used for this study because the equipment is light,
sturdy, low cost, simple to manufacture and repair and could be easily purchased in Nigeria
for about $500- $800. A more detailed description of the process follows:
a. Measuring and mixing of required proportions materials (i.e. laterite, sand, OPC, RHA
and water). Wetting with water was done to ensure workability and binding of the
materials.
b. The mix was poured into the mould of the mechanical pressing machine in Figure 3.5.
manual Pressure was applied manually for a few seconds for uniform compaction; and
c. afterwards the blocks were extruded and placed for curing.
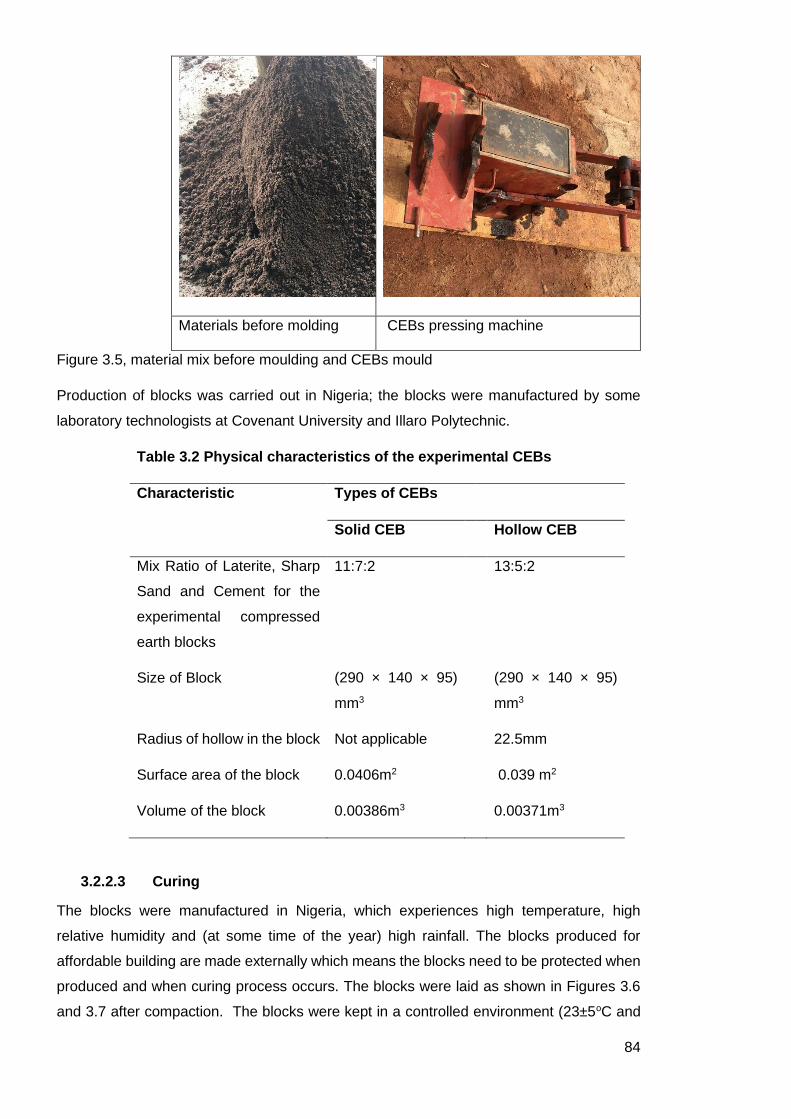
84
Materials before molding CEBs pressing machine
Figure 3.5, material mix before moulding and CEBs mould
Production of blocks was carried out in Nigeria; the blocks were manufactured by some
laboratory technologists at Covenant University and Illaro Polytechnic.
Table 3.2 Physical characteristics of the experimental CEBs
Characteristic Types of CEBs
Solid CEB Hollow CEB
Mix Ratio of Laterite, Sharp
Sand and Cement for the
experimental compressed
earth blocks
11:7:2 13:5:2
Size of Block (290 × 140 × 95)
mm3
(290 × 140 × 95)
mm3
Radius of hollow in the block Not applicable 22.5mm
Surface area of the block 0.0406m2 0.039 m2
Volume of the block 0.00386m3 0.00371m3
3.2.2.3 Curing
The blocks were manufactured in Nigeria, which experiences high temperature, high
relative humidity and (at some time of the year) high rainfall. The blocks produced for
affordable building are made externally which means the blocks need to be protected when
produced and when curing process occurs. The blocks were laid as shown in Figures 3.6
and 3.7 after compaction. The blocks were kept in a controlled environment (23±5oC and

85
90%RH) during curing. Extreme shrinking and cracking were prevented by covering the
blocks with a 1mm thick tarpaulin sheet to control the rate of moisture desorption. Watering
of blocks was done with a spray bucket at least twice daily to ensure adequate occurrence
of hydration reactions (Adam & Agib, 2001). Sets of blocks were cured for 14, 21 and 28
days. After curing, the blocks were then stored in a dry room in preparation for the
subsequent tests. The production and curing incorporated the procedure for clay masonry
units according to British standard (BS, EN 771-1:2011+A1:2015).
Table 3.3a, Composition of mix for CEBs – Solid
Shape CODE Laterite
proportion
Sharp
sand
proportion
Stabilizer
proportion
Curing
time
(days) OPC RHA
Solid S/0 RHA*
0% RHA
11 7 2* - 14
21
28
S/0.2 RHA
10% RHA
11 7 1.8 0.2 14
21
28
S/0.4 RHA
20% RHA
11 7 1.6 0.4 14
21
28
S/0.6 RHA
30% RHA
11 7 1.4 0.6 14
21
28
S/0.8 RHA
40% RHA
11 7 1.2 0.8 14
21
28
S/1 RHA
50% RHA
11 7 1.0 1.0 14
21
28
* Control sample

86
Table 3.3b, Composition of mix for CEBs – Hollow
Hollow % RHA 13
5
2* - 14
21
28
H/0.2 RHA
10% RHA
13 5
1.8 0.2 14
21
28
H/0.4 RHA
20% RHA
13 5 1.6 0.4 14
21
28
H/0.6 RHA
30% RHA
13 5 1.4 0.6 14
21
28
H/0.8 RHA
40% RHA
13 5 1.2 0.8 14
21
28
H/1 RHA
50% RHA
13 5 1 1 14
21
28
* Control sample
Samples of the experimental hollow and solid compressed earth blocks produced in this
study are shown in Figures 3.6 and 3.7, respectively.
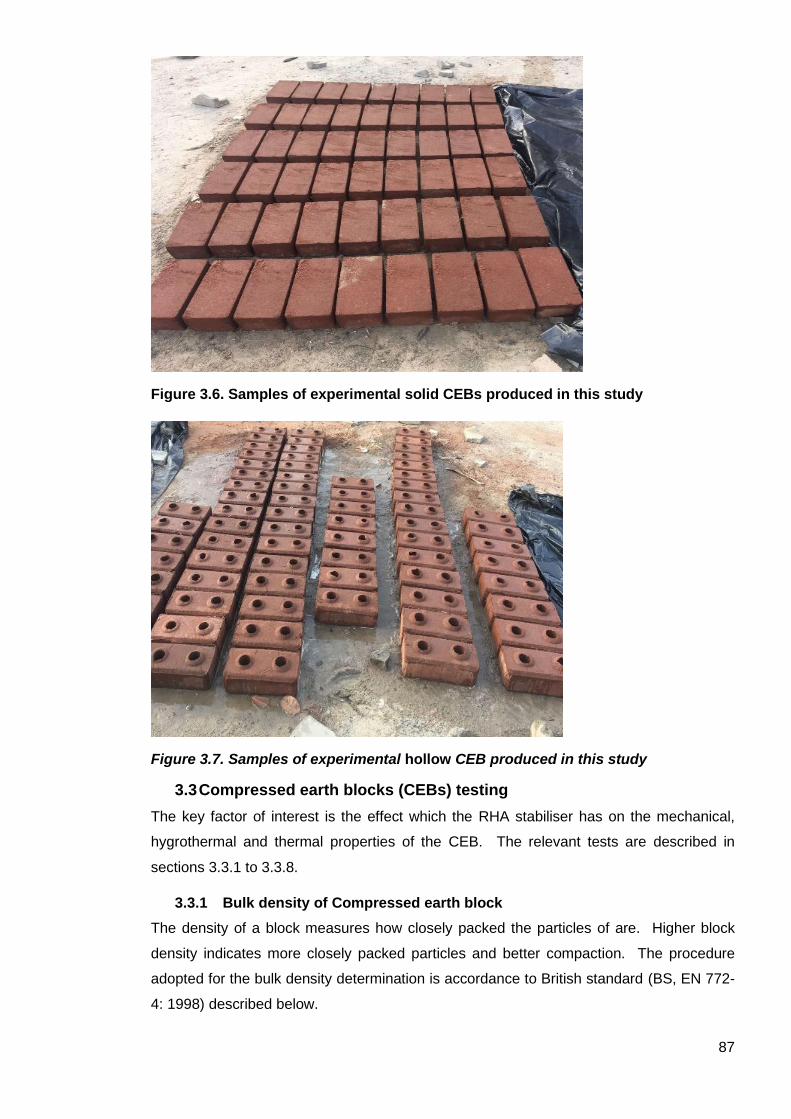
87
Figure 3.6. Samples of experimental solid CEBs produced in this study
Figure 3.7. Samples of experimental hollow CEB produced in this study
3.3 Compressed earth blocks (CEBs) testing
The key factor of interest is the effect which the RHA stabiliser has on the mechanical,
hygrothermal and thermal properties of the CEB. The relevant tests are described in
sections 3.3.1 to 3.3.8.
3.3.1 Bulk density of Compressed earth block
The density of a block measures how closely packed the particles of are. Higher block
density indicates more closely packed particles and better compaction. The procedure
adopted for the bulk density determination is accordance to British standard (BS, EN 772-
4: 1998) described below.
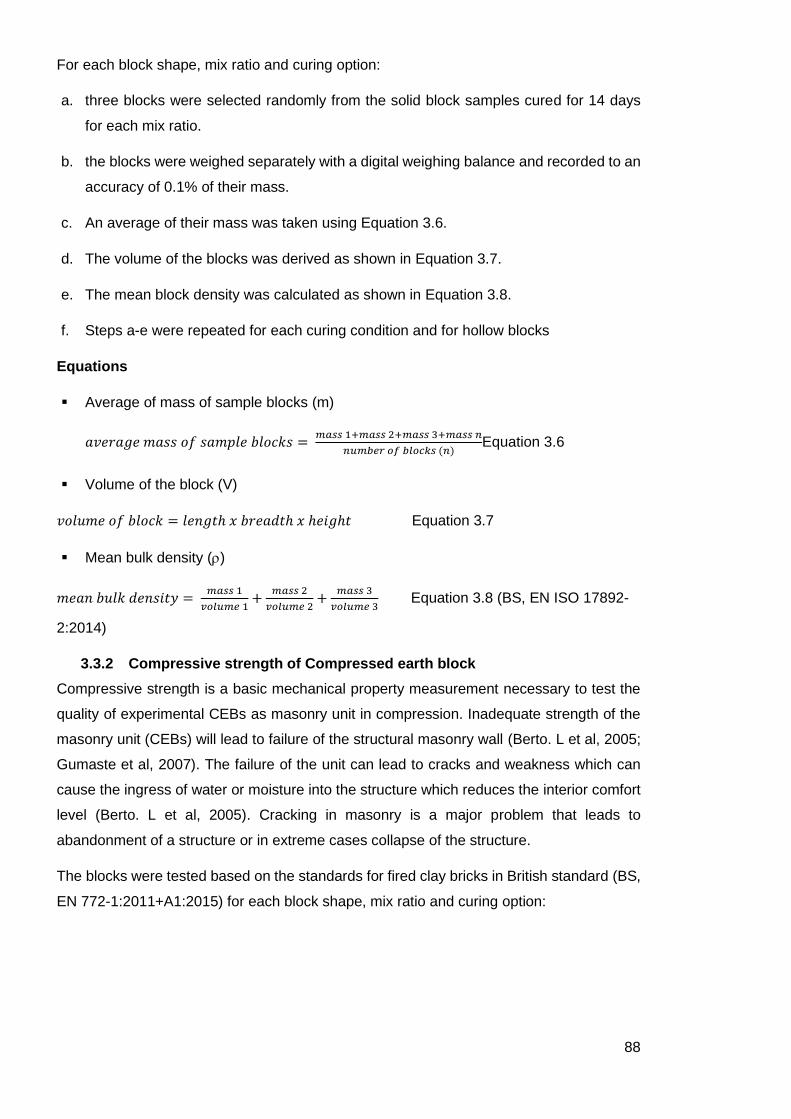
88
For each block shape, mix ratio and curing option:
a. three blocks were selected randomly from the solid block samples cured for 14 days
for each mix ratio.
b. the blocks were weighed separately with a digital weighing balance and recorded to an
accuracy of 0.1% of their mass.
c. An average of their mass was taken using Equation 3.6.
d. The volume of the blocks was derived as shown in Equation 3.7.
e. The mean block density was calculated as shown in Equation 3.8.
f. Steps a-e were repeated for each curing condition and for hollow blocks
Equations
▪ Average of mass of sample blocks (m)
𝑎𝑣𝑒𝑟𝑎𝑔𝑒 𝑚𝑎𝑠𝑠 𝑜𝑓 𝑠𝑎𝑚𝑝𝑙𝑒 𝑏𝑙𝑜𝑐𝑘𝑠 = 𝑚𝑎𝑠𝑠 1+𝑚𝑎𝑠𝑠 2+𝑚𝑎𝑠𝑠 3+𝑚𝑎𝑠𝑠 𝑛
𝑛𝑢𝑚𝑏𝑒𝑟 𝑜𝑓 𝑏𝑙𝑜𝑐𝑘𝑠 (𝑛)Equation 3.6
▪ Volume of the block (V)
𝑣𝑜𝑙𝑢𝑚𝑒 𝑜𝑓 𝑏𝑙𝑜𝑐𝑘 = 𝑙𝑒𝑛𝑔𝑡ℎ 𝑥 𝑏𝑟𝑒𝑎𝑑𝑡ℎ 𝑥 ℎ𝑒𝑖𝑔ℎ𝑡 Equation 3.7
▪ Mean bulk density ()
𝑚𝑒𝑎𝑛 𝑏𝑢𝑙𝑘 𝑑𝑒𝑛𝑠𝑖𝑡𝑦 = 𝑚𝑎𝑠𝑠 1
𝑣𝑜𝑙𝑢𝑚𝑒 1+
𝑚𝑎𝑠𝑠 2
𝑣𝑜𝑙𝑢𝑚𝑒 2+
𝑚𝑎𝑠𝑠 3
𝑣𝑜𝑙𝑢𝑚𝑒 3 Equation 3.8 (BS, EN ISO 17892-
2:2014)
3.3.2 Compressive strength of Compressed earth block
Compressive strength is a basic mechanical property measurement necessary to test the
quality of experimental CEBs as masonry unit in compression. Inadequate strength of the
masonry unit (CEBs) will lead to failure of the structural masonry wall (Berto. L et al, 2005;
Gumaste et al, 2007). The failure of the unit can lead to cracks and weakness which can
cause the ingress of water or moisture into the structure which reduces the interior comfort
level (Berto. L et al, 2005). Cracking in masonry is a major problem that leads to
abandonment of a structure or in extreme cases collapse of the structure.
The blocks were tested based on the standards for fired clay bricks in British standard (BS,
EN 772-1:2011+A1:2015) for each block shape, mix ratio and curing option:
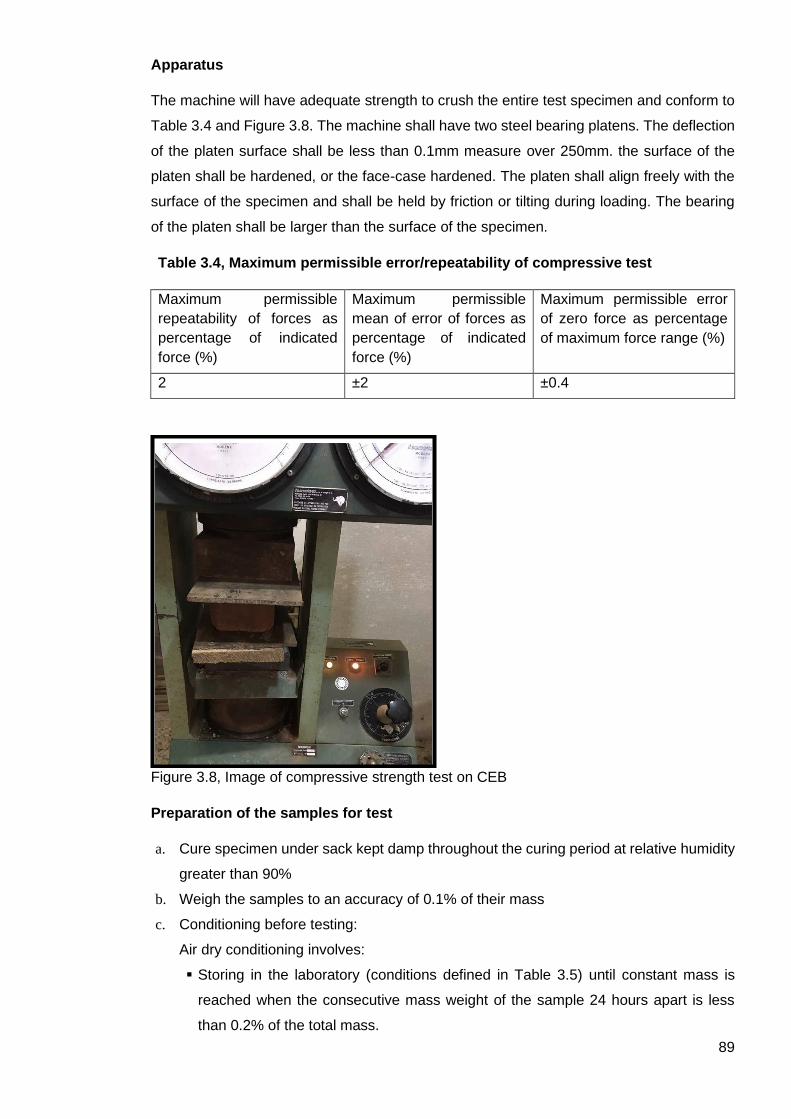
89
Apparatus
The machine will have adequate strength to crush the entire test specimen and conform to
Table 3.4 and Figure 3.8. The machine shall have two steel bearing platens. The deflection
of the platen surface shall be less than 0.1mm measure over 250mm. the surface of the
platen shall be hardened, or the face-case hardened. The platen shall align freely with the
surface of the specimen and shall be held by friction or tilting during loading. The bearing
of the platen shall be larger than the surface of the specimen.
Table 3.4, Maximum permissible error/repeatability of compressive test
Maximum permissible
repeatability of forces as
percentage of indicated
force (%)
Maximum permissible
mean of error of forces as
percentage of indicated
force (%)
Maximum permissible error
of zero force as percentage
of maximum force range (%)
2 ±2 ±0.4
Figure 3.8, Image of compressive strength test on CEB
Preparation of the samples for test
a. Cure specimen under sack kept damp throughout the curing period at relative humidity
greater than 90%
b. Weigh the samples to an accuracy of 0.1% of their mass
c. Conditioning before testing:
Air dry conditioning involves:
▪ Storing in the laboratory (conditions defined in Table 3.5) until constant mass is
reached when the consecutive mass weight of the sample 24 hours apart is less
than 0.2% of the total mass.
90
Alternatively, dry the specimen in an oven at 105°C ±5°C for at least 24 hours and
cool at room temperature for 4 hours.
Table 3.5, Condition of CEBs in a laboratory
Temperature Greater than or equal 15°C
Relative humidity Less than or equal to 65%
Procedure for determination of compressive strength of CEBs
a. three blocks were selected randomly from the solid block samples cured for 14 days
from the controlled mix ratio.
b. The gross area (mm2) of the surface of the sample shall be calculated by multiplying
the length and the width of the specimen. Equation 3.9 was used for solid CEBs and
Equation 3.10 was used for hollow blocks.
c. Wipe the surface of the machine clean to remove loose grits from the bed of the
specimen. Alig the specimen to the centre of the platen so uniform load can be applied
across the surface.
d. Application of force perpendicular to the CEBs was gradually increased until failure or
a visible crack occurs.
e. The Force at the point of failure for each block was recorded.
f. The compressive strength of the blocks was calculated using Equation (3.9).
g. The mean compressive strength of the blocks was calculated from Equation (3.10).
h. steps a – g was repeated for the block samples cured for each combination of curing
and mix ratio; and
i. steps a – h was repeated for hollow block samples.
Equations
▪ cross section area of the block
𝑐𝑟𝑜𝑠𝑠 𝑠𝑒𝑐𝑡𝑖𝑜𝑛𝑎𝑙 𝑎𝑟𝑒𝑎 (𝐴)𝑆𝑜𝑙𝑖𝑑 𝑏𝑙𝑜𝑐𝑘 = 𝑙𝑒𝑛𝑔𝑡ℎ 𝑥 𝑏𝑟𝑒𝑎𝑑𝑡ℎ Equation 3.9
𝑐𝑟𝑜𝑠𝑠 𝑠𝑒𝑐𝑡𝑖𝑜𝑛𝑎𝑙 𝑎𝑟𝑒𝑎 (𝐴𝐻)𝐻𝑜𝑙𝑙𝑜𝑤 𝑏𝑙𝑜𝑐𝑘 =
(𝑙𝑒𝑛𝑔ℎ𝑡 1 𝑥𝑏𝑟𝑒𝑎𝑑𝑡ℎ1) − 2(𝑙𝑒𝑛𝑔𝑡ℎ2𝑥𝑏𝑟𝑒𝑎𝑑𝑡ℎ2) Equation 3.10
▪ compressive strength of the blocks (fb) (BS, EN 772-1:2011+A1:2015)
Compressive strength (𝑀𝑃𝑎) =P
A ... Equation 3.11
Where P= Force at point of failure
▪ mean compressive strength of the blocks
mean compressive strength =
91
C1+C2+C3+Cn
number of compressive strength …………. Equation 3.12
3.3.3 Water absorption Capacity of compressed earth block
Principle:
Water absorption is the quantity of water in kg absorbed by a unit of block when fully
immersed in water for duration of 24 hours. Water absorption rate is expressed as a
percentage of the weight of the dry unit. The water absorption rate of the block samples
was determined in accordance with British standard (BS, EN 772-21:2011) highlighted in
the procedure below for each block shape, mix ratio and curing option:
Apparatus
• Water tank large enough to soak the samples, with base slightly raised, so that water
encounters all the surfaces of the samples
• Ventilated oven to maintain temperature of 105±5°C
• Weighing device to accuracy of 0.1% of dry mass
Procedure
a. Three blocks were selected randomly from the solid block samples cured for 14 days
from the controlled mix ratio.
b. The sample was dried in the oven at temperature of 105±5oC until constant mass is
reached. Constant mass is reached when two consecutive mass measures taken
24hrs apart are within 0.2% of the total mass. Allow to cool to room temperature
before weighing.
c. The blocks were weighed separately with a digital weighing balance and their
weights were recorded.
d. The blocks were fully submerged in water for 24±0.5 hours.
e. The blocks were removed from the water and the surface of the blocks were dried
with damp cloth.
f. The damp blocks were weighed with a digital weighing balance separately and their
weighs were recorded.
g. The water absorption rate was calculated from Equation 3.13 to the nearest 1%.
h. The mean water absorption rate was calculated from Equation 3.14.
i. Steps a – h was repeated for the block samples cured for 21 and 28 days for each
mix ratio: and
j. Steps a – i was repeated for hollow block samples
92
Equations
▪ Water absorption capacity/rate (BS, EN 772-21:2011):
Water absorption rate WS = Ms-Md
Md x 100…….. Equation 3.13
Ms is mass of sample soaked and Md mass of sample when dried.
▪ mean water absorption rate:(BS, EN 772-1:2011+A1:2015)
mean of water absorption = WS1+WS2+WS3+….WSn
number of samples………………. Equation 3.14
3.3.4 Water absorption coefficient of compressed earth block
The British standards defines water absorption coefficient as the mass of water absorbed
by a material per surface area and per square root of time. The British standard (BS, EN
ISO 15148:2002+A1:2016) specifies the procedure described below for the determination
of water absorption coefficient. Consequently, the procedure was adopted in this study for
a selected solid blocks mix ratio cured for 28 days, further test was abandoned for hollowed
blocks as it didn’t meet the requirement for mechanical strength:
a. Three blocks were selected randomly from the solid block samples cured for 28 days
from the controlled mix ratio.
b. The blocks were weighed separately with a digital weighing balance and their
weights were recorded.
c. The area of the horizontal surface to be partially immersed in water was calculated
by the expression in Equation 3.9.
d. The blocks were placed in separate PVC containers over small PVC studs to ensure
the blocks did not touch the surface of container.
e. The water level was maintained during the test at 5±2mm above the base of the test
block samples as shown in Figure 3.9.
f. The block samples were removed after 20 minutes and blotted with dry cloth to
remove excess water on their surfaces.
g. The block samples were weighed, and the new masses were recorded.
h. Steps d – g were repeated several times allowing immersion in water to continue for
1 hour, 2 hours, 4 hours, 8 hours, 12 hours, 18 hours and 24 hours;

93
i. The change in mass per area was calculated as expressed in Equation 3.15,
j. The water absorption coefficient was calculated as expressed in Equation 3.16, and
3.17.
k. Steps a – j was repeated for the block samples cured 28 days for each mix ratio.
Equations
▪ Change in mass (BS, EN ISO 15148:2002+A1:2016):
𝑐ℎ𝑎𝑛𝑔𝑒 𝑖𝑛 𝑚𝑎𝑠𝑠(∆mt) = (mt − mi)/A … Equation 3.15
The change in mass shall be plotted against √t. The graph plotted could either be straight
or curved. The water absorption coefficient is dependent on the shape of the graph.
▪ Straight graph equation represents a sample with no water on top of surface after
longest immersion time (illustrated in Figure 3.10) (BS, EN ISO
15148:2002+A1:2016):
𝑊𝐴𝐶 (Aw) = (∆mtf − ∆m0)/ √tftf … Equation 3.16
Where:
∆mtf= the value of ∆m on the straight line at time tf, in kg/m2;
∆m0 is the mass at time zero on the graph that cuts the vertical axis when the line
is extended,
tf is the duration in seconds.
▪ Water absorption coefficient (WAC) when the graph is curved represents a sample with water on top of surface after a period of immersion (illustrated in Figure 3.11) (BS, EN ISO 15148:2002+A1:2016):
𝑊𝐴𝐶(Aw, 24) = ∆mtf/√86400 … Equation 3.17

94
Figure 3.9 Section of Water Absorption Coefficient test set up
Figure 3.10, Change of mass per area vs square root of immersion time - This represents
a sample which did not develop water on the top surface even after the longest immersion
time
Figure 3.11 Change of mass per area vs square root of immersion time - This represents a
sample which developed water on the top surface

95
3.3.5 Water vapour transmission
The British Standard (BS, EN ISO 12572:2016) describes the procedure for the
determination of water vapour transmission. The block samples were subjected to different
conditions in order to determine the density of water flow rate, water vapour resistance,
water vapour permeability, and water vapour resistance factor. The procedures described
below were followed for a selected solid block mix ratio cured for 28 days:
Procedure
a. Three block samples were selected randomly from the solid block samples cured for
28 days from a mix ratio.
b. The block samples were conditioned by keeping them in controlled environment at a
temperature and relative humidity of 23±5oC and 50±5% respectively.
c. The block samples were sealed with waterproof tapes at all sides to leave the top and
bottom exposed.
d. The blocks were weighed, and their weights were recorded.
e. The area of the exposed surfaces was calculated from equation (3.9)
f. The block sample was placed over a dry cup 0% (calcium chloride) in such a way that
the bottom surface of the block was exposed and sealed from exposure to the external
conditions, the overhanging part of the block was sealed with waterproof tape.
g. The sample in step f was placed in an airtight PVC container containing aqueous salt
solution (Magnesium nitrate) to control the relative humidity to 50% as shown in Figure
3.12. The temperature was maintained at 23±1oC;
h. The block sample was weighed every 24 hours until the difference in masses of five
consecutive readings was within ±5% of the running mean value of the block sample
weight.
i. Steps e – h was repeated for other two blocks.
j. The mass change rate was determined by the expression in Equation 3.18.
k. The density of water vapour flow rate was calculated from Equation 3.19.
l. The water vapour permeance was calculated from Equation 3.20.
m. The water resistance was calculated from Equation 3.21.
n. The water vapour permeability was calculated from Equation 3.22.
o. The water vapour resistance factor was determined by from Equation 3.23.
p. The water vapour permeability of air was calculated from Equation 3.24; and
96
q. Steps a – p will be repeated for the block samples cured 28 days for other mix ratio.
Equations
• Change of mass rate for water vapour transmission (BS, EN ISO 12572:2016):
… Equation 3.18
Where:
m2 is the mass of the test assembly at time t2, in kg
m1 is the mass of the test assembly at time t1, in kg
t1 and t2 are successive time in seconds.
Δm12 is the mass per time for a single determination, given as kg/s
• Water vapour flow rate through specimen (G) is the mean of five consecutive Δm12
• Density of water vapour flow rate for water vapour transmission (g) (BS, EN ISO
12572:2016):
… Equation 3.19
Where:
A is area from Equation 3.9
G is water vapour flow rate
▪ Water vapour permeance for water vapour transmission (WP) (BS, EN ISO
12572:2016):
𝑊𝑃 =𝐺
𝐴∆𝑝 … Equation 3.20
The value of ∆pV (water vapour pressure difference across specimen) shall be
calculated from the mean of the measure temperature and relative humidity over the
course of the test.
Note: for temperature greater than 0oC, vapour pressure on either side of the specimen
can be calculated as (BS, EN ISO 12572:2016):
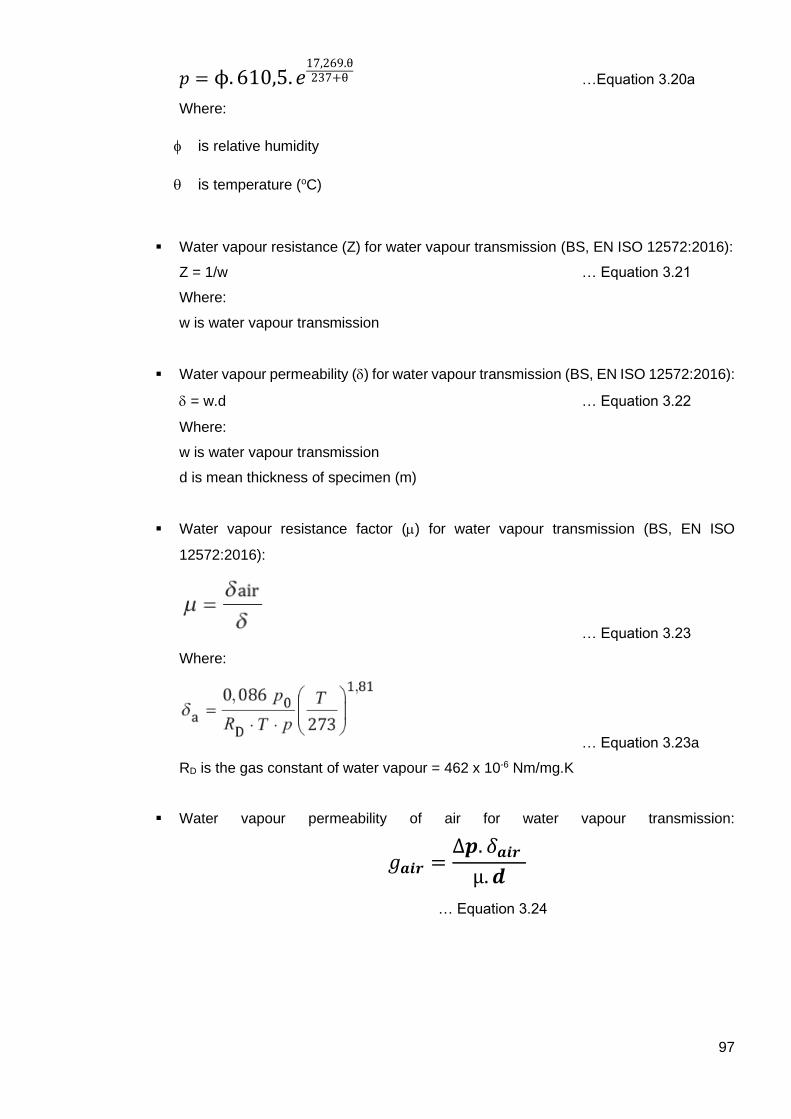
97
𝑝 = ϕ. 610,5. 𝑒17,269.θ237+θ …Equation 3.20a
Where:
is relative humidity
is temperature (oC)
▪ Water vapour resistance (Z) for water vapour transmission (BS, EN ISO 12572:2016):
Z = 1/w … Equation 3.21
Where:
w is water vapour transmission
▪ Water vapour permeability () for water vapour transmission (BS, EN ISO 12572:2016):
= w.d … Equation 3.22
Where:
w is water vapour transmission
d is mean thickness of specimen (m)
▪ Water vapour resistance factor () for water vapour transmission (BS, EN ISO
12572:2016):
… Equation 3.23
Where:
… Equation 3.23a
RD is the gas constant of water vapour = 462 x 10-6 Nm/mg.K
▪ Water vapour permeability of air for water vapour transmission:
𝑔𝒂𝒊𝒓 =∆𝒑. 𝛿𝒂𝒊𝒓
µ. 𝒅
… Equation 3.24
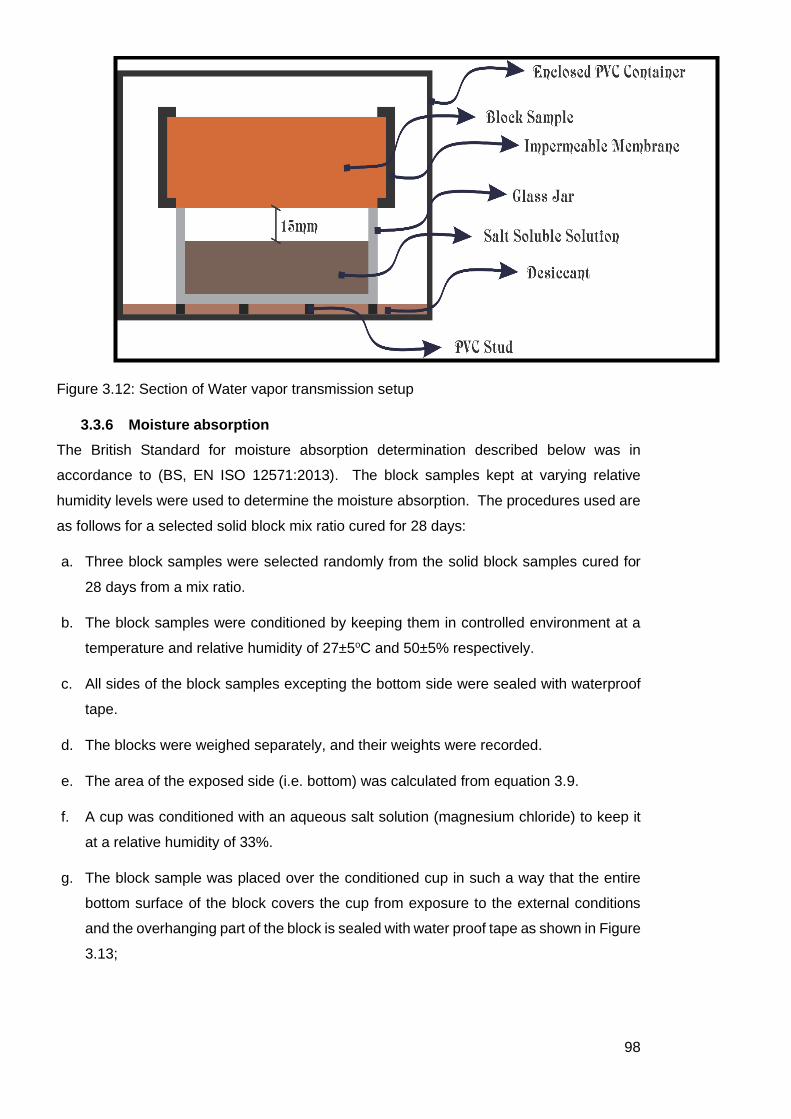
98
Figure 3.12: Section of Water vapor transmission setup
3.3.6 Moisture absorption
The British Standard for moisture absorption determination described below was in
accordance to (BS, EN ISO 12571:2013). The block samples kept at varying relative
humidity levels were used to determine the moisture absorption. The procedures used are
as follows for a selected solid block mix ratio cured for 28 days:
a. Three block samples were selected randomly from the solid block samples cured for
28 days from a mix ratio.
b. The block samples were conditioned by keeping them in controlled environment at a
temperature and relative humidity of 27±5oC and 50±5% respectively.
c. All sides of the block samples excepting the bottom side were sealed with waterproof
tape.
d. The blocks were weighed separately, and their weights were recorded.
e. The area of the exposed side (i.e. bottom) was calculated from equation 3.9.
f. A cup was conditioned with an aqueous salt solution (magnesium chloride) to keep it
at a relative humidity of 33%.
g. The block sample was placed over the conditioned cup in such a way that the entire
bottom surface of the block covers the cup from exposure to the external conditions
and the overhanging part of the block is sealed with water proof tape as shown in Figure
3.13;
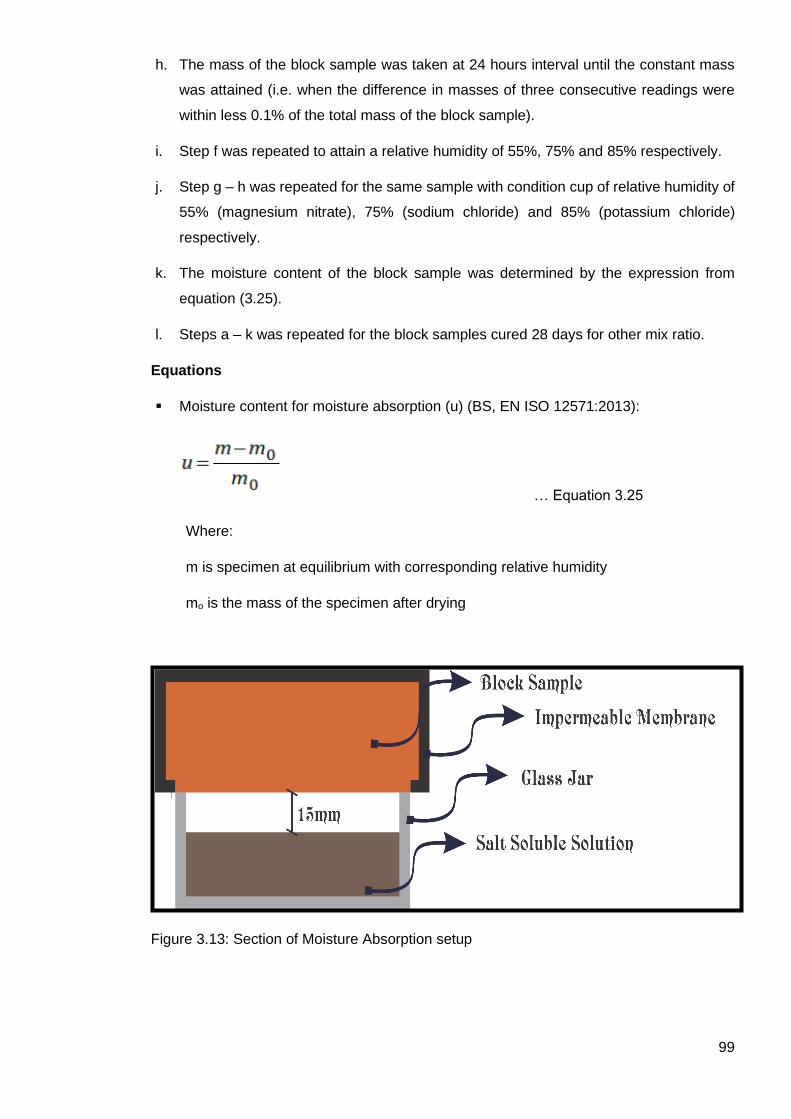
99
h. The mass of the block sample was taken at 24 hours interval until the constant mass
was attained (i.e. when the difference in masses of three consecutive readings were
within less 0.1% of the total mass of the block sample).
i. Step f was repeated to attain a relative humidity of 55%, 75% and 85% respectively.
j. Step g – h was repeated for the same sample with condition cup of relative humidity of
55% (magnesium nitrate), 75% (sodium chloride) and 85% (potassium chloride)
respectively.
k. The moisture content of the block sample was determined by the expression from
equation (3.25).
l. Steps a – k was repeated for the block samples cured 28 days for other mix ratio.
Equations
▪ Moisture content for moisture absorption (u) (BS, EN ISO 12571:2013):
… Equation 3.25
Where:
m is specimen at equilibrium with corresponding relative humidity
mo is the mass of the specimen after drying
Figure 3.13: Section of Moisture Absorption setup

100
3.3.7 Moisture buffering
The moisture buffering test was done according to the NORDTEST work group process
(McGregor et al, 2014; Rode et al, 2005; Zhang et al, 2017). The block samples were tested
at varying relative humidity level to determine the moisture buffering. The procedures used
are as follows for a selected solid block mix ratio cured for 28 days:
a. Three block samples were selected randomly from the solid block samples cured for
28 days from a mix ratio.
b. The block samples were conditioned in controlled environment at a temperature and
relative humidity of 23±5oC and 50±5% respectively.
c. The block samples were sealed at all sides with a waterproof tape except the bottom
that was left exposed.
d. The blocks were weighed separately, and their weights were recorded.
e. The area of the exposed side is calculated with the expression from the equation (3.26).
f. A cup was conditioned with an aqueous salt solution (magnesium chloride) to keep it
at a relative humidity of 33%.
g. The block sample was placed over the conditioned cup in such a way that the entire
bottom surface of the block covers the cup from exposure to the external conditions
and the overhanging part of the block is sealed with water proof tape as shown in Figure
3.14;
h. The mass of the block sample was taken after 8 hours of exposure.
i. Step f was repeated to attain a relative humidity of 75% (sodium chloride).
j. Step g was repeated for the same sample with condition cup kept at a relative humidity
of 75%.
k. The mass of the block sample was taken after 16 hours of exposure.
l. The mass of the block sample was taken at 8 hours interval until the constant mass
was attained (i.e. when the difference in masses of three consecutive readings was
within less 0.1% of the total mass of the block sample.
m. The moisture buffering of the block sample was calculated from equation (3.27).
n. Steps a – l was repeated for the block samples cured 28 days for other mix ratio
Equations
i. Moisture effusivity for moisture buffering test (bm) (Rode et al. 2005, (Rode et al,
2007)):
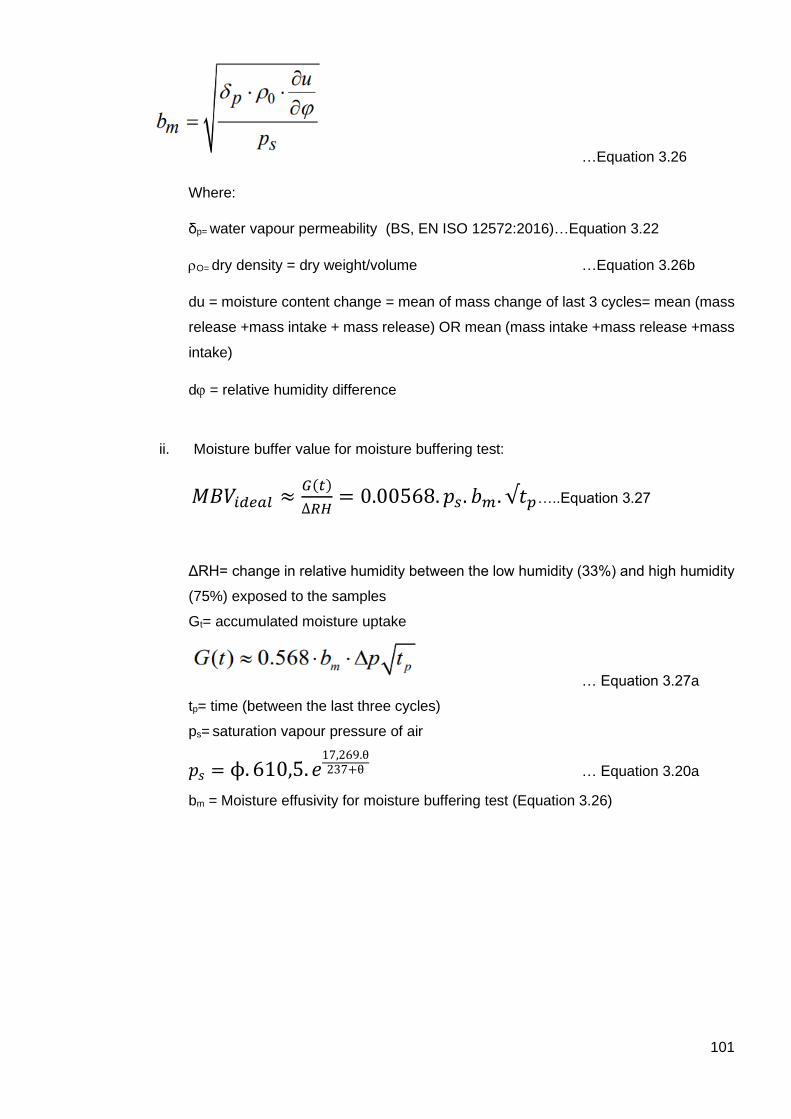
101
…Equation 3.26
Where:
δp= water vapour permeability (BS, EN ISO 12572:2016)…Equation 3.22
O= dry density = dry weight/volume …Equation 3.26b
du = moisture content change = mean of mass change of last 3 cycles= mean (mass
release +mass intake + mass release) OR mean (mass intake +mass release +mass
intake)
d = relative humidity difference
ii. Moisture buffer value for moisture buffering test:
𝑀𝐵𝑉𝑖𝑑𝑒𝑎𝑙 ≈𝐺(𝑡)
∆𝑅𝐻= 0.00568. 𝑝𝑠. 𝑏𝑚. √𝑡𝑝…..Equation 3.27
ΔRH= change in relative humidity between the low humidity (33%) and high humidity
(75%) exposed to the samples
Gt= accumulated moisture uptake
… Equation 3.27a
tp= time (between the last three cycles)
ps= saturation vapour pressure of air
𝑝𝑠 = ϕ. 610,5. 𝑒17,269.θ237+θ … Equation 3.20a
bm = Moisture effusivity for moisture buffering test (Equation 3.26)
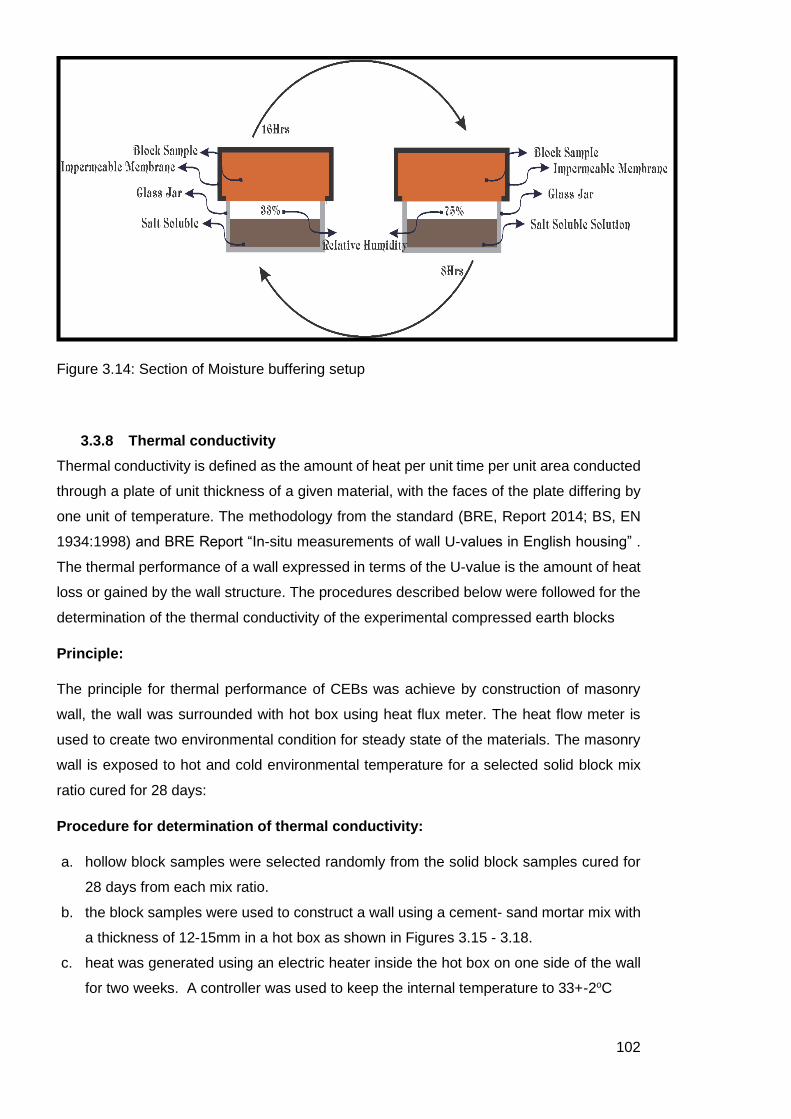
102
Figure 3.14: Section of Moisture buffering setup
3.3.8 Thermal conductivity
Thermal conductivity is defined as the amount of heat per unit time per unit area conducted
through a plate of unit thickness of a given material, with the faces of the plate differing by
one unit of temperature. The methodology from the standard (BRE, Report 2014; BS, EN
1934:1998) and BRE Report “In-situ measurements of wall U-values in English housing” .
The thermal performance of a wall expressed in terms of the U-value is the amount of heat
loss or gained by the wall structure. The procedures described below were followed for the
determination of the thermal conductivity of the experimental compressed earth blocks
Principle:
The principle for thermal performance of CEBs was achieve by construction of masonry
wall, the wall was surrounded with hot box using heat flux meter. The heat flow meter is
used to create two environmental condition for steady state of the materials. The masonry
wall is exposed to hot and cold environmental temperature for a selected solid block mix
ratio cured for 28 days:
Procedure for determination of thermal conductivity:
a. hollow block samples were selected randomly from the solid block samples cured for
28 days from each mix ratio.
b. the block samples were used to construct a wall using a cement- sand mortar mix with
a thickness of 12-15mm in a hot box as shown in Figures 3.15 - 3.18.
c. heat was generated using an electric heater inside the hot box on one side of the wall
for two weeks. A controller was used to keep the internal temperature to 33+-2oC
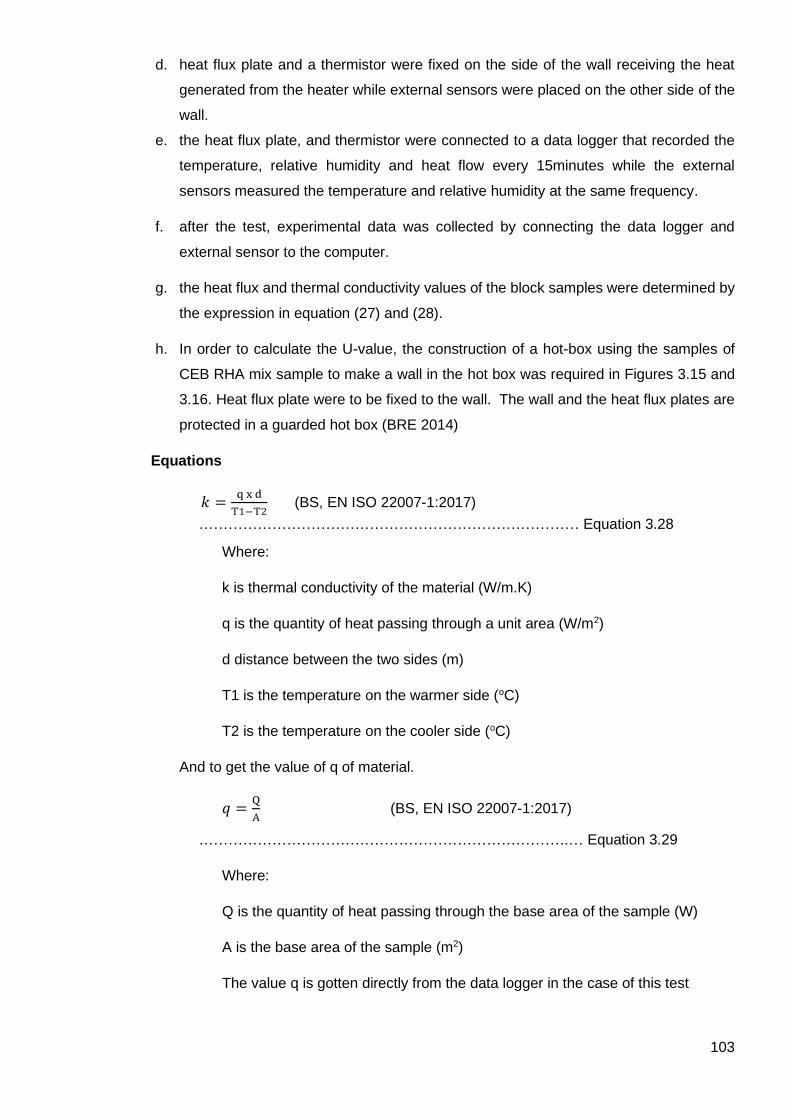
103
d. heat flux plate and a thermistor were fixed on the side of the wall receiving the heat
generated from the heater while external sensors were placed on the other side of the
wall.
e. the heat flux plate, and thermistor were connected to a data logger that recorded the
temperature, relative humidity and heat flow every 15minutes while the external
sensors measured the temperature and relative humidity at the same frequency.
f. after the test, experimental data was collected by connecting the data logger and
external sensor to the computer.
g. the heat flux and thermal conductivity values of the block samples were determined by
the expression in equation (27) and (28).
h. In order to calculate the U-value, the construction of a hot-box using the samples of
CEB RHA mix sample to make a wall in the hot box was required in Figures 3.15 and
3.16. Heat flux plate were to be fixed to the wall. The wall and the heat flux plates are
protected in a guarded hot box (BRE 2014)
Equations
𝑘 =q x d
T1−T2 (BS, EN ISO 22007-1:2017)
…………………………………………………………………… Equation 3.28
Where:
k is thermal conductivity of the material (W/m.K)
q is the quantity of heat passing through a unit area (W/m2)
d distance between the two sides (m)
T1 is the temperature on the warmer side (oC)
T2 is the temperature on the cooler side (oC)
And to get the value of q of material.
𝑞 =Q
A (BS, EN ISO 22007-1:2017)
………………………………………………………………….… Equation 3.29
Where:
Q is the quantity of heat passing through the base area of the sample (W)
A is the base area of the sample (m2)
The value q is gotten directly from the data logger in the case of this test
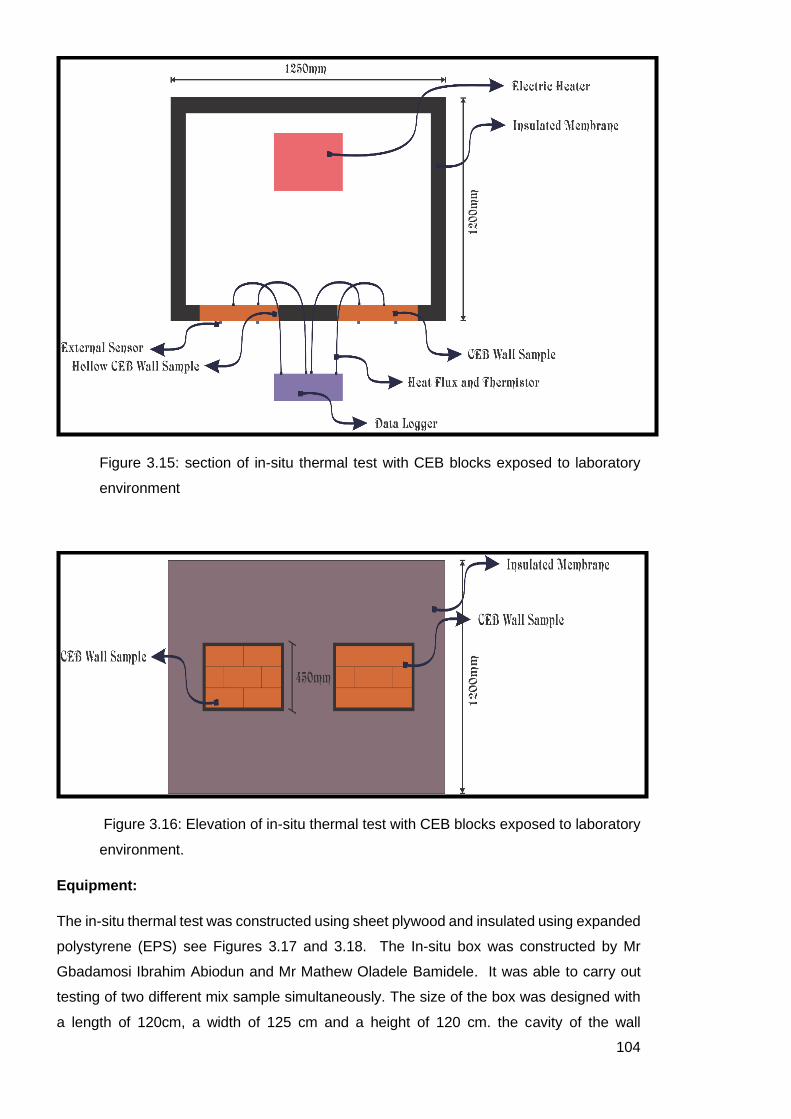
104
Figure 3.15: section of in-situ thermal test with CEB blocks exposed to laboratory
environment
Figure 3.16: Elevation of in-situ thermal test with CEB blocks exposed to laboratory
environment.
Equipment:
The in-situ thermal test was constructed using sheet plywood and insulated using expanded
polystyrene (EPS) see Figures 3.17 and 3.18. The In-situ box was constructed by Mr
Gbadamosi Ibrahim Abiodun and Mr Mathew Oladele Bamidele. It was able to carry out
testing of two different mix sample simultaneously. The size of the box was designed with
a length of 120cm, a width of 125 cm and a height of 120 cm. the cavity of the wall
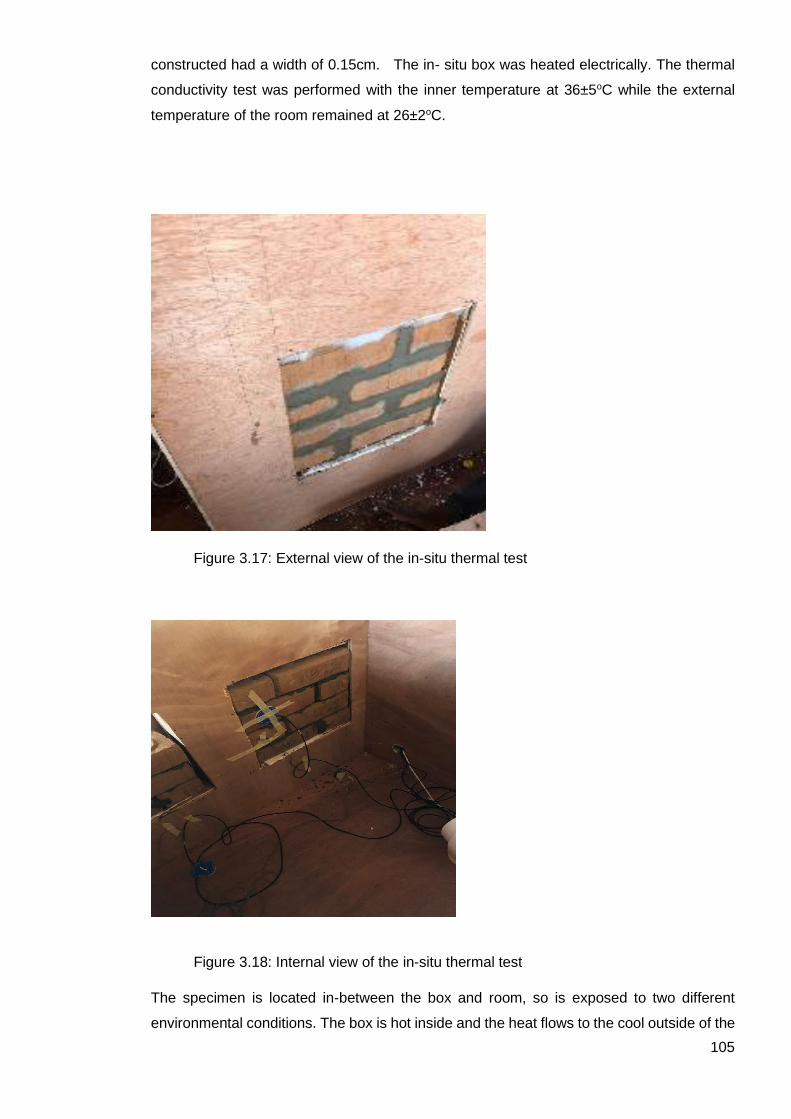
105
constructed had a width of 0.15cm. The in- situ box was heated electrically. The thermal
conductivity test was performed with the inner temperature at 36±5oC while the external
temperature of the room remained at 26±2oC.
Figure 3.17: External view of the in-situ thermal test
Figure 3.18: Internal view of the in-situ thermal test
The specimen is located in-between the box and room, so is exposed to two different
environmental conditions. The box is hot inside and the heat flows to the cool outside of the
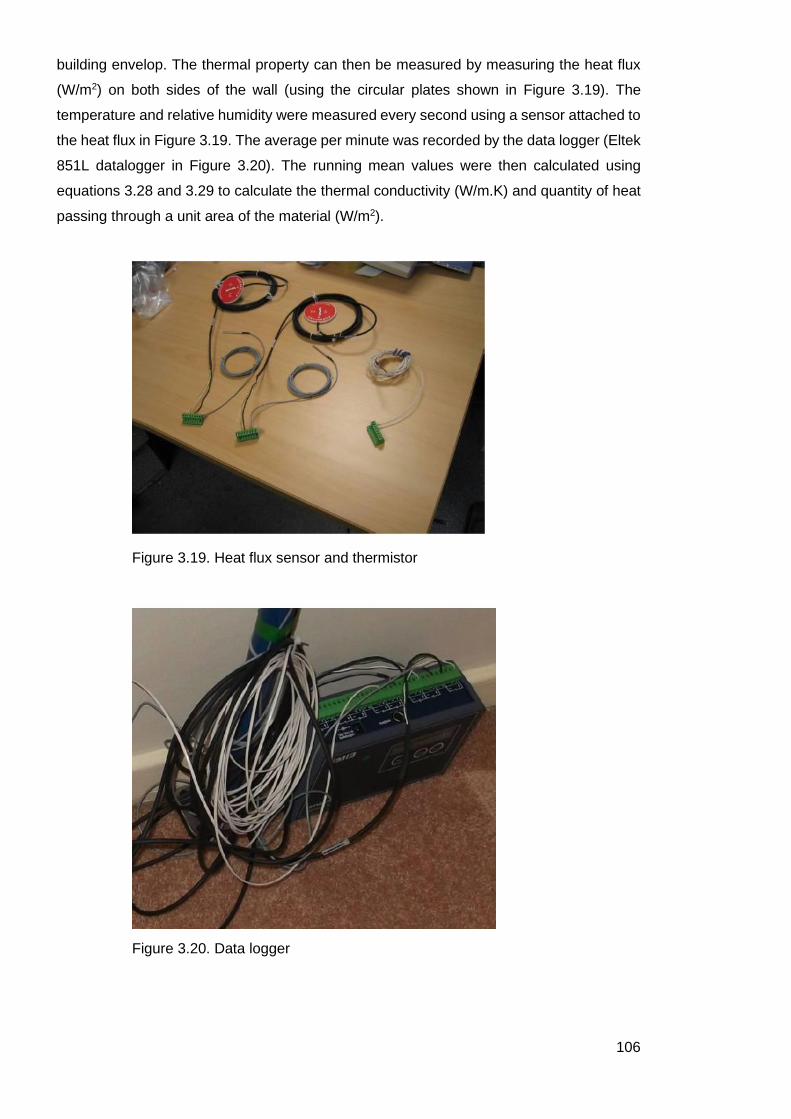
106
building envelop. The thermal property can then be measured by measuring the heat flux
(W/m2) on both sides of the wall (using the circular plates shown in Figure 3.19). The
temperature and relative humidity were measured every second using a sensor attached to
the heat flux in Figure 3.19. The average per minute was recorded by the data logger (Eltek
851L datalogger in Figure 3.20). The running mean values were then calculated using
equations 3.28 and 3.29 to calculate the thermal conductivity (W/m.K) and quantity of heat
passing through a unit area of the material (W/m2).
Figure 3.19. Heat flux sensor and thermistor
Figure 3.20. Data logger
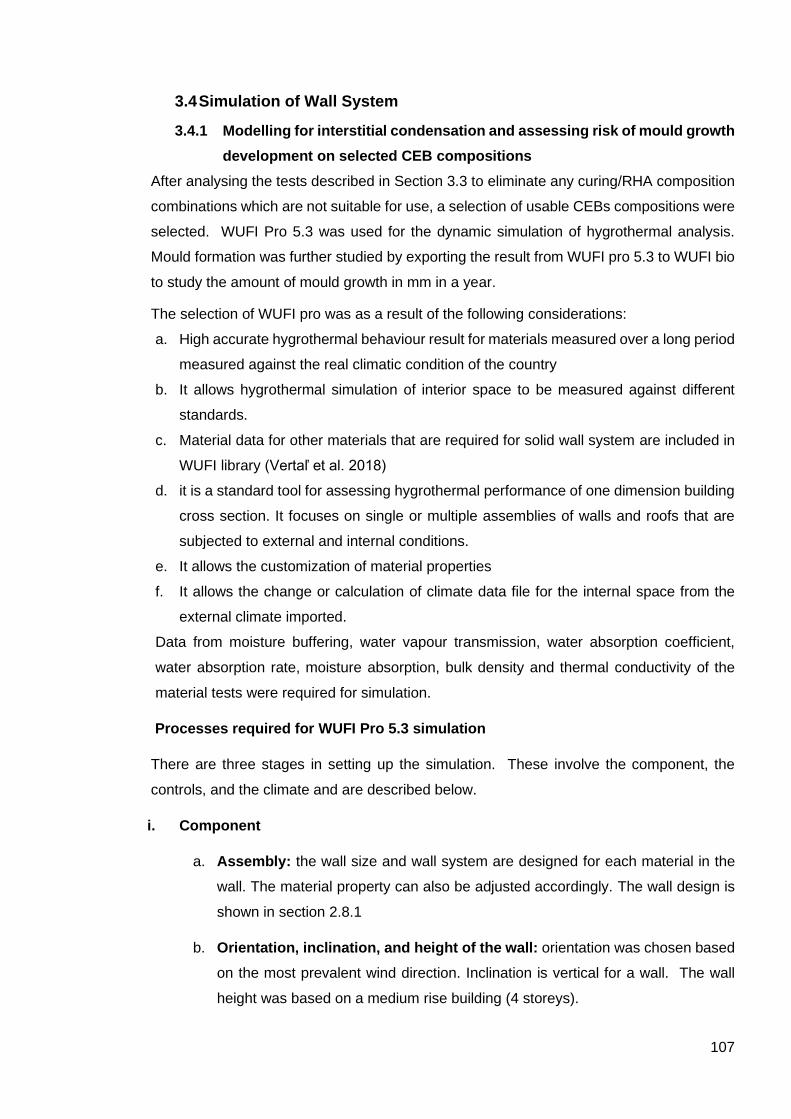
107
3.4 Simulation of Wall System
3.4.1 Modelling for interstitial condensation and assessing risk of mould growth
development on selected CEB compositions
After analysing the tests described in Section 3.3 to eliminate any curing/RHA composition
combinations which are not suitable for use, a selection of usable CEBs compositions were
selected. WUFI Pro 5.3 was used for the dynamic simulation of hygrothermal analysis.
Mould formation was further studied by exporting the result from WUFI pro 5.3 to WUFI bio
to study the amount of mould growth in mm in a year.
The selection of WUFI pro was as a result of the following considerations:
a. High accurate hygrothermal behaviour result for materials measured over a long period
measured against the real climatic condition of the country
b. It allows hygrothermal simulation of interior space to be measured against different
standards.
c. Material data for other materials that are required for solid wall system are included in
WUFI library (Vertaľ et al. 2018)
d. it is a standard tool for assessing hygrothermal performance of one dimension building
cross section. It focuses on single or multiple assemblies of walls and roofs that are
subjected to external and internal conditions.
e. It allows the customization of material properties
f. It allows the change or calculation of climate data file for the internal space from the
external climate imported.
Data from moisture buffering, water vapour transmission, water absorption coefficient,
water absorption rate, moisture absorption, bulk density and thermal conductivity of the
material tests were required for simulation.
Processes required for WUFI Pro 5.3 simulation
There are three stages in setting up the simulation. These involve the component, the
controls, and the climate and are described below.
i. Component
a. Assembly: the wall size and wall system are designed for each material in the
wall. The material property can also be adjusted accordingly. The wall design is
shown in section 2.8.1
b. Orientation, inclination, and height of the wall: orientation was chosen based
on the most prevalent wind direction. Inclination is vertical for a wall. The wall
height was based on a medium rise building (4 storeys).

108
c. Surface coefficient: heat resistant of different types of building structure was
given in the tool, so selection of external wall was chosen. The selection of short-
wave radiation absorptivity was brick, clay, cream and glazed was chosen as the
most similar from the options for the simulation of Compressed earth blocks walls.
The other parameters were left at the default values.
d. Initial condition: the initial moisture component to be calculated in the
component was for each layer of the wall system proposed. The initial relative
humidity was the as typically built (60-80%) and initial temperature of 23oC.
ii. Controls:
a. Calculation period and profiles: the start date and the end date are selected.
The simulation process was investigated for 1 year, and in some cases 3 years
b. Numerics: it allows the selection of the mode of calculation which typically
includes heat transport, moisture transport and temperature.
iii. Climate:
a. Outdoor (external side): selection of weather file for simulation of WUFI/ WAC
format from Meteonorm. This format is necessary to analyse the driving rain
direction in the location selected. The rain factor was calculated according to the
ASHRAE standard 160, with the wall exposed by a medium level and the wall
below a steep slope room for southern climate (Aw) of Nigeria. The data from
Lagos was used (as detailed in Section 3.4).
b. Indoor (internal side): two internal condition were selected. The first one
represented the indoor climate for areas like kitchen and bathroom with moisture
content resulting from the high relative humidity of about 85% by selecting the
sine curves. The other for areas with “normal” climate condition like living room,
dining rooms, bedrooms, by selecting EN 15026. The indoor climate in EN 15026
was calculate from the external climate.
Process required for WUFI bio simulation.
WUFI bio is an add-on tool that can be used in connection with results from WUFI Pro to
analyse mould growth in the building. It is important to study different boundary conditions
that may potentially be experienced within the interior space of the building. The tool studies
the boundary conditions compared with growth conditions that are typical for mould growth
to thrive. It compares the critical water content and the water content that would support
the germination of spores. The analysis tells if the material used for wall is wet enough to
grow mould. The internal temperature, the relative humidity and substrate quality are
required for analysis. The mould spores that are close to the wall surface change water
content as the temperature and the relative humidity change. Biological activity begins and
the spores germinate at the point at which water content reaches the critical.

109
Limitations to the tools are highlighted below:
▪ It can only simulate for interior spaces.
▪ Influence of other factors such as pH value, salt content, light, oxygen content, surface
quality and biogenic factors are not considered.
A variety of available substrates for mould growth in building simulation include the
following:
Substrate class 0: it refers to possible any mould growth in the building.
Substrate class I: it refers to mould growth in bio-utilizable substrates, such as
wallpaper, plaster boards, etc.
Substrate class II: it refers to less bio-utilizable substrate with porous structure such
as plaster, earth blocks, mineral building material, wood, etc. This is the category of
substrate to be used for the earth wall that is analysed. The internal temperature and
relative humidity for mould growth at this stage is 25-30oC and 80%, respectively.
Substrate class K: it refers to fungi growth that leads to possible health risk to the
users of the space and building that has nutrient within. The internal relative humidity
is higher than 80% and temperature 25- 30%
Mould index for classification with WUFI bio
There are seven possible classifications of mould growth. These are:
0: No growth
1: Some growth visible under microscope
2: Moderate growth visible under microscope, coverage more than 10%
3: Some growth seen visually; thin hyphae found under microscope.
4: Visual coverage more than 10%
5: Cover more than 50%
6: Tight coverage, 100%
The results of the analysis are shown as traffic light colours and implications are highlighted
in Table 3.6.

110
Table 3.6 WUFI Bio traffic light indicators
Traffic light
signal
Implication of the light on building materials
This is shown when the analysis is done for less than 1
year.
Mould growth on wall surface is more than 200mm/year.
The material of wall with this result is not acceptable.
Mould growth on the wall surface is between
50mm/year and 200mm/year. The materials need to be
studied further for it to be acceptable for usage
Mould growth on the wall surface is below 50mm/year.
The value is usually acceptable.
3.4.2 Simulation for thermal comfort performance
The bioclimatic analysis of Lagos, Nigeria was developed to develop an appropriate
schematic unit house for CEBs and Nigeria climate. The passive design strategies
implemented for CEBs wall material was used for compared with concrete blocks with
similar U- value to understand the thermal comfort level of the users of the space.
3.4.2.1 Climatic Analysis
Climatic design responds to the climate of the area and acknowledges the topography of
the area. The climatic classifications present across Nigeria were identified in Section 2.3.1
and used to identify relevant design strategies. However, more detailed climatic analysis is
useful to ensure an appropriate design strategy is being followed. The following climatic
analysis was carried for Lagos state in the south (Aw).
i. Weather data was obtained from Meteonorm 7v7.3.3 for Lagos located at 6.50N/3.50E
– tropical savannah climate (Aw) which covers the largest area of Nigeria (compared
to the other three climates present). The data was based on the 1991-2010 period for
radiation, while temperature was from 2000-2009.
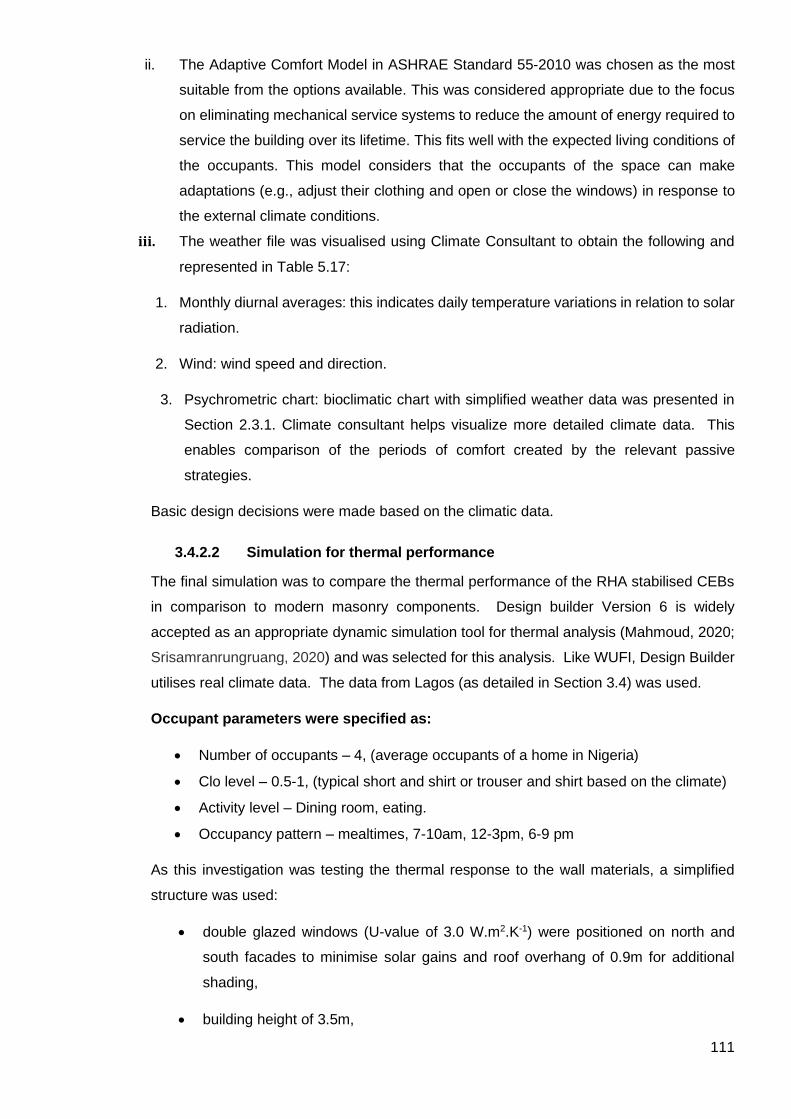
111
ii. The Adaptive Comfort Model in ASHRAE Standard 55-2010 was chosen as the most
suitable from the options available. This was considered appropriate due to the focus
on eliminating mechanical service systems to reduce the amount of energy required to
service the building over its lifetime. This fits well with the expected living conditions of
the occupants. This model considers that the occupants of the space can make
adaptations (e.g., adjust their clothing and open or close the windows) in response to
the external climate conditions.
iii. The weather file was visualised using Climate Consultant to obtain the following and
represented in Table 5.17:
1. Monthly diurnal averages: this indicates daily temperature variations in relation to solar
radiation.
2. Wind: wind speed and direction.
3. Psychrometric chart: bioclimatic chart with simplified weather data was presented in
Section 2.3.1. Climate consultant helps visualize more detailed climate data. This
enables comparison of the periods of comfort created by the relevant passive
strategies.
Basic design decisions were made based on the climatic data.
3.4.2.2 Simulation for thermal performance
The final simulation was to compare the thermal performance of the RHA stabilised CEBs
in comparison to modern masonry components. Design builder Version 6 is widely
accepted as an appropriate dynamic simulation tool for thermal analysis (Mahmoud, 2020;
Srisamranrungruang, 2020) and was selected for this analysis. Like WUFI, Design Builder
utilises real climate data. The data from Lagos (as detailed in Section 3.4) was used.
Occupant parameters were specified as:
• Number of occupants – 4, (average occupants of a home in Nigeria)
• Clo level – 0.5-1, (typical short and shirt or trouser and shirt based on the climate)
• Activity level – Dining room, eating.
• Occupancy pattern – mealtimes, 7-10am, 12-3pm, 6-9 pm
As this investigation was testing the thermal response to the wall materials, a simplified
structure was used:
• double glazed windows (U-value of 3.0 W.m2.K-1) were positioned on north and
south facades to minimise solar gains and roof overhang of 0.9m for additional
shading,
• building height of 3.5m,

112
• roof - clay tile (U-value of 0.25 W.m2.K-1) and pitch of 300 to facilitate rainwater
removal,
• natural ventilation,
• floor area of 360m2. It’s size for residential house.
Two material options were tested:
a. Concrete as a typical modern material (wall type EP) (U-value of 1.19)
b. CEB with 20% RHA in an EP wall type (described in Section 5.1.15) (U-value of 1.219).
This material was chosen as it meets it has adequately provided a scenario that provides
adequate air quality required in the climate considered, the factors are discussed in
section 6.3.
Two structure shapes were tested:
The area of the building tested was 360m2. The rectangular shape building is the most
suitable to ensure easy penetration of air into the building space. The two different shapes
are to understand the change of comfort level when the building is less compact to a larger
difference between the length and breadth.
a. 24x15m (area to volume ratio of 0.50238) oriented with long dimensions facing
North/South.
b. 36x10m (area to volume ratio of 0.54127) oriented with long dimensions facing
North/South.
Both shaped were intended to facilitate natural ventilation.
Two window wall ratios (WWR) were tested:
a. 40%- according to Mahoney chart the window to wall ratio for the climate can fall
between 40-80%. To reduce the area of window area exposed to sun radiation,
reduction of window is necessary to reduce the U-value.
b. 60%
These material options were analysed for occupant thermal comfort by checking the number
of hours of comfort in the house for a year. The intention of this analysis is to determine
whether occupant comfort is being adversely affected using CEBs in comparison with
typical modern materials.

113
4. Laboratory Test Results
_______________________________________________________________________
This chapter presents the results of laboratory testing on raw materials (laterite and rice
husk ash) in Section 4.1
In section 4.2 the results of laboratory testing of mechanical (4.2.1 bulk density, 4.2.2
compressive strength) and hygrothermal (4.2.3 water absorption, 4.2.4 water absorption
coefficient, 4.2.5 water vapour transmission, 4.2.6 moisture absorption, 4.2.7 moisture
buffering, 4.2.8 thermal conductivity) properties are presented for:
• Solid and hollow CEBs
• CEBS with OPC partially replaced with RHA at 0%, 10%, 20%, 30%, 40%, and
50%
• Curing times of 14, 21 and 28 days.
These results will be discussed in Chapter 6.
4.1Testing of raw materials used for CEB production.
This section categorises the earth in relation to the Unified Soil Classification and its linear
shrinkage. It also assesses the phase composition of the silica within the RHA for its
suitability.
4.1.1 Atterberg limit test for laterite soil
The process of determining the parameters which define the Atterberg limits of a laterite
soil was described in section 3.2.1.3. The properties of local laterite earth for liquid limit,
plastic limit, plastic index and linear shrinkage are presented in Table 4.1.
Table 4.1 Properties of laterite sample used for making the experimental CEB
Property Mean ± SD
Liquid limit 43.30 ± 4.679
Plastic limit 16.06 ± 5.586
Plasticity index 27.24 ± 4.376
Linear shrinkage 6.50 ± 0.990
Plotting the results of laterite properties (Table 4.1) in the unified soil classification chart
(Figure 4.1) showed that the laterite sample corresponds to soil classification CL.
Description of soil classes highlighted in Table 4.2 indicated the laterite sample is classified
114
in the category of clays. The Soil CL is inorganic clay of low to medium plasticity, gravelly,
sandy and silty clays. The results of liquid limit as shown in Figure 4.1 suggest that the soil
has low plasticity.
Table 4.2 Description of the unified soil classification with laterite classification
highlighted
Fin
e g
rain
ed
so
ils (
50%
+ p
asse
s n
o. 2
00
sie
ve)
Silt
s
Low plasticity (liquid limit
<50)
ML Inorganic silts, clayey silts of low to
medium plasticity
High plasticity (liquid limit
50+)
MH Inorganic silts, micaceous or
diatomaceous silty soils, elastic
silts
Cla
ys
Low plasticity (liquid
limit <50)
CL Inorganic clays of low to medium
plasticity, gravelly, sandy, and
silty clays
High plasticity (liquid limit
50+)
CH Inorganic clays of high plasticity, fat
clays, sandy clays of high plasticity
Org
an
ic s
ilts a
nd c
lays Low plasticity (liquid limit
<50)
OL Organic silts and clays of low to
medium plasticity, sandy organic
silts and clays
High plasticity (liquid limit
50+)
OH Organic silts and clays of high
plasticity, sandy organic silts and
clays
Organic soils
Primarily organic matter
(dark in colour and organic
odor)
PT Peat
The findings about the laterite soil are discussed further in Section 6.1.1.(Hind K.J, 2007)
4.1.2 Phase identification of silica in RHA
Two methods of processing rice husk in order to achieve ash with an appropriate silica
content were trialled. The method used for production of the rice husk ash was shown in
section 3.2.1.3
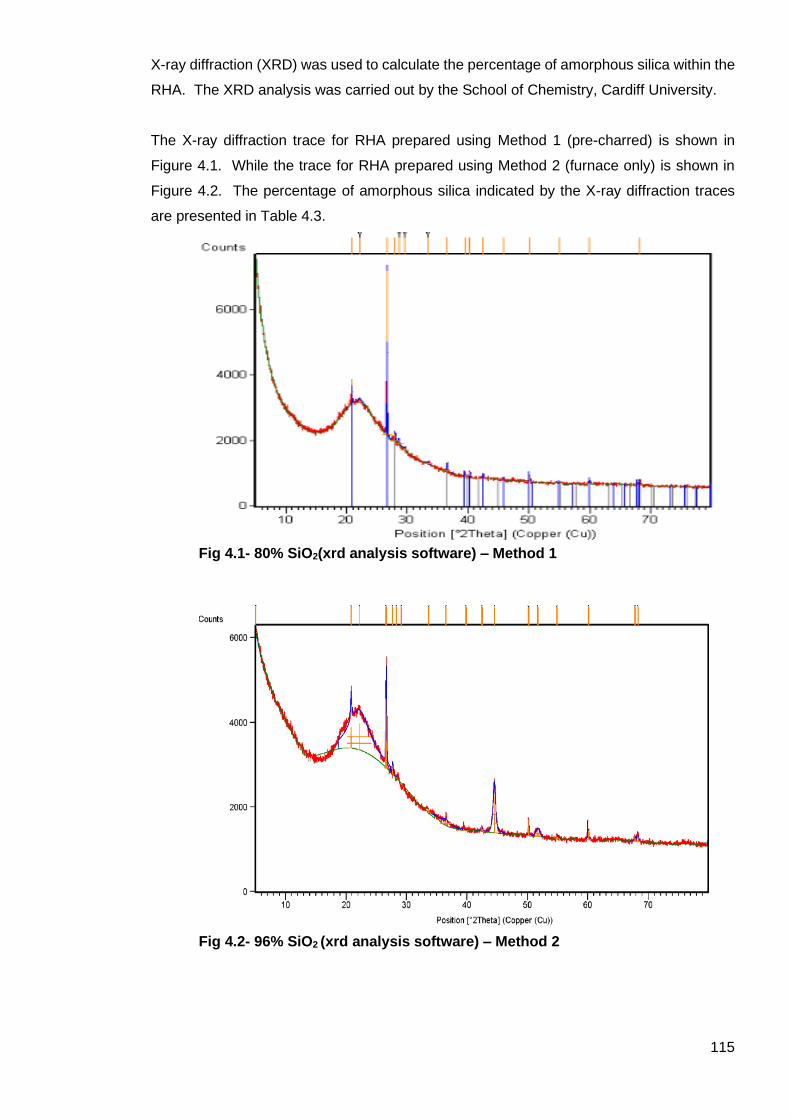
115
X-ray diffraction (XRD) was used to calculate the percentage of amorphous silica within the
RHA. The XRD analysis was carried out by the School of Chemistry, Cardiff University.
The X-ray diffraction trace for RHA prepared using Method 1 (pre-charred) is shown in
Figure 4.1. While the trace for RHA prepared using Method 2 (furnace only) is shown in
Figure 4.2. The percentage of amorphous silica indicated by the X-ray diffraction traces
are presented in Table 4.3.
Fig 4.1- 80% SiO2(xrd analysis software) – Method 1
Fig 4.2- 96% SiO2 (xrd analysis software) – Method 2

116
Table 4.3 Percentage amorphous silica contents of experimental Rice Husk Ash
(RHA) samples at different combustion times
RHA produced from: Combustion duration (hr) Silica (%)
Method 1 (Fig 4.1) 2-3 80%
Method 2 (Fig 4.2) 2.5 -4 96%
Both methods produced ashes containing amorphous silica contents adequate for
pozzolan chemical reaction when used for stabilization. Combusting the rice husk for a
longer period at the applied temperature (i.e. 550 to 780oC) as in Method 2, resulted in
ash that contained higher amount of silica, but incurred an energy penalty for using the
furnace for a longer period.
The findings about RHA are discussed further in Section 6.1.2.
4.2 Mechanical and Hygrothermal properties of the Experimental CEBs
The results of the laboratory tests on the experimental CEBs are presented in this section.
The different types (solid vs hollow), curing periods and RHA compositions were expected
to influence the mechanical and hygrothermal properties of the CEBs. These properties
were tested and are reported in the following sections of Chapter 4. As hollow blocks were
only intended for internal use, these were not tested for hygrothermal properties.
4.2.1 Bulk density of experimental CEBs
The methodology used to determine bulk density of the CEBs was described in section
3.3.1. The results of bulk density of the experimental solid and hollow CEBs with varying
levels of RHA cured for 14, 21 and 28 days are presented in Tables 4.4 and 4.5,
respectively. As three samples were tested for each condition the mean and standard
deviation (SD) are presented. The mean bulk density values ranged from 1738.0 ± 34 to
1935.9 ± 51 kg/m3 in solid CEBs, and from 1753.9 ± 66 to 1977.9 ± 29 kg/m3 in hollow
CEBs.
The mean bulk density values of the solid CEBs and duration of curing are shown in Table
4.4 and Figure 4.3 (abbreviated y-axis to illustrate this point).

117
Table 4.4. Bulk density of solid CEBs produced with varying partial replacement of OPC with RHA
Code Duration of curing (days)
RHA (%) OPC (%) Bulk density (kg/m3)
Mean ± SD
S/0 RHA
0% RHA
14 0 100 1891.8 ± 14
21 0 100 1790.7 ± 57
28 0 100 1768.2 ± 40
S/0.2 RHA
10% RHA
14 10 90 1885.7 ± 12
21 10 90 1816.6 ± 16
28 10 90 1855.5 ± 19
S/0.4 RHA
20% RHA
14 20 80 1916.0 ± 28
21 20 80 1738.0 ± 34
28 20 80 1783.8 ± 26
S/0.6 RHA
30% RHA
14 30 70 1860.7 ± 41
21 30 70 1782.0 ± 28
28 30 70 1777.7 ± 27
S/0.8 RHA
40% RHA
14 40 60 1935.9 ± 51
21 40 60 1782.0 ± 31
28 50 60 1756.1 ± 29
S/1 RHA
50% RHA
14 50 50 1800.2 ± 43
21 50 50 1791.5 ± 39
28 50 50 1824.4 ± 49
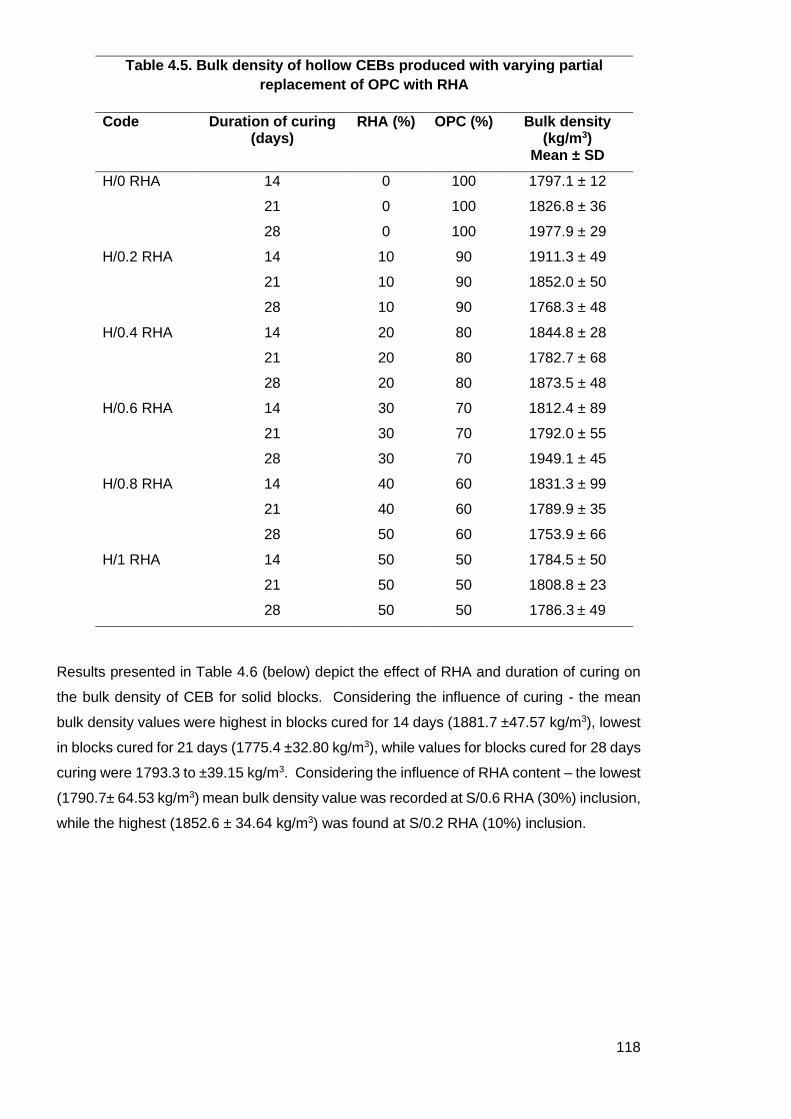
118
Table 4.5. Bulk density of hollow CEBs produced with varying partial
replacement of OPC with RHA
Code Duration of curing (days)
RHA (%) OPC (%) Bulk density (kg/m3)
Mean ± SD
H/0 RHA 14 0 100 1797.1 ± 12
21 0 100 1826.8 ± 36
28 0 100 1977.9 ± 29
H/0.2 RHA 14 10 90 1911.3 ± 49
21 10 90 1852.0 ± 50
28 10 90 1768.3 ± 48
H/0.4 RHA 14 20 80 1844.8 ± 28
21 20 80 1782.7 ± 68
28 20 80 1873.5 ± 48
H/0.6 RHA 14 30 70 1812.4 ± 89
21 30 70 1792.0 ± 55
28 30 70 1949.1 ± 45
H/0.8 RHA 14 40 60 1831.3 ± 99
21 40 60 1789.9 ± 35
28 50 60 1753.9 ± 66
H/1 RHA 14 50 50 1784.5 ± 50
21 50 50 1808.8 ± 23
28 50 50 1786.3 ± 49
Results presented in Table 4.6 (below) depict the effect of RHA and duration of curing on
the bulk density of CEB for solid blocks. Considering the influence of curing - the mean
bulk density values were highest in blocks cured for 14 days (1881.7 ±47.57 kg/m3), lowest
in blocks cured for 21 days (1775.4 ±32.80 kg/m3), while values for blocks cured for 28 days
curing were 1793.3 to ±39.15 kg/m3. Considering the influence of RHA content – the lowest
(1790.7± 64.53 kg/m3) mean bulk density value was recorded at S/0.6 RHA (30%) inclusion,
while the highest (1852.6 ± 34.64 kg/m3) was found at S/0.2 RHA (10%) inclusion.
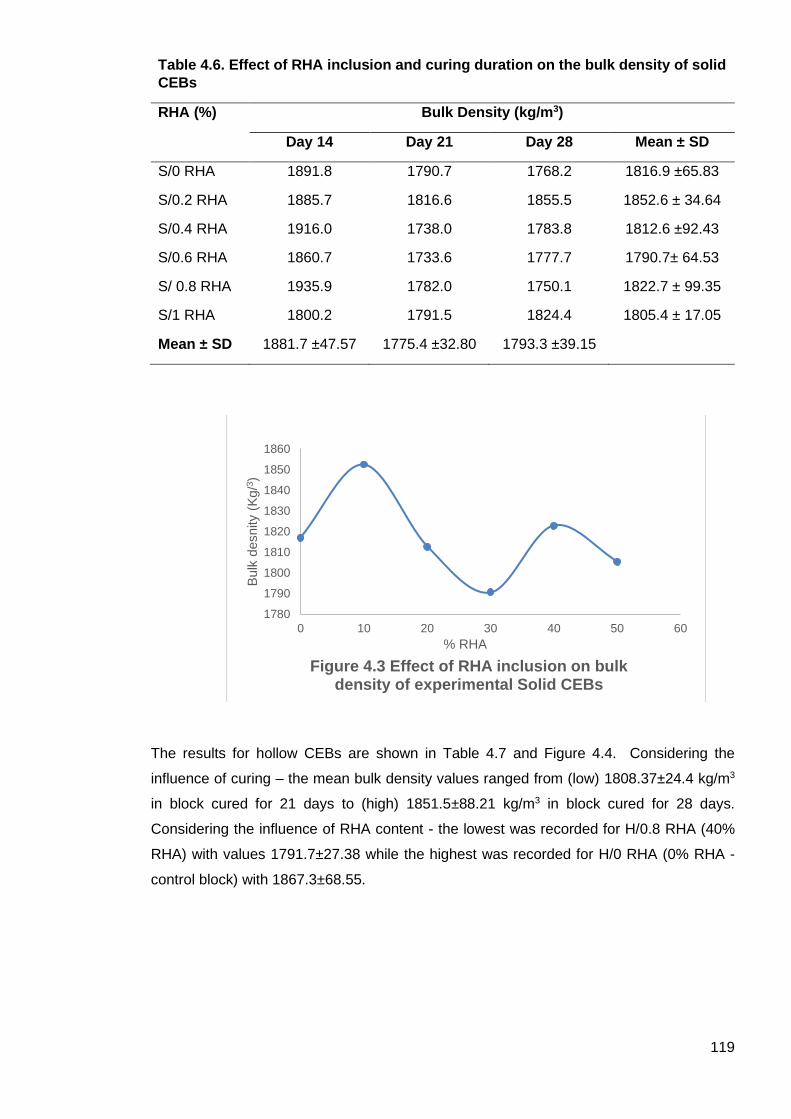
119
Table 4.6. Effect of RHA inclusion and curing duration on the bulk density of solid
CEBs
RHA (%) Bulk Density (kg/m3)
Day 14 Day 21 Day 28 Mean ± SD
S/0 RHA 1891.8 1790.7 1768.2 1816.9 ±65.83
S/0.2 RHA 1885.7 1816.6 1855.5 1852.6 ± 34.64
S/0.4 RHA 1916.0 1738.0 1783.8 1812.6 ±92.43
S/0.6 RHA 1860.7 1733.6 1777.7 1790.7± 64.53
S/ 0.8 RHA 1935.9 1782.0 1750.1 1822.7 ± 99.35
S/1 RHA 1800.2 1791.5 1824.4 1805.4 ± 17.05
Mean ± SD 1881.7 ±47.57 1775.4 ±32.80 1793.3 ±39.15
The results for hollow CEBs are shown in Table 4.7 and Figure 4.4. Considering the
influence of curing – the mean bulk density values ranged from (low) 1808.37±24.4 kg/m3
in block cured for 21 days to (high) 1851.5±88.21 kg/m3 in block cured for 28 days.
Considering the influence of RHA content - the lowest was recorded for H/0.8 RHA (40%
RHA) with values 1791.7±27.38 while the highest was recorded for H/0 RHA (0% RHA -
control block) with 1867.3±68.55.
1780
1790
1800
1810
1820
1830
1840
1850
1860
0 10 20 30 40 50 60
Bulk
desnity (
Kg/3
)
% RHA
Figure 4.3 Effect of RHA inclusion on bulk density of experimental Solid CEBs

120
Table 4.7. Effect of RHA inclusion and curing duration on the bulk density of
hollow CEBs
RHA (%) Bulk Density (kg/m3)
Day 14 Day 21 Day 28 Mean ± SD
H/0 RHA 1797.1 1826.8 1977.9 1867.3 ±68.55
H/0.2 RHA 1911.3 1852.0 1768.3 1843.9 ± 50.80
H/0.4 RHA 1844.8 1782.7 1873.5 1833.7 ± 32.81
H/0.6 RHA 1812.4 1790.0 1949.1 1850.5 ± 60.90
H/ 0.8 RHA 1831.3 1789.9 1753.9 1791.7 ± 27.38
H/1 RHA 1784.5 1808.8 1786.3 1793.2 ± 9.5
Mean ± SD 1830.23 ±41.41 1808.37 ±24.4 1851.5 ±88.21
For solid blocks, the bulk mean density of blocks cured for 14 days was found to be higher
than those cured for longer periods; however, this finding did not hold for hollow blocks.
There was no clear difference relating to RHA content for solid or hollow blocks. Nor was
there a clear difference in the bulk mean density between solid and hollow blocks.
The findings related to bulk density are discussed further in Section 6.2.1.1.
4.2.2 Compressive strength of experimental CEBs
The methodology used to determine compressive strength of the CEBs was described in
section 3.3.2. The results of compressive strength of the experimental solid and hollow
CEB with varying levels of RHA at different curing duration are presented in Tables 4.8 and
4.9, respectively. Mean values of compressive strength ranged from 2.39 ± 0.3 N/mm2
1780
1790
1800
1810
1820
1830
1840
1850
1860
1870
1880
0 10 20 30 40 50 60
Bulk
density (
Kg/m
3)
% RHA
Figure 4.4 Effect of RHA inclusion on bulk density of experimental Hollow CEBs
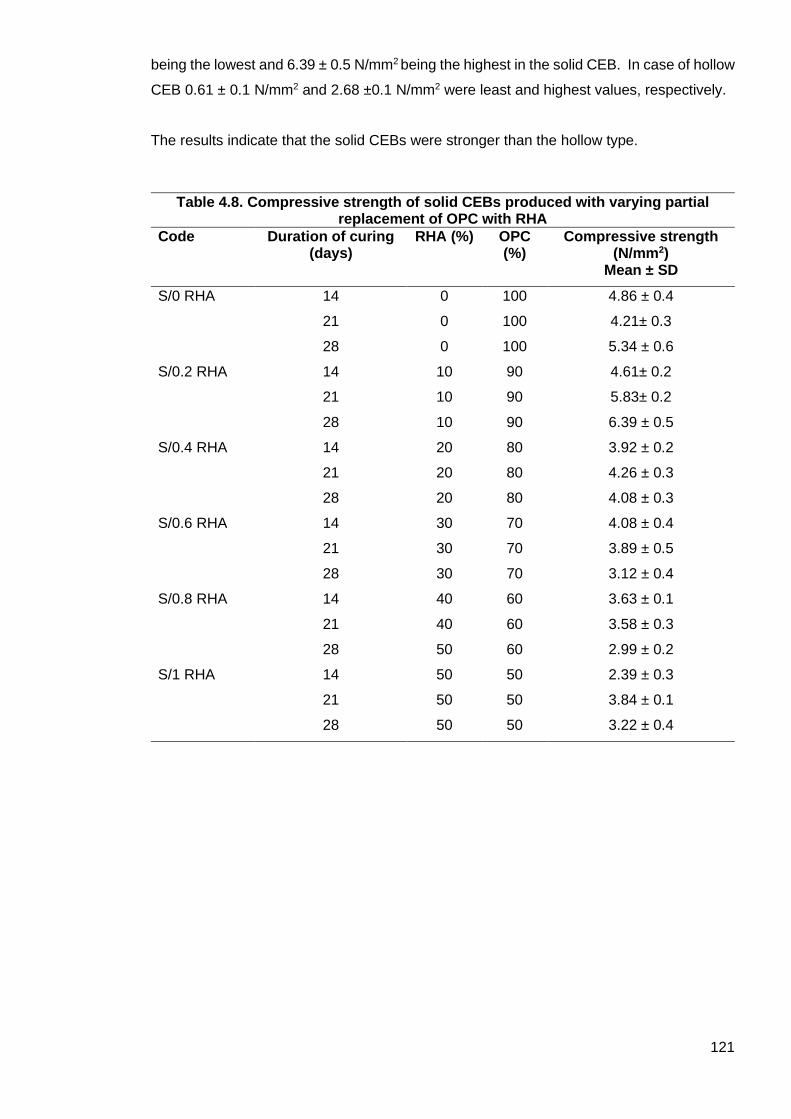
121
being the lowest and 6.39 ± 0.5 N/mm2 being the highest in the solid CEB. In case of hollow
CEB 0.61 ± 0.1 N/mm2 and 2.68 ±0.1 N/mm2 were least and highest values, respectively.
The results indicate that the solid CEBs were stronger than the hollow type.
Table 4.8. Compressive strength of solid CEBs produced with varying partial replacement of OPC with RHA
Code Duration of curing (days)
RHA (%) OPC (%)
Compressive strength (N/mm2)
Mean ± SD
S/0 RHA 14 0 100 4.86 ± 0.4
21 0 100 4.21± 0.3
28 0 100 5.34 ± 0.6
S/0.2 RHA 14 10 90 4.61± 0.2
21 10 90 5.83± 0.2
28 10 90 6.39 ± 0.5
S/0.4 RHA 14 20 80 3.92 ± 0.2
21 20 80 4.26 ± 0.3
28 20 80 4.08 ± 0.3
S/0.6 RHA 14 30 70 4.08 ± 0.4
21 30 70 3.89 ± 0.5
28 30 70 3.12 ± 0.4
S/0.8 RHA 14 40 60 3.63 ± 0.1
21 40 60 3.58 ± 0.3
28 50 60 2.99 ± 0.2
S/1 RHA 14 50 50 2.39 ± 0.3
21 50 50 3.84 ± 0.1
28 50 50 3.22 ± 0.4

122
Table 4.9. Compressive strength of hollow CEBs produced with varying partial replacement of OPC with RHA
Code Duration of curing (days)
RHA (%)
OPC (%) Compressive strength (N/mm2)
Mean ± SD
H/0 RHA 14 0 100 2.22 ± 0.4
21 0 100 2.30 ± 0.4
28 0 100 2.68 ±0.1
H/0.2 RHA 14 10 90 2.61 ±0.6
21 10 90 2.45 ± 0.2
28 10 90 2.45 ±0.2
H/0.4 RHA 14 20 80 1.46 ± 0.1
21 20 80 1.53 ± 0.1
28 20 80 1.92 ± 0.1
H/0.6 RHA 14 30 70 1.38 ± 0
21 30 70 1.46 ±0.1
28 30 70 1.46 ± 0.1
H/0.8 RHA 14 40 60 1.30 ± 0.3
21 40 60 1.38 ± 0
28 50 60 1.30 ± 0.1
H/1 RHA 14 50 50 0.61 ± 0.2
21 50 50 0.61 ± 0.1
28 50 50 0.84± 0.3
Mean values of compressive strength of experimental CEBs cured from 14 to 28 days for
solid blocks are shown in Table 4.10. Considering the influence of curing – the mean
compressive strength ranged from (low) 3.92±0.873 N/mm2 in blocks cured for 14 days to
(high) 4.27 ±0.803 N/mm2 in blocks cured for 21 days. However, the difference in the
compressive strength between different curing periods was not clear.
Considering the influence of RHA content - the results show that the values varied from
(low) 3.15±0.732 N/mm2 for the group with 50% RHA inclusion to (high) 5.61±0.910 N/mm2
for the group with 10%RHA inclusion. The group having 10% RHA inclusion has a higher
compression strength than the groups with higher RHA inclusions and were comparable to
CEBs stabilised using OPC only.

123
Table 4.10. Effect of RHA inclusion and curing duration on the compressive
strength of experimental solid CEBs
RHA (%) Compressive Strength (N/mm2)
Day 14 Day 21 Day 28 Mean ± SD
0 4.86 4.21 5.34 4.80±0.567
10 4.61 5.83 6.39 5.61±0.910
20 3.97 4.26 4.08 4.10±0.146
30 4.08 3.90 3.12 3.70±0.510
40 3.63 3.58 2.99 3.40±0.356
50 2.39 3.85 3.22 3.15±0.732
Mean ± SD 3.92±0.873 4.27 ±0.803 4.19 ±1.393
Figure 4.5 illustrates the trend in the compressive strength of the solid CEBs as affected by
the RHA inclusion. The picture depicted suggests that inclusion of RHA in the mix caused
the reduction of strength by almost half.
Mean values of compressive strength of experimental CEBs cured from 14 to 28 days for
hollow blocks are shown in Table 4.11. Considering the influence of curing - the mean
compressive strength was least (1.6±0.65 N/mm2) after 14 days curing and highest (1.78
±1.393 N/mm2) after 28 days of curing. However, the difference in the compressive
strength between different curing periods was not clear.
0
1
2
3
4
5
6
0 10 20 30 40 50 60
Com
pre
ssiv
e s
trength
(N
/mm
2)
% RHA
Figure 4.5 Effect of RHA inclusion on compressive strength of experimental solid CEBs

124
The results show that the values varied with varying levels of RHA inclusion in the mix.
The group having 10% RHA inclusion recorded the highest value (2.40 ± 0.17 N/mm2)
while the group with 50%RHA inclusion had the least value (0.69±0.09 N/mm2). The
group having 10% RHA inclusion has a higher compressive strength than the groups with
higher RHA inclusions and was comparable to CEBs stabilised using OPC only. The
group with 50% RHA had a compressive strength which was lower than all other groups
tested. The group with 40% RHA had a compressive strength which was lower than all
other groups tested apart from those containing 50% RHA. Although there was an
overlap in the compressive strength results from groups containing 20 and 30% RHA, the
overall trend that increased RHA proportion reduces the compressive strength appears to
hold true for hollow blocks.
Table 4.11. Effect of RHA inclusion and curing duration on the compressive
strength of experimental hollow CEBs
RHA (%) Compressive Strength (N/mm2)
Day 14 Day 21 Day 28 Mean ± SD
0 2.22 2.30 2.68 2.40 ± 0.17
10 2.61 2.45 2.45 2.50 ± 0.07
20 1.46 1.53 1.92 1.63 ± 0.17
30 1.38 1.46 1.46 1.43 ± 0.03
40 1.30 1.38 1.30 1.33 ± 0.03
50 0.61 0.61 0.84 0.69 ± 0.09
Mean ± SD 1.60 ±0.65 1.62 ±0.61 1.78 ±1.393
Figure 4.6 illustrates the trend in the compressive strength of the hollow CEBs as affected by the RHA inclusion.

125
For curing periods of 14 and 21 days, the solid blocks show a higher compressive
strength than hollow blocks. There is not a difference in compressive strength for blocks
cured for 28 days for solid and hollow blocks. Considering RHA content, the “solid”
version of each RHA content has a higher compressive strength than the “hollow” version
with the same RHA content.
The findings for compressive strength are further discussed in Section 6.2.1.2.
4.2.3 Water Absorption Capacity of experimental CEBs
The methodology used to determine water absorption capacity was described in Section
3.3.3. The results of water absorption capacity of the experimental solid and hollow CEB
with varying levels of RHA at different curing duration are presented in Tables 4.12 and
4.13, respectively. Mean values of water absorption capacity ranged from 5.25 ± 0.16
% to 9.66 ± 2.29% in solid CEB, and from 4.26 ± 0.93% to 7.96 ± 1.48% in hollow CEB.
0
1
2
3
4
5
6
0 10 20 30 40 50 60
Com
pre
ssiv
e s
trength
(N/m
m2)
% RHA
Figure 4.6 Effect of RHA inclusion on compressive strength of experimental hollow
CEBs

126
Table 4.12. Water absorption capacity of solid CEBs produced with varying partial replacement of OPC with RHA
Code Duration of curing (days)
RHA (%) OPC (%)
Water absorption capacity
(%) Mean ± SD
S/0 RHA 14 0 100 5.25 ± 0.16
21 0 100 7.43 ± 0.45
28 0 100 8.75 ± 0.47
S/0.2 RHA 14 10 90 5.40 ± 0.54
21 10 90 8.89 ± 0.24
28 10 90 5.88 ± 1.07
S/0.4 RHA 14 20 80 5.60 ± 0.65
21 20 80 9.66 ± 2.29
28 20 80 5.95 ± 0.82
S/0.6 RHA 14 30 70 6.88 ± 0.48
21 30 70 9.67 ± 1.23
28 30 70 7.90 ± 1.82
S/0.8 RHA 14 40 60 4.31 ± 0.87
21 40 60 8.51 ± 1.99
28 40 60 9.17 ± 2.29
S/1 RHA 14 50 50 7.68 ± 0.65
21 50 50 9.43 ± 1.03
28 50 50 7.43 ± 0.83

127
Table 4.13. Water absorption capacity of hollow CEBs produced with varying partial replacement of OPC with RHA
Code Duration of curing (days)
RHA (%) OPC (%)
Water absorption capacity
(%) Mean ± SD
H/0 RHA 14 0 100 6.07 ± 1.46
21 0 100 7.38 ± 0.47
28 0 100 5.84 ± 1.66
H/0.2 RHA 14 10 90 5.34 ± 1.60
21 10 90 5.24 ± 0.77
28 10 90 6.16 ± 0.35
H/0.4 RHA 14 20 80 4.26 ± 0.93
21 20 80 6.70 ± 1.17
28 20 80 6.59 ± 0.42
H/0.6 RHA 14 30 70 6.61 ± 1.39
21 30 70 8.03 ± 0.25
28 30 70 6.99 ± 1.13
H/0.8 RHA 14 40 60 6.83 ± 0.89
21 40 60 7.40 ± 1.00
28 50 60 8.47 ± 1.53
H/1 RHA 14 50 50 7.96 ± 1.48
21 50 50 6.71 ± 1.14
28 50 50 7.15 ± 0.23
The mean water absorption capacity of the test solid CEB samples presented in Table 4.14
revealed that the lowest (4.31 ± 0.87%) and the highest (9.66 ± 2.29%) values were
obtained at 14 and 21 days of curing, respectively. Also, the least value (6.76±1.59%) and
the highest value (8.20±0.91%) were recorded in blocks that had 10% and 50%,
respectively.

128
Table 4.14 Water absorption capacity of solid CEBs with varying RHA levels
cured for 14, 21 and 28 days
RHA (%) Water Absorption Capacity (%)
Day 14 Day 21 Day 28 Mean ± SD
0 5.25 7.43 8.75 7.14±1.44
10 5.40 8.99 5.88 6.76±1.59
20 5.60 9.99 5.95 7.18±1.99
30 6.88 9.67 7.90 8.15±1.14
40 4.31 8.51 9.17 7.33±2.15
50 7.68 9.48 7.43 8.20±0.91
Mean ± SD 5.85±1.11 9.01±0.85 7.51±1.26
Figure 4.7 illustrates the trends in the water absorption capacity of the solid CEBs as
affected by RHA inclusion. However, none of the RHA compositions performed differently
from the control sample (0% RHA). Similarly, there was no clear difference in water
absorption capacity between different curing periods.
The mean water absorption capacity of the test hollow CEB samples presented in Table
4.15 revealed that the lowest (5.85±1.11%) and the highest (9.01±0.85%) values were
obtained at 14 and 21 days of curing, respectively. Also, the least value (6.76±1.59) and
the highest value 8.20±0.91%) were recorded in blocks that had 10% and 50% RHA,
respectively
0
1
2
3
4
5
6
7
8
9
0 10 20 30 40 50 60
Wate
r absoprt
ion c
apacity
(%)
% RHA
Figure 4.7 Effect of RHA inclusion on water absorption capacity on experimental Solid CEBs

129
Table 4.15 Water absorption capacity of hollow CEBs with varying RHA levels
cured for 14, 21 and 28 days
RHA (%) Water Absorption Capacity (%)
Day 14 Day 21 Day 28 Mean ± SD
0 6.07 7.38 5.84 6.43 ± 0.78
10 5.34 5.24 6.16 5.58 ± 0.41
20 4.26 6.70 6.59 5.85 ± 01.13
30 6.61 8.03 6.99 7.21 ± 0.60
40 6.83 7.40 8.47 7.57 ± 0.68
50 7.96 6.71 7.15 7.27±0.52
Mean ± SD 6.18±1.17 6.91±0.87 6.87±0.84
Figure 4.8 illustrates the trends in the water absorption of the hollow CEBs as affected by
RHA inclusion. The group having 10% RHA inclusion has a lower water absorption capacity
than the groups with 40% or higher RHA inclusions. However, there was no clear difference
in water absorption capacity between different curing periods.
The findings for water absorption capacity are further discussed in Section 6.2.1.3.
4.2.4 Water Absorption coefficient of Compressed Earth Blocks
The methodology used to determine the water absorption coefficient was described in
Section 3.3.4. Solid blocks which had been cured for 28 days were tested. This test was
not applied to hollow blocks intended for internal use. The results are presented in Tables
4.16 to 4.22 and Figures 4.10 to 4.15.
0
1
2
3
4
5
6
7
8
9
0 10 20 30 40 50 60
Wate
r absorp
tion c
apacity
(%)
% RHA
Figure 4.8 Effect of RHA inclusion on water absorption capacity on experimental hollow
CEBs
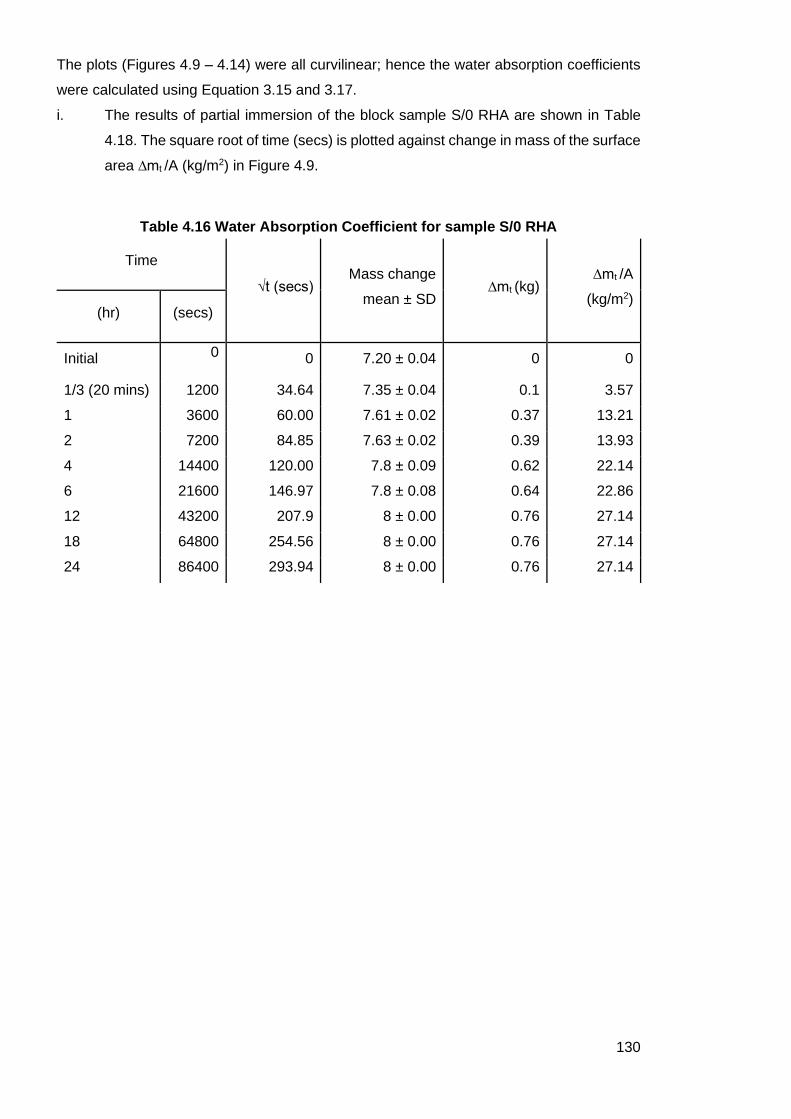
130
The plots (Figures 4.9 – 4.14) were all curvilinear; hence the water absorption coefficients
were calculated using Equation 3.15 and 3.17.
i. The results of partial immersion of the block sample S/0 RHA are shown in Table
4.18. The square root of time (secs) is plotted against change in mass of the surface
area ∆mt /A (kg/m2) in Figure 4.9.
Table 4.16 Water Absorption Coefficient for sample S/0 RHA
Time
√t (secs) Mass change
mean ± SD ∆mt (kg)
∆mt /A
(kg/m2) (hr) (secs)
Initial 0 0 7.20 ± 0.04 0 0
1/3 (20 mins) 1200 34.64 7.35 ± 0.04 0.1 3.57
1 3600 60.00 7.61 ± 0.02 0.37 13.21
2 7200 84.85 7.63 ± 0.02 0.39 13.93
4 14400 120.00 7.8 ± 0.09 0.62 22.14
6 21600 146.97 7.8 ± 0.08 0.64 22.86
12 43200 207.9 8 ± 0.00 0.76 27.14
18 64800 254.56 8 ± 0.00 0.76 27.14
24 86400 293.94 8 ± 0.00 0.76 27.14

131
Using equation 3.17, Water coefficient for S/0 RHA (Control)= 0.09 kg/m2 s1/2
Table 4.17 Water Absorption Coefficient for sample S/0.2 RHA
Time
√t (secs) Mass change
mean ± SD ∆mt (kg)
∆mt /A
(kg/m2) (hr) (secs)
Initial 0 0 7.35 ± 0.04 0 0
1/3 (20 mins) 1200 34.64 7.55 ± 0.04 0.2 7.14
1 3600 60.00 7.75 ± 0.02 0.38 13.57
2 7200 84.85 7.8 ± 0.00 0.45 16.07
4 14400 120.00 7.85 ± 0.00 0.5 17.86
6 21600 146.97 7.93 ± 0.02 0.58 20.71
12 43200 207.9 8.10 ± 0.05 0.78 27.86
18 64800 254.56 8.15 ± 0.00 0.8 28.57
24 86400 293.94 8.15 ± 0.00 0.8 28.57
0
5
10
15
20
25
30
35
40
0 50 100 150 200 250 300 350
∆m
t /
A (
kg/m
2)
√t (secs)Fig 4.9 Water content change over surface area and
square root of time in 24 hrs (control, S/0 RHA)

132
Using equation 3.17, Water coefficient for S/0.2 RHA (Control)= 0.10 kg/m2 s1/2
Table 4.18 Water Absorption Coefficient for sample S/0.4 RHA
Time
√t (secs) Mass change
mean ± SD ∆mt (kg)
∆mt /A
(kg/m2) (hr) (secs)
Initial 0 0 6.98 ± 0.06 0 0
1/3 (20 mins) 1200 34.64 7.15 ± 0.04 0.17 6.07
1 3600 60.00 7.31 ± 0.08 0.34 12.1
2 7200 84.85 7.45 ± 0.04 0.47 16.8
4 14400 120.00 7.57 ± 0.09 0.59 21.1
6 21600 146.97 7.61 ± 0.02 0.64 22.9
12 43200 207.85 7.8 ± 0.00 0.82 29.3
18 64800 254.56 7.82 ± 0.02 0.84 30
24 86400 293.94 7.82 ± 0.02 0.84 30
0
5
10
15
20
25
30
35
40
0 50 100 150 200 250 300 350
∆m
t /
A (
kg/m
2)
√t (secs)
Fig 4.10 Water content change over surface area and square root of time in 24 hrs (S/0.2 RHA)
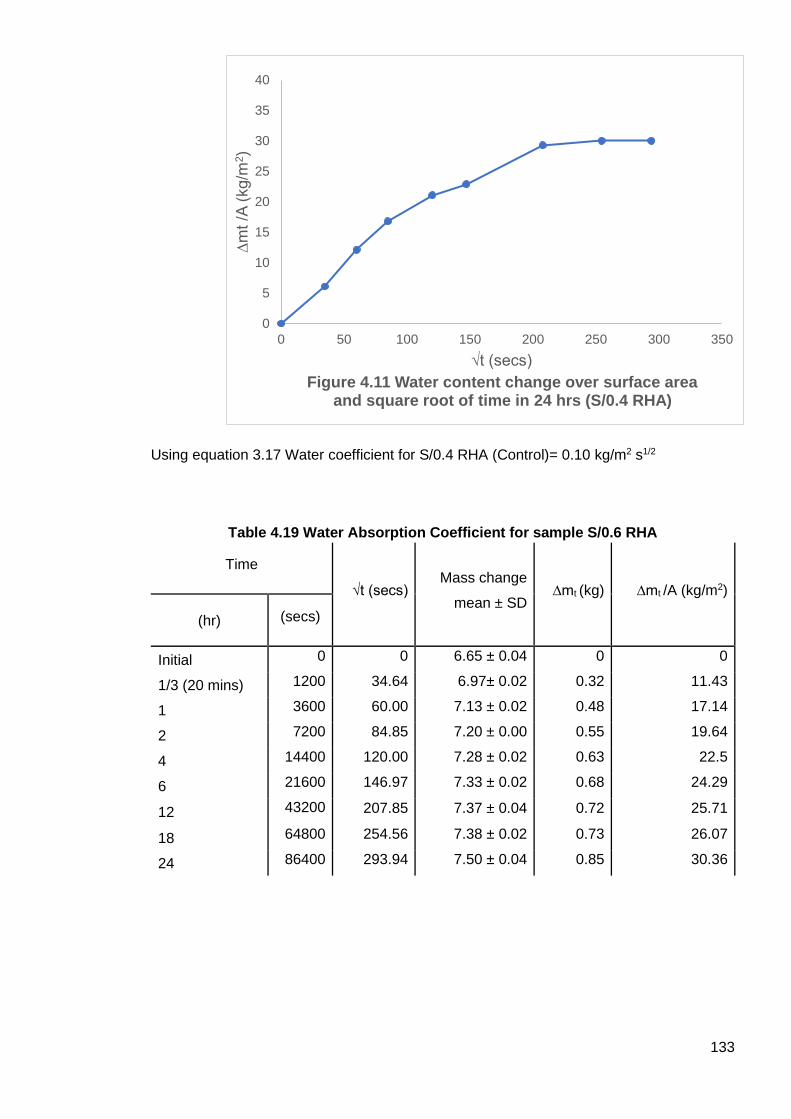
133
Using equation 3.17 Water coefficient for S/0.4 RHA (Control)= 0.10 kg/m2 s1/2
Table 4.19 Water Absorption Coefficient for sample S/0.6 RHA
Time
√t (secs) Mass change
mean ± SD ∆mt (kg) ∆mt /A (kg/m2)
(hr) (secs)
Initial 0 0 6.65 ± 0.04 0 0
1/3 (20 mins) 1200 34.64 6.97± 0.02 0.32 11.43
1 3600 60.00 7.13 ± 0.02 0.48 17.14
2 7200 84.85 7.20 ± 0.00 0.55 19.64
4 14400 120.00 7.28 ± 0.02 0.63 22.5
6 21600 146.97 7.33 ± 0.02 0.68 24.29
12 43200 207.85 7.37 ± 0.04 0.72 25.71
18 64800 254.56 7.38 ± 0.02 0.73 26.07
24 86400 293.94 7.50 ± 0.04 0.85 30.36
0
5
10
15
20
25
30
35
40
0 50 100 150 200 250 300 350
∆m
t /A
(kg/m
2)
√t (secs)
Figure 4.11 Water content change over surface area and square root of time in 24 hrs (S/0.4 RHA)

134
Using equation 3.17 Water coefficient for S/0.6 RHA (Control)= 0.10 kg/m2 s1/2
Table 4.20 Water Absorption Coefficient for sample S/0.8 RHA
Time
√t (secs) Mass change
mean ± SD ∆mt (kg)
∆mt /A (kg/m2)
(hr) (secs)
Initial 0 0 6.63 ± 0.05 0.00 0
1/3 (20 mins) 1200 34.64 6.97± 0.02 0.34 12.14
1 3600 60.00 7.11 ± 0.02 0.49 17.50
2 7200 84.85 7.26 ± 0.02 0.64 22.86
4 14400 120.00 7.38 ± 0.05 0.75 26.79
6 21600 146.97 7.41 ± 0.02 0.79 28.21
12 43200 207.85 7.53 ± 0.04 0.90 32.14
18 64800 254.56 7.56 ± 0.04 0.94 33.57
24 86400 293.94 7.60 ± 0.00 0.97 34.64
0
5
10
15
20
25
30
35
40
0 50 100 150 200 250 300 350
∆m
t /A
(kg/m
2)
√t (secs)
Figure 4.12 Water content change over surface area and square root of time in 24 hrs (S/0.6 RHA)

135
Using equation 3.17 Water coefficient for S/0.8 RHA (Control)= 0.12 kg/m2 s1/2
Table 4.21 Water Absorption Coefficient for sample S/1 RHA
Time
√t (secs) Mass change
mean ± SD ∆mt (kg) ∆mt /A (kg/m2)
(hr) (secs)
Initial 0 0 6.65 ± 0.04 0.00 0
1/3 (20 mins) 1200 34.64 6.97± 0.02 0.40 14.29
1 3600 60.00 7.13 ± 0.02 0.48 17.14
2 7200 84.85 7.20 ± 0.00 0.56 20.00
4 14400 120.00 7.28 ± 0.02 0.66 23.57
6 21600 146.97 7.33 ± 0.02 0.66 23.57
12 43200 207.85 7.37 ± 0.04 0.70 25.00
18 64800 254.56 7.38 ± 0.02 0.71 25.36
24 86400 293.94 7.50 ± 0.04 0.73 26.07
0
5
10
15
20
25
30
35
40
0 50 100 150 200 250 300 350
∆m
t /A
(kg/m
2)
√t (secs)
Figure 4.13 Water content change over surface area and square root time in 24 hrs (S/0.8 RHA)

136
Using equation 3.17, Water coefficient for S/0.8 RHA (Control)= 0.089 kg/m2 s1/2.
The water absorption coefficient of experimental CEB at different RHA inclusion levels are
shown in Table 4.24. The results indicated that water absorption coefficient ranged from
0.089 (kg/m2 s1/2) at 50%RHA inclusion to 0.12 (kg/m2 s1/2) at 40%RHA inclusion. All the
plots of change in mass per area against square root of time exhibited curvilinear graphs.
Table 4.22 Water absorption coefficient of experimental solid CEB at different RHA
inclusion level
%RHA Water absorption
coefficient
(kg/m2 s1/2)
Type of Graph
0 0.090 Curvilinear
10 0.100 Curvilinear
20 0.100 Curvilinear
30 0.100 Curvilinear
40 0.120 Curvilinear
50 0.089 Curvilinear
*Experiment was conducted within the laboratory temperature conditions of 25±5oC
The findings for water absorption coefficient are further discussed in Section 6.2.2.1.
0
5
10
15
20
25
30
35
40
0 50 100 150 200 250 300 350
∆m
t /A
(kg/m
2)
√t (secs)
Figure 4.14 Water content change over surface area and square root time in 24 hrs (S/1 RHA)

137
4.2.5 Water Vapour Transmission of Compressed Earth Blocks
The methodology used to determine the water vapour transmission was described in
Section 3.3.5. Solid blocks which had been cured for 28 days were tested and control
blocks were not tested, the result are to be extrapolated from literature. This test was not
applied to hollow blocks which are intended for internal use.
The results of mass changes due to moisture content until equilibrium is reached for
experimental CEBs with varying RHA are presented in Table 4.25. This data is then
illustrated graphically in Figures 4.15– 4.19. The hygroscopic properties are then presented
in Table 4.23.
Table 4.23 Changes in moisture contents in CEB at varying levels of RHA
inclusion (water vapour transmission)
Time (secs) Moisture change (kg)
0%RHA S/0.2
RHA
S/ 0.4
RHA
S/0.6
RHA
S/0.8
RHA
S/1
RHA
0 - 0 0 0 0 0
86400 (24 hrs) - 0.1 0.05 0.022 0.008 0.018
172800 (48 hrs) - 0.2 0.068 0.036 0.018 0.026
259200 (72 hrs) - 0.148 0.08 0.044 0.024 0.042
345600 (96 hrs) - 0.162 0.084 0.05 0.124 0.052

138
The figure 4.15 plotted was plotted to get the slope of the moisture change until equilibrium
is achieved. The slope of the figure is 4E-07
The figure 4.16 plotted was plotted to get the slope of the moisture change until equilibrium
is achieved. The slope of the figure is 2E-07
y = 4E-07x + 0.0476R² = 0.5832
0
0.05
0.1
0.15
0.2
0.25
0 50000 100000 150000 200000 250000 300000 350000 400000
Mo
istu
re c
ha
nge
(K
g)
Time (s)
Figure 4.15 Changes in moisture contents in CEBs at 10%RHA (S/0.2 RHA) inclusion
y = 2E-07x + 0.0168R² = 0.8386
0
0.05
0.1
0.15
0.2
0.25
0 100000 200000 300000 400000
Mo
istu
re c
ha
nge
(K
g)
Time (s)
Figure 4.16 Changes in moisture contents in CEBs at 20%RHA (S/0.4 RHA) inclusion
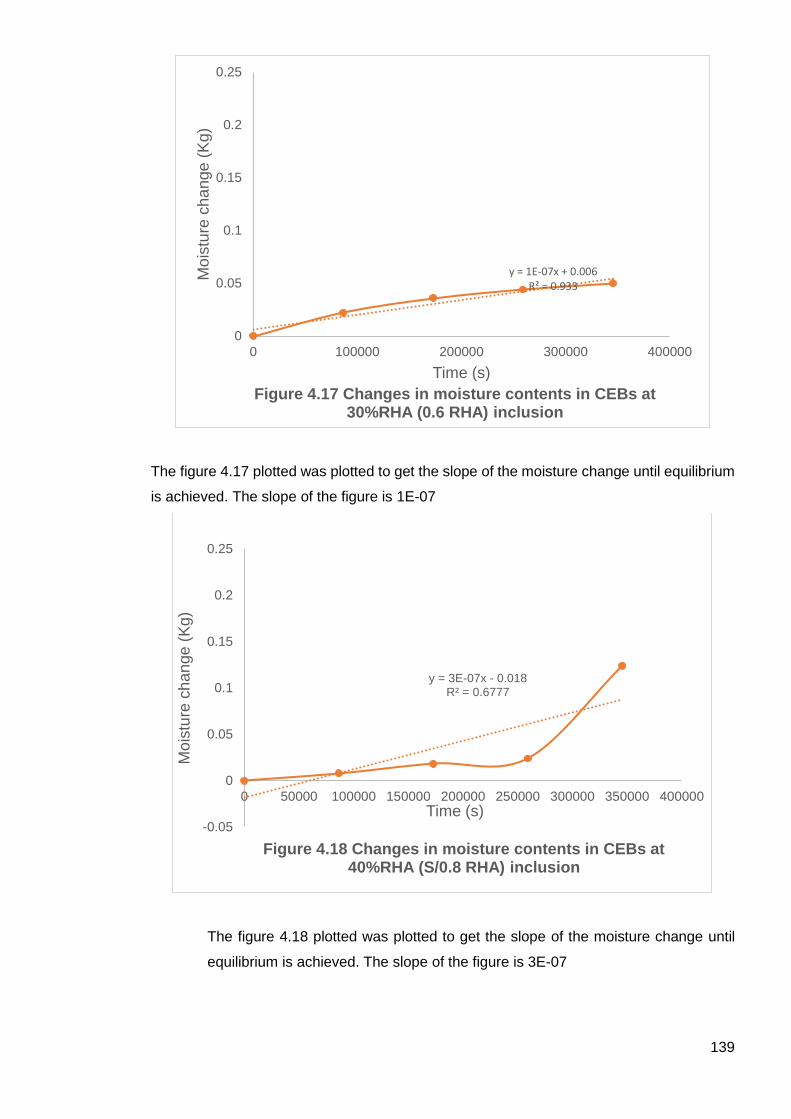
139
The figure 4.17 plotted was plotted to get the slope of the moisture change until equilibrium
is achieved. The slope of the figure is 1E-07
The figure 4.18 plotted was plotted to get the slope of the moisture change until
equilibrium is achieved. The slope of the figure is 3E-07
y = 1E-07x + 0.006R² = 0.933
0
0.05
0.1
0.15
0.2
0.25
0 100000 200000 300000 400000
Mo
istu
re c
ha
nge
(K
g)
Time (s)
Figure 4.17 Changes in moisture contents in CEBs at 30%RHA (0.6 RHA) inclusion
y = 3E-07x - 0.018R² = 0.6777
-0.05
0
0.05
0.1
0.15
0.2
0.25
0 50000 100000 150000 200000 250000 300000 350000 400000
Mo
istu
re c
ha
nge
(K
g)
Time (s)
Figure 4.18 Changes in moisture contents in CEBs at 40%RHA (S/0.8 RHA) inclusion

140
The figure 4.19 plotted was plotted to get the slope of the moisture change until equilibrium
is achieved. The slope of the figure is 1E-07
Density of water vapour rate, water vapour permeance, water vapour resistance, water
vapour permeability of the CEB and of the air, and water vapour resistance factor were all
computed, and the results are shown in Table 4.26. The results showed consistently that
excepting water vapour resistance factor and water vapour permeability of air, other
parameters were higher in CEB in which 10%RHA was included. Water vapour permeability
of air remained constant in all the treatment groups.
y = 1E-07x + 0.002R² = 0.9875
0
0.05
0.1
0.15
0.2
0.25
0 100000 200000 300000 400000
Mo
istu
re c
ha
nge
(K
g)
Time (s)
Figure 4.19 Changes in moisture contents in CEBs at 50%RHA (S/1 RHA) inclusion
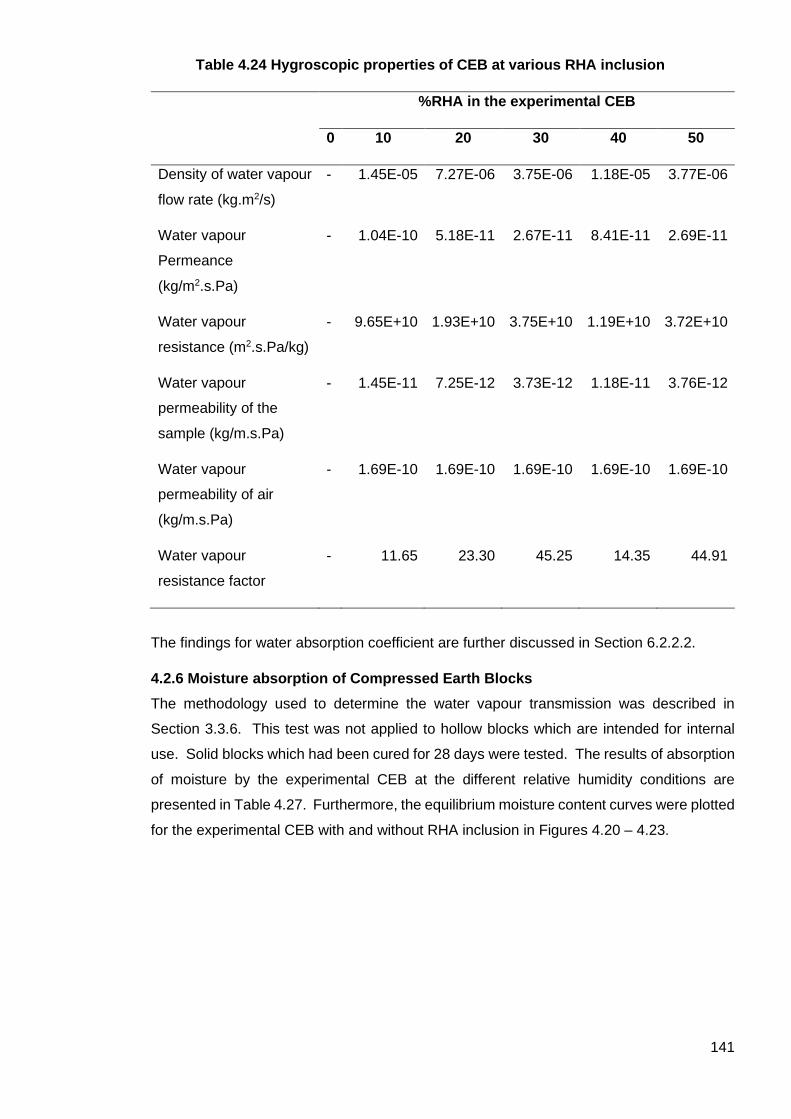
141
Table 4.24 Hygroscopic properties of CEB at various RHA inclusion
%RHA in the experimental CEB
0 10 20 30 40 50
Density of water vapour
flow rate (kg.m2/s)
- 1.45E-05 7.27E-06 3.75E-06 1.18E-05 3.77E-06
Water vapour
Permeance
(kg/m2.s.Pa)
- 1.04E-10 5.18E-11 2.67E-11 8.41E-11 2.69E-11
Water vapour
resistance (m2.s.Pa/kg)
- 9.65E+10 1.93E+10 3.75E+10 1.19E+10 3.72E+10
Water vapour
permeability of the
sample (kg/m.s.Pa)
- 1.45E-11 7.25E-12 3.73E-12 1.18E-11 3.76E-12
Water vapour
permeability of air
(kg/m.s.Pa)
- 1.69E-10 1.69E-10 1.69E-10 1.69E-10 1.69E-10
Water vapour
resistance factor
- 11.65 23.30 45.25 14.35 44.91
The findings for water absorption coefficient are further discussed in Section 6.2.2.2.
4.2.6 Moisture absorption of Compressed Earth Blocks
The methodology used to determine the water vapour transmission was described in
Section 3.3.6. This test was not applied to hollow blocks which are intended for internal
use. Solid blocks which had been cured for 28 days were tested. The results of absorption
of moisture by the experimental CEB at the different relative humidity conditions are
presented in Table 4.27. Furthermore, the equilibrium moisture content curves were plotted
for the experimental CEB with and without RHA inclusion in Figures 4.20 – 4.23.
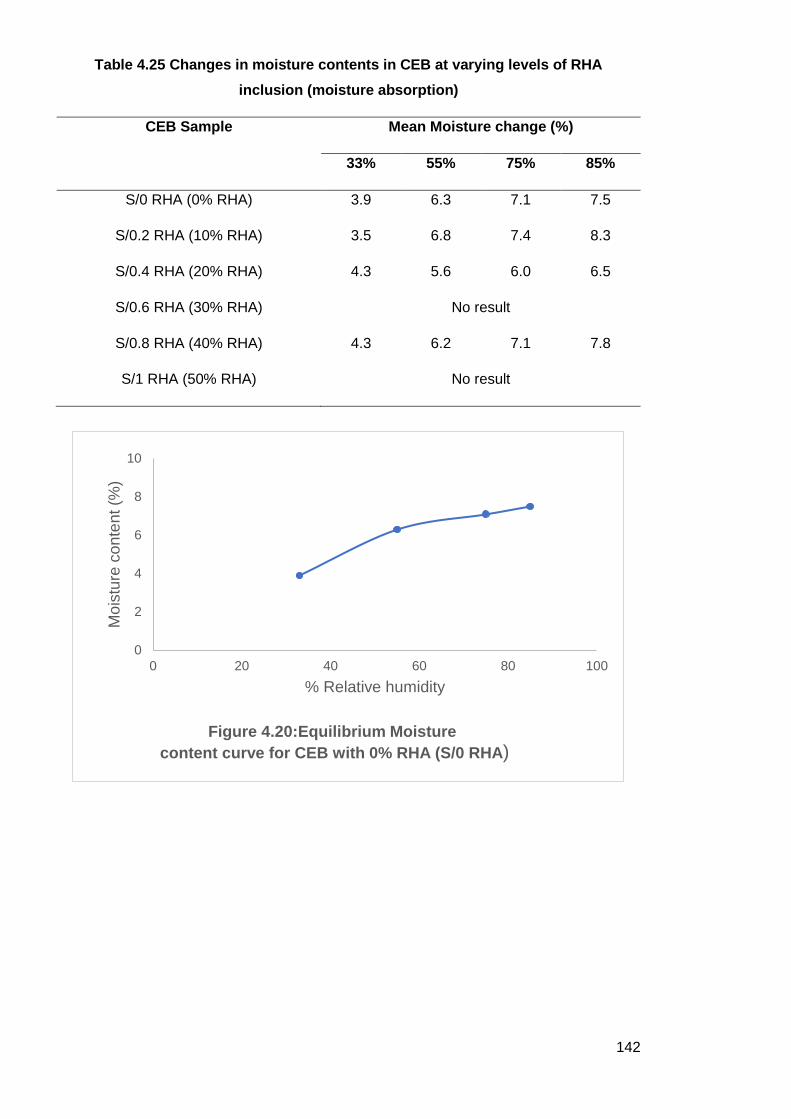
142
Table 4.25 Changes in moisture contents in CEB at varying levels of RHA
inclusion (moisture absorption)
CEB Sample Mean Moisture change (%)
33% 55% 75% 85%
S/0 RHA (0% RHA) 3.9 6.3 7.1 7.5
S/0.2 RHA (10% RHA) 3.5 6.8 7.4 8.3
S/0.4 RHA (20% RHA) 4.3 5.6 6.0 6.5
S/0.6 RHA (30% RHA) No result
S/0.8 RHA (40% RHA) 4.3 6.2 7.1 7.8
S/1 RHA (50% RHA) No result
0
2
4
6
8
10
0 20 40 60 80 100
Mo
istu
re c
on
ten
t (%
)
% Relative humidity
Figure 4.20:Equilibrium Moisture
content curve for CEB with 0% RHA (S/0 RHA)
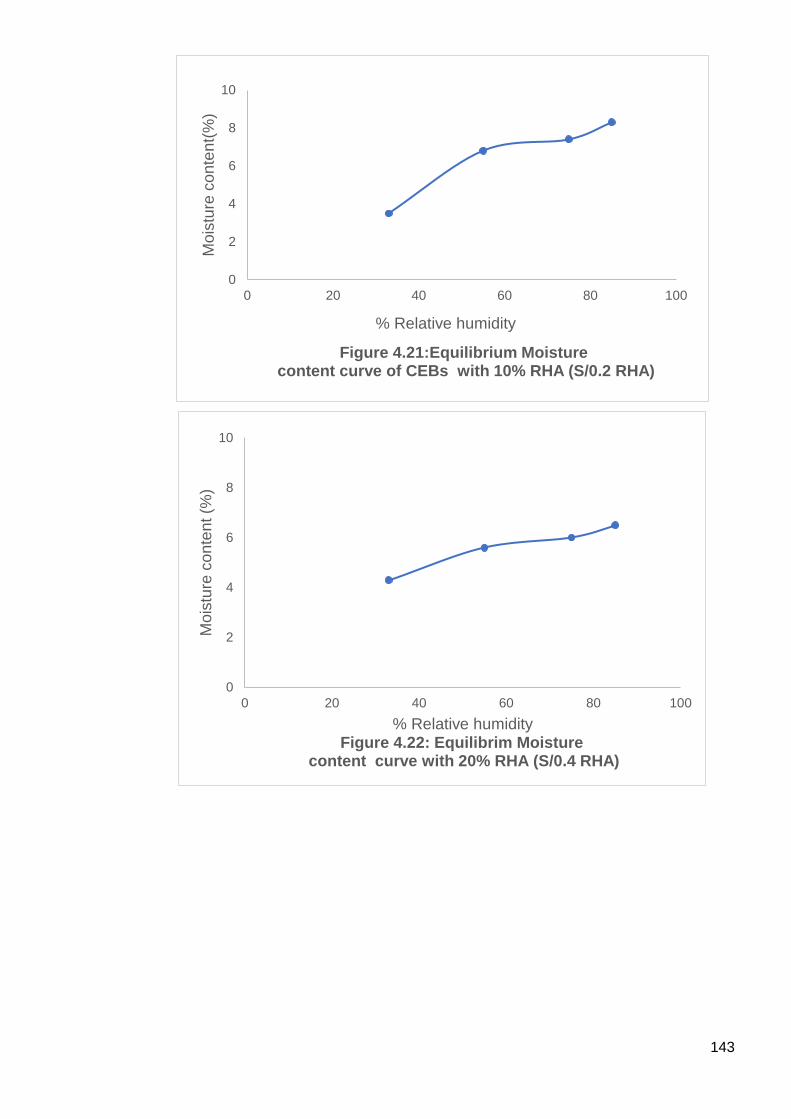
143
0
2
4
6
8
10
0 20 40 60 80 100
Mo
istu
re c
on
ten
t(%
)
% Relative humidity
Figure 4.21:Equilibrium Moisturecontent curve of CEBs with 10% RHA (S/0.2 RHA)
0
2
4
6
8
10
0 20 40 60 80 100
Mo
istu
re c
on
ten
t (%
)
% Relative humidity Figure 4.22: Equilibrim Moisture
content curve with 20% RHA (S/0.4 RHA)

144
The findings for moisture absorption are further discussed in Section 6.2.2.3.
4.2.7 Moisture Buffering of Compressed Earth Blocks
The ability of a material to properly absorb or release moisture from its structure plays a
significant role in the risk of biological growth on the surface of the material (i.e. mould
growth on wall surface). The effect of moisture buffering on the compressed earth blocks
stabilized with ordinary Portland cement and rice husk ash was explored using the
methodology described in Section 3.3.7. The results presented in Table 4.28 showed that
the least moisture buffering value (1.2 g/m2 %RH) was found in CEB with 20%RHA inclusion
whereas CEB with 10%RHA inclusion had the highest value (2.1 g/m2 %RH). The CEB
with 10% RHA was classified as “Excellent” in comparison to the CEB stabilised with OPC
which was classified as “Good”. CEBs stabilised with more than 10%RHA were also
classified as “Good”, showing comparable performance with OPC stabilised CEBs.
0
2
4
6
8
10
0 20 40 60 80 100
Mo
istu
re c
on
ten
t (%
)
% Relative humidity
Figure 4.23: Equilibrium Moisturecontent curve with 40% (S/0.8 RHA)
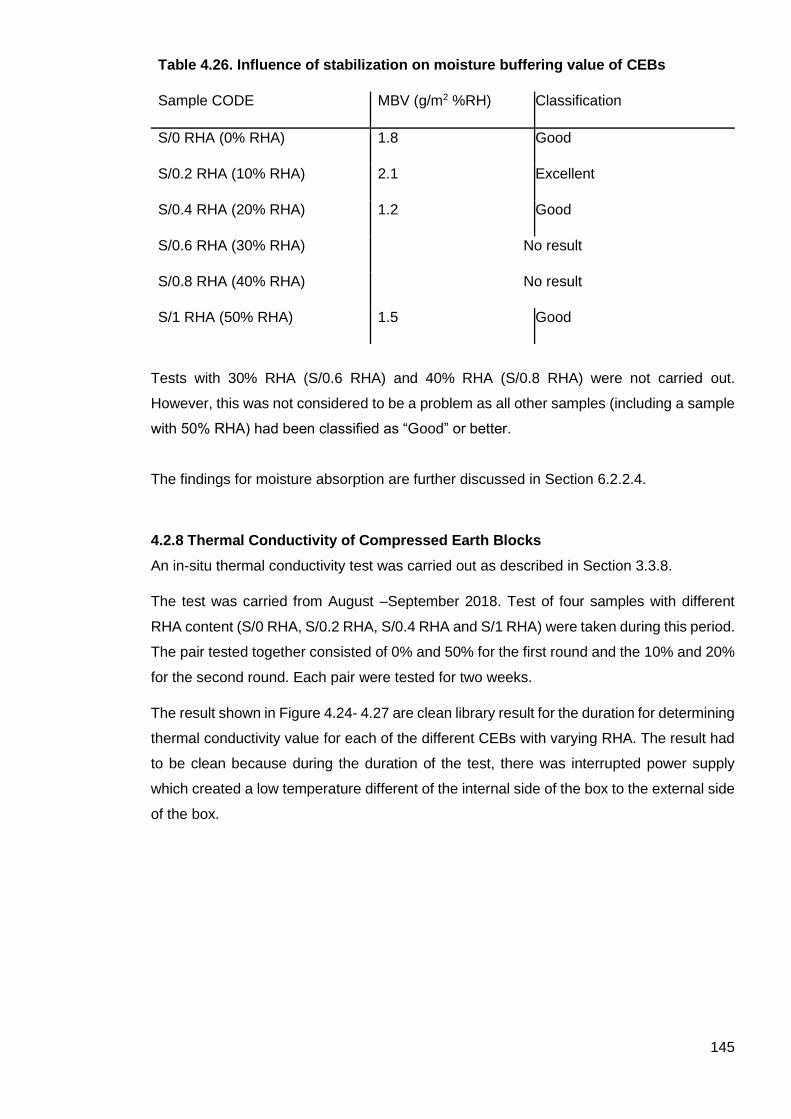
145
Table 4.26. Influence of stabilization on moisture buffering value of CEBs
Sample CODE MBV (g/m2 %RH) Classification
S/0 RHA (0% RHA) 1.8 Good
S/0.2 RHA (10% RHA) 2.1 Excellent
S/0.4 RHA (20% RHA) 1.2 Good
S/0.6 RHA (30% RHA) No result
S/0.8 RHA (40% RHA) No result
S/1 RHA (50% RHA) 1.5 Good
Tests with 30% RHA (S/0.6 RHA) and 40% RHA (S/0.8 RHA) were not carried out.
However, this was not considered to be a problem as all other samples (including a sample
with 50% RHA) had been classified as “Good” or better.
The findings for moisture absorption are further discussed in Section 6.2.2.4.
4.2.8 Thermal Conductivity of Compressed Earth Blocks
An in-situ thermal conductivity test was carried out as described in Section 3.3.8.
The test was carried from August –September 2018. Test of four samples with different
RHA content (S/0 RHA, S/0.2 RHA, S/0.4 RHA and S/1 RHA) were taken during this period.
The pair tested together consisted of 0% and 50% for the first round and the 10% and 20%
for the second round. Each pair were tested for two weeks.
The result shown in Figure 4.24- 4.27 are clean library result for the duration for determining
thermal conductivity value for each of the different CEBs with varying RHA. The result had
to be clean because during the duration of the test, there was interrupted power supply
which created a low temperature different of the internal side of the box to the external side
of the box.
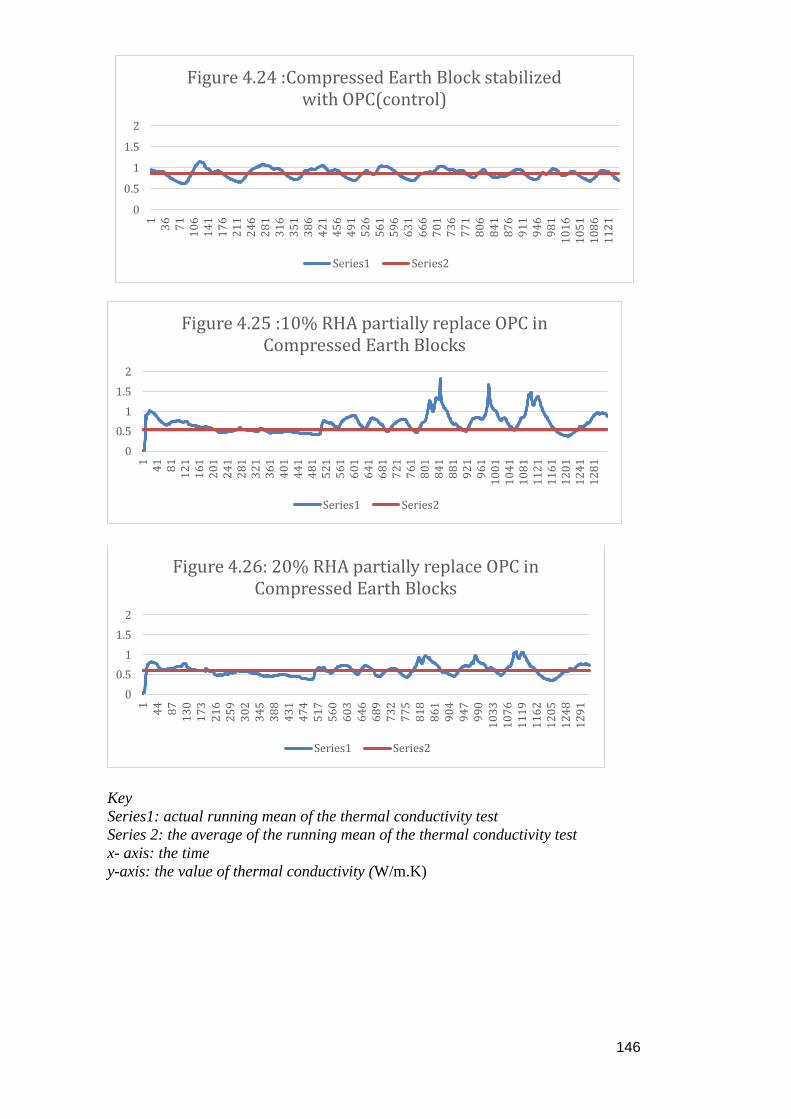
146
Key
Series1: actual running mean of the thermal conductivity test
Series 2: the average of the running mean of the thermal conductivity test
x- axis: the time
y-axis: the value of thermal conductivity (W/m.K)
0
0.5
1
1.5
2
13
67
11
06
14
11
76
21
12
46
28
13
16
35
13
86
42
14
56
49
15
26
56
15
96
63
16
66
70
17
36
77
18
06
84
18
76
91
19
46
98
11
01
61
05
11
08
61
12
1
Figure 4.24 :Compressed Earth Block stabilized with OPC(control)
Series1 Series2
0
0.5
1
1.5
2
14
18
11
21
16
12
01
24
12
81
32
13
61
40
14
41
48
15
21
56
16
01
64
16
81
72
17
61
80
18
41
88
19
21
96
11
00
11
04
11
08
11
12
11
16
11
20
11
24
11
28
1
Figure 4.25 :10% RHA partially replace OPC in Compressed Earth Blocks
Series1 Series2
0
0.5
1
1.5
2
14
48
71
30
17
32
16
25
93
02
34
53
88
43
14
74
51
75
60
60
36
46
68
97
32
77
58
18
86
19
04
94
79
90
10
33
10
76
11
19
11
62
12
05
12
48
12
91
Figure 4.26: 20% RHA partially replace OPC in Compressed Earth Blocks
Series1 Series2

147
Key
Series1: actual running mean of the thermal conductivity test
Series 2: the average of the running mean of the thermal conductivity test
x- axis: the time
y-axis: the value of thermal conductivity (W/m.K)
The results of mean thermal conductivity are presented in Table 4.29 and Figure 4.28 of
the tested CEBs with varying RHA
Table 4.29: Thermal Conductivity of CEBs masonry wall with varying RHA content
% RHA Thermal conductivity (W/m.K) Bulk density (kg/m3)
0% 0.87 1816.9
10% 0.55 1852.6
20% 0.61 1812.6
50% 0.57 1805.4
The findings for thermal conductivity are further discussed in Section 6.2.2.5.
00.5
11.5
2
13
67
11
06
14
11
76
21
12
46
28
13
16
35
13
86
42
14
56
49
15
26
56
15
96
63
16
66
70
17
36
77
18
06
84
18
76
91
19
46
98
11
01
61
05
11
08
61
12
1
Figure 4.27: 50% RHA partially replace OPC in Compressed Earth Blocks
Series1 Series2
0
0.1
0.2
0.3
0.4
0.5
0.6
0.7
0.8
0.9
1
0% 10% 20% 30% 40% 50% 60%Therm
al conductivty
(W
/m.K
)
% RHA
Figure 4.28: Thermal conductivity for masonry CEBs stabilized with RHA

148
5. Simulation Results
_______________________________________________________________________
This chapter reports the findings from two simulation investigations. Firstly, the simulation
of mould growth and interstitial condensation is reported in Section 5.1. Then the
simulation for thermal comfort performance is reported in Section 5.2.
5.1. Hygrothermal behaviour of Wall system
There are several parameters which are required for simulation of moisture content,
temperature, relative humidity of the wall and mould growth. These relate to the material,
the wall system, and the boundary conditions. These are detailed in Sections 5.1.
The simulation is reported in five sections: temperature gradient (Section 5.1.2), RH
gradient (5.1.3), moisture content (5.1.4), mould growth (5.1.5) and total water content
(5.1.6).
5.1.1. Boundaries of Simulation
5.1.1.1. Choice of Material for Simulation
In the present study, various laboratory tests were carried out on compressed earth blocks
(CEBs) partially stabilized with rice husk ash (RHA). Materials used for CEB production
were sourced in Nigeria. The results of the mechanical and hygrothermal tests were
described in Chapter 4 of this thesis and further discussion in Sections 6.2.1-6.2.2. From
these results four CEB materials were chosen for investigation, the exclusion of 40% and
50% RHA was because the materials didn’t meet the requirement for hygrothermal
property required. These were solid blocks with 0% RHA (as the control) and RHA
contents of 10%, 20% and 30% and appropriate for external walls. The properties of the
CEB materials chosen for this investigation are detailed in Table 5.1.
Table 5.1 Properties Summary of CEB materials included in simulation study
CEBs with varying RHA Percentage
Material property 0% 10% 20% 30%
Bulk density (Kg/m3) 1768.2 1855.5 1783.8 1777.7
Water absorption coefficient
(Kg/m2 s1/2)
0.090 0.100 0.100 0.100
Moisture absorption (%) 7.5 8.3 6.5 8.0
Water vapour resistance factor 20 11.65 23.30 45.25
Thermal conductivity (W/m.K) 0.87 0.55 0.61 0.65

149
5.1.1.2 Wall system
A range of wall systems were considered in the literature review (Section 2.8.1). The design
for the compressed earth block wall (intended to be used for affordable and sustainable
design) could use two different types of wall systems. The wall system was designed
bearing in the mind the following factors:
a. A cavity is required to prevent ingress of driving rain. The options for this were:
i. masonry (CEB) external wall with plaster (EP)
ii. masonry (CEB) external wall partially filled with insulation (NP)
Both options (EP and NP) were chosen for further investigation because the masonry
wall with cavity prevent driving rain from the inner skin of the wall.
b. The CEB thickness was determined by the typical dimensions and placement of CEBs
during construction, the thickness of a typical CEBs and cavity gives a typical U-value
of wall requirement in Nigeria.
c. The Option EP with external plaster is to increase the hygrothermal property of the
outer skin layer. The external plaster is commonly used as the external wall finish in
Nigeria. This option is illustrated in Figure 5.1.
d. The Option NP has partially filled cavity to increase the hygrothermal property of the
wall. It designed to creates an extra layer of thermal insulation from external condition
and the cavity to prevent driving rain form penetrating the internal skin layer. The
addition MDF as insulation material was in order to use a typical insulating material and
one that the cost of the material compared to Option EP is similar. This option is
illustrated in Figure 5.2.
The masonry wall options were input to WUFI Pro 5.3 and are illustrated in Figures 5.1
and 5.2. These illustrations also show the assumed monitor positions on the internal and
external surfaces
Figure 5.1 Masonry wall section EP
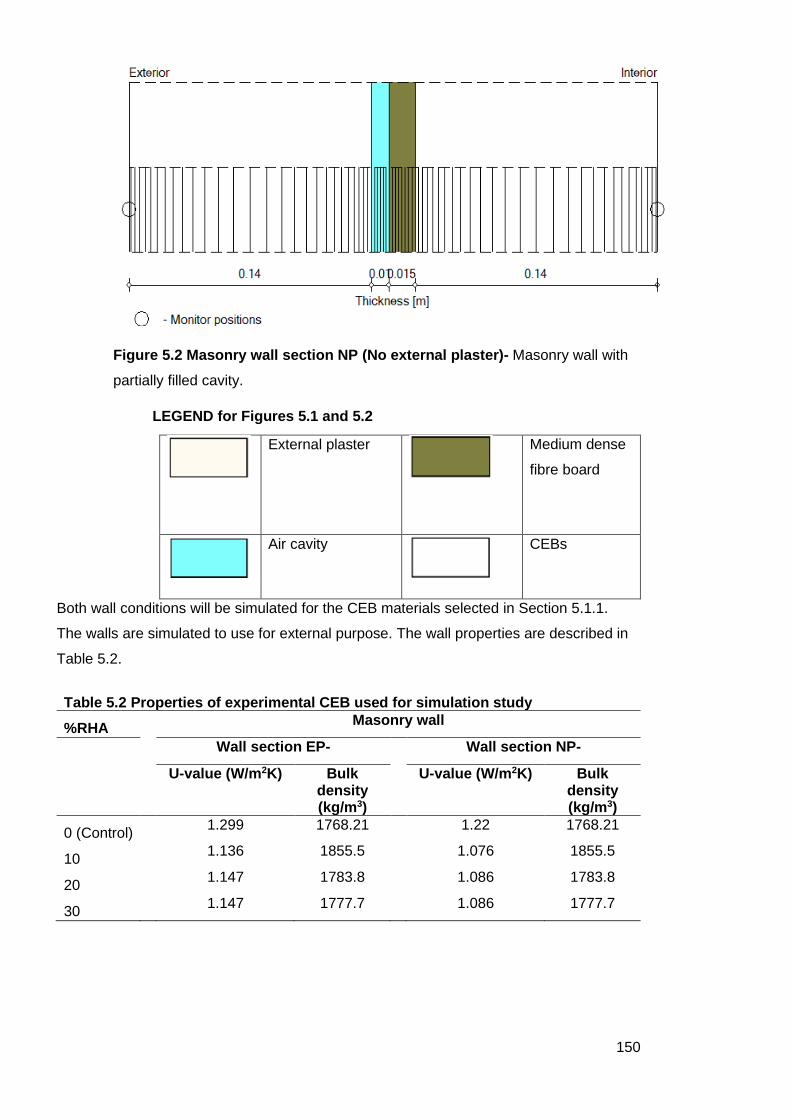
150
Figure 5.2 Masonry wall section NP (No external plaster)- Masonry wall with
partially filled cavity.
LEGEND for Figures 5.1 and 5.2
External plaster
Medium dense
fibre board
Air cavity
CEBs
Both wall conditions will be simulated for the CEB materials selected in Section 5.1.1.
The walls are simulated to use for external purpose. The wall properties are described in
Table 5.2.
Table 5.2 Properties of experimental CEB used for simulation study
%RHA Masonry wall
Wall section EP- Wall section NP-
U-value (W/m2K) Bulk
density (kg/m3)
U-value (W/m2K) Bulk density (kg/m3)
0 (Control) 1.299 1768.21 1.22 1768.21
10 1.136 1855.5 1.076 1855.5
20 1.147 1783.8 1.086 1783.8
30 1.147 1777.7 1.086 1777.7

151
5.1.1.2. External boundary condition
The boundary condition relates to the external situation and as such relates to the climate
in Lagos, Nigeria as described below. As a wall is being tested, the inclination is specified
as 90o (vertical).
The image in Figure 5.3 shows the direction and annual sum of the driving rain. As South
West is one of the orientations experiencing the most driving rain, this orientation is selected
for testing. The minimum mean and maximum relative humidity and temperature are
presented in Table 5.3 along with mean wind speed and normal annual rain sum.
Simulation of the South West wall was carried out in WUFI as it’s the most challenging
option.
Fig 5.3 Driving rain direction
Table 5.3 External condition for simulation
Mean relative humidity (%) 85
Max. relative humidity (%) 100
Min relative humidity (%) 56
Mean wind speed (m/s) 3.94
Normal rain sum (mm/a) 100
Mean Temperature (oC) 27.4
Max Temperature (oC) 34.9
Min Temperature (oC) 19.3
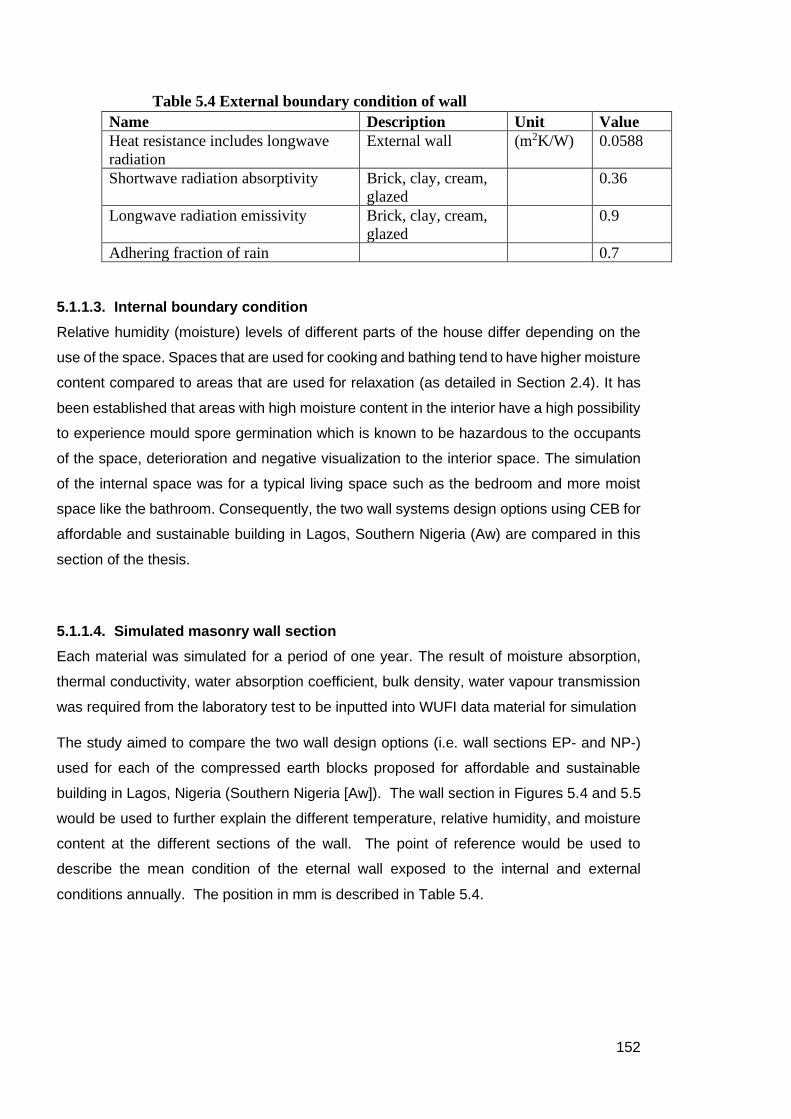
152
Table 5.4 External boundary condition of wall
Name Description Unit Value
Heat resistance includes longwave
radiation
External wall (m2K/W) 0.0588
Shortwave radiation absorptivity Brick, clay, cream,
glazed
0.36
Longwave radiation emissivity Brick, clay, cream,
glazed
0.9
Adhering fraction of rain 0.7
5.1.1.3. Internal boundary condition
Relative humidity (moisture) levels of different parts of the house differ depending on the
use of the space. Spaces that are used for cooking and bathing tend to have higher moisture
content compared to areas that are used for relaxation (as detailed in Section 2.4). It has
been established that areas with high moisture content in the interior have a high possibility
to experience mould spore germination which is known to be hazardous to the occupants
of the space, deterioration and negative visualization to the interior space. The simulation
of the internal space was for a typical living space such as the bedroom and more moist
space like the bathroom. Consequently, the two wall systems design options using CEB for
affordable and sustainable building in Lagos, Southern Nigeria (Aw) are compared in this
section of the thesis.
5.1.1.4. Simulated masonry wall section
Each material was simulated for a period of one year. The result of moisture absorption,
thermal conductivity, water absorption coefficient, bulk density, water vapour transmission
was required from the laboratory test to be inputted into WUFI data material for simulation
The study aimed to compare the two wall design options (i.e. wall sections EP- and NP-)
used for each of the compressed earth blocks proposed for affordable and sustainable
building in Lagos, Nigeria (Southern Nigeria [Aw]). The wall section in Figures 5.4 and 5.5
would be used to further explain the different temperature, relative humidity, and moisture
content at the different sections of the wall. The point of reference would be used to
describe the mean condition of the eternal wall exposed to the internal and external
conditions annually. The position in mm is described in Table 5.4.

153
Figure 5.4: Point of reference (PR) through Wall section EP
Figure 5.5: Point of reference (PR) through Wall section NP

154
Table 5.5 Distance of wall with varying Positions on wall
Wall section EP Wall section NP
Point of
reference (PR)
Position in wall
section (mm)
Point of
reference (PR)
Position in wall
section (mm)
A-A 0 E-E 0
B-B 14 F-F 150
C-C 164 G-G 165
D-D 300 H-H 300
5.1.1.5. Summary of Parameters to be Simulated
Table 5.6 Summary of parameter simulated on WUFI Pro
CONSTANTS Values
Curing time 28 days
External wall orientation SW wall as a result driving rain direction
Wall height 3-5 storey
Exposure of wall Sheltered
Type of Roof Pitch roof
External boundary Aw, tropical savanna climate (Lagos, Nigeria)
Simulation period 1 year and 3 years
VARIABLES
Wall material 0%,10%,20%, 30%
Wal type Option EP and NP
Internal Relative humidity
(RH)
Normal RH- 50%-65%
High RH- 65%-85%
Normal and High relative humidity (varying
depending on use space producing varying
moisture rate).
Calculated from moisture load EN 15026.
Internal temperature Calculated from external climate
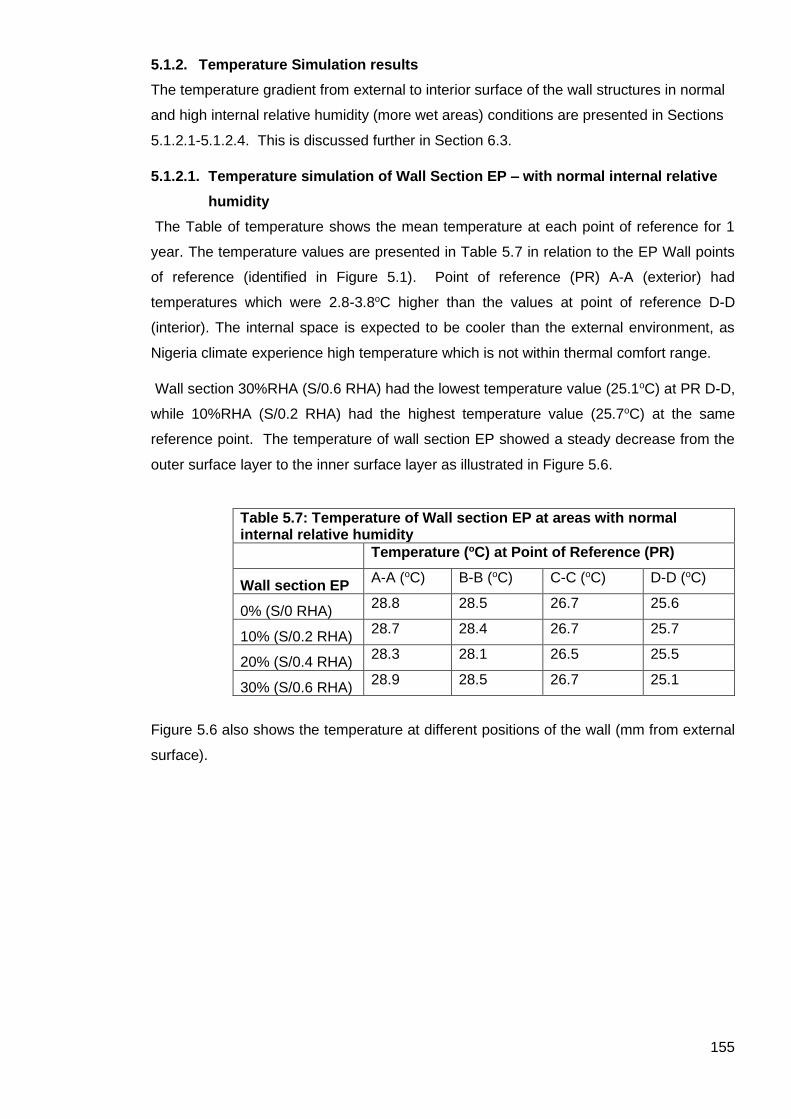
155
5.1.2. Temperature Simulation results
The temperature gradient from external to interior surface of the wall structures in normal
and high internal relative humidity (more wet areas) conditions are presented in Sections
5.1.2.1-5.1.2.4. This is discussed further in Section 6.3.
5.1.2.1. Temperature simulation of Wall Section EP – with normal internal relative
humidity
The Table of temperature shows the mean temperature at each point of reference for 1
year. The temperature values are presented in Table 5.7 in relation to the EP Wall points
of reference (identified in Figure 5.1). Point of reference (PR) A-A (exterior) had
temperatures which were 2.8-3.8oC higher than the values at point of reference D-D
(interior). The internal space is expected to be cooler than the external environment, as
Nigeria climate experience high temperature which is not within thermal comfort range.
Wall section 30%RHA (S/0.6 RHA) had the lowest temperature value (25.1oC) at PR D-D,
while 10%RHA (S/0.2 RHA) had the highest temperature value (25.7oC) at the same
reference point. The temperature of wall section EP showed a steady decrease from the
outer surface layer to the inner surface layer as illustrated in Figure 5.6.
Table 5.7: Temperature of Wall section EP at areas with normal internal relative humidity
Temperature (oC) at Point of Reference (PR)
Wall section EP A-A (oC) B-B (oC) C-C (oC) D-D (oC)
0% (S/0 RHA) 28.8 28.5 26.7 25.6
10% (S/0.2 RHA) 28.7 28.4 26.7 25.7
20% (S/0.4 RHA) 28.3 28.1 26.5 25.5
30% (S/0.6 RHA) 28.9 28.5 26.7 25.1
Figure 5.6 also shows the temperature at different positions of the wall (mm from external
surface).
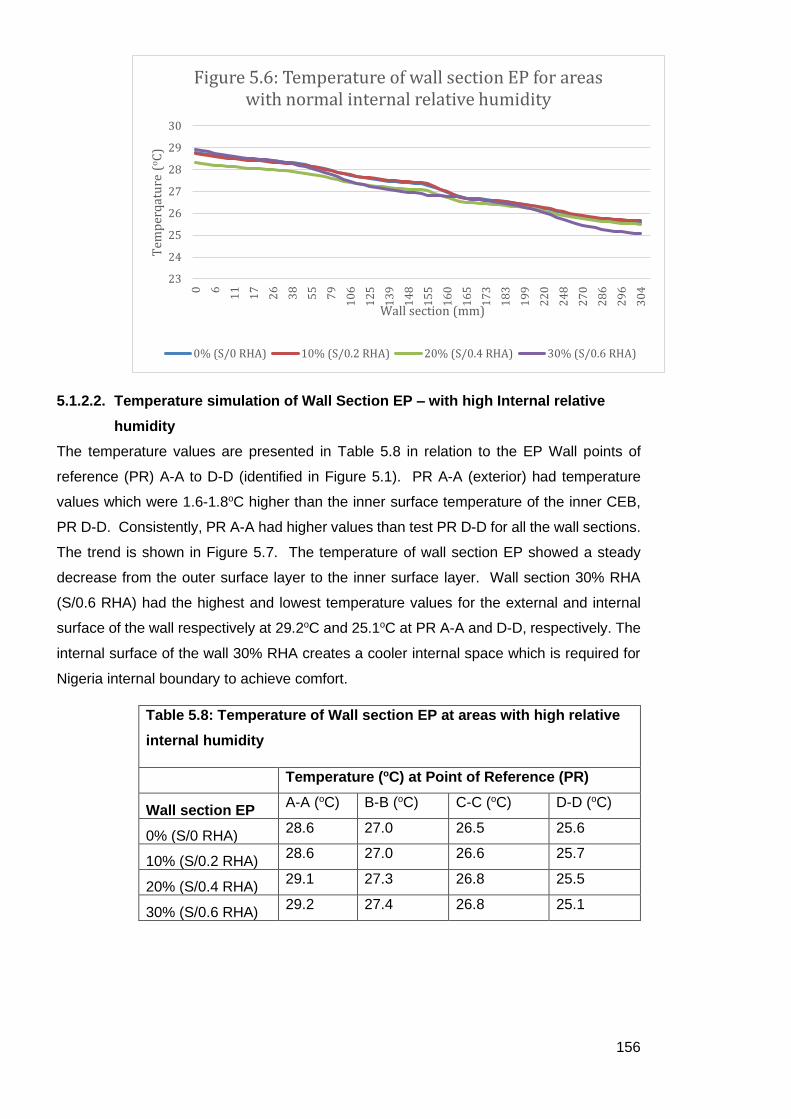
156
5.1.2.2. Temperature simulation of Wall Section EP – with high Internal relative
humidity
The temperature values are presented in Table 5.8 in relation to the EP Wall points of
reference (PR) A-A to D-D (identified in Figure 5.1). PR A-A (exterior) had temperature
values which were 1.6-1.8oC higher than the inner surface temperature of the inner CEB,
PR D-D. Consistently, PR A-A had higher values than test PR D-D for all the wall sections.
The trend is shown in Figure 5.7. The temperature of wall section EP showed a steady
decrease from the outer surface layer to the inner surface layer. Wall section 30% RHA
(S/0.6 RHA) had the highest and lowest temperature values for the external and internal
surface of the wall respectively at 29.2oC and 25.1oC at PR A-A and D-D, respectively. The
internal surface of the wall 30% RHA creates a cooler internal space which is required for
Nigeria internal boundary to achieve comfort.
Table 5.8: Temperature of Wall section EP at areas with high relative
internal humidity
Temperature (oC) at Point of Reference (PR)
Wall section EP A-A (oC) B-B (oC) C-C (oC) D-D (oC)
0% (S/0 RHA) 28.6 27.0 26.5 25.6
10% (S/0.2 RHA) 28.6 27.0 26.6 25.7
20% (S/0.4 RHA) 29.1 27.3 26.8 25.5
30% (S/0.6 RHA) 29.2 27.4 26.8 25.1
23
24
25
26
27
28
29
30
0 6
11
17
26
38
55
79
10
6
12
5
13
9
14
8
15
5
16
0
16
5
17
3
18
3
19
9
22
0
24
8
27
0
28
6
29
6
30
4
Tem
per
qat
ure
(oC
)
Wall section (mm)
Figure 5.6: Temperature of wall section EP for areas with normal internal relative humidity
0% (S/0 RHA) 10% (S/0.2 RHA) 20% (S/0.4 RHA) 30% (S/0.6 RHA)
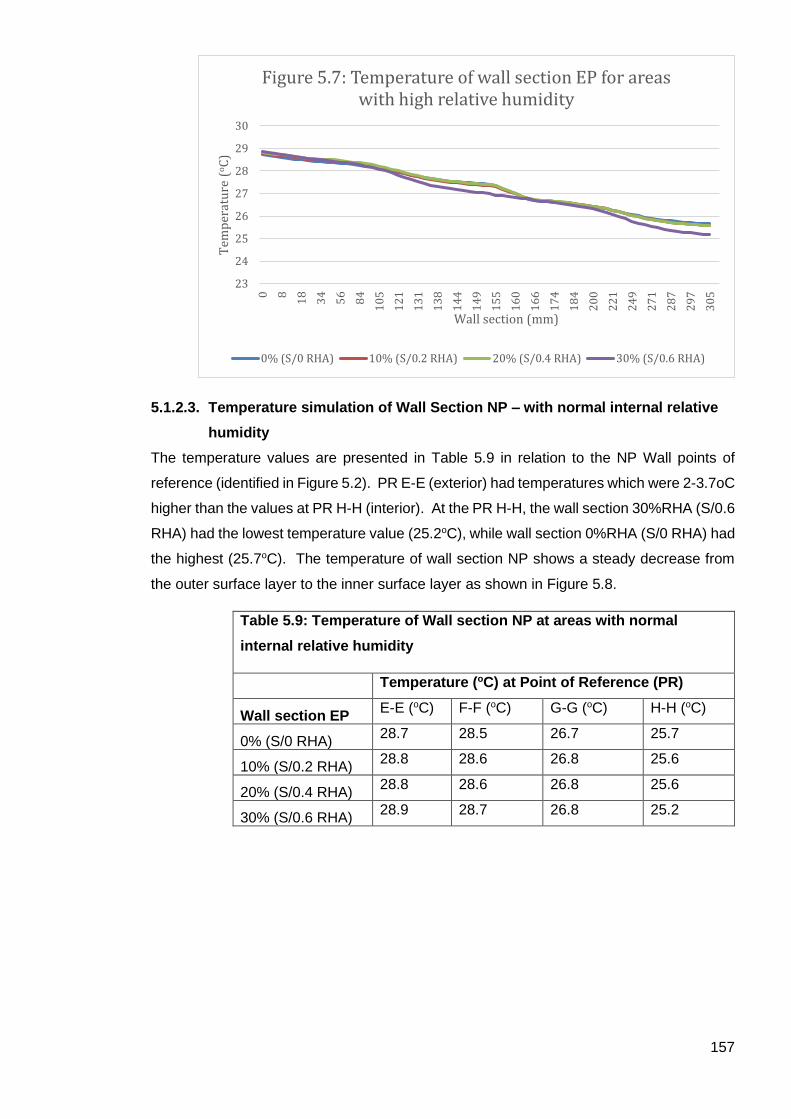
157
5.1.2.3. Temperature simulation of Wall Section NP – with normal internal relative
humidity
The temperature values are presented in Table 5.9 in relation to the NP Wall points of
reference (identified in Figure 5.2). PR E-E (exterior) had temperatures which were 2-3.7oC
higher than the values at PR H-H (interior). At the PR H-H, the wall section 30%RHA (S/0.6
RHA) had the lowest temperature value (25.2oC), while wall section 0%RHA (S/0 RHA) had
the highest (25.7oC). The temperature of wall section NP shows a steady decrease from
the outer surface layer to the inner surface layer as shown in Figure 5.8.
Table 5.9: Temperature of Wall section NP at areas with normal
internal relative humidity
Temperature (oC) at Point of Reference (PR)
Wall section EP E-E (oC) F-F (oC) G-G (oC) H-H (oC)
0% (S/0 RHA) 28.7 28.5 26.7 25.7
10% (S/0.2 RHA) 28.8 28.6 26.8 25.6
20% (S/0.4 RHA) 28.8 28.6 26.8 25.6
30% (S/0.6 RHA) 28.9 28.7 26.8 25.2
23
24
25
26
27
28
29
30
0 8
18
34
56
84
10
5
12
1
13
1
13
8
14
4
14
9
15
5
16
0
16
6
17
4
18
4
20
0
22
1
24
9
27
1
28
7
29
7
30
5
Tem
per
atu
re (
oC
)
Wall section (mm)
Figure 5.7: Temperature of wall section EP for areas with high relative humidity
0% (S/0 RHA) 10% (S/0.2 RHA) 20% (S/0.4 RHA) 30% (S/0.6 RHA)
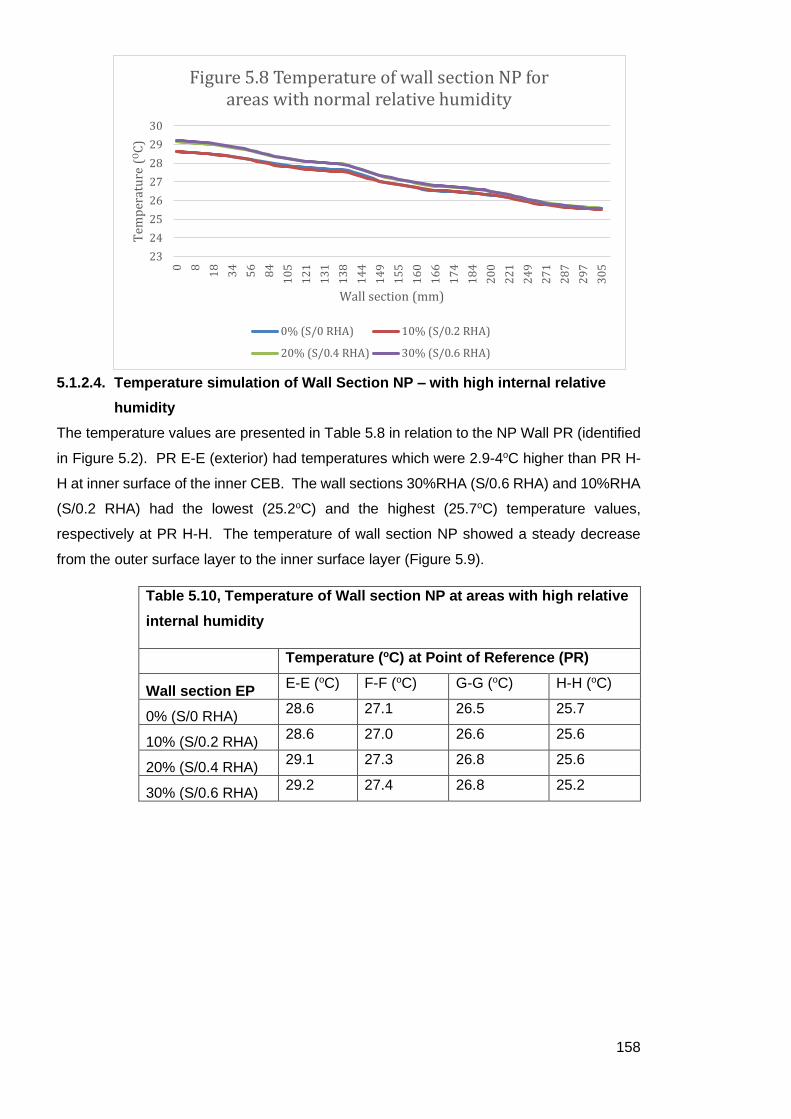
158
5.1.2.4. Temperature simulation of Wall Section NP – with high internal relative
humidity
The temperature values are presented in Table 5.8 in relation to the NP Wall PR (identified
in Figure 5.2). PR E-E (exterior) had temperatures which were 2.9-4oC higher than PR H-
H at inner surface of the inner CEB. The wall sections 30%RHA (S/0.6 RHA) and 10%RHA
(S/0.2 RHA) had the lowest (25.2oC) and the highest (25.7oC) temperature values,
respectively at PR H-H. The temperature of wall section NP showed a steady decrease
from the outer surface layer to the inner surface layer (Figure 5.9).
Table 5.10, Temperature of Wall section NP at areas with high relative
internal humidity
Temperature (oC) at Point of Reference (PR)
Wall section EP E-E (oC) F-F (oC) G-G (oC) H-H (oC)
0% (S/0 RHA) 28.6 27.1 26.5 25.7
10% (S/0.2 RHA) 28.6 27.0 26.6 25.6
20% (S/0.4 RHA) 29.1 27.3 26.8 25.6
30% (S/0.6 RHA) 29.2 27.4 26.8 25.2
23
24
25
26
27
28
29
30
0 8
18
34
56
84
10
5
12
1
13
1
13
8
14
4
14
9
15
5
16
0
16
6
17
4
18
4
20
0
22
1
24
9
27
1
28
7
29
7
30
5
Tem
per
atu
re (
OC
)
Wall section (mm)
Figure 5.8 Temperature of wall section NP for areas with normal relative humidity
0% (S/0 RHA) 10% (S/0.2 RHA)
20% (S/0.4 RHA) 30% (S/0.6 RHA)
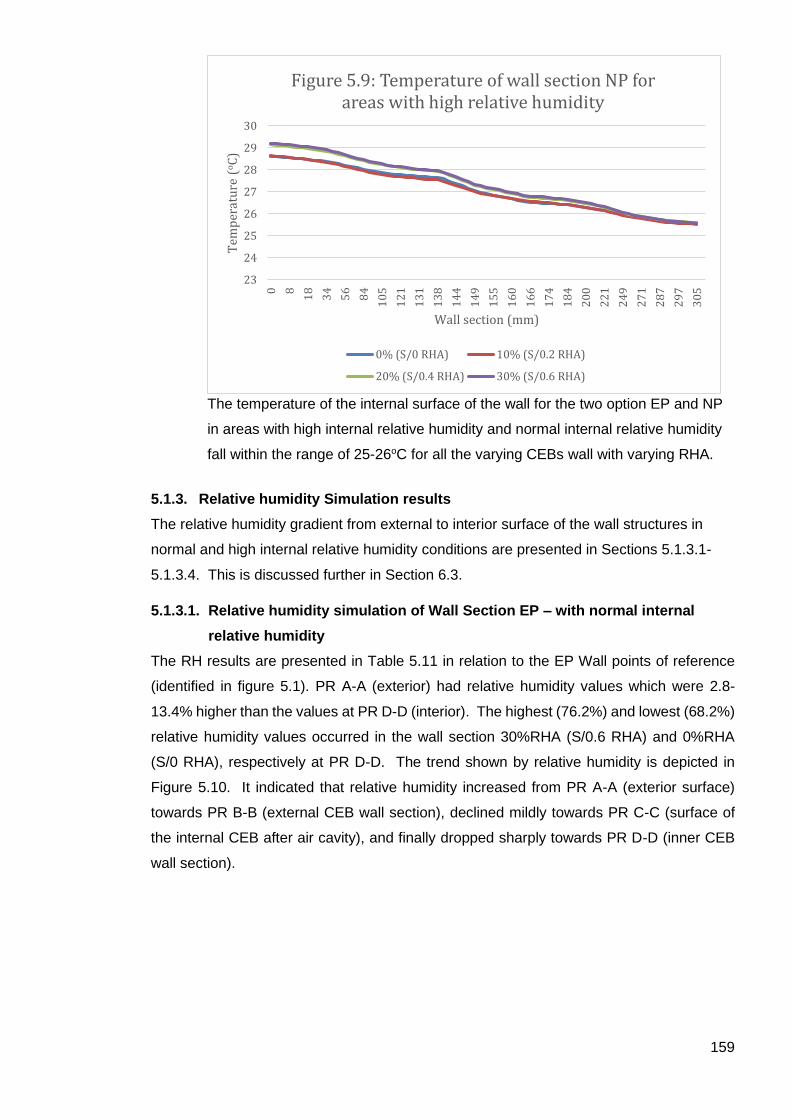
159
The temperature of the internal surface of the wall for the two option EP and NP
in areas with high internal relative humidity and normal internal relative humidity
fall within the range of 25-26oC for all the varying CEBs wall with varying RHA.
5.1.3. Relative humidity Simulation results
The relative humidity gradient from external to interior surface of the wall structures in
normal and high internal relative humidity conditions are presented in Sections 5.1.3.1-
5.1.3.4. This is discussed further in Section 6.3.
5.1.3.1. Relative humidity simulation of Wall Section EP – with normal internal
relative humidity
The RH results are presented in Table 5.11 in relation to the EP Wall points of reference
(identified in figure 5.1). PR A-A (exterior) had relative humidity values which were 2.8-
13.4% higher than the values at PR D-D (interior). The highest (76.2%) and lowest (68.2%)
relative humidity values occurred in the wall section 30%RHA (S/0.6 RHA) and 0%RHA
(S/0 RHA), respectively at PR D-D. The trend shown by relative humidity is depicted in
Figure 5.10. It indicated that relative humidity increased from PR A-A (exterior surface)
towards PR B-B (external CEB wall section), declined mildly towards PR C-C (surface of
the internal CEB after air cavity), and finally dropped sharply towards PR D-D (inner CEB
wall section).
23
24
25
26
27
28
29
30
0 8
18
34
56
84
10
5
12
1
13
1
13
8
14
4
14
9
15
5
16
0
16
6
17
4
18
4
20
0
22
1
24
9
27
1
28
7
29
7
30
5
Tem
per
atu
re (
oC
)
Wall section (mm)
Figure 5.9: Temperature of wall section NP for areas with high relative humidity
0% (S/0 RHA) 10% (S/0.2 RHA)
20% (S/0.4 RHA) 30% (S/0.6 RHA)

160
Table 5.11, Relative humidity of Wall section EP at areas with normal
internal relative humidity
Wall section EP Relative humidity (%) at Point of Reference (PR)
A-A (%) B-B (%) C-C (%) D-D (%)
0% (S/0 RHA) 80.3 91.2 85.4 68.2
10% (S/0.2 RHA) 80.2 91.1 83.8 68.5
20% (S/0.4 RHA) 81.9 89.1 81.1 68.5
30% (S/0.6 RHA) 79.0 84.1 79.2 76.2
5.1.3.2. Relative humidity simulation of Wall Section EP – with high internal relative
humidity
The RH results are presented in Table 5.12 in relation to EP Wall points of reference
(identified in Figure 5.1), PR A-A (exterior) had RH values which were 3.5-12.5% higher
than the values at PR D-D (the inner CEB). The relative humidity of the wall at the PR D-D
records the highest value at 30% RHA (S/0.6 RHA) and lowest value at 0% RHA (S/0RHA)
with value of 72.9% and 68.6% respectively.
Table 5.12: Relative humidity of Wall section EP at areas with high
internal relative humidity
Relative humidity (%) at Point of Reference (PR)
Wall section EP A-A (%) B-B (%) C-C (%) D-D (%)
0% (S/0 RHA) 81.1 89.6 88.4 68.6
10% (S/0.2 RHA) 81.1 88.8 86.5 68.8
20% (S/0.4 RHA) 77.7 74.4 75.6 67.9
30% (S/0.6 RHA) 76.4 82.6 77.3 72.9
6065707580859095
100
0 6
11
17
26
38
55
79
10
6
12
5
13
9
14
8
15
5
16
0
16
5
17
3
18
3
19
9
22
0
24
8
27
0
28
6
29
6
30
4Rel
ativ
e h
um
idit
y (
%)
Wall section (mm)
Figure 5.10: Relative humdity of wall section EP for areas with normal relative humidity
0% (S/0 RHA) 10% (S/0.2 RHA)
20% (S/0.4 RHA) 30% (S/0.6 RHA)

161
The results of relative humidity values of the entire PR in the wall section EP at areas with
high RH presented in Table 5.10 revealed a similar trend with that shown under normal RH.
For all the wall sections, there were initial rises in RH from A-A, and thereafter the values
declined to the lowest at D-D. Figure 5.11 illustrates the pattern exhibited in the trend of
RH changes at the various PR.
5.1.3.3. Relative humidity simulation of Wall Section NP – with normal internal
relative humidity
The RH results are presented in Table 5.13 in relation to the EP Wall points of reference
(identified in figure 5.2). PR E-E (exterior) had RH values which were 4.8-16.6% higher than
the values at PR H-H (interior). The lowest (63.7%) and highest (74.5%) RH was found in
wall sections 0%RHA (S/0 RHA) and 30%RHA (S/0.6 RHA), respectively. The RH trend
pattern is illustrated in Figure 5.12. The RH of wall section NP showed an increase from
PR E-E (Exterior surface) to F-F (External CEBs wall section), and thereafter decreases
towards PR G-G (surface of Internal CEBs after air cavity|) and finally dropping to the lowest
level at PR H-H (Inner CEBs wall section).
Table 5.13; Relative humidity of Wall section NP at areas with normal
internal relative humidity
Relative humidity (%) at Point of Reference (PR)
Wall section EP E-E (%) F-F (%) G-G (%) H-H (%)
0% (S/0 RHA) 80.3 90.4 83.5 63.7
10% (S/0.2 RHA) 80.2 90.2 82.5 63.9
20% (S/0.4 RHA) 79.8 88.6 86.2 64.5
30% (S/0.6 RHA) 79.3 86.4 82.6 74.5
6065707580859095
1000 8
18
34
56
84
10
5
12
1
13
1
13
8
14
4
14
9
15
5
16
0
16
6
17
4
18
4
20
0
22
1
24
9
27
1
28
7
29
7
30
5Rel
ativ
e h
um
idit
y (
%)
Wall section (mm)
Figure 5.11: Relative humidity of Wall section EP for areas with High relative humidity
0% (S/0 RHA) 10% (S/0.2 RHA)
20% (S/0.4 RHA) 30% (S/0.6 RHA)

162
5.1.3.4. Relative humidity simulation of Wall Section NP – with high internal relative
humidity
The RH results are presented in Table 5.14 in relation to the EP Wall points of reference
(identified in figure 5.2). PR E-E (exterior) had RH values which were 7.7-17.1% higher than
the values at PR H-H at the inner CEB. Also, at the PR H-H, the wall section 30%RHA
(S/0.6 RHA) had the highest (68.7%) relative humidity value whereas the wall sections
0%RHA (S/0 RHA) and 20%RHA (S/0.4 RHA) had the lowest (64.0-64.1%). The trend
pattern of RH shown in Figure 5.13 was like those observed earlier. The RH of the wall
section NP regardless of the %RHA increased from PR E-E (External surface of outer
CEBs) towards F-F (surface of MDF facing air cavity), and thereafter decreased towards
PR G-G (Joints between air cavity and Internal CEBs); and finally dropped to the lowest
level at the PR H-H (Inner CEBs wall section).
Table 5.14; Relative humidity of Wall section NP at areas with high internal relative humidity
Relative humidity (%) at Point of Reference (PR)
Wall section EP E-E (%) F-F (%) G-G (%) H-H (%)
0% (S/0 RHA) 81.1 88.5 87.2 64.0
10% (S/0.2 RHA) 81.0 86.8 84.0 64.1
20% (S/0.4 RHA) 77.7 79.1 80.8 64.0
30% (S/0.6 RHA) 76.4 82.9 79.6 68.7
60
65
70
75
80
85
90
95
100
0 8
18
34
56
84
10
5
12
1
13
1
13
8
14
4
14
9
15
5
16
0
16
6
17
4
18
4
20
0
22
1
24
9
27
1
28
7
29
7
30
5
Rel
ativ
e h
um
idit
y (
%)
Wall section (mm)
Figure 5.12: Relative humdity of wall section NP for areas with normal relative humdity
0% (S/0 RHA) 10% (S/0.2 RHA) 20% (S/0.4 RHA) 30% (S/0.6 RHA)
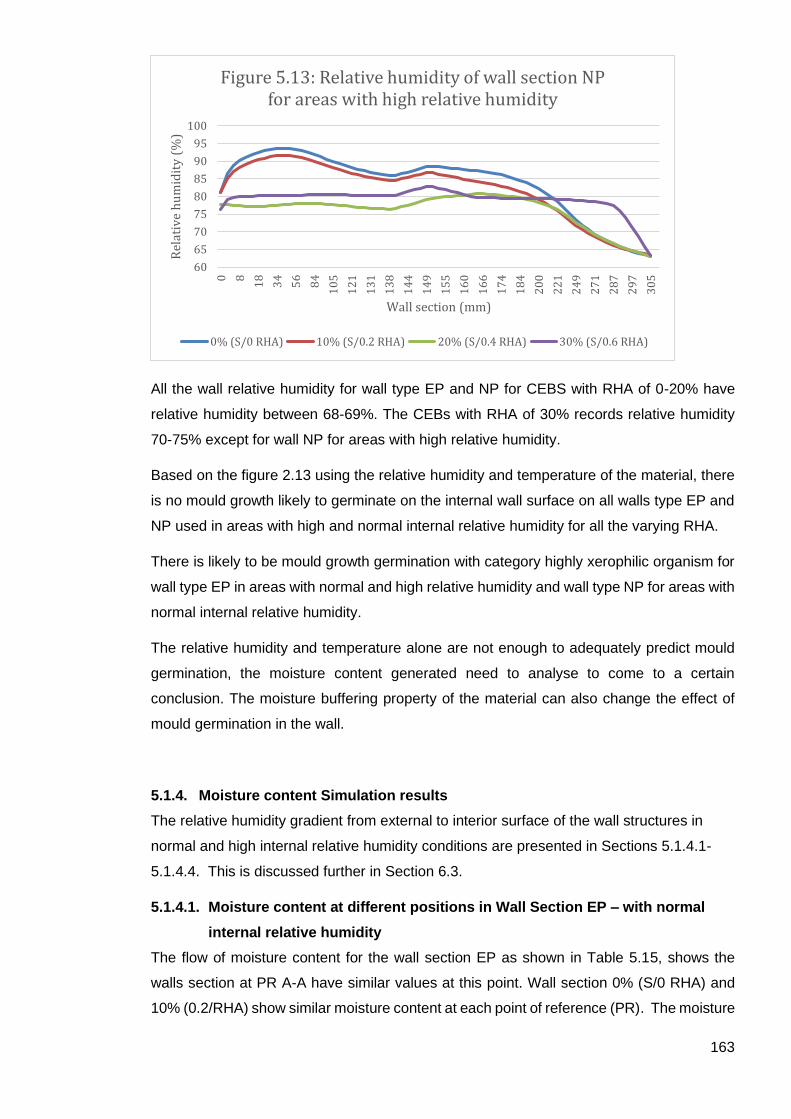
163
All the wall relative humidity for wall type EP and NP for CEBS with RHA of 0-20% have
relative humidity between 68-69%. The CEBs with RHA of 30% records relative humidity
70-75% except for wall NP for areas with high relative humidity.
Based on the figure 2.13 using the relative humidity and temperature of the material, there
is no mould growth likely to germinate on the internal wall surface on all walls type EP and
NP used in areas with high and normal internal relative humidity for all the varying RHA.
There is likely to be mould growth germination with category highly xerophilic organism for
wall type EP in areas with normal and high relative humidity and wall type NP for areas with
normal internal relative humidity.
The relative humidity and temperature alone are not enough to adequately predict mould
germination, the moisture content generated need to analyse to come to a certain
conclusion. The moisture buffering property of the material can also change the effect of
mould germination in the wall.
5.1.4. Moisture content Simulation results
The relative humidity gradient from external to interior surface of the wall structures in
normal and high internal relative humidity conditions are presented in Sections 5.1.4.1-
5.1.4.4. This is discussed further in Section 6.3.
5.1.4.1. Moisture content at different positions in Wall Section EP – with normal
internal relative humidity
The flow of moisture content for the wall section EP as shown in Table 5.15, shows the
walls section at PR A-A have similar values at this point. Wall section 0% (S/0 RHA) and
10% (0.2/RHA) show similar moisture content at each point of reference (PR). The moisture
60
65
70
75
80
85
90
95
100
0 8
18
34
56
84
10
5
12
1
13
1
13
8
14
4
14
9
15
5
16
0
16
6
17
4
18
4
20
0
22
1
24
9
27
1
28
7
29
7
30
5
Rel
ativ
e h
um
idit
y (
%)
Wall section (mm)
Figure 5.13: Relative humidity of wall section NP for areas with high relative humidity
0% (S/0 RHA) 10% (S/0.2 RHA) 20% (S/0.4 RHA) 30% (S/0.6 RHA)
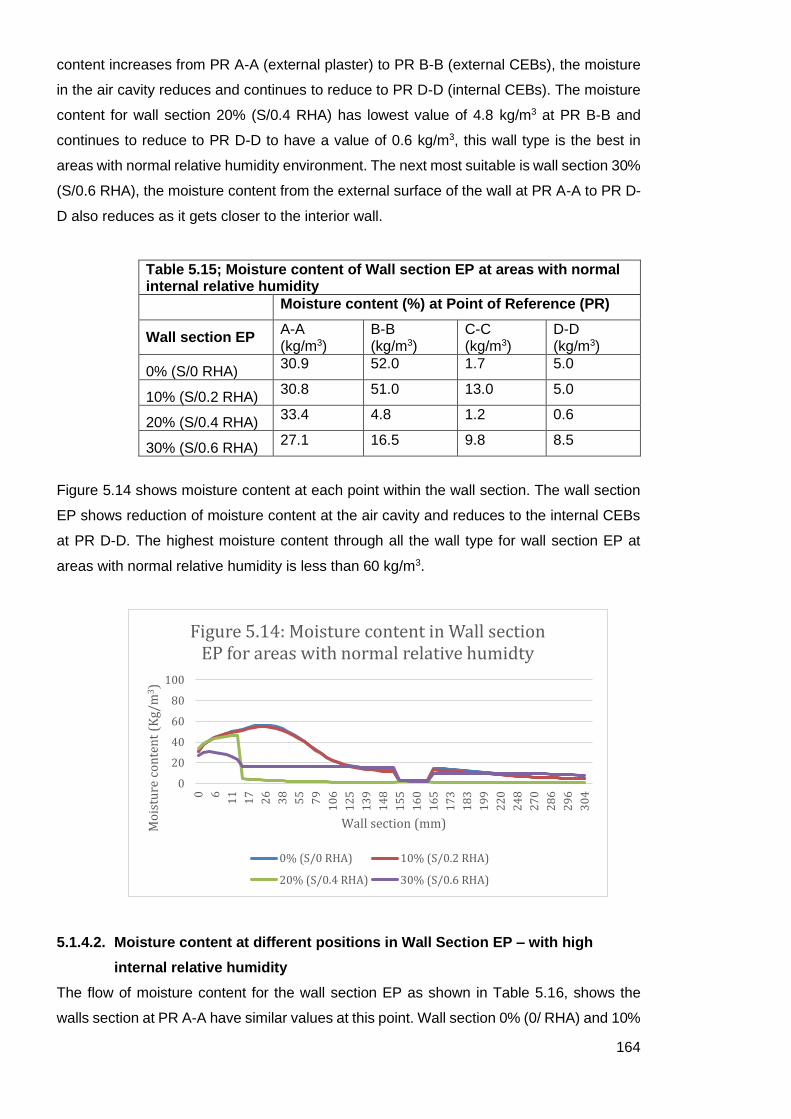
164
content increases from PR A-A (external plaster) to PR B-B (external CEBs), the moisture
in the air cavity reduces and continues to reduce to PR D-D (internal CEBs). The moisture
content for wall section 20% (S/0.4 RHA) has lowest value of 4.8 kg/m3 at PR B-B and
continues to reduce to PR D-D to have a value of 0.6 kg/m3, this wall type is the best in
areas with normal relative humidity environment. The next most suitable is wall section 30%
(S/0.6 RHA), the moisture content from the external surface of the wall at PR A-A to PR D-
D also reduces as it gets closer to the interior wall.
Table 5.15; Moisture content of Wall section EP at areas with normal internal relative humidity
Moisture content (%) at Point of Reference (PR)
Wall section EP A-A (kg/m3)
B-B (kg/m3)
C-C (kg/m3)
D-D (kg/m3)
0% (S/0 RHA) 30.9 52.0 1.7 5.0
10% (S/0.2 RHA) 30.8 51.0 13.0 5.0
20% (S/0.4 RHA) 33.4 4.8 1.2 0.6
30% (S/0.6 RHA) 27.1 16.5 9.8 8.5
Figure 5.14 shows moisture content at each point within the wall section. The wall section
EP shows reduction of moisture content at the air cavity and reduces to the internal CEBs
at PR D-D. The highest moisture content through all the wall type for wall section EP at
areas with normal relative humidity is less than 60 kg/m3.
5.1.4.2. Moisture content at different positions in Wall Section EP – with high
internal relative humidity
The flow of moisture content for the wall section EP as shown in Table 5.16, shows the
walls section at PR A-A have similar values at this point. Wall section 0% (0/ RHA) and 10%
0
20
40
60
80
100
0 6
11
17
26
38
55
79
10
6
12
5
13
9
14
8
15
5
16
0
16
5
17
3
18
3
19
9
22
0
24
8
27
0
28
6
29
6
30
4
Mo
istu
re c
on
ten
t (K
g/m
3)
Wall section (mm)
Figure 5.14: Moisture content in Wall section EP for areas with normal relative humidty
0% (S/0 RHA) 10% (S/0.2 RHA)
20% (S/0.4 RHA) 30% (S/0.6 RHA)

165
(0.2/RHA) show similar moisture content at each point of reference (PR). The moisture
content increases from PR A-A (external plaster) to PR B-B (external CEBs), the air cavity
in the wall reduces and continues to reduce to PR D-D (internal CEBs). The moisture
content for wall section 20% (S/0.4 RHA) has lowest value of 4.1 kg/m3 at PR B-B and
continues to reduce to PR D-D to have a value of 0.8 kg/m3, this wall type is the best in
areas with high relative humidity environment. The next most suitable is wall section 30%
(S/0.6 RHA), the moisture content from the external surface of the wall at PR A-A to PR D-
D also reduces as it gets closer to the interior wall.
Table 5.16; Moisture content of Wall section EP at areas with high internal relative humidity
Moisture content (%) at Point of Reference (PR)
Wall section EP A-A (kg/m3)
B-B (kg/m3)
C-C (kg/m3)
D-D (kg/m3)
0% (S/0 RHA) 30.6 51.0 13.1 6.3
10% (S/0.2 RHA) 30.5 50.0 13.1 6.5
20% (S/0.4 RHA) 30.8 4.1 4.4 0.8
30% (S/0.6 RHA) 27.5 22.0 13.8 11.6
Figure 5.15 shows moisture content at each point within the wall section. The wall section
EP shows reduction of moisture content at the air cavity and reduces to the internal CEBs
at PR D-D. The highest moisture content through all the wall type for wall section EP at
areas with normal relative humidity is less than 60 kg/m3.
0
20
40
60
80
100
0 6
11
17
26
28
55
79
10
6
12
5
13
9
14
8
15
5
16
0
16
5
17
3
18
3
19
9
22
0
24
8
27
0
28
6
29
6
30
4
Mo
istu
re c
on
ten
t (K
g/m
3)
Wall section (mm)
Figure 5.15: Moisture content in Wall section EP for areas with high relative humidty
0% (S/0 RHA) 10% (S/0.2 RHA)
20% (S/0.4 RHA) 30% (S/0.6 RHA)
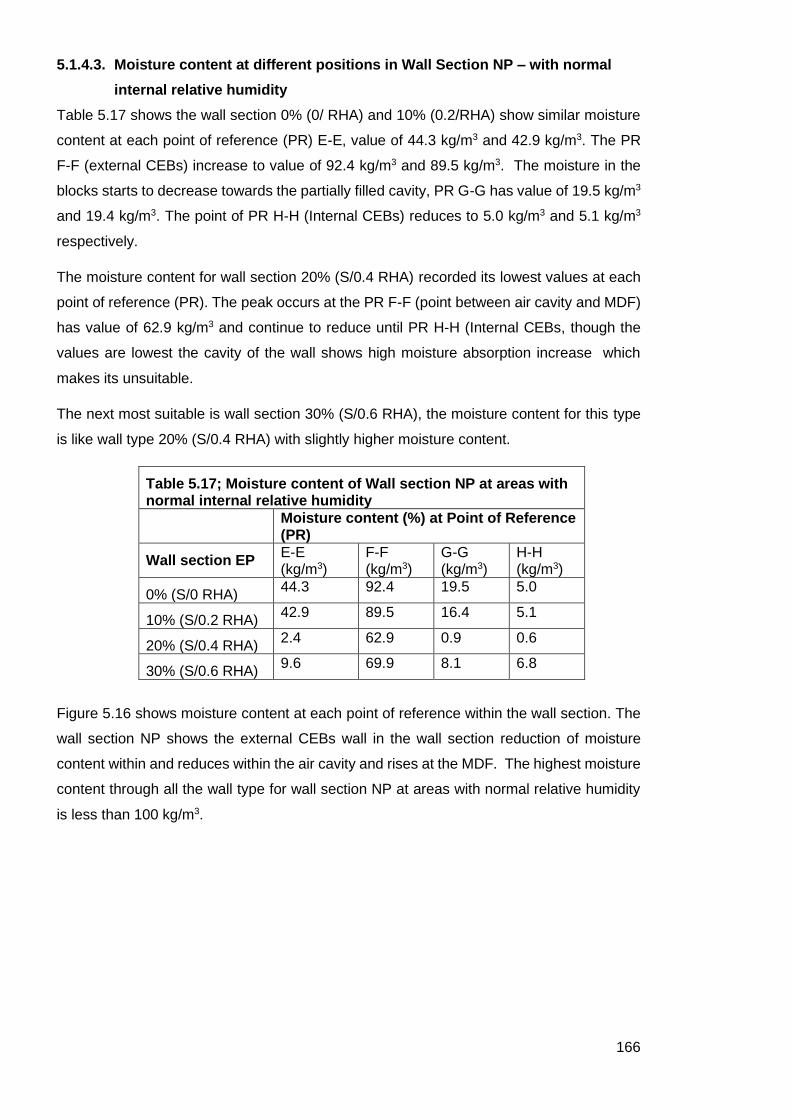
166
5.1.4.3. Moisture content at different positions in Wall Section NP – with normal
internal relative humidity
Table 5.17 shows the wall section 0% (0/ RHA) and 10% (0.2/RHA) show similar moisture
content at each point of reference (PR) E-E, value of 44.3 kg/m3 and 42.9 kg/m3. The PR
F-F (external CEBs) increase to value of 92.4 kg/m3 and 89.5 kg/m3. The moisture in the
blocks starts to decrease towards the partially filled cavity, PR G-G has value of 19.5 kg/m3
and 19.4 kg/m3. The point of PR H-H (Internal CEBs) reduces to 5.0 kg/m3 and 5.1 kg/m3
respectively.
The moisture content for wall section 20% (S/0.4 RHA) recorded its lowest values at each
point of reference (PR). The peak occurs at the PR F-F (point between air cavity and MDF)
has value of 62.9 kg/m3 and continue to reduce until PR H-H (Internal CEBs, though the
values are lowest the cavity of the wall shows high moisture absorption increase which
makes its unsuitable.
The next most suitable is wall section 30% (S/0.6 RHA), the moisture content for this type
is like wall type 20% (S/0.4 RHA) with slightly higher moisture content.
Table 5.17; Moisture content of Wall section NP at areas with normal internal relative humidity
Moisture content (%) at Point of Reference (PR)
Wall section EP E-E (kg/m3)
F-F (kg/m3)
G-G (kg/m3)
H-H (kg/m3)
0% (S/0 RHA) 44.3 92.4 19.5 5.0
10% (S/0.2 RHA) 42.9 89.5 16.4 5.1
20% (S/0.4 RHA) 2.4 62.9 0.9 0.6
30% (S/0.6 RHA) 9.6 69.9 8.1 6.8
Figure 5.16 shows moisture content at each point of reference within the wall section. The
wall section NP shows the external CEBs wall in the wall section reduction of moisture
content within and reduces within the air cavity and rises at the MDF. The highest moisture
content through all the wall type for wall section NP at areas with normal relative humidity
is less than 100 kg/m3.

167
5.1.4.4. Moisture content at different positions in Wall Section NP – with high
internal relative humidity
Table 5.18 shows the wall section 0% (0/ RHA) and 10% (0.2/RHA) have similar moisture
content at each point of reference (PR) E-E, value of 43.5 kg/m3 and 42.0 kg/m3. The PR
F-F (external CEBs) increase to value of 88.7 kg/m3 and 85.4 kg/m3. The blocks then start
to decrease towards the partially filled cavity, PR G-G has value of 17.6 kg/m3 and 14.8
kg/m3. The point of PR H-H (Internal CEBs) reduces to 6.4 kg/m3 and 6.5 kg/m3 respectively.
The moisture content for wall section 20% (S/0.4 RHA) has lowest value at each point of
reference (PR). The peak occurs at the PR F-F (point between air cavity and MDF) has
value of 70.1 Kg/m3 and continue to reduce until PR H-H (Internal CEBs). Although the
internal moisture content is lowest in the internal layer of the wall, the moisture level in the
cavity is high which makes it unsuitable.
The next most suitable is wall section 30% (S/0.6 RHA), the moisture content for this type
is like wall type 20% (S/0.4 RHA) but is slightly higher.
Table 5.18; Moisture content of Wall section NP at areas with high internal relative humidity
Moisture content (%) at Point of Reference (PR)
Wall section EP E-E (kg/m3)
F-F (kg/m3)
G-G (kg/m3)
H-H (kg/m3)
0% (S/0 RHA) 43.5 88.7 17.6 6.4
10% (S/0.2 RHA) 42.0 85.4 14.8 6.5
20% (S/0.4 RHA) 2.4 70.1 2.0 0.8
30% (S/0.6 RHA) 9.5 70.3 10.6 7.7
0
20
40
60
80
100
0 8
18
34
56
84
10
5
12
1
13
1
13
8
14
4
14
9
15
5
16
0
16
6
17
4
18
4
20
0
22
1
24
9
27
1
28
7
29
7
30
5
Mo
istu
re c
on
ten
t (K
g/m
3)
Wall section(mm)
Figure 5.16: Moisture content in Wall section NP for areas with normal relative humidity
areas
0% (S/0 RHA) 10% (S/0.2 RHA)
20% (S/0.4 RHA) 30% (S/0.6 RHA)
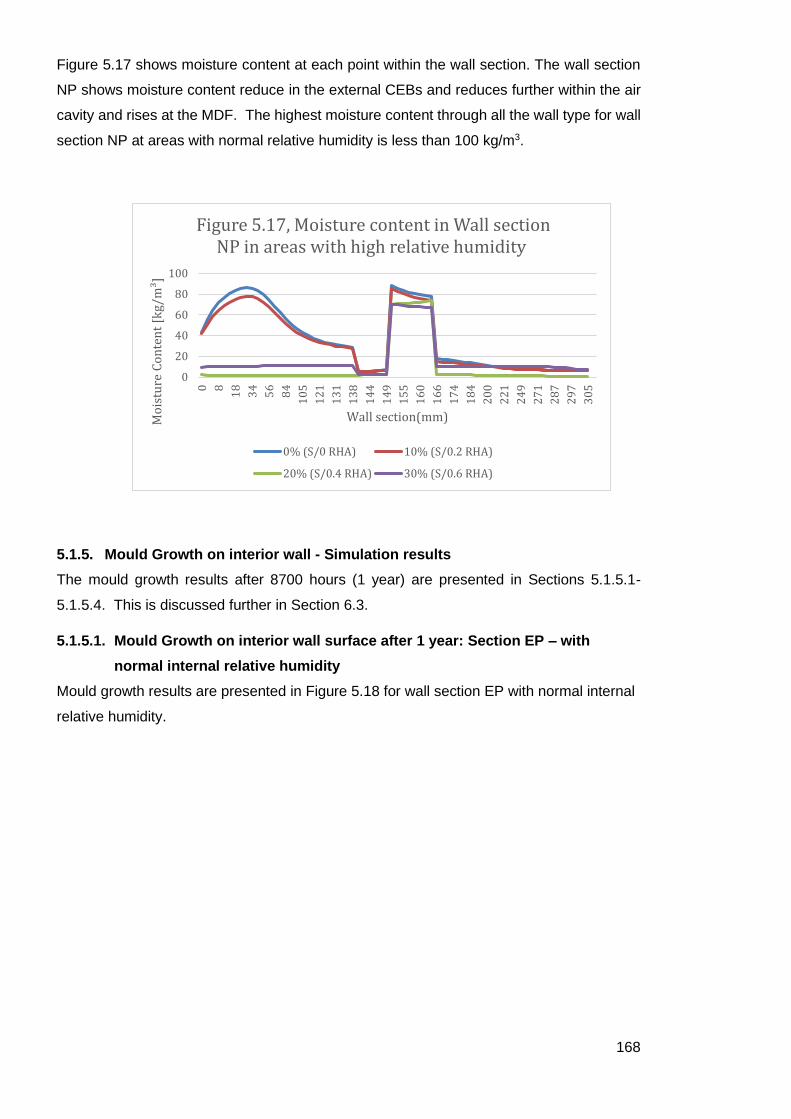
168
Figure 5.17 shows moisture content at each point within the wall section. The wall section
NP shows moisture content reduce in the external CEBs and reduces further within the air
cavity and rises at the MDF. The highest moisture content through all the wall type for wall
section NP at areas with normal relative humidity is less than 100 kg/m3.
5.1.5. Mould Growth on interior wall - Simulation results
The mould growth results after 8700 hours (1 year) are presented in Sections 5.1.5.1-
5.1.5.4. This is discussed further in Section 6.3.
5.1.5.1. Mould Growth on interior wall surface after 1 year: Section EP – with
normal internal relative humidity
Mould growth results are presented in Figure 5.18 for wall section EP with normal internal
relative humidity.
0
20
40
60
80
100
0 8
18
34
56
84
10
5
12
1
13
1
13
8
14
4
14
9
15
5
16
0
16
6
17
4
18
4
20
0
22
1
24
9
27
1
28
7
29
7
30
5
Mo
istu
re C
on
ten
t [k
g/m
³]
Wall section(mm)
Figure 5.17, Moisture content in Wall section NP in areas with high relative humidity
0% (S/0 RHA) 10% (S/0.2 RHA)
20% (S/0.4 RHA) 30% (S/0.6 RHA)

169
No Mould growth occurred on interior wall surface for CEBs wall section 0%, 10%, 20% for
1 year. The mould growth on wall CEBs 30% for 1 year was zero until, third quarter of the
year, and was less than 50mm at the end of the year.
5.1.5.2. Mould Growth on interior wall surface after 1 year: Section EP – with high
internal relative humidity
Mould growth results are presented in Figure 5.19 for wall section EP with high internal
relative humidity.
There was mould growth in all the EP wall sections in areas with high relative humidity. The
mould growth for CEB with 30% RHA was two times more than for CEBs with 0%, 10%,
and 20%. The mould growth for CEBs with 30% RHA is 258mm and that of 0%-20% CEBs
RHA wall is approximately 116mm.
0
50
100
150
200
250
300
0 2000 4000 6000 8000 10000M
ould
gro
wth
(m
m)
Time (hours)
Figure 5.18: Mould growth on interior wall surface EP in areas with normal relative
humidity
0% EP N 10% EP N 20% EP N 30% EP N
0
50
100
150
200
250
300
0 2000 4000 6000 8000 10000
Mould
gro
wth
(m
m)
Time (hours)
Figure 5.19: Mould growth on interior wall surface EP in areas with high relative
humidity
0% EP H 10% EP H 20% EP H 30% EP H

170
5.1.5.3. Mould Growth on interior wall surface after 1 year: Section NP – with
normal internal relative humidity
Mould growth results are presented in Figure 5.20 for wall section NP with normal internal
relative humidity.
All the wall section with various degree of partial stabilization of RHA for wall section NP
had no mould growth on the interior wall surface after 1 year.
5.1.5.4. Mould Growth on interior wall surface after 1 year: Section NP – with high
internal relative humidity
Mould growth results are presented in Figure 5.21 for wall section NP with high internal
relative humidity.
All the wall section NP in areas with high relative humidity had mould growth of 107mm at
the end of the year.
0
50
100
150
200
250
300
0 2000 4000 6000 8000 10000
Mould
gro
wth
(m
m)
Time (hours)
Figure 5.20: Mould growth on interior wall surface NP in areas with normal relative
humidity
0% NP N 10% NP N 20% NP N 30% NP N
0
50
100
150
200
250
300
0 2000 4000 6000 8000 10000
,Mould
gro
wth
(m
m)
Time (hours)
Figure 5.21: Mould growth on interior wall surface NP in areas with high relative
humidity
0% NP H 10% NP H 20% NP H 30% NP H

171
5.1.5.5. Mould Growth – Summary
The wall sections with normal relative humidity showed little to no mould growth after a
year on all wall sections. These do not need further investigation. However, the wall
sections under high relative humidity showed mould growth which warrants further
investigation – these results are presented in section 5.1.6.
Table 5.19 Building use, proportion of OPC replacement with RHA, mould
growth and WUFI code
Building
use
Proportion of OPC replaced
with RHA
Mould growth
depth (mm)
WUFI Bio
code
Option EP
High
relative
humidity
0% 112.5
10% 114.8
20% 116.3
30% 257.9
Option NP
High
relative
humidity
0% 116
10% 118
20% 111
30% 105
Option EP
Normal
relative
humidity
0% 0
10% 0
20% 0
30% 25.2
Option NP
Normal
relative
humidity
0% 0
10% 0
20% 0
30% 0
5.1.6. Total water content Simulation results
The wall sections which showed significant mould growth in Section 5.1.5 are initially
investigated for total water content after one year (Sections 5.1.6.1-5.1.6.2), then for 3
years (Sections 5.1.6.3-5.1.6.4). This is discussed further in Section 6.3.
5.1.6.1. Total water content after 1 year: Section EP – with high internal relative
humidity
Total water content results after 1 year are presented in Figure 5.22 for wall section EP with
high internal relative humidity.
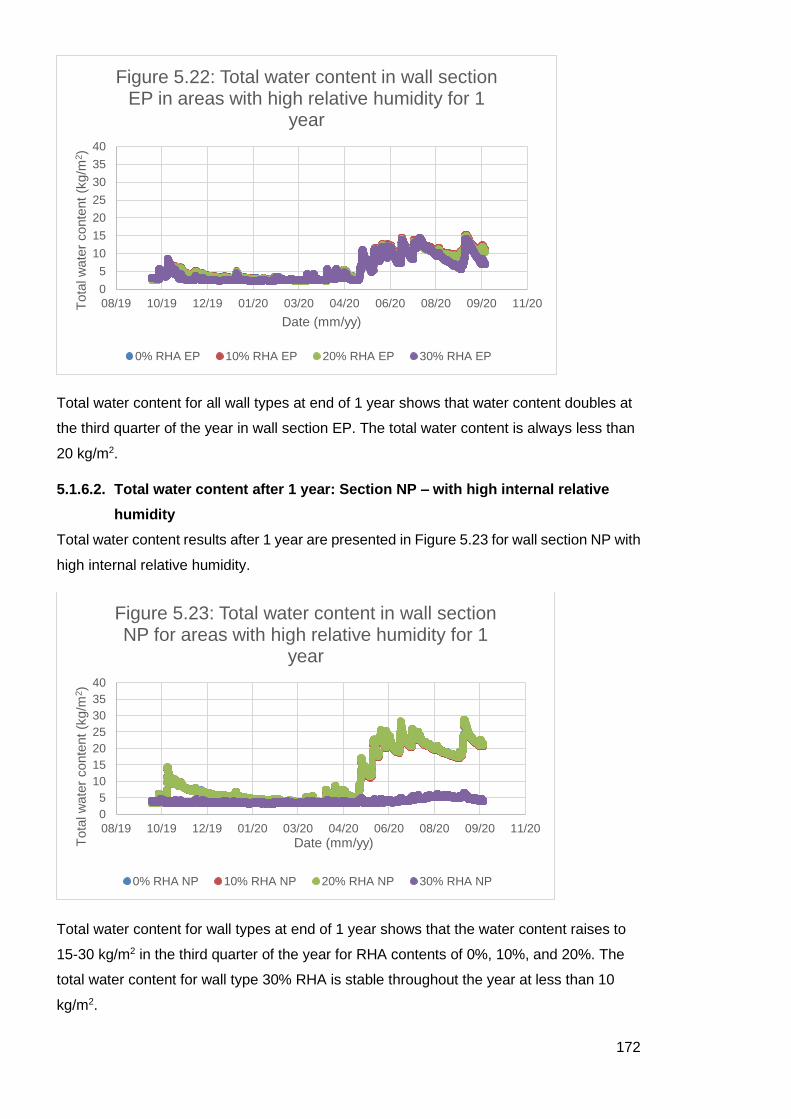
172
Total water content for all wall types at end of 1 year shows that water content doubles at
the third quarter of the year in wall section EP. The total water content is always less than
20 kg/m2.
5.1.6.2. Total water content after 1 year: Section NP – with high internal relative
humidity
Total water content results after 1 year are presented in Figure 5.23 for wall section NP with
high internal relative humidity.
Total water content for wall types at end of 1 year shows that the water content raises to
15-30 kg/m2 in the third quarter of the year for RHA contents of 0%, 10%, and 20%. The
total water content for wall type 30% RHA is stable throughout the year at less than 10
kg/m2.
0
5
10
15
20
25
30
35
40
08/19 10/19 12/19 01/20 03/20 04/20 06/20 08/20 09/20 11/20Tota
l w
ate
r conte
nt
(kg/m
2)
Date (mm/yy)
Figure 5.22: Total water content in wall section EP in areas with high relative humidity for 1
year
0% RHA EP 10% RHA EP 20% RHA EP 30% RHA EP
0
5
10
15
20
25
30
35
40
08/19 10/19 12/19 01/20 03/20 04/20 06/20 08/20 09/20 11/20
Tota
l w
ate
r conte
nt
(kg/m
2)
Date (mm/yy)
Figure 5.23: Total water content in wall section NP for areas with high relative humidity for 1
year
0% RHA NP 10% RHA NP 20% RHA NP 30% RHA NP

173
5.1.6.3. Total water content after 3 years: Section EP – with high internal relative
humidity
Total water content results after 3 years are presented in Figure 5.24 for wall section EP
with high internal relative humidity.
Total water content for the wall section EP rises and drops as the total water content is
studied for 3 years. This shows that the wall absorbs and desorbs over time.
5.1.6.4. Total water content after 3 years: Section NP – with high internal relative
humidity
Total water content results after 3 years are presented in Figure 5.25 for wall section NP
with high internal relative humidity.
0
5
10
15
20
25
30
35
40
05/19 12/19 06/20 01/21 07/21 02/22 08/22 03/23Tota
l w
ate
r conte
nt
(kg/m
2)
Date (mm/yy)
Figure 5.24: Total water content in wall section EP for areas with high relative humidity for 3
years
0% RHA EP 10% RHA EP 20% RHA EP 30% RHA EP
0
5
10
15
20
25
30
35
40
05/19 12/19 06/20 01/21 07/21 02/22 08/22 03/23Tota
l w
ate
r conte
nt
(kg/m
2)
Date (mm/yy)
Figure 5.25: Total water content in wall section NP in areas with high relative humidity for 3
years
0% RHA NP 10% RHA NP 20% RHA NP 30% RHA NP

174
Total water content for wall type 0%, 10%, and 20% for wall section absorbs and desorbs
from less than 5 to 40 kg/m2. The total water content for wall type 30% RHA is stable for 3
years at a value of less than 10kg/m2.
5.1.7. Summary of Hygrothermal behaviour of wall system
All the varying RHA content in wall type EP and NP are all suitable for use in areas with
normal internal relative humidity (living room, bedroom). In areas exposed to high relative
humidity (Kitchen) because of the use of the space, the material surface need to further
treated to prevent mould growth. The most suitable wall system design for the tropical
savanna climate, Lagos Nigeria is the wall system type EP, 20% RHA, it was selected as
it’s the least likely to allow germination of mould growth. For it to be provide adequate air
quality in the space in areas like bathroom or kitchen, the internal surface layer needs to
be treated to prevent mould growth (i.e. Moisture retarding material).
5.2. Simulation of Thermal Comfort Performance
The process for comparing the thermal comfort performance of CEB walls in comparison
to concrete walls was described in Section 3.4.2. In summary: the tropical savannah
climate (Aw) represented by the climate data from Lagos (described in Section 3.4.2.1)
which indicates high temperatures and high relative humidity – monthly data is presented
in Table 5.20 and visual representation of climate shown Figure 5.26, 5.27,5.28.
76
78
80
82
84
86
88
90
0
5
10
15
20
25
30
35
JAN FEB MAR APR MAY JUN JUL AUG SEP OCT NOV DEC
Rel
ativ
e h
um
idit
y (
%)
Tem
per
atu
re (
oC
)
months
Figure 5.26: Annual temperature and relative humidity of Lagos, Nigeria
Temperature Max Temperature Min RH (%)

175
Table 5.20: Average Climatic data of Lagos, Nigeria (2000-2009)
Month Temperature RH
(%)
Wind Rainfall (mm)
Max Min Speed
(m/s)
Direction
(dominant)
JAN 31 24 78 2.19 SW 14.3
FEB 32.5 26 80 3.09 SW 42
MAR 32.5 26.5 81 3.49 SW 77.1
APR 31.5 25 84 3.4 SW 142.4
MAY 31.5 24.5 83 2.5 SW 204.8
JUN 28 23.5 87 2.6 SW 312.2
JUL 27 24 85 3.8 SW 256.9
AUG 28 24 86 3.9 SW 112.4
SEP 28 25 88 3.4 SW 167.1
OCT 29 25 84 2.6 SW 135.8
NOV 32 25.5 84 2.4 SW 54
DEC 32.5 25.5 82 2.3 SW 19
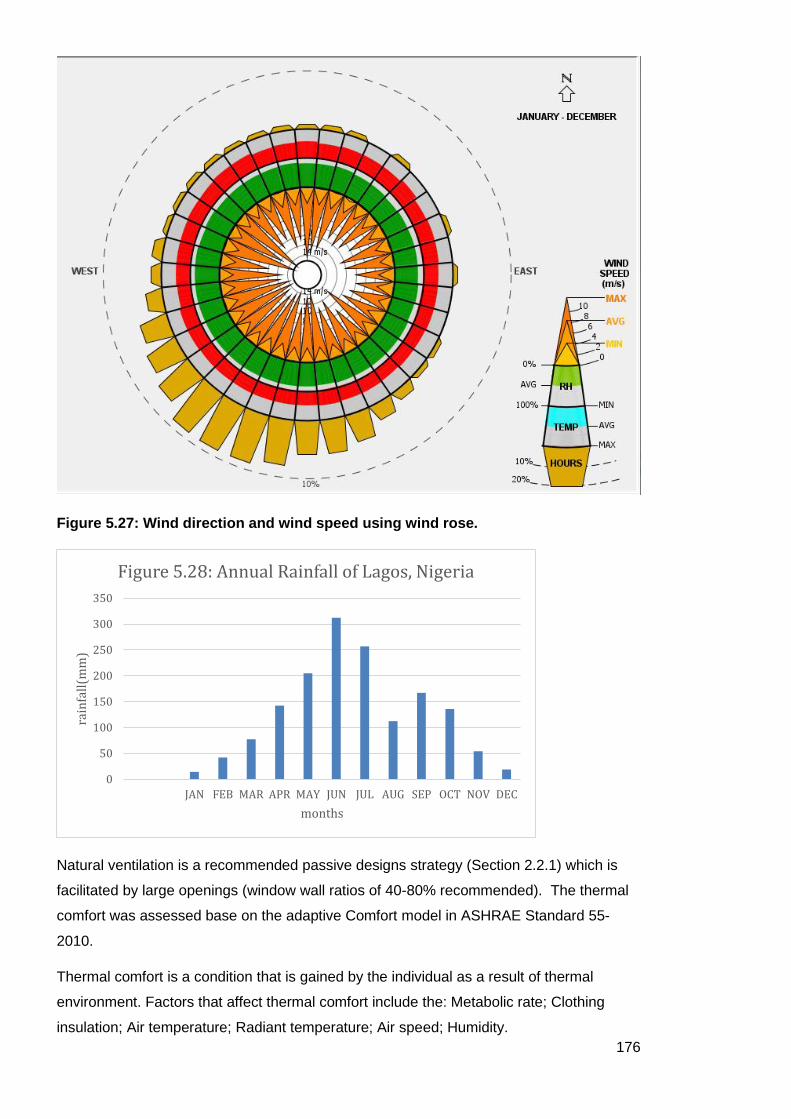
176
Figure 5.27: Wind direction and wind speed using wind rose.
Natural ventilation is a recommended passive designs strategy (Section 2.2.1) which is
facilitated by large openings (window wall ratios of 40-80% recommended). The thermal
comfort was assessed base on the adaptive Comfort model in ASHRAE Standard 55-
2010.
Thermal comfort is a condition that is gained by the individual as a result of thermal
environment. Factors that affect thermal comfort include the: Metabolic rate; Clothing
insulation; Air temperature; Radiant temperature; Air speed; Humidity.
0
50
100
150
200
250
300
350
JAN FEB MAR APR MAY JUN JUL AUG SEP OCT NOV DEC
rain
fall
(mm
)
months
Figure 5.28: Annual Rainfall of Lagos, Nigeria
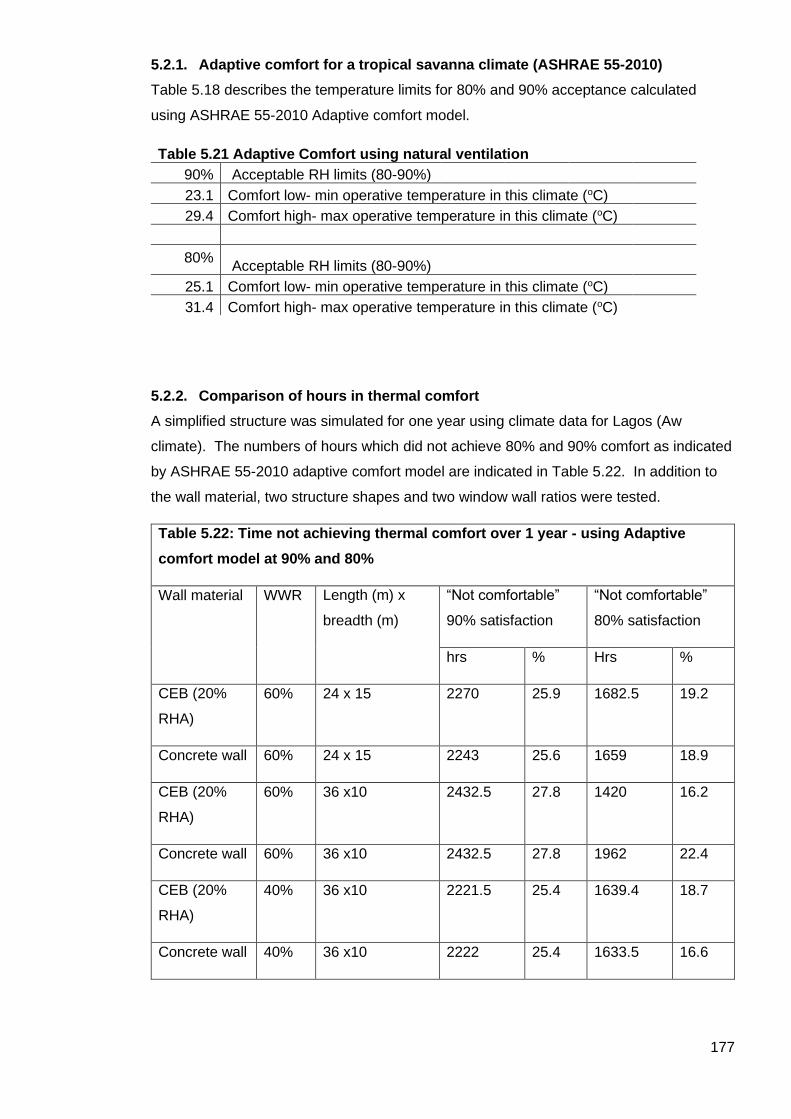
177
5.2.1. Adaptive comfort for a tropical savanna climate (ASHRAE 55-2010)
Table 5.18 describes the temperature limits for 80% and 90% acceptance calculated
using ASHRAE 55-2010 Adaptive comfort model.
Table 5.21 Adaptive Comfort using natural ventilation
90% Acceptable RH limits (80-90%)
23.1 Comfort low- min operative temperature in this climate (oC)
29.4 Comfort high- max operative temperature in this climate (oC)
80% Acceptable RH limits (80-90%)
25.1 Comfort low- min operative temperature in this climate (oC)
31.4 Comfort high- max operative temperature in this climate (oC)
5.2.2. Comparison of hours in thermal comfort
A simplified structure was simulated for one year using climate data for Lagos (Aw
climate). The numbers of hours which did not achieve 80% and 90% comfort as indicated
by ASHRAE 55-2010 adaptive comfort model are indicated in Table 5.22. In addition to
the wall material, two structure shapes and two window wall ratios were tested.
Table 5.22: Time not achieving thermal comfort over 1 year - using Adaptive
comfort model at 90% and 80%
Wall material WWR Length (m) x
breadth (m)
“Not comfortable”
90% satisfaction
“Not comfortable”
80% satisfaction
hrs % Hrs %
CEB (20%
RHA)
60% 24 x 15 2270 25.9 1682.5 19.2
Concrete wall 60% 24 x 15 2243 25.6 1659 18.9
CEB (20%
RHA)
60% 36 x10 2432.5 27.8 1420 16.2
Concrete wall 60% 36 x10 2432.5 27.8 1962 22.4
CEB (20%
RHA)
40% 36 x10 2221.5 25.4 1639.4 18.7
Concrete wall 40% 36 x10 2222 25.4 1633.5 16.6

178
In relation to achieving 90% thermal satisfaction, there was little difference between CEB
(20% RHA) and concrete wall materials. In relation to achieving 80% thermal satisfaction,
the results were more variable. The two wall materials had similar performance for
24x15m shape structure. CEB (20% RHA) had a better performance for 36x10m shape
structure with 60% WWR, while the opposite result held true for 40% WWR.

179
6. Discussion
_______________________________________________________________________
6.1. Raw materials for CEBs
6.1.1. Laterite soil
The results of tests conducted on the laterite used in the current research presented in
Table 4.1 showed that the soil had higher liquid limit (43.3%) and plastic index (27.24%)
values but lower plastic limit value (16.06%) than those reported by Bodian et al., 2018 for
laterite soil (Liquid limit, 38%; Plastic index, 16.1%; Plastic limit, 21.9%). However, charting
the readings in the Unified Soil Classification Chart (Figure 6.1) showed that both soil
samples fell in the CL soil category. The results for laterite sample used in the current
research indicate that it had more clay content. Hence, the soil is susceptible to shrinkage,
cracks easily when it dries, and is more vulnerable to exposure. Also, the characteristics
shown by the laterite soil used in the current study showed that the soil met the standards
recommended for use in compressed earth block (Uzoegbo, 2020). The author
recommended liquid limit (25 – 50%), plastic limit (10 – 25%), plastic index (3 – 30%), linear
shrinkage (<4%), and soil of CL category. The relationship of the laterite used in this
research to the conditions indicated by (Uzoegbo, 2020) is shown in Figure 6.1.
A preliminary test was conducted on using the laterite soil and ordinary Portland cement to
make some samples of compressed earth block and cured for between 14 and 28 days.
The blocks during the curing period developed visible cracks and when lifted began to
crumble. Consequently, sand particles were introduced in the mix to reduce the proportion
of clay in the mix and to neutralize the effect of shrinkage and cracking.

180
Figure 6.1 Chart for the unified soil classification showing data points for laterite soil used for this research (blue star) and soil analysed by Bodian et al (2018) (orange cross). Acceptable properties for use in CEBs (Uzoegbo, 2020) indicated with rectangle. (Bodian et al, 2018; Hind K.J, 2007; Uzoegbo, 2020)
The plastic index, plastic limit and liquid limit for laterite are similar with other findings from
literature (Anifowose, 2000; Bodian et al, 2018; Uzoegbo, 2020). These sources state that
it responds to stabilisation to improve compressive strength. Laterite soil (even when
adequately stabilized) may disintegrate over time when it’s not properly protected. The soil
property improves when compaction pressure increases to reduce the water absorption rate
in the soil.
6.1.2. Amorphous Silica in RHA
Malhotra and Mehta (1996) defined pozzolan as siliceous or siliceous and aluminous
material, which when in a finely divided form and in the presence of moisture chemically
react with calcium hydroxide at ordinary temperatures to form compounds possessing
cementitious properties. Rice husk, an agricultural waste from the paddy rice processing,
was burnt and ignited in furnace under controlled temperature and time to produced Rice
Husk Ash used in current study. The x-ray analysis of the RHA using x-ray diffraction
machine revealed the ash samples contained between 80 and 96% SiO2 (Figures 4.2 and
4.3, and Table 4.3). The results of the x-ray diffraction analysis indicated that the RHA
could have pozzolanic properties in the presence of moisture and calcium hydroxide. Also,
that it could be used as stabilizing agent in CEB or as partial replacement for Ordinary
Portland cement.
181
Optimisation of the amorphous silica in the RHA was necessary for the economics of
production, and this could be ensured through the control of the combustion process. The
production process had a controlled time and temperature for combustion to ensure the
phase change of the ash does not reach crystalline state when burnt for too long and higher
temperature than required.
In the current research two methods of producing ash from the rice husk were tried. In the
first method, the rice husk was subjected to charring before igniting in the furnace for 2 –
3h. The charring process could be done by the indigent users who would use the rice husk
first as source of fuel for their local cooking, then the charred rice husk would be sent to the
furnace. The disadvantage of using this method is that the process to seek out the waste
might take a longer process before it goes to the furnace.
The second method for producing high amorphous silica rice husk ash can be achieved
ensuring a standard procedure for collecting the rice husk and combusting by the waste
management body converting the agricultural waste to rice husk ash. The waste from the
agricultural rice farm can be sourced directly by commercial industry and taken to the
furnace for combustion process and be bagged into to standard sizes for the end user
(construction industry).
To ensure that there is a form of standardization the second method that allows the
commercial industry to process or produce the rice husk ash is the most suitable method.
The combustion furnace is not easily available as mentioned is section 3.2.1.4 by a layman.
The management of RHA waste helps provide another income revenue to the farmers and
ensures that every part of the rice is made useful. The use of agricultural waste means there
can be a positive improvement of the urban metabolism of the country.
6.2. CEBs for residential buildings
It was established that the soil (type and proportion), stabilizer (type and content), mix,
compaction pressure, and curing condition affected the quality of compressed earth blocks
(Uzoegbo, 2020). Consequently, a mechanical press (shown in Figure 3.5) was used to
ensure application of adequate pressure for compaction of compressed earth blocks. Two
types of compressed earth blocks (solid and hollow types) were prepared for experiments
in the current research. The rationale for using different mix for solid (11:7:2) and hollow
blocks (13:5:2) was the requirement for improved workability of the hollow blocks.
Otherwise, the hollow blocks tended to break apart as soon as the mould was removed;
hence more laterite was added to the mix for hollow blocks in order to increase the clay
content in the mix.
The volumes of solid and hollow blocks were 0.00386m3 and 0.00371m3, respectively. The
production of the hollow blocks required 3.9% less of materials than the solid blocks and

182
resulted in 0.39% of OPC less in hollow blocks than solid. This implied that hollow CEB
would save production cost and may be particularly economical in construction areas
requiring less compressive strength and hygrothermal property as in the internal partition
walls.
The curing process in an open environment is a common and affordable practice in the
Nigerian construction industry. The blocks were laid (as shown in Figures 3.6 and 3.7) in
an open environment where they remained covered with water-proof plastic film as covering
the blocks with waterproof plastic film to allow for curing. The blocks were prevented from
direct exposure to high solar radiation and rainfall but were sprayed with water intermittently.
Curing reduced the rate of moisture loss, thus preventing cracking of the blocks (Serbah et
al, 2018). Curing periods were 14, 21 and 28 days. The production and construction of the
compressed earth blocks in this research was intended for sustainable and affordable wall
material in Nigeria. Also, it was to incorporate simple and current method used by the semi-
skilled workers (laborers). Apart from combusting the RHA in the furnace and transporting
it and the laterite were transported to site, the remaining processes of block production and
curing were manual, so CEB production required low energy.
In the current research, ordinary Portland cement was replaced gradually with RHA at the
rates of 0% to 50% in the mix used to produce experimental compressed earth blocks. The
blocks were tested for mechanical and hygrothermal properties to ascertain the effects of
RHA on the properties of the blocks and or whether RHA replacing a proportion of the
cement would be acceptable as a stabilizing agent in CEB.
6.2.1. Mechanical Properties
6.2.1.1. Bulk Density
Bulk density, a function of the weight of material in a unit volume of space, depends on the
extent to which the material is compressed per unit of space during block moulding. Results
obtained in the current research showed that bulk density values of CEB ranged from
1738.0 ± 34 to 1935.9 ± 51 kg/m3 in solid CEBs, and from 1753.9 ± 66 to 1977.9 ± 29 kg/m3
in hollow CEBs (Tables 4.4 and 4.5). The results affirmed earlier findings by Mansour et al.
(2016), Taallah and Guettala (2016), and Nshimiyimana et al. (2020). These authors
reported that bulk density of CEB ranged from 1700 to 2000 kg/m3.
6.2.1.2. Compressive Strength
Compressive strength, defined as the maximum load a material can bear before fracturing,
is a key index used to ascertain the quality of building construction materials. Consequently,
compressive strength value as high as 3-4N/mm2 and as low as 0.35N/mm2 depending on
the bulk density of stabilized CEB had been reported (Mansour et al., 2016; Mostafa and
Uddin, 2016). Also, researchers (Kolawole et al, 2020; Mansour et al, 2016; Mkaouar et al,
183
2019; Nshimiyimana et al, 2020) reported a range of between 0.4 and 12 N/mm2
(compressive strength) for CEB. (Nshimiyimana et al, 2020) recommended compressive
strength requirements for CEB use in the construction of wall structure for affordable and
sustainable building in the tropical climate including Nigeria – these are indicated in Table
6.1.
Table 6.1 Required CEB compressive strength for wall structures ((Nshimiyimana et al,
2020)
CEB use (Structure type) Required Compressive Strength (N/mm2)
Non-load bearing 2
Load bearing – 2 storeys 2-4
Load bearing – 3 storeys 3-6
In the present study, compressive stength for solid CEB ranged from 2.39 ± 0.3 to 6.39 ±
0.5 N/mm2 (Table 4.8). While compressive strength for hollow CEB ranged from 0.61 ± 0.1
to 2.68 ±0.1 N/mm2 (Tables 4.9). The results indicate that the solid CEBs were significantly
stronger than the hollow type. This may be due to the perforations in the hollow blocks, or
to the higher laterite mix composition.
Mansour et al. (2016) noted that the variation in the compressive strength values reported
for the CEB was due to the differences in the bulk densities (1800-2100 kg/m3) of the blocks.
The ranges of bulk density values obtained in the present study (1738.0 ± 34 to 1935.9 ±
51 kg/m3 in solid CEBs, and from 1753.9 ± 66 to 1977.9 ± 29 kg/m3 in hollow CEBs) as
presented in Tables 4.6 and 4.7 were lower than the range reported by Mansour et al.
(2016). The difference might be attributed to the differences in mixes used for the various
CEB in the earlier and current studies. However, positive correlation between compressive
strength and bulk density of the CEB was observed (Table 4.16), and the correlation
coefficient, r being 0.740422. The results, therefore, affirmed earlier findings reported by
Mansour et al. (2016).
Results shown in Table 4.10 indicated that compressive strength for solid blocks increased
with increased duration of curing up to 21 days but declined thereafter. The highest
compressive strength (4.27 ± 0.803 N/mm2) was attained at 21 days of curing. Also,
inclusion of RHA in the mix affected the compressive strength of the CEB where the group
having 10%RHA inclusion recorded the highest value (5.61±0.910 N/mm2) whereas the
group with 50%RHA inclusion had the least value (3.15±0.732 N/mm2). The results suggest
that inclusion of RHA in the mix beyond 10% resulted in the lowering of the compressive
strength. Indeed, the results of correlation analysis presented in Table 4.16 showed that
184
the correlation coefficient, r of the relationship between RHA inclusion in the aggregate mix
and compressive strength of CEB was -0.87885.
In both types of CEBs, substitution of OPC with 10% RHA raised the compressive strength
by about 4.2% and 16.9% beyond control CEBs which OPC alone.
All the solid CEBs would be considered acceptable for non-load bearing or load bearing
use in 2 storey buildings. All solid CEBs (excepting those with 40% RHA cured for 28 days
and 50% RHA cured for 14 days) would be considered acceptable for load bearing use in
3 storey buildings. Hollow CEBs with 10% RHA would be considered acceptable for non-
load bearing or load bearing use in 2 storey buildings according to (Nshimiyimana et al,
2020).
6.2.1.3. Water absorption capacity
In the current study, the mean values of water absorption capacity ranged from 6.76% to
8.20% in solid CEB, and from 0.39% to 0.55% in hollow CEB (Tables 4.12 and 4.13). The
mean values observed in the experimental CEB were within the range (6 - 9%) reported in
earlier studies (Kolawole et al, 2020; Narayanaswamy et al, 2020).
It was observed also that duration of curing affected water absorption capacity of the CEB.
The lowest (5.85±1.11%) and the highest (9.01±0.85%) values were obtained at 14 and 21
days of curing, respectively (Table 4.14). Water absorption capacity declined slightly
beyond 21 days of curing. The group having 10% RHA inclusion has a lower water
absorption capacity than the groups with 20% or higher RHA inclusions. However, there
was no clear difference in water absorption capacity between different curing periods. Both
the water absorption capacity and RHA inclusion were positively correlated. The correlation
coefficient, r was 0.67619. Also, the least value (6.76±1.59%) and the highest value
(8.20±0.91%) were recorded in blocks that had 10% and 50%, respectively. All the blocks
have acceptable water absorption capacity.
6.2.1.4. Relationship among the mechanical properties of CEB and the effect of
RHA inclusion
In order to examine any possible correlation among the RHA inclusion in the compressed
earth solid and hollow blocks and the mechanical properties of the latter, data obtained in
the study were subjected to correlation analysis. Results of the analysis are presented for
solid blocks in Table 6.2.
Bulk density is a function of the weight of material in a unit volume of space, whereas water
absorption capacity is a function of voids in the block. Therefore, an inverse relationship is
expected to exist between bulk density and water absorption capacity. Indeed, the results
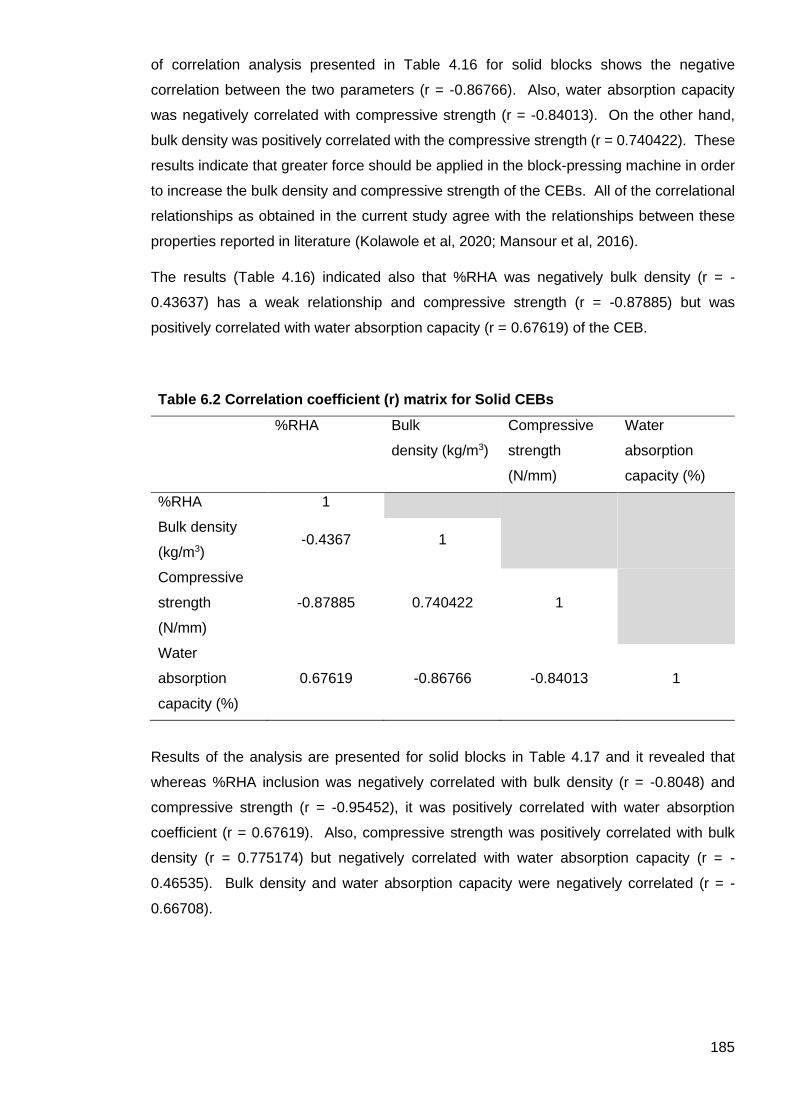
185
of correlation analysis presented in Table 4.16 for solid blocks shows the negative
correlation between the two parameters (r = -0.86766). Also, water absorption capacity
was negatively correlated with compressive strength (r = -0.84013). On the other hand,
bulk density was positively correlated with the compressive strength (r = 0.740422). These
results indicate that greater force should be applied in the block-pressing machine in order
to increase the bulk density and compressive strength of the CEBs. All of the correlational
relationships as obtained in the current study agree with the relationships between these
properties reported in literature (Kolawole et al, 2020; Mansour et al, 2016).
The results (Table 4.16) indicated also that %RHA was negatively bulk density (r = -
0.43637) has a weak relationship and compressive strength (r = -0.87885) but was
positively correlated with water absorption capacity (r = 0.67619) of the CEB.
Table 6.2 Correlation coefficient (r) matrix for Solid CEBs
%RHA Bulk
density (kg/m3)
Compressive
strength
(N/mm)
Water
absorption
capacity (%)
%RHA 1
Bulk density
(kg/m3) -0.4367 1
Compressive
strength
(N/mm)
-0.87885 0.740422 1
Water
absorption
capacity (%)
0.67619 -0.86766 -0.84013 1
Results of the analysis are presented for solid blocks in Table 4.17 and it revealed that
whereas %RHA inclusion was negatively correlated with bulk density (r = -0.8048) and
compressive strength (r = -0.95452), it was positively correlated with water absorption
coefficient (r = 0.67619). Also, compressive strength was positively correlated with bulk
density (r = 0.775174) but negatively correlated with water absorption capacity (r = -
0.46535). Bulk density and water absorption capacity were negatively correlated (r = -
0.66708).
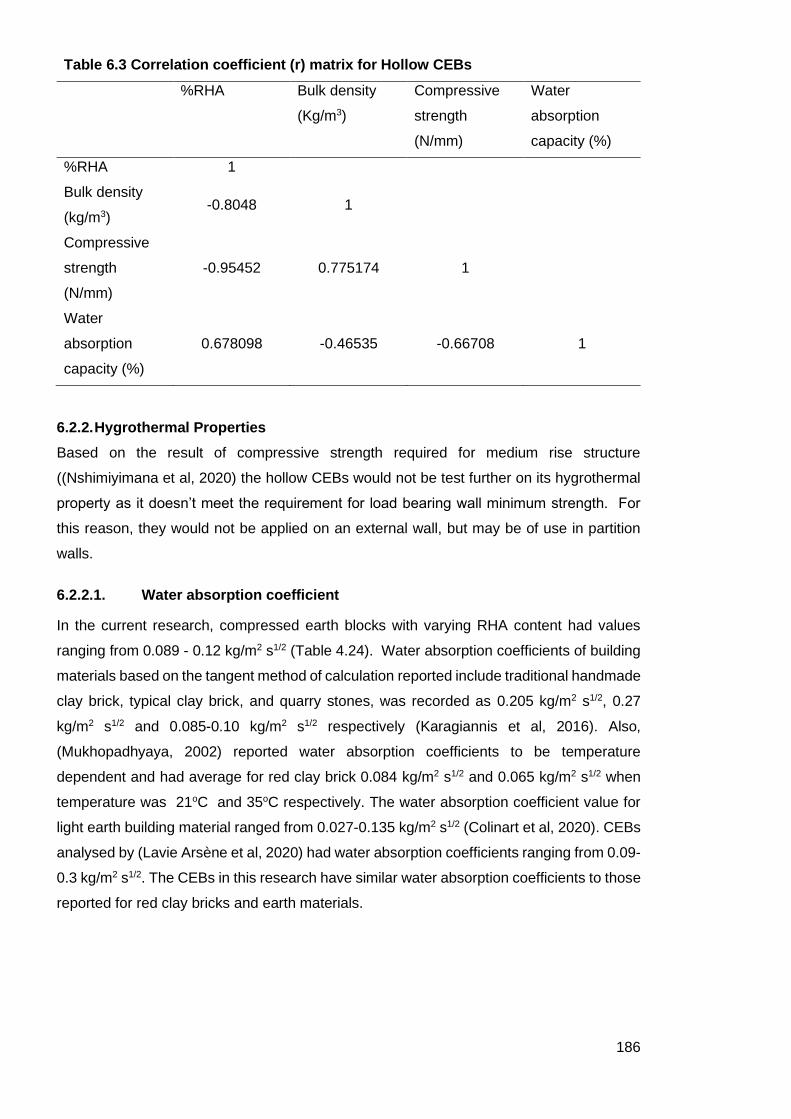
186
Table 6.3 Correlation coefficient (r) matrix for Hollow CEBs
%RHA Bulk density
(Kg/m3)
Compressive
strength
(N/mm)
Water
absorption
capacity (%)
%RHA 1
Bulk density
(kg/m3) -0.8048 1
Compressive
strength
(N/mm)
-0.95452 0.775174 1
Water
absorption
capacity (%)
0.678098 -0.46535 -0.66708 1
6.2.2. Hygrothermal Properties
Based on the result of compressive strength required for medium rise structure
((Nshimiyimana et al, 2020) the hollow CEBs would not be test further on its hygrothermal
property as it doesn’t meet the requirement for load bearing wall minimum strength. For
this reason, they would not be applied on an external wall, but may be of use in partition
walls.
6.2.2.1. Water absorption coefficient
In the current research, compressed earth blocks with varying RHA content had values
ranging from 0.089 - 0.12 kg/m2 s1/2 (Table 4.24). Water absorption coefficients of building
materials based on the tangent method of calculation reported include traditional handmade
clay brick, typical clay brick, and quarry stones, was recorded as 0.205 kg/m2 s1/2, 0.27
kg/m2 s1/2 and 0.085-0.10 kg/m2 s1/2 respectively (Karagiannis et al, 2016). Also,
(Mukhopadhyaya, 2002) reported water absorption coefficients to be temperature
dependent and had average for red clay brick 0.084 kg/m2 s1/2 and 0.065 kg/m2 s1/2 when
temperature was 21oC and 35oC respectively. The water absorption coefficient value for
light earth building material ranged from 0.027-0.135 kg/m2 s1/2 (Colinart et al, 2020). CEBs
analysed by (Lavie Arsène et al, 2020) had water absorption coefficients ranging from 0.09-
0.3 kg/m2 s1/2. The CEBs in this research have similar water absorption coefficients to those
reported for red clay bricks and earth materials.
187
6.2.2.2. Water vapour transmission
Water vapour test is about movement of moisture from a point of higher relative humidity to
a point of lower relative humidity. While conducting water vapour test, Liuzzi et al. (2017)
noted that water resistance factor was dependent on the bulk density of materials. Also,
BS EN 12524-2000 affirmed that materials varied in their water vapour resistance factor
according to their bulk densities. That is, fired clay bricks with bulk density 1000-2400 kg/m3
has water vapour resistance factor of 16 and 10 (dry and wet respectively), calcium silicate
brick with bulk density of 900-1200 kg/m3 had a resistance of 20 and 5 (dry and wet
respectively), concrete masonry with bulk density of 500-1300 kg/m3 had a water vapour
resistance of 50 and 40 (dry and wet conditions respectively) (BS, EN 12524:2000). The
implication is that the higher the water resistance factor is the more resistant the building
material is to water vapour passing through its structure. Therefore, a larger water vapour
resistant factor is more beneficial in a material to use in places that have high moisture or
high relative humidity such as Nigeria.
Similarly, documentation in the WUFI library on some building materials revealed that the
water vapour resistance factors were: concrete blocks with pumice aggregate has a vapour
resistance factor of 4 (664 kg/m3 bulk density); fired clay blocks has a vapour resistance
factor of 15 (800 kg/m3 bulk density), solid brick extruded has a vapour resistance factor of
9.5 (1650 kg/m3 bulk density); solid brick hand formed has a vapour resistance factor of 17
(1725 kg/m3 bulk density) and solid bricks historically has a vapour resistance factor of 15
(1800 kg/m3 bulk density).
In the current research, compressed earth blocks with varying RHA content had water
vapour resistance factor values ranging from 11.65-44.91 (Table 4.26), the highest values
relating to RHA content of 20% and 50%, which had comparable water vapour resistance
factor values to concrete masonry
6.2.2.3. Moisture absorption
Moisture absorption of test material is a function of the quantity of water vapour absorbed
from the climatically controlled environment. Consequently, the relative humidity and
temperature of the environment affect the moisture absorption of the test material. The
experimental CEB were subjected to the test and the moisture absorption equilibrium
curves were plotted (Figures 4.21 – 4.25). The water absorption patterns shown by the
various CEB indicated that regardless of the level of inclusion of RHA (and its non-inclusion)
water absorption increased progressively, though at different rates, as the relative humidity
increased. The results thus suggested that inclusion of RHA in the CEB affected water
absorption properties of the latter (Table 4.27). Indeed, moisture absorption rate increase
when relative humidity increases from 33%- 85%; For the inclusion of RHA, CEBs material
0% RHA,10% RHA, 20% RHA and 40% RHA has an increase of 3.6%,4.8%, 2.2% and

188
3.5% respectively. The result obtained in this study agrees with the findings of Wang et al.
(2020) who reported that the addition of fibre increased moisture absorption in geopolymer
concrete reinforced by polypropylene fibres but the results obtained in this study agree with
the findings of Ouedraogo et al. (2020), who reported that stabilization of earth with 4-8%
cement reduces moisture adsorption rate by 20%. Replacement of ordinary Portland
cement by up to 40% with RHA in the CEB aggregate mix resulted in 33.985% reduction in
the moisture absorption (Table 4.28). However, 10% replacement caused an increase of
19.535% in moisture absorption. The results tended to suggest that up to 10% replacement
of ordinary Portland cement with RHA was not enough to serve as a stabilizing agent in the
CEB and hence could not cause a reduction in the moisture absorption in the earth block.
For practical application, Hola et al (2017) classified masonry wall into five categories
according to the moisture absorption or content as: I, permissible moisture content (0.3%);
II, masonry with elevated moisture content (>3-5%); III, medium damp masonry (>5-8); IV,
very damp masonry (>8-12%); and V, wet masonry wall (>12%). Nigeria’s climate being
tropical – hot and humid, surface walls are exposed to a range of relative humidity would
remain medium damp unless the wall has adequate buffering property. The continuous
exposure to moisture could cause chipping of wall and mortar, and crystallization of salts
on the wall material. This would lead to continuous degradation of the material’s strength,
cross section area and load bearing capacity of the wall. Furthermore, it would affect the
wall surface finishing – mould growth, deterioration and peeling of the paint, etc. The CEBs
with 20% RHA is the most suitable material for external use (Hola, 2017).
6.2.2.4. Moisture buffering
The incidence of mould and indeed biological growth on the wall surface is a function of the
wall material’s ability to absorb or release moisture from its structure. Also, the ability of the
material to mitigate the effect of wetness or high moisture absorption of the masonry wall is
dependent on the moisture buffering characteristic of the material (Hola et al., 2017). The
moisture buffering values (MBV) of the experimental CEB in the current research are shown
in Table 4.28. The range of MBV obtained in this study (i.e. 1.2 – 2.1 g/m2 %RH) agrees
with literature values of 1.2-3.9 g/m2 %RH (Rode et al. 2005; Zhang et al. 2017; Bruno et al
2017). In addition, application of the NORDTEST classification (Rode et al. 2005; Zhang
et al. 2017) indicated that RHA inclusion in the CEB’s aggregate mix remarkably affected
the moisture buffering value of the CEB where RHA inclusion of 0%,10%, 20%, 40%
boosted the moisture buffering characteristic. Indeed, the CEB with RHA up to 40% made
them good. The excellent moisture buffering characteristic of the CEB would be of pactical
importance in the provision of affordable low-cost housing in Nigeria. The excellent
moisture buffering ability of the CEB to which RHA has been included would ameliorate the
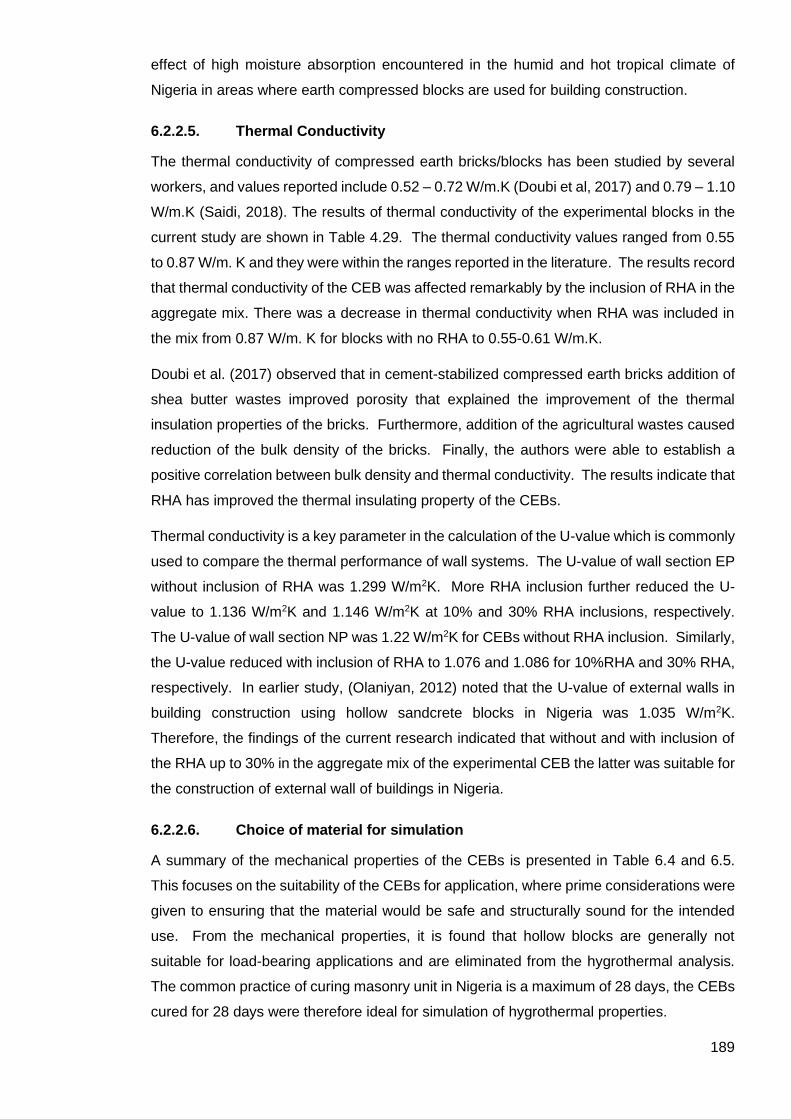
189
effect of high moisture absorption encountered in the humid and hot tropical climate of
Nigeria in areas where earth compressed blocks are used for building construction.
6.2.2.5. Thermal Conductivity
The thermal conductivity of compressed earth bricks/blocks has been studied by several
workers, and values reported include 0.52 – 0.72 W/m.K (Doubi et al, 2017) and 0.79 – 1.10
W/m.K (Saidi, 2018). The results of thermal conductivity of the experimental blocks in the
current study are shown in Table 4.29. The thermal conductivity values ranged from 0.55
to 0.87 W/m. K and they were within the ranges reported in the literature. The results record
that thermal conductivity of the CEB was affected remarkably by the inclusion of RHA in the
aggregate mix. There was a decrease in thermal conductivity when RHA was included in
the mix from 0.87 W/m. K for blocks with no RHA to 0.55-0.61 W/m.K.
Doubi et al. (2017) observed that in cement-stabilized compressed earth bricks addition of
shea butter wastes improved porosity that explained the improvement of the thermal
insulation properties of the bricks. Furthermore, addition of the agricultural wastes caused
reduction of the bulk density of the bricks. Finally, the authors were able to establish a
positive correlation between bulk density and thermal conductivity. The results indicate that
RHA has improved the thermal insulating property of the CEBs.
Thermal conductivity is a key parameter in the calculation of the U-value which is commonly
used to compare the thermal performance of wall systems. The U-value of wall section EP
without inclusion of RHA was 1.299 W/m2K. More RHA inclusion further reduced the U-
value to 1.136 W/m2K and 1.146 W/m2K at 10% and 30% RHA inclusions, respectively.
The U-value of wall section NP was 1.22 W/m2K for CEBs without RHA inclusion. Similarly,
the U-value reduced with inclusion of RHA to 1.076 and 1.086 for 10%RHA and 30% RHA,
respectively. In earlier study, (Olaniyan, 2012) noted that the U-value of external walls in
building construction using hollow sandcrete blocks in Nigeria was 1.035 W/m2K.
Therefore, the findings of the current research indicated that without and with inclusion of
the RHA up to 30% in the aggregate mix of the experimental CEB the latter was suitable for
the construction of external wall of buildings in Nigeria.
6.2.2.6. Choice of material for simulation
A summary of the mechanical properties of the CEBs is presented in Table 6.4 and 6.5.
This focuses on the suitability of the CEBs for application, where prime considerations were
given to ensuring that the material would be safe and structurally sound for the intended
use. From the mechanical properties, it is found that hollow blocks are generally not
suitable for load-bearing applications and are eliminated from the hygrothermal analysis.
The common practice of curing masonry unit in Nigeria is a maximum of 28 days, the CEBs
cured for 28 days were therefore ideal for simulation of hygrothermal properties.

190
Table 6.4 Suitability of solid CEBs for application based on mechanical properties
RHA (%) Curing time (Day) Compressive strength for wall
structures ((Nshimiyimana et al,
2020)
Water
absorption
capacity
0 14 3 storey No issue
21 3 storey No issue
28 3 storey No issue
10 14 3 storey No issue
21 3 storey No issue
28 3 storey No issue
20 14 3 storey No issue
21 3 storey No issue
28 3 storey No issue
30 14 3 storey No issue
21 3 storey No issue
28 3 storey No issue
40 14 3 storey No issue
21 3 storey No issue
28 2 storey No issue
50 14 2 storey No issue
21 3 storey No issue
28 3 storey No issue

191
Table 6.5 Suitability of hollow CEBs for application based on mechanical
properties
RHA (%) Curing time (Day) Compressive strength for wall
structures ((Nshimiyimana et al,
2020)
Water
absorption
capacity
0 14 3 storey No issue
21 3 storey No issue
28 3 storey No issue
10
14 3 storey No issue
21 3 storey No issue
28 3 storey No issue
20 14 N/A (not acceptable) No issue
21 N/A No issue
28 N/A No issue
30 14 N/A No issue
21 N/A No issue
28 N/A No issue
40 14 N/A No issue
21 N/A No issue
28 N/A No issue
50 14 N/A No issue
21 N/A No issue
28 N/A No issue
Hygrothermal performance is important for several factors including, durability of the
material, acceptable indoor air quality, thermal comfort, and prevention of mould growth. A
summary of the hygrothermal performance focussing on suitability for application is
presented in Table 6.6 for solid CEBs which had been cured for 28 days.
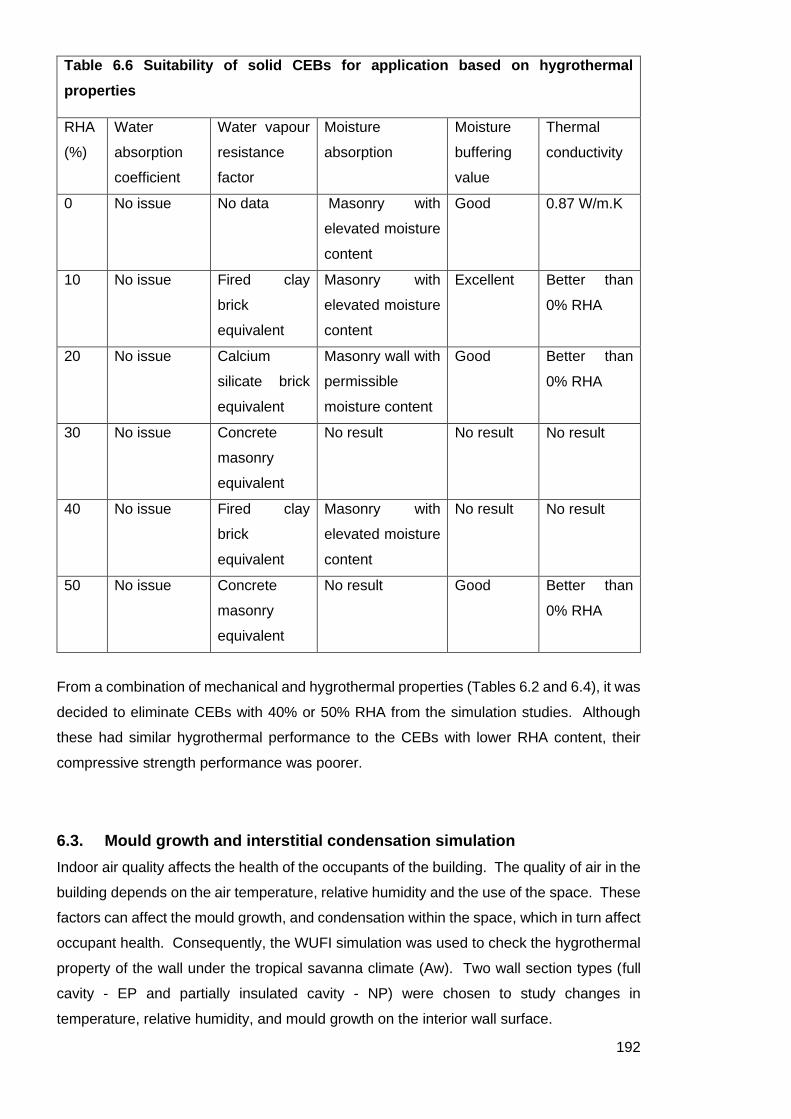
192
Table 6.6 Suitability of solid CEBs for application based on hygrothermal
properties
RHA
(%)
Water
absorption
coefficient
Water vapour
resistance
factor
Moisture
absorption
Moisture
buffering
value
Thermal
conductivity
0 No issue No data Masonry with
elevated moisture
content
Good 0.87 W/m.K
10 No issue Fired clay
brick
equivalent
Masonry with
elevated moisture
content
Excellent Better than
0% RHA
20 No issue Calcium
silicate brick
equivalent
Masonry wall with
permissible
moisture content
Good Better than
0% RHA
30 No issue Concrete
masonry
equivalent
No result No result No result
40 No issue Fired clay
brick
equivalent
Masonry with
elevated moisture
content
No result No result
50 No issue Concrete
masonry
equivalent
No result Good Better than
0% RHA
From a combination of mechanical and hygrothermal properties (Tables 6.2 and 6.4), it was
decided to eliminate CEBs with 40% or 50% RHA from the simulation studies. Although
these had similar hygrothermal performance to the CEBs with lower RHA content, their
compressive strength performance was poorer.
6.3. Mould growth and interstitial condensation simulation
Indoor air quality affects the health of the occupants of the building. The quality of air in the
building depends on the air temperature, relative humidity and the use of the space. These
factors can affect the mould growth, and condensation within the space, which in turn affect
occupant health. Consequently, the WUFI simulation was used to check the hygrothermal
property of the wall under the tropical savanna climate (Aw). Two wall section types (full
cavity - EP and partially insulated cavity - NP) were chosen to study changes in
temperature, relative humidity, and mould growth on the interior wall surface.

193
Mould growth occurs within a space when the environment is moist and warm. Mould grows
on wall surfaces within the temperature range of 10 - 500C and relative humidity of 80% and
above. The use of the space determines the relative humidity and temperature, so the
activities such as cooking, and bathing generate more moisture in the air than spaces used
for resting. Also, the type of surface material and its porosity also determines its
susceptibility to mould growth.
The results in the current research showed that the temperature of the wall sections in areas
with normal and high relative humidity values shows that temperature reduced
progressively from the external to the internal space (Figure 5.6-5.9). The results inferred
that heat transfer into the internal wall was retarded. This could be considered a good
property to have in this climate.
The results of relative humidity of all the wall sections are shown in Figures 5.10 – 5.13.
Throughout the year, the relative humidity of the wall surfaces was less than 100%, a
condition required for condensation to occur. So, there was no occurrence of condensation
on the external or inner wall surfaces.
The highest relative humidity on internal surface of the wall section EP were 76.2% and
72.9% for areas with normal and high relative humidity. The highest RH values were
obtained in wall having 30% RHA inclusion. The wall section NP relative humidity also
reduces at the internal surface to 74.5 and 68.7%, again for 30% RHA inclusion. The
moisture value for areas with high and normal relative in the interior surface reduces in wall
section NP compared to EP.
The wall should be studied to understand the moisture content on the whole wall section.
The areas where normal and high relative humidity prevails, the wall section EP had
moisture content of less than 30 kg/m3. The wall section also showed that the cavity in the
wall retarded movement of moisture from the external layer to the internal layer. In the
cases of all wall types in NP, moisture movement reduced from external to the cavity but
increased towards internal surface. This phenomenon might promote mould growth inside
the wall section where the MDF insulation is placed where normal and high relative humidity
are prevalent.
A key consideration in this investigation is mould growth. Figures 5.18-5.21 show the
simulated mould growth on each wall type and humidity condition over a period of a year.
In regions where normal relative humidity is prevalent, the inclusion of RHA beyond 20%
might result in potential mould growth in the wall section EP. Inclusion of 30% RHA resulted
in the wall section having less than 50mm mould growth. Testing on WUF bio, resulted in
a green traffic signal indicated that it is acceptable. However, in the case of regions where
high relative humidity is common, the highest mould growth on the wall section EP occurred
at 30% RHA inclusion and reached approximately 200mm. Testing on WUF bio showed a

194
red traffic signal, indicating that the material is not suitable in the region. The wall types
having 0%, 10% and 20% RHA inclusion had mould growth of less than 200mm, showed
yellow signal on the WUFI bio, suggesting further investigation was required.
The results of the present study showed further that no mould growth occurred on the
interior surface of wall section NP that had been partially stabilized with varying percentages
of RHA in regions where normal relative humidity is prevalent. On the other hand, under
the condition of high relative humidity, mould growth on the interior wall surface was more
than 50mm but less than 200mm. In addition, yellow traffic signal was observed.
Consequent upon the results of total water contents and mould growth on all the wall types
in the regions where high relative humidity is prevalent, further investigation was required.
This was carried out as a study on the changes in total water content for wall section types
EP and NP in high humidity and is illustrated over 1 year in Figures 5.22-5.23 and over 3
years in Figures 5.24-5.25. The water content in wall section absorbs for a quarter of the
year and desorbs for the three quarter of the year for wall type EP. This pattern shows that
the wall structure can desorb satisfactorily after absorbing. The study revealed that wall
type NP absorbed water for a quarter of the year, and it desorbed for three quarter of the
year. The wall type NP showed a higher water content than the wall section EP as shown
in Figures 5.24 and 5.25.
The simulation results are visualised in Table 6.7.
195
Table 6.7 Suitability of solid CEBs for application based on results from mould
growth and interstitial condensation simulation
RHA
(%)
Wall
Structure
RH Temp
interior
(oC)
RH
interior
(%)
Moisture
(%)
Mould
growth
(mm)
WUFI
BIO
traffic
light
Water
content
(Kg/m2)
1 yr 3 yr
0 EP Normal
sim
ilar
64-68 5 0 Green -
High 6.3 112.5 Yellow <20 <20
NP Normal 5 0 Green -
High 6.4 116 Yellow <40 <40
10 EP Normal 5 0 Green -
High 6.5 114.8 Yellow <20 <20
NP Normal 5.1 0 Green -
High 6.5 118 Yellow <40 <40
20 EP Normal 0.6 0 Green -
High 0.8 116.3 Yellow <20 <20
NP Normal 0.6 0 Green -
High 0.8 111 Yellow <40 <40
30 EP Normal 68-76 8.5 25.2 Green -
High 11.6 257.9 Red <20 <20
NP Normal 6.8 0 Green -
High 7.7 105 Yellow <20 <20
From the findings so far, CEB with 20%RHA inclusion was considered the most suitable
material using the wall type EP. This was because it combined the highest possible RHA
content (displacing expensive OPC) with suitable properties for use in the region where
normal and high relative humidity conditions are prevalent. This material and wall type were
analysed further for thermal comfort performance (Section 6.4).

196
6.4. Thermal comfort simulation
Prior to undertaking thermal comfort simulation, key passive design strategies for cooling
were considered in relation to the building. Key factors to be included in the design of the
simplified structure are:
• appropriate building orientation and form to minimise solar gains and facilitate
natural ventilation for cooling (long axis running North South) with large openings
to receive cooling breezes.
• Thermal mass to reduce heat absorption and to use in conjunction with night cooling
in appropriate climates.
• Cross ventilation to allow easy natural flow of air into the building to improve thermal
comfort.
• Pitch insulated roof to allow the flow of rainwater easily and reduce the solar heat
gain from the roof.
• Shading of the windows and walls using the roof overhang (Ogunsote et al, 2010).
Consequent upon the above, the performance of the simplified structure incorporating 20%
RHA CEBs in the wall section was compared to the wall section with concrete.
According to ASHRAE 55-2010 Adaptive comfort standard, the 80% and 90% thermal
comfort satisfaction temperature and relative humidity for tropical savanna climate where
natural ventilation only is prevalent are 25.1 - 31.4oC and 80 - 90% and 23.1 - 29.4oC and
80 - 90%, respectively (Table 5.18). Banerjee et al. (2020) noted 19.5 - 31oC as the thermal
comfort temperature of people inhabiting in the tropical climate, which shows a reasonable
agreement with the 90% thermal comfort satisfaction conditions. The relative humidity
ranged from 70% to 100%.
The climate data presented in Table 5.17, indicated that the outside air temperatures were
higher than acceptable comfort levels in February to May. Also, for Lagos, Nigeria the wind
was from the south western direction. The wind brings moist air with high relative humidity
from the Atlantic Ocean.
For 90% satisfaction in the base building design (24x15m) there was little difference in the
number of hours where thermal comfort was achieved (Table 5.19). The use of CEB
provided thermal comfort for the user for 74% of the hours at a 90% thermal satisfaction
level. At an 80% thermal satisfaction level, this increased to 80% of hours. These results
were like those using concrete with same U value in the Aw climate in Nigeria.
An initial investigation was able to increase the hours in comfort by elongating the building
(keeping the same floor area) and reducing the window wall ratio. A more detailed
investigation could potentially further increase the hours in comfort.
197
7 Conclusion and contribution to knowledge
_______________________________________________________________________
7.1 Introduction
The concept of this research was based on the need to provide a possible solution for
deficit of residential houses for the low-income earner in Nigeria. The deficit of residential
houses in Nigeria is because of growing urbanisation and inadequate planning to meet
expansion. Nigeria is a developing country that has a large population of people living
below the poverty level as discussed in Section 2.1, there is a need for low-cost building
that minimises harm to the present and future environment. The present generation of
low-income earners have created an organic response to the income inequality faced to
provide housing for themselves through slums, dilapidated houses, squatter housing,
unauthorised land development, room, or flats in uncompleted or dilapidated houses. One
in 7 people live in informal settlement (Gan et al. 2017). The people are then faced with
problems such as overcrowding, inadequate waste management, poor health, poor
sanitary systems, insecure residential status, and poor structural buildings. The
government have tried to create more houses from the period when the country gained
her independence. The reason for the deficit was because of the high cost for providing
residential buildings, inadequate policies, poor planning, and mismanagement as
indicated in Section 2.2.4. Based on this research, the government needs inclusion of the
people that require the houses, agricultural industry, and construction industry to work as
a team to ensure the system works. The methods for construction of the buildings for the
low-income earners require minimum energy as the country experiences interrupted
power supply daily. It also requires simple method of construction, so the people can build
their houses themselves and reduce the cost of the construction by eliminating expensive
devices and reducing labour. The construction of medium rise building to reduce the land
use caused by low rise building is the most suitable. The construction industry can have
positive impact by improving by encouraging low energy and low emission products,
introducing low carbon material and technology (i.e earth) and embracing circular
economy (IEA, 2019). The construction industry uses about 36% of related emission
globally (Cao et al, 2016) and 70 of energy consumption in residential buildings in 2018.
By aiming to a more sustainable material, design, and principles; the cost of building can
also be reduced as indicated in Section 2.1.
This research concentrated on the sourcing, processing of a sustainable, earth-based
masonry unit to achieve optimized mechanical and hygrothermal property. The material
showed adequate property for indoor air quality on the health of the users.
198
7.1.1 Aim and objectives
The aim of this research was to investigate the provision of a possible low cost,
sustainable building material for wall construction in Nigeria. To provide this solution the
research concentrated on using locally sourced material (earth) partially stabilized with
pozzolanic agricultural waste to reduce the amount of ordinary Portland cement (OPC)
that was used in the construction of houses. The reduction of OPC means an
improvement on the environment caused by reducing the pollution caused by the cement
industry in the country over time and the preservation of the raw material for the future
generation. The use of local material (laterite soil) and reduction of OPC for wall material
has significant potential to reduce the cost of the material (Section 2.1).
The objectives set to facilitate this research were.
1. To investigate the raw materials, particularly proportions of laterite, RHA, OPC and
sharp sand needed to produce RHA CEBs for walls in the tropical savanna climate
of Nigeria.
2. Evaluate the mechanical and hygrothermal properties of the resulting CEBs and
analyse them against wall construction requirements.
3. Simulate the hygrothermal and thermal performance to evaluate indoor air quality
and thermal comfort.
7.2 Conclusions
The first objective was to investigate the raw materials, particularly the proportions
required to produce RHA stabilised CEBs for walls. The selection of RHA as the most
suitable pozzolanic material for this research, was based on the following factors.
i.) the availability of RHA: the selection of rice husk ash (RHA) as the most suitable
pozzolan to be used for the tropical savanna climate is because of the proximity of the
raw rice husk and the amount of waste produced from the agricultural industry to
meet the needs of the users. Laterite and sand are also readily available to the
potential site of construction. This means there would be reduction in the cost of
transportation, emission of greenhouse gas (GHG) to the environment from the trucks
commonly used in the country. It also means a potential reduction on the damage to
the roads infrastructure which uses a large amount of the country’s available funds for
maintenance. It is the most accessible pozzolan compare to SBA, POFA to tropical
savanna climate urban areas in the country.
ii.) the ease of processing RHA to get high silica content required for the
pozzolanic reaction to occur processing the rice husk ash (RHA) will be a
challenging initially, as experienced during the research. Furnaces are required
which burn at a controlled temperature (550-700oC). Such a furnace was found at a
199
private sculptor. To provide energy for the combustion of the furnace the purchase of
hydrocarbon gas from a fuelling station is needed regularly. The device is not
connected to the electrical grid of the country. The reason for not connecting the grid
was the large amount of power the furnace required and the electricity supply in the
country is unstable and inadequate. The controlled combustion of rice husk to rice
husk ash ensures that there is high amorphous silica content of about 80-96%.
Amorphous silica ensures that there is pozzolanic reaction in the particles when water
is added to the mix. Although there are challenges involved for production of RHA;
OPC required higher combustion temperature of 14500C and expensive equipment to
manufacture.
The most appropriate proportions of laterite, RHA, OPC and sharp sand required to
produce RHA stabilised CEBs was based on the results of mechanical and hygrothermal
properties (objective 2). The conclusions based on mechanical properties are presented
in section 7.2.1, while the conclusions based on hygrothermal properties are presented in
section 7.2.2.
The final objective was to simulate the hygrothermal and thermal performance to evaluate
indoor air quality and thermal comfort. The conclusions based on indoor air quality are
presented in Section 7.2.3, while the conclusions based on thermal comfort are presented
in Section 7.2.4.
7.2.1 Mechanical property of compressed earth blocks
The methods used for testing the mechanical and hygrothermal properties were described
in Chapter 3 (Methodology). The British standard used for masonry units (BS, EN 772-
1:2011+A1:2015) was referred to as Nigeria does not have a particular standard for
testing earth blocks. This was particularly important in relation to minimum bulk density
and compressive strength allowed for use in residential building construction. There were
two shape of blocks made, the solid and the hollow blocks. The results (Tables 4.8 and
4.9) show that solid compressed earth blocks were about two times stronger than the
hollow compressed earth blocks with similar rice husk ash content. The compressive
strength requirement for different wall structures and the corresponding experimental CEB
types are presented in Table 7.1.
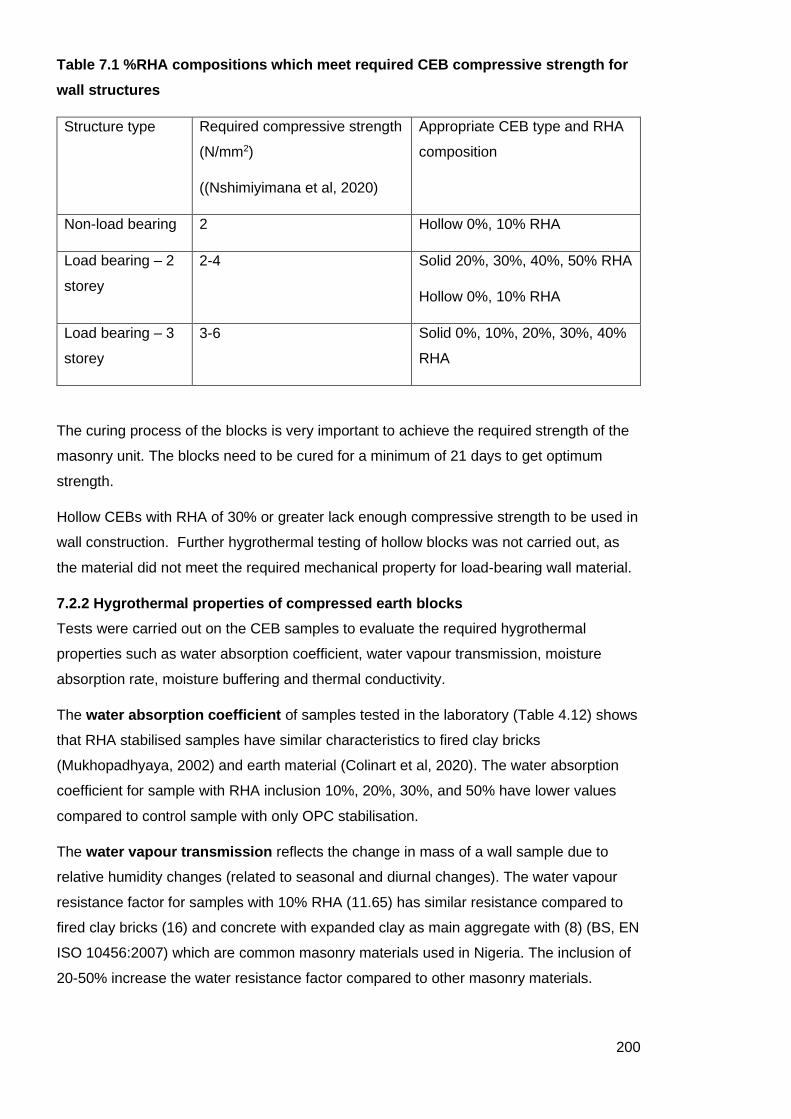
200
Table 7.1 %RHA compositions which meet required CEB compressive strength for
wall structures
Structure type Required compressive strength
(N/mm2)
((Nshimiyimana et al, 2020)
Appropriate CEB type and RHA
composition
Non-load bearing 2 Hollow 0%, 10% RHA
Load bearing – 2
storey
2-4 Solid 20%, 30%, 40%, 50% RHA
Hollow 0%, 10% RHA
Load bearing – 3
storey
3-6 Solid 0%, 10%, 20%, 30%, 40%
RHA
The curing process of the blocks is very important to achieve the required strength of the
masonry unit. The blocks need to be cured for a minimum of 21 days to get optimum
strength.
Hollow CEBs with RHA of 30% or greater lack enough compressive strength to be used in
wall construction. Further hygrothermal testing of hollow blocks was not carried out, as
the material did not meet the required mechanical property for load-bearing wall material.
7.2.2 Hygrothermal properties of compressed earth blocks
Tests were carried out on the CEB samples to evaluate the required hygrothermal
properties such as water absorption coefficient, water vapour transmission, moisture
absorption rate, moisture buffering and thermal conductivity.
The water absorption coefficient of samples tested in the laboratory (Table 4.12) shows
that RHA stabilised samples have similar characteristics to fired clay bricks
(Mukhopadhyaya, 2002) and earth material (Colinart et al, 2020). The water absorption
coefficient for sample with RHA inclusion 10%, 20%, 30%, and 50% have lower values
compared to control sample with only OPC stabilisation.
The water vapour transmission reflects the change in mass of a wall sample due to
relative humidity changes (related to seasonal and diurnal changes). The water vapour
resistance factor for samples with 10% RHA (11.65) has similar resistance compared to
fired clay bricks (16) and concrete with expanded clay as main aggregate with (8) (BS, EN
ISO 10456:2007) which are common masonry materials used in Nigeria. The inclusion of
20-50% increase the water resistance factor compared to other masonry materials.

201
The moisture absorption for in CEB samples with 20% RHA was lower than the control
sample (0% RHA). All other RHA inclusions caused an increase in moisture absorption
compared to the control sample.
The moisture buffering value property of the building materials has a significant effect on
the amount of energy required to cool building in Nigeria. The higher the buffering value of
building material the lower the energy required to cool the building. All the tested
compressed earth blocks show values that can be categorised as good or excellent. The
CEBs with RHA inclusion of 10% had better performance than control CEBs which were
only stabilised with OPC.
The thermal conductivity property of CEBs with inclusion of RHA were all significantly
lower than the control (0% RHA). CEBs with 10% RHA had the lowest thermal
conductivity. The CEBs exhibited favourable thermal conductivity performance to common
building bricks (0.6-1.0 W/m. K) and was comparable with concrete (0.4-0.7 W/m. K)
(Engineering Toolbox A, No Date).
Based on the mechanical and hygrothermal property analysis of the CEBs, inclusion of
RHA from 10-30% have properties which are similar or better than conventional wall
materials in Nigeria.
7.2.3 Indoor air quality
It is essential that the hygrothermal properties of the materials should be considered in
relation the climate of the country. This is mainly to determine potential issues such as
condensation and mould growth which can adversely affect air quality and the health and
comfort of the occupants. It can also indicate potential issues which would adversely
affect wall durability. In this case, the tropical savanna climate part of Nigeria ensures that
the building structure is exposed to high rainfall, high relative humidity and high
temperature from the high sun radiation of the climate. The building wall material is
required to ensure that the internal temperature and relative humidity is reduced to retard
mould growth and condensation on the wall of the building.
Full year simulation of two wall types (full cavity and partial cavity) in high relative humidity
spaces (e.g., bathroom or kitchen) and normal relative humidity spaces, utilising solid
CEBs with 0%, 10%, 20% and 30% RHA assessed temperature, relative humidity,
moisture content, mould growth and total water content for a full year. From this, the most
suitable wall design for Nigeria could be identified.
The masonry wall design with cavity partially filled with thermal insulation material (MDF)
(NP) does not have mould growth on internal side of the wall in spaces with high and
normal internal relative humidity. However, this wall design wasn’t chosen because of

202
high relative humidity within the internal cavity which could cause mould growth in the wall
cavity. This would adversely affect the wall durability.
For a full cavity masonry wall (EP) RHA inclusions up to 20% were suitable for both high
and normal relative humidity spaces. The inclusion of RHA beyond 20% was found to
have potential to allow mould growth on the wall.
7.2.4 Thermal Comfort
A full cavity masonry wall utilising 20% RHA solid CEBs was considered for thermal comfort
analysis. This was selected based on the previous research which showed it to combine:
- the highest possible RHA substitution for OPC
- mechanical properties suitable for 3 storey loads bearing walls
- hygrothermal properties which minimise mould growth even in high humidity
bathroom/kitchen spaces in the tropical savannah climate.
This wall construction was compared to a “typical” concrete wall structure for a 360m2
dwelling. The comparison was based on the hours “not comfortable” at 90% satisfaction
levels. The number of hours “not comfortable” achieved for CEBs partial stabilised with
20% RHA were like concrete walls using the same design strategy and building area.
7.3 Contribution to knowledge
The following points summarise the contribution to knowledge from this research:
1) A comprehensive literature review outlining the challenges of providing dwellings
for low-income earners in Nigeria and discussing the potential material options for
construction of such dwellings.
2) With existing materials and facilities in Nigeria, there is capability of:
a. producing rice husk ash with suitable pozzolanic qualities
b. producing solid CEBs partially stabilised using RHA with suitable
mechanical properties for use in load bearing walls for 2 and 3 storey
buildings
c. producing hollow CEBs with reduced material content and lower OPC &
RHA content with suitable mechanical properties for use in non-load
bearing walls
3) Data from a comprehensive study of mechanical properties of hollow and solid
CEBs which considered 3 curing periods and OPC replaced by 0%, 10%, 20%,
30%, 40%, 50% RHA. This meets a research gap identified after the literature
review and concludes that:
a. at least 21 days curing time is required to achieve full comprehensive
strength.
203
b. solid CEBs have approximately double the compressive strength of hollow
CEBs.
4) Data from a comprehensive study of hygrothermal properties for solid CEBs with
OPC replaced by 0%, 10%, 20%, 30%, 40%, 50% RHA. This meets a research
gap identified after the literature review and concludes that up to 30% of OPC can
be replaced with RHA in solid CEBs while meeting the required mechanical and
hygrothermal properties for load-bearing walls up to 3 storeys.
5) Data from hygrothermal simulation of full cavity and partially insulated cavity wall
structures over a full year for the tropical savannah climate of Nigeria. This
considered the impact of high humidity internal spaces (eg kitchen, bathroom) as
well as normal humidity internal spaces on the hygrothermal performance of the
wall structures utilising solid CEBs with 0%, 10%, 20% and 30% for temperature,
relative humidity, moisture content, mould growth and total water content (also
evaluated over 3 years). This data indicates structures which could cause
potential indoor air quality issues with mould growth which could affect occupant
health and comfort as well as potential impact on the durability of the structure.
This meets a research gap identified after the literature review and concludes that
the full cavity wall type is less liable to excessive humidity in the cavity which could
reduce the wall durability. This is achieved while minimising the environmental /
economic impact.
6) Data from thermal simulation over a full year for the tropical savannah climate of
Nigeria. This considered a dwelling with 360m2 floor area. 90% satisfaction “not
comfortable” hours are very similar for the CEB and concrete structures, which is
considered acceptable, particularly since CEB is a more cost-effective structure
material. “Not comfortable” hours at 80% satisfaction could be reduced to 16.2%
of the year using CEB full cavity wall with 20% RHA CEBs without introducing any
mechanical ventilation or cooling. This is an important finding as Nigeria’s
electricity supply is not stable and some houses only receive supply for 3 hours a
day, energy supply in Nigeria is costly when available.
7) As the use of local materials has been found to reduce the total cost of housing to
approximately 50% (Olotuah, 2002), proving the capability of CEBs for use in wall
construction, gives an opportunity for residential dwellings to be made more
affordable to Nigeria’s low-income earners.
8) As a typical concrete mixture (1 part cement, 2 parts sand, 4 parts aggregate)
contains 14% cement (discounting water and entrained air), while CEB stabilised
with 20% RHA contains 8% cement, a structure has been proposed which
significantly reduces the amount of OPC required with corresponding drop in
environmental impacts. Particularly since the remaining CEB production is labour
intensive with little fossil fuel requirement.
204
7.3.1 Limitation of research
Simulations were only analysed for the tropic savannah climate in Nigeria. This climate
was chosen because it covers a larger area and population than each of the other three
climates. It cannot be assumed that simulation findings for tropic savannah climate apply
to the other climates, particularly the arid climates. Besides, simulation cannot include
every situation and that the computer software are unable to create real-life
situations. However, computer simulation offers the advantage of providing guidance
towards a possible solution or model creation. Furthermore, it serves as a stopgap where
it is impossible to have real-life experience. Because of limitations of time and resources,
therefore, the application of computer simulation for the tropical climate was chosen to
understand the model of mould growth and thermal comfort of the CEB/RHA wall.
7.3.2 Further research
Further research could be carried out in the further topics:
i.) The condensation and interstitial condensation of the building material to ensure
that adequate indoor air quality is meant needs to be analysed on the material.
ii.) The full environmental impact of RHA stabilised CEBs. This would include
greenhouse gas (GHG) emissions, embodied energy, operating energy (assuming
uninterrupted power supply available for mechanical services), treatment at end of
life.
iii.) The financial cost of raw materials, labour required for construction of the CEBs.
iv.) To obtain the hygrothermal property (mould growth) and thermal performance of
CEBs partially stabilized with RHA in this research, the numerical simulation was
applied. Further test to achieve a more realistic result could apply the in-situ
measurement research approach in future studies.
7.4 Summary
The stated aim of this research was to investigate the provision of a possible low cost,
sustainable building material for wall construction in Nigeria. This has been achieved.
Solid CEB with RHA at 20% replacement of OPC has been selected as having the best
combination of maximum OPC replacement while attaining appropriate mechanical and
hygrothermal properties. In some cases, properties such as moisture buffering, water
absorption coefficient, water absorption capacity, water vapor transmission, the inclusion
of RHA provides improved characteristics of the CEB masonry unit.
The 20% RHA CEB has also been found suitable in relation to the impact on occupant’s
health and thermal comfort. Hygrothermal simulation under the local climate conditions
205
indicates there is unlikely to be a risk of internal condensation and mould generation.
Thermal simulation was undertaken for a free-running building as the local electricity
supply is expensive and erratic. The thermal simulation showed similar thermal comfort
hours for CEB with 20% RHA and for concrete walls. Although there was no improved
comfort for CEB with 20% RHA, this replacement does not cause a detrimental effect on
the user.
The major environmental impacts from concrete arise from cement, which is
approximately 14% of concrete (excluding water and entrained air). CEBs with 20% of
the cement substituted from RHA reduces the cement content to 8%. The remaining
material was sourced locally and utilised waste material as a pozzolan. The use of local
materials has been indicated as delivering a 50% saving in the construction cost (Olotuah,
2002) while the labour-intensive nature of CEB production also minimises energy used in
the process.
The introduction of the proposed compressed earth blocks partially stabilized with 20% RHA
would affect the economy, environment, and social aspect of the country. The lack of
adequate funds to reduce the housing deficit can be combated by using locally available
material, cheaper labour, and low-cost equipment to provide wall material which will also
improve the economy of the country. The constant build-up of the slums and informal
settlement in the urban city can be reduced when the CEBs masonry is used which will
improve the environment over time.
206
8 Reference
_______________________________________________________________________
Abd Rashid, A. F. & Yusoff, S. (2015) A review of life cycle assessment method for
building industry. Renewable and Sustainable Energy Reviews, 45(Supplement C), 244-
248.
Adabre, M. A., Chan, A. P. C., Darko, A., Osei-Kyei, R., Abidoye, R. & Adjei-Kumi, T.
(2020) Critical barriers to sustainability attainment in affordable housing: International
construction professionals’ perspective. Journal of Cleaner Production, 253, 119995.
Adam, E. A. & Agib, A. R. A. (2001) Compressed Stabilised Earth Block Manufacture in
Sudan. Improvement of Educational Facilities in the Least Developed Countries of the
Arab
States, 522.
Ade Bilau, A., Witt, E. & Lill, I. (2018) Research methodology for the development of a
framework for managing post-disaster housing reconstruction. Procedia Engineering, 212,
598-605.
Adedokun, A. (2014) Incorporating Traditional Architecture into Modern Architecture:
Case Study of Yoruba Traditonal Architecture. British Journal of Humanities and Social
Sciences, 11(1), 39-45.
Akadiri, P. O. (2015) Understanding barriers affecting the selection of sustainable
materials in building projects. Journal of Building Engineering, 4, 86-93.
Al-Saadi, H. (2014) Demystifying Ontology and Epistemology in Research Methods.
Alabsi, A. A. N., Song, D. X. & Garfield, W. H. (2016) Sustainable Adaptation Climate of
Traditional Buildings Technologies in the Hot Dry Regions. Procedia Engineering,
169(Supplement C), 150-157.
Almeida, F. C. R., Sales, A., Moretti, J. P. & Mendes, P. C. D. (2015) Sugarcane bagasse
ash sand (SBAS): Brazilian agroindustrial by-product for use in mortar. Construction and
Building Materials, 82, 31-38.
Alsubari, B., Shafigh, P. & Jumaat, M. Z. (2016) Utilization of high-volume treated palm oil
fuel ash to produce sustainable self-compacting concrete. Journal of Cleaner Production,
137, 982-996.
Amin, N. (2011) Use of bagasse ash in concrete and its impact on the strength and
chloride resistivity. ASCE J Mater Civ Eng, 23(5), 717–20.
Anifowose, A. Y. B. (2000) Stabilisation of lateritic soils as a raw material for building
blocks. Bulletin of Engineering Geology and the Environment, 58(2), 151-157.
207
Antiohos, S. K., Papadakis, V. G. & Tsimas, S. (2014) Rice husk ash (RHA) effectiveness
in cement and concrete as a function of reactive silica and fineness. Cement and
Concrete Research, 61–62, 20-27.
Aprianti, E., Shafigh, P., Bahri, S. & Farahani, J. N. (2015) Supplementary cementitious
materials origin from agricultural wastes – A review. Construction and Building Materials,
74, 176-187.
Arthur, H. & Kessler, D. W. (1950) Thermal and Moisture Expansion studies of some
domestic granites. Journal of research of the national bureau of standards.
Ashby, M. F. (2013) Materials and the environment : eco-informed material choice, 2nd
ed. edition. Oxford : Butterworth-Heinemann.
Ashour, T., Korjenic, A., Korjenic, S. & Wu, W. (2015) Thermal conductivity of unfired
earth bricks reinforced by agricultural wastes with cement and gypsum. Energy and
Buildings, 104, 139-146.
Aste, N., Adhikari, R. S., Del Pero, C., Leonforte, F. & Timis, I. (2017) Sustainable
Building Design in Kenya. Energy Procedia, 105(Supplement C), 2803-2810.
ASTM (Standard D 4318 2005) Standard Test Methods for Liquid Limit, Plastic Limit,and
Plasticity Index of Soils. ASTM International, West Conshohocken, PA.
Baden-Powell, C. (2011) Architect's Pocket bookRoutledge Ltd-M.U.A.
Bahurudeen, A., Kanraj, D., Gokul Dev, V. & Santhanam, M. (2015) Performance
evaluation of sugarcane bagasse ash blended cement in concrete. Cement and Concrete
Composites, 59, 77-88.
Bahurudeen, A., Marckson, A. V., Kishore, A. & Santhanam, M. (2014) Development of
sugarcane bagasse ash based Portland pozzolana cement and evaluation of compatibility
with superplasticizers. Construction and Building Materials, 68, 465-475.
Bahurudeen, A. & Santhanam, M. (2015) Influence of different processing methods on the
pozzolanic performance of sugarcane bagasse ash. Cement and Concrete Composites,
56, 32-45.
Beck, H. E., Zimmermann, N. E., McVicar, T. R., Vergopolan, N., Berg, A. & Wood, E. F.
(2018) Present and future Köppen-Geiger climate classification maps at 1-km resolution.
Scientific Data, 5(1), 180214.
Berge, B. (2000) The ecology of building materialsOxford : Butterworth-Heinemann.
Berto. L, Saetta. A, Scotta. R & Vitaliani. R (2005) Failure mechanism of masonry prism
loaded in axial compression: computational aspects. Materials and structures, 38(2), 249-
256.
Binici, H., Aksogan, O., Bakbak, D., Kaplan, H. & Isik, B. (2009) Sound insulation of fibre
reinforced mud brick walls. Construction and Building Materials, 23(2), 1035-1041.
Bodian, S., Faye, M., Sene, N. A., Sambou, V., Limam, O. & Thiam, A. (2018) Thermo-
mechanical behavior of unfired bricks and fired bricks made from a mixture of clay soil and
laterite. Journal of Building Engineering, 18, 172-179.
208
BRE (Report 2014) In-situ measurements of wall U-values in English housing. Department
of Energy and Climate Change.
Britain, S. F. o. G. (2011) Natural stone, the oldest sustainable material. Stone Federation
of Great Britain.
BS (5250:2011+A1:2016) Code of practice for condesation in building.
BS (EN 771-1:2011+A1:2015) EN 771-1:2011+A1:2015: Specification for masonry units.
Clay masonry units.
BS (EN 772-1:2011+A1:2015) EN 772-1:2011+A1:2015: Methods of test for masonry
units. Determination of compressive strength.
BS (EN 772-4: 1998) EN 772-4: 1998: Methods of test for masonry units. Determination of
real and bulk density and of total and open porosity for natural stone masonry units.
BS (EN 772-21:2011) EN 772-21:2011: Method of test for masonry units. Determination of
water absorption of clay and calcium silicate masonry units by cold water absorption.
BS (EN 1934:1998) EN 1934:1998: Thermal performance of buildings. Determination of
thermal resistance by hot box method using heat flow meter. Masonry.
BS (EN 12524:2000) EN 12524:2000: Building materials and products- hygrothermal
proerties- Tabulated design values.
BS (EN ISO 10456:2007) EN ISO 10456:2007: Building materials and products-
Hygrothermal properties- Tabulated design values and procedure for determining
declared and design thermal values.
BS (EN ISO 12571:2013) EN ISO 12571:2013: Hygrothermal performance of building
materials and products — Determination of hygroscopic sorption properties.
BS (EN ISO 12572:2016) EN ISO 12572:2016: Hygrothermal performance of building
materials and products. Determination of water vapour transmission properties. Cup
method.
BS EN. (13788:2012) 13788:2012: Hygrothermal performance of building components
and building elements. Internal surface temperature to avoid critical surface humidity and
interstitial condensation. Calculation methods.
BS (EN ISO 14688-1:2018) EN ISO 14688-1:2018: Geotechnical investigation and
testing. Identification and classification of soil. Identification and description.
BS (EN ISO 14688-2:2018) EN ISO 14688-2:2018: Geotechnical investigation and
testing. identification and classification of soil. Principles for a classification.
BS (EN ISO 15148:2002+A1:2016) EN ISO 15148:2002+A1:2016: Hygrothermal
performance of building materials and products. Determination of water absorption
coefficient by partial immersion.
BS EN. (15026:2007) 15026:2007: Hygrothermal performance of building component and
building elements- assessment of moisture transfer by numerical simulation.

209
Engelbrecht, C. J. & Engelbrecht, F. A. (2016) Shifts in Köppen-Geiger climate zones over
southern Africa in relation to key global temperature goals. Theoretical and applied
climatology, 123, 247-261.
BS (EN ISO 17892-2:2014) EN ISO 17892-2:2014: Geotechnical investigation and
testing. Laboratory testing of soil. Determination of bulk density.
BS (EN ISO 17892-12:2018) EN ISO 17892-12:2018: Geotechnical investigation and
testing. Laboratory testing of soil. Determination of liquid and plastic limits.
BS (EN ISO 22007-1:2017) EN ISO 22007-1:2017: Plastics- Determination of thermal
conductivity and thermal diffusivity- Part 1: General princilple.
Burney, S. M. A. & Saleem, H. (2008) Inductive and Deductive Research Approach.
Cabeza, L. F., Barreneche, C., Miró, L., Martínez, M., Fernández, A. I. & Urge-Vorsatz, D.
(2013) Affordable construction towards sustainable buildings: review on embodied energy
in building materials. Current Opinion in Environmental Sustainability, 5(2), 229-236.
Cao, X., Xilei, D. & Liu, J. (2016) Building energy-consumption status worldwide and the
state-of-the-art technologies for zero-energy buildings during the past decade. Energy and
Buildings, 128.
Charlett, A. J. (2013) Fundamental building technology, 2nd ed. edition. London: London :
Routledge.
Charlotte, B.-P. (2011) Architect's Pocket bookRoutledge Ltd-M.U.A.
Chiang, K.-Y., Chou, P.-H., Hua, C.-R., Chien, K.-L. & Cheeseman, C. (2009) Lightweight
bricks manufactured from water treatment sludge and rice husks. Journal of Hazardous
Materials, 171(1–3), 76-82.
Chizoba, I. (2019) Federal civil service commision salary structure 2020, 2019. Available
online: https://nigerianinfopedia.com.ng/federal-civil-service-commission-salary-structure/
[Accessed.
Chong, W. O., Chang, J., Parrish, K., Berardi, U., Madurwar, M., Sakhare, V. &
Ralegaonkar, R. (2015) Defining the future of sustainability and resilience in design,
engineering and constructionMulti Objective Optimization of Mix Proportion for a
Sustainable Construction Material. Procedia Engineering, 118, 276-283.
Chowdhury, S., Mishra, M. & Suganya, O. (2015) The incorporation of wood waste ash as
a partial cement replacement material for making structural grade concrete: An overview.
Ain Shams Engineering Journal, 6(2), 429-437.
Clarke, J. A., Johnstone, C. M., Kelly, N. J., McLean, R. C., anderson, J. A., Rowan, N. J.
& Smith, J. E. (1999) A technique for the prediction of the conditions leading to mould
growth in buildings. Building and Environment, 34(4), 515-521.
Colinart, T., Vinceslas, T., Lenormand, H., Menibus, A. H. D., Hamard, E. & Lecompte, T.
(2020) Hygrothermal properties of light-earth building materials. Journal of Building
Engineering, 29, 101134.

210
Cook, D. J. (1986) Natural pozzolanasSurrey University press
Cordeiro, G. C., Toledo Filho, R. D. & Fairbairn, E. M. R. (2009a) Effect of calcination
temperature on the pozzolanic activity of sugar cane bagasse ash. Construction and
Building Materials, 23(10), 3301-3303.
Cordeiro, G. C., Toledo Filho, R. D., Tavares, L. M. & Fairbairn, E. d. M. R. (2009b)
Ultrafine grinding of sugar cane bagasse ash for application as pozzolanic admixture in
concrete. Cement and Concrete Research, 39(2), 110-115.
Cordeiro, G. C., Toledo Filho, R. D., Tavares, L. M. & Fairbairn, E. M. R. (2008)
Pozzolanic activity and filler effect of sugar cane bagasse ash in Portland cement and
lime mortars. Cement and Concrete Composites, 30(5), 410-418.
Coutinho, J. S. (2002) The combined benefits of CPF and RHA in improving the durability
of concrete structures. Cement and Concrete Composites, 25(1), 51-59.
Craighead, G. (2009) High-Rise Security and Fire Life Safety 3rd Edition.
Creswell, J. W. (2018) Research design : qualitative, quantitative & mixed methods
approaches, Fifth edition, international student edition. edition. Los Angeles ; London :
Sage.
d-maps.com (2020) Map Nigeria, Federal republick of Nigeria, boundaries, states names,
2020. Available online: https://d-maps.com/carte.php?num_car=4866&lang=en
[Accessed.
Dai, Z., Wu, Y., Hu, L., Zhang, W. & Mao, L. (2019) Evaluating physical-mechanical
properties and long periods environmental risk of fired clay bricks incorporated with
electroplating sludge. Construction and Building Materials, 227, 116716.
Dakroury, A. E. & and Gasser, M. S. (2008) Rice husk ash (RHA) as cement admixture for
immobilization of liquid radioactive waste at different temperatures. Journal of Nuclear
Materials, 381(3), 271–277.
Darko, A., Chan, A. P. C., Gyamfi, S., Olanipekun, A. O., He, B.-J. & Yu, Y. (2017) Driving
forces for green building technologies adoption in the construction industry: Ghanaian
perspective. Building and Environment, 125(Supplement C), 206-215.
de Soares, M. M. N. S., Garcia, D. C. S., Figueiredo, R. B., Aguilar, M. T. P. & Cetlin, P.
R. (2016) Comparing the pozzolanic behavior of sugar cane bagasse ash to amorphous
and crystalline SiO2. Cement and Concrete Composites, 71, 20-25.
Dixit, M. K. (2017) Life cycle embodied energy analysis of residential buildings: A review
of literature to investigate embodied energy parameters. Renewable and Sustainable
Energy Reviews, 79(Supplement C), 390-413.
Donkor, P. & Obonyo, E. (2015) Earthen construction materials: Assessing the feasibility
of improving strength and deformability of compressed earth blocks using polypropylene
fibers. Materials & Design, 83, 813-819.

211
Doubi, H., Kouamé, A., Konan, L., Tognonvi, M. & Oyetola, S. (2017) Thermal
Conductivity of Compressed Earth Bricks Strengthening by Shea Butter Wastes with
Cement. Materials Sciences and Applications, 08, 848-858.
Ducoulombier, L. & Lafhaj, Z. (2017) Comparative study of hygrothermal properties of five
thermal insulation materials. Case Studies in Thermal Engineering, 10, 628-640.
Egenti, C., Khatib, J. M. & Oloke, D. (2014) Conceptualisation and pilot study of shelled
compressed earth block for sustainable housing in Nigeria. International Journal of
Sustainable Built Environment, 3(1), 72-86.
Emmanuel, J. B. (2012) “Housing Quality” To the Low Income Housing Producers in
Ogbere, Ibadan, Nigeria. Procedia - Social and Behavioral Sciences, 35, 483-494.
Engineering, Toolbox. (2002) Thermal conductivity of selected materials and gases 2002.
Available online: https://www.engineeringtoolbox.com/thermal-conductivity-d_429.html
[Accessed.
Engineering, Toolbox. (2008) Compression and tension strength of some common
materials, 2008. Available online: https://www.engineeringtoolbox.com/compression-
tension-strength-d_1352.html [Accessed.
Fairbairn, E. M. R., Americano, B. B., Cordeiro, G. C., Paula, T. P., Toledo Filho, R. D. &
Silvoso, M. M. (2010) Cement replacement by sugar cane bagasse ash: CO2 emissions
reduction and potential for carbon credits. Journal of Environmental Management, 91(9),
1864-1871.
Fantucci, S., Isaia, F., Serra, V. & Dutto, M. (2017) Insulating coat to prevent mold growth
in thermal bridges. Energy Procedia, 134, 414-422.
FAS, U. (2019) Sugar Annual 2019, UpTick in Nigeria's sugar consumptions and imports.
Fasona, M., Tadross, M., Abiodun, B. & Omojola, A. (2013) Some implications of
terrestrial ecosystems response to climate change for adaptation in Nigeria's wooded
savannah. Environmental Development, 5, 73-95.
Fedorik, F. & Illikainen, K. (2013) HAM and mould growth analysis of a wooden wall.
International Journal of Sustainable Built Environment, 2(1), 19-26.
Fockenberg, F. (1991) STUDIES ON THE RELATIONSHIP BETWEEN WATER
ABSORPTION AND CRISTALLISATION TEST FOR IMPREGNATED STONE
MATERIALS, in Baer, N. S., Sabbioni, C. & Sors, A. I. (eds), Science, Technology and
European Cultural HeritageButterworth-Heinemann, 660-663.
Gan, X., Zuo, J., Wu, P., Wang, J., Chang, R. & Wen, T. (2017) How affordable housing
becomes more sustainable? A stakeholder study. Journal of Cleaner Production,
162(Supplement C), 427-437.
Ganesan, K., Rajagopal, K. & and Thangavel, K. (2007) Evaluation of bagasse ash as
supplementary cementitious material. Cement Concrete Composition, 29(5), 515-24.

212
Ganesan, K., Rajagopal, K. & Thangavel, K. (2008) Rice husk ash blended cement:
Assessment of optimal level of replacement for strength and permeability properties of
concrete. Construction and Building Materials, 22(8), 1675-1683.
Gberevbie, D. (2010) Strategies for employee recruitment, retention and performance:
Dimension of the Federal civil service of Nigeria. African Journal of Business
Management, 4, 1447-1456.
Givi, A. N., Rashid, S. A., Aziz, F. N. A. & Salleh, M. A. M. (2010) Assessment of the
effects of rice husk ash particle size on strength, water permeability and workability of
binary blended concrete. Construction and Building Materials, 24(11), 2145-2150.
Givoni, B. (1992) Comfort, climate analysis and building design guidelines. Energy and
Buildings, 18(1), 11-23.
González-Jorge, H., Puente, I., Riveiro, B., Martínez-Sánchez, J. & Arias, P. (2013)
Automatic segmentation of road overpasses and detection of mortar efflorescence using
mobile LiDAR data. Optics & Laser Technology, 54(Supplement C), 353-361.
GTM-7 (2015) Geotechnical test method: Test method for liquid limit, plastic limit, and
plasticity indest.
Gradeci, K., Labonnote, N., Time, B. & Köhler, J. (2017) Mould growth criteria and design
avoidance approaches in wood-based materials – A systematic review. Construction and
Building Materials, 150, 77-88.
Gradeci, K., Labonnote, N., Time, B. & Köhler, J. (2018) A probabilistic-based
methodology for predicting mould growth in façade constructions. Building and
Environment, 128, 33-45.
Sadovský, Z. & Koronthályová, O. (2017) Exploration of probabilistic mould growth
assessment. Applied Mathematical Modelling, 42, 566-575.
Gumaste, K. S., Rao, K. S. N., Reddy, B. V. V. & Jagadish, K. S. (2007) Strength and
Elasticity of brick masonry prims and wallettes under compression. Materials and
structures, 40(2).
Gyurkó, Z., Jankus, B., Fenyvesi, O. & Nemes, R. (2019) Sustainable applications for
utilization the construction waste of aerated concrete. Journal of Cleaner Production, 230,
430-444.
Habeeb, G. A. & and Fayyadh, M. M. (2009) Rice Husk Ash Concrete: the Effect of RHA
Average Particle Size on Mechanical Properties and Drying Shrinkage. Australian Journal
of Basic and Applied Sciences, 3(3), 1616-1622.
Hall, M. R., Lindsay, R. & Krayenhoff, M. (2012) Modern Earth Building, in Hall, M. R.,
Lindsay, R. & Krayenhoff, M. (eds), Modern Earth BuildingsWoodhead Publishing, 3-16.
Hegger, M. (2006) Construction materials manualBerlin : Birkhauser.
Heung Fai, L. A. M., Kishore, R., Bhikshma, V. & Prakash, P. J. (2011) The Proceedings
of the Twelfth East Asia-Pacific Conference on Structural Engineering and

213
ConstructionStudy on Strength Characteristics of High Strength Rice Husk Ash Concrete.
Procedia Engineering, 14, 2666-2672.
Hind K.J (2007) The Casagrande plasticity chart – does it help or hinder the NZGS soil
classification process?, Proceeding of 20th NZGS Geotechnical symposium. Eds GJ
Alexander & CY Chin, Napier.
Hjort, B. & Widén, K. (2015) Introduction of Sustainable Low-cost Housing in Ethiopia – an
Innovation Diffusion Perspective. Procedia Economics and Finance, 21(Supplement C),
454-460.
Hola, A. (2017) Measuring of the moisture content in brick walls of historical buildings –
the overview of methods. IOP Conference Series: Materials Science and Engineering,
251, 012067.
Holland, M. (2011) practical Guide to Diagnosing structural Movement in Buildings.
IEA, I. E. a. (2019) 2019 Global status report for building and construction.
Jamil, M., Kaish, A. B. M. A., Raman, S. N. & Zain, M. F. M. (2013) Pozzolanic
contribution of rice husk ash in cementitious system. Construction and Building Materials,
47, 588-593.
Jaturapitakkul, C., Tangpagasit, J., Songmue, S. & Kiattikomol, K. (2011) Filler effect and
pozzolanic reaction of ground palm oil fuel ash. Construction and Building Materials,
25(11), 4287-4293.
Jester, T. C. & Tomlan, M. A. (2014) Twentieth-century building materials : history and
conservationLos Angeles, California : Getty Conservation Institute.
Kaewkhao, J., Limsuwan, P., P.Yupapin, P. P. Y., JanJai, S. J., Sutas, J., Mana, A. &
Pitak, L. (2012) ISEECEffect of Rice Husk and Rice Husk Ash to Properties of Bricks.
Procedia Engineering, 32, 1061-1067.
Kalpana, M. & Mohith, S. (2020) Study on autoclaved aerated concrete: Review. Materials
Today: Proceedings, 22, 894-896.
Karagiannis, N., Karoglou, M., Bakolas, A. & Moropoulou, A. (2016) Effect of temperature
on water capillary rise coefficient of building materials. Building and Environment, 106,
402-408.
Karim, M. R., Zain, M. F. M., Jamil, M. & Lai, F. C. (2013) Fabrication of a non-cement
binder using slag, palm oil fuel ash and rice husk ash with sodium hydroxide. Construction
and Building Materials, 49, 894-902.
Kazmi, S. Minhaj S., Abbas, S., Munir, M. J. & Khitab, A. (2016a) Exploratory study on the
effect of waste rice husk and sugarcane bagasse ashes in burnt clay bricks. Journal of
Building Engineering, 7, 372-378.
Kazmi, S. M. S., Abbas, S., Saleem, M. A., Munir, M. J. & Khitab, A. (2016b)
Manufacturing of sustainable clay bricks: Utilization of waste sugarcane bagasse and rice
husk ashes. Construction and Building Materials, 120, 29-41.
214
Khalid, N. H. A., Hussin, M. W., Mirza, J., Ariffin, N. F., Ismail, M. A., Lee, H.-S.,
Mohamed, A. & Jaya, R. P. (2016) Palm oil fuel ash as potential green micro-filler in
polymer concrete. Construction and Building Materials, 102, Part 1, 950-960.
Khambadkone, N. K. & Jain, R. (2017) A bioclimatic analysis tool for investigation of the
potential of passive cooling and heating strategies in a composite Indian climate. Building
and Environment, 123, 469-493.
Khankhaje, E., Hussin, M. W., Mirza, J., Rafieizonooz, M., Salim, M. R., Siong, H. C. &
Warid, M. N. M. (2016) On blended cement and geopolymer concretes containing palm oil
fuel ash. Materials & Design, 89, 385-398.
Kırbaş, B. & Hızlı, N. (2016) Learning from Vernacular Architecture: Ecological Solutions
in Traditional Erzurum Houses. Procedia - Social and Behavioral Sciences,
216(Supplement C), 788-799.
Knoema (2020) Production, supply and distribuiton of agricultural commodies by market
year, 2020. Available online: https://knoema.com/USDAPSD2020Feb/production-supply-
and-distribution-of-agricultural-commodities-by-market-year-feb-2020 [Accessed.
Kočí, J., Žumár, J., Pavlík, Z. & Černý, R. (2011) Application of genetic algorithm for
determination of water vapor diffusion parameters of building materials. Journal of
Building Physics, 35(3), 238-250.
Kolawole, J. T., Olalusi, O. B. & Orimogunje, A. J. (2020) Adhesive bond potential of
compressed stabilised earth brick. Structures, 23, 812-820.
Krosnowski, A. D. (2011) A Proposed Best Practice Method of Defining a Standard of
Care for Stabilized Compressed Earthen Block Production.
Kumar, A. & Gupta, D. (2016) Behavior of cement-stabilized fiber-reinforced pond ash,
rice husk ash–soil mixtures. Geotextiles and Geomembranes, 44(3), 466-474.
Laskar, A. I. & and Talukdar, S. (2007) Rheological behavior of high performance
concrete with mineral admixtures and their blending. Construction and Building Materials,
22(12), 2345-2354.
Lavie Arsène, M.-I., Frédéric, C. & Nathalie, F. (2020) Improvement of lifetime of
compressed earth blocks by adding limestone, sandstone and porphyry aggregates.
Journal of Building Engineering, 29, 101155.
Liu, X., Fan, Y. & Wang, C. (2017) An estimation of the effect of carbon pricing for CO2
mitigation in China’s cement industry. Applied Energy, 185, Part 1, 671-686.
Lyons, A. (2014) Materials for architects and builders, Fifth edition. edition. London :
Routledge.
Maia de Souza, D., Lafontaine, M., Charron-Doucet, F., Chappert, B., Kicak, K., Duarte, F.
& Lima, L. (2016) Comparative life cycle assessment of ceramic brick, concrete brick and
cast-in-place reinforced concrete exterior walls. Journal of Cleaner Production, 137, 70-
82.
215
Maillard, P. & Aubert, J. E. (2014) Effects of the anisotropy of extruded earth bricks on
their hygrothermal properties. Construction and Building Materials, 63, 56-61.
Malalgoda, C., Amaratunga, D. & Haigh, R. (2018) Empowering local governments in
making cities resilient to disasters: research methodological perspectives. Procedia
Engineering, 212, 902-909.
Malhotra, V. M. & Mehta, P. K. (1996) Pozzolanic and cementitious materials, 1Gordon
and Breach.
Mansour, M. B., Jelidi, A., Cherif, A. S. & Jabrallah, S. B. (2016) Optimizing thermal and
mechanical performance of compressed earth blocks (CEB). Construction and Building
Materials, 104, 44-51.
Maxwell, J. & Loomis, D. (2003) Mixed method design: An alternative approach.
Handbook of Mixed Methods in Social and Behavioral Research, 241-272.
McGregor, F., Heath, A., Fodde, E. & Shea, A. (2014) Conditions affecting the moisture
buffering measurement performed on compressed earth blocks. Building and
Environment, 75, 11-18.
McHenry, P. G. (1984) Adobe and rammed earth buildings : design and constructionNew
York Chichester : Wiley.
Mehta, B. R., Sahay, M. K., Malhotra, L. K., Avasthi, D. K. & Soni, R. K. (1996) High
energy heavy ion induced changes in the photoluminescence and chemical composition
of porous silicon. Thin Solid Films, 289(1–2), 95-98.
Mehta, D. U., Sathawane, S. H., Vairagade, V. S. & Kene, K. S. (2013) Chemical, Civil
and Mechanical Engineering Tracks of 3rd Nirma University International Conference on
Engineering (NUiCONE2012)Combine Effect of Rice Husk Ash and Fly Ash on Concrete
by 30% Cement Replacement. Procedia Engineering, 51, 35-44.
Mkaouar, S., Maherzi, W., Pizette, P., Zaitan, H. & Benzina, M. (2019) A comparative
study of natural Tunisian clay types in the formulation of compacted earth blocks. Journal
of African Earth Sciences, 160, 103620.
Mostafa, M. & Uddin, N. (2016a) Experimental analysis of Compressed Earth Block (CEB)
with banana fibers resisting flexural and compression forces. Case Studies in
Construction Materials, 5, 53-63.
Mostafa, M. & Uddin, N. (2016b) Experimental analysis of Compressed Earth Block (CEB)
with banana fibers resisting flexural and compression forces. Case Studies in
Construction Materials, 5(Supplement C), 53-63.
Moughtin, J. C. (2013) The Traditional Settlement of Hausa People. The Town Planning
Review, Vol. 35, No. 1 (Apr., 1964), pp. 21-34.
Mukhopadhyaya, P. K., K.; Normandin, N.; Goudreau, P (2002) Effect of surface
temperature on water absorption coeffcient of building materials. Thermal Envelop and
Building Science, 26, 179-195.
216
Nagrale, S. D., Hajare, H. & and Modak, P. R. (2012) Utilization of Rice Husk Ash.
.International Journal of Engineering Research and Applications, 2(4), 001-005.
Narayanaswamy, A. H., Walker, P., Venkatarama Reddy, B. V., Heath, A. & Maskell, D.
(2020) Mechanical and thermal properties, and comparative life-cycle impacts, of
stabilised earth building products. Construction and Building Materials, 243, 118096.
Nehdi, M., Duquette, J. & El Damatty, A. (2003) Performance of rice husk ash produced
using a new technology as a mineral admixture in concrete. Cement and Concrete
Research, 33(8), 1203-1210.
Norsuraya, S., Fazlena, H. & Norhasyimi, R. (2016) Sugarcane Bagasse as a Renewable
Source of Silica to Synthesize Santa Barbara Amorphous-15 (SBA-15). Procedia
Engineering, 148, 839-846.
Nshimiyimana, P., Fagel, N., Messan, A., Wetshondo, D. O. & Courard, L. (2020)
Physico-chemical and mineralogical characterization of clay materials suitable for
production of stabilized compressed earth blocks. Construction and Building Materials,
241, 118097.
Ogunsote, O. O., Ogunsote, B. P. & Morisade, A. (2010) Optimizing passive cooling
systems in residential buildings: A case study of Akure, Nigeria.
Okeyinka, Y. R. a. O., S.A (2015) Houseform Characteristics of the Yoruba Culture.
Journal of Culture, Society and Development, 10.
Olaniyan, S. A. (2012) Optimizing thermal comfort for tropical residential designs in
Nigeria: How significant are the walling fabrics?, People and Buildings. London
Metropolitan University, London, UK, 18th September 2012.
Olanrewaju, A., Anavhe, P. & Hai, T. K. (2016) A Framework for Affordable Housing
Governance for the Nigerian Property Market. Procedia Engineering, 164, 307-314.
Olayiwola, L. M., Adeleye, O. & Ogunsakin, L. (2005) Urban Housing Crisis and
Responses in Nigeria: The planners' view point. World Congress on Housing
Transforming Housing Environments through the Design.
Olotuah, A. O. (2002) Recourse to earth for low-cost housing in Nigeria. Building and
Environment, 37(1), 123-129.
Oluwagbemiga, P. A. & Modi, S. Z. (2014) Development of Traditional Architecture in
Nigeria: A Case Study of Hause House Form. international journal of African Society
Cultures and Traditions, 1(1), 61-74.
Ouedraogo, K. A. J., Aubert, J.-E., Tribout, C. & Escadeillas, G. (2020) Is stabilization of
earth bricks using low cement or lime contents relevant? Construction and Building
Materials, 236, 117578.
Pacheco-Torgal, F. (2015) Eco-efficient Masonry Bricks and Blocks, in Pacheco-Torgal,
F., Lourenço, P. B., Labrincha, J. A., Kumar, S. & Chindaprasirt, P. (eds), Eco-Efficient
Masonry Bricks and Blocks. Oxford: Woodhead Publishing, 1-10.
217
Phonphuak, N., Saengthong, C. & Srisuwan, A. (2019) Physical and mechanical
properties of fired clay bricks with rice husk waste addition as construction materials.
Materials Today: Proceedings, 17, 1668-1674.
Rama, K. B., Ratnam, M. K. M. V. & and Raju, U. R. (2015) Experimental Studies on
Concrete with Rice Husk Ash as a Partial Replacement of Cement Using Magnesium
Sulphate Solution. International Journal for Innovative Research in Science & Technology,
1(7), 333 - 340.
Ramezanianpour, A. A., Mahdi khani, M. & and Ahmadibeni, G. (2009) The effect of rice
husk ash on mechanical properties and durability of sustainable concretes. International
Journal of Civil Engineerng., 7(2), 83–91.
Raut, S., Ralegaonkar, R. & Mandavgane, S. (2013) Utilization of recycle paper mill
residue and rice husk ash in production of light weight bricks. Archives of Civil and
Mechanical Engineering, 13(2), 269-275.
Richardson, B. A. (2001) Defects and deterioration in buildings, 2nd ed. edition. London:
London : Spon.
Rigassi, V. & CRATerre-EAG. (1985) Compressed Earth Blocks: Manual of Production, 1.
Rode, C., Peuhkuri, R., Time, B., Svennberg, K. & Ojanen, T. (2007) Moisture buffer value
of building materials. ASTM Special Technical Publication, 1495, 33-44.
Rode, C., R, P., L.H, M., K.K, H., B, T., A, G., T, O., J, A., K, S. & L.E, H. (2005) Moisture
Buffering of Building Materials. Department of Civil Engineering Technical University of
Denmark.
Rodrigues, C. S., Ghavami, K. & and Stroeven, P. ((2006)) Porosity and water
permeability of rice husk ash-blended cement composites reinforced with bamboo pulp.
Journal of Materials Science, 41(21), 6925-6937.
Roshan, G., Oji, R. & Attia, S. (2019) Projecting the impact of climate change on design
recommendations for residential buildings in Iran. Building and Environment, 155, 283-
297.
Salas, A., Delvasto, S., R.M., D. G. & D., a. L. (2009) Comparison of two processes for
treating rice husk ash for use in high performance concrete. Cement and Concrete
Research,, 39, 773–8.
Saraswathy, V. & and Ha-Won, S. (2007) Corrosion performance of rice husk ash blended
concrete. Construction and Building Materials., 21(8), 1779–1784.
Sekhar C, D. & Nayak, S. (2018) Utilization of granulated blast furnace slag and cement in
the manufacture of compressed stabilized earth blocks. Construction and Building
Materials, 166, 531-536.
Serbah, B., Abou-Bekr, N., Bouchemella, S., Eid, J. & Taibi, S. (2018) Dredged sediments
valorisation in compressed earth blocks: Suction and water content effect on their
mechanical properties. Construction and Building Materials, 158, 503-515.
218
SFGB (2011) Natural stone, the oldest sustainable material. Stone Federation of Great
Britain.
Solutions, M. N. (2017) BlockFlash™* | The Complete Flashing Solution for Single Wythe
Concrete Masonry Unit Walls. Moisture Management for Masonry.
Sore, S. O., Messan, A., Prud’homme, E., Escadeillas, G. & Tsobnang, F. (2016)
Synthesis and characterization of geopolymer binders based on local materials from
Burkina Faso – Metakaolin and rice husk ash. Construction and Building Materials, 124,
301-311.
Steve, G. (2016) Sustainable Construction processesWiley- Blackwell.
Stowell (2020) Dense concrete blocks/bricks, 2020. Available online:
https://stowellconcrete.co.uk/dense-concrete-blocksbricks-10-4nmm2/ [Accessed.
Sturm, P., Gluth, G. J. G., Brouwers, H. J. H. & Kühne, H. C. (2016) Synthesizing one-part
geopolymers from rice husk ash. Construction and Building Materials, 124, 961-966.
Subramaniyan, K. S. & and Sivaraja, M. (2016) Assessment of sugarcane bagasse ash
concrete on mechanical and durability properties. Middle-East Journal of Scientific
Research, 24(S1), 257-267.
Taallah, B. & Guettala, A. (2016) The mechanical and physical properties of compressed
earth block stabilized with lime and filled with untreated and alkali-treated date palm
fibers. Construction and Building Materials, 104, 52-62.
Takhelmayan, G., Prasad, R. & and Savithal, A. L. (2014) Experimental Study on
Properties of Cement Using Riced Husk Ash. International Journal of Engineering Science
and Innovative Technology (IJESIT), 3(6), 101-107.
Tangchirapat, W., Jaturapitakkul, C. & Chindaprasirt, P. (2009) Use of palm oil fuel ash as
a supplementary cementitious material for producing high-strength concrete. Construction
and Building Materials, 23(7), 2641-2646.
Tay, J. H. (1990) Ash from oil-palm waste as a conrete material. Journal of materials in
civil engineering, 2(2), 94-105.
Taylor, P., Fuller, R. J. & Luther, M. B. (2008) Energy use and thermal comfort in a
rammed earth office building. Energy and Buildings, 40(5), 793-800.
Tettey, U. Y. A., Dodoo, A. & Gustavsson, L. (2017) Energy use implications of different
design strategies for multi-storey residential buildings under future climates. Energy, 138,
846-860.
Thomas, D. & Ding, G. (2018) Comparing the performance of brick and timber in
residential buildings – The case of Australia. Energy and Buildings, 159(Supplement C),
136-147.
Tian, H. & Zhang, Y. X. (2016) The influence of bagasse fibre and fly ash on the long-term
properties of green cementitious composites. Construction and Building Materials, 111,
237-250.

219
Toe, D., Toe, C. & Kubota, T. (2010) A Review of Adaptive Model of Thermal Comfort for
Naturally Ventilated Buildings in Hot-Humid Climate.
Torgal, F. P. & Said, J. (2011) Eco-efficient construction and building materialsSpringer.
Tsado, T. Y., Yewa, M., Yaman, S. & and Yewa, F. (2014) Comparative Analysis of
Properties of Some Artificial Pozzolana in Concrete Production. International Journal of
Engineering and Technology, 4(5), 251 - 255.
Udawattha, C. & Halwatura, R. (2017) Life cycle cost of different Walling material used for
affordable housing in tropics. Case Studies in Construction Materials, 7, 15-29.
Ugochukwu, I. B. & Chioma, M. I. B. (2015) Local Building Materials: Affordable Strategy
for Housing the Urban Poor in Nigeria. Procedia Engineering, 118, 42-49.
UN-Habitat (2011) Annual Report.
UN, D. o. e. a. s. A. (2018) 68% of World Population projected to live in urban areas by
2050, 2018. Available online:
https://www.un.org/development/desa/en/news/population/2018-revision-of-world-
urbanization-prospects.html [Accessed.
Uzoegbo, H. C. (2020) 12 - Dry-stack and compressed stabilized earth-block construction,
in Harries, K. A. & Sharma, B. (eds), Nonconventional and Vernacular Construction
Materials (Second Edition)Woodhead Publishing, 305-350.
Van Damme, H. & Houben, H. (2017) Earth concrete. Stabilization revisited. Cement and
Concrete Research.
Van Tuan, N., Ye, G., van Breugel, K., Fraaij, A. L. A. & Bui, D. D. (2011) The study of
using rice husk ash to produce ultra high performance concrete. Construction and
Building Materials, 25(4), 2030-2035.
Vincent Rigassi & CRATerre-EAG. (1985) COMPRESSED EARTH BLOCKS: MANUAL
OF PRODUCTION, 1.
Walsh, A., Cóstola, D. & Labaki, L. C. (2017) Review of methods for climatic zoning for
building energy efficiency programs. Building and Environment, 112(Supplement C), 337-
350.
Wang, C., Li, Y., Myint, S. W., Zhao, Q. & Wentz, E. A. (2019) Impacts of spatial
clustering of urban land cover on land surface temperature across Köppen climate zones
in the contiguous United States. Landscape and Urban Planning, 192, 103668.
Wang, Y., Zheng, T., Zheng, X., Liu, Y., Darkwa, J. & Zhou, G. (2020) Thermo-mechanical
and moisture absorption properties of fly ash-based lightweight geopolymer concrete
reinforced by polypropylene fibers. Construction and Building Materials, 251, 118960.
World, M. o. (2020) Nigeria Latitude and Longitude Map, 2020. Available online:
https://www.mapsofworld.com/lat_long/nigeria-lat-long.html [Accessed.
220
Worldometer (2019) Current world population, Main cities by population in Nigeria, 2019.
Available online: https://www.worldometers.info/world-population/nigeria-population/
[Accessed.
Xiao, X., Guan, B., Ihamouten, A., Villain, G., Dérobert, X. & Tian, G. (2018) Monitoring
water transfers in limestone building materials with water retention curve and Ground
Penetrating Radar: A comparative study. NDT & E International, 100, 31-39.
Xu, W., Lo, T. Y. & Memon, S. A. (2012) Microstructure and reactivity of rich husk ash.
Construction and Building Materials, 29, 541-547.
Zak, P., Ashour, T., Korjenic, A., Korjenic, S. & Wu, W. (2016) The influence of natural
reinforcement fibers, gypsum and cement on compressive strength of earth bricks
materials. Construction and Building Materials, 106, 179-188.
Zhang, M., Qin, M., Rode, C. & Chen, Z. (2017) Moisture buffering phenomenon and its
impact on building energy consumption. Applied Thermal Engineering, 124, 337-345.
Zhao, J. & Plagge, R. (2015) Characterization of hygrothermal properties of sandstones—
Impact of anisotropy on their thermal and moisture behaviors. Energy and Buildings, 107,
479-494.

221
SOFTWARE TOOLS
Meteonorm 7v7.3.3
Climatic consultant 6.0
Design Builder 5.5
WUFI Pro 5.3

222
Publication
Ojerinde,A., Adekunle,A., Fatai, O., Stevenson, V. & Latif, E. The partial replacement of
Ordinary Portland Cement with Rice Husk Ash to stabilize Compressed Earth Blocks for
Affordable Building materials. PLEA 2018: Smart and healthy within the two-degree limit,
Hong Kong, China, 10-12 Dec 2018. PLEA 2018-34th International Conference on Passive
and Low Energy Architecture. The Chinese University of Hong Kong, pp. 321-325.
Copyright © 2022 FDOKUMEN