Re-Visiting Homosexuality in Cameroon: Effective Advocacy ...
Upload
independentCategory
view
0download
0
STATISTICAL CONCERNS IN EDUCATIONAL ASSESSMENT: INTERPRETATION OFTEST SCORES IN HIGH STAKE EXAMINATIONS IN CAMEROON
BY
Agborbechem Peter Tambi Faculty of EducationUniversity of Buea
CameroonTel: (+237 50537092)
E-mail: [email protected].
ABSTRACT
In recent times the interpretation of students’ scores has passedthrough a lot of scrutiny during class council meetings insecondary and primary schools, in senate meetings in universitiesas well as in grading meetings in examination bodies the worldover. In most cases (if not all) “teachers” are the majorparticipants in making decisions on students’ fate sometimesinvolving very few parents who are not knowledgeable aboutexamination procedures and a very negligible number of studentswhose opinions are limited or not even listened to. The mostcommon comments during such meetings that are teacher dominatedare “we can’t allow standards to drop this far!”, “studentsnowadays do not read!”, “there is no seriousness amongst studentsanymore!” etc. The blame for poor performances is thereforetotally lashed on the students, whenever teachers/examiners meetwith their peers to make final and significant decisions onstudents’ academic performances. This study, which is an expost-facto study, is designed to assess statistical concerns ineducational assessment: interpretation of test scores in highstake examinations in Cameroon and proffer interventionstrategies. The results of students for some major courses inselected faculties in the University of Buea were used for thestudy. The means and standard deviations of the scores were usedand the Z- scores were used for standardization. The resultsindicated that students’ results would be better ifstandardization of scores was carried on the raw scores.Scientific/political bodies are required to get involved indecision making on students’ fate in high stake examinations such
are those in Universities which offer degrees that the societyholds at a very high esteem the world over.
Key word: Time stealers, fire-brigade, high stake examinations,test score standardization,
Introduction
In recent times the interpretation of students’ scores has passed
through a lot of scrutiny during class council meetings in
secondary and primary schools, in senate meetings in universities
as well as in grading meetings in examination bodies the world
over. In most cases teachers who did the teaching and the grading
are the major participants in making decisions on students’ fate.
Sometimes one parent and one student who are not knowledgeable
about examination procedures are invited to be witnesses to the
lashing the teachers give to the students; their opinions being
in the minority or not even listened to. The most common comments
during such meetings that are teacher dominated are; “we can’t
allow standards to drop this far!”, “students nowadays do not
read!”, “there is no seriousness amongst students anymore!” etc.
The blame for poor performances is therefore totally lashed on
the students whenever teachers/examiners meet with their peers to
make final and significant decisions on students’ academic
performances. This researcher took a look at the results of some
courses in selected faculties of the university of Buea. Students
are bound to accept the results the way they are as they are not
given a chance to tell their own part of the story before the
final decision on the results are made. Some of these results
have rendered many students frustrated after publication and keep
both they and their parent wondering without knowing where to
present their problems. They become defenseless under these
decision makers and swallow the pill no matter how bitter it is
as they have at least one other year to spend waiting to be
redeemed from this unfortunate crisis.
On the other hand some examiners flood the testees with
undeserved marks as if to hide their deficiencies in teaching.
These types of scores become too deceitful to the public as the
students do not show proof of their academic acquisition in their
daily lives.

Theoretical Framework
In this study, two theories will be examined. These are the
Ossowski’s class theory and the Classical Test theory.
Class theory
Class theories ascribe group membership on the basis of certain
observable characteristics of individuals, whether or not the
individuals involved see themselves in those terms. Class
membership is usually determined by the presence or absence of
certain characteristics, usually (but not always) related to the
economy/reasoning. According to Stanislaw Ossowski’ class refers
to groups differentiated in various ways within a more inclusive
category, such as the category of social groups with same
economic or social interest, or the category of groups whose
members share economic/social conditions which are identical in a
certain respect. This class theory interprets policy in
capitalist societies as reflecting the interest of the
capitalists’ class. In fact the state is merely an instrument in
the hands of the capitalists which is used for the purposes of
maintaining the capitalists’ system and increasing profits,
necessarily at the expense of labour. This autonomy in turn
allows the state to adopt measures favourable to the subordinate

class if that is found to be politically unavoidable or necessary
for promoting the long term interest of capital for social
stability.
In this study lecturers form the capitalist class as they share
the same characteristics of being teachers and examiners alike.
The discussions and comments made by this class of people reflect
a common reasoning. Tale for instance the decision that the pass
mark for any course in the University is 50%. The capitalist
decision of a magic number 50 cannot be put to argument by people
who do not belong to that class of teachers or examiners. They
can further arrive at another decision as if they are allowed to
throw sympathy by exceptionally accepting 48% as a pass mark. In
some subjects at the Cameroon GCE, some subject panels go ahead
to say that they have brought the pass mark to 40% with regrets
that they have dropped down standards and doubt the type of
Cameroonians they are preparing for the future. The capitalist
teachers who are themselves examiners thereby maintain their
capitalist system by protecting their pride at the expense of the
unprivileged group who are the students.
Classical Test Theory (CTT)
Classical test theory (CTT) propounded by Spearman (1904) is an
emanation of the early 20th century approaches to measuring
individual differences. It provides a model for assessing random
measurement error. CTT introduces three basic measurement
concepts (1) test score or observed score, (2) true score, and
(3) error score. Classical Test Theory postulates linking the
observed test score (X) to the sum of the true score (latent
unobservable score) and error score: X = T + e. The following
assumptions underlie CTT: (a) true scores (T) and error scores
(e) are uncorrelated, (b) the average error score in the
population of examinees or on an examinee’s multiple assessment
is zero, and (c) error scores on parallel tests are uncorrelated.
Classical Test Theory utilizes a variety of related psychometric
statistical techniques.
The focus of classical test theory (CTT) is on determining
error of the measurement e. Although e could represent many
different types of error, such as rater or instrument error, CTT
only allows the estimation of one type of error at a time.
Essentially it throws all sources of error into one error term.
The CTT therefore assumes that each testee has a true score that
would be attained if there were no errors in measurements. Error

of measurements will include and not limited to nature of
measuring instruments, societal distortions and psychological
conditions within the examining zone. Warm (1978) cautions that
the statistics used in the CTT are relative to the
characteristics of the test and of the examinees.
In universities the measurement error can emanate from teachers’
teaching inconsistencies where pedagogic principles of teaching
are sometimes violated, principles of test of test construction
that are most of the time not respected, school learning time
that is many time interrupted learning facilities of students
that in most cases not guaranteed etc. all these accumulate and
increase the error of measurement in the students’ abilities
thereby affecting the standing of the observed score. A well
designed test or test condition should minimize this measurement
error so that the error is not highly correlated with the true
score.
Conceptual frame:
Meaning of test score: Joshua (2005) defines a test as an
instrument systematically designed to measure sample bahaviour.
The sample behavior that is measured is considered as the sample
behavior acquired in the case of an achievement test. Agborbechem
(2010) holds that an achievement test is a series of questions or
exercises for measuring acquired skills, knowledge, intelligence,
capacities, or aptitudes of an individual or group. A student
who scores ‘13 out of 20’ in a Mathematics test, or ‘72%’ in an
English language examination readily knows what proportion of the
total marks the student has gained, but these scores do not
account for factors such as how hard the test is, how exposed
were the students to the skills tested, where the student stands
in relation to other people, and the margin of error in the test
score. Likewise the student would not know how well the
performance is against others if the examination was national and
keeps to national curriculum standards. Many professionally
produced tests, give outcomes that are different from simple
proportions or percentages by giving scores or measures that
account for many of the outcomes of educational or psychometric
tests.
The central tendency: According to Amin (2006), central tendency
is the point at which the distribution is in balance. How do we
arrive at this point in a school setting? Many societal factors
contribute to this central tendency.

Policy factor: Government policy according to vision 2035 gives
access to education by all Cameroonians. By so doing schools are
opened in all nooks and crannies of the country without a
corresponding man power to run the schools. Some schools in
certain rural areas have no teachers at all or a teacher student
ratio that is so appalling with respect to educational norms. In
certain schools untrained personnel are requested to carry out
daunting tasks of administering examinations due to the absence
of staff. For instance a History teacher requested to read
English dictation or a military officer from the French speaking
zone of Cameroon requested to read French dictation. This
invariably affects the performance of the students in such
examinations if they were to be compared with students that have
perfect conditions in the same examination.
The poverty factor: It is easy to find students in schools
without text books or even uniforms. Some hardly find food to eat
during school time and some live in environments that are so
challenging to academic success, yet they are expected to cope
with the challenges set before them by the organisers of
examinations.
Teachers on their part pose a lot of variations in teaching and
managing classrooms. Strikes in schools a becoming rife, some
teachers accumulate teaching materials for the last days of the
term or semester. Some teachers abandon classes to attend to
personal problems yet construct examinations that cover the
scheme in it totality. Hand outs are sold to students as “fire-
brigade” measures to cover up lost teaching time.
A host of societal problems plague the students teaching
environment that account for the central tendency to vary with
respect to subject and environment.
The student factor: Students are not left out of this saga.
Students on their part do not use appropriate learning time well.
They are affected by many time stealers.
Standardization of scores:
Umoinyang, Asim, Akwa & Bassey (2004) hold that raw scores do not
have the manipulative properties (Mathematic) of real numbers.
They emphasize that “the meaning that is supposed to be attached
to examination scores could not be done with raw scores”. To
allow therefore for judgment of performance of an examinee, raw
scores must be transformed into scales with more desirable
properties. These scales are generally called standard scores.
Some examples of standard scores are Z-scores, T-scores,
percentile ranks, normalized standard scores, stanine scores etc.
“Standard scores generally describe or specify the individual’s
performance in terms of the distance of the raw score from the
mean of the reference group in standard deviation units” (Joshua,
2005).
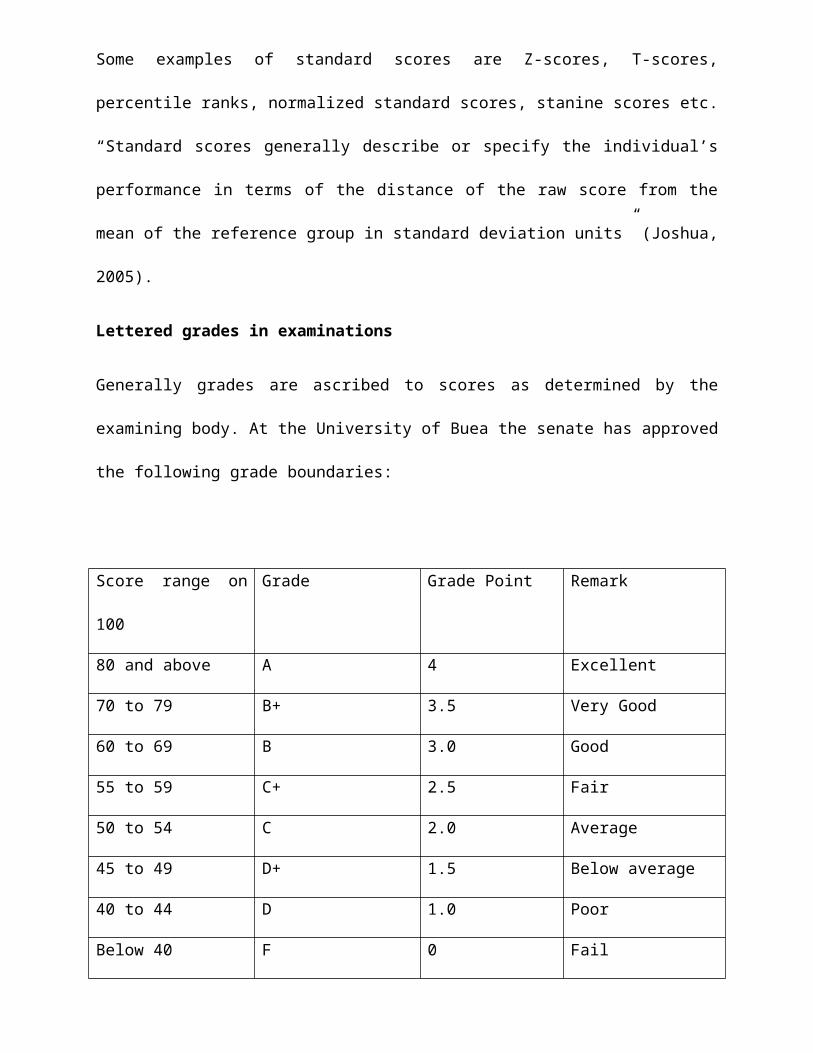
Lettered grades in examinations
Generally grades are ascribed to scores as determined by the
examining body. At the University of Buea the senate has approved
the following grade boundaries:
Score range on
100
Grade Grade Point Remark
80 and above A 4 Excellent
70 to 79 B+ 3.5 Very Good
60 to 69 B 3.0 Good
55 to 59 C+ 2.5 Fair
50 to 54 C 2.0 Average
45 to 49 D+ 1.5 Below average
40 to 44 D 1.0 Poor
Below 40 F 0 Fail

Source: University of Buea students’ guide, 2005 revised edition.
These grades are maintained no matter the examination condition,
session or teaching dynamics of the year in question.
For the University of Calabar
Score range on
100
Grade Grade Point Remark
70 and above A 5 Excellent
60 to 69 B 4 Very Good
50 to 59 C 3 Good
45 to 49 D 2 Fair
40 to 44 E 1 Pass
0 to 39 F 0 Fail
Source: University of Calabar, Faculty of Education students’ handbook: 2007-
2009
These score ranges can be accepted if the scores follow a normal
curve. That is to say all the conditions of teaching, testing and
analysis are strictly followed. In most cases during the
discussion of these results the teachers of the courses are
allowed to give their sentimental expressions about the results
without scientific support. In the situation where the scores are
skewed there will be need for normalization before these score
ranges can be used as reference.
Mbong 2010 laments on the persistent poor results over many
years, in particular subjects, like Mathematics, English and
French. He pins the source of the results mostly to the teacher
or the administrator in either the poor handling of the subject
in classrooms or poor handling of the examination administration
in which he Christians “management induced crisis”, state and
political crisis, parent induced crisis, and candidate induced
crisis. These then gear to the fact that if the raw scores are
not well managed, the examinees become the victim with the
escalation of a result catastrophe.
Purpose of the study
This study looks into statistical concerns in educational
assessment: interpretation of test scores in high stake
examinations in Cameroon. Specifically the study seeks to find
out:
i. The implication on students results if raw scores were
standardized.
ii. If there is any significant difference between the raw
scores and transformed scores in high stake examinations.
Methodology
This study uses the expost Facto research design. This is because
the researcher will not have the ability to manipulate the
information gathered from the major variables so as to manipulate
the results expected. This study is carried out using data from
selected courses from some faculties of the University of Buea as
reported in senate. These are Faculty of Education, Faculty of
Arts and the Faculty of Social and Management Studies. For the
purpose of this study the T- score standardization tool was used.
The raw scores from selected courses are passed through a
standardization process using the T-score. This standardization
is used because it ends up with scores in 100 as is the tradition
with many examination bodies and Universities. Grade boundaries
are determined using the number of standard deviations from the
mean. The dependent t-test is used to determine if there is any
significant difference between the raw scores and standardized
scores.
Findings
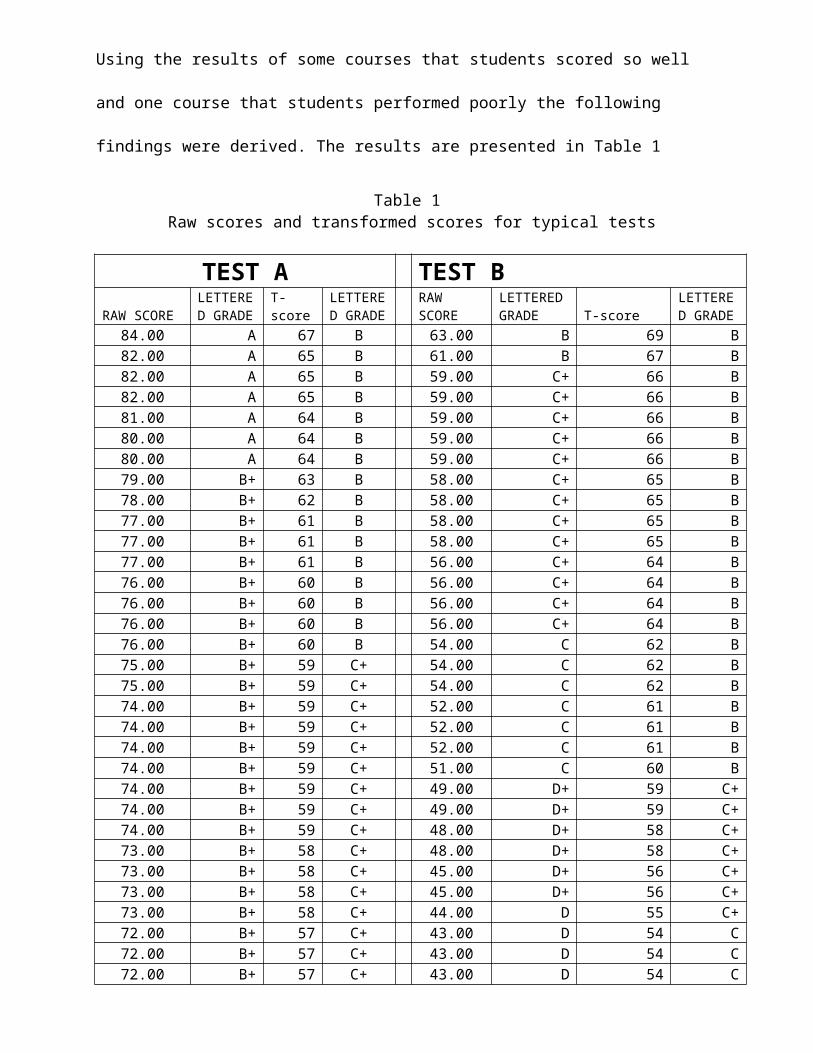
Using the results of some courses that students scored so well
and one course that students performed poorly the following
findings were derived. The results are presented in Table 1
Table 1 Raw scores and transformed scores for typical tests
TEST A TEST BRAW SCORE
LETTERED GRADE
T-score
LETTERED GRADE
RAW SCORE
LETTEREDGRADE T-score
LETTERED GRADE
84.00 A 67 B 63.00 B 69 B82.00 A 65 B 61.00 B 67 B82.00 A 65 B 59.00 C+ 66 B82.00 A 65 B 59.00 C+ 66 B81.00 A 64 B 59.00 C+ 66 B80.00 A 64 B 59.00 C+ 66 B80.00 A 64 B 59.00 C+ 66 B79.00 B+ 63 B 58.00 C+ 65 B78.00 B+ 62 B 58.00 C+ 65 B77.00 B+ 61 B 58.00 C+ 65 B77.00 B+ 61 B 58.00 C+ 65 B77.00 B+ 61 B 56.00 C+ 64 B76.00 B+ 60 B 56.00 C+ 64 B76.00 B+ 60 B 56.00 C+ 64 B76.00 B+ 60 B 56.00 C+ 64 B76.00 B+ 60 B 54.00 C 62 B75.00 B+ 59 C+ 54.00 C 62 B75.00 B+ 59 C+ 54.00 C 62 B74.00 B+ 59 C+ 52.00 C 61 B74.00 B+ 59 C+ 52.00 C 61 B74.00 B+ 59 C+ 52.00 C 61 B74.00 B+ 59 C+ 51.00 C 60 B74.00 B+ 59 C+ 49.00 D+ 59 C+74.00 B+ 59 C+ 49.00 D+ 59 C+74.00 B+ 59 C+ 48.00 D+ 58 C+73.00 B+ 58 C+ 48.00 D+ 58 C+73.00 B+ 58 C+ 45.00 D+ 56 C+73.00 B+ 58 C+ 45.00 D+ 56 C+73.00 B+ 58 C+ 44.00 D 55 C+72.00 B+ 57 C+ 43.00 D 54 C72.00 B+ 57 C+ 43.00 D 54 C72.00 B+ 57 C+ 43.00 D 54 C
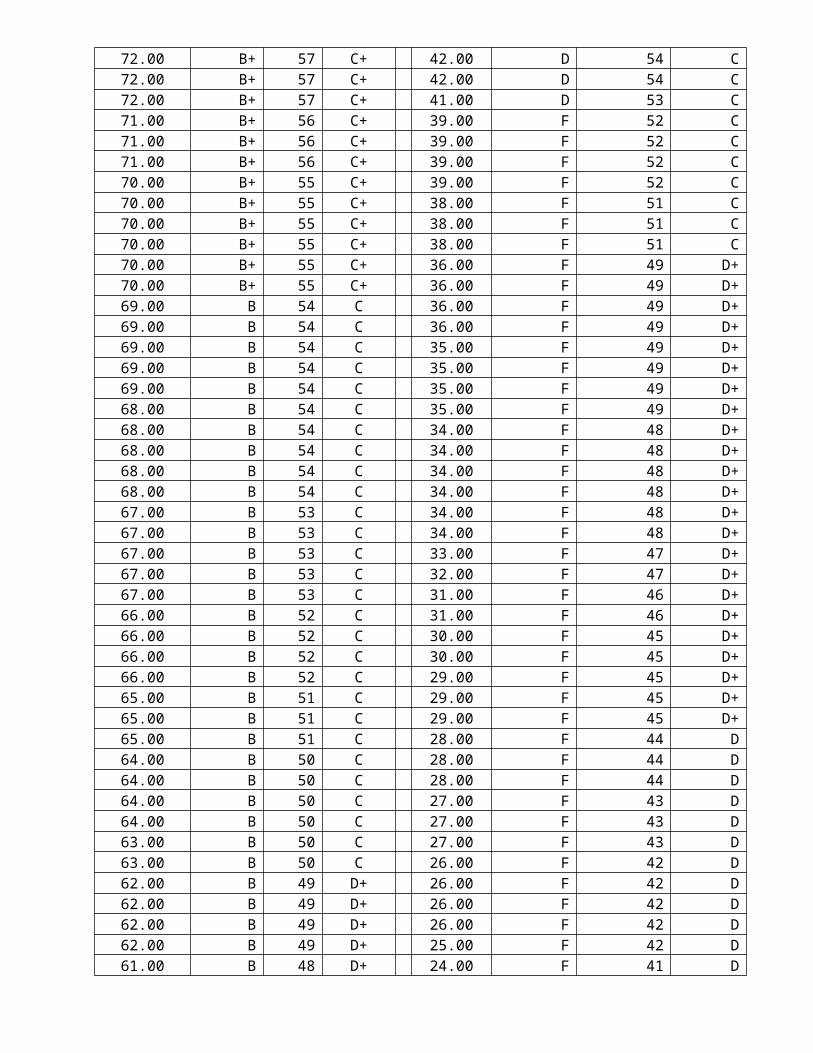
72.00 B+ 57 C+ 42.00 D 54 C72.00 B+ 57 C+ 42.00 D 54 C72.00 B+ 57 C+ 41.00 D 53 C71.00 B+ 56 C+ 39.00 F 52 C71.00 B+ 56 C+ 39.00 F 52 C71.00 B+ 56 C+ 39.00 F 52 C70.00 B+ 55 C+ 39.00 F 52 C70.00 B+ 55 C+ 38.00 F 51 C70.00 B+ 55 C+ 38.00 F 51 C70.00 B+ 55 C+ 38.00 F 51 C70.00 B+ 55 C+ 36.00 F 49 D+70.00 B+ 55 C+ 36.00 F 49 D+69.00 B 54 C 36.00 F 49 D+69.00 B 54 C 36.00 F 49 D+69.00 B 54 C 35.00 F 49 D+69.00 B 54 C 35.00 F 49 D+69.00 B 54 C 35.00 F 49 D+68.00 B 54 C 35.00 F 49 D+68.00 B 54 C 34.00 F 48 D+68.00 B 54 C 34.00 F 48 D+68.00 B 54 C 34.00 F 48 D+68.00 B 54 C 34.00 F 48 D+67.00 B 53 C 34.00 F 48 D+67.00 B 53 C 34.00 F 48 D+67.00 B 53 C 33.00 F 47 D+67.00 B 53 C 32.00 F 47 D+67.00 B 53 C 31.00 F 46 D+66.00 B 52 C 31.00 F 46 D+66.00 B 52 C 30.00 F 45 D+66.00 B 52 C 30.00 F 45 D+66.00 B 52 C 29.00 F 45 D+65.00 B 51 C 29.00 F 45 D+65.00 B 51 C 29.00 F 45 D+65.00 B 51 C 28.00 F 44 D64.00 B 50 C 28.00 F 44 D64.00 B 50 C 28.00 F 44 D64.00 B 50 C 27.00 F 43 D64.00 B 50 C 27.00 F 43 D63.00 B 50 C 27.00 F 43 D63.00 B 50 C 26.00 F 42 D62.00 B 49 D+ 26.00 F 42 D62.00 B 49 D+ 26.00 F 42 D62.00 B 49 D+ 26.00 F 42 D62.00 B 49 D+ 25.00 F 42 D61.00 B 48 D+ 24.00 F 41 D
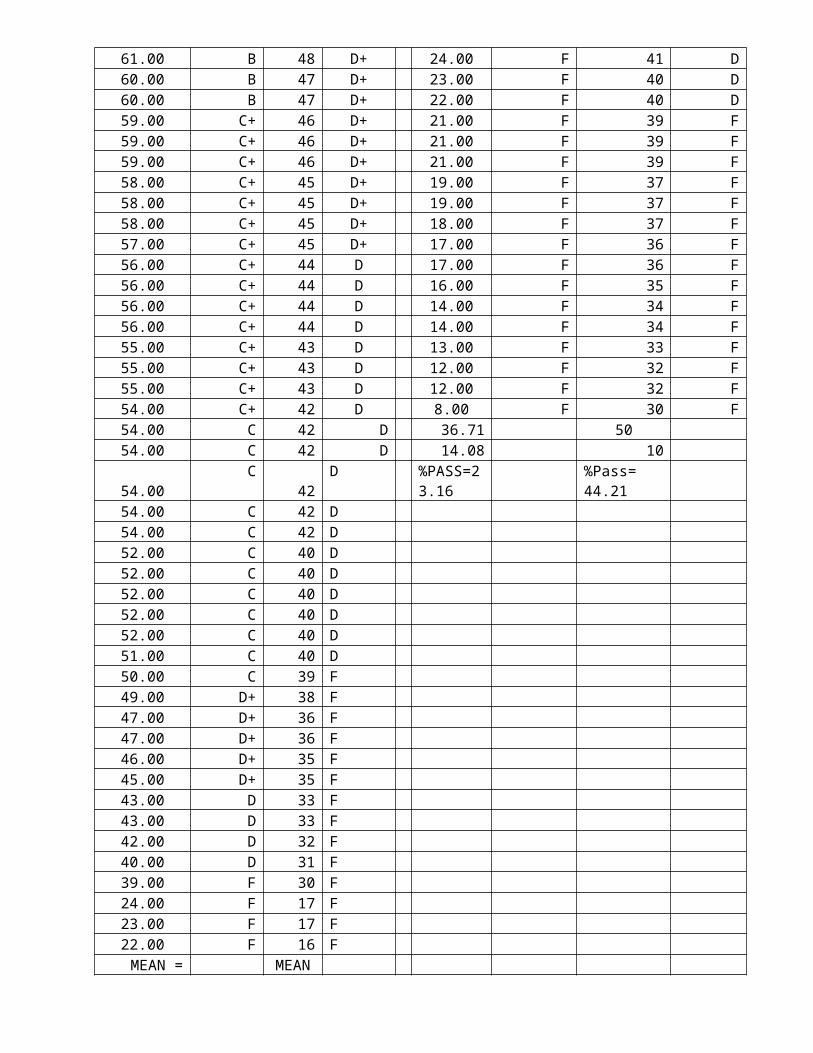
61.00 B 48 D+ 24.00 F 41 D60.00 B 47 D+ 23.00 F 40 D60.00 B 47 D+ 22.00 F 40 D59.00 C+ 46 D+ 21.00 F 39 F59.00 C+ 46 D+ 21.00 F 39 F59.00 C+ 46 D+ 21.00 F 39 F58.00 C+ 45 D+ 19.00 F 37 F58.00 C+ 45 D+ 19.00 F 37 F58.00 C+ 45 D+ 18.00 F 37 F57.00 C+ 45 D+ 17.00 F 36 F56.00 C+ 44 D 17.00 F 36 F56.00 C+ 44 D 16.00 F 35 F56.00 C+ 44 D 14.00 F 34 F56.00 C+ 44 D 14.00 F 34 F55.00 C+ 43 D 13.00 F 33 F55.00 C+ 43 D 12.00 F 32 F55.00 C+ 43 D 12.00 F 32 F54.00 C+ 42 D 8.00 F 30 F54.00 C 42 D 36.71 5054.00 C 42 D 14.08 10
54.00C
42D %PASS=2
3.16%Pass= 44.21
54.00 C 42 D54.00 C 42 D52.00 C 40 D52.00 C 40 D52.00 C 40 D52.00 C 40 D52.00 C 40 D51.00 C 40 D50.00 C 39 F49.00 D+ 38 F47.00 D+ 36 F47.00 D+ 36 F46.00 D+ 35 F45.00 D+ 35 F43.00 D 33 F43.00 D 33 F42.00 D 32 F40.00 D 31 F39.00 F 30 F24.00 F 17 F23.00 F 17 F22.00 F 16 FMEAN = MEAN
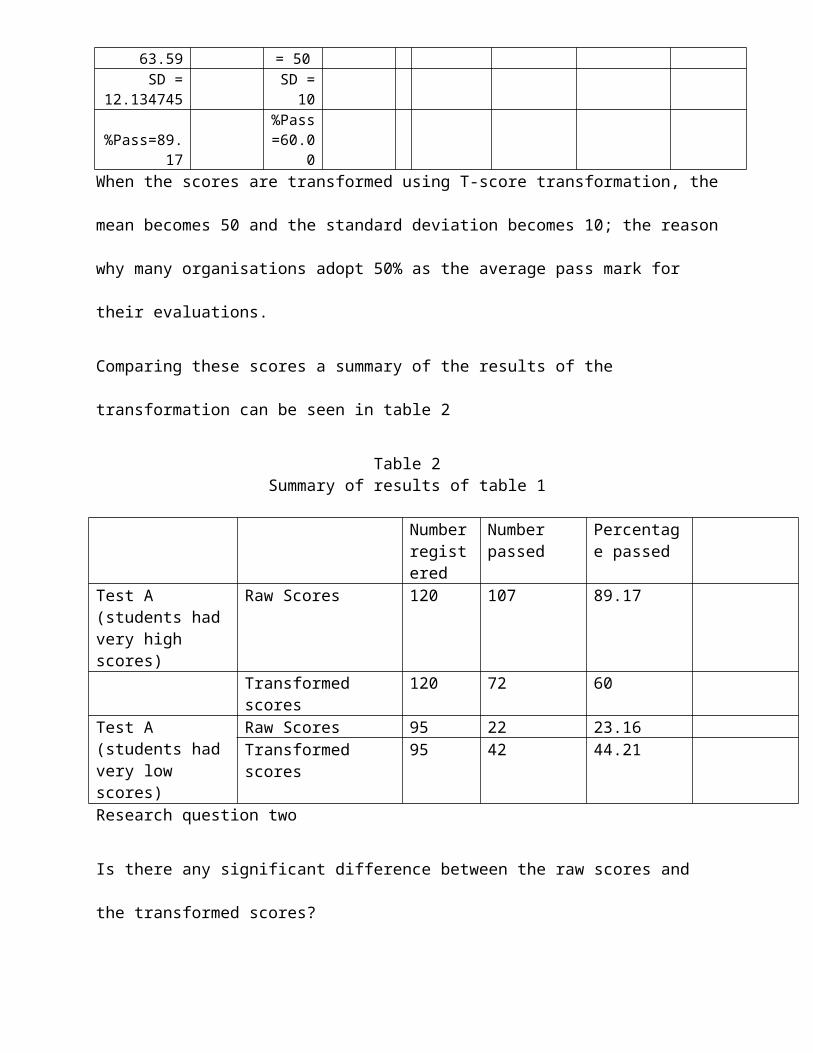
63.59 = 50SD =
12.134745SD =10
%Pass=89.17
%Pass=60.0
0When the scores are transformed using T-score transformation, the
mean becomes 50 and the standard deviation becomes 10; the reason
why many organisations adopt 50% as the average pass mark for
their evaluations.
Comparing these scores a summary of the results of the
transformation can be seen in table 2
Table 2Summary of results of table 1
Numberregistered
Number passed
Percentage passed
Test A (students had very high scores)
Raw Scores 120 107 89.17
Transformed scores
120 72 60
Test A (students had very low scores)
Raw Scores 95 22 23.16Transformed scores
95 42 44.21
Research question two
Is there any significant difference between the raw scores and
the transformed scores?
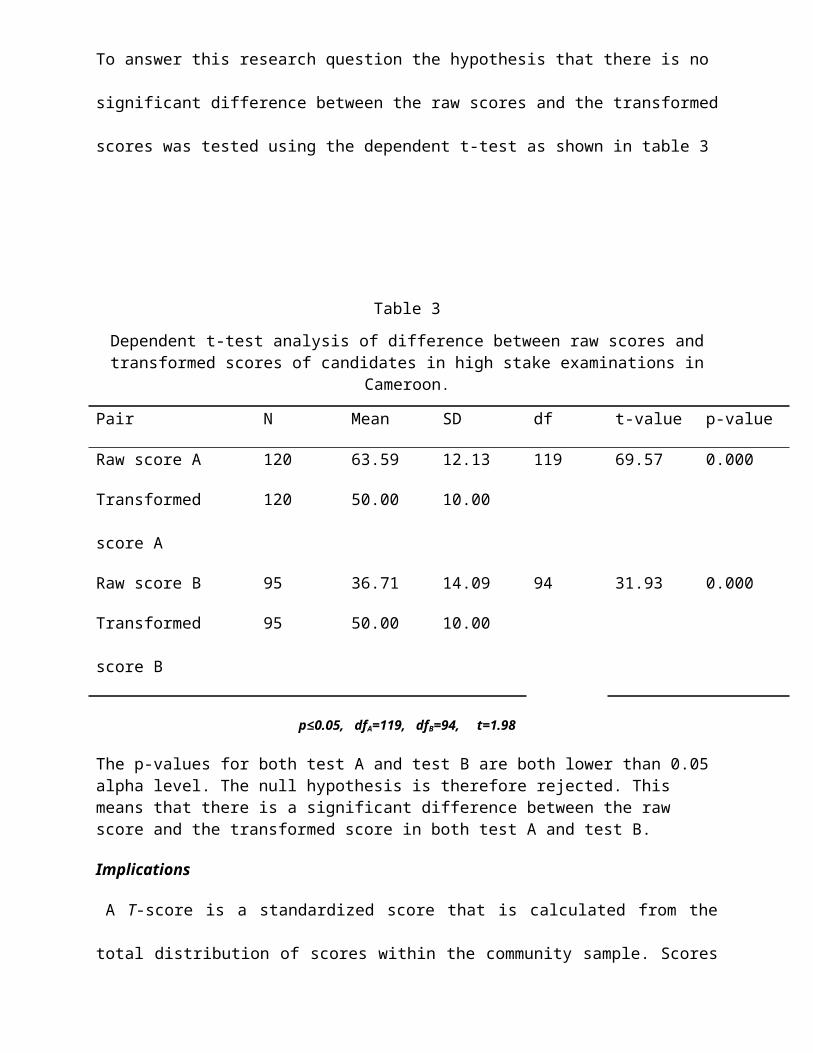
To answer this research question the hypothesis that there is no
significant difference between the raw scores and the transformed
scores was tested using the dependent t-test as shown in table 3
Table 3
Dependent t-test analysis of difference between raw scores andtransformed scores of candidates in high stake examinations in
Cameroon.
Pair N Mean SD df t-value p-value
Raw score A 120 63.59 12.13 119 69.57 0.000
Transformed
score A
120 50.00 10.00
Raw score B 95 36.71 14.09 94 31.93 0.000
Transformed
score B
95 50.00 10.00
p 0.05, df≤ A=119, dfB=94, t=1.98
The p-values for both test A and test B are both lower than 0.05 alpha level. The null hypothesis is therefore rejected. This means that there is a significant difference between the raw score and the transformed score in both test A and test B.
Implications
A T-score is a standardized score that is calculated from the
total distribution of scores within the community sample. Scores
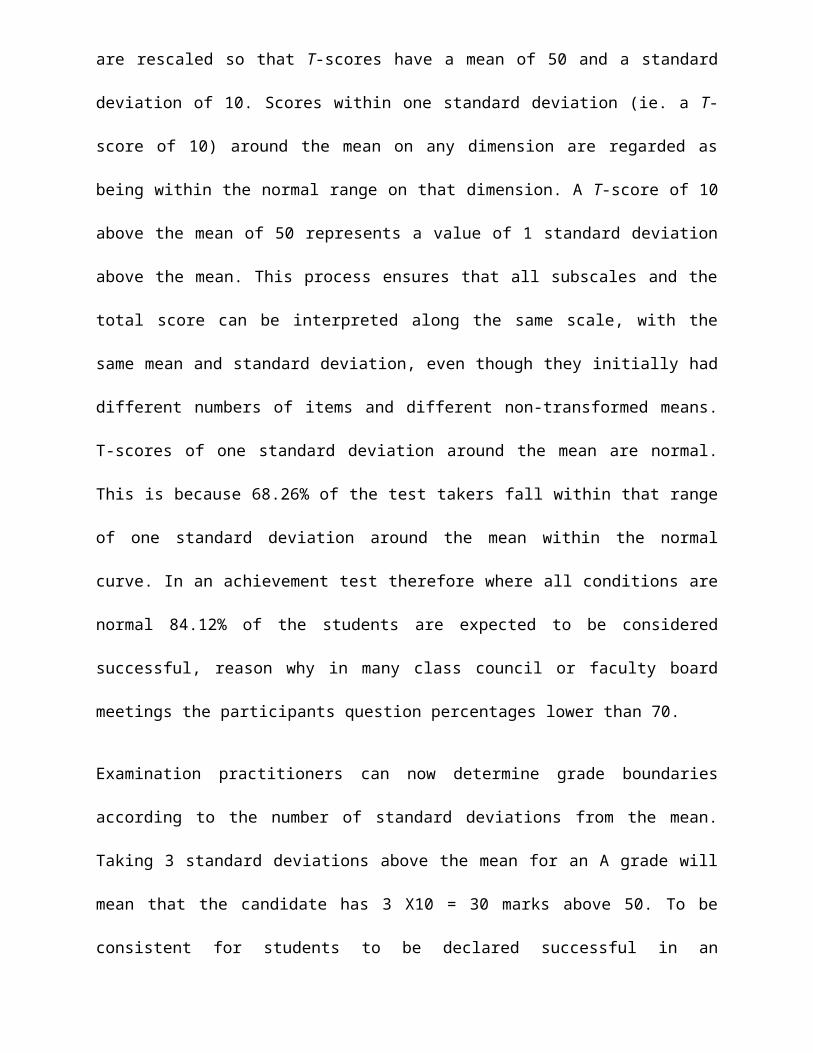
are rescaled so that T-scores have a mean of 50 and a standard
deviation of 10. Scores within one standard deviation (ie. a T-
score of 10) around the mean on any dimension are regarded as
being within the normal range on that dimension. A T-score of 10
above the mean of 50 represents a value of 1 standard deviation
above the mean. This process ensures that all subscales and the
total score can be interpreted along the same scale, with the
same mean and standard deviation, even though they initially had
different numbers of items and different non-transformed means.
T-scores of one standard deviation around the mean are normal.
This is because 68.26% of the test takers fall within that range
of one standard deviation around the mean within the normal
curve. In an achievement test therefore where all conditions are
normal 84.12% of the students are expected to be considered
successful, reason why in many class council or faculty board
meetings the participants question percentages lower than 70.
Examination practitioners can now determine grade boundaries
according to the number of standard deviations from the mean.
Taking 3 standard deviations above the mean for an A grade will
mean that the candidate has 3 X10 = 30 marks above 50. To be
consistent for students to be declared successful in an
achievement test, some standard deviations below the mean can be
agreed upon. Some institutions accept that D+ should be accepted
for a pass. This means that 0.5 standard deviations (0.5 x10 = 5
marks) below the mean have been accepted for a minimum pass mark.
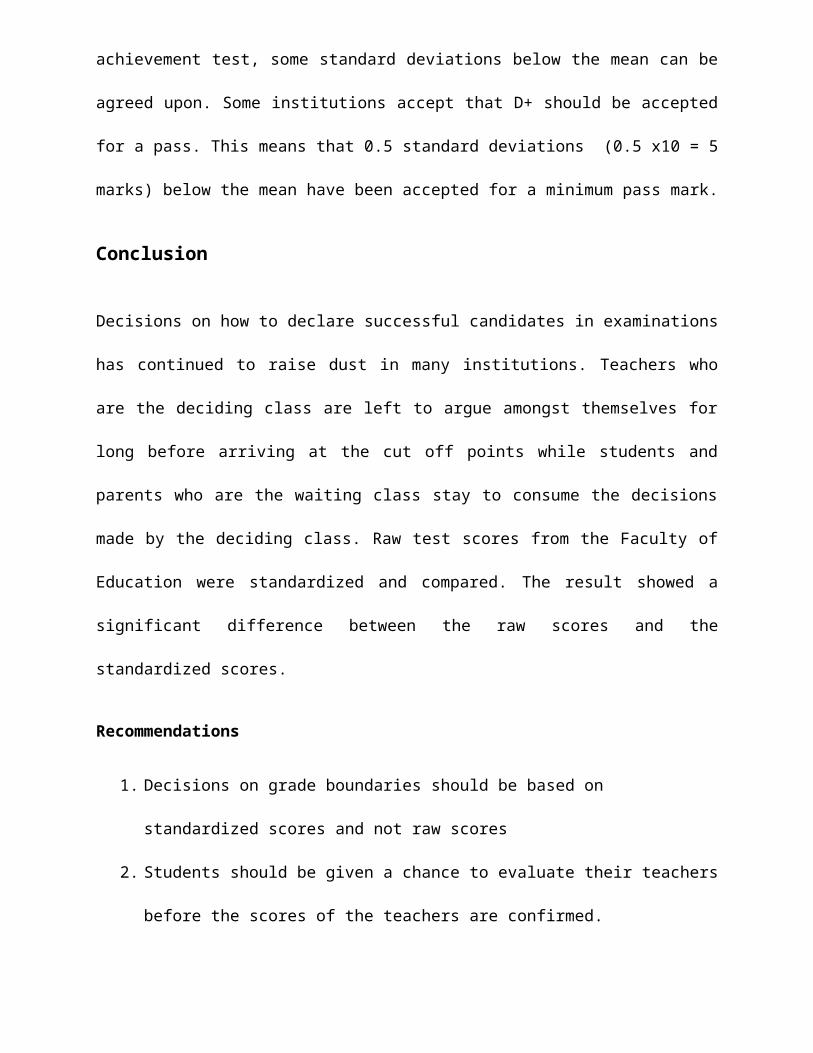
Conclusion
Decisions on how to declare successful candidates in examinations
has continued to raise dust in many institutions. Teachers who
are the deciding class are left to argue amongst themselves for
long before arriving at the cut off points while students and
parents who are the waiting class stay to consume the decisions
made by the deciding class. Raw test scores from the Faculty of
Education were standardized and compared. The result showed a
significant difference between the raw scores and the
standardized scores.
Recommendations
1. Decisions on grade boundaries should be based on
standardized scores and not raw scores
2. Students should be given a chance to evaluate their teachers
before the scores of the teachers are confirmed.
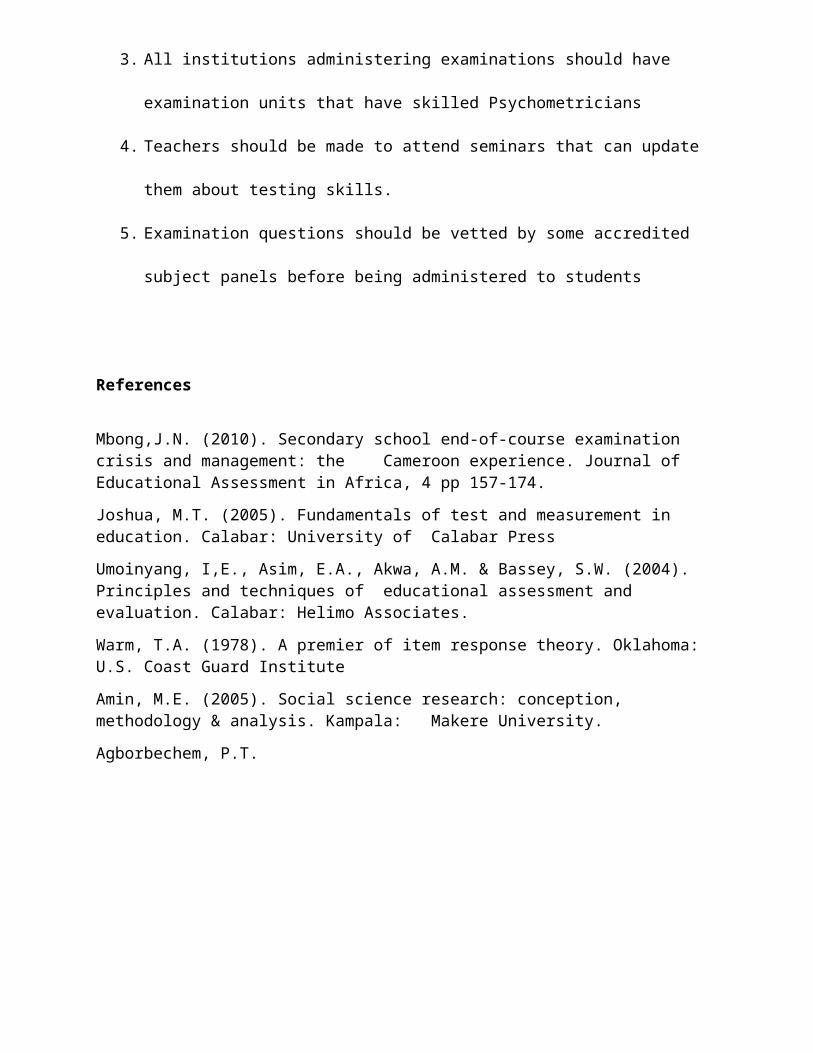
3. All institutions administering examinations should have
examination units that have skilled Psychometricians
4. Teachers should be made to attend seminars that can update
them about testing skills.
5. Examination questions should be vetted by some accredited
subject panels before being administered to students
References
Mbong,J.N. (2010). Secondary school end-of-course examination crisis and management: the Cameroon experience. Journal of Educational Assessment in Africa, 4 pp 157-174.
Joshua, M.T. (2005). Fundamentals of test and measurement in education. Calabar: University of Calabar Press
Umoinyang, I,E., Asim, E.A., Akwa, A.M. & Bassey, S.W. (2004). Principles and techniques of educational assessment and evaluation. Calabar: Helimo Associates.
Warm, T.A. (1978). A premier of item response theory. Oklahoma: U.S. Coast Guard Institute
Amin, M.E. (2005). Social science research: conception, methodology & analysis. Kampala: Makere University.
Agborbechem, P.T.
Copyright © 2022 FDOKUMEN