Household Solid Waste Management in Limbe Cameroon
115
By PAN AFRICAN INSTITUTE FOR DEVELOPMENT- WEST AFRICA (PAID-WA) P.O.BOX 133, BUEA BY Din-Louis Georges (PAIDWA0070) A THESIS SUBMITTED TO THE PAN AFRICAN INSTITUTE FOR DEVELOPMENT-WEST AFRICA IN PARTIAL FULFILLMENT FOR THE AWARD OF A MASTERS (MSc.) DEGREE IN SUSTAINABLE DEVELOPMENT WITH SPECIALIZING IN REGIONNAL PLANNING AND PROJECT MANAGEMENT Supervised by: DAN EKONGWE (PhD Fellow) JUNE 2015 Household Solid Waste Management in Limbe Cameroon; Practices, Problems and Prospects
-
Upload
khangminh22 -
Category
Documents
-
view
1 -
download
0
Transcript of Household Solid Waste Management in Limbe Cameroon

By
PAN AFRICAN INSTITUTE FOR DEVELOPMENT- WEST AFRICA
(PAID-WA)
P.O.BOX 133, BUEA
BY
Din-Louis Georges
(PAIDWA0070)
A THESIS SUBMITTED TO THE PAN AFRICAN INSTITUTE FOR DEVELOPMENT-WEST
AFRICA IN PARTIAL FULFILLMENT FOR THE AWARD OF A MASTERS (MSc.) DEGREE
IN SUSTAINABLE DEVELOPMENT WITH SPECIALIZING IN REGIONNAL PLANNING
AND PROJECT MANAGEMENT
Supervised by:
DAN EKONGWE (PhD Fellow)
JUNE 2015
Household Solid Waste Management in Limbe Cameroon;
Practices, Problems and Prospects


DEDICATION
This study is dedicated to my son, Kitarvidzem Michael Njoh-Din.

TABLE OF CONTENT
Statement of originality……………………………………………………………………………………………….i
Declaration…………………………………………………………………………………………………….…….ii
Dedication………………………………………………………………………………………………………………...iii
Table of Content…………………………………………………………………………………………..…………iv
Acronyms and Abbreviations……………………………………………………………..……………...…………..v
Acknowledgement……………………………………………………………………………………..……….…..…….vi
Abstract………………………………………………………………………………………………………………….vii
CHAPTER ONE
INTRODUCTION
1.1. BACKGROUND TO THE STUDY……………………………………………………………………………….………….1
1.2 STRUCTURE OF WASTE MANAGEMENT IN CAMEROON: THE LEGAL FRAMEWORK……………………….8
1.3. WASTE MANAGEMENT HIERARCHY………………………………………………………………….…………….10
1.4 STATEMENT OF THE PROBLEM……………………………………………………………………………………….13
1.5 THE OBJECTIVES OF THE STUDY……………………………………………………………………………………..14
1.6 RESEARCH QUESTIONS ………………………………………………………………………………………………...15
1.7 THE SIGNIFICANCE OF THE STUDY……………………………………………………………………………………..15
1.8 ORGANIZATION OF THE STUDY…………………………………………………………………………………… ..... 15
CHAPTER TWO
LITERATURE REVIEW AND THEORETICAL FRAMEWORK
2.1 DEFINITION OF KEY TERMS………………………………………………………………………………….………….17
2.2 THE CONCEPT OF WASTE MANAGEMENT………………………………………..…………………………………...21
2.3 EFFECTIVE PARTNERSHIP FOR WASTE MANAGEMENT ……………………………….…………..…………..…..22
2.4 THE HEALTH CHALLENGES OF POOR WASTE MANAGEMENT………………………………..…….……………24
2.5 THE MANAGEMENT OF GLOBAL MUNICIPAL SOLID WASTE …………………………………………….………26

2.6 SOLID WASTE MANAGEMENT IN DEVELOPING COUNTRIES: THE AFRICAN EXAMPLE………………….…..28
2.7 WASTE MANAGEMENT AND THE ENVIRONMENT……………………………………………………………….….32
2.8 URBAN SYSTEM THEORIES AND WASTE MANAGEMENT……………………………………………….……….…34
2.9 INSTITUTIONAL FRAMEWORK………………………………………………………………………………………….36
2.10 THE SIGNIFICANCE OF GIS MODELING IN WASTE COLLECTION AND TRANSPORTATION……….………...38
CHAPTER THREE
MATERIALS AND METHODS
3.1 RESEACRH DESIGN……………………………………………………………………….……..…………….41
3.2 DATA COLLECTION……………………………………………………………………………….…………...43
3.3 DATA ANALYSIS…………………………………………………………………………………….…………46
CHAPTER FOUR
PRESENTATION AND ANALYSIS OF FINDINGS
4.1 DEMOGRAPHIC DISTRIBUTION OF THE POPULATION OF LIMBE……………………….……..…….47
4.2 TYPES AND QUANTITY OF MUNICIPAL SOLID WASTE GENERATED IN LIMBE……………….….48
4.3 WASTE GENERATION IN RELATION TO INCOME AND HOUSEHOLD SIZE………………..…….….53
4.4 WASTE MANAGEMENT PRACTICES IN LIMBE……………………………………………………….…56
4.5 PLANNER’S ROLE IN SUSTAINABLE WASTE PLANNING………………………………………………64
4.6 PROBLEMS AND COMMUNITY PERCEPTION OF MUNICIPAL SOLID WASTE MANAGEMENT IN LIMBE
MUNICIPALITY………………………………………………………………………………………………….………….…..67
4.7. WASTE MANAGEMENT IN LIMBE AND SOUND PRACTICES……………..…………………………..99
CHAPTER FIVE
SUMMARY OF FINDINGS, CONCLUSION AND RECOMENDATIONS
5.1 SUMMARY OF FINDINGS……………………………………………………………………………..……79

5.2 CONCLUSION………………………………………………………………………………………………..80
5.3 RECOMMENDATIONS……………………………………………………………………………….……...80
5.2 IMPLICATIONS FOR FURTHER RESEARCH……………………………………………………………..84
REFERENCES……………………………………………………………………………………………….……85
Appendix I Questionnaire for Household Survey………………………………………………………………91
Appendix-II Appendix – II: Authorities and Waste Management Agency Survey List …………………..…..95

Acronyms and Abbreviations
LIST OF ACRONYMS
CBO Community Based Organization
CNIC Chantier Navale et Industrie du Cameroun
CDC Cameroon Development Corporation
EPA Environmental Protection Agency
FEICOM Support Fund for Local Councils
GIS Geographic Information System
HYSACAM Hygiene et Salubrite du Cameroun
LCC Limbe City Council
MINUDH Ministry of Urban Development and Housing
MINTAD Ministry of Territorial Administration and Decentralization
MINEPRD Ministry of the Economy, Planning and Regional Development
MSWM Municipal Solid Waste Management
NGO Non-governmental Organization
OECD Organization for Economic Corporation and Development
SONARA Societe Nationale de rafinage
SWM Solid Waste Management
UNDESA United Nations Department of Economic and Social Affairs
UNEP United Nations Environmental Program
UNDP United Nations Development Program

LIST OF TABLES
Table 1.1: Categories of Problems Common to Waste Management in Developing Countries
..................................................................................................................................................................................... 25
Table 1.2 Roles of key Ministries related to waste management Cameroon………………………..……..26
Table 1.3 Legal Frameworks for Waste Management in Cameroon………………...…………....…...28
Table 1.4 Different stages of waste management hierarchy…………………………………...…...…..31
Table 2.1 Diseases linked with waste………………………………………………….……….….….44
Table 2.2 Percentage of population living in urban areas – with projections for 2015………………46
Table 3.1 Interviews with stakeholders and their positions and interview dates in Limb…………....63
Table 3.2 Sample Population in Limbe ……………………..……………………………………..…64
Table 3.3: Sampling Matrix in Limbe …..……..………………………………………………………66
Table 4.1: Composition of household waste in Limbe…………………………………………......….71
Table 4.2: The Amount of Waste Collected from 2010 to 2014 in tons by HYSACAM in Limbe……75
Table 4.3: Correlation between Income and Daily Waste Generated in Limbe …………………..……77
Table 4.4 Correlation between Household size and Amount of Daily Generated Waste in Limbe …...78
Table 4.5 Number of vehicles operated by HYSACAM in Limbe …………………………...……...80
Table 4.6 Fixed collection points operated by HYSACAM in Limbe ……………………………...….81
Table4.7 Preferred Methods of Waste Disposal in Limbe …………………………………….………..83
Table 4.8 Sustainable Waste Management Methods used by Respondents in Limbe ………...…………83
Table 4.9 Detailed Monthly Data for January 2013 in Limbe ………………………………….………83
Table 4.10 Detailed Monthly Data for February 2013 in Limbe ……………………….………………...88
Table 4.11 Detailed monthly data for March 2013 in Limbe …………………………….….….………..88
Table 4.12 Waste Management Problems in Limbe ………………………………….………..….….…..94
Table 5.1 Popular desire for Waste reduction Programs in Limbe ……………..…….………..……....111

LIST OF FIGURES
Figure 1.1: 1908 painting by R. Hellgrewe of Victoria…………………………………………….….……16
Figure 1.2 Traditional fishing boats on the beach in Limbe ……………….…..………….……….…...…..16
Figure 1.3 The Limbe Coastline With Bioko In The Background………………………..…………..……17
Figure 1.4: Map of Cameroon showing the Study Area.........................................................................……...18
Figure 1.5: Map of Limbe………………………………………………………………………….……..…19
Figure 1.6: Waste management hierarchy………………………………………….……………..….……..26
Figure 2.1 Municipal solid waste treatments in various countries…………………………………..…….43
Figure 3.1: Number of Men and Women that Participated in the Survey in Limbe ……………….……....60
Figure 3.2: Map of sample Area……………………………...……………………………………..………62
Figure 4.1: Showing the evolution of the population of Limbe from 2001 -2010…………………..…..…66
Figure 4.2: Estimated amount of waste generated per day in Kilograms in Limbe ………………….…….69
Figure 4.3: Total distribution of waste collected yearly in the Limbe from 2010-2014……………….....…70
Figure 4.4: Income Distribution of the Population in Limbe ……………………………………..…..……72
Figure 4.5 Pictures of existing waste management practices in Limbe …………………………….…….75
Figure 4.6 Most common storage Method in Limbe ……………………………………….…………..…78
Figure 4.7 Waste disposal Trucks in Limbe …………………………………………….……….….…….81
Figure 4.8 Fixed collection points by HYSACAM in Limbe …………………………..………….…..….82
Figure 4.9 Disposal Process by HYSACAM in Limbe ………………………………..…………………..85
Figure 4.10 Municipal Dumpsite in Limbe ……………………………..…………..……………….……..85
Figure 4.11 Rational Planning process……………………………………………………………….………86
Figure 4.12 Community perception about waste management in Limbe ………………………......….……89
Figure 4.13 Concern about diseases in Limbe ……………..……………………………….…………….…91

Figure 4.14 Blocked drainage in Limbe ………………………………………………………….………..92
Figure 4.15 Concern about litter in Limbe ……………………………………………….………….……..92
Figure 4.16 Concern about flooding in Limbe ……………………………………………………..………93
Figure 4.17 Part of Limbe and Terrain……………………………………………………..………………98
Figure 4.18 Narrow streets in Limbe ……………………………………..……………………..…………98
Figure 5.11 Proposed new Model for MSWM in Cameroon………………………………………..… . 105

ACKNOWLEDGMENT
I am thankful to God Almighty who gave me the strength, health and protection to bring this
work to a successful completion.
I am indebted to a number of persons and would like to acknowledge their support for the
successful completion of this study. Firstly, I thank the entire Management of HYSACAM for
giving me the opportunity to carry out this study in their institution and the Limbe City Council.
I am grateful to Mrs. Diboma Head of the Hygiene and Sanitation Department for providing me
with valuable information as well as assisting me to visit the municipal dumpsite during the field
trip.
I am thankful to my supervisor Mr. Dan EKONGWE for reading through my work and making
valuable suggestions. My appreciation also goes to the lecturers and the entire administrative
staff of PAID-WA. I am thankful to my classmates especially Mrs. Melombi and Mrs. Bassong
for their mutual support and assistance. And Dr. Jude Kimengsi for his assistance
Furthermore, I am grateful to my beloved siblings, Alice Enanga, Eleanor Ngowo, and Asheri
Sendze for their invaluable contribution during every step of this project, I lack words to
appreciate their enormous support.

ABSTRACT
Generally, cities in the developing world face challenges in solid waste management and the
situation in Limbe, Cameroon is no different. The city has an urbanization rate of 52% and it is
estimated that its population will reach 150,000 inhabitants by 2020. Proper planning of waste
management from generation to disposal will therefore ease waste management in the future.
Accordingly, this research seeks to examine To assess the type and quantity of waste generated in
the Limbe municipality; To assess the municipal waste management practices in Limbe and To
investigate the problems faced by stakeholders in waste management in Limbe. In carrying out
the study interviews, questionnaires and participant observation were used as the methods to
collect data. The data was analyzed using the Statistical Package for Social Sciences (SPSS) and
excel spreadsheet. The results reveal that, urbanization, rising income, increasing
commercialization and household size leads to an increase in the generation of Household solid
waste. Being a fast growing town managing solid waste in Limbe has become a big headache for
municipal authorities in Limbe. The Limbe City Council and central state authority need to
commit more resources for the keeping of Limbe clean and green and bring in community
participation. The study recommends that a special agency for waste management should be
created since this will reduce the confusion associated with having several agencies working on
waste management at the same time. Also, Municipal authorities should start introducing
composting and recycling programs of waste management.
Key Words: Household, Solid Waste, Practices, Problems and Prospects.

1
CHAPTER ONE
INTRODUCTION
1.1. BACKGROUND TO THE STUDY
Rapid urban development facing developing countries including Cameroon has come with
serious environmental challenges concerning solid waste management. Solid waste arising from
domestic, social and industrial activities is increasing in quantity and variety as a result of
growing population, rising standards of living in most African countries and the development of
technology (Dickerson, 1999). Solid waste management (SWM) is a common term that
encompasses a wide variety of activities and practices that describes unwanted residues of any
given culture.
Human activities generate waste which can be harmful to the environment, animals, plants and
the ecosystem. However, only a careful management can limit the damage done to the
environment and conserve scarce resources (Powell, 2001). SWM is an important facet of
sustainable development for any country and global initiatives support the prioritizing of SWM.
Global effort to maintain the quality of the earth’s environment is linked to sustainable
development and is now propounded by governments as well as international organizations. For
instance, a clean environment and effective waste management systems was one of the UN
Millennium Development Goals MDGs. This recommendation, (on like in Agenda 21) MDGs
indirectly advocates sustainable Solid waste management (SWM) within the framework of the
‘seventh goal’ which addresses environmental sustainability. The aim is to foster the integration
of the principles of sustainable development (SD) into each country’s development policies and
programs (UNDP, 2007).
Waste generation dates back to man’s origin and the early way of life which principally was
foraging through the nomadic experience and pattern of life. The abandonment of the nomadic
way of life led to the creation of permanent communities. With mutations and evolutions that
have accompanied humanity, waste that was earlier given low priority in most communities

2
increasingly gained attention for proper management. Recently, and through communal and
municipal actions, conferences and training workshops as well as government action waste
management has become a conjecture for responsible public health and safety (Pichtel, 2005).
The fundamental environmental issue in industrial and developing countries throughout the
world over waste is the identification and management of waste streams (Twardowska, 2004).
As urbanization continues to take place, the management of solid waste becomes a major
challenge posing major public health and environmental problems for many countries. As a
result, development must be sustainable, in the sense of reducing the ecological footprint while
simultaneously improving the quality of life – for ours and future generations – within the
capacity limits of the globe (Lundström, 2007).
The characteristics and quantity of Municipal Solid Waste Management (MSW) arising from
domestic, commercial, and industrial activities is not only the result of growing population,
rising standards of living and technological development, but also due to the abundance and type
of the natural resources from the country or community (Dongqing et. al, 2010). The approach
for SWM also varies and should be compatible with the nature of a given society. For instance,
many studies on MSW management structures and systems in developing countries have
revealed that the quantity of waste and composition vary according to the characteristics of the
area and the management must be adapted to limitations common to such environment. These
limitations are attributed to immaturity in terms of expertise in developing appropriate models
and effective legal framework for the MSW management. As a result, the citizens and the
community depend on the municipal authorities for solid waste collection and disposal (Puentes,
2004).
Consequently, looking at the problems and challenges that have plagued municipal authorities in
carrying out their duties is pertinent because it will help to design possible solutions. Such a
prospect will facilitate the task of the municipal authorities by guiding their decision making
process, practice and help encourage research on sustainable ways to address this growing
problem.
According to Pearce, (1994) developing countries face several major problems as a result of
solid waste management and has been classifies thus:
- Health hazards from uncollected waste

3
- Health hazards from collected but poorly disposed of waste
- Economic burden of waste disposal on towns and cities.
According to Flintoff, (1984), the total population of developing countries accounts for more
than 70 % of the world's population. Waste management in these countries is of grave concern
from two points of view: Firstly, the process of urbanization and population concentration that is
inextricably linked to waste management issues is progressing at a pace that is much faster than
was ever experienced by today's industrialized countries. The issue of waste management in
developing countries, therefore, has emerged as a critical and impending disaster. Secondly,
these countries often have difficulty in streamlining the institutional systems, administrative
bodies, management capabilities and human resources that are needed to take the lead in solving
solid waste problems. It is thus difficult for them to respond effectively to the emerging
challenges of solid waste management.
In Cameroon, like other African countries, waste management is poorly practiced. The study of
Manga et al, (2007) indicated that solid waste management services are rudimentary. The
practice is primarily concerned with the collection and dumping of waste without proper
management methods. This form of management is due to factors such as inadequate financial
resources, low levels of law enforcement as well as poor governance and lack of human
resource. Moreover, current regulations do not adequately address waste handling or disposal.
Inefficient implementation of waste management policies and documentation is affected by a
duplication iof functions and responsibilities between several governmental agencies and the
local councils (Manga et al, 2007). Furthermore, the infancy of literature on local cases makes it
inadequate for the proper functioning of waste management. In this regard, waste management in
Limbe is inefficient in hazard minimization because sustained efforts have not been developed in
the domain of waste education, collection, transportation, treatment and final disposal. The
sustainable management of solid waste systems is necessary in order to minimize environmental
and public health risks worldwide (Manga et al, 2007). The balance between the specific
components of this system in delivering sustainable waste management are already well
understood and established in most developed countries, unlike in developing countries like
Cameroon. Waste management could be efficient through the involvement of all stakeholders

4
that is, waste generators, waste processors, formal and informal sectors, financial institutions and
private initiatives such as non-governmental and community based organizations (Manga et al,
2007).
1.1.2 Geo-Historical Background: Location and Biophysical Characteristics of Limbe
Figure 1.1: Map of Cameroon showing the Study Area
Source: http://en.wikipedia.org/wiki/File:Southwest_Cameroon_divisions.png
The republic of Cameroon which is found in the Central African Region (2°-13°N and 8°-16°E)
is situated on the extreme north-eastern end of the Gulf of Guinea. This exposes the territory to a
variety of natural hazards, some of which are associated with volcanic activity. Such hazards are
concentrated around the Cameroon Volcanic Line (CVL), especially around Mt. Cameroon,
(Zogning et al, 2009). Cameroon shares boundaries with the Atlantic Ocean, Nigeria, Central
African Republic, Equatorial Guinea, Gabon and Congo Brazzaville. Cameroon is located
between Central and West Africa, but belongs to the Central African Union. It has a surface area
of 469,440km² and population of about 20 million inhabitants (Eyong and Mbuagbo, 2003;
Manga et al, 2007).

5
The climate of Cameroon results from the combined convergence effects of the tropical oceanic
low-pressure zone and the inter-tropical front within Africa. Two distinct seasons are witnessed
in the country: a long rainy season normally up to 7 month (March-October) and an extremely
short dry season (November-February). The south-westerly monsoon winds are the most
predominant with wind speed reaching 18m/sec (Eyong and Mbuagbo, 2003). The duration of
the rainy season and the amount of rainfall decreases from south to the northern part of
Cameroon. Apart of these characteristics there are three major climatic zones that can be
identified in the country and include the following:
1. The Equatorial zone in the south, which is characterized by abundant rainfall (about seven
months) and forest vegetation;
2. The Sudanian zone in the north-central part of the country, which is characterized by a
combination of grasslands and scanty forest vegetation;
3. The Sudano-Sahelian zone in the north, which is characterized mainly by semi-arid grassland
vegetation (Asong, 2010).
Geographically, Limbe is situated between longitude 9° and 13° E and latitude 4° and 9° N.
Climatically, Limbe is dominated by the equatorial climate of high rain fall and high
temperatures. The yearly average temperature is 26.5°c, and yearly average rainfall is above 250
mm, while the annual average related humidity is above 82.5%. According to the World Bank
census (2010) Limbe which was formerly known as Victoria has a population of about 120, 000
inhabitants with an estimated percentage of 2.9% growth rates. The city is divided into 4 local
councils namely: the Limbe city council managed by a Government Delegate; then Limbe 1,
Limbe II and Limbe III managed by Mayors.

6
Figure 1.2: Map of Limbe
Source: Awum et al 2000
For instance, a growing night life culture, tourism and motel/bar life will generate waste of a
certain category principally plastic and seasonal domestic waste. The fishing industry of
historical significance has environmental connotations linked to public sanitation and pollution
from increasing fish smoking. These activities increasingly generate interest with researches and
studies on environmental protection and it is from this background that the motivation for my
study was developed.

7
Figure 1.3 R Hellgrewe painting of Victoria-1908
Figure 1.4 Present day Traditional fishing boats on the Limbe beach
Figure 1.5 The Limbe coastlines with Bioko in the background

8
1.2 STRUCTURE OF WASTE MANAGEMENT IN CAMEROON
In Cameroon, waste management has developed at a gradual pace over the past decade. Many
ministerial departments have the mandate to implement solid waste management regulations and
the highest body responsible for municipal solid waste management in Cameroon is the Inter-
Ministerial Commission for Municipal Waste Management (ICMWM), created under the
direction of Prime Ministerial Decree No. 95/230/PM of31/04/95. It is charged with formulation
and policy development for appropriate municipal solid waste management strategies. According
to Cameroon Law on Environmental Management No. 96/12 of 5/ 08 1996:
“Waste shall be any residue from the production, processing or utilization process, any
substance or material produced or, more generally, any movable and immovable goods
abandoned or intended to be abandoned” and “Waste management” shall be the collection,
transportation, recycling and elimination of waste, including the monitoring of disposal
sites.”
Limbe was selected because it is one of the fastest growing cities in the country due to increasing
industrialization, commercialization and demography caused by recent migration into the city.
The population growth is about 2.9% per annum and the population will reach 200,000
inhabitants by 2020 (LCC). This population increase as argued above is also due to the fact that
the city is experiencing economic expansion and this attracts people from all over the country.
Hence, the challenges to manage household waste will continue to grow, and for this it is
important to address the problems of solid waste management to ensure that the kind of problems
faced in Douala and Yaoundé in matters of waste management do not occur in Limbe or rather
can be handled more effectively.
Limbe has the unique opportunity and challenge for the study because of the diversity and
categorization of its waste which include solid, liquid and hazardous health disposable waste.
The first category comes from seasonal variations as well as the points of increasing
commercialization as argued above and which is the focus of this study. Table 1.3 shows the
responsibility of key ministerial department on waste management in Cameroon. On the other

9
hand table 1.4 shows the laws and regulations guiding waste management in Cameroon and the
statutory order which gives them the legal jurisdiction or powers of implementation.
1.2.1 Institutional Framework for Waste Management- Cameroon
Table 1.2 Activities of Ministerial Departments related to Waste Management-Cameroon
Ministry Responsibility in SWM Statutory order
Ministry of territorial
administration and
decentralization
(MINAT)
Follow-up and implement regulations for organizations and functioning of Councils; Oversees the execution of the budget of the government’ council support fund(FEICOM); Restoration of hygiene and public sanitation; supervises Urban Councils which are responsible for follow-up and control-industrial waste management, management of all public spaces and infrastructure; Sweeping of streets, collection transportation and treatment of household waste ,
Circular letter No.0040/LC/MINAT/DCTD of 04/04/00, Order No. 00072/MINAT/MINVILLE of 21/05/00, Law No. 714/23 of 5/12/74, Law no.2004/18 of 22/07/04
Ministry of Mines,
Industries and
Technological
Development(MINMI
TD)
Develop strategies for industrial development and the control of Classified and commercial installations for pollution, security, hygiene and industrial nuisance; Define norms for industrial pollution; List of dangerous, obnoxious and polluting facilities in order to inform the public; Develops regulations governing installation and exploitation of facilities classified as dangerous, obnoxious and polluting
Decree No. 99/818/PM of 9/11/99, Order No. 13/MINME/DMG/SL of 19/04/77, 02/MINMEE/DMG/SDAMI Of 4/01/9
Ministry of Economy
and Finance(MINEFI)
Financial control of organizations benefiting from supplementary budgets and autonomous public establishments, i.e. Councils; Responsible for managing the Finance Law as enacted by Parliament.
Constitution Decree No. 2004/320 of 08/12/04
Ministry of Urban
Development and
Housing(MINDUH)
Develops and implement Urban restructuring, management strategies, sanitation and drainage; Defines and enforces norms of hygiene/sanitation, collection and/or treatment of household waste; Liaises with international agencies for urban development
Order No. 00072/MINAT/MINVILL of 21/05/00
Ministry of
Environment and
Nature
Protection(MINENP)
Collaborates with other agencies to define measures for the rational management of natural resources; Effective control of investigation and pollution in the field; Specifies the criteria(project specific) and supervises environmental impact assessments
Decree No. 2005/0577/PM of 23/02/05 7), Order No. 006/MINEP of 08/03/05
Ministry of Public
Health(MINPH)
Creates Hygiene and Sanitation Units in Councils; Renders technical support to the Hygiene and Sanitation Units Councils, Proposes norms for collection, transportation and treatment of industrial, domestic waste and emptying of septic
Order No. D67/NS/NN/ST/SG/BMPHP/NNPA of 11/08/87, Circular letter No. D69/N6/DMHK/SHPA of

10
tanks; Designs and implements public education campaigns on hygiene and sanitation.
August 1980
Table 1.3 Showing Legal Frameworks for Waste Management in Cameroon
Law Points related to waste management Statutory order
Law relating to
Environmental
Management(No.96/12 of
5/08 1996)
modalities for the conduct of Environmental Impact Assessments(EIA) and categories of operations subject to EIA; Specifies air emission and waste water discharge standards; Set conditions for issuing authorizations for allotment and management of land for uses, i.e. industrial, urban; Prescriptions relating to waste elimination by persons producing or treating waste; Stipulates the terms of reference for the supervision of municipal dumps by the competent authorities
Decree No. 2005/0577/PM of 23/02/05, Order No. 006/MINEP of 08/03/05
National Environmental
Management Plan
Five year amendable plan; set up environmental information system; Preparation of bi-annual reports on the state of the environment in Cameroon, e.g. identifying problems arising from urban pollution and devising suitable micro-projects to mitigate the problems
Law relating to the
installation of Classified
establishment(Law No.
98/15 of 14/07/98)
Stipulates two types of Classified establishments (Class 1 and Class 11).Dump sites are classified as Class II establishments for which operations and management must followed prescribed guidance. It sets out the regulations governing the installation and exploitation of facilities classified dangerous, obnoxious and polluting
9/11/99, Order No. 13/MINMEE/DMG/SL of 19/04/77, 02/MINMEE/DMG/SDAMIC of 04/01/99
National Water Code (Law
No. 98/005/of 14/04/98)
Provides framework for the exploitation of water resources including waste disposal, Specifies modalities for the protection of surface and groundwater from pollution (including from dump sites).
Decree No. 2001/165/PM of 08/05/01
New Urban Strategy, 1999 Partnership among the state, local council and authorities and civil society in urban intervention in areas such as solid waste management.
Source: Manga et al, 2007
\

11
1.3. WASTE MANAGEMENT HIERARCHY
The Waste Management Hierarchy was first put into use by the United States Federal legislation
in the Federal Facilities Compliance Act of 1992. However, Waste Management Hierarchy had
been used for most of the decade before it was incorporated into the Federal Facilities
Compliance Act of 1992. The Waste Management Hierarchy is itself an evolution of the waste
management ideology of the”3 Rs”; (i.e, to reduce, reuse and recycle). The Sustainability
Hierarchy, like the Waste Management Hierarchy, is a statement of ideology (Envirobiz, 2010).
Waste management hierarchy is a widely accepted order of waste management options. The
European Council in its Waste Directive of 1991 sets the hierarchy of waste management options
as follows:
1. Waste prevention
2. Recovery
3. Safe disposal
However, for a long time, the waste management hierarchy was ordered as follows (Kirkpatrick,
1992) reduce, reuse, recycle, recovery and disposal. The hierarchy is intended to encourage
people to re-think not only how their waste is managed and divert away landfill, but also how
they can reduce the amount of waste they produce.
Explanation of the five steps of the hierarchy is exposed in the diagram below.

12
Fig 1.6 Waste management hierarchy
Source: Pongrácz et al. 2010
1.2.1 Reduce
as well as looking at reducing the amount of things we buy, particularly goods which are not
constructed or packaged using recyclable material, the reduce step can be applied to the general
“think green” motive such as turning lights and electrical items off when not in use.
1.2.2 Reuse
It can be applied to the composting of certain food waste materials but also things like repairing
damaged furniture or buying second hand goods. Many consider re-use as the second preferred
option after waste minimization. Re-use for the same purpose is included in the waste
minimization options by EEA, but re-use for another purpose is listed as “waste management
option”. Re-use, is however not included in recovery options of Table 3, neither is defined as
such in waste legislation, only related to packaging end end-of-life vehicles. Re-use is best
defined by Lox (1994): as use, for the second or more time, of a product for the same purpose,
under the same form and with the same properties of the material as the first use, the material
having constantly remained under the same form between several uses.
1.2.3 Recycle
Waste is sorted by the kind of material it is constructed of, then it can either be processed to
produce a higher quality product or “down cycled” to produce a low-value raw material. For
recycling to be environmentally beneficial, the effects of the collection, transportation and
reprocessing operations must be less harmful than those resulting from the extraction and
processing of the virgin raw material that the recycled product replaces. Recycling actually only
occurs once the secondary material has been converted into a new product, or is utilized in
another way. Thus, the availability of markets for the secondary materials generated is
fundamental to the success of recycling. For recycling to be environmentally beneficial,
resources use optimization guidelines have to be considered (Pongrácz et al. 2010)

13
1.2.4 Energy Recovery
This is the process of creating energy by incinerating waste material typically using material
which cannot be recycled into a usable product.
1.2.5 Disposal
Any remaining waste which cannot be recycled or used for energy must be disposed of in an
appropriate manner. Both of the hierarchies are correct, and all of these concepts are widely
used. Lime falls under this section which is disposal as there is little or none of the above
methods being practiced on a bigger scale. The relative order of new and old hierarchies is
illustrated bellow
Table 1.4 Different stages of waste management hierarchy
New hierarchy “Old” hierarchy
Waste prevention
Recovery
Safe disposal
Waste minimization
Re-use, Recycling,
Incineration
Disposal
Source: Pongrácz et al. 2010
One of these hierarchies is using waste prevention as the most preferable option, and the other
waste minimization (Pongrácz et al. 2010)
1.4 STATEMENT OF THE PROBLEM
Public planning in the area of solid waste management is an extremely complex subject
especially when dealing with planning collection routes, sitting processing facilities, as well as
choosing locations for landfills and planning what will become of the landfill once they are full.
Such challenges and the impact of waste disposal on the environment have led to the search for
sustainable solutions in waste management in both developed and developing countries.
The disposal and burning of domestic waste can cause profound strain on the environment,
contamination of ground water resources, organic and inorganic pollution of nearby surface

14
water and carbon dioxide released from landfills as the main disposal site. Economic and
population growth, urbanization and industrialization as well as commercialization are
responsible for the challenges that national and the local government council’s face in their
efforts to organize a sustainable waste management.
In 2006 the global amount of municipal solid waste generated reached 2.02 billion tones,
representing a 7% annual increase since 2003 (Global Waste Management Market Report 2007).
Before now studies have been conducted on waste management in Cameroon and in Limbe. For
instance, Mbeng et al. (2012) carried out a study on waste characterization in Limbe as an
element of household waste management operations. The study focused on the composition of
household waste in the municipality. Manga et al (2007) examined waste management in
Cameroon and looked at policies and how these institutions are set to better handle this situation.
This study therefore attempts to identify and document the existing practices, problems of solid
waste management in Limbe, as well as propose possible solution for an effective and
sustainable waste management in the Limbe municipality.
Waste management is an exercise that has moved from manual to scientific operations. Such
include when planning collection routes, siting processing facilities, as well as choosing
locations for landfills and planning what will become of the landfill once it is full. AS many
waste managers will attest, planning routes for garbage, yard-waste and recycling collection is
complex and includes many factors such as planning collection routes, including the number of
stops, fuel efficiency of the collection vehicles, as well as measuring each load of garbage into
the trucks.
To this effect, efforts have been made to enhance solid waste management from urban
agglomerations like HYSACAM in Limbe,, yet many problems persist and this is the focus of
this study. Such problems include the measure of collection/week, the distance and zonal
mapping of the collection routes as well as inappropriate dump site. Furthermore, there is the
problem of a very ineffective process of measuring the volume and weight of each truck load of
collected waste. Although these challenges could come from multiple sources such as the lack of
the political will from the government to allow local councils to autonomously handle the waste
management, local councils themselves need to develop effective and sustainable system and
implement sound practices and policies for sustainable waste management.

15
This study therefore, examines the way forward for the Limbe City Council in matters of waste
management in partnership with HYSACAM by asking the following questions:
1.5 THE OBJECTIVES OF THE STUDY
The general objective of this study is to assess the practices, problems and prospects of
municipal solid waste management in the Limbe municipality.
1.5.1 The specific objectives will include the following:
1. To assess the type and quantity of waste generated in the Limbe municipality.
2. To assess the municipal waste management practices in Limbe.
3. To investigate the problems faced by stakeholders in waste management in
Limbe.
1.6 RESEARCH QUESTIONS
In other to achieve the research objectives, the following research questions were raised:
• What type and quantity of municipal solid waste is produced in the Limbe municipality?
• How is municipal solid waste managed in Limbe?
• What are the problems faced by the stake holders involved in waste management?
1.7 THE SIGNIFICANCE OF THE STUDY
The justification for this study stems from the fact that solid waste management globally is
shifting from manual to more scientific and technologically advanced methods and models. The
practice and problems of solid waste management in Limbe at least from the stand point of this
study suggest that the can be better options to manage waste in the city if effective attention,
research and community participation is undertaking. The study therefore will help the
municipality of Limbe develop better management models which will go a long way to improve
the hygiene and hence livelihood of the inhabitants. While other towns and cities in Cameroon

16
continue to grapple with solid waste management, this study attempts to introduce the concept of
GIS in waste management as the way forward that will accommodate and facilitate the process
of waste management in a town that is witnessing increasing commercialization, population and
rapid urban development.
1.8 ORGANIZATION OF THE STUDY
The study is organized in five chapters and each chapter deals with a specific theme of the study.
Chapter one is the introduction of the study and focuses on the background of the study,
statement of the problem and research questions as well the significance of the study and
limitations of the research. Chapter two examines the literature review and theoretical
framework. Chapter three examines the research methodology and Chapter four is the
presentation and analysis of data otherwise described as discussion of the subject matter of the
study. Lastly, Chapter five presents the summary findings, conclusion and recommendation of
the study.
17
CHAPTER TWO
LITERATURE REVIEW AND THEORETICAL FRAMEWORK
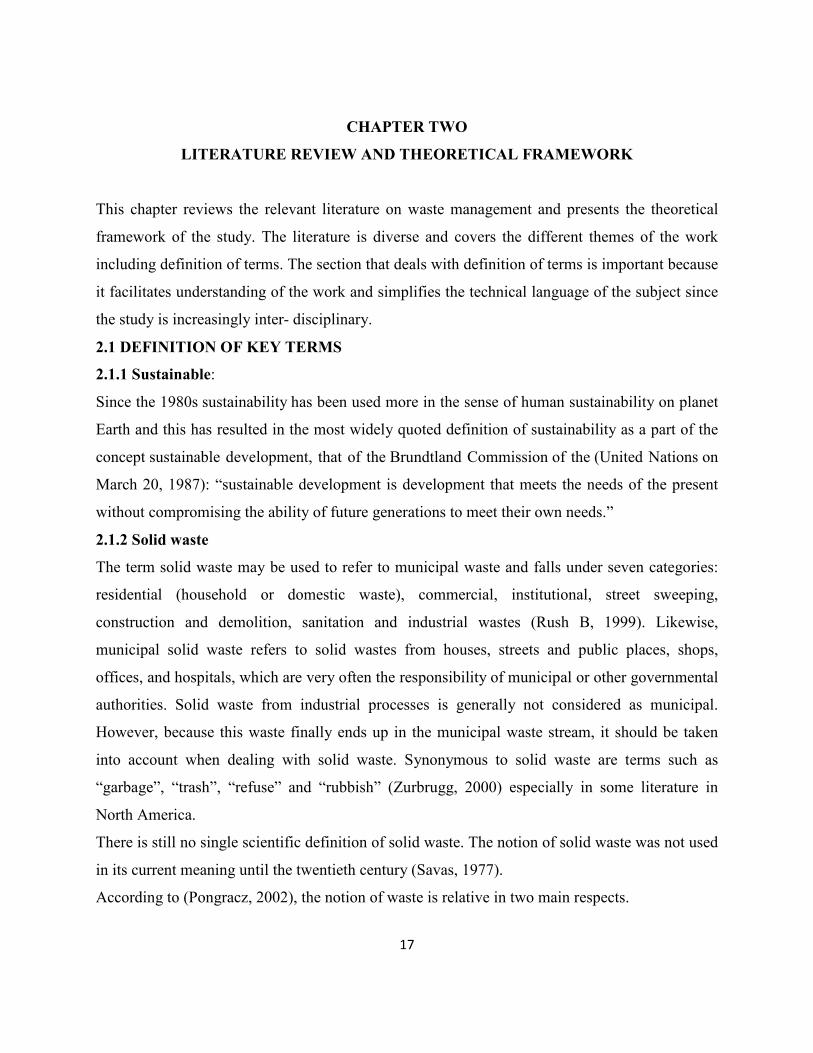
This chapter reviews the relevant literature on waste management and presents the theoretical
framework of the study. The literature is diverse and covers the different themes of the work
including definition of terms. The section that deals with definition of terms is important because
it facilitates understanding of the work and simplifies the technical language of the subject since
the study is increasingly inter- disciplinary.
2.1 DEFINITION OF KEY TERMS
2.1.1 Sustainable:
Since the 1980s sustainability has been used more in the sense of human sustainability on planet
Earth and this has resulted in the most widely quoted definition of sustainability as a part of the
concept sustainable development, that of the Brundtland Commission of the (United Nations on
March 20, 1987): “sustainable development is development that meets the needs of the present
without compromising the ability of future generations to meet their own needs.”
2.1.2 Solid waste
The term solid waste may be used to refer to municipal waste and falls under seven categories:
residential (household or domestic waste), commercial, institutional, street sweeping,
construction and demolition, sanitation and industrial wastes (Rush B, 1999). Likewise,
municipal solid waste refers to solid wastes from houses, streets and public places, shops,
offices, and hospitals, which are very often the responsibility of municipal or other governmental
authorities. Solid waste from industrial processes is generally not considered as municipal.
However, because this waste finally ends up in the municipal waste stream, it should be taken
into account when dealing with solid waste. Synonymous to solid waste are terms such as
“garbage”, “trash”, “refuse” and “rubbish” (Zurbrugg, 2000) especially in some literature in
North America.
There is still no single scientific definition of solid waste. The notion of solid waste was not used
in its current meaning until the twentieth century (Savas, 1977).
According to (Pongracz, 2002), the notion of waste is relative in two main respects.

18
- When something loses its primary function to a given user, it becomes waste. Therefore, one
person’s waste output is often someone else’s raw material input.
- The notion of waste is relative to the technological state of the art and to the location of its
generation.
2.1.3 Waste emission
At present waste continues to be disposed of on the land, in intermediate zone of the ground, air
and water. Environmentalists and waste management practitioners coincide that disposal of
waste still poses a major environmental problem. For instance Bidlingmaier, (1990), says MSW
has the potential to contaminate our natural environment (air, water and land), if its disposal is
not correctly managed, thus affecting human health and compromising ecological conditions.
Landfills have been historically associated to environmental issues such as gas emissions,
surface and ground contaminations and land cover issues.
2.1.4 Leachate
Waste can also affect water and soil through the slow escape of Leachate from waste disposal
sites, heaps of garbage, and inadequate waste collection systems. Leachate is known to be
contaminated water that percolates through waste. Bilitewski et al. (2000) define leachate as “all
contaminated water that has been in contact with waste”.
Porteous (2000) further notes that leachate properties differ depending on the type of waste, the
physical condition where it is generated, weather conditions, and the chemical processes
occurring in disposal sites or landfills. Extensive research on leachate from MSW has shown that
it includes a high level of organic components from household waste. Leachate is characterized
by a high concentration of ammonia and organic nitrogen compared to uncontaminated water.
The leaching of household waste that is untreated can produce a substance with a “high
biochemical oxygen demand” BOD which has negative effect on neighboring water sources.
2.1.5 Solid Waste Management (SWM)
The World Bank (2011) definition of Solid Waste management means “to collect, treat and
dispose of solid wastes generated by all urban population groups in an environmentally and
socially satisfactory manner using the most economical means available”. In his paper, Schubler
(1996) separates the definition of Solid waste management into two. Solid waste is defined to
include “refuse from households, non-hazardous solid waste from industrial, commercial and

19
institutional establishments (including hospitals), market waste, yard waste and street sweeping”
and the management of the waste is a cyclical process which includes “setting objectives,
establishing long-term plans, programming, budgeting, implementation, operation and
maintenance, monitoring and evaluation, cost control, revision of objectives and plans”.
Squires (2005) further explain that the objective of solid waste management is basically
the use of resources efficiently in the process of waste materials. According to Baud et al, there
are a range of actors in urban solid waste management and they can be clustered into four groups
which are the public sector (national authorities, local authorities and local public departments)
constituting a central set of players; the private sector (large and small registered enterprises
carrying out collection, transport, disposal and recycling); the small-scale, non-recognized
private sector (waste pickers, itinerant buyers, traders in waste materials and non-registered
small-scale enterprises); local community and its representatives (NGOs and CBOs) . In recent
years there been differences in the opinions about how solid waste should be managed. (Obirih-
Opareh, 2004) looks at one of the issues concerning solid waste management whether it should
be decentralized, whether it should be under community participation, privatized or whether it
should be managed a combination of all these different actors. The focus here is how SWM
practices were organized and the PCPs that happened or did not happen under the SWM
activities.
2.1.6 The principles of waste management
The principles of waste management, as identified by Schubeller et al. (1996) are “to minimize
waste generation, maximize waste recycling and reuse, and ensure the safe and environmentally
sound disposal of waste”. This means that waste management should be approached from the
perspective of the entire cycle of material use which includes production, distribution and
consumption as well as waste collection and disposal. While immediate priority must be given to
effective
Collection and disposal, waste reduction and recycling should be pursued as equally important
longer-term objectives.
20
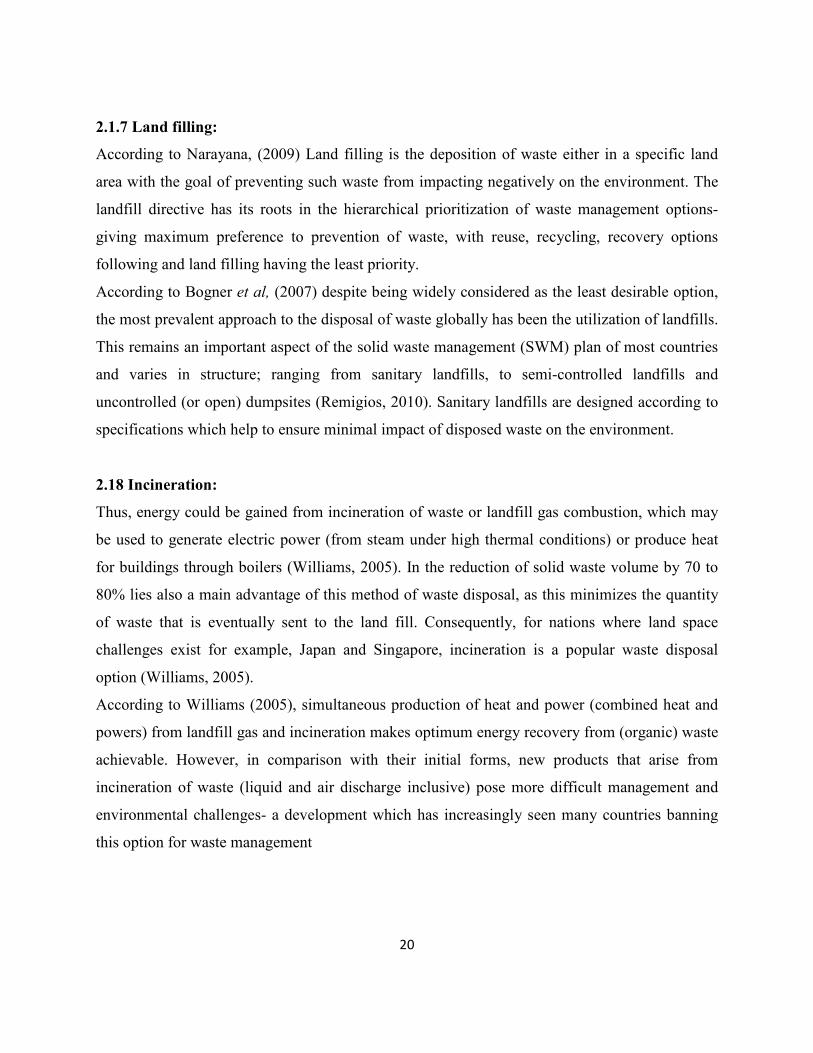
2.1.7 Land filling:
According to Narayana, (2009) Land filling is the deposition of waste either in a specific land
area with the goal of preventing such waste from impacting negatively on the environment. The
landfill directive has its roots in the hierarchical prioritization of waste management options-
giving maximum preference to prevention of waste, with reuse, recycling, recovery options
following and land filling having the least priority.
According to Bogner et al, (2007) despite being widely considered as the least desirable option,
the most prevalent approach to the disposal of waste globally has been the utilization of landfills.
This remains an important aspect of the solid waste management (SWM) plan of most countries
and varies in structure; ranging from sanitary landfills, to semi-controlled landfills and
uncontrolled (or open) dumpsites (Remigios, 2010). Sanitary landfills are designed according to
specifications which help to ensure minimal impact of disposed waste on the environment.
2.18 Incineration:
Thus, energy could be gained from incineration of waste or landfill gas combustion, which may
be used to generate electric power (from steam under high thermal conditions) or produce heat
for buildings through boilers (Williams, 2005). In the reduction of solid waste volume by 70 to
80% lies also a main advantage of this method of waste disposal, as this minimizes the quantity
of waste that is eventually sent to the land fill. Consequently, for nations where land space
challenges exist for example, Japan and Singapore, incineration is a popular waste disposal
option (Williams, 2005).
According to Williams (2005), simultaneous production of heat and power (combined heat and
powers) from landfill gas and incineration makes optimum energy recovery from (organic) waste
achievable. However, in comparison with their initial forms, new products that arise from
incineration of waste (liquid and air discharge inclusive) pose more difficult management and
environmental challenges- a development which has increasingly seen many countries banning
this option for waste management

21
2.1.9 Types of Solid waste
Usually, solid wastes are one of three types namely: municipal wastes, industrial wastes and
hazardous wastes (Asnani, 2006).
• Municipal waste
The definitions of terms and the classifications used to describe the components of solid wastes
vary greatly in practice as well as in the literature. The definitions presented above are intended
to serve as guide for municipal solid wastes (Colas, 2000).
• Industrial wastes
Industrial wastes are waste arising from industrial activities. They include rubbish (associated
with the support personnel), process wastes, ashes, demolition and construction wastes, special
wastes and hazardous wastes. (Colas, 2000).
• Hazardous wastes
Hazardous waste are classified as wastes that pose a substantial danger, either immediately or
over a period of time, to human, plant or animal life. A waste is classified hazardous based on
the fact that it exhibits any of the following characteristics: ignitability, corrosively, reactivity
(Asnani, 2006).
2.2 THE CONCEPT OF WASTE MANAGEMENT
Gbekor (2003) refers to waste management as involving “the collection, transport, treatment and
disposal of waste including after care of disposal sites”. Similarly, Gilpin (1996) has defined
waste management as “purposeful, systematic control of the generation, storage, collection,
transportation, separation, processing, recycling, recovery and disposal of solid waste in a
sanitary, aesthetically acceptable and economical manner”. To Schubeller et al. (1996),
municipal solid waste management is “the collection, transfer, treatment, recycling, resource
recovery and disposal of solid waste in urban areas”.
From these suppositions, it can be deduced that waste management is the practice of protecting
the environment from the polluting effects of waste materials as a measure to protect public
health and the natural environment. Thus, the priority of a waste management system is the

22
provision of a cleaning service which helps to maintain the health and safety of citizens and their
environment (Cooper, 1999). In this regard, Gilpin, cited by Baabereyi, (2009) regards the
business of waste management as a professional practice which goes beyond the physical aspects
of handling waste. It also “involves preparing policies, determining the environmental standards,
fixing emission rates, enforcing regulations, monitoring air, water and soil quality and offering
advice to government, industry and land developers, planners and the public.”
Waste management, therefore, involves a wide range of stakeholders who perform various
functions to help maintain a clean, safe and pleasant physical environment in human settlements
in order to protect the health and well-being of the population and the environment. Effective
waste management is, however, a growing challenge to all municipal governments, especially in
developing countries. One reason for the challenge is that reading the positions advocated above
one realizes the absence of waste generators in the chain of production or the life cycle of waste
management systems. It could be argued that it is important to identify the sources of waste and
build a historical gradient of the exercise to be able to determine the high periods and simpler
categorization of waste from any particular region. This is so because waste from colonial
societies which were at infancy within the framework of an emerging world economy produced
waste significantly small and diverse from the present society of multi-billion dollar industries.
2.3 EFFECTIVE PARTNERSHIP FOR WASTE MANAGEMENT
Obiri-Opareh (2003) defines partnership as “enduring, mutually beneficial relationships between
two or more actors based on written or verbal agreement and having a concrete, physical
manifestation. The author further notes that the core objectives of partnerships in basic urban
settings is to deliver services in a more effective and efficient way. In the case of waste
management for example, these can be garbage bins, transfer stations, disposal sites and
collection vehicles). On his part, Gray (1989) defines partnerships as “a process through which
parties who see different aspects of a problem can constructively explore their differences and
search for solutions that go beyond their own limited visions of what is possible”.
From an institutional point of view, the OECD (1990) defines partnerships as “systems of
formalized co-operation, grounded in legally binding arrangements or informal understanding,
co-operative working relationships, mutually and adopted plans among a number of institutions.
They involve agreements on policy and programme objective and sharing of responsibility,
23
resources, risks and benefits over a specified period of time: Effective development requires
sustainable partnerships at different levels of government, the private sector, donor groups and
the civil society.
Public - Private Partnership (PPP) can be defined as a partnership in which government and
private companies assume co-responsibility and co-ownership for the delivery of city services
(Ahmed and Ali, 2004). For example, the partnership between the Cameroon Government and
HYSACAM whose nature and structure can be linked to the legal framework reached at the Rio
de Janeiro and the Kyoto agreements from 1992. The partnership was reached in 2007 with
HYSACAM to improve on the collection of garbage in Cameroonian towns. HYSACAM is an
off-shot of a multi-national waste management company in France called VEOLIA PROPRIETE
Sa. The mother company is engaged in water, energy, transport and waste management and it is
globally established in thirty eight countries with a good reputation in service delivery and
improvement in environmental conditions.
HYSACAM is expected to conform to international standards as prescribed by the Kyoto
agreement. The main goal of the Kyoto Protocol was to contain emissions of the main
anthropogenic (human-emitted) greenhouse gases (GHGs) in ways that reflect underlying
national differences in GHG emissions, wealth, and capacity to make the reductions. The treaty
is a follow up to the main principles of the original 1992 UN Framework Convention. The Kyoto
Protocol's first round commitments are the first detailed step taken within the UN Framework
Convention on Climate Change (Gupta et al., 2007). The Protocol establishes a structure of
rolling emission reduction commitment periods. It set a timetable starting in 2006 for
negotiations to establish emission reduction commitments for a second commitment period. It is
important at this stage to show a historical gradient and build up to the Kyoto agreements. As
concerns for the environment and climate change gathered momentum amongst researchers,
academic institutions, governments and international organizations, discussions through
international networks led to the need to develop a legal framework to allow the world
community to operate regarding the environment according to official standards. The high water
mark came in 1992 first with the Rio de Janeiro declaration; a time line is shown below:
24
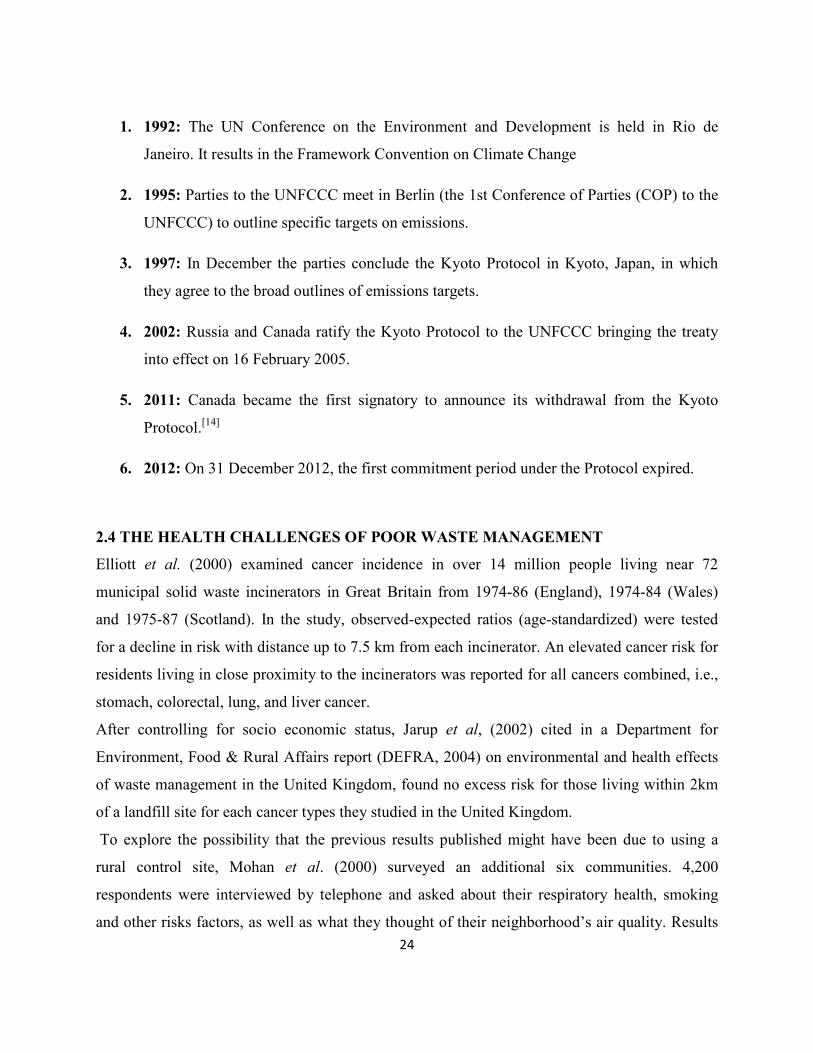
1. 1992: The UN Conference on the Environment and Development is held in Rio de
Janeiro. It results in the Framework Convention on Climate Change
2. 1995: Parties to the UNFCCC meet in Berlin (the 1st Conference of Parties (COP) to the
UNFCCC) to outline specific targets on emissions.
3. 1997: In December the parties conclude the Kyoto Protocol in Kyoto, Japan, in which
they agree to the broad outlines of emissions targets.
4. 2002: Russia and Canada ratify the Kyoto Protocol to the UNFCCC bringing the treaty
into effect on 16 February 2005.
5. 2011: Canada became the first signatory to announce its withdrawal from the Kyoto
Protocol.[14]
6. 2012: On 31 December 2012, the first commitment period under the Protocol expired.
2.4 THE HEALTH CHALLENGES OF POOR WASTE MANAGEMENT
Elliott et al. (2000) examined cancer incidence in over 14 million people living near 72
municipal solid waste incinerators in Great Britain from 1974-86 (England), 1974-84 (Wales)
and 1975-87 (Scotland). In the study, observed-expected ratios (age-standardized) were tested
for a decline in risk with distance up to 7.5 km from each incinerator. An elevated cancer risk for
residents living in close proximity to the incinerators was reported for all cancers combined, i.e.,
stomach, colorectal, lung, and liver cancer.
After controlling for socio economic status, Jarup et al, (2002) cited in a Department for
Environment, Food & Rural Affairs report (DEFRA, 2004) on environmental and health effects
of waste management in the United Kingdom, found no excess risk for those living within 2km
of a landfill site for each cancer types they studied in the United Kingdom.
To explore the possibility that the previous results published might have been due to using a
rural control site, Mohan et al. (2000) surveyed an additional six communities. 4,200
respondents were interviewed by telephone and asked about their respiratory health, smoking
and other risks factors, as well as what they thought of their neighborhood’s air quality. Results

25
from the telephone interviews indicated a higher prevalence of self-reported respiratory
symptoms in one community near a hazardous waste incinerator when compared with its control
group.
Hu et al. (2001) investigated the chronic effects of emissions from three different waste
incinerators on pulmonary function of both healthy and sensitive subjects with chronic
respiratory symptoms. A total of 1,018 participants underwent a Spiro metric test once a year
between 1992 and 1994. Three measures were used as surrogates of exposure: living in an
incinerator community, distance from the incinerator, and an incinerator exposure index, which
was a function of the distance and direction of each subject's residence to the incinerator, days
downwind, and average time spent outdoors.
Overall the results generally showed no statistically significant association between pulmonary
function and exposure from these three incinerators
Tango et al. (2004) conducted Japan’s first-ever large-scale national study to examine the
adverse reproductive effects associated with proximity to 63 municipal solid waste incinerators
that emit high levels of dioxin. The adverse reproductive outcomes of mothers living within 10
km of from the 63 municipal solid waste incinerators were examined using vital statistics records
of live births, fetal deaths, and infant deaths. The number of observed cases was compared
against the expected cases calculated from national rates adjusted for region. Observed versus
expect ratios were compared for decline in risk or peak-decline in risk with distance up to 10 km
from the incineration facilities. During the study period, 1997-1998, Japanese mothers had
225,215 live births, 3,387fetal deaths, and 835 infant deaths. There was no statistically
significant increase in adverse reproductive outcomes for residents living within 2 km of a
facility.
Regarding our study, Limbe maintains one method of disposal and that is land filling which
comes with its own problems and challenges as noted above. Once waste is landfilled, complex
and variable chemical and biological degradation commences in the presence of moisture and
naturally occurring micro-organisms. Five stages have been recognized in this degradation
process which are; designated ‘initial adjustment’, ‘transition’, ‘acid formation’, ‘methane
fermentation’ and ‘final maturation’ (Environmental Protection Agency (US), 1995). Landfill

26
produces carbon dioxide (CO2) and Methane gas (CH4), and also carbon monoxide (CO) but it is
mostly related to burning of waste (Westlake, 1995).
Leachate management is also a major concern. The volume of leachate directly correlates with
the precipitation rate and Limbe has one of the highest precipitation rates in the country.
Municipal solid waste (MSW) leachate contains a wide variety of hazardous, toxic or
carcinogenic chemical contaminants (EEA 2000). Table 2.1 shows potential effects of poorly
managed waste systems on humans. It shows a variety of diseases and their causes.
Table 2.1: Showing diseases linked with waste
Disease Parasite Disease Vector Breeding Ground Malaria Plasmodium vivax
Salmonella typhoid
Mosquitoes from disposal sites Standing water, ponds, untreated landfills and open dumping
Cholera Vibrio cholera Mosquitoes from waste disposal sites
Standing water, ponds, untreated landfills and open dumping
Typhoid Salmonella typhoid
Infection of humans by fleas and contaminated food
Water borne pathogens
Pneumonia Mycoplasma
pneumonia Inhalation of contaminated air Polluted air
Bronchitis Mycoplasma pneumonia
Inhalation of contaminated air Polluted air
Paratyphoild Salmonela paratyphoid
Sucking blood from human and infected merogoite
Open dumps, standing waters and open ponds
Source: Mount Mary Hospital, 2004
2.5 THE MANAGEMENT OF GLOBAL MUNICIPAL SOLID WASTE
The challenges of waste generation and disposal can be traced to the development of human
congregations as communities. The accumulation of waste was a consequence of the way of life
due to littering of food and other solid wastes. This has been linked to the breeding of rats and
the outbreak of plagues and epidemic which killed many Europeans in the 14th century
(Tchobanoglous et al. 1977).
Increasing population, urbanization and industrialization in the different regions of the world
have contributed to a major increase of industrial and municipal waste. Urbanization induces a

27
consumer based society characterized by increase in concentration of people and
industrial/commercial development. This implies an accumulation of waste which needs to be
properly disposed of and managed safely.
Solid waste management is one of the main responsibilities of both urban and rural communities
and the fundamental objective of solid waste management programmes is to minimize the
pollution of the environment as well as utilize the waste as a resource.
Although per capita waste generation rates in developing countries is less than in higher-income
countries, the capacity of the local authorities to manage waste from collection, to recycling or
reuse and disposal, is limited (Barton, et. al., 2007). Targets can be achieved using methods that
can be afforded by the community over the long term and with less risk to the persons involved.
An input of universally valid skills or techniques, or a set of similar culture-neutral attitudes
defines management itself, while management of waste requires particular kind of intellectual
insight, which would be expected to yield value-specific solutions to local problems (Kapoor,
2009).
A research carried out by Couth, et al (2010) reveals that the average inorganic content for urban
municipal solid waste in Africa is around 56 percent and its degradation is a major contributor to
greenhouse gas emissions. Rapid population growth overwhelms the capacity of most municipal
authorities to provide the basic services.
Adequate municipal solid waste management is much more than a technological issue; it
involves other issues such as institutional, social, legal, and financial considerations. Also, it
involves coordinating and managing a large workforce and collaborating with many other
stakeholders including the general public (Zurbrugg, 2003). Table 2.2 shows the growth of the
urban population in the world, with projection to 2015, the table shows a steady growth of the
urban population and this trend will continue.

28
Table No 2.2 Percentage of population living in urban areas – with projections for 2015
Region 1950
1975 1995 2015
Africa 14.6 25.2 34.9 46.4
Asia 15.3 22.2 33.0 45.6
Latin America 41.4 61.2 73.4 79.9
Industrial countries 54.9 69.9 74.9 80.0
World 29.7 37.8 45.3 54.4
Source: Adapted from U.N. 1998
Low income areas have higher population densities and the lowest level of municipal solid waste
service provision (Louigueur, 2007).Through poor sanitation conditions in low-income
neighborhoods there are health threats to residents including the wider population due to poor
disposal units and management mechanism. According to Vaishali (2009) much of the waste
generated worldwide (57-85percent) where primarily disposed in landfills including open and
engineered landfill. The figure below shows waste disposal methods in some countries. You see
that a country like Japan has a more balanced approach with recycling taking about fifty percent
of disposal methods. While other countries like the USA, Germany, Ireland and Mexico use
more of landfills and incineration see fig 2.1

29
Fig No 2.1: Municipal solid waste treatment in various countries
Source: Cortinas de Nava, 2001
2.6 SOLID WASTE MANAGEMENT IN DEVELOPING COUNTRIES: THE AFRICAN
EXAMPLE
According to Palczynski (2002) solid waste management policies and programs in some African
cities Ghana and Kenya were formulated and implemented by government agencies without
significant public participation. The emergence of environment protection and compliance to
international standards peaked in Africa as part of the developing world in the 1990s as part of
public demands and sensitization to government actions, policies and laxity. Political and social
changes across the African continent in the early 1990s led to the growth of nongovernmental
organization (NGOs) in diverse sectors including environmental non-governmental
organizations. These organizations have through various campaigns and working conferences
fostered increased awareness about environmental issues including waste management. The task
of local governments especially in urban areas is to ensure the provision of healthy and
stimulating environment for their inhabitants. Such global consensus is due to the closeness of

30
local governments to the people and their responsibility for delivering municipal services to all
its citizens (Hardoy, et al, 1992; DCD, 1999).
A feasibility study on solid waste incineration for the largest cities in Kenya, Malawi and
Zimbabwe (DFID, 1999) reveals that, 75-80% of municipal solid waste was organic. While in
India, 70% was organic (Yedla and Parikh, 2002), and reported values for Dhaka city
(Bangladesh) from domestic properties were between 85% and 95% (JICA, 2005; BCAS, 1998).
In developed countries, total organic content is lower typically 6% of which in some cases only
10 percent is composed of food waste and the rest made of paper and cardboard (Tchobanoglous
and Kreith, 2002).According to UNEP (2005), the rate of waste generation generally increases in
direct proportion to that of a nation’s advance in development. Failure to provide a management
system could result in greater environmental degradation with increase health risk to the urban
population.
As much as waste generally can be managed by municipalities of different countries in Africa,
like else where it is important to evaluate what has worked well so that such models can be
replicated in other African communities. This way the principle of environmental friendliness
can gain and gather momentum as an aspect of human reality and scientific fiction as argued by
many in the increasing debate on climate change and human contribution to the process.
For this reason, this study examines the scope, nature and form of waste management in
Cameroon by focusing on Limbe as an emerging city with both municipal and urban properties.
Limbe is an emerging industrial city experiencing rapid urbanization and population growth, and
poorly organized waste management will create a lot of health and environmental problems.
Poorly disposed waste end up in the rivers, gullies and water ways around the city and the
proliferation of waste like plastic for example will lead to flooding in the wet season since such
waste will choke and block passages of the drainage and sewage systems. In the long term, the
absence of effective action to clear the waste will cause disruption of the infrastructure and lead
to water logging which in turn leads to environmental health problems. Through standing water
and accumulated forage health hazards such as high incidence of malaria and mosquito breeding
areas.
Increasingly, authors argue that waste management challenges area positive outcome for
environmental consciousness, (Stoyanov, 2000; Dhir Newlands and Dyer 2003; UNEP 2005;

31
Dhamija, 2006; Nhamo, 2008; El Haggar, 2010; Robertson, 2012).These groups of authors
focused on the environmental and economic impact of plastic waste (Nhamo, 2008; UNEP,
2005). The environmental impact on big cities is devastating and for a city like Limbe it will be
very difficult if a comprehensive plan is not put in place.
In other towns in Cameroon for instance Douala, strategies have been developed to manage
plastic waste; plastic waste recycling is attracting big business with high income potentials. The
project seeks to make the collection, transportation and disposal of solid waste (including plastic
waste) a means to which the low income earners of the municipality will generate income
(UNDP, 2009).
Equally, the United Nations Development Program (UNDP) project on solid waste management
in Nairobi (2006) focuses on a sustainable solid waste management system for the city of
Nairobi. The main beneficiaries will be the urban poor through increased sanitation conditions in
the informal settlements and the development of income generating activities related to solid
waste.
In relation to the Limbe project, the goal will be first to support the creation of an enabling
policy environment for sustainable solid waste management practices. Then increase the capacity
of actors within government and the informal sectors to develop effective information and
networking systems and promote and develop pro-poor partnerships.
The project is modeled on the comprehensive plastic waste management strategy for the city of
Nairobi by (Kenya National Cleaner Production Centre, (2006).The model of the project is based
on the 3R approach that focuses on reducing, reusing and recycling generated wastes. The 3R
approach was endorsed by the World Summit on Sustainable Development (WSSD) as an
effective means of achieving sustainable consumption and production.
The 3R policy calls for an increase in the ratio of recyclable plastic wastes, further reusing of raw
materials and manufacturing wastes, and overall reduction in resources and energy use. It aims
to set up a sound material’s economy where the consumption of natural resources is sustainable.
This strategy seeks to bring together in a form of a working partnership key plastic waste
management stakeholders. According to the Nairobi model the City Council of Nairobi, relevant
Government ministries, regulatory agencies, business associations, plastic manufacturers,

32
retailers, research institutions, NGOs, youth groups, informal waste recyclers, community based
organizations (CBOs), consumers, donors, and the media) into a functional Plastic Waste Return
Scheme and/or buy back scheme that will facilitate the collection and returning for reuse,
recovery and recycling of all categories of plastics that find their way into the city environment
under what is referred to as the “Expanded Stakeholder Responsibility”.
From another perspective Wienaah (2007) examines the Ghanaian experience and shows how the
problem affects every urban area. He also proposes solutions and the benefits of recycling this
plastic waste which can create jobs and income for some people. Furthermore, he argues that
plastic waste component of MSW is problematic because it is non-biodegradable and therefore
can stay in the environment for a considerable length of time causing all sorts of problems.
From the above evaluations it can be argued that the management of plastic waste through
combustion (incineration) is not environmentally friendly and sustainable since it releases carbon
dioxide, a major contributor to global warming (greenhouse effect). Landfilling with plastic
waste is not also desirable since plastic is non-degradable and no economic value would have
been derived from the waste in that case.
The best option for sustainable plastic waste management is therefore through recycling. This is
so because the benefits of recycling of plastic waste are numerous and are also environmentally
friendly in comparative terms with the other methods of waste disposal. Through recycling of
plastic waste, we can have material and energy recovery and therefore added value will be
derived from the waste instead of regarding it as garbage or trash.
According to a study conducted in Accra, Ghana by GOPA Consultants in 1983, plastic waste
accounts for 1-5 percent (of net weight) of the total amount of waste generated (Lardinois and
Van de Klundert, 1995). Since then, there has been a tremendous increase in plastic waste
particularly sachet water bags due to growing urbanization and consumption pattern.
Converting waste plastics into resources demands an examination of the methods that can be
used to generate income from waste plastic. In doing so one must consider that due to lack of an
integrated solid waste management, most of the plastic waste remains uncollected since they are

33
not properly disposed of in the appropriate manner. Such practices lead to negative impacts on
the environment and leads to public health.
Waste plastics cause littering and choking of sewage system due to the long periods required for
its natural decomposition. Plastic waste is often the most visible component in waste dumps and
open landfills. In most of the situations, plastic waste recycling could also be economically
viable since it generates resources which are in high demand for instance plastic shoes.
Plastic waste recycling has great potential for resource conservation and GHG (greenhouse
gases) emissions reduction such as producing fuel. These methods of resource conservation can
be important for national and local governments where rapid industrialization and economic
development puts pressure on natural resources. Some of the developed countries have already
established commercial level resource recovery from waste plastics such as Australia. Therefore,
having a “latecomer’s advantage,” developing countries can learn from these experiences and
technologies available to them. UNEP has developed a programme on integrated solid waste
management to support capacity building and technology transfer and under which a set of
guidelines on development of ISWM Plan (UNEP,2009).
Solid waste management problems in developing countries are different from those found
developed countries. This can be justified by the fact that the very composition of their waste is
different from those of developed countries and solid waste rates average only 0.4 to 0.6
kg/person/day, as opposed to 0.7 to1.8kg/person/day in fully industrialized nations (Cointeau,
1982; Blight and Mbande, 1996). Thus a cost effective comprehensive solution that can create
jobs is required.
2.7 WASTE MANAGEMENT AND THE ENVIRONMENT
The percentage of toxic materials in the MSW has increased in the past decades after synthetic
materials became widely manufactured, consumed, and discarded (Geiser,2002).The toxic
materials, if mingled with other non-hazardous waste in the MSW stream and ended in landfills,
generate the greatest impacts on the environment through the life cycle, compared to all the other
waste management options (Denison, 1996; El-Fadel et al., 1997; Morris, 2005)
34
2.7.1 Complaints about Noise and Odour from Landfills
From the data provided by the Chartered Institute of Environmental Health (CIEH, 2003), the
numbers of complaints associated with odour and noise from landfills can be estimated thus:
Odour: estimates of between 4,000 and 10,000 complaints/year in the United Kingdom! Noise:
approximately 300 complaints/year. A total of between 12,000 and 30,000 complaints of odour
are also received annually by local authorities. An accurate total cannot be estimated because of
incomplete reporting to the CIEH, and the unpredictable pattern of complaints (e.g. a single
incident may generate one complaint, or hundreds of complaints). This estimate is therefore of
poor quality. The total number of noise complaints recorded by the CIEH is approximately
400,000/year. This value is of moderate quality. This indicates that landfills account for a
significant proportion of odour complaints, likely to be between 10% and 25% of all odour
complaints received by local authorities. Landfills and other waste management operations are
unlikely to account for a significant proportion of noise complaints.
2.7.2 Effects of Waste Management on Plants
The principal route by which incineration processes could affect flora is via the deposition of
substances emitted to air. Emissions of acid gases or nutrient species to air could have significant
impacts on sensitive habitat sites. These issues are managed via the identification of critical load
functions for different habitat types, and assessment of actual deposition of acid gases or nutrient
nitrogen species against these critical loads. Lichens are particularly sensitive to deposition of
sulphur dioxide.
Lisk (1988) cited studies that demonstrated bioaccumulation in plants and accumulation in soils
of metals emitted from incinerators. The review also illustrated that bioaccumulation appears to
be species dependent. A study from Finland (Kukkonen and Raunemaa 1984) suggested that
concentrations of 10 elements (bromine, calcium, chlorine, iron, nickel, lead, silicon, titanium,
vanadium and zinc) in birch leaves demonstrated a strong inverse relationship with distance from
an incinerator. This phenomenon was noted from only a few elements in grass samples from
similar locations. Experiments undertaken with cabbage and barley (Wadge and Hutton 1986),
Lisk also noted that incinerators could contribute to acid rain which could then affect plants.

35
Mika et al (1985) found no phytotoxic effects around an incinerator ash disposal site adjacent to
a freshwater wetland.
2.7.3 Effects of Waste Management on Animals
The principal route by which incineration processes could affect fauna is via the deposition of
substances emitted to air. The possibility also exists for soil contamination via leaching of
substances from incinerator ash streams.
Reineke and Ash (1984) carried out a study showed that earthworms living within contaminated
soils exhibit a fivefold increase in dioxin levels in tissues compared to the surrounding soils
within 5- days, indicating that bioaccumulation occurs.
Travis and Blaylock (1995) discuss mercury dispersion from all anthropomorphic sources
including MSW incineration, and subsequent bioaccumulation in fish, the paper also indicates
that up to 58% of human mercury uptake is via fish and 31% via vegetation.
2.8 Urban System Theories and Waste Management
Intensive human activities in cities often require imports of resources and transform raw
materials, energy, and water into the built environment, air emissions, and waste. As early as
19th century, Marsh looked into the historical degradation of nature along with human
development and asserted that humans had played a destructive role in the nature transformation.
He contended that humans should respect the laws of nature and act as coworkers of the nature,
because man and nature shape each other (Marsh,1864).Wolman’s (1969) analogy of city
activities as a metabolism process represents pioneering research on system-wide impacts on
resource consumption and waste generation in an urban environment (Decker et al., 2000).
Wolman argued that “the metabolic cycle is not completed until the wastes and residues of daily
life have been removed and disposed of with a minimum of nuisance and hazard”. Wolman
further demonstrated the problem in the case of water use in a hypothetical city in the U.S. With
a particular focus on waste materials, Bower (1977) introduced the concept of “residuals” and
the model of residuals-environmental quality management (REQM), and the criteria to evaluate

36
REQM strategies. Since the first study by Wolman half a century ago, at least 20 comprehensive
studies have been undertaken across the world (Kennedy et al 2010). It is noteworthy that a
majority of the current case studies are located in European or Asian regions. It appears only two
studies were conducted in the U.S.; one by Zucchetto (1975) in Miami, and the other by Ngo and
Pataki (2008) in the Los Angeles County.
Researchers have found that material flow analysis, especially at a refined geographical scale, is
rather constrained by data availability than by methodology (Leigh et al., 2007).Data
requirements are particularly a challenge for urban system analysis also because a uniform unit
of measurement is typically needed. Three common types of measurements have been adopted
by researchers in urban system models: (1) material masses (such as Niza, Rosado, and Ferrão,
2009); (2) energy (such as Odum, 1983); and (3) land area, which is associated with studies of
carrying capacity and ecological footprint. Carrying capacity refers to “the level of population or
development that can be sustained in an area without adversely affecting that area beyond an
acceptable level”(Randolph, 2004). Even if technology innovations may increase the carrying
capacity, researchers represented by Meadows argued that the current pace of population growth,
industrialization, pollution, resource depletion may create the limits of growth on this planet in
an abrupt way (Meadows et al., 1972, 1992). Ecological footprint measures the amount of
biologically productive land area needed to sustain resource consumption and to assimilate
residuals from a person, a region, or an activity, such as manufacturing a computer (Wackernagel
and Rees, 1996). Embedded in life-cycle thinking, ecological footprint analysis can be used as an
indicator for self-sufficiency and sustainability in an easily comprehensible way.
Both theoretical and empirical studies on urban systems suggest that urban and environmental
systems are interdependent and thus we must consider environmental processes as drivers of
urban change (Alberti, 1999). Urban systems cannot be sustainable if it requires more resources
than it can produce and generates more waste than it can assimilate.
The integration of urban system models and economic system analysis, although not always
recorded in the same unit of measurement, represents a significant advancement in system
analysis in that previously separated systems are finally considered as one unity. Based on the

37
regional economic input-output model that was developed by Leontief in 1936 to trace the flows
of goods and services among sectors, Leontief and Ford (1972) extended the economic input-
output model that originally developed to examine air pollution problems. Pattern (1976) and
Finn (1977) extended the framework of economic system to ecological systems. Applications of
environmental input-output framework have proliferated after these pioneering studies (Thoss
and Wiik, 1974; Hendricks, 1982; Xie et al, 1991; Bouhia, 1998; Chen, 1990, 1992, 2000).
These studies have covered both marketable environmental goods (e.g., water supply for
production and consumption) and non-market environmental goods (e.g., water Inventory Rivers,
lakes, etc.).
2.9 INSTITUTIONAL FRAMEWORK
Institutional framework refers to the laws, rules and regulations or the existing structure that
facilitates or prohibits partnerships or collaboration between the state authority and private stake
holders in waste management. According to Schudler (1996) the institutional conditions for
municipal solid waste management include the institutional structures and arrangements as well
as the organizational procedures and the capacity of the institutions. Key components of the
institutional framework include the following:
2.9.1 Distribution of Functions and Responsibilities
This regards the distribution of functions, responsibilities and authority between local, regional
and central government institutions and between local governments in metropolitan areas
including CBOs and NGOs in the area of MSWM. This is important because if local authorities
are given the ability to manage their affairs as it has been proven, the bottom up approach to
waste management will be very effective. Also giving responsibilities to competent individuals
will make waste manage better.
2.9.2 Organizational Structure
The institutions responsible for MSWM , include the coordination between MSWM and other
sectors and/or urban management functions. A well structural organization for waste
management is necessary in Cameroon.

38
2.9.3 Incentives and Interests
Incentives are seen as the principles and motivations underlying partnerships. According to
various scholars, “the general principles upon which incentive systems should be based include
the need to ensure that risks and rewards are commensurably and fairly distributed among the
parties concerned and that they are tailored to specific project objectives” (CII, 1991; Bennett
and Jayes, 1996; Barlow et al., 1997). Clark and Wilson (1961) have grouped incentives under
three categories, namely; material incentives, purposive incentives and solidarity incentives.
Material incentives include tangible rewards such as money in the form of wages, fringe benefits
and patronage. Purposive incentives includes intangible rewards that are related to the goals of
an organization and solidarity incentives are rewards from being part of an organization,
examples of this are sociability, status and identification.
Incentives are the forces that will drive two actors to come into partnerships, in this case the local
government and the community organizations including NGOs go into partnerships. According
to Ahmed and Ali (2003), partnerships will not be effective and sustainable, if there are no
incentives for the actors to enter into it.
2.9.4 Accountability
Yaaba 2012 define accountability as ‘the liability to give an account of what one has done, or not
done, to another who has authority to assess the account and allocate praise or blame. The
concept of accountability is broad and envelopes more terms such as public exposure,
monitoring, control, oversight, punishment and public exposure. Accountability has two
dimensions which are enforceability and answerability. Enforceability is defined as “the capacity
of accounting agencies to impose sanctions on power holders who have violated their public
duties” and answerability is defined as “the obligation of public officials to explain what they
are doing; and enforcement, the capacity of accounting agencies to impose sanctions on power
holders who have violated their public duties” Schedler, (1999), defines accountability as
subjecting of power to the threat of sanctions; obliging it to be exercised in transparent ways; and
forcing it to justify its acts. According to the World Bank (2004), in service provision there are
long routes and short routes of accountability. The short route is when the citizens can hold the

39
service providers accountable themselves, and the long route is when the community a mediator
to voice to demand accountability.
Most of the literatures consulted focused on other aspects of waste management like health
challenges and the general problems faced by most developing countries. However this study
looks critically at the problems faced by all stakeholders in municipal solid waste management in
the Limbe municipality. The study focuses only on household waste management which is very
important as it generates more than 70% of waste in the lime municipality. Most of the
recommendations are tailored for a better access to waste services that suits the community.
2.10 THE SIGNIFICANCE OF GIS MODELING IN WASTE COLLECTION AND
TRANSPORTATION
Modern and scientific models of disposal, collection and transportation of municipal solid waste
are crucial for an environmentally friendly approach and a cost effective means of solid waste
management. However, the process demands knowledge of the geography of the study area; that
is the problem of vehicle routing since each vehicle must travel in the study area visiting every
communal waste bin in a way that minimizes the total travel cost. This is so because they are
most often defined in terms of distance, time, fuel consumption, amount of waste from each
truck and the tonnage per day or week as well as CO2 emissions. However, the problem of
optimizing the route system of solid waste collection networks is not convention
The effectiveness of the decision making process depends on proper processing of the
information made available to the authorities concerned. In this regard, the use of GIS as a
support tool has gained currency as a result of technology maturation and increase of the quantity
and complexity of spatial information handled (Santos et al., 2008). In this regard, some authors
have researched route optimization regarding waste collection in both developed and developing
countries. In the process they have incorporated the environment and transport minimization,
through improved sitting of transfer stations (Esmaili, 1972), landfills (Despotakis &
Economopoulos, 2007) and treatment installations for integrated regional waste management
(Adamides et al., 2009; Zsigraiova et al., 2009).

40
According to Johansson, (2006) and Kim et al, (2006), optimization of waste collection and
transport involves the novelty of spatial modeling techniques and GIS. These models can provide
more effective and sustainable economic and environmental savings in waste management
through the reduction of travel time, distance, fuel consumption and pollutants emissions These
systems are particularly absent in the Limbe and HYSACAM partnership for waste management
in the Limbe city council area.
Tavares et al. (2008) have argued that effective decision making in the field of management
systems demands the use of vehicle routing techniques that are capable of using new
technologies such as the geographic information systems. For example, the use of GIS 3D
modeling in the island of Santo Antao in the republic of Cape Verde, an area characterized by a
challenging topography, they achieved up to 52% fuel savings compared to the shortest distance,
even travelling a 34% longer distance.
In another study in the US Sahoo et al. (2005) presented a comprehensive route-management
system, the Waste Route for the optimal management of nearly 26000 collection and transfer
vehicles that collect over 80 million tons of garbage every year for more than 48 states of USA.
The Implementation of Waste Route from March 2003 to the end of 2003 yielded 984 fewer
routes, saving $18 million.
On his part, Alvarez et al. (2008) presented a methodology for the design of routes for the based
on a “bin to bin” collection in relation to paper and cardboard waste in five shopping areas of the
city of Leganés Spain. In this study, the authors proposed system was based on GIS technology
and optimized urban routes according to different restrictions. From the comparison of their
system with the previous situation they concluded that the proposed “bin to bin” system
improved the quality of the paper and cardboard in the containers and avoided overflows thereby
reducing the percentage of rejected material.
Teixeira et al. (2004) applied heuristic techniques to solve a collection model in order to define
the geographic zones served by the vehicles, as well as the collection routes for recyclable waste
collection of the Centre-Littoral Region of Portugal. The study indicated that proper modelling of
the collection procedure can provide cost effective solutions.

41
Nuortio el al. (2006) developed a GIS-based method for the optimization of waste collection
routes in Eastern Finland. They estimated an average route improvement in comparison with the
existing practice of about 12%. Moreover they proposed a combination of routing and
rescheduling optimization. This combination in some cases introduced extremely significant
savings (~40%). They concluded that by allowing rescheduling it is possible to significantly
increase the improvement rate.
Apaydin & Gonullu (2007) developed an integrated system with the combination of GIS and
GPS technology in order to optimize the routing of MSW collection in Trabzon city, northeast
Turkey. The comparison of the proposed optimized routes with the existing ones revealed
savings of 4–59% in terms of distance and 14-65% in terms of time, with a benefit of 24% in
total cost.
Karadimas & Loumos (2008) proposed a method for the estimation of municipal solid waste
generation, optimal waste collection and calculation of the optimal number of waste bins and
their allocation. This method uses a spatial Geodatabase, integrated in a GIS environment and
was tested in a part of the municipality of Athens, Greece. After the reallocation of the waste
bins, their total number was reduced by more than 30%. This reduction had a direct positive
impact on collection time and distance.
Chalkias & Lasaridi (2009) developed a model in ArcGIS Network Analyst in order to improve
the efficiency of waste collection and transport in the Municipality of Nikea, Athens, Greece, via
the reallocation of waste collection bins and the optimization of vehicle routing in terms of
distance and time travelled. First results demonstrated that all the examined scenarios provided
savings compared to the existing empirical collection organization, in terms of both collection
time (savings of 3.0% -17.0%) and travel distance (savings of 5.5% - 12.5%).
Finally, Kanchanabhan et al. (2011) attempted to design and develop an appropriate storage,
collection and routing system for Tambaram Municipality in South Chennai, India using GIS.
The optimal routing was investigated, based on population density, waste generation capacity,
road network, storage bins and collection vehicles. They roughly estimated 30% cost-savings
with this approach.
42
CHAPTER THREE
MATERIALS AND METHODS
This chapter discusses the methods used in carrying out the empirical aspect of the study. Two
main sources for collecting data are used; the primary and secondary sources. Secondary data
was obtained from the national, regional, and a community level of society was summarized
using qualitative and quantitative research methods. Other secondary information was obtained
from national statistics, reports, and studies.
Primary data was gathered through consultative interviews with national and local institutions
that play varying roles within the solid waste management system. Quantitative data were
gathered through a questionnaire survey conducted at the household and individual level within
the chosen study area.
3.1 STUDY DESIGN
A sample design is a definite plan for obtaining a sample from a given population. It refers to the
technique or the procedure the researcher would adopt in selecting items for the sample ( Kothari
2004). In order to understand the waste streams, the study area was divided into five zones
adapted from HYSACAM’s collection points. Within these zones a purposive sampling was used
to select one neighborhood from each zone based on demography and income, which the
questionnaires had to be distributed. This is because the study had to include both rich and poor
neighborhoods. Then a systematic sampling Technique was used for the distribution of the
questionnaires. These techniques where used and tested in other studies like Waste Management
in Jamaica by Jenifer Post in 2007 and Waste Characterization As An Element Of Household
Waste Management Operations by Mbeng et al 2012.
. The rationale for the selection of households was based on the following reasons:
• Household is one of the most important institutions in a society and within which the
gender norms are expressed, reinforced and reflected in large institutions of society.

43
• Household is a basic unit of society where individuals both cooperate and compete for
resources (World Bank, 1999).
As a result, an understanding of the effects of social factors on service programs can be
examined through households. To analyze these data SPSS 13.0 and excel spreadsheets were
used. However, in order to select a statistically significant sample from these communities it was
necessary to identify the study area boundaries. Fig 3.1 below identifies the areas which the
samples were collected from.
Figure 3.1 Map of sample area
Source: Adapted from Awum et al. 2000

44
For data presentation through current and future projections in graphs and in tables as well as
categorization regarding the various waste streams and the list of materials that cover recyclable
and non-recyclable materials.
3.2 DATA COLLECTION
1. Listing material types after the demarcation of various waste streams. It is important to
decide on the list of material types which might be available in various waste streams.
2. Timing for sample collection to get a representative sample or data. Waste disposal
patterns often vary according to the time of day or week. Therefore, based on the
economic viability, the study collected data covering the entire period and chain of
disposal.
3. Communal education was principal in the process for waste sampling. Without
community sensitization waste management cannot be complete or effective. Community
knowledge played an important role in identifying and planning appropriate timings for
data collection for the various waste streams and different types of materials. This was
essential because there must be effective regulations for disposing of certain types of
wastes at certain timings such as residential waste or commercial waste whether in the
morning or during certain days of the week.
3.2.1 Interviews
The consultative interview targeted three main respondents namely; the waste management
company HYSACAM, Ministry of Urban Development and the Limbe City Council.(see table
3.1 for a list of those interviewed and their dates) Interviews were chosen as one of the methods
for gathering data because the information provided by the respondents is a source of qualitative
information to describe the existing solid waste management system as well as assess the factors
that may influence public participation and the overall success of waste management in
Cameroon.

45
Table 3.1: interviews with main stakeholders and their positions and interview dates
Institutions position of respondent
location level Date of interview
Hygiene et salubrite du Cameroun (HYSACAM)
Limbe Branch manager,
chief of exploitation,
Limbe Private 28th august 2014
Driver, Head of technical
division
Limbe Private 26th and 27th august 2014
Ministry of housing and urban development
Divisional delegate Limbe National 28th august 2014
Limbe City Council Head of Hygiene and sanitary department
Limbe Local 1st September 2014
3.2.2 Questionnaire administration
Households were selected by a systematic random technique from Five different residential areas
in Limbe . Household size (number of people living in the house at the time of the study and
making use of the waste bin) was used in this study as a requirement for determining the per-
capita waste generation.
Households for the study were selected from two residential areas:
• High income residential areas made up of single detached houses outside the city centre with
gardens;
• Medium income residential areas made up of high rise buildings or multiple occupancy
properties with no gardens and close to shopping centre or the central business district;
A total of 120 questionnaires were distributed but only 100 questionnaires were returned. Some
of the questionnaires were administered directly to assist those surveyed with little or no
education and to build a relationship of trust. The area covered included Ngeme, Newtown, Mile
One, cite SIC, GRA, cite SONARA and Mile Four which are peripheral neighborhood of Limbe.
Questionnaires rely on self-reported data which assumes that the information provided by the
respondent is accurate for their solid waste practices and concerns. With the aim of increasing
the questionnaire’s credibility for the respondent, the survey was prefaced with an introduction

46
explaining the purpose of the questionnaire and how the responses would be beneficial to the
municipality.
While it was easy to get data on the number of persons per households from questionnaires and
interviews in these areas, it was difficult to get the actual populations.
The weighing was done with a hand scale and the data were recorded in kilograms on data sheets
during all weighing operations. A study period of seven days was chosen with the aim of:
• Providing daily fluctuations during the week days and Week-ends;
• Educating residents of the impacts of pre-selection and source separation on the baseline data.
The sorting procedure was in line with procedures used in waste characterization studies by
Mbeng et a,l 2012.
Table 3.3 District Sampling Intervals showing the number of Questionnaires distributed and those returned. District Number of questionnaires
distributed/Number of questionnaires returned
Sample interval
New town 50/40 Every third house Ngeme 10/10 Every other house Cite SONARA 10/10 Every other house Cite SIC 10/10 Every other house Mile One 20/15 Every third house Mile Four 10/5 Every other house GRA 10/10 Every other house
3.2.4 Direct observation
According to Yin (1982), observations are a form of evidence that do not depend on verbal
behavior, and the method enables the investigator to directly observe the phenomenon under
study. On their part, Miller and Brewer (2003)categorized observation into ‘unobtrusive
observation’ and ‘participant observation’ based on the degree of participation by the researcher,
and into ‘covert’ and ‘overt’ observations based on the level of awareness subjects have of being
observed.
In carrying out this study, a field trip was conducted with HYSACAM which entailed following
their waste collection trucks from 6 a.m. to 2 p.m. Their activities and working conditions were
observed and notes taken down. This method was useful because it permitted actual and active
participation and made it possible to survey the opportunities and challenges open to the

47
HYSACAM team and employees in the field. The observation was done throughout the week
covering HYSACAM trucks as well as timings to follow the patterns to waste disposal in the
different zones. All the areas could not be covered and this was overcome by sampling zonal
lifestyle.
3.2.5 Secondary data
Secondary data was a review of appropriate literature. A wide variety of literature was covered
relating to the key words; waste management, recycling, sustainability, problems and prospects.
A thorough critical review of selected literature was conducted. This study was developed with
the use of information from primary and secondary sources. Many academics suggest starting all
research work with secondary data (Ghauri and Gronhaug 2005).For secondary data a review of
the appropriate literature was carried out, a wide variety of recent literature was used. The
literature related with key words like sustainable solid waste management problems and
prospects.
3.3 Data analysis
The data collected was analyzed using the Statistical Package for Social Sciences (SPSS 13.0)
tool and excel spreadsheets. Results were presented using charts, graphs and tables. The
qualitative data from interviews conducted with all other categories of respondents were
analyzed manually by making summaries of the views of the respondents, supported with data
from documentary sources and my own field observations of the waste situations.

48
CHAPTER FOUR
PRESENTATION AND ANALYSIS OF FINDINGS
This chapter is focused on the presentation and analysis of the findings during the period of
study.
4.1 DEMOGRAPHIC DISTRIBUTION OF THE POPULATION OF LIMBE
According to Limbe City Council, the population of the city in 2010 was 102,780 inhabitants
with a growth rate of 2.9% compared to the national average of 4.1%/ year. The population is
projected to grow at an average of 2,900 habitants/ year and Limbe is expected to exceed the
150,000 mark by 2020 according to the World Bank, (2002). Such an increase will bring
different geo-environmental and economic dynamics like the life style and consumption habits of
the population as well urbanization and settlement patterns accompanied by new challenges for
waste management in the Limbe metropolis. Figure 4.1 shows the projection of population
growth in Limbe since 2001 indicating an upward trend and showing a steady increase in the
population. From about 80,000 inhabitants in 2001 to more than 100,000 in 2010 Limbe has
steadily grown into a big city.
Fig 4.1 Evolution of Population Growth in Limbe 2001 -2010
Source: Limbe City Council
0
20000
40000
60000
80000
100000
120000
2001 2002 2003 2004 2005 2006 2007 2008 2009 2010
Population growth of limbe
2001-2010

49
The composition of gender distribution in the study shows that more women participated in the
survey. The reason was due to the fact that most men did not want to answer the question that the
women were in charge of waste management in the household. Also the questionnaires were
administered on a weekend when most families where at home and it showed that mostly women
were at home and were in charge of household activities. Fig 4.2 below shows the gender
dimension of the survey: 63% of the respondents surveyed are females and 37% males.
Figure 4.2: Number of Men and Women that Participated in the Survey
Table 4.1: Sample of Population Size and the Average Number of Residents in a Household
As the results on table 4.1 shows the number of distributed questionnaires for the survey was 120
although the amount of returned questionnaires was100. This gave a total sample of household
size of 406 and this gave a success rate of about 80%. An average of four people lives in a house.
Males
37%
Females
63%
Statistics
number of residents in a household
100
4.06
4.00
406
ValidN
Mean
Median
Sum

50
4.2 TYPES AND QUANTITY OF HOUSEHOLD SOLID WASTE GENERATED IN
LIMBE
4.1.1 Type of Municipal Solid Waste generated in Limbe
There are different types of waste produced in the Limbe municipality and are composed of the
following; household waste, industrial wastes, Clinical wastes, Wastes from Construction sites.
Nonetheless, this study is focused principally on household waste as provided in table 4.2.
Categories Food waste Garden
waste
Plastics Metals Papers Glass Textiles
Sub-
categories
Food
remnants,
fresh and
decaying
leaves,
vegetation
and
other
garden
waste
Plastic
bottles
and
packaging
Cans and
bottle
caps,
ferrous
metal and
aluminum
items
Newspapers,
magazines,
office
papers,
junk mails
and
envelopes
Glass
bottles
and jars
Clothes
and
shoes
Table 4.2 Composition of Household Waste in Limbe
Table 4.2 shows that the production of solid waste in Limbe is complex and diverse and the type
of waste generated depends on the location in the city. The table only indicates household waste
because it is the focus of this study. However, since the scope of the study and the management
of solid waste demands identification of the various waste systems or better categorization, the
study further divides the city into five zones of categorization and zonal location of each waste
produced.
1. Zone A: This zone is composed of Down Beach, Mbonjo, Man o War Bay, and Doke
Yard. The area is spatially populated and generates principally domestic waste and
seasonal fishing waste. Also there is increasing tourism, night life and location of offices.
For this reason our discussion according to the data and the future projection of
increasing population and socio-economic growth warrants a pilot project.
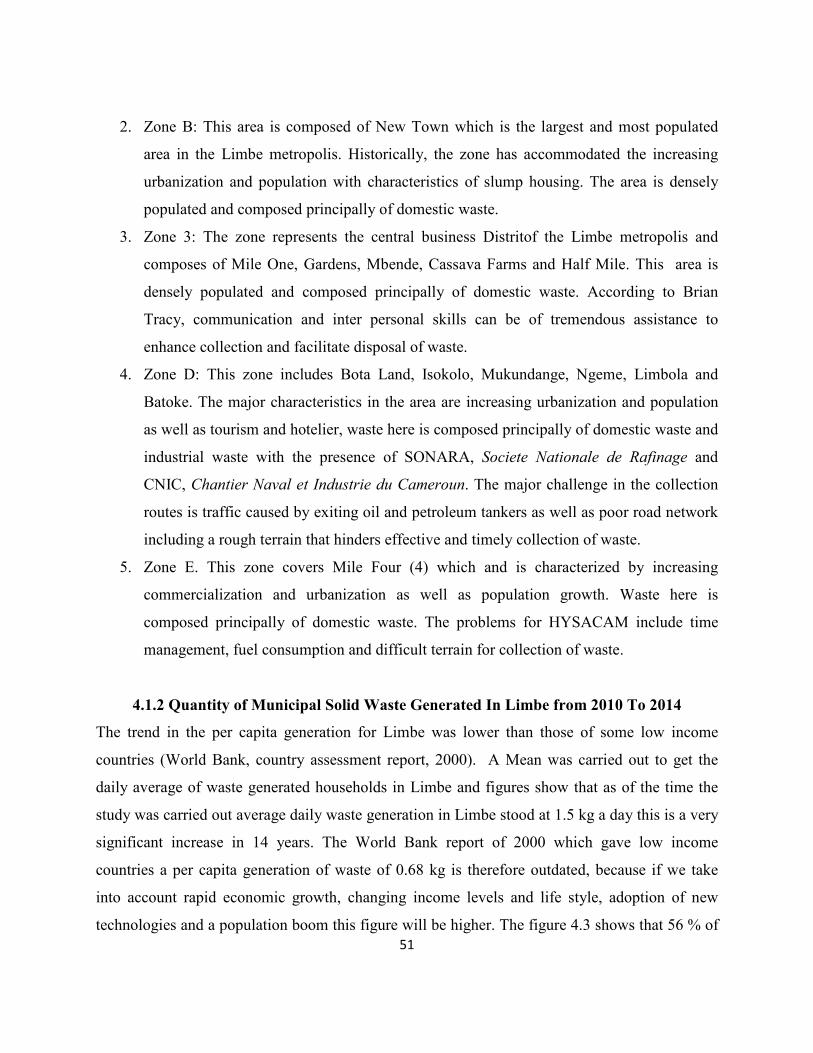
51
2. Zone B: This area is composed of New Town which is the largest and most populated
area in the Limbe metropolis. Historically, the zone has accommodated the increasing
urbanization and population with characteristics of slump housing. The area is densely
populated and composed principally of domestic waste.
3. Zone 3: The zone represents the central business Distritof the Limbe metropolis and
composes of Mile One, Gardens, Mbende, Cassava Farms and Half Mile. This area is
densely populated and composed principally of domestic waste. According to Brian
Tracy, communication and inter personal skills can be of tremendous assistance to
enhance collection and facilitate disposal of waste.
4. Zone D: This zone includes Bota Land, Isokolo, Mukundange, Ngeme, Limbola and
Batoke. The major characteristics in the area are increasing urbanization and population
as well as tourism and hotelier, waste here is composed principally of domestic waste and
industrial waste with the presence of SONARA, Societe Nationale de Rafinage and
CNIC, Chantier Naval et Industrie du Cameroun. The major challenge in the collection
routes is traffic caused by exiting oil and petroleum tankers as well as poor road network
including a rough terrain that hinders effective and timely collection of waste.
5. Zone E. This zone covers Mile Four (4) which and is characterized by increasing
commercialization and urbanization as well as population growth. Waste here is
composed principally of domestic waste. The problems for HYSACAM include time
management, fuel consumption and difficult terrain for collection of waste.
4.1.2 Quantity of Municipal Solid Waste Generated In Limbe from 2010 To 2014
The trend in the per capita generation for Limbe was lower than those of some low income
countries (World Bank, country assessment report, 2000). A Mean was carried out to get the
daily average of waste generated households in Limbe and figures show that as of the time the
study was carried out average daily waste generation in Limbe stood at 1.5 kg a day this is a very
significant increase in 14 years. The World Bank report of 2000 which gave low income
countries a per capita generation of waste of 0.68 kg is therefore outdated, because if we take
into account rapid economic growth, changing income levels and life style, adoption of new
technologies and a population boom this figure will be higher. The figure 4.3 shows that 56 % of

52
the population reported their average waste generation/day between 0-5 kg and 37% putting their
figure between 5-10 kg/ day. This is a significant increase in the per capita generate rate of
limbe, falls in line with some studies like Abu-qdais et al. (2007) found it statistically significant
but weak negative relationship between waste generation and household size in Abu Dhabi (R2 =
0.11) who have based their argument on the observation that household size and waste
generation are strongly linked.
Fig 4.3: estimated amount of waste generated/day in Limbe
As figure 4.4 shows a total of 33,002 tons of wastes was collected in 2010, 30,246/ton in 2011,
26,450.03 tons in 2012, 27,527.92 tons in 2013 and 13941.86 tons by mid-2014. There was a dip
in the amount of tonnage collected from 2012 and this was due to many factors which prevented
HYSACAM from meeting up with the 100 tons day which as fixed by the legal framework and
contractual terms with the Limbe city council.

53
Fig 4.4: Total Distribution of Yearly Collected Waste in Limbe Municipality (2010-2014)
Source: HYSACAM
A further breakdown of the collection data from HYSACAM is displayed on table 4.3 with
monthly collection figures for 42 months for four year in the limbe municipality. The irregularity
in the amount of tones collected per month is due to in part to frequent breakdown of trucks and
insufficient amount of trucks present at the time to meet up with the rising waste generation in
the municipality.
Year/tons 2010 2011 2012 2013 2014
Month
January 2932 2166 2430
2150.12 2799.80
February 2725 2123 2346 1670.38 2576.92
March 3179 2676 2318 2237.12 3293.36
April 2686 2575 2086 2353.54 2829.58
May 2959 2600 1988.16 2007.72 2442.2
June 2762 2450 2119.96 2305.28
July 3050 2664 2136.04 2401.18
August 2475 2599
2252.46 2583.82
September 2662
2663
2172.68
2384.34

54
October 2489 2551 2591.52 2548.34
November 2759 2611 2205.15 2361.48
December 2324 2568 1804.06 2524.74
Table 4.2: Amount of Waste Collected from 2010 to 2014 in tons by HYSACAM in Limbe Source: HYSACAM Limbe
4.3WASTE GENERATION IN RELATION TO INCOME AND HOUSEHOLD SIZE
4.3.1 The Correlation between Income and Waste Generation
Fig 4.5 Income Distribution of Respondents who participated in the Survey in Limbe (CFA
Francs)
According to the income distribution, Majority of the population fall under the mid-level of
100,000-250,000 FRSCFA. 35% of the population reported a monthly income that fall between
no income>500,000250,000-500,000
100,000-250,000
50,000-100,000<50,000
income of respondents per month
40
30
20
10
0
Percent
income of respondents per month

55
100, 000 FRS CFA to 250000 FRS. Less than 28% reported 50, 000 FRS as their monthly
income. 20% of the income fell between 500,00frs to 100,000 FRS, about15% of respondents
fell between the high income bracket of 250,000frs to 500,000frs and about 1% reported income
of over 500,000frs a month.
Pearson correlation was carried out to evaluate the relation between income levels and the
amount of waste generated by each household. The results (as shown in table 4.3) show a
significant relationship confirming that, increase income affects life style of households as well
as the consumption habits. In this event they generate more waste than low income inhabitants.
The Pearson coefficient for the relationship between income and the amount of waste generated
is (table 4.3) .367 and it is positive. At .367 the results show a strong relationship between the
monthly income of a family and the amount of waste they generate.
Table 4.3 Correlation between Income and Daily Amount of Waste in Limbe
The findings indicate that income is a welcome development with the tendency to generate more
waste. Income in Limbe rose by more than 15% since 2005 (Institute National des statistics).
Increase in income leads to more consumption, and in our study from 0.68kg a day of waste
generation in 2000, to the current waste generation rate in Limbe is at 1.5kg/day which is a
significant increase. It was therefore observed that an increase in income leads to an increase in
the amount of waste generated per day.
1 .367**
.000
100 100
.367** 1
.000
100 100
Pearson Correlation
Sig. (2-tailed)
N
Pearson Correlation
Sig. (2-tailed)
N
income of respondents
per month
estimated amount in
kilograms of waste
produced by a
household daily
income of
respondents
per month
estimated
amount in
kilograms of
waste
produced by
a household
daily
Correlation is significant at the 0.01 level (2-tailed).**.

56
4.3.2 The Correlation between Household Size and Waste Generation
The findings indicate that the population of Limbe will exceed 150,000 by 2020. With an annual
growth rate of 2.9% this will increase the amount and diversity of waste produced daily, and
more resources would be needed to be committed to waste management. A bivariate analysis
conducted on household size and the amount of waste generated (tale 4.4) shows a positive
relationship with (P=.395) thus accepting the view that household size is positively related to the
amount of waste generated/day in a household.
Table 4.4 Correlation between Household Size and Daily Production of Waste in Limbe
Few studies in Cameroon have investigated the relationship of waste generation to household
size. According to Abu-qdais, et al (2007) there is a relationship between waste generation and
household size. He argues further that as the number of household occupant’s increases, waste
generation has been found to decrease per person, mainly because of economies of scale in the
consumption of goods and packaging in developing countries.
Nevertheless, he found a statistically significant but weak negative relationship between waste
generation and household size in Abu Dhabi (R2 = 0.11). Adedibu (1988) results from a waste
characterization study in Ilorin, Nigeria, revealed that, the number of people living in a house can
fluctuate from week to week as relatives move in.
According to UNEP (2005) generation rates and composition are unique from country to country
and even between communities within a country, since they are affected by factors such as
degree of industrialization; extent and nature of socio -economic development and the climate.

57
When the residence increases this is followed by the amount of waste they generate which will
also increase. This argument by UNEP corroborates the position of the studies mentioned above.
The size of households is an important predictor of the amount of waste generated, so also is
household income and consumption habits.
1.6 WASTE MANAGEMENT PRACTICES IN LIMBE
4.4.1 Collection, Transportation and Disposal of Waste In Limbe
HYSACAM is a private company and part of the VEOLLA Propriete Sa.a global agglomerate in
waste management. In Cameroon and throughout its waste management structure (except for
councils like Bamaneda that opted out of the arrangement) waste management contract was
awarded to HYSACAM and since a formal contract with the city council in Limbe, has been
doing so. The company was created in 1969 in Douala and has services in Douala, Yaoundé,
Bafoussam, Kribi, Limbe, Penja/Njombe, Sa’a/Obala, Soa, Mbalmayo etc. The number of
employees totals about 1500 including the permanent staff. According to the Limbe City Council
the contract stipulates that HYSACAM is to dispose of at least 100 tons of waste from the streets
of Limbe per day. In Limbe the Company has 105 workers including 34 women.
In executing their services their equipment’s include brooms, wheelbarrows, rakes, mobile
dustbins and truck for collection of waste from points at particular routes in the town. Below are
pictures of some waste management Practices in the Limbe Municipality.
Figure 4.6 shows a series of pictures with blocked drainages filled with poorly discarded waste,
an open dump in a residential area and waste piling up days before collection in Limbe. The
implications of these practice is the increased presence of mosquitoes and the presence of odour
due to these poorly discarded waste. This shows that the current practices in Lime are not
sustainable and require a proper strategy in other to better serve the community in terms of waste
management services.

58
Figure 4.6 Unsustainable Waste Management Practices in Limbe
The table 4.5 below gives us the amount of vehicles in circulation and the models used by
HYSACAM as of May 2014 in Limbe. There were eight (8) in total because others were on
repair or broken down. The tonnage is also displayed in other to portray the capacity of each
truck. This small amount of vehicles possessed by HYSACAM makes it impossible for them to
fully carry out their mandate and that is why we see waste pile up for days before collection as
the small numbers of trucks have to do more rotations in other to meet up with demand. This in
turn rings wear and tear on the trucks and might lead to frequent breakdowns.
Tonnage Number of vehicles Compactor trucks (10 tons) 10 4 Paris-model trucks (maximum 5 tons 5 2 Dustin carrier (2 tons) 2 2
Table 4.5 Number of vehicles in Circulation by HYSACAM Limbe

59
Figure 4.7 shows from left to right a compactor truck and a Dustin carrier operated by
HYSACAM in Limbe
4.4.2 Hysacam Work Schedule
According to the work plan of HYSACAM, there are two work shifts that last from 6 - 2 pm and
from 4- 10 pm. The work day starts at 6 am and only two trucks are allowed to leave the
company headquarters located which is located in Bota. The collection of waste starts from
Unity Quarters and then proceeds using the door to door collection method and following the
collection route. Added to this casual method there are fixed collection points where trucks pick
up waste and they are located at specific points in town, (table 4.6).
There are twenty five fixed collection points facilitated by 6m3 green plastic and metallic
containers. The population is expected to drop their waste in these containers which
unfortunately do not carry markers to facilitate the separation of waste. Actually, some locations
have double containers which could be used to promote waste categorization and separation such
as bottles and plastics or other hazardous waste especially in the areas such as Mile One where
clinical or hazardous medical waste is generated from the hospital. table 4.6 below shows the
twenty five collection points according to HYSACAM classification. In the effort to reclassify
the collection points we have in this study, grouped them according to the five zones discussed
earlier in the chapter.

60
Zonal Location of HYSACAM’s 6m3 green Collection Containers in Limbe 1 Zone A Dock Yard 1, Dock Yard 2, Fish Area, Man O War Bat, 2 Zone B Mawoh Bridge, Lifanda City, Sabis Prince, Main Garrage New Town, Cemetery New
Town, Snail Area, Tomatoe Market 3 Zone C Coconut Island, Ambassy Bay, Mbende, Cassava Farms, Unity Quarters, Animal Farms
and Maternity Quarters 4 Zone D Ngeme New lay Out, Da Crown Hotel, Opposite Fini Hotel Bobende, Batoke 5 Zone E Mile Four Market, MTN Antennae
Table 4.6: HYSACAM’S Fixed Collection Points in Limbe Source: HYSACAM As seen above the city is divided into sectors and is further partitioned into zones. HYSACAM
uses 6m³ metallic containers, 0.770 and 0.360 plastic containers. There are also120 liter plastic
containers used for manual cleaning and sweeping enhanced with wheelbarrows. Previously, 59
waste paper baskets were installed around the city but most of them after being damaged have
not been replaced.
Out of the myriad of containers reported in the survey the most widely used storage method by
the household are closed containers with lid. As shown in figure 4.8 the study found out that
52% of the community uses this storage method. The second method is the use of plastic bags
with 34% of the community.
Figure 4.8: Household Storage of Waste according to the Survey in Limbe
In terms of household waste disposal method widely used table 4.7 shows that the most used
disposal method by the respondents is the garbage truck for paper, plastics, metals and glass and
Closed
container
with lid
52%
Open
container
14%
Plastic Bags
34%

61
90% of the community indicated that they use this method. Only 2% of the community whom we
identified as small scale farmers practicing composting and recycling, 23% recycle their yard
waste and 17% their food waste. The practice involves using domestic waste such as food for
animal feed and yard waste for manure.
Food waste Yard
trimming Plastic Paper Metal Glass
% % % % % % Burn 10 4 16 1 Bury 3 Dump in yard 1 1 1 1 1 2 Dump in River
2 2 1
Dump on the Road
8 2 2 2 2 2
Garbage truck 53 54 90 81 94 96 Recycle 17 23 2 2
Reuse 15 6
Compost 1 2.0
Table 4.7: Most Preferred Disposal Methods by the Population of Limbe Regarding education in waste management table 4.7 shows that there is some knowledge about
waste management methods. 25% of the communities recycle their garden waste and 20%
recycle their food item. This attitude indicates a glimpse of hope because such behavior can
encourage sensitization and benefit future programs on recycling and other waste reduction
strategy. Source separation of waste from the beginning of the chain or life cycle is important
when consideration is given to the quality of the final recycled or composted product.
Food Items Plastics Paper Metals Glass Garden Waste
% % % % % %
Reuse 18 4 5 1 1 16
Recycle 20 1 2 5 25
Reduce 11 23 17 19 22 10
None above 51 72 76 75 77 49
Table 4.8: Sustainable Waste Management Methods used by Respondents in Limbe

62
4.4.3 Street Cleaning
The main streets of the Limbe metropolitan area are swept daily while the secondary streets are
cleaned twice a week. Unpaved roads in neighborhoods and villages are not part of this sweeping
schedule and collection of waste is not organized by any standard calendar. As a result, unpaved
roads and areas of challenging terrain are usually filled with litter. The consequences of such
over sight lead to nuisance and odour from abandoned and rotting waste. Other setbacks include
the increasing blockage of water ways in these areas of the town.
4.4.4 Market Cleaning
Markets in the Limbe municipality have the same sweeping schedules and that is the day after
the major market days of Wednesday and Saturday. The cleaning calendar of the streets seems to
have been organized with respect to this pattern of marketing activities.
4.4.5 Sweeping of Green Belt
This practice is employed by the Limbe City Council and increasingly it is being used by other
councils around the country. The practice involves the cleaning of public space and rehabilitation
of its green environment and habitat. For instance the Community field area at the roundabout at
Black and White junction and the area opposite the Central Police Station (which has now been
ceded to the Limbe Botanic Garden).
4.4.6 Beach Cleaning
Municipal beaches such as Down Beach and Mile Six are cleaned daily and general public
campaigns are carried out. The “Clean up campaign” is a campaign to keep Limbe clean and is
run under the supervision of the Hygiene and Sanitation Department of the Limbe City Council.
Cleaning of surroundings and business premises takes place twice each month between 8 am and
12 noon with all government offices, public and private businesses closed to respect the exercise
and uphold commitment from the public. However, an exemption levy of 500 FRSCFA for taxis
encourages non participation.
4.4.7 Transportation of Waste
Figure 4.8 shows 25 main collection points operated by HYSACAM in Limbe. Most of these
fixed locations are served by the Dustin carrier. These fixed collection points are located in areas
where they can be easily accessed by the collection trucks. Due to rapid urbanization and
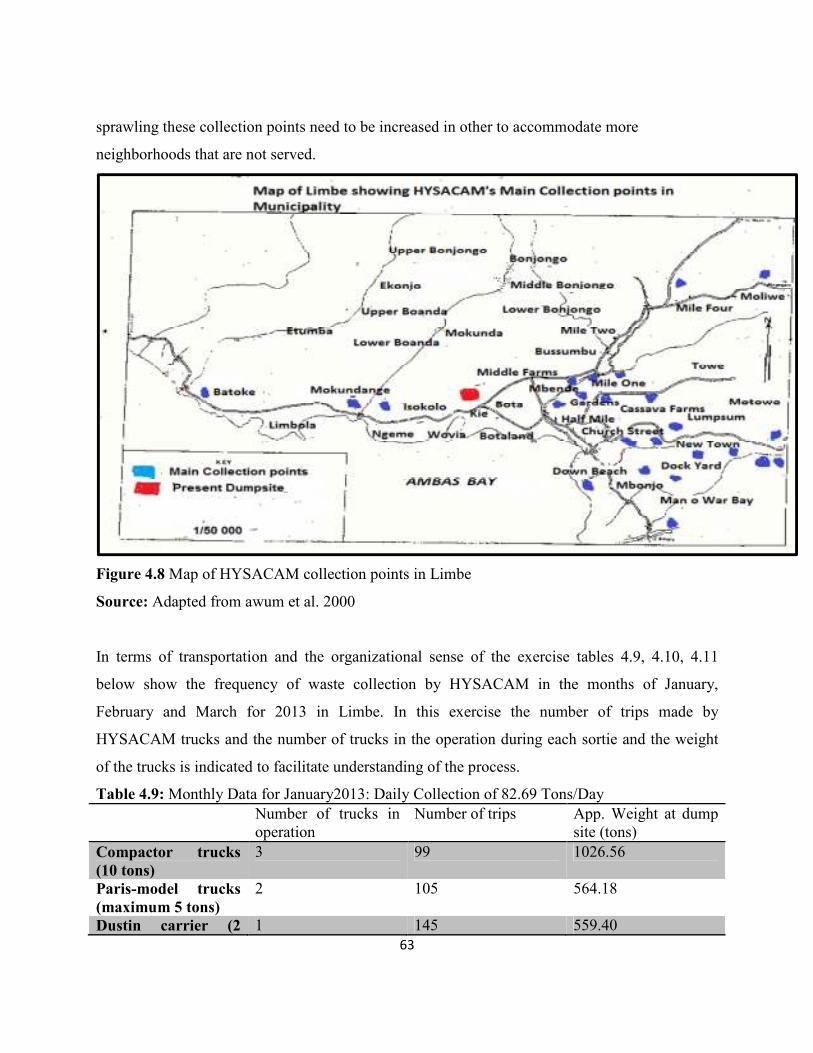
63
sprawling these collection points need to be increased in other to accommodate more
neighborhoods that are not served.
Figure 4.8 Map of HYSACAM collection points in Limbe
Source: Adapted from awum et al. 2000
In terms of transportation and the organizational sense of the exercise tables 4.9, 4.10, 4.11
below show the frequency of waste collection by HYSACAM in the months of January,
February and March for 2013 in Limbe. In this exercise the number of trips made by
HYSACAM trucks and the number of trucks in the operation during each sortie and the weight
of the trucks is indicated to facilitate understanding of the process.
Table 4.9: Monthly Data for January2013: Daily Collection of 82.69 Tons/Day Number of trucks in
operation Number of trips App. Weight at dump
site (tons) Compactor trucks
(10 tons)
3 99 1026.56
Paris-model trucks
(maximum 5 tons)
2 105 564.18
Dustin carrier (2 1 145 559.40

64
tons)
Total 6 506 2,150.12
Table 4.10: Monthly Data for February 2013: Daily Collection of 64.24 Tons/Day Number of trucks in
operation Number of trips App. Weight at dump
site (tons) Compactor trucks
(10 tons)
3 88 739.52
Paris-model trucks
(maximum 5 tons)
2 133 396.74
Dustin carrier (2
tons)
2 170 534.12
Total 7 494 1670.38
Table 4.11: Monthly data for March 2013: Daily Collection of 86.04 Tons/Day Number of trucks in
operation Number of trips App. Weight at dump
site (tons) Compactor trucks
(10 tons)
4 97 916.16
Paris-model trucks
(maximum 5 tons)
2 99 434.50
Dustin carrier (2
tons)
2 226 886.46
Total 8 565 2237.12
Source: Limbe City council
From the above figures provided by the Limbe City Council it can be seen that in January 2013
an average of 82.69 tons per day was collected by HYSACAM and in February of the same year
64.24 tons was collected with the availability of 7 vehicles. The drop in tons was due to the
frequent breakdown of the collection vehicles. Consequently, HYSACAM could not meet the
collection stipulations. In March due to the addition of one more truck after repairs there was an
increase of the amount of tons transported.
4.4.8 Disposal
Disposal is the end point in the life cycle or chain in solid waste management and usually poses
the main challenge due to its long term effect on the surrounding environment. After collection
the waste in Limbe is transported to a dump site situated at Karata around Kie in the Bota Land
area and this is the main and only municipal dumpsite. It is an open dumpsite and there is no

65
form of recycling practiced except for organized action by scavengers picking up valuable items.
When a section of the dump site is full it is covered with laterite to allow for the process of
natural decomposition. Figure 4.9 shows the process at the dumpsite in Karata. It should be noted
that this is not a landfill but an open dump site which is filed with soil for natural decomposition
to take place (Figure 4.10.)
Figure 4.9 Disposal Process by HYSACAM
Figure 4.10 Picture showing the practice of open dump site, at the Municipal Dumpsite in
Limbe-Karata, Botaland
Control Weighing Emptying
the trucks
Treatment Compacting

66
4.5 PLANNER’S ROLE IN SUSTAINABLE WASTE PLANNING
All these practices as analyzed above are unsustainable and require a new approach for waste
management in Limbe and other localities. Apart from the conventional way of thinking that
waste management starts from generation, another model will probably be very effective if we
start from the actual process of production.
A study conducted by Fobil, et al (2002) examined the waste stream generated from three
residential groups in Ghana: (High, Middle and Low residential areas). Fobil and colleagues
found that the waste stream generated by different groups “consists of entirely different
proportions of the waste components”. The authors suggest that different waste management
schemes should be adapted to the various residential areas.
This brings into light the relationship between proper urban planning and waste management
because the cities are organized to play a role in the type of waste they generate. Industrial zones
will not produce the same kind of waste as residential zones. From the data above it was realized
that road network in Limbe also plays an important role in the collection rate in the city while the
high residential areas benefit from frequent collection, low residential areas do not because of the
ad nature of roads in these areas. Figure 4.11 gives a rational planning process, which will help
make waste management better and lead to more efficient process in communities.
Figure 4.11 Rational Planning Processes
Define Goals
Identify Problems
Generate solutions
Evaluate Alternative
Implement
Evaluate
Select Alternative

67
While city planners’ involvement in waste management has been largely limited to waste
infrastructure siting, planners have great potentials to contribute to sustainable waste planning in
terms of both practice and research.
First of all, planners have a special focus on spatial implications of policy making and are
familiar with local and regional demographic characteristics as well as the built environment,
which provides the basis for material and waste flow analysis and community-specific waste
management policy design (Leigh et al., 2007). In particular, there is great potential for planners
to identify material flows through urban systems, given that land use and zoning determines the
destination of material inputs and source of waste generation.
Second, planners have access and can make the influence on infrastructure planning, which
could include not only landfill and WTE facilities, but also recycling centers, drop-off sites, and
even remanufacturing facilities within urban centers. Strategic plans, such as locating waste
management facilities in Greenfield, can mitigate environmental consequences of material flows,
advance closed-loop production systems within urban areas, and promote increased economic
opportunities for urban residents (Leigh, et al., 2007)
Third, planners are adept at using local data for dynamic estimates of infrastructure and
community planning, and waste management programs may naturally fit in the long-term plan.
Thus, planners naturally process the knowledge and skills for long-term waste management
planning. One approach of integrating waste management into long term planning could be
designing urban sustainability indicators from a system perspective and promoting regular data
collection in a consistent format.
Fourth, planners hold a holistic view of a region and are most capable of managing the highly
interdisciplinary issues of waste management. A good understanding of the complexity in waste
management helps minimize the conflicts between stakeholders and planning objectives in waste
planning, from the beginning of material extraction and production, instead of the narrow focus
on its final destination.
Fifth, planners have the access to influence the business development strategies and promote
environmentally conscious production activities. In particular, planners can promote the network
of businesses that cooperate with each other through exchange or sharing of resources

68
(information, materials, water, energy, infrastructure and natural habitat) to achieve both
economic and environment gains, as the notion of “industrial symbiosis” suggests.
Sixth, a more vigorous approach than the voluntary one discussed above for planners is to
advocate for federal legislations and coordinated regional efforts for management. Even and
consistent enforcement methods should be developed to discourage waste export to other
regions, facilitate advancement and adoption of green technology, and promote self-reliance of
waste management for each urban region.
Lastly, planners can and should contribute to public education and help transform the public
perception of waste. In particular, public education should address the life cycle impacts of
consumption and the long-term risks of waste disposal facilities, which are immediately tangible
and measurable. Economic incentives and technology advances still need the support of public
education to be feasible and efficient for waste reduction, which is the primary condition for
urban sustainability.
4.6 PROBLEMS AND COMMUNITY PERCEPTION OF MUNICIPAL SOLID WASTE
MANAGEMENT IN LIMBE MUNICIPALITY
In the present situation of MSWM in Cameroon and Limbe in particular, two basic questions
arise:
1. how effective have the present schemes been in meeting the desired Objectives
2. What challenges need to be over combed to transform existing situation into sustainable
ones?
4.6.1 Public Perception on Services Provided By HYSACAM
According to the survey carried out for this study, the population indicated that there were waste
disposal problems in the Limbe community. 79.4% of population acknowledged that there is a
problem of waste collection and disposal (Fig 4.12). But their response was diverse when asked
why they thought that there was a waste problem in their community.

69
Fig 4.12: Community Participation in Waste Disposal Methods
Table 4.12 shows that the distribution of waste problems in targeted communities in the city is
three-fold:
One, communities from Ngeme in zone D, New Town in Zone B, Mile Four in Zone E and Mile
One in Zone C blamed poor waste management on the frequency of service provided
HYSACAM.
Two, the same communities complain of litter as well as the absence of garbage containers to put
in their garbage. On the other hand those living in residential areas did not have complaints on
the way waste is managed in the city. This can be explained by the fact that this zone enjoys
regular collection done through door to door methods. The diagram below illustrates the position
of these communities.
Yes
79%
No
21%

70
District Nature of the Problem reported
Pile of Garage
Litter No Garbage containers
Regular collection
No Litter
New town 53% 10% 35%
Ngeme 75% 2% 15%
Cite SONARA 95% 2%
Cite SIC 85% 10%
Mile One 63% 12% 25%
Mile Four 79% 11% 5%
GRA 93% 4%
Table 4.12 Communal Categorization Waste Management Problems
4.6.2 Perception on Health
From field data 98% of the population said they were concerned about diseases related to
improper waste manage while only 2% did not respond which shows that majority of the
population know that waste has negative effects on their health if disposed of haphazardly.
Blocked drainage (showing in fig 4.14) undoubtedly, serves as breeding grounds for mosquitoes,
which contributed to diseases such as malaria. In addition, blocked drainage also caused flooding
in Limbe especially around the Down Beach area. This result is in line with the findings of
Lambi (2001) who noted that in most parts of the Yaoundé and Bamenda, streets are partially or
wholly blocked by solid wastes. Sharing the views of Raymond (1968), the problem of solid
waste disposal is difficult, since vast quantities of it are produced by an industrial society. Their
released nutrients encourage blooms of undesirable algae in water bodies. Frequently, wood and
paper wastes have been burned together which only causes air pollution. In Limbe many people
turn to burn their household wastes while some dispose theirs in water bodies, posing
environmental problems as the gas released from these substances (carbon monoxide) or CO.
Figure 4.13 also demonstrates the presence of plastic bottles and papers in gutters along major
streets in the city of Limbe

71
Figure 4.13 Evidence of waste disposed in gutters in limbe
Figure 4.14 Concern about Diseases related to improper waste disposal
4.6.3 Perception about the environment
The result from field observation in Limbe shows that, the population prefer to dispose of their
waste like papers and plastic bottles in gutters, such waste may stay within drainage for very
long periods of time. As Figure 4.15 shows despite these habits 95% of the population are
concerned about litter on roads and environment which doesn’t play well with the beauty of the
Concerned
98%
No Opinion
2%
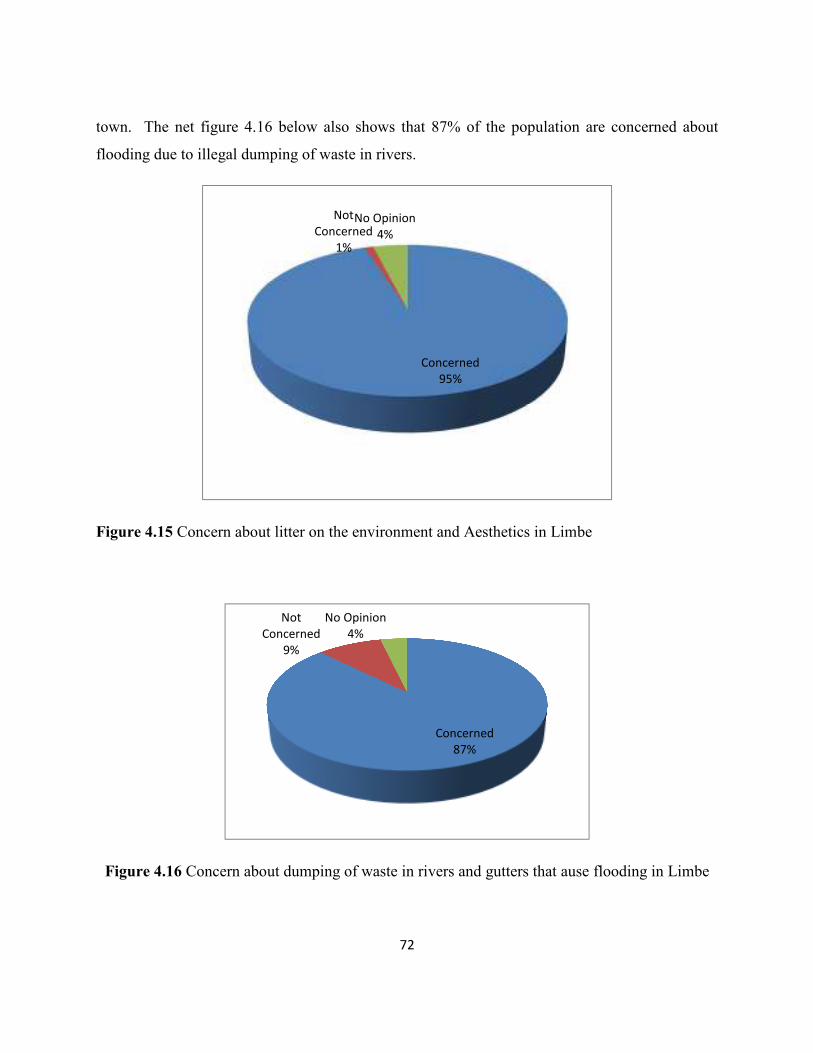
72
town. The net figure 4.16 below also shows that 87% of the population are concerned about
flooding due to illegal dumping of waste in rivers.
Figure 4.15 Concern about litter on the environment and Aesthetics in Limbe
Figure 4.16 Concern about dumping of waste in rivers and gutters that ause flooding in Limbe
Concerned
95%
Not
Concerned
1%
No Opinion
4%
Concerned
87%
Not
Concerned
9%
No Opinion
4%
73
CONSTRAINTS
4.6.4 ECONOMIC FACTORS
According to Hoornweg and Bhada-Taa (2012) developing countries annually spend USD 46 bil-
lion on MSW management and are estimated to spend another USD 40 billion to cover the
service delivery gap. Considering the projected increase in MSW generation, their financing
needs could surpass USD 150 billion annually by 2025 (Hoornweg & Bhada-Tata, 2012). In
Cameroon the removal of household waste represents almost 20% of the municipal budgets of
Douala and Yaoundé totaling CFA 42 billion (€64 million) and CFA 35 billion (€53,5 million)
respectively (Ymele, 2012).
In Limbe the costs for the city council was about 85 million CFA 2013 to manage household
waste (Limbe City Council, 2013). The taxation index for municipal solid waste management in
Cameroon is based on a system of direct local taxes attributed for the provision and financing of
local services such as street lighting, water supplies and the removal of household waste. The
government allocates 85% of the finances necessary for the management of waste in Cameroon’s
main cities from state budget and the councils pays the remainder 15%. With increasing waste
production and cost the challenge and burden becomes troubling for the government to shoulder
more than 50% of the budget each year. The government spent 30 billion CFA on MSW
management in 2012 and the cost is expected to rise to about 95 billion CFA by 2030 (Ymele,
2012).
4.6.5 INSTITUTIONAL FACTORS
The study noted that too many regulatory bodies exist in the waste management sector in
Cameroon. Problems with enforcement are a reflection of a lack of supportive text for the
implementation of the statutory instrument. For instance, the technical description and special
rules on dump disposal Law 96/12 Chap. IV Sec. 1 Art. 47 (2) 51.1 lays out the conditions for
the authorization of discharge of pollutants into the environment; air, water or soil.
Law 96/12 Chap IV Sec. I Art.53 also directs conditions for the authorization of discharge of
pollutants into the air, water and soil. As a consequence regulatory enforcement officials are

74
compelled to apply guidelines that pre-date the present law. This is evident with Decree No.
D67/NS/NN/ST/SG/BMPHP/NNPA of August 11th 1987: Circular letter No.
69/N6/DMHK/SHPA of August 1980 instead of aforementioned decrees, upon current and
recent laws (i.e. Art. 43 (2), 47 Part 111, Sec. 1 of Law 96/12 of August 1996) and in some cases
either apply or adopt arbitrary guidelines or ignore the regulations entirely. This does not provide
a clear regulatory framework for the operation of waste management.
Furthermore, the cumbersome nature of these statutory provisions limits efficient delivery and
enforcement. For example, the duties of monitoring and evaluation for regulatory compliance are
devolved between four ministerial departments and this affects enforceability due to the lack of
clarity and definition of responsibilities. Many of the inspectors interviewed in this study cited
the lack of manpower, finances, expertise, testing facilities, and equipment as impediments to the
enforcement of the regulations. Incomplete regulations, lack of clarity of roles and the absence of
coordination are evidence of poor administrative planning.
Despite Governmental efforts to create and implement legislation relating to sustainable waste
management and environmental protection, the current policy framework is not adequate, which
leads to lack of effective engagement of industry, commerce and the general public on more
sustainable waste management practices. In the Limbe Municipality and Cameroon in general,
this suggests the need for the implementation of more robust measures including drawing lessons
from best practices from tested models on waste management.
However, it could be argued that for a successful implementation of best practice examples, there
is need for such models to be adapted to the local reality in Limbe and Cameroon in general.
Such measures will guarantee the active engagement of the stakeholders in order to ensure
successful delivery of the sustainable waste management practices; for instance, the Strategic
Planning Guide (SPG) by Wilson et al., 2003; Read and Wilson, 2003). The Guide lays down
procedures for assisting decision makers in actively engaging with stakeholders in the decision
making process. They have argued the model ranges from identifying the baseline situation for
MSWM in the city and then establishing a framework for the delivery of sustainable waste

75
management solutions. The SPG has already been shown to be a key document in developing
economy (Manga et al. 2012).
The major problem faced by the Cameroon Government is common to other developing
countries. According to Manga et al. (2007), there exist a duplication of service and
responsibilities in the ministries concern. This leads to inefficiencies and a waste of both
resources. The current regulatory system operates a top–down approach in decision making
wherein the ministerial departments are able to exercise control over local councils which have
limited autonomy. These results politically influenced decisions rather than scientific reality.
This situation is common in the provision of technical assistance from the government and its
agencies in the local councils.
The delivery of waste management services is a statutory duty for the municipal councils. They
are responsible for the provision and maintenance of infrastructure, e.g. Waste disposal facilities;
financing of all activities related to waste management; street sweeping, collection,
transportation and disposal of household wastes as well as the management of all public spaces
and infrastructure. To discharge these duties and provide such services the council raise funds
from three main sources:
• Taxes and revenues generated by council activities;
• Supplementary budgets from the state through MINEFI and,
• Lending facilities from the Government’s Council Development Fund (FEICOM).
Supplementary budgets are subject to scrutiny by MINEFI which is responsible for
allocation of government funds on the basis of projected fiscal revenue flows.
Waste management related responsibilities are under the jurisdiction of the Health and Safety
Officers in the Hygiene and Sanitation Units of each Municipal Council. The highest qualified
staff in each authority is the supervisor who is usually health worker. The Council has the
responsibility for creating and managing these units with responsibility for waste management.
The council has the power to subcontract such responsibilities to third parties, such as the case of
HYSACAM as a specialized waste management company.

76
The Limbe Council like others in Cameroon opted for this option, to engage HYSACAM,
because like the other Municipal authorities, Limbe City Council faces the same problem that of
the absence of qualified and skilled staff. This means that in the case of default or a breach in the
execution of the contract, the Limbe City Council faces the problem of evaluation. For instance,
the Council demands that HYSACAM should execute a daily collection of 100 tons of garbage.
The weighing system at the disposal site does not provide adequate measuring mechanisms for
the council. Measurements are carried out by approximation. To solve this problem the council
can afford to attach weighing technology to the carriage so that when the measurement can be
made accurate before the vehicles reach the final deposit site.
There is also the absence of a bottom up approach for waste management, allows the central
government to execute policies unsuitable for the local environment and councils. This is a major
obstacle for effective waste management in Limbe. Furthermore, the lack of funding hampers the
project on waste management since adequate fund is needed for effective sensitization
campaigns on proper techniques of waste management. Another reason is the lack of autonomy
in matters of finance with the council. Despite the decree on decentralization and regionalism the
councils still do not have enough powers to manage their finances autonomously. For example,
the budget needed for the collection and disposal of waste is controlled by the government
through MINDUH (Divisional Delegate of Urban Development and Housing Limbe, 2014).
Another example is the difficulty of the council to handle the challenges posed by the present
and only dumpsite in Limbe. There present dumpsite needs to be shut down and moved to the
periphery of the city because within its area of location there is increasing population and
expanding urbanization. Ultimately, the will be problems of nuisance to the population owing to
the odour and related effects from the fields. This is a major problem with waste management. In
the US, for example, it is a major problem for waste management company to even secure a
license due to the difficulty attached to regulations relating to environmental sanitation and the
effect of waste management to societies such as health hazards that have been found to include
cancer.

77
4.6.6 Urban Planning and Geomorphologic Aspects
Figures 4.17 and 4.18 attempt to demonstrate how the terrains in some quarters in Limbe make it
difficult for HYSACAM vehicles to move easily or maneuver their way through the narrow
streets of the town. Furthermore, the challenges of the terrain in some communities make it
difficult and limit the access to some areas of the city. HYSACAM drivers have complained
about such effects from the difficult maneuvers of the trucks that often leave them tired at the
end of their work shift. They also show the terrain of Limbe and how rapid urbanization has
made the population to build on slopes and difficult terrain compounding the problem of waste
collection further.
Figure 4.17 partial view of residential areas in Limbe and the terrain

78
Figure 4.18 narrow streets in Limbe
Furthermore, there’s a behavioral problem from the larger community who have consistently
failed to develop the attitude to respect the official points of collection. There is little sense of
organization in terms of community participation in solid waste management especially with
regard to the timing of the exercise. Some residence keeps their waste longer and unattended and
will only dispose of it when it begins to decay. Such attitude toward waste management needs to
change. HYSACAM workers also complained that people frequently throw burning things into
the plastic containers setting them on fire and this requires the expensive exercise of changing
the waste containers. In all there is need for public education on the characterization,
categorization and management of solid waste. This point marks the difference between waste
management in developed countries and developing countries like Cameroon. Despite a legal
framework that makes the exercise legal rendering culpability, less respect is paid to the practice
because it’s not yet a culture to punish defaulters.
Another major problem observed is time management it is very important in waste management
to think about how to save time. For example during field visits it took us eight (8) hours to
complete just two neighborhoods which is a very important factor. Because a reduction in the
time used to collect waste will definably reduce fuel consumption and save money. Also as the
map shows the dumpsite is located at the center of the of municipality this a problem because
trucks leaving Batoke, Man o war Bay and Mile Four have to travel through the municipality to

79
reach the dumpsite which is time consuming and that lead to more fuel consumption and odour
pollution.
Another factor is the lack of technology to facilitate the work of the waste management
company. A good example is during field trip the drivers have to estimate when the truck has
reached it maximum capacity. And a final weighing takes place at the dumpsite that is where we
get an accurate measurement of the amount of waste collected. And other forms of technology
can be adapted to our environment to best suit our communities.
4.7 WASTE MANAGEMENT IN LIMBE AND SOUND PRACTICES
The United Nations Environmental Program in 2012 gave some gloal guidelines for sound
environmental practices in waste management. These guideline could be adapted to local
environments. Decision makers need to assess how the specific, prevailing background
conditions constrain the choices available. It is unlikely that all of the following points will be
important in any one instance, but the list of conditions that help to determine what sound
practice is includes:
Level of development
• economic development, including relative cost of capital, labor, and other resources;
• technological development; and
• Human resource development, in the MSW field and in the society as a whole.
Natural conditions
• physical conditions, such as topography, soil characteristics, and type and proximity of
bodies of water;
• climate temperature, rainfall, propensity for thermal inversions, and winds;
and

80
• Specific environmental sensitivities of a region. Conditions primarily affected by human
activities
• waste characteristics density, moisture content, combustibility, recyclability, and
inclusion of hazardous waste in MSW; and
• City characteristics size, population density, and infrastructure development.
Social and political considerations
• degree to which decisions are constrained by political considerations, and the nature of
those constraints;
• degree of importance assigned to community involvement (including that of women and
the poor) in carrying out MSWM activities; and
• Social and cultural practices.
These background conditions can occur in a huge number of combinations. This means, once
again, that decision making has to be honed to a particular situation. The Source Book, in its role
of offering guidance on sound practices, refers to these conditions where they affect what should
be considered sound practice, but it cannot substitute for on-the-ground analysis of the interplay
of these factors.
An example or sound practice
The Latin American model for integration of small-scale waste collection enterprises with the
formal waste collection system is an example of sound collection practice. These systems were
developed in the Andean countries and are increasingly being copied in some Central American
countries and can be applied to African cities like Limbe.
The enterprises are paid by the municipal government or by a community organization to provide
collection using muscle-powered or semi-motorized carts. They serve marginal or hilly areas
which are not currently served and which collection trucks cannot reach (UNEP 2012).

81
Due in part to the low cost of the equipment used, collection tends to cost approximately two-
thirds as much as standard motorized collection methods. Administrative costs are minimal,
particularly because members of the enterprise take part in its administration as well as in its
operation. Finally, operation and maintenance of the equipment is quite simple and inexpensive
and can usually be done by a member of the enterprise (UNEP 2012).
What qualifies this model as a sound practice is its wide reach in terms of creating benefit. The
community benefits since it gets waste removal service. The city benefits, since it secures
collection service at 65% of the "normal" cost and satisfies its mandate to maintain public
cleanliness. Local individuals, especially single mothers, are often the first to respond to a call
for the formation of such an enterprise, and benefit through creating jobs for themselves (UNEP
2012).

82
CHAPTER FIVE
SUMMARY OF FINDINGS, CONCLUSION AND RECOMENDATIONS
This research work titled “Household Solid Waste Management in Limbe, Cameroon;
Practices, Problems and Prospects “is aimed at looking at the major problems in waste
management in the city of Limbe by identifying the opportunities and challenges in the chain or
life cycle in solid waste management in Limbe. To achieve its objective, both primary and
secondary data were collected and analyzed using the Statistical Package for Social Sciences
(SPSS) and excel spreadsheets. The key findings are summarized below:
5.1 SUMMARY OF FINDINGS
In summary, the following findings were made:
1. The result revealed that a diverse municipal solid waste is being generated in the Limbe
and the type of waste generated depended on the source. The different sources of
municipal solid waste identified include: household, health centers and industries.
2. Existing MSWM practices is not sustainable as the practice constitutes issues in the
environmental protection and sustainable development debate that is still wanting of
deserved attention. Management has been built over a long time on the basis of “keep
Limbe clean” thus focus has always been placed on collection and disposal. Addressing
these issues implies evaluating the various stages in the existing MSWM systems for
Limbe and a proposed system to upgrade the existing systems.
3. The challenges and perceptions that confronts effective waste management and which
limits management from becoming sustainable includes: infrastructure and logistics; poor
urban planning and geomorphological factors; poor landfilling practices, inadequate
funding; political and other institutional aspects.

83
5.2 CONCLUSION
The research aimed at examining the problems associated with municipal solid waste
management in Limbe and recommends measures to improve waste management in the face of
increasing urbanization. The study has shown that solid waste management has become a big
problem in Cameroon. The challenges and perceptions that confronts effective waste
management and which limits management from becoming sustainable includes: infrastructure
and logistics; poor urban planning and geomorphological factors; poor landfilling practices,
inadequate funding; political and other institutional aspects; long held perceptions about waste.
Existing MSWM practices is not efficient as the practice constitutes issues in the environmental
protection and sustainable development debate that is still wanting of deserved attention.
Besides, there is also the lack of required legal framework to enforce existing by-laws on waste
disposal, and to check the poor waste-handling attitude of the population as well as the inability
to enforce standards on land use and shelter development within the city. This continues to
frustrate the efforts of local governments in their attempts to keep the city clean and safe. The
frustrating waste problem, however, has also been caused by poor governance practices in the
organization of waste disposal. Municipal authorities in the country have failed to promote
partnership with the waste-producing public and to involve them in the various aspects of waste
management including needs assessment, financing, waste collection and final disposal.
5.3 RECOMMENDATIONS
In response to the conclusions presented the following recommendations are provided for
improving the management of household waste for the residents of the study area. The
recommendations are specific to each stakeholder that should be involved in the strategic
planning of the specific interventions. The recommendations are based on the synthesis of
information gathered in the survey findings, in-depth interviews and available literature.
The way forward in solid waste management is to introduce a system whereby the chain and life
cycle of waste management can be controlled by technology. In the age of globalization there are

84
models where information and data about waste management is run using suitable GIS systems.
The system functions in a way that the sortie route and collection points are introduce into a GIS
system to generate a workable framework or model specific to the realities of the study area. The
daily or weekly tons of waste generated in the study area fitted in a GIS system to produce zonal
mappings that facilitate the identification of waste categorization and separation. Furthermore,
the vehicles can be monitored from a central point during the collection process. New Landfills
should be opened on the three outskirts locations of the Limbe municipality in other to save the
travel time and save cost for the waste management company. Areas around Batoke, Bimbia and
Mile Four should be considered for further research in a bit to create new landfills.
In other to address the problem of terrain there should be an introduction of muscle powered
vehicles in these areas so that waste management services should reach even the most
inaccessible areas in lime especially those in areas with elevated terrain.
An animal feed program which can be derived from food waste should be introduced. In this
regard 52.3% of the community acknowledged that they either grow crops or rear animals. This
means that introducing animal feed program from food waste will be important. According Post
(2007) promoting animal feeding program is a preferred method of managing food waste and
that composting has it disadvantages for the following reasons: a community composting
program should be introduced in which a central location chosen for materials can be processed.
However this particular program requires the availability of the raw materials and a market for
the finished products. Also the community has to also put in place ways to sustainably manage
the program.
Another waste reduction strategy is to encourage recyclable production of goods to allow access
to recyclable products. More eco-friendly articles which will facilitate the reduction of the
amount of waste generated. Because these materials will be easily eliminated from the waste
streams by recycling them each time they are used to produce other goods. Furthermore
companies starting up on eco-friendly solutions like recycling of plastics and other materials
should be given incentives by the government of Cameroon. Loans and grants should be made
available to encourage such initiatives and this will be very important to develop the green

85
economy in the country. Instead of starting waste management from generation, a new Model is
proposed to government starting from the Production of goods and services that will facilitate the
actual disposal process. Figure 5.1 gives us a clear view of the process.
Figure 5.1: A new approach for Municipal Solid Waste Management in Cameroon.
Waste management should equally be mainstreamed through education and public sensitization
systems. Literature has a supportive role for public education in successful solid waste
management programs. In order to raise public awareness and encourage behavioral change and
thereby gain public participation public campaigns should be part of the strategy including
punitive methods for violators of the program. The development of effective public education
campaigns is a step in realizing the cultural transformation that is necessary for solid waste
management reform in Cameroon. In this regard, the Limbe City Council should collaborate with
Non-governmental organizations to transmit the message to the local population.
The ultimate goal should be to encourage public participation in source separation programs
Also programs educating the population about source separation. The table 5.1 illustrates the
willingness of the population to participate in better waste management program, 69.0%
reported unwillingness to pay for recycling pickup; the community did not demonstrated
enthusiasm for other programs not associated with an incentive for them. On the other hand 93%
were willing to participate in a program that paid for each bottle they returned; this shows that
incentives would have to be given to motivate the public to participate in a program of that
nature. However all the population were interested in more information on composting, reuse
and recycling with this enthusiasm to learn it is but important to introduce these programs.
Generation Storage Collection
Production
of Goods
and Services
Transportati
on
Disposal

86
Table 5.1 Respondent’s Willingness to participate in Waste Reduction Program
Planners should also be involved in the waste manage planning process. This because planners
will tend to ring out a better process which will probably lead to better organization. The
involvement of the community in the planning process is very important and should be taken
seriously because without their participation the process will be cumbersome since they are the
producers of waste. Thus a top down policy application should be stopped and a bottom up
approach should be used. According Post (2007) community participates in a program or project
on waste have a 90 percent success rate. The following can be done to ensure effective
participation by the community;
• Share findings and recommendations with residents of study area and conduct
consultation for opinions and feedback
• Form a steering committee for planning process (Community members and stakeholders)
The current collection service is reaching only a fraction of the study area population, and in
response to the current collection situation, unsustainable disposal methods are utilized to
dispose of non-biodegradable materials, like metal, glass, and plastic. The inadequate services
are of great concern to the community and 74% conveyed the need for improved service,
recommending a collection frequency of everyday. In light of the concern of residents and the
expressed need for increased services, HYSACAM should work with the community to establish
a collection schedule that meets the needs of the community, by matching the disposal cycle of
the residents. Furthermore the amount of plastic containers distributed in the city is insufficient;
more should be done following the zonal proposition of this study.
7 7.0% 11 11.0% 1 1.0%
69 69.0% 2 2.0% 6 6.0%
24 24.0% 87 87.0% 93 93.0% 100 100.0%
100 100.0% 100 100.0% 100 100.0% 100 100.0%
dont know
No
Yes
Total
Count %
respondents willing to
to pay for pick up of
these recycling
materials from home
Count %
respondents willing to
participate in program
to compost food and
yard waste
Count %
respondents willing to
participate in program
that pays for each
plastic bottles they
returned
Count %
respondents that will
like more information
about compost, reuse,
and recycle

87
Appropriate legislations for a comprehensive waste management law should be enacted in
Cameroon. The law should allow for the harmonization of the functions of the different
ministries in the waste management sector. The law should also make provisions for PPP in
waste management and provide the municipalities and City Council with adequate funds to
match the growing need to waste management.
The government is doing a good job by constructing new roads in limbe which has given access
to once inaccessible neighborhoods to waste trucks from HYSACAM. Example is the Mile One -
Bota hospital road and the Mbende-Lumpsum road. Plans are in place to pave more roads in
Lime which is very important.
5.2 Implications for Further Research
The study examined urban solid waste problem in Limbe, particularly the constraints to waste
management efforts in the country. In the course of the study, however, a number of themes have
been identified that critically affect the organization of solid waste management in Limbe. These
areas include appropriate technologies for solid waste management, waste management
financing, the governance of waste management, urban land use and housing planning, waste
stream studies for data generation, liquid waste disposal, medical waste disposal and E-waste
disposal. These other factors should benefit from further research in other to understand and plan
urban development.

88
REFERENCES
Ahmed S A & Ali M. (2004).Partnerships for solid waste management in developing countries:
Linking theories to realities Habitat International.
Alberti M. (1999). Urban patterns and environmental performance: What do we know? Journal
of Planning Education and Research. 2, (2):6-10.
Ali M Snel M. (1999), Well Study Lessons from Community-Based Initiatives in Solid Waste.
London School of Hygiene & Tropical Medicine, Loughborough University
Adane L Deriba M. (2011) Survey on the Usage of Plastic Bags: Their Disposal and Adverse
Impacts on Environment: A Case Study in Jimma City, Southwestern Ethiopia. Journal of
Toxicology and Environmental Health Sciences, 3, (4): 5.
Achere R. (2012) Solid Waste Management: A World Perspective and the Cameroon Case Study
(MSc thesis Universidad Fernanado Pessoa, Porto Portugal).
Asnani P.U. (2006), Solid Waste Management. In India Infrastructure Report 2006, Urban
Infrastructure, Ed. Anupam Rastogi, 16089. New Delhi: Oxford University Press.
Bilitewski BHardetle G and Marek K. (1997).Waste Management Berlin Germany: Pringer
Publications.
Baabereyir A (2009) Urban Environmental Problems in Ghana: A Case Study of Social and
Environmental Injustice in Solid Waste Management in Accra And Sekondi-Takoradi, (PhD
Thesis University Of Nottingham).
Bahri G. (2005) Sustainable Management of Plastic Bag Waste: The Case of Nairobi, Kenya
(Master’s Theses Lund, Sweden).
Bertrand M. and Mullainathan S. (2001) Do People Mean What They Say? Implications for
Subjective Survey Data: The American Economic Review, 91, (2), 67-72.

89
Bernard Colas (2000), Global Economic Co-operation: A Guide to Agreements and
Organization, United Nations University Press, Inc.
Bower, B. T. (1977), The Why and What of Regional Residuals: Environmental Quality
Management Modeling in B. T. Bower, (ed.), Washington DC.
Cooper J. (1999). Solid Waste Management in Copenhagen. Copenhagen, Denmark: Ashgate
Cortinas de Nava C. (2001).Haciaun Mexico sin Basura. LVIII Legislatura H Congreso de la
Union Mexico.
Chen X (2000). Shanxi Water Resource input-occupancy-output table and its Applicationin
Shanxi Province of China. Presented at Proceedings of the 13th International Conference on
Input-Output Techniques, Macerata, Italy.
Cointreau S. (2001) Declaration of Principles for Sustainable and Integrated Solid Waste
Management .
Chati J (2012) Solid Waste Management in Ghanaian Towns: A Case of Saboba (Kwame
Nkrumah University of Science and technology, Ghana).
Kobus. D. (2003). Bertelsmann Stiftung, Güterslo. The World Bank, Washington D C Practical
Guidebook on Strategic Planning in Municipal Waste Management. Retrieved from
www.citiesofchange.net. Accessed March, 2nd 2014.
Dhamija, U. (2006). Sustainable Solid Waste Management: Issues, Policies, and Structures.
Retrieved from http://books.google.cm/books. Accessed March, 2nd 2014.
Dhir R Newlands M & Dyer T (2003) Sustainable Waste Management. Retrieved from
http://books.google.cm/books. Accessed March, 2nd 2014.
Dongquing Z Tan S Gersberg R. (2010). A Comparison of Municipal Solid Waste Management
in Berlin and Singapore.

90
DFID (1999) Research Development and Design of a Simple Solid Waste Incinerator: Review of
Demand and Selection of Partner Country. Intermediate Technology Consultants Limited (ITC).
Daniel B. Botkin & Edward A. Keller (1997), Environmental Science: Earth as a Living Planet.
John Wiley & S.
Ewoko N. (2010) Municipal Solid Waste Management, Limbe Municipality Cameroon (Master’s
thesis, Mid Sweden University, Östersund).
El Haggar S. (2006).Sustainable Industrial Design and Waste Management Retrieved from
http://books.google.cm/books. Accessed March, 2nd 2014.
Etengeneng D. (2012) Municipal Solid Waste Management in Grahams town, Republic of South
Africa (NOVIA University of applied sciences).
Eugenea A Busch G. (2011). Community Based Solid Waste Management in Sub-Saharan
Africa: The Case of Buea – Cameroon. Waste Management Conference February Phoenix, AZ
Gbekor, A. (2003) Domestic Waste Management Ghana Environmental Protection Agency
(EPA) Newsletter, 47, (5) 5.Accra, Ghana EPA.
Hendricks, D. W. (1982). Modeling of Water Supply/Demand in the South Platte river basin,
1970-2020. Water Resource Bulletin, 18 (2):279-287.
Hu, S.W., Shy, C.M. (2001). Health Effects of Waste Incineration: A Review of Epidemiologic
Studies. Journal of the Air & Waste Management Association, 51, (7):6.
Kenya National Cleaner Production Centre. (2006).Comprehensive plastic waste management
strategy for the city of Nairobi. Retrieved from http://www.unep.org. Accessed March, 22nd
2014.
Kapoor R. (2009) Public Attitude towards Solid Waste Management: An Empirical Analysis.
Proceedings of International Conference on Energy and Environment.

91
Kennedy, C., Pincetl, S., and Bunje, P. (2010). The Study of Urban Metabolism and its
Applications to Urban Planning and Design.
Leigh, N. G.; Ai, N., and French, S. (2006). The Role of Product inventory Estimates in Regional
Waste Diversion impact analyses. Presented at the 47th ACSP Annual Conference, Fort Worth,
TX.
Leontief, W. (1936), Quantitative input-output relations in the economic system of the United
States. Review of Economics and Statistics, 18, (2): 105-125.
Lundström. (2007) Sustainable Waste Management: International Perspectives. Proceedings of
the International Conference on Sustainable Solid Waste Management, India.
Ministry of Local Government and Provincial Councils Srilanka (2008) Solid Waste Planning
and Disposal.
Mbeng O Phillips S and Fairweather R. (2012) Waste Characterization as an Element of
Household Waste Management Operations: A Case Study in Limbe, Cameroon. The Open Waste
Management Journal, 5, (4): 49-58.
Mangaa E; Tening O and Read D B. (2007) Waste Management in Cameroon: A New Policy
Perspective. Resources Conservation and Recycling journal, 10, (3): 7.
Medina M. (1997) Informal Recycling and Collection of Solid Wastes in Developing Countries:
Issues and Opportunities. The United Nations University
Marsh, G. P. (1864). Man and Nature, or, Physical Geography as Modified by Human Action,
Cambridge, MA: Belknap Press.
Meadows D. H, Meadows D. L, Randers, J, and W. W Behrens III (1972), The Limits to
Growth: A Report for the Club of Rome's Project on the Predicament of Mankind, New York:
Universe Books.

92
Nhemo G. (2008).Environmental Policy Processes surrounding South Africa’s Plastic Shopping
Bags Litter and Waste Regulation and How These Influenced Development. Retrieved from
http://books.google.cm/books. Accessed March, 22nd 2014.
Nabegu, A. (2010) An Analysis of Municipal Solid Waste in Kano Metropolis. Journal Human
Ecology. 2, (4) 40-45.
Ndum A. (2013) Bottom-Up Approach to Sustainable Solid Waste Management in African
Countries, (PhD Thesis BT University Cottbus, Germany).
Niza, S.; Rosado, L. and Ferrão, P. (2009), Urban Metabolism: methodological advances in
urban material flow accounting based on the Lisbon case. Journal of Industrial Ecology, 13(3),
384-405.
Ngo N. S, & Pataki, D. E (2008), The Energy and Mass Balance of Los Angeles County. Urban
Ecosystems.
Robertson M. (2002).Sustainable Cities: Local Solution in the Global South. Retrieved from
http://books.google.cm/books. Accessed March, 22nd 2014.
Odum, H. T. (1983). Systems Ecology: An Introduction, New York Wiley-Inter-science.
Patten, B. C., Bosserman, R. W., Finn, J. T., and Cale, W. G. (1976), Propagation of Cause in
Ecosystems, in B. C. Patten, (ed.), Systems Analysis and Simulation in Ecology. New York:
Academic Press.
Pearce D, Turner R. (1994). Economics and Solid Waste Management in the Developing World.
Retrieve from http://www.cserge.uea.ac.uk/sites/default/files/wm. Accessed March, 15th 2014.
Pichtel, J. (1988), Waste Management Practices: Municipal, Hazardous, and Industrial, Second
Edition.CRC press.
Randolph, J. (2004). Environmental Land Use Planning and Management, Washington DC:
Island Press.

93
Pongrácz E; Phillips S and Keiski L. (2004) From Waste Minimization to Resources use
Optimization: Definitions and legislative Background. Oulu University Press
Palczynski R J &Scotia W N (2002), Study on Solid Waste Management Options for Africa
Project Report Prepared for African Development Bank Sustainable Development and Poverty
Reduction Unit, Abidjan, July 2002.
Post L.(2007) Solid Waste Management in Jamaica: An Investigation into Waste Reduction
Strategies. (M.Sc. Thesis Michigan Technological University USA).
Regassa N; Sundaraa D and Seboka B. (2011) Challenges and Opportunities in Municipal Solid
Waste Management: The Case of Addis Ababa City. Journal Human Ecology. 2 (4) 65-70.
Shivapullaiah, P.V. (1977), Waste Characterization in Waste Disposal in Engineered Landfills
M. Datta (Ed.) Narosa New Delhi.
Schedler A. (1999), The Self-restraining State: Power and Accountability in New Democracies.
Lynne Rienner Publishers.
Steiner, F. (1983), Regional Planning: Historic and Contemporary Examples
Singdha, C. (2005), Economics of Urban Waste Management in Dimensions of Environmental
and Ecological Economics by Nirmal Chandra Sahu and Amita Kumari Choudhury (Ed),
Universities Press, Hyderabad.
Thoss R., and Wiik, K. (1974), A Linear Decision Model for the Management of Water Quality
in the Ruhr in J. Rothenberg and I. G. Heggie, (eds.), Management of Water Quality and the
Environment. London: MacMillan.
Tchobanoglous G; Theisen H and Vigil S A. (1993). Integrated Solid Waste Management. New
York: McGraw Hill.

94
Twardowska I. (2004) Solid Waste: Assessment, Monitoring and Remediation. Waste
Management Series: 4, (2004) 56.
United Nations Environmental Program (UNEP, 2005). Selection, Design and Implementation of
Economic Instrument in Solid Waste Management Sector in Kenya: The Case of Plastic Bags.
Retrieved fromhttp://books.google.cm/books. Accessed March, 22nd 2014.
UNEP. (2009). Integrated solid waste management to support capacity building and technology
transfer Retrieved from: http://www.unep.or.jp. Accessed March, 22nd 2014.
UNDESA. (2005).Agenda 21, Chapter 21. Environmentally Sound Management of Solid Waste
and Sewage related Issues.Division for Sustainable Development. Retrieved from
http://www.un.org/esa/sustdev/documents/agenda21/index.htm) Accessed March, 22nd 2014.
UNDP. (2007).United Nations Millennium Development Goals United Nations Development
Programme .Retrieved from http://www.undp.org/mdg/. Accessed March, 22nd 2014.
United Nations Environment Programme. (2007) Assessment of Solid Waste Management in
Liberia.
United Nations Environment Programme UNEP. (2005) Solid Waste Management.
US Department of Interior, Bureau of Mines, (1993), Mineral Commodity Summaries.
Wadge A and Hutton M. (1986), The uptake of Cadmium, Lead and Selemum by Barley and
Cabbages grown on Soils amended with refuse incinerator Fly ash. Plant Soil
Wackernagel M, and Rees, W. (1996). Our Ecological Footprint: Reducing Human Impact on
the Earth, New Society Publishers.
Wolman, A. (1969). The Metabolism of Cities, in G. F. White, (ed.), Water, Health and Society:
Selected Papers by Abel Wolman. Bloomington and London: Indiana University Press.

95
Williams, P. T. (2005). Waste Treatment and Disposal (Second Edition ed.). West Sussex, England: John Wiley & Sons.
Yaaba S.(2012). Public Community Partnerships: Success and Failures International institute of Social Studies, The Hague, Netherlands
Ymelé, J. (2012). Cameroon own path towards Municipal Solid Waste Management
Zurbrugg C (2002) Solid Waste Management in Developing Countries SANDEC/EAWAG

96
Appendix-I QUESTIONAIRE FOR HOUSEHOLD SURVEY
1. Personal information of respondent
Please provide the following information for the occupants in the household. Household
member No.
Age Gender
1 Male
2 Female
Education Level
1 FSLC
2 O/levels
3 A/levels
4 Tertiary
5 Other
6 No school
Employment
1 Employed
2 Unemployed
3 Student
4 Retired
5 Not of
working age
6 Don’t know
Income/month
in FCFA
1.< 50,000
2. 50,000-
100,000
3. 100,000-
250,000
4. 250,000-
500,000
5. >500,000
6.no income
Respondent
2
3
4
5
6
7
Which person is responsible for taking care of the garbage from your house? (Please indicate
on the above table)
WASTE CHARACTERISTICS IN LIMBE
Waste generated by your home monthly consists of ; ( if no precise data is available give the
nearest estimate)
Types of waste 100% 75% 50% 25% 15% 10% 5% 2% 1%
9 8 7 6 5 4 3 2 1
Food Items
Papers
Metal
Glass
Garden waste
plastics
Other (please
specify)
What is the estimated amount of waste produced by your home daily? Please tick one
i. 0-5 Kg
ii. 5-10 Kg

97
iii. 10-15 kg
iv 15-20kg
V More than 20 Kg
Problems of solid waste management in Limbe
Do you think that your community has a waste collection or disposal problem?
Yes No
Why or why not, please explain ……………………………………………………………………………………………………
………………………………………………………………………………………………………………………
To the following 11 questions, please answer with either:
yes, no, or don’t know.
Yes No Don’t
Know
1 Have you ever heard about composting?
2 Have you ever heard about recycling?
3 If a recycling program was set up, that collected materials like plastic,
paper, metals, etc, would you
be willing to separatethese into separate bags for collection purposes
4 Would you be willing to pay for pickup of these recycling materials
from your home?
5 Would you be willing to participate in a program to compost food
and yard waste?
6 If you were paid for every plastic bottle that you returned to the
grocery store, would you participate
in a program to return the plastic bottles?
7 Would you like more information about how and what types of
garbage you can compost, reuse,
and recycle in order to reduce the amount of garbage that you need
to get rid of?
Do you make use of the following waste options? Yes No (please indicate the waste type and method used)
Waste type reuse recycle restore reduce
Food Items
Papers
Metal
Glass
Garden waste
Where do you dispose of your waste?

98
Types of Garbage Burn Bury Dump Garbage
truck
Recycle Reuse Compost others
River/gully In
yard
On
road
1 2 3 4 5 6 7 8 9 10
Food waste
Yard trimming
Paper/cardboard
Plastic
Metal
Glass
How often do you dispose of your household waste?
Frequency of disposal
1 One/weekly
2 Twice/weekly
3 Thrice/weekly
4 Other( please specify )
How far do you agree with each of these statements?
Please tick one box per row.
Strongly
disagree
Disagree Neutral Agree Strongly
agree
Public education about proper garbage management is
one way to fix the garage crisis
correct garbage management should not be taught in
schools
The purchase decisions that I make an increase or
decrease the amount of garbage my house holds must
get rid of
People throw garbage on the streets and in the drains
and gullies because they have no other means of
getting rid of their garbage
The recent government ban on plastic bags from
shops and general usage
Please describe how your household stores the garbage from the house select any choice below.
1 Closed Container, please describe;
2 Open container, please describe
3 Plastic bags
4 Pile in the yard

99
5 other
6 Don’t know
Does your household rear animals or grow crops for household consumption? Yes No
(please tick one) To the following questions please tell me whether you are; concerned Not concerned No opinion
1 2 3
How concerned are you about the piling of garbage for many
days before collection?
How concerned are u about illegal dumps polluting rivers,
streams and wells?
How concerned are you about the diseases that are related to
improper storage and disposal methods like malaria?
How concerned are you about health risk related to burning
garage?
How concerned are you about flooding due to garbage looking
drains and gullies from improper garbage disposal?
How concerned are you about the service provided y the garage
truck in this area?
How concerned are you about litter in this area?
In your opinion what is the best method to dispose of waste. Recycle
burn
Increased collection frequency y waste truck
Restore
Reuse
Reduce
compost
Don’t Know
Appendix – II: Authorities and Waste Management Agency Survey List
• Who is responsible for solid waste management in Limbe? Where does this agency derive its power from
(constitution, acts, and regulations etc)?
• Does the agency hold enough power to formulate rules, laws or policies pertaining to solid waste management in
Limbe? If not, who formulates such rules, laws or policies?
• Who finances solid waste management in Limbe? Is it the local municipality, or the central government? What are the
financial provisions? Does the local municipality collect taxes, levies etc for solid waste management?
• What is the current population being catered to by the waste management agency?
• What is the situation in terms of infrastructure (number of waste collection vehicles, personnel employed for waste
collection and management etc)?
• How is the waste collected and transported in Limbe municipality area? Describe the method of collection, e.g. pick-
up by tractors/trucks; individual drop-off, transfer station, and frequency of collection;

100
• What are the major components of solid waste management currently practiced?
• Identify problems with the system, e.g. dumping along the access road.
• Is there any reduction or reuse programmes? Describe in details if any.
• Is there any composting of organic wastes? Is there any centralized or backyard composting? If so, how many
households participate? Is there any institutional composting e.g. by municipality office, school, etc.
• Describe any barriers to participation in composting activities
• Is there any recycling programmes? Describe (if any) the programs for paper, glass, metals, cardboard, and plastic.
Give details of collection and separation.
• Describe any barriers to participation.
• How many dumps are in operation? How far are they from the town? Are there any households near these dumps?
• Is there any abandoned dumps? Where are they located?
• What is the state of operation for this dump site?
• Who manages the operation of dump?
• Is the site supervised during operation hours?
• Is the access to the site is controlled (fenced, locked)?
• What kind of waste is not accepted in the dump site?
• Are the wastes separated? If yes, How?
• What is the method for filling (trenching, burying, dumping down a hillside, piling, compacting, covering etc)?
• What are the problem with this site ?
• Questions on nature of waste composition
• What are the major constituents of waste (Organic, biodegradable, non-degradable, inorganic, plastics etc)?
• How has waste composition changed over the years (trends and changes)?
• What has been the major area of concern in terms of waste composition (particular article/item, changing nature of
composition etc)?
• Are existing policies adequate to promote sustainable waste management? If not, what are the policies issues that
needs to be looked into? Who are the main players? How to bring them to a common platform? What are possible
road maps in this regards?
• What should be the areas of priorities in terms of waste management (reduction, composting, source separation,
improving collection and transportation of waste etc)?
• Should private sector be involved in sustainable solid waste management? If yes, what role can be played by the
private players?

101
• What role can general people, local solid waste management experts, community, Non-governmental organization,
development agencies, government at various levels, can and should play in promoting sustainable solid waste
management?