Evaluation of waste management options and resource conservation potentials according to the waste...
11
Resources, Conservation and Recycling 58 (2012) 114–124 Contents lists available at SciVerse ScienceDirect Resources, Conservation and Recycling journa l h o me pag e: www.elsevier.com/locate/resconrec Evaluation of waste management options and resource conservation potentials according to the waste characteristics and household income: A case study in Aegean Region, Turkey Gorkem Akinci ∗ , Elif Duyusen Guven, Gulden Gok Dokuz Eylul University, Department of Environmental Engineering, Kaynaklar Campus, 35160 Buca, Izmir, Turkey a r t i c l e i n f o Article history: Received 6 April 2011 Received in revised form 21 October 2011 Accepted 6 November 2011 Keywords: Domestic solid wastes Income group Green wastes Fine wastes Recyclable wastes Aegean Region a b s t r a c t The current study investigates the major components and characteristics of the domestic solid wastes (DSW) as a function of economical conditions for a study area, in order to define the recycling resources and biomass recovery options, as well as to discuss the possible waste management methods for these regions by considering the current and developing environmental legislations and national waste man- agement plans in Turkey. Seasonal variations are also considered in addition to the measured winter data and future projection is designed for waste management in the study area for the following years. The selected area includes Izmir city, Kula town, and Usak city which exist in Aegean Region (Turkey) with different topographic, climatic, economic, and socio-cultural conditions, and populations. Districts representing different income levels in the study sites were determined and detailed sampling stud- ies were conducted in winter. The general distributions of green fraction, fine fraction (<10 mm), and the recyclables were determined in samples as well as personal generation rates (PGRs). The pH, water content, organic matter content, dissolved organic carbon, dissolved nitrogen concentrations, and the calorific values of the green wastes were detected and evaluated. The daily PGRs of the DSW were found as 0.46, 0.74, and 0.86 kg ca −1 d −1 for Izmir, Kula, and Usak, respectively. For all the income groups and districts, green fraction constitutes the major component of the total DSW where the PGRs of the fine fraction increase as the income level decreases. Source separation and collection of the green wastes, recyclable wastes, and ash is inevitable for all of the sites. According to the findings, 620,865 tones of organic waste is expected to be generated in Izmir in 2032. Due to the waste amount and characteristics, the inactive composting plants should be operated and biomethanization facilities should be constructed for the biological degradation of Izmir green wastes which has a potential of producing 84,000 m 3 d −1 of methane at the end of 2032. There is a potential of 8550 MWh electricity per year between 2022 and 2032 in Izmir and thermal destruction should be considered in the second phase. Composting is recom- mended for processing the total green wastes of Kula and Usak. The ash should be landfilled separately for all districts as defined in the Turkish Legislation on Sanitary Landfilling of the Solid Wastes. Additional inert waste landfill areas are recommended with 8.2 ha and 2 ha. On the other hand, the recyclables may provide an economic income of 677 million USD for Izmir, and 40 million USD for Kula and Usak by the end of 2032 while the recycling activities and facilities are poor and insufficient. In order to realize the targets of the legal obligations, new investments are necessary to build new recycling plants for Izmir metropolitan city. In Kula and Usak, illegal scavenging activities are recommended to be formalized in corporation with the municipalities and the current unlicensed recycling plants can be revised for legal recycling activities. © 2011 Elsevier B.V. All rights reserved. 1. Introduction Solid waste management (SWM) is a global reality and it has been handled in various ways in different parts of the world. ∗ Corresponding author. Tel.: +90 2324127132; fax: +90 2324531143. E-mail addresses: [email protected] (G. Akinci), [email protected] (E.D. Guven), [email protected] (G. Gok). The countries with the developed economies show a sustainable approach through solid waste management as a result of reliable data on waste generation, standardized collection and transporta- tion systems, proper recycling and final disposal technologies. On the other hand, solid waste generation is increasing in devel- oping countries with the growing population. Depending on the technical, institutional, economical, and social limits in the devel- oping countries, SWM faces serious problems such as irregular collection, informal scavenging activities, crude wild dumping, 0921-3449/$ – see front matter © 2011 Elsevier B.V. All rights reserved. doi:10.1016/j.resconrec.2011.11.005
Transcript of Evaluation of waste management options and resource conservation potentials according to the waste...
EaA
GD
a
ARRA
KDIGFRA
1
b
d
0d
Resources, Conservation and Recycling 58 (2012) 114– 124
Contents lists available at SciVerse ScienceDirect
Resources, Conservation and Recycling
journa l h o me pag e: www.elsev ier .com/ locate / resconrec
valuation of waste management options and resource conservation potentialsccording to the waste characteristics and household income: A case study inegean Region, Turkey
orkem Akinci ∗, Elif Duyusen Guven, Gulden Gokokuz Eylul University, Department of Environmental Engineering, Kaynaklar Campus, 35160 Buca, Izmir, Turkey
r t i c l e i n f o
rticle history:eceived 6 April 2011eceived in revised form 21 October 2011ccepted 6 November 2011
eywords:omestic solid wastes
ncome groupreen wastesine wastesecyclable wastesegean Region
a b s t r a c t
The current study investigates the major components and characteristics of the domestic solid wastes(DSW) as a function of economical conditions for a study area, in order to define the recycling resourcesand biomass recovery options, as well as to discuss the possible waste management methods for theseregions by considering the current and developing environmental legislations and national waste man-agement plans in Turkey. Seasonal variations are also considered in addition to the measured winterdata and future projection is designed for waste management in the study area for the following years.The selected area includes Izmir city, Kula town, and Usak city which exist in Aegean Region (Turkey)with different topographic, climatic, economic, and socio-cultural conditions, and populations. Districtsrepresenting different income levels in the study sites were determined and detailed sampling stud-ies were conducted in winter. The general distributions of green fraction, fine fraction (<10 mm), andthe recyclables were determined in samples as well as personal generation rates (PGRs). The pH, watercontent, organic matter content, dissolved organic carbon, dissolved nitrogen concentrations, and thecalorific values of the green wastes were detected and evaluated. The daily PGRs of the DSW were foundas 0.46, 0.74, and 0.86 kg ca−1 d−1 for Izmir, Kula, and Usak, respectively. For all the income groups anddistricts, green fraction constitutes the major component of the total DSW where the PGRs of the finefraction increase as the income level decreases. Source separation and collection of the green wastes,recyclable wastes, and ash is inevitable for all of the sites. According to the findings, 620,865 tones oforganic waste is expected to be generated in Izmir in 2032. Due to the waste amount and characteristics,the inactive composting plants should be operated and biomethanization facilities should be constructedfor the biological degradation of Izmir green wastes which has a potential of producing 84,000 m3 d−1
of methane at the end of 2032. There is a potential of 8550 MWh electricity per year between 2022 and2032 in Izmir and thermal destruction should be considered in the second phase. Composting is recom-mended for processing the total green wastes of Kula and Usak. The ash should be landfilled separatelyfor all districts as defined in the Turkish Legislation on Sanitary Landfilling of the Solid Wastes. Additionalinert waste landfill areas are recommended with 8.2 ha and 2 ha. On the other hand, the recyclables may
provide an economic income of 677 million USD for Izmir, and 40 million USD for Kula and Usak by theend of 2032 while the recycling activities and facilities are poor and insufficient. In order to realize thetargets of the legal obligations, new investments are necessary to build new recycling plants for Izmirmetropolitan city. In Kula and Usak, illegal scavenging activities are recommended to be formalized incorporation with the municipalities and the current unlicensed recycling plants can be revised for legal recycling activities.. Introduction
Solid waste management (SWM) is a global reality and it haseen handled in various ways in different parts of the world.
∗ Corresponding author. Tel.: +90 2324127132; fax: +90 2324531143.E-mail addresses: [email protected] (G. Akinci),
[email protected] (E.D. Guven), [email protected] (G. Gok).
921-3449/$ – see front matter © 2011 Elsevier B.V. All rights reserved.oi:10.1016/j.resconrec.2011.11.005
© 2011 Elsevier B.V. All rights reserved.
The countries with the developed economies show a sustainableapproach through solid waste management as a result of reliabledata on waste generation, standardized collection and transporta-tion systems, proper recycling and final disposal technologies. Onthe other hand, solid waste generation is increasing in devel-
oping countries with the growing population. Depending on thetechnical, institutional, economical, and social limits in the devel-oping countries, SWM faces serious problems such as irregularcollection, informal scavenging activities, crude wild dumping,
G. Akinci et al. / Resources, Conservation and Recycling 58 (2012) 114– 124 115
Table 1Municipal solid waste composition for some developed and developing countries.
Country Organic Paper and paperboard Plastic Glass Metal Textile/leather, etc. Inert and other Adapted from
China 35.8 3.7 3.8 2 0.3 47.5 Shekdar (2009)Indonesia 74 10 8 2 2 2 2 Shekdar (2009)India 42 6 4 2 2 4 40 Shekdar (2009)Nepal 80 7 2.5 3 0.5 7 Shekdar (2009)Japan 26 46 9 7 8 12 Shekdar (2009)Singapore 44.4 28.3 11.8 4.1 4.8 6.6 Shekdar (2009)South Korea 25 26 7 4 9 29 Shekdar (2009)Germany 30 24 13 10 1 4 18 Mühle et al. (2010)UK 38 18 7 7 8 3 19 Mühle et al. (2010)USA 25.3 32.7 12.1 5.3 8.2 16.4 USEPA (2008)Greece 41 23 13 3 4 6 10 Koifodimos and Samaras (2002)
aemdt2dtc
fif(onta
ltswScLtarGi
TM
Italy 31 24 11 8 4
nd uncontrolled burning. Solid waste composition is also influ-nced by economic status. The recyclables (paper, plastics, glass,etals, etc.) in municipal wastes have high proportions in the
eveloped economies, while degradable organic matter is high inhose countries with low GDP (gross domestic product) (Shekdar,009). Municipal solid waste composition for some developed andeveloping countries are shown in Table 1. As it is seen, not onlyhe recyclables, the proportion of organic and inert materials alsohange in a wide range through the world.
In 2002, European Environmental Agency reported target issuesor biodegradable municipal waste management in Europe whichncludes integrated approach to developing national strategies andocuses on the need for good quality and consistent informationCrowe et al., 2002). Lack of data is one of the most important limitsf SWM in developing countries. In addition, further researches areecessary in specific areas or group of countries in depth in ordero complement quantitative analyses with country level (Mazzantind Zoboli, 2008).
In 2008, Turkish Ministry of Environment and Forestry pub-ished the Solid Waste Management Action Plan (SWMAP) for theime period between 2008 and 2012. This plan exhibits the currentituation in Turkey and determines a strategic road map for theaste management activities in the upcoming period. Due to the
WMAP, the waste management studies are planned both in theounty and provincial scale (TMEF, 2008). According to the Turkishaw of Metropolitan Municipalities, the metropolitan municipali-ies are responsible for arranging solid waste management plans,
nd providing facilities of source collection, transportation, andecovery of the municipal, industrial, and medical wastes (Officialazette, 2004). At current, there are 3129 municipalities receiv-ng municipal waste services in Turkey collecting approximately
able 2unicipal solid waste composition for various cities in Turkey.
Geographical region Organic Paper andpaperboard
Plastic Glass M
Izmir Aegean 46 12 12 4 3
Denizli Aegean 42 12 17.5 4 1.Antalya Mediterrenean 55.9 15.7 11.3 8.1 0.Antalya Mediterrenean 50.8 17.7 12 9.6 1.Istanbul Marmara 50.2 13.3 14.4 5.8 1.Bursa Marmara 53.1 18.4 11.6 3.4 3
Sakarya Marmara 48 8 11 3 2
Kocaeli Marmara 38.4 11.5 14.3 3.3 1.Kocaeli Marmara 43.8 13.3 16.1 3.6 1.Eskis ehir Central Anatolia 67 10.1 5.6 2.5 1.Bolu Blacksea 40 6 21 15 2
Gümüs hane Blacksea 20.3 6.6 4.6 3.1 0.Gümüs hane Blacksea 40 12.8 11 4.3 1.Erzurum Eastern Anatolia 48 9 11 3 3
S anlıurfa Southeastern Anatolia 80 6 3 2 1
Gaziantep Southeastern Anatolia 49 9 12 5 1
5.5 16.5 Calabro (2009)
24,361 thousand tones of urban waste by the year 2008. Thereare 37 controlled landfills, 4 composting plants, and 2 incinerationplants which are actively under service (TurkStat, 2009). Therefore,only 10,321 thousand tones of municipal solid wastes are han-dled in the controlled landfills, composting plants, and incinerationplants, which means 58% of the municipal solid wastes gener-ated in Turkey is not under control. In most parts of Turkey, solidwastes are disposed in open dumps in an uncontrolled way. Sucha method causes various environmental problems like surface andunderground water pollution, uncontrolled atmospheric emissionsof landfill gases, dust and odor formation, and aesthetic pollution. Inaddition, the metropolitan areas enlarge with the increasing pop-ulation and the landfill areas are engulfed by the cities. The majoraim of the SWMAP is to constitute a regional and national wasteplan and provide its sustainability.
Implementation of appropriate solid waste management prac-tices requires reliable waste statistics (Metin et al., 2003). Inaddition, the knowledge of waste composition is of particularimportance for decision makers to determine the proper municipalsolid waste management options. Recently, some studies have beenconducted in Turkey to specify the waste composition at regionalscales. Table 2 gives brief information about the major componentsof municipal solid wastes in different cities in Turkey. According tothis data, the organic wastes vary between 20.3 and 80%, the recy-clables range between 12 and 44%, and the rest of the wastes (inertand other) change between 0.3 and 64.5% of the total in variousprovinces of Turkey. The large intervals for these values depend
on the different sampling seasons as well as the climatic condi-tions of the study areas and the sampling years. The ratios of theinert wastes (mainly ash) are relatively high in the northern andthe eastern parts of the country depending on the severe climateetal Textile, etc. Inert andother
Study season Adapted from
23 Unknown Metin et al. (2003)5 3 20 Unknown Agdag (2009)7 4.9 3.4 Winter Yılmaz et al. (2011)5 7.1 0.3 Summer Yılmaz et al. (2011)6 5.6 9.1 Yearly around Kanat (2010)
10.5 Unknown Metin et al. (2003)1 27 Winter Yay et al. (2011)
5 17.2 22.8 Winter Kahraman et al. (2011)3 19.6 2.3 Summer Kahraman et al. (2011)3 13.5 Unknown Banar et al. (2009)
18 Unknown Kose et al. (2011)6 0.3 64.5 Winter Nas and Bayram (2008)7 1 29.2 Summer Nas and Bayram (2008)
26 Unknown Atabarut and Edgu (2005)8 Yearly around Yılmaz et al. (2003)
2 22 Unknown Aydogan et al. (2011)
1 ation
csatoiKrpfuihio(domdt
gasismaArfefitttetrM
2
2
aCGiuvstsc
baah2
p
16 G. Akinci et al. / Resources, Conserv
onditions. On the other hand, the use of natural gas instead ofolid fuel has been increased in Turkey since 2001, reducing themount of inert wastes originated from heating activities in win-er. The waste characterization studies conducted in different partsf Turkey usually cover the winter or yearly data. As can be seenn Table 2, the summer and winter data are available for Antalya,ocaeli, and Gümüs hane cities in Turkey. For all these cities, theatios of recyclables decrease in winter depending on higher pro-ortion of inert wastes. Since the most extreme weather conditionsor winter are observed in Gümüs hane, and there is no use of nat-ral gas in this city, the most definite difference for inert wastes
s observed with a ratio of 64.5% (Nas and Bayram, 2008). Kocaelias a humid subtropical climate and the amount of inert wastes
ncrease in winter (from 2.3% to 22.8%) reducing the amount ofrganics (from 43.8% to 38.4%) and recyclables (from 34.3% to 30.6%)Kahraman et al., 2011). In Antalya, natural gas is available foromestic heating in addition to the mild climate, therefore the ratiof inert wastes in winter (3.4%) are only slightly higher than in sum-er (0.3%) (Yılmaz et al., 2011). Since each region has got its own
istinctive features, further regional studies are necessary in ordero implement the aims of the SWMAP.
There are various factors influencing municipal solid wasteeneration and composition of a region such as geographicalnd climatic conditions, population, economic income levels, andocio-cultural properties. Among them, household income is anmportant factor and its effect on waste generation has not beentudied extensively in Turkey. The current study investigates theajor components and characterization of the urban solid wastes
s a function of economical conditions in a selected study area inegean Region, Turkey. We mentioned the seasonal variations andecycling economics as well as the resource conservation optionsor biodegradable wastes and in consideration of these knowl-dge, a two-phase waste management plan is predicted for theollowing 20 years. The selected area includes the Izmir city, whichs the third highly populated metropolitan city in Turkey, Kulaown, which is located 147 km east to Izmir, and Usak city onhe easternmost of the study area. Since the study area includeshree different settlements with different topographic, climatic,conomic, and socio-cultural conditions, and populations, we aimo discuss the possible waste management methods for these threeegions, according to the targets of the Turkish National Wasteanagement Directive.
. Study area
.1. Izmir
Izmir is the third largest metropolitan city of Turkey with anrea of 12,007 km2. Located on the western Anaotolia on the Aegeanoast, the city is surrounded by the Aegean Sea, and it encloses theulf of Izmir. According to the latest data, total population of Izmir
s 3,868,000 consisting of 28 townships. In Izmir, 91% of the pop-lation lives in province and district centers, while 9% lives in theillages (TurkStat, 2009). Since it is a metropolis, there are variousources of income in Izmir city. There are touristic and agricul-ural activities in some of its surrounding districts while peopleubsist on commercial, industrial, and educational activities in theity center.
Izmir has a typical Mediterranean climate which is characterizedy long, hot and dry summers, and mild to cool, rainy winters. Theverage temperature of 33 years in Izmir was recorded as 18 ◦Cnd the total precipitation for Izmir averages 690 mm per year;
owever, 78% of that falls during November through March (TSMS,011).According to the SWMAP, the amount of municipal solid wasteer capita in Izmir was found as 1.28 kg ca−1 d−1. Approximately
and Recycling 58 (2012) 114– 124
3100 t d−1 of municipal solid waste is collected by the IzmirMetropolitan Municipality in the adjacent areas. Harmandalı SolidWaste Landfill Area operated by the Izmir Metropolitan Municipal-ity, has been under service since 1992, and is accepting most of themunicipal, industrial and medical wastes generated in Izmir. Uzun-dere and Menemen Composting Plants were active until a shortwhile ago, but they became inactive in 2006 and 2009, respectively.In Izmir, still, some of the wastes are disposed in surrounding dis-tricts. As the Law for Metropolitan Municipalities was published in2004, 22 non-sanitary landfill sites in the city adjacent were inac-tivated and the wastes accepted by these sites were canalized toHarmandalı Landfill Site on the north axe of Izmir. Since Harman-dalı Landfill Area has already completed its capacity, a new sanitarylandfill area has been planned to be constructed around the southaxe of Izmir. Since 2007, some recycling studies have been car-ried on by some of the municipalities but they are on pilot scaleand there is no formal data available related with these studies inIzmir.
2.2. Kula
Kula is a town of Manisa City in the Aegean region of Turkey.According to the 2008 data, population of the district is 48,000.Approximately, half of the population lives in the town center andthe other half lives in the villages of Kula. People in the villagesdo agriculture and other citizens subsist on various activities suchas shoe manufacturing, woodwork, mechanical works. With its917 km2 area, Kula covers 7% of the Manisa city. Located on theAnkara-Izmir state highway axe, Kula is 140 km to Izmir from eastand 70 km to Usak from west. Since the town is in the middle ofwestern and inner Anatolia, Kula has got the mixture of Mediter-ranean and continental climate types. According to the four years ofmeteorological observation data, the average temperature of Kulawas recorded as 14 ◦C (Municipality of Kula, 2010).
In Kula, solid wastes are collected with the trucks by the munic-ipality and disposed in the unsanitary dumpsite which is located14 km north of the town. There are no recycling facilities in thetown but its neighbourhood, except illegal scavenging activities.
2.3. Usak
Usak is a province in the central-west of Aegean Region with5341 km2 area. Located on the 211 km east of Izmir, Usak has got apopulation of 338,000 and 67% of this population lives in the urbanarea while rest of them lives in the rural districts (TurkStat, 2009).In Usak, people’s sources of income depend on industrial activi-ties mainly textile, leather, and ceramic manufacturing. Similar likeKula town, Usak has got the combination of Mediterranean and con-tinental climates with the yearly average temperature of 12.5 ◦Cand 533 mm precipitation (TSMS, 2011).
According to the SWMAP, annually 134,000 tones of solid wastesare generated in Usak and the amount of municipal solid waste percapita is found to be 1.16 kg ca−1 d−1. The solid wastes are collectedby the municipality of Usak and the municipal solid wastes aredisposed in an unsanitary dumpsite which is spilled over 21.3 ha(Akinci et al., 2010). Since this area has been used for approxi-mately 50 years, it has completed its lifetime and new facilitiesare necessary for the solid waste management in Usak.
3. Materials and methods
3.1. Sampling procedure
The samplings were conducted in winter. Since the ashes fromheating increase the amount of waste and deteriorate the wasteproperties due to mixed collection, the data obtained in winter

G. Akinci et al. / Resources, Conservation
Table 3The distribution of the populations of the household income levels in the study area(%).
District HIG MIG LIG
Izmir 26 36 38
smshsmUUiSooaa
Grpwtdgs
tifm
3
dalc(tq5osw
tddpa
3
og
d
Kula 39 51 10Usak 19 37 44
eason allow to express the worst case scenario for waste manage-ent purposes. Districts representing different income levels in the
tudy areas were selected by joint working with the municipalities,ousehold interviews and also according to the observations of thetudy group. The average monthly incomes of households are deter-ined as; below 600$ for low income group (LIG); between 600SD and 1200 USD for middle income group (MIG); and over 1200SD for high income group (HIG). The distribution of the household
ncome groups are given in Table 3 (ACSR, 2009; TurkStat, 1997).ince there was no written data related with Kula, the populationsf the income groups were calculated according to the documentsbtained from the reeves. The distribution of the income groupsccording to their populations were used to calculate the weightedverage of the obtained data.
Since Izmir is a metropolitan city, three central regions; namelyuzelyali, Gaziemir and Buca were selected for sampling. In every
egion, two districts of each income group were chosen for sam-le collection. By this way, domestic solid wastes of 18 districtsere sampled in Izmir City for 14 d, consecutively. In Usak, two dis-
ricts from each economy group were selected and the DSW of sixistricts were sampled. Similarly, two districts from each incomeroup were sampled in Kula. Eight and six days of consecutiveamplings were carried out in Usak and Kula, respectively.
In sampling districts, a route of waste collection was determinedo collect about 500 kg of DSW each day and the number of liv-ng families on the routes was reported. Samples were collectedrom the curbside containers in front of the residences in the early
orning hours, before the waste trucks of the municipality served.
.2. Sample preparation
Each daily sample collected was weighted and sorted imme-iately to determine its composition and prepared for furthernalytical procedures. Samples from each district and economicevel were sorted to determine the components of paper andardboard, plastics, metals, glass, composites, textile, and othersleather, wood, etc.) After the sortable materials are removed fromhe bulk and weighted, the rest of the waste is homogenized anduartered until the weight of the sub-sample was reduced about0 kg. The sub-sample was then screened through 10 mm sieve inrder to determine the amount of (i) fine fraction which mainly con-ists of ash and inert material (<10 mm) and (ii) the larger materialhich is rich in organics (green fraction > 10 mm).
Approximately 5 kg of each of the green fraction and fine frac-ion were also sampled for further analyses by the help of a shovel,eposited into a plastic bag, sealed and sent to the laboratory imme-iately. The average values of the data obtained during the studyeriod from the daily laboratory sortings, weightings, and chemicalnalyses were used in the following sections.
.3. Analytical methods
All the samples were analyzed for their pH, water content,
rganic matter content, dissolved organic carbon, dissolved nitro-en concentrations and the calorific values.The water content of the samples was determined from theecrease in weight through drying at 105 ◦C. The organic matter
and Recycling 58 (2012) 114– 124 117
contents of the samples were conducted by igniting the materialat 600 ◦C in a furnace. The pH values were measured by using aWTW pH 720 pH meter according to EPA Method 9045C (USEPA,1995). The dried samples were extracted according to EPA 1310B(USEPA, 2004) and the supernatants were analyzed for dissolvedorganic carbon DOC and dissolved nitrogen (Nd). DOC concen-trations of the samples were analyzed by using a TOC analyzer(Teledyne Tekmar Apollo 9000 Combustion TOC Analyzer, USA) andNd values were determined by using MERCK NOVA 60 Photome-ter with MERCK Kits. The calorific values of the dry samples weredetermined by using a Gallencamp GC101 Adiabatic Calorime-ter.
4. Results
4.1. The personal generation rates (PGRs) and generaldistributions of the major waste components
The average daily personal generation rates (PGRs) of greenfraction, fine fraction, and recyclables and the average distribu-tion of these three major components in the total domestic solidwaste (DSW) for the studies sites are shown in Fig. 1. Dependingon the climatic conditions, the total PGR increases from west toeast as a result of the increasing amount of fine fraction whichmainly consists of ash and inert material. The weighted aver-age of daily PGRs are found as 0.46, 0.74, and 0.86 kg ca−1 d−1
for Izmir, Kula, and Usak, respectively. The low PGR in Izmirdepends on the developed socio-economic life in Izmir. Of the threesites, Izmir is the only metropolitan city with its almost 4 mil-lion population and most of the people take place in the businesslife, therefore, the DSW generated in the households is signifi-cantly lower. In Izmir, the lowest personal waste generation rate(0.34 kg ca−1 d−1) was observed in the MIG which can be explainedwith the members of this group dominate in the professional worklife.
The differences between the shares of green, fine, and recy-clable fractions of income groups are more significant for Izmir(Fig. 1a). This is because of the different lifestyle habits living inthis cosmopolite city. On the other hand, the shares of three majorcomponents depending on the economic conditions show similar-ities in Kula, since it is a small town and lifestyles are not muchdifferent from each other in various income level groups.
For all the income groups and study sites, green fraction consti-tutes the major component of the total DSW with the minimum38.9% in Kula LIG and maximum 72.9% in Usak HIG (Fig. 1a).Although the numbers of supermarkets, where cleaned and packedfoods are sold, have significantly increased, the people still sup-ply their fresh food from the open bazaars and farmers’ marketsin Turkey. Since the fresh fruits and vegetables take a consider-able part in the Turkish cuisine, the residues from these foodsoccupy the largest portion in the waste bins. Additionally, the PGRof green fraction increases from Izmir to Usak; the minimum andmaximum values are reported as 0.21 kg ca−1 d−1 in Izmir MIG and0.6 kg ca−1 d−1 in Usak LIG (Fig. 1b).
Generally, the PGRs of fine fraction increase as the income leveldecreases. As mentioned before, the fine fraction mainly consistsof ash and inert material. The minimum and maximum PGR valuesof the fine fraction were reported as 0.03 kg ca−1 d−1 (Izmir-HIG)and 0.42 kg ca−1 d−1 (Kula-LIG) (Fig. 1b). The highest PGR and dis-tribution ratio values of the fine fraction were determined in Kuladepending on the common use of solid fuels by individual heating
systems. Also, the portions of fine fraction in the DSW for all incomelevels are consistently high in Kula with 40.2, 33.3, and 41.5% forhigh, medium, and low income levels (Fig. 1a). Since the use of nat-ural gas has become prevalent in the central and individual heating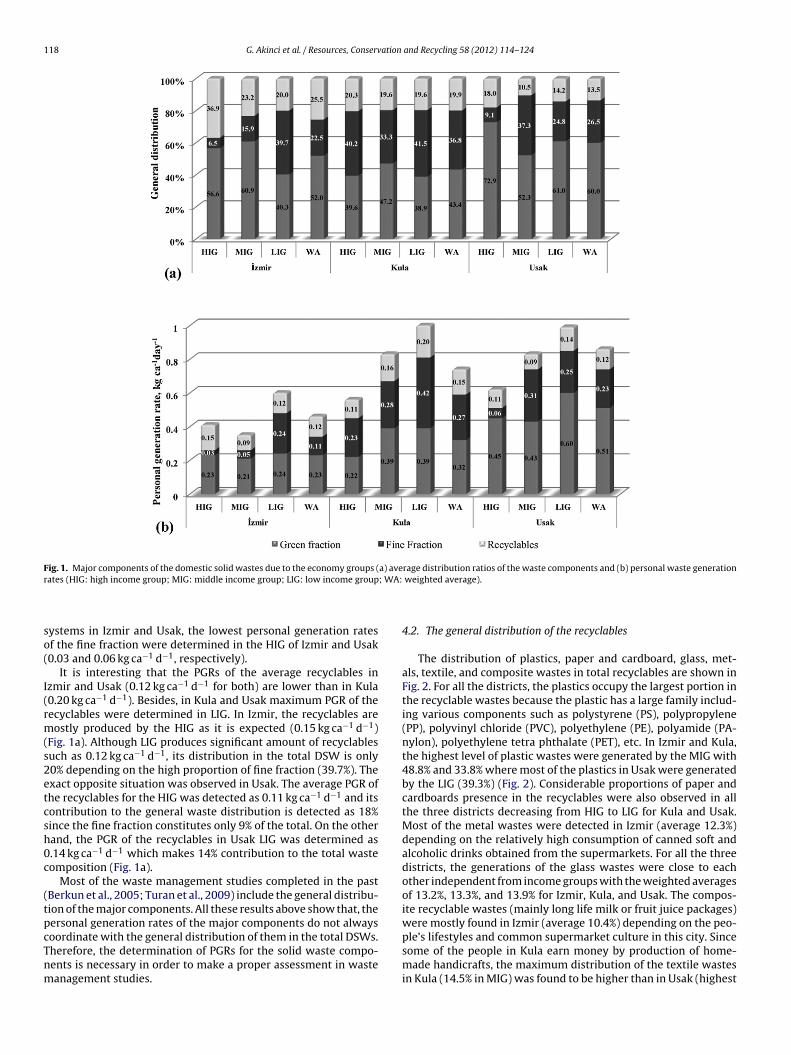
118 G. Akinci et al. / Resources, Conservation and Recycling 58 (2012) 114– 124
Fig. 1. Major components of the domestic solid wastes due to the economy groups (a) average distribution ratios of the waste components and (b) personal waste generationr ; WA:
so(
I(rm(s2etcsh0c
(tpcTnm
ates (HIG: high income group; MIG: middle income group; LIG: low income group
ystems in Izmir and Usak, the lowest personal generation ratesf the fine fraction were determined in the HIG of Izmir and Usak0.03 and 0.06 kg ca−1 d−1, respectively).
It is interesting that the PGRs of the average recyclables inzmir and Usak (0.12 kg ca−1 d−1 for both) are lower than in Kula0.20 kg ca−1 d−1). Besides, in Kula and Usak maximum PGR of theecyclables were determined in LIG. In Izmir, the recyclables areostly produced by the HIG as it is expected (0.15 kg ca−1 d−1)
Fig. 1a). Although LIG produces significant amount of recyclablesuch as 0.12 kg ca−1 d−1, its distribution in the total DSW is only0% depending on the high proportion of fine fraction (39.7%). Thexact opposite situation was observed in Usak. The average PGR ofhe recyclables for the HIG was detected as 0.11 kg ca−1 d−1 and itsontribution to the general waste distribution is detected as 18%ince the fine fraction constitutes only 9% of the total. On the otherand, the PGR of the recyclables in Usak LIG was determined as.14 kg ca−1 d−1 which makes 14% contribution to the total wasteomposition (Fig. 1a).
Most of the waste management studies completed in the pastBerkun et al., 2005; Turan et al., 2009) include the general distribu-ion of the major components. All these results above show that, theersonal generation rates of the major components do not always
oordinate with the general distribution of them in the total DSWs.herefore, the determination of PGRs for the solid waste compo-ents is necessary in order to make a proper assessment in wasteanagement studies.weighted average).
4.2. The general distribution of the recyclables
The distribution of plastics, paper and cardboard, glass, met-als, textile, and composite wastes in total recyclables are shown inFig. 2. For all the districts, the plastics occupy the largest portion inthe recyclable wastes because the plastic has a large family includ-ing various components such as polystyrene (PS), polypropylene(PP), polyvinyl chloride (PVC), polyethylene (PE), polyamide (PA-nylon), polyethylene tetra phthalate (PET), etc. In Izmir and Kula,the highest level of plastic wastes were generated by the MIG with48.8% and 33.8% where most of the plastics in Usak were generatedby the LIG (39.3%) (Fig. 2). Considerable proportions of paper andcardboards presence in the recyclables were also observed in allthe three districts decreasing from HIG to LIG for Kula and Usak.Most of the metal wastes were detected in Izmir (average 12.3%)depending on the relatively high consumption of canned soft andalcoholic drinks obtained from the supermarkets. For all the threedistricts, the generations of the glass wastes were close to eachother independent from income groups with the weighted averagesof 13.2%, 13.3%, and 13.9% for Izmir, Kula, and Usak. The compos-ite recyclable wastes (mainly long life milk or fruit juice packages)were mostly found in Izmir (average 10.4%) depending on the peo-
ple’s lifestyles and common supermarket culture in this city. Sincesome of the people in Kula earn money by production of home-made handicrafts, the maximum distribution of the textile wastesin Kula (14.5% in MIG) was found to be higher than in Usak (highest
G. Akinci et al. / Resources, Conservation and Recycling 58 (2012) 114– 124 119
F comeM
7ti2
4
wngtgo
are attached to the green fraction and increase the pH. Similarly,pH of fine fraction increased due to the decreasing income lev-els (Table 4). The pH variations may also depend on the use ofalternative solid fuels (such as olive bagasse) in different districts.
Table 4General properties of fine fraction of the waste due to the income level.
pH Water content, % Organic matter, %dw
ig. 2. Distribution of recyclables in the total recyclable wastes according to the inIG: middle income group; LIG: low income group; WA: weighted average).
.4% in MIG) and Izmir (highest 7.5% in HIG). On the other hand,he amounts of non-classified wastes (such as leather, wood, etc.)n the total recyclables were in significant ratios for Kula (average2.7%) and Usak (22.5%).
.3. General characterization of the green and fine fraction
The average pH, water content, organic matter content (dryeight), calorific value, dissolved organic carbon, and dissolveditrogen values of the green fraction according to the economy
roups are shown in Fig. 3 and the general properties of fine frac-ions are summarized in Table 4. In general, the pH values of thereen fraction increased as the income level decreased becausef the higher amount of fine fraction (mainly ash) in the wasteslevel in the study area. (a) Izmir, (b) Kula, and (c) Usak (HIG: high income group;
of decreasing income levels. Since mixed collection is applied forall the districts, higher amounts of fine fraction in LIG wastes
HIG MIG LIG HIG MIG LIG HIG MIG LIG
Izmir 7.2 7.9 8.3 40.5 31.9 35.2 23.9 33.5 29.7Kula 7.9 8.2 8.8 41.0 40.2 36.4 36.3 25.2 25.3Usak 7.4 9.8 10.1 49.3 34.4 37.9 39.2 14.2 15.7

120 G. Akinci et al. / Resources, Conservation and Recycling 58 (2012) 114– 124
F vels.
o come
uwwwdoSwwr
t(wihte
ocKti
l1(tttoKlp
ig. 3. Characteristics of the solid wastes in the study area according to the income lerganic carbon, and (f) dissolved nitrogen (HIG: high income group; MIG: middle in
For all the districts and income groups, the water content val-es of the green fraction are over 60% as it is expected. The highestater content level in green fraction was observed for Izmir LIGaste (81%) and the lowest value was found as 61% in Kula MIGaste (Fig. 3b). The values observed in Kula were close to the valuesetected in Usak. The higher water content values of Izmir dependn the lower amount of fine fraction waste (22.5%) in this city.ince mixed collection of DSW is applied, the fine fraction absorbsater from the green fraction. This situation is also seen from theater content of fine fractions in Kula and Usak (36.4% and 49.3%,
espectively) (Table 4).The maximum and minimum organic matter (OM) contents of
he green fraction were determined as 52% (Kula-MIG) and 89%Izmir-HIG) (Fig. 3c). The average organic matter values in Izmirere higher than that observed in Kula and Usak. Another finding
s, the OM contents of the HIG in Kula and Usak were found to beigher than the values detected for MIG and LIG. On the other hand,here are no significant differences between the OM ratios of theconomy groups in Izmir.
The calorific values of the samples are compatible with therganic matter contents of the dry solid wastes. The averagealorific value in Usak (2395 kcal/kg) was found to be lower than inula (2775 kcal/kg) and Izmir (3182 kcal/kg). It was also observed
hat, the calorific values tend to decrease with the decreasingncome level (Fig. 3d).
The dissolved organic carbon (DOC) values for all the incomeevels and districts change in a large range between 15,650 and45,510 mg/kg (Fig. 3e). Considerably high DOC concentrationsaverage 128,000 mg/kg) were detected in Izmir when comparedo Usak and Kula (average 29,500 and 21,700 mg/kg). This showshat cooked dining occupy a larger portion than the raw food inhe green wastes of Izmir. Besides, the concentrations of dissolved
rganic carbon that can be easily taken by the bacteria are lower inula and Usak depending on the presence of materials containingarge organic molecules (yard trimmings, unburned coal or woodenroducts, etc.). Besides, the food wastes including higher amounts
(a) pH, (b) water content, (c) organic matter content, (d) calorific value, (e) dissolved group; LIG: low income group; WA: weighted average).
of soluble organic carbon dominate in the green fraction of Izmirresulting as higher DOC values in this area.
The dissolved nitrogen and DOC values were found to be par-allel to each other for all districts. The Nd concentrations in Izmir(average 14,471 mg/kg) were significantly higher than the values inKula and Usak (average 3718 and 2845 mg/kg) (Fig. 3f). The DOC/Ndvalues were also detected in very low levels (minimum 3.3 forKula-MIG and maximum 14.9 for Usak-HIG).
5. Discussion
5.1. Legal obligations
In the content of National Solid Waste Management Action Plan(SWMAP) and Turkey’s accession to the European Union activities,the “Legislation on the Sanitary Landfilling of the Solid Wastes”(LSL) has been regulated in March 2010 which obligates thebiodegradable wastes minimization through certain ratios (OfficialGazette, 2010). In the scope of LSL, it is stipulated that, a nationalstrategy is going to be prepared by the end of 2012 by the Ministry ofEnvironment and Urban Planning for the reduction of biodegrad-able urban solid waste through biological and thermal methods.The decision making procedure for technology selection will alsobe covered in the content of this strategy. Additionally, according tothe LSL, the different types of solid wastes should be classified andlandfilled separately, due to the appropriate criteria. The first classincludes the hazardous wastes mostly originated from the indus-trial facilities, the second class consists of the non hazardous anddomestic solid wastes (mainly the municipal wastes), and the thirdclass of wastes are the inert materials consisting of ash and otherbiologically stable matters.
On the other hand, the “Packaging Wastes Control Regulation”
(PWCR) puts annual targets for the recovery of the packagingwastes (Official Gazette, 2007). According to the regulation, theauthorized organizations and manufacturers will be responsible forthe collection and recovery of the 38% of the packaging wastes in
ation
ttop
5e
KraMap
bsis(ebilbr
ti2rU(gs6wt0nAiw(An
idtr5UwSiAoiatmcws
G. Akinci et al. / Resources, Conserv
he market in 2011. PWCR also puts the municipalities in charge ofhe organization and operation of source separation and collectionf DSW. Although there are difficulties in practice, the responsiblearties try to realize these targets in recent years.
.2. Future predictions for waste management options withxpected seasonal variations
A two phase future planning for the waste management in Izmir,ula, and Usak is prepared in this study in order to define possibleecycling resources and resource conservation aspects, for the firstnd second 10 years by using the literature data and the aims of theinistry of Environment and Urban Planning. The seasonal changes
re also considered to predict reliable data for summer and futureredictions.
Currently, the urban solid wastes are collected in a mixed statey the municipalities and sent to the landfills in all of the threeites. Since the above mentioned regulations have been broughtn to force, source separated collection is inevitable. The urbanolid wastes should be separated into three components; (i) greenbiodegradable) wastes which include food wastes, yard trimmings,tc., (ii) recyclable wastes consisting of plastics, paper and card-oard, glass, metals, and (iii) ash as inert material. In this way, the
ntermingling of the green waste and ash, which inhibits the bio-ogical processes of the organic fraction, will be prevented and theiodegradable green fraction can be processed for volume and masseduction as well as energy and biomass recovery.
According to the investigation of The Turkish Statistical Insti-ute covering 3215 municipalities, there is a general decreasen the urban personal waste generation rates (UPGR) since001, depending on the domestic and industrial use of natu-al gas (NGU) in Turkey (TurkStat, 2008). The country’s averagePGR decreased from 1.36 kg ca−1 d−1 (2001) to 1.13 kg ca−1 d−1
2008), expressing variations due to the distribution of naturalas in different geographical regions. The decrease in UPGR inummer varies between 0.05 kg ca−1 d−1 (Marmara Region with4% NGU) and 0.25 kg ca−1 d−1 (Aegean Region with 88% NGU)here the decreases are observed more significantly in win-
er with 0.32 kg ca−1 d−1 (Black Sea Region with 72% NGU) and.27 kg ca−1 d−1 (Aegean Region). On the other hand, the uses ofatural gas are lower in the Eastern Anatolia and Southeasternnatolia such as 40–50%, therefore no decreases were observed
n the UPGRs of these areas, oppositely small scale increasesere determined such as 0.06 kg ca−1 d−1 and 0.11 kg ca−1 d−1
The Energy Market Regulatory Authority, 2011). In Marmara andegean Regions, domestic uses of natural gas are high, therefore sig-ificant decreases are not expected in the UPGRs (TurkStat, 2008).
In all over the world, the shares of domestic solid wastes (DSW)n the urban solid wastes (USW) depend on the level of industrialevelopments. In Turkey, the yearly average of the DSW consti-utes a significant ratio which is 59% of the USW. In summer, thisatio was determined as 67% where in winter it was detected as0% (Metin et al., 2003). The summer UPGRs for Izmir, Kula, andsak are recorded as 1.08, 1.16, and 1.35 kg ca−1 d−1, respectively,here these values are 1.02, 1.27, and 1.39 kg ca−1 d−1 by TURK-
TAT for the year of 2009. According to the literature studies, theres an important decrease of inert wastes production in summer inntalya and Kocaeli cities which are located on the south and northf Izmir (Table 2). Similarly, in summer, the recyclable waste ratiosncrease in Antalya and Kocaeli. Therefore, these fluctuations canlso be available for Izmir which is located between the latitudes ofhese two cities in order to predict the waste composition in sum-
er. On the other hand, Kula and Usak provinces have the roughlimatic conditions as in Gümüshane city. In Gümüshane, the inertastes ratio decreases to the half of winter where the recyclables
hare increase two fold of winter in summer season (Table 2) which
and Recycling 58 (2012) 114– 124 121
exhibit similarity with Kula and Usak cities and these changes canbe applied for summer predictions.
The future predictions for solid waste composition and amountsincluding the seasonal variations are calculated and summarized inTable 5. According to the SWMAP, annually 0.4% decrease for thebiodegradable wastes productions and 0.75% increase for the recy-clable waste productions are expected in the metropolitan citieslike Izmir. In the future, more common use of natural gas in Izmirincluding the low income group areas will decrease the amountof inert wastes produced in winter slightly and it is estimatedthat the daily domestic personal generation rate of inert wastesfor Izmir will decrease from 0.11 kg ca−1 d−1 to 0.05 kg ca−1 d−1 by2032 while the total PGR will be 0.53 kg ca−1 d−1. Therefore, annu-ally 620,865 tones of organic wastes, 360,620 tones of recyclablewastes, and 70,262 tones of inert wastes will be produced in Izmirin 2032 (Table 5).
The changes in the waste production rates are similar forUsak and Kula as reported in SWMAP. According to the plan, thebiodegradable wastes will annually decrease by 0.5% where therecyclables will increase by 1%. At current, there is no use of nat-ural gas in Kula, but it is estimated that, in the future, NGU (2032)will decrease the personal generation rate of the inert wastes from0.27 kg ca−1 d−1 to 0.1 kg ca−1 d−1. According to the future com-pliances, annually 4380 tones of biodegradable wastes and 4197tones of recyclables are expected to be generated in Kula in 2032.As the population decreases in Kula depending on the migrations,the amount of recyclables does not increase significantly in time.In Usak, it is estimated that, the natural gas use will become com-mon in the middle and low income group areas, decreasing thepersonal generation rate of the inert wastes from 0.23 kg ca−1 d−1
to 0.09 kg ca−1 d−1 in 2032. The organic waste production will be66,795 t year−1 and the recyclables will be 30,660 t year−1 after 20years of projection period in Usak (Table 5).
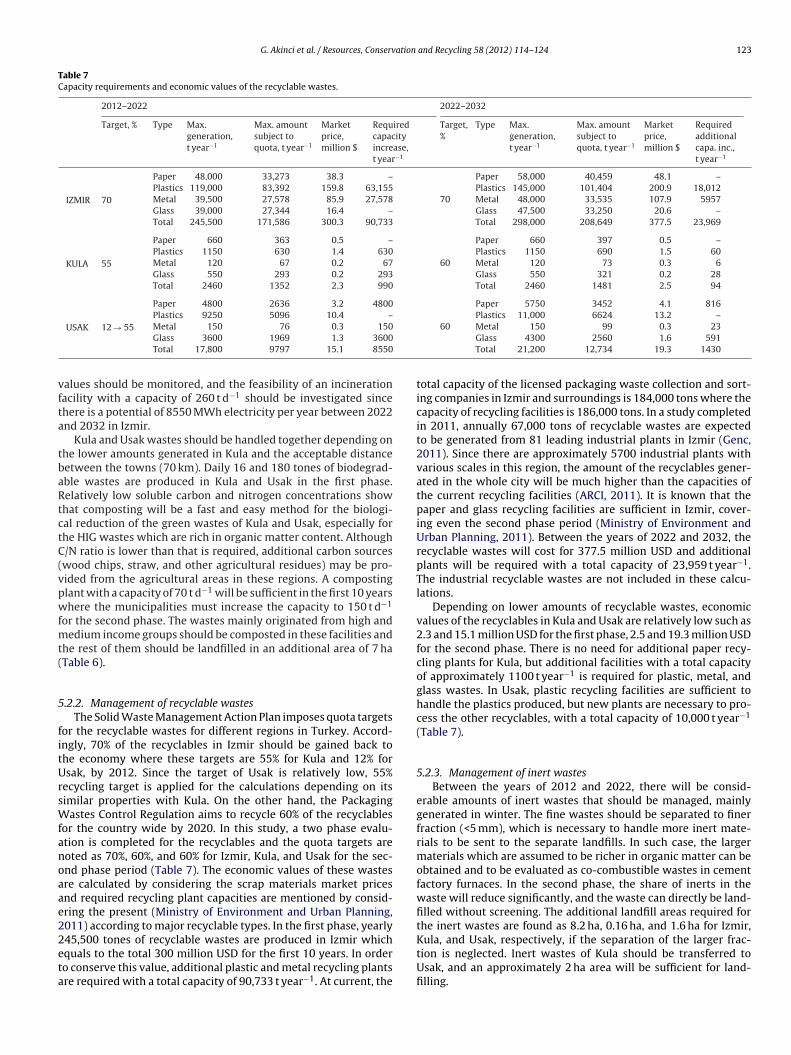
5.2.1. Management of organic wastesAccording to the SWMAP, the ministry set target ratios to reduce
the amount of biodegradable wastes that will be sent to the land-fill areas. According to the target ratios, the wastes diverted fromlandfills are 50% by the end of 2014, and 75% by the end of 2020for Turkey average. Izmir’s target is defined as 41% where Kula andUsak should reduce their landfilled organic wastes by 35% by theend of 2012. The two phase organic wastes management optionsare planned according to the targets of the SWMAP (Table 6).
The maximum annual organic waste generation is 558,000 tonesfor the first 10 years period and 621,000 tones for the second 10years, for Izmir. In the first phase, composting is recommendedto process these organic wastes mainly generated from the highincome groups which include high amount of organic matter. Theaim of composting includes not only the volume reduction of thewastes and production of a soil conditioner that allows the trans-mission of the required macro/micro nutrients for the plants, butalso the stabilization of the readily available carbon during the pro-cess for protection of the flora and fauna in the soil. There are largeagricultural areas in Aegean Region (7.5 million ha) in which thesecomposts can be used. At current, there are two inactive compost-ing plants in Izmir with a total of 400 t d−1 capacities. These facilitiesshould be reactivated and operated for both time periods. On theother hand, highest TOCd values are detected for the middle incomegroups in Izmir, and biomethanization (anaerobic digestion) will bean appropriate method to handle these wastes and recover energyat the end. During digestion, the considerable portion of the carbonwill be transferred to biogas and the remained wastes will be suit-
able to be used as soil conditioner after pasteurization because of itsdecreased readily available carbon concentration and rich nitrogencontent. There is a potential of 34,000 m3 d−1 methane productionfor the first phase and a total of 84,000 m3 d−1 of methane can be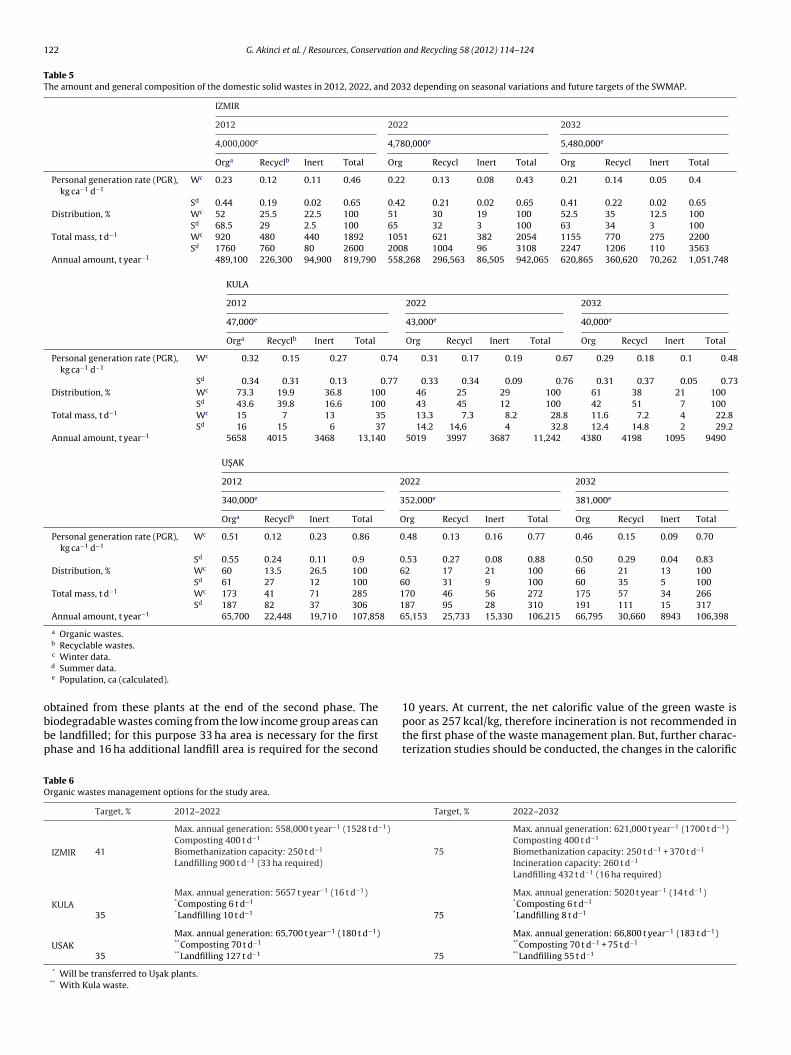
122 G. Akinci et al. / Resources, Conservation and Recycling 58 (2012) 114– 124
Table 5The amount and general composition of the domestic solid wastes in 2012, 2022, and 2032 depending on seasonal variations and future targets of the SWMAP.
IZMIR
2012 2022 2032
4,000,000e 4,780,000e 5,480,000e
Orga Recyclb Inert Total Org Recycl Inert Total Org Recycl Inert Total
Personal generation rate (PGR),kg ca−1 d−1
Wc 0.23 0.12 0.11 0.46 0.22 0.13 0.08 0.43 0.21 0.14 0.05 0.4
Sd 0.44 0.19 0.02 0.65 0.42 0.21 0.02 0.65 0.41 0.22 0.02 0.65Distribution, % Wc 52 25.5 22.5 100 51 30 19 100 52.5 35 12.5 100
Sd 68.5 29 2.5 100 65 32 3 100 63 34 3 100Total mass, t d−1 Wc 920 480 440 1892 1051 621 382 2054 1155 770 275 2200
Sd 1760 760 80 2600 2008 1004 96 3108 2247 1206 110 3563Annual amount, t year−1 489,100 226,300 94,900 819,790 558,268 296,563 86,505 942,065 620,865 360,620 70,262 1,051,748
KULA
2012 2022 2032
47,000e 43,000e 40,000e
Orga Recyclb Inert Total Org Recycl Inert Total Org Recycl Inert Total
Personal generation rate (PGR),kg ca−1 d−1
Wc 0.32 0.15 0.27 0.74 0.31 0.17 0.19 0.67 0.29 0.18 0.1 0.48
Sd 0.34 0.31 0.13 0.77 0.33 0.34 0.09 0.76 0.31 0.37 0.05 0.73Distribution, % Wc 73.3 19.9 36.8 100 46 25 29 100 61 38 21 100
Sd 43.6 39.8 16.6 100 43 45 12 100 42 51 7 100Total mass, t d−1 Wc 15 7 13 35 13.3 7.3 8.2 28.8 11.6 7.2 4 22.8
Sd 16 15 6 37 14.2 14,6 4 32.8 12.4 14.8 2 29.2Annual amount, t year−1 5658 4015 3468 13,140 5019 3997 3687 11,242 4380 4198 1095 9490
US AK
2012 2022 2032
340,000e 352,000e 381,000e
Orga Recyclb Inert Total Org Recycl Inert Total Org Recycl Inert Total
Personal generation rate (PGR),kg ca−1 d−1
Wc 0.51 0.12 0.23 0.86 0.48 0.13 0.16 0.77 0.46 0.15 0.09 0.70
Sd 0.55 0.24 0.11 0.9 0.53 0.27 0.08 0.88 0.50 0.29 0.04 0.83Distribution, % Wc 60 13.5 26.5 100 62 17 21 100 66 21 13 100
Sd 61 27 12 100 60 31 9 100 60 35 5 100Total mass, t d−1 Wc 173 41 71 285 170 46 56 272 175 57 34 266
Sd 187 82 37 306 187 95 28 310 191 111 15 317Annual amount, t year−1 65,700 22,448 19,710 107,858 65,153 25,733 15,330 106,215 66,795 30,660 8943 106,398
a Organic wastes.b Recyclable wastes.
obbp
TO
c Winter data.d Summer data.e Population, ca (calculated).
btained from these plants at the end of the second phase. Theiodegradable wastes coming from the low income group areas cane landfilled; for this purpose 33 ha area is necessary for the firsthase and 16 ha additional landfill area is required for the second
able 6rganic wastes management options for the study area.
Target, % 2012–2022
IZMIR
Max. annual generation: 558,000 t year−1 (1528 t d−1)
Composting 400 t d−1
41 Biomethanization capacity: 250 t d−1
Landfilling 900 t d−1 (33 ha required)
KULAMax. annual generation: 5657 t year−1 (16 t d−1)
*Composting 6 t d−1
35 *Landfilling 10 t d−1
USAKMax. annual generation: 65,700 t year−1 (180 t d−1)
**Composting 70 t d−1
35 **Landfilling 127 t d−1
* Will be transferred to Us ak plants.** With Kula waste.
10 years. At current, the net calorific value of the green waste ispoor as 257 kcal/kg, therefore incineration is not recommended inthe first phase of the waste management plan. But, further charac-terization studies should be conducted, the changes in the calorific
Target, % 2022–2032
Max. annual generation: 621,000 t year−1 (1700 t d−1)Composting 400 t d−1
75 Biomethanization capacity: 250 t d−1 + 370 t d−1
Incineration capacity: 260 t d−1
Landfilling 432 t d−1 (16 ha required)
Max. annual generation: 5020 t year−1 (14 t d−1)*Composting 6 t d−1
75 *Landfilling 8 t d−1
Max. annual generation: 66,800 t year−1 (183 t d−1)**Composting 70 t d−1 + 75 t d−1
75 **Landfilling 55 t d−1
G. Akinci et al. / Resources, Conservation and Recycling 58 (2012) 114– 124 123
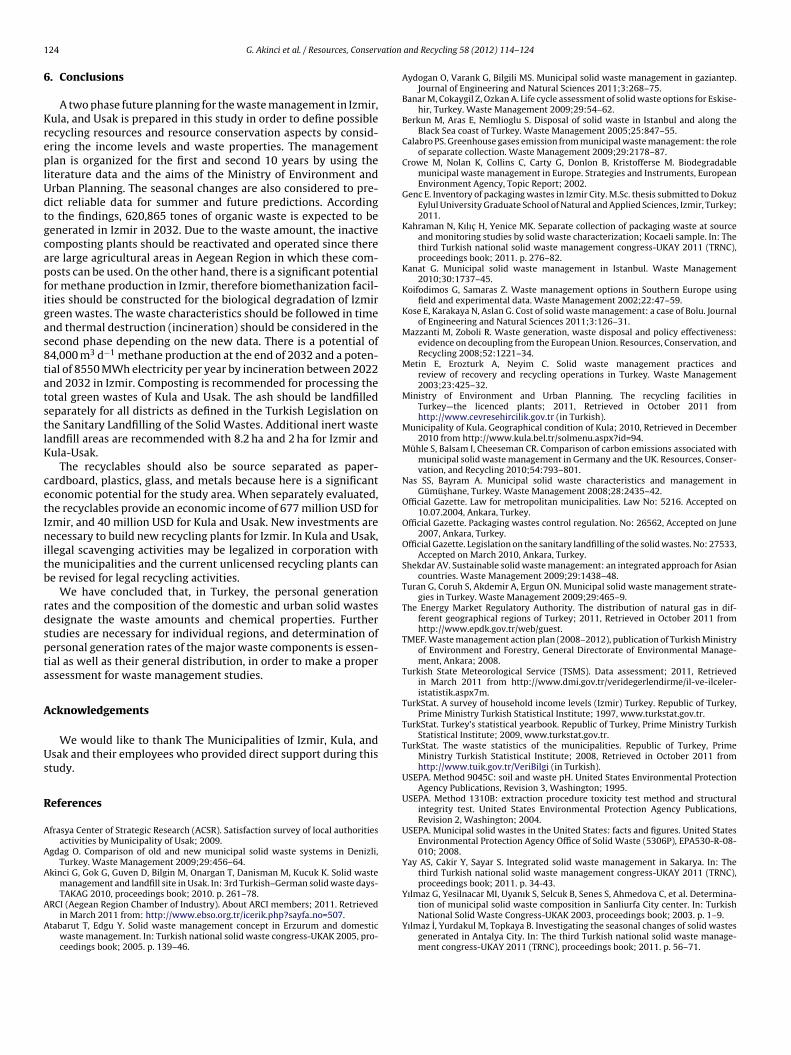
Table 7Capacity requirements and economic values of the recyclable wastes.
2012–2022 2022–2032
Target, % Type Max.generation,t year−1
Max. amountsubject toquota, t year−1
Marketprice,million $
Requiredcapacityincrease,t year−1
Target,%
Type Max.generation,t year−1
Max. amountsubject toquota, t year−1
Marketprice,million $
Requiredadditionalcapa. inc.,t year−1
IZMIR 70
Paper 48,000 33,273 38.3 – Paper 58,000 40,459 48.1 –Plastics 119,000 83,392 159.8 63,155 Plastics 145,000 101,404 200.9 18,012Metal 39,500 27,578 85.9 27,578 70 Metal 48,000 33,535 107.9 5957Glass 39,000 27,344 16.4 – Glass 47,500 33,250 20.6 –Total 245,500 171,586 300.3 90,733 Total 298,000 208,649 377.5 23,969
KULA 55
Paper 660 363 0.5 – Paper 660 397 0.5 –Plastics 1150 630 1.4 630 Plastics 1150 690 1.5 60Metal 120 67 0.2 67 60 Metal 120 73 0.3 6Glass 550 293 0.2 293 Glass 550 321 0.2 28Total 2460 1352 2.3 990 Total 2460 1481 2.5 94
Paper 4800 2636 3.2 4800 Paper 5750 3452 4.1 816Plastics 9250 5096 10.4 – Plastics 11,000 6624 13.2 –
vfta
tbaRtctC(vpwfmt(
5
fitUrsWfanoaae22eta
the inert wastes are found as 8.2 ha, 0.16 ha, and 1.6 ha for Izmir,
USAK 12 → 55 Metal 150 76 0.3 150Glass 3600 1969 1.3 3600Total 17,800 9797 15.1 8550
alues should be monitored, and the feasibility of an incinerationacility with a capacity of 260 t d−1 should be investigated sincehere is a potential of 8550 MWh electricity per year between 2022nd 2032 in Izmir.
Kula and Usak wastes should be handled together depending onhe lower amounts generated in Kula and the acceptable distanceetween the towns (70 km). Daily 16 and 180 tones of biodegrad-ble wastes are produced in Kula and Usak in the first phase.elatively low soluble carbon and nitrogen concentrations showhat composting will be a fast and easy method for the biologi-al reduction of the green wastes of Kula and Usak, especially forhe HIG wastes which are rich in organic matter content. Although/N ratio is lower than that is required, additional carbon sourceswood chips, straw, and other agricultural residues) may be pro-ided from the agricultural areas in these regions. A compostinglant with a capacity of 70 t d−1 will be sufficient in the first 10 yearshere the municipalities must increase the capacity to 150 t d−1
or the second phase. The wastes mainly originated from high andedium income groups should be composted in these facilities and
he rest of them should be landfilled in an additional area of 7 haTable 6).
.2.2. Management of recyclable wastesThe Solid Waste Management Action Plan imposes quota targets
or the recyclable wastes for different regions in Turkey. Accord-ngly, 70% of the recyclables in Izmir should be gained back tohe economy where these targets are 55% for Kula and 12% forsak, by 2012. Since the target of Usak is relatively low, 55%
ecycling target is applied for the calculations depending on itsimilar properties with Kula. On the other hand, the Packaging
astes Control Regulation aims to recycle 60% of the recyclablesor the country wide by 2020. In this study, a two phase evalu-tion is completed for the recyclables and the quota targets areoted as 70%, 60%, and 60% for Izmir, Kula, and Usak for the sec-nd phase period (Table 7). The economic values of these wastesre calculated by considering the scrap materials market pricesnd required recycling plant capacities are mentioned by consid-ring the present (Ministry of Environment and Urban Planning,011) according to major recyclable types. In the first phase, yearly
45,500 tones of recyclable wastes are produced in Izmir whichquals to the total 300 million USD for the first 10 years. In ordero conserve this value, additional plastic and metal recycling plantsre required with a total capacity of 90,733 t year−1. At current, the60 Metal 150 99 0.3 23Glass 4300 2560 1.6 591Total 21,200 12,734 19.3 1430
total capacity of the licensed packaging waste collection and sort-ing companies in Izmir and surroundings is 184,000 tons where thecapacity of recycling facilities is 186,000 tons. In a study completedin 2011, annually 67,000 tons of recyclable wastes are expectedto be generated from 81 leading industrial plants in Izmir (Genc,2011). Since there are approximately 5700 industrial plants withvarious scales in this region, the amount of the recyclables gener-ated in the whole city will be much higher than the capacities ofthe current recycling facilities (ARCI, 2011). It is known that thepaper and glass recycling facilities are sufficient in Izmir, cover-ing even the second phase period (Ministry of Environment andUrban Planning, 2011). Between the years of 2022 and 2032, therecyclable wastes will cost for 377.5 million USD and additionalplants will be required with a total capacity of 23,959 t year−1.The industrial recyclable wastes are not included in these calcu-lations.
Depending on lower amounts of recyclable wastes, economicvalues of the recyclables in Kula and Usak are relatively low such as2.3 and 15.1 million USD for the first phase, 2.5 and 19.3 million USDfor the second phase. There is no need for additional paper recy-cling plants for Kula, but additional facilities with a total capacityof approximately 1100 t year−1 is required for plastic, metal, andglass wastes. In Usak, plastic recycling facilities are sufficient tohandle the plastics produced, but new plants are necessary to pro-cess the other recyclables, with a total capacity of 10,000 t year−1
(Table 7).
5.2.3. Management of inert wastesBetween the years of 2012 and 2022, there will be consid-
erable amounts of inert wastes that should be managed, mainlygenerated in winter. The fine wastes should be separated to finerfraction (<5 mm), which is necessary to handle more inert mate-rials to be sent to the separate landfills. In such case, the largermaterials which are assumed to be richer in organic matter can beobtained and to be evaluated as co-combustible wastes in cementfactory furnaces. In the second phase, the share of inerts in thewaste will reduce significantly, and the waste can directly be land-filled without screening. The additional landfill areas required for
Kula, and Usak, respectively, if the separation of the larger frac-tion is neglected. Inert wastes of Kula should be transferred toUsak, and an approximately 2 ha area will be sufficient for land-filling.
1 ation
6
KreplUdtgcapfigas8tatstlK
cetInitb
rdspta
A
Us
R
A
A
A
A
A
24 G. Akinci et al. / Resources, Conserv
. Conclusions
A two phase future planning for the waste management in Izmir,ula, and Usak is prepared in this study in order to define possibleecycling resources and resource conservation aspects by consid-ring the income levels and waste properties. The managementlan is organized for the first and second 10 years by using the
iterature data and the aims of the Ministry of Environment andrban Planning. The seasonal changes are also considered to pre-ict reliable data for summer and future predictions. Accordingo the findings, 620,865 tones of organic waste is expected to beenerated in Izmir in 2032. Due to the waste amount, the inactiveomposting plants should be reactivated and operated since therere large agricultural areas in Aegean Region in which these com-osts can be used. On the other hand, there is a significant potentialor methane production in Izmir, therefore biomethanization facil-ties should be constructed for the biological degradation of Izmirreen wastes. The waste characteristics should be followed in timend thermal destruction (incineration) should be considered in theecond phase depending on the new data. There is a potential of4,000 m3 d−1 methane production at the end of 2032 and a poten-ial of 8550 MWh electricity per year by incineration between 2022nd 2032 in Izmir. Composting is recommended for processing theotal green wastes of Kula and Usak. The ash should be landfilledeparately for all districts as defined in the Turkish Legislation onhe Sanitary Landfilling of the Solid Wastes. Additional inert wasteandfill areas are recommended with 8.2 ha and 2 ha for Izmir andula-Usak.
The recyclables should also be source separated as paper-ardboard, plastics, glass, and metals because here is a significantconomic potential for the study area. When separately evaluated,he recyclables provide an economic income of 677 million USD forzmir, and 40 million USD for Kula and Usak. New investments areecessary to build new recycling plants for Izmir. In Kula and Usak,
llegal scavenging activities may be legalized in corporation withhe municipalities and the current unlicensed recycling plants cane revised for legal recycling activities.
We have concluded that, in Turkey, the personal generationates and the composition of the domestic and urban solid wastesesignate the waste amounts and chemical properties. Furthertudies are necessary for individual regions, and determination ofersonal generation rates of the major waste components is essen-ial as well as their general distribution, in order to make a properssessment for waste management studies.
cknowledgements
We would like to thank The Municipalities of Izmir, Kula, andsak and their employees who provided direct support during this
tudy.
eferences
frasya Center of Strategic Research (ACSR). Satisfaction survey of local authoritiesactivities by Municipality of Usak; 2009.
gdag O. Comparison of old and new municipal solid waste systems in Denizli,Turkey. Waste Management 2009;29:456–64.
kinci G, Gok G, Guven D, Bilgin M, Onargan T, Danisman M, Kucuk K. Solid wastemanagement and landfill site in Usak. In: 3rd Turkish–German solid waste days-TAKAG 2010, proceedings book; 2010. p. 261–78.
RCI (Aegean Region Chamber of Industry). About ARCI members; 2011. Retrievedin March 2011 from: http://www.ebso.org.tr/icerik.php?sayfa no=507.
tabarut T, Edgu Y. Solid waste management concept in Erzurum and domesticwaste management. In: Turkish national solid waste congress-UKAK 2005, pro-ceedings book; 2005. p. 139–46.
and Recycling 58 (2012) 114– 124
Aydogan O, Varank G, Bilgili MS. Municipal solid waste management in gaziantep.Journal of Engineering and Natural Sciences 2011;3:268–75.
Banar M, Cokaygil Z, Ozkan A. Life cycle assessment of solid waste options for Eskise-hir, Turkey. Waste Management 2009;29:54–62.
Berkun M, Aras E, Nemlioglu S. Disposal of solid waste in Istanbul and along theBlack Sea coast of Turkey. Waste Management 2005;25:847–55.
Calabro PS. Greenhouse gases emission from municipal waste management: the roleof separate collection. Waste Management 2009;29:2178–87.
Crowe M, Nolan K, Collins C, Carty G, Donlon B, Kristofferse M. Biodegradablemunicipal waste management in Europe. Strategies and Instruments, EuropeanEnvironment Agency, Topic Report; 2002.
Genc E. Inventory of packaging wastes in Izmir City. M.Sc. thesis submitted to DokuzEylul University Graduate School of Natural and Applied Sciences, Izmir, Turkey;2011.
Kahraman N, Kılıc H, Yenice MK. Separate collection of packaging waste at sourceand monitoring studies by solid waste characterization; Kocaeli sample. In: Thethird Turkish national solid waste management congress-UKAY 2011 (TRNC),proceedings book; 2011. p. 276–82.
Kanat G. Municipal solid waste management in Istanbul. Waste Management2010;30:1737–45.
Koifodimos G, Samaras Z. Waste management options in Southern Europe usingfield and experimental data. Waste Management 2002;22:47–59.
Kose E, Karakaya N, Aslan G. Cost of solid waste management: a case of Bolu. Journalof Engineering and Natural Sciences 2011;3:126–31.
Mazzanti M, Zoboli R. Waste generation, waste disposal and policy effectiveness:evidence on decoupling from the European Union. Resources, Conservation, andRecycling 2008;52:1221–34.
Metin E, Erozturk A, Neyim C. Solid waste management practices andreview of recovery and recycling operations in Turkey. Waste Management2003;23:425–32.
Ministry of Environment and Urban Planning. The recycling facilities inTurkey—the licenced plants; 2011, Retrieved in October 2011 fromhttp://www.cevresehircilik.gov.tr (in Turkish).
Municipality of Kula. Geographical condition of Kula; 2010, Retrieved in December2010 from http://www.kula.bel.tr/solmenu.aspx?id=94.
Mühle S, Balsam I, Cheeseman CR. Comparison of carbon emissions associated withmunicipal solid waste management in Germany and the UK. Resources, Conser-vation, and Recycling 2010;54:793–801.
Nas SS, Bayram A. Municipal solid waste characteristics and management inGümüs hane, Turkey. Waste Management 2008;28:2435–42.
Official Gazette. Law for metropolitan municipalities. Law No: 5216. Accepted on10.07.2004, Ankara, Turkey.
Official Gazette. Packaging wastes control regulation. No: 26562, Accepted on June2007, Ankara, Turkey.
Official Gazette. Legislation on the sanitary landfilling of the solid wastes. No: 27533,Accepted on March 2010, Ankara, Turkey.
Shekdar AV. Sustainable solid waste management: an integrated approach for Asiancountries. Waste Management 2009;29:1438–48.
Turan G, Coruh S, Akdemir A, Ergun ON. Municipal solid waste management strate-gies in Turkey. Waste Management 2009;29:465–9.
The Energy Market Regulatory Authority. The distribution of natural gas in dif-ferent geographical regions of Turkey; 2011, Retrieved in October 2011 fromhttp://www.epdk.gov.tr/web/guest.
TMEF. Waste management action plan (2008–2012), publication of Turkish Ministryof Environment and Forestry, General Directorate of Environmental Manage-ment, Ankara; 2008.
Turkish State Meteorological Service (TSMS). Data assessment; 2011, Retrievedin March 2011 from http://www.dmi.gov.tr/veridegerlendirme/il-ve-ilceler-istatistik.aspx7m.
TurkStat. A survey of household income levels (Izmir) Turkey. Republic of Turkey,Prime Ministry Turkish Statistical Institute; 1997, www.turkstat.gov.tr.
TurkStat. Turkey’s statistical yearbook. Republic of Turkey, Prime Ministry TurkishStatistical Institute; 2009, www.turkstat.gov.tr.
TurkStat. The waste statistics of the municipalities. Republic of Turkey, PrimeMinistry Turkish Statistical Institute; 2008, Retrieved in October 2011 fromhttp://www.tuik.gov.tr/VeriBilgi (in Turkish).
USEPA. Method 9045C: soil and waste pH. United States Environmental ProtectionAgency Publications, Revision 3, Washington; 1995.
USEPA. Method 1310B: extraction procedure toxicity test method and structuralintegrity test. United States Environmental Protection Agency Publications,Revision 2, Washington; 2004.
USEPA. Municipal solid wastes in the United States: facts and figures. United StatesEnvironmental Protection Agency Office of Solid Waste (5306P), EPA530-R-08-010; 2008.
Yay AS, Cakir Y, Sayar S. Integrated solid waste management in Sakarya. In: Thethird Turkish national solid waste management congress-UKAY 2011 (TRNC),proceedings book; 2011. p. 34-43.
Yılmaz G, Yesilnacar MI, Uyanık S, Selcuk B, Senes S, Ahmedova C, et al. Determina-
tion of municipal solid waste composition in Sanliurfa City center. In: TurkishNational Solid Waste Congress-UKAK 2003, proceedings book; 2003. p. 1–9.Yılmaz I, Yurdakul M, Topkaya B. Investigating the seasonal changes of solid wastesgenerated in Antalya City. In: The third Turkish national solid waste manage-ment congress-UKAY 2011 (TRNC), proceedings book; 2011. p. 56–71.