The GPS velocity field of the Aegean. New observations ...
25
Geophys. J. Int. (2021) 226, 468–492 doi: 10.1093/gji/ggab089 Advance Access publication 2021 March 10 GJI Geodynamics and Tectonics The GPS velocity field of the Aegean. New observations, contribution of the earthquakes, crustal blocks model Pierre Briole , 1 Athanassios Ganas, 2 Panagiotis Elias 3 and Dimitar Dimitrov 4 1 UMR 8538 CNRS - ´ Ecole Normale Sup´ erieure - PSL Research University, F-75005 Paris, France. E-mail: [email protected] 2 National Observatory of Athens, Institute of Geodynamics, GR-11810 Athens, Greece 3 National Observatory of Athens, IAASARS, GR-15236 Penteli, Greece 4 Bulgarian Academy of Sciences, National Institute of Geophysics, Geodesy and Geography, BG-1113 Sofia, Bulgaria Accepted 2021 March 2. Received 2021 February 23; in original form 2020 July 27 SUMMARY We calculate and analyse the coordinate time-series of 282 permanent GPS stations located in Greece and 47 in surrounding countries. The studied period is 2000–2020. The average GPS time-series length is 6.5 yr. The formal velocity uncertainties are rescaled to be con- sistent with the velocity scatters measured at 110 pairs of stations separated by less 15 km. We remove the effect of the crustal earthquakes of M w ≥ 5.3. We quantify and model the post-seismic deformations. Two relaxation times are usually needed: one short of some weeks and one long of 1 yr or more. For the large M w = 6.9 events of Samothraki 2014 and Methoni 2008, the post-seismic deformation equals or exceeds the coseismic one. We detect at three stations a deformation transient in May 2018 that may correspond to a slow earthquake be- neath Zakynthos and northwest Peloponnese, with equivalent magnitude 5.8. The density and accuracy of the velocities make it possible to better quantify several characteristics of the deformation in the Aegean, in particular: (i) the transition from the Anatolian domain, located in the southeast, to the European domain through the western end of the North Anatolian fault; (ii) the north–south extension in the western Aegean; (iii) the east–west extension of the western Peloponnese; (iv) the clockwise rotation of the Pindos; (v) the north–south ex- tension in central Macedonia. Large parts of the central Aegean, eastern Peloponnese and western Crete form a wide stable domain with internal deformation below 2 nstrain yr −1 . We build a kinematic model comprising 10 crustal blocks corresponding to areas where the velocities present homogeneous gradients. The blocks boundaries are set to fit with known localized deformation zones, for example, the rift of Corinth, the North Anatolian fault and the Katouna fault. When the velocity steps are clear but not localized, for example, through the Peloponnese, the boundary line is arbitrary and represents the transition zone. The model fits the velocities with a root-mean-square deviation of ±0.9 mm yr −1 . At the boundaries between blocks we compare the predicted and observed deformations. We find shear rates of 7.4 and 9.0 mm yr −1 along the Movri and Katouna faults, 14.9 and 8.7 mm yr −1 along the North Anatolian fault near Lemnos and near Skopelos respectively, extension of 7.6, 1.5 and 12.6 mm yr −1 across the Gulf of Patras, the Trichonis Lake and the Ambracian Gulf. The com- pression across western Epirus is 3.7 mm yr −1 . There is a dextral transtensional movement of 4.5 mm yr −1 between the Amorgos and Astypalea islands. Only the Ionian Islands region shows evidence of coupling along the subduction interface. Key words: Space geodetic surveys; Transient deformation; Europe; Earthquake ground motions; Fractures, faults, and high strain deformation zones; Kinematics of crustal and mantle deformation. 468 C The Author(s) 2021. Published by Oxford University Press on behalf of The Royal Astronomical Society. All rights reserved. For permissions, please e-mail: [email protected] Downloaded from https://academic.oup.com/gji/article/226/1/468/6166783 by guest on 13 July 2022
-
Upload
khangminh22 -
Category
Documents
-
view
0 -
download
0
Transcript of The GPS velocity field of the Aegean. New observations ...

Geophys J Int (2021) 226 468ndash492 doi 101093gjiggab089Advance Access publication 2021 March 10GJI Geodynamics and Tectonics
The GPS velocity field of the Aegean New observationscontribution of the earthquakes crustal blocks model
Pierre Briole 1 Athanassios Ganas2 Panagiotis Elias 3 and Dimitar Dimitrov4
1UMR 8538 CNRS - Ecole Normale Superieure - PSL Research University F-75005 Paris France E-mail brioleensfr2National Observatory of Athens Institute of Geodynamics GR-11810 Athens Greece3National Observatory of Athens IAASARS GR-15236 Penteli Greece4Bulgarian Academy of Sciences National Institute of Geophysics Geodesy and Geography BG-1113 Sofia Bulgaria
Accepted 2021 March 2 Received 2021 February 23 in original form 2020 July 27
S U M M A R YWe calculate and analyse the coordinate time-series of 282 permanent GPS stations locatedin Greece and 47 in surrounding countries The studied period is 2000ndash2020 The averageGPS time-series length is 65 yr The formal velocity uncertainties are rescaled to be con-sistent with the velocity scatters measured at 110 pairs of stations separated by less 15 kmWe remove the effect of the crustal earthquakes of Mw ge 53 We quantify and model thepost-seismic deformations Two relaxation times are usually needed one short of some weeksand one long of 1 yr or more For the large Mw = 69 events of Samothraki 2014 and Methoni2008 the post-seismic deformation equals or exceeds the coseismic one We detect at threestations a deformation transient in May 2018 that may correspond to a slow earthquake be-neath Zakynthos and northwest Peloponnese with equivalent magnitude 58 The density andaccuracy of the velocities make it possible to better quantify several characteristics of thedeformation in the Aegean in particular (i) the transition from the Anatolian domain locatedin the southeast to the European domain through the western end of the North Anatolianfault (ii) the northndashsouth extension in the western Aegean (iii) the eastndashwest extension ofthe western Peloponnese (iv) the clockwise rotation of the Pindos (v) the northndashsouth ex-tension in central Macedonia Large parts of the central Aegean eastern Peloponnese andwestern Crete form a wide stable domain with internal deformation below 2 nstrain yrminus1We build a kinematic model comprising 10 crustal blocks corresponding to areas where thevelocities present homogeneous gradients The blocks boundaries are set to fit with knownlocalized deformation zones for example the rift of Corinth the North Anatolian fault andthe Katouna fault When the velocity steps are clear but not localized for example throughthe Peloponnese the boundary line is arbitrary and represents the transition zone The modelfits the velocities with a root-mean-square deviation of plusmn09 mm yrminus1 At the boundariesbetween blocks we compare the predicted and observed deformations We find shear rates of74 and 90 mm yrminus1 along the Movri and Katouna faults 149 and 87 mm yrminus1 along theNorth Anatolian fault near Lemnos and near Skopelos respectively extension of 76 15 and126 mm yrminus1 across the Gulf of Patras the Trichonis Lake and the Ambracian Gulf The com-pression across western Epirus is 37 mm yrminus1 There is a dextral transtensional movement of45 mm yrminus1 between the Amorgos and Astypalea islands Only the Ionian Islands regionshows evidence of coupling along the subduction interface
Key words Space geodetic surveys Transient deformation Europe Earthquake groundmotions Fractures faults and high strain deformation zones Kinematics of crustal andmantle deformation
468Ccopy The Author(s) 2021 Published by Oxford University Press on behalf of The Royal Astronomical Society All rights reserved Forpermissions please e-mail journalspermissionsoupcom
Dow
nloaded from httpsacadem
icoupcomgjiarticle22614686166783 by guest on 13 July 2022
The GPS velocity field of the Aegean 469
1 I N T RO D U C T I O N
Since its origin space geodesy has been used in Greece for a widerange of geophysical applications (Marinou et al 2016) Theseinclude sea level monitoring (Becker et al 2002) quantifying ofplate tectonics (Le Pichon et al 1995) and study of the seismicity(eg Jackson et al 1994 Meyer et al 1996 Bernard et al 1997)The first technique used was the Satellite Laser Ranging (SLRAardoom amp Van Gelder 1984 Christodoulidis et al 1985 Smithet al 1994) followed soon by the Global Positioning System (GPSNoomen et al 1996 Clarke et al 1998 Cocard et al 1999) TheDoppler Orbitography and Radiopositioning Integrated by Satellite(DORIS) system was used for the calibration of satellite altimetryand GPS measurements (Willis et al 2013) Among the first GPSworks it is worth mentioning Billiris et al (1991) who comparedthe coordinates of first-order geodetic points measured by triangu-lation at the end of the 19th century with new coordinates obtainedby GPS This work has been the first to quantify the extension incentral Greece across the Gulf of Corinth Synthetic Aperture RadarInterferometry (InSAR) has been widely used for the study of earth-quakes most of the time coupled with GPS (eg Briole et al 20002015)
After the appearance of a small number of permanent GPS sta-tions in the 1990s their number increased during the 2000s withthe deployment of stations throughout the territory (Ganas et al2008) by the National Observatory of Athens (NOA) and in greaterdensity in the Corinth rift by the Centre National de la RechercheScientifique (CNRS) At the end of the 2000s three nationwidepermanent networks were created for the needs of land use plan-ning and supporting the work of the surveyors doing geodesy inGreece the Hepos (httpswwwheposgr) network funded by theEuropean Union and managed by the Greek State through its Cadas-tre Department and two networks operated by the Metrica SA(HxGN SmartNet httpswwwmetricagr) and TreeComp (Uranusnetwork httpwwwuranusgr) companies Despite its status as oftoday the first network is not freely open to the science commu-nity (only a portion of its data is available on request) whereaswe have access to the data from the two others which represent180 stations
We analysed the GPS data acquired at 329 stations (Fig 1 Sup-porting Information Table S1) 282 located in Greece 28 in Turkey12 in Bulgaria 6 in Albania and 1 in Northern Macedonia InGreece 96 stations belong to TreeComp 84 to Metrica and 102to various Greek European and foreign research centres 30 to theFrench CNRS 18 to the National Observatory of Athens (NOA) 13(not any more in use) to the British COMET (Billiris et al 2014)8 to the National Technical University of Athens (NTUA) 6 to theCharles University of Prague (CUP) 6 to the University of Col-orado (UNAVCO) 5 to the Italian Istituto Nazionale di Geofisica eVulcanologia (INGV) 5 to the Technological Educational Instituteof Crete (TEIC) and 11 to various others Five of those academicstations AUT1 DYNG KATC PAT0 and TUC2 (see Fig 1 forlocations) are included in both the ITRF2014 solution (Altamimiet al 2016) and the EUREF network (httpswwwepncbomabe)The Turkish stations are part of the General Command of Map-ping (GCM) network The data cover the period 2000ndash2020and especially 2010ndash2020 because of the larger number of GPSstations
With respect to the previous velocities fields (eg Clarke et al1998 Kahle et al 2000 Kreemer amp Chamot-Rooke 2004 Nystamp Thatcher 2004 Serpelloni et al 2005 Reilinger et al 2006Hollenstein et al 2006 Floyd et al 2010 Reilinger et al 2010
Muller 2011 Nocquet 2012 Perouse et al 2012 Ganas et al 2013Muller et al 2013 Chousianitis et al 2013 2015 Vernant et al2014 Metois et al 2015 England et al 2016 Devoti et al 2017Bitharis et al 2019 Ganas et al 2019 DrsquoAgostino et al 2020) thisone is much denser It is more accurate because it is based entirelyon data from permanent stations and with longer time periods ofacquisition Moreover it is improved thanks to the correction of thedeformations induced by the earthquakes
In the first part of the paper we describe our method for process-ing the data Details on the processing are presented in SupportingInformation Section S2
In the second part we quantify the coseismic and post-seismiccontributions to the GPS velocity field of the Aegean area for the pe-riod 2000ndash2020 Indeed the inaccurate correction for the coseismicand post-seismic displacements leads to biased estimates of secularvelocities This is visible for example at the EUREF station PAT0(location in Fig 1) where the seismic part of the velocity field ac-counts (for the 12 yr of observation) for 067 and 085 mm yrminus1
in east and north respectively (Supporting Information Fig S24)In Supporting Information Section S3 we review the models ofcoseismic and post-seismic deformations of the earthquakes listedin Table 1 In Supporting Information Section S4 we discuss someother signals found in the time-series
In the third part we discuss the secular velocity field obtainedafter the removal of the contribution of the earthquakes
In the fourth part we present a crustal blocks kinematic modeltailored to fit this secular velocity field This model fits the velocitieswith a root-mean-square (rms) deviation of plusmn 09 mm yrminus1
Fig 2 shows on a map the location of the various sites mentionedin the text and Supporting Information Table S2 contains a glossaryof the site names with some additional details
2 G P S DATA P RO C E S S I N G
In the following we use the acronym GPS and not GNSS (GlobalNavigation Satellite System) because we have processed and anal-ysed only the GPS data acquired by the receivers
21 Calculation
We processed all the data except those from Turkey since they are notpublicly available but only the time-series produced by the NevadaGeodetic Laboratory (NGL httpgeodesyunredu Blewitt et al2018) Details on the processing method are available in SupportingInformation Section S2
We analyse the velocities only for stations with an acquisitionperiod greater than 2 yr and velocity accuracy better that 1 mmyrminus1 which sums up to 309 stations out of the 329 We providein the additional material (Supporting Information Table S7) thecoordinates of the GPS stations in ITRF2014 at the epoch 20200For the 20 stations with short acquisition period these coordinatesare established by using for their velocity an interpolation of thevelocities available at the neighbouring stations Those 20 extrastations having a short acquisition period were kept because inseveral cases they were valuable for the measurement and mod-elling of coseismic deformations Therefore they contribute in thismanner to the quality of the final velocity field
We model the annual term of the coordinate time-series usinga simple sine function of annual period In this way only two pa-rameters are needed an amplitude and a phase The time-series ofcoordinates of the 329 stations are available in ASCII format in the
Dow
nloaded from httpsacadem
icoupcomgjiarticle22614686166783 by guest on 13 July 2022
470 P Briole et al
Figure 1 Location of the 329 GPS stations (see Table 1) The 47 magenta stations correspond to GPS stations outside Greece in Albania (6) NorthernMacedonia (1) Bulgaria (12) and Turkey (28) The 96 green stations belong to the Uranus network (httpuranusgr) operated by the Tree Company corporationThe 84 orange stations belong to the Metrica company (httpsmetricagr) The 102 red stations are owned and operated by academic or assimilated institutionsThey are denser in southwestern Greece in the Corinth rift (inset) and in Santorini
Supporting Information We applied a Gaussian filter F(t) = σminus1
(2π )minus12 exp (-t22σ 2) to the time-series presented in some of thefigures using the characteristic time σ = 224 d This filter whichis involving weighted data acquired in the window of one weekbefore and after each epoch reduces the noise of the time-series(for both the horizontal and the vertical components) by a factorclose to 2
22 Assessing the uncertainties
In the case where the time-series does indeed show a linear trendwithout marked fluctuations which is almost always the case forhorizontal components but not for verticals the uncertainty de-pends on (i) the total duration of the observations (ii) the meandispersion of the daily solutions (iii) the uncertainties related to thecorrection of possible jumps in the series and (iv) the uncertaintiesrelated to the correction of the coseismic and post-seismic motions
In order to establish a realistic law for the uncertainties we studiedhow the velocity differences between neighbouring stations evolveas a function of their distance This was possible because the data setcontains several clusters of neighbouring stations We selected 110pairs of stations located within 15 km of each other and analysedthe scatter of their velocities in east north and vertical (SupportingInformation Table S3) We used those scatters to scale the formaluncertainties provided by the calculation so they fit with the ob-served scatters Fig 3 shows the alignment of the scatters and theuncertainties for the east north and vertical components Support-ing Information Fig S7 shows the histogram of the uncertaintiesin east and vertical In the way that it is made our estimation ofthe uncertainties does not take into account the velocity deviationsthat may exist in some cases between fairly close (typically a fewkm) stations due to the activity of local active faults during theperiod 2000ndash2020 or to any other local effect for example hydro-logical effects or site instability This is the case for example atAigion where the three nearby stations of AIGI VALI and EGIO
Dow
nloaded from httpsacadem
icoupcomgjiarticle22614686166783 by guest on 13 July 2022
The GPS velocity field of the Aegean 471
Table 1 Significant earthquakes from 2001 to 2020 considered for the calculation of coseismic displacements in the GPS network Magnitude strike dipand rake are from G-CMT (Ekstrom et al 2012) In the case of Zakynthos 2006 and Gulpinar 2017 the various focal mechanisms of the sequence are verysimilar and we used the average angles Longitude latitude and depth are those inferred from the modelling of the GPS data Time constant of post-seismicdeformation is provided when a post-seismic signal was observed and quantified The Samos earthquake of 2020 October 30 is mentioned and plotted becausewe mention it in the discussion but we do not evaluate the fault parameters of the co- and post-seismic displacements
Name Mw Date Long () Lat() Depth (km) Strike () Dip () Rake ()Fast post-seismic
(d)Slow post-seismic
(d)
Skyros 64 26072001 2434 3895 9 148 76 minus1Lefkada 62 14082003 2063 3883 9 18 59 minus174Zakynthos (sixevents)
50ndash57 3-1942006 2095 3768 145 3 29 122
Methoni 69 14022008 2180 3617 265 332 6 120 10 449Movri 64 08062008 2152 3794 22 209 83 164 103Efpalion 53 18012010 2194 3844 55 296 49 minus66Efpalion 53 22012010 2198 3843 55 296 51 minus59Western Crete 64 12102013 2337 3530 22 339 3 130Cephalonia 61 26012014 2042 3818 55 19 76 176 85Cephalonia 60 03022014 2041 3824 3 12 57 157Samothraki 69 24052014 2568 4028 5 73 85 minus177 65 1295Lefkada 65 17112015 2045 3876 5 22 64 179 138 471Gulpinar (fourevents)
52ndash54 6-12022017 2613 3953 55 125 47 -89
Lesvos 63 12062017 2631 3889 65 110 47 minus87 4 140Kos 66 20072017 2749 3692 65 278 36 minus82 220Zakynthos 68 25102018 2070 3740 65 11 28 165 21 183Preveza 54 05022019 2061 3893 10 2 81 180Eratini 53 30032019 2227 3829 10 292 39 minus62Magoula 53 19072019 2351 3799 11 103 55 minus89Kanallaki 57 21032020 2061 3926 7 337 39 119Samos 70 30102020 2668 3776 17 270 37 minus95
(location in the inset of Fig 1) have differential velocities ofsim1 mm yrminus1 due to the local tectonic activity as shown by Elias ampBriole (2018) However this particular context is minor in our setof 110 pairs Therefore we believe that our uncertainties are wellscaled and robust
3 C O S E I S M I C A N D P O S T - S E I S M I CD E F O R M AT I O N S
In the first subsection below we review and quantify the coseis-mic and post-seismic contributions to the GPS velocity field ofGreece and the Aegean area for the period 2000ndash2020 In thesecond subsection we review the other phenomena found to dis-rupt some of the GPS time-series The correction of those sig-nals is needed to estimate a secular velocity field of the wholeregion
31 Earthquakes disrupting the GPS time-series
Table 1 and Fig 2 contain and display the list of earthquakes (orswarms for Zakynthos 2006 and Gulpinar 2017) occurred in Greeceor close to Greece having produced a displacement larger than1 mm at one at least of our 329 stations To make this list weextracted from the European Mediterranean Seismological Centre(EMSC httpswwwemsc-csemorg) catalogue the earthquakesof magnitude ge 53 having occurred at a depth of less than 40 kmbetween January 2000 and July 2020 in the box 20ndash29 in lon-gitude and 34ndash42 in latitude For each of those earthquakeswe used the Global Centroid Moment Tensor Catalog (G-CMT
httpswwwglobalcmtorg Ekstrom et al 2012) focal mechanismor if unavailable the NOA focal mechanism We assume the fol-lowing values for the length L = 247 (M μminus1)(13) with widthW = 0625 L and slip D = M (μLW) where M is the GCMT(or NOA) seismic moment (in N m) and μ the rigidity of the crustassumed to be equal to 3 times 1010 Pa This value of rigidity currentlyused for the crust is giving on average a good fit between the seismicand geodetic moments for the population of earthquakes analysedThose scaling relations are used by Briole (2020) for the a prioriestimate of fault parameters of crustal earthquakes in the Mediter-ranean aimed to produce a priori synthetic GPS displacements andinterferograms after events and to initialize inverse models Theyare simple and for the required need sufficiently consistent withthose published by Wells and Coppersmith (1994) and Thingbaijamet al (2017) the former being based on models while the secondbeing constrained from field observations Indeed what is neededto estimate displacements in the intermediate and far field is notthe detail of the fault geometry and slip but the use of the cor-rect focal mechanism and seismic moment provided by seismologyMoreover the a posteriori analysis of the faults we modelled in thispaper shows that their geometric parameters sometimes changed bymore than 50 per cent with respect to their a priori value predictedby the above relations This emphasizes the fact that these scalerelations for seismic faults have a statistical value but cannot beused to precisely prescribe the geometric parameters of a particularevent
For each event the predicted values were then used to calculatewith the model of Okada (1992) the theoretical displacements at the329 stations This protocol eliminated all earthquakes occurred inthe central and western Hellenic arc and Karpathos basin several
Dow
nloaded from httpsacadem
icoupcomgjiarticle22614686166783 by guest on 13 July 2022
472 P Briole et al
Figure 2 Toponymy (coordinates and description are in Supporting Information Table S2) topography bathymetry major faults from Ganas (2020) andG-CMT focal mechanisms of the events analysed in the text
with magnitude larger than 6 except the Mw = 64 earthquake ofwestern Crete of 2013 October 12 Some moderate earthquakesof continental Greece such as the Mw = 54 and 53 Kallidromonearthquakes of 2013 August 7 and September 16 (Ganas et al 2014)the Mw = 53 Amfilochia earthquake of 2014 October 24 and theMw = 53 northern Evia earthquake of 2015 June 9 (Ganas et al2016a) were also eliminated after checking carefully the time-seriesof the nearby GPS stations
The events of Table 1 are analysed one by one in SupportingInformation Section S3
32 Other transients disrupting the time-series
We identified transients in the time-series of several stations Themost noteworthy are described in Supporting Information SectionS4 Most of them correspond to earthquakes The most interestingof those events is a possible slow-slip event recorded at severalstations close to the island of Zakynthos five months before theearthquake of 2018 October 25 We also re-analysed the GPS data
of Santorini Thanks to the longer time-series it is possible to re-visit the unrest period to correct its effect and to assess a secularvelocity of the stations located on this volcanic island This knowl-edge is important for the analysis of the volcanic and local tectonicdeformations
33 Separating transient and secular velocity fields
Among the five major earthquakes of the period 2000ndash2020 theones that most disrupt the GPS time-series are those of Methoni2008 February 14 Samothraki 2014 May 24 Lefkada 2015 Novem-ber 17 Zakynthos 2018 October 25 and Samos 2020 October 30The last one is not analysed in this paper
Figure 4 shows the part of the velocity field induced by coseismicand post-seismic displacements during the sampled period at theGPS stations (only the 129 stations where the velocity is biased bymore than 06 mm yrminus1 are plotted) and Supporting InformationTable S7 contains the numerical values of this contribution of theearthquakes to the velocity field
Dow
nloaded from httpsacadem
icoupcomgjiarticle22614686166783 by guest on 13 July 2022
The GPS velocity field of the Aegean 473
Figure 3 Estimating the uncertainties (in mm yrminus1) in the east north and vertical axes by using the observed scatters between neighbouring stations as ametrics
The field of vectors shown in Fig 4 is not a stationary fieldIt depends on the earthquakes that occured during the investi-gated period and on the duration of the available time-series theshorter being more biased Fig 4 as a whole may however exhibitsome characteristics likely to be relatively stationary in the long-term
This is in particular the case of the overall southwestern velocitypattern of the stations of western Greece around the western Gulf ofCorinth and the Ionian Islands In that area the contribution of theearthquakes to the velocity field exceeds 10 mm yrminus1 towards thesouthwest at stations not necessarily located in the near field of anyrecent earthquake The most characteristic is the case of the EUREFstation PAT0 (Supporting Information Fig S24) where the velocityis affected with no abrupt anomaly in the time-series except for theZakynthos earthquake of 2018
The contribution of the earthquakes is also significant aroundLemnos and Lesvos The long duration of the post-seismic relax-ation of the May 2014 Samothraki earthquake induces velocityanomalies at all stations located in northeastern Greece betweenThessaloniki and Alexandroupoli The correction of this effect isneeded to properly measure and interpret the northndashsouth extensionof northern Greece and southern Bulgaria
In Fig 4 we distinguish two wide areas not affected by largeearthquakes from 2000 to 2020 that is below the threshold of06 mm yrminus1 northwestern Greece and the Cyclades region
While the time-series of the stations located close to the epi-centres show clear offsets (which are actually the offsets used toconstrain the models) it is not the case of the time-series of GPSstations located at larger distances For many GPS stations located atintermediate distance (say 50 km) the coseismic and post-seismiceffects can be present and significant in the time-series but hidden inthe noise or in the yearly fluctuations This is the case in particularfor the post-seismic effects that are smooth especially when therelaxation time is long The corrections of the velocities can reach
sim1 mm yrminus1 at stations located at several tens of km of the epicentreof the closest large event
Supporting Information Table S6 shows how the velocity of PAT0and the IGS stations AUT1 DYNG KATC and TUC are biased bythe earthquakes Those biases are 02 and minus02 mm yrminus1 at AUT1minus03 and minus05 mm yrminus1 at DYNG minus07 and minus09 mm yrminus1 atPAT0 (Supporting Information Fig S24) 00 and minus08 mm yrminus1 atKATC and minus04 and minus06 mm yrminus1 at TUC2 in east and northrespectively
Supporting Information Table S6 shows also a comparison of thevelocities of four fundamental stations of Greece computed by fivegroups LTK-EUREF ROB-EUREF UGA-CNRS (all three pro-vided by the online EPOS portal httpsgnssproductseposubipt)NGL and ourselves The velocities differ from one solution to an-other with the rms deviation of the solutions notably larger thanthe claimed velocity uncertainties in the case of LTK-EUREF andROB-EUREF the others being more conservative Our solution be-fore applying the correction of co- and post-seismic is relativelyconsistent with their average The solution of NGL is closer toour final solution because NGL includes like us a routine cor-rection for the coseismic motion of the largest earthquakes yetusing standard parameters provided by the seismological centresand not an accurate modelling of the observed offsets as we dohere
The velocities in Supporting Information Table S1 are correctedfor the effects of the earthquakes and other effects discussed in thenext section
34 Weight of the post-seismic relaxations
It appears that post-seismic relaxation is not the exception but therule In several cases we can distinguish two distinct relaxationtimes a first fast component with a relaxation time of a few weeks
Dow
nloaded from httpsacadem
icoupcomgjiarticle22614686166783 by guest on 13 July 2022
474 P Briole et al
Figure 4 Velocity biases corresponding to the coseismic and post-seismic signals for the period 2000ndash2020 The amplitudes of those biases are dependent onthe duration of the available time-series The projections of the faults of the earthquakes considered in Table 1 are plotted in red for the coseismic and green forthe post-seismic (parameters of the faults in Table 2 use also the supporting KML file) and the six main ones labelled The ellipses correspond to uncertaintiesat 95 per cent confidence level The circle in the velocity scale bar corresponds to an uncertainty of 05 mm yrminus1 Only the 129 stations where the velocity isbiased by more than 06 mm yrminus1 are drawn The location of the five IGS and EUREF reference stations of AUT1 DYNG KATC PAT0 and TUC2 is shown
and sometimes even a few days (eg in Lesvos 2017) a secondslower component with a relaxation time ranging from severalmonths to several years
Although an exponential law allows to fit well the post-seismicrelaxation we found several cases in which it was needed to com-bine two exponentials for example in the case of the Samothraki2014 earthquake (Supporting Information Fig S2) one short re-laxation time (65 d) and one long relaxation time (1295 d) Theneed to involve two time constants arises also for the earthquakesof Methoni 2008 Lefkada 2015 and Zakynthos 2018 For theother earthquakes with magnitude less than Mw = 65 the am-plitude of their post-seismic signals is less and the dual processnot clearly apparent even if it may also exist and not needed tofit the data well below the level of noise of the time-series Table1 indicates the post-seismic relaxation times found for the studiedearthquakes
Figure 5 shows the percentage of the seismic moment releasedduring the post-seismic phase for nine large events that is thequantity 100 Mp (Mw + Mp) where Mw is the coseismic momentand Mp the post-seismic moment For two of the largest earthquakesMp is comparable or larger than Mw up to three times larger forMethoni 2008 (see values in Table 3) while around the magnitude
Mw = 6 the average weight of Mp is around 15 per cent Our sampleis however insufficient to attempt to establish a relationship betweenthe magnitude and the weight of the post-seismic component
As the relaxation time can be of several years especially for thelarge events the post-seismic effects are often smoothed in time andcan be hard to distinguish from the secular velocity Fig 6 showshow according to our fault parameters (Table 2) and relaxationtimes (Table 1) the seismic moment is released as a function oftime This lsquobreathingrsquo impacts the velocities of the GPS stationsthat are affected by it and it could well be invisible when usingsparse campaign data instead of continuous data
When modelling the post-seismic signal we find that the short-term relaxation can always be modelled with a slight extension ofthe initial fault plane laterally upward and downward For exam-ple for Zakynthos 2018 the rapid post-seismic can be modelledby an extension of the slip on a vertical fault on top of the co-seismic one connected at the depth of 3 km below the seafloor tothe surface (Ganas et al 2020) For long-period relaxation it isthe case for Samothraki 2014 only with the GPS data fitted by a45 km downward extension of the slip on the fault plane from 85to 13 km depth The cases of Lefkada 2015 and Zakynthos 2018are different with the post-seismic slip occurring on planes with
Dow
nloaded from httpsacadem
icoupcomgjiarticle22614686166783 by guest on 13 July 2022
The GPS velocity field of the Aegean 475
Table 2 Parameters of the modelled coseismic and post-seismic dislocations
Name Date Long () Lat () Depth (km)Fault length
(km)Fault width
(km)Strike-slip
(mm) Dip slip (mm)Fault azim
()Fault dipangle ()
Skyros0ndash1 26072001 24349 38950 52 166 76 1500 0 148 76Lefkada2 14082003 20601 38840 45 16 10 minus750 0 18 59Zakynthos0ndash1 3ndash1942006 20921 37683 13 10 7 minus290 minus385 3 25Methoni0-3 14022008 21700 36089 245 30 23 minus631 minus901 310 8Methoni0ndash3 Coseismic + 10 d 21705 36089 245 34 26 minus631 minus901 310 8Methoni0ndash3 Post-seismic 449 d 21189 36271 225 130 15 minus631 minus901 310 8Movri4 08062008 21523 37937 175 15 87 minus1200 0 25 90Efpalion5 18-22012010 21954 38416 41 88 5 0 182 minus75 38Western Crete0 12102013 23320 35275 20 18 12 minus840 minus1000 325 12Cephalonia6 26012014 20406 38180 25 16 65 minus1160 0 14 70Cephalonia6 03022014 20394 38243 2 15 4 minus300 minus300 14 30Samothraki0 24052014 25683 40283 08 101 85 minus900 0 66 90Samothraki0 Coseismic + 1295 d 25631 40268 08 110 13 minus900 0 66 90Lefkada7 17112015 20518 38595 015 23 10 minus1200 0 18 71Lefkada0 Post-seismic 138 d 20529 38598 20 25 12 minus100 0 18 71Lefkada0 Post-seismic 471 d 20643 38758 135 51 22 minus29 minus21 18 15Gulpinar8 6ndash12022017 26136 39549 33 6 6 0 280 110 45Lesvos0 12062017 + 4 d 26325 38910 4 161 67 98 1250 111 45Lesvos0 Coseismic + 140 d 26332 38915 28 168 78 98 1250 111 45Kos9 20072017 27471 36874 25 14 125 525 1961 283 37Zakynthos10 25102018 20627 37415 3 26 165 minus1900 minus350 9 25Zakynthos10 Post-seismic 21 d 20627 37415 0 26 3 minus1900 0 9 90Zakynthos0 Post-seismic 183 d 20876 37353 12 26 78 0 minus90 310 12Preveza0 05022019 20608 38929 92 42 27 minus467 0 2 81Eratini0 30032019 22269 38283 9 4 3 0 363 291 39Magoula0 19072019 23544 38127 5 38 24 0 500 103 50Kanallaki11 21032020 20592 39247 7 47 47 minus87 minus492 327 39Transient ofMay 20180
1052018 21408 37595 22 24 13 minus90 0 310 12
The index in the first column is the source of the information 0 this study 1 Muller (2011) 2 Ilieva et al (2016) 3 Howell et al (2017a) 4 Serpetsidaki et al(2014) 5 Elias (2013) 6 Briole et al (2015) 7 Ganas et al (2016b) 8 Ganas et al (2018) 9 Ganas et al (2019) 10 Ganas et al (2020) 11 Valkaniotis et al(2020) A value preceded by a zero means that we calculated a model starting initially from the indicated reference The coordinates (longitude latitude anddepth) are those of the centre of the top edge of the rectangular fault Positive values of slip mean left lateral and normal negative values right lateral andreverse respectively The zero reference for the fault azimuth is the north The models were made with assuming the value of 3 times 1010 Pa for the rigidity ofthe medium
Figure 5 Percentage of the seismic moment released during the post-seismic phase for nine events of magnitude larger than 6 The parameters used for theearthquakes are presented in Tables 2 and 3
Dow
nloaded from httpsacadem
icoupcomgjiarticle22614686166783 by guest on 13 July 2022
476 P Briole et al
Table 3 Contribution of the post-seismic signal to the total seismic moment for the major events of magnitude larger than 6 The largest events are those thatalso trigger the post-seismic signals with major relative weight For several events we could not separate accurately the coseismic and the fast post-seismic sowe give only one value of the total moment of the two phases
Earthquake Mw
Coseismicmoment
(times 1016 N m)
Fast post-seismicmoment
(times 1016 N m) Time constant (d)
Slow post-seismicmoment
(times 1016 N m)Time constant
(d)Total moment(times 1016 N m)
Weight of thepost-seismic
Skyros 2001 64 568 UnknownLefkada 2003 62 360 No evidences lt20 per centMethoni 2008 69 2277 640 10 6435 449 9352 sim75 per centMovri 2008 64 470 103 Small seen at
RLSO onlysim 10 per cent
Cephalonia 2014(two events)
equiv 62 438 minor Not seen in GPStime-series
lt10 per cent
Samothraki 2014 69 2318 65 1543 1295 3861 sim 45 per centLefkada 2015 65 828 90 138 121 471 1039 20 per centLesvos 2017 63 406 4 87 140 493 sim25 per centKos 2017 66 1066 Not seen Data not available 220 lt25 per centZakynthos 2018 68 2486 445 21 548 183 3479 sim30 per centSamos 2020 70 3200 Not estimated Not estimatedTotal 14417 1175 8734
Figure 6 Evolution of the seismic moment released by the events listed in Table 3
low dip angle and not coplanar with the coseismic plane yet adja-cent to it In all studied cases the azimuth of the post-seismic slipvector remains little different from the azimuth of the coseismicslip
4 A NA LY S I S O F T H E V E L O C I T Y F I E L D
The secular velocity field represented with respect to stable Europeis plotted in Fig 7 The three profiles in red pass through the Eulerpole of rotation of Anatolia with respect to Europe (AT-EU) asdefined and located by Le Pichon amp Kreemer (2010) at 3196E3202N The radial and tangential vector amplitudes along thoseprofiles are discussed in the Supporting Information Those profilesare useful in particular because they display well the gradients ofvelocities
41 Northndashsouth extension in central Macedonia
Fig 7 shows that there is a gradient of northndashsouth velocity be-tween the stations located in central Macedonia and those locatedin Thrace The latter located in Bulgaria and east of the Strymonriver (LOVE SOFI KAVA THAS) present an average rate of
extension of 9 times 10minus9 strain yrminus1 The former (TEIS PROV MARM AFY0) present an average rate of extension of 42 times 10minus9
strain yrminus1 thus more than four times larger This extension is ac-companied by the occurrence of large earthquakes such as duringthe 20th century the Ierissos 1932 (Pavlides amp Tranos 1991) andthe Thessaloniki 1978 (Stiros amp Drakos 2000) events
42 Northndashsouth extension in the eastern Aegean
Fig 8 shows the vectors obtained after removing a counter-clockwise rotation of 156 Maminus1 (eg 273 times 10minus9 rad yrminus1) arounda pole located at 3196E 3202N (Fig 7) In this representationthat cancels the rotation of Anatolia the vectors along the coast ofTurkey are oriented almost northndashsouth with increasing length fromnorth to south The major step of velocity is located between theislands of Lesvos and Chios (see also Supporting Information FigS27) between which we measure a northndashsouth extension of 8 mmyrminus1 This is the area of the Mw = 63 earthquake of 2017 June 12(Papadimitriou et al 2018) and the large Mw = 68 earthquake of1949 July 23 (Melis et al 2020) Further south there is another stepbetween the stations KALY and KALU (Kalymnos) and the stations
Dow
nloaded from httpsacadem
icoupcomgjiarticle22614686166783 by guest on 13 July 2022
The GPS velocity field of the Aegean 477
Figure 7 Velocities of the 309 selected stations corrected of the effect of the earthquakes (Fig 4 Supporting Information Table S1) plotted with respect tostable Europe The three profiles along which the velocities are plotted in Supporting Information Figs S25 S27 and S29 are shown in red The main segmentof the North Anatolian fault is plotted from the west of Lemnos to the east of the Marmara Sea The labelled stations are those of the profile of SupportingInformation Fig S25 The pole of rotation AnatoliandashEurasia located at the 3196E 3202N is the one proposed by Le Pichon amp Kreemer (2010)
DATC and TILO (Tilos island) We interpret the velocity step be-tween Kalymnos and Tilos as corresponding to extension across theeastndashwest Gokova Gulf and its westward continuation south of Kos(Ganas et al 2019)
43 The wide stable area of central Aegean easternPeloponnese and western Crete
Fig 9 is a plot of the velocities shifted by 156 and minus252 mmyrminus1 with respect to the velocity of stable Europe in east and northrespectively It shows a vast area with little deformation in the centralAegean stretching from the central and southeastern Peloponnesein the west to the islands of Ikaria Leros and Kalymnos in the east
To the north the transition is abrupt at the south shore of theGulf of Corinth and extends to the east from the region of Thiva tothe south of Evia as suggested previously by Briole et al (2000)Avallone et al (2004) and Chousianitis et al (2013)
The western part of Crete can be included to this stable domainIndeed within our bars of uncertainties there is minor deformationbetween the Lefka mountains of Crete west of VAM0 (82 plusmn 03and minus113 plusmn 03 mm yrminus1 in east and north) and the stable central
Aegean and eastern Peloponnese region (79 plusmn 01 and minus117 plusmn01 mm yrminus1)
44 The southeastern Aegean
The domain including the eastern part of Crete Karpathos Ro-dos Astypalea and Tilos constitutes a region where distributeddeformation occurs As discussed in the previous section to thewest this domain starts in central Crete where there is a veloc-ity step of sim15 mm yrminus1 between the Lefka and the Psiloritismountains (Fig 9 and Supporting Information Fig S31) There isanother step of sim15 mm yrminus1 visible mostly in the east velocitythat concerns the most eastern stations SITI (Sitia) and ZKRO(Zakros) This step is consistent with the location and mechanismof deformation of the northeastsouthwest Ierapetra fault zone andthe Ptolemy trench (Caputo et al 2010) Our velocity field forCrete is on the whole in line with the one of Saltogianni et al(2020)
If we now consider Crete as a single body the ITRF2014 veloci-ties of the centre of the island are 87 plusmn 015 and minus124 plusmn 015 mmyrminus1 in east and north respectively With respect to the stable
Dow
nloaded from httpsacadem
icoupcomgjiarticle22614686166783 by guest on 13 July 2022
478 P Briole et al
Figure 8 Residual velocities after removing a rigid rotation of the Anatolian plate assuming the pole of rotation at 3196E 3202N and a rate of counter-clockwise rotation of 156 Maminus1 (eg 273 times 10ndash9 rad yrminus1)
central Aegean region this represented a velocity towards southeastof 08 plusmn 02 and minus07 plusmn 02 mm yrminus1 in east and north respectivelyTherefore the whole island can be considered as rotating clockwiseat a rate of 11 10minus9 rad yrminus1 (ie 06 Maminus1) This overall rotation isconsistent with the azimuth and amplitude of the vectors observedat Karpathos further east The overall rate of eastndashwest extensionof Crete when considered as a single body is 59 times 10minus9 strainyrminus1 (see the slope of the east velocity in Supporting InformationFig S31) which means that the net extension from the east to thewest coast is around 15 mm yrminus1
To the north this southeastern Aegean domain is bounded bya gradient of velocity of around 4 mm yrminus1 between Astypaleaand Naxos (Supporting Information Fig S29) with the deformationmore likely to be localized in the NEndashSW Amorgos basin south ofthe eponymous island (Nomikou et al 2018)
To the northeast this domain terminates south of the island of Kosand in the Gokova gulf that is known to be active with a localizedand relatively fast extension of sim4 mm yrminus1 (Ganas et al 2019) andwhere the Mw = 66 Kos earthquake occurred in 2017
45 Eastndashwest extension in the western Peloponnese
In the western Peloponnese Fig 9 shows a significant extensionthat starts west of the line joining Kalavrita Tripoli and Mon-emvasia This extension almost eastndashwest has been described byLyon-Caen et al (1988) after the Mw = 59 1986 September 13Kalamata earthquake [see also Stiros amp Kontogianni (2008) forgeodetic observations of that earthquake] and by Armijo et al(1992) who studied the historical Sparta earthquake of 464 BCwhich they estimated around M = 72 It was also analysed using
Dow
nloaded from httpsacadem
icoupcomgjiarticle22614686166783 by guest on 13 July 2022
The GPS velocity field of the Aegean 479
Figure 9 Velocities shifted by 156 and minus252 mm yrminus1 with respect to the velocity of the stable Europe in east and north respectively highlighting thestability of a region constituted of the central Aegean eastern Peloponnese and western Crete
GPS data in particular by Floyd et al (2010) and Chousianitiset al (2015) The extension captured by the GPS stations can beanalysed in Supporting Information Fig S30 It concerns mostlythe domain located between Sparta and the western coast (Pylos)with sim4 mm yrminus1 eastndashwest extension localized there in a band ofsim50 km To the east of Sparta there is also extension but it is muchsmaller with amplitude sim2 mm yrminus1 occurring in a wider band ofsim100 km
46 Rotation of the Pindos region and collision with theApulian platform
Fig 10 shows the vectors of northern Greece after removing aclockwise rotation of 26 Ma minus1 (see Fig 7) with respect to stableEurope This rotation minimizes almost completely the vectors inan extended area starting in central Greece around the latitude 385
and bounded to the east by the line formed by the Olympus mountainrange East of this range Fig 10 shows that the rotation rapidly failsto minimize the vectors To the west the rotation does not minimizethe vectors along the western coast of Epirus (eg station GARD)and in the islands of Paxoi and Corfu This is expected as we knowthat there is a significant and localized compression in the mountainranges along the Epirus coast (eg Baker et al 1997 Ganas et al2013 DrsquoAgostino et al 2020) with the frequent occurrence ofsignificant earthquakes for example the Kanallaki earthquake of2020 March 21 (Table 1)
Using our GPS velocities Valkaniotis et al (2020) have estab-lished that at the latitude of Kanallaki and Paxoi the convergencebetween the Apulian platform (using the velocity of DrsquoAgostinoet al 2020) and the central Pindos region (using our velocity) is
89 mm yrminus1 in the N228E azimuth This azimuth is significantlydifferent than the N247E obtained by Louvari et al (2001) byanalysing the slip vectors of the earthquakes in northwestern GreeceConcerning the rate of convergence we find an extra 37 mm yrminus1
with respect to the value of the convergence between Apulian andstable Europe at that location (52 mm yrminus1) This extra convergenceis induced by the compression imposed by the motion of the Anato-lian micro plate itself resulting in the rotation of the Pindos region(Valkaniotis et al 2020) In consequence we expect a larger rate ofconvergence to the south of this zone around Preveza and a lowerrate of convergence to the north around Corfu and the continuationof this decrease until Vlora Valkaniotis et al (2020) evaluated at60 km the width of the deforming zone (defined as the zone where80 per cent of the total convergence is accommodated) a value con-sistent with that found by Kassaras et al (2016) from their analysisof a large database of focal mechanisms (see top section in theirfig 11)
The thickness of the brittle (lockedseismic) area found by Valka-niotis et al (2020) is 11 km a value consistent with the depth ofthe fault of the Kanallaki earthquake They showed also that thecentral axis of the plate boundary runs along the southwestern coastof Corfu and the northeastern coast of Paxoi which means that halfof the strain is accommodated offshore in a band of sim30 km
47 Distributed deformation in central Greece
This is an eastndashwest shaped area that roughly coincides with theazimuth projected inland of the major branch of the North Ana-tolian fault (Hatzfeld et al 1999) It is a region with distributedextension and the largest strain rates observed in Europe especially
Dow
nloaded from httpsacadem
icoupcomgjiarticle22614686166783 by guest on 13 July 2022
480 P Briole et al
Figure 10 Velocities in and around the Pindos region plotted after counter-clockwise rotation of 26 Ma -1 of the vectors of Fig 7 around a pole of rotationPindos-Eurasia located 10 km west of Permet (Albania) represented by the large red circle The small red circle is the location of the pole obtained when usingalso the stations of central Greece located south of the latitude 385 and north of the Gulf of Corinth
in the western Gulf of Corinth (Clarke et al 1998 Avallone et al2004) where strong historical seismicity is recorded (Ambraseysamp Jackson 1990 1997) and large faults well exposed in the fieldfor example Roberts amp Ganas (2000) and Goldsworthy amp Jackson(2001) There are several grabens that localize most of the defor-mation
(1) the graben of the Ambracian Gulf south of Arta where wemeasure an extension larger than 10 mm yrminus1 between the stationsof ARTA and ARTU and the stations AMFI and ABEL
(2) the graben of the Trichonis lake with an oblique extension ofsim2 mm yrminus1 measured between the station of AGRI AGRU PVOGand the stations MESO and RETS and where moderate seismicityis recorded with the occurrence of events of swarms like the one of2007 (Kiratzi et al 2008)
(3) the Gulf of Patras with an extension rate of sim7 mm yrminus1
measured between RETS and MESO to the north and MAOR andANOA to the south
(4) the rift of Corinth extensively studied for decades (eg Am-braseys amp Jackson 1997) where the deformation reaches its acmein the western part of the rift west of the island of Trizonia with anintense level of microseismicity recorded almost at all times
(5) the graben of Evia with major normal faults north-dipping(Ganas amp Papoulia 2000) and showing less seismicity during the20th century with respect to the Gulf of Corinth
The whole area of central Greece is rotating with respect to thecentral Aegean domain Here taking the stations located south ofthe latitude of sim385 (defined in the previous section as the ap-proximate limit of the Pindos domain) and the northern shore ofthe Gulf of Corinth we find a clockwise rotation of sim4 Maminus1
for this domain thus more than the 26 Maminus1 of the Pindos do-main This value is consistent with the determination of Chousianitiset al 2015 The larger value of 7 plusmn 05 Maminus1 found by Avalloneet al (2004 see their fig 3) is due to the fact that they use mostlystations located very close to the Gulf of Corinth and thereforeaffected by the extension (increasing from east to west) along therift
48 The South Ionian Islands and surroundings
This south Ionian domain at the northwestern termination of theHellenic megathrust is an area of high seismicity and strong internaldeformation (Ganas et al 2020 Haddad et al 2020) It is bounded
Dow
nloaded from httpsacadem
icoupcomgjiarticle22614686166783 by guest on 13 July 2022
The GPS velocity field of the Aegean 481
by the Cephalonia fault zone to the west and by the major strike-slip faults of Movri and Katouna to the east The deformation ofthis relatively small area (Kahle et al 1993 Louvari et al 1999)is complex as a significant part of the deformation corresponds tothe accumulation of strain in the vicinity of the major right lateralCephalonia fault zone where the recurrence time of earthquakes isshort (Briole et al 2015)
The left lateral strike-slip motion along the Katouna fault is largerthan 6 mm yrminus1 according to the GPS as inferred by the relativevelocities of KTCH (and to some extent RGNI yet it should belocalized in the deforming zone of the fault) with respect to MESOand RETS
In our velocity field we can see also a difference in the behaviourof the vectors when moving from north to south While compressionis visible in Lefkada Cephalonia and Zakynthos it disappears fur-ther south at Strofades This suggests the existence of two differentdomains To the north the plate interface is dominantly locked andproduce earthquakes along the subduction megathrust and alongthe Cephalonia fault zone The GPS velocities at the southern sta-tions of Cephalonia KIPO KEFA ARGO VLSM and SISS whichare roughly aligned perpendicular to the Cephalonia fault showwell a gradient of velocities characteristic of strain accumulationduring the interseismic period The observed gradient is consistentwith the one evaluated by Briole et al (2015) using the velocities ofcampaign stations located in the south of Cephalonia To the southof Zakynthos in particular at Strofades (STRF) the convergenceappears almost unlocked as it is also observed in the entire offshoresouthern Peloponnese and south of Crete (see Section 44) witha population of subduction earthquakes small compared to what itwould be in the case of a fully coupled zone This strong unlockinghas been quantified and discuss by various authors since the earlyworks of the 1990s in particular Ekstrom amp England (1989)
49 The vertical velocities
Fig 11 shows the vertical velocities at a selection of 177 points hav-ing an uncertainty on that velocity lower than 1 mm yrminus1 We do notsee clustering in the distribution of the velocities with areas showingpreferential up or down movement within the bars of uncertaintiesSupporting Information Fig S33 shows the cumulative distributionand best Gaussian fit calculated with the whole set of 322 stationsand with the subset of 177 stations having velocity uncertainty lowerthan 1 mm yrminus1 The best Gaussian fit is calculated for the velocitiescomprised between minus27 and 14 mm yrminus1 only which correspondsto 90 per cent of the population of stations the data at the edge ofthe distribution (6 per cent on the negative velocity side and 4 percent on the positive velocity side) showing clear departure from aGaussian distribution Most of the outliers of the negative velocityside are likely to correspond to local subsidence that can have var-ious causes natural or anthropogenic for example GEYB that ismentioned in Supporting Information Section S47 The median ofthe 177 best velocities is minus038 mm yrminus1 This overall subsidenceof the whole area is slightly less but relatively consistent with theobservations and models of Serpelloni et al (2013) who find (eg intheir fig 8) a subsidence of Greece and western Turkey in the rangeminus04 to minus08 mm yrminus1 increasing towards southwest with averageminus06 mm yrminus1 Our geodetic results are not sufficient to investigatelocal aspects of the vertical deformations in geological timescalesand therefore we do not compare our velocities with the veloci-ties predicted by Howell et al (2017b) or with the observations ofRobertson et al (2019)
5 M O D E L W I T H T E N C RU S TA L B L O C K S
Using the analysis made in the previous section we will now buildand assess a kinematic model composed of ten crustal blocks Thismodel is intended to reproduce at the first order the velocity fieldThe applications of a deformation model can concern geophysicalconsiderations but also various practical needs of surveyors workingin Greece To set up the model requires (i) deciding the number ofblocks (ii) deciding the boundaries between the blocks (iii) decid-ing the parameters that will characterize each block (iv) evaluatingthose parameters and (v) assessing the performance of the modelLet us also point out that there was already such a block model inthe article of Nyst amp Thatcher (2004) yet coarser because of thelimited available GPS velocities at that time but it shares alreadyseveral conceptual characteristics with ours
51 Definition of the crustal blocks
In the previous sections we have seen that there is a relatively welldefined and large stable region located in the central Aegean Sea andthe eastern Peloponnese To the southeast the islands of KarpathosRodos and Astypalea belong to a different structure that is movingtowards the southeast with respect to the previous one and rotatingas we have seen for southeast Crete and even more in KarpathosThose two structures will constitute our blocks CA (Central Aegean)and SA (Southern Aegean) We have seen that there is a large eastndashwest extension in the western Peloponnese mostly located west ofthe Taygetus mountain but with some minor expression even eastof it Our third block called WP (West Peloponnese) will containthis eastndashwest extension as well as most of the variable deformationrelated to the subduction in the West Hellenic arc
To the northeast of the CA block we define a block that wecall NA (Northern Aegean) that contains all the islands locatedbetween the north of Samos and Lemnos including Skyros andSkopelos to the west We have seen in Section 42 that this domainis deforming internally However in our model we consider it as asingle block despite the strong internal deformation between Lesvosand Chios The reason is that we do not have enough GPS stationsand long enough time-series to split the zone in two and retrieverobust parameters for both
North and northwest of the North Anatolian fault we have seenthat there are three domains with relatively distinct velocity fieldsthe largest one is the one that we will call PI (Pindos) and that weused to estimate the rotation of this region East of it we have seenthat central Macedonia east of the line of the Olympus mountainpresent a different kinematics with minor rotation and large northndashsouth extension Further east we have seen that this large extensionends at the longitude of the elbow of the North Anatolian faultwhich corresponds to the region of Thrace east of the Strymonriver Therefore this defines two other blocks that we call CM(Central Macedonia) and TH (Thrace) To the west of the Pindosblock we have seen that despite the limited number of stationsthe GPS vectors show well the compression in the mountain rangeslocated along the coast in the west of Epirus We define a blockthere that we call WE (Western Epirus)
Between the Pindos area and the Peloponnese there is the areaof central Greece north of the Gulf of Corinth and including thecentre and north of Evia We define a block there that we call CG(Central Greece) The limit between the PI and CG blocks is notwell defined because of the limited number of GPS points and thedistributed nature of the deformation However Fig 10 indicatesthat KARP (Karpenissi) LAMI and LAMA (Lamia) belong to the
Dow
nloaded from httpsacadem
icoupcomgjiarticle22614686166783 by guest on 13 July 2022
482 P Briole et al
Figure 11 Vertical velocities of the 177 points with uncertainty on this velocity lower than 1 mm yrminus1 Black and white dots mean that the velocity is belowminus2 mm yrminus1 or above 2 mm yrminus1 respectively The size of the dots is inversely proportional to the uncertainty The 68 points where the uncertainty is below07 mm yrminus1 have their code plotted
former while ANOC and LIDO belong to the latter so we drawthe boundary from the Trichonis Lake where we know that there isactive faulting and northndashsouth extension to the northern entranceof the Gulf of Evia
Our last block which fits with the IAB (Ionian IslandsndashAkarnaniaBlock) of Perouse et al (2017) contains the South Ionian is-lands (Zakynthos Cephalonia Lefkada) and the regions of north-west Peloponnese (around Killini) and the western part of Aetolia-Acarnania west of the Katouna fault we call it the SI block
Supporting Information Fig S34 presents the location of theten blocks together with the focal mechanisms (those for depthsshallower than 35 km) published by the National and KapodistrianUniversity of Athens for the period 2003ndash2018
52 Boundaries of the blocks
The boundaries of the blocks are plotted in Fig 12 Details of thecriteria and location of 21 of the boundaries segments (coded usingthe letters andashu) are given in Table 4 For practical reasons to simplifyfurther analysis we minimized the number of edges and maximizethe boundaries located at sea (eg at the north entrance of the Eviagulf south of Pilion) where the boundary matters for seismologyand geology but cannot be well constrained by GPS
The major fault zones and zones of localized deformation ofGreece constitute boundaries between the blocks this is the casein particular of the North Anatolian fault (segments i and j) theCorinth rift and its extension through the south of Evia (segments cand m) the Amorgos basin fault zone (segment k) the Movri-Patrasfault (segment a) the Katouna fault (segment e) the narrow anddeforming mountain ranges of WE (segment h) The Cephaloniafault (segment l) is also an obvious boundary with the Apulianplatform To the north the boundary with stable Europe is arbitrarybut can be used to verify that our model is not implying a gapof velocity there which can be verified in Fig 13 To the east theboundary inside Turkey is also arbitrary To the south and west theboundaries of the model are at sea
53 Parameters of the blocks
For each block we define seven parameters Two are the coordi-nates of the barycentre of the GPS stations of the block Two are thehorizontal components of the estimated velocity of this barycentrecalculated using the average of the velocities of the various GPS sta-tions of the block without weighting by their uncertainties We foundinsignificant differences (below 01 mm yrminus1) when weighting eachvelocity by its uncertainty The fifth parameter is the rotation of the
Dow
nloaded from httpsacadem
icoupcomgjiarticle22614686166783 by guest on 13 July 2022
The GPS velocity field of the Aegean 483
Figure 12 Boundaries of the crustal blocks model HelVel2020 The letters in yellow (andashu) correspond to boundaries that are discussed in Table 4 and in thetext The residual velocities after applying the blocks model are plotted (compare with the original vectors plotted at the same scale in Figs 7 and 8) Amongthe 265 stations used for determining the parameters of the model 119 with post-fit residual lower than 1 mm yrminus1 are not plotted 80 with post-fit residualbetween 1 and 2 mm yrminus1 are plotted with green arrow 32 with post-fit residual between 2 and 3 mm yrminus1 are plotted with purple arrow and 34 with post-fitresidual larger than 3 mm yrminus1 are plotted with black arrows
block determined for all block in the same way we did for Pindosin the previous section The last two parameters are a homogeneous(linear) component of strain in the east and north components esti-mated by minimization of the residuals obtained after the rotationThe parameters of the ten blocks are listed in Table 5 In two of theblocks not all stations were used for the minimization This is thecase of CA where nine stations located in a radius of 10 km aroundthe city of Patras were removed because of the large discrepancyof those stations that are located right in the boundary between twoor more blocks (Elias amp Briole 2018 Papadopoulos et al 2019)This is also the case of TH where six stations of Bulgaria wereincluded for further analysis but not used for the minimizationThe total number of stations used for the assessment of the modelare therefore 249 (for a total of 265 included in the blocks anal-ysis) The number of stations used in each block is reported inTable 5
The background concept of our crustal blocks model is closeto the concept of blocks model developed by Simpson et al(2012) and refined in particular by Savage amp Simpson (2013ab)
Savage amp Well (2015) and Savage (2018) Both are using the con-cept of Euler-vector clustering with the same theoretical back-ground but instead of inverting for the two coordinates of a Eulerpole defined with respect to the ITRF2014 and a rotation with re-spect to this pole we invert for the velocity of our blocks in theITRF2014 and an internal rotation of the block (with respect toits barycentre) Both methods are mathematically equivalent andwe believe that ours is more intuitive in terms of understandingof the local relative displacements and differential rotations of theblocks Concerning the internal deformation of the block in theirformalism Savage amp Simpson (2013a) make the assumption thatthe upper crust is elastic They use the corresponding equations foruniform strain and rotation rates (their eq 4) so they invert forfour parameters εE εN εEN and However later in their article(section [39]) they discuss the fact that the upper crust might beinelastic and discuss the impact for the rotation rate Savage ampSimpson (2013b) make the same observation and in their section[24] indicate that the strain accumulation they calculate need not beinelastic In the case of the Aegean there is a distributed faulting
Dow
nloaded from httpsacadem
icoupcomgjiarticle22614686166783 by guest on 13 July 2022
484 P Briole et al
Table 4 Definition of the edges of the ten blocks model The codes are plotted in Fig 12
Code Long Lat Nature of the discontinuity data supporting placing a block boundary there
a 2153 3795 Right-lateral strike-slip illustrated by the 2008 Movri earthquake (Serpetsidaki et al 2014)b 2156 3819 Extension across the Gulf of Patras involving eastndashwest faults located south of the Gulf according to Flotte et al (2005)c 2214 3831 Zone of the fastest extension of the rift of Corinth around Aigiond 2280 3818 Eastern rift of Corinthe 2119 3870 Left-lateral strike-slip across the Katouna-Stamna fault zone (Perouse et al 2017)f 2149 3856 Extension across the Trichonis lake (see also u)g 2088 3896 Extension across the Ambracian Gulfh 2044 3953 Compression in western Epirus where moderate to strong seismicity occurs episodically for example on March 21 2020
with the Mw = 57 Kanallaki earthquake (Valkaniotis et al 2020)i 2528 4018 Main branch of the North Anatolian fault on which the Mw = 69 Samothraki 2004 earthquake occurredj 2402 3958 Main branch of the North Anatolian fault west of the elbow located southeast of the Athos mount rangek 2588 2667 Extension across the Amorgos basinl 2040 3871 Major right lateral fault of Lefkada-Cephaloniam 2376 3832 Crosses through southern Evia to reach the eastern termination of the Gulf of Corinth in the region of the Kaparelli fault
(1981 earthquake) and other faultsn 2755 3683 Extension across the Gokova gulf (where the Kos 2017 earthquake occurred) and further west and south of Koso 2425 3526 Location of the offset of velocity between western Crete (which shows almost no motion with respect to central Greece)
and eastern Crete (see Supporting Information Fig S31)p 2289 3694 Diffuse zone where the eastndashwest extension in the Peloponnese becomes significant The western part of the Peloponnese
is characterized by distributed extensionq 2231 4034 Discontinuity observed in the GPS data along the Olympus mountain range and further north towards Naoussa and Florinar 2382 4111 Discontinuity observed in the GPS velocities following approximately the course of the Strymon valleys 2466 3829 Eastern coast of Evia Andros and Tinost 2647 3775 Extension across a major fault zone located along the northern coasts of Ikaria and Samos The residual velocity at the
station SAMU (east of Samos) might correspond to strain accumulation in this deforming fault zone Indeed SAMU islocated in the footwall of the 2020 fault close to it thus within the region sensitive to strain accumulation and releaseduring the seismic cycle
u 2250 3881 Through the northwestern entrance of the Gulf of Evia and south of the Pindos mountains towards the triple junction ofStamna west of Agrinion
Table 5 Characteristics of the ten blocks of our velocity model HelVel2020 The codes of the domains are the following SA Southern Aegean CA CentralAegean WP Western Peloponnese SI Southern Ionian Islands WE Western Epirus PI Pindos CM Central Macedonia TH Thrace NA Northern AegeanCG Central Greece The file with the boundaries of the 10 domains is in the Supporting Information The longitude and latitude are those of the barycentre ofthe GPS stations used to characterize the domain The velocities are the average of the ITRF2014 velocities of the stations considered for each domain (withoutweighting with the single uncertainty of each station) The uncertainties σE and σN are the rms deviations of the residual vectors in the block after rotationand corrected for the strain divided by the square root of the number of stations aThere are nine extra stations in this block located around Patras not usedfor the modelling because they are in the deforming zone between the block CA SI and CG bThere are seven extra stations further north in Bulgaria not usedfor the modelling but present in the final list of residual velocities The rms deviations of the residual vectors are listed in the last two columns The globalaverage scatters for the whole selection of 249 stations (used in the model) is 087 and 097 mm yrminus1 in east and north respectively Fig 12 shows the map ofthe residual vectors corrected from the blocks model at the 265 selected GPS stations
Block Stations Long Lat vE vN σE σN σ εE εN rmsE rmsN
used () () (mm yr-1) (mm yr-1) (mm yr-1) (mm yr-1) ( Ma minus1) ( Ma minus1) (nstrain) (nstrain) (mm yr-1) (mm yr-1)
SA 28 25731 35538 101 minus135 028 021 06 02 151 43 101 099CA 47a 23994 37414 81 minus115 008 008 02 01 minus06 21 069 071WP 21 22213 36923 50 minus120 020 009 01 03 264 56 076 050SI 24 20863 38263 152 12 021 027 62 08 minus505 28 148 143WE 7 20140 39485 216 144 023 015 07 11 76 minus325 097 049PI 39 21874 39602 201 71 010 019 26 02 34 182 088 082CM 21 23141 40649 239 79 010 019 04 03 minus90 361 039 072TH 18b 25340 41191 232 123 007 010 minus04 02 minus36 102 041 045NA 18 25718 38943 82 minus36 056 028 05 07 minus339 482 109 293CG 26 22628 38477 117 minus24 022 020 40 04 minus161 569 083 093
and we do not expect the upper crust to be perfectly elastic There-fore in our formalism we calculated three terms only εE εN and thus ignoring εEN This approximation is also making the dis-cussion simpler for the geological analysis with only two terms ofeastndashwest and northndashsouth homogeneous deformations within theblocks
A major difference is the fact that we have established the bound-aries of our blocks based on the analysis of the GPS velocity field
the geology and fault maps and the seismicity without trying to per-form a ldquoneutralrdquo clustering analysis like the k-medoids method ap-plied by Savage amp Simpson (2013a) or Savage amp Simpson (2013b)
54 Fit to the data
For the 249 stations used for defining the parameters of the blockswe calculated the residuals after applying the deformation of the
Dow
nloaded from httpsacadem
icoupcomgjiarticle22614686166783 by guest on 13 July 2022
The GPS velocity field of the Aegean 485
Figure 13 Velocities (vectors) of the ten blocks with respect to Eurasia and their rates of rotation (see numerical values in Table 5) The areas in grey representthe theoretical location of the blocks after two million years The gaps and overlaps that exist between some limits of blocks correspond to areas where thereis a localized deformation (extension compression strike-slip) between the two blocks not taken into account in the blocks model In particular the rift ofCorinth and its eastern continuation across Evia are well identified The areas listed in Table 6 are shown with boxes containing the letters andashm (the sameletters as those used in Fig 12 and Table 5)
block Fig 12 shows the residual vectors The average rms fit is087 and 097 mm yrminus1 respectively in east and north
55 A programme to calculate the modelled velocities
We wrote a Fortran programme (called helvel2020f) to calculatethe predicted velocity of any point of Greece along with the blockto which it belongs The programme and its documentation areprovided in the supplementary material The programme can be usedto estimate the velocity gradient in several boundaries of blocks thiscan be particularly useful where there are no (or only a few) pointslocated close to the analysed boundary
56 Discussion of the model
We calculated and mapped in Fig 13 the motion and internal defor-mation of the ten blocks considering arbitrarily a period of 2 Ma
We used this duration because it allows at the same time a goodvisual understanding of Fig 13 and a correct kinematic analysisas during Quaternary the main features of active tectonics have notchanged much Several features are visible in particular as expectedwhen setting the boundaries the localized deformation along themThis is the case in particular of the Gulf of Corinth the North Anato-lian fault the Amorgos basin the Movri fault zone We observe alsoad hoc deformation in the central Peloponnese this is because weplaced arbitrarily the boundary there while we know from the GPSvelocities (Supporting Information Fig S30) and from seismologi-cal analysis (eg Kapetanidis amp Kassaras 2019) that it is a diffuseboundary
Table 6 gathers the predictions of the model at various blockboundaries We find shear velocities of 74 mm yrminus1 and shorteningof 23 mm yrminus1 across the Movri fault zone at the location of the Mw
= 64 2008 June 8 earthquake in northwest Peloponnese Given thelimited accuracy of the parameters of the SI block (see Table 5) andthe amplitude of the residuals the uncertainty on the component ofcompression is around plusmn 2 mm yrminus1 therefore we conclude that
Dow
nloaded from httpsacadem
icoupcomgjiarticle22614686166783 by guest on 13 July 2022
486 P Briole et al
Table 6 Relative east (dVE) and north (dVN) velocities between blocks at several specific areas of interest Az Azimuth of the boundary with respect to north(positive = clockwise) Str Strike-slip component (positive = left lateral) Ext Extension component (positive = extension) acomponents estimated assumingthat the fault is oriented eastndashwest in the studied area
Object Code in Long Lat dVE dVN Az Str Ext
Fig 13 () () (mm yrminus1) (mm yr-1) ()(mm yr
-1)(mm yr
-1)
Movri fault near the epicentre of the 2008 earthquake a 2153 3795 52 57 25 minus74 minus23Extension across the Gulf of Patras b 2156 3819 minus01 79 285 21 76Extension of the Gulf of Corinth at the longitude of Aigion c 2214 3831 28 104 284 02 108Extension of the Gulf of Corinth at the longitude of Kiato d 2283 3817 08 54 284 minus07 54Strike-slip along the Katouna fault e 2119 3870 minus36 83 336 90 minus01Extension across the Trichonis lake f 2149 3856 10 15 90 10a 15a
Extension across the Ambracian Gulf g 2088 3896 minus17 126 90 minus17a 126a
Compression across the Paramythia mountains (assumingthat they localize the entire compression)
h 2053 3945 28 23 321 00 minus37
North Anatolian fault near Lemnos i 2502 4008 126 82 65 minus149 22North Anatolian north of Alonissos (west of the elbow) j 2402 3958 89 31 48 minus87 minus37Amorgos right lateral basin k 2612 3671 43 minus11 70 37 25North end of the Cephalonia fault (north of Lefkada) l 2060 3891 minus27 106 17 minus94 57Shear component in the transition zone Corinth-Evia m 2376 3832 07 10 70 minus10 07
compression is probable across this fault zone with an amplitudenot well defined in the range sim05ndash4 mm yrminus1
Further north along the Rio-Patras right lateral fault we find121 mm yrminus1 of right lateral shear and 38 mm yrminus1 of extensiontwo values relatively close to those (15 and 62 mm yrminus1) inferredby Elias amp Briole (2018) by modelling the gradients of GPS vectorsacross the termination of the Corinth rift (see their table 4) To thewest of those strike-slip faults we find an extension of 76 mm yrminus1
across the Gulf of Patras with a small component of left lateralstrike-slip of 21 mm yrminus1 The relatively low seismicity there asrecorded during the last decades (Haddad et al 2020) suggests that asignificant part of the extension may be accommodated aseismicallyFurther north we find a shear rate of 90 mm yrminus1 on the left-lateralKatouna fault which is in the upper range of what was predicted byPerouse et al (2017) using geological evidence (minimum 4 mmyrminus1) and the GPS data available at that time (around 10 mm yrminus1)North of this fault we find a fast extension of 126 mm yrminus1 withminor right lateral component of 17 mm yrminus1 across the AmbracianGulf an area poorly documented by GPS especially to the northThis fast extension is comparable to that of the western end of theCorinth rift (which is coherent and expected from the kinematicspoints of view) but it does not produce intense microseismicitylike the western Corinth rift does The compression across WEis estimated at 37 mm yrminus1 There are not enough GPS stationsthere especially in the southern part of this block between Prevezaand Parga along the coast and along the line Arta-Ioannina in theinterior to characterize accurately this deformation It may occur ina relatively narrow zone of 50 km or less but much more GPS datais needed there to get the required accuracy
We find 149 mm yrminus1 of shear with small extension of 22 mmyrminus1 on the North Anatolian fault north of Lemnos and 87 mmyrminus1 with 37 mm yrminus1 of shortening along the Sporades segmentof the fault located between Skopelos and the elbow of the faultwest of Lemnos where the strike of the fault changes from N68Eto N50E The extension of the Gulf of Corinth is well fitted by themodel with almost pure extension of 108 mm yrminus1 at the longitudeof Aigion and 55 mm yrminus1 at the longitude of Kiato consistentwith the velocities given by Elias amp Briole (2018) Chousianitiset al (2013) and Avallone et al (2004) There is a transtensionalmovement of 45 mm yrminus1 between the islands of Amorgos andAstypalea
Only the Ionian Islands region shows evidence of dominant cou-pling along the subduction interface For the Cephalonia fault if weassume that the central axis of the fault zone is in the middle of thePalliki peninsula following Briole et al (2015) and use their veloc-ity of Apulia in front of Cephalonia (236 and 189 mm yrminus1 in eastand north) our model gives a velocity of 169 and 57 mm yrminus1 atthat point thus a vector relative to Apulia of 67 and 132 mm yrminus1Projected along the fault axis azimuth this corresponds to 143 mmyrminus1 for the shear velocity along the fault at that latitude of 3825Nthus significantly less than the 195 mm yrminus1 proposed by Brioleet al (2015) There is also a significant component of shorteningof 38 mm yrminus1 At the northern tip of the Cephalonia fault zonein the north of Lefkada we measure 94 mm yrminus1 of shear betweenthe block SI and the southeast of the block WE thus 49 mm yrminus1
less than the fault velocity at the south of Cephalonia This decreaseof velocity on the Cephalonia fault zone at its northern termina-tion is consistent with the description made by Valkaniotis et al(2020) of the location and size of the deforming band between theApulian platform and the Pindos block According to them the offshore extension of the deforming band is sim30 km Therefore theprogressive attenuation of the slip rate on the Cephalonia fault isexpected to occur on this length scale The amplitude of the attenu-ation should be sim44 mm yrminus1 (half convergence rate at the latitudeof GARD) plus sim04 mm yrminus1 due to the northndashsouth increase ofconvergence rate induced by the rotation of the Pindos block (seeSection 55) thus a total of sim48 mm yrminus1 of difference which fitsvery well with the 49 mm yrminus1 of the model
The right lateral shear in the transition zone Corinth-Evia isaround 1 mm yrminus1
6 C O N C LU S I O N S
The velocity field presented here for Greece is taking into accountprecisely the coseismic and post-seismic displacements producedby the earthquakes This is something that Muller (2011) did alreadyin his thesis quantifying and correcting the effects of the Strofades1997 (Hollenstein et al 2008) Skyros 2001 and Zakynthos 2006earthquakes for which there were GPS data available from perma-nent and campaign stations Here we extended the analysis to theperiod 2000ndash2020 and we added the correction of the post-seismicdeformations Our coordinates of the stations at the epoch 20200
Dow
nloaded from httpsacadem
icoupcomgjiarticle22614686166783 by guest on 13 July 2022
The GPS velocity field of the Aegean 487
(Supporting Information Table S7) and velocity field (SupportingInformation Table S1) provide a precise framework for the nestingof denser local geodetic networks such as the one of the westernCorinth rift (httpcrlabeu) and for the nesting of any geodeticwork in Greece After applying this correction for the effect of theearthquakes we constructed a crustal blocks model comprising tenblocks This model reproduces the Greek GPS velocity field within1 mm yrminus1 on average on the entire country
Compared to the duration of the seismic cycles the time periodsampled by GPS is short from a few years to 20 yr with an av-erage of 10 yr This time interval allowed us to draw a number ofconclusions about the role of earthquakes based on the populationof earthquakes occurring in the period But what is the representa-tiveness of this population of earthquakes and what would be thesituation with a different period Would a longer period lead tovery different conclusions or not so different With the data al-ready available can we already draw scenarios over periods longerthan the 20 yr of GPS If we consider a period twice as long weshould have integrated important earthquakes such as those of Thes-saloniki 1978 (Stiros amp Drakos 2000) Volos 1980 (Drakos et al2001) Corinth 1981 (Stiros et al 2007) Kalamata 1986 (Stiros ampKontogianni 2008) Grevena 1995 (Meyer et al 1996) and Aigion1995 (Bernard et al 1997) which affected regions different fromthose affected by the earthquakes of the period 2000ndash2020 We notethat the 1981 and June 1995 events occurred along a block bound-ary (CA-CG) while the 1978 1980 1986 and May 1995 events allwith extensional kinematics occurred inside several of our blocksThis highlights the fact that significant amounts of seismic strainsare accumulated and released across fault zones located inside thedeforming blocks
We observed a transient signal affecting stations located betweenZakynthos and the Peloponnese in May 2018 (Supporting Informa-tion Fig S10) This is the first detection of this type of transientmade in Greece It is also reported by Mouslopoulou et al (2020)yet their estimate of the magnitude and the fault size is too large anddoes not fit the GPS data We modelled this event as slow aseismicslip on the subduction interface The fact that no other events of thistype have been found in all the time-series studied does not meanthat there were no others in the period but simply shows that if thisis the case their amplitude was such that they passed through themeshes of the net allowed by the GPS
The velocity field presented in this paper relatively dense andaccurate gives a more accurate vision of the velocity field ofGreece For example the fast relative motion across the Katounafault (Perouse et al 2017) is better quantified as well as the exten-sion across the Amorgos Basin in the area of the 1956 earthquake(Okal et al 2009) Like Mouslopoulou et al (2014) we find pos-sible evidence of tectonic activity along the Strymon river valleywhich is a site of crustal weakness because of the previous phase ofMiocene extension in central-north Macedonia (Dinter 1998) butthere is not enough resolution to further discuss this observationin terms of activity of a specific fault and in view of geologicaldata suggesting northndashsouth extension during Quaternary (Tranos2011)
We find a significant gradient of extensional deformation in themarine basin between Lesvos and Chios while the gradient is mi-nor between Lemnos and Lesvos In the latter region we note thesynchronous activation of northeastsouthwest right lateral faults(Pavlides amp Tranos 1991 Ganas et al 2014) and eastndashwest normalfaults such as the 2017 Gulpinar sequence (Ganas et al 2018)
The GPS networks including most of the 102 academic stationswere not designed with enough care to capture well the vertical
tectonic velocities A majority of the GPS stations are located onbuildings and sedimentary areas possibly affected by deformationsin the subsurface of anthropogenic or natural origin This is a weak-ness to be addressed when upgrading the scientific GPS networksin the future Improving the understanding of the geodynamic pro-cesses and the forces involved inside and below the brittle crust(on top of which the GPS observations are made) requires morehigh-quality data on the vertical
A C K N OW L E D G E M E N T S
We are grateful to the EUREF IGS and several academic institu-tions from Greece (NOA NTUA TEIC AUTH TUC NKUA UPatras) France (CNRS) Bulgaria (BAS) Italy (INGV) Czech Re-public (Charles University) UK (COMET) and USA (UNAVCO)for distributing their GPS data through open channels We are grate-ful to the companies TreeComp and Metrica SA (HxGN SmartNet)who provided us with the GPS data of their stations The data fromAlbania are distributed by ALBPOS The time-series of the Turk-ish stations (GCM network) are those distributed by the NevadaGeodetic Laboratory (Blewitt et al 2018) We had access to datafrom three stations of the Greek KTIMATOLOGO SA networkWe thank JPLNASA for the GIPSY 64 software that was usedto process the GPS data We thank Nicolas Chamot-Rooke SimonBufferal Helene Lyon-Caen Ioannis Kassaras Sotiris Valkaniotisand Antonio Avallone for fruitful discussions We thank VassilisZorapas (IGME) for providing us borehole water level data Forseveral figures we used the Generic Mapping Tool (Wessel amp Smith1998) and SRTM and EMODNET topography data Author contri-bution statement The four authors have been deeply involved for20 yr in the deployment maintenance and data management of theacademic permanent GPS stations from Greece and Bulgaria con-tributing to this paper PB and AG gathered the RINEX data PBprocessed the GPS data analysed the time-series made the blocksmodel and wrote the paper with the help from co-authors All au-thors contributed to the edition and review of the manuscript Weare very grateful to the Editor one anonymous reviewer and WayneThatcher for their very detailed and constructive reviews
DATA AVA I L A B I L I T Y
The GPS data acquired by the academic partners is available throughtheir web portals
The time-series of the GPS station coordinates are provided inthe Supporting Information
The computer code HelVel2020 that calculates velocities inGreece is provided in the Supporting Information
The ITRF2014 coordinates of all GPS stations at the epoch 20200are provided in the Supporting Information (Table S1)
R E F E R E N C E SAardoom L amp Van Gelder BGW 1984 Satellite laser ranging to measure
crustal motion in the eastern Mediterranean areamdashinstrumentation andnetwork design Ann Geophys 2(3) 249ndash258
Altamimi Z Rebischung P Metivier L amp Collilieux X 2016 ITRF2014a new release of the International Terrestrial Reference Frame modelingnonlinear station motions J geophys Res 121 6109ndash6131
Ambraseys NN amp Jackson JA 1990 Seismicity and associated strain ofcentral Greece between 1890 and 1988 Geophys J Int 101(3) 663ndash708
Ambraseys NN amp Jackson JA 1997 Seismicity and strain in the gulf ofCorinth (Greece) since 1694 J Earthq Eng 1(3) 433ndash474
Dow
nloaded from httpsacadem
icoupcomgjiarticle22614686166783 by guest on 13 July 2022
488 P Briole et al
Armijo R Lyon-Caen H amp Papanastassiou D 1992 Eastndashwest extensionand Holocene normal-fault scarps in the Hellenic arc Geology 20(6)491ndash494
Avallone A et al 2004 Analysis of eleven years of deformation measuredby GPS in the Corinth Rift Laboratory area C R Geosci 336(4ndash5)301ndash311
Baker C Hatzfeld D Lyon-Caen H Papadimitriou E amp Rigo A 1997Earthquake mechanisms of the Adriatic Sea and Western Greece implica-tions for the oceanic subduction-continental collision transition GeophysJ Int 131 559ndash594
Becker M et al 2002 Assessment of height variations by GPS at Mediter-ranean and Black Sea coast tide gauges from the SELF projects GlobPlanet Change 34(1ndash2) 5ndash35
Berardino P Fornaro G Lanari R amp Sansosti E 2002 A new algorithmfor surface deformation monitoring based on small baseline differentialSAR interferograms IEEE Transactions on Geosciences and RemoteSensing 40(11)2375ndash2383 httpsdoiorg101109TGRS2002803792
Bernard P et al 1997 The Ms = 62 June 15 1995 Aigion earthquake(Greece) evidence for low angle normal faulting in the Corinth rift JSeismol 1(1997) 131ndash150
Billiris H England P Floyd M Nocquet JM Palamartchouk K Par-adissis D Parsons B amp Raptakis C 2014 COMET continuous GPSmeasurements from the Aegean from 2002 to present NERC Earth Ob-servation Data Centre httpcataloguecedaacukuuid8aa71e3a6899480baea9d0f7e8e21239
Billiris H et al 1991 Geodetic determination of tectonic deformation incentral Greece from 1900 to 1988 Nature 350(6314) 124ndash129
Bitharis S Papadopoulos N Pikridas C Fotiou A Rossikopou-los D amp Kagiadakis V 2019 Assessing a new velocity field inGreece towards a new semi-kinematic datum Surv Rev 51(368)450ndash459
Blewitt G Hammond WC amp Kreemer C 2018 Harnessing the GPSdata explosion for interdisciplinary science EOS Trans Am geophysUn 99 httpsdoiorg1010292018EO104623
Briole P 2020 Monitor (estimates seismic fault parameters fromavailable centroid moment tensors version 32) Zenodo httpdoiorg105281zenodo4295872
Briole P et al 2000 Active deformation of the Corinth rift Greece resultsfrom repeated Global Positioning System surveys between 1990 and 1995J geophys Res 105(B11) 25 605ndash25 625
Briole P et al 2015 The seismic sequence of JanuaryndashFebruary 2014 atCephalonia Island (Greece) constraints from SAR interferometry andGPS Geophys J Int 203(3) 1528ndash1540
Caputo R Catalano S Monaco C Romagnoli G Tortorici G amp Tor-torici L 2010 Active faulting on the island of Crete (Greece) GeophysJ Int 183(1) 111ndash126
Casu F 2014 SBAS-DInSAR parallel processing for defor-mation time-series computation IEEE JSTARS 7(8)3285ndash3296httpsdoiorg101109JSTARS20142322671
Chousianitis K Ganas A amp Evangelidis CP 2015 Strain and rotationrate patterns of mainland Greece from continuous GPS data and com-parison between seismic and geodetic moment release J geophys Res120(5) 3909ndash3931
Chousianitis K Ganas A amp Gianniou M 2013 Kinematic interpretationof present-day crustal deformation in central Greece from continuousGPS measurements J Geodyn 71 1ndash13
Christodoulidis DC Smith DE Kolenkiewicz R Klosko SM Tor-rence MH amp Dunn PJ 1985 Observing tectonic plate motions anddeformations from satellite laser ranging J geophys Res 90(NB11)9249ndash9263
Clarke PJ et al 1998 Crustal strain in central Greece from repeated GPSmeasurements in the interval 1989ndash1997 Geophys J Int 135(1) 195ndash214
Cocard M Kahle HG Peter Y Geiger A Veis G Felekis S Paradis-sis D amp Billiris H 1999 New constraints on the rapid crustal motionof the Aegean region recent results inferred from GPS measurements(1993-1998) across the West Hellenic Arc Greece Earth planet SciLett 172(1-2) 39ndash47
DrsquoAgostino N et al 2020 Active crustal deformation and rotations in thesouthwestern Balkans from continuous GPS measurements Earth planetSci Lett 539 116246 httpsdoiorg101016jepsl2020116246
Devoti R et al 2017 A combined velocity field of the Mediterraneanregion Ann Geophys 60(2) httpsdoiorg104401ag-7059
Dinter DA 1998 Late Cenozoic extension of the Alpine collisional orogennortheastern Greece origin of the north Aegean basin Bull geol SocAm 110(9) 1208ndash1230
Drakos AG Stiros SC amp Kiratzi AA 2001 Fault parameters of the1980 (Mw 65) Volos central Greece earthquake from inversion of re-peated leveling data Bull seism Soc Am 91(6) 1673ndash1684
Ekstrom G amp England P 1989 Seismic strain rates in regions of distributedcontinental deformation J geophys Res 94(B8) 10 231ndash10 257
Ekstrom G Nettles M amp Dziewonski AM 2012 The global CMTproject 2004ndash2010 centroid-moment tensors for 13017 earthquakesPhys Earth planet Inter 200ndash201 1ndash9
Elias P amp Briole P 2018 Ground deformations in the Corinth rift Greeceinvestigated through the means of SAR multitemporal interferometryGeochem Geophys Geosyst 19(12) 4836ndash4857
Elias P 2013 Ground deformation observed in the western Corinth rift(Greece) by means of SAR interferometry PhD thesis Ecole NormaleSuperieure of Paris and University of Patras
England P Houseman G amp Nocquet JM 2016 Constraints from GPSmeasurements on the dynamics of deformation in Anatolia and theAegean J geophys Res 121(12) 8888ndash8916
Flotte N Sorel D Muller C amp Tensi J 2005 Along strike changes inthe structural evolution over a brittle detachment fault example of thePleistocene CorinthndashPatras rift (Greece) Tectonophysics 403 77ndash94
Floyd MA et al 2010 A new velocity field for Greece implications for thekinematics and dynamics of the Aegean J geophys Res 115 B10403httpdxdoiorg1010292009JB007040
Ganas A 2020 NOAFAULTS KMZ layer Version 30 (2020 update) [Dataset] Zenodo httpdoiorg105281zenodo4304613
Ganas A Karastathis V Moshou A Valkaniotis S Mouzakiotis Eamp Papathanassiou G 2014 Aftershock relocation and frequency-sizedistribution stress inversion and seismotectonic setting of the 7 August2013 M = 54 earthquake in Kallidromon Mountain central GreeceTectonophysics 617 101ndash113
Ganas A Kourkouli P Briole P Moshou A Elias P amp Parcharidis I2018 Coseismic displacements from moderate-size earthquakes mappedby Sentinel-1 differential interferometry the case of February 2017Gulpinar earthquake sequence (Biga Peninsula Turkey) Remote Sens10(7) 1089 httpsdoiorg103390rs10071089
Ganas A Marinou A Anastasiou D Paradissis D Papazissi KTzavaras P amp Drakatos G 2013 GPS-derived estimates of crustal de-formation in the central and north Ionian Sea Greece 3-yr results fromNOANET continuous network data J Geodyn 67 62ndash71
Ganas A Mouzakiotis E Moshou A amp Karastathis V 2016a Left-lateral shear inside the North Gulf of Evia Rift Central Greece evi-denced by relocated earthquake sequences and moment tensor inversionTectonophysics 682 237ndash248
Ganas A amp Papoulia I 2000 High-resolution digital mapping of theseismic hazard within the Gulf of Evia rift Eastern Central Greece usingnormal fault segments as line sources Nat Hazards 22 203ndash223
Ganas A et al 2008 NOANET the new permanent GPS network forgeodynamics in Greece in Geophysical Research Abstracts Vol 10EGU2008ndashA-04380 EGU General Assembly 2008 httpswwwcosisnetabstractsEGU200804380EGU2008-A-04380pdf
Ganas A et al 2016b Coseismic deformation field observations and seis-mic fault of the 17 November 2015 M = 65 Lefkada Island Greeceearthquake Tectonophysics 687 210ndash222
Ganas A et al 2019 The July 20 2017 M66 Kos Earthquake seismic andgeodetic evidence for an active north-dipping normal fault at the westernend of the Gulf of Gokova (SE Aegean Sea) Pure appl Geophys 176(10)4177ndash4211
Ganas A et al 2020 The 25 October 2018 Mw = 67 Zakyn-thos earthquake (Ionian Sea Greece) a low-angle fault model basedon GNSS data relocated seismicity small tsunami and implications
Dow
nloaded from httpsacadem
icoupcomgjiarticle22614686166783 by guest on 13 July 2022
The GPS velocity field of the Aegean 489
for the seismic hazard in the west Hellenic Arc J Geodyn 137httpsdoiorg101016jjog2020101731
Goldsworthy M amp Jackson J 2001 Migration of activity within normalfault systems examples from the Quaternary of mainland Greece JStruct Geol 23(2ndash3) 489ndash506
Haddad A Ganas A Kassaras I amp Lupi M 2020 Seismicity andgeodynamics of western Peloponnese and central Ionian Islands in-sights from a local seismic deployment Tectonophysics 778 228353httpsdoiorg101016jtecto2020228353
Hatzfeld D Ziazia M Kementzetzidou D Hatzidimitriou P Pana-giotopoulos D amp Makropoulos K 1999 Microseismicity and focalmechanisms at the western termination of the North Anatolian Fault andtheir implications for continental tectonics Geophys J Int 137(3) 891ndash908
Hollenstein C Geiger A Kahle HG amp Veis G 2006 CGPS time-seriesand trajectories of crustal motion along the West Hellenic Arc GeophysJ Int 164(1) 182ndash191
Hollenstein C Muller M Geiger A amp Kahle HG 2008 GPS-derivedcoseismic displacements associated with the 2001 Skyros and 2003Lefkada earthquakes in Greece Bull seism Soc Am 98(1) 149ndash161
Howell A Jackson J Copley A McKenzie D amp Nissen E 2017bSubduction and vertical coastal motions in the eastern MediterraneanGeophys J Int 211(1) 593ndash620
Howell A Palamartchouk K Papanikolaou X Paradissis D RaptakisC Copley A England P amp Jackson J 2017a The 2008 Methoniearthquake sequence the relationship between the earthquake cycle onthe subduction interface and coastal uplift in SW Greece Geophys J Int208(3) 1592ndash1610
Ilieva M Briole P Ganas A Dimitrov D Elias P Mouratidis A ampCharara R 2016 Fault plane modelling of the 2003 August 14 LefkadaIsland (Greece) earthquake based on the analysis of ENVISAT SARinterferograms Tectonophysics 693 47ndash65
Jackson J Haines J amp Holt W 1994 A comparison of satellite laserranging and seismicity data in the Aegean region Geophys Res Lett21(25) 2849ndash2852
Kahle HG Cocard M Peter Y Geiger A Reilinger R Barka A ampVeis G 2000 GPS-derived strain rate field within the boundary zonesof the Eurasian African and Arabian Plates J geophys Res 105(10)23 353ndash23 370
Kahle HG Muller MV Mueller S amp Veis G 1993 The Kephaloniatransform-fault and the rotation of the Apulian platform ndash evidence fromsatellite geodesy Geophys Res Lett 20(8) 651ndash654
Kapetanidis V amp Kassaras I 2019 Contemporary crustal stress of theGreek region deduced from earthquake focal mechanisms J Geodyn123 55ndash82
Kassaras I Kapetanidis V amp Karakonstantis A 2016 On the spatial dis-tribution of seismicity and the 3D tectonic stress field in western GreecePhys Chem Earth 95 50ndash72
Kiratzi A et al 2008 The April 2007 earthquake swarm near LakeTrichonis and implications for active tectonics in western GreeceTectonophysics 452 51ndash65
Kreemer C amp Chamot-Rooke N 2004 Contemporary kinematics of thesouthern Aegean and the Mediterranean ridge Geophys J Int 157(3)1377ndash1392
Le Pichon X Chamot-Rooke N Lallemant S Noomen R amp Veis G1995 Geodetic determination of the kinematics of central Greece withrespect to Europemdashimplications for eastern Mediterranean tectonics Jgeophys Res 100(B7) 12 675ndash12 690
Le Pichon X amp Kreemer C 2010 The Miocene-to-present kinematic evo-lution of the eastern Mediterranean and Middle East and Its implicationsfor dynamics Annu Rev Earth Planet Sci 38 323ndash351
Louvari E Kiratzi A Papazachos B amp Hatzidimitriou P 2001Fault-plane solutions determined by waveform modeling confirm tec-tonic collision in the eastern Adriatic Pure appl Geophys 1581613ndash1637
Louvari E Kiratzi AA amp Papazachos BC 1999 The Cephalonia Trans-form Fault and its extension to western Lefkada Island Tectonophysics308(1) 223ndash236
Lyon-Caen H et al 1988 The 1986 Kalamata (south Peloponnesus) earth-quake detailed study of a normal fault evidences for eastndashwest extensionin the Hellenic arc J geophys Res 93(B12) 14 967ndash15 000
Marinou A Anastasiou D Papanikolaou X Paradissis D amp ZacharisV 2016 Dionysos satellite observatory and higher geodesy laboratoryhistory and perspectives Bull Geol Soc Greece 50(2) 1091ndash1099
Melis NS Okal EA Synolakis CE Kalogeras IS amp Kanoglu U2020 The Chios Greece earthquake of 23 july 1949 seismologicalreassessment and tsunami investigations Pure appl Geophys 177(3)1295ndash1313
Meyer B et al 1996 The 1995 Grevena (Northern Greece) earthquake faultmodel constrained with tectonic observations and SAR interferometryGeophys Res Lett 23(19) 2677ndash2680
Mouslopoulou V Bocchini GM Cesca S Saltogianni V Bed-ford J Petersen G Giannou amp Oncken O 2020 Earthquake-swarms slop-slip and fault-interactions at the western-end of theHellenic Subduction System precede the Mw 69 Zakynthos earth-quake Greece Geochem Geophys Geosyst 21(12) e2020GC009243httpsdoiorg1010292020GC009243
Mouslopoulou V Saltogianni V Gianniou M amp Stiros S 2014 Geodeticevidence for tectonic activity on the Strymon fault system northeastGreece Tectonophysics 633 246ndash255
Metois M et al 2015 Insights on continental collisional processes fromGPS data dynamics of the peri-Adriatic belts J geophys Res 120(12)8701ndash8719
Muller MD 2011 Analysis of long-term GPS observations in Greece(1993-2009) and geodynamic implications for the Eastern MediterraneanPhD thesis ETH Zurich
Muller MD Geiger A Kahle HG Veis G Billiris H Paradissis Damp Felekis S 2013 Velocity and deformation fields in the North Aegeandomain Greece and implications for fault kinematics derived from GPSdata 1993ndash2009 Tectonophysics 597 34ndash49
Nocquet JM 2012 Present-day kinematics of the Mediterranean a com-prehensive overview of GPS results Tectonophysics 579 220ndash242
Nomikou P Hubscher C Papanikolaou D Farangitakis GP RuhnauM amp Lampridou D 2018 Expanding extension subsidence and lateralsegmentation within the SantorinindashAmorgos basins during Quaternaryimplications for the 1956 Amorgos events central-south Aegean SeaGreece Tectonophysics 722 138ndash153
Noomen R Springer TA Ambrosius BAC Herzberger K KuijperDC Mets GJ Overgaauw B amp Wakker KF 1996 Crustal deforma-tions in the Mediterranean area computed from SLR and GPS observa-tions J Geodyn 21(1) 73ndash96
Nyst M amp Thatcher W 2004 New constraints on the active tec-tonic deformation of the Aegean J geophys Res 209(B11) B11406httpsdoiorg1010292003JB002830
Okada Y 1992 Internal deformation due to shear and tensile faults in ahalf space Bull seism Soc Am 82 1018ndash1040
Okal EA Synolakis CE Uslu B Kalligeris N amp Voukouvalas E2009 The 1956 earthquake and tsunami in Amorgos Greece GeophysJ Int 178(3) 1533ndash1554
Papadimitriou P et al 2018 The 12th June 2017 Mw = 63 Lesvos earth-quake from detailed seismological observations J Geodyn 115 23ndash42
Papadopoulos A Parcharidis I Elias P amp Briole P 2019 Spatio-temporal evolution of the deformation around the Rio-Patras fault(Greece) observed by synthetic aperture radar interferometry from 1993to 2017 Int J Remote Sens 40(16) 6365ndash6382
Pavlides SB amp Tranos MD 1991 Structural characteristics of two strongearthquakes in the North Aegean ierissos (1932) and Agios-Efstratios(1968) J Struct Geol 13(2) 205ndash214
Perouse E Chamot-Rooke N Rabaute A Briole P Jouanne FGeorgiev I amp Dimitrov D 2012 Bridging onshore and offshore present-day kinematics of central and eastern Mediterranean implications forcrustal dynamics and mantle flow Geochem Geophys Geosyst 13Q09013 httpsdoiorg1010292012GC004289
Perouse E et al 2017 Transition from collision to subduction in WesternGreece the Katouna-Stamna active fault system and regional kinematicsInt J Earth Sci 106(3) 967ndash989
Dow
nloaded from httpsacadem
icoupcomgjiarticle22614686166783 by guest on 13 July 2022
490 P Briole et al
Reilinger R et al 2006 GPS constraints on continental deformationin the AfricandashArabiandashEurasia continental collision zone and implica-tions for the dynamics of plate interactions J geophys Res BO5411httpsdoiorg1010292005JB004051
Reilinger R et al 2010 Geodetic constraints on the tectonic evolution ofthe Aegean region and strain accumulation along the Hellenic subductionzone Tectonophysics 488(1ndash4) 22ndash30
Roberts GP amp Ganas A 2000 Fault-slip directions in central and southernGreece measured from striated and corrugated fault planes comparisonwith focal mechanism and geodetic data J geophys Res 105(B10)23 443ndash23 462
Robertson J Meschis M Roberts GP Ganas A amp Gheorghiu DM2019 Temporally constant Quaternary uplift rates and their relationshipwith extensional upper-plate faults in south Crete (Greece) constrainedwith Cl-36 cosmogenic exposure dating Tectonics 38(4) 1189ndash1222
Saltogianni V Mouslopoulou V Oncken O Nicol A Gianniou M ampMertikas S 2020 Elastic Fault Interactions and Earthquake RuptureAlong the Southern Hellenic Subduction Plate Interface Zone in GreeceGeophys Res Lett 47(13) httpsdoiorg1010292019GL08660
Savage JC 2018 Euler-vector clustering of GPS velocities defines mi-croplate geometry in southwest Japan J geophys Res 123 1954ndash1968
Savage JC amp Simpson RW 2013a Clustering of GPS velocities in theMojave Block southeastern California J geophys Res 118 1747ndash1759
Savage JC amp Simpson RW 2013b Clustering of velocities in a GPSnetwork spanning the Sierra Nevada Block the Northern Walker LaneBelt and the Central Nevada Seismic Belt California-Nevada J geophysRes 118 4937ndash4947
Savage JC amp Wells RE 2015 Identifying block structure in the PacificNorthwest USA J geophys Res 120 7905ndash7916
Serpelloni E Anzidei M Baldi P Casula G amp Galvani A 2005Crustal velocity and strain-rate fields in Italy and surrounding regionsnew results from the analysis of permanent and non-permanent GPSnetworks Geophys J Int 161(3) 861ndash880
Serpelloni E Faccenna C Spada G Dong D amp Williams SDP 2013Vertical GPS ground motion rates in the Euro-Mediterranean region newevidence of velocity gradients at different spatial scales along the Nubia-Eurasia plate boundary J geophys Res 118(11) 6003ndash6024
Serpetsidaki A et al 2014 New constraints from seismology and geodesyon the Mw = 64 2008 Movri (Greece) earthquake evidence for a growingstrike-slip fault system Geophys J Int 198(3) 1373ndash1386
Simpson R W Thatcher W amp Savage JC 2012 Using cluster analysis toorganize and explore regional GPS velocities Geophys Res Lett 39(18)L18307 httpsdoiorg1010292012GL052755
Smith DE Kelenkiewicz R Robbins JW Dunn PJ amp Torrence MH1994 Horizontal crustal motion in the central and eastern Mediterraneaninferred from satellite laser ranging measurements Geophys Res Lett21(18) 1979ndash1982
Stiros S amp Kontogianni V 2008 Modelling of the 1986 Kalamata (SWGreece) earthquake faulting using geodetic data J Appl Geod 2 179ndash185
Stiros SC amp Drakos A 2000 Geodetic constraints on the fault pat-tern of the 1978 Thessaloniki (Northern Greece) earthquake (Ms = 64)Geophys J Int 143(3) 679ndash688
Stiros SC Psimoulis P amp Pitharouli S 2007 Geodetic constraints tothe kinematics of the Kapareli fault reactivated during the 1981 Gulf ofCorinth earthquakes Tectonophysics 440(1ndash4) 105ndash119
Thingbaijam KKS Martin Mai P amp Goda K 2017 New empiricalearthquake source-scaling laws Bull seism Soc Am 107(5) 2225ndash2246
Tranos MD 2011 Strymon and Strymonikos Gulf basins (NorthernGreece) implications on their formation and evolution from faultingJ Geodyn 51(4) 285ndash305
Valkaniotis S Briole P Ganas A Elias P Tsironi V Fokaefs APartheniou H amp Paschos P 2020 The Mw = 57 Kanallaki earthquakeof March 21 2020 in Epirus Greece reverse fault model and seismo-tectonic implications for Apulia-Eurasia collision Geosciences 10 454httpsdoiorg103390geosciences10110454
Vernant P Reilinger R amp McClusky S 2014 Geodetic evidence for lowcoupling on the Hellenic subduction plate interface Earth planet SciLett 385(C) 122ndash129
Wells DL amp Coppersmith KJ 1994 New empirical relationships amongmagnitude rupture length rupture width rupture area and surface dis-placement Bull seism Soc Am 84(4) 974ndash1002
Wessel P amp Smith W 1998 New improved version of the Generic MappingTool released EOS Trans Am geophys Un 79 579
Willis P Mertikas S Argus DF amp Bock O 2013 DORIS and GPSmonitoring of the Gavdos calibration site in Crete Adv Space Res 511438ndash1447
S U P P O RT I N G I N F O R M AT I O N
Supplementary data are available at GJI online
Figure S1 Greece and surroundings with the location of the 21earthquakes listed in Table 1 and the seismicity from the NOAcatalogue for the period 2000ndash2020 magnitude ge 4 and depthle 35 km The beachballs show the focal mechanism of the studiedevents they are centred at the location of the epicentresFigure S2 Time-series of the north coordinate of the GPS sta-tion LEMN The large offset corresponds to the nearby Samothrakiearthquake of 2014 May 24 (Tables 1 and 2) After the earthquakethe velocity of the station has changed The transient can be mod-elled with a sum of two exponential terms of time constant 65 and1295 d respectivelyFigure S3 Additional toponymy for features not mentioned in themain text but in the Supporting Information (coordinates and de-scription of the sites in Table S2)Figure S4 Duration of the time-series of GPS data for the 329stations The average duration is 65 yrFigure S5 Completeness of the time-series acquired at the 329 GPSstations The average for the whole set of stations is 85 per centFigure S6 Comparison of our solution with the solution of theNevada Geodetic Laboratory (NGL) here for the time-series of thestation LEMN The curves are de-trended from the modelled effectof the earthquakes and the average secular velocity The differencebetween the slopes is below 005 mm yrminus1 See the native time-seriesof the north component of LEMN in Fig S2Figure S7 Histogram of east and up velocity uncertainties at the329 GPS stationsFigure S8 Time-series of the RLSO station showing the coseismicoffset of the Mw = 64 2008 June 8 Movri earthquake of amplitudeminus34 mm in east and 98 mm in north and the post-seismic de-formation with relaxation time of 103 d and amplitudes minus11 and14 mm in east and northFigure S9 Time-series of the stations MET0 AGTH AIGU andATHI The vertical line corresponds to the Mw = 53 Magoulaearthquake of 2019 July 19 At AIGU and ATHI we measure anoffset at the date of the earthquake with amplitudes that are reportedin Table S4Figure S10 Residual time-series of the east component of variousstations corrected for coseismic post-seismic and secular terms(top) and common mode noise correction (bottom) estimated usingthe eight top stations (MET0 to PAT0) The solid vertical line is on2018 October 25 day of the Mw = 68 Zakynthos earthquake Thedashed line corresponds to a transient visible at the stations AMALand PYRG on 2018 May 10 (see Section S41 and see Fig S11 forthe north and up components)Figure S11 North and up components of the same stations whoseeast component is plotted in Fig S10 The solid vertical line is on2018 October 25 day of the Mw = 68 Zakynthos earthquake The
Dow
nloaded from httpsacadem
icoupcomgjiarticle22614686166783 by guest on 13 July 2022
The GPS velocity field of the Aegean 491
dashed line corresponds to the transient observed in Fig S10 at thestations AMAL and PYRG on 2018 May 10 Here a subsidence isobserved at TROP PYRG and AMAL around 2018 May 10Figure S12 Time-series of the east and up components of the GPSstation NOMI used to assess the linear character of the deformationduring unrest and the starting and ending dates of the volcanicunrest We see also a large annual term of the vertical componentthat was modelled and removedFigure S13 Time-series of the east component of the GPS stationsof Santorini (a) Original time-series (b) time-series corrected froma linear signal starting on 2011 February 12 and ending on 2012May 3 (446 d) See Table S5 for the amplitude of the slope at thestationsFigure S14 Time-series of the vertical coordinate of the GPS sta-tions VALI and XILI The secular trends are 24 mm yrminus1 for VALIand minus62 mm yrminus1 for XILI The Zakynthos earthquake of Octo-ber 2018 (vertical line) produced a subsidence of the two stationsthat we model with a decreasing exponential starting the day of theearthquake with time constant 36 d for VALI and 16 d for XILI andamplitude 102 and 96 mm respectivelyFigure S15 Sentinel-1 interferogram of the western Gulf of Corinthmade with the scenes acquired on 2013 October 20 and November13 on the descending track 80 using DIAPASON InSAR Sentinel-1TOPSAR version 118 on the GEP-TEP (httpgeohazards-tepeu)One cycle of colour corresponds to 28 mm of displacement alongthe line of sight The geoinformation layer is from OpenTopoMap(httpopentopomaporg)Figure S16 InSAR ground velocities in the region of Larissa (Thes-saly) in the line of sight of the Sentinel-1 descending track 7 mea-sured for the period 2019 October 16 to 2010 May 31 using theCNR-IREA P-SBAS processor on the GEP-TEP (Berardino et al2002 Casu et al 2014) Red dots are permanent GPS stations Bluecolour on the map indicates range increase from minus5 cm yrminus1 (uplift)to 5 cm yrminus1 (subsidence)Figure S17 Time-series of the station TRIP On 2019 January 12(vertical line) a transient deformation starts with a sudden motionof minus19 mm in east 02 mm in north and 00 mm in up followedby a progressive deformation that we model with an exponential oftime constant 17 d and amplitude minus33 mm in east minus97 mm innorth and 297 mm in upFigure S18 Sentinel-1 interferogram of the Tripoli area madewith the scenes acquired on 2018 December 31 and 2019 Jan-uary 24 on the ascending track 175 The two GPS stations TRIPand TRIU (time-series in Fig S17) are located in the centre ofTripoliFigure S19 Time-series of the horizontal coordinates of the GPSstations KALU and KALY Kalymnos Island The vertical line in-dicates the date of the Lesvos 2017 earthquake The amplitudes ofthe offset are minus17 and 3 mm in east and north for KALU and 02and 35 mm for KALY The relaxation time of the signal is 16 dSee also Fig S20Figure S20 Sentinel-1 interferogram of the Kalymnos Island madewith the scenes acquired on 2017 May 25 and June 30 on thedescending track 36 The vectors correspond to the offset plotted inFig S19Figure S21 Time-series of the three components of the vectorKRIN (located on a landslide) minus KOUN (the closest permanentstation considered here as a local reference) See also Figs S22 andS23Figure S22 Ground velocities in the line of sight of the Sentinel-1ascending track 175 over the area of KRIN calculated for the pe-riod 2017 January 1 to 2020 May 15 using the TRE-ALTAMIRA
FASTVEL processor on the GEP-TEP The amplitude of the ve-locity of the station KRIN is 1015 minus212 and minus187 mm yrminus1
in east north and up respectively The approximate boundary ofthe landslide (according also to the interferogram made with theCNR-IREA P-SBAS processor see Fig S23) is plotted as a lightred contour Red indicates motion away from the satelliteFigure S23 InSAR ground velocities around the station KRINrepresented in the line of sight of the Sentinel-1 ascending track 175for the period January 1 2017 to May 15 2020 using the CNR-IREA P-SBAS processor on the GEP-TEP Red indicates motionaway from the satelliteFigure S24 Time-series of the horizontal coordinates of the EUREF(httpswwwepncbomabe) station PAT0 Top is corrected for thecoseismic and post-seismic effects of the various earthquakes bot-tom is not For example the Zakynthos 2018 earthquake is clear inthe uncorrected east component The differences in slope betweenthe two solutions are minus067 mm yrminus1 in east and minus085 mm yrminus1 innorth East and north ITRF2014 velocities of PAT0 EUREF 835minus659 mm yrminus1 our uncorrected velocities 743 minus665 mm yrminus1our corrected velocities 81 minus58 mm yrminus1Figure S25 Istanbul profile Velocities plotted with X axis along theline Istanbul - pole ATEU and Y profile perpendicular The solid anddashed line represents the best-fitting linear increase of the velocity(using the five points in red) as a function of the distance to the poleThe corresponding rate is 273 times 10minus9 rad yrminus1 counter-clockwisethat is 156 Maminus1Figure S26 Velocities along a profile Sandanski (Bulgaria)mdashRodos We plotted of a subset of stations located at less than 55km from the profile The axis is aligned with the azimuth of theEuler pole of rotation of Anatolia with respect to Eurasia locatedat 3196E and 3202N according to Le Pichon amp Kreemer (2010)Figure S27 Sandanski profile (location of the points and vectorsin Fig S26) Velocities of the stations located in the vicinity (plusmn55 km) of the line Sandanski-Rodos aligned with the Euler pole ofrotation of Anatolia with respect to Eurasia according to Le Pichonamp Kreemer (2010) The oblique solid line shows the tangentialvelocities that are expected for a rigid rotation of Anatolia aroundthe pole plotted in Fig 7 The grey dots show the values at LIMNLEMN and MOUD after correcting for the expected component ofstrain accumulation due to the vicinity of the North Anatolian faultFigure S28 Velocities along a profile Tirana-Karpathos We plottedof a subset of stations located at less than 55 km from the axisconnecting Tirana and Karpathos aligned with the Euler pole ofrotation of Anatolia with respect to Eurasia located at 3196E and3202N according to Le Pichon amp Kreemer (2010)Figure S29 TiranandashKarpathos profile Velocities of the stationslocated in the vicinity (plusmn55 km) of the line See location of thepoints and line and the vectors in Fig S28Figure S30 Section of the south Peloponnese Pylos-SpetsopoulaFigure S31 East and north velocities in Crete with respect to aver-ageFigure S32 Northndashsouth profile across central Macedonia (seepoints in Fig 10)Figure S33 Cumulative distribution of the whole set of 322 ver-tical velocities (grey) and the subset of 177 (black) with velocityuncertainties lower than 1 mm yrminus1 (see Table S1) Best Gaussianfits are calculated for 90 per cent of the population which corre-sponds to velocities comprises between minus27 and 14 mm yrminus1 inthe case of the 177-station distribution The remaining 6 per cent onthe negative velocities side and 4 per cent on the positive velocitiesside (drawn with + symbol) do not fit with a Gaussian distribu-tion and were not used to calculate the best fit The median μ of
Dow
nloaded from httpsacadem
icoupcomgjiarticle22614686166783 by guest on 13 July 2022
492 P Briole et al
the distribution is minus038 mm yrminus1 with the best 177 stations andminus027 mm yrminus1 for the whole set of 322 stations The correspondingstandard deviation σ is 079 and 95 mm yrminus1 respectively Two sta-tions (GEYB and PSAT) present anomalous subsidence discussedin the text GEYB (mentioned in Section S47) is built on a recentthick (gt10 m) embankment built during the construction of thebridge Rio-Antirio PSAT is located near (sim1 km) the fault plane ofthe active Psathopirgos fault on its footwall Three stations presentanomalous uplift ZAKY and AMAL presumably affected local up-lift (insufficiently modelled by our post-seismic model see SectionS314) during the post-seismic relaxation following the 2018 Za-kynthos earthquake VALI affected by the uplift of the Selinoutasriver delta (see Section S43) as shown in Fig S14 induced by theactivity of the offshore fault north of AigionFigure S34 The boundaries of the ten blocks of our model TheNorth Aegean block is the combination of two sub-blocks one forthe north (Lemnos and Lesvos) one for the south (Chios Samos)Here we use one single block (despite the large northndashsouth exten-sion and the localization zone between Lesvos and Chios) becausewe do not have yet at the moment enough GPS stations in thearea and long enough time-series to divide the zone in two Thefocal mechanisms are for events located between 0 and 35 km ofdepth published by the National and Kapodistrian University ofAthens (httpwwwgeophysicsgeoluoagr) for the period 2003ndash2018Table S1 Coordinates and velocities in the ITRF2014 (Altamimiet al 2016) of the 329 pointsTable S2 Glossary and coordinates of site names (Fig 2 and FigS3) used in the text figures and tables In the column lsquoTextrsquo Mmeans main document and S means Supporting InformationTable S3 Scatter of velocities for 110 pairs of stations separated byless than 15 km The formal uncertainties provided by the calcula-tions and the linear regression of the time-series are scaled to bet fitwith the scatters of velocities See Fig 3 for graphic representationof the east north and vertical scatters
Table S4 Observed and modelled coseismic and post-seismic dis-placements for the earthquakes listed in Table 1 The faults param-eters are in Table 2 We provide those numbers only for the eventsmodelled in this paper For the event modelled in previous worksthe observed and modelled displacements can be found in Ilievaet al (2016) Serpetsidaki et al (2014) Elias (2013) Briole et al(2015) and Ganas et al (2016b 2018 2019 2020) For the Methoni2008 earthquake the vertical displacement cannot be assessed forthe instantaneous coseismic but it can be assessed for the first 10 dTable S5 Observed and modelled displacements corresponding forsome of the transients presented in Section S4Table S6 Comparison of solutions (velocities and uncertainties)for the stations AUT1 DYNG PAT0 TUC2 (blue dots in Fig4) The solutions ROB-EUREF LTK-EUREF and UGA-CNRSare published by the European Plate Observing System (EPOShttpsgnssproductseposubipt) The solution NGL is publishedby the Nevada Geodetic Laboratory (httpgeodesyunredu) Ourinitial solution is the one before correcting the velocity biases in-duced by the coseismic and post-seismic displacementsTable S7 ITRF2014 coordinates of the 329 points at the epoch20200 and component of the velocity due to the coseismic andpost-seismic displacements (plotted in Fig 4)
briole-et-al GPS-pointskmlbriole-et-al analysed-earthquakeskmlbriole-et-al blocks-modelkmlbriole-et-al tabS1csvbriole-et-al tabS3csvbriole-et-al tabS7csvbriole-et-al GPS-time-seriesbriole-et-al helvel2020-model
Please note Oxford University Press is not responsible for the con-tent or functionality of any supporting materials supplied by theauthors Any queries (other than missing material) should be di-rected to the corresponding author for the paper
Dow
nloaded from httpsacadem
icoupcomgjiarticle22614686166783 by guest on 13 July 2022
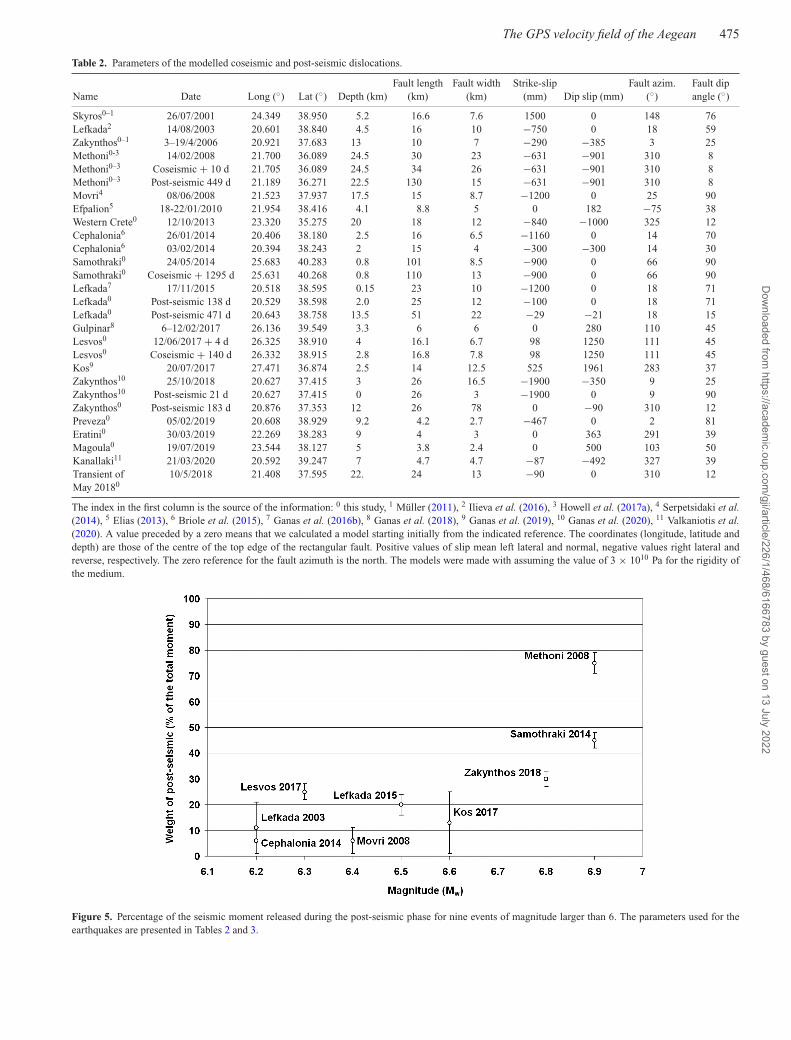
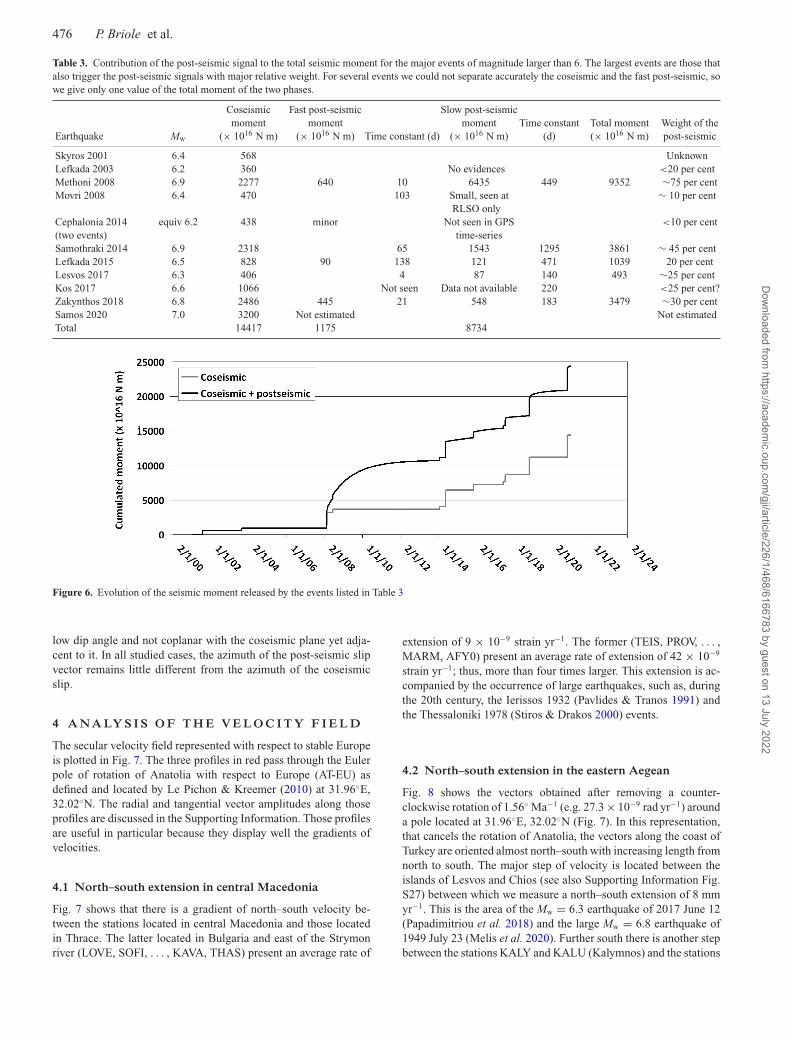