according to the ddbd approach - Zenodo
38
1 SEISMIC PERFORMANCE OF IRREGULAR RC FRAMES DESIGNED 2 ACCORDING TO THE DDBD APPROACH 3 4 P. Giannakouras 1 and C. Zeris 2 5 6 Direct Displacement Based Design; reinforced concrete; irregular frame; height irregularity; seismic 7 design; ductility; nonlinear analysis 8 9 1 Post Graduate Structural Engineer, National Technical University of Athens, Greece, [email protected] 2 Corresponding Author: Associate Professor, Laboratory of Reinforced Concrete, School of Civil Engineering, National Technical University of Athens, Greece, [email protected]
-
Upload
khangminh22 -
Category
Documents
-
view
4 -
download
0
Transcript of according to the ddbd approach - Zenodo

1
SEISMIC PERFORMANCE OF IRREGULAR RC FRAMES DESIGNED 2
ACCORDING TO THE DDBD APPROACH 3
4
P. Giannakouras1 and C. Zeris2 5
6
Direct Displacement Based Design; reinforced concrete; irregular frame; height irregularity; seismic 7
design; ductility; nonlinear analysis 8
9
1 Post Graduate Structural Engineer, National Technical University of Athens, Greece,
2 Corresponding Author: Associate Professor, Laboratory of Reinforced Concrete, School of Civil
Engineering, National Technical University of Athens, Greece, [email protected]

ABSTRACT 10
The Direct Displacement-Based seismic Design (DDBD) method has been a major development 11
in the context of Performance-Based seismic Design of reinforced concrete (RC) frames. The 12
method has been positively received from the engineering community, while, at the same time, 13
significant improvements have been proposed. Even though its field of application is constantly 14
widening, no specific rules are generally provided for specific cases, such as RC frames with 15
setback irregularity, under the claim that, in this case, no modifications in the basic approach are 16
needed. The validity of this assumption is examined by assessing the DDBD provisions through 17
design of such irregular RC structures and assessment of their seismic performance under non-18
linear static and dynamic analyses. Local ductility associated with global behavior is examined 19
and incompatibilities in demands with the global design displacement are identified, where they 20
occur. Guidelines are provided to ensure that rational performance results are obtained, when the 21
DDBD method is applied. 22
23
1. Introduction and Statement of the Problem 24
Taking advantage of the post-elastic behavior of materials is critical in order to design both 25
safe and economic structures against seismic excitations. To that end, a rational approach in 26
earthquake engineering is Performance-Based Design (PBD), where performance levels are 27
defined and a different damage level is prescribed for every performance level set (SEAOC 28
1995). The damage that a structure exhibits is directly related to the displacements that are 29
predicted during the structure’s response. Parallel to the evolution of conventional seismic 30
design, still currently enforced to a PBD context, extensive efforts have recently been given 31
towards formulating alternative seismic design methodologies that make use of the global 32
structural displacement, instead of the acceleration response and the corresponding inertial 33
force, as the controlled design parameter. One of the most promising methods is the Direct 34
Displacement-Based Design (DDBD) approach, primarily developed by Priestley et al. 35
(2007). Reliable guidelines for the implementation of this methodology for the seismic design 36
of a wide range of structures were incorporated into DBD12, the Model Code for DDBD 37
(Sullivan et al. 2012), while investigations are ongoing for improvement of the method, that 38
will inevitably lead to further revisions of this code. 39
Significant efforts have been made towards the extension of the applicability of the DDBD 40
approach to different structural building forms and structural materials other than reinforced 41
concrete (RC) (Vidot-Vega and Kowalsky 2013), such as structural steel (Malekpour et al. 42
2013) and masonry (Paparo and Beyer 2015), while keeping its simplicity unaffected. The 43
method has also found increasing applicability in the seismic design of bridges, due to the 44
relatively simpler structural configuration of this type of structural system (Mergos 2013, 45
Gkatzogias and Kappos 2015, Amiri et al. 2016) and innovative structural systems, such as 46
base isolation (Cardone et al. 2010) and precast prestressed concrete (Yang and Lu 2017). 47
Meanwhile, engineers are encouraged to implement state-of-the-art techniques in everyday 48
practice, such as non-linear analyses, to verify the performance of the structure under 49
consideration. Furthermore, explicit rules or modifications of the basic DDBD approach are 50
not readily available for many commonly encountered structural irregularities such as vertical 51
setback buildings, since, it is claimed, in this case the storey mass to stiffness ratio remains 52
essentially constant. Vertical setbacks are often imposed by architectural considerations and 53
significantly affect the seismic response, as post-earthquake field observations (Inel and 54
Meral 2016) or different analytical studies of conventionally design irregular buildings have 55
demonstrated (Zhou et al. 2015, Landi et al. 2014, Nezhad and Poursha 2015). However, 56
irregular RC frames have received comparatively little attention within the context of the 57
DDBD approach. Nievas and Sullivan (2015) modified the higher mode effects reduction 58
factor !" for steel plane frames with setbacks. Varughese et al. (2012) focused on the base 59
shear distribution in in-height stepped buildings, including torsional effects and, more 60
recently, for the DDBD of soft open ground story buildings (Varughese et al. 2015). Other 61
types of irregularities, such as out-of-plane-offsets in frames, have also been assessed in the 62
recent literature (Muljati et al. 2015). 63
Currently, two methods of analysis have been proposed in DDBD for estimating the required 64
flexural strength of plastic hinges (Priestley et al. 2007). According to the first method, 65
conventional structural analysis is conducted, using modeling assumptions that conform to 66
the design procedure approximations for an accurate estimation of members’ stiffness. 67
Alternatively, approximate calculations based on equilibrium considerations and appropriate 68
assumptions can be employed, thus eliminating the need for member stiffness estimation. 69
Even though the abundance of conventional analysis software renders the first method easier 70
to apply, researchers prefer the second method. The inevitable approximate nature of the 71
structural analysis process and the uncertainties associated suggest that simplified procedures 72
such as the second method are attractive. 73
The scope of this work is to investigate the applicability of the DDBD conventional analysis 74
approach on plane RC frames with height irregularity in the form of setbacks, with emphasis 75
on the comparison of local demands that are imposed to the members under nonlinear static 76
and dynamic analysis with the design assumed values. To that effect, Seven and Ten Storey 77
RC frames with constant bay widths and setbacks and their regular counterparts, were 78
designed according to the current DDBD approach (Sullivan et al. 2012). The influence of 79
the design analysis method is examined, by comparing the final designs of the Seven Story 80
frames, designed by the application of either of two conventional approaches, namely the 81
direct approach and an iterative approach for establishing the design moment capacity. 82
Furthermore, since unequal bay lengths may introduce unequal local demands at the beams 83
(O’Reilly et al. 2017), a set of irregular Ten Storey frames with unequal bays is also 84
examined. 85
Nonlinear static and dynamic time-history analyses are conducted and the results are 86
compared with design predictions, while differences in the response of both the regular and 87
the irregular frames and the influence of higher modes and second order (P-$) effects, are 88
addressed. While the vast majority of DDBD research deals with the limitation of global 89
storey drifts within the design adopted performance limit state related limits, special attention 90
is paid in this work to the local ductility demands associated with the prescribed global 91
deformation ductility and possible exceedances from design expected response are examined. 92
The successful application of the DDBD method is judged by an integrated approach, where 93
global displacement objectives and local ductility criteria are simultaneously met. 94
95
2. Brief Description of the DDBD Method 96
In order to evaluate the basic assumptions inherent in the basic DDBD procedure, a brief outline of 97
the method is considered. The method is based on the substitution of the actual structure with an 98
equivalent single-degree-of-freedom system (e-SDOF). The e-SDOF representation is characterized 99
by the effective stiffness that corresponds to either the peak displacement response or the target 100
displacement of the design performance level, instead of the initial elastic stiffness of the SDOF 101
system. Using the design displacement profile of the actual structure, the equivalent properties of 102
the e-SDOF, namely its design displacement ∆d, effective mass %& and effective height '& 103
are derived, as weighted average values of the corresponding actual properties (Sullivan et al. 104
2012). The design of moment resisting frames is likely to be governed by code prescribed drift 105
limitation rather than material strain limits, so their design displacement profile is based upon the 106
determination of the maximum allowable global drift () for the design limit state. For repairable 107
damage, ()= 2.5% is assumed. Following the definition of (), Eq. (6.2) of Sullivan et al (2012) 108
provides the limit state displacements at each storey, as a function of the global drift. These values 109
correspond to the first inelastic mode of vibration. Since higher modes can increase the 110
deformations, they are multiplied with a reduction factor !", which is provided by Fig 5.1 of 111
Sullivan et al (2012) in order to obtain the design displacements. 112
It is evident that the dimensionless yield curvature of a cross-section remains comparatively 113
invariant (Priestley et al 2007). As a result, an expression that provides the yield drift (*of a frame 114
building with an enforced weak beam – strong column mechanism can be derived, leading to the 115
evaluation of the yield displacement (see Eqs. C7.1 & 7.2 of Sullivan et al (2012)) and 116
subsequently the design global displacement ductility +. The equivalent viscous damping (EVD) 117
coefficient ,&- of the e-SDOF is then calculated; EVD represents the combined elastic and 118
hysteretic energy absorbed during the inelastic response that is prescribed by the aforementioned 119
displacement ductility. Assuming an appropriate hysteretic rule for RC frames, such as the rule 120
proposed by Takeda (1970), with parameters α and β equal to 0.3 and 0.6 respectively (Eq. (7.4) of 121

Sullivan et al. 2012), yields ,&- from the design global ductility +. 122
After selecting an appropriate design displacement spectrum consistent with the seismic design 123
intensity, the damped spectral ordinates are calculated using a damping reduction factor. A typical 124
displacement spectrum comprises an approximately linear ascending branch followed by a constant 125
displacement plateau at the spectrum corner point period and displacement ./ and0/,2, with all 126
the relevant design properties indexed D. The non-linearity at low periods, corresponding to the 127
constant acceleration period range, can be safely disregarded. Currently, the appropriate damping 128
reduction factor 32 is given by Eq. (1.2) of Sullivan et al. (2012). It is noted, however, that the 129
calculation of the inelastic displacement demand is subject to further development, such as adopting 130
the findings of Pennucci et al (2011), also incorporated in Annex 2 of Sullivan et al (2012). If the 131
design displacement does not exceed the damped spectrum corner displacement0/,2 , as is 132
common for RC frames in moderate to high seismicity, the effective period of the e-SDOF structure 133
is obtained from Eqs. (1.1) and (5.6) of Sullivan et al (2012), thereby yielding the effective stiffness 134
of the e-SDOF system 4& (Eq. 5.4 of Sullivan et al 2012). 135
The influence of P-$ effects is directly incorporated into the DDBD design process by increasing 136
the total base shear force 5678& by an additional force 59:∆, if the stability coefficient of the e-137
SDOF structure namely %&< 4&'&⁄ , exceeds 0.05. Furthermore the stability coefficient of each 138
storey should not exceed 0.30, which would rarely be the case for RC frames. The total base shear 139
force can be obtained from Eqs. (5.1) and (5.8) of Sullivan et al (2012). An upper bound is usually 140
checked in order to correct for the response at extremely low periods of vibration, where the 141
displacement spectral shape has been distorted. In order to evaluate the flexural strength of plastic 142
hinges, the design base shear is distributed as equivalent lateral forces according to the distributions 143
of the storey masses %>, using Eqs. (8.1a)–(8.1b) (Sullivan et al 2012). Structural analysis of the 144
model can now be performed, yielding the design internal forces. As noted above, two alternative 145
methods have been proposed to perform analysis, both requiring the determination of the column 146
base flexural strength by utilizing equilibrium considerations. 147
Upon completion of the analysis, bending moments at joint faces, shear and axial forces are readily 148
available. Detailing of plastic hinges is performed by moment – curvature analyses of the sections 149
where hinging is expected. Such analyses are conducted with material strain limits depending on 150
the design limit state, using expected material strengths without reduction partial factors. On the 151
other hand, strength for capacity protected actions (shear, flexure in locations where no plastic 152
hinges are expected to form) is calculated with characteristic values of the material capacities, 153

reduced by partial factors. The required dependable strength for these sections is derived from the 154
value corresponding to the design lateral force distribution, amplified due to material overstrength 155
and higher mode effects. The required column flexural and shear strengths, in particular, are 156
obtained from Eqs. (9.2)-(9.5) of Sullivan et al (2012), respectively. If no further calculations are 157
performed, a material overstrength factor ?@ equal to 1.25 is assumed. The higher mode dynamic 158
amplification factor !A is height dependent and is obtained from Fig (9.1) of Sullivan et al (2012), 159
for plane frames. 160
Having outlined the basic DDBD method, it is noted that the local ductility demands are not 161
explicitly defined in terms of plastic rotation or other, during the design process. No minimum 162
curvature ductility is prescribed and, consequently, no confining reinforcement is dictated, as in 163
current force based seismic design codes (EC8-1 2004). It is therefore assumed that the strain limits 164
adopted during the section detailing would suffice in providing the necessary local ductility. To 165
accommodate the needs of the present study, the design plastic rotation is defined for every plastic 166
hinge by multiplying the design plastic curvature with the plastic hinge length, proposed by 167
Priestley et al. (2007), as also outlined in the following section. 168
169
3. Description of the Frames and DDBD Design Procedure 170
The basic geometry of the Seven-Storey and Ten-Storey frames that are investigated herein is 171
depicted in Figs.1a, 1b. The frames consist of three bays with constant bay length equal to 172
6m. Furthermore, for the Ten-Storey building, a set of frames with unequal bays (6m – 3m – 173
6m) is introduced, with different locations of the unequal bay within the setback. Storey 174
height is retained constant in all the frames, and is equal to 3m at all levels. There is no 175
setback at the perpendicular direction of irregular buildings, so no torsional response is 176
anticipated. As a result, the seismic response can be decoupled and plane frame models 177
describe adequately the behavior of the structures. Frame spacing at the perpendicular 178
direction is equal to the bay length. Due to the monolithic nature of RC structures, seismic 179
forces are resisted by every frame in the respective direction. As a result, two unique frames 180
exist for each building with different seismic masses (inner and outer). A typical plan is 181
illustrated in Fig.2, where the tributary areas that are used for the distribution of the slab loads 182
to the beams are also depicted. 183

Fig. 1a Frame elevations of the Ten-Storey Frames
Fig. 1b Frame elevations of the Seven-Storey Frames Fig. 2 Typical Plan View
The gravity loads were considered according to the seismic combination G+0.3Q (EC8-1 184
2004). Maximum factored gravity loads - combination 1.35G+1.50Q (EC8-1 2004) was also 185
taken into account and governed the required flexural strength of the roof beams. The self 186
weight was evaluated as 4.0 kN/m2, assuming constant slab thickness equal to 0.16m and 187
typical element cross-sections. Super-imposed dead load and live load were also accounted, 188
with characteristic values equal to 1.5 kN/m2 and 2.0 kN/m2 respectively. Interior moveable 189
masonry partitions were substituted by an equivalent uniformly distributed load equal to 1.0 190
kN/m2. The perimeter infill is only applied to the outer frame beams as a line load with 191
characteristic value 9.0 kN/m. It is suggested that the plastic hinges are designed for either 192
the maximum factored gravity loads or the seismic loads only, while the axial force of 193
column bases is derived only from the gravity loads. (Priestley et al. 2007). 194
Beam height governs the yielding of frames and has to be predefined in order to proceed with 195
the calculations. For the frames considered, a beam height equal to 0.60m was selected. 196
Columns are square and their size is defined with respect to the upper limits of the 197
normalized axial force proposed by EC8 (2004). Column size is also reduced with height and 198
is only needed when the calculation of moments at joint faces is performed. The seismic mass 199
of stories without setback for outer and inner frames is equal to 65 tons and 87 tons, 200
Levels - Elevations Frame Designation
Frame Designation
Frame Designation
Frame Designation
Frame Designation
Frame Designation
Frame Designation
Frame Designation
Levels - Elevations

respectively while, for setback stories, it is reduced to 43 tons and 58 tons, respectively. 201
In Fig.3a and 3b, the design displacement profiles of the Seven-Storey and the Ten-Storey 202
Frames (R or A) are given for the design assumed limit state of repairable damage (()= 203
2.5%). For the evaluation of the design plastic rotations, frame members are considered as 204
equivalent cantilevers and the design plastic curvature is calculated using the design drift above as 205
input, following Priestley et al. (2007). It is assumed that each storey’s beams are subject to plastic 206
rotations stemming from the drift demand of the respective storey lower columns. For example, 207
design plastic rotations of the 2nd storey beams are calculated using the drift demands of the second 208
storey columns (Fig. 3c); it is, therefore, reasonably assumed that a storey’s beams are subjected to 209
the largest rotation induced to the joint by the columns. The equivalent cantilevers’ length was 210
taken as follows: for beams, it was assumed equal to the half of the clear span, neglecting for 211
gravity loads, an approximation which is compatible with the DDBD approach. For ground floor 212
columns, it was explicitly defined during the calculation of the required strength at the column 213
bases. Other columns are capacity protected from inelastic action and, therefore, no design plastic 214
rotation is defined. 215
(a) (b) (c)
Fig. 3 Design Displacement Profiles of a) the Seven – Storey and b) the Ten – Storey Frames
(R or A); and c) Evaluation of the typical 2nd storey beam plastic rotation.
It has been repeatedly reported that the current codified displacement spectra are incapable of 216
reliably predicting the displacement demand in the medium and high period range (Akkar and 217
Bommer (2007), Priestley et al. (2007), Cauzzi et al. (2008)). A finding that has been attested 218
by the authors, since designing frames to DDBD using EC8 elastic displacement spectrum 219
without any modifications led to unrealistic results. Therefore, seismological research has 220
focused on the reliable estimation of appropriate spectral values in the long period range, to 221
accompany the DDBD method. Priestley et al. (2007) propose Eqs. (1) – (2) for the corner 222
period ./ (transition period between constant spectral velocity and constant spectral 223

displacement areas) and the peak displacement response $C7D, respectively (Faccioli et al. 224
2004), also adopted herein. For design purposes, a typical seismic scenario of a moment 225
magnitude EF = 7 earthquake at an epicentral distance 3 = 10 km on firm ground (G8 = 1) 226
was assumed, yielding the design displacement spectrum used in the present study with H/ = 227
4.25s and 0/,I% = 0.631m (Eqs. (1), (2)): 228
H/ = 1 + 2.5(EF − 5.7S (1)
$C7D = 0/,I% = G8 ∙10VW:X.Y
3 (2)
The e-SDOF properties that result from the application of the DDBD procedure described in 229
Section (2) are summarized in Table 1. For simplicity, only the results of the outer frames 230
(types A and R) are provided, with the response parameters of the other cases being similar. 231
232
Table 1. Properties of the case structures’ e-SDOF systems. 233
Frames Seven-storey Ten storey
A R A R
Design Displacement 0Z(mS 0.290 0.304 0.400 0.423
Yield Displacement 0*(mS 0.189 0.201 0.264 0.281
Ductility + 1.53 1.52 1.52 1.50
% EVD ,&- 11.24 11.11 11.13 11.03
Damped Corner Displacement 0/,2 (m) 0.459 0.461 0.461 0.462
Effective Fundamental Period .&(sS 2.68 2.80 3.69 3.89
Effective Mass %&(tonsS 342.5 382.2 432.7 536.2
% Effective to Total Seismic Mass 83.3 84.0 80.1 82.5
Effective Height '&(mS 13.75 14.61 19.18 20.46
% Effective to Total Building Height 65.5 69.6 63.9 68.2
Base Shear 5678&(kNS 543.6 583.7 545.9 646.8
% Base Shear to Total Seismic Weight 3b 13.5 13.1 10.3 10.1
% e-SDOF Stability Coefficient (9:c 14.4 14.8 17.7 18.4
Additional Base Shear 59:c(kNS 34.8 38.4 44.3 54.4
Additional to Total Base Shear 6.6% 6.8% 8.1% 8.4%
234
Elastic and damped design spectra are plotted in Fig.4. It is evident that the design point is 235
located at the ascending branch (constant velocity period range), with minor differences being 236
observed among irregular and regular frames. Since frame displacements are governed by 237

drift limits, their design ductility demand is low (µ ≈ 1.50). Taller frames are inherently more 238
flexible (.&≈ 3.8s > 2.8s) and attract comparatively less base shear, including the added force 239
for P-$ compensation (3d ≈ 10% < 13%). 240
Fig. 4 Elastic and damped DDBD compatible design spectra
241
4. Structural Analysis in DDBD Design 242
As noted in the introduction and depicted in Fig. 5, two alternative design analysis methods 243
have been proposed for the estimation of the required flexural capacity of the members. The 244
first method includes conventional iterative or non-iterative linear structural analysis, with 245
modeling assumptions conforming to the guidelines of Priestley et al (2007). On the other 246
hand, the second method makes use of approximate hand calculations based on equilibrium. 247
248
Fig 5 Available design analysis methods to accompany the DDBD method 249
250
4.1 Non iterative conventional design analysis 251
The difference of the conventional analysis methods, as far as their application using 252
commonly available structural analysis software is concerned, lies in the effective stiffness 253
values utilized for the beams. In line with the direct nature of the DDBD procedure, direct 254
0,00
0,25
0,50
0,75
0,0 2,0 4,0 6,0
Spec
tral
Displa
cem
ent
(m)
Period (s)
Elastic
ξ=5%
Damped
ξ=ξeq =
11%
(2) Equilibrium Considerations

non-iterative analyses have been proposed, if reliable estimates of the cracked stiffness are 255
employed. Such estimates can be found in Paulay and Priestley (1992), Priestley (2003) and 256
currently enforced seismic design codes (EC8-1 2004, EC8-3 2005, KANEPE 2012). It 257
should be noted, however, that since differences are observed among these proposed values, 258
designers are encouraged to use the most up-to-date estimates of cracked stiffness. 259
4.2 Iterative conventional design analysis 260
While tabulated or codified values of the stiffness can be used, other approximate design 261
analysis methods may also be employed, based on the yield curvature; the fact that constant 262
yield curvature is a more realistic assumption for sections than constant effective stiffness 263
(Priestley et al 2007), allows for incorporating this parameter into an iterative design process 264
instead, such as the one described below, whereby the effective stiffness is iteratively 265
obtained. Such an iterative method would seem a rational approach to apply, particularly in 266
the case of unequal column sizes within the same storey, in view of the fact that irregular 267
forms of setback structures are considered and columns do not carry the same gravity load. 268
The procedure, depicted in the flowchart of Fig. 6, rather than using closed form expressions, 269
iterates in order to obtain the correct value of the effective stiffness, since this depends on the 270
member’s flexural resistance, which is not readily available at the initial stage of the 271
calculation. In order to estimate the effective member stiffness h)i, the average moment Ej 272
from both member ends is utilized, while yield curvature (?* ) values are adopted from 273
Sullivan et al. (2012) (Fig. 6). 274

Fig. 6 Iterative structural analysis flowchart
4.3 Direct equilibrium design analysis 275
Regarding the second method of Fig. 5 (equilibrium considerations), its general outline is 276
extensively described in the literature (Priestley et al. 2007). After the column base moments 277
are identified, a bottom-to-top sequence of member equilibrium is followed to determine the 278
required flexural strength in other locations. Nievas and Sullivan (2015) introduced a 279
modification of the sequence to encompass the effect of setbacks at the corresponding joints. 280
According to this procedure, the moment demand of the setback beam is equated with the 281
moment of the concurring column, while the moments of the remaining beams, derived from 282
equilibrium, are increased. Trial hand calculations by the authors showed that the increased 283
demand of the other beams was comparable to the demand derived from the application of 284
the conventional procedure in Priestley et al. (2007). 285
4.4 Critical examination of the conventional design of the Seven Storey Frames 286
In order to investigate the two conventional design analysis approaches described above, both 287
the iterative and non-iterative conventional procedures were applied for the design of the 288
Seven-Storey Frames in order to examine any differences in the member design outcome. For 289
the iterative scheme, the relative and absolute difference tolerances were 1% and 1.0 kNm, 290
respectively (Fig. 6). Both procedures were coded on the OpenSees platform (McKenna et al. 291
2010), since its scripting interface renders it extremely efficient in applying such 292
unconventional iterative analysis procedures. 293
Given that for the Seven-Storey Frame A, inner and outer columns of the same storey had 294
initially different dimensions, reflecting the differences in axial load due to the presence of 295
the setback, it was observed that, the algorithm of the iterative procedure altered the load 296
carrying behavior of the frames. Following the sequence of calculations described in Eq. (3) 297
led the stiffer bays to fully attract the seismic forces, while the other members became 298
seismically not critical. Step by step, the differences in stiffness were exaggerated, leading to 299
excessive demands by the stiffer bays. Such a design procedure is naturally not apparent in 300
the non-iterative analysis method, whereby the member effective stiffness remains constant. 301
ℎl < ℎY ⟹1ℎl> 1ℎY⟹ ?*,l > ?*,Y ⟹
1?*,l
< 1?*,Y
⟹ (oh)iSl < (oh)iSY (3)
Further analysis proved that the same design behavior was encountered in the irregular 302

building as well, if non uniform member sizes were initially selected. As a result, the iterative 303
procedure on constant yield curvature was deemed to be incapable of distributing equally the 304
seismic load in cases of unequal column width, regardless of frame irregularity, as it can be 305
deduced from the corresponding bending moment diagrams, derived from the iterative design 306
analysis procedure, illustrated in Fig.7 (only the results of the outer frame are provided, since 307
the inner frame’s results were similar). 308
(a) (b)
Fig. 7 Bending moment diagrams for Seven-Storey Frames R and A with: a) uniform; and b) non-uniform column section dimensions.
It is additionally noted that similar behavior was observed during the design of the frames 309
with unequal bay lengths, even with uniform sections. Stiffer bays (currently determined by 310
beam lengths rather than column section dimensions) also attracted the majority of seismic 311
loads, leading to unusual and doubtful designs. Consequently, equal dimensions for the 312
columns in each storey were adopted in all cases considered. For completeness of the 313
argument put forward, however, the two Seven-Storey Frame A designs using uniform or non 314
uniform column configurations, are compared in detail under inelastic seismic response, in 315
Section (8). It is expected that the frame with unequal bay capacities will demonstrate 316
unfavorable seismic behavior, an issue further discussed in Section (8). 317
318
5. Detailing of Frame Member Sections and Inelastic Modeling 319
Having determined the required flexural strength at critical locations, the appropriate amount 320
of reinforcement for all members is calculated. The influence of the iterative algorithm on 321
section uniformity was tested on the Seven-Storey Setback Frame, where two configurations 322
were designed. Detailing of plastic hinges and capacity design was applied according to the 323
principles outlined in Section (3). Cross section dimensions and detailing of all frames are 324
illustrated in Figs. A1 to A7, Appendix A. Characteristic concrete compressive strength was 325
assumed equal to 30 MPa, while characteristic steel yield stress was taken equal to 500 MPa. 326
Stirrup pattern and spacing were initially selected according to EC8-1 (2004) specifications 327
and modified where needed. Specifically, the number of ties was determined by the number 328
of longitudinal reinforcing bars, since the distance between two consecutive bars dictates that 329
every rebar should be tied by transverse reinforcement. 330
Capacity design provisions for columns lead to more reinforcement than the amount 331
necessary at the base plastic hinge. It is uncommon construction practice to put an increasing 332
amount of reinforcement up the height of the column compared to the reinforcement at the 333
base. Therefore, the largest number of reinforcing bars that is required at any column section 334
is set at the column base and is curtailed along the column height as needed. Such a distortion 335
to the design flexural strengths is unavoidable and is expected to affect the displacement 336
profiles. In order to further investigate the influence of this practice, the Ten - Storey Frame R 337
was also analyzed with reduced reinforcement at column bases. It is stressed out that this 338
reduced amount, despite being closer to the design demands than initial detailing, was still 339
necessarily increased; minimum reinforcement clauses still governed the design, even though 340
for this case they were relaxed to 0,7% adopted, in lieu of 1% (EC2-1 2004). 341
The inelastic models of the frames were assembled in the OpenSees platform (McKenna et 342
al. 2010) and non-linear static pushover (SPO) and dynamic time-history analyses (NLTHA) 343
were carried out. Material model Concrete01 was used for both unconfined and confined 344
concretes, while material model Hysteretic was deemed appropriate for reinforcing steel. 345
Confined concrete properties were calculated based on Eurocode 2 provisions (EC2-1 2004). 346
Beams and columns were modeled with distributed damage force-based 347
nonlinearBeamColumn finite elements with five integration points. Frame joints were 348
modeled with effectively rigid elastic elements. Diaphragmatic action was imposed with rigid 349
truss members, instead of kinematic constraints of the respective degrees-of-freedom. It has 350

been reported that fictitious axial forces can be obtained in constrained elements with 351
sections having asymmetric position of the neutral axis (Zeris et al (2007) and OpenSees 352
online manual). To avoid such a distorted behavior, the modeling convention adopted in Zeris 353
et al. (2007) were adopted, whereby double nodes were created and the beam axial degree-of-354
freedom only was released at one beam end. P-$ effects were accounted for in all the 355
analyses. Following the recommendations by Priestley et al. (2007), 5% Rayleigh damping 356
for NLTHA was assigned as tangent-stiffness proportional to the period of the fundamental 357
mode, excluding mass – proportional terms. The first fundamental mode was calculated with 358
OpenSees after the gravity loads were applied and cracking was initiated to the model. 359
Special attention was also paid to the local behavior of members. The plastic rotation of 360
member ends was compared with plastic rotational capacity, calculated according to EC8-3 361
(2005). It should be noted however that this comparison is indicative, since codified 362
equations yield the chord rotation of members, including shear contribution and bar pullout. 363
For the NLTHA, a set of fourteen accelerograms was selected from the PEER NGA-West2 364
database (PEER 2014). Their selection was based on the moment magnitude and distance that 365
characterize the design seismic scenario, while pulse-like records were avoided. A scaling 366
factor was automatically computed, so that the mean response spectrum is well fitted with the 367
Design Spectrum. The selected record characteristics and scaling are displayed in Table 2. 368
The spectral displacements of the individual scaled records, as well as their mean spectrum 369
are compared with the design spectrum in Fig 8. 370
371
Table 2 Selected characteristics of the ground-motion records used in NLTHA 372
ID Earthquake and Station Name Year Scale
Factor Magnitude Rjb (km)
1 Imperial Valley-02, El Centro Array #9 1940 1.9007 6.95 6.09
2 Imperial Valley-06, El Centro Array #11 1979 1.5702 6.53 12.56
3 Irpinia, Italy-01, Calitri 1980 3.2386 6.9 13.34
4 Corinth, Greece, Corinth 1981 2.5486 6.6 10.27
5 Kalamata, Greece-01, Kalamata (bsmt) 1986 2.3315 6.2 6.45
6 Superstition Hills-02, El Centro Imperial 1987 1.7267 6.54 18.2
7 Loma Prieta, Gilroy Array #4 1989 1.8076 6.93 13.81
8 Northridge-01, W Lost Canyon 1994 1.503 6.69 11.39

9 Kobe, Japan, Shin-Osaka 1995 2.1925 6.9 19.14
10 Chi-Chi, Taiwan, CHY029 1999 2.0986 7.62 10.96
11 Chi-Chi, Taiwan; TCU055 1999 1.8928 7.62 6.34
12 Iwate, Japan, IWTH26 2008 1.1183 6.9 5.97
13 El Mayor-Cucapah, El Centro Array #10 2010 1.5072 7.2 19.36
14 Christchurch, Botanical Gardens 2011 0.9914 6.2 5.52
373
Fig. 8 Displacement spectrum of scaled records, mean spectrum and DDBD spectrum
374
6. SPO and NLTHA Analysis Results: Global Drift and Resistance Demands 375
The seismic behavior of the frames was evaluated by both global and local criteria. All 376
response parameters have been established through SPO analyses and were subsequently 377
compared with the average NLTHA envelope values. Global behavior in terms of total base 378
shear and roof displacement is commonly been used in the literature as a criterion for the 379
successful application of the design method. In the present study, local member ductility 380
demands, imposed by frame displacements, were further addressed as well. 381
The SPO capacity curves depicted in Fig. 9 show a stable post-elastic behavior, apart from 382
the Regular Ten-Storey Frame R. For this frame, the P-$ effects and the lower ductility 383
supply associated with the relatively larger magnitude of gravity loads, led to unstable 384
behavior with significant degradation of resistance. The overstrength factor Ω varied between 385
1.0 and 1.20. The average overstrength from the dynamic analyses was slightly increased 386
0
20
40
60
80
100
120
0 1 2 3 4
SD (cm
)
T (s)
IMPVALL02 IMPVALL06IRPINIA CORINTHKALAMATA SUPHILLSLOMAP NORTHRKOBE CHICHI_029CHICHI_055 IWATESIERRA.MEX CCHURCHMean Spectrum Design

(1.25-1.50), while the maximum overstrength observed was 1.35 and 1.60, for the Seven-387
Storey and Ten-Storey Frames, respectively (both A and R). The maximum base shear is 388
obtained at a roof displacement lower than the design value. It is evident that setback frames 389
are less susceptible to P-$ effects than regular frames are. Furthermore, Ten – Storey Frame 390
C, exhibits an even more stable behavior, owing to the relatively lower mass on the upper 391
storeys. On the other hand, higher order effects are more influential on the behavior of Seven 392
– Storey Frame B, than in the rest of the Seven – Storey frames. This phenomenon can be 393
attributed to the more irregular geometric form of these frames. The amount and the 394
distribution of the total base shear, as proposed by Eqs.(5.1), (5.8) and (8.1) of Sullivan et al 395
(2012), are sufficient for counteracting these effects in terms of total base shear. 396
Consequently, a stable behavior is generally achieved with reasonable overstrength factors for 397
both the Regular and Setback structures. 398
(a) Seven – Storey Frame A (b) Seven – Storey Frame R
(c) Ten-Storey Frame A (d) Ten-Storey Frame R
0
1
2
3
4
0 0,2 0,4 0,6
Tota
l Ba
se S
hear
(M
N)
Roof Displacement Δtop (m)
0
1
2
3
4
0 0,2 0,4 0,6
Roof Displacement Δtop (m)
0
1
2
3
4
5
0 0,3 0,6 0,9
Tota
l Ba
se S
hear
(M
N)
Roof Displacement Δtop (m)
0
1
2
3
4
5
0 0,3 0,6 0,9Roof Displacement Δtop (m)

Fig. 9 also depicts the envelope values from the NLTHA analyses (absolute values considered 399
throughout). Both maximum base shear at the corresponding roof displacement and base 400
shear at the instance of maximum roof displacement are shown. It is observed that the design 401
roof displacement is rarely attained during NLTHA, whilst higher base shears and increased 402
overstrength is developed by the frames. It is therefore attested that using the DDBD 403
methodology together with the design displacement spectrum adopted, leads to conservative 404
predictions of the irregular frames’ roof displacement under NLTHA. Furthermore, it is 405
observed that, generally, SPO predictions provide a median behavior to the NLTHA results in 406
terms of base shear, which are more conservative in terms of roof displacement demand. 407
The drift profiles of the Seven-Storey and Ten-Storey Frames are depicted in Fig. 10. 408
Maximum absolute values from individual NLTHA and their average are plotted, along with 409
the corresponding SPO values at the , and are compared to the design profile. Since the 410
design drift profile corresponds to the first inelastic mode of vibration, alterations are 411
expected in the displacement profiles obtained from analyses due to higher modes 412
contribution. Therefore, fundamental criterion for the success of the DDBD method is the 413
non-exceedance of the maximum allowable drift of the design limit state, which has been 414
previously defined as ()= 2.5%. Even though Pettinga and Priestley (2005) observed good 415
agreement between the design displacement profile and the NLTHA results of regular frames, 416
more spurious results are obtained herein, especially for the Ten-Storey frames. This 417
phenomenon is both attributed to record type and P-$ effects. Since natural accelerograms 418
are scaled to match the design spectrum, a scatter in spectral demands exists throughout the 419
period range; therefore, the various modes of vibration are expected to have different 420
(e) Seven – Storey Frame B (f) Ten Storey Frame C
Fig. 9 Comparison of the SPO capacity curves and the NLTHA peak base shear and roof displacement, all buildings and records considered.
0
1
2
3
4
0 0,2 0,4 0,6
Tota
l Ba
se S
hear
(MN
)
Roof Displacement Δtop (m)
0
1
2
3
4
5
0 0,2 0,4 0,6 0,8Roof Displacement Δtop (m)

demands at different records, which will generally remain different as the structure softens. 421
The way P-$ effects modify response is similar to the behavior depicted on Fig. 9. In general, 422
the displacements of the first levels are less than the design displacements. A plausible 423
explanation lies with the fact that the reinforcement at the base of the columns is increased in 424
order to comply with capacity design requirements of the upper levels. Thus, the lower part 425
of the frame is made stiffer than the design assumptions and lower displacements are 426
expected. It is also noted that SPO produces more conservative results than NLTHA, closer to 427
the maxima than the average obtained values. The standard SPO is incapable of incorporating 428
the higher mode effects at the response of the Ten-Storey Setback Frame, identifying the need 429
of a more sophisticated procedure for such frames. 430
The drift profiles of the Seven-Storey Frames are in good agreement with the design drift 431
profile, except for the first levels and the roof. The similarity of the SPO and the NLTHA 432
results is also pointed out. The influence of the setback is not always evident, since both 433
Regular and irregular type A frames exhibit similar behavior. On the contrary, setting the 434
setback at a lower storey, as in Frame B, renders higher mode effects more important and 435
imposes higher drifts on the upper storeys. This influence of higher modes is more apparent 436
at the Ten-Storey Frames. Drifts are initially increasing with setback height, leading to 437
significant excess of the design values in the middle and upper parts of the Ten Storey frames, 438
especially in Ten Storey Frame A. 439
(a) Seven–Storey Frame A (b) Seven–Storey Frame R
0
3
6
9
12
15
18
21
0% 1% 2% 3% 4%
Hei
ght
(m
)
Storey Drift
0
3
6
9
12
15
18
21
0% 1% 2% 3% 4%
Hei
ght
(m
)
Storey Drift

Ten – Storey Frame 10C exhibits storey drifts at the upper storeys that are less than their 440
counterparts of Frame A, a behavior that could be anticipated from the capacity curves. 441
Absolute drifts are constantly lower than the design values. The average NLTHA response of 442
all frames does not exceed the 2.5% limit, in terms of drift. Therefore, the drift reduction 443
factor !" used for design does not need modification. In conjunction with this observation, 444
together with the predicted capacity curves, it can be concluded that handling of P-$ and 445
higher mode effects at the global level is sufficient both for regular and irregular RC frames 446
considered. 447
The storey shear profiles of the Seven-Storey and the Ten-Storey Frames are illustrated in 448
Fig. 11. For simplicity, only the shear forces of the inner frame columns are shown. The 449
average column shear forces obtained by NLTHA are in excellent agreement with the 450
capacity design assumptions, while SPO results underestimate their magnitude, a finding that 451
(c) Ten-Storey Frame A (d) Ten-Storey Frame R
(e) Seven-Storey Frame B (f) Ten-Storey Frame C
Fig. 10 Comparison of the peak absolute drift profiles under NLTHA, with design limit and SPO prediction at the design roof deformation, all buildings and records
considered.
0369
12151821242730
0% 1% 2% 3% 4%
Hei
ght
(m
)
Storey Drift
0369
12151821242730
0% 1% 2% 3% 4%
Hei
ght
(m
)
Storey Drift
0
3
6
9
12
15
18
21
0% 1% 2% 3% 4%
Hei
ght
(m)
Storey Drift
0369
12151821242730
0% 1% 2% 3% 4%
Hei
ght
(m)
Storey Drift

is consistent with the base shear plots of Fig.9; this is attributed to the fact that the imposed 452
lateral force profile under SPO, for these irregular frames, does not necessarily correspond to 453
the inertia force profiles during dynamic response under NLTHA. In some cases, the 454
envelope shear forces are also well predicted. The inherent conservatism of Eq. (9.5) of 455
Sullivan et al (2012) for tall regular frames has been attested by Priestley et al. (2007), but 456
this safety margin is shown to be sufficient to cover the shear amplification for the irregular 457
frames. Shear failure was avoided at every analysis. In fact, the margin between shear 458
demands and dependable shear strength was significant, since the detailing rules that are 459
enforced by codes were taken into account during shear design; the provided stirrup spacing 460
was governed by avoidance of buckling of the longitudinal reinforcement. It is stressed out 461
that Priestley’s et al (2007) suggestion is stricter than Eurocode limits. 462
463
7. SPO and NLTHA Analysis Results: Implications on Local Member Demands 464
Attention is now drawn to the local level in order to identify if the global displacement 465
(a) Seven – Storey Frame A (b) Seven – Storey Frame R
(c) Ten-Storey Frame A (d) Ten-Storey Frame R
Fig. 11 Comparison of the storey shear profiles under NLTHA with design and SPO at the design roof deformation, all buildings (interior frames) and records considered.
0
3
6
9
12
15
18
21
0 350 700 1050 1400
Hei
ght
(m
)
Storey Shear (kN)
0
3
6
9
12
15
18
21
0 350 700 1050 1400
Hei
ght
(m
)
Storey Shear (kN)
0369
12151821242730
0 400 800 1200 1600
Heig
ht (m
)
Storey Shear (kN)
0369
12151821242730
0 425 850 1275 1700
Hei
ght
(m
)
Storey Shear (kN)

demands cause depletion of the local ductility capacity. Implications of global demands to the 466
local level are important, since the achievement of the design performance level (i.e. the 467
formation of a favorable collapse mechanism within the prescribed drift limits) depend on the 468
condition of no failure at the local level, i.e. plastic rotation demands do not exceed the 469
plastic rotation capacity. Both average maximum values and the development of plastic 470
rotations are hereafter considered. 471
The average value of the maximum absolute plastic rotations obtained from NLTHA at each 472
plastic hinge is depicted graphically in Fig. 12a (again, only the inner setback frames are 473
shown for clarity). The percent total hysteretic energy absorbed separately by the beams and 474
columns of each storey, is illustrated in Fig.12b. Since no exact values are plotted, these 475
figures provide a more qualitative approach; the formation of the prescribed collapse 476
mechanism (beam-sway) is attested and the sections that absorb more hysteretic energy are 477
identified. The spatial distribution and magnitude of the plastic rotations appear strongly 478
correlated with the drift profile. It is noted that the regular ten-storey frame utilizes middle 479
height beams and upper storey columns significantly more than the respective setback frame 480
that is depicted in Fig. 12. Capacity design has been successfully implemented since 481
insignificant plastic deformations were observed at columns. Therefore, Eq. (9.2) of Sullivan 482
et al (2012) seems to sufficiently enforce the as predicted hinge distribution in the beams, and 483
therefore needs no modification. 484
485
(a)
(b)
Fig. 12 Distribution of plastic hinges (Left) and hysteretic energy absorption (Right) of: a) Seven-Storey Frame A and; b) Ten-Storey Frame A
486
0% 10% 20% 30% 40%
1
3
5
7
Store
y Beams Columns
0% 8% 15%
1
3
5
7
9
Store
y

Apart from the formation of a suitable collapse mechanism, essential are the checks 487
confirming that the plastic rotational capacity has not been exceeded. Fig. 13 illustrates the 488
development of plastic rotations during SPO at characteristic locations (continuous line), 489
along with the envelope values of NLTHA (dashes and crosses), compared to the rotational 490
capacity (dashed line, following EC8 – 3 2005, KANEPE 2012) and the design plastic 491
rotation (square point). In order to maintain the clarity of the plots, only the maximum plastic 492
rotations are plotted. The values depicted correspond to the beam end under negative 493
bending, because they are more critical due to the influence of gravity loads on the shear 494
span’s length. Similar to Fig. 9, both the maximum plastic rotation with the corresponding 495
roof displacement (dashes) and the plastic rotation at the instance of maximum roof 496
displacement (crosses) are depicted. In order to provide a better comparison between local 497
and global behavior, plastic rotations are also plotted against the corresponding storey drift – 498
a more localized global deformation parameter, compared to the roof displacement. It is also 499
noted that the scatter from the monotonic trend is in this case reduced, compared with the 500
results plotted against the roof displacement, thus validating the use of the storey drift as a 501
reliable index of local damage for the case of irregular buildings. 502
Depletion of the rotational capacity was often observed in members that were subjected to 503
increased demands, such as base columns and first-storey beams. Since codified equations 504
include fixed-end rotations and shear deformations (EC8 – 3 2005, KANEPE 2012), failure 505
would be expected to be much more imminent than what these figures imply. The increase of 506
(a) Seven-Storey Frame A (b) Ten-Storey Frame A
0,0%
0,5%
1,0%
1,5%
2,0%
2,5%
3,0%
3,5%
0% 1% 2% 3% 4%
θpl (rad
)
Storey Drift
0,0%
0,5%
1,0%
1,5%
2,0%
2,5%
3,0%
3,5%
4,0%
0% 1% 2% 3% 4%
θpl (rad
)
Storey Drift

plastic rotation demands with reference to roof displacement, as obtained by NLTHA, 507
displayed a tendency that was effectively described by the static SPO. An exception to this 508
rule was posed by the Ten-Storey Frame R, where plastic rotation demands accumulated 509
earlier than predicted by SPO. The situation has been anticipated and is in line with the 510
disharmony between displacements and the global instability of that structure, which has 511
been previously noted. Furthermore, the departure of drift demands from the drift design 512
profile is in line with the difference between design plastic rotation and analysis results. Even 513
though in terms of drift, the outcome was not severe, because ultimately there was 514
conformation with the drift limit of the limit state, this is not the case for plastic rotations; 515
Failure can be imminent, therefore jeopardizing the whole structure’s response, while the 516
designer is not aware of the exceedance that could be accommodated during the design. It is 517
(c) Seven-Storey Frame A (d) Ten-Storey Frame A
(e) Ten-Storey Frame R (f) Ten-Storey Frame R
Fig. 13 Development of plastic rotations in the building beams in terms of: a) and b)
the corresponding storey drift and; c) to e) the roof displacement
0,0%
0,5%
1,0%
1,5%
2,0%
2,5%
3,0%
3,5%
4,0%
0,0 0,2 0,4 0,6
θpl (rad
)
Roof Displacement Δtop (m)
0,0%
0,5%
1,0%
1,5%
2,0%
2,5%
3,0%
3,5%
4,0%
0,0 0,3 0,6 0,9
θpl (rad
)
Roof Displacement Δtop (m)
0,0%
0,5%
1,0%
1,5%
2,0%
2,5%
3,0%
3,5%
4,0%
0,0 0,2 0,4 0,6
θpl (rad
)
Roof Displacement Δtop (m)
0,0%
0,5%
1,0%
1,5%
2,0%
2,5%
3,0%
3,5%
4,0%
0,0 0,3 0,6 0,9
θpl (rad
)
Roof Displacement Δtop (m)
also pointed out that the response of the 10storey frame with the reduced reinforcement at 518
column bases is effectively the same with its regular counterpart with unreduced 519
reinforcement; the reduction of moment capacity at the bases is not enough to alter the global 520
behavior in terms of drift. On the contrary, the frame is susceptible to soft storey failure at 521
ground floor; Plastic rotations of the upper end of the ground floor column are doubled, when 522
compared to their regular counterpart and become comparable to those at the base, where a 523
hinge formed. 524
The influence of unequal bay lengths on local demands is now examined, considering the Ten 525
– Storey Frames, types B – C and D. After evaluation of the SPO and NLTHA results, it is 526
concluded that the global behavior in terms of drift remains unaffected by the shorter span 527
frame and bears similarity with their equal – bay counterparts. Fig. 14 illustrates the 528
development of plastic rotations from SPO (continuous line) and the NLTHA maxima (dashes 529
and crosses), compared with the rotational capacity (dashed line) for a long and a short beam 530
at the 6th storey (Figs. 14a and 14b, respectively). At first, it is observed that the local 531
demands on shorter beams do not significantly differ from the demands on longer beams and 532
therefore cannot provide the basis for a rule, without further investigation. During SPO, the 533
similarity was anticipated, since a beam-sway mechanism is practically enforced. 534
Furthermore, the development of plastic rotations during SPO is characterized by a linear 535
trend, which is further validated by the maxima points of the NLTHA. The discrepancies 536
between design predictions and analysis demands that have been identified for drifts are also 537
valid for plastic rotations, signaling an overestimation of plastic rotation at the lower and an 538
underestimation at the upper storeys, respectively. Depletion of rotation capacity is noted as 539
well, especially at the upper storeys. It is also noted that insignificant differences at the 540
seismic behavior where observed, when the external left bay was shortened instead of the 541
central. 542

(a) (b)
Fig. 14 Development of beam plastic rotations of Ten-Storey Frame C, at: a) The longer span; and b) The shorter span.
In order to further investigate the effect of height irregularity, the setback storey at the Seven 543
– Storey Frames is set at the 3rd storey instead of the 5th. Thus, the upper part of the frame has 544
formed a tower, where higher mode effects are expected to be more significant. Fig. 15a 545
depicts the development of plastic rotations at a 4th storey beam along with the maxima points 546
of NLTHA for this case. It is observed that the trend of the SPO is still validated by the 547
NLTHA, albeit with higher scatter in the demands. It is further noted that the many NLTHA 548
maxima are accompanied with an increased storey drift exceeding the 2.5% design limit, a 549
phenomenon that was less frequently observed in the other case buildings studied. The design 550
plastic rotation is once again underestimated and the tower beams are more utilized than 551
expected. This finding is attested by Fig 15b, where the hysteretic energy absorption is 552
depicted. Increased amounts of energy are absorbed by the beams of the tower, especially 553
when compared to Fig 12a-(right), which represents a more regular behavior; Seven – Storey 554
Frame C absorbs energy more uniformly, while Frame A shows a triangular distribution. 555
0,0%
0,5%
1,0%
1,5%
2,0%
2,5%
3,0%
3,5%
4,0%
0% 1% 2% 3%
θpl (rad
)
Storey drift
0,0%
0,5%
1,0%
1,5%
2,0%
2,5%
3,0%
3,5%
4,0%
0% 1% 2% 3%
θpl (rad
)
Storey drift

(a) (b)
Fig. 15. Seven-Storey Frame C (Tower): a) Development of beam plastic rotations; and b) Hysteretic energy absorption with height
A similar behavior was encountered at the profile of increasing vertical interstorey drifts with 556
roof displacement, but the presented figures are more informative, because of the presence of 557
an upper bound indicative of failure. Plastic rotational and drift demands differ from their 558
respective design values in a similar manner. 559
560
8. Performance of the Frame with Non-Uniform Column Section Dimensions 561
So far, only the frame configurations with uniform sections have been considered. Figs. 16 – 562
17 summarize the response of the Seven-Storey Setback Frame with the adoption of non-563
uniform column dimensions and designed using the iterative conventional analysis described 564
in Section (4.2). It is apparent that a frame designed according to such principles exhibits an 565
unfavorable behavior and is susceptible to soft storey at the setback level (Fig. 16a). Shear 566
failures are also observed, since both single NLTHA and average behavior shows that shear 567
demand overrides the dependable strength (Fig. 16b). For these failures to be avoided, stirrup 568
configurations denser than design requirements were assumed, as shown in Fig. A1. 569
In terms of total base shear, significant overstrength (Ω ≈ 2.0) was observed. The drift 570
profiles are constantly increasing with height, signifying a stiff behavior characteristic of 571
wall-type structures rather than frames (Fig. 16a). They also significantly deviate not only 572
from the design drift profile, but also from the drift limit, thus implying relatively higher 573
0%
1%
2%
3%
0% 1% 2% 3%
θpl (rad
)
Storey drift0% 10% 20% 30% 40%
1
2
3
4
5
6
7
Store
y
Beams
Columns

damage in this structure than intended by the design performance level. Furthermore, as can 574
be seen from the spatial distribution of plastic hinges in Fig. 17a, hysteretic energy was 575
absorbed in a limited number of cross-sections, while, their rotational capacity was exceeded 576
in several nonlinear dynamic analyses (Fig. 17b). Thus, the disharmony between design 577
predictions and analysis results that is apparent in drift profiles is also observed in the 578
member local behavior. 579
9. Conclusions 580
581
The DDBD method has been applied to the design of several in height regular or irregular 582
(a) (b)
Fig. 16 Seven-Storey Setback Frame with non-uniform sections: a) Drift profiles and; b) Storey shear
(a)
(b)
Fig. 17 Seven-Storey Setback Frame A with non-uniform column section dimensions:
a) Plastic rotation spatial distribution and; b) Development of a typical beam's plastic
rotation under SPO and NLTHA (for notation, see Fig. 18).
0
3
6
9
12
15
18
21
0,0% 1,0% 2,0% 3,0% 4,0% 5,0%
Hei
ght
(m
)
Drift
0
3
6
9
12
15
18
21
0 330 660 990 1320 1650
Heig
ht (m
)
Storey Shear (kN)
0%
2%
4%
6%
0 0,2 0,4 0,6
θpl (rad
)
Roof Displacement Δtop (m)
setback RC frames seven and ten stories tall, with different numbers of recessed stories and 583
span irregularity. All structures were subsequently analyzed as plane frames under nonlinear 584
SPO and NLTHA analyses, using a set of fourteen base excitations. Considering the global 585
and local performance of the case structures, the following are concluded: 586
• With minor exceptions for the tall setback configurations, the peak roof displacement 587
demand under NLTHA did not exceed the design roof displacement adopted in the DDBD 588
design of the frames using the damped DDBD compatible design spectra proposed in 589
Priestley et al. (2007). 590
• Even though the influence of higher modes and P-$ effects were considered in 591
design, their contribution to the response introduced significant deviations from the design 592
drift profiles observed by the NLTHA predictions, particularly for the Ten Storey Frames. 593
The maximum allowable drift for the design limit state, namely 2.5% was not, on average, 594
exceeded for all fourteen NLTHA, thus confirming the success of the design in terms of drift. 595
However, considerable scattering deviation by as much as 200% of the design anticipated 596
value was obtained at the upper third of the buildings studied and for selected ground 597
motions, with most notable differences obtained in the case of the Ten – Storey Setback and 598
Regular frames. 599
• The SPO capacity curves of the buildings indicated an acceptable behavior and the 600
preservation of instability at acceptable levels. Therefore, the treatment of higher modes and 601
P-$ effects, as is currently incorporated into DDBD design, is satisfactory for the cases 602
considered. However, based on the analysis findings, it is concluded that the taller regular 603
frames were more susceptible to P- $ effects than the corresponding setback frames. 604
Additionally, the calculation of the required shear strength, as is currently enforced in 605
DDBD, was conservative enough to account for the shear amplification observed in the 606
irregular frames. 607
• Capacity design provisions were also proven to be sufficient for the irregular frame 608
designs, since no significant column hinging was observed apart from the base critical region 609
apthe ground storey. Furthermore, no column hinging was observed at the recess levels. 610
Weak beam – strong column collapse mechanism was successfully enforced at all cases, 611
leading to a more stable behavior; inelastic behavior is limited to the inherently more ductile 612
members, namely the beams.The interrelation between local (member) and global (e-SDOF 613
structural) ductility demands requires further development, for better control of the local 614

damages incurred at the ultimate limit state design displacement. It has been repeatedly 615
observed in the analyses herein that global e-SDOF displacements, characterizing the design 616
limit state, led to excessive local plastic rotation ductility demands that did not conform with 617
the design limit state assumptions, leading many members to exhibit premature failure due to 618
depletion of their plastic deformation capacity. Therefore, not only the subsequent limit state 619
(collapse prevention) was more imminent than intended, but the achievement of the design 620
limit state in itself (repairable damage) may be questionable. Further investigation is also 621
needed for a more accurate establishment of the beams’ design plastic rotation; their values 622
have been repeatedly underestimated, a phenomenon that is consistent with the exceedance 623
of the design drift. 624
• On the other hand, investigation of the local demands induced for the different forms 625
of irregularity show insignificant correlation between them. For the cases considered, 626
setbacks with both equal or unequal bay lengths do not significantly alter the plastic rotation 627
demands on the beams, when compared to the regular configurations. Given the limited 628
amount of data, however, further investigation is needed, where other configurations, taller 629
and relatively slender building forms and additional types of geometric irregularity can be 630
examined (e.g., other tower forms, frames with discontinuous beams or columns), before the 631
establishment of a general design rule. 632
• An extensive comparative study of the alternative methods for linear structural 633
analysis showed that the iterative conventional procedure is inadequate for the design of 634
frames whose stiffness is inherently non – uniformly distributed. Such are the cases of 635
unequal column dimensions or unequal bay lengths within the same storey. Stiffer bays 636
attracted the majority of the seismic load, regardless of the irregularity of the frame. The 637
seismic behavior of such frames was unacceptable, since drift limits and deformation 638
capacity were often exceeded, while they were found to be susceptible to a soft storey 639
collapse mechanism and shear failures. Consequently, the only viable solution for the 640
rational design of such frames – apart from equilibrium considerations – is the adoption of 641
realistic estimates of the cracked stiffness in non-iterative analyses. 642
643
References 644
645
Akkar, S. and Bommer, J.J. (2007) “Prediction of elastic displacement response spectra in 646
Europe and the Middle East”, Earthquake Engng Struct Dyn, 36,1275-1301 647

Amiri, G. G., Shalmaee, A. M. and Namiranian, P. (2016) “Evaluation of a DDB design 648
method for bridges isolated with triple pendulum bearings”, Structural Engineering and 649
Mechanics, 59(5), 803-820. 650
Cardone, D., Palermo G. and Dolce M. (2010) “Direct Displacement-Based Design of 651
Buildings with Different Seismic Isolation Systems”, Journal of Earthquake Engineering, 652
14(2), 163-191. 653
Cauzzi, C., Faccioli, E., Paolucci, R. and Villani, M. (2008), “Long – Period Ground 654
Motion Evaluation from a Large Worldwide Digital Strong Motion Database”, 14th World 655
Conference on Earthquake Engineering, Beijing, China 656
EC2-1 (2004), EN 1992-1-1:2004, Design of Concrete Structures – Part 1: General Rules 657
and Rules for Buildings, European Committee for Standardization, Brussels, Belgium. 658
EC8-1 (2004), EN 1998-1:2004. Design of Structures for Earthquake Resistance – Part 1: 659
General Rules, Seismic Actions and Rules for Buildings, CEN, Brussels, Belgium. 660
EC8-3 (2005), EN 1998-3:2005. Design of Structures for Earthquake Resistance – Part 3: 661
Assessment and retrofitting of buildings, CEN, Brussels, Belgium. 662
Faccioli, E., Paolucci, R. and Rey, J. (2004), “Displacement spectra for long periods”, 663
Earthquake Spectra, 20(2), 347-376. 664
Gkatzogias, K. and Kappos, A. (2015) “Deformation-based seismic design of concrete 665
bridges”, Earthquakes and Structures, 9(5), 1045-1067. 666
KANEPE (2012), Code of Structural Interventions, Earthquake Planning and Protection 667
Organization of Greece, Athens, Greece. 668
Inel, M. and Meral, E. (2016) “Seismic performance of RC buildings subjected to past 669
earthquakes in Turkey”, Earthquakes and Structures, 11(3), 483-503. 670
Landi, L., Pollio, B., and Diotallevi, P. P. (2014) “Effectiveness of different standard and 671
advanced pushover procedures for regular and irregular RC frames”, Structural 672
Engineering and Mechanics, 51(3), 433-446. 673
McKenna, F., Scott, M. H., and Fenves, G. L. (2010) “Nonlinear Finite-Element Analysis 674
Software Architecture Using Object Composition,” Journal of Computing in Civil 675
Engineering, Vol. 24, No.1, pp. 95–107. 676
Malekpour, S., Ghaffarzadeh, H., and Dashti, F., (2013). “Direct displacement-based 677

design of steel-braced reinforced concrete frames”. Structural Design of Tall and Special 678
Buildings. 22(18), 1422-1438. 679
Mergos, P. E. (2013) “The anchorage-slip effect on direct displacement-based design of 680
R/C bridge piers for limiting material strains”, Computers and Concrete, 11(6), 493-513. 681
Muljati, I., Kusuma, A. and Hindarto, F. (2015), “Direct displacement based design on 682
moment resisting frame with out-of-plane offset of frame”, Procedia Engineering, 125, 683
1057 – 1064 684
NGA-West2 (2014), PEER Ground Motion Database, Pacific Earthquake Engineering 685
Research (PEER) Center, Berkeley, CA, USA, http://ngawest2.berkeley.edu 686
Nezhad, M. E., and Poursha, M. (2015) “Seismic evaluation of vertically irregular building 687
frames with stiffness, strength, combined-stiffness-and-strength and mass irregularities”, 688
Earthquakes and Structures, 9(2), 353-373. 689
Nievas, C.I. and Sullivan, T.J. (2015), “Applicability of the direct displacement-based 690
design method to steel moment resisting frames with setbacks”, Bull. Earthqu. Eng., 691
13(12), 3841-3870. 692
O’Reilly, G. J., Sullivan, T. J., and Filiatrault, A. (2017) “Implications of a More Refined 693
Damage Estimation Approach in the Assessment of RC Frames,” 16th World Conference 694
on Earthquake Engineering, Santiago, Chile 695
Paparo, A. and Beyer, K. (2015) “Development of a displacement-based design approach 696
for modern mixed RC-URM wall structures”, Earthquakes and Structures, 9(4), 789-830. 697
Pettinga, J.D. and Priestley, M.J.N. (2005), “Dynamic behaviour of reinforced concrete 698
frames designed with direct displacement-based design”, J. of Earthqu. Eng., 9(2), 309-699
330. 700
Paulay, T. and Priestley, M.J.N. (1992), Seismic Design of Reinforced Concrete and 701
Masonry Buildings, Wiley, New York. 702
Pennucci, D., Sullivan, T.J. and Calvi G.M., Displacement Reduction Factors for the 703
Design of Medium and Long Period Structures, J. of Earthqu. Eng., 15(1), 1-29. 704
Priestley, M.J.N. (2003), Myths and Fallacies in Earthquake Engineering, Revisited, The 705
9th Mallet Milne Lecture, IUSS Press, Pavia, Italy. 706
Priestley, M.J.N., Calvi, G.M. and Kowalsky, M.J. (2007), Displacement-Based Seismic 707
Design of Structures, IUSS Press, Pavia, Italy. 708
SEAOC. (1995) Vision 2000: Performance-based seismic engineering of buildings, 709
Sacramento, California 710
Sullivan, T.J., Priestley, M.J.N. and Calvi, G.M. (2012), A Model Code for the 711
Displacement-Based Seismic Design of Structures DBD12, IUSS Press, Pavia, Italy. 712
Takeda T., Sozen M. and Nielsen N. (1970). “Reinforced Concrete Response to Simulated 713
Earthquake”, Journal of the Structural Division, ASCE, 96, 2557-2573. 714
Varughese, J.A., Menon, D. and Prasad, A.M. (2012), “Simplified procedure for 715
displacement-based design of stepped buildings”, 15th World Conf. on Earthq. Eng., 716
Lisbon, September. 717
Varughese, J., A., Menon, D. and Prasad, M. (2015) “Displacement-based seismic design 718
of open ground storey buildings”, Structural Engineering and Mechanics, 54(1), 19-33. 719
Vidot-Vega, A.L. and Kowalsky, M.J. (2013) “Drift, strain limits and ductility demands 720
for RC moment frames designed with displacement-based and force-based design 721
methods”, Engineering Structures, 51, 128-140. 722
Yang, B. and Lu, X. (2017) “Displacement-Based Seismic Design Approach for 723
Prestressed Precast Concrete Shear Walls and its Application”, Journal of Earthquake 724
Engineering. https://doi.org/10.1080/13632469.2017.1309607 725
Zeris, C., Vamvatsikos, D., Giannitsas, P. and Alexandropoulos K. (2007), “Impact of FE 726
modelling in the seismic performance prediction of existing RC buildings”, ECCOMAS 727
Thematic Conference on Computational Methods in Structural Dynamics and Earthquake 728
Engineering, Rethimno, Greece. 729
Zhou, J., Zhao, W. and Mao, W. (2015) “Least Favorable Probability of Failure for 5-and 730
10-story RC Frame Structures with Vertical Irregularities,” Journal of Earthquake 731
Engineering, 19(7), 1158-1180. 732
733
Appendix 734
735
The following figures depict the section dimensions and detailing of the frames designed and 736
analyzed herein. 737
738

Fig. A1 Section dimensions and detailing of the Seven-Storey Frames R and A.
739
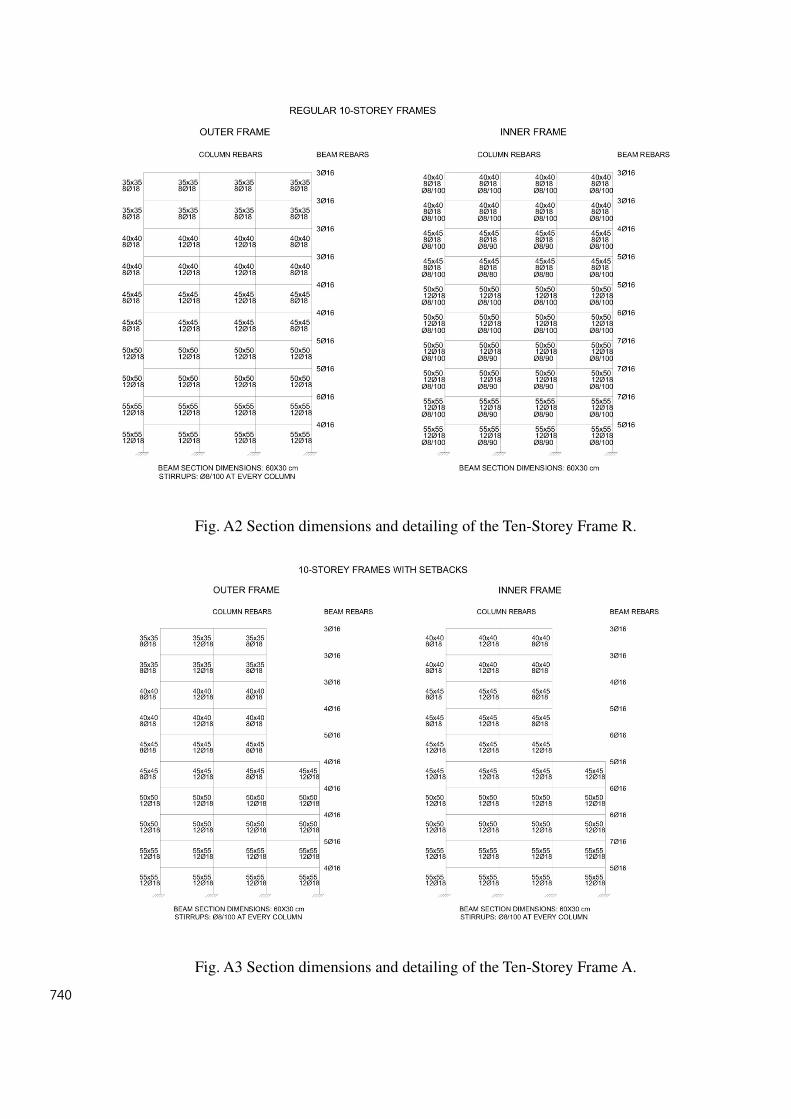
Fig. A2 Section dimensions and detailing of the Ten-Storey Frame R.
Fig. A3 Section dimensions and detailing of the Ten-Storey Frame A.
740

Fig. A5 Section dimensions and detailing of the Ten-Storey Frame B with Unequal Middle
Bay length.

741
Fig. A6 Section dimensions and detailing of the Ten-Storey Setback Frame D with Unequal
External Bay length.
Fig. A7 Section dimensions and detailing of the Seven-Storey Tower Frame B.
742
View publication statsView publication stats