Towards a Multiple Language Shift in Cameroon - Sciedu Press
Upload
khangminh22Category
view
0download
0
This report has been prepared at the request of the EITI Committee charged with the implementation of the Extractive Industries Transparency Initiative in Cameroon (EITI Cameroon). The views expressed in the report are those of the Independent Reconcilers and in no way reflect the official opinion of the EITI Cameroon Committee. This report has been prepared exclusively for use by EITI Cameroon and must not be used by other parties, nor for any purposes other than those for which it is intended.
REPUBLIC OF CAMEROON
EITI COMMITTEE
REPORT ON THE RECONCILIATION OF PAYMENT FLOWS AND VOLUMES RELATING TO THE EXPLORATION AND
EXPLOITATION OF HYDROCARBONS AND SOLID MINERALS FOR THE FISCAL YEAR 2013
June 2015
Report on the reconciliation of cash flows and volumes relating to the exploration and exploitation of Hydrocarbons and solid Minerals for the fiscal year 2013
Moore Stephens LLP | P a g e 2
This translation of the report into English aims to facilitate the understanding by stakeholders, but should not be regarded as the original version. In case of discrepancies between the original French version and this text, please refer to the original French version.
Report on the reconciliation of payment flows and volumes relating to the exploration and exploitation of Hydrocarbon and solid Minerals for the fiscal year 2013
Moore Stephens LLP | P a g e 3
CONTENTS
INTRODUCTION ............................................................................................................... 6
Background ................................................................................................................................... 6
Objective ................................................................................................................................... 6
Nature and extent of our work ......................................................................................................... 6
1. EXECUTIVE SUMMARY ........................................................................................... 8
1.1. EITI scope ............................................................................................................................... 8
1.2. Revenue from the Extractive Sector ....................................................................................... 8
1.3. Production of extractive sector in 2013 ................................................................................ 10
1.4. Results of reconciliation works ............................................................................................. 12
1.5. Completeness and Accuracy of Data ................................................................................... 14
2. APPROACH AND METHODOLOGY ...................................................................... 16
2.1. Scoping study ....................................................................................................................... 16
2.2. Data Collection ..................................................................................................................... 16
2.3. Reconciliation and Investigation of Discrepancies ............................................................... 16
2.4. Reliability and Credibility of EITI Reported Data .................................................................. 17
2.5. Degree of aggregation .......................................................................................................... 17
2.6. Basis of Reporting ................................................................................................................ 17
3. CONTEXTUAL INFORMATION ON THE EXTRATIVE INDUSTRY ........................ 18
3.1. Extractive sector in Cameroon ............................................................................................. 18
3.2. Regulatory framework and context of the hydrocarbons sector ........................................... 18
3.3. Context of the hydrocarbon transportation sector ................................................................ 23
3.4. Legal framework and context of the mining sector ............................................................... 24
3.5. Beneficial ownership ............................................................................................................. 31
3.6. Collection and distribution of extractive industry revenues .................................................. 31
3.7. Contribution of the extractive sector ..................................................................................... 35
3.8. Audit practices in Cameroon ................................................................................................ 36
4. DETERMINATION OF THE RECONCILIATION SCOPE ........................................ 37
4.1. Selection of payment flows and other data .......................................................................... 37
4.2. Selection of extractive companies ........................................................................................ 41
4.3. Selection of government entities .......................................................................................... 43
5. RECONCILIATION RESULTS ................................................................................ 44
5.1. Reconciliation of in kind payments ....................................................................................... 44
5.2. Reconciliation of cash payments .......................................................................................... 47
5.3. Reconciliation of the EITI data with other sources ............................................................... 63
6. ANALYSIS OF MAIN DATA .................................................................................... 65
6.1. State revenues ..................................................................................................................... 65
6.2. Social payments ................................................................................................................... 70
6.3. Exports of the extractive sector ............................................................................................ 71
6.4. Sub-national transfer ............................................................................................................ 72
Report on the reconciliation of payment flows and volumes relating to the exploration and exploitation of Hydrocarbon and solid Minerals for the fiscal year 2013
Moore Stephens LLP | P a g e 4
7 FINDINGS AND RECOMMENDATIONS ................................................................. 73
7.1 Findings and Recommendations for 2013 ............................................................................ 73
7.2 Follow-up to the of recommendations of the previous reports ............................................. 76
ANNEXES ....................................................................................................................... 82
Annex 1 : Profile of companies included in the reconciliation scope ............................................. 83
Annex 2 : Unilateral disclosure of DGT and DGTCFM .................................................................. 85
Annex 3 : Details of the social payments ..................................................................................... 116
Annex 4 : Permanent employment by extractive company ......................................................... 119
Annex 5 : Structure of Capital and beneficial ownership ............................................................. 120
Annex 6 : Reporting Templates ................................................................................................... 122
Annex 7: Map of oil blocks in Cameroon ..................................................................................... 137
Annex 8 : Distribution of Exploration and Exploitation permit ...................................................... 138
Annex 9 : Reconciliation sheets by company .............................................................................. 140
Annex 10 : Production and exports data declared by extractive company.................................. 162
Annex 11 : Map of Mining rights .................................................................................................. 163
Annex 12 : Statement of Mining titles .......................................................................................... 164
Annex 13 : Tracking table of certified declaration forms.............................................................. 171
Annex 14 : Persons contacted or involved .................................................................................. 172
Report on the reconciliation of payment flows and volumes relating to the exploration and exploitation of Hydrocarbon and solid Minerals for the fiscal year 2013
Moore Stephens LLP | P a g e 5
LIST OF ABBREVIATIONS
bbl. Barrel
BEAC Bank of Central African States
BPW Buildings and Public Works
CSPHM Centre Of Support and Promotion of Mining Handicrafts
EMCCA Economic and Monetary Community of Central Africa
GTC General Tax Code
COTCO Cameroon Oil Transportation Company
UCY Urban Community of Yaoundé
DGC Directorate-General of Customs
DGE Large Enterprises Division
DGI Directorate-General of Taxes
DGTFMC Directorate-General of Treasury and the Financial and Monetary Cooperation
DMG Directorate of Mines and Geology
FCFA Franc CFA (African Financial Community)
FEICOM Special Council Support Fund for Mutual Assistance
IFAC International Federation of Accountants
NSI National Statistics Institute
IRCM Income Tax from Movable Capital
IS Corporate Tax
EITI Extractive Industries Transparency Initiative
MINFI Ministry of Finance
MINIMITD Ministry of Industry, Mines and Technological Development
MPCI Mobil Producing Cameroon Inc.
KFCFA / KUSD Thousands of FCFA / Thousands of US Dollars
OHADA Organisation for the Harmonization of Business Law in Africa
PSRMEE Program Securing Mines, Water and Energy Revenues
NHC National Hydrocarbons Corporation
SONARA National Refining Company
ToR Terms of Reference
GFOT Government Financial Operations Table
SIT Special Income Tax
VAT Value Added Tax
USD United States dollars
ITIE TS EITI Technical Secretariat

Report on the reconciliation of payment flows and volumes relating to the exploration and exploitation of Hydrocarbon and solid Minerals for the fiscal year 2013
Moore Stephens LLP | P a g e 6
INTRODUCTION
Background
Extractive Industries Transparency Initiative (EITI) 1
The Extractive Industries Transparency Initiative (EITI) is a global standard to promote open and accountable management of natural resources. It seeks to strengthen government and company systems, inform public debate, and enhance trust. In each implementing country it is supported by a coalition of governments, companies and civil society working together.
Wealth derived from natural resources can lead a country onto the path of economic growth and social development. The lack of disclosure of such wealth increases the risk of mistrust, weak governance and conflicts. Transparency in the management of natural resources is necessary to ensure that these resources benefit all citizens.
The Extractive Industries Transparency Initiative (EITI) was first announced in September 2002 at the World Summit on Sustainable Development in Johannesburg and was officially launched in London in 2003. The initiative aims to improve transparency by publishing the payment of taxes for companies operating in the extractive industries and disclosure by government organisations of the revenue from these companies.
EITI in Cameroon2
Cameroon announced its intention to join the initiative in March 2005 at the Lancaster House Conference in London and was declared a “Candidate” to the EITI Requirements on 27 September 2007. During its meeting in Abidjan on 17 October 2013, the EITI Board declared Cameroon Compliant to the EITI Rules.
The current structure of EITI governance in the Republic of Cameroon was established in June 2005. The Multi-Stakeholder Group in charge of the implementation and monitoring of EITI in Cameroon is called the “Steering Committee” (Comité de Suivi). It is currently headed by the Minister of Finance. The functions of this committee and its operating procedures are set out in Decree n°2005/2176/PM dated 16 June 2005. A Technical Secretariat of the Coordination Committee was established by Resolution N° 002328/MINEFI/CAB of the 15
th of September 2005.
Cameroon published its seventh EITI report covering the Fiscal Year 2012 in December 2014. This is the eighth Cameroon EITI report, which covers the period from 1 January to 31 December 2013. Cameroon’s next validation is due by October 2016.
Objective
EITI requires the publication of comprehensive reports, including full disclosure of state revenues from extractive industries, as well as disclosure of all material payments to governments by hydrocarbon/gas and mining companies. The purpose of this report is to reconcile the payment flow and volumes data for the exploration and exploitation of hydrocarbons and minerals in 2013.
The overall objectives of the reconciliation exercise are to assist the Government of Cameroon in identifying the contribution of the extractive sectors to the economic development of the Country and to improve resources governance and transparency in the extractive industries sector.
Nature and extent of our work
This report summarises the results of the reconciliation work and payment flows from the extractive sector for the year 2013 which forms part of the EITI process in Cameroon. This report also covers the reconciliation of production volumes and exports of the extractive sector.
1 For further information about EITI, please visit the web site https://eiti.org
2 For further information about EITI Cameroon, please visit the web site http://www.eiticameroon.org.
Report on the reconciliation of payment flows and volumes relating to the exploration and exploitation of Hydrocarbon and solid Minerals for the fiscal year 2013
Moore Stephens LLP | P a g e 7
We have performed our work in accordance with the International Auditing Standards applicable to related services (ISRS 4400 Engagements to perform agreed upon procedures regarding Financial Information) as well as the IFAC Code of Ethics. The procedures performed were those set out in the terms of reference as established in the Request for Proposal and approved by the EITI Committee.
The reconciliation procedures carried out were not designed to constitute an audit or review in accordance with International Standards on Auditing or International Standards on Review Engagements and as a result we do not express any assurance on the transactions beyond the explicit statements set out in this report. Had we performed additional procedures, other matters may have come to our attention that would have been reported to you.
The report consists of seven (7) chapters presented as follows:
- Executive Summary with key data collected in the extractive sector, reconciliation results and conclusions on data (Chapter 1);
- Approach and Methodology to the reconciliation process (Chap 2); - Description of the contextual information on the mining industry and its contribution
(Chapter 3); - Determination of the reconciliation scope (Chapter 4); - Reconciliation results of reported data (Chapter 5); - Analysis of reported data (Chapter 6); and - Findings and recommendations for improvement of future EITI reconciliation processes
(Chapter 7).
Our report incorporates information and data received up to 4 May 2015. Any information received after this date is not included in our report. The amounts in this report are stated in FCFA, unless stated otherwise.
Report on the reconciliation of payment flows and volumes relating to the exploration and exploitation of Hydrocarbon and solid Minerals for the fiscal year 2013
Moore Stephens LLP | P a g e 8
1. Executive Summary
This report summarises information about the reconciliation of payment flows and volumes data from the extractive industry in Cameroon as part of the implementation of the Extractive Industries Transparency Initiative (EITI) process. In this context, extractive companies and Government Entities report payments and income respectively from the extractive industry for government hydrocarbon profit, royalties, profit taxes, dividends, bonuses, rights and costs of licenses and other material industry related payment flows. In addition this report includes reconciliation data of production, exports, employments, social payments and to provide other contextual information.
1.1. EITI scope
The scope of this report is stated by the EITI Committee and includes revenues from oil/ gas sector and transportation of hydrocarbons and minerals collected during the fiscal year 2013
3.
The reconciliation exercise has covered 99.9% of total revenues of the extractive sector presented in this report. This, however, excludes revenues derived from commercialisation, made from non-extractive entities of the State (Public Power and Associate) in production and social payments.
In addition, the reconciliation exercise has covered 100% of in-kind revenues under the State’s share (Public Power and Associate) in production.
The determination of the materiality threshold and the reconciliation scope are detailed in the Chapter 4 of this report.
1.2. Revenue from the Extractive Sector
Revenues from extractive sector
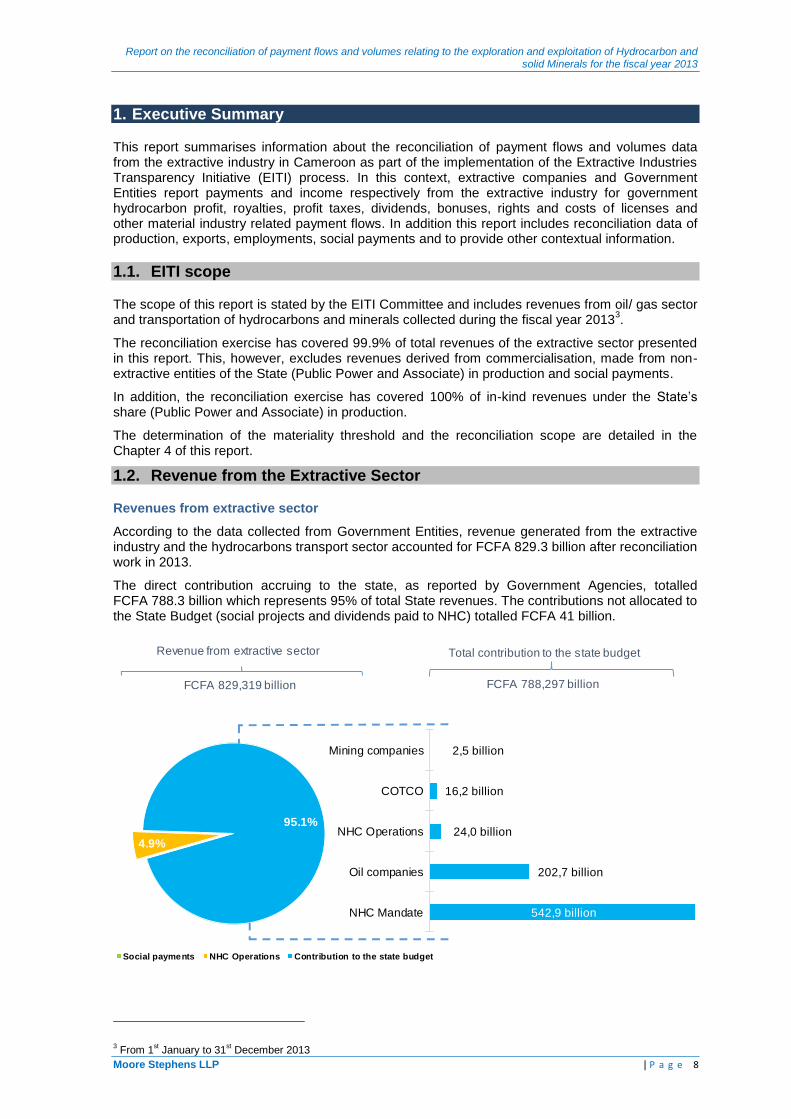
According to the data collected from Government Entities, revenue generated from the extractive industry and the hydrocarbons transport sector accounted for FCFA 829.3 billion after reconciliation work in 2013.
The direct contribution accruing to the state, as reported by Government Agencies, totalled FCFA 788.3 billion which represents 95% of total State revenues. The contributions not allocated to the State Budget (social projects and dividends paid to NHC) totalled FCFA 41 billion.
3 From 1
st January to 31
st December 2013
2,5 billion
16,2 billion
24,0 billion
202,7 billion
542,9 billion
Mining companies
COTCO
NHC Operations
Oil companies
NHC Mandate
4.9%
95.1%
Social payments NHC Operations Contribution to the state budget
Revenue from extractive sector Total contribution to the state budget
FCFA 788,297 billionFCFA 829,319 billion

Report on the reconciliation of payment flows and volumes relating to the exploration and exploitation of Hydrocarbon and solid Minerals for the fiscal year 2013
Moore Stephens LLP | P a g e 9
The contribution of the oil sector to the State Budget amounts to FCFA 769.6 billion in 2013 which represents 29% of the total revenues while the contribution of the Oil transportation and the mining sectors amounts to FCFA 18.7 billion which represent 0.7% of State’s revenues. The contribution of the extractive industry to the State Budget represents 30% of total State revenues for the year 2013
4.
Movement of revenues in the extractive sector
(i) Revenues of the hydrocarbons sector
Revenues from the hydrocarbon sector increased by FCFA 17.1 billion (2%) from FCFA 790.0 billion
5 in 2012 to FCFA 807.1 billion in 2013. This rise is explained as follows:
Aggregated payments 2012 2013 Variance Value Variance %
(In billion FCFA)
Direct Transfers from NHC to Treasury 390 306 375 241 (15 065) -4%
Indirect Transfers from NHC to Treasury (NHC Direct intervention)
142 069 163 491 21 422 15%
NHC dividends - 4 175 4 175 0%
Transfers from NHC to Treasury(a) 532 375 542 907 10 532 2%
Corporate Tax (Oil) 165 835 186 781 20 946 13%
Special Income Tax 15 112 27 774 12 662 84%
Customs Duties 5 227 6 663 1 436 27%
Other 6 642 5 534 (1 108) -17%
Total payments from entities (b) 192 816 226 752 33 936 18%
Total contribution to the State Budget (a+b) 725 191 769 659 44 468 6%
State’s share of oil sales by NHC 23 910 17 729 (6 181) -26%
Dividends 40 749 19 466 (21 283) -52%
Total payments to NHC (c) 64 659 37 196 (27 464) -42%
Voluntary social payments 145 179 34 23%
Mandatory social payments 17 120 103 606%
Total social payments (d) 162 299 137 85%
Total revenues of oil sector (a+b+c+d) 790 012 807 154 17 141 2%
(ii) Revenues of the oil transport sector
Revenues generated from the transportation of oil via the Chad/Cameroon pipeline operated by COTCO decreased by FCFA 0.988 billion (5%) from FCFA 20,642 billion in 2012 to FCFA 19,657 billion in 2013. This slight decline is explained by the drop in dividend payments which amounted to FCFA 0.962 billion. Moreover, the decline of volume transported had no impact due to appreciation of the US dollar on the one hand and the increase in transit rights in October 2013 on the other hand.
The breakdown of the variance is shown in the table below:
Aggregated payments 2012 2013
Variance Value
Variance % (In billion FCFA)
Transit fees 7 745 8 182 437 6%
Other taxes 8 424 7 981 (443) -5%
Total payments to State budget 16 169 16 163 (6) 0%
Dividends 4 445 3 483 (962) -22%
Total payments to NHC 4 445 3 483 (962) -22%
Voluntary social payments - 8 8 0%
Mandatory social payments 28 - (28) -100%
Total social payments 28 8 (20) -71%
Total revenues of oil transport sector 20 642 19 654 (988) -5%
Volume transported (in bbl.) 36 877 755 30 325 961 (6 551 794) -18%
4 Total State revenues amounts to FCFA 2 622 billion as per TOFE 2013 (version dated 24 April 2014), DGTCFM
5 EITI Report 2012
Report on the reconciliation of payment flows and volumes relating to the exploration and exploitation of Hydrocarbon and solid Minerals for the fiscal year 2013
Moore Stephens LLP | P a g e 10
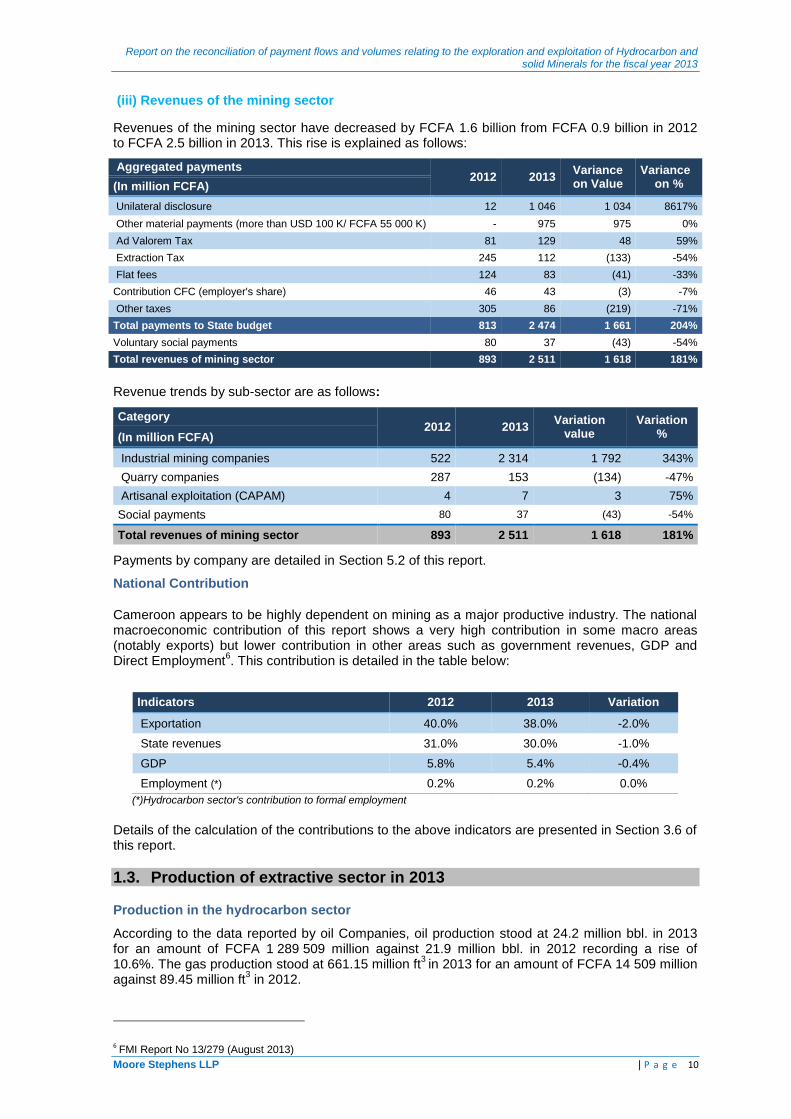
(iii) Revenues of the mining sector
Revenues of the mining sector have decreased by FCFA 1.6 billion from FCFA 0.9 billion in 2012 to FCFA 2.5 billion in 2013. This rise is explained as follows:
Aggregated payments 2012 2013
Variance on Value
Variance on % (In million FCFA)
Unilateral disclosure 12 1 046 1 034 8617%
Other material payments (more than USD 100 K/ FCFA 55 000 K) - 975 975 0%
Ad Valorem Tax 81 129 48 59%
Extraction Tax 245 112 (133) -54%
Flat fees 124 83 (41) -33%
Contribution CFC (employer's share) 46 43 (3) -7%
Other taxes 305 86 (219) -71%
Total payments to State budget 813 2 474 1 661 204%
Voluntary social payments 80 37 (43) -54%
Total revenues of mining sector 893 2 511 1 618 181%
Revenue trends by sub-sector are as follows:
Category 2012 2013
Variation value
Variation % (In million FCFA)
Industrial mining companies 522 2 314 1 792 343%
Quarry companies 287 153 (134) -47%
Artisanal exploitation (CAPAM) 4 7 3 75%
Social payments 80 37 (43) -54%
Total revenues of mining sector 893 2 511 1 618 181%
Payments by company are detailed in Section 5.2 of this report.
National Contribution
Cameroon appears to be highly dependent on mining as a major productive industry. The national macroeconomic contribution of this report shows a very high contribution in some macro areas (notably exports) but lower contribution in other areas such as government revenues, GDP and Direct Employment
6. This contribution is detailed in the table below:
Indicators 2012 2013 Variation
Exportation 40.0% 38.0% -2.0%
State revenues 31.0% 30.0% -1.0%
GDP 5.8% 5.4% -0.4%
Employment (*) 0.2% 0.2% 0.0%
(*)Hydrocarbon sector's contribution to formal employment
Details of the calculation of the contributions to the above indicators are presented in Section 3.6 of this report.
1.3. Production of extractive sector in 2013
Production in the hydrocarbon sector
According to the data reported by oil Companies, oil production stood at 24.2 million bbl. in 2013 for an amount of FCFA 1 289 509 million against 21.9 million bbl. in 2012 recording a rise of 10.6%. The gas production stood at 661.15 million ft
3 in 2013 for an amount of FCFA 14 509 million
against 89.45 million ft3 in 2012.
6 FMI Report No 13/279 (August 2013)
Report on the reconciliation of payment flows and volumes relating to the exploration and exploitation of Hydrocarbon and solid Minerals for the fiscal year 2013
Moore Stephens LLP | P a g e 11
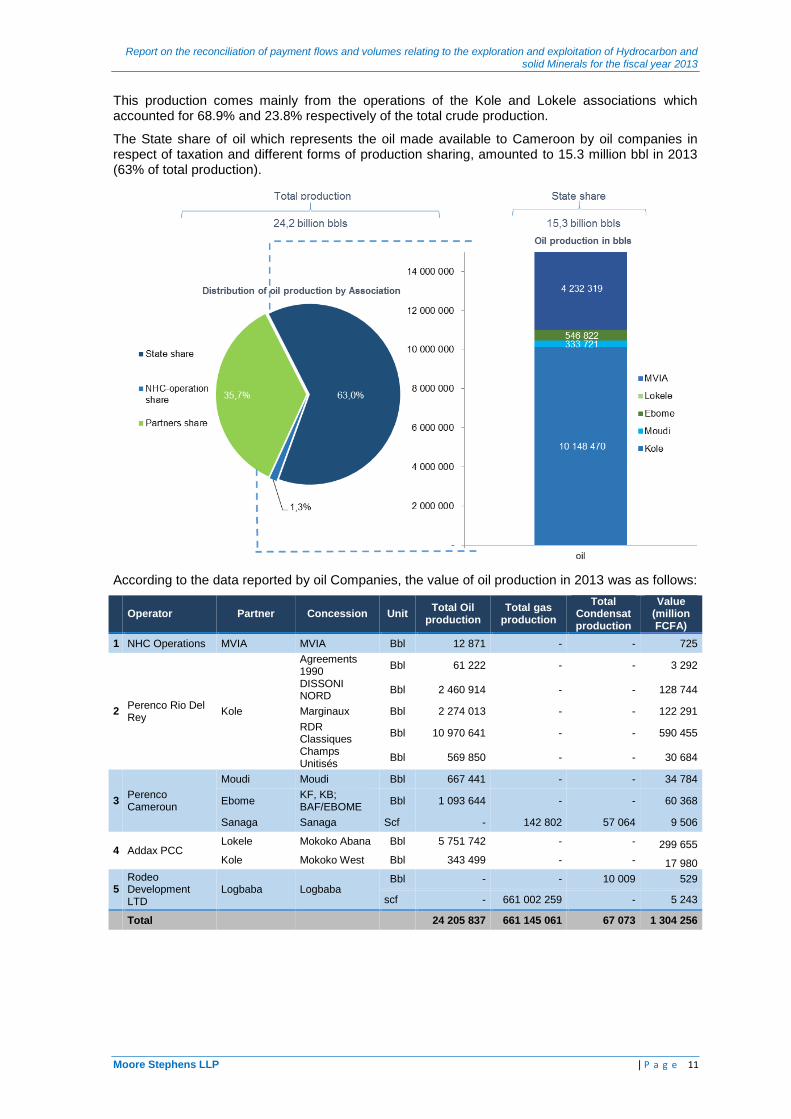
This production comes mainly from the operations of the Kole and Lokele associations which accounted for 68.9% and 23.8% respectively of the total crude production.
The State share of oil which represents the oil made available to Cameroon by oil companies in respect of taxation and different forms of production sharing, amounted to 15.3 million bbl in 2013 (63% of total production).
According to the data reported by oil Companies, the value of oil production in 2013 was as follows:
Operator Partner Concession Unit
Total Oil production
Total gas production
Total Condensat production
Value (million FCFA)
1 NHC Operations MVIA MVIA Bbl 12 871 - - 725
2 Perenco Rio Del Rey
Kole
Agreements 1990
Bbl 61 222 - - 3 292
DISSONI NORD
Bbl 2 460 914 - - 128 744
Marginaux Bbl 2 274 013 - - 122 291
RDR Classiques
Bbl 10 970 641 - - 590 455
Champs Unitisés
Bbl 569 850 - - 30 684
3 Perenco Cameroun
Moudi Moudi Bbl 667 441 - - 34 784
Ebome KF, KB; BAF/EBOME
Bbl 1 093 644 - - 60 368
Sanaga Sanaga Scf - 142 802 57 064 9 506
4 Addax PCC Lokele Mokoko Abana Bbl 5 751 742 - - 299 655
Kole Mokoko West Bbl 343 499 - - 17 980
5 Rodeo Development LTD
Logbaba Logbaba Bbl - - 10 009 529
scf - 661 002 259 - 5 243
Total 24 205 837 661 145 061 67 073 1 304 256
Report on the reconciliation of payment flows and volumes relating to the exploration and exploitation of Hydrocarbon and solid Minerals for the fiscal year 2013
Moore Stephens LLP | P a g e 12
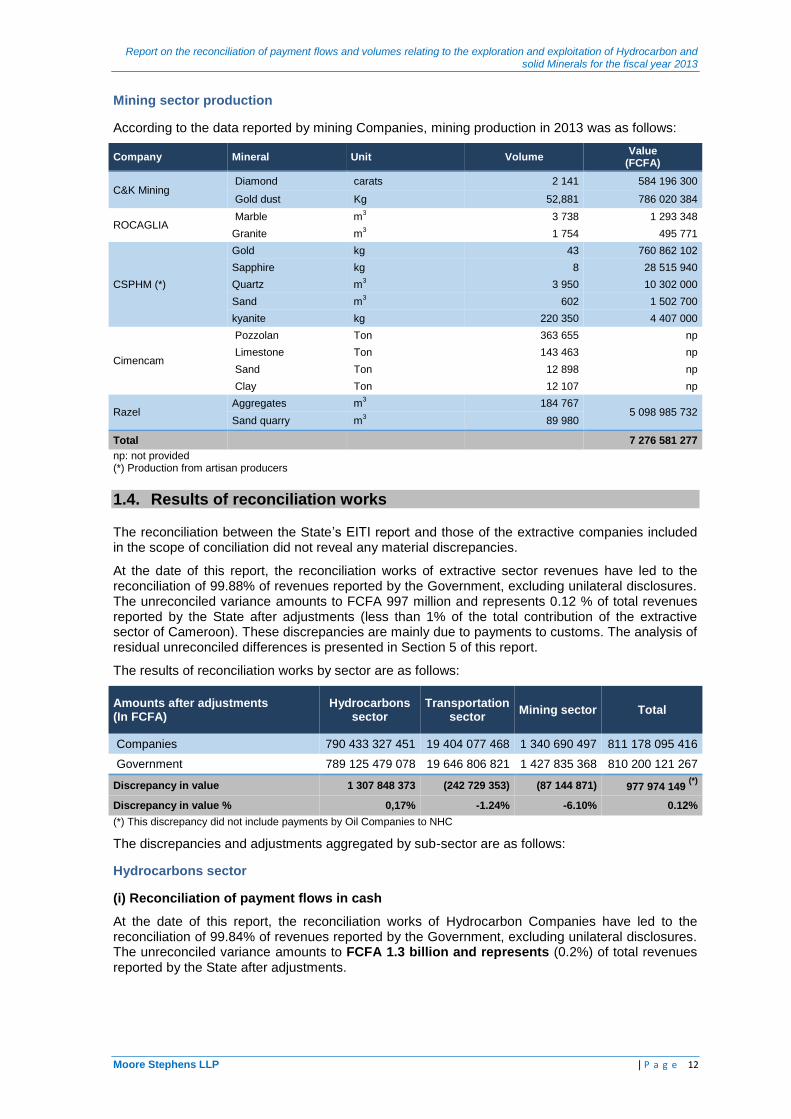
Mining sector production
According to the data reported by mining Companies, mining production in 2013 was as follows:
Company Mineral Unit Volume Value
(FCFA)
C&K Mining Diamond carats 2 141 584 196 300
Gold dust Kg 52,881 786 020 384
ROCAGLIA Marble m
3 3 738 1 293 348
Granite m3 1 754 495 771
CSPHM (*)
Gold kg 43 760 862 102
Sapphire kg 8 28 515 940
Quartz m3 3 950 10 302 000
Sand m3 602 1 502 700
kyanite kg 220 350 4 407 000
Cimencam
Pozzolan Ton 363 655 np
Limestone Ton 143 463 np
Sand Ton 12 898 np
Clay Ton 12 107 np
Razel Aggregates m
3 184 767
5 098 985 732 Sand quarry m
3 89 980
Total 7 276 581 277
np: not provided (*) Production from artisan producers
1.4. Results of reconciliation works
The reconciliation between the State’s EITI report and those of the extractive companies included in the scope of conciliation did not reveal any material discrepancies.
At the date of this report, the reconciliation works of extractive sector revenues have led to the reconciliation of 99.88% of revenues reported by the Government, excluding unilateral disclosures. The unreconciled variance amounts to FCFA 997 million and represents 0.12 % of total revenues reported by the State after adjustments (less than 1% of the total contribution of the extractive sector of Cameroon). These discrepancies are mainly due to payments to customs. The analysis of residual unreconciled differences is presented in Section 5 of this report.
The results of reconciliation works by sector are as follows:
Amounts after adjustments (In FCFA)
Hydrocarbons sector
Transportation sector
Mining sector Total
Companies 790 433 327 451 19 404 077 468 1 340 690 497 811 178 095 416
Government 789 125 479 078 19 646 806 821 1 427 835 368 810 200 121 267
Discrepancy in value 1 307 848 373 (242 729 353) (87 144 871) 977 974 149 (*)
Discrepancy in value % 0,17% -1.24% -6.10% 0.12%
(*) This discrepancy did not include payments by Oil Companies to NHC
The discrepancies and adjustments aggregated by sub-sector are as follows:
Hydrocarbons sector
(i) Reconciliation of payment flows in cash
At the date of this report, the reconciliation works of Hydrocarbon Companies have led to the reconciliation of 99.84% of revenues reported by the Government, excluding unilateral disclosures. The unreconciled variance amounts to FCFA 1.3 billion and represents (0.2%) of total revenues reported by the State after adjustments.

Report on the reconciliation of payment flows and volumes relating to the exploration and exploitation of Hydrocarbon and solid Minerals for the fiscal year 2013
Moore Stephens LLP | P a g e 13
Aggregated payments Initial reporting Adjustment Adjusted amount
(In billion FCFA)
NHC- ETAT(I)
NHC –Mandate 538 731 4 176 542 907
Government 542 907 - 542 907
Discrepancy (4 176) 4 176 (0)
Oil companies (II)
Oil companies (included NHC Operation) 235 967 (7 907) 228 060
Government 226 323 429 226 752
Discrepancy 9 664 (8 336) 1 308
Total allocated to the budget (a=(I+II))
Oil companies + NHC 774 698 (3 731) 770 967
Government 769 230 429 769 659
Discrepancy 5 468 (4 160) 1 308
Collected by NHC (b)
Oil companies 20 820 (1 354) 19 466
NHC – Operation 19 466 - 19 466
Discrepancy 1 354 (1 354) (0)
Total reconciled figures (a+b)
Oil companies 795 518 (5 085) 790 433
Government and other beneficiaries 788 696 429 789 125
Discrepancy in value 6 822 (5 514) 1 308
Discrepancy (%) 0.9% 0.17%
Furthermore, payments of hydrocarbon tax from hydrocarbon Companies to NHC-Mandate which goes to the State in addition to commercialisation revenues of profit-oil have been reconciled. The reconciliation did not reveal any material discrepancies.
Aggregated payments (In million FCFA)
Initial reporting Adjustments
Adjusted amount Companies NHC-Mandate
SNH-Mandate
Oil companies 14 254 36 - 14 290
NHC – Mandate 14 284 - - 14 284
Discrepancy (30) 36 - 6
(ii) Reconciliation of in kind payment flows
The sum of unreconciled discrepancies of in kind payments related to hydrocarbon is detailed as follows:
Aggregated payments Initial reporting Adjustment Adjusted
amount Companies NHC
Oil shares – State (bbl)
Extractive companies 15 295 765 - - 15 295 765
NHC (Mandate) 15 295 915 - - 15 295 915
Discrepancy (150) - - (150)
Profit oil – NHC (bbl.)
Extractive companies 532 083 - - 532 083
NHC (Operation) 533 116 - - 533 116
Discrepancy (1 033) - - (1 033)
Oil transportation sector
At the date of this report, we reconciled 98.8% of revenues reported by the State excluding unilateral disclosures. The unreconciled residual variance amounts to FCFA (0.2) billion and represents (1.2%) of total revenues reported by the State after adjustments.

Report on the reconciliation of payment flows and volumes relating to the exploration and exploitation of Hydrocarbon and solid Minerals for the fiscal year 2013
Moore Stephens LLP | P a g e 14
Aggregated payments Initial reporting
Adjustments Adjusted amount
(In million FCFA) of reconciliation
Reconciled figures allocated to the National Budget (a)
COTCO 15 921 - 15 921
Government 12 149 4 014 16 164
Discrepancy 3 771 (4 014) (243)
Reconciled figures collected by NHC (b)
COTCO 3 483 - 3 483
NHC 3 483 - 3 483
Discrepancy 0 - 0
Total reconciled figures (a+b)
COTCO 19 404 - 19 404
Government and NHC 15 633 4 014 19 647
Discrepancy in value 3 771 (4 014) (243)
Discrepancy (%) 24.13% -1.24%
Mining sector
At the date of this report, we have reconciled 93.9% of revenues reported by the State excluding unilateral disclosures. The unreconciled variance amounts to FCFA (0.09) billion and represents (6.1%) of total revenues reported by the State after adjustment.
Aggregated payments Initial reporting
Adjustment of reconciliation
Adjusted amount (In billion FCFA)
Allocated to the National Budget
Mining Companies 1 432 (91) 1 341
Government 13 011 (11 583) 1 428
Discrepancy in value (11 579) 11 492 (87)
Discrepancy (%) -89.99% -6.10%
1.5. Completeness and Accuracy of Data
Data submission
(i) All extractive companies selected for the 2013 reconciliation submitted their reports according to the template approved by EITI Committee.
(ii) Some companies did not disclose all the data related to their beneficial ownership. The missing data are detailed in Appendix 5 of this report.
(iii) All Government Agencies selected for the 2013 reconciliation submitted their tax templates for the extractive companies selected for the reconciliation.
(iv) The reconciliation between the State EITI reporting and those of extractive companies included in the 2013 reconciliation scope did not reveal any material discrepancies. The unreconciled residual variance (after adjustments) is not material (less than 1% of the total contribution of the extractive sector of Cameroon).
(v) DGTCFM and DGT reported the data related to sub-national transfers for 2013 using an aggregated format. Sub-national transfers provided by DGY amounted to FCFA 1 662 million while reimbursements declared by DGTCFM amounted to FCFA 64 million. The reporting template of DGTCFM did not include all the information as per the reporting instructions. This did not allow us to assess the existence of any discrepancies with the regulations relating to the transfer modalities.

Report on the reconciliation of payment flows and volumes relating to the exploration and exploitation of Hydrocarbon and solid Minerals for the fiscal year 2013
Moore Stephens LLP | P a g e 15
Data Certification
(i) All extractive companies selected have submitted their reporting templates signed by the management and certified by an external auditor except for C&K mining for which the reporting template was not signed by management.
(ii) 14 companies, out of the 22 entities included in the reconciliation scope, have audited financial statements for the year 2013. These entities represent 99.3% of total revenues reconciled as reported by the Government agencies. The companies whose accounts have not been audited are mostly in the exploration phase or are not obliged to be audited under the regulations in force (see Annex 1).
(iii) For Public Entities, all reporting templates have been signed by the Inspector General. The statements made by the Government have also been certified by the National Audit Office (Chambre des Comptes).
On the basis of the above, we can reasonably conclude that this report adequately covers all significant revenues from the extractive sector in Cameroon for the year 2013.
Tim Woodward 150 Aldersgate Street Partner London EC1A 4AB Moore Stephens LLP
22 June 2015

Report on the reconciliation of payment flows and volumes relating to the exploration and exploitation of Hydrocarbon and solid Minerals for the fiscal year 2013
Moore Stephens LLP | P a g e 16
2. APPROACH AND METHODOLOGY
The reconciliation process consisted of the following steps:
- scoping study to collect contextual information, determine the scope of the reconciliation exercise and update the reporting template;
- collection of payment data from Government Entities and extractive companies which provided the basis for the reconciliation;
- comparison of amounts reported by Government Entities and extractive companies to identify potential discrepancies;
- contact with Government Entities and extractive companies to resolve discrepancies identified; and
- comparison of other reported data against other accessible public data, where the required level of detail is available.
2.1. Scoping study
The scoping study covered the Hydrocarbon sector, the Oil Transport sector and the Mining sector, which represent the sources of revenues of the extractive Industries in Cameroon, including:
payment flows and other data to include in the reconciliation scope;
extractive companies and Government Agencies which should be included within the scope;
the process of guaranteeing the credibility of EITI data provided by the reporting entities; and
the level of detail required in the data for the purpose of the reconciliation work.
The results of the scoping study were submitted to EITI Committee for approval as described in Section 4 of this report.
2.2. Data Collection
Data collection was preceded by a training workshop for the reporting parties and focused on the presentation of the reporting templates, presented in Annex 6 of this report, as well as the reporting instructions. Guidelines, reporting rules and templates approved by the EITI Committee were communicated to the reporting parties in soft copy by email.
The EITI Committee agreed that the deadline for submission of reporting templates and certified data would be 27 March and 3 April 2015 respectively.
Companies and Government Entities were requested to submit breakdown of payments by date and by receipt in the supporting schedules as well as their certified financial statements for the year 2013.
2.3. Reconciliation and Investigation of Discrepancies
The process of reconciling data and investigating discrepancies was carried out during April 2015. In carrying out the reconciliation, we performed the following:
reconciliation of payment flows reported by extractive companies to the revenues reported by Government Agencies;
identification and analysis of differences and significant discrepancies;
gathering evidence from Companies and Government Entities in relation to the discrepancies identified and performing checks on supporting documentation; and
identification of the necessary adjustments. These adjustments were made on the basis of the evidence and / or confirmations obtained from the reporting parties.
Report on the reconciliation of payment flows and volumes relating to the exploration and exploitation of Hydrocarbon and solid Minerals for the fiscal year 2013
Moore Stephens LLP | P a g e 17
We contacted the reporting entities and arranged meetings to review additional supporting documentation evidencing the payments reported. In some cases, the discrepancies remained unresolved. The results of our work are presented in Section 5 of this report.
2.4. Reliability and Credibility of EITI Reported Data
In order to ensure reliability and completeness of data reported in the 2013 EITI report, the following measures were agreed with the EITI committee:
For extractive companies
The reporting templates, submitted by extractive companies selected in the reconciliation scope, should be:
signed by a senior official of the company;
supported by a breakdown of payments by date and by receipt in the supporting schedules;
complemented by certified 2013 financial statements of the company; and
certified by an external auditor attesting that amounts reported are in compliance with the entity’s accounts and that no evidence has been brought to their attention, which is likely to put into question the reliability or the completeness of payments reported by Companies.
Government Entities
Reporting Templates of Government Entities should be:
signed by an authorised official of the financial authorities;
supported by a breakdown showing receipt of reported payments; and
certified by the National Audit Office.
Details of submissions of signed and certified Reporting Templates are listed in Annex 13 of this report.
2.5. Degree of aggregation
In order to comply with EITI Requirement 5.2 (e), data have been reported by company, by payment flow and by Government Entity. Companies included in the reconciliation scope have submitted for each figure reported a breakdown by payment and date.
2.6. Basis of Reporting
Payments and revenues reported in this EITI report are strictly limited to payment flows and contributions which occurred during 2013. Accordingly, any payment made prior to 1 January 2013 was excluded. The same applied to payments made after 31 December 2013.
For payments made in foreign currencies, the reporting entities were required to report the amount in the actual currency of payment. Payments made in US Dollars have been converted to FCFA at the rate of 1 USD: 494.06448 FCFA
7.
7 Source: oanda.com – average annual rate 2013 USD/FCFA
Report on the reconciliation of payment flows and volumes relating to the exploration and exploitation of Hydrocarbon and solid Minerals for the fiscal year 2013
Moore Stephens LLP | P a g e 18
3. CONTEXTUAL INFORMATION ON THE EXTRATIVE INDUSTRY
3.1. Extractive sector in Cameroon
Cameroon has substantial hydrocarbon resources, including offshore oil deposits. Cameroon also hosts on its territory the pipeline which serves as a route for transportation of Chad’s oil production.
It also has a sub-soil rich in mineral resources, which includes bauxite, cobalt, gold, diamonds, iron and uranium, all of which are still relatively underexploited.
Bauxite reserves are located in the North of the country, in the Western Adamaoua region. Cobalt reserves are mainly available in the South East, near the town of Dschang. The main deposits of gold and diamonds which have been discovered are located around the Bétarié-Oya city in the East of the country.
3.2. Regulatory framework and context of the hydrocarbons sector
3.2.1. General context of the hydrocarbons sector8
Oil exploration in Cameroon effectively began in 1947. The first research permit for hydrocarbons was granted on 16 April 1952 in the Douala Basin. Cameroon effectively became an oil producer in 1977. From 1980 to 1986, the country experienced its most active exploration and production period, with a record production of 186,000 barrels/day in 1985.
Since then, production has declined due to the depletion of reserves, the ageing infrastructure and the deferral of certain development projects and investments in the wake of the financial crisis.
In 2013, oil production reached 24.2 million barrels. This production comes mostly from offshore fields in the Rio del Rey basin, while the rest comes from the Douala basin. Rio del Rey is an old deposit that extends to 7 000 km² in the Niger delta and generates 90% of national oil production. The deposit of Douala/Kribi-Campo, located on the West Coast of Cameroon, covers an area of 19,000 Km
2 of which 7,000 Km
2 are onshore.
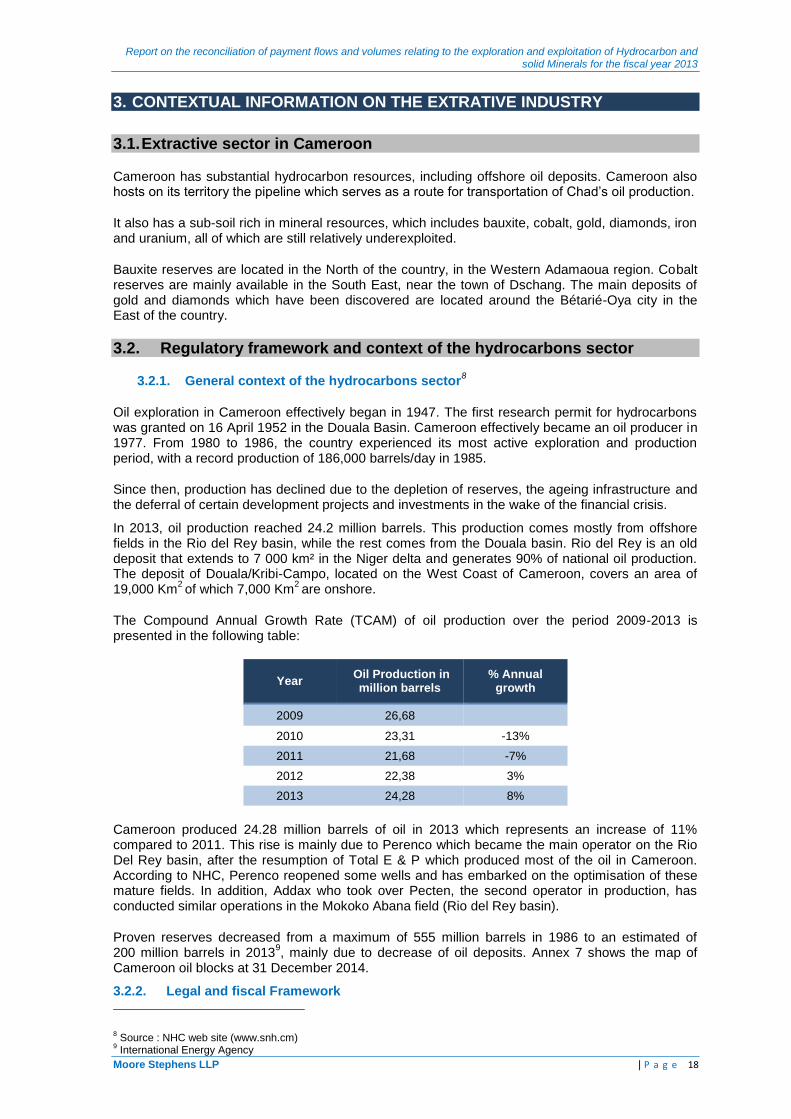
The Compound Annual Growth Rate (TCAM) of oil production over the period 2009-2013 is presented in the following table:
Year Oil Production in
million barrels % Annual
growth
2009 26,68
2010 23,31 -13%
2011 21,68 -7%
2012 22,38 3%
2013 24,28 8%
Cameroon produced 24.28 million barrels of oil in 2013 which represents an increase of 11% compared to 2011. This rise is mainly due to Perenco which became the main operator on the Rio Del Rey basin, after the resumption of Total E & P which produced most of the oil in Cameroon. According to NHC, Perenco reopened some wells and has embarked on the optimisation of these mature fields. In addition, Addax who took over Pecten, the second operator in production, has conducted similar operations in the Mokoko Abana field (Rio del Rey basin).
Proven reserves decreased from a maximum of 555 million barrels in 1986 to an estimated of 200 million barrels in 2013
9, mainly due to decrease of oil deposits. Annex 7 shows the map of
Cameroon oil blocks at 31 December 2014.
3.2.2. Legal and fiscal Framework
8 Source : NHC web site (www.snh.cm)
9 International Energy Agency
Report on the reconciliation of payment flows and volumes relating to the exploration and exploitation of Hydrocarbon and solid Minerals for the fiscal year 2013
Moore Stephens LLP | P a g e 19
Hydrocarbon exploitation in Cameroon is carried out in accordance with Act No. 99/013 of 22 December 1999 related to the Hydrocarbon Code and its implementation Decree No. 2000/485 of 30 June 2000, General taxes and Hydrocarbon Contract Codes.
Authorisation of exploitation related to an hydrocarbon contract could be either a concession for exploitation in the case of a Concession Contract (CC) or an exclusive authorisation of exploitation in the case of a Shared Production Contract.
CC gives to the oil company exclusive rights to explore, develop, produce and commercialise the resource by taking the associated risks at its own expense. In return for the concession, the contractor is required to pay royalties and taxes. Currently, oil production contracts are concluded in the form of CC.
For Production Sharing Agreements (PSA), the State retains ownership of oil resources in the ground. The agreement between the State and the oil company stipulates that the latter bears all the exploration and development costs in return for a share of production, but entitles the oil company the right to explore, develop and produce oil.
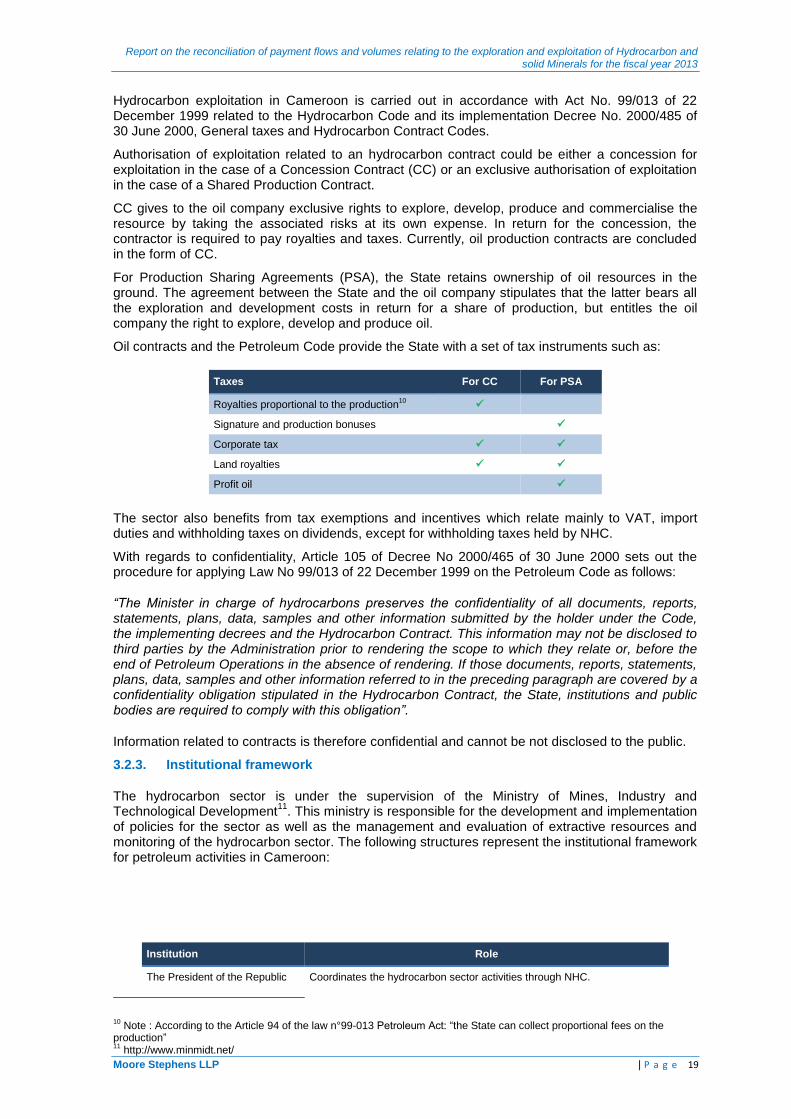
Oil contracts and the Petroleum Code provide the State with a set of tax instruments such as:
Taxes For CC For PSA
Royalties proportional to the production10
Signature and production bonuses
Corporate tax
Land royalties
Profit oil
The sector also benefits from tax exemptions and incentives which relate mainly to VAT, import duties and withholding taxes on dividends, except for withholding taxes held by NHC.
With regards to confidentiality, Article 105 of Decree No 2000/465 of 30 June 2000 sets out the procedure for applying Law No 99/013 of 22 December 1999 on the Petroleum Code as follows:
“The Minister in charge of hydrocarbons preserves the confidentiality of all documents, reports, statements, plans, data, samples and other information submitted by the holder under the Code, the implementing decrees and the Hydrocarbon Contract. This information may not be disclosed to third parties by the Administration prior to rendering the scope to which they relate or, before the end of Petroleum Operations in the absence of rendering. If those documents, reports, statements, plans, data, samples and other information referred to in the preceding paragraph are covered by a confidentiality obligation stipulated in the Hydrocarbon Contract, the State, institutions and public bodies are required to comply with this obligation”.
Information related to contracts is therefore confidential and cannot be not disclosed to the public.
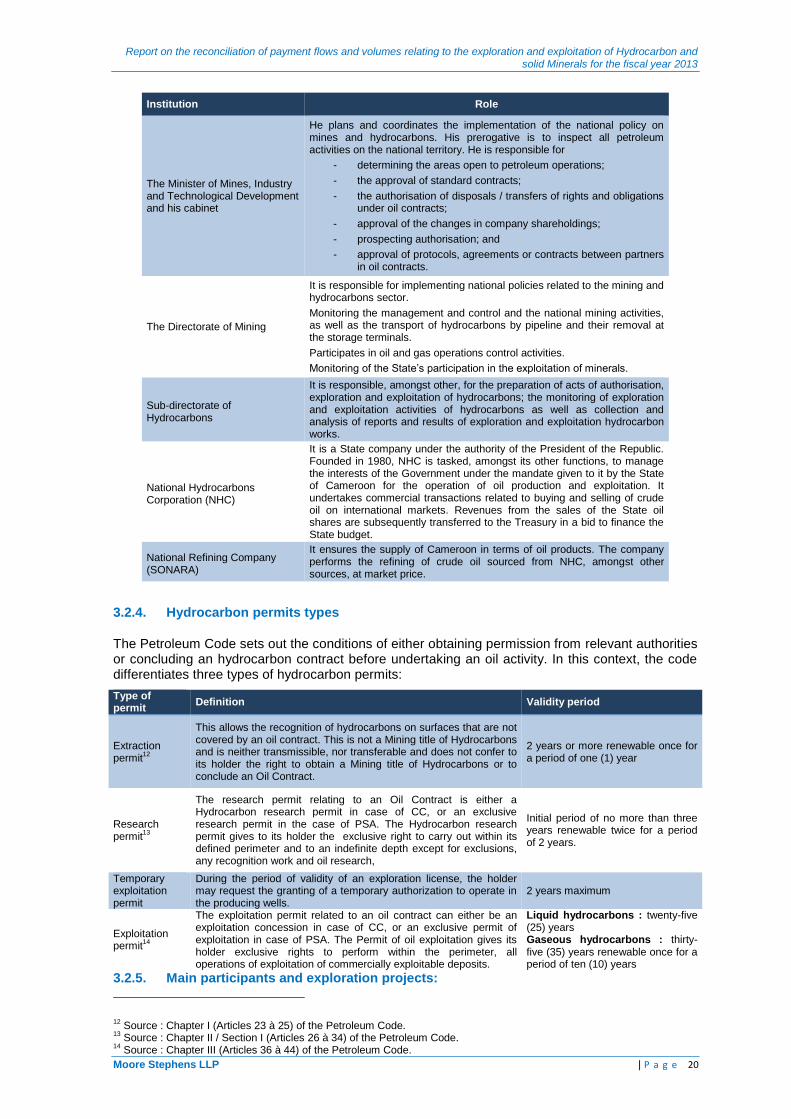
3.2.3. Institutional framework
The hydrocarbon sector is under the supervision of the Ministry of Mines, Industry and Technological Development
11. This ministry is responsible for the development and implementation
of policies for the sector as well as the management and evaluation of extractive resources and monitoring of the hydrocarbon sector. The following structures represent the institutional framework for petroleum activities in Cameroon:
Institution Role
The President of the Republic Coordinates the hydrocarbon sector activities through NHC.
10 Note : According to the Article 94 of the law n°99-013 Petroleum Act: “the State can collect proportional fees on the
production” 11
http://www.minmidt.net/
Report on the reconciliation of payment flows and volumes relating to the exploration and exploitation of Hydrocarbon and solid Minerals for the fiscal year 2013
Moore Stephens LLP | P a g e 20
Institution Role
The Minister of Mines, Industry and Technological Development and his cabinet
He plans and coordinates the implementation of the national policy on mines and hydrocarbons. His prerogative is to inspect all petroleum activities on the national territory. He is responsible for
- determining the areas open to petroleum operations;
- the approval of standard contracts;
- the authorisation of disposals / transfers of rights and obligations under oil contracts;
- approval of the changes in company shareholdings;
- prospecting authorisation; and
- approval of protocols, agreements or contracts between partners in oil contracts.
The Directorate of Mining
It is responsible for implementing national policies related to the mining and hydrocarbons sector.
Monitoring the management and control and the national mining activities, as well as the transport of hydrocarbons by pipeline and their removal at the storage terminals.
Participates in oil and gas operations control activities.
Monitoring of the State’s participation in the exploitation of minerals.
Sub-directorate of Hydrocarbons
It is responsible, amongst other, for the preparation of acts of authorisation, exploration and exploitation of hydrocarbons; the monitoring of exploration and exploitation activities of hydrocarbons as well as collection and analysis of reports and results of exploration and exploitation hydrocarbon works.
National Hydrocarbons Corporation (NHC)
It is a State company under the authority of the President of the Republic. Founded in 1980, NHC is tasked, amongst its other functions, to manage the interests of the Government under the mandate given to it by the State of Cameroon for the operation of oil production and exploitation. It undertakes commercial transactions related to buying and selling of crude oil on international markets. Revenues from the sales of the State oil shares are subsequently transferred to the Treasury in a bid to finance the State budget.
National Refining Company (SONARA)
It ensures the supply of Cameroon in terms of oil products. The company performs the refining of crude oil sourced from NHC, amongst other sources, at market price.
3.2.4. Hydrocarbon permits types
The Petroleum Code sets out the conditions of either obtaining permission from relevant authorities or concluding an hydrocarbon contract before undertaking an oil activity. In this context, the code differentiates three types of hydrocarbon permits:
Type of permit
Definition Validity period
Extraction permit
12
This allows the recognition of hydrocarbons on surfaces that are not covered by an oil contract. This is not a Mining title of Hydrocarbons and is neither transmissible, nor transferable and does not confer to its holder the right to obtain a Mining title of Hydrocarbons or to conclude an Oil Contract.
2 years or more renewable once for a period of one (1) year
Research permit
13
The research permit relating to an Oil Contract is either a Hydrocarbon research permit in case of CC, or an exclusive research permit in the case of PSA. The Hydrocarbon research permit gives to its holder the exclusive right to carry out within its defined perimeter and to an indefinite depth except for exclusions, any recognition work and oil research,
Initial period of no more than three years renewable twice for a period of 2 years.
Temporary exploitation permit
During the period of validity of an exploration license, the holder may request the granting of a temporary authorization to operate in the producing wells.
2 years maximum
Exploitation permit
14
The exploitation permit related to an oil contract can either be an exploitation concession in case of CC, or an exclusive permit of exploitation in case of PSA. The Permit of oil exploitation gives its holder exclusive rights to perform within the perimeter, all operations of exploitation of commercially exploitable deposits.
Liquid hydrocarbons : twenty-five (25) years Gaseous hydrocarbons : thirty-five (35) years renewable once for a period of ten (10) years
3.2.5. Main participants and exploration projects:
12 Source : Chapter I (Articles 23 à 25) of the Petroleum Code.
13 Source : Chapter II / Section I (Articles 26 à 34) of the Petroleum Code.
14 Source : Chapter III (Articles 36 à 44) of the Petroleum Code.

Report on the reconciliation of payment flows and volumes relating to the exploration and exploitation of Hydrocarbon and solid Minerals for the fiscal year 2013
Moore Stephens LLP | P a g e 21
a) Main participants
In 2013, the production came from deposits of Rio del Rey, Mokoko Abana, Moudi and Ebomé,
operated by Perenco Rio Del Rey, Addax and Perenco as detailed in the table below:
Concession Operators Partners
Rio del Rey
Dissoni Perenco Rio Del Rey NHC, Addax
Lokele Addax Petroleum Cameroon Company (APCC) NHC, Perenco Rio Del Rey
Moudi
Ebome Perenco NHC
The National Hydrocarbons Corporation (NHC), State Company, is a partner at each field. The shares of each entity in the concessions are detailed in Annex 8 to this report.
b) Exploration projects
In 2013, Perenco CAM signed a PSA for the exploration of block Moabi (former permit Mondoni) located in the Rio Del Rey Basin. The first well should be drilled and tested in 2015
15.
In September 2013, an exploitation permit was granted to Addax PCL after the discovery of oil and on preparation of a development plan approved by the Government of Cameroon.
3.2.6. Award and management of titles and contracts
According to the provisions of the Petroleum Code, the State treats at its absolute discretion, the awards of hydrocarbon contracts and permit applications.
According to Article 5 of Decree N° 2000/465 dated 30 June 2000, there are two (2) ways of awarding titles for oil contracts (direct negotiation or tender).
Law No. 99/013 sets out the conditions to be met by a company which wants to enter into an hydrocarbon contract in Cameroon, especially through its provisions of Articles 2 (l, p) and 7 which state that the company must have the technical and financial capacity to carry out its activities.
The company must hold a portfolio of activities demonstrating that it can be considered as petroleum company (Article 2 p) on the one hand, and an operator (Article 2l) on a mining claim in the area of exploration / production on the other hand. In fact the company must have both the technical and financial capacities to undertake petroleum activities. These provisions are applied as part of the pre-qualification process of hydrocarbon companies.
The procedure for the award of a block by tender is as described below:
Terms of Reference (ToR) are developed for blocks advertised which include a definition of the context, the contents of proposals to be submitted, the contractual and fiscal terms, the criteria for pre-qualification and evaluation of tenders, the destination of offers, and the schedule of the tender;
these ToR are published in leading newspapers of the petroleum industry including "Upstream", IHS Energy and Africa Oil & Gas, as well as NHC’s website;
organisation of the consultation of data (data room) at NHC’s headquarters in Yaoundé and / or Houston (USA) and London (UK) by making technical presentations to companies which have expressed an interest in the blocks advertised;
at the end of each consultation and following the planning of the tender, the public opening of bids is held at the headquarters of NHC in Yaoundé by the Permanent Bids Evaluation Commission, in the presence of all bidders or their representatives. Bids received are evaluated by the Permanent Bids Evaluation Commission. The results are published and notified to bidders; and
15 Source : website of Perenco (http://www.perenco.com/cameroon)
Report on the reconciliation of payment flows and volumes relating to the exploration and exploitation of Hydrocarbon and solid Minerals for the fiscal year 2013
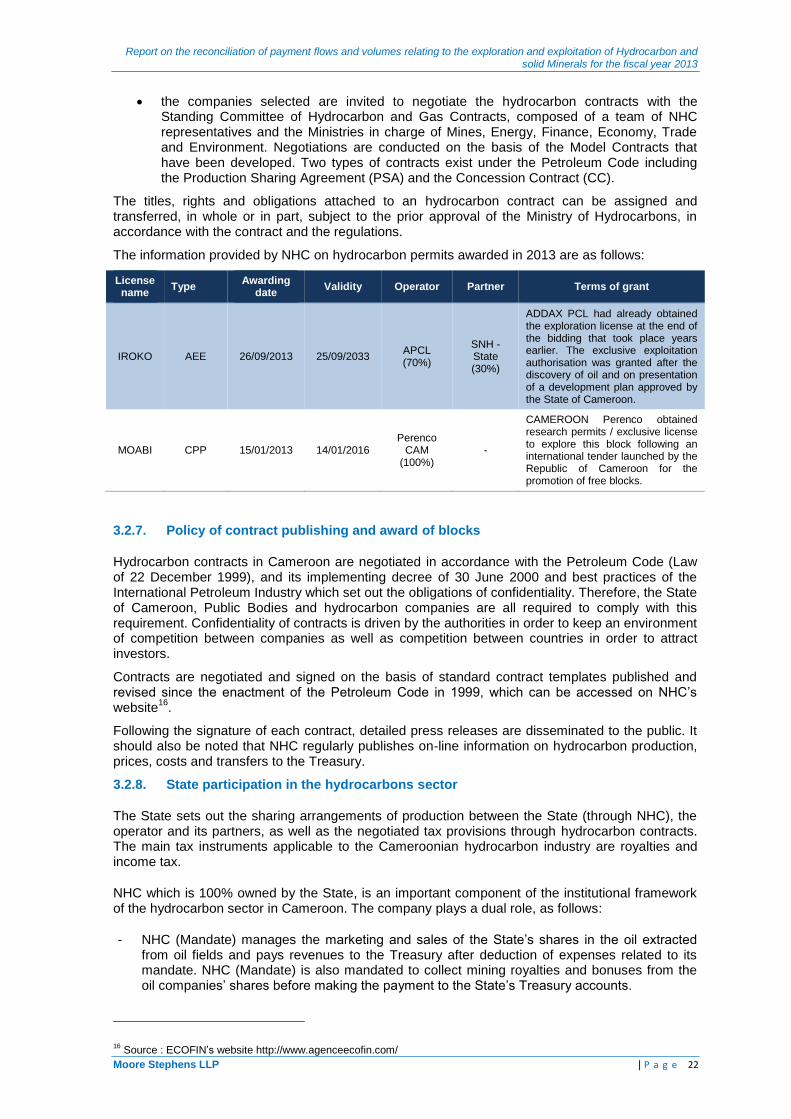
Moore Stephens LLP | P a g e 22
the companies selected are invited to negotiate the hydrocarbon contracts with the Standing Committee of Hydrocarbon and Gas Contracts, composed of a team of NHC representatives and the Ministries in charge of Mines, Energy, Finance, Economy, Trade and Environment. Negotiations are conducted on the basis of the Model Contracts that have been developed. Two types of contracts exist under the Petroleum Code including the Production Sharing Agreement (PSA) and the Concession Contract (CC).
The titles, rights and obligations attached to an hydrocarbon contract can be assigned and transferred, in whole or in part, subject to the prior approval of the Ministry of Hydrocarbons, in accordance with the contract and the regulations.
The information provided by NHC on hydrocarbon permits awarded in 2013 are as follows:
License name
Type Awarding
date Validity Operator Partner Terms of grant
IROKO AEE 26/09/2013 25/09/2033 APCL (70%)
SNH - State (30%)
ADDAX PCL had already obtained the exploration license at the end of the bidding that took place years earlier. The exclusive exploitation authorisation was granted after the discovery of oil and on presentation of a development plan approved by the State of Cameroon.
MOABI CPP 15/01/2013 14/01/2016 Perenco
CAM (100%)
-
CAMEROON Perenco obtained research permits / exclusive license to explore this block following an international tender launched by the Republic of Cameroon for the promotion of free blocks.
3.2.7. Policy of contract publishing and award of blocks
Hydrocarbon contracts in Cameroon are negotiated in accordance with the Petroleum Code (Law of 22 December 1999), and its implementing decree of 30 June 2000 and best practices of the International Petroleum Industry which set out the obligations of confidentiality. Therefore, the State of Cameroon, Public Bodies and hydrocarbon companies are all required to comply with this requirement. Confidentiality of contracts is driven by the authorities in order to keep an environment of competition between companies as well as competition between countries in order to attract investors.
Contracts are negotiated and signed on the basis of standard contract templates published and revised since the enactment of the Petroleum Code in 1999, which can be accessed on NHC’s website
16.
Following the signature of each contract, detailed press releases are disseminated to the public. It should also be noted that NHC regularly publishes on-line information on hydrocarbon production, prices, costs and transfers to the Treasury.
3.2.8. State participation in the hydrocarbons sector
The State sets out the sharing arrangements of production between the State (through NHC), the operator and its partners, as well as the negotiated tax provisions through hydrocarbon contracts. The main tax instruments applicable to the Cameroonian hydrocarbon industry are royalties and income tax.
NHC which is 100% owned by the State, is an important component of the institutional framework of the hydrocarbon sector in Cameroon. The company plays a dual role, as follows:
- NHC (Mandate) manages the marketing and sales of the State’s shares in the oil extracted from oil fields and pays revenues to the Treasury after deduction of expenses related to its mandate. NHC (Mandate) is also mandated to collect mining royalties and bonuses from the oil companies’ shares before making the payment to the State’s Treasury accounts.
16 Source : ECOFIN’s website http://www.agenceecofin.com/
Report on the reconciliation of payment flows and volumes relating to the exploration and exploitation of Hydrocarbon and solid Minerals for the fiscal year 2013
Moore Stephens LLP | P a g e 23
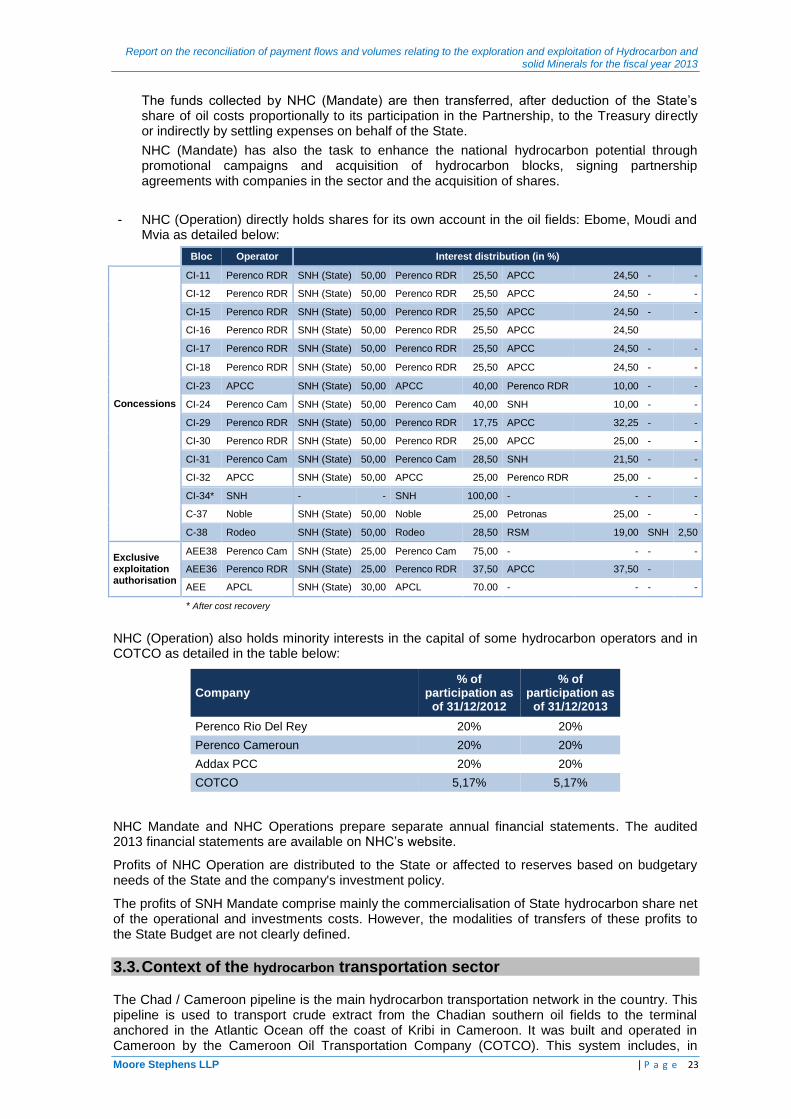
The funds collected by NHC (Mandate) are then transferred, after deduction of the State’s share of oil costs proportionally to its participation in the Partnership, to the Treasury directly or indirectly by settling expenses on behalf of the State.
NHC (Mandate) has also the task to enhance the national hydrocarbon potential through promotional campaigns and acquisition of hydrocarbon blocks, signing partnership agreements with companies in the sector and the acquisition of shares.
- NHC (Operation) directly holds shares for its own account in the oil fields: Ebome, Moudi and Mvia as detailed below:
Bloc Operator Interest distribution (in %)
Concessions
CI-11 Perenco RDR SNH (State) 50,00 Perenco RDR 25,50 APCC 24,50 - -
CI-12 Perenco RDR SNH (State) 50,00 Perenco RDR 25,50 APCC 24,50 - -
CI-15 Perenco RDR SNH (State) 50,00 Perenco RDR 25,50 APCC 24,50 - -
CI-16 Perenco RDR SNH (State) 50,00 Perenco RDR 25,50 APCC 24,50
CI-17 Perenco RDR SNH (State) 50,00 Perenco RDR 25,50 APCC 24,50 - -
CI-18 Perenco RDR SNH (State) 50,00 Perenco RDR 25,50 APCC 24,50 - -
CI-23 APCC SNH (State) 50,00 APCC 40,00 Perenco RDR 10,00 - -
CI-24 Perenco Cam SNH (State) 50,00 Perenco Cam 40,00 SNH 10,00 - -
CI-29 Perenco RDR SNH (State) 50,00 Perenco RDR 17,75 APCC 32,25 - -
CI-30 Perenco RDR SNH (State) 50,00 Perenco RDR 25,00 APCC 25,00 - -
CI-31 Perenco Cam SNH (State) 50,00 Perenco Cam 28,50 SNH 21,50 - -
CI-32 APCC SNH (State) 50,00 APCC 25,00 Perenco RDR 25,00 - -
CI-34* SNH - - SNH 100,00 - - - -
C-37 Noble SNH (State) 50,00 Noble 25,00 Petronas 25,00 - -
C-38 Rodeo SNH (State) 50,00 Rodeo 28,50 RSM 19,00 SNH 2,50
Exclusive exploitation authorisation
AEE38 Perenco Cam SNH (State) 25,00 Perenco Cam 75,00 - - - -
AEE36 Perenco RDR SNH (State) 25,00 Perenco RDR 37,50 APCC 37,50 -
AEE APCL SNH (State) 30,00 APCL 70.00 - - - -
* After cost recovery
NHC (Operation) also holds minority interests in the capital of some hydrocarbon operators and in COTCO as detailed in the table below:
Company % of
participation as of 31/12/2012
% of participation as
of 31/12/2013
Perenco Rio Del Rey 20% 20%
Perenco Cameroun 20% 20%
Addax PCC 20% 20%
COTCO 5,17% 5,17%
NHC Mandate and NHC Operations prepare separate annual financial statements. The audited 2013 financial statements are available on NHC’s website.
Profits of NHC Operation are distributed to the State or affected to reserves based on budgetary needs of the State and the company's investment policy.
The profits of SNH Mandate comprise mainly the commercialisation of State hydrocarbon share net of the operational and investments costs. However, the modalities of transfers of these profits to the State Budget are not clearly defined.
3.3. Context of the hydrocarbon transportation sector
The Chad / Cameroon pipeline is the main hydrocarbon transportation network in the country. This pipeline is used to transport crude extract from the Chadian southern oil fields to the terminal anchored in the Atlantic Ocean off the coast of Kribi in Cameroon. It was built and operated in Cameroon by the Cameroon Oil Transportation Company (COTCO). This system includes, in
Report on the reconciliation of payment flows and volumes relating to the exploration and exploitation of Hydrocarbon and solid Minerals for the fiscal year 2013
Moore Stephens LLP | P a g e 24
Cameroonian territory along a 980 out of 1070 km terrestrial pipeline, two pumping stations, pressure reduction station and a Floating Storage and offloading (Terminal Komé-Kribi 1).
This project has had many social, economic and environmental benefits and helped boost oil exploration. Indeed, the Chad / Cameroon pipeline, which connects southern Chad to the Atlantic Coast is a means of egress for all liquid hydrocarbons that has been discovered and extracted in the Logone Birni basin Cameroon, the Lake Chad region, as well as western Central African Republic.
Oil transportation via the pipeline also generates revenue for the State of Cameroon including from amongst others the right of transit directly paid by COTCO to the Treasury.
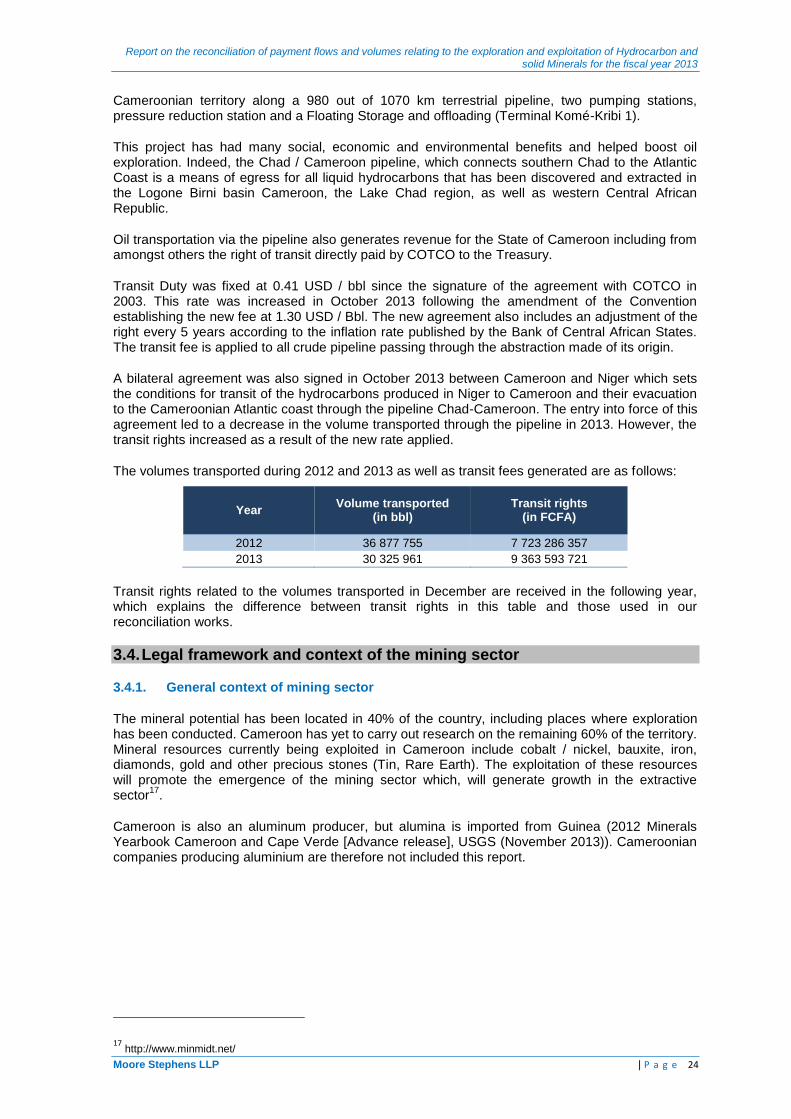
Transit Duty was fixed at 0.41 USD / bbl since the signature of the agreement with COTCO in 2003. This rate was increased in October 2013 following the amendment of the Convention establishing the new fee at 1.30 USD / Bbl. The new agreement also includes an adjustment of the right every 5 years according to the inflation rate published by the Bank of Central African States. The transit fee is applied to all crude pipeline passing through the abstraction made of its origin.
A bilateral agreement was also signed in October 2013 between Cameroon and Niger which sets the conditions for transit of the hydrocarbons produced in Niger to Cameroon and their evacuation to the Cameroonian Atlantic coast through the pipeline Chad-Cameroon. The entry into force of this agreement led to a decrease in the volume transported through the pipeline in 2013. However, the transit rights increased as a result of the new rate applied.
The volumes transported during 2012 and 2013 as well as transit fees generated are as follows:
Year Volume transported
(in bbl) Transit rights
(in FCFA)
2012 36 877 755 7 723 286 357
2013 30 325 961 9 363 593 721
Transit rights related to the volumes transported in December are received in the following year, which explains the difference between transit rights in this table and those used in our reconciliation works.
3.4. Legal framework and context of the mining sector
3.4.1. General context of mining sector
The mineral potential has been located in 40% of the country, including places where exploration has been conducted. Cameroon has yet to carry out research on the remaining 60% of the territory. Mineral resources currently being exploited in Cameroon include cobalt / nickel, bauxite, iron, diamonds, gold and other precious stones (Tin, Rare Earth). The exploitation of these resources will promote the emergence of the mining sector which, will generate growth in the extractive sector
17.
Cameroon is also an aluminum producer, but alumina is imported from Guinea (2012 Minerals Yearbook Cameroon and Cape Verde [Advance release], USGS (November 2013)). Cameroonian companies producing aluminium are therefore not included this report.
17 http://www.minmidt.net/

Report on the reconciliation of payment flows and volumes relating to the exploration and exploitation of Hydrocarbon and solid Minerals for the fiscal year 2013
Moore Stephens LLP | P a g e 25
3.4.2. Legal and fiscal framework
The mining sector is governed by the Mining Code promulgated by Law No. 2001/001 of 16 April 2001 and its implementing Decree No. 2002/648/PM of 26 March 2002. According to the Mining Code, mining companies are subjected to specific duties and taxes in addition to taxes prescribed by the CEMAC General Tax and Customs Codes. The payment flows generated by the mining companies are presented in Section 4 of this report.
While the Mining sector has been opened to free enterprises, the Mining Code prescribes that a mining title or permit should first be obtained from relevant authorities prior to undertaking any mining activity.
Any application for the award of a Mining title is subject to the signing of a Mining agreement between the owner of the exploitation permit and the State. This agreement includes in particular, arrangements related to entitlements and obligations of the holder, the modalities of an eventual participation of the State in a mining development covered by an exploitation permit and relationship with communities affected by the mining development. The Mining agreement must be in accordance with the Mining Code. In case of derogations, the Mining agreement should be established by an Act authorising the State to end it.
18
3.4.3. Institutional framework
According to the mining legislation, the structures in charge of the management and operation of mines in Cameroon are as follows:
Institution Rôle
Ministry of Mining, Industry and Technology Development
19
Designs and coordinates the implementation of the national mining policy.
Has a right to inspect all mining activities in the country including, among others :
- valuation of mineral resources;
- licensing research and exploration;
- approval of transactions on mining titles; and
- authorise the marketing of minerals from artisanal exploitation.
Directorate of Mines
Implementation of the mining national policy
Monitor the management, control and national mining activities
Participates in oil and gas operations control activities
Follow the State's interests in the exploitation of mineral substances20
.
Participation in data collection, analysis, publication and preservation of statistical data mining.
Sub-Directorate of Mining Activities
Processing of applications for authorisation and preparation of acts relating to the marketing of mineral substances and careers.
Administrative and technical supervision of the operation, transport, processing and marketing of mineral substances and career.
Sub-Directorate of the Mining Cadastre
Processing of applications for authorisation and preparation of acts relating to mining titles and quarries operating license.
Elaboration and updating of national mining cadastral map.
Maintenance and preservation of the geological and mining cadastral documentation.
The Center for Support and Promotion of Handicrafts Mining (CSPHM)
Structure established within the Ministry of Mines to coordinate, organise, facilitate, support, promote, develop and standardise artisanal mining activities.
Organise the artisanal production of Cameroon mining (gold, diamond, sapphire, quartzite, tin, kyanite, rutile and other minerals).
On 1 August 2014, a new Decree No. 2014/2349 / PM signed by Prime Minister, entrusted CSPHM a new mission to collect 15% of the gross production of artisanal operating mining companies.
18 Source: Art. 16 (new) of the Mining Code
19 http://www.minmidt.net/
20 Article 24 du décret N°2012/432

Report on the reconciliation of payment flows and volumes relating to the exploration and exploitation of Hydrocarbon and solid Minerals for the fiscal year 2013
Moore Stephens LLP | P a g e 26
3.4.4. Types of Mining titles
The Mining Code sets out the conditions for obtaining a mining title or a reconnaissance permit prior to starting any mining activity.
The operation of artisanal mining is restricted to Cameroon nationals, subject to obtaining an individual Prospector card of and / or an exploitation permit.
Activity type Permit Type Definition Validity period
Artisanal mining activities
Individual card prospector
21
It is issued to Cameroon citizens wishing to prospect for minerals.
Set by regulation
Permits for Artisanal Exploitation
22
It provides its holder the right to set up in the assigned zone as well as an exclusive right to explore and extract minerals within the defined scope of artisanal exploitation, and to take and use those minerals. It gives the right to operating works to a maximum depth of thirty (30) meters. The area of each field for which authorisation permit of artisanal exploitation is granted may not exceed one hundred (100) by one hundred (100) meters. A holder may obtain up to four (4) permits, provided they relate to adjoining lands.
Initial period of two (2) years from the date of registration of the permit and is renewable every two years.
Industrial mining activities
Recognition permit
23
It may be issued to conduct systematic investigations of surface by geological surveys, geophysical or other methods involving large areas to detect traces or concentrations of useful mineral substances. The total area of land for which the permit is attributed must not exceed ten thousand (10,000) square km
2
and must be composed of a single block of polygonal shape.
One (1) year renewable
Research permit24
It is issued to conduct investigations in order to locate and evaluate mineral deposits and determine the commercial operating conditions.
Initial period of three (3) years renewable four (4) times with periods of two (2) years each.
Exploitation permit 25
It is granted for the extraction of solid mineral substances, liquid or gas by any process or land-based method or in the subsurface in order to extract useful substances; it includes all necessary operations directly or indirectly related to it.
Initial period of no longer than twenty-five (25) years renewable under certain conditions for periods of ten (10) years each.
3.4.5. Award of mining titles
The provision and management of permits and authorisations are governed by the Mining Code and Decree No. 2002/648 / PM dated 26 March 2002 which sets out the procedures for implementing the Law on Mining Code.
The award of a mining claim on the basis of "first come, first served" with the conditions required by the Article 60 of the aforementioned decree. The award of an operating license is guaranteed in the event of discovery of a deposit and in cases of compliance with the provisions of the Mining Code.
The Code does not provide for the mode of use of the tendering procedure for the award of the titles in the mining sector.
3.4.6. Artisanal mining activities
Artisanal mining remains the most common type of operation for gold and diamonds. This activity is performed in a traditional form by locals without mechanisation or in collaboration with technical and financial partners.
In Cameroon, artisanal mining is the most important sector of the mining activity, both in terms of production and number of persons involved.
21 Source: Chapter 1, section 1, Art. 24 of the Mining Code.
22 Source: Chapter 1, section 2, Art. 24 of the Mining Code.
23 Source: Chapter 2, section 1, Art. from 32 to 36 of the Mining Code.
24 Source: Chapter 2, section 2, Art. from 37 to 44 of the Mining Code.
25 Source: Chapter 2, section 3, Art. from 45 à 52 of the Mining Code.
Report on the reconciliation of payment flows and volumes relating to the exploration and exploitation of Hydrocarbon and solid Minerals for the fiscal year 2013
Moore Stephens LLP | P a g e 27
However, the sector suffers from environmental and safety issues due to the informal nature of most artisanal activities. The sector also suffers from the lack of updated mapping of operators and the lack of indicators due to the difficulties in monitoring such activities.
In order to promote and regulate this sector, Cameroon has launched a number of actions in recent years including, amongst others:
The Center for Support and Promotion of Handicrafts Mining (CSPHM) was set up by the Ministry of Mines in 2003 to the coordinate, organise, facilitate, support, promote, develop and standardise artisanal mining activities.
Among its most important prerogatives, CSPHM is responsible for:
- channelling artisanal production of gold, diamond, sapphire, quartzite, tin, kyanite, rutile and other minerals in Cameroon;
- extending the security on other mining sites ; and
- improve local gold processing.
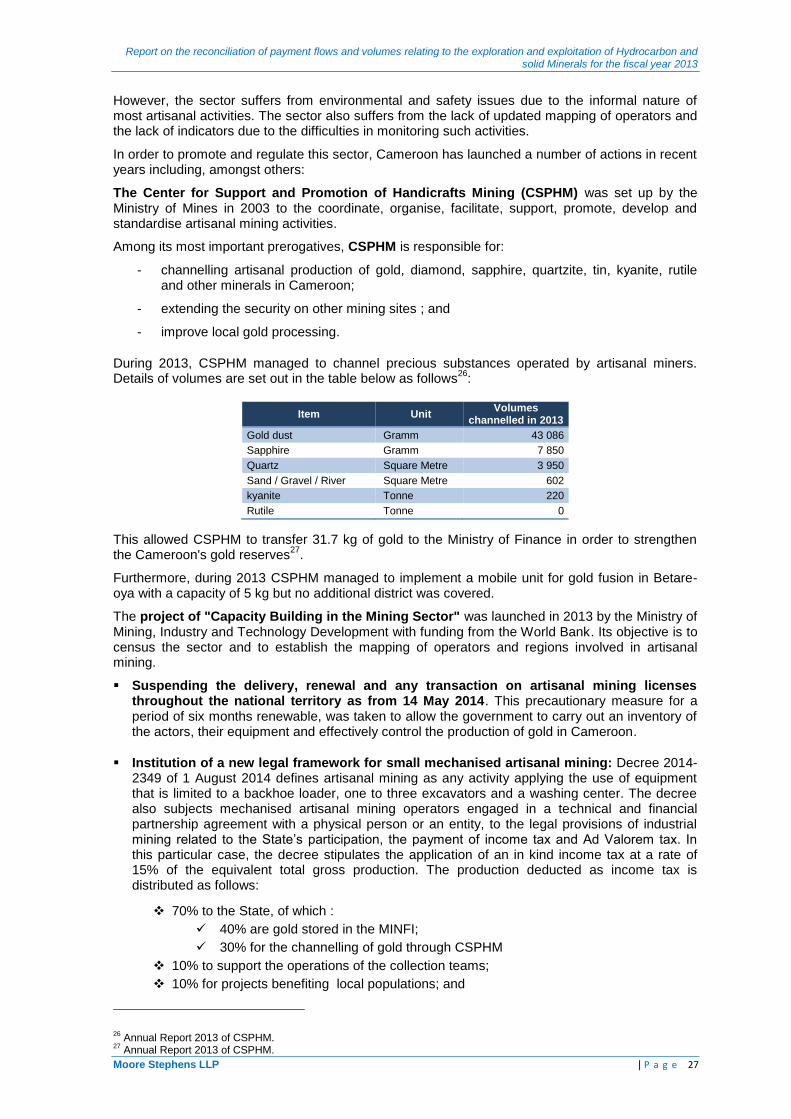
During 2013, CSPHM managed to channel precious substances operated by artisanal miners. Details of volumes are set out in the table below as follows
26:
Item Unit Volumes
channelled in 2013
Gold dust Gramm 43 086
Sapphire Gramm 7 850
Quartz Square Metre 3 950
Sand / Gravel / River Square Metre 602
kyanite Tonne 220
Rutile Tonne 0
This allowed CSPHM to transfer 31.7 kg of gold to the Ministry of Finance in order to strengthen the Cameroon's gold reserves
27.
Furthermore, during 2013 CSPHM managed to implement a mobile unit for gold fusion in Betare-oya with a capacity of 5 kg but no additional district was covered.
The project of "Capacity Building in the Mining Sector" was launched in 2013 by the Ministry of Mining, Industry and Technology Development with funding from the World Bank. Its objective is to census the sector and to establish the mapping of operators and regions involved in artisanal mining.
Suspending the delivery, renewal and any transaction on artisanal mining licenses throughout the national territory as from 14 May 2014. This precautionary measure for a period of six months renewable, was taken to allow the government to carry out an inventory of the actors, their equipment and effectively control the production of gold in Cameroon.
Institution of a new legal framework for small mechanised artisanal mining: Decree 2014-2349 of 1 August 2014 defines artisanal mining as any activity applying the use of equipment that is limited to a backhoe loader, one to three excavators and a washing center. The decree also subjects mechanised artisanal mining operators engaged in a technical and financial partnership agreement with a physical person or an entity, to the legal provisions of industrial mining related to the State’s participation, the payment of income tax and Ad Valorem tax. In this particular case, the decree stipulates the application of an in kind income tax at a rate of 15% of the equivalent total gross production. The production deducted as income tax is distributed as follows:
70% to the State, of which :
40% are gold stored in the MINFI;
30% for the channelling of gold through CSPHM
10% to support the operations of the collection teams;
10% for projects benefiting local populations; and
26 Annual Report 2013 of CSPHM.
27 Annual Report 2013 of CSPHM.

Report on the reconciliation of payment flows and volumes relating to the exploration and exploitation of Hydrocarbon and solid Minerals for the fiscal year 2013
Moore Stephens LLP | P a g e 28
10% to support the Committee of monitoring of mechanised artisanal operation.
This deduction is made by CSPHM, which according to its 2014 annual report has already carried out this operation by providing a sampling of 37 kg of Gold dust. This operation consists in monitoring daily production via the controllers placed on mining sites.
3.4.7. Registry of mining titles
Any act related to a mining title must be recorded in the mining title register. This register must be regularly checked and initialled by the Director of Mines. It includes a record of all registered mining titles, applications, and subsequent decisions of attribution, renewals, and removals and as well as any other relevant information. This register is however not available online on MINIMIDT’s website.
3.4.8. Key actors and exploration projects
Mbalam Project: In 2012, Cameroon and the Republic of Congo signed an agreement for joint operations of their iron deposits of Mbalam (Cameroon) and Nabeba (Congo), notably by: the pooling of their mining projects which have been renamed “Mbalam-Nabeba” and the possibility that Congo would transport minerals from the Northern part of the country via Cameroon’s railway and the deep-water port of Kribi. As a result a bilateral agreement was signed to provide a legal framework for this activity.
Hydromine Global Mineral: Hydromine, which held the exploration permit has been able to mobilise two giants of the mining industry in a joint venture consisting of the Indian firm Hindalco (45%), the Dubaï Aluminum Company (Dubal, 45%), and Hydromine which has a 10% shareholding . This group is set under Hydromine Global Mineral (HGM), which owns 100% of Cameroon Alumina (CAL). The explorations carried out in 2009 indicated the presence of more than 560 million tons of bauxite, potentially exceeding 700 million tons, which is equivalent to exploitation and transformation lasting over 60 years. The consortium expects annual production of 3.5 million tons of alumina from the 7.5 million tons of bauxite extracted. According to optimistic projections, exports of alumina of Ngaoundal could represent 30% of the current annual export revenues of Cameroon
28.
Rutile of Akonolinga : According to the support framework to artisanal mining (CSPHM), the company Free Mining explored in association with the American company Gilla, a deposit of three million tons of reserves of rutile in Akonolinga in the Centre of Cameroon, but their license was withdrawn in June 2013 and awarded to Sicamines an English entity
29.
Nickel Cobalt project: One of the major mining projects underway is the Nickel/Cobalt in the Lomié area in the South East of the country, where an exploitation permit was granted to Geovic Cameroon, a subsidiary of the Geovic Mining Corp. This company also holds permits for Mada and Nkamouna which represent the first Cobalt deposits to be developed in Cameroon.
Inventory of the mining potential: Since January 2014, the Capacity Building Project in the mining sector (Precasem) hosted by the Cameroon Ministry of Mines and co-funded by the State of Cameroon and the World Bank, launched in six regions (North , Adamawa, West, East, Littoral and Centre), a campaign of "airborne geophysical survey." The Cameroonian Minister of Mines stated that the campaign aimed to identify new areas of potential mining in the Cameroonian territory, but which has never been the subject of inventory previously. This operation will take place until June 2015 and has been entrusted to the South African company Geotech Airborne Limited.
30.
3.4.9. State participation in the mining sector
Article 11 of Act n°2010/011 of 29 July 2010 which amends and supplements some of the provisions of Act N° 2001-1 of 16 April 2001 “the Mining Code”, entitles the State to a right of 10% of the shares in the exploitation company upon granting the exploitation permit. The modalities of this participation are set out in an agreement to be concluded prior to exploitation.
28 http://newsducamer.com/index.php?option=com_k2&view=item&id=1977:le-secteur-minier-prend-de-l-
ampleur&Itemid=672 29
Invest in Cameroon – February 2014 – N°23 30
Invest in Cameroon – February 2014 – N°23
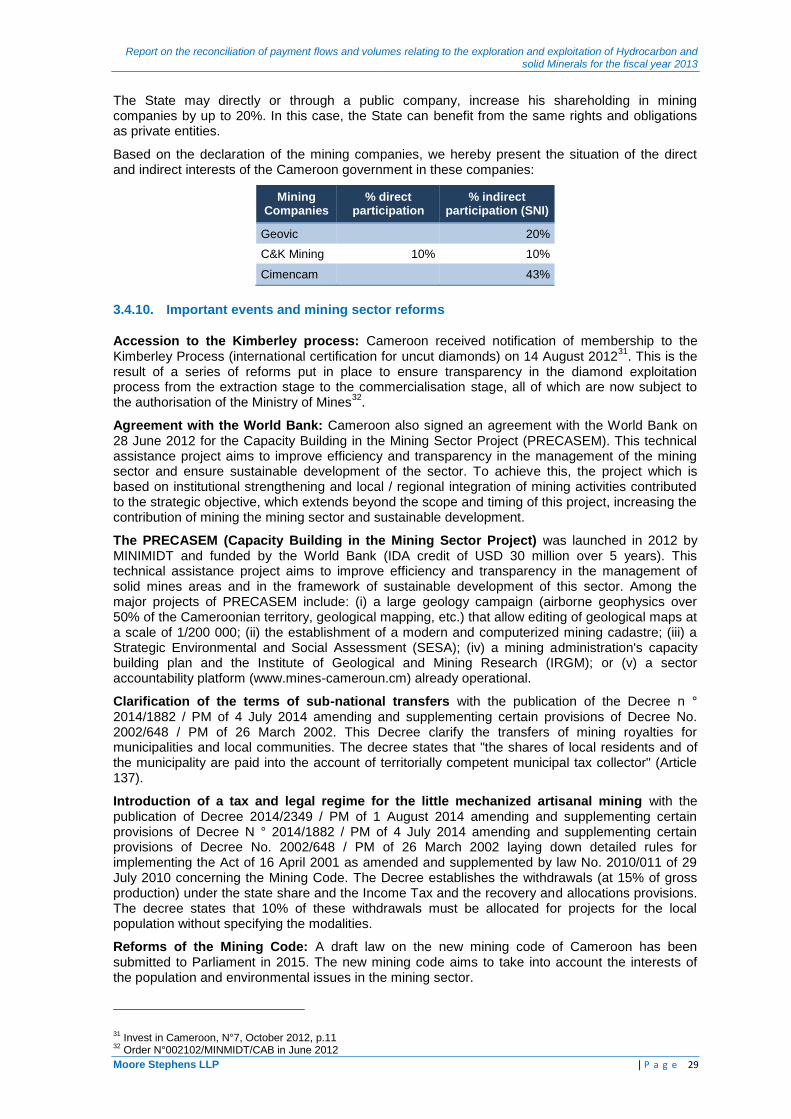
Report on the reconciliation of payment flows and volumes relating to the exploration and exploitation of Hydrocarbon and solid Minerals for the fiscal year 2013
Moore Stephens LLP | P a g e 29
The State may directly or through a public company, increase his shareholding in mining companies by up to 20%. In this case, the State can benefit from the same rights and obligations as private entities.
Based on the declaration of the mining companies, we hereby present the situation of the direct and indirect interests of the Cameroon government in these companies:
Mining Companies
% direct participation
% indirect participation (SNI)
Geovic 20%
C&K Mining 10% 10%
Cimencam 43%
3.4.10. Important events and mining sector reforms
Accession to the Kimberley process: Cameroon received notification of membership to the Kimberley Process (international certification for uncut diamonds) on 14 August 2012
31. This is the
result of a series of reforms put in place to ensure transparency in the diamond exploitation process from the extraction stage to the commercialisation stage, all of which are now subject to the authorisation of the Ministry of Mines
32.
Agreement with the World Bank: Cameroon also signed an agreement with the World Bank on 28 June 2012 for the Capacity Building in the Mining Sector Project (PRECASEM). This technical assistance project aims to improve efficiency and transparency in the management of the mining sector and ensure sustainable development of the sector. To achieve this, the project which is based on institutional strengthening and local / regional integration of mining activities contributed to the strategic objective, which extends beyond the scope and timing of this project, increasing the contribution of mining the mining sector and sustainable development.
The PRECASEM (Capacity Building in the Mining Sector Project) was launched in 2012 by MINIMIDT and funded by the World Bank (IDA credit of USD 30 million over 5 years). This technical assistance project aims to improve efficiency and transparency in the management of solid mines areas and in the framework of sustainable development of this sector. Among the major projects of PRECASEM include: (i) a large geology campaign (airborne geophysics over 50% of the Cameroonian territory, geological mapping, etc.) that allow editing of geological maps at a scale of 1/200 000; (ii) the establishment of a modern and computerized mining cadastre; (iii) a Strategic Environmental and Social Assessment (SESA); (iv) a mining administration's capacity building plan and the Institute of Geological and Mining Research (IRGM); or (v) a sector accountability platform (www.mines-cameroun.cm) already operational.
Clarification of the terms of sub-national transfers with the publication of the Decree n ° 2014/1882 / PM of 4 July 2014 amending and supplementing certain provisions of Decree No. 2002/648 / PM of 26 March 2002. This Decree clarify the transfers of mining royalties for municipalities and local communities. The decree states that "the shares of local residents and of the municipality are paid into the account of territorially competent municipal tax collector" (Article 137).
Introduction of a tax and legal regime for the little mechanized artisanal mining with the publication of Decree 2014/2349 / PM of 1 August 2014 amending and supplementing certain provisions of Decree N ° 2014/1882 / PM of 4 July 2014 amending and supplementing certain provisions of Decree No. 2002/648 / PM of 26 March 2002 laying down detailed rules for implementing the Act of 16 April 2001 as amended and supplemented by law No. 2010/011 of 29 July 2010 concerning the Mining Code. The Decree establishes the withdrawals (at 15% of gross production) under the state share and the Income Tax and the recovery and allocations provisions. The decree states that 10% of these withdrawals must be allocated for projects for the local population without specifying the modalities.
Reforms of the Mining Code: A draft law on the new mining code of Cameroon has been submitted to Parliament in 2015. The new mining code aims to take into account the interests of the population and environmental issues in the mining sector.
31 Invest in Cameroon, N°7, October 2012, p.11
32 Order N°002102/MINMIDT/CAB in June 2012
Report on the reconciliation of payment flows and volumes relating to the exploration and exploitation of Hydrocarbon and solid Minerals for the fiscal year 2013
Moore Stephens LLP | P a g e 30

Report on the reconciliation of payment flows and volumes relating to the exploration and exploitation of Hydrocarbon and solid Minerals for the fiscal year 2013
Moore Stephens LLP | P a g e 31
3.5. Beneficial ownership
3.5.1. Definition of beneficial ownership
According to EITI Standard 3.11(d).i, a beneficial owner in respect of a company means the natural person(s) who directly or indirectly ultimately owns or controls the corporate entity. According to the Committee's decision, an individual is deemed to have control if he directly or indirectly holds at least 10% of the shares or voting rights of the extractive company. Companies listed on the stock exchange, including their wholly owned subsidiaries, are not required to disclose information about their beneficial ownership.
3.5.2. Data collection
The government of Cameroon does not have a policy in place to disclose information on the capital structure and actual beneficial ownership. Thus reporting templates were submitted to extractive companies to collect this information. We have taken into account all information received up to the day of issue of this report.
3.5.3. Results
Out of the 22 companies included in the 2013 EITI scope, six (6) oil companies and three (3) mining companies did not provide relevant information on beneficial ownership. These companies are as follows:
Hydrocarbon companies
Mining companies
PERENCO RIO DEL REY
C&K MINING INCORPORATION SA
PERENCO CAMEROON SA
ROCAGLIA PIERRE
PERENCO OIL & GAS CAMEROON Ltd
LES CIMENTERIES DU CAMEROUN
RODEO DEVELOPMENT LTD
YAN CHANG LOGONE DEVELOPMENT COMPANY
DANA PETRLEUM CAMEROON LIMITED
The information provided by hydrocarbon and mining companies on the capital and beneficial ownership are presented in Annex 1 of this report.
3.6. Collection and distribution of extractive industry revenues
3.6.1. The budgetary process
The budgetary process in Cameroon includes the following steps 33
:
(i) Preparation, presentation and vote of the draft Finance Law
The draft Finance Law comprises three parts. The first part authorises the collection of public resources and contains means and measures to ensure financial stability. The second part, sets the global amount of credits applicable to government. The third part sets out the financial provisions.
The draft finance bill for the year is submitted to the National Assembly for review and approval.
(ii) The budget regulation
The Government is required to submit to the National Assembly, together with the Finance Act of the year, the income statement for the previous financial year. This income statement, which confirms the final amounts of revenue and expenditure, provides of the financial results of the relevant year.
33 Prescription n°62/0F/4 of 7 February 1962 modified by the law N° 2002/001 of 19 April 2002
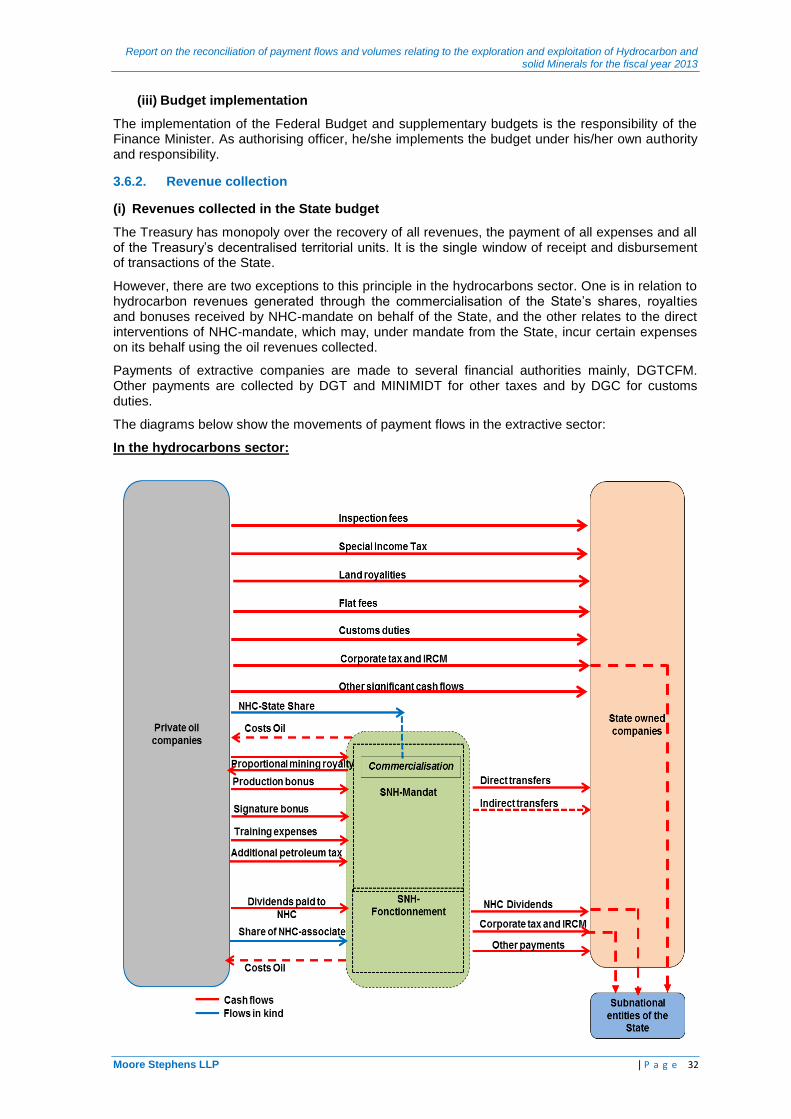
Report on the reconciliation of payment flows and volumes relating to the exploration and exploitation of Hydrocarbon and solid Minerals for the fiscal year 2013
Moore Stephens LLP | P a g e 32
(iii) Budget implementation
The implementation of the Federal Budget and supplementary budgets is the responsibility of the Finance Minister. As authorising officer, he/she implements the budget under his/her own authority and responsibility.
3.6.2. Revenue collection
(i) Revenues collected in the State budget
The Treasury has monopoly over the recovery of all revenues, the payment of all expenses and all of the Treasury’s decentralised territorial units. It is the single window of receipt and disbursement of transactions of the State.
However, there are two exceptions to this principle in the hydrocarbons sector. One is in relation to hydrocarbon revenues generated through the commercialisation of the State’s shares, royalties and bonuses received by NHC-mandate on behalf of the State, and the other relates to the direct interventions of NHC-mandate, which may, under mandate from the State, incur certain expenses on its behalf using the oil revenues collected.
Payments of extractive companies are made to several financial authorities mainly, DGTCFM. Other payments are collected by DGT and MINIMIDT for other taxes and by DGC for customs duties.
The diagrams below show the movements of payment flows in the extractive sector:
In the hydrocarbons sector:
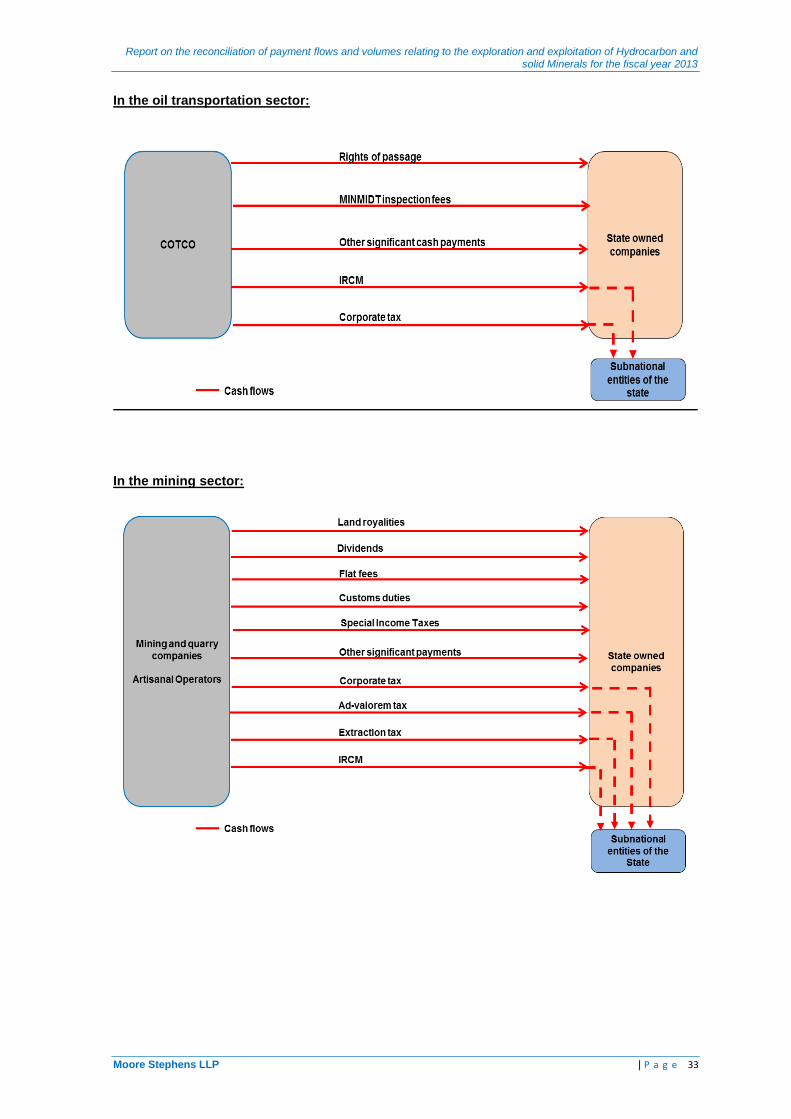
Report on the reconciliation of payment flows and volumes relating to the exploration and exploitation of Hydrocarbon and solid Minerals for the fiscal year 2013
Moore Stephens LLP | P a g e 33
In the oil transportation sector:
In the mining sector:
Report on the reconciliation of payment flows and volumes relating to the exploration and exploitation of Hydrocarbon and solid Minerals for the fiscal year 2013
Moore Stephens LLP | P a g e 34
(ii) Revenues transferred to subnational entities
Law N° 2007-006 dated 26 December 2007 which sets out the financial regime of the State establishes the principle of the uniqueness of the Public Treasury account, which has a monopoly on the collection of the State revenues including on regional and local authorities and legal entities.
The legislation provides a revenue sharing mechanism with subnational entities and local residents through:
Article 89 of the Mining Code sets out compensation for people affected by the mining operations. The amount of compensation is deducted from the ad valorem tax and the extraction tax. The rates and terms of compensation are as follows
34:
10% to the benefit of local residents;
15% to the benefit of the common territorial jurisdiction;
25% to the benefit of MINIMIDT; and
50% to the benefit of Public Treasury.
Article 6 of the Decree N° 2011/1731/PM dated 18 July 2011 setting the modalities of centralization, allocation and transfers of the communal taxes subject to equalization:
paragraph 1 : the product of the municipal surcharges (10% of the Income Tax and the IRCM collected from mining entities in the case) is allocated as follows:
10% to the benefit of the State;
20% to the benefit of FEICOM ; et
70% the benefit of Commons, administrative districts and urban communities 70%.
paragraph 2 : on the proportionate share of the municipal surcharges for the municipalities (i.e. 70%), a deduction at 28% is made to the benefit of the municipality and 42% are centralized in FEICOM for equalization
Definitely, the distribution is as follows:
10% to the benefit of the State;
62% to the benefit of FEICOM;
28% the benefit of Commons, administrative districts and urban communities’.
The analysis of the payment mechanism of these taxes and their lending process to the regions indicate that:
the reporting entities pay the taxes directly to DGI or the Public Treasury conducting the accounting of these shares in the accounts of the beneficiaries who are then made available to municipalities and town halls by the Public Treasury; and
the allocation of these revenues in the budgets of local authorities and town halls is aggregated and not detailed by nature and company.
34 Art. 137 ph 1 of the Decree N°2002/048/PM dated 26/03/2002

Report on the reconciliation of payment flows and volumes relating to the exploration and exploitation of Hydrocarbon and solid Minerals for the fiscal year 2013
Moore Stephens LLP | P a g e 35
3.7. Contribution of the extractive sector
3.7.1. Contribution to the State Budget
Based on the data collected for the purpose of this reconciliation report, the contribution of the extractive sector to the budget revenues decreased from 31% in 2012 to 30% in 2013, this is set out as follows:
Indicators 2012 2013
(In billion FCFA) Amount % Amount %
Total revenues (*) 2 425(*)
2 622(**)
Oil revenues allocated to the State Budget
725.2 29.9% 769.6 29.4%
Transfers to NHC – Mandate 532.4 22.0% 542.9 20.7%
Income Tax Oil 165.8 6.8% 186.8 7.1%
Other revenues 27 1.1% 39.9 1.5%
Transportation revenues allocated to the State Budget
16.2 0,7% 16.1 0.6%
Transit fees 7.7 0.3% 8.2 0.3%
Other revenues 8.5 0.3% 7.9 0.3%
Mining revenues allocated to the State Budget
0.8 - 2.4 0.1%
Extractive revenues allocated to the State Budget
742.2 30.6% 788.1 30.1%
(*)Source: TFOS 2012 - Version of the 10th October 2013, DGTCFM.
(**)Source: TFOS 2013 - Version of the 24th April 2014, DGTCFM.
3.7.2. Contribution to GDP
Based on the data collected for the purpose of the present reconciliation report, the contribution of the extractive sector to the GDP. This table provides also information on the proportion of GDP from the petroleum sector, which amounted to 7.4% in 2013:
Indicators 2012 2013
(In billion FCFA) Amount % Amount %
GDP at market prices35
13 515.0
14 463.0
Oil GDP36
1 075.0 8,0% 1 067.0 7.4%
Budgetary revenues – Oil sector 725.2 5,4% 769.6 5.3%
Budgetary revenues – Transport sector 16.2 0,1% 16.1 0.1%
Budgetary revenues – Mining sector 0.8 0.0% 2.4 0.0%
Total budgetary revenues from extractive sector
742.2 5.5% 788.1 5.4%
35 IMF Report No. 14/212
36 IMF Report No. 14/212

Report on the reconciliation of payment flows and volumes relating to the exploration and exploitation of Hydrocarbon and solid Minerals for the fiscal year 2013
Moore Stephens LLP | P a g e 36
3.7.3. Contribution to Exports
According to export data collected and reconciled, the exports of extractive sector amounted to FCFA 1 133.6 billion in 2013 against FCFA 1 137.6 billion in 2012. Their contribution to the global exports of the country is detailed in the table below:
Indicator Unit 2012 2013
Volume Amount % Volume Amount %
Total country exports 2 829 2 980
Crude oil exports billion bbl 20,4 1 135,60 40,10% 21,4 1 131,96 37,98%
Gold exports Kg 134,2 2 0,10% 84,9 1,41 0,05%
Diamond exports carats - - - 2 141 0,22 0,01%
Total exports in the extractive sector
1 137,60 40,20%
1 133,59 38,00%
3.7.4. Contribution to Employment
According to the figures collected from the companies included in the reconciliation scope, the extractive sector employed 2 127
37 workers, 2 008 of whom are Cameroon nationals. Of these
1 281 work in the oil sector while 727 are employed in the mining sector. Details of the workforce by company are set out in Annex 4 of this report.
According to the figures published by NSI (National Statistics Institute), the number of workers employed in 2012 in the Hydrocarbons Extraction sector was 1,760 out of a total workforce of 8.8 million, which included 7.9 million workers in the informal sector. Based on the NSI data, the hydrocarbon sector employed 0.3% of all private sector workforce and 0.2% of the formal sector workforce in Cameroon.
The NSI figures do not therefore represent sectorial data for the mining industry. The data stated above are not complete and cannot therefore be taken into account for the calculation of this sector’s contribution to employment.
3.8. Audit practices in Cameroon
3.8.1. Companies
The law in Cameroon requires hydrocarbon and mining companies which meet certain criteria to certify their financial statements annually.
38. Based on the data collected, most companies in the
hydrocarbons and mining sector are subsidiaries of multinational companies listed on the stock exchange and their financial statements are audited in accordance with international standards.
This requirement also applies to the State owned company, NHC, whose accounts are subject to an annual audit by local auditors. The results of the audit are published in the annual reports of NHC and on its website
39. By law, the Court of Auditors can also audit NHC accounts. In addition to
financial reporting, NHC also publishes data on production and transfers to the Treasury on its website.
3.8.2. Public administration
The Court of Auditors is responsible for control of and auditing the financial reports of public institutions as well as those of State owned and parastatal companies. It has final judgment on decisions of last resort made by lower courts. Annual reports of the institution are available on its website
40.
37 Staff including CIMENCAM
38 Source : OHADA’s website (http://www.ohada.com)
39 Source : NHC’s website (http://www.nhc.cm/).
40 http://www.chambredescomptes.net

Report on the reconciliation of payment flows and volumes relating to the exploration and exploitation of Hydrocarbon and solid Minerals for the fiscal year 2013
Moore Stephens LLP | P a g e 37
4. Determination of the reconciliation scope
4.1. Selection of payment flows and other data
4.1.1. Hydrocarbon sector
The table below shows the payments flows reported by government entities during the determination of the reconciliation scope 2013:
FCFA billion
Payments flows DGT DGTCFM Customs NHC CNPS Total Cumul Cumul in %
Direct transfers NCH 0 375 241 0 0 0 375 241 375 241 44,5%
Indirect transfers NCH 0 163 491 0 0 0 163 491 538 732 63,8%
Income Tax Oil 136 736 0 0 0 0 136 736 675 468 80,0%
MINING ROYALTY 0 0 0 47 191 0 47 191 722 659 85,6%
Balance Income Tax Oil 32 909 0 0 0 0 32 909 755 568 89,5%
SPECIAL LEVY (TSR) 24 491 0 0 0 0 24 491 780 059 92,4%
DIVIDENDS 0 0 0 20 370 0 20 370 800 429 94,9%
Balance Income Tax 17 861 0 0 0 0 17 861 818 290 97,0%
Duties and taxes 0 0 6 775 0 0 6 775 825 065 97,8%
Dividends NCH 0 4 175 0 0 0 4 175 829 240 98,3%
Advance Income Tax WTH 2 822 0 0 0 0 2 822 832 062 98,6%
Adv on Revenues 2 715 0 0 0 0 2 715 834 777 98,9%
IRCM 1 994 0 0 0 0 1 994 836 771 99,2%
SIGNATURE BONUS 0 0 0 1 810 0 1 810 838 581 99,4%
Employer share 0 0 0 0 1 508 1 508 840 089 99,6%
Income Tax adjustment 894 0 0 0 0 894 840 983 99,7%
TSR Techical Assistance 637 0 0 0 0 637 841 620 99,7%
Land royalities 536 0 0 0 0 536 842 156 99,8%
Flat fees 383 0 0 0 0 383 842 539 99,8%
PENALITIES 323 0 0 0 0 323 842 862 99,9%
PREC. SALES/PURCH 250 0 0 0 0 250 843 112 99,9%
FNE 196 0 0 0 0 196 843 308 99,9%
Fines 0 0 155 0 0 155 843 463 100,0%
Training fees 0 0 0 150 0 150 843 613 100,0%
RAV 100 0 0 0 0 100 843 713 100,0%
MONTHLY ADVANCE 1% 51 0 0 0 0 51 843 764 100,0%
OPERATING TAX 39 0 0 0 0 39 843 803 100,0%
REGISTRATION FEES 24 0 0 0 0 24 843 827 100,0%
LEASE RIGHTS 20 0 0 0 0 20 843 847 100,0%
LOCAL DEV TAX 15 0 0 0 0 15 843 862 100,0%
ADV on REVENUES. 5 0 0 0 0 5 843 867 100,0%
PATENTE 0 0 0 0 0 0 843 867 100,0%
STAMP 0 0 0 0 0 0 843 867 100,0%
Total 223 001 542 907 6 930 69 521 1 508 843 867
Based on the data presented above, the EITI Committee decided to select:
- the same payment flows selected for the 2012 report, which covers 99.8% of the oil sector revenues;
- the payments in kind included in the reconciliation scope 2013. These payments are the oil shares made available by the oil companies to the State and NCH; and
- a materiality threshold of USD 100 K (FCFA 55 Million) by payment for the "other significant payment flows".
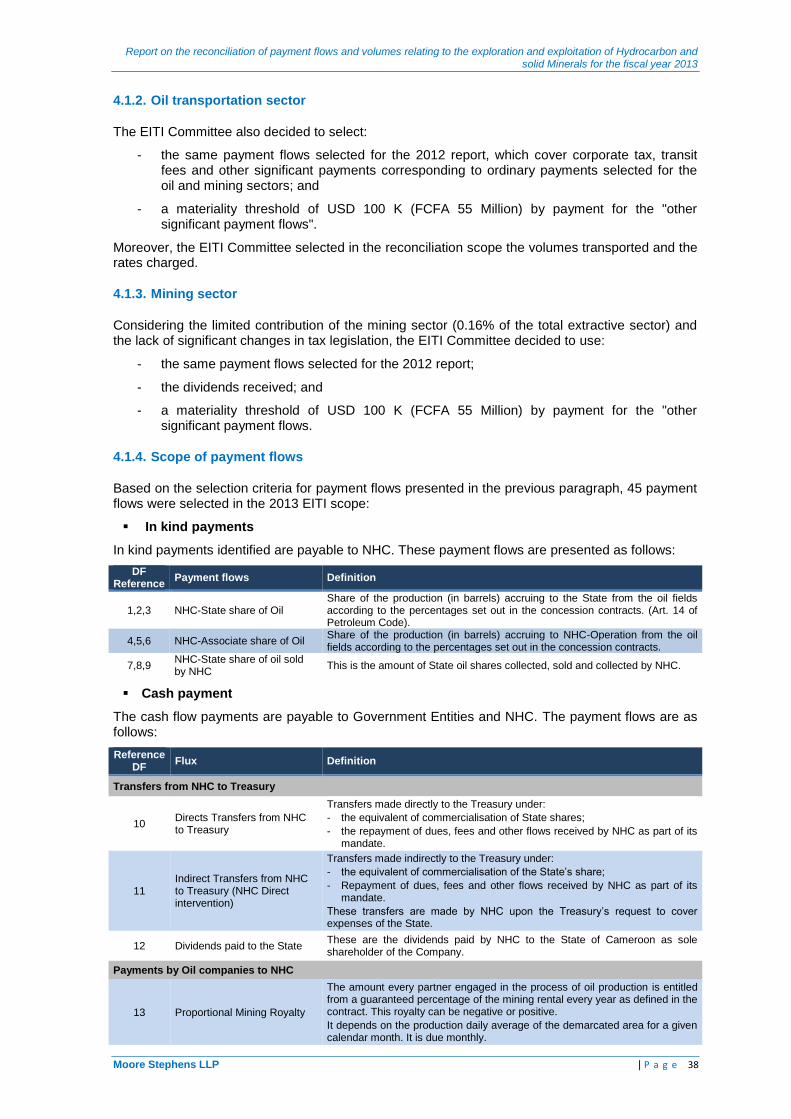
Report on the reconciliation of payment flows and volumes relating to the exploration and exploitation of Hydrocarbon and solid Minerals for the fiscal year 2013
Moore Stephens LLP | P a g e 38
4.1.2. Oil transportation sector
The EITI Committee also decided to select:
- the same payment flows selected for the 2012 report, which cover corporate tax, transit fees and other significant payments corresponding to ordinary payments selected for the oil and mining sectors; and
- a materiality threshold of USD 100 K (FCFA 55 Million) by payment for the "other significant payment flows".
Moreover, the EITI Committee selected in the reconciliation scope the volumes transported and the rates charged.
4.1.3. Mining sector
Considering the limited contribution of the mining sector (0.16% of the total extractive sector) and the lack of significant changes in tax legislation, the EITI Committee decided to use:
- the same payment flows selected for the 2012 report;
- the dividends received; and
- a materiality threshold of USD 100 K (FCFA 55 Million) by payment for the "other significant payment flows.
4.1.4. Scope of payment flows
Based on the selection criteria for payment flows presented in the previous paragraph, 45 payment flows were selected in the 2013 EITI scope:
In kind payments
In kind payments identified are payable to NHC. These payment flows are presented as follows:
DF Reference
Payment flows Definition
1,2,3 NHC-State share of Oil Share of the production (in barrels) accruing to the State from the oil fields according to the percentages set out in the concession contracts. (Art. 14 of Petroleum Code).
4,5,6 NHC-Associate share of Oil Share of the production (in barrels) accruing to NHC-Operation from the oil fields according to the percentages set out in the concession contracts.
7,8,9 NHC-State share of oil sold by NHC
This is the amount of State oil shares collected, sold and collected by NHC.
Cash payment
The cash flow payments are payable to Government Entities and NHC. The payment flows are as follows:
Reference DF
Flux Definition
Transfers from NHC to Treasury
10 Directs Transfers from NHC to Treasury
Transfers made directly to the Treasury under:
- the equivalent of commercialisation of State shares;
- the repayment of dues, fees and other flows received by NHC as part of its mandate.
11 Indirect Transfers from NHC to Treasury (NHC Direct intervention)
Transfers made indirectly to the Treasury under:
- the equivalent of commercialisation of the State’s share;
- Repayment of dues, fees and other flows received by NHC as part of its mandate.
These transfers are made by NHC upon the Treasury’s request to cover expenses of the State.
12 Dividends paid to the State These are the dividends paid by NHC to the State of Cameroon as sole shareholder of the Company.
Payments by Oil companies to NHC
13 Proportional Mining Royalty
The amount every partner engaged in the process of oil production is entitled from a guaranteed percentage of the mining rental every year as defined in the contract. This royalty can be negative or positive.
It depends on the production daily average of the demarcated area for a given calendar month. It is due monthly.
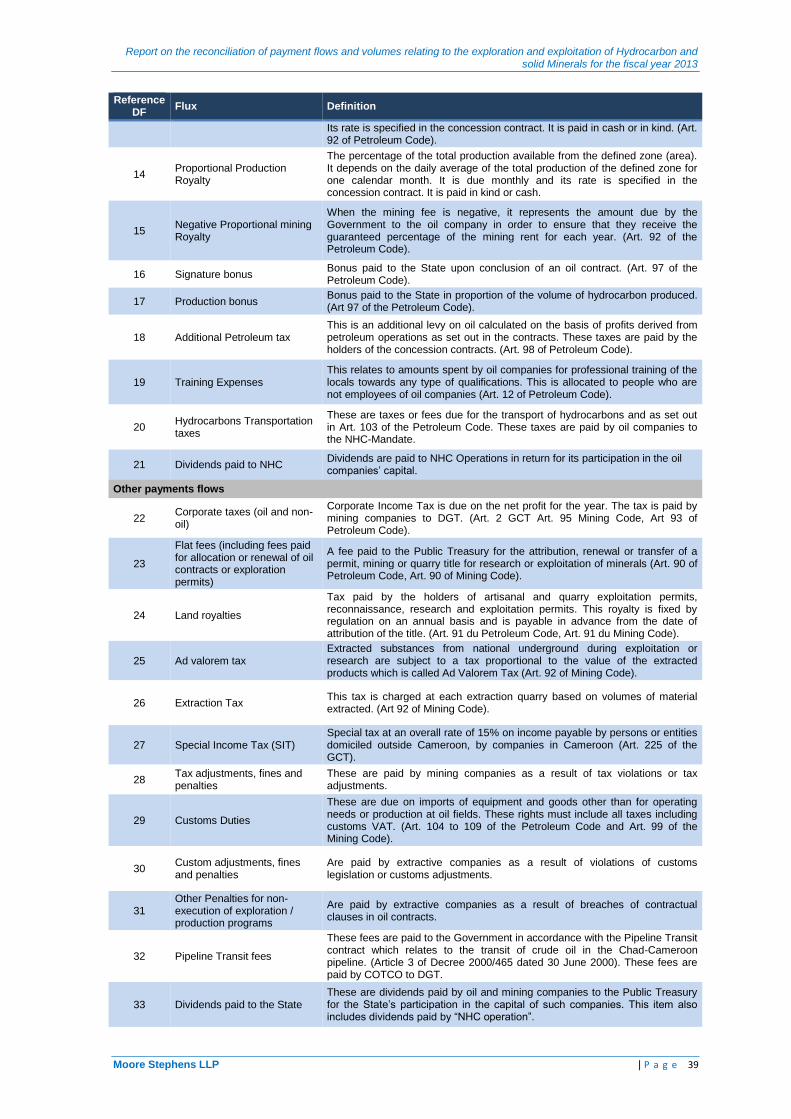
Report on the reconciliation of payment flows and volumes relating to the exploration and exploitation of Hydrocarbon and solid Minerals for the fiscal year 2013
Moore Stephens LLP | P a g e 39
Reference DF
Flux Definition
Its rate is specified in the concession contract. It is paid in cash or in kind. (Art. 92 of Petroleum Code).
14 Proportional Production Royalty
The percentage of the total production available from the defined zone (area). It depends on the daily average of the total production of the defined zone for one calendar month. It is due monthly and its rate is specified in the concession contract. It is paid in kind or cash.
15 Negative Proportional mining Royalty
When the mining fee is negative, it represents the amount due by the Government to the oil company in order to ensure that they receive the guaranteed percentage of the mining rent for each year. (Art. 92 of the Petroleum Code).
16 Signature bonus Bonus paid to the State upon conclusion of an oil contract. (Art. 97 of the Petroleum Code).
17 Production bonus Bonus paid to the State in proportion of the volume of hydrocarbon produced. (Art 97 of the Petroleum Code).
18 Additional Petroleum tax This is an additional levy on oil calculated on the basis of profits derived from petroleum operations as set out in the contracts. These taxes are paid by the holders of the concession contracts. (Art. 98 of Petroleum Code).
19 Training Expenses This relates to amounts spent by oil companies for professional training of the locals towards any type of qualifications. This is allocated to people who are not employees of oil companies (Art. 12 of Petroleum Code).
20 Hydrocarbons Transportation taxes
These are taxes or fees due for the transport of hydrocarbons and as set out in Art. 103 of the Petroleum Code. These taxes are paid by oil companies to the NHC-Mandate.
21 Dividends paid to NHC Dividends are paid to NHC Operations in return for its participation in the oil companies’ capital.
Other payments flows
22 Corporate taxes (oil and non-oil)
Corporate Income Tax is due on the net profit for the year. The tax is paid by mining companies to DGT. (Art. 2 GCT Art. 95 Mining Code, Art 93 of Petroleum Code).
23
Flat fees (including fees paid for allocation or renewal of oil contracts or exploration permits)
A fee paid to the Public Treasury for the attribution, renewal or transfer of a permit, mining or quarry title for research or exploitation of minerals (Art. 90 of Petroleum Code, Art. 90 of Mining Code).
24 Land royalties
Tax paid by the holders of artisanal and quarry exploitation permits, reconnaissance, research and exploitation permits. This royalty is fixed by regulation on an annual basis and is payable in advance from the date of attribution of the title. (Art. 91 du Petroleum Code, Art. 91 du Mining Code).
25 Ad valorem tax Extracted substances from national underground during exploitation or research are subject to a tax proportional to the value of the extracted products which is called Ad Valorem Tax (Art. 92 of Mining Code).
26 Extraction Tax This tax is charged at each extraction quarry based on volumes of material extracted. (Art 92 of Mining Code).
27 Special Income Tax (SIT) Special tax at an overall rate of 15% on income payable by persons or entities domiciled outside Cameroon, by companies in Cameroon (Art. 225 of the GCT).
28 Tax adjustments, fines and penalties
These are paid by mining companies as a result of tax violations or tax adjustments.
29 Customs Duties
These are due on imports of equipment and goods other than for operating needs or production at oil fields. These rights must include all taxes including customs VAT. (Art. 104 to 109 of the Petroleum Code and Art. 99 of the Mining Code).
30 Custom adjustments, fines and penalties
Are paid by extractive companies as a result of violations of customs legislation or customs adjustments.
31 Other Penalties for non-execution of exploration / production programs
Are paid by extractive companies as a result of breaches of contractual clauses in oil contracts.
32 Pipeline Transit fees
These fees are paid to the Government in accordance with the Pipeline Transit contract which relates to the transit of crude oil in the Chad-Cameroon pipeline. (Article 3 of Decree 2000/465 dated 30 June 2000). These fees are paid by COTCO to DGT.
33 Dividends paid to the State These are dividends paid by oil and mining companies to the Public Treasury for the State’s participation in the capital of such companies. This item also includes dividends paid by “NHC operation”.
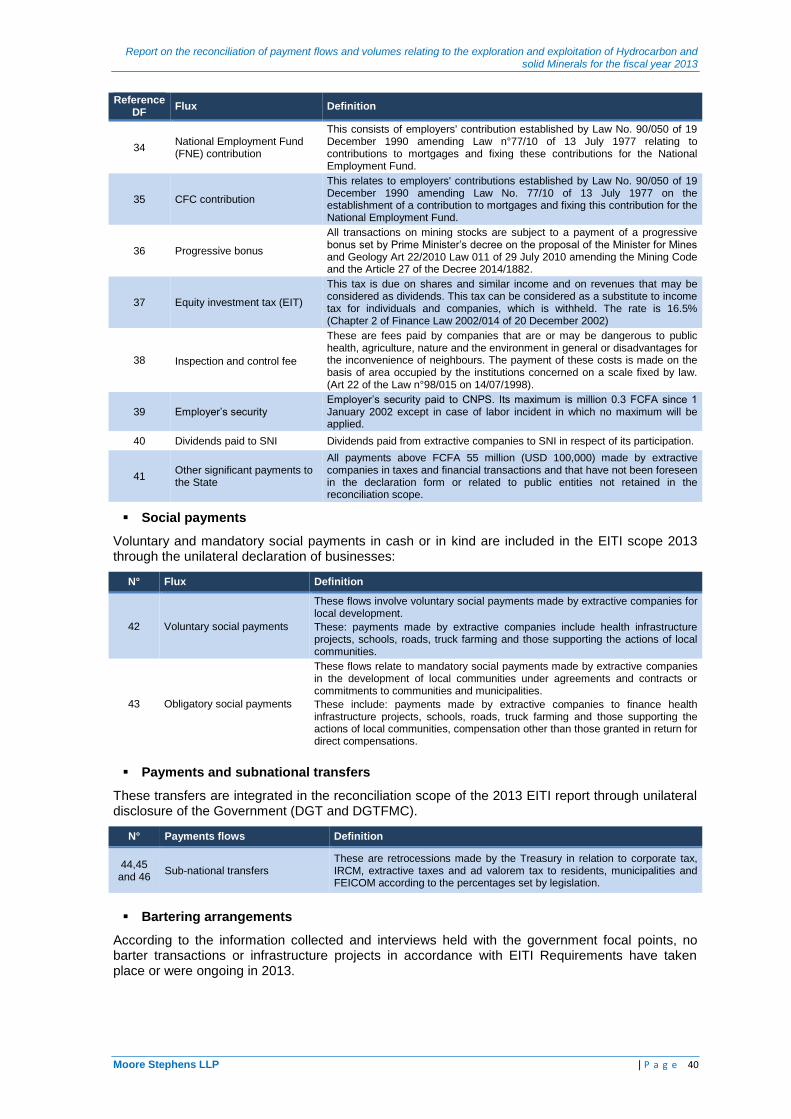
Report on the reconciliation of payment flows and volumes relating to the exploration and exploitation of Hydrocarbon and solid Minerals for the fiscal year 2013
Moore Stephens LLP | P a g e 40
Reference DF
Flux Definition
34 National Employment Fund (FNE) contribution
This consists of employers' contribution established by Law No. 90/050 of 19 December 1990 amending Law n°77/10 of 13 July 1977 relating to contributions to mortgages and fixing these contributions for the National Employment Fund.
35 CFC contribution
This relates to employers' contributions established by Law No. 90/050 of 19 December 1990 amending Law No. 77/10 of 13 July 1977 on the establishment of a contribution to mortgages and fixing this contribution for the National Employment Fund.
36 Progressive bonus
All transactions on mining stocks are subject to a payment of a progressive bonus set by Prime Minister’s decree on the proposal of the Minister for Mines and Geology Art 22/2010 Law 011 of 29 July 2010 amending the Mining Code and the Article 27 of the Decree 2014/1882.
37 Equity investment tax (EIT)
This tax is due on shares and similar income and on revenues that may be considered as dividends. This tax can be considered as a substitute to income tax for individuals and companies, which is withheld. The rate is 16.5% (Chapter 2 of Finance Law 2002/014 of 20 December 2002)
38 Inspection and control fee
These are fees paid by companies that are or may be dangerous to public health, agriculture, nature and the environment in general or disadvantages for the inconvenience of neighbours. The payment of these costs is made on the basis of area occupied by the institutions concerned on a scale fixed by law. (Art 22 of the Law n°98/015 on 14/07/1998).
39 Employer’s security Employer’s security paid to CNPS. Its maximum is million 0.3 FCFA since 1 January 2002 except in case of labor incident in which no maximum will be applied.
40 Dividends paid to SNI Dividends paid from extractive companies to SNI in respect of its participation.
41 Other significant payments to the State
All payments above FCFA 55 million (USD 100,000) made by extractive companies in taxes and financial transactions and that have not been foreseen in the declaration form or related to public entities not retained in the reconciliation scope.
Social payments
Voluntary and mandatory social payments in cash or in kind are included in the EITI scope 2013 through the unilateral declaration of businesses:
N° Flux Definition
42 Voluntary social payments
These flows involve voluntary social payments made by extractive companies for local development.
These: payments made by extractive companies include health infrastructure projects, schools, roads, truck farming and those supporting the actions of local communities.
43 Obligatory social payments
These flows relate to mandatory social payments made by extractive companies in the development of local communities under agreements and contracts or commitments to communities and municipalities.
These include: payments made by extractive companies to finance health infrastructure projects, schools, roads, truck farming and those supporting the actions of local communities, compensation other than those granted in return for direct compensations.
Payments and subnational transfers
These transfers are integrated in the reconciliation scope of the 2013 EITI report through unilateral disclosure of the Government (DGT and DGTFMC).
N° Payments flows Definition
44,45 and 46
Sub-national transfers These are retrocessions made by the Treasury in relation to corporate tax, IRCM, extractive taxes and ad valorem tax to residents, municipalities and FEICOM according to the percentages set by legislation.
Bartering arrangements
According to the information collected and interviews held with the government focal points, no barter transactions or infrastructure projects in accordance with EITI Requirements have taken place or were ongoing in 2013.

Report on the reconciliation of payment flows and volumes relating to the exploration and exploitation of Hydrocarbon and solid Minerals for the fiscal year 2013
Moore Stephens LLP | P a g e 41
Production and export
The EITI Committee decided to include volume in the 2013 EITI report as follows:
- Production volume and value: following several meetings held with the government, we concluded that it would be difficult to reconcile production data, given the possible contradiction of data between administrations and the lack of a credible source of information.
- Export volumes and values: the volume and value of exports will be subject to reporting by extractive companies and by the Ministry of Mines and Hydrocarbons General Secretariat for Mining and Oil Sectors respectively.
4.2. Selection of extractive companies
The table below shows revenues collected during 2013 by Government Entities and SOEs detailed by sector:
Sector Revenues 2013
in millions of FCFA in %
Hydrocarbons sector 843 865 92.0%
Mining sector 29 565 3.2%
Oil transportation sector 12 638 1.4%
Total of extractive sector revenues 886 068 96,6%
Revenues outside the EITI scope 31 030 3.4%
Total of revenues reported by government entities and NHC 917 098 100.0%
We present below the criteria for determining the reconciliation scope for each sector.
4.2.1. Hydrocarbons sector
a. Company payments
in Millions FCFA
Company DGT DGTFMC
Customs
NHC CNPS
Total Cumulative Cumulative
in %
SNH 24 155 542 907 74 0 207 567 343 567 343 67.23%
ADDAX PETROLUM CAM LTD
84 203 0 960 38 066 0 123 229 690 572 81.83%
Perenco RDR 94 351 0 4 124 21 076 449 120 000 810 572 96.05%
Perenco CAM 18 472 0 1 441 10 229 158 30 300 840 872 99.65%
GLENCORE 1 524 0 68 0 10 1 602 842 474 99.84%
PERENCO OIL & GAZ CAM 0 0 0 0 292 292 842 766 99.87%
NOBLE ENERGY CAM LIMITED
208 0 3 0 18 229 842 995 99,90%
PECTEN CAMEROON COMPANY
0 0 213 0 0 213 843 208 99.92%
ADDAX PCC 0 0 0 0 173 173 843 381 99.94%
STE KOSMOS ENERGY CAM.H.C
0 0 20 150 0 170 843 551 99.96%
YAN CHANG LOGONE 85 0 4 0 2 92 843 642 99.97%
RODEO (GAZ CAM) 0 0 0 0 91 91 843 733 99.98%
KOSMOS ENERGY 0 0 0 0 52 52 843 785 99,99%
EUROIL 0 0 0 0 50 50 843 835 100.00%
STE EUROIL LTD 0 0 23 0 0 23 843 858 100.00%
MURPHY CAMEROON ELOMBO
0 0 0 0 4 4 843 862 100.00%
DANA PETROLEUM 0 0 0 0 1 1 843 863 100.00%
Total 222 998 542 907 6 930 69 521 1 508 843 863
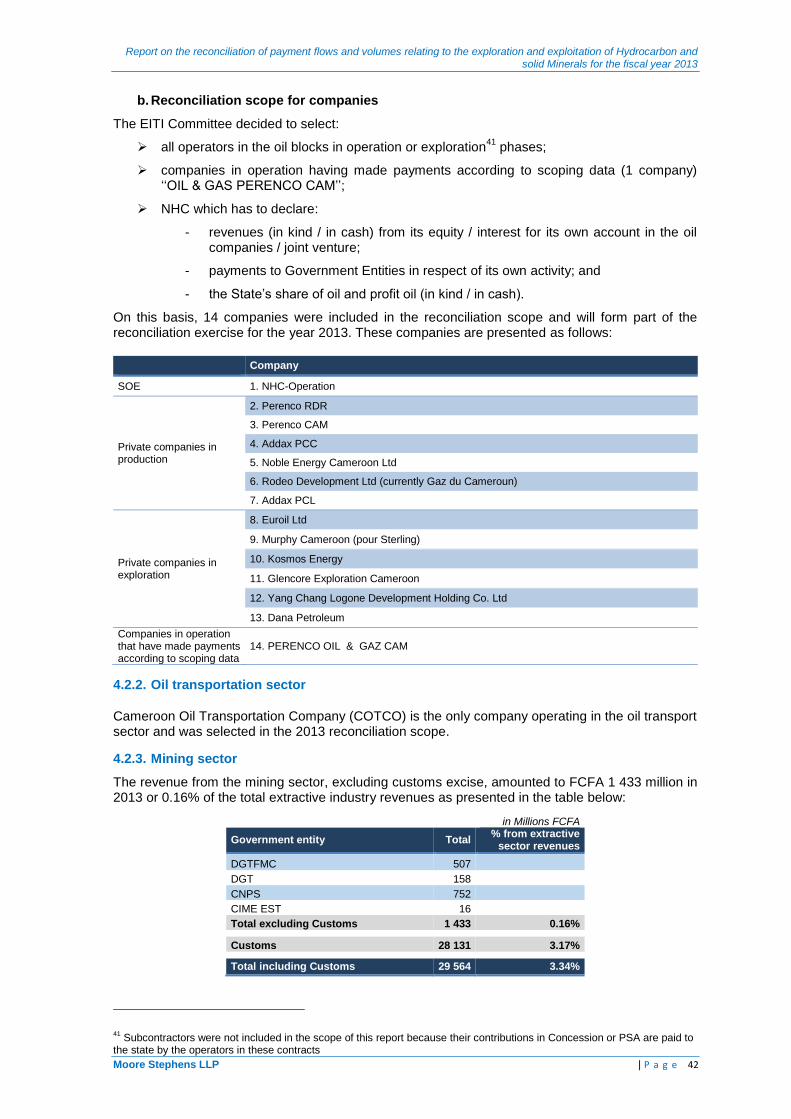
Report on the reconciliation of payment flows and volumes relating to the exploration and exploitation of Hydrocarbon and solid Minerals for the fiscal year 2013
Moore Stephens LLP | P a g e 42
b. Reconciliation scope for companies
The EITI Committee decided to select:
all operators in the oil blocks in operation or exploration41
phases;
companies in operation having made payments according to scoping data (1 company) ‘‘OIL & GAS PERENCO CAM’’;
NHC which has to declare:
- revenues (in kind / in cash) from its equity / interest for its own account in the oil companies / joint venture;
- payments to Government Entities in respect of its own activity; and
- the State’s share of oil and profit oil (in kind / in cash).
On this basis, 14 companies were included in the reconciliation scope and will form part of the reconciliation exercise for the year 2013. These companies are presented as follows:
Company
SOE 1. NHC-Operation
Private companies in production
2. Perenco RDR
3. Perenco CAM
4. Addax PCC
5. Noble Energy Cameroon Ltd
6. Rodeo Development Ltd (currently Gaz du Cameroun)
7. Addax PCL
Private companies in exploration
8. Euroil Ltd
9. Murphy Cameroon (pour Sterling)
10. Kosmos Energy
11. Glencore Exploration Cameroon
12. Yang Chang Logone Development Holding Co. Ltd
13. Dana Petroleum
Companies in operation that have made payments according to scoping data
14. PERENCO OIL & GAZ CAM
4.2.2. Oil transportation sector
Cameroon Oil Transportation Company (COTCO) is the only company operating in the oil transport sector and was selected in the 2013 reconciliation scope.
4.2.3. Mining sector
The revenue from the mining sector, excluding customs excise, amounted to FCFA 1 433 million in 2013 or 0.16% of the total extractive industry revenues as presented in the table below:
in Millions FCFA
Government entity Total % from extractive
sector revenues
DGTFMC 507
DGT 158 CNPS 752
CIME EST 16 Total excluding Customs 1 433 0.16%
Customs 28 131 3.17%
Total including Customs 29 564 3.34%
41 Subcontractors were not included in the scope of this report because their contributions in Concession or PSA are paid to
the state by the operators in these contracts

Report on the reconciliation of payment flows and volumes relating to the exploration and exploitation of Hydrocarbon and solid Minerals for the fiscal year 2013
Moore Stephens LLP | P a g e 43
The table below shows the 2013 mining revenues detailed by company:
in Millions FCFA
Company CIME EST DGT DGTFMC CNPS Total % from extractive sector revenues
CIMENCAM 0 86 26 294 406 0.05%
RAZEL CAMEROUN 0 72 5 380 457 0.05%
C & K MINING INCORPORATION S.A 0 0 35 53 88 0.01%
ROCAGLIA PIERRE HUBERT 0 0 9 6 15 0.00%
CAM IRON SA 6 0 2 0 8 0.00%
GEOVIC CAMEROON 0 0 0 19 19 0.00%
CAPAM 0 0 0 0 0 0.00%
Other companies (more than 250) 9 0 431 0 440 0.05%
Total (excluding customs) 15 158 507 752 1 433 0.16%
Given the immateriality of the mining sector’s revenues, the EITI Committee decided to renew with the 2012 scope which included:
companies holding exploitation permit;
CSPHM as it is the Collector of the artisanal production; and
CAM-IRON due to the integrated nature of the "Mbalam" project.
Based on the scoping study, seven (7) companies were included for the 2013 reconciliation exercise:
1. Geovic 3. ROCAGLIA 5. Cimencam * 7. CAM IRON
2. C&K Mining 4. CSPHM 6. Razel *
(*) Given the secondary importance of the quarry companies, only the payment flows specific to the mining sector have been retained in the reconciliation scope of this report. Common Law taxes have therefore been excluded.
The Committee also decided to include revenues from mining companies not included in the scope of the 2013 EITI report through the unilateral of Government Entities.
4.3. Selection of government entities
Based on the scoping study of extractive companies and payments flows selected for 2013, six (6) Government Entities have been solicited to send their Reporting Templates as follows:
Government Entities
1. Directorate-General of Taxes (DGT)
2. Directorate-General of Treasury and the Financial and Monetary Cooperation (DGTFMC)
3. Directorate-General of Customs (DGD)
4. Ministry of Industry, Mines and Technological Development (MINMITD)
5. National Fund of Social Security (CNPS)
SOEs
1. National Hydrocarbons Company (NHC)
2. National Company of Investments in Cameroon (SNI)
Report on the reconciliation of payment flows and volumes relating to the exploration and exploitation of Hydrocarbon and solid Minerals for the fiscal year 2013
Moore Stephens LLP | P a g e 44
5. RECONCILIATION RESULTS
We present below detailed results of our reconciliation exercise, as well as the differences found between the amounts paid by extractive companies and the amounts received by Government Agencies.
We have highlighted the amounts initially reported and the adjustments made following our reconciliation work, as well as the final amounts and unreconciled differences.
5.1. Reconciliation of in kind payments
5.1.1. Reconciliation by Extractive Companies
The tables below summarise the differences between in kind payments reported by extractive companies and the receipts reported by NHC.
The tables include consolidated quantities based on the Reporting Templates made by every extractive company and Government Agency. Detailed reconciliation reports for each company are included in Annex 9.

Report on the reconciliation of cash flows and volumes relating to the exploration and exploitation of Hydrocarbons and solid Minerals for the fiscal year 2013
Moore Stephens LLP | P a g e 45
The reconciliation between in kind payments reported by oil companies and NHC – Mandate is detailed as below: In bbl.
No. Company Initial volumes Adjustments Final volumes
Companies NHC Difference Companies NHC Difference Companies NHC Difference
1 Perenco Rio Del Rey 10 148 470 10 148 470 - - - - 10 148 470 10 148 470 -
2 Perenco Cameroun 883 539 883 539 - - - - 883 539 883 539 -
3 Addax Petroleum Cam Comapany
4 232 319 4 232 319 - - - - 4 232 319 4 232 319 -
Total 15 264 328 15 264 328 - - - - 15 264 328 15 264 328 -
In bbl.
No. Company Initial volumes Adjustments Final volumes
Companies NHC Difference Companies NHC Difference Companies NHC Difference
1 Perenco Cameroun 31 437 31 587 (150) - - - 31 437 31 587 (150)
Total 31 437 31 587 (150) - - - 31 437 31 587 (150)
The reconciliation between in kind payments reported by oil companies and NHC – Operation is detailed as below: In bbl.
No. Company Initial volumes Adjustments Final volumes
Companies NHC Difference Companies NHC Difference Companies NHC Difference
1 Perenco Cameroun 315 394 315 390 4 - - - 315 394 315 390 4
Total 315 394 315 390 4 - - - 315 394 315 390 4
In bbl.
No. Company Initial volumes Adjustments Final volumes
Companies NHC Difference Companies NHC Difference Companies NHC Difference
1 Perenco Cameroun 216 689 217 726 (1 037) - - - 216 689 217 726 (1 037)
Total 216 689 217 726 (1 037) - - - 216 689 217 726 (1 037)

Report on the reconciliation of payment flows and volumes relating to the exploration and exploitation of Hydrocarbon and solid Minerals for the fiscal year 2013
Moore Stephens LLP | P a g e 46
5.1.2. In kind payments reconciliation
The table below shows the total quantities of oil reported by extractive companies and NHC-Mandate, taking into account all adjustments: In bbl.
No. Payment flows Initial volumes Adjustments Final volumes
Companies Government Difference Companies Government Companies Government Difference Difference
1 NHC-State share of Oil produced 15 264 328 15 264 328 - - - - 15 264 328 15 264 328 -
Total 15 264 328 15 264 328 - - - - 15 264 328 15 264 328 -
The table below shows the total quantities of oil reported by extractive companies and NHC-Operation, taking into account all adjustments: In bbl.
No. Payment flows Initial volumes Adjustments Final volumes
Companies Government Difference Companies Government Companies Government Difference Difference
1 NHC-Associate share of Oil produced 315 394 315 390 4 - - - 315 394 315 390 4
Total 315 394 315 390 4 - - - 315 394 315 390 4

Report on the reconciliation of cash flows and volumes relating to the exploration and exploitation of Hydrocarbons and solid Minerals for the fiscal year 2013
Moore Stephens LLP | P a g e 47
5.2. Reconciliation of cash payments
5.2.1. Reconciliation by Extractive Companies
The tables below give a summary of the differences between the payments reported by Extractive Companies and revenue reported by Government Agencies.
The tables include consolidated figures based on the Reporting Templates made by every Oil Company and Government Agency, the adjustments made by us following our reconciliation work, and the residual, unreconciled differences. Detailed reconciliation reports for each company are included in Annex 9.

Report on the reconciliation of cash flows and volumes relating to the exploration and exploitation of Hydrocarbons and solid Minerals for the fiscal year 2013
Moore Stephens LLP | P a g e 48
Hydrocarbon sector
Reconciliation of payments paid by NHC- Mandate to the Government are detailed in the table below: In FCFA
No. Initial amounts Adjustments Final amounts
NHC Government Difference NHC Government Difference NHC Government Difference
SNH - Mandate 538 731 469 388 542 907 469 390 (4 176 000 002) 4 176 000 000 - 4 176 000 000 542 907 469 388 542 907 469 390 (2)
Total 538 731 469 388 542 907 469 390 (4 176 000 002) 4 176 000 000 - 4 176 000 000 542 907 469 388 542 907 469 390 (2)
Reconciliation of flow payments paid by oil companies (including NHC- Operation) to the Government are detailed below:
In FCFA
No. Company Initial amounts Adjustments Final amounts
Companies Government Difference Companies Government Difference Companies Government Difference
1 NHC 27 057 908 846 24 047 778 380 3 010 130 466 (3 016 669 124) (7 895 824) (3 008 773 300) 24 041 239 722 24 039 882 556 1 357 166
2 Perenco Rio Del Rey 99 509 080 795 93 574 177 589 5 934 903 206 (3 775 153 731) 1 041 287 583 (4 816 441 314) 95 733 927 064 94 615 465 172 1 118 461 892
3 Perenco Cameroun 20 508 525 119 19 246 351 300 1 262 173 819 (1 189 722 133) - (1 189 722 133) 19 318 802 986 19 246 351 300 72 451 686
4 Perenco Oil & Gas Cameroun
- - - - - - - - -
5 Addax Petroleum Cam Comapany
82 628 060 804 83 172 913 150 (544 852 346) - (680 452 061) 680 452 061 82 628 060 804 82 492 461 089 135 599 715
6 Euroil Ltd 114 210 537 112 787 387 1 423 150 5 000 1 427 659 (1 422 659) 114 215 537 114 215 046 491
7 Noble Energy Cameroon LTD
215 240 377 213 153 727 2 086 650 653 066 2 845 967 (2 192 901) 215 893 443 215 999 694 (106 251)
8 ADDAX Petroleum Cameroon Limited
2 469 786 407 2 469 786 407 - - - - 2 469 786 407 2 469 786 407 -
9 Murphy 36 662 047 21 671 080 14 990 967 - 13 779 357 (13 779 357) 36 662 047 35 450 437 1 211 610
10 Rodeo Development LTD (Gaz de Cameroun)
272 873 542 377 442 302 (104 568 760) 132 702 055 42 630 052 90 072 003 405 575 597 420 072 354 (14 496 757)
11 Kosmos Energy 1 912 726 358 1 791 134 385 121 591 973 (131 904 558) 9 480 500 (141 385 058) 1 780 821 800 1 800 614 885 (19 793 085)
12 Glencore Exploration Cameroon
1 226 914 027 1 210 654 034 16 259 993 (11 955 552) 5 466 789 (17 422 341) 1 214 958 475 1 216 120 823 (1 162 348)
13 Yang Chang Logone 382 955 85 449 413 (85 066 458) 85 060 000 - 85 060 000 85 442 955 85 449 413 (6 458)
14 Dana Petroleum 14 330 714 - 14 330 714 - - - 14 330 714 - 14 330 714
Total 235 966 702 528 226 323 299 154 9 643 403 374 (7 906 984 977) 428 570 022 (8 335 554 999) 228 059 717 551 226 751 869 176 1 307 848 375

Report on the reconciliation of payment flows and volumes relating to the exploration and exploitation of Hydrocarbon and solid Minerals for the fiscal year 2013
Moore Stephens LLP | P a g e 49
Reconciliation of payments paid by hydrocarbon companies to NHC-Operation are detailed in the table below:
In FCFA
No. Company Initial amounts Adjustments Final amounts
Companies NHC Difference Companies NHC Difference Companies NHC Difference
1 NHC 1 354 034 293 - 1 354 034 293 (1 354 034 293) - (1 354 034 293) - - -
2 Perenco Rio Del Rey 10 078 915 392 10 078 915 392 - - - - 10 078 915 392 10 078 915 392 -
3 Perenco Cameroun 1 482 193 440 1 482 193 440 - - - - 1 482 193 440 1 482 193 440 -
4 Addax Petroleum Cam Comapany
7 905 031 680 7 905 031 680 - - - - 7 905 031 680 7 905 031 680 -
Total 20 820 174 805 19 466 140 512 1 354 034 293 (1 354 034 293) - (1 354 034 293) 19 466 140 512 19 466 140 512 -
Reconciliation of payments paid by hydrocarbon companies to NHC-Mandate are detailed in the table below:
In FCFA
No. Company Initial amounts Adjustments Final amounts
Companies NHC Difference Companies NHC Difference Companies NHC Difference
1 Perenco Rio Del Rey (15 433 753 714) (15 433 753 714) - - - - (15 433 753 714) (15 433 753 714) -
2 Perenco Cameroun 8 292 949 015 8 292 926 150 22 865 - - - 8 292 949 015 8 292 926 150 22 865
3 Perenco Oil & Gas Cameroun
- - - - - - - - -
4 Addax Petroleum Cam Comapany
21 281 145 667 21 281 120 964 24 703 - - - 21 281 145 667 21 281 120 964 24 703
5 Kosmos Energy 22 677 560 143 723 357 (121 045 797) 121 045 798 - 121 045 798 143 723 358 143 723 357 1
6 Yang Chang Logone 85 060 000 - 85 060 000 (85 060 000) - (85 060 000) - - -
7 Dana Petroleum 5 805 000 - 5 805 000 - - - 5 805 000 - 5 805 000
Total 14 253 883 528 14 284 016 757 (30 133 229) 35 985 798 - 35 985 798 14 289 869 326 14 284 016 757 5 852 569
Hydrocarbon transport sector
Reconciliation of payments paid by COTCO to the Government is detailed in the table below:
In FCFA
No. Company Initial amounts Adjustments Final amounts
COTCO Government Difference COTCO Government Difference COTCO Government Difference
COTCO 15 920 932 765 12 149 492 393 3 771 440 372 - 4 014 175 160 (4 014 175 160) 15 920 932 765 16 163 667 553 (242 734 788)
Total 15 920 932 765 12 149 492 393 3 771 440 372 - 4 014 175 160 (4 014 175 160) 15 920 932 765 16 163 667 553 (242 734 788)
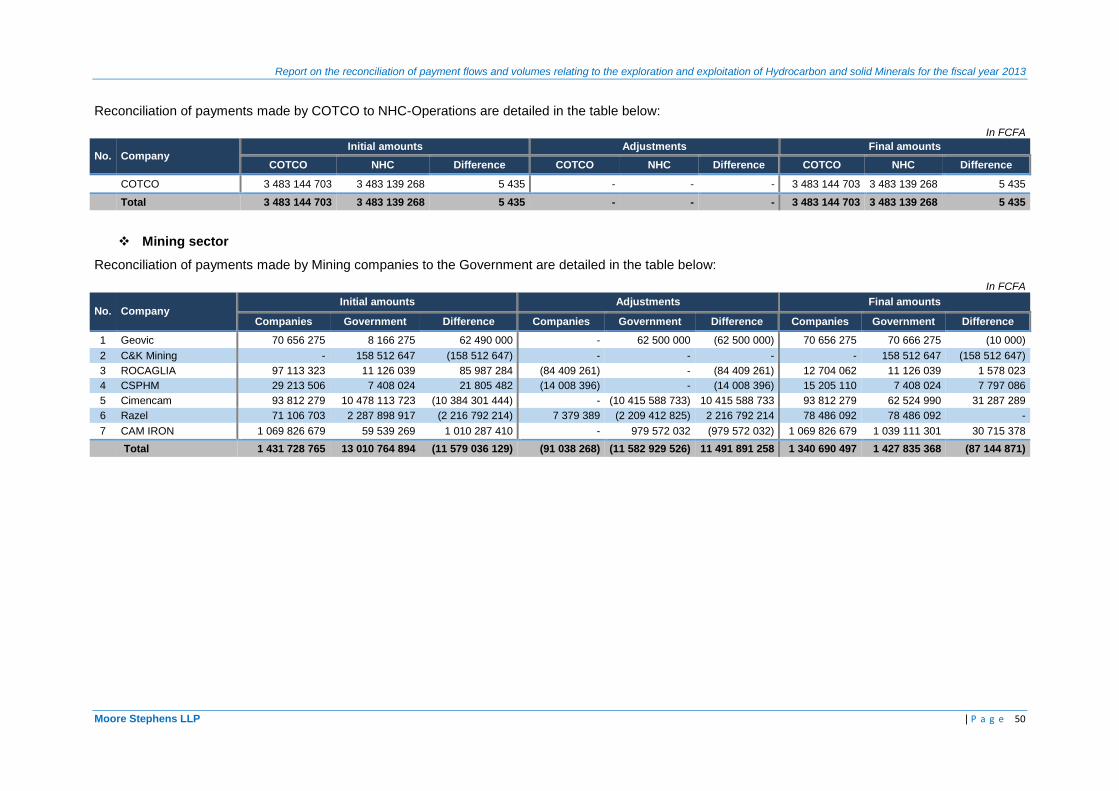
Report on the reconciliation of payment flows and volumes relating to the exploration and exploitation of Hydrocarbon and solid Minerals for the fiscal year 2013
Moore Stephens LLP | P a g e 50
Reconciliation of payments made by COTCO to NHC-Operations are detailed in the table below:
In FCFA
No. Company Initial amounts Adjustments Final amounts
COTCO NHC Difference COTCO NHC Difference COTCO NHC Difference
COTCO 3 483 144 703 3 483 139 268 5 435 - - - 3 483 144 703 3 483 139 268 5 435
Total 3 483 144 703 3 483 139 268 5 435 - - - 3 483 144 703 3 483 139 268 5 435
Mining sector
Reconciliation of payments made by Mining companies to the Government are detailed in the table below:
In FCFA
No. Company Initial amounts Adjustments Final amounts
Companies Government Difference Companies Government Difference Companies Government Difference
1 Geovic 70 656 275 8 166 275 62 490 000 - 62 500 000 (62 500 000) 70 656 275 70 666 275 (10 000)
2 C&K Mining - 158 512 647 (158 512 647) - - - - 158 512 647 (158 512 647)
3 ROCAGLIA 97 113 323 11 126 039 85 987 284 (84 409 261) - (84 409 261) 12 704 062 11 126 039 1 578 023
4 CSPHM 29 213 506 7 408 024 21 805 482 (14 008 396) - (14 008 396) 15 205 110 7 408 024 7 797 086
5 Cimencam 93 812 279 10 478 113 723 (10 384 301 444) - (10 415 588 733) 10 415 588 733 93 812 279 62 524 990 31 287 289
6 Razel 71 106 703 2 287 898 917 (2 216 792 214) 7 379 389 (2 209 412 825) 2 216 792 214 78 486 092 78 486 092 -
7 CAM IRON 1 069 826 679 59 539 269 1 010 287 410 - 979 572 032 (979 572 032) 1 069 826 679 1 039 111 301 30 715 378
Total 1 431 728 765 13 010 764 894 (11 579 036 129) (91 038 268) (11 582 929 526) 11 491 891 258 1 340 690 497 1 427 835 368 (87 144 871)

Report on the reconciliation of payment flows and volumes relating to the exploration and exploitation of Hydrocarbon and solid Minerals for the fiscal year 2013
Moore Stephens LLP | P a g e 51
5.2.2. Reconciliation of cash payments
The tables below summarise the global amounts of fees and taxes reported by Government Agencies and extractive companies after adjustments.
Hydrocarbons sector
Reconciliation of payments made by NHC-Mandate to the Government are detailed in the table below: In FCFA
N°
Payment flows
Initial amounts Adjustments Final amounts
Companies Government Difference Companies Government Difference Companies Government Differen
ce
1 Directs Transfers from NHC to Treasury
375 241 000 000 375 241 000 000 - - - - 375 241 000 000 375 241 000 000 -
2 Indirect Transfers from NHC to Treasury (NHC Direct intervention)
163 490 469 388 163 491 469 390 (1 000 002) 1 000 000 - 1 000 000 163 491 469 388 163 491 469 390 (2)
3 Dividends NHC - 4 175 000 000 (4 175 000 000) 4 175 000 000 - 4 175 000 000 4 175 000 000 4 175 000 000 -
Total 538 731 469 388 542 907 469 390 (4 176 000 002) 4 176 000 000 - 4 176 000 000 542 907 469 388 542 907 469 390 (2)
Reconciliation of payments made by oil companies (including NHC-Operations) to the Government are detailed in the table below:
In FCFA
N° Payment flows Initial amounts Adjustments Final amounts
Companies Government Difference Companies Government Difference Companies Government Difference
1 Corporation Tax (oil and non-oil )
186 787 638 198 185 734 136 999 1 053 501 199 - 1 046 754
372 (1 046 754 372) 186 787 638 198 186 780 891 371 6 746 827
2
Flat fees (including fees paid for allocation or renewal of permit)
509 467 298 365 110 000 144 357 298 (74 734 798) 69 622 000 (144 356 798) 434 732 500 434 732 000 500
3 Land royalties 392 953 598 478 426 848 (85 473 250) 38 749 000 (47 401 500) 86 150 500 431 702 598 431 025 348 677 250
4 Ad Valorem Tax - - - - - - - - -
5 Extraction Tax - - - - - - - - -
6 Special Income Tax 27 678 677 398 27 773 686 353 (95 008 955) 95 089 926 11 972 95 077 954 27 773 767 324 27 773 698 325 68 999
7 Tax adjustments, fines and penalties
1 859 661 787 1 000 662 534 858 999 253 50 662 534 909 661 787 (858 999 253) 1 910 324 321 1 910 324 321 -
8 Customs Duties 7 968 146 397 7 403 704 821 564 441 576 (11 955 552) (740 452 061) 728 496 509 7 956 190 845 6 663 252 760 1 292 938 085
9 Custom adjustments, fines and penalties
155 000 000 95 000 000 60 000 000 - 60 000 000 (60 000 000) 155 000 000 155 000 000 -
10
Other Penalties for non-execution of exploration / production programs
- - - - - - - - -
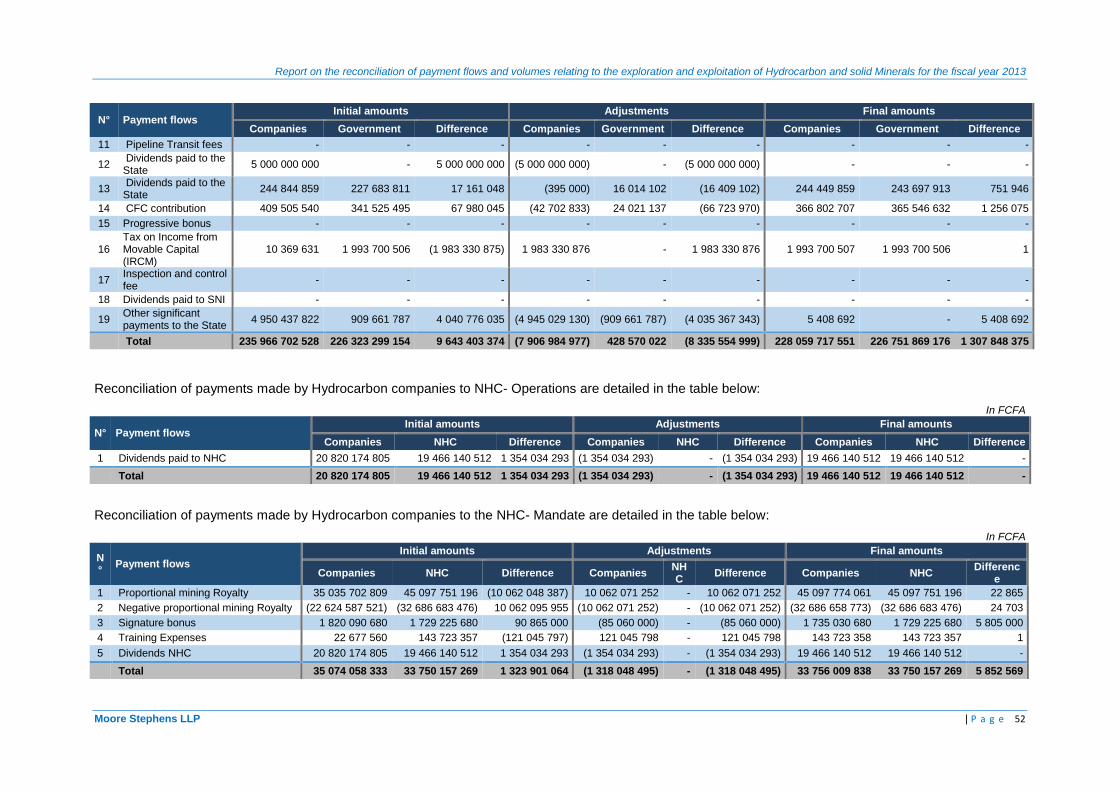
Report on the reconciliation of payment flows and volumes relating to the exploration and exploitation of Hydrocarbon and solid Minerals for the fiscal year 2013
Moore Stephens LLP | P a g e 52
N° Payment flows Initial amounts Adjustments Final amounts
Companies Government Difference Companies Government Difference Companies Government Difference
11 Pipeline Transit fees - - - - - - - - -
12 Dividends paid to the State
5 000 000 000 - 5 000 000 000 (5 000 000 000) - (5 000 000 000) - - -
13 Dividends paid to the State
244 844 859 227 683 811 17 161 048 (395 000) 16 014 102 (16 409 102) 244 449 859 243 697 913 751 946
14 CFC contribution 409 505 540 341 525 495 67 980 045 (42 702 833) 24 021 137 (66 723 970) 366 802 707 365 546 632 1 256 075
15 Progressive bonus - - - - - - - - -
16 Tax on Income from Movable Capital (IRCM)
10 369 631 1 993 700 506 (1 983 330 875) 1 983 330 876 - 1 983 330 876 1 993 700 507 1 993 700 506 1
17 Inspection and control fee
- - - - - - - - -
18 Dividends paid to SNI - - - - - - - - -
19 Other significant payments to the State
4 950 437 822 909 661 787 4 040 776 035 (4 945 029 130) (909 661 787) (4 035 367 343) 5 408 692 - 5 408 692
Total 235 966 702 528 226 323 299 154 9 643 403 374 (7 906 984 977) 428 570 022 (8 335 554 999) 228 059 717 551 226 751 869 176 1 307 848 375
Reconciliation of payments made by Hydrocarbon companies to NHC- Operations are detailed in the table below:
In FCFA
N° Payment flows Initial amounts Adjustments Final amounts
Companies NHC Difference Companies NHC Difference Companies NHC Difference
1 Dividends paid to NHC 20 820 174 805 19 466 140 512 1 354 034 293 (1 354 034 293) - (1 354 034 293) 19 466 140 512 19 466 140 512 -
Total 20 820 174 805 19 466 140 512 1 354 034 293 (1 354 034 293) - (1 354 034 293) 19 466 140 512 19 466 140 512 -
Reconciliation of payments made by Hydrocarbon companies to the NHC- Mandate are detailed in the table below:
In FCFA
N°
Payment flows
Initial amounts Adjustments Final amounts
Companies NHC Difference Companies NHC
Difference Companies NHC Differenc
e
1 Proportional mining Royalty 35 035 702 809 45 097 751 196 (10 062 048 387) 10 062 071 252 - 10 062 071 252 45 097 774 061 45 097 751 196 22 865
2 Negative proportional mining Royalty (22 624 587 521) (32 686 683 476) 10 062 095 955 (10 062 071 252) - (10 062 071 252) (32 686 658 773) (32 686 683 476) 24 703
3 Signature bonus 1 820 090 680 1 729 225 680 90 865 000 (85 060 000) - (85 060 000) 1 735 030 680 1 729 225 680 5 805 000
4 Training Expenses 22 677 560 143 723 357 (121 045 797) 121 045 798 - 121 045 798 143 723 358 143 723 357 1
5 Dividends NHC 20 820 174 805 19 466 140 512 1 354 034 293 (1 354 034 293) - (1 354 034 293) 19 466 140 512 19 466 140 512 -
Total 35 074 058 333 33 750 157 269 1 323 901 064 (1 318 048 495) - (1 318 048 495) 33 756 009 838 33 750 157 269 5 852 569
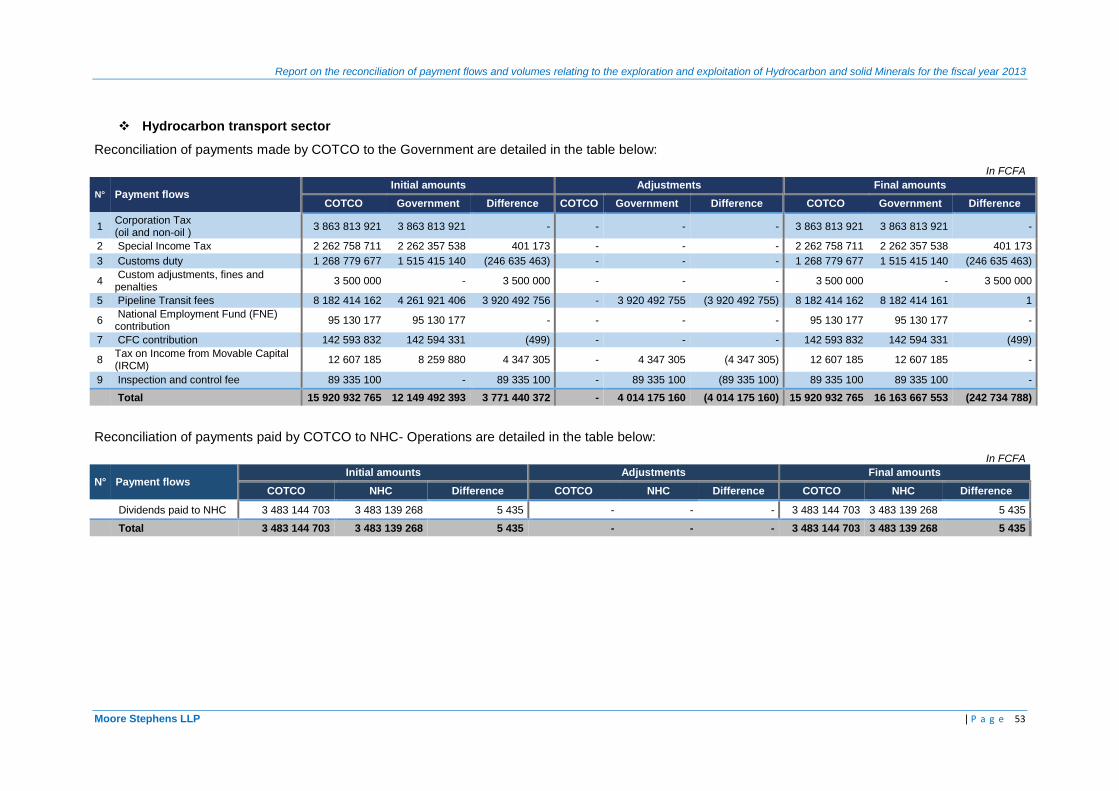
Report on the reconciliation of payment flows and volumes relating to the exploration and exploitation of Hydrocarbon and solid Minerals for the fiscal year 2013
Moore Stephens LLP | P a g e 53
Hydrocarbon transport sector
Reconciliation of payments made by COTCO to the Government are detailed in the table below:
In FCFA
N° Payment flows Initial amounts Adjustments Final amounts
COTCO Government Difference COTCO Government Difference COTCO Government Difference
1 Corporation Tax (oil and non-oil )
3 863 813 921 3 863 813 921 - - - - 3 863 813 921 3 863 813 921 -
2 Special Income Tax 2 262 758 711 2 262 357 538 401 173 - - - 2 262 758 711 2 262 357 538 401 173
3 Customs duty 1 268 779 677 1 515 415 140 (246 635 463) - - - 1 268 779 677 1 515 415 140 (246 635 463)
4 Custom adjustments, fines and penalties
3 500 000 - 3 500 000 - - - 3 500 000 - 3 500 000
5 Pipeline Transit fees 8 182 414 162 4 261 921 406 3 920 492 756 - 3 920 492 755 (3 920 492 755) 8 182 414 162 8 182 414 161 1
6 National Employment Fund (FNE) contribution
95 130 177 95 130 177 - - - - 95 130 177 95 130 177 -
7 CFC contribution 142 593 832 142 594 331 (499) - - - 142 593 832 142 594 331 (499)
8 Tax on Income from Movable Capital (IRCM)
12 607 185 8 259 880 4 347 305 - 4 347 305 (4 347 305) 12 607 185 12 607 185 -
9 Inspection and control fee 89 335 100 - 89 335 100 - 89 335 100 (89 335 100) 89 335 100 89 335 100 -
Total 15 920 932 765 12 149 492 393 3 771 440 372 - 4 014 175 160 (4 014 175 160) 15 920 932 765 16 163 667 553 (242 734 788)
Reconciliation of payments paid by COTCO to NHC- Operations are detailed in the table below:
In FCFA
N° Payment flows Initial amounts Adjustments Final amounts
COTCO NHC Difference COTCO NHC Difference COTCO NHC Difference
Dividends paid to NHC 3 483 144 703 3 483 139 268 5 435 - - - 3 483 144 703 3 483 139 268 5 435
Total 3 483 144 703 3 483 139 268 5 435 - - - 3 483 144 703 3 483 139 268 5 435

Report on the reconciliation of payment flows and volumes relating to the exploration and exploitation of Hydrocarbon and solid Minerals for the fiscal year 2013
Moore Stephens LLP | P a g e 54
Mining sector
The table below shows the total payments reported by Mining Companies to Government Entities:
In FCFA
N° Payment flow Initial amounts Adjustments Final amounts
Companies Government Difference Companies Government Difference Companies Government Difference
1 Flat fees (including fees paid for allocation or renewal of permit)
64 458 500 20 301 400 44 157 100 2 741 500 62 500 000 (59 758 500) 67 200 000 82 801 400 (15 601 400)
2 Land royalties 7 954 460 17 223 000 (9 268 540) 1 958 500 1 958 900 (400) 9 912 960 19 181 900 (9 268 940)
3 Ad Valorem Tax 11 696 000 128 731 752 (117 035 752) 3 345 213 216 000 3 129 213 15 041 213 128 947 752 (113 906 539)
4 Extraction Tax 160 147 875 77 099 935 83 047 940 2 679 389 34 420 902 (31 741 513) 162 827 264 111 520 837 51 306 427
5 Customs duty 32 277 421 12 692 872 512 (12 660 595 091) - (12 658 297 360) 12 658 297 360 32 277 421 34 575 152 (2 297 731)
6 Customs penalties - 3 300 000 (3 300 000) - (3 300 000) 3 300 000 - - -
7 NEF Contribution 28 449 554 26 595 455 1 854 099 - 1 869 827 (1 869 827) 28 449 554 28 465 282 (15 728)
8 CFC Contribution (Employer's contribution)
46 399 412 39 889 040 6 510 372 - 2 804 732 (2 804 732) 46 399 412 42 693 772 3 705 640
9 Inspection and control fees 3 685 200 4 751 800 (1 066 600) - - - 3 685 200 4 751 800 (1 066 600)
10 Other material payments to the Government ( over USD 100,000 / FCFA 55 million)
1 076 660 343 - 1 076 660 343 (101 762 870) 974 897 473 (1 076 660 343) 974 897 473 974 897 473 -
Total 1 431 728 765 13 010 764 894 (11 579 036 129) (91 038 268) (11 582 929 526) 11 491 891 258 1 340 690 497 1 427 835 368 (87 144 871)

Report on the reconciliation of cash flows and volumes relating to the exploration and exploitation of Hydrocarbons and solid Minerals for the fiscal year 2013
Moore Stephens LLP | Page 55
5.2.3. Adjustments
a. For extractive companies
Adjustments to extractive company payments are detailed as follows:
Adjustments to Extractive companies payments FCFA
Taxes paid but reported outside the reconciliation scope (a) (6 426 974 441)
Taxes incorrectly reported (amounts and description) (b) (37 118 196)
Taxes paid but not reported (d) 1 324 020 897
Total (5 140 071 740)
(a) These are payments reported which fall outside the 2012 EITI reconciliation scope. We present the main adjustments in the table below by tax:
Payment flows FCFA
Dividends from subsidiaries of NCH (i) (1 354 034 293)
CFC Contribution (Employer's contribution) (ii) (26 148 148)
Other significant payments to the Government (iii) (5 046 792 000)
Total (6 426 974 441)
(i) These are the dividends paid by Tradex companies (State Owned Company specialising in oil trade) and the Cameroon Society of Petroleum Deposits (SCDP) to NHC. These two companies do not operate in the extractive sector and are not included in the reconciliation scope.
(ii) The employee’ share of the CFC is a withholding tax on wages not supported by the company and was therefore excluded from the reconciliation scope.
(iii) These are taxes reported by extractive companies but which are not included in the reconciliation scope. These payments are detailed as follows:
Companies Taxes Amount (FCFA)
Perenco Rio Del Rey IRPP 2 236 732 955
VAT 1 532 324 851
Perenco Cameroun IRPP 667 699 675
VAT 508 271 649
ROCAGLIA Services taxes 87 754 474
CSPHM IRPP 14 008 396
Total 5 046 792 000
The adjustments are detailed by company as follows:
Companies FCFA
NCH (1 354 034 293)
Perenco Rio Del Rey (3 769 057 806)
Perenco Cameroun (1 202 119 472)
ROCAGLIA (87 754 474)
CSPHM (14 008 396)
Total (6 426 974 441)

Report on the reconciliation of payment flows and volumes relating to the exploration and exploitation of Hydrocarbon and solid Minerals for the fiscal year 2013
Moore Stephens LLP | Page 56
(b) These are differences between the total amounts shown in the templates and details provided by company or the amount of the receipt. These adjustments were made on the basis of receipts and/or confirmations from companies. These adjustments are detailed by tax as follows:
Payment flows FCFA
Indirect transfers to the Public Treasury 1 000 000
Special Income Tax (SIT) 113 066
Customs Duties (21 281 577)
National Employment Fund (FNE) contribution (395 000)
CFC contribution (employers share) (16 554 685)
Total (37 118 196)
The adjustments are detailed by company as follows:
Companies FCFA
NCH 1 000 000
Perenco Rio Del Rey (6 095 925)
Euroil Ltd 5 000
Noble Energy Cameroon LTD 653 066
Rodeo Development LTD (Gaz de Cameroun) (540 000)
Kosmos Energy (10 858 760)
Glencore Exploration Cameroon (21 281 577)
Total (37 118 196)
(c) These are payment flows made by extractive companies but which were not reported. These cash flows, initially declared by Government Agencies, have subsequently been confirmed by the relevant extractive companies. These adjustments by tax are as follows:
Payment flows FCFA
Flat fees (including fees paid for allocation or renewal of oil contracts or exploration permits) 4 700 000
Ad valorem tax 3 345 213
Extraction Tax 2 679 389
Special Income Tax (SIT) 145 639 394
Customs Duties 9 326 025
Tax on Income from Movable Capital (IRCM) 1 158 330 876
Total 1 324 020 897
The adjustments are detailed by company as follows:
Companies FCFA
NCH 1 158 330 876
Perenco Cameroun 12 397 339
Rodeo Development LTD (Gaz de Cameroun) 133 242 055
Glencore Exploration Cameroon 9 326 025
ROCAGLIA 3 345 213
Razel 7 379 389
Total 1 324 020 897

Report on the reconciliation of payment flows and volumes relating to the exploration and exploitation of Hydrocarbon and solid Minerals for the fiscal year 2013
Moore Stephens LLP | Page 57
b. For Government Agencies
We set out in the table below adjustments made to Government Agency payments:
Adjustments to Government Agency declarations FCFA
Taxes paid but reported outside the reconciliation scope (a) (12 661 611 860)
Tax incorrectly reported (amount and detail) (b) (796 723 683)
Tax paid but reported outside the period covered (c) (36 463 417)
Amount doubling reported (d) (2 693 426)
Tax not reported by Government (e) 6 357 308 042
Total (7 140 184 344)
(a) There are payments reported but which fall outside the 2013 EITI reconciliation scope. Details by tax are as follows:
Adjustments to Government Agency declarations FCFA
Customs Duties (i) (12 658 297 360)
Customs penalties (i) (3 300 000)
Land royalties (ii) (14 500)
Total (12 661 611 860)
(i) These are payments made by the companies Cimencam and Razel for which only specific payments are retained within the reconciliation scope.
(ii) This is the operating tax, falling outside the reconciliation scope, submitted by the DGI as Land royalties.
Adjustments by company are detailed as below:
Companies FCFA
Cimencam (10 415 588 733)
Razel (2 246 008 627)
Noble Energy Cameroon LTD (14 500)
Total (12 661 611 860)
(b) These are differences between the total amount shown in the templates and details provided by company or the amount shown by the receipt. These adjustments were made on the basis of receipts and/or confirmations from companies. These adjustments are detailed by tax as follows:
Adjustments to Government payments FCFA
Special Income Tax (56 271 622)
Customs Duties (740 452 061)
Total adjustments (796 723 683)
Adjustments by company are as follows:
Companies FCFA
NHC (59 132 089)
Addax Petroleum Cam Company (740 452 061)
Noble Energy Cameroon LTD 2 860 467
Total payments (796 723 683)

Report on the reconciliation of payment flows and volumes relating to the exploration and exploitation of Hydrocarbon and solid Minerals for the fiscal year 2013
Moore Stephens LLP | Page 58
(c) These are payments made by Government Entities but reported outside the reconciliation period, i.e. before 1 January 2013 or after 31 December 2013. These adjustments are detailed below by tax and by company:
Adjustments to Government payments FCFA
Special Income Tax (18 191 654)
National Employment Fund (FNE) contribution (7 308 706)
CFC contribution (10 963 057)
Total (36 463 417)
Adjustments by company are as below:
Company FCFA
NCH (18 271 763)
Rodeo Development LTD (Gaz de Cameroun) (18 191 654)
Total (36 463 417)
(d) These are payments reported twice. Details by company and tax are set out below:
Adjustments to Government payments FCFA
National Employment Fund (FNE) contribution (1 077 370)
CFC Contribution (Employer's contribution) (1 616 056)
Total (2 693 426)
Adjustments by company are as follows:
Companies FCFA
Euroil Ltd (2 693 426)
Total (2 693 426)
(a)
(e) These are payment flows made by extractive companies but not reported by Government Entities. These adjustments are detailed by tax as follows :
Adjustments to Government payments FCFA
Corporate taxes (oil and non-oil) 1 046 754 372
Flat fees (including fees paid for allocation or renewal of oil contracts or exploration permits)
62 500 000
Land tax 24 193 900
Ad valorem tax 216 000
Extraction Tax 34 420 902
Special Income Tax (SIT) 74 475 248
Tax adjustments, fines and penalties 60 000 000
Pipeline Transit fees (COTCO) 3 920 492 755
National Employment Fund (FNE) contribution 26 270 005
CFC Contribution (Employer's contribution) 39 404 982
Tax on Income from Movable Capital (IRCM) 4 347 305
Inspection and control fee 89 335 100
Payment to iron unit of Mbalam 974 897 473
Total 6 357 308 042
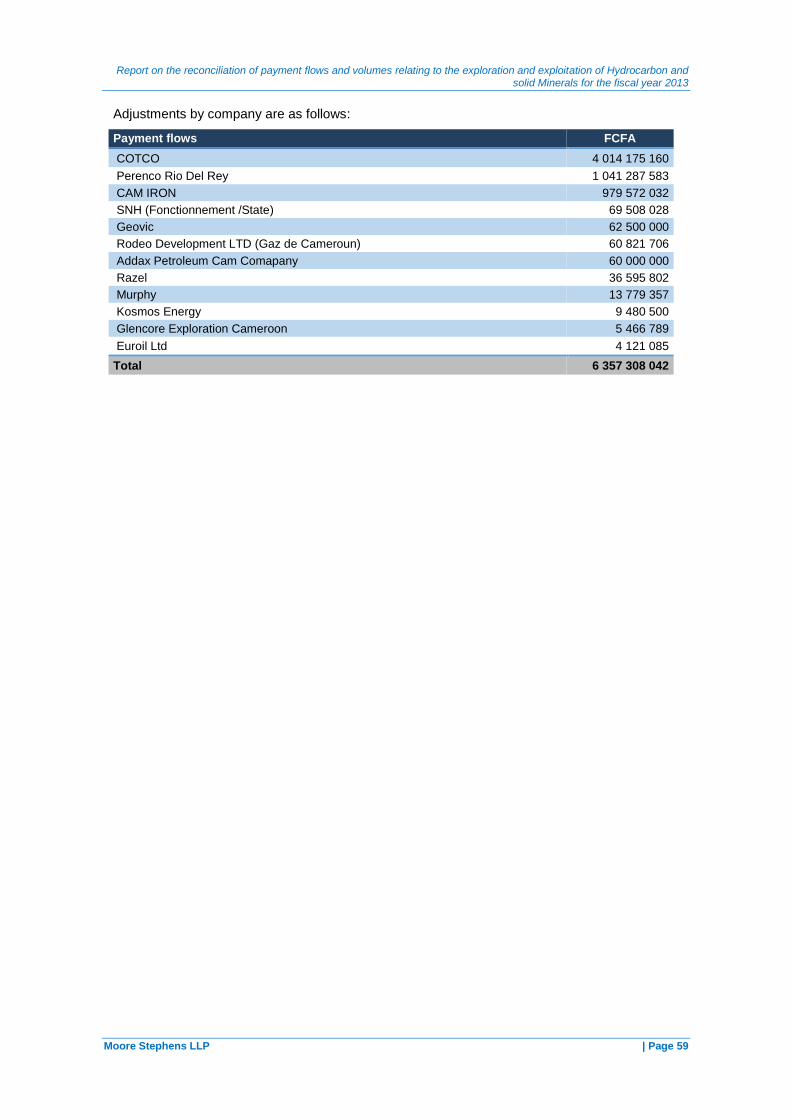
Report on the reconciliation of payment flows and volumes relating to the exploration and exploitation of Hydrocarbon and solid Minerals for the fiscal year 2013
Moore Stephens LLP | Page 59
Adjustments by company are as follows:
Payment flows FCFA
COTCO 4 014 175 160
Perenco Rio Del Rey 1 041 287 583
CAM IRON 979 572 032
SNH (Fonctionnement /State) 69 508 028
Geovic 62 500 000
Rodeo Development LTD (Gaz de Cameroun) 60 821 706
Addax Petroleum Cam Comapany 60 000 000
Razel 36 595 802
Murphy 13 779 357
Kosmos Energy 9 480 500
Glencore Exploration Cameroon 5 466 789
Euroil Ltd 4 121 085
Total 6 357 308 042
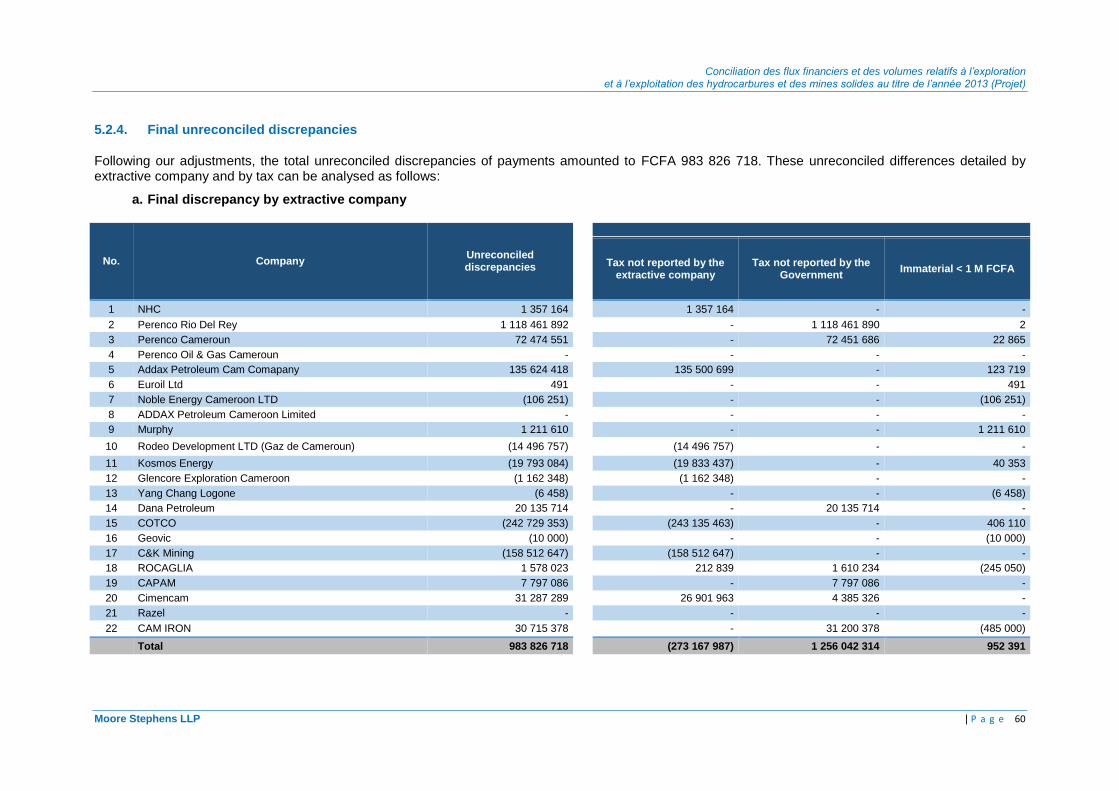
Conciliation des flux financiers et des volumes relatifs à l’exploration et à l’exploitation des hydrocarbures et des mines solides au titre de l’année 2013 (Projet)
Moore Stephens LLP | P a g e 60
5.2.4. Final unreconciled discrepancies
Following our adjustments, the total unreconciled discrepancies of payments amounted to FCFA 983 826 718. These unreconciled differences detailed by extractive company and by tax can be analysed as follows:
a. Final discrepancy by extractive company
No. Company Unreconciled discrepancies
Tax not reported by the
extractive company Tax not reported by the
Government Immaterial < 1 M FCFA
1 NHC 1 357 164
1 357 164 - -
2 Perenco Rio Del Rey 1 118 461 892
- 1 118 461 890 2
3 Perenco Cameroun 72 474 551
- 72 451 686 22 865
4 Perenco Oil & Gas Cameroun -
- - -
5 Addax Petroleum Cam Comapany 135 624 418
135 500 699 - 123 719
6 Euroil Ltd 491
- - 491
7 Noble Energy Cameroon LTD (106 251)
- - (106 251)
8 ADDAX Petroleum Cameroon Limited -
- - -
9 Murphy 1 211 610
- - 1 211 610
10 Rodeo Development LTD (Gaz de Cameroun) (14 496 757)
(14 496 757) - -
11 Kosmos Energy (19 793 084)
(19 833 437) - 40 353
12 Glencore Exploration Cameroon (1 162 348)
(1 162 348) - -
13 Yang Chang Logone (6 458)
- - (6 458)
14 Dana Petroleum 20 135 714
- 20 135 714 -
15 COTCO (242 729 353)
(243 135 463) - 406 110
16 Geovic (10 000)
- - (10 000)
17 C&K Mining (158 512 647)
(158 512 647) - -
18 ROCAGLIA 1 578 023
212 839 1 610 234 (245 050)
19 CAPAM 7 797 086
- 7 797 086 -
20 Cimencam 31 287 289
26 901 963 4 385 326 -
21 Razel -
- - -
22 CAM IRON 30 715 378
- 31 200 378 (485 000)
Total 983 826 718
(273 167 987) 1 256 042 314 952 391
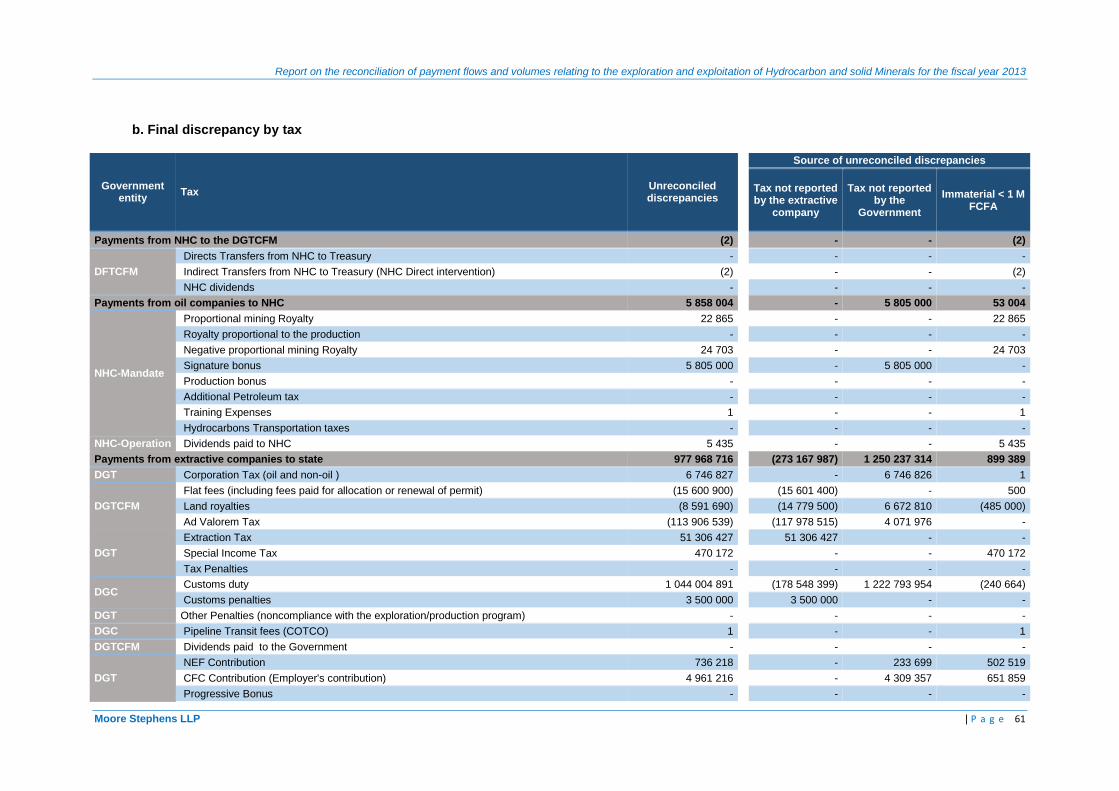
Report on the reconciliation of payment flows and volumes relating to the exploration and exploitation of Hydrocarbon and solid Minerals for the fiscal year 2013
Moore Stephens LLP | P a g e 61
b. Final discrepancy by tax
Government entity
Tax Unreconciled discrepancies
Source of unreconciled discrepancies
Tax not reported by the extractive
company
Tax not reported by the
Government
Immaterial < 1 M FCFA
Payments from NHC to the DGTCFM (2)
- - (2)
DFTCFM
Directs Transfers from NHC to Treasury -
- - -
Indirect Transfers from NHC to Treasury (NHC Direct intervention) (2)
- - (2)
NHC dividends -
- - -
Payments from oil companies to NHC 5 858 004
- 5 805 000 53 004
NHC-Mandate
Proportional mining Royalty 22 865
- - 22 865
Royalty proportional to the production -
- - -
Negative proportional mining Royalty 24 703
- - 24 703
Signature bonus 5 805 000
- 5 805 000 -
Production bonus -
- - -
Additional Petroleum tax -
- - -
Training Expenses 1
- - 1
Hydrocarbons Transportation taxes -
- - -
NHC-Operation Dividends paid to NHC 5 435
- - 5 435
Payments from extractive companies to state 977 968 716
(273 167 987) 1 250 237 314 899 389
DGT Corporation Tax (oil and non-oil ) 6 746 827
- 6 746 826 1
DGTCFM
Flat fees (including fees paid for allocation or renewal of permit) (15 600 900)
(15 601 400) - 500
Land royalties (8 591 690)
(14 779 500) 6 672 810 (485 000)
Ad Valorem Tax (113 906 539)
(117 978 515) 4 071 976 -
DGT
Extraction Tax 51 306 427
51 306 427 - -
Special Income Tax 470 172
- - 470 172
Tax Penalties -
- - -
DGC Customs duty 1 044 004 891
(178 548 399) 1 222 793 954 (240 664)
Customs penalties 3 500 000
3 500 000 - -
DGT Other Penalties (noncompliance with the exploration/production program) -
- - -
DGC Pipeline Transit fees (COTCO) 1
- - 1
DGTCFM Dividends paid to the Government -
- - -
DGT
NEF Contribution 736 218
- 233 699 502 519
CFC Contribution (Employer's contribution) 4 961 216
- 4 309 357 651 859
Progressive Bonus -
- - -

Report on the reconciliation of payment flows and volumes relating to the exploration and exploitation of Hydrocarbon and solid Minerals for the fiscal year 2013
Moore Stephens LLP | P a g e 62
Government entity
Tax Unreconciled discrepancies
Source of unreconciled discrepancies
Tax not reported by the extractive
company
Tax not reported by the
Government
Immaterial < 1 M FCFA
Tax on Income from Movable Capital (IRCM) 1
- - 1
Inspection and control fees (1 066 600)
(1 066 600) - -
Dividends paid to SNI -
- - -
All Other material payments to the Government ( over USD 100,000 / FCFA 55 million) 5 408 692
- 5 408 692 -
Total 983 826 718
(273 167 987) 1 256 042 314 952 391

Conciliation des flux financiers et des volumes relatifs à l’exploration et à l’exploitation des hydrocarbures et des mines solides au titre de l’année 2013 (Projet)
Moore Stephens LLP | Page 63
5.3. Reconciliation of the EITI data with other sources
5.3.1. Reconciliation of the EITI data with the GFOT
According to Government Financial Operations Tables for the years 2012 and 2013, the main revenue sources of Cameroon are as follows:
Indicators 2012 (*) 2013 (**)
(In billion of FCFA) Amount % Amount %
Total revenues and grants 2 425 2 622
Oil revenues 693 29% 700 27%
Non-oil revenues 1 676 69% 1 861 71%
Of which: Direct taxes 471 19% 513.1 20%
Special tax on petroleum products 97 4% 109.6 4%
Other taxes on goods and services 720,2 30% 852.5 33%
Taxes on international trade 294.1 12% 289.7 11%
Non-fiscal revenues 94 4% 96.8 4%
Including: transit fees 7.7 0.3% 8.8 0.3%
Grants 56 2% 46.3 2%
Privatisation revenues 0 0 15.0 0.5%
(*)Source: GFOT 2012 - Version of the 10th of October 2013, DGTCFM.
(**)Source: GFOT 2013 - Version of the 24th of April 2014, DGTCFM.
The table does not show a separate line for mineral revenue which does not allow to appreciate the contribution of this sector. Only oil revenues and transit fees are presented separately with respective contributions of 27% and 0.34% of total State revenue for the year 2013. The reconciliation between this aggregate and revenues collected in this report showed an overall gap of FCFA 77.7 billion which is as follows:
Indicators (In billion FCFA) GFOT 2013 EITI 2013 Difference
Revenues of the oil sector 699.7 769.6 (69.9)
Transfers from NHC to the Treasury 530.0 538.7 (8.7)
Taxes on oil companies 169.7 186.8 (17.1)
Dividends paid by NHC - 40.2 (4.2)
Other payments - 39.9 (39.9)
Revenues of the oil transport sector 8.8 16.1 (7.3)
Transit fees 8.8 8.2 0.6
Other payments - 7.9 (7.9)
Oil revenues included in the GFOT 2013 do not include dividends paid by NHC to the State and other taxes paid by oil companies. These revenues include only transfers of NHC-Mandate from sales of the State oil share and corporate tax for which we found differences in the GFOT 2013 for FCFA 8.7 billion and FCFA 17.1 billion respectively.
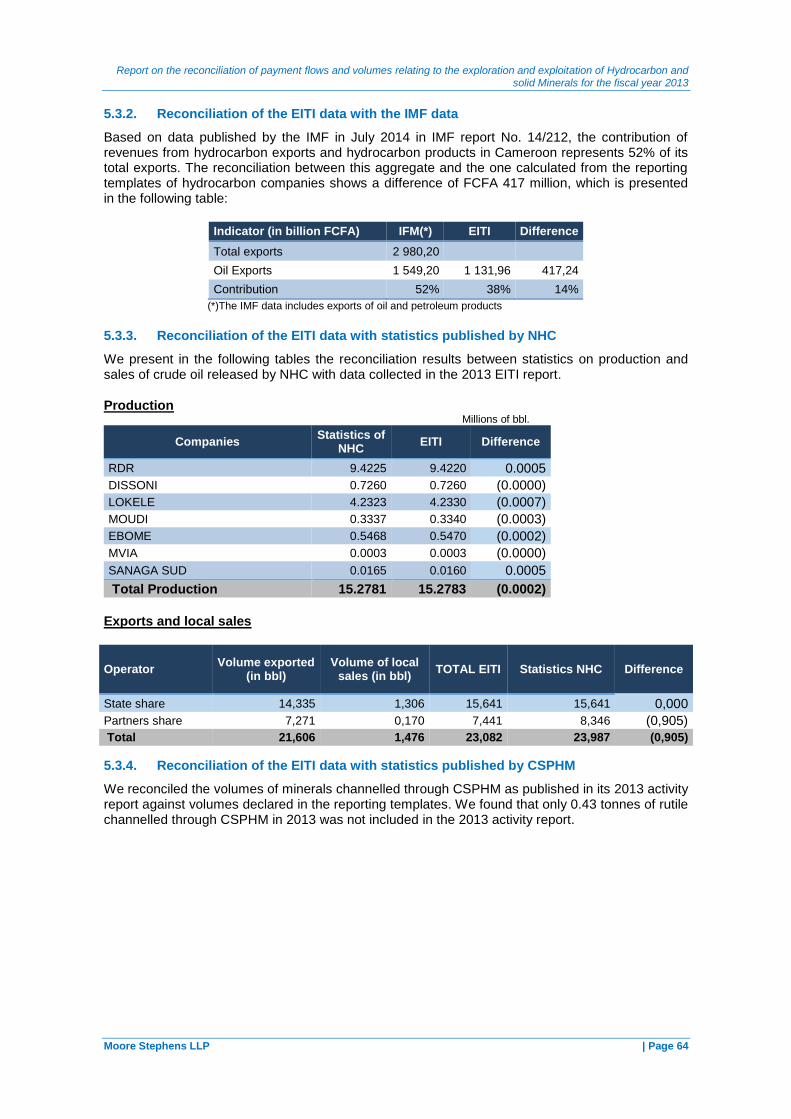
Report on the reconciliation of payment flows and volumes relating to the exploration and exploitation of Hydrocarbon and solid Minerals for the fiscal year 2013
Moore Stephens LLP | Page 64
5.3.2. Reconciliation of the EITI data with the IMF data
Based on data published by the IMF in July 2014 in IMF report No. 14/212, the contribution of revenues from hydrocarbon exports and hydrocarbon products in Cameroon represents 52% of its total exports. The reconciliation between this aggregate and the one calculated from the reporting templates of hydrocarbon companies shows a difference of FCFA 417 million, which is presented in the following table:
Indicator (in billion FCFA) IFM(*) EITI Difference
Total exports 2 980,20
Oil Exports 1 549,20 1 131,96 417,24
Contribution 52% 38% 14%
(*)The IMF data includes exports of oil and petroleum products
5.3.3. Reconciliation of the EITI data with statistics published by NHC
We present in the following tables the reconciliation results between statistics on production and sales of crude oil released by NHC with data collected in the 2013 EITI report.
Production Millions of bbl.
Companies Statistics of
NHC EITI Difference
RDR 9.4225 9.4220 0.0005
DISSONI 0.7260 0.7260 (0.0000)
LOKELE 4.2323 4.2330 (0.0007)
MOUDI 0.3337 0.3340 (0.0003)
EBOME 0.5468 0.5470 (0.0002)
MVIA 0.0003 0.0003 (0.0000)
SANAGA SUD 0.0165 0.0160 0.0005
Total Production 15.2781 15.2783 (0.0002)
Exports and local sales
Operator Volume exported
(in bbl) Volume of local
sales (in bbl) TOTAL EITI Statistics NHC Difference
State share 14,335 1,306 15,641 15,641 0,000
Partners share 7,271 0,170 7,441 8,346 (0,905)
Total 21,606 1,476 23,082 23,987 (0,905)
5.3.4. Reconciliation of the EITI data with statistics published by CSPHM
We reconciled the volumes of minerals channelled through CSPHM as published in its 2013 activity report against volumes declared in the reporting templates. We found that only 0.43 tonnes of rutile channelled through CSPHM in 2013 was not included in the 2013 activity report.

Conciliation des flux financiers et des volumes relatifs à l’exploration et à l’exploitation des hydrocarbures et des mines solides au titre de l’année 2013 (Projet)
Moore Stephens LLP | Page 65
6. ANALYSIS OF MAIN DATA
6.1. State revenues
6.1.1. Hydrocarbons sector contribution
Analysis of in kind revenues by project
No. Operator Association Concession Unit Total oil
production (in bbl.)
Total gas production
(in scf)
Total Production Condensat
State share (in bbl.)
NHC Operation share
(in bbl.)
% State share
% NHC-Operation share
1 NHC Operation MVIA MVIA bbl 12 871 - - 283 12 588 2,2% 97,8%
1 Perenco Rio Del Rey Kole
Champs Accords 1990 bbl. 61 222 - -
10 148 470 - 62,1% 0,0%
Champs DISSONI NORD bbl. 2 460 914 - -
Champs Marginaux bbl. 2 274 013 - -
Champs RDR Classiques bbl. 10 970 641 - -
Champs Unitisés bbl. 569 850 - -
2 Perenco Cameroun
Moudi Moudi bbl. 667 441 - - 333 721 66 744 50,0% 10,0%
Ebome KF, KB; BAF/EBOME bbl. 1 093 644 - - 546 822 235 133 50,0% 21,5%
Sanaga Sanaga scf - 142 802 57 064 - - 0,0% 0,0%
3 Addax PCC Lokele Mokoko Abana bbl. 5 751 742 - - 4 232 319 - 73,6% 0,0%
Kole Mokoko West bbl. 343 499 - - - - 0,0% 0,0%
5 Rodeo Development LTD Logbaba Logbaba
bbl. - - 10 009 - - 0,0% 0,0%
scf - 661 002 259 - - - 0,0% 0,0%
Total 24 205 838 661 145 061 67 073 15 261 615 314 465 63,0% 1,3%

Conciliation des flux financiers et des volumes relatifs à l’exploration et à l’exploitation des hydrocarbures et des mines solides au titre de l’année 2013 (Projet)
Moore Stephens LLP | Page 66
Hydrocarbon shares transferred to the State of Cameroon from the oil and gas fields in production amounted to 15.3 million barrels out of total production of 24.2 million barrels. The 15.3 million barrels were allocated as follows:
10.1 million barrels, equivalent to FCFA 538.7 billion were allocated to the State budget and therefore recorded in the 2013 GFOT;
5.3 million barrels, equivalent to FCFA 280.6 billion, were directly allocated to cover the share of the State Oil costs and were therefore not recorded in the 2013 GFOT;
(0.1) million barrel are the inventory change of oil share, which is difference between the entitlement and effective removal between 1
st January 2013 and 31 December 2013.
6.1.2. Analysis of the revenues by sector and by company
We present in the charts below the distribution of extractive sector revenues in 2013 for the oil and mining sectors as well as the top 5 oil companies and all mining companies. The amounts presented are after adjustments.
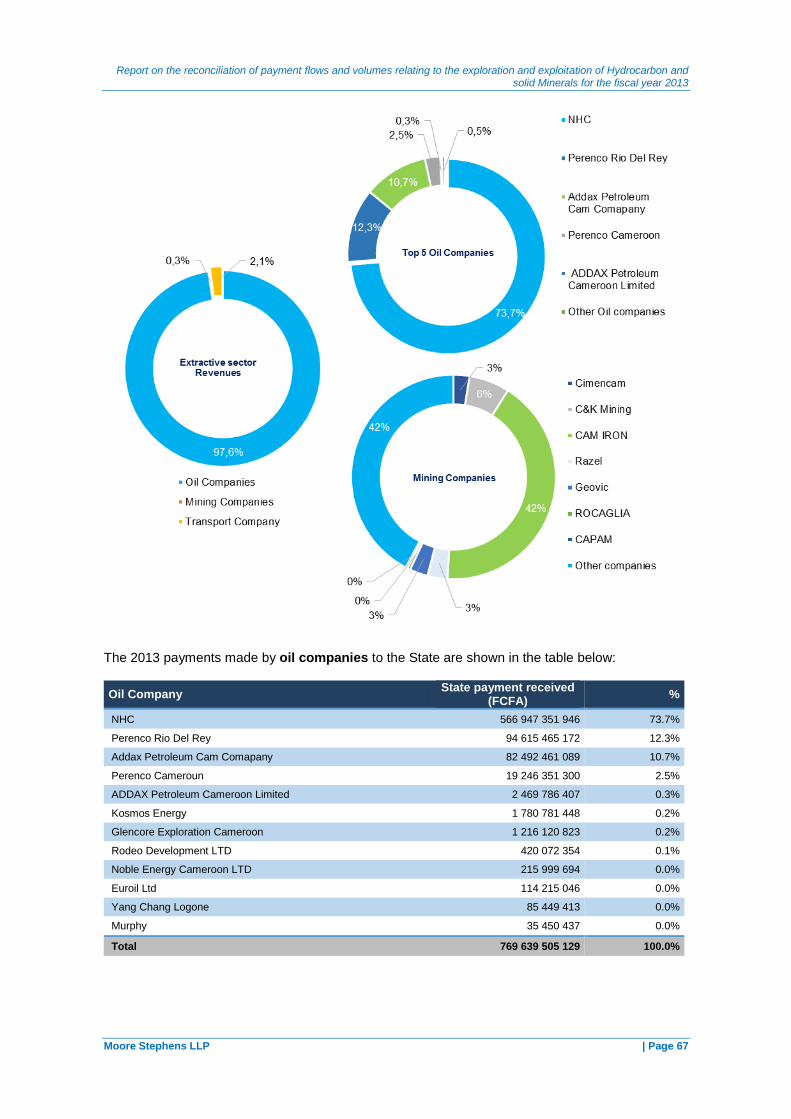
Report on the reconciliation of payment flows and volumes relating to the exploration and exploitation of Hydrocarbon and solid Minerals for the fiscal year 2013
Moore Stephens LLP | Page 67
The 2013 payments made by oil companies to the State are shown in the table below:
Oil Company State payment received
(FCFA) %
NHC 566 947 351 946 73.7%
Perenco Rio Del Rey 94 615 465 172 12.3%
Addax Petroleum Cam Comapany 82 492 461 089 10.7%
Perenco Cameroun 19 246 351 300 2.5%
ADDAX Petroleum Cameroon Limited 2 469 786 407 0.3%
Kosmos Energy 1 780 781 448 0.2%
Glencore Exploration Cameroon 1 216 120 823 0.2%
Rodeo Development LTD 420 072 354 0.1%
Noble Energy Cameroon LTD 215 999 694 0.0%
Euroil Ltd 114 215 046 0.0%
Yang Chang Logone 85 449 413 0.0%
Murphy 35 450 437 0.0%
Total 769 639 505 129 100.0%
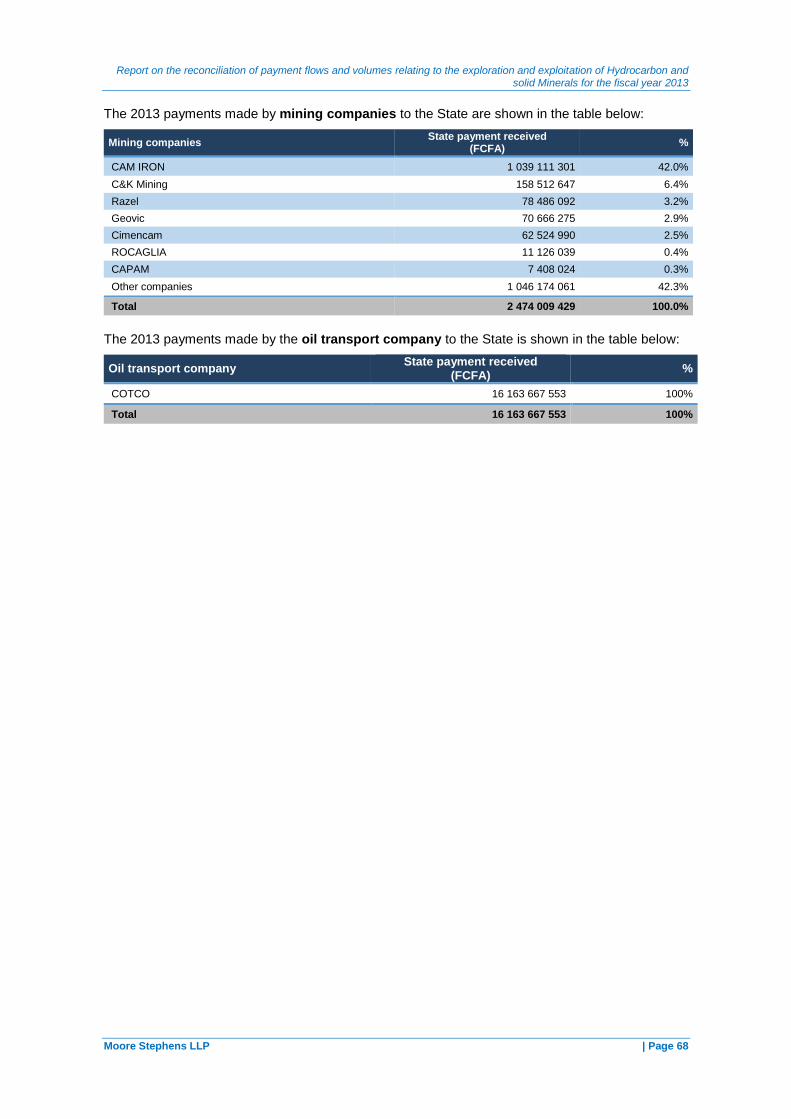
Report on the reconciliation of payment flows and volumes relating to the exploration and exploitation of Hydrocarbon and solid Minerals for the fiscal year 2013
Moore Stephens LLP | Page 68
The 2013 payments made by mining companies to the State are shown in the table below:
Mining companies State payment received
(FCFA) %
CAM IRON 1 039 111 301 42.0%
C&K Mining 158 512 647 6.4%
Razel 78 486 092 3.2%
Geovic 70 666 275 2.9%
Cimencam 62 524 990 2.5%
ROCAGLIA 11 126 039 0.4%
CAPAM 7 408 024 0.3%
Other companies 1 046 174 061 42.3%
Total 2 474 009 429 100.0%
The 2013 payments made by the oil transport company to the State is shown in the table below:
Oil transport company State payment received
(FCFA) %
COTCO 16 163 667 553 100%
Total 16 163 667 553 100%
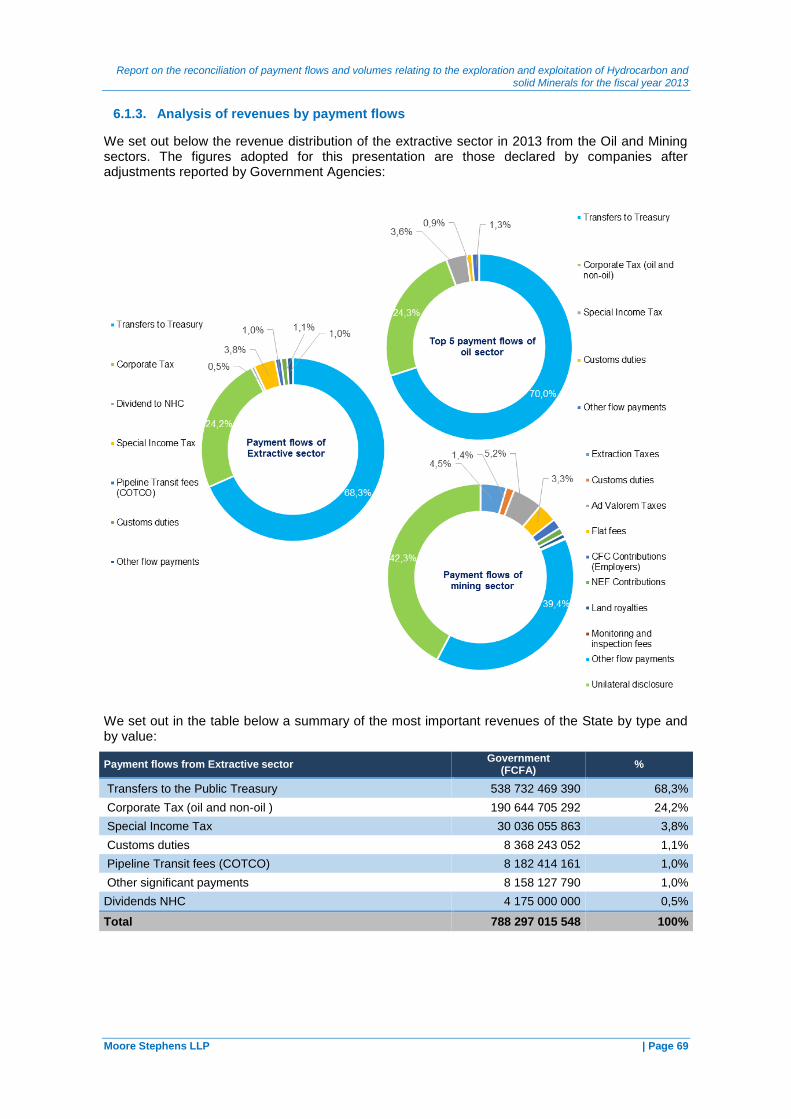
Report on the reconciliation of payment flows and volumes relating to the exploration and exploitation of Hydrocarbon and solid Minerals for the fiscal year 2013
Moore Stephens LLP | Page 69
6.1.3. Analysis of revenues by payment flows
We set out below the revenue distribution of the extractive sector in 2013 from the Oil and Mining sectors. The figures adopted for this presentation are those declared by companies after adjustments reported by Government Agencies:
We set out in the table below a summary of the most important revenues of the State by type and by value:
Payment flows from Extractive sector Government
(FCFA) %
Transfers to the Public Treasury 538 732 469 390 68,3%
Corporate Tax (oil and non-oil ) 190 644 705 292 24,2%
Special Income Tax 30 036 055 863 3,8%
Customs duties 8 368 243 052 1,1%
Pipeline Transit fees (COTCO) 8 182 414 161 1,0%
Other significant payments 8 158 127 790 1,0%
Dividends NHC 4 175 000 000 0,5%
Total 788 297 015 548 100%
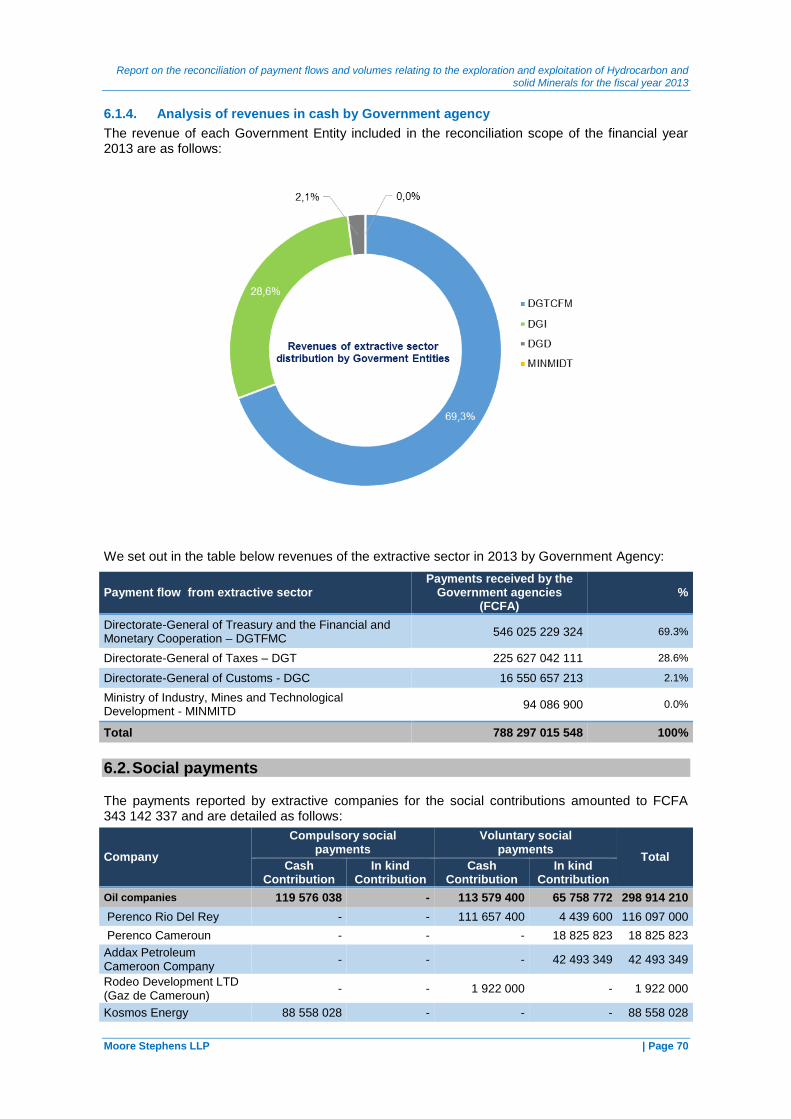
Report on the reconciliation of payment flows and volumes relating to the exploration and exploitation of Hydrocarbon and solid Minerals for the fiscal year 2013
Moore Stephens LLP | Page 70
6.1.4. Analysis of revenues in cash by Government agency
The revenue of each Government Entity included in the reconciliation scope of the financial year 2013 are as follows:
We set out in the table below revenues of the extractive sector in 2013 by Government Agency:
Payment flow from extractive sector Payments received by the
Government agencies (FCFA)
%
Directorate-General of Treasury and the Financial and Monetary Cooperation – DGTFMC
546 025 229 324 69.3%
Directorate-General of Taxes – DGT 225 627 042 111 28.6%
Directorate-General of Customs - DGC 16 550 657 213 2.1%
Ministry of Industry, Mines and Technological Development - MINMITD
94 086 900 0.0%
Total 788 297 015 548 100%
6.2. Social payments
The payments reported by extractive companies for the social contributions amounted to FCFA 343 142 337 and are detailed as follows:
Company
Compulsory social payments
Voluntary social payments
Total Cash
Contribution In kind
Contribution Cash
Contribution In kind
Contribution
Oil companies 119 576 038 - 113 579 400 65 758 772 298 914 210
Perenco Rio Del Rey - - 111 657 400 4 439 600 116 097 000
Perenco Cameroun - - - 18 825 823 18 825 823
Addax Petroleum Cameroon Company
- - - 42 493 349 42 493 349
Rodeo Development LTD (Gaz de Cameroun)
- - 1 922 000 - 1 922 000
Kosmos Energy 88 558 028 - - - 88 558 028
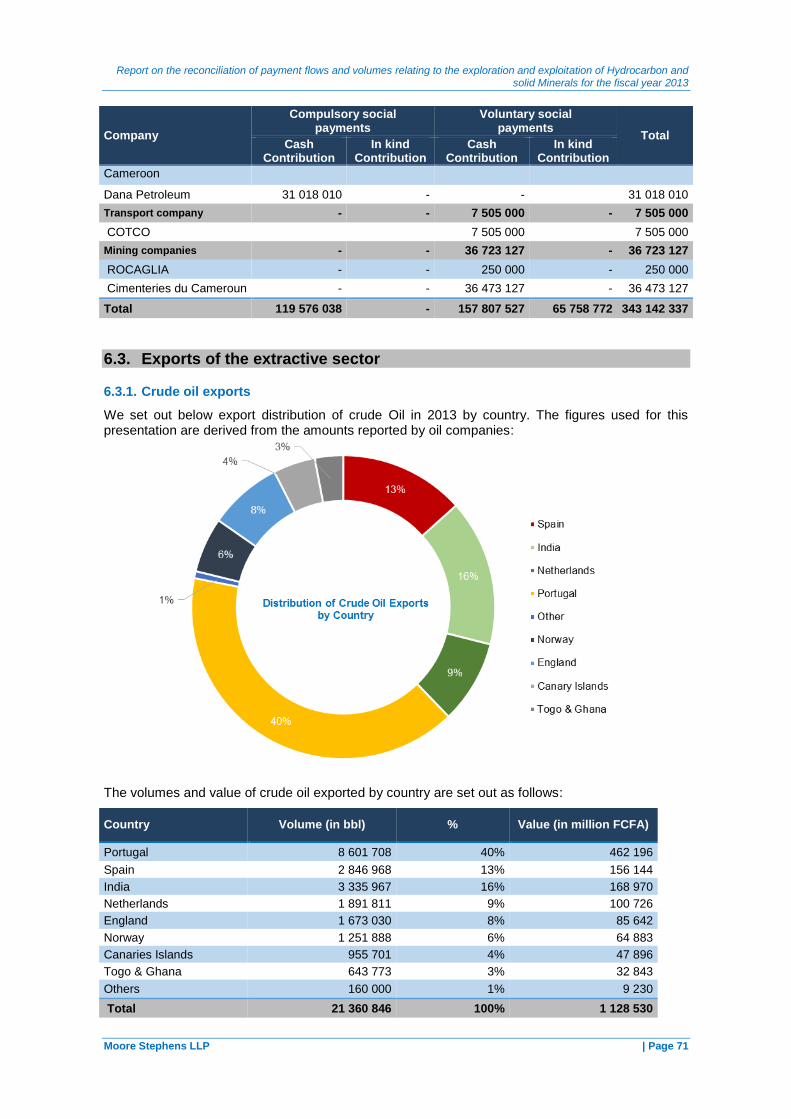
Report on the reconciliation of payment flows and volumes relating to the exploration and exploitation of Hydrocarbon and solid Minerals for the fiscal year 2013
Moore Stephens LLP | Page 71
Company
Compulsory social payments
Voluntary social payments
Total Cash
Contribution In kind
Contribution Cash
Contribution In kind
Contribution
Cameroon
Dana Petroleum 31 018 010 - -
31 018 010
Transport company - - 7 505 000 - 7 505 000
COTCO
7 505 000
7 505 000
Mining companies - - 36 723 127 - 36 723 127
ROCAGLIA - - 250 000 - 250 000
Cimenteries du Cameroun - - 36 473 127 - 36 473 127
Total 119 576 038 - 157 807 527 65 758 772 343 142 337
6.3. Exports of the extractive sector
6.3.1. Crude oil exports
We set out below export distribution of crude Oil in 2013 by country. The figures used for this presentation are derived from the amounts reported by oil companies:
The volumes and value of crude oil exported by country are set out as follows:
Country Volume (in bbl) % Value (in million FCFA)
Portugal 8 601 708 40% 462 196
Spain 2 846 968 13% 156 144
India 3 335 967 16% 168 970
Netherlands 1 891 811 9% 100 726
England 1 673 030 8% 85 642
Norway 1 251 888 6% 64 883
Canaries Islands 955 701 4% 47 896
Togo & Ghana 643 773 3% 32 843
Others 160 000 1% 9 230
Total 21 360 846 100% 1 128 530

Report on the reconciliation of payment flows and volumes relating to the exploration and exploitation of Hydrocarbon and solid Minerals for the fiscal year 2013
Moore Stephens LLP | Page 72
6.3.2. Mining products exports
The quantities and values of exported mining products can be presented in the following table:
Company Quantity Material Unit Value
(in million FCFA) Country of destination
C&K Mining 85 Gold Kg 1 408 South Korea
C&K Mining 2 141 Diamond carats 225 South Korea
Total 1 633
6.4. Sub-national transfer
Sub-national transfers of revenue from the extractive sector, as reported by DGT amount to FCFA 1 662 million and are detailed as follows:
Company FEICOM Community TOTAL
NHC 889 759 440 401 826 844 1 291 586 284
COTCO 218 244 158 133 762 551 352 006 709
Razel - 9 297 572 9 297 572
Cimencam
9 208 341 9 208 341
Total 1 108 003 598 554 095 308 1 662 098 906
In return, the subnational transfers for 2013 as reported by the Treasury amounted to FCFA 61 million and are detailed per beneficiary as follows:
DGTCFM Local Councils Total (FCFA)
East Council 28 146 500
Yaoundé Council 18 308 387
LIMBE Council 11 713 007
DIBAMBA Council 2 303 936
Douala III Council 1 323 141
MOMBO Council 654 688
Douala V Council 549 200
Council 250 000
Community Douala I Council 242 080
EDEA Council 190 395
DIZANGUE Council 181 125
NJOMBE-PENJA Council 96 000
EDEA I Council 76 745
YABASSI Council 4 650
TOTAL 64 039 854
Report on the reconciliation of payment flows and volumes relating to the exploration and exploitation of Hydrocarbon and solid Minerals for the fiscal year 2013
Moore Stephens LLP | Page 73
7 FINDINGS AND RECOMMENDATIONS
7.1 Findings and Recommendations for 2013
7.1.1 Certified Financial Statements
According to the reporting instructions, extractive companies based in Cameroon were required to provide their audited financial statements for 2013.
However, we found that only 6 companies (NHC, APCC, Geovic, CAM IRON, Perenco RDR and Perenco Cameroon) submitted their financial statements. As a result, we were not in a position to assess whether the financial statements of reporting entities were audited as recommended by Requirement 5.3 (e).
To improve the credibility of the data disclosed in the EITI reports, we recommend that measures should be taken to encourage reporting companies to provide their audited financial statements in future.
7.1.2 Creation of a database for the extractive sector
The new EITI standard requires the publication of contextual data on the extractive sector including especially:
data on the legal, fiscal and institutional framework and on the publication of contract policies;
an overview of the extractive sector in terms of regions, projects, reserves and governance;
the sector's contribution to the economy; and
a description of the permits award process, data on beneficial ownership, etc.
During the collection of this information, we encountered numerous difficulties as such data were either not available or not updated or scattered among several government institutions. We also note that this data is not generally made available to the public.
To increase transparency in the extractive sector, it is necessary that all information on the extractive sector is recorded, processed and distributed to the public.
We recommend that the EITI Secretariat considers the possibility of setting up a database on the extractive sector, in a bid to centralise all contextual data relating to the sector. This database should be updated on a regular basis.
7.1.3 Lack of the beneficial ownership register
According to Requirement 3.11 of the EITI standard, it is recommended that a publicly available register of the beneficial owners of corporate entities is put in place. Where this information is already publicly available, e.g. through filing with corporate regulators or stock exchanges, the EITI Report should include guidance on how to access this information. We note, however, the absence of such a register.
We recommend that MSG makes all the necessary arrangements to put in place a public register of beneficial owners of all companies operating in the EITI sector in Cameroon. That register should give details of bids the companies have submitted, whether they operate or invest in extractive assets, complete details of the identity of their ultimate beneficial owners and the level of ownership.
Report on the reconciliation of payment flows and volumes relating to the exploration and exploitation of Hydrocarbon and solid Minerals for the fiscal year 2013
Moore Stephens LLP | Page 74
7.1.4 Differences between the EITI and GFOT data
The reconciliation of EITI data with that of GFOT resulted in discrepancies. Details of these differences were highlighted in Section 5.3 above.
Although the reconciliation of EITI data with public data is not a requirement of the EITI standard, we recommend that MSG encourages the relevant Government Agencies to provide explanations for these variances. The explanations and analysis of these differences will support the procedures implemented to ensure the credibility of EITI data.
7.1.5 Subnational transfers
EITI Requirement 4.2 (e) stipulates that "When transfers between national and sub-national Government Entities are related to revenues generated by extractive industries as mandated by a national constitution, statue or other revenue sharing mechanism, the multi-stakeholder group is required to ensure that material transfers are disclosed in EITI reports. The EITI Report should disclose the revenue sharing formula, if any, as well as any discrepancies between the calculation of the amount transferred in accordance with the relevant revenue sharing formula and the actual amount that was transferred between Central Government and each relevant sub-national entity.
Sub-national transfers provided by DGTCFM amounting to FCFA 64 million did not include all the information required by the reporting instructions. Moreover, the amounts transferred are lower than allocations made by DGI, totalling FCFA 1 662 million.
As a result, we were unable to identify the existence of discrepancies with the transfer procedures as set out by EITI Requirement 4.2 (e).
We recommend that MSG encourages DGTCFM to take all necessary measures for the adoption of clear procedures for the terms and rules used for the transfer of extractive industry revenues to municipalities and sub-national entities
7.1.6 Submission of information on the beneficial ownership
As part of the preparations for the implementation of the provisions of EITI Requirement 3.11 on the beneficial ownership which will be compulsory in 2016, MSG requested from the companies included in the 2013 reconciliation scope disclosure of information on their beneficial owners.
Six (6) oil companies and three (3) mining companies out of the 22 companies included in the 2013 EITI scope did not report exhaustive information on their beneficial ownership.
In order to improve the quality of the information reported by companies in the next EITI reports, we recommend that MSG initiates a study on the regulatory requirements for disclosure of information on beneficial ownership in Cameroon. This study will allow MSG to agree a definition of beneficial ownership and the process for the collection of this information for the purpose of EITI reporting.
7.1.7 Problems with payments to customs
We noted during the reconciliation works that some companies reported the total of payments to customs without submitting a detail by receipt. We understand that the management of payments at customs is performed by companies through freight forwarders and that companies have only the related invoices sent by the freight forwarders.
This situation does not allow us to reconcile payments to the customs and analyse or adjust the differences.
As part of the preparation of future EITI reports, we recommend that extractive companies require from their freight forwarders to join details of paid receipts of each invoice. The details must include the date, number of releases and additional information about the liquidation receipts and the customs office that issued the receipt.
Report on the reconciliation of payment flows and volumes relating to the exploration and exploitation of Hydrocarbon and solid Minerals for the fiscal year 2013
Moore Stephens LLP | Page 75
7.1.8 Traceability of the social payments
According to requirement 4.1 (e) of the EITI standard “Where material social expenditures by companies are mandated by law or the contract with the government that governs the extractive investment, the EITI report must disclose and, where possible, reconcile the transactions.
The same requirement states also that “Where the MSG agrees that discretionary social expenditures and transfers are material, the MSG is encouraged to develop a reporting process with a view to achieving transparency commensurate with the disclosure of other payments and revenue streams to government entities”
The analysis of social payments for 2012 and 2013 shows a significant change especially with regard to compulsory payments. We understand that it is not currently a structure which is responsible for monitoring the legal or contractual businesses in this area. We also understand that there are no mechanisms for accounting and monitoring of social payments.
To ensure the tractability of social payments and their allocation, we recommend:
The implementation of an entity which will be in charge of the monitoring and the follow up of the companies social and environmental engagements
The implementation of mechanisms that can ensure the tractability of social payments with the objective to maximise their impact on local communities and population.
7.1.9 Implementation of the previous EITI recommendations
The follow-up of the recommendations of previous EITI Reports has not been communicated to us.
The 2013 EITI standard stipulates that the multi-stakeholder group is required to take action based on lessons learned [...] and to consider proposals for improvement from the Independent Administrator’s recommendations.
42
To improve the quality of the information reported by companies in the next EITI reports, we recommend that MSG:
prepares a list of recommendations and actions to be implemented;
reviews and updates this list regularly and annexes that list to the annual activity report; and
conducts an assessment of the impact of actions taken to strengthen transparency and good governance in the extractive sector.
42 Requirement 7.1 of the EITI Standard (version 2013)

Conciliation des flux financiers et des volumes relatifs à l’exploration et à l’exploitation des hydrocarbures et des mines solides au titre de l’année 2013
Moore Stephens LLP | Page 76
7.2 Follow-up to the of recommendations of the previous reports
Follow-up to the of recommendations of the EITI report 2012
Recommandation Implementation
(Yes / No / ongoing)
Description of actions taken
Contracts publication
In accordance with EITI Requirement “3.12 contracts”, implementing countries are encouraged to publicly disclose any contracts and licenses that provide the terms attached to the exploitation of hydrocarbon, gas and minerals". We note, however, that the contracts signed between the Government and oil and mining companies are not publicly disclosed mainly because of confidentiality reasons in accordance with Article 105 of the Petroleum Code.
We recommend that the Petroleum Code is revised in order to promote transparency in accordance with EITI Requirement 3.12.
Not provided
NHC data publication
NHC publishes on its website statistics of production, volumes and sales prices, oil costs and transfers to the Treasury.
The statistics published are not yet available in a format allowing comparison between years. Statistics are also not accompanied by a narrative report on the evolution of activities and the management mandate. This situation does not simplify the exploitation and analysis of the data published.
We recommend reviewing the support and the format of the data published by the NHC to allow better use of information on the company mandate.
Not provided
Publication of extractive sector statistics
As part of our reconciliation work, we found that the MINIMIDT website does not provide statistics on the extractive sector in Cameroon. We understand that MINIMIDT does not publish periodic reports containing specific and disaggregated data in the extractive sector.
This does not allow comparison of MINIMIDT data with data collected as part of the
Not provided
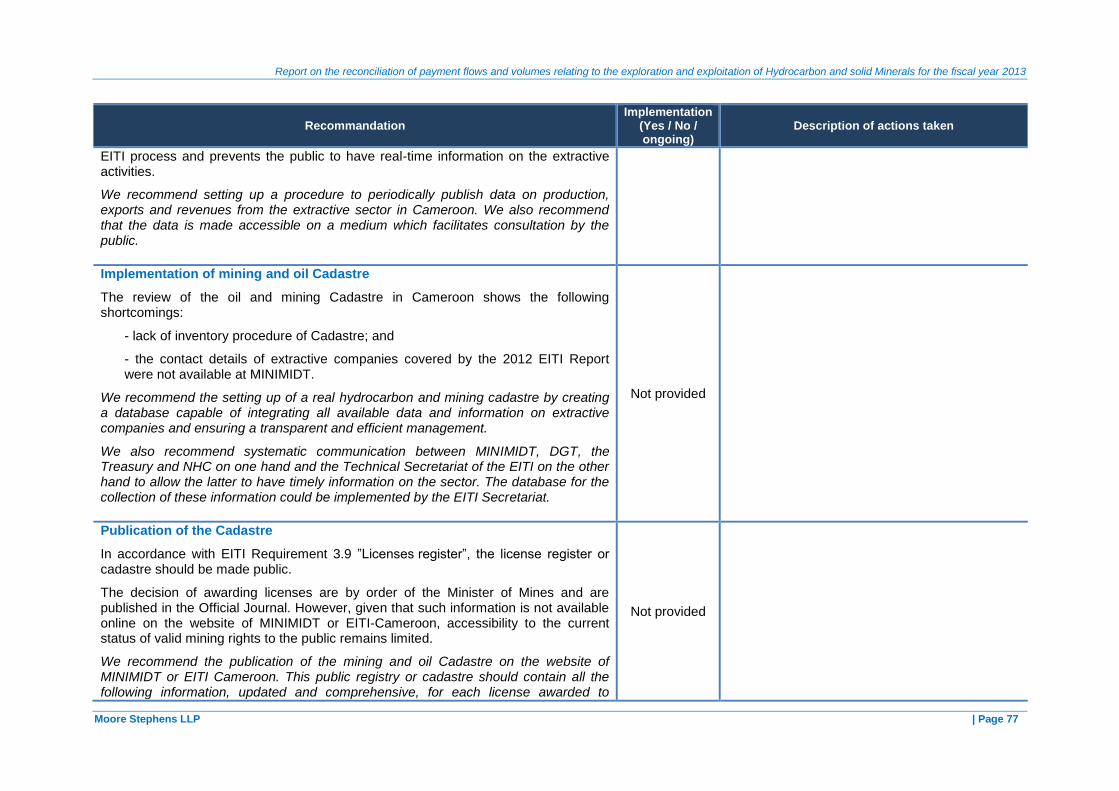
Report on the reconciliation of payment flows and volumes relating to the exploration and exploitation of Hydrocarbon and solid Minerals for the fiscal year 2013
Moore Stephens LLP | Page 77
Recommandation Implementation
(Yes / No / ongoing)
Description of actions taken
EITI process and prevents the public to have real-time information on the extractive activities.
We recommend setting up a procedure to periodically publish data on production, exports and revenues from the extractive sector in Cameroon. We also recommend that the data is made accessible on a medium which facilitates consultation by the public.
Implementation of mining and oil Cadastre
The review of the oil and mining Cadastre in Cameroon shows the following shortcomings:
- lack of inventory procedure of Cadastre; and
- the contact details of extractive companies covered by the 2012 EITI Report were not available at MINIMIDT.
We recommend the setting up of a real hydrocarbon and mining cadastre by creating a database capable of integrating all available data and information on extractive companies and ensuring a transparent and efficient management.
We also recommend systematic communication between MINIMIDT, DGT, the Treasury and NHC on one hand and the Technical Secretariat of the EITI on the other hand to allow the latter to have timely information on the sector. The database for the collection of these information could be implemented by the EITI Secretariat.
Not provided
Publication of the Cadastre
In accordance with EITI Requirement 3.9 ”Licenses register”, the license register or cadastre should be made public.
The decision of awarding licenses are by order of the Minister of Mines and are published in the Official Journal. However, given that such information is not available online on the website of MINIMIDT or EITI-Cameroon, accessibility to the current status of valid mining rights to the public remains limited.
We recommend the publication of the mining and oil Cadastre on the website of MINIMIDT or EITI Cameroon. This public registry or cadastre should contain all the following information, updated and comprehensive, for each license awarded to
Not provided
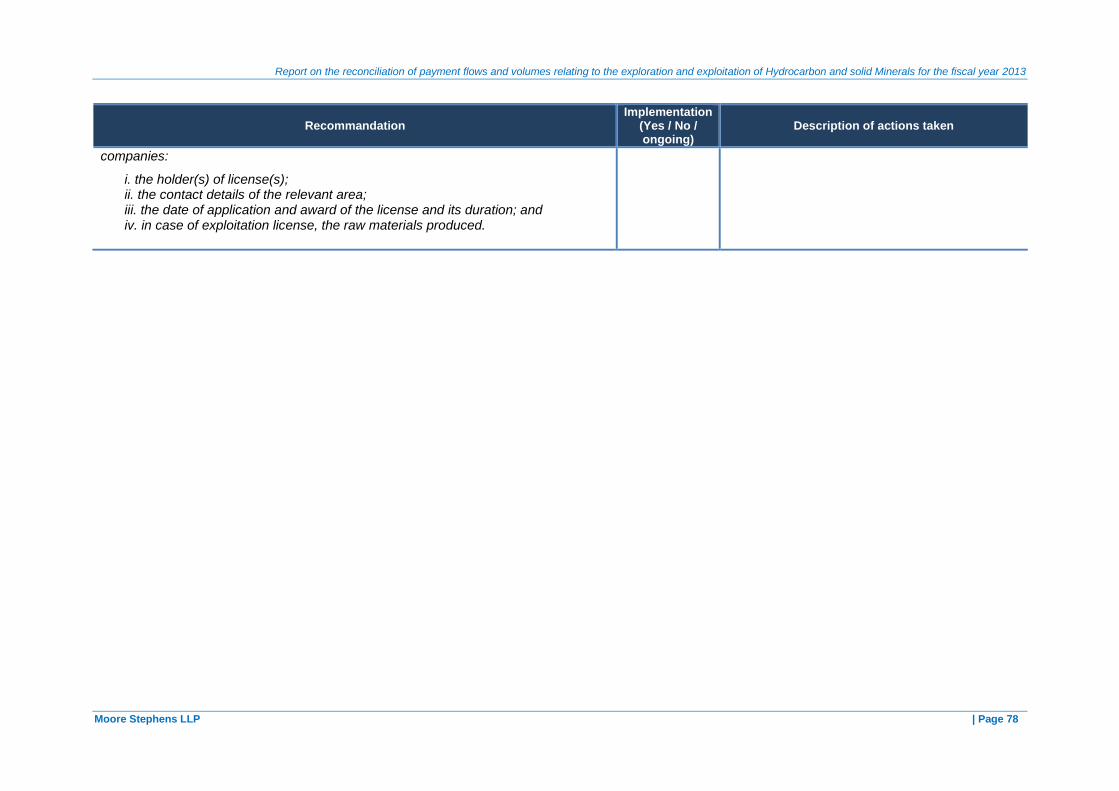
Report on the reconciliation of payment flows and volumes relating to the exploration and exploitation of Hydrocarbon and solid Minerals for the fiscal year 2013
Moore Stephens LLP | Page 78
Recommandation Implementation
(Yes / No / ongoing)
Description of actions taken
companies:
i. the holder(s) of license(s); ii. the contact details of the relevant area; iii. the date of application and award of the license and its duration; and iv. in case of exploitation license, the raw materials produced.

Report on the reconciliation of payment flows and volumes relating to the exploration and exploitation of Hydrocarbon and solid Minerals for the fiscal year 2013
Moore Stephens LLP | Page 79
Follow-up to the of recommendations of the EITI report 2011
Recommandation Implementation
(Yes / No / ongoing)
Description of actions taken
Communication enhancement
We note that the data available on the EITI website including the action plan and Reconciliation Reports are published only in French whilst English is also one of the official languages of the country.
We recommend that the EITI Cameroon website includes a portal in both languages in which all data and documents published are duplicated in English to enable better dissemination to wider audience.
On-going
This recommendation has been partially implemented. Indeed, there are two windows on the EITI website, one in French and one in English, but when you reach the window in English, some information is presented in French (costed work plan, purpose, composition of technical secretariat, data related to oil, mining, gas sectors …).
Strengthening the collection and recovery system of mining taxes
We noted unexplained differences between the amounts of Land Royalties reported by MINMITD, and those reported by certain oil and mining companies included in the reconciliation scope such as Rodeo Development Ltd and Yan Chang companies which did not reported royalties of 2011.
This situation, which may cause a shortfall to the State, is amongst other things, due to the current process of collection and control of mining taxes, which is characterised by:
- the decentralisation of mining taxes recovery to DGT and NHC;
- the decentralisation of revenue tracking to MINMITD and Security Program Revenue of Mines, Water and Energy attached to MINFI;
- lack of effective coordination between DGT and MINMITD in tracking and controlling mining revenues;
- the lack of a comprehensive state of control and reconciliation of the amounts due and the amounts paid by the mining companies; and
- a manual tracking of taxes collected by middlemen, on behalf of MINMITD, which are paid to the Treasury without tax identifier assignment.
We recommend reviewing the collection of the mining taxes process to rectify these deficiencies and allow a tighter control of mining revenues.
On-going
Changes was performed in the Finance Law
2015 which provides for the recovery of taxes
exclusively to DGT.

Report on the reconciliation of payment flows and volumes relating to the exploration and exploitation of Hydrocarbon and solid Minerals for the fiscal year 2013
Moore Stephens LLP | Page 80
Recommandation Implementation
(Yes / No / ongoing)
Description of actions taken
Creation of a website for MINMITD
We note that MINMITD does not have its own website as well as some other ministry. The other Government websites which refer to MINIMITD and its activities are either limited in terms of contents or non-functional.
We recommend that MINMITD considers setting up its own website, which should include information on :
the exploration, investment and production sectors;
the Mining Cadastre including all operating entities, areas, regions, grant date and duration of the permits;
regulations governing mining activities and reforms; and
regulations governing the granting and licensing of researches, operations and contracts in the sector.
On-going
MINIMIDT currently has a website. However improvements are expected to provide the information on exploration, investment and production sectors. The site must also mention the Mining Cadastre including all operating entities, zones and regions of the permits, the date these concessions were awarded as well as the duration of permits.
Enhance PSRMEE’s role The Program Securing Revenue from Mines, Water and Energy (PSRMEE) is attached to the DGT with the aim to monitor the collection of extractive taxes.
When analysing statistics provided by PSRMEE through DGTI and the reconciliation of these figures with the amounts recovered at the Treasury, we found that the actual collection exceeds the amounts shown in the statistics. This is due to the limited mandate of PSRMEE in the recovery process of mining taxes and the lack of resources allocated.
We recommend a review of PSRMEE’s mandate and its capacity building so that it can play a role in the collection of mining taxes, calculation of payments allocated to local governments, the allocation of funds at the local level in collaboration with DGTI. We also recommend that the reports and statistics produced by PSRMEE are made public in a bid to promote transparency in the extractive industries.
On-going
The monitoring of mining operators remains difficult because the information of MINIMIDT to PSRMEE is not always complete. The data obtained by PSRMEE is submitted to DGT and published under publications of recovery tax revenues of the State.
Regulation of sub-national transfers Proportional taxes paid by mining companies are lent to municipalities and local communities in accordance with percentages set by law. The decree of the 2002 Mining Code provides in Article 137 (2) that the Ministry of Finance and the Ministry of
On-going
Changes are expected as part of the Finance Law 2015 which provides for the recovery of taxes exclusively to DGT and promotes the distribution of revenues of the ad valorem tax as
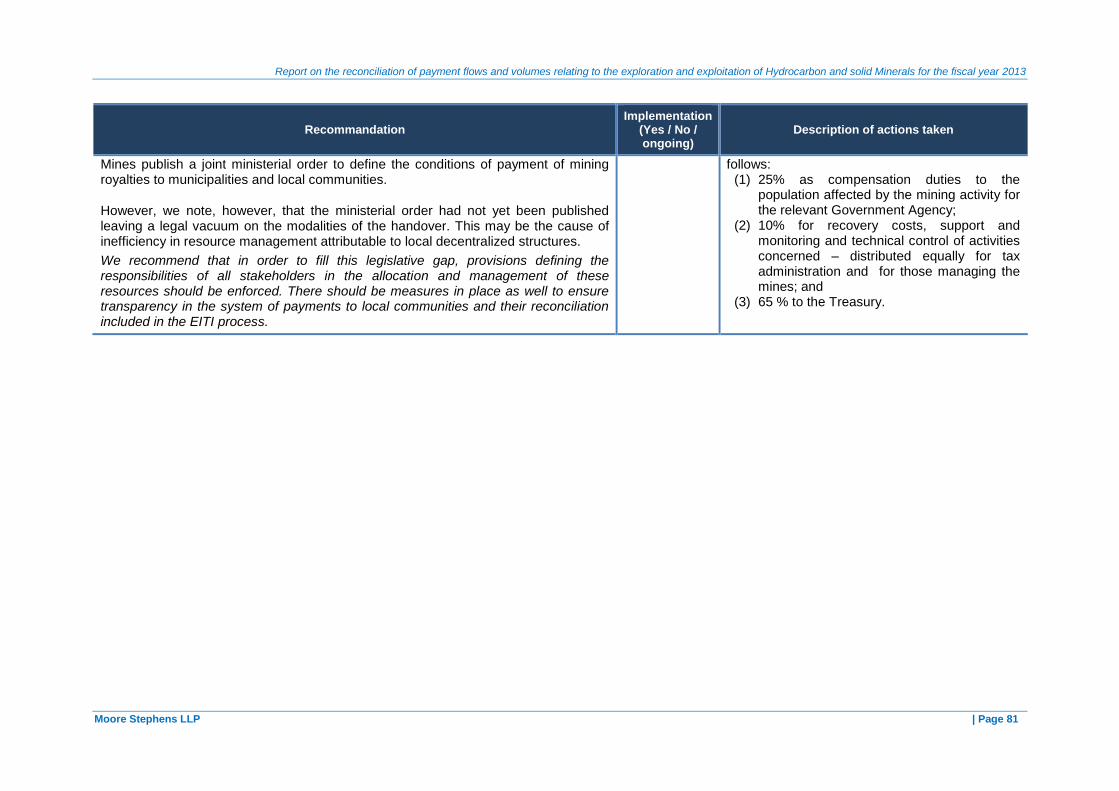
Report on the reconciliation of payment flows and volumes relating to the exploration and exploitation of Hydrocarbon and solid Minerals for the fiscal year 2013
Moore Stephens LLP | Page 81
Recommandation Implementation
(Yes / No / ongoing)
Description of actions taken
Mines publish a joint ministerial order to define the conditions of payment of mining royalties to municipalities and local communities.
However, we note, however, that the ministerial order had not yet been published leaving a legal vacuum on the modalities of the handover. This may be the cause of inefficiency in resource management attributable to local decentralized structures.
We recommend that in order to fill this legislative gap, provisions defining the responsibilities of all stakeholders in the allocation and management of these resources should be enforced. There should be measures in place as well to ensure transparency in the system of payments to local communities and their reconciliation included in the EITI process.
follows: (1) 25% as compensation duties to the
population affected by the mining activity for the relevant Government Agency;
(2) 10% for recovery costs, support and monitoring and technical control of activities concerned – distributed equally for tax administration and for those managing the mines; and
(3) 65 % to the Treasury.

Conciliation des flux financiers et des volumes relatifs à l’exploration et à l’exploitation des hydrocarbures et des mines solides au titre de l’année 2013
Moore Stephens LLP | P a g e 82
ANNEXES
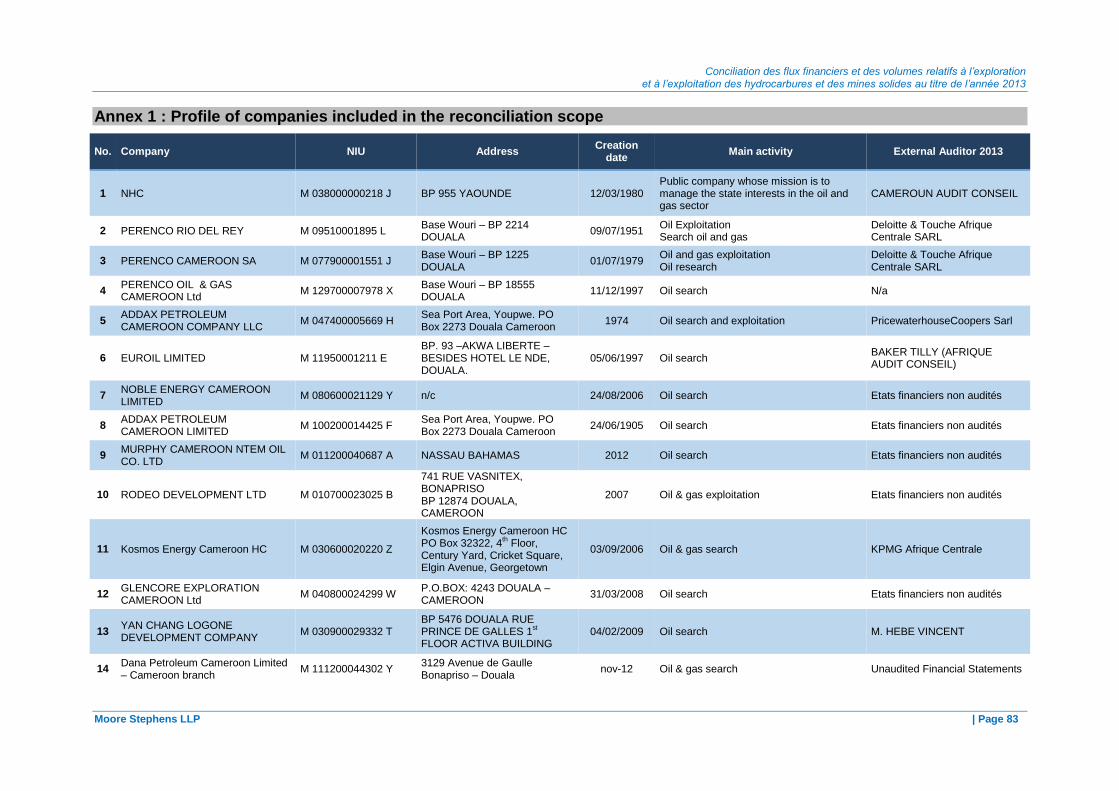
Conciliation des flux financiers et des volumes relatifs à l’exploration et à l’exploitation des hydrocarbures et des mines solides au titre de l’année 2013
Moore Stephens LLP | Page 83
Annex 1 : Profile of companies included in the reconciliation scope
No. Company NIU Address Creation
date Main activity External Auditor 2013
1 NHC M 038000000218 J BP 955 YAOUNDE 12/03/1980 Public company whose mission is to manage the state interests in the oil and gas sector
CAMEROUN AUDIT CONSEIL
2 PERENCO RIO DEL REY M 09510001895 L Base Wouri – BP 2214 DOUALA
09/07/1951 Oil Exploitation Search oil and gas
Deloitte & Touche Afrique Centrale SARL
3 PERENCO CAMEROON SA M 077900001551 J Base Wouri – BP 1225 DOUALA
01/07/1979 Oil and gas exploitation Oil research
Deloitte & Touche Afrique Centrale SARL
4 PERENCO OIL & GAS CAMEROON Ltd
M 129700007978 X Base Wouri – BP 18555 DOUALA
11/12/1997 Oil search N/a
5 ADDAX PETROLEUM CAMEROON COMPANY LLC
M 047400005669 H Sea Port Area, Youpwe. PO Box 2273 Douala Cameroon
1974 Oil search and exploitation PricewaterhouseCoopers Sarl
6 EUROIL LIMITED M 11950001211 E BP. 93 –AKWA LIBERTE –BESIDES HOTEL LE NDE, DOUALA.
05/06/1997 Oil search BAKER TILLY (AFRIQUE AUDIT CONSEIL)
7 NOBLE ENERGY CAMEROON LIMITED
M 080600021129 Y n/c 24/08/2006 Oil search Etats financiers non audités
8 ADDAX PETROLEUM CAMEROON LIMITED
M 100200014425 F Sea Port Area, Youpwe. PO Box 2273 Douala Cameroon
24/06/1905 Oil search Etats financiers non audités
9 MURPHY CAMEROON NTEM OIL CO. LTD
M 011200040687 A NASSAU BAHAMAS 2012 Oil search Etats financiers non audités
10 RODEO DEVELOPMENT LTD M 010700023025 B
741 RUE VASNITEX, BONAPRISO BP 12874 DOUALA, CAMEROON
2007 Oil & gas exploitation Etats financiers non audités
11 Kosmos Energy Cameroon HC M 030600020220 Z
Kosmos Energy Cameroon HC PO Box 32322, 4
th Floor,
Century Yard, Cricket Square, Elgin Avenue, Georgetown
03/09/2006 Oil & gas search KPMG Afrique Centrale
12 GLENCORE EXPLORATION CAMEROON Ltd
M 040800024299 W P.O.BOX: 4243 DOUALA – CAMEROON
31/03/2008 Oil search Etats financiers non audités
13 YAN CHANG LOGONE DEVELOPMENT COMPANY
M 030900029332 T BP 5476 DOUALA RUE PRINCE DE GALLES 1
st
FLOOR ACTIVA BUILDING 04/02/2009 Oil search M. HEBE VINCENT
14 Dana Petroleum Cameroon Limited – Cameroon branch
M 111200044302 Y 3129 Avenue de Gaulle Bonapriso – Douala
nov-12 Oil & gas search Unaudited Financial Statements

Report on the reconciliation of payment flows and volumes relating to the exploration and exploitation of Hydrocarbon and solid Minerals for the fiscal year 2013
Moore Stephens LLP | Page 84
No. Company NIU Address Creation
date Main activity External Auditor 2013
15 CAMEROON OIL TRANSPORTATION COMPANY (COTCO) S.A.
M 089700006137 L 164, Rue Toyota (Rue 1.239), Bonapriso, B.P. 3738 Douala
19/08/1997 Oil Pipeline PricewaterhouseCoopers Sarl
16 GEOVIC CAMEROON PLC M 039500001091 F B.P.11555 YAOUNDE 01/03/1995 mining DELOITTE & TOUCHE AFRIQUE CENTRALE
17 C&K MINING INCORPORATION SA
M 03060002142 S AVENUE ROSA PARK, QUARTIER GOLF, BP 35293 BASTOS YAOUNDE
01/04/2015 mining CAMEROUN AUDIT CONSEIL
18 ROCAGLIA PIERRE P 114400001443 U BP 1 FIGUIL 29/04/1905 mining Etats financiers non audités
19 CAPAM (CADRE D’APPUI ET DE PROMOTION DE L’ARTISANAT MINIER)
M 070300039458 P n/c 25/07/2003 Coordination, organization, facilitation, support, promotion, development and standardization of artisanal mining
Unaudited accounts
20 LES CIMENTERIES DU CAMEROUN
M 066300000649 C BP 1323 Douala juin-63 Quarrying DELOITTE & TOUCHE AFRIQUE CENTRALE
21 RAZEL FAYAT CAMEROUN M 077800000953 N BP 11306 YAOUNDE 01/07/1998 mining AXYS
22 CAM IRON SA M O40500021217 C POBox 33059 YAOUNDE 27/04/2005 mining DELOITTE & TOUCHE AFRIQUE CENTRALE
n/c : Not provided n/a : Not applicable
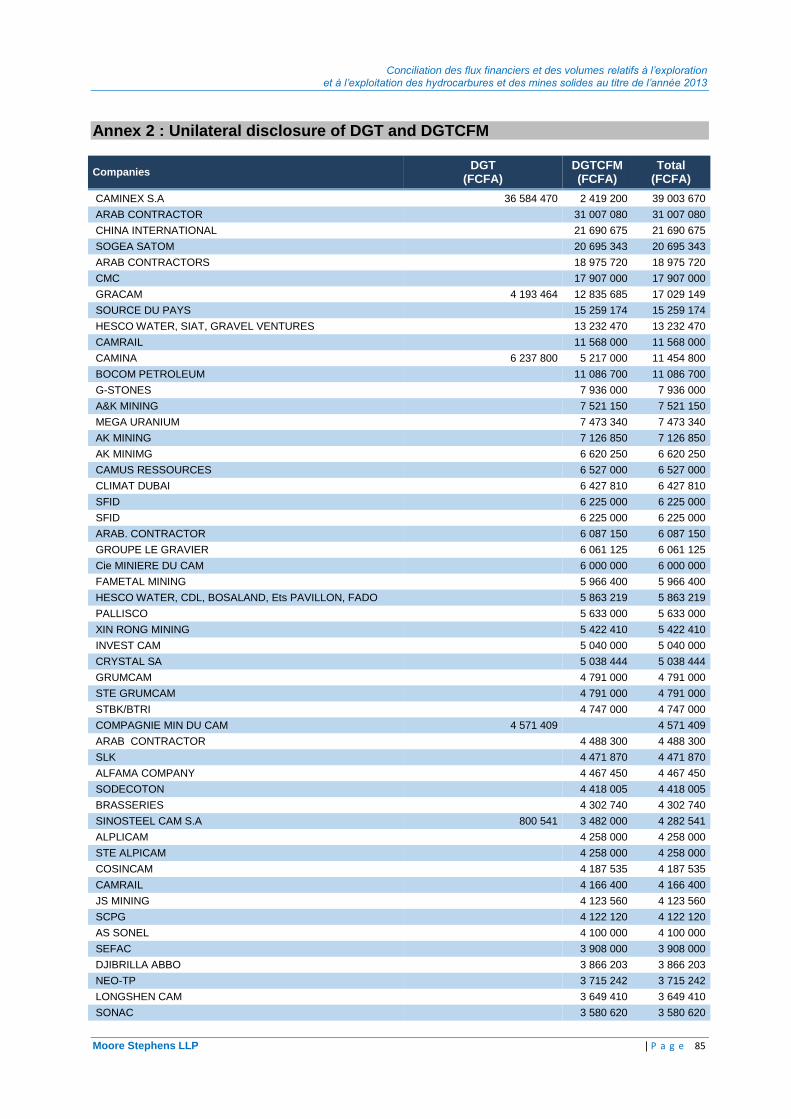
Conciliation des flux financiers et des volumes relatifs à l’exploration et à l’exploitation des hydrocarbures et des mines solides au titre de l’année 2013
Moore Stephens LLP | P a g e 85
Annex 2 : Unilateral disclosure of DGT and DGTCFM
Companies DGT
(FCFA) DGTCFM (FCFA)
Total (FCFA)
CAMINEX S.A 36 584 470 2 419 200 39 003 670
ARAB CONTRACTOR 31 007 080 31 007 080
CHINA INTERNATIONAL
21 690 675 21 690 675
SOGEA SATOM 20 695 343 20 695 343
ARAB CONTRACTORS
18 975 720 18 975 720
CMC 17 907 000 17 907 000
GRACAM 4 193 464 12 835 685 17 029 149
SOURCE DU PAYS 15 259 174 15 259 174
HESCO WATER, SIAT, GRAVEL VENTURES 13 232 470 13 232 470
CAMRAIL 11 568 000 11 568 000
CAMINA 6 237 800 5 217 000 11 454 800
BOCOM PETROLEUM 11 086 700 11 086 700
G-STONES
7 936 000 7 936 000
A&K MINING 7 521 150 7 521 150
MEGA URANIUM
7 473 340 7 473 340
AK MINING 7 126 850 7 126 850
AK MINIMG
6 620 250 6 620 250
CAMUS RESSOURCES 6 527 000 6 527 000
CLIMAT DUBAI
6 427 810 6 427 810
SFID 6 225 000 6 225 000
SFID
6 225 000 6 225 000
ARAB. CONTRACTOR 6 087 150 6 087 150
GROUPE LE GRAVIER
6 061 125 6 061 125
Cie MINIERE DU CAM 6 000 000 6 000 000
FAMETAL MINING
5 966 400 5 966 400
HESCO WATER, CDL, BOSALAND, Ets PAVILLON, FADO 5 863 219 5 863 219
PALLISCO
5 633 000 5 633 000
XIN RONG MINING 5 422 410 5 422 410
INVEST CAM
5 040 000 5 040 000
CRYSTAL SA 5 038 444 5 038 444
GRUMCAM
4 791 000 4 791 000
STE GRUMCAM 4 791 000 4 791 000
STBK/BTRI
4 747 000 4 747 000
COMPAGNIE MIN DU CAM 4 571 409 4 571 409
ARAB CONTRACTOR
4 488 300 4 488 300
SLK 4 471 870 4 471 870
ALFAMA COMPANY
4 467 450 4 467 450
SODECOTON 4 418 005 4 418 005
BRASSERIES
4 302 740 4 302 740
SINOSTEEL CAM S.A 800 541 3 482 000 4 282 541
ALPLICAM
4 258 000 4 258 000
STE ALPICAM 4 258 000 4 258 000
COSINCAM
4 187 535 4 187 535
CAMRAIL 4 166 400 4 166 400
JS MINING
4 123 560 4 123 560
SCPG 4 122 120 4 122 120
AS SONEL
4 100 000 4 100 000
SEFAC 3 908 000 3 908 000
DJIBRILLA ABBO
3 866 203 3 866 203
NEO-TP 3 715 242 3 715 242
LONGSHEN CAM
3 649 410 3 649 410
SONAC 3 580 620 3 580 620
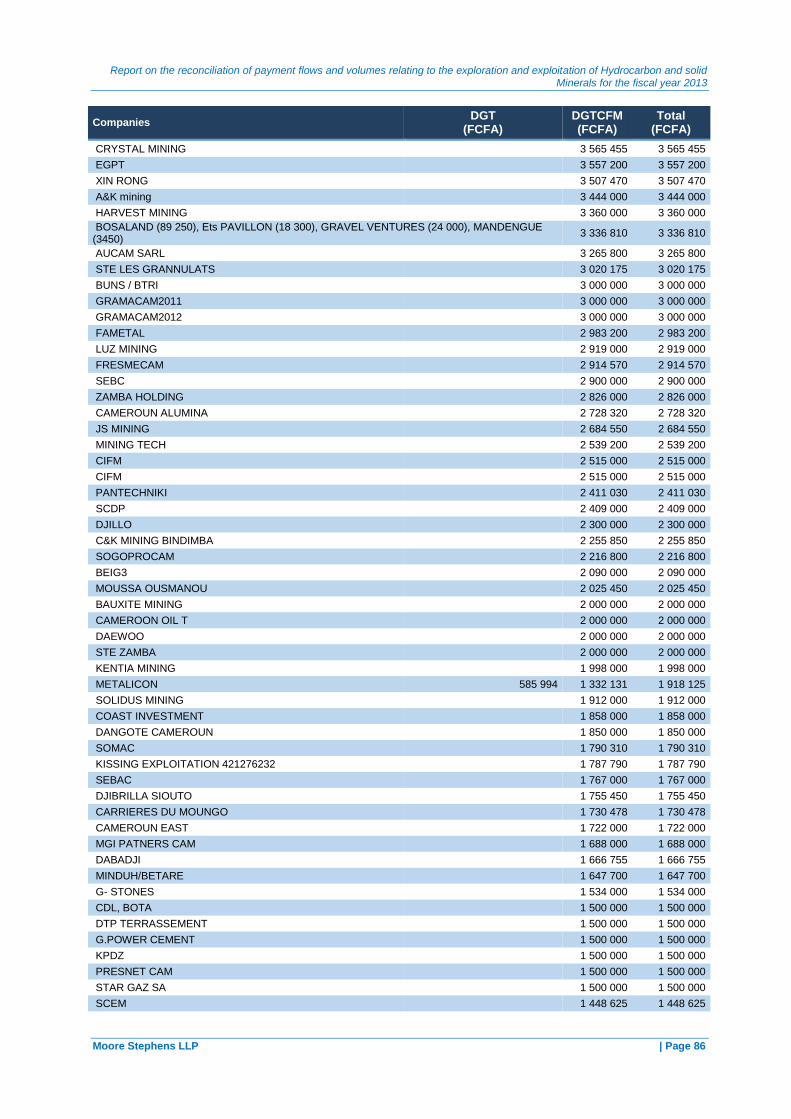
Report on the reconciliation of payment flows and volumes relating to the exploration and exploitation of Hydrocarbon and solid Minerals for the fiscal year 2013
Moore Stephens LLP | Page 86
Companies DGT
(FCFA) DGTCFM (FCFA)
Total (FCFA)
CRYSTAL MINING
3 565 455 3 565 455
EGPT 3 557 200 3 557 200
XIN RONG
3 507 470 3 507 470
A&K mining 3 444 000 3 444 000
HARVEST MINING
3 360 000 3 360 000
BOSALAND (89 250), Ets PAVILLON (18 300), GRAVEL VENTURES (24 000), MANDENGUE (3450)
3 336 810 3 336 810
AUCAM SARL
3 265 800 3 265 800
STE LES GRANNULATS 3 020 175 3 020 175
BUNS / BTRI
3 000 000 3 000 000
GRAMACAM2011 3 000 000 3 000 000
GRAMACAM2012
3 000 000 3 000 000
FAMETAL 2 983 200 2 983 200
LUZ MINING
2 919 000 2 919 000
FRESMECAM 2 914 570 2 914 570
SEBC
2 900 000 2 900 000
ZAMBA HOLDING 2 826 000 2 826 000
CAMEROUN ALUMINA
2 728 320 2 728 320
JS MINING 2 684 550 2 684 550
MINING TECH
2 539 200 2 539 200
CIFM 2 515 000 2 515 000
CIFM
2 515 000 2 515 000
PANTECHNIKI 2 411 030 2 411 030
SCDP
2 409 000 2 409 000
DJILLO 2 300 000 2 300 000
C&K MINING BINDIMBA
2 255 850 2 255 850
SOGOPROCAM 2 216 800 2 216 800
BEIG3
2 090 000 2 090 000
MOUSSA OUSMANOU 2 025 450 2 025 450
BAUXITE MINING
2 000 000 2 000 000
CAMEROON OIL T 2 000 000 2 000 000
DAEWOO
2 000 000 2 000 000
STE ZAMBA 2 000 000 2 000 000
KENTIA MINING
1 998 000 1 998 000
METALICON 585 994 1 332 131 1 918 125
SOLIDUS MINING
1 912 000 1 912 000
COAST INVESTMENT 1 858 000 1 858 000
DANGOTE CAMEROUN
1 850 000 1 850 000
SOMAC 1 790 310 1 790 310
KISSING EXPLOITATION 421276232 1 787 790 1 787 790
SEBAC 1 767 000 1 767 000
DJIBRILLA SIOUTO
1 755 450 1 755 450
CARRIERES DU MOUNGO 1 730 478 1 730 478
CAMEROUN EAST
1 722 000 1 722 000
MGI PATNERS CAM 1 688 000 1 688 000
DABADJI
1 666 755 1 666 755
MINDUH/BETARE 1 647 700 1 647 700
G- STONES
1 534 000 1 534 000
CDL, BOTA 1 500 000 1 500 000
DTP TERRASSEMENT
1 500 000 1 500 000
G.POWER CEMENT 1 500 000 1 500 000
KPDZ
1 500 000 1 500 000
PRESNET CAM 1 500 000 1 500 000
STAR GAZ SA
1 500 000 1 500 000
SCEM 1 448 625 1 448 625
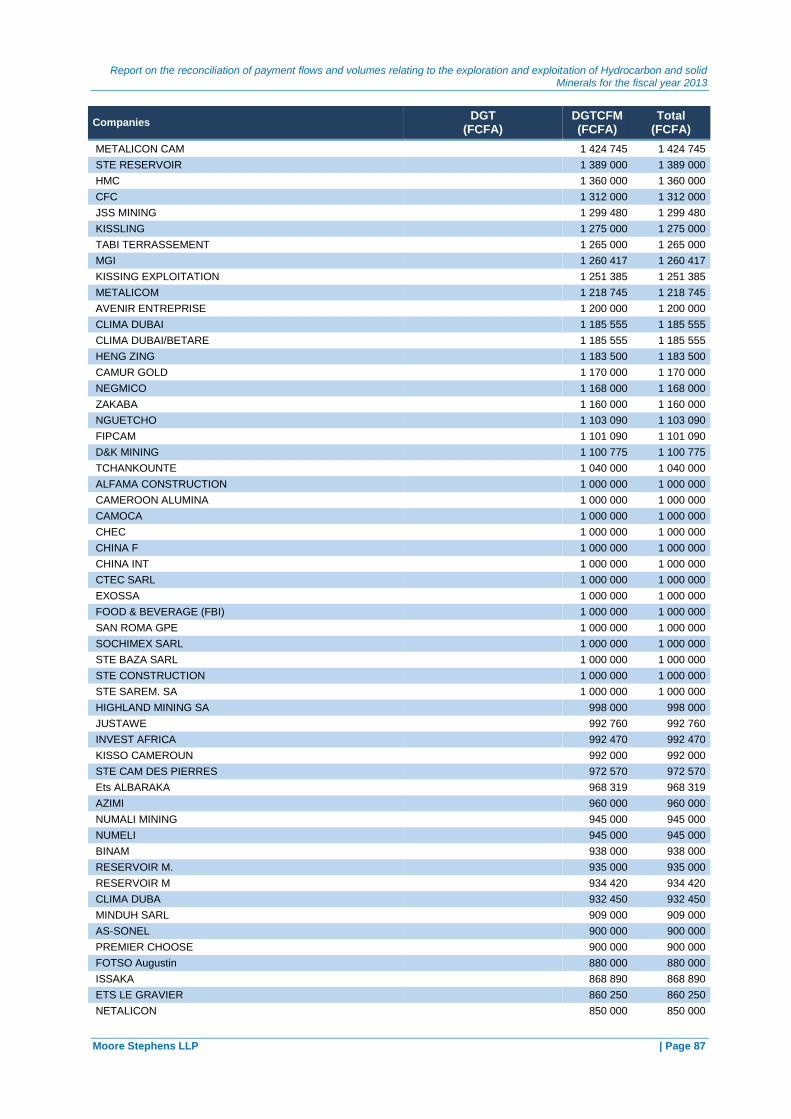
Report on the reconciliation of payment flows and volumes relating to the exploration and exploitation of Hydrocarbon and solid Minerals for the fiscal year 2013
Moore Stephens LLP | Page 87
Companies DGT
(FCFA) DGTCFM (FCFA)
Total (FCFA)
METALICON CAM
1 424 745 1 424 745
STE RESERVOIR 1 389 000 1 389 000
HMC
1 360 000 1 360 000
CFC 1 312 000 1 312 000
JSS MINING
1 299 480 1 299 480
KISSLING 1 275 000 1 275 000
TABI TERRASSEMENT
1 265 000 1 265 000
MGI 1 260 417 1 260 417
KISSING EXPLOITATION
1 251 385 1 251 385
METALICOM 1 218 745 1 218 745
AVENIR ENTREPRISE
1 200 000 1 200 000
CLIMA DUBAI 1 185 555 1 185 555
CLIMA DUBAI/BETARE
1 185 555 1 185 555
HENG ZING 1 183 500 1 183 500
CAMUR GOLD
1 170 000 1 170 000
NEGMICO 1 168 000 1 168 000
ZAKABA
1 160 000 1 160 000
NGUETCHO 1 103 090 1 103 090
FIPCAM
1 101 090 1 101 090
D&K MINING 1 100 775 1 100 775
TCHANKOUNTE
1 040 000 1 040 000
ALFAMA CONSTRUCTION 1 000 000 1 000 000
CAMEROON ALUMINA
1 000 000 1 000 000
CAMOCA 1 000 000 1 000 000
CHEC
1 000 000 1 000 000
CHINA F 1 000 000 1 000 000
CHINA INT
1 000 000 1 000 000
CTEC SARL 1 000 000 1 000 000
EXOSSA
1 000 000 1 000 000
FOOD & BEVERAGE (FBI) 1 000 000 1 000 000
SAN ROMA GPE
1 000 000 1 000 000
SOCHIMEX SARL 1 000 000 1 000 000
STE BAZA SARL
1 000 000 1 000 000
STE CONSTRUCTION 1 000 000 1 000 000
STE SAREM. SA
1 000 000 1 000 000
HIGHLAND MINING SA 998 000 998 000
JUSTAWE
992 760 992 760
INVEST AFRICA 992 470 992 470
KISSO CAMEROUN
992 000 992 000
STE CAM DES PIERRES 972 570 972 570
Ets ALBARAKA
968 319 968 319
AZIMI 960 000 960 000
NUMALI MINING
945 000 945 000
NUMELI 945 000 945 000
BINAM
938 000 938 000
RESERVOIR M. 935 000 935 000
RESERVOIR M
934 420 934 420
CLIMA DUBA 932 450 932 450
MINDUH SARL
909 000 909 000
AS-SONEL 900 000 900 000
PREMIER CHOOSE
900 000 900 000
FOTSO Augustin 880 000 880 000
ISSAKA
868 890 868 890
ETS LE GRAVIER 860 250 860 250
NETALICON
850 000 850 000

Report on the reconciliation of payment flows and volumes relating to the exploration and exploitation of Hydrocarbon and solid Minerals for the fiscal year 2013
Moore Stephens LLP | Page 88
Companies DGT
(FCFA) DGTCFM (FCFA)
Total (FCFA)
PAGA AIME 845 000 845 000
JIN LONG
843 520 843 520
NGUE 840 000 840 000
YOSEF
830 126 830 126
UTA 822 100 822 100
DJIBRILLA SIOUTO
788 850 788 850
SOFAMAC 770 820 770 820
SAFACAM
761 580 761 580
LANQUIN FAMILLE 761 050 761 050
ABOUBAKAR
760 000 760 000
GARAGE IBRAHIM BILEF 747 500 747 500
TCHASSEM Gilbert
745 500 745 500
LONG SHENG 738 600 738 600
SAEE
724 500 724 500
ABDOU 720 000 720 000
OUMAROU
720 000 720 000
OUSMANOU 720 000 720 000
OPTIMUM
698 270 698 270
BEIG 3 695 300 695 300
FIRCAM
690 000 690 000
FOKOU 688 000 688 000
BABOU JEAN PAUL
645 000 645 000
BELLO 645 000 645 000
AMADOU SADOU
640 000 640 000
AMINATOU 640 000 640 000
BABA MARCELLE
640 000 640 000
BOBO ABDOULAI 640 000 640 000
BOUBA ADAMOU
640 000 640 000
DJARO 640 000 640 000
DJOUMESSI
640 000 640 000
DOKO HENRI 640 000 640 000
HAOUA
640 000 640 000
HATOU 640 000 640 000
MBOULAI
640 000 640 000
MOHAMADOU HADI 640 000 640 000
MPAY LIONEL
640 000 640 000
MPAY PHILIPPE 640 000 640 000
NGO LIBOT
640 000 640 000
NGORAN 640 000 640 000
SAMBA
640 000 640 000
SANGA 640 000 640 000
SECK GEM
640 000 640 000
SODEA 640 000 640 000
YARO
640 000 640 000
MINDUH 628 900 628 900
NDIC
624 630 624 630
BILOUNGA 600 000 600 000
LEUCHA
600 000 600 000
STATION TOTAL 600 000 600 000
AFRICAN AURA
592 900 592 900
STE NEGMO 582 000 582 000
HUMPREY
580 000 580 000
SOURCE VOLCANIQUE 575 600 575 600
BETORO MINING
563 850 563 850
TOK 561 000 561 000

Report on the reconciliation of payment flows and volumes relating to the exploration and exploitation of Hydrocarbon and solid Minerals for the fiscal year 2013
Moore Stephens LLP | Page 89
Companies DGT
(FCFA) DGTCFM (FCFA)
Total (FCFA)
DOKO ANDRE
560 000 560 000
ELVIS TARZENYUY 560 000 560 000
NGOUBOU
560 000 560 000
GEOCAM 552 000 552 000
MOUHAMADOU DJAFAR
546 250 546 250
ZONDHA MINE 531 300 531 300
ABDOULAZIZ
520 000 520 000
AMINA 520 000 520 000
AOUDOU
520 000 520 000
ATTA 520 000 520 000
AZIA DOKO
520 000 520 000
BEGUIMA 520 000 520 000
BEKOMBO
520 000 520 000
BINGUE 520 000 520 000
BOUBAKARI
520 000 520 000
DJEGUE ALINE 520 000 520 000
EKAME
520 000 520 000
GADO 520 000 520 000
HAMADOU BABA
520 000 520 000
ISSA BABA 520 000 520 000
KAMZO
520 000 520 000
KEMZONG MOKENG 520 000 520 000
KONGONO OLIVE
520 000 520 000
KPANOU 520 000 520 000
MADA
520 000 520 000
MAIDUNA IBRAHIM 520 000 520 000
MASSIKE
520 000 520 000
MEKE BOSSIS 520 000 520 000
MOAZOUNG
520 000 520 000
MPOAL 520 000 520 000
NDANGA WAI
520 000 520 000
NDINGA 520 000 520 000
NDONGO
520 000 520 000
NGALAME CYRUS 520 000 520 000
NKOA
520 000 520 000
OLOUME 520 000 520 000
OUSMANOU ADAMOU
520 000 520 000
SAIDOU 520 000 520 000
SAMBO
520 000 520 000
TENDOU 520 000 520 000
YANGNE
520 000 520 000
YATIA 520 000 520 000
YAYA
520 000 520 000
ZANGUE 520 000 520 000
SOCADIOR
519 702 519 702
JSS MINING 512 725 512 725
D&K MINING
504 975 504 975
BOCOM/BETARE 504 755 504 755
RIGWAY ENERGY
504 000 504 000
HORSE SHOE 502 740 502 740
BOEM INDUSTRY
500 000 500 000
BOJERO 500 000 500 000
CAM TRAV
500 000 500 000
CAMEROON CHINA 500 000 500 000
CAMEROON D
500 000 500 000
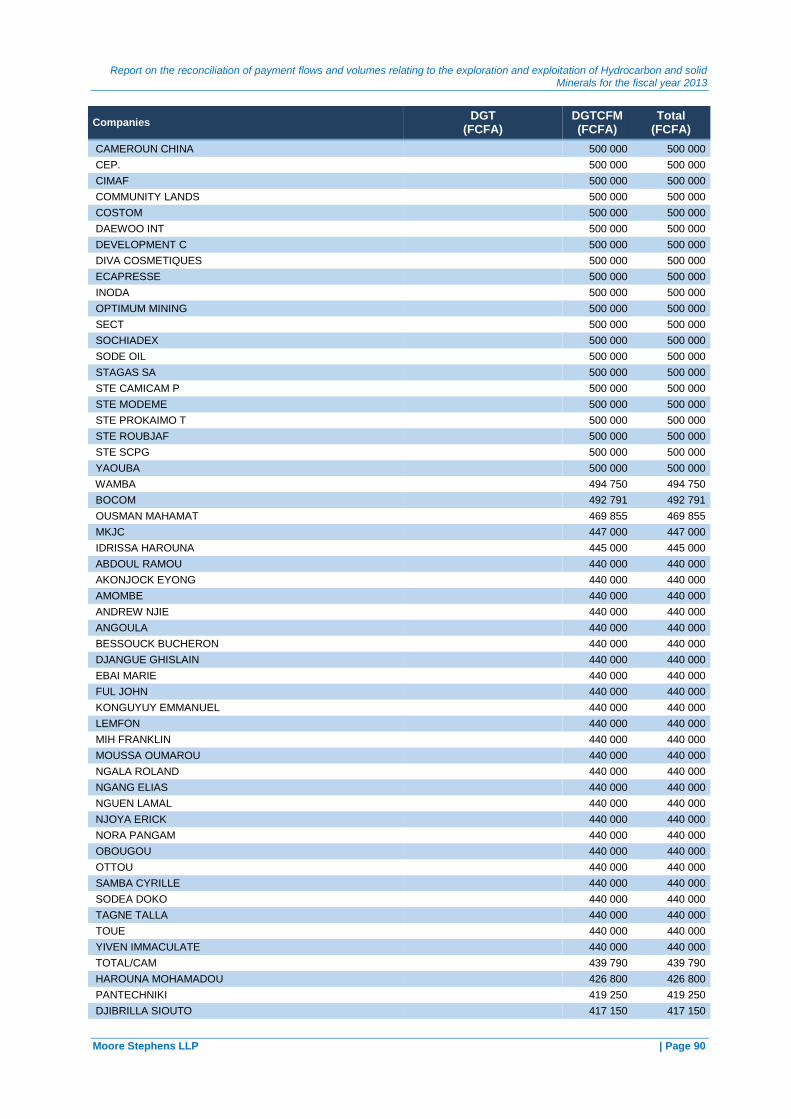
Report on the reconciliation of payment flows and volumes relating to the exploration and exploitation of Hydrocarbon and solid Minerals for the fiscal year 2013
Moore Stephens LLP | Page 90
Companies DGT
(FCFA) DGTCFM (FCFA)
Total (FCFA)
CAMEROUN CHINA 500 000 500 000
CEP.
500 000 500 000
CIMAF 500 000 500 000
COMMUNITY LANDS
500 000 500 000
COSTOM 500 000 500 000
DAEWOO INT
500 000 500 000
DEVELOPMENT C 500 000 500 000
DIVA COSMETIQUES
500 000 500 000
ECAPRESSE 500 000 500 000
INODA
500 000 500 000
OPTIMUM MINING 500 000 500 000
SECT
500 000 500 000
SOCHIADEX 500 000 500 000
SODE OIL
500 000 500 000
STAGAS SA 500 000 500 000
STE CAMICAM P
500 000 500 000
STE MODEME 500 000 500 000
STE PROKAIMO T
500 000 500 000
STE ROUBJAF 500 000 500 000
STE SCPG
500 000 500 000
YAOUBA 500 000 500 000
WAMBA
494 750 494 750
BOCOM 492 791 492 791
OUSMAN MAHAMAT
469 855 469 855
MKJC 447 000 447 000
IDRISSA HAROUNA
445 000 445 000
ABDOUL RAMOU 440 000 440 000
AKONJOCK EYONG
440 000 440 000
AMOMBE 440 000 440 000
ANDREW NJIE
440 000 440 000
ANGOULA 440 000 440 000
BESSOUCK BUCHERON
440 000 440 000
DJANGUE GHISLAIN 440 000 440 000
EBAI MARIE
440 000 440 000
FUL JOHN 440 000 440 000
KONGUYUY EMMANUEL
440 000 440 000
LEMFON 440 000 440 000
MIH FRANKLIN
440 000 440 000
MOUSSA OUMAROU 440 000 440 000
NGALA ROLAND
440 000 440 000
NGANG ELIAS 440 000 440 000
NGUEN LAMAL
440 000 440 000
NJOYA ERICK 440 000 440 000
NORA PANGAM
440 000 440 000
OBOUGOU 440 000 440 000
OTTOU
440 000 440 000
SAMBA CYRILLE 440 000 440 000
SODEA DOKO
440 000 440 000
TAGNE TALLA 440 000 440 000
TOUE
440 000 440 000
YIVEN IMMACULATE 440 000 440 000
TOTAL/CAM
439 790 439 790
HAROUNA MOHAMADOU 426 800 426 800
PANTECHNIKI
419 250 419 250
DJIBRILLA SIOUTO 417 150 417 150

Report on the reconciliation of payment flows and volumes relating to the exploration and exploitation of Hydrocarbon and solid Minerals for the fiscal year 2013
Moore Stephens LLP | Page 91
Companies DGT
(FCFA) DGTCFM (FCFA)
Total (FCFA)
LANQUIN
411 668 411 668
EYENGA ALVINE 410 000 410 000
BOKOM PETROEUM
406 100 406 100
GUOLONG MINIMG 406 060 406 060
DAHIROU
405 000 405 000
MAHAMAT/SOCAEPE 405 000 405 000
SOCADIOR
400 050 400 050
DJANGUE 400 000 400 000
DJOULDE
400 000 400 000
ETS DJIBO 400 000 400 000
FADIMATOU
400 000 400 000
GARBA 400 000 400 000
HAMADOU
400 000 400 000
KENDAO 400 000 400 000
MBARGA
400 000 400 000
MISSOK 400 000 400 000
NDOUMA SALOI
400 000 400 000
NGONO 400 000 400 000
NOUTARE
400 000 400 000
NTC 400 000 400 000
SOPRIT
400 000 400 000
TEHNA 400 000 400 000
OMEGA
390 000 390 000
SOCARIC 384 000 384 000
GASSAMAN
380 000 380 000
TGS 376 800 376 800
CORLAY
362 012 362 012
TOTAL/CAM 361 850 361 850
SOULEYMANOU
357 790 357 790
KOULAGNA 355 000 355 000
TIOMO
355 000 355 000
SCTM 351 400 351 400
TIOGNING
350 000 350 000
TRADEX 347 000 347 000
MANSA HOTEL
346 000 346 000
DJIBRILLA ABBO 345 970 345 970
CWE
343 125 343 125
ADAMOU 338 600 338 600
ABDOULMOUMINI
325 000 325 000
ADAMOU ZAORO 325 000 325 000
AHMADOU AHMADOU
325 000 325 000
AHMADOU RAZIL 325 000 325 000
ASONFACK
325 000 325 000
HASSAN HOUSSEINI 325 000 325 000
MAINA ANDRE
325 000 325 000
MBARDOU 325 000 325 000
NANGA WOFLGANG
325 000 325 000
NDINGA SEMEGA 325 000 325 000
NGONO AGATHE
325 000 325 000
NGUIARO 325 000 325 000
NOUHOU
325 000 325 000
OTSENG 325 000 325 000
OUNGWA KEMAYOU
325 000 325 000
SEKE PATRICE 325 000 325 000
SOMBE
325 000 325 000

Report on the reconciliation of payment flows and volumes relating to the exploration and exploitation of Hydrocarbon and solid Minerals for the fiscal year 2013
Moore Stephens LLP | Page 92
Companies DGT
(FCFA) DGTCFM (FCFA)
Total (FCFA)
ABBAGANA HADJI 320 000 320 000
ABBO MOUSTAPHA
320 000 320 000
ABDOU GUIRANDA 320 000 320 000
ABDOUL KADIN
320 000 320 000
ABDOUL NASSER 320 000 320 000
ABDOUL WAHARO
320 000 320 000
ABDOULAYE OUSMANOU 320 000 320 000
ABDOULMANOU
320 000 320 000
ABDOURAMAN 320 000 320 000
ABEDIN
320 000 320 000
ABENKOU 320 000 320 000
ABIBA
320 000 320 000
ABO ERNEST 320 000 320 000
ABOUKAR MIKAIL
320 000 320 000
ABU BAWIE NADEGE 320 000 320 000
ADAMOU ASSANA
320 000 320 000
ADAMOU DENIS 320 000 320 000
ADAMOU JEAN
320 000 320 000
ADAMOU MAL 320 000 320 000
ADAWA MARIE
320 000 320 000
AGAYO 320 000 320 000
AGBOR
320 000 320 000
AGBOR JUDE 320 000 320 000
AGILU
320 000 320 000
AGOAK DESIRE 320 000 320 000
AHMADOU ALI
320 000 320 000
AHMADOU GILBERT 320 000 320 000
AISSA TOUMPAY
320 000 320 000
AISSATOU 320 000 320 000
AISSATOU HOUMA
320 000 320 000
AISSATOU MPAY 320 000 320 000
AKA EMMANUEL
320 000 320 000
AKENGNE 320 000 320 000
AKO FLOBERT
320 000 320 000
AKO FLOBERT 320 000 320 000
ALADJI
320 000 320 000
ALEMBA 320 000 320 000
ALEMBA ALEXIS
320 000 320 000
ALHASSAN DATIDJO 320 000 320 000
ALI EMMA
320 000 320 000
ALIOU 320 000 320 000
ALONFONG
320 000 320 000
AMANGANA 320 000 320 000
AMBASSA
320 000 320 000
ANEGA 320 000 320 000
ANGOUDA
320 000 320 000
ANYAM 320 000 320 000
ARREY ENOW
320 000 320 000
ASMAOU HADJA 320 000 320 000
ASSABE SERDIMA
320 000 320 000
ASSIO 320 000 320 000
AZIA TOUE
320 000 320 000
BABA ISMAILA 320 000 320 000
BABOUKA JEAN
320 000 320 000
BAHA LOUIS 320 000 320 000
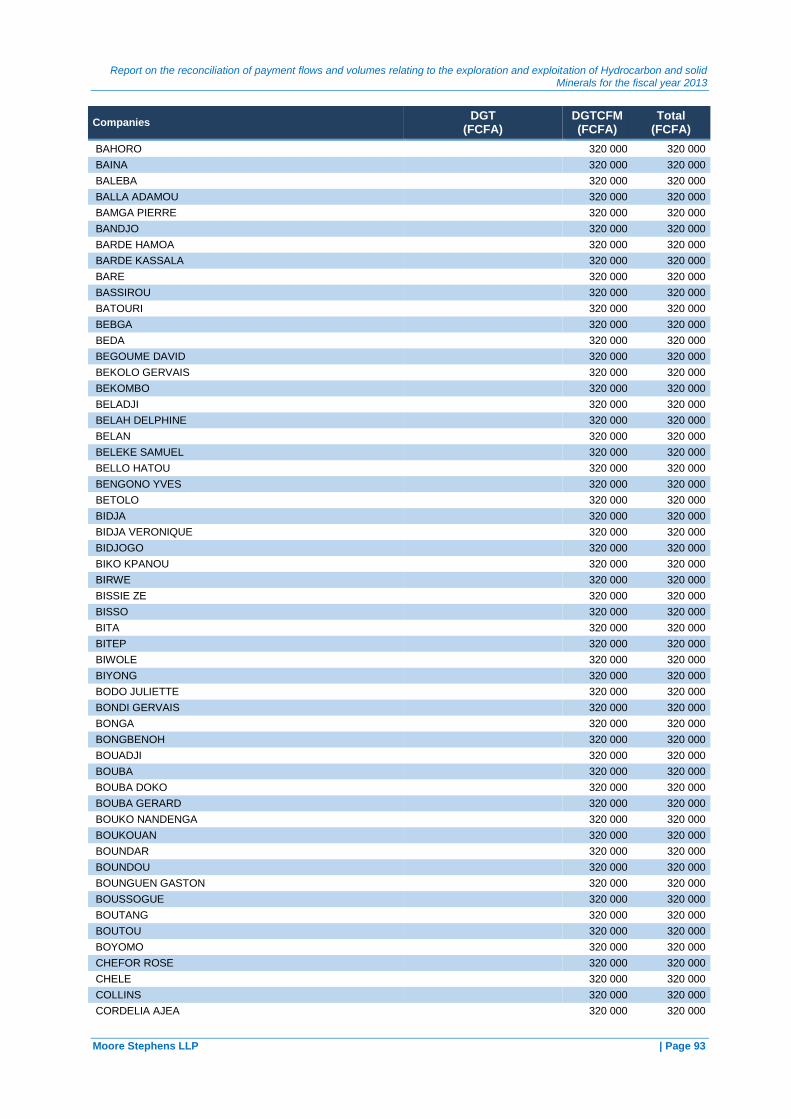
Report on the reconciliation of payment flows and volumes relating to the exploration and exploitation of Hydrocarbon and solid Minerals for the fiscal year 2013
Moore Stephens LLP | Page 93
Companies DGT
(FCFA) DGTCFM (FCFA)
Total (FCFA)
BAHORO
320 000 320 000
BAINA 320 000 320 000
BALEBA
320 000 320 000
BALLA ADAMOU 320 000 320 000
BAMGA PIERRE
320 000 320 000
BANDJO 320 000 320 000
BARDE HAMOA
320 000 320 000
BARDE KASSALA 320 000 320 000
BARE
320 000 320 000
BASSIROU 320 000 320 000
BATOURI
320 000 320 000
BEBGA 320 000 320 000
BEDA
320 000 320 000
BEGOUME DAVID 320 000 320 000
BEKOLO GERVAIS
320 000 320 000
BEKOMBO 320 000 320 000
BELADJI
320 000 320 000
BELAH DELPHINE 320 000 320 000
BELAN
320 000 320 000
BELEKE SAMUEL 320 000 320 000
BELLO HATOU
320 000 320 000
BENGONO YVES 320 000 320 000
BETOLO
320 000 320 000
BIDJA 320 000 320 000
BIDJA VERONIQUE
320 000 320 000
BIDJOGO 320 000 320 000
BIKO KPANOU
320 000 320 000
BIRWE 320 000 320 000
BISSIE ZE
320 000 320 000
BISSO 320 000 320 000
BITA
320 000 320 000
BITEP 320 000 320 000
BIWOLE
320 000 320 000
BIYONG 320 000 320 000
BODO JULIETTE
320 000 320 000
BONDI GERVAIS 320 000 320 000
BONGA
320 000 320 000
BONGBENOH 320 000 320 000
BOUADJI
320 000 320 000
BOUBA 320 000 320 000
BOUBA DOKO
320 000 320 000
BOUBA GERARD 320 000 320 000
BOUKO NANDENGA
320 000 320 000
BOUKOUAN 320 000 320 000
BOUNDAR
320 000 320 000
BOUNDOU 320 000 320 000
BOUNGUEN GASTON
320 000 320 000
BOUSSOGUE 320 000 320 000
BOUTANG
320 000 320 000
BOUTOU 320 000 320 000
BOYOMO
320 000 320 000
CHEFOR ROSE 320 000 320 000
CHELE
320 000 320 000
COLLINS 320 000 320 000
CORDELIA AJEA
320 000 320 000
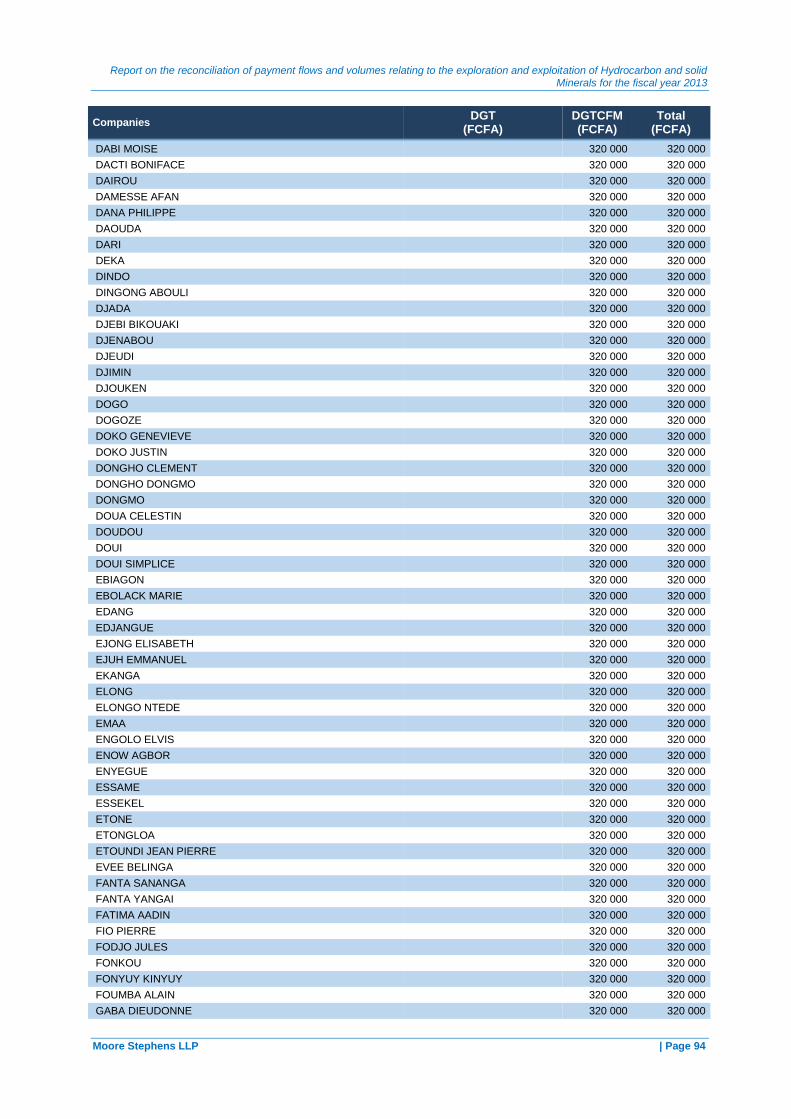
Report on the reconciliation of payment flows and volumes relating to the exploration and exploitation of Hydrocarbon and solid Minerals for the fiscal year 2013
Moore Stephens LLP | Page 94
Companies DGT
(FCFA) DGTCFM (FCFA)
Total (FCFA)
DABI MOISE 320 000 320 000
DACTI BONIFACE
320 000 320 000
DAIROU 320 000 320 000
DAMESSE AFAN
320 000 320 000
DANA PHILIPPE 320 000 320 000
DAOUDA
320 000 320 000
DARI 320 000 320 000
DEKA
320 000 320 000
DINDO 320 000 320 000
DINGONG ABOULI
320 000 320 000
DJADA 320 000 320 000
DJEBI BIKOUAKI
320 000 320 000
DJENABOU 320 000 320 000
DJEUDI
320 000 320 000
DJIMIN 320 000 320 000
DJOUKEN
320 000 320 000
DOGO 320 000 320 000
DOGOZE
320 000 320 000
DOKO GENEVIEVE 320 000 320 000
DOKO JUSTIN
320 000 320 000
DONGHO CLEMENT 320 000 320 000
DONGHO DONGMO
320 000 320 000
DONGMO 320 000 320 000
DOUA CELESTIN
320 000 320 000
DOUDOU 320 000 320 000
DOUI
320 000 320 000
DOUI SIMPLICE 320 000 320 000
EBIAGON
320 000 320 000
EBOLACK MARIE 320 000 320 000
EDANG
320 000 320 000
EDJANGUE 320 000 320 000
EJONG ELISABETH
320 000 320 000
EJUH EMMANUEL 320 000 320 000
EKANGA
320 000 320 000
ELONG 320 000 320 000
ELONGO NTEDE
320 000 320 000
EMAA 320 000 320 000
ENGOLO ELVIS
320 000 320 000
ENOW AGBOR 320 000 320 000
ENYEGUE
320 000 320 000
ESSAME 320 000 320 000
ESSEKEL
320 000 320 000
ETONE 320 000 320 000
ETONGLOA
320 000 320 000
ETOUNDI JEAN PIERRE 320 000 320 000
EVEE BELINGA
320 000 320 000
FANTA SANANGA 320 000 320 000
FANTA YANGAI
320 000 320 000
FATIMA AADIN 320 000 320 000
FIO PIERRE
320 000 320 000
FODJO JULES 320 000 320 000
FONKOU
320 000 320 000
FONYUY KINYUY 320 000 320 000
FOUMBA ALAIN
320 000 320 000
GABA DIEUDONNE 320 000 320 000
Report on the reconciliation of payment flows and volumes relating to the exploration and exploitation of Hydrocarbon and solid Minerals for the fiscal year 2013
Moore Stephens LLP | Page 95
Companies DGT
(FCFA) DGTCFM (FCFA)
Total (FCFA)
GAINSOM
320 000 320 000
GANLE NDOZENG 320 000 320 000
GANSAM
320 000 320 000
GARAMA 320 000 320 000
GARBA JOSEPH
320 000 320 000
GAUL JEAN 320 000 320 000
GAUL JEAN
320 000 320 000
GODANGA 320 000 320 000
GOGO JEAN
320 000 320 000
GOL ANDRE 320 000 320 000
GOLIKA YERIMA
320 000 320 000
GOLIKE DOUMBA 320 000 320 000
GOMETIE
320 000 320 000
GORO 320 000 320 000
GWET
320 000 320 000
GWET GERAD 320 000 320 000
GWET JEAN GILBERT
320 000 320 000
HABIBOUL ABDOUL 320 000 320 000
HALIBU
320 000 320 000
HALIDOU 320 000 320 000
HALIMA
320 000 320 000
HAMADJIDA CHRISTIAN 320 000 320 000
HAMADOU ALI
320 000 320 000
HAMADOU LANLO 320 000 320 000
HAMADOU SAIBOU
320 000 320 000
HAMAN 320 000 320 000
HAMBOA
320 000 320 000
HAMIDOU HAMADOU 320 000 320 000
HAMIDOU LAMINOU
320 000 320 000
HANSATOU 320 000 320 000
HARNADO JEAN
320 000 320 000
HAROUNA ABASSI 320 000 320 000
HAROUNA ISSA
320 000 320 000
HASSANA 320 000 320 000
HAWA KOULOU
320 000 320 000
HAWAOU MODIBO 320 000 320 000
HOUMA
320 000 320 000
IBADOUA 320 000 320 000
IBRAHIM
320 000 320 000
IBRAHIMA 320 000 320 000
IDRISSOU
320 000 320 000
INA BETARE 320 000 320 000
ISSA NDIMA
320 000 320 000
JEUFO 320 000 320 000
KACK KACK
320 000 320 000
KACK KACK 320 000 320 000
KACK KACK ETIENNE
320 000 320 000
KACK KACK PHILIPPE 320 000 320 000
KACK SUZANNE
320 000 320 000
KAMDEM 320 000 320 000
KAMDEM KOM
320 000 320 000
KAMENI 320 000 320 000
KAMHOUA
320 000 320 000
KAMHOUA DOKO 320 000 320 000
KAMWA
320 000 320 000
Report on the reconciliation of payment flows and volumes relating to the exploration and exploitation of Hydrocarbon and solid Minerals for the fiscal year 2013
Moore Stephens LLP | Page 96
Companies DGT
(FCFA) DGTCFM (FCFA)
Total (FCFA)
KENDI 320 000 320 000
KOE
320 000 320 000
KOEKE KONTA 320 000 320 000
KOMBELE
320 000 320 000
KOMOL 320 000 320 000
KONA
320 000 320 000
KONATE 320 000 320 000
KONGEH
320 000 320 000
KONGOLO 320 000 320 000
KONTA
320 000 320 000
KOTUNWA BENOIT 320 000 320 000
KOUDJOU
320 000 320 000
KOULSSOUMI 320 000 320 000
KOULTOUMI
320 000 320 000
KOUSSIE 320 000 320 000
KOYO
320 000 320 000
KUISSI YVES 320 000 320 000
LEKABOT
320 000 320 000
LEMA 320 000 320 000
LINGBONA
320 000 320 000
LONO 320 000 320 000
LOUIS MARIE BEGNE
320 000 320 000
LUKONG CHRISTIAN 320 000 320 000
MABIANG
320 000 320 000
MADOUKOU 320 000 320 000
MAKANI
320 000 320 000
MAKON EUVAN 320 000 320 000
MAKOUN BOSCO
320 000 320 000
MAMADOU 320 000 320 000
MANDARI FLORENCE
320 000 320 000
MANGA ATEBA 320 000 320 000
MANI SAMUEL
320 000 320 000
MARIGOH 320 000 320 000
MASSOP
320 000 320 000
MAYEMI 320 000 320 000
MBAKA CATHERINE
320 000 320 000
MBALI 320 000 320 000
MBALKAM
320 000 320 000
MBALLA 320 000 320 000
MBALLA CATHERINE
320 000 320 000
MBALLA ELLIANE 320 000 320 000
MBALLA ERIC
320 000 320 000
MBALLA SERAPHINE 320 000 320 000
MBARZOUA
320 000 320 000
MBELE BELOKO 320 000 320 000
MBELE DESIRE
320 000 320 000
MBELE FRANCOIS 320 000 320 000
MBELLA MBAPPE
320 000 320 000
MBEMBI 320 000 320 000
MBENOUN
320 000 320 000
MBOA 320 000 320 000
MBOGDA
320 000 320 000
MBOLO 320 000 320 000
MBOMBA
320 000 320 000
MBOMBE ARMAND 320 000 320 000
Report on the reconciliation of payment flows and volumes relating to the exploration and exploitation of Hydrocarbon and solid Minerals for the fiscal year 2013
Moore Stephens LLP | Page 97
Companies DGT
(FCFA) DGTCFM (FCFA)
Total (FCFA)
MBONGO
320 000 320 000
MBONJO 320 000 320 000
MBOUDI
320 000 320 000
MEFIRE 320 000 320 000
MEGAPTCHE
320 000 320 000
MEKE SIM 320 000 320 000
MELAMBI
320 000 320 000
MELOM JEAN 320 000 320 000
MENBOLO
320 000 320 000
MENDOLO 320 000 320 000
MENGONDO
320 000 320 000
MEPOUTH MEPOUTH 320 000 320 000
MESSANGA
320 000 320 000
METEA 320 000 320 000
METELLEGO
320 000 320 000
METSAWA 320 000 320 000
MEZOGOU
320 000 320 000
MINDANG 320 000 320 000
MINDOUMBOU
320 000 320 000
MINKOUS CLOTILDE 320 000 320 000
MINTYENE
320 000 320 000
MOHAMADOU BACHIROU 320 000 320 000
MOHAMADOU KARIBOU
320 000 320 000
MOHAMADOU MOCTAR 320 000 320 000
MOHAMADOU MOUSTAPHA
320 000 320 000
MOHAMADOU OUMAROU 320 000 320 000
MOHAMADOU TAHIB
320 000 320 000
MOHAMAN DJALLO 320 000 320 000
MOIROBO
320 000 320 000
MOLOUK 320 000 320 000
MONDJOL
320 000 320 000
MOUEMBLE YAKOUROU 320 000 320 000
MOUHAMADOU MOUSTOUPHA 320 000 320 000
MOUSSA ANDRE 320 000 320 000
MOUSSA BAKO
320 000 320 000
MOUSSA HASSANA 320 000 320 000
MOUSSA MAMANG
320 000 320 000
MOUSSA MOUHAMAN 320 000 320 000
MOUSTAPHA GONI
320 000 320 000
MPAY ANNE 320 000 320 000
MPAY EPSE IFOT
320 000 320 000
MPAY JEAN CLAUDE 320 000 320 000
MPAY JEAN MARC
320 000 320 000
MPAY MPONDI 320 000 320 000
MPAY PIERRE
320 000 320 000
MPAY SAMUEL 320 000 320 000
MPIANG FRANCOIS
320 000 320 000
MVIE 320 000 320 000
MVONDO NNA
320 000 320 000
NADUWA 320 000 320 000
NAKASSOU
320 000 320 000
NALAO JACQUELINE 320 000 320 000
NAMFACK
320 000 320 000
NANDO 320 000 320 000
NANDO GOLIKE
320 000 320 000

Report on the reconciliation of payment flows and volumes relating to the exploration and exploitation of Hydrocarbon and solid Minerals for the fiscal year 2013
Moore Stephens LLP | Page 98
Companies DGT
(FCFA) DGTCFM (FCFA)
Total (FCFA)
NANFACK 320 000 320 000
NANGA JEAN
320 000 320 000
NANGARE 320 000 320 000
NAPHTALEY
320 000 320 000
NARAM 320 000 320 000
NARGABA MBELE
320 000 320 000
NARMAI 320 000 320 000
NATOU
320 000 320 000
NDANGA CYRILLE 320 000 320 000
NDANGA EMMA
320 000 320 000
NDANGA REMY 320 000 320 000
NDASSI
320 000 320 000
NDENG EVELYNE 320 000 320 000
NDERENGUE
320 000 320 000
NDIDI ABEL 320 000 320 000
NDIMA
320 000 320 000
NDINGA ETIENNE 320 000 320 000
NDINGA MAINA
320 000 320 000
NDOE 320 000 320 000
NDONGO DOUME
320 000 320 000
NDOUM BELINGA 320 000 320 000
NDOUMBE
320 000 320 000
NDZANA 320 000 320 000
NEMBE
320 000 320 000
NGA NANG 320 000 320 000
NGAITOM
320 000 320 000
NGALAME AIDAN 320 000 320 000
NGAMY
320 000 320 000
NGASSA FLOBERT 320 000 320 000
NGIAGNI
320 000 320 000
NGO YEMNA 320 000 320 000
NGO BASSANALA
320 000 320 000
NGO BATA 320 000 320 000
NGO HIAG
320 000 320 000
NGO ISSI ROLANDE 320 000 320 000
NGO KOMOL
320 000 320 000
NGO MBOCK 320 000 320 000
NGO MBOCK DIANE
320 000 320 000
NGO MBONG 320 000 320 000
NGO MPAY JACQUELINE
320 000 320 000
NGO NGOCK 320 000 320 000
NGO NGUE
320 000 320 000
NGO YAYI 320 000 320 000
NGO ZOUM
320 000 320 000
NGOM 320 000 320 000
NGOMBEA
320 000 320 000
NGONDI FABRICE 320 000 320 000
NGONO MARIE PAULE
320 000 320 000
NGONO SYLVIE 320 000 320 000
NGOSSO
320 000 320 000
NGOZO NDINGA 320 000 320 000
NGUE NGUE
320 000 320 000
NGUE THERESE 320 000 320 000
NGUEFANG
320 000 320 000
NGUELE 320 000 320 000
Report on the reconciliation of payment flows and volumes relating to the exploration and exploitation of Hydrocarbon and solid Minerals for the fiscal year 2013
Moore Stephens LLP | Page 99
Companies DGT
(FCFA) DGTCFM (FCFA)
Total (FCFA)
NGUELE NGUELE SYLVIE
320 000 320 000
NGUETCHUENG 320 000 320 000
NGWA
320 000 320 000
NJIKENG 320 000 320 000
NKAINSUT ENOW
320 000 320 000
NKAMZOK SAINCLAIR 320 000 320 000
NKOA MINSI
320 000 320 000
NKOUEFET ROBERTINE 320 000 320 000
NKOUFUET
320 000 320 000
NKOUMOU MPAY 320 000 320 000
NKOUMOU ZE
320 000 320 000
NKOUREH 320 000 320 000
NKWEMI
320 000 320 000
NLEND LUC 320 000 320 000
NLOM MVONDO
320 000 320 000
NNA JEAN 320 000 320 000
NOKO
320 000 320 000
NONO ELOI 320 000 320 000
NOUBAYA
320 000 320 000
NOUDJOU BRICE 320 000 320 000
NSET HELL
320 000 320 000
NTCHETMI 320 000 320 000
NTCHEUMENI
320 000 320 000
NTEPP 320 000 320 000
NTONGA
320 000 320 000
NTSAMA BENE 320 000 320 000
NTY
320 000 320 000
NYA 320 000 320 000
NYAA MARCEL
320 000 320 000
NYAMEN 320 000 320 000
NYAT NYAT
320 000 320 000
NYI PENG HE 320 000 320 000
NZOUENKEU
320 000 320 000
ODI CHRISTEL 320 000 320 000
OKOMO
320 000 320 000
OLINGA 320 000 320 000
ON ROD
320 000 320 000
ONANA 320 000 320 000
ONDOA OWONO
320 000 320 000
ONDOUA 320 000 320 000
OTTOU DENIS
320 000 320 000
OUMARA SANDA 320 000 320 000
OUMAROU FARIKOU
320 000 320 000
OUSMANOU TELESPHORE 320 000 320 000
OUSSOUMANOU
320 000 320 000
OWONO NGONO 320 000 320 000
OYANDA
320 000 320 000
OYONO 320 000 320 000
PATOUMA
320 000 320 000
PICHE INNE 320 000 320 000
PONDA
320 000 320 000
PONDI 320 000 320 000
PORO
320 000 320 000
PORO NDANGA 320 000 320 000
POUMBAY
320 000 320 000
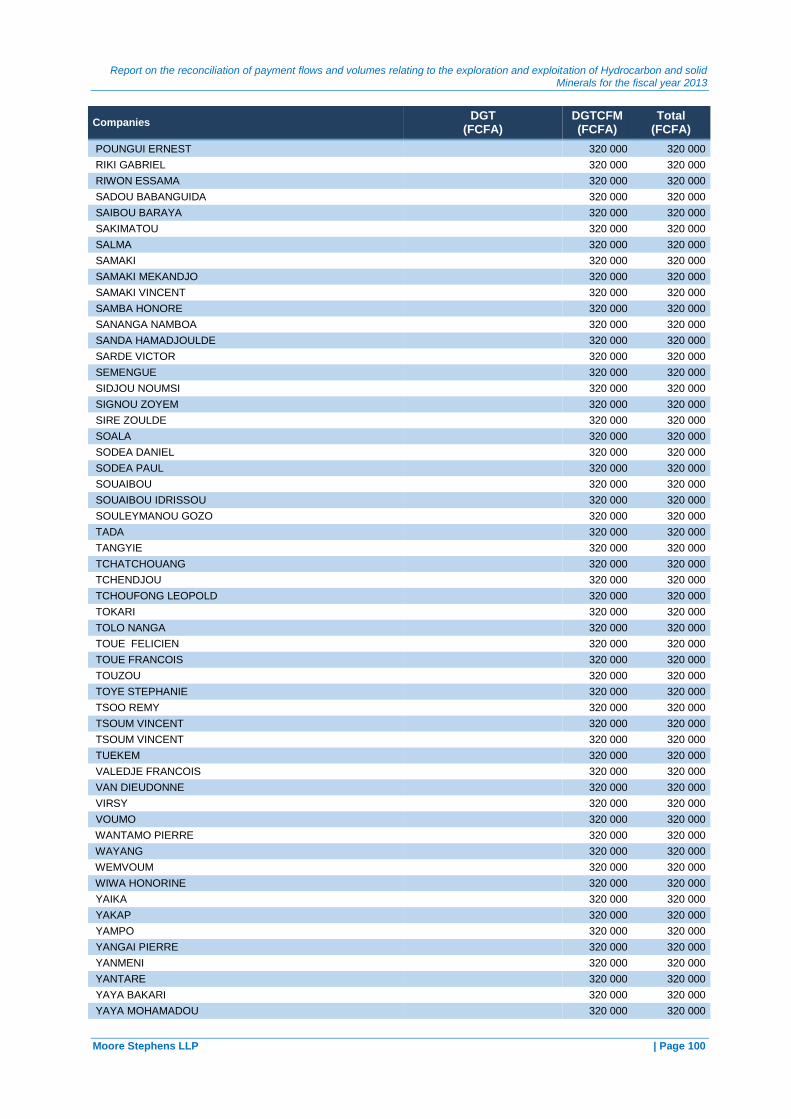
Report on the reconciliation of payment flows and volumes relating to the exploration and exploitation of Hydrocarbon and solid Minerals for the fiscal year 2013
Moore Stephens LLP | Page 100
Companies DGT
(FCFA) DGTCFM (FCFA)
Total (FCFA)
POUNGUI ERNEST 320 000 320 000
RIKI GABRIEL
320 000 320 000
RIWON ESSAMA 320 000 320 000
SADOU BABANGUIDA
320 000 320 000
SAIBOU BARAYA 320 000 320 000
SAKIMATOU
320 000 320 000
SALMA 320 000 320 000
SAMAKI
320 000 320 000
SAMAKI MEKANDJO 320 000 320 000
SAMAKI VINCENT
320 000 320 000
SAMBA HONORE 320 000 320 000
SANANGA NAMBOA
320 000 320 000
SANDA HAMADJOULDE 320 000 320 000
SARDE VICTOR
320 000 320 000
SEMENGUE 320 000 320 000
SIDJOU NOUMSI
320 000 320 000
SIGNOU ZOYEM 320 000 320 000
SIRE ZOULDE
320 000 320 000
SOALA 320 000 320 000
SODEA DANIEL
320 000 320 000
SODEA PAUL 320 000 320 000
SOUAIBOU
320 000 320 000
SOUAIBOU IDRISSOU 320 000 320 000
SOULEYMANOU GOZO
320 000 320 000
TADA 320 000 320 000
TANGYIE
320 000 320 000
TCHATCHOUANG 320 000 320 000
TCHENDJOU
320 000 320 000
TCHOUFONG LEOPOLD 320 000 320 000
TOKARI
320 000 320 000
TOLO NANGA 320 000 320 000
TOUE FELICIEN
320 000 320 000
TOUE FRANCOIS 320 000 320 000
TOUZOU
320 000 320 000
TOYE STEPHANIE 320 000 320 000
TSOO REMY
320 000 320 000
TSOUM VINCENT 320 000 320 000
TSOUM VINCENT
320 000 320 000
TUEKEM 320 000 320 000
VALEDJE FRANCOIS
320 000 320 000
VAN DIEUDONNE 320 000 320 000
VIRSY
320 000 320 000
VOUMO 320 000 320 000
WANTAMO PIERRE
320 000 320 000
WAYANG 320 000 320 000
WEMVOUM
320 000 320 000
WIWA HONORINE 320 000 320 000
YAIKA
320 000 320 000
YAKAP 320 000 320 000
YAMPO
320 000 320 000
YANGAI PIERRE 320 000 320 000
YANMENI
320 000 320 000
YANTARE 320 000 320 000
YAYA BAKARI
320 000 320 000
YAYA MOHAMADOU 320 000 320 000
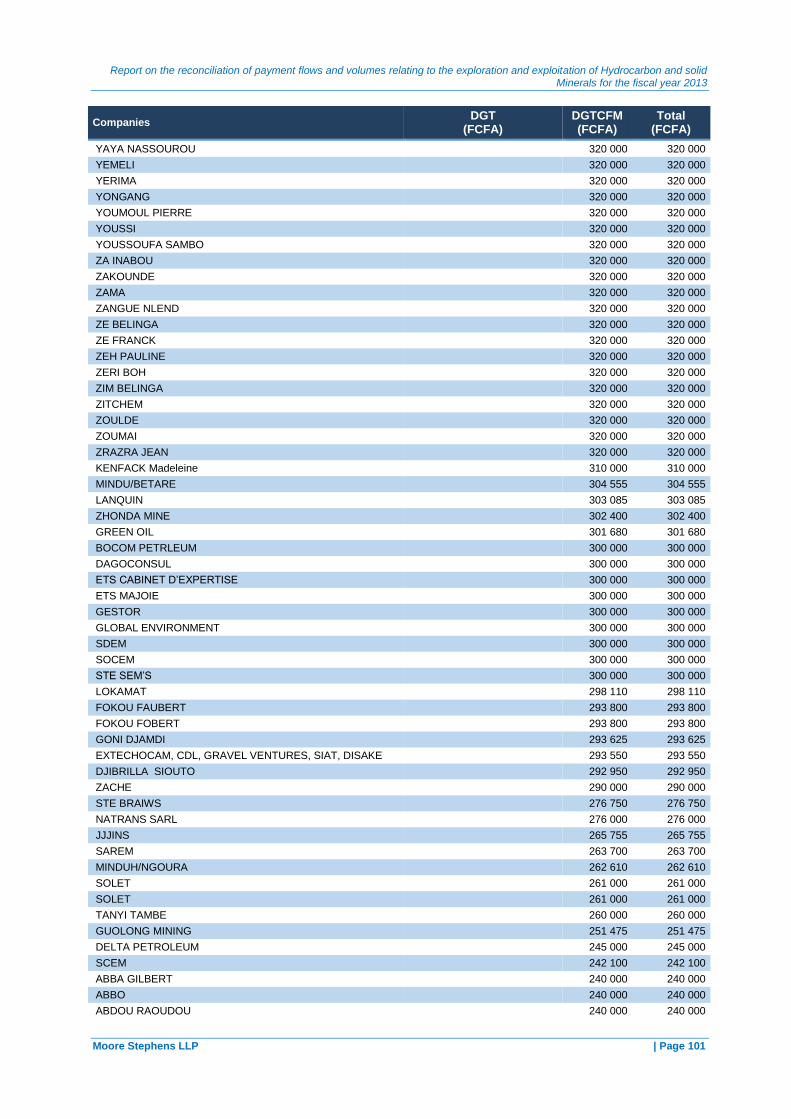
Report on the reconciliation of payment flows and volumes relating to the exploration and exploitation of Hydrocarbon and solid Minerals for the fiscal year 2013
Moore Stephens LLP | Page 101
Companies DGT
(FCFA) DGTCFM (FCFA)
Total (FCFA)
YAYA NASSOUROU
320 000 320 000
YEMELI 320 000 320 000
YERIMA
320 000 320 000
YONGANG 320 000 320 000
YOUMOUL PIERRE
320 000 320 000
YOUSSI 320 000 320 000
YOUSSOUFA SAMBO
320 000 320 000
ZA INABOU 320 000 320 000
ZAKOUNDE
320 000 320 000
ZAMA 320 000 320 000
ZANGUE NLEND
320 000 320 000
ZE BELINGA 320 000 320 000
ZE FRANCK
320 000 320 000
ZEH PAULINE 320 000 320 000
ZERI BOH
320 000 320 000
ZIM BELINGA 320 000 320 000
ZITCHEM
320 000 320 000
ZOULDE 320 000 320 000
ZOUMAI
320 000 320 000
ZRAZRA JEAN 320 000 320 000
KENFACK Madeleine
310 000 310 000
MINDU/BETARE 304 555 304 555
LANQUIN
303 085 303 085
ZHONDA MINE 302 400 302 400
GREEN OIL
301 680 301 680
BOCOM PETRLEUM 300 000 300 000
DAGOCONSUL
300 000 300 000
ETS CABINET D’EXPERTISE 300 000 300 000
ETS MAJOIE
300 000 300 000
GESTOR 300 000 300 000
GLOBAL ENVIRONMENT
300 000 300 000
SDEM 300 000 300 000
SOCEM
300 000 300 000
STE SEM’S 300 000 300 000
LOKAMAT
298 110 298 110
FOKOU FAUBERT 293 800 293 800
FOKOU FOBERT
293 800 293 800
GONI DJAMDI 293 625 293 625
EXTECHOCAM, CDL, GRAVEL VENTURES, SIAT, DISAKE 293 550 293 550
DJIBRILLA SIOUTO 292 950 292 950
ZACHE
290 000 290 000
STE BRAIWS 276 750 276 750
NATRANS SARL
276 000 276 000
JJJINS 265 755 265 755
SAREM
263 700 263 700
MINDUH/NGOURA 262 610 262 610
SOLET
261 000 261 000
SOLET 261 000 261 000
TANYI TAMBE
260 000 260 000
GUOLONG MINING 251 475 251 475
DELTA PETROLEUM
245 000 245 000
SCEM 242 100 242 100
ABBA GILBERT
240 000 240 000
ABBO 240 000 240 000
ABDOU RAOUDOU
240 000 240 000
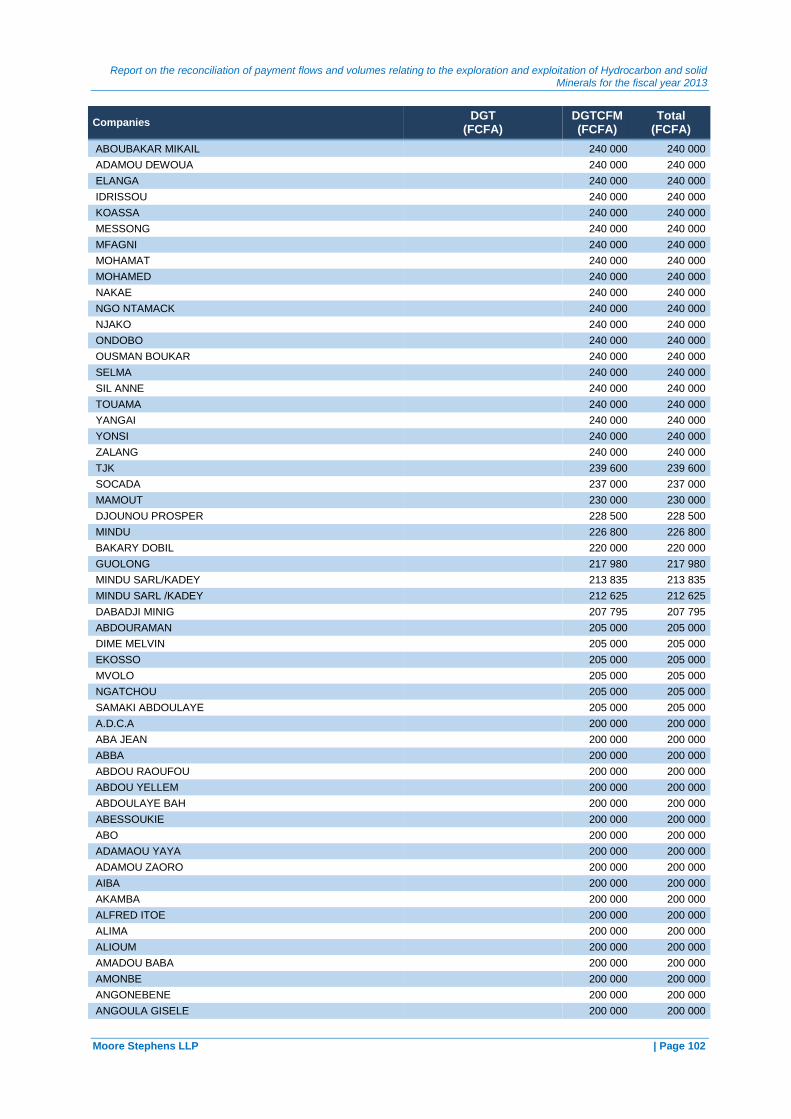
Report on the reconciliation of payment flows and volumes relating to the exploration and exploitation of Hydrocarbon and solid Minerals for the fiscal year 2013
Moore Stephens LLP | Page 102
Companies DGT
(FCFA) DGTCFM (FCFA)
Total (FCFA)
ABOUBAKAR MIKAIL 240 000 240 000
ADAMOU DEWOUA
240 000 240 000
ELANGA 240 000 240 000
IDRISSOU
240 000 240 000
KOASSA 240 000 240 000
MESSONG
240 000 240 000
MFAGNI 240 000 240 000
MOHAMAT
240 000 240 000
MOHAMED 240 000 240 000
NAKAE
240 000 240 000
NGO NTAMACK 240 000 240 000
NJAKO
240 000 240 000
ONDOBO 240 000 240 000
OUSMAN BOUKAR
240 000 240 000
SELMA 240 000 240 000
SIL ANNE
240 000 240 000
TOUAMA 240 000 240 000
YANGAI
240 000 240 000
YONSI 240 000 240 000
ZALANG
240 000 240 000
TJK 239 600 239 600
SOCADA
237 000 237 000
MAMOUT 230 000 230 000
DJOUNOU PROSPER
228 500 228 500
MINDU 226 800 226 800
BAKARY DOBIL
220 000 220 000
GUOLONG 217 980 217 980
MINDU SARL/KADEY
213 835 213 835
MINDU SARL /KADEY 212 625 212 625
DABADJI MINIG
207 795 207 795
ABDOURAMAN 205 000 205 000
DIME MELVIN
205 000 205 000
EKOSSO 205 000 205 000
MVOLO
205 000 205 000
NGATCHOU 205 000 205 000
SAMAKI ABDOULAYE
205 000 205 000
A.D.C.A 200 000 200 000
ABA JEAN
200 000 200 000
ABBA 200 000 200 000
ABDOU RAOUFOU
200 000 200 000
ABDOU YELLEM 200 000 200 000
ABDOULAYE BAH
200 000 200 000
ABESSOUKIE 200 000 200 000
ABO
200 000 200 000
ADAMAOU YAYA 200 000 200 000
ADAMOU ZAORO
200 000 200 000
AIBA 200 000 200 000
AKAMBA
200 000 200 000
ALFRED ITOE 200 000 200 000
ALIMA
200 000 200 000
ALIOUM 200 000 200 000
AMADOU BABA
200 000 200 000
AMONBE 200 000 200 000
ANGONEBENE
200 000 200 000
ANGOULA GISELE 200 000 200 000
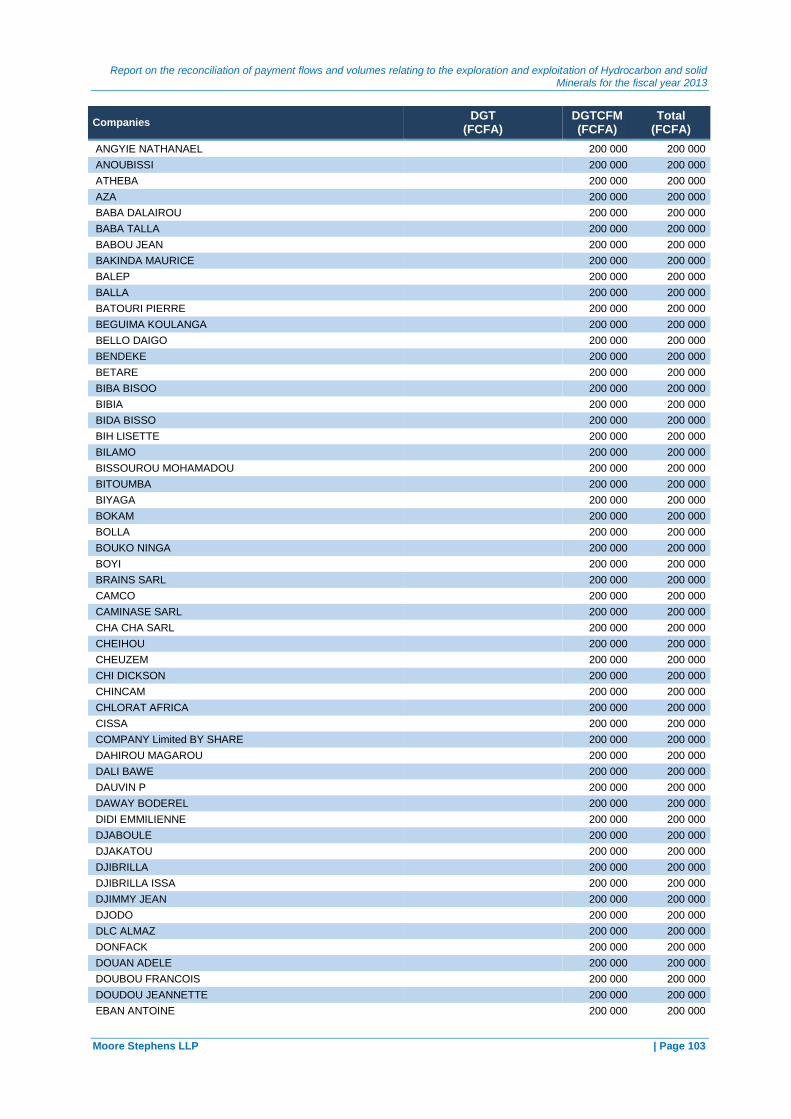
Report on the reconciliation of payment flows and volumes relating to the exploration and exploitation of Hydrocarbon and solid Minerals for the fiscal year 2013
Moore Stephens LLP | Page 103
Companies DGT
(FCFA) DGTCFM (FCFA)
Total (FCFA)
ANGYIE NATHANAEL
200 000 200 000
ANOUBISSI 200 000 200 000
ATHEBA
200 000 200 000
AZA 200 000 200 000
BABA DALAIROU
200 000 200 000
BABA TALLA 200 000 200 000
BABOU JEAN
200 000 200 000
BAKINDA MAURICE 200 000 200 000
BALEP
200 000 200 000
BALLA 200 000 200 000
BATOURI PIERRE
200 000 200 000
BEGUIMA KOULANGA 200 000 200 000
BELLO DAIGO
200 000 200 000
BENDEKE 200 000 200 000
BETARE
200 000 200 000
BIBA BISOO 200 000 200 000
BIBIA
200 000 200 000
BIDA BISSO 200 000 200 000
BIH LISETTE
200 000 200 000
BILAMO 200 000 200 000
BISSOUROU MOHAMADOU
200 000 200 000
BITOUMBA 200 000 200 000
BIYAGA
200 000 200 000
BOKAM 200 000 200 000
BOLLA
200 000 200 000
BOUKO NINGA 200 000 200 000
BOYI
200 000 200 000
BRAINS SARL 200 000 200 000
CAMCO
200 000 200 000
CAMINASE SARL 200 000 200 000
CHA CHA SARL
200 000 200 000
CHEIHOU 200 000 200 000
CHEUZEM
200 000 200 000
CHI DICKSON 200 000 200 000
CHINCAM
200 000 200 000
CHLORAT AFRICA 200 000 200 000
CISSA
200 000 200 000
COMPANY Limited BY SHARE 200 000 200 000
DAHIROU MAGAROU
200 000 200 000
DALI BAWE 200 000 200 000
DAUVIN P
200 000 200 000
DAWAY BODEREL 200 000 200 000
DIDI EMMILIENNE
200 000 200 000
DJABOULE 200 000 200 000
DJAKATOU
200 000 200 000
DJIBRILLA 200 000 200 000
DJIBRILLA ISSA
200 000 200 000
DJIMMY JEAN 200 000 200 000
DJODO
200 000 200 000
DLC ALMAZ 200 000 200 000
DONFACK
200 000 200 000
DOUAN ADELE 200 000 200 000
DOUBOU FRANCOIS
200 000 200 000
DOUDOU JEANNETTE 200 000 200 000
EBAN ANTOINE
200 000 200 000
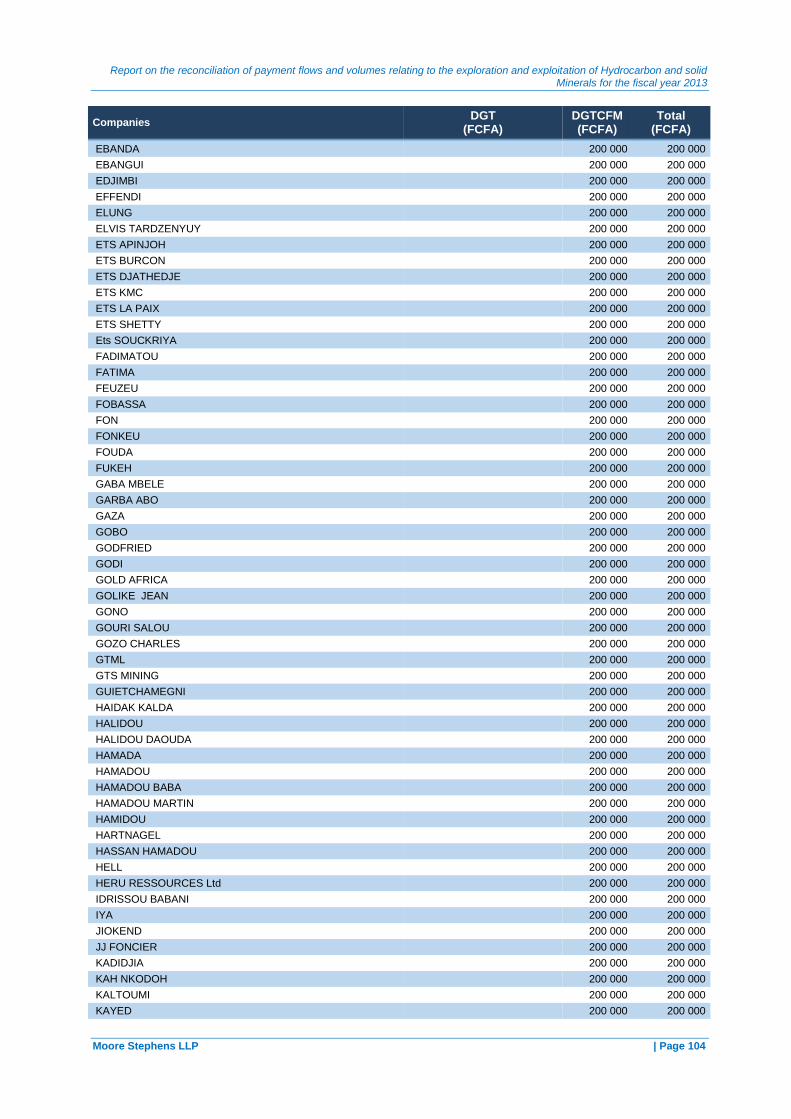
Report on the reconciliation of payment flows and volumes relating to the exploration and exploitation of Hydrocarbon and solid Minerals for the fiscal year 2013
Moore Stephens LLP | Page 104
Companies DGT
(FCFA) DGTCFM (FCFA)
Total (FCFA)
EBANDA 200 000 200 000
EBANGUI
200 000 200 000
EDJIMBI 200 000 200 000
EFFENDI
200 000 200 000
ELUNG 200 000 200 000
ELVIS TARDZENYUY
200 000 200 000
ETS APINJOH 200 000 200 000
ETS BURCON
200 000 200 000
ETS DJATHEDJE 200 000 200 000
ETS KMC
200 000 200 000
ETS LA PAIX 200 000 200 000
ETS SHETTY
200 000 200 000
Ets SOUCKRIYA 200 000 200 000
FADIMATOU
200 000 200 000
FATIMA 200 000 200 000
FEUZEU
200 000 200 000
FOBASSA 200 000 200 000
FON
200 000 200 000
FONKEU 200 000 200 000
FOUDA
200 000 200 000
FUKEH 200 000 200 000
GABA MBELE
200 000 200 000
GARBA ABO 200 000 200 000
GAZA
200 000 200 000
GOBO 200 000 200 000
GODFRIED
200 000 200 000
GODI 200 000 200 000
GOLD AFRICA
200 000 200 000
GOLIKE JEAN 200 000 200 000
GONO
200 000 200 000
GOURI SALOU 200 000 200 000
GOZO CHARLES
200 000 200 000
GTML 200 000 200 000
GTS MINING
200 000 200 000
GUIETCHAMEGNI 200 000 200 000
HAIDAK KALDA
200 000 200 000
HALIDOU 200 000 200 000
HALIDOU DAOUDA
200 000 200 000
HAMADA 200 000 200 000
HAMADOU
200 000 200 000
HAMADOU BABA 200 000 200 000
HAMADOU MARTIN
200 000 200 000
HAMIDOU 200 000 200 000
HARTNAGEL
200 000 200 000
HASSAN HAMADOU 200 000 200 000
HELL
200 000 200 000
HERU RESSOURCES Ltd 200 000 200 000
IDRISSOU BABANI
200 000 200 000
IYA 200 000 200 000
JIOKEND
200 000 200 000
JJ FONCIER 200 000 200 000
KADIDJIA
200 000 200 000
KAH NKODOH 200 000 200 000
KALTOUMI
200 000 200 000
KAYED 200 000 200 000
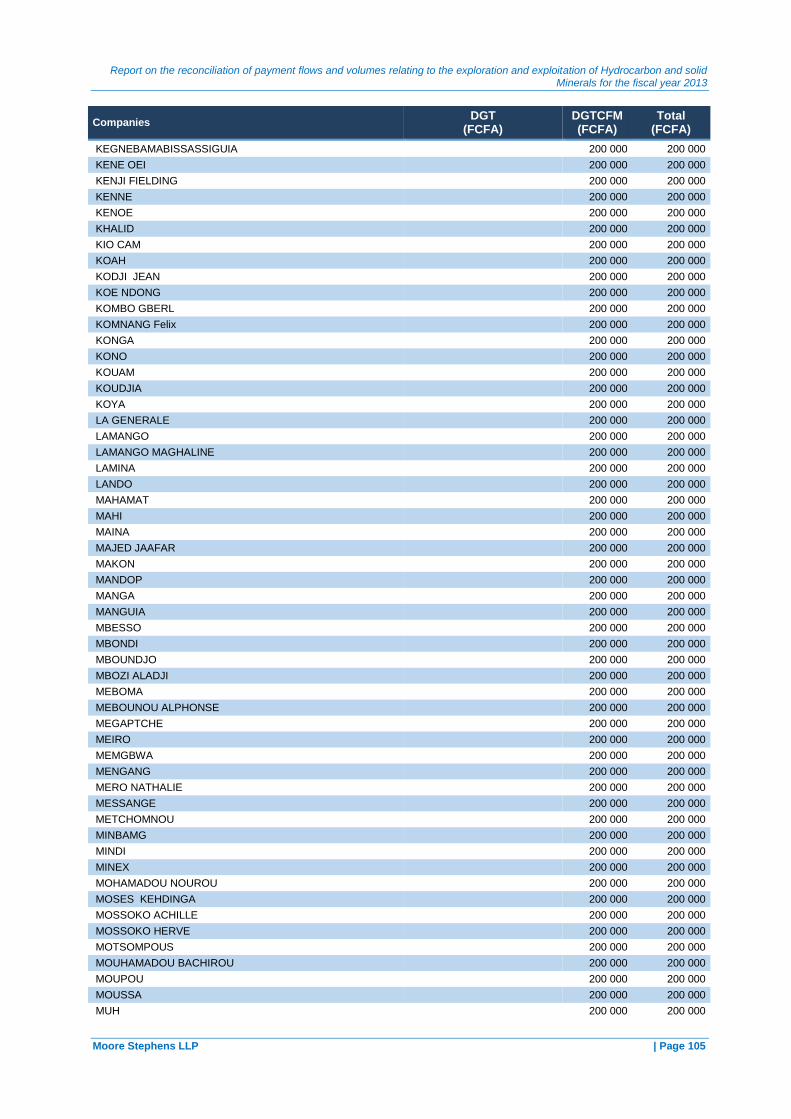
Report on the reconciliation of payment flows and volumes relating to the exploration and exploitation of Hydrocarbon and solid Minerals for the fiscal year 2013
Moore Stephens LLP | Page 105
Companies DGT
(FCFA) DGTCFM (FCFA)
Total (FCFA)
KEGNEBAMABISSASSIGUIA
200 000 200 000
KENE OEI 200 000 200 000
KENJI FIELDING
200 000 200 000
KENNE 200 000 200 000
KENOE
200 000 200 000
KHALID 200 000 200 000
KIO CAM
200 000 200 000
KOAH 200 000 200 000
KODJI JEAN
200 000 200 000
KOE NDONG 200 000 200 000
KOMBO GBERL
200 000 200 000
KOMNANG Felix 200 000 200 000
KONGA
200 000 200 000
KONO 200 000 200 000
KOUAM
200 000 200 000
KOUDJIA 200 000 200 000
KOYA
200 000 200 000
LA GENERALE 200 000 200 000
LAMANGO
200 000 200 000
LAMANGO MAGHALINE 200 000 200 000
LAMINA
200 000 200 000
LANDO 200 000 200 000
MAHAMAT
200 000 200 000
MAHI 200 000 200 000
MAINA
200 000 200 000
MAJED JAAFAR 200 000 200 000
MAKON
200 000 200 000
MANDOP 200 000 200 000
MANGA
200 000 200 000
MANGUIA 200 000 200 000
MBESSO
200 000 200 000
MBONDI 200 000 200 000
MBOUNDJO
200 000 200 000
MBOZI ALADJI 200 000 200 000
MEBOMA
200 000 200 000
MEBOUNOU ALPHONSE 200 000 200 000
MEGAPTCHE
200 000 200 000
MEIRO 200 000 200 000
MEMGBWA
200 000 200 000
MENGANG 200 000 200 000
MERO NATHALIE
200 000 200 000
MESSANGE 200 000 200 000
METCHOMNOU
200 000 200 000
MINBAMG 200 000 200 000
MINDI
200 000 200 000
MINEX 200 000 200 000
MOHAMADOU NOUROU
200 000 200 000
MOSES KEHDINGA 200 000 200 000
MOSSOKO ACHILLE
200 000 200 000
MOSSOKO HERVE 200 000 200 000
MOTSOMPOUS
200 000 200 000
MOUHAMADOU BACHIROU 200 000 200 000
MOUPOU
200 000 200 000
MOUSSA 200 000 200 000
MUH
200 000 200 000

Report on the reconciliation of payment flows and volumes relating to the exploration and exploitation of Hydrocarbon and solid Minerals for the fiscal year 2013
Moore Stephens LLP | Page 106
Companies DGT
(FCFA) DGTCFM (FCFA)
Total (FCFA)
NADAN 200 000 200 000
NALA MADELEINE
200 000 200 000
NAMBONA JEAN 200 000 200 000
NANARIMI CONSULTING
200 000 200 000
NDAD SUZANNE 200 000 200 000
NDANGA PLACIDE
200 000 200 000
NDEMTSOA 200 000 200 000
NDENGUE
200 000 200 000
NDI 200 000 200 000
NDIMA
200 000 200 000
NDISSARA 200 000 200 000
NDONNIE
200 000 200 000
NGAMBA EMMANUEL 200 000 200 000
NGANGUI
200 000 200 000
NGO BISSE 200 000 200 000
NGO DIPOUMBI
200 000 200 000
NGON 200 000 200 000
NGONDI NGWA
200 000 200 000
NGONDJO 200 000 200 000
NGONIA SUZANNE
200 000 200 000
NGONO ANNIE 200 000 200 000
NGUENSTING
200 000 200 000
NJANKO 200 000 200 000
NJUMBAN
200 000 200 000
NLEBE 200 000 200 000
NOAH JEAN
200 000 200 000
NOMO 200 000 200 000
NWAFO TALOM
200 000 200 000
NZIGOUAGNI 200 000 200 000
OUSMANOU CHEIHOU
200 000 200 000
OWONA 200 000 200 000
PEPINOU
200 000 200 000
PIEULI 200 000 200 000
REPDES SARL
200 000 200 000
RS INDUSTRY 200 000 200 000
SADOU BABANGUINDA
200 000 200 000
SALIHOU MAMADOU 200 000 200 000
SALIOU
200 000 200 000
SALOU NGAROU 200 000 200 000
SANTING SERGES
200 000 200 000
SEIDOU 200 000 200 000
SERENDIMA
200 000 200 000
SEWOLE GANAVA 200 000 200 000
SIDAKO
200 000 200 000
SOUIABOU BARAYA 200 000 200 000
SOULEYMANU
200 000 200 000
STE CHINA 200 000 200 000
STE FRAICHEUR
200 000 200 000
SZE SHUK 200 000 200 000
TAGNE
200 000 200 000
TAHI 200 000 200 000
TANG BILINGO
200 000 200 000
TANGUYIE 200 000 200 000
TANKO
200 000 200 000
TCHAGNA 200 000 200 000

Report on the reconciliation of payment flows and volumes relating to the exploration and exploitation of Hydrocarbon and solid Minerals for the fiscal year 2013
Moore Stephens LLP | Page 107
Companies DGT
(FCFA) DGTCFM (FCFA)
Total (FCFA)
TCHUNYEM
200 000 200 000
TEMBAR 200 000 200 000
THEUTOU
200 000 200 000
THOUSSAM NYAMSI 200 000 200 000
TOUKO
200 000 200 000
VERONIQUE GAZ 200 000 200 000
WAFO KEGNE
200 000 200 000
WAFO MOKAM 200 000 200 000
WAZIKI
200 000 200 000
WITGNA 200 000 200 000
YATCHOU
200 000 200 000
YELLEM 200 000 200 000
YEPMO
200 000 200 000
YERIME 200 000 200 000
YEUFO
200 000 200 000
YOULAMAYO 200 000 200 000
YOUNOUSSA GNAKINA
200 000 200 000
YOUSSOUFOU 200 000 200 000
ZAORO MIOT
200 000 200 000
ZARA 200 000 200 000
ZARI
200 000 200 000
ZIM 200 000 200 000
ZOULDE JODE
200 000 200 000
ZOULDE PLACIDE 200 000 200 000
THEFIL MINING
191 000 191 000
SOPROCAM 190 700 190 700
UCB MADIBA
189 520 189 520
GARGA ALIM 189 450 189 450
OIL LIBYA
186 500 186 500
CLIMA DUBAI/NGOUA 186 200 186 200
ISSA IBRAHIM
181 250 181 250
BOCOM 179 120 179 120
LJB
177 000 177 000
ISSAKA IB 171 945 171 945
MOUSSA OUSMANOU
166 500 166 500
MCT 165 000 165 000
ETS MOUBJAF
163 150 163 150
CLIMA DUBAI/NGOURA 162 960 162 960
CLIMAT DUBAI/NGOURA
162 960 162 960
ZENITH 160 860 160 860
KANANKE Mathurin Aimé
160 000 160 000
NYAMEN TAHI 160 000 160 000
BOCOM MINING
158 214 158 214
SOCIA 157 500 157 500
STE CAMEROUN DES INDUSTRIES 157 500 157 500
ADOUM OUSMANOU 156 075 156 075
CHINA DUBAI
150 000 150 000
STE AMAR GREEN 142 570 142 570
MINDU/WOUMBOU
139 500 139 500
OUSMAN MAHAMAT 138 865 138 865
LOKAMAT
137 080 137 080
CAMI TOYOTA 135 250 135 250
ROYAL FIRST COMPANY
134 600 134 600
OUSMANOU MAHAMAT 134 325 134 325
BCOG OIL
130 000 130 000

Report on the reconciliation of payment flows and volumes relating to the exploration and exploitation of Hydrocarbon and solid Minerals for the fiscal year 2013
Moore Stephens LLP | Page 108
Companies DGT
(FCFA) DGTCFM (FCFA)
Total (FCFA)
NKOUM ADOLPHE 130 000 130 000
ASSO LAURETTE
125 000 125 000
ISSA ADAMOU 125 000 125 000
MAHAMAT
125 000 125 000
MINDI JEAN 125 000 125 000
NEUBARH OUSMAN
125 000 125 000
NGONDO 125 000 125 000
NKOA JEAN
125 000 125 000
NLEND WONYU 125 000 125 000
ODI CHRISTEL
125 000 125 000
SOUAIBOU BARAYA 125 000 125 000
YOUSSOUFFA NGOUROU
125 000 125 000
ABDOU FATH 120 000 120 000
ABDOULAYE BAH
120 000 120 000
ABDOURAMAN BABA 120 000 120 000
ABESSOUKIE
120 000 120 000
AIBA 120 000 120 000
AKAMABA
120 000 120 000
ALEMA 120 000 120 000
ALIMA FONGHA
120 000 120 000
AMADOU MAODJI 120 000 120 000
AMINA
120 000 120 000
ANGONOBENE GERTRUDE 120 000 120 000
ANGYE NATHANAEL
120 000 120 000
ANOUBISSI PASCALINE 120 000 120 000
AROUNA SAMBO
120 000 120 000
ASSANA ZIDERE 120 000 120 000
ATEBA
120 000 120 000
ATTA MARIE 120 000 120 000
AZA ZAM
120 000 120 000
AZIA 120 000 120 000
BABA MARCEL
120 000 120 000
BABA NICOLAS 120 000 120 000
BALA NDELE
120 000 120 000
BALEP RITA 120 000 120 000
BALLA ADAMOU
120 000 120 000
BAMABISSASSIGUA 120 000 120 000
BAOUSSE
120 000 120 000
BEDA GASPARD 120 000 120 000
BEGUIMA
120 000 120 000
BEGUIMA KOULAGNA 120 000 120 000
BENDEKE MBOUA
120 000 120 000
BETAL 120 000 120 000
BIBIA OLOA
120 000 120 000
BILOUNGA ALICE 120 000 120 000
BINGUE
120 000 120 000
BITOMO 120 000 120 000
BITOUMBA
120 000 120 000
BIYAGA YOB 120 000 120 000
BOAYEK ABOULEDDY
120 000 120 000
BOLLA EUGENE 120 000 120 000
BOUKO NINGA
120 000 120 000
BOUNDAB 120 000 120 000
CHEIHOU OUSMANOU
120 000 120 000
CHI DICKSON 120 000 120 000

Report on the reconciliation of payment flows and volumes relating to the exploration and exploitation of Hydrocarbon and solid Minerals for the fiscal year 2013
Moore Stephens LLP | Page 109
Companies DGT
(FCFA) DGTCFM (FCFA)
Total (FCFA)
CISSA JULES
120 000 120 000
DAMBOURA 120 000 120 000
DJAKATOU BANYO
120 000 120 000
DJOBO 120 000 120 000
DJOULDE
120 000 120 000
DJOULDE ALAIN 120 000 120 000
DONFACK MANESSE
120 000 120 000
DOUDOU JEANETTE 120 000 120 000
EBAN ANTOINE
120 000 120 000
EBANGUI 120 000 120 000
EKOSSO
120 000 120 000
EMPOM 120 000 120 000
FADIMATOU DAMDAM
120 000 120 000
FADIMATOU YEIWA 120 000 120 000
FEUZEU PAUL
120 000 120 000
FONCHA 120 000 120 000
FONKOU OSCAR
120 000 120 000
FOUDA FRANCOIS 120 000 120 000
FOULEFACK
120 000 120 000
GADO NGAMA 120 000 120 000
GANAVA
120 000 120 000
GARBA DAOUDA 120 000 120 000
GARBA FRANCOIS
120 000 120 000
GAZA 120 000 120 000
GOBO DIUDONNE
120 000 120 000
GODANG FRANCOIS 120 000 120 000
GODFRED MBIKONGWIE
120 000 120 000
GOLIKE 120 000 120 000
GOZO CHARLES
120 000 120 000
HALIDOU DAOUDA 120 000 120 000
HAMADA AUGUSTIN
120 000 120 000
HAMADA DANIEL 120 000 120 000
HAMADOU MAL
120 000 120 000
HAMIDOU 120 000 120 000
IYA HASSANA
120 000 120 000
JIOKEND HERMAN 120 000 120 000
KADIDJA
120 000 120 000
KAH NDOKO H 120 000 120 000
KEGNE MICHEL
120 000 120 000
KELLA 120 000 120 000
KENJU FIELDING
120 000 120 000
KENNE LAMATA 120 000 120 000
KENNE ODI
120 000 120 000
KOAH EDJAH 120 000 120 000
KODI JEAN
120 000 120 000
KOMBO GBERI 120 000 120 000
KOUDJA
120 000 120 000
KOYA MARTIN 120 000 120 000
LAMANGO
120 000 120 000
MAHI TANGUIE 120 000 120 000
MAKOUN JEAN
120 000 120 000
MANGA RAYMOND 120 000 120 000
MBARGA AIME
120 000 120 000
MBARGA NDZANA 120 000 120 000
MBELE EUGENE
120 000 120 000
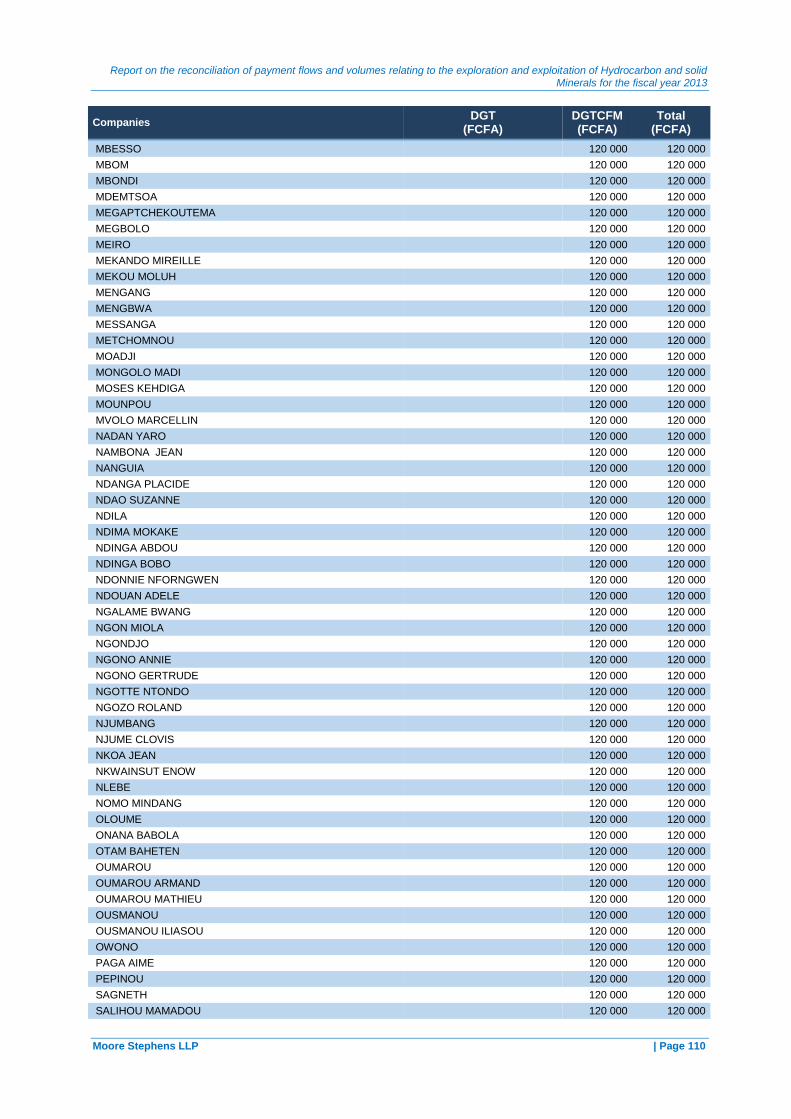
Report on the reconciliation of payment flows and volumes relating to the exploration and exploitation of Hydrocarbon and solid Minerals for the fiscal year 2013
Moore Stephens LLP | Page 110
Companies DGT
(FCFA) DGTCFM (FCFA)
Total (FCFA)
MBESSO 120 000 120 000
MBOM
120 000 120 000
MBONDI 120 000 120 000
MDEMTSOA
120 000 120 000
MEGAPTCHEKOUTEMA 120 000 120 000
MEGBOLO
120 000 120 000
MEIRO 120 000 120 000
MEKANDO MIREILLE
120 000 120 000
MEKOU MOLUH 120 000 120 000
MENGANG
120 000 120 000
MENGBWA 120 000 120 000
MESSANGA
120 000 120 000
METCHOMNOU 120 000 120 000
MOADJI
120 000 120 000
MONGOLO MADI 120 000 120 000
MOSES KEHDIGA
120 000 120 000
MOUNPOU 120 000 120 000
MVOLO MARCELLIN
120 000 120 000
NADAN YARO 120 000 120 000
NAMBONA JEAN
120 000 120 000
NANGUIA 120 000 120 000
NDANGA PLACIDE
120 000 120 000
NDAO SUZANNE 120 000 120 000
NDILA
120 000 120 000
NDIMA MOKAKE 120 000 120 000
NDINGA ABDOU
120 000 120 000
NDINGA BOBO 120 000 120 000
NDONNIE NFORNGWEN
120 000 120 000
NDOUAN ADELE 120 000 120 000
NGALAME BWANG
120 000 120 000
NGON MIOLA 120 000 120 000
NGONDJO
120 000 120 000
NGONO ANNIE 120 000 120 000
NGONO GERTRUDE
120 000 120 000
NGOTTE NTONDO 120 000 120 000
NGOZO ROLAND
120 000 120 000
NJUMBANG 120 000 120 000
NJUME CLOVIS
120 000 120 000
NKOA JEAN 120 000 120 000
NKWAINSUT ENOW
120 000 120 000
NLEBE 120 000 120 000
NOMO MINDANG
120 000 120 000
OLOUME 120 000 120 000
ONANA BABOLA
120 000 120 000
OTAM BAHETEN 120 000 120 000
OUMAROU
120 000 120 000
OUMAROU ARMAND 120 000 120 000
OUMAROU MATHIEU
120 000 120 000
OUSMANOU 120 000 120 000
OUSMANOU ILIASOU
120 000 120 000
OWONO 120 000 120 000
PAGA AIME
120 000 120 000
PEPINOU 120 000 120 000
SAGNETH
120 000 120 000
SALIHOU MAMADOU 120 000 120 000
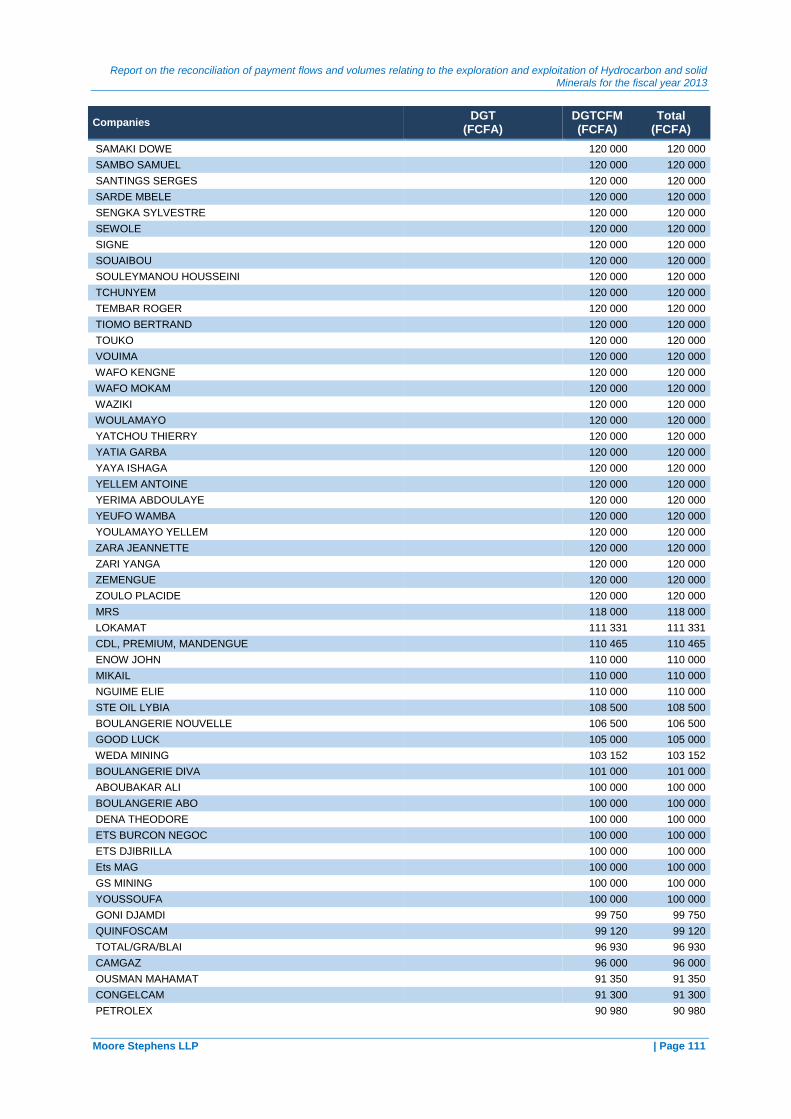
Report on the reconciliation of payment flows and volumes relating to the exploration and exploitation of Hydrocarbon and solid Minerals for the fiscal year 2013
Moore Stephens LLP | Page 111
Companies DGT
(FCFA) DGTCFM (FCFA)
Total (FCFA)
SAMAKI DOWE
120 000 120 000
SAMBO SAMUEL 120 000 120 000
SANTINGS SERGES
120 000 120 000
SARDE MBELE 120 000 120 000
SENGKA SYLVESTRE
120 000 120 000
SEWOLE 120 000 120 000
SIGNE
120 000 120 000
SOUAIBOU 120 000 120 000
SOULEYMANOU HOUSSEINI
120 000 120 000
TCHUNYEM 120 000 120 000
TEMBAR ROGER
120 000 120 000
TIOMO BERTRAND 120 000 120 000
TOUKO
120 000 120 000
VOUIMA 120 000 120 000
WAFO KENGNE
120 000 120 000
WAFO MOKAM 120 000 120 000
WAZIKI
120 000 120 000
WOULAMAYO 120 000 120 000
YATCHOU THIERRY
120 000 120 000
YATIA GARBA 120 000 120 000
YAYA ISHAGA
120 000 120 000
YELLEM ANTOINE 120 000 120 000
YERIMA ABDOULAYE
120 000 120 000
YEUFO WAMBA 120 000 120 000
YOULAMAYO YELLEM
120 000 120 000
ZARA JEANNETTE 120 000 120 000
ZARI YANGA
120 000 120 000
ZEMENGUE 120 000 120 000
ZOULO PLACIDE
120 000 120 000
MRS 118 000 118 000
LOKAMAT
111 331 111 331
CDL, PREMIUM, MANDENGUE 110 465 110 465
ENOW JOHN
110 000 110 000
MIKAIL 110 000 110 000
NGUIME ELIE
110 000 110 000
STE OIL LYBIA 108 500 108 500
BOULANGERIE NOUVELLE
106 500 106 500
GOOD LUCK 105 000 105 000
WEDA MINING
103 152 103 152
BOULANGERIE DIVA 101 000 101 000
ABOUBAKAR ALI
100 000 100 000
BOULANGERIE ABO 100 000 100 000
DENA THEODORE
100 000 100 000
ETS BURCON NEGOC 100 000 100 000
ETS DJIBRILLA
100 000 100 000
Ets MAG 100 000 100 000
GS MINING
100 000 100 000
YOUSSOUFA 100 000 100 000
GONI DJAMDI
99 750 99 750
QUINFOSCAM 99 120 99 120
TOTAL/GRA/BLAI
96 930 96 930
CAMGAZ 96 000 96 000
OUSMAN MAHAMAT
91 350 91 350
CONGELCAM 91 300 91 300
PETROLEX
90 980 90 980
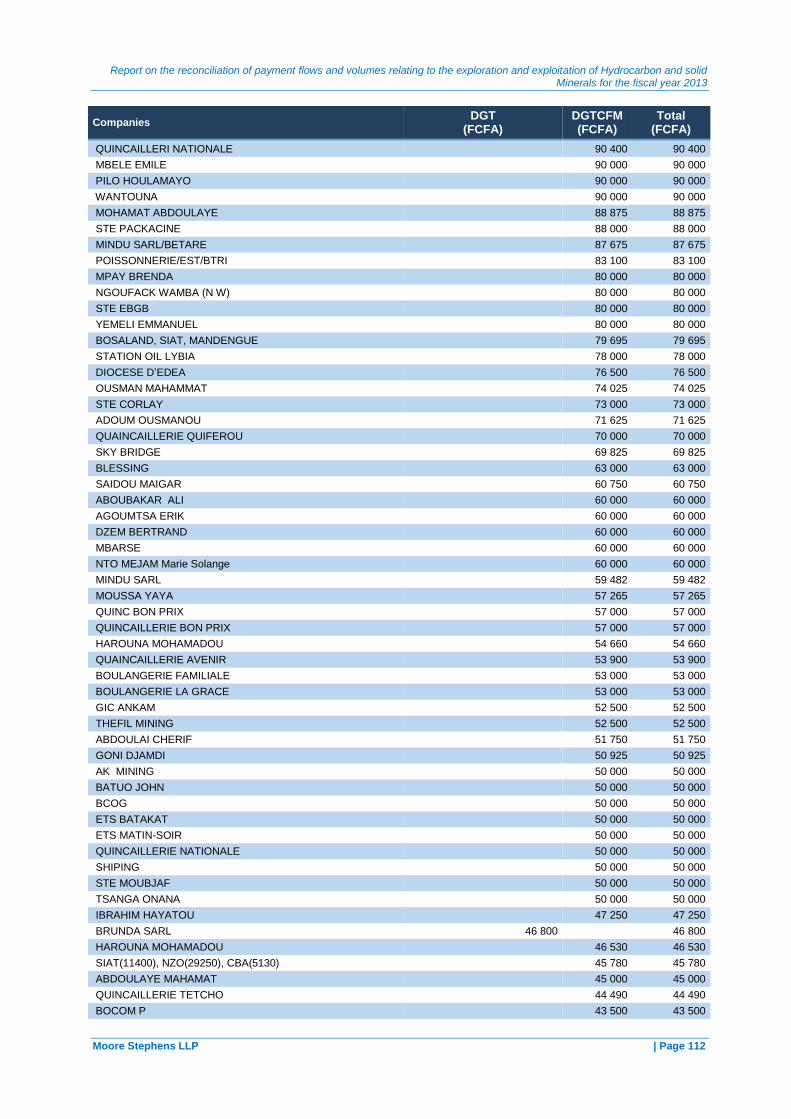
Report on the reconciliation of payment flows and volumes relating to the exploration and exploitation of Hydrocarbon and solid Minerals for the fiscal year 2013
Moore Stephens LLP | Page 112
Companies DGT
(FCFA) DGTCFM (FCFA)
Total (FCFA)
QUINCAILLERI NATIONALE 90 400 90 400
MBELE EMILE
90 000 90 000
PILO HOULAMAYO 90 000 90 000
WANTOUNA
90 000 90 000
MOHAMAT ABDOULAYE 88 875 88 875
STE PACKACINE
88 000 88 000
MINDU SARL/BETARE 87 675 87 675
POISSONNERIE/EST/BTRI
83 100 83 100
MPAY BRENDA 80 000 80 000
NGOUFACK WAMBA (N W)
80 000 80 000
STE EBGB 80 000 80 000
YEMELI EMMANUEL
80 000 80 000
BOSALAND, SIAT, MANDENGUE 79 695 79 695
STATION OIL LYBIA
78 000 78 000
DIOCESE D’EDEA 76 500 76 500
OUSMAN MAHAMMAT
74 025 74 025
STE CORLAY 73 000 73 000
ADOUM OUSMANOU
71 625 71 625
QUAINCAILLERIE QUIFEROU 70 000 70 000
SKY BRIDGE
69 825 69 825
BLESSING 63 000 63 000
SAIDOU MAIGAR
60 750 60 750
ABOUBAKAR ALI 60 000 60 000
AGOUMTSA ERIK
60 000 60 000
DZEM BERTRAND 60 000 60 000
MBARSE
60 000 60 000
NTO MEJAM Marie Solange 60 000 60 000
MINDU SARL
59 482 59 482
MOUSSA YAYA 57 265 57 265
QUINC BON PRIX
57 000 57 000
QUINCAILLERIE BON PRIX 57 000 57 000
HAROUNA MOHAMADOU
54 660 54 660
QUAINCAILLERIE AVENIR 53 900 53 900
BOULANGERIE FAMILIALE
53 000 53 000
BOULANGERIE LA GRACE 53 000 53 000
GIC ANKAM
52 500 52 500
THEFIL MINING 52 500 52 500
ABDOULAI CHERIF
51 750 51 750
GONI DJAMDI 50 925 50 925
AK MINING
50 000 50 000
BATUO JOHN 50 000 50 000
BCOG
50 000 50 000
ETS BATAKAT 50 000 50 000
ETS MATIN-SOIR
50 000 50 000
QUINCAILLERIE NATIONALE 50 000 50 000
SHIPING
50 000 50 000
STE MOUBJAF 50 000 50 000
TSANGA ONANA
50 000 50 000
IBRAHIM HAYATOU 47 250 47 250
BRUNDA SARL 46 800
46 800
HAROUNA MOHAMADOU 46 530 46 530
SIAT(11400), NZO(29250), CBA(5130) 45 780 45 780
ABDOULAYE MAHAMAT 45 000 45 000
QUINCAILLERIE TETCHO
44 490 44 490
BOCOM P 43 500 43 500

Report on the reconciliation of payment flows and volumes relating to the exploration and exploitation of Hydrocarbon and solid Minerals for the fiscal year 2013
Moore Stephens LLP | Page 113
Companies DGT
(FCFA) DGTCFM (FCFA)
Total (FCFA)
MINDU SARL/NGOURA
42 525 42 525
BOULANGERIE 42 000 42 000
MAHAMAT ABDOULAYE
42 000 42 000
BAKARI 40 000 40 000
KAMKUMOU
40 000 40 000
STE SOPRAT 40 000 40 000
HOTEL CHRITIANA
36 000 36 000
DOKO GOBONG 35 000 35 000
GOBONG
35 000 35 000
MBANA 35 000 35 000
SERIDONG
35 000 35 000
SOULEYMANOU 32 775 32 775
SOULEYMANOU
32 400 32 400
BOULANGERIE DJOCK 31 000 31 000
BOULANGERIE DOCK TIMOLEON 31 000 31 000
GIC ANKAM 30 600 30 600
ALEMA JANVIER
30 000 30 000
B.R.E.D.E 30 000 30 000
FLOT-CO
30 000 30 000
GHOMSI KAMGUIA Dénis José 30 000 30 000
MBINKUI Jérôme
30 000 30 000
NAMI NANA MERMOZ 30 000 30 000
NGUBOD NAZARIUS
30 000 30 000
NJOUME MALLO 30 000 30 000
PIWELE TCHANGUE Claude
30 000 30 000
SANAGA CONSTRUCTION 30 000 30 000
SOPROICAM
30 000 30 000
STE EBOSENGUI 30 000 30 000
DANY QUAINCAILLERIE
28 600 28 600
MENUISERIE YEFOUO LEANCE 28 000 28 000
BOULANGERIE BOBO ADAMOU 27 750 27 750
BOULANGERIE WELCOME 27 500 27 500
MENUISERIE TAKAM SADEU
27 500 27 500
DALIH ABBA 27 000 27 000
RAHAMAT MINING
26 250 26 250
RAHMAT MINING 26 250 26 250
FEDESCAM
25 600 25 600
MENUISERIE ESSAY 25 000 25 000
MENUISERIE MOMO ET FILS
25 000 25 000
MENUISERIE ARABO 24 000 24 000
MENUISERIE WHITE
24 000 24 000
MOUHAMOUDOU 23 850 23 850
ADOUM OUSMANOU 7357
23 625 23 625
MENUISERIE AFRIQUE 23 000 23 000
QUINCAILLERIE LA GLOIRE
23 000 23 000
ABDOULAYE MAHAMAT 22 500 22 500
FOSSILE
22 500 22 500
MENUISERIE NDIFO 22 500 22 500
MENUISERIE WAMBA
22 500 22 500
QUINCAILLERIE QUINONO 22 500 22 500
BOULANGERIE YAYA ADAMOU SOLET QUINCAILLERIE 21 600 21 600
QUAINCAILLERIE SOCOMACE 21 000 21 000
HOTEL TOURISTIQUE
20 000 20 000
MAX SYSTEM 20 000 20 000
ETS ORES
19 575 19 575

Report on the reconciliation of payment flows and volumes relating to the exploration and exploitation of Hydrocarbon and solid Minerals for the fiscal year 2013
Moore Stephens LLP | Page 114
Companies DGT
(FCFA) DGTCFM (FCFA)
Total (FCFA)
JBM 19 500 19 500
CAMEROUN BREVAGE
18 340 18 340
QUAINCAILLERIE ABOUBAKAR 18 000 18 000
QUANCAILLERIE TAMBOULA
18 000 18 000
SOULEYMANOU OUMAROU 16 650 16 650
MENUISERIE SHU
15 000 15 000
QUINCAILLERIE RENAISSANCE 15 000 15 000
CRUSTAL SA
14 000 14 000
SOULEMANOU 13 950 13 950
SOPRAT
12 400 12 400
SOULEYMANOU OUMAROU 11 700 11 700
HOTEL DE PARIS
10 000 10 000
SOPROLVIN 10 000 10 000
ZE ISIDORE
10 000 10 000
SOULEYMANOU OUMAROU 9 450 9 450
ABDOUMOUMINI
5 000 5 000
ABOH SAMUEL 5 000 5 000
ABOUB RENI
5 000 5 000
AHMADOU MOAJI 5 000 5 000
ANYOUAG CHRISTOPHE
5 000 5 000
APOUNA SAMBO 5 000 5 000
BANGO JULIENNE
5 000 5 000
BEGNI 5 000 5 000
BENGONO YVES
5 000 5 000
BIAMB BIBIANE 5 000 5 000
BOUBA MOKAWOU
5 000 5 000
BOUNDAR EVARISTE 5 000 5 000
DOUA PHILEMON
5 000 5 000
EBELA 5 000 5 000
GARBA BERTRAND
5 000 5 000
GORO DIEUDONNE 5 000 5 000
HAMADOU HAMIDOU
5 000 5 000
HONGLA HONGLA Jacques Benjamin 5 000 5 000
KENE LAMATA
5 000 5 000
LULLE ABRAHAM 5 000 5 000
MBALLA ELIANE
5 000 5 000
MEGBOLO JANVIER 5 000 5 000
MELONG JEAN
5 000 5 000
MONGOUE 5 000 5 000
NAMFACK
5 000 5 000
NGAGNIGNI AMADOU 5 000 5 000
NGALA IGNASUS
5 000 5 000
NGATCHOU 5 000 5 000
NGENE
5 000 5 000
NGO BASSANAGA 5 000 5 000
NGO MBOG
5 000 5 000
NGO NSAMA 5 000 5 000
NGO NTEP
5 000 5 000
NJAKO 5 000 5 000
NNAMA
5 000 5 000
OWONO MATHIEU 5 000 5 000
SANTING SERGES
5 000 5 000
SARYA BABA 5 000 5 000
SONFO MICHEL
5 000 5 000
SOULEYMANOU HOUSSENI 5 000 5 000
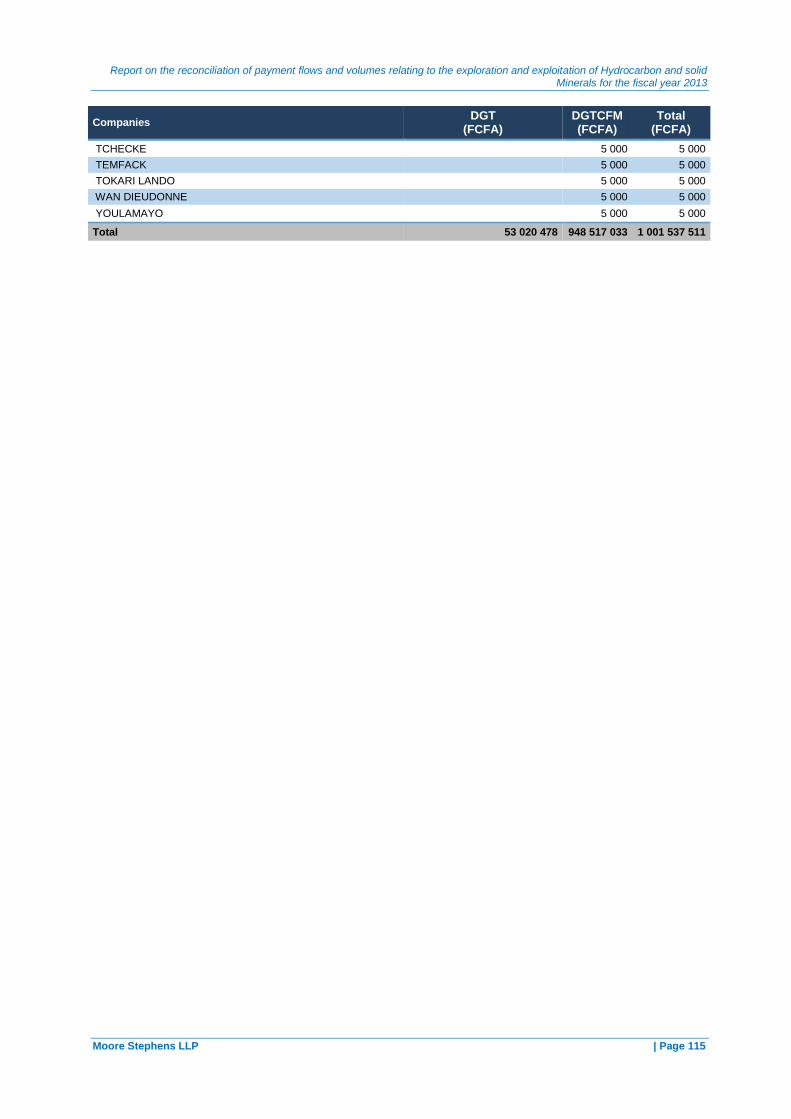
Report on the reconciliation of payment flows and volumes relating to the exploration and exploitation of Hydrocarbon and solid Minerals for the fiscal year 2013
Moore Stephens LLP | Page 115
Companies DGT
(FCFA) DGTCFM (FCFA)
Total (FCFA)
TCHECKE
5 000 5 000
TEMFACK 5 000 5 000
TOKARI LANDO
5 000 5 000
WAN DIEUDONNE 5 000 5 000
YOULAMAYO
5 000 5 000
Total 53 020 478 948 517 033 1 001 537 511
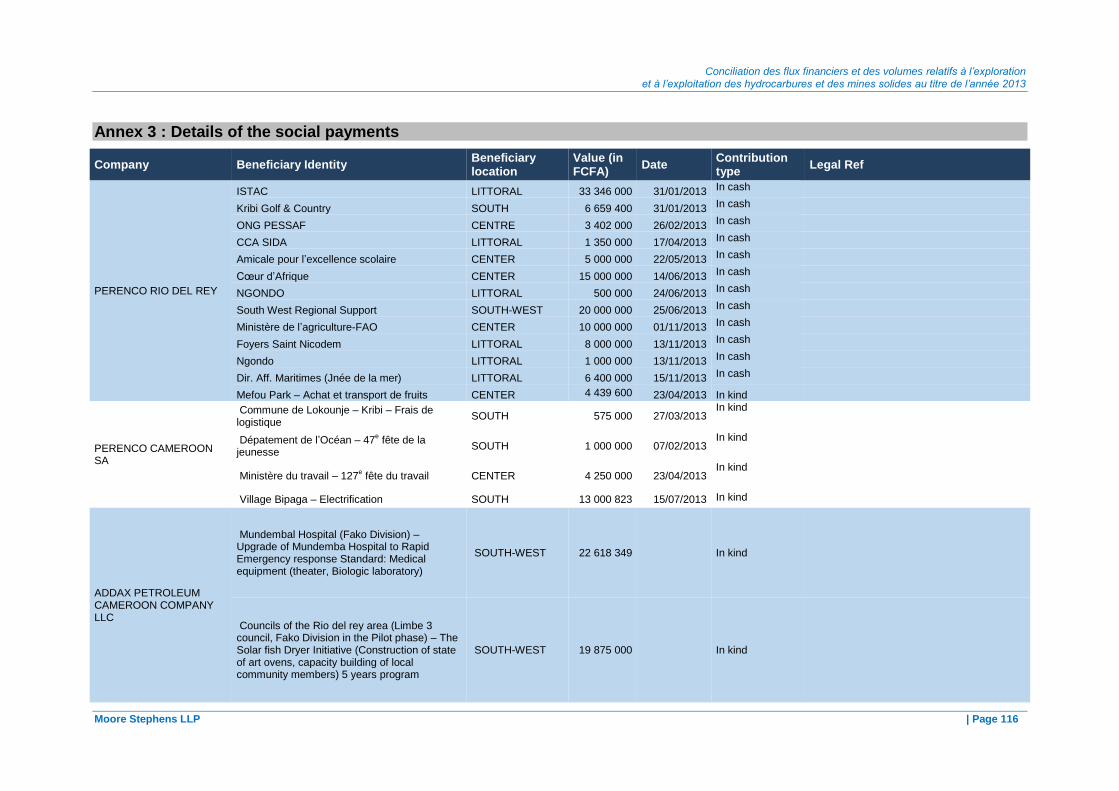
Conciliation des flux financiers et des volumes relatifs à l’exploration et à l’exploitation des hydrocarbures et des mines solides au titre de l’année 2013
Moore Stephens LLP | Page 116
Annex 3 : Details of the social payments
Company Beneficiary Identity Beneficiary location
Value (in FCFA)
Date Contribution type
Legal Ref
PERENCO RIO DEL REY
ISTAC LITTORAL 33 346 000 31/01/2013 In cash
Kribi Golf & Country SOUTH 6 659 400 31/01/2013 In cash
ONG PESSAF CENTRE 3 402 000 26/02/2013 In cash
CCA SIDA LITTORAL 1 350 000 17/04/2013 In cash
Amicale pour l’excellence scolaire CENTER 5 000 000 22/05/2013 In cash
Cœur d’Afrique CENTER 15 000 000 14/06/2013 In cash
NGONDO LITTORAL 500 000 24/06/2013 In cash
South West Regional Support SOUTH-WEST 20 000 000 25/06/2013 In cash
Ministère de l’agriculture-FAO CENTER 10 000 000 01/11/2013 In cash
Foyers Saint Nicodem LITTORAL 8 000 000 13/11/2013 In cash
Ngondo LITTORAL 1 000 000 13/11/2013 In cash
Dir. Aff. Maritimes (Jnée de la mer) LITTORAL 6 400 000 15/11/2013 In cash
Mefou Park – Achat et transport de fruits CENTER 4 439 600 23/04/2013 In kind
PERENCO CAMEROON SA
Commune de Lokounje – Kribi – Frais de logistique
SOUTH 575 000 27/03/2013 In kind
Dépatement de l’Océan – 47e fête de la
jeunesse SOUTH 1 000 000 07/02/2013
In kind
Ministère du travail – 127e fête du travail CENTER 4 250 000 23/04/2013
In kind
Village Bipaga – Electrification SOUTH 13 000 823 15/07/2013 In kind
ADDAX PETROLEUM CAMEROON COMPANY LLC
Mundembal Hospital (Fako Division) – Upgrade of Mundemba Hospital to Rapid Emergency response Standard: Medical equipment (theater, Biologic laboratory)
SOUTH-WEST 22 618 349 In kind
Councils of the Rio del rey area (Limbe 3 council, Fako Division in the Pilot phase) – The Solar fish Dryer Initiative (Construction of state of art ovens, capacity building of local community members) 5 years program
SOUTH-WEST 19 875 000 In kind

Report on the reconciliation of payment flows and volumes relating to the exploration and exploitation of Hydrocarbon and solid Minerals for the fiscal year 2013
Moore Stephens LLP | Page 117
Company Beneficiary Identity Beneficiary location
Value (in FCFA)
Date Contribution type
Legal Ref
Rodeo Development LTD (Gaz de Cameroun) Logbaba Hospital Douala 1 922 000 20/05/2013
In cash
Kosmos Energy Cameroon HC
Reach Out Cameroon – Bamusso Sub-Division Bamusso Sub-Division – Cameroon
30 771 235
19/02/2013 In cash
Contract CAM-03-12-012 dated 12-Dec-2012
Cabinet Medou – Boa Village Boa Village – Cameroon
19 845 000
03/07/2013 In cash
Contract CAM-03-004-00 dated 01-Oct-2010
Reach Out Cameroon – Bamusso Sub-Division Bamusso Sub-Division – Cameroon
16 120 340
19/07/2013 In cash
Contract CAM-03-12-012 dated 12-Dec-2012
Cabinet Medou – Boa Village Boa Village – Cameroon
5 670 000
01/08/2013 In cash
Contract CAM-03-004-00 dated 01-Oct-2010
Reach Out Cameroon – Bamusso Sub-Division Bamusso Sub-Division – Cameroon
2 326 153
12/08/2013 In cash
Contract CAM-03-12-012 dated 12-Dec-2012
Sodicam – BIR equipment Douala, Cameroon 2 485
300 19/09/2013
In cash n/a
Cabinet Medou – Boa Village Boa Village – Cameroon
8 505 000
02/10/2013 In cash
Contract CAM-03-004-00 dated 01-Oct-2010
Cabinet Medou – Boa Village Boa Village – Cameroon
2 835 000
25/10/2013 In cash
Contract CAM-03-004-00 dated 01-Oct-2010
Dana Petroleum
Njomo (EP) Omam Esther Bakassi 500 000 05/02/2013 In cash
CSR payment obligations within Bakassi PSC
Bir Mr Teresi Issobo 7 000 000 19/08/2013 In cash
Da – Azimi Oumarou (Patrick Teresi) Issobo 7 000 000 03/09/2013 In cash
Da – Azimi Oumarou (Patrick Teresi) Issobo 7 000 000 10/09/2013 In cash
Da – Azimi Oumarou (Patrick Teresi) Issobo 5 100 000 23/09/2013 In cash
Issobo Primary School Issobo 1 270 000 06/11/2013 In cash
Issobo Primary School Issobo 2 216 464 14/11/2013 In cash
Orunyan II Primary School Orunyan 931 546 20/12/2013 In cash
COTCO
LIMI MAMA Belabo village 3 159 000 09/01/2013 In cash
Section 5.5.4 PGE de COTCO Vol. 3
NDAGA Albert Ngaye 200 000 08/02/2013 In cash
WIRIMBOLE Samori Ngaye 5 000 08/02/2013 In cash
SELMA Théophile Ndoumba Kanga 670 000 08/10/2013 In cash
ANANA Daniel Ndoumba Kanga 1 228 000 08/10/2013 In cash
NDANGA Raymond Ndoumba Kanga 360 000 08/10/2013 In cash
BANA Olivier Ndoumba Kanga 694 000 08/10/2013 In cash
NGOMO Jean Martin Bandevouri 491 000 28/11/2013 In cash
DONGO Emilienne Ndoumba Kanga 51 000 19/12/2013 In cash
SEDI Jeanne D’arc Ndoumba Kanga 647 000 19/12/2013 In cash

Report on the reconciliation of payment flows and volumes relating to the exploration and exploitation of Hydrocarbon and solid Minerals for the fiscal year 2013
Moore Stephens LLP | Page 118
Company Beneficiary Identity Beneficiary location
Value (in FCFA)
Date Contribution type
Legal Ref
ROCAGLIA PIERRE
Conseil National de la Jeunesse Figuil NORTH 30 000 01/02/2013 In cash
-
FENASCO FIGUIL NORTH 30 000 01/03/2013 In cash -
DELEGATION FEMME ET FAMILLE/ Figuil NORTH
30 000 07/03/2013 In cash
-
CODE BIOU /FIGUIL NORTH 50 000 In cash -
Don Sous-Préfecture/Figuil NORTH 50 000 03/05/2013 In cash -
Don Sous-Préfecture/Figuil NORTH 50 000 01/05/2013 In cash -
LES CIMENTERIES DU CAMEROUN
Mairie de Mombo LITTORAL
36 473 127 2 013 In cash
342 132 337

Conciliation des flux financiers et des volumes relatifs à l’exploration et à l’exploitation des hydrocarbures et des mines solides au titre de l’année 2013
Moore Stephens LLP | P a g e 119
Annex 4 : Permanent employment by extractive company
No. Companies
Employment 2013
National employment Non national employment
Permanent Contract Permanent Contract
1 NHC 329 - - -
2 Perenco Rio Del Rey 224 25
3 Perenco Cameroun 76 - 6 -
4 Perenco Oil & Gas Cameroun - - - -
5 Addax Petroleum Cam Company 114 130 9 33
6 Euroil Ltd 42 1
7 Noble Energy Cameroon LTD 9 2
8 ADDAX Petroleum Cameroon Limited 1 1 1
9 MURPHY CAMEROON NTEM OIL CO., LTD - 2
10 Rodeo Development LTD 123 5
11 Kosmos Energy 5 2
12 Glencore Exploration Cameroon 9 1
13 Yang Chang Logone 10 - - 6
14 Dana Petroleum 1 1
15 COTCO 207 - 27 -
16 Geovic 46 1
17 C&K Mining 171 -
18 ROCAGLIA 34 - - -
19 CAPAM 272 - - -
20 Cimencam NP NP NP NP
21 Razel 154 2 3 -
22 CAM IRON 34 14
Total 2 008 119
n/p : not provided

Conciliation des flux financiers et des volumes relatifs à l’exploration et à l’exploitation des hydrocarbures et des mines solides au titre de l’année 2013
Moore Stephens LLP | Page 120
Annex 5 : Structure of Capital and beneficial ownership
No. Company
Listed entity or a 100% subsidiary of a publicly traded company
shareholders % ownership Real property information
1 NHC n/a (public company)
Cameroonian State 100% n/a
2 PERENCO RIO DEL REY no NHC Perenco Oil & Gas International LTD – Bahamas Paris Orléans – France
20% 75,8% 4,2%
n/c
3 PERENCO CAMEROON SA no NHC Perenco Oil & Gas International LTD – Bahamas
20% 80%
n/c
4 PERENCO OIL & GAS CAMEROON Ltd n/a Succursal de Perenco Cameroun n/a n/a
5 ADDAX PETROLEUM CAMEROON COMPANY LLC
no NHC Addax Petroleum Holdings Limited – Chine
20% 80%
SINOPEC GROUP – Company of the State of China SINOPEC is listed on the stock exchanges in Hon Kong, New York, London and Shanghai (www.addaxpetroleum.com)
6 EUROIL LIMITED yes Bowleven PLC 100% Bowleven PLC is listed on the stock market AIM
7 NOBLE ENERGY CAMEROON LIMITED yes NOBLE ENERGY INC - USA 100% NOBLE ENERGY INC is listed on the stock market in New York
8 ADDAX PETROLEUM CAMEROON LIMITED no NHC Addax Petroleum Holdings Limited – Chine
20% 80%
SINOPEC GROUP – Company of the State of China SINOPEC is listed on the stock exchanges in Hon Kong, New York, London and Shanghai (www.addaxpetroleum.com)
9 MURPHY CAMEROON NTEM OIL CO. LTD yes Murphy Exploration & Production Company – International
100% NOBLE ENERGY INC is listed on the stock market in New York
10 RODEO DEVELOPMENT LTD yes VICTORIA OIL AND GAS RSM
60% 40%
n/c
11 Kosmos Energy Cameroon HC yes Kosmos Energy Operating – Cayman Island 100% Kosmos Energy Operating 100% owned by Kosmos Energy Ltd. Which is listed on the stock market in New York
12 GLENCORE EXPLORATION CAMEROON Ltd yes Glencore IAG 100% Glencore is listed on the London Stock Exchange (GLUK)
13 YAN CHANG LOGONE DEVELOPMENT COMPANY
n/c n/c n/c n/c
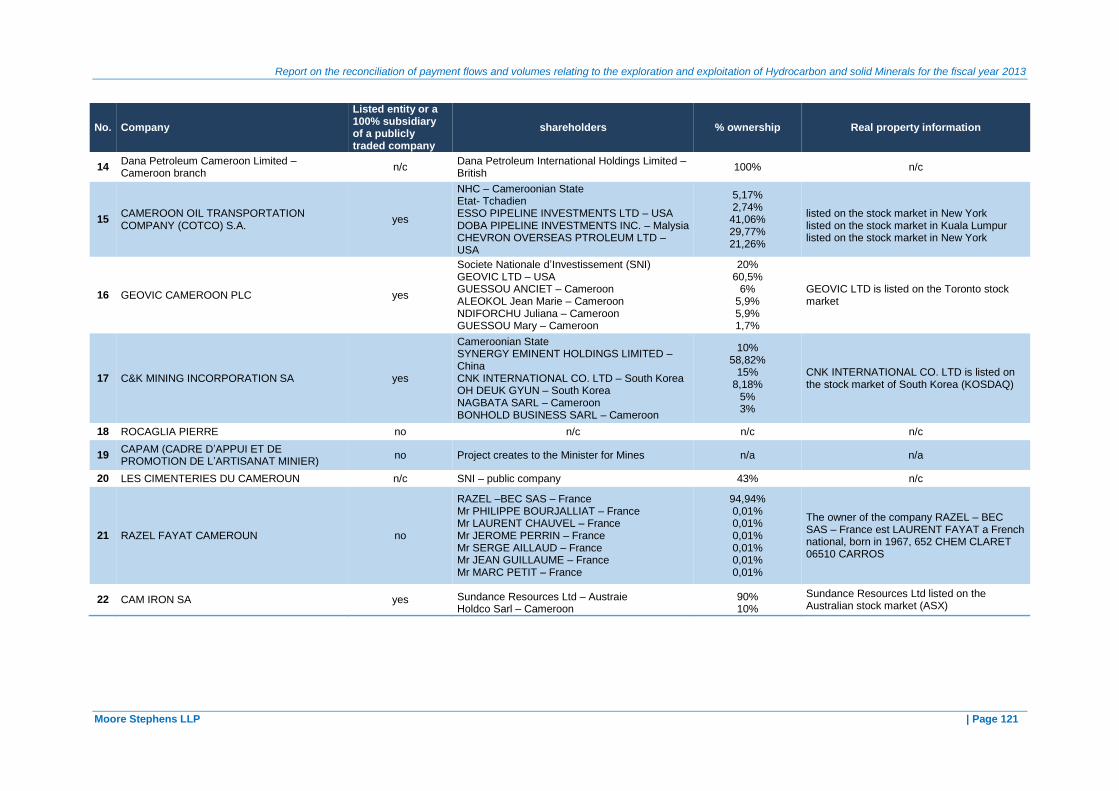
Report on the reconciliation of payment flows and volumes relating to the exploration and exploitation of Hydrocarbon and solid Minerals for the fiscal year 2013
Moore Stephens LLP | Page 121
No. Company
Listed entity or a 100% subsidiary of a publicly traded company
shareholders % ownership Real property information
14 Dana Petroleum Cameroon Limited – Cameroon branch
n/c Dana Petroleum International Holdings Limited – British
100% n/c
15 CAMEROON OIL TRANSPORTATION COMPANY (COTCO) S.A.
yes
NHC – Cameroonian State Etat- Tchadien ESSO PIPELINE INVESTMENTS LTD – USA DOBA PIPELINE INVESTMENTS INC. – Malysia CHEVRON OVERSEAS PTROLEUM LTD – USA
5,17% 2,74%
41,06% 29,77% 21,26%
listed on the stock market in New York listed on the stock market in Kuala Lumpur listed on the stock market in New York
16 GEOVIC CAMEROON PLC yes
Societe Nationale d’Investissement (SNI) GEOVIC LTD – USA GUESSOU ANCIET – Cameroon ALEOKOL Jean Marie – Cameroon NDIFORCHU Juliana – Cameroon GUESSOU Mary – Cameroon
20% 60,5%
6% 5,9% 5,9% 1,7%
GEOVIC LTD is listed on the Toronto stock market
17 C&K MINING INCORPORATION SA yes
Cameroonian State SYNERGY EMINENT HOLDINGS LIMITED – China CNK INTERNATIONAL CO. LTD – South Korea OH DEUK GYUN – South Korea NAGBATA SARL – Cameroon BONHOLD BUSINESS SARL – Cameroon
10% 58,82%
15% 8,18%
5% 3%
CNK INTERNATIONAL CO. LTD is listed on the stock market of South Korea (KOSDAQ)
18 ROCAGLIA PIERRE no n/c n/c n/c
19 CAPAM (CADRE D’APPUI ET DE PROMOTION DE L’ARTISANAT MINIER)
no Project creates to the Minister for Mines n/a n/a
20 LES CIMENTERIES DU CAMEROUN n/c SNI – public company 43% n/c
21 RAZEL FAYAT CAMEROUN no
RAZEL –BEC SAS – France Mr PHILIPPE BOURJALLIAT – France Mr LAURENT CHAUVEL – France Mr JEROME PERRIN – France Mr SERGE AILLAUD – France Mr JEAN GUILLAUME – France Mr MARC PETIT – France
94,94% 0,01% 0,01% 0,01% 0,01% 0,01% 0,01%
The owner of the company RAZEL – BEC SAS – France est LAURENT FAYAT a French national, born in 1967, 652 CHEM CLARET 06510 CARROS
22 CAM IRON SA yes Sundance Resources Ltd – Austraie Holdco Sarl – Cameroon
90% 10%
Sundance Resources Ltd listed on the Australian stock market (ASX)

Conciliation des flux financiers et des volumes relatifs à l’exploration et à l’exploitation des hydrocarbures et des mines solides au titre de l’année 2013
Moore Stephens LLP | Page 122
Annex 6 : Reporting Templates
FORMULAIRE DE DECLARATION (Paiements / Recettes)
Période couverte : 1er janvier au 31 décembre 2013
Type de produit Quantité de productionUnité de productionValeur de la production
1
2
3
Type de produit Quantité exportéeUnité Valeur des exportations
1
2
3
Fonction
Tél.
bbl FCFA USD
Flux de Paiement en nature
1 Parts d'huile de la SNH-Etat (Petrole) SNH-Mandat
2 Parts d'huile de la SNH-Etat (Gaz) SNH-Mandat
3 Parts d'huile de la SNH-Etat (Condensat) SNH-Mandat
4 Parts d'huile de la SNH-Associé (Petrole) SNH-Fonct
5 Parts d'huile de la SNH-Associé (Gaz) SNH-Fonct
6 Parts d'huile de la SNH-Associé (Cendensat) SNH-Fonct
Total paiements en nature #
Parts d'huile de l'Etat Commercialisées
7 Parts d'huile SNH-ETAT commercialisées par la SNH (Petrole)DMG/MINMIDT
8 Parts d'huile SNH-ETAT commercialisées par la SNH (Gas)DMG/MINMIDT
9 Parts d'huile SNH-ETAT commercialisées par la SNH (Condensat)DMG/MINMIDT
Total Parts d'huile commercialisés #
Flux de paiement en numéraires
10 Transferts directs au Trésor Public par la SNH DGTCFM
11 Transferts indirects au Trésor Public (Interventions directes SNH)DGTCFM
12 Dividendes SNH DGTCFM
Total transferts au Trésor Public par la SNH - -
13 Redevance Minière Proportionnelle SNH-Mandat
14 Redevance Proportionnelle à la Production SNH-Mandat
15 Redevance Minière Négative ( à mettre en signe - ) SNH-Mandat
16 Bonus de signature SNH-Mandat
17 Bonus de Production SNH-Mandat
18 Prélèvement pétrolier additionnel SNH-Mandat
19 Frais de Formation SNH-Mandat
20 Taxes sur les activités de transport des
hydrocarbures SNH-Mandat
21 Dividendes Filiales SNH SNH-Fonct
Total paiements des sociétés pétrolières à la SNH - -
Exportation
Adresse email
Formulaire préparé par
Taxes Nomenclature des flux Payé àPaiements / Recettes (*)
Commentaires
Nom de l'entité (Entreprise / Administration publique)
Numéro d'Indentification Unique (NIU)
Production/Transport
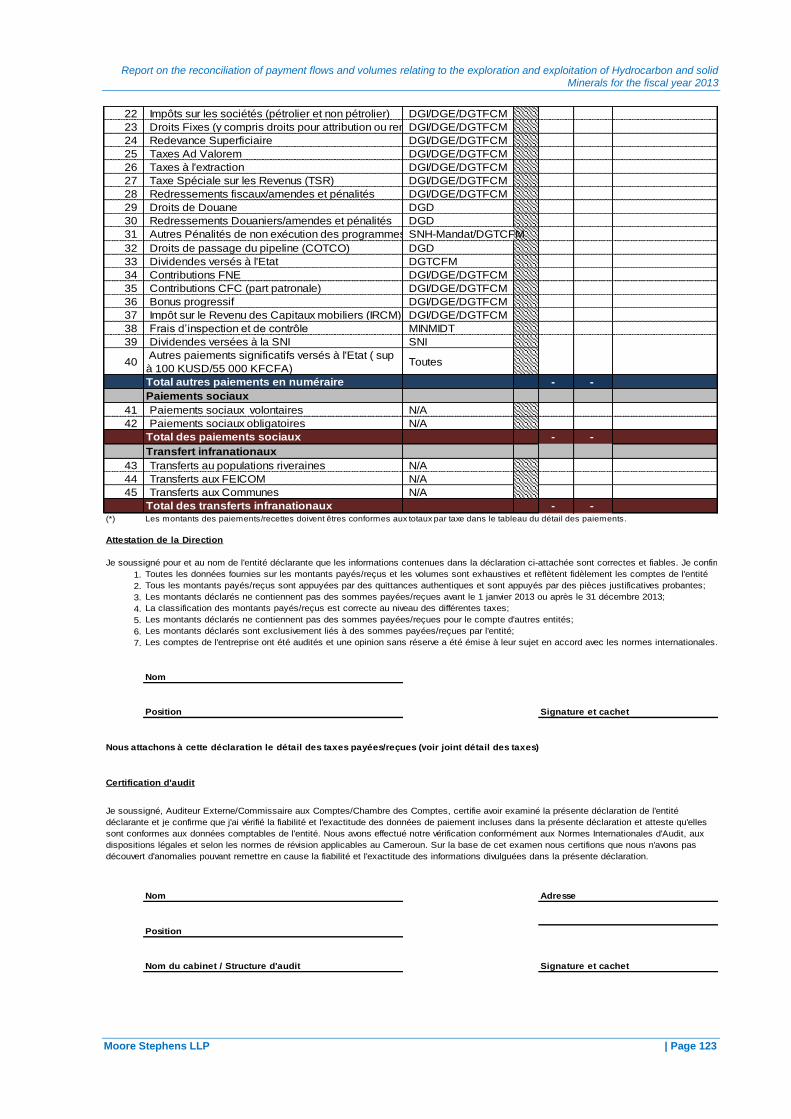
Report on the reconciliation of payment flows and volumes relating to the exploration and exploitation of Hydrocarbon and solid Minerals for the fiscal year 2013
Moore Stephens LLP | Page 123
22 Impôts sur les sociétés (pétrolier et non pétrolier) DGI/DGE/DGTFCM
23 Droits Fixes (y compris droits pour attribution ou renouvellement de permis)DGI/DGE/DGTFCM
24 Redevance Superficiaire DGI/DGE/DGTFCM
25 Taxes Ad Valorem DGI/DGE/DGTFCM
26 Taxes à l'extraction DGI/DGE/DGTFCM
27 Taxe Spéciale sur les Revenus (TSR) DGI/DGE/DGTFCM
28 Redressements fiscaux/amendes et pénalités DGI/DGE/DGTFCM
29 Droits de Douane DGD
30 Redressements Douaniers/amendes et pénalités DGD
31 Autres Pénalités de non exécution des programmes d'exploration/productionSNH-Mandat/DGTCFM
32 Droits de passage du pipeline (COTCO) DGD
33 Dividendes versés à l'Etat DGTCFM
34 Contributions FNE DGI/DGE/DGTFCM
35 Contributions CFC (part patronale) DGI/DGE/DGTFCM
36 Bonus progressif DGI/DGE/DGTFCM
37 Impôt sur le Revenu des Capitaux mobiliers (IRCM) DGI/DGE/DGTFCM
38 Frais d’inspection et de contrôle MINMIDT
39 Dividendes versées à la SNI SNI
40 Autres paiements significatifs versés à l'Etat ( sup
à 100 KUSD/55 000 KFCFA) Toutes
Total autres paiements en numéraire - -
Paiements sociaux
41 Paiements sociaux volontaires N/A
42 Paiements sociaux obligatoires N/A
Total des paiements sociaux - -
Transfert infranationaux
43 Transferts au populations riveraines N/A
44 Transferts aux FEICOM N/A
45 Transferts aux Communes N/A
Total des transferts infranationaux - - (*) Les montants des paiements/recettes doivent êtres conformes aux totaux par taxe dans le tableau du détail des paiements.
1.
2.
3.
4.
5.
6.
7.
Nom
Position Signature et cachet
Nom Adresse
Position
Nom du cabinet / Structure d'audit Signature et cachet
Les montants déclarés ne contiennent pas des sommes payées/reçues pour le compte d'autres entités;
Attestation de la Direction
Je soussigné pour et au nom de l'entité déclarante que les informations contenues dans la déclaration ci-attachée sont correctes et fiables. Je confirme particulièrement que:
Toutes les données fournies sur les montants payés/reçus et les volumes sont exhaustives et reflètent fidèlement les comptes de l'entité
Tous les montants payés/reçus sont appuyées par des quittances authentiques et sont appuyés par des pièces justificatives probantes;
Les montants déclarés ne contiennent pas des sommes payées/reçues avant le 1 janvier 2013 ou après le 31 décembre 2013;
Je soussigné, Auditeur Externe/Commissaire aux Comptes/Chambre des Comptes, certifie avoir examiné la présente déclaration de l'entité
déclarante et je confirme que j'ai vérifié la fiabilité et l'exactitude des données de paiement incluses dans la présente déclaration et atteste qu'elles
sont conformes aux données comptables de l'entité. Nous avons effectué notre vérification conformément aux Normes Internationales d'Audit, aux
dispositions légales et selon les normes de révision applicables au Cameroun. Sur la base de cet examen nous certifions que nous n'avons pas
découvert d'anomalies pouvant remettre en cause la fiabilité et l'exactitude des informations divulguées dans la présente déclaration.
La classification des montants payés/reçus est correcte au niveau des différentes taxes;
Les montants déclarés sont exclusivement liés à des sommes payées/reçues par l'entité;
Les comptes de l'entreprise ont été audités et une opinion sans réserve a été émise à leur sujet en accord avec les normes internationales.
Nous attachons à cette déclaration le détail des taxes payées/reçues (voir joint détail des taxes)
Certification d'audit
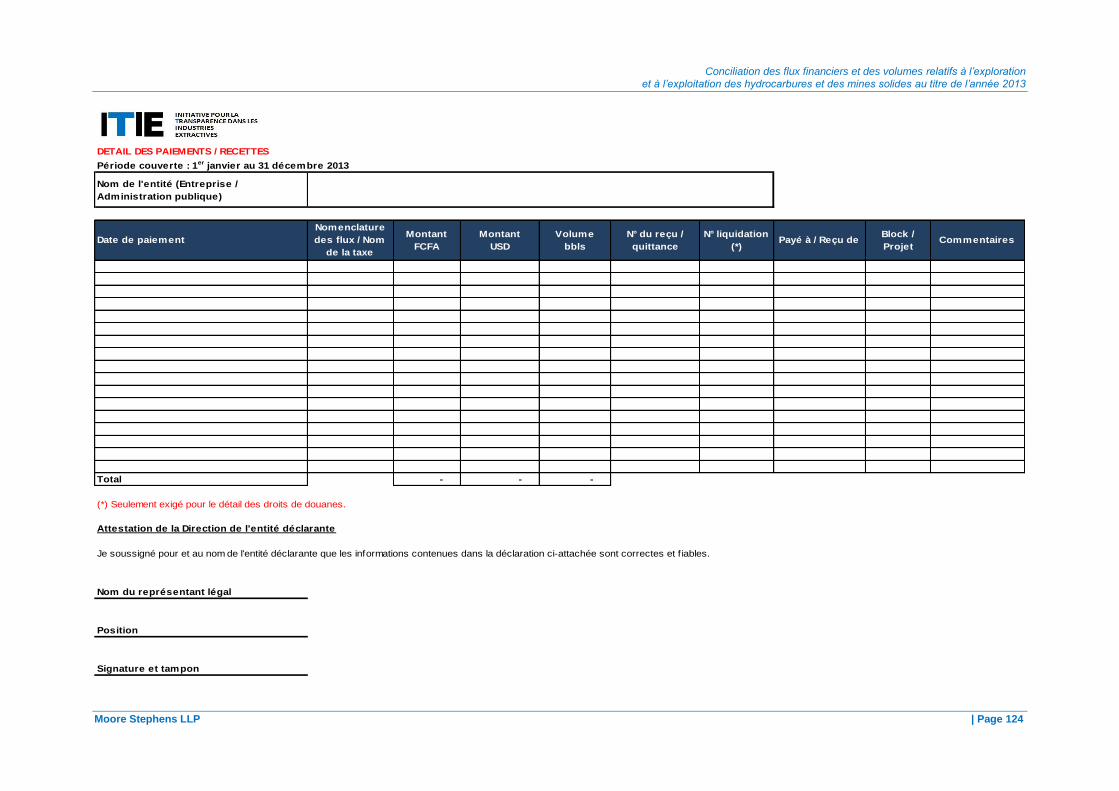
Conciliation des flux financiers et des volumes relatifs à l’exploration et à l’exploitation des hydrocarbures et des mines solides au titre de l’année 2013
Moore Stephens LLP | Page 124
Nom de l'entité (Entreprise /
Administration publique)
Date de paiement
Nomenclature
des flux / Nom
de la taxe
Montant
FCFA
Montant
USD
Volume
bbls
N° du reçu /
quittance
N° liquidation
(*)Payé à / Reçu de
Block /
ProjetCommentaires
Total - - -
(*) Seulement exigé pour le détail des droits de douanes.
Nom du représentant légal
Position
Signature et tampon
DETAIL DES PAIEMENTS / RECETTES
Période couverte : 1er janvier au 31 décembre 2013
Détail des paiements
Attestation de la Direction de l'entité déclarante
Je soussigné pour et au nom de l'entité déclarante que les informations contenues dans la déclaration ci-attachée sont correctes et f iables.

Report on the reconciliation of payment flows and volumes relating to the exploration and exploitation of Hydrocarbon and solid Minerals for the fiscal year 2013
Moore Stephens LLP | Page 125
DETAIL DES EXPORTATIONS / VENTES
Période couverte : 1er janvier au 31 décembre 2013
N° / Ref. Expédition /
Cargaison
Date
d'expédition /
Cargaison
Poids /
Volume
Unité
[à renseigner]
Qualité
(Concentration)
Prix unitaire
(USD)
Décote /
Brent USD
Valeur totale
(en USD)
Valeur totale
(en FCFA)
Entité
acheteur
Pays du
destinataire de
l'expédition/la
cargaison
0 0 0
Je soussigné pour et au nom de l'entité déclarante que les informations contenues dans la déclaration ci-attachée sont correctes et f iables.
Nom du représentant légal
Position
Signature et tampon
Attestation de la Direction de l'entité déclarante
Exportations/Ventes
Ce formulaire est destiné aux entreprises et à la DGD
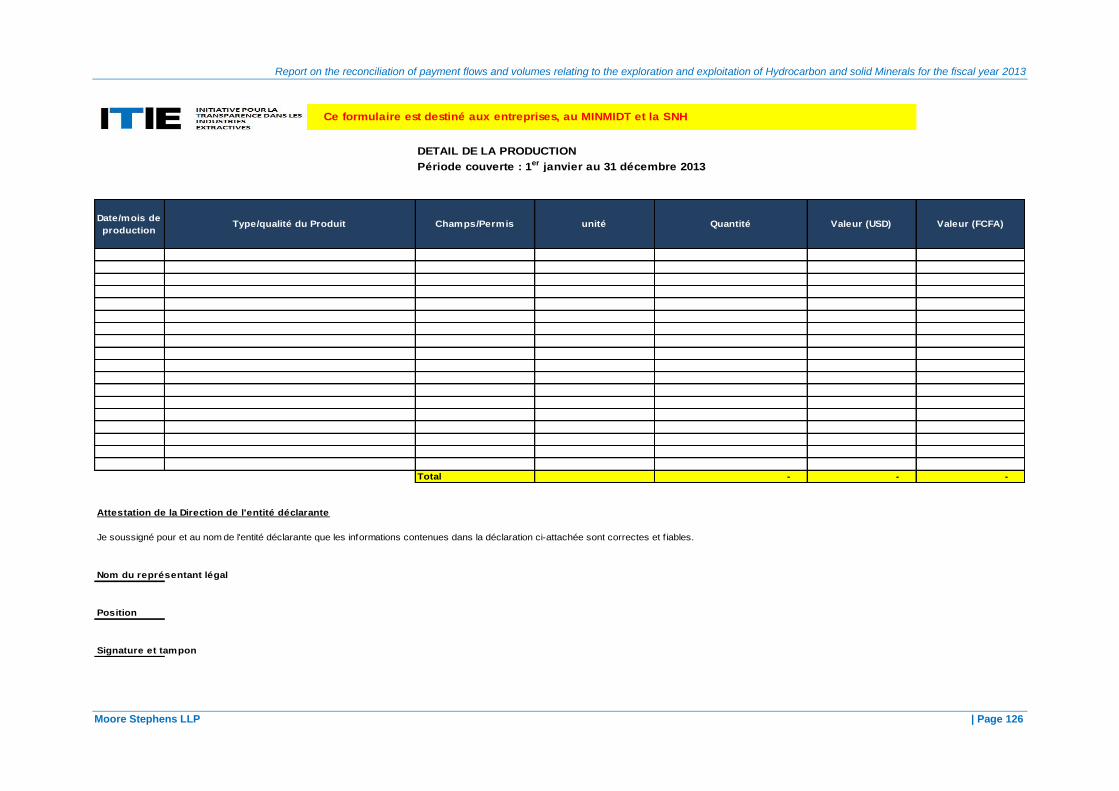
Report on the reconciliation of payment flows and volumes relating to the exploration and exploitation of Hydrocarbon and solid Minerals for the fiscal year 2013
Moore Stephens LLP | Page 126
DETAIL DE LA PRODUCTION
Période couverte : 1er janvier au 31 décembre 2013
Date/mois de
productionChamps/Permis unité Quantité Valeur (USD) Valeur (FCFA)
Total - - -
Nom du représentant légal
Position
Signature et tampon
Attestation de la Direction de l'entité déclarante
Je soussigné pour et au nom de l'entité déclarante que les informations contenues dans la déclaration ci-attachée sont correctes et f iables.
Ce formulaire est destiné aux entreprises, au MINMIDT et la SNH
Type/qualité du Produit

Conciliation des flux financiers et des volumes relatifs à l’exploration et à l’exploitation des hydrocarbures et des mines solides au titre de l’année 2013
Moore Stephens LLP |Page 127
DETAIL DES VOLUMES TRANSPORTES
Période couverte : 1er janvier au 31 décembre 2013
N
Date / Mois
Volume
transporté
(en bbl)
Pays de
Provenance
taux unitaire
du droit de
transit (USD)
Droits de transit
dû (USD)
Droits de transit
versés (en FCFA)
0 0
Nom du représentant légal
Position
Signature et tampon
Attestation de la Direction de l'entité déclarante
Ce formulaire est destiné à la COTCO et la DGD
Exportations/Ventes
Je soussigné pour et au nom de l'entité déclarante que les informations contenues dans la déclaration ci-attachée
sont correctes et f iables.
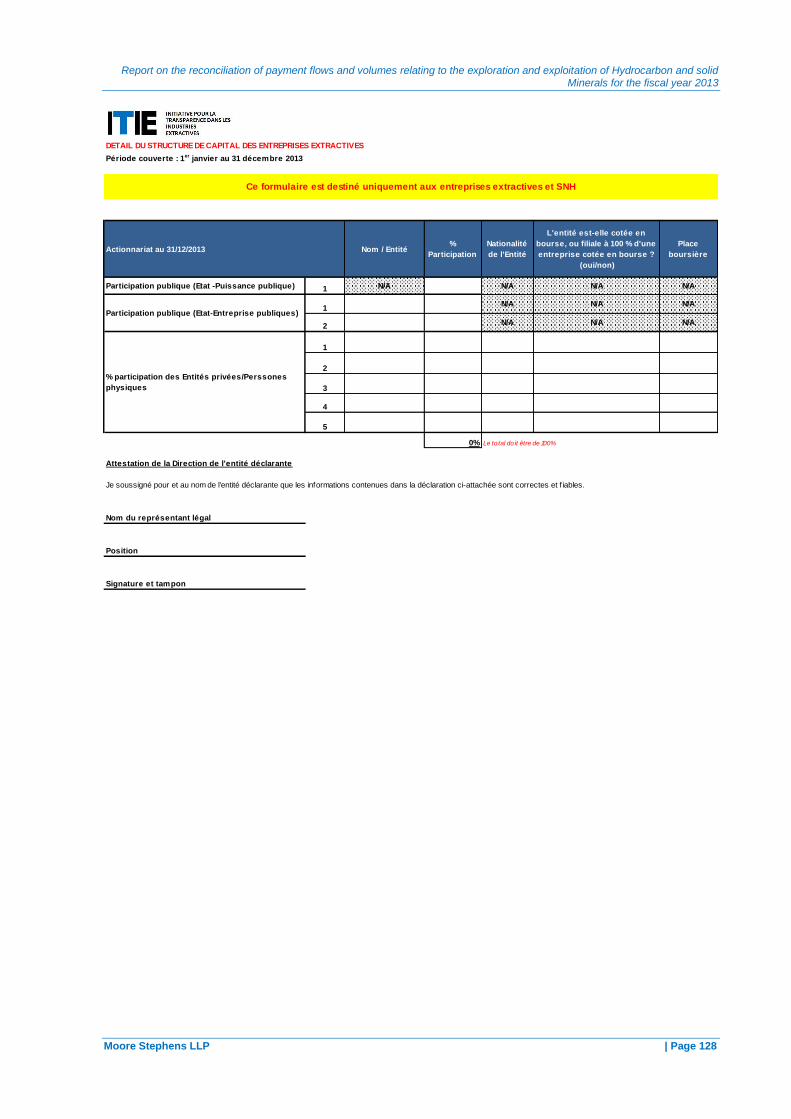
Report on the reconciliation of payment flows and volumes relating to the exploration and exploitation of Hydrocarbon and solid Minerals for the fiscal year 2013
Moore Stephens LLP | Page 128
DETAIL DU STRUCTURE DE CAPITAL DES ENTREPRISES EXTRACTIVES
Actionnariat au 31/12/2013 Nom / Entité%
Participation
Nationalité
de l'Entité
L'entité est-elle cotée en
bourse, ou filiale à 100 % d'une
entreprise cotée en bourse ?
(oui/non)
Place
boursière
Participation publique (Etat -Puissance publique) 1 N/A N/A N/A N/A
1N/A N/A N/A
2 N/A N/A N/A
1
2
3
4
5
0% Le to tal do it être de 100%
Nom du représentant légal
Position
Signature et tampon
Attestation de la Direction de l'entité déclarante
Je soussigné pour et au nom de l'entité déclarante que les informations contenues dans la déclaration ci-attachée sont correctes et f iables.
% participation des Entités privées/Perssones
physiques
Structure du Capital
Période couverte : 1er janvier au 31 décembre 2013
Ce formulaire est destiné uniquement aux entreprises extractives et SNH
Participation publique (Etat-Entreprise publiques)

Report on the reconciliation of payment flows and volumes relating to the exploration and exploitation of Hydrocarbon and solid Minerals for the fiscal year 2013
Moore Stephens LLP | Page 129
FORMULAIRE DE DECLARATION DE LA PROPRIETE REELLE
Identité du propriétaire réel (1)
Date d'acquisition de
la propriété réelle
Moyens de contact
[adresse
rés identiel le ou de [Nom comlplet, tel qu'i l figure sur la carte
d'identi té nationale]
[autres déta i l s de
contact]
[Date de naissance et/ou numéro
d'identi fication national ][National i té]
[Pays de rés idence] [nombre
d'actions]
[% d’actions] [% de droits
de vote
directs]
[% de droits
de vote
indirects]
[Si le contrôle de
l 'entreprise s 'exerce
par d'autres
moyens , i l s doivent
être déta i l lés ici .]
Identité du propriétaire réel (2)Date d'acquisition de
la propriété réelle
Moyens de contact
[adresse
rés identiel le ou de
service][Nom comlplet, tel qu'i l figure sur la carte
d'identi té nationale]
[autres déta i l s de
contact]
[Date de naissance et/ou numéro
d'identi fication national ]
[National i té]
[Pays de rés idence] [nombre
d'actions]
[% d’actions] [% de droits
de vote
directs]
[% de droits
de vote
indirects]
[Si le contrôle de
l 'entreprise s 'exerce
par d'autres
moyens , i l s doivent
être déta i l lés ici .]
Une PPE est défini comme suit :
L’expression personnes politiquement exposées (PPE) étrangères désigne les personnes qui exercent ou ont exercé d'importantes fonctions publiques dans un pays étranger, par exemple,
les chefs d'État et de gouvernement, les politiciens de haut rang, les hauts responsables au sein des pouvoirs publics,
les magistrats et militaires de haut rang, les dirigeants d'entreprise publique et les hauts responsables de partis politiques.
L’expression PPE nationales désigne les personnes physiques qui exercent ou ont exercé d'importantes fonctions publiques dans le pays,
par exemple, les chefs d'État et de gouvernement, les politiciens de haut rang,
les hauts responsables au sein des pouvoirs publics, les magistrats et militaires de haut rang, les dirigeants d'entreprise publique et les hauts responsables de partis politiques.
Les personnes qui exercent ou ont exercé d’importantes fonctions au sein de ou pour le compte d’une organisation internationale désigne les membres de la haute direction,
c’est-à- dire les directeurs, les directeurs adjoints et les membres du conseil d’administration et toutes les personnes exerçant des fonctions équivalentes.
La notion de PPE ne couvre pas les personnes de rang moyen ou inférieur relevant des catégories ci-dessus.
Nom du représentant légal
Position
Signature et tampon
Attestation de la Direction de l'entité déclarante
Je soussigné pour et au nom de l'entité déclarante que les informations contenues dans la déclaration ci-attachée sont correctes et f iables.
Par actions Par un % des droi ts de
voteAutres [date]
Informations sur la manière dont la propriété est détenue ou dont le
contrôle de l'entreprise est exercé
Par actions Par un % des droi ts de
vote
Autres [date]
Est-ce que certains des propriétaires réels sont des personnes politiquement exposées (PPE) ?
□ Oui. Nom :_______________________________Fonction et rôle public : ___________Date de début du mandat : / / Date de fin du mandat, le
Propriété réelle
Période couverte : 1er janvier au 31 décembre 2013
Ce formulaire est destiné uniquement aux entreprises extractives
Définition de la propriété réelle
Conformément à l'Exigence 3.11(d).i de la Norme ITIE, un propriétaire réel d’une entreprise est la (ou les) personne(s) physique(s) qui, directement ou indirectement, possède(nt) ou
exerce(nt) en dernier ressort le contrôle de l’entité juridique. Selon la décision du Comité, une personne physique est réputée détenir le controle si elle detient directement ou
indirectement au moins 10% du actions ou des droits de vote de l'entreprise extractive. Les entreprises cotées en bourse, y compris leurs filiales en propriété exclusive, ne sont pas
tenues de divulguer les informations concernant leur(s) propriétaire(s) réel(s). Dès lors, les entreprises cotées en bourse ou leurs filiales exclusives ne sont pas tenues de remplir
ce formulaire.
Déclaration de propriété réelle Conformément à la définition de la propriété réelle, le(s) propriétaire(s) réel(s) de [l'entreprise] en date du 31/12/2013 est/sont :
Informations sur la manière dont la propriété est détenue ou dont le
contrôle de l'entreprise est exercé
[Fonction]_____________________ [Signature]_________________
[Nous joignons les informations complémentaires suivantes pour permettre de vérifier les informations fournies relatives à la propriété réelle :]
….
□ Non.
Certification Je, soussigné, confirme, au nom de l'entité déclarante, que les informations fournies dans la présente déclaration de propriété réelle sont exactes et fidèles.
[Nom]______________________
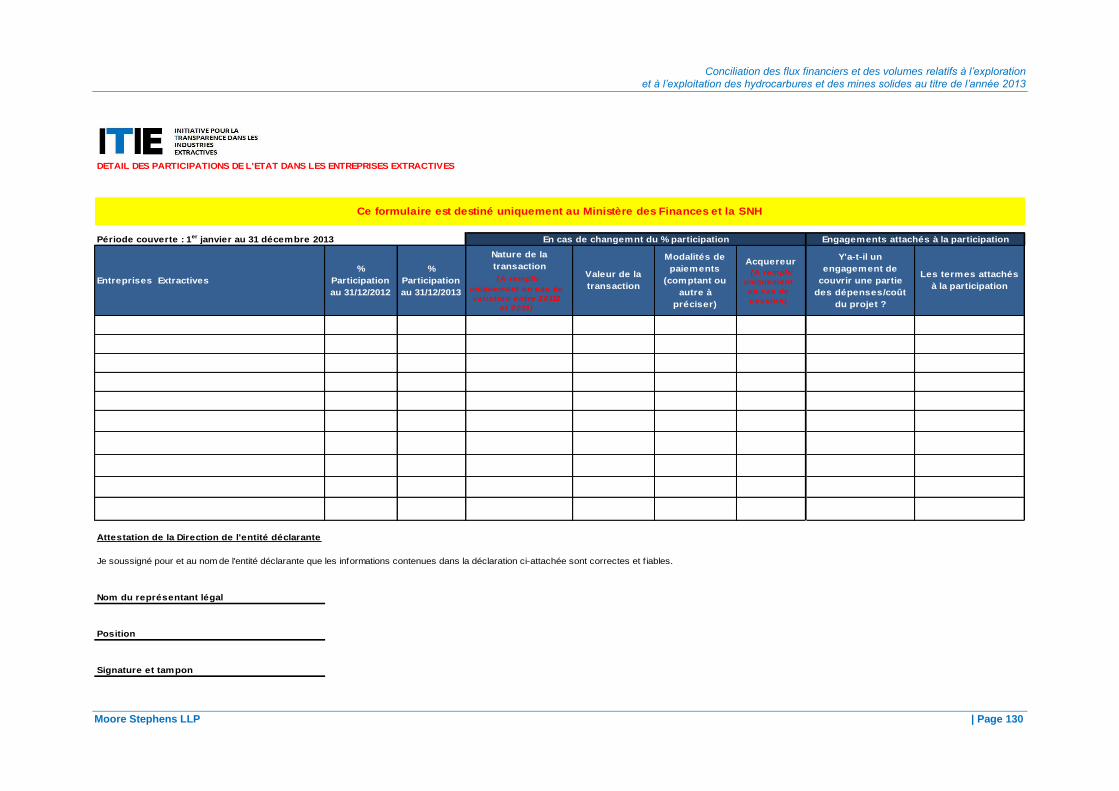
Conciliation des flux financiers et des volumes relatifs à l’exploration et à l’exploitation des hydrocarbures et des mines solides au titre de l’année 2013
Moore Stephens LLP | Page 130
DETAIL DES PARTICIPATIONS DE L'ETAT DANS LES ENTREPRISES EXTRACTIVES
Période couverte : 1er janvier au 31 décembre 2013
Entreprises Extractives
%
Participation
au 31/12/2012
%
Participation
au 31/12/2013
Nature de la
transaction
(A remplir
uniquement en cas de
variat io n entre 20112
et 2013)
Valeur de la
transaction
Modalités de
paiements
(comptant ou
autre à
préciser)
Acquereur
(A remplir
uniquement
en cas de
cessio n)
Y'a-t-il un
engagement de
couvrir une partie
des dépenses/coût
du projet ?
Les termes attachés
à la participation
Nom du représentant légal
Position
Signature et tampon
Engagements attachés à la participation
Ce formulaire est destiné uniquement au Ministère des Finances et la SNH
Participation publique
Attestation de la Direction de l'entité déclarante
Je soussigné pour et au nom de l'entité déclarante que les informations contenues dans la déclaration ci-attachée sont correctes et f iables.
En cas de changemnt du % participation

Report on the reconciliation of payment flows and volumes relating to the exploration and exploitation of Hydrocarbon and solid Minerals for the fiscal year 2013
Moore Stephens LLP | Page 131
DETAIL DES PAIEMNENT SOCIAUX
Période couverte : 1er janvier au 31 décembre 2013
Montant Date Description Coût du Projet encouru durant 201x
Total 0 0
(Annexer les convention si applicable)
Nom du représentant légal
Position
Signature et tampon
Paiements Sociaux
Identité du Bénéficiaire (Nom,
fonction)
Région du
bénéficiaire
Paiements en numéraires Paiements en nature (sous forme de projet)Ref juridique /
contractuelle
Ce formulaire est destiné uniquement aux entreprises extractives
Attestation de la Direction de l'entité déclarante
Je soussigné pour et au nom de l'entité déclarante que les informations contenues dans la déclaration ci-attachée sont correctes et f iables.
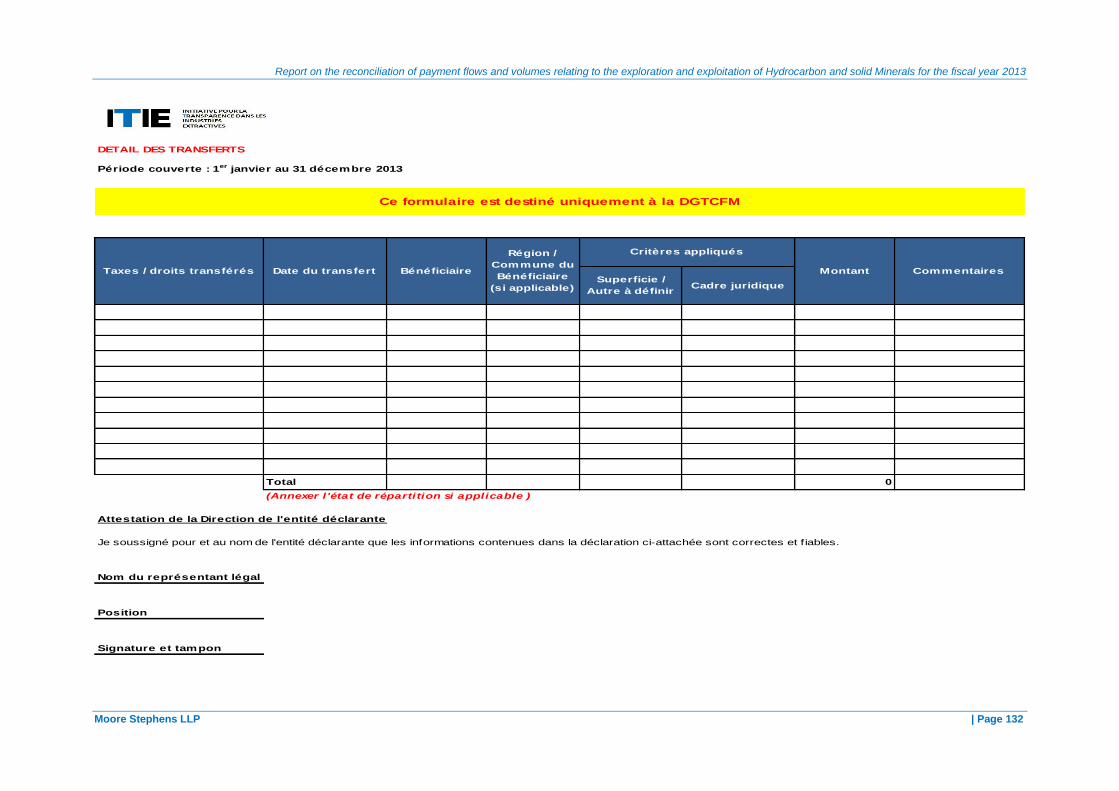
Report on the reconciliation of payment flows and volumes relating to the exploration and exploitation of Hydrocarbon and solid Minerals for the fiscal year 2013
Moore Stephens LLP | Page 132
Période couverte : 1er janvier au 31 décembre 2013
Superficie /
Autre à définirCadre juridique
Total 0
(Annexer l 'état de répartition si applicable )
Attestation de la Direction de l'entité déclarante
Je soussigné pour et au nom de l'entité déclarante que les informations contenues dans la déclaration ci-attachée sont correctes et f iables.
Nom du représentant légal
Position
Signature et tampon
Transferts
Date du transfert Bénéficiaire
Critères appliqués
DETAIL DES TRANSFERTS
Commentaires
Ce formulaire est destiné uniquement à la DGTCFM
Taxes / droits transférés
Région /
Commune du
Bénéficiaire
(si applicable)
Montant
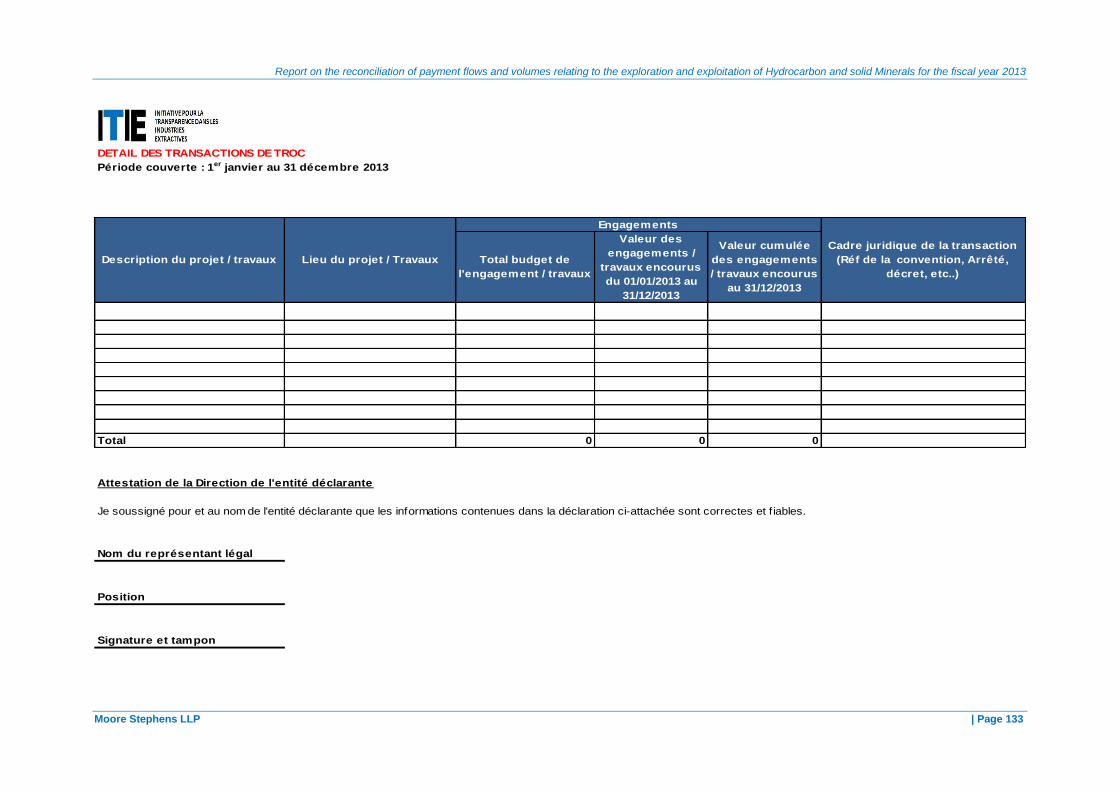
Report on the reconciliation of payment flows and volumes relating to the exploration and exploitation of Hydrocarbon and solid Minerals for the fiscal year 2013
Moore Stephens LLP | Page 133
DETAIL DES TRANSACTIONS DE TROC
Période couverte : 1er janvier au 31 décembre 2013
Total budget de
l'engagement / travaux
Valeur des
engagements /
travaux encourus
du 01/01/2013 au
31/12/2013
Valeur cumulée
des engagements
/ travaux encourus
au 31/12/2013
Total 0 0 0
Attestation de la Direction de l'entité déclarante
Je soussigné pour et au nom de l'entité déclarante que les informations contenues dans la déclaration ci-attachée sont correctes et f iables.
Nom du représentant légal
Position
Signature et tampon
Cadre juridique de la transaction
(Réf de la convention, Arrêté,
décret, etc..)
Engagements
Transactions de troc/projets intégrés
Description du projet / travaux Lieu du projet / Travaux

Report on the reconciliation of payment flows and volumes relating to the exploration and exploitation of Hydrocarbon and solid Minerals for the fiscal year 2013
Moore Stephens LLP | Page 134
Période couverte : 1er janvier au 31 décembre 2013
Unité Date d'octroiPériode de
remboursement% d'intérêt
Encours non
remboursé
au 31/12/2013
Montant
remboursé
durant la
période
Total 0 0 0 0
Nom du représentant légal
Position
Signature et tampon
Attestation de la Direction de l'entité déclarante
Ce formulaire est destiné uniquement à la DGTCFM et la SNH
Je soussigné pour et au nom de l'entité déclarante que les informations contenues dans la déclaration ci-attachée sont correctes et f iables.
Bénéficiaire (Nom
de l'entité)
Montant (valeur)
du prêt /
garantie /
Subvention
Termes de la Transaction
Autres commentaires
Prêts / Garanties / Subventions accordés à des entités opérantes dans le secteur extractif ou accordés par compensation des revenus du secteur
extractif
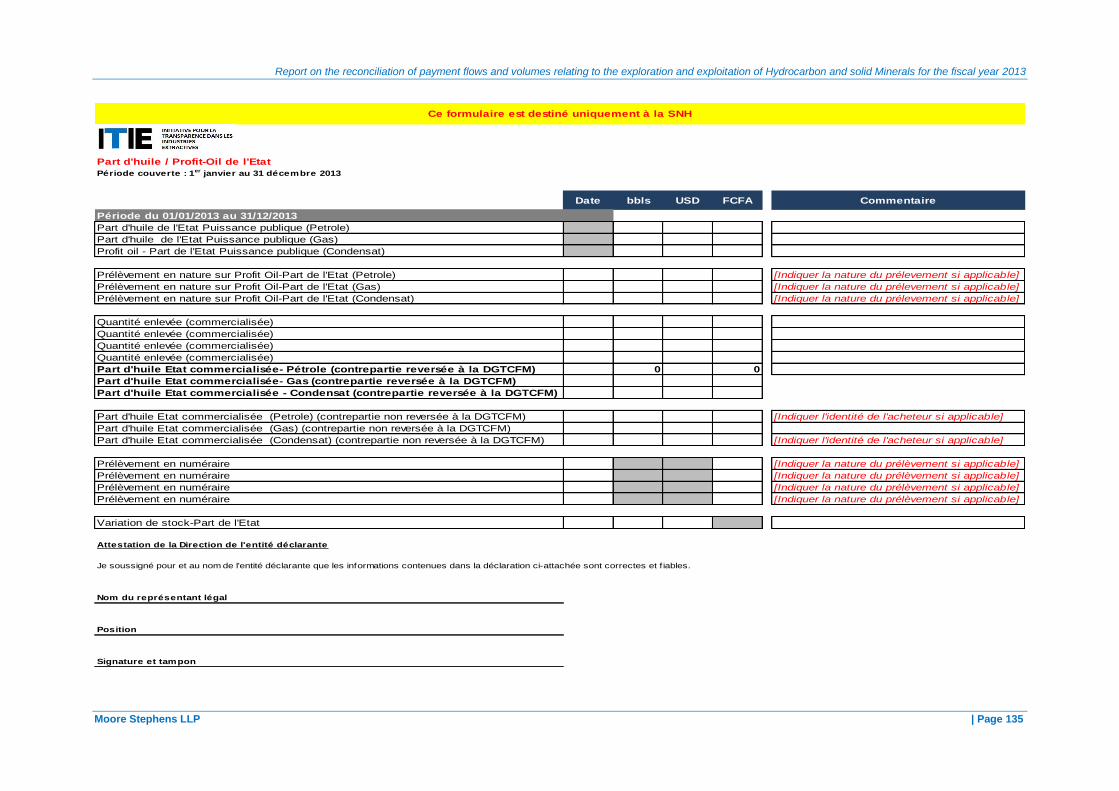
Report on the reconciliation of payment flows and volumes relating to the exploration and exploitation of Hydrocarbon and solid Minerals for the fiscal year 2013
Moore Stephens LLP | Page 135
Part d'huile / Profit-Oil de l'Etat
Période couverte : 1er janvier au 31 décembre 2013
Date bbls USD FCFA Commentaire
Période du 01/01/2013 au 31/12/2013
Part d'huile de l'Etat Puissance publique (Petrole)
Part d'huile de l'Etat Puissance publique (Gas)
Profit oil - Part de l'Etat Puissance publique (Condensat)
Prélèvement en nature sur Profit Oil-Part de l'Etat (Petrole) [Indiquer la nature du prélevement si applicable]
Prélèvement en nature sur Profit Oil-Part de l'Etat (Gas) [Indiquer la nature du prélevement si applicable]
Prélèvement en nature sur Profit Oil-Part de l'Etat (Condensat) [Indiquer la nature du prélevement si applicable]
Quantité enlevée (commercialisée)
Quantité enlevée (commercialisée)
Quantité enlevée (commercialisée)
Quantité enlevée (commercialisée)
Part d'huile Etat commercialisée- Pétrole (contrepartie reversée à la DGTCFM) 0 0
Part d'huile Etat commercialisée- Gas (contrepartie reversée à la DGTCFM)
Part d'huile Etat commercialisée - Condensat (contrepartie reversée à la DGTCFM)
Part d'huile Etat commercialisée (Petrole) (contrepartie non reversée à la DGTCFM) [Indiquer l'identité de l'acheteur si applicable]
Part d'huile Etat commercialisée (Gas) (contrepartie non reversée à la DGTCFM)
Part d'huile Etat commercialisée (Condensat) (contrepartie non reversée à la DGTCFM) [Indiquer l'identité de l'acheteur si applicable]
Prélèvement en numéraire [Indiquer la nature du prélèvement si applicable]
Prélèvement en numéraire [Indiquer la nature du prélèvement si applicable]
Prélèvement en numéraire [Indiquer la nature du prélèvement si applicable]
Prélèvement en numéraire [Indiquer la nature du prélèvement si applicable]
Variation de stock-Part de l'Etat
Nom du représentant légal
Position
Signature et tampon
Ce formulaire est destiné uniquement à la SNH
Je soussigné pour et au nom de l'entité déclarante que les informations contenues dans la déclaration ci-attachée sont correctes et f iables.
Attestation de la Direction de l'entité déclarante

Report on the reconciliation of payment flows and volumes relating to the exploration and exploitation of Hydrocarbon and solid Minerals for the fiscal year 2013
Moore Stephens LLP | Page 136
Attribution/Transferts des licencesPériode couverte : 1er janvier au 31 décembre 2013
Attributaire
Entité/ConsortiumProcessus
d’attribution Critères techniques
Critères
Financiers
Liste des
candidats
Lorsque les informations requises
sont déjà publiques, il suffit de
mentionner une référence (ou un
lien)
Nom du représentant légal
Position
Signature et tampon
Attestation de la Direction de l'entité déclarante
Je soussigné pour et au nom de l'entité déclarante que les informations contenues dans la déclaration ci-attachée sont correctes et f iables.
Ce formulaire est destiné uniquement à la SNH et au MINMIDT
Ref du Titre
attribuéDate d'octroi
Modalités d'octroi
Autres commentaires
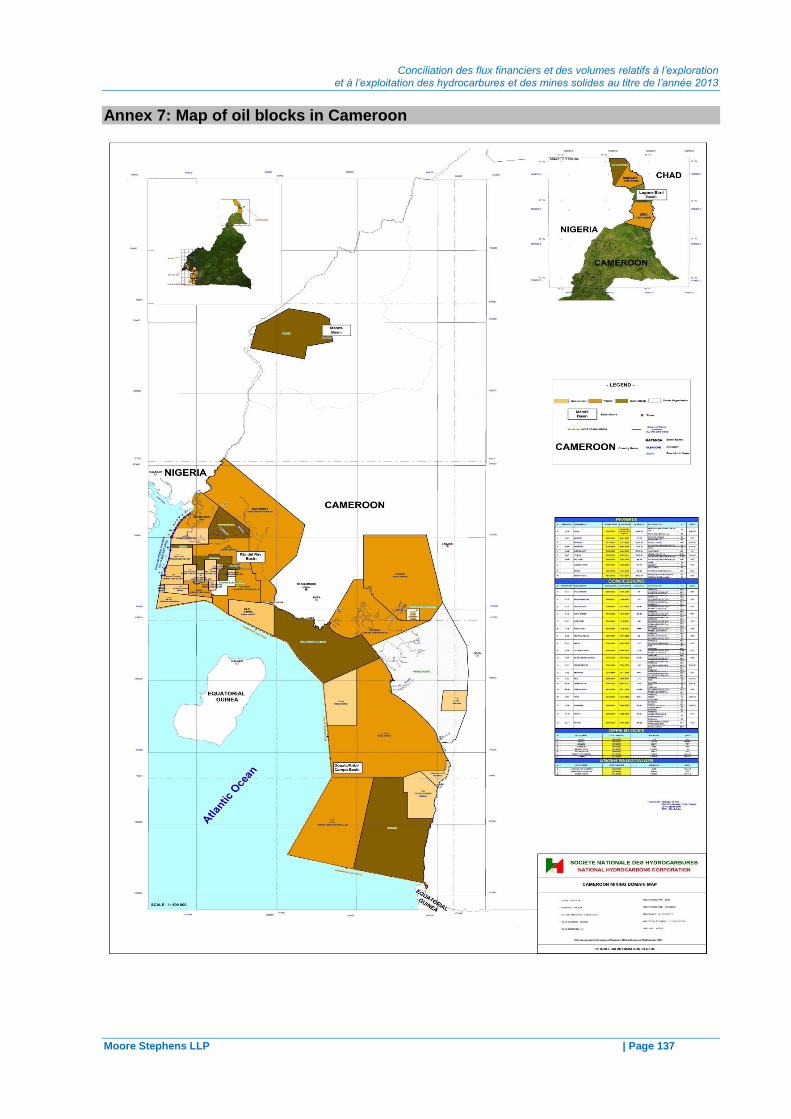
Conciliation des flux financiers et des volumes relatifs à l’exploration et à l’exploitation des hydrocarbures et des mines solides au titre de l’année 2013
Moore Stephens LLP | Page 137
Annex 7: Map of oil blocks in Cameroon
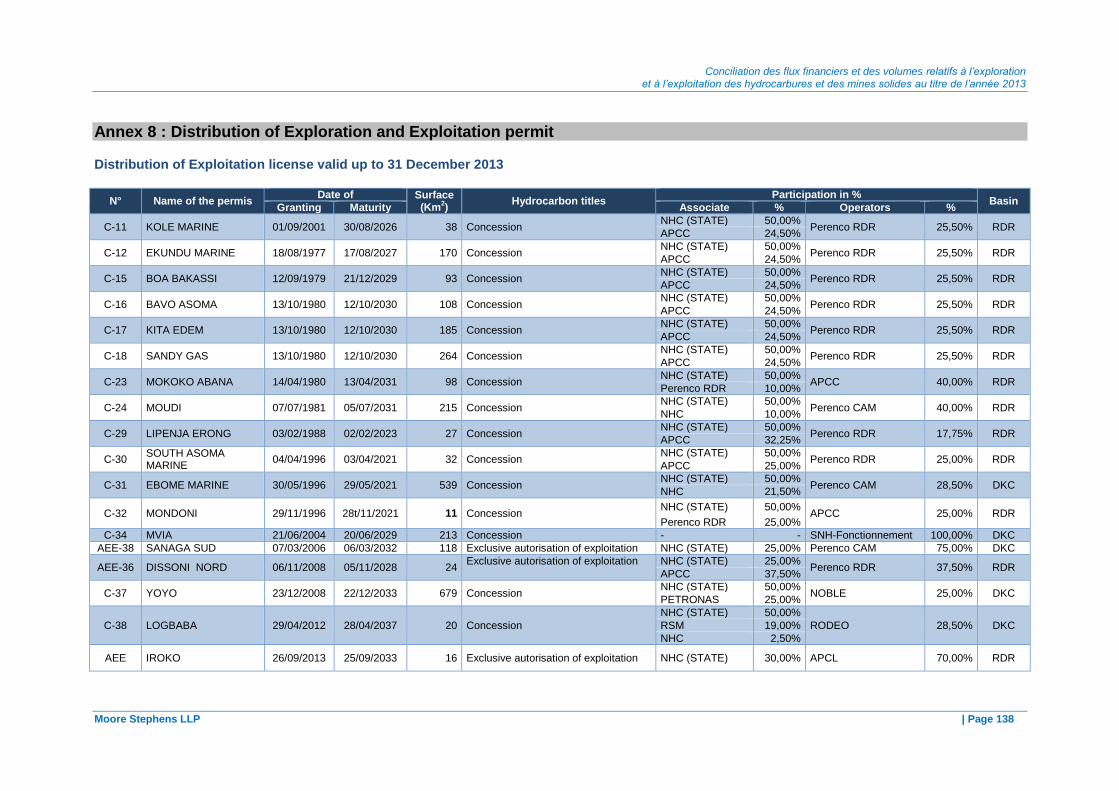
Conciliation des flux financiers et des volumes relatifs à l’exploration et à l’exploitation des hydrocarbures et des mines solides au titre de l’année 2013
Moore Stephens LLP | Page 138
Annex 8 : Distribution of Exploration and Exploitation permit
Distribution of Exploitation license valid up to 31 December 2013
N° Name of the permis Date of Surface
(Km2)
Hydrocarbon titles Participation in %
Basin Granting Maturity Associate % Operators %
C-11 KOLE MARINE 01/09/2001 30/08/2026 38 Concession NHC (STATE) 50,00%
Perenco RDR 25,50% RDR APCC 24,50%
C-12 EKUNDU MARINE 18/08/1977 17/08/2027 170 Concession NHC (STATE) 50,00%
Perenco RDR 25,50% RDR APCC 24,50%
C-15 BOA BAKASSI 12/09/1979 21/12/2029 93 Concession NHC (STATE) 50,00%
Perenco RDR 25,50% RDR APCC 24,50%
C-16 BAVO ASOMA 13/10/1980 12/10/2030 108 Concession NHC (STATE) 50,00%
Perenco RDR 25,50% RDR APCC 24,50%
C-17 KITA EDEM 13/10/1980 12/10/2030 185 Concession NHC (STATE) 50,00%
Perenco RDR 25,50% RDR APCC 24,50%
C-18 SANDY GAS 13/10/1980 12/10/2030 264 Concession NHC (STATE) 50,00%
Perenco RDR 25,50% RDR APCC 24,50%
C-23 MOKOKO ABANA 14/04/1980 13/04/2031 98 Concession NHC (STATE) 50,00%
APCC 40,00% RDR Perenco RDR 10,00%
C-24 MOUDI 07/07/1981 05/07/2031 215 Concession NHC (STATE) 50,00%
Perenco CAM 40,00% RDR NHC 10,00%
C-29 LIPENJA ERONG 03/02/1988 02/02/2023 27 Concession NHC (STATE) 50,00%
Perenco RDR 17,75% RDR APCC 32,25%
C-30 SOUTH ASOMA MARINE
04/04/1996 03/04/2021 32 Concession NHC (STATE) 50,00%
Perenco RDR 25,00% RDR APCC 25,00%
C-31 EBOME MARINE 30/05/1996 29/05/2021 539 Concession NHC (STATE) 50,00%
Perenco CAM 28,50% DKC NHC 21,50%
C-32 MONDONI 29/11/1996 28t/11/2021 11 Concession NHC (STATE) 50,00%
APCC 25,00% RDR Perenco RDR 25,00%
C-34 MVIA 21/06/2004 20/06/2029 213 Concession - - SNH-Fonctionnement 100,00% DKC
AEE-38 SANAGA SUD 07/03/2006 06/03/2032 118 Exclusive autorisation of exploitation NHC (STATE) 25,00% Perenco CAM 75,00% DKC
AEE-36 DISSONI NORD 06/11/2008 05/11/2028 24 Exclusive autorisation of exploitation NHC (STATE) 25,00%
Perenco RDR 37,50% RDR APCC 37,50%
C-37 YOYO 23/12/2008 22/12/2033 679 Concession NHC (STATE) 50,00%
NOBLE 25,00% DKC PETRONAS 25,00%
C-38 LOGBABA 29/04/2012 28/04/2037 20 Concession
NHC (STATE) 50,00%
RODEO 28,50% DKC RSM 19,00%
NHC 2,50%
AEE IROKO 26/09/2013 25/09/2033 16 Exclusive autorisation of exploitation NHC (STATE) 30,00% APCL 70,00% RDR

Report on the reconciliation of payment flows and volumes relating to the exploration and exploitation of Hydrocarbon and solid Minerals for the fiscal year 2013
Moore Stephens LLP | Page 139
Distribution of Exploration permit valid up to 31 December 2013
N° Nom du Permis
Date d’ Surface (Km
2)
Titres d’Hydrocarbures
Participation en %
Bassin
Octroi Échéance Associés % Opérateurs %
H-78 NTEM 03/09/2002 Durée suspendue depuis 05/06/2005 (Situation de
force majeure) 2 319 Permis de Recherche STERLING 50,00% Murphy Cameroon 50,00% DKC
H-81 NGOSSO 19/04/2004 02/01/2014 474 Permis de Recherche Pronodar Ltd 40,00% APCL 60,00% RDR
- BOMONO 12/12/2007 11/12/2014 2 327 Autorisation Exclusive de Recherche - - EUROIL 100,00% DKC
H-105 MATANDA 10/04/2008 09/04/2014 1 235 Autorisation Exclusive de Recherche AFEX 10,00% GLENCORE EXPLORATION CAMEROON
90,00% DKC
H-74 ETINDE 22/12/2008 21/12/2014 2 316 Autorisation Exclusive de Recherche New Age 25,00% EUROIL 75,00% DKC
H-108 ZINA MAKARY 02/04/2009 01/04/2013 8 506 Autorisation Exclusive de Recherche - - Yang Chang Logone Development Holding Co. Ltd
100,00% LB
H-107 TILAPIA 07/07/2009 06/07/2015 3 875 Autorisation Exclusive de Recherche GLENCORE 33,33% NOBLE ENERGY 66,67% DKC
H-106 BOLONGO 16/07/2009 15/07/2015 462 Autorisation Exclusive de Recherche - - GLENCORE EXPLORATION CAMEROON
100,00% RDR
H-111 ELOMBO 11/03/2010 10/03/2015 2 405 Autorisation Exclusive de Recherche Murphy Cameroon
50,00% PERENCO CAMEROON 50,00% DKC
H-112 NIDIAN RIVER 20/11/2006 19/11/2013 1 757 Autorisation Exclusive de Recherche - - KOSMOS ENERGY 100,00% RDR
- FAKO 12/01/2012 11/01/2014 1 289 Autorisation Exclusive de Recherche - - KOSMOS ENERGY 100,00% RDR
- BAKASSI OUEST
14/06/2012 13/06/2016 373 Autorisation Exclusive de Recherche
MADISON 35,00%
DANA 55,00% DKC
SOFTROCK 10,00%
- MOABI 15/01/2013 14/01/2016 137 Autorisation Exclusive de Recherche - - PERENCO CAMEROON 100,00% RDR
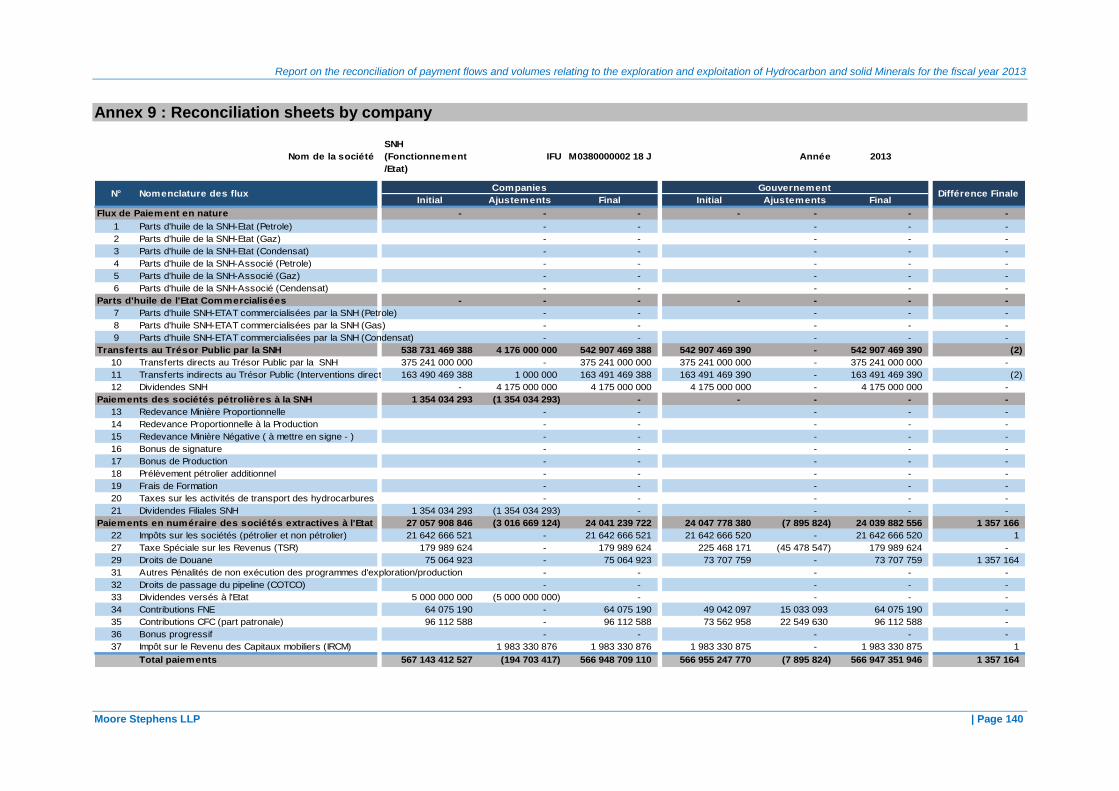
Report on the reconciliation of payment flows and volumes relating to the exploration and exploitation of Hydrocarbon and solid Minerals for the fiscal year 2013
Moore Stephens LLP | Page 140
Annex 9 : Reconciliation sheets by company
Nom de la société
SNH
(Fonctionnement
/Etat)
IFU M0380000002 18 J Année 2013
Initial Ajustements Final Initial Ajustements Final
Flux de Paiement en nature - - - - - - -
1 Parts d'huile de la SNH-Etat (Petrole) - - - - -
2 Parts d'huile de la SNH-Etat (Gaz) - - - - -
3 Parts d'huile de la SNH-Etat (Condensat) - - - - -
4 Parts d'huile de la SNH-Associé (Petrole) - - - - -
5 Parts d'huile de la SNH-Associé (Gaz) - - - - -
6 Parts d'huile de la SNH-Associé (Cendensat) - - - - -
Parts d'huile de l'Etat Commercialisées - - - - - - -
7 Parts d'huile SNH-ETAT commercialisées par la SNH (Petrole) - - - - -
8 Parts d'huile SNH-ETAT commercialisées par la SNH (Gas) - - - - -
9 Parts d'huile SNH-ETAT commercialisées par la SNH (Condensat) - - - - -
Transferts au Trésor Public par la SNH 538 731 469 388 4 176 000 000 542 907 469 388 542 907 469 390 - 542 907 469 390 (2)
10 Transferts directs au Trésor Public par la SNH 375 241 000 000 - 375 241 000 000 375 241 000 000 - 375 241 000 000 -
11 Transferts indirects au Trésor Public (Interventions directes SNH)163 490 469 388 1 000 000 163 491 469 388 163 491 469 390 - 163 491 469 390 (2)
12 Dividendes SNH - 4 175 000 000 4 175 000 000 4 175 000 000 - 4 175 000 000 -
Paiements des sociétés pétrolières à la SNH 1 354 034 293 (1 354 034 293) - - - - -
13 Redevance Minière Proportionnelle - - - - -
14 Redevance Proportionnelle à la Production - - - - -
15 Redevance Minière Négative ( à mettre en signe - ) - - - - -
16 Bonus de signature - - - - -
17 Bonus de Production - - - - -
18 Prélèvement pétrolier additionnel - - - - -
19 Frais de Formation - - - - -
20 Taxes sur les activités de transport des hydrocarbures - - - - -
21 Dividendes Filiales SNH 1 354 034 293 (1 354 034 293) - - - -
Paiements en numéraire des sociétés extractives à l'Etat 27 057 908 846 (3 016 669 124) 24 041 239 722 24 047 778 380 (7 895 824) 24 039 882 556 1 357 166
22 Impôts sur les sociétés (pétrolier et non pétrolier) 21 642 666 521 - 21 642 666 521 21 642 666 520 - 21 642 666 520 1
27 Taxe Spéciale sur les Revenus (TSR) 179 989 624 - 179 989 624 225 468 171 (45 478 547) 179 989 624 -
29 Droits de Douane 75 064 923 - 75 064 923 73 707 759 - 73 707 759 1 357 164
31 Autres Pénalités de non exécution des programmes d'exploration/production - - - - -
32 Droits de passage du pipeline (COTCO) - - - - -
33 Dividendes versés à l'Etat 5 000 000 000 (5 000 000 000) - - - -
34 Contributions FNE 64 075 190 - 64 075 190 49 042 097 15 033 093 64 075 190 -
35 Contributions CFC (part patronale) 96 112 588 - 96 112 588 73 562 958 22 549 630 96 112 588 -
36 Bonus progressif - - - - -
37 Impôt sur le Revenu des Capitaux mobiliers (IRCM) 1 983 330 876 1 983 330 876 1 983 330 875 - 1 983 330 875 1
Total paiements 567 143 412 527 (194 703 417) 566 948 709 110 566 955 247 770 (7 895 824) 566 947 351 946 1 357 164
N° Nomenclature des fluxCompanies Gouvernement
Différence Finale
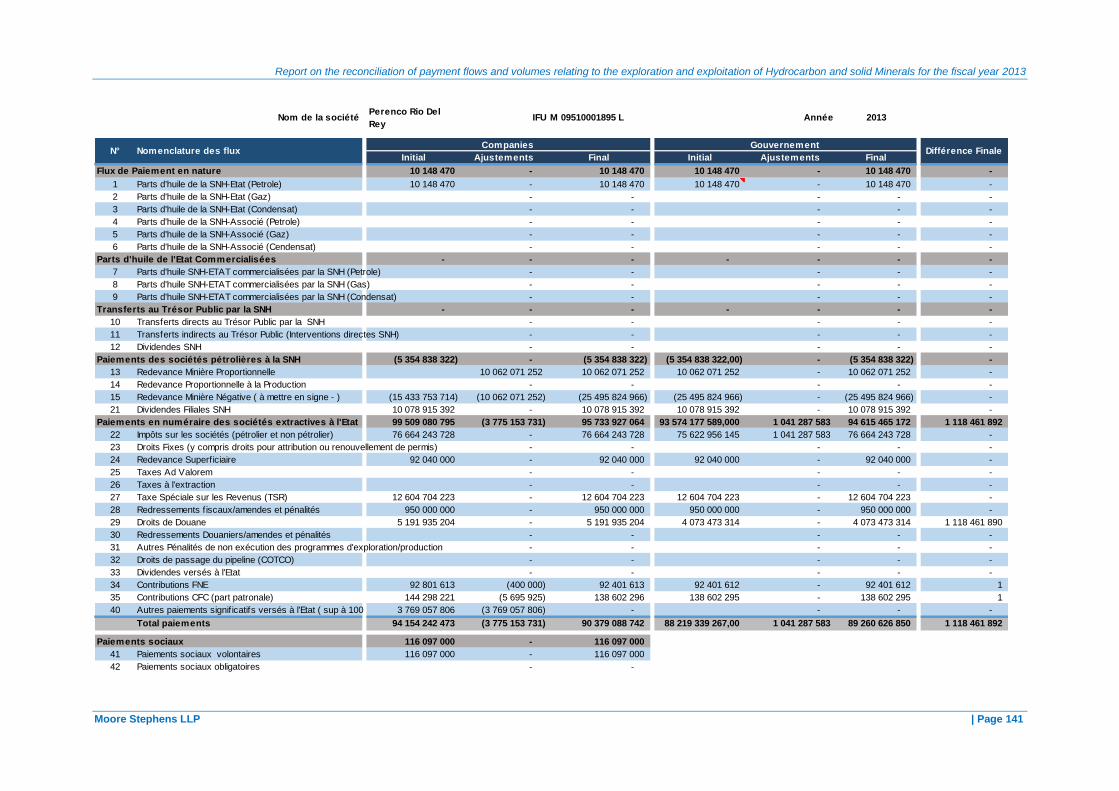
Report on the reconciliation of payment flows and volumes relating to the exploration and exploitation of Hydrocarbon and solid Minerals for the fiscal year 2013
Moore Stephens LLP | Page 141
Nom de la sociétéPerenco Rio Del
ReyIFU M 09510001895 L Année 2013
494,0644800
Initial Ajustements Final Initial Ajustements Final
Flux de Paiement en nature 10 148 470 - 10 148 470 10 148 470 - 10 148 470 -
1 Parts d'huile de la SNH-Etat (Petrole) 10 148 470 - 10 148 470 10 148 470 - 10 148 470 -
2 Parts d'huile de la SNH-Etat (Gaz) - - - - -
3 Parts d'huile de la SNH-Etat (Condensat) - - - - -
4 Parts d'huile de la SNH-Associé (Petrole) - - - - -
5 Parts d'huile de la SNH-Associé (Gaz) - - - - -
6 Parts d'huile de la SNH-Associé (Cendensat) - - - - -
Parts d'huile de l'Etat Commercialisées - - - - - - -
7 Parts d'huile SNH-ETAT commercialisées par la SNH (Petrole) - - - - -
8 Parts d'huile SNH-ETAT commercialisées par la SNH (Gas) - - - - -
9 Parts d'huile SNH-ETAT commercialisées par la SNH (Condensat) - - - - -
Transferts au Trésor Public par la SNH - - - - - - -
10 Transferts directs au Trésor Public par la SNH - - - - -
11 Transferts indirects au Trésor Public (Interventions directes SNH) - - - - -
12 Dividendes SNH - - - - -
Paiements des sociétés pétrolières à la SNH (5 354 838 322) - (5 354 838 322) (5 354 838 322,00) - (5 354 838 322) -
13 Redevance Minière Proportionnelle 10 062 071 252 10 062 071 252 10 062 071 252 - 10 062 071 252 -
14 Redevance Proportionnelle à la Production - - - - -
15 Redevance Minière Négative ( à mettre en signe - ) (15 433 753 714) (10 062 071 252) (25 495 824 966) (25 495 824 966) - (25 495 824 966) -
21 Dividendes Filiales SNH 10 078 915 392 - 10 078 915 392 10 078 915 392 - 10 078 915 392 -
Paiements en numéraire des sociétés extractives à l'Etat 99 509 080 795 (3 775 153 731) 95 733 927 064 93 574 177 589,000 1 041 287 583 94 615 465 172 1 118 461 892
22 Impôts sur les sociétés (pétrolier et non pétrolier) 76 664 243 728 - 76 664 243 728 75 622 956 145 1 041 287 583 76 664 243 728 -
23 Droits Fixes (y compris droits pour attribution ou renouvellement de permis) - - - - -
24 Redevance Superficiaire 92 040 000 - 92 040 000 92 040 000 - 92 040 000 -
25 Taxes Ad Valorem - - - - -
26 Taxes à l'extraction - - - - -
27 Taxe Spéciale sur les Revenus (TSR) 12 604 704 223 - 12 604 704 223 12 604 704 223 - 12 604 704 223 -
28 Redressements f iscaux/amendes et pénalités 950 000 000 - 950 000 000 950 000 000 - 950 000 000 -
29 Droits de Douane 5 191 935 204 - 5 191 935 204 4 073 473 314 - 4 073 473 314 1 118 461 890
30 Redressements Douaniers/amendes et pénalités - - - - -
31 Autres Pénalités de non exécution des programmes d'exploration/production - - - - -
32 Droits de passage du pipeline (COTCO) - - - - -
33 Dividendes versés à l'Etat - - - - -
34 Contributions FNE 92 801 613 (400 000) 92 401 613 92 401 612 - 92 401 612 1
35 Contributions CFC (part patronale) 144 298 221 (5 695 925) 138 602 296 138 602 295 - 138 602 295 1
40 Autres paiements signif icatifs versés à l'Etat ( sup à 100 KUSD/55 000 KFCFA)3 769 057 806 (3 769 057 806) - - - -
Total paiements 94 154 242 473 (3 775 153 731) 90 379 088 742 88 219 339 267,00 1 041 287 583 89 260 626 850 1 118 461 892
Paiements sociaux 116 097 000 - 116 097 000
41 Paiements sociaux volontaires 116 097 000 - 116 097 000
42 Paiements sociaux obligatoires - -
GouvernementDifférence FinaleN° Nomenclature des flux
Companies
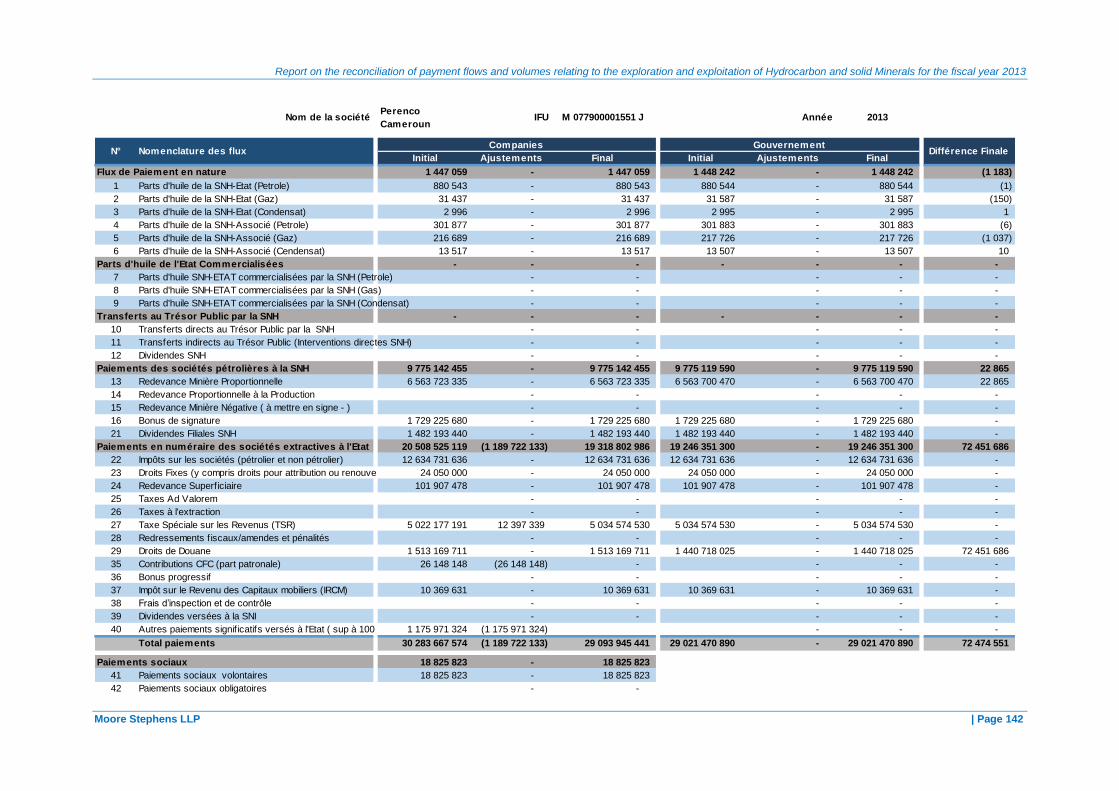
Report on the reconciliation of payment flows and volumes relating to the exploration and exploitation of Hydrocarbon and solid Minerals for the fiscal year 2013
Moore Stephens LLP | Page 142
Nom de la sociétéPerenco
CamerounIFU M 077900001551 J Année 2013
494,0644800
Initial Ajustements Final Initial Ajustements Final
Flux de Paiement en nature 1 447 059 - 1 447 059 1 448 242 - 1 448 242 (1 183)
1 Parts d'huile de la SNH-Etat (Petrole) 880 543 - 880 543 880 544 - 880 544 (1)
2 Parts d'huile de la SNH-Etat (Gaz) 31 437 - 31 437 31 587 - 31 587 (150)
3 Parts d'huile de la SNH-Etat (Condensat) 2 996 - 2 996 2 995 - 2 995 1
4 Parts d'huile de la SNH-Associé (Petrole) 301 877 - 301 877 301 883 - 301 883 (6)
5 Parts d'huile de la SNH-Associé (Gaz) 216 689 - 216 689 217 726 - 217 726 (1 037)
6 Parts d'huile de la SNH-Associé (Cendensat) 13 517 - 13 517 13 507 - 13 507 10
Parts d'huile de l'Etat Commercialisées - - - - - - -
7 Parts d'huile SNH-ETAT commercialisées par la SNH (Petrole) - - - - -
8 Parts d'huile SNH-ETAT commercialisées par la SNH (Gas) - - - - -
9 Parts d'huile SNH-ETAT commercialisées par la SNH (Condensat) - - - - -
Transferts au Trésor Public par la SNH - - - - - - -
10 Transferts directs au Trésor Public par la SNH - - - - -
11 Transferts indirects au Trésor Public (Interventions directes SNH) - - - - -
12 Dividendes SNH - - - - -
Paiements des sociétés pétrolières à la SNH 9 775 142 455 - 9 775 142 455 9 775 119 590 - 9 775 119 590 22 865
13 Redevance Minière Proportionnelle 6 563 723 335 - 6 563 723 335 6 563 700 470 - 6 563 700 470 22 865
14 Redevance Proportionnelle à la Production - - - - -
15 Redevance Minière Négative ( à mettre en signe - ) - - - - -
16 Bonus de signature 1 729 225 680 - 1 729 225 680 1 729 225 680 - 1 729 225 680 -
21 Dividendes Filiales SNH 1 482 193 440 - 1 482 193 440 1 482 193 440 - 1 482 193 440 -
Paiements en numéraire des sociétés extractives à l'Etat 20 508 525 119 (1 189 722 133) 19 318 802 986 19 246 351 300 - 19 246 351 300 72 451 686
22 Impôts sur les sociétés (pétrolier et non pétrolier) 12 634 731 636 - 12 634 731 636 12 634 731 636 - 12 634 731 636 -
23 Droits Fixes (y compris droits pour attribution ou renouvellement de permis)24 050 000 - 24 050 000 24 050 000 - 24 050 000 -
24 Redevance Superficiaire 101 907 478 - 101 907 478 101 907 478 - 101 907 478 -
25 Taxes Ad Valorem - - - - -
26 Taxes à l'extraction - - - - -
27 Taxe Spéciale sur les Revenus (TSR) 5 022 177 191 12 397 339 5 034 574 530 5 034 574 530 - 5 034 574 530 -
28 Redressements f iscaux/amendes et pénalités - - - - -
29 Droits de Douane 1 513 169 711 - 1 513 169 711 1 440 718 025 - 1 440 718 025 72 451 686
35 Contributions CFC (part patronale) 26 148 148 (26 148 148) - - - -
36 Bonus progressif - - - - -
37 Impôt sur le Revenu des Capitaux mobiliers (IRCM) 10 369 631 - 10 369 631 10 369 631 - 10 369 631 -
38 Frais d’inspection et de contrôle - - - - -
39 Dividendes versées à la SNI - - - - -
40 Autres paiements signif icatifs versés à l'Etat ( sup à 100 KUSD/55 000 KFCFA)1 175 971 324 (1 175 971 324) - - -
Total paiements 30 283 667 574 (1 189 722 133) 29 093 945 441 29 021 470 890 - 29 021 470 890 72 474 551
Paiements sociaux 18 825 823 - 18 825 823
41 Paiements sociaux volontaires 18 825 823 - 18 825 823
42 Paiements sociaux obligatoires - -
GouvernementDifférence FinaleN° Nomenclature des flux
Companies
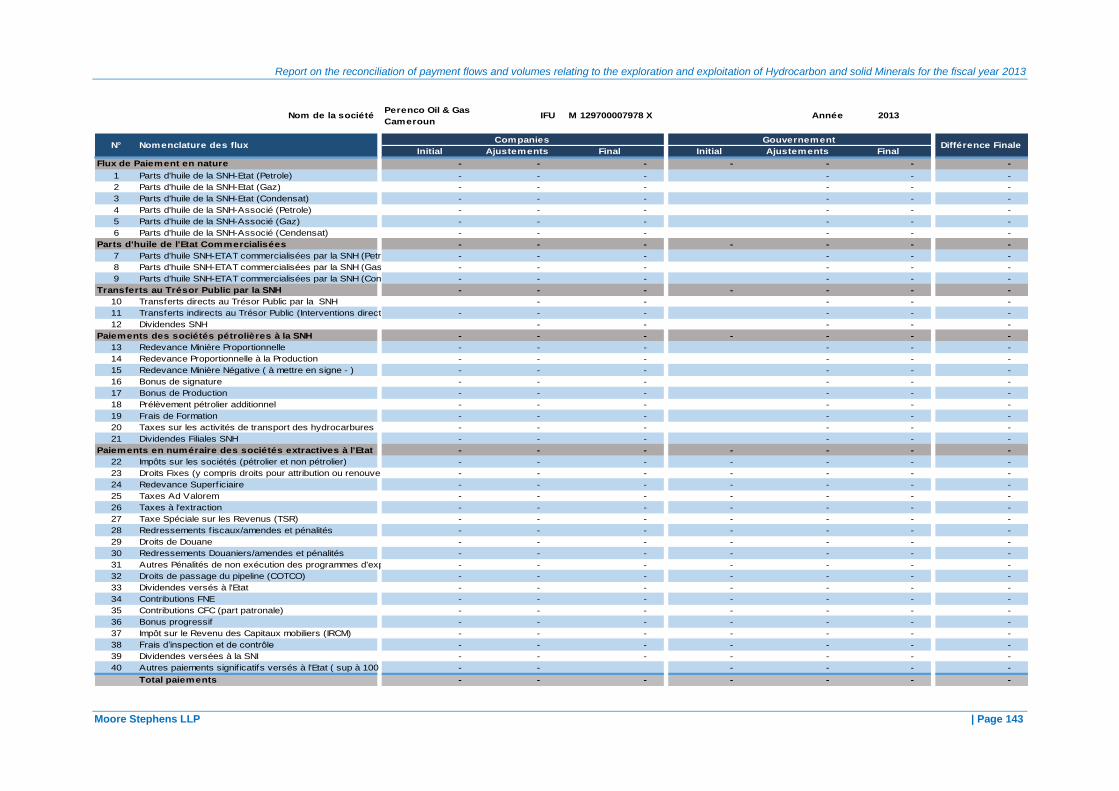
Report on the reconciliation of payment flows and volumes relating to the exploration and exploitation of Hydrocarbon and solid Minerals for the fiscal year 2013
Moore Stephens LLP | Page 143
Nom de la sociétéPerenco Oil & Gas
CamerounIFU M 129700007978 X Année 2013
Initial Ajustements Final Initial Ajustements Final
Flux de Paiement en nature - - - - - - -
1 Parts d'huile de la SNH-Etat (Petrole) - - - - - -
2 Parts d'huile de la SNH-Etat (Gaz) - - - - - -
3 Parts d'huile de la SNH-Etat (Condensat) - - - - - -
4 Parts d'huile de la SNH-Associé (Petrole) - - - - - -
5 Parts d'huile de la SNH-Associé (Gaz) - - - - - -
6 Parts d'huile de la SNH-Associé (Cendensat) - - - - - -
Parts d'huile de l'Etat Commercialisées - - - - - - -
7 Parts d'huile SNH-ETAT commercialisées par la SNH (Petrole) - - - - - -
8 Parts d'huile SNH-ETAT commercialisées par la SNH (Gas) - - - - - -
9 Parts d'huile SNH-ETAT commercialisées par la SNH (Condensat) - - - - - -
Transferts au Trésor Public par la SNH - - - - - - -
10 Transferts directs au Trésor Public par la SNH - - - - -
11 Transferts indirects au Trésor Public (Interventions directes SNH) - - - - - -
12 Dividendes SNH - - - - -
Paiements des sociétés pétrolières à la SNH - - - - - - -
13 Redevance Minière Proportionnelle - - - - - -
14 Redevance Proportionnelle à la Production - - - - - -
15 Redevance Minière Négative ( à mettre en signe - ) - - - - - -
16 Bonus de signature - - - - - -
17 Bonus de Production - - - - - -
18 Prélèvement pétrolier additionnel - - - - - -
19 Frais de Formation - - - - - -
20 Taxes sur les activités de transport des hydrocarbures - - - - - -
21 Dividendes Filiales SNH - - - - - -
Paiements en numéraire des sociétés extractives à l'Etat - - - - - - -
22 Impôts sur les sociétés (pétrolier et non pétrolier) - - - - - - -
23 Droits Fixes (y compris droits pour attribution ou renouvellement de permis) - - - - - - -
24 Redevance Superficiaire - - - - - - -
25 Taxes Ad Valorem - - - - - - -
26 Taxes à l'extraction - - - - - - -
27 Taxe Spéciale sur les Revenus (TSR) - - - - - - -
28 Redressements f iscaux/amendes et pénalités - - - - - - -
29 Droits de Douane - - - - - - -
30 Redressements Douaniers/amendes et pénalités - - - - - - -
31 Autres Pénalités de non exécution des programmes d'exploration/production- - - - - - -
32 Droits de passage du pipeline (COTCO) - - - - - - -
33 Dividendes versés à l'Etat - - - - - - -
34 Contributions FNE - - - - - - -
35 Contributions CFC (part patronale) - - - - - - -
36 Bonus progressif - - - - - - -
37 Impôt sur le Revenu des Capitaux mobiliers (IRCM) - - - - - - -
38 Frais d’inspection et de contrôle - - - - - - -
39 Dividendes versées à la SNI - - - - - - -
40 Autres paiements signif icatifs versés à l'Etat ( sup à 100 KUSD/55 000 KFCFA)- - - - - -
Total paiements - - - - - - -
GouvernementDifférence FinaleN° Nomenclature des flux
Companies
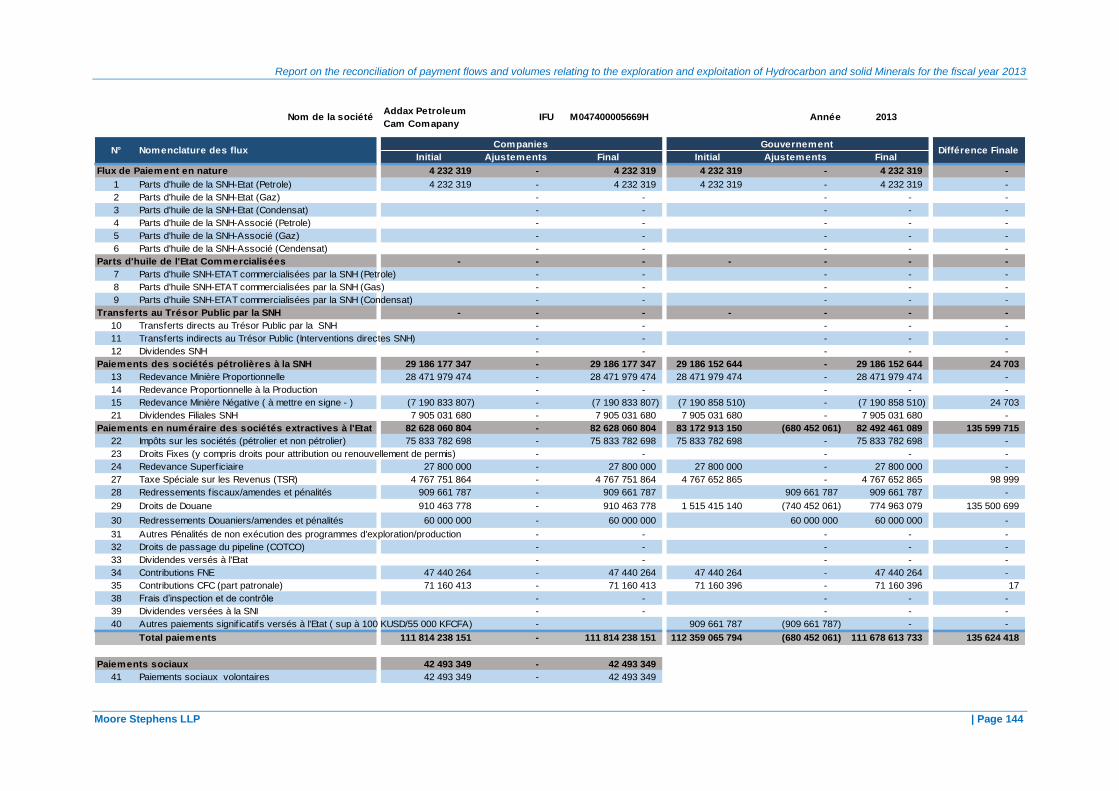
Report on the reconciliation of payment flows and volumes relating to the exploration and exploitation of Hydrocarbon and solid Minerals for the fiscal year 2013
Moore Stephens LLP | Page 144
Nom de la sociétéAddax Petroleum
Cam ComapanyIFU M047400005669H Année 2013
494,06448000
Initial Ajustements Final Initial Ajustements Final
Flux de Paiement en nature 4 232 319 - 4 232 319 4 232 319 - 4 232 319 -
1 Parts d'huile de la SNH-Etat (Petrole) 4 232 319 - 4 232 319 4 232 319 - 4 232 319 -
2 Parts d'huile de la SNH-Etat (Gaz) - - - - -
3 Parts d'huile de la SNH-Etat (Condensat) - - - - -
4 Parts d'huile de la SNH-Associé (Petrole) - - - - -
5 Parts d'huile de la SNH-Associé (Gaz) - - - - -
6 Parts d'huile de la SNH-Associé (Cendensat) - - - - -
Parts d'huile de l'Etat Commercialisées - - - - - - -
7 Parts d'huile SNH-ETAT commercialisées par la SNH (Petrole) - - - - -
8 Parts d'huile SNH-ETAT commercialisées par la SNH (Gas) - - - - -
9 Parts d'huile SNH-ETAT commercialisées par la SNH (Condensat) - - - - -
Transferts au Trésor Public par la SNH - - - - - - -
10 Transferts directs au Trésor Public par la SNH - - - - -
11 Transferts indirects au Trésor Public (Interventions directes SNH) - - - - -
12 Dividendes SNH - - - - -
Paiements des sociétés pétrolières à la SNH 29 186 177 347 - 29 186 177 347 29 186 152 644 - 29 186 152 644 24 703
13 Redevance Minière Proportionnelle 28 471 979 474 - 28 471 979 474 28 471 979 474 - 28 471 979 474 -
14 Redevance Proportionnelle à la Production - - - - -
15 Redevance Minière Négative ( à mettre en signe - ) (7 190 833 807) - (7 190 833 807) (7 190 858 510) - (7 190 858 510) 24 703
21 Dividendes Filiales SNH 7 905 031 680 - 7 905 031 680 7 905 031 680 - 7 905 031 680 -
Paiements en numéraire des sociétés extractives à l'Etat 82 628 060 804 - 82 628 060 804 83 172 913 150 (680 452 061) 82 492 461 089 135 599 715
22 Impôts sur les sociétés (pétrolier et non pétrolier) 75 833 782 698 - 75 833 782 698 75 833 782 698 - 75 833 782 698 -
23 Droits Fixes (y compris droits pour attribution ou renouvellement de permis) - - - - -
24 Redevance Superficiaire 27 800 000 - 27 800 000 27 800 000 - 27 800 000 -
27 Taxe Spéciale sur les Revenus (TSR) 4 767 751 864 - 4 767 751 864 4 767 652 865 - 4 767 652 865 98 999
28 Redressements f iscaux/amendes et pénalités 909 661 787 - 909 661 787 909 661 787 909 661 787 -
29 Droits de Douane 910 463 778 - 910 463 778 1 515 415 140 (740 452 061) 774 963 079 135 500 699
30 Redressements Douaniers/amendes et pénalités 60 000 000 - 60 000 000 60 000 000 60 000 000 -
31 Autres Pénalités de non exécution des programmes d'exploration/production - - - - -
32 Droits de passage du pipeline (COTCO) - - - - -
33 Dividendes versés à l'Etat - - - - -
34 Contributions FNE 47 440 264 - 47 440 264 47 440 264 - 47 440 264 -
35 Contributions CFC (part patronale) 71 160 413 - 71 160 413 71 160 396 - 71 160 396 17
38 Frais d’inspection et de contrôle - - - - -
39 Dividendes versées à la SNI - - - - -
40 Autres paiements signif icatifs versés à l'Etat ( sup à 100 KUSD/55 000 KFCFA) - 909 661 787 (909 661 787) - -
Total paiements 111 814 238 151 - 111 814 238 151 112 359 065 794 (680 452 061) 111 678 613 733 135 624 418
Paiements sociaux 42 493 349 - 42 493 349
41 Paiements sociaux volontaires 42 493 349 - 42 493 349
GouvernementDifférence FinaleN° Nomenclature des flux
Companies

Report on the reconciliation of payment flows and volumes relating to the exploration and exploitation of Hydrocarbon and solid Minerals for the fiscal year 2013
Moore Stephens LLP | Page 145
Nom de la société Euroil Ltd IFU M119500012111E Année 2013
Initial Ajustements Final Initial Ajustements Final
Flux de Paiement en nature - - - - - - -
1 Parts d'huile de la SNH-Etat (Petrole) - - - - -
2 Parts d'huile de la SNH-Etat (Gaz) - - - - -
3 Parts d'huile de la SNH-Etat (Condensat) - - - - -
4 Parts d'huile de la SNH-Associé (Petrole) - - - - -
5 Parts d'huile de la SNH-Associé (Gaz) - - - - -
6 Parts d'huile de la SNH-Associé (Cendensat) - - - - -
Parts d'huile de l'Etat Commercialisées - - - - - - -
7 Parts d'huile SNH-ETAT commercialisées par la SNH (Petrole) - - - - -
8 Parts d'huile SNH-ETAT commercialisées par la SNH (Gas) - - - - -
9 Parts d'huile SNH-ETAT commercialisées par la SNH (Condensat) - - - - -
Transferts au Trésor Public par la SNH - - - - - - -
10 Transferts directs au Trésor Public par la SNH - - - - -
11 Transferts indirects au Trésor Public (Interventions directes SNH) - - - - -
12 Dividendes SNH - - - - -
Paiements des sociétés pétrolières à la SNH - - - - - - -
13 Redevance Minière Proportionnelle - - - - -
14 Redevance Proportionnelle à la Production - - - - -
15 Redevance Minière Négative ( à mettre en signe - ) - - - - -
16 Bonus de signature - - - - -
17 Bonus de Production - - - - -
18 Prélèvement pétrolier additionnel - - - - -
19 Frais de Formation - - - - - -
20 Taxes sur les activités de transport des hydrocarbures - - - - -
21 Dividendes Filiales SNH - - - - -
Paiements en numéraire des sociétés extractives à l'Etat 114 210 537 5 000 114 215 537 112 787 387 1 427 659 114 215 046 491
22 Impôts sur les sociétés (pétrolier et non pétrolier) - - - - -
23 Droits Fixes (y compris droits pour attribution ou renouvellement de permis)69 622 500 - 69 622 500 69 622 000 69 622 000 500
24 Redevance Superficiaire 25 528 250 - 25 528 250 95 150 250 (69 622 000) 25 528 250 -
34 Contributions FNE 7 620 921 5 000 7 625 921 7 054 849 571 066 7 625 915 6
35 Contributions CFC (part patronale) 11 438 866 - 11 438 866 10 582 288 856 593 11 438 881 (15)
36 Bonus progressif - - - - -
37 Impôt sur le Revenu des Capitaux mobiliers (IRCM) - - - - -
38 Frais d’inspection et de contrôle - - - - -
39 Dividendes versées à la SNI - - - - -
40 Autres paiements signif icatifs versés à l'Etat ( sup à 100 KUSD/55 000 KFCFA) - - - -
Total paiements 114 210 537 5 000 114 215 537 112 787 387 1 427 659 114 215 046 491
GouvernementDifférence FinaleN° Nomenclature des flux
Companies

Report on the reconciliation of payment flows and volumes relating to the exploration and exploitation of Hydrocarbon and solid Minerals for the fiscal year 2013
Moore Stephens LLP | Page 146
Nom de la sociétéNoble Energy
Cameroon LTDIFU M080600021129Y Année 2013
Initial Ajustements Final Initial Ajustements Final
Flux de Paiement en nature - - - - - - -
1 Parts d'huile de la SNH-Etat (Petrole) - - - - -
2 Parts d'huile de la SNH-Etat (Gaz) - - - - -
3 Parts d'huile de la SNH-Etat (Condensat) - - - - -
4 Parts d'huile de la SNH-Associé (Petrole) - - - - -
5 Parts d'huile de la SNH-Associé (Gaz) - - - - -
6 Parts d'huile de la SNH-Associé (Cendensat) - - - - -
Parts d'huile de l'Etat Commercialisées - - - - - - -
7 Parts d'huile SNH-ETAT commercialisées par la SNH (Petrole) - - - - -
8 Parts d'huile SNH-ETAT commercialisées par la SNH (Gas) - - - - -
9 Parts d'huile SNH-ETAT commercialisées par la SNH (Condensat) - - - - -
Transferts au Trésor Public par la SNH - - - - - - -
10 Transferts directs au Trésor Public par la SNH - - - - -
11 Transferts indirects au Trésor Public (Interventions directes SNH) - - - - -
12 Dividendes SNH - - - - -
Paiements des sociétés pétrolières à la SNH - - - - - - -
13 Redevance Minière Proportionnelle - - - - -
14 Redevance Proportionnelle à la Production - - - - -
15 Redevance Minière Négative ( à mettre en signe - ) - - - - -
16 Bonus de signature - - - - -
17 Bonus de Production - - - - -
18 Prélèvement pétrolier additionnel - - - - -
19 Frais de Formation - - - - -
20 Taxes sur les activités de transport des hydrocarbures - - - - -
21 Dividendes Filiales SNH - - - - -
Paiements en numéraire des sociétés extractives à l'Etat 215 240 377 653 066 215 893 443 213 153 727 2 845 967 215 999 694 (106 251)
22 Impôts sur les sociétés (pétrolier et non pétrolier) - - - - -
23 Droits Fixes (y compris droits pour attribution ou renouvellement de permis)38 749 000 (38 749 000) - - - -
24 Redevance Superficiaire 89 221 950 38 749 000 127 970 950 127 985 450 (14 500) 127 970 950 -
25 Taxes Ad Valorem - - - - -
26 Taxes à l'extraction - - - - -
27 Taxe Spéciale sur les Revenus (TSR) 76 364 280 653 066 77 017 346 74 156 879 2 860 467 77 017 346 -
28 Redressements f iscaux/amendes et pénalités - - - - -
29 Droits de Douane 3 146 521 - 3 146 521 3 354 086 - 3 354 086 (207 565)
30 Redressements Douaniers/amendes et pénalités - - - - -
31 Autres Pénalités de non exécution des programmes d'exploration/production - - - - -
32 Droits de passage du pipeline (COTCO) - - - - -
33 Dividendes versés à l'Etat - - - - -
34 Contributions FNE 3 103 450 - 3 103 450 3 062 924 - 3 062 924 40 526
35 Contributions CFC (part patronale) 4 655 176 - 4 655 176 4 594 388 - 4 594 388 60 788
Total paiements 215 240 377 653 066 215 893 443 213 153 727 2 845 967 215 999 694 (106 251)
GouvernementDifférence FinaleN° Nomenclature des flux
Companies

Report on the reconciliation of payment flows and volumes relating to the exploration and exploitation of Hydrocarbon and solid Minerals for the fiscal year 2013
Moore Stephens LLP | Page 147
Nom de la sociétéADDAX Petroleum
Cameroon LimitedIFU M100200014425F Année 2013
Initial Ajustements Final Initial Ajustements Final
Flux de Paiement en nature - - - - - - -
1 Parts d'huile de la SNH-Etat (Petrole) - - - - -
2 Parts d'huile de la SNH-Etat (Gaz) - - - - -
3 Parts d'huile de la SNH-Etat (Condensat) - - - - -
4 Parts d'huile de la SNH-Associé (Petrole) - - - - -
5 Parts d'huile de la SNH-Associé (Gaz) - - - - -
6 Parts d'huile de la SNH-Associé (Cendensat) - - - - -
Parts d'huile de l'Etat Commercialisées - - - - - - -
7 Parts d'huile SNH-ETAT commercialisées par la SNH (Petrole) - - - - -
8 Parts d'huile SNH-ETAT commercialisées par la SNH (Gas) - - - - -
9 Parts d'huile SNH-ETAT commercialisées par la SNH (Condensat) - - - - -
Transferts au Trésor Public par la SNH - - - - - - -
10 Transferts directs au Trésor Public par la SNH - - - - -
11 Transferts indirects au Trésor Public (Interventions directes SNH) - - - - -
12 Dividendes SNH - - - - -
Paiements des sociétés pétrolières à la SNH - - - - - - -
13 Redevance Minière Proportionnelle - - - - -
14 Redevance Proportionnelle à la Production - - - - -
15 Redevance Minière Négative ( à mettre en signe - ) - - - - -
16 Bonus de signature - - - - -
17 Bonus de Production - - - - -
18 Prélèvement pétrolier additionnel - - - - -
19 Frais de Formation - - - - -
20 Taxes sur les activités de transport des hydrocarbures - - - - -
21 Dividendes Filiales SNH - - - - -
Paiements en numéraire des sociétés extractives à l'Etat 2 469 786 407 - 2 469 786 407 2 469 786 407 - 2 469 786 407 -
22 Impôts sur les sociétés (pétrolier et non pétrolier) - - - - - -
23 Droits Fixes (y compris droits pour attribution ou renouvellement de permis)250 000 000 - 250 000 000 250 000 000 - 250 000 000 -
24 Redevance Superficiaire 2 699 125 - 2 699 125 2 699 125 - 2 699 125 -
27 Taxe Spéciale sur les Revenus (TSR) 2 031 454 206 - 2 031 454 206 2 031 454 206 - 2 031 454 206 -
28 Redressements f iscaux/amendes et pénalités - - - - -
29 Droits de Douane 89 958 474 - 89 958 474 89 958 474 - 89 958 474 -
30 Redressements Douaniers/amendes et pénalités 95 000 000 - 95 000 000 95 000 000 - 95 000 000 -
31 Autres Pénalités de non exécution des programmes d'exploration/production - - - - -
32 Droits de passage du pipeline (COTCO) - - - - -
33 Dividendes versés à l'Etat - - - - -
34 Contributions FNE 269 838 - 269 838 269 838 - 269 838 -
35 Contributions CFC (part patronale) 404 764 - 404 764 404 764 - 404 764 -
Total paiements 2 469 786 407 - 2 469 786 407 2 469 786 407 - 2 469 786 407 -
GouvernementDifférence FinaleN° Nomenclature des flux
Companies

Report on the reconciliation of payment flows and volumes relating to the exploration and exploitation of Hydrocarbon and solid Minerals for the fiscal year 2013
Moore Stephens LLP | Page 148
Nom de la société Murphy IFU M011200040687 A Année 2013
Initial Ajustements Final Initial Ajustements Final
Flux de Paiement en nature - - - - - - -
1 Parts d'huile de la SNH-Etat (Petrole) - - - - -
2 Parts d'huile de la SNH-Etat (Gaz) - - - - -
3 Parts d'huile de la SNH-Etat (Condensat) - - - - -
4 Parts d'huile de la SNH-Associé (Petrole) - - - - -
5 Parts d'huile de la SNH-Associé (Gaz) - - - - -
6 Parts d'huile de la SNH-Associé (Cendensat) - - - - -
Parts d'huile de l'Etat Commercialisées - - - - - - -
7 Parts d'huile SNH-ETAT commercialisées par la SNH (Petrole) - - - - -
8 Parts d'huile SNH-ETAT commercialisées par la SNH (Gas) - - - - -
9 Parts d'huile SNH-ETAT commercialisées par la SNH (Condensat) - - - - -
Transferts au Trésor Public par la SNH - - - - - - -
10 Transferts directs au Trésor Public par la SNH - - - - -
11 Transferts indirects au Trésor Public (Interventions directes SNH) - - - - -
12 Dividendes SNH - - - - -
Paiements des sociétés pétrolières à la SNH - - - - - - -
13 Redevance Minière Proportionnelle - - - - -
14 Redevance Proportionnelle à la Production - - - - -
15 Redevance Minière Négative ( à mettre en signe - ) - - - - -
16 Bonus de signature - - - - -
17 Bonus de Production - - - - -
18 Prélèvement pétrolier additionnel - - - - -
19 Frais de Formation - - - - -
20 Taxes sur les activités de transport des hydrocarbures - - - - -
21 Dividendes Filiales SNH - - - - -
Paiements en numéraire des sociétés extractives à l'Etat 36 662 047 - 36 662 047 21 671 080 13 779 357 35 450 437 1 211 610
22 Impôts sur les sociétés (pétrolier et non pétrolier) - - - - -
23 Droits Fixes (y compris droits pour attribution ou renouvellement de permis) - - - - -
24 Redevance Superficiaire 25 509 000 - 25 509 000 12 754 500 12 754 500 25 509 000 -
25 Taxes Ad Valorem - - - - -
26 Taxes à l'extraction - - - - -
27 Taxe Spéciale sur les Revenus (TSR) - - - - -
28 Redressements f iscaux/amendes et pénalités - - - - -
29 Droits de Douane 9 103 333 - 9 103 333 8 916 580 - 8 916 580 186 753
30 Redressements Douaniers/amendes et pénalités - - - - -
31 Autres Pénalités de non exécution des programmes d'exploration/production - - - - -
32 Droits de passage du pipeline (COTCO) - - - - -
33 Dividendes versés à l'Etat - - - - -
34 Contributions FNE 819 886 - 819 886 409 943 409 943 409 943
35 Contributions CFC (part patronale) 1 229 828 - 1 229 828 614 914 614 914 614 914
Total paiements 36 662 047 - 36 662 047 21 671 080 13 779 357 35 450 437 1 211 610
GouvernementDifférence FinaleN° Nomenclature des flux
Companies

Report on the reconciliation of payment flows and volumes relating to the exploration and exploitation of Hydrocarbon and solid Minerals for the fiscal year 2013
Moore Stephens LLP | Page 149
Nom de la société
Rodeo
Development LTD
(Gaz de
Cameroun)
IFU M010700023025B Année 2013
Initial Ajustements Final Initial Ajustements Final
Flux de Paiement en nature - - - - - - -
1 Parts d'huile de la SNH-Etat (Petrole) - - - - -
2 Parts d'huile de la SNH-Etat (Gaz) - - - - -
3 Parts d'huile de la SNH-Etat (Condensat) - - - - -
4 Parts d'huile de la SNH-Associé (Petrole) - - - - -
5 Parts d'huile de la SNH-Associé (Gaz) - - - - -
6 Parts d'huile de la SNH-Associé (Cendensat) - - - - -
Parts d'huile de l'Etat Commercialisées - - - - - - -
7 Parts d'huile SNH-ETAT commercialisées par la SNH (Petrole) - - - - -
8 Parts d'huile SNH-ETAT commercialisées par la SNH (Gas) - - - - -
9 Parts d'huile SNH-ETAT commercialisées par la SNH (Condensat) - - - - -
Transferts au Trésor Public par la SNH - - - - - - -
10 Transferts directs au Trésor Public par la SNH - - - - -
11 Transferts indirects au Trésor Public (Interventions directes SNH) - - - - -
12 Dividendes SNH - - - - -
Paiements des sociétés pétrolières à la SNH - - - - - - -
13 Redevance Minière Proportionnelle - - - - -
14 Redevance Proportionnelle à la Production - - - - -
15 Redevance Minière Négative ( à mettre en signe - ) - - - - -
16 Bonus de signature - - - - -
17 Bonus de Production - - - - -
18 Prélèvement pétrolier additionnel - - - - -
19 Frais de Formation - - - - -
20 Taxes sur les activités de transport des hydrocarbures - - - - -
21 Dividendes Filiales SNH - - - - -
Paiements en numéraire des sociétés extractives à l'Etat 272 873 542 132 702 055 405 575 597 377 442 302 42 630 052 420 072 354 (14 496 757)
22 Impôts sur les sociétés (pétrolier et non pétrolier) - - - - - -
23 Droits Fixes (y compris droits pour attribution ou renouvellement de permis) - - - - -
24 Redevance Superficiaire 6 000 000 - 6 000 000 6 000 000 - 6 000 000 -
25 Taxes Ad Valorem - - - - -
26 Taxes à l'extraction - - - - -
27 Taxe Spéciale sur les Revenus (TSR) 133 616 459 132 702 055 266 318 514 223 688 462 42 630 052 266 318 514 -
28 Redressements f iscaux/amendes et pénalités - - - - -
29 Droits de Douane 96 021 224 - 96 021 224 110 517 981 - 110 517 981 (14 496 757)
30 Redressements Douaniers/amendes et pénalités - - - - -
31 Autres Pénalités de non exécution des programmes d'exploration/production - - - - -
32 Droits de passage du pipeline (COTCO) - - - - -
33 Dividendes versés à l'Etat - - - - -
34 Contributions FNE 14 894 317 - 14 894 317 14 894 317 - 14 894 317 -
35 Contributions CFC (part patronale) 22 341 542 - 22 341 542 22 341 542 - 22 341 542 -
Total paiements 272 873 542 132 702 055 405 575 597 377 442 302 42 630 052 420 072 354 (14 496 757)
Paiements sociaux 1 922 000 - 1 922 000
41 Paiements sociaux volontaires 1 922 000 - 1 922 000
GouvernementDifférence FinaleN° Nomenclature des flux
Companies
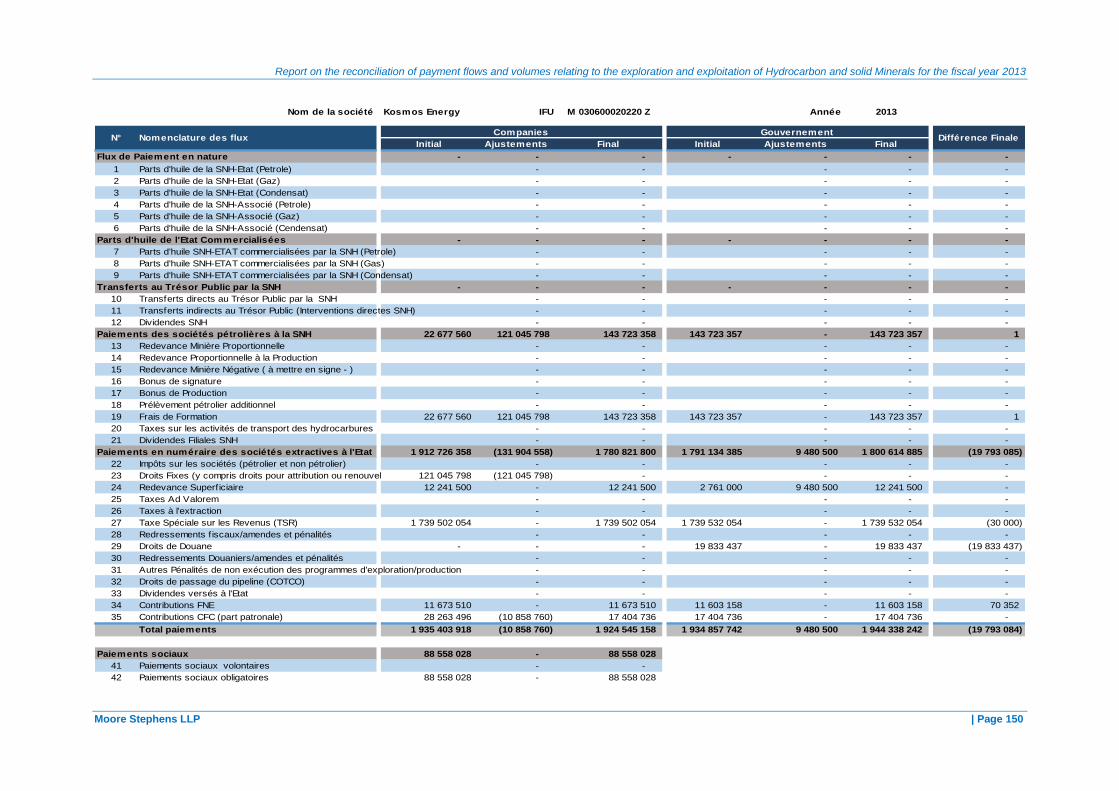
Report on the reconciliation of payment flows and volumes relating to the exploration and exploitation of Hydrocarbon and solid Minerals for the fiscal year 2013
Moore Stephens LLP | Page 150
Nom de la société Kosmos Energy IFU M 030600020220 Z Année 2013
494,0644800
Initial Ajustements Final Initial Ajustements Final
Flux de Paiement en nature - - - - - - -
1 Parts d'huile de la SNH-Etat (Petrole) - - - - -
2 Parts d'huile de la SNH-Etat (Gaz) - - - - -
3 Parts d'huile de la SNH-Etat (Condensat) - - - - -
4 Parts d'huile de la SNH-Associé (Petrole) - - - - -
5 Parts d'huile de la SNH-Associé (Gaz) - - - - -
6 Parts d'huile de la SNH-Associé (Cendensat) - - - - -
Parts d'huile de l'Etat Commercialisées - - - - - - -
7 Parts d'huile SNH-ETAT commercialisées par la SNH (Petrole) - - - - -
8 Parts d'huile SNH-ETAT commercialisées par la SNH (Gas) - - - - -
9 Parts d'huile SNH-ETAT commercialisées par la SNH (Condensat) - - - - -
Transferts au Trésor Public par la SNH - - - - - - -
10 Transferts directs au Trésor Public par la SNH - - - - -
11 Transferts indirects au Trésor Public (Interventions directes SNH) - - - - -
12 Dividendes SNH - - - - -
Paiements des sociétés pétrolières à la SNH 22 677 560 121 045 798 143 723 358 143 723 357 - 143 723 357 1
13 Redevance Minière Proportionnelle - - - - -
14 Redevance Proportionnelle à la Production - - - - -
15 Redevance Minière Négative ( à mettre en signe - ) - - - - -
16 Bonus de signature - - - - -
17 Bonus de Production - - - - -
18 Prélèvement pétrolier additionnel - - - - -
19 Frais de Formation 22 677 560 121 045 798 143 723 358 143 723 357 - 143 723 357 1
20 Taxes sur les activités de transport des hydrocarbures - - - - -
21 Dividendes Filiales SNH - - - - -
Paiements en numéraire des sociétés extractives à l'Etat 1 912 726 358 (131 904 558) 1 780 821 800 1 791 134 385 9 480 500 1 800 614 885 (19 793 085)
22 Impôts sur les sociétés (pétrolier et non pétrolier) - - - - -
23 Droits Fixes (y compris droits pour attribution ou renouvellement de permis)121 045 798 (121 045 798) - - - -
24 Redevance Superficiaire 12 241 500 - 12 241 500 2 761 000 9 480 500 12 241 500 -
25 Taxes Ad Valorem - - - - -
26 Taxes à l'extraction - - - - -
27 Taxe Spéciale sur les Revenus (TSR) 1 739 502 054 - 1 739 502 054 1 739 532 054 - 1 739 532 054 (30 000)
28 Redressements f iscaux/amendes et pénalités - - - - -
29 Droits de Douane - - - 19 833 437 - 19 833 437 (19 833 437)
30 Redressements Douaniers/amendes et pénalités - - - - -
31 Autres Pénalités de non exécution des programmes d'exploration/production - - - - -
32 Droits de passage du pipeline (COTCO) - - - - -
33 Dividendes versés à l'Etat - - - - -
34 Contributions FNE 11 673 510 - 11 673 510 11 603 158 - 11 603 158 70 352
35 Contributions CFC (part patronale) 28 263 496 (10 858 760) 17 404 736 17 404 736 - 17 404 736 -
Total paiements 1 935 403 918 (10 858 760) 1 924 545 158 1 934 857 742 9 480 500 1 944 338 242 (19 793 084)
Paiements sociaux 88 558 028 - 88 558 028
41 Paiements sociaux volontaires - -
42 Paiements sociaux obligatoires 88 558 028 - 88 558 028
GouvernementDifférence FinaleN° Nomenclature des flux
Companies

Report on the reconciliation of payment flows and volumes relating to the exploration and exploitation of Hydrocarbon and solid Minerals for the fiscal year 2013
Moore Stephens LLP | Page 151
Nom de la société
Glencore
Exploration
Cameroon
IFU M 040800024 299W Année 2013
Initial Ajustements Final Initial Ajustements Final
Flux de Paiement en nature - - - - - - -
1 Parts d'huile de la SNH-Etat (Petrole) - - - - -
2 Parts d'huile de la SNH-Etat (Gaz) - - - - -
3 Parts d'huile de la SNH-Etat (Condensat) - - - - -
4 Parts d'huile de la SNH-Associé (Petrole) - - - - -
5 Parts d'huile de la SNH-Associé (Gaz) - - - - -
6 Parts d'huile de la SNH-Associé (Cendensat) - - - - -
Parts d'huile de l'Etat Commercialisées - - - - - - -
7 Parts d'huile SNH-ETAT commercialisées par la SNH (Petrole) - - - - -
8 Parts d'huile SNH-ETAT commercialisées par la SNH (Gas) - - - - -
9 Parts d'huile SNH-ETAT commercialisées par la SNH (Condensat) - - - - -
Transferts au Trésor Public par la SNH - - - - - - -
10 Transferts directs au Trésor Public par la SNH - - - - -
11 Transferts indirects au Trésor Public (Interventions directes SNH) - - - - -
12 Dividendes SNH - - - - -
Paiements des sociétés pétrolières à la SNH - - - - - - -
13 Redevance Minière Proportionnelle - - - - - -
14 Redevance Proportionnelle à la Production - - - - - -
15 Redevance Minière Négative ( à mettre en signe - ) - - - - - -
16 Bonus de signature - - - - - -
17 Bonus de Production - - - - - -
18 Prélèvement pétrolier additionnel - - - - - -
19 Frais de Formation - - - - - -
20 Taxes sur les activités de transport des hydrocarbures - - - - - -
21 Dividendes Filiales SNH - - - - - -
Paiements en numéraire des sociétés extractives à l'Etat 1 226 914 027 (11 955 552) 1 214 958 475 1 210 654 034 5 466 789 1 216 120 823 (1 162 348)
22 Impôts sur les sociétés (pétrolier et non pétrolier) 5 466 789 - 5 466 789 5 466 789 5 466 789 -
23 Droits Fixes (y compris droits pour attribution ou renouvellement de permis)6 000 000 - 6 000 000 6 000 000 - 6 000 000 -
24 Redevance Superficiaire 9 329 045 - 9 329 045 9 329 045 - 9 329 045 -
25 Taxes Ad Valorem - - - - -
26 Taxes à l'extraction - - - - -
27 Taxe Spéciale sur les Revenus (TSR) 1 123 117 497 (50 662 534) 1 072 454 963 1 072 454 963 - 1 072 454 963 -
28 Redressements f iscaux/amendes et pénalités 50 662 534 50 662 534 50 662 534 - 50 662 534 -
29 Droits de Douane 78 603 229 (11 955 552) 66 647 677 67 810 025 - 67 810 025 (1 162 348)
30 Redressements Douaniers/amendes et pénalités - - - - -
31 Autres Pénalités de non exécution des programmes d'exploration/production - - - - -
32 Droits de passage du pipeline (COTCO) - - - - -
33 Dividendes versés à l'Etat - - - - -
34 Contributions FNE 1 758 986 - 1 758 986 1 758 987 - 1 758 987 (1)
35 Contributions CFC (part patronale) 2 638 481 - 2 638 481 2 638 480 - 2 638 480 1
Total paiements 1 226 914 027 (11 955 552) 1 214 958 475 1 210 654 034 5 466 789 1 216 120 823 (1 162 348)
GouvernementDifférence FinaleN° Nomenclature des flux
Companies
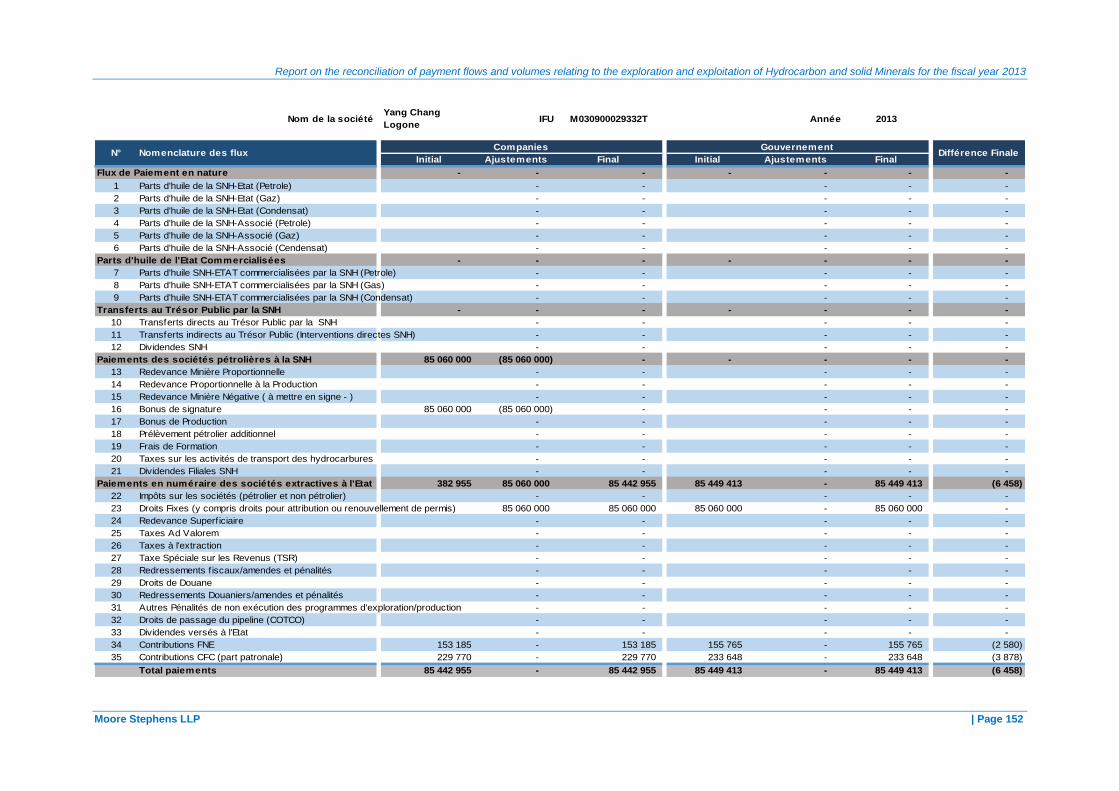
Report on the reconciliation of payment flows and volumes relating to the exploration and exploitation of Hydrocarbon and solid Minerals for the fiscal year 2013
Moore Stephens LLP | Page 152
Nom de la sociétéYang Chang
LogoneIFU M030900029332T Année 2013
Initial Ajustements Final Initial Ajustements Final
Flux de Paiement en nature - - - - - - -
1 Parts d'huile de la SNH-Etat (Petrole) - - - - -
2 Parts d'huile de la SNH-Etat (Gaz) - - - - -
3 Parts d'huile de la SNH-Etat (Condensat) - - - - -
4 Parts d'huile de la SNH-Associé (Petrole) - - - - -
5 Parts d'huile de la SNH-Associé (Gaz) - - - - -
6 Parts d'huile de la SNH-Associé (Cendensat) - - - - -
Parts d'huile de l'Etat Commercialisées - - - - - - -
7 Parts d'huile SNH-ETAT commercialisées par la SNH (Petrole) - - - - -
8 Parts d'huile SNH-ETAT commercialisées par la SNH (Gas) - - - - -
9 Parts d'huile SNH-ETAT commercialisées par la SNH (Condensat) - - - - -
Transferts au Trésor Public par la SNH - - - - - - -
10 Transferts directs au Trésor Public par la SNH - - - - -
11 Transferts indirects au Trésor Public (Interventions directes SNH) - - - - -
12 Dividendes SNH - - - - -
Paiements des sociétés pétrolières à la SNH 85 060 000 (85 060 000) - - - - -
13 Redevance Minière Proportionnelle - - - - -
14 Redevance Proportionnelle à la Production - - - - -
15 Redevance Minière Négative ( à mettre en signe - ) - - - - -
16 Bonus de signature 85 060 000 (85 060 000) - - - -
17 Bonus de Production - - - - -
18 Prélèvement pétrolier additionnel - - - - -
19 Frais de Formation - - - - -
20 Taxes sur les activités de transport des hydrocarbures - - - - -
21 Dividendes Filiales SNH - - - - -
Paiements en numéraire des sociétés extractives à l'Etat 382 955 85 060 000 85 442 955 85 449 413 - 85 449 413 (6 458)
22 Impôts sur les sociétés (pétrolier et non pétrolier) - - - - -
23 Droits Fixes (y compris droits pour attribution ou renouvellement de permis) 85 060 000 85 060 000 85 060 000 - 85 060 000 -
24 Redevance Superficiaire - - - - -
25 Taxes Ad Valorem - - - - -
26 Taxes à l'extraction - - - - -
27 Taxe Spéciale sur les Revenus (TSR) - - - - -
28 Redressements f iscaux/amendes et pénalités - - - - -
29 Droits de Douane - - - - -
30 Redressements Douaniers/amendes et pénalités - - - - -
31 Autres Pénalités de non exécution des programmes d'exploration/production - - - - -
32 Droits de passage du pipeline (COTCO) - - - - -
33 Dividendes versés à l'Etat - - - - -
34 Contributions FNE 153 185 - 153 185 155 765 - 155 765 (2 580)
35 Contributions CFC (part patronale) 229 770 - 229 770 233 648 - 233 648 (3 878)
Total paiements 85 442 955 - 85 442 955 85 449 413 - 85 449 413 (6 458)
GouvernementDifférence FinaleN° Nomenclature des flux
Companies
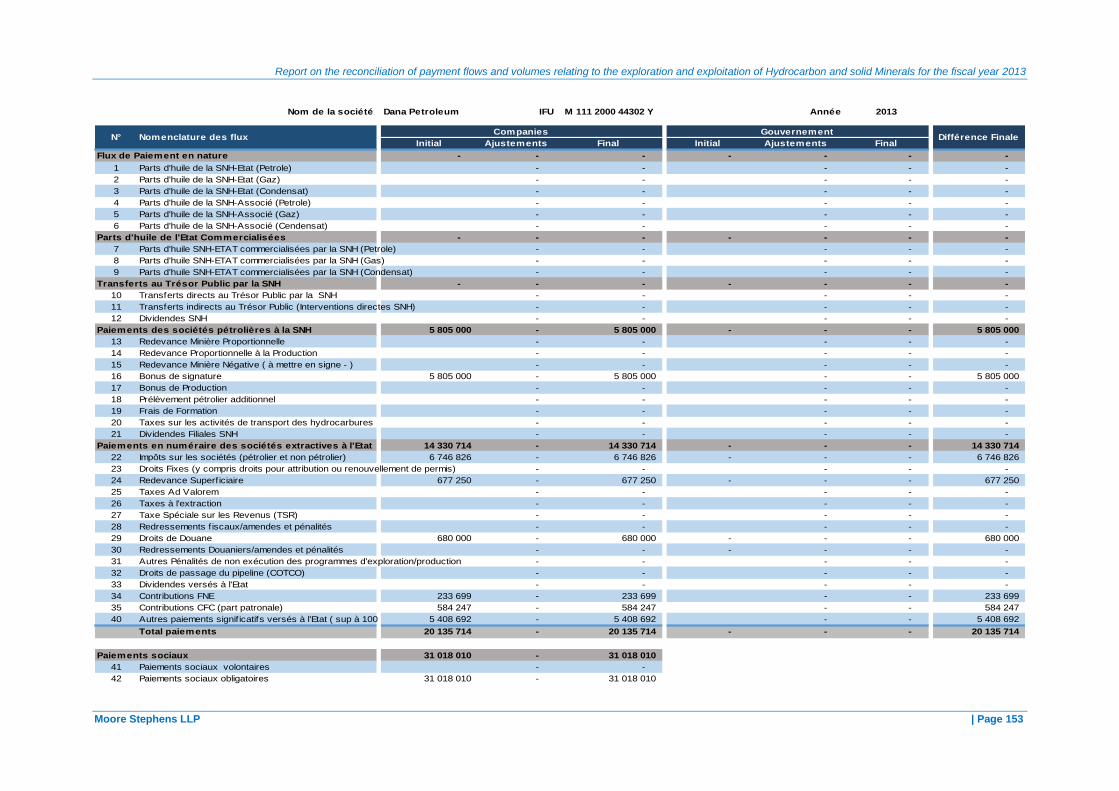
Report on the reconciliation of payment flows and volumes relating to the exploration and exploitation of Hydrocarbon and solid Minerals for the fiscal year 2013
Moore Stephens LLP | Page 153
Nom de la société Dana Petroleum IFU M 111 2000 44302 Y Année 2013
Initial Ajustements Final Initial Ajustements Final
Flux de Paiement en nature - - - - - - -
1 Parts d'huile de la SNH-Etat (Petrole) - - - - -
2 Parts d'huile de la SNH-Etat (Gaz) - - - - -
3 Parts d'huile de la SNH-Etat (Condensat) - - - - -
4 Parts d'huile de la SNH-Associé (Petrole) - - - - -
5 Parts d'huile de la SNH-Associé (Gaz) - - - - -
6 Parts d'huile de la SNH-Associé (Cendensat) - - - - -
Parts d'huile de l'Etat Commercialisées - - - - - - -
7 Parts d'huile SNH-ETAT commercialisées par la SNH (Petrole) - - - - -
8 Parts d'huile SNH-ETAT commercialisées par la SNH (Gas) - - - - -
9 Parts d'huile SNH-ETAT commercialisées par la SNH (Condensat) - - - - -
Transferts au Trésor Public par la SNH - - - - - - -
10 Transferts directs au Trésor Public par la SNH - - - - -
11 Transferts indirects au Trésor Public (Interventions directes SNH) - - - - -
12 Dividendes SNH - - - - -
Paiements des sociétés pétrolières à la SNH 5 805 000 - 5 805 000 - - - 5 805 000
13 Redevance Minière Proportionnelle - - - - -
14 Redevance Proportionnelle à la Production - - - - -
15 Redevance Minière Négative ( à mettre en signe - ) - - - - -
16 Bonus de signature 5 805 000 - 5 805 000 - - 5 805 000
17 Bonus de Production - - - - -
18 Prélèvement pétrolier additionnel - - - - -
19 Frais de Formation - - - - -
20 Taxes sur les activités de transport des hydrocarbures - - - - -
21 Dividendes Filiales SNH - - - - -
Paiements en numéraire des sociétés extractives à l'Etat 14 330 714 - 14 330 714 - - - 14 330 714
22 Impôts sur les sociétés (pétrolier et non pétrolier) 6 746 826 - 6 746 826 - - - 6 746 826
23 Droits Fixes (y compris droits pour attribution ou renouvellement de permis) - - - - -
24 Redevance Superficiaire 677 250 - 677 250 - - - 677 250
25 Taxes Ad Valorem - - - - -
26 Taxes à l'extraction - - - - -
27 Taxe Spéciale sur les Revenus (TSR) - - - - -
28 Redressements f iscaux/amendes et pénalités - - - - -
29 Droits de Douane 680 000 - 680 000 - - - 680 000
30 Redressements Douaniers/amendes et pénalités - - - - - -
31 Autres Pénalités de non exécution des programmes d'exploration/production - - - - -
32 Droits de passage du pipeline (COTCO) - - - - -
33 Dividendes versés à l'Etat - - - - -
34 Contributions FNE 233 699 - 233 699 - - 233 699
35 Contributions CFC (part patronale) 584 247 - 584 247 - - 584 247
40 Autres paiements signif icatifs versés à l'Etat ( sup à 100 KUSD/55 000 KFCFA)5 408 692 - 5 408 692 - - 5 408 692
Total paiements 20 135 714 - 20 135 714 - - - 20 135 714
Paiements sociaux 31 018 010 - 31 018 010
41 Paiements sociaux volontaires - -
42 Paiements sociaux obligatoires 31 018 010 - 31 018 010
GouvernementDifférence FinaleN° Nomenclature des flux
Companies
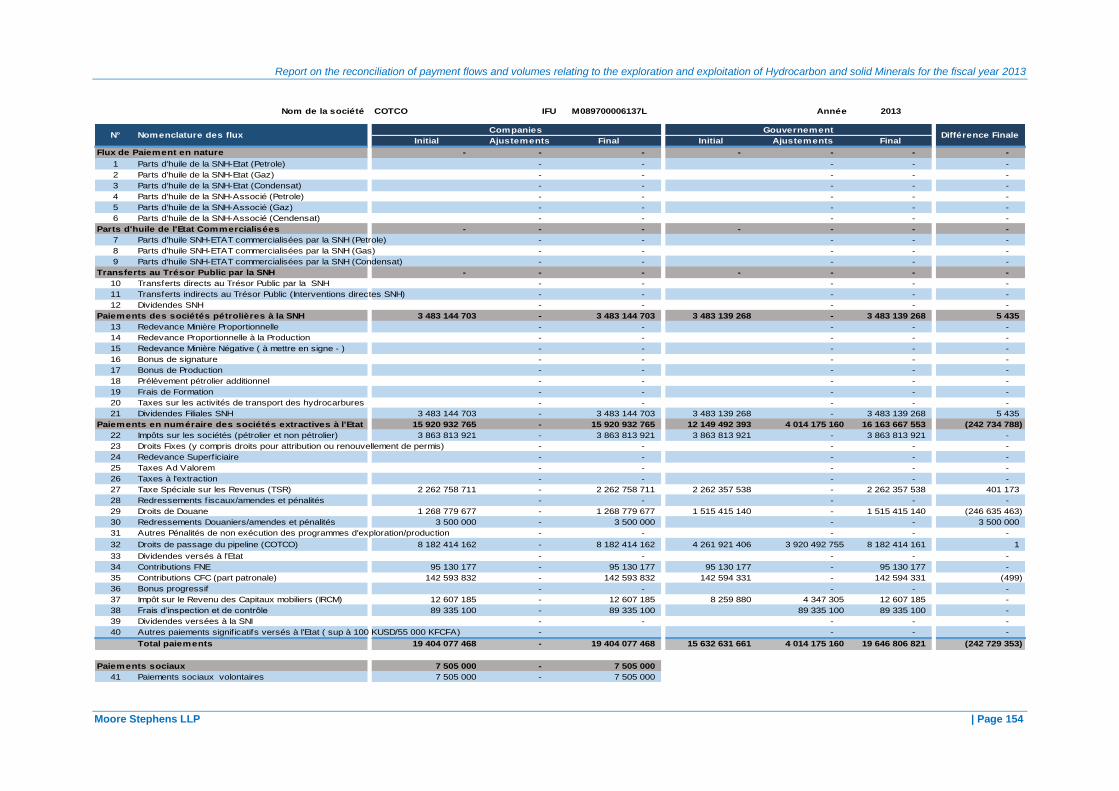
Report on the reconciliation of payment flows and volumes relating to the exploration and exploitation of Hydrocarbon and solid Minerals for the fiscal year 2013
Moore Stephens LLP | Page 154
Nom de la société COTCO IFU M089700006137L Année 2013
494,0644800
Initial Ajustements Final Initial Ajustements Final
Flux de Paiement en nature - - - - - - -
1 Parts d'huile de la SNH-Etat (Petrole) - - - - -
2 Parts d'huile de la SNH-Etat (Gaz) - - - - -
3 Parts d'huile de la SNH-Etat (Condensat) - - - - -
4 Parts d'huile de la SNH-Associé (Petrole) - - - - -
5 Parts d'huile de la SNH-Associé (Gaz) - - - - -
6 Parts d'huile de la SNH-Associé (Cendensat) - - - - -
Parts d'huile de l'Etat Commercialisées - - - - - - -
7 Parts d'huile SNH-ETAT commercialisées par la SNH (Petrole) - - - - -
8 Parts d'huile SNH-ETAT commercialisées par la SNH (Gas) - - - - -
9 Parts d'huile SNH-ETAT commercialisées par la SNH (Condensat) - - - - -
Transferts au Trésor Public par la SNH - - - - - - -
10 Transferts directs au Trésor Public par la SNH - - - - -
11 Transferts indirects au Trésor Public (Interventions directes SNH) - - - - -
12 Dividendes SNH - - - - -
Paiements des sociétés pétrolières à la SNH 3 483 144 703 - 3 483 144 703 3 483 139 268 - 3 483 139 268 5 435
13 Redevance Minière Proportionnelle - - - - -
14 Redevance Proportionnelle à la Production - - - - -
15 Redevance Minière Négative ( à mettre en signe - ) - - - - -
16 Bonus de signature - - - - -
17 Bonus de Production - - - - -
18 Prélèvement pétrolier additionnel - - - - -
19 Frais de Formation - - - - -
20 Taxes sur les activités de transport des hydrocarbures - - - - -
21 Dividendes Filiales SNH 3 483 144 703 - 3 483 144 703 3 483 139 268 - 3 483 139 268 5 435
Paiements en numéraire des sociétés extractives à l'Etat 15 920 932 765 - 15 920 932 765 12 149 492 393 4 014 175 160 16 163 667 553 (242 734 788)
22 Impôts sur les sociétés (pétrolier et non pétrolier) 3 863 813 921 - 3 863 813 921 3 863 813 921 - 3 863 813 921 -
23 Droits Fixes (y compris droits pour attribution ou renouvellement de permis) - - - - -
24 Redevance Superficiaire - - - - -
25 Taxes Ad Valorem - - - - -
26 Taxes à l'extraction - - - - -
27 Taxe Spéciale sur les Revenus (TSR) 2 262 758 711 - 2 262 758 711 2 262 357 538 - 2 262 357 538 401 173
28 Redressements f iscaux/amendes et pénalités - - - - -
29 Droits de Douane 1 268 779 677 - 1 268 779 677 1 515 415 140 - 1 515 415 140 (246 635 463)
30 Redressements Douaniers/amendes et pénalités 3 500 000 - 3 500 000 - - 3 500 000
31 Autres Pénalités de non exécution des programmes d'exploration/production - - - - -
32 Droits de passage du pipeline (COTCO) 8 182 414 162 - 8 182 414 162 4 261 921 406 3 920 492 755 8 182 414 161 1
33 Dividendes versés à l'Etat - - - - -
34 Contributions FNE 95 130 177 - 95 130 177 95 130 177 - 95 130 177 -
35 Contributions CFC (part patronale) 142 593 832 - 142 593 832 142 594 331 - 142 594 331 (499)
36 Bonus progressif - - - - -
37 Impôt sur le Revenu des Capitaux mobiliers (IRCM) 12 607 185 - 12 607 185 8 259 880 4 347 305 12 607 185 -
38 Frais d’inspection et de contrôle 89 335 100 - 89 335 100 89 335 100 89 335 100 -
39 Dividendes versées à la SNI - - - - -
40 Autres paiements signif icatifs versés à l'Etat ( sup à 100 KUSD/55 000 KFCFA) - - - -
Total paiements 19 404 077 468 - 19 404 077 468 15 632 631 661 4 014 175 160 19 646 806 821 (242 729 353)
Paiements sociaux 7 505 000 - 7 505 000
41 Paiements sociaux volontaires 7 505 000 - 7 505 000
GouvernementDifférence FinaleN° Nomenclature des flux
Companies
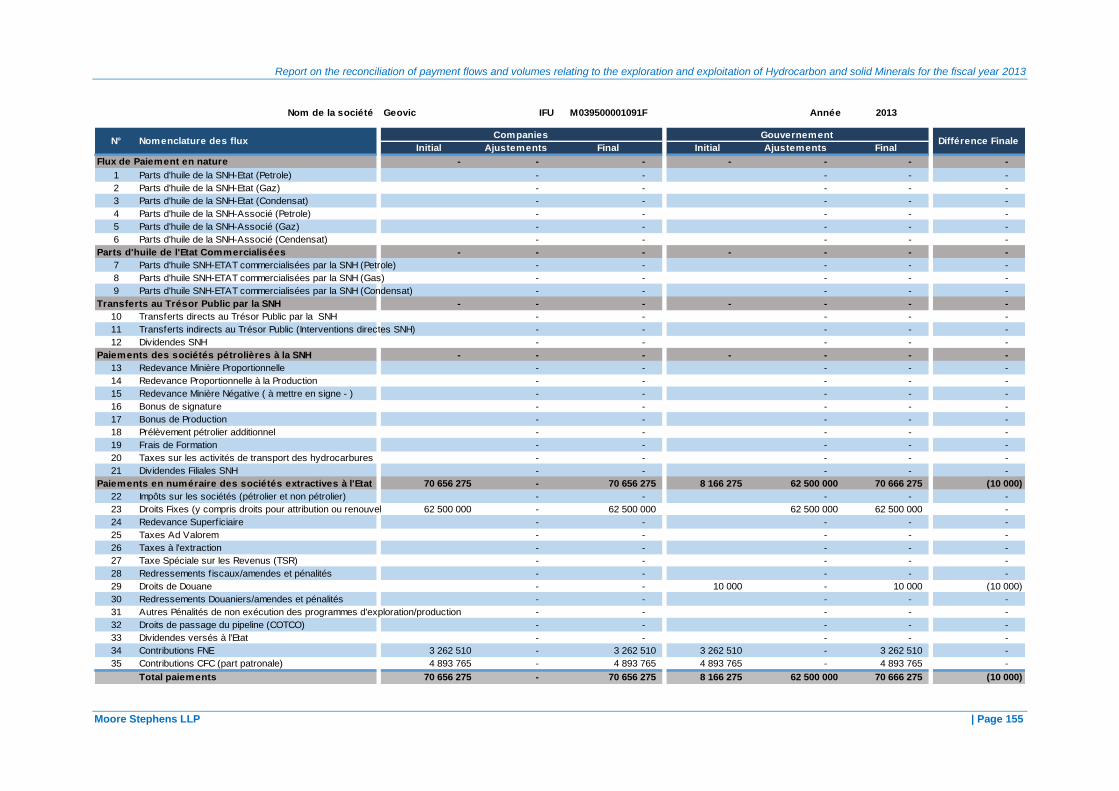
Report on the reconciliation of payment flows and volumes relating to the exploration and exploitation of Hydrocarbon and solid Minerals for the fiscal year 2013
Moore Stephens LLP | Page 155
Nom de la société Geovic IFU M039500001091F Année 2013
Initial Ajustements Final Initial Ajustements Final
Flux de Paiement en nature - - - - - - -
1 Parts d'huile de la SNH-Etat (Petrole) - - - - -
2 Parts d'huile de la SNH-Etat (Gaz) - - - - -
3 Parts d'huile de la SNH-Etat (Condensat) - - - - -
4 Parts d'huile de la SNH-Associé (Petrole) - - - - -
5 Parts d'huile de la SNH-Associé (Gaz) - - - - -
6 Parts d'huile de la SNH-Associé (Cendensat) - - - - -
Parts d'huile de l'Etat Commercialisées - - - - - - -
7 Parts d'huile SNH-ETAT commercialisées par la SNH (Petrole) - - - - -
8 Parts d'huile SNH-ETAT commercialisées par la SNH (Gas) - - - - -
9 Parts d'huile SNH-ETAT commercialisées par la SNH (Condensat) - - - - -
Transferts au Trésor Public par la SNH - - - - - - -
10 Transferts directs au Trésor Public par la SNH - - - - -
11 Transferts indirects au Trésor Public (Interventions directes SNH) - - - - -
12 Dividendes SNH - - - - -
Paiements des sociétés pétrolières à la SNH - - - - - - -
13 Redevance Minière Proportionnelle - - - - -
14 Redevance Proportionnelle à la Production - - - - -
15 Redevance Minière Négative ( à mettre en signe - ) - - - - -
16 Bonus de signature - - - - -
17 Bonus de Production - - - - -
18 Prélèvement pétrolier additionnel - - - - -
19 Frais de Formation - - - - -
20 Taxes sur les activités de transport des hydrocarbures - - - - -
21 Dividendes Filiales SNH - - - - -
Paiements en numéraire des sociétés extractives à l'Etat 70 656 275 - 70 656 275 8 166 275 62 500 000 70 666 275 (10 000)
22 Impôts sur les sociétés (pétrolier et non pétrolier) - - - - -
23 Droits Fixes (y compris droits pour attribution ou renouvellement de permis)62 500 000 - 62 500 000 62 500 000 62 500 000 -
24 Redevance Superficiaire - - - - -
25 Taxes Ad Valorem - - - - -
26 Taxes à l'extraction - - - - -
27 Taxe Spéciale sur les Revenus (TSR) - - - - -
28 Redressements f iscaux/amendes et pénalités - - - - -
29 Droits de Douane - - 10 000 - 10 000 (10 000)
30 Redressements Douaniers/amendes et pénalités - - - - -
31 Autres Pénalités de non exécution des programmes d'exploration/production - - - - -
32 Droits de passage du pipeline (COTCO) - - - - -
33 Dividendes versés à l'Etat - - - - -
34 Contributions FNE 3 262 510 - 3 262 510 3 262 510 - 3 262 510 -
35 Contributions CFC (part patronale) 4 893 765 - 4 893 765 4 893 765 - 4 893 765 -
Total paiements 70 656 275 - 70 656 275 8 166 275 62 500 000 70 666 275 (10 000)
GouvernementDifférence FinaleN° Nomenclature des flux
Companies
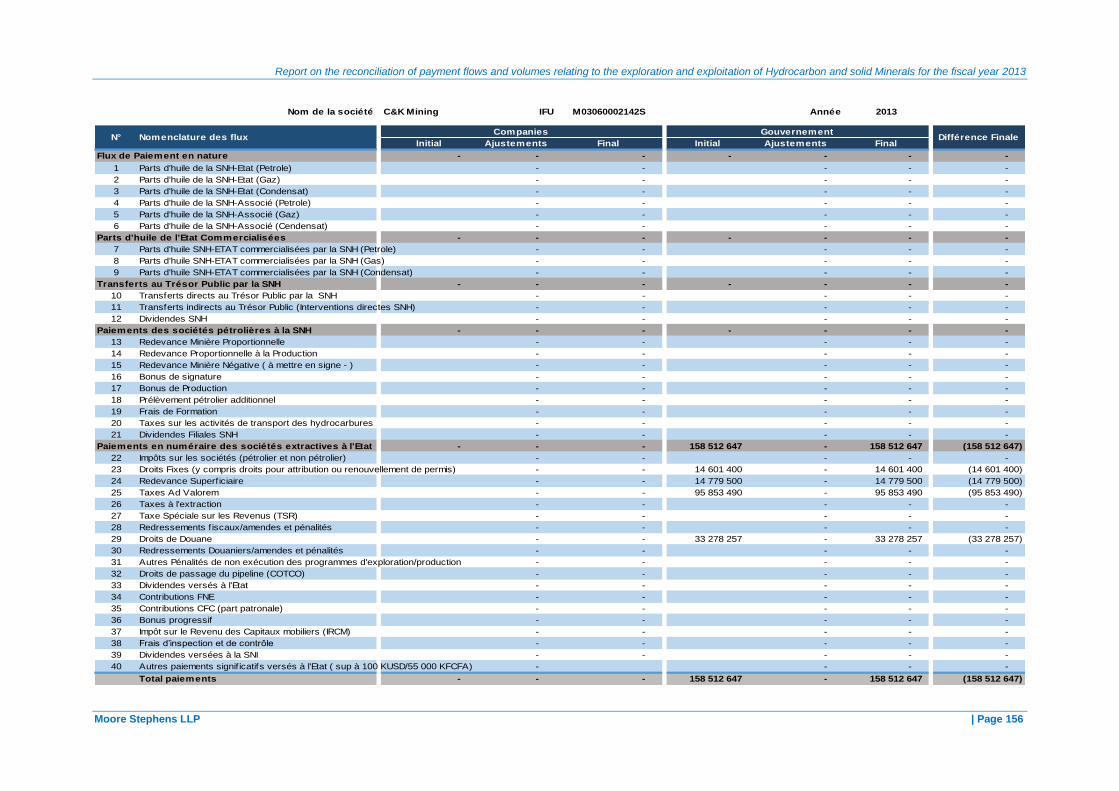
Report on the reconciliation of payment flows and volumes relating to the exploration and exploitation of Hydrocarbon and solid Minerals for the fiscal year 2013
Moore Stephens LLP | Page 156
Nom de la société C&K Mining IFU M03060002142S Année 2013
Initial Ajustements Final Initial Ajustements Final
Flux de Paiement en nature - - - - - - -
1 Parts d'huile de la SNH-Etat (Petrole) - - - - -
2 Parts d'huile de la SNH-Etat (Gaz) - - - - -
3 Parts d'huile de la SNH-Etat (Condensat) - - - - -
4 Parts d'huile de la SNH-Associé (Petrole) - - - - -
5 Parts d'huile de la SNH-Associé (Gaz) - - - - -
6 Parts d'huile de la SNH-Associé (Cendensat) - - - - -
Parts d'huile de l'Etat Commercialisées - - - - - - -
7 Parts d'huile SNH-ETAT commercialisées par la SNH (Petrole) - - - - -
8 Parts d'huile SNH-ETAT commercialisées par la SNH (Gas) - - - - -
9 Parts d'huile SNH-ETAT commercialisées par la SNH (Condensat) - - - - -
Transferts au Trésor Public par la SNH - - - - - - -
10 Transferts directs au Trésor Public par la SNH - - - - -
11 Transferts indirects au Trésor Public (Interventions directes SNH) - - - - -
12 Dividendes SNH - - - - -
Paiements des sociétés pétrolières à la SNH - - - - - - -
13 Redevance Minière Proportionnelle - - - - -
14 Redevance Proportionnelle à la Production - - - - -
15 Redevance Minière Négative ( à mettre en signe - ) - - - - -
16 Bonus de signature - - - - -
17 Bonus de Production - - - - -
18 Prélèvement pétrolier additionnel - - - - -
19 Frais de Formation - - - - -
20 Taxes sur les activités de transport des hydrocarbures - - - - -
21 Dividendes Filiales SNH - - - - -
Paiements en numéraire des sociétés extractives à l'Etat - - - 158 512 647 - 158 512 647 (158 512 647)
22 Impôts sur les sociétés (pétrolier et non pétrolier) - - - - -
23 Droits Fixes (y compris droits pour attribution ou renouvellement de permis) - - 14 601 400 - 14 601 400 (14 601 400)
24 Redevance Superficiaire - - 14 779 500 - 14 779 500 (14 779 500)
25 Taxes Ad Valorem - - 95 853 490 - 95 853 490 (95 853 490)
26 Taxes à l'extraction - - - - -
27 Taxe Spéciale sur les Revenus (TSR) - - - - -
28 Redressements f iscaux/amendes et pénalités - - - - -
29 Droits de Douane - - 33 278 257 - 33 278 257 (33 278 257)
30 Redressements Douaniers/amendes et pénalités - - - - -
31 Autres Pénalités de non exécution des programmes d'exploration/production - - - - -
32 Droits de passage du pipeline (COTCO) - - - - -
33 Dividendes versés à l'Etat - - - - -
34 Contributions FNE - - - - -
35 Contributions CFC (part patronale) - - - - -
36 Bonus progressif - - - - -
37 Impôt sur le Revenu des Capitaux mobiliers (IRCM) - - - - -
38 Frais d’inspection et de contrôle - - - - -
39 Dividendes versées à la SNI - - - - -
40 Autres paiements signif icatifs versés à l'Etat ( sup à 100 KUSD/55 000 KFCFA) - - - -
Total paiements - - - 158 512 647 - 158 512 647 (158 512 647)
GouvernementDifférence FinaleN° Nomenclature des flux
Companies
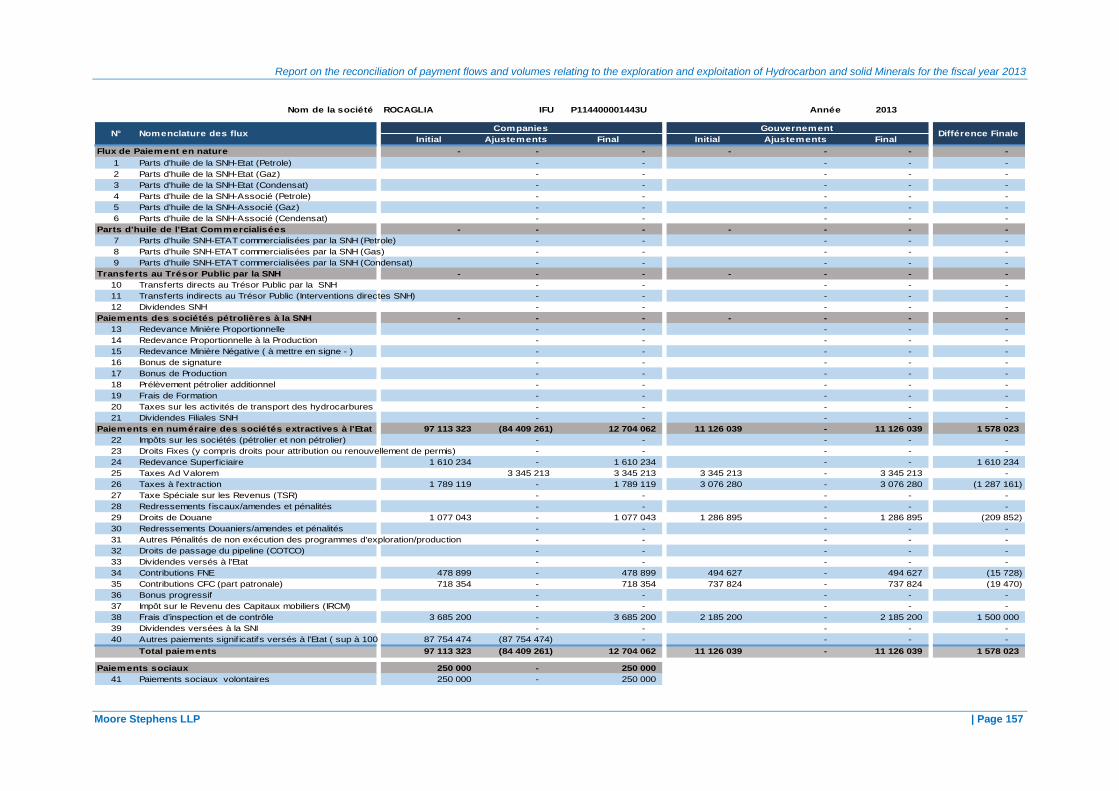
Report on the reconciliation of payment flows and volumes relating to the exploration and exploitation of Hydrocarbon and solid Minerals for the fiscal year 2013
Moore Stephens LLP | Page 157
Nom de la société ROCAGLIA IFU P114400001443U Année 2013
Initial Ajustements Final Initial Ajustements Final
Flux de Paiement en nature - - - - - - -
1 Parts d'huile de la SNH-Etat (Petrole) - - - - -
2 Parts d'huile de la SNH-Etat (Gaz) - - - - -
3 Parts d'huile de la SNH-Etat (Condensat) - - - - -
4 Parts d'huile de la SNH-Associé (Petrole) - - - - -
5 Parts d'huile de la SNH-Associé (Gaz) - - - - -
6 Parts d'huile de la SNH-Associé (Cendensat) - - - - -
Parts d'huile de l'Etat Commercialisées - - - - - - -
7 Parts d'huile SNH-ETAT commercialisées par la SNH (Petrole) - - - - -
8 Parts d'huile SNH-ETAT commercialisées par la SNH (Gas) - - - - -
9 Parts d'huile SNH-ETAT commercialisées par la SNH (Condensat) - - - - -
Transferts au Trésor Public par la SNH - - - - - - -
10 Transferts directs au Trésor Public par la SNH - - - - -
11 Transferts indirects au Trésor Public (Interventions directes SNH) - - - - -
12 Dividendes SNH - - - - -
Paiements des sociétés pétrolières à la SNH - - - - - - -
13 Redevance Minière Proportionnelle - - - - -
14 Redevance Proportionnelle à la Production - - - - -
15 Redevance Minière Négative ( à mettre en signe - ) - - - - -
16 Bonus de signature - - - - -
17 Bonus de Production - - - - -
18 Prélèvement pétrolier additionnel - - - - -
19 Frais de Formation - - - - -
20 Taxes sur les activités de transport des hydrocarbures - - - - -
21 Dividendes Filiales SNH - - - - -
Paiements en numéraire des sociétés extractives à l'Etat 97 113 323 (84 409 261) 12 704 062 11 126 039 - 11 126 039 1 578 023
22 Impôts sur les sociétés (pétrolier et non pétrolier) - - - - -
23 Droits Fixes (y compris droits pour attribution ou renouvellement de permis) - - - - -
24 Redevance Superficiaire 1 610 234 - 1 610 234 - - 1 610 234
25 Taxes Ad Valorem 3 345 213 3 345 213 3 345 213 - 3 345 213 -
26 Taxes à l'extraction 1 789 119 - 1 789 119 3 076 280 - 3 076 280 (1 287 161)
27 Taxe Spéciale sur les Revenus (TSR) - - - - -
28 Redressements f iscaux/amendes et pénalités - - - - -
29 Droits de Douane 1 077 043 - 1 077 043 1 286 895 - 1 286 895 (209 852)
30 Redressements Douaniers/amendes et pénalités - - - - -
31 Autres Pénalités de non exécution des programmes d'exploration/production - - - - -
32 Droits de passage du pipeline (COTCO) - - - - -
33 Dividendes versés à l'Etat - - - - -
34 Contributions FNE 478 899 - 478 899 494 627 - 494 627 (15 728)
35 Contributions CFC (part patronale) 718 354 - 718 354 737 824 - 737 824 (19 470)
36 Bonus progressif - - - - -
37 Impôt sur le Revenu des Capitaux mobiliers (IRCM) - - - - -
38 Frais d’inspection et de contrôle 3 685 200 - 3 685 200 2 185 200 - 2 185 200 1 500 000
39 Dividendes versées à la SNI - - - - -
40 Autres paiements signif icatifs versés à l'Etat ( sup à 100 KUSD/55 000 KFCFA)87 754 474 (87 754 474) - - - -
Total paiements 97 113 323 (84 409 261) 12 704 062 11 126 039 - 11 126 039 1 578 023
Paiements sociaux 250 000 - 250 000
41 Paiements sociaux volontaires 250 000 - 250 000
GouvernementDifférence FinaleN° Nomenclature des flux
Companies
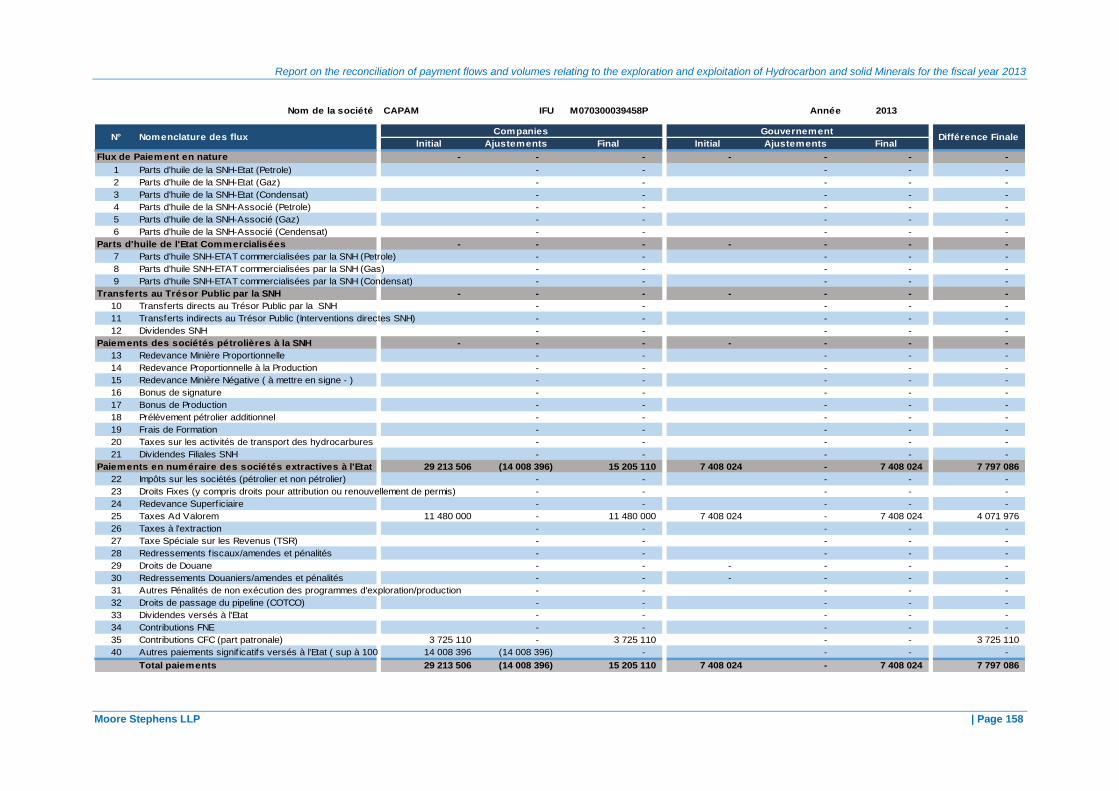
Report on the reconciliation of payment flows and volumes relating to the exploration and exploitation of Hydrocarbon and solid Minerals for the fiscal year 2013
Moore Stephens LLP | Page 158
Nom de la société CAPAM IFU M070300039458P Année 2013
Initial Ajustements Final Initial Ajustements Final
Flux de Paiement en nature - - - - - - -
1 Parts d'huile de la SNH-Etat (Petrole) - - - - -
2 Parts d'huile de la SNH-Etat (Gaz) - - - - -
3 Parts d'huile de la SNH-Etat (Condensat) - - - - -
4 Parts d'huile de la SNH-Associé (Petrole) - - - - -
5 Parts d'huile de la SNH-Associé (Gaz) - - - - -
6 Parts d'huile de la SNH-Associé (Cendensat) - - - - -
Parts d'huile de l'Etat Commercialisées - - - - - - -
7 Parts d'huile SNH-ETAT commercialisées par la SNH (Petrole) - - - - -
8 Parts d'huile SNH-ETAT commercialisées par la SNH (Gas) - - - - -
9 Parts d'huile SNH-ETAT commercialisées par la SNH (Condensat) - - - - -
Transferts au Trésor Public par la SNH - - - - - - -
10 Transferts directs au Trésor Public par la SNH - - - - -
11 Transferts indirects au Trésor Public (Interventions directes SNH) - - - - -
12 Dividendes SNH - - - - -
Paiements des sociétés pétrolières à la SNH - - - - - - -
13 Redevance Minière Proportionnelle - - - - -
14 Redevance Proportionnelle à la Production - - - - -
15 Redevance Minière Négative ( à mettre en signe - ) - - - - -
16 Bonus de signature - - - - -
17 Bonus de Production - - - - -
18 Prélèvement pétrolier additionnel - - - - -
19 Frais de Formation - - - - -
20 Taxes sur les activités de transport des hydrocarbures - - - - -
21 Dividendes Filiales SNH - - - - -
Paiements en numéraire des sociétés extractives à l'Etat 29 213 506 (14 008 396) 15 205 110 7 408 024 - 7 408 024 7 797 086
22 Impôts sur les sociétés (pétrolier et non pétrolier) - - - - -
23 Droits Fixes (y compris droits pour attribution ou renouvellement de permis) - - - - -
24 Redevance Superficiaire - - - - -
25 Taxes Ad Valorem 11 480 000 - 11 480 000 7 408 024 - 7 408 024 4 071 976
26 Taxes à l'extraction - - - - -
27 Taxe Spéciale sur les Revenus (TSR) - - - - -
28 Redressements f iscaux/amendes et pénalités - - - - -
29 Droits de Douane - - - - - -
30 Redressements Douaniers/amendes et pénalités - - - - - -
31 Autres Pénalités de non exécution des programmes d'exploration/production - - - - -
32 Droits de passage du pipeline (COTCO) - - - - -
33 Dividendes versés à l'Etat - - - - -
34 Contributions FNE - - - - -
35 Contributions CFC (part patronale) 3 725 110 - 3 725 110 - - 3 725 110
40 Autres paiements signif icatifs versés à l'Etat ( sup à 100 KUSD/55 000 KFCFA)14 008 396 (14 008 396) - - - -
Total paiements 29 213 506 (14 008 396) 15 205 110 7 408 024 - 7 408 024 7 797 086
GouvernementDifférence FinaleN° Nomenclature des flux
Companies
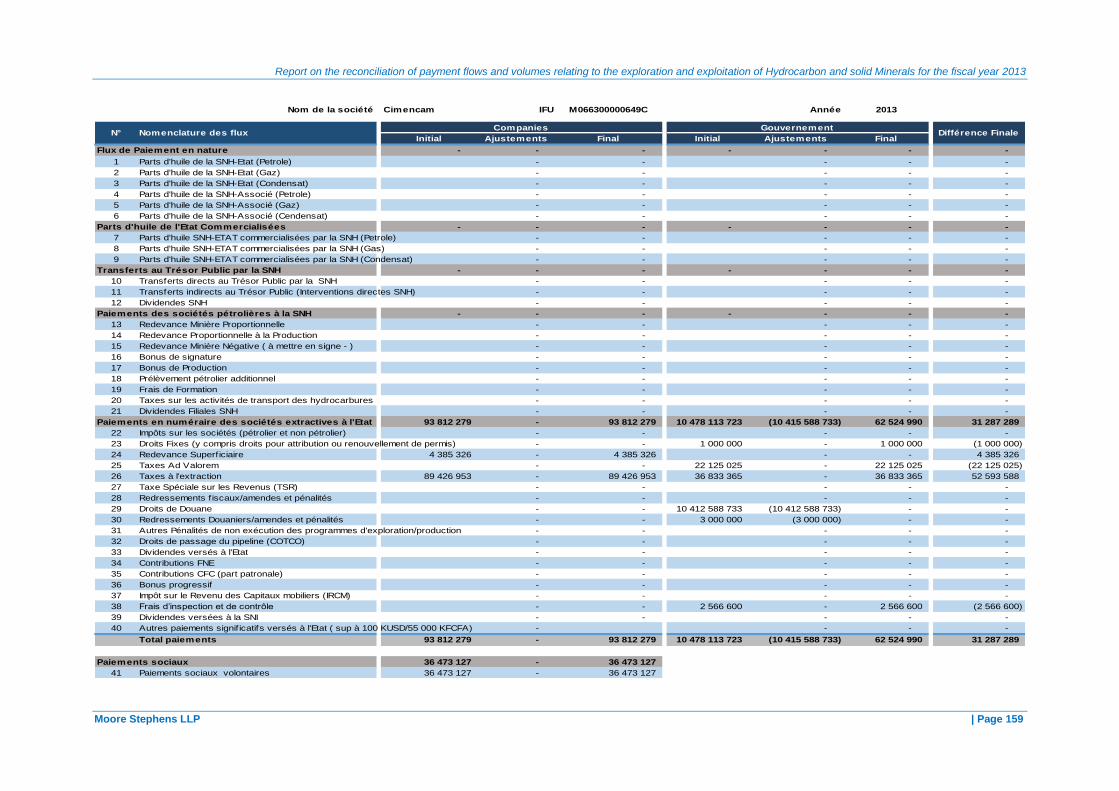
Report on the reconciliation of payment flows and volumes relating to the exploration and exploitation of Hydrocarbon and solid Minerals for the fiscal year 2013
Moore Stephens LLP | Page 159
Nom de la société Cimencam IFU M066300000649C Année 2013
Initial Ajustements Final Initial Ajustements Final
Flux de Paiement en nature - - - - - - -
1 Parts d'huile de la SNH-Etat (Petrole) - - - - -
2 Parts d'huile de la SNH-Etat (Gaz) - - - - -
3 Parts d'huile de la SNH-Etat (Condensat) - - - - -
4 Parts d'huile de la SNH-Associé (Petrole) - - - - -
5 Parts d'huile de la SNH-Associé (Gaz) - - - - -
6 Parts d'huile de la SNH-Associé (Cendensat) - - - - -
Parts d'huile de l'Etat Commercialisées - - - - - - -
7 Parts d'huile SNH-ETAT commercialisées par la SNH (Petrole) - - - - -
8 Parts d'huile SNH-ETAT commercialisées par la SNH (Gas) - - - - -
9 Parts d'huile SNH-ETAT commercialisées par la SNH (Condensat) - - - - -
Transferts au Trésor Public par la SNH - - - - - - -
10 Transferts directs au Trésor Public par la SNH - - - - -
11 Transferts indirects au Trésor Public (Interventions directes SNH) - - - - -
12 Dividendes SNH - - - - -
Paiements des sociétés pétrolières à la SNH - - - - - - -
13 Redevance Minière Proportionnelle - - - - -
14 Redevance Proportionnelle à la Production - - - - -
15 Redevance Minière Négative ( à mettre en signe - ) - - - - -
16 Bonus de signature - - - - -
17 Bonus de Production - - - - -
18 Prélèvement pétrolier additionnel - - - - -
19 Frais de Formation - - - - -
20 Taxes sur les activités de transport des hydrocarbures - - - - -
21 Dividendes Filiales SNH - - - - -
Paiements en numéraire des sociétés extractives à l'Etat 93 812 279 - 93 812 279 10 478 113 723 (10 415 588 733) 62 524 990 31 287 289
22 Impôts sur les sociétés (pétrolier et non pétrolier) - - - - -
23 Droits Fixes (y compris droits pour attribution ou renouvellement de permis) - - 1 000 000 - 1 000 000 (1 000 000)
24 Redevance Superficiaire 4 385 326 - 4 385 326 - - 4 385 326
25 Taxes Ad Valorem - - 22 125 025 - 22 125 025 (22 125 025)
26 Taxes à l'extraction 89 426 953 - 89 426 953 36 833 365 - 36 833 365 52 593 588
27 Taxe Spéciale sur les Revenus (TSR) - - - - -
28 Redressements f iscaux/amendes et pénalités - - - - -
29 Droits de Douane - - 10 412 588 733 (10 412 588 733) - -
30 Redressements Douaniers/amendes et pénalités - - 3 000 000 (3 000 000) - -
31 Autres Pénalités de non exécution des programmes d'exploration/production - - - - -
32 Droits de passage du pipeline (COTCO) - - - - -
33 Dividendes versés à l'Etat - - - - -
34 Contributions FNE - - - - -
35 Contributions CFC (part patronale) - - - - -
36 Bonus progressif - - - - -
37 Impôt sur le Revenu des Capitaux mobiliers (IRCM) - - - - -
38 Frais d’inspection et de contrôle - - 2 566 600 - 2 566 600 (2 566 600)
39 Dividendes versées à la SNI - - - - -
40 Autres paiements signif icatifs versés à l'Etat ( sup à 100 KUSD/55 000 KFCFA) - - - -
Total paiements 93 812 279 - 93 812 279 10 478 113 723 (10 415 588 733) 62 524 990 31 287 289
Paiements sociaux 36 473 127 - 36 473 127
41 Paiements sociaux volontaires 36 473 127 - 36 473 127
GouvernementDifférence FinaleN° Nomenclature des flux
Companies

Report on the reconciliation of payment flows and volumes relating to the exploration and exploitation of Hydrocarbon and solid Minerals for the fiscal year 2013
Moore Stephens LLP | Page 160
Nom de la société Razel IFU M077800000953N Année 2013
Initial Ajustements Final Initial Ajustements Final
Flux de Paiement en nature - - - - - - -
1 Parts d'huile de la SNH-Etat (Petrole) - - - - -
2 Parts d'huile de la SNH-Etat (Gaz) - - - - -
3 Parts d'huile de la SNH-Etat (Condensat) - - - - -
4 Parts d'huile de la SNH-Associé (Petrole) - - - - -
5 Parts d'huile de la SNH-Associé (Gaz) - - - - -
6 Parts d'huile de la SNH-Associé (Cendensat) - - - - -
Parts d'huile de l'Etat Commercialisées - - - - - - -
7 Parts d'huile SNH-ETAT commercialisées par la SNH (Petrole) - - - - -
8 Parts d'huile SNH-ETAT commercialisées par la SNH (Gas) - - - - -
9 Parts d'huile SNH-ETAT commercialisées par la SNH (Condensat) - - - - -
Transferts au Trésor Public par la SNH - - - - - - -
10 Transferts directs au Trésor Public par la SNH - - - - -
11 Transferts indirects au Trésor Public (Interventions directes SNH) - - - - -
12 Dividendes SNH - - - - -
Paiements des sociétés pétrolières à la SNH - - - - - - -
13 Redevance Minière Proportionnelle - - - - -
14 Redevance Proportionnelle à la Production - - - - -
15 Redevance Minière Négative ( à mettre en signe - ) - - - - -
16 Bonus de signature - - - - -
17 Bonus de Production - - - - -
18 Prélèvement pétrolier additionnel - - - - -
19 Frais de Formation - - - - -
20 Taxes sur les activités de transport des hydrocarbures - - - - -
21 Dividendes Filiales SNH - - - - -
Paiements en numéraire des sociétés extractives à l'Etat 71 106 703 7 379 389 78 486 092 2 287 898 917 (2 209 412 825) 78 486 092 -
22 Impôts sur les sociétés (pétrolier et non pétrolier) - - - - -
23 Droits Fixes (y compris droits pour attribution ou renouvellement de permis) 4 700 000 4 700 000 4 700 000 - 4 700 000 -
24 Redevance Superficiaire 1 958 900 - 1 958 900 1 958 900 1 958 900 -
25 Taxes Ad Valorem 216 000 - 216 000 216 000 216 000 -
26 Taxes à l'extraction 68 931 803 2 679 389 71 611 192 37 190 290 34 420 902 71 611 192 -
27 Taxe Spéciale sur les Revenus (TSR) - - - - -
28 Redressements f iscaux/amendes et pénalités - - - - -
29 Droits de Douane - - 2 245 708 627 (2 245 708 627) - -
30 Redressements Douaniers/amendes et pénalités - - 300 000 (300 000) - -
31 Autres Pénalités de non exécution des programmes d'exploration/production - - - - -
32 Droits de passage du pipeline (COTCO) - - - - -
33 Dividendes versés à l'Etat - - - - -
34 Contributions FNE - - - - -
35 Contributions CFC (part patronale) - - - - -
36 Bonus progressif - - - - -
37 Impôt sur le Revenu des Capitaux mobiliers (IRCM) - - - - -
38 Frais d’inspection et de contrôle - - - - -
39 Dividendes versées à la SNI - - - - -
40 Autres paiements signif icatifs versés à l'Etat ( sup à 100 KUSD/55 000 KFCFA) - - - -
Total paiements 71 106 703 7 379 389 78 486 092 2 287 898 917 (2 209 412 825) 78 486 092 -
GouvernementDifférence FinaleN° Nomenclature des flux
Companies

Report on the reconciliation of payment flows and volumes relating to the exploration and exploitation of Hydrocarbon and solid Minerals for the fiscal year 2013
Moore Stephens LLP | Page 161
Nom de la société CAM IRON IFU M040500021217C Année 2013
Initial Ajustements Final Initial Ajustements Final
Flux de Paiement en nature - - - - - - -
1 Parts d'huile de la SNH-Etat (Petrole) - - - - -
2 Parts d'huile de la SNH-Etat (Gaz) - - - - -
3 Parts d'huile de la SNH-Etat (Condensat) - - - - -
4 Parts d'huile de la SNH-Associé (Petrole) - - - - -
5 Parts d'huile de la SNH-Associé (Gaz) - - - - -
6 Parts d'huile de la SNH-Associé (Cendensat) - - - - -
Parts d'huile de l'Etat Commercialisées - - - - - - -
7 Parts d'huile SNH-ETAT commercialisées par la SNH (Petrole) - - - - -
8 Parts d'huile SNH-ETAT commercialisées par la SNH (Gas) - - - - -
9 Parts d'huile SNH-ETAT commercialisées par la SNH (Condensat) - - - - -
Transferts au Trésor Public par la SNH - - - - - - -
10 Transferts directs au Trésor Public par la SNH - - - - -
11 Transferts indirects au Trésor Public (Interventions directes SNH) - - - - -
12 Dividendes SNH - - - - -
Paiements des sociétés pétrolières à la SNH - - - - - - -
13 Redevance Minière Proportionnelle - - - - -
14 Redevance Proportionnelle à la Production - - - - -
15 Redevance Minière Négative ( à mettre en signe - ) - - - - -
16 Bonus de signature - - - - -
17 Bonus de Production - - - - -
18 Prélèvement pétrolier additionnel - - - - -
19 Frais de Formation - - - - -
20 Taxes sur les activités de transport des hydrocarbures - - - - -
21 Dividendes Filiales SNH - - - - -
Paiements en numéraire des sociétés extractives à l'Etat 1 069 826 679 - 1 069 826 679 59 539 269 979 572 032 1 039 111 301 30 715 378
22 Impôts sur les sociétés (pétrolier et non pétrolier) - - - - - -
23 Droits Fixes (y compris droits pour attribution ou renouvellement de permis)1 958 500 (1 958 500) - - - -
24 Redevance Superficiaire - 1 958 500 1 958 500 2 443 500 - 2 443 500 (485 000)
25 Taxes Ad Valorem - - - - - -
26 Taxes à l'extraction - - - - - -
27 Taxe Spéciale sur les Revenus (TSR) - - - - - -
28 Redressements f iscaux/amendes et pénalités - - - - - -
29 Droits de Douane 31 200 378 - 31 200 378 - - 31 200 378
30 Redressements Douaniers/amendes et pénalités - - - - - -
31 Autres Pénalités de non exécution des programmes d'exploration/production- - - - - -
32 Droits de passage du pipeline (COTCO) - - - - - -
33 Dividendes versés à l'Etat - - - - - -
34 Contributions FNE 24 708 145 - 24 708 145 22 838 318 1 869 827 24 708 145 -
35 Contributions CFC (part patronale) 37 062 183 - 37 062 183 34 257 451 2 804 732 37 062 183 -
36 Bonus progressif - - - - - -
37 Impôt sur le Revenu des Capitaux mobiliers (IRCM) - - - - - -
38 Frais d’inspection et de contrôle - - - - - -
39 Dividendes versées à la SNI - - - - - -
40 Autres paiements signif icatifs versés à l'Etat ( sup à 100 KUSD/55 000 KFCFA)974 897 473 - 974 897 473 974 897 473 974 897 473 -
Total paiements 1 069 826 679 - 1 069 826 679 59 539 269 979 572 032 1 039 111 301 30 715 378
GouvernementDifférence FinaleN° Nomenclature des flux
Companies
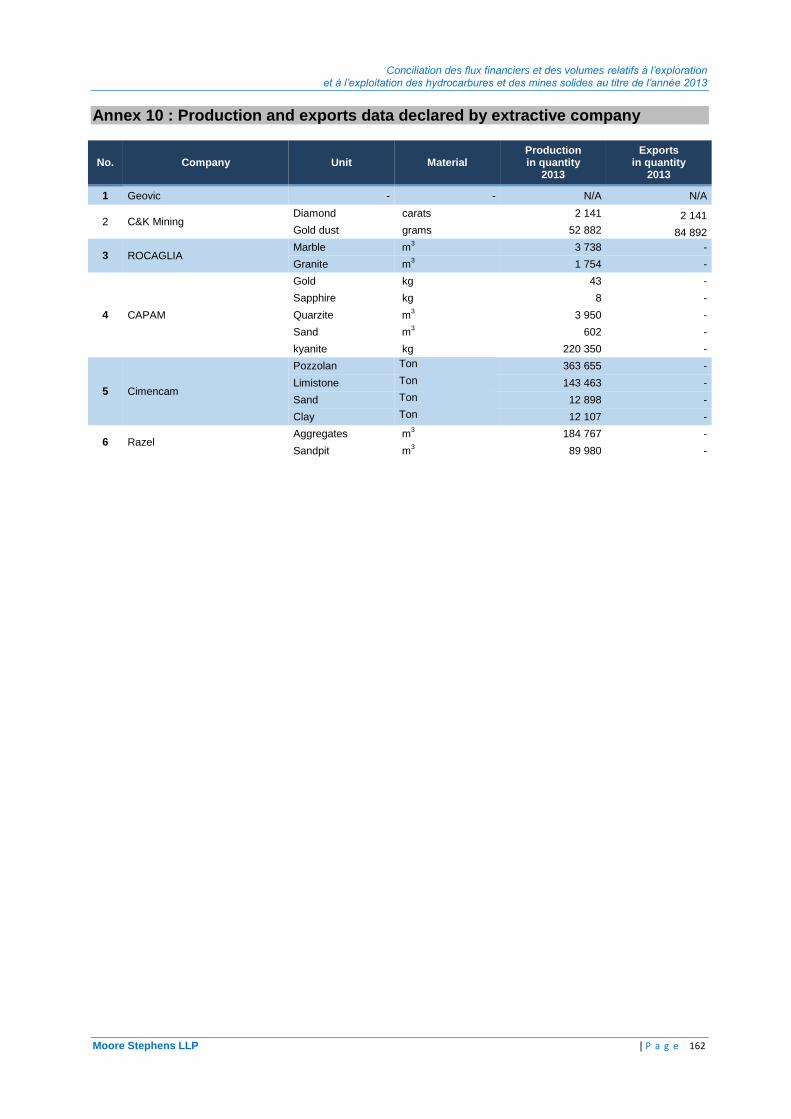
Conciliation des flux financiers et des volumes relatifs à l’exploration et à l’exploitation des hydrocarbures et des mines solides au titre de l’année 2013
Moore Stephens LLP | P a g e 162
Annex 10 : Production and exports data declared by extractive company
No. Company Unit Material Production in quantity
2013
Exports in quantity
2013
1 Geovic - - N/A N/A
2 C&K Mining Diamond carats 2 141 2 141
Gold dust grams 52 882 84 892
3 ROCAGLIA Marble m
3 3 738 -
Granite m3 1 754 -
4 CAPAM
Gold kg 43 -
Sapphire kg 8 -
Quarzite m3 3 950 -
Sand m3 602 -
kyanite kg 220 350 -
5 Cimencam
Pozzolan Ton 363 655 -
Limistone Ton 143 463 -
Sand Ton 12 898 -
Clay Ton 12 107 -
6 Razel Aggregates m
3 184 767 -
Sandpit m3 89 980 -

Conciliation des flux financiers et des volumes relatifs à l’exploration et à l’exploitation des hydrocarbures et des mines solides au titre de l’année 2013
Moore Stephens LLP | Page 163
Annex 11 : Map of Mining rights
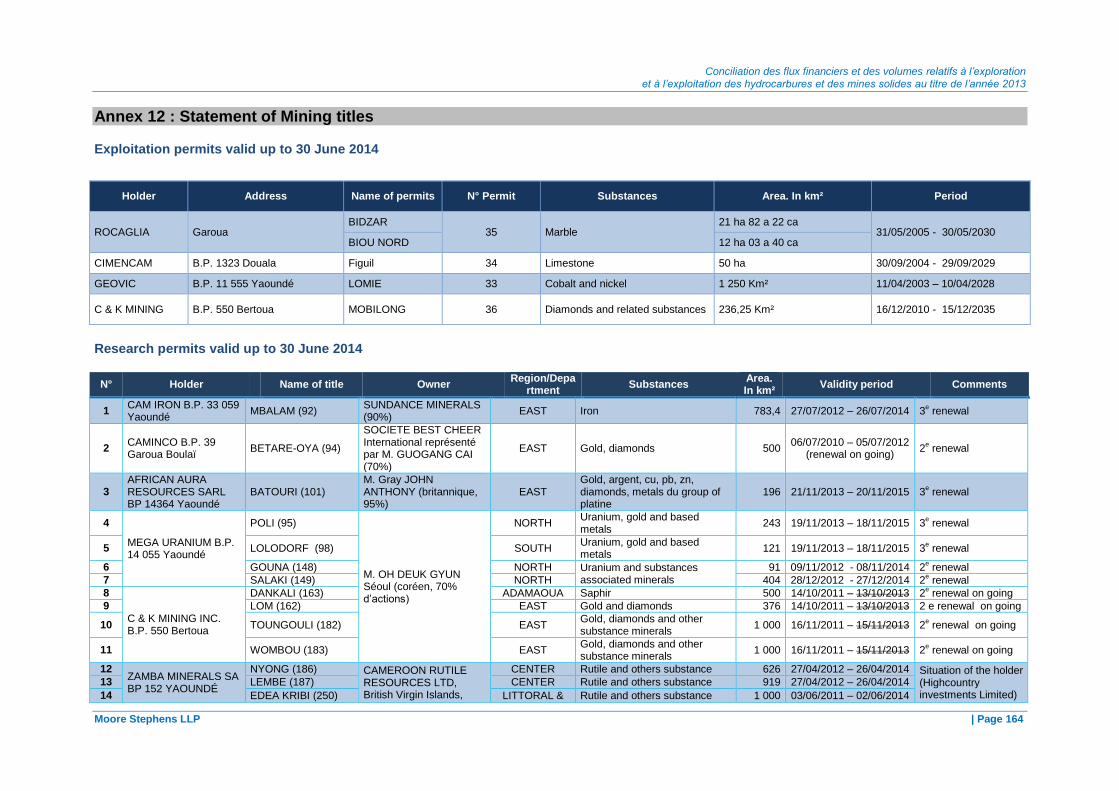
Conciliation des flux financiers et des volumes relatifs à l’exploration et à l’exploitation des hydrocarbures et des mines solides au titre de l’année 2013
Moore Stephens LLP | Page 164
Annex 12 : Statement of Mining titles
Exploitation permits valid up to 30 June 2014
Holder Address Name of permits N° Permit Substances Area. In km² Period
ROCAGLIA Garoua BIDZAR
35 Marble 21 ha 82 a 22 ca
31/05/2005 - 30/05/2030 BIOU NORD 12 ha 03 a 40 ca
CIMENCAM B.P. 1323 Douala Figuil 34 Limestone 50 ha 30/09/2004 - 29/09/2029
GEOVIC B.P. 11 555 Yaoundé LOMIE 33 Cobalt and nickel 1 250 Km² 11/04/2003 – 10/04/2028
C & K MINING B.P. 550 Bertoua MOBILONG 36 Diamonds and related substances 236,25 Km² 16/12/2010 - 15/12/2035
Research permits valid up to 30 June 2014
N° Holder Name of title Owner Region/Depa
rtment Substances
Area. In km²
Validity period Comments
1 CAM IRON B.P. 33 059 Yaoundé
MBALAM (92) SUNDANCE MINERALS (90%)
EAST Iron 783,4 27/07/2012 – 26/07/2014 3e renewal
2 CAMINCO B.P. 39 Garoua Boulaï
BETARE-OYA (94)
SOCIETE BEST CHEER International représenté par M. GUOGANG CAI (70%)
EAST Gold, diamonds 500 06/07/2010 – 05/07/2012
(renewal on going) 2
e renewal
3 AFRICAN AURA RESOURCES SARL BP 14364 Yaoundé
BATOURI (101) M. Gray JOHN ANTHONY (britannique, 95%)
EAST Gold, argent, cu, pb, zn, diamonds, metals du group of platine
196 21/11/2013 – 20/11/2015 3e renewal
4
MEGA URANIUM B.P. 14 055 Yaoundé
POLI (95)
M. OH DEUK GYUN Séoul (coréen, 70% d’actions)
NORTH Uranium, gold and based metals
243 19/11/2013 – 18/11/2015 3e renewal
5 LOLODORF (98) SOUTH Uranium, gold and based metals
121 19/11/2013 – 18/11/2015 3e renewal
6 GOUNA (148) NORTH Uranium and substances associated minerals
91 09/11/2012 - 08/11/2014 2e renewal
7 SALAKI (149) NORTH 404 28/12/2012 - 27/12/2014 2e renewal
8
C & K MINING INC. B.P. 550 Bertoua
DANKALI (163) ADAMAOUA Saphir 500 14/10/2011 – 13/10/2013 2e renewal on going
9 LOM (162) EAST Gold and diamonds 376 14/10/2011 – 13/10/2013 2 e renewal on going
10 TOUNGOULI (182) EAST Gold, diamonds and other substance minerals
1 000 16/11/2011 – 15/11/2013 2e renewal on going
11 WOMBOU (183) EAST Gold, diamonds and other substance minerals
1 000 16/11/2011 – 15/11/2013 2e renewal on going
12 ZAMBA MINERALS SA BP 152 YAOUNDÉ
NYONG (186) CAMEROON RUTILE RESOURCES LTD, British Virgin Islands,
CENTER Rutile and others substance 626 27/04/2012 – 26/04/2014 Situation of the holder (Highcountry investments Limited)
13 LEMBE (187) CENTER Rutile and others substance 919 27/04/2012 – 26/04/2014
14 EDEA KRIBI (250) LITTORAL & Rutile and others substance 1 000 03/06/2011 – 02/06/2014

Report on the reconciliation of payment flows and volumes relating to the exploration and exploitation of Hydrocarbon and solid Minerals for the fiscal year 2013
Moore Stephens LLP | Page 165
N° Holder Name of title Owner Region/Depa
rtment Substances
Area. In km²
Validity period Comments
représenté par M. KOUAM Marcel Léopold
SOUTH to be clarified
15
CAMERICAN MINING B.P. 3789 Douala
MONGUELE (207)
REALFORCE MINING GROUP LIMITED (85%)
EAST Uranium, gold and based metals
980 07/07/2010 - 06/07/2013 1st renewal on going
16 BADEKOK (208) EAST Uranium, gold and based metals
964,2 07/07/2010 - 06/07/2013 1st renewal on going
17 NKI (206) EAST Uranium, gold and based metals
991 07/07/2010 - 06/07/2013 1st renewal on going
18
CAMINEX B.P. 14 364 Yaoundé
AKONOLINGA (112)
AFRICAN AURARESOURCES (100%)
CENTER Or, uranium, métaux base, MGP
241,6 19/11/2013 – 18/11/2015 3e renewal
19 DJOUM III (115) SOUTH Or, uranium, métaux base, MGP
242,5 18/07/2011 – 17/07/2013 3e renewal
20 NTEM (138) SOUTH Or, uranium, métaux base, MGP
245 26/07/2012 – 25/07/2014 2e renewal Still valid
21 RIDGEWAY ENERGY LTD BP 14364 Yaoundé
ESSONG (134) M. Steven James POULTON, UK
SOUTH Uranium, gold, iron , MPG, diamonds
252 26/07/2012 – 25/07/2014 2e renewal (Still valid)
22
CAMINA S.A.B.P. 33057 Yaoundé
NGOYANG (144) SAMBA SARL représenté par Mme MATAGNE FOGANG Lucienne (40% d’action), M. SUH CHEO Emmanuel (20%)
SOUTH Iron and by-product 1 000 26/04/2012 – 26/07/2014 2e renewal
23 NGOYANG II (221) SOUTH Iron, gold and related substances
657 04/02/2014 – 03/02/2017 Still valid
24 NGOYANG III (307) SOUTH Iron and related substances 308 16/04/2014 – 15/04/2017 Still valid
25 KOREA & CAMEROON MINING INC.B.P. 16131 Yaoundé
MBOUKOU (131) ADAMAOUA &
EAST Gold and related substances 155 05/10/2012 – 04/10/2014 2
e renewal
26 SINOSTEEL CAM B.P. 252 Yaoundé
LOBE (154) M. ZHENG ZHENGHAO (97,5%)
SOUTH Iron and related substances 500 14/09/2011 – 13/09/2013 3e renewal
27 LOBE II (319) SOUTH Iron and related substances 471 04/02/2014 – 03/04/2017 Still valid
28 HARVEST MINING CORPORATION SA BP 4331 Ydé
KOMBO LAKA (135) ADAMAOUA Gold and related substances 498 09/07/2010 – 08/0720/12 1st renewal on going
29 SADC MINERALS & MINING CAMEROON Sarl B.P 2011 Dla
SANAGA (170)
SOUTHERN AFRICAN MINERALS AND MINING GROUP representé par M. HATTINGH, South Africa
CENTER Rutile, quartz, related subst 493 09/07/2012 – 08/07/2014 1er renewal Still valid
30 KISSLING EXPLORATION B.P. 5850 Yaoundé
GAROUA-SAMBE (187B)
KISSLING SWISS SWITCHES AG rép par Dr KNAPP ULRICH CHRISTOPH
EAST Gold, diamant and related substances
800 10/04/2012 – 09/04/2014 1st renewal on going
31 RITAGOLD LEADER IN GOLD MINING BP 3789 DOUALA
NDOKAYO (216)
GEO EXPLORATION AND MINING LIMITED représenté par Mme CROCE MASSIMO (50,4%)
EAST Gold and other substances 1 000 03/08/2010 – 02/08/2013 1st renewal on going
32 CAMEROON DIAMOND AND GOLD
YOKADOUMA (215) Mr TOPE MOHLIE Martin EAST Gold and other substances 1 000 03/08/2010 – 02/08/2013 1st renewal on going
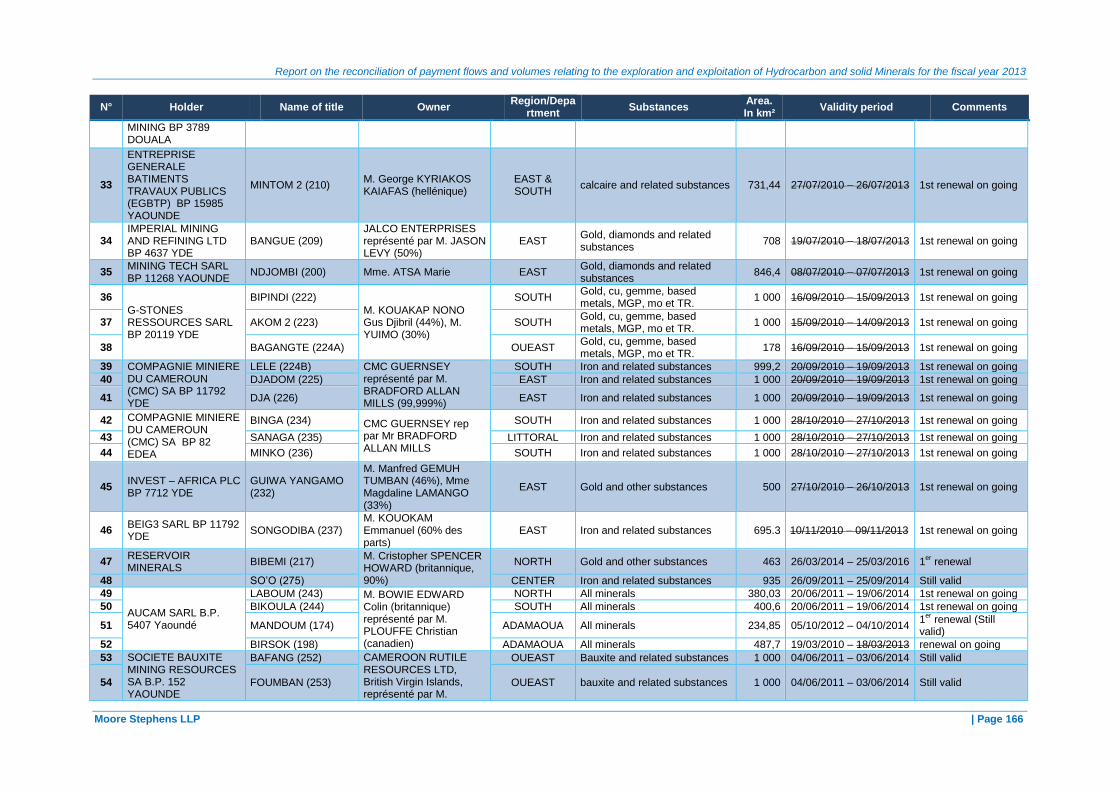
Report on the reconciliation of payment flows and volumes relating to the exploration and exploitation of Hydrocarbon and solid Minerals for the fiscal year 2013
Moore Stephens LLP | Page 166
N° Holder Name of title Owner Region/Depa
rtment Substances
Area. In km²
Validity period Comments
MINING BP 3789 DOUALA
33
ENTREPRISE GENERALE BATIMENTS TRAVAUX PUBLICS (EGBTP) BP 15985 YAOUNDE
MINTOM 2 (210) M. George KYRIAKOS KAIAFAS (hellénique)
EAST & SOUTH
calcaire and related substances 731,44 27/07/2010 – 26/07/2013 1st renewal on going
34 IMPERIAL MINING AND REFINING LTD BP 4637 YDE
BANGUE (209) JALCO ENTERPRISES représenté par M. JASON LEVY (50%)
EAST Gold, diamonds and related substances
708 19/07/2010 – 18/07/2013 1st renewal on going
35 MINING TECH SARL BP 11268 YAOUNDE
NDJOMBI (200) Mme. ATSA Marie EAST Gold, diamonds and related substances
846,4 08/07/2010 – 07/07/2013 1st renewal on going
36
G-STONES RESSOURCES SARL BP 20119 YDE
BIPINDI (222)
M. KOUAKAP NONO Gus Djibril (44%), M. YUIMO (30%)
SOUTH Gold, cu, gemme, based metals, MGP, mo et TR.
1 000 16/09/2010 – 15/09/2013 1st renewal on going
37 AKOM 2 (223) SOUTH Gold, cu, gemme, based metals, MGP, mo et TR.
1 000 15/09/2010 – 14/09/2013 1st renewal on going
38 BAGANGTE (224A) OUEAST Gold, cu, gemme, based metals, MGP, mo et TR.
178 16/09/2010 – 15/09/2013 1st renewal on going
39 COMPAGNIE MINIERE DU CAMEROUN (CMC) SA BP 11792 YDE
LELE (224B) CMC GUERNSEY représenté par M. BRADFORD ALLAN MILLS (99,999%)
SOUTH Iron and related substances 999,2 20/09/2010 – 19/09/2013 1st renewal on going
40 DJADOM (225) EAST Iron and related substances 1 000 20/09/2010 – 19/09/2013 1st renewal on going
41 DJA (226) EAST Iron and related substances 1 000 20/09/2010 – 19/09/2013 1st renewal on going
42 COMPAGNIE MINIERE DU CAMEROUN (CMC) SA BP 82 EDEA
BINGA (234) CMC GUERNSEY rep par Mr BRADFORD ALLAN MILLS
SOUTH Iron and related substances 1 000 28/10/2010 – 27/10/2013 1st renewal on going
43 SANAGA (235) LITTORAL Iron and related substances 1 000 28/10/2010 – 27/10/2013 1st renewal on going
44 MINKO (236) SOUTH Iron and related substances 1 000 28/10/2010 – 27/10/2013 1st renewal on going
45 INVEST – AFRICA PLC BP 7712 YDE
GUIWA YANGAMO (232)
M. Manfred GEMUH TUMBAN (46%), Mme Magdaline LAMANGO (33%)
EAST Gold and other substances 500 27/10/2010 – 26/10/2013 1st renewal on going
46 BEIG3 SARL BP 11792 YDE
SONGODIBA (237) M. KOUOKAM Emmanuel (60% des parts)
EAST Iron and related substances 695.3 10/11/2010 – 09/11/2013 1st renewal on going
47 RESERVOIR MINERALS
BIBEMI (217) M. Cristopher SPENCER HOWARD (britannique, 90%)
NORTH Gold and other substances 463 26/03/2014 – 25/03/2016 1er renewal
48 SO’O (275) CENTER Iron and related substances 935 26/09/2011 – 25/09/2014 Still valid
49
AUCAM SARL B.P. 5407 Yaoundé
LABOUM (243) M. BOWIE EDWARD Colin (britannique) représenté par M. PLOUFFE Christian (canadien)
NORTH All minerals 380,03 20/06/2011 – 19/06/2014 1st renewal on going
50 BIKOULA (244) SOUTH All minerals 400,6 20/06/2011 – 19/06/2014 1st renewal on going
51 MANDOUM (174) ADAMAOUA All minerals 234,85 05/10/2012 – 04/10/2014 1
er renewal (Still
valid)
52 BIRSOK (198) ADAMAOUA All minerals 487,7 19/03/2010 – 18/03/2013 renewal on going
53 SOCIETE BAUXITE MINING RESOURCES SA B.P. 152 YAOUNDE
BAFANG (252) CAMEROON RUTILE RESOURCES LTD, British Virgin Islands, représenté par M.
OUEAST Bauxite and related substances 1 000 04/06/2011 – 03/06/2014 Still valid
54 FOUMBAN (253) OUEAST bauxite and related substances 1 000 04/06/2011 – 03/06/2014 Still valid

Report on the reconciliation of payment flows and volumes relating to the exploration and exploitation of Hydrocarbon and solid Minerals for the fiscal year 2013
Moore Stephens LLP | Page 167
N° Holder Name of title Owner Region/Depa
rtment Substances
Area. In km²
Validity period Comments
KOUAM Marcel Léopold
55 SOCIÉTÉ COAST INVESTMENTS INTERNATIONAL SARL – B.P. 35387 YAOUNDE
MESSENG (255) SOCIETE JIANG XIN GEO-MINERAL DEV. CO. Ltd (Chine) représenté par M. Huang Xiaohai
CENTER Rutile et substances connexes 493 05/07/2011 – 04/07/2014 Still valid
56 BEK (256) EAST Uranium and related substances
468 05/07/2011 – 04/07/2014 Still valid
57 BOUGMA (257) NORTH Gold and other substances 490 05/07/2011 – 04/07/2014 Still valid
58 NGOUNDI (258) EAST Gold and other substances 470,3 05/07/2011 – 04/07/2014 Still valid
59 DAEWOO INTERNATIONAL CAMEROON –
MAYO DARLE (259) Mme LEE KYEONG SUN (coréenne)
ADAMAOUA Tin and related substances 247 11/07/2011 – 10/07/2014 Still valid
60 B.P. 11539 YAOUNDE LEGALGORO (325) ADAMAOUA & EAST
Tin and related substances 498 10/06/2014 – 09/06/2017 Still valid
61 NGOURI (324) Tin and related substances 500 10/06/2014 – 09/06/2017 Still valid
62 SLK. INVESTMENT COMPANY CAMEROON SARL BP 34310 YAOUNDÉ
BANGBEL EST (260)
M. DJOUKEN Guy
EAST Gold and polymetallic substances
500 20/07/2011 – 19/07/2014 Still valid
63 NORD MEDJE (246) ADAMAOUA Gold and polymetallic substances
491 03/06/2011 – 02/11/2014 Still valid
64 NORD NTYAM (247) ADAMAOUA &
EAST Gold and polymetallic substances
458,2 03/06/2011 – 02/11/2014 Still valid
65 KUKAMA DIAMONDS CAMEROON LTD B.P. 15277 YAOUNDÉ
LIBONGO (265)
O HARGAIN DAIBHID SEAN rep par BITOUMOU BETOLO Paul
EAST diamonds and other mineral substances
430 11/08/2011 – 10/08/2014 Still valid
66
SOCIETE BOCOM PETROLEUM SA B.P. 12262 DOUALA.
BINKA (266)
M. BOUGNE (98,25%)
NORTH-OUEAST
Iron and related substances 745 19/08/2011 – 18/08/2014 Still valid
67 AKO (267) NORTH-OUEAST
cassitérite, iron, rutile and related substances
1 000 19/08/2011 – 18/08/2014 Still valid
68 NTAM (268) EAST Gold, nickel, cobalt and related substances Iron and other substances
722,8 19/08/2011 – 18/08/2014 Still valid
69 LOMBO (269) NORTH Gold, platine and related substances
999,8 26/09/2011 – 25/09/2014 Still valid
70 NKAMBE (241) NORTH-OUEAST
Iron and other substances 1 000 13/05/2011 – 12/05/2014 1er renewal on going
71 BANI (242) NORTH Gold and related substances 1 000 13/05/2011 – 12/05/2014 1er renewal on going
72 WUM (245) NORTH OUEAST
Cassitérite, rutile, Iron, others 1 000 30/05/2011 – 29/05/2014 1st renewal on going
73 MPOUOP (213) EAST Gold, nickel, cobalt and related substances
983,3 03/08/2010 – 02/08/2013 1er renewal on going
74 DIBANGO (230) CENTER &
SOUTH Iron and related substances 1 000 15/10/2010 – 14/11/2013 1
er renewal on going
75 NIEP (231) CENTER Iron and related substances 1 000 15/10/2010 – 14/11/2013 1er renewal on going
76 MOTASE & SONS COMPANY BP 382 KUMBA
NWANGALE 2 (270) HON. CHIEF. MOTASE NGOH DAVID
SOUTH-OUEAST
Valuable gemstones, gold and others
500 31/08/2011 – 30/08/2014 Still valid
77 BAKOGO (271) SOUTH-OUEAST
Valuable gemstones, gold and others
500 31/08/2011 – 30/08/2014 Still valid
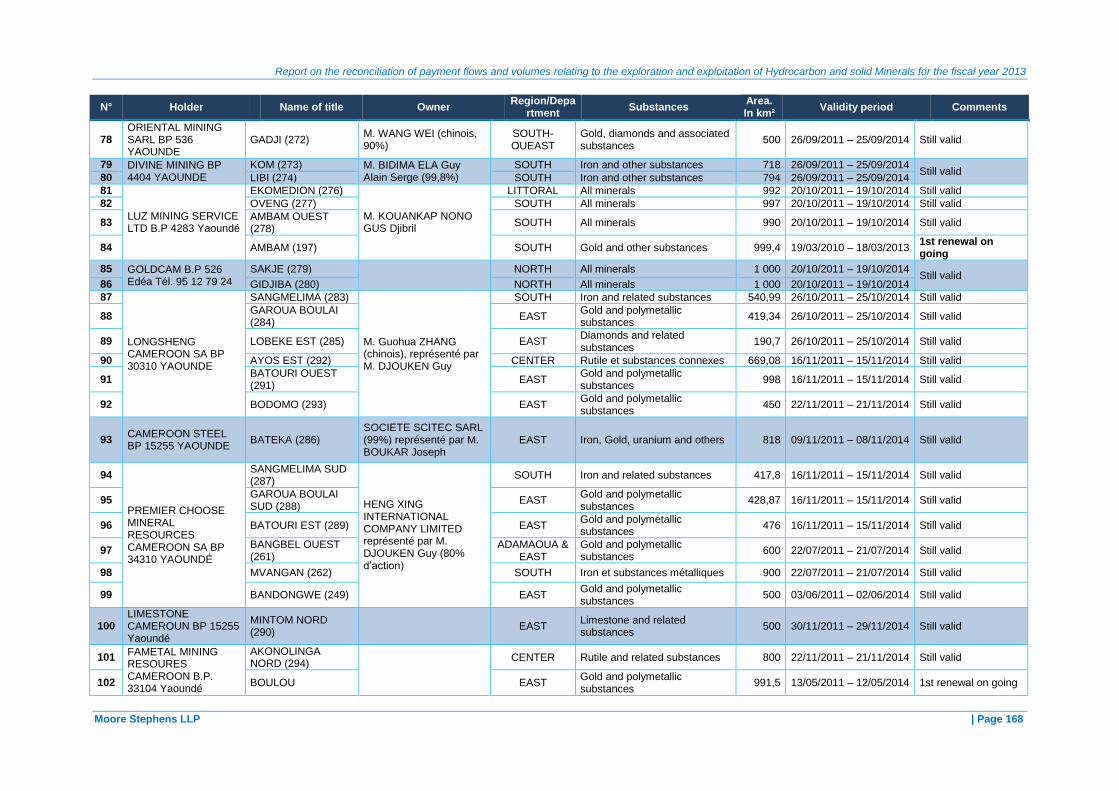
Report on the reconciliation of payment flows and volumes relating to the exploration and exploitation of Hydrocarbon and solid Minerals for the fiscal year 2013
Moore Stephens LLP | Page 168
N° Holder Name of title Owner Region/Depa
rtment Substances
Area. In km²
Validity period Comments
78 ORIENTAL MINING SARL BP 536 YAOUNDE
GADJI (272) M. WANG WEI (chinois, 90%)
SOUTH-OUEAST
Gold, diamonds and associated substances
500 26/09/2011 – 25/09/2014 Still valid
79 DIVINE MINING BP 4404 YAOUNDE
KOM (273) M. BIDIMA ELA Guy Alain Serge (99,8%)
SOUTH Iron and other substances 718 26/09/2011 – 25/09/2014 Still valid
80 LIBI (274) SOUTH Iron and other substances 794 26/09/2011 – 25/09/2014
81
LUZ MINING SERVICE LTD B.P 4283 Yaoundé
EKOMEDION (276)
M. KOUANKAP NONO GUS Djibril
LITTORAL All minerals 992 20/10/2011 – 19/10/2014 Still valid
82 OVENG (277) SOUTH All minerals 997 20/10/2011 – 19/10/2014 Still valid
83 AMBAM OUEST (278)
SOUTH All minerals 990 20/10/2011 – 19/10/2014 Still valid
84 AMBAM (197) SOUTH Gold and other substances 999,4 19/03/2010 – 18/03/2013 1st renewal on going
85 GOLDCAM B.P 526 Edéa Tél. 95 12 79 24
SAKJE (279)
NORTH All minerals 1 000 20/10/2011 – 19/10/2014 Still valid
86 GIDJIBA (280) NORTH All minerals 1 000 20/10/2011 – 19/10/2014
87
LONGSHENG CAMEROON SA BP 30310 YAOUNDE
SANGMELIMA (283)
M. Guohua ZHANG (chinois), représenté par M. DJOUKEN Guy
SOUTH Iron and related substances 540,99 26/10/2011 – 25/10/2014 Still valid
88 GAROUA BOULAI (284)
EAST Gold and polymetallic substances
419,34 26/10/2011 – 25/10/2014 Still valid
89 LOBEKE EST (285) EAST Diamonds and related substances
190,7 26/10/2011 – 25/10/2014 Still valid
90 AYOS EST (292) CENTER Rutile et substances connexes 669,08 16/11/2011 – 15/11/2014 Still valid
91 BATOURI OUEST (291)
EAST Gold and polymetallic substances
998 16/11/2011 – 15/11/2014 Still valid
92 BODOMO (293) EAST Gold and polymetallic substances
450 22/11/2011 – 21/11/2014 Still valid
93 CAMEROON STEEL BP 15255 YAOUNDE
BATEKA (286) SOCIETE SCITEC SARL (99%) représenté par M. BOUKAR Joseph
EAST Iron, Gold, uranium and others 818 09/11/2011 – 08/11/2014 Still valid
94
PREMIER CHOOSE MINERAL RESOURCES CAMEROON SA BP 34310 YAOUNDÉ
SANGMELIMA SUD (287)
HENG XING INTERNATIONAL COMPANY LIMITED représenté par M. DJOUKEN Guy (80% d’action)
SOUTH Iron and related substances 417,8 16/11/2011 – 15/11/2014 Still valid
95 GAROUA BOULAI SUD (288)
EAST Gold and polymetallic substances
428,87 16/11/2011 – 15/11/2014 Still valid
96 BATOURI EST (289) EAST Gold and polymetallic substances
476 16/11/2011 – 15/11/2014 Still valid
97 BANGBEL OUEST (261)
ADAMAOUA & EAST
Gold and polymetallic substances
600 22/07/2011 – 21/07/2014 Still valid
98 MVANGAN (262) SOUTH Iron et substances métalliques 900 22/07/2011 – 21/07/2014 Still valid
99 BANDONGWE (249) EAST Gold and polymetallic substances
500 03/06/2011 – 02/06/2014 Still valid
100 LIMESTONE CAMEROUN BP 15255 Yaoundé
MINTOM NORD (290)
EAST Limestone and related substances
500 30/11/2011 – 29/11/2014 Still valid
101 FAMETAL MINING RESOURES CAMEROON B.P. 33104 Yaoundé
AKONOLINGA NORD (294)
CENTER Rutile and related substances 800 22/11/2011 – 21/11/2014 Still valid
102 BOULOU EAST Gold and polymetallic substances
991,5 13/05/2011 – 12/05/2014 1st renewal on going

Report on the reconciliation of payment flows and volumes relating to the exploration and exploitation of Hydrocarbon and solid Minerals for the fiscal year 2013
Moore Stephens LLP | Page 169
N° Holder Name of title Owner Region/Depa
rtment Substances
Area. In km²
Validity period Comments
103 MOMPWE EAST Gold and polymetallic substances
997,3 13/05/2011 – 12/05/2014 1st renewal on going
104
ZAMBA HOLDING BP 152 YAOUNDÉ
BAFIA (296) CAMEROON RUTILE RESOURCES LTD, British Virgin Islands, représenté par M. KOUAM Marcel Léopold
CENTER Rutile and related substances 1 000 28/11/2011 – 27/11/2014 Buyer situation (Highcountry investments Limited) for clarify
105 NKOLKOSSE (295) CENTER Rutile and related substances 1 000 28/11/2011 – 27/11/2014
106 BOULOU (299) CENTER &
SOUTH Rutile and related substances 826 02/12/2011 – 01/12/2014
107 C & K MINING INC. B.P. 550 Bertoua
NGOURA (298) EAST Gold and other substances 403 02/12/2011 – 01/12/2014 Still valid
108 NUMALI MINING AND EXPLORATION SA BP 15447 YAOUNDE
NDOKAYO (300) M. Charles Arthur Michael EDMUNDS (sud-africain, 42,5%), M. Peter Ernest CREMER (sud-africain, 42,5%)
EAST Gold and other substances 471 05/12/2011 – 04/12/2014 Still valid
109 MARARABA NORD (301)
EAST Gold and other substances 474 05/12/2011 – 04/12/2014 Still valid
110 XPLOR – TEC SA B.P. 1921 Yaoundé
BAMBOUTI (303) Me Emmanuel MBIAM (92% d’action)
EAST Gold, diamonds and related substances
1 000 08/12/2011 – 07/12/2014 Still valid
111 YANGAMO (304) EAST Gold, diamonds and related substances
1 000 08/12/2011 – 07/12/2014 Still valid
112 MGI PARTNERS CAMEROON S.A B.P. 35 589 Yaoundé
BEKE KETTE (309) M. JAEJOON HAN (70% d’action)
EAST Gold and other substances 475 04/03/2014 – 03/03/2017 Still valid
113 MAMA III (310) EAST Gold and other substances 419 04/03/2014 – 03/03/2017 Still valid
114 SU YANG Sarl B.P. 12111 Yaoundé
ZIMBI (311) REN XIAUJUN EAST Gold and other substances 500 05/03/2014 – 04/03/2017 Still valid
115 ESTUARY MINING COMPAGNY B.P. 1117 LIMBE
MINDOUROU (315)
M. PUNGONG KINGSLEY ACHU PROMBO PUPESIE (67%)
EAST Iron and related substances 494 05/03/2014 – 04/03/2017 Still valid
116 TIAN YU MINING B.P 12111
KETTE (312) M. REN XIAOJUN (chinois)
EAST Gold and other substances 500 05/03/2014 – 04/03/2017 Still valid
117
EASTERN MINING CORPORATION (EMICO) B.P. 88 Bertoua
LELE II (320)
TATAMOT ALEOKOL Denis Olivier (97 39 52 71) (50%) et MONDJOL Alain Leon (50%)
SOUTH Iron and related substances 434 04/02/2014 – 03/02/2016 1er renewal
118 CLIMA DUBAI INTERNATIONAL B.P.12 Betaré-Oya
KOUBOU (330) M. MOHAMMED A.A. RAMADAN (80% des parts, Palestine)
EAST Gold and other substances 401 10/06/2014 – 09/06/2017 Still valid
119 ZUMER MINING INC S.A B.P.14371 Yaoundé
BEKA ZIKI (323) M. ESSOUMA ASSOUMOU Emile David
ADAMAOUA Gold and other substances 500 10/06/2014 – 09/06/2017 Still valid
120
CAMEROON MEIGE MINING DEVELOPMENT COMPANY (CMMDC) LTD B.P. 87 Yaoundé
MEIGANGA SUD-OUEST (329)
M. LIU ZHONGNAN (chinois)
ADAMAOUA Gold and other substances 495 10/06/2014 – 09/06/2017 Still valid
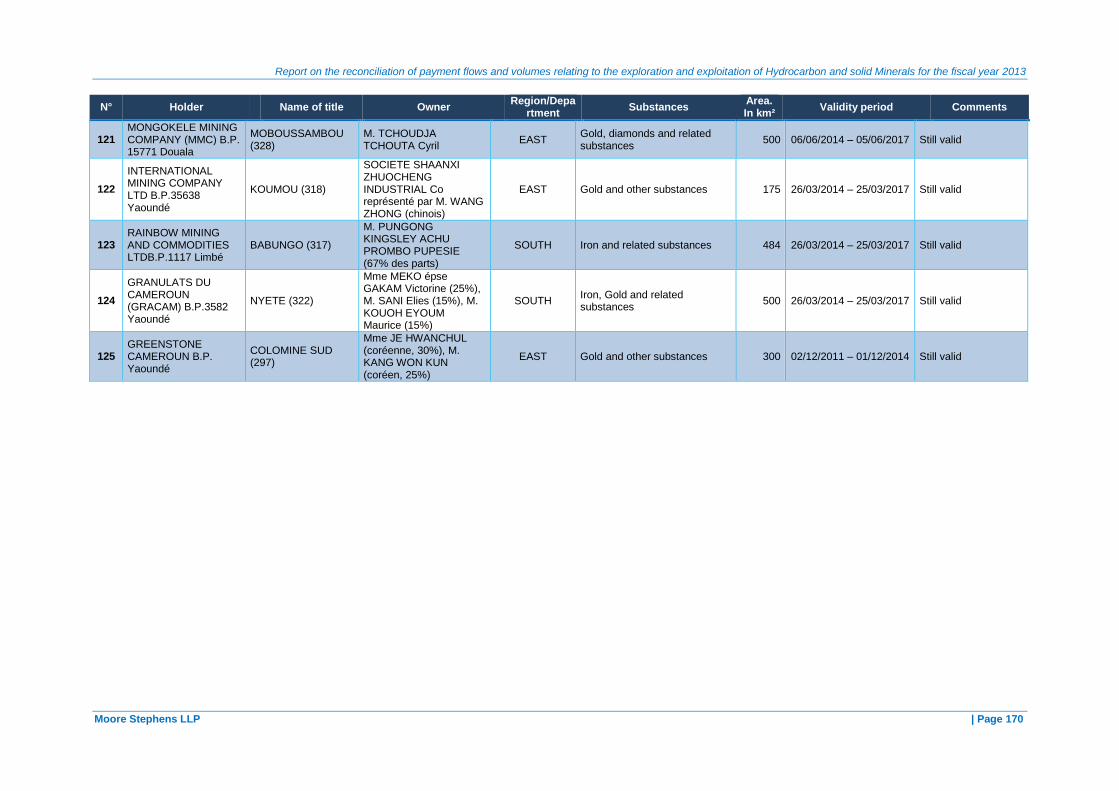
Report on the reconciliation of payment flows and volumes relating to the exploration and exploitation of Hydrocarbon and solid Minerals for the fiscal year 2013
Moore Stephens LLP | Page 170
N° Holder Name of title Owner Region/Depa
rtment Substances
Area. In km²
Validity period Comments
121 MONGOKELE MINING COMPANY (MMC) B.P. 15771 Douala
MOBOUSSAMBOU (328)
M. TCHOUDJA TCHOUTA Cyril
EAST Gold, diamonds and related substances
500 06/06/2014 – 05/06/2017 Still valid
122
INTERNATIONAL MINING COMPANY LTD B.P.35638 Yaoundé
KOUMOU (318)
SOCIETE SHAANXI ZHUOCHENG INDUSTRIAL Co représenté par M. WANG ZHONG (chinois)
EAST Gold and other substances 175 26/03/2014 – 25/03/2017 Still valid
123 RAINBOW MINING AND COMMODITIES LTDB.P.1117 Limbé
BABUNGO (317)
M. PUNGONG KINGSLEY ACHU PROMBO PUPESIE (67% des parts)
SOUTH Iron and related substances 484 26/03/2014 – 25/03/2017 Still valid
124
GRANULATS DU CAMEROUN (GRACAM) B.P.3582 Yaoundé
NYETE (322)
Mme MEKO épse GAKAM Victorine (25%), M. SANI Elies (15%), M. KOUOH EYOUM Maurice (15%)
SOUTH Iron, Gold and related substances
500 26/03/2014 – 25/03/2017 Still valid
125 GREENSTONE CAMEROUN B.P. Yaoundé
COLOMINE SUD (297)
Mme JE HWANCHUL (coréenne, 30%), M. KANG WON KUN (coréen, 25%)
EAST Gold and other substances 300 02/12/2011 – 01/12/2014 Still valid
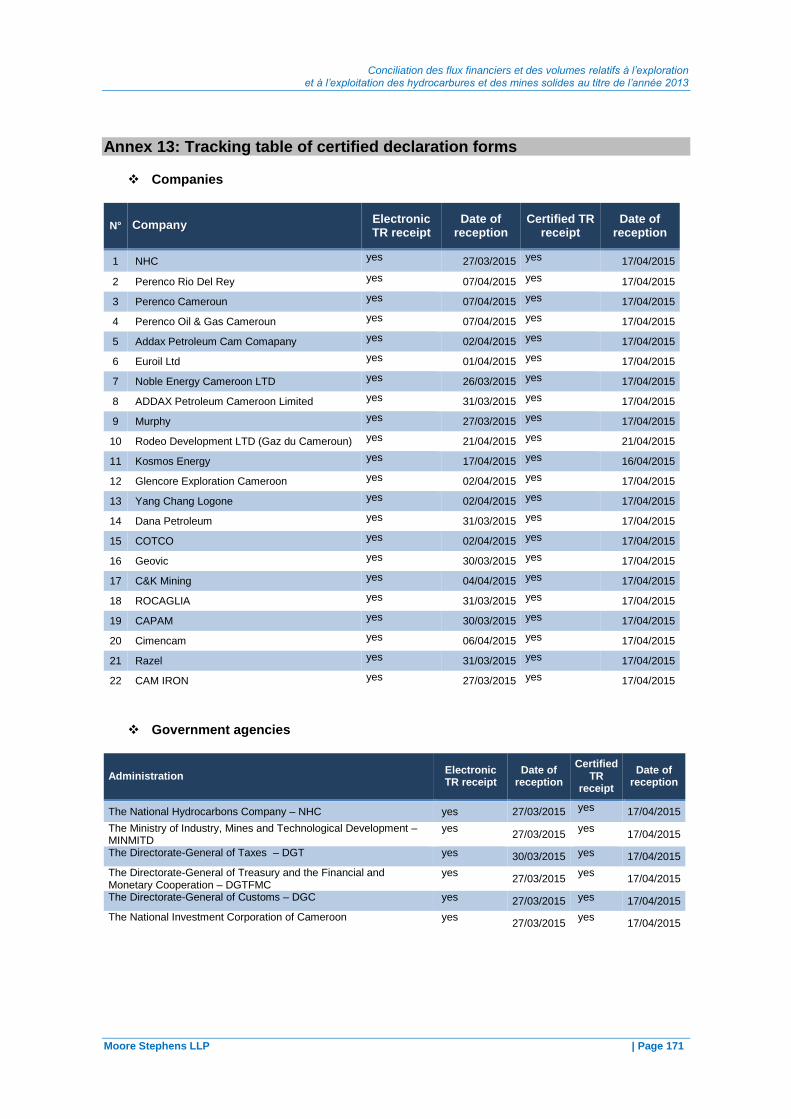
Conciliation des flux financiers et des volumes relatifs à l’exploration et à l’exploitation des hydrocarbures et des mines solides au titre de l’année 2013
Moore Stephens LLP | Page 171
Annex 13: Tracking table of certified declaration forms
Companies
N° CompanyElectronic TR receipt
Date of reception
Certified TR receipt
Date of reception
1 NHC yes 27/03/2015 yes 17/04/2015
2 Perenco Rio Del Rey yes 07/04/2015 yes 17/04/2015
3 Perenco Cameroun yes 07/04/2015 yes 17/04/2015
4 Perenco Oil & Gas Cameroun yes 07/04/2015 yes 17/04/2015
5 Addax Petroleum Cam Comapany yes 02/04/2015 yes 17/04/2015
6 Euroil Ltd yes 01/04/2015 yes 17/04/2015
7 Noble Energy Cameroon LTD yes 26/03/2015 yes 17/04/2015
8 ADDAX Petroleum Cameroon Limited yes 31/03/2015 yes 17/04/2015
9 Murphy yes 27/03/2015 yes 17/04/2015
10 Rodeo Development LTD (Gaz du Cameroun) yes 21/04/2015 yes 21/04/2015
11 Kosmos Energy yes 17/04/2015 yes 16/04/2015
12 Glencore Exploration Cameroon yes 02/04/2015 yes 17/04/2015
13 Yang Chang Logone yes 02/04/2015 yes 17/04/2015
14 Dana Petroleum yes 31/03/2015 yes 17/04/2015
15 COTCO yes 02/04/2015 yes 17/04/2015
16 Geovic yes 30/03/2015 yes 17/04/2015
17 C&K Mining yes 04/04/2015 yes 17/04/2015
18 ROCAGLIA yes 31/03/2015 yes 17/04/2015
19 CAPAM yes 30/03/2015 yes 17/04/2015
20 Cimencam yes 06/04/2015 yes 17/04/2015
21 Razel yes 31/03/2015 yes 17/04/2015
22 CAM IRON yes 27/03/2015 yes 17/04/2015
Government agencies
Administration Electronic TR receipt
Date of reception
Certified TR
receipt
Date of reception
The National Hydrocarbons Company – NHC yes 27/03/2015 yes 17/04/2015
The Ministry of Industry, Mines and Technological Development – MINMITD
yes 27/03/2015
yes 17/04/2015
The Directorate-General of Taxes – DGT yes 30/03/2015 yes 17/04/2015
The Directorate-General of Treasury and the Financial and Monetary Cooperation – DGTFMC
yes 27/03/2015
yes 17/04/2015
The Directorate-General of Customs – DGC yes 27/03/2015 yes 17/04/2015
The National Investment Corporation of Cameroon
yes 27/03/2015
yes 17/04/2015
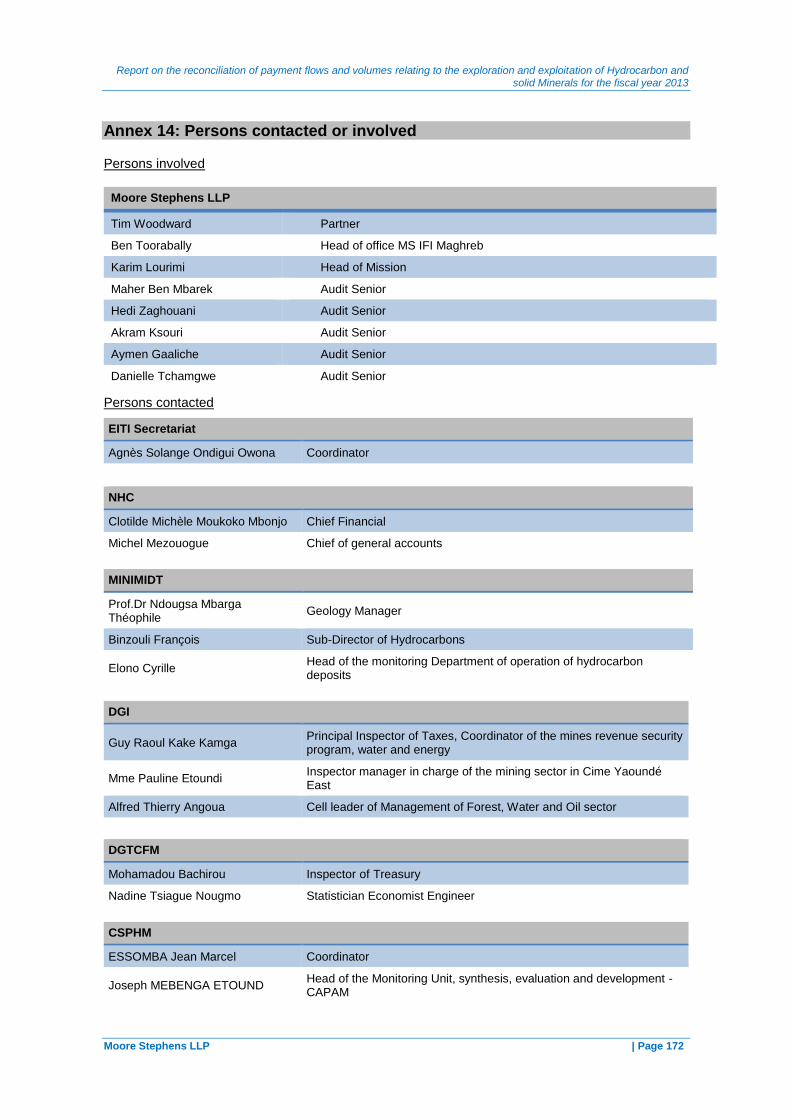
Report on the reconciliation of payment flows and volumes relating to the exploration and exploitation of Hydrocarbon and solid Minerals for the fiscal year 2013
Moore Stephens LLP | Page 172
Annex 14: Persons contacted or involved
Persons involved
Moore Stephens LLP
Tim Woodward Partner
Ben Toorabally Head of office MS IFI Maghreb
Karim Lourimi Head of Mission
Maher Ben Mbarek Audit Senior
Hedi Zaghouani Audit Senior
Akram Ksouri Audit Senior
Aymen Gaaliche Audit Senior
Danielle Tchamgwe Audit Senior
Persons contacted
EITI Secretariat
Agnès Solange Ondigui Owona Coordinator
NHC
Clotilde Michèle Moukoko Mbonjo Chief Financial
Michel Mezouogue Chief of general accounts
MINIMIDT
Prof.Dr Ndougsa Mbarga Théophile
Geology Manager
Binzouli François Sub-Director of Hydrocarbons
Elono Cyrille Head of the monitoring Department of operation of hydrocarbon deposits
DGI
Guy Raoul Kake Kamga Principal Inspector of Taxes, Coordinator of the mines revenue security program, water and energy
Mme Pauline Etoundi Inspector manager in charge of the mining sector in Cime Yaoundé East
Alfred Thierry Angoua Cell leader of Management of Forest, Water and Oil sector
DGTCFM
Mohamadou Bachirou Inspector of Treasury
Nadine Tsiague Nougmo Statistician Economist Engineer
CSPHM
ESSOMBA Jean Marcel Coordinator
Joseph MEBENGA ETOUND Head of the Monitoring Unit, synthesis, evaluation and development - CAPAM
Copyright © 2022 FDOKUMEN