Household waste and recycling research report - NSW ...
149
Household waste and recycling research report Prepared for NSW EPA April 2016
-
Upload
khangminh22 -
Category
Documents
-
view
0 -
download
0
Transcript of Household waste and recycling research report - NSW ...

Household waste and recycling research report
Prepared for NSW EPA April 2016

Contents
Executive summary ....................................................................................... 4
Objectives and research design ........................................................................ 4
Findings ............................................................................................................. 4
Conclusions and recommendations ............................................................. 21
Research objectives .................................................................................... 25
Methodology .............................................................................................. 27
Phase 1 – Exploratory qualitative research....................................................... 27
Phase 2 – Online survey .................................................................................... 28
Phase 3 – Message testing ................................................................................ 31
Qualitative findings .................................................................................... 32
5.1 The environment is important… ...................................................................... 32
In everyday life, environmental concerns fade into the background ............... 35
5.2 Recycling is a key part of being environmentally friendly................................ 37
Recycling is easy, and I’m good at it ................................................................. 37
People often have a default response when they are unsure about an item .. 39
If still unsure, there are two schools of thought ............................................... 40
5.3 If recycling requires time and effort, it won’t be done .................................... 41
5.4 There is a wide variety of in-home systems ..................................................... 42
Recycling systems vary widely .......................................................................... 42
Distance to bins has an impact on MUD residents’ disposal behaviour ........... 45
Rinsing behaviour also varies ............................................................................ 46
However, bin collections are also important .................................................... 47
Usage of the green bin was varied .................................................................... 48
Behaviours can vary within the household ....................................................... 48
Others residents are the problem ..................................................................... 49
Terminology varies ............................................................................................ 50
5.5 Recycling knowledge comes from an array of sources .................................... 51
The main information sources are council-supplied ......................................... 51
Proactive information seeking is rare ............................................................... 52
However, there were a range of areas where participants clearly identified information gaps ........................................................................................................................... 53
5.6 Food waste collection is a good idea ............................................................... 58
There was appetite for FOGO collection among those without it .................... 58
But the sensory experience is a barrier ............................................................ 59
The switch to FOGO will need to be well-communicated ................................ 59

EPA Household waste and recycling research 3
Quantitative findings .................................................................................. 61
6.1 Awareness and use of services ......................................................................... 61
Collection services ............................................................................................. 61
Home composting and worm farms ................................................................. 62
Perceptions of recycling .................................................................................... 63
6.2 Psychological capability - recycling .................................................................. 65
Images presented to participants ..................................................................... 65
Certainty about recycling status ....................................................................... 66
Recycling decisions ............................................................................................ 67
Reconsideration of recycling difficulty .............................................................. 69
6.3 Psychological capability - organics ................................................................... 71
Organics images presented to participants ...................................................... 71
Garden only collections ..................................................................................... 71
FOGO collections ............................................................................................... 73
Disposal method for organic waste when uncertain ........................................ 73
6.4 In-home waste system ..................................................................................... 83
General waste system ....................................................................................... 83
Recycling system ............................................................................................... 85
Food waste system ............................................................................................ 90
Frequency of emptying receptacles .................................................................. 91
6.5 Physical opportunity ......................................................................................... 92
Time taken to empty waste and recycling ........................................................ 92
Bin capacity ....................................................................................................... 93
6.6 Recycling behaviour ......................................................................................... 98
Frequency of recycling items ............................................................................ 98
Preparation of materials ................................................................................... 101
6.7 Waste and recycling information ..................................................................... 105
Sources of information ...................................................................................... 105
Additional information ...................................................................................... 106
6.8 Segmentation ................................................................................................... 108
Demographic summary of segments ................................................................ 108
Segment attitudes ............................................................................................. 109
Recycling attitudes and behaviours .................................................................. 113
Bin capacity ....................................................................................................... 117
Information search ............................................................................................ 117
Preparation behaviours ..................................................................................... 119
Recycling of common household items ............................................................ 123
6.9 Recycling terms ................................................................................................ 130
6.10 General values and attitudes ......................................................................... 144
Attitudes towards the environment ................................................................. 145
Attitudes towards life........................................................................................ 147

EPA Household waste and recycling research 4
Executive summary
Objectives and research design Ipsos Social Research Institute was commissioned by the NSW Environment Protection Authority to undertake research among the general public with the objectives of:
• Understanding the drivers of waste and recycling behaviours
• Understanding which terms residents use in regard to waste and recycling items and behaviours
• Understanding which messages and media are most likely to change waste and recycling
behaviour
The research was conducted over three phases, as outlined in the figure below.
This report outlines the attitudinal and behavioural findings. Findings relating to campaign development are presented in a separate report.
Findings The findings of the qualitative and quantitative phases of the research are outlined below.
General attitudes towards the environment and recycling are positive
The majority of residents are concerned about the environment and take actions to minimise their
environmental impact. Many focus participants report undertaking behaviours such as avoiding
plastic bags, walking or taking public transport instead of driving and reducing the volume of
products used. Over half of survey respondents (55%) say they try to minimise the amount of
packaging on products they buy.
Phase 1: Qualitative
Phase 2: Quantitative
Group discussionsn=10
In-depth interviewsn=5 LGAs
OnlineA: n=1200
Boosts:n=300 young people (aged 18-24)
n=300 people living in MUDsn=300 people with access to kerbside food and garden
organics collections
Phase 3: Qualitative
Mini-group discussionsn=8

EPA Household waste and recycling research 5
Recycling is mentioned by many as an important way for consumers to minimise their impact on the
environment. Indeed, 84% of residents agree that recycling makes a big difference to the
environment (as shown below).
Q27_4 To what extent do you personally agree with each of the statements below? – Recycling well makes big difference to the
environment (Base: All respondents n=2070)
Waste and recycling behaviours and capabilities
Use of waste services
Almost all NSW residents are aware that their local council provides general waste (98%) and recycling collection (93%) services. Those who are aware of the services provided by their council overwhelmingly make use of them. The figure below shows the proportion of people in NSW using each kerbside collection service. Lower figures for organics waste reflect the lower levels of garden and food and garden (FOGO) services provided to households. The survey also found that 28% use a home composting or worm farming system to recycle food at home.
This high level of engagement is related to the ease of access of waste collection services. Recycling is seen as a low effort, and often low involvement, activity by most residents. During the qualitative phase of the research many participants felt that that they undertake recycling in a reflexive manner.
“Recycling for me is just automatic, I don’t plan it, it just happens.”
“Easy, if you’ve got half a brain.”

EPA Household waste and recycling research 6
The survey findings support this, with just 8% of participants in the quantitative survey indicating that they felt recycling takes a lot of effort. Only 10% indicated that deciding which items to recycle is difficult. The vast majority (94%) feel that they understand which materials can and cannot be recycled very or fairly well.
Recycling decision making and capability
Many residents have well established habits which they rely on when making decisions about whether to recycle an item or put it in the general waste stream. In many cases, resident’s perceptions of the guidelines for recycling are over-simplistic or out-of-date. This leads in some cases to general waste items being placed in recycling bins, and to recyclable items being placed in general waste.
“To me recycling is bottles and paper… so anything else is not. It goes in the
rubbish for me.”
“It's pretty simple. It's just paper and glass and plastic.”
The survey findings underline the extent to which incorrect items are placed in each waste/resource recovery stream. A core set of items is familiar to many residents as being recyclable, with the majority allocating them to the correct stream (see figure below).
Q8. You said that you are unsure whether you are allowed to recycle the following items below. Please indicate how you would most likely dispose of it if you
had to... (Base: Those who have used recycling collection in the last 12 months n=1874)
Q9. Please indicate which of the following items you are allowed to recycle through your council kerbside collection… (Base: Those who have used recycling
collection in the last 12 months n=1874)
However, other items cause more confusion. As the figure below shows, items such as drinking glasses, aluminium foil trays and ceramic plates are allocated to the wrong stream by a high proportion of residents.

EPA Household waste and recycling research 7
Q8. You said that you are unsure whether you are allowed to recycle the following items below. Please indicate how you would most likely dispose of it if you
had to... (Base: Those who have used recycling collection in the last 12 months n=1874)
Q9. Please indicate which of the following items you are allowed to recycle through your council kerbside collection… (Base: Those who have used recycling
collection in the last 12 months n=1874)
Similarly, some items cause high levels of confusion in relation to their admissibility in organics collections. As the figure below illustrates, residents with food and garden waste (FOGO) collection services are often unsure or incorrect about which items can be recycling in this stream.
Q10. Are you unsure whether you are allowed to put any of the items shown below in your council garden or food and garden waste collection? (Base: Those
who use their council food and garden waste collection n=454)
EPA Household waste and recycling research 8
Q12. Please indicate which of the following items you are allowed to put in your council garden or food and garden waste collection? (Base: Those who use
their council food and garden waste collection n=454)
In-home waste and recycling systems
A variety of in-home systems are used for management of waste and recycling. The qualitative phase
highlighted the fact that, in many cases, residents have been using their current system of waste
disposal for a long time. As such, their systems have become habitual. Parents were a key source of
behaviour for these habits, in that the systems participants had used for dry recycling when growing
up tend to have translated into the systems they were using nowadays. There has often been no
prompt or motivation for residents to change their system.
The types of receptacle used are relatively uniform across households for general waste. The majority of residents use a plastic bag (49%) and/or a lined bin (47%) to collect general waste items in their homes. For recyclables, most use a receptacle such as a bin or crate (41%), box (14%) or plastic bag (10%). Almost a third (31%) carry recyclables straight out to the bin provided by the council; this is more popular among those living in single unit dwellings (SUDs) than multi-unit dwellings (MUDs).
Evidence from the qualitative phase suggests that those who do not consistently use an in-home receptacle for recyclables may be less inclined to set materials aside for recycling. This was most commonly reported by those living in MUDs, where council bins are often located some distance (and often several flights of stairs) from the dwelling. In these circumstances, putting recyclables in the in-home general waste bin is a much easier proposition than carrying them by hand to the council bin located outside.
“Unless it's a big bottle or a wine bottle or something that's going to take
up a lot of room, if it's something like this size [smaller] I just put it in the
normal bin. I know, I'm really bad.”
The majority have waste bins located in the kitchen (81%), with some having secondary bins in locations such as the bathroom (30%), toilet (18%) or bedroom (18%). Recycling receptacles tend to be kept in the kitchen (54%), garage (11%) or laundry (9%). No differences are observed between MUDs and SUDs in relation to bin location.
Almost half of residents take their recycling to the council bin in a smaller bin or crate (47%) at times, with 20% taking it in a plastic bag and 20% carrying it by hand. Of the 20% who take items out in a plastic bag, 12% always leave it in the bag when putting it the council bin, with 20% sometimes doing so. This translates to between 6% and 7% of the percent of the population leaving their recycling in plastic bags at least some of the time.
Of those who dispose of food waste via FOGO collections, composing and worm farming, most use a kitchen caddy (24% use their own and 16% use a council provided caddy). One in five (20%) use a plastic bag and similar proportion (19%) report taking scraps directly out to the council bin, compost or worm farm. The majority of food waste receptacles are stored in the kitchen (80%).
Physical opportunity
A range of contextual challenges impact the ability of residents to recycle.
Time taken to empty waste and recycling
During the qualitative phase, some MUD residents described their annoyance at having to take their
rubbish and recycling out.

EPA Household waste and recycling research 9
“I find that it's difficult personally. Just because you've got to…so you collect
all your rubbish at your home obviously, the bins, then you've got to take it
to the big bins which is (sic) way down the stairs.”
“In my complex it's a pain...we've got like 50 stairs to get down to where it
is and back up again...time I think is a huge factor these days.”
This was borne out by survey findings about the time it can take to get to the council bin for MUDs.
As shown in figure below, this can be significantly longer for those in multi-level buildings than for
other dwelling types.
Q22. Approximately how long does it take you to carry your rubbish and recycling out to the bins provided by the council? (Base:
Freestanding house n=1,298, semi-detached or terrace n=72, town house or villa n=221, 1-3 story apartment block n=291, 4 or more story
apartment block n=171) ↑↓ Denotes significant difference
The time taken to get to council bins has a material impact on perception of the difficulty of recycling. This is illustrated by the fact that those who believed that managing their household waste takes a lot of effort were more likely than others to report taking longer than three minutes to carry their waste to the council bins (40%). In comparison, among those who indicated that recycling takes little effort, 18% took more than three minutes. Among those who indicated it took no effort, 17% took more than three minutes.
Bin capacity
Lack of bin capacity can also be a barrier to recycling. Almost three in five residents (58%) say their bins sometimes become so full they cannot fit any more into them before collection, as shown in the figure below. While a greater proportion of SUDs than MUDs report this happening, it happens with greater frequency in MUDs. For example, 33% of MUDs report overfilling of their general waste occurring weekly compared to 21% of SUDs.

EPA Household waste and recycling research 10
Q23. Do the bins provided by your local council ever become so full you can’t fit anymore into them? (Base: All respondents n=2070) ↑↓
Denotes significant difference
The majority of residents (54%) react to overfull bins by storing the items until the next collection, while 14% use other bins on their street. Both these behaviours are most common among those in SUDs. Less desirable behaviours include putting items next to or on top of the bin (6% do this) or putting the items into the wrong bin (4% report putting recyclables into the general waste bin or vice versa).
Information on waste and recycling Most residents are conscious that they have received information on recycling in the recent past. Few, however, have actively sought out this information, instead receiving it via flyers or signage.
Receiving information
During the qualitative phase of the research, some participants believed that their knowledge of how
to recycle and what they can and cannot recycle mainly stemmed from their upbringing. Beyond this
parental influence on recycling habits, the key information sources were usually council-provided.
“On our bins they actually have information about what can go in there,
small limbs only, that kind of stuff.”
Some had engaged with a range of other council communications. These included pamphlets in the
post and fridge magnets that showed the dates of council collections. For both of these types of
communications, key messaging was related to when residents were able to recycle, rather than the
types of items that are and are not recyclable.
“Years ago I think the council used to hand out leaflets telling you what you
can and can’t recycle. That’s how I got educated, before that I thought
everything was recyclable.”
However, reactions to council communications like these were mixed. Some engaged with them and
council communications more broadly; they were interested in receiving information and would
position the collateral in their home so that they were able to easily refer to it. Others mentioned
that they would not even open these letters, instead disposing of them, in some cases without even
having read them.
“I do. That’s what I do like to read. Junk mail and whatever. I don’t mind
reading that stuff. And normally I do put it on the side of my fridge as well
when it’s something new.”

EPA Household waste and recycling research 11
“Yeah. Straight to the bin.”
The quantitative phase revealed that the vast majority (83%) of residents had found information or
learnt something about waste and recycling in the past two years without actively looking for it.
Importantly, those with a poor understanding of recycling are less likely to have found or learnt any
information about waste management in the past two years (34% reporting having learnt or found
no information compared with 16% among those who have a good understanding).
The figure below shows sources from which residents gain waste and recycling information.
Q31. In the last 2 years, where have you found information or learnt something about waste and recycling? (Base: All respondents n=2070)
Again, those with a good understanding of recyclable materials are more likely to have found or
learnt something about waste management through the following channels:
• Local council mail or flyers (46% compared to 14% with a poor understanding)
• Signage on or near bins (35% compared to 22% with a poor understanding)
• Signage on rubbish or recycling trucks (23% compared to 10% with a poor understanding)
Proactive searching for information is rare
Some participants in the qualitative phase perceived that rules in relation to what can and cannot be
recycled had changed over time. This led to confusion about whether the rules they had learnt many
years ago still applied, or whether these had since been updated. Participants felt as though their
knowledge might be out of date and had an appetite for changes over time to be communicated
effectively.
“I’m in North Sydney council and two, three years ago the list of things they
actually sent and I did actually read it. It became a lot more relaxed.”
“I mean technologies have obviously changed so that we you can have
things where like paper and glass and that are together, whereas previously

EPA Household waste and recycling research 12
that wasn’t the case. But there doesn’t seem to be any public information
about that.”
Most were aware that information on which types of items are recyclable and which are not is easily
available online, or at least assumed as much. If they needed to find this information, their first ports
of call would be to conduct a Google search or visit their council’s website.
“I'm sure you can visit websites, council websites and find out stuff about
it.”
Despite knowing the information is available, however, the qualitative phase demonstrated that
looking for this type of information is rare. This was the case despite participants being able to
identify many occasions in the past when they had been uncertain as to whether an item was
recyclable or not. Participants usually put their failure to search for information down to a lack of
motivation. Despite their stated concern about the environment, they deemed other issues worthier
of their time and energy than ensuring that they placed their item in the correct bin. Indeed, the idea
of conducting a Google search while standing next to the bins to determine whether or not
something was recyclable was seen as humorous and ridiculed.
“Normal people would not know because they don't care. There's (sic)
bigger problems in the world. We're not going to go look up a website to go
‘oh what can I recycle?’”
“Because if I'm standing over the bin with it then I'm not going to go, hang
on (laughter)…I'm just going to play it safe and put it in the bin.”
The quantitative phase revealed that one in five (21%) residents have actively sought out additional
information about waste and recycling in the past two years. Home composters (30%) and those with
access to FOGO collection (27%) are more likely to have searched for additional information
(compared to 16% of non-composters and 17% with no FOGO collection). This may indicate that
home composting and the introduction of FOGO services involve higher levels of engagement for
residents, or that residents are more conscious of instances where they lack knowledge of how to
use these services.
Among those who have sought out additional information, how to dispose of e-waste (46%) and
whether a particular item can be recycled (46%) are most commonly searched for. Bulky item
disposal is also a key driver of searches, with 34% booking or finding out when bulky items
collections are, and 33% searching for information on how to dispose of bulky items.

EPA Household waste and recycling research 13
Q33. What information were you looking for? (Base: Those who have search for additional information n=427)
Pleasingly, the majority of those who searched for information (87%) were able to find the
information they had searched for.
Recycling segmentation
A latent class analysis was conducted in order to identify segments within the population based on
recycling attitudes. Five segments were identified:
• Committed (28% of the sample)
• Aspirational (26%)
• Disengaged (19%)
• Indifferent (23%)
• Resistant (4%)
The figure below shows differences across the five segments for the attitudes upon which the
segmentation was based. The central figure within each chart displays the top-two box score
(strongly + somewhat agree).
Committeds and Aspirationals share strong positive beliefs in relation to the environment, although
Committeds see themselves as far more organised and hard-working. Aspirationals are younger, and
tend to have more progressive views on the issue of climate change.
Disengageds tend to believe in recycling as a way to look after the environment, but not to stay
informed about waste issues (or political issues in general). Their sense of self efficacy in relation to
impacting the environment is mixed.
Indifferents have much lower levels of belief that recycling makes a difference, and also tend to be
less likely to agree with all the statements than the previous three segments. They are, however,

EPA Household waste and recycling research 14
more likely than Disengageds to take an interest in politics, and more likely than Committeds to rate
themselves as disorganised and doing just enough to get by.
Resistants exhibit very low levels of agreement with all statements, but make up just 4% of the
population.
Q27. To what extent do you personally agree or disagree with each of the following statements below? (Base: All segmented respondents
n=1857) Note dashboard score displays top 2 box total (strongly agree + somewhat agree). Blue bar denotes proportion of respondents
who agreed (strongly agree + somewhat agree). Red bar denotes proportion of respondents who disagreed (strongly disagree + somewhat
disagreed).

EPA Household waste and recycling research 15
The figure below shows the demographic profile of each segment.
The segments also exhibit differences in other attitudes and behaviours relating to waste and
recycling. A selection of key points of note is outlined below.
Attitudes and beliefs
As the figure below shows, Committed recyclers have the most positive view of their own
understanding of which items can and cannot be recycled (49% believe they understand very well),
while the majority of people in other segments all perceive themselves to have a fairly good
understanding. It was demonstrated in the qualitative phase that Committeds’ glowing perception of
their own knowledge can mean they are less open to hearing new information about how to recycle.

EPA Household waste and recycling research 16
Q5. How well would you say you understand which materials can and cannot be recycled? (Base: All segmented responses n=1857)
Information search
However, those in the Committed (29%) and Aspirational (28%) segments are significantly more
likely than others to have actively searched for waste and recycling information on their own accord.
Q32. In the last 2 years, have you actively tried to find any information about waste and recycling? (Base: All segmented responses n=1857)
It is worth noting that no significant differences exist between segments in regard to the type of
information they searched for and whether or not the information was found.
Recycling behaviours
There are distinct differences in the frequency with which the segments recycle items. Two examples
are shown below. Firstly, HDPE milk bottles:

EPA Household waste and recycling research 17
Q28. Please indicate how often you put the item shown below in the recycling bin when you are at home? – HDPE milk bottles (Base:
Segmented respondents allocated to this option n=826)
And secondly, steel aerosol cans:
Q28. Please indicate how often you put the item shown below in the recycling bin when you are at home? – Steel aerosol cans (Base:
Segmented respondents allocated to this option n=852)
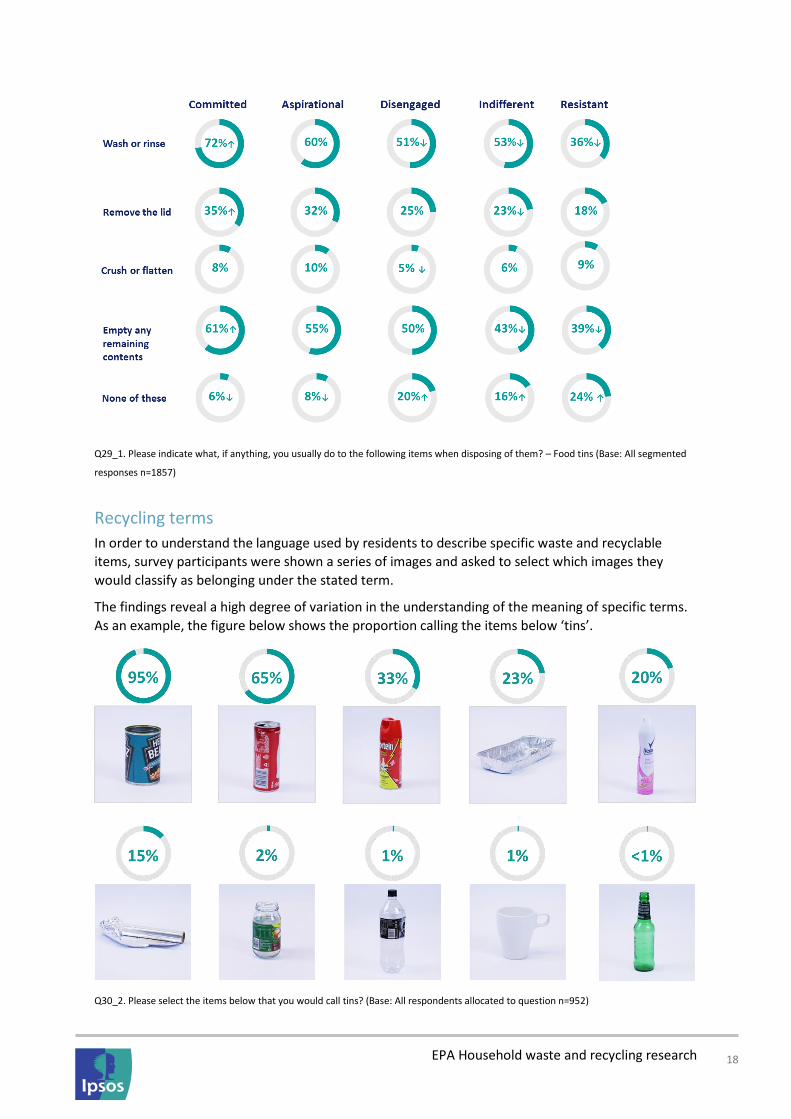
The extent to which each segment prepares items for recycling also varies, as the figure below shows
for the preparation of food cans.
EPA Household waste and recycling research 18
Q29_1. Please indicate what, if anything, you usually do to the following items when disposing of them? – Food tins (Base: All segmented
responses n=1857)
Recycling terms
In order to understand the language used by residents to describe specific waste and recyclable
items, survey participants were shown a series of images and asked to select which images they
would classify as belonging under the stated term.
The findings reveal a high degree of variation in the understanding of the meaning of specific terms.
As an example, the figure below shows the proportion calling the items below ‘tins’.
Q30_2. Please select the items below that you would call tins? (Base: All respondents allocated to question n=952)
EPA Household waste and recycling research 19
As might be expected, a high proportion (95%) identify the steel baked bean container as a tin. However, a range of other items are also seen by relatively large proportions of the population as being tins, including aluminium cans, steel and aluminium aerosol cans, and aluminium foil.
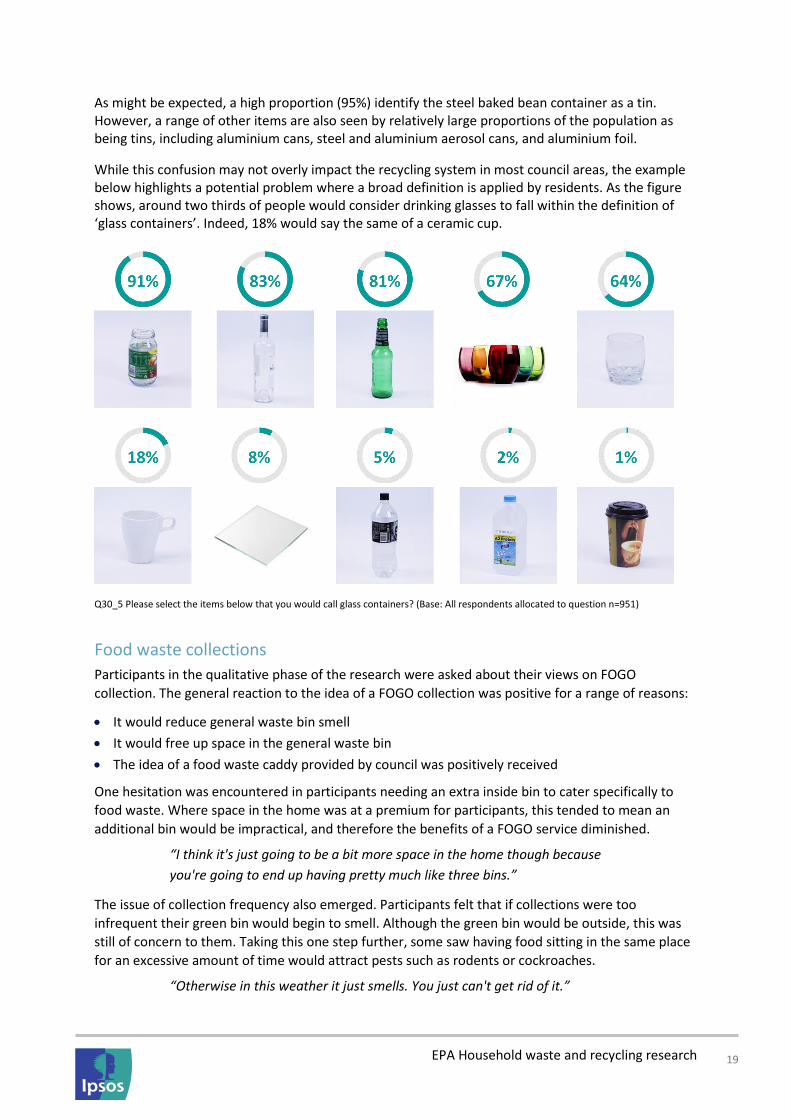
While this confusion may not overly impact the recycling system in most council areas, the example below highlights a potential problem where a broad definition is applied by residents. As the figure shows, around two thirds of people would consider drinking glasses to fall within the definition of ‘glass containers’. Indeed, 18% would say the same of a ceramic cup.
Q30_5 Please select the items below that you would call glass containers? (Base: All respondents allocated to question n=951)
Food waste collections
Participants in the qualitative phase of the research were asked about their views on FOGO
collection. The general reaction to the idea of a FOGO collection was positive for a range of reasons:
• It would reduce general waste bin smell
• It would free up space in the general waste bin
• The idea of a food waste caddy provided by council was positively received
One hesitation was encountered in participants needing an extra inside bin to cater specifically to
food waste. Where space in the home was at a premium for participants, this tended to mean an
additional bin would be impractical, and therefore the benefits of a FOGO service diminished.
“I think it's just going to be a bit more space in the home though because
you're going to end up having pretty much like three bins.”
The issue of collection frequency also emerged. Participants felt that if collections were too
infrequent their green bin would begin to smell. Although the green bin would be outside, this was
still of concern to them. Taking this one step further, some saw having food sitting in the same place
for an excessive amount of time would attract pests such as rodents or cockroaches.
“Otherwise in this weather it just smells. You just can't get rid of it.”

EPA Household waste and recycling research 20
“I think it could be a like a risk, you know, like you’re attracting insects and
rats.”
Related to this, some participants were also concerned about placing food waste into a bin without it
first being placed in a plastic bag. Although food in the red bin still produces smell, the fact that it is
bagged (in most cases) mitigates this to some extent, while also keeping the bin clean and meaning
that residents are not forced to see old, mouldy food when opening their bins.
“If it is a good bin and is sealed well then it won’t be a problem.”

EPA Household waste and recycling research 21
Conclusions and recommendations
The conclusions based on the findings of the research, and corresponding recommendations are outlined in the table below.
Conclusion Recommendation
1
Attitudes towards recycling are positive
Attitudes towards the environment generally, and recycling specifically, are positive among most residents.
84% of residents somewhat or strongly agree that recycling makes a big difference to the environment.
General messaging relating to the environmental benefits of recycling is not required to encourage engagement with the system.
Instead, messaging should focus on encouraging behaviours that maximise recycling rates. Messages relating to ensuring that recycling efforts aren’t wasted (by items being placed in the wrong stream) may be valuable.
2
Utilisation of collection services is high
Barriers to accessing council waste and recycling services are relatively low, leading to high levels of engagement with the system.
97% of residents use general waste collection services, while 91% use recycling services. This equates to over 97% of those who are aware of these services utilising them.
Only 58% of those who live in areas where FOGO is offered use the service. However, 85% of those who are aware of FOGO services utilise them.
General messages encouraging engagement with the waste and recycling system are not required.
The exceptions to this may include:
▪ Those with new or recently implemented services such as FOGO collections; and
▪ New immigrants and CALD audiences.
3
Waste and recycling decisions are made via automatic mental processes (habit and guess-work)
Residents’ decision-making processes in relation to which stream to put specific items in is relatively low effort and low involvement. Most do not make decisions using reflective processes, but rely on habit or guesswork when deciding whether to recycle an item or put it into the general waste.
The clear majority (more than 89%) believe that recycling does not take a lot of effort and is not at all or not very difficult.
Messaging should encourage residents to engage in reflective cognition, rather than relying on automatic processes when making decisions about which stream items should be placed in.
5
Most residents are confident in their ability to recycle correctly
In addition to believing that recycling is easy, the majority if residents are confident in their ability to recycle correctly.
94% believe that they know very or fairly well which items are recyclable.
Messaging should challenge residents’ beliefs about the accuracy of their own recycling knowledge.
This is particularly important for those in the Committed segment. Members of this segment are very confident in their knowledge, yet do get some items wrong.

EPA Household waste and recycling research 22
Conclusion Recommendation
6
Knowledge of which streams specific items should be placed in vary widely
Despite confidence in their ability to recycle and the ease of recycling, many residents are putting items in the wrong stream.
For a core set of materials (including glass, cardboard, and PET/HDPE plastics), at least 80% of residents can accurately identify the stream the materials should be placed in.
However, there is a long tail of materials that a high proportion of residents are confused about. These include items made of non-PET/HDPE plastics, glass and ceramic plates and drinking vessels, aluminium foil containers and steel aerosol cans.
For FOGO collections, residents are most confused about paper towels or serviettes and pizza boxes.
Messaging should focus on challenging knowledge about items which are commonly placed in the incorrect stream.
This will have three positive impacts. It will:
▪ Increase knowledge about which stream to put problem items into.
▪ Alert residents to the fact that their knowledge is imperfect and/or out of date; and
▪ Encourage questioning of knowledge about other materials.
6
Residents rarely undertake searches for recycling information
Residents tend to be learn about recycling from media and messaging directed to them, rather than seeking it out.
Only 21% of residents have actively tried to find information about recycling in the past two years. Those who have done so tend to have looked on council websites.
Information on recycling should be actively pushed out to residents, rather than relying on residents to search for information.
▪ These communications should model or encourage residents to save and use reference materials such as flyers and bin labels.
▪ Reference materials should be provided to residents in coordination with wider communications about recycling.
8
The in-home recycling systems employed by residents influence recycling behaviour
Residents’ in-home recycling behaviours vary widely. The systems used to store and transport recyclables to the bin vary from storing items on the bench and carrying them to the bin by hand, to using a box or crate for the whole process. The rooms in which waste and recycling bins are located also vary.
These in-home systems appear to influence the extent to which households recycle all the materials they could. Those who store materials on the bench and carry them to council bins in their hands, for example, report being less likely to recycle smaller items.
As a secondary priority, messaging that models ideal sorting, storage and transportation behaviours will encourage residents to maximise the volume.

EPA Household waste and recycling research 23
Conclusion Recommendation
9
Travel time to council bins influences perception of effort involved in recycling
The length of time it takes to take waste from the home to council bins varies greatly depending on housing stock. Those in SUDs report taking less time to take items to the council bin (one minute and 41 seconds on average) compared to those in MUDs (two minutes and 29 seconds on average).
Travel time is correlated with perceptions of effort involved in recycling. Among those who rate recycling as taking a lot of effort, 40% take more than three minutes to take items to the council bins. Among those who say it takes no effort, only 17% take more than three minutes.
Government approaches to encouraging recycling in MUDs should consider the higher levels of time and effort involved for residents of MUDs.
10
Bin capacity is limited, particularly in MUDs, but this does not appear to lead to residents putting items in the wrong stream in most cases
More than half of MUD residents indicate that their waste, recycling and food waste bins (where these are available) are overfilled at least two or three times a month.
The issue is less prevalent in SUDs. More than 40% indicate they have overfull waste or recycling bins at least two or three times a month. 25% say the same for food waste bins.
However, this does not appear to translate to the stream-mixing behaviour. Among those whose bins become overfull, only 4% indicate that they use the general waste bin if the recycling bin is full, or vice versa. Most (54%) store the items until the following week, while other use neighbours’ bins.
Despite this, many focus group participants expressed frustration at overfull bins.
Overfull bins are an issue impacting and frustrating a high proportion of residents.
This issue does not, at face value, appear to have a major impact on recycling rates. However, further research into the impacts of overfull bins on recycling behaviour is recommended.
11
There is a high degree of variation in the terms used by residents for waste and recyclable items
The findings show that the names applied by residents to items vary greatly. Therefore, when using names alone to identify items in communications, the interpretation applied by any given resident about what is included under that label is likely to vary greatly from the interpretation of others.
Government should provide both names and images when providing information on which items should go in each stream.
In addition to this, more detailed guidance may be required for some labels/names to make it clear to residents which items are included and how they should be treated.
EPA Household waste and recycling research 24
Conclusion Recommendation
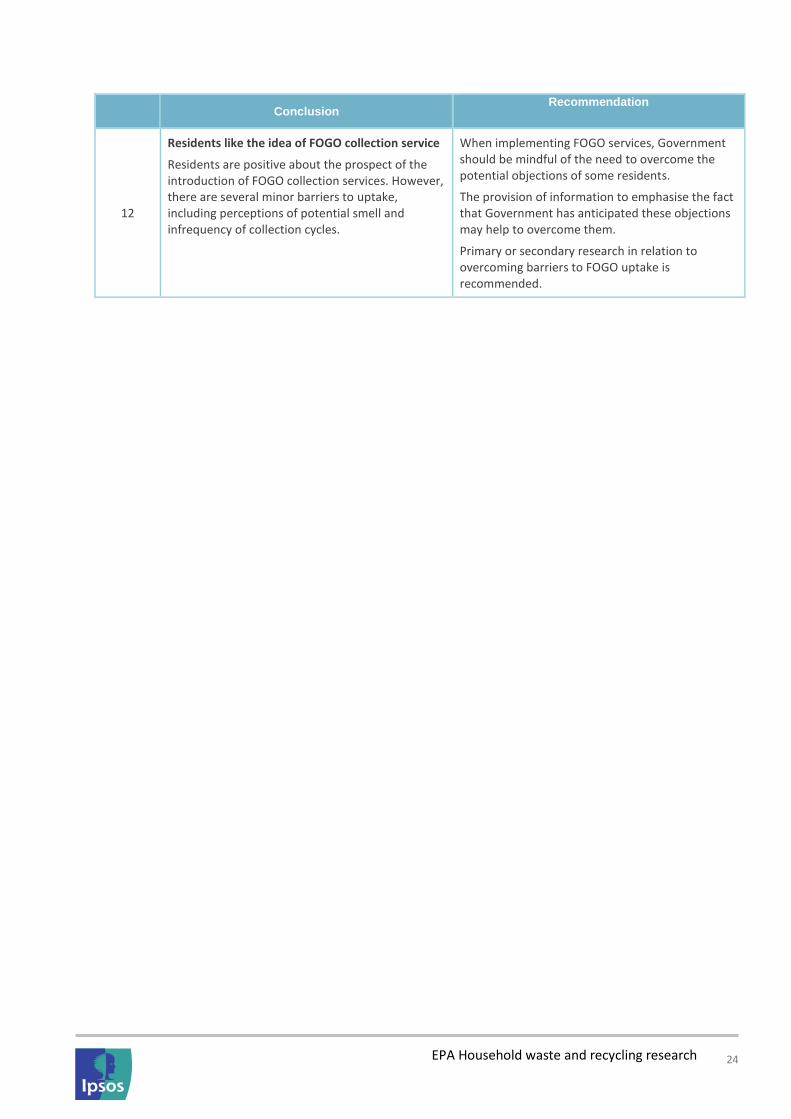
12
Residents like the idea of FOGO collection service
Residents are positive about the prospect of the introduction of FOGO collection services. However, there are several minor barriers to uptake, including perceptions of potential smell and infrequency of collection cycles.
When implementing FOGO services, Government should be mindful of the need to overcome the potential objections of some residents.
The provision of information to emphasise the fact that Government has anticipated these objections may help to overcome them.
Primary or secondary research in relation to overcoming barriers to FOGO uptake is recommended.

EPA Household waste and recycling research 25
Research objectives
The overall objective of this research was to explore the NSW community’s knowledge, attitudes,
behaviours and abilities in regard to waste and recycling (as well as the opportunities and other
external factors that act as facilitators and barriers to good waste related behaviours). The research
has three separate, but aligned objectives:
• Understanding the drivers of waste and recycling behaviour;
• Understanding which terms residents use in regard to waste and recycling items and
behaviours; and
• Understanding which messages and media are most likely to change waste and recycling
behaviour.
These objectives were pursued at both the level of the whole population, and at the level of sub-
populations of interest. Sub-populations include young people, those living in multi-unit dwellings,
culturally and linguistically diverse (CALD) audiences, and those who have council-provided food and
garden organics collections.
Understanding the drivers of waste and recycling behaviours
The first key objective of the research was to understand the factors that impact waste and recycling
behaviour. This included:
• Motivations to recycle, including:
- Values
- Levels of concern
- Willingness of act or change behaviour
• Capabilities, including:
- Awareness and knowledge about how to recycle correctly
- Awareness of the impacts of recycling correctly (or incorrectly)
- Awareness of what happens to materials once they are collected
• Opportunities, including:
- Environmental factors in day to day life which impact perceived ability to recycle
- Social norms around waste and recycling
- Perceptions of the behaviours undertaken by others
Understanding which terms residents use in regard to waste and recycling items and behaviours
The research also aimed to understand which terms are most readily understood in relation to
recycling materials and behaviours. This included:
• Understanding the range of different terms used for various materials and behaviours
• Measuring which are most commonly understood and used by residents.
Understanding which messages and media are most likely to change waste and recycling behaviour
Message testing is required to determine the most effective methods of communicating behavioural
interventions to the NSW community.

EPA Household waste and recycling research 26
The research also aimed to understand which media and channels are the most effective in reaching
specific target audiences.

EPA Household waste and recycling research 27
Methodology
This research was conducted over three discrete phases, as outlined in the figure below. Each phase
was designed to build on outcomes of the previous phases.
Phase 1 – Exploratory qualitative research
The focus of Phase 1 was exploratory. The objective was to understand the contexts in which
recycling behaviours are undertaken, and how these, along with residents’ motivations and
capabilities, impact recycling behaviour.
Conduct of in-depth interviews
Five in-depth interviews were conducted with managers of waste services for local councils and
council organisation in NSW. These interviews were used to develop an understanding of residents’
waste and recycling behaviours, as well as the potential barriers and enablers to recycling correctly.
The discussions also covered the context in which recycling is undertaken, including council
communications, infrastructure and services.
These interviews were conducted during April 2015.
Conduct of group discussions
Ten focus group discussions were undertaken in Sydney, Casino and Lismore between 24 November
and 2 December 2015.
Group participants were selected based on their age, dwelling type, whether they were from
culturally and linguistically diverse backgrounds, household income, and whether they had access to
Phase 1: Qualitative
Phase 2: Quantitative
Group discussionsn=10
In-depth interviewsn=5 LGAs
OnlineA: n=1200
Boosts:n=300 young people (aged 18-24)
n=300 people living in MUDsn=300 people with access to kerbside food and garden
organics collections
Phase 3: Qualitative
Mini-group discussionsn=8
Figure 1: Research design overview

EPA Household waste and recycling research 28
a council green waste collection (based on the LGA they lived in). The sample design is laid out in the
table below.
Table 1: Sample design for groups discussions (Phase 1)
Group Location Age Gender Dwelling
type CALD status
Income Green waste collection
1 North Sydney Mixed Mixed - - $110k+ -
2 North Sydney Mixed Mixed SUD - - -
3 Parramatta 18-29 Mixed MUD - - -
4 Parramatta 18-29 Mixed - CALD - -
5 Hurstville 30+ Mixed MUD - - -
6 Hurstville 30+ Mixed - CALD - -
7 Casino 18-29 Mixed - - - Garden only (food planned)
8 Casino 30+ Mixed - - - Garden only (food planned)
9 Lismore 18-29 Mixed - - - Food and garden collection
10 Sydney CBD 30+ Mixed - - - Food and garden collection
Group discussions ran for between 90 and 110 minutes and involved between six and eight
participants. Participants were paid $90 as a token of thanks for their time and effort in attending.
Phase 2 – Online survey
Phase 2 of the research involved an online survey of residents in NSW. The broad objective of this
phase was to provide benchmark measures of recycling behaviours in the NSW population.
Questionnaire development
The questionnaire for the quantitative phase was developed based on the insights gained during
Phase 1. A COM-B approach was applied to the questionnaire, ensuring that relevant capabilities,
opportunities, motivations and behaviours identified in the qualitative phase were incorporated in a
systematic way.
Conduct of fieldwork The survey was conducted online with a total of n=2,190 people living in NSW aged 18 years and over
during February 2016.
The core sample of n=1,201 was surveyed to be representative of the NSW population by age,
gender, and location (i.e., Greater Sydney and Rest of NSW) using data from the 2011 Australian
Bureau of Statistics’ Census. The sample was then boosted with an additional n=900 respondents
across three groups of particular interest to the EPA:
• Young people (aged 18-24)
• People living in multi-unit dwellings (MUDS)
• People with access to council-supplied food and garden (FOGO) organics collection services
The sample for the general population survey was drawn from accredited online research panels.

EPA Household waste and recycling research 29
Table 2: Sample Structure
Quote group Quota value
Gender
Male 553
Female 648
Age
18-24 89
25-44 445
45-64 424
65+ 243
Location
Greater Sydney 742
Rest of NSW 459
Core sample total 1,201
Interest groups (including boost)
Young people (18-24) 341
MUDS 690
FOGO collection 476
TOTAL (including boosts) 2,070
The sample was weighted by age, gender and location in order to ensure it was representative of the
NSW population, based on 2011 Census data.
Quantitative analysis and interpretation
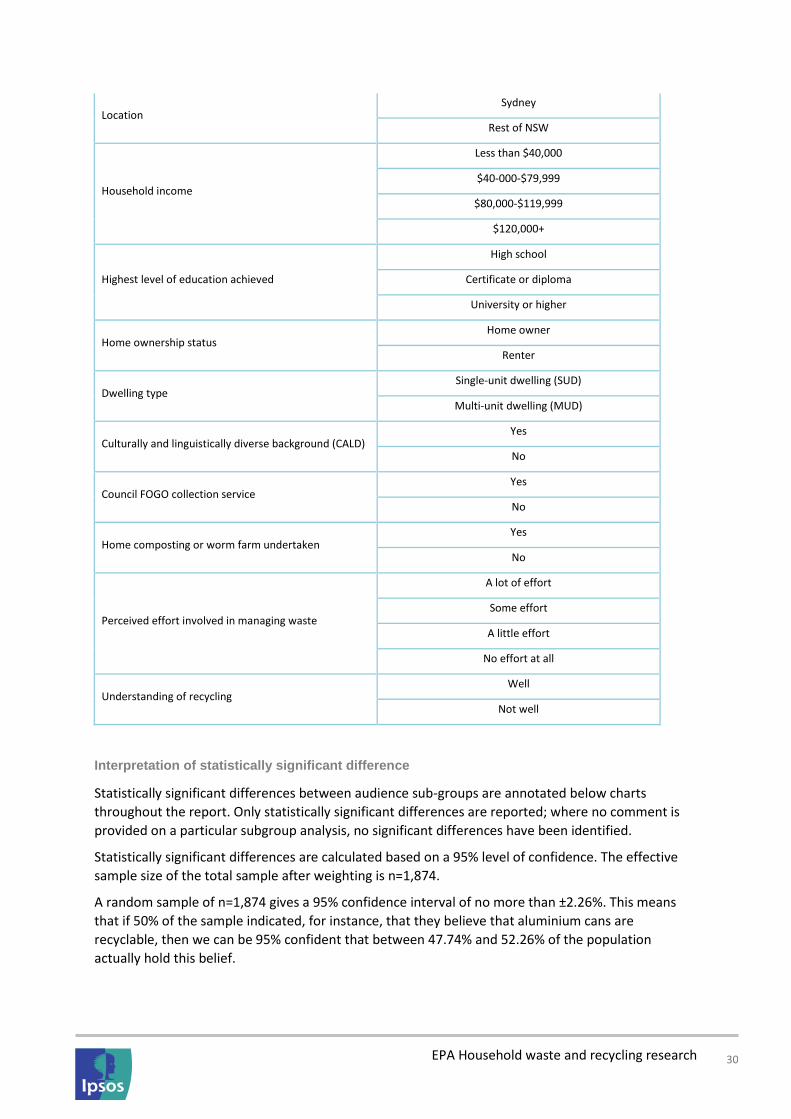
Sample profile variables for sub-group analysis
Quantitative data was analysed by the subgroups shown in the table below.
Profile variable Profile groupings
Age bands
18-24
25-44
45-64
65+
Profile variable Profile groupings
Age (grouped) 18-24
25+
Gender Female
Male
EPA Household waste and recycling research 30
Location Sydney
Rest of NSW
Household income
Less than $40,000
$40-000-$79,999
$80,000-$119,999
$120,000+
Highest level of education achieved
High school
Certificate or diploma
University or higher
Home ownership status Home owner
Renter
Dwelling type Single-unit dwelling (SUD)
Multi-unit dwelling (MUD)
Culturally and linguistically diverse background (CALD) Yes
No
Council FOGO collection service Yes
No
Home composting or worm farm undertaken Yes
No
Perceived effort involved in managing waste
A lot of effort
Some effort
A little effort
No effort at all
Understanding of recycling Well
Not well
Interpretation of statistically significant difference
Statistically significant differences between audience sub-groups are annotated below charts
throughout the report. Only statistically significant differences are reported; where no comment is
provided on a particular subgroup analysis, no significant differences have been identified.
Statistically significant differences are calculated based on a 95% level of confidence. The effective
sample size of the total sample after weighting is n=1,874.
A random sample of n=1,874 gives a 95% confidence interval of no more than ±2.26%. This means
that if 50% of the sample indicated, for instance, that they believe that aluminium cans are
recyclable, then we can be 95% confident that between 47.74% and 52.26% of the population
actually hold this belief.

EPA Household waste and recycling research 31
Rounding in charts
In some charts, response categories shown may not sum to 100% due to rounding of the numbers
displayed. It should also be noted that for questions where multiple responses were allowed,
response categories may sum to more than 100%. Similarly, where the figures for the ‘top two’ or
‘bottom two’ response options are combined (for example in an agree/disagree scale question,
where the top two responses would be ‘very satisfied’ and ‘fairly satisfied’) in one chart but
separated in the next, the two sets of figures may appear not to reach the same total, again due to
rounding.
Segmentation
A segmentation analysis was also undertaken to understand how recycling behaviours differ
between groups sharing simular attitudes within the population.
Phase 3 – Message testing
The objectives of Phase 3 were to test a range of recycling campaign elements and executions with
residents from different attitudinal segments. A corollary of this was some additional findings
relating to recycling capabilities, motivations and behaviours.
Conduct of fieldwork
Eight mini-group discussions were undertaken in Sydney between 16 and 23 November 2016.
Group participants were drawn from those who responded to the survey during Phase 2 of the study.
They were selected to groups based on their allocation to the segments developed from the survey.
The sample design is laid out in the table below.
Table 3: Sample design for groups discussions (Phase 3)
Group Location Segment
1 Sydney CBD Committed
2 Sydney CBD Aspirational
3 Sydney CBD Disengaged
4 Sydney CBD Indifferent
5 Sydney CBD Committed
6 Sydney CBD Aspirational
7 Sydney CBD Disengaged
8 Sydney CBD Indifferent
Mini-group discussions ran for between 90 and 110 minutes and involved between four and six
participants. Participants were paid $100 as a token of thanks for their time and effort in attending.
Reporting of Phase 3 findings
Phase 3 findings are reported in full in a separate document focused on concept testing. The report
provides detailed feedback on a range of campaign concepts and execution elements.
EPA Household waste and recycling research 32
Additional findings relating to capabilities, motivations and behaviours are included in Section 5 of
this report, and are labelled as being drawn from Phase 3 with the following tag:
Qualitative findings
5.1 The environment is important… Participants generally expressed concern about the environment. When it was discussed among
other issues, many ranked it relatively highly on their list of priorities, with some ranking it at or
towards the top.
“I'm concerned about the Earth and the health of it.”
There was much spontaneous discussion about climate change when the environment was brought
up during groups. It appeared that a main motivation for environmentally friendly behaviour was to
prevent climate change. Some participants were cognisant of the impact of environmental issues, in
particular climate change, on future generations, and they felt that it is important to protect the
environment in order to provide for their children’s futures. There was also motivation simply to
protect the wonders of the planet’s natural environment more generally.
“Well what are we leaving them [our children]? If we destroy the Earth,
what are we leaving them?”
…and I’m doing my part
Many participants reported being environmentally conscious in their behaviour. This usually involved
doing certain small things on a day to day basis that they considered environmentally friendly and
that did not require much in the way of money or effort. Almost all of the 74 participants involved in
the phase 2 group discussions were able to identify at least one activity they were doing, reportedly
in a bid to protect the environment. The breadth of examples is included in the table below.
Transportation behaviours Using public transport or walking instead of driving
“Sometimes where I am going from Artarmon to Chatswood I will walk and that’s more than a kilometre. If I feel up to it I will walk.”
Resource use behaviours Saving electricity, for example by switching off lights and power points
“I only leave my TV power point on and my fridge. Everything else I switch off.”
“I mean always like if somebody left a light on, turn off the light if you don’t need an electric (sic) on, you turn it off.”
Avoiding excessive usage of appliances “Dryer…I ask my son not to use that often, just hang out clothes outside,
Phase 3 finding

EPA Household waste and recycling research 33
natural sunlight rather than just dry from the dryer.”
Saving water, for example by installing water saving taps, not allowing water to run when not needed, or using a dishwasher instead of hand washing
“Using a dishwasher as opposed to washing up because it uses less water.”
“I don't run the water while I'm brushing my teeth and I turn my shower off when I'm putting conditioner in my hair.”
“We've got all the water saving taps and things.”
Avoiding excessive usage of paper “Getting all our bills electronically as opposed to paper based.”
“Try not to print too much from emails.”
Purchasing behaviours Minimising packaging in the products they purchase
“I've stopped using plastic, like I don't buy things in takeaway containers.”
Avoiding purchasing products that require large amounts of energy to produce
“I’m really wary, and not just for the food products but they’re just not very green when they’re creating their products. So I’m quite conscious of that.”
Trying to reuse products “Buying second hand things and not throwing things in the bin if they're reasonably useful but asking people if they have a need for it.”
Avoiding plastic bag wastage, for example by using canvas bags instead or recycling or reusing shopping bags
“Yeah, so I have my shopping bags in my boot and I use those every time I shop.”
Moderator: “You were saying that you can take them [plastic bags] to a supermarket and recycle them.” Participant: “They [Aldi supermarket] have big garbage bins there for the recycled plastic bags.”
Participants often saw these types of behaviour as stemming from a more general societal move
towards more environmentally aware behaviour in general. This was exemplified by water
restrictions over recent years and a growing emphasis on energy efficient and biodegradable new
products.
“It could even be small things like not driving your car to the shop one day
or not driving to work or planting some veggies in the garden. They can be
EPA Household waste and recycling research 34
small things that you could do that isn’t going to be impacted by cost and
those sort of things.”
EPA Household waste and recycling research 35
“I’m quite conscious of my carbon footprint…only because I’ve been
introduced to the idea of having showers that don’t go so long, or products
you use that are biodegradable. And you buy things with energy ratings and
stuff on it…”
These activities are often motivated by factors other than environmental concern
Although participants seemed eager to mention the activities described above as examples of
environmentally friendly behaviour, for most examples the primary benefit was either a cost or a
time saving. The environmental benefit was usually an added bonus, rather than the key motivator.
Some participants recognised that this was the case, while for others this became apparent from
interpreting their responses. Some key examples where this was either stated or observable are
below.
Walking can be easier than driving for short distances “I walk to work. So I'm not driving. Less pollution kind of thing. I do that more for convenience though because it would be more effort to drive down the road.”
Fuel efficient cars also mean spending less money on petrol “The reason for the fuel efficiency was because petrol's expensive, not because I'm worried about the emissions honestly.”
Receiving email bills rather than paper is more convenient “I use it [email] out of laziness rather than…”
Minimising packaging through refills can mean saving money
“I use metho and water instead of the glass cleaner...well I refill it instead of going out and buying another bottle. I think it's cheaper…”
The eagerness to mention their environmentally friendly behaviours, even if the environment was
not the primary motivator for them, suggested that participants were aware of the social
acceptability of this behaviour, and felt a ‘green glow’ from looking as though they were taking care
of the environment. Many participants appeared to pride themselves on this, and wanted to look as
though they’re doing their ‘bit.’
“I think we feel good when we do it [things for the environment].”
“I think a lot of the stuff that most people do is feel good stuff for yourself.”
In everyday life, environmental concerns fade into the background
Although concerned about the environment, participants in the phase 2 group discussions
commonly noted that these concerns would become secondary to other, more pressing, issues
throughout their daily lives. When asked to rank an array of various concerns, a number of
participants placed the environment below other issues for this reason.
“I've got environment for eight…just because the other ones were a
priority.”
Other concerns that they ranked more highly were more personal to them; these included caring for
their families or staying healthy. Some saw these issues as more selfish, or even more grounded in a
survival instinct, whereby they were concerned about their immediate circle, with environmental

EPA Household waste and recycling research 36
concerns sitting beyond this and therefore rarely top-of-mind in comparison. With these concerns
taking up the majority of their focus, participants often found little room for conscious thought about
the environment in their everyday behaviours.
“I think for me it’s about…my top three are things that are very close to me,
very personal to me that affect me directly and have a direct impact and the
rest is it kind of filters out.”
“It [the environment] should be to the top [of the list of priorities] but with
things that happen in your life it plummets down because there's (sic) other
things that seem more important.”
“I’m almost like a base instinct, almost like a survival thing. So looking after
your family is like a natural instinct, the cub type mentality and holding
down a job is part of that like providing food.”
Further to this, some participants talked about situations where they had been highly stressed or
emotional, and fell into environmentally unfriendly habits. Examples here included taking long
showers as a form of relaxation, or driving rather than walking or taking public transport in order to
allow themselves additional time to sleep in.
…and there are only so many things they think they can do
There was often debate about the extent of the impact individuals can have in protecting the
environment, with many participants feeling that environmental issues are out of their individual
control. Instead, they felt that change needed to be driven by government and industry. They
perceived that there is very little point in undertaking environmentally friendly behaviour themselves
if the community at large was not doing the same. They felt that this push could not come from the
individual but instead needed to come from a higher authority, with government needing to regulate
both individuals and businesses.
“To me it’s like it’s policy changes that really impacts (sic) the environment.
We contribute as individuals probably about 80 per cent of the world’s
pollution but it’s going to be business and burning fossil fuels for our
electricity. We all use part of it but it really has to start at the top.”
“I actually think businesses should be responsible as well as government
because if you are going to produce products or services to the world, to a
community or whatever, you need to be responsible to make sure that what
you are doing is sustainable and not impacting the environment.”
“Businesses are inherently self-interested at the cost of the environment and
it is the government’s job to regulate this.”
In the opinion of many, these changes should be made upstream of the consumer by ensuring that
products and packaging are more sustainable. This would mean that the impacts of consumption are
lower, lessening consumers’ need to be concerned about the impacts of their own behaviour.
EPA Household waste and recycling research 37
5.2 Recycling is a key part of being environmentally friendly Many participants in group discussions spontaneously mentioned recycling when identifying some of
the environmentally friendly activities they undertook; it was often the first thing mentioned in
groups. Participants saw it as one of the key behaviours in terms of mitigating the impact of society
on the environment. They generally believed that recycling is important, particularly in terms of
preventing climate change.
Recycling is easy, and I’m good at it
Participants’ top-of-mind response was that recycling was a relatively easy thing to do. It was seen as
an activity without much in the way of effort or time commitment, and an easy win in terms of being
environmentally friendly. In addition, most participants believed they were effective recyclers.
“Taking the rubbish out and sorting through it doesn’t take very long.”
“Easy, if you’ve got half a brain.”
“Yeah, I think I do well.”
Recycling tended to be a System 1 process. That is, participants reported acting automatically or
being on ‘autopilot’ when deciding how to dispose of waste. It was a low-mid level engagement
behaviour in this respect, and not one they often dedicated much conscious energy towards. Instead,
recycling behaviour appeared to be more habitual. When explaining this, some pointed to the fact
that they had been recycling for such a long time that it had become second nature to them.
“Recycling for me is just automatic, I don’t plan it, it just happens.”
“It's second nature.”
There are automatic triggers for some items to be recycled
Participants generally have a firm set of items in mind that they see as recyclable, and others that
they see as clearly not recyclable. As mentioned, this is not an entirely conscious process; instead
participants appear to have made strong pre-existing associations between recycling and certain
types of items. In particular, plastic bottles, paper, cardboard and glass were seen as obviously
recyclable, and therefore ‘recyclables.’ For such items, reflexive, or System 1, responses meant these
were immediately thrown in the recycling bin.
“To me recycling is bottles and paper. That's my way of – so anything else is
not. It goes in the rubbish for me.”
“It's pretty simple. It's just paper and glass and plastic.”
However, for some, reacting reflexively to this clear set of ‘recyclables’ means that they are not
recycling other items which are eligible to be recycled. Rather than strictly seeing them as non-
recyclable and making a conscious decision that that item should not be recycled, they instead see an
item, subconsciously determine that it does not fit within the ‘recyclable’ set, and then dispose of it
in the general waste.
“That's what I do with the foil because it's like, to me it's not cardboard or
paper.”
“I've never really given it [recycling food cans] any thought.”

EPA Household waste and recycling research 38
Recycling is easy…until I think about it
Although participants generally rated their own recycling abilities highly, when they were asked to
examine their recycling knowledge in further detail, it became evident that there is a ‘grey area’
between what they know can definitely be recycled and what they are sure cannot be. In this grey
area, participants were required to engage System 2, and make conscious decisions about how they
disposed of their waste.
“You have to think a little bit where you're putting it [waste] and stuff.”
It was at this stage that some participants admitted to lacking confidence in their recycling ability.
Some were surprised at how many items they were unsure about when challenged. They were
concerned that they may not have been recycling correctly as a result of their lack of knowledge
about how to dispose of items that sit within this grey area.
“I'm not confident that I'm doing it right.”
“I'm feeling guilt now. Just hearing the way other people recycle and I'm
like, ‘am I doing it right?’”
The table below identifies some of the types of materials that participants generally thought were
clearly designated for the recycling bin, and those that sit within the grey area. Note that these are
generalisations, and do not represent the views of all participants. For example, some participants
were very conscious that food could be composted, or put in FOGO collections, where available.
Yellow bin (recycling) Grey area Red bin (general waste)
Plastic bottles Plastic bags Food
Glass Styrofoam
Cans/tins Liquid paperboard
Cardboard Plastics 3-7
Paper Lids
Soft/flimsy plastics
Broken glass
Glassware
Bottle lids
Aerosol cans
This stage of discussions revealed that there have been many participants who have been in
situations in the past where they were uncertain whether or not a specific item can be recycled. In
some group discussions, participants were informing each other of whether certain items are
recyclable, and there were a number of reactions of surprise when they realised they had been
incorrectly disposing of certain items for many years.

EPA Household waste and recycling research 39
“Are caps recyclable? The caps on bottles.”
“We had a broken glass and there was a big argument, does it go in the
recycling bin or not?”
“Can your aerosol cans and all that get recycled?”
“In public like I’ll have lunch at the food court and I will be like can I recycle
this? I don’t even know.”
People often have a default response when they are unsure about an item
Some check for the recycling symbol
Many participants were aware of the recycling symbol on packaging. If they were unsure about
whether an item was recyclable, they would simply check to see whether the packaging featured this
symbol. If it did, this would indicate to them that they should recycle it. If not, they would dispose of
it in the general waste.
“I mean I certainly check the packaging first for the little symbol and if it
hasn't then I do throw it out.”
However, some were not aware of this symbol. In many cases, participants who were not aware of
the symbol were informed about it for the first time by others during groups. They had never
previously examined an item’s packaging to determine whether it was recyclable.
Some pay attention to the numbers associated with the symbol, others do not
Awareness of the numbers associated with the symbol was relatively low. Only a small number of
participants regularly engaged with them. Among those who were aware of the numbers, many
provided feedback that reviewing the number before disposing of an item every time they were
unsure would require too much effort. In these cases, they would simply ignore the numbers and
instead just check whether the item had the symbol.
“I'd probably still put all the plastics in the recycling.”
Others did not know what the numbers meant and found them too confusing. For those who were
previously unaware of the numbers, and had this system explained to them, common feedback was
that this overcomplicated recycling. They felt as though they were already doing enough by sorting
their waste, and that requiring them to check the number was asking too much of them.
“The thing is I think that system is not a good system because as you can
see nobody knows what it means. We in Germany just have a green…these
arrows. If the green arrows are on you can recycle it and if it's not you
cannot. As easy as it is. Here you have one, five, seven, whatever so you
don't know. Can I put that in that bin? Do I need to bring that somewhere
else?

EPA Household waste and recycling research 40
Some look at charts on or near bins
A number of participants, particularly those living in MUDs, mentioned that they rely on information
on and around bins to determine whether an item is recyclable. For example, many participants’ bins
included stickers or signs identifying the types of waste that could be placed in each bin, and in some
cases which items were excluded. This was also often the case for public bins, such as those in
shopping centres. Here, participants would simply classify the item they had to dispose of according
to those categories included in the chart, and act accordingly. This was acknowledged as not being a
fool proof system, however, as participants occasionally had items to dispose of that did not appear
on the charts.
“There's usually a set of instructions with apartments and stuff. They usually
put it next to the bins. I've seen it. Well if you're unsure…”
If still unsure, there are two schools of thought
‘Don’t mess with the system’
If still unsure of whether an item is recyclable, it appeared most common for participants to dispose
of the item in the general waste, rather than to recycle it.
“If I'm not sure on something I'll just chuck it in my normal garbage.”
“When in doubt chuck it out.”
The main reason for this was a concern that if anything non-recyclable was included among a batch
of recyclable items, it would mean the entire batch would need to be diverted to landfill as a result of
the non-recyclable item somehow ‘contaminating’ the others.
“I probably wouldn’t recycle it if I wasn’t sure.”
“I wouldn't want to wreck a whole bin's worth of recycling with one bad
product.”
Alternatively, some perceived that non-recyclable items need to be manually removed by workers at
recycling centres or, instead, that there was a chance that non-recyclables could interfere with the
recycling centre’s equipment. In this case, participants were hesitant to create additional work for
these workers, or cause damage by disposing of an item in their recycling bin that they were not sure
was actually recyclable.
“One of our clients is a recycling sorter and I used to be really blasé about it
until I actually saw guys physically blowing up because somebody has put
garbage – non-recyclable stuff – into this and stuffing up all this crazy
machinery and these guys are literally like…just doing this most complicated
job as it is sorting all the crap but then that’s just another element of their
job which has added because of laziness and ignorance.”
For some, this school of thought extends to problem waste. These participants were able to identify
certain types of items that may be thought of as recyclable, but are actually not as they contain
chemicals. These items included light globes and batteries. However, rather than take these items to
special recycling facilities, such as a Community Recycling Centre, the default response here
appeared to be to throw these in the general waste. The thought process was simply to keep these
non-recyclable items out of the conventional recycling system, rather than thinking beyond this to
the impacts of disposing of them in landfill and more environmentally friendly ways of disposal.

EPA Household waste and recycling research 41
Participant 1: “But why not just take the whole thing [globe] and chuck it in
the recycling?”
Participant 2: “Because there's (sic) chemicals in it.”
Participant 3: “The inside of the light globes and things which aren't
recyclable.”
‘The system will deal with it’
Conversely, for some participants, the default response when unsure was to dispose of the item in
the recycling bin.
These participants were of the opinion that sorting out non-recyclable waste was one of Council’s
roles and that recycling facilities cater for this, particularly given the perception that many in the
community place items in the wrong bins (discussed later). Further, they believe that at least
attempting to recycle an item, if at all possible, was preferable to the certainty of it going to landfill
by putting it in the general waste bin.
“Just chuck it in. Just give it the benefit of the doubt and hope that it'd get
recycled.”
They also did not believe that the system would be so fragile that one non-recyclable item means a
whole batch of items cannot be recycled, or cause damage to a recycling facility’s equipment.
Supporting this view, some believed that if this was a major issue, they would have seen media
coverage about it, or campaigning designed to deter people from placing non-recyclable items in
their rubbish bin.
“Well I would have thought that we’d hear much more about it if it really
was a problem…that small contaminants were like destroying whole
truckloads of recycling, that there’d be more don’t do it.”
5.3 If recycling requires time and effort, it won’t be done As mentioned, environmental concerns often fade into the background when people are confronted
with other, more pressing issues in their everyday lives. In these cases, time and effort are seen as
finite and are devoted to these problems, rather than to environmentally friendly behaviour – unless,
as discussed, the environmentally friendly behaviour leads to a time, effort or cost saving.
Many participants identified the time and effort required to recycle properly as the key de-motivator
for this behaviour. Although in most cases participants were concerned about the environment and
saw recycling as an important step in protecting it, they were more inclined to follow the path of
least resistance when in a rush or simply lacking the energy to recycle properly.
Moderator: “What is it about an activity that makes it a pain in the arse do
you think?”
Participant: “The effort. I reckon most generally, the effort you have to put
into doing it.”
“Lack of time is my biggest issue.”
“There’s always a rush. I open it, put it in, bang, in the bin.”
EPA Household waste and recycling research 42
Participants nominated several key situations where they were particularly unmotivated to recycle
properly. One of these was when rushing to prepare a meal, and rather than carrying recyclable
containers or food products to the appropriate bin, simply throwing them into the bin nearby.
Likewise, recyclables generated in the bathroom were sometimes placed in a general waste bin in
that room, and not separated later. Another was after consuming fast food, and placing all of the
packaging into a single bag and throwing this into the waste bin, instead of separating each of the
recyclable materials out.
“If they are together [recyclable and non-recyclable items] I don’t worry
about dividing them…in the plastic bag. I don’t open the plastic bag and
then divide everything.”
This issue extended beyond simple household recycling habits to other forms of waste reuse. In
particular, many were unwilling to compost their food scraps purely as a result of the additional
effort required to do so. Others saw the idea of taking their used plastic bags back to the
supermarket as simply too much effort and, as a consequence, were unwilling to do so.
Participant 1: “Composting is work, extra jobs.”
Participant 2: “It's a lot of time.”
5.4 There is a wide variety of in-home systems All group discussion participants had at least one main inside bin, and in most cases, this was located
in the kitchen. This is confirmed in the quantitative survey which found 81% of household have the
main inside bin in the kitchen. The primary reason for this appeared to be the kitchen’s position as
the centre of the household in terms of both usage and waste generation.
Some had secondary bins around their homes, most often for collecting general waste in rooms
other than the kitchen. These were most often located in bathrooms, bedrooms or studies. Each of
these had its own purpose. For example, bins in the bathroom were for disposing of toiletries and
sanitary products, while those in the studies were usually recycling bins for paper. The secondary
bins allowed participants to dispose of their waste while in the room, without having to carry it to
their main bin.
In rare cases, participants had bins in other locations, such as at their back doors, on balconies or in
laundries. These were usually purpose-specific. For example, a participant who barbequed on a
regular basis had a bin on the balcony in order to easily throw away cleaning towels or scraps of
meat.
Recycling systems vary widely
While most participants had an indoor facility for recyclables, these facilities varied. In many cases, it
was either a bin separate from their rubbish bin, or a crate or box, such as a leftover cardboard box.
This was usually located next to the rubbish bin, so as to have a central, convenient hub for disposing
of all waste types. Alternatively, some collected their recyclables in the laundry generating large
volumes of waste or because they had a small kitchen area. In some cases, participants had a bag,
which would be left on a handle or a hook. Others simply had areas on their benchtop or next to
their bins which is designated for temporary storage of recyclables.
“I keep a big plastic bag on my kitchen floor for my recycling.”
“It's usually bourbon cans just goes on the bench until I can be bothered
taking them out.”

EPA Household waste and recycling research 43
“My recyclables I usually leave on the end of the bench because you go
down every morning and you just take it down with you.”
Having a dedicated bin or box was more common among SUD residents than MUD residents. The
primary reason for this was the lack of space in MUDs, which meant they did not have anywhere to
physically store an additional bin or box. However, some used the excuse that they did not want to
pay for an additional recycling bin, not seeming to factor in that they could simply use a large,
leftover box like many other participants did. In these cases, some participants suggested they would
use a recycling bin – instead of simply placing their waste on the counter top – if their council were
to provide them with one for free.
It should be noted that in cases where residents in MUDs lacked storage space, this often meant that
they would not recycle larger items because they simply do not have the space for a recycling
receptacle. Instead, items may be placed in the waste bin. However, some participants who do not
have a dedicated bin, box or bag were more likely to throw smaller recyclables into their waste bin,
rather than recycle them, while they would recycle larger items, such as wine bottles or cardboard
boxes. This appeared to be because smaller items were impractical to carry to their council bin, while
larger items were not.
“We do but I really hate to say it, unless it's a big bottle or a wine bottle or
something that's going to take up a lot of room, if it's something like this
size I just put it in the normal bin. I know, I'm really bad (laughter). I would
just put that in the normal bin but if it's like a wine bottle or a bigger bottle,
cardboard box or something like that, I'd put it on the side and then when
you're going down…”
“I've lived in a house before and I've only had the one bin. It was normally
up on the bench, that's where you'd put the things that you are going to
recycle and once again, it would just come down to is a bigger. If it's bigger
than put it on the table to recycle but if it's smaller, it would just somehow
make its way into the normal bin.”
In addition to these systems, there were a handful of participants who would take their recyclable
items to their yellow bin as soon as they had finished with them. This was more common among SUD
residents, whose bins were located to the side of their home, and they could therefore simply walk a
few metres to dispose of the items. However, some MUD residents would also do this, as they were
able to take the items with them on trips to the carpark, if their bins were kept there.
“With the boxes I will just go take them straight out to the yellow bin.”
Participant 1: “No. I just literally like go downstairs from the third floor with
an arm full of containers…”
Participant 2: “Wine bottles.”
Participant 1: “Yeah, wine bottles and pizza boxes (laughter).”
While it was rare for participants to simply have one bin in their home that catered to both
recyclable and non-recyclable waste, there were a handful of participants who did so. They would
then take the bin, or the bag in which the waste inside it was sitting, and sort once at the council
bins. The main motivation here appeared to be to avoid having to make choices about what is and is
not recyclable while in the home and potentially busy with other concerns. Sorting at the bin instead
allowed them to do so with their mind fully engaged and therefore presumably to recycle more
effectively.

EPA Household waste and recycling research 44
“What I do, normally I will have a bag, if I’ve got a bag in the kitchen I will
just put everything in there and I will just take it downstairs outside and just
sort them all out in the bins.”
Those who recycle food scraps have a separate food waste bin
Food recycling was relatively rare among discussion group participants, especially as a result of the
low incidence of FOGO collection among the sample, however those who did reuse food had a
separate food waste bin. This was usually located in the kitchen given the convenience of being able
to cook or prepare food and simply place the food into that bin. In some cases, participants preferred
to keep the food waste bin outdoors to avoid odours. From here, the food waste bin would be taken
to the green bin when it was full or when the smell became excessive, or emptied into the home
composting bin.
A lot of systems are very long-standing
In many cases, participants had been using their current system of waste disposal for a long time. As
such, their systems had become habitual. Parents were a key source of behaviour here, in that the
systems participants had used for dry recycling when growing up tended to have translated into the
systems they were using nowadays. There was no prompt or motivation for them to change their
system.
The only exception here, for some, was with recycling. Many participants were able to recall the
experience of recycling collections commencing, or of switching from, for example, small council-
supplied recycling crates in the 1990s to the large yellow-lidded bins. With more items being made
with recyclable packaging and a greater emphasis on the need to recycle in communications over
time, for some this had led to a need for a more comprehensive in-home recycling system in order to
allow for additional items. However, participants were very rarely able to recall this process of
change, given how long ago it had taken place.
Recyclables in bins in other rooms tend to be thrown in general waste
A key barrier to recycling was identified in participants typically only having one recycling bin in their
household, meaning that bins in other areas of their home were either designated as waste only, or
combined waste and recycling bins. Having two separate bins in each room – one for waste and one
for recycling – was often not possible as a result of space restrictions. Participants were generally
unwilling to make the effort to move from one room to another to dispose of an item. For example,
rather than taking a used shampoo bottle (that is recyclable) from the bathroom to the recycling bin
in the kitchen, they would place it in the bin in that room instead. This appeared not to be a
conscious decision, and was more as a result of System 1 reflexive thought processes. It was only in
the group discussions that many participants who did this reflected on it for the first time.
In these cases, it was rare for participants to then take the bin and sort the waste from the
recyclables at a later point. Some also commented on the nature of waste in these bins, for example
the bin in their bathroom having unhygienic products in it that they were not willing to handle.
Instead of sorting, in most cases, all of those items would be put in the general waste bin.
“Like sanitary napkins and stuff - I'm not fishing through there [to sort the
recyclable items].”
There were, however, some participants who reported that they did take some of the larger
recyclable items from those rooms and put them in the recycling bin, although this may have been
motivated more by the fact that it was impractical to dispose of a large item in a small bathroom bin.

EPA Household waste and recycling research 45
Participants realise that recyclables cannot be placed in the yellow bin inside a bag
Discussion group participants who used a recycling bag rather than a bin or box generally realised
that they were required to empty the items from the bag rather than placing the bag in the yellow
bin. They understood that the bags themselves were not recyclable.
“When you take it out in a plastic bag remove it from the plastic bag.”
“I take mine down in a plastic bag…but I tip it into the bin.”
A number of participants reported having seen others placing their recyclables into the yellow bin
inside a plastic bag, or opening their yellow bin to find bags in there. These participants expressed
frustration at this, and in some cases linked it back to what they saw as ignorance or laziness. Among
those who were of the belief that a single non-recyclable item in the yellow bin can spoil the whole
batch, this action was seen as having a major impact on the recycling process.
“I think the bins are generally well labelled in my building, but it always
annoys me that people put recycling, it’s mixed recycling, in plastic bags.
Not using bags. So you try and do something and then you get the feeling
that it’s like contaminated because some moron can’t see like a pictogram
right in front of them. They can’t be bothered to take an extra two seconds.”
Distance to bins has an impact on MUD residents’ disposal behaviour
Distance to bins was a key differentiator between SUD and MUD residents. For most SUD residents,
their bins were located to the side of their home, and were within a short distance. For MUD
residents, on the other hand, accessing bins usually required descending stairs and/or walking to the
carpark or another designated area outside of their building – meaning additional time and effort.
Because of this additional effort, many MUD residents described their annoyance at having to take
their rubbish and recycling out. It usually meant they had to make a deliberate trip, and in many
cases they wanted to avoid this and therefore would keep their waste in their household for longer
than they would ideally like.
“I find that it's difficult personally. Just because you've got to…so you collect
all your rubbish at your home obviously, the bins, then you've got to take it
to the big bins which is (sic) way down the stairs.”
“In my complex it's a pain...we've got like 50 stairs to get down to where it
is and back up again...time I think is a huge factor these days.”
This situation meant that, in a lot of cases, rather than make trips specifically for the purpose of
disposing of their waste, participants would time their waste disposal so that it coincided with their
leaving the home. For example, if their waste room was located within their garage complex, they
might take their waste with them on their way to the car. Those that did so often stated that
disposing of their waste in their council bins was not an overly taxing process. However, in some
cases participants did not have the opportunity to do this if their bins were not located on their exit
from their building.
“I usually go down once in the morning when I go to wherever.”
“You have to remember to do it while you're walking out.”

EPA Household waste and recycling research 46
Rinsing behaviour also varies
There was a considerable range of behaviours when it came to rinsing recyclables before putting
them in the bin. Some rinsed unclean items before disposing of them all or most of the time, while
others rarely or never did so.
“But even so far as rinsing it out. Like when you finish your milk cartons and
stuff rinsing it out so that it's actually clean.”
Among those who regularly rinsed, there was a perception that unclean items are not able to be
recycled. For some, this meant the item simply needed to be free of large chunks of food, while for
others it meant it had to be spotless. When asked why they thought they had to rinse unclean items,
participants often stated they had heard about a need to do so through word of mouth, or
something they had read, although they were unable to nominate specific sources.
“I mean it's like it's a food item so if it's got food in it I've always been…I'm
sure I read somewhere that you can't throw something in the recycling bin if
it's dirty and it's got food in it.”
Other participants were not convinced that they needed to rinse items before recycling. In part, this
appeared to be due to the lack of specifically recalled sources explaining that items may need to be
rinsed. To others, the possible need to rinse came as a surprise, as they had not previously given any
thought to rinsing or the potential impact on the recycling process if unclean items were recycled.
Some participants were sceptical about this apparent requirement to rinse items. Even some of
those who regularly rinsed were not convinced that they needed to be doing so, and wondered
whether or not an item could still be recycled if it was not clean. Participants also debated the extent
to which an item needed to be rinsed in order to be recyclable – that is, whether it needed to be
spotless or simply without large food chunks. Further, some perceived that recycling centres would
clean items as well, and would be likely to do a better job of cleaning than the resident themselves
could do, hence rendering their efforts effectively redundant.
“I always wonder what happens, like if you don't rinse the can, what's the
problem? Can it not be recycled or does it still go in with everything? I
always think what happens if you don't rinse it, is it not recyclable?”
“Well it's like how much organic material, how much is enough to make it
not recyclable? Do you have to clean out the container spotless or just a
quick rinse will do?”
In addition to the belief that items had to be rinsed before being recycled, an added benefit of
rinsing is removing the potential for smell. This was particularly important for recyclables, as in many
cases recyclables would simply be stored in open spaces, and for those who had a bin, box or bag for
their recyclables, these did not usually feature a lid to block smells. Some would rinse non-recyclable
items as well, with the reason for doing so being to keep their bins clean and without odour.
Moderator: “So it's more like keeping your bin clean?”
Participant: “Yeah, pretty much.”
On the other hand, the perceived need to rinse, whether in order for the item to be recyclable or to
minimise smell, led to some simply not bothering to recycle unclean items. Instead, participants
would dispose of them in the rubbish bin, which was covered in the majority of cases. Instead, they
would only recycle those items that do not require cleaning or produce smells.

EPA Household waste and recycling research 47
“Because I don’t like food. If it’s water bottle (sic), if it’s like something
that’s closable I will chuck them in the bin. They won’t smell, they won’t do
anything to it. But however because living by myself I don’t take rubbish out
every day. I don’t want it to stink…for me it’s more like paper, plastic bags,
containers that I put in the recycling that will last for weeks.”
“If I have to wash my milk cartons I probably think I wouldn’t do it. The
majority of times I would just throw them in the bin.”
There was also a small number of participants who were concerned about cutting themselves on tins
when trying to wash them. For this reason, they decided not to rinse them, instead throwing them
into the general waste.
“You can cut yourself on a tin can if you're cleaning it. Why would you
bother cutting yourself?”
In addition, many felt that there are items that would otherwise be recyclable that are beyond
cleaning, and they would therefore throw these in the rubbish bin instead of recycling them.
Examples included paper bags that have had food products on them, such as oil or stuck on bits of
food, and pizza boxes.
Moderator: “So a greasy cheese and bacon roll that I'd get from Baker's
Delight and that comes in a brown paper bag.”
Participant 1: “Then I'd put it in the rubbish.”
Participant 2: “Rubbish.”
Participant 3: “Yeah, pop it in the rubbish.”
Participant 4: “That goes in the rubbish.”
Participant 1: “Because it's all oily.”
However, bin collections are also important
One of the hurdles to recycling properly that participants reported most often was their yellow bins
filling too quickly. There were two reasons for this. Firstly, some were of the opinion that their yellow
bins were collected too infrequently or were too small. Most participants lived in council areas with
yellow bin collection fortnightly, and many felt that they could benefit from increasing this frequency
to weekly. Secondly, a number of MUD residents thought that they had too few yellow bins in their
complex, or again that the frequency of collection should be increased.
“Well our recycle bin always fills up like that *clicks fingers* and it's only
emptied like once every two weeks so it's a pain in the arse. I always put
recycling into the normal bin.”
“It would be better if recycling was every week. Because we have these
chlorine bottles and we chuck two of them in there and it's just filled up
already.”
“I remember when I was 16 when we used to all drink and then we'd have
our whole entire bin just full of beer bottles and then you'd have to use the
rubbish bin. That's all they recycled at my friend's house, was glass bottles
because that's all they had to recycle.”

EPA Household waste and recycling research 48
In both of these cases, this led to participants placing recyclable items in their red bin rather than in
the yellow, as they were not willing to hold onto the recycling until the next council collection or, in
the case of some MUD residents, carry the recyclables back up the stairs to their unit.
“I do do it [recycle] but if my yellow bin's full I'll put it in the red bin.”
“Every bin is overflowing on the street, there is insufficient waste disposal.”
Usage of the green bin was varied
Some of those with green bin services used the bin on a regular basis or could fill it up very quickly,
while others rarely or never used it. The former participants were often gardening or maintaining
their yards and often producing green waste. Some would fill it up quickly as a result of storms,
which knocked down branches and leaves, meaning a large amount of plant matter to dispose of.
“I can spend one full day or half a day in my yard and fill that bin up
completely.”
Those who did not use their green bin either did not have a yard or much in the way of plant life on
their property. Alternatively, some of those with yards preferred to place their green waste in the
garden as mulch rather than to dispose of it.
“Well I don't even put my lawnmower clippings in the green bin. They go
around the base of my trees as mulch.”
Among those who filled the green bin up quickly, there was an appetite for more frequent green bin
collection. Some of these participants reported that when their green bin was full, they would take
the waste that would normally go into that bin and instead dispose of it in their general waste bin.
This was particularly common for those with FOGO collection, as discussed in Section 5.6.
Some of this feedback was provided by MUD residents. In MUDs in council areas with green waste
collection, it appeared common for very few, or even only one green bin to be provided for the
entire MUD. While this could be appropriate for MUDs with little in the way of gardens or grassed
common areas, this could be a problem for those where residents have their own individual patches
of garden, large common garden areas or large numbers of potted plants.
“We only have one green bin for 12 apartments.”
“The food scraps unfortunately don’t go in the green bin because the
apartment’s only got one of those.”
Behaviours can vary within the household
In most cases, discussion group participants reported that others in their household were just as
environmentally conscious and effective recyclers as themselves. Recycling was often a team effort
within the household, with all household members doing their part. Many of those with children
mentioned having trained their children to recycle responsibly, and in some households the children
themselves were mainly responsible for taking bins in and out.
However, several participants mentioned that their family members were not as recycling friendly as
they were, and expressed frustration at this. They felt that their family members were less concerned
about environmental issues, or alternatively lacked the willingness to place items in the indoor
recycling bin when the waste bin was more convenient. They had often tried to correct their family
members’ behaviour, but had not noticed improvements.

EPA Household waste and recycling research 49
“My fiancé doesn't recycle and that annoys me. It annoys me mostly
because it fills up the bin too quickly, it ends up full of cans and bottles and I
take that out.”
“It is hard I think when they don't value things the same way. So my 15 year
old, and my hubby as well, will put their bottles in that very small one which
is mainly mine with my food…so whatever I'm doing in the kitchen and
they'll be sticking out of this and I am thinking ‘what is this?’ It's literally
underneath where they are, stop doing that.”
Other residents are the problem
Many MUD residents were of the opinion that most of their neighbours were not recycling properly.
As evidence, they reported seeing contamination in their neighbours’ bins, particularly objects that
were clearly recyclable in the red bin. Some participants were of the opinion that these neighbours
were not concerned about waste-related issues, or even environmental issues more broadly. Others
thought that there was a particular problem with residents from other cultural backgrounds, who
they suggested were not familiar with proper waste disposal practices in Australia. However, for both
of these, they were unable to provide any evidence to support these perspectives.
“They put the recycling in the red ones and it's all mixed up.”
“They just don't care.”
For some participants, their perception that others do not recycle properly acted as a demotivation
towards their own recycling behaviour. A number of participants questioned why they bothered to
recycle properly themselves, or to sort out others’ waste if it had been placed in the incorrect bin.
“It’s also frustrating at times when you live in an apartment and you try to
do your best and you get to the bins and you see like it’s all a mess.
Sometimes I open the bins, and I’m not fanatic about it, but it upsets me, so
I start getting things out. And then I say why do I do this, there’s another
nine apartments and they don’t care. And they don’t care what I’m doing
right now.”
Some take action on others’ waste disposal practices
Participants’ reactions to neighbours who they saw inappropriately disposing of waste differed
throughout the discussion groups. Some claimed they would take action. For example, they would
confront their neighbours and point out their mistakes or educate them about how to dispose of
certain types of waste properly, or even engage in passive aggressive behaviour such as taking the
waste and leaving it at their neighbour’s door. This was rare, however. Instead, participants were
more likely to take items out of the wrong bin and put them where they believed they should be
placed.
“Sometimes I open the bins and I’m not fanatic, but it upsets me so I will
start sorting it. Then I think why I am bothering when there are so many
people who don’t care.”
“If no one was watching I'd pull it [recycling out of the rubbish bin] out and
leave it on their door.”

EPA Household waste and recycling research 50
In general, though, participants were unlikely to take action. There were several reasons identified
for not doing so. Most commonly, participants simply felt that it was not worth worrying about in the
scheme of other issues they had to deal with in their lives, or they did not have the time or the
willingness to make the effort. Beyond this, many participants were simply unwilling to confront their
neighbours. They did not want to create conflict, feared retribution if the neighbour felt as though
they were being attacked and they themselves broke the rules at some point, or simply did not feel
that it was appropriate for them to pull their neighbours aside.
“There's bigger problems in life.”
“Well I've seen people put recyclable things into the general rubbish and I
just felt it was inappropriate for me to say something to them.”
Terminology varies
To refer to general waste bins, the terms ‘rubbish’ and ‘garbage’ were often interchangeable.
Participants understood what was meant if a waste bin was referred to as either a ‘rubbish bin’ or a
‘garbage bin’. However, the term rubbish bin was more commonly used when participants discussed
their internal general waste bins, and rubbish was more common when referring to the type of waste
itself. Some thought that the term ‘garbage’ was more of an Americanism, and less popular in the
Australian context.
“I think in this environment we use words like household waste but if we're
at home we call it rubbish.”
Terminology for council-provided bins was also variable. There was no consensus as to what they
were called. Many referred to them as ‘wheelie bins’, and this term was generally understood to
refer to council-provided bins. However, some referred to them as ‘SULO bins’, as a result of the
SULO branding on them, and others simply called them ‘outside bins’. In addition, one participant
used ‘rubbish bin’ to refer to their inside bin, while referring to their outdoor bin as a ‘garbage bin’.
“I think of that and if someone said SULO bin, I'd think of those.”
“I just say wheelie bins but I don't know.”
“If they said outside bin, because…we call them outside bins.”
Finally, when moderators used the word ‘contamination’, participants were often confused. Many
were unsure as to what this was referring to in the context of household waste. The term tended not
to conjure the image of recyclables in the red bin or general waste in the yellow bin. Participants
were more likely to think of hazardous materials.
Participant 1: “What you mean by contamination?”
Participant 2: “I wouldn't know what the hell they were talking about.”
“Hazardous. If you use the word contaminated, it feels more hazardous
material.”

EPA Household waste and recycling research 51
5.5 Recycling knowledge comes from an array of sources The majority of discussion group participants believed that their knowledge of how to recycle and
what they can and cannot recycle mainly stemmed from their upbringing. As mentioned,
participants’ in-home recycling systems and behaviours were based to a large extent on how their
parents had recycled.
The main information sources are council-supplied
Beyond this parental influence on recycling habits, the key information sources were usually council-
provided. The source most commonly mentioned were charts on or around bins, such as stickers,
posters and signage. These were often the go-to to determine whether an item is recyclable, and is
consulted on a fairly regular basis by many.
“We've got a sticker on the front that tells us.”
“On our bins they actually have information about what can go in there,
small limbs only, that kind of stuff.”
Some had engaged with a range of other council communications. These included pamphlets in the
post and fridge magnets that showed the dates of council collections. For both of these types of
communications, key messaging was related to when residents were able to recycle, rather than the
types of items that are and are not recyclable.
“Years ago I think the council used to hand out leaflets telling you what you
can and can’t recycle. That’s how I got educated, before that I thought
everything was recyclable.”
“We get with our rates in Ku-ring-gai, we always get the little slips that
come with the rates.”
“I think a calendar on somebody's fridge from the local council that just had
the colours marked according to the month when which bin went out and
then down the bottom what goes into each, just a little fridge magnet thing.
It was really easy to read.”
Reactions to council communications like these were mixed. Some engaged with them and council
communications more broadly; they were interested in receiving these and would position them in
their house so that they were able to easily refer to them. Others mentioned that they would not
even open these letters, instead disposing of them, in some cases without even having read them.
“I do. That’s what I do like to read. Junk mail and whatever. I don’t mind
reading that stuff. And normally I do put it on the side of my fridge as well
when it’s something new.”
“Yeah. Straight to the bin.”
“Probably read it once and throw it away.”

EPA Household waste and recycling research 52
Some have learnt from warnings from their council
A number of participants mentioned having received warning stickers from their council, or that they
or someone else they knew had had their collection service stopped as a result of contamination.
Their councils employed audits of bins when collecting them. Such action had been taken by councils
when non-recyclable items were placed in the yellow bin, or when larger items had been placed in
the green bin than allowed. Participants who had received these warnings generally appeared to
recall the message the council had intended to impart, and changed their behaviour accordingly.
“We once had a sticker put on our green bin because my hubby put in a log
or whatever that was bigger than it could take on very quickly, the day it
was meant to be picked up, stuck on there and so we haven't done that.”
“I remember I used to coordinate a day centre in Willoughby and because
we had some second language people working there they didn’t realise that
there was the recycle bin so they just chucked rubbish in the recycle and the
council didn’t empty the bin a couple of times.”
Proactive information seeking is rare
Participants in group discussions were aware that information on which types of items are recyclable
and which are not is easily available online, or at least assumed as much. If they needed to find this
information, their first ports of call would be to conduct a Google search or visit their council’s
website.
“I'm sure you can visit websites, council websites and find out stuff about
it.”
Moderator: “Where would you go to look up the information?”
Participant 1: “Google.”
Participant 2: “Google.”
Participant 3: “Yeah, definitely.”
Participant 1: “Just Google ‘can I recycle…’”
Despite knowing the information is available, however, the groups demonstrated that looking for this
type of information is extremely rare. This was the case despite participants being able to identify so
many occasions in the past when they had been uncertain as to whether an item was recyclable or
not. Participants who have not done so usually attribute this to a lack of motivation. Despite their
stated concern about the environment, they deemed other issues more worthy of their time and
energy than ensuring that they placed their item in the correct bin. Indeed, the idea of conducting a
Google search while standing next to the bins to determine whether or not something was recyclable
was seen as humorous and ridiculed.
“Normal people would not know because they don't care. There's (sic)
bigger problems in the world. We're not going to go look up a website to go
‘oh what can I recycle?’”
Moderator: “So what do you reckon stopped you going to find out that
information?”
Participant: “Because it's not important enough.”
“Because if I'm standing over the bin with it then I'm not going to go, hang
on (laughter)…I'm just going to play it safe and put it in the bin.”

EPA Household waste and recycling research 53
The only major exception to this rule was when participants were trying to determine how to dispose
of bulky waste or items that they were aware are not recyclable using the yellow bin. Several
participants mentioned having accessed their council website or conducted a Google search after a
renovation for example, when they had items such as paint and other renovation waste to dispose
of.
“I know when I painted my house a number of years ago, that I had to look
up how to get rid of paints and stuff. But I think it was a council website but
they listed everything, how you should go about it, what you should do and
all that sort of stuff. Some sort of eco-friendly website I suppose.”
A web link is in demand, but there would be barriers to accessing it
Many participants mentioned that they expected a recycling campaign to include a website (and
sometimes a smartphone app) which they could refer to if they are unsure whether an item is
recyclable or not. This was often mentioned unprompted, particularly by those in the Committed
segment (see Section 6.8 for segment definitions).
However, when pushed by the moderator, many participants admitted that they had never looked
up how to correctly dispose of items online in the past despite frequently being unsure about what is
recyclable. Committeds were often the exception to this rule, with some having actively searched for
information about how to recycle. Aspirationals were often the most open about the fact that they
would not make the effort to go to a website.
“For me if there is a web link I’ve got to be able to just click on it. I’m not
going to memorize it, I’m not going to write it down, so for me that has to
be an online ad.”
“If I had a QI code [I might look up the website]. But I couldn’t be bothered
checking. Depends how long the bus ride is.”
However, there were a range of areas where participants clearly identified information gaps
A number of phase 3 discussion group participants were of the belief
that information about how to recycle properly was lacking at a
general level. While they were not motivated enough to go online
and search for information themselves, many felt there is not enough
information coming directly to them. In many cases, participants felt
that this information would be valuable for the main culprits, even if not necessarily for them.
“I think the council could do more in terms of education at the coalface.”
“I think the council should be doing a better job of advertising.”
In terms of how this information should be delivered, some participants were not positive about the
idea of receiving pamphlets or other items in the mail. As mentioned, a large number of discussion
group participants simply discarded communications from council or anything that looked like it
might be junk mail. Instead, they suggested campaigning through mediums that they would actually
be paying attention to, such as through television. Several discussion group participants also raised
the idea of more effective signage on and around bins, seeing as these were among the most
commonly referred to resources, and ones that they would be engaging with when conscious of how
to dispose of their waste.
Phase 3 findings

EPA Household waste and recycling research 54
“So maybe signs, occasional ads on TV.”
“I would pay more attention to stickers on the bin than pamphlets, because
you get so much crap in the mail.”
Clarify the grey area
Although many group discussion participants still saw themselves as effective recyclers following the
discussion around the grey area, it showed that they could still benefit from additional
communications. Many felt that it needed to be made as clear as possible whether an item was
recyclable or not, without requiring additional effort from the individual. Some felt that councils
were not investing enough in providing these types of resources.
“I just think like if it was clearly defined which is which then probably more
people would do it.”
Participant 1: “But I think that's why it's so hard, is that I don't think there's
enough education about what is and isn't recyclable. If you have waxy
cardboard, I don't believe you're supposed to recycle. It's always in my
recycling bin from my neighbours.”
Participant 2: “I had no idea that you weren't supposed to recycle that.”
Participant 3: “Me either.”
In particular, majority of participants in phase 1 and 3 groups perceived that rules in relation to what
can and cannot be recycled have changed over time. This led to confusion about whether the rules
they had learnt many years ago still applied, or whether these had since been updated. Participants
felt as though their knowledge might be out of date and had an appetite for changes over time to be
communicated effectively.
“I’m in North Sydney council and two, three years ago the list of things they
actually sent and I did actually read it. It became a lot more relaxed.”
“I mean technologies have obviously changed so that we you can have
things where like paper and glass and that are together, whereas previously
that wasn’t the case. But there doesn’t seem to be any public information
about that.”
Further, when participants were discussing some of these changes, it became apparent that many
were not aware that the types of waste allowed and disallowed for recycling may have changed over
time. These participants did not realise the knowledge they have may have be outdated. This is
particularly pertinent given that many participants rated themselves as good recyclers, and may have
considered themselves so when comparing what they did against an outdated set of rules.
Participants were clear in their feedback that information resources should not try to explain what to
do with the items that are obviously recyclable or non-recyclable. Most felt that knowledge about
the key recyclable items, such as paper, plastic bottles and cardboard was sufficiently widespread
from education growing up and learning over time. Instead, the information needs to focus
specifically on confusing items or processes.
Explain what happens to recycling and waste once it has been collected
The two schools of thought on how to dispose of an item when unsure whether it is recyclable – in
the yellow bin or the red bin – demonstrate the low level of awareness of how recyclable waste is
EPA Household waste and recycling research 55
dealt with once it is collected from yellow bins. Providing information on this, as well as guidance on
which direction residents should head in when they are unsure, could help to resolve the issue.
Additionally, participants themselves generally recognised that they could benefit from this type of
information, and many were interested in obtaining it, either spontaneously or when queried as to
whether they would like to learn more about the system.
“The thing is we are not very clear on how recycling gets done.”
“I think we need to know more how the recycling process is really.”
Some participants reported that they, or other members of their household, would place personally
addressed letters in the waste bin when finished with them, rather than in the recycling. This was
due to a concern that if they were recycled, there was a chance that those sorting their waste would
read their letters. Again, this is a concern that could be overcome by explaining how the process at
recycling centres actually works.
“Yeah because recycling actually gets sorted so there's a chance that
someone's going to look at your letters. If you throw them in the bin it goes
straight to the tip.”
Trust in the system impacts behaviour
Phase 3 group discussions uncovered additional insights relating to
the impact of trust in the recycling system on behaviour. Some
participants expressed confusion and distrust in the recycling system.
This tended to take the two forms outlined below. Some had heard
these as rumours, but were unsure whether to believe them. Others were convinced they were true.
1) A small minority of the phase 3 discussion group participants believed (or at least entertained the
idea) that all recyclables are taken to landfill, and that the whole recycling process is a sham.
• This view appeared to be held most frequently by participants from the Disengaged segment
• Those who held this high level of distrust in the system tended to be more resistant to
messages about how to recycle correctly
2) A larger proportion of participants believed that any level of contamination in a load of recycling
causes the entire load to be sent to landfill.
• This view was held by participants in all segments, and was often voiced more as an
uncertainty than as fact
• Many who expressed uncertainty were interested to know the truth of the situation
These findings underline the importance of ensuring that residents trust the recycling system. A lack
of trust can at worst lead to disengagement from the recycling system completely. A lack of
understanding of the system can also lead to confusion and residents choosing not to recycle all the
materials that they could. Confusion on its own, however, does not appear to lead to the same level
of disengagement as distrust in the system.
Explain the environmental impacts of not recycling, and the benefits recycling provides
Some phase 1 discussion group participants, in particular younger ones, were of the opinion that if
the benefits of recycling were more clearly explained to them, this might motivate them to be more
vigilant in their recycling practices. They also felt that this would spur others into recycling more
often. While they knew there were environmental benefits, in many cases they were not able to
Phase 3 findings

EPA Household waste and recycling research 56
articulate what these were. This was identified as a limitation that perhaps, in the moment, meant
they were less likely to be concerned about how they disposed of their waste in amongst the range
of other concerns in their everyday lives. Participants felt that they had not received enough
information about this in the past, and several participants who had attempted to access this type of
information stated that there was insufficient information easily available online.
“I don’t really know the impact of not recycling, but I know that there is
one.”
“If I knew more I think I would make more of an effort.”
These participants thought it was important that any information about these impacts be clear and
explicit in terms of what ineffective or non-recycling would mean, and in a way that people can relate
to. A key example here was showing the tangible effects within a short timeframe, rather than
showing the environment in the distant future, which people might not necessarily be able to
fathom, or that seems too far away to be a concern.
“Maybe talk about the impact of not recycling, what is it going to do in 5
years? 10 years? Because that is in our lifespan.”
“You know that Simpsons episode where Lisa cuts up the things for the
dolphins? I still remember it.”
Ensure information provision when someone moves to the country
In CALD groups, participants raised the issue of insufficient information about recycling practices in
Australia being provided when first arriving. As far as they were aware, no information was provided
specifically for this group. Some were worried that this would mean these individuals not actually
ever becoming familiar with recycling practices.
“Like if you don’t know it’s very hard to find out unless you do your own
research. There’s hardly anything showing us you’ve got to do this, you’ve
got to do that. Yeah, there isn’t.”
“There isn’t anything…there isn’t anything because you can see we are so
many people sitting here, some have been here 20 years, 25 years and you
are still not sure what happens with that because no one has told them.”
Many of the CALD group participants in the phase 1 discussion groups were able to recall when they
first came to Australia and were not familiar with how and what to recycle. Other CALD group
participants imagined themselves in the situation of someone just arriving and came to the
conclusion that these new residents would not be aware of what they should and should not be
recycling, if they were familiar with the concept of recycling in the first place. One participant was
able to use the example of his parents who had been in Australia for 30 years yet did not recycle at
all.
“I tell you now, my parents, no idea. They’re like the oldies that hardly…they
don’t speak English properly and they’ve been here for 30 years too but I
don’t think my mum and dad recycle anything. They live in units. I don’t
think they will ever recycle. They wouldn’t know what it is, what needs to be
recycling. They don’t know.”
These participants provided suggestions for how this type of information could be provided. The
most common suggestion was having information about recycling and what can and cannot be

EPA Household waste and recycling research 57
recycled provided to new residents as part of as ‘welcome package’ of information provided with
other documents relevant to that time, such as their visa. To make the process even easier for them,
participants suggested that the information could be provided in languages other than English or be
mainly picture-based, thereby catering to those who do not speak English well.
“To actually get that as a form with your application just as information
sent through because you get a lot of information with your visa stuff and
just being a general information thing.”
“Just part of general information…put your little package together in your
language so you actually can have a look what you need for it.”
Ensure information provision when someone moves to a new area
Participants saw information provision when moving to a new council area as extremely important
given the wide array of differences between waste disposal practices in each council. In particular,
this related to the types of bins provided, how often these were collected (and what day of the
week) and, for those councils with green waste collection, whether this also catered to food waste.
This information could be expanded to cover all waste issues, such as bulky waste collections or local
tips and facilities for disposing of problem waste. In addition, discussion about numbers associated
with the recycling symbol raised the issue of different councils potentially having different types of
plastics that they could and could not recycle. Participants considered this another important piece
of information to cover in any welcome information provided to new residents.
Participant 1: “It's…about acceptance of your new place and fitting in with
the neighbourhood that you're in.”
Participant 2: “So you're going to want to learn how to do it…you're going
to be looking for that information.”
Some suggested this type of information be provided by real estate agents, and many were positive
about this idea. They saw real estate agents as the ideal conduits of this information given that they
are interacting with new residents regardless, and could provide pamphlets and the like as a matter
of course with other materials when moving to a new home.
“Real estate agents should give that out.”
Visuals of posters and flyers need to be big and clear
Throughout testing of the ad concepts in phase 3 of the research,
participants consistently preferred visuals that were large, simple and
easy to read. This view was held by participants in all segments. Some
participants felt that they would be more likely to keep and refer to
flyers that were easy to interpret.
Participants expressed concern about the small size of images on flyers they had received in the past.
This was seen as adding to the difficulty of interpreting which materials are recyclable.
Participant: “I probably wouldn’t stick it on my fridge but I think I would
look at it and remember the content.”
Moderator: “So what is it about it that is stopping you?”
Phase 3 findings
EPA Household waste and recycling research 58
Participant: “So for a fridge, everything would be shrunk down to maybe a
quarter of that [size] and therefore all of those pictures would be really
small, the font would be small.”
No consistent preference was expressed by participants for the use of photographs or icons,
although many noted the need for the images to be easily recognisable in either format. Some also
noted that there is a need for flyers to provide sufficient detail beyond the most common materials
so that they work well as a reference document.
“I have [kept flyers] but they are only small and only give you the basics.”
5.6 Food waste collection is a good idea
There was appetite for FOGO collection among those without it
As one of the primary motivators for a FOGO collection, a number of participants saw it as providing
a partial solution to the issue of smell. Food was the main culprit of bin smell. This smell meant that
bins would have to be emptied into the council bins more often than they would otherwise.
“Firstly have smelly food. Who wants meat in, you know what I mean? It
would be easier just to like…you could not take garbage out as often
because you could just take your food out.”
As mentioned, many participants with green bins were either rarely or never using them, and for
these participants, being able to use them for food waste provided the bins with a purpose. Some
participants identified the benefit of a FOGO bin allowing additional space in their red bin through
them being able to relocate the food waste that would otherwise be placed in there. It would also
mean not having to take their inside rubbish bin to the red bin as often as they currently did.
Participants commonly estimated that food accounted for around two-thirds of their general waste.
“You wouldn’t have to take garbage out as often, just the food and that is
what makes the bin smell.”
Participants were also positive about using a caddy for food waste when they were shown it in
groups. Its small size allowed it to be placed in the kitchen without taking up an excessive amount of
space. This catered to MUD residents, who often cited not having much space in their homes for
bins. It also allowed participants to easily throw in food scraps while they were preparing meals,
removing excessive effort from the process. However, it should be noted that participants generally
seemed unwilling to pay for a caddy; instead they expected it to be provided by councils for free.
On the other hand, a number of discussion group participants saw little benefit in being able to
dispose of their food waste in the green bin because they were already disposing of it in other ways.
In particular, many participants – especially those in regional areas – had pets or farm animals such
as dogs, chickens or cows, and provided their leftover scraps to them. In addition, a small number of
participants recycled their food waste at home, for example through home composting or using a
worm farm, although in the case of composting, this usually only catered to certain types of food
waste such as fruit or vegetable peelings.
Feeding animals and composting were seen by these participants as more effective uses for their
food waste than placing them in a FOGO bin, as they provided their animals and gardens with direct
benefits. In comparison, they were often not sure what the process would be once the food was
taken away as part of the FOGO service, in particular if they would have to pay for any compost
generated by the council using it.

EPA Household waste and recycling research 59
“I don't have to worry, I have a dog.”
“I've just got like an ice cream container on our windowsill that I put food
waste in and then we've got a worm farm that we got the other day.”
One hesitation was encountered in participants needing an extra inside bin to cater specifically to
food waste. As mentioned, space was at a premium for many participants, especially MUD residents
who often had smaller floor plans. For some with particularly little space, this tended to mean an
additional bin would be impractical, and therefore the benefits of a FOGO service essentially
negated.
“I think it's just going to be a bit more space in the home though because
you're going to end up having pretty much like three bins.”
But the sensory experience is a barrier
Again, the issue of collection frequency emerged. Participants recognised that if collections were too
infrequent their green bin would begin to smell. Although the green bin would be outside, this was
still of concern to them. Taking this one step further, some saw having food sitting in the same place
for an excessive amount of time would attract pests such as rodents or cockroaches. Participants
were particularly concerned about putting meat waste in their bins, which they saw as contributing
to the smell of their bins more than other types of food. For this reason, they suggested that the
collection be weekly, rather than fortnightly.
“Otherwise in this weather it just smells. You just can't get rid of it.”
“It attracts insects so you couldn’t really do that.”
“I think it could be a like a risk, you know, like you’re attracting insects and
rats.”
“If I started throwing that on my balcony it’s just going to involve a lot of
flies.”
Related to this, some participants were also concerned about placing food waste into a bin without it
first being bagged. Although food in the red bin still produces smell, the fact that it is bagged (in most
cases) mitigates this to some extent, while also keeping the bin clean and meaning that residents are
not forced to see old, mouldy food when opening their bins.
“If it is a good bin and is sealed well then it won’t be a problem.”
The switch to FOGO will need to be well-communicated
A relatively large number of discussion group participants from council areas with FOGO collection
were unaware that they were able to put food waste in their green bins. In these cases, other
participants informed them that they were able to.
Participant 1: “I thought it was green waste.”
Participant 2: “Yeah, I thought it was just for trees and plants. I didn't know
you could put food in there.”
Participant 3: “Yeah. You can put…it's all biodegradable.”

EPA Household waste and recycling research 60
When asked how they had first found out that they were now able to dispose of their food waste in
their green bin, participants commonly identified local community-based sources such as
newspapers and newsletters.
In those councils with non-FOGO green bins, there is a very clear association between the green bins
and plant material. There was very little confusion about what goes into this bin. This is likely to be
difficult to overcome in introducing residents to the ability to place food waste in their green bins, as
demonstrated by the habitual nature of most recycling.
“The main idea, you put whatever from the garden, you put it in the green
one.”
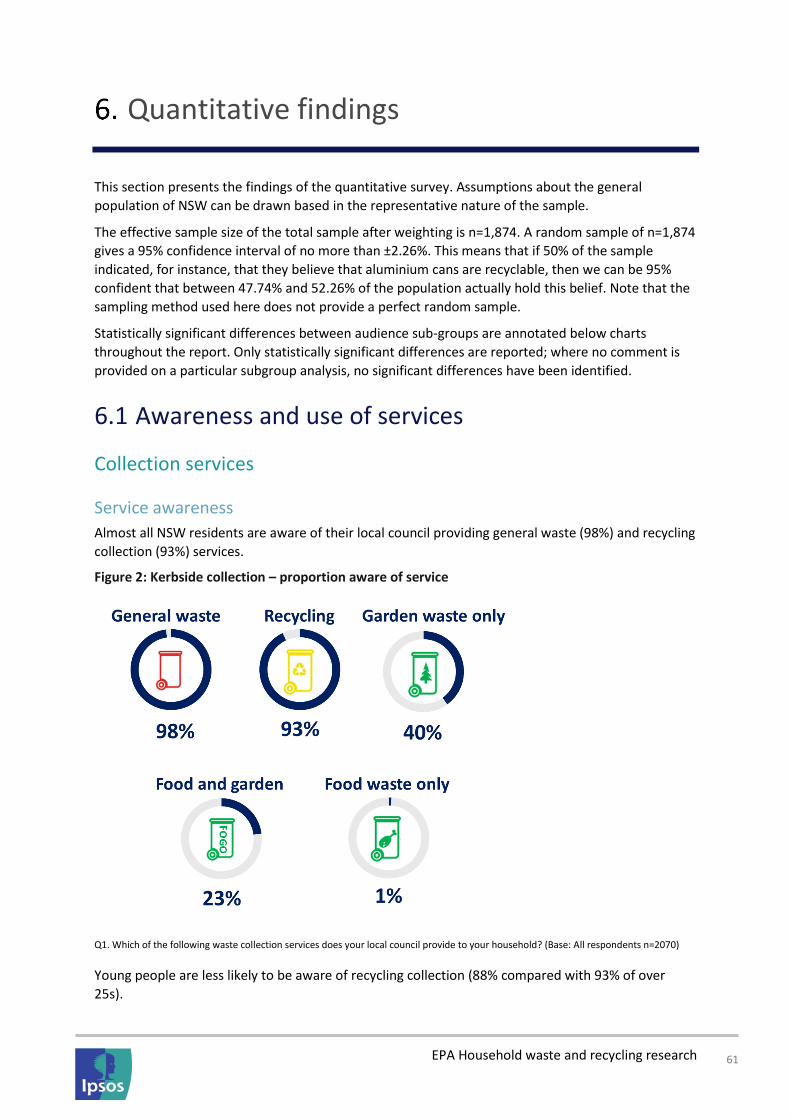
EPA Household waste and recycling research 61
Quantitative findings
This section presents the findings of the quantitative survey. Assumptions about the general
population of NSW can be drawn based in the representative nature of the sample.
The effective sample size of the total sample after weighting is n=1,874. A random sample of n=1,874
gives a 95% confidence interval of no more than ±2.26%. This means that if 50% of the sample
indicated, for instance, that they believe that aluminium cans are recyclable, then we can be 95%
confident that between 47.74% and 52.26% of the population actually hold this belief. Note that the
sampling method used here does not provide a perfect random sample.
Statistically significant differences between audience sub-groups are annotated below charts
throughout the report. Only statistically significant differences are reported; where no comment is
provided on a particular subgroup analysis, no significant differences have been identified.
6.1 Awareness and use of services
Collection services
Service awareness
Almost all NSW residents are aware of their local council providing general waste (98%) and recycling
collection (93%) services.
Figure 2: Kerbside collection – proportion aware of service
Q1. Which of the following waste collection services does your local council provide to your household? (Base: All respondents n=2070)
Young people are less likely to be aware of recycling collection (88% compared with 93% of over
25s).

EPA Household waste and recycling research 62
Two in five (40%) are aware of their council providing a garden waste only collection. Those living in
SUDs are more likely to be aware of this service (42% compared with 36% of MUDs).
Service use
Those who are aware of the services provided by their council overwhelmingly make use of them.
Service use is similar to awareness with 97% utilising their general waste collection and 91% their
recycling collection.
Figure 3: Kerbside collection – proportion using service
Q2. And which of these services have you used in the last 12 months? (Base: All respondents n=2070)
Young people are less likely to make use of their recycling service (86% compared with over 25s
91%). Just over one third (34%) are using garden waste only collection and 21% are using a combined
food and garden waste collection. Home owners are more likely to be using both garden only (38%),
and combined food and garden collection (23%) services (compared with 27% and 17% of renters).
Over half (58%) of those with access to FOGO collection are using the service.
Awareness and use of garden, food and garden and food waste-only services may be a reflection of
the lower levels of council provision organics recycling services (green bins). In 2014-15 only 82
councils reported provision of kerbside organics services and 71 councils reported no service.
Home composting and worm farms
Almost one third (28%) of residents in NSW have used a home composting or worm farming system
to recycle food in their homes. Just under one third (31%) of FOGO users are also composting or
worm farming. However, this is not significantly different from the proportion of non-FOGO users
who compost or worm farm (27%).

EPA Household waste and recycling research 63
Figure 4: Proportion using home composting or worm farming
Q3. Do you recycle your food at home through composting or a worm farm? (Base: All respondents n=2070)
Home owners are significantly more likely to be using one of these systems (33% compared with 17%
of renters). Similarly, those living outside of Sydney are more likely to have a home composting
system in place (32% compared with 26% in Sydney).
Perceptions of recycling
Effort involved in recycling More than half (59%) indicated that they believe it takes little to no effort to manage their waste and
recycling properly. Only 8% indicate that recycling takes a lot of effort.
Figure 5: Waste management effort
Q4. How much effort would you say it takes to manage your waste and recycling properly? (Base: All respondents n=2070)
A higher proportion of young people believe it takes them some to a lot of effort to manage their
waste and recycling (56% compared with 40% of over 25s). Similarly, those living in Sydney are much
more likely to believe it takes some to a lot of effort (47% compared with 34% in the rest of NSW).
MUDs are also more likely to perceive a greater level of effort (46% compared with 39% of SUDs).
Difficulty of deciding what to recycle

EPA Household waste and recycling research 64
One in ten (9%) residents in NSW find it difficult to decide which items to recycle. Among young
people, this figure is a lot higher with 22% finding it difficult (compared with 9% of over 25s).
One third (32%) do not find it at all difficult to decide which items to recycle. Men are more likely to
think it is not at all difficult (36% compared with 29% of women).
Figure 6: Recycling decision difficulty
Q6. How difficult do you find deciding which items to recycle? (Base: Those who have used recycling collection in the last 12 months
n=1874)
Understanding of what can be recycled The majority (59%) believe they understand which materials can and cannot be recycled fairly well, a
further 35% feel they understand this very well.
Figure 7: Understanding of recyclable materials
Q5. How well would you say you understand which materials can and cannot be recycled? (Base: Those who have used recycling collection
in the last 12 months n=1874)
There are a number of key demographic groups that are more likely to believe they understand
which items can and cannot be recycled very well:
• Over 25s 36% compared with 20% of young people;
• Men 39% compared with 31% of women;
• Those with a FOGO collection 41% compared to 33% of those with no FOGO collection; and
• Those living outside of Sydney 40% compared with 31% of those in Sydney.

EPA Household waste and recycling research 65
Understanding of the recycling process
More than half (55%) of participants indicated that they have little to no understanding of how waste
and recycling is processed after it has been collected.
Figure 8: Understanding of how waste and recycling is processed after collection
Q26. How well would you say you understand how your waste and recycling is processed after it is collected by the council? (Base: All
respondents n=2070)
Almost a quarter of young people (24%) report not understanding the process well at all compared
to 17% of over 25s.
Home composters (46% compared with 34% of non-composters) and home owners (41% compared
with 33% of renters) are more likely to say they understand the process fairly or very well.
6.2 Psychological capability - recycling
Images presented to participants
The following sections present the results of Q7, Q8 and Q9, which were designed to test the
psychological capability (i.e. knowledge) of residents in relation to recycling. In these questions
respondents were shown a series of images and first asked to select which images they were
uncertain about the recyclability of. After this, they were then asked whether they would place the
items in their recycling or general waste bin. Given the volume of images to be tested, respondents
were randomly allocated to ten terms each. This process of randomisation has produced a sample
range of n=862 to n=1050 for each of the items. The items shown to participants are displayed in
Figure 9 below.

EPA Household waste and recycling research 66
Figure 9: Items shown to participants in Q7, Q8 and Q9
Certainty about recycling status
Participants were shown the range of household packaging items shown in Figure 9, and asked to
indicate whether they were unsure about whether each item is accepted for recycling.
While the majority of participants indicated that they were sure about collection status of all
materials, some caused a particularly high level of confusion. Polystyrene meat trays (38%), food
pouches (37%), steel aerosol cans (36%) and ceramic plates (33%) were the most confusing items for
participants when determining whether or not the listed items are recyclable.

EPA Household waste and recycling research 67
Figure 10: Recyclable materials knowledge
Q7. Are you unsure whether you are allowed to recycle any of the items shown? Please select any items that you are unsure about. (Base:
Those who have used recycling collection in the last 12 months, sample range n=862 to n=1050)
Recycling decisions
After indicating whether they were sure or unsure about whether a particular item is recyclable,
participants were asked a follow-up question:
• Those who were unsure were asked how they would most likely dispose of the item (i.e. in the
general waste, or the recycling)
• Those who were sure were asked whether they would put the item in the general waste or
recycling.
Frequently recycled items
As the following charts show, there is a core range of items which at least 80% of the population
believes they can recycle. These tend to be common household waste item (such as cardboard
boxes, aluminium drink cans and PET drink bottles) which have been widely accepted in collection
services for a long time. However, 10% indicated that they believed that common recyclables such as
steel food tins and glass jars belong in their general waste bin.

EPA Household waste and recycling research 68
Figure 11: Recycling decisions Part A
Q8. You said that you are unsure whether you are allowed to recycle the following items below. Please indicate how you would most likely
dispose of it if you had to... (Base: Those who have used recycling collection in the last 12 months n=1874)
Q9. Please indicate which of the following items you are allowed to recycle through your council kerbside collection… (Base: Those who
have used recycling collection in the last 12 months n=1874)
Confusing items
As Figure 12 shows, there is a great deal of variety in perceptions of the recyclability of items that are
not in the core set of recyclable items about which most residents are knowledgeable. While hard
plastics such as HDPE and PP were seen as being recyclable by more than 70% of participants, items
such as steel aerosol cans (56%), aluminium foil trays (40%) and flimsy PET punnets (33%) are less
often believed to be recyclable. Relatively high proportions of participants were uncertain whether
they are accepted in recycling collections.
Some non-recyclable items also caused high levels of confusion. More than half (57%) mistakenly
believed that drinking glasses are recyclable and a third (33%) mistakenly believed ceramic plates are
recyclable in their kerbside recycling bin.

EPA Household waste and recycling research 69
Figure 12: Recycling decisions Part B
Q8. You said that you are unsure whether you are allowed to recycle the following items below. Please indicate how you would most likely
dispose of it if you had to... (Base: Those who have used recycling collection in the last 12 months n=1874)
Q9. Please indicate which of the following items you are allowed to recycle through your council kerbside collection… (Base: Those who
have used recycling collection in the last 12 months n=1874)
Course of action where status is uncertain
As Figure 12 shows, the majority of survey participants, when unsure about whether an item is
accepted for recycling by their council, choose to put the item in the general waste, rather than the
recycling stream.
Reconsideration of recycling difficulty
After being asked about which items are accepted for recycling, participants were again asked how
difficult they find it deciding which items to recycle.
As Figure 13 shows, there was a significant decrease in the proportion of participants who indicated
it is not at all difficult to decide which items to recycle. Prior to being asked to consider the
recyclability of the items 32% believed it was not difficult at all, but after answering the questions
this dropped to 23%. Additionally, the proportion finding recycling quite difficult increased
significantly from 9% to 15%.

EPA Household waste and recycling research 70
Figure 13: Decision difficultly post recycling knowledge and behaviour questions
Q13. Having answered these questions, how difficult would you now say you find deciding which items to recycle? (Base: Those who have
used recycling collection in the last 12 months n=1874)

EPA Household waste and recycling research 71
6.3 Psychological capability - organics
Organics images presented to participants
The following sections display the results of Q10. In this question survey respondents who used
garden or food and garden organics kerbside collection bins were shown a series of images and
asked whether or not the items are allowed in their garden or food and garden organics bin. The
items shown to participants are displayed in Figure 14.
Note garden collection and food and garden collection use was determined based on the
respondents answer to Q2. And which of these services have you used in the last 12 months?
Producing the following sample sizes:
• Garden only (n=702)
• Food and garden collection (n=454)
Figure 14: Images shown to participants in Q10
Garden only collections
The majority of those using their garden waste collection understand that grass clippings (85%),
garden cuttings (85%) and larger branches (81%) are allowed in their bin. Additionally, almost a third
also believe that fruit and vegetable scraps (30%), and coffee grounds and teabags (27%) belong in
their garden organics bin.
Most believe that pizza boxes (67%), meat scraps (67%), paper towels (69%), plate leftovers (66%)
and bread (66%) are not allowed in their garden organics bin. However, more than a quarter are
unsure whether or not each of these items belongs in their council bin.

EPA Household waste and recycling research 72
Figure 15: Garden organics knowledge
Q10. Are you unsure whether you are allowed to put any of the items shown below in your council garden or food and garden waste
collection? (Base: Those who use their council garden waste collection n=702)
Q12. Please indicate which of the following items you are allowed to put in your council garden or food and garden waste collection?
(Base: Those who use their council garden waste collection n=702)

EPA Household waste and recycling research 73
FOGO collections
Those with access to food and garden waste collection services generally had a relatively good
understanding of which items are accepted in this bin. Almost one third are confused about whether
pizza boxes (31 %) and papers towels (27%) are allowed in the food and garden bin.
Figure 16: Food and garden organics knowledge
Q10. Are you unsure whether you are allowed to put any of the items shown below in your council garden or food and garden waste
collection? (Base: Those who use their council food and garden waste collection n=454)
Q12. Please indicate which of the following items you are allowed to put in your council garden or food and garden waste collection?
(Base: Those who use their council food and garden waste collection n=454)
Disposal method for organic waste when uncertain
After indicating whether particular items were allowed or not allowed in their garden or food and
garden bin, those who were unsure were asked a follow up question:
• You said that you are unsure whether you are allowed to put the item(s) shown below in your
council garden or food and garden waste collection. Please indicate how you would most likely
dispose of it if you had to.
The following section outlines the results for each item. Note that no significant differences were
observed between the knowledge of those who compost and that of those who do not. Note further
that small base sizes in these analyses render differences in the population difficult to identify.
Those using garden waste collection were most likely to place fruit and vegetable scraps in their
general waste bin (53%), while those using FOGO collections were most likely to place these in their
FOGO bin (68%).

EPA Household waste and recycling research 74
Figure 17: Likely disposal method of fruit and vegetable scraps
Q11. You said that you are unsure whether you are allowed to put the item(s) shown below in your council garden or food and garden
waste collection. Please indicate how you would most likely dispose of it if you had to. (Base: Garden collection n= 68, FOGO collection
n=25)

EPA Household waste and recycling research 75
Uncooked meat scraps
Uncooked meat scraps would most likely be placed in the general waste bin by both garden (66%)
and FOGO (43%) users. Though almost a third (29%) of FOGO users would place their uncooked meat
scraps in this bin.
Figure 18: Likely disposal method of uncooked meat scraps
Q11. You said that you are unsure whether you are allowed to put the item(s) shown below in your council garden or food and garden
waste collection. Please indicate how you would most likely dispose of it if you had to. (Base: Garden collection n= 128, FOGO collection
n=48)

EPA Household waste and recycling research 76
Plate leftovers
The majority (77%) of garden collection users would place their plate leftovers in their general waste
bins. Half (51%) of FOGO users would put plate leftovers in their general waste and 30% in their
FOGO bin.
Figure 19: Likely disposal method of plate leftovers
Q11. You said that you are unsure whether you are allowed to put the item(s) shown below in your council garden or food and garden
waste collection. Please indicate how you would most likely dispose of it if you had to. (Base: Garden collection n= 119, FOGO collection
n=26)

EPA Household waste and recycling research 77
Larger branches
The majority of both garden (61%) and FOGO (64%) users would place their larger branches in these
bins.
Figure 20: Likely disposal method of larger branches
Q11. You said that you are unsure whether you are allowed to put the item(s) shown below in your council garden or food and garden
waste collection. Please indicate how you would most likely dispose of it if you had to. (Base: Garden collection n=70 , FOGO collection
n=29)

EPA Household waste and recycling research 78
Grass clippings
The majority of both garden (62%) and FOGO (66%) users would place their grass clippings in these
bins.
Figure 21: Likely disposal method of grass clippings
Q11. You said that you are unsure whether you are allowed to put the item(s) shown below in your council garden or food and garden
waste collection. Please indicate how you would most likely dispose of it if you had to. (Base: Garden collection n= 58, FOGO collection
n=30)

EPA Household waste and recycling research 79
Garden Cuttings
Similarly, almost two thirds of both garden (62%) and FOGO (64%) users would place their garden
cuttings in these bins.
Figure 22: Likely disposal method of garden cuttings
Q11. You said that you are unsure whether you are allowed to put the item(s) shown below in your council garden or food and garden
waste collection. Please indicate how you would most likely dispose of it if you had to. (Base: Garden collection n= 56, FOGO collection
n=22)

EPA Household waste and recycling research 80
Bread
Two thirds (67%) of garden waste users would be likely to place bread in their general waste bin.
Bread disposal is split across FOGO users with over a quarter being likely to place it in their FOGO bin
(29%), general waste (28%), or feed it to pets or livestock (26%).
Figure 23: Likely disposal method of bread
Q11. You said that you are unsure whether you are allowed to put the item(s) shown below in your council garden or food and garden
waste collection. Please indicate how you would most likely dispose of it if you had to. (Base: Garden collection n=82 , FOGO collection
n=27)

EPA Household waste and recycling research 81
Coffee grounds and tea bags
Both garden waste (61%) and FOGO (55%) users would be most likely to place their coffee grounds
and tea bags in their general waste bins.
Figure 24: Likely disposal method of coffee grounds and tea bags
Q11. You said that you are unsure whether you are allowed to put the item(s) shown below in your council garden or food and garden
waste collection. Please indicate how you would most likely dispose of it if you had to. (Base: Garden collection n= 83, FOGO collection
n=33)

EPA Household waste and recycling research 82
Paper towels, napkins and serviettes
Paper towels are likely to be disposed of in similar ways among both garden and FOGO users, with
half opting to put them in general waste and two fifths in their recycling bins.
Figure 25: Likely disposal method of paper towels, napkins and serviettes
Q11. You said that you are unsure whether you are allowed to put the item(s) shown below in your council garden or food and garden
waste collection. Please indicate how you would most likely dispose of it if you had to. (Base: Garden collection n=108 , FOGO collection
n=110)

EPA Household waste and recycling research 83
Pizza boxes
Garden waste users would be most likely to put pizza boxes in their general waste bin (49%), while
FOGO users would be more likely to place them in their recycling bin (45%).
Figure 26: Likely disposal method of pizza boxes
Q11. You said that you are unsure whether you are allowed to put the item(s) shown below in your council garden or food and garden
waste collection. Please indicate how you would most likely dispose of it if you had to. (Base: Garden collection n=140 , FOGO collection
n=134)
6.4 In-home waste system The following section covers the in-home general, recycling and food waste systems. Across the
three waste streams a key similarity is that the kitchen is generally the centre of in-home waste
management.
General waste system
General waste receptacles
General waste is most commonly stored in a plastic bag (49%) or a bin with a plastic bag lining (46%)
before it is taken out to the council bin.
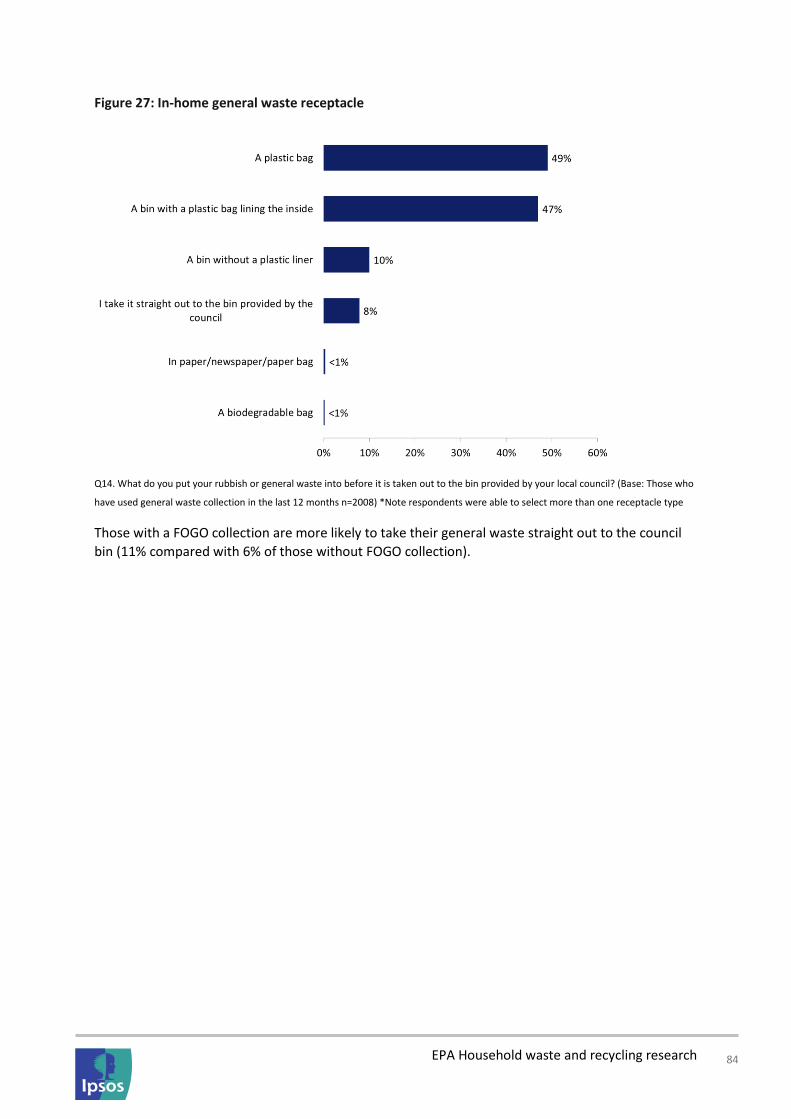
EPA Household waste and recycling research 84
Figure 27: In-home general waste receptacle
Q14. What do you put your rubbish or general waste into before it is taken out to the bin provided by your local council? (Base: Those who
have used general waste collection in the last 12 months n=2008) *Note respondents were able to select more than one receptacle type
Those with a FOGO collection are more likely to take their general waste straight out to the council
bin (11% compared with 6% of those without FOGO collection).

EPA Household waste and recycling research 85
Location of general receptacles
General waste receptacles are most commonly located in the kitchen (81%).
Figure 28: In-home location of general waste receptacles
Q17_1. In which rooms of your home do you have bins, boxes or crates for waste and recycling? (Base: Those who use general waste collection n=2008)
Young people are more likely to keep general waste receptacles in a number of rooms including:
• Kitchen 92% compared with 79% of over 25s;
• Bathroom 46% compared with 28% of over 25s;
• Toilet 35% compared with 16% of over 25s;
• Bedroom 42% compared with 15% of over 25s; and
• Living room 12% compared with 5% of over 25s.
Recycling system
Recycling receptacles
Almost one third (31%) of residents take recyclable materials straight out to their council bin.
However, when stored in the home, recyclable materials are most commonly placed in a bin or crate
(41%) before being taken outside to the council bins.

EPA Household waste and recycling research 86
Figure 29: In-home storage of recycling
Q15. Where do you store recyclable materials in your home before they are taken out to the bins provided by your local council? (Base:
Those who have used recycling collection in the last 12 months n=1874) *Note respondents were able to select more than one receptacle
type
There are a number of groups that are more likely to take these items straight out to the council bin:
• SUDs 34% compared with 24% of MUDs;
• Men 35% compared with 27% of women;
• Over 25s 32% compared with 21% of young people; and
• Home owners 34% compared with 25% of renters.
A greater proportion of SUDs use a bin or crate to store recyclable materials (45% compared with
32% of MUDs), while MUDs are more likely to use a cardboard box (17% compared with 13% of
SUDs), a plastic bag (16% compared with 7% of SUDs) or a reusable bag (14% compared with 5% of
SUDs).
Location of recycling receptacles
The kitchen (54%) is the most common location of in-home recycling receptacles. It is worth noting
that 15% of recyclers do not have recycling receptacles in any room of their homes. Further, 69% of
those who do not have a receptacle take their recycling straight out to their council bins.

EPA Household waste and recycling research 87
Figure 30: In-home storage of recycling receptacles
Q17_2. In which rooms of your home do you have bins, boxes or crates for waste and recycling? (Base: Those who have used recycling collection in the last
12 months n=1874)

EPA Household waste and recycling research 88
Transportation of recyclables to council bins
In-line with the most common receptacle, recycling was most commonly carried out to the council
bin in a box or crate (47%). One in five (20%) carried their recycling in a plastic bag or their hands.
Figure 31: Method used to carry recycling to council bin
Q18. How do you carry your recyclables out to the recycling bin provided by the council? (Base: Those who have a recycling receptacle in at least one room
n=1306) *Note respondents were able to select more than one receptacle type
Use of plastic bags in recycling
Of those who carry their recyclables out to the bin in a plastic bag (20% of those who have a recycling
receptacle in at least one room), 68% indicated that they never leave them in the bag.
However, almost one third (32%, n=80) sometimes or always leave recyclables in the bag, potentially
hindering the recycling process. This equates to 4% of recyclers overall.

EPA Household waste and recycling research 89
Figure 32: Leave recyclables in plastic bag
Q19. Do you ever leave your recyclables in the plastic bag when putting them into the yellow lidded wheelie bin? (Base: Those who carry recyclables out to
the council bin in a plastic bag n=252)

EPA Household waste and recycling research 90
Food waste system
Food waste receptacles
One in five (19%) take their food waste straight out to their council bin or compost/worm farm.
When stored in the home a kitchen caddy (24%) or plastic bag (20%) are the most common
receptacles.
Figure 33: In-home food waste receptacle
Q16. What do you put your food waste into before it is taken out of the home? (Base: Those who do not always use the general waste bin
to dispose of food waste n=903)
A much greater proportion of over 25s use their own or council provided kitchen caddies (42%
compared with 18% of younger people). Similarly, those with FOGO collection are more likely to use
kitchen caddies (55% compared to 30% without FOGO collection). Conversely, those without FOGO
collection are more likely to use the following receptacles:
• A plastic bag (25% compared with 11% of FOGO users);
• A plastic box bowl or container (21% compared with 10% of FOGO users); and
• Rubbish or general waste bin (17% compared with 10% of FOGO users).
Home composters are more likely to take their food waste straight out to the bin or their compost
(23% compared to 11% of non-composters), or use a plastic box, bowl or container to store it (23%
compared with 3% of non-composters).
Location of food waste receptacles
The kitchen (79%) is the most common location for food waste receptacles. It is worth noting that
one in ten (10%) do not keep a food waste receptacle in any of these locations and instead opt to
take their waste straight out to their council bin or worm farm, as displayed in previous chart above.
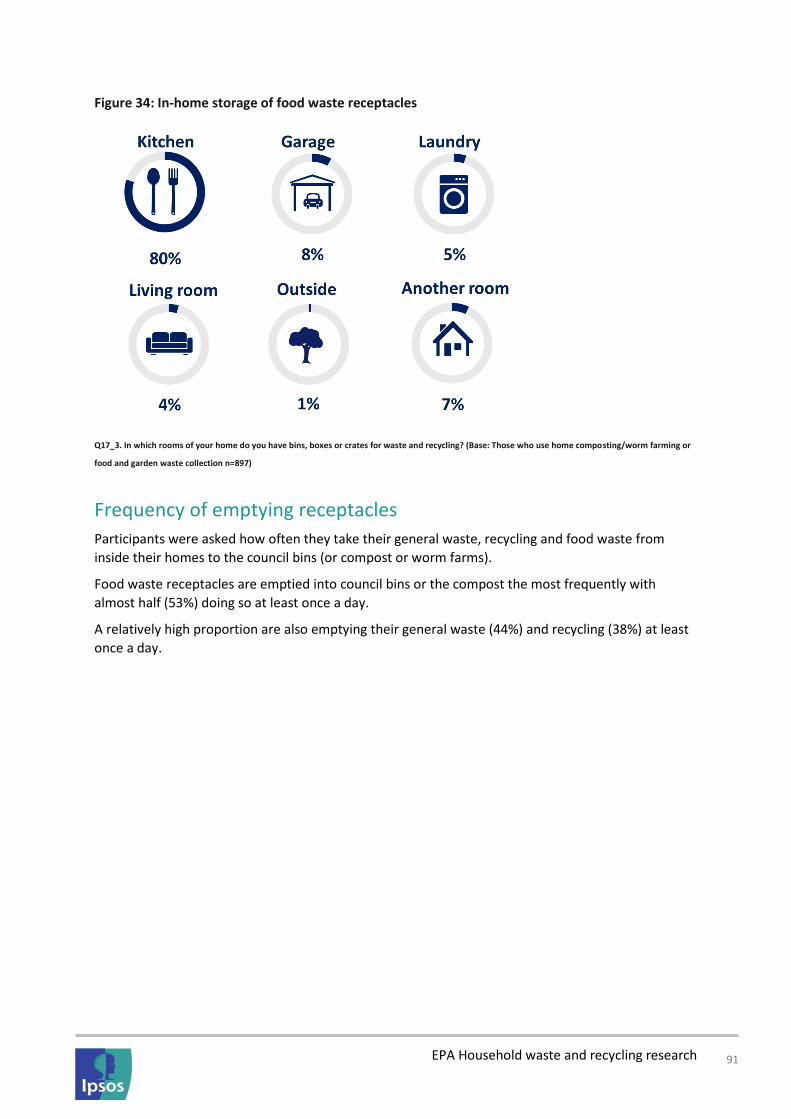
EPA Household waste and recycling research 91
Figure 34: In-home storage of food waste receptacles
Q17_3. In which rooms of your home do you have bins, boxes or crates for waste and recycling? (Base: Those who use home composting/worm farming or
food and garden waste collection n=897)
Frequency of emptying receptacles
Participants were asked how often they take their general waste, recycling and food waste from
inside their homes to the council bins (or compost or worm farms).
Food waste receptacles are emptied into council bins or the compost the most frequently with
almost half (53%) doing so at least once a day.
A relatively high proportion are also emptying their general waste (44%) and recycling (38%) at least
once a day.

EPA Household waste and recycling research 92
Figure 35: Frequency in-home waste receptacles are emptied into council bins
Q20. Approximately how often do you take each of the following out to the bins provided by your local council or compost/worm farm?
(Base: All respondents n=2070)
SUDs (45%) and over 25s (40%) are more likely to empty their recycling at least once a day
(compared with 26% of MUDs and 27% of young people respectively).
6.5 Physical opportunity
Time taken to empty waste and recycling
On average, participants reported that it takes nearly two minutes to carry their waste and recycling
out to their council bins. One in five (22%) reported taking longer than three minutes.
Figure 36: Average time taken to carry waste and recycling out to council bins
Q22. Approximately how long does it take you to carry your rubbish and recycling out to the bins provided by the council? (Base: All
respondents n=2070)
It takes MUDs 48 seconds longer on average to take out their waste recycling, compared to SUDs.
MUDs are more likely to take longer than three minutes to take their waste and recycling out (32%
compared with 16% of SUDs).
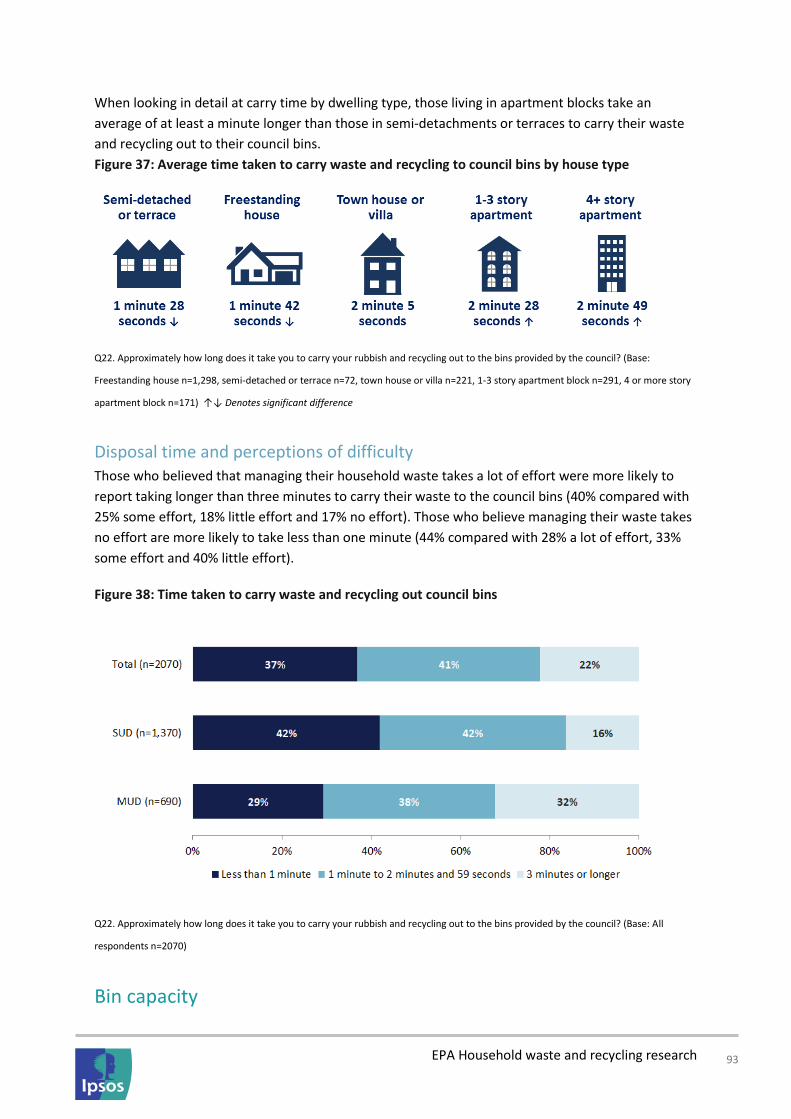
EPA Household waste and recycling research 93
When looking in detail at carry time by dwelling type, those living in apartment blocks take an
average of at least a minute longer than those in semi-detachments or terraces to carry their waste
and recycling out to their council bins.
Figure 37: Average time taken to carry waste and recycling to council bins by house type
Q22. Approximately how long does it take you to carry your rubbish and recycling out to the bins provided by the council? (Base:
Freestanding house n=1,298, semi-detached or terrace n=72, town house or villa n=221, 1-3 story apartment block n=291, 4 or more story
apartment block n=171) ↑↓ Denotes significant difference
Disposal time and perceptions of difficulty Those who believed that managing their household waste takes a lot of effort were more likely to
report taking longer than three minutes to carry their waste to the council bins (40% compared with
25% some effort, 18% little effort and 17% no effort). Those who believe managing their waste takes
no effort are more likely to take less than one minute (44% compared with 28% a lot of effort, 33%
some effort and 40% little effort).
Figure 38: Time taken to carry waste and recycling out council bins
Q22. Approximately how long does it take you to carry your rubbish and recycling out to the bins provided by the council? (Base: All
respondents n=2070)
Bin capacity
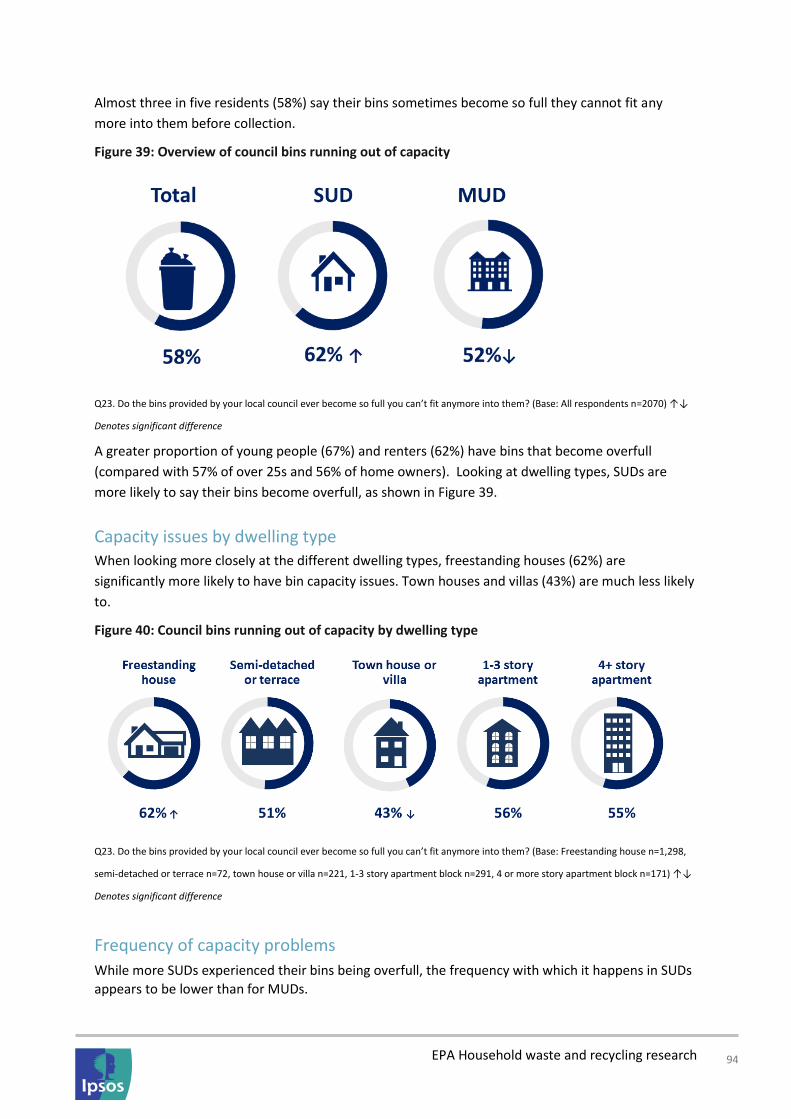
EPA Household waste and recycling research 94
Almost three in five residents (58%) say their bins sometimes become so full they cannot fit any
more into them before collection.
Figure 39: Overview of council bins running out of capacity
Q23. Do the bins provided by your local council ever become so full you can’t fit anymore into them? (Base: All respondents n=2070) ↑↓
Denotes significant difference
A greater proportion of young people (67%) and renters (62%) have bins that become overfull
(compared with 57% of over 25s and 56% of home owners). Looking at dwelling types, SUDs are
more likely to say their bins become overfull, as shown in Figure 39.
Capacity issues by dwelling type When looking more closely at the different dwelling types, freestanding houses (62%) are
significantly more likely to have bin capacity issues. Town houses and villas (43%) are much less likely
to.
Figure 40: Council bins running out of capacity by dwelling type
Q23. Do the bins provided by your local council ever become so full you can’t fit anymore into them? (Base: Freestanding house n=1,298,
semi-detached or terrace n=72, town house or villa n=221, 1-3 story apartment block n=291, 4 or more story apartment block n=171) ↑↓
Denotes significant difference
Frequency of capacity problems
While more SUDs experienced their bins being overfull, the frequency with which it happens in SUDs
appears to be lower than for MUDs.

EPA Household waste and recycling research 95
General waste
One quarter (25%) say their council general waste bin becomes too full on a weekly basis. One in five
(21%) of those in SUDs indicate this is the case, compared to a third (33%) for MUDs.
Figure 41: Frequency of rubbish or general waste bins being too full
Q24. How often would you say each bin type gets too full? – Rubbish or general waste
There are a several demographic groups who are more likely to say their rubbish bin gets too full
every week:
• MUDs (33% compared with 21% of SUDs);
• Renters (33% compared with 20% of home owners);
• CALD (32% compared with 23% of non-CALD); and
• Non-composters (28% compared with 18% of home composters).
Recycling
One in five (21%) say their council recycling bin gets too full on a weekly basis. As with general waste,
we see among those who have experienced overfull bins, MUDs are more likely to indicate it is a
weekly occurrence (27%) than SUDs 18%.

EPA Household waste and recycling research 96
Figure 42: Frequency of recycling bin being too full
Q24. How often would you say each bin type gets too full? – Recycling
A much greater proportion of MUDs say their recycling bin gets too full on a weekly basis (33%
compared with 18% of SUDs). Similarly, those who believe managing their waste and recycling takes
a lot of effort are more likely to find their council recycling bin gets too full each week (33%
compared to 20% of both some and a little effort, and 18% of no effort at all).
Food waste
Few (13%) find their food waste bin being too full on a weekly basis, and almost one third (31%) say
that it never happens.
Figure 43: Frequency of food waste or FOGO bin being too full
Q24. How often would you say each bin type gets too full? – Food waste or FOGO
SUDs are more likely to say their food waste bin never gets too full (35% compared with 17% of
MUDs).

EPA Household waste and recycling research 97
Managing capacity problems
When their bins are full, residents reported being most likely to store the waste or recycling until the
next collection (54%). SUDs are more likely to store it until the next collection (60%) or use other bins
on their street without asking (14%), compared with 42% and 16% of MUDs respectively. Young
people are more likely to place their excess waste and recycling on top of or next to the bins (14%
compared with 5% of over 25s).
Figure 44: Measures taken when council bins are full
Q25. What do you do with your waste or recycling when the council bins are full? (Base: Those who have bins that become overfilled
n=1208)

EPA Household waste and recycling research 98
6.6 Recycling behaviour
Frequency of recycling items
The following sections display the results of Q28 of the survey. In this question, respondents were
shown a series of images and asked to indicate how often they place the items into their recycling
bin. Given the volume of images to be tested respondents were randomly allocated to ten terms
each. As such this process of randomisation has produced a sample range of n=880 to n=1085 for
each of the items.
The items shown to participants are displayed in Figure 45.
Figure 45: Items shown to participants in Q28
HDPE milk bottles (86%), boxboard food packages (84%), corrugated cardboard boxes (84%) and PET
drink bottles (83%) are the most frequently recycled items across NSW households.

EPA Household waste and recycling research 99
Figure 46: Frequency materials are recycled Part A
Q28. Please indicate how often you put the item shown below in the recycling bin when you are at home (Base: Those who have used
recycling collection in the last 12 months n=1874)
The majority (73%) say they never recycle plastic bags and half (50%) ceramic plates. Many are not
always recycling items such as steel aerosol cans (67%) and aluminium trays (57%) even though they
could be.

EPA Household waste and recycling research 100
Figure 47: Frequency materials are recycled Part B
Q28. Please indicate how often you put the item shown below in the recycling bin when you are at home (Base: Those who have used
recycling collection in the last 12 months n=1874)

EPA Household waste and recycling research 101
Preparation of materials
Food tins
Prior to disposing of food tins, people are most likely to wash or rinse (59%) and empty any
remaining contents (52%).
Figure 48: Measures taken before disposing of food tins
Q29_1. Please indicate what, if anything, you usually do to the following items when disposing of them? (Base: All respondents n=2070)
There are several key demographic groups that are more likely to wash or rinse tins:
• Those with a FOGO collection (67% compared with 57% no FOGO);
• Over 25s (61% compared with 50% of young people);
• SUDs (62% compared with 55% of MUDs);
• Those outside of Sydney (66% compared with 55% of Sydney); and
• Those who understand recycling well (63% compared to 40% of those with a poor understanding
40%).
Plastic milk bottles Similarly, with plastic bottles, people are most likely to rinse (57%) and empty any remaining
contents (52%) before disposal. One third also remove the lid (37%) and flatten the bottle (30%).
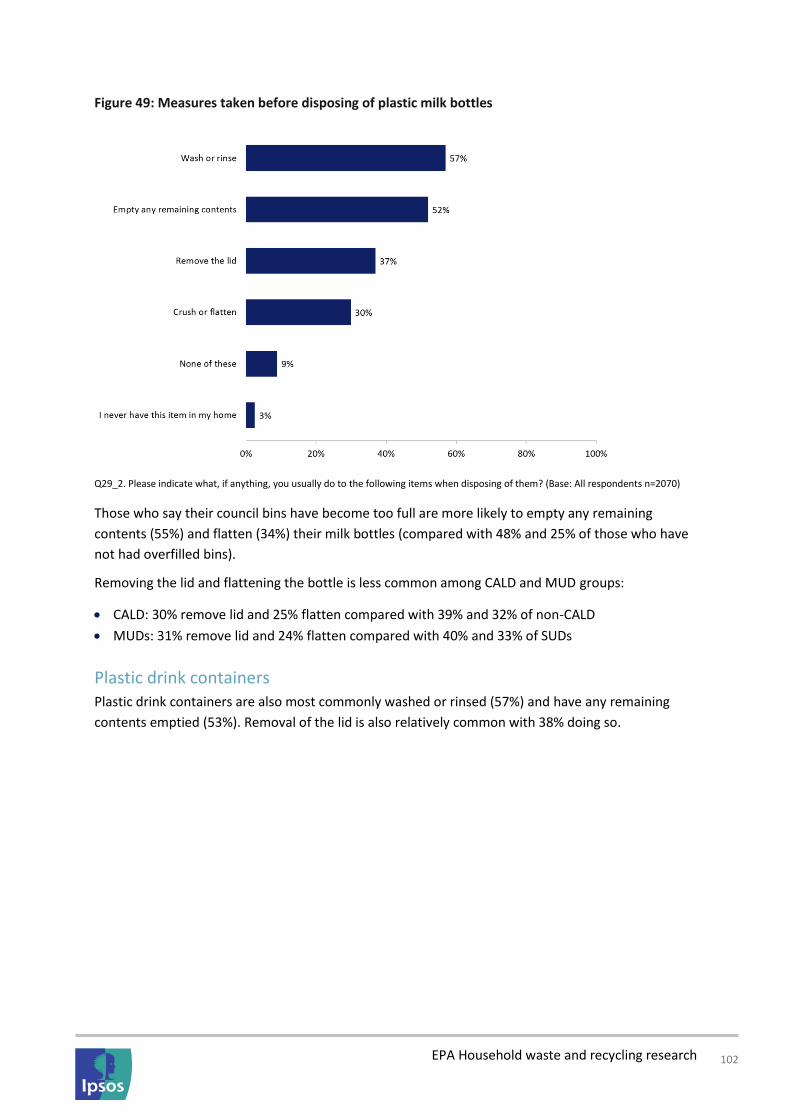
EPA Household waste and recycling research 102
Figure 49: Measures taken before disposing of plastic milk bottles
Q29_2. Please indicate what, if anything, you usually do to the following items when disposing of them? (Base: All respondents n=2070)
Those who say their council bins have become too full are more likely to empty any remaining
contents (55%) and flatten (34%) their milk bottles (compared with 48% and 25% of those who have
not had overfilled bins).
Removing the lid and flattening the bottle is less common among CALD and MUD groups:
• CALD: 30% remove lid and 25% flatten compared with 39% and 32% of non-CALD
• MUDs: 31% remove lid and 24% flatten compared with 40% and 33% of SUDs
Plastic drink containers Plastic drink containers are also most commonly washed or rinsed (57%) and have any remaining
contents emptied (53%). Removal of the lid is also relatively common with 38% doing so.

EPA Household waste and recycling research 103
Figure 50: Measures taken before disposing of plastic drink containers
Q29_3. Please indicate what, if anything, you usually do to the following items when disposing of them? (Base: All respondents n=2070)
Those who say their council bins have become too full are more likely to empty any remaining
contents (56%) and flatten (33%) their plastic drink containers (compared with 50% and 25% of those
who have not had overfilled bins). However, they are less likely to wash or rinse plastic drink
containers (54% compared with 61% of those who have not experienced overfilled council bins).
Several key demographic groups are more likely to rinse, remove the lid and flatten:
• Those with FOGO collection; 62% rinse and 35% flatten compared to 56% and 28% with no FOGO
collection
• SUDs; 59% rinse, 42% remove lid and 33% flatten compared with 53%, 29% and 25% of MUDs
• Non-CALD; 59% rinse and 40% remove lid compared with 52% and 29% of CALD
• Women; 61% rinse and 57% empty remaining contents compared with 53% and 49% of men

EPA Household waste and recycling research 104
Milk cartons
Half (50%) empty the remaining contents from milk cartons and two in five (41%) are rinsing and
removing the lid.
Figure 51: Measures taken before disposing of milk cartons
Q29_4. Please indicate what, if anything, you usually do to the following items when disposing of them? (Base: All respondents n=2070)
Those who have experienced overfilled council bins are more likely to crush or flatten their milk
cartons (44% compared with 37% of those who have not experienced overfilled bins).
There are several demographic groups who are more likely to wash or rinse:
• Women 44% compared with 38% of men
• Home owners 44% compared with 36% of renters
• Home composters and worm farmers 52% compared with 36% of non-composters

EPA Household waste and recycling research 105
Food jars
Three quarters (75%) wash or rinse food jars before disposing, the highest proportion among the five
items, though fewer remove the lid (42%). Figure 52: Measures taken before disposing of food jars
Q29_5. Please indicate what, if anything, you usually do to the following items when disposing of them? (Base: All respondents n=2070)
There are several groups who are less likely to remove the lid:
• Young people 30% compared with 43% of over 25s
• MUDs 36% compared with 45% of SUDs
• CALD 36% compared with 44% of non-CALD
6.7 Waste and recycling information Participants were asked about their information search behaviour. This revealed that most have
received information about waste and recycling in the past two years, but few have actively sought
information. However, on the occasion when they have, the majority were able to find what they
were looking for.
Sources of information
In the last two years, the vast majority (83%) of participants had found information or learnt
something about waste and recycling without actively looking. Importantly, those with a poor
understanding of recycling are less likely to have found or learnt any information about waste
management in the past two years (34% reporting having found no information compared with 16%
who have a good understanding).
Local council mail or flyers (43%) are the most common waste management information sources for
residents, followed by signage on or near bins (33%). Young people are more likely to rely on their
family and friends (29%), and educational institution (24%) as a source of information (compared
with over 25s 15% and 4% respectively).

EPA Household waste and recycling research 106
Those with a good understanding of recyclable materials are more likely to have found or learnt
something about waste management through the following channels:
• Local council mail or flyers (46% compared to 14% with a poor understanding)
• Signage on or near bins (35% compared to 22% with a poor understanding)
• Signage on rubbish or recycling trucks (23% compared to 10% with a poor understanding)
Figure 53: Information sources
Q31. In the last 2 years, where have you found information or learnt something about waste and recycling? (Base: All respondents n=2070)
Additional information Only one in five (21%) residents have actively sought out additional information about waste and
recycling. Home composters (30%) and those with access to FOGO collection (27%) are more likely to
have searched for additional information (compared to 16% of non-composters and 17% with no
FOGO collection).

EPA Household waste and recycling research 107
Figure 54: Additional information search
Q32. In the last 2 years have you ever actively tried to find additional information about waste and recycling? (Base: All respondents
n=2070)
Among those who have sought out additional information, how to dispose of e-waste (46%) and
whether a particular item can be recycled (46%) are most commonly searched.
Figure 55: Type of information sought
Q33. What information were you looking for? (Base: Those who have search for additional information n=427)

EPA Household waste and recycling research 108
Pleasingly, the vast majority of those who searched for information (87%) were able to find the
information they had searched for.
Figure 56: Information found
Q34. Did you find the information you were looking for? (Base: Those who have searched for additional information n=427)
6.8 Segmentation A latent class analysis was conducted in order to identify segments within the population based on
recycling attitudes. This section provides an overview of the demographic profile, attitudes and
behaviours of each of the five segments:
• Committed (28% of the sample)
• Aspirational (26%)
• Disengaged (19%)
• Indifferent (23%)
• Resistant (4%)
Demographic summary of segments
Figure 57 below outlines the breakdown within each segment of the following key demographic
subgroups:
• Gender
• Age
• Dwelling type
• Location
• The keeping of a home composting or worm farming system

EPA Household waste and recycling research 109
Figure 57: Demographic profile of segments
Segment attitudes
Figure 58 shows the differences in these attitudes between the five segments for the attitudes upon
which the segmentation was based. The central figure within each mini-pie chart displays the top-
two box score (strongly agree + somewhat agree). Following Figure 58 below is summary of each
segments attitudes and how this differentiates them from the other segments.

EPA Household waste and recycling research 110
Figure 58: Summary of attitudes towards environmental issues and life in general
Q27. To what extent do you personally agree or disagree with each of the following statements below? (Base: All segmented respondents
n=1857) Note dashboard score displays top 2 box total (strongly agree + somewhat agree). Blue bar denotes proportion of respondents
who agreed (strongly agree + somewhat agree). Red bar denotes proportion of respondents who disagreed (strongly disagree + somewhat
disagreed).
Committed
The Committed segment believe that recycling can make a difference to the environment. None of
the members of this segment disagreed with this statement. Additionally, almost all (92%) of this
segment believe their own actions can make a difference to the environment.

EPA Household waste and recycling research 111
They are generally well informed, with three quarters (75%) agreeing that they make an effort to
keep up with information about the impact of waste on the environment. At the same time, the
majority of Committed recyclers (79%) say they always try to minimise the amount of packaging on
the products they purchase.
This segment displays a relatively strong interest in political affairs (76%). They believe there is a role
for the government to play in slowing the advance of climate change, regardless of the current
economic and social climate (70%). However, what they would most like to see is businesses doing
more to tackle environmental problems (91%).
When looking more broadly at their general attitude towards life, the Committed segment take a lot
of pride in the responsibilities they have in their lives (95%). They feel that they have a hard-working
nature, with very few (6%) saying they do just enough work to get by and even less (3%)
acknowledging they can be disorganised or careless.
Aspirational
Similar to the Committed segment, the Aspirationals display very positive attitudes towards the
environment. Almost all believe recycling well makes a big difference to the environment (98%) and
that they personally can make a difference to the environment (94%). At the same time, they are
eager to minimise the amount of packaging on items they buy (86%).
They are a very well informed segment, with the vast majority saying they make an effort to keep up-
to-date with impact of waste on the environment (91%) and political events within Australia and
abroad (81%). With this knowledge, they believe both the businesses (97%) and the government
should be taking greater action to tackle climate change and other environmental issues.
In contrast to the Committed segment, there are key differences in the Aspirationals attitudes
towards life in general. While the vast majority are proud of the responsibilities they have in their
lives (85%), many are doing just enough work to get by (60%) and more agree that they are
disorganised and careless in their lives (40%).
Disengaged
The Disengaged segment displays very mixed attitudes towards environmental issues. While they
appreciate the environmental benefits that can be gained from recycling (97%), they tend to lack a
sense of self-efficacy. This is demonstrated by the fact that they are less likely to believe they can
personally make a difference to the environment (62%) than Committeds and Aspirationals.
Most in this segment believe that both businesses (88%) and governments (70%) should be doing
more to tackle both climate change and other environmental issues. However, few are interested in
staying informed about the impact of waste on the environment (17%) and political events (21%).
When it comes to life in general, some in the Disengaged group have a tendency to do just enough
work to get by (38%) and to be disorganised and careless (31%) in their lives. However, many are still
proud of their responsibilities in life (63%).
Indifferent
The Indifferent segment tend to have a relatively undeveloped opinion towards environmental
issues. This may be in part due to the lack of effort they devote to staying informed about the impact
of waste on the environment (just 18% agree that they do this). Indifferents are even more likely to
lack a sense of self-efficacy than Disengageds, with just 23% feeling that they personally can make a
difference to the environment.

EPA Household waste and recycling research 112
Around half are interested in political events in Australia and other countries (50%). However, many
are ambivalent as to whether or not the businesses (59% neither) and the government (57% neither)
should be doing more to tackle climate change and environmental issues.
Looking at their attitude towards life more broadly, many are relatively indifferent towards their
responsibilities in life (only 50% agree that they are proud of these). They do not tend to view
themselves as being careless or disorganised people (43% disagree).
Resistant
Those in the Resistant segment have a negative attitude towards the environment in general and
they make little to no effort in staying informed with the impact of waste on the environment (9%).
In effect, they do not feel they have the ability to make a personal difference to the environment and
as a result very few Resisters believe recycling well actually makes a big difference to the
environment (9%).
Resisters tend to display a lack of interest in political affairs (36%) in comparison to the other
segments. Despite this disinterest, they are in great disagreement with the notion that the
government (70%) and businesses (64%) should be doing more to intervene with climate change and
other environmental issues.
Looking at life more broadly, Resisters are not particularly proud of the responsibilities they have in
their lives (31%). However, they are relatively hard-working with the majority disagreeing that they
do just enough work to get by (61%). Moreover, this segment does not view themselves as being
disorganised or careless (66%).

EPA Household waste and recycling research 113
Recycling attitudes and behaviours
Effort involved in managing waste and recycling
Committed recyclers generally perceive the management of household waste and recycling to take
little to no effort at all (80%). Conversely, the Aspirationals who have a positive attitude towards
environmental issues and a generally green outlook are significantly more likely to perceive
household waste management as taking a lot of effort (17%).
Figure 59: Perceived level of effort required to manage waste and recycling properly
Q4. How much effort would you say it takes to manage your waste and recycling properly? (Base: All segmented responses n=1857)
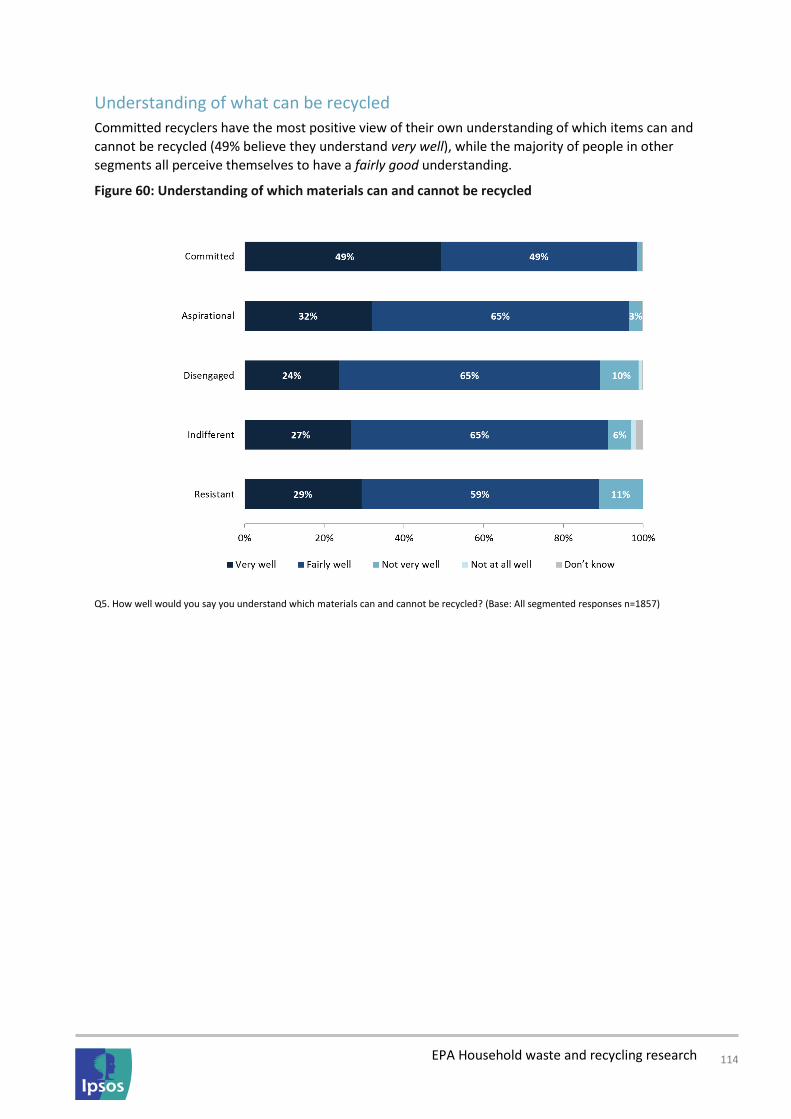
EPA Household waste and recycling research 114
Understanding of what can be recycled
Committed recyclers have the most positive view of their own understanding of which items can and
cannot be recycled (49% believe they understand very well), while the majority of people in other
segments all perceive themselves to have a fairly good understanding.
Figure 60: Understanding of which materials can and cannot be recycled
Q5. How well would you say you understand which materials can and cannot be recycled? (Base: All segmented responses n=1857)

EPA Household waste and recycling research 115
Understanding of waste and recycling processing
Those in the Committed (46%) and Aspirational (43%) segments tend to have a greater
understanding of what happens to their waste and recycling once it has been collected by their local
council. Whereas the majority (78%) of the Disengaged segment have little to no understanding of
the process.
Figure 61: Understanding of waste and recycling process (after collection)
Q26. How well would you say you understand how your waste and recycling is processed after it is collected by the council? (Base: All
segmented responses n=1857)

EPA Household waste and recycling research 116
Changes in perceptions of recycling difficulty
After assessing their knowledge in Q7, Q8 and Q9, participants in all segments rated the level of
difficulty they face when deciding which items should be placed into their recycling bin higher than
they did prior to being tested. A decrease of 17% was revealed among the Committed recyclers
saying decision making is not at all difficult in the follow up question (Q13). The Disengaged segment
experienced the greatest shift into the quite difficult group, with a 9% change between pre (Q6) and
post (Q13).
Figure 62: Decision difficulty pre and post knowledge testing
Q6. How difficult do you find deciding which items to recycle? (Base: All segmented responses n=1857)
Q13. Having answered these questions, how difficult would you now say you find deciding which items to recycle? (Base: All segmented
responses n=1857)

EPA Household waste and recycling research 117
Bin capacity
Those in the Disengaged segment are significantly more likely to have found their council bins
overfull at some stage.
Figure 63: Council bins running out of capacity by segment (proportion saying ‘yes’)
Q23. Do the bins provided by your local council ever become so full you can’t fit anymore into them? (Base: All segmented respondents
n=1857) ↑↓ Denotes significant difference
Note there are no significant differences between segments and the bin stream that has become
overfilled, nor are there any difference in frequency (Q24).
Information search
Sources of information
Across the segments council mail and flyers, and signage on bins are the main sources of waste and
recycling information. The Disengaged, Indifferent and Resistant segments are all significantly less
likely to have learnt something about waste and recycling in the past two years.

EPA Household waste and recycling research 118
Figure 64: Sources of waste and recycling information by segment
Q31. In the last 2 years, where have you found information or learnt something about waste and recycling? (Base: All segmented responses
n=1857) ↑↓ Denotes significant difference
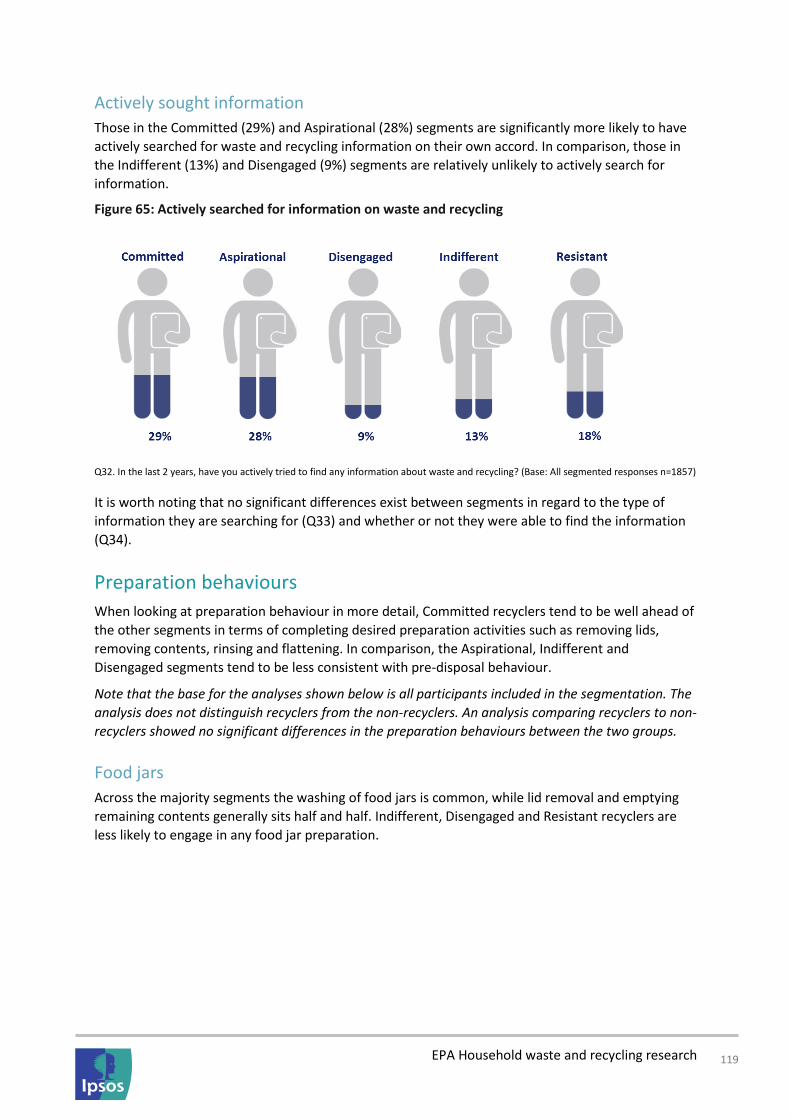
EPA Household waste and recycling research 119
Actively sought information
Those in the Committed (29%) and Aspirational (28%) segments are significantly more likely to have
actively searched for waste and recycling information on their own accord. In comparison, those in
the Indifferent (13%) and Disengaged (9%) segments are relatively unlikely to actively search for
information.
Figure 65: Actively searched for information on waste and recycling
Q32. In the last 2 years, have you actively tried to find any information about waste and recycling? (Base: All segmented responses n=1857)
It is worth noting that no significant differences exist between segments in regard to the type of
information they are searching for (Q33) and whether or not they were able to find the information
(Q34).
Preparation behaviours
When looking at preparation behaviour in more detail, Committed recyclers tend to be well ahead of
the other segments in terms of completing desired preparation activities such as removing lids,
removing contents, rinsing and flattening. In comparison, the Aspirational, Indifferent and
Disengaged segments tend to be less consistent with pre-disposal behaviour.
Note that the base for the analyses shown below is all participants included in the segmentation. The
analysis does not distinguish recyclers from the non-recyclers. An analysis comparing recyclers to non-
recyclers showed no significant differences in the preparation behaviours between the two groups.
Food jars
Across the majority segments the washing of food jars is common, while lid removal and emptying
remaining contents generally sits half and half. Indifferent, Disengaged and Resistant recyclers are
less likely to engage in any food jar preparation.

EPA Household waste and recycling research 120
Figure 66: Activities undertaken prior to disposing food jars
Q29_5. Please indicate what, if anything, you usually do to the following items when disposing of them? – Food jars (Base: All segmented
responses n=1857)
Food tins
Washing and rinsing, and emptying any remaining contents are the most common food tin
preparations with Committed recyclers being significantly more likely to carry out both of these
activities. A relatively high proportion of Resistant (24%) and Disengaged (20%) recyclers are not
carrying out any pre-disposal behaviour on food tins.

EPA Household waste and recycling research 121
Figure 67: Activities undertaken prior to disposing food tins
Q29_1. Please indicate what, if anything, you usually do to the following items when disposing of them? – Food tins (Base: All segmented
responses n=1857)
Plastic milk bottles
Washing and rinsing is the most common milk bottle preparation activity, with the Committed
segment being significantly more likely to undertake to do this.
Figure 68: Activities undertaken prior to disposing milk bottles
Q29_2. Please indicate what, if anything, you usually do to the following items when disposing of them? - Plastic milk bottles (Base: All
segmented responses n=1857)

EPA Household waste and recycling research 122
Plastic drink containers
Similar to plastic milk bottles, plastic drink containers are most commonly washed or rinsed before
disposal. Resistants are significantly less likely to engage in any preparation behaviours before
disposing plastic drink containers.
Figure 69: Activities undertaken prior to disposing plastic drink containers
Q29_2. Please indicate what, if anything, you usually do to the following items when disposing of them? – Plastic drink containers (Base: All
segmented responses n=1857)

EPA Household waste and recycling research 123
Milk cartons
Comparative to other items, the segments are undertaking fewer milk carton disposal preparation
activities. However, the Aspirationals are the most likely to wash or rinse milk cartons, and the
Committeds are mostly likely to empty any remaining contents.
Figure 70: Activities undertaken prior to disposing milk cartons
Q29_2. Please indicate what, if anything, you usually do to the following items when disposing of them? - Milk cartons (Base: All
segmented responses n=1857)
Recycling of common household items
This section examines the differences between the segments in terms of the frequency at which they
are recycling common household items including; HDPE milk bottles, boxboard food packaging, glass
food jars, polypropylene containers, steel aerosol cans, drinking glasses and ceramic plates.
HDPE milk bottles
Recycling of HDPE milk bottles is high across all segments, but a significantly greater proportion of
those in the Committed segment are always doing so.
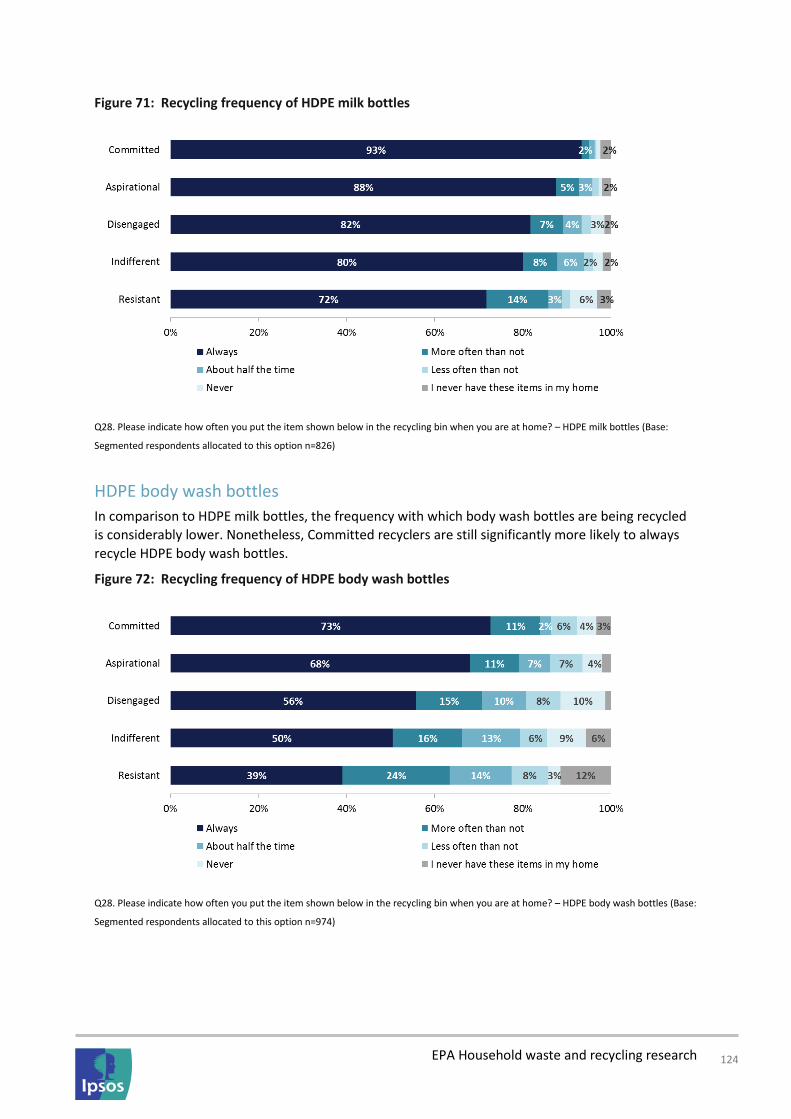
EPA Household waste and recycling research 124
Figure 71: Recycling frequency of HDPE milk bottles
Q28. Please indicate how often you put the item shown below in the recycling bin when you are at home? – HDPE milk bottles (Base:
Segmented respondents allocated to this option n=826)
HDPE body wash bottles
In comparison to HDPE milk bottles, the frequency with which body wash bottles are being recycled
is considerably lower. Nonetheless, Committed recyclers are still significantly more likely to always
recycle HDPE body wash bottles.
Figure 72: Recycling frequency of HDPE body wash bottles
Q28. Please indicate how often you put the item shown below in the recycling bin when you are at home? – HDPE body wash bottles (Base:
Segmented respondents allocated to this option n=974)

EPA Household waste and recycling research 125
Boxboard food packaging
Committed recyclers are significantly more likely to always place boxboard packaging in their
recycling bins, with almost all in the segment doing so. Whereas the Indifferent segment are
significantly less likely to always do so.
Figure 73: Recycling frequency of boxboard food packaging
Q28. Please indicate how often you put the item shown below in the recycling bin when you are at home? – Boxboard food packaging
(Base: Segmented respondents allocated to this option n=806)
Glass food jars
A significant divide exists between Committed recyclers and the other segments when it comes to
always recycling glass food jars. Almost half of the Resisters are not always recycling this everyday
item.
Figure 74: Recycling frequency of glass food jars
Q28. Please indicate how often you put the item shown below in the recycling bin when you are at home? - Glass food jars (Base:
Segmented respondents allocated to this option n=907)

EPA Household waste and recycling research 126
Steel food tins
Similar to glass food jars, there is a significant divide between those in the committed segment and
other segments when it comes to always recycling steel food tins. Resistant recyclers are significantly
more likely to never recycle steel food cans.
Figure 75: Recycling frequency of steel food tins
Q28. Please indicate how often you put the item shown below in the recycling bin when you are at home? – Steel food tins (Base:
Segmented respondents allocated to this option n=896)
Aluminium drink cans
Those in the Committed segment are significantly more likely to always recycle aluminium drink cans.
While not significant, it is worth noting that those in the Disengaged segment are always recycling
aluminium cans more frequently than Aspirationals.
Figure 76: Recycling frequency of aluminium drink cans
Q28. Please indicate how often you put the item shown below in the recycling bin when you are at home? – Aluminium drink cans (Base:
Segmented respondents allocated to this option n=915)

EPA Household waste and recycling research 127
Steel aerosol cans
In comparison to food tins and aluminium cans, steel aerosol cans present a great deal of confusion
across the segments with a substantial proportion in each saying they would never recycle them.
However, as with polypropylene containers, the Committed segment are much more likely to always
place steel aerosol cans in their recycling bins.
Figure 77: Recycling frequency of steel aerosol cans
Q28. Please indicate how often you put the item shown below in the recycling bin when you are at home? – Steel aerosol cans (Base:
Segmented respondents allocated to this option n=852)
Polypropylene container
Polypropylene containers are an item of confusion across the segments with a considerable
proportion of Committed recyclers failing to recognize their recyclability. However, the majority of
Committeds are still significantly more likely to always recycle them. The Indifferents and Resisters
are much less likely to recycle polypropylene containers.

EPA Household waste and recycling research 128
Figure 78: Recycling frequency of polypropylene containers
Q28. Please indicate how often you put the item shown below in the recycling bin when you are at home? – Polypropylene containers
(Base: Segmented respondents allocated to this option n=862)
Food pouch
Food pouches are generally less common in NSW homes. However, amongst those who are
purchasing them, there recyclability seems to be a point of confusion across the segments. Note that
no significant differences exist between the segments and recycling frequency.
Figure 79: Recycling frequency of food pouches
Q28. Please indicate how often you put the item shown below in the recycling bin when you are at home? – Food pouches (Base:
Segmented respondents allocated to this option n=839)
Drinking glasses
Committed recyclers are significantly more likely to always recycle drinking glasses. While these are
not recyclable it suggests there is a desire among this segment to do what is perceived to be the right

EPA Household waste and recycling research 129
thing. Conversely, a much greater proportion of Disengaged and Resistant recyclers are never putting
drinking glasses in their recycling bins.
Figure 80: Recycling frequency of drinking glasses
Q28. Please indicate how often you put the item shown below in the recycling bin when you are at home? – Drinking glasses (Base:
Segmented respondents allocated to this option n=894)
Ceramic plates
Across the five segments, few are always disposing of ceramic plates in their recycling. It is worth
acknowledging that no significant differences exist between the segments.
Figure 81: Recycling frequency of ceramic plates
Q28. Please indicate how often you put the item shown below in the recycling bin when you are at home? – Ceramic plates (Base:
Segmented respondents allocated to this option n=895)

EPA Household waste and recycling research 130
6.9 Recycling terms This section provides the results of Q30 (Wording: Please select the item(s) shown below that you
would call <category>?). In order to understand the language used by residents to describe specific
waste and recyclable items, participants were shown a series of images and asked to select which
images they would classify as belonging under the stated term e.g. cans as displayed in Figure 82
below.
Technical note: Given the high number of terms and items to be tested respondents were randomly
allocated to ten terms each. As such this process of randomisation has produced a sample range of
n=884 to n=953 for each of the terms.
Cans
Participants were asked which of the items displayed in Figure 82 they would call cans.
Aluminium drink cans (96%) and steel food tins (90%) are the items people are most likely to
consider cans. A relatively low proportion (44%) would consider a steel aerosol to be a can.
Figure 82: Items referred to as cans
Q30_1. Please select the items below that you would call cans? (Base: All respondents allocated to question n=944)
Tins
Almost all (95%) would refer to steel food tins as tins, and a substantial group (65%) would also
consider aluminium drink cans to be tins.

EPA Household waste and recycling research 131
Figure 83: Items referred to as tins
Q30_2. Please select the items below that you would call tins? (Base: All respondents allocated to question n=952)
Aluminium foil
Almost all consider both aluminium foil (96%) and aluminium foil trays (92%) to be aluminium foil.
Figure 84: Items referred to as aluminium foil
Q30_3. Please select the items below that you would call aluminium foil? (Base: All respondents allocated to question n=928)
Bottles and jars

EPA Household waste and recycling research 132
Almost all would call glass jars (95%), and glass bottles coloured and clear (both 95%) bottles and
jars. A substantial proportion (69%) also considers PET drink bottles to be bottles and jars.
Figure 85: Items referred to bottles and jars
Q30_4 Please select the items below that you would call bottles and jars? (Base: All respondents allocated to question n=934)
Glass containers
The vast majority would refer to glass jars (91%), and glass bottles clear (83%) and coloured (81%) as
glass containers. Fewer, but still a large proportion, would also refer to coloured (67%) and clear
(64%) drinking glasses as glass containers.

EPA Household waste and recycling research 133
Figure 86: Items referred to as glass containers
Q30_5 Please select the items below that you would call glass containers? (Base: All respondents allocated to question n=951)
Glassware
Almost all would refer to drinking glasses coloured and clear (both 92%) as glassware. Three quarters
would also consider glass jars (75%), clear glass bottles (75%) and coloured glass bottles (73%) to be
glassware.
Figure 87: Items referred to as glassware
Q30_6 Please select the items below that you would call glassware? (Base: All respondents allocated to question n=921)

EPA Household waste and recycling research 134
Cardboard boxes
Corrugated cardboard boxes (96%), waxed banana boxes (96%), cereal boxes (93%) and washing
powder boxes (93%) are all generally considered to be cardboard boxes. Much fewer (55%) would
call a pizza box a cardboard box.
Figure 88: Items referred to as cardboard boxes
Q30_7 Please select the items below that you would call cardboard boxes? (Base: All respondents allocated to question n=925)
Cardboard packaging
Similar to the items above, almost all would call cereal boxes (93%), corrugated cardboard boxes
(91%), waxed banana boxes (91%) and washing power boxes (91%) to be cardboard packaging.
Again, fewer (57%) would consider pizza boxes to be cardboard packaging.

EPA Household waste and recycling research 135
Figure 89: Items referred to as cardboard packaging
Q30_8 Please select the items below that you would call cardboard packaging? (Base: All respondents allocated to question n=918)
Cardboard and paper
Cardboard and paper is a fairly wide reaching term with the majority of items displayed in Figure 90
falling into this category, though fewer would called pizza boxes (62%) and takeaway cups (46%)
cardboard and paper.
Figure 90: Items referred to as cardboard and paper
Q30_9 Please select the items below that you would call cardboard and paper? (Base: All respondents allocated to question n=935)

EPA Household waste and recycling research 136
Drink cartons
Almost all consider gable-top milk cartons (93%) and aseptic tetrapaks (90%) to be drink cartons.
Figure 91: Items referred to as drink cartons
Q30_10 Please select the items below that you would call drink cartons? (Base: All respondents allocated to question n=920)
Drink containers
The range of items considered to be drink containers is varied with many placing items including; PET
drink bottles (78%), aluminium drink cans (75%), takeaway coffee cups (74%), HDPE milk bottles
(73%), gable top milk cartons (70%), and coloured glass bottles (69%) under this term.

EPA Household waste and recycling research 137
Figure 92: Items referred to as drink containers
Q30_11 Please select the items below that you would call drink containers? (Base: All respondents allocated to question n=953)
Plastic containers
Similarly, the range of items considered to be plastic containers is varied with at least three quarters
or more considering flimsy PET punnets (87%), polypropylene food containers (85%), HDPE milk
bottles (76%), HDPE stain remover (75%), and PET body wash and drink bottles (both 74%) to fall
under the plastic container term.

EPA Household waste and recycling research 138
Figure 93: Items referred to as plastic containers
Q30_12 Please select the items below that you would call plastic containers? (Base: All respondents allocated to question n=910)
Food pouches
Food pouches (75%) themselves are the most common item to be classified under this term,
although 55% would also call frozen vegetable bags food pouches.
Figure 94: Items referred to as food pouches
Q30_13 Please select the items below that you would call food pouches? (Base: All respondents allocated to question n=908)

EPA Household waste and recycling research 139
Plastic bags
Plastic shopping bags (95%) are almost unanimously called plastic bags. Two thirds (67%) would also
consider a frozen vegetable bag to be a plastic bag.
Figure 95: Items referred to as plastic bags
Q30_14 Please select the items below that you would call plastic bags? (Base: All respondents allocated to question n=951)
Recyclable plastics
Almost all would call the common household plastics including PET drink bottles (93%), HDPE milk
bottles (93%) and PET kitchen spray (88%) recyclable plastics. It is worth noting that one in five (20%)
would consider plastic shopping bags to fall under the term recyclable plastics.

EPA Household waste and recycling research 140
Figure 96: Items referred to as recyclable plastics
Q30_15 Please select the items below that you would call recyclable plastics? (Base: All respondents allocated to question n=939)
Organic waste
Organic waste is a relatively broad term with range of different items covering this term including;
grass clippings (84%), fruit and vegetable peelings (74%), and large and small branches (both 69%).
Figure 97: Items referred to as organic waste
Q30_16 Please select the items below that you would call organic waste? (Base: All respondents allocated to question n=906)
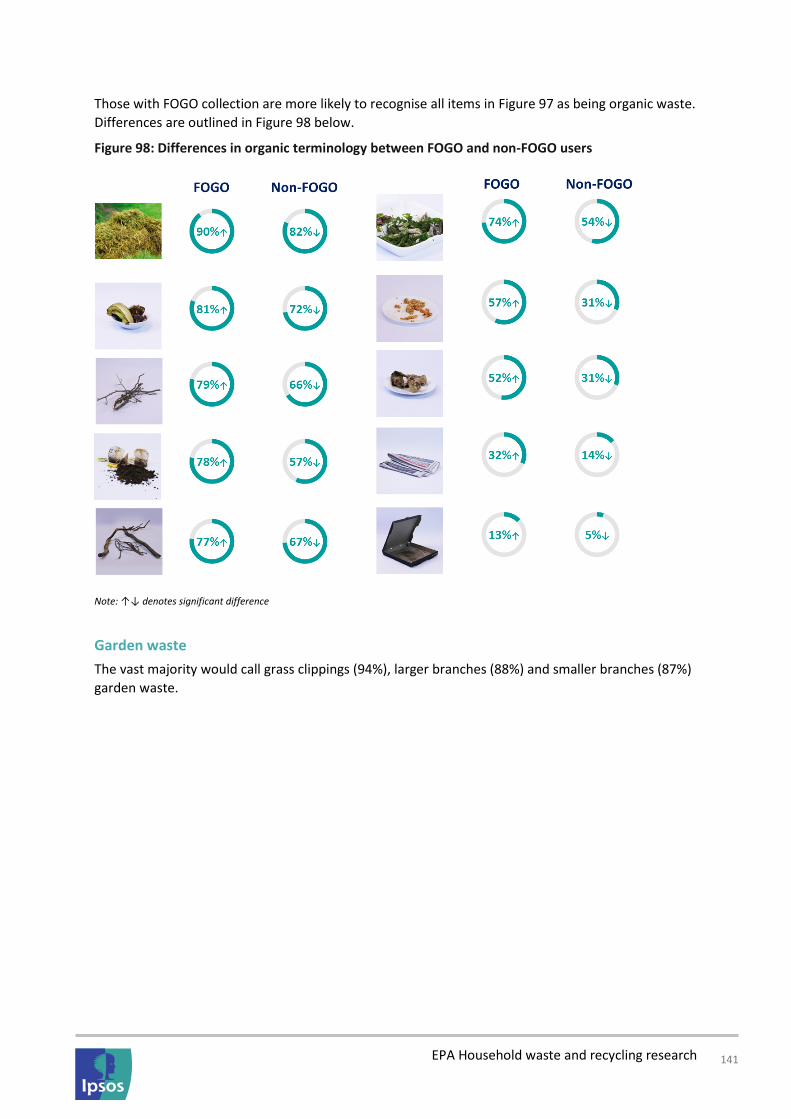
EPA Household waste and recycling research 141
Those with FOGO collection are more likely to recognise all items in Figure 97 as being organic waste.
Differences are outlined in Figure 98 below.
Figure 98: Differences in organic terminology between FOGO and non-FOGO users
Note: ↑↓ denotes significant difference
Garden waste
The vast majority would call grass clippings (94%), larger branches (88%) and smaller branches (87%)
garden waste.

EPA Household waste and recycling research 142
Figure 99: Items referred to as garden waste
Q30_20 Please select the items below that you would call garden waste? (Base: All respondents allocated to question n=884)
Those using garden waste collection are more likely to recognise small branches (92%) and larger
branches (91%) as garden waste (compared with 86% and 85% of non-garden waste users,
respectively). Garden waste users are also more likely to recognise that mouldy food is not garden
waste (19% compared with 27% of non-garden waste users).
Food waste
Plate scrapings (88%), fruit and vegetable peelings (87%), leftovers (87%), meat scraps and bones
(84%), and mouldy food (82%) are all generally considered to be food waste by most.

EPA Household waste and recycling research 143
Figure 100: Items referred to as food waste
Q30_17 Please select the items below that you would call food waste? (Base: All respondents allocated to question n=947)
Food scraps
Similarly, plate scrapings (91%), leftovers (88%), meat scraps and bones (88%), fruit and vegetables
peelings (86%) and mouldy food (82%) are all generally considered by most to be food scraps. Much
fewer (46%) would call vegetable tops food scraps.
Figure 101: Items referred to as food scraps
Q30_18 Please select the items below that you would call food scraps? (Base: All respondents allocated to question n=922)

EPA Household waste and recycling research 144
Those using FOGO collection are more likely to recognise the following items as being food scraps:
• Vegetable and fruit peelings (92% compared with 84% of those without FOGO);
• Tea bags and coffee grounds (72% compared with 55% of those without FOGO) and
• Vegetable tops (59% compared with 42% of those without FOGO).
Leftovers
Most would call leftovers (86%) and plate scrapings (84%) leftovers. Three quarters would also
consider mouldy food (74%), and meat scraps and bones (73%) to be leftovers.
Figure 102: Items referred to as leftovers
Q30_19 Please select the items below that you would call leftovers? (Base: All respondents allocated to question n=922)
6.10 General values and attitudes In order to develop a greater understanding of New South Wales’ overall attitude towards the
environment and life in general and how this feeds into household waste and recycling behaviour,
participants were asked to rate their agreement with a series of statements covering these topics.
These statements fed into the segmentation reported above. Overall findings are reported here.
In summary, there is an overwhelmingly positive attitude towards recycling, and many feel they can
personally make a difference to the environment. Around half are making an effort to stay informed
about the impact of waste on the environment and a similar proportion are choosing to minimise the
amount of packaging on products they buy.
Over half are interested in political events within Australia and overseas and many would like to see
the government taking greater action against climate change regardless of the current social and
economic environment. Additionally, almost three quarters believe businesses should be doing more
to combat environmental issues.
The following sections cover these attitudes in greater depth by examining the key subgroups of the
population.

EPA Household waste and recycling research 145
Attitudes towards the environment
Recycling well makes a difference
The majority (84%) believe that recycling well makes a big difference to the environment.
Figure 103: Recycling well makes a difference to the environment
Q27_4 To what extent do you personally agree with each of the statements below? – Recycling well makes big difference on the
environment (Base: All respondents n=2070)
Those who believe they understand the recycling system well are more likely to believe recycling well
makes a difference to the environment (86% compared to 74% those with a poor understanding).
The government’s role in climate change management
More than half (58%) believe the government should be doing more to tackle climate change
regardless of economic or social conditions.
Figure 104: The government should be taking more action against climate change
Q27_1 To what extent do you personally agree with each of the statements below? – The government should take urgent action on climate
change regardless of the current economic and social conditions (Base: All respondents n=2070)
Those with a home composting system are more likely to agree (67% compared to 55% of those
without). Similarly, MUDs are more likely to think the government should be taking more action
against climate change (64% compared with 55% of SUDs).
Business’ role in environmental management
Three quarters (74%) think business should be doing more to tackle environmental problems.

EPA Household waste and recycling research 146
Figure 105: Businesses should be doing more to tackle environmental problems
Q27_2 To what extent do you personally agree with each of the statements below? – I believe business should be doing more to tackle
environmental problems (Base: All respondents n=2070)
Women (78%) and those with a home composting system (80%) are more likely to believe this should
be the case compared with men (72%) and those without home composting (73%) respectively.
Effort to stay informed on waste
Only half (50%) say they make an effort to stay informed about the impacts of waste on the
environment.
Figure 106: Make an effort to stay informed about the impact of waste on the environment
Q27_10 To what extent do you personally agree with each of the statements below? – I make efforts to stay informed about the impacts of
waste on the environment (Base: All respondents n=2070)
Those who understand the recycling system well are significantly more likely to stay informed (53%
compared to 19% of those with a poor understanding).
Personal ability to make an environmental difference
However, two thirds (66%) believe they can personally make a difference to the environment.
Figure 107: Ability to make a personal difference to the environment
Q27_3 To what extent do you personally agree with each of the statements below? – I feel I can personally make a difference to the
environment (Base: All respondents n=2070)
Home composters (75%) and those who understand the recycling system well (69%) are more likely
to believe in their ability to make a difference compared with those without composting (62%) and

EPA Household waste and recycling research 147
those with a poor understanding of recycling (44%). Women are also more likely to believe they can
make a difference to the environment (70% compared to 62% of men).
Packaging minimisation
Over half (55%) say they try to minimise the amount of packaging on products they buy.
Figure 108: Minimise amount of packaging bought
Q27_5 To what extent do you personally agree with each of the statements below? –I always try to minimise the amount of packaging on
the products I buy (Base: All respondents n=2070)
Home composters (68%) and over 25s (56%) are more likely to make an effort to minimise packaging
compared with those without home composting (50%) and young people (46%).
Attitudes towards life
Doing just enough work to get by
Almost one third (29%) say they do just enough work to get by.
Figure 109: Do just enough work to get by
Q27_6 To what extent do you personally agree with each of the statements below? – I do just enough work to get by (Base: All
respondents d n=2070)
There are a number of demographic groups that are more likely to identify with this statement:
• Young people 37% compared with 28% of over 25s;
• MUDs 34% compared with 26% of SUDs;
• Those living in Sydney 32% compared with 23% of the rest of NSW;
• CALD 35% compared with 27% of Australian born; and
• Renters 34% compared with 26% of home owners.
Pride in responsibilities
The majority (72%) are proud of their responsibilities in life, particularly home owners (76%
compared with 68% of renters) and over 25s (73% compared with 61% of young people).

EPA Household waste and recycling research 148
Figure 110: Proud of responsibilities in life
Q27_8 To what extent do you personally agree with each of the statements below? – I am proud of the responsibilities I have in my life
(Base: All respondents n=2070)
Being careless and disorganised
Few (20%) say they are disorganised and careless at times, though young people are more likely to
agree that they are (36% compared with 19% of over 25s).
Figure 111: Disorganised and careless nature
Q27_7 To what extent do you personally agree with each of the statements below? – I can be disorganised and careless (Base: All
respondents n=2070)
Other demographic groups who are more likely to say they can be disorganised and careless are:
• Renters 26% compared with 17% of home owners;
• Men 26% compared with 20% of women; and
• Those with a poor understanding of the recycling system 38% compared to 19% of those with a
good understanding.
Interest in political events
Over half (57%) say they are interested in political events within Australia and abroad.
Figure 112: Interested in political events
Q27_9 To what extent do you personally agree with each of the statements below? – I am interested in political events in Australia and
other countries (Base: All respondents n=2070)

EPA Household waste and recycling research 149
There are several demographic groups that are more likely to stay abreast with these events
including:
• Men 66% compared with 49% of women;
• Over 25s 59% compared with young people 42%;
• Home owners 63% compared with renters 51%;
• Those with a good understanding of the recycling system 59% compared to those with a poor
understanding 47%; and
Those with a university degree or higher 65% compared with other 53%.