aNNUal REpORT 2010 - OpenGov NSW
196
ANNUAL REPORT 2010
-
Upload
khangminh22 -
Category
Documents
-
view
4 -
download
0
Transcript of aNNUal REpORT 2010 - OpenGov NSW

aNNUal REpORT2010
TH
E U
NIV
ER
SIT
Y O
F S
YD
NE
Y A
NN
UA
l Re
pO
RT
2010

The University of Sydney
NSW 2006
April 2011
The Hon. Adrian piccoli, Mp Minister for education level 34 Governor Macquarie Tower 1 Farrer place Sydney NSW 2000
Dear Minister,
The Senate of the University of Sydney has the honour of presenting to you, in accordance with the Annual Reports (Statutory Bodies) Act 1984 and its subsequent amendments, the report of the proceedings and financial statements of the University of Sydney for the year ended 31 December 2010.
Her Excellency professor Marie Bashir aC CVOChancellor
Dr Michael SpenceVice-Chancellor and principal

contents
statutory report 201058 Senate report72 Governance75 Student statistics76 Human resources80 Equal employment opportunity84 Multicultural policies and services
program report86 Occupational health and safety88 Legal affairs89 Privacy and personal information90 Freedom of information99 Waste management100 Risk management100 Consumer response101 International promotion
Financial reports and statements 2010104 Independent auditor’s report106 Statement by appointed officers107 Annual financial statements 2010176 Financial review of 2010
190 index
2010 in review02 Our charter, purpose
and objectives04 Chancellor’s message05 Vice-Chancellor’s message06 2010 in review: monthly highlights54 University officers55 Organisational chart56 Promotions to professor 2010

our objectives
Our new strategic plan outlines a range of strategies that are vital to ensure our ongoing academic strength and international competitiveness into the future. We aim to implement these strategies through a consistent program of collective planning, decision-making and management.
Many of the initiatives build on existing projects on the ‘Vice-Chancellor’s Work Slate’, which was launched in late 2008 to support the projects and activities that are critical to achieving our strategic objectives.
Throughout 2010, work continued on Work Slate projects to advance the five major objectives in the 2007 to 2010 Strategic Plan, as well as to address other priorities and opportunities. A review of the progress we made towards these objectives during 2010 is provided on pages 67 to 69.
our purpose and values
The University of Sydney can make a strong claim to being the first university in the world to admit students purely on the basis of academic merit.
We aim to create and sustain a university in which, for the benefit of both Australia and the wider world, the brightest researchers and the most promising students, whatever their social or cultural background, can thrive and realise their full potential.
This purpose is at the heart of our 2011–15 Strategic Plan – the outcome of a wide-ranging internal and external consultation that culminated in 2010. It also resonates with the historical aims of our institution, as captured in our charter, as well as our current ethos.
See page 70 for more information about the strategic planning process.
the university oF sydney
A busy campus: students outside the University’s historic Quadrangle buildings, at the top of the recently pedestrianised Eastern Avenue
2 2010 In REVIEW
our charter
The University of Sydney was incorporated by the Parliament of new South Wales on 1 October 1850, making it the first university to be established in Australia.
Under the University of Sydney Act 1989 (as amended), the University’s principal functions include:
– the provision of facilities for education and research of university standard
– the encouragement of the dissemination, advancement, development and application of knowledge informed by free enquiry
– the provision of courses of study or instruction across a range of fields, and the carrying out of research, to meet the needs of the community
– the participation in public discourse – the conferring of degrees, including those of bachelor, master and doctor, and the awarding of diplomas, certificates and other awards
– the provision of teaching and learning that engage with advanced knowledge and enquiry.


From the chancellor
4
This has been a year of continuing achievement at the University, with the completion of the new strategic plan and increasing collaboration between faculties in research and teaching, as well as with international colleagues.
Much of our international focus was on China. In October we held a formal academic ceremony in Shanghai to celebrate the achievement of 213 of our most recent Chinese graduates. Also in Shanghai, an alumni reception began with an impressive presentation by the University’s astrophysicists, accompanied by a performance of Holst’s The Planets by a combined ensemble of Sydney and Shanghai student musicians.
These events coincided with our highly successful involvement in the Shanghai World Expo. The University was well represented throughout the expo, attracting much favourable comment from senior Chinese academics and friends of the University.
Back in Sydney, important discussions began between student representatives and the University’s administration to ensure continuing quality and support for those aspects of campus life that enhance the student experience.
There were many academic highlights. For example, the third symposium of the Sydney University Tissue Engineering network, an event of far-reaching scientific implications, brought together the faculties of Engineering and Information Technologies, Science and Veterinary Science.
The Faculty of Agriculture, Food and natural Resources celebrated its centenary with an eye on the future as it continues to lead our region in meeting future challenges of food security. At a Great Hall ceremony, we formally recognised as alumni graduates of the Sydney Conservatorium of Music who achieved their qualifications prior to the incorporation of the Conservatorium into the University.
The Senate of the University welcomed several new members from the ranks of undergraduate and postgraduate students, and from state government nominees. And we acknowledged with considerable appreciation the valuable contributions of two retiring members: the Hon. John Aquilina MP (eight years service) and Ms Kim Anderson (seven years service).
As we celebrate the progress and successes of 2010, the University of Sydney can anticipate with confidence continuing achievement in the year ahead.
her excellency proFessor marie bashir ac cvoCHAnCELLOR

From the vice-chancellor
The University of Sydney Strategic Plan 2011–2015, which was developed with wide community consultation and endorsed by Senate in 2010, offers a vision of a university characterised not by disciplinary speciality, but by a commitment to excellence, to the service of its multiple communities, and to the diversity of its students and staff.
It is also the vision of a university as a single academic community. That is, it envisages a university able to benefit its communities not only through outstanding work in the disciplines, but also through work that draws them together in cross-disciplinary initiatives to find solutions to the problems that those communities face.
We believe that to achieve our vision, the University of Sydney must have structures of collective governance that draw on the insights of all our disciplinary communities, an ability to bring them together in cross-
disciplinary teaching and research, and an ongoing capacity for self-reflection, for performance assessment, and for focusing our efforts in areas of demonstrated and emerging strength.
It is to this end that we worked, with a renewed clarity of institutional purpose and direction, in 2010. The results of this endeavour can be seen in the pages of this annual report.
The highlights were many. Two new major interdisciplinary projects were given the green light: a University-wide centre for obesity, diabetes and cardiovascular disease that aims to transform the global health landscape; and a new China Studies Centre which will provide national leadership in the study of modern China.
Internationally, the breadth and depth of our expertise was highlighted in a program of academic, business and cultural events over six months at the 2010 World Expo in Shanghai.
At home, we concentrated on embedding principles of transparency and mutual accountability in our governance and management. We introduced important reforms in the way we collectively make decisions and allocate costs and resources so that we can now do so with greater transparency and greater contestability.
We have set ourselves a high bar in all we do. I believe we are a better university because of this.
dr michael spenceVICE-CHAnCELLOR And PRInCIPAL
5

We opened our minds to the city through the Sydney Festival and welcomed the IT leaders of tomorrow to campus for a summer school.
6
opening our minds to the city
January 2010 saw the start of the University’s three-year creative partnership with the Sydney Festival. Our campus came alive with exhilarating theatre, film, art, music and debate as we welcomed an eclectic and thought-provoking program of events and performers from around the world.
The Great Hall was at the heart of some of the most memorable events, from contemporary music performances to a ‘world café’ – described by some as speed dating for the intellectually curious – where participants joined and left tables of group discussions over and over again
january to build on conversations and allow cross-pollination of ideas on the theme of “Are we happy yet?”.
When the Great Hall was first opened to the public more than 150 years ago it was the largest building in the colony and the obvious centre for major cultural events, so it makes perfect sense that the University’s iconic building continues to be a wonderful venue for a festival of theatre, music and discussion.
Sharing our passion for the arts, performance and intellectual debate with the wider community is at the heart of our vision and values, and is something that we aim to do every day of the year.
1
2

In 2010 our Sydney Ideas public lecture series continued to spark debate (see page 13), and our museums and galleries, celebrating their 150th year, welcomed record numbers of visitors free-of-charge (see page 48), while the diverse year-round performing arts program presented by the University’s Seymour Centre went from strength to strength.
1. Ensemble Offspring, which includes Sydney Conservatorium of Music alumni, transformed the Great Hall into a unique sonic and visual environment. Photo: Jamie Williams.
2. The World Café held in the Great Hall. Photo: Jamie Williams.
3. The Manganiyar Seduction in the University’s Seymour Centre. Photo: Prudence Upton.
4. Participants in Ruhe (or Silence),which combined recitals of Schubert lieder with spoken monologues drawing on archives of the confessions of Dutch veterans who had enlisted with the Nazis. Photo: Jamie Williams.
5. Australian Buddhist monk Bhante Sujato on stage at the World Café. Photo: Jamie Williams.
4
5
3

Students from the January 2010 National Computer Science School pictured with Dr James Curran of the School of Information Technologies.
“In the computing world that’s ancient history. The challenge is our opportunity to inject some enthusiasm and energy into schools and teach programming in a way that’s more like computer science at university level.”
In September 2010 the nCSS received the Engineers Australia Excellence Award for Education and Training (Sydney division), which Curran says demonstrates the value industry places on the University’s work in attracting talented high school students from around Australia to IT and engineering more broadly.
dr Curran and dr Murphy also received a citation from the Australian Learning and Teaching Council (ALTC) for their outstanding commitment to first-year IT teaching, as well as a Vice-Chancellor’s Award for Outstanding Teaching (along with several other colleagues from the Faculty of Engineering and Information Technologies).
In January 2010, year 11 and 12 students spent 10 days on the University’s campus receiving expert tuition in programming for web applications and embedded systems for robotics. They also had the opportunity to meet representatives of nCSS sponsors including Altium, Atlassian, CargoWise, Embedded Systems Australia (ESA), Google, Macquarie Group and nSW Industry and Investment.
dr Curran and his colleague dr Tara Murphy have also worked with nICTA to develop a web-based programming challenge for nCSS that puts a series of computer programming challenges to school students over five weeks.
Although only in the early stages of their careers, dr Curran and dr Murphy recognise the importance of promoting the next generation of IT professionals.
“In new South Wales the software design and development curriculum was last updated in 1999,” says dr Curran.
the new it crowd
In January each year promising students descend on the national Computer Science School (nCSS), which was developed by the University’s School of Information Technologies in 1996 to address the significant problem of low interest among secondary school students in information and communications technology-related tertiary study and careers.
“The field of IT is an exciting and challenging one to work in,” says Sydney academic dr James Curran, current director of the nCSS. “But computing studies in schools rarely give that impression.”
A collaboration with national ICT Australia (nICTA), the nCSS is about giving students a realistic experience of studying computer science at university and helping them understand what it is like to work in the IT industry.
8 JAnUARy

Virology expert Professor Tony Cunningham was awarded the Order of Australia in the 2010 Australia Day honours. As Director of Westmead Millennium Institute and the Centre for Virus Research, he has significantly contributed to making infectious disease a research strength of Sydney Medical School.
“In January 2010 my studies took me to Laos. It was an amazing experience that dealt with the future of agriculture in developing countries and it really opened my eyes to the issues facing the world.”ash zamek AGRICULTURAL SCIEnCE UndERGRAdUATE
honorary professor bruce thom school of geosciences For service to the environment as an adviser and advocate for the ecological management of the coastal zone, as a contributor to public debate on natural resource policy, and to the academic and professional discipline of geography.
member oF the order oF australia (oam)associate professor joseph canalese school of rural health For service to medicine, to rural health, and to the community of dubbo.
professor andrew short school of geosciences For service to science in the area of coastal studies, and to the Australian Beach Safety and Management Program.
To read about other accolades awarded to University of Sydney staff in 2010, visit sydney.edu.au/about/profile/accolades
professor john christodoulou discipline of paediatrics and child health, director of western sydney genetics program For service to human genetics, particularly the metabolic disorders of children, as a researcher and clinician.
emeritus professor ken eltis Faculty of education and social work For service to education through teaching, administrative and research roles and through the design and implementation of innovative curriculum and reporting methods.
dr jill Forrest university carillonist For service to medicine as an academic, researcher and educator, and to music, as a composer and carillon recitalist.
roslyn giles Faculty of education and social work For service to the community, particularly in the field of social work, as an educator, researcher and practitioner, through professional associations and health care.
professor yiu-wing mai Faculty of engineering and information technologies For service to engineering, particularly in the fields of advanced composite materials and fracture research.
2010 australia day and Queen’s birthday honour roll
oFFicer oF the order oF australia (ao)associate professor judy cashmore sydney law school For distinguished service to the protection of children, as a research psychologist and advocate for the rights of children, through the development and implementation of social policy and law, and through leadership roles of organisations supporting child welfare.
professor anthony cunningham discipline of medicine For service to medicine, particularly in the field of viral research and through the development and leadership of medical and biomedical research.
member oF the order oF australia (am)professor louise baur discipline of paediatrics and child health For service to medicine, particularly in the field of paediatric obesity, as a researcher and academic, and to the community through support for a range of children’s charities.
professor michael boyer discipline of medicine For service to medical oncology as an educator and clinical researcher and through the development of integrated care facilities for people with cancer.

“We are among the leaders in improving mathematics and science education across the board. That means we have a responsibility to share what we are doing with others.”
We aim to make a difference in the real world: from improving science and mathematics teaching in schools to innovative new management education programs.
10
February
education innovation
Some of our finest minds are working together to propel mathematics and science education to the forefront of our national education conversation.
The Faculty of Science and the Faculty of Education and Social Work teamed up in February 2010 to address Australia’s serious shortage of secondary-school teachers across these disciplines, forming the Institute for Innovation in Science and Mathematics Education.
The cross-faculty partnership was born after three years of background work and informal discussions. The faculties’ shared teaching expertise is generating new and exciting ways of learning for high-school students. They hope to transform the image of mathematics and science, rekindle interest in these disciplines beyond year 10 and ultimately boost the teaching ranks.
A review conducted by former University of Sydney vice-chancellor Professor Gavin Brown in 2009 highlighted an alarming slump in interest, with the number of Australian students taking advanced mathematics dropping by 27 percent between 1995 and 2007.
“Learning science by doing science is at the core of all of our approaches to show the excitement of what real science is,” says the Faculty of Education and Social Work’s Professor Michael Jacobson, the institute’s deputy director.
One year on, the institute has had demonstrable success with that ‘real science’ approach in its adaptation of the MyScience initiative, where practising scientists and undergraduate science students act as mentors and support teachers – transforming classrooms into enquiry-based laboratories.
Associate Professor Manjula Sharma

The University’s ‘Science Alliance’ outreach programs bring 12,000 primary and high school students – as well as members of the public – on to campus each year for science workshops, shows and lectures. Left: a student dissects a sea urchin. Above: Students use an oscillator to measure the speed of a soundwave.
The scheme, MyScience@Sydney, has been a revelation for primary-school students, teachers and mentors, inspiring a whole new mindset for science education and hopefully generational change that will create a new breed of dedicated primary school teachers.
“Primary school students now feel that they can ‘do’ science in classrooms through this initiative, and quite often they continue with studying science,” says institute director and physicist Associate Professor Manjula Sharma.
“And the science mentors love it. They had totally forgotten that this is another way of looking at simple things, and how complex simple things can be from the eyes of little ones.”
Associate Professor Sharma describes the push to revitalise mathematics and science education as a “movement”. Supporting that push is an extraordinary array of academic expertise from across
the University, including mathematics, physics, technology, biology, chemistry, microbiology and, of course, education.
She believes this kind of cross-faculty collaboration is unique internationally, and agrees with Professor Jacobson that the University deserves much credit for its support of groundbreaking partnerships like this one.
“As a top-tier international, research-intensive university, the University of Sydney has faculties who excel in their respective research disciplines in science, mathematics, education, the learning sciences, and computer and information sciences,” says Professor Jacobson.
“What is relatively unique at Sydney, however, is a culture that actively encourages cross-disciplinary collaborative projects and activities.”
This collaboration will foster interdisciplinary research into how
school students learn and how teachers can better engage with them. It is also helping the University to improve the practice of education by encouraging more undergraduate and postgraduate students who love science to enter the teaching workforce.
“One excited young person from our University can go in and affect the entire attitude of a staffroom in a school’s science faculty,” adds Associate Professor Sharma.
She hopes the institute will set a national example for mathematics and science education that will give the movement more traction.
“We are changing the business of education. We are also changing the value that is given to education.”
11

12
London and Languedoc in France. In each place they learn to manage a different phase of the business lifecycle and are required to complete a real-life business consulting project.
One project EMBA participants tackled in 2010 was helping not-for-profit agency Foodbank new South Wales. They advised Foodbank how it could achieve its ambitious five-year goal to increase the amount of food it provides to hungry Australians from three million to 17 million kilograms a year.
Foodbank sources and distributes food and grocery industry donations to welfare agencies who feed the hungry. It is the largest hunger relief organisation in Australia with affiliates in six states and the northern Territory.
Participants visited Foodbank warehouses, suppliers and other relief agencies to understand the organisation’s challenges and how they could help it grow. They presented a
managing to make a diFFerence
In 2010, the University launched a new academic program that offers an outstanding group of senior professionals the opportunity to develop the skills, knowledge and personal attributes that will lead and inspire organisations globally.
The first cohort of the Global Executive MBA program (EMBA), included a diverse group of high-performing managers who have worked in a total of 26 countries, including Papua new Guinea, Germany, China and the United States. Employed across the private, public and not-for-profit sectors, the individuals contribute a rich tapestry of managerial experience that enhances group discussions and projects.
during five two-week intensive residential courses spread over 18 months, participants spend time in Bangalore, California’s Silicon Valley,
comprehensive business plan to the board of directors that recommended ways to improve inventory control, workplace capability planning and marketing.
“When we agreed to involve a group of EMBA students, we expected the ‘minds’ but we certainly didn’t expect the hearts as well,” Foodbank nSW Chairman Ern Pope said after the project. “We are so impressed with what we’ve seen.”
“We didn’t really know what to expect when we began the project but it has had an effect on all of us,” said Steve Jurkovich, a course participant who is a senior executive at Westpac new Zealand.
“As amazing as this country is, it is frustrating and really vexing that so many people go to work or send their kids off to school hungry. It is hard now for us to turn a blind eye and we are all deeply committed to the cause.”
Participants in the Global Executive MBA program in the classroom (photo: Adrian Cook) and making a difference in the field working on the Foodbank New South Wales project.
FEBRUARy

tackling the big Questions at sydney ideas
Renowned climate change scientist dr Michael Oppenheimer, the lead author on the third and fourth assessment reports of the Intergovernmental Panel on Climate Change, opened the 2010 Sydney Ideas public lecture series on 23 February by tackling recent controversy surrounding scientific reporting of global warming.
In his only Australian public lecture, dr Oppenheimer discussed how government policy – locally, nationally and internationally – needs to catch up with the science behind global warming.
Sydney Ideas attracts some of the world’s leading thinkers to speak at free public lectures on subjects as diverse as women’s rights across Asia Pacific, and defining the great Australian dream. More than 8500 people attended Sydney Ideas events in 2010.
13
a cashless campus – the new student smart card
Students enrolling in 2010 were able to take advantage of an Australian first: their student identification card contained a visa prepaid payment functionality powered by AnZ.
As well as providing photo Id, library borrowing privileges and secure building access, the ‘smarter’ student campus card allows students to load their own funds on to the card, which they can then use as an alternative to cash in stores or online. Students don’t have to be an AnZ customer to use this optional feature of their card.
The initiative – the first of its kind in Australia – received two major awards for innovation from the finance sector.
Renowned climate change scientist Dr Michael Oppenheimer, who opened the 2010 Sydney Ideas public lecture series.
The new visa-enabled student card.

As the first semester of 2010 got underway, the excellence of Sydney researchers was recognised with Fulbright scholarships and elections to learned academies.
The University of Sydney’s 2010 Fulbright scholars. Left to right: Dr James Curran, Dr Mary Haines and Professor Robert Park.
14
march Fulbright scholars step onto world stage
In March 2010 the Australian-American Fulbright commission named three University of Sydney academics among the 25 Australians to be honoured with a Fulbright scholarship: dr James Curran, Professor Robert Park and dr Mary Haines.
dr Curran, a senior lecturer in history, spent six months in Washington dC gaining new insights into political relations between Australia and America.
“Much of the recent writing on the Australian/American relationship has drawn extensively on Australian sources,” says dr Curran.
“My Fulbright scholarship gave me the opportunity to conduct research in Washington dC on the transformation of America’s East Asia policy in the 1970s and its impact on Asia-Pacific allies.”
He consulted records of the State department, national Security Council, department of defense and the White House, giving particular attention to recently released archival documents of key US administration officials.
The work of another scholar, Robert Park, is set to improve worldwide food security by helping to safeguard one of the world’s primary crops – wheat.

“My first semester kind of blew me out of the water. There were so many extracurricular things to get involved with. Sydney really lived up to its prestigious academic standard and I found the work extremely challenging. In order to have the best Sydney experience you really need to find a balance.”will leak ECOnOMICS/LAW STUdEnT
His scholarship enabled him to spend four months in the Cereal disease Laboratory at the US department of Agriculture, researching the genetic basis of resistance to a fungus-caused disease known as stem rust.
Rust diseases cause significant losses in wheat crops in north America, Australia and worldwide.
“Along with insects, pathogens reduce yields of the eight most important crops by a staggering 42 percent,” says Professor Park, Professor of Cereal Rust Research in Sydney’s Faculty of Agriculture, Food and natural Resources.
The third Sydney Fulbright scholar, dr Mary Haines, used her scholarship to visit the United States for three months to research health-care reform – a policy priority in the US and Australia.
“national health agencies recognise the acute shortage of health system researchers in Australia to inform health care reforms,” says dr Haines, an honorary senior lecturer in the Sydney Medical School and Health Services Research director at the Sax Institute.
Will Leak was one of the more than 12,500 students who began to study at the University in March 2010.

The three members of the Faculty of Science elected to the Australian Academy of Science in March 2010. Left to right: Professor Elaine Sadler, Dr Marianne Frommer and Professor Jeffrey Reimers.
16 MARCH
The only other woman to be elected to the academy in 2010 was dr Marianne Frommer, an Honorary Research Associate in the School of Biological Sciences, who was distinguished for her work in molecular genetics.
“I am rather gobsmacked to be chosen as a fellow, but thrilled on behalf of women in science,” dr Frommer said at the time of her election.
“Although I’ve been very fortunate, female scientists often struggle to build and maintain a research profile when faced with family responsibilities. It’s great that both women elected to the Academy of Science have come from the University of Sydney.”
The third member of the Faculty of Science appointed to the academy was Professor Jeffrey Reimers, from the School of Chemistry. An expert on
the electronic and vibrational structure of complex materials, he remembered being inspired as a student by the brilliance of members of the academy.
“My hope is that one day new students will look back at what we have done in terms of making first principles calculations of complex chemical systems a tool for experimental design, and think of it as just ‘everyday business’, and that people will be inspired to have new dreams and new breakthroughs,” he said.
Completing the Sydney quartet was Professor Roger Reddel, the director of the Children’s Medical Research Institute at Westmead Hospital, who was elected for his work on the molecular genetics of immortalisation – the ability of cancer cells to divide an unlimited number of times.
sydney scientists recognised by peers
Four Sydney academics were honoured among Australia’s leading scientists when they were elected as fellows of the Australian Academy of Science in March 2010.
Professor Elaine Sadler, an expert in the evolution of galaxies, was one of three members of the Faculty of Science to be elected. Along with colleagues in the School of Physics, she is playing a leading role in the development of the Australian SKA Pathfinder (ASKAP) radio telescope currently under construction in Western Australia.
“In this work, we hope to solve one of the biggest mysteries in cosmology: why did the largest galaxies in the Universe stop forming new stars at least seven billion years ago?” she says.

AusAID scholars Ntsiuoa Castalia from Lesotho, Barnaby Mulenga from Zambia and Janice Jonathan from South Africa.
and infection control assessment in hospitals in East Timor.
The three students pictured were approaching the end of their study and preparing to return to their home country.
A major benefit of the program is that scholarship recipients must be employed by the government of their home country, and continue to work for the government for at least two years after the completion of their scholarship.
“If you talk to anyone in the program, we talk about our vision,” said Janice Jonathan, who works for the South African government in trade and investment. She was studying for a double master’s degree in commerce and international business.
“We talk about how, when we get back home, we are going to be the future leaders.”
ntsiuoa Castalia, a journalist for the Lesotho Ministry of Communications who studied media practice at Sydney, and Barnaby Mulenga, employed by the Zambian Ministry of Land and studying a master’s in environmental science and law, agreed with Janice that their time at Sydney had been a life-changing experience.
“The way we are taught is so different,” said Janice. “Back home it’s far more instructional. At Sydney, things are much more democratic. you participate and interact and talk with other people. And that’s added so much value to life and what we’ve learned.”
However, it has been a two-way exchange of thoughts and ideas.
“We have first-hand experience of real issues, like poverty and AIdS, and this is extremely important in discussions with fellow students.”
making a diFFerence in the developing world
In 2010, 175 students sponsored by AusAId were enrolled in programs at the University of Sydney.
AusAId is the Australian government agency responsible for managing Australia’s overseas aid program. The scholarship program enables promising students from developing countries to complete postgraduate studies at Australian universities. The students then return to their home countries, where they use their expertise to implement positive changes.
Recent research by Sydney AusAId scholarship holders covers a broad range of topics and regions including maternal and child health services in rural Indonesia, human rights and corporate social responsibility in Vietnam, caste-based discrimination in nepal, reproductive health in the context of disasters in Pakistan,

“Sydney has changed the way that I think about the world. now I think that it is much more connected. I have felt that through my studies, but particularly through my relations with people from different countries who study at the University.”ali reza yunespour
We share important values with the Smith Family: giving people the chance to succeed, and to transform their lives through education. Our law students also have the opportunity to make a difference through a new social justice program.
his family to attend university, he plans to study a Phd in international relations, drawing on his own experiences.
“University should no longer be something only for people of advantage,” says Ali. “It should be a right in the same way as there is a right to attend high school. That’s how important higher education is: education is how you can change your circumstances in life.”
Under the new three-year agreement, the University will provide $90,000 annually to support Learning for Life scholarships for secondary school students from low-income families who are committed to their child’s education.
The University will also provide $10,000 each year to support a program of art-making workshops and exhibition tours for Learning for Life students aged between 15 and 18 years old.
partnership For change
In April the University of Sydney and the Smith Family renewed their joint commitment to supporting students of promise, with the University pledging more than a quarter of a million dollars to provide scholarships to disadvantaged students.
In 2004 Sydney became the first university to partner with the Smith Family through the Learning for Life program, which provides students and their families with financial, personal and mentoring support.
Students who have benefited from the partnership include Ali Reza yunespour, who completed his undergraduate degree in international studies in 2010 before moving on to honours.
Ali came to Australia from Afghanistan in 2005 and says the support he received through the Smith Family partnership was invaluable. The first in
april

1. Matt Costa, one of the 120 students to have taken part in Sydney Law School’s Social Justice Program since it launched in 2009.
2. School students attending a ‘University experience day’, organised with the Smith Family.
3. Senior Dental Education Officer Michael Jean-Louis shows school students how dental technology can be used to make appliances such as false teeth when people have lost structures after surgery.
Over the past six years, the program has helped to smooth the transition from secondary school, resulting in a marked difference: the proportion of students in the program undertaking further education increased from 21 percent in 2005 to 50 percent in 2009.
Identifying, attracting and supporting students of promise regardless of their background is a major goal of the University’s new strategic plan, which was developed during 2010.
While the Smith Family partnership is just one way we support students of the future, a program that enables our current students to support disadvantaged communities had its first full year of operations in 2010.
The Sydney Law School’s Social Justice Program provides undergraduate law students with an opportunity to gain practical legal experience while providing vital services to
disadvantaged communities through partnerships with community legal centres and other organisations that represent and advise special interest groups, such as Refugee Advice and Casework Services (RACS).
In 2009 the Law School received a $50,000 grant through the University’s Teaching Improvement and Equipment Scheme to develop curriculum design guidelines and a model curriculum for the program to help ensure good learning and teaching practice and consistency across all units of study as the program develops.
“Working with RACS, I had the opportunity to use my legal skills to benefit disadvantaged individuals and groups in our community,” says Matt Costa, one of the 120 students to have taken part in the program since launch.
“The experience broadened my perspective and changed my career and life goals in ways I never anticipated.”
19
“I didn’t just study, I participated. I learned things you can’t learn in a classroom.”
The program is directed by Professor Peter Cashman, appointed in 2009 as the inaugural Kim Santow Chair in Law and Social Justice.
1
2
3

20 APRIL
a tireless campaigner in this area. He and Becky Freeman undertook a significant review of the advertising methods used by tobacco companies, the risks associated with smoking, and ways to combat its massive impact on public health. At present, lung cancer is the leading cause of cancer deaths worldwide.
In 2008 they published a review of their findings, and followed this up with a multifaceted campaign to push a strategy for changing the packaging. They set up a campaigning page on Facebook to monitor ‘below-the-line’ tobacco promotions around the world, which has garnered major interest, and lobbied governments at state and federal level.
Professor Chapman believes the government’s decision will have a major effect on smoking-related deaths, and builds on valuable progress already made.
“Thanks to public health and awareness campaigns, tighter advertising and packaging controls, we are now seeing a dramatic downturn in deaths from lung cancer in Australia. you have to go back to 1962 to see the rates we have today.”
He hopes that Australia’s success in reversing its trend of smoking deaths means the lung cancer epidemic could be ‘history’ for the next generation.
team eFFort turns tide
University of Sydney tobacco control researcher Professor Simon Chapman and Phd student Becky Freeman scored a major win in April 2010, when the federal government announced a dramatic tax increase on cigarettes and an overhaul of packaging laws.
The new legislation proposed a ban on any colours, logos, brand imagery or promotional text that distinguishes one brand of cigarettes from another; only brand names will be allowed. This will have the effect of limiting the promotional power of cigarettes and reducing their uptake.
Professor Chapman, based in the School of Public Health, has been
Photo: Marco Del Grande/Fairfaxphotos

dictionary deFines a new vision For sydney history
A landmark collaboration between the University and the City of Sydney – the online dictionary of Sydney – won a national Trust Heritage Award in April, demonstrating its value as a community learning resource.
The dictionary, which launched earlier in 2010, provides locals, visitors and academics worldwide with access to detailed information about Sydney and its history in a digital format.
Initiated by a former city historian, Shirley Fitzgerald, the project received an Australian Research Council grant in 2005, with Professor Stephen
Garton, then dean of the Faculty of Arts and now Provost and deputy Vice-Chancellor, as chief investigator.
The ARC grant enabled the initial research and development, which also involved State Records nSW, the State Library of nSW and University of Technology, Sydney.
With input from more than 200 authors, the dictionary is an ever-expanding resource, with hundreds of entries, over 1000 multimedia items and thousands of fact snippets so far. It will eventually contain tens of thousands of entries about Sydney’s history – from prehistory and Aboriginal custodianship to colonial days and modern life.
The University is linked to the city in many ways. The Dictionary of Sydney, launched in 2010, was the outcome of a research collaboration over the course of five years.
The online collection includes an image of the legislation that established the University.
But it’s not just a one-way channel of information: website users can make suggestions, provide images, film and stories themselves to make it a true community resource.
The dictionary of Sydney is available at www.dictionaryofsydney.org
21

Supporting Indigenous participation and enabling change is core to our new strategy. We’ll build on our longstanding commitment in this area.
22
supporting reconciliation and driving change
In late May and early June the University held a program of events to mark national Reconciliation Week – a time to focus on building relationships between Indigenous and non-Indigenous Australians.
The University of Sydney has long played a role in reconciliation with the establishment in 1992 of the Koori Centre, which aims to be a centre of excellence in Indigenous Australian higher education.
To coincide with national Reconciliation Week 2010, Sydney University Press released a new history of the centre.
Taking Our Place tells the history of the interaction between the Aboriginal community and the University of Sydney – from 1966, when Charlie Perkins became the first known man
may
of Aboriginal origin to graduate with a degree from a university, to the present, when Indigenous people graduate across the academic spectrum.
Written by John Cleverley and current Koori Centre director Janet Mooney, the book explores the 1975 creation of the Aboriginal Teachers Aides program, which opened up universities for Aboriginal people. While ultimately absorbed into the TAFE system, the success of the groundbreaking program provided the catalyst for the creation of the Aboriginal Education Centre, renamed the Koori Centre in 1992.
To close national Reconciliation Week 2010, the University hosted an ‘experience day’ for Indigenous high school students from across nSW, many of whom had never considered tertiary education as an option.
School teachers and students explore the University at the 2010 Indigenous Students Experience Day.

23
Over 150 high school students from years 7 and 8 attended the second Indigenous Students’ Experience day, organised in partnership with the Smith Family and the Koori Centre. Students had the opportunity to experience university life through a tour of the campus and a series of hands-on workshops.
Elective workshops provided a range of opportunities for students including designing their ‘dream job’, handling insect collections, rock climbing for physical fitness, and solving Indigenous language puzzles.
our Future plans
Promoting Indigenous participation, engagement, education and research is one of the core strategies in the University’s new strategic plan.
There is a strong commitment across the University to enhance our approach to Indigenous participation. We see it as an essential and prominent part of our overall mission.
We also want to ensure that the voice of our Indigenous staff and students is heard at all levels of our decision-making and that we enjoy strong relationships with local and regional Indigenous communities.
We have already agreed to act on more than half of the recommendations made by a University-commissioned
independent review of Indigenous education, which was completed in August 2009.
We are working to implement those recommendations and reached a major milestone in late 2010 with the decision to recruit a deputy vice-chancellor specifically tasked with promoting Indigenous education and research.

Charlie Perkins enrolled at the University of Sydney in 1963 after being inspired to undertake university study when a stint playing soccer professionally in the UK led him to play in a game against Oxford University.
As well as being remembered as the first Indigenous Australian man to graduate from university, Perkins also organised the 1965 ‘freedom ride’, when 30 students travelled through rural new South Wales to protest against discrimination and poor living conditions for Indigenous Australians.
a springboard to oxFord
In May a University of Sydney alumnus won one of the inaugural Charlie Perkins Scholarships, becoming one of the first two Indigenous Australians to study at Oxford University.
Paul Gray holds a Bachelor of Science (Honours) in Psychology and a Bachelor of Arts in Sociology/Aboriginal Studies from the University of Sydney. He was the first Indigenous Australian student admitted to the combined degree at Sydney, and the first to graduate with honours in psychology.
Thanks to the scholarship, he is now studying in Oxford for a dPhil in Experimental Psychology.
The Charlie Perkins scholarships were launched in 2008 to enable Indigenous Australian students to study at Oxford. despite a significant Australian student body, it is believed an Indigenous Australian has never studied at Oxford.
1. University of Sydney graduate Paul Gray (right) pictured in Oxford with the other inaugural Charlie Perkins scholarship holder: RMIT graduate Christian Thompson. Photo: Christian Thompson.
2. Indigenous health promotion student Jake Byrne.
3. Left to right: Students on the Graduate Diploma in Health Promotion Sarah Boyne, Geoffrey Angeles, Kay Pinnock (from Radio 2SER), James Briggs, Simon Westaway (actor), Suzanne Plater (lecturer).
1
24 MAy
improving indigenous health
There were 16 Aboriginal and Torres Strait Islander students from across Australia enrolled in the School of Public Health’s Graduate diploma in Indigenous Health Promotion in 2010.
As part of their course, students learned how they can use the media to best advantage when ‘selling’ healthy behaviours to their communities.
For example, course organisers have partnered with Radio 2SER’s Jailbreak program to develop a ‘radio sting’ about hepatitis C for inmates in nSW prisons. With help from communications expert and actor Simon Westaway and Professor Gary Egger, students learn important practical skills in using the media as a health promotion tool.
“The whole aim of health promotion is to enable people to take control of their health and its determinants, thereby improving it,” explains course coordinator Suzanne Plater.
3
2

Honorary degree recipients in May included (right)virtuoso didgeridoo player William Barton, an honorary associate at the Sydney Conservatorium of Music, and (left) world-renowned conductor and pianist Vladimir Ashkenazy. Photos: Memento Photography.
25
her excellency Quentin bryce acGovernor-General of the Commonwealth of Australiadoctor of Laws (honoris causa)
emeritus professor edward watson mcwhinney QcFormer barrister, solicitor and academic at yale, Toronto, McGill, Indiana and other universities Honorary Fellow of the University of Sydney
28 mayvladimir ashkenazyPrincipal Conductor and Artistic Advisor of the Sydney Symphony Orchestradoctor of Music (honoris causa)
17 decemberdr kevin doylenational Veterinary director of the Australian Veterinary Association doctor of Veterinary Science (honoris causa)
george mackPresident of the Centre for Veterinary Education and its predecessor, the Post Graduate Foundation in Veterinary ScienceHonorary Fellow of the University of Sydney
16 aprilhelen ann mitchell oamExecutive director of the former Women’s Sports Association, former deputy director of the Sydney University Sport and President of the Sydney University Blues AssociationHonorary Fellow of the University of Sydney
kenneth Frank charles woolley amArchitect and teacher doctor of Science in Architecture (honoris causa)
7 maybunny gardiner-hill Honorary Governor of the Sydney Medical School Foundation Council, and former member of the Executive Committee and the Foundation’s Women’s CommitteeHonorary Fellow of the University of Sydney
14 mayjohn michael grillEngineers Australia Professional Engineer of the year 2007doctor of Engineering (honoris causa)
21 maywilliam bartondidgeridoo player and composer doctor of Music (honoris causa)
honorary awards conFerred at 2010 graduations
18 Februarydame janet ritterman dbeAcademic, educator and musician doctor of Music (honoris causa)
26 marchmarc newsonIndustrial designerdoctor of Visual Arts (honoris causa)
9 aprilowen harriesForeign policy analyst doctor of Letters (honoris causa)
dr dugald esler mclellanSenior Tutor, St Paul’s College Honorary Fellow of the University of Sydney

The Australian Pavilion at the Shanghai Expo. Photo: Department of Foreign Affairs and Trade.
The Shanghai Expo was the focus of our international engagement in 2010, and a platform for even better collaboration with government and partner universities overseas.
26
to host a series of academic, business and cultural events, highlighting the University’s research capabilities and the strength of its links with China.
The Expo underlined Sydney’s position as the most active Australian university in China, emphasised its standing as a world-class research university, and demonstrated to the governments of both countries the level of its commitment to China.
The sponsorship also strengthened our partnership with Australia’s department of Foreign Affairs and Trade (dFAT), and our links with China’s top universities and business community.
Highlights of the Expo program included six ‘frontiers of knowledge’ symposia, with some of the University’s leading academics and Chinese partners. Topics included spintronics, economics and
strengthening china ties
Two years on from the Beijing Olympics, China gave the world another demonstration of its economic and cultural revival at the 2010 World Expo.
The six-month event – for which 200 national pavilions were built on the site of a run-down industrial area of Shanghai – was visited by 73 million people, nearly all of them Chinese.
At the Australian Pavilion – an $83 million showcase for the country’s sights, sounds and tastes – the University of Sydney joined some of the biggest names in corporate Australia as a gold sponsor.
The sponsorship gave the University a continuous visible presence at the pavilion, which attracted more than 8 million visitors during the Expo’s duration. It also provided an opportunity
june

President of the Democratic Republic of Timor-Leste and Nobel Peace Prize laureate José Ramos-Horta gave a public address in the Great Hall in June 2010. He appeared as part of the University’s International Forum series, which brings together leaders from around the world to present their views on strategic international issues and the way in which these issues impact on Australia and the world.
University academics took part in the Shanghai Expo throughout the second half of 2010. Pictured here is Professor Hans Hendrischke, Professor of Chinese Political Economy and Director of the Confucius Institute at the University.
business, biomedical engineering and IT, translational health, higher education, and teaching and social work.
The University also managed a business program on behalf of dFAT, organising a series of high-level roundtables where government, business and academic leaders discussed key issues in the Australia-China relationship. University representatives took part in all the events, with the Vice-Chancellor chairing a roundtable on energy security and international trade law.
In other Expo events, a series of videos about the University was shown on a giant screen in the Australian Pavilion, while musicians from the Sydney Conservatorium of Music enhanced their international experience by giving live performances at the pavilion.
Conservatorium musicians also joined forces with their counterparts from the Shanghai Conservatory of Music and astronomers from the School of Physics for a special performance of the audiovisual show Music and the Cosmos, attended by many of the University’s Chinese alumni. The performance was followed by a gala dinner at the Australian Pavilion which saw the launch of a book celebrating the achievements of the Gang of nine, the first Chinese postgraduate students to enter Australia after the Cultural Revolution.
The Expo program, with its requirement to organise events in a different country and a different culture, posed a considerable logistical challenge for the University.
But its success will provide a springboard for the University’s longer-term activities in China, which include participation in the year of Australian Culture in China, research partnerships with the leading group of Chinese universities, and new opportunities with universities in western China.

28 JUnE
The scale of the nanoscience project is enormous, with a three-year timeline and two years of scheduled building works, due to start in July 2012.
The first major construction step is the demolition of the current annexe behind the School of Physics, in June 2012, to make way for the institute. This will involve relocating 100 postgraduate students and academic staff to temporary accommodation.
dealing with such challenges is a new experience for Professor Baldock, and provided an inspiring learning curve.
“during this project we have to do things which we’re not trained to do as academics,” he says.
“For instance, assessing architects, having conversations about land negotiations with the University’s infrastructure team and various financial aspects are things that someone like me – a scientist, academic and teacher – hasn’t necessarily come across before.”
In relative terms this project is still in its infancy, and the same could be said for nanoscience.
research, particularly for the School of Physics, which already houses two Australian Research Council centres of excellence.
“The school has gone from strength to strength,” says Professor Baldock. “That has happened on the basis of our research successes, being one of the top research schools at the University and one of the top, if not the top, schools of physics in Australia. Our researchers are leading their fields in the world.
“It’s on that basis that we’ve managed to get the funding for the new institute building, which will enable us to grow even bigger.”
Even bigger means doubling in size and housing more than 100 new researchers and 120 new postgraduate (Phd) students during the institute’s first three years of operation, due to start in mid-2014.
This growth will translate into the publication of more journal papers (the school has published around 500 papers in the past year) in quality academic journals such as Nature and Science.
thinking small For greater good
In nanoscience size really does matter, and tiny nano-devices have enormous potential to revolutionise the world as we know it.
The University of Sydney will soon lead the charge across this exciting scientific frontier, as home to the newly created Australian Institute for nanoscience.
nanoscience has the potential to deliver more energy-efficient communications and advances in medical imaging and treatment of diseases through nano-devices based on quantum physics and photonics.
Professor Clive Baldock, Head of the School of Physics, describes it as a “once-in-a-generation opportunity” for Sydney. As academic director, Baldock is helping to steer the $110 million-project, which is partly funded by a $40 million grant the University secured in June from the federal government’s Education Investment Fund.
It’s a golden opportunity to enhance our reputation as a world leader in transformative and interdisciplinary
Dr David Reilly in his laboratory.

“The nanoscience institute will be a unique facility in Australia. It will attract individuals from all over Australia and from overseas. But it will also enable us to have collaborative projects with colleagues within the University.”
29
“nanotechnology is really at a stage where we still don’t even understand the basics,” explains dr david Reilly, a senior lecturer in physics.
“Basic experiments need to be done into further understanding how nature works, and that will eventually lead to outcomes like nanomedicine and future computing devices.”
dr Reilly’s current laboratory in the basement of the School of Physics building is crammed with equipment, such as a fridge capable of operating at minus 273.14 degrees Celsius – one of the coldest places in the universe.
He explains that matter is jiggling about in a blur of motion at room temperature. If we cool things down, it makes it possible to see how matter is working.
dr Reilly likens this process to observing freeze-frame photos of a galloping horse to better understand how it runs.
So a few furlongs down the track, what could those outcomes mean for our everyday lives? Using quantum physics and photonics technologies, institute researchers could develop nano-devices that boost computer power and enhance medical diagnostics.
And their revolutionary work could also extend into optical communications – advancing the internet with speedier broadband and using new astronomical instruments and satellites to better understand our universe.
All this work needs to happen under carefully controlled laboratory conditions, including no vibrations and stable temperatures, dr Reilly adds.
The new institute will provide high-tech labs that meet those criteria and allow researchers to make those all-important discoveries about nature’s habits.
Ultimately the end product will be a “unique facility in Australia”, says Professor Baldock. The institute will be located a mere 200 metres from the building for the University’s new centre for obesity, diabetes and cardiovascular disease.
Such proximity will undoubtedly foster the interdisciplinary collaboration that the University believes is core to answering some of the critical problems of the 21st century.
Professor Clive Baldock

In July, some of our leading researchers were recognised among Australia’s best. Others made an exciting medical breakthrough, while we also launched a new human rights course.
understanding the technology oF learning
In July, Professor Peter Goodyear was awarded an Australian Laureate Fellowship by the Australian Research Council (ARC) – the first for a researcher working in the field of education.
An expert in learning technology and the learning sciences, Professor Goodyear will use the fellowship as a springboard to launch a series of related research projects that will look at how people learn with the aid of technology.
“Part of the point is to try and understand how to use technology in more productive ways in education, how to design better and more congenial learning environments, and how to help teachers in schools or universities make better decisions about organising, managing and designing learning environments,” he explains.
The fellowship, worth $2.75 million over the next five years, will be used to fund seven additional positions for postdoctoral and postgraduate researchers at the University’s Centre for Research on Computer-supported Learning and Cognition (CoCo).
CoCo was created in 2004 as a focus for the University’s research on the science and technology of learning. Located in the Faculty of Education and Social Work, it supports collaborations with teams in other disciplines such as IT, engineering and science.
july
“The bigger vision is to see if we can improve the science of design for networked learning,” says Professor Goodyear.
“People learn with and from each other, in relationships that depend, at least in part, on digital communications. Our new team will be trying to distil design principles by analysing successful learning networks.
“CoCo has a reputation for cutting-edge research on educational design and we attract academic visitors and Phd students from around the world. The ARC funding will also help us firm up our links with other leading research groups in the Asia Pacific region.”
The University scooped two of the 15 Laureate Fellowships awarded in 2010 (the other went to our world-leading physicist Professor Bryan Gaensler).
Professor Goodyear’s award comes close on the heels of his senior fellowship of the Australian Learning and Teaching Council and makes him the only person in Australia to have won top honours in both teaching and research.
Competition for Australian Laureate Fellowships is highly competitive because the award carries with it ARC recognition that the researcher has an outstanding international reputation, including as a mentor to early-career researchers. Their project must also support research that will deliver significant economic, environmental, social or cultural benefits to Australia.
Australian Laureate Fellow Professor Peter Goodyear, an expert in learning technology and the learning sciences.

models of human disorders that use a range of histological and biochemical analysis, behavioural and motor testing, and microsurgery. He now heads the BMRI’s translational neurodegeneration laboratory.
The research Professor Götz and dr Ittner released in July 2010 focused on the link between amyloid-beta and TAU.
Their finding challenged the accepted research paradigm by discovering how TAU affects and mediates the toxicity of amyloid-beta, which together with TAU causes the symptoms of Alzheimer’s.
“By genetically deleting TAU or introducing a non-functional variant of TAU, we found we could prevent the development of symptoms in mouse models of Alzheimer’s disease,” says dr Ittner, who received the Merck young Achiever Award 2010 for Excellence in Translational Medical Research.
Professor Götz and dr Ittner then explored the potential of their discovery to identify a treatment for Alzheimer’s.
“We translated our findings into a novel therapeutic approach by using a small peptide that mimics the effects of removing TAU from the synapse,” says dr Ittner.
“We were thrilled to find that this not only fully prevented the pathology in our Alzheimer’s disease models but cleared their memory deficits.”
closing in on a cure For alzheimer’s
University of Sydney researchers achieved a major breakthrough in 2010 by finding the causes of Alzheimer’s disease at a cellular level, thereby coming closer to identifying a potential cure.
The groundbreaking new study was led by Professor Jürgen Götz and dr Lars Ittner, based at the University’s Brain and Mind Research Institute (BMRI).
“More than 250,000 Australians are currently diagnosed with dementia, with numbers reaching epidemic proportions,” says Professor Götz, who heads the BMRI’s Alzheimer’s and Parkinson’s disease Laboratory.
“Of all diseases with a memory loss, Alzheimer’s is the most prevalent, predicted to affect one in 85 people globally by 2050. And, unfortunately, to date Alzheimer’s disease is incurable.”
Professor Götz was named as one of Australia’s leading researchers in 2010 by the national Health and Medical Research Council, Australia’s peak body for health and medical research. In a milestone work published in the influential journal Science in 2001, he had already showed that the two hallmark proteins amyloid-beta and TAU act together in Alzheimer’s, but their exact connection remained unexplained.
In 2005, dr Ittner joined Professor Götz, bringing his expertise in developing and analysing mouse
“The toll of Alzheimer’s disease on patients, their families and their carers, is enormous. Although there is still a long way to go we believe we may have found a way of treating it.”proFessor jürgen götz
Professor Jürgen Götz (left) with Dr Lars Ittner

developing human rights
In July, 30 Sydney postgraduates broke new ground by becoming the first students to take part in an innovative new human rights degree.
The challenge to build democracy and defend human rights in the Asia Pacific, the largest and most diverse region in the world, faces significant obstacles, not least the lack of strong institutions, a supportive public, appropriate legal frameworks and, lastly, education.
“In the Asia Pacific region there is very little formal higher education in the area of human rights and democratisation, especially education that takes a social science and humanities approach,” says Associate Professor danielle Celermajer, director of the Master of Human Rights and democratisation program.
“From the point of view of effective advocacy, however, the social sciences and humanities have major contributions to make.”
An activist and policy maker before becoming an academic, Associate Professor Celermajer’s work has influenced her belief that promoting human rights and democracy must encompass more than a legal response; it also involves research and creating social movements.
So it’s no surprise that she was the driving force behind the creation of the interdisciplinary master’s program, supported by a European Union grant of 1.5 million Euros (worth A$2.6 million at the time of the grant).
The program involves four overseas partners: Gadjah Mada University in Indonesia, Kathmandu School of Law in nepal, Thailand’s Mahidol University and the University of Colombo in Sri Lanka. Students spend a foundation semester in Sydney then move to one of these universities.
The partners were chosen for their regional importance and academic
credentials. Like the University of Sydney, they are also involved with local government and non-government organisations doing front-line human rights work – links that provide students with opportunities to undertake internships as part of their degree.
The range of nationalities on the program match the diversity of partners. The first intake included students from Australia, nepal, Pakistan, Bangladesh, India, Sri Lanka, the Maldives, Papua new Guinea, Indonesia, the Philippines, Vietnam, Thailand and Burma.
“These students came with an enormous wealth of knowledge and an extraordinary diversity of perspectives,” says Associate Professor Celermajer, who hopes that graduates will go on to establish a powerful regional network.
Based on this year’s experience that desire is well-founded.
“Already a Pakistani student has not only independently visited other
“We encourage students to interact in this course but the degree of shared learning was deeply inspiring.”
32 JULy
Associate Professor Danielle Celermajer

students in Thailand, but also secured funding for a group of fellow students to make a one-week field trip to Pakistan. Relationships and exchanges have started happening even before the creation of an alumni network.”
Four students have decided to use the course as a stepping stone to a Phd.
“Many people in the Asia Pacific have master’s degrees (most in subjects other than human rights) but not many have Phds so there is a tremendous deficit of higher research skills and academic capacity,” she says.
One of the Burmese students in the course described his excitement at the realisation that he could make a contribution as an ‘activist scholar’ through higher research. He plans to return to Sydney to research the situation of ethnic minorities in Burma.
In a different form of educational activism, another student is determined to establish a human rights curriculum
in Pakistan’s schools, where students are not exposed to the idea of a human rights-based approach to governance or political order.
These achievements will directly address the problem that most educational material on human rights has been developed in America or Europe, and most published research on human rights and democracy in the region comes from outside the Asia Pacific. The teaching of the master’s degree itself also answers this need for relevant content created in the region.
At the start of the course a Filipino student eloquently expressed her feelings about her work in a soliloquy, inspired by Hamlet. “To be” is the chance to change people’s lives for the better, she said, and “not to be” sums up the agonising losses and setbacks.
Associate Professor Celermajer hopes the master’s degree will give many more students the chance “to be”.
inForming government policy on parental leave
In July, the University of Sydney’s Professor Marian Baird (above) was named as part of a team of Australian researchers that won a $2.7 million project to conduct the federal government’s Paid Parental Leave (PPL) scheme evaluation.
Professor Baird joined the team, led by the University of Queensland’s Institute for Social Science Research, to probe the PPL scheme, which will offer up to 18 weeks of taxable payments at the federal minimum wage, subject to meeting certain eligibility criteria.
“This is a very exciting project which will have significant outcomes for Australian families,” said Professor Baird, from Sydney’s discipline of Work and Organisational Studies. “The team brings together experts in public policy, child and maternal welfare, gender relations and industrial relations.”
33
Professor Marian Baird

In 2010 we set our priorities for the next five years and changed the way we operate as a University. We are confident we will make better decisions as a result.
34
august
dialogue shaping change
Throughout 2010 almost 10,000 staff, students, alumni and friends took part in a wide-ranging consultation about the University’s strategy for the next five years. It was a chance for us, as an institution, to take a step back and ask ourselves “what direction do we want to take?”
“In the 1980s and 90s the University grew not just in the quality but also the quantity of what it did,” says Vice-Chancellor dr Michael Spence.
“I think it’s fair to say the University had grown so large and disparate that we had become many different units joined by a common name, but were not actually a federation of academic communities with a collective purpose.”
That gave rise to administrative duplication, as well as an inability to bring all of the University’s academic activities together to allow us to be more than the sum of our parts.
“Our consultations told us that people want to work for an institution that is transparent and where staff are held accountable both academically and financially,” says dr Spence. “They also want to be in a place where great
work is going on, and know that their institution is committed to dealing with the complex social issues faced by the community of which it is a part.”
The 2011–15 Strategic Plan, published in August 2010, therefore sets out 17 strategies that cover every area of our work – from research and education to community engagement at an international, national, and local level. It also aims to change fundamentally how the University operates, by ensuring we all share two key values: mutual accountability and engaged enquiry.
In short, it’s not just what we do – it’s how we do it.
“The problems of the 21st century are complex and cut across neat disciplinary lines,” says dr Spence.
“So we need to respond flexibly, to bring people together from different parts of the University for particular projects in research or teaching. That only works when different academic communities understand what is going on across the University and have had a part in shaping our priorities as a whole.
“We need to make sure that all the parts are strong, and they can only be
Consultation and discussion across the University were hallmarks of our strategic planning process throughout 2010.

35
strong when they are accountable to each other.”
Two major interdisciplinary projects in teaching and research stand at the centre of the strategic plan as exemplars for our new model.
We are developing a University-wide centre for obesity, diabetes and cardiovascular disease to examine everything from the economics of the grocery store to the physiology of obesity, as we try to find solutions to these chronic conditions, which are among the biggest killers in Australia and a growing threat to the developing and industrialised world.
Meanwhile, the China Studies Centre, launched in January 2011, will bring together almost 200 academic staff across the University who are working on modern China.
“Establishing these centres gives us the opportunity to prove that the University of Sydney can do interdisciplinary work in a pan-university way,” dr Spence says. “That is a very exciting prospect.”
The Vice-Chancellor highlights two other areas of the strategic plan that have particular appeal to him personally.
“We must carefully review the curriculum of our generalist undergraduate degrees, to make sure they are structured around the need to give our undergraduate students an education that is both broad and deep, and teaches them core skills in critical thinking and communication.
“If at the same time we can meet our agenda to diversify the student body and reach out to students from underrepresented groups then we will have achieved something really special.”
The foundation for greater academic excellence will come from our revised governance structure, including a new model for allocating income and costs.
Under the new strategic plan, management decision-making for the University as a whole now takes place at a fortnightly meeting of deans and deputy vice-chancellors, representing all parts of the University.
“Some universities are more hierarchical and follow a corporate model of governance,” dr Spence explains. “That will not work in an environment such as Sydney.”
“We think our flatter management structure, which is accountable to Senate, not only presents the opportunity to provide greater coherence across the University, but also to make decisions that are tested against the insights and wisdoms of the different academic communities.”
While many of the strategic changes will only be felt over the next couple of years, 2010 still ended with many of our people feeling differently about the University, as dr Spence recalls.
“Late last year I heard a professor – who is not involved in a central leadership role – talking about what 2010 had been like in the life of the University. She said that for the first time she felt like part of the University: part of a collective conversation about what it meant to be the University of Sydney and part of a collective process to set the agenda for our future.”
“That’s exactly what I hoped we would achieve in 2010.”
To learn more about the 2011–15 Strategic Plan, visit sydney.edu.au/strategy
“2010 has been a year of enormous activity and progress. We came together as a community of communities, to set priorities for the institution as a whole.”dr michael spence
Dr Michael Spence with Professor Lu Yongxiang, President of the Chinese Academy of Sciences, during a November visit to the University.

36 AUGUST
“Conservation cannot happen in isolation. Scientists need to work with local communities and other organisations like national parks and charities to succeed in protecting the environment.”
The Simpson desert, which straddles the northern Territory, Queensland and South Australia and accounts for 2.3 percent of the Australian landmass, may appear devoid of life, but it is home to a wide range of reptiles, small mammals, birds and vegetation and is extremely sensitive to environmental change.
Since launch, the project has made three or four field trips a year to the Simpson’s red dunes, which Professor dickman describes as a ‘biodiversity hotspot’.
Academics, students and volunteers have all taken part. Together they have discovered the amazing adaptations that frogs and desert mice use to cope with extreme conditions, how floods, wildfires and invasive species affect native small mammals and how so many species seem to appear and disappear at different times and places in the desert. His team has also documented the local extinction of several small mammals.
thriving in the hot zone
When biologist Professor Chris dickman first started to explore the Simpson desert in January 1990, he expected he would be moving on to another project after about five years.
However in 2010 his study of biodiversity in Australia’s arid zones notched up its 20-year anniversary. during that time Professor dickman and his team have explored the extraordinary ‘boom’ and ‘bust’ cycles that characterise inland Australia.
“After the first five or six years it became very clear that we were just scratching the surface,” says Professor dickman, who came to the University in 1989 and is now Professor in Terrestrial Ecology.
“The ecological processes driving the patterns of biodiversity we were seeing were so great and so variable. We realised we had to keep coming back through the good and bad seasons.”

37
Images from the Simpson Desert research project led by Professor Chris Dickman (above left). Photos: Aaron Greenville.
With arid zones making up 70 percent of Australia, the Simpson research has collected important data that reveal patterns of biodiversity impacting Australia’s environment. Furthermore, with climate change expected to make more parts of Australia and the wider world arid, the research also provides insight into how ecological patterns in other parts of the world will change in decades to come.
In 2009 Professor dickman and his research colleague Associate Professor Glenda Wardle received Australian Research Council funding to continue their research for five more years. In doing so they will create the longest ecological dataset for any arid zone in the southern hemisphere.
“At that point we’ll be in a position to consolidate a lot of the information that we have, and build some really good understanding to allow the on-ground management to take place, to conserve the biodiversity of the Simpson
and other arid environments,” says Professor dickman.
In August 2010, the University launched an exhibition in its SciTech Library to give visitors a snapshot of the 20-year project, helping them to experience the life of a desert ecologist.
Professor dickman hoped the exhibition would foster an appreciation of the challenges facing Australia’s unique wildlife, as well as an understanding of the key role of ecological research.
In recognition of his dedicated investigation into threats faced by nSW wildlife and achieving practical conservation outcomes in restoring biodiversity, he was named nSW Scientist of the year in the ‘Plant and Animal Sciences’ category in 2010.
He was one of three University of Sydney scientists honoured in the nSW-government-backed awards. Professor Bryan Gaensler won the ‘Physics, Earth Sciences, Chemistry
and Astronomy’ category and Professor Hugh durrant-Whyte, from the Faculty of Engineering and Information Technologies, won the overall nSW Scientist of the year title.
To date, over 500 volunteers have made the epic 2000km journey from the University of Sydney to the Simpson. Many have chosen to return to the desert again and again – testament, Professor dickman says, to the fascinating qualities of the work.
“In addition to the fact that the environment out there is beautiful and has some magnetic quality that gets under your skin and draws you back irresistibly every year, there are so many fascinating questions from a biological or ecological point of view.
“you really can’t wait to get back out there to find out what new surprises the desert will throw at you.”

As our involvement in the Shanghai World Expo continued, a high-profile roundtable probed some of the health problems facing our world. Back in Sydney, we launched a new facility to improve the sustainability of biofuels.
sharing the beneFits oF a healthy relationship
China and Australia have fundamentally different health systems, but the University’s sponsorship of the Shanghai World Expo gave the two countries the opportunity to explore the common challenges they face at a high-level translational health roundtable in Shanghai in September.
In both countries, chronic disease is now the largest preventable cause of death, with the situation in China exacerbated by diet and lifestyle changes related to urbanisation.
The roundtable speakers included academics from the University of Sydney, La Trobe and the Australian national University, along with specialists from Peking University, Fudan University and Shanghai Jiao Tong. It was also attended by representatives from government and medical organisations from both countries.
Participants discussed recent childhood obesity and diabetes research and explored how to translate research findings into real health outcomes.
One University of Sydney specialist suggested that action to tackle chronic disease could be linked to policies aimed at combating climate change.
“If we link these two issues – the need to reduce carbon emissions and deal with these serious health issues – then we can get more people out of their cars and school students walking to school,” Professor Louise Baur told the roundtable.
“We can encourage the consumption of locally grown unprocessed foods and we will be making a contribution to both climate change and diabetes and childhood obesity.”
Founding editor of the International Journal of Pediatric Obesity and a director of World Vision, Professor Baur has been a leading advocate against the marketing of junk food to children.
Part of the discipline of Paediatrics and Child Health at the Children’s Hospital at Westmead, she will play a significant role in the University’s new centre for obesity, diabetes and cardiovascular disease.
38
september
Professor Louise Baur, who was appointed a Member of the Order of Australia in 2010, was one of many University staff to participate in the Shanghai Expo.

The health symposium was part of a series of high-level roundtables that brought together experts from universities, governments and industry to discuss key challenges facing Australia and China.
Some of the social and economic factors discussed at the health roundtable were increased intake of processed foods, larger portion sizes, busier lifestyles with less time for considered food preparation and choice, and decreased physical activity.
Other attendees included four Sydney medical students, pictured above, who travelled to Shanghai as guests of China Eastern Airlines to take part in the symposium.
The students were chosen from a competitive selection process and spent five days in Shanghai, also attending the third Sino-Australian Symposium on translational medicine at Shanghai Jiao Tong University.
promoting disabled rights
In September, Professor Ron McCallum AO was re-elected to the United nations Committee on the Rights of Persons with disabilities. He was the first candidate elected, indicating the tremendous level of support he attracted during his recent term as committee chair.
Professor McCallum was the foundation professor in industrial law at the University of Sydney, and from 2002, served five years as dean of Law. When appointed to a full professorship in 1993 he was the first totally blind person to be appointed to such in a position in either Australia or new Zealand.
In January 2011, he was named Senior Australian of the year for 2011 (having been named nSW Senior Australian of the year the previous november). He plans to use his position to change the attitudes of Australians to disability, to one of greater understanding and acceptance.
Four Sydney students who travelled to the Shanghai Expo: Li Ming Wen, a PhD candidate at Sydney Medical School, who is researching obesity; Suat Dervish, also a PhD candidate at Sydney Medical School, studying immunology and rheumatoid arthritis; Cheryl Pui-Yan Au from Sydney School of Public Health, an honours student studying reproductive endocrinology; and Monica Cristina Robotin, a PhD candidate studying hepatitis-B related hepatocellular cancers.
39

The plant allows experimentation with the variables of production, with the aim of finding a viable processing method. The plant converts biomasses into biofuel under hydrothermal conditions, created by hot water (up to 350 degrees Celsius) and high pressure (equivalent to up to 250 atmospheres).
“So-called first-generation biofuels such as biodiesel compete with food supplies,” says Professor Thomas Maschmeyer from the School of Chemistry.
“We’re looking at increasingly important methods that produce fuel from whole plants, including stems and leaves, and not just seeds.”
Operating on a small scale, the new plant provides flexibility in the choice of operating conditions to enable
researchers to develop optimal methods. They can experiment with different production methods relatively cheaply and quickly, facilitating both fundamental and industrial research.
Researchers will also look at how biomass can be used to produce more efficiently chemicals used in food, fragrance and plastics production.
The plant was officially opened in September 2010 by deputy Vice-Chancellor (Research) Professor Jill Trewhella. Its construction was funded through the federal government’s national Collaborative Research Infrastructure Strategy, with additional support from the nSW Science Leveraging Fund and the University.
exploring new sources For our Future Fuel
Cross-faculty collaboration between two University of Sydney research groups is helping us take a step closer to meeting demand for a commercially viable, sustainable energy source through improving biofuel production.
Biofuels have long been touted as an alternative fuel source, and as ‘Peak Oil’ approaches – the point when the maximum rate of oil extraction is reached – demand for renewable liquid transport is growing.
“Before biofuels become a viable alternative to petrol we need to improve many aspects of production,” says Professor Brian Haynes from the School of Chemical and Biomolecular Engineering, home to a new pilot biomass processing plant.
40 SEPTEMBER
“We’re looking at increasingly important methods that produce fuel from whole plants, including stems and leaves, and not just seeds. Sources might include sugarcane bagasse or forestry by-products.”proFessor thomas maschmeyer
Left to right: Professor Brian Haynes and Professor Thomas Maschmeyer.

Aisha Harun, who chose to spend her Fulbright scholarship at the University of Sydney.
41
Floral anniversary tribute
The University brought new colour to people’s gardens in 2010 through the launch of a new variety of daisy.
The daisy Crazy centenary daisy, available at Australian garden centres from September and notable for its large blooms and high flower count, was developed by the Plant Breeding Institute as part of the celebrations to mark the 100th anniversary of the Faculty of Agriculture, Food and natural Resources
Over the course of 100 years, the faculty grew from having just four students, overseen by Australia’s first professor of agriculture, to the present day, with more than 600 students and researchers working at the cutting-edge of sustainable land practices. The faculty offers and teaches expertise in areas as diverse as economics, soil microbiology and bushfire management.
overseas scholars choose sydney For research
Aisha Harun, a medical student at the Johns Hopkins School of Medicine in Baltimore, Maryland, came to Sydney to spend 12 months on a Fulbright Postgraduate Scholarship, carrying out research into the interaction between multiculturalism and health outcomes in Australia.
As part of her work, she planned to identify the unmet needs for supportive care for Australian patients with colorectal cancer.
She chose Australia because of its long history of immigration and diversity. She will draw on her own experiences as a Muslim African-American woman, and contrast those with the experiences of other individuals living in a diverse society.

changing lives through development economics
nat Ware will head to Oxford as the University of Sydney’s latest Rhodes scholar with a clear aim: to make a tangible difference to those in need by reducing their vulnerability to natural and other disasters through improving their access to insurance services.
nat, named in October 2010 as the 2011 nSW Rhodes Scholar, recently completed an honours thesis at Sydney that focused on micro-insurance, which is designed to support low-income people and businesses not served by typical social or commercial insurance schemes.
His interest in development economics was first sparked by a visit to Mozambique as a 16-year-old World Vision sponsor. As a University of Sydney student in 2007 he founded 180 degrees Consulting, a pro bono student consultancy that helps
non-profit organisations to identify and overcome any challenges they are facing.
Over the past four years, 180 degrees Consulting has grown from a small student group to an international organisation with chapters in Australia, Mexico, Sweden, Turkey and Russia. At present there are 70 consulting projects, involving over 360 student consultants worldwide. One project involves combating arsenic poisoning in Bangladesh and another involves helping to reduce the incidence of sex trafficking in Cambodia.
Clients have included groups such as youth Off the Streets, the Cancer Council and the Red Cross.
“It’s a good opportunity for students to have a social impact and also gain work experience at the same time,” says nat.
“I am convinced that extending micro-insurance to poor villagers in a
“Sydney has encouraged me to do what I’m passionate about, rather than what I’m expected to do. The University of Sydney isn’t just about getting a degree: it’s about getting an all-round education.”
Nat Ware
In October, one of our departing students was awarded a Rhodes scholarship. We also focused our minds on the university students of the future.
42
october

cost-effective and scalable manner is the single greatest way to make a difference, with the potential to positively impact literally billions of lives, much like micro-credit has done.
“Working to increase access to essential financial services in developing countries is not something I want to do for a month, a year or even a decade. It is something I hope to do through my lifetime through academic research, pro bono consulting and on-the-ground projects.”
At Oxford he will study for a master’s in development economics, followed by a doctorate in micro-insurance. He relishes the challenges that await.
As he prepares to head overseas, nat acknowledges the opportunities that the University has given him, enabling him to put academic work into practice.
University of Sydney students have been successful in the last seven successive nSW Rhodes Scholarships.
43
school. Previously, ‘aspiration-raising’ exercises tended to focus on high school students, particularly in years 10, 11 and 12.
However the program also works closely with teachers and parents, recognising the influential role they have on school students.
Since launch, 375 teachers have been provided with professional development and more than 700 parents have been engaged.
We also learn a great deal from the program. Over 100 University of Sydney students have been involved as volunteers, delivering programs in Compass schools such as homework clubs and numeracy and literacy workshops.
providing a new direction For Future students
In its second year of operation, the University’s Compass program continued to work to change the perceptions of school students from low socioeconomic status backgrounds about higher education and encourage them to think about choosing to study at university.
Since the program launched in mid-2009 almost 7000 school students have taken part in 170 Compass events, activities and projects.
In 2010 the Compass program, part of the University’s Social Inclusion Unit, had partnerships to widen participation with 18 Sydney schools.
A partnership with the nSW and federal governments, Compass is the only program of its kind that starts working with children in early primary
Participants at October’s Compass showcase.

Sydney Bachelor of Music students Oliver Simpson and Sigrid Harris rehearsing during the Conservatorium’s October 2010 US tour. Photos: Dan White.
sharing a stage with the best
Musicians from the Sydney Conservatorium of Music capped an outstanding 2010 by linking up with new york’s Juilliard School for a joint concert at the Lincoln Centre.
The collaboration came on top of successful performances by Conservatorium students at the Bronnbach Festival in Germany and the World Expo in Shanghai earlier in the year.
It was only the second time that the Julliard – the world’s leading music education college – had teamed up with another music school for a concert performance. Thirty-four musicians from each college combined to form a 68-piece orchestra, conducted by Professor Imré Pallo from the Conservatorium and James dePreist, the Juilliard’s director of Conducting and Orchestral Studies.
44 OCTOBER

1. Master’s student Alex Croak at the Delhi Commonwealth Games. Photo courtesy of Sydney Uni Sport & Fitness.
2. The rugby team’s new recruit, Wallaby Berrick Barnes, is currently studying for a Graduate Certificate in Commerce. Photo courtesy of Sydney Uni Sport & Fitness.
3. The victorious men’s rowing eight after defeating the University of Melbourne, pictured with federal Minister for Sport Mark Arbib and University Vice-Chancellor Dr Michael Spence.
45
sporting heroics bring international gold
University of Sydney athletes had their most successful Commonwealth Games ever, with nine of 12 participating athletes returning from delhi in October as medal winners. The nine medallists between them won four gold, nine silver and two bronze.
Alex Croak, a master’s student in health sciences, became the first Australian athlete to win Commonwealth gold in two sports, adding her gold medal in the 10-metre synchronised platform diving to the gymnastics gold she won at the 2002 Manchester Commonwealth Games.
On the rugby field, the men’s XV won its sixth consecutive Shute Shield grand final and several players were selected for the Australian national team.
Also in October, the men’s rowing eight defeated their University of Melbourne equivalents in a 7.3km open-water race on Sydney harbour – the first time in 150 years that the boat clubs from Australia’s two oldest universities had met. In the previous meeting, a race on Melbourne’s yarra River in 1860, the Sydney eight included a young Edmund Barton, later to become Australia’s first Prime Minister.
1
2
3
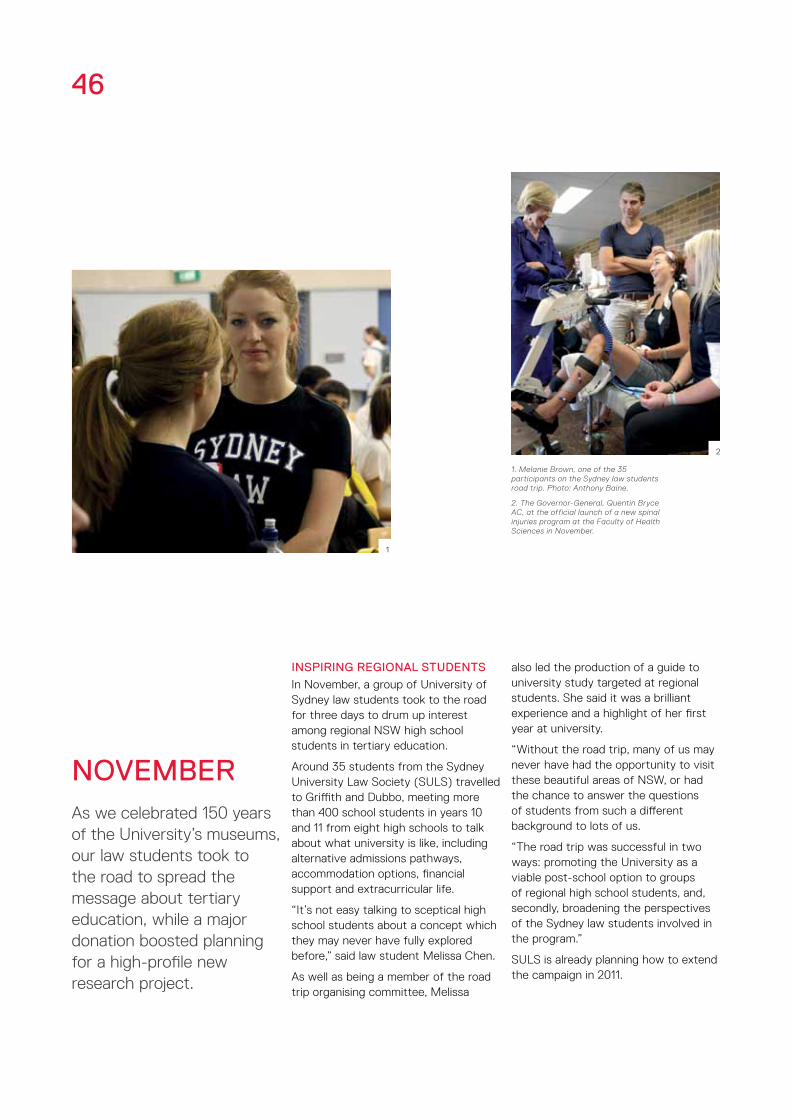
As we celebrated 150 years of the University’s museums, our law students took to the road to spread the message about tertiary education, while a major donation boosted planning for a high-profile new research project.
1. Melanie Brown, one of the 35 participants on the Sydney law students road trip. Photo: Anthony Baine.
2. The Governor-General, Quentin Bryce AC, at the official launch of a new spinal injuries program at the Faculty of Health Sciences in November.
1
2
46
november
inspiring regional students
In november, a group of University of Sydney law students took to the road for three days to drum up interest among regional nSW high school students in tertiary education.
Around 35 students from the Sydney University Law Society (SULS) travelled to Griffith and dubbo, meeting more than 400 school students in years 10 and 11 from eight high schools to talk about what university is like, including alternative admissions pathways, accommodation options, financial support and extracurricular life.
“It’s not easy talking to sceptical high school students about a concept which they may never have fully explored before,” said law student Melissa Chen.
As well as being a member of the road trip organising committee, Melissa
also led the production of a guide to university study targeted at regional students. She said it was a brilliant experience and a highlight of her first year at university.
“Without the road trip, many of us may never have had the opportunity to visit these beautiful areas of nSW, or had the chance to answer the questions of students from such a different background to lots of us.
“The road trip was successful in two ways: promoting the University as a viable post-school option to groups of regional high school students, and, secondly, broadening the perspectives of the Sydney law students involved in the program.”
SULS is already planning how to extend the campaign in 2011.

1. University of Sydney Vice-Chancellor Dr Michael Spence with Australian Diabetes Council President Dr Neville Howard at a ceremony to mark a major endowment.
2. Concept drawing for the building of the University’s centre for obesity, diabetes and cardiovascular disease.
2
47
$5 million endowment to combat disease
In november the Australian diabetes Council (AdC) announced it would provide a $5 million endowment that will enable the University to appoint a new Chair of diabetes as part of a major new research and teaching initiative.
When appointed, the new Australian diabetes Council Chair of diabetes will become a pivotal part of the University’s new centre for obesity, diabetes and cardiovascular disease, which aims to improve the prevention, diagnosis and treatment of these and related conditions.
AdC President dr neville Howard said at the time of the announcement that his organisation had been inspired by the University’s vision for the centre as a place that would break down barriers between academic disciplines to deliver new solutions that tackle chronic lifestyle diseases.
“All facets of the community need to be engaged and working together to turn around the diabetes epidemic,” dr Howard said.
“The scale of the epidemic, and its cost both in human and monetary terms, is such that we have to continually think of new ways to try and combat the disease.”
The centre will be a high-profile example of interdisciplinary research in action. Because these ‘chronic lifestyle diseases’ have implications for many areas of society, including food production, public health and policymaking, the centre will draw on expertise from across the University – from agriculture, through basic and clinical research through to social policy, education and urban planning – to help us to understand and overcome these diseases.
1
new partnership to improve outcomes aFter spinal injury
The Governor-General, Quentin Bryce AC, visited the University’s Cumberland Campus in early november to officially launch the first Spinal Cord Injuries Australia ‘Walk On’ program in nSW.
The program, which focuses on maximising functional recovery through exercise, is delivered by therapists at the Faculty of Health Sciences under a unique partnership arrangement that embeds community-based service delivery into teaching and research.
“The partnership allows us to offer this vital service to the community while also introducing our students to cutting-edge exercise rehabilitation techniques and research,” dean of Health Sciences Professor Gwynnyth Llewellyn said at the launch.
With an estimated 360 Australians sustaining a spinal cord injury each year, the demand for services is high.

Into the Light: 150 years of cultural treasures at the University of Sydney contains a selection of photographs of items in the collections, accompanied by essays by the museums’ senior curators and writer david Malouf, that are inspired by the collections and offer additional insights into their historic, academic and cultural resonance.
The University’s Macleay Museum, nicholson Museum and University Art Gallery attracted a record number of 79,000 visitors in 2010, including over 8000 school students in curricula-based classes. The museums and gallery held 10 exhibitions and 59 public lectures, talks and forums, including two study days and six children’s workshops.
celebrating our cultural treasures
In november the University published a new book on some of Australia’s best-hidden cultural treasures to mark the 150th birthday of the nation’s oldest university museum collection.
Since the University of Sydney’s first museum – the nicholson – opened its doors in 1860, its three museums have grown to become home to internationally significant, yet relatively unknown collections comprising 700,000-plus artefacts and objects. The University’s antiquities collection is the largest in the southern hemisphere, its insect collection includes specimens used by entomologists around the world and its art collection contains more than 6000 works acquired since 1850.
1. South Italian funerary nestoris. 350–300 BC. Nicholson Museum NM 46.46
2. Canoe ornament, before 1870, unknown Santa Isabel maker wood, plant fibre, pigments, 75 × 21 cm Macleay Family collections, donated 1865–1891, Macleay Museum ETI.586
3. An epitome of the natural history of the insects of China Edward Donovan, London: printed for the author by T Bensley, 1798 Fisher Library, Rare Books and Special Collections
4. Carbon filament light globe, c.1880 glass, 13 cm (h) × 6 cm (diam.) St George Lane-Fox Unknown donor, 1977 Macleay Museum SC1977.158
Images ©Michael Myers 2010
48 nOVEMBER
1
2
3
4

mexican honours insight
History student Stephanie Mawson spent months in Mexico to research her honours thesis, scouring archives of 17th-century documents to gain greater insight into the movement of people between Spain, Mexico and the Philippines.
“Research needs to have relevance for people now,” she comments. “I found it really instructive to look at the lives of everyday people in the pre-industrial age, and their power to shape society.
“As a historian, you have to engage in understanding the present as well as the past.”
The quality of Mawson’s work was recognised by the award of the University Medal. In november she also received the Convocation Medal, which is awarded each year to an outstanding student who has completed their undergraduate studies with excellent results and made an exceptional contribution to the life of the University.
As co-founder and executive member of the History Students Society, Mawson enriched the experiences of her fellow history students, campaigned tirelessly for greater student engagement in the history curriculum, and created an acclaimed program of seminars and workshops run by and for students and academics.
1
2
49
humanities excellence
Three University of Sydney academics were among 19 elected as fellows of the Australian Academy of the Humanities in november, in recognition of their outstanding scholarship.
Professor Alison Bashford has published widely on the cultural history of medicine and public health, Her most recent work analyses the problem of world overpopulation in the 1920s.
Professor Alison Betts (above) is particularly interested in the archaeology and history of nomadic peoples. Her research has led her down a range of paths including the prehistory of the north Arabian steppe, rock art, hunting traps and water harvesting systems, and nomad-state relations.
Professor Moira Gatens is internationally recognised for her research in social and political philosophy, ethics, 17th-century philosophy (especially dutch philosopher Spinoza) and feminist theory.
1. Convocation medallist Stephanie Mawson.
2. Entertainment at the November Alumni Awards ceremony in the University’s Great Hall.
3. Professor Alison Betts, one of three Sydney academics elected to the Australian Academy of the Humanities in November.
3

As 2010 drew to an end, we were already preparing for 2011: supporting academics to develop their research, showcasing the work of departing students, and allocating funds from generous donations.
50
december
promoting eQuity
For dr Sue Goodwin, 2010 was a busy year that took her research to a new level thanks to the support of an innovative new University fellowship.
The Thompson fellowship enabled dr Goodwin, from the Faculty of Education and Social Work, to step away from teaching in 2010 to deepen her understanding of how preconceptions about gender and social class can impact people’s lives.
She wants her work to inform policy so that, for example, career choices do not continue to be so heavily shaped by gender or social background.
“My work is about confronting key issues in our culture that really constrain people’s attitudes.”
One of the books she produced during 2010, The Good Mother: contemporary motherhoods in Australia (co-edited with dr Kate Huppatz), explores the reality that contemporary mothers in Australia are no longer exclusively white, heterosexual, economically dependent and child focused.
“Australia is a laggard,” says dr Goodwin. “dominant ideas and
policies relating to motherhood in Australia really constrain and disadvantage women.”
The University introduced the Thompson Fellowships in 2009 to counter the underrepresentation of women at senior academic levels in the University. The fellowships provide opportunities for mid-career female academics to develop and strengthen their research, preparing them to apply for and succeed in more senior academic roles in the near future.
“As well as producing a lot of research, the fellowship gave me the opportunity to do a lot of other things, such as taking part in wider community events such as the Festival of dangerous Ideas and Sydney Ideas,” says dr Goodwin.
“It really opened up opportunities for me that were so valuable.”
The next round of Thompson fellows were announced in december 2010, along with two other equity fellowships. The Brown Fellowships support academics who are resuming their academic careers after sustained caring duties, while the Laffan Fellowships support researchers who have experienced a significant disability.

2
1
valuing the support oF donors
In 2010 the University once again saw substantial growth in philanthropic income for the University thanks to the generosity and loyalty of our donors. Over $44 million was donated, up from $35 million in 2009.
More than 8700 donors contributed to the University, across all 16 of our faculties. Across the University, donor numbers grew by 16 percent, and 2010 was a record year for bequest income – totalling more than $20 million. Bequests were primarily directed toward student support and research, but considerable unrestricted bequests were also received, which allow the University to apply funds to its highest priorities now and in the future.
Particularly exciting was a new initiative encouraging alumni who have recently graduated to give to the University.
donations to the ‘Challenge Fund’ are matched dollar-for-dollar from a specific fund established by a small number of generous alumni.
new treatment For trauma
Sydney nursing School’s Clinical Associate Professor Kate Curtis “is among the new breed of nurse conquering academia” according to the Sydney Morning Herald, which in december named her among its 100 most influential people for 2010.
She is currently leading a major research collaboration across 10 trauma centres and two universities – the first phase of a research program that will enable the assessment of the broader financial, clinical and health impacts associated with trauma – the major cause of death for people under 45. The research will have significant planning, budget and resource implications for the Australian health care system.
Associate Professor Curtis, who was appointed as an honorary professorial fellow at the George Institute for Global Health, was one of five Sydney academics named in the Herald’s list. The others were IT specialist dr James Curran (see page 8), robotics expert Professor Hugh durrant-Whyte, Professor of Physics Bryan Gaensler and Professor Peter Goodyear (see page 30).
51
Launched in november 2009, the Challenge Fund has been used in six separate giving programs, and by the end of 2010 had received a total of 901 gifts. It proved a fantastic incentive for young alumni considering their first-ever gift to the University, and has greatly expanded alumni support at Sydney.
1. Clinical Associate Professor Kate Curtis
2. Students take to the phones to encourage donations to the University as part of a fundraising campaign. Photo: Second Storey Productions.

a new understanding oF creative arts research
Every december, Sydney College of the Arts (SCA) showcases the work of more than 50 postgraduate students who are completing their degrees.
They join the artist ranks of our alumni, who have had a significant impact on Australia’s cultural life across the visual arts, music and architecture.
Over coming years we aim to continue this cultural contribution and develop new understandings of practice-based creative arts research by grouping the SCA with the Faculty of Architecture, design and Planning and the Sydney Conservatorium of Music in one of the University’s seven new divisional groupings.
1. A visitor to the SCA walks past Solve et Coagula, a work by Master of Studio Art candidate Stevie Fieldsend. Photographer: Ian Hobbs.
2. Jack McGrath, Journey to the Centre of the Mind, Master of Fine Arts candidate.
3. Lucas Davidson, Present Absence, Master of Studio Art candidate.
52 dECEMBER
“In addition, there is a rich diversity that promises synergies arising out of the coming together of difference that, communally, we haven’t even begun to explore.”
Professor Rhodes sees this as a significant point for creative arts in the life of the University.
While the Faculty of Architecture (as it was originally called) became part of the University in the 1920s, the Conservatorium and SCA were only incorporated into the University in 1990.
Professor Rhodes describes the period since then as a time of transition during which the new faculties – highly successful in their previous incarnations – adapted to being part
The creation of the divisions aims to enable better decision-making and joint planning among faculties that have professional or academic areas of common interest, ensuring better coordination and accountability across the University as a whole.
The dean of the SCA, Professor Colin Rhodes, says the new division of Architecture and Creative Arts, which he chairs, promises a highly productive future.
“These three faculties share much in common, especially in aspects of teaching and learning delivery, research methodologies and cultural centrality,” he says.
2
1 3

531. Jan Howlin, Comforts of Home, Master of Fine Arts candidate. Photographer: Antony Bowell.
2. Work by third-year Bachelor of Design in Architecture student Aysha Abu-sharifa.
3. Visitors to the Faculty of Architecture, Design and Planning’s Graduate Exhibition in November/December 2010.
of the University (and vice versa), particularly when ‘traditional’ academic activities such as journal papers were not the main result of research.
“Although outcomes like journal papers and books are valid in the creative arts, it’s highly unlikely they would be the primary outcomes of research – which are more likely to be works of art, performances, a building or a patented design, for example,” he says.
The 2010 Excellence in Research for Australia federal government review provided an opportunity to reassess our view of research in the creative arts through changed methodologies that enabled outputs like works of art or performances to be used as benchmarking measures.
“Suddenly there’s a mechanism where those kinds of measures come into play and in a context where it doesn’t feel like the creative arts have to pretend to be something else.”
This new understanding of the value of creative arts research, coupled with the creation of the divisional board promises much.
Professor Rhodes points out that productive cross-pollination already arises from collaboration between the creative arts faculties, for example in the area of sound. However, the more formal relationship will strengthen collaboration, not just within the division but across the University as a whole.
“I think some of the big University research projects, such as the centre for obesity, diabetes and cardiovascular disease, have enormous possibilities for research connections with music, architecture, design and visual arts in all sorts of ways.
With some of the top architecture and creative arts academics in the country, and a generation of new alumni who take the value of practice-based research in their stride, the University is perfectly poised to welcome a new acknowledged research strength to its portfolio.
1
2
3
54
university oFFicers & organisational chartAS AT 31 dECEMBER 2010
chancellorher excellency professor marie bashir ac cvoMB BS HonMd Sydney, FRAnZCP
deputy chancelloralan cameron amBA LLM Sydney
vice-chancellor and principaldr michael spenceBA LLB Sydney dPhil PGdipTheol Oxf
provost and deputy vice-chancellorprofessor stephen gartonBA Sydney Phd UNSW, FAHA FASSA FRAHS
deputy vice-chancellor (education) and registrarprofessor derrick armstrongBA Lond MA Phd Lanc
deputy vice-chancellor (international)professor john hearnMSc Dublin Phd ANU
deputy vice-chancellor (research)professor jill trewhellaMSc UNSW Phd Sydney, FAAAS
deputy vice-chancellor (strategic management)professor ann brewerBA Macquarie MCom Phd UNSW
chair oF the academic boardassociate professor peter mccallum BMus Dunelm MMus Lond Phd Sydney, dSCM
general counselrichard Fisher amMEc UNE LLB Sydney
university librarianjohn shippBA dipEd Macquarie BA UOW dipArchiveAdmin UNSW, FALIA
deans
Faculty oF agriculture, Food and natural resourcesprofessor mark adamsBSc Phd Melbourne
Faculty oF architecture, design and planningprofessor john redmondBA CSAD MA(RCA) RCA dipId(Eng) CSAd, FRSA AAdM FdIA
Faculty oF arts*professor duncan ivison BA McGill MSc Phd LSE
Faculty oF dentistryprofessor chris peckMScdent Sydney Phd BrCol GraddipScMed (Pain) Sydney, GAIC
Faculty oF economics and business*professor peter wolnizerBEc UTas MEc Phd Sydney, FCA FCPA
Faculty oF education and social workprofessor robert j tierneyMEd Phd Georgia
Faculty oF engineering and inFormation technologiesprofessor archie johnstonPhd H-W, FTSE FIEAust EngExec FICE FAICd
Faculty oF health sciencesprofessor gwynnyth llewellynBA MEd UNE Phd Sydney dipContEd UNE dipOT NSWCollOT
Faculty oF lawprofessor gillian triggsLLB Melbourne LLM SMU Phd Melbourne
Faculty oF medicineprofessor bruce robinsonMd BS MSc Sydney, FRACP
Faculty oF nursing and midwiFeryprofessor jill whiteBEd SCAE MEd Sydney Phd Adelaide AssdipnEd Cumb, Rn RM
Faculty oF pharmacyprofessor iqbal ramzanMSc Phd Sydney dipPharm CIT(NZ), MPS
Faculty oF scienceprofessor trevor hambleyBSc UWA Phd Adelaide, FRACI CChem
sydney college oF the artsprofessor colin rhodesBA Lond MA Phd Essex
sydney conservatorium oF musicprofessor kim walkerPremier Prix de Virtuosité Conservatoire de Music de Genève
Faculty oF veterinary scienceprofessor rosanne taylorBVSc dipVetClinStud Phd GradCertHighE Sydney
*On 1 January 2011 these faculties were renamed the Faculty of Arts and Social Sciences and the University of Sydney Business School respectively.
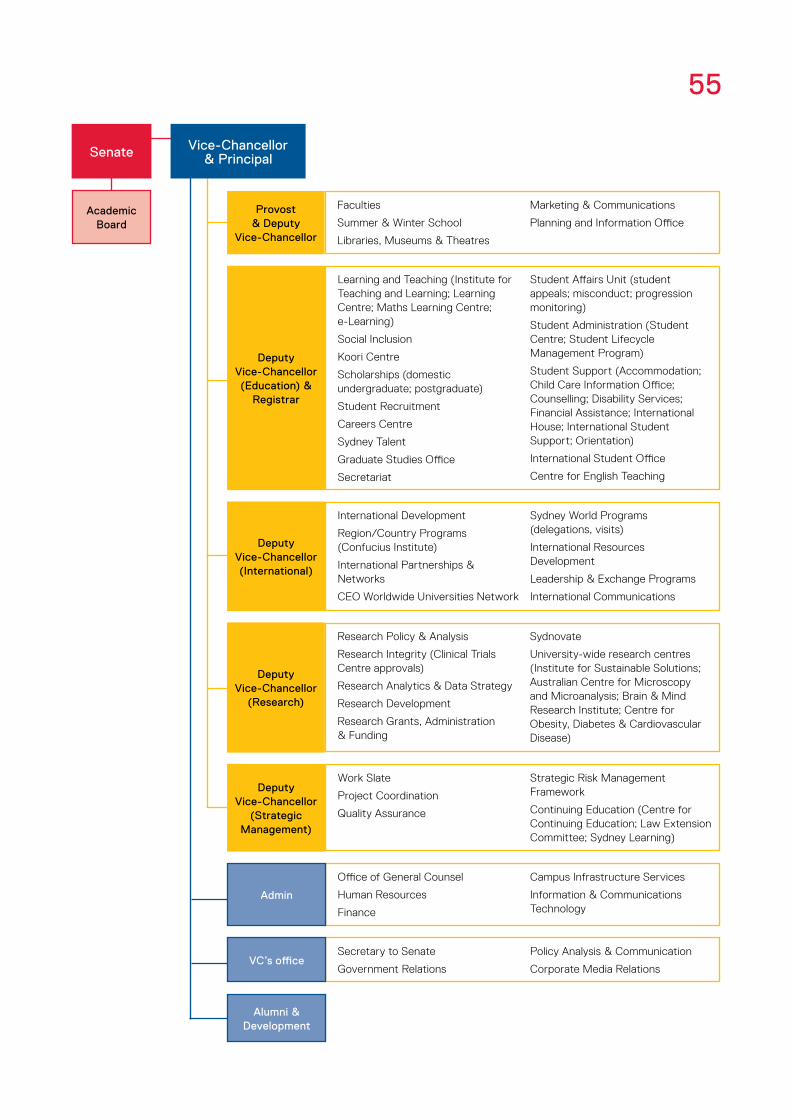
55
senate vice-chancellor & principal
academic board
provost & deputy
vice-chancellor
Faculties
Summer & Winter School
Libraries, Museums & Theatres
Marketing & Communications
Planning and Information Office
deputy vice-chancellor (education) &
registrar
Learning and Teaching (Institute for Teaching and Learning; Learning Centre; Maths Learning Centre; e-Learning)
Social Inclusion
Koori Centre
Scholarships (domestic undergraduate; postgraduate)
Student Recruitment
Careers Centre
Sydney Talent
Graduate Studies Office
Secretariat
Student Affairs Unit (student appeals; misconduct; progression monitoring)
Student Administration (Student Centre; Student Lifecycle Management Program)
Student Support (Accommodation; Child Care Information Office; Counselling; disability Services; Financial Assistance; International House; International Student Support; Orientation)
International Student Office
Centre for English Teaching
Research Policy & Analysis
Research Integrity (Clinical Trials Centre approvals)
Research Analytics & data Strategy
Research development
Research Grants, Administration & Funding
Sydnovate
University-wide research centres (Institute for Sustainable Solutions; Australian Centre for Microscopy and Microanalysis; Brain & Mind Research Institute; Centre for Obesity, diabetes & Cardiovascular disease)
deputy vice-chancellor
(research)
International development
Region/Country Programs (Confucius Institute)
International Partnerships & networks
CEO Worldwide Universities network
Sydney World Programs (delegations, visits)
International Resources development
Leadership & Exchange Programs
International Communications
deputy vice-chancellor (international)
Work Slate
Project Coordination
Quality Assurance
Strategic Risk Management Framework
Continuing Education (Centre for Continuing Education; Law Extension Committee; Sydney Learning)
deputy vice-chancellor
(strategic management)
Office of General Counsel
Human Resources
Finance
Campus Infrastructure Services
Information & Communications Technology
admin
Secretary to Senate
Government Relations
Policy Analysis & Communication
Corporate Media Relationsvc’s office
alumni & development

professor dale lindsay baileyFaculty of Health Sciences
professor marian baird Faculty of Economics and Business
professor john boyages Faculty of Medicine
professor sanjay chawla Faculty of Engineering and Information Technologies
professor glen davis Faculty of Health Sciences
professor joseph g davis Faculty of Engineering and Information Technologies
professor richard john de dear Faculty of Architecture, design and Planning
professor alan Fekete Faculty of Engineering and Information Technologies
professor ines krassFaculty of Pharmacy
promotions to proFessor 2010
professor rosemary lyster Faculty of Law
professor nicholas manolios Faculty of Medicine
professor lyn march Faculty of Medicine
professor allan mcconnell Faculty of Arts
professor barbara mcdonald Faculty of Law
professor scott menzies Faculty of Medicine
professor murray print Faculty of Education and Social Work
professor carolyn sue Faculty of Medicine
professor merrilyn walton Faculty of Medicine
professor christopher wright Faculty of Economics and Business
Left: Professor Rosemary Lyster, the University’s inaugural Professor of Climate and Environmental Law
Above: Professor Ines Krass, whose research focuses on health services in community pharmacy.
Right: Professor Glen Davis, Director of the Rehabilitation Research Centre within the Faculty of Health Sciences.
promotions to proFessorial research Fellow 2010
professor christine clarkeFaculty of Medicine
professor colin wg clifford Faculty of Science
professor joel mackay Faculty of Science
professor andrew martin Faculty of Education and Social Work
professor catherine jane waldby Faculty of Arts
professor ruibin zhang Faculty of Science
56


58 THE UnIVERSITy OF SydnEy STATUTORy REPORT 2010
The fellows of the Senate of the University of Sydney present their report on the consolidated entity consisting of the University of Sydney and the entities it controlled at the end of, or during, the year ended 31 december 2010.
senate reportROLE And MEMBERS
the role oF the senateThe Senate of the University oversees all major decisions concerning the conduct of the University, including staff appointments and welfare, student welfare and discipline, financial matters and the physical and academic development of the University.
It awards all degrees and diplomas and is responsible to the Parliament of new South Wales. Under the University of Sydney Act 1989, the Senate comprises 22 fellows who hold office for differing periods in accordance with various categories of membership.
The Chair of the Academic Board and the Vice-Chancellor and Principal are both ex-officio members of the Senate. The Senate elects the Chancellor for a four-year term of office and the deputy Chancellor for a two-year term. There are seven committees of Senate (see pages 60 to 64).
Fellows oF senateIn 2010 the Senate comprised:
chancellor her excellency professor marie bashir ac cvoMB BS HonMd Sydney, FRAnZCPChancellor from 1 June 2007
deputy chancellormr alan cameron amBA LLM Sydney(an external fellow appointed by the Minister for Education and Training)deputy Chancellor from 4 February 2008
vice-chancellor and principaldr michael spenceBA LLB Sydney dPhil PGdipTheol Oxf Fellow from 11 July 2008
chair oF the academic boardAssociate Professor Peter McCallumBMus Dunelm MMus Lond Phd Sydney, dSCMFellow from 12 december 2009
appointedSix external fellows appointed by the Minister for Education and Training for four years from 1 January 2006, except for the Hon. John J Aquilina whose four-year term of office is to 4 March 2011:
The Hon. John J Aquilina BA dipEd Sydney, FACE, MPFellow to 21 december 2004, from 4 May 2005to 2 March 2007, and from 6 August 2007
Mr Alexander n BrennanBSc(Food Technology) UNSW MBA City(UK)Fellow from 1 January 2006
Mr Alan Cameron AMBA LLM SydneyFellow from 20 February 2004
Mrs dorothy Hoddinott AOMA dipEd Sydney, FACE FACELFellow from 1 January 2010
Mr Kevin McCann AMBA LLB Sydney LLM Harv, FAICdFellow from 9 March 2010
Mr david Mortimer AOBEc Sydney, FCPAFellow from 1 January 2010
One fellow appointed by Senate for two years from 1 March 2007 and for two years from 1 March 2009:
Ms Kim AndersonBA Sydney dipLibInfSc UTSFellow from 1 March 2004
59
electedFour fellows elected by and from the academic staff for two years from 1 June 2009:
Professor Belinda BennettBEc/LLB Macquarie LLM SJd Wis, GAICdFellow from 1 June 2009
dr Roslyn BohringerBSc Phd MEdAdmin UNSWFellow from 1 december 2005
Professor Simon F ChapmanBA UNSW Phd Sydney, FASSAFellow from 1 June 2007
Professor Margaret A HarrisMA Sydney Phd LondFellow from 1 december 2001
One fellow elected by and from the non-academic staff for two years from 1 June 2009:
Ms Kim Wilson MA Macquarie Fellow from 1 december 2001
One fellow elected by and from the undergraduate students of the University for one year from 1 December 2009 and for one year from 1 December 2010:
Mr Thomas d Kaldor Fellow to 30 november 2010
Mr Benjamin G VenessBAcc UTSFellow from 1 december 2010
One fellow elected by and from the postgraduate students of the University for one year from 1 December 2009 and for one year from 1 December 2010:
Mr Samuel J GreenlandBTeach Sydney MChem OxfFellow to 16 February 2010
Mr nicholas (nick) R IrvingBA SydneyFellow to 30 november 2010
Ms Chirine dadaBEcSocSc SydneyFellow from 1 december 2010
Five fellows elected by and from the graduates of the University for four years from 1 December 2009:
dr Barry R CatchloveMB BS Sydney, FRACP FRACMAFellow from 1 december 2009
dr Michael C CopemanBA MB BS Sydney dPhil Oxf Fellow from 22 February 1996 to 30 november 2001 and from 1 december 2005
Mr Peter J FitzSimonsBA SydneyFellow from 1 december 2009
Ms Jane F SpringBEc LLB MPA Sydney, ACIS CSAFellow from 1 december 2009
Mr david W TurnerBArch MdesSc Sydney, FAIAFellow from 1 december 2009

60 THE UnIVERSITy OF SydnEy STATUTORy REPORT 2010
Following an extensive review of Senate committees in 2009, major changes to the committee structure were implemented in 2010.
senate committees as at 31 december 2010buildings and estates committeeThis new committee’s role is to monitor and advise Senate on matters of planning, development and general oversight of the management of the University’s real property and physical infrastructure with particular reference to: major capital developments; infrastructure management; operating resource allocation; sustainability and ensuring effective risk management in the areas covered by the committee’s remit. Its membership comprises:
Ex-officio:The ChancellorThe deputy ChancellorThe Vice-Chancellor and Principal
The committee chair, who is a fellow of Senate (not a staff member or student) and is elected by Senate:
Ms Kim Anderson (from 29 March 2010)
Two fellows of Senate, appointed by Senate after consultation by the committee chair with the Chancellor and Vice-Chancellor:
Ms Jane Spring (from 3 May 2010)Mr david Turner (from 3 May 2010)
Two external members with appropriate professional expertise and experience, appointed by Senate on the recommendation of the committee chair, following consultation with fellows of Senate and others as appropriate:
Mr Tony Sukkar (from 21 June 2010)Mr Lindsay Thomas (from 21 June 2010)
chair appointments committeeThis continuing committee’s role is to approve offers of appointment at a professorial level; promotions to professor; the awarding of the title of professor; and proposals for the establishment of/change of name of named lectureships, senior lectureships, associate professorships and chairs. It also advises the Vice-Chancellor on appropriate procedures relating to senior academic appointments. Its membership comprises:
Ex-officio:The Chancellor (chair)The deputy Chancellor The Vice-Chancellor and Principal The Chair of the Academic Board
A deputy vice-chancellor on the nomination of the Vice-Chancellor: the Provost and deputy Vice-Chancellor (Professor Stephen Garton)
Five fellows of Senate elected by Senate:Professor Belinda Bennett (from 3 May 2010)Professor Simon ChapmanProfessor Margaret HarrisMrs dorothy Hoddinott (from 6 december 2010)Mr nick Irving (to 30 november 2010)Mr Tom Kaldor (to 30 november 2010)Mr david Turner (from 6 december 2010)
Finance and audit committeeThis new committee’s role is to monitor and advise Senate on issues relating to the financial performance and sustainability of the University of Sydney. It also monitors and advises Senate on matters relating to the University’s IT infrastructure, and has the responsibility of ensuring the effective management of financial risk across the University. Its membership comprises:
Ex-officio:The ChancellorThe deputy ChancellorThe Vice-Chancellor and PrincipalThe Chair of the Academic Board
The committee chair, who is a fellow of Senate (not a staff member or student) and is elected by Senate:Mr Alec Brennan (from 29 March 2010)
Two fellows of Senate, appointed by Senate after consultation by the committee chair with the Chancellor and Vice-Chancellor:Mrs dorothy Hoddinott (from 3 May 2010)Mr Kevin McCann (from 3 May 2010)
Two external members with appropriate professional expertise and experience, appointed by Senate on the recommendation of the committee chair, following consultation with fellows of Senate and others as appropriate:Mr Michael Cameron (from 3 May 2010)Ms Meredith Scott (from 3 May 2010)
human resources committeeThis new committee’s role is to monitor and advise Senate on matters relating to the University’s strategies and policies supporting the recruitment and management of its academic and non-academic staff; to review the performance of the Vice-Chancellor and determine his or her incentive payments, recommend to Senate the terms of employment of the Vice-Chancellor and review and approve the Vice-Chancellor’s travel plans; to review and approve the Vice-Chancellor’s recommendations regarding the remuneration, terms of employment and performance assessment of his direct reports; and to ensure the effective management of risk in areas within the committee’s remit.
senate reportSEnATE COMMITTEES

61
Its membership comprises:
Ex-officio:The ChancellorThe deputy Chancellor The Chair of the Finance and Audit Committee (chair)
One fellow of Senate (not a staff member or student), appointed by Senate after appropriate consultation by the committee chair:The Hon. John Aquilina MP (from 3 May 2010)
One external member with appropriate professional expertise and experience, appointed by Senate on the recommendation of the committee chair, following consultation with fellows of Senate and others as appropriate:Ms Rilla Moore (from 3 May 2010)
investment and commercialisation committee(revised role and membership from 3 may 2010)The committee’s role is to monitor and advise Senate on matters relating to the University’s investment portfolio and commercialisation activities with particular reference to: the appropriateness of policies and the success of investment and commercialisation strategies; sustainability and ensuring the effective management of risk in areas covered by the committee’s remit. The committee is authorised by Senate to receive recommendations as to the appointment and retirement, as appropriate, of consultants and external managers, and make such decisions subject to reporting to Senate after the event. Its membership comprises:
Ex-officio:The ChancellorThe deputy Chancellor The Vice-Chancellor and Principal
The committee chair, who is a fellow of Senate (not a staff member or student) and is elected by Senate:Mr Alan Cameron (from 29 March 2010)
Two fellows of Senate, appointed by Senate after consultation by the committee chair with the Chancellor and Vice-Chancellor:Professor Belinda BennettMr david Mortimer (from 3 May 2010)(Ms Kim Anderson was a member before the committee’s role and membership was revised on 3 May.)
Two external members with appropriate professional expertise and experience, appointed by Senate on the recommendation of the committee chair, following consultation with fellows of Senate and others as appropriate:Mr Chris Condon (to 2 August 2010)Mr Ian MacounMr Andrew Spence (from 2 August 2010)
nominations and appointments committeeThis new committee’s role is as follows:
– as specified in Clause 46B of Chapter 4A of the University of Sydney By-Law 1999 with regard to appointed fellows of Senate
– to consider suggestions for honorary degrees and honorary fellowships and submit a report to Senate
– to review and make recommendations to Senate as regards naming proposals, changes to existing names or the discontinuation of existing names in relation to: University buildings and other significant assets; scholarships and prizes; centres and institutes and foundations
– to monitor and advise Senate on governance issues generally as they relate to Senate and the University including induction and continuing education of fellows, Senate performance reviews, committee structure and remits, and related matters
– to approve appointments to University-related entities subject to reporting to Senate after the event.
Its membership comprises:
Ex-officio:The Chancellor (chair)The deputy Chancellor The Vice-Chancellor and Principal The Chair of the Academic Board
Three fellows of Senate who are external fellows within the meaning of s9(9) of the University of Sydney Act 1989 and are appointed by Senate:dr Barry Catchlove (from 2 August 2010)Mr Peter FitzSimons (from 3 May 2010)Ms Jane Spring (from 3 May 2010)
Two fellows of Senate elected by Senate:Professor Simon Chapman (from 3 May 2010)Professor Margaret Harris (from 3 May 2010)
Senate may, on the advice of the committee, or on its own volition, appoint additional members as required:Mr Tom Kaldor (to 30 november 2010)

62 THE UnIVERSITy OF SydnEy STATUTORy REPORT 2010
saFety and risk management committeeThis new committee’s role is to monitor and advise Senate on matters relating to the safety of staff, students and others who have occasion to be present on the University’s campuses and specifically to the maintenance of occupational health and safety standards and practices and compliance with occupational health and safety laws and regulations as they apply to the University.
The committee will regularly review occupational health and safety reports prepared by management and may request reports on specific matters as it sees fit. The committee also has responsibility for ensuring the effective management of risk in areas within its remit and for monitoring non-financial risk matters generally within the University unless they are dealt with by another committee of Senate. Its membership comprises:
Ex-officio:The ChancellorThe deputy Chancellor The Vice-Chancellor and Principal
The committee chair, who is a fellow of Senate (not a staff member or student) and is elected by Senate:dr Barry Catchlove (from 29 March 2010)
Two fellows of Senate appointed by Senate after consultation by the committee chair with the Chancellor and Vice-Chancellor:Professor Simon Chapman Ms Kim Wilson (from 3 May 2010)
Two external members with appropriate professional expertise and experience in risk management and the occupational health and safety field appointed by Senate on the recommendation of the committee chair following consultation by the chair with fellows of Senate and others as appropriate:Mr Hutch Ranck (from 21 June 2010)Mr John Trowbridge (from 21 June 2010)
senate nominees/appointees to other university-related organisationsFellows of Senate are also nominated or appointed by Senate to membership of other University-related organisations. In 2010 these nominations/appointments included:
– dr Roslyn Bohringer: Senate nominee on the Women’s College Council
– Professor Margaret Harris: Fellow of Senate on the International House Council
– Ms Kim Wilson: Senate representative on the Abercrombie Street Child Care Limited Council
senate committees disestablished 3 may 2010advisory committee For honorary awards* The committee’s role was to consider suggestions annually for honorary degrees and honorary fellowships, and submit a report and recommendations to Senate. Its membership comprised:
Ex-officio:The Chancellor (Chair)The deputy ChancellorThe Vice-Chancellor and PrincipalThe Chair of the Academic BoardThe deputy vice-chancellors (non-voting)
Not more than six other fellows, elected by Senate.
audit and risk management committee The committee’s role was to monitor and report to Senate on:
– effective management of financial and non-financial risks – reliable management and financial reporting – compliance with laws and regulations – maintenance of an effective and efficient internal audit capability
– maintenance of an effective and efficient risk management capability
– the financial and non-financial risks of subsidiaries and controlled entities such as foundations and cooperative research centres, and commercial activities.
Its membership comprised:The committee chair, elected by fellows of Senate (not a University of Sydney staff member or student), for two years:Mr Alan Cameron (to 3 May 2010)
Two fellows of Senate, appointed by Senate after consultation by the committee chair (neither should be a University of Sydney staff member or student), for two years (or for so long as in office if shorter):Ms Kim Anderson (to 3 May 2010)
Two external members, with appropriate professional expertise and experience, appointed by Senate on the nomination of the committee chair with appropriate consultation, for up to two years:Mr John Trowbridge (to 3 May 2010)

63
Finance and inFrastructure committee The committee’s primary role was to monitor and advise Senate on issues relating to the financial performance and sustainability of the University of Sydney. Its membership comprised:
Ex-officio:The ChancellorThe deputy ChancellorThe Vice-Chancellor and Principal The Chair of the Academic Board
The committee chair, elected by fellows of Senate (not a University of Sydney staff member or student), for two years:Mr Alexander Brennan (to 3 May 2010)
Two fellows of Senate, appointed by Senate after consultation by the committee chair with the Vice-Chancellor and the Chancellor, for two years (or for so long as in office if shorter):The Hon. John Aquilina (to 3 May 2010)
Four external members, two with appropriate professional expertise and experience in finance and two with appropriate professional expertise and experience in infrastructure, appointed by Senate on the nomination of the committee chair with appropriate consultation, for up to two years:Mr Michael Cameron (finance) (to 3 May 2010)Ms Meredith Scott (finance) (to 3 May 2010)
nominations committee*This committee’s role was, on a case-by-case basis, to identify (i) persons who might be suitable for nomination/suggestion to the Minister in the category of “six external persons appointed by the Minister” and (ii) persons who might be suitable for the category “one external person appointed by the Senate”, and then make recommendations to Senate. Its membership comprised:
Ex officio:The Chancellor (chair)The deputy ChancellorThe Vice-Chancellor and PrincipalThe Chair of the Academic Board
Three fellows who were external persons (within the meaning of section 9(9) of the Act), appointed to the committee by the Senate.
remuneration and beneFits committee* The terms of reference for this committee were as follows.
1. Employment strategies and practices
Overview the University’s strategies and policies in the following areas to ensure they attract, motivate and retain employees of sufficient quality as to enable it to achieve if not surpass its aspiration of 1:5:40:
– reward (fixed and variable remuneration including incentives superannuation and other benefits)
– recruitment and retention – workforce and succession planning – workplace relations – organisation development – compliance with workplace legislation.
2. Vice-Chancellor
– Review the performance of the Vice-Chancellor and determine his or her incentive payments.
– Recommend to Senate the overall terms of employment (including termination) of the Vice-Chancellor.
– Review and approve the Vice-Chancellor’s travel schedule.
3. direct reports
Review and approve the Vice-Chancellor’s recommendations for:
– remuneration and terms of employment (including termination) of direct reports (and include incentives)
– performance assessment of direct reports
4. Report regularly to Senate on its deliberations
5. Maintain adequate records
Its membership comprised:
Ex-officio:The ChancellorThe deputy Chancellor The Chair of the Finance and Investment Committee (chair)
One other fellow appointed by Senate and one external appointment by Senate.
* The Advisory Committee for Honorary Awards, the nominations Committee and the Remuneration and Benefits Committee did not meet in 2010 before being disestablished and replaced by new committees.

64 THE UnIVERSITy OF SydnEy STATUTORy REPORT 2010
attendance by Fellows at senate and its committees in 2010
name senate armc bec cac Fac Fic hrc icc nac srmc
a b a b a b a b a b a b a b a b a b a b
Ms K Anderson 9 7 1 1 4 4 1 1
The Hon. J Aquilina 9 9 2 2 3 2
HE Professor M Bashir 9 9 4 – 13# 12 4 3 2 – 3 3 3 – 4 4 3 –
Professor B Bennett 9 8 9 5 4 4
dr R Bohringer 9 6
Mr A Brennan 8 8 4 4 2 2 3 3
Mr A Cameron 8 8 1 1 4 4 13# 13 4 4 2 2 2 2 3 3 4 2 3 1
dr B Catchlove 9 9 4 4 3 3
Professor S Chapman 9 9 13# 10 4 4 3 3
dr M Copeman 9 7
Ms C dada 1 1
Mr P FitzSimons 9 6 4 –
Mr S Greenland 1 1
Professor M Harris 9 7 13# 10 4 3
Mrs d Hoddinott 8 8 2# - 4 4
Mr n Irving 6 6 6# 3
Mr T Kaldor 8 8 6# 5 4 4
Associate Professor P McCallum 9 9 13# 12 4 4 2 1 4 4
Mr K McCann 9 9 4 4
Mr d Mortimer 8 7 3 2
dr M Spence 9 9 4 4* 13# 9 4 4 2 2 4 4* 4 4 3 3
Ms J Spring 9 8 4 4 4 3
Mr d Turner 9 8 4 1 2# 1
Mr BG Veness 1 1
Ms K Wilson 9 7 3 3
key:
a number of meetings held during the time the fellow was a member of Senate/the committee (as appropriate)
b number of meetings attended # includes meetings by circulation+ includes representation by acting Vice-Chancellor* includes representation by nominee
armc Audit and Risk Management Committeebec Buildings and Estates Committeecac Chair Appointments CommitteeFac Finance and Audit CommitteeFic Finance and Infrastructure Committeehrc Human Resources Committeeicc Investment and Commercialisation Committeenac nominations and Appointments Committeesrmc Safety and Risk Management Committee
The Advisory Committee for Honorary Awards, the nominations Committee and the Remuneration and Benefits Committee did not meet in 2010 before being disestablished and replaced by new committees.

65
senate reportPRInCIPAL ACTIVITIES & FInAnCIAL SnAPSHOT
principal activities
Under the University of Sydney Act 1989 (as amended), the object of the University is the promotion, within the limits of the University’s resources, of scholarship, research, free enquiry, the interaction of research and teaching, and academic excellence.
The University has the following principal functions for the promotion of its object.
– The provision of facilities for education and research of university standard.
– The encouragement of the dissemination, advancement, development and application of knowledge informed by free enquiry.
– The provision of courses of study or instruction across a range of fields, and the carrying out of research, to meet the needs of the community.
– The participation in public discourse. – The conferring of degrees, including those of bachelor, master and doctor, and the awarding of diplomas, certificates and other awards.
– The provision of teaching and learning that engage with advanced knowledge and enquiry.
– The development of governance, procedural rules, admission policies, financial arrangements and quality-assurance processes that are underpinned by the values and goals referred to in the functions set out in this subsection, and that are sufficient to ensure the integrity of the University’s academic programs.
The University has other functions as follow.
– The University may exercise commercial functions comprising the commercial exploitation or development, for the University’s benefit, of any facility, resource or property of the University or in which the University has a right or interest (including, for example, study, research, knowledge and intellectual property and the practical application of study, research, knowledge and intellectual property), whether alone or with others.
– The University may develop and provide cultural, sporting, professional, technical and vocational services to the community.
– The University has such general and ancillary functions as may be necessary or convenient for enabling or assisting the University to promote the object and interests of the University, or as may complement or be incidental to the promotion of the object and interests of the University.
– The University has such other functions as are conferred or imposed on it by or under this or any other Act.
The functions of the University may be exercised within or outside the state, including outside Australia.
2010 2009* increase for 2010
$M $M $M
Operating revenue 1,505.6 1,392.3 113.3
Operating expenses 1,388.0 1,322.2 65.8
net operating result 117.6 70.1 47.5
Impairment of available-for-sale assets
(3.9) (8.5) 4.6
operating result after impairment
113.7 61.6 52.1
* The comparatives for 2009 have changed due to a change in accounting policy (refer to note 34 of the financial statements for detail).
Financial snapshot
The University recorded a net operating result before impairment of available-for-sale financial assets of $117.6 million for the year ended 31 december 2010, an increase of $47.5 million or 67.8 percent from 2009.
After accounting for an impairment loss of $3.9 million on available-for-sale assets, the net operating result for the year ended 31 december 2010 was $113.7 million, an increase of $52.1 million on the previous year’s result.
Overall, the University completed 2010 with a very close position to its budget of $119.2 million. The key contributors to this success can be attributed to the increased income from Commonwealth-supported places due to increased load, realised gains in investment income and strong cost management.
For a comparison of the 2010 results to 2009, see the table at right. For more information, see the financial review section starting on page 176.

66 THE UnIVERSITy OF SydnEy STATUTORy REPORT 2010
senate reportnEW & CEASEd ACTIVITIES
new strategic planIn 2010 the University adopted a strategic plan for the period between 2011 and 2015. For more information on the new strategic plan, see the section below on ‘Likely developments and expected results of operations’.
australian institute for nanoscienceThe University will build a world-leading facility for specialist research into nanoscience after the federal government pledged a $40 million contribution through its Education Investment Fund.
The Australian Institute for nanoscience (AIn) will be located in a major research precinct at the University, spanning medical and physical science and will host a range of nationally accessible research infrastructure. Researchers will be able to develop nano-devices that will have impacts in many fields and lead to the development of leading-edge innovations in broadband and low-energy secure communications; advanced medical diagnostics and therapies; and advances in knowledge through new astronomy instruments. See pages 28 and 29 for more information.
arc centres of excellenceThe University will host two new Australian Research Council (ARC) centres of excellence under funding announced in July 2010. The two centres, both based within the University’s School of Physics, have ARC funding for a total of $44.4 million from 2011.
– The ARC Centre of Excellence for All-sky Astrophysics will boost Australia’s outstanding track record as a world leader in astronomy, and will find solutions to fundamental processing problems that can potentially be applied to communications, medical imaging and remote sensing.
– The ARC Centre of Excellence for Ultrahigh Bandwidth devices for Optical Systems will build on existing work in the School of Physics and create technology that will revolutionise information systems, create and develop Australian industry, and train and mentor young researchers in the science and application of nanophotonics and photonic processing. The centre is a collaboration across seven Australian universities and has major links with partner organisations around the world.
The ARC received 111 expressions of interest in funding for ARC centres of excellence across Australia during this round of funding, and approved funding for 13. The University of Sydney is also a collaborator on several other centres hosted by other Australian institutions.
improving research and education in mathematics and scienceIn early 2010 the University launched the Institute for Innovation in Science and Mathematics Education (IISME). An initiative of the Faculty of Science and Faculty of Education and Social Work, the IISME aims to become a leading national and international centre for research and educational programs that promote new ways to learn science and maths at all levels of schooling. See pages 10 and 11 for more information.
china studies centreThe University announced it would launch a China Studies Centre (CSC) to coordinate and direct the University’s work on and in China. See page 67 for more information.
ceased activities
The following centres of the University were closed during 2010.
– Centre for Research on Ecological Impacts of Coastal Cities – Coral Reef Research Institute – Centre for Behavioural Sciences in Medicine – Centre for Perinatal Health Services Research – Sydney University Prince Alfred Molecular Analysis Centre
The following foundations of the University were closed during 2010.
– Aerospace, Mechanical and Mechatronic Engineering Foundation
– Ear and Allied Research Foundation
The following controlled entity of the University was closed during 2010.
– The Bosch Institute, a public company limited by guarantee, was deregistered on 4 July 2010. (note, this company vehicle never started operating and so was deregistered. The actual operations of the Bosch Institute have always been and remain within the Sydney Medical School.)

67
senate reportSUMMARy REVIEW OF OPERATIOnS
The University’s strategic plan for 2007 to 2010 identified five major objectives to guide the University’s activities to the end of 2010 and ensure it achieved its vision while remaining true to its purpose. In summary, these objectives aimed to:
– build our reputation as a leading international research university
– improve flexibility, choice, learning outcomes and the student experience
– increase the proportion of high-performing staff – communicate with, engage and contribute to the cultural, social, economic and political fabric of our national and international community
– develop a world-class campus environment.
Work continued throughout 2010 on a range of programs on the ‘Vice-Chancellor’s Work Slate’, which was launched in late 2008 to support projects and activities considered to be critical to achieving the University’s strategic objectives.
during the year the University introduced additional Work Slate projects to support new initiatives under the 2011–15 Strategic Plan, which was approved by Senate in mid-2010. (See pages 34 to 35 and page 70 for more information.)
Work Slate projects are selected and approved by the University’s Senior Executive Group (SEG) and reported to the Vice-Chancellor and Senate. Taken together, they provide a core set of indicators of the University’s performance and how it is progressing towards its stated objectives.
during 2010 a total of 20 Work Slate projects were completed. At 31 december, 40 remained in progress.
A summary of progress under the Work Slate during 2010 follows.
governance – There were a number of changes to the University’s principal decision-making bodies. Following a 2009 review, the Senate implemented a new committee structure. The Academic Board had its first year of full operations under a revised structure introduced in 2009, while the Senior Executive Group (SEG) and its committees were restructured with effect from January 2011. See pages 72 and 73 for more information.
– As part of the 2011–15 Strategic Plan, work began to create new divisional boards as committees of SEG to bring faculties together in a relationship of mutual accountability.
– A review of the structure of the University’s disciplines began, including the transfer of the discipline of Economics from the Faculty of Economics and Business to the Faculty of Arts. As a consequence of this transfer, it was agreed that the Faculty of Economics and Business should be
renamed the University of Sydney Business School, and the Faculty of Arts should become the Faculty of Arts and Social Sciences, both with effect from 1 January 2011. Work will continue throughout 2011, including analysis of how the University might better profile and coordinate teaching, research training and research in the social sciences.
research and education – The University continued work towards the launch of its Centre for Obesity, diabetes and Cardiovascular disease (COdCd), including the design of the building. Construction is due to begin in 2011, and the building is due to open in early 2014. Thanks to a $5 million endowment from the Australian diabetes Council, the University announced it would appoint a new chair of diabetes as a pivotal part of the COdCd – the first such chair in Australia dedicated to medical research into diabetes. The academic vision for the COdCd is for an integrated research, teaching and learning environment in an area of high social impact. As such, it will be a model for the small number of other major cross-disciplinary initiatives the University plans to develop under its 2011–15 Strategic Plan.
– Consistent with its ‘area studies’ strategy, the University examined a proposal to create a China Studies Centre (CSC) to coordinate and provide direction to the University’s work on and in China across the full spectrum of academic activities, including research, education and outreach. The centre is designed to aid social, cultural and economic interactions between China and Australia. After considering a business plan and proposed governance structure, SEG gave approval for the CSC to come into operation on 1 January 2011.
– The University established a Course and Curriculum Planning Committee of SEG to oversee a University-wide program of curriculum renewal and ensure coherence of our programs and courses. Work will include the development of University-wide principles for curriculum development and a fundamental review of the major undergraduate generalist degree programs.
– The University is preparing clear strategies in response to the Indigenous Education Review, completed in mid-2009. It is intended that the consequent University-wide strategy should align with the national priorities as specified by the Indigenous Higher Education Advisory Council.
– The University participated in the Excellence in Research for Australia (ERA) government research quality exercise, and was one of just five universities in the ERA assessment where more than 90 percent of research ranked as world-class or higher. An additional outcome from the ERA was a significant step forward in the digitisation of research outputs. This undertaking also contributed towards the development of the University’s open access policy for

68 THE UnIVERSITy OF SydnEy STATUTORy REPORT 2010
its research publications and data, to ensure the widest communication to other researchers and the community through the internet.
– The University conducted a Research Management Process Review, which aimed to establish an agreed ‘end-to-end’ definition of research processes. The review resulted in 10 highly interdependent recommendations to support that goal, each of which will be pursued by a series of projects involving stakeholders from across the University. Work on three of the recommended initiatives began before the end of 2010.
– The University established a working party to consider the University’s Phd strategy and investigate how to achieve the University’s stated goal of increasing the number of Phd students. Proposals include extending the standard full-time duration of the Phd program to four years and developing clearer pathways to the Phd from honours and alternate prior programs.
– The University implemented the recommendations from the 2009 review of its animal research activities to assess the adequacy of its administrative systems and practices. It also increased its capability to manage allegations of research misconduct and has actively promoted the responsible conduct of research by appointing a team of research integrity advisers with representation from all disciplines. during 2011 the University will implement programs for the training of researchers in animal welfare and the legislation governing the use of animals in research, and conduct a review of the administration of human ethics.
– The University established a working party to review take-up of existing overseas programs (exchange, study abroad and less formal faculty-based programs), to identify barriers and propose a strategy for increasing participation.
– The University began work to examine its admissions strategy with a view to broadening access so that it attracts the most promising students, regardless of their background.
– The University established a working party to bring greater coherence to the virtual experience of students and teachers through e-learning technologies so that the learning and teaching enterprise can be better integrated across physical and virtual spaces.
– The University announced that it will host the Australian Institute for nanoscience and two Australian Research Council centres of excellence (see page 66 for more details).
student experience and support – Work continued on the Sydney Student project, due for completion by 2013, which will create a seamless student experience of the University’s administration, from first enquiry to alumni engagement.
– A review of support services for international students, finalised in 2010, led to a series of recommendations to the Vice-Chancellor about the delivery of high-quality, comprehensive support services, compliance with quality assurance, legislative and government obligations, as well as addressing any other issues of concern.
– Following an audit of current University, faculty and residential college scholarships, the University developed a strategy to better coordinate, promote and make use of available scholarship funds.
– The University implemented a number of recommendations made under the Indigenous Education Review, which was completed in mid-2009, including the decision to recruit a deputy Vice-Chancellor (Indigenous Strategy and Services). In responding to the review, the University has developed a comprehensive integrated strategy to enhance Indigenous participation, engagement, education and research.
– The University continued work to identify ways of increasing available and affordable student housing, reviewing market demand, financial constraints and available locations.
social inclusion – The University expanded its partnerships with specific schools and community organisations to raise awareness of the value of tertiary education, support educational attainment and increase aspirations for further study. The University began work to review its admissions criteria and policies, including those covering pathways, special admissions programs, and Australian Tertiary Admission Rank (ATAR) bonuses, to increase participation by underrepresented groups. As an initial step, the University expanded its five-point ATAR bonus scheme to cover all disadvantaged schools in nSW for 2011 entry.
– The University set institution-wide and faculty-specific targets for recruitment and retention of low socioeconomic status (SES), Indigenous and rural and remote students. Students from low SES backgrounds currently make up only about 8.5 percent of the undergraduate student population. The University aims to increase this to at least 12 percent over the planning period.
– The University completed negotiations with the University of new England (UnE) to facilitate entrance to the University of Sydney for students from a low SES background who have already completed a year of study at UnE.
international and external relations – The University developed a set of clear ethical principles to underpin the University’s negotiation and acceptance of gifts from third parties, and reviewed against these principles current policies and processes governing the negotiation and acceptance of third-party gifts.

69
– In early 2010, the University launched a refreshed brand to enable the University to communicate more effectively its values and qualities. The refreshed brand position aims to distinguish the University of Sydney by drawing upon its reputation, the quality and character of its unique intellectual heritage and the ideas-driven people among its alumni, current staff and students.
– The University reviewed current arrangements for overseas representation and developed a strategy to support alumni, development, research, recruitment and outreach activities overseas. Throughout the second half of 2010, the University hosted a series of academic symposia through its gold sponsorship of the Shanghai Expo, which brought together leading Australian and Chinese researchers. See pages 26 to 27 for more information.
global and local partnerships – The University began work to introduce a World Fellows Program to encourage short-term visits by leading international academics and public figures.
– The University refocused its regional engagement efforts on China, South-East Asia, and India as top priorities; Korea, Japan, north America and Europe as medium priorities; and Latin America and Africa as emerging priorities.
human resources – The University reviewed its processes for handling complaints, disputes, grievances and misconduct proceedings. Following the review, the University is preparing a scoping paper that will identify issues around reform of student complaint, grievance, dispute and misconduct processes and lead to a program of work around those issues identified as priorities.
– The University continued its analysis of child care, family-friendly policies, flexibility, carers’ responsibilities and leave. The University also continued to devise and implement appropriate strategies to support workforce diversity and increase the number of women in senior level University roles, and determined to develop a campaign to close the pay gap between male and female staff. (See pages 80 to 83 for more information about the University’s achievements in the area of equal employment opportunity in 2010.)
– The University continued work to revise governance structures and review guidelines, standards and training for occupational health and safety (OH&S). (See pages 86 to 87 for more information about the University’s OH&S performance in 2010.)
– Work continued to review the University’s Indigenous employment strategy, which will form an integral part of a new University-wide Indigenous strategy.
– The University progressed work to produce guidelines, both technical and practical, for faculties wishing to appoint an academic to serve part of the year in Sydney and part of the year at an overseas institution.
– The University continued to review general staff performance, development and remuneration strategy. This is a realignment of the Merit program, funded by a Commonwealth Workplace Productivity Program (WPP) grant, which had originally focused on Australian Workplace Agreements (AWAs).
administration – The University developed and began to introduce a new economic model for the allocation of budgets to academic units and central portfolios. The new model will introduce greater transparency to the University’s finances and align budget allocation models within the new divisional structure. It operates on the assumption that academic units are the key revenue generators for the institution and that resources and costs should be transparently allocated to them. The new model will be adjusted gradually to ease the adjustment of academic units to the implications of the University Economic Model, and provides for cross-subsidies for units where there is an academic justification for supporting them.
– The University established a Policy Management Unit to support a regime of effective policy drafting, promulgation, implementation and updating.
– The University improved the coordination of its input to external public policy processes and started making its formal submissions to government and parliamentary reviews publicly available through the University website.
– The University worked to develop and implement a consultation process to encourage contribution to the finalisation of the Campus 2020 Masterplan, which will include consideration of the infrastructure required to create and sustain a viable cultural precinct in the suburbs around the University.
– The University continued to implement its Carbon Reduction Strategy throughout 2010, which includes the measurement of performance against emission-reduction targets and monitoring energy use. Work also began on a ‘green travel plan’ to survey current travel behaviours by staff and students as well as vehicle use of the Camperdown Campus.
– Work began on the University’s submission to the forthcoming Australian Universities Quality Agency (AUQA) audit, to verify that the University of Sydney is performing according to its stated objectives and is carrying out regular self-assurance checks. The University will deliver its performance portfolio to AUQA by 9 May 2011.

70 THE UnIVERSITy OF SydnEy STATUTORy REPORT 2010
senate reportOTHER MATTERS
likely developments and expected results oF operations
In August 2010 the University adopted a strategic plan for the five years to 2015. At the heart of this strategy is our shared common purpose to create and sustain a university in which, for the benefit of both Australia and the wider world, the brightest researchers and the most promising students, whatever their social or cultural background, can thrive and realise their full potential.
The strategic plan and accompanying white paper followed extensive consultation with the University community and beyond, including a March 2010 green paper. A clear vision emerged during this period, not only of the direction we should take but also of the way in which we should conduct our life together.
We are confident that the strategic plan is vital to building upon our work as a university, and that implementing it through a consistent program of collective planning, decision-making and management will help ensure our ongoing academic strength and future international competitiveness.
The plan outlines 17 key strategies, which we believe are fundamental in responding to the external and internal challenges that the consultation process identified as critical to maintaining our current position in an increasingly competitive global education sector. We will pursue each of the 17 strategies through a range of projects, which will be monitored and coordinated through the Vice-Chancellor’s Work Slate.
For more information, see sydney.edu.au/strategy
The 17 key strategies are as follows.
1. Refine our governance structures.2. Manage more effectively the size and shape of
the University.3. Initiate a University-wide program of curriculum renewal.4. Enrich the experience of University life for all our students.5. Expand and diversify opportunities for students to develop
as global citizens.6. develop our capacity to identify and support
research excellence.7. develop our capacity to identify and promulgate excellence
in teaching.8. develop a small number of major cross-disciplinary
initiatives in research and education.9. Agree coordinated strategies for identifying, developing
and supporting research talent from undergraduates to research leaders.
10. Promote Indigenous participation, engagement, education and research.
11. Attract and support promising students from a diversity of social and cultural backgrounds.
12. Provide enhanced learning opportunities for all our staff.13. Prioritise international engagement on a regional basis
to support the effective development of University-wide partnerships and networks.
14. develop and implement a coordinated University-wide framework for local and rural community engagement.
15. deepen our engagement with a supportive network of alumni and friends.
16. Refine and apply the new University Economic Model to ensure greater transparency in resource and cost allocation and support strategic decision-making.
17. Systematically review arrangements for the provision of administrative and professional services.
The plan underpins the University’s negotiation of its first full ‘mission-based compact’ funding agreement with the federal government covering the period from 2011 to the end of 2013.

71
Each Australian university will have such a compact with the government, clearly defining its mission, and describing how it will fulfil that mission and meet the government’s policy goals over the course of the agreement. Compacts will facilitate the distribution of Commonwealth funding for teaching and research, as well as performance-based funding linked to government policy priorities for the higher education sector as a whole.
The University expects to complete negotiation of its compact with Canberra in early 2011.
matters subseQuent to the end oF the Financial year
none as at 21 March 2011.
environmental regulation
The University has not been required to hold an Environment Protection Licence for the generation of hazardous waste since April 2008. However, hazardous waste continues to be managed in accordance with the previous licence conditions.
The University was gazetted in 2005 to develop a four-year Energy Savings Action Plan (ESAP) for the Camperdown/darlington Campus, and two four-year Water Savings Action Plans (WSAPs), one for the Camperdown/darlington Campus and one for the Camden Campus. While development of the plans was mandatory, implementation was not. nevertheless, the nSW government reserves the power to ‘call in’ implementation of the actions.
development of the ESAP was completed in July 2008 and, given their cost-effectiveness, the University voluntarily began implementation of actions.
The University had already demonstrated capacity to save water through a number of initiatives prior to those outlined in its WSAPs, nevertheless it has taken new actions in a number of new areas since 2008.
The University has an obligation to report energy usage and carbon emissions under the National Greenhouse and Energy Reporting (NGER) Act 2007. The University is compliant with this requirement.
The University has Trade Waste Agreements with Sydney Water that regulate what waste can be disposed of to sewer. The most recent review of the University’s Guidelines for the disposal of Hazardous Waste provides detailed guidance on what waste can and cannot be disposed of down the drain.
The University’s Camden Campus holds a licence for water extraction under the Water Act 1912 (nSW). It is issued and renewed annually by the nSW department of natural Resources. no breaches of this licence have been recorded. The Camden Campus also has a small sewage treatment plant that is self-monitored and consistently meets Sydney Water and nSW health guidelines.
The University’s One Tree Island Marine Research Facility in Queensland is subject to the Great Barrier Reef Marine Park Act 1975, and is now also subject to the Environment Protection and Biodiversity Conservation Act 1999 (Cwth). It forms part of the Capricornia Cays national Park. All facilities and operations on the island meet the Environmental Protection Act 1994 (Queensland).
insurance oF oFFicersThe University maintains a comprehensive insurance program to protect itself against the financial effects of insurable risks. This program extends to its subsidiaries and controlled entities, and also includes the Senate and Senate subcommittee members, the University’s officers, employees, volunteers and students. The University’s insurance program is renewed annually at the end of October.
This report is made in accordance with a resolution of the Senate on 21 March 2011.
her excellency professor marie bashir ac cvoChancellor

72 THE UnIVERSITy OF SydnEy STATUTORy REPORT 2010
the senate
The Senate is the governing authority of the University of Sydney and has the functions conferred on it by the University of Sydney Act 1989 (as amended) (the Act). Under the Act the Senate is responsible for the control and management of the affairs and concerns of the University. It is responsible to the Parliament of new South Wales.
The Senate consists of 22 fellows, three of whom are official members – the Chancellor, the Vice-Chancellor and Principal, and the chair of the Academic Board. The balance of Senate’s membership consists of elected and appointed fellows. See pages 58 to 59 for a list of Senate members during 2010.
The Senate met nine times in 2010. details of Senate meetings are on page 64.
governance reformsIn 2010 Senate implemented a new committee structure, resulting from a review of all Senate committees in 2009.
Following the changes, two committees continued (the Chair Appointments Committee and the Investment and Commercialisation Committee, the latter with a revised constitution and terms of reference). The other seven committees were disestablished and replaced by the following five new committees: Buildings and Estates; Finance and Audit; Human Resources; nominations and Appointments; and Safety and Risk Management.
This new structure has resulted in fewer committees providing more comprehensive coverage of Senate’s areas of responsibility, better coordination of issues within each committee and improved coordination across committees.
It also enables a more comprehensive approach to risk management, both financial and non-financial, and extends Senate’s oversight into new areas, most notably safety (including oversight of the University’s extensive occupational health and safety obligations).
Additionally, the model provides for better alignment of finance and audit functions and the creation of a new committee dedicated to oversight of the University’s physical infrastructure. The expanded role of the nominations and Appointments Committee brings together the oversight of a range of University awards and appointments as well as providing a source of advice to Senate on governance issues.
academic board
The principal responsibility of the Academic Board is to safeguard the academic freedom of the University and maintain the highest standards in teaching, scholarship and research.
It reports to Senate and provides advice to Senate and the Vice-Chancellor on all academic matters, including their relation to the University’s strategic priorities and policies, the conditions of appointment and employment of academic staff, and the maintenance of academic standards.
In 2010 the Academic Board approved 10 new postgraduate courses. A wide range of courses was revised, and 40 were discontinued.
policiesThe University is in the process of replacing its student information system, and much of the Academic Board’s policy work in 2010 focused on developing an appropriate policy framework for the new system. This involved amending the University of Sydney (Coursework) Rule 2000 (as amended), approving a new plain English framework for faculty and course resolutions, the rescission of Senate resolutions for individual courses and initial work on developing a Higher degree Research Rule. This work was undertaken in conjunction with the Sydney Student Project and the Office of General Counsel.
Other policy initiatives and amendments in 2010 included:
– amending the Admission to Undergraduate Courses policy following a review of the Elite Athletes and Performers Scheme
– amending the Academic Promotions Policy following a review of processes
– deleting a number of redundant postgraduate policies – amending the Creation, Variation and deletion of Award Courses and Units of Study Policy to reflect major changes to the University’s course approvals process
– determining the semester and vacation dates for the years from 2013 to 2015 inclusive.
academic qualityThe Academic Board is nearing the end of its third cycle of reviews of faculties’ academic activities.
The third cycle, which will conclude by mid-2011, is modelled on the Education Criteria for Performance Excellence 2007 in the Baldridge national Quality Program, and focuses on how to build and maintain cultures and processes that lead to and maintain continuous quality improvement. Work has commenced on developing the framework for the fourth cycle of reviews.
governance
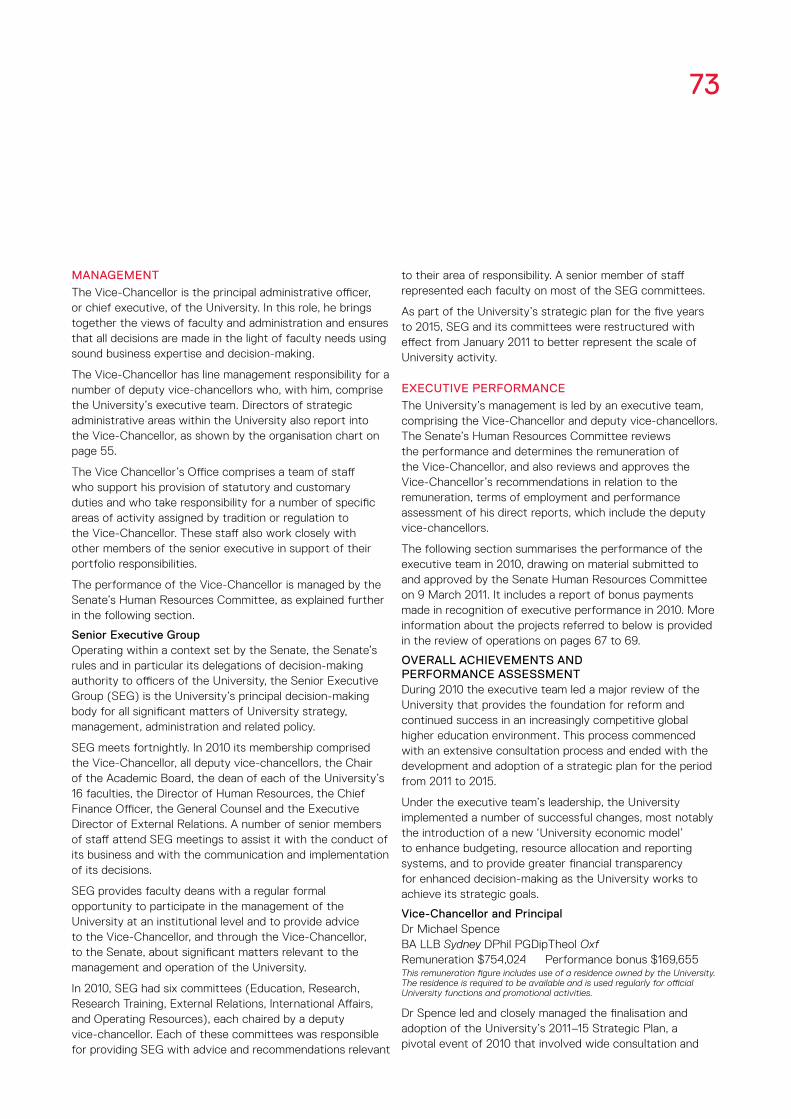
73
management
The Vice-Chancellor is the principal administrative officer, or chief executive, of the University. In this role, he brings together the views of faculty and administration and ensures that all decisions are made in the light of faculty needs using sound business expertise and decision-making.
The Vice-Chancellor has line management responsibility for a number of deputy vice-chancellors who, with him, comprise the University’s executive team. directors of strategic administrative areas within the University also report into the Vice-Chancellor, as shown by the organisation chart on page 55.
The Vice Chancellor’s Office comprises a team of staff who support his provision of statutory and customary duties and who take responsibility for a number of specific areas of activity assigned by tradition or regulation to the Vice-Chancellor. These staff also work closely with other members of the senior executive in support of their portfolio responsibilities.
The performance of the Vice-Chancellor is managed by the Senate’s Human Resources Committee, as explained further in the following section.
senior executive groupOperating within a context set by the Senate, the Senate’s rules and in particular its delegations of decision-making authority to officers of the University, the Senior Executive Group (SEG) is the University’s principal decision-making body for all significant matters of University strategy, management, administration and related policy.
SEG meets fortnightly. In 2010 its membership comprised the Vice-Chancellor, all deputy vice-chancellors, the Chair of the Academic Board, the dean of each of the University’s 16 faculties, the director of Human Resources, the Chief Finance Officer, the General Counsel and the Executive director of External Relations. A number of senior members of staff attend SEG meetings to assist it with the conduct of its business and with the communication and implementation of its decisions.
SEG provides faculty deans with a regular formal opportunity to participate in the management of the University at an institutional level and to provide advice to the Vice-Chancellor, and through the Vice-Chancellor, to the Senate, about significant matters relevant to the management and operation of the University.
In 2010, SEG had six committees (Education, Research, Research Training, External Relations, International Affairs, and Operating Resources), each chaired by a deputy vice-chancellor. Each of these committees was responsible for providing SEG with advice and recommendations relevant
to their area of responsibility. A senior member of staff represented each faculty on most of the SEG committees.
As part of the University’s strategic plan for the five years to 2015, SEG and its committees were restructured with effect from January 2011 to better represent the scale of University activity.
executive perFormance
The University’s management is led by an executive team, comprising the Vice-Chancellor and deputy vice-chancellors. The Senate’s Human Resources Committee reviews the performance and determines the remuneration of the Vice-Chancellor, and also reviews and approves the Vice-Chancellor’s recommendations in relation to the remuneration, terms of employment and performance assessment of his direct reports, which include the deputy vice-chancellors.
The following section summarises the performance of the executive team in 2010, drawing on material submitted to and approved by the Senate Human Resources Committee on 9 March 2011. It includes a report of bonus payments made in recognition of executive performance in 2010. More information about the projects referred to below is provided in the review of operations on pages 67 to 69.
overall achievements and perFormance assessmentduring 2010 the executive team led a major review of the University that provides the foundation for reform and continued success in an increasingly competitive global higher education environment. This process commenced with an extensive consultation process and ended with the development and adoption of a strategic plan for the period from 2011 to 2015.
Under the executive team’s leadership, the University implemented a number of successful changes, most notably the introduction of a new ‘University economic model’ to enhance budgeting, resource allocation and reporting systems, and to provide greater financial transparency for enhanced decision-making as the University works to achieve its strategic goals.
vice-chancellor and principaldr Michael Spence BA LLB Sydney dPhil PGdipTheol Oxf Remuneration $754,024 Performance bonus $169,655This remuneration figure includes use of a residence owned by the University. The residence is required to be available and is used regularly for official University functions and promotional activities.
dr Spence led and closely managed the finalisation and adoption of the University’s 2011–15 Strategic Plan, a pivotal event of 2010 that involved wide consultation and

74 THE UnIVERSITy OF SydnEy STATUTORy REPORT 2010
the agreement of 17 core strategies covering all aspects of the work of the University. The plan will be fundamental for the University’s success during the planning period. He also brought significant change to the management of the University, including reforms to its academic and governance structures, and to the allocation of income and costs within the University. Under his oversight the University also prepared to launch a China Studies Centre in January 2011 and agreed to proceed with the Centre for Obesity, diabetes and Cardiovascular disease.
provost & deputy vice-chancellorProfessor Stephen Garton BA Sydney Phd UNSW, FAHA FASSA FRAHS Remuneration $519,999 Performance bonus $80,000
during 2010, Professor Garton played a key leadership role in the strategic planning process and, as chair, developed the key strategic role of the Course Planning Steering Committee in approving new courses. He managed the 16 faculty deans, including recruiting new deans for the Faculty of Architecture, design and Planning and the Faculty of Science and inducting the newly appointed deans in Arts and dentistry. He played a key role in the development of revised policies on promotion and performance management and development. He worked closely with the Chief Financial Officer (CFO) in the development and implementation of the new University Economic Model in its application to faculty budgets.
deputy vice-chancellor (education) & registrarProfessor derrick Armstrong BA Lond MA Phd Lanc Remuneration $444,047 Performance bonus $53,828
Professor Armstrong has established a new portfolio for a comprehensive, University-wide approach to education
reform. He continued to lead the ‘Sydney Student’ project, which will transform the student administration system. Under his leadership, Phase 1 of the project has been completed successfully. He also oversaw the Indigenous Education Review and responses to it, as well as changes to the management of graduate studies.
deputy vice-chancellor (international)Professor John Hearn MSc Dublin Phd ANU Remuneration $492,987 Performance bonus $52,947
Professor Hearn led the University’s involvement as a major sponsor of the 2010 Shanghai Expo, a significant investment by the University that played an important role in strengthening our links with the Chinese and Australian governments, and academic partners, through a series of academic symposia. He led the implementation of regional and country-specific action plans, refined our international strategy and further developed relationships with UnESCO, the OECd and the World Bank. He worked with the Vice-Chancellor to implement the ‘Area Studies’ program, beginning with the launch of the China Studies Centre. In addition, he continued to build successful international university networks for the University, especially through his work with the Worldwide Universities network (WUn).
deputy vice-chancellor (research)Professor Jill Trewhella MSc UNSW Phd Sydney, FAAAS Remuneration $459,339 Performance Bonus $61,880
during 2010 Professor Trewhella established the role of the Research Committee, developed the group of Research Integrity Advisors to educate and support staff on their obligations under the codes of conduct and applicable legislation and rules,
restructured the Research Portfolio and conducted an end-to-end review of research support processes, laying the foundation for an enhanced understanding of, and support for, successful research at Sydney. Having established the Research Analytics and data Strategy, she led the University’s participation in the Excellence in Research for Australia (ERA) government research quality exercise, as well as a review of ethics administration. In addition, she continued to oversee the University’s plans for a Centre for Obesity, diabetes and Cardiovascular disease, which made substantial progress in 2010.
deputy vice-chancellor (strategic management)Professor Ann Brewer BA Macquarie MCom Phd UNSW Remuneration $416,131 Performance bonus $60,464
Professor Brewer played a key role in academic leadership and designed and established the process for coordination and leadership of the Vice-Chancellor’s ‘Work Slate’ of reform projects. She also coordinated the work of the CFO and the directors of IT and Campus Infrastructure Services in implementing important reform projects relating to campus infrastructure and administrative services. She crucially assisted in the development of the University’s new strategic plan, especially in managing the critical consultation process. She worked with the Office of General Counsel to design and establish the Risk Management Framework and with the faculty deans to develop University-wide, disciplinary-appropriate KPIs.

75
student statisticsAS AT 31 MARCH 2010
undergraduate enrolments by attendance and gender
attendance gender enrolments
Full-time Women 16,591
Men 12,471
part-time Women 2135
Men 1415
total undergraduate 32,612
postgraduate enrolments by course level
course level enrolments
higher doctorate (research) 2
doctorate (research) 3367
doctorate (coursework) 97
master's (research) 839
master's (coursework) 9835
graduate diploma 1282
graduate certificate 711
non-award postgraduate 278
cross-institutional postgraduate 36
total postgraduate 16,447
postgraduate enrolments by attendance and gender
attendance gender enrolments
Full-time Women 5200
Men 3677
part-time Women 4391
Men 3179
total postgraduate 16,447
enrolments by Faculty oF course registration and course level
Faculty postgraduate undergraduate total
agriculture, Food & natural resources 137 499 636
architecture, design & planning 747 539 1286
arts 2092 7307 9399
dentistry 105 433 538
economics & business 3964 4094 8058
education & social work 709 2253 2962
engineering & information technologies 1230 3161 4391
health sciences 1544 3075 4619
law (sydney law school) 1523 980 2503
medicine (sydney medical school) 1938 1113 3051
nursing (sydney nursing school) 366 577 943
pharmacy 184 1126 1310
science 1210 4458 5668
sydney college of the arts 228 586 814
sydney conservatorium of music 220 696 916
veterinary science 173 931 1104
special programs* 70 761 831
rural management 7 23 30
total enrolments 16,447 32,612 49,059
* Special programs includes enrolments in Cadigal Program, Exchange Program, Study Abroad Program and Summer School only.
Student enrolment, student load and human resource figures included in this publication are based on a reference date of 31 March 2010. This is the data currently used to inform the University’s institutional targets for funding, budgeting and performance monitoring purposes.
Source: Planning and Information Office

human resources
76 THE UnIVERSITy OF SydnEy STATUTORy REPORT 2010
during 2010 there was a substantial increase in the volume and impact of the services offered by the University’s Human Resources (HR) unit.
The HR function made a significant contribution to the University’s overall people strategy, which is critical to its ability to meet performance objectives in a time of significant budgetary constraints.
developments included the following:
– HR partnered with executive and line managers to provide strategic advice and support as they began to implement initiatives in the University’s new strategic plan.
– A greater emphasis on reporting and enhanced data collection resulted in improved decision-making on staff issues at the ground level. (For example, HR worked with managers to improve leave planning practices and proactively reduce annual leave accruals.)
– Centralisation of University recruitment and implementation of a streamlined recruitment strategy and procedures enabled the University to be more agile and efficient in sourcing and recruiting talent.
– Upgrades to HR payroll and administration systems led to greater automation and a reduced workload associated with HR transactional processes. new software was implemented for position management, bonus payments and the processing of casual claims.
– Staff development activities focused on mentoring for academic staff, programs for researchers at key stages of their careers and leadership coaching.
– The range of remuneration benefits available to staff, such as salary packaging and the ‘living away from home allowance’, was expanded and there was increased emphasis on communicating these benefits to staff.
industrial relations policies and practices during 2010, HR worked to implement the provisions contained within the University’s new enterprise agreement, which came into effect on 23 november 2009 and will be in place until 2012.
This involved the development and review of a number of human resources policies and procedures to support implementation of the agreement, as well as an education and information program for University leaders.
The focus of industrial relations in 2010 was a highly consultative approach to strategic planning and change, through initiatives such as the new Management and Staff Consultative Committee, and effective dispute resolution.
HR developed a change management guide to assist managers to successfully implement change while minimising the negative impact on staff.
Meanwhile, the engagement of a new counselling provider has resulted in a more comprehensive staff counselling service.
human resources policies and practicesThe University continued to audit and review all human resources policies and procedures in 2010. As a result, 21 policies were revised, including those relating to performance management and development, occupational health and safety, flexible working arrangements and employment conditions such as clinical loadings.
Policies relating to the prevention of sexual harassment and discrimination, and injury management were also revised to meet changing regulatory requirements, and encourage compliance. In addition, policies and guidelines covering parental, study and long service leave were updated so the University could continue to provide staff with a wide range of leave options to suit individual needs. In order to help staff balance their work and personal responsibilities, the University also developed and implemented a new policy on working from home.
In addition to policy revisions, HR increased communication to staff and stakeholders about human resources policy and related employment issues so that information relating to working at the University was made more readily available and easy to understand.
Changes included the creation of an online index to enable web searches, the development of protocols to support more thorough policy implementation and the introduction of a feedback process to ensure stakeholder involvement in all phases of policy change and development.
Work to develop HR policies will continue in 2011 in response to changes in strategic direction and staff needs.
eQual employment opportunitySee pages 80 to 83.
occupational health and saFetySee pages 86 and 87.

77
staFF level and salary ranges as at 31 march 2010
academic staFF
level e & above $152,201+
level d $118,156 – $130,167
level c $98,131 – $113,151
level b $80,109 – $95,128
level a $56,076 – $76,098
general staFF
heo 10 & above $98,239+
heo 9 $91,903 – $96,972
heo 8 $79,247 – $89,374
heo 7 $70,802 – $77,134
heo 6 $64,470 – $69,534
heo 5 $56,028 – $62,780
heo 4 $51,807 – $54,763
heo 3 $45,477 – $50,540
heo 2 $43,365 – $44,631
heo 1 & below <=$42,098
academic staFF positions 2010 by appointment term, level and gender (shown as a percentage)
appointment termwomen
(%)men
(%)
continuing
level e & above 24 76
level d 33 67
level c 46 54
level b 53 47
level a 62 38
subtotal 42 58
Fixed term
level e & above 19 81
level d 38 62
level c 51 49
level b 52 48
level a 57 43
subtotal 48 52
total academic 46 54
combined totals oF academic and general staFF positions 2010 by appointment term and gender (shown as a percentage)
appointment termwomen
(%)men
(%)
continuing 53 47
Fixed term 59 41
total 56 44
general staFF positions 2010 by appointment term, level and gender (shown as a percentage)
appointment termwomen
(%)men
(%)
continuing
heo 10 & above 46 54
heo 9 47 53
heo 8 50 50
heo 7 63 37
heo 6 65 35
heo 5 72 28
heo 4 68 32
heo 3 42 58
heo 2 45 55
heo 1 & below 100 0
subtotal 60 40
Fixed term
heo 10 & above 42 58
heo 9 55 45
heo 8 69 31
heo 7 68 32
heo 6 68 32
heo 5 77 23
heo 4 74 26
heo 3 83 17
heo 2 68 32
heo 1 & below 13 88
subtotal 68 32
total general 63 37
staFF numbers
The following tables provide information about:
– staff salary data – the percentage of employees by category and executive position
– the number of employees by category and executive position, compared to the prior three years
– the number of female executive officers for current and previous reporting years.

78 THE UnIVERSITy OF SydnEy STATUTORy REPORT 2010
academic staFF positions 2007–10 by appointment term, level and gender
2007 2008 2009 2010
Women Men Total Women Men Total Women Men Total Women Men Total
continuing
level e & above 43 209 252 53 203 256 57 205 262 65 202 267
level d 66 148 214 67 150 217 75 153 228 86 176 262
level c 205 252 457 213 240 453 220 257 477 219 255 474
level b 259 217 476 244 202 446 237 209 446 225 199 424
level a 34 21 55 38 16 54 36 17 53 34 21 55
subtotal 607 847 1454 615 811 1426 625 841 1466 629 853 1482
Fixed term
level e & above 23 91 114 20 112 132 32 136 168 37 162 199
level d 31 51 82 34 62 96 42 74 116 46 74 120
level c 72 81 153 85 101 186 99 100 199 114 108 222
level b 200 190 390 222 207 429 236 211 447 234 215 449
level a 264 257 521 280 247 527 308 276 584 337 258 595
subtotal 590 670 1260 641 729 1370 717 797 1514 768 817 1585
total academic 1197 1517 2714 1256 1540 2796 1342 1638 2980 1397 1670 3067
combined totals oF academic and general staFF positions 2007–10 by appointment term and gender
2007 2008 2009 2010
Women Men Total Women Men Total Women Men Total Women Men Total
continuing 1858 1738 3596 1882 1681 3563 1955 1754 3709 2023 1793 3816
Fixed term 1443 1071 2514 1638 1178 2816 1813 1332 3145 1894 1336 3230
total 3301 2809 6110 3520 2859 6379 3768 3086 6854 3917 3129 7046

79
general staFF positions 2007–10 by appointment term, level and gender
2007 2008 2009 2010
Women Men Total Women Men Total Women Men Total Women Men Total
continuing
heo 10 & above 48 45 93 62 60 122 71 82 153 70 81 151
heo 9 58 65 123 72 80 152 76 86 162 79 88 167
heo 8 128 139 267 134 135 269 154 156 310 156 158 314
heo 7 173 124 297 190 126 316 206 131 337 237 139 376
heo 6 304 164 468 308 170 478 332 181 513 361 193 554
heo 5 285 116 401 271 106 377 272 99 371 274 104 378
heo 4 157 85 242 136 62 198 126 52 178 121 58 179
heo 3 50 60 110 50 83 133 47 87 134 59 81 140
heo 2 47 93 140 35 48 83 38 39 77 31 38 69
heo 1 & below 1 - 1 9 - 9 8 - 8 6 - 6
subtotal 1251 891 2142 1267 870 2137 1330 913 2243 1394 940 2334
Fixed term
heo 10 & above 28 36 64 38 51 89 34 59 93 44 61 105
heo 9 46 24 70 42 36 78 50 39 89 46 37 83
heo 8 107 66 173 120 71 191 129 67 196 144 66 210
heo 7 124 46 170 152 53 205 193 89 282 199 94 293
heo 6 192 88 280 235 94 329 274 122 396 248 118 366
heo 5 232 75 307 272 85 357 288 101 389 305 93 398
heo 4 56 25 81 75 24 99 71 31 102 70 25 95
heo 3 51 11 62 46 12 58 43 13 56 54 11 65
heo 2 9 13 22 6 7 13 12 6 18 15 7 22
heo 1 & below 8 17 25 11 16 27 2 8 10 1 7 8
subtotal 853 401 1254 997 449 1446 1096 535 1631 1126 519 1645
total general 2104 1292 3396 2264 1319 3583 2426 1448 3874 2520 1459 3979
note: data is for full-time and fractional full-time staff (staff on leave without pay and casuals are excluded). “Staff positions” refers to the number of appointments as some fractional full-time staff may occupy more than one position.Student enrolment, student load and human resource figures included in this publication are based on a reference date of 31 March 2010. This is the data currently used to inform the University’s institutional targets for funding, budgeting and performance monitoring purposes.Source: Planning and Information Office

80 THE UnIVERSITy OF SydnEy STATUTORy REPORT 2010
eQual employment opportunity
The University is committed to attracting, rewarding and retaining staff of outstanding quality and international standing, by removing barriers to employment and supporting equal participation of equity target groups. The Staff and Student Equal Opportunity Unit supports this goal through policy development, affirmative action programs, training and education, and monitoring and reporting on equal opportunity outcomes. The report below outlines initiatives undertaken in 2010 to eliminate discrimination and promote equity in employment.
harassment and discrimination prevention
In 2010 the University continued to support staff training to promote a positive workplace and prevent and address harassment and discrimination. It also continued to use EOOnline, an interactive professional development program that includes material on harassment and discrimination prevention and other aspects of positive equal opportunity practice. In 2011 the University will continue to use EOOnline and, through the Equal Opportunity Practitioners in Higher Education group, inform further development of EOOnline modules.
The University’s harassment and discrimination resolution procedures were reviewed in 2010 to include its residential colleges, and to provide simpler and more accessible resolution procedures. Students and staff also now have a range of contacts available if they need assistance.
indigenous education and employmentindigenous educationThe University sought to strengthen strategies for promoting Indigenous education through its Indigenous Education Advisory Committee in 2010. The committee aims to incorporate Indigenous perspectives in teaching and learning, and research on Indigenous welfare and health issues.
The Work Slate Review of Indigenous Education was completed in August 2009 by an external panel of Indigenous academic leaders, and in 2010 the University finalised its response. One of the key recommendations was the appointment of a senior person with responsibility for Indigenous affairs: the new position of deputy Vice-Chancellor (Indigenous Strategy and Services) was announced at the end of 2010 with a view to the successful applicant commencing in early 2011.
indigenous employmentThe Indigenous Employment Strategy, drafted in 2010 and managed by the Staff and Student Equal Opportunity Unit, is designed to support Indigenous Australians through employment at the University to launch and develop their
chosen careers. It encompasses a range of initiatives including cadetships, apprenticeships and traineeships as well as general employment opportunities.
The Broken Hill University department of Rural Health, together with the University of Sydney’s Indigenous Employment Strategy, established a three-year Indigenous Academic Traineeship Program pilot. Based in Broken Hill, the program aims to ensure that Indigenous people in rural or remote areas seeking an academic career are not disadvantaged by living in that area. The current trainee is enrolled in a Graduate diploma in Public Health at Broken Hill.
supporting women in the workplace
In March 2010 the University was recognised for the seventh consecutive year as an Employer of Choice for Women by the federal government’s Equal Opportunity for Women in the Workplace Agency (EOWA).
In 2010, the University pursued several initiatives to support its efforts to attract and retain female staff.
– The University awarded four Thompson Fellowships in 2010. These provide academic employment opportunities for women at Levels C and d and prepare them for roles at Levels d and E, where they remain significantly underrepresented. Four Brown Fellowships were also awarded. Open to University researchers whose careers have been interrupted by sustained primary caring duties, they aim to assist recipients to re-establish or enhance their academic research credentials.
– In 2010 the Staff and Student Equal Opportunity Unit developed a ‘Welcome to Women’ orientation program, providing information particularly relevant to new female staff.
– The Women in Leadership program was well attended in 2010. It fosters the professional development of women who aspire to, or are in, leadership or management roles at the University, inviting guest speakers to share their career highlights and how they have negotiated barriers to female achievement.
– Several events were held to mark International Women’s day 2010, including a morning tea hosted for female staff by the Chancellor and the Vice-Chancellor and addressed by Heather Gordon from EOWA.
– The University participated in the Group of Eight Human Resources directors Staff Equity Subcommittee, which developed the paper Consideration of merit relative to opportunity. It is anticipated that the paper will be widely used as a guide across the University and in other Group of Eight universities.

81
– In response to feedback from senior female staff, the University organised a professional development program for women on negotiating and influencing skills. Recognising the need for more women at Levels E and d and at Level 10 and above, the program targets women at the levels immediately below these.
– The Faculty of Economics and Business has a Gender and diversity Committee, which became a permanent subcommittee of the faculty executive to advise the dean on policy and oversee initiatives, such as an equity scholarship awarded for the first time in 2010. An Appropriate Behaviours Workshop for academics at associate professor and professorial level began this year, as did a new mentoring program.
– The Faculty of Science offers fellowships to assist parents with substantial childcare responsibilities to travel to and attend conferences in their field. The faculty’s re-entry fellowships provide women with either teaching relief or research funds in their first year back at work after maternity leave (male candidates are also eligible). Three were awarded in 2010.
– The Women in Science Project – sponsored by the Faculty of Science and including consultation with the faculties of Veterinary Science and of Agriculture, Food and natural Resources, and the School of Medical Science – supports women in senior academic roles in science. Begun in 2008, the project was continued in 2010, when a seminar series for women in science was also initiated.
supporting people with a disability
The University’s disability Action Plan 2006–2010 details strategies designed to ensure the equitable participation of people with a disability in education and employment. The University’s website, other publications, services, buildings and facilities continued to be upgraded throughout 2010 to improve accessibility.
The first two Laffan Fellowships for researchers with disabilities were awarded in 2010. They provide teaching relief or technical support, allowing researchers to focus on re-establishing or enhancing their careers.
The University employs two staff members with moderate intellectual disabilities, continuing in 2010, with the assistance of Jobsupport, a government-funded employment service.
Meanwhile, Sydney Law School’s Professor Ron McCallum AO was appointed Chair of the United nations Committee on the Rights of Persons with disabilities for 2010, and in november 2010 was named nSW Senior Australian of the year for 2011. Professor McCallum was dean of the faculty between 2002 and 2007, and the first totally blind person appointed to a full professorship at an Australian university.
cultural and linguistic diversity
The University’s achievements and plans in relation to its linguistically and culturally diverse staff are detailed in the Multicultural Policies and Services Program report on pages 84 and 85.

82 THE UnIVERSITy OF SydnEy STATUTORy REPORT 2010
The following tables show data for the previous three years on the representation of equal opportunity groups and the distribution of each group in academic and general staff subgroups.
trends in the representation oF eeo groups – academic staFF
eeo target group percentage oF total academic staFF
academic staffbenchmark
or target2007 2008 2009 2010
Women 50 44 45 45 46
Aboriginal and Torres Strait Islander people 2 0.6 0.9 0.6 0.7
People whose first language was not English 19 11 9 6 5
People with a disability 12 2 2 2 2
People with a disability requiring work-related adjustment 7 0.3 0.1 0.4 0.2
trends in the representation oF eeo groups – general staFF
eeo target group percentage oF total general staFF
general staffbenchmark
or target2007 2008 2009 2010
Women 50 62 64 63 63
Aboriginal and Torres Strait Islander people 2 0.6 0.6 0.7 1
People whose first language was not English 19 10 12 5 6
People with a disability 12 2 2 2 2
People with a disability requiring work-related adjustment 7 0.3 0.1 0.2 0
REPRESEnTATIOn OF EEO GROUPS THROUGHOUT THE UnIVERSITy

83
trends in the distribution oF eeo groups – academic staFF
eeo target group distribution index*
academic staffbenchmark
or target2007 2008 2009 2010
Women 100 78 79 80 80
Aboriginal and Torres Strait Islander people 100 n/c n/c n/c n/c
People whose first language was not English 100 75 92 96 97
People with a disability 100 133 111 100 100
People with a disability requiring work-related adjustment 100 n/c n/c n/c n/c
trends in the distribution oF eeo groups – general staFF
eeo target group distribution index*
general staffbenchmark
or target2007 2008 2009 2010
Women 100 92 95 94 94
Aboriginal and Torres Strait Islander people 100 n/c 71 77 83
People whose first language was not English 100 88 97 96 98
People with a disability 100 106 96 97 101
People with a disability requiring work-related adjustment 100 n/c n/c n/c n/c
n/c distribution index not calculable due to the small number of staff in the indicated EEO group
notesdata as at 31 March 2010.These tables exclude casual staff. The data shows a marked difference between 2008 and 2009 in the percentages of people whose first language was not English. This relates to a change in the human resources information system used by the University.A distribution index of 100 indicates that the centre of the distribution of the EEO group across salary levels is equivalent to that of other staff. Values of less than 100 mean that the EEO group tends to be more concentrated at lower salary levels than is the case for other staff. The more pronounced this tendency, the lower the index. Values of greater than 100 indicate that the EEO group is less concentrated at lower salary levels.

84 THE UnIVERSITy OF SydnEy STATUTORy REPORT 2010
The University of Sydney is committed to supporting and fully engaging all members of its culturally, linguistically and religiously diverse staff and student community. In 2010 the University undertook a wide range of activities devoted towards this goal.
diversity in teaching, learning and research
The University’s Learning and Teaching Plan for 2007 to 2010 set out seven major principles, one of which was a commitment to value the diversity of staff and student bodies in their reflection of the wider community, and promote internationalisation, cultural diversity and equity. The plan aimed to add an international and intercultural dimension to the student experience, for example through international placements and study abroad. Teachers were also encouraged to offer a curriculum that values cultural diversity, practise ‘inclusive teaching’, audit units of study for evidence of cultural diversity, and improve the participation of Indigenous students.
The International Student Office diversified international placements in 2010, increasing those in the Asia-Pacific region and in South-East Asia, particularly within the Faculty of Health Sciences and the Faculty of Agriculture, Food and natural Resources. In 2011 the International Student Office will initiate a new short-term study option at the University of Athens in Greece, working with the Sydney’s Faculty of Arts and Social Sciences.
The University signed nine new Cotutelle agreements in 2010, giving students the opportunity to add an international dimension to their research and achieve simultaneous degree candidature at two universities. The agreements were signed with universities in China, France, Hong Kong, Italy, Switzerland, Thailand and the United Kingdom.
The Institute for Teaching and Learning (ITL), in collaboration with the Social Inclusion Unit, established a network of scholars with expertise in ‘inclusive teaching‘: the principle of supporting students from diverse and disadvantaged backgrounds. These scholars will play a major role through sharing inclusive teaching strategies with their peers and leading curriculum development. The network will be supported by a new website with specific resources on inclusive teaching, and act as a hub to connect staff with relevant initiatives within and beyond the University.
The ITL also collaborated with Learning Solutions to develop a workshop for new staff to highlight University resources available on social inclusion. These initiatives will be built on in 2011, including by providing a number of small research grants and ‘curriculum renewal’ seeding grants to support social inclusion. The ITL will also complete a research study on the learning experiences of first-year Equity Scholarship
recipients, and develop a new module for incorporation into academic staff orientation and professional development.
The Faculty of Law piloted an undergraduate peer-to-peer mentoring program to boost support networks, help students’ transition to university, and better integrate the domestic, international and exchange cohorts. The faculty also sought to increase exchange programs to diversify its student body and provide international opportunities for local students.
The faculty also refined a two-day bridging program for international students in 2010, providing orientation and transition support. Overseas-taught units of study were enhanced, including the establishment of a Himalayan Field School to explore human rights and the role of international law to assist poor and vulnerable communities. A new Juris doctor curriculum was implemented, with an emphasis on international, comparative and transnational aspects of law, to prepare students for global legal practice.
The Faculty of dentistry encourages students from culturally, linguistically and religiously diverse backgrounds to conduct research projects as visiting scholars. In 2010 the faculty’s orthodontics discipline accepted four students from the Academic Centre for dentistry Amsterdam (University of Amsterdam and Vrije University Amsterdam).
The University of Sydney Business School has a high proportion of students from language backgrounds other than English, in particular from China, and provides language and presentation support for academics from language backgrounds other than English, and hosts forums for academic staff to consider the challenges of teaching across language boundaries. In 2010 more than 1500 faculty students participated in the Peer Assisted Study Scheme (PASS). Facilitators were given training in intercultural communication, and peer mentors and mentees were matched culturally where possible.
Sydney College of the Arts (SCA) supports a significant student exchange program. Seventeen SCA students went abroad during 2010, while 15 incoming exchange students were welcomed from Austria, Canada, Germany, Israel, Taiwan and the United States. In 2010 SCA offered 12 scholarships to students going on exchange. It also welcomed 13 renowned overseas-based artists into its Research Residency program.
In 2010 International House, a residential college with students of more than 40 nationalities, introduced a cultural-awareness program, which aims to help residents develop a deeper understanding of the challenges of working within a multicultural environment and learn strategies to overcome these challenges.
multicultural policies and services program report

85
student support services
The Learning Centre offers specific courses for students from language backgrounds other than English. In 2010 approximately two-thirds of the centre’s almost 2000 enrolments were students from such a background. The centre also ran teaching programs in 13 faculties for almost 3000 students, with approximately 40 percent targeting local students.
The Campus Security Unit increased to four the number of safety seminars targeted at international students during the year. It also increased diversity in its own workforce to reflect the culturally diverse demographic of the University. The benefits have already been substantial: feedback has indicated that students feel more comfortable speaking to security staff from a similar cultural or linguistic background.
promoting social inclusion
The University’s Compass program continued to encourage school students from low socioeconomic backgrounds to participate in higher education. Since the project’s 2009 launch, thousands of students, teachers, parents and University of Sydney students and staff have participated in a range of events and activities focused on promoting aspiration and attainment in Compass school communities.
Throughout 2010 dr Fiona White and dr Hisham Abu-Raaya, from the Faculty of Science’s School of Psychology, conducted the Harmony Program, an Australian Research Council-funded longitudinal field study. The study compared the effectiveness of a 10-week program between groups of high school Muslim and Christian students working in mixed and separated groups. The results revealed significant improvements in knowledge and attitudes towards the other religion among students in the mixed group.
community engagement
The University was involved in the World Expo 2010 in Shanghai as a Gold Sponsor of the Australian Pavilion. The University’s Expo program involved a series of symposia that brought together academic leaders from both countries to discuss topics of mutual interest (see pages 26 to 27 for more information).
The University announced in 2010 it would open a new China Studies Centre in 2011, with a focus on the developing areas in the west of China. It is also participating in Imagine Australia, the year of Australian Culture in China.
The 5th International Conference on the Arts in Society was hosted by Sydney College of the Arts in 2010. Speakers included Indigenous Australian, Chinese and European art practitioners and researchers.
The Macleay Museum held children’s and families’ activities and talks for the Chinese year of the Tiger, in both Mandarin and English, as part of the City of Sydney’s 2010 Chinese new year Festival. The museum also hosted a public lecture and launch of the book Modern approaches to historic photographs: returning photographs to Vanuatu, by dr Anita Here.
The University Art Gallery hosted an exhibition of contemporary Chinese artists’ work reflecting on Chinese propaganda art of the 1960s, together with a series of talks by the artists.
key multicultural strategies For 2011
The University’s key multicultural strategies proposed for 2011 are embodied in initiatives listed in the University’s 2011–15 Strategic Plan. These include:
– prioritising the implementation of the recommendations of the University’s review of support for international students, which seeks to offer increased support to and improve the experience of international students at the University
– attracting and supporting promising students from a diversity of social and cultural backgrounds, and ensuring appropriate support for the retention and achievement of students from underrepresented groups
– expanding and diversifying opportunities for students to develop as global citizens through greater exchange opportunities, and through attracting overseas students and academics
– prioritising international engagement to support the effective development of University-wide partnerships and networks.
* The legislative requirement for the University to report on ethnic affairs and cultural diversity is overseen by the new South Wales Community Relations Commission, which has monitored the University’s progress against the University’s Ethnic Affairs Priorities Statement. Following recent legislative change, in 2010 the name of the Ethnic Affairs Policies Statement Program changed to the Multicultural Policies and Services Program.

86 THE UnIVERSITy OF SydnEy STATUTORy REPORT 2010
occupational health and saFety
In 2010 the University undertook a range of strategies to ensure the ongoing achievement of its goal of maintaining a safe and healthy workplace. These and other strategies emphasised the importance of safety, health and wellbeing to the University and encouraged all staff to embrace this commitment.
ohs perFormance
This year the University established a new committee to oversee the management of OHS issues, revised and updated a number of its OHS-related policies and introduced online OHS training and reporting systems.
governance
safety and risk management committeeIn June 2010 the University introduced new governance arrangements for the management of OHS issues, with the establishment of a Safety and Risk Management Committee (SRMC) of Senate, chaired by dr Barry Catchlove, a fellow of Senate.
The role of the SRMC is to monitor and advise Senate on matters relating to the safety of staff, students and visitors to the University’s campuses, and specifically to the maintenance of OHS standards and practices and compliance with OHS laws and regulations as they apply to the University.
The SRMC endorsed a Workplace Health and Safety (WHS) strategic plan as the keystone of a renewed effort to achieve the University’s aspiration of becoming an industry leader in OHS, with a positive reputation and a culture to match. A WHS action plan was subsequently adopted, listing key priority actions that will deliver the University’s OHS strategic goals.
The Central OHS Committee continued its function of monitoring OHS performance and ensuring a coordinated approach to University-wide OHS issues. The committee is chaired by the director of Human Resources.
policyIn 2010 the University revised and updated its OHS policy as a shorter, easy-to-read document, providing links to further information where necessary. It describes clearly defined roles and responsibilities, in particular those of principal officers and fellows of Senate, and highlights the consultation process as a significant means of resolving any OHS issues.
The University’s Policy for Children in University Workplace and Premises was also revised and re-released in October
2010. This policy aims to maintain equal opportunity for those with childcare responsibilities while observing the University’s OHS obligations. It expresses the University’s commitment to being a family-friendly organisation, and outlines the circumstances under which children may be brought into University workplaces and premises.
A new Working from Home Policy was introduced in december. It recognises that contemporary working arrangements sometimes involve the flexibility of working from home, and requires that appropriate consideration for OHS issues be made by staff when working from home. An updated Working from Home OHS Checklist was also provided to support this new policy.
A revised Injury Management Policy was also released in december, which provides guidance to staff who have sustained a work-related injury or illness and are eligible to submit a workers’ compensation claim. The policy complies with the NSW Workplace Injury Management and Workers Compensation Act 1998. It is concise and easy to read, clearly identifying staff roles and responsibilities, steps in the injury-management process and sources of further information.
training and communicationThis year the University introduced online OHS induction training for new employees. An important step in developing a safe and healthy culture among staff, the training emphasises the importance of safety, health and wellbeing to the University and enlists the commitment of new staff to embrace this.
Specialist OHS training programs were also provided to staff and students working in key risk areas, such as with hazardous substances, ionising radiation and biological hazards (see ‘Inspections and licensing’, below), as well as more general training in first aid, CPR and emergency management.
The University’s OHS website was revised to make it more user friendly, with improved navigation and the introduction of a student safety page. OHS information and events were also regularly featured in the weekly email newsletter sent to staff.

87
ohs awardThe University presents an annual Peter dunlop Memorial OHS Award in recognition of outstanding contributions to OHS. The 2010 award was given to Greg Gaal, facilities and assets manager of the Faculty of Health Sciences. Greg has been an OHS Committee representative since 1992, serving as chair for seven of those years. He has also been very active on the University’s Cumberland Campus, coordinating chief wardens, first aid officers and first-attack fire fighting training, as well as Safe Work Australia Week events.
perFormance monitoring
auditingThe biennial University-wide OHS audit was conducted in 2010, covering 105 departments. The results showed a 4 percent improvement in OHS performance since the previous audit. Key recommendations for further improvement were to incorporate safety planning into department business or strategic plans, and to improve OHS risk-management training for supervisors.
inspections and licensingThe Institutional Biosafety Committee monitored the University’s research involving gene technology. Physical containment facilities were inspected and certified by the Office of the Gene Technology Regulator, while researchers involved with biological hazards received biosafety training.
University facilities used for work with ionising radiation and irradiating apparatus were also registered as required with the nSW department of Environment and Climate Change and Water. The University’s Radiation Safety Committee met regularly in 2010 to monitor the research and clinical use of ionising radiation and promote safe work practices.
online reporting and managementIn September the University introduced RiskWare, a new online system for reporting OHS incidents, injuries, hazards and risks. The system is user friendly and automatically prompts supervisors to take corrective action to prevent future mishaps. As well as reporting, it enables users to view history of reported incidents, injuries, hazards and risks; record and track corrective actions; generate management reports; and conduct and record risk assessments.
ohs incidents in 2010
There were 791 incidents reported in 2010, continuing the trend of increased reporting from previous years. during the latter part of the year, 23 hazards were reported through RiskWare (see above).
workers’ compensationduring the year, 206 incidents progressed to become workers compensation claims. Of these, 138 had been finalised as at 31 december 2010 while 68 remained open.
The total gross claims cost was $1,384,337.48, and the net claims cost (premium impacting) was $684,493.84. The average cost per claim was $6,435.19, and the average time loss per claim was 41.62 hours.
The two most common mechanisms of injury were body stressing from manual handling or repetitive movement (25 percent by number and 35 percent by gross cost) and slips, trips and falls (19 percent by number and 25 percent by gross cost).
regulatory actionThe University was issued with a WorkCover nSW prohibition notice relating to the use of a table saw that was involved in causing a serious injury to a staff member at Sydney College of the Arts on the University’s Rozelle Campus on 27 July 2010. A consulting engineer was engaged to dismantle and reassemble the machine, and the mechanical problems were identified and resolved. A statement was issued by the engineer to WorkCover indicating that the machine was in good working order. This was accepted by the regulator and the prohibition notice was lifted.
Subsequently, the University engaged a machinery safety consultant to assess machinery safety standards in all its workshops and provide recommendations for improvement.
injury prevention measuresIn 2010 the University conducted ergonomic worksite assessments in areas identified as high risk. It also carried out manual-handling projects, and continued to issue electronic reminders to computer users to take breaks in areas where discomfort at work has been reported.
Early-intervention and conflict-resolution measures were also undertaken, in consultation with the Case Management Group, to reduce the number of psychological incidents progressing to claims.

88 THE UnIVERSITy OF SydnEy STATUTORy REPORT 2010
changes to legislation
Higher Education Support Amendment (2010 Budget Measures) Act 2010 (Cth)This legislation amended the Higher Education Support Act 2003 to provide additional funding on a transitional basis during the implementation of a new student-centred funding system. The system was adopted in response to the recommendations of the Bradley Review of Australian Higher Education.
The new arrangements include a transitional period in 2010 and 2011 during which the cap on over-enrolment for Commonwealth-supported places has been lifted from 5 percent to 10 percent in funding terms.
Government Information (Public Access) Act 2009 (NSW)The Government Information (Public Access) Act 2009 (the GIPA Act) was passed in 2009 and commenced operation on 1 July 2010. It replaced the Freedom of Information Act 1989 (NSW) and established a new scheme for access to information held by public-sector agencies, including universities.
The objective of the GIPA Act is to provide access to information on the basis of a presumption in favour of disclosure, except where there is an overriding public interest to the contrary. The University has updated its procedures for managing requests for information to ensure compliance with the new requirements of the Act. These measures have included establishing new timeframes for dealing with requests for access to information and reviews of decisions, and new requirements for the information that agencies must make publicly available.
legal aFFairs
court decisions
UWA v Gray (Full Federal Court decision stands)As noted in the Annual Report 2009, in September 2009 the Full Federal Court handed down its decision relating to the ownership of inventions created by dr Bruce Gray in the course of research conducted while he was a full-time employee of the University of Western Australia (UWA). The court held that, in the absence of an express agreement to the contrary, rights to inventions made by academic staff in the course of their research ordinarily belong to the academic staff member as an inventor under the Patents Act.
In reaching this conclusion, the court found that the term generally implied in employment contracts – assigning intellectual property created in the course of employment to the employer – does not apply in the academic employment context. Further, it was held that UWA’s intellectual property regulations, which purported to assign ownership of intellectual property created in the course of dr Gray’s employment to UWA, were invalid, as they were outside the rule-making power of UWA’s Senate under its Act.
In February 2010 the High Court of Australia dismissed UWA’s application for special leave to appeal the Full Federal Court decision, meaning that avenues for appealing this decision are now exhausted.

89
Section 33(3) of the Privacy and Personal Information Protection Act 1998 (NSW) (the Act) requires the University to report on the actions it has taken to comply with the Act and to provide statistical details of any review conducted by it or on its behalf.
The steps the University has taken to comply with the privacy legislation include:
– featuring privacy notices on electronic and hard-copy forms used to collect personal information
– featuring links to privacy statements on the University’s websites
– considering privacy issues in the development of University systems, policies, resolutions, rules and procedures
– adding warnings against the unauthorised disclosure of personal information to login screens of corporate computer systems
– administering an awareness and training program on privacy legislation and related matters
– maintaining a privacy website, with links to the University’s Privacy Management Plan and other sources of information, at sydney.edu.au/arms/privacy
– incorporating a section on privacy in the University’s Recordkeeping Manual (available in hard-copy format and electronically)
– revising the access and security regime for the University’s corporate recordkeeping system to further enhance information privacy
– providing accurate and timely advice on privacy matters to members of the University community.
privacy and personal inFormation
reviews conducted under part 5 oF the privacy and personal inFormation protection act
Four reviews were conducted under part 5 of the Act during 2010.
1. An employee of a student organisation complained that a member of University staff had breached a student’s privacy by asking the employee to specify the information he had provided to assist the student. The University investigated the complaint as a matter of good faith, as it was not obliged to accept a third-party application for an internal review about an alleged breach of an individual’s personal information. It was found that the student had been aware that the student organisation would in due course be contacted by the University. no breach of the privacy principles was found to have occurred.
2. A student complained that an academic staff member had breached his privacy by discussing his academic record in such a way that other students could hear what was said. The member of staff provided a different account of what occurred. In the absence of any other evidence it was not possible to come to a conclusion, and no further action was taken.
3. Another student complained that his faculty had sought information from a counsellor in relation to an academic appeal he had lodged. It was found that the faculty had sought information from the counsellor and that this information was supplied and used by the faculty in the appeal process. The faculty wrongly believed that the counsellor had obtained the student’s consent to release the information to them. Apologies were made by the faculty and by the Student Services department to the student, and faculty procedures were changed to ensure that students give their consent to the release of any information by student services staff.
4. A third student complained that an examiner had disclosed information regarding his performance in an assessment to other students. Circumstances arose under which it was not possible to fully investigate the matter. It was also not possible to explain to the complainant what the circumstances were, without breaching the privacy of the staff member. no further action was taken.

90 THE UnIVERSITy OF SydnEy STATUTORy REPORT 2010
Freedom oF inFormation
2010 was a year of transition for the legislation relating to access to information. The Freedom of Information Act 1989 nSW applied to the University’s documents until June 2010, but was replaced on 1 July 2010 by the Government Information (Public Access) Act 2009 nSW.
Under the former piece of legislation, the University was required to report on the processing of freedom of information (FOI) requests it received in the first half of 2010. The University is also required to make public a report of its activities under the replacement legislation for the second half of 2010.
This section provides a commentary on both acts. The tables on pages 91 to 96 show the figures for reporting under the Freedom of Information Act, from January to June 2010, while the tables on pages 96 to 98 show the figures for reporting under the Government Information (Public Access) Act, from July to december 2010.
FREEDOM OF INFORMATION ACT 1989 nsw: applicable 1 january – 30 june 2010
As in previous years, there were relatively few applications under the Freedom of Information Act 1989 nSW. This may be partially the result of the University’s long-standing administrative arrangements, enabling students to access their files without a formal application, and the rise in the use of applications for access to personal information under section 14 of the NSW Privacy and Personal Information Protection Act 1998.
Material exempted from release under both types of applications generally concerned the personal affairs of third parties, staff or students. Applications often covered documents that contained incidental third-party information; the privacy of those persons was protected by a specific exemption. In addition, legal privilege was a relevant factor in not releasing documents in two applications.
during its two decades of operation the Freedom of Information Act (nSW) had little impact on the University’s operations. Most applications were made by people seeking information about themselves; and as stated above, such formal applications have been increasingly dealt with under privacy legislation.
Much information regarding the University’s affairs has been publicly available for many decades; technological change has made access to information by students, staff and the public easier. The internet and new administrative systems have increasingly allowed staff and students to access information about their candidature or employment from any location that offers an internet connection. Almost all administrative publications of the University are available online, as is a great deal of information regarding the
University’s governance bodies.
external reviews in 2010One external review was concluded by the nSW Administrative decisions Tribunal in 2010, and there were two Appeal Panel matters stemming from a 2009 tribunal case. The review was: GA v The University of Sydney 2010 nSWAdT 76 and the two panel matters were GA v The University of Sydney (Gd) 2010 nSWAdTAP 31 and GA v University of Sydney (no. 2) (Costs) (Gd) 2010 nSWAdTAP 53.
The matter considered by the nSW Administrative Appeals Tribunal (GA v The University of Sydney 2010 nSWAdT 76) dealt with three related appeals to the tribunal by GA. One concerned access and the other two concerned amendment of records. The tribunal dismissed the first matter as misconceived under section 73(5)(g)(ii) of the Administrative Decisions Tribunal Act 1997 nSW. The remaining matters were dismissed because the tribunal did not have jurisdiction to hear them. GA had claimed that particular information was personal and had sought amendment under the Freedom of Information Act. The tribunal did not find that the information was personal and so it had no jurisdiction to consider amendment.
The first Appeal Panel matter, GA v The University of Sydney (Gd) 2010 nSWAdTAP 31, had its origins in a 2009 external review of a refusal by the University to amend its student records (GA v The University of Sydney 2009 nSWAdT 230), which the tribunal dismissed. The appeal panel rejected the appeal, stating:
“In our view, GA’s use of the amendment facilities of the two Acts borders on the absurd. He had the opportunity back in February 2001 to ventilate this issue, and again in the context of the Supreme Court proceedings of 2004.”
directions for costs were made, which were then dealt with in the second Appeal Panel matter, GA v University of Sydney (No. 2) (Costs) (GD) 2010 NSWADTAP 53. The tribunal ordered that GA pay costs of $4700 to the University.

91
section a: new Foi applications
how many applications were received, discontinued or completed?
number oF Foi applications
personal other total
2009 2010 2009 2010 2009 2010
a1 new 8 5 6 4 14 9
a2 brought forward 1 0 0 0 1 0
a3 total to be processed 9 5 6 4 15 9
a4 completed 9 5 5 4 14 9
a5 discontinued 0 0 1 0 1 0
a6 total processed 9 5 5 4 0 9
a7 unfinished (carried forward) 0 0 0 0 1 0
section b: discontinued applications
why were Foi applications discontinued?
number oF discontinued Foi applications
personal other total
2009 2010 2009 2010 2009 2010
b1 request transferred out to another agency (s.20)
0 0 0 0 0 0
b2 applicant withdrew request 0 0 0 0 0 0
b3 applicant failed to pay advance deposit (s.22)
0 0 0 0 0 0
b4 applicant failed to amend a request that would have been an unreasonable diversion of resources to complete (s.25(1)(a1))
0 0 1 0 1 0
b5 total discontinued 0 0 1 0 1 0
note: If request discontinued for more than one reason, select the reason first occurring in the above table. The figures in B5 should correspond to those in A5.
section c: completed applications
what happened to completed Foiapplications? number oF completed Foi applications
personal other total
2009 2010 2009 2010 2009 2010
c1 granted or otherwise available in full 4 1 0 1 4 2
c2 granted or otherwise available in part 4 3 2 1 6 4
c3 refused 1 1 3 2 4 3
c4 no documents held 0 0 0 0 0 0
c5 total completed 9 5 5 4 14 9
note: A request is granted or otherwise available in full if all documents requested are either provided to the applicant (or the applicant’s medical practitioner) or are otherwise publicly available. The figures in C5 should correspond to those in A4.

92 THE UnIVERSITy OF SydnEy STATUTORy REPORT 2010
section d: applications granted or otherwise available in Full
how were the documents made available to the applicant?
number oF Foi applications(granted or otherwise available in Full)
personal other total
2009 2010 2009 2010 2009 2010
d1 provided to the applicant 4 1 0 1 4 2
d2 provided to the applicant’s
medical practitioner 0 0 0 0 0 0
d3 available for inspection 0 0 0 0 0 0
d4 available for purchase 0 0 0 0 0 0
d5 library material 0 0 0 0 0 0
d6 subject to deferred access 0 0 0 0 0 0
d7 available by a combination of any of the reasons listed in d1 to d6 above
0 0 0 0 0 0
d8 total granted or otherwise available in full 4 1 0 1 4 2
note: The figures in d8 should correspond to those in C1.
section e: applications granted or otherwise available in part
how were the documents made available to the applicant?
number oF Foi applications(granted or otherwise available in Full)
personal other total
2009 2010 2009 2010 2009 2010
e1 provided to the applicant 4 3 2 0 6 3
e2 provided to the applicant’s medical practitioner
0 0 0 0 0 0
e3 available for inspection 0 0 0 0 0 0
e4 available for purchase 0 0 0 0 0 0
e5 library material 0 0 0 0 0 0
e6 subject to deferred access 0 0 0 1 0 1
e7 available by a combination of any of the reasons listed in e1 to e6 above
0 0 0 0 0 0
e8 total granted or otherwise available in part 4 3 2 1 6 4
note: The figures in E8 should correspond to those in C2.
section F: reFused Foi applications
why was access to the documents reFused?
number oF reFused Foi applications
personal other total
2009 2010 2009 2010 2009 2010
F1 exempt 0 0 3 0 3 0
F2 deemed refused 1 1 0 2 1 3
F3 total refused 1 1 3 2 4 3
note: The figures in F3 should correspond with those in C3.

93
section g: exempt documents
why were the documents classiFied as exempt?
(identiFy one reason only)
number oF Foi applications(reFused or access granted or otherwise available in part only)
personal other total
2009 2010 2009 2010 2009 2010
restricted documents: 0 0 0 0 0 0
g1 cabinet documents (clause 1) 0 0 0 0 0 0
g2 executive council documents (clause 2) 0 0 0 0 0 0
g3 documents affecting law enforcement and public safety (clause 4)
0 0 0 0 0 0
g4 documents affecting counter terrorism measures (clause 4a)
0 0 0 0 0 0
documents requiring consultation:
g5 documents affecting intergovernmental relations (clause 5) 0 2 0 0 0 2
g6 documents affecting personal affairs (clause 6) 2 2 2 0 4 2
g7 documents affecting business affairs (clause 7) 0 0 1 1 1 1
g8 documents affecting the conduct of research (clause 8) 0 0 0 0 0 0
documents otherwise exempt:
g9 schedule 2 exempt agency 0 0 1 0 1 0
g10 documents containing information confidential to olympic committees (clause 22)
0 0 0 0 0 0
g11 documents relating to threatened species, aboriginal objects or aboriginal places (clause 23)
0 0 0 0 0 0
g12 documents relating to threatened species conservation (clause 24)
0 0 0 0 0 0
g13 plans of management containing information of aboriginal significance (clause 25)
0 0 0 0 0 0
g14 private documents in public library collections (clause 19) 0 0 0 0 0 0
g15 documents relating to judicial functions (clause 11) 0 0 0 0 0 0
g16 documents subject to contempt (clause 17) 0 0 0 0 0 0
g17 documents arising out of companies and securities legislation (clause 18)
0 0 0 0 0 0
g18 exempt documents under interstate Foi legislation (clause 21)
0 0 0 0 0 0
g19 documents subject to legal professional privilege (clause 10)
2 0 0 0 2 0
g20 documents containing confidential material (clause 13) 0 0 0 0 0 0
g21 documents subject to secrecy provisions (clause 12) 0 0 0 0 0 0
g22 documents affecting the economy of the state (clause 14) 0 0 0 0 0 0
g23 documents affecting financial or property interests of the state or an agency (clause 15)
0 0 0 0 0 0
g24 documents concerning operations of agencies (clause 16) 0 0 0 0 0 0
g25 internal working documents (clause 9) 0 0 0 0 0 0
g26 other exemptions (eg, clauses 20, 22a and 26) 0 0 1 0 1 0
g27 total applications including exempt documents 4 3 5 1 9 4
note: Where more than one exemption applies to a request select the exemption category first occurring in the above table. The figures in G27 should correspond to the sum of the figures in C2 and F1.

94 THE UnIVERSITy OF SydnEy STATUTORy REPORT 2010
section h: ministerial certiFicates (s.59)
how many ministerial certiFicates were issued?
number
2009 2010
h1 ministerial certificates issued 0 0
section i: Formal consultations
how many Formal consultations were conducted?
number
2009 2010
i1 number of applications requiring formal consultation
4 1
i2 number of persons formally consulted 6 8
note: Include all formal offers to consult issued irrespective of whether a response was received.
section j: amendment oF personal records
how many applications For amendment oF personal records were agreed or reFused?
number oF applications For amendment oF personal records
2009 2010
j1 agreed in full 0 0
j2 agreed in part 0 0
j3 refused 0 1
j4 total 0 1
note: Include all formal offers to consult issued irrespective of whether a response was received.
section k: notation oF personal records
how many applications For notation oF personal records were made (s.46)?
number oF applications For notation
2009 2010
k1 applications for notation 0 0
section l: Fees and costs
what Fees were assessed and received For Foi applications processed (excluding applications transFerred out)?
assessed costs Fees received
2009 2010 2009 2010
l1 all completed applications $400 $565 $400 $565
section m: Fee discounts
how many Fee waivers or discounts were allowed and why?
number oF Foi applications (where Fees were waived or discounted)
personal other total
2009 2010 2009 2010 2009 2010
m1 processing fees waived in full 0 0 0 0 0 0
m2 public interest discounts 0 0 0 0 0 0
m3 Financial hardship discounts – pensioner or child
7 1 0 1 7 2
m4 Financial hardship discounts – non profit organisation
0 0 0 0 0 0
m5 total 7 1 0 1 7 2
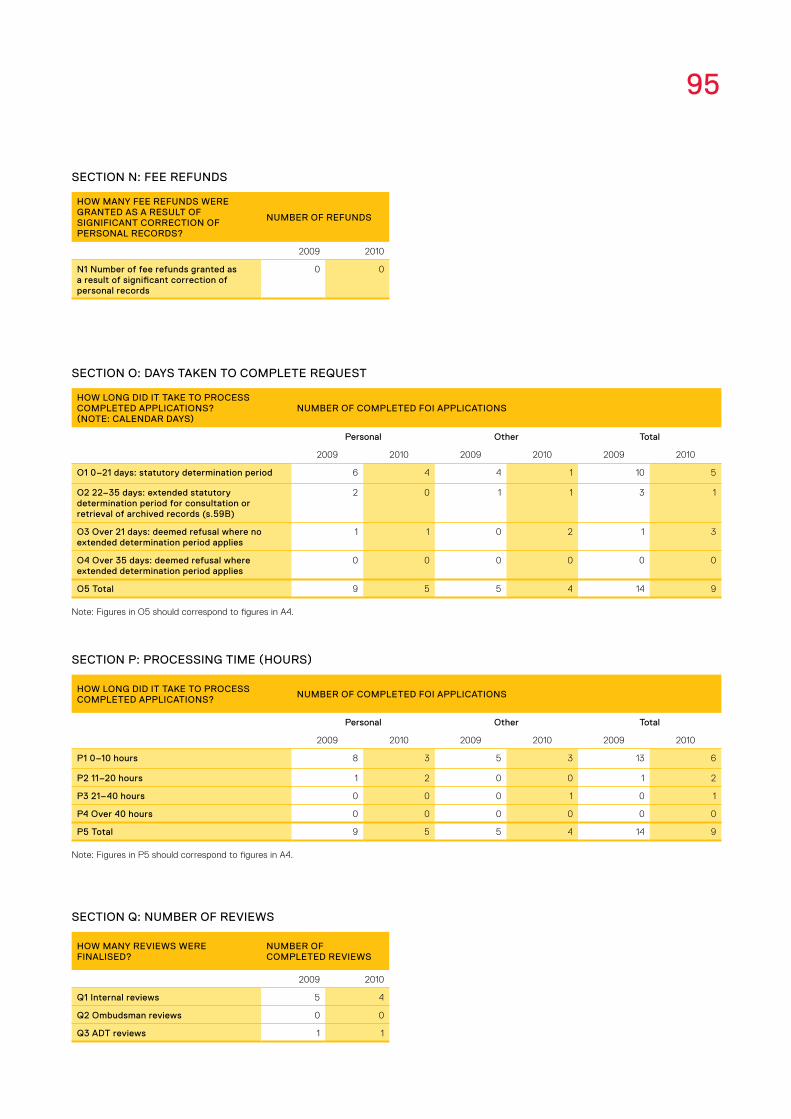
95
section o: days taken to complete reQuest
how long did it take to process completed applications?(note: calendar days)
number oF completed Foi applications
personal other total
2009 2010 2009 2010 2009 2010
o1 0–21 days: statutory determination period 6 4 4 1 10 5
o2 22–35 days: extended statutory determination period for consultation or retrieval of archived records (s.59b)
2 0 1 1 3 1
o3 over 21 days: deemed refusal where no extended determination period applies
1 1 0 2 1 3
o4 over 35 days: deemed refusal where extended determination period applies
0 0 0 0 0 0
o5 total 9 5 5 4 14 9
note: Figures in O5 should correspond to figures in A4.
section n: Fee reFunds
how many Fee reFunds were granted as a result oF signiFicant correction oF personal records?
number oF reFunds
2009 2010
n1 number of fee refunds granted as a result of significant correction of personal records
0 0
section p: processing time (hours)
how long did it take to process completed applications?
number oF completed Foi applications
personal other total
2009 2010 2009 2010 2009 2010
p1 0–10 hours 8 3 5 3 13 6
p2 11–20 hours 1 2 0 0 1 2
p3 21–40 hours 0 0 0 1 0 1
p4 over 40 hours 0 0 0 0 0 0
p5 total 9 5 5 4 14 9
note: Figures in P5 should correspond to figures in A4.
section Q: number oF reviews
how many reviews were Finalised?
number oF completed reviews
2009 2010
Q1 internal reviews 5 4
Q2 ombudsman reviews 0 0
Q3 adt reviews 1 1

96 THE UnIVERSITy OF SydnEy STATUTORy REPORT 2010
section r: results oF internal reviews
what were the results oF internal reviews Finalised?
grounds on which the internal review was reQuested
number oF internal reviews
personal other total
Original agency decision upheld
Original agency decision varied
Original agency decision upheld
Original agency decision varied
Original agency decision upheld
Original agency decision varied
r1 access refused 1 0 0 1 1 1
r2 access deferred 0 0 0 0 0 0
r3 exempt matter deleted from documents 0 0 0 0 0 0
r4 unreasonable charges 0 0 0 0 0 0
r5 Failure to consult with third parties 0 0 0 0 0 0
r6 third parties views disregarded 0 0 0 1 0 1
r7 amendment of personal records refused 0 0 0 0 0 0
r8 total 1 0 0 2 1 2
table a: number oF applications by type oF applicant and outcome
access granted in Full
access granted in part
access reFused
inFormation not held
inFormation already available
reFusal to deal with application
reFusal to conFirm/deny whether inFormation is held
application withdrawn
media 0 0 0 0 0 0 0 0
member of parliament
1 0 0 0 1 0 0 0
private-sector business
0 0 0 0 0 0 0 0
not-for-profit organisation or community group
1 0 0 0 1 0 0 0
member of the public (application by legal representative)
0 0 0 0 0 0 0 0
member of the public (other)
1 1 0 0 1 0 0 0
note: More than one decision can be made with respect to a particular access application. If so, a recording must be made in relation to each such decision.
GOVERNMENT INFORMATION (PUBLIC ACCESS) ACT 2009 nsw: applicable From 1 july – 31 december 2010
program For the release oF inFormationUnder the Government Information (Public Access) Act 2009, the University must review, at least annually, its program for the release of information that should be made publicly available in the public interest without imposing unreasonable additional costs on the University. Because the Act had not yet been in
force for 12 months at the time of writing, no such review has yet been carried out.
total number oF access applicationsThe University received six applications under the Act between 1 July 2010 and 31 december 2010. One application was not fully processed within the reporting period: it will be recorded in the 2011 statistics.
applications reFused under schedule 1 oF the actThe University must report the total number of access applications it
refused from those received during the reporting year. These refusals are either whole or partial, on the basis that the application related to the disclosure of information referred to in Schedule 1 of the Act (information for which there is conclusive presumption of overriding public interest against disclosure).
The University did not refuse any applications, either wholly or partially, on the grounds provided by Schedule 1 during the reporting period.

97
table b: number oF applications by type oF application and outcome
access granted in Full
access granted in part
access reFused
inFormation not held
inFormation already available
reFusal to deal with application
reFusal to conFirm/deny whether inFormation is held
application withdrawn
personal information application*
1 0 0 0 0 0 0 0
access application (other than personal information application)
2 1 0 0 0 1 0 0
access application that is partly personal information application and partly other
0 0 0 0 0 0 0 0
* A ‘personal information application’ is an access application for personal information (as defined in clause 4 of Schedule 4 to the Act) about the applicant (the applicant being an individual).
note: More than one decision can be made with respect to a particular access application. If so, a recording must be made in relation to each such decision. This also applies to Table B.
table c: invalid applications
reason For invalidity no. oF applications
application does not comply with formal requirements (section 41 of the act) 0
application is for excluded information of the agency (section 43 of the act) 0
application contravenes restraint order (section 110 of the act) 0
total number of invalid applications received 0
invalid applications that subsequently became valid applications 0
table d: conclusive presumption oF overriding public interest against disclosure – matters listed in schedule 1 to the act
number oF timesconsideration used*
overriding secrecy laws 0
cabinet information 0
executive council information 0
contempt 0
legal professional privilege 0
excluded information 0
documents affecting law enforcement and public safety 0
transport safety 0
adoption 0
care and protection of children 0
ministerial code of conduct 0
aboriginal and environmental heritage 0
* More than one public interest consideration may apply in relation to a particular access application. If so, each such consideration is to be recorded (but only once per application). This also applies in relation to Table E.

98 THE UnIVERSITy OF SydnEy STATUTORy REPORT 2010
table e: other public interest considerations against disclosure – matters listed in table to section 14 oF the act
number oF occasions whenapplication not successFul
responsible and effective government 0
law enforcement and security 0
individual rights, judicial processes and natural justice 1
business interests of agencies and other persons 0
environment, culture, economy and general matters 0
secrecy provisions 0
exempt documents under interstate Freedom of information legislation
0
table F: timeliness
no. oF applications
decided within the statutory timeframe (20 days plus any extensions) 4
decided after 35 days (by agreement with applicant) –
not decided within time (deemed refusal) 1
total 5
table h: applications For review under part 5 oF the act (by type oF applicant)
no. oF applications For review
applications by access applicants 0
applications by persons to whom information the subject of access application relates (see section 54 of the act)
0
table g: number oF applications reviewed under part 5 oF the act (by type oF review and outcome)
decision varied
decision upheld
total
internal review 0 0 0
review by information commissioner* 0 0 0
internal review following recommendation under section 93 of act
0 0 0
review by administrative decisions tribunal 0 0 0
total 0 0 0
* The Information Commissioner does not have the authority to vary decisions, but can make recommendations to the original decision-maker. The data in this case indicates that a recommendation to vary or uphold the original decision has been made by the Information Commissioner.

99
reducing waste generation, resource recovery and use oF recycled material The University’s Campus Infrastructure and Services unit (CIS) commissioned a comprehensive waste audit in October 2010 to determine the levels of different material types in the general waste stream and recommend improvements to the waste service in the lead up to a new waste contract that is due to commence in September 2011.
The outcomes of the audit suggested a number of actions the University could take to reduce the amount of waste it sends to landfill, including the introduction of a compostable waste recycling service and wider promotion of existing paper/cardboard and e-waste recycling programs.
The University currently generates more than 3100 tonnes of waste, which is managed under its waste contract. This includes general waste which is destined for a landfill site near Goulburn, paper and cardboard recycled at the Amcor plant in Botany, and e-waste recycled at the SIMs recycling centre in Chullora.
In 2010 the University’s Sustainable Workplace initiative, which provides small grants for faculties and units to introduce local sustainability projects, supported a number of faculty-based initiatives aimed at reducing waste generation and recycling. These included:
– The establishment of worm farms to process the new Law Building’s food waste. Rather than being sent to landfill, waste is converted to composting material that the faculty makes available free-of-charge. The worm farms have already reduced average general waste output.
– The Faculty of Pharmacy centralised its printing fleet, replacing more than 40 desktop printers and two fax machines with three large multi-function devices (MFds) that print, copy and scan. The change led to significant savings in energy, paper and costs. The faculty estimates that the initiative has halved its overall printing bill.
– Wider use of Envirobank ‘reverse vending machines’, which allow staff and students to deposit empty bottles and cans for recycling in exchange for ‘crunch credits’ or instant-win coupons and prizes such as retail vouchers.
Other developments at a University level in 2010 included the following.
– Information and Communications Technology (ICT) introduced a new policy to ensure that all computers in computer labs and all new computers in offices default to ‘sleep’ mode after a period of inactivity. This will save the
University money and reduce its carbon footprint. ICT had identified that many of the University’s approximately 20,000 computers, which are responsible for around 8 to 10 percent of the University’s daily energy use, were being left on overnight, unnecessarily consuming electricity.
– The number of toner cartridge recycling boxes available throughout the University’s Camperdown/darlington Campus increased in 2010 to almost 60. The boxes accept inkjet and laser cartridges, toner bottles, drum kits and fuser kits from all printers, photocopier and fax machines.
– The air-conditioning and building management systems of the Eastern Avenue Lecture Theatres were upgraded, improving performance and energy efficiency, and energy-efficient ‘T5’ lights were installed in the Cumberland Campus library.
– The University installed water-filling stations in busy areas to provide staff and students with facilities to refill reusable water bottles.
– The University is able to maintain around 450,000 litres of harvested rainwater storage as a result of recent capital works. CIS supported the research of two graduate students to investigate the performance of some of the rainwater harvesting systems.
hazardous wasteThe volume of routine chemical and clinical/biological waste generated fell by 3 percent in 2010. However, due to several extraordinary chemical waste collections, including the removal of all chemicals from the Ross Street Building ahead of its demolition, there was an increase in overall hazardous waste generation. The total volume of chemical and clinical/biological waste generated during 2010 was 69 tonnes, a five percent increase from 2009.
Onsite decontamination of clinical/biological waste is recommended and in some areas is routinely carried out prior to disposal of all clinical/biological waste. In other areas there has been a shift towards a reduction in onsite decontamination, so that it is only carried out when required by law or when working with higher risk biological agents.
Further hazardous waste is disposed of by other means, for example bulk liquid waste disposal and incineration. The volume of waste generated each year depends on University activities, for example contaminated waste generated during capital works and animal waste generated in association with the operation of the veterinary clinic.
waste

100 THE UnIVERSITy OF SydnEy STATUTORy REPORT 2010
risk management
during 2010 the University significantly raised the profile of risk management. The responsibility for managing risk was elevated to deputy vice-chancellor level. As a result, the University’s Senior Executive Group is now routinely informed about, and involved in, the ongoing monitoring and management of risk throughout the organisation.
Also in 2010, the University’s Senate established a Safety and Risk Committee, which is responsible for ensuring the effective management of risk in areas within its remit and for monitoring non-financial risk matters generally within the University (except for those that are dealt with by another Senate committee).
during the year the University also established a register of key consolidated risks, which is intrinsically linked to the University’s strategic aims and objectives as set out in its ‘white paper’. The key recommendations of the white paper have been incorporated in the register to ensure that each risk has associated strategic future actions that can be monitored and reviewed. Both the Senior Executive Group and the Safety and Risk Committee have endorsed the register.
In addition to the above, all faculties and key administrative units revised and updated their local risk registers as part of the 2011 budget submission process.
risk management, consumer response
consumer response
There were 32 complaints to the Vice-Chancellor’s Office in 2010. All but five of these were resolved either at a local level, or through the provision of further information or an apology, the amendment of an administrative process, or through referral to established appeals processes. Three were withdrawn and two are still to be resolved.
The majority of complaints, numbering 10, were about alleged staff misconduct or interpersonal issues, five related to disputed academic decisions, four to allegations of plagiarism, three each to student behaviour, teaching standards or the provision of disability services, while four related to other miscellaneous matters.

101
international promotion
The Vice-Chancellor and the deputy Vice-Chancellor (International) are the two main senior officials who travel internationally to promote the University. The lists on this page describe the overseas visits they made in 2010 for promotional purposes.
In addition, the International Office, which is responsible for international student recruitment, undertook a range of missions to conduct interviews, train local agencies, visit local schools and universities, and recruit students. International Office staff visited the following countries in 2010:
Australia, Austria, Bahrain, Brazil, Botswana, Cambodia, Canada, Chile, PR China, Colombia, France, Germany, Hong Kong, India, Indonesia, Japan, Kenya, Laos, Malaysia, Mexico, the netherlands, new Zealand, norway, the Philippines, Saudi Arabia, Singapore, South Africa, South Korea, Sri Lanka, Sweden, Taiwan, Thailand, the United States of America, the United Arab Emirates, and Vietnam.
The range of students targeted included Foundation students, full-degree undergraduate, postgraduate and research students, Study Abroad students, and AusAId and other sponsored students.
overseas promotional visits in 2010 by the vice-chancellor
30 april – 2 may
Singapore – Inaugural Merewether Medal presentation dinner – development meetings
Kuala Lumpur – Malaysia alumni reception
7–9 june
Shanghai – Speak at Celebration of women in Australia and
China event at Shanghai World Expo
9–11 augustShanghai
– development meetings, Shanghai World Expo – Visit to East China University of Political Science
and Law – Participate in department of Foreign Affairs and
Trade roundtable on Energy, Security and Trade Law at Shanghai World Expo
11–15 august
Chicago – Meeting with Australian Consulate General – Speak at Sydney University Graduates Union
north America (SUGUnA) annual meeting and related events
– Alumni meetings
5–9 september
Western China – Visits to Sichuan University, Xian Jiao Tong
University, Suzhou Industrial Park – Meeting with Vice-Governor of Sichuan
20–26 october
Shanghai – Participate in University Reform in Australia and
China events at Shanghai World Expo
Hong Kong – Attend graduations in Hong Kong
overseas promotional visits in 2010 by the deputy vice-chancellor (international)*
21 january – 5 February
India – Meetings with Australian Ambassador to India,
business representatives
Saudi Arabia – Meetings with Australian Ambassador to Saudi
Arabia and senior government officials, speak at higher education conference
Europe – Meetings with Australian diplomats, plus
officials at World Health Organization (WHO), University of Geneva, Organisation for Economic Cooperation and development (OECd), United nations Educational, Scientific and Cultural Organization (UnESCO), University College London (UCL) and British Council
10–17 march
Tokyo – Attend senior staff meeting of Association of Pacific
Rim Universities
Shanghai – Planning for Shanghai Expo and briefings with
government ministries
28 april – 5 may
Jakarta – Lead University delegation, including
Chancellor. Hold ‘Frontiers of Knowledge’ session, plus meetings with government officials.
Singapore – Attend award dinner and alumni meetings
Kuala Lumpur – Accompany Vice-Chancellor at a VIP and alumni
reception
Shanghai – Meetings for Shanghai Expo
24 may – 14 june
Washington DC – Attend climate change workshop, meet with
Australian ambassador to United States
Europe – Meetings with partners and funding agencies
5–16 july
Nairobi – Meetings with Kenyan government officials and
scientists, and Australian High Commissioner – Attend WHO workshop and give keynote speech
at international stem cell conference
5–14 september
Beijing – Meetings with Hanban Confucius Institute,
China Scholarships Council, Australian Embassy, alumni and AustCham
Shanghai – Participate in Translational Health symposium at
Shanghai Expo – Meeting with AustCham Shanghai
9 october – 9 november
Shanghai – Attend Shanghai Expo, Academic Consortium 21
Conference, and China 9/Hong Kong 3/Group of Eight Conference
Hong Kong – Meet Australian High Commissioner, University
of Hong Kong, Chinese University of Hong Kong, and attend alumni reception
Paris – Attend OECd’s Programme on Institutional
Management in Higher Education – Meet Australian ambassadors to OECd and France
London – Meetings at UCL, Royal Society and Welcome
Trust
* 40 percent of the travel costs of the Deputy Vice-Chancellor (International) are reimbursed by the Worldwide Universities Network

102 THE UnIVERSITy OF SydnEy STATUTORy REPORT 2010
intentionally leFt blank

annual report 2010financial reports and statements

104

105

106
In accordance with a resolution of the Senate of The University of Sydney dated 4 February 1991 and pursuant to Section 41C (1B) and (1C) of the Public Finance and Audit Act 1983, we state that to the best of our knowledge and belief:
1. ThefinancialstatementspresentatrueandfairviewofthefinancialpositionoftheUniversityat31December2010andthefinancialperformanceoftheUniversity for the year then ended.
2. Thefinancialstatementshavebeenpreparedinaccordancewiththeprovisions of the New South Wales Public Finance and Audit Act 1983, the PublicFinanceandAuditRegulation2010andthe“FinancialStatementGuidelinesforAustralianHigherEducationProvidersforthe2010ReportingPeriod”issuedbytheAustralianGovernmentDepartmentofEducation,Employment,andWorkplaceRelations.
3. ThefinancialreporthasbeenpreparedinaccordancewithapplicableAccountingStandardsandothermandatoryprofessionalreportingrequirementsinAustralia.
4. Wearenotawareofanycircumstanceswhichwouldrenderanyparticularsincludedinthefinancialreportstobemisleadingorinaccurate.
5. There are reasonable grounds to believe that the University will be able to pay its debts as and when they fall due.
6. TheamountofAustralianGovernmentfinancialassistanceexpendedduringthe reporting period was for the purposes for which it was granted and the Universityhascompliedwithapplicablelegislation,contracts,agreementsandprogrammeguidelinesinmakingexpenditure.

annual FInanCIal StateMentS 2010start of audited financial statements
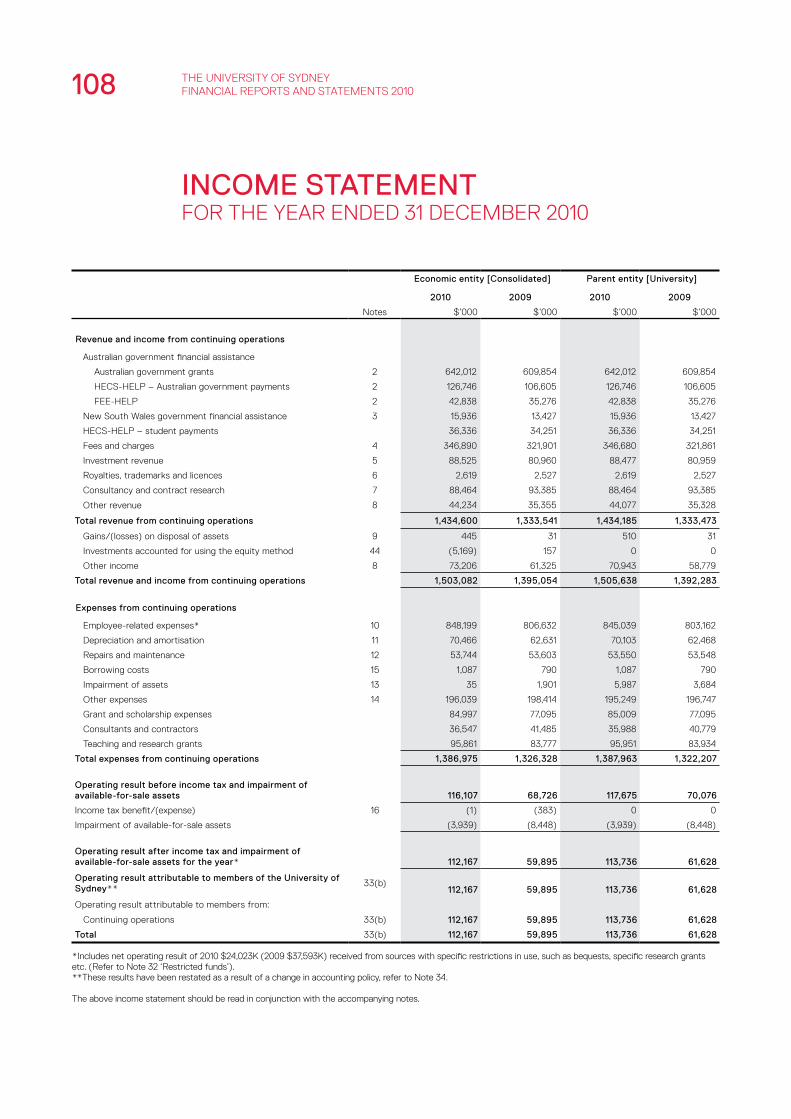
108 tHe uniVersitY of sYdneY financial reports and statements 2010
InCoMe StateMent for tHe Year ended 31 december 2010
economic entity [Consolidated] parent entity [university]
2010 2009 2010 2009
notes $’000 $’000 $’000 $’000
revenue and income from continuing operations
australian government financial assistance
australian government grants 2 642,012 609,854 642,012 609,854
Hecs‑Help – australian government payments 2 126,746 106,605 126,746 106,605
fee‑Help 2 42,838 35,276 42,838 35,276
new south Wales government financial assistance 3 15,936 13,427 15,936 13,427
Hecs‑Help – student payments 36,336 34,251 36,336 34,251
fees and charges 4 346,890 321,901 346,680 321,861
investment revenue 5 88,525 80,960 88,477 80,959
royalties, trademarks and licences 6 2,619 2,527 2,619 2,527
consultancy and contract research 7 88,464 93,385 88,464 93,385
other revenue 8 44,234 35,355 44,077 35,328
total revenue from continuing operations 1,434,600 1,333,541 1,434,185 1,333,473
Gains/(losses) on disposal of assets 9 445 31 510 31
investments accounted for using the equity method 44 (5,169) 157 0 0
other income 8 73,206 61,325 70,943 58,779
total revenue and income from continuing operations 1,503,082 1,395,054 1,505,638 1,392,283
expenses from continuing operations
employee‑related expenses* 10 848,199 806,632 845,039 803,162
depreciation and amortisation 11 70,466 62,631 70,103 62,468
repairs and maintenance 12 53,744 53,603 53,550 53,548
borrowing costs 15 1,087 790 1,087 790
impairment of assets 13 35 1,901 5,987 3,684
other expenses 14 196,039 198,414 195,249 196,747
Grant and scholarship expenses 84,997 77,095 85,009 77,095
consultants and contractors 36,547 41,485 35,988 40,779
teaching and research grants 95,861 83,777 95,951 83,934
total expenses from continuing operations 1,386,975 1,326,328 1,387,963 1,322,207
operating result before income tax and impairment of available‑for‑sale assets 116,107 68,726 117,675 70,076
income tax benefit/(expense) 16 (1) (383) 0 0
impairment of available‑for‑sale assets (3,939) (8,448) (3,939) (8,448)
operating result after income tax and impairment of available‑for‑sale assets for the year* 112,167 59,895 113,736 61,628
operating result attributable to members of the university of Sydney**
33(b)112,167 59,895 113,736 61,628
operating result attributable to members from:
continuing operations 33(b) 112,167 59,895 113,736 61,628
total 33(b) 112,167 59,895 113,736 61,628
*includes net operating result of 2010 $24,023K (2009 $37,593K) received from sources with specific restrictions in use, such as bequests, specific research grants etc. (refer to note 32 ‘restricted funds’).**these results have been restated as a result of a change in accounting policy, refer to note 34.
the above income statement should be read in conjunction with the accompanying notes.

109
StateMent oF CoMprehenSIve InCoMefor tHe Year ended 31 december 2010
economic entity [Consolidated] parent entity [university]
2010 2009 2010 2009
notes $’000 $’000 $’000 $’000
operating result after income tax for the period and impairment of available‑for‑sale for the year
112,167 59,895 113,736 61,628
other comprehensive income
Gain/(loss) on revaluation of land and buildings, net of tax 33 9,939 8,618 9,939 8,618
realised (gains)/loss transferred from reserves 33 (37,627) (6,775) (37,627) (6,775)
change in fair value of available‑for‑sale financial assets 33 1,307 52,030 1,307 52,030
defined benefit actuarial gains/(losses)* 33, 34 (3,572) 9,254 (3,572) 9,254
reserve transfer relating to associates and joint ventures, net of tax
33 0 4 0 0
reserve transfer relating to impairment of available‑for‑sale‑assets
133,939 8,448 3,939 8,448
total other comprehensive income (26,014) 71,579 (26,014) 71,575
total comprehensive income 86,153 131,474 87,722 133,203
total comprehensive income attributable to non‑controlling interest 0 0 0 0
total comprehensive income attributable to members of the university of Sydney 86,153 131,474 87,722 133,203
*these results have been restated as a result of a change in accounting policy, refer to note 34.
the above statement of comprehensive income should be read in conjunction with the accompanying notes.

StateMent oF FInanCIal poSItIonas at 31 december 2010
economic entity [Consolidated] parent entity [university]
2010 2009 2010 2009
notes $’000 $’000 $’000 $’000
aSSetS
Current assets
cash and cash equivalents 17 163,350 130,106 163,240 129,920
receivables 18 77,359 76,425 84,023 81,305
inventories 19 454 11 441 0
available‑for‑sale financial assets 20 66,015 5,150 66,015 5,150
total current assets 307,178 211,692 313,719 216,375
non‑current assets
receivables 18 734,955 649,827 734,955 649,827
investments accounted for using the equity method 44 7,796 12,965 0 0
available‑for‑sale financial assets 20 727,964 826,042 727,964 826,042
investment properties 22 13,832 13,300 13,832 13,300
property, plant and equipment 23 1,765,309 1,776,522 1,764,743 1,775,729
deferred tax assets 28 16 17 0 0
intangible assets 27 58,113 48,136 58,076 47,901
other financial assets 21 4,165 4,303 4,165 4,303
other non‑financial assets 29 3,306 2,393 3,306 2,393
Heritage assets 24 228,099 220,074 228,099 220,074
library collections 25 472,279 469,384 472,279 469,384
Works in progress 26 61,286 42,955 61,286 42,955
total non‑current assets 4,077,120 4,065,918 4,068,705 4,051,908
total assets 4,384,298 4,277,610 4,382,424 4,268,283
lIaBIlItIeS
Current liabilities
trade and other payables 30 146,025 216,073 151,882 216,144
provisions 31 132,777 131,720 132,684 131,533
total current liabilities 278,802 347,793 284,566 347,677
non‑current liabilities
provisions 31 789,514 699,988 789,482 699,952
total non‑current liabilities 789,514 699,988 789,482 699,952
total liabilities 1,068,316 1,047,781 1,074,048 1,047,629
net assets 3,315,982 3,229,829 3,308,376 3,220,654
eQuItY
parent entity interest
restricted funds 32 781,140 757,117 781,140 757,117
reserves 33(a) 277,817 304,808 277,208 300,709
retained earnings 33(b) 2,257,025 2,167,904 2,250,028 2,162,828
parent entity interest 3,315,982 3,229,829 3,308,376 3,220,654
total equity 3,315,982 3,229,829 3,308,376 3,220,654
the above statement of financial position should be read in conjunction with the accompanying notes.
110 tHe uniVersitY of sYdneY financial reports and statements 2010

111
Co
nS
ol
Ida
te
dp
ar
en
t
res
erve
sr
estr
icte
d f
un
ds
ret
ain
ed e
arn
ing
sto
tal
res
erve
sr
estr
icte
d f
un
ds
ret
ain
ed
earn
ing
sto
tal
$’0
00
$’0
00
$’0
00
$’0
00
$’0
00
$’0
00
$’0
00
$’0
00
Co
nS
ol
Ida
te
d
Bal
ance
at
1 Ja
nuar
y 20
09
243,
044
684
,36
52,
170,
946
3,0
98,
355
238,
949
684
,36
52,
164,
137
3,0
87,4
51
ret
rosp
ecti
ve a
pplic
atio
n/re
stat
emen
t*0
35,15
9(3
5,15
9)0
035
,159
(35,
159)
0
Bal
ance
as
rest
ate
d2
43
,04
471
9,5
24
2,1
35
,78
73
,09
8,3
55
23
8,9
49
719
,52
42
,12
8,9
783
,08
7,4
51
cha
nges
res
ulti
ng f
rom
the
ope
rati
ng r
esul
t0
37,5
9322
,30
25
9,89
50
37,5
9324
,035
61,
628
rev
alua
tion
of
land
and
bui
ldin
gs, n
et o
f ta
x8,
618
00
8,6
188,
618
00
8,6
18
res
erve
s tr
ansf
erre
d to
ret
aine
d ea
rnin
gs(5
61)
05
61
0(5
61)
05
61
0
rea
lised
(g
ain)
/los
s tr
ansf
erre
d fr
om r
eser
ves
(6,7
75)
00
(6,7
75)
(6,7
75)
00
(6,7
75)
cha
nge
in f
air
valu
e of
ava
ilabl
e‑f o
r‑sa
le fi
nanc
ial a
sset
s5
2,0
300
05
2,0
305
2,0
300
05
2,0
30
res
erv e
tra
nsfe
r re
lati
ng t
o as
soci
ates
and
join
t ve
ntur
e, n
et o
f ta
x4
00
40
00
0
res
erve
tra
nsfe
r re
lati
ng t
o im
pairm
ent
of a
vaila
ble‑
for‑
sale
ass
ets
8,44
80
08,
448
8,44
80
08,
448
act
uaria
l gai
ns/(
loss
es)
defi
ned
ben
efit
plan
00
9,25
49,
254
00
9,25
49,
254
tota
l co
mp
reh
ensi
ve in
com
e6
1,76
437
,59
33
2,1
1713
1,4
746
1,76
037
,59
33
3,8
50
133,
203
Bal
ance
at
31
dec
emb
er 2
00
93
04
,80
875
7,11
72
,16
7,9
04
3,2
29,
82
93
00,
709
757,
117
2,1
62
,828
3,2
20,6
54
Bal
ance
at
1 Ja
nu
ary
20
103
04
,80
875
7,11
72,
167,
90
43,
22
9,8
29
30
0,7
09
757,
117
2,16
2,8
283,
220
,65
4
cha
nges
res
ulti
ng f
rom
the
ope
rati
ng r
esul
t0
24,0
2388
,144
112,
167
024
,023
89,7
1311
3,73
6
rev
alua
tion
of
land
and
bui
ldin
gs, n
et o
f ta
x9,
939
00
9,9
399,
939
00
9,9
39
res
erve
s tr
ansf
erre
d to
ret
aine
d ea
rnin
gs(1
,05
9)0
1,0
59
0(1
,05
9)0
1,0
59
0
rea
lised
(ga
in)/
loss
tra
nsfe
rred
fro
m r
eser
ves
(37,
627
)0
0(3
7,6
27)
(37,
627
)0
0(3
7,6
27)
cha
nge
in f
air
valu
e of
ava
ilabl
e‑fo
r‑sa
le fi
nanc
ial a
sset
s1,
307
00
1,30
71,
307
00
1,30
7
res
erve
tra
nsfe
r re
lati
ng t
o as
soci
ates
and
join
t ve
ntur
e, n
et o
f ta
x(3
,49
0)0
3,49
00
00
00
res
erve
tra
nsfe
r re
lati
ng t
o im
pai
rmen
t of
ava
ilab
le‑f
or‑s
ale
asse
ts3,
939
00
3,9
393,
939
00
3,9
39
ac t
uaria
l gai
ns/(
loss
es)
defi
ned
ben
efit
plan
00
(3,5
72)
(3,5
72)
00
(3,5
72)
(3,5
72)
tota
l com
pre
hen
sive
inco
me
(26,
99
1)24
,023
89,
121
86,
153
(23,
50
1)24
,023
87,2
00
87,7
22
Bal
ance
at
31
dec
emb
er 2
010
277,
817
781,
140
2,2
57,
025
3,3
15,9
82
277,
208
781,
140
2,2
50,
028
3,3
08,
376
the
abo
ve s
tate
men
t of
cha
nges
in e
quity
sho
uld
be r
ead
in c
onju
nctio
n w
ith t
he a
ccom
pany
ing
note
s.
*adj
ustm
ent
for
2008
cap
ital g
rant
s w
hich
wer
e re
clas
sifie
d to
res
tric
ted
fund
s.
Sta
te
Me
nt
oF
C
ha
ng
eS
In e
Qu
ItY
for
tH
e Y
ea
r e
nd
ed
31
de
ce
mb
er
201
0

economic entity [Consolidated] parent entity [university]
2010 2009 2010 2009
notes $’000 $’000 $’000 $’000
Cash flows from operating activities
australian government grants received 2(h) 816,267 750,095 816,267 750,095
new south Wales government grants received 3 15,936 13,427 15,936 13,427
Hecs‑Help – student payments 36,335 34,251 36,336 34,251
receipts from student fees and others 615,980 552,998 615,032 552,798
dividends received 11,681 12,199 11,681 12,199
interest received 25,121 23,597 25,121 23,596
other investment income received 10,433 17,294 10,433 17,294
payments for employee‑related expenses (836,455) (802,427) (835,981) (802,334)
payments to suppliers (inclusive of goods and services tax) (525,299) (490,660) (524,596) (490,660)
net cash provided by/(used in) operating activities 45 169,999 110,774 170,229 110,666
Cash flows from investing activities
proceeds from sale of shares, managed funds and fixed income securities
205,968 403,706 205,968 403,706
proceeds from sale of property, plant and equipment 1,634 1,489 1,619 1,489
receipts/(payments) for joint venture partnership and associates
274 (4,732) 54 (4,732)
payments for property, plant and equipment (97,605) (150,062) (97,524) (150,062)
payments for shares, managed funds and fixed income securities
(245,522) (268,849) (245,522) (268,849)
net cash provided by/(used in) investing activities (135,251) (18,448) (135,405) (18,448)
Cash flows from financing activities
repayment of borrowings (1,087) (790) (1,087) (790)
net cash provided by/(used in) financing activities (1,087) (790) (1,087) (790)
net increase/(decrease) in cash and cash equivalents 33,661 91,536 33,737 91,428
cash and cash equivalents at beginning of financial year 130,106 38,567 129,920 38,489
effects of exchange rate changes on cash and cash equivalents (417) 3 (417) 3
Cash and cash equivalents at the end of the financial year 17 163,350 130,106 163,240 129,920
non‑cash financing and investing activities 47
the above statement of cash flows should be read in conjunction with the accompanying notes.
StateMent oF CaSh FlowSfor tHe Year ended 31 december 2010
112 tHe uniVersitY of sYdneY financial reports and statements 2010

113
note Contents of the notes to the financial statements page
1 summary of significant accounting policies 114
revenue
2 australian government financial assistance including Hecs‑Help and fee‑Help
123
3new south Wales state government financial assistance
125
4 fees and charges 125
5 investment revenue 125
6 royalties, trademarks and licences 126
7 consultancy and contract research 126
8 other revenue and income 126
9 Gains/(losses) on disposal of assets 127
expenses
10 employee‑related expenses 127
11 depreciation and amortisation 128
12 repairs and maintenance 128
13 impairment of assets 128
14 other expenses 129
15 borrowing costs 129
16 income tax (benefit)/expense 129
assets
17 cash and cash equivalents 130
18 receivables 131
19 inventories 132
20 available‑for‑sale financial assets 133
21 other financial assets 133
22 investment properties 133
23 property, plant and equipment 134
24 Heritage assets 138
25 library collections 139
26 Works in progress 140
27 intangible assets 141
28 deferred tax assets 143
29 other non‑financial assets 143
noteS to the FInanCIal StateMentSfor tHe Year ended 31 december 2010
note Contents of the notes to the financial statements page
liabilities
30 trade and other payables 144
31 provisions 145
equity
32 restricted funds 147
33 reserves and retained earnings 148
34 change in accounting policy 148
disclosure notes
35 Key management personnel disclosures 149
36 remuneration of auditors 150
37 commitments 150
38 contingencies 153
39 amounts owing by commonwealth/state governments 153
40 defined benefit plans 153
41 subsidiaries 158
42 investments in associates 160
43 interests in joint venture partnerships 162
44 investments accounted for using the equity method 163
45reconciliation of net operating result after income tax to net cash flows from operating activities
163
46 financial risk management 164
47 non‑cash financing and investing activities 169
48 events after reporting date 169
49 financing facilities and balances 169
50 acquittal of australian government financial assistance 170
51 disaggregated information 175

1 SuMMarY oF SIgnIFICant aCCountIng polICIeS
the principal accounting policies adopted in the preparation of the financial report are set out below. these policies have been consistently applied to all the years presented, unless otherwise stated. the financial report includes separate financial statements for the university as an individual entity and the consolidated entity consisting of the university of sydney and its subsidiaries.
the financial statements were authorised for issue, under the delegation of the senate, on 10 march 2011.
(a) Basis of preparationthese financial statements are general purpose financial statements that have been prepared on an accrual basis in accordance with australian accounting standards (including australian accounting standards board (aasb) interpretations), the requirements of the department of education, employment and Workplace relations (deeWr) and with the Public Finance and Audit Act 1983, the public finance and audit regulation 2010.
the financial statements are prepared in australian dollars. any items payable or receivable in foreign currency that were outstanding at year‑end have been converted to australian currency using the applicable year‑end exchange rate.
Compliance with International Financial Reporting Standards (IFRS)
the financial statements and notes of the university of sydney comply with australian accounting standards, some of which contain requirements specific to not‑for‑profit (nfp) entities that are inconsistent with ifrs requirements.
– accounting for government grants. under aasb 1004 ‘contributions’ a not‑for‑profit (nfp) entity is required to recognise government grants upon receipt, irrespective of whether these grants have been expended in the year of receipt.
– impairment of assets. under aasb 136 ‘impairment of assets’ a not‑for‑profit (nfp) entity is entitled to recognise any impairment loss on a revalued asset directly against the available revaluation reserve in respect of the same class of asset.
– assets received at nil or nominal value. under aasb 102 ‘inventories’, aasb 138 ‘intangible assets’, aasb 140 ‘investment properties’, and aasb 116 ‘property plant and equipment’, a not‑for‑profit (nfp) entity is entitled to recognise an asset acquired at no cost or nominal cost at its fair value as at the date of acquisition.
– property held to meet service delivery objectives. under aasb 140 ‘investment property’, a not‑for‑profit (nfp) entity is entitled to hold investment property to meet service delivery objectives and as such must account for these assets under aasb 116 ‘property plant and equipment’.
Historical cost convention
these financial statements have been prepared under the historical cost convention, as modified by the revaluation of available‑for‑sale financial assets, financial assets and liabilities (including derivative instruments) at fair value through profit or loss, certain classes of property, plant and equipment and investment property.
Critical accounting estimates
the preparation of financial statements in conformity with australian accounting standards requires the use of certain critical accounting estimates. it also requires management to exercise its judgement in the process of applying the university’s accounting policies. these are detailed in the notes that follow.
Accrual basis of accounting
the financial statements have been prepared on an accrual accounting basis and on the basis of historical costs and, except where stated in notes 1(a) and 1(i), does not take into account changing money values or current valuations of non‑current assets.
Consolidated financial statements
the consolidated financial statements are prepared in accordance with aasb 127 ’consolidated and separate financial statements’. the financial statement includes the accounts of the parent entity, the university of sydney and the accounts of the economic entity, comprising the university of sydney and the entities it controlled at the end of or during the financial year, as shown in note 41. the balances and effects of transactions between subsidiaries included in the consolidated financial statements have been eliminated. separate financial statements are also prepared by the university’s subsidiaries and are audited by the auditor‑General of new south Wales.
114 tHe uniVersitY of sYdneY financial reports and statements 2010

115
(b) Changes in accounting policiesin the current year, the university has adopted all of the new and revised standards and interpretations issued by the australian accounting standards board that are relevant to the operations and effective for the current annual reporting period. the adoption of these new and revised standards and interpretations have not resulted in changes to the university’s accounting policies for the current and prior years.
the university has adopted the following new and amended australian accounting standards and aasb interpretations as of 1 January 2010.
(i) aasb 2009‑5 ‘further amendments to australian accounting standards’ arising from the annual improvements project (aasb 5, 8, 101, 107, 117, 118, 136 & 139) effective 1 January 2010
(ii) aasb 3 ‘business combinations’ (revised 2008) effective 1 July 2009
(iii) aasb 127 ‘consolidated and separate financial statements’ (revised 2008) effective 1 July 2009
(iv) aasb 2009‑4 ‘amendments to australian accounting standards’ arising from the annual improvements project effective 1 July 2009
(v) aasb 2008‑6 ‘further amendments to australian accounting standards’ arising from the annual improvements project (aasb 1 & aasb 5) effective 1 July 2009
(vi) aasb 2008‑3 ‘amendments to australian accounting standards’ arising from aasb 3 and aasb 127 effective 1 July 2009
in 2010, the university of sydney changed its accounting policy with respect to the recognition of defined benefit superannuation actuarial gains and losses. the impact of this change is explained in note 34 ‘change in accounting policy’.
(c) Insurancethe university and its subsidiaries have insurance policies for coverage of properties, public liability, professional indemnity, clinical trials, veterinary malpractice, directors and officers, personal accident/travel, motor vehicles, workers compensation, aviation hull and liability, principal controlled contract works, marine hull and liability, marine transit and crops. there are elements of self‑insurance within the overall insurance program including cover for university staff and students engaged in medical and other clinical activities.
(d) Income taxthe university is exempt from income tax under commonwealth income tax legislation. Within the consolidated entity there are entities that are not exempt from income tax. for these entities, the income tax expense or revenue for the period is the tax payable on the current period’s taxable income, adjusted by changes in deferred tax assets and liabilities attributable to temporary differences between the tax bases of assets and liabilities and their carrying amounts in the financial statements, and to unused tax losses.
deferred income tax is provided in full, using the liability method, on temporary differences arising between the tax bases of assets and liabilities and their carrying amounts in the consolidated financial statements. However, the deferred income tax is not accounted for if it arises from initial recognition of an asset or liability in a transaction other than a business combination that at the time of the transaction affects neither accounting nor taxable profit or loss. deferred income tax is determined using tax rates (and laws) that have been enacted or substantially enacted by the statements of financial position date and are expected to apply when the related deferred income tax asset is realised or the deferred income tax liability is settled.
deferred tax assets are recognised for deductible temporary differences and unused tax losses, only if it is probable that future taxable amounts will be available to utilise those temporary differences and losses.
deferred tax liabilities and assets are not recognised for temporary differences between the carrying amount and tax bases of investments in controlled entities where the parent entity is able to control the timing of the reversal of the temporary differences and it is probable that the differences will not reverse in the foreseeable future.
deferred tax assets and liabilities relating to the same taxation authority are offset when there is a legally enforceable right to offset current tax assets and liabilities and they are intended to be either settled on a net basis, or the asset is to be realised and the liability settled simultaneously.
current and deferred tax assets and liabilities relating to the same taxation authority are offset when there is a legally enforceable right to offset current tax assets and liabilities and they are intended to be either settled on a net basis, or the asset is to be realised and the liability settled simultaneously.

(e) Business combinationsbusiness combinations are accounted for using the acquisition method. the consideration transferred in a business combination shall be measured at fair value, which shall be calculated as the sum of the acquisition date fair values of the assets transferred by the acquirer, the liabilities incurred by the acquirer to former owners of the acquiree and the equity by the acquirer, and the amount of any non‑controlling interest in the acquiree. for each business combination, the acquirer measures the non‑controlling interest in the acquiree whether at fair value or at the proportionate share of the acquiree’s identifiable assets. acquisition‑related costs are expensed as incurred.
When the parent acquires a business, it assesses the financial assets and liabilities assumed for appropriate classification and designation in accordance with the contractual terms, economic conditions, the parent’s operating or accounting policies and other pertinent conditions as at the acquisition date. this includes the separation of embedded derivatives in host contracts by the acquiree.
if the business combination is achieved in stages, the acquisition date fair value of the acquirer’s previously held equity interest in the acquiree is re‑measured at fair value as at the acquisition date through profit or loss.
any contingent consideration to be transferred by the acquirer will be recognised at fair value at the acquisition date. subsequent changes to the fair value of the contingent consideration that is deemed to be an asset or liability will be recognised in accordance with aasb 139 either in profit or loss or in other comprehensive income. if the contingent consideration is classified as equity, it shall not be re‑measured.
business combinations were accounted for using the purchase method. transaction costs directly attributable to the acquisition formed part of the acquisition costs. the non‑controlling interest (formerly known as minority interest) was measured at the proportionate share of the acquiree’s identifiable net assets.
(f) revenue recognition (i) operating revenue the university’s operating activity income primarily
consists of commonwealth grants, Higher education contribution scheme commonwealth payments, Higher education loan program student payments, nsW state government grants, other research grants and consultancy and contracts, investment income, and fees and charges.
revenue is recognised where it can be reliably measured. amounts disclosed as revenue are net of returns, trade allowances and duties and taxes.
(ii) government grants the university treats operating grants received from
australian government entities as income in the year of receipt, irrespective of whether these grants have been expended in the year of receipt.
(iii) Fees and charges student fees are recognised as debtors in the relevant
session. revenue from rendering services is recognised in the period in which the service is provided, having regard to the stage of completion of the service.
(iv) Investment income investment income is recognised as it is earned.
(v) rental income rental income is recognised as it is earned over the period
that the properties are leased to third parties.
(vi) asset sales net realised gains/(losses) are included as income/
(expenses) and are further analysed in note 9.
(vii) other revenue and income represents donations, bequests and contributions from
external organisations and miscellaneous income not derived from core operations. donations, bequests and contributions from external organisations are recognised when the university becomes entitled to receive the contribution and the contribution can be reliably measured. miscellaneous income is brought to account as it is earned and is recognised when the goods and services are provided.
(g) goods and Services tax (gSt)revenues, expenses and fixed assets are recognised net of the amount of goods and services tax (Gst), except where the amount of Gst incurred is not recoverable from the australian taxation office (ato). in these circumstances the Gst is recognised as part of the cost of acquisition of the asset or as part of the item of expense.
receivables and payables are stated inclusive of the amount of Gst receivable or payable.
the net amount of Gst recoverable from, or payable to, the ato is included as a current asset or liability in the statement of financial position. cash flows are included in the cash flow statement on a gross basis. the Gst component of cash flows arising from investing and financing activities which are recoverable from, or payable to, the ato are classified as operating cash flows.
(h) rounding of amountsamounts in the financial statement have been rounded off to the nearest thousand dollars, or in certain cases, the nearest dollar.
116 tHe uniVersitY of sYdneY financial reports and statements 2010

117
(i) valuation of assets
Cash and cash equivalentscash and cash equivalents includes cash on hand and short‑term deposits with a maturity of three months or less that are readily convertible to known amounts of cash and which are subject to insignificant risk of change in value. for the purpose of the cash flow statement, cash and cash equivalents consist of cash and cash equivalents as defined above, net of outstanding bank overdrafts.
available‑for‑sale financial assets with a maturity date of three months or less, from the date of deposit or issue and where there is an insignificant risk of a change in value, are re‑classified to cash and cash equivalents.
Property, plant and equipmentin accordance with aasb 116 the university has chosen to apply the ‘cost model’ to value its plant and equipment, library collections and non‑commercial teaching and research land, buildings and infrastructure. cost includes expenditure directly attributable to acquisition of items. after recognition these classes of assets are carried at cost less any accumulated depreciation and any accumulated impairment losses. non‑commercial land, buildings and infrastructure are identified as assets that are subject to specific restrictions, for example land grants, zoned specific use and specific contractual arrangements. in regard to commercial teaching and research land, buildings, infrastructure, farms, student housing and heritage the university has determined given these assets classes can be reliably measured to apply the revaluation model. after recognition these classes of assets are recorded at their fair value and carried at a revalued amount, being the fair value at the date of the revaluation less any subsequent accumulated depreciation and subsequent accumulated impairment losses. under the revaluation model revaluations are undertaken of all classes of assets with sufficient regularity to ensure the carrying amount does not differ materially from the value determined using fair value at the reporting date. at the date of revaluation the accumulated depreciation is eliminated against the gross carrying amount of the assets and the net amount restated to the revalued amount of the assets. any increase in the asset class‑carrying amount is credited to the revaluation reserve. commercial teaching and research land, buildings, and infrastructure are externally revalued every three years and in the remaining two years by an internal valuer.
subsequent costs are included in the asset’s carrying amount or recognised as a separate asset, as appropriate, only when it is probable that future economic benefits associated with the item will flow to the university and the cost of the item can be measured reliably. all other repairs and maintenance are charged to the income statement during the financial period in which they are incurred.
increases in the carrying amounts arising on revaluation of land and buildings are recognised, net of tax, in other comprehensive income and accumulated in equity under the headings of revaluation surplus. to the extent that the increase reverses a decrease previously recognised in profit, increases of the same revaluation surpluses in equity to the extent of the remaining reserve attributable to the asset are charged to the income statement.
Investment commercial teaching and research propertiesinvestment commercial teaching and research properties are land and buildings carried at fair value and are used by the university to meet service delivery obligations.
Infrastructureinfrastructure includes roads, paths and paving, ovals, playing fields, perimeter fencing, boundary gates, farm fencing (wire, electric or post and rail), water, electricity, gas, telecommunications services, sewerage, drainage, bridges, pedestrian ramps, surface car parks, power generation plants, reservoirs, dams and landscaping. the university applies the cost basis for its non‑commercial infrastructure and the fair value basis for commercial teaching and research infrastructure.
Commercial farms the university’s commercial farms have been revalued at 31 december 2010.
Student housing the university’s student housing has been revalued at 31 december 2010.
Plant and equipmentthe university’s plant and equipment are recorded at historical cost.
Embedded plant and equipment in buildingsembedded plant and equipment in buildings includes assets that are capitalised with the building, and can be separately identified and depreciated at a different rate than the host building.
Motor vehiclesthe university’s motor vehicles are recorded at historical cost less accumulated depreciation.
Heritage assetsValuations for the university’s heritage assets were provided by the curators of each collection. the valuation for the university’s rare books collection was as at 31 december 2010. the power collection of contemporary art is owned by the university and is on loan under a management agreement with the museum of contemporary art.
the collection was last valued in 2008 by the museum of contemporary art limited and is recorded on the university’s books at a value of $28,324,000. the valuations for the other collections are provided annually by the curators of each collection and are based on current market value using a combination of prices at auction of similar works, the curator’s experience and appropriate indexation. Where assets are valued in a foreign currency they are translated into the australian dollar equivalent at reporting date. these assets are not subject to depreciation. With the application of aasb 116 the valuations are arrived at by curators using the fair value method.
LibraryValuations for the university’s libraries were provided by university librarians. the university’s research and undergraduate collections were capitalised as at 31 december 1998 based on 1997 prices indexed to 1998 prices to reflect current market value. under aasb 116, the library collections continue to be valued on the cost model less any loss on impairment. only the undergraduate collection is subject to depreciation; the research collection does not diminish in value because of the nature of the collection.
Works in progressWorks in progress represent the cost of unoccupied and incomplete building projects and other major capital works projects at reporting date. it also includes the costs of major information technology (it) systems developments that had not been implemented as at the reporting date.
Agriculture assetsagriculture assets comprise livestock and other living assets such as crops. the university values its agriculture assets on a fair value less cost to sell.
Inventoriesinventories consist of store stock and unsold crops in silos. inventories are valued at cost. costs have been assigned to inventory quantities on hand at reporting date using the ‘first in first out’ basis. unsold crops in silos are valued at fair value.
Trade and other receivablestrade receivables are recognised initially at fair value and subsequently measured at amortised cost using the effective interest method less provision for impairment.
collectability of trade receivables is reviewed on an ongoing basis. debtor uncollectability is established when there is objective evidence that the university will not be able to collect all amounts due according to the original terms of the receivable.
the following matters are considered when assessing the level of impairment in relation to receivables: the level of financial difficulty of the debtor, the probability that the debtor will enter bankruptcy or financial organisation, default or delinquency in payments (more than 30 days overdue).
bad debts are written off against the allowance account if provided for and any change in the allowance account is recognised in the income statement.
Available‑for‑sale financial assetsavailable‑for‑sale financial assets, comprising principally marketable securities, unit trusts and debt instruments are non derivative financial assets. they are included in non‑current assets unless the maturity date of the asset is within 12 months of the balance date.
available‑for‑sale financial assets (see note 20) are initially brought to account at fair value. subsequent increases or decreases arising from changes in the fair value of an available‑for‑sale financial asset, that is not part of a hedging relationship is recognised directly in equity in the asset revaluation reserve, except for impairment losses until the financial asset is de‑recognised. on de‑recognition, the cumulative gain or loss is recognised in the income statement.
the fair value of financial assets and financial liabilities are estimated for recognition, measurement or for disclosure purposes.
the university classifies fair value measurements using a fair value hierarchy that reflects the significance of the inputs used in making the measurements. the fair value of financial instruments traded in active markets (such as available‑for‑sale securities) is based on quoted market prices for assets or liabilities at the statement of financial position date (level 1). the fair values of quoted investments are based on current bid prices.
if the market for a financial asset is not active (and for unlisted securities), the university establishes fair value by using valuation techniques. the university uses a variety of methods and makes assumptions that are based on market conditions existing at each balance date. these include reference to the fair values of recent arm’s length transactions, involving the same instruments or other instruments that are substantially the same (level 2). other techniques that are not based on observable market data (level 3), such as discounted cash flow analysis, and option pricing models refined for the issuer’s specific circumstances, are used to determine fair value for the remaining financial instruments.
118 tHe uniVersitY of sYdneY financial reports and statements 2010

119
Other financial assetsthe university has investments in a number of companies that are unlisted. these are brought to account at cost as there is no available market value. based on the latest available published financial accounts the university estimates that the recoverable amounts are greater than cost.
Impairment of assetsthe university assesses at each balance due date whether there is objective evidence that a financial asset or group of financial assets is impaired. in the case of equity classified as available‑for‑sale, a significant or prolonged decline in the fair value of a security below its cost is considered in determining whether the security is impaired. if any such evidence exists for available‑for‑sale financial assets, the cumulative loss – measured as the difference between the acquisition cost and the current fair value, less any impairment loss on that financial asset previously recognised in profit and loss – is removed from equity and recognised in the income statement.
impairment losses recognised in the income statement on equity instruments are not reversed through the income statement.
Investment propertiesinvestment properties are initially recognised at cost. costs incurred subsequent to initial acquisition are capitalised when it is probable that future economic benefits in excess of the originally assessed performance of the asset will flow to the university. Where the investment property is acquired at no cost or for nominal consideration, its cost shall be deemed to be its fair value as at the date of acquisition.
subsequent to initial recognition at cost, investment property is carried at fair value, which is based on comparable market prices, adjusted, if necessary, for any difference in the nature, location or condition of the specific asset. if this information is not available, the university uses alternative valuation methods such as recent prices in less comparable markets or discounted cash flow projections. these valuations are reviewed annually. changes in fair value are recorded in the income statement as part of the other income.
(j) trade and other payablestrade payables are measured at amortised cost. due to their short‑term nature, they are not discounted.
trade and other payables, including accruals not yet billed, represent liabilities for goods and services provided to the economic entity prior to the end of the reporting period. these amounts are unsecured and are usually settled within 30 days of recognition.
securities sold subject to repurchase agreements are retained in ‘available‑for‑sale financial assets’ (note 20). the counterparty liability is included in ‘trade and other payables’ (note 30). the difference between sale and repurchase price is treated as interest and accrued over the life of the agreements using the effective interest method.
(k) Foreign currency transactionsforeign currency transactions are translated into australian currency at rates of exchange ruling at the dates of the transactions. amounts receivable and payable in foreign currency at the reporting date are translated at the rates of exchange ruling on that date. exchange differences relating to amounts payable and receivable in foreign currencies are brought to account as exchange gains or losses in the income statement.
foreign exchange difference relating to available‑for‑sale financial assets which are not monetary items are recognised directly in the asset revaluation reserve. on de‑recognition of such an asset, the cumulative exchange difference previously recognised in equity is recognised in the income statement.
(l) Intangible assetsintangibles include major it computer software, the digitalised library collection and the right to use specific assets (cyclotron), which represent the cost to the university of major information technology systems, the digitalised library and the right to use assets that have been purchased/developed and/or implemented.
major it software is recorded at historic cost and depreciated at 40 percent per annum. digitalised library collections are held by perpetual licence and not expected to be subject to technical obsolescence or incur maintenance costs. they are recorded at historic costs and are not depreciated as they are deemed to have an indefinite useful life. the right to use a cyclotron was acquired at cost and is depreciated over its effective life, which is 20 years.
(m) employee benefits
(i) annual leave liabilities for annual leave expected to be settled within
12 months of the reporting date are recognised for staff leave entitlements up to the reporting date and are measured at the amounts expected to be paid when the liabilities are settled. accrued annual leave is treated as a current liability.

(ii) long service leave
a liability for long service leave is recognised and measured as the present value of expected future payments to be made in respect of services provided by employees up to the reporting date using the project unit cost method. consideration is given to expected future wage and salary levels, trends of employee departures and periods of service. expected future payments are discounted using market yields at the reporting date on notional government bonds with monthly terms to maturity currencies that match, as closely as possible to the estimated future cash outflows. an actuarial valuation of the university’s liability was undertaken by alea actuarial consulting pty limited as at 31 december 2010.
accrued long service leave is treated as both a current and a non‑current liability.
(iii) Superannuation
the university provides for superannuation based on information and formulae provided by the superannuation administration corporation in respect of contributors to the defined benefit schemes administered by the sas trustee corporation. these schemes include the state superannuation scheme, the state authorities superannuation scheme and the state authorities non‑contributory scheme. in addition the university contributes to the superannuation scheme for australian universities, which is a fully funded defined benefit scheme that also provides an accumulation superannuation plan. the university also contributes to the university of sydney professorial superannuation scheme.
a liability or asset in respect of defined benefit superannuation plans is recognised in the statement of financial position, and is measured as the present value of the defined obligation at the reporting date less the fair value of the superannuation fund’s assets at the date and any unrecognised past service cost. the present value of the defined benefit obligation is based on expected future payments which arise from membership of the fund to the reporting date, calculated annually by independent actuaries using the projected unit credit method. consideration is given to expected future wage and salary levels, trends of employee departures and periods of service.
actuarial gains and losses arising from experience adjustments and changes in actuarial assumptions on all superannuation funds are recognised in the period in which they occur, outside of the income statement, in the statement of comprehensive income (refer note 34 ‘change in accounting policy’).
expected future payments are discounted using market yields at the reporting date on national government bonds with terms to maturity and currency that match, as closely as possible to the estimated future cash outflows.
past service costs are recognised immediately in the income statement, unless the changes to the superannuation funds are on the employees remaining in service for a specified period of time (the vesting period). in this case, the past service costs are amortised on a straight‑line basis over the vesting period.
(n) depreciation
depreciation is calculated on a straight‑line basis. the depreciation rates are based on the estimated useful lives of the various classes of assets employed. pro‑rata depreciation is charged in the year of purchase and disposal. depreciation rates by class of assets are as follows:
per annumplant and equipment 10% computing equipment 25%motor vehicles 15%buildings and infrastructure 2%embedded plant and equipment in buildings – embedded mech and electrical install 6.70% – embedded plant and equipment 10%library undergraduate collection 20%leasehold improvements* 2%intangibles – computer software 5%–40%commercial teaching and research farms 2%commercial teaching and research student housing
2%
*depreciated at 2% or over the life of lease if lease is for a period less than 50 years.
the assets’ residual values, useful lives and amortisation methods are reviewed, and adjusted as required, for any loss of service potential.
(o) leases
the university leases various plant and equipment under operating leases. under these arrangements a significant portion of the risks and rewards of ownership are retained by the lessor. the costs in relation to these are presented in note 14 ‘other expenses’ as ‘operating lease and rental expenses’.
payments made under operating leases (net of any incentives received from the lessor) are charged to the income statement on a straight‑line basis, over the period of the lease.
120 tHe uniVersitY of sYdneY financial reports and statements 2010

121
(p) restricted funds
restricted funds are funds or assets granted by external parties under conditions that they may only be used for specified expenditure purposes and cannot be allocated to general purpose expenditure. the grantor of the funds specifies how the funds are supposed to be used.
(q) reserves
the university has the following reserves:
(i) asset revaluation reserve
this reserve is used to account for the increases or decreases in the value of assets as a result of revaluations.
increases in the value of reserves are in accordance with valuation of assets policies stated in note 1(i). decrements in reserves are either on disposal of assets where the disposed asset had previously been revalued and a reserve existed or on impairment of assets in accordance with aasb 136 ‘impairment of assets’ where a revaluation reserve had existed for that asset class.
(ii) associates’ reserves
this represents the reserves held by associated entities and is brought to account in the consolidated financial statement using the equity method of accounting (see note 42).
in addition an initial asset valuation reserve was created in 1992 for the purpose of bringing to account the university’s assets for the first time. this includes the transfer of properties between the university and the department of school education in 1994; this transfer did not involve any cash transactions. this initial asset valuation reserve is included in retained earnings.
(r) Joint ventures and cooperative research centres (CrCs)
the university’s crc involvement is reported in note 37(d) ‘crc commitments’.
the interest in a joint venture partnership is accounted for using the equity method. under the equity method, the share of the profits or losses of the partnership is recognised in the income statements, and the share of movements in reserves is recognised in reserves in the statement of financial position. details relating to the partnerships are set out in note 43.
(s) associates
associates are entities over which the university has significant influence, generally accompanying a shareholding of between 20 percent and 50 percent of the voting rights. investments in associates are accounted for in the parent entity using the cost method and in the consolidated financial statements using equity method of accounting.
the university’s share of its associates’ post‑acquisition profits or losses is recognised in the income statement and its share of post acquisition movements in reserves is recognised in the associate reserve. the cumulative post‑acquisition movements are adjusted against the carrying amount of the investment.
dividends received from associates are recognised in the parent entity’s income statement, while in the consolidated financial statements they reduce the carrying amount of the investment.
When the Group’s share of losses in an associate equals or exceeds its interest in the associate, including any other unsecured receivables, the company does not recognise further losses, unless it has incurred obligations or made payments on behalf of the associate.
(t) private sector participation in the provision of student accommodation
the university of sydney entered into an arrangement where, under a long‑term lease of its land in carillon avenue, newtown, a student university village (suV) has been constructed and is being operated in partnership with the private sector. this 650‑bed suV was opened in January 2003. under the terms of the project deed, ownership in the accommodation complex reverts to the university 40 years after the opening of the suV. at this stage the emerging share of the asset is not material.

(u) new accounting Standards and aaSB Interpretations
the university has assessed the new australian accounting standards that have recently been issued or amended but are not yet effective or applied. it has been determined that these new accounting standards will have no material impact on the university’s financial statements in the period of initial application with the exception of aasb 9 ‘financial instruments’. the university has not adopted aasb 9 in accordance with deeWr’s instructions included in their 2010 guidelines. mandatory adoption of this standard is required on 1 January 2013; the likely adoption date for the university is 1 January 2013. the adoption of the standard will result in the reclassification of available‑for‑sale assets to various other asset categories. the adoption of the standard may have a material impact on the results of the university. at the date of this report we are unable to quantify the effect of this change.
at the reporting date, a number of new accounting standards and interpretations have been issued but are not yet operative and have not been early adopted by the university.
(v) Charitable Fundraising act 1991 (CFa)
the Charitable Fundraising Amendment (Exemptions) Regulation 2007 authorises universities to conduct fundraising appeals without holding an authority under cfa. this exemption does not extend to subsidiaries of the university.
122 tHe uniVersitY of sYdneY financial reports and statements 2010

123
2 auStralIan governMent FInanCIal aSSIStanCe InCludIng heCS‑help and Fee‑help
economic entity [Consolidated] parent entity [university]
2010 2009 2010 2009
notes $’000 $’000 $’000 $’000
(a) Commonwealth grants Scheme and other grants 50.1
commonwealth Grants scheme 258,108 225,638 258,108 225,638
indigenous support program 1,495 1,722 1,495 1,722
partnership and participation program 1,535 219 1,535 219
disability support program 233 159 233 159
Workplace reform program 0 2,544 0 2,544
Workplace productivity program 1,216 1,161 1,216 1,161
learning and teaching performance fund 0 5,488 0 5,488
capital development pool 6,283 0 6,283 0
diversity and structural adjustment program 1,783 1,526 1,783 1,526
practical component of teacher education 0 579 0 579
transition cost program 540 1,282 540 1,282
total Commonwealth grants Scheme and other grants 271,193 240,318 271,193 240,318
(b) higher education loan programs 50.2
Hecs‑Help 126,746 106,605 126,746 106,605
fee‑Help 42,838 35,276 42,838 35,276
total higher education loan programs 169,584 141,881 169,584 141,881
(c) Scholarships 50.3
australian postgraduate awards 17,037 12,379 17,037 12,379
international postgraduate research scholarships 2,105 2,036 2,105 2,036
commonwealth education costs scholarships 227 2,174 227 2,174
commonwealth accommodation scholarships 5 2,358 5 2,358
indigenous access scholarships 55 4 55 4
total scholarships 19,429 18,951 19,429 18,951
(d) dIISr – research 50.4
Joint research engagement program 36,803 36,276 36,803 36,276
research training scheme 62,641 60,706 62,641 60,706
research infrastructure block Grants 26,845 25,483 26,845 25,483
implementation assistance program 184 348 184 348
australian scheme for Higher education repositories 0 428 0 428
commercialisation training scheme 585 572 585 572
deeWr sre threshold 7,966 0 7,966 0
deeWr sre base & threshold 1 1,861 0 1,861 0
total dIISr – research 136,885 123,813 136,885 123,813
(e) other capital funding 50.5
education investment fund 17,500 41,040 17,500 41,040
total other capital funding 17,500 41,040 17,500 41,040

2 auStralIan governMent FInanCIal aSSIStanCe InCludIng heCS‑help and Fee‑help (continued)
economic entity [Consolidated] parent entity [university]
2010 2009 2010 2009
notes $’000 $’000 $’000 $’000
(f) australian research Council 50.6
(i) discovery 50.6(a)
projects 39,353 40,099 39,353 40,099
future fellowships 2,645 1,559 2,645 1,559
federation fellowships 2,429 2,377 2,429 2,377
indigenous researchers 130 102 130 102
deeWr arc super science fellowship 186 0 186 0
total discovery 44,743 44,137 44,743 44,137
(ii) linkages 50.6(b)
linkage – infrastructure 5,460 2,350 5,460 2,350
international researcher exchange 13 22 13 22
laureate fellowships 2,481 937 2,481 937
projects 9,756 10,362 9,756 10,362
total linkages 17,710 13,671 17,710 13,671
(iii) networks and centres 50.6(c)
research networks 0 442 0 442
centres 4,335 4,459 4,335 4,459
total networks and centres 4,335 4,901 4,335 4,901
(g) other australian government financial assistance
education, science and training 15,505 18,703 15,505 18,703
Human services and health 97,140 92,357 97,140 92,357
industry, technology and regional development 7,837 4,715 7,837 4,715
primary industry and energy 8,216 7,248 8,216 7,248
other 1,519 0 1,519 0
total other australian government financial assistance 130,217 123,023 130,217 123,023
total australian government financial assistance 811,596 751,735 811,596 751,735
reconciliation
australian government grants [(a) + (c) + (d) + (e) + (f) + (g)] 642,012 609,854 642,012 609,854
Hecs‑Help payments 126,746 106,605 126,746 106,605
fee‑Help – other australian government loan programs 42,838 35,276 42,838 35,276
total australian government financial assistance 811,596 751,735 811,596 751,735
(h) australian government grants received ‑ cash basis
commonwealth Grants scheme and other grants 271,193 240,318 271,193 240,318
Higher education loan programs 174,224 139,726 174,224 139,726
scholarships 19,429 18,951 19,429 18,951
diisr – research 136,885 123,813 136,885 123,813
arc – discovery 44,743 44,137 44,743 44,137
arc – linkages 17,710 13,671 17,710 13,671
arc – networks and centres 4,335 4,901 4,335 4,901
other australian government financial assistance 130,217 123,023 130,217 123,023
other capital funding 17,500 41,040 17,500 41,040
total australian government grants received ‑ cash basis 816,236 749,580 816,236 749,580
oS‑help liability to australian government (net) 31 515 31 515
total australian government funding received ‑ cash basis 816,267 750,095 816,267 750,095
124 tHe uniVersitY of sYdneY financial reports and statements 2010

125
3 new South waleS State governMent FInanCIal aSSIStanCe
economic entity [Consolidated] parent entity [university]
2010 2009 2010 2009
notes $’000 $’000 $’000 $’000
state government research grants 14,062 11,491 14,062 11,491
other 1,874 1,936 1,874 1,936
total state government financial assistance 15,936 13,427 15,936 13,427
4 FeeS and ChargeS
economic entity [Consolidated] parent entity [university]
2010 2009 2010 2009
notes $’000 $’000 $’000 $’000
Course fees and charges
fee‑paying overseas students 261,472 241,846 261,472 241,846
continuing education 9,259 7,076 9,075 7,079
fee‑paying domestic postgraduate students 21,283 20,327 21,283 20,327
fee‑paying domestic undergraduate students 9,398 10,787 9,398 10,787
students undertaking non‑award courses 4,791 1,577 4,791 1,577
course fees 12,093 10,187 12,067 10,151
law extension course fees 2,182 2,053 2,182 2,053
summer school fees 12,098 11,774 12,098 11,774
total course fees and charges 332,576 305,627 332,366 305,594
other fees and charges
Hire of equipment and venues 1,861 1,801 1,861 1,794
fees late enrolment 122 123 122 123
library fines 4 638 4 638
parking fees 2,481 1,844 2,481 1,844
rental – other 1,659 1,671 1,651 1,671
student residences 6,146 5,434 6,146 5,434
library service charges 263 937 263 937
miscellaneous 1,778 3,826 1,786 3,826
total other fees and charges 14,314 16,274 14,314 16,267
total fees and charges 346,890 321,901 346,680 321,861
5 InveStMent revenue
economic entity [Consolidated] parent entity [university]
2010 2009 2010 2009
notes $’000 $’000 $’000 $’000
distributions from managed funds 14,262 11,393 14,262 11,393
dividends received 10,988 12,024 10,988 12,024
rental income from investment properties 557 568 557 568
other investment income 1,909 324 1,861 324
interest and discount from investments 26,537 24,981 26,537 24,980
realised gains 34,272 31,670 34,272 31,670
total investment revenue 88,525 80,960 88,477 80,959

6 roYaltIeS, tradeMarkS and lICenCeS
economic entity [Consolidated] parent entity [university]
2010 2009 2010 2009
notes $’000 $’000 $’000 $’000
licence, trademarks and royalty income 2,619 2,527 2,619 2,527
total royalties, trademarks and licences 2,619 2,527 2,619 2,527
7 ConSultanCY and ContraCt reSearCh
economic entity [Consolidated] parent entity [university]
2010 2009 2010 2009
notes $’000 $’000 $’000 $’000
local collaborative and other research 22,372 20,569 22,372 20,569
consultancy 10,342 11,900 10,342 11,900
research grants industry 17,161 7,706 17,161 7,706
research grants individuals and foundations 19,052 32,987 19,052 32,987
research grants overseas organisations 19,537 20,223 19,537 20,223
total consultancy and contracts research 88,464 93,385 88,464 93,385
8 other revenue and InCoMe
economic entity [Consolidated] parent entity [university]
2010 2009 2010 2009
notes $’000 $’000 $’000 $’000
donations and bequests 44,234 35,355 44,077 35,328
total other revenue 44,234 35,355 44,077 35,328
other income
Veterinary/medical practice income 12,754 9,974 12,754 9,974
recovery of expenses from external organisations 479 6,116 479 6,191
commission received 738 790 738 762
memberships and subscriptions 153 505 153 405
contributions (external organisations) 28,370 22,561 27,819 22,553
shop sales (incl. commercial services) 7,473 6,646 5,966 5,613
other 20,524 11,375 20,319 9,923
farms 2,715 3,358 2,715 3,358
total other income 73,206 61,325 70,943 58,779
total other revenue and income 117,440 96,680 115,020 94,107
126 tHe uniVersitY of sYdneY financial reports and statements 2010

127
9 gaInS/(loSSeS) on dISpoSal oF aSSetS
economic entity [Consolidated] parent entity [university]
2010 2009 2010 2009
notes $’000 $’000 $’000 $’000
disposal of ppe and investment property
proceeds from sale 1,634 1,489 1,619 1,489
carrying amount of assets sold (1,189) (1,458) (1,109) (1,458)
total of net gain/(loss) on disposal of assets 445 31 510 31
the consolidated net gain on disposal of property, plant and equipment in 2010 includes a gain of $97K on the sale of motor vehicles and a $348K gain on the remaining equipment sold in 2010.
10 eMploYee‑related expenSeS
economic entity [Consolidated] parent entity [university]
2010 2009 2010 2009
notes $’000 $’000 $’000 $’000
academic
salaries 355,502 329,396 355,497 329,394
contributions to superannuation and pension schemes 52,043 48,918 52,043 48,918
payroll tax 22,925 22,290 22,925 22,290
Workers compensation 2,191 1,869 2,191 1,869
long service leave expense 9,877 8,670 9,877 8,670
annual leave 1,981 2,730 1,981 2,730
total academic 444,519 413,873 444,514 413,871
non‑academic
salaries 326,150 316,052 323,764 313,502
contributions to superannuation and pension schemes 45,226 43,559 44,791 43,118
payroll tax 20,516 20,707 20,203 20,384
Workers compensation 1,579 1,477 1,581 1,469
long service leave expense 7,904 7,208 7,899 7,200
annual leave 1,583 3,384 1,565 3,246
total non‑academic 402,958 392,387 399,803 388,919
deferred employment benefits for superannuation* 722 372 722 372
total employee‑related expenses 848,199 806,632 845,039 803,162 *includes $94K (2009 $205K) of professorial superannuation scheme and $628K (2009 $167K) of state authorities non‑contributory scheme.
as a result of the university’s change in policy (refer note 34) superannuation actuarial gains and losses are now recognised in other comprehensive income. as a result, comparative figures for 2009 have been restated to reflect the change in policy. for 2009, the economic entity’s and the parent’s actuarial gains of $9,254K are now recognised in other comprehensive income.

11 depreCIatIon and aMortISatIon
economic entity [Consolidated] parent entity [university]
2010 2009 2010 2009
notes $’000 $’000 $’000 $’000
depreciation
buildings 25,773 24,655 25,773 24,655
plant and equipment 24,241 20,597 24,012 20,532
leasehold improvements 2,307 1,789 2,307 1,789
motor vehicles 1,124 1,260 1,124 1,260
computer equipment 852 1,141 852 1,141
infrastructure 3,342 3,308 3,342 3,308
libraries 940 882 940 882
commercial t & r buildings/infrastructure 1,000 1,674 1,000 1,674
total depreciation 59,579 55,306 59,350 55,241
amortisation
intangibles – computer software 10,887 7,325 10,753 7,227
total depreciation and amortisation 70,466 62,631 70,103 62,468
12 repaIrS and MaIntenanCe
economic entity [Consolidated] parent entity [university]
2010 2009 2010 2009
notes $’000 $’000 $’000 $’000
maintenance of buildings and grounds 26,652 29,654 26,621 29,654
other buildings and grounds expenses 27,092 23,949 26,929 23,894
total repairs and maintenance 53,744 53,603 53,550 53,548
13 IMpaIrMent oF aSSetS
economic entity [Consolidated] parent entity [university]
2010 2009 2010 2009
notes $’000 $’000 $’000 $’000
bad debts 202 51 422 1,886
doubtful debts (407) 1,849 5,325 1,797
impairment of library assets 240 1 240 1
total impairment of debts and library assets 35 1,901 5,987 3,684
impairment of available‑for‑sale assets 3,939 8,448 3,939 8,448
total impairment of assets 3,974 10,349 9,926 12,132
128 tHe uniVersitY of sYdneY financial reports and statements 2010

129
14 other expenSeS
economic entity [Consolidated] parent entity [university]
2010 2009 2010 2009
notes $’000 $’000 $’000 $’000
non‑capitalised equipment 21,678 26,163 21,660 26,055
advertising, marketing and promotional expenses 3,504 3,434 3,478 3,312
audit fees, bank charges, legal costs, insurance and taxes 9,554 10,852 9,482 10,752
printing, postage and stationery 12,651 12,923 12,598 12,803
operating lease expenses 14,810 13,648 14,794 13,636
rent and room hire 4,261 3,701 4,109 3,580
telecommunications 10,328 11,409 10,295 11,382
travel and related staff development and training 37,004 35,680 36,992 35,437
farm operations 5,735 5,750 5,676 5,722
laboratory, medical supplies and materials 24,517 24,552 24,493 24,529
library materials 4,811 6,342 4,811 6,337
licences, patents, copyright and commissions 12,840 13,222 12,816 13,222
miscellaneous expenses 16,058 17,020 15,920 16,885
retired assets at net book value 7,236 4,327 7,172 3,724
equipment repairs and maintenance 11,052 9,391 10,953 9,371
total other expenses 196,039 198,414 195,249 196,747
15 BorrowIng CoStS
economic entity [Consolidated] parent entity [university]
2010 2009 2010 2009
notes $’000 $’000 $’000 $’000
borrowing costs 1,087 790 1,087 790
total borrowing costs 1,087 790 1,087 790
16 InCoMe tax (BeneFIt)/expenSe
economic entity [Consolidated]
2010 2009
notes $’000 $’000
(a) Income tax expense (benefit)
income tax expense (income) is attributable to:
deferred tax 1 (17)
adjustment for current tax of the prior year 0 400
Income tax (benefit)/expense 1 383
(b) numerical reconciliation of income tax expense to prima facie tax payable
operating result from continuing operations before income tax expense 112,168 60,278
tax at the australian tax rate of 30% (2009 – 30%) 33,650 18,084
tax effect of amounts which are not deductible/(taxable) in calculating taxable income net income (loss) of the tax‑exempt entities.
(34,016) (18,700)
differential on tax attributed to equity accounted entities 1,551 (47)
less: tax effect of exempt income included in the taxable entities results (1,788) 646
reversal of prior period deferred tax assets 0 400
current period tax losses not brought to account 604 0
total income tax expense 1 383

17 CaSh and CaSh eQuIvalentS
economic entity [Consolidated] parent entity [university]
2010 2009 2010 2009
notes $’000 $’000 $’000 $’000
cash at bank and on hand* 58,233 38,152 58,123 37,966
cash equivalents** 105,117 91,954 105,117 91,954
total cash and cash equivalents 163,350 130,106 163,240 129,920
*these are interest bearing at a variable average rate of 3.67%.**these are reclassified investments with a maturity date of three months or less from the date of deposit and have an insignificant risk of a change in value.
reconciliation to cash at the end of the year
the above figures are reconciled to cash at the end of the financial year as shown in the cash flow statement as follows:
economic entity [Consolidated] parent entity [university]
2010 2009 2010 2009
notes $’000 $’000 $’000 $’000
Gross cash balance 163,350 130,106 163,240 129,920
Balances per cash flow statement 163,350 130,106 163,240 129,920
included in the cash/bank balances of the university are the following foreign currency accounts. the balances shown are the australian‑dollar equivalent as at 31 december 2010. the accounts and balances are:
australian dollars 155,421 125,017 155,311 124,831
us dollars 1,977 629 1,977 629
uK pounds 685 354 685 354
euros 5,267 4,106 5,267 4,106
163,350 130,106 163,240 129,920
130 tHe uniVersitY of sYdneY financial reports and statements 2010

131
18 reCeIvaBleS
economic entity [Consolidated] parent entity [university]
2010 2009 2010 2009
notes $’000 $’000 $’000 $’000
Current
receivables
student fees 4,947 1,734 4,947 1,734
provision for impaired receivables (176) (297) (176) (297)
total receivables 4,771 1,437 4,771 1,437
gSt recoverable
Gst recoverable 5,988 5,418 5,977 5,409
total gSt recoverable 5,988 5,418 5,977 5,409
debtors
debtors 45,243 53,304 44,558 52,981
provision for impaired receivables (3,101) (3,554) (3,045) (3,502)
total debtors 42,142 49,750 41,513 49,479
other
student loans 851 1,138 850 1,138
amount due from associated company 9,028 6,090 9,028 6,090
amount due from controlled entities 0 0 7,369 5,232
total other 9,879 7,228 17,247 12,460
other current receivables
accrued income 14,579 12,592 14,515 12,520
total other receivables 14,579 12,592 14,515 12,520
total current receivables 77,359 76,425 84,023 81,305
non‑current
deferred government contribution for superannuation (refer to note 39)
722,061 635,766 722,061 635,766
super asset plan (state authorities superannuation trustee corporation)
12,703 14,257 12,703 14,257
student loans 191 (196) 191 (196)
total non‑current receivables 734,955 649,827 734,955 649,827
total receivables 812,314 726,252 818,978 731,132
(a) Impaired receivablesas at 31 december 2010 current receivables with a nominal value of $3,277K (2009 $3,851K) were impaired.
the amount of the provision that relates to specific provisions was $2,973K (2009 $2,591K).
the individually impaired receivables mainly relate to private sector organisations, which are in unexpectedly difficult economic situations. the remaining provision of $304K (2009 $1,260K) is a general provision for receivables over 90 days. it was assessed that a portion of the receivable is expected to be recovered.
the ageing of these receivables is as follows:
economic entity [Consolidated] parent entity [university]
2010 2009 2010 2009
$’000 $’000 $’000 $’000
3 to 6 months 645 553 645 552
over 6 months 2,632 3,298 2,576 3,247
3,277 3,851 3,221 3,799

132 tHe uniVersitY of sYdneY financial reports and statements 2010
as at 31 december 2010, trade receivables of $8,190K (2009: $8,468K) were past due but not impaired.
these relate to a number of independent customers on which there is no recent history of defaults.
the ageing analysis of these receivables is as follows:
economic entity [Consolidated] parent entity [university]
2010 2009 2010 2009
$’000 $’000 $’000 $’000
under 3 months 5,537 3,509 5,451 3,491
3 to 6 months 2,308 3,981 2,235 3,852
over 6 months 345 978 345 978
8,190 8,468 8,031 8,321
movements in the provision for impaired receivables are as follows:
economic entity [Consolidated] parent entity [university]
2010 2009 2010 2009
$’000 $’000 $’000 $’000
at 1 January 3,851 2,808 3,799 2,808
provision for impaired recognised during the year (208) 1,879 (210) 1,827
receivables written off during the year as uncollectible (366) (836) (368) (836)
at 31 december 2010 3,277 3,851 3,221 3,799
the creation and release of the provision for impaired receivables has been included in ‘impairment of assets’ in the income statement. amounts charged to the provision account are generally written off when there is no expectation of recovering additional cash. the other amounts within receivables do not contain impaired assets and are not past due. based on credit history, it is expected that these amounts will be received when due.
(b) Foreign exchange and interest rate risk the carrying amounts of the consolidated and parent entity’s current and non‑current receivables are denominated in australian dollars, and are non‑interest bearing.
19 InventorIeS
economic entity [Consolidated] parent entity [university]
2010 2009 2010 2009
$’000 $’000 $’000 $’000
Current
crops 454 11 441 0

133
20 avaIlaBle‑For‑Sale FInanCIal aSSetS
economic entity [Consolidated] parent entity [university]
2010 2009 2010 2009
$’000 $’000 $’000 $’000
Summarised by maturity date
Within 3 months 0 0 0 0
Within 4 to 12 months 66,015 5,150 66,015 5,150
Within 1 to 5 years 90,632 169,817 90,632 169,817
more than 5 years 120,418 145,942 120,418 145,942
no maturing date (shares, convertible notes, property trusts, etc.) 516,914 510,283 516,914 510,283
at end of year 793,979 831,192 793,979 831,192
Current
fixed interest bonds 66,015 5,150 66,015 5,150
total current available‑for‑sale financial assets 66,015 5,150 66,015 5,150
non‑current
investment securities at fair value:
listed securities 208,873 201,285 208,873 201,285
external fund managers* 315,280 319,046 315,280 319,046
unlisted securities 2,940 0 2,940 0
fixed interest bonds 138,591 263,667 138,591 263,667
floating rate notes 50,939 30,573 50,939 30,573
secured company loans 7,186 7,533 7,186 7,533
convertible notes 4,155 3,915 4,155 3,915
loans to affiliated organisations 0 23 0 23
total non‑current available‑for‑sale financial assets 727,964 826,042 727,964 826,042
total available‑for‑sale financial assets 793,979 831,192 793,979 831,192
* includes listed/unlisted unit trusts, listed property trusts and listed managed investment schemes.
21 other FInanCIal aSSetS
economic entity [Consolidated] parent entity [university]
2010 2009 2010 2009
$’000 $’000 $’000 $’000
shares in associates and other companies 2,165 2,303 2,165 2,303
unsecured company loan 2,000 2,000 2,000 2,000
total other financial assets 4,165 4,303 4,165 4,303
22 InveStMent propertIeS
economic entity [Consolidated] parent entity [university]
2010 2009 2010 2009
$’000 $’000 $’000 $’000
at fair value
opening balance at 1 January 13,300 13,000 13,300 13,000
net gain/(loss) from fair value adjustment 532 300 532 300
Closing balance at 31 december 13,832 13,300 13,832 13,300

134 tHe uniVersitY of sYdneY financial reports and statements 2010
23
pr
op
er
tY,
pl
an
t a
nd
eQ
uIp
Me
nt
eco
no
mic
en
tity
(C
on
solid
ated
)t
& r
lan
dn
on
‑co
m
t &
r b
ldg
Co
m t
& r
b
ldg
Inve
stm
ent
Ct
& r
p
rop
erti
es
em
be
dd
ed
p &
e in
b
ldg
no
n‑c
om
t
& r
infr
aC
om
t &
r
infr
aC
om
mer
cial
fa
rms
Stu
den
t h
ou
sin
gp
lan
t an
d eq
uip
men
tM
oto
r ve
hic
les
Co
mp
ute
r e
qu
ipm
ent
lea
seh
old
im
pro
vem
ents
tota
l
$’0
00
$’0
00
$’0
00
$’0
00
$’0
00
$’0
00
$’0
00
$’0
00
$’0
00
$’0
00
$’0
00
$’0
00
$’0
00
$’0
00
as
at 1
Jan
uar
y 2
00
9
cos
t16
3,78
41,
088
,492
00
18,0
06
154,
265
00
018
8,6
09
8,9
4916
,70
936
,127
1,67
4,9
41
at
v alu
atio
n24
,46
25,
431
69,
575
84,5
340
022
817
,541
53,
635
00
00
255,
406
acc
umul
ated
de
prec
iati
on0
(19
6,5
55
)(2
73)
(80)
(2,6
52)
(33,
282)
(1)
(10)
(124
)(1
08,
392)
(3,6
59)
(14,
537
)(1
,66
6)(3
61,
231)
net
bo
ok
amo
un
t18
8,2
46
89
7,3
68
69
,30
28
4,4
54
15,3
54
120
,98
32
27
17,5
315
3,5
118
0,2
175
,29
02
,172
34
,46
11,
56
9,1
16
Year
en
ded
31
de c
emb
er 2
00
9
ope
ning
net
boo
k am
ount
188,
246
897,
368
69,
302
84,
454
15,3
54
120,
983
227
17,5
315
3,51
180
,217
5,29
02,
172
34,4
61
1,5
69,
116
rev
alua
tion
in
crem
ent/
(d
ecre
men
t)(5
89)
(1,15
7)0
(3,7
56)
00
(24)
859
7,71
60
00
03,
049
add
itio
ns/
reca
tego
risat
ions
(21,
573)
(53,
825
)(6
9,9
41)
102,
759
44,0
04
(3)
00
021
,819
1,15
86
28(4
08)
24,6
18
add
/les
s co
mpl
eted
cap
ital
w
orks
018
8,67
836
625
,78
82,
80
04,
187
00
380
00
15,12
823
6,9
85
dis
posa
ls/
reti
rem
ents
0(7
4)0
(59
5)
0(1
1)0
00
(9,6
12)
(1,6
32)
(2,9
19)
(73)
(14,
916
)
dep
reci
atio
n ch
arg
e0
(24
,023
)27
3(3
,413
)(4
,19
0)(3
,30
7)(6
)(6
4)(6
64)
(6,4
01)
(46
6)1,
704
(1,7
73)
(42,
33
0)
Clo
sin
g n
et b
oo
k am
ou
nt
166,
08
41,
00
6,9
67
020
5,2
375
7,9
68
121,
84
919
718
,326
60,
60
18
6,0
234
,35
01,
58
54
7,3
35
1,77
6,5
22
at
3 1 d
ecem
ber
2
00
9
cos
t16
2,44
01,
223,
271
00
64,
810
158,
438
00
020
1,16
28,
475
14,4
245
0,87
01,
883,
890
at
v alu
atio
n3,
644
4,15
30
205,
714
00
198
18,3
386
0,73
50
00
029
2,78
2
acc
umul
ated
de
prec
iati
on0
(220
,457
)0
(477
)(6
,842
)(3
6,5
89)
(1)
(12)
(134
)(1
15,13
9)(4
,125
)(1
2,83
9)(3
,535
)(4
00,
150)
ne t
bo
ok
amo
un
t16
6,0
84
1,0
06
,96
70
20
5,2
37
57,
96
812
1,8
49
197
18,3
26
60
,60
18
6,0
23
4,3
50
1,5
85
47,
33
51,
776
,52
2

1352
3
pr
op
er
tY,
pl
an
t a
nd
eQ
uIp
Me
nt
(co
ntin
ued
)
eco
no
mic
en
tity
(C
on
solid
ated
)t
& r
lan
dn
on
‑co
m
t &
r b
ldg
Co
m t
& r
b
ldg
Inve
stm
ent
Ct
& r
p
rop
erti
es
em
be
dd
ed
p &
e in
b
ldg
no
n‑c
om
t
& r
infr
aC
om
t &
r
infr
aC
om
mer
cial
fa
rms
Stu
den
t h
ou
sin
gp
lan
t an
d eq
uip
men
tM
oto
r ve
hic
les
Co
mp
ute
r e
qu
ipm
ent
lea
seh
old
im
pro
vem
ents
tota
l
$’0
00
$’0
00
$’0
00
$’0
00
$’0
00
$’0
00
$’0
00
$’0
00
$’0
00
$’0
00
$’0
00
$’0
00
$’0
00
$’0
00
Year
en
ded
31
dec
emb
er 2
010
ope
ning
net
boo
k am
ount
166,
084
1,0
06,
967
020
5,23
75
7,9
68
121,
849
197
18,3
266
0,6
01
86,0
234,
350
1,5
8547
,335
1,77
6,5
22
rev
alua
tion
in
crem
ent/
(d
ecre
men
t)
(76
5)
(323
)0
2,19
10
05
358
726
00
00
2,19
2
add
itio
ns/
reca
tego
risat
ions
3,
434
(9,3
08)
0(7
,437
)9,
631
(213
)0
07,
453
18,7
60
547
223
123
,09
1
add
/(le
ss)
com
plet
ed c
apit
al
wor
ks0
21,5
430
2,8
96
306
1,187
00
475
00
03,
06
929
,476
dis
posa
ls/
reti
rem
ents
0
(7,0
22)
0(5
30)
00
0(1
2)0
(7,3
76)
(1,3
21)
(1,3
11)
0(1
7,57
2)
dep
reci
atio
n ch
arge
0(2
5,77
3)0
(2,7
41)
(6,10
1)(3
,342
)(5
)(8
0)(9
15)
(15,
396)
(1,12
4)(8
55
)(2
,307
)(5
8,6
39)
Wri
te b
ack
accu
mul
ated
d
epre
ciat
ion
01,
794
00
00
00
06
,15
08
68
1,42
70
10,2
39
Clo
sin
g n
et b
oo
k am
ou
nt
168,
753
987
,878
019
9,6
166
1,8
04
119,
48
119
718
,59
26
8,3
40
88,
161
3,3
20
1,0
69
48,
09
81,
765
,30
9
at
31 d
ecem
ber
20
10
cos
t16
5,87
41,
228,
586
00
74,7
4715
9,41
20
00
212,
377
7,70
113
,335
53,
843
1,9
15,8
75
Val
uati
on2,
879
3,72
80
200,
05
50
019
818
,60
56
8,5
06
00
00
293,
971
acc
umul
ated
de
prec
iati
on0
(244
,436
)0
(439
)(1
2,9
43)
(39,
931)
(1)
(13)
(16
6)(1
24,2
16)
(4,3
81)
(12,
266)
(5,7
45)
(444
,537
)
net
bo
ok
amo
un
t16
8,7
53
98
7,8
780
199
,616
61,
80
411
9,4
81
197
18,5
92
68
,34
08
8,1
61
3,3
20
1,0
69
48
,09
81,
765
,30
9

136 tHe uniVersitY of sYdneY financial reports and statements 2010
23
pr
op
er
tY,
pl
an
t a
nd
eQ
uIp
Me
nt
(co
ntin
ued
)
par
ent
enti
ty
(un
iver
sity
)t
& r
lan
dn
on
‑co
m
t &
r b
ldg
Co
m t
& r
b
ldg
Inve
stm
ent
Ct
& r
p
rop
erti
es
em
be
dd
ed
p &
e in
b
ldg
no
n‑c
om
t
& r
infr
aC
om
t &
r
infr
aC
om
mer
cial
fa
rms
Stu
den
t h
ou
sin
gp
lan
t an
d eq
uip
men
tM
oto
r ve
hic
les
Co
mp
ute
r e
qu
ipm
ent
lea
seh
old
im
pro
vem
ents
tota
l
$’0
00
$’0
00
$’0
00
$’0
00
$’0
00
$’0
00
$’0
00
$’0
00
$’0
00
$’0
00
$’0
00
$’0
00
$’0
00
$’0
00
at
1 Ja
nu
ary
20
09
cos
t16
3,78
41,
088
,492
00
18,0
06
154,
265
00
018
7,6
65
8,9
4916
,66
036
,127
1,67
3,9
48
Val
uati
on24
,46
25,
431
69,
575
84,
534
00
228
17,5
415
3,6
350
00
025
5,40
6
acc
umul
ated
de
prec
iati
on0
(19
6,5
55
)(2
73)
(80)
(2,6
52)
(33,
282)
(1)
(10)
(124
)(1
08,
142)
(3,6
59)
(14,
537
)(1
,66
6)(3
60,
981
)
net
bo
ok
amo
un
t18
8,2
46
89
7,3
68
69
,30
28
4,4
54
15,3
54
120
,98
32
27
17,5
315
3,5
1179
,52
35
,29
02
,12
33
4,4
61
1,5
68
,373
Year
end
ed 3
1 d
ecem
ber
20
09
ope
ning
net
boo
k am
ount
188,
246
897,
368
69,
302
84,
454
15,3
54
120,
983
227
17,5
315
3,51
179
,523
5,29
02,
123
34,4
61
1,5
68,
373
rev
alua
tion
in
crem
ent/
(d
ecre
men
t)(5
89)
(1,15
7)0
(3,7
56)
00
(24)
859
7,71
60
00
03,
049
add
itio
ns/
reca
tego
risat
ions
(21,
573)
(53,
825
)(6
9,9
41)
102,
759
44,0
04
(3)
00
021
,723
1,15
86
28(4
08)
24,5
22
add
/(le
ss)
com
plet
ed c
apit
al
wor
ks0
188,
678
366
25,7
88
2,8
00
4,18
70
038
00
015
,128
236,
985
dis
pos
als/
re
tire
men
ts0
(74)
0(5
95
)0
(11)
00
0(9
,612
)(1
,632
)(2
,873
)(7
3)(1
4,8
70)
de p
reci
atio
n ch
arg
e0
(24
,023
)27
3(3
,413
)(4
,19
0)(3
,30
7)(6
)(6
4)(6
64)
(6,4
01)
(46
6)1,
704
(1,7
73)
(42,
33
0)
Clo
sing
net
boo
k am
ount
166
,08
41,
00
6,9
67
02
05
,237
57,
96
812
1,8
49
197
18,3
266
0,6
01
85
,23
34
,35
01,
58
24
7,3
35
1,77
5,7
29
as
at 3
1 d
ecem
ber
2
00
9
cos
t16
2,44
01,
223,
271
00
64,
810
158,
438
00
019
9,77
68,
475
14,4
155
0,77
41,
882,
399
Val
uati
on3,
644
4,15
30
205,
714
00
198
18,3
386
0,73
50
00
029
2,78
2
acc
umul
ated
de
prec
iati
on0
(220
,457
)0
(477
)(6
,842
)(3
6,5
89)
(1)
(12)
(134
)(1
14,5
43)
(4,12
5)
(12,
833)
(3,4
39)
(39
9,45
2)
ne t
bo
ok
amo
un
t16
6,0
84
1,0
06
,96
70
20
5,2
37
57,
96
812
1,8
49
197
18,3
26
60
,60
18
5,2
33
4,3
50
1,5
82
47,
33
51,
775
,72
9

1372
3
pr
op
er
tY,
pl
an
t a
nd
eQ
uIp
Me
nt
(co
ntin
ued
)
par
ent
enti
ty
(un
iver
sity
)t
& r
lan
dn
on
‑co
m
t &
r b
ldg
Co
m t
& r
b
ldg
Inve
stm
ent
Ct
& r
p
rop
erti
es
em
bed
de
d p
& e
in
bld
gn
on
‑co
m t
&
r in
fra
Co
m t
& r
in
fra
Co
mm
erci
al
farm
sS
tud
ent
ho
usi
ng
pla
nt
and
equ
ipm
ent
Mo
tor
veh
icle
sC
om
pu
ter
eq
uip
men
tl
ease
ho
ld
imp
rove
men
tsto
tal
$’0
00
$’0
00
$’0
00
$’0
00
$’0
00
$’0
00
$’0
00
$’0
00
$’0
00
$’0
00
$’0
00
$’0
00
$’0
00
$’0
00
Year
en
de
d 3
1 d
ecem
ber
20
10
ope
ning
net
boo
k am
ount
166,
084
1,0
06,
967
020
5,23
757
,96
812
1,84
919
718
,326
60,
60
185
,233
4,35
01,
582
47,3
351,
775,
729
re v
alua
tion
in
crem
ent/
(d
ecre
men
t)(7
65
)(3
23)
02,
191
00
535
872
60
00
02,
192
add
itio
ns/
reca
tego
risat
ions
3,43
4(9
,215
)0
(7,4
37)
9,6
31(2
13)
00
7,45
318
,681
547
220
123
,102
add
/(le
ss)
com
plet
ed c
apit
al
wor
ks0
21,5
430
2,89
630
61,1
870
047
50
00
3,0
69
29,4
76
dis
posa
ls/
reti
rem
ents
0(7
,022
)0
(530
)0
00
(12)
0(7
,29
6)(1
,321
)(1
,311
)0
(17,
492)
dep
reci
atio
n ch
arge
0(2
5,77
3)0
(2,7
41)
(6,10
1)(3
,342
)(5
)(8
0)(9
15)
(15,
170)
(1,12
4)(8
52)
(2,3
07)
(58,
410)
Wri
te b
ack
accu
mul
ated
d
epre
ciat
ion
01,
701
00
00
00
06
,14
98
68
1,42
80
10,1
46
Clo
sin
g n
et b
oo
k am
ou
nt
168
,75
39
87,
878
019
9,6
166
1,8
04
119
,48
119
718
,59
26
8,3
40
87,
59
73
,32
01,
06
74
8,0
98
1,76
4,7
43
at
31
dec
emb
er
2010
cos
t16
5,87
41,
228,
586
00
74,7
4715
9,41
20
00
211,1
61
7,70
113
,324
53,
843
1,9
14,6
48
Val
uati
on2,
879
3,72
80
200,
05
50
019
818
,60
56
8,5
06
00
00
293,
971
acc
umul
a ted
de
prec
iati
on0
(244
,436
)0
(439
)(1
2,9
43)
(39,
931)
(1)
(13)
(16
6)(1
23,5
64)
(4,3
81)
(12,
257)
(5,7
45)
(443
,876
)
net
bo
ok
amo
un
t16
8,7
53
98
7,8
780
199
,616
61,
80
411
9,4
81
197
18,5
92
68
,34
08
7,5
97
3,3
20
1,0
67
48
,09
81,
764
,74
3

138 tHe uniVersitY of sYdneY financial reports and statements 2010
24 herItage aSSetS
economic entity [Consolidated] parent entity [university]
2010 2009 2010 2009
$’000 $’000 $’000 $’000
Works of art – university collection* 49,765 49,197 49,765 49,197
rare books 77,645 70,875 77,645 70,875
museum collection 100,689 100,002 100,689 100,002
total heritage assets 228,099 220,074 228,099 220,074
*the collection does not include a significant unique donation that was received during 2010. the university is undertaking a comprehensive process of due diligence and this process is not yet complete. the university has also been unable to establish a reliable measurement of the value of this donation due to the variability of the limited market evidence available. for these reasons the donation has not been included in the financial statements. these issues are expected to be resolved during 2011.
works of art – university collection*
rare booksMuseum
collectiontotal
$’000 $’000 $’000 $’000
economic entity (Consolidated) – 2009
balance 1 January 48,017 69,474 96,213 213,704
revaluations 958 782 3,757 5,497
disposals (10) 0 (1) (11)
recategorisations 232 619 33 884
Balance 31 december 49,197 70,875 100,002 220,074
economic entity (Consolidated) – 2010
balance 1 January 49,197 70,875 100,002 220,074
revaluations 219 6,503 1,025 7,747
disposals 0 0 (27) (27)
additions/recategorisations 349 267 (311) 305
Balance 31 december 49,765 77,645 100,689 228,099
parent entity (university) – 2009
balance 1 January 48,017 69,474 96,213 213,704
revaluations 958 782 3,757 5,497
disposals (10) 0 (1) (11)
recategorisations 232 619 33 884
Balance 31 december 49,197 70,875 100,002 220,074
parent entity (university) – 2010
balance 1 January 49,197 70,875 100,002 220,074
revaluations 219 6,503 1,025 7,747
disposals 0 0 (27) (27)
additions/recategorisations 349 267 (3,227) (2,611)
Balance 31 december 49,765 77,645 97,773 225,183

139
25 lIBrarY ColleCtIonS
economic entity [Consolidated] parent entity [university]
2010 2009 2010 2009
$’000 $’000 $’000 $’000
undergraduate collection 45,398 44,607 45,398 44,607
research collection 495,952 492,957 495,952 492,957
accumulated depreciation (43,342) (42,451) (43,342) (42,451)
accumulated impairment (25,729) (25,729) (25,729) (25,729)
total library collections 472,279 469,384 472,279 469,384
undergraduate collection
research collection
accum depn – undergraduate
collection
accum impairment – research collection total
$’000 $’000 $’000 $’000 $’000
economic entity (Consolidated) – 2009
balance 1 January 43,737 490,122 (41,570) (25,729) 466,560
acquisitions 872 3,930 0 0 4,802
retirements 0 (1,095) 0 0 (1,095)
disposals (2) 0 0 0 (2)
depreciation 0 0 (881) 0 (881)
Balance 31 december 44,607 492,957 (42,451) (25,729) 469,384
economic entity (Consolidated) – 2010
balance 1 January 44,607 492,957 (42,451) (25,729) 469,384
acquisition 840 3,225 0 0 4,065
disposals (49) (230) 49 0 (230)
depreciation 0 0 (940) 0 (940)
Balance 31 december 45,398 495,952 (43,342) (25,729) 472,279
parent entity (university) – 2009
balance 1 January 43,737 490,122 (41,570) (25,729) 466,560
acquisitions 872 3,930 0 0 4,802
retirements 0 (1,095) 0 0 (1,095)
disposals (2) 0 0 0 (2)
depreciation 0 0 (881) 0 (881)
Balance 31 december 44,607 492,957 (42,451) (25,729) 469,384
parent entity (university) – 2010
balance 1 January 44,607 492,957 (42,451) (25,729) 469,384
acquisitions 840 3,225 0 0 4,065
disposals (49) (230) 49 0 (230)
depreciation 0 0 (940) 0 (940)
Balance 31 december 45,398 495,952 (43,342) (25,729) 472,279

140 tHe uniVersitY of sYdneY financial reports and statements 2010
26 workS In progreSS
economic entity [Consolidated] parent entity [university]
2010 2009 2010 2009
$’000 $’000 $’000 $’000
capital works in progress 25,264 13,119 25,264 13,119
major it works in progress 36,022 29,836 36,022 29,836
total works in progress 61,286 42,955 61,286 42,955
Capital works in progress
Major It works in progress total
$’000 $’000 $’000
economic entity (Consolidated) – 2009
balance 1 January 157,029 22,012 179,041
add: capital works expenditure 93,075 20,578 113,653
completed capital works – buildings and infrastructure (236,985) 0 (236,985)
major it computer software capitalised 0 (12,754) (12,754)
Balance 31 december 13,119 29,836 42,955
economic entity (Consolidated) – 2010
balance 1 January 13,119 29,836 42,955
add: capital works expenditure 42,095 20,067 62,162
completed capital works – buildings and infrastructure (29,476) 0 (29,476)
projects abandoned (474) (47) (521)
major it computer software capitalised 0 (13,834) (13,834)
Balance 31 december 25,264 36,022 61,286
parent entity (university) – 2009
balance 1 January 157,029 22,012 179,041
add: capital works expenditure 93,075 20,578 113,653
completed capital works – buildings and infrastructure (236,985) 0 (236,985)
major it computer software capitalised 0 (12,754) (12,754)
Balance 31 december 13,119 29,836 42,955
parent entity (university) – 2010
balance 1 January 13,119 29,836 42,955
add: capital works expenditure 42,095 20,067 62,162
completed capital works – buildings and infrastructure (29,476) 0 (29,476)
projects abandoned (474) (47) (521)
major it computer software capitalised 0 (13,834) (13,834)
Balance 31 december 25,264 36,022 61,286

141
27 IntangIBle aSSetS
economic entity (Consolidated)Computer software
other intangible assets
digitalised library collection total
$’000 $’000 $’000 $’000
at 1 January 2009
at cost 35,974 0 29,800 65,774
less: accumulated amortisation (27,762) 0 0 (27,762)
net book amount 8,212 0 29,800 38,012
Year ended 31 december 2009
opening net book amount 8,212 0 29,800 38,012
add: completed capital works 12,754 0 5,605 18,359
acquisitions 318 0 0 318
disposal/retirements (14,832) 0 0 (14,832)
amortisation charge 6,279 0 0 6,279
Closing net book amount 12,731 0 35,405 48,136
accumulated impairment
closing net book amount 34,315 0 35,405 69,720
accumulated amortisation and impairment (21,584) 0 0 (21,584)
net book amount 12,731 0 35,405 48,136
Year ended 31 december 2010
opening net book amount 12,731 0 35,405 48,136
add: completed capital works 13,823 0 0 13,823
additions 225 2,100 5,496 7,821
disposal/retirements (5,170) 0 0 (5,170)
less: amortisation charge (10,826) (61) 0 (10,887)
Writeback accumulated amortisation 4,390 0 0 4,390
Closing net book amount 15,173 2,039 40,901 58,113
accumulated impairment
closing net book amount 42,979 2,100 40,901 85,980
accumulated amortisation and impairment (27,806) (61) 0 (27,867)
net book amount 15,173 2,039 40,901 58,113

142 tHe uniVersitY of sYdneY financial reports and statements 2010
27 IntangIBle aSSetS (continued)
parent entity (university) Computer software
other intangible assets
digitalised library collection total
$’000 $’000 $’000 $’000
as at 1 January 2009
cost 35,974 0 29,800 65,774
less: accumulated amortisation (27,762) 0 0 (27,762)
net book amount 8,212 0 29,800 38,012
Year ended 31 december 2009
opening net book amount 8,212 0 29,800 38,012
add: completed capital works 12,754 0 0 12,754
acquisitions 0 0 5,605 5,605
disposal/retirements (14,749) 0 0 (14,749)
amortisation charge 6,279 0 0 6,279
Closing net book amount 12,496 0 35,405 47,901
accumulated impairment
cost 33,980 0 35,405 69,385
accumulated amortisation and impairment (21,484) 0 0 (21,484)
net book amount 12,496 0 35,405 47,901
Year ended 31 december 2010
opening net book amount 12,496 0 35,405 47,901
acquisitions 225 2,100 5,496 7,821
completed capital works 13,823 0 0 13,823
disposal/retirements (5,170) 0 0 (5,170)
less: amortisation charge (10,692) (61) 0 (10,753)
Writeback accumulated amortisation 4,454 0 0 4,454
Closing net book amount 15,136 2,039 40,901 58,076
accumulated impairment
closing net book amount 42,858 2,100 40,901 85,859
accumulated amortisation and impairment (27,722) (61) 0 (27,783)
net book amount 15,136 2,039 40,901 58,076

143
28 deFerred tax aSSetS
economic entity [Consolidated] parent entity [university]
2010 2009 2010 2009
$’000 $’000 $’000 $’000
deferred tax asset 16 17 0 0
total deferred tax assets 16 17 0 0
the balance comprises temporary differences attributable to:
amounts recognised in operating result
tax losses 15 16 0 0
deferred tax asset relating to the origination and reversal of temporary differences 1 1 0 0
16 17 0 0
Movements – [Consolidated] tax losses
$’000
at 1 January 2009 470
tax losses 17
reversal of tax losses (470)
at 31 december 2009 17
Movements – [Consolidated] total losses
$’000
at 1 January 2010 17
tax losses (1)
at 31 december 2010 16
deferred tax assets not taken into account equates to $137K as at 31 december 2010.
this benefit will only be obtained if the company derives the necessary future assessable income and capital gains and there are no adverse changes in relevant income tax legislation.
29 other non‑FInanCIal aSSetS
economic entity [Consolidated] parent entity [university]
2010 2009 2010 2009
$’000 $’000 $’000 $’000
livestock
balance 1 January 2,393 2,322 2,393 2,322
purchases 12 44 12 44
natural increase/revaluation 1,446 658 1,446 658
sales (523) (613) (523) (613)
natural decrease (22) (18) (22) (18)
Balance 31 december 3,306 2,393 3,306 2,393

144 tHe uniVersitY of sYdneY financial reports and statements 2010
30 trade and other paYaBleS
economic entity [Consolidated] parent entity [university]
2010 2009 2010 2009
$’000 $’000 $’000 $’000
Current
creditors 46,500 53,369 46,401 53,478
Joint venture liability 0 6,462 0 6,462
prepaid income 47,518 44,162 46,576 43,777
accrued expenses 37,289 31,132 37,047 30,856
os‑Help liability to australian government 429 398 429 398
amounts due to associates 14,289 9,375 14,289 9,375
amounts owed to controlled entities 0 0 7,140 623
repurchase agreement 0 71,175 0 71,175
total trade and other payables current 146,025 216,073 151,882 216,144
Foreign currency risk
the carrying amounts of the Group’s and parent entity’s trade and other payables are denominated in the following currencies:
economic entity [Consolidated] parent entity [university]
2010 2009 2010 2009
$’000 $’000 $’000 $’000
australian dollars 141,954 213,906 147,811 213,977
us dollars 3,504 1,541 3,504 1,541
canadian dollars 1 4 1 4
swiss francs 9 3 9 3
euros 98 135 98 135
uK pounds 457 463 457 463
new Zealand dollars 1 8 1 8
Japanese yen 1 0 1 0
singapore dollars 0 13 0 13
146,025 216,073 151,882 216,144

145
31 provISIonS
economic entity [Consolidated] parent entity [university]
$’000 $’000 $’000 $’000
Current provisions expected to be settled within 12 months
employee benefits
annual leave 42,901 44,024 42,808 43,837
long service leave 16,235 14,410 16,235 14,410
professorial Widow superannuation scheme 3,276 4,245 3,276 4,245
Subtotal 62,412 62,679 62,319 62,492
Current provisions expected to be settled after more than 12 months
employee benefits
annual leave 10,726 10,959 10,726 10,959
long service leave 59,639 58,082 59,639 58,082
Subtotal 70,365 69,041 70,365 69,041
total current provisions 132,777 131,720 132,684 131,533
non‑current provisions
employee benefits
long service leave 22,675 19,957 22,643 19,921
deferred contribution to superannuation schemes 766,839 680,031 766,839 680,031
total non‑current provisions 789,514 699,988 789,482 699,952
total provisions 922,291 831,708 922,166 831,485
(a) Movements in provisions movements in each class of provision during the financial year are set out below:
annual leave <12 months
professorial widow Superannation Scheme <12 months
annual leave >12 months
long service leave <12 months (current)
long service leave >12 months (current)
deferred contribs to super schemes (non‑current)
long service leave >12 months (non‑current)
total
$’000 $’000 $’000 $’000 $’000 $’000 $’000 $’000
economic entity (Consolidated) – 2009
carrying amount at start last year 39,090 4,161 9,759 13,257 57,919 796,613 18,136 938,935
additional provisions recognised 4,934 0 1,200 1,153 163 0 1,821 9,271
increase/(decrease) in unfunded liability (sancs, sss) 0 0 0 0 0 (104,478) 0 (104,478)
increase/(decrease) in unfunded liability (professorial/ widow) 0 84 0 0 0 (12,104) 0 (12,020)
Carrying amount at end of year 44,024 4,245 10,959 14,410 58,082 680,031 19,957 831,708
economic entity (Consolidated) – 2010
carrying amount at start of year 44,024 4,245 10,959 14,410 58,082 680,031 19,957 831,708
additional provisions recognised (1,123) 0 (233) 1,825 1,557 0 2,718 4,744
increase/(decrease) in unfunded liability (sancs, sss) 0 0 0 0 0 86,708 0 86,708
increase/(decrease) in unfunded liability (professorial/widow) 0 0 0 0 0 100 0 100
increase in discounted amount 0 (969) 0 0 0 0 0 (969)
Carrying amount at end of year 42,901 3,276 10,726 16,235 59,639 766,839 22,675 922,291

146 tHe uniVersitY of sYdneY financial reports and statements 2010
annual leave <12 months
professorial widow Superannuation Scheme <12 months
annual leave >12 months
long service leave <12 months (current)
long service leave >12 months (current)
deferred contribs to super schemes (non‑current)
long service leave >12 months (non‑current)
total
$’000 $’000 $’000 $’000 $’000 $’000 $’000
parent entity (university) – 2009
carrying amount at start of year 39,036 4,161 9,759 13,257 57,919 796,609 18,136 938,877
additional provisions recognised 4,801 0 1,200 1,153 163 0 1,785 9,102
increase/(decrease) in unfunded liability (sancs, sss) 0 0 0 0 0 (104,474) 0 (104,474)
increase/(decrease) in unfunded liability (professorial/widow) 0 84 0 0 0 (12,104) 0 (12,020)
Balance 31 december 43,837 4,245 10,959 14,410 58,082 680,031 19,921 831,485
parent entity (university) – 2010
carrying amount at start of year 43,837 4,245 10,959 14,410 58,082 680,031 19,921 831,485
additional provisions recognised (1,029) 0 (233) 1,825 1,557 0 2,722 4,842
increase/(decrease) in unfunded liability (sancs, sss) 0 0 0 0 0 86,708 0 86,708
increase/(decrease) in unfunded liability (professorial/widow) 0 (969) 0 0 0 100 0 (869)
Balance 31 december 42,808 3,276 10,726 16,235 59,639 766,839 22,643 922,166

147
32 reStrICted FundS
economic entity [Consolidated] parent entity [university]
2010 2009 2010 2009
$’000 $’000 $’000 $’000
Capital preserved trusts
accumulated funds at the beginning of the reporting period 281,742 264,680 281,742 264,680
total income 12,234 23,234 12,234 23,234
total expenses (6,705) (6,172) (6,705) (6,172)
accumulated funds at 31 december 287,271 281,742 287,271 281,742
Bequests
accumulated funds at the beginning of the reporting period 367,494 369,358 367,494 369,358
total income 28,043 7,240 28,043 7,240
total expenses (11,746) (9,104) (11,746) (9,104)
accumulated funds at 31 december 383,791 367,494 383,791 367,494
australian government financial assistance
accumulated funds at the beginning of the reporting period 83,092 10,619 83,092 10,619
adjustment for 2008 capital grants* 0 35,159 0 35,159
total income 614,383 565,998 614,383 565,998
total expenses (619,399) (528,684) (619,399) (528,684)
accumulated funds at 31 december 78,076 83,092 78,076 83,092
Scholarships
accumulated funds at the beginning of the reporting period 15,923 13,008 15,923 13,008
total income 8,392 10,177 8,392 10,177
total expenses (7,575) (7,262) (7,575) (7,262)
accumulated funds at 31 december 16,740 15,923 16,740 15,923
prizes
accumulated funds at the beginning of the reporting period 1,286 1,301 1,286 1,301
total income 560 237 560 237
total expenses (185) (252) (185) (252)
accumulated funds at 31 december 1,661 1,286 1,661 1,286
arC grants
accumulated funds at the beginning of the reporting period 7,811 17,577 7,811 17,577
total income 68,559 62,709 68,559 62,709
total expenses (67,304) (72,475) (67,304) (72,475)
accumulated funds at 31 december 9,066 7,811 9,066 7,811
nhMrC grants
accumulated funds at the beginning of the reporting period (231) 7,822 (231) 7,822
total income 97,492 77,208 97,492 77,208
total expenses (92,726) (85,261) (92,726) (85,261)
accumulated funds at 31 december 4,535 (231) 4,535 (231)
total accumulated funds at 1 January 757,117 719,524 757,117 719,524
total income 829,663 746,803 829,663 746,803
total expenses (805,640) (709,210) (805,640) (709,210)
net operating result 24,023 37,593 24,023 37,593
total accumulated funds at 31 december 781,140 757,117 781,140 757,117
*australian government financial assistance includes capital funding. in 2008 the accumulated capital funding carried forward was $35,159K. it was previously included in ‘other commonwealth grants’.

148 tHe uniVersitY of sYdneY financial reports and statements 2010
33 reServeS and retaIned earnIngS
economic entity [Consolidated] parent entity [university]
2010 2009 2010 2009
$’000 $’000 $’000 $’000
(a) reserves
property, plant and equipment revaluation reserve 267,067 258,187 267,067 258,187
available‑for‑sale investments revaluation reserve 10,141 42,522 10,141 42,522
associates’ reserves 609 4,099 0 0
Balance 31 december 277,817 304,808 277,208 300,709
Movements:
property, plant and equipment revaluation reserve
balance 1 January 258,187 250,130 258,187 250,130
less: reserves transferred to retained earnings (1,059) (561) (1,059) (561)
revaluation increments/(decrements) 9,939 8,618 9,939 8,618
Balance 31 december 267,067 258,187 267,067 258,187
available‑for‑sale investments revaluation reserve
balance 1 January 42,522 (11,181) 42,522 (11,181)
realised (gains)/losses transferred from reserves (37,627) (6,775) (37,627) (6,775)
revaluation increments/(decrements) and adjustments 1,307 52,030 1,307 52,030
impairment available‑for‑sale assets 3,939 8,448 3,939 8,448
Balance 31 december 10,141 42,522 10,141 42,522
associates’ reserves
balance 1 January 4,099 4,095 0 0
less: transfers from reserves (3,490) 4 0 0
Balance 31 december 609 4,099 0 0
economic entity [Consolidated] parent entity [university]
2010 2009 2008 2010 2009 2008
$’000 $’000 $’000 $’000 $’000 $’000
(b) retained earnings
retained earnings at 1 January 2,167,904 2,170,946 2,385,928 2,162,828 2,164,137 2,377,179
plus: net operating result for the year 112,167 59,895 (145,396) 113,736 61,628 (143,456)
less: adjustment for 2008 restricted funds 0 (35,159) 0 0 (35,159) 0
less: amount set aside for restricted funds (24,023) (37,593) (51,866) (24,023) (37,593) (51,866)
actuarial (gains)/losses defined benefit plan (3,572) 9,254 (21,997) (3,572) 9,254 (21,997)
transfer (to)/from reserves 4,549 561 4,276 1,059 561 4,276
total retained earnings 2,257,025 2,167,904 2,170,945 2,250,028 2,162,828 2,164,136
34 Change In aCCountIng polICY
during the year, the university changed its accounting policy with respect to the recognition of defined benefit superannuation actuarial gains and losses. superannuation actuarial gains and losses are now recognised, outside of the income statement, in other comprehensive income as permitted by aasb 119 employee benefits. previously these gains and losses were recognised in the income statement. the comparative figures for 2009 have been restated to reflect the change in policy.
this change in accounting policy is consistent with the preference expressed by by deeWr in the financial statement Guidelines for australian Higher education providers.
this change in policy has been adopted on the basis that the recognition outside the income statement provides reliable and more relevant information as it better reflects the nature of superannuation actuarial gains and losses. this is because actuarial gains and losses are re‑measurements, based on assumptions that do not necessarily reflect the ultimate cost of providing superannuation.
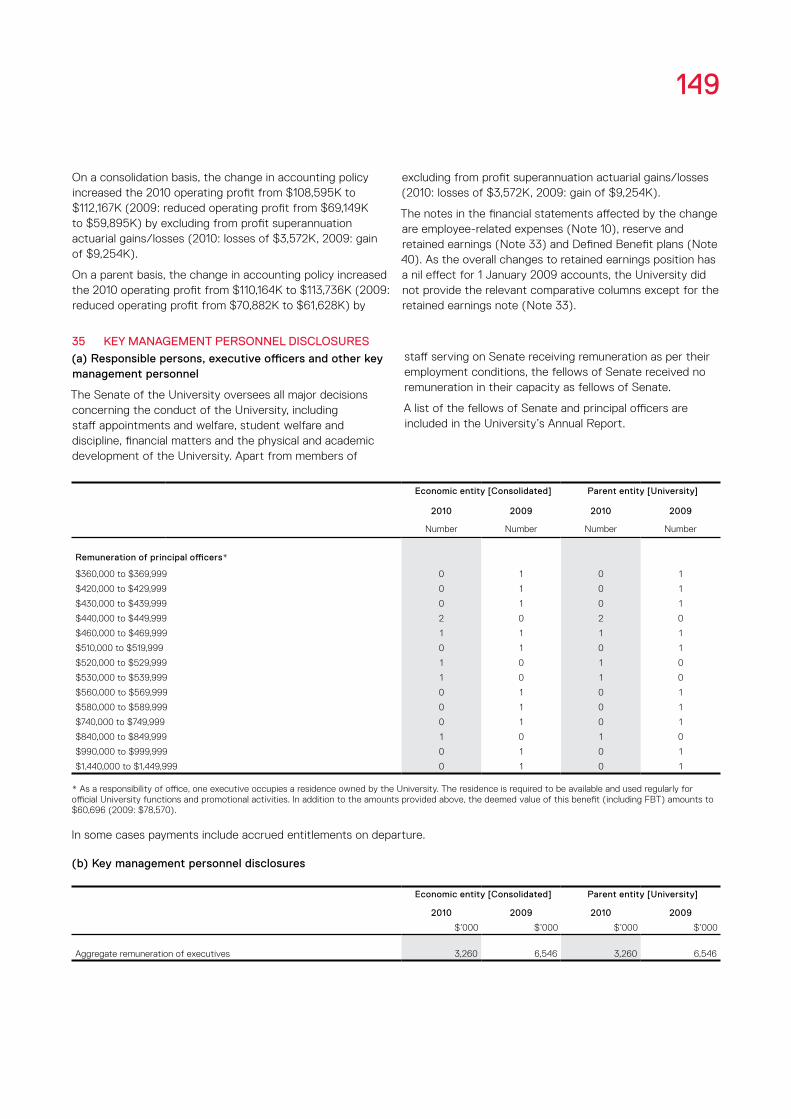
149
on a consolidation basis, the change in accounting policy increased the 2010 operating profit from $108,595K to $112,167K (2009: reduced operating profit from $69,149K to $59,895K) by excluding from profit superannuation actuarial gains/losses (2010: losses of $3,572K, 2009: gain of $9,254K).
on a parent basis, the change in accounting policy increased the 2010 operating profit from $110,164K to $113,736K (2009: reduced operating profit from $70,882K to $61,628K) by
excluding from profit superannuation actuarial gains/losses (2010: losses of $3,572K, 2009: gain of $9,254K).
the notes in the financial statements affected by the change are employee‑related expenses (note 10), reserve and retained earnings (note 33) and defined benefit plans (note 40). as the overall changes to retained earnings position has a nil effect for 1 January 2009 accounts, the university did not provide the relevant comparative columns except for the retained earnings note (note 33).
economic entity [Consolidated] parent entity [university]
2010 2009 2010 2009
number number number number
remuneration of principal officers*
$360,000 to $369,999 0 1 0 1
$420,000 to $429,999 0 1 0 1
$430,000 to $439,999 0 1 0 1
$440,000 to $449,999 2 0 2 0
$460,000 to $469,999 1 1 1 1
$510,000 to $519,999 0 1 0 1
$520,000 to $529,999 1 0 1 0
$530,000 to $539,999 1 0 1 0
$560,000 to $569,999 0 1 0 1
$580,000 to $589,999 0 1 0 1
$740,000 to $749,999 0 1 0 1
$840,000 to $849,999 1 0 1 0
$990,000 to $999,999 0 1 0 1
$1,440,000 to $1,449,999 0 1 0 1
* as a responsibility of office, one executive occupies a residence owned by the university. the residence is required to be available and used regularly for official university functions and promotional activities. in addition to the amounts provided above, the deemed value of this benefit (including fbt) amounts to $60,696 (2009: $78,570).
in some cases payments include accrued entitlements on departure.
(b) key management personnel disclosures
economic entity [Consolidated] parent entity [university]
2010 2009 2010 2009
$’000 $’000 $’000 $’000
aggregate remuneration of executives 3,260 6,546 3,260 6,546
35 keY ManageMent perSonnel dISCloSureS
(a) responsible persons, executive officers and other key management personnel
the senate of the university oversees all major decisions concerning the conduct of the university, including staff appointments and welfare, student welfare and discipline, financial matters and the physical and academic development of the university. apart from members of
staff serving on senate receiving remuneration as per their employment conditions, the fellows of senate received no remuneration in their capacity as fellows of senate.
a list of the fellows of senate and principal officers are included in the university’s annual report.

150 tHe uniVersitY of sYdneY financial reports and statements 2010
36 reMuneratIon oF audItorS
economic entity [Consolidated] parent entity [university]
assurance services 2010 2009 2010 2009
$’000 $’000 $’000 $’000
(a) audit services
fees paid to the audit office of nsW
audit and review of financial statements and other audit work under the corporations act 2001
438 470 419 454
audit fees for subsidiaries paid by parent entity 13 10 13 10
audit services by private sector contractors 100 83 83 83
total remuneration for audit services 551 563 515 547
(b) non‑audit services
audit‑related services
fees paid to the audit office of nsW
audit of regulatory returns 17 17 17 17
controls assurance services 3 3 3 3
total remuneration for audit‑related services 20 20 20 20
total remuneration for audit and audit‑related services 571 583 535 567
37 CoMMItMentS
economic entity [Consolidated] parent entity [university]
2010 2009 2010 2009
$’000 $’000 $’000 $’000
(a) Capital expenditure commitments
property, plant and equipment
Within one year 53,845 18,168 53,845 18,168
later than one year but not later than five years 4,400 138 4,400 138
58,245 18,306 58,245 18,306
Intangible assets
Within one year 8,160 597 8,160 597
later than one year but not later than five years 4,271 105 4,271 105
12,431 702 12,431 702
(b) operating lease commitments
Within one year 18,482 12,967 18,471 12,953
later than one year but not later than five years 36,534 20,272 36,530 20,259
later than five years* 12,872 1,477 12,872 1,477
67,888 34,716 67,873 34,689
*the university has a lease arrangement which terminates in 2095 for the sydney college of the arts (sca) in the heritage‑protected Kirkbride complex at callan park, rozelle. the long‑term portion of this lease is not included above as the university may outgrow the premises or relocate the sca to another campus or location in the longer term. the university may terminate the leasing arrangements by giving three months notice (subject to ministerial approvals).
(c) other non‑payroll expenditure commitmentsWithin one year 36,491 35,814 36,491 35,814
later than one year and not later than five years 10,731 16,814 10,731 16,814
later than five years 2,575 3,789 2,575 3,789
49,797 56,417 49,797 56,417
note: commitments are Gst inclusive.

151
parent entity [university] parent entity [university]
2010 2010 2009 2009
cash $’000 in‑kind $’000 cash $’000 in‑kind $’000
(d) CrC commitments
the university of sydney is either a core or supporting participant of the following cooperative research centres (crcs). the university has made cash and in‑kind contributions for the current year and has a commitment to cover salaries, equipment, use of facilities and other expenditure for future years.
australasian Invasive animals CrC
the principal activity is to develop new biological control agents for australia’s most damaging pest animals.
current year involvement 100 100 308 308
future years involvement 150 250 445 753
australian Biosecurity CrC for emerging Infectious disease
the principal activity is to enhance the national capacity to respond to emerging infectious diseases by developing new capabilities to detect, monitor, assess, predict and respond to emerging infectious disease threats.
current year involvement 0 0 137 274
future years involvement 0 0 0 137
Cotton Catchment Communities CrC
the principal activity is to enhance the development of the australian cotton industry through the application of collaborative research, education and the adoption of sustainable farming systems.
current year involvement 100 100 673 673
future years involvement 151 251 1,010 1,683
CrC for advanced Composite structures
the principal activity is to conduct research and development programs into the design, manufacture, testing, durability and supportability of advanced composite structures.
current year involvement 50 100 230 460
future years involvement 0 50 0 230
CrC for asthma and airways
the principal activity is to reduce the burden of asthma on the australian community.
current year involvement 200 200 278 282
future years involvement 300 500 417 695
CrC for Internationally Competitive pork Industry
the principal activity is to enhance international competitiveness of the australian pork industry by providing and adopting new and novel technologies that reduce feed costs, improve herd feed conversion efficiency and increases the functionality of pork products.
current year involvement 20 20 332 332
future years involvement 30 50 498 830
CrC for Mining
the principal activity is the development of a range of new technologies and processes to generate major improvements in the way mining operations are conducted.
current year involvement 50 100 444 888
future years involvement 0 50 0 444
37 CoMMItMentS (continued)

152 tHe uniVersitY of sYdneY financial reports and statements 2010
parent entity [university] parent entity [university]
2010 2010 2009 2009
cash $’000 in‑kind $’000 cash $’000 in‑kind $’000
CrC for polymers
the principal activity of which is to undertake research into polymer synthesis.
current year involvement 120 120 0 0
future years involvement 60 180 0 0
Smart Services CrC (previously CrC for Internet technology)
the principal activity is to capitalise the outcomes of world class internet research and development for australia.
current year involvement 150 150 659 659
future years involvement 525 675 2,303 2,961
Capital Markets CrC (previously CrC for technology enabled Capital Markets)
the principal activity is to develop new technologies that drive the future of capital markets.
current year involvement 200 200 400 400
future years involvement 700 900 1,400 1,800
australian poultry CrC
the principal activity is to deliver the following key outcomes: sustainable production of chicken meat without reliance on antibiotics, development and commercialisation of new poultry health products and improved diagnostic tools, a poultry industry with enhanced bird health and welfare standards and improved education and skills of industry personnel.
current year involvement 0 0 137 269
future years involvement 0 0 0 137
Sustainable resource processing CrC
the principal activity is the sustainable processing of minerals and metals and to progressively eliminate waste and emissions in the minerals cycle, while enhancing business performance and meeting community expectations.
current year involvement 0 0 291 582
future years involvement 0 0 0 291
total CrC commitments
Current year involvement 990 1,090 3,889 5,127
Future years involvement 1,916 2,906 6,073 9,961
37 CoMMItMentS (continued)

153
38 ContIngenCIeS
an estimate of the maximum exposure on proceedings against the university amounts to $440,000 for 2010 (2009 $450,000) However, there are no significant legal claims outstanding that are not covered by appropriate insurance.
occupancy Support deed – Carillon avenue pty ltd
the university has given certain financial undertakings in support of bed vacancies that may occur at the sydney university Village (suV), which is owned by carillon avenue pty ltd. this financial support gradually reduces to nil over the first 20 years and can only be called upon when overall occupancy falls below 98 percent. any payments made under this deed are considered not to be material as they can firstly be offset by “claw back” payment arrangements that can be served on the operator and summer income net operating profits.
the university currently has a bank guarantee facility up to a limit of $3,500,000 of which $2,616,451 was unused during 2010. the bank guarantees given primarily relate to construction and maintenance projects.
the university has provided its controlled entities with letters of comfort guaranteeing the liabilities of the controlled entities. at the date of this report the net liabilities of the controlled entities total $348K (2009: $4,071K).
39 aMountS owIng BY CoMMonwealth/State governMentS
since 1987, the university has recognised amounts owing from the commonwealth and state governments for unfunded deferred liability for superannuation schemes on the basis of a number of past events. these events include correspondence that provides for the commonwealth Government, together with the state government, to meet the unfunded liability for the university’s state superannuation schemes on an emerging cost basis. recent correspondence from the commonwealth Government indicates the reimbursement right in respect of the state authorities non‑contributory scheme has become questionable and the relevant receivable has been reduced to nil. the events also include the State Grants (General Reserve) Amendment Act 1987, the Higher Education Funding Act 1988 and subsequent amending legislation which authorises annual expenditure, and estimates for the expenditure in the commonwealth’s three‑year forward program. While there is no formal agreement and therefore no guarantee regarding these specific amounts between the state government, the commonwealth Government and the university, and the three‑year life of the forward budget estimates is less than the time period which the commonwealth Government would require to meet its obligations, the university is of the view that the commonwealth and state governments will continue to progressively meet this amount in accordance with current practice. the amount owing in respect of the remaining two schemes as at 31 december 2010 was $722,060,694 (2009: $635,765,675) and this is reflected in note 18 as non‑current trade and other receivables.
40 deFIned BeneFIt planS
(a) Fund‑specific disclosure
State authorities trustee Corporationthe university maintains a reserve account within the state authorities superannuation trustee corporation to assist in financing the employer contributions to the state authorities superannuation scheme (sass), the state authorities non‑contributory scheme (sancs) and the state superannuation scheme (sss).
these schemes are all defined benefits schemes – at least a component of the final benefit is derived from a multiple of member salary and years of membership. all three schemes are closed to new members (sass, sancs and sss). the actuarially assessed income in the net unfunded liability of these schemes excluding sancs (expense) of $86,295,018 (2009: $113,484,778) has been netted against the reimbursement (deferred commonwealth Government contribution for superannuation) in the income statement of the same amount.
professorial Superannuation Scheme (pSS)
the professorial superannuation scheme is closed to new members and provides active members with a combination of accumulation benefits and defined benefits. pensioner members receive pension payments from the system. the ‘defined benefits section’ of the system provides members with an optional funded Widows’ contributory pension; an optional funded spouses’ contributory pension; and an unfunded ‘non‑contributory pension’ payable from age 65. these benefits are fully funded by contributions from system members and the university. accumulation benefit entitlements are not included – for these members assets and liabilities are always equal in value and so have no impact on the university’s net liability.
the gross liability for the university of sydney professorial superannuation scheme was based on the alea actuarial consulting pty ltd assessment as at 31 december 2010.
liability
a net unfunded liability for retirement benefits of $757,411,697 (2009:$670,019,641) is included in the statement of financial position as $754,135,697 within non‑current liability and $3,276,000 current liability. $722,060,694 of this is payable by the commonwealth and state governments (refer note 39).
the valuation methodology and principal actuarial assumptions as at 31 december 2010 are as follows:
(i) valuation method
the projected unit credit (puc) valuation method was used to determine the present value of the defined benefit obligations and the related current service costs.
this method sees each period of service as giving rise to an additional unit of benefit entitlement and measures each unit separately to build up the final obligation.

154 tHe uniVersitY of sYdneY financial reports and statements 2010
(ii) economic assumptions
the principal assumptions used for the purposes of the actuarial valuations were as follows (expressed as weighted averages):
2010 (%) 2009 (%)
discount rate(s)* 5.59 5.81
expected return on plan assets**
8.60 8.30
expected rate(s) of salary increase***
3.50 3.50
*the actuarial calculation for the professorial super fund specifically for the university of sydney in 2010 used 5.7% (2009 6%) discount rate assumption.
**the actuarial calculation for the professorial super fund specifically for the university of sydney in 2010 used 7.4% (2009: 7.5%) expected return on assets assumption.
***the actuarial calculation for the professorial super fund specifically for the university of sydney in 2010 used 4.0% (2009 4.0%) salary increase assumption. in respect of the sass, sancs and sss funds, the salary increase assumption for 2010 3.50% (2009 and 3.5%).
the analysis of the plan assets and the expected rate of return at the statements of financial position date is as follows:
2010 (%) 2009 (%)
australian equities 33.70 33.80
overseas equities 29.30 26.30
australian fixed interest securities
5.70 6.80
overseas fixed interest securities
2.90 4.40
property 9.50 8.60
cash 6.10 7.30
other 12.80 12.80
all fund assets are invested by the superannuation trustee corporation (stc) for sass, sancs and sss and by the professorial superannuation scheme at arm’s length through independent fund managers.
the overall expected rate of return is a weighted average of the expected returns of the various categories of plan assets held. the university’s assessment of the expected returns is based on historical return trends and actuarial predictions of the market for the asset in the next 12 months.
the history of experience adjustments is as follows:
2010 2009 2008 2007 2006
$’000 $’000 $’000 $’000 $’000
2010
fair value of plan assets 493,964 533,868 534,740 717,613 684,269
present value of defined benefit obligation (1,251,376) (1,203,888) (1,331,288) (1,047,489) (1,088,853)
surplus/(deficit) (757,412) (670,020) (796,548) (329,876) (404,584)
experience adjustments on plan liabilities 47,064 (110,764) 296,696 (63,257) (86,567)
experience adjustments on plan assets 17,769 (8,498) (162,143) 17,372 49,280

155
(b) Financial impact for funds guaranteed by Commonwealth government
SaSS SanCS SSS pSS total
$’000 $’000 $’000 $’000 $’000
present value obligations – 2010
opening defined benefit obligation 113,406 26,373 1,024,884 39,225 1,203,888
current service cost 4,311 1,189 2,235 513 8,248
interest cost 6,261 1,405 57,687 2,054 67,407
contributions from plan participants 1,951 0 3,865 0 5,816
actuarial losses/(gains) 1,151 913 43,952 2,014 48,030
benefits paid (10,909) (4,794) (61,754) (4,057) (81,514)
expenses paid 0 0 0 (498) (498)
Closing defined Benefit obligation 116,171 25,086 1,070,869 39,251 1,251,377
present value of plan assets – 2010
opening fair value of plan assets 127,663 3,348 369,197 33,661 533,869
expected return on plan assets 10,489 473 28,972 2,474 42,408
actuarial gains/(losses) (4,503) (425) (12,621) (220) (17,769)
contributions from the employer 4,183 1,492 2,781 3,196 11,652
contributions from plan participants 1,951 0 3,865 0 5,816
benefits paid (10,909) (4,794) (61,754) (4,057) (81,514)
expenses paid 0 0 0 (498) (498)
Closing fair value of plan assets 128,874 94 330,440 34,556 493,964
reimbursement rights – 2010
opening value of reimbursement right (14,257) 0 650,023 0 635,766
actuarial losses/(gains) 5,654 0 56,573 0 62,227
employer contributions (4,183) 0 (2,781) 0 (6,964)
expected return on reimbursement right 83 0 30,949 0 31,032
Closing value of reimbursement right (12,703) 0 734,764 0 722,061
net liability – 2010
defined benefit obligation 116,171 25,086 1,070,869 39,251 1,251,377
fair value of plan assets (128,874) (94) (330,440) (34,556) (493,964)
net liability (12,703) 24,992 740,428 4,695 757,412
reimbursement right (12,703) 0 734,764 0 722,061
total liability/(asset) 0 24,992 5,664 4,695 35,351
expense recognised 2010
current service cost 4,311 1,189 2,235 513 8,248
interest on obligation 6,261 1,405 57,687 2,054 67,407
expected return on plan assets (10,489) (473) (28,973) (2,474) (42,409)
expected return on reimbursement rights (83) 0 (30,949) 0 (31,032)
expense/(income) 0 2,121 0 93 2,214
actual returns – 2010
actual return on plan assets 5,636 49 15,576 2,254 23,515
actual return on reimbursement right 83 0 30,949 0 31,032
5,719 49 46,525 2,254 54,547
other comprehensive income – 2010
actuarial (losses)/gains on defined benefit obligations
(1,151) (913) (43,952) (2,014) (48,030)
actuarial (losses)/gains on reimbursement rights (4,503) (425) (12,621) (220) (17,769)
actuarial gains on plan assets 5,654 0 56,573 0 62,227
net actuarial gain/(loss) recognised in other comprehensive income
0 (1,338) 0 (2,234) (3,572)
Cumulative total net actuarial (losses)/gains 0 (7,511) 0 (8,804) (16,315)

156 tHe uniVersitY of sYdneY financial reports and statements 2010
SaSS SanCS SSS pSS total
$’000 $’000 $’000 $’000 $’000
present value obligations – 2009
opening defined benefit obligation 116,975 29,424 1,141,528 43,361 1,331,288
current service cost 4,845 1,394 3,438 292 9,969
interest cost 4,578 1,120 45,385 1,466 52,549
contributions from plan participants 2,007 0 4,153 0 6,160
actuarial losses/(gains) (3,209) (1,256) (107,346) (1,982) (113,793)
benefits paid (11,790) (4,309) (62,274) (3,641) (82,014)
past service costs 0 0 0 (271) (271)
Closing defined Benefit obligation 113,406 26,373 1,024,884 39,225 1,203,888
present value of plan assets – 2009
opening fair value of plan assets 121,197 5,375 382,391 25,777 534,740
expected return on plan assets 9,636 670 29,068 1,554 40,928
actuarial gains/(losses) 2,371 (65) 12,274 6,081 20,661
exchange differences on foreign plans 0 0 0 0 0
contributions from the employer 4,242 1,677 3,585 4,161 13,665
contributions from plan participants 2,007 0 4,153 0 6,160
benefits paid (11,790) (4,309) (62,274) (3,641) (82,014)
expenses paid 0 0 0 (271) (271)
Closing fair value of plan assets 127,663 3,348 369,197 33,661 533,869
reimbursement rights – 2009
opening value of reimbursement right (4,222) 0 753,474 0 749,252
actuarial losses (5,580) 0 (119,620) 0 (125,200)
employer contributions (4,242) 0 (3,585) 0 (7,827)
expected return on reimbursement assets (213) 0 19,754 0 19,541
Closing value of reimbursement right (14,257) 0 650,023 0 635,766
net liability – 2009
defined benefit obligation 113,406 26,374 1,024,883 39,225 1,203,888
fair value of plan assets (127,663) (3,348) (369,197) (33,661) (533,869)
net liability (14,257) 23,026 655,686 5,564 670,019
reimbursement right (14,257) 0 650,023 0 635,766
total liability/(asset) 0 23,026 5,663 5,564 34,253
expense recognised 2009
current service cost 4,846 1,394 3,438 292 9,970
interest on obligation 4,578 1,120 45,385 1,466 52,549
expected return on plan assets (9,637) (670) (29,068) (1,554) (40,929)
expected return on reimbursement rights 213 0 (19,754) 0 (19,541)
expense/(income) 0 1,844 1 204 2,049
actual returns – 2009
actual return on plan assets 13,000 605 37,459 7,635 58,699
actual return on reimbursement right (213) 0 19,754 0 19,541
12,787 605 57,213 7,635 78,240
other comprehensive income – 2009
actuarial (losses)/gains on defined benefit obligations
3,209 1,256 107,346 1,982 113,793
actuarial (losses)/gains on plan assets 2,371 (65) 12,274 6,081 20,661
actual (loss) on reimbursement rights (5,580) 0 (119,620) 0 (125,200)
recognised in other comprehensive income 0 1,191 0 8,063 9,254
Cumulative total net actuarial (losses)/gains 0 (6,173) 0 (6,570) (12,743)
*the gross liability for the university of sydney professorial scheme is fully funded by the university.

157
Superannuation Scheme for australian universities
the parent entity also contributes to unisuper defined benefit division (unisuper), formerly known as the superannuation scheme for australian universities (ssau) for academic staff appointed since 1 march 1988 and all other staff from 1 July 1991.
clause 34 of the unisuper trust deed outlines the process unisuper must undertake (including employer notifications and notice periods) in order to request additional contributions from employers if the unisuper assets are considered by the trustee to be insufficient to provide benefits payable under the deed. at least four years notice that such a request may be made is required. if such a request was agreed to by all employers then members would also have to also contribute additional contributions. if all employers did not agree to increase contributions the trustee would have to reduce benefits on a fair and equitable basis. the trustee notified employers during 2003 that such a request may be made in the future but considered that this was unlikely at the time.
should the balance of unisuper fund become a deficit, the universities are not liable to make any payments to unisuper unless all the universities (including the university of sydney) who are members of the unisuper fund unanimously agree to make additional contributions to the fund. it is only on this basis that the universities would be liable for the agreed additional contribution. management of the parent entity believe it is unlikely that any additional contribution will be required in the foreseeable future.
Historically, surpluses in unisuper have been used to improve members’ benefits and have not affected the amount of participating employers’ contributions.
as at 30 June 2010, the total assets of unisuper were estimated to be $1,217m in deficiency of vested benefits. as at 30 June 2009 the total assets of unisuper were estimated to be $1,396m in deficiency of vested benefits. the vested benefits are benefits that are not conditional upon continued membership (or any factor other than leaving the service of the participating institution) and include the value of cpi‑indexed pensions being provided by the defined benefit division (dbd).
as at 30 June 2010, the total assets of unisuper were estimated to be $312m in excess of accrued benefits. as at 30 June 2009 the assets of the fund were estimated to be $39m in deficiency of accrued benefits. the accrued benefits have been calculated as the present value of expected future benefits payments to members and cpi indexed pensioners that arise from membership of unisuper up to the reporting date.

158 tHe uniVersitY of sYdneY financial reports and statements 2010
41 SuBSIdIarIeS
the consolidated financial statements incorporating assets, liabilities and results of the following subsidiaries in accordance with the accounting policy described in note 1:
name of entityCountry of incorporation equity holding
2010 2009
% %
Wentworth annexe limited was incorporated in 1987 as a company limited by guarantee. the objects include the administration of the planning and construction of the Wentworth annexe and other building works the university of sydney union may wish to undertake. a summary of the company's result is shown below.
australia the university approves the
appointment of directors
the university approves the
appointment of directors
sport Knowledge australia pty limited (sKapl) was established as an international centre of excellence in sport, science and technology by way of a grant from the department of education, employment and Workplace relations (deeWr). a summary of the company’s result is shown below.
australia 100 100
the bosch institute was incorporated in 2006 as an australian public company, limited by guarantee. the object is the advancement of public health and medical research activities to improve the health of individuals and the community. its members are the university of sydney and the sydney south West area Health service. the company was deregistered on 4 July 2010.
australia 0 50
sydneylearning pty limited was established to enhance the capability of working adults, professionals and corporate enterprises by designing and delivering award and non‑award continuing professional development and leadership programs. a summary of the company’s result is shown below.
australia 100 100
sydney talent pty limited was incorporated in January 2008, to promote the advancement of the education of the students of the university of sydney through provision of employment opportunities that will assist the students to pursue their studies while enhancing their experience as students of the university. a summary of the company’s results is shown below.
australia 100 100
the Warren centre for advanced engineering limited was established in april 2008 to engage and work with industry, government and the faculty of engineering and information technologies at the university of sydney to foster excellence and innovation in advanced engineering throughout australia. a summary of the company’s results is shown below.
australia 100 100
Wayahead pty limited was incorporated in april 2008 to prepare students for university entry by designing and delivering pre‑tertiary and tertiary level programs, and encourages extra‑curricular educational, cultural, recreational and employment opportunities, including study abroad for students who are not studying at the university of sydney. the company has not traded since incorporation.
australia 100 100
bandwidth foundry international pty limited became a subsidiary in october 2009 and their mission is to enable photonics innovation and commercialisation by providing prototyping facilities and services to developers of photonic integrated circuits. a summary of the company’s results is shown below.
australia 100 100
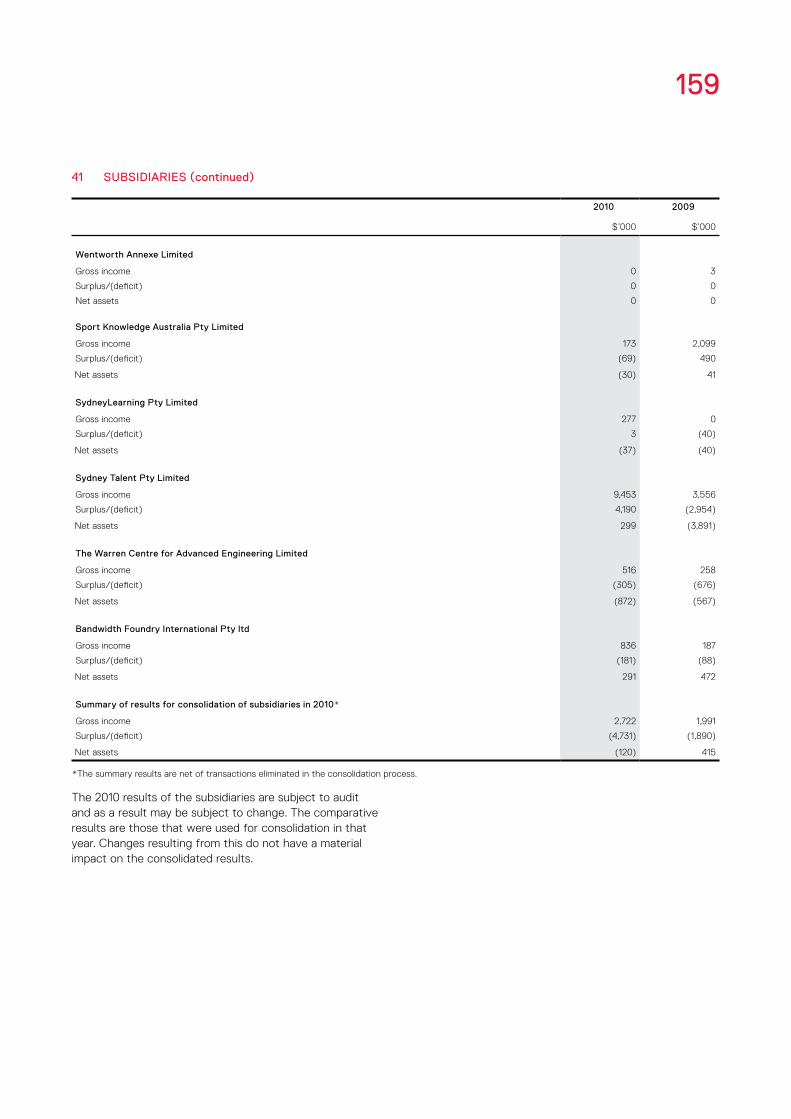
159
41 SuBSIdIarIeS (continued)
2010 2009
$’000 $’000
wentworth annexe limited
Gross income 0 3
surplus/(deficit) 0 0
net assets 0 0
Sport knowledge australia pty limited
Gross income 173 2,099
surplus/(deficit) (69) 490
net assets (30) 41
Sydneylearning pty limited
Gross income 277 0
surplus/(deficit) 3 (40)
net assets (37) (40)
Sydney talent pty limited
Gross income 9,453 3,556
surplus/(deficit) 4,190 (2,954)
net assets 299 (3,891)
the warren Centre for advanced engineering limited
Gross income 516 258
surplus/(deficit) (305) (676)
net assets (872) (567)
Bandwidth Foundry International pty ltd
Gross income 836 187
surplus/(deficit) (181) (88)
net assets 291 472
Summary of results for consolidation of subsidiaries in 2010*
Gross income 2,722 1,991
surplus/(deficit) (4,731) (1,890)
net assets (120) 415
*the summary results are net of transactions eliminated in the consolidation process.
the 2010 results of the subsidiaries are subject to audit and as a result may be subject to change. the comparative results are those that were used for consolidation in that year. changes resulting from this do not have a material impact on the consolidated results.

160 tHe uniVersitY of sYdneY financial reports and statements 2010
42 InveStMentS In aSSoCIateS
associates are all entities over which the Group has significant influence but not control, generally accompanying a shareholding of between 20 percent and 50 percent of the voting rights.
investments in associates are accounted for in the financial statements using the equity method of accounting. information relating to the associates is set out below.
for the purposes of the university’s final accounts and due to the lack of audited or published accounts at 31 december 2010.
1. the university’s equity interest at 31 december 2010 is based on audited accounts: (a) as at 30 June 2010:
Glycemic index limited
2. the university’s equity interest at 31 december 2010 is based on management/unaudited accounts:(a) as at 30 June 2010:
acumine pty limitedaustralian technology park innovations pty limitednuflora international pty limited
(b) as at 31 december 2010:university of sydney foundation program pty limited united states studies centre limitedZingotx pty limiteduniversity of sydney Hong Kong foundationWestmead millennium institute
(c) as at 30 June 2009ucom two pty limited
name of entity principal activity ownership interest Carrying amount
2010 2009 2010 2009
% % $’000 $’000
acumine pty limited commercialisation of research 25 25 68 56
australian technology park innovations pty limited (atpi)
business incubation 25 25 4,510 4,514
nuflora international pty limited commercialisation of research 38 38 62 118
sydney institutes of Health and medical research
public health and medical research 0 20 0 0
ucom two pty limited commercialisation of research 50 50 1 1
university of sydney foundation program pty limited
education programs 50 50 216 784
universal solar and surface science pty limited (previously university of solar science pty limited)*
commercialisation of research 0 50 0 922
united states studies centre limited collaborative research on us and australia relationship
50 50 2,362 1,756
Zingotx pty limited commercialisation of research 21 21 48 56
Glycemic index limited Gi symbol program 50 50 273 249
university of sydney Hong Kong foundation
Higher education in Hong Kong 50 0 0 0
Westmead millennium institute Health research 33 0 256 0
7,796 8,456
*universal solar and surface science pty limited was sold in march 2010

161
42 InveStMentS In aSSoCIateS (continued)
economic entity [Consolidated]
2010 2009
$’000 $’000
(a) Movements in carrying amounts
carrying amount of investments at the beginning of the year 8,456 8,430
share of net operating results 262 (21)
other movements (922) 47
Carrying amount at the end of the financial year 7,796 8,456
(b) Share of associates’ operating result
operating profits/(losses) before income tax 262 (21)
income tax benefits (expense) 0 0
net operating result after income tax 262 (21)
add/(less): adjustment for change in equity interest 2,568 43
retained profits/(losses) attributable to associates at the beginning of the financial year 4,357 4,335
retained profits/(losses) attributable to associates at the end of the financial year 7,187 4,357
(c) reserves attributable to associates
associates’ capital reserve
balance at the beginning of the financial year 4,099 4,095
add/(less) adjustment for change in equity interest (3,490) 4
balance at the end of the financial year 609 4,099
the associates’ share of contingent liabilities is 2010 $nil (2009: $nil)

162 tHe uniVersitY of sYdneY financial reports and statements 2010
43 IntereStS In JoInt venture partnerShIpS
management have reviewed the university’s interest in australian microscopy microanalysis research facility and the synchrotron consortium and have come to
the conclusion that these operations form part of the university’s operations.
accordingly, the equity accounted interest in joint venture partnerships has been transferred to the university.
% ownership interest
name of joint venture partnerships principal activity 2010 2009
australian Key centre for microscopy and microanalysis electron microscope unit
australia’s peak research facility for characterisation of materials by microscopy and microanalysis.
0 27.4
consortium synchrotron nsW consortium of the australian synchrotron project 0 25.0
economic entity [Consolidated]
2010 2009
$’000 $’000
equity accounted investment
Carrying amount of investment in partnerships
carrying amount at the beginning of the financial year 4,509 4,374
share of profits from ordinary activities before income tax 0 135
transfer to the parent operations (4,509) 0
0 4,509
Share of partnerships assets and liabilities
current assets
cash 6,462
non‑current assets
plant and equipment 1,728
total assets 8,190
liabilities
payables 3,681
total liabilities 3,681
net assets 4,509
Share of partnerships revenue, expenses and results
operating revenue 5,087
operating expenses (4,952)
net operating result before income tax 135
retained earnings:
at the beginning of the financial year 4,374
at the end of the financial year 4,509

163
44 InveStMentS aCCounted For uSIng the eQuItY Method
economic entity [Consolidated] parent entity [university]
2010 2009 2010 2009
$’000 $'000 $’000 $’000
Summary of results of associates and joint venture partnerships before income tax:
associated entities (660) 22 0 0
Joint venture partnerships* (4,509) 135 0 0
(5,169) 157 0 0
Summary of net assets of associates and joint venture partnerships:
associated entities 7,796 8,456 0 0
interest in joint venture partnerships* 0 4,509 0 0
total investments accounted for using the equity method 7,796 12,965 0 0
*interest transferred to the university.
45 reConCIlIatIon oF net operatIng reSult aFter InCoMe tax to net CaSh FlowS FroM operatIng aCtIvItIeS
economic entity [Consolidated] parent entity [university]
2010 2009 2010 2009
notes $’000 $’000 $’000 $’000
net operating result 112,167 59,895 113,736 61,628
depreciation/amortisation expense 70,466 62,631 70,103 62,468
retired assets written off 7,236 4,325 7,173 3,724
(Gain)/loss on disposal of assets (34,874) (33,526) (34,939) (31,701)
non‑cash investment income (1,372) (1) (1,372) 0
non‑cash investment impairment 13 3,939 8,448 3,939 8,448
non‑cash other (income)/expenses 3,198 11,439 2,421 11,439
(increase)/decrease in inventories (443) 314 (441) 318
(increase)/decrease in receivables (85,427) 101,403 (87,211) 101,776
(increase)/decrease increase in joint venture partnership and associates 5,307 1,292 138 1,449
(increase)/decrease in other assets (913) 312 (913) (71)
increase/(decrease) in payables 127 (1,413) 6,913 (1,420)
increase/(decrease) in provisions 90,588 (104,345) 90,682 (107,392)
net cash provided by/(used in) operating activities 169,999 110,774 170,229 110,666

164 tHe uniVersitY of sYdneY financial reports and statements 2010
economic entity [Consolidated] parent entity [university]
2010 2009 2010 2009
notes $’000 $’000 $’000 $’000
Financial assets
cash and cash equivalents 163,350 130,106 163,240 129,920
trade and other receivables 77,550 76,229 84,214 81,109
available‑for‑sale financial assets 793,979 831,192 793,979 831,192
other financial assets 4,165 4,303 4,165 4,303
1,039,044 1,041,830 1,045,598 1,046,524
Financial liabilities
trade and other payable 146,025 216,073 151,882 216,144
other financial liabilities 0 0 0 0
146,025 216,073 151,882 216,144
46 FInanCIal rISk ManageMent
the university’s overall risk management program focuses on the risk versus return feature of financial markets and seeks to minimise adverse effects on the university’s investment returns. the university’s overall risk management program focuses on the unpredictability of financial markets and seeks to minimise adverse effects on the university’s financial performance.
the university did not materially enter into derivative contracts such as forward foreign exchange contracts and interest rate swaps to hedge its risk exposure at 31 december 2010. the university uses a variety of risk mitigation measures to manage the types of risk to which it is exposed. these include maintaining foreign currency balances as a natural hedge against foreign exchange risk or occasionally entering into short dated forward contracts ahead of the underlying payment schedule. the university also maintains a short‑term debt investment portfolio as a liquidity buffer, as well as engaging in the active management of timing mismatches of revenue inflows and expense outflows, supported by weekly cash flow forecasting to manage its liquidity risk. other price risks may be managed by externally appointed fund managers in accordance with approved investment mandates.
the university maintains a number of investment portfolios, to address a variety of objectives.
– a short‑term debt portfolio performs the role of working capital fund, and is used as a liquidity buffer to manage the timing differences of revenue and expenditure flows. this comprises a short‑duration low‑risk portfolio of fixed rate and discount securities.
– a longer term debt portfolio is used to generate a fixed income stream. this portfolio invests in short‑to‑medium‑term fixed and floating rate securities.
– a long‑term growth portfolio representing the university’s asset reserves endowments and which has a long‑term investment horizon. this portfolio has an investment profile oriented towards growth assets and is managed by external fund managers.
– risk management of the university’s investment portfolio is carried out by the investments and capital management department under policies approved by the investment and commercialisation committee (icc), a committee of the senate. the icc resolves policies for overall risk management, as well as policies covering specific areas, such as foreign exchange risk, interest rate risk, credit risk, use of derivative financial instruments, appointment of external fund managers and investment of excess liquidity. the icc meets on a quarterly basis to review the performance of the university’s investment portfolio, set new policies/investment strategies and review compliance with existing policies/investment strategies.
– the following risk management disclosures are materially the same for both parent and economic entity. the numbers below relate to the consolidated figures. the parent entity includes receivables from subsidiaries that are closely monitored.

165
(a) Market risk
(i) Foreign exchange risk
the university has exposure to foreign exchange risk. this arises from holding investments denominated in foreign currencies and balances in bank accounts used to pay overseas suppliers. the university has no material foreign exchange hedging arrangements.
if the australian dollar had weakened/strengthened by 10 percent with all other variables held constant, profit for the year would have been $880,947 higher/$720,775 lower (2009: $580,000/$475,000), as a result of foreign gains/losses on translation of the foreign currency bank accounts balances. equity would have been $11,118,771 higher/ $9,097,176 lower (2009: $7,130,000/$5,834,000) had the australian dollar weakened/strengthened by 10 percent against the us dollar, arising from the available‑for‑sale investments denominated in us dollars.
(ii) price risk
the university has exposure to equity securities price risk. this arises from investments held by the university and classified on the statement of financial position as available‑for‑sale. for example, the impact of a change in value of the securities would be reflected as either an increase or decrease in the fair value of the security through equity, unless it is otherwise impaired. the university is not exposed to commodity price risk.
to manage its price risk from investments in equity securities, the university has contracted out the management of the portfolio to external fund managers. these fund managers are mandated to diversify the investments of the portfolio under their management. the quantum of funds under management per external fund manager and the investment objectives of each external fund manager are in accordance with limits and policies set by the icc.
a majority of the university’s equity investments managed by external fund managers are denominated in australian dollars, are publicly traded and included in the asX 300 index.
the impact of increases/decreases of the asX 300 index on the university’s equity would be increase/decrease of $52,333,074/$52,333,074 (2009: $52,110,000/$52,110,000). the analysis is based on the assumption that the asX 300 index changes by 10 percent, with all other variables held constant, and the university’s equity portfolio moves according to the historical correlation with the index.
(iii) Cash flow and fair value interest rate risk
the university’s interest rate risk arises from the investment in debt securities (fixed and floating interest and short‑term money market securities). the debt portfolio consists of debt which is a combination of fixed coupon interest payments with repayment of principal on maturity, discounted securities with principal repaid upon maturity and floating rate notes. the debt portfolio is fully invested in australian dollar denominated securities. all counterparties are rated as investment grade. the debt portfolio is classified as available for sale. as such, the impact of an interest rate change would be reflected as either an increase or decrease in the fair value of the security through equity.
at 31 december 2010 if interest rates decreased/increased by 25 basis points with all other variables held constant, equity would have been $1,491,576 higher/$1,490,938 lower (2009: $1,972,000/$1,972,000) as a result of an increase/decrease in the fair value of the debt security.
(iv) Summarised sensitivity analysis
the following tables summarise the sensitivity of the university’s financial assets to interest rate risk, foreign exchange risk and other price risk. the disclosures are materially the same for both the parent and economic entity.

166 tHe uniVersitY of sYdneY financial reports and statements 2010
[Consolidated] Interest rate risk Foreign exchange risk other price risk
‑0.25% +0.25% ‑10% +10% ‑10% +10%
31 december 2010
Carrying amount
result equity result equity result equity result equity result equity result equity
$’000 $’000 $’000 $’000 $’000 $’000 $’000 $’000 $’000 $’000 $’000 $’000 $’000
cash and cash equivalents 163,350 4 0 (4) 0 881 0 (721) 0 2 0 (2) 0
afs investments 793,979 0 1,492 0 (1,491) 0 11,119 0 (9,097) 0 (52,333) 0 52,333
other financial assets 4,165 0 0 0 0 0 0 0 0 0 0 0 0
total increase/ (decrease) 4 1,492 (4) (1,491) 881 11,119 (721) (9,097) 2 (52,333) (2) 52,333
[Consolidated] Interest rate risk Foreign exchange risk other price risk
‑0.25% +0.25% ‑10% +10% ‑10% +10%
31 december 2009
Carrying amount
result equity result equity result equity result equity result equity result equity
$’000 $’000 $’000 $’000 $’000 $’000 $’000 $’000 $’000 $’000 $’000 $’000 $'000
Financial assets
cash and cash equivalents 130,106 20 0 (20) 0 580 0 (475) 0 (3) 0 3 0
afs investments 831,192 0 1,953 0 (1,953) 0 7,130 0 (5,834) 0 (52,107) 0 52,107
other financial assets 4,303 0 0 0 0 0 0 0 0 0 0 0 0
total increase/ (decrease)
20 1,953 (20) (1,953) 580 7,130 (475) (5,834) (3) (52,107) 3 52,107
(b) Credit risk
credit risk refers to the risk that a counterparty will default on its contractual obligations, resulting in a financial loss to the university. the university has a policy of only dealing with creditworthy counterparties as a means of mitigating the financial loss from defaults. the university’s aggregate exposure to and the credit ratings of counterparties are continuously monitored. credit exposure of the debt portfolio is controlled by counterparty limits that are reviewed and approved by icc.
the university does not have any significant credit risk exposure to any single counterparty or any group of counterparties having similar characteristics. the credit risk on liquid funds is limited because counterparties are banks with high credit ratings assigned by international credit rating agencies.
impairment and provision against debtors have been duly considered in determining the carrying amounts of financial assets. therefore the carrying amount of financial assets recorded in the statement of financial position represents the university’s maximum exposure to credit risk.
the university does not hold any securities or guarantees.
(c) liquidity risk
liquidity risk is the risk that the university will not be able to meet its financial obligations as and when they fall due. the university’s approach to manage liquidity is to ensure, as far as possible, that it will always have sufficient liquidity to meet its liabilities when due, under normal and stressed conditions, without incurring unacceptable losses or risks that may damage the university’s reputation.
the university receives from the australian government regular payments, which constitute a significant proportion of the university’s income, which are known as to the date and amount in advance of their receipt. similarly the majority of expenses of the university are known in quantum and date in advance of their due date for payment. the short‑term debt portfolio is used as a liquidity buffer for any timing mismatches of revenue inflows and expense outflows.
in addition, the university maintains the following lines of credit:
– $25m overdraft facility which is unsecured. interest would be payable at the national australia bank’s base lending indicator rate.
– there is also a $400K letter of credit facility and credit card facility of up to $12.5m. these facilities were fully available as at 31 december 2010.
the university has no other drawn or undrawn borrowing facilities.
the university has in place weekly cash flow forecasting and review procedures to manage its liquidity risk.

167
Consolidated entity – at 31 december 2010
average interest rate
variable interest rate
less than 1 year 1 to 5 years
More than 5 years non Interest total
% $’000 $’000 $’000 $’000 $’000 $’000
Financial assets
cash 3.67 58,233 0 0 0 0 58,233
cash equivalents 5.02 0 105,117 0 0 0 105,117
receivables 0 0 77,359 191 0 0 77,550
fixed interest bonds 6.16 0 66,015 80,453 58,138 0 204,606
floating rate notes 4.45 0 0 0 50,939 0 50,939
convertible notes 6.30 0 0 0 4,155 0 4,155
secured company loans 8.03 0 0 0 7,186 0 7,186
listed securities 0 0 0 10,179 0 198,694 208,873
shares – unquoted 0 0 0 0 0 5105 5,105
external fund managers 0 0 0 0 0 315,280 315,280
loans to affiliated organisations 0 0 0 0 0 2,000 2,000
total financial assets 58,233 248,491 90,823 120,418 521,079 1,039,044
Financial liabilities
other current liabilities 0 0 100,295 0 0 0 100,295
creditors 0 0 45,730 0 0 0 45,730
total financial liabilities 0 146,025 0 0 0 146,025
Consolidated entity – at 31 december 2009
average interest rate
variable interest rate
less than 1 year 1 to 5 years
More than 5 years non Interest total
% $’000 $’000 $’000 $’000 $’000 $’000
Financial assets
cash 3.44 38,233 0 0 0 0 38,233
cash equivalents 4.13 0 91,873 0 0 0 91,873
receivables 0 0 76,425 (196) 0 0 76,229
fixed interest bonds 6.66 0 5,150 154,855 108,812 0 268,817
floating rate notes 5.12 0 0 4,891 25,682 0 30,573
convertible notes 5.26 0 0 0 3,915 0 3,915
secured company loans 8.03 0 0 0 7,533 0 7,533
listed securities 0 0 0 10,071 191,214 0 201,285
share futures 0 0 0 0 0 0 0
shares – unquoted 0 0 0 0 0 2,303 2,303
external fund managers 0 0 0 0 0 319,046 319,046
loans to affiliated organisations 0 0 0 0 0 2,023 2,023
total financial assets 38,233 173,448 169,621 337,156 323,372 1,041,830
Financial liabilities
other current liabilities 0 0 0 0 0 162,704 162,704
creditors 0 0 0 0 0 53,369 53,369
total financial liabilities 0 0 0 0 216,073 216,073
Financial Instrumentsthe following tables detail the economic entity’s maturity profile as at 31 december 2010 and as at 31 december 2009:
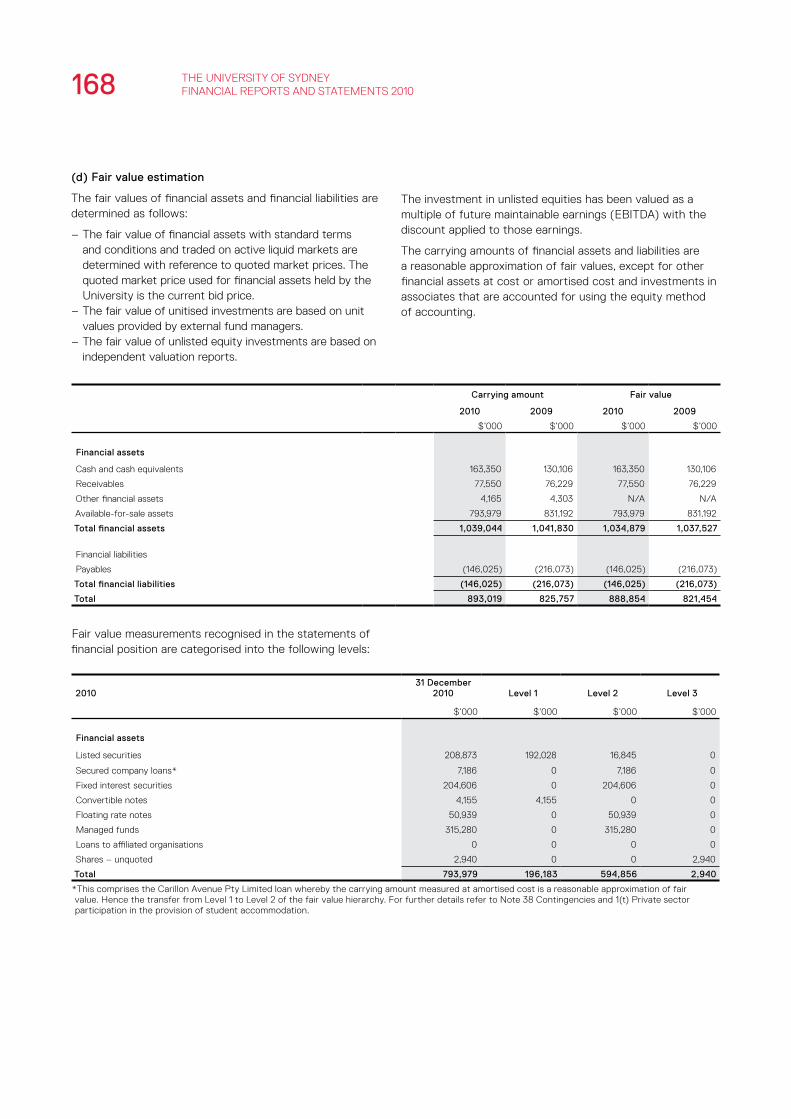
168 tHe uniVersitY of sYdneY financial reports and statements 2010
(d) Fair value estimation
the fair values of financial assets and financial liabilities are determined as follows:
– the fair value of financial assets with standard terms and conditions and traded on active liquid markets are determined with reference to quoted market prices. the quoted market price used for financial assets held by the university is the current bid price.
– the fair value of unitised investments are based on unit values provided by external fund managers.
– the fair value of unlisted equity investments are based on independent valuation reports.
Carrying amount Fair value
2010 2009 2010 2009
$’000 $’000 $’000 $’000
Financial assets
cash and cash equivalents 163,350 130,106 163,350 130,106
receivables 77,550 76,229 77,550 76,229
other financial assets 4,165 4,303 n/a n/a
available‑for‑sale assets 793,979 831,192 793,979 831,192
total financial assets 1,039,044 1,041,830 1,034,879 1,037,527
financial liabilities
payables (146,025) (216,073) (146,025) (216,073)
total financial liabilities (146,025) (216,073) (146,025) (216,073)
total 893,019 825,757 888,854 821,454
fair value measurements recognised in the statements of financial position are categorised into the following levels:
the investment in unlisted equities has been valued as a multiple of future maintainable earnings (ebitda) with the discount applied to those earnings.
the carrying amounts of financial assets and liabilities are a reasonable approximation of fair values, except for other financial assets at cost or amortised cost and investments in associates that are accounted for using the equity method of accounting.
201031 december
2010 level 1 level 2 level 3
$’000 $’000 $’000 $’000
Financial assets
listed securities 208,873 192,028 16,845 0
secured company loans* 7,186 0 7,186 0
fixed interest securities 204,606 0 204,606 0
convertible notes 4,155 4,155 0 0
floating rate notes 50,939 0 50,939 0
managed funds 315,280 0 315,280 0
loans to affiliated organisations 0 0 0 0
shares – unquoted 2,940 0 0 2,940
total 793,979 196,183 594,856 2,940
*this comprises the carillon avenue pty limited loan whereby the carrying amount measured at amortised cost is a reasonable approximation of fair value. Hence the transfer from level 1 to level 2 of the fair value hierarchy. for further details refer to note 38 contingencies and 1(t) private sector participation in the provision of student accommodation.

169
200931 december
2009 level 1 level 2 level 3
$’000 $’000 $’000 $’000
Financial assets
listed securities 201,285 198,201 3,084 0
secured company loans 7,533 0 7,533 0
fixed interest securities 268,817 0 268,817 0
convertible notes 3,915 3,915 0 0
floating rate notes 30,573 0 30,573 0
managed funds 319,046 0 319,046 0
loans to affiliated organisations 23 0 23 0
total 831,192 202,116 629,076 0
level 3 Financial assets 2010
Investments using the equity
method total
$’000 $’000
opening balance 0 0
total gains or losses (recognised in other comprehensive income)
2,940 2,940
level 3 Financial assets 2009
opening balance 0 0
total gains or losses 0 0
sales 0 0
Closing balance 0 0
47 non‑CaSh FInanCIng and InveStIng aCtIvItIeS
economic entity [Consolidated] parent entity [university]
2010 2009 2010 2009
$’000 $’000 $’000 $’000
non‑cash investing and financing activities 710 1,476 710 1,476
the university had no non‑cash financing or investing activities, with the exception of the following non‑cash items received in 2010; books of $304K (2009: $683K) and works of art gifted to the university of $334K (2009: $212K), museum collectibles of $8K (2009: $28K) and plant and equipment of $32K (2009: $352K) and rare books of $32K (2009: $201K).
48 eventS aFter reportIng date unless otherwise disclosed, there are no other matters or circumstances that have arisen since the end of the financial year that have affected or may subsequently affect the financial position of the university or its subsidiaries.
49 FInanCIng FaCIlItIeS and BalanCeS the university has access to an unsecured overdraft facility of $25 million of which nil has been used as at 31 december 2010 and has no other borrowings.
there is also a $12.5 million credit card facility of which $2.9 million has been used as at 31 december 2010, a letter of credit facility of up to $400K of which nil has been used during 2010 and a bank guarantee facility of up to $3.5 million of which $884K has been used.

170 tHe uniVersitY of sYdneY financial reports and statements 2010
50
a
CQ
uIt
ta
l o
F a
uS
tr
al
Ian
go
ve
rn
Me
nt
FIn
an
CIa
l a
SS
ISt
an
Ce
50.
1
de
ew
r‑C
gS
an
d o
th
er
de
ew
r g
ra
nt
S
par
ent
enti
ty [
un
iver
sity
] o
nlY
Co
mm
on
wea
lth
gra
nts
Sch
eme
1In
dig
eno
us
Su
pp
ort
F
un
dp
artn
ersh
ip a
nd
par
tici
pat
ion
pro
gra
md
isab
ility
Su
pp
ort
p
rog
ram
wo
rkp
lace
ref
orm
p
rog
ram
wo
rkp
lace
p
rod
uct
ivit
y p
rog
ram
lea
rnin
g &
tea
chin
g p
erfo
rman
ce F
un
d
20
102
00
92
010
20
09
20
102
00
92
010
20
09
20
102
00
92
010
20
09
20
102
00
9
$’0
00
$’0
00
$’0
00
$’0
00
$’0
00
$’0
00
$’0
00
$’0
00
$’0
00
$’0
00
$’0
00
$’0
00
$’0
00
$’0
00
fin
anci
al a
ssis
tanc
e re
ceiv
ed in
cas
h du
ring
the
rep
orti
ng p
erio
d (t
otal
ca
sh r
ecei
ved
from
the
aus
tral
ian
gove
rnm
ent
for
the
prog
ram
s)25
8,10
822
5,6
381,
495
1,72
21,
535
219
233
159
02,
544
1,21
61,1
61
05,
488
net
acc
rual
adj
ustm
ents
00
00
00
00
00
00
00
re v
enue
for
the
per
iod
258,
108
225,
638
1,49
51,
722
1,5
3521
923
315
90
2,5
441,
216
1,16
10
5,48
8
sur
plus
/(de
ficit)
fro
m t
he p
revi
ous
year
00
00
140
200
(59
8)(3
51)
00
1,47
71,1
310
0
tota
l rev
enu
e in
clu
din
g a
ccru
ed
reve
nu
e25
8,10
82
25
,63
81,
49
51,
722
1,6
754
19(3
65
)(1
92)
02
,54
42
,69
32
,29
20
5,4
88
less
exp
ense
s in
clud
ing
accr
ued
expe
nses
(25
8,10
8)(2
25,6
38)
(1,4
95
)(1
,722
)(2
72)
(279
)(4
06)
(40
6)0
(2,5
44)
(1,0
88)
(815
)0
(5,4
88)
Su
rplu
s/(d
efici
t) f
or
rep
ort
ing
per
iod
00
00
1,4
03
140
(771
)(5
98
)0
01,
60
51,
477
00
par
ent
enti
ty [
un
iver
sity
] o
nlY
Cap
ital
dev
elo
pm
ent
po
ol
div
ersi
ty &
Str
uct
ura
l ref
orm
p
rog
ram
pra
ctic
al C
om
po
nen
t o
f te
ach
er e
du
cati
on
tran
siti
on
Co
st p
rog
ram
tota
l
20
102
00
92
010
20
09
20
102
00
92
010
20
09
20
102
00
9
$’0
00
$’0
00
$’0
00
$’0
00
$’0
00
$’0
00
$’0
00
$’0
00
$’0
00
$’0
00
fin
anci
al a
ssis
tanc
e re
ceiv
ed in
cas
h du
ring
the
repo
rtin
g pe
riod
(to
tal c
ash
rece
ived
fr
om t
he a
ustr
alia
n go
vern
men
t fo
r th
e pr
ogra
ms)
6,28
30
1,78
31,
526
057
95
401,
282
271,1
9324
0,31
8
net
acc
rual
adj
ustm
ents
00
00
00
00
00
re v
enue
for
the
per
iod
6,28
30
1,78
31,
526
057
95
401,
282
271,1
9324
0,31
8
sur
plus
/(de
ficit
) fr
om t
he p
revi
ous
year
00
1,22
61,
200
00
00
2,24
52,
180
tota
l rev
enu
e in
clu
din
g a
ccru
ed
rev
enu
e6,
283
03,
00
92
,726
05
795
40
1,28
227
3,4
38
242
,49
8
less
exp
ense
s in
clud
ing
accr
ued
expe
nses
(1,0
42)
0(2
,073
)(1
,50
0)0
(579
)(5
40)
(1,2
82)
(26
5,0
24)
(240
,25
3)
Sur
plu
s/(d
efici
t) f
or r
epo
rtin
g p
erio
d5
,24
10
93
61,
22
60
00
08
,414
2,2
45
1 inc
lude
s th
e ba
sic
cG
s g
rant
am
ount
, cG
s‑r
egio
nal l
oadi
ng, c
Gs
‑ena
bled
loa
ding
, mat
hs a
nd s
cien
ce t
rans
ition
loa
ding
and
ful
l fee
pla
ces
tran
sitio
n lo
adin
g.

1715
0.2
h
Igh
er
ed
uC
at
Ion
lo
an
pr
og
ra
MS
(e
xC
lud
Ing
oS
‑he
lp
)
par
ent
enti
ty [
un
iver
sity
] o
nlY
he
CS
‑he
lp
– a
ust
ralia
n g
ove
rnm
ent
pay
men
tF
ee
‑he
lp
tota
l
20
102
00
92
010
20
09
20
102
00
9
$’0
00
$’0
00
$’0
00
$’0
00
$’0
00
$’0
00
fin
anci
al a
ssis
tanc
e re
ceiv
ed in
cas
h du
ring
the
re
port
ing
perio
d12
6,74
610
6,6
05
47,4
7833
,121
174,
224
139,
726
net
acc
rual
adj
ustm
ents
00
(4,6
40)
2,15
5(4
,640
)2,
155
rev
enue
for
the
per
iod
126,
746
106,
60
542
,838
35,2
7616
9,5
8414
1,88
1
sur
plus
/(de
ficit)
fro
m t
he p
revi
ous
year
00
00
00
tota
l rev
enue
incl
udin
g a
ccru
ed r
even
ue12
6,74
610
6,6
05
42
,83
83
5,2
7616
9,5
84
141,
88
1
less
exp
ense
s in
clud
ing
accr
ued
expe
nses
(126
,746
)(1
06,
60
5)
(42,
838)
(35,
276)
(16
9,5
84)
(141
,881
)
Sur
plu
s/(d
efici
t) f
or
rep
orti
ng p
erio
d0
00
00
0
50
.3
SC
ho
la
rS
hIp
S
par
ent
enti
ty [
un
iver
sity
] o
nlY
au
stra
lian
po
stg
rad
uat
e a
war
ds
Inte
rnat
ion
al
po
stg
rad
uat
e r
esea
rch
Sch
ola
rsh
ip
Co
mm
on
wea
lth
ed
uca
tio
n C
ost
S
cho
lars
hip
s
Co
mm
on
wea
lth
acc
om
mo
dat
ion
Sch
ola
rsh
ips
Ind
igen
ou
s a
cces
s S
cho
lars
hip
tota
l
20
102
00
92
010
20
09
20
102
00
92
010
20
09
20
102
00
92
010
20
09
$’0
00
$’0
00
$’0
00
$’0
00
$’0
00
$’0
00
$’0
00
$’0
00
$’0
00
$’0
00
$’0
00
$’0
00
fin
anci
al a
ssis
tanc
e re
ceiv
ed in
cas
h du
ring
the
repo
rtin
g pe
riod
17,0
3712
,379
2,10
52,
036
1,22
62,
174
52,
358
55
420
,428
18,9
51
net
acc
rual
adj
ustm
ents
00
00
(99
9)0
00
00
(99
9)0
rev
enue
for
the
per
iod
17,0
3712
,379
2,10
52,
036
227
2,17
45
2,35
85
54
19,4
2918
,951
sur
plus
/(de
ficit
) fr
om t
he p
revi
ous
year
2,83
51,
703
56
53
967
886
1,92
61,
679
56
98
5,8
404,
419
tota
l rev
enue
incl
udin
g a
ccru
ed r
even
ue19
,872
14,0
82
2,1
61
2,0
89
1,19
43,
06
01,
931
4,0
3711
110
225
,26
923
,370
less
exp
ense
s in
clud
ing
accr
ued
expe
nses
(15,
96
4)(1
1,24
7)(2
,166)
(2,0
33)
(3,3
03)
(2,0
93)
(1,9
31)
(2,11
1)(1
11)
(46)
(23,
475
)(1
7,5
30)
Sur
plu
s/(d
efici
t) f
or r
epor
ting
per
iod
3,9
08
2,8
35
(5)
56
(2,1
09
)9
67
01,
926
05
61,
794
5,8
40

172 tHe uniVersitY of sYdneY financial reports and statements 2010
50.
4
dII
Sr
– r
eS
ea
rC
h
par
ent
enti
ty [
un
iver
sity
] o
nlY
Jo
int
res
earc
h e
ng
agem
ent
pro
gra
mr
esea
rch
tra
inin
g S
chem
e
res
earc
h In
fras
tru
ctu
re B
lock
g
ran
tsIm
ple
men
tati
on
ass
ista
nce
pro
gra
m
au
stra
lian
Sch
eme
for
hig
her
ed
uca
tio
n r
epo
sito
ries
Co
mm
erci
alis
atio
n tr
ain
ing
de
ew
r S
re
Bas
e &
t
hre
sho
ld 1
20
102
00
92
010
20
09
20
102
00
92
010
20
09
20
102
00
92
010
20
09
20
102
00
9
$’0
00
$’0
00
$’0
00
$’0
00
$’0
00
$’0
00
$’0
00
$’0
00
$’0
00
$’0
00
$’0
00
$’0
00
$’0
00
$’0
00
fin
anci
al a
ssis
tanc
e re
ceiv
ed in
cas
h du
ring
th
e re
port
ing
perio
d36
,80
336
,276
62,
641
60,
706
26,8
4525
,483
184
348
042
85
8557
21,
861
0
net
acc
rual
adj
ustm
ents
00
00
00
00
00
00
00
rev
enue
for
the
per
iod
36,8
03
36,2
766
2,6
416
0,70
626
,845
25,4
8318
434
80
428
585
572
1,86
10
sur
plus
/(de
ficit)
fro
m t
he p
revi
ous
year
00
00
6,0
073,
50
6(5
56)
(4)
(639
)(1
66)
1,07
26
800
0
tota
l rev
enue
incl
udin
g a
ccru
ed r
even
ue3
6,8
03
36,
276
62
,64
16
0,7
06
32
,85
228
,98
9(3
72)
34
4(6
39
)26
21,
65
71,
252
1,8
61
0
less
exp
ense
s in
clud
ing
accr
ued
expe
nses
(36,
803)
(36,
276)
(62,
641
)(6
0,70
6)(3
3,5
39)
(22,
982
)(8
11)
(90
0)6
39(9
01)
(410
)(1
80)
(1,8
61)
0
Su
rplu
s/(d
efici
t) f
or
rep
ort
ing
per
iod
00
00
(68
7)6
00
7(1
,18
3)(5
56
)0
(63
9)
1,2
47
1,0
720
0
p
aren
t en
tity
[u
niv
ersi
ty]
on
lYd
ee
wr
Sr
e
th
resh
old
tota
l
20
102
00
92
010
20
09
$’0
00
$’0
00
$’0
00
$’0
00
fin
anci
al a
ssis
tanc
e re
ceiv
ed in
cas
h du
ring
th
e re
port
ing
perio
d7,
96
60
136,
885
123,
813
net
acc
rual
adj
ustm
ents
00
00
rev
enue
for
the
per
iod
7,9
66
013
6,88
512
3,81
3
sur
plus
/(de
ficit)
fro
m t
he p
revi
ous
year
00
5,8
84
4,0
16
tota
l rev
enue
incl
udin
g a
ccru
ed r
even
ue7,
96
60
142
,76
912
7,8
29
less
exp
ense
s in
clud
ing
accr
ued
expe
nses
(5,0
58)
0(1
40,4
84)
(121
,945
)
Su
rplu
s/(d
efici
t) f
or
rep
ort
ing
per
iod
2,9
08
02
,28
55
,88
4

1735
0.5
o
th
er
Ca
pIt
al
Fu
nd
Ing
[un
iver
sity
] en
tity
on
lY B
ette
r u
niv
ersi
ties
r
enew
al F
un
din
ge
du
cati
on
Inve
stm
ent
Fu
nd
tota
l
20
102
00
92
010
20
09
20
102
00
9
$’0
00
$’0
00
$’0
00
$’0
00
$’0
00
$’0
00
fin
anci
al a
ssis
tanc
e re
ceiv
ed in
cas
h du
ring
the
rep
orti
ng p
erio
d (t
otal
cas
h re
ceiv
ed f
rom
the
aus
tral
ian
gove
rnm
ent
for
the
prog
ram
s)0
017
,50
041
,040
17,5
00
41,0
40
net
acc
rual
adj
ustm
ents
00
00
00
rev
enue
for
the
per
iod
00
17,5
00
41,0
4017
,50
041
,040
sur
plus
/(de
ficit)
fro
m t
he p
revi
ous
year
30,7
2035
,159
38,19
50
68,
915
35,15
9
tota
l rev
enue
incl
udin
g a
ccru
ed r
even
ue3
0,72
03
5,1
59
55
,69
54
1,0
40
86,
415
76,1
99
less
exp
ense
s in
clud
ing
accr
ued
expe
nses
(9,3
63)
(4,4
39)
(11,
469)
(2,8
45)
(20,
832)
(7,2
84)
Su
rplu
s/(d
efici
t) f
or
rep
ort
ing
per
iod
21,
35
73
0,7
20
44
,22
63
8,1
95
65
,58
36
8,9
15
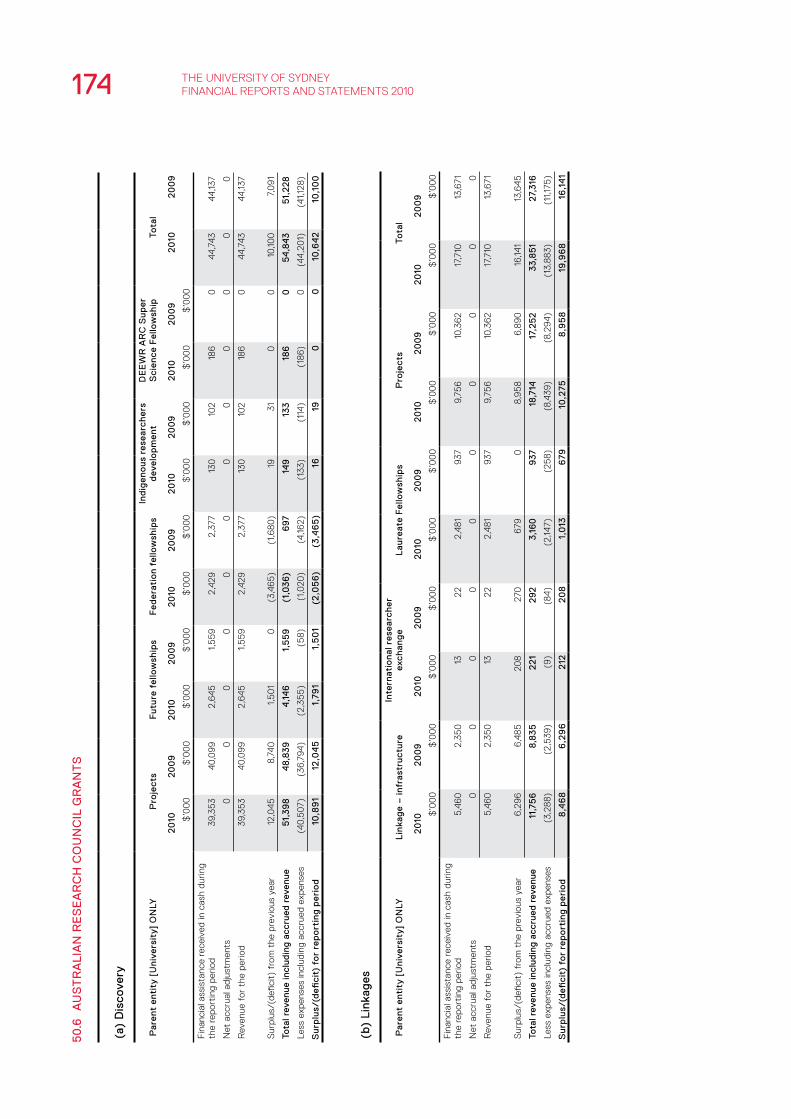
174 tHe uniVersitY of sYdneY financial reports and statements 2010
50
.6
au
St
ra
lIa
n r
eS
ea
rC
h C
ou
nC
Il g
ra
nt
S
(a)
dis
cove
ry
par
ent
enti
ty [
un
iver
sity
] o
nlY
pro
ject
sF
utu
re f
ello
wsh
ips
Fed
erat
ion
fello
wsh
ips
Ind
igen
ou
s re
sear
cher
s d
evel
op
men
td
ee
wr
ar
C S
up
er
Sci
ence
Fel
low
ship
tota
l
20
102
00
92
010
20
09
20
102
00
92
010
20
09
20
102
00
92
010
20
09
$’0
00
$’0
00
$’0
00
$’0
00
$’0
00
$’0
00
$’0
00
$’0
00
$’0
00
$’0
00
fin
anci
al a
ssis
t anc
e re
ceiv
ed in
cas
h du
ring
th
e re
port
ing
perio
d39
,35
340
,09
92,
645
1,5
59
2,42
92,
377
130
102
186
044
,743
44,13
7
net
acc
rual
adj
ustm
ents
00
00
00
00
00
00
rev
enue
for
the
per
iod
39,3
53
40,0
99
2,6
451,
55
92,
429
2,37
713
010
218
60
44,7
4344
,137
sur
plus
/(de
ficit)
fro
m t
he p
revi
ous
year
12,0
458,
740
1,5
01
0(3
,46
5)
(1,6
80)
1931
00
10,10
07,
09
1
tota
l rev
enue
incl
udin
g a
ccru
ed r
even
ue5
1,3
98
48,
83
94
,14
61,
55
9(1
,03
6)
697
149
133
186
05
4,8
43
51,
228
less
exp
ense
s in
clud
ing
accr
ued
expe
nses
(40,
507
)(3
6,79
4)(2
,35
5)
(58)
(1,0
20)
(4,16
2)(1
33)
(114
)(1
86)
0(4
4,20
1)(4
1,128
)
Su
rplu
s/(d
efici
t) f
or
rep
ort
ing
per
iod
10,8
91
12,0
45
1,79
11,
50
1(2
,05
6)
(3,4
65
)16
190
010
,64
210
,10
0
(b)
lin
kag
es
par
ent
enti
ty [
un
iver
sity
] o
nlY
lin
kag
e –
infr
astr
uct
ure
Inte
rnat
ion
al r
esea
rch
er
exch
ang
el
aure
ate
Fel
low
ship
sp
roje
cts
tota
l
20
102
00
92
010
20
09
20
102
00
92
010
20
09
20
102
00
9
$’0
00
$’0
00
$’0
00
$’0
00
$’0
00
$’0
00
$’0
00
$’0
00
$’0
00
$’0
00
fin
anci
al a
ssis
tanc
e re
ceiv
ed in
cas
h du
ring
the
repo
rtin
g pe
riod
5,46
02,
350
1322
2,48
193
79,
756
10,3
62
17,7
1013
,671
net
acc
rual
adj
ustm
ents
00
00
00
00
00
rev
enue
for
the
per
iod
5,46
02,
350
1322
2,48
193
79,
756
10,3
62
17,7
1013
,671
sur
plus
/ (de
ficit
) fr
om t
he p
revi
ous
year
6,29
66,
485
208
270
679
08,
95
86,
89
016
,141
13,6
45
tota
l rev
enue
incl
udin
g a
ccru
ed r
even
ue11
,75
68,
83
52
21
29
23,
160
937
18,7
1417
,25
23
3,8
51
27,3
16
less
exp
ense
s in
clud
ing
accr
ued
expe
nses
(3,2
88)
(2,5
39)
(9)
(84)
(2,14
7)(2
58)
(8,4
39)
(8,2
94)
(13,
883)
(11,1
75)
Su
rplu
s/(d
efici
t) f
or
rep
ort
ing
per
iod
8,4
68
6,2
96
212
20
81,
013
679
10,2
758
,95
819
,96
816
,14
1

175
(c) networks and centres
parent entity [university] onlY research networks Centres total
2010 2009 2010 2009 2010 2009
$’000 $’000 $’000 $’000 $’000 $’000
financial assistance received in cash during the reporting period 0 442 4,335 4,459 4,335 4,901
net accrual adjustments 0 0 0 0 0 0
revenue for the period 0 442 4,335 4,459 4,335 4,901
surplus/(deficit) from the previous year 72 425 (1,567) (1,406) (1,495) (981)
total revenue including accrued revenue 72 867 2,768 3,053 2,840 3,920
less expenses including accrued expenses (155) (795) (4,436) (4,620) (4,591) (5,415)
Surplus/(deficit) for reporting period (83) 72 (1,668) (1,567) (1,751) (1,495)
50.7 oS‑help
parent entity the university of Sydney onlY
2010 2009
cash received during the reporting period 580 648
cash spent during the reporting period (549) (133)
net cash received 31 515
cash surplus/(deficit) from the previous period 398 (117)
Cash surplus/(deficit) for reporting period 429 398
51 dISaggregated InForMatIon
(a) Industry
economic entity (Consolidated) revenue results1 assets
2010 2009 2010 2009 2010 2009
$’000 $’000 $’000 $’000 $’000 $’000
Higher education 1,414,933 1,317,281 101,982 52,075 4,376,502 4,264,645
tafe 0 0 0 0 0 0
other 88,149 77,773 10,185 7,820 7,796 12,965
total 1,503,082 1,395,054 112,167 59,895 4,384,298 4,277,610
(b) geographical
economic entity (Consolidated) revenue results1 assets
2010 2009 2010 2009 2010 2009
$’000 $’000 $’000 $’000 $’000 $’000
australia 1,497,885 1,393,135 110,833 59,068 4,384,298 4,277,610
asia 3,722 1,717 1,341 727 0 0
other 1,475 202 (7) 100 0 0
total 1,503,082 1,395,054 112,167 59,895 4,384,298 4,277,610
1 the university reports revenue, results and assets by segments in accordance with the Financial Statement Guidelines for Australian Higher Education Providers for the 2010 reporting period issued by the department of education, employment and Workplace relations.
end oF audIted FInanCIal StateMentS audIted BY the audItor‑general
Mark eassonchief financial officer

176 THE UNIVERSITY OF SYDNEY FINaNcIal REpORTS aND STaTEmENTS 2010
2010 2009* Increase for 2010
$m $m $m $m $m
Operating revenue 1,505.6 1,392.3 113.3
Operating expenses 1,388.0 1,322.2 65.8
Net operating result 117.6 70.1 47.5
Impairment of available-for-sale assets (3.9) (8.5) 4.6
Operating result after impairment 113.7 61.6 52.1
Adjusted for:
Realised revaluation loss/(gain) on disposal of investments (37.6) (6.8)
Research income received with specific restrictions on use (166.0) (139.9)
Research expenditure on those projects 160.0 157.7
Overspent/(unexpended) research grants (6.0) 17.8
Net operating result available for appropriation 70.1 72.6 (2.5)
lESS
Expenditure on assets
capital works program (including the acquisition of buildings) 62.2 113.6
Equipment/IT 35.3 36.5
Expenditure on assets (97.5) (150.1) 52.6
Surplus/(shortfall) for the year (27.4) (77.5) 52.2
* The comparatives for 2009 have changed due to a change in accounting policy (refer to Note 34 of the financial statements for detail).
FINANcIAl rEvIEw OF 2010
The University recorded a net operating result before impairment of available-for-sale financial assets of $117.6 million for the year ended 31 December 2010 ($70.1 million in 2009), an increase of $47.5 million or 67.8 percent on the 2009 result.
after accounting for an impairment loss of $3.9 million on available-for-sale assets (2009: $8.5 million), the net operating result for the year ended 31 December 2010 was $113.7 million (2009: $61.6 million), an increase of $52.1 million on the previous year’s result.
Overall, the University completed 2010 with a very close position to its budget of $119.2 million. The key contributors to this success can be attributed to the increased income from commonwealth-supported places due to increased load, realised gains in investment income and strong cost management.
a comparison of the 2010 results to 2009 is set out below.

177
NEt OpErAtINg rESult AFtEr ImpAIrmENt ($113.7 mIllION)
This general purpose financial report has been prepared in line with and is based on Department of Education, Employment and Workplace Relations (DEEWR) guidelines, which include adopting the australian equivalents to International Financial Reporting Standards (aIFRS).
The net operating surplus of $113.7 million was derived from operating revenue of $1,505.6 million, less operating expenditure of $1,388.0 million and impairment of available-for-sale assets of $3.9 million.
NEt OpErAtINg rESult AvAIlAblE FOr ApprOprIAtION ($70.1 mIllION)
In accordance with current accounting standards, the University is obliged to record all research income on receipt as income. at the end of 2010, the University had $6.0 million of unspent government research grants with specific restrictions on their use (2009: overspent $17.8 million).
revenue from continuing operations 2010
$538.3m, 35.7%
$1.9m, 0.1% $220.9m, 14.7%
$17.5m, 1.2%
$455.8m, 30.3%
$271.2m, 18%
2010 2009 Increase for 2010
$m $m $m %
n Income from students (incl. HEcS & FEE-HElp)
538.3 481.7 56.6 11.8
n commonwealth Government operating grants
271.2 240.3 30.9 12.9
n Research and consultancy activities
455.8 433.4 22.4 5.2
n capital grants 17.5 41.0 (23.5) (57.3)
n NSW government operating grant
1.9 1.9 (0.0) (0.0)
n Income from private sources 220.9 194.0 26.9 13.8
total 1,505.6 1,392.3 113.3 8.1
OpErAtINg rEvENuE
Operating revenue for 2010 of $1,505.6 million was $113.3 million more than in 2009. The major components of the increased revenue were as follows.

178 THE UNIVERSITY OF SYDNEY FINaNcIal REpORTS aND STaTEmENTS 2010
INcOmE FrOm StudENtS
The increased revenue from students of $56.6 million was mainly attributable to additional fees from overseas students of $19.6 million (up 8.1 percent) and an increase of $29.7 million in HEcS-HElp and FEE-HElp.
Full fee-paying students (FFpS) continued to provide significant sources of income to the University, and remain a larger source of income than that derived from HEcS-HElp payments.
0
50
100
150
200
250
300
2001 2002 2003 2004 2005 2006 2007 2008 2009 2010
FFpS – postgraduate (incl. FEE-HElp)
11.2 14.9 24.5 34.1 33.2 37.1 37.6 40.8 47.5 58.1
FFpS – overseas 60.6 77.9 102.2 124.3 136.8 148.1 171.9 208.1 241.8 261.5
FFpS – local undergraduate (incl. FEE-HElp)
6.8 10.7 14.2 18.6 19.6 17.6 25.9 27.4 18.9 15.5
HEcS-HElp 104.0 103.9 106.2 113.8 117.1 123.3 127.6 141.3 140.8 163.0
Summer School 3.8 6.0 7.6 10.2 1.5 8.8 9.7 11.0 11.8 12.1
Non-award 22.2 19.7 19.6 17.5 19.0 21.2 24.3 22.0 20.8 28.2
Income from students 2010
FFpS – overseas, $261.5m, 49%
FFpS – postgraduate (incl. FEE-HElp), $58.1m, 11%
HEcS-HElp, $163m, 30%
FFpS – local undergraduate (incl. FEE-HElp), $15.5m, 3%
Summer School, $12.1m, 2%
Non-award, $28.2m, 5%
Income from students 2001–10 ($ million)

179
2001 2002 2003 2004 2005 2006 2007 2008 2009 2010
commonwealth operating grant 29.9 19.5 18.7 15.8 17.8 15.8 16.0 17.7 17.3 18.0
HEcS-HElp 13.4 12.7 12.1 11.9 11.6 10.2 9.8 10.9 100.1 10.8
Student income (excluding HEcS) 13.5 15.8 19.2 21.4 20.8 19.2 20.7 24.0 24.5 24.9
HEcS-HElp + student income 26.9 28.6 31.4 33.4 32.4 29.4 30.5 34.9 34.6 35.8
university revenue sources as a percentage of total revenue
cOmmONwEAlth gOvErNmENt FuNdINg
The overall level of funding from the commonwealth increased by $32.2 million in 2010, or 5.3 percent, to $642.0 million.
Income from the Department of Innovation, Industry, Science and Research (DIISR) research funding and other scholarships increased by $13.5 million, or 9.5 percent, to
$156.3 million and accounted for 54 percent of the overall additional commonwealth research funding of $24.8 million. Funds from the Teaching and learning commonwealth Grants Scheme increased by $30.9 million to $271.2 million, whereas capital funding dropped by $23.5 million, or 57.3 percent, to $17.5 million.
2010 2009 Increase for 2010
$m $m $m
australian Research council 66.8 62.7 4.1
DIISR research funding and other scholarships 156.3 142.8 13.5
Other commonwealth agencies – research 130.1 123.0 7.1
Subtotal commonwealth research funding 353.2 328.5 24.7
Teaching and learning operating grants 271.3 240.3 31.0
capital funding 17.5 41.0 (23.5)
total commonwealth funding 642.0 609.8 32.2
The continued growth in student fee income/HEcS and the relative decline of funding through the commonwealth operating grant meant that the proportion of the University revenue from HEcS and student income, at 35.8 percent (2009: 34.6 percent), is considerably more than the 26.9 percent in 2001, with most of the increase attributable to student income. On the other hand, the commonwealth
operating grants proportion of 18 percent (2009: 17.3 percent) is considerably less than the 29.9 percent in 2001.
The following graph sets out the continual financial pressure on the University arising from the ongoing decline in financial support from the commonwealth.
5%
10%
15%
20%
25%
30%
35%
40%

180 THE UNIVERSITY OF SYDNEY FINaNcIal REpORTS aND STaTEmENTS 2010
rESEArch ANd cONSultANcy ActIvItIES
Income received by the University for research, collaborative research and consultancy activities increased by $19.8 million, or 4.5 percent, to $455.8 million. commonwealth research funding of $353.2 million represented 77.5 percent of the total funding in this category.
The major sources of funding within research and consultancy activities were as follows.
2010 2009 Increase for 2010
$m $m $m
australian Research council 66.8 62.7 4.1
National Health and medical Research council 97.5 77.2 20.3
DIISR – Research Training Scheme 62.6 60.7 1.9
– Joint Research Engagement program 36.8 36.3 0.5
– Infrastructure funding 26.8 25.5 1.3
– postgraduate funding 19.4 19.0 0.4
– Other research schemes 10.6 1.3 9.3
Other commonwealth agencies 32.7 45.8 (13.1)
Subtotal commonwealth research funding 353.2 328.5 24.7
NSW government research grants 14.1 11.5 2.6
Industry research grants 17.2 7.7 9.5
Foundations and individual research grants 19.1 33.0 (13.9)
local collaborative research funds 22.4 20.6 1.8
Overseas collaborative research funds 19.5 20.2 (0.7)
consultancies 10.3 11.9 (1.6)
total research and consultancy income 455.8 433.4 22.4
NSw StAtE gOvErNmENt grANtS
Grants provided by the NSW government increased by $2.6 million, or 19.4 percent, to $16.0 million in 2010, attributable to an increase in research grants received.
2010 2009 Increase for 2010
$m $m $m
Research grants 14.1 11.5 2.6
Operating grants 1.9 1.9 0
total NSw government grants 16.0 13.4 2.6

181
INcOmE FrOm prIvAtE SOurcES
Income from private sources was $220.9 million in 2010, an increase of $26.9 million, or 13.8 percent, from the previous year. There was an increase across the board in all areas, including investment income, contributions from external organisations and commercial and other activities.
The income from philanthropic activities increased by $8.7 million, or 24.6 percent, from the previous year.
The major components of this income group were as follows.
2010 2009 Increase for 2010
$m $m $m
Investment income (including gains/(losses) on disposal of assets) 89.0 81.0 8.0
contributions from external organisations 27.8 22.6 5.2
commercial and other activities 45.7 38.7 7.0
Other fees and charges 14.3 16.3 (2.0)
Donations and bequests 44.1 35.4 8.7
total income from private sources 220.9 194.0 26.9

182 THE UNIVERSITY OF SYDNEY FINaNcIal REpORTS aND STaTEmENTS 2010
$845.0m, 61%
$36.0m, 3%
$181.0m, 13%
$202.3m, 14%
$53.6m, 4%
$70.1m, 5%
Expenses from continuing operations 2010 2010 2009 Increase for 2010
$m $m $m %
Salaries 679.3 642.9 36.4 5.7
payroll on-costs 165.7 160.2 5.5 3.4
n Total employee benefits 845.0 803.1 41.9 5.2
n payments for consumables and non-capitalised equipment, travel and staff development
202.3 201.3 1.0 0.5
n Buildings and grounds maintenance
53.6 53.5 0.1 0.2
n Teaching/research grants and scholarships
181.0 161.0 20.0 12.4
n consultants and contractors
36.0 40.8 (4.8) (11.8)
n Depreciation and amortisation
70.1 62.5 7.6 12.2
total expenses 1,388.0 1,322.2 65.8 5.0
OpErAtINg ExpENSES
The 2010 operating expenditure of $1,388.0 million was $65.8 million, or 5 percent, greater than that for 2009.
The increase of $41.9 million in salary payments was 5.2 percent higher than the expenses for 2009. Of the overall increase in salaries, $26.1 million related to academic salaries and $10.3 million to non-academic salary costs. The increase in employee-related costs was mainly due to salary increases of 2 percent in January 2010 and 2.5 percent in July 2010.
Expenditure on teaching/research grants and scholarships increased by $20.0 million from 2009, or 12.4 percent. The major components of the increase included student stipends ($5.9 million), which increased both in number as well as the payment rate, and an increase in payment of grants to external organisations, which include payments to institutes, centres and other universities ($12.4 million).
Buildings and grounds expenses, at $53.6 million, held constant compared to the previous year. This expenditure needs to be considered along with the expenditure on capital works in the year to gain a true picture of the overall level of building and infrastructure construction, refurbishment and maintenance activity across the University.
The combined maintenance and capital works expenditure on buildings and infrastructure was $50.9 million lower than the previous year, due mostly to the completion of the campus 2010 project.
The mix of expenditure in this area between maintenance (operating expense) and asset improvements (non-current asset – works in progress) is shown in the following table.
2010 2009 Increase for 2010
$m $m $m
Buildings and grounds (operating expense – income statement) 53.6 53.5 0.1
capital works in progress (non-current asset – balance sheet) 42.1 93.1 (51.0)
95.7 146.6 (50.9)
In addition, the University has entered into commitments totalling $70.7 million (2009: $19.0 million) for capital expenditure.

183
2010 2009 Increase for 2010
$m $m $m
Restricted funds 781.1 757.1 24.0
Reserves 277.2 300.7 (23.5)
Retained earnings 2,250.0 2,162.8 87.2
total equity 3,308.3 3,220.6 87.7
EquIty
The total equity of the University at 31 December 2010, at $3,308.3 million, was $87.7 million higher than in 2009.
The three major components of the total equity are as follows.
restricted funds, which include the unexpended portion of funds received through the income statement and which have specific statutory restrictions on their use. The net operating income included $24.0 million of restricted use funds relating to unspent research grants, bequests, capital preserved trusts, scholarships and prizes.
reserves, which are revaluation reserves and relate to revaluation of land and buildings and available-for-sale financial assets. There was a net decrease of $23.5 million in 2010 in these reserves.
retained earnings of $2,250.0 million is made up of the initial revaluation reserve of $1,660.5 million created in 1992 and the cumulative net operating surpluses excluding reserves at 31 December 2010.
a comparison of balances with 2009 and their movement is set out in the following table.
ExpENdIturE ON ASSEtS
The net operating surplus of $117.6 million provided the University with funding for its $97.5 million expenditure on assets. The major areas of expenditure are shown in the following table.
2010 2009 Increase for 2010
$m $m $m
Non-current assets
land and buildings 3.5 1.7 1.8
Equipment 19.5 24.6 (5.1)
capital works – software 20.1 20.6 (0.5)
capital works – buildings 42.1 93.1 (51.0)
Other 12.3 10.1 2.2
97.5 150.1 (52.6)
The reduction in capital expenditure in 2010 is mainly due to the completion of prior years’ capital projects. a new program of capital expenditure is under development as part of implementing the strategic plan.
Where the capital expenditure is greater than the operating surplus, the balance has been funded from reserves.

184 THE UNIVERSITY OF SYDNEY FINaNcIal REpORTS aND STaTEmENTS 2010
thE uNIvErSIty OF SydNEy OpErAtINg StAtEmENt FOr thE yEAr ENdEd 31 dEcEmbEr 2010
comparison to budget
[2010] [2011]
parent entity – university Budget Forecast actual Budget
$’000 $’000 $’000 $’000
revenue and income from continuing operations
australian government financial assistance:
australian government grants 577,972 632,244 642,012 691,541
HEcS-HElp – australian government payments 113,940 132,115 126,746 136,931
FEE-HElp 35,276 42,331 42,838 42,852
New South Wales government financial assistance 8,798 16,771 15,936 14,988
HEcS-HElp – student payments 34,251 37,874 36,336 39,254
Fees and charges 362,925 338,340 346,680 362,571
Investment revenue 60,488 72,600 88,477 62,962
Royalties, trademarks and licences 2,253 3,179 2,619 2,409
consultancy and contract research 115,343 91,826 88,464 82,550
Other revenue 62,550 43,711 44,077 42,034
Other income 81,946 78,368 70,943 88,587
Gains/(losses) on disposal of assets 80 (304) 5101 (1,430)
total revenue and income from continuing operations 1,455,822 1,489,055 1,505,638 1,565,249
Expenses from continuing operations
Employee-related expenses 822,689 848,755 845,039 892,221
Depreciation and amortisation 62,000 69,000 70,103 73,423
Repairs and maintenance 79,421 54,240 53,550 55,251
Impairment of assets 0 0 5,987 0
Other expenses 176,992 205,685 196,336 206,289
Grant and scholarship expenses 79,721 82,144 85,009 89,319
consultants and contractors 38,603 38,814 35,988 32,099
Teaching and research grants 77,242 78,054 95,951 83,507
total expenses from continuing operations 1,336,668 1,376,692 1,387,963 1,432,109
Operating result before income tax 119,154 112,363 117,675 133,140
Income tax benefit/(expense)
Impairment of available-for-sale assets 0 (2,300) (3,939) 0
Operating result after income tax and impairment of available-for-sale assets for the period 119,154 112,363 113,736 133,140
Operating result attributable to members of the university of Sydney 119,154 112,363 113,736 133,140
1 Net gain/(loss) on sale of shares, managed funds and fixed income securities.

185
INvEStmENtS ANd INvEStmENt pErFOrmANcE
as detailed in chart 1 below, 2010 was mostly a positive year from an asset class return perspective, particularly after taking into account the strong appreciation of the australian dollar. This contrast is perhaps best demonstrated by the difference in the hedged and unhedged annual returns for the international equities sector, where the annual market return difference was a little over 15 percent. Some 88 percent of this return divergence reflects the strengthening of the australian dollar, which appreciated by around 13.3 percent over the year.
chart 1: the investment environment: asset class returns
-9
-6
-3
0
3
6
9
12
15
Ret
urn
%
4.7
6.0
1.7
13.1
-2.0
-8.0
5.15.4
10.3
12 months to December 2010
long-term cash Fixed interest australian equities
International equities
(hedged)
International equities
(unhedged)
REITs Domestic infrastructure
(unlisted)
International infrastructure
(listed)
private equity
Notwithstanding the standout performance of the australian economy in weathering the impacts of the global financial crisis, the strong rise in commodity prices and australia’s markedly improved terms of trade, the australian share market underperformed the hedged international equities sector by 11.4 percent over the year, This underperformance is not easily explained, but can to some degree be attributed to australia’s more restrictive monetary policy, the impact of the stronger australian dollar on exporters and the higher potential for corporate earnings to rebound in overseas economies, particularly in the United States where substantial labour shedding occurred.
Investment performance relative to internal approved benchmarks for the key aggregate portfolios managed by the Investment and capital management team was favourable (see chart 2 below). all four categories of funds outperformed benchmarks over rolling one and three-year periods. The long-Term Endowment portfolio, which amounts to approximately $725 million and makes up the majority of the Investment portfolio, outperformed the internal benchmark by 2.4 percent in 2010 (before external manager fees).1
1 The outperformance relative to benchmark after external manager fees and equivalent NSW Treasury corporation administration fees for the debt and cash sectors was around 1.6 percent.

186 THE UNIVERSITY OF SYDNEY FINaNcIal REpORTS aND STaTEmENTS 2010
Table 1 below provides a peer-based comparison (on an after-fees basis) of the University’s long-Term Endowment portfolio’s performance over one- and three-year rolling periods, including the performance relative to the NSW Treasury corporation long-Term Funds Facility which is the nominated statutory benchmark for the Endowment portfolio.
chart 2: total portfolio performance – rolling 12-month returns as at end-december 2010
university of Sydney long-term Endowment Funds
(mid-Saa target range: 60–80% growth, with 70% mid-target)1
mercer Employer Super, balanced growth (60–80% growth)
all Balanced Growth (68 funds reported one-year returns)
NSw t-corp hour-glass long-term growth Facility
(mid-target of 70% growth)
1 yr +5.1% +3.9% [ +5.0% ]
+3.4%
3 yr, p.a. +0.4% (2.0)% [ (0.1)% ]
(1.6)%
Notes:
– all results are after fees. – Superannuation returns are also net of tax. The University is a zero tax payer while the investment earnings of superannuation funds are presumably taxed at 15
percent. – mercer Survey results are median returns except figures in square brackets [ ] which represent the upper quartile cut-offs.
1 The mid-term strategic asset allocation (Saa) target for growth is currently 69 percent (with a 25 percent target for fixed interest and a temporary target of 6 percent for long-term cash). The mid-term Saa target range for growth assets is 60–80 percent.
4.8 4.7
7.5
5.1
3.5
7.5
5.3
5.9
0
1
2
3
4
5
6
7
8
SHORT-TERm FUNDS mEDIUm-TERm FUNDS lONG-TERm ENDOWmENT FOUNDaTION FUNDS
n actual
n Benchmark
Notes – all results are before fees. – all benchmarks refer to Investment and capital management Internal benchmarks, which are approved by the Investment and commercialisation committee, a
committee of Senate.
table 1long-term funds performance against peers – rolling one and three-year periods ended december 2010
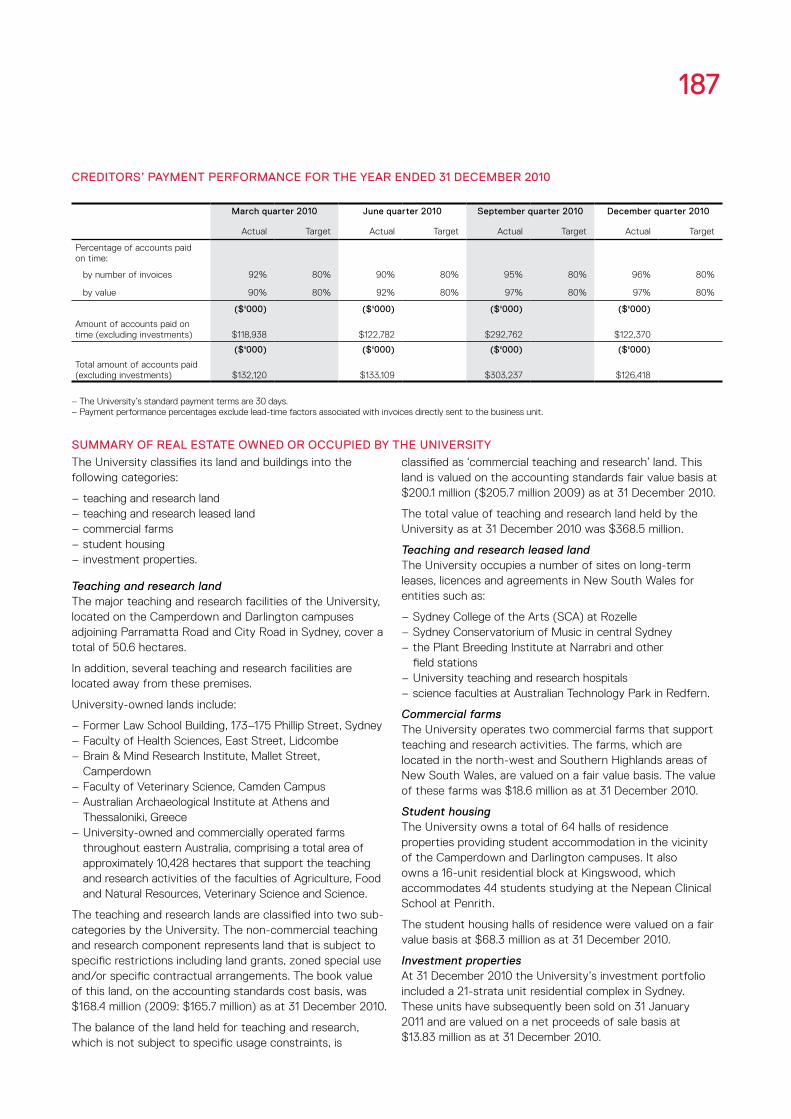
187
crEdItOrS’ pAymENt pErFOrmANcE FOr thE yEAr ENdEd 31 dEcEmbEr 2010
march quarter 2010 June quarter 2010 September quarter 2010 december quarter 2010
actual Target actual Target actual Target actual Target
percentage of accounts paid on time:
by number of invoices 92% 80% 90% 80% 95% 80% 96% 80%
by value 90% 80% 92% 80% 97% 80% 97% 80%
($'000) ($'000) ($'000) ($'000)
amount of accounts paid on time (excluding investments) $118,938 $122,782 $292,762 $122,370
($'000) ($'000) ($'000) ($'000)
Total amount of accounts paid (excluding investments) $132,120 $133,109 $303,237 $126,418
–– The University’s standard payment terms are 30 days.–– payment performance percentages exclude lead-time factors associated with invoices directly sent to the business unit.
SummAry OF rEAl EStAtE OwNEd Or OccupIEd by thE uNIvErSIty
The University classifies its land and buildings into the following categories:
– teaching and research land – teaching and research leased land – commercial farms – student housing – investment properties.
Teaching and research landThe major teaching and research facilities of the University, located on the camperdown and Darlington campuses adjoining parramatta Road and city Road in Sydney, cover a total of 50.6 hectares.
In addition, several teaching and research facilities are located away from these premises.
University-owned lands include:
– Former law School Building, 173–175 phillip Street, Sydney – Faculty of Health Sciences, East Street, lidcombe – Brain & mind Research Institute, mallet Street, camperdown
– Faculty of Veterinary Science, camden campus – australian archaeological Institute at athens and Thessaloniki, Greece
– University-owned and commercially operated farms throughout eastern australia, comprising a total area of approximately 10,428 hectares that support the teaching and research activities of the faculties of agriculture, Food and Natural Resources, Veterinary Science and Science.
The teaching and research lands are classified into two sub-categories by the University. The non-commercial teaching and research component represents land that is subject to specific restrictions including land grants, zoned special use and/or specific contractual arrangements. The book value of this land, on the accounting standards cost basis, was $168.4 million (2009: $165.7 million) as at 31 December 2010.
The balance of the land held for teaching and research, which is not subject to specific usage constraints, is
classified as ‘commercial teaching and research’ land. This land is valued on the accounting standards fair value basis at $200.1 million ($205.7 million 2009) as at 31 December 2010.
The total value of teaching and research land held by the University as at 31 December 2010 was $368.5 million.
Teaching and research leased landThe University occupies a number of sites on long-term leases, licences and agreements in New South Wales for entities such as:
– Sydney college of the arts (Sca) at Rozelle – Sydney conservatorium of music in central Sydney – the plant Breeding Institute at Narrabri and other field stations
– University teaching and research hospitals – science faculties at australian Technology park in Redfern.
Commercial farmsThe University operates two commercial farms that support teaching and research activities. The farms, which are located in the north-west and Southern Highlands areas of New South Wales, are valued on a fair value basis. The value of these farms was $18.6 million as at 31 December 2010.
Student housingThe University owns a total of 64 halls of residence properties providing student accommodation in the vicinity of the camperdown and Darlington campuses. It also owns a 16-unit residential block at Kingswood, which accommodates 44 students studying at the Nepean clinical School at penrith.
The student housing halls of residence were valued on a fair value basis at $68.3 million as at 31 December 2010.
Investment propertiesat 31 December 2010 the University’s investment portfolio included a 21-strata unit residential complex in Sydney. These units have subsequently been sold on 31 January 2011 and are valued on a net proceeds of sale basis at $13.83 million as at 31 December 2010.

188 THE UNIVERSITY OF SYDNEY FINaNcIal REpORTS aND STaTEmENTS 2010
SubSIdIArIES
The Wentworth Annexe Limited The Wentworth annexe limited administers the planning and construction of the Wentworth annexe and other building work that the University of Sydney Union may wish to undertake. as this is a non-trading enterprise, performance and accrual performance measures are not applicable.
Sport Knowledge Australia Pty LimitedSport Knowledge australia pty limited was established as an International centre of Excellence in Sport, Science and Technology. The company commenced operations in January 2005 with the University being one of three stakeholders. On 11 June 2008 the University of Sydney acquired the remaining shares to acquire 100 percent ownership.
The Bosch InstituteThe Bosch Institute was incorporated in 2006 as an australian public company limited by guarantee for the advancement of public health and medical research activities to improve the health of individuals and the community. It has not had any activity since incorporation and was deregistered on 4 July 2010.
SydneyLearning Pty LimitedSydneylearning pty limited was established in april 2008 to enhance the capability of working adults, professionals and corporate enterprises by designing and delivering award and non-award continuing professional development and leadership programs. The company commenced trading in 2009.
Sydney Talent Pty LimitedSydney Talent pty limited was incorporated in January 2008. It is a supporting service of the University of Sydney and an initiative in the University’s quest to equip its future graduates for immediate and successful employment.
The Warren Centre for Advanced Engineering Limited The Warren centre for advanced Engineering limited was established in april 2008 to stimulate the application and further development of new engineering technology and provide independent comment and advice to government and industry on these and related issues.
WayAhead Pty LimitedWayahead pty limited was incorporated in april 2008 to prepare students for university entry by designing and delivering pre-tertiary and tertiary level programs. It did not have any activity in 2010.
Bandwidth Foundry International Pty LtdBandwidth Foundry International pty ltd became a subsidiary in October 2009. Its mission is to enable photonics innovation and commercialisation by providing prototyping facilities and services to developers of photonic integrated circuits.
The following subsidiary was deregistered in 2010:The Bosch Institute
FINANcIAl StAtEmENtS FOr SubSIdIArIES
The financial statements for the subsidiaries, which form part of the University’s annual report tabled in the NSW parliament, are available on request by contacting the University’s Web and print production unit on +61 2 9351 4625, fax +61 2 9351 3289 or email [email protected].

189
THIS paGE HaS BEEN INTENTIONallY lEFT BlaNK

190 THE UNIVERSITY OF SYDNEY ANNUAL REPORT 2010
A
Access ibc*
Accounts, payment of 187
Aims and objectives 2, 65–71
B
Budget, comparison to 184
C
Chancellor’s message 4
Charter 2
Consumer response 100
Contact details ibc*
D
Disability plans 81
Disclosure of subsidiaries 158–159
E
Equal employment opportunity 80–81
F
Financial statements 107–175
Freedom of information 90–98
Funds granted to non-government community organisations 18–19
G
Governance 67, 72–73
H
Human resources 76–79
I
Independent auditor’s report 104–105
Insurance 71, 115
Investment performance 125, 185–186
J
Joint ventures 162
L
Legal change 88
Letter of submission ifc§
M
Management 54, 58–59
Multicultural policies and services program report 84–85
InDEx
* inside back cover§ inside front cover
This index is intended to help readers locate contents relating to the University’s reporting obligations.
For detailed financial information, readers should refer to the list of contents of notes to the financial statements on page 113.

191
O
Objectives, progress towards 65–71
Occupational health and safety 86–87
Officers 54
Opening hours ibc*
Organisational chart 55
P
Payment of accounts 187
Performance and numbers of executive officers 73–74, 149
Principal activities 65
Privacy and personal information 89
Production costs ibc*
Promotion (overseas visits) 101
Public availability of annual reports ibc*
R
Research grants 123–125, 170–175
Risk management 100
S
Senate, attendance at meetings 64
Senate, committees, 60–64
Senate, list of members 58–59
Staff statistics 77–79
Statement by appointed officers 106
Strategic objectives 2, 70–71
Student statistics 75
Subsidiaries 158–159, 188
Summary review of operations 67–69
U
University officers 54
University governance 72–73
V
Vice-Chancellor’s message 5
W
Waste 99

192 THE UNIVERSITY OF SYDNEY FINANCIAL REPORTS AND STATEMENTS 2009

The address of The UniversiTy
The University of Sydney NSW 2006 Australia T +61 2 9351 2222 sydney.edu.au
HOURS OF OpENINg
Main switchboardMonday to Friday: 9am to 5pm
Fisher library (during semester)Monday to Thursday: 8am to 10pm Friday: 8am to 8pm Saturday: 9am to 5pm Sunday: 1pm to 5pm
library hours outside semester vary throughout the year.
See sydney.edu.au/library, for details and opening hours of other University libraries.
Student CentreMonday to Friday: 9am to 5pm
See sydney.edu.au/student_centre for contact details for student administration services.
University of Sydney Union facilitiesMonday to Friday (during semester) 6am to 8pm
Hours for specific services vary. Non-semester opening hours are reduced and vary throughout the year. See www.usuonline.com for more details.
Many offices of the University are open beyond the above times. To check opening times, please telephone the unit or department you wish to visit.
aBOUT THE aNNUal REpORT
This report was produced by the University of Sydney’s Marketing and Communications division.
For further copies, please contact: Information Management Officer Marketing and Communications The University of Sydney NSW 2006 T +61 2 9351 4625 F +61 2 9351 3289 E [email protected]
The Annual Report is also available online at sydney.edu.au/about/publications/annual_report
editor: Ben Wilson Subediting: Martin Foster and Katie leach Writing: Martin Foster, Katie leach, Verity leatherdale, Richard North, Ben Wilson, Media Office staff Design: Rhys Holland, Camille Manley, Katharine Vanderwal Additional photography: lee Besford, Rhys Holland, Ted Sealey, Jamie Williams printing: SOS print & Media Group printing costs: $14,720 (excluding GST)
ISSN 0313-4474
© The University of Sydney 2011
FURTHER INFORMaTION
This publication is printed on Novatech, an environmentally responsible paper certified by the Forest Stewardship Council (FSC). The paper is produced from mixed-source pulp from well-managed forests and other controlled sources and is elemental chlorine free (eCF). printed with vegetable-based inks by SOS print and Media, an FSC Chain of Custody certified printer.
Cert no. SGS-COC-3047
The University of Sydney NSW 2006 Australia T +61 2 9351 2222 sydney.edu.au
ABN 15 211 513 464 CRICOS 00026A
The University reserves the right to make alterations to any information contained within this publication without notice. 11/2464