san luis obispo rta tda triennial performance audit | final report
Upload
khangminh22Category
view
0download
0
Annual Report

LETTER TO THE MINISTER
The Hon. David Campbell, MPMinister for TransportMinister for IllawarraGovernor Macquarie Tower1 Farrer PlaceSydney NSW 2000
Dear Minister
I have pleasure in submitting the Annual Report and Financial Statements of the Roads and Traffi c Authority for presentation to the Parliament of New South Wales for the fi nancial year ended 30 June 2009. It has been prepared in accordance with the Annual Reports (Statutory Bodies) Act 1984 and the Public Finance and Audit Act 1983.
Yours sincerely
Michael Bushby | Chief Executive
VisionA safe, sustainable and effi cient road transport system.
ValuesThe RTA has for so long been a leader in many fi elds, including road safety, customer service, engineering, maintenance, accounting and workforce development. Our values should refl ect this. That is why our values are:
L learning – committed to improving our business through developing our staff and our technical and professional capabilities.
E expertise – using our extensive experience to deliver quality results.
A accountability – being fi nancially, environmentally and socially accountable.
D dynamic – striving to be an organisation that is innovative in its approach to all business activities and adaptive to change.
E equity – being open, honest, ethical and fair in all our dealings.
R responsiveness – achieving effective results through fl exibility, effi ciency and continuous improvement.
S safety – ensuring the community and our workforce are safe.
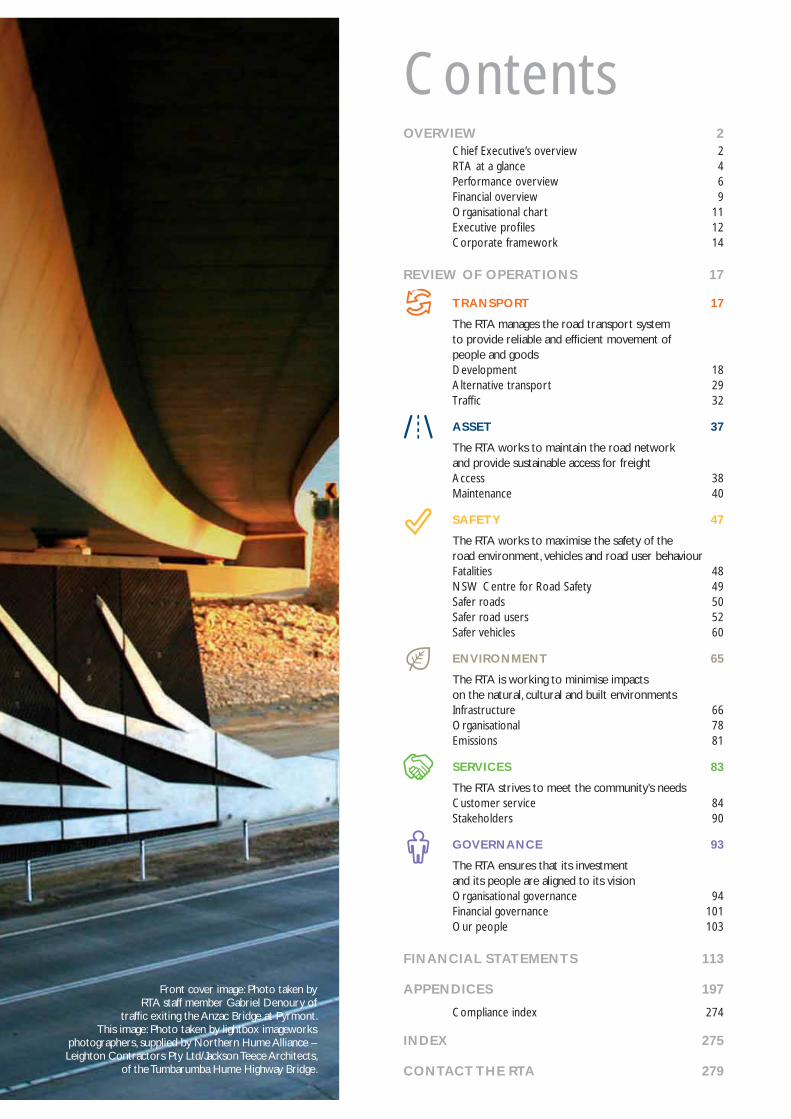
ContentsOVERVIEW 2
Chief Executive’s overview 2RTA at a glance 4Performance overview 6Financial overview 9Organisational chart 11Executive profi les 12Corporate framework 14
REVIEW OF OPERATIONS 17
TRANSPORT 17
The RTA manages the road transport system to provide reliable and effi cient movement of people and goodsDevelopment 18Alternative transport 29Traffi c 32
ASSET 37
The RTA works to maintain the road network and provide sustainable access for freightAccess 38Maintenance 40
SAFETY 47
The RTA works to maximise the safety of the road environment, vehicles and road user behaviourFatalities 48NSW Centre for Road Safety 49Safer roads 50Safer road users 52Safer vehicles 60
ENVIRONMENT 65
The RTA is working to minimise impacts on the natural, cultural and built environmentsInfrastructure 66Organisational 78Emissions 81
SERVICES 83
The RTA strives to meet the community’s needsCustomer service 84Stakeholders 90
GOVERNANCE 93
The RTA ensures that its investment and its people are aligned to its visionOrganisational governance 94Financial governance 101Our people 103
FINANCIAL STATEMENTS 113
APPENDICES 197
Compliance index 274
INDEX 275
CONTACT THE RTA 279
Front cover image: Photo taken by RTA staff member Gabriel Denoury of
traffi c exiting the Anzac Bridge at Pyrmont. This image: Photo taken by lightbox imageworks
photographers, supplied by Northern Hume Alliance – Leighton Contractors Pty Ltd/Jackson Teece Architects,
of the Tumbarumba Hume Highway Bridge.

2 CHIEF EXECUTIVE’S OVERVIEW OVERVIEW
Chief Executive’s overview
The RTA is an agency with many important responsibilities and the community expects concrete achievements from us. In 2008-09, I’m proud to report substantial successes in many areas, but in a report such as this we are always looking forward to the challenges of the future. These challenges are many and we have a plan to meet them – a corporate plan we’ve called Blueprint. This report is structured around the key result areas contained in Blueprint – transport, asset (the road network), safety, environment, services and governance. Following are the highlights of our performance in delivering results in these important areas in the past fi nancial year. Throughout the report, you’ll see a Blueprint symbol noting if a particular action has contributed to achieving a Blueprint outcome.
TransportThe transport task in NSW is immense and growing. The transport system is crucial to the economy as well as the daily lives of everyone in the community. This year the RTA managed the planning and construction of 82 major projects, with a total expenditure of almost $1.8 billion. Ten projects were opened to traffi c, including in Sydney and the regions. Upgrades of key regional roads such as the Pacifi c and the Hume highways continued at a steady pace – these projects are having great results in saving lives and improving travel times.
In Sydney, the RTA manages traffi c through the Transport Management Centre using an array of technological tools and human know-how. Despite steadily increasing traffi c volumes, travel speeds on key major routes were unchanged for the afternoon peak period and actually increased slightly in the morning peak – a testament to the RTA’s careful management and planning.
AssetAs well as building new roads, the RTA has a huge job to ensure the road network is maintained to acceptable standards. In 2008-09, the RTA delivered a $1.089 billion infrastructure maintenance program – a signifi cant increase on the previous year. We built 10 replacement bridges and replaced, resealed or widened millions of square metres of road surface. Ride quality continued to trend upwards. Our approach focuses resources on critical maintenance activities and this will continue.
SafetyThe past year was a record-breaking one for road safety in NSW. The 2008 calendar year was the sixth consecutive year in which the road toll decreased in NSW – the fi rst time this has happened since records began a century ago. The last time there were so few fatalities on our roads was 1944.
While this reduction refl ects the excellent work of the RTA’s NSW Centre for Road Safety, and our effective ‘Safe System Approach’, there is no possibility that we will become complacent. In the fi rst six months of 2009, provisional data indicated a marked increase in the road toll. The RTA will continue its multi-layered approach, working on programs that improve the safety of the road environment and support safer driving and safer vehicles. Innovation was again a feature of our work in road safety, from new point-to-point cameras to tackle heavy vehicle speeding, to the trial of the world-leading Intelligent Speed Adaptation technology which uses satellites to monitor and control speeding vehicles.
EnvironmentThe RTA’s statutory responsibilities in relation to the environment are enormous (for example, in the past year we determined 247 review of environmental factors). However, we also work across numerous other areas to protect and enhance the environment. From reducing our own energy use and installing rainwater tanks at depots, to providing safe crossings of highways for threatened animal populations, the RTA’s environmental staff are making a real difference. Achievements in this area also include the less obvious – such as the discovery and preservation of a mid-19th century sandstone road in the Blue Mountains, or clever urban design to ensure new works fi t into the built and natural landscape.
ServicesWe continued to improve our motor registry network with a number of key registries being refurbished or relocated to more convenient and accessible locations. Our suite of tolling products was improved and expanded, with new short-term and Easy Toll tags proving popular with motorists. We have also progressed work to introduce new facial recognition technology to further protect the community against identity fraud.
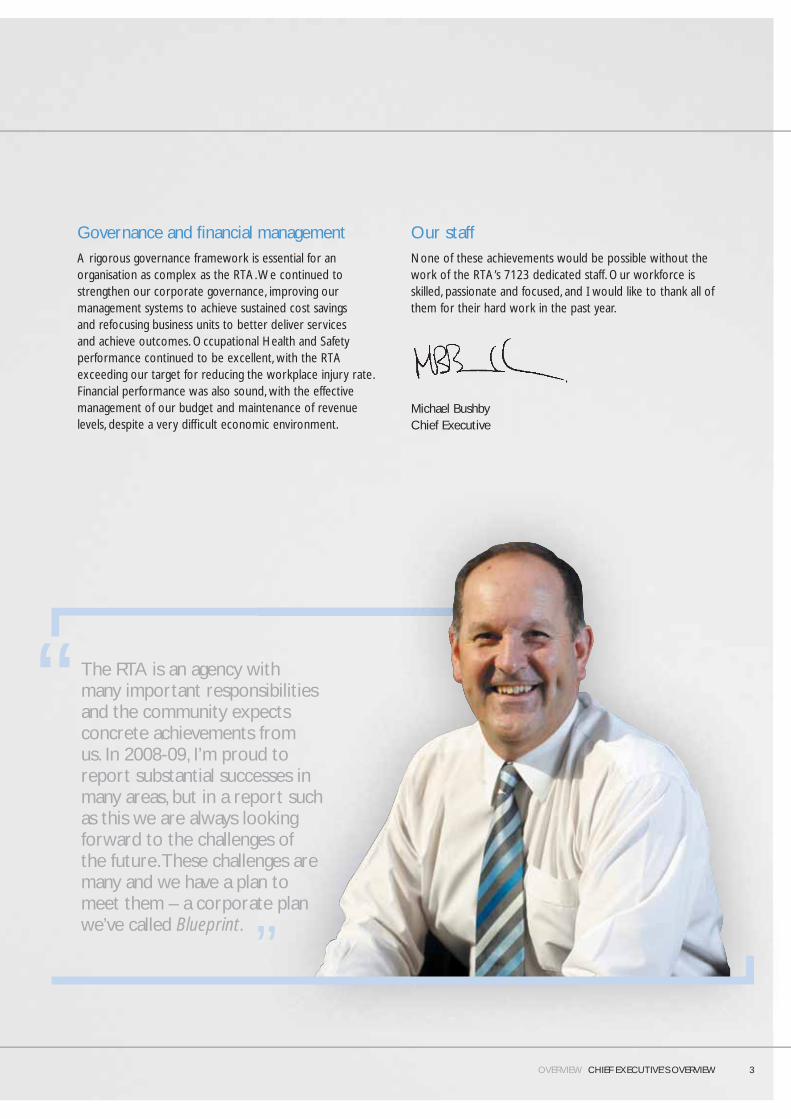
Governance and fi nancial managementA rigorous governance framework is essential for an organisation as complex as the RTA. We continued to strengthen our corporate governance, improving our management systems to achieve sustained cost savings and refocusing business units to better deliver services and achieve outcomes. Occupational Health and Safety performance continued to be excellent, with the RTA exceeding our target for reducing the workplace injury rate. Financial performance was also sound, with the effective management of our budget and maintenance of revenue levels, despite a very diffi cult economic environment.
Our staffNone of these achievements would be possible without the work of the RTA’s 7123 dedicated staff. Our workforce is skilled, passionate and focused, and I would like to thank all of them for their hard work in the past year.
Michael Bushby Chief Executive
OVERVIEW CHIEF EXECUTIVE’S OVERVIEW 3
The RTA is an agency with many important responsibilities and the community expects concrete achievements from us. In 2008-09, I’m proud to report substantial successes in many areas, but in a report such as this we are always looking forward to the challenges of the future. These challenges are many and we have a plan to meet them – a corporate plan we’ve called Blueprint.
‘‘
‘‘

4 RTA AT A GLANCE OVERVIEW
RTA at a glanceResponsibilitiesThe RTA is a NSW statutory authority that was established in 1989 under the Transport Administration Act 1988.
The RTA’s primary responsibilities are to:
• Manage the road network to reduce travel times.
• Provide road capacity and maintenance solutions.
• Test and license drivers and register and inspect vehicles.
• Improve road safety.
ActivitiesThe RTA’s activities are diverse and extensive.
Key activities include:
• Designing and constructing new roads and bridges and maintaining and enhancing road transport infrastructure.
• Managing traffi c – a complex task which requires technological expertise, careful planning and the coordinated effort of engineers, planners and other staff.
• Managing and regulating the road network, to ensure the respective needs of motorists, public transport, freight, commuters and pedestrians are balanced.
• Implementing sustainable practices and environmental management to ensure the environmental impacts of construction, maintenance, road travel and congestion are managed, minimised and mitigated.
• Taking a central role in road safety, including implementing a ‘safe system’ approach to designing and managing the road network; encouraging safer driving through promotions, campaigns, testing and training; and working with the NSW Police Force and using licensing and registration functions to enforce and support safer road user behaviour.
Key dimensions
Assets and fundingThe RTA manages a road network that includes:
• 17,981km of RTA-managed State roads, including 4269km of National Road Network, for which the Australian Government provides a funding contribution, and 163km of privately-funded toll roads.
• 2946km of regional and local roads in the unincorporated area of NSW.
• 5051 bridges, major culverts and 22 tunnels.
• 3751 traffi c signals and other traffi c facilities, systems and corridor assets.
The RTA’s non-road assets include:
• 180 offi ces including 129 motor registries.
• Purpose-built facilities including RTA Crashlab, the Transport Management Centre, Document Management Centre, Argyle Street offi ce building and the RTA Contact Centre.
• Other facilities including work depots, motorcycle rider training centres, fl eet workshops, mobile service units, laboratories and inspection stations.
The RTA holds road, bridge and traffi c infrastructure with a written down value of $86 billion including land under roads. It also holds property, plant and equipment, private sector-provided infrastructure and other non-current assets with a written-down value of $4 billion. The RTA owns assets which are held for road projects including heritage-listed properties which are tenanted, maintained and managed by RTA property staff.
The RTA Roads Program was $4.3 billion ($4,247 million) this year including contributions from the State and Australian governments, and revenue raised directly by the RTA from road user charges and other RTA generated revenue such as number plate sales, contributions to works from third parties, and sales of surplus properties.
Licensing and registrationIn 2008-09 the RTA provided registration and licensing services to 4.72 million licence holders and 5.33 million registered vehicles in NSW. The RTA managed about 20 million licensing and registration-related transactions in the past year. For more information on licensing and registration please see the Services chapter.
EmployeesThe RTA currently employs 7123 full time equivalent staff across NSW. About 48 per cent are employed in country locations, of which 30 per cent are wages staff and 70 per cent salaried.
Given the diversity of the RTA’s activities, our staff work in a vast array of disciplines across many trades and professions. For more information on RTA staff please see the Governance chapter.
Stakeholders and the communityThe RTA values its role in the community and undertakes signifi cant stakeholder consultation. Its external customers and stakeholders include motorists, commuters, pedestrians, private organisations, community and road transport groups, business groups, local councils and state and federal government agencies.
OVERVIEW RTA AT A GLANCE 5
In 2008-09, local communities were involved in more than 250 different construction and maintenance projects. This involvement included community focus or liaison groups, community meetings, community display and information sessions, distribution of community updates and household letters, community events and regular meetings between RTA staff and individuals.
The RTA participates in a wide range of signifi cant advisory groups and committees, as set out in Appendix 3. The RTA uses these and other avenues to remain informed about reports, reviews, impact statements and inquiries relevant to its operations and operating environment.
The RTA liaises with the Australian Government, other state governments and local government across NSW.
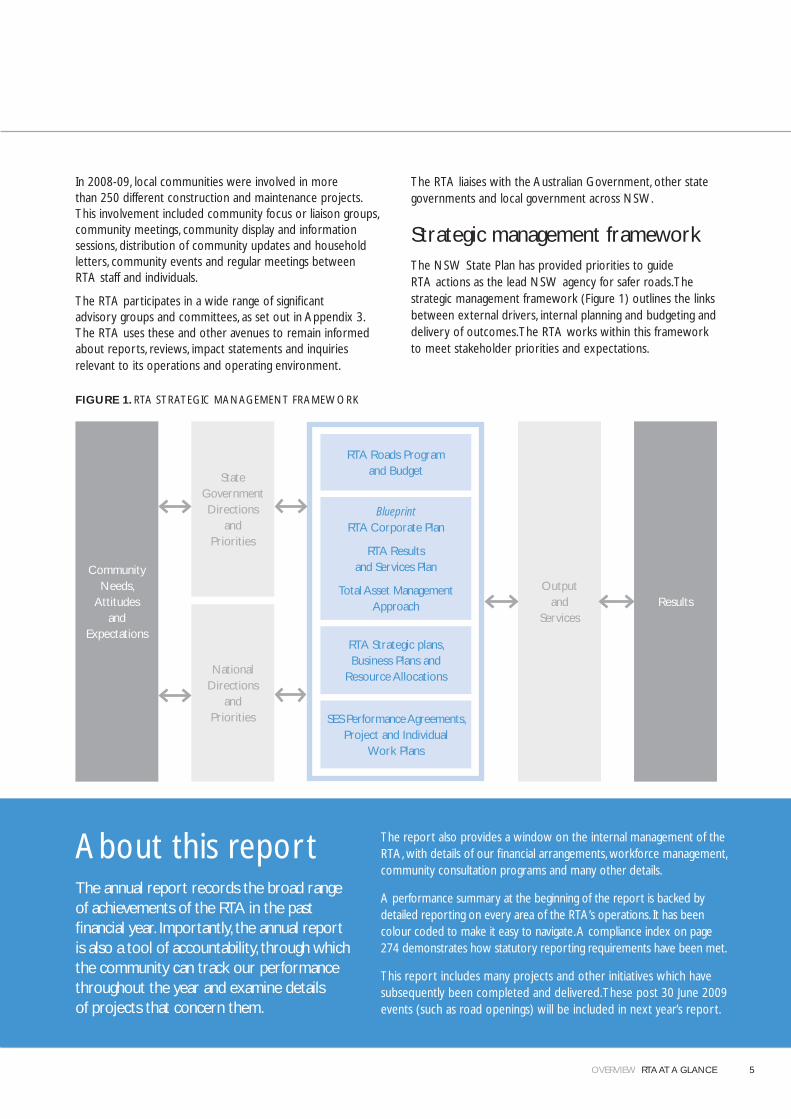
Strategic management frameworkThe NSW State Plan has provided priorities to guide RTA actions as the lead NSW agency for safer roads. The strategic management framework (Figure 1) outlines the links between external drivers, internal planning and budgeting and delivery of outcomes. The RTA works within this framework to meet stakeholder priorities and expectations.
About this reportThe annual report records the broad range of achievements of the RTA in the past fi nancial year. Importantly, the annual report is also a tool of accountability, through which the community can track our performance throughout the year and examine details of projects that concern them.
The report also provides a window on the internal management of the RTA, with details of our fi nancial arrangements, workforce management, community consultation programs and many other details.
A performance summary at the beginning of the report is backed by detailed reporting on every area of the RTA’s operations. It has been colour coded to make it easy to navigate. A compliance index on page 274 demonstrates how statutory reporting requirements have been met.
This report includes many projects and other initiatives which have subsequently been completed and delivered. These post 30 June 2009 events (such as road openings) will be included in next year’s report.
FIGURE 1. RTA STRATEGIC MANAGEMENT FRAMEWORK
ResultsOutput
and Services
Community Needs,
Attitudes and
Expectations
RTA Roads Program and Budget
SES Performance Agreements, Project and Individual
Work Plans
Blueprint RTA Corporate Plan
RTA Results and Services Plan
Total Asset Management Approach
RTA Strategic plans, Business Plans and
Resource AllocationsNational
Directions and
Priorities
State Government Directions
and Priorities
Performance overview
6 PERFORMANCE OVERVIEW OVERVIEW
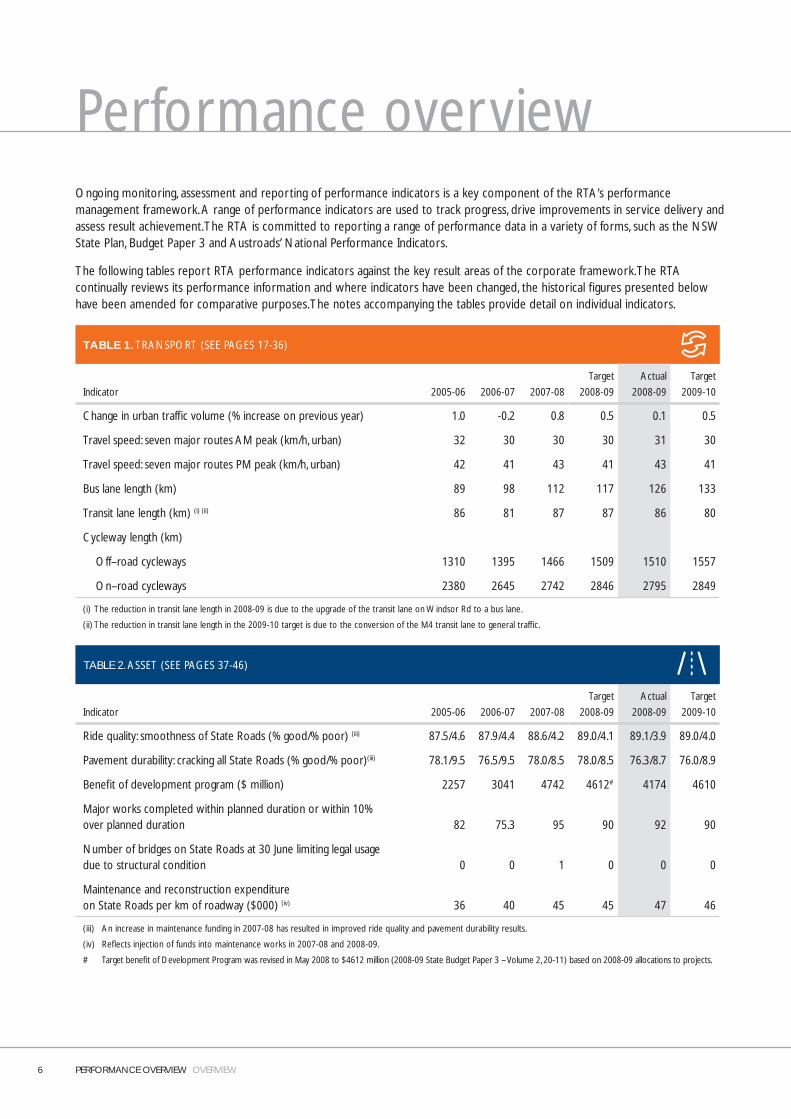
Ongoing monitoring, assessment and reporting of performance indicators is a key component of the RTA’s performance management framework. A range of performance indicators are used to track progress, drive improvements in service delivery and assess result achievement. The RTA is committed to reporting a range of performance data in a variety of forms, such as the NSW State Plan, Budget Paper 3 and Austroads’ National Performance Indicators.
The following tables report RTA performance indicators against the key result areas of the corporate framework. The RTA continually reviews its performance information and where indicators have been changed, the historical fi gures presented below have been amended for comparative purposes. The notes accompanying the tables provide detail on individual indicators.
TABLE 1. TRANSPORT (SEE PAGES 17-36)
Indicator 2005-06 2006-07 2007-08
Target
2008-09
Actual
2008-09
Target
2009-10
Change in urban traffi c volume (% increase on previous year) 1.0 -0.2 0.8 0.5 0.1 0.5
Travel speed: seven major routes AM peak (km/h, urban) 32 30 30 30 31 30
Travel speed: seven major routes PM peak (km/h, urban) 42 41 43 41 43 41
Bus lane length (km) 89 98 112 117 126 133
Transit lane length (km) (i) (ii) 86 81 87 87 86 80
Cycleway length (km)
Off–road cycleways 1310 1395 1466 1509 1510 1557
On–road cycleways 2380 2645 2742 2846 2795 2849
(i) The reduction in transit lane length in 2008-09 is due to the upgrade of the transit lane on Windsor Rd to a bus lane.
(ii) The reduction in transit lane length in the 2009-10 target is due to the conversion of the M4 transit lane to general traffi c.
TABLE 2. ASSET (SEE PAGES 37-46)
Indicator 2005-06 2006-07 2007-08
Target
2008-09
Actual
2008-09
Target
2009-10
Ride quality: smoothness of State Roads (% good/% poor) (iii) 87.5/4.6 87.9/4.4 88.6/4.2 89.0/4.1 89.1/3.9 89.0/4.0
Pavement durability: cracking all State Roads (% good/% poor)(iii) 78.1/9.5 76.5/9.5 78.0/8.5 78.0/8.5 76.3/8.7 76.0/8.9
Benefi t of development program ($ million) 2257 3041 4742 4612# 4174 4610
Major works completed within planned duration or within 10% over planned duration 82 75.3 95 90 92 90
Number of bridges on State Roads at 30 June limiting legal usage due to structural condition 0 0 1 0 0 0
Maintenance and reconstruction expenditureon State Roads per km of roadway ($000) (iv) 36 40 45 45 47 46
(iii) An increase in maintenance funding in 2007-08 has resulted in improved ride quality and pavement durability results.
(iv) Refl ects injection of funds into maintenance works in 2007-08 and 2008-09.
# Target benefi t of Development Program was revised in May 2008 to $4612 million (2008-09 State Budget Paper 3 – Volume 2, 20-11) based on 2008-09 allocations to projects.
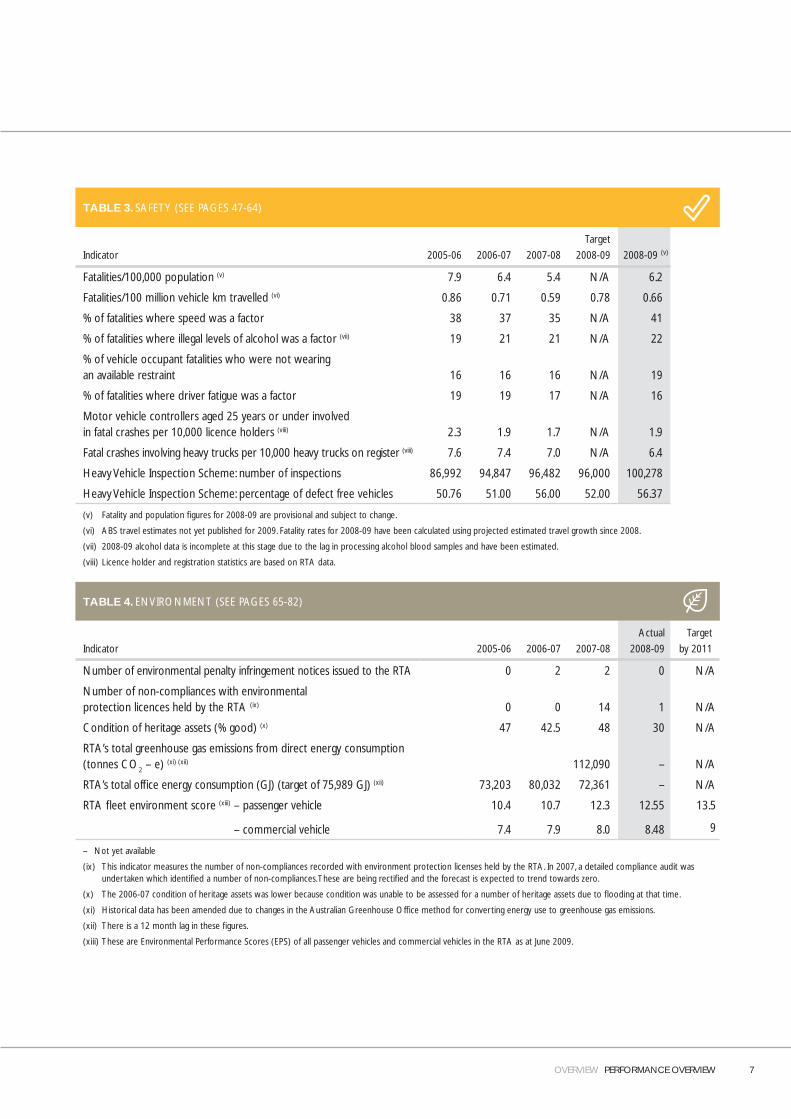
TABLE 3. SAFETY (SEE PAGES 47-64)
Indicator 2005-06 2006-07 2007-08
Target
2008-09 2008-09 (v)
Fatalities/100,000 population (v) 7.9 6.4 5.4 N/A 6.2
Fatalities/100 million vehicle km travelled (vi) 0.86 0.71 0.59 0.78 0.66
% of fatalities where speed was a factor 38 37 35 N/A 41
% of fatalities where illegal levels of alcohol was a factor (vii) 19 21 21 N/A 22
% of vehicle occupant fatalities who were not wearing an available restraint 16 16 16 N/A 19
% of fatalities where driver fatigue was a factor 19 19 17 N/A 16
Motor vehicle controllers aged 25 years or under involved in fatal crashes per 10,000 licence holders (viii) 2.3 1.9 1.7 N/A 1.9
Fatal crashes involving heavy trucks per 10,000 heavy trucks on register (viii) 7.6 7.4 7.0 N/A 6.4
Heavy Vehicle Inspection Scheme: number of inspections 86,992 94,847 96,482 96,000 100,278
Heavy Vehicle Inspection Scheme: percentage of defect free vehicles 50.76 51.00 56.00 52.00 56.37
(v) Fatality and population fi gures for 2008-09 are provisional and subject to change.
(vi) ABS travel estimates not yet published for 2009. Fatality rates for 2008-09 have been calculated using projected estimated travel growth since 2008.
(vii) 2008-09 alcohol data is incomplete at this stage due to the lag in processing alcohol blood samples and have been estimated.
(viii) Licence holder and registration statistics are based on RTA data.
TABLE 4. ENVIRONMENT (SEE PAGES 65-82)
Indicator 2005-06 2006-07 2007-08
Actual
2008-09
Target
by 2011
Number of environmental penalty infringement notices issued to the RTA 0 2 2 0 N/A
Number of non-compliances with environmental protection licences held by the RTA (ix) 0 0 14 1 N/A
Condition of heritage assets (% good) (x) 47 42.5 48 30 N/A
RTA’s total greenhouse gas emissions from direct energy consumption (tonnes CO2 – e) (xi) (xii) 112,090 – N/A
RTA’s total offi ce energy consumption (GJ) (target of 75,989 GJ) (xii) 73,203 80,032 72,361 – N/A
RTA fl eet environment score (xiii) – passenger vehicle 10.4 10.7 12.3 12.55 13.5
– commercial vehicle 7.4 7.9 8.0 8.48 9
– Not yet available
(ix) This indicator measures the number of non-compliances recorded with environment protection licenses held by the RTA. In 2007, a detailed compliance audit was undertaken which identifi ed a number of non-compliances. These are being rectifi ed and the forecast is expected to trend towards zero.
(x) The 2006-07 condition of heritage assets was lower because condition was unable to be assessed for a number of heritage assets due to fl ooding at that time.
(xi) Historical data has been amended due to changes in the Australian Greenhouse Offi ce method for converting energy use to greenhouse gas emissions.
(xii) There is a 12 month lag in these fi gures.
(xiii) These are Environmental Performance Scores (EPS) of all passenger vehicles and commercial vehicles in the RTA as at June 2009.
OVERVIEW PERFORMANCE OVERVIEW 7

8 PERFORMANCE OVERVIEW OVERVIEW
TABLE 5. SERVICES (SEE PAGES 83-92)
Indicator 2005-06 2006-07 2007-08
Target
2008-09
Actual
2008-09
Target
2009-10
Use of RTA website (million visits) 11.35 13.97 16.45 N/A 21 N/A
Customers rating service as ‘good or very good’ (%) 95 93 93 ≥ 90 94 ≥ 90
TABLE 6. GOVERNANCE (SEE PAGES 93-112)
Indicator 2005-06 2006-07 2007-08
Target
2008-09
Actual
2008-09
Target
2009-10
Workplace injuries/100 employees (EFT) 7.0 6.4 6.1 5.6 4.9 5.1
OHS liability workplace claims costs ($ million) (xv) 2.4 2.2 2.2 N/A 2.2 N/A
Separation rate of staff (%) (xvi) 6.29 8.46 8.4 N/A 7.62 N/A
(xv) Excludes journey and recess away claims (those occurring at lunch time away from the workplace). The liability target of $2.6 million is based on the Working Together pro rata target for 2006-07 of $6000 per claim and a reported result of 430 claims.
(xvi) Separation rate is the proportion of staff that left the organisation. It includes salaried, wages and casual staff. The actual separation rate for 2005-06 was 9.92%. School Crossing Supervisors (accounting for 3.63% of the separations) were excluded from the annual separation fi gures resulting in an annual separation rate of 6.29%.

OVERVIEW FINANCIAL OVERVIEW 9
Underpinning RTA business deliveryIn 2008-09, a key focus for the RTA’s Finance and Performance Directorate was working in partnership with other business areas to ensure that program delivery and investment decisions were underpinned by solid fi nancial principles.
This focus has been supported by the RTA Finance Strategy Committee which, in its governance role, has provided strong direction for the alignment and allocation of funding to strategic priorities, and review and evaluation of budget performance across all RTA programs.
A number of initiatives also supported this approach, including:
• Completion of a major upgrade of the Financial Information Management System in November 2008.
• The enhancement of specialist fi nancial support to the RTA through the establishment of the Corporate Finance Strategy and Commercial Strategy Development teams, both of which directly contribute to the delivery of the RTA corporate plan.
• Partnerships between the Corporate Finance Strategy team and directorates to provide high level fi scal and economic leadership. This allows the RTA to optimise the benefi ts of public/private partnership road infrastructure projects and deliver sustainable revenue streams to contribute to the RTA roads program.
• Work of the specialist Commercial Strategy and Development team across the RTA to drive a commercial approach to management of businesses and identify and develop commercial opportunities to contribute to the funding of core RTA programs.
• Development of a dedicated management system to track the fi nancial aspects of all public/private partnerships arrangements over the full span of each contract.
Financial performanceQuantitative examples of the RTA’s effective fi nancial management include:
• Management of its $4.3 billion funding and expenditure program.
• Generation of $64.3 million gross revenue from the sale of surplus property and leasing of residual property.
• Maintenance of revenue levels for the sales of general goods and services in a diffi cult economic climate.
• Management of property information relating to $3.0 billion of property assets.
Detailed fi nancial results are shown in the Financial Statements section (see page 113).
Financial overview
10 FINANCIAL OVERVIEW OVERVIEW
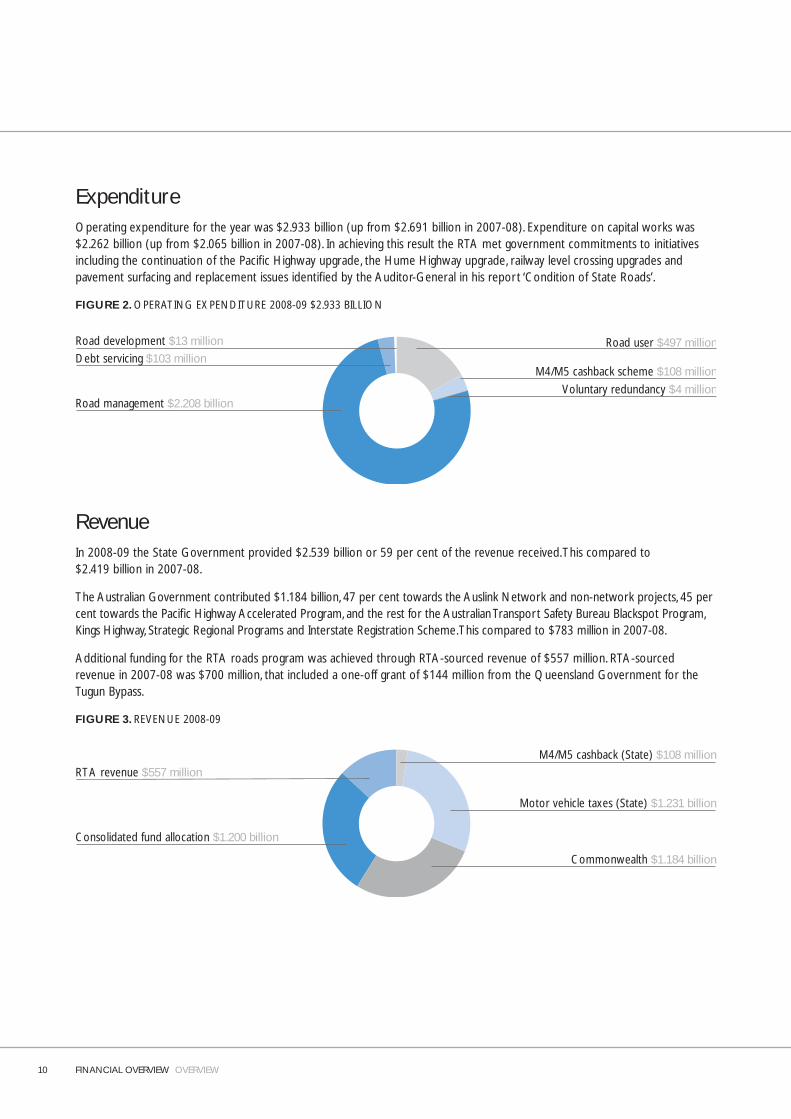
ExpenditureOperating expenditure for the year was $2.933 billion (up from $2.691 billion in 2007-08). Expenditure on capital works was $2.262 billion (up from $2.065 billion in 2007-08). In achieving this result the RTA met government commitments to initiatives including the continuation of the Pacifi c Highway upgrade, the Hume Highway upgrade, railway level crossing upgrades and pavement surfacing and replacement issues identifi ed by the Auditor-General in his report ‘Condition of State Roads’.
FIGURE 2. OPERATING EXPENDITURE 2008-09 $2.933 BILLION
Road development $13 million
M4/M5 cashback scheme $108 million
Road management $2.208 billion Voluntary redundancy $4 million
Road user $497 millionDebt servicing $103 million
RevenueIn 2008-09 the State Government provided $2.539 billion or 59 per cent of the revenue received. This compared to $2.419 billion in 2007-08.
The Australian Government contributed $1.184 billion, 47 per cent towards the Auslink Network and non-network projects, 45 per cent towards the Pacifi c Highway Accelerated Program, and the rest for the Australian Transport Safety Bureau Blackspot Program, Kings Highway, Strategic Regional Programs and Interstate Registration Scheme. This compared to $783 million in 2007-08.
Additional funding for the RTA roads program was achieved through RTA-sourced revenue of $557 million. RTA-sourced revenue in 2007-08 was $700 million, that included a one-off grant of $144 million from the Queensland Government for the Tugun Bypass.
FIGURE 3. REVENUE 2008-09
Consolidated fund allocation $1.200 billion
Motor vehicle taxes (State) $1.231 billion
M4/M5 cashback (State) $108 million
Commonwealth $1.184 billion
RTA revenue $557 million

OVERVIEW ORGANISATIONAL CHART 11
Organisational chartThe RTA is made up of seven directorates supported by the Environment branch, Governance branch and General Counsel that work closely together to achieve results in all key areas. These business areas and their key tasks are outlined below.
DIRECTOR MAJOR INFRASTRUCTURE
• Managing the Road Development Program.• Project management services and contract
administration.• Acting as the Principal for infrastructure projects.• Promoting best practice in project and
contract management.• Managing RTA’s strategy and policy for
infrastructure contracts.• Managing tendering processes, property acquisition
and the design and construction of motorways, and providing expert advice on tunnel technology.
• Managing the upgrading of the Pacifi c and Hume Highways.
• Managing the community involvement and communications process for infrastructure planning, development and maintenance.
DIRECTOR REGIONAL OPERATIONS & ENGINEERING SERVICES
• Regional construction and maintenance program.• Regional asset and network management.• Integrated delivery of network enhancement,
network maintenance, road safety and traffi c management programs.
• Specialist engineering and technical advice.• Bridge engineering.• Road design.• Pavements and geotechnical engineering.• Intelligent transport systems.• Surveys.• Road and fl eet services.
DIRECTOR FINANCE & PERFORMANCE
• Monitoring and evaluating fi nancial performance in all key areas.
• Provision of high-level fi nancial and commercial advice to support strategic business decision-making.
• Leading improvements in budgeting and investment decision-making.
• Ensuring fi nancial and commercial discipline in the utilisation of the RTA’s real estate portfolio.
• Strategic management of risk exposures.• Contributing to effective management of
RTA assets and fi nancial resources.• RTA wide service support. • Corporate planning and driving
organisational performances.
DIRECTOR ROAD SAFETY
• Road safety strategy, policy, legislation and guidelines.
• Road safety in road design, construction, maintenance and operation.
• Improve positive road user behaviour.• Road safety in vehicle design, construction
and maintenance.• Road safety research.• Road safety related data, evidence and advice.• Emerging road safety technology.
DIRECTOR LICENSING, REGISTRATION & FREIGHT
• Legislation and regulation development and compliance.
• Individual and industry compliance and enforcement, including heavy vehicles, tow trucks and auto trade sectors.
• Assessment, licensing and education of drivers and riders.
• Assessment and registration of vehicles.• Customer services and products.• Identity management processes.• Freight policy. • Reduction of vehicle emissions. • Sanctions and prosecutions management. • National transport reform. • Tolling operations.
DIRECTOR NETWORK MANAGEMENT
• Network planning.• Road Network Investment Strategy.• Travel demand management.• Maintenance and enhancement.• Motorway management.• Traffi c systems.• Traffi c facilities asset management• Incident and event management.• Tolling facilities and processes.• Bus priority initiatives on strategic corridors.• Pedestrian and cyclist facilities.• Railway level crossing enhancements.• Road use information.• Road environment safety program.• Operational performance of the road network.
CHIEF EXECUTIVE
Delivery of corporate vision and results in support of NSW Government priorities.
DIRECTOR CORPORATE SERVICES • Healthy and safe workplace. • Leadership and workforce
capability management.• Communication and education.• Industrial relations.• Community liaison consultation
and inquiries.• Internal communication.• Information technology.• Freedom of Information, privacy
and contract reporting.• Marketing and media.• Ministerial correspondence.
GENERAL MANAGER ENVIRONMENT
• Environment policies, procedures and advice.
• Management of environmental risks.
• Environment and heritage asset management.
• Review environmental outcomes for project planning and delivery.
• Contribute to government environmental objectives.
GENERAL COUNSEL LEGAL BRANCH
• Legal representation.• Legal strategy, policy
and advice.• Specialist legal services.• Legal risk framework
development.
GENERAL MANAGER, GOVERNANCE
• Governance.• Risk Management.• Audit / Assurance.• Fraud and Corruption Prevention.• Fraud and Corruption
Investigations.
• Organisational management and improvement.
• Inter-agency planning and delivery.• Network development and management.
• Road safety.• Service delivery to road users.

12 EXECUTIVE PROFILES OVERVIEW
Executive profi lesAs at 30 June 2009
Michael Bushby | Chief ExecutiveBE, BBus, MEng (Project and Construction Management), FAICD, MIE (Aust)
Michael has nearly 30 years’ career experience, with a focus on managing state road networks in Tasmania and New South Wales. He was responsible for Tasmania’s state road network before moving to NSW in 1998 to take up the role of General Manager, Infrastructure Maintenance, at the RTA. Michael has for periods held the roles of Director, Road Safety, Licensing and Vehicle Management and Director, Network Management. After a period acting in the role, Michael was appointed Chief Executive of the RTA in July 2009.
Peter Collins | A/Director, Network ManagementBE (Civil)
Peter has more than 38 years’ experience with the RTA. He has progressed through the engineering ranks since beginning as an RTA cadet and has held positions all over the State including Regional Manager, Northern Region. Peter has worked on a range of major road projects including the upgrade of the Pacifi c Highway. From 16 February this year, Peter assumed responsibility for leading the planning, management and maintenance of the road network as Acting Director of the Network Management Directorate. His substantive role is Director Regional Operations and Engineering Services.
Paul Hesford | Director, Finance and PerformanceBSc(Hons),CA (ICAEW)
Paul Hesford was appointed to his current position in July 2008 after working in various roles for the RTA since 2005. Previously, he was the Group Financial Controller in the Asia Pacifi c Region for a US group. He has been Senior Manager for Audit for KPMG in its Darwin offi ce and was Financial Controller for the government-owned Power and Water Authority. Before moving to Australia, Paul was a Chartered Accountant at KPMG in Britain.
Ann King | Director, Licensing Registration and Freight
Ann has more than 25 years’ experience in customer-focused senior executive roles in both the public and private sector. Before joining the RTA, Ann held a number of director and senior management roles with companies including Nokia, Vodafone and NIB. Leading over 1600 people, Ann’s various responsibilities include licensing and educating the State’s 4.72 million licence holders, managing State and national freight programs, managing compliance and enforcement programs, regulating the heavy vehicle and tow truck industries and leading various environmental initiatives. Ann has also designed industry award winning customer service offerings within the RTA’s contact centre, property and e-business disciplines.
Rod Tout | Director, Corporate ServicesDip.Pub.Admin, BBus, MAdminLaw & Policy, Fellow AIM
Rod has worked in seven government organisations at State and Commonwealth level, including a central government agency, the federal courts, commercialised business and direct public service-delivery agencies. Rod manages a range of services including human resources, technology, communications, health and safety and ministerial correspondence.

OVERVIEW EXECUTIVE PROFILES 13
Dr Soames Job | Director, Centre for Road SafetyPhD (psychology), BA (fi rst class honours in Psychology)
Soames has more than 25 years’ experience in program management, delivery, research, policy analysis and development in road safety. Soames was a key player in the introduction of random breath testing to NSW in his former position as Head of the then Alcohol and Drug Division of the Traffi c Accident Centre. Soames has led the implementation of the RTA Safe Systems Partnership approach to road safety and is listed in Who’s Who in the World, Who’s Who in Science and Technology, Who’s Who in Health and Medicine, and the Cambridge International Biographical Centre’s 2000 Outstanding People of the 20th Century for his work in road safety and health psychology. Soames’ scientifi c publications include four books, 17 book chapters, more than 360 scientifi c papers and more than 260 conference papers.
Mike Veysey | A/Director, Regional Operations and Engineering ServicesBE, MEngSc, Dip LR & Law
Mike has more than 30 years’ experience in State and local government and has held a number of senior executive positions in the RTA including General Manager, Technology Strategy, and Regional Manager, Sydney. Mike is responsible for regional asset and network management and delivering regional construction and maintenance programs. He is also responsible for providing specialist engineering and technical support across the RTA.
Brian Watters | Director, Major InfrastructureBSc (Civil), MEngSc (Transport), Dip TCP
Brian has more than 35 years’ experience in transport planning, infrastructure development and program management. He has been involved in the planning of most major road projects in NSW over the past 24 years, and has worked closely with other government agencies. Notable projects have included the planning and procurement of the Sydney Harbour Tunnel as NSW’s fi rst Public Private Partnership and planning of the Eastern Distributor, M5 and Westlink M7 motorways and the Lane Cove Tunnel.
Erica Adamson | General Manager, EnvironmentBSc, MSc (Hons), LLB
Erica has extensive environmental management experience in the private and government sectors, including planning, assessment and delivery of some of Sydney’s largest transport infrastructure projects – the Airport Railway Line, Chatswood to Epping Railway and the Lane Cove Tunnel. Erica has responsibility for environmental direction, policy and performance improvement across RTA.
Rob McCarthy | General Manager, Governance BranchACA
Rob is a Chartered Accountant with more than 35 years’ experience in the accounting profession, banking and the RTA. Before joining the RTA, he held a range of senior executive positions. He has been responsible for a number of major projects including the conversion of a building society to a trading bank, the start of a life insurance company and the implementation of a risk management process across the RTA.
As at 30 June 2009 the Legal Counsel position was vacant.
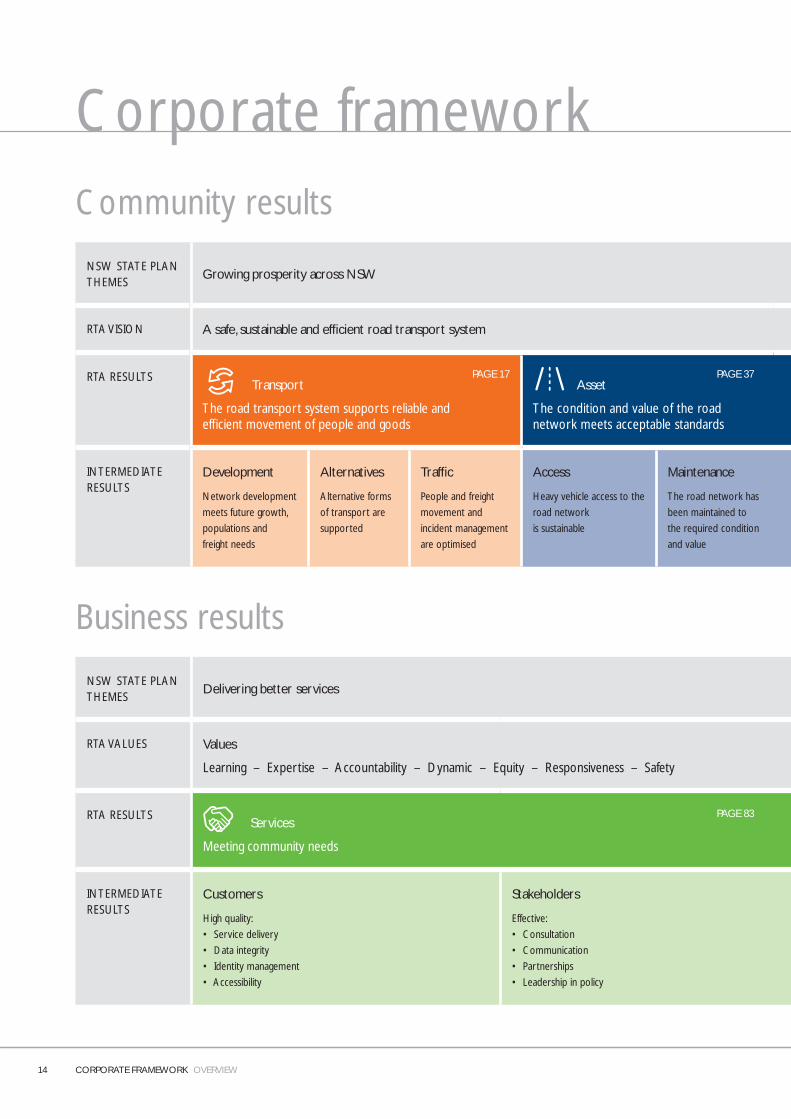
Corporate frameworkCommunity results
NSW STATE PLAN THEMES
Growing prosperity across NSW
RTA VISION A safe, sustainable and effi cient road transport system
RTA RESULTS Transport
The road transport system supports reliable and effi cient movement of people and goods
Asset
The condition and value of the road network meets acceptable standards
INTERMEDIATE RESULTS
Development
Network development
meets future growth,
populations and
freight needs
Alternatives
Alternative forms
of transport are
supported
Traffi c
People and freight
movement and
incident management
are optimised
Access
Heavy vehicle access to the
road network
is sustainable
Maintenance
The road network has
been maintained to
the required condition
and value
Business results
NSW STATE PLANTHEMES
Delivering better services
RTA VALUES Values
Learning – Expertise – Accountability – Dynamic – Equity – Responsiveness – Safety
RTA RESULTS Services
Meeting community needs
INTERMEDIATE RESULTS
Customers
High quality:
• Service delivery
• Data integrity
• Identity management
• Accessibility
Stakeholders
Effective:
• Consultation
• Communication
• Partnerships
• Leadership in policy
PAGE 17 PAGE 37
PAGE 83
14 CORPORATE FRAMEWORK OVERVIEW

Delivering better services Environment for living
Safety
The safety of the road environment, vehicles and road user behavior is maximised
Environment
Impacts on the natural, cultural and built environments are minimised
Roads
The safety of the
road environment
is maximised
Vehicles
The safety
of vehicles is
maximised
Users
The safety of road
user behavior is
maximised
Infrastructure
The impact of roadworks
on the environment is
minimised and positive urban
design outcomes produced
Organisational
Use less resources,
reduce waste and
reduce our footprint
Emissions
Contribute to
a reduction in
vehicle emissions
Fairness and opportunity
Governance
Aligning our investment and people to our vision
Financial
Advanced:
• Business opportunities
• Accountability
• Financial performance
Organisational
High quality:
• Planning and risk management
• Performance management
• Operational and information systems
• Reporting framework
Our people
Delivering:
• High performance culture
• Workforce capability
• Diversity and equity
• Occupational Health and Safety (OHS)
PAGE 47 PAGE 65
PAGE 93
OVERVIEW CORPORATE FRAMEWORK 15
Corporate frameworkThe RTA’s corporate framework, which forms the basis of this report’s structure, expresses the alignment between government priorities, and the RTA’s vision, values and result areas. The framework clearly sets out the results that the RTA is working towards. The framework provides a basis for integrated performance reporting that is aligned with business plans, the corporate plan and key result areas. The framework is consistent with NSW Treasury’s results and services planning and reporting requirements.
Sustainability principles are recognised in the framework’s inclusion of economic, social, and environmental results. The framework enhances the shared responsibility principle where NSW Government agencies work in partnerships with other government agencies, local councils, the private sector and other stakeholders to achieve outcomes.
The framework is a tool used to demonstrate the contribution the RTA makes to the NSW State Plan and other government priorities and ensures that its strategies are transparent, accountable and fi scally responsible.
Corporate plan – BlueprintThe RTA corporate plan, Blueprint, sets the priorities and milestones for the short term. The Blueprint agenda does not cover all aspects of the RTA’s operations, but clearly demonstrates our areas of focus. These are the tasks the organisation has set itself to achieve:
• Managing Sydney roads.
• Managing rural and regional roads.
• Transporting freight.
• Improving maintenance.
• Advancing business opportunities.
• Improving road safety.
• Improving services.
• Developing careers.
• The Green Plan.
To ensure a focus on the implementation of the RTA Blueprint within the broad scope of the RTA’s responsibilities, the RTA Blueprint commitments have been integrated into existing RTA business planning and monitoring mechanisms. The following icon is used throughout this report to highlight where signifi cant work has progressed on an RTA Blueprint related activity.
The RTA continues the commitment to delivering the Blueprint through a focus on the corporate framework and agenda items.
Blueprint is aligned with the NSW State Plan, clearly outlines the corporate framework and provides the direction for the RTA over the coming years to achieve its results and deliver its services. Blueprint drives the organisational planning and performance management processes.
Blueprint can be viewed in full at www.rta.nsw.gov.au
16 CORPORATE FRAMEWORK OVERVIEW
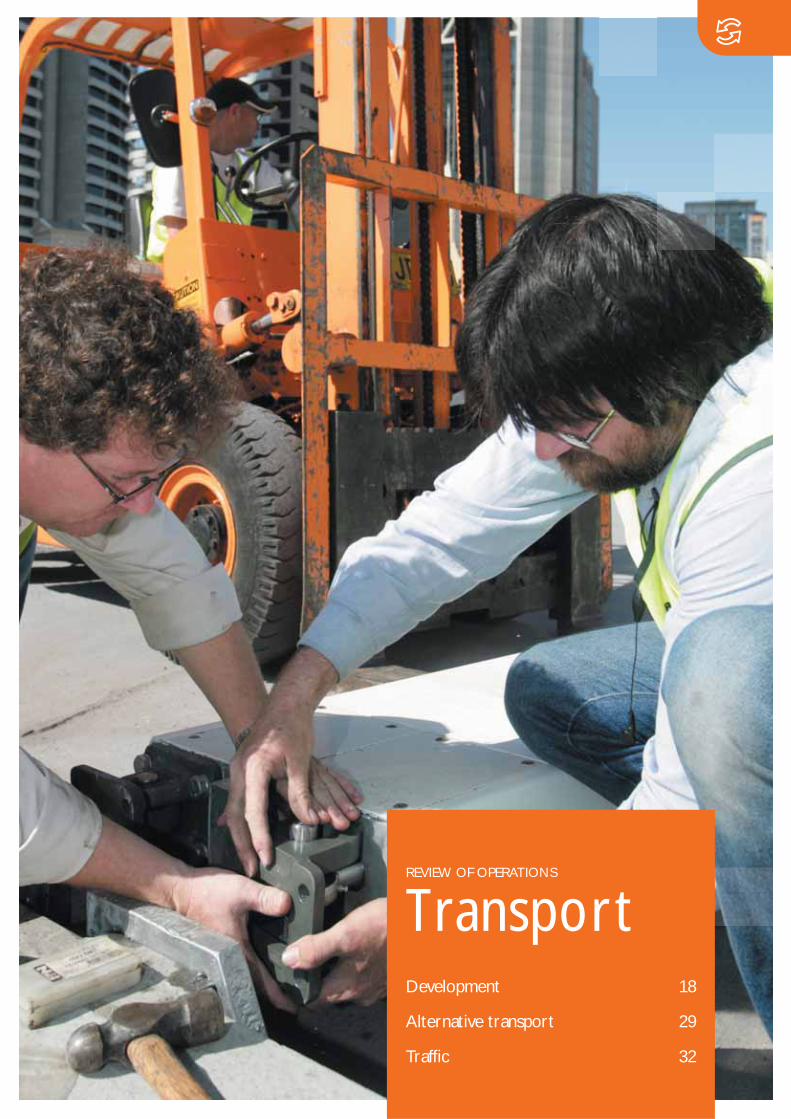
REVIEW OF OPERATIONS
TransportDevelopment 18
Alternative transport 29
Traffi c 32
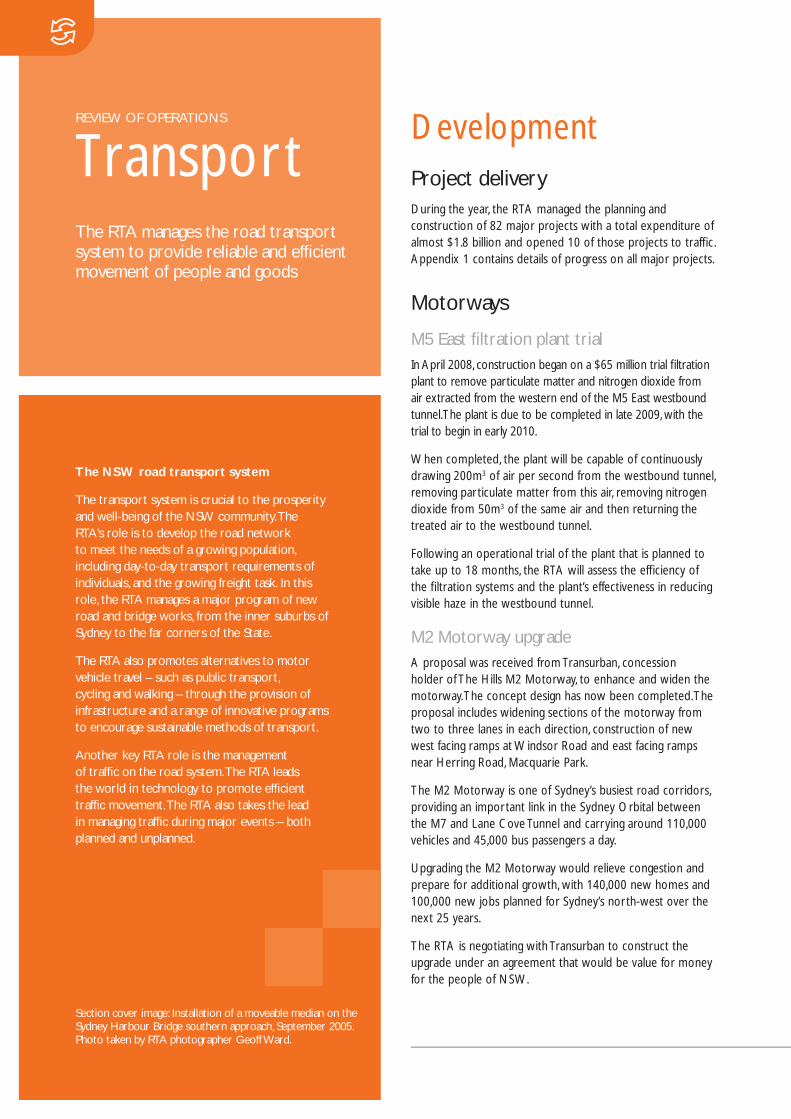
DevelopmentProject delivery During the year, the RTA managed the planning and construction of 82 major projects with a total expenditure of almost $1.8 billion and opened 10 of those projects to traffi c. Appendix 1 contains details of progress on all major projects.
Motorways
M5 East fi ltration plant trialIn April 2008, construction began on a $65 million trial fi ltration plant to remove particulate matter and nitrogen dioxide from air extracted from the western end of the M5 East westbound tunnel. The plant is due to be completed in late 2009, with the trial to begin in early 2010.
When completed, the plant will be capable of continuously drawing 200m3 of air per second from the westbound tunnel, removing particulate matter from this air, removing nitrogen dioxide from 50m3 of the same air and then returning the treated air to the westbound tunnel.
Following an operational trial of the plant that is planned to take up to 18 months, the RTA will assess the effi ciency of the fi ltration systems and the plant’s effectiveness in reducing visible haze in the westbound tunnel.
M2 Motorway upgradeA proposal was received from Transurban, concession holder of The Hills M2 Motorway, to enhance and widen the motorway. The concept design has now been completed. The proposal includes widening sections of the motorway from two to three lanes in each direction, construction of new west facing ramps at Windsor Road and east facing ramps near Herring Road, Macquarie Park.
The M2 Motorway is one of Sydney’s busiest road corridors, providing an important link in the Sydney Orbital between the M7 and Lane Cove Tunnel and carrying around 110,000 vehicles and 45,000 bus passengers a day.
Upgrading the M2 Motorway would relieve congestion and prepare for additional growth, with 140,000 new homes and 100,000 new jobs planned for Sydney’s north-west over the next 25 years.
The RTA is negotiating with Transurban to construct the upgrade under an agreement that would be value for money for the people of NSW.
The NSW road transport system
The transport system is crucial to the prosperity and well-being of the NSW community. The RTA’s role is to develop the road network to meet the needs of a growing population, including day-to-day transport requirements of individuals, and the growing freight task. In this role, the RTA manages a major program of new road and bridge works, from the inner suburbs of Sydney to the far corners of the State.
The RTA also promotes alternatives to motor vehicle travel – such as public transport, cycling and walking – through the provision of infrastructure and a range of innovative programs to encourage sustainable methods of transport.
Another key RTA role is the management of traffi c on the road system. The RTA leads the world in technology to promote effi cient traffi c movement. The RTA also takes the lead in managing traffi c during major events – both planned and unplanned.
Section cover image: Installation of a moveable median on the Sydney Harbour Bridge southern approach, September 2005. Photo taken by RTA photographer Geoff Ward.
REVIEW OF OPERATIONS
TransportThe RTA manages the road transport system to provide reliable and effi cient movement of people and goods

REVIEW OF OPERATIONS TRANSPORT 19
M5 Motorway wideningA proposal was received from Interlink Roads, concession holder of the M5 Motorway, to widen sections of the motorway to three lanes in each direction between Camden Valley Way and King Georges Road.
High traffi c volumes on the M5 Motorway, especially during peak periods. Widening the M5 from four to six lanes would improve the level of service and help cater for future growth in south-west Sydney.
The RTA is expecting a revised proposal and will then negotiate with Interlink Roads to construct the upgrade under an agreement that would be value for money for the people of NSW.
M5 transport corridor studyThe Australian and NSW governments have committed $15 million for a feasibility study into potential improvements to the M5 transport corridor between Port Botany/Sydney Airport and south-west Sydney.
The study would result in a preferred transport strategy that outlines improvements to public transport services and capacity enhancement options for the M5 East Motorway.
The study is being overseen by a task force convened by the NSW Coordinator General, and includes the Chief Executive of the RTA and senior representatives from NSW Transport and Infrastructure, the Department of Planning and NSW Treasury.
M4 Motorway extension The M4 Motorway services a signifi cant economic corridor, from Penrith through Sydney Olympic Park to the city, which is expected to grow considerably in population and employment density. The NSW Government’s Metropolitan Strategy for Sydney, released in December 2005, highlighted the critical signifi cance of better linkages between Port Botany, Sydney Airport and Western Sydney.
Feasibility studies have been carried out to examine options to extend the M4 Motorway east of its termination at North Strathfi eld to the city and Port Botany and Sydney Airport. Motorway options were submitted to Infrastructure Australia for its consideration of national priority projects and for potential funding in late 2008. However, no funds were committed to the project from the Building Australia Fund (announced in conjunction with the May 2009 federal budget).
If a decision is made by the NSW Government to proceed with planning for the project, further development activities and a detailed environmental assessment will be undertaken before construction begins. Community and stakeholder involvement would form an important component of the development phase.
F3 Freeway to M2 Motorway link A proposed motorway would connect the F3 Freeway at Wahroonga with the M2 at Carlingford. This motorway would fi ll a missing link in the national highway network between Melbourne and Brisbane.
In May 2004, the Australian Government announced a preferred corridor option for the link. Following the announcement, a number of representations were received from the community. A subsequent independent review of the corridor selection process, published in August 2007, concluded that the original 2004 study recommendations should be upheld: that is, the preferred Pennant Hills Road or ‘Purple Route’ corridor option should be progressed and an additional western corridor should be separately planned.
A proposal was submitted to Infrastructure Australia for its consideration of national priority projects and for potential funding in late 2008. However, no funds were committed to the project from the Building Australia Fund (announced in conjunction with the May 2009 federal budget).
If a decision is made by the NSW Government to proceed with planning for the project, further development activities and a detailed environmental assessment will be undertaken before construction begins. Community and stakeholder involvement would form an important component of the development phase.
Lane Cove TunnelThe Lane Cove Tunnel was opened on 25 March 2007. The tunnel provides a link between the M2 Motorway and the Gore Hill Freeway and completed the Sydney Orbital Motorway network, connecting the north-west sector of Sydney with the city. New ramps have been provided to and from the north, between Falcon Street at Neutral Bay and the Warringah Freeway, to improve access to the Gore Hill Freeway–M2 corridor.
Stage 2 of the project, which included the reconfi guration of Epping Road, and the introduction of bus lanes and a shared pedestrian/cycle path, was opened for use in March 2008. Transit lanes were also introduced on the widened Gore Hill Freeway from the Pacifi c Highway to the Warringah Freeway. Final landscaping was completed in September 2008. Local road amenity has been improved by introducing right turn access into Parklands Avenue and Centennial Avenue, Lane Cove.
In the fi rst half of 2009, the tunnel was being used by around 58,000 vehicles every weekday. Tolling is fully electronic and interoperable with other Sydney toll roads.
Connector Motorways Pty Ltd has a contract to operate and maintain the tunnel and adjoining motorway areas for 30 years.
20 TRANSPORT REVIEW OF OPERATIONS
Following community consultation for the Falcon Street access ramps, the RTA determined a need for a new pedestrian/cycle bridge across the Warringah Freeway between Falcon Street at North Sydney and Merlin Street in Neutral Bay, providing direct access to Military Road.
The contract was awarded in July 2008 and construction of the new bridge and other pedestrian facilities began in September 2008. The $15 million project will provide a continuous, uninterrupted crossing for pedestrians and cyclists travelling along this busy route and is expected to be complete in August 2009.
Pacifi c Highway Upgrading Program The Pacifi c Highway not only links Sydney and Brisbane, it also passes through regions that continue to experience the State’s highest rates of population growth. This growth has increased pressure on the road transport system. In response, the RTA has overseen improvements in road infrastructure to allow safe and effi cient transport along the route.
The Pacifi c Highway is part of the National Land Transport Network. The Australian and NSW governments have been jointly upgrading the Pacifi c Highway since 1996.
The Pacifi c Highway upgrade is being delivered in three stages:
• Stage 1: Hexham to Port Macquarie, Raleigh to Woolgoolga and Ballina to the Queensland border.
• Stage 2: Port Macquarie to Raleigh.
• Stage 3: Woolgoolga to Ballina.
Together, the governments have committed $3.6 billion to continue the upgrade of the highway over the fi ve years to mid 2014 to complete Stage 1 and begin Stage 2.
By June 2009, 277km of the highway’s 667km length were four-lane divided road. Since 1995, the upgrade has achieved travel time savings of about 80 minutes for heavy vehicles and 70 minutes for light vehicles. A further 77km of upgraded highway are under construction, 75km are in preconstruction, 103km are being environmentally assessed and all other sections have the preferred route identifi ed with concept designs fi nalised for most of these.
The number of fatal crashes has fallen from 32 in 1996 to 28 in 2008, despite a 50 per cent increase in travel on much of the highway.
Karuah to Bulahdelah sections 2 and 3 Construction began in March 2007 on this $262 million project to provide 23km of dual carriageway, generally following the existing highway alignment. The project includes seven pairs of new bridges and rest areas on the northbound carriageway at Nerong Waterholes and the southbound carriageway at Browns Flat. The upgrade is on schedule to be completed in October 2009.
Bulahdelah Bypass Early work and detailed design began following planning approval in October 2007. The fi rst stage of early earthwork construction has been completed south of the Myall River. Tenders for the main contract are expected to be invited in late 2009.
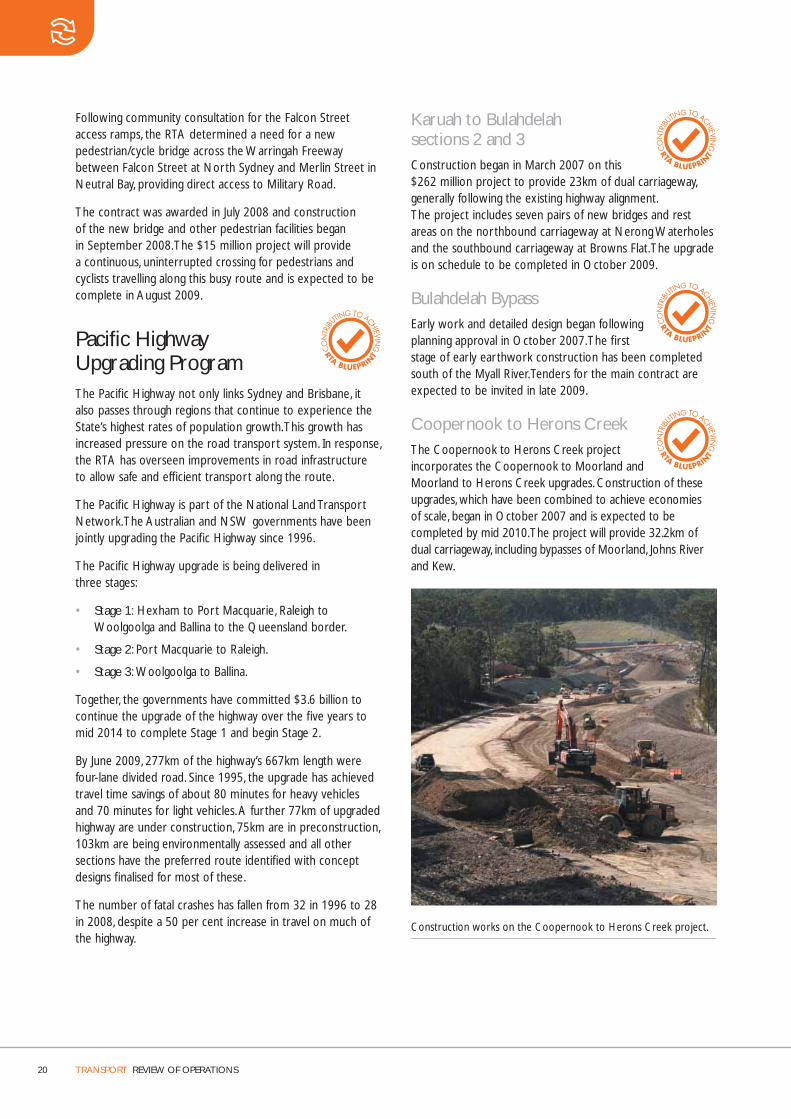
Coopernook to Herons Creek The Coopernook to Herons Creek project incorporates the Coopernook to Moorland and Moorland to Herons Creek upgrades. Construction of these upgrades, which have been combined to achieve economies of scale, began in October 2007 and is expected to be completed by mid 2010. The project will provide 32.2km of dual carriageway, including bypasses of Moorland, Johns River and Kew.
Construction works on the Coopernook to Herons Creek project.
REVIEW OF OPERATIONS TRANSPORT 21
Bonville Bypass The upgrade of this section of the highway between Perrys Road and Lyons Road south of Coffs Harbour was opened to traffi c in September 2008. Completion of the 9.9km-long, $233 million Bonville Bypass resulted in 19.5km of dual carriageway between Coffs Harbour and Urunga.
Ballina Bypass An alliance for the main construction of the bypass was formed in June 2008, and detailed design was completed in December 2008. Construction work is now well advanced.
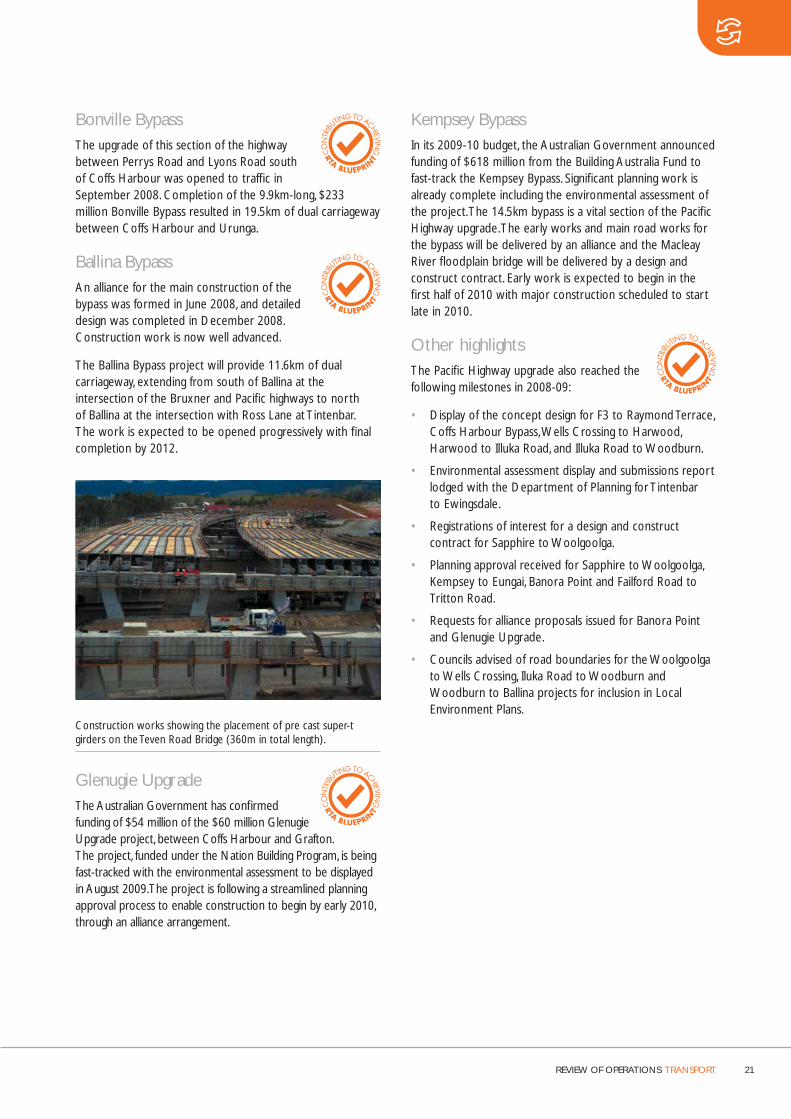
The Ballina Bypass project will provide 11.6km of dual carriageway, extending from south of Ballina at the intersection of the Bruxner and Pacifi c highways to north of Ballina at the intersection with Ross Lane at Tintenbar. The work is expected to be opened progressively with fi nal completion by 2012.
Construction works showing the placement of pre cast super-t girders on the Teven Road Bridge (360m in total length).
Glenugie Upgrade The Australian Government has confi rmed funding of $54 million of the $60 million Glenugie Upgrade project, between Coffs Harbour and Grafton. The project, funded under the Nation Building Program, is being fast-tracked with the environmental assessment to be displayed in August 2009. The project is following a streamlined planning approval process to enable construction to begin by early 2010, through an alliance arrangement.
Kempsey BypassIn its 2009-10 budget, the Australian Government announced funding of $618 million from the Building Australia Fund to fast-track the Kempsey Bypass. Signifi cant planning work is already complete including the environmental assessment of the project. The 14.5km bypass is a vital section of the Pacifi c Highway upgrade. The early works and main road works for the bypass will be delivered by an alliance and the Macleay River fl oodplain bridge will be delivered by a design and construct contract. Early work is expected to begin in the fi rst half of 2010 with major construction scheduled to start late in 2010.
Other highlights The Pacifi c Highway upgrade also reached the following milestones in 2008-09:
• Display of the concept design for F3 to Raymond Terrace, Coffs Harbour Bypass, Wells Crossing to Harwood, Harwood to Illuka Road, and Illuka Road to Woodburn.
• Environmental assessment display and submissions report lodged with the Department of Planning for Tintenbar to Ewingsdale.
• Registrations of interest for a design and construct contract for Sapphire to Woolgoolga.
• Planning approval received for Sapphire to Woolgoolga, Kempsey to Eungai, Banora Point and Failford Road to Tritton Road.
• Requests for alliance proposals issued for Banora Point and Glenugie Upgrade.
• Councils advised of road boundaries for the Woolgoolga to Wells Crossing, Iluka Road to Woodburn and Woodburn to Ballina projects for inclusion in Local Environment Plans.

22 TRANSPORT REVIEW OF OPERATIONS
Sydney projects
F3 Freeway, Cowan to Mount ColahConstruction began in January 2007 to widen an 11.5km section of the F3 Freeway between Cowan and Mount Colah from four to six lanes. The $104 million project is jointly funded by the Australian and NSW governments and is expected to be completed by late 2009. Once the project is completed, the F3 Freeway will have six continuous lanes between the southern end of the freeway at Wahroonga and the Gosford exit at Kariong, a distance of approximately 43km.
Alfords Point BridgeConstruction of the $42 million duplication of Alfords Point Bridge over the Georges River began in early 2007. The project, which opened to traffi c in August 2008, eliminated the need for tidal traffi c fl ow arrangements on the bridge.
Alfords Point Bridge, opened to traffi c in August 2008.
Alfords Point Bridge northern approachTenders for the Alfords Point Bridge northern approach were invited in December 2008 and a contract was awarded in June 2009. Construction is expected to begin in late 2009 with the fi nal stage to be opened in early 2011.
Bangor Bypass Stage 2Tenders for the Bangor Bypass Stage 2 were invited in December 2008 and awarded in June 2009. Construction is expected to begin in late 2009 with the project expected to be opened to traffi c in late 2010.
Mamre Road The Mamre Road/M4 overpass duplication was completed in February 2009 and is now providing benefi ts to both the local community and through traffi c by reducing congestion and delays, particularly during peak traffi c times.
Former Premier Morris Iemma, Dianne Beamer and the construction team during an inspection of the works on the $15 million Mamre Road bridge over the M4.
Hoxton Park Road Hoxton Park Road is being progressively upgraded to provide a divided road of at least four lanes and an off-road cycleway. It carries the Liverpool to Parramatta Bus T-way on two separate, central lanes between Banks Road and Brickmakers Creek. A contract was awarded in February 2009 for the $71 million fi nal section between Cowpasture Road and Banks Road and work is expected to be completed in early 2011.
Cowpasture Road Cowpasture Road is being progressively upgraded to a four-lane divided road for 12.8 km between the roundabout at The Horsley Drive, Wetherill Park, to Camden Valley Way, Leppington. The last two remaining lengths to be upgraded are from Main Street to Camden Valley Way and from North Liverpool Road to the M7 Motorway.
Construction of the $18 million upgrade from Main Street to Camden Valley Way began in June 2008 and is scheduled to be opened to traffi c in late 2009. A contract was awarded for the $72 million upgrade from North Liverpool Road to the M7 in November 2008 and work began in January 2009. Completion of this section is expected in early 2011.

REVIEW OF OPERATIONS TRANSPORT 23
Camden Valley Way In March 2009, the RTA invited tenders for the $65 million upgrade of Camden Valley Way from Bernera Road to Cowpasture Road. In addition, the RTA is progressing the concept design and environmental assessment for the four-lane upgrade of Camden Valley Way between Cowpasture Road and Narellan Road. Tenders are expected to be invited to construct the section between Cobbitty Road and Narellan Road by mid 2010.
Aerial photo of Camden Valley Way.
Great Western Highway The Great Western Highway upgrade program is improving travel times for motorists and providing a safer road environment for all road users including pedestrians and cyclists. The NSW Government has committed $360 million towards the upgrade, with the Australian Government contributing $100 million and committing a further $100 million.
Leura to KatoombaSection 1 of the Leura to Katoomba upgrade between Willow Park Avenue and East View Avenue was opened to traffi c in May 2006. Section 2, between East View Avenue and Bowling Green Avenue, was opened in March 2009. The major feature of this project is a grade separated interchange at Leura Mall to provide access for local road users and preserve local heritage.
Woodford to HazelbrookWork continued on the $160 million upgrade from Woodford to Hazelbrook, with the Oaklands Road local traffi c railway underpass and Hazelbrook Parade completed. Work continued on the highway widening between Winbourne Road and Ferguson Avenue and this work is expected to be opened to traffi c in September 2009. Tenders will be invited for the fi nal stage from Station Street to Winbourne Road in August 2009. This project is funded by the NSW and Australian governments.
Great Western Highway at Hazelbrook. The skywalk across Gloria Park has been constructed and is opened to pedestrians and cyclists.
LawsonConstruction of the $220 million upgrade between Ferguson Avenue and Ridge Street began in March 2009 under an alliance agreement. Construction is underway between Bass and Ridge streets and detailed design of the section between Ferguson Avenue and Bass Street is well advanced.
Wentworth Falls EastA contract has been awarded for the $115 million upgrade of the section between Tableland Road and Station Street. Construction began in June 2009 and is expected to be completed in early 2012. This project is funded by the NSW and Australian governments.
24 TRANSPORT REVIEW OF OPERATIONS
Mt Victoria to LithgowInvestigations and planning began to develop options for the upgrade of the highway between Mt Victoria and Lithgow. Community consultation for selection of a new route continued during the year. This project is funded by the NSW and Australian governments.
Other projects on the Great Western HighwayPlanning, investigations and environmental assessments continued on the remaining sections of the highway to be upgraded between Bullaburra and Wentworth Falls. The environmental assessment for Bullaburra to Wentworth Falls was completed in September 2008, and the Review of Environmental Factors for Bullaburra was displayed for community comment in June 2009.
Improving access between cities and regions
Hume HighwaySouthern Hume Highway Duplication
The Australian Government aims to have full dual carriageways on the Hume Highway between Sydney and Melbourne by 2012. There are 87km to upgrade between the Sturt Highway and Table Top, near Albury. In June 2006 the NSW and Australian governments signed a Memorandum of Understanding to accelerate 67km of duplication and the Australian Government provided $800 million to complete the work by December 2009. The interest earned on this funding will also be applied to the project. This will leave 20km of highway as single carriageway at Tarcutta, Holbrook and Woomargama.
Two alliance partners for the duplication were engaged in December 2006: the Northern Hume Alliance for 35km and the Hume Highway Southern Alliance for 32km. Work began in October 2007 and substantial work has been completed. The project is on track for completion by December 2009, with a variety of sections opening to traffi c from mid-2009.
Bypasses of Tarcutta, Holbrook and Woomargama
A contract was awarded in October 2007 to assist in the route selection and planning of the three bypasses. Preferred routes were confi rmed in September 2008 and planning approvals are expected in 2009-10. The bypasses of Tarcutta, Holbrook and Woomargama will make up the fi nal 20km of dual carriageway highway to be completed by 2012.
Sheahan Bridge duplication, Gundagai
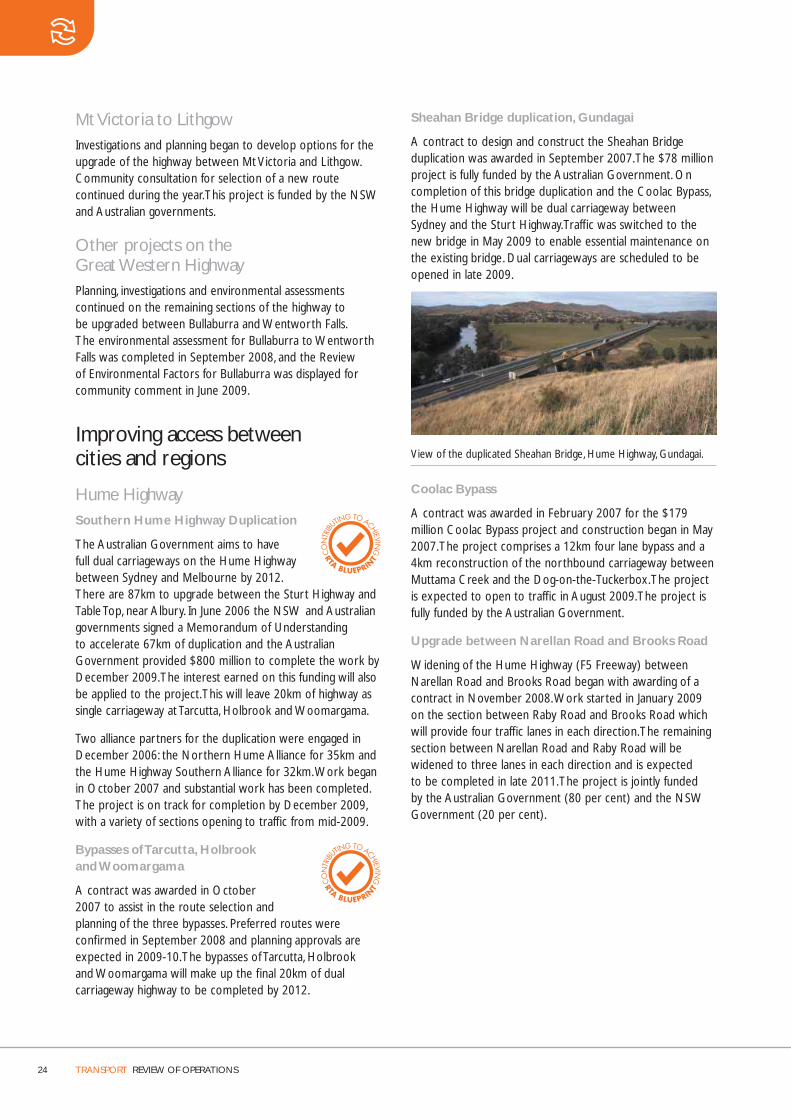
A contract to design and construct the Sheahan Bridge duplication was awarded in September 2007. The $78 million project is fully funded by the Australian Government. On completion of this bridge duplication and the Coolac Bypass, the Hume Highway will be dual carriageway between Sydney and the Sturt Highway. Traffi c was switched to the new bridge in May 2009 to enable essential maintenance on the existing bridge. Dual carriageways are scheduled to be opened in late 2009.
View of the duplicated Sheahan Bridge, Hume Highway, Gundagai.
Coolac Bypass
A contract was awarded in February 2007 for the $179 million Coolac Bypass project and construction began in May 2007. The project comprises a 12km four lane bypass and a 4km reconstruction of the northbound carriageway between Muttama Creek and the Dog-on-the-Tuckerbox. The project is expected to open to traffi c in August 2009. The project is fully funded by the Australian Government.
Upgrade between Narellan Road and Brooks Road
Widening of the Hume Highway (F5 Freeway) between Narellan Road and Brooks Road began with awarding of a contract in November 2008. Work started in January 2009 on the section between Raby Road and Brooks Road which will provide four traffi c lanes in each direction. The remaining section between Narellan Road and Raby Road will be widened to three lanes in each direction and is expected to be completed in late 2011. The project is jointly funded by the Australian Government (80 per cent) and the NSW Government (20 per cent).

REVIEW OF OPERATIONS TRANSPORT 25
Newell HighwayMoree Town Centre Bypass
The project will remove heavy vehicles from the town centre and improve safety and access. A contract was awarded in August 2007 for Stage 1 construction, which includes a new Mehi River Bridge and road work. Detailed design of Stage 2, comprising road work through Moree, is complete. Tenders for construction of Stage 2 have been delayed while land contamination is rectifi ed by a third party. The $56.2 million project is fully funded by the Australian Government.
Princes Highway Lawrence Hargrave Drive intersection upgrade
Tenders were invited in May 2009 for construction of a $31 million major upgrade of this intersection at the foot of Bulli Pass. The new intersection will provide a bridge to separate northbound traffi c on Lawrence Hargrave Drive from traffi c on the Princes Highway and will signifi cantly improve road safety, reduce congestion and improve traffi c fl ow. Construction is scheduled to start in late 2009 and the project is expected to be completed by mid 2011.
Wollongong Northern Distributor
The major construction contract for the $110 million Northern Distributor extension in Wollongong was awarded in December 2006 and work began in April 2007. The Northern Distributor will be extended by 3km through Wollongong’s northern suburbs from Bellambi Lane to the Princes Highway at Molloy Street, Bulli. It will provide a four-lane divided carriageway with four new intersections along the route (two grade separated intersections at Campbell Street and Park Road). The proposal also includes a shared pedestrian cycle bridge at Farrell Road and 2.5m sealed shoulders on both sides for cyclists. The project is expected to be opened to traffi c in late 2009.
Oak Flats to Dunmore
Construction of the $120 million Oak Flats to Dunmore deviation continued. This 5.5km four-lane divided carriageway deviation of the Princes Highway will link the Oak Flats Interchange with the North Kiama Bypass, completing four lanes to south of Kiama. A contract for the work was awarded in February 2007 and work began in June 2007. Work to upgrade Shellharbour Road to four lanes to provide improved connectivity with the Princes Highway has been carried out by the RTA and was completed in September 2008. When opened to traffi c in late 2009 the project will signifi cantly improve road safety, reduce congestion and improve traffi c fl ows.
Former Minister for Roads Eric Roozendaal, Member for Kiama, Matt Brown, Member for Shell Harbour, Lylea McMahon, inspecting works in August 2008. The crane on site is the largest in Australia with a 1000 tonne rating.
Kiama Ramps
Construction of this $13 million project began in September 2007 to provide two additional ramps on the Kiama Bypass. The work was undertaken by the RTA with the southbound off load ramp completed in October 2008 and the northbound on load ramp completed in February 2009.
Gerringong to Bomaderry
Work continued on planning for the future upgrade of the Princes Highway between Gerringong and Bomaderry. A number of route options were displayed in November 2007. The preferred route, including access arrangements for Gerringong and Berry, was announced in June 2009.
26 TRANSPORT REVIEW OF OPERATIONS
South Nowra road safety improvements
Work began in June 2007 to widen part of the Princes Highway between South Nowra and Jervis Bay Road to four lanes, including duplication of the two-lane bridge over Currambene Creek. The $24.6 million project was jointly funded, with the Australian Government contributing $15 million and the NSW Government $9.6 million. The project was opened to traffi c in November 2008.
Conjola Mountain realignment
Funding for this $58 million project includes a $10 million contribution from the Australian Government arranged by the Southern Region of Councils. A contract for Stage 1 (bridge over Conjola Creek) was awarded in August 2007 and completed in December 2008. A contract for the remaining work was awarded in October 2008 with completion expected in March 2010.
New England Highway Hunter Expressway – F3 Freeway to Branxton
In May 2009 the Australian Government announced $1.451 billion from the Building Australia Fund and the NSW Government committed a further $200 million to construct the Hunter Expressway. During 2008-09 the RTA continued planning work for the 39.5km link between the F3 Freeway at Seahampton and the New England Highway west of Branxton. The four-lane link will relieve congestion on the New England Highway through Maitland and provide an east-west connection between the Newcastle regional centre and urban centres in the lower Hunter. The project will be broken into two contracts to refl ect the complexity and challenges involved and these are expected to be awarded in 2010.
This project will also provide a direct boost to the NSW economy and is expected to create signifi cant direct and indirect employment in the Hunter region.
Weakleys Drive Interchange The $51.8 million interchange at Weakleys Drive, Beresfi eld, was opened to traffi c in October 2008. The interchange eliminates three sets of traffi c signals for through traffi c on the New England Highway. The project was fully funded by the Australian Government.
Other Newcastle and Hunter projectsNewcastle Inner City Bypass
Planning continued for the Newcastle Inner City Bypass to provide an orbital road linking Newcastle’s radial road network. Planning is progressing on the next stage of the bypass between Sandgate Road, Shortland, and the Pacifi c Highway at Sandgate. Detailed design, land acquisition and public utility adjustments will be progressed in 2009-10.
Preliminary planning for the Rankin Park to Jesmond section that would pass to the west of John Hunter Hospital has been fi nalised and a preferred route adopted for inclusion in Newcastle City Council’s Local Environment Plan. Although this section of the bypass is not expected to be needed for many years, identifi cation of the preferred route will provide certainty for residents and businesses about the upgrade’s location.
Tourle Street bridge replacement, Mayfi eld West
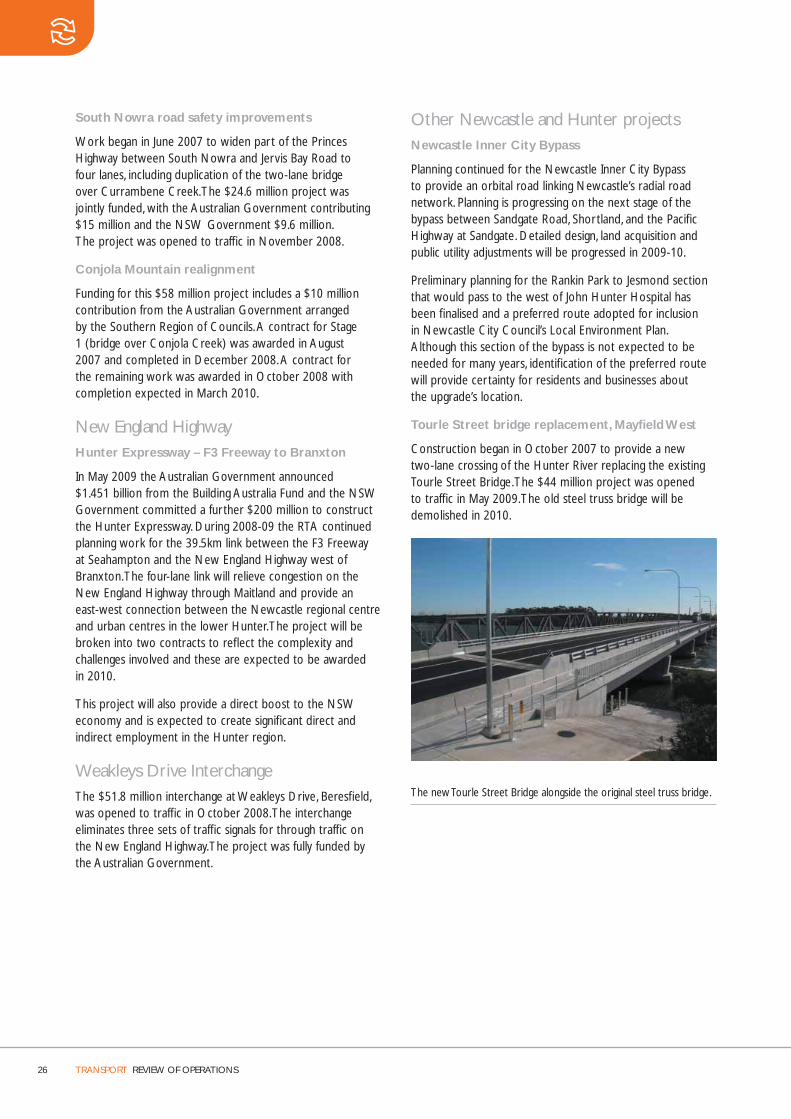
Construction began in October 2007 to provide a new two-lane crossing of the Hunter River replacing the existing Tourle Street Bridge. The $44 million project was opened to traffi c in May 2009. The old steel truss bridge will be demolished in 2010.
The new Tourle Street Bridge alongside the original steel truss bridge.
REVIEW OF OPERATIONS TRANSPORT 27
Third Hunter River Crossing at Maitland
Preliminary work began in March 2007 for a new two-lane road and bridge crossing of the Hunter River between East Maitland and Bolwarra. Stage 1 of the project, comprising an upgrade of the intersection at the New England Highway and Melbourne Street and the installation of traffi c signals at the Melbourne Street/Lawes Street and Pitnacree Road intersection in East Maitland, was completed in October 2007. Stage 2 work, consisting of bridge work over the Hunter River and road work between Paterson Road, Bolwarra, and Melbourne Street, East Maitland, began in July 2009 and is planned to be completed in 2011.
Central Coast projects Avoca Drive upgrade, Sun Valley Road to Bayside Drive, Green Point
Planning was completed to extend the dual carriageways south of Sun Valley Road for a further 1.2km to complete a continuous four lanes between the Central Coast Highway and Davistown Road. The environmental assessment was determined in August 2008, and in April 2009 Gosford City Council began early works on a new link road as part of the project. A contract for major road works was awarded in June 2009.
Central Coast Highway (The Entrance Road), Carlton Road to Matcham Road, Erina Heights
Planning continued for the upgrade of this 2.2km length of highway. The project extends the four-lane divided carriageway from Erina to the north, and will signifi cantly contribute to the four lanes planned for the section between the F3 at Kariong and Tumbi Road at Wamberal. Planning approval was achieved in June 2009 and tenders for construction will be invited in August 2009.
Central Coast Highway (The Entrance Road), Matcham Road to Ocean View Drive, Wamberal
Planning continued for the upgrade of this 2.2km length of highway. The project is the fi nal stage of a four-lane carriageway between the F3 at Kariong and Tumbi Road at Wamberal. A Review of Environmental Factors was displayed for community comment in October 2008 and planning approval was achieved in June 2009.
Central Coast Highway (The Entrance Road), Ocean View Drive to Tumbi Road, Wamberal
This $42 million project provides two lanes in each direction, a continuous off-road shared cycleway/footway, bus bays and pedestrian facilities for the full 1.5km length. Work began in March 2007 and was opened to traffi c in July 2008.
Central Coast Highway (The Entrance Road), Woy Woy Road intersection upgrade, Kariong
Planning continued for the upgrade of this critical intersection which controls access from the Woy Woy Peninsula and Gosford to the F3 Freeway. The upgrade would increase the capacity of the intersection and reduce congestion that regularly extends towards the F3 freeway in the afternoon peak periods. A school development by the Department of Education and Training at Kariong will change the demands at The Avenue, and a developer-funded pedestrian underpass is being coordinated with the road upgrade. Major construction is planned to start in early 2010.
Pacifi c HighwayGlen Road to Burns Road, Ourimbah
A contract was awarded in March 2008 for Stage 2 of the Pacifi c Highway widening between Glen Road and Burns Road, Ourimbah. Construction began in June 2008 and the project is expected to be progressively opened to traffi c as new sections are built, with full completion planned by mid 2010. The project is estimated to cost $52 million.
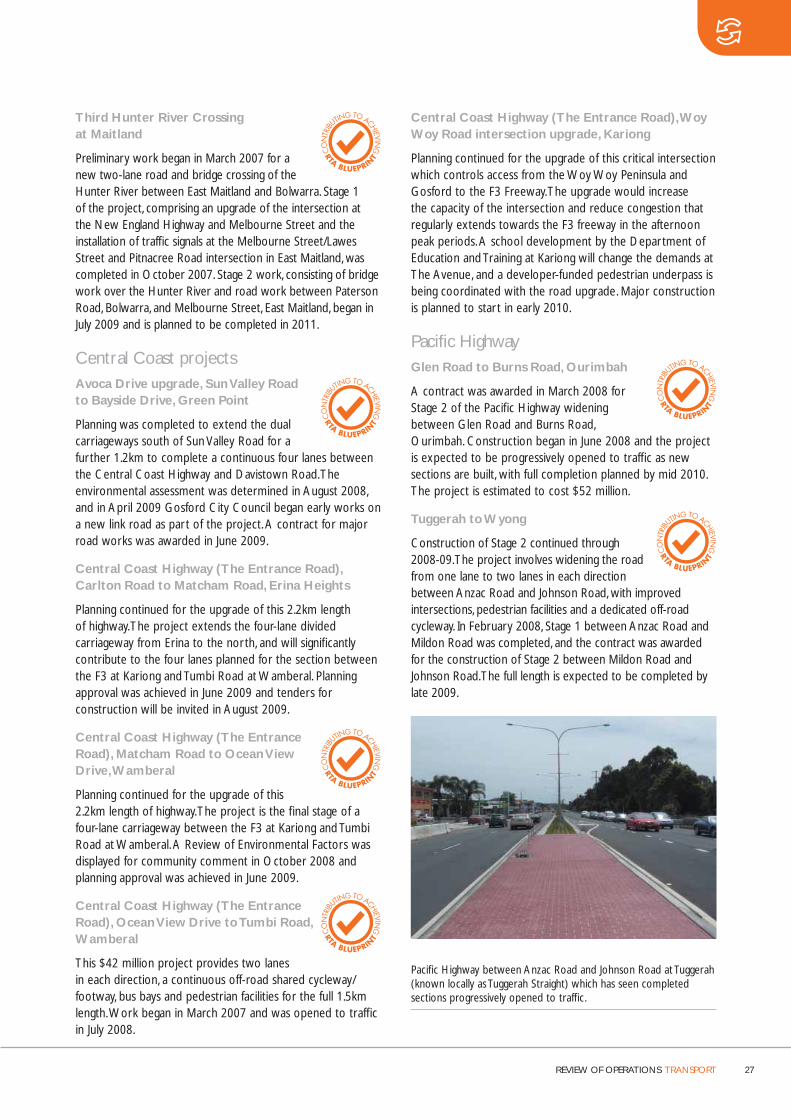
Tuggerah to Wyong
Construction of Stage 2 continued through 2008-09. The project involves widening the road from one lane to two lanes in each direction between Anzac Road and Johnson Road, with improved intersections, pedestrian facilities and a dedicated off-road cycleway. In February 2008, Stage 1 between Anzac Road and Mildon Road was completed, and the contract was awarded for the construction of Stage 2 between Mildon Road and Johnson Road. The full length is expected to be completed by late 2009.
Pacifi c Highway between Anzac Road and Johnson Road at Tuggerah (known locally as Tuggerah Straight) which has seen completed sections progressively opened to traffi c.
28 TRANSPORT REVIEW OF OPERATIONS
Other rural projectsLanyon Drive, Queanbeyan
Design work to extend the four-lane section of Lanyon Drive from Tompsitt Drive (NSW) to the Monaro Highway (ACT) is being managed by ACT Roads. The design is being fi nalised and planning approval for the work in NSW was achieved in June 2008. Construction will begin in 2009-10, in conjunction with work in the ACT.
Nowra to Nerriga
Stage 1 of the reconstruction of Main Road No. 92 over a length of 24km was completed in June 2007. A contract for Stage 2 was awarded in July 2007 involving the reconstruction of a 9km section through Bulee Gap including a new bridge. This work is expected to open to traffi c in August 2009. A contract was awarded for Stage 3 in December 2008 with completion expected in late 2010.
Kings Highway improvements
This $26.3 million project involves improvements along the Kings Highway between Queanbeyan and a new defence facility at Bungendore. The improvements include shoulder widening, intersection upgrades and a realignment of the eastern approach to Queanbeyan. Work started in May 2008. Shoulder widening, and improvements at the Weetalabah Drive intersection have been completed. Improvements at other intersections are planned to be completed in late 2009 and construction of the realignment is scheduled to start in late 2009.
Shoulder widening along the Kings Highway.
New England Highway, Sunnyside realignment
This $13.5 million project involves upgrading 2km of the New England Highway from 17km to 19km north of Armidale to improve the road alignment to a safe 100km/h standard and to provide a consistent travel speed along the highway. Construction started in March 2009 and is scheduled to be completed in early 2010. This project is fully funded by the Australian Government.
Bruxner Highway, Alstonville Bypass
The 6.6km Alstonville Bypass is estimated to cost $101 million, and will provide signifi cant benefi ts including quicker journey times, improved traffi c fl ow and safety, and reduced through traffi c and congestion in Alstonville. Construction began in April 2009 and is expected to be completed in late 2010. This project is fully funded by the Australian Government.
Construction works at the Alstonville Bypass, expected to be completed in late 2010.
Oxley Highway, Wrights Road to the Pacifi c Highway
This project involves the realignment and widening of a 6km section of the Oxley Highway to provide a dual carriageway from Wrights Road to the Pacifi c Highway, west of Port Macquarie. The project will improve road safety and provide shorter travel times for motorists travelling from the Pacifi c Highway and surrounding areas into Port Macquarie. It will also reduce traffi c noise for residents living near the highway and improve access for all road users including cyclists and pedestrians. Preliminary work began in February 2008 and tenders for the main construction contract were invited in June 2009. Major work is expected to start in 2009-10 and be completed in late 2011.

REVIEW OF OPERATIONS TRANSPORT 29
Alternative transportBus priority
Inner West Busway along Victoria Road The Inner West Busway, including the Iron Cove Bridge duplication, seeks to improve the effi ciency and reliability of bus services between Gladesville Bridge and The Crescent at Rozelle, by providing ‘city bound’ bus lanes during the morning and evening peak periods.
The project is estimated to cost $175 million. Following extensive community consultation the proposal was revised to minimise local impacts while still providing the required improvements to public transport. Planning approval was achieved in March 2009 and the alliance agreement will be fi nalised in July 2009. Preliminary construction has begun, and the project is expected to be opened to traffi c in early 2011.
Strategic bus corridors The release of the NSW Government’s Review of Bus Services in 2004 identifi ed 43 strategic bus corridors across the Sydney metropolitan area, four in Newcastle, two in Wollongong and two on the Central Coast. NSW Treasury allocated an initial $90 million to the RTA ’s budget over three years (2005-06 to 2007-08) to implement bus priority measures on strategic bus corridors. A further $100 million has been allocated over four years from 2008-09 to accelerate the delivery of the bus priority program. The funding is in addition to the RTA’s $15 million annual bus priority allocation.
Bus priority measures include bus lanes, transit lanes, priority traffi c signals and bus bays along major bus corridors. Initial emphasis for the introduction of bus priority measures has been placed on the Sydney corridors, particularly those connecting the centres of Parramatta, Bankstown, Hurstville, Burwood and Macquarie Park. By June 2009, 97 bus priority infrastructure projects had been completed across Sydney. Construction was continuing on a further 10 projects.
The Public Transport Information and Priority System (PTIPS) improves bus reliability by giving traffi c signal priority to late running buses. Bus management and service planning will be improved through better information on fl eet performance. When this new GPS-based bus priority system is fully deployed it will be the largest of its kind in the world. More than 4000 metropolitan buses operated by nine companies will be fi tted with satellite tracking devices. More than 6500 bus routes, 100,000 timing points and 3500 traffi c signal sites will be monitored to improve bus travel time reliability.
Broad scale deployment began in early 2008, with more than 1200 State Transit Authority buses equipped by June 2009.
Bus lane cameras There are 34 bus lane cameras and 36 transitway cameras operating across Sydney.
Since bus lanes were introduced in the early 1990s, illegal use has had an impact on bus travel times and added to operating costs. A number of initiatives are in place to improve motorists’ compliance with bus lane rules. These include colouring Sydney’s bus lanes red and public education campaigns to increase road user awareness of how to use bus lanes. Enforcement strategies have been developed using camera technology that is able to detect and automate an infringement process for illegal use of bus lanes and transitways.
In 2008-09 six more bus lane camera enforcement zones were added to the 28 zones in the Sydney CBD. In addition there are 16 cameras on the North West Transitway and 20 cameras on the Liverpool to Parramatta Transitway.
Bicycle facilities The RTA recognises that bicycle riding is an affordable, fl exible, healthy and environmentally friendly form of transport. Promoting bicycle riding is an important part of the NSW Government’s planning and transport strategy, particularly as it can reduce traffi c congestion and improve the environment.
The RTA is committed to making comprehensive provision for bicycles in new major road infrastructure and maintenance work. During 2008-09 bicycle facilities were constructed as part of the following major road upgrades:
• Alfords Point Bridge Duplication: shared use path along the eastern side of the new bridge over the Georges River, Padstow Heights.
• Great Western Highway – Leura to Katoomba, Section 2: shared use path along the northern side from East View Avenue, Leura, to Bowling Green Avenue, Katoomba.
• Mamre Road, M4 Overpass Duplication: shared use path along the western side of the new bridge over the M4, St Marys.
• Windsor Road – Windsor to MacGraths Hill: shared use path along southwest side from Flattes Lagoon Bridge to Macquarie Street, Windsor. Includes a bridge over South Creek.
• Central Coast Highway – Ocean View Drive to Tumbi Road, Stage 2: shared use path along southern side from Ocean View Drive to Pitt Road, Wamberal.
• New England Highway – Weakleys Drive Interchange: shared use path along eastern side from the Beresfi eld Smash Repairs’ new driveway to Glenwood Drive, Thornton.
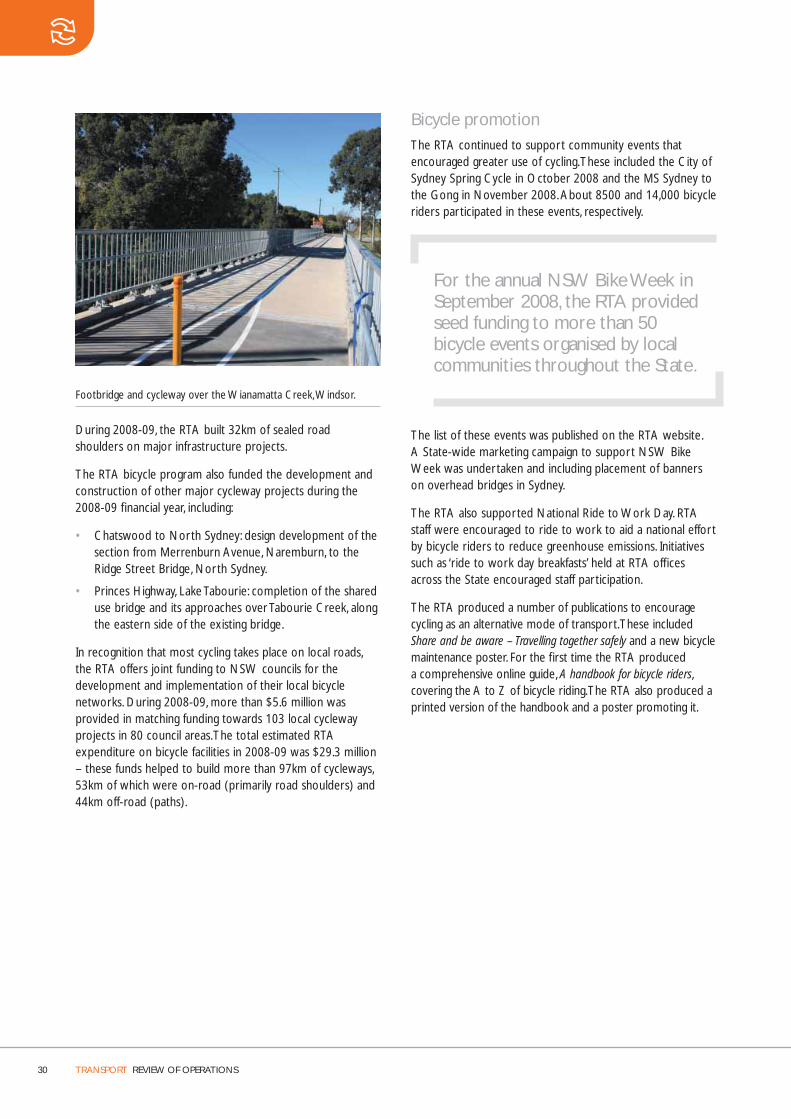
30 TRANSPORT REVIEW OF OPERATIONS
Footbridge and cycleway over the Wianamatta Creek, Windsor.
During 2008-09, the RTA built 32km of sealed road shoulders on major infrastructure projects.
The RTA bicycle program also funded the development and construction of other major cycleway projects during the 2008-09 fi nancial year, including:
• Chatswood to North Sydney: design development of the section from Merrenburn Avenue, Naremburn, to the Ridge Street Bridge, North Sydney.
• Princes Highway, Lake Tabourie: completion of the shared use bridge and its approaches over Tabourie Creek, along the eastern side of the existing bridge.
In recognition that most cycling takes place on local roads, the RTA offers joint funding to NSW councils for the development and implementation of their local bicycle networks. During 2008-09, more than $5.6 million was provided in matching funding towards 103 local cycleway projects in 80 council areas. The total estimated RTA expenditure on bicycle facilities in 2008-09 was $29.3 million – these funds helped to build more than 97km of cycleways, 53km of which were on-road (primarily road shoulders) and 44km off-road (paths).
Bicycle promotionThe RTA continued to support community events that encouraged greater use of cycling. These included the City of Sydney Spring Cycle in October 2008 and the MS Sydney to the Gong in November 2008. About 8500 and 14,000 bicycle riders participated in these events, respectively.
For the annual NSW Bike Week in September 2008, the RTA provided seed funding to more than 50 bicycle events organised by local communities throughout the State.
The list of these events was published on the RTA website. A State-wide marketing campaign to support NSW Bike Week was undertaken and including placement of banners on overhead bridges in Sydney.
The RTA also supported National Ride to Work Day. RTA staff were encouraged to ride to work to aid a national effort by bicycle riders to reduce greenhouse emissions. Initiatives such as ‘ride to work day breakfasts’ held at RTA offi ces across the State encouraged staff participation.
The RTA produced a number of publications to encourage cycling as an alternative mode of transport. These included Share and be aware – Travelling together safely and a new bicycle maintenance poster. For the fi rst time the RTA produced a comprehensive online guide, A handbook for bicycle riders, covering the A to Z of bicycle riding. The RTA also produced a printed version of the handbook and a poster promoting it.

REVIEW OF OPERATIONS TRANSPORT 31
Pedestrians The RTA implemented a number of initiatives to improve pedestrian access and safety. Facilities for pedestrians built in 2008-09 included pedestrian crossings, refuges, additional audio-tactile push buttons to assist vision impaired pedestrians, kerb ramps and pedestrian fencing.
Other work for pedestrians in 2008-09 included:
• Local government pedestrian facilities: matching funding of $1.5 million was provided for 33 local pedestrian facility works within 61 council areas.
• State government pedestrian facilities: $3 million was spent on 63 pedestrian improvement projects in the arterial road network.
• Pedestrian bridges: construction began on bridges at Parramatta Road, Haberfi eld, and Silverwater Road, Ermington. Community consultation and detailed design began for a bridge at Epping Road, Marsfi eld.
• State Road Multi-Laned Pedestrian Crossings: the $17 million program continued to upgrade pedestrian crossings on multi-laned State Government-controlled roads. Fifty-nine crossings will be upgraded as part of the program. By 30 June 2009, 49 of the 59 sites had been upgraded, with traffi c signals installed at 38 sites. A further two sites are under construction, with eight sites in the design and community consultation stages.
New Haberfi eld pedestrian bridge.
The RTA helped local councils to prepare Pedestrian Access and Mobility Plans (PAMPs) for integrated pedestrian networks. Ninety-one councils now have a PAMP, including fi ve completed during 2008-09. The RTA continued to support councils to implement these plans which enhance safety, convenience and mobility in key areas of pedestrian movement, such as between public transport and other public places.
In April 2009, the RTA and the Australian Institute of Traffi c Planning and Management worked together to conduct a workshop titled ‘Universal Access: the practical sides of providing for people with disabilities’. The workshop discussed the design aspects of providing access for people with disabilities, and summarised current Australian practice. The workshop was well attended and many RTA staff also participated.
The fi rst automated bicycle and pedestrian counter in NSW was installed on the shared pedestrian and bicycle path under the Gore Hill Freeway viaduct at Naremburn. The device detects pedestrian and bicycle movements simultaneously using Piezo technology embedded in the surface to count the bicycles and an infra-red counter mounted in the overhead pod to count the pedestrians as they pass underneath. The new counter replaced the old system of using metal boxes and rubber tubes.
Travel demand managementThe increase in traffi c volumes expected over the next two to three decades demands increased effi ciency in roads and public transport. The RTA develops and implements travel demand initiatives designed to increase the effi cient use of the road network. These initiatives include promoting modes of travel that are viable alternatives to conventional, single-occupant motor vehicle travel.
During 2008-09, the RTA implemented a number of measures, including:
• Sustainable Travel Workshops: the RTA carried out sustainable travel workshops at Wollongong University and Campbelltown Hospital.
• Teleworking (working from home): the RTA published a new manual to assist people in setting up and implementing a teleworking program within their organisation. A NSW Teleworking Manual: A comprehensive guide to setting up and implementing a teleworking program can be found on the RTA’s website.
• Transport Access Guides: these provide detailed information on public transport options, bicycle paths and walking time, and therefore encourage these ‘active’ transport options. The RTA produced guides for RTA motor registries and offi ces in Sydney and regional NSW. The guides are available on the RTA’s website and encourage customers and RTA staff to use active transport modes.

32 TRANSPORT REVIEW OF OPERATIONS
Traffi cSpeed and traffi c volume trendsThe trends in AM and PM peak speeds on the seven major routes to and from Sydney have remained broadly consistent despite a growth in traffi c on these routes of more than 46 per cent since 1990.
FIGURE 4. SPEED AND TRAFFIC VOLUME TRENDS FOR SEVEN MAJOR ROUTES TO AND FROM SYDNEY
5
10
20
30
40
50
2008-20091990
AVERAGE SPEED (KM/H) PERCENTAGE CHANGE
0
20
40
60
80
100
2000-01
PM SPEEDAM SPEED % CHANGE IN TRAFFIC VOLUME
Between 2007-08 and 2008-09, overall travel speeds have increased slightly for the AM peak period and remained unchanged for the PM peak period.
For the AM peak, the rise between 2007-08 and 2008-09 in the overall average speed was from 30 to 31km/h. Of the seven routes, speeds on four improved, two remained the same and one was lower. The routes with a marked increase in speed were the M5 corridor which changed from 34 to 41 km/h and the M2/Lane Cove Tunnel/Gore Hill Freeway corridor which changed from 31 to 36 km/h. The Lane Cove Tunnel continues to perform well and there has been some improvement on the previously lower speeds west of Pennant Hills Road. The other two corridors that improved in 2008-09 were the Princes Highway, up from 28 to 30 km/h, and the M4/City West Link, up from 28 to 29 km/h. The only route with a decline in average speed was Victoria Road, which was down from 23 to 21 km/h.
For the PM peak, the overall average speed of 43 km/h was unchanged between 2007-08 and 2008-09. The routes with the highest change in speed were the M5 corridor, up from 48 to 56 km/h, and the M2/Lane Cove Tunnel/Gore Hill Freeway corridor which increased from 61 to 66 km/h. There was also a small positive change on Victoria Road from 32 to 33 km/h. The Princes Highway was the only corridor with a notable decrease from 36 to 32 km/h, due in part to roadworks. The other three corridors decreased slightly compared to 2007-08, although all of these were equal to or higher than their 2006-07 speeds.
Figure 5 shows the patterns in overall speeds on the seven routes in the AM peak over the past 10 years.
FIGURE 5. AM PEAK SPEEDS
AVERAGE SPEED (KM/H)
20
15
10
25
30
35
40
45
50
M5/EASTERN DISTRIBUTORPRINCES HWY
M4/PARRAMATTA RD/CITY WEST LINKVICTORIA RD
F3/PACIFIC HWY/F1PITTWATER RD/MILITARY RD/F1
COMBINED 7 ROUTESM2/LCT/GORE HILL FWY
1997-98 2008-092004-052001-02
Note: From 2007-08, the Lane Cove Tunnel (LCT) is part of the M2 corridor (formerly parallel sections including Epping Road).
Keeping the traffi c fl owingThe focus for 2008-09 was to maintain consistent travel times for road users, particularly during peak hours by:
• Providing more effi cient response to incidents to ensure good traffi c fl ow.
• Reducing the causes of delay through improved operation of intersections, electronic tolling on motorways and improvements to the traffi c signal control system.
• Helping road users navigate the road system more effectively.
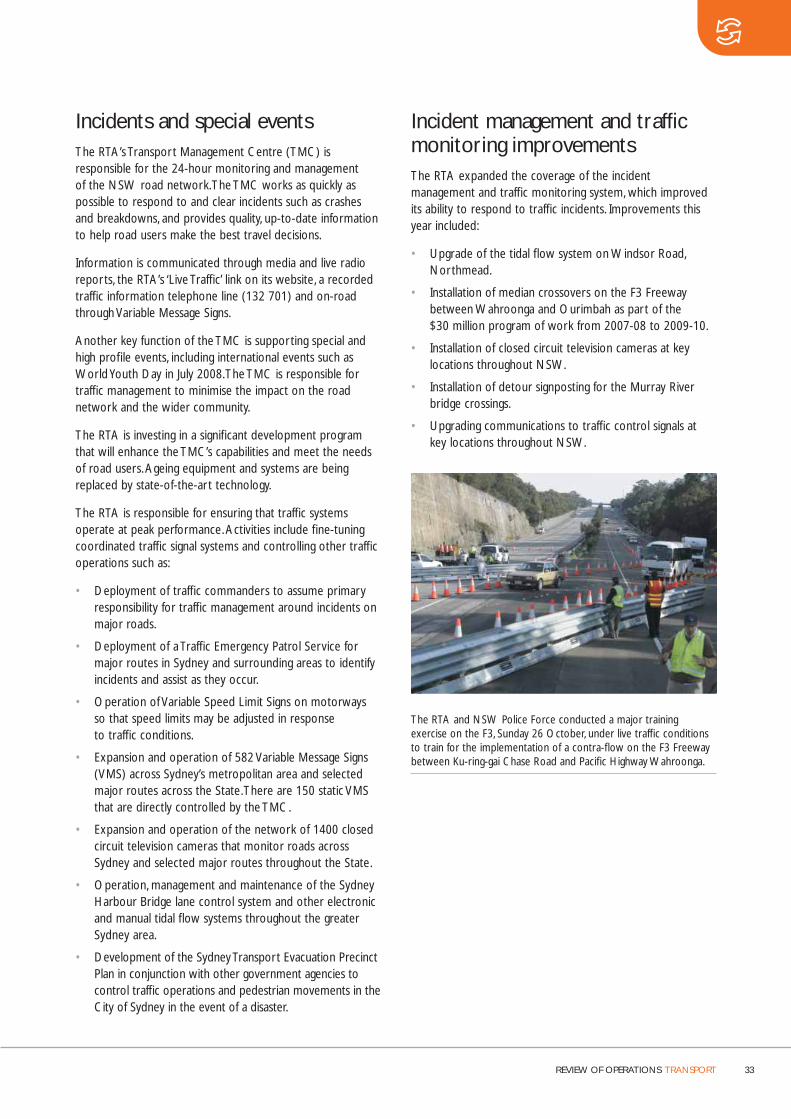
REVIEW OF OPERATIONS TRANSPORT 33
Incidents and special eventsThe RTA’s Transport Management Centre (TMC) is responsible for the 24-hour monitoring and management of the NSW road network. The TMC works as quickly as possible to respond to and clear incidents such as crashes and breakdowns, and provides quality, up-to-date information to help road users make the best travel decisions.
Information is communicated through media and live radio reports, the RTA’s ‘Live Traffi c’ link on its website, a recorded traffi c information telephone line (132 701) and on-road through Variable Message Signs.
Another key function of the TMC is supporting special and high profi le events, including international events such as World Youth Day in July 2008. The TMC is responsible for traffi c management to minimise the impact on the road network and the wider community.
The RTA is investing in a signifi cant development program that will enhance the TMC’s capabilities and meet the needs of road users. Ageing equipment and systems are being replaced by state-of-the-art technology.
The RTA is responsible for ensuring that traffi c systems operate at peak performance. Activities include fi ne-tuning coordinated traffi c signal systems and controlling other traffi c operations such as:
• Deployment of traffi c commanders to assume primary responsibility for traffi c management around incidents on major roads.
• Deployment of a Traffi c Emergency Patrol Service for major routes in Sydney and surrounding areas to identify incidents and assist as they occur.
• Operation of Variable Speed Limit Signs on motorways so that speed limits may be adjusted in response to traffi c conditions.
• Expansion and operation of 582 Variable Message Signs (VMS) across Sydney’s metropolitan area and selected major routes across the State. There are 150 static VMS that are directly controlled by the TMC.
• Expansion and operation of the network of 1400 closed circuit television cameras that monitor roads across Sydney and selected major routes throughout the State.
• Operation, management and maintenance of the Sydney Harbour Bridge lane control system and other electronic and manual tidal fl ow systems throughout the greater Sydney area.
• Development of the Sydney Transport Evacuation Precinct Plan in conjunction with other government agencies to control traffi c operations and pedestrian movements in the City of Sydney in the event of a disaster.
Incident management and traffi c monitoring improvementsThe RTA expanded the coverage of the incident management and traffi c monitoring system, which improved its ability to respond to traffi c incidents. Improvements this year included:
• Upgrade of the tidal fl ow system on Windsor Road, Northmead.
• Installation of median crossovers on the F3 Freeway between Wahroonga and Ourimbah as part of the $30 million program of work from 2007-08 to 2009-10.
• Installation of closed circuit television cameras at key locations throughout NSW.
• Installation of detour signposting for the Murray River bridge crossings.
• Upgrading communications to traffi c control signals at key locations throughout NSW.
The RTA and NSW Police Force conducted a major training exercise on the F3, Sunday 26 October, under live traffi c conditions to train for the implementation of a contra-fl ow on the F3 Freeway between Ku-ring-gai Chase Road and Pacifi c Highway Wahroonga.

34 TRANSPORT REVIEW OF OPERATIONS
Traffi c signal coordinationThe essential task of moving traffi c effi ciently on the arterial road network is carried out by the Sydney Coordinated Adaptive Traffi c System (SCATS ). SCATS is a computerised Area Traffi c Control system designed and developed by RTA traffi c engineers. This world leading system, which uses the latest computing technology, responds to traffi c demand in real-time and coordinates traffi c signal timings to ensure smooth traffi c fl ows. SCATS continued to be a success, with an expanding international market. At 30 June 2009, SCATS was licensed to 30,804 intersections across 138 cities worldwide.
Due to the high global demand for SCATS, the RTA appointed three SCATS authorised distributors in November 2008. The role of the SCATS distributors is to sell licenses for SCATS and other related software internationally (excluding Australia, New Zealand and Singapore).
Annual upgrade arrangements are in place with all RTA-supported SCATS users in Australia, New Zealand and Singapore. These users have the latest version of the SCATS software, reducing the demand on RTA resources to support superceded versions. The annual update arrangements, along with local and international sales of SCATS and related products, also provide a guaranteed annual income stream to offset SCATS development and support costs.
The RTA continually improves SCATS and releases a new version each year. An Australian SCATS user group meets once a year to discuss enhancements of SCATS. All major cities in Australia use SCATS, with the exception of most cities in Queensland. SCATS remains at the forefront of modern technology due to the feedback from SCATS users throughout Australia and worldwide, as well as ongoing innovation in design by RTA traffi c engineers.
To research longer-term enhancements to support SCATS capabilities, the RTA is continuing its collaborative research and development agreement with National ICT Australia Limited (NICTA). As NICTA is part funded by the Australian and NSW governments (Department of State and Regional Development), this collaboration comes at no fi nancial cost to the RTA, other than the resource costs for staff working with NICTA researchers. The collaboration is pursuing research into new vehicle detection systems, new approaches to improve traffi c signal control effi ciency that take advantage of modern computing technology and the potential longer-term use of wireless mesh networks to replace conventional cable-based SCATS communication systems.
NICTA has also been engaged to assist the TMC in investigating the development of a Decision Support System that could assist the decision-making process in real time traffi c operations.
Intersection and corridor improvementsLocations requiring improvements in traffi c fl ow are identifi ed by monitoring congestion and travel times on key routes. Improvements made at these locations include construction of traffi c signals, roundabouts and general intersection upgrades.
The Pinch Point strategy is a NSW Government initiative aimed at improving traffi c fl ows at key congestion points on Sydney’s major arterial road corridors. This fi ve-year strategy was announced by the Premier in November 2006, in which $100 million was committed to improvements on the road network, starting in July 2007.
The Pinch Point strategy is targeting peak hour traffi c ‘hot spots’ in 23 corridors in Sydney and will develop measures to provide reliable travel times. Draft corridor strategies are being prepared for more than half of these routes, with planning for the remainder to be undertaken by the end of 2009.
Projects completed as part of the Pinch Point program include:
• Extension and duplication of the right turn bay at Campbelltown Road and Blaxland Road, Campbelltown.
• Increase right turn bay capacity on King Georges Road and:
– Stoney Creek Road, Beverly Hills.
– Moorefi elds Road, Beverly Hills.
– M5 Motorway, Beverly Hills.
– Broadarrow Road, Beverly Hills.
– Forest Road, Penshurst.
– Roselands Drive, Roselands.
– The Boulevard, Wiley Park.
• New right turn bay at King Georges Road and Punchbowl Road, Punchbowl.
• Increased right turn bay capacity at Princes Highway and Kingsway, Kirrawee; and Princes Highway and Heathcote Road, Heathcote.
• Local widening and installation of traffi c lights at Richmond Road and St Marys Road, Windsor Downs.
• Parking rationalisation along Pacifi c Highway between Wilson Street and William Street, Chatswood.
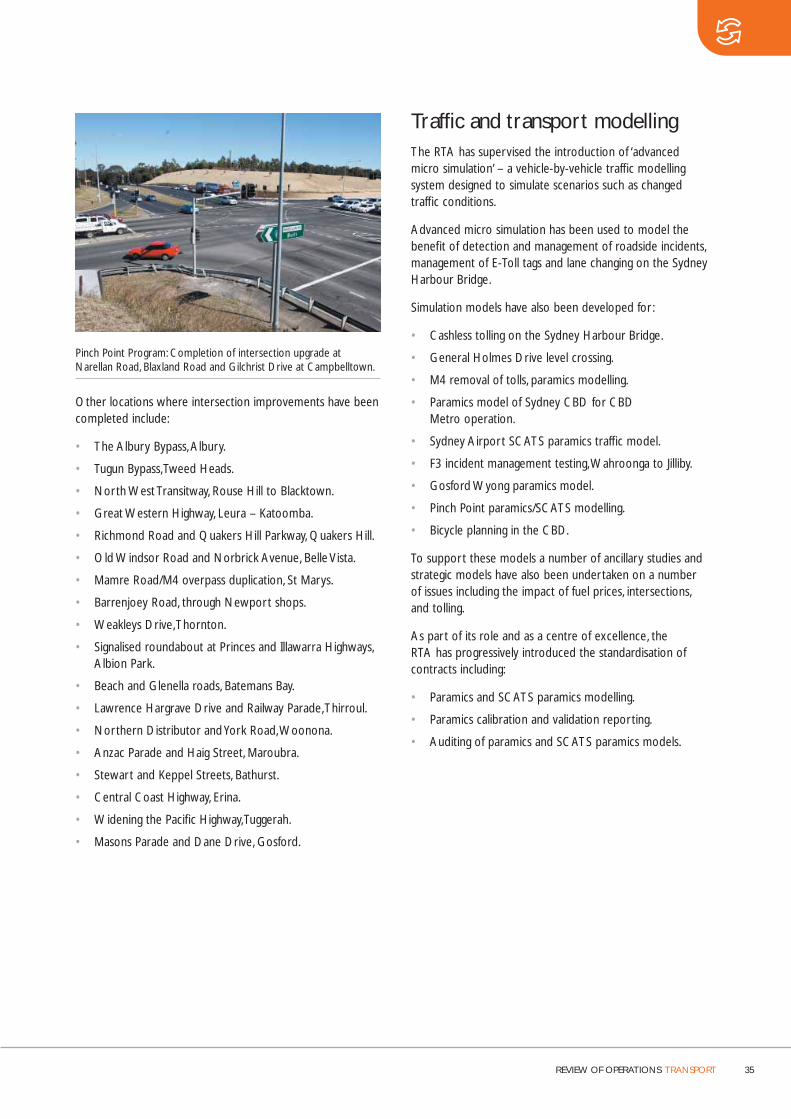
REVIEW OF OPERATIONS TRANSPORT 35
Pinch Point Program: Completion of intersection upgrade at Narellan Road, Blaxland Road and Gilchrist Drive at Campbelltown.
Other locations where intersection improvements have been completed include:
• The Albury Bypass, Albury.
• Tugun Bypass, Tweed Heads.
• North West Transitway, Rouse Hill to Blacktown.
• Great Western Highway, Leura – Katoomba.
• Richmond Road and Quakers Hill Parkway, Quakers Hill.
• Old Windsor Road and Norbrick Avenue, Belle Vista.
• Mamre Road/M4 overpass duplication, St Marys.
• Barrenjoey Road, through Newport shops.
• Weakleys Drive, Thornton.
• Signalised roundabout at Princes and Illawarra Highways, Albion Park.
• Beach and Glenella roads, Batemans Bay.
• Lawrence Hargrave Drive and Railway Parade, Thirroul.
• Northern Distributor and York Road, Woonona.
• Anzac Parade and Haig Street, Maroubra.
• Stewart and Keppel Streets, Bathurst.
• Central Coast Highway, Erina.
• Widening the Pacifi c Highway, Tuggerah.
• Masons Parade and Dane Drive, Gosford.
Traffi c and transport modellingThe RTA has supervised the introduction of ‘advanced micro simulation’ – a vehicle-by-vehicle traffi c modelling system designed to simulate scenarios such as changed traffi c conditions.
Advanced micro simulation has been used to model the benefi t of detection and management of roadside incidents, management of E-Toll tags and lane changing on the Sydney Harbour Bridge.
Simulation models have also been developed for :
• Cashless tolling on the Sydney Harbour Bridge.
• General Holmes Drive level crossing.
• M4 removal of tolls, paramics modelling.
• Paramics model of Sydney CBD for CBD Metro operation.
• Sydney Airport SCATS paramics traffi c model.
• F3 incident management testing, Wahroonga to Jilliby.
• Gosford Wyong paramics model.
• Pinch Point paramics/SCATS modelling.
• Bicycle planning in the CBD.
To support these models a number of ancillary studies and strategic models have also been undertaken on a number of issues including the impact of fuel prices, intersections, and tolling.
As part of its role and as a centre of excellence, the RTA has progressively introduced the standardisation of contracts including:
• Paramics and SCATS paramics modelling.
• Paramics calibration and validation reporting.
• Auditing of paramics and SCATS paramics models.
36 TRANSPORT REVIEW OF OPERATIONS
Future challengesRoad development• The creation of the NSW Department of Transport and
Infrastructure will help strengthen the partnerships with other agencies including the Department of Environment and Climate Change (DECC) and the Department of Planning (DoP) as well as with the transport agencies themselves. The RTA needs to build closer relationships with DoP and DECC to help streamline the approval process for high priority infrastructure projects, so that government infrastructure priorities can be achieved.
• The Federal Government’s Nation Building Program continues to drive a substantial proportion of the RTA’s Road Development Program including the Pacifi c Highway Upgrade and the duplication of the Southern Hume Highway. Delivering these priority projects on time and budget is a key challenge for the RTA.
• Planning and delivery of high priority projects announced under the recent Building Australia Fund for NSW will continue, including the $1.45 billion towards the Hunter Expressway (F3 to Branxton link) and $618 million for Kempsey Bypass on the Pacifi c Highway.
• Participate with other NSW Government agencies in the implementation of the NSW State Plan, State Infrastructure Strategy and Metropolitan and Regional Strategies.
• Work with the NSW Treasury to improve the Total Asset Management data requirements including project justifi cation and prioritisation for inclusion in the State Infrastructure Strategy.
• Planning of the Sydney Motorway Network including the M5 expansion and F3 to M2 link will continue. An air fi ltration plant will be built for the M5 East tunnel and trialled during 2010. Proposals to expand the capacity of the M2 and M5 Motorways will be assessed and implemented if approved by Government.
• The forward program of major projects that service Sydney’s growth areas, primarily in the north-west and south-west, will continue to be a key focus of the RTA’s liaison with the DoP.
• Complete the upgrading of Cowpasture Road and Hoxton Park Road to four lanes, and planning for the upgrade of Camden Valley Way to four lanes between Cowpasture Road and Narellan Road. Complete F3 Widening from Mt Colah to Cowan by 2009.
• Continue to deliver the upgrade of the Pacifi c Highway over the fi ve years to 2014, following the commitment of $3.6 billion from the Australian and NSW governments.
• Complete the 67km Southern Hume duplication work within budget by December 2009 and commence construction of the bypasses of Tarcutta, Holbrook and Woomargama.
• Progress the Great Western Highway upgrade in the Blue Mountains.
• Plan and deliver accelerated upgrades on the Central Coast.
• Progress the development of Princes Highway upgrades.
• Continue to implement urban design corridor strategies to ensure a whole of government approach to land use and transport planning.
Alternative transport• Deliver the balance of the four-year $100 million
bus priority program.
• Continue broad scale deployment of the Public Transport Information and Priority System across the strategic bus corridors network.
• Continue the rollout of the bus priority enforcement systems.
• Develop a network of facilities to make cycling and walking more attractive.
• Publish and promote the proposed NSW BikePlan.
• Provide improved priority to pedestrians where high volume pedestrians traffi c.
• Promote teleworking and transport choices that can increase the effective use of the road network by reducing the number of single-occupant private motor vehicle trips.
• Continue working with businesses, local councils and other organisations to develop and implement workplace travel plans which promote sustainable travel.
• Ensure that multi-modal transport operations are improved as a result of major road projects, transport and integration.
Traffi c management• Continue implementing the Pinch Point program
in Sydney.
• Implement traffi c effi ciency improvements in Penrith.
• Continue to enhance incident management and traveller information services in NSW.
• Continue to enhance the operational capability of the Sydney Coordinated Adaptive Traffi c System.
• Begin the roll out of enhanced directional signposting featuring alpha-numeric road marking and improved road name signage.

REVIEW OF OPERATIONS
AssetAccess 38
Maintenance 40
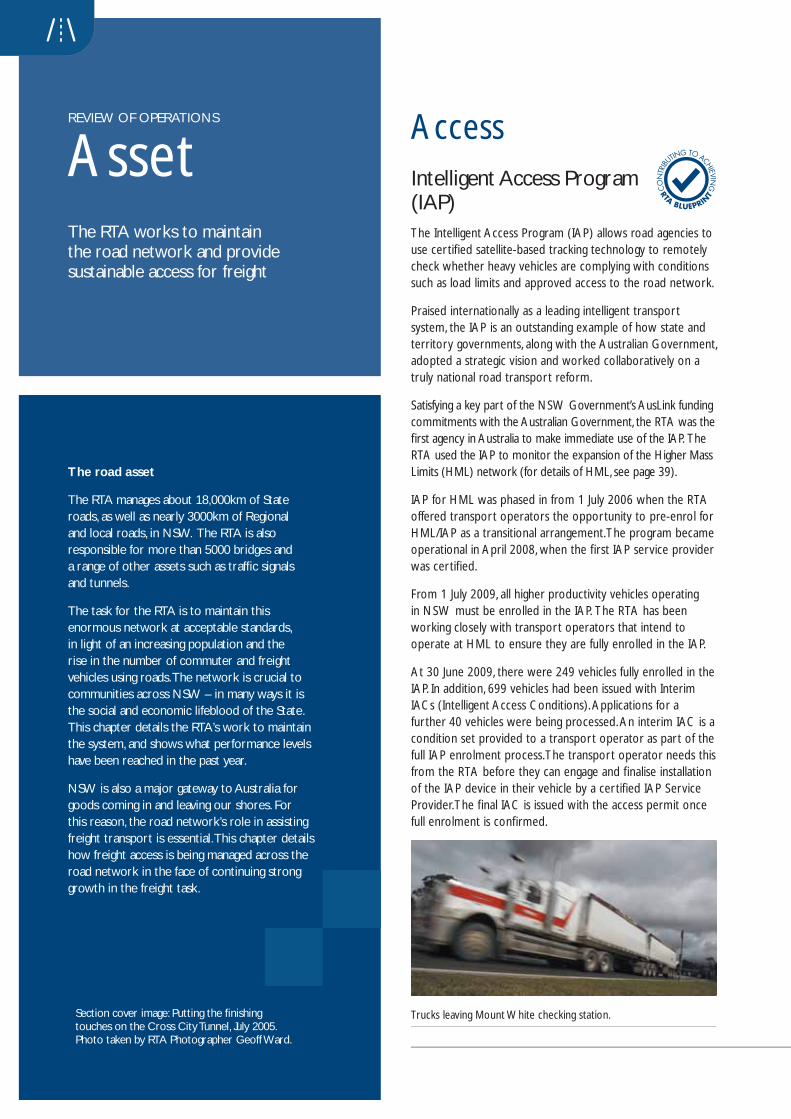
The road asset
The RTA manages about 18,000km of State roads, as well as nearly 3000km of Regional and local roads, in NSW. The RTA is also responsible for more than 5000 bridges and a range of other assets such as traffi c signals and tunnels.
The task for the RTA is to maintain this enormous network at acceptable standards, in light of an increasing population and the rise in the number of commuter and freight vehicles using roads. The network is crucial to communities across NSW – in many ways it is the social and economic lifeblood of the State. This chapter details the RTA’s work to maintain the system, and shows what performance levels have been reached in the past year.
NSW is also a major gateway to Australia for goods coming in and leaving our shores. For this reason, the road network’s role in assisting freight transport is essential. This chapter details how freight access is being managed across the road network in the face of continuing strong growth in the freight task.
Section cover image: Putting the fi nishing touches on the Cross City Tunnel, July 2005. Photo taken by RTA Photographer Geoff Ward.
AccessIntelligent Access Program(IAP) The Intelligent Access Program (IAP) allows road agencies to use certifi ed satellite-based tracking technology to remotely check whether heavy vehicles are complying with conditions such as load limits and approved access to the road network.
Praised internationally as a leading intelligent transport system, the IAP is an outstanding example of how state and territory governments, along with the Australian Government, adopted a strategic vision and worked collaboratively on a truly national road transport reform.
Satisfying a key part of the NSW Government’s AusLink funding commitments with the Australian Government, the RTA was the fi rst agency in Australia to make immediate use of the IAP. The RTA used the IAP to monitor the expansion of the Higher Mass Limits (HML) network (for details of HML, see page 39).
IAP for HML was phased in from 1 July 2006 when the RTA offered transport operators the opportunity to pre-enrol for HML/IAP as a transitional arrangement. The program became operational in April 2008, when the fi rst IAP service provider was certifi ed.
From 1 July 2009, all higher productivity vehicles operating in NSW must be enrolled in the IAP. The RTA has been working closely with transport operators that intend to operate at HML to ensure they are fully enrolled in the IAP.
At 30 June 2009, there were 249 vehicles fully enrolled in the IAP. In addition, 699 vehicles had been issued with Interim IACs (Intelligent Access Conditions). Applications for a further 40 vehicles were being processed. An interim IAC is a condition set provided to a transport operator as part of the full IAP enrolment process. The transport operator needs this from the RTA before they can engage and fi nalise installation of the IAP device in their vehicle by a certifi ed IAP Service Provider. The fi nal IAC is issued with the access permit once full enrolment is confi rmed.
Trucks leaving Mount White checking station.
REVIEW OF OPERATIONS
AssetThe RTA works to maintain the road network and provide sustainable access for freight
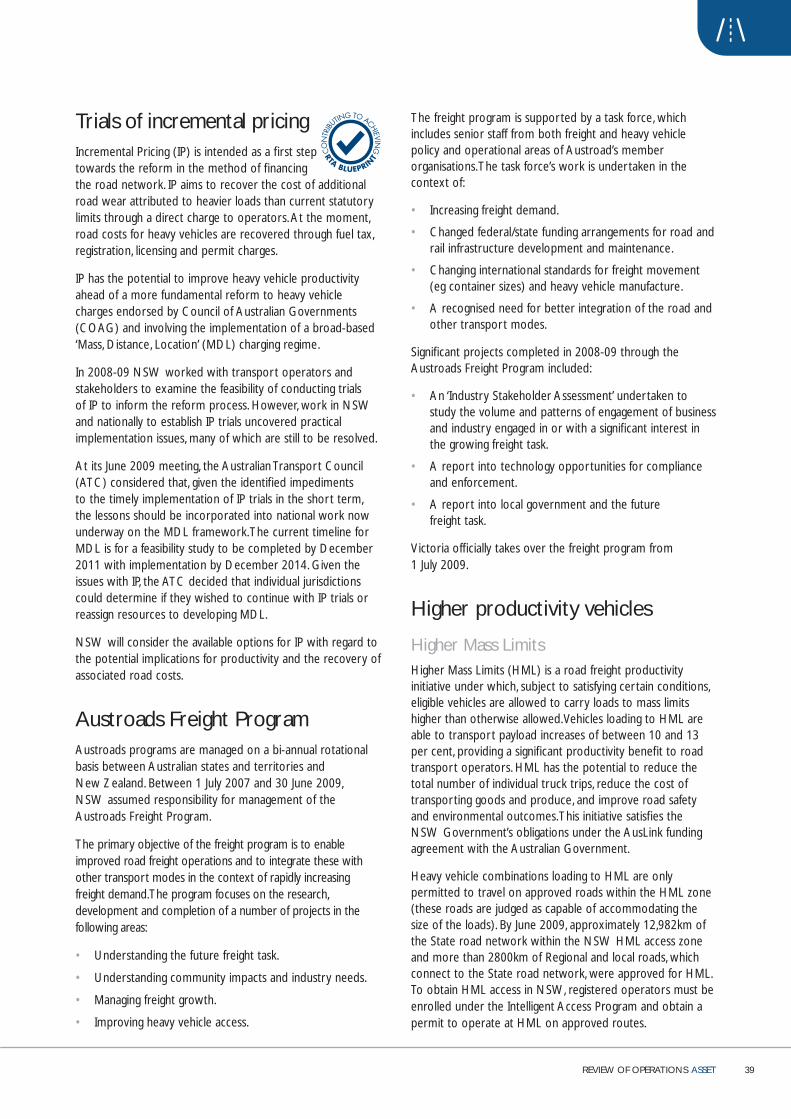
REVIEW OF OPERATIONS ASSET 39
Trials of incremental pricing Incremental Pricing (IP) is intended as a fi rst step towards the reform in the method of fi nancing the road network. IP aims to recover the cost of additional road wear attributed to heavier loads than current statutory limits through a direct charge to operators. At the moment, road costs for heavy vehicles are recovered through fuel tax, registration, licensing and permit charges.
IP has the potential to improve heavy vehicle productivity ahead of a more fundamental reform to heavy vehicle charges endorsed by Council of Australian Governments (COAG) and involving the implementation of a broad-based ‘Mass, Distance, Location’ (MDL) charging regime.
In 2008-09 NSW worked with transport operators and stakeholders to examine the feasibility of conducting trials of IP to inform the reform process. However, work in NSW and nationally to establish IP trials uncovered practical implementation issues, many of which are still to be resolved.
At its June 2009 meeting, the Australian Transport Council (ATC) considered that, given the identifi ed impediments to the timely implementation of IP trials in the short term, the lessons should be incorporated into national work now underway on the MDL framework. The current timeline for MDL is for a feasibility study to be completed by December 2011 with implementation by December 2014. Given the issues with IP, the ATC decided that individual jurisdictions could determine if they wished to continue with IP trials or reassign resources to developing MDL.
NSW will consider the available options for IP with regard to the potential implications for productivity and the recovery of associated road costs.
Austroads Freight ProgramAustroads programs are managed on a bi-annual rotational basis between Australian states and territories and New Zealand. Between 1 July 2007 and 30 June 2009, NSW assumed responsibility for management of the Austroads Freight Program.
The primary objective of the freight program is to enable improved road freight operations and to integrate these with other transport modes in the context of rapidly increasing freight demand. The program focuses on the research, development and completion of a number of projects in the following areas:
• Understanding the future freight task.
• Understanding community impacts and industry needs.
• Managing freight growth.
• Improving heavy vehicle access.
The freight program is supported by a task force, which includes senior staff from both freight and heavy vehicle policy and operational areas of Austroad’s member organisations. The task force’s work is undertaken in the context of:
• Increasing freight demand.
• Changed federal/state funding arrangements for road and rail infrastructure development and maintenance.
• Changing international standards for freight movement (eg container sizes) and heavy vehicle manufacture.
• A recognised need for better integration of the road and other transport modes.
Signifi cant projects completed in 2008-09 through the Austroads Freight Program included:
• An ‘Industry Stakeholder Assessment’ undertaken to study the volume and patterns of engagement of business and industry engaged in or with a signifi cant interest in the growing freight task.
• A report into technology opportunities for compliance and enforcement.
• A report into local government and the future freight task.
Victoria offi cially takes over the freight program from 1 July 2009.
Higher productivity vehicles
Higher Mass LimitsHigher Mass Limits (HML) is a road freight productivity initiative under which, subject to satisfying certain conditions, eligible vehicles are allowed to carry loads to mass limits higher than otherwise allowed. Vehicles loading to HML are able to transport payload increases of between 10 and 13 per cent, providing a signifi cant productivity benefi t to road transport operators. HML has the potential to reduce the total number of individual truck trips, reduce the cost of transporting goods and produce, and improve road safety and environmental outcomes. This initiative satisfi es the NSW Government’s obligations under the AusLink funding agreement with the Australian Government.
Heavy vehicle combinations loading to HML are only permitted to travel on approved roads within the HML zone (these roads are judged as capable of accommodating the size of the loads). By June 2009, approximately 12,982km of the State road network within the NSW HML access zone and more than 2800km of Regional and local roads, which connect to the State road network, were approved for HML. To obtain HML access in NSW, registered operators must be enrolled under the Intelligent Access Program and obtain a permit to operate at HML on approved routes.

40 ASSET REVIEW OF OPERATIONS
Quad Axle Pilot scheme Following the COAG’s agreement on the general use of quad axle groups to improve industry productivity, the RTA introduced a three-year pilot scheme for semi-trailers with quad axle groups. The pilot aims to assess the engineering and economic issues associated with the operation of quad axle groups at higher load limits than currently allowed within articulated freight vehicle confi gurations.
Since it began in 2007, the pilot has improved productivity and road safety by reducing the number of truck trips on NSW roads. Quad axle groups provide a payload increase of up to 28 per cent for a semi-trailer, with signifi cant commercial benefi ts for operators (eg it allows the movement of fully laden shipping containers).
In addition to the quad-axle semi trailer pilot scheme, in 2008 the RTA introduced a three-year pilot of the quad-axle super B-doubles for operation in the immediate vicinity of Port Botany. Vehicles operating under this pilot scheme are approved under the Performance Based Standards Scheme and are able to carry two 40-foot containers, utilising a quad axle group. Previously, vehicles could only carry one such container.
At June 2009, six permits had been issued to super B-Double vehicles and nine permits to quad axle semi-trailers to operate under the pilot scheme. In 2008-09 a quad-axle semi-trailer vehicle operating under an Export Productivity Scheme in Dubbo was commissioned to work between a meat processing facility and a rail intermodal terminal.
Performance Based Standards The nationally agreed Performance Based Standards (PBS) regulatory framework for heavy vehicles operating in NSW focuses on how well a heavy vehicle ‘performs’ on the road, rather than prescriptive dimension and mass limits. The vehicle’s performance is assessed against an agreed set of safety and infrastructure protection standards. The PBS approach enables innovation in the transport industry and achieves community benefi ts such as improved productivity, safer performance and the least possible impact on the road.
At 30 June 2009 the number of vehicles registered to operate in NSW under the PBS framework reached 17, and a total of 25 permits had been issued. The road network in NSW is continually being assessed for its capability to carry and therefore be classifi ed for use by various PBS vehicles.
MaintenanceRoad managementThe 184,761km NSW road network is a signifi cant public asset, providing access across the State for commuters, travellers, business and freight.
The road system can be divided into four categories:
• 17,981km of RTA-managed State roads including 4269km of National Network, for which the Australian Government provides a funding contribution, and 163km of privately funded toll roads.
• 2946km of RTA-managed Regional and local roads in the unincorporated area of NSW.
• 18,490km of council-managed Regional roads, which receive signifi cant State grant funds administered by the RTA.
• 145,344km of council-managed local access roads, funded by local ratepayers and Australian Government programs such as the Financial Assistance Grants and the Roads to Recovery program.
Aerial view of Warringah and Gore Hill freeways.
The RTA is also responsible for maintaining and operating:
• 5094 structures including bridges, major culverts and 22 tunnels.
• 3751 traffi c signal sites.
• 4100 street lights.
• 400 traffi c intelligent transport systems.
• Five automated tidal fl ow systems.
• 53,000km of longitudinal line markings and other pavement markings.
• Two million refl ective raised pavement markers.
• 70,000 signs with major structures and 200,000 parking, regulatory and warning signs.
• Nine vehicular ferries.
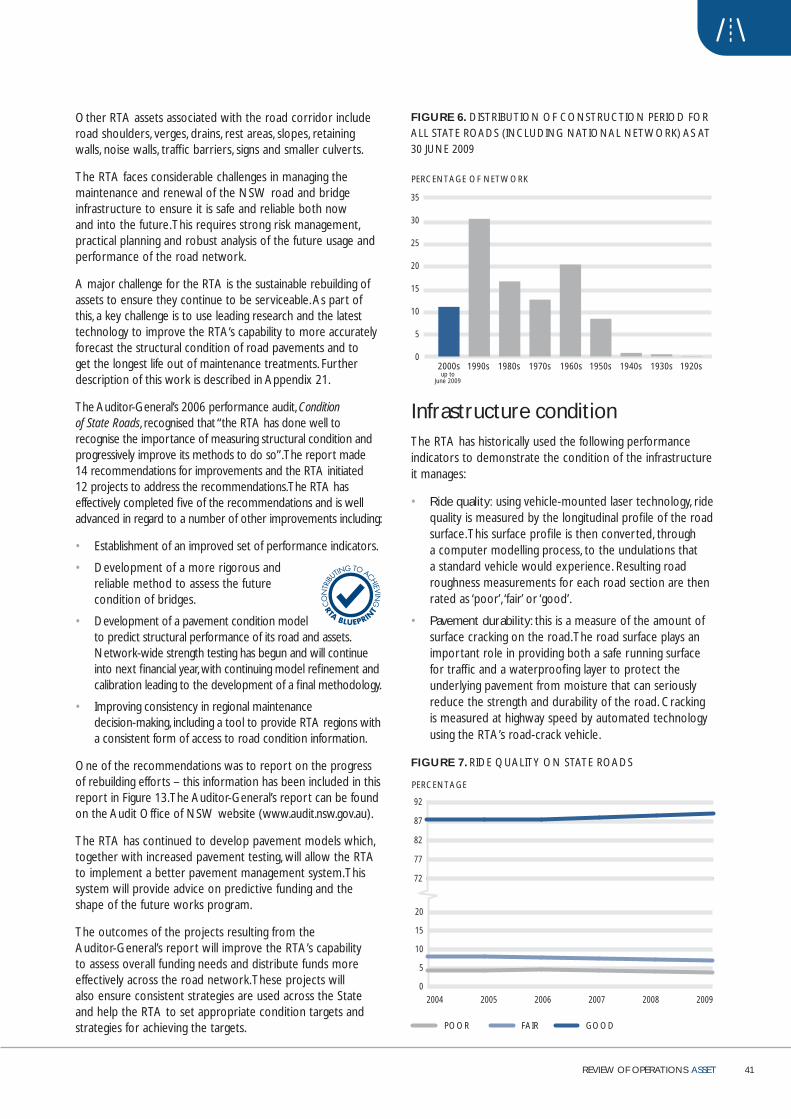
REVIEW OF OPERATIONS ASSET 41
Other RTA assets associated with the road corridor include road shoulders, verges, drains, rest areas, slopes, retaining walls, noise walls, traffi c barriers, signs and smaller culverts.
The RTA faces considerable challenges in managing the maintenance and renewal of the NSW road and bridge infrastructure to ensure it is safe and reliable both now and into the future. This requires strong risk management, practical planning and robust analysis of the future usage and performance of the road network.
A major challenge for the RTA is the sustainable rebuilding of assets to ensure they continue to be serviceable. As part of this, a key challenge is to use leading research and the latest technology to improve the RTA’s capability to more accurately forecast the structural condition of road pavements and to get the longest life out of maintenance treatments. Further description of this work is described in Appendix 21.
The Auditor-General’s 2006 performance audit, Condition of State Roads, recognised that “the RTA has done well to recognise the importance of measuring structural condition and progressively improve its methods to do so”. The report made 14 recommendations for improvements and the RTA initiated 12 projects to address the recommendations. The RTA has effectively completed fi ve of the recommendations and is well advanced in regard to a number of other improvements including:
• Establishment of an improved set of performance indicators.
• Development of a more rigorous and reliable method to assess the future condition of bridges.
• Development of a pavement condition model to predict structural performance of its road and assets. Network-wide strength testing has begun and will continue into next fi nancial year, with continuing model refi nement and calibration leading to the development of a fi nal methodology.
• Improving consistency in regional maintenance decision-making, including a tool to provide RTA regions with a consistent form of access to road condition information.
One of the recommendations was to report on the progress of rebuilding efforts – this information has been included in this report in Figure 13. The Auditor-General’s report can be found on the Audit Offi ce of NSW website (www.audit.nsw.gov.au).
The RTA has continued to develop pavement models which, together with increased pavement testing, will allow the RTA to implement a better pavement management system. This system will provide advice on predictive funding and the shape of the future works program.
The outcomes of the projects resulting from the Auditor-General’s report will improve the RTA’s capability to assess overall funding needs and distribute funds more effectively across the road network. These projects will also ensure consistent strategies are used across the State and help the RTA to set appropriate condition targets and strategies for achieving the targets.
FIGURE 6. DISTRIBUTION OF CONSTRUCTION PERIOD FOR ALL STATE ROADS (INCLUDING NATIONAL NETWORK) AS AT 30 JUNE 2009
1990s2000s 1980s 1970s 1960s 1950s 1940s 1930s 1920s
PERCENTAGE OF NETWORK
0
5
10
15
20
25
30
35
up toJune 2009
Infrastructure conditionThe RTA has historically used the following performance indicators to demonstrate the condition of the infrastructure it manages:
• Ride quality: using vehicle-mounted laser technology, ride quality is measured by the longitudinal profi le of the road surface. This surface profi le is then converted, through a computer modelling process, to the undulations that a standard vehicle would experience. Resulting road roughness measurements for each road section are then rated as ‘poor’, ‘fair’ or ‘good’.
• Pavement durability: this is a measure of the amount of surface cracking on the road. The road surface plays an important role in providing both a safe running surface for traffi c and a waterproofi ng layer to protect the underlying pavement from moisture that can seriously reduce the strength and durability of the road. Cracking is measured at highway speed by automated technology using the RTA’s road-crack vehicle.
FIGURE 7. RIDE QUALITY ON STATE ROADS
FAIRPOOR GOOD
2004 20092008200720062005
72
77
82
87
92
0
5
10
15
20
PERCENTAGE

42 ASSET REVIEW OF OPERATIONS
The percentage of road surface roughness rated as good on State roads and the National Network continues to improve, with major routes such as the Hume, Pacifi c, Newell, Great Western and Mitchell highways all indicating improved performance. In particular, the improvement of the Pacifi c Highway refl ects the signifi cant level of investment in that route over recent years.
FIGURE 8. RIDE QUALITY ON SYDNEY STATE ROADS
FAIRPOOR GOOD
2004 20092008200720062005
72
77
82
87
92
0
5
10
15
20
PERCENTAGE
The 2006 NSW Auditor-General’s report, Condition of State Roads, highlighted the ride quality on Sydney’s roads as being below that of other capital cities and country roads. Over the past three years additional pavement works in the Sydney area have resulted in an improvement in the condition of roads. This focus will continue in future years and further improvements are expected.
FIGURE 9. ROAD SURFACE ROUGHNESS % GOOD ON SELECTED STATE ROADS
PERCENTAGE
NEW ENGLANDHUME
SOUTH COASTNEWELLPACIFIC HWYGREAT WESTERN/MITCHELLALL STATE ROADSALL NATIONAL NETWORK
COUNTRY STATE ROADS
1992 200920042000199680
82
84
86
88
90
92
94
96
98
100
FIGURE 10. PAVEMENT DURABILITY – ALL STATE ROADS
FAIRPOOR GOOD
2004 20092008200720062005
72
77
82
87
92
0
5
10
15
20
PERCENTAGE
FIGURE 11. PAVEMENT DURABILITY – URBAN STATE ROADS
PERCENTAGE
25
30
35
40
45
FAIRPOOR GOOD
2004 20092008200720062005
FIGURE 12. PAVEMENT DURABILITY – RURAL STATE ROADS
FAIRPOOR GOOD
2004 20092008200720062005
72
77
82
87
92
0
5
10
15
20
PERCENTAGE

REVIEW OF OPERATIONS ASSET 43
Pavement durability on the rural road network has been relatively stable over the past fi ve years, and shows signifi cantly less poor-rated pavement than urban roads. The RTA has previously given priority to the weaker and more water sensitive rural granular pavements ahead of the urban asphalt roads made from manufactured materials. These urban roads are more resilient to prolonged rainfall than natural gravel roads. Urban roads are also typically lower speed, and therefore represent less of a road safety risk than rural high-speed roads. Following the recommendations of the Auditor-General, additional attention is being given to the urban network without diminishing the maintenance effort on the rural network.
As road pavements continually deteriorate over time the RTA must rebuild roads to ensure that the road network is sustainable and to restore pavement conditions to acceptable standards. The RTA mainly rebuilds road pavements through its maintenance program but new works also contribute to this aim.
FIGURE 13. REBUILDING OF ROAD PAVEMENTS
ANNUAL PERCENTAGE
0
0.5
1.0
1.5
2005-06 2006-07 2007-08 2008-09 2009-10(Target)
MAINTENANCE NEW PROJECTS
The method of calculating the maintenance and new works contribution has changed.
1. Maintenance now includes the contribution to the pavement rebuilding from lane/shoulder-widening works.
2. The new method discounts the contribution from new works based on the remaining life of the pavement being replaced.
The contribution of rebuilding activity from new works is dependent on the nature of projects undertaken in any year, and whether they involve rebuilding existing pavement, or provision of new infrastructure. Increased funding has been applied to pavement rehabilitation and reconstruction activities under maintenance since 2007-08.
Maintenance programThe Infrastructure Asset Management Program establishes priorities for maintenance work and replacement activities on a risk basis to support ongoing safe and reliable travel on State roads. Roads are one of the largest public assets managed by government. Carefully planned maintenance programs are required to protect the original investment in these assets to ensure their service into the future. Affordable service levels are prioritised across the various components of the road infrastructure and programs are developed in line with corporate maintenance program guidelines. Routine maintenance work is delivered through a mixture of external council contracts and in-house providers. Maintenance specifi cations set consistent minimum levels of service and specify requirements for identifying and rectifying defects, procedures and management systems for worker safety, traffi c control and safety, environmental protection and work quality.
Achievements during 2008-09 included delivery of the $1.089 billion Infrastructure Maintenance Program which represented an increase of $103 million compared to 2007-08. Signifi cant program outcomes included:
• Construction of 10 replacement bridges.
• 1.66 million m2 of asphalt surface replaced (3.9 per cent of the asphalt network).
• 12.7 million m2 of bitumen surface resealed (10.1 per cent of the sealed network).
• 1.83 million m2 of road pavement rebuilt and/or widened (0.99 per cent of the total network).
Endeavour Bridge after concrete repair work, cathodic protection of reinforcements and application of anti-carbonation coatings work.
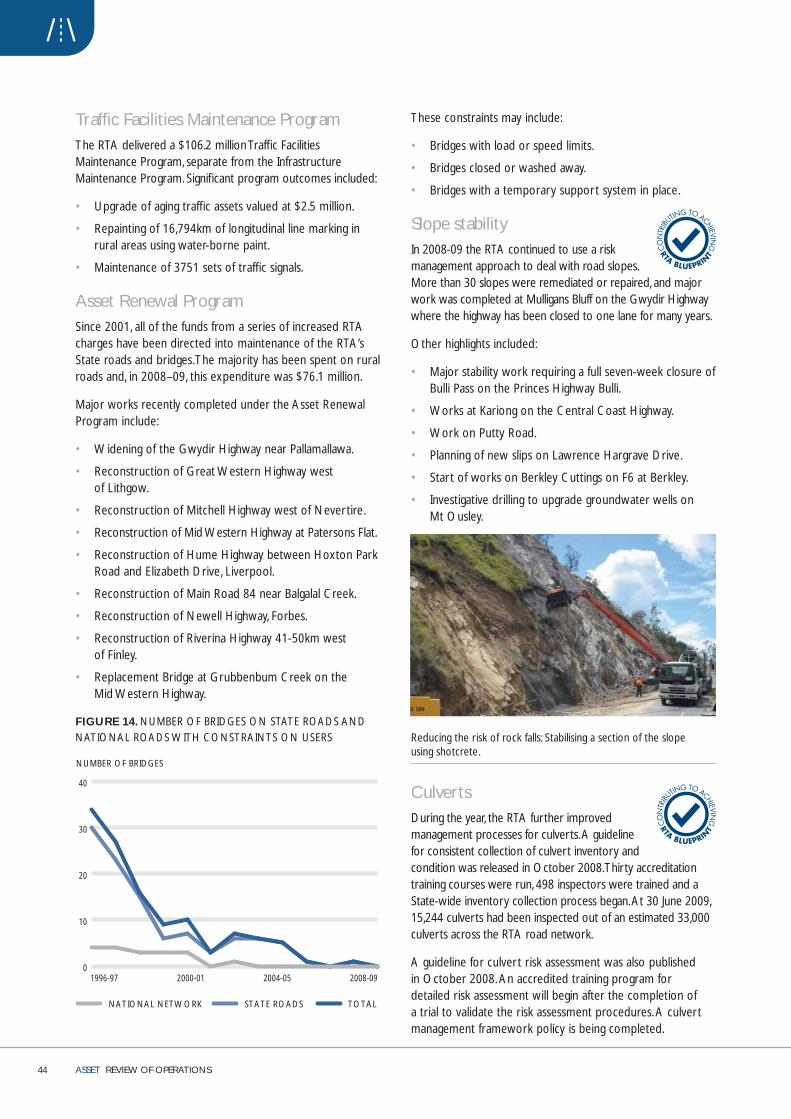
44 ASSET REVIEW OF OPERATIONS
Traffi c Facilities Maintenance ProgramThe RTA delivered a $106.2 million Traffi c Facilities Maintenance Program, separate from the Infrastructure Maintenance Program. Signifi cant program outcomes included:
• Upgrade of aging traffi c assets valued at $2.5 million.
• Repainting of 16,794km of longitudinal line marking in rural areas using water-borne paint.
• Maintenance of 3751 sets of traffi c signals.
Asset Renewal ProgramSince 2001, all of the funds from a series of increased RTA charges have been directed into maintenance of the RTA’s State roads and bridges. The majority has been spent on rural roads and, in 2008–09, this expenditure was $76.1 million.
Major works recently completed under the Asset Renewal Program include:
• Widening of the Gwydir Highway near Pallamallawa.
• Reconstruction of Great Western Highway west of Lithgow.
• Reconstruction of Mitchell Highway west of Nevertire.
• Reconstruction of Mid Western Highway at Patersons Flat.
• Reconstruction of Hume Highway between Hoxton Park Road and Elizabeth Drive, Liverpool.
• Reconstruction of Main Road 84 near Balgalal Creek.
• Reconstruction of Newell Highway, Forbes.
• Reconstruction of Riverina Highway 41-50km west of Finley.
• Replacement Bridge at Grubbenbum Creek on the Mid Western Highway.
FIGURE 14. NUMBER OF BRIDGES ON STATE ROADS AND NATIONAL ROADS WITH CONSTRAINTS ON USERS
NUMBER OF BRIDGES
0
10
20
30
40
STATE ROADSNATIONAL NETWORK TOTAL
1996-97 2008-092004-052000-01
These constraints may include:
• Bridges with load or speed limits.
• Bridges closed or washed away.
• Bridges with a temporary support system in place.
Slope stability In 2008-09 the RTA continued to use a risk management approach to deal with road slopes. More than 30 slopes were remediated or repaired, and major work was completed at Mulligans Bluff on the Gwydir Highway where the highway has been closed to one lane for many years.
Other highlights included:
• Major stability work requiring a full seven-week closure of Bulli Pass on the Princes Highway Bulli.
• Works at Kariong on the Central Coast Highway.
• Work on Putty Road.
• Planning of new slips on Lawrence Hargrave Drive.
• Start of works on Berkley Cuttings on F6 at Berkley.
• Investigative drilling to upgrade groundwater wells on Mt Ousley.
Reducing the risk of rock falls: Stabilising a section of the slope using shotcrete.
Culverts During the year, the RTA further improved management processes for culverts. A guideline for consistent collection of culvert inventory and condition was released in October 2008. Thirty accreditation training courses were run, 498 inspectors were trained and a State-wide inventory collection process began. At 30 June 2009, 15,244 culverts had been inspected out of an estimated 33,000 culverts across the RTA road network.
A guideline for culvert risk assessment was also published in October 2008. An accredited training program for detailed risk assessment will begin after the completion of a trial to validate the risk assessment procedures. A culvert management framework policy is being completed.
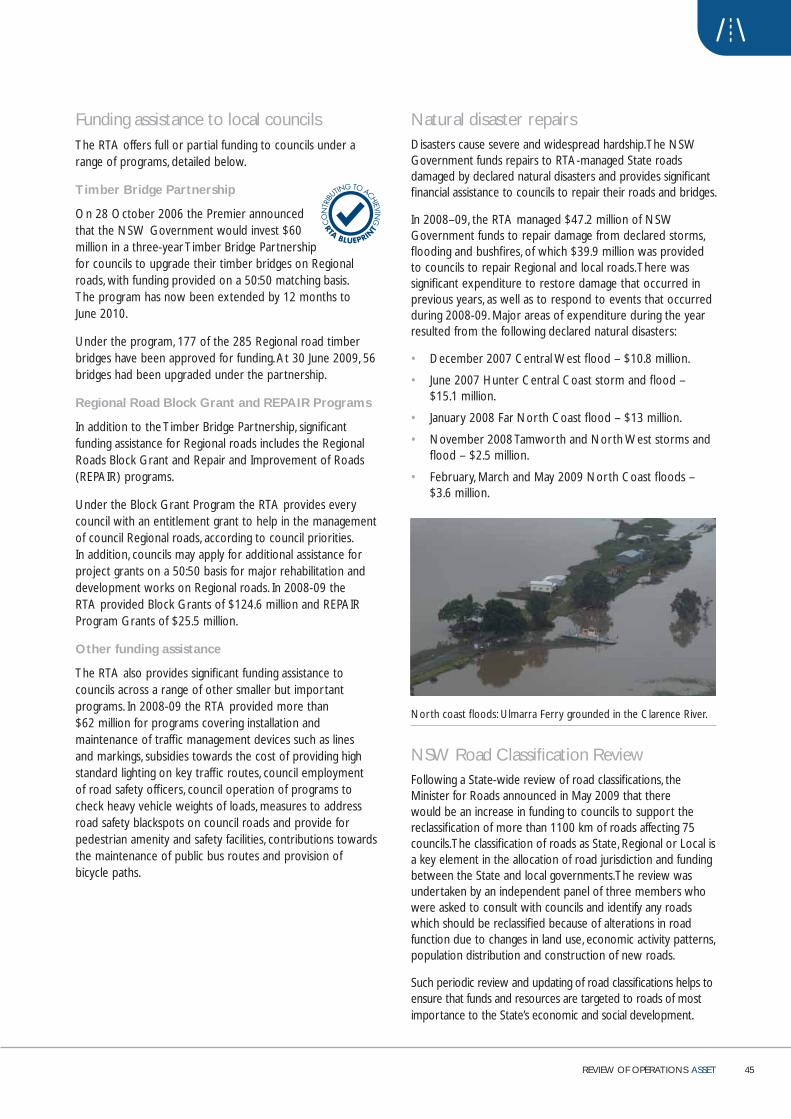
REVIEW OF OPERATIONS ASSET 45
Funding assistance to local councilsThe RTA offers full or partial funding to councils under a range of programs, detailed below.
Timber Bridge Partnership
On 28 October 2006 the Premier announced that the NSW Government would invest $60 million in a three-year Timber Bridge Partnership for councils to upgrade their timber bridges on Regional roads, with funding provided on a 50:50 matching basis. The program has now been extended by 12 months to June 2010.
Under the program, 177 of the 285 Regional road timber bridges have been approved for funding. At 30 June 2009, 56 bridges had been upgraded under the partnership.
Regional Road Block Grant and REPAIR Programs
In addition to the Timber Bridge Partnership, signifi cant funding assistance for Regional roads includes the Regional Roads Block Grant and Repair and Improvement of Roads (REPAIR) programs.
Under the Block Grant Program the RTA provides every council with an entitlement grant to help in the management of council Regional roads, according to council priorities. In addition, councils may apply for additional assistance for project grants on a 50:50 basis for major rehabilitation and development works on Regional roads. In 2008-09 the RTA provided Block Grants of $124.6 million and REPAIR Program Grants of $25.5 million.
Other funding assistance
The RTA also provides signifi cant funding assistance to councils across a range of other smaller but important programs. In 2008-09 the RTA provided more than $62 million for programs covering installation and maintenance of traffi c management devices such as lines and markings, subsidies towards the cost of providing high standard lighting on key traffi c routes, council employment of road safety offi cers, council operation of programs to check heavy vehicle weights of loads, measures to address road safety blackspots on council roads and provide for pedestrian amenity and safety facilities, contributions towards the maintenance of public bus routes and provision of bicycle paths.
Natural disaster repairsDisasters cause severe and widespread hardship. The NSW Government funds repairs to RTA-managed State roads damaged by declared natural disasters and provides signifi cant fi nancial assistance to councils to repair their roads and bridges.
In 2008–09, the RTA managed $47.2 million of NSW Government funds to repair damage from declared storms, fl ooding and bushfi res, of which $39.9 million was provided to councils to repair Regional and local roads. There was signifi cant expenditure to restore damage that occurred in previous years, as well as to respond to events that occurred during 2008-09. Major areas of expenditure during the year resulted from the following declared natural disasters:
• December 2007 Central West fl ood – $10.8 million.
• June 2007 Hunter Central Coast storm and fl ood – $15.1 million.
• January 2008 Far North Coast fl ood – $13 million.
• November 2008 Tamworth and North West storms and fl ood – $2.5 million.
• February, March and May 2009 North Coast fl oods – $3.6 million.
North coast fl oods: Ulmarra Ferry grounded in the Clarence River.
NSW Road Classifi cation ReviewFollowing a State-wide review of road classifi cations, the Minister for Roads announced in May 2009 that there would be an increase in funding to councils to support the reclassifi cation of more than 1100 km of roads affecting 75 councils. The classifi cation of roads as State, Regional or Local is a key element in the allocation of road jurisdiction and funding between the State and local governments. The review was undertaken by an independent panel of three members who were asked to consult with councils and identify any roads which should be reclassifi ed because of alterations in road function due to changes in land use, economic activity patterns, population distribution and construction of new roads.
Such periodic review and updating of road classifi cations helps to ensure that funds and resources are targeted to roads of most importance to the State’s economic and social development.

46 ASSET REVIEW OF OPERATIONS
Improved information for local government The management of the road network is shared between the NSW Government (through the RTA) for State roads and local councils for Regional and local roads. Details of the working arrangements are set out in a manual – ‘RTA arrangements with councils for road management’ – known as the ‘Yellow Book’. The manual was published in 1993 and outlines the administrative, fi nancial and legal frameworks relating to a range of programs, such as Regional Road Block Grants and natural disasters.
In 2008-09 the RTA replaced the 1993 manual with a more comprehensive web version. The new ‘Local Government Relations’ link on the RTA internet is a one-stop-shop for local government offi cers and RTA staff to access updated information previously covered in the 1993 manual. In addition, there is a wide range of useful information on topics such as heavy vehicles, road maintenance council contracts, road safety as well as technical documents which serve as a base for the working arrangements between local government and the RTA.
Future challengesHeavy vehicle access• Support the COAG’s reforms to enhance the effi ciency,
productivity and sustainability of road and rail freight infrastructure through the reform of heavy vehicle road user charges, and contribute to the national debate on user access.
• Continue to promote the use of innovative, higher productivity vehicles to improve freight movement.
• Continue to implement the IAP to facilitate better use of the network to match the right truck to the right road.
MaintenanceThe future challenges facing the RTA in managing the NSW road network need to be considered within the context of population growth, economic prosperity and environmental sustainability. The priorities of the NSW State Plan and the fi ndings of the NSW Auditor-General’s report, Condition of State Roads, are signifi cant infl uences on RTA performance in this area.
To meet these challenges the RTA will:
• Continue to divert funds, where possible, to critical maintenance activities.
• Continue to strengthen older RTA bridges and to facilitate wider use of higher productivity vehicles across the network.
• Improve capability to model the impacts of increasing freight movements on the road network.
• Continue to consult with local government, internal providers and industry on infrastructure planning.
• Continue to implement the recommendations of the NSW Auditor-General’s report.
• Continue to seek improvements in technology supporting road maintenance assessment and maintenance treatments.
• Increase the level of asphalt resurfacing and pavement rebuilding.
• Continue to review the RTA’s 10-year Strategic Asset Maintenance Plan.
• Revise and implement consistent service and technical standards.
• Enhance the planning of maintenance through the development of a comprehensive pavement management system (to begin in 2009-10).
• Enhance the project delivery of maintenance and minor work through the alliance model with internal providers and road maintenance contracts with local councils.
• Maintain and improve the performance of the road network within available funding.
• Seek opportunities for increased effi ciencies in maintenance delivery.
• Continue to infl uence project development to construct infrastructures or systems that are robust and reliable to achieve long-term operation and maintenance.
REVIEW OF OPERATIONS
SafetyFatalities 48
NSW Centre for Road Safety 49
Safer roads 50
Safer road users 52
Safer vehicles 60

Fatalities There were 374 fatalities on NSW roads in 2008 – a 14 per cent reduction from 2007 when 435 people died on our roads. This result is the lowest annual NSW road toll since 1944, when the population was less than half that of 2008.
The NSW fatality rate per 100,000 population in 2008 was 5.4, the lowest fi gure since records began in 1908. This also compares favourably with the rate for the whole of Australia, which was 6.7 fatalities per 100,000 population in 2008. International comparisons show NSW ahead of other Organisation for Economic Co-operation and Development countries such as France (7.5 fatalities per 100,000 population), Italy (8.7), New Zealand (9.4) and the United States (13.6), but still behind the leaders the Netherlands (4.3), the United Kingdom (5.0) and Sweden (5.2).
The NSW State Plan states:
we will reduce road fatalities to 0.7 per 100 million vehicle kilometres travelled by 2016”.
Based on Australian Bureau of Statistics travel data for 2008, the fatality rate per 100 million vehicle kilometres in NSW in 2008 was 0.57.
REVIEW OF OPERATIONS
SafetyThe RTA works to maximise the safety of the road environment, vehicles and road user behaviour
“
The RTA and road safety
NSW has again broken records with further reductions in the road toll.
The calendar year 2008 was the sixth year in a row that the road toll has decreased in NSW – the fi rst time this has happened since records began 100 years ago. This record has been achieved despite there being 15 times as many vehicles, 11 times as many licensed drivers and double the population on our roads since 1944 – the last time so few fatalities were recorded on NSW roads.
However, the road toll has been increasing signifi cantly in 2009. During the fi rst six months of 2009, provisional data indicated that there were 232 fatalities on NSW roads, an increase of 66 (or 40 per cent) compared to the same period in 2008.
The RTA is implementing a ‘Safe System Partnership’ approach to road safety, used effectively in Europe. This approach recognises that human error is inevitable and requires roads and roadside environments that are forgiving of driver error.
Road safety is a key priority for the RTA and it is being ‘mainstreamed’ throughout the organisation. Under this approach all managers are accountable for road safety outcomes relevant to their area of responsibility. Road safety performance indicators and road safety impact statements guide investment decisions – road safety impact statements are being completed for work programs to ensure programs and projects meet desired road safety outcomes. The Executive Road Safety Management Committee oversees a coordinated approach to road safety. This year, as a further sign of the prioritisation of road safety, the NSW Centre for Road Safety began reporting directly to the RTA Chief Executive.
This chapter summarises the measures the RTA has taken in the past year to improve the safety of roads, vehicles and users. It also provides data about road fatalities in the past year, trends in road fatalities and the key factors behind the fi gures.
Section cover image: RTA staff member, Devaraj Muniswamy, at the Huntingwood Crashlab, September 2007. Photographer Geordie McRae.

REVIEW OF OPERATIONS SAFETY 49
Factors in crashesAnalysis of crashes for the calendar year ending 31 December 2008 revealed that:
• Speeding was a factor in around 41 per cent of fatalities.
• At least 21 per cent of fatalities were the result of a crash involving a driver or rider with a blood alcohol level above the legal limit.
• At least 18 per cent of people killed in motor vehicles were not wearing available restraints.
• Driver fatigue contributed to about 16 per cent of fatalities.
• At least nine per cent of motorcyclists killed were not wearing helmets. Motorcyclists accounted for 15 per cent of fatalities.
FIGURE 15. TRENDS FOR FATALITIES NSW v REST OF AUSTRALIA 2002-2008
350
400
450
500
550
600
20082002 2003 2005 2007
NO. FATALITIES NSW NO. FATALITIES REST OF AUSTRALIA
700
800
900
1,000
1,100
1,200
2004 2006
REST OF AUSTRALIA(7% decrease since 2002)
NSW(33% decrease since 2002)
NSW Centre for Road SafetyThe NSW Centre for Road Safety became fully operational on 1 January 2008, and a stand-alone Directorate reporting to the Chief Executive in December 2008. It is working to become a world-class road safety centre for policy development, high-level research, advice and delivery of behavioural change strategies.
The centre is overseeing the ‘mainstreaming’ of road safety into all RTA programs and developing projects and policy to continue to improve road safety.
The centre consists of four specialist areas – safer vehicles, safer people, safer roads and road safety technology. These ‘four pillars’ of road safety each represents a key component of the RTA Safe System Partnership approach to road safety. This approach is based on the premise that the road, vehicles and the road environment must be designed and maintained with the recognition that motorists do make mistakes. It challenges road designers, vehicle manufacturers, network development, management decision-makers and vehicle regulation managers to achieve a balance in the key factors on the road network. This requires the following:
• Designing, constructing, maintaining and regulating a road system so that the impact and forces on the human body generated by crashes are less than those resulting in fatality or chronic debilitating injury.
• Designing, constructing and improving roads and roadsides to reduce the risk and, especially, severity of crashes.
• Regulating or encouraging the development and adoption of high quality active and passive safety systems in vehicles.
• Speed management, in view of the risks in any part of the system.
• Educating road users and encouraging them to obey the road rules.
• Using enforcement and penalties to deter road users from breaking the rules.
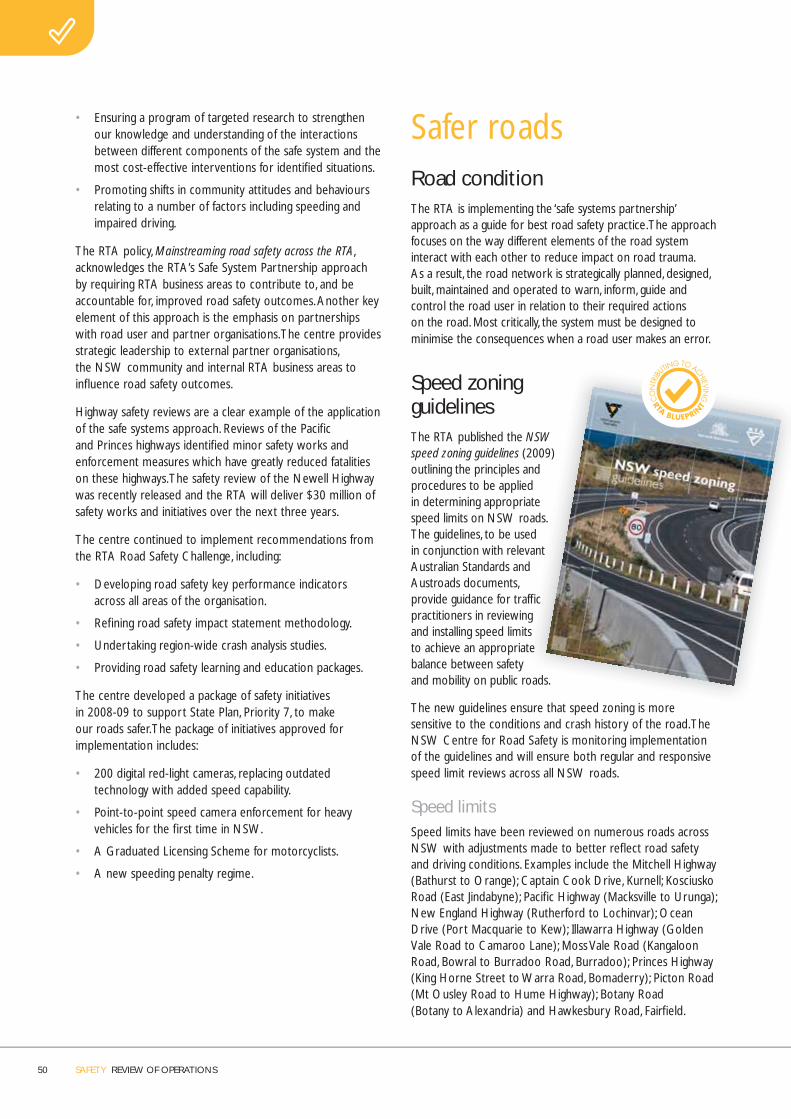
50 SAFETY REVIEW OF OPERATIONS
• Ensuring a program of targeted research to strengthen our knowledge and understanding of the interactions between different components of the safe system and the most cost-effective interventions for identifi ed situations.
• Promoting shifts in community attitudes and behaviours relating to a number of factors including speeding and impaired driving.
The RTA policy, Mainstreaming road safety across the RTA, acknowledges the RTA’s Safe System Partnership approach by requiring RTA business areas to contribute to, and be accountable for, improved road safety outcomes. Another key element of this approach is the emphasis on partnerships with road user and partner organisations. The centre provides strategic leadership to external partner organisations, the NSW community and internal RTA business areas to infl uence road safety outcomes.
Highway safety reviews are a clear example of the application of the safe systems approach. Reviews of the Pacifi c and Princes highways identifi ed minor safety works and enforcement measures which have greatly reduced fatalities on these highways. The safety review of the Newell Highway was recently released and the RTA will deliver $30 million of safety works and initiatives over the next three years.
The centre continued to implement recommendations from the RTA Road Safety Challenge, including:
• Developing road safety key performance indicators across all areas of the organisation.
• Refi ning road safety impact statement methodology.
• Undertaking region-wide crash analysis studies.
• Providing road safety learning and education packages.
The centre developed a package of safety initiatives in 2008-09 to support State Plan, Priority 7, to make our roads safer. The package of initiatives approved for implementation includes:
• 200 digital red-light cameras, replacing outdated technology with added speed capability.
• Point-to-point speed camera enforcement for heavy vehicles for the fi rst time in NSW.
• A Graduated Licensing Scheme for motorcyclists.
• A new speeding penalty regime.
Safer roadsRoad conditionThe RTA is implementing the ‘safe systems partnership’ approach as a guide for best road safety practice. The approach focuses on the way different elements of the road system interact with each other to reduce impact on road trauma. As a result, the road network is strategically planned, designed, built, maintained and operated to warn, inform, guide and control the road user in relation to their required actions on the road. Most critically, the system must be designed to minimise the consequences when a road user makes an error.
Speed zoning guidelinesThe RTA published the NSW speed zoning guidelines (2009) outlining the principles and procedures to be applied in determining appropriate speed limits on NSW roads. The guidelines, to be used in conjunction with relevant Australian Standards and Austroads documents, provide guidance for traffi c practitioners in reviewing and installing speed limits to achieve an appropriate balance between safety and mobility on public roads.
The new guidelines ensure that speed zoning is more sensitive to the conditions and crash history of the road. The NSW Centre for Road Safety is monitoring implementation of the guidelines and will ensure both regular and responsive speed limit reviews across all NSW roads.
Speed limitsSpeed limits have been reviewed on numerous roads across NSW with adjustments made to better refl ect road safety and driving conditions. Examples include the Mitchell Highway (Bathurst to Orange); Captain Cook Drive, Kurnell; Kosciusko Road (East Jindabyne); Pacifi c Highway (Macksville to Urunga); New England Highway (Rutherford to Lochinvar); Ocean Drive (Port Macquarie to Kew); Illawarra Highway (Golden Vale Road to Camaroo Lane); Moss Vale Road (Kangaloon Road, Bowral to Burradoo Road, Burradoo); Princes Highway (King Horne Street to Warra Road, Bomaderry); Picton Road (Mt Ousley Road to Hume Highway); Botany Road (Botany to Alexandria) and Hawkesbury Road, Fairfi eld.

REVIEW OF OPERATIONS SAFETY 51
Speed Zone Management System A Speed Zone Management System has been developed to record and map the locations of all speed limit signs and zones in NSW. The system provides an asset register, helps facilitate speed reviews and is enabling a trial of an in-car speed zone warning system (Intelligent Speed Adaptation). The data from the Speed Zone Management System is also used for travel times for the Safe-T-Cam system which targets speeding heavy vehicles. Speed zones for State roads are mapped into the database and, to date, 30 per cent of all NSW roads have been mapped.
Road safety and Aboriginal communitiesThe RTA is leading the assessment of road safety issues affecting about 65 Aboriginal communities. The assessments are being undertaken in close consultation with local councils. The assessments focus on roads within communities as well as the roads connecting Aboriginal communities with the nearest townships. The assessments began in April 2009 and, by 30 June, 23 communities had been assessed.
These assessments are being undertaken as part of the delivery of the State Plan Priority S7 – Safer Roads, and to assist the Department of Aboriginal Affairs (DAA) in its delivery of State Plan Priority F1 – Improved health and education for Aboriginal people. The RTA is planning to submit the fi nal report on the assessments to the DAA in late 2009.
Left to right: Scott Single, Aboriginal community elder, Barry Gunther, RTA, Soames Job, RTA and Richard Swan, Aboriginal community elder, at a recent Aboriginal infrastructure road safety assessment in Stanley Village, Moree.
Pedestrian areasIn 2008-09, 40km/h zones were installed or upgraded in eight pedestrian areas and a further two sites were under construction. The program includes the installation of traffi c calming measures, safe and convenient pedestrian crossings and 40km/h speed limits.
For information on initiatives undertaken to improve pedestrian access and safety please see the Transport chapter.
Specialist safety adviceThe NSW Centre for Road Safety regularly provides road safety engineering advice on a range of projects through informal and formal meetings such as the Major Projects Review Committee (which reviews all major road infrastructure projects). The RTA ensures that each major project, from planning through to delivery, addresses road safety engineering principles. This is supported by a number of key management tools which have clear road safety objectives and outcomes, such as Road Safety Audits, Road Safety Impact Statements, Development Program Guidelines, Project OHS Development Plans, and ProjectPack.
Road Safety Impact Statement/ Safety BCR Calculation Model The Road Safety Impact Statement / Safety BCR Calculation Model project involved developing and implementing analytical tools to sensitively quantify the safety outcomes of new engineering works. This project facilitated an improved methodology that focused on the impact of trauma rather than just on crashes.
CrashcamThe RTA’s Crashcam program continued with two new sites. Sites are distributed across the State in high crash frequency locations where traditional crash investigation and analysis has not had a signifi cant impact. Crashcam provides invaluable footage of crashes, ‘near miss’ incidents and driver behaviour to help determine the causes of crashes and identify appropriate remedial treatments.
In 2008-09, two new Crashcam sites were installed. The fi rst, commissioned in August 2008, was at the intersection of the M4 and The Northern Rd, South Penrith. The second site, commissioned in May 2009, is at the intersections of the Pacifi c Highway and Harrington Rd/Coopernook Rd, Coopernook.
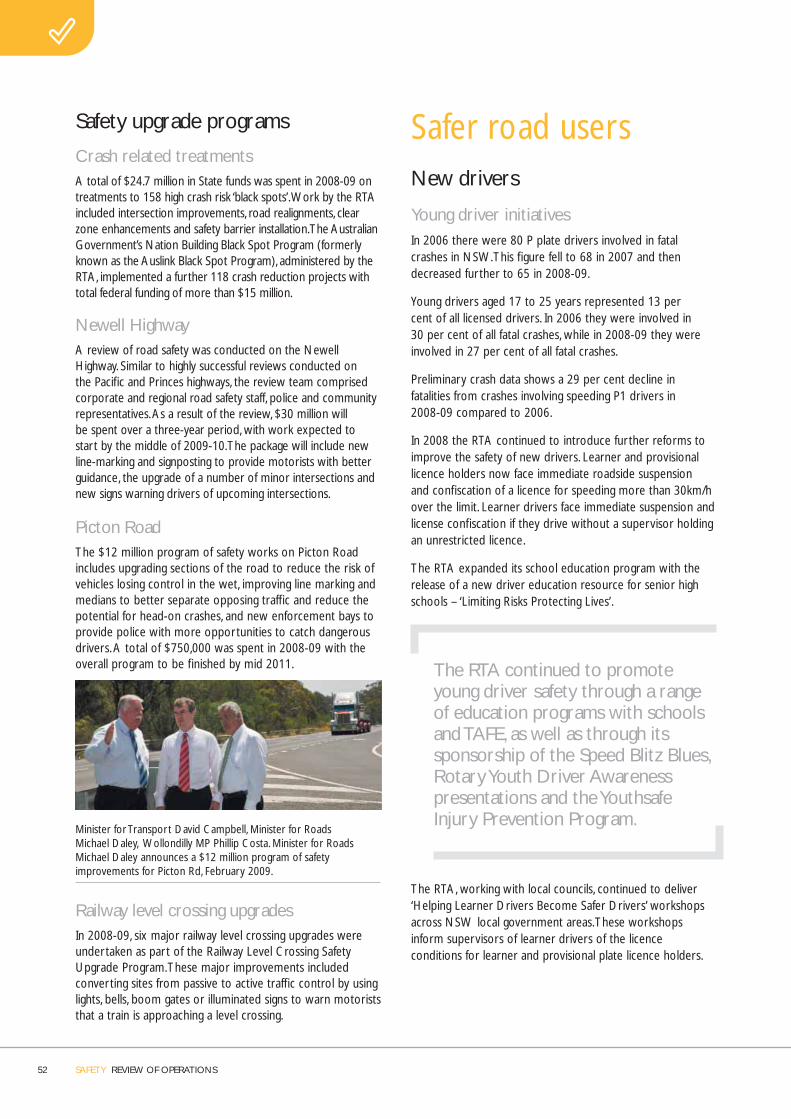
52 SAFETY REVIEW OF OPERATIONS
Safety upgrade programs
Crash related treatmentsA total of $24.7 million in State funds was spent in 2008-09 on treatments to 158 high crash risk ‘black spots’. Work by the RTA included intersection improvements, road realignments, clear zone enhancements and safety barrier installation. The Australian Government’s Nation Building Black Spot Program (formerly known as the Auslink Black Spot Program), administered by the RTA, implemented a further 118 crash reduction projects with total federal funding of more than $15 million.
Newell HighwayA review of road safety was conducted on the Newell Highway. Similar to highly successful reviews conducted on the Pacifi c and Princes highways, the review team comprised corporate and regional road safety staff, police and community representatives. As a result of the review, $30 million will be spent over a three-year period, with work expected to start by the middle of 2009-10. The package will include new line-marking and signposting to provide motorists with better guidance, the upgrade of a number of minor intersections and new signs warning drivers of upcoming intersections.
Picton RoadThe $12 million program of safety works on Picton Road includes upgrading sections of the road to reduce the risk of vehicles losing control in the wet, improving line marking and medians to better separate opposing traffi c and reduce the potential for head-on crashes, and new enforcement bays to provide police with more opportunities to catch dangerous drivers. A total of $750,000 was spent in 2008-09 with the overall program to be fi nished by mid 2011.
Minister for Transport David Campbell, Minister for Roads Michael Daley, Wollondilly MP Phillip Costa. Minister for Roads Michael Daley announces a $12 million program of safety improvements for Picton Rd, February 2009.
Railway level crossing upgradesIn 2008-09, six major railway level crossing upgrades were undertaken as part of the Railway Level Crossing Safety Upgrade Program. These major improvements included converting sites from passive to active traffi c control by using lights, bells, boom gates or illuminated signs to warn motorists that a train is approaching a level crossing.
Safer road usersNew drivers
Young driver initiativesIn 2006 there were 80 P plate drivers involved in fatal crashes in NSW. This fi gure fell to 68 in 2007 and then decreased further to 65 in 2008-09.
Young drivers aged 17 to 25 years represented 13 per cent of all licensed drivers. In 2006 they were involved in 30 per cent of all fatal crashes, while in 2008-09 they were involved in 27 per cent of all fatal crashes.
Preliminary crash data shows a 29 per cent decline in fatalities from crashes involving speeding P1 drivers in 2008-09 compared to 2006.
In 2008 the RTA continued to introduce further reforms to improve the safety of new drivers. Learner and provisional licence holders now face immediate roadside suspension and confi scation of a licence for speeding more than 30km/h over the limit. Learner drivers face immediate suspension and license confi scation if they drive without a supervisor holding an unrestricted licence.
The RTA expanded its school education program with the release of a new driver education resource for senior high schools – ‘Limiting Risks Protecting Lives’.
The RTA continued to promote young driver safety through a range of education programs with schools and TAFE, as well as through its sponsorship of the Speed Blitz Blues, Rotary Youth Driver Awareness presentations and the Youthsafe Injury Prevention Program.
The RTA, working with local councils, continued to deliver ‘Helping Learner Drivers Become Safer Drivers’ workshops across NSW local government areas. These workshops inform supervisors of learner drivers of the licence conditions for learner and provisional plate licence holders.
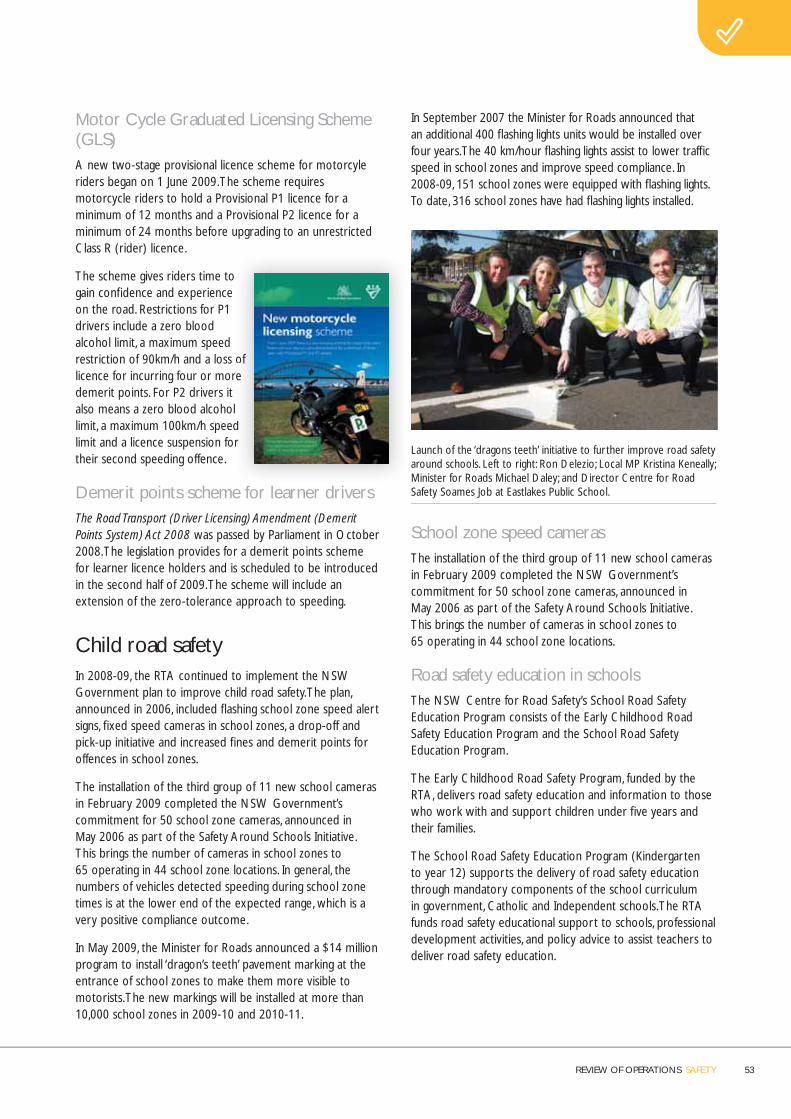
REVIEW OF OPERATIONS SAFETY 53
Motor Cycle Graduated Licensing Scheme (GLS)A new two-stage provisional licence scheme for motorcyle riders began on 1 June 2009. The scheme requires motorcycle riders to hold a Provisional P1 licence for a minimum of 12 months and a Provisional P2 licence for a minimum of 24 months before upgrading to an unrestricted Class R (rider) licence.
The scheme gives riders time to gain confi dence and experience on the road. Restrictions for P1 drivers include a zero blood alcohol limit, a maximum speed restriction of 90km/h and a loss of licence for incurring four or more demerit points. For P2 drivers it also means a zero blood alcohol limit, a maximum 100km/h speed limit and a licence suspension for their second speeding offence.
Demerit points scheme for learner driversThe Road Transport (Driver Licensing) Amendment (Demerit Points System) Act 2008 was passed by Parliament in October 2008. The legislation provides for a demerit points scheme for learner licence holders and is scheduled to be introduced in the second half of 2009. The scheme will include an extension of the zero-tolerance approach to speeding.
Child road safetyIn 2008-09, the RTA continued to implement the NSW Government plan to improve child road safety. The plan, announced in 2006, included fl ashing school zone speed alert signs, fi xed speed cameras in school zones, a drop-off and pick-up initiative and increased fi nes and demerit points for offences in school zones.
The installation of the third group of 11 new school cameras in February 2009 completed the NSW Government’s commitment for 50 school zone cameras, announced in May 2006 as part of the Safety Around Schools Initiative. This brings the number of cameras in school zones to 65 operating in 44 school zone locations. In general, the numbers of vehicles detected speeding during school zone times is at the lower end of the expected range, which is a very positive compliance outcome.
In May 2009, the Minister for Roads announced a $14 million program to install ‘dragon’s teeth’ pavement marking at the entrance of school zones to make them more visible to motorists. The new markings will be installed at more than 10,000 school zones in 2009-10 and 2010-11.
In September 2007 the Minister for Roads announced that an additional 400 fl ashing lights units would be installed over four years. The 40 km/hour fl ashing lights assist to lower traffi c speed in school zones and improve speed compliance. In 2008-09, 151 school zones were equipped with fl ashing lights. To date, 316 school zones have had fl ashing lights installed.
Launch of the ‘dragons teeth’ initiative to further improve road safety around schools. Left to right: Ron Delezio; Local MP Kristina Keneally; Minister for Roads Michael Daley; and Director Centre for Road Safety Soames Job at Eastlakes Public School.
School zone speed camerasThe installation of the third group of 11 new school cameras in February 2009 completed the NSW Government’s commitment for 50 school zone cameras, announced in May 2006 as part of the Safety Around Schools Initiative. This brings the number of cameras in school zones to 65 operating in 44 school zone locations.
Road safety education in schoolsThe NSW Centre for Road Safety’s School Road Safety Education Program consists of the Early Childhood Road Safety Education Program and the School Road Safety Education Program.
The Early Childhood Road Safety Program, funded by the RTA, delivers road safety education and information to those who work with and support children under fi ve years and their families.
The School Road Safety Education Program (Kindergarten to year 12) supports the delivery of road safety education through mandatory components of the school curriculum in government, Catholic and Independent schools. The RTA funds road safety educational support to schools, professional development activities, and policy advice to assist teachers to deliver road safety education.
of re
d r

54 SAFETY REVIEW OF OPERATIONS
Early childhood education In 2008-09 more than 3200 early childhood services across NSW were registered with the RTA-funded Early Childhood Road Safety Education Program at Macquarie University. Each service received a free copy of the Kids and Traffi c Gazette and Road Safety Songs and Rhymes for Young Children music CD. The program offered nine different professional development workshops in early childhood road safety education to staff, management and families in children’s services across NSW.
Primary educationIn Term 3, 2008, a new Kindergarten Orientation Day resource was distributed to all NSW primary schools. This resource assists schools to provide parents and carers with the best road safety information and advice before their child begins school. The project is supported by a road safety pack of brochures, stickers and a fridge magnet giving the main road safety messages for students beginning primary school.
During 2008-09, additional road safety education resources were developed and produced. These included the 2009 road safety education catalogue from which schools can order RTA road safety education resources; the 2009 ‘Road safety issues around schools and advice and take home notes for schools’ which communicates safety around schools advice to parents, carers and the school community; a double CD of road safety stories and songs for students; a new helmet-fi tting poster and updated brochure, The law and safety advice for bicycles, foot scooters, skateboards and rollerblades.
These resources and sample copies of basic brochures on safe school travel were also included in the RTA’s annual Bike Week mail-out to all NSW primary schools.
High school educationIn March 2009, the Centre for Road Safety produced and distributed a new educational resource, via a professional development course for high school teachers across NSW. The resource, ‘Limiting risks, protecting lives – Choices for novice drivers and their passengers’, was developed provide road safety education for students in years 10 and 11 through their student welfare programs. The resource provides activities to challenge students’ attitudes about driving. It aims to promote deeper thinking and better decision-making about road safety for drivers and passengers.
Older driversThe NSW population as a whole is expected to age over the next 30 years, with the proportion of those aged 70 years or more increasing from 10 per cent to 17 per cent by 2036, and those aged 80 years or more increasing from four per cent to eight per cent over the same period. Crash statistics show that the elderly are over-represented among pedestrian fatalities and drivers involved in fatal crashes.
A number of reforms to the licensing system for older drivers were announced in April 2008. The following reforms were progressively introduced:
• Redesigning the over 85 driving test, making it more practical, with testing every two years beginning on 1 July 2008.
• An annual medical check-up from the age of 75 to aid the early identifi cation of issues such as deteriorating eyesight and dementia (implemented 1 December 2008).
• Introduction of a voluntary driver assessment scheme through accredited driver training organisations like the NRMA and the Australian Driver Trainers Association (implemented 1 December 2008).
• Maintaining modifi ed licence options for drivers aged over 85 (implemented 1 December 2008).
Drink and drug driving
Alcohol Interlock Program The Alcohol Interlock Program is available for courts as an option in sentencing drivers convicted of certain serious drink driving offences. The program allows convicted drivers to suspend part of their licence disqualifi cation period if they install an alcohol interlock device in their car and obtain an interlock driver licence. An alcohol interlock is an electronic device that tests a driver’s breath and prevents a motor vehicle from being started if the driver’s concentration of alcohol exceeds the pre-set limit of 0.02. The benefi ts of the program are that offenders are able to continue to drive legally and have a greater chance of maintaining employment if they need to drive a car as part of their job.
More than 1500 interlock licences have been issued and 834 participants have successfully completed the program to date. In 2008-09, 355 interlock licences were issued.
Two key publications were published in 2008-09, providing information for participants and criminal law specialists.
ad .

REVIEW OF OPERATIONS SAFETY 55
Drug driving Roadside Drug Testing (RDT), which uses oral fl uid samples to test for the presence of three illicit drugs, began in NSW in January 2007. Since RDT began, the NSW Police Force has conducted 37,605 roadside drug tests of 8245 heavy vehicle drivers and 29,360 light vehicle drivers. Of these, 825 drivers, or one in 46, tested positive to one or more of the illicit drugs.
Sober driver program The NSW Sober Driver Program (SDP) is an education and relapse prevention program for repeat drink drive offenders who are convicted of two or more offences within fi ve years. The program’s overall goal is to reduce drink driving re-offending. The program, which combines educational and remedial approaches and activities, is delivered in two formats – a standard nine week format and a condensed three week format. Participation is by referral from a magistrate or a probation and parole offi cer. The program is funded by the RTA, and delivered by the Probation and Parole Service of the Department of Corrective Services. A total of 6706 participants have enrolled in the program to date.
A previous independent evaluation of the Sober Driver Program showed that repeat drink drive offenders who completed the Sober Driver Program are half as likely to have re-offended compared to those offenders who have not completed the program.
In 2008-09, there was a 10 per cent increase in delivery of the program, contributing to the goals of the NSW State Plan. This increase was seen across the State and enabled more participants who meet the SDP criteria to access the program. In 2008-09, 850 people completed the course which was delivered 85 times in 44 location across the State.
Road safety marketing campaigns
CampaignsRoad safety campaigns are key components of public education strategies to raise community awareness of important road safety issues and encourage behavioural change.
Drink driving
Drink driving continues to be a major problem. The Paranoia campaign highlights the risk of being caught by mobile RBT’s. The key message – ‘You won’t know where. You won’t know when’ – challenges the driver to think twice before drinking and driving due to the unpredictability of mobile policing.
The campaign uses television, radio and press messages. The television advert uses an emotive ‘hook’ to capture the target audience, while press and other elements of the campaign provide rational information about the police presence on the roads.
The recent evaluation of the campaign showed that exposure to the ‘Paranoia’ ad was high with 83 per cent of all respondents having seen or heard Paranoia advertising, peaking at 85 per cent for regional and rural males. Importantly the evaluation found that higher exposure to the campaign was associated with increased perceived risk of being breathalysed.
Double demerit points
Double demerit points are enforced during high-risk periods, such as holiday long weekends. A new double demerit points campaign was launched in April 2009. The TV advertisement highlights the fact that a speeding or seatbelt offence could result in the driver losing their licence. It uses visual and sound effects to highlight the message that during the double demerit points period you could ‘blow your licence’. This campaign is conducted during every holiday double demerit period.
‘Speeding. No one thinks big of you.’
The ‘Speeding. No one thinks big of you campaign’ continued to be a key advertising campaign aimed at young drivers throughout 2008-09.
Independently conducted campaign research showed the campaign maintained a 97 per cent awareness among young male drivers and recorded a 92 per cent awareness among the wider community in its second year. It continued to encourage 70 per cent of male drivers to obey the speed limit. This result illustrates the campaign’s contribution to making speeding socially unacceptable amongst the target audience.
The campaign received top prize in the State and National AMI awards for social marketing and was short-listed for 2009 Australian Effi e Awards.
Motorcycle safety
The motorcycle cornering campaign continued throughout 2008-09. The campaign uses highly appealing motorcycle riding images to prompt riders to think about the technical issues associated with riding corners safely. Media elements were print, outdoor and convenience advertising.convenience advertising.
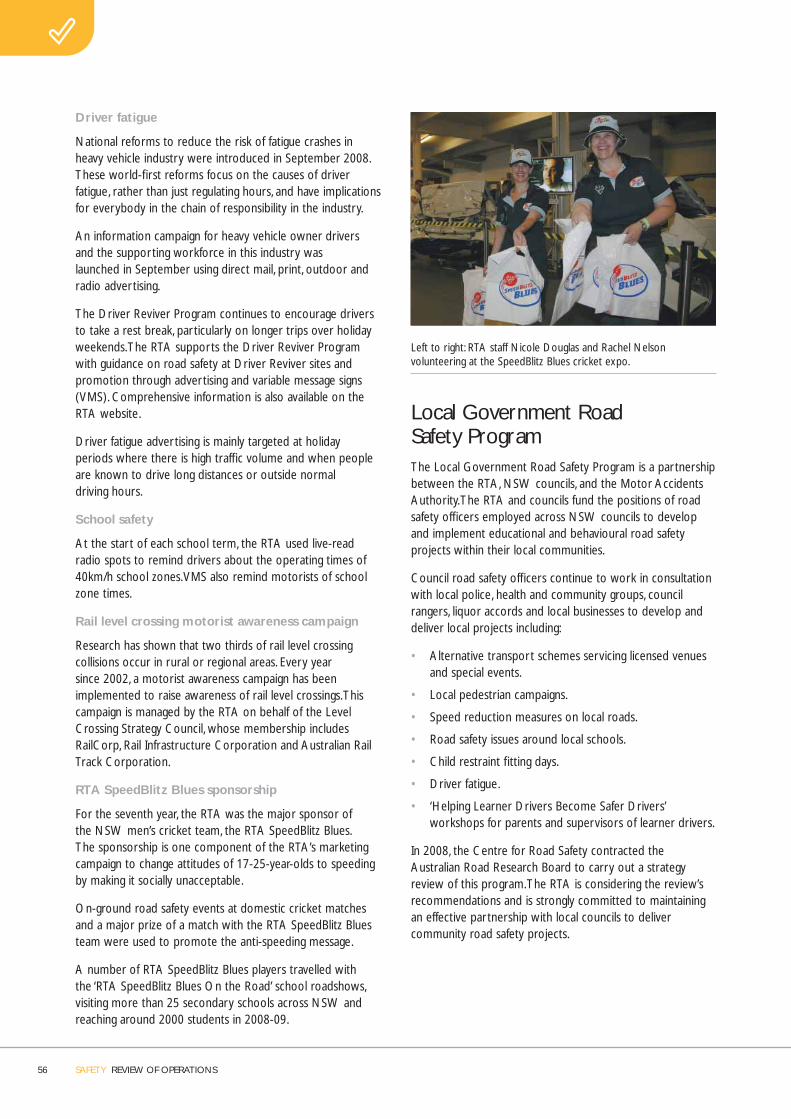
56 SAFETY REVIEW OF OPERATIONS
Driver fatigue
National reforms to reduce the risk of fatigue crashes in heavy vehicle industry were introduced in September 2008. These world-fi rst reforms focus on the causes of driver fatigue, rather than just regulating hours, and have implications for everybody in the chain of responsibility in the industry.
An information campaign for heavy vehicle owner drivers and the supporting workforce in this industry was launched in September using direct mail, print, outdoor and radio advertising.
The Driver Reviver Program continues to encourage drivers to take a rest break, particularly on longer trips over holiday weekends. The RTA supports the Driver Reviver Program with guidance on road safety at Driver Reviver sites and promotion through advertising and variable message signs (VMS). Comprehensive information is also available on the RTA website.
Driver fatigue advertising is mainly targeted at holiday periods where there is high traffi c volume and when people are known to drive long distances or outside normal driving hours.
School safety
At the start of each school term, the RTA used live-read radio spots to remind drivers about the operating times of 40km/h school zones. VMS also remind motorists of school zone times.
Rail level crossing motorist awareness campaign
Research has shown that two thirds of rail level crossing collisions occur in rural or regional areas. Every year since 2002, a motorist awareness campaign has been implemented to raise awareness of rail level crossings. This campaign is managed by the RTA on behalf of the Level Crossing Strategy Council, whose membership includes RailCorp, Rail Infrastructure Corporation and Australian Rail Track Corporation.
RTA SpeedBlitz Blues sponsorship
For the seventh year, the RTA was the major sponsor of the NSW men’s cricket team, the RTA SpeedBlitz Blues. The sponsorship is one component of the RTA’s marketing campaign to change attitudes of 17-25-year-olds to speeding by making it socially unacceptable.
On-ground road safety events at domestic cricket matches and a major prize of a match with the RTA SpeedBlitz Blues team were used to promote the anti-speeding message.
A number of RTA SpeedBlitz Blues players travelled with the ‘RTA SpeedBlitz Blues On the Road’ school roadshows, visiting more than 25 secondary schools across NSW and reaching around 2000 students in 2008-09.
Left to right: RTA staff Nicole Douglas and Rachel Nelson volunteering at the SpeedBlitz Blues cricket expo.
Local Government Road Safety ProgramThe Local Government Road Safety Program is a partnership between the RTA, NSW councils, and the Motor Accidents Authority. The RTA and councils fund the positions of road safety offi cers employed across NSW councils to develop and implement educational and behavioural road safety projects within their local communities.
Council road safety offi cers continue to work in consultation with local police, health and community groups, council rangers, liquor accords and local businesses to develop and deliver local projects including:
• Alternative transport schemes servicing licensed venues and special events.
• Local pedestrian campaigns.
• Speed reduction measures on local roads.
• Road safety issues around local schools.
• Child restraint fi tting days.
• Driver fatigue.
• ‘Helping Learner Drivers Become Safer Drivers’ workshops for parents and supervisors of learner drivers.
In 2008, the Centre for Road Safety contracted the Australian Road Research Board to carry out a strategy review of this program. The RTA is considering the review’s recommendations and is strongly committed to maintaining an effective partnership with local councils to deliver community road safety projects.
REVIEW OF OPERATIONS SAFETY 57
Regulation and enforcement
Enhanced Enforcement Program The Enhanced Enforcement Program is a partnership of the RTA and the NSW Police Force to reduce road trauma.
The program, which began in 1995, builds on the success of State-wide operations to reduce fatalities and injuries during holiday periods. The RTA contributed $9.4 million in 2008-09 to support police operations targeting speeding, drink driving, fatigue, heavy vehicle safety, and seatbelt and helmet use. These operations are now underpinned by detailed crash data that clearly outline the road safety priorities. Such operations are supported with communication campaigns both State-wide and locally.
Heavy vehicle initiativesFatigue reform
The Heavy Vehicle Driver Fatigue Reform was implemented in NSW, Queensland, South Australia and Victoria in September 2008. NSW was the only State to implement the Heavy Vehicle Speeding Compliance Regulation at the same time as the fatigue legislation. The fatigue reform applies to trucks and truck and trailer combinations with gross vehicle mass (GVM) of over 12 tonnes and buses and coaches that seat over 12 adults, including the driver. The speed compliance legislation applies to heavy vehicles with a GVM of more than 4.5 tonnes.
The key element of the reform includes a general duty in road transport law, consistent with Occupational Health and Safety laws, to manage fatigue. This changes the focus from regulating hours to managing fatigue. It includes ‘chain of responsibility’ provisions which extend to parties in the supply chain, namely drivers, operators, employers, loaders, unloaders, schedulers, consignors, consignees and prime contractors. There is a duty on all of these parties to take reasonable steps to ensure a driver does not speed or drive while impaired by fatigue.
There are three fatigue management schemes in the fatigue legislation: Standard Hours, Basic Fatigue Management and Advanced Fatigue Management. These provide alternative work and rest requirements with varying levels of fl exibility, in return for controls to manage fatigue, and compliance responsibilities on operators and drivers.
Following extensive consultation with industry stakeholders on the implementation of these laws in NSW, a range of modifi cations to the new laws were announced by the Minister for Roads. These include work diary exemptions for local area journeys, fl exibility for livestock carriers if they encounter unexpected delays and a blanket exemption for the emergency services.
The RTA is continuing to work with industry groups and fatigue experts to consider other practical improvements to the new laws for specifi c industry sectors including primary producers, waste collectors, concrete suppliers and passenger bus operators.
At the request of NSW, the National Transport Commission has agreed to undertake a national review of the Basic Fatigue Management work and rest hours option, which will consider enabling fortnightly work schedules and greater fl exibility in rest break requirements.
A comprehensive communication plan to increase awareness and knowledge of the new heavy vehicle driver fatigue laws was delivered to the trucking industry and included a direct mail pack with a letter, brochure, three fact sheets, information bulletins, a poster and a DVD; 90 fatigue reform public information sessions attended by over 4400 people; pages on the RTA and National Transport Commission websites; and attendance at industry events and meetings.
Basic/advanced fatigue management
The basic and advanced fatigue management schemes were introduced in September 2008 as part of the new heavy vehicle driver fatigue law. Basic Fatigue Management (BFM) and Advanced Fatigue Management (AFM) allow the driver, operator and/or owner greater fl exibility for managing fatigue levels and scheduling. Accreditation encourages operators to take more responsibility for management of the fatigue of their drivers, while encouraging drivers to be more active in monitoring their own fatigue levels. Operators are required to have their fatigue management systems periodically audited to ensure compliance with the BFM or AFM systems.
To make it easier to join the schemes, operators can apply online. At 30 June 2009, 196 operators were accredited in the BFM scheme with 3313 drivers covered by these accreditations.
Transition arrangements are in place for operators/owners and drivers who were enrolled in the previous accreditation scheme. These transitional arrangements enable drivers to access the BFM hours until the end of September 2009. There is also an exemption in place to allow operators who were enrolled in the previous accreditation scheme to employ new drivers to drive BFM hours. This exemption also expires at the end of September. It is anticipated that there will be an increase in applications for accreditation leading up to this date.
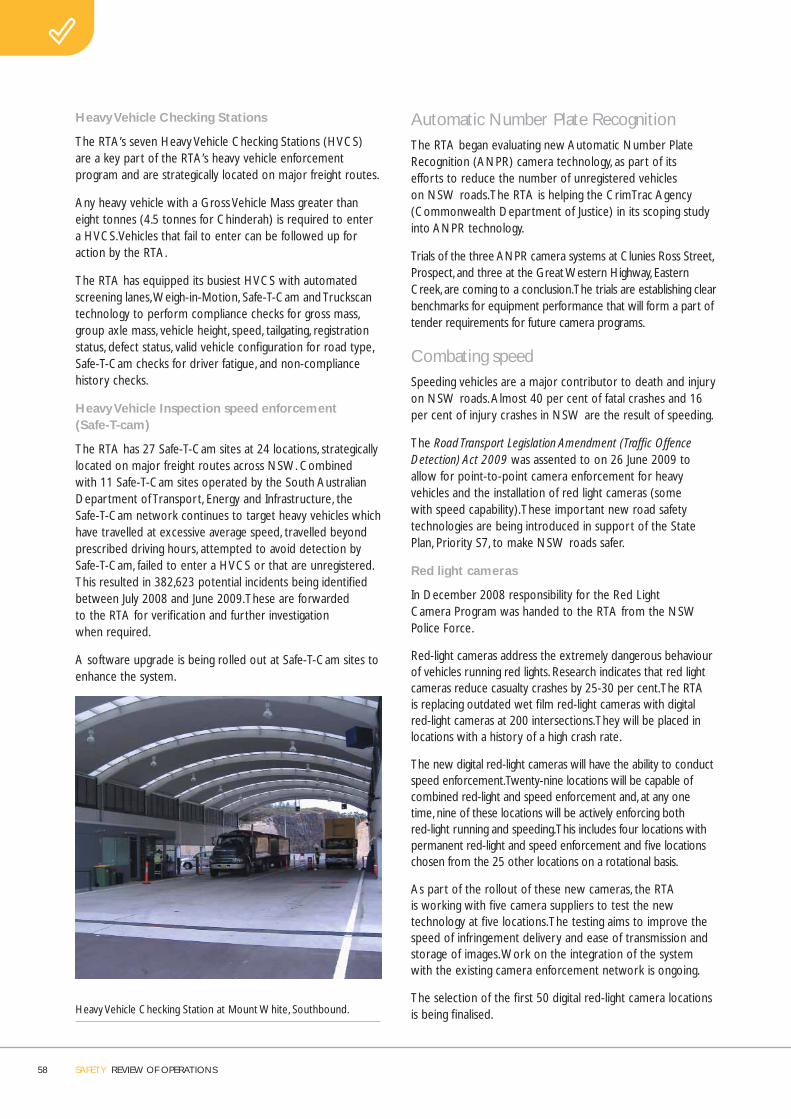
58 SAFETY REVIEW OF OPERATIONS
Heavy Vehicle Checking Stations
The RTA’s seven Heavy Vehicle Checking Stations (HVCS) are a key part of the RTA’s heavy vehicle enforcement program and are strategically located on major freight routes.
Any heavy vehicle with a Gross Vehicle Mass greater than eight tonnes (4.5 tonnes for Chinderah) is required to enter a HVCS. Vehicles that fail to enter can be followed up for action by the RTA.
The RTA has equipped its busiest HVCS with automated screening lanes, Weigh-in-Motion, Safe-T-Cam and Truckscan technology to perform compliance checks for gross mass, group axle mass, vehicle height, speed, tailgating, registration status, defect status, valid vehicle confi guration for road type, Safe-T-Cam checks for driver fatigue, and non-compliance history checks.
Heavy Vehicle Inspection speed enforcement (Safe-T-cam)
The RTA has 27 Safe-T-Cam sites at 24 locations, strategically located on major freight routes across NSW. Combined with 11 Safe-T-Cam sites operated by the South Australian Department of Transport, Energy and Infrastructure, the Safe-T-Cam network continues to target heavy vehicles which have travelled at excessive average speed, travelled beyond prescribed driving hours, attempted to avoid detection by Safe-T-Cam, failed to enter a HVCS or that are unregistered. This resulted in 382,623 potential incidents being identifi ed between July 2008 and June 2009. These are forwarded to the RTA for verifi cation and further investigation when required.
A software upgrade is being rolled out at Safe-T-Cam sites to enhance the system.
Heavy Vehicle Checking Station at Mount White, Southbound.
Automatic Number Plate RecognitionThe RTA began evaluating new Automatic Number Plate Recognition (ANPR) camera technology, as part of its efforts to reduce the number of unregistered vehicles on NSW roads. The RTA is helping the CrimTrac Agency (Commonwealth Department of Justice) in its scoping study into ANPR technology.
Trials of the three ANPR camera systems at Clunies Ross Street, Prospect, and three at the Great Western Highway, Eastern Creek, are coming to a conclusion. The trials are establishing clear benchmarks for equipment performance that will form a part of tender requirements for future camera programs.
Combating speedSpeeding vehicles are a major contributor to death and injury on NSW roads. Almost 40 per cent of fatal crashes and 16 per cent of injury crashes in NSW are the result of speeding.
The Road Transport Legislation Amendment (Traffi c Offence Detection) Act 2009 was assented to on 26 June 2009 to allow for point-to-point camera enforcement for heavy vehicles and the installation of red light cameras (some with speed capability). These important new road safety technologies are being introduced in support of the State Plan, Priority S7, to make NSW roads safer.
Red light cameras
In December 2008 responsibility for the Red Light Camera Program was handed to the RTA from the NSW Police Force.
Red-light cameras address the extremely dangerous behaviour of vehicles running red lights. Research indicates that red light cameras reduce casualty crashes by 25-30 per cent. The RTA is replacing outdated wet fi lm red-light cameras with digital red-light cameras at 200 intersections. They will be placed in locations with a history of a high crash rate.
The new digital red-light cameras will have the ability to conduct speed enforcement. Twenty-nine locations will be capable of combined red-light and speed enforcement and, at any one time, nine of these locations will be actively enforcing both red-light running and speeding. This includes four locations with permanent red-light and speed enforcement and fi ve locations chosen from the 25 other locations on a rotational basis.
As part of the rollout of these new cameras, the RTA is working with fi ve camera suppliers to test the new technology at fi ve locations. The testing aims to improve the speed of infringement delivery and ease of transmission and storage of images. Work on the integration of the system with the existing camera enforcement network is ongoing.
The selection of the fi rst 50 digital red-light camera locations is being fi nalised.
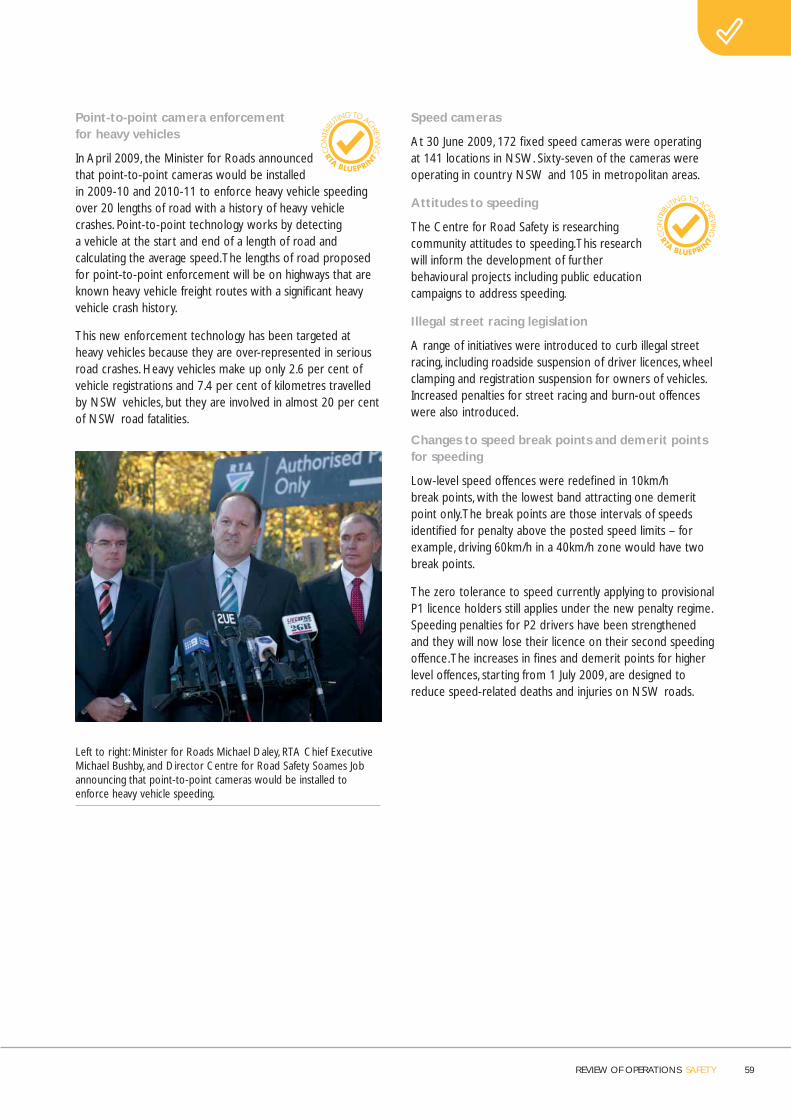
REVIEW OF OPERATIONS SAFETY 59
Point-to-point camera enforcement for heavy vehicles
In April 2009, the Minister for Roads announced that point-to-point cameras would be installed in 2009-10 and 2010-11 to enforce heavy vehicle speeding over 20 lengths of road with a history of heavy vehicle crashes. Point-to-point technology works by detecting a vehicle at the start and end of a length of road and calculating the average speed. The lengths of road proposed for point-to-point enforcement will be on highways that are known heavy vehicle freight routes with a signifi cant heavy vehicle crash history.
This new enforcement technology has been targeted at heavy vehicles because they are over-represented in serious road crashes. Heavy vehicles make up only 2.6 per cent of vehicle registrations and 7.4 per cent of kilometres travelled by NSW vehicles, but they are involved in almost 20 per cent of NSW road fatalities.
Left to right: Minister for Roads Michael Daley, RTA Chief Executive Michael Bushby, and Director Centre for Road Safety Soames Job announcing that point-to-point cameras would be installed to enforce heavy vehicle speeding.
Speed cameras
At 30 June 2009, 172 fi xed speed cameras were operating at 141 locations in NSW. Sixty-seven of the cameras were operating in country NSW and 105 in metropolitan areas.
Attitudes to speeding
The Centre for Road Safety is researching community attitudes to speeding. This research will inform the development of further behavioural projects including public education campaigns to address speeding.
Illegal street racing legislation
A range of initiatives were introduced to curb illegal street racing, including roadside suspension of driver licences, wheel clamping and registration suspension for owners of vehicles. Increased penalties for street racing and burn-out offences were also introduced.
Changes to speed break points and demerit points for speeding
Low-level speed offences were redefi ned in 10km/h break points, with the lowest band attracting one demerit point only. The break points are those intervals of speeds identifi ed for penalty above the posted speed limits – for example, driving 60km/h in a 40km/h zone would have two break points.
The zero tolerance to speed currently applying to provisional P1 licence holders still applies under the new penalty regime. Speeding penalties for P2 drivers have been strengthened and they will now lose their licence on their second speeding offence. The increases in fi nes and demerit points for higher level offences, starting from 1 July 2009, are designed to reduce speed-related deaths and injuries on NSW roads.
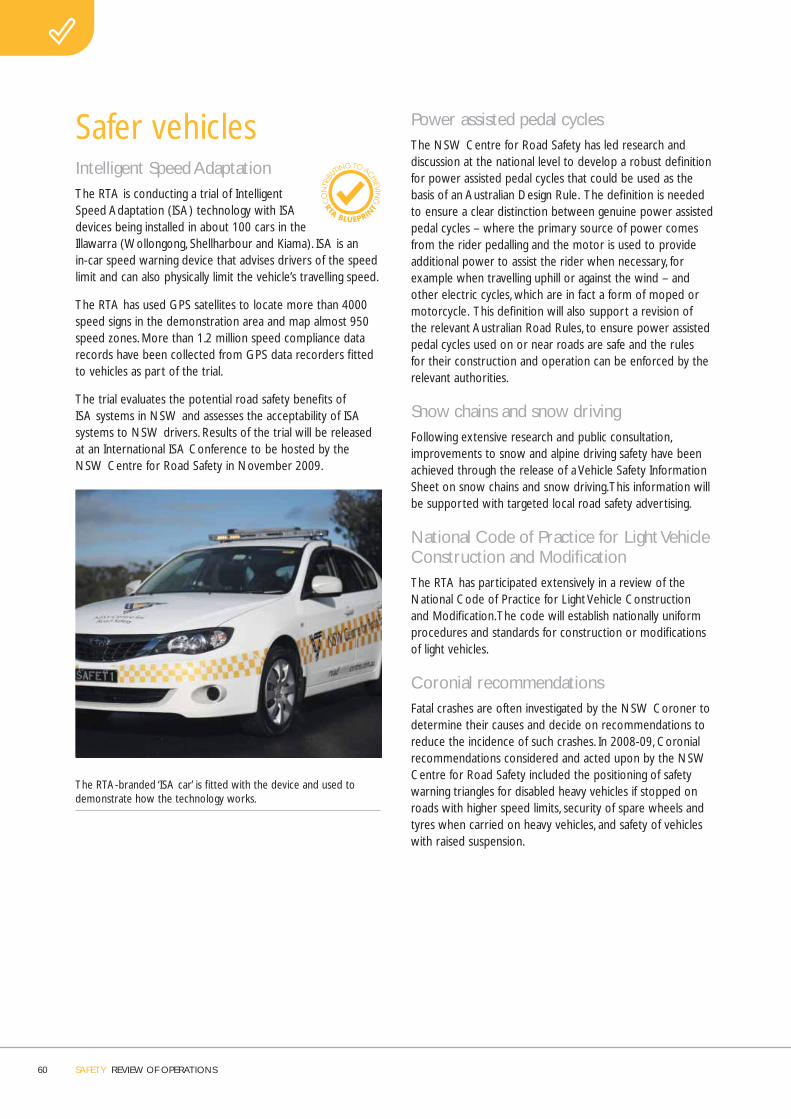
60 SAFETY REVIEW OF OPERATIONS
Safer vehiclesIntelligent Speed Adaptation The RTA is conducting a trial of Intelligent Speed Adaptation (ISA) technology with ISA devices being installed in about 100 cars in the Illawarra (Wollongong, Shellharbour and Kiama). ISA is an in-car speed warning device that advises drivers of the speed limit and can also physically limit the vehicle’s travelling speed.
The RTA has used GPS satellites to locate more than 4000 speed signs in the demonstration area and map almost 950 speed zones. More than 1.2 million speed compliance data records have been collected from GPS data recorders fi tted to vehicles as part of the trial.
The trial evaluates the potential road safety benefi ts of ISA systems in NSW and assesses the acceptability of ISA systems to NSW drivers. Results of the trial will be released at an International ISA Conference to be hosted by the NSW Centre for Road Safety in November 2009.
The RTA-branded ‘ISA car’ is fi tted with the device and used to demonstrate how the technology works.
Power assisted pedal cyclesThe NSW Centre for Road Safety has led research and discussion at the national level to develop a robust defi nition for power assisted pedal cycles that could be used as the basis of an Australian Design Rule. The defi nition is needed to ensure a clear distinction between genuine power assisted pedal cycles – where the primary source of power comes from the rider pedalling and the motor is used to provide additional power to assist the rider when necessary, for example when travelling uphill or against the wind – and other electric cycles, which are in fact a form of moped or motorcycle. This defi nition will also support a revision of the relevant Australian Road Rules, to ensure power assisted pedal cycles used on or near roads are safe and the rules for their construction and operation can be enforced by the relevant authorities.
Snow chains and snow drivingFollowing extensive research and public consultation, improvements to snow and alpine driving safety have been achieved through the release of a Vehicle Safety Information Sheet on snow chains and snow driving. This information will be supported with targeted local road safety advertising.
National Code of Practice for Light Vehicle Construction and Modifi cation The RTA has participated extensively in a review of the National Code of Practice for Light Vehicle Construction and Modifi cation. The code will establish nationally uniform procedures and standards for construction or modifi cations of light vehicles.
Coronial recommendations Fatal crashes are often investigated by the NSW Coroner to determine their causes and decide on recommendations to reduce the incidence of such crashes. In 2008-09, Coronial recommendations considered and acted upon by the NSW Centre for Road Safety included the positioning of safety warning triangles for disabled heavy vehicles if stopped on roads with higher speed limits, security of spare wheels and tyres when carried on heavy vehicles, and safety of vehicles with raised suspension.
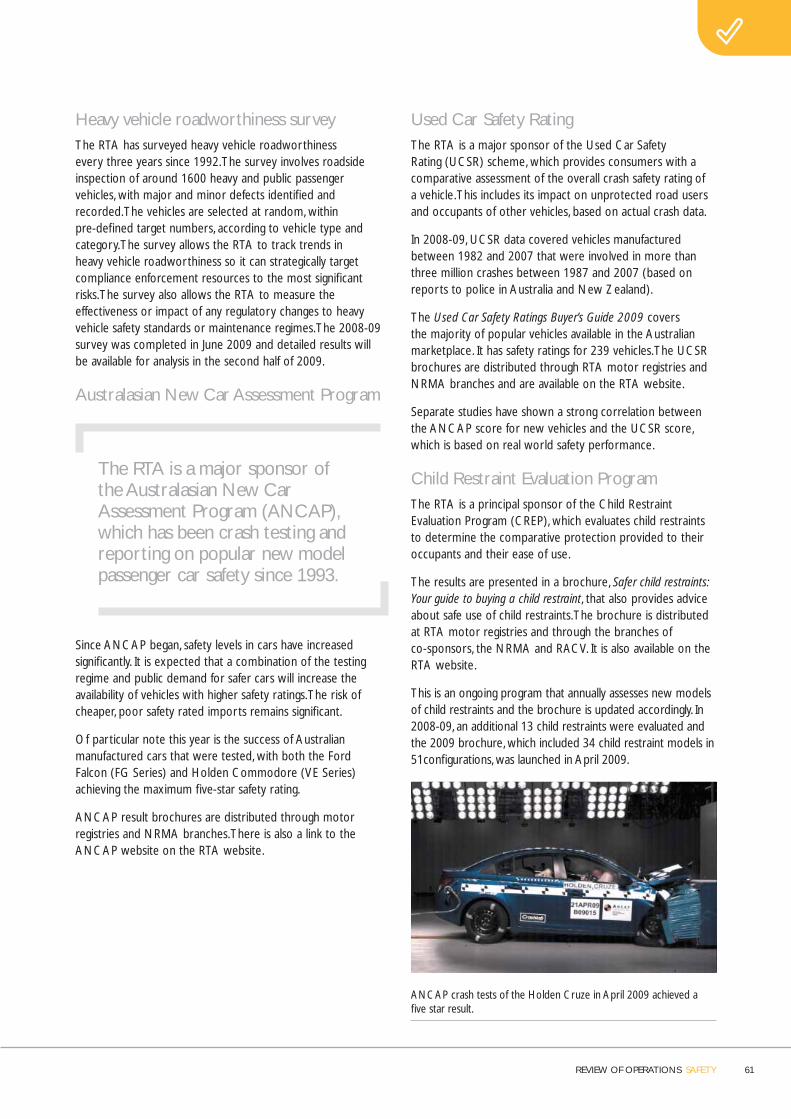
REVIEW OF OPERATIONS SAFETY 61
Heavy vehicle roadworthiness survey The RTA has surveyed heavy vehicle roadworthiness every three years since 1992. The survey involves roadside inspection of around 1600 heavy and public passenger vehicles, with major and minor defects identifi ed and recorded. The vehicles are selected at random, within pre-defi ned target numbers, according to vehicle type and category. The survey allows the RTA to track trends in heavy vehicle roadworthiness so it can strategically target compliance enforcement resources to the most signifi cant risks. The survey also allows the RTA to measure the effectiveness or impact of any regulatory changes to heavy vehicle safety standards or maintenance regimes. The 2008-09 survey was completed in June 2009 and detailed results will be available for analysis in the second half of 2009.
Australasian New Car Assessment Program
The RTA is a major sponsor of the Australasian New Car Assessment Program (ANCAP), which has been crash testing and reporting on popular new model passenger car safety since 1993.
Since ANCAP began, safety levels in cars have increased signifi cantly. It is expected that a combination of the testing regime and public demand for safer cars will increase the availability of vehicles with higher safety ratings. The risk of cheaper, poor safety rated imports remains signifi cant.
Of particular note this year is the success of Australian manufactured cars that were tested, with both the Ford Falcon (FG Series) and Holden Commodore (VE Series) achieving the maximum fi ve-star safety rating.
ANCAP result brochures are distributed through motor registries and NRMA branches. There is also a link to the ANCAP website on the RTA website.
Used Car Safety Rating The RTA is a major sponsor of the Used Car Safety Rating (UCSR) scheme, which provides consumers with a comparative assessment of the overall crash safety rating of a vehicle. This includes its impact on unprotected road users and occupants of other vehicles, based on actual crash data.
In 2008-09, UCSR data covered vehicles manufactured between 1982 and 2007 that were involved in more than three million crashes between 1987 and 2007 (based on reports to police in Australia and New Zealand).
The Used Car Safety Ratings Buyer’s Guide 2009 covers the majority of popular vehicles available in the Australian marketplace. It has safety ratings for 239 vehicles. The UCSR brochures are distributed through RTA motor registries and NRMA branches and are available on the RTA website.
Separate studies have shown a strong correlation between the ANCAP score for new vehicles and the UCSR score, which is based on real world safety performance.
Child Restraint Evaluation ProgramThe RTA is a principal sponsor of the Child Restraint Evaluation Program (CREP), which evaluates child restraints to determine the comparative protection provided to their occupants and their ease of use.
The results are presented in a brochure, Safer child restraints: Your guide to buying a child restraint, that also provides advice about safe use of child restraints. The brochure is distributed at RTA motor registries and through the branches of co-sponsors, the NRMA and RACV. It is also available on the RTA website.
This is an ongoing program that annually assesses new models of child restraints and the brochure is updated accordingly. In 2008-09, an additional 13 child restraints were evaluated and the 2009 brochure, which included 34 child restraint models in 51confi gurations, was launched in April 2009.
ANCAP crash tests of the Holden Cruze in April 2009 achieved a fi ve star result.

62 SAFETY REVIEW OF OPERATIONS
Helmet Evaluation ProgramThe Helmet Evaluation Program is a new RTA research and reporting program designed to assess the relative safety performance of motorcycle helmets available in Australia. The information will help motorcyclists to purchase the safest motorcycle helmet. The assessment protocol compares helmets in impacts beyond the requirements of the Australian Standard and determines how well they will protect the wearer’s head in a range of crash scenarios. It also assesses important rider comfort factors.
Pedal and motorcycle helmet performance studyThe RTA is co-funding an Australian Research Council Linkage Grant project, along with the Victorian Transport Accident Commission, NRMA, Dv Experts, Melbourne University and the Australian Transport Safety Bureau. The research program, by the University of NSW School of Risk and Safety Sciences, aims to assess and improve the performance of helmets via a study of their performance in real world crashes. The project will analyse impact characteristics and injury outcomes, utilising lab testing and numerical simulation. It is also recognised that helmet design can infl uence inappropriate or non-use, therefore the study will investigate how to improve the use of helmets through design. The body of understanding of the biomechanics of head and neck injury will also be improved. This is a three-year study program that is in its second year.
Laboratory evaluation of child safety harnessesThe RTA was a partner in a research program with Prince of Wales Medical Research Institute on the safety performance of child safety harnesses when used correctly and incorrectly. The results were compared to the performance of a lap-sash seat belt.
The fi ndings suggest that the risks associated with child safety harness systems most likely outweigh any potential benefi ts, in frontal impacts at least.
The program results and recommendations will be published in the September 2009 issue of the Accident Analysis and Prevention Journal and presented at the RTA-hosted Road Safety Education and Policing Summit in November 2009.
Appropriateness and effectiveness of child restraintsThis study project was funded by an Australian Research Council Linkage Grant and was undertaken by the Prince of Wales Medical Research Institute and the University of NSW Injury Risk Management Centre. The research was co-funded by the Centre for Road Safety and the Motor Accidents Authority.
The program sought to defi ne child restraint usage patterns across the population, identify patterns of restraint misuse, the limitations of current restraint designs in terms of biomechanical and anatomical factors, and determine the injury and cost implications of these fi ndings.
The research was completed in 2008-09 and fi nal reports and recommendations were provided to the RTA and presented at a number of important Australian and international road safety conferences.
The key fi nding of this study showed that there is a clear need to encourage appropriate restraint use for child occupants over the age of two years. Approaches may include the planned legislative changes to require child restraint use up to four years of age and booster seats up to seven years of age. These need to be supplemented with education and other programs to maximise adherence with these requirements. The study also strongly recommends the need for education campaigns to reduce the misuse of child restraints.
The results of this research are being incorporated into training and public education programs as well as informing policy and regulation development.
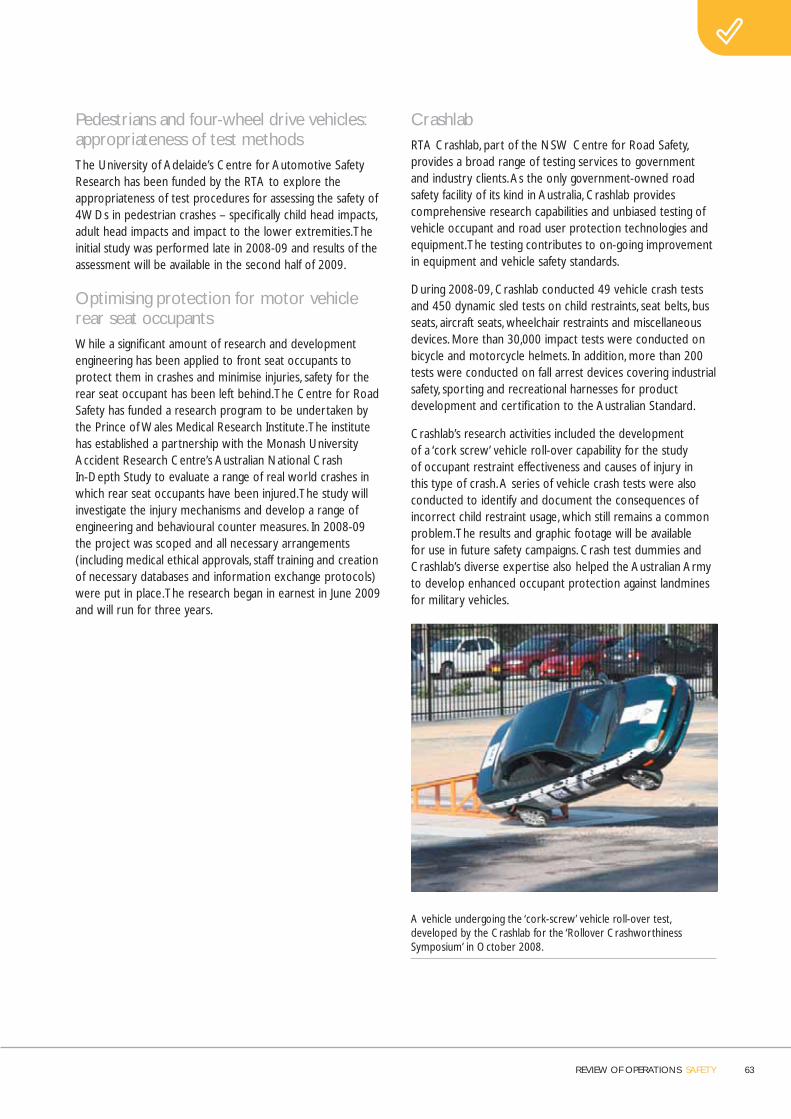
REVIEW OF OPERATIONS SAFETY 63
Pedestrians and four-wheel drive vehicles: appropriateness of test methodsThe University of Adelaide’s Centre for Automotive Safety Research has been funded by the RTA to explore the appropriateness of test procedures for assessing the safety of 4WDs in pedestrian crashes – specifi cally child head impacts, adult head impacts and impact to the lower extremities. The initial study was performed late in 2008-09 and results of the assessment will be available in the second half of 2009.
Optimising protection for motor vehicle rear seat occupantsWhile a signifi cant amount of research and development engineering has been applied to front seat occupants to protect them in crashes and minimise injuries, safety for the rear seat occupant has been left behind. The Centre for Road Safety has funded a research program to be undertaken by the Prince of Wales Medical Research Institute. The institute has established a partnership with the Monash University Accident Research Centre’s Australian National Crash In-Depth Study to evaluate a range of real world crashes in which rear seat occupants have been injured. The study will investigate the injury mechanisms and develop a range of engineering and behavioural counter measures. In 2008-09 the project was scoped and all necessary arrangements (including medical ethical approvals, staff training and creation of necessary databases and information exchange protocols) were put in place. The research began in earnest in June 2009 and will run for three years.
CrashlabRTA Crashlab, part of the NSW Centre for Road Safety, provides a broad range of testing services to government and industry clients. As the only government-owned road safety facility of its kind in Australia, Crashlab provides comprehensive research capabilities and unbiased testing of vehicle occupant and road user protection technologies and equipment. The testing contributes to on-going improvement in equipment and vehicle safety standards.
During 2008-09, Crashlab conducted 49 vehicle crash tests and 450 dynamic sled tests on child restraints, seat belts, bus seats, aircraft seats, wheelchair restraints and miscellaneous devices. More than 30,000 impact tests were conducted on bicycle and motorcycle helmets. In addition, more than 200 tests were conducted on fall arrest devices covering industrial safety, sporting and recreational harnesses for product development and certifi cation to the Australian Standard.
Crashlab’s research activities included the development of a ‘cork screw’ vehicle roll-over capability for the study of occupant restraint effectiveness and causes of injury in this type of crash. A series of vehicle crash tests were also conducted to identify and document the consequences of incorrect child restraint usage, which still remains a common problem. The results and graphic footage will be available for use in future safety campaigns. Crash test dummies and Crashlab’s diverse expertise also helped the Australian Army to develop enhanced occupant protection against landmines for military vehicles.
A vehicle undergoing the ‘cork-screw’ vehicle roll-over test, developed by the Crashlab for the ‘Rollover Crashworthiness Symposium’ in October 2008.
64 SAFETY REVIEW OF OPERATIONS
Future challengesAfter six consecutive years of road toll reductions, NSW is experiencing a signifi cant increase in the road toll which is eroding some of the gains made since 2002. Developing and implementing further initiatives to reduce road trauma will be essential.
Safer roadsThe fundamental challenge for the RTA as it develops safer roads is to further integrate the safe system approach to minimise the severity of road crashes.
Other challenges will be to:
• Set speed limits that appropriately refl ect and manage risk, using the new speed zoning guidelines.
• Facilitate and undertake collaborative research, analysis and investigation of road safety engineering strategies targeted at promoting best practice and road safety engineering.
• Exchange of road safety knowledge, information and research to build safer road partnerships with road safety practitioners in NSW and beyond.
• Represent the RTA on peak committees and forums to provide leadership and constructive infl uence in the development of NSW, local and national road safety outcomes.
• Develop, implement and monitor performance in improving safety of NSW roads and roadsides.
• Integrate road safety engineering into policies, planning, strategies, business processes, programs and operations across the RTA.
• Complete the road infrastructure assessments of Aboriginal communities.
• Develop new partnerships with agencies such as the Department of Planning, Energy Australia and Integral Energy to address road safety concerns with infrastructure such as power poles.
• Deliver key safety works on the Newell Highway and undertake a safety review of the Great Western Highway.
• Continue and improve the rollout of ‘blackspot’ work.
Safer road users• Continue to meet the challenge of making speeding a
socially unacceptable behaviour.
• Review public education campaigns to ensure their ongoing relevance and effectiveness.
• High visibility RTA/NSW Police Force operations to target speeding, drink driving, fatigue, heavy vehicle safety, seatbelt use and helmet use.
• Implement point-to-point speed enforcement for heavy vehicles and red light and speed cameras.
• Develop the new Local Government Road Safety Program for 2010 and beyond.
• Amend the Australian Road Rules to enhance road safety where required.
• Monitor and evaluate the rollout of reforms to the licensing system for older drivers.
• Continue the focus on heavy vehicle driver fatigue and refresh fatigue campaigns for light vehicles.
• Safely manage the increasing freight activity which will lead to an increase in heavy vehicle movements and is likely to lead to increases in the number and size of heavy vehicles.
• Continue to implement initiatives to increase child road safety across NSW including the further installation of fl ashing lights in school zones and the installation of ‘dragon’s teeth’ pavement markings to improve the visibility of school zones.
Safer vehiclesThe RTA will continue to advocate and advise on safer vehicles. The challenges in this area will be to encourage more:
• Australian manufacturers to achieve the maximum fi ve-star result in the ANCAP testing.
• Manufacturers to make Electronic Stability Control a standard item in all models.
• Consumers to demand safer vehicles with comprehensive safety features.
• Manufacturers and consumers to adopt the ISA technology in vehicles.
Increasing fuel costs are leading to the increased use of motorcycles, scooters, bicycles, and smaller and more fuel effi cient cars, which generally offer their occupants less protection in a crash. The RTA continues to promote ANCAP as a means of choosing the safest vehicle within price and environmental performance parameters.
The forecast increase in the number and size of heavy vehicles and the increases in smaller light vehicles and motorcycles presents a real road safety challenge.

REVIEW OF OPERATIONS
EnvironmentInfrastructure 66
Organisational 78
Emissions 81

InfrastructureInfrastructure planning and road works
Environmental assessmentIn all of its activities, the RTA works to minimise the impact on the natural, cultural and built environments. The RTA also has statutory responsibilities to assess the environmental impact of its activities as part of the planning process. The Environmental Planning and Assessment Act, 1979 (EP&A Act) provides the framework for these assessments, during which the RTA identifi es measures to avoid, minimise, mitigate, manage, monitor and, if necessary, offset the environmental impact of its activities.
During 2008–09 the Minister for Planning approved four RTA projects under Part 3A of the EP&A Act, as follows:
• Banora Point upgrade (Pacifi c Highway).
• Kempsey to Eungai upgrade (Pacifi c Highway).
• Sapphire to Woolgoolga upgrade (Pacifi c Highway).
• Inner West Busway (Sydney).
In addition, the Minister for Planning approved seven modifi cations to RTA projects that had been previously assessed and approved under Part 3A of the EP&A Act. The Part 3A modifi cations were:
• Ballina Bypass modifi cations (Pacifi c Highway).
• Moorlands to Heron Creek (Pacifi c Highway).
• Albury-Wodonga national highway modifi cation (Hume Highway).
• Hume Highway duplication modifi cation.
• Bangor Bypass Stage 2 modifi cation.
• Main Road 92 upgrade modifi cation.
Environmental assessments were exhibited for public comment during 2008-09 for the following projects:
• Failford Road to Tritton Road (Pacifi c Highway).
• Central Coast Highway upgrade – Carlton Road, Erina to Matcham Road, Erina Heights.
• Central Coast Highway upgrade – Matcham Road to Ocean View Drive, Erina Heights.
• Marx Hill (Waterfall Way).
• Cameron’s Corner (Waterfall Way).
• Shark Creek stage three (Pacifi c Highway).
The RTA and the environment
This chapter outlines the RTA’s measures to protect the environment. It is divided into three main sections. The infrastructure section contains information about environmental initiatives related to RTA road work and bridge building, including how the organisation protects threatened species and biodiversity. The organisational section focuses on the RTA’s internal environmental measures, from reducing water use in offi ce buildings to improving the effi ciency of its light vehicle fl eet. The fi nal section, emissions, discusses the important work the RTA does to reduce emissions from vehicles.
Section cover image: The Pied Oystercatcher is a State threatened species. This chick successfully hatched and fl edged on site during the building of the Brunswick River Bridges on the Brunswick Heads to Yelgun project. Parents and chick were carefully monitored and protected by site engineers and construction team. Photo taken by RTA staff member Peter Borrelli.
REVIEW OF OPERATIONS
EnvironmentThe RTA is working to minimise impacts on the natural, cultural and built environments
REVIEW OF OPERATIONS ENVIRONMENT 67
During the year the RTA also completed 247 Reviews of Environmental Factors (REFs). These assessments examine potential environment impacts of projects under Part 5 of the EP&A Act. REFs are prepared in accordance with the RTA Environmental Impact Assessment Policy, Guidelines and Procedures.
The RTA referred one project to the Australian Government Department of Environment, Water, Heritage and the Arts (DEWHA) for a decision on whether assessment and approval would be required under the Commonwealth Environmental Protection and Biodiversity Conservation Act, 1999 (EPBC Act). Where projects have, or are likely to have, a signifi cant impact on a matter of national environmental signifi cance (known as a ‘controlled action’ under the EPBC Act), approval is required from the Australian Government Minister for the Environment, Water, Heritage and the Arts.
The referred project – Central Coast Highway upgrade, Matcham Road to Ocean View Drive, Erina Heights – was determined not to be a controlled action and did not require approval from the Minister.
More information on the environmental impact assessment of RTA projects, including the projects listed here, can be found on the RTA website.
Environmental performanceThe RTA is required to hold Environment Protection Licences (EPLs) under the Protection of the Environment Operations (POEO) Act 1997 for certain activities that trigger the licensing schedule in the Act. The RTA currently holds nine EPLs under the POEO Act. These EPLs were issued for various activities including road construction for the F3 and F5 widening projects and a gravel extraction quarry at Mewburn.
In 2008, amendments to the POEO Act resulted in variations to licensing requirements for waste management and the potential need to licence RTA stockpiles. The Department of Environment, Climate Change and Water (DECCW) issued the RTA with a temporary exemption to the licensing of stockpiles to allow a comprehensive stockpile audit to be undertaken. The audit will review the location and environmental management of RTA storage stockpiles across NSW.
In the past year, the RTA’s Environment Branch continued a program of voluntary licence compliance audits as part of its environmental performance improvement program. The audits revealed one non-compliance, which was a signifi cant decrease compared to previous years (to 21 September 2008, the EPL return date). This administrative issue involved a non-compliance of the community notifi cation requirements of the EPL for out–of-hours works. The identifi ed non-compliance has been rectifi ed and the RTA will use the audit’s results to improve compliance and procedures.
In 2008-09, a strategic focus was placed on the environmental performance of the RTA’s major project contractors, with the RTA’s Environment Branch starting to develop a contractor environmental performance database. This will assist in the RTA’s contractor performance reporting processes.
During 2008-09, the RTA received one Penalty Notice from DECCW, for a breach of the National Parks and Wildlife Act 1974, which related to a vegetation clearing incident in Western Region in May 2007.
Noise managementEngine compression brake noise
The RTA continued to progress trials of an engine brake noise camera, in response to the Australian Transport Council’s unanimous approval in 2007 of a proposal from the National Transport Commission to introduce an in-service standard for engine brake noise.
In 2007, the RTA erected a permanent engine brake noise camera site at Mt Ousley and trialled, at two sites, two noise cameras set at the new engine brake noise standard. These systems operate on a similar principle to speed cameras. Following camera detection, the RTA sends heavy vehicle operators a letter notifying them that they have exceeded the standard with information on how to reduce engine brake noise (such as ensuring the vehicle’s exhaust system is in good condition or fi tting a specially designed muffl er).
Technology for the fi xed engine brake noise camera, a prototype portable trailer and a hand-held system have now been developed. The RTA took possession of the new prototype trailer on 30 June 2009. The hand-held sound meters have been trailled since March 2009 to evaluate systems and develop procedures for operation. All these systems are to be used at locations experiencing high levels of engine compression brake noise.
RTA Noise Abatement Program
In 2008-09, the RTA treated 88 dwellings exposed to high levels of road traffi c noise under the RTA’s Noise Abatement Program. Architectural noise treatments include sealing around doors and windows, installing mechanical ventilation and replacing doors and windows with acoustically rated units. The majority of building treatments were provided in the Sydney region (approximately 58 homes) with the remaining treatments in the Illawarra, Hunter and Northern areas of the State. The RTA spent $3.1 million on the Noise Abatement Program in 2008-09.
68 ENVIRONMENT REVIEW OF OPERATIONS
Internal noise limits for new dwellings
Construction of dwellings and other noise sensitive developments such as churches, hospitals and schools on land near roads carrying more than 40,000 vehicles on average each day triggers the need to consider noise mitigation measures under the State Environmental Planning Policy (Infrastructure) 2007. In addition dwellings must meet specifi c internal noise levels for bedrooms and other living areas. Maps showing the location of roads carrying more than 40,000 vehicles on average each day have been published on the RTA’s website. The maps are available to help home builders identify when they must account for internal levels of traffi c noise in the construction of a new dwelling.
In late 2008, the NSW Department of Planning gazetted a new guideline to assist in the planning, design and assessment of development in, or adjacent to, rail corridors and busy roads. The guideline supports provisions of the State Environmental Planning Policy (Infrastructure) 2007 dealing with incorporating noise mitigation measures in new dwellings around high volume roads and rail lines. The guideline is available on the DECCW website.
Land and water RTA Contaminated Land Management Consultant Panel
In 2008-09 the RTA selected a new panel of contaminated land management consultants, following a public tender. The panel consultants provide services including preliminary and detailed site investigations, site management and remediation strategies, cost estimates, site validations and third party auditing services.
The tender was publicly advertised through the NSW Government’s E-tendering system and an advertisement in the Sydney Morning Herald. Twenty-three proposals were received by the due date and all were assessed against selection criteria that evaluated their ability to provide high level technical services to the RTA across NSW.
The RTA appointed fi ve companies to the panel:
• ENSR/AECOM.
• Parsons Brinkerhoff.
• GHD.
• JBS Environmental.
• Sinclair Knight Merz (SKM).
Water Sensitive Urban Design Guidelines
The RTA prepared draft RTA Guidelines for Water Sensitive Urban Design (WSUD). WSUD is an approach that considers water management as a key element in the planning and design of road infrastructure development.
The draft guideline includes an analysis of the WSUD techniques that are generally available to industry. The draft guideline identifi es techniques which are applicable to RTA projects given the constraints which may apply to a range of road development situations. It seeks to:
• Promote effective WSUD principles for use in RTA projects.
• Minimise the use of pipes and other hard drainage elements by utilising landform, natural materials and vegetation in a project’s stormwater design.
• Identify WSUD techniques that improve quality of stormwater runoff, control erosion, promote groundwater infi ltration, re-use rainwater for irrigation and provide a more aesthetically integrated road design.
• Identify WSUD techniques that are cost effective over their working life including during construction and maintenance.
The draft guideline is expected to be approved as a fi nal version in the coming fi nancial year.
Environmental performance reviews
The RTA’s Environment Branch conducted a series of environmental performance reviews on several major projects. The reviews included site inspections of projects and evaluation of the understanding of, and compliance with, environmental requirements, with a focus on erosion and sedimentation control performance. The reviews provide feedback and recommendations to the project teams. In the past year, the RTA reviewed the Ballina Bypass and Coopernook to Herons Creek projects on the Pacifi c Highway and the Northern and Southern Hume Highway Duplication alliances.
The outcomes of the reviews are reported to the RTA Executive Environment Committee. They inform the executive about performance issues and good examples of innovative techniques, and provide recommendations for improving site practices and policy directions. The RTA has used the reviews for the ongoing development of policy and guidelines.

REVIEW OF OPERATIONS ENVIRONMENT 69
Design of up-gradient stormwater diversion and temporary cross drainage
Environmental performance reviews of the RTA’s major projects have identifi ed up-gradient clean water diversion and the transfer of clean water across construction sites as a major issue that requires additional guidance. The separation of clean water from above a construction site reduces the volume and velocity of stormwater that may cause erosion on exposed areas. The effective management of this issue is essential to achieve the required performance on our construction sites.
The RTA has contracted a specialist engineer to inspect major works sites and interview site engineers, designers and environment staff. The engineer will provide guidelines and a series of model drawings which will be reviewed by relevant RTA Directorates before their approval and release in the 2009-10 fi nancial year.
Protecting biodiversityThe RTA uses many mechanisms to protect biodiversity including route selection and design, Environmental Impact Assessment policies, guidelines and procedures and stringent environmental specifi cations. The RTA also conducts regular environmental audits and inspections of its construction sites. The RTA engages specialist ecologists to assist in its work and environmental awareness training is provided to RTA staff and council workers. An outline of the RTA’s projects to protect and enhance biodiversity in 2008-09 are included in Table 7 on page 71.
An example of the RTA’s commitment to biodiversity is the connectivity measures and threatened species monitoring being undertaken as part of the Hume Highway duplication. These measures assess the impact of construction on the population of threatened Squirrel Gliders, woodland birds and legless lizards. This project has also involved the construction of crossing structures for arboreal animals and the implementation of a biodiversity offset strategy.
Threatened Species
The RTA contributed to a number of Threatened Species Recovery Plans prepared by DECCW in accordance with Part 4 of the Threatened Species Conservation Act 1995. Refer to Appendix 2 for full details.
Green and Golden Bell Frog, Arncliffe
The RTA is continuing to manage the Green and Golden Bell Frog population in breeding ponds constructed as a compensatory habitat measure for the M5 East Motorway. Regular monitoring has occurred since the ponds’ construction in 2000 to record changes to the frog population. The 2008 calendar year was a very good season for Green and Golden Bell frogs at Arncliffe, with breeding evident and populations increasing following a period of drought.
Purple Copper Butterfl y, Lidsdale
The RTA continued to fund monitoring and habitat enhancement works for a population of threatened Purple Copper Butterfl y at Lidsdale. The Purple Copper Butterfl y is listed as a threatened species under State and Commonwealth legislation. The RTA worked closely with DECCW to translocate the butterfl y larvae and upgrade habitat as part of the Castlereagh Highway (SH18) upgrade near Lithgow in 2005–06. Population monitoring in December 2008 confi rmed that the butterfl y population at Lidsdale is continuing to expand as a result of habitat enhancement. The RTA met representatives from Lithgow City Council, the NSW Department of Lands and the DECCW in April 2009 to discuss ongoing management of the site.
Purple Copper Butterfl y, Lidsdale.
A scientifi c article on this project was published in The Journal of Ecological Management and Restoration Vol.9 No.2 August 2008.

70 ENVIRONMENT REVIEW OF OPERATIONS
CASE STUDY
Glider crossings on the Hume Highway duplication The Hume Highway duplication project between the Sturt Highway and Mullengandra in southern NSW is an example of the RTA’s commitment to minimising impacts on biodiversity. One of the key issues identifi ed during the environmental impact assessment process was the need for the project to maintain safe movement of threatened Squirrel Gliders.
Where possible the highway was designed to avoid areas of vegetation that could be used by Squirrel Gliders to glide across the highway. For those areas of vegetation that could not be avoided, the RTA sought to retain as much vegetation in the road corridor as possible and incorporated a range of innovative glider crossing structures. The RTA consulted with biodiversity specialists and DECCW to design and install glider poles and rope bridges that provide opportunities for Squirrel Gliders to safely cross the highway. In one 300m section, two sets of three glider poles and a rope bridge were installed.
While it is too early to assess the success of the poles, the RTA is monitoring the Squirrel Glider population with scientists from Melbourne University.
Squirrel Glider poles on the Hume Highway duplication.
Vegetation management at Beverly Grove
The RTA, as part of its commitment to reducing biodiversity impacts from the construction of the M5 East Motorway, has been managing a remnant patch of vegetation at Beverly Grove. The vegetation, near the motorway, contains the endangered ecological community of the Cooks River/Castlereagh ironbark forest.
The RTA has entered a new fi ve-year contract with the National Trust to continue bush regeneration and maintenance to improve the condition of the ecological community and ensure its ongoing viability.
Duffys Forest endangered ecological community
The RTA has prepared a plan of management for two adjacent parcels of land in Frenchs Forest owned by the RTA. The land is about 3.25 hectares in area: about two thirds is vegetated by remnant bushland in excellent condition and the remaining third is cleared bushland covered in a range of environmental and noxious weeds. Most of the remnant bushland on the site is identifi ed as Duffys Forest Ecological Community, an endangered ecological community listed under the NSW Threatened Species Conservation Act 1995. A two-year plan of management has been prepared and will be implemented by a bush regeneration contractor beginning early in 2009-10.

REVIEW OF OPERATIONS ENVIRONMENT 71
TABLE 7: BIODIVERSITY PROJECTS
Activity Purpose Progress in 2008-09
Developing measures to minimise road impacts on biodiversity
Management of wildlife on roads
The RTA has been part of a community working party to investigate measures to minimise road kill in Pittwater and Warringah Local Government Areas.
The RTA is researching the issue of road kill and animal collisions at a State-wide level, involving collaborations with DECCW and wildlife rescue groups.
Contribution to the NSW Wildlife Council
Management of wildlife on roads
For the second year, the RTA provided $20,000 to the NSW Wildlife Council. The council coordinates wildlife carer groups and advises carers on wildlife management policy.
Trialling the effectiveness of odour repellents
Management of wildlife on roads
The RTA continued to fund a postgraduate university project on the use of odour repellents for reducing wildlife collisions. The study concluded in April 2009, with results identifying the need for further species specifi c trials.
Expenditure in the 2008-09 fi nancial year was $4990.
Hume Highway Threatened Species Monitoring Program
Minimise impacts on biodiversity
The RTA continued this program as part of the Hume Highway duplication. The monitoring includes Squirrel Gliders, threatened woodland birds, threatened reptiles and threatened fi sh.
Fund research into effects of road construction and operation on koala populations adjacent to the Pacifi c Highway at Bonville
Koala population research The Pacifi c Highway upgrade at Bonville was opened to traffi c in November 2008. In 2008-09, the RTA provided funding of $190,667 to the Australian Museum for studies on the effectiveness of mitigation structures such as underpasses and overpasses for koalas. Koalas have been recorded using the underpasses in 2009. The monitoring program will continue for another two years.
Threatened orchid translocation project at Bulahdelah
Minimise impacts to biodiversity
The RTA has worked with experts from the CSIRO to develop a management and translocation plan for threatened orchids potentially impacted by the Pacifi c Highway upgrade at Bulahdelah. The research for the project has successfully identifi ed the fungi that are associated with some of the orchids, and some of the methods of pollination.
Research into effectiveness of measures to allow threatened fauna to move across roads
Minimise impacts on biodiversity
The RTA continued to participate in a joint research project with VicRoads and the University of Melbourne to determine the effectiveness of fauna crossing structures for roads. The RTA provided $50,000 for this project in 2007-08. Preliminary results are being used in design of crossing structures for RTA projects.

72 ENVIRONMENT REVIEW OF OPERATIONS
Roadside environment
The RTA continued to support the NSW Roadside Environment Committee (REC). The RTA funded the REC’S secretariat support and meeting costs in 2008-09. The REC was formed in 1994 to encourage better management of linear reserves and the roadside environment. It comprises 11 organisations:
• RTA
• Nature Conservation Council
• Country Energy
• Rural Fire Service
• Rail Corp
• Institute of Public Works Engineering Australia
• Local Government and Shires Association of NSW
• Livestock Health and Pest Authorities
• DECCW
• NSW Department of Lands
• Catchment Management Authorities (supporting member).
Achievements of the REC in 2008-09 included:
• The appointment of Molino Stewart Pty Ltd to provide the secretariat to the REC for three years.
• Publication of best practice information on management of linear reserve environments on the REC website.
• Liaison with local government procurement and the RTA to develop a procedure for local councils to purchase Signifi cant Roadside Environment Area (SREA) signage.
• Support for local councils with guidelines and advice for the design of SREA signage.
• The start of negotiations with catchment management authorities to further support roadside environment initiatives including the implementation of roadside vegetation management plans by local councils.
• Provision of a report to the NSW Environmental Trust on the successful outcomes of the trust-funded project that supported local councils in their development of roadside vegetation management plans.
• Assistance for community members with inquiries about linear reserve environment issues such as fi re management, threatened species, weed management, biodiversity and litter.
CASE STUDY
Oxley Highway BioBanking and offset strategyBioBanking is a new approach developed by DECCW that enables the impact on biodiversity of a development to be offset by ensuring the protection and improvement of biodiversity on other land. The BioBanking scheme provides a process to calculate the amount of biodiversity credits that would be required to offset the loss from the proposed development. These credits are then obtained from landowners who commit to enhance and protect biodiversity values on their land through a BioBanking agreement. In determining the amount of credits required, the BioBanking assessment methodology considers the amount of clearing, the value of the vegetation to be removed, the impacts on threatened species and the impact on the local and regional landscape. It also takes into consideration the mitigation actions proposed by the developer.
The RTA is undertaking the Oxley Highway Upgrade between Wrights Road and the Pacifi c Highway at Port Macquarie. Although mitigation and management measures have been incorporated into the project to minimise biodiversity impacts, some clearing of vegetation and impact on threatened species habitat will still occur. As a result, the RTA has committed to developing a biodiversity offset package for the project, and DECCW and the RTA have agreed to trial the BioBanking scheme as a method for implementing this package. The RTA has used the assessment methodology to calculate the offset requirements and is now working with DECCW to see how BioBanking credits could be purchased through the scheme.
More information on BioBanking can be found on the DECCW website.
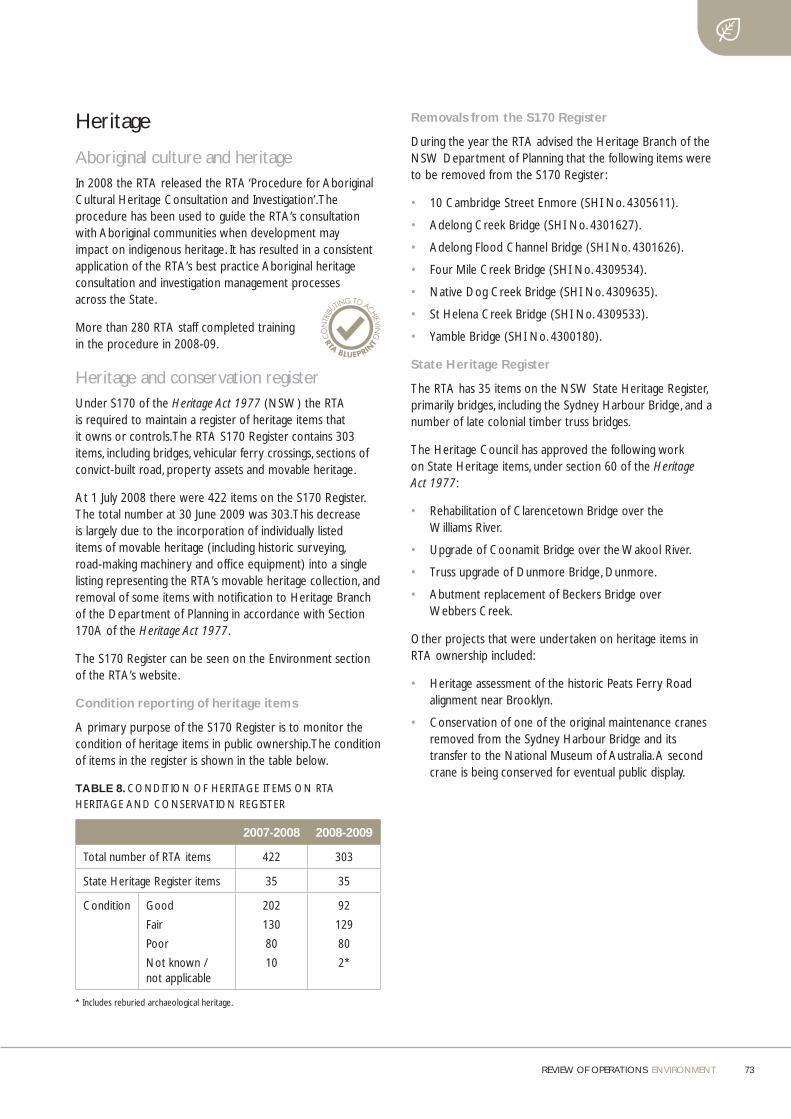
REVIEW OF OPERATIONS ENVIRONMENT 73
Heritage
Aboriginal culture and heritageIn 2008 the RTA released the RTA ‘Procedure for Aboriginal Cultural Heritage Consultation and Investigation’. The procedure has been used to guide the RTA’s consultation with Aboriginal communities when development may impact on indigenous heritage. It has resulted in a consistent application of the RTA’s best practice Aboriginal heritage consultation and investigation management processes across the State.
More than 280 RTA staff completed training in the procedure in 2008-09.
Heritage and conservation registerUnder S170 of the Heritage Act 1977 (NSW) the RTA is required to maintain a register of heritage items that it owns or controls. The RTA S170 Register contains 303 items, including bridges, vehicular ferry crossings, sections of convict-built road, property assets and movable heritage.
At 1 July 2008 there were 422 items on the S170 Register. The total number at 30 June 2009 was 303. This decrease is largely due to the incorporation of individually listed items of movable heritage (including historic surveying, road-making machinery and offi ce equipment) into a single listing representing the RTA’s movable heritage collection, and removal of some items with notifi cation to Heritage Branch of the Department of Planning in accordance with Section 170A of the Heritage Act 1977.
The S170 Register can be seen on the Environment section of the RTA’s website.
Condition reporting of heritage items
A primary purpose of the S170 Register is to monitor the condition of heritage items in public ownership. The condition of items in the register is shown in the table below.
TABLE 8. CONDITION OF HERITAGE ITEMS ON RTA HERITAGE AND CONSERVATION REGISTER
2007-2008 2008-2009
Total number of RTA items 422 303
State Heritage Register items 35 35
Condition Good
Fair
Poor
Not known / not applicable
202
130
80
10
92
129
80
2*
* Includes reburied archaeological heritage.
Removals from the S170 Register
During the year the RTA advised the Heritage Branch of the NSW Department of Planning that the following items were to be removed from the S170 Register :
• 10 Cambridge Street Enmore (SHI No. 4305611).
• Adelong Creek Bridge (SHI No. 4301627).
• Adelong Flood Channel Bridge (SHI No. 4301626).
• Four Mile Creek Bridge (SHI No. 4309534).
• Native Dog Creek Bridge (SHI No. 4309635).
• St Helena Creek Bridge (SHI No. 4309533).
• Yamble Bridge (SHI No. 4300180).
State Heritage Register
The RTA has 35 items on the NSW State Heritage Register, primarily bridges, including the Sydney Harbour Bridge, and a number of late colonial timber truss bridges.
The Heritage Council has approved the following work on State Heritage items, under section 60 of the Heritage Act 1977:
• Rehabilitation of Clarencetown Bridge over the Williams River.
• Upgrade of Coonamit Bridge over the Wakool River.
• Truss upgrade of Dunmore Bridge, Dunmore.
• Abutment replacement of Beckers Bridge over Webbers Creek.
Other projects that were undertaken on heritage items in RTA ownership included:
• Heritage assessment of the historic Peats Ferry Road alignment near Brooklyn.
• Conservation of one of the original maintenance cranes removed from the Sydney Harbour Bridge and its transfer to the National Museum of Australia. A second crane is being conserved for eventual public display.

74 ENVIRONMENT REVIEW OF OPERATIONS
Oral history
Oral history provides an important record of our changing society. It documents in spoken word the fi rst-hand experiences of individuals and complements the formal written historical record.
The RTA undertook the following oral history work during 2008-09:
• An oral history examining the bypasses of Goulburn, Armidale and Karuah was completed. It highlights the planning processes and construction of these projects and the various ways that the towns have changed since being bypassed.
• A major oral history of road safety began. Road safety thinking and practices have evolved over the years, and this project will record the recollections of current and former staff and several prominent academics who have made major contributions. Interviews will focus on the three basic strands of road safety – the vehicle, the road environment and the driver – and the signifi cant developments within each area. Also covered will be the changes in the administrative structures, from the Traffi c Accident Research Unit to the NSW Centre for Road Safety.
• An oral history on the Gerringong-Bomaderry upgrade.
• Planning began for an oral history of tolling on Sydney Harbour Bridge, following the removal of cash tolls on 11 January 2009.
CDs of the RTA’s oral histories are available for purchase through the RTA Library, and mp3 versions are available for free download from the RTA website.
Other heritage activities
RTA Heritage Committee
The RTA’s Heritage Committee meets quarterly to discuss issues relating to projects and policy development with key external stakeholders. The committee includes representatives from:
• The Department of Planning, Heritage Branch.
• The Royal Australian Historical Society.
• The National Trust.
• Engineers Australia.
The meetings also enable members to raise issues with the RTA. Examples of key projects discussed during the year include:
• Mount Victoria to Lithgow (route selection).
• Bulahdelah Bypass.
• The timber bridge strategy.
• Inner West Busway.
Research, public events and other activities
The move of the RTA’s corporate headquarters from Centennial Plaza, Surry Hills, to Miller Street, North Sydney, provided an opportunity to present some of the RTA’s extensive movable heritage collection throughout the building. Items displayed, such as historic survey equipment, were from both the RTA and the former Department of Main Roads. Sixteen oil paintings by artist Dudley Parker are displayed in the Miller Street offi ces including in the Chief Executive’s offi ce. A program to label heritage items across the State will improve the security of items.
During construction of the Great Western Highway duplication in the Blue Mountains, masonry walling and mid-19th century roadway stonework was exposed. The stonework was cleaned and archivally recorded and, where possible, retained in situ.
View of sandstone block road base c.1860 exposed and recorded at Leura during duplication works for the Great Western Highway in December 2008. Ref: Final Archaeological Report – Great Western Highway, Leura-Katoomba, Stages I, II and III. Archaeological Management and Consulting Group Pty Limited, March 2009.
A timber procurement strategy for the long-term supply of timber bridge stock has been developed by URS Forestry Services, New Zealand. The aim is to ensure the creation and maintenance of a sustainable supply of timber that meets dimension and strength standards for timber bridge construction.
Finding of Milestone 1
Milestone 1 was built in 1814 and originally set in place on the corner of George and Liverpool streets in Sydney. It was placed at an exact distance from the Obelisk in Macquarie Place and has special signifi cance for the history of the NSW road system as it was used as the base point for road measurements from 1933. Milestone 1 had been hit by a number of vehicles and was regularly repaired. It was removed in 1987 but has recently been identifi ed in a City of Sydney depot after an RTA-initiated search. The RTA has been in contact with the City of Sydney regarding its conservation and eventual display.
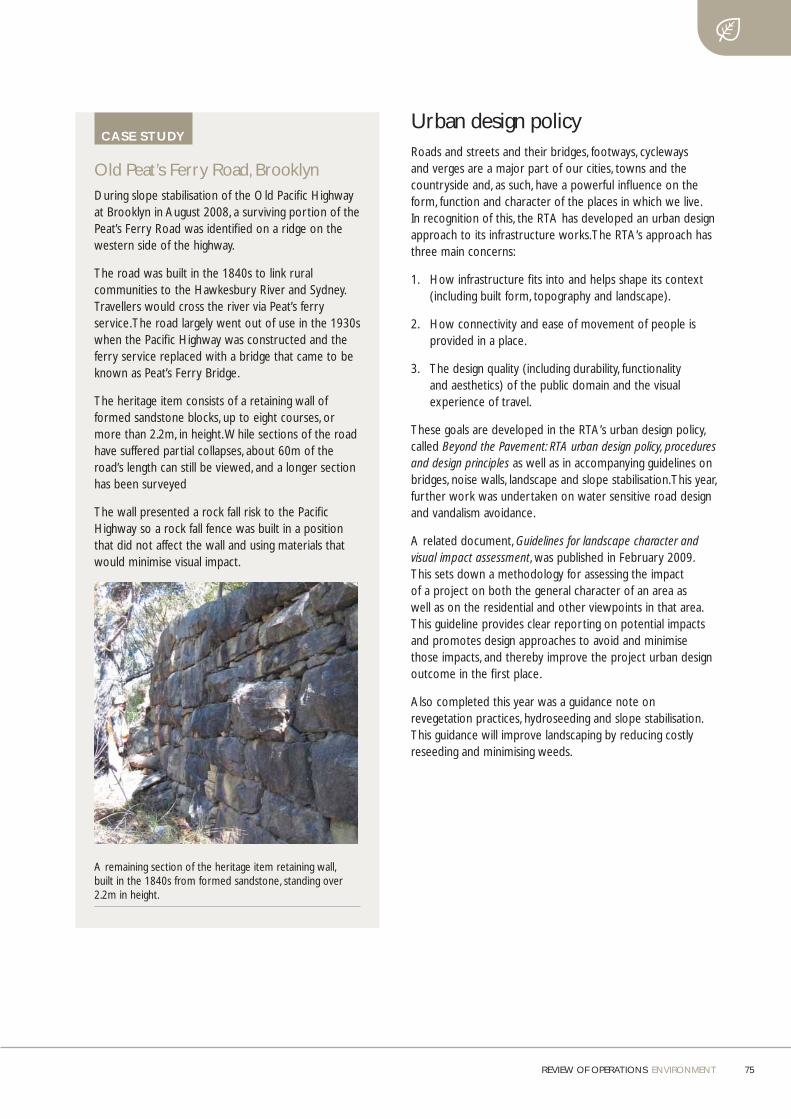
REVIEW OF OPERATIONS ENVIRONMENT 75
CASE STUDY
Old Peat’s Ferry Road, BrooklynDuring slope stabilisation of the Old Pacifi c Highway at Brooklyn in August 2008, a surviving portion of the Peat’s Ferry Road was identifi ed on a ridge on the western side of the highway.
The road was built in the 1840s to link rural communities to the Hawkesbury River and Sydney. Travellers would cross the river via Peat’s ferry service. The road largely went out of use in the 1930s when the Pacifi c Highway was constructed and the ferry service replaced with a bridge that came to be known as Peat’s Ferry Bridge.
The heritage item consists of a retaining wall of formed sandstone blocks, up to eight courses, or more than 2.2m, in height. While sections of the road have suffered partial collapses, about 60m of the road’s length can still be viewed, and a longer section has been surveyed
The wall presented a rock fall risk to the Pacifi c Highway so a rock fall fence was built in a position that did not affect the wall and using materials that would minimise visual impact.
A remaining section of the heritage item retaining wall, built in the 1840s from formed sandstone, standing over 2.2m in height.
Urban design policyRoads and streets and their bridges, footways, cycleways and verges are a major part of our cities, towns and the countryside and, as such, have a powerful infl uence on the form, function and character of the places in which we live. In recognition of this, the RTA has developed an urban design approach to its infrastructure works. The RTA’s approach has three main concerns:
1. How infrastructure fi ts into and helps shape its context (including built form, topography and landscape).
2. How connectivity and ease of movement of people is provided in a place.
3. The design quality (including durability, functionality and aesthetics) of the public domain and the visual experience of travel.
These goals are developed in the RTA’s urban design policy, called Beyond the Pavement: RTA urban design policy, procedures and design principles as well as in accompanying guidelines on bridges, noise walls, landscape and slope stabilisation. This year, further work was undertaken on water sensitive road design and vandalism avoidance.
A related document, Guidelines for landscape character and visual impact assessment, was published in February 2009. This sets down a methodology for assessing the impact of a project on both the general character of an area as well as on the residential and other viewpoints in that area. This guideline provides clear reporting on potential impacts and promotes design approaches to avoid and minimise those impacts, and thereby improve the project urban design outcome in the fi rst place.
Also completed this year was a guidance note on revegetation practices, hydroseeding and slope stabilisation. This guidance will improve landscaping by reducing costly reseeding and minimising weeds.
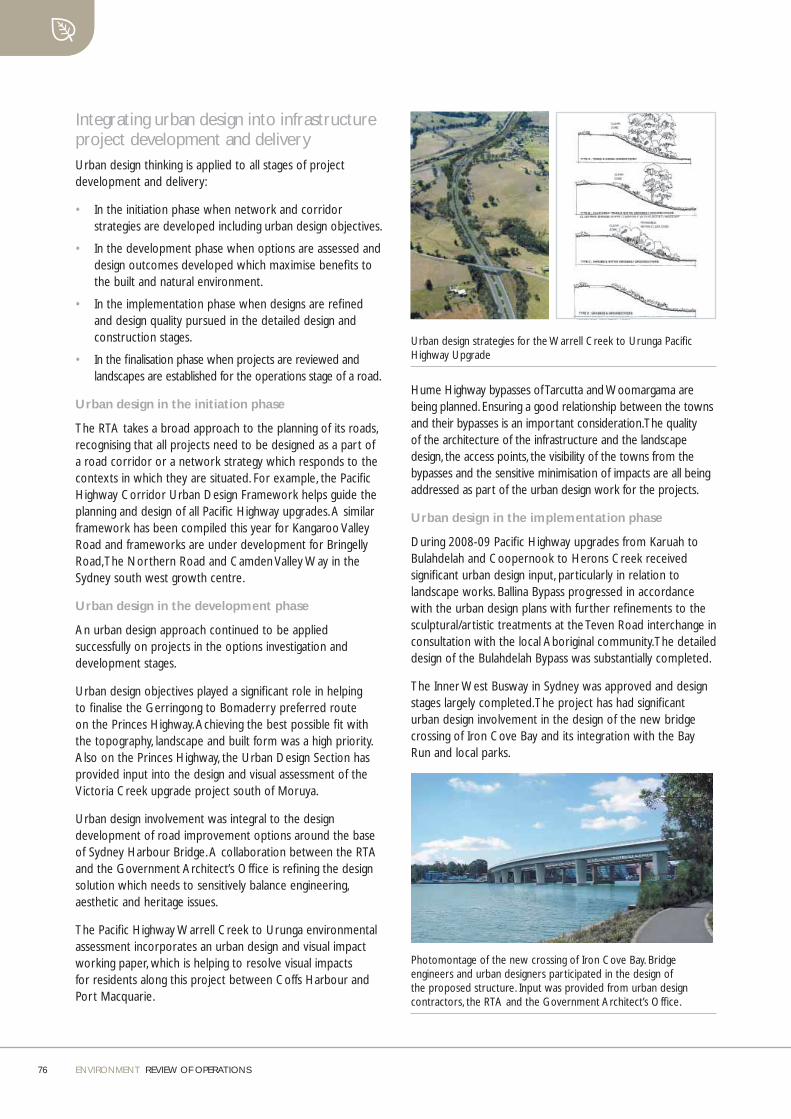
76 ENVIRONMENT REVIEW OF OPERATIONS
Integrating urban design into infrastructure project development and deliveryUrban design thinking is applied to all stages of project development and delivery:
• In the initiation phase when network and corridor strategies are developed including urban design objectives.
• In the development phase when options are assessed and design outcomes developed which maximise benefi ts to the built and natural environment.
• In the implementation phase when designs are refi ned and design quality pursued in the detailed design and construction stages.
• In the fi nalisation phase when projects are reviewed and landscapes are established for the operations stage of a road.
Urban design in the initiation phase
The RTA takes a broad approach to the planning of its roads, recognising that all projects need to be designed as a part of a road corridor or a network strategy which responds to the contexts in which they are situated. For example, the Pacifi c Highway Corridor Urban Design Framework helps guide the planning and design of all Pacifi c Highway upgrades. A similar framework has been compiled this year for Kangaroo Valley Road and frameworks are under development for Bringelly Road, The Northern Road and Camden Valley Way in the Sydney south west growth centre.
Urban design in the development phase
An urban design approach continued to be applied successfully on projects in the options investigation and development stages.
Urban design objectives played a signifi cant role in helping to fi nalise the Gerringong to Bomaderry preferred route on the Princes Highway. Achieving the best possible fi t with the topography, landscape and built form was a high priority. Also on the Princes Highway, the Urban Design Section has provided input into the design and visual assessment of the Victoria Creek upgrade project south of Moruya.
Urban design involvement was integral to the design development of road improvement options around the base of Sydney Harbour Bridge. A collaboration between the RTA and the Government Architect’s Offi ce is refi ning the design solution which needs to sensitively balance engineering, aesthetic and heritage issues.
The Pacifi c Highway Warrell Creek to Urunga environmental assessment incorporates an urban design and visual impact working paper, which is helping to resolve visual impacts for residents along this project between Coffs Harbour and Port Macquarie.
Urban design strategies for the Warrell Creek to Urunga Pacifi c Highway Upgrade
Hume Highway bypasses of Tarcutta and Woomargama are being planned. Ensuring a good relationship between the towns and their bypasses is an important consideration. The quality of the architecture of the infrastructure and the landscape design, the access points, the visibility of the towns from the bypasses and the sensitive minimisation of impacts are all being addressed as part of the urban design work for the projects.
Urban design in the implementation phase
During 2008-09 Pacifi c Highway upgrades from Karuah to Bulahdelah and Coopernook to Herons Creek received signifi cant urban design input, particularly in relation to landscape works. Ballina Bypass progressed in accordance with the urban design plans with further refi nements to the sculptural/artistic treatments at the Teven Road interchange in consultation with the local Aboriginal community. The detailed design of the Bulahdelah Bypass was substantially completed.
The Inner West Busway in Sydney was approved and design stages largely completed. The project has had signifi cant urban design involvement in the design of the new bridge crossing of Iron Cove Bay and its integration with the Bay Run and local parks.
Photomontage of the new crossing of Iron Cove Bay. Bridge engineers and urban designers participated in the design of the proposed structure. Input was provided from urban design contractors, the RTA and the Government Architect’s Offi ce.
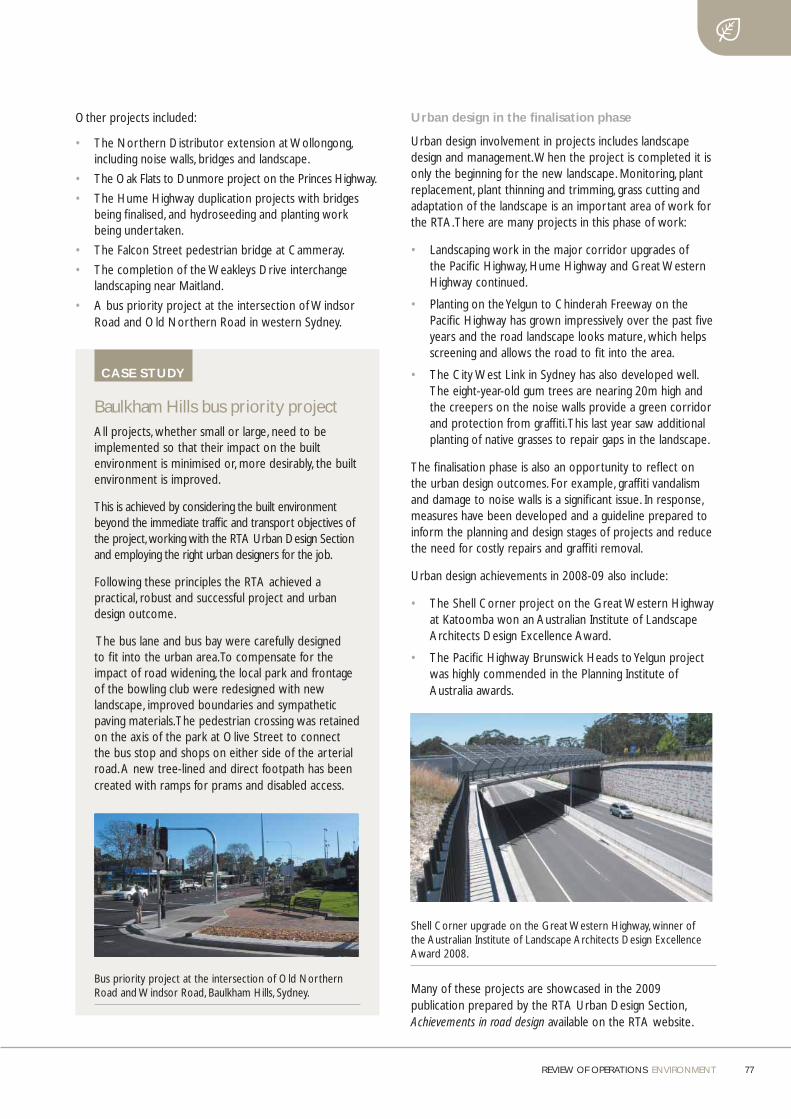
REVIEW OF OPERATIONS ENVIRONMENT 77
Other projects included:
• The Northern Distributor extension at Wollongong, including noise walls, bridges and landscape.
• The Oak Flats to Dunmore project on the Princes Highway.
• The Hume Highway duplication projects with bridges being fi nalised, and hydroseeding and planting work being undertaken.
• The Falcon Street pedestrian bridge at Cammeray.
• The completion of the Weakleys Drive interchange landscaping near Maitland.
• A bus priority project at the intersection of Windsor Road and Old Northern Road in western Sydney.
CASE STUDY
Baulkham Hills bus priority projectAll projects, whether small or large, need to be implemented so that their impact on the built environment is minimised or, more desirably, the built environment is improved.
This is achieved by considering the built environment beyond the immediate traffi c and transport objectives of the project, working with the RTA Urban Design Section and employing the right urban designers for the job.
Following these principles the RTA achieved a practical, robust and successful project and urban design outcome.
The bus lane and bus bay were carefully designed to fi t into the urban area. To compensate for the impact of road widening, the local park and frontage of the bowling club were redesigned with new landscape, improved boundaries and sympathetic paving materials. The pedestrian crossing was retained on the axis of the park at Olive Street to connect the bus stop and shops on either side of the arterial road. A new tree-lined and direct footpath has been created with ramps for prams and disabled access.
Bus priority project at the intersection of Old Northern Road and Windsor Road, Baulkham Hills, Sydney.
Urban design in the fi nalisation phase
Urban design involvement in projects includes landscape design and management. When the project is completed it is only the beginning for the new landscape. Monitoring, plant replacement, plant thinning and trimming, grass cutting and adaptation of the landscape is an important area of work for the RTA. There are many projects in this phase of work:
• Landscaping work in the major corridor upgrades of the Pacifi c Highway, Hume Highway and Great Western Highway continued.
• Planting on the Yelgun to Chinderah Freeway on the Pacifi c Highway has grown impressively over the past fi ve years and the road landscape looks mature, which helps screening and allows the road to fi t into the area.
• The City West Link in Sydney has also developed well. The eight-year-old gum trees are nearing 20m high and the creepers on the noise walls provide a green corridor and protection from graffi ti. This last year saw additional planting of native grasses to repair gaps in the landscape.
The fi nalisation phase is also an opportunity to refl ect on the urban design outcomes. For example, graffi ti vandalism and damage to noise walls is a signifi cant issue. In response, measures have been developed and a guideline prepared to inform the planning and design stages of projects and reduce the need for costly repairs and graffi ti removal.
Urban design achievements in 2008-09 also include:
• The Shell Corner project on the Great Western Highway at Katoomba won an Australian Institute of Landscape Architects Design Excellence Award.
• The Pacifi c Highway Brunswick Heads to Yelgun project was highly commended in the Planning Institute of Australia awards.
Shell Corner upgrade on the Great Western Highway, winner of the Australian Institute of Landscape Architects Design Excellence Award 2008.
Many of these projects are showcased in the 2009 publication prepared by the RTA Urban Design Section, Achievements in road design available on the RTA website.
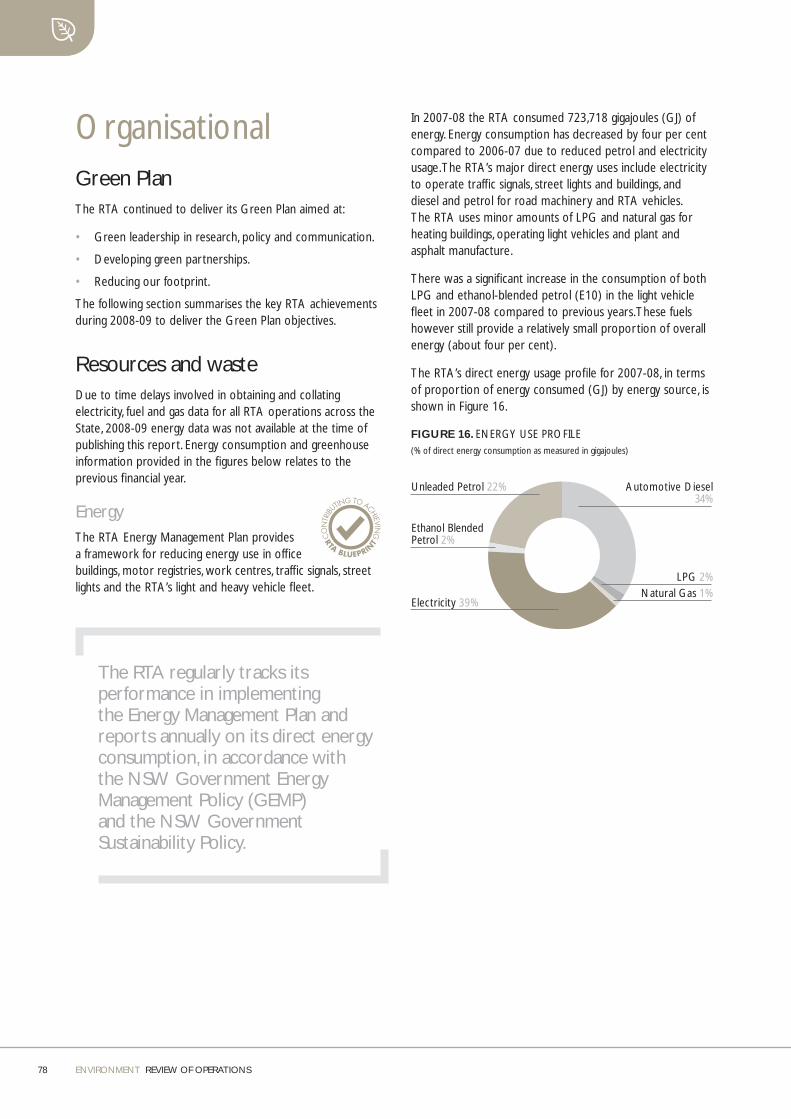
78 ENVIRONMENT REVIEW OF OPERATIONS
OrganisationalGreen PlanThe RTA continued to deliver its Green Plan aimed at:
• Green leadership in research, policy and communication.
• Developing green partnerships.
• Reducing our footprint.
The following section summarises the key RTA achievements during 2008-09 to deliver the Green Plan objectives.
Resources and wasteDue to time delays involved in obtaining and collating electricity, fuel and gas data for all RTA operations across the State, 2008-09 energy data was not available at the time of publishing this report. Energy consumption and greenhouse information provided in the fi gures below relates to the previous fi nancial year.
Energy The RTA Energy Management Plan provides a framework for reducing energy use in offi ce buildings, motor registries, work centres, traffi c signals, street lights and the RTA’s light and heavy vehicle fl eet.
The RTA regularly tracks its performance in implementing the Energy Management Plan and reports annually on its direct energy consumption, in accordance with the NSW Government Energy Management Policy (GEMP) and the NSW Government Sustainability Policy.
In 2007-08 the RTA consumed 723,718 gigajoules (GJ) of energy. Energy consumption has decreased by four per cent compared to 2006-07 due to reduced petrol and electricity usage. The RTA’s major direct energy uses include electricity to operate traffi c signals, street lights and buildings, and diesel and petrol for road machinery and RTA vehicles. The RTA uses minor amounts of LPG and natural gas for heating buildings, operating light vehicles and plant and asphalt manufacture.
There was a signifi cant increase in the consumption of both LPG and ethanol-blended petrol (E10) in the light vehicle fl eet in 2007-08 compared to previous years. These fuels however still provide a relatively small proportion of overall energy (about four per cent).
The RTA’s direct energy usage profi le for 2007-08, in terms of proportion of energy consumed (GJ) by energy source, is shown in Figure 16.
FIGURE 16. ENERGY USE PROFILE(% of direct energy consumption as measured in gigajoules)
Ethanol BlendedPetrol 2%
Electricity 39%
Automotive Diesel34%
LPG 2%
Unleaded Petrol 22%
Natural Gas 1%
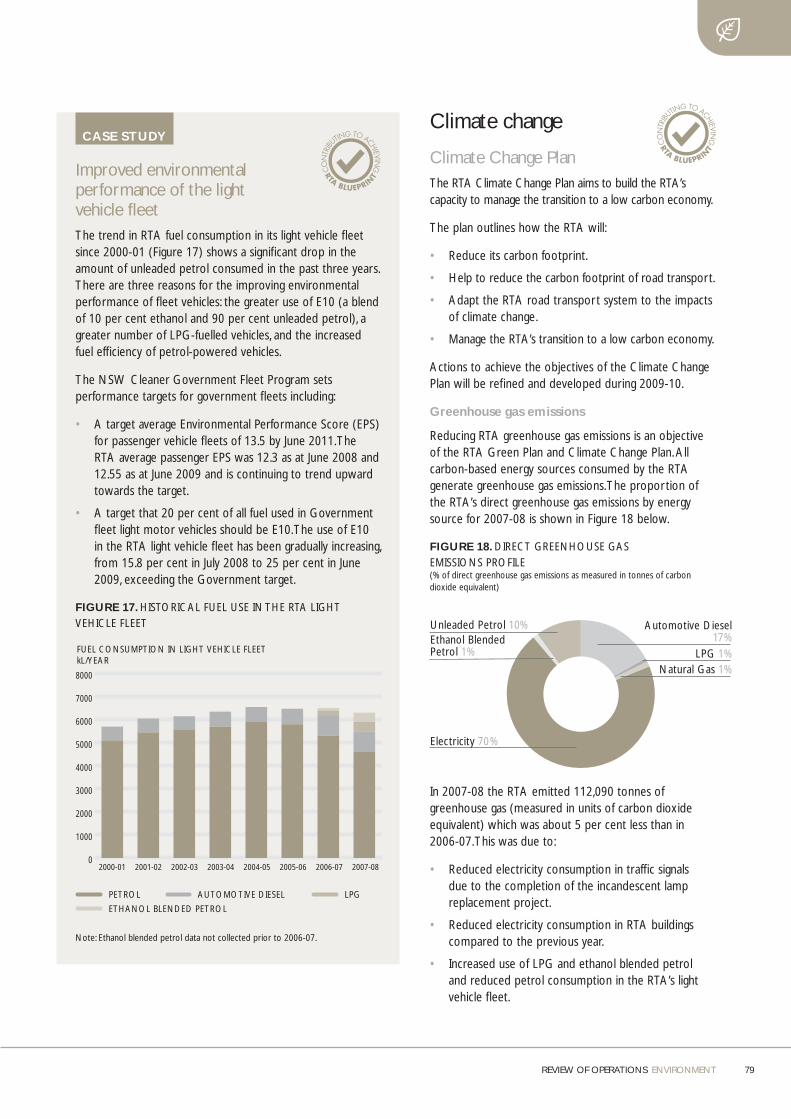
REVIEW OF OPERATIONS ENVIRONMENT 79
CASE STUDY
Improved environmental performance of the light vehicle fl eetThe trend in RTA fuel consumption in its light vehicle fl eet since 2000-01 (Figure 17) shows a signifi cant drop in the amount of unleaded petrol consumed in the past three years. There are three reasons for the improving environmental performance of fl eet vehicles: the greater use of E10 (a blend of 10 per cent ethanol and 90 per cent unleaded petrol), a greater number of LPG-fuelled vehicles, and the increased fuel effi ciency of petrol-powered vehicles.
The NSW Cleaner Government Fleet Program sets performance targets for government fl eets including:
• A target average Environmental Performance Score (EPS) for passenger vehicle fl eets of 13.5 by June 2011. The RTA average passenger EPS was 12.3 as at June 2008 and 12.55 as at June 2009 and is continuing to trend upward towards the target.
• A target that 20 per cent of all fuel used in Government fl eet light motor vehicles should be E10. The use of E10 in the RTA light vehicle fl eet has been gradually increasing, from 15.8 per cent in July 2008 to 25 per cent in June 2009, exceeding the Government target.
FIGURE 17. HISTORICAL FUEL USE IN THE RTA LIGHT VEHICLE FLEET
FUEL CONSUMPTION IN LIGHT VEHICLE FLEETkL/YEAR
0
1000
2000
3000
4000
5000
6000
7000
8000
2000-01 2001-02 2002-03 2003-04 2004-05 2005-06 2006-07 2007-08
AUTOMOTIVE DIESELPETROL
ETHANOL BLENDED PETROL
LPG
Note: Ethanol blended petrol data not collected prior to 2006-07.
Climate change
Climate Change Plan The RTA Climate Change Plan aims to build the RTA’s capacity to manage the transition to a low carbon economy.
The plan outlines how the RTA will:
• Reduce its carbon footprint.
• Help to reduce the carbon footprint of road transport.
• Adapt the RTA road transport system to the impacts of climate change.
• Manage the RTA’s transition to a low carbon economy.
Actions to achieve the objectives of the Climate Change Plan will be refi ned and developed during 2009-10.
Greenhouse gas emissions
Reducing RTA greenhouse gas emissions is an objective of the RTA Green Plan and Climate Change Plan. All carbon-based energy sources consumed by the RTA generate greenhouse gas emissions. The proportion of the RTA’s direct greenhouse gas emissions by energy source for 2007-08 is shown in Figure 18 below.
FIGURE 18. DIRECT GREENHOUSE GAS EMISSIONS PROFILE(% of direct greenhouse gas emissions as measured in tonnes of carbon dioxide equivalent)
Electricity 70%
Automotive Diesel17%
LPG 1% Natural Gas 1%
Ethanol BlendedPetrol 1%
Unleaded Petrol 10%
In 2007-08 the RTA emitted 112,090 tonnes of greenhouse gas (measured in units of carbon dioxide equivalent) which was about 5 per cent less than in 2006-07. This was due to:
• Reduced electricity consumption in traffi c signals due to the completion of the incandescent lamp replacement project.
• Reduced electricity consumption in RTA buildings compared to the previous year.
• Increased use of LPG and ethanol blended petrol and reduced petrol consumption in the RTA’s light vehicle fl eet.
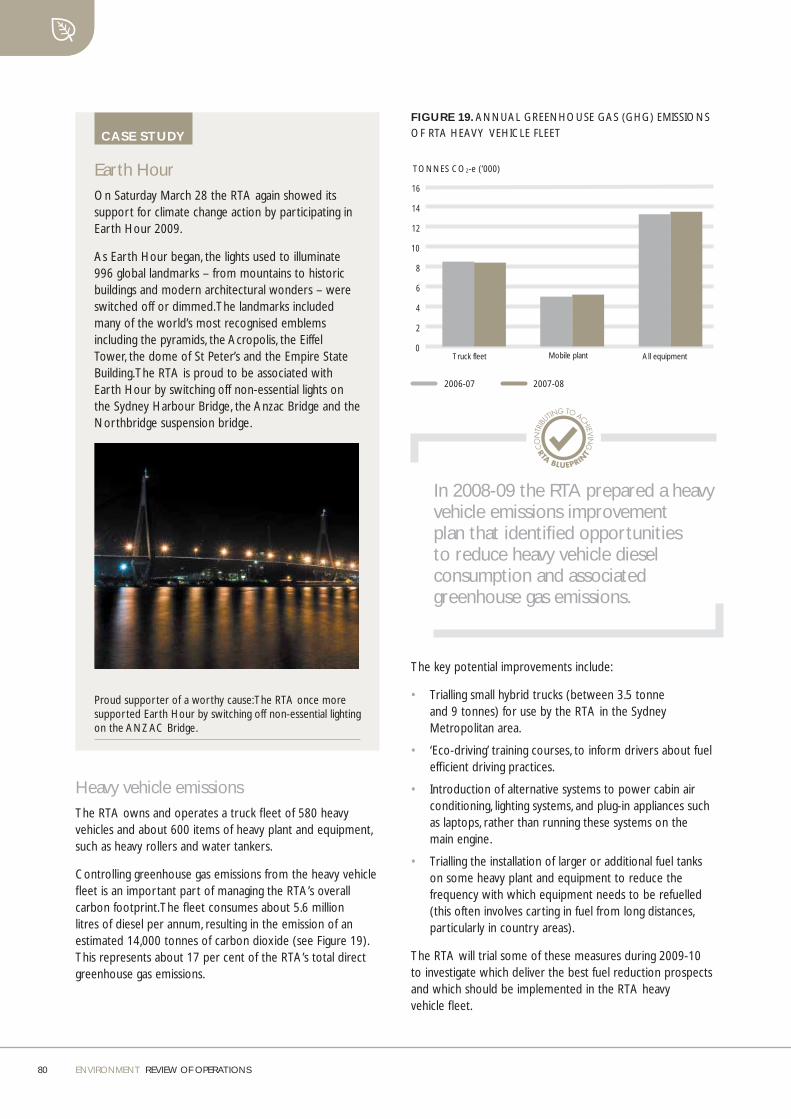
80 ENVIRONMENT REVIEW OF OPERATIONS
CASE STUDY
Earth HourOn Saturday March 28 the RTA again showed its support for climate change action by participating in Earth Hour 2009.
As Earth Hour began, the lights used to illuminate 996 global landmarks – from mountains to historic buildings and modern architectural wonders – were switched off or dimmed. The landmarks included many of the world’s most recognised emblems including the pyramids, the Acropolis, the Eiffel Tower, the dome of St Peter’s and the Empire State Building. The RTA is proud to be associated with Earth Hour by switching off non-essential lights on the Sydney Harbour Bridge, the Anzac Bridge and the Northbridge suspension bridge.
Proud supporter of a worthy cause: The RTA once more supported Earth Hour by switching off non-essential lighting on the ANZAC Bridge.
Heavy vehicle emissionsThe RTA owns and operates a truck fl eet of 580 heavy vehicles and about 600 items of heavy plant and equipment, such as heavy rollers and water tankers.
Controlling greenhouse gas emissions from the heavy vehicle fl eet is an important part of managing the RTA’s overall carbon footprint. The fl eet consumes about 5.6 million litres of diesel per annum, resulting in the emission of an estimated 14,000 tonnes of carbon dioxide (see Figure 19). This represents about 17 per cent of the RTA’s total direct greenhouse gas emissions.
FIGURE 19. ANNUAL GREENHOUSE GAS (GHG) EMISSIONS OF RTA HEAVY VEHICLE FLEET
Truck fleet Mobile plant All equipment
2007-082006-07
TONNES CO2-e (’000)
0
2
4
6
8
10
12
14
16
In 2008-09 the RTA prepared a heavy vehicle emissions improvement plan that identifi ed opportunities to reduce heavy vehicle diesel consumption and associated greenhouse gas emissions.
The key potential improvements include:
• Trialling small hybrid trucks (between 3.5 tonne and 9 tonnes) for use by the RTA in the Sydney Metropolitan area.
• ‘Eco-driving’ training courses, to inform drivers about fuel effi cient driving practices.
• Introduction of alternative systems to power cabin air conditioning, lighting systems, and plug-in appliances such as laptops, rather than running these systems on the main engine.
• Trialling the installation of larger or additional fuel tanks on some heavy plant and equipment to reduce the frequency with which equipment needs to be refuelled (this often involves carting in fuel from long distances, particularly in country areas).
The RTA will trial some of these measures during 2009-10 to investigate which deliver the best fuel reduction prospects and which should be implemented in the RTA heavy vehicle fl eet.

REVIEW OF OPERATIONS ENVIRONMENT 81
Water managementThe RTA has prepared Water Management Plans for three areas of operation which are known to consume signifi cant amounts of water – administration properties, road maintenance and road construction.
The plans are based on a review of RTA water management policies and practices and baseline water use data. The development of the plans also considered the fi ndings of water effi ciency checks completed in 2008 as part of the RTA’s involvement in Sydney Water’s ‘Every drop counts’ program.
The plans identify immediate and long-term opportunities to save water and recommend measures to improve water management, including benchmarking and tracking water use.
Implementation of the plans will help the RTA to achieve its corporate goal of reducing potable water consumption by 15 per cent by 2010-11, compared to 2005-06 levels.
CASE STUDY
Rainwater tanksThree rainwater tanks made from High Density Polyethylene were installed and commissioned this year at the Ballina Depot in Northern Region. Similar rainwater tanks have also been installed at the Wyong, Granville, Tamworth and Goulburn work centres and the Woodburn Timber Storage Facility and Bathurst Heavy Vehicle Inspection Station.
The tanks are designed to save water, in line with the RTA’s Water Management Plan and the NSW Government’s Sustainability Policy.
Another 18 sites have been identifi ed for potential installation of water tanks in 2009-10.
EmissionsAlternative fuelsThe RTA continues to conduct emissions tests on a variety of vehicles to assist the Liquid Petroleum Gas (LPG) after market equipment industry. The testing ensures that LPG fi tted vehicles continue to meet emissions standards. Eighty-eight LPG kits were tested in 2008-09.
Clean Fleet ProgramThe Clean Fleet Program is an audited vehicle maintenance program designed to improve air quality by reducing diesel emissions. Participants are eligible to seek a fuel tax credit under the Federal Fuel Tax Credits Program. Participants must meet standards for using clean fuel, correct engine settings, regular vehicle maintenance and effective fault identifi cation and repair.
The Ministry of Transport requires Metropolitan Bus Systems Contract Operators to join the Clean Fleet Program and the DECCW Model Waste and Recycling Collection Contract also requires waste management contractors to join the Clean Fleet Program.
The RTA is implementing a strategy to increase participation in the program, including direct promotion via mail-outs to all metropolitan councils and shires and all organisations with registered diesel vehicles. At June 2009 there were more than 6000 vehicles in the program.
Diesel emissionsThe RTA sponsors a free TAFE course on reducing heavy vehicle emissions. The course, run in Sydney, Shellharbour, Kurri-Kurri, Tamworth and Wagga Wagga, is designed for truck and bus owners, drivers and operators, diesel mechanics and fl eet and workshop managers. One module of the course is about how to join the Clean Fleet Program. In 2008-09, 39 courses were run, attended by 337 participants.
The Diesel Retrofi t Program aims to improve the emissions performance of heavy diesel vehicles operating in the Sydney Greater Metropolitan area. Under the program, after-treatment devices are fi tted to vehicle exhaust systems to fi lter out particulate matter and improve air quality. The continuing success of the program has led to further funding being provided by DECCW for a co-contribution style retrofi t program. Seventy fl eets participate in the co-contribution program and more than 400 vehicles have been fi tted with the devices.
82 ENVIRONMENT REVIEW OF OPERATIONS
Light vehicle emissions testingIn 2008-09, the RTA conducted 1282 emissions tests on light vehicles at Botany and Penrith motor registries. Vehicles are referred for testing by DECCW and modifi ed vehicles are referred by engineering certifi cation signatories.
National In-Service Emissions (NISE) 2 Federal Government Study The Federal Government provided funding to the RTA to project manage emissions testing of a representative sample of the Australian light vehicle fl eet built between 1994 and 2007. Testing began in November 2007 and 254 in-service vehicles were tested to the appropriate emissions Australian Design Rules for the age of the vehicle. In June 2009 a report was submitted to the Australian Department of Environment, Water, Heritage and the Arts. The fi ndings will provide valuable up-to-date emissions data for modelling and future policy development.
Smoky vehicle enforcementDuring 2008-09 RTA inspectors reported 18 vehicles that were considered to be emitting excessive visible smoke. As a result, six Penalty Infringement Notices were issued by DECCW.
Emission standardsNew emission standards (Euro 4) for new light vehicle models were introduced for all vehicles manufactured from 1 July 2008. The standards are aimed at improving air quality.
Emissions trainingTraining sessions were run for University of Western Sydney environmental students and TAFE apprentice motor mechanics to demonstrate the RTA’s light vehicle emissions testing facilities. During 2008-09, 70 students attended these sessions.
Future challenges • Develop better systems for analysing and reporting on
the environmental performance of RTA’s contractors.
• Implement the RTA Water Management Plans for RTA properties and road construction and maintenance works.
• Develop actions under the RTA’s Climate Change Plan.
• Enhancing reporting systems and key performance indicators to track the RTA’s progress towards sustainability.
• Continue working with DECCW on resource recovery opportunities in road construction.
• Implement the RTA’s heavy vehicle emissions reduction plan and promote any positive outcomes to other agencies and fl eet managers.
• Develop best practice guidelines to protect biodiversity during construction projects.
• Implement conservation strategies for asset classes, such as timber truss bridges, that refl ect amendments to the NSW Heritage Act 1977 to provide for representative listing, while also meeting road user and network requirements and broader community expectations of heritage stewardship.
• Track international development of new approaches to reducing motor vehicle noise such as low noise tyres that are currently a focus in Europe, and ongoing development of quieter pavement technologies.
REVIEW OF OPERATIONS
ServicesCustomer service 84
Stakeholders 90

Customer serviceIn 2008-09 the RTA provided registration and licensing services to 4.72 million licence holders and 5.33 million registered vehicles in NSW.
These services were delivered through motor registries, agencies, the RTA Contact Centre and online.
Motor registriesThe RTA has a network of 129 motor registries, a Contact Centre in Newcastle, fi ve Government Access Centres and 33 agencies which provide RTA services. Services are also provided at 40 itinerant sites in remote areas.
A survey of customers conducted in May 2009 found that 94 per cent rated motor registry services as ‘good’ or ‘very good’.
In 2008-09, the motor registry network was improved through the relocation and refurbishment of several sites:
• Parramatta Motor Registry moved to new premises at Argyle St, Parramatta, within walking distance of a major transport interchange.
• Driver testing services were relocated from Parramatta to upgraded premises at Silverwater Motor Registry. Saturday trading was also introduced at Silverwater.
• City South Motor Registry moved to new premises in Surry Hills closer to Central Station, following the relocation of the RTA head offi ce to North Sydney.
• New premises were opened at St Marys making it easier for the local community to access essential services and providing a comfortable environment for customers. Trading hours were also extended to Saturdays.
New premises at St Marys Motor Registry.
The RTA’s services
The RTA works to meet the needs and expectations of its broad range of customers, such as those who use its licensing and registration services and those who are affected by the RTA’s road work and management of the NSW road system.
The RTA provides its services in many ways, including through an extensive network of motor registries which are the central point for licensing and registration transactions. This network also provides important information to the community about issues such as the comparative safety of new and used cars and the safety and ease of use of child restraints.
This chapter highlights key activities that the RTA has undertaken in the past year to serve the people of NSW.
Section cover image: RTA motor registry staff member, Alexandra Garas, serving customers in Parramatta. Photographer Christopher Shain.
REVIEW OF OPERATIONS
ServicesThe RTA strives to meet the community’s needs
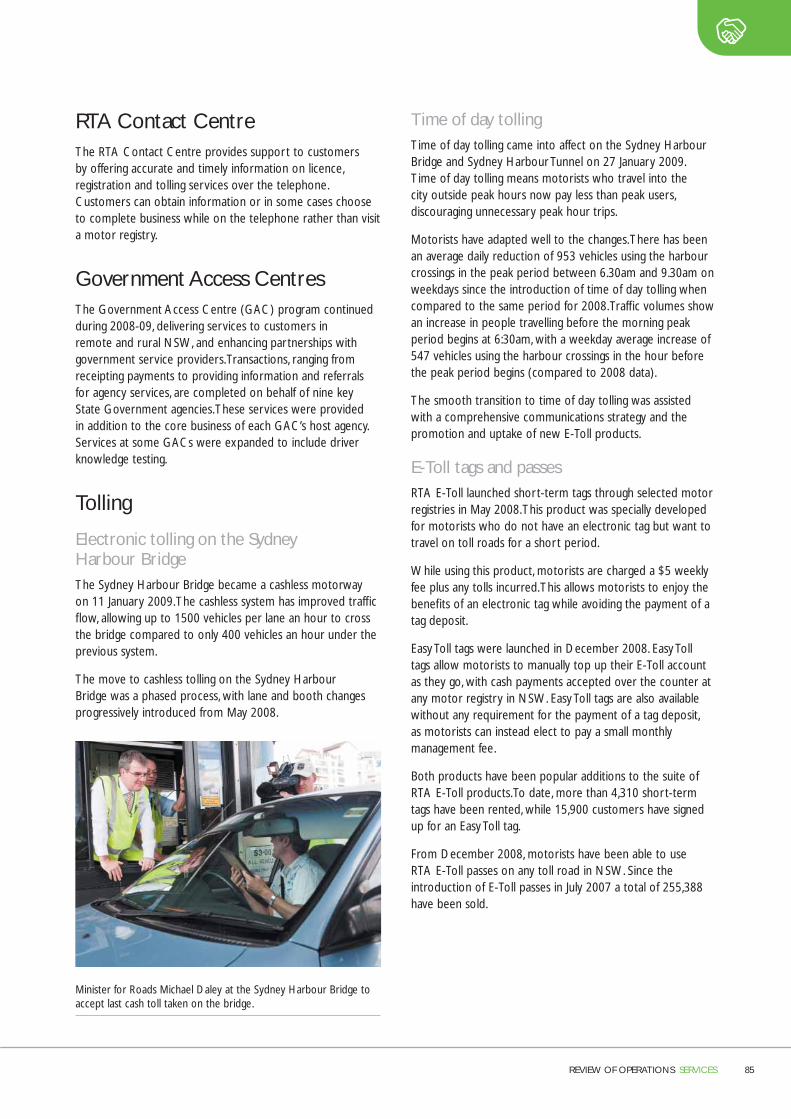
REVIEW OF OPERATIONS SERVICES 85
RTA Contact CentreThe RTA Contact Centre provides support to customers by offering accurate and timely information on licence, registration and tolling services over the telephone. Customers can obtain information or in some cases choose to complete business while on the telephone rather than visit a motor registry.
Government Access CentresThe Government Access Centre (GAC) program continued during 2008-09, delivering services to customers in remote and rural NSW, and enhancing partnerships with government service providers. Transactions, ranging from receipting payments to providing information and referrals for agency services, are completed on behalf of nine key State Government agencies. These services were provided in addition to the core business of each GAC’s host agency. Services at some GACs were expanded to include driver knowledge testing.
Tolling
Electronic tolling on the Sydney Harbour BridgeThe Sydney Harbour Bridge became a cashless motorway on 11 January 2009. The cashless system has improved traffi c fl ow, allowing up to 1500 vehicles per lane an hour to cross the bridge compared to only 400 vehicles an hour under the previous system.
The move to cashless tolling on the Sydney Harbour Bridge was a phased process, with lane and booth changes progressively introduced from May 2008.
Minister for Roads Michael Daley at the Sydney Harbour Bridge to accept last cash toll taken on the bridge.
Time of day tollingTime of day tolling came into affect on the Sydney Harbour Bridge and Sydney Harbour Tunnel on 27 January 2009. Time of day tolling means motorists who travel into the city outside peak hours now pay less than peak users, discouraging unnecessary peak hour trips.
Motorists have adapted well to the changes. There has been an average daily reduction of 953 vehicles using the harbour crossings in the peak period between 6.30am and 9.30am on weekdays since the introduction of time of day tolling when compared to the same period for 2008. Traffi c volumes show an increase in people travelling before the morning peak period begins at 6:30am, with a weekday average increase of 547 vehicles using the harbour crossings in the hour before the peak period begins (compared to 2008 data).
The smooth transition to time of day tolling was assisted with a comprehensive communications strategy and the promotion and uptake of new E-Toll products.
E-Toll tags and passesRTA E-Toll launched short-term tags through selected motor registries in May 2008. This product was specially developed for motorists who do not have an electronic tag but want to travel on toll roads for a short period.
While using this product, motorists are charged a $5 weekly fee plus any tolls incurred. This allows motorists to enjoy the benefi ts of an electronic tag while avoiding the payment of a tag deposit.
Easy Toll tags were launched in December 2008. Easy Toll tags allow motorists to manually top up their E-Toll account as they go, with cash payments accepted over the counter at any motor registry in NSW. Easy Toll tags are also available without any requirement for the payment of a tag deposit, as motorists can instead elect to pay a small monthly management fee.
Both products have been popular additions to the suite of RTA E-Toll products. To date, more than 4,310 short-term tags have been rented, while 15,900 customers have signed up for an Easy Toll tag.
From December 2008, motorists have been able to use RTA E-Toll passes on any toll road in NSW. Since the introduction of E-Toll passes in July 2007 a total of 255,388 have been sold.

86 SERVICES REVIEW OF OPERATIONS
Identity management In September 2008, the RTA issued a Request for Proposal for the supply, installation and maintenance of a facial recognition system. A steering group was established to assess tender responses, including reference site visits and a product trial for short-listed companies. The steering group assessed the proposal from Sagem Australasia Pty Ltd (Sagem) as best meeting the tender requirements and a contract with Sagem was executed in May 2009.
The new facial recognition system will help protect the community against identity fraud by making it harder for people to illegally obtain licenses.
The system uses biometric technology, which identifi es each person according to the unique underlying bone structure of his or her face. The system can be used to compare the photographic image taken when a person applies for a licence, against the images stored within the RTA database. This means that the program can identify someone who tries to apply for more than one licence or photo card using more than one identity.
Illustration showing how the biometric data is measured and used to identify an individual.
Austroads Registration and Licensing programThe RTA continued to manage the Austroads Registration and Licensing Task Force in 2008-09.
The following projects were completed this fi nancial year :
• The Australian Transport Council approved the Smartcard Licence Interoperability Protocol (SLIP) and its associated schedules in November 2008. SLIP will ensure the interoperability of smartcard driver licences for Australian jurisdictions using this technology.
• A feasibility study was completed on options for ‘Greater Harmonisation of Registration and Licensing Practices’ as requested by the Council for the Australian Federation.
• A Memorandum of Understanding was signed with the Commonwealth Attorney-General’s Department for participation in the Document Verifi cation Service System. The National Document Verifi cation Service is an online system allowing authorised government agencies to verify key documents presented by individuals as evidence of identity.
• Support and participation in CrimTrac’s Automatic Number Plate Recognition Project, as part of a federal proposal that will be linked across all Australian states and territories. The proposal aims to address major crime, counter-terrorism and road safety.
• The RTA commissioned a research report on the feasibility of introducing additional biometrics (biological data gathering) for driver licensing and vehicle registration. The report provides a fi ve-year outlook for the use of additional biometrics that will complement and strengthen identity management.
• A project was undertaken to improve the security and identity management of Australian driver licences.
REVIEW OF OPERATIONS SERVICES 87
NEVDISThe National Exchange of Vehicle and Driver Information System (NEVDIS) is a database that provides road agencies with access to information on all registered vehicles and licensed drivers in Australia. It was implemented in an effort to reduce licence fraud, vehicle theft and vehicle fraud. The RTA supports the NEVDIS Administration Unit under the Memorandum of Understanding between Austroads and the RTA.
In 2008-09, the NEVDIS Administration Unit achieved the following:
• Began a strategic review to identify and analyse alternative technical models for NEVDIS to meet policy and business requirements including a preferred service delivery model that will support future business directions.
• Participated in the National Document Verifi cation System as an issuer, user and as a hub for all jurisdictions.
• Provided the Demerit Point Exchange System to ensure the transfer of demerit points between jurisdictions, enabling licence suspension, cancellation or driver disqualifi cation in any jurisdiction.
• Completed a review of the Demerit Point Exchange System including identifi cation of immediate and longer-term options for improvement and recommendations for system improvements.
• Ensured the heavy vehicle codes in NEVDIS supported the National Heavy Vehicle reforms to heavy vehicle charges by 1 July 2009.
• Provided safety recall information to vehicle manufacturers on request.
• Implemented the regular execution of data cleansing to prevent the issue of multiple drivers’ licences by different jurisdictions, preventing the issue of multiple heavy vehicle log books by different jurisdictions and other initiatives to support the ‘one vehicle – one Vehicle Identifi cation Number’ principle.
• Supported the National Transport Commission with input to its project for the harmonisation of demerit points.
• Undertook the Vehicle Information Request Service pilot to assess the merit of supplying vehicle data to insurers via an information broker. A major objective of this initiative is to reduce motor vehicle fraud.
• Supported the SLIP project through representation on the steering committee and the provision of expertise, advice and technical support.
• Supported a CrimTrac feasibility study on upgrading its National Police Reference System.
• Supported the Commonwealth Attorney-General’s Department to develop the Personal Property Security Register to ensure written-off and stolen vehicle information is provided as part of future vehicle fi nancial encumbrance checks.
• Completed the connection and data upload to ensure Tasmania is part of NEVDIS.
Vehicle identifi cation and inspection
The Vehicle Identifi cation and Inspection Unit (VIIU) controls and combats fraudulent use of the RTA’s registration system to launder re-birthed and stolen vehicles.
It conducts inspections on high-risk vehicles in the Sydney, Newcastle and Wollongong areas. Outside these regions, VIIU has a monitoring program to detect vehicle re-birthing.
VIIU manages the Written-off Vehicle Register (WOVR), the allocation of Vehicle Identifi cation Numbers (VINs) and inspections to identify re-birthed vehicles before registration. The WOVR ensures that insurers, dealers, dismantlers and other individuals comply with the law in relation to written-off vehicles, and provides notifi cations where necessary.
The VIIU manages the issue of VINs and chassis and engine numbers for trailers, low-volume, imported and rally vehicle types, which are primarily identifi ed by manufacturers and Authorised Unregistered Vehicle Inspection Stations. Each year the VIIU issues around 10,500 VINs. The unit inspects approximately 17,531 vehicles annually.
In 2008-09, 41,112 vehicles were reported as written off – a 13.8 per cent increase on the previous year. The VIIU has responded by increasing the WOVR audit program. The VIIU remains at the forefront of the RTA’s efforts to ensure that only vehicles correctly identifi ed are eligible for registration. The RTA has been working closely with the NSW Police Force in response to changes in the methods of people involved in vehicle crime.

88 SERVICES REVIEW OF OPERATIONS
Tow trucksThe RTA’s achievements in relation to tow trucks included:
• The relocation of the former Tow Truck Authority to the RTA offi ce in Argyle Street, Parramatta.
• Remake of the Tow Truck Industry Regulation 2008, which commenced on 1 September 2008.
• Amendments to the Tow Truck Industry Act 1998, which were passed by NSW Parliament on 29 October 2008.
• The formation and inaugural meeting of the Tow Truck Advisory Council (TTAC).
• The expansion of tow truck licensing services at Wollongong, Botany, Blacktown and Newcastle from 1 April 2009.
• Expansion of compliance and enforcement operations within the Botany and Grafton areas, with the assistance of Vehicle Regulation Inspectors.
Road transport legislationIn February 2009, Cabinet approved the consolidation of the six road transport Acts into one. The objective is to ensure that road laws are better understood and more easily accessed by the public, the police, the courts and the legal profession. The RTA expects the Road Transport Bill, which consolidates the six Acts, to proceed through the NSW Parliament in 2010.
Online servicesThe RTA’s range of online services continued to grow and improve in 2008-09.
RTA websiteThe RTA website recorded more than 21 million visits in 2008-09, a 29 per cent increase on 2007-08. The site continues to maintain its unrivalled position as the most visited NSW Government website, the most visited state and territory government website and the sixth most visited government site.
The increase in visits to the online services pages, myRTA.com, was a signifi cant part of this growth.
myRTA.com myRTA.com allows customers to access a range of services through the RTA website. The site gives customers the convenience of making online payments, renewing registration, changing their address details and booking licensing tests.
This year the percentage of online transactions increased from 23.6 per cent to 31.3 per cent. This increase was supported by marketing campaigns which used online, radio and press advertising to promote the address change, registration and vehicle history check services.
Sydney Motorways websiteThe motorways website at sydneymotorways.com.au provides the public with comprehensive motorway information, including entry and exit points and toll costs.
In 2008-09 there were more than 234,000 visits to the website (a 43 per cent increase on 2007-08) and 68,436 toll calculations (a 30 per cent increase on 2007-08).
The majority of visitors to the site arrived there directly by typing the website address, indicating that there is strong awareness of the site.
GearedGeared.com.au is a site for 16-25 year olds, which aims to be the defi nitive source of all the information that they need to know to gain and keep their licence. The site promotes safe driving skills to young people, who are over-represented in crash statistics.
In 2008-09 there were more than 182,000 visits to the website, with more than 1126 people registering on the site. Each month an electronic newsletter was sent to registered users advising them of new content and features on the site.
Screenshot showing the Geared.com.au homepage.

REVIEW OF OPERATIONS SERVICES 89
e-Safety CheckThe RTA authorises around 6000 Authorised Inspection Stations across NSW to conduct ‘pink slip’ inspections on light vehicles. Inspections are compulsory on many vehicles before renewing registration. The scheme conducts more than three million inspections annually.
The RTA’s e-Safety Check, which replaced the paper-based pink slip inspection report, became compulsory for the 6000 Authorised Inspection Stations from 1 July 2008. The system transmits inspection results electronically which allows customers to conveniently renew their registration without having to go to a motor registry.
In March 2009, the RTA began a trial of new electronic schemes for Authorised Unregistered Vehicle Inspection Stations and Heavy Vehicle Authorised Inspection Stations. The electronic schemes will complement the e-Safety Check by electronically transmitting not only inspection results but also vehicle details to the RTA. These details are used to provide vehicle information for unregistered or interstate registered vehicles seeking to enter the NSW fl eet.
The new electronic system will also allow inspection stations to clear defect notices online. Customers will no longer need to present a signed defect notice to a motor registry to have it cleared from the system.
Vehicle history checkA new online vehicle history check was introduced to allow vehicle buyers the chance to gain more information about a vehicle before purchase. The additional information includes registered owners of a vehicle, odometer readings and whether the vehicle has been classifi ed as a ‘written off ’ vehicle and, if so, for what reason (eg fl ood, hail damage etc).
In 2008-09, there were 47,000 vehicle history checks completed through the online service with the majority of these being free to customers. Of the 47,000 checks completed, about 5000 were for the additional information available through the payment of a fee.
Launch of RTA Vehicle History Check. Left to right: Motor Traders Association David Smith, RTA Group General Manager of Driver and Vehicle Services Terry Hickey, and Minister for Roads Michael Daley.
Heavy vehicle online renewal A new online service was implemented in December 2008 to allow heavy vehicle operators to renew their registration online for three, six and 12 month periods.
By 30 June 2009, approximately 1500 heavy vehicle renewals were completed through the online service.
Prosecution Pilot Program The RTA, NSW Police Force, the Attorney-General’s Department and the State Debt Recovery Offi ce (SDRO) established a six-month pilot program for the RTA to undertake Police prosecution work for camera-detected offences in three NSW metropolitan Local Courts.
The new pilot has been set up to improve the criminal prosecution process relating to traffi c matters. The program included a training and evaluation program, provided to the RTA court advocates by the NSW Police Force.
The Police Prosecutors mentored the RTA court advocates to further develop their confi dence and capabilities when presenting evidentiary briefs and prosecuting camera-detected matters.
Following a positive evaluation of the pilot, the program will be extended to other metropolitan courts. The program has fostered stronger relationships between a number of agencies, as well as ensuring effi cient court processes.
Mobility Parking SchemeThe Mobility Parking Scheme (MPS) provides parking concessions to eligible people who have a mobility disability to help them travel independently either as a driver or passenger. Enhancements to the MPS were introduced this year including regulatory changes to improve on-road enforcement by providing clearer powers for local council offi cers and a requirement for a medical report about a driver licence holder’s fi tness to drive. This is required when a person holds both a driver licence and an MPS card and has not previously notifi ed the RTA of any medical condition. This new requirement ensures that NSW drivers are medically fi t to drive, contributing to safer roads in NSW.
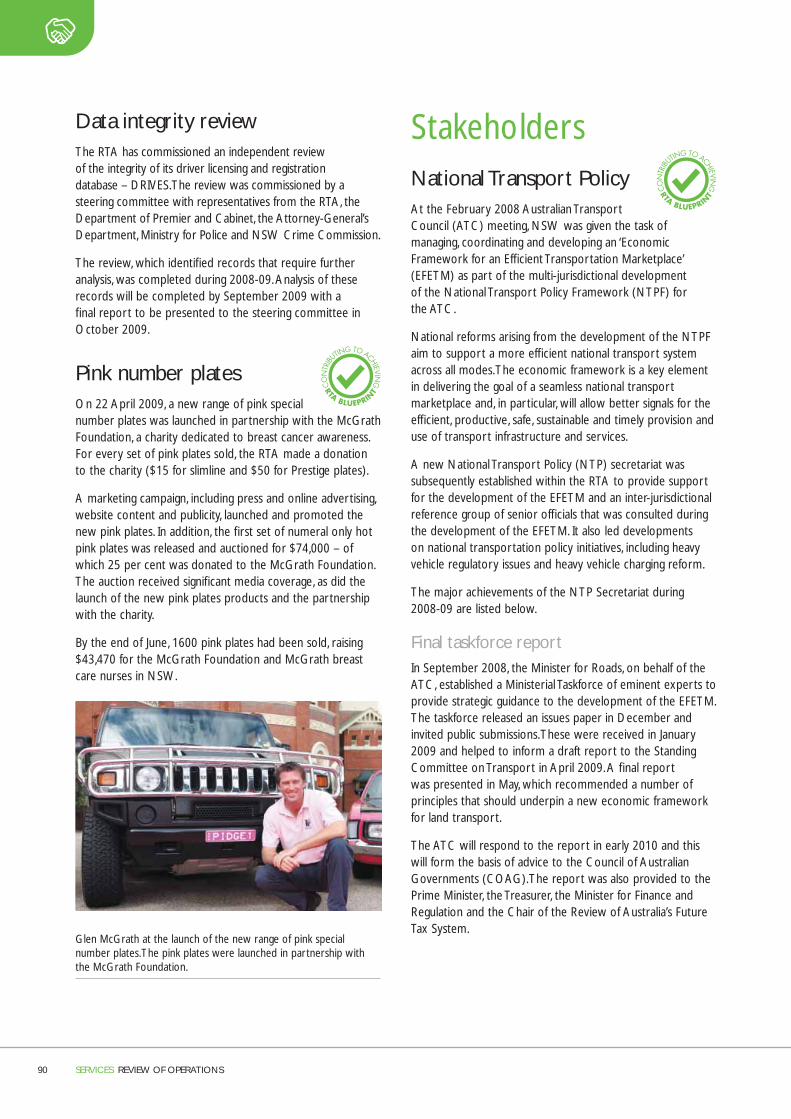
90 SERVICES REVIEW OF OPERATIONS
Data integrity review The RTA has commissioned an independent review of the integrity of its driver licensing and registration database – DRIVES. The review was commissioned by a steering committee with representatives from the RTA, the Department of Premier and Cabinet, the Attorney-General’s Department, Ministry for Police and NSW Crime Commission.
The review, which identifi ed records that require further analysis, was completed during 2008-09. Analysis of these records will be completed by September 2009 with a fi nal report to be presented to the steering committee in October 2009.
Pink number plates On 22 April 2009, a new range of pink special number plates was launched in partnership with the McGrath Foundation, a charity dedicated to breast cancer awareness. For every set of pink plates sold, the RTA made a donation to the charity ($15 for slimline and $50 for Prestige plates).
A marketing campaign, including press and online advertising, website content and publicity, launched and promoted the new pink plates. In addition, the fi rst set of numeral only hot pink plates was released and auctioned for $74,000 – of which 25 per cent was donated to the McGrath Foundation. The auction received signifi cant media coverage, as did the launch of the new pink plates products and the partnership with the charity.
By the end of June, 1600 pink plates had been sold, raising $43,470 for the McGrath Foundation and McGrath breast care nurses in NSW.
Glen McGrath at the launch of the new range of pink special number plates. The pink plates were launched in partnership with the McGrath Foundation.
StakeholdersNational Transport Policy At the February 2008 Australian Transport Council (ATC) meeting, NSW was given the task of managing, coordinating and developing an ‘Economic Framework for an Effi cient Transportation Marketplace’ (EFETM) as part of the multi-jurisdictional development of the National Transport Policy Framework (NTPF) for the ATC.
National reforms arising from the development of the NTPF aim to support a more effi cient national transport system across all modes. The economic framework is a key element in delivering the goal of a seamless national transport marketplace and, in particular, will allow better signals for the effi cient, productive, safe, sustainable and timely provision and use of transport infrastructure and services.
A new National Transport Policy (NTP) secretariat was subsequently established within the RTA to provide support for the development of the EFETM and an inter-jurisdictional reference group of senior offi cials that was consulted during the development of the EFETM. It also led developments on national transportation policy initiatives, including heavy vehicle regulatory issues and heavy vehicle charging reform.
The major achievements of the NTP Secretariat during 2008-09 are listed below.
Final taskforce reportIn September 2008, the Minister for Roads, on behalf of the ATC, established a Ministerial Taskforce of eminent experts to provide strategic guidance to the development of the EFETM. The taskforce released an issues paper in December and invited public submissions. These were received in January 2009 and helped to inform a draft report to the Standing Committee on Transport in April 2009. A fi nal report was presented in May, which recommended a number of principles that should underpin a new economic framework for land transport.
The ATC will respond to the report in early 2010 and this will form the basis of advice to the Council of Australian Governments (COAG). The report was also provided to the Prime Minister, the Treasurer, the Minister for Finance and Regulation and the Chair of the Review of Australia’s Future Tax System.
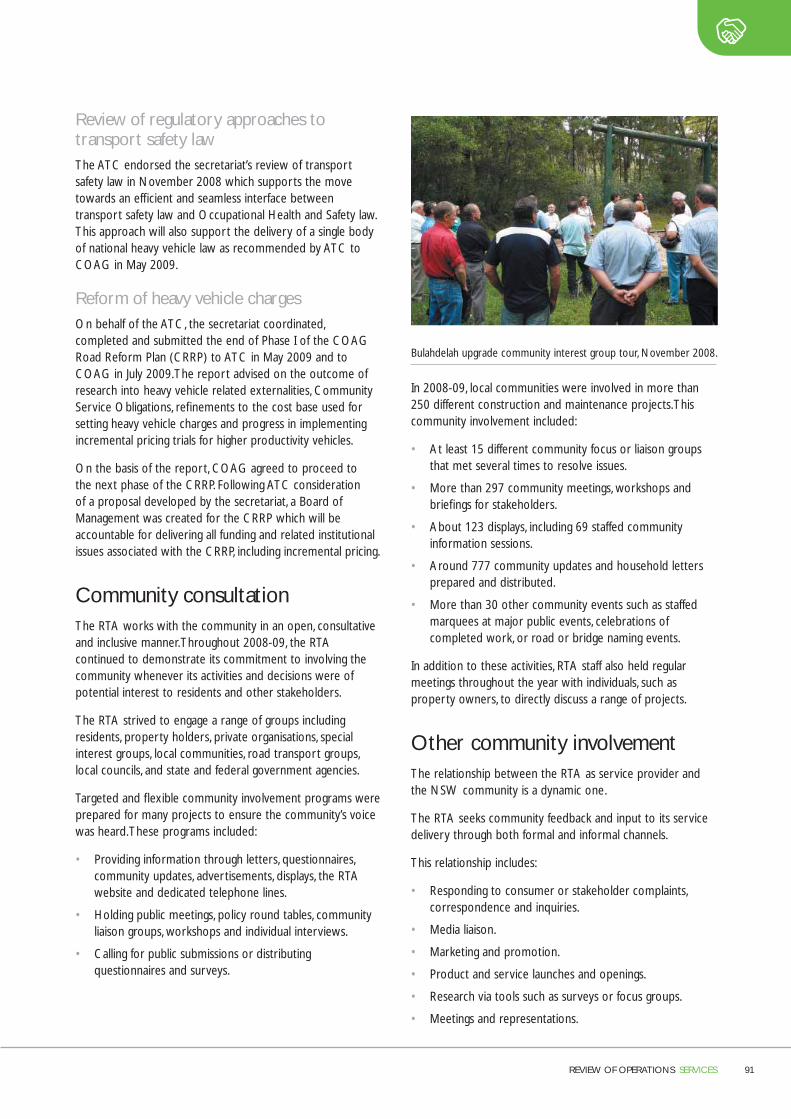
REVIEW OF OPERATIONS SERVICES 91
Review of regulatory approaches to transport safety lawThe ATC endorsed the secretariat’s review of transport safety law in November 2008 which supports the move towards an effi cient and seamless interface between transport safety law and Occupational Health and Safety law. This approach will also support the delivery of a single body of national heavy vehicle law as recommended by ATC to COAG in May 2009.
Reform of heavy vehicle chargesOn behalf of the ATC, the secretariat coordinated, completed and submitted the end of Phase I of the COAG Road Reform Plan (CRRP) to ATC in May 2009 and to COAG in July 2009. The report advised on the outcome of research into heavy vehicle related externalities, Community Service Obligations, refi nements to the cost base used for setting heavy vehicle charges and progress in implementing incremental pricing trials for higher productivity vehicles.
On the basis of the report, COAG agreed to proceed to the next phase of the CRRP. Following ATC consideration of a proposal developed by the secretariat, a Board of Management was created for the CRRP which will be accountable for delivering all funding and related institutional issues associated with the CRRP, including incremental pricing.
Community consultation The RTA works with the community in an open, consultative and inclusive manner. Throughout 2008-09, the RTA continued to demonstrate its commitment to involving the community whenever its activities and decisions were of potential interest to residents and other stakeholders.
The RTA strived to engage a range of groups including residents, property holders, private organisations, special interest groups, local communities, road transport groups, local councils, and state and federal government agencies.
Targeted and fl exible community involvement programs were prepared for many projects to ensure the community’s voice was heard. These programs included:
• Providing information through letters, questionnaires, community updates, advertisements, displays, the RTA website and dedicated telephone lines.
• Holding public meetings, policy round tables, community liaison groups, workshops and individual interviews.
• Calling for public submissions or distributing questionnaires and surveys.
Bulahdelah upgrade community interest group tour, November 2008.
In 2008-09, local communities were involved in more than 250 different construction and maintenance projects. This community involvement included:
• At least 15 different community focus or liaison groups that met several times to resolve issues.
• More than 297 community meetings, workshops and briefi ngs for stakeholders.
• About 123 displays, including 69 staffed community information sessions.
• Around 777 community updates and household letters prepared and distributed.
• More than 30 other community events such as staffed marquees at major public events, celebrations of completed work, or road or bridge naming events.
In addition to these activities, RTA staff also held regular meetings throughout the year with individuals, such as property owners, to directly discuss a range of projects.
Other community involvementThe relationship between the RTA as service provider and the NSW community is a dynamic one.
The RTA seeks community feedback and input to its service delivery through both formal and informal channels.
This relationship includes:
• Responding to consumer or stakeholder complaints, correspondence and inquiries.
• Media liaison.
• Marketing and promotion.
• Product and service launches and openings.
• Research via tools such as surveys or focus groups.
• Meetings and representations.

92 SERVICES REVIEW OF OPERATIONS
World Youth DayMore than 300,000 Catholic pilgrims from Australia and overseas travelled to Sydney for World Youth Day celebrations in July 2008.
The RTA played a leading role in managing all traffi c arrangements, with a number of specialist teams working to ensure the week-long celebrations were a success for pilgrims, residents and business. About 200 RTA staff formed the core team of planners and operators.
RTA teams worked closely with the World Youth Day Coordination Authority and other government agencies to develop and implement a seamless approach to traffi c and transport.
The RTA worked for more than a year on extensive traffi c management plans, resident parking schemes and a communication plan, including a comprehensive community relations component.
The RTA managed 547 special event clearways and 340 road closures, installed about 18,000 traffi c signs, catered for about 500 buses and support vehicles transporting an estimated 30,000 pilgrims, and managed more than 3000 inquiries over three weeks.
It was the biggest traffi c and transport operation in Sydney’s history, after the 2000 Sydney Olympics, and it was delivered successfully and seamlessly and without incident.
World Youth Day: Pilgrims make their way across the Sydney Harbour Bridge to Randwick racecourse for the fi nal Papal Mass.
Future challenges• Strengthen identity management by introducing
a new customer enrolment model and facial recognition technology.
• Deliver services that meet customer needs by implementing myRTA.com and initiatives for whole-of-government services.
• Improve camera data certifi cation by making camera compliance certifi cation available on the State Debt Recovery Offi ce or RTA website.
• Quality implementation of the new modernisation project to improve customer experiences of all tolling transactions and toll road use.
• Ensure the effective and timely implementation of COAG heavy vehicle productivity, safety and compliance initiatives.
• Develop an understanding of and gain support for extended best practice regulatory principles and strategies that enhance the governance and effectiveness of the RTA’s regulatory frameworks, schemes and practices.
REVIEW OF OPERATIONS
GovernanceOrganisational governance 94
Financial governance 101
Our people 103

Governance of the RTA
The RTA is one of Australia’s largest asset managers and service providers, with a multi-billion-dollar budget serving millions of customers, communities and stakeholders. For this reason, the RTA seeks to uphold the highest standards of organisational governance, coupled with sound strategic planning and performance management across its business.
This chapter details activities by the RTA in the past year to strengthen organisational governance in relation to:
• Finances, including business opportunities, accountability and performance.
• Organisational factors, including planning and risk management, performance management, operational and information systems and the reporting framework.
• RTA staff, including developing a high performance culture, workforce capability, diversity and equity and Occupational Health and Safety (OHS).
For more information about organisational governance, including the organisational structure, see page 11.
Section cover image: Chief Executive Michael Bushby addressing RTA staff at the staff awards ceremony.
Organisational governanceExecutiveThe Chief Executive, seven Directors, General Counsel, General Manager Governance and General Manager Environment form the Executive of the RTA. The Chief Executive manages and controls the affairs of the RTA and is involved in all major decisions about policy and planning. The Chief Executive also has a wider role interacting with heads of other transport and road agencies in NSW, across Australia, and internationally. The Chief Executive is accountable to the Minister for Roads and Parliament for the RTA’s overall performance and compliance.
The RTA Executive supports the Chief Executive in ensuring effective governance of the organisation and has collective responsibility for key functions related to organisational strategy and performance. The Executive meets weekly to discuss operational issues, with meetings to discuss policy and strategy held once a month. Executive Committees manage a number of key issues within the RTA.
Each committee comprises Directors and key managers from across the organisation to ensure an integrated approach to the management of these issues.
REVIEW OF OPERATIONS
GovernanceThe RTA ensures that its investment and its people are aligned to its vision

REVIEW OF OPERATIONS GOVERNANCE 95
TABLE 9. EXECUTIVE COMMITTEES
Committee name Purpose
Legislation To oversee the RTA ’s legislative program including:
• Developing and reviewing organisational priorities for legislation.
• Coordinating cross directorate legislative proposals.
• Directing and overseeing strategic legislative projects.
• Providing advice to the Chief Executive on legislative matters.
The committee meets bi-monthly.
Road safety To review the RTA ’s development and implementation of road safety strategy, policy and initiatives, including:
• Leading the development and integration of a road safety culture and ensuring effective coordination of road safety initiatives across the organisation.
• Reviewing the NSW road toll including crash factors and trends.
• Overseeing the development and implementation of specifi c road safety initiatives.
• Determining the road safety priorities across the State.
• Developing and implementing a communication plan that will convey road safety priorities to the whole of the RTA.
• Reviewing road safety objectives and targets set out in other Directorate and branch business plans.
• Reviewing the RTA ’s road safety performance and assessing the extent to which RTA delivered and sponsored projects and programs are contributing to road safety outcomes.
• Reviewing the Road Safety Impact Statement for the RTA ’s annual Road Maintenance Plan and Traffi c Management Plan.
• Reviewing the contribution that major projects make to achieving road safety benefi ts.
• Overseeing research activities.
The committee meets bi-monthly.
Environment To review the RTA’s environmental performance and provide strategic direction on programs and policies, including:
• Leading continuous improvement of the environmental culture across the RTA.
• Reviewing environmental performance and advising on priorities for allocation of environmental resources.
• Leading the review of policy and contractual implications of serious environmental incidents.
• Ensuring effective coordination of performance improvement strategies, environmental policy and incident management across the RTA.
The committee meets bi-monthly.
Commercial development
To steer the RTA’s commercial strategy and to ensure the appropriate and coordinated identifi cation, prioritisation and delivery of commercial opportunities. Responsibilities include:
• Endorsing commercial budgets and business plans for identifi ed business units.
• Referring endorsed commercial budgets to the Finance Strategy Committee for approval.
• Holding business units accountable for the successful delivery of commercial opportunities and recording of cash return on investment.
• Approving expenditure on external consultants contracted by business units in support of their commercial strategies or opportunities.
The committee meets bi-monthly.
Audit and risk To provide assurance to the Governance Committee that the RTA has an effective process in place to identify risks and an effective control framework to manage those risks.In terms of audit, the committee:
• Approves internal and external audit programs and reports.
• Reviews performance of internal and external audit functions.
• Reviews internal control frameworks.
• Approves external reporting of fi nancial information.
• Reviews compliance with audit and fi nance related policies, procedures, central agency requirements and applicable laws and regulations.
In terms of risk management the committee:
• Reviews risk management practices.
• Reviews the RTA’s corporate risk profi le.
• Reviews compliance with risk management standards, policies, central agency requirements, relevant legislation and regulations.
• Approves internal and external risk reporting.
The committee meets quarterly.
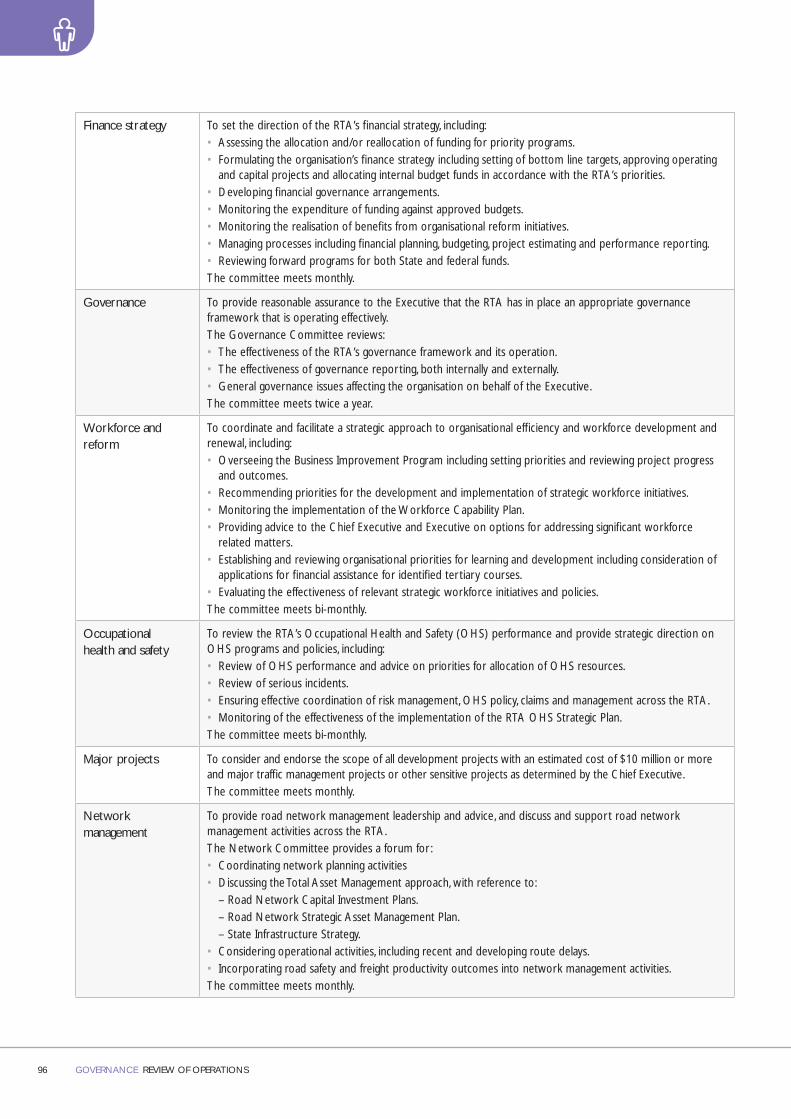
96 GOVERNANCE REVIEW OF OPERATIONS
Finance strategy To set the direction of the RTA’s fi nancial strategy, including:
• Assessing the allocation and/or reallocation of funding for priority programs.
• Formulating the organisation’s fi nance strategy including setting of bottom line targets, approving operating and capital projects and allocating internal budget funds in accordance with the RTA’s priorities.
• Developing fi nancial governance arrangements.
• Monitoring the expenditure of funding against approved budgets.
• Monitoring the realisation of benefi ts from organisational reform initiatives.
• Managing processes including fi nancial planning, budgeting, project estimating and performance reporting.
• Reviewing forward programs for both State and federal funds.
The committee meets monthly.
Governance To provide reasonable assurance to the Executive that the RTA has in place an appropriate governance framework that is operating effectively.
The Governance Committee reviews:
• The effectiveness of the RTA’s governance framework and its operation.
• The effectiveness of governance reporting, both internally and externally.
• General governance issues affecting the organisation on behalf of the Executive.
The committee meets twice a year.
Workforce and reform
To coordinate and facilitate a strategic approach to organisational effi ciency and workforce development and renewal, including:
• Overseeing the Business Improvement Program including setting priorities and reviewing project progress and outcomes.
• Recommending priorities for the development and implementation of strategic workforce initiatives.
• Monitoring the implementation of the Workforce Capability Plan.
• Providing advice to the Chief Executive and Executive on options for addressing signifi cant workforce related matters.
• Establishing and reviewing organisational priorities for learning and development including consideration of applications for fi nancial assistance for identifi ed tertiary courses.
• Evaluating the effectiveness of relevant strategic workforce initiatives and policies.
The committee meets bi-monthly.
Occupational health and safety
To review the RTA’s Occupational Health and Safety (OHS) performance and provide strategic direction on OHS programs and policies, including:
• Review of OHS performance and advice on priorities for allocation of OHS resources.
• Review of serious incidents.
• Ensuring effective coordination of risk management, OHS policy, claims and management across the RTA.
• Monitoring of the effectiveness of the implementation of the RTA OHS Strategic Plan.
The committee meets bi-monthly.
Major projects To consider and endorse the scope of all development projects with an estimated cost of $10 million or more and major traffi c management projects or other sensitive projects as determined by the Chief Executive.
The committee meets monthly.
Network management
To provide road network management leadership and advice, and discuss and support road network management activities across the RTA.
The Network Committee provides a forum for :
• Coordinating network planning activities
• Discussing the Total Asset Management approach, with reference to:
– Road Network Capital Investment Plans.
– Road Network Strategic Asset Management Plan.
– State Infrastructure Strategy.
• Considering operational activities, including recent and developing route delays.
• Incorporating road safety and freight productivity outcomes into network management activities.
The committee meets monthly.

REVIEW OF OPERATIONS GOVERNANCE 97
Executive appointments and remunerationThe Minister for Roads is responsible for approving the Chief Executive’s appointment and contract, and for determining remuneration.
The Chief Executive approves senior executives’ appointments and contracts. The contracts have a term of up to fi ve years and include annual performance agreements. The Chief Executive determines the remuneration of senior executives in accordance with determinations issued by the Statutory and Other Offi ces Remuneration Tribunal. For additional information on executive appointments, remuneration and performance go to Appendix 4.
Strategic and business planningIntegrated strategic and business planning
The RTA uses corporate strategic plans to link results and services with broader Government priorities and to align internal business plans to deliver results. The plans used to communicate the RTA’s contribution to Government priorities are the Corporate Plan, the Results and Services Plan and the Total Asset Management approach.
The RTA’s strategic direction and planning are also promoted through the corporate framework (see pages 14-15) that provides the RTA’s high level outcomes, results, and priorities and is an integral component of the corporate plan. It allows alignment of the corporate plan, business plans and the strategies employed to achieve the RTA’s results.
These high level outcomes are then translated throughout the organisation through internal strategic plans that help to drive and coordinate the business activities of the RTA to deliver its intended outcomes. These internal strategic plans are cross-directorate plans that provide a three to fi ve year framework and strategic direction, and set priorities for key areas of business (core and business support functions) and policy. These plans also provide the basis for making decisions about the allocation of resources and set out medium to long-term performance targets.
Planning and performance reporting guidelines exist within the organisation to maintain an effective and consistent planning and performance reporting system.
State Plan
The State Plan sets out the priorities for Government action to deliver better services and improve accountability across the public sector.
The RTA has lead agency responsibility for coordinating with partner agencies to deliver the S7 – Safer roads priority and is also identifi ed as a partner agency contributing to a variety of other State Plan priorities.
The NSW State Plan challenges the RTA to improve the effi ciency of the road network and reduce vehicle emissions, as well as maintain and invest in infrastructure, and support public transport usage.
Corporate strategic plans
The RTA has a number of corporate level strategic plans that collectively help to drive and coordinate the allocation and management of resources and activities of the organisation in order to deliver its intended outcomes. These include the Results and Services Plan, the Total Asset Management approach and the Corporate Plan. These are in line with NSW Treasury’s requirements and link agency funding with achievement of Government priorities through demonstrating agency results and services and represent a considered approach to planning and asset management.
The RTA continues to work with NSW Treasury to improve the information provided within these strategies.
Business improvements
Workplace Change and CultureThe former Business Reform Program responsibilities were transferred to the Human Resource Strategy Branch during the reporting period. Under the management of Workplace Change and Culture, which sits as part of the HR Strategy Branch, the business improvement program is driving initiatives to ensure the RTA delivers integrated, effi cient and customer-focused services.
Initiatives during 2008-09 included:
• Business improvement projects to create savings to fund the wages and salary increases from the 2008 industrial awards and achieve projected cost savings. Key projects are related to travel and accommodation, video-conferencing and sick leave reduction.
• Start of high performance environment diagnostic work, including developing clear, individual performance measures as a result of education sessions. The purpose is to drive innovation and sustain organisational performance.
• Completion of new organisational arrangements for OHS to ensure the RTA maintains a safety performance approach, a positive safety culture, and continuously improves and delivers effective and value-for-money OHS practice, process and initiatives.
• Realignment of the Compliance and Freight Strategy Branch to meet the needs of the emerging national reforms and ensure transparency and consistency of compliance activities.

98 GOVERNANCE REVIEW OF OPERATIONS
• The introduction of new organisational structure and management arrangements in the Ministerial Coordination Branch. The objective was to foster strategic partnerships to deliver optimal business outcomes, resource management and engage staff in key initiatives that support the RTA’s Blueprint corporate plan.
• Training and roll-out of the Enabling Change Toolkit. This kit is designed to:
– Support the adoption of effective and robust processes for introducing change, including project management methodologies consistent with the scale and complexity of the organisational design and change initiative.
– Provide practical tools and process guidance that will allow teams to focus on the development of solutions rather than developing their own project processes.
– Avoid duplication and time wasting by providing templates for common tasks and outputs.
– Increase the awareness, understanding and skills of team members who may be involved in organisational design and change initiatives.
Integrated Management SystemThe Integrated Management System (IMS) is the RTA’s strategic platform for managing people, time and money. Based on the SAP suite of software, it supports fi nance, purchasing, HR/Payroll, project management, Employee Self Service, the Cashback scheme and several internal Help Desks. Following a comprehensive assessment of the SAP upgrade options, an upgrade project was started in June 2008 and completed in November 2008. As well as upgrading SAP and related software, the project introduced the following improvements:
• More Employee Self Service options.
• Manager Self-Service, a new service for online approval of employee requests and human resource reporting.
• A streamlined accounts payable process that includes scanning of invoices, automatic matching of invoices to purchase orders and goods receipts, and automatic payment of trade vendor invoices.
• Enhancements enabling the management of electronic remittance and payment to vendors and to employees for payment of expense claims.
• Strengthening the underlying security confi guration to support formal segregation of duties across the organisation.
Other improvement projects started include:
• Transition from position-based to role-based authorisation profi les.
• Enhancement of technical confi guration change management processes.
• Automation of training course access and approval.
The upgrade also positions the RTA to take advantage of the new whole-of-Government licence for SAP software, which offers signifi cant cost savings and the opportunity to access a wide range of functionality.
The second stage of the SAP upgrade project was initiated in this fi nancial year and will be completed by June 2010. This will see the Customer Relationship Management function upgraded, ensuring continued support for internal service desks and access to online complaints management.
Voice Over Internet ProtocolThe RTA successfully completed the upgrade of its voice equipment to Voice Over Internet Protocol (VOIP), with the fi nal project completed at the Sydney Harbour Bridge offi ce. The equipment had been up to 15 years old and beyond its economic life. The upgrade was completed on time and on budget. The new technology is a fi rm foundation for future improvements to the RTA’s communications systems.
New head offi ce Another major success for the RTA was the consolidation of staff in a new head offi ce in North Sydney. The site has been recognised as one of the best installed IT infrastructure sites in Australia. The RTA ‘future proofed’ the move by installing the very latest cabling technology, allowing the delivery of fi rst class video/voice technology services to every RTA desktop in the new offi ce. The move will also result in a reduction in aggregate occupancy expenditure over the term of the lease when compared to the previous head offi ce in Surry Hills.
The new RTA head offi ce at Miller Street, North Sydney.

REVIEW OF OPERATIONS GOVERNANCE 99
Information Technology benchmarkingBenchmarking of the RTA’s Information Technology (IT) services resulted in sustained cost savings and improvements in 2008-09. The RTA and its outsourced service provider Fujitsu, which has provided infrastructure services to the RTA data centre since winning a public tender in 2004, have implemented ongoing improvements to reduce data centre costs by up to $1 million per year. In addition to sustained cost savings, the recent benchmarking study also showed continuing improvements in customer satisfaction and staff morale.
DRIVES realignment project DRIVES is the core IT system used to manage driver licensing and vehicle registration across NSW. DRIVES is one of the largest systems of its kind in the world and is now more than 16 years old. Faced with a replacement cost of more than $100 million, the RTA has embarked on an extensive annual enhancement program to restructure parts of the DRIVES system. This is expected to extend the life of DRIVES by more than 10 years and will make it easier to maintain and support service delivery.
About 50 per cent of targeted areas of DRIVES have been restructured with the assistance of a number of vendors. The majority of benefi ts are expected to be realised during 2010-11, as the program nears completion. This initiative also includes improvements to development tools and processes to further reduce maintenance and development costs.
IT security accreditationThe RTA continues to enhance the security of customer information. Three key IT areas of the organisation – the Transport Management Centre, the RTA Contact Centre and Information Management and Information Technology Branch – were successfully audited by a third party certifi cation body this year.
The audits were to ensure compliance with the international information security standard ISO 27001. The standard requires that risks to information be managed to reduce the likelihood of breaches of confi dentiality, compromises in integrity or system failures which prevent access to information.
The RTA also continues to work towards compliance to the Payment Card Industry Data Security Standard.
Corporate data warehouseThe corporate data warehouse was established to improve access to information by enhancing the ability to query and analyse data. Continuous updates capture data from various RTA corporate systems databases and other sources, where appropriate, to deliver better integration, access and consistency.
Risk managementThe RTA has a well-established, enterprise-wide corporate risk framework and system. This systematic approach allows the consistent identifi cation and assessment of the major risks for each area of the RTA’s business operations and for the organisation as a whole. Risks are managed and regularly reviewed at all levels as part of business management and performance reporting systems and processes.
Internal auditThe Governance Branch provides a high quality, cost-effective auditing service for the RTA. This auditing function is focused primarily on the four areas of high risk to the RTA – licensing and vehicle registration management, information technology, engineering, and fi nancial and operational aspects.
Licensing and registration
Regular audits were conducted this year on motor registry operations, other service delivery outlets, back offi ces supporting licensing and registration, and external organisations’ access to information. The risk management framework for dealing with the exposures in these operations is continually reviewed to ensure controls remain effective and appropriate. Outcomes of investigations and other reviews are incorporated into the auditing programs, where appropriate, to ensure any additional risks highlighted are adequately addressed.
IT
IT audits this year covered newly purchased and installed systems, systems under development and, to a limited extent, those in production. IT security and e-commerce audits focus on aspects of operating systems such as access and permissions security.
IT audit staff maintained membership of a range of steering committees and working parties to enhance their focus on critical IT processes and systems, IT security and e-commerce, IT infrastructure and the provision of risk/control advice. Audit and risk staff worked closely with business units on risk assessments of new IT initiatives and system purchases and developments.
Systems Inspector Karl Hanghofer and apprentice Mark Harris at the Rockdale depot.
100 GOVERNANCE REVIEW OF OPERATIONS
Engineering
The review of major engineering programs, systems and products continued to be the main focus.
Major reviews undertaken included:
• Bridge Information System data reliability.
• Managing environmental issues (following up NSW Audit Offi ce fi ndings).
• Establishment and implementation of the Alliance Management System audit (Ballina Bypass Alliance).
• Coopernook to Herons Creek Alliance Project (product quality audit).
Audits were prioritised based on the identifi cation and analysis of major operational risks and an assessment of the control environment addressing these risks. In conjunction with line management, audits resulted in the identifi cation of a range of opportunities for improvement to controls and practices.
Finance and operations
The Annual Financial and Operational Audit Program’s coverage for 2008-09 included the RTA’s fi nancial support functions and a range of activities in road safety, traffi c and other RTA businesses. The audit projects included an independent assessment of risks and compliance with policies, procedures and Treasury guidelines.
Some of the key audit projects included business continuity planning, e-tendering, corporate online banking, cash management and investments, accounts receivable, Traffi c Management Centre procurement and fi nancial services, minor contracts administration in Road Services, use of purchasing cards, as well as the fi nancial and administrative support functions at selected administration centres in Business Services Group.
The Financial and Operations Section also performed the year-end accruals verifi cation for the NSW Audit Offi ce.
InvestigationsThe RTA performs a range of internal corruption and fraud investigations, as well as investigations into maladministration and serious and substantial waste. Where appropriate, matters are investigated and outcomes forwarded to RTA senior management for action, including consideration of disciplinary action. Recommendations are made to line management to address any weaknesses or areas of concern relating to risks, policies, procedures or controls.
Internal corruption claims are also referred to the ICAC in compliance with the ICAC Act 1998.
Fraud by community members that impacts on the RTA’s business is primarily referred to the NSW Police Force for investigation and prosecution. Where appropriate, these matters are also referred to RTA senior management to address any policy, procedure and control issues identifi ed by the investigations. Matters referred by law enforcement agencies, such as identity fraud and motor vehicle re-birthing, are also investigated.
Corruption risk managementThe RTA has implemented a range of initiatives to minimise the risk of corrupt activity by staff and business partners.
Highlights during the year included:
• Development of a ‘Probity Plan’ template which must be used by staff involved in the procurement of goods and services worth more than $150,000.
• The delivery of ethics seminars to 160 senior offi cers by leading business ethics academics and consultants.
• Conducting probity seminars with staff to reinforce the corruption-resistant culture of the RTA.
• The provision of corruption information through the RTA’s intranet.
• Provision of advice to staff and management on a broad range of corruption risks and ethical, probity and policy issues.
REVIEW OF OPERATIONS GOVERNANCE 101
Financial governanceFinancial strategyFinancial strategy within the RTA is directed towards facilitating effective decision-making regarding the allocation of resources to deliver programs and services to the NSW community. The focus during 2008-09 has remained on enhancing business effi ciency and risk management across all RTA operations through the provision of timely, accurate and relevant information and reporting systems. The Finance Strategy Committee continued its governance role, including the direction of funding allocations and review of program and resource budget performance.
The fi nancial strategy is supported by the following key reporting and review areas:
Policy and procedure reviewAn ongoing review and update of fi nancial policies and procedures is conducted to ensure that the RTA has a robust fi nancial management framework to mitigate risk and to support the RTA’s statutory and business requirements. A policy focus area in 2008-09 was awareness of the procurement process for non-construction goods and services.
In support of this focus, a Commercial Contracts Manual, together with supporting policies and procedures, was developed and published during the year. The purpose of the manual was to provide a structured framework to defi ne the processes required when committing RTA resources. This has signifi cantly enhanced the integrity of purchasing and procurement decisions across the RTA.
DashboardThe dashboard continues to provide business critical advice to Directors and senior management by providing a single consistent reference point to aid key decision-making across all RTA operational areas. The dashboard will be refi ned to reduce duplication of reporting and to integrate the dashboard development platform within the business intelligence module of the RTA’s Integrated Management System (IMS). Another dashboard development initiative planned for 2009-10 is further enhancement of reporting on the RTA’s commercial businesses.
Management reporting There has been an increased reporting emphasis on the alignment of expenditure with specifi c program funding allocations. This process continues with a reporting process developed to reconcile government appropriations received to their source, nature and underlying funded program.
An enhanced operational capital budgeting and business initiatives reporting system is being developed in IMS. The key objective of this system is to better align expenditure to the asset replacement plan and enhance benefi ts realisation reporting.
State Plan frameworkThe NSW State Plan guides the RTA’s operations and activities. The RTA developed a fi nancial framework to monitor expenditure against State Plan priorities for which the RTA is a lead or partner agency. The RTA tracks initial budget allocations to these priorities as well as movements in the budgets, together with the reasons for any changes. Actual expenditure is closely monitored.
Strategic investmentSound strategic investment decisions are fundamental to the development of a strong and sustainable road system for NSW. The priorities set out by the NSW State Plan require targeted investment to support program delivery.
A Commercial Development Committee (CDC) has been established to steer the process of pursuing business opportunities to improve services and generate additional resources for investment in the road network. Underpinning the CDC is a commercial assessment panel whose role is to evaluate commercial opportunities as they are identifi ed and recommend suitable business cases to the CDC. The CDC prioritises, approves and controls commercial initiatives. This evaluation and approval framework provides a governance model that enables the RTA to develop business opportunities within market constraints.
Strategic risk forms an integral component of a robust investment decision framework. The corporate risk management framework continues to be refi ned.
Corporate card and purchasing cardThe RTA ’s use of corporate credit and purchasing cards has been in accordance with the Premier’s memorandum and the Treasurer’s directions.
Financial performanceFor details of the RTA’s fi nancial performance in 2008-09, refer to the fi nancial statements (see page 113).
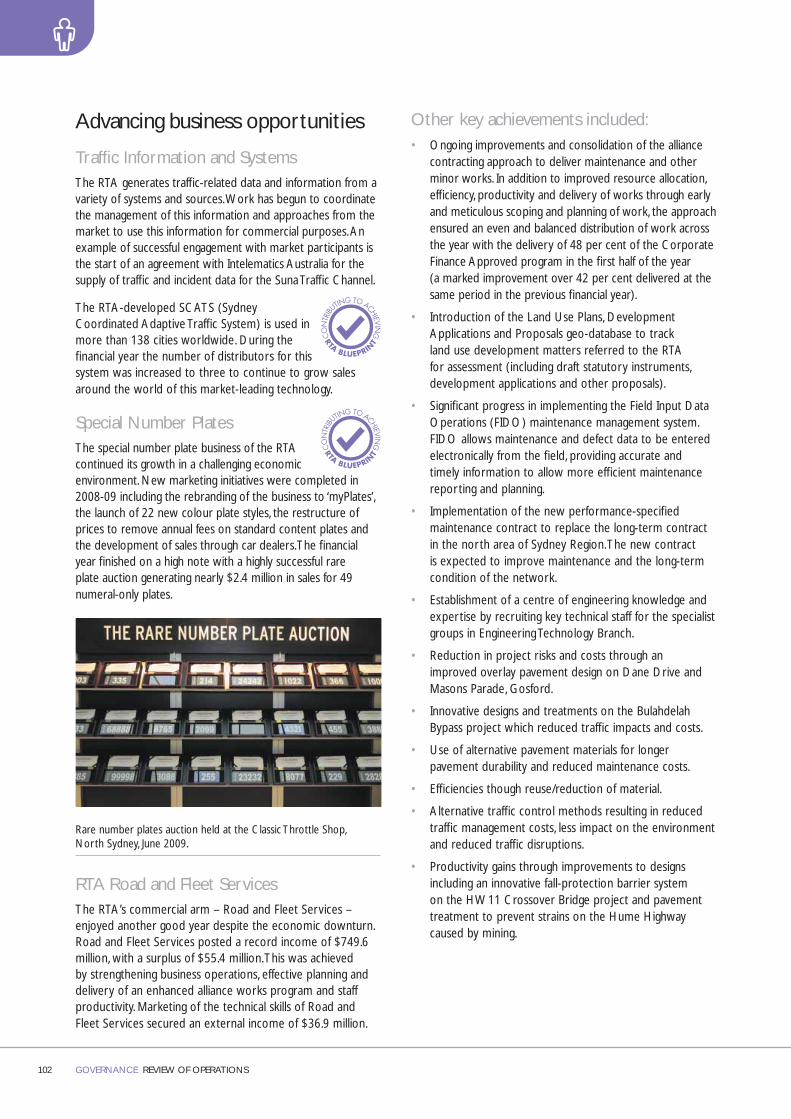
102 GOVERNANCE REVIEW OF OPERATIONS
Advancing business opportunities
Traffi c Information and SystemsThe RTA generates traffi c-related data and information from a variety of systems and sources. Work has begun to coordinate the management of this information and approaches from the market to use this information for commercial purposes. An example of successful engagement with market participants is the start of an agreement with Intelematics Australia for the supply of traffi c and incident data for the Suna Traffi c Channel.
The RTA-developed SCATS (Sydney Coordinated Adaptive Traffi c System) is used in more than 138 cities worldwide. During the fi nancial year the number of distributors for this system was increased to three to continue to grow sales around the world of this market-leading technology.
Special Number Plates The special number plate business of the RTA continued its growth in a challenging economic environment. New marketing initiatives were completed in 2008-09 including the rebranding of the business to ‘myPlates’, the launch of 22 new colour plate styles, the restructure of prices to remove annual fees on standard content plates and the development of sales through car dealers. The fi nancial year fi nished on a high note with a highly successful rare plate auction generating nearly $2.4 million in sales for 49 numeral-only plates.
Rare number plates auction held at the Classic Throttle Shop, North Sydney, June 2009.
RTA Road and Fleet ServicesThe RTA’s commercial arm – Road and Fleet Services – enjoyed another good year despite the economic downturn. Road and Fleet Services posted a record income of $749.6 million, with a surplus of $55.4 million. This was achieved by strengthening business operations, effective planning and delivery of an enhanced alliance works program and staff productivity. Marketing of the technical skills of Road and Fleet Services secured an external income of $36.9 million.
Other key achievements included:• Ongoing improvements and consolidation of the alliance
contracting approach to deliver maintenance and other minor works. In addition to improved resource allocation, effi ciency, productivity and delivery of works through early and meticulous scoping and planning of work, the approach ensured an even and balanced distribution of work across the year with the delivery of 48 per cent of the Corporate Finance Approved program in the fi rst half of the year (a marked improvement over 42 per cent delivered at the same period in the previous fi nancial year).
• Introduction of the Land Use Plans, Development Applications and Proposals geo-database to track land use development matters referred to the RTA for assessment (including draft statutory instruments, development applications and other proposals).
• Signifi cant progress in implementing the Field Input Data Operations (FIDO) maintenance management system. FIDO allows maintenance and defect data to be entered electronically from the fi eld, providing accurate and timely information to allow more effi cient maintenance reporting and planning.
• Implementation of the new performance-specifi ed maintenance contract to replace the long-term contract in the north area of Sydney Region. The new contract is expected to improve maintenance and the long-term condition of the network.
• Establishment of a centre of engineering knowledge and expertise by recruiting key technical staff for the specialist groups in Engineering Technology Branch.
• Reduction in project risks and costs through an improved overlay pavement design on Dane Drive and Masons Parade, Gosford.
• Innovative designs and treatments on the Bulahdelah Bypass project which reduced traffi c impacts and costs.
• Use of alternative pavement materials for longer pavement durability and reduced maintenance costs.
• Effi ciencies though reuse/reduction of material.
• Alternative traffi c control methods resulting in reduced traffi c management costs, less impact on the environment and reduced traffi c disruptions.
• Productivity gains through improvements to designs including an innovative fall-protection barrier system on the HW11 Crossover Bridge project and pavement treatment to prevent strains on the Hume Highway caused by mining.

REVIEW OF OPERATIONS GOVERNANCE 103
Our peopleA safe and healthy workplace
Occupational Health and Safety statementThe RTA is committed to providing a safe and healthy workplace and eliminating conditions or hazards that could result in personal injury or ill health. Workplace health, safety and welfare in road and traffi c operations are always given precedence over production demands.
The Executive and senior management provide leadership that supports and enables the vision of a safe workplace. This leadership facilitates a positive engagement with the workforce that encourages a strong safety culture, enhancing the safety and well-being of RTA staff.
Policy and commitment statementThe RTA Occupational Health and Safety Policy statement confi rms the RTA’s commitment to providing leadership, direction, resources and support, to ensure workplaces are safe and without risk to health. The policy confi rms the RTA’s commitment to effective consultation between management and employees on the development, implementation and refi nement of the OHS program and seeks the cooperation of all employees to achieve OHS objectives.
Risk managementA risk management approach to OHS continued to be applied to all of the RTA’s activities. Signifi cant OHS risks were addressed in the areas of construction, road maintenance, traffi c control, working at heights, working near utilities and effective workplace implementation of OHS policies and procedures. A variety of targeted risk assessment approaches have been applied to these areas including:
• Project ‘whole-of-life’ risk control documents – a risk assessment at the concept and design stage aimed at improving OHS through better design.
• Environment and safety risk assessment undertaken by stakeholders for projects in the range of $250,000 to $5 million, with an OHS development plan for major projects worth more than $5 million.
• Situational awareness risk assessment to provide traffi c signal and maintenance crews with tools to identify and deal with risks encountered during routine maintenance at each site.
• Risk profi les developed by each RTA business area so that hazards can be eliminated or controlled, and reviewed on an ongoing basis.
Road maintenanceThe 2009 Safety Summit for Road and Fleet Services managers identifi ed key focus areas for OHS. These included improving the quality of SAFE Engagements (behaviour audits), increasing near miss reporting, disseminating lessons from incidents, working on foot around plant, working near utilities, working near traffi c, working at heights, dispelling the fallacy of ‘no time for safety’, and ‘looking out for one another’ to create a culture of mutual protection.
The RTA Road and Fleet Services Branch continue to maintain certifi cation to AS 4801 (Australian Standard for Occupation Health and Safety Management Systems) and accreditation with the Offi ce of the Federal Safety Commission.
Traffi c control at worksitesTraffi c control at worksites was improved in 2008-09. Key actions included information sharing by regional working groups of traffi c control practitioners, re-evaluation of speed zone authorisation processes, the development of a Technical Direction on working with the NSW Police Force to identify roadwork sites that require a police presence, and speed zone enforcement.
UtilitiesUtility ‘strikes’, such as unplanned contacts with electricity, gas, water and telecommunication services, continued to be a major cause of potentially serious incidents. Continued efforts to prevent these incidents included the formation of a Utilities Coalition to review incidents and develop strategies to prevent utility strikes. In 2008-09 there were 93 serious incidents reported.
Contractor safetyThe RTA continued to achieve a high safety performance for its projects and set benchmark standards in OHS management of contractors. The annual contractor safety forum provided an opportunity to share best practice. The forum, held in November 2008 and attended by more than 70 contractors and RTA employees, discussed tools and systems to drive stronger safety cultures and performance.
The NSW Civil Industry Coalition, which includes key RTA contractors, was established to address serious incidents in construction projects. The coalition successfully negotiated a number of initiatives including the WorkCover Noise Memorandum of Understanding among industry partners, the incorporation of site safety rules into OHS contract specifi cations, a Safe Work Method Statement review system, and revisions to the strategy of managing contact with utilities.
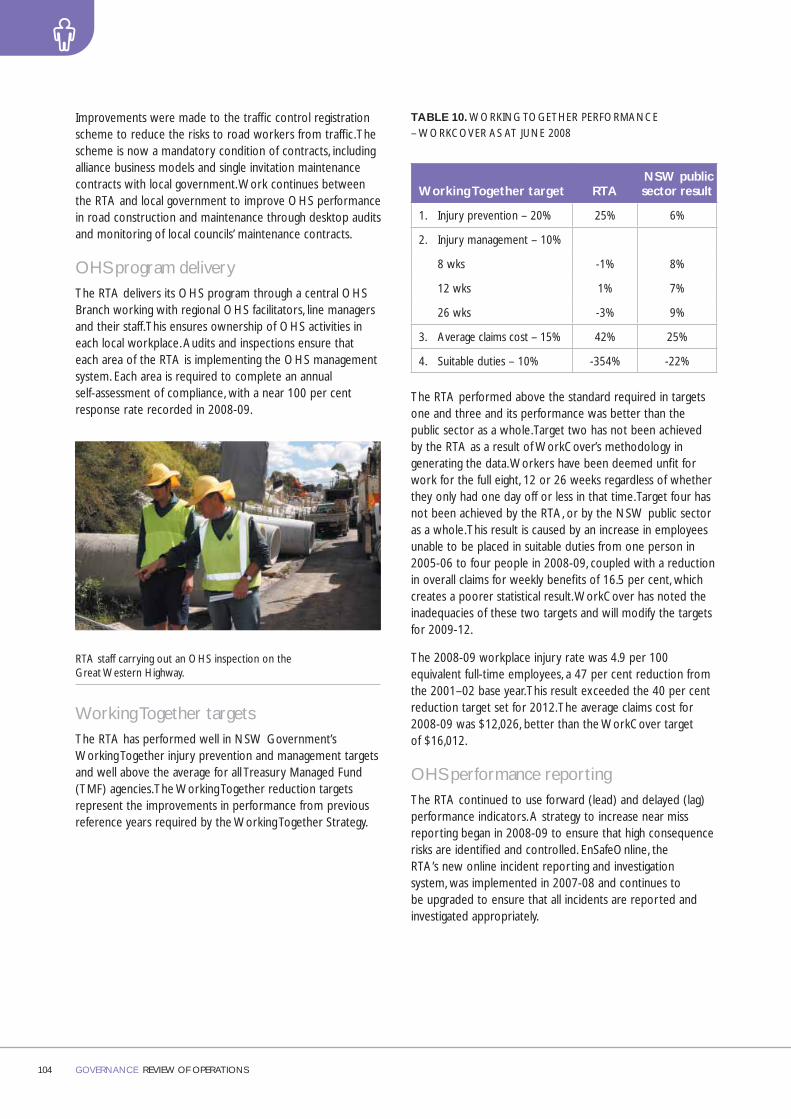
104 GOVERNANCE REVIEW OF OPERATIONS
Improvements were made to the traffi c control registration scheme to reduce the risks to road workers from traffi c. The scheme is now a mandatory condition of contracts, including alliance business models and single invitation maintenance contracts with local government. Work continues between the RTA and local government to improve OHS performance in road construction and maintenance through desktop audits and monitoring of local councils’ maintenance contracts.
OHS program deliveryThe RTA delivers its OHS program through a central OHS Branch working with regional OHS facilitators, line managers and their staff. This ensures ownership of OHS activities in each local workplace. Audits and inspections ensure that each area of the RTA is implementing the OHS management system. Each area is required to complete an annual self-assessment of compliance, with a near 100 per cent response rate recorded in 2008-09.
RTA staff carrying out an OHS inspection on the Great Western Highway.
Working Together targetsThe RTA has performed well in NSW Government’s Working Together injury prevention and management targets and well above the average for all Treasury Managed Fund (TMF) agencies. The Working Together reduction targets represent the improvements in performance from previous reference years required by the Working Together Strategy.
TABLE 10. WORKING TOGETHER PERFORMANCE – WORKCOVER AS AT JUNE 2008
Working Together target RTA NSW public sector result
1. Injury prevention – 20% 25% 6%
2. Injury management – 10%
8 wks -1% 8%
12 wks 1% 7%
26 wks -3% 9%
3. Average claims cost – 15% 42% 25%
4. Suitable duties – 10% -354% -22%
The RTA performed above the standard required in targets one and three and its performance was better than the public sector as a whole. Target two has not been achieved by the RTA as a result of WorkCover’s methodology in generating the data. Workers have been deemed unfi t for work for the full eight, 12 or 26 weeks regardless of whether they only had one day off or less in that time. Target four has not been achieved by the RTA, or by the NSW public sector as a whole. This result is caused by an increase in employees unable to be placed in suitable duties from one person in 2005-06 to four people in 2008-09, coupled with a reduction in overall claims for weekly benefi ts of 16.5 per cent, which creates a poorer statistical result. WorkCover has noted the inadequacies of these two targets and will modify the targets for 2009-12.
The 2008-09 workplace injury rate was 4.9 per 100 equivalent full-time employees, a 47 per cent reduction from the 2001–02 base year. This result exceeded the 40 per cent reduction target set for 2012. The average claims cost for 2008-09 was $12,026, better than the WorkCover target of $16,012.
OHS performance reportingThe RTA continued to use forward (lead) and delayed (lag) performance indicators. A strategy to increase near miss reporting began in 2008-09 to ensure that high consequence risks are identifi ed and controlled. EnSafeOnline, the RTA’s new online incident reporting and investigation system, was implemented in 2007-08 and continues to be upgraded to ensure that all incidents are reported and investigated appropriately.
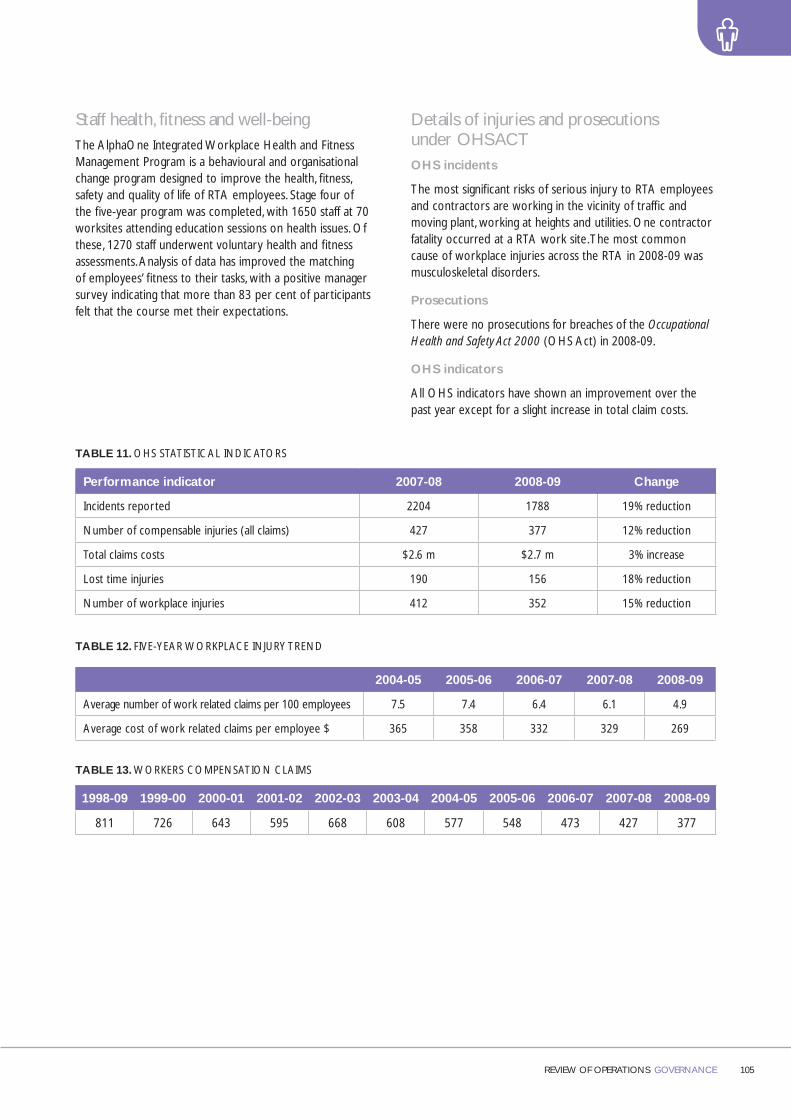
REVIEW OF OPERATIONS GOVERNANCE 105
Staff health, fi tness and well-beingThe AlphaOne Integrated Workplace Health and Fitness Management Program is a behavioural and organisational change program designed to improve the health, fi tness, safety and quality of life of RTA employees. Stage four of the fi ve-year program was completed, with 1650 staff at 70 worksites attending education sessions on health issues. Of these, 1270 staff underwent voluntary health and fi tness assessments. Analysis of data has improved the matching of employees’ fi tness to their tasks, with a positive manager survey indicating that more than 83 per cent of participants felt that the course met their expectations.
Details of injuries and prosecutions under OHS ACTOHS incidents
The most signifi cant risks of serious injury to RTA employees and contractors are working in the vicinity of traffi c and moving plant, working at heights and utilities. One contractor fatality occurred at a RTA work site. The most common cause of workplace injuries across the RTA in 2008-09 was musculoskeletal disorders.
Prosecutions
There were no prosecutions for breaches of the Occupational Health and Safety Act 2000 (OHS Act) in 2008-09.
OHS indicators
All OHS indicators have shown an improvement over the past year except for a slight increase in total claim costs.
TABLE 11. OHS STATISTICAL INDICATORS
Performance indicator 2007-08 2008-09 Change
Incidents reported 2204 1788 19% reduction
Number of compensable injuries (all claims) 427 377 12% reduction
Total claims costs $2.6 m $2.7 m 3% increase
Lost time injuries 190 156 18% reduction
Number of workplace injuries 412 352 15% reduction
TABLE 12. FIVE-YEAR WORKPLACE INJURY TREND
2004-05 2005-06 2006-07 2007-08 2008-09
Average number of work related claims per 100 employees 7.5 7.4 6.4 6.1 4.9
Average cost of work related claims per employee $ 365 358 332 329 269
TABLE 13. WORKERS COMPENSATION CLAIMS
1998-09 1999-00 2000-01 2001-02 2002-03 2003-04 2004-05 2005-06 2006-07 2007-08 2008-09
811 726 643 595 668 608 577 548 473 427 377
106 GOVERNANCE REVIEW OF OPERATIONS
Workforce capabilityThe RTA has strengthened its resources in critical skills development, succession management and knowledge management. These moves are in response to the increased global competition for scarce road-based technical skills such as engineers, road designers and surveyors. The RTA has established a Professional and Technical Skills Advisory Board made up of some of the organisation’s most talented and senior professionals to oversee and inform the skills development program and advise the RTA Executive Workforce and Reform Committee. The RTA is focused on ensuring its workforce is not only ready now, but is prepared for future demands.
The RTA is proud of the ability and dedication that all staff bring to their work. To ensure that the capability of the organisation remains high, the RTA invests signifi cantly in the development of its workforce.
As well as investing in targeted employment programs to bring graduates, paraprofessionals, apprentices and trainees into the RTA and supporting the study of undergraduate students in specifi c disciplines, the RTA provides generous support for the continuing education and development of its permanent workforce. The RTA also invests signifi cantly in Aboriginal employment programs, as well as programs to maintain, encourage and develop the diversity of our workforce.
A number of initiatives are underway, including:
• Strengthening the RTA Alumni Program.
• A program to capture knowledge from key staff retiring from the organisation and staff with critical skills.
• In collaboration with Engineers Australia, the e+ development program for engineers.
• The leadership development program.
• Development of an RTA Online Learning Centre.
• Transformation of the recruitment process.
• Development of workforce strategies for skill priorities in areas such as civil engineering, road designers, traffi c and transport management and policy.
Leadership development The RTA’s workforce strategy addresses the full spectrum of leadership skills required by an organisation integral to the community of NSW. Our world-class leadership development framework is informed by global best practice.
This framework refl ects the core values and the key behaviours needed to drive the RTA’s leadership and management capability. It is being used to improve leadership development, assist with recruitment and succession planning and to ensure that the RTA has a strong basis for continuing organisational leadership. The RTA conducts an annual assessment of managers against this framework.
Workplace innovation As well as concentrating on building the workforce of the future, the RTA continues to implement initiatives to improve the work environment for our staff. The RTA supports innovation in workplace practices and processes through management and staff development, enhanced workforce mobility and fl exibility, internal communication, employee health awareness and development programs, diversity and equity initiatives, and improved workplace conduct support.
Teleworking The RTA encourages teleworking – a fl exible work practice that enables staff to balance their work and personal commitments. Teleworking reduces vehicle kilometres travelled and car dependency, and improves air quality. The RTA holds workshops on the implementation of sustainable travel initiatives including teleworking. It also continues to promote the benefi ts of teleworking to government agencies and businesses via manuals, meetings, forums and the internet. The RTA provides opportunities for staff to telework on a regular or needs basis. Staff have access to telecentres in Penrith and the Central Coast, and hot desks across the organisation. Staff are also able to telework from home.

REVIEW OF OPERATIONS GOVERNANCE 107
Targeted recruitment programs The RTA’s targeted employment programs bring graduates, paraprofessionals, apprentices and trainees into the organisation. Through these programs we provide both fi nancial support and work experience to ensure the skills needed by the RTA are grown progressively and professionally. The RTA also works with the State’s leading universities to support and attract students through a program of scholarships and cadetships.
Apprentices The trade apprenticeship program rotates apprentices between workshops and worksites across NSW to ensure they gain exposure to a broad range of skills and experiences. In 2008-09 the RTA recruited apprentices across a range of trade classifi cations including electricians, painters, bridge and wharf carpenters and plant mechanics. In June 2009 the RTA employed 71 trade apprentices.
Traineeships RTA trainees are working towards a variety of vocational education and training qualifi cations. Traineeships are located in the RTA Contact Centre, regional offi ces, administration centres, motor registries, road construction and other RTA functional centres. As at 30 June 2009, the RTA employed 133 trainees.
Graduate Recruitment and Development Program (GRAD) RTA graduates come from a range of disciplines such as chemistry/material science, urban design, town planning, transport planning, policy, traffi c and transport, engineering, computer systems engineering, land economics, environment and community liaison. Over recent years, the GRAD program has consistently averaged a retention rate of 97 per cent. At 30 June 2009 the RTA employed 152 graduates.
Left to right: Graduates Jeff Seeney and Amy McCann with staff member Zen Huang at work at Miller Street, North Sydney.
Undergraduate scholarship, rural cadetship and para-professional programs The RTA’s Undergraduate Scholarship Program encourages university undergraduates to consider careers in the roads industry. The rural cadetship scheme targets undergraduates from rural NSW and aims to support engineering and related professionals to return to these rural communities to work after completing their degree. At 30 June 2009, the RTA supported 123 undergraduates studying the disciplines of engineering and surveying. Twenty-four of the 123 undergraduates were employed in the RTA’s Rural Cadet Scheme.
The RTA’s para-professional programs are proving to be very successful in generating renewable pools of talent in critical technical skill areas. These programs combine on-the-job experience with a course of study towards the attainment of an Associate Diploma of Engineering. At 30 June 2009 there were 41 participants in the programs with 36 of those in the Road Designer in Training Program.
Capability in trades and non-trades grades Competency-based assessment continues to underpin an enterprise classifi cation structure for trades and non-trades wages staff in the RTA Road and Fleet Services business. The Wages Classifi cation Structure Assessment Project is a key mechanism in maintaining a responsive and capable operational workforce. It ensures the competency of staff who are upgrading their skills for new positions within the organisation.
All new staff entering the RTA’s road construction and maintenance workforce, including apprentices and trainees retained after the completion of their training, are also assessed. The Wages Classifi cation Structure Assessment project encourages wages staff to develop multi-disciplinary skills and training, allowing for fl exible deployment and greater productivity gains at the grass-roots level.
A new plant operator safety certifi cation system of competency-based training and assessment was developed and implemented. This system ensures compliance-based certifi cation of staff working with mobile plant and construction/maintenance machinery.

108 GOVERNANCE REVIEW OF OPERATIONS
Staff training and education The RTA is a leading provider of technology, professional and technical skills in many areas including road safety, traffi c management, road and bridge building and maintenance. To maintain and grow its capability, the RTA supports on-the-job and formal training delivered by RTA technical experts or external specialists. During 2008-09, 8029 staff (including contractors, skill-hire and business partners) attended a total of 3999 approved training courses at a cost of $2.81 million (excluding GST). Technical, OHS and environmental training accounted for 61 per cent of the training. Outsourcing training for vendor management saved $170,111 for external programs.
Commercial Contracts Template training was provided to 247 staff who have a role in tendering and managing contracts for the RTA. The training ensures staff know the correct guidelines for the tendering and evaluation process for goods and services, the correct policy and NSW government legislation.
The environment remained a key focus area for 2008-09. Aboriginal cultural heritage training was delivered to 303 staff and Environmental Procedures for Routine and Minor Works were provided to 641 staff.
The RTA continues to develop e-Learning to provide fl exible options for staff development. Initiatives included the establishment of an online learning centre.
Working ethically and professionallyIn accordance with the principles of good governance, all RTA staff attended an internally developed, one-hour, interactive Code of Conduct and Ethics presentation. Approximately 8600 staff (including contractors, skill-hire and business partners) attended a total of 670 sessions.
The Workplace Practices Unit also developed and ran a ‘Working with Young People’ presentation for Driver Testers and others (24 sessions, 339 staff) and Disclosure Offi cer training (eight sessions, 72 staff) for senior RTA offi cers receiving and dealing with protected disclosures. In addition to the Code of Conduct and Ethics sessions, a total of 1951 staff attended 150 conduct-related presentations including:
• Managing unsatisfactory performance and conduct.
• Grievance resolution.
• Harassment, Discrimination and Workplace Bullying.
Strategies to resolve workplace grievances continued with the appointment of mediators to the RTA’s Grievance Resolution Mediation Panel and the appointment of Grievance Contact Offi cers for a three-year term.
Workplace Conferencing, which deals with multi-party disputes, has been successfully trialled. This resource is offered in addition to facilitated discussions and mediation. In 2008-09, there were 34 facilitated discussions, mediations or workplace conferences. The vast majority of disputes were resolved to the satisfaction of the parties concerned.
Sponsored programs The RTA sponsors many of its staff to undertake postgraduate qualifi cations across a range of disciplines to ensure continued capability across all functions. Sponsorships were approved in the following postgraduate qualifi cations:
• Master of Technology in Pavements (Centre for Pavement Engineering Education CPEE).
• Master of Engineering in Pavements (CPEE).
• Advanced Certifi cate in Transport and Traffi c Management (Institute of Transport and Logistics Studies ITLS).
• Master of Transport Management (ITLS).
Staff orientationThe RTA continued to deliver its formal orientation program. The program includes an increased focus on the role, responsibilities and achievements of the RTA, and was delivered to 377 new staff during the year.
REVIEW OF OPERATIONS GOVERNANCE 109
Internal communication
With about 7123 staff spread across NSW and a diverse workforce both in age and professions, internal communication is a priority at the RTA.
The RTA has three main communication tools to engage staff about organisational issues, projects, policies and events.
A monthly team brief from the Chief Executive provides managers across the business with a framework for two-way communication with their teams about issues of strategic importance.
The RTA staff magazine, Momentum, features key achievements, projects and activities in which staff are involved. There are 11 issues a year and each issue includes a branch profi le to introduce the team and explain their roles and functions.
Staff news is published on the RTA’s intranet home page. This is the main vehicle for more time-critical announcements and information. This year has seen an increased use of video clips and Flash software to produce presentations and illustrations.
In 2009-10 the challenge for the organisation continues to be to investigate and adopt communication tools and channels that further improve internal communication.
External panels
NSW Premier’s Capability TaskforceThe RTA is a signifi cant public sector employer and plays a major role in many of the NSW Public Sector Workforce Strategies. The RTA has participated in strategies to address accounting and engineering skill shortages and to improve the attractiveness of the public sector as an employer. The RTA will continue to play a major role in the development and implementation of public sector workforce strategies as part of the NSW Premier’s Capability Taskforce, particularly as they apply to key infrastructure areas.
Austroads Capability TaskforceThrough its membership of this peak industry body, the RTA contributes to work to ease the workforce capability pressures shared by road infrastructure organisations across Australia and New Zealand. This forum is used to raise the profi le of the industry rather than the individual profi le of just one agency.
In 2008-09, the RTA took a leading role in the delivery of the National Skills Marketing Plan – an Austroads Capability Taskforce campaign to promote engineering skills in the roads sector, targeting senior high school and fi rst year university students.
The RTA played a key role in the start of the Austroads Capability Taskforce project ‘Australia and New Zealand Roads Capability Analysis – 2009 Update’. This project aims to assess future skilled labour supply and demand in the roads sector, and is using data from a similar project in 2006 as a baseline for comparison.
Staff awardsThe RTA Staff Awards recognise excellent performance in areas of critical importance to the RTA and provide an opportunity to acknowledge and reward staff who have made an outstanding contribution.
An awards presentation ceremony was held on 27 February 2009. The event was attended by the Minister for Roads who presented 20 awards to 177 winners. Winners included staff from nine regional and four metropolitan work locations.

110 GOVERNANCE REVIEW OF OPERATIONS
Staff achievementsThe RTA’s staff continued to receive accolades from industry and other external bodies for the high quality of their work.
• The RTA project team responsible for the Pacifi c Highway Upgrade from Brunswick Heads to Yelgun won a prestigious Engineering Excellence Award. The Newcastle Division of the Institution of Engineers recognised the team for its outstanding achievements in the design and delivery of this complicated project.
The prizes are awarded each year in recognition of the expertise of individuals and organisations across a range of engineering and environmental criteria.
The 8.7km project has delivered signifi cant improvements to road safety, transport effi ciency and community access, and a high environmental standard.
Left to right: Peter Borrelli, Stephen Summerell, Ron Homes and Joe Canceri.
• The RTA’s expertise in surveying was recognised with two major industry awards.
The 2008 NSW Excellence in Surveying and Spatial Information Awards were announced in September 2008. Competition for the awards is intense and open to private industry, the public sector and academia.
The RTA has been a sponsor of the awards since 2002. The surveying discipline of the RTA has won nine major awards since 1998 – more than any other organisation.
Jai Reddy, Project Development Manager and RTA Graduate of the Year in 2007, received the $15,000 2008 Surveyor-General’s International Fellowship from the Surveyor-General and Director-General of the Department of Lands, Warwick Watkins.
RTA Manager Surveying Mark Gordon was presented with the major award of the evening, the prestigious 2008 NSW Professional of the Year.
An RTA submission on road boundaries in national parks was also a fi nalist in the ‘Extra Dimension’ category. The entry was submitted by John Gillies and Ray Gilmour, Manager of Survey Technologies and Practice.
Left to right: Peter Collins, Director Regional Operations & Engineering Services, Jai Reddy, Project Development Manager, Mark Gordon, Manager Surveying, and Chris Harrison, General Manager Engineering Technology, at the 2008 NSW Excellence in Surveying and Spatial Information awards evening.
• The RTA won a gold award for its interactive and informative stand in the Home, Garden and Lifestyle Hall section of the 2009 Royal Easter Show.
The stand carried a strong road safety message and was developed around the theme of ‘My life, my way. My RTA’. The stand included a display on child restraints, a tolling booth where e-tags and passes could be purchased, and a display of number plates, including the newly launched RTA pink plates.
Ninety RTA volunteers staffed the stand over 14 days.
Providing a strong road safety message and great customer service: the winning RTA stand at the Royal Easter Show.
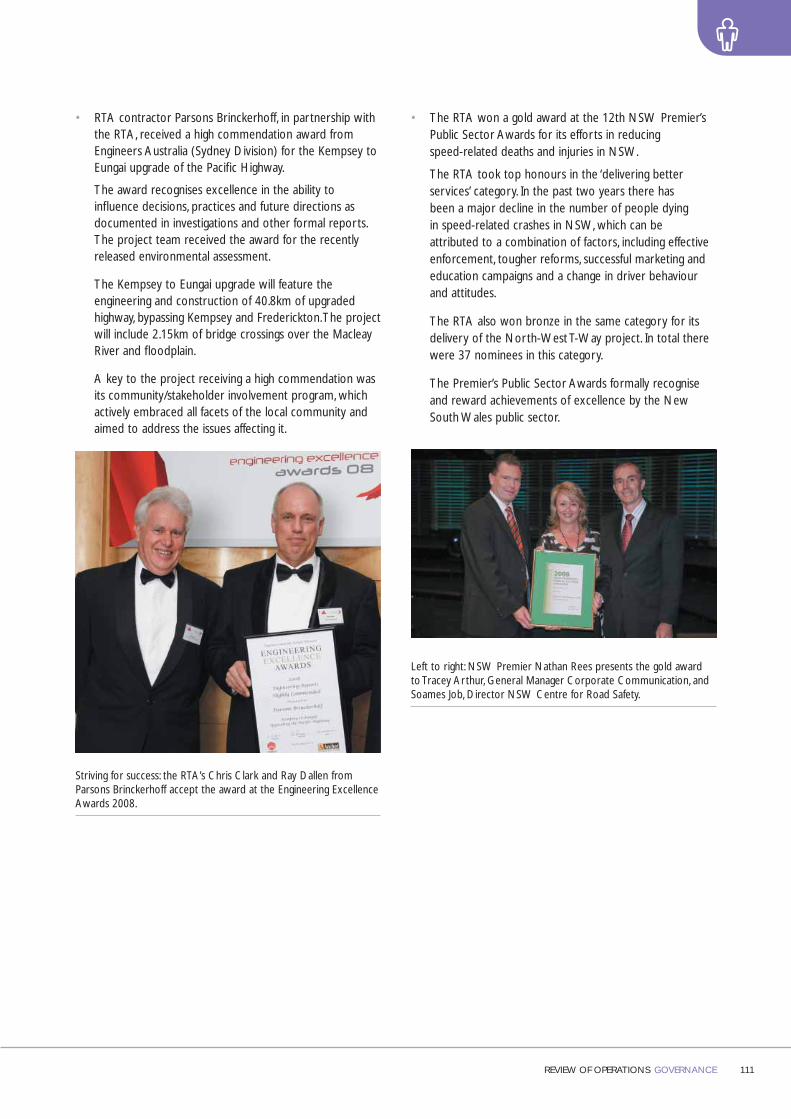
REVIEW OF OPERATIONS GOVERNANCE 111
• RTA contractor Parsons Brinckerhoff, in partnership with the RTA, received a high commendation award from Engineers Australia (Sydney Division) for the Kempsey to Eungai upgrade of the Pacifi c Highway.
The award recognises excellence in the ability to infl uence decisions, practices and future directions as documented in investigations and other formal reports. The project team received the award for the recently released environmental assessment.
The Kempsey to Eungai upgrade will feature the engineering and construction of 40.8km of upgraded highway, bypassing Kempsey and Frederickton. The project will include 2.15km of bridge crossings over the Macleay River and fl oodplain.
A key to the project receiving a high commendation was its community/stakeholder involvement program, which actively embraced all facets of the local community and aimed to address the issues affecting it.
Striving for success: the RTA’s Chris Clark and Ray Dallen from Parsons Brinckerhoff accept the award at the Engineering Excellence Awards 2008.
• The RTA won a gold award at the 12th NSW Premier’s Public Sector Awards for its efforts in reducing speed-related deaths and injuries in NSW.
The RTA took top honours in the ‘delivering better services’ category. In the past two years there has been a major decline in the number of people dying in speed-related crashes in NSW, which can be attributed to a combination of factors, including effective enforcement, tougher reforms, successful marketing and education campaigns and a change in driver behaviour and attitudes.
The RTA also won bronze in the same category for its delivery of the North-West T-Way project. In total there were 37 nominees in this category.
The Premier’s Public Sector Awards formally recognise and reward achievements of excellence by the New South Wales public sector.
Left to right: NSW Premier Nathan Rees presents the gold award to Tracey Arthur, General Manager Corporate Communication, and Soames Job, Director NSW Centre for Road Safety.
112 GOVERNANCE REVIEW OF OPERATIONS
Future challengesOHS• Working near high speed, high volume traffi c continues
to pose the greatest risk to RTA staff and contractors. A signifi cant work program continues to address the management of this risk and will continue to be a key priority into the future. Similarly, working near mobile construction plant and in the vicinity of underground and overhead utilities also present continuing challenges.
• Increasing near miss reporting is an important proactive strategy aimed at better identifi cation and control of risks before injuries occur. Near miss reporting is also an important component of the strategy to prevent high consequence incidents through site-specifi c risk control mechanisms.
• Ensuring strong safety leadership is critical to achieving a safe work culture. Strategies to strengthen leadership skills include training and mentoring programs and implementation of leadership tools such as SAFE Engagements, reward and recognition and performance management programs.
HR • The most signifi cant challenges that face HR include:
– Global economic challenges.
– The ageing of the workforce.
– Critical skills shortages.
– Growing demands on the NSW road system.
• To meet the challenges ahead the RTA needs a workforce with the right mix of professional, technical and management skills. The RTA is building on the agenda outlined in Blueprint, the RTA Corporate Plan, through three broad streams of activity:
– Renewing our workforce: recruiting motivated, skilled and ambitious staff and developing ways to retain our experienced staff and plan for their successors when they decide to move on.
– Growing our own: developing our people, their leadership potential, skills and expertise, through a suite of programs.
– Driving innovation: sustaining the RTA’s performance by fostering innovation across all areas of the RTA.
Financial Statements
114 FINANCIAL STATEMENTS
Contents
Section cover image: Photo taken by RTA staff member Greg Jackson of the Seacliff Bridge.
Roads And Traffi c Authority of New South WalesIndependent audit report 115
Statement by the Chief Executive and the Director, Finance and Performance
117
Operating statement 118
Statement of recognised income and expense 119
Balance sheet 120
Cash fl ow statement 121
Service group statements expenses and income 122
Service group statements assets and liabilities 123
Summary of compliance with fi nancial directives 124
Notes to and forming part of the fi nancial statements
1. Summary of signifi cant accounting policies 1252. Expenses excluding losses 136
3. Revenue 138
4. Gains (losses) on disposal 139
5. Appropriations 140
6. Individually signifi cant items 140
7. Service groups of the agency 141
8. Current assets – cash and cash equivalents 141
9. Current assets/non-current assets – receivables and other fi nancial assets
142
10. Non-current assets – property, plant and equipment 143
11. Non-current assets – intangible assets and other
148
12. Non-current assets held for sale 151
13. Current liabilities – payables 152
14. Current/non-current liabilities – borrowings 152
15. Financial instruments 153
16. Current/non-current liabilities – provisions 158
17. Current/non-current liabilities – other 166
18. Changes in equity 167
19. Increase/decrease in net assets from equity transfer 168
20. Commitments for expenditure 169
21. After balance sheet date event 171
22. Contingent assets and contingent liabilities 171
23. Native title 172
24. Administered liabilities 172
25. Budget review 172
26. Reconciliation of cash fl ows from operating activities to net cost of services
173
27. Non cash fi nancing and investing activities 173
28. Prior Period Errors 174
Roads And Traffi c Authority Division of the Government Services of New South WalesIndependent audit report 179
Statement by the Chief Executive and the Director, Finance and Performance
181
Income statement 182
Statement of recognised income and expense 182
Balance sheet 183
Cash fl ow statement 183
Notes to and forming part of the fi nancial statements
1. Summary of signifi cant accounting policies 184
2. Current assets 187
3. Current liabilities/non-current liabilities 185
4. Audit fee 196
5. Related party transaction 196
6. After balance sheet date event 196
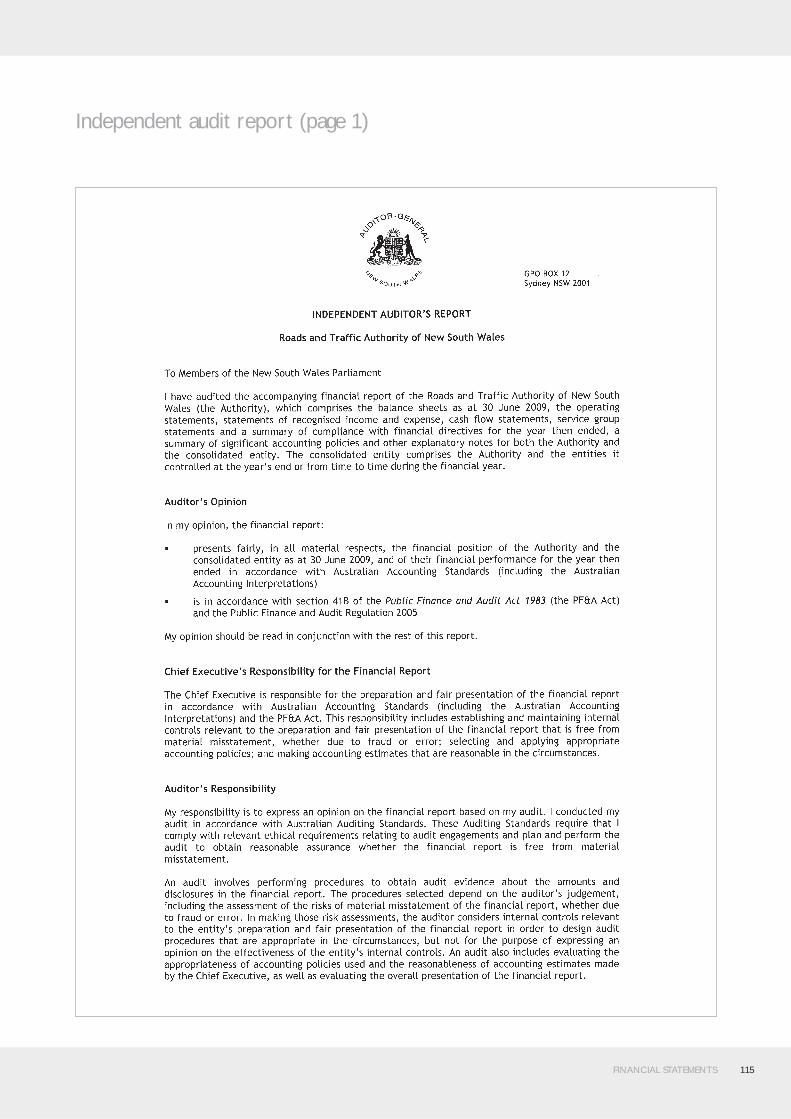
FINANCIAL STATEMENTS 115
Independent audit report (page 1)

116 FINANCIAL STATEMENTS
Independent audit report (page 2)

FINANCIAL STATEMENTS 117
Statement by the Chief Executive and the Director, Finance and Performance

118 FINANCIAL STATEMENTS
Operating statementfor the year ended 30 June 2009
Consolidated Parent
Notes
Budget2009$’000
Actual2009$’000
Actual2008$’000
Actual2009$’000
Actual2008$’000
Expenses excluding losses
Operating Expenses
– Employee related 2(a) 478,871 533,543 503,811 886,395 639,033
– Other operating expenses 2(b) 437,670 403,477 287,085 403,477 287,085
Maintenance 2(b) 756,754 694,771 671,304 694,771 671,304
Depreciation and amortisation 2(c) 838,639 853,456 836,429 853,456 836,429
Grants and subsidies 2(d) 99,906 345,160 281,022 345,160 281,022
Finance costs 2(e) 55,932 102,535 111,813 102,535 111,813
Total Expenses excluding losses 2,667,772 2,932,942 2,691,464 3,285,794 2,826,686
Revenue
Sales of goods and services 3(a) 361,632 386,317 389,606 386,317 389,606
Investment revenue 3(b) 13,385 10,027 15,352 10,027 15,352
Grants and contributions 3(c) 21,696 47,707 190,334 47,707 190,334
Other revenue 3(d) 157,829 112,687 104,275 112,687 104,275
Total Revenue 554,542 556,738 699,567 556,738 699,567
Gain on disposal 4(a) 229 1,213 15,692 1,213 15,692
Other losses 4(b) (1,000) (34,024) (157,859) (34,024) (157,859)
Net Cost of Services 26 2,114,001 2,409,015 2,134,064 2,761,867 2,269,286
Government Contributions
Recurrent appropriation 5 1,591,128 1,578,527 1,421,222 1,578,527 1,421,222
Capital appropriation 5 2,144,554 2,144,518 1,780,807 2,144,518 1,780,807
Total Government Contributions 3,735,682 3,723,045 3,202,029 3,723,045 3,202,029
SURPLUS FOR THE YEAR 18 1,621,681 1,314,030 1,067,965 961,178 932,743
The accompanying notes form part of these fi nancial statements.

FINANCIAL STATEMENTS 119
Statement of recognised income and expense for the year ended 30 June 2009***
Consolidated Parent
Notes
Budget2009$’000
Actual2009$’000
Actual2008$’000
Actual2009$’000
Actual2008$’000
Net increase in asset revaluation reserve 18 - 6,931,949 4,766,164 6,931,949 4,766,164
Superannuation actuarial losses 18 - (352,852) (135,222) - -
Total income and expense recognised directly in equity - 6,579,097 4,630,942 6,931,949 4,766,164
Surplus for the Year 18 1,621,681 1,314,030 1,067,965 961,178 932,743
Total income and expense recognised for the year 1,621,681 7,893,127 5,698,907 7,893,127 5,698,907
Effect of change in accounting policies and correction of errors
Accumulated Funds 28 - - (417,408) - (417,408)
Reserves 28 - - (2,696,430) - (2,696,430)
- - (3,113,838) - (3,113,838)
The accompanying notes form part of these fi nancial statements.

120 FINANCIAL STATEMENTS
Balance sheet as at 30 June 2009
Consolidated Parent
Notes
Budget2009$’000
Actual2009$’000
Actual2008$’000
Actual2009$’000
Actual2008$’000
ASSETSCurrent Assets
Cash and cash equivalents 8 206,219 186,179 179,958 186,179 179,958
Receivables 9(a) 129,655 147,560 129,655 147,560 129,655
Inventories 10,245 10,715 10,245 10,715 10,245
346,119 344,454 319,858 344,454 319,858
Non-current assets held for sale 12 71,122 40,893 71,122 40,893 71,122
Total Current Assets 417,241 385,347 390,980 385,347 390,980
Non-Current Assets
Other fi nancial assets 9(b) 106,527 108,529 98,402 108,529 98,402
Property, Plant and Equipment
– Land and Buildings 10(a) 2,939,852 2,996,887 2,890,778 2,996,887 2,890,778
– Plant and Equipment 10(b) 147,779 161,478 140,279 161,478 140,279
– Infrastructure Systems 10(c) 79,000,347 85,723,210 77,726,966 85,723,210 77,726,966
Total property, plant and equipment 82,087,978 88,881,575 80,758,023 88,881,575 80,758,023
Intangible assets 11(b) 16,160 30,788 19,599 30,788 19,599
Private Sector Provided Infrastructure 11(a) 580,266 539,105 448,419 539,105 448,419
Total Non-Current Assets 82,790,931 89,559,997 81,324,443 89,559,997 81,324,443
Total Assets 83,208,172 89,945,344 81,715,423 89,945,344 81,715,423
LIABILITIESCurrent Liabilities
Payables 13 551,601 609,710 551,601 1,386,704 955,840
Borrowings 14 141,401 140,548 141,306 140,548 141,306
Provisions 16 219,213 237,469 213,493 - -
Other 17 139,139 144,273 138,008 139,224 134,968
Total Current Liabilities 1,051,354 1,132,000 1,044,408 1,666,476 1,232,114
Non-Current Liabilities
Borrowings 14 1,229,488 1,246,492 1,311,218 1,246,492 1,311,218
Provisions 16 187,693 534,476 187,706 - -
Other 17 333,924 357,793 366,730 357,793 366,730
Total Non-Current Liabilities 1,751,105 2,138,761 1,865,654 1,604,285 1,677,948
Total Liabilities 2,802,459 3,270,761 2,910,062 3,270,761 2,910,062
Net Assets 80,405,713 86,674,583 78,805,361 86,674,583 78,805,361
EQUITYReserves 18 35,025,304 41,837,842 35,053,304 41,837,842 35,053,304
Accumulated Funds 18 45,380,409 44,836,741 43,752,057 44,836,741 43,752,057
Total Equity 80,405,713 86,674,583 78,805,361 86,674,583 78,805,361
The accompanying notes form part of these fi nancial statements.
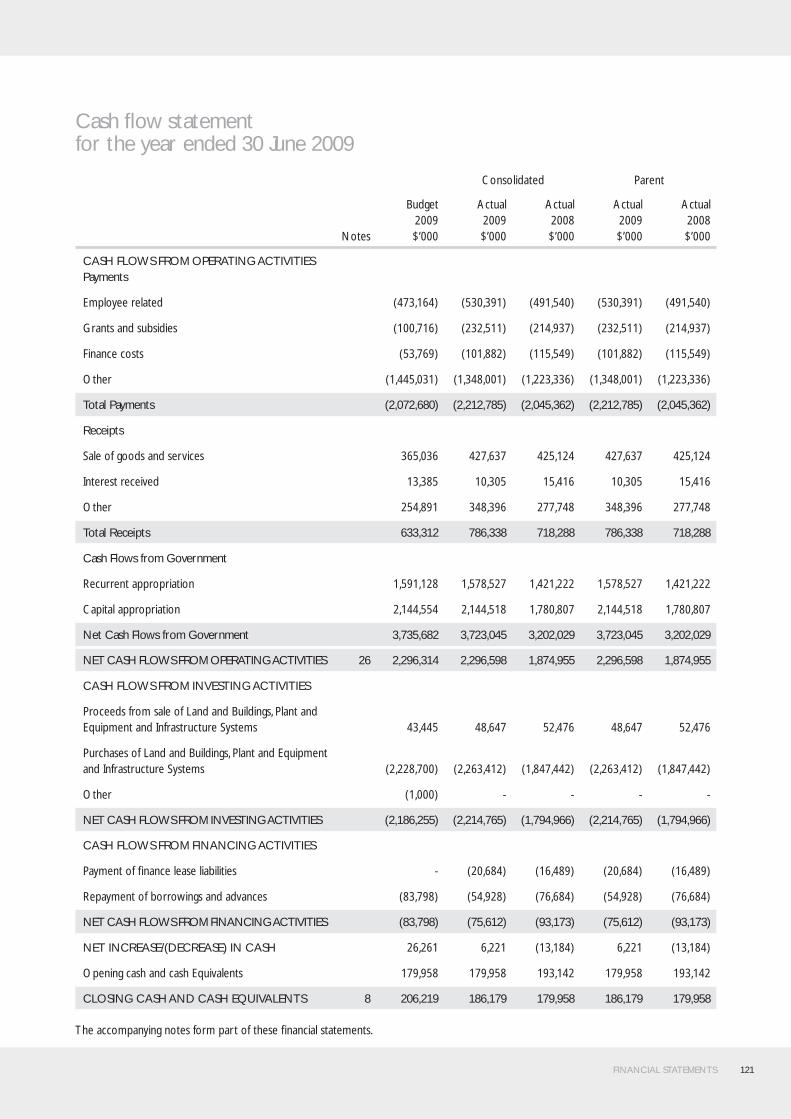
FINANCIAL STATEMENTS 121
Cash fl ow statementfor the year ended 30 June 2009
Consolidated Parent
Notes
Budget2009$’000
Actual2009$’000
Actual2008$’000
Actual2009$’000
Actual2008$’000
CASH FLOWS FROM OPERATING ACTIVITIESPayments
Employee related (473,164) (530,391) (491,540) (530,391) (491,540)
Grants and subsidies (100,716) (232,511) (214,937) (232,511) (214,937)
Finance costs (53,769) (101,882) (115,549) (101,882) (115,549)
Other (1,445,031) (1,348,001) (1,223,336) (1,348,001) (1,223,336)
Total Payments (2,072,680) (2,212,785) (2,045,362) (2,212,785) (2,045,362)
Receipts
Sale of goods and services 365,036 427,637 425,124 427,637 425,124
Interest received 13,385 10,305 15,416 10,305 15,416
Other 254,891 348,396 277,748 348,396 277,748
Total Receipts 633,312 786,338 718,288 786,338 718,288
Cash Flows from Government
Recurrent appropriation 1,591,128 1,578,527 1,421,222 1,578,527 1,421,222
Capital appropriation 2,144,554 2,144,518 1,780,807 2,144,518 1,780,807
Net Cash Flows from Government 3,735,682 3,723,045 3,202,029 3,723,045 3,202,029
NET CASH FLOWS FROM OPERATING ACTIVITIES 26 2,296,314 2,296,598 1,874,955 2,296,598 1,874,955
CASH FLOWS FROM INVESTING ACTIVITIES
Proceeds from sale of Land and Buildings, Plant and Equipment and Infrastructure Systems 43,445 48,647 52,476 48,647 52,476
Purchases of Land and Buildings, Plant and Equipment and Infrastructure Systems (2,228,700) (2,263,412) (1,847,442) (2,263,412) (1,847,442)
Other (1,000) - - - -
NET CASH FLOWS FROM INVESTING ACTIVITIES (2,186,255) (2,214,765) (1,794,966) (2,214,765) (1,794,966)
CASH FLOWS FROM FINANCING ACTIVITIES
Payment of fi nance lease liabilities - (20,684) (16,489) (20,684) (16,489)
Repayment of borrowings and advances (83,798) (54,928) (76,684) (54,928) (76,684)
NET CASH FLOWS FROM FINANCING ACTIVITIES (83,798) (75,612) (93,173) (75,612) (93,173)
NET INCREASE/(DECREASE) IN CASH 26,261 6,221 (13,184) 6,221 (13,184)
Opening cash and cash Equivalents 179,958 179,958 193,142 179,958 193,142
CLOSING CASH AND CASH EQUIVALENTS 8 206,219 186,179 179,958 186,179 179,958
The accompanying notes form part of these fi nancial statements.

122 FINANCIAL STATEMENTS
Service group statements expenses and incomefor the year ended 30 June 2009***
Road Development* Road Management* Road Use*
M4/M5 CashbackScheme* Not Attributable Total
Actual
2009
$’000
Actual
2008
$’000
Actual
2009
$’000
Actual
2008
$’000
Actual
2009
$’000
Actual
2008
$’000
Actual
2009
$’000
Actual
2008
$’000
Actual
2009
$’000
Actual
2008
$’000
Actual
2009
$’000
Actual
2008
$’000
Expenses excluding losses
Operating expenses
– Employee related 12,865 11,043 236,612 200,301 281,158 288,012 2,908 4,455 - - 533,543 503,811
– Other Operating expenses - - 106,060 90,165 192,815 100,802 104,602 96,118 - - 403,477 287,085
Maintenance - - 694,771 671,304 - - - - - - 694,771 671,304
Depreciation and amortisation - - 842,427 826,155 11,029 10,274 - - - - 853,456 836,429
Grants and subsidies - - 333,594 270,953 11,566 10,069 - - - - 345,160 281,022
Finance costs - - 102,535 111,813 - - - - - - 102,535 111,813
Total Expenses excluding losses 12,865 11,043 2,315,999 2,170,691 496,568 409,157 107,510 100,573 - - 2,932,942 2,691,464
Revenue
Sale of goods and services - - 123,005 137,253 263,312 252,353 - - - - 386,317 389,606
Investment revenue - - 2,507 3,839 7,520 11,513 - - - - 10,027 15,352
Grants and contributions 14,794 13,775 31,096 168,307 1,817 8,252 - - - - 47,707 190,334
Other revenue - 112,687 104,275 - - - - - - 112,687 104,275
Total Revenue 14,794 13,775 269,295 413,674 272,649 272,118 - - - - 556,738 699,567
Gain/(Loss) on disposal - - 1,269 15,692 (56) - - - - - 1,213 15,692
Other gains/(losses) - - (31,754) (157,836) (2,270) (23) - - - - (34,024) (157,859)
Net Cost of Services (1,929) (2,732) 2,077,189 1,899,161 226,245 137,062 107,510 100,573 - - 2,409,015 2,134,064
Government contributions** - - - - - - - - 3,723,045 3,202,029 3,723,045 3,202,029
NET EXPENDITURE/
(INCOME) FOR THE YEAR (1,929) (2,732) 2,077,189 1,899,161 226,245 137,062 107,510 100,573 (3,723,045) (3,202,029) (1,314,030) (1,067,965)
ADMINISTERED INCOME Road
Development* Road Management* Road Use*M4/M5 Cashback
Scheme* Not Attributable Total
2009$’000
2008$’000
2009$’000
2008$’000
2009$’000
2008$’000
2009$’000
2008$’000
2009$’000
2008$’000
2009$’000
2008$’000
Administered Income
Transfer receipts - - - - - - - - - - - -
Consolidated Fund
– Taxes, fees and fi nes - - - - - - - - 435,593 403,547 435,593 403,547
– Other - - - - - - - - 573,041 631,167 573,041 631,167
Total Administered Income - - - - - - - - 1,008,634 1,034,714 1,008,634 1,034,714
* The description and objectives of each activity are summarised in Note 7.
** Appropriations are made on an agency basis and not to individual service groups. Consequently, government contributions are included in the “Not Attributable” column.
*** NSW Budget Paper No. 3 has replaced program statements with service group statements. Service group statements focus on the key measures of service delivery performance. The RTA’s former program structure correlates exactly to the new service group structure.

FINANCIAL STATEMENTS 123
Service group statements assets and liabilitiesfor the year ended 30 June 2009
Road Development* Road Management* Road Use*
M4/M5 CashbackScheme*
Not Attributable Total
2009$’000
2008$’000
2009$’000
2008$’000
2009$’000
2008$’000
2009$’000
2008$’000
2009$’000
2008$’000
2009$’000
2008$’000
Current Assets
Cash and cash equivalents - - 46,545 44,990 139,634 134,968 - - - - 186,179 179,958
Receivables 9,948 13,211 112,237 92,621 24,912 23,209 463 614 - - 147,560 129,655
Inventories - - 10,179 9,733 536 512 - - - - 10,715 10,245
Non-current assets held for sale - - 40,878 71,097 15 25 - - - - 40,893 71,122
Total Current Assets 9,948 13,211 209,839 218,441 165,097 158,714 463 614 - - 385,347 390,980
Non-Current Assets
Other fi nancial assets - - 108,529 98,402 - - - - - - 108,529 98,402
Property, Plant and Equipment
– Land and Buildings - - 2,642,612 2,558,525 354,275 332,253 - - - - 2,996,887 2,890,778
– Plant and Equipment - - 40,888 32,079 120,590 108,200 - - - - 161,478 140,279
– Infrastructure Systems 2,836,719 1,880,882 82,852,721 75,823,693 33,770 22,391 - - - - 85,723,210 77,726,966
Total Property, Plant and Equipment 2,836,719 1,880,882 85,536,221 78,414,297 508,635 462,844 - - - - 88,881,575 80,758,023
Intangible assets - - 7,697 4,900 23,091 14,699 - - - - 30,788 19,599
Other - - 539,105 448,419 - - - - - - 539,105 448,419
Total Non-Current Assets 2,836,719 1,880,882 86,191,552 78,966,018 531,726 477,543 - - - - 89,559,997 81,324,443
TOTAL ASSETS 2,846,667 1,894,093 86,401,391 79,184,459 696,823 636,257 463 614 - - 89,945,344 81,715,423
Current Liabilities
Payables 243,099 254,000 174,215 148,170 192,346 149,371 50 60 - - 609,710 551,601
Borrowings - - 139,515 140,331 1,033 975 - - - - 140,548 141,306
Provisions - - 125,071 112,720 111,356 98,621 1,042 2,152 - - 237,469 213,493
Other - - 25,720 27,833 118,477 110,129 76 46 - - 144,273 138,008
Total Current Liabilities 243,099 254,000 464,521 429,054 423,212 359,096 1,168 2,258 - - 1,132,000 1,044,408
Non-Current Liabilities
Borrowings - - 1,246,492 1,311,218 - - - - - - 1,246,492 1,311,218
Provisions - - 282,022 99,484 250,780 87,779 1,674 443 - - 534,476 187,706
Other - - 354,727 366,730 3,066 - - - - - 357,793 366,730
Total Non-Current Liabilities - - 1,883,241 1,777,432 253,846 87,779 1,674 443 - - 2,138,761 1,865,654
TOTAL LIABILITIES 243,099 254,000 2,347,762 2,206,486 677,058 446,875 2,842 2,701 - - 3,270,761 2,910,062
NET ASSETS 2,603,568 1,640,093 84,053,629 76,977,973 19,765 189,382 (2,379) (2,087) - - 86,674,583 78,805,361
* The description and objectives of each activity are summarised in Note 7.

124 FINANCIAL STATEMENTS
Summary of compliance with fi nancial directivesfor the year ended 30 June 2009
2009 2008
Recurrent Appropriation
Expenditure/net claim on consolidated
fundCapital
Appropriation
Expenditure/net claim on consolidated
fundRecurrent
Appropriation
Expenditure/net claim on consolidated
fundCapital
Appropriation
Expenditure/ net claim on consolidated
fund
$’000 $’000 $’000 $’000 $’000 $’000 $’000 $’000
Original Budget Appropriation/ Expenditure
Appropriation Act 1,536,128 1,523,361 2,115,154 2,115,118 1,429,711 1,406,402 1,828,911 1,775,307
s26 PF&AA – Commonwealth specifi c purpose payments 55,000 55,000 29,400 29,400 - - (51,399) -
Other Appropriations/Expenditure
Treasurer’s advance 166 166 - - 9,820 9,820 5,500 5,500
Section 22A(2) – Motor Vehicle Taxation Act (hypothecation of motor vehicle tax) - - - - 5,000 5,000 - -
Transfers to/from another agency (s31 of the Appropriation Act) (3,522) - - - (129) - - -
Other adjustments (1,325) - - - - - - -
Total Appropriations/ Expenditure/Net Claim on Consolidated Fund (includes transfer payments) 1,586,447 1,578,527 2,144,554 2,144,518 1,444,402 1,421,222 1,783,012 1,780,807
Amount drawn down against Appropriation 1,578,527 2,144,518 1,421,222 1,780,807
Liability to Consolidated Fund - - - -
The summary of Compliance is based on the assumption that Consolidated Fund monies are spent fi rst.
Consolidated funding for the RTA’s Road Program is classifi ed as recurrent and capital appropriation based upon the way in which the appropriations are expended. The Program, as part of its appropriation, receives all the revenue from motor vehicle taxes in accordance with the Motor Vehicle Taxation Act, with the level of the funds from the motor vehicle taxes not known until 30 June each year.
Liability to Consolidated Fund represents the difference between the ‘Amount drawn down against Appropriation’ and the ‘Total Appropriations/Expenditure/Net Claim on Consolidated Fund’.

FINANCIAL STATEMENTS 125
Notes to and forming part of the Financial Statements of the Roads and Traffi c Authority for the Year Ended 30 June 2009
1. Summary of signifi cant accounting policies
(a) Reporting Entity
The Roads and Traffi c Authority (the RTA) was established in 1989 under the Transport Administration Act 1988. The Authority comprises all the entities under its control and it reports on the following transactions:
Roads and Traffi c Authority
• Testing and licensing drivers and registering and inspecting vehicles;
• Managing road usage to achieve consistent travel times, particularly during peak periods, by reducing congestion delays and helping the community use the road system more effectively;
• Improving road safety by encouraging better road user behaviour, ensuring compliance with regulations, improving roads and enhancing vehicle standards;
• Arterial road development, construction and maintenance, to meet community, environmental, regulatory and economic needs; and
• Administration of the M4/M5 Cashback Scheme.
Roads and Traffi c Authority Division (The Division)
The Division was established on 17 March 2006 pursuant to Part 2 of Schedule I of the Public Sector Employment and Management Act 2002. The Division’s objective is to provide the personnel services to the RTA.
The accounts of the RTA are consolidated as part of the NSW Total State Sector Accounts.
The RTA is a not-for-profi t reporting entity for accounting purposes and it has no cash generating units.
This consolidated fi nancial report for the year ended 30 June 2009 has been authorised for issue by the Audit and Risk Committee on 9 October 2009.
(b) Basis of Preparation
The RTA’s consolidated fi nancial report is a general purpose fi nancial report which has been prepared in accordance with:
• Applicable Australian Accounting Standards (which include Australian Accounting Interpretations),
• The requirements of the Public Finance and Audit Act 1983 and Regulation; and
• The Financial Reporting Directions published in the Financial Reporting Code (FRC) for Budget Dependent General Government Sector Agencies or issued by the Treasurer under Section 9(2) (n) of the Public Finance and Audit Act 1983.
In the event of any inconsistency between accounting standards and legislative requirements, the latter prevails.
Property, plant and equipment, assets (or disposal groups) held for sale and fi nancial assets at ‘fair value through profi t or loss’ and available for sale are measured at fair value. Other fi nancial report items are prepared in accordance with the historical cost convention.
Cost is based on the fair value of the consideration given in exchange for assets.
Judgements, estimates and associated assumptions made by management about carrying values of assets and liabilities are disclosed in the relevant notes to the fi nancial statements.
Unless otherwise stated, all amounts are rounded to the nearest one thousand dollars ($’000) and are expressed in Australian currency.
The Accounting policies set out below have, except where stated, been applied consistently to all periods presented in these consolidated fi nancial statements, and have been applied consistently by the consolidated and parent entities.
Certain comparatives amounts have been reclassifi ed to conform with the restatement of the accounting policies for the Sydney Harbour Tunnel (refer to note 28 for further details) and superannuation actuarial gains and losses (refer to note 1(x) for further details).
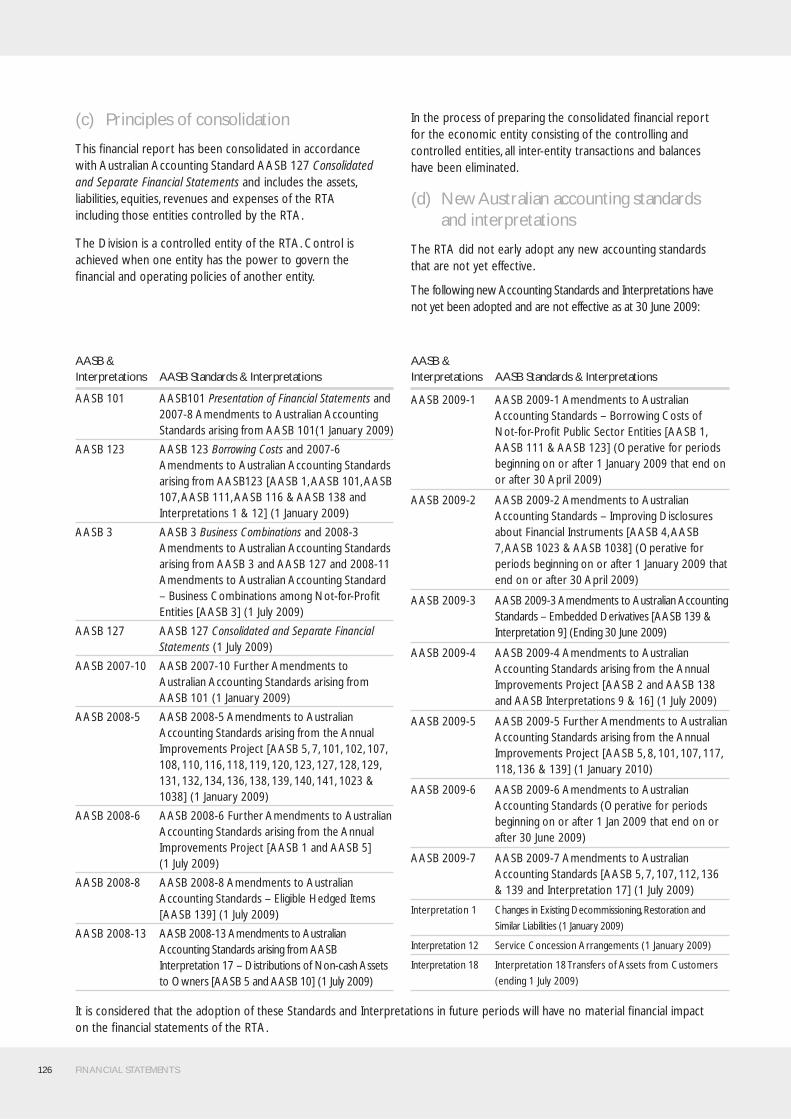
126 FINANCIAL STATEMENTS
(c) Principles of consolidation
This fi nancial report has been consolidated in accordance with Australian Accounting Standard AASB 127 Consolidated and Separate Financial Statements and includes the assets, liabilities, equities, revenues and expenses of the RTA including those entities controlled by the RTA.
The Division is a controlled entity of the RTA. Control is achieved when one entity has the power to govern the fi nancial and operating policies of another entity.
In the process of preparing the consolidated fi nancial report for the economic entity consisting of the controlling and controlled entities, all inter-entity transactions and balances have been eliminated.
(d) New Australian accounting standards and interpretations
The RTA did not early adopt any new accounting standards that are not yet effective.
The following new Accounting Standards and Interpretations have not yet been adopted and are not effective as at 30 June 2009:
AASB & Interpretations AASB Standards & Interpretations
AASB 101 AASB101 Presentation of Financial Statements and 2007-8 Amendments to Australian Accounting Standards arising from AASB 101(1 January 2009)
AASB 123 AASB 123 Borrowing Costs and 2007-6 Amendments to Australian Accounting Standards arising from AASB123 [AASB 1, AASB 101, AASB 107, AASB 111, AASB 116 & AASB 138 and Interpretations 1 & 12] (1 January 2009)
AASB 3 AASB 3 Business Combinations and 2008-3 Amendments to Australian Accounting Standards arising from AASB 3 and AASB 127 and 2008-11 Amendments to Australian Accounting Standard – Business Combinations among Not-for-Profi t Entities [AASB 3] (1 July 2009)
AASB 127 AASB 127 Consolidated and Separate Financial Statements (1 July 2009)
AASB 2007-10 AASB 2007-10 Further Amendments to Australian Accounting Standards arising from AASB 101 (1 January 2009)
AASB 2008-5 AASB 2008-5 Amendments to Australian Accounting Standards arising from the Annual Improvements Project [AASB 5, 7, 101, 102, 107, 108, 110, 116, 118, 119, 120, 123, 127, 128, 129, 131, 132, 134, 136, 138, 139, 140, 141, 1023 & 1038] (1 January 2009)
AASB 2008-6 AASB 2008-6 Further Amendments to Australian Accounting Standards arising from the Annual Improvements Project [AASB 1 and AASB 5] (1 July 2009)
AASB 2008-8 AASB 2008-8 Amendments to Australian Accounting Standards – Eligible Hedged Items [AASB 139] (1 July 2009)
AASB 2008-13 AASB 2008-13 Amendments to Australian Accounting Standards arising from AASB Interpretation 17 – Distributions of Non-cash Assets to Owners [AASB 5 and AASB 10] (1 July 2009)
AASB & Interpretations AASB Standards & Interpretations
AASB 2009-1 AASB 2009-1 Amendments to Australian Accounting Standards – Borrowing Costs of Not-for-Profi t Public Sector Entities [AASB 1, AASB 111 & AASB 123] (Operative for periods beginning on or after 1 January 2009 that end on or after 30 April 2009)
AASB 2009-2 AASB 2009-2 Amendments to Australian Accounting Standards – Improving Disclosures about Financial Instruments [AASB 4, AASB 7, AASB 1023 & AASB 1038] (Operative for periods beginning on or after 1 January 2009 that end on or after 30 April 2009)
AASB 2009-3 AASB 2009-3 Amendments to Australian Accounting Standards – Embedded Derivatives [AASB 139 & Interpretation 9] (Ending 30 June 2009)
AASB 2009-4 AASB 2009-4 Amendments to Australian Accounting Standards arising from the Annual Improvements Project [AASB 2 and AASB 138 and AASB Interpretations 9 & 16] (1 July 2009)
AASB 2009-5 AASB 2009-5 Further Amendments to Australian Accounting Standards arising from the Annual Improvements Project [AASB 5, 8, 101, 107, 117, 118, 136 & 139] (1 January 2010)
AASB 2009-6 AASB 2009-6 Amendments to Australian Accounting Standards (Operative for periods beginning on or after 1 Jan 2009 that end on or after 30 June 2009)
AASB 2009-7 AASB 2009-7 Amendments to Australian Accounting Standards [AASB 5, 7, 107, 112, 136 & 139 and Interpretation 17] (1 July 2009)
Interpretation 1 Changes in Existing Decommissioning, Restoration and
Similar Liabilities (1 January 2009)
Interpretation 12 Service Concession Arrangements (1 January 2009)
Interpretation 18 Interpretation 18 Transfers of Assets from Customers
(ending 1 July 2009)
It is considered that the adoption of these Standards and Interpretations in future periods will have no material fi nancial impact on the fi nancial statements of the RTA.
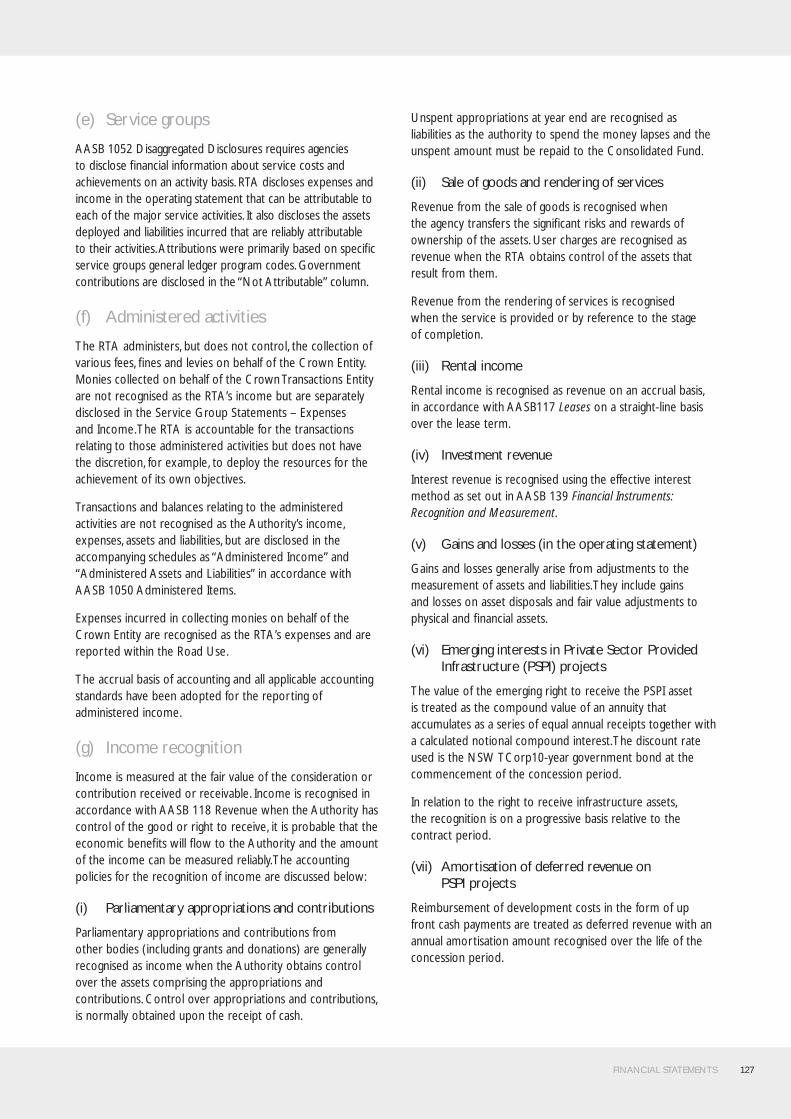
FINANCIAL STATEMENTS 127
(e) Service groups
AASB 1052 Disaggregated Disclosures requires agencies to disclose fi nancial information about service costs and achievements on an activity basis. RTA discloses expenses and income in the operating statement that can be attributable to each of the major service activities. It also discloses the assets deployed and liabilities incurred that are reliably attributable to their activities. Attributions were primarily based on specifi c service groups general ledger program codes. Government contributions are disclosed in the “Not Attributable” column.
(f) Administered activities
The RTA administers, but does not control, the collection of various fees, fi nes and levies on behalf of the Crown Entity. Monies collected on behalf of the Crown Transactions Entity are not recognised as the RTA’s income but are separately disclosed in the Service Group Statements – Expenses and Income. The RTA is accountable for the transactions relating to those administered activities but does not have the discretion, for example, to deploy the resources for the achievement of its own objectives.
Transactions and balances relating to the administered activities are not recognised as the Authority’s income, expenses, assets and liabilities, but are disclosed in the accompanying schedules as “Administered Income” and “Administered Assets and Liabilities” in accordance with AASB 1050 Administered Items.
Expenses incurred in collecting monies on behalf of the Crown Entity are recognised as the RTA’s expenses and are reported within the Road Use.
The accrual basis of accounting and all applicable accounting standards have been adopted for the reporting of administered income.
(g) Income recognition
Income is measured at the fair value of the consideration or contribution received or receivable. Income is recognised in accordance with AASB 118 Revenue when the Authority has control of the good or right to receive, it is probable that the economic benefi ts will fl ow to the Authority and the amount of the income can be measured reliably. The accounting policies for the recognition of income are discussed below:
(i) Parliamentary appropriations and contributions
Parliamentary appropriations and contributions from other bodies (including grants and donations) are generally recognised as income when the Authority obtains control over the assets comprising the appropriations and contributions. Control over appropriations and contributions, is normally obtained upon the receipt of cash.
Unspent appropriations at year end are recognised as liabilities as the authority to spend the money lapses and the unspent amount must be repaid to the Consolidated Fund.
(ii) Sale of goods and rendering of services
Revenue from the sale of goods is recognised when the agency transfers the signifi cant risks and rewards of ownership of the assets. User charges are recognised as revenue when the RTA obtains control of the assets that result from them.
Revenue from the rendering of services is recognised when the service is provided or by reference to the stage of completion.
(iii) Rental income
Rental income is recognised as revenue on an accrual basis, in accordance with AASB117 Leases on a straight-line basis over the lease term.
(iv) Investment revenue
Interest revenue is recognised using the effective interest method as set out in AASB 139 Financial Instruments: Recognition and Measurement.
(v) Gains and losses (in the operating statement)
Gains and losses generally arise from adjustments to the measurement of assets and liabilities. They include gains and losses on asset disposals and fair value adjustments to physical and fi nancial assets.
(vi) Emerging interests in Private Sector Provided Infrastructure (PSPI) projects
The value of the emerging right to receive the PSPI asset is treated as the compound value of an annuity that accumulates as a series of equal annual receipts together with a calculated notional compound interest. The discount rate used is the NSW TCorp10-year government bond at the commencement of the concession period.
In relation to the right to receive infrastructure assets, the recognition is on a progressive basis relative to the contract period.
(vii) Amortisation of deferred revenue on PSPI projects
Reimbursement of development costs in the form of up front cash payments are treated as deferred revenue with an annual amortisation amount recognised over the life of the concession period.

128 FINANCIAL STATEMENTS
(h) Employee benefi ts and other provisions
(i) Salaries and wages, annual leave, sick leave and on-costs
Liabilities for salaries and wages (including non-monetary benefi ts), annual leave and paid sick leave that fall due wholly within 12 months of the reporting date are recognised and measured in respect of employees’ services up to the reporting date where it is probable that settlement will be required and where they are capable of being measured reliably on an undiscounted basis.
Long-term annual leave that is not expected to be taken within 12 months is measured at present value in accordance with AASB 119 Employee Benefi ts. Market yields on government bonds are used to discount long-term annual leave.
Sick leave accrued by employees of the RTA is all non-vesting and does not give rise to a liability as it is not considered probable that sick leave taken in the future will be greater than the benefi ts accrued in the future.
The outstanding amounts of payroll tax and fringe benefi ts tax, which are consequential to employment, are recognised as liabilities and expenses where the employee benefi ts to which they relate have been recognised. Workers compensation that may be applicable to leave entitlements has not been recognised as this expense is based on actual premiums paid, determined from past claims history, and not as a general percentage raise on salaries and wages.
(ii) Long service leave and superannuation
The RTA is responsible for the long service leave liability for employees with fi ve or more years of service and all superannuation liabilities. These liabilities are recognised in the Balance Sheet. The long service leave is measured at present value in accordance with AASB 119 Employee Benefi ts. This is based on the application of the valuation ratio at the 10 year Commonwealth government bond rate at the reporting date to employees with fi ve or more years of service, using current rates of pay. This ratio is determined based on an actuarial review to approximate present value.
In accordance with AASB 101 Presentation of Financial Statements, all annual leave and unconditional long service leave are classifi ed as current liabilities, even where the authority does not expect to settle the liability within 12 months. This does not necessarily align with the distinction between short-term and long-term employee benefi ts under AASB 119 Employee Benefi ts.
Defi ned contribution plans
Contributions to defi ned contribution superannuation plans are expensed when incurred.
Defi ned benefi t plans
For defi ned benefi t plans, the actuarial valuations are carried out at each reporting date by Pillar Administration and the actuarial superannuation gains and losses are recognised outside profi t and loss in the Statement of Recognised Income and Expense in the period in which they occur as per NSW Treasury’s mandate.
The defi ned benefi t position recognised in the balance sheet represents the present value of the defi ned benefi t obligation, adjusted for unrecognised past service costs, net of the fair value of the plan assets.
(iii) Other provisions
Other provisions exist when, the RTA has a present legal or constructive obligation as a result of a past event; it is probable that an outfl ow of resources will be required to settle the obligation; and a reliable estimate can be made of the amount of the obligation.
Any provisions for restructuring are recognised only when an agency has a detailed formal plan and the agency has raised a valid expectation in those affected by the restructuring that it will carry out the restructuring by starting to implement the plan or announcing its main features to those affected.
If the effect of the time value of money is material, provisions are discounted at 5.50%, which is a pre-tax rate that refl ects the current market assessments of the time value of money and the risks specifi c to the liability.
(i) Borrowing costs
Borrowing costs are recognised as expenses in the period in which they are incurred, in accordance with Treasury’s Mandate to general government sector agencies.
(j) Insurance
The RTA’s insurance activities are conducted through the NSW Treasury Managed Fund Scheme. The expense (premium) is determined by the Fund Manager based on past claim experience. CTP Insurance is arranged with a private sector provider by NSW Treasury.
The RTA, from October 2001, introduced a Principal Arranged Insurance Scheme, which provides cover for all parties involved in its construction projects and the premium is amortised over the term of the contract.

FINANCIAL STATEMENTS 129
(k) Accounting for the Goods and Services Tax (GST)
Income, expenses and assets are recognised net of the amount of GST, except that:
• The amount of GST incurred by the RTA as a purchaser that is not recoverable from the Australian Taxation Offi ce (ATO) is recognised as part of the cost of acquisition of an asset or as part of an item of expense.
• Receivables, payables, accruals and commitments are stated with the amount of GST included.
• Cash fl ows are included in the cash fl ow statement on a gross basis. However, the GST components of cash fl ows arising from investing and fi nancing activities which is recoverable from, or payable to, the Australian Taxation Offi ce are classifi ed as operating cash fl ows.
(l) Asset management policy
Acquisition of assets
The cost method of accounting is used for the initial recording of all acquisitions of assets controlled by the RTA. Cost is the amount of cash or cash equivalents paid or the fair value of the other consideration given to acquire the asset at the time of its acquisition or construction or, where applicable, the amount attributed to that asset when initially recognised in accordance with the requirements of other Australian Accounting Standards.
The cost of assets constructed for own use includes the cost of materials, direct labour and foreign exchange gains and losses arising during construction as well as an appropriate proportion of variable and fi xed overhead costs that can be reliably attributed to the assets.
Assets acquired at no cost, or for nominal consideration, are initially recognised at their fair value at the date of acquisition.
Fair value is the amount for which an asset could be exchanged between knowledgeable, willing parties in an arm’s length transaction.
Capitalisation thresholds
Property, plant and equipment and intangible assets costing above $10,000 individually or forming part of a network costing more than $10,000 are capitalised. Some computer equipment and intangible assets costing above $1,000 are capitalised.
Valuation and depreciation
Physical non-current assets are valued in accordance with the ’Valuation of Physical Non-Current Assets at Fair Value’ Policy and Guidelines Paper (TPP 07-01). This policy adopts fair value in accordance with AASB 116 Property, Plant and Equipment.
Property, plant and equipment is measured on an existing use basis, where there are no feasible alternative uses in the existing natural, legal, fi nancial and socio-political environment. However, in the limited circumstances where there are feasible alternative uses, assets are valued at their highest and best use.
Fair value of property, plant and equipment is determined based on the best available market evidence, including current market selling prices for the same or similar assets. Where there is no available market evidence, the asset’s fair value is measured at its market buying price, the best indicator of which is depreciated replacement cost.
The RTA revalues each class of property, plant and equipment at least every fi ve years or with suffi cient regularity to ensure the carrying amount of each asset in the class does not differ materially from its fair value at reporting date.
Non-specialised assets with short useful lives are measured at depreciated historical cost, as a surrogate for fair value.
When revaluing non-current assets by reference to current prices for assets newer than those being revalued (adjusted to refl ect the present condition of the assets), the gross amount and the related accumulated depreciation are separately restated.
Otherwise, any balances of accumulated depreciation at the revaluation date in respect of those assets are credited to the asset accounts to which they relate. The net asset accounts are then increased or decreased by the revaluation increments or decrements.
Revaluation increments are credited directly to the asset revaluation reserve, except that, to the extent that an increment reverses a revaluation decrement in respect of that class of asset previously recognised as an expense in the surplus/defi cit, the increment is recognised immediately as revenue in the surplus/defi cit.
Revaluation decrements are recognised immediately as expenses in the surplus/defi cit, except that, to the extent that a credit balance exists in the asset revaluation reserve in respect of the same class of assets, they are debited directly to the asset revaluation reserve.
As a not-for-profi t entity, revaluation increments and decrements are offset against one another within a class of non-current assets, but not otherwise.
Where an asset that has previously been revalued is disposed of, any balance remaining in the asset revaluation reserve in respect of that asset is transferred to accumulated funds.
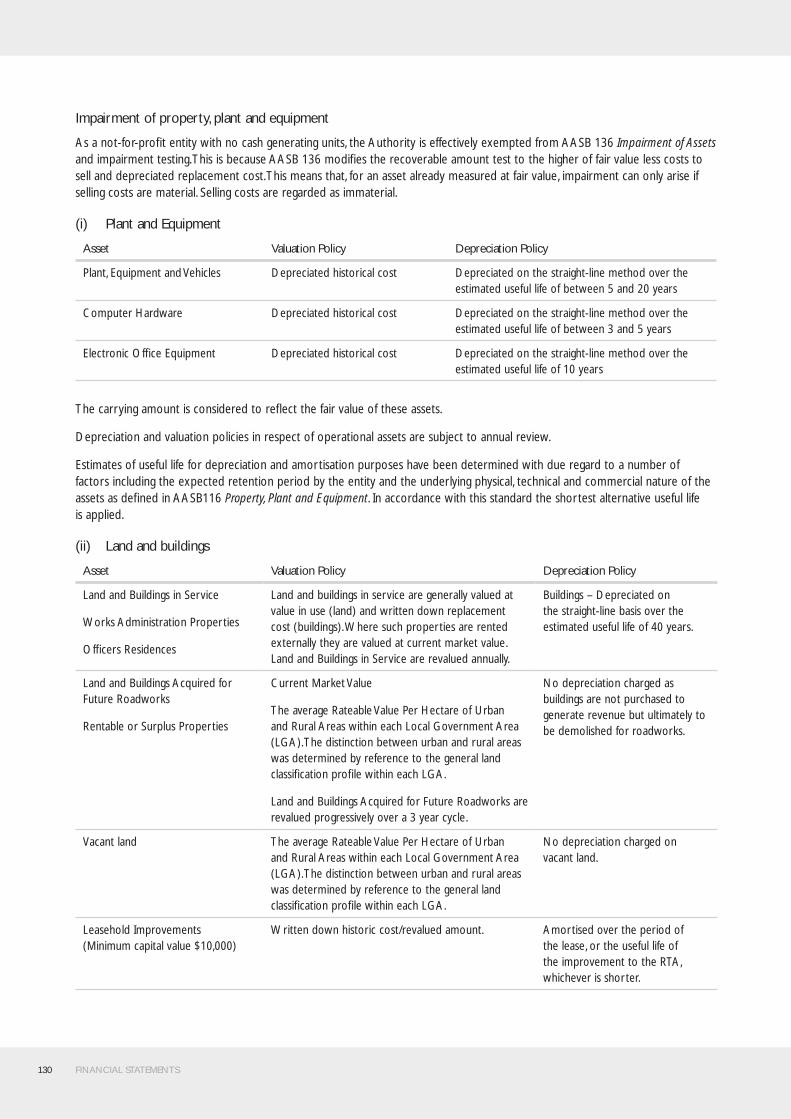
130 FINANCIAL STATEMENTS
Impairment of property, plant and equipment
As a not-for-profi t entity with no cash generating units, the Authority is effectively exempted from AASB 136 Impairment of Assets and impairment testing. This is because AASB 136 modifi es the recoverable amount test to the higher of fair value less costs to sell and depreciated replacement cost. This means that, for an asset already measured at fair value, impairment can only arise if selling costs are material. Selling costs are regarded as immaterial.
(i) Plant and Equipment
Asset Valuation Policy Depreciation Policy
Plant, Equipment and Vehicles Depreciated historical cost Depreciated on the straight-line method over the estimated useful life of between 5 and 20 years
Computer Hardware Depreciated historical cost Depreciated on the straight-line method over the estimated useful life of between 3 and 5 years
Electronic Offi ce Equipment Depreciated historical cost Depreciated on the straight-line method over the estimated useful life of 10 years
The carrying amount is considered to refl ect the fair value of these assets.
Depreciation and valuation policies in respect of operational assets are subject to annual review.
Estimates of useful life for depreciation and amortisation purposes have been determined with due regard to a number of factors including the expected retention period by the entity and the underlying physical, technical and commercial nature of the assets as defi ned in AASB116 Property, Plant and Equipment. In accordance with this standard the shortest alternative useful life is applied.
(ii) Land and buildings
Asset Valuation Policy Depreciation Policy
Land and Buildings in Service
Works Administration Properties
Offi cers Residences
Land and buildings in service are generally valued at value in use (land) and written down replacement cost (buildings). Where such properties are rented externally they are valued at current market value. Land and Buildings in Service are revalued annually.
Buildings – Depreciated on the straight-line basis over the estimated useful life of 40 years.
Land and Buildings Acquired for Future Roadworks
Rentable or Surplus Properties
Current Market Value
The average Rateable Value Per Hectare of Urban and Rural Areas within each Local Government Area (LGA). The distinction between urban and rural areas was determined by reference to the general land classifi cation profi le within each LGA.
Land and Buildings Acquired for Future Roadworks are revalued progressively over a 3 year cycle.
No depreciation charged as buildings are not purchased to generate revenue but ultimately to be demolished for roadworks.
Vacant land The average Rateable Value Per Hectare of Urban and Rural Areas within each Local Government Area (LGA). The distinction between urban and rural areas was determined by reference to the general land classifi cation profi le within each LGA.
No depreciation charged on vacant land.
Leasehold Improvements (Minimum capital value $10,000)
Written down historic cost/revalued amount. Amortised over the period of the lease, or the useful life of the improvement to the RTA, whichever is shorter.

FINANCIAL STATEMENTS 131
(ii) Land and buildings
Included in the value of land and buildings in service is an amount of $14.330 million (2008: $14.911 million) for buildings on Crown land. As the RTA effectively “controls” this Crown land, it has been included in the RTA’s Balance Sheet. Should such Crown land be transferred or disposed of, associated buildings are written off in the year the transfer or disposal takes place.
The RTA’s land and buildings are valued by registered valuers. Land and Buildings Acquired for Future Roadworks comprise Untenanted Land for Roads which is revalued annually and Rental Properties and Surplus Properties which are revalued progressively within a three year timeframe. The selection of assets within Land and Buildings Acquired for Future Roadworks to be revalued in each reporting period within the current progressive revaluation is made by reference to the asset’s acquisition date or previous revaluation date.
Commencement date of the current progressive revaluation: 1 July 2008
Completion date of the current progressive revaluation: 30 June 2011
For details refer to Note 10(a)
(iii) Infrastructure Systems
Asset Valuation Policy Depreciation Policy
Roads:EarthworksPavement
Written down replacement costWritten down replacement cost
Depreciated over estimated useful life of 100 yearsDepreciated over estimated useful life dependant on pavement surface15 years (unsealed)20-50 years (fl ush seal/asphalt)25-50 years (asphalt/concrete)40-50 years (concrete)
Bridges:
Timber structureConcrete structuresSteel structuresX Trusses (timber and steel)High Value BridgesBridge Size Culverts/Tunnels
Written down replacement cost Depreciated over estimated useful life dependant on bridge type60 years100 years100 years60 years200 years100 years
Traffi c Signals: Written down replacement cost Depreciated over estimated useful life of 20 years
Traffi c Control Network:Traffi c SystemsTransport Management CentreVariable Message Signs
Written down replacement cost Depreciated over estimated useful life of 5-20 years5-20 years30 years
Land under roads and within road reserves
The average Rateable Value Per Hectare of Urban and Rural Areas within each Local Government Area (LGA). The distinction between urban and rural areas was determined by reference to the general land classifi cation profi le within each LGA.
No depreciation applied as land does not have a limited useful life
Sydney Harbour Tunnel:
Immersed TubeMechanical & ElectricalPavementEarthworks
Written down replacement cost Depreciated over estimated useful life depending on asset type:100 years20 years20 years100 years
132 FINANCIAL STATEMENTS
The determination of unit replacement rates for road, bridge and traffi c control signal infrastructure valuations is carried out at least every fi ve years by suitably qualifi ed engineering contractors and employees of the RTA.
These assets are recorded initially at construction cost and the annual percentage increase in the Road Cost Index (RCI) is applied each year until the following unit replacement review is undertaken. Subsequent to the review, infrastructure is valued using the unit replacement rates, adjusted by the Road Cost Index as applicable.
Land under roads and within road reserves are revalued annually by applying the most recent rateable average value per hectare provided by the Valuer-General to the land under roads and within reserves within each Local Government Area (LGA). The valuations are based on certain assumptions including property being vacant and therefore do not take into account costs that may be incurred in removing roads and other improvements. The Valuer-General’s average rateable values are calculated by reference to land values only and do not include the value of any improvements.
The Australian Valuers-General are currently developing a standard methodology for valuing Land Under Roads. This method may differ from the methodology currently used by the RTA.
The distinction was made between urban and rural areas by reference to the general land classifi cation profi le within each LGA provided by the Local Government Grants Commission.
Major works-in-progress are valued at construction cost and exclude the cost of land, which is currently disclosed as land under roads.
(iv) Intangible Assets
The RTA recognises intangible assets only if it is probable that future economic benefi ts will fl ow to the RTA and the cost of the asset can be measured reliably. Intangible assets are measured initially at cost. Where an Intangible asset is acquired at no or nominal cost, the cost is its fair value as at the date of acquisition.
All research costs are expensed. Development costs are only capitalised when the following criteria are met:
i. the technical feasibility of completing the intangible asset so that it will be available for use or sale;
ii. the intention to complete the intangible asset and use or sell it;
iii. the ability to use or sell the intangible asset;
iv. the intangible asset will generate probable future economic benefi ts;
v. the availability of adequate technical, fi nancial and other resources to complete the development and to use or sell the intangible asset; and
vi. the ability to measure reliably the expenditure attributable to the intangible asset during its development.
The useful lives of intangible assets are assessed to be fi nite and are carried at cost less any accumulated amortisation.
Asset Valuation Policy Amortisation Policy
Intangible Assets Depreciated Historical cost Amortised on the straight-line method over the estimated useful life of between 3 and 10 years
Intangible assets are tested for impairment where an indicator of impairment exists. If the recoverable amount is less than its carrying amount the carrying amount is reduced to recoverable amount and the reduction is recognised as an impairment loss.
(v) Private Sector Provided Infrastructure (PSPI)
In respect of the infrastructure assets, M2, M4, M5 Motorways, the Eastern Distributor, the Cross City Tunnel, the Westlink M7 Motorway and the Lane Cove Tunnel, the RTA values each right to receive asset by reference to the RTA’s emerging share of the written down replacement cost of each asset apportioned using an annuity approach. Under this approach, the ultimate value of the right to receive the property is treated as the compound value of an annuity that accumulates as a series of equa1 annual receipts together with an amount representing notional compound interest.
(vi) Cultural collection assets
The RTA has minor cultural collection items such as prints, drawings and artefacts that cannot be reliably valued and are considered immaterial.

FINANCIAL STATEMENTS 133
(vii) Leased assets
A distinction is made between fi nance leases which effectively transfer from the lessor to the lessee substantially all the risks and benefi ts incidental to ownership of the leased assets, and operating leases under which the lessor effectively retains all such risks and benefi ts.
Where a non-current asset is acquired by means of a fi nance lease, the asset is recognised at the lower of its fair value and the present value of minimum lease payments at the commencement of the lease term. The corresponding liability is established at the same amount. Lease payments are allocated between the principal component and the interest expense. Subsequent to initial recognition, the asset is accounted for in accordance with the accounting policy applicable to that class of asset.
Operating lease payments are charged to the operating statement in the periods in which they are incurred.
(m) Major inspection costs
The labour cost of performing major inspections for faults is recognised in the carrying amount of an asset as a replacement of a part, if the recognition criteria are satisfi ed.
(n) Restoration costs
The estimated cost of dismantling and removing an asset and restoring the site is included in the cost of an asset, to the extent it is recognised as a liability.
(o) Maintenance
Day-to-day servicing costs or maintenance are charged as expenses as incurred, except where they relate to the replacement of a part or component of an asset, in which case the costs are capitalised and depreciated over the life of the asset.
(p) Inventories
Inventories held for distribution are stated at cost. Cost is calculated using the weighted average cost or “fi rst in fi rst out” method. Inventories consist mainly of raw materials and supplies used for the construction and maintenance of roads, bridges and traffi c signals.
The cost of inventories acquired at no cost or for nominal consideration is the current replacement cost as at the date of acquisition. Current replacement cost is the cost the agency would incur to acquire the asset on the reporting date.
Inventories (other than those held for distribution) are stated at the lower of cost and net realisable value. Cost is calculated using the weighed average cost or “fi rst in fi rst out” method.
Net realisable value is the estimated selling price in the ordinary course of business less the estimated costs of completion and the estimated costs necessary to make the sale.
(q) Capitalisation of expenditure
Expenditure (including employee costs and depreciation) in respect of road development and construction, bridge and tunnel replacement and some road safety and traffi c management are capitalised as infrastructure systems (refer to Note 2(a)).
(r) Non-current assets held for sale
The RTA has certain non-current assets classifi ed as held for sale, where their carrying amount will be recovered principally through a sale transaction, not through continuing use. This condition is regarded as met when the sale is highly probable, the asset is available for immediate sale in its present condition and the sale of the asset is expected to be completed within one year from the date of classifi cation. Non-current assets held for sale are recognised at the lower of carrying amount and fair value less costs to sell. These assets are not depreciated while they are classifi ed as held for sale.
(s) Other assets
Other assets including prepayments are recognised on a cost basis.
(t) Budgeted amounts
The budgeted amounts are drawn from the budgets as formulated at the beginning of the fi nancial year and with any adjustments for the effects of additional appropriations under s21A, s24 and/or s26 of the Public Finance and Audit Act 1983.
The budgeted amounts in the Operating Statement and Cash Flow Statement are generally based on the amounts disclosed in the NSW Budget Papers (as adjusted above). However, in the Balance Sheet, the amounts vary from the Budget Papers, as the opening balances of the budgeted amounts are based on carried forward actual amounts: i.e. per the audited fi nancial statements (rather than carried forward estimates).

134 FINANCIAL STATEMENTS
(u) Financial instruments
The following accounting policies were applied to accounting for fi nancial instruments. Additional disclosures regarding carrying amount and risk management disclosures are presented at Notes 15.
(a) Financial assets
(i) Cash and cash equivalents
Cash and cash equivalents in the balance sheet comprise cash on hand, cash at bank and short-term deposits and include deposits in the NSW Treasury Corporation’s (TCorp) Hour-Glass cash facility, Treasury Corporation deposits (less than 30 days) and other at-call deposits that are not quoted in an active market are considered to have an insignifi cant risk of changes in value. Bank overdrafts are included within liabilities.
In accordance with AASB139, cash and cash equivalents are measured at fair value with interest revenue accrued as earned such that fair value is refl ected at no less than the amount payable on demand.
For the purposes of the Cash Flow Statement, cash and cash equivalents consist of cash and cash equivalents as defi ned above, net of outstanding bank overdrafts.
(ii) Loans and receivables
Loans and receivables are non-derivative fi nancial assets with fi xed or determinable payments that are not quoted in an active market. These fi nancial assets are recognised initially at fair value, usually based on the transaction cost or face value. Subsequent measurement is at amortised cost using the effective interest method, less an allowance for any impairment of receivables. Short-term receivables with no stated interest rate are measured at the original invoice amount where the effect of discounting is immaterial. An allowance for impairment of receivables is established when there is objective evidence that the entity will not be able to collect all amounts due. The amount of the allowance is the difference between the asset’s carrying amount and the present value of estimated future cash fl ows, discounted at the effective interest rate. Bad debts are written off as incurred.
(iii) Other fi nancial assets
Other fi nancial assets consist of non-derivative fi nancial assets measured at amortised cost, using the effective interest method (refer Note 9(b)).
(iv) Impairment of fi nancial assets
All fi nancial assets, except those measured at fair value through profi t and loss, are subject to an annual review for impairment. An allowance for impairment is established when there is objective evidence that the entity will not be able to collect all amounts due.
For fi nancial assets carried at amortised cost, the amount of the allowance is the difference between the asset’s carrying amount and the present value of estimated future cash fl ows, discounted at the effective interest rate. The amount of the impairment loss is recognised in the operating statement.
Any reversals of impairment losses are reversed through the operating statement, where there is objective evidence. Reversals of impairment losses of fi nancial assets carried at amortised cost cannot result in a carrying amount that exceeds what the carrying amount would have been had there not been an impairment loss.
(v) Derecognition of fi nancial assets
A fi nancial asset is derecognised when the contractual rights to the cash fl ows from the fi nancial assets expire; or if the RTA transfers the fi nancial asset:
• where substantially all the risks and rewards have been transferred; or
• where the RTA has not transferred substantially all the risks and rewards, if the entity has not retained control.
Where the RTA has neither transferred nor retained substantially all the risks and rewards or transferred control, the asset is recognised to the extent of the agency’s continuing involvement in the asset.
(b) Financial liabilities
(i) Payables
These amounts represent liabilities for goods and services provided to the RTA and other amounts, including interest. Payables are recognised initially at fair value, usually based on the transaction cost or face value. Subsequent measurement is at amortised cost using the effective interest method. Short-term payables with no stated interest rate are measured at the original invoice amount where the effect of discounting is immaterial.
(ii) Borrowings
Borrowings are recorded initially at fair value, net of transaction costs. Loans are not held for trading and are recognised at amortised cost using the effective interest method. Amortised cost is the face value of the debt less unamortised premiums. The discount or premiums are treated as fi nance charges and amortised over the term of the debt.
Finance lease liabilities are recognised in accordance with AASB117 Leases. Minimum lease payments made under fi nance leases are apportioned between the interest expense and the reduction of the outstanding liability. The fi nance expense is allocated to each period during the lease term so as to produce a consistent periodic rate of interest on the remaining balance of the liability.

FINANCIAL STATEMENTS 135
(iii) Derecognition of fi nancial liabilities
A fi nancial liability is derecognised when the obligation specifi ed in the contract is discharged or cancelled or expires.
When a lender replaces an existing fi nancial liability with one on signifi cantly different or modifi ed terms, the Authority derecognises the original liability and recognises the new liability. It then recognises the difference in their carrying amounts in the Operating Statement.
(iv) Financial guarantees
A fi nancial guarantee contract is a contract that requires the issuer to make specifi ed payments to reimburse the holder for a loss it incurs because a specifi ed debtor fails to make payment when due in accordance with the original or modifi ed terms of a debt instrument.
Under AASB 139, fi nancial guarantee contracts are recognised as a liability at the time the guarantee is issued and initially measured at fair value, where material. After initial recognition, the liability is measured at the higher of the amount determined in accordance with AASB 137 Provisions, Contingent Liabilities and Contingent Assets and the amount initially recognised, less accumulated amortisation.
The RTA carries out minor works contracts for entities outside of the NSW public sector. In order to tender for the contracts and remain on an equal footing the RTA is required to lodge a security deposit in the form of bank guarantee. Under the Public Authorities and (Financial Arrangements) Act 1987, the RTA has an approved limit of $3 million till 30 June 2010 from TCorp.
The RTA has reviewed its fi nancial guarantees and determined that there is no material liability to be recognised for fi nancial guarantee contracts at 30 June 2009 and at 30 June 2008. However, refer Note 22 regarding disclosures on contingent liabilities
(v) Equity transfers
The transfer of net assets between agencies as a result of an administrative restructure, transfers of programs / functions and parts thereof between NSW public sector agencies are designated as contributions by owners and recognised as an adjustment to “Accumulated Funds”. This treatment is consistent with AASB 1004 Contributions and Australian Interpretation 1038 Contributions by Owners Made to Wholly Owned Public Sector Entities.
Transfers arising from an administrative restructure between not-for-profi t entities and for-profi t government departments are recognised at the amount at which the asset was recognised by the transferor immediately prior to the restructure. In most instances this will approximate fair value
All other equity transfers are recognised at fair value, except for intangibles. Where an intangible has been recognised at amortised cost by the transferor because there is no active market, the agency recognises the asset at the transferor’s carrying amount. Where the transferor is prohibited from recognising internally generated intangibles, the agency does not recognise that asset.
(w) Comparative information
Except when an Australian Accounting Standard permits or requires otherwise, comparative information is disclosed in respect of the previous period for all amounts reported in the fi nancial statements.
(x) Change in accounting policy
According with NSW Treasury policy, the entity has changed its policy on the recognition of superannuation actuarial gains and losses. Such actuarial gains and losses are now recognised outside of profi t or loss in the ‘statement of recognised income and expense’. Previously, actuarial gains and losses were recognised through profi t or loss. Both options are permissible under AASB 119 Employee Benefi ts.
The change in policy has been adopted on the basis that recognition outside profi t or loss provides reliable and more relevant information as it better refl ects the nature of actuarial gains and losses. This is because actuarial gains/losses are re-measurements, based on assumptions that do not necessarily refl ect the ultimate cost of providing superannuation.
Recognition outside profi t or loss also harmonises better with the Government Finance Statistics / GAAP comprehensive income presentation for the whole of government and general government sector, required under AASB 1049 Whole of Government and General Government Sector Financial Reporting.
A comprehensive income presentation will also be available at the entity level from 2009-10 under AASB 101 Presentation of Financial Statements.
The change in accounting policy increases 2009 ‘profi t for the period’ from $961.178 million to $1,314.030 million (2008: from $932.743 million to $1,067.965 million), by excluding from profi t the superannuation actuarial loss (2009: $352.852 million 2008: $135.222 million).
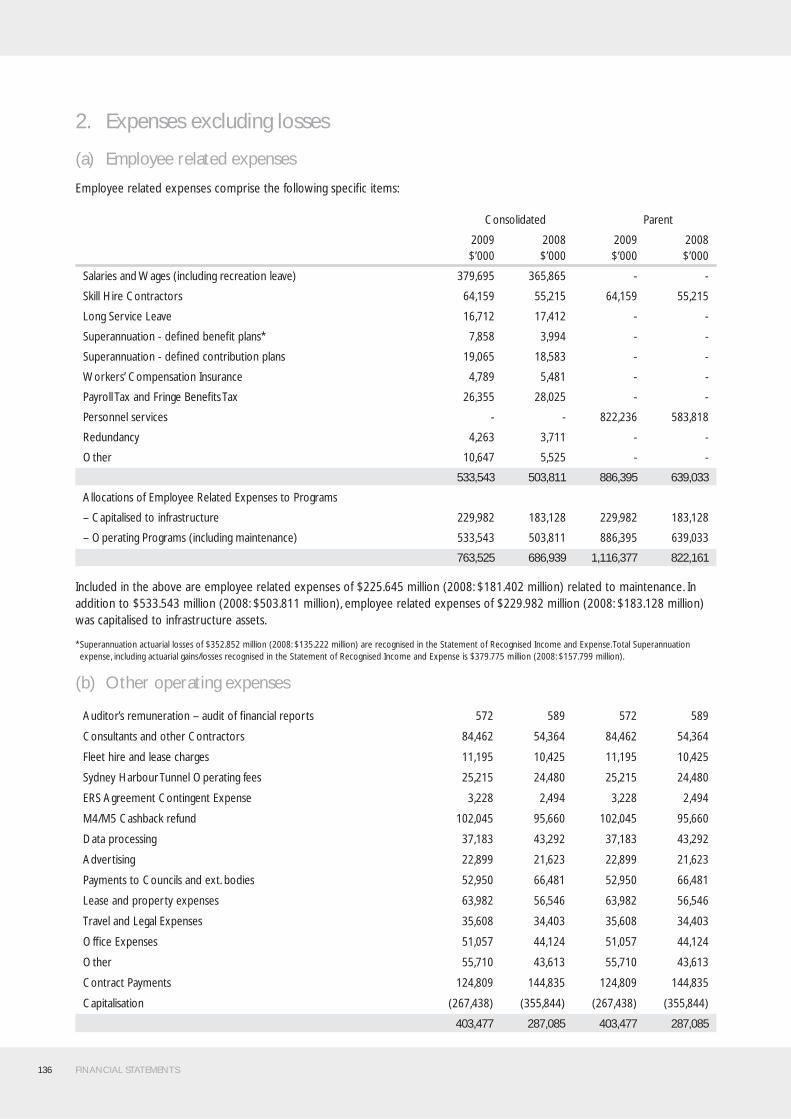
136 FINANCIAL STATEMENTS
2. Expenses excluding losses
(a) Employee related expenses
Employee related expenses comprise the following specifi c items:
Consolidated Parent
2009$’000
2008$’000
2009$’000
2008$’000
Salaries and Wages (including recreation leave) 379,695 365,865 - -
Skill Hire Contractors 64,159 55,215 64,159 55,215
Long Service Leave 16,712 17,412 - -
Superannuation - defi ned benefi t plans* 7,858 3,994 - -
Superannuation - defi ned contribution plans 19,065 18,583 - -
Workers’ Compensation Insurance 4,789 5,481 - -
Payroll Tax and Fringe Benefi ts Tax 26,355 28,025 - -
Personnel services - - 822,236 583,818
Redundancy 4,263 3,711 - -
Other 10,647 5,525 - -
533,543 503,811 886,395 639,033
Allocations of Employee Related Expenses to Programs
– Capitalised to infrastructure 229,982 183,128 229,982 183,128
– Operating Programs (including maintenance) 533,543 503,811 886,395 639,033
763,525 686,939 1,116,377 822,161
Included in the above are employee related expenses of $225.645 million (2008: $181.402 million) related to maintenance. In addition to $533.543 million (2008: $503.811 million), employee related expenses of $229.982 million (2008: $183.128 million) was capitalised to infrastructure assets.
* Superannuation actuarial losses of $352.852 million (2008: $135.222 million) are recognised in the Statement of Recognised Income and Expense. Total Superannuation expense, including actuarial gains/losses recognised in the Statement of Recognised Income and Expense is $379.775 million (2008: $157.799 million).
(b) Other operating expenses
Auditor’s remuneration – audit of fi nancial reports 572 589 572 589
Consultants and other Contractors 84,462 54,364 84,462 54,364
Fleet hire and lease charges 11,195 10,425 11,195 10,425
Sydney Harbour Tunnel Operating fees 25,215 24,480 25,215 24,480
ERS Agreement Contingent Expense 3,228 2,494 3,228 2,494
M4/M5 Cashback refund 102,045 95,660 102,045 95,660
Data processing 37,183 43,292 37,183 43,292
Advertising 22,899 21,623 22,899 21,623
Payments to Councils and ext. bodies 52,950 66,481 52,950 66,481
Lease and property expenses 63,982 56,546 63,982 56,546
Travel and Legal Expenses 35,608 34,403 35,608 34,403
Offi ce Expenses 51,057 44,124 51,057 44,124
Other 55,710 43,613 55,710 43,613
Contract Payments 124,809 144,835 124,809 144,835
Capitalisation (267,438) (355,844) (267,438) (355,844)
403,477 287,085 403,477 287,085

FINANCIAL STATEMENTS 137
Infrastructure maintenance
Major reconstruction of road segments on State Roads are capitalised and as such not charged against maintenance expenditure. The RTA capitalised $209.859 million of such works (2008: $217.067 million).
The RTA expended $47.218 million in 2009 (2008: $40.560 million) on natural disaster restoration works from State funds, and $180.047 million in 2009 (2008: $170.607 million) on block grants and other maintenance grants to councils for Regional and Local Roads. The majority of this expenditure was classifi ed as maintenance grants to councils.
Consolidated Parent
2009$’000
2008$’000
2009$’000
2008$’000
Maintenance expenses in operating statement 694,771 671,304 694,771 671,304
Maintenance related employee expenses (refer to Note 2a) 225,645 181,402 225,645 181,402
Total maintenance expenses including employee related 920,416 852,706 920,416 852,706
(c) Depreciation and amortisation
Depreciation raised against Operational and Property Assets 20,717 17,258 20,717 17,258
Depreciation raised against Infrastructure 828,203 814,573 828,203 814,573
Amortisation of Intangible Assets 4,536 4,598 4,536 4,598
853,456 836,429 853,456 836,429
(d) Grants and subsidies
Grants Under Road Safety Program 12,610 10,069 12,610 10,069
Maintenance grants to Councils 219,901 204,867 219,901 204,867
Roads and Bridges transferred to Councils 112,649 66,086 112,649 66,086
345,160 281,022 345,160 281,022
(e) Finance costs
Interest expense from fi nancial liabilities not at fair value through profi t or loss 41,994 52,371 41,994 52,371
Debt Guarantee 3,000 3,000 3,000 3,000
Finance lease interest charges 51,894 53,246 51,894 53,246
Other 5,647 3,196 5,647 3,196
102,535 111,813 102,535 111,813
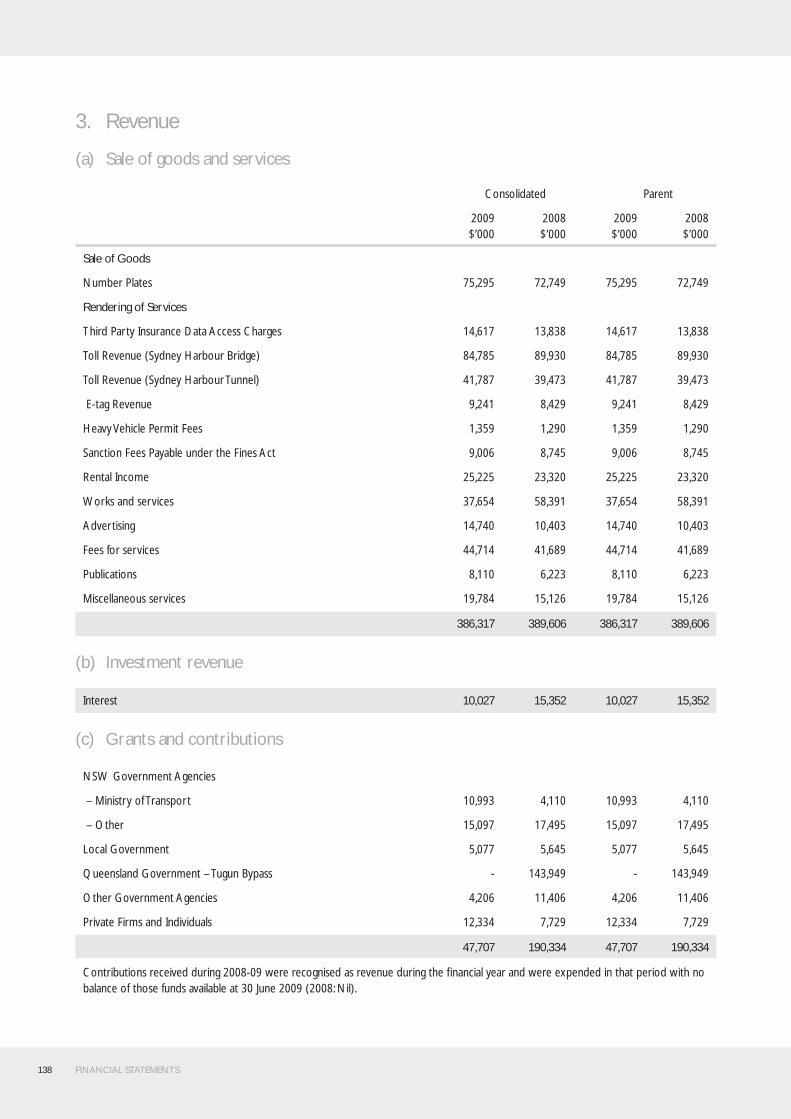
138 FINANCIAL STATEMENTS
3. Revenue
(a) Sale of goods and services
Consolidated Parent
2009$’000
2008$’000
2009$’000
2008$’000
Sale of Goods
Number Plates 75,295 72,749 75,295 72,749
Rendering of Services
Third Party Insurance Data Access Charges 14,617 13,838 14,617 13,838
Toll Revenue (Sydney Harbour Bridge) 84,785 89,930 84,785 89,930
Toll Revenue (Sydney Harbour Tunnel) 41,787 39,473 41,787 39,473
E-tag Revenue 9,241 8,429 9,241 8,429
Heavy Vehicle Permit Fees 1,359 1,290 1,359 1,290
Sanction Fees Payable under the Fines Act 9,006 8,745 9,006 8,745
Rental Income 25,225 23,320 25,225 23,320
Works and services 37,654 58,391 37,654 58,391
Advertising 14,740 10,403 14,740 10,403
Fees for services 44,714 41,689 44,714 41,689
Publications 8,110 6,223 8,110 6,223
Miscellaneous services 19,784 15,126 19,784 15,126
386,317 389,606 386,317 389,606
(b) Investment revenue
Interest 10,027 15,352 10,027 15,352
(c) Grants and contributions
NSW Government Agencies
– Ministry of Transport 10,993 4,110 10,993 4,110
– Other 15,097 17,495 15,097 17,495
Local Government 5,077 5,645 5,077 5,645
Queensland Government – Tugun Bypass - 143,949 - 143,949
Other Government Agencies 4,206 11,406 4,206 11,406
Private Firms and Individuals 12,334 7,729 12,334 7,729
47,707 190,334 47,707 190,334
Contributions received during 2008-09 were recognised as revenue during the fi nancial year and were expended in that period with no balance of those funds available at 30 June 2009 (2008: Nil).

FINANCIAL STATEMENTS 139
(d) Other revenue
Consolidated Parent
2009$’000
2008$’000
2009$’000
2008$’000
Amortisation of Deferred Revenue on PSPI projects 11,575 11,575 11,575 11,575
Value of Emerging Interest of Private Sector Provided
Infrastructure
– M2 (Refer Note 11(a)) 4,620 4,291 4,620 4,291
– M4 (Refer Note 11(a)) 23,410 21,425 23,410 21,425
– M5 (Refer Note 11(a)) 12,935 11,917 12,935 11,917
– Eastern Distributor (Refer Note 11 (a)) 3,754 3,498 3,754 3,498
– Cross City Tunnel (Refer Note 11 (a)) 9,517 9,036 9,517 9,036
– Western Sydney Orbital M7 (Refer Note 11 (a)) 22,970 21,778 22,970 21,778
– Lane Cove Tunnel (Refer Note 11(a)) 13,480 12,722 13,480 12,722
– Loan to Sydney Harbour Tunnel Company 5,826 5,469 5,826 5,469
M2 and Eastern Distributor Promissory Notes 4,301 2,169 4,301 2,169
Fuel Tax Credits 314 137 314 137
Other (15) 258 (15) 258
112,687 104,275 112,687 104,275
4. Gains/(losses) on disposal
(a) Gain/(loss) on disposalGain on Sale of Property, Plant and Equipment
– Proceeds from Sale 66,068 60,828 66,068 60,828
– Written Down Value of Assets Sold (64,855) (45,136) (64,855) (45,136)
Net Gain on Sale of Non-Current Assets 1,213 15,692 1,213 15,692
(b) Other gains/(losses)
Bad / Doubtful debt expense (3,147) (160) (3,147) (160)
Bad debts written off 120 130 120 130
Written Down Value of Infrastructure Assets Written Off (30,997) (157,829) (30,997) (157,829)
Total Other Gains/(Losses) (34,024) (157,859) (34,024) (157,859)

140 FINANCIAL STATEMENTS
5. Appropriations
Consolidated Parent
2009$’000
2008$’000
2009$’000
2008$’000
Recurrent Appropriation
Total recurrent drawdowns from NSW Treasury(per Summary of Compliance) 1,578,527 1,421,222 1,578,527 1,421,222
1,578,527 1,421,222 1,578,527 1,421,222
Capital Appropriation
Total capital drawdowns from NSW Treasury(per Summary of Compliance) 2,144,518 1,780,807 2,144,518 1,780,807
2,144,518 1,780,807 2,144,518 1,780,807
6. Individually signifi cant items
(a) Write-down of infrastructure assets
Infrastructure Assets Written Down 30,997 157,829 30,997 157,829
The following infrastructure assets were written off during 2008-09.
ReplacementCosts$’000
AccumulatedDepreciation
$’000WDRC
$’000
Bridges 37,897 (7,930) 29,967
Traffi c Signals Network 270 (98) 172
Traffi c Control Network 992 (134) 858
39,159 (8,162) 30,997
(b) Capital grants from other state government
Consolidated Parent
2009$’000
2008$’000
2009$’000
2008$’000
Infrastructure Assets - Tugun Bypass - 143,949 - 143,949
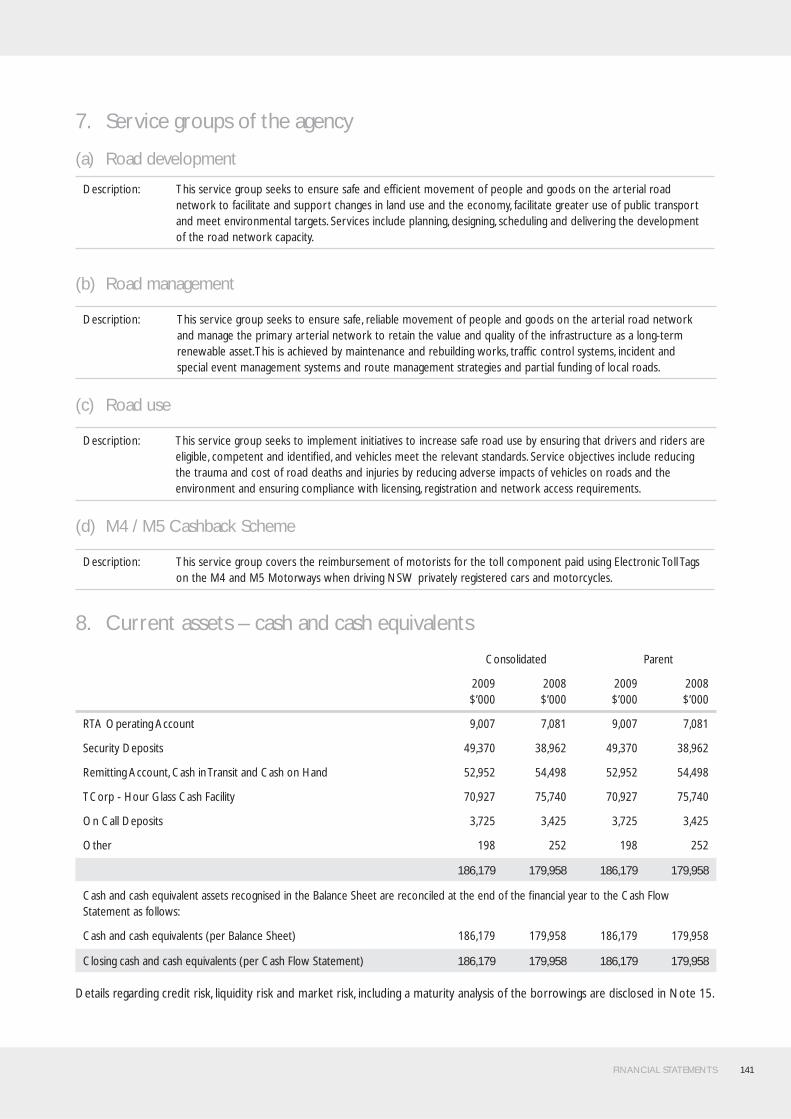
FINANCIAL STATEMENTS 141
7. Service groups of the agency
(a) Road development
Description: This service group seeks to ensure safe and effi cient movement of people and goods on the arterial road network to facilitate and support changes in land use and the economy, facilitate greater use of public transport and meet environmental targets. Services include planning, designing, scheduling and delivering the development of the road network capacity.
(b) Road management
Description: This service group seeks to ensure safe, reliable movement of people and goods on the arterial road network and manage the primary arterial network to retain the value and quality of the infrastructure as a long-term renewable asset. This is achieved by maintenance and rebuilding works, traffi c control systems, incident and special event management systems and route management strategies and partial funding of local roads.
(c) Road use
Description: This service group seeks to implement initiatives to increase safe road use by ensuring that drivers and riders are eligible, competent and identifi ed, and vehicles meet the relevant standards. Service objectives include reducing the trauma and cost of road deaths and injuries by reducing adverse impacts of vehicles on roads and the environment and ensuring compliance with licensing, registration and network access requirements.
(d) M4 / M5 Cashback Scheme
Description: This service group covers the reimbursement of motorists for the toll component paid using Electronic Toll Tags on the M4 and M5 Motorways when driving NSW privately registered cars and motorcycles.
8. Current assets – cash and cash equivalents
Consolidated Parent
2009$’000
2008$’000
2009$’000
2008$’000
RTA Operating Account 9,007 7,081 9,007 7,081
Security Deposits 49,370 38,962 49,370 38,962
Remitting Account, Cash in Transit and Cash on Hand 52,952 54,498 52,952 54,498
TCorp - Hour Glass Cash Facility 70,927 75,740 70,927 75,740
On Call Deposits 3,725 3,425 3,725 3,425
Other 198 252 198 252
186,179 179,958 186,179 179,958
Cash and cash equivalent assets recognised in the Balance Sheet are reconciled at the end of the fi nancial year to the Cash Flow Statement as follows:
Cash and cash equivalents (per Balance Sheet) 186,179 179,958 186,179 179,958
Closing cash and cash equivalents (per Cash Flow Statement) 186,179 179,958 186,179 179,958
Details regarding credit risk, liquidity risk and market risk, including a maturity analysis of the borrowings are disclosed in Note 15.
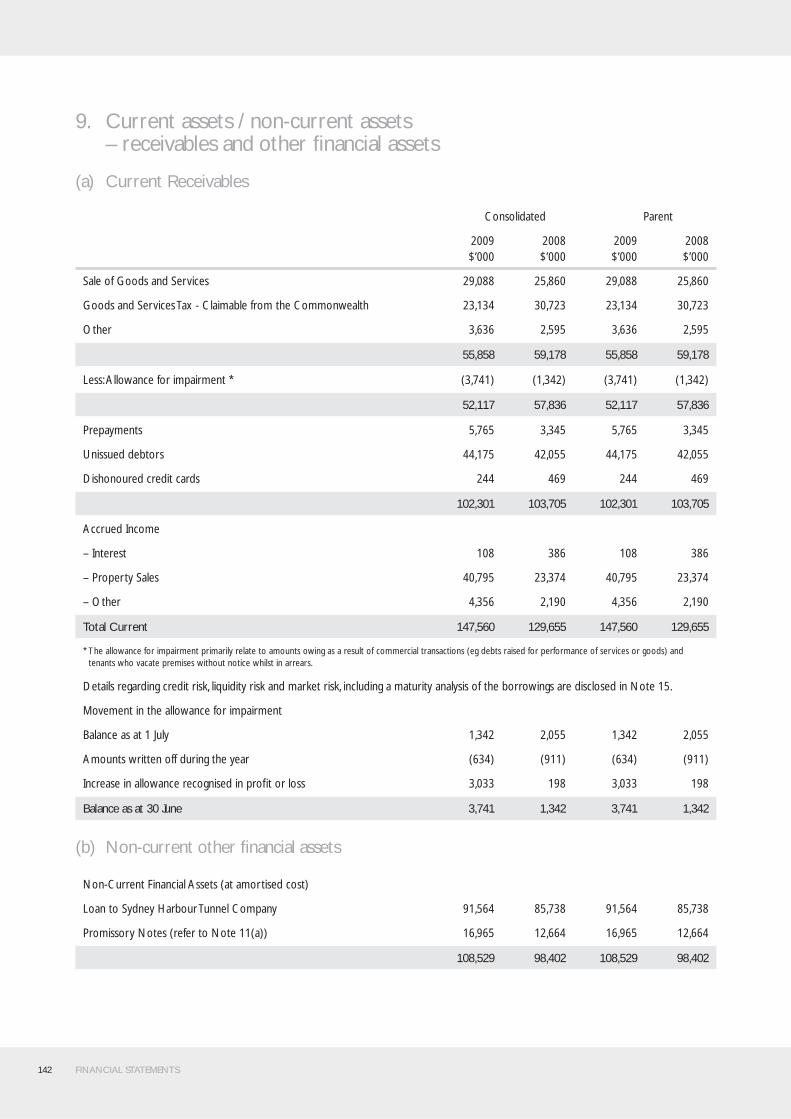
142 FINANCIAL STATEMENTS
9. Current assets / non-current assets – receivables and other fi nancial assets
(a) Current Receivables
Consolidated Parent
2009$’000
2008$’000
2009$’000
2008$’000
Sale of Goods and Services 29,088 25,860 29,088 25,860
Goods and Services Tax - Claimable from the Commonwealth 23,134 30,723 23,134 30,723
Other 3,636 2,595 3,636 2,595
55,858 59,178 55,858 59,178
Less: Allowance for impairment * (3,741) (1,342) (3,741) (1,342)
52,117 57,836 52,117 57,836
Prepayments 5,765 3,345 5,765 3,345
Unissued debtors 44,175 42,055 44,175 42,055
Dishonoured credit cards 244 469 244 469
102,301 103,705 102,301 103,705
Accrued Income
– Interest 108 386 108 386
– Property Sales 40,795 23,374 40,795 23,374
– Other 4,356 2,190 4,356 2,190
Total Current 147,560 129,655 147,560 129,655
* The allowance for impairment primarily relate to amounts owing as a result of commercial transactions (eg debts raised for performance of services or goods) and tenants who vacate premises without notice whilst in arrears.
Details regarding credit risk, liquidity risk and market risk, including a maturity analysis of the borrowings are disclosed in Note 15.
Movement in the allowance for impairment
Balance as at 1 July 1,342 2,055 1,342 2,055
Amounts written off during the year (634) (911) (634) (911)
Increase in allowance recognised in profi t or loss 3,033 198 3,033 198
Balance as at 30 June 3,741 1,342 3,741 1,342
(b) Non-current other fi nancial assets
Non-Current Financial Assets (at amortised cost)
Loan to Sydney Harbour Tunnel Company 91,564 85,738 91,564 85,738
Promissory Notes (refer to Note 11(a)) 16,965 12,664 16,965 12,664
108,529 98,402 108,529 98,402
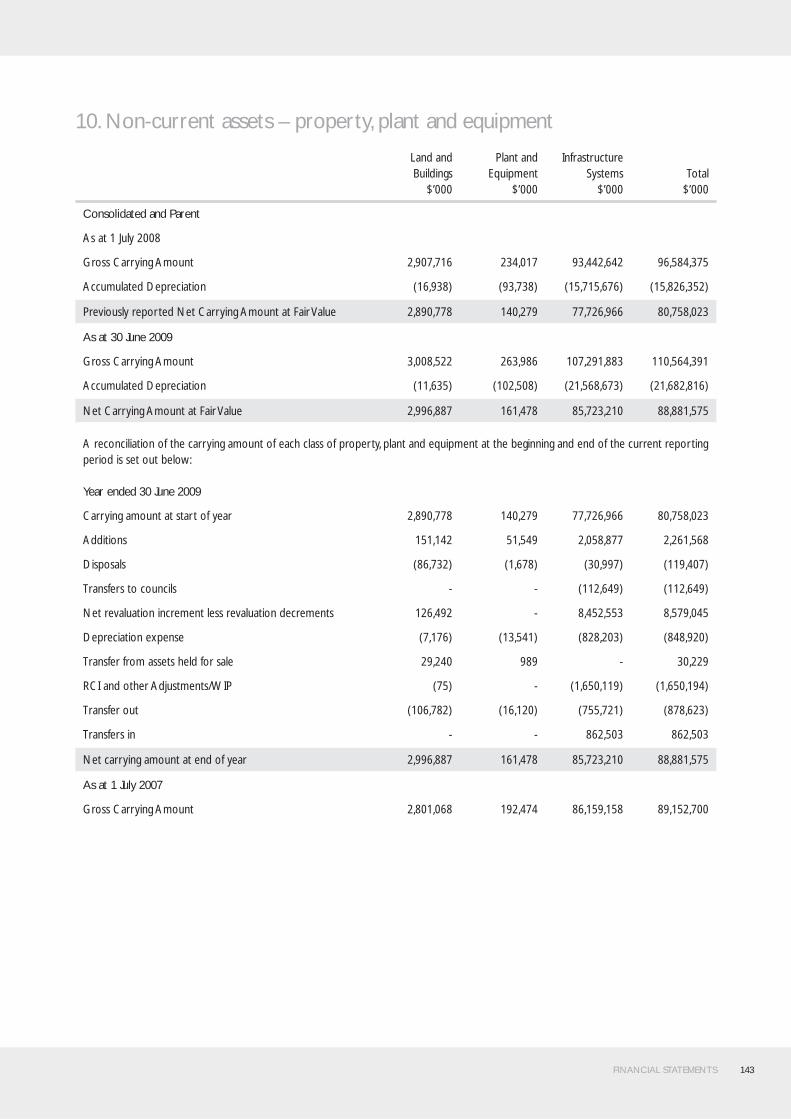
FINANCIAL STATEMENTS 143
10. Non-current assets – property, plant and equipment
Land andBuildings
$’000
Plant andEquipment
$’000
InfrastructureSystems
$’000Total
$’000
Consolidated and Parent
As at 1 July 2008
Gross Carrying Amount 2,907,716 234,017 93,442,642 96,584,375
Accumulated Depreciation (16,938) (93,738) (15,715,676) (15,826,352)
Previously reported Net Carrying Amount at Fair Value 2,890,778 140,279 77,726,966 80,758,023
As at 30 June 2009
Gross Carrying Amount 3,008,522 263,986 107,291,883 110,564,391
Accumulated Depreciation (11,635) (102,508) (21,568,673) (21,682,816)
Net Carrying Amount at Fair Value 2,996,887 161,478 85,723,210 88,881,575
A reconciliation of the carrying amount of each class of property, plant and equipment at the beginning and end of the current reporting period is set out below:
Year ended 30 June 2009
Carrying amount at start of year 2,890,778 140,279 77,726,966 80,758,023
Additions 151,142 51,549 2,058,877 2,261,568
Disposals (86,732) (1,678) (30,997) (119,407)
Transfers to councils - - (112,649) (112,649)
Net revaluation increment less revaluation decrements 126,492 - 8,452,553 8,579,045
Depreciation expense (7,176) (13,541) (828,203) (848,920)
Transfer from assets held for sale 29,240 989 - 30,229
RCI and other Adjustments/WIP (75) - (1,650,119) (1,650,194)
Transfer out (106,782) (16,120) (755,721) (878,623)
Transfers in - - 862,503 862,503
Net carrying amount at end of year 2,996,887 161,478 85,723,210 88,881,575
As at 1 July 2007
Gross Carrying Amount 2,801,068 192,474 86,159,158 89,152,700
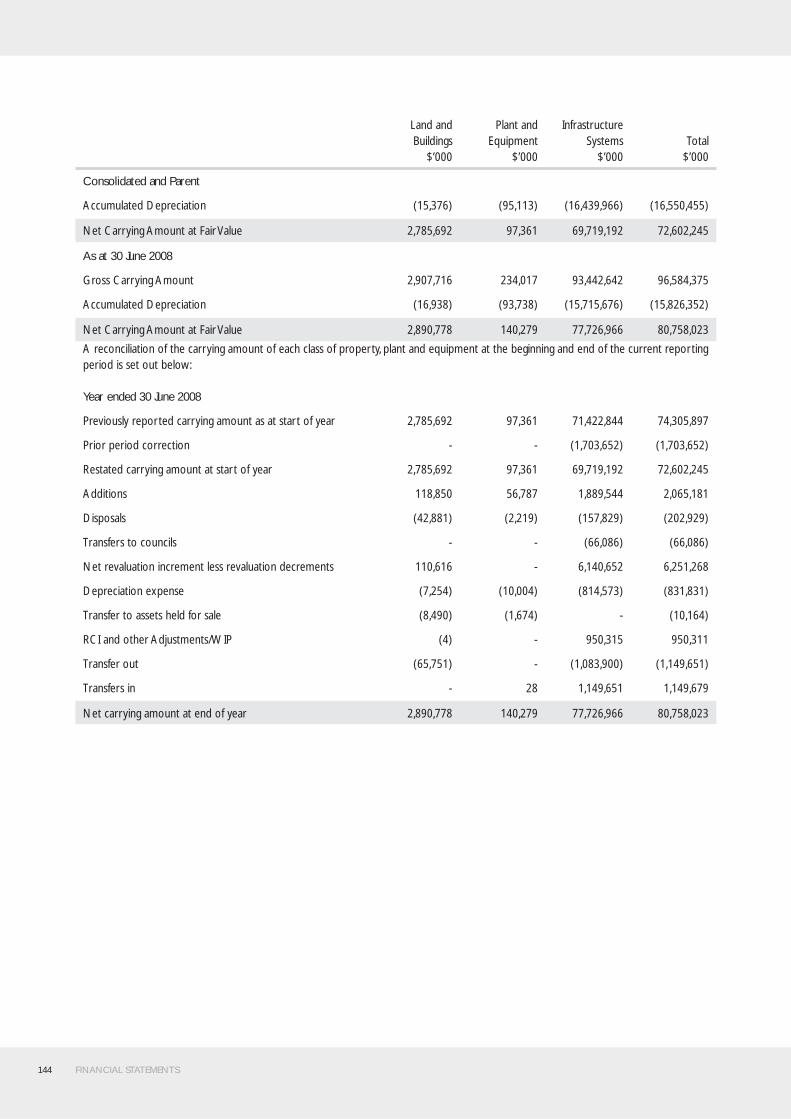
144 FINANCIAL STATEMENTS
Land andBuildings
$’000
Plant andEquipment
$’000
InfrastructureSystems
$’000Total
$’000
Consolidated and Parent
Accumulated Depreciation (15,376) (95,113) (16,439,966) (16,550,455)
Net Carrying Amount at Fair Value 2,785,692 97,361 69,719,192 72,602,245
As at 30 June 2008
Gross Carrying Amount 2,907,716 234,017 93,442,642 96,584,375
Accumulated Depreciation (16,938) (93,738) (15,715,676) (15,826,352)
Net Carrying Amount at Fair Value 2,890,778 140,279 77,726,966 80,758,023
A reconciliation of the carrying amount of each class of property, plant and equipment at the beginning and end of the current reporting period is set out below:
Year ended 30 June 2008
Previously reported carrying amount as at start of year 2,785,692 97,361 71,422,844 74,305,897
Prior period correction - - (1,703,652) (1,703,652)
Restated carrying amount at start of year 2,785,692 97,361 69,719,192 72,602,245
Additions 118,850 56,787 1,889,544 2,065,181
Disposals (42,881) (2,219) (157,829) (202,929)
Transfers to councils - - (66,086) (66,086)
Net revaluation increment less revaluation decrements 110,616 - 6,140,652 6,251,268
Depreciation expense (7,254) (10,004) (814,573) (831,831)
Transfer to assets held for sale (8,490) (1,674) - (10,164)
RCI and other Adjustments/WIP (4) - 950,315 950,311
Transfer out (65,751) - (1,083,900) (1,149,651)
Transfers in - 28 1,149,651 1,149,679
Net carrying amount at end of year 2,890,778 140,279 77,726,966 80,758,023
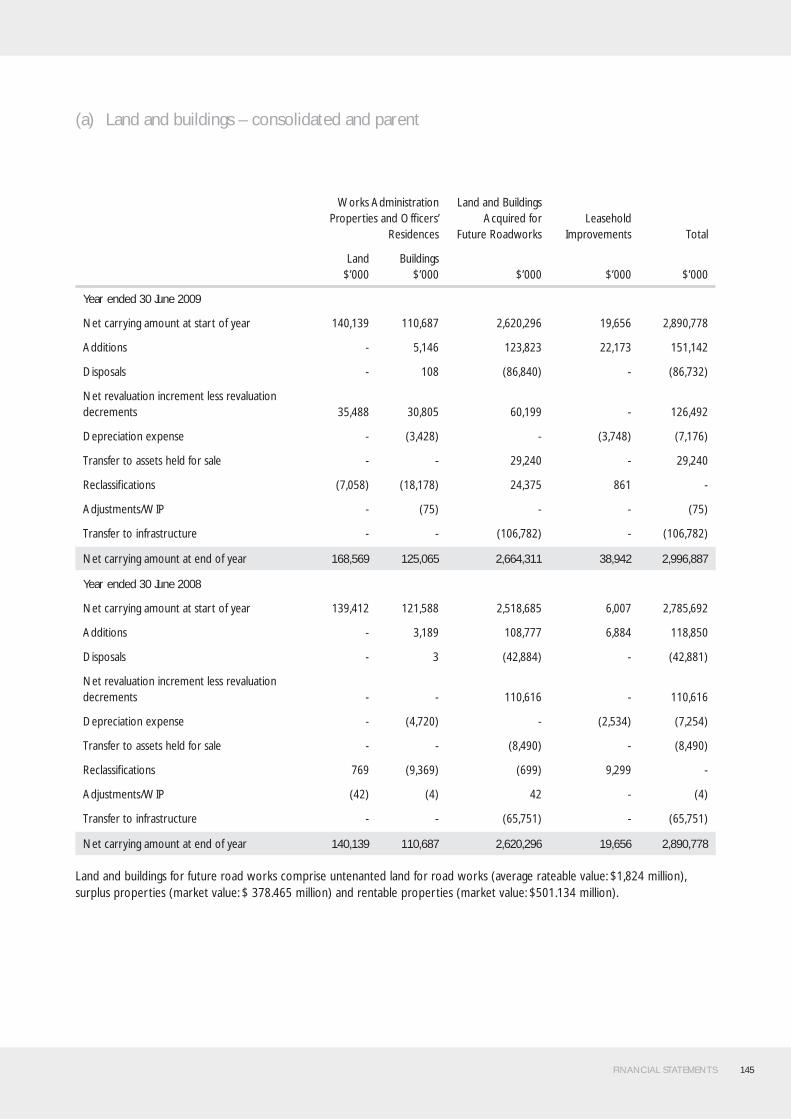
FINANCIAL STATEMENTS 145
(a) Land and buildings – consolidated and parent
Works Administration Properties and Offi cers’
Residences
Land and Buildings Acquired for
Future RoadworksLeasehold
Improvements Total
Land$’000
Buildings$’000 $’000 $’000 $’000
Year ended 30 June 2009
Net carrying amount at start of year 140,139 110,687 2,620,296 19,656 2,890,778
Additions - 5,146 123,823 22,173 151,142
Disposals - 108 (86,840) - (86,732)
Net revaluation increment less revaluation decrements 35,488 30,805 60,199 - 126,492
Depreciation expense - (3,428) - (3,748) (7,176)
Transfer to assets held for sale - - 29,240 - 29,240
Reclassifi cations (7,058) (18,178) 24,375 861 -
Adjustments/WIP - (75) - - (75)
Transfer to infrastructure - - (106,782) - (106,782)
Net carrying amount at end of year 168,569 125,065 2,664,311 38,942 2,996,887
Year ended 30 June 2008
Net carrying amount at start of year 139,412 121,588 2,518,685 6,007 2,785,692
Additions - 3,189 108,777 6,884 118,850
Disposals - 3 (42,884) - (42,881)
Net revaluation increment less revaluation decrements - - 110,616 - 110,616
Depreciation expense - (4,720) - (2,534) (7,254)
Transfer to assets held for sale - - (8,490) - (8,490)
Reclassifi cations 769 (9,369) (699) 9,299 -
Adjustments/WIP (42) (4) 42 - (4)
Transfer to infrastructure - - (65,751) - (65,751)
Net carrying amount at end of year 140,139 110,687 2,620,296 19,656 2,890,778
Land and buildings for future road works comprise untenanted land for road works (average rateable value: $1,824 million), surplus properties (market value: $ 378.465 million) and rentable properties (market value: $501.134 million).

146 FINANCIAL STATEMENTS
Category of Land and Building Acquired for Future Roadworks Aggregate carrying amount $’000
Carried at cost of acquisition less, where applicable, any accumulated depreciation. -
Carried at revalued amounts determined prior to the beginning of the current progressive revaluation less, where applicable, any accumulated depreciation.
-
Revalued as part of the current progressive revaluation and carried at fair value as at 30 June 2009 less, where applicable, any subsequent accumulated depreciation.
840,250
Revalued as part of the current progressive revaluation and carried at an amount other than fair value as at 30 June 2008 less, where applicable, any subsequent accumulated depreciation.
-
Carried at recoverable amount less, where applicable, any subsequent accumulated depreciation. -
Untenanted land for Roads – revalued annually not subject to progressive revaluation. 1,824,061
Total Land and Buildings Acquired for Future Roadworks at 30 June 2009 2,664,311
(b) Plant and equipment – consolidated and parent
Plant Equipment and Motor
Vehicles$’000
Computer Hardware and
Software$’000
Electronic Offi ce
Equipment$’000
Total$’000
Year ended 30 June 2009
Net carrying amount at start of year 119,778 20,075 426 140,279
Additions 13,357 38,171 21 51,549
Disposals (1,309) (365) (4) (1,678)
Depreciation expense (8,821) (4,625) (95) (13,541)
Transfer from Assets held for sale 989 - - 989
Reclassifi cations 668 (668) - -
Transfers out (6,355) (9,765) - (16,120)
Net carrying amount at end of year 118,307 42,823 348 161,478
Year ended 30 June 2008
Net carrying amount at start of year 84,388 12,306 667 97,361
Additions 48,182 8,561 44 56,787
Disposals (2,055) (84) (80) (2,219)
Depreciation expense (7,701) (2,186) (117) (10,004)
Transfer to Assets held for sale (1,674) - - (1,674)
Reclassifi cations (1,364) 1,452 (88) -
Transfers in 2 26 - 28
Net carrying amount at end of year 119,778 20,075 426 140,279
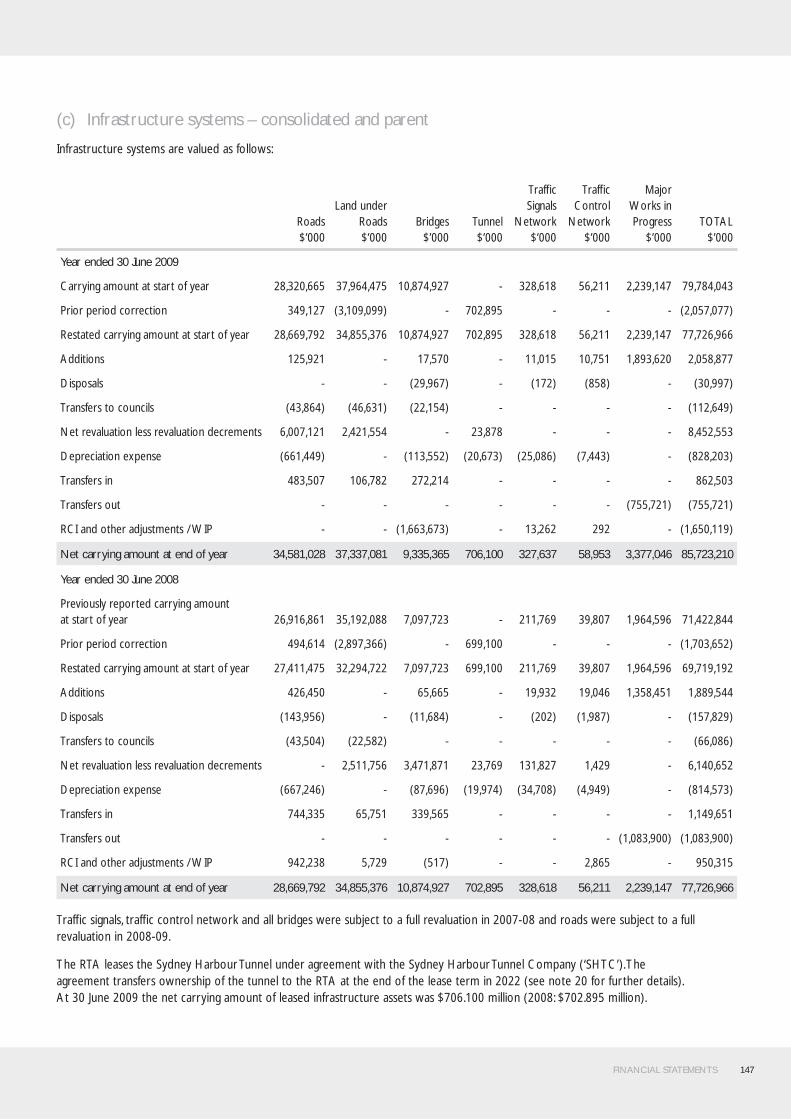
FINANCIAL STATEMENTS 147
(c) Infrastructure systems – consolidated and parent
Infrastructure systems are valued as follows:
Roads$’000
Land under Roads$’000
Bridges$’000
Tunnel $’000
Traffi c Signals
Network$’000
Traffi c Control
Network$’000
Major Works in Progress
$’000TOTAL
$’000
Year ended 30 June 2009
Carrying amount at start of year 28,320,665 37,964,475 10,874,927 - 328,618 56,211 2,239,147 79,784,043
Prior period correction 349,127 (3,109,099) - 702,895 - - - (2,057,077)
Restated carrying amount at start of year 28,669,792 34,855,376 10,874,927 702,895 328,618 56,211 2,239,147 77,726,966
Additions 125,921 - 17,570 - 11,015 10,751 1,893,620 2,058,877
Disposals - - (29,967) - (172) (858) - (30,997)
Transfers to councils (43,864) (46,631) (22,154) - - - - (112,649)
Net revaluation less revaluation decrements 6,007,121 2,421,554 - 23,878 - - - 8,452,553
Depreciation expense (661,449) - (113,552) (20,673) (25,086) (7,443) - (828,203)
Transfers in 483,507 106,782 272,214 - - - - 862,503
Transfers out - - - - - - (755,721) (755,721)
RCI and other adjustments / WIP - - (1,663,673) - 13,262 292 - (1,650,119)
Net carrying amount at end of year 34,581,028 37,337,081 9,335,365 706,100 327,637 58,953 3,377,046 85,723,210
Year ended 30 June 2008
Previously reported carrying amount at start of year 26,916,861 35,192,088 7,097,723 - 211,769 39,807 1,964,596 71,422,844
Prior period correction 494,614 (2,897,366) - 699,100 - - - (1,703,652)
Restated carrying amount at start of year 27,411,475 32,294,722 7,097,723 699,100 211,769 39,807 1,964,596 69,719,192
Additions 426,450 - 65,665 - 19,932 19,046 1,358,451 1,889,544
Disposals (143,956) - (11,684) - (202) (1,987) - (157,829)
Transfers to councils (43,504) (22,582) - - - - - (66,086)
Net revaluation less revaluation decrements - 2,511,756 3,471,871 23,769 131,827 1,429 - 6,140,652
Depreciation expense (667,246) - (87,696) (19,974) (34,708) (4,949) - (814,573)
Transfers in 744,335 65,751 339,565 - - - - 1,149,651
Transfers out - - - - - - (1,083,900) (1,083,900)
RCI and other adjustments / WIP 942,238 5,729 (517) - - 2,865 - 950,315
Net carrying amount at end of year 28,669,792 34,855,376 10,874,927 702,895 328,618 56,211 2,239,147 77,726,966
Traffi c signals, traffi c control network and all bridges were subject to a full revaluation in 2007-08 and roads were subject to a full revaluation in 2008-09.
The RTA leases the Sydney Harbour Tunnel under agreement with the Sydney Harbour Tunnel Company (‘SHTC’). The agreement transfers ownership of the tunnel to the RTA at the end of the lease term in 2022 (see note 20 for further details). At 30 June 2009 the net carrying amount of leased infrastructure assets was $706.100 million (2008: $702.895 million).

148 FINANCIAL STATEMENTS
11. Non-current assets – intangible assets and other
(a) Non-current
Consolidated Parent
2009$’000
2008$’000
2009$’000
2008$’000
Private Sector Provided Infrastructure
M2 Motorway
Carrying amount at start of year 33,502 29,211 33,502 29,211
Annual Increment - Emerging Right to Receive 4,620 4,291 4,620 4,291
Carrying amount at end of year 38,122 33,502 38,122 33,502
M4 Motorway
Carrying amount at start of year 183,636 162,211 183,636 162,211
Annual Increment - Emerging Right to Receive 23,410 21,425 23,410 21,425
Carrying amount at end of year 207,046 183,636 207,046 183,636
M5 Motorway
Carrying amount at start of year 94,656 82,739 94,656 82,739
Annual Increment - Emerging Right to Receive 12,935 11,917 12,935 11,917
Carrying amount at end of year 107,591 94,656 107,591 94,656
Eastern Distributor
Carrying amount at start of year 24,128 20,630 24,128 20,630
Annual Increment - Emerging Right to Receive 3,754 3,498 3,754 3,498
Carrying amount at end of year 27,882 24,128 27,882 24,128
Cross City Tunnel (CCT)
Carrying amount at start of year 25,762 16,726 25,762 16,726
Annual Increment - Emerging Right to Receive 9,517 9,036 9,517 9,036
Carrying amount at end of year 35,279 25,762 35,279 25,762
Western Sydney Orbital (M7)
Carrying amount at start of year 62,005 40,227 62,005 40,227
Annual Increment - Emerging Right to Receive 22,970 21,778 22,970 21,778
Carrying amount at end of year 84,975 62,005 84,975 62,005
Lane Cove Tunnel
Carrying amount at start of year 24,730 12,008 24,730 12,008
Annual Increment - Emerging Right to Receive 13,480 12,722 13,480 12,722
Carrying amount at end of year 38,210 24,730 38,210 24,730
Total Carrying Amount at end of year 539,105 448,419 539,105 448,419
Totals
Carrying amount at start of year 448,419 363,752 448,419 363,752
Annual increment - Emerging Rights to Receive 90,686 84,667 90,686 84,667
Carrying Amount at end of year 539,105 448,419 539,105 448,419
FINANCIAL STATEMENTS 149
M2 Motorway
To facilitate the fi nancing, design and construction of the Motorway, the RTA leased land detailed in the M2 Motorway Project Deed for the term of the Agreement.
Until the project realises a real after tax internal rate of return of 12.25 percent per annum, the rent is payable, at the Lessee’s discretion, in cash or by promissory note. On achievement of the required rate, the rent is payable in cash. Under the terms of the lease, the RTA must not present any of the promissory notes for payment until the earlier of the end of the term of Agreement or the achievement of the required rate of return.
Payments for the rents for the Trust Lease and the Trust Concurrent Lease for the year ended 30 June 2009 have been made by promissory notes in the value of $7.737 million and $1.934 million respectively. The RTA, as at 30 June 2009, has received promissory notes for rent on the above leases totalling $106.234 million. The term of the Agreement ends on the forty-fi fth anniversary of the M2 commencement date, (i.e. 26 May 2042), subject to the provisions of the M2 Motorway Project Deed. The net present value of these promissory notes, as at 30 June 2009, is $6.185 million (2008: $5.181 million).
The RTA has, from the date of completion of the M2 Motorway on 26 May 1997, valued the asset by reference to the RTA’s emerging share of the written down replacement cost of the asset at date of handback over the concession period calculated using the effective interest rate method (refer Note 1(g)(vi)).
Under the terms of the Project Deed, ownership of the M2 Motorway will revert to the RTA on the earlier of the achievement of specifi ed fi nancial returns outlined in the Deed or 45 years from the M2 Commencement Date of 26 May 1997. Base on the historical rental returns, the conservative period of 45 years has been used to calculate the RTA’s emerging share of the asset.
M4 and M5 Motorways
The RTA has valued the infrastructure assets in respect of the M4 and M5 Motorways by reference to the RTA’s emerging share of the written down replacement cost of each asset apportioned over the period of the respective concession agreement calculated using the effective interest rate method (refer Note 1(g)(vi)).
Ownership of the M4 Motorway and M5 Motorway will revert to the RTA in 2010 and 2023 respectively. The initial concession period for the M5 Motorway was for the period 14 August 1992 to 14 August 2022. In consideration for the Concession Holder undertaking construction of an interchange at Moorebank (M5 Improvements), the initial concession period was extended by 1.11 years to 23 September 2023.
The M5 Motorway Call Option Deed provides that if, after at least 25 years from the M5 Western Link commencement date of 26 June 1994, the RTA determines that the expected fi nancial return has been achieved, the RTA has the right to purchase either the business from ILR or the shares in ILR from Infrastructure Trust of AustralAsia Ltd (ITA) and the Commonwealth Bank of Australia (CBA). The exercise price under the M5 Call Option Deed will be based on open market valuation of the business or shares.
Eastern Distributor
An agreement was signed with the Concession Holder in August 1997 to fi nance, design, construct, operate, maintain and repair the Eastern Distributor which was opened to traffi c on 18 December 1999.
In consideration of the RTA granting to the Concession Holder the right to levy and retain tolls on the Eastern Distributor, the Concession Holder is required to pay concession fees in accordance with the Agreement. From the date of Financial Close, which occurred on 18 August 1997, the Concession Holder has paid $180 million by way of promissory notes (being $15 million on Financial Close and $15 million on each anniversary of Financial Close). A further $2.2 million was received in cash six months after Financial Close and $8 million in cash on the third anniversary of Financial Close. Under the Agreement, the promissory notes show a payment date (subject to provisions in the Project Deed) of 31 December 2042 and, as at 30 June 2009, the promissory notes have a net present value of $10.780 million (2008: $7.483 million).
Under the terms of the Project Deed, ownership of the Eastern Distributor will revert to the RTA on the earlier of the achievement of specifi ed fi nancial returns outlined in the Deed or 48 years from the Eastern Distributor Commencement Date of 18 December 1999. The conservative period of 48 years has been used to calculate the RTA’s emerging share of the asset.

150 FINANCIAL STATEMENTS
Cross City Tunnel
An agreement was signed with the Concession Holder in December 2002 to design, construct, operate and maintain the Cross City Tunnel. Major construction started on 28 January 2003. The Cross City Tunnel was completed and opened to traffi c on 28 August 2005.
The Concession Holder was placed into receivership in 2006-07. The Receivers subsequently sold the CCT asset to a private operator in June 2007.
The construction cost was $642 million with the cost being met by the private sector. Under the terms of the agreement, an external party will operate the motorway for a total of 30 years and two months from the opening of the Tunnel to traffi c, after which the motorway will be transferred back to the Government.
The RTA values the asset by reference to the RTA’s emerging share of the written down replacement cost of the asset over the period of the concession period calculated using the effective interest rate method (refer Note 1(g)(vi)).
Reimbursement of certain development costs was received by the RTA from the operator in the form of an upfront cash payment. The amount of this payment was $96.860 million.
Westlink M7 Motorway
An agreement was signed with the Concession Holder in February 2003 to design, construct, operate and maintain the Westlink M7 Motorway. Major construction started on 7 July 2003 and the completed motorway was opened to traffi c on 16 December 2005.
The construction cost was $1.54 billion. The Federal Government contributed $356 million towards the cost of the project with the remainder of the cost being met by the private sector. The RTA had responsibility under the contract for the provision of access to property required for the project. Under the terms of the agreement, the Concession Holder will operate the motorway for a total of 31 years to Februry 2037, after which the motorway will be transferred back to the Government.
The RTA values the asset by reference to the RTA’s emerging share of the written down replacement cost of the asset over the period of the concession period calculated using the effective interest rate method (refer Note 1(g)(vi)).
Reimbursement of certain development costs were received by the RTA from the operator in the form of an upfront cash payment. The amount of this payment was $193.754 million.
Lane Cove Tunnel
An agreement was signed with the Concession Holder in December 2003 to fi nance, design, construct, operate and maintain the Lane Cove Tunnel Project. Major construction started on 24 June 2004 and was opened to traffi c on 20 March 2007.
The construction cost was $1.1 billion, with the cost being met by the private sector. The RTA was responsible under the contract for the provision of access to property required for the project, which were identifi ed by the Project Deed. Under the terms of the agreement, the Concession Holder designed and constructed the motorway and is now operating the motorway for the remainder of the term of 29 years and nine months. The term commenced on the date the agreement with the Concession Holder became effective, and will end on 9 January 2037 after which the motorway will be transferred back to the Government.
The RTA values the asset by reference to the RTA’s emerging share of the written down replacement cost of the asset over the period of the concession period calculated using the effective interest rate method (refer Note 1(g)(vi)).
Reimbursement of certain development costs were received by the RTA from the operator in the form of an upfront cash payment. The amount of this payment was $79.301 million.

FINANCIAL STATEMENTS 151
(b) Other intangible assets – consolidated and parent
Software
2009$’000
2008$’000
Balance at start of the year 1 July 88,443 88,841
Additions 15 516
Disposals (308) (914)
Transfer in from WIP - -
Transfer in from PPE 15,808 -
Balance at close of the year 30 June 103,958 88,443
Accumulated Amortisation
Balance at start of the year 1 July 68,844 65,053
Amortisation expense 4,536 4,598
Write Back on Disposal (210) (807)
Balance at close of the year 30 June 73,170 68,844
Written Down Value
As at close of the year 30 June 30,788 19,599
As at start of the year 1 July 19,599 23,788
12. Non-current assets held for sale
Consolidated Parent
2009$’000
2008$’000
2009$’000
2008$’000
Assets held for sale
Balance 1 July
Land and buildings(i) 68,589 60,099 68,589 60,099
Plant and equipment 2,533 859 2,533 859
Transfer (to)/from Land & Buildings (29,240) 8,490 (29,240) 8,490
Transfer (to)/from Plant and Equipment (989) 1,674 (989) 1,674
40,893 71,122 40,893 71,122
Balance 30 June
Land and buildings(ii) 39,349 68,589 39,349 68,589
Plant and equipment 1,544 2,533 1,544 2,533
40,893 71,122 40,893 71,122
(i) The RTA has an annual sales program for the sale of surplus properties that are placed on the market throughout the year. No impairment loss was recognised on reclassifi cation of the land as held for sale as at the reporting date.
(ii) At the end of June 2009, decreases to Assets Held for Sale were due to less surplus properties that were not required for road work and less land/properties had cleared by region reviewed for future proposals; as well as less plant and equipments considered uneconomical to repair.
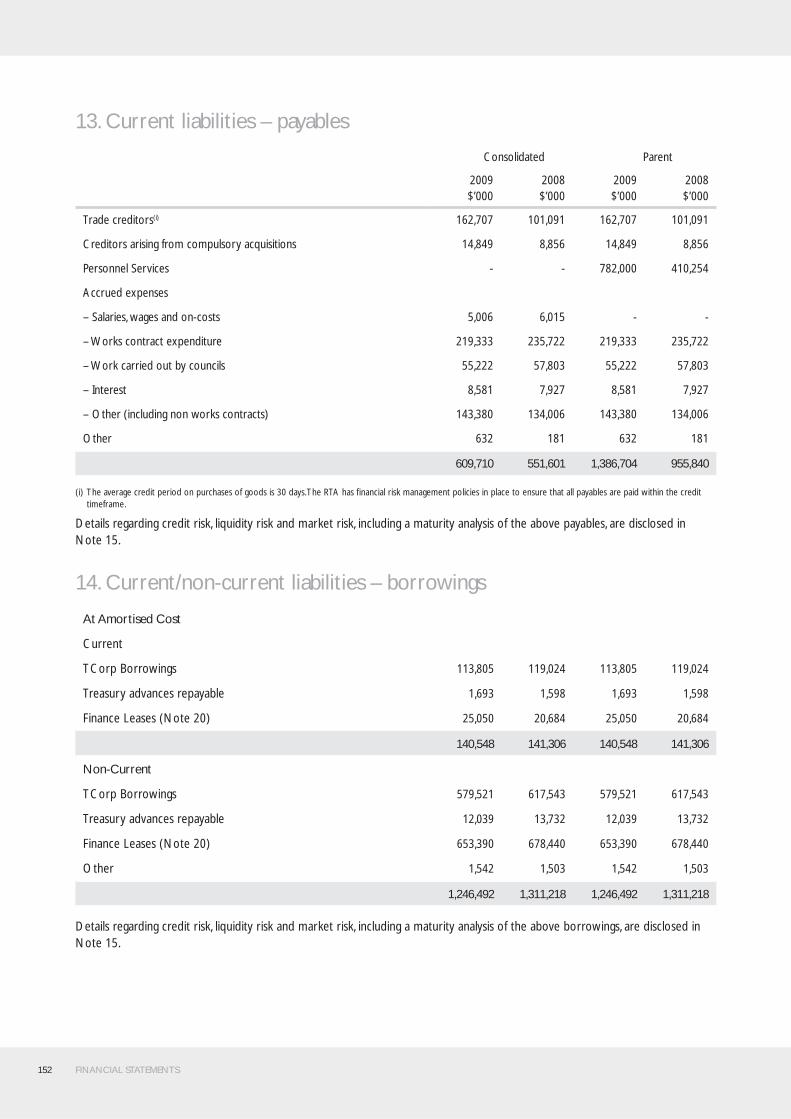
152 FINANCIAL STATEMENTS
13. Current liabilities – payables
Consolidated Parent
2009$’000
2008$’000
2009$’000
2008$’000
Trade creditors(i) 162,707 101,091 162,707 101,091
Creditors arising from compulsory acquisitions 14,849 8,856 14,849 8,856
Personnel Services - - 782,000 410,254
Accrued expenses
– Salaries, wages and on-costs 5,006 6,015 - -
– Works contract expenditure 219,333 235,722 219,333 235,722
– Work carried out by councils 55,222 57,803 55,222 57,803
– Interest 8,581 7,927 8,581 7,927
– Other (including non works contracts) 143,380 134,006 143,380 134,006
Other 632 181 632 181
609,710 551,601 1,386,704 955,840
(i) The average credit period on purchases of goods is 30 days. The RTA has fi nancial risk management policies in place to ensure that all payables are paid within the credit timeframe.
Details regarding credit risk, liquidity risk and market risk, including a maturity analysis of the above payables, are disclosed in Note 15.
14. Current/non-current liabilities – borrowings
At Amortised Cost
Current
TCorp Borrowings 113,805 119,024 113,805 119,024
Treasury advances repayable 1,693 1,598 1,693 1,598
Finance Leases (Note 20) 25,050 20,684 25,050 20,684
140,548 141,306 140,548 141,306
Non-Current
TCorp Borrowings 579,521 617,543 579,521 617,543
Treasury advances repayable 12,039 13,732 12,039 13,732
Finance Leases (Note 20) 653,390 678,440 653,390 678,440
Other 1,542 1,503 1,542 1,503
1,246,492 1,311,218 1,246,492 1,311,218
Details regarding credit risk, liquidity risk and market risk, including a maturity analysis of the above borrowings, are disclosed in Note 15.
FINANCIAL STATEMENTS 153
15. Financial instrumentsThe RTA’s principal fi nancial instruments are outlined below. These fi nancial instruments arise directly from the RTA’s operations or are required to fi nance the RTA’s operations. The RTA does not enter into or trade fi nancial instruments, including derivative fi nancial instruments, for speculative purposes. The RTA’s main risks arising from fi nancial instruments are outlined below, together with the RTA’s objectives, policies and processes for measuring and managing risk. Further quantitative and qualitative disclosures are included throughout this fi nancial report.
The Chief Executive has overall responsibility for the establishment and oversight of risk management and reviews and agrees policies for managing each of these risks. Risk management policies are established to identify and analyse the risks faced by the RTA, to set risk limits and controls and to monitor risks. Compliance with policies is reviewed by the Audit and Risk Committee on a continuous basis.
(a) Market risk
Market risk is the risk that the fair value or future cash fl ows of a fi nancial instrument will fl uctuate because of changes in market prices. The RTA’s exposures to market risk are primarily through interest rate risk on borrowings and other price risks associated with the movement in the unit price of the Hour Glass Investment facilities. The RTA has no exposure to foreign currency risk and does not enter into commodity contracts.
The effect on profi t and equity due to a reasonably possible change in risk variable is outlined in the table below, for interest rate risk and other price risk. A reasonably possible change in risk variable has been determined after taking into account the economic environment in which the RTA operates and the time frame for the assessment (i.e. until the end of the next annual reporting period). The sensitivity analysis is based on risk exposures in existence at the balance sheet date. The analysis is performed on the same basis for 2008 and assumes that all other variables remain constant.
(i) Interest rate risk
Exposure to interest rate risk arises primarily through the RTA’s interest bearing liabilities. This risk is minimised by undertaking mainly fi xed rate borrowings, primarily with NSW Treasury Corporation (NSW TCorp).
NSW TCorp manages interest rate risk exposures applicable to specifi c borrowings of the RTA in accordance with the debt management policies determined by the NSW Debt Management Committee (DMC), to a benchmark and other criteria similar to those applying to the Crown debt portfolio and receives a fee for this service.
TCorp uses derivatives, primarily interest rate futures, to establish short-term (tactical) and longer term (strategic) positions within agreed tolerance limits to manage portfolio duration and maturity profi les. At reporting date the carrying value of borrowings and derivatives (net of funds held at call) managed by TCorp stood at $693.326 million (2008: $736.567 million).
The RTA does not account for any fi xed rate fi nancial instruments at fair value through profi t or loss or as available-for-sale.
Therefore, for these fi nancial instruments, a change in interest rates would not affect profi t or loss or equity. The RTA’s exposure to interest rate risk is set out in the table on the following page.
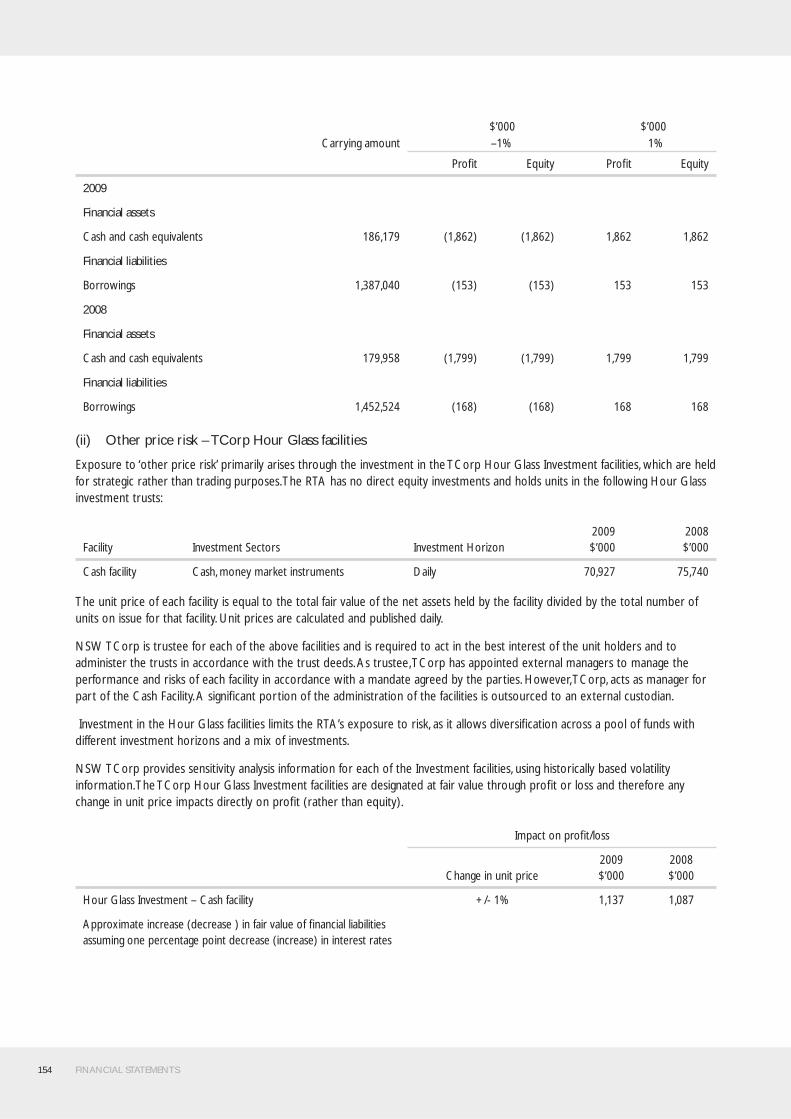
154 FINANCIAL STATEMENTS
$’000 $’000Carrying amount –1% 1%
Profi t Equity Profi t Equity
2009
Financial assets
Cash and cash equivalents 186,179 (1,862) (1,862) 1,862 1,862
Financial liabilities
Borrowings 1,387,040 (153) (153) 153 153
2008
Financial assets
Cash and cash equivalents 179,958 (1,799) (1,799) 1,799 1,799
Financial liabilities
Borrowings 1,452,524 (168) (168) 168 168
(ii) Other price risk – TCorp Hour Glass facilities
Exposure to ‘other price risk’ primarily arises through the investment in the TCorp Hour Glass Investment facilities, which are held for strategic rather than trading purposes. The RTA has no direct equity investments and holds units in the following Hour Glass investment trusts:
Facility Investment Sectors Investment Horizon2009$’000
2008$’000
Cash facility Cash, money market instruments Daily 70,927 75,740
The unit price of each facility is equal to the total fair value of the net assets held by the facility divided by the total number of units on issue for that facility. Unit prices are calculated and published daily.
NSW TCorp is trustee for each of the above facilities and is required to act in the best interest of the unit holders and to administer the trusts in accordance with the trust deeds. As trustee, TCorp has appointed external managers to manage the performance and risks of each facility in accordance with a mandate agreed by the parties. However, TCorp, acts as manager for part of the Cash Facility. A signifi cant portion of the administration of the facilities is outsourced to an external custodian.
Investment in the Hour Glass facilities limits the RTA’s exposure to risk, as it allows diversifi cation across a pool of funds with different investment horizons and a mix of investments.
NSW TCorp provides sensitivity analysis information for each of the Investment facilities, using historically based volatility information. The TCorp Hour Glass Investment facilities are designated at fair value through profi t or loss and therefore any change in unit price impacts directly on profi t (rather than equity).
Impact on profi t/loss
Change in unit price2009$’000
2008$’000
Hour Glass Investment – Cash facility +/- 1% 1,137 1,087
Approximate increase (decrease ) in fair value of fi nancial liabilities assuming one percentage point decrease (increase) in interest rates

FINANCIAL STATEMENTS 155
(b) Credit risk
Credit risk arises when there is the possibility of the RTA’s debtors defaulting on their contractual obligations, resulting in a fi nancial loss to the RTA. The maximum exposure to credit risk is generally represented by the carrying amount of the fi nancial assets (net of any allowance for impairment).
Credit risk arises from the fi nancial assets of the RTA, including cash, receivables and authority deposits. The RTA does not hold any collateral and has not granted any fi nancial guarantees.
Credit risk associated with the RTA’s fi nancial assets, other than receivables, is managed through the selection of counterparties and establishment of minimum credit rating standards. Authority deposits held with NSW TCorp are guaranteed by the State.
Banks Governments Other Total
2009$000
2008$000
2009$000
2008$000
2009$000
2008$000
2009$000
2008$000
Financial Assets
Cash 115,251 104,218 70,928 75,740 - - 186,179 179,958
Receivables - - - - 118,661 95,587 118,661 95,587
Other - - - - 108,529 98,402 108,529 98,402
Total Financial Assets 115,251 104,218 70,928 75,740 227,190 193,989 413,369 373,947
(i) Cash
Cash comprises cash on hand and bank balances within the NSW Treasury Banking System. Interest is earned on daily bank balances at the monthly average NSW Treasury Corporation (TCorp) 11am unoffi cial cash rate, adjusted for a management fee to NSW Treasury.
(ii) Receivables –Trade Debtors
All trade debtors are recognised as amounts receivable at balance date. Collectibility of trade debtors is reviewed on an ongoing basis. Procedures as established in the Treasurer’s Directions are followed to recover outstanding amounts, including letters of demand. An allowance for impairment is raised when there is objective evidence that the entity will not be able to collect all amounts due. This evidence includes past experience, and current and expected changes in economic conditions and debtor credit ratings. Debts which are known to be uncollectible are written off. No interest is earned on trade debtors. Sales are made on 35 day terms.
The RTA is not materially exposed to concentrations of credit risk to a single trade debtor or group of debtors. Based on past experience, debtors that are not past due (2009: $19.159 million; 2008: $9.672 million) and not less than 6 months past due (2009: $2.259 million; 2008: $2.773million) are not considered impaired and together these represent 70% of the total trade debtors. There are no debtors which are currently not past due or impaired whose terms have been renegotiated.
The only fi nancial assets that are past due or impaired are ‘sales of goods and services’ in the ‘receivables’ category of the balance sheet.
$’000
Total1, 2 Past due but not impaired1, 2 Considered impaired1, 2
2009
< 3 months overdue 9,384 6,430 2,954
3 months – 6 months overdue 1,395 1,282 114
> 6 months overdue 2,983 2,309 674
2008
< 3 months overdue 6,675 5,141 107
3 months – 6 months overdue 10,751 10,101 288
> 6 months overdue 3,758 2,773 947
1. Each column in the table reports “gross receivables”.
2. The ageing analysis excludes statutory receivables, as these are not within the scope of AASB 7 Financial Instruments: Disclosures and excludes receivables that are not past due and not impaired. Therefore, the “total” will not reconcile to the receivables total recognised in the balance sheet.
156 FINANCIAL STATEMENTS
(iii) Other fi nancial assets
The repayment of the Sydney Harbour Tunnel Loan ranks behind all creditors to be paid. Redemption of the M2 and Eastern Distributor promissory notes is dependent upon counterparties generating suffi cient cash fl ows to enable the face value to be repaid.
(iv) Authority deposits
The RTA has placed funds on deposit with TCorp, (which has been rated “AAA” by Standard and Poor’s). These deposits are similar to money market or bank deposits and can be placed “at call” or for a fi xed term. For fi xed term deposits, the interest rate payable by TCorp is negotiated initially and is fi xed for the term of the deposit, while the interest rate payable on at call deposits can vary. The deposits at balance date were earning an average interest rate of 4.674% (2008: 6.818%), while over the year the weighted average interest rate was 4.239% (2008: 6.807%) on a weighted average balance during the year of $9.633 million (2008: $11.451 million). None of these assets are past due or impaired.
(c) Fair value
Financial instruments are generally recognised at cost, with the exception of the TCorp Hour Glass facilities, which are measured at fair value. As discussed, the value of the Hour Glass Investments is based on the Authority’s share of the value of the underlying assets of the facility, based on the market value. All of the Hour Glass facilities are valued using ‘redemption’ pricing.
The amortised cost of fi nancial instruments recognised in the balance sheet approximates the fair value, because of the short-term nature of many of the fi nancial instruments. The future cash fl ows of the M2 and Eastern Distributor promissory notes are discounted using standard valuation techniques at the applicable yield having regard to the timing of the cash fl ows.
The fair value of the Sydney Harbour Tunnel fi nance lease liability is calculated based on the present value of the minimum lease liability, discounted at the interest rate implicit in the lease agreement.
(d) Liquidity risk
The RTA manages liquidity risk by maintaining adequate reserves, banking facilities and reserve borrowing facilities by continuously monitoring forecast and actual cash fl ows.
Liquidity risk is the risk that the RTA will be unable to meet its payment obligations when they fall due. The RTA continuously manages risk through monitoring future cash fl ows and maturities planning to ensure adequate holding of high quality liquid assets. The objective is to maintain a balance between continuity of funding and fl exibility through the use of overdrafts, loans and other advances.
The RTA has a Come and Go Facility with TCorp valued at $100 million that has current approval to 30 June 2009 for cash management purposes. This year the facility was used occasionally to fund shortfalls incurring a total interest charge of $0.031 million (2008: $Nil)
Consolidated Parent
2009$’000
2008$’000
2009$’000
2008$’000
Financing arrangements
Unrestricted access was available at the balance sheetdate to the Come and Go facility
Total facility 100,000 100,000 100,000 100,000
Used at balance sheet date - - - -
Unused at balance sheet date 100,000 100,000 100,000 100,000
During the current and prior years, there were no defaults or breaches on any loans payable. No assets have been pledged as collateral. The RTA’s exposure to liquidity risk is deemed insignifi cant based on prior periods’ data and current assessment of risk.
The liabilities are recognised for amounts due to be paid in the future for goods or services received, whether or not invoiced. Amounts owing to suppliers (which are unsecured) are settled in accordance with the policy set out in Treasurer’s Direction 219.01. If trade terms are not specifi ed, payment is made no later than the end of the month following the month in which an invoice or a statement is received.
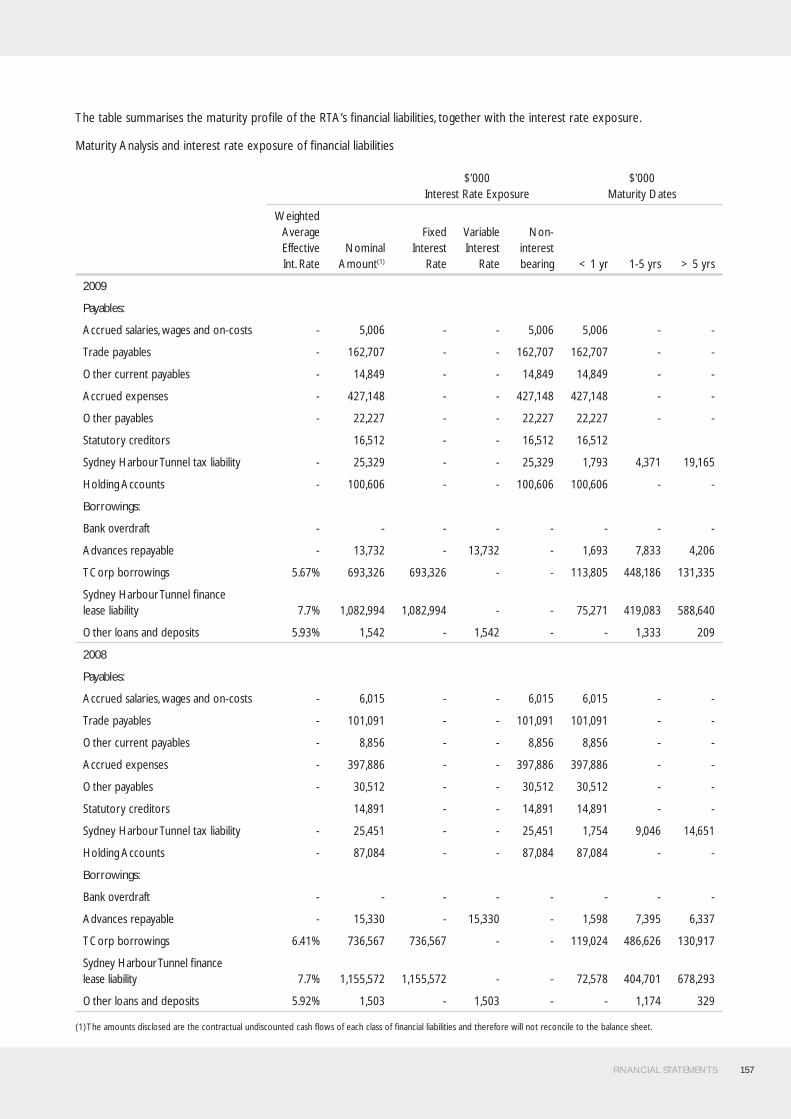
FINANCIAL STATEMENTS 157
The table summarises the maturity profi le of the RTA’s fi nancial liabilities, together with the interest rate exposure.
Maturity Analysis and interest rate exposure of fi nancial liabilities
$’000Interest Rate Exposure
$’000Maturity Dates
WeightedAverageEffectiveInt. Rate
NominalAmount(1)
FixedInterest
Rate
VariableInterest
Rate
Non-interestbearing < 1 yr 1-5 yrs > 5 yrs
2009
Payables:
Accrued salaries, wages and on-costs - 5,006 - - 5,006 5,006 - -
Trade payables - 162,707 - - 162,707 162,707 - -
Other current payables - 14,849 - - 14,849 14,849 - -
Accrued expenses - 427,148 - - 427,148 427,148 - -
Other payables - 22,227 - - 22,227 22,227 - -
Statutory creditors 16,512 - - 16,512 16,512
Sydney Harbour Tunnel tax liability - 25,329 - - 25,329 1,793 4,371 19,165
Holding Accounts - 100,606 - - 100,606 100,606 - -
Borrowings:
Bank overdraft - - - - - - - -
Advances repayable - 13,732 - 13,732 - 1,693 7,833 4,206
TCorp borrowings 5.67% 693,326 693,326 - - 113,805 448,186 131,335
Sydney Harbour Tunnel fi nance lease liability 7.7% 1,082,994 1,082,994 - - 75,271 419,083 588,640
Other loans and deposits 5.93% 1,542 - 1,542 - - 1,333 209
2008
Payables:
Accrued salaries, wages and on-costs - 6,015 - - 6,015 6,015 - -
Trade payables - 101,091 - - 101,091 101,091 - -
Other current payables - 8,856 - - 8,856 8,856 - -
Accrued expenses - 397,886 - - 397,886 397,886 - -
Other payables - 30,512 - - 30,512 30,512 - -
Statutory creditors 14,891 - - 14,891 14,891 - -
Sydney Harbour Tunnel tax liability - 25,451 - - 25,451 1,754 9,046 14,651
Holding Accounts - 87,084 - - 87,084 87,084 - -
Borrowings:
Bank overdraft - - - - - - - -
Advances repayable - 15,330 - 15,330 - 1,598 7,395 6,337
TCorp borrowings 6.41% 736,567 736,567 - - 119,024 486,626 130,917
Sydney Harbour Tunnel fi nance lease liability 7.7% 1,155,572 1,155,572 - - 72,578 404,701 678,293
Other loans and deposits 5.92% 1,503 - 1,503 - - 1,174 329
(1) The amounts disclosed are the contractual undiscounted cash fl ows of each class of fi nancial liabilities and therefore will not reconcile to the balance sheet.
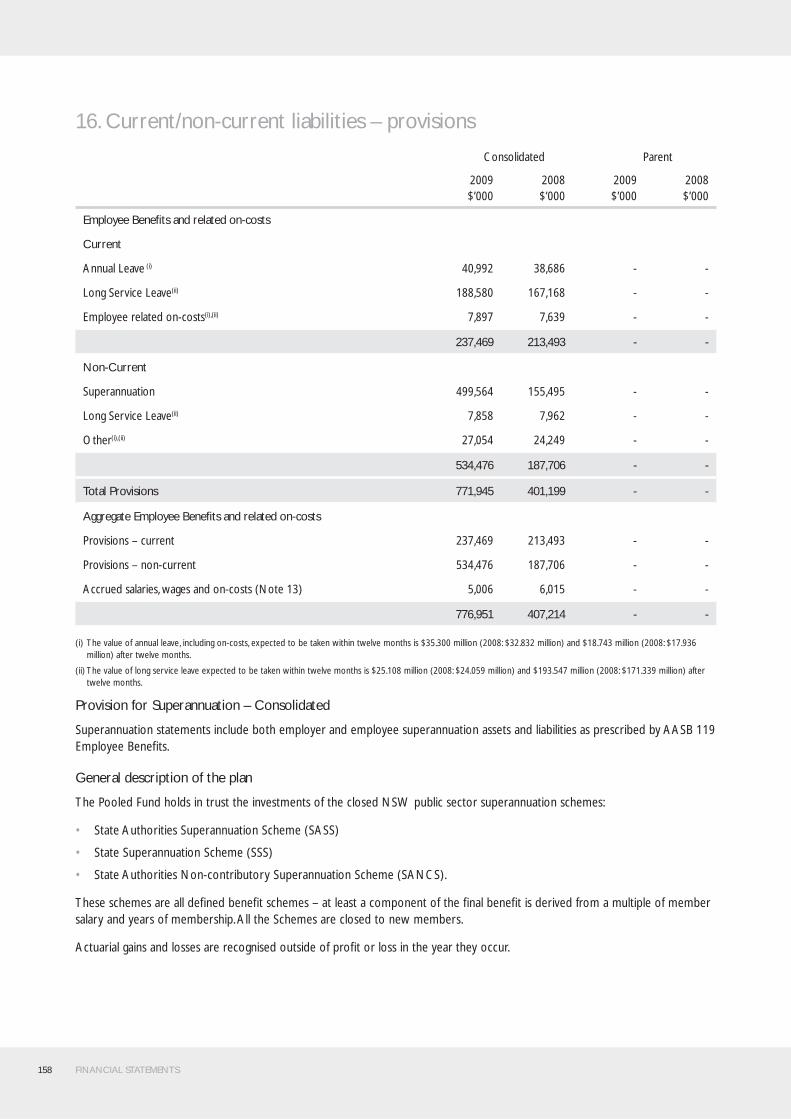
158 FINANCIAL STATEMENTS
16. Current/non-current liabilities – provisions
Consolidated Parent
2009$’000
2008$’000
2009$’000
2008$’000
Employee Benefi ts and related on-costs
Current
Annual Leave (i) 40,992 38,686 - -
Long Service Leave(ii) 188,580 167,168 - -
Employee related on-costs(i),(ii) 7,897 7,639 - -
237,469 213,493 - -
Non-Current
Superannuation 499,564 155,495 - -
Long Service Leave(ii) 7,858 7,962 - -
Other(i),(ii) 27,054 24,249 - -
534,476 187,706 - -
Total Provisions 771,945 401,199 - -
Aggregate Employee Benefi ts and related on-costs
Provisions – current 237,469 213,493 - -
Provisions – non-current 534,476 187,706 - -
Accrued salaries, wages and on-costs (Note 13) 5,006 6,015 - -
776,951 407,214 - -
(i) The value of annual leave, including on-costs, expected to be taken within twelve months is $35.300 million (2008: $32.832 million) and $18.743 million (2008: $17.936 million) after twelve months.
(ii) The value of long service leave expected to be taken within twelve months is $25.108 million (2008: $24.059 million) and $193.547 million (2008: $171.339 million) after twelve months.
Provision for Superannuation – Consolidated
Superannuation statements include both employer and employee superannuation assets and liabilities as prescribed by AASB 119 Employee Benefi ts.
General description of the plan
The Pooled Fund holds in trust the investments of the closed NSW public sector superannuation schemes:
• State Authorities Superannuation Scheme (SASS)
• State Superannuation Scheme (SSS)
• State Authorities Non-contributory Superannuation Scheme (SANCS).
These schemes are all defi ned benefi t schemes – at least a component of the fi nal benefi t is derived from a multiple of member salary and years of membership. All the Schemes are closed to new members.
Actuarial gains and losses are recognised outside of profi t or loss in the year they occur.

FINANCIAL STATEMENTS 159
The following information has been prepared by the scheme actuary.
Superannuation position for AASB 119 purposes
SASSFinancial year to
30 June 2009$’000
SANCS Financial year to
30 June 2009$’000
SSS Financial year to
30 June 2009$’000
Total$’000
Accrued liability 491,663 76,059 908,205 1,475,927
Estimated reserve account balance (407,203) (60,656) (508,504) (976,363)
84,460 15,403 399,701 499,564
Future Service Liability (57,447) (28,749) (35,917) (122,113)
Net (asset)/liability to be recognised in balance sheet 84,460 15,403 399,701 499,564
SASSFinancial year to
30 June 2008$’000
SANCS Financial year to
30 June 2008$’000
SSS Financial year to
30 June 2008$’000
Total$’000
Accrued liability 472,399 70,460 740,966 1,283,825
Estimated reserve account balance (457,610) (69,275) (601,445) (1,128,330)
14,789 1,185 139,521 155,495
Future Service Liability (53,716) (24,883) (26,379) (104,978)
Net (asset)/liability to be recognised in balance sheet 14,789 1,185 139,521 155,495
All Fund assets are invested by Superannuation Trustee Corporation at arm’s length through independent fund managers.
Reconciliation of the present value of the defi ned benefi t obligation
SASSFinancial year to
30 June 2009$’000
SANCS Financial year to
30 June 2009$’000
SSS Financial year to
30 June 2009$’000
Total$’000
Present value of partly funded defi ned benefi t obligation at the beginning of the year 472,399 70,460 740,966 1,283,825
Current service cost 10,691 3,588 4,457 18,736
Interest cost 29,694 4,365 47,470 81,529
Contributions by Fund participants 6,890 - 6,196 13,086
Actuarial (gains)/losses 5,917 3,540 156,888 166,345
Benefi ts paid (33,928) (5,894) (47,772) (87,594)
Present value of partly funded defi ned benefi t obligation at the end of the year 491,663 76,059 908,205 1,475,927

160 FINANCIAL STATEMENTS
SASSFinancial year to
30 June 2008$’000
SANCS Financial year to
30 June 2008$’000
SSS Financial year to
30 June 2008$’000
Total$’000
Present value of partly funded defi ned benefi t obligation at the beginning of the year 489,099 69,623 734,718 1,293,440
Current service cost 11,152 3,746 5,056 19,954
Interest cost 30,055 4,226 45,987 80,268
Contributions by Fund participants 6,903 - 6,632 13,535
Actuarial (gains)/losses (23,538) 138 (11,564) (34,964)
Benefi ts paid (41,272) (7,273) (39,863) (88,408)
Present value of partly funded defi ned benefi t obligation at the end of the year 472,399 70,460 740,966 1,283,825
Reconciliation of the present value of fund assets
SASSFinancial year to
30 June 2009$’000
SANCS Financial year to
30 June 2009$’000
SSS Financial year to
30 June 2009$’000
Total$’000
Present value of Fund assets at the beginning of the year 457,610 69,275 601,445 1,128,330
Expected return on Fund assets 35,938 5,456 47,600 88,994
Actuarial gains/(losses) (74,458) (12,121) (99,929) (186,508)
Employer contributions 15,151 3,940 964 20,055
Contributions by Fund participants 6,890 - 6,196 13,086
Benefi ts paid (33,928) (5,894) (47,772) (87,594)
Present value of fund assets at the end of the year 407,203 60,656 508,504 976,363
SASSFinancial year to
30 June 2008$’000
SANCS Financial year to
30 June 2008$’000
SSS Financial year to
30 June 2008$’000
Total$’000
Present value of Fund assets at the beginning of the year 411,205 37,754 784,113 1,233,072
Expected return on Fund assets 30,654 2,913 61,199 94,766
Actuarial gains/(losses) (57,145) (6,081) (106,961) (170,187)
Employer contributions 107,266 41,962 (103,675) 45,553
Contributions by Fund participants 6,902 - 6,632 13,534
Benefi ts paid (41,272) (7,273) (39,863) (88,408)
Present value of fund assets at the end of the year 457,610 69,275 601,445 1,128,330

FINANCIAL STATEMENTS 161
Reconciliation of the assets and liability recognised in the balance sheetSASS
Financial year to 30 June 2009
$’000
SANCS Financial year to
30 June 2009$’000
SSS Financial year to
30 June 2009$’000
Total$’000
Present value of partly funded defi ned benefi ts at end of the year 491,663 76,059 908,205 1,475,927
Fair value of Fund assets at end of year (407,203) (60,656) (508,504) (976,363)
Net Liability/(Asset) recognised in balance sheet at the end of the year 84,460 15,403 399,701 499,564
SASSFinancial year to
30 June 2008$’000
SANCS Financial year to
30 June 2008$’000
SSS Financial year to
30 June 2008$’000
Total$’000
Present value of partly funded defi ned benefi ts at end of the year 472,399 70,460 740,966 1,283,825
Fair value of Fund assets at end of year (457,610) (69,275) (601,445) (1,128,330)
Net Liability/(Asset) recognised in balance sheet at the end of the year 14,789 1,185 139,521 155,495
Expense recognised in operating statementSASS
Financial year to 30 June 2009
$’000
SANCS Financial year to
30 June 2009$’000
SSS Financial year to
30 June 2009$’000
Total$’000
Current service cost 10,691 3,588 4,457 18,736
Interest on obligation 29,694 4,365 47,470 81,529
Expected return on Fund assets (net of expenses) (35,938) (5,456) (47,600) (88,994)
Expense/(income) recognised 4,447 2,497 4,327 11,271
SASSFinancial year to
30 June 2008$’000
SANCS Financial year to
30 June 2008$’000
SSS Financial year to
30 June 2008$’000
Total$’000
Current service cost 11,152 3,746 5,056 19,954
Interest on obligation 30,055 4,226 45,987 80,268
Expected return on Fund assets (net of expenses) (30,654) (2,913) (61,199) (94,766)
Expense/(income) recognised 10,553 5,059 (10,156) 5,456
Amount recognised in the statement of recognised income and expenseSASS
Financial year to 30 June 2009
$’000
SANCS Financial year to
30 June 2009$’000
SSS Financial year to
30 June 2009$’000
Total$’000
Actuarial (gains)/losses 80,375 15,660 256,817 352,852
SASSFinancial year to
30 June 2008$’000
SANCS Financial year to
30 June 2008$’000
SSS Financial year to
30 June 2008$’000
Total$’000
Actuarial (gains)/losses 33,607 6,219 95,396 135,222
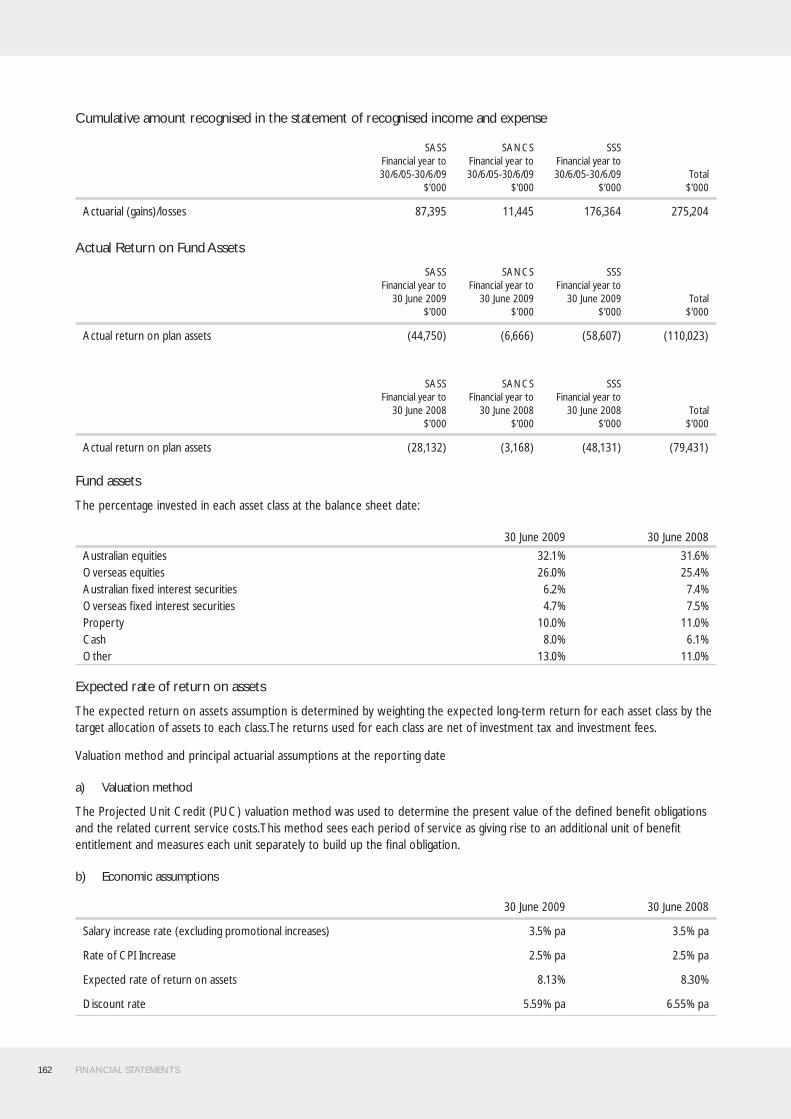
162 FINANCIAL STATEMENTS
Cumulative amount recognised in the statement of recognised income and expense
SASSFinancial year to 30/6/05-30/6/09
$’000
SANCS Financial year to 30/6/05-30/6/09
$’000
SSS Financial year to 30/6/05-30/6/09
$’000Total
$’000
Actuarial (gains)/losses 87,395 11,445 176,364 275,204
Actual Return on Fund Assets
SASSFinancial year to
30 June 2009$’000
SANCS Financial year to
30 June 2009$’000
SSS Financial year to
30 June 2009$’000
Total$’000
Actual return on plan assets (44,750) (6,666) (58,607) (110,023)
SASSFinancial year to
30 June 2008$’000
SANCS Financial year to
30 June 2008$’000
SSS Financial year to
30 June 2008$’000
Total$’000
Actual return on plan assets (28,132) (3,168) (48,131) (79,431)
Fund assets
The percentage invested in each asset class at the balance sheet date:
30 June 2009 30 June 2008
Australian equities 32.1% 31.6%Overseas equities 26.0% 25.4%Australian fi xed interest securities 6.2% 7.4%Overseas fi xed interest securities 4.7% 7.5%Property 10.0% 11.0%Cash 8.0% 6.1%Other 13.0% 11.0%
Expected rate of return on assets
The expected return on assets assumption is determined by weighting the expected long-term return for each asset class by the target allocation of assets to each class. The returns used for each class are net of investment tax and investment fees.
Valuation method and principal actuarial assumptions at the reporting date
a) Valuation method
The Projected Unit Credit (PUC) valuation method was used to determine the present value of the defi ned benefi t obligations and the related current service costs. This method sees each period of service as giving rise to an additional unit of benefi t entitlement and measures each unit separately to build up the fi nal obligation.
b) Economic assumptions
30 June 2009 30 June 2008
Salary increase rate (excluding promotional increases) 3.5% pa 3.5% pa
Rate of CPI Increase 2.5% pa 2.5% pa
Expected rate of return on assets 8.13% 8.30%
Discount rate 5.59% pa 6.55% pa

FINANCIAL STATEMENTS 163
Historical information
SASSFinancial year to
30 June 2009$’000
SANCS Financial year to
30 June 2009$’000
SSS Financial year to
30 June 2009$’000
Total$’000
Present value of defi ned benefi t obligation 491,663 76,059 908,205 1,475,927
Fair value of Fund assets (407,203) (60,656) (508,504) (976,363)
(Surplus)/Defi cit in Fund 84,460 15,403 399,701 499,564
Experience adjustments – Fund liabilities 5,917 3,540 156,888 166,345
Experience adjustments – Fund assets 74,458 12,121 99,929 186,508
SASSFinancial year to
30 June 2008$’000
SANCS Financial year to
30 June 2008$’000
SSS Financial year to
30 June 2008$’000
Total$’000
Present value of defi ned benefi t obligation 472,399 70,460 740,966 1,283,825
Fair value of Fund assets (457,610) (69,275) (601,445) (1,128,330)
(Surplus)/Defi cit in Fund 14,789 1,185 139,521 155,495
Experience adjustments – Fund liabilities (23,538) 138 (11,564) (34,964)
Experience adjustments – Fund assets 57,145 6,081 106,961 170,187
SASSFinancial year to
30 June 2007$’000
SANCS Financial year to
30 June 2007$’000
SSS Financial year to
30 June 2007$’000
Total$’000
Present value of defi ned benefi t obligation 489,099 69,623 734,718 1,293,440
Fair value of Fund assets (411,205) (37,753) (784,113) (1,233,071)
(Surplus)/Defi cit in Fund 77,894 31,870 (49,395) 60,369
Experience adjustments – Fund liabilities 7,547 (1,540) (54,318) (48,31)
Experience adjustments – Fund assets (21,801) (2,159) (46,741) (70,701)
SASSFinancial year to
30 June 2006$’000
SANCS Financial year to
30 June 2006$’000
SSS Financial year to
30 June 2006$’000
Total$’000
Present value of defi ned benefi t obligation 471,698 70,059 750,583 1,292,340
Fair value of Fund assets (370,708) (34,720) (669,479) (1,074,907)
(Surplus)/Defi cit in Fund 100,990 35,339 81,104 217,433
Experience adjustments – Fund liabilities 979 (4,450) (77,765) (81,236)
Experience adjustments – Fund assets (31,372) (3,807) (54,383) (89,562)
SASSFinancial year to
30 June 2005$’000
SANCS Financial year to
30 June 2005$’000
SSS Financial year to
30 June 2005$’000
Total$’000
Present value of defi ned benefi t obligation 301,738 71,750 678,578 1,052,066
Fair value of Fund assets (138,094) (53,818) (454,466) (646,378)
(Surplus)/Defi cit in Fund 163,644 17,932 224,112 405,688
Experience adjustments – Fund liabilities 23,937 4,202 78,885 107,024
Experience adjustments – Fund assets (5,877) (2,681) (21,528) (30,086)

164 FINANCIAL STATEMENTS
Expected contributions
SASSFinancial year to
30 June 2009$’000
SANCS Financial year to
30 June 2009$’000
SSS Financial year to
30 June 2009$’000
Total$’000
Expected employer contributions 7,303 3,387 929 11,619
SASSFinancial year to
30 June 2008$’000
SANCS Financial year to
30 June 2008$’000
SSS Financial year to
30 June 2008$’000
Total$’000
Expected employer contributions 19,312 5,077 25,775 50,164
Funding arrangements for employer contributions
The following is a summary of the 30 June 2009 fi nancial position of the Fund calculated in accordance with AASB 25 – Financial Reporting by Superannuation Plans.
SASSFinancial year to
30 June 2009$’000
SANCS Financial year to
30 June 2009$’000
SSS Financial year to
30 June 2009$’000
Total$’000
Accrued benefi ts 448,930 69,924 671,912 1,190,766
Net market value of Fund assets (407,203) (60,656) (508,504) (976,363)
Net (surplus)/defi cit 41,727 9,268 163,408 214,403
SASSFinancial year to
30 June 2008$’000
SANCS Financial year to
30 June 2008$’000
SSS Financial year to
30 June 2008$’000
Total$’000
Accrued benefi ts 468,896 70,757 682,075 1,221,728
Net market value of Fund assets (457,610) (69,275) (601,445) (1,128,330)
Net (surplus)/defi cit 11,286 1,482 80,630 93,398
Recommended contribution rates for the entity are:
SASS SANCS SSS
multiple of member contributions % member salary multiple of member contributions
1.06 2.07% pa 0.15
Funded method
The method used to determine the employer contribution recommendations at the last actuarial review was the Aggregate Funding method. The method adopted affects the timing of the cost to the employer.
Under the Aggregate Funding method, the employer contribution rate is determined so that suffi cient assets will be available to meet benefi t payments to existing members, taking into account the current value of assets and future contributions.

FINANCIAL STATEMENTS 165
Economic assumptions
The economic assumptions adopted for the current actuarial review of the Fund were:
Weighted-Average Assumptions 2009 2008
Expected rate of return on Fund assets backing current pension liabilities 8.3% pa 7.7% pa
Expected rate of return on Fund assets backing other liabilities 7.3% pa 7.0% pa
Expected salary increase rate 4.0% pa 4.0% pa
Expected rate of CPI increase 2.5% 2.5%
Nature of asset/liability
If a surplus exists in the employer’s interest in the Fund, the employer may be able to take advantage of it in the form of a reduction in the required contribution rate, depending on the advice of the Fund’s actuary.
Where a defi ciency exists, the employer is responsible for any difference between the employer’s share of fund assets and the defi ned benefi t obligation.
Provision for Long Service Leave (LSL)
Long service leave is measured at present value in accordance with AASB 119 Employee Benefi ts. This is based on the application of the valuation ratio at the Commonwealth Government bond rate at the reporting date to employees with fi ve or more years of service, using current rates of pay. This ratio is determined based on an actuarial review to approximate present value.
The actuarial assessment is based on the accrued long service leave liabilities and employee data of the RTA as at 31 December 2007. Long Service leave accrued at the rate of 4.4 days per annum for the fi rst 10 years of service and then at the rate of 11 days per annum.
Employees who exit with less than fi ve years service get no benefi ts. Those who leave with between fi ve and seven years service have been assumed to only receive benefi ts if exiting due to death, disability or age retirement. Benefi ts are paid in service or on exit after seven years service on a pro rata basis.
Assumptions:
An allowance has been determined for each relevant on-cost separately to the LSL liability, as their accounting treatment and the adoption of liability is different to the LSL liability. The on-costs to LSL present value liabilities are:
Payroll Tax 5.75%
Superannuation 9.0 %
Superannuation accruing while on LSL 3.6 %
LSL accruing while on LSL 1.6 %
Annual Leave accruing while on LSL 3.0 %
As workers’ compensation is determined without direct reference to salary, and does not accrue while an employee is on long service leave there is no future workers’ compensation expense that will be incurred when currently accrued LSL is taken during future service, and hence there is no attaching on-cost.
Assumptions about rates of taking leave in service are based on historical details of payments of LSL for calendar years 2005-07 and projected future payments are broadly consistent with this data. It has been assumed that 6 days of LSL will be taken per year by employees who are eligible.
General salary increases of 4% per annum have been assumed for all future years, consistent with NSW Treasury expectations for the NSW public sector in the medium term.
Promotional salary increases have been assumed at rates based on NSW public sector superannuation scheme rates expected to reasonable refl ect employees’ promotional salary experience.
The rates of resignation, death, age retirement and ill-health retirement assumed have been adopted from superannuation valuations of NSW public servants. Withdrawal rates for those with less than 10 years of service are based on experience from NSW and other superannuation schemes.
The discount rate is based on the 10 year bond rate at 30 June, but adjusted from a semi-annual rate to an annual rate.
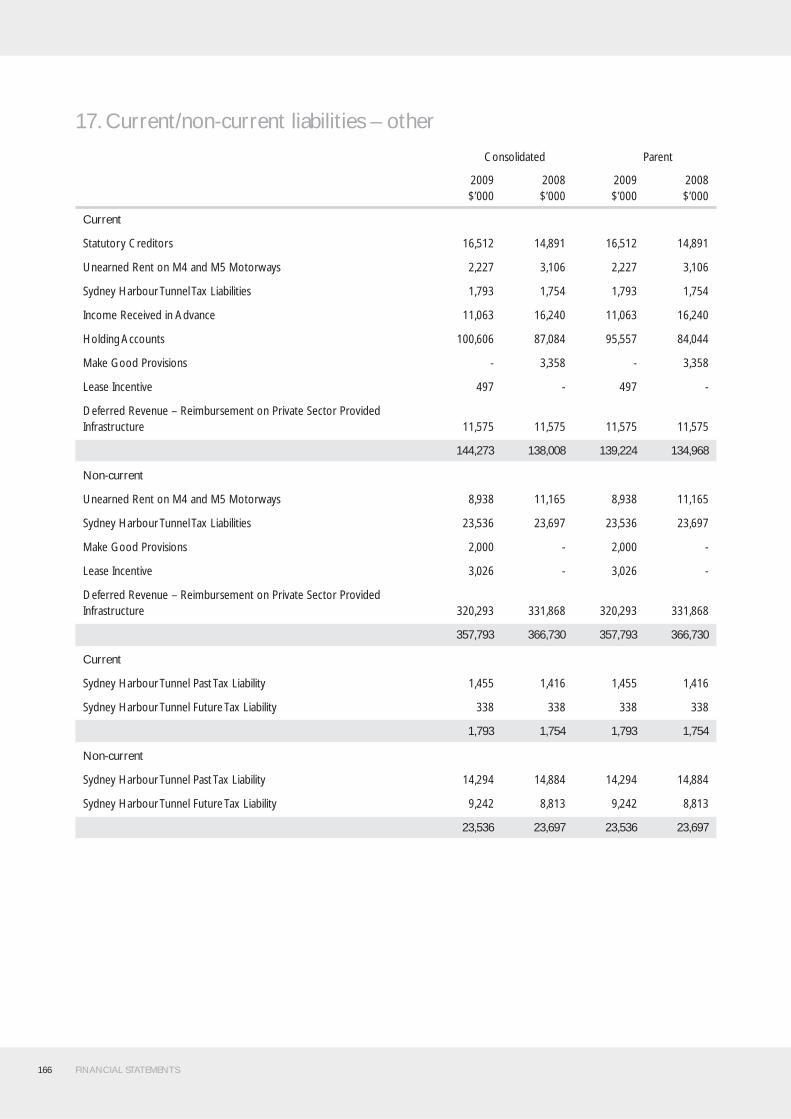
166 FINANCIAL STATEMENTS
17. Current/non-current liabilities – other
Consolidated Parent
2009$’000
2008$’000
2009$’000
2008$’000
Current
Statutory Creditors 16,512 14,891 16,512 14,891
Unearned Rent on M4 and M5 Motorways 2,227 3,106 2,227 3,106
Sydney Harbour Tunnel Tax Liabilities 1,793 1,754 1,793 1,754
Income Received in Advance 11,063 16,240 11,063 16,240
Holding Accounts 100,606 87,084 95,557 84,044
Make Good Provisions - 3,358 - 3,358
Lease Incentive 497 - 497 -
Deferred Revenue – Reimbursement on Private Sector Provided Infrastructure 11,575 11,575 11,575 11,575
144,273 138,008 139,224 134,968
Non-current
Unearned Rent on M4 and M5 Motorways 8,938 11,165 8,938 11,165
Sydney Harbour Tunnel Tax Liabilities 23,536 23,697 23,536 23,697
Make Good Provisions 2,000 - 2,000 -
Lease Incentive 3,026 - 3,026 -
Deferred Revenue – Reimbursement on Private Sector Provided Infrastructure 320,293 331,868 320,293 331,868
357,793 366,730 357,793 366,730
Current
Sydney Harbour Tunnel Past Tax Liability 1,455 1,416 1,455 1,416
Sydney Harbour Tunnel Future Tax Liability 338 338 338 338
1,793 1,754 1,793 1,754
Non-current
Sydney Harbour Tunnel Past Tax Liability 14,294 14,884 14,294 14,884
Sydney Harbour Tunnel Future Tax Liability 9,242 8,813 9,242 8,813
23,536 23,697 23,536 23,697

FINANCIAL STATEMENTS 167
Under the M4 lease agreement, $46.615 million was received from the Concession Holder as rent in advance. In accordance with generally accepted accounting principles, this revenue is brought to account over the period of the lease. This treatment is summarised as follows:
Consolidated Parent
2009$’000
2008$’000
2009$’000
2008$’000
Rent earned in prior years 42,745 40,370 42,745 40,370
Rent earned in current year 2,375 2,375 2,375 2,375
Unearned rent as at 30 June 2009 1,495 3,870 1,495 3,870
46,615 46,615 46,615 46,615
The land acquisition loan of $22.000 million, based on the cost of land under the M5 originally purchased by the RTA, was repaid in June 1997 by the Concession Holder. The repayment of the loan is considered to be a prepayment of the remaining rental over the period of the concession agreement. In accordance with AASB 117, this revenue is brought to account over the period of the lease.
In consideration for the Concession Holder undertaking construction of an interchange at Moorebank (M5 Improvements) on the M5 Motorway, the original concession period (to 14 August 2022) has been extended by 1.11 years to 23 September 2023.
The treatment is summarised as follows:
Rent earned in prior years 11,601 10,870 11,601 10,870
Rent earned in current year 731 731 731 731
Unearned rent as at 30 June 2009 9,668 10,399 9,668 10,399
22,000 22,000 22,000 22,000
Under the various Private Sector Provided Infrastructure $369.915 million was received following the letting of the Lane Cove Tunnel, Cross City Tunnel and Western M7 Motorway contracts as reimbursement of development costs. NSW Treasury have mandated the adoption of TPP 06-08 “Accounting for Privately Funded Projects”, which requires revenue to be brought to account over the period of the concessions. The treatment is summarised as follows.
Amortisation of deferred revenue in prior years 26,472 14,897 26,472 14,897
Amortisation of deferred revenue in current year 11,575 11,575 11,575 11,575
Unearned reimbursement as at 30 June 2009 331,868 343,443 331,868 343,443
369,915 369,915 369,915 369,915
18. Changes in equity Consolidated Parent
2009$’000
2008$’000
2009$’000
2008$’000
Reserves
Accumulated Funds 44,836,741 43,752,057 44,836,741 43,752,057
Asset Revaluation Reserve 41,837,842 35,053,304 41,837,842 35,053,304
86,674,583 78,805,361 86,674,583 78,805,361
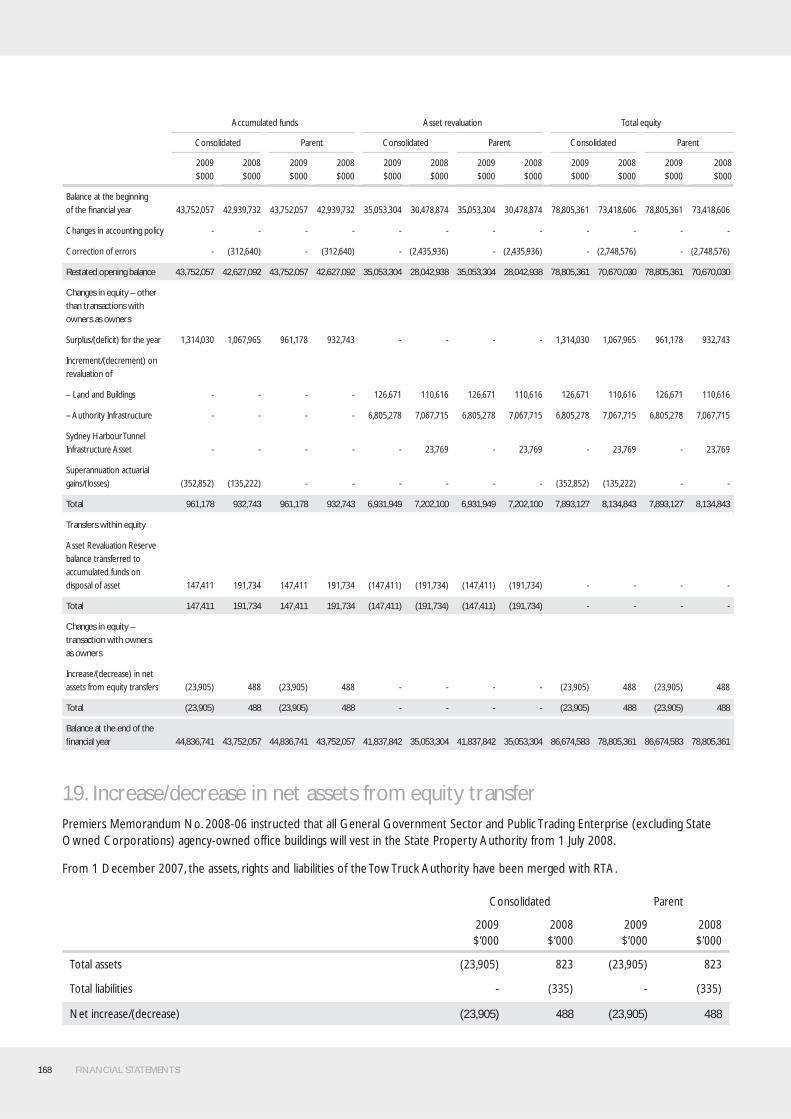
168 FINANCIAL STATEMENTS
Accumulated funds Asset revaluation Total equity
Consolidated Parent Consolidated Parent Consolidated Parent
2009$000
2008$000
2009$000
2008$000
2009$000
2008$000
2009$000
2008$000
2009$000
2008$000
2009$000
2008$000
Balance at the beginning of the fi nancial year 43,752,057 42,939,732 43,752,057 42,939,732 35,053,304 30,478,874 35,053,304 30,478,874 78,805,361 73,418,606 78,805,361 73,418,606
Changes in accounting policy - - - - - - - - - - - -
Correction of errors - (312,640) - (312,640) - (2,435,936) - (2,435,936) - (2,748,576) - (2,748,576)
Restated opening balance 43,752,057 42,627,092 43,752,057 42,627,092 35,053,304 28,042,938 35,053,304 28,042,938 78,805,361 70,670,030 78,805,361 70,670,030
Changes in equity – other than transactions with owners as owners
Surplus/(defi cit) for the year 1,314,030 1,067,965 961,178 932,743 - - - - 1,314,030 1,067,965 961,178 932,743
Increment/(decrement) on revaluation of
– Land and Buildings - - - - 126,671 110,616 126,671 110,616 126,671 110,616 126,671 110,616
– Authority Infrastructure - - - - 6,805,278 7,067,715 6,805,278 7,067,715 6,805,278 7,067,715 6,805,278 7,067,715
Sydney Harbour Tunnel Infrastructure Asset - - - - - 23,769 - 23,769 - 23,769 - 23,769
Superannuation actuarial gains/(losses) (352,852) (135,222) - - - - - - (352,852) (135,222) - -
Total 961,178 932,743 961,178 932,743 6,931,949 7,202,100 6,931,949 7,202,100 7,893,127 8,134,843 7,893,127 8,134,843
Transfers within equity
Asset Revaluation Reserve balance transferred to accumulated funds on disposal of asset 147,411 191,734 147,411 191,734 (147,411) (191,734) (147,411) (191,734) - - - -
Total 147,411 191,734 147,411 191,734 (147,411) (191,734) (147,411) (191,734) - - - -
Changes in equity – transaction with owners as owners
Increase/(decrease) in net assets from equity transfers (23,905) 488 (23,905) 488 - - - - (23,905) 488 (23,905) 488
Total (23,905) 488 (23,905) 488 - - - - (23,905) 488 (23,905) 488
Balance at the end of the fi nancial year 44,836,741 43,752,057 44,836,741 43,752,057 41,837,842 35,053,304 41,837,842 35,053,304 86,674,583 78,805,361 86,674,583 78,805,361
19. Increase/decrease in net assets from equity transferPremiers Memorandum No. 2008-06 instructed that all General Government Sector and Public Trading Enterprise (excluding State Owned Corporations) agency-owned offi ce buildings will vest in the State Property Authority from 1 July 2008.
From 1 December 2007, the assets, rights and liabilities of the Tow Truck Authority have been merged with RTA.
Consolidated Parent
2009$’000
2008$’000
2009$’000
2008$’000
Total assets (23,905) 823 (23,905) 823
Total liabilities - (335) - (335)
Net increase/(decrease) (23,905) 488 (23,905) 488

FINANCIAL STATEMENTS 169
20. Commitments for expenditure
(a) Capital commitments
Aggregate capital expenditure for the road works contracted for at balance date and not provided for :
Consolidated Parent
2009$’000
2008$’000
2009$’000
2008$’000
Payable no later than 1 year 587,545 254,957 587,545 254,957
Payable later than 1 year and not later than 5 years 591,957 1,455,616 591,957 1,455,616
Payable later than 5 years 34,870 111,513 34,870 111,513
Total (including GST) 1,214,372 1,822,086 1,214,372 1,822,086
(b) Other expenditure commitments
Aggregate other expenditure for the acquisition of goods and services contracted for at balance date and not provided for :
Payable no later than 1 year 265,355 287,695 265,355 287,695
Payable later than 1 year and not later than 5 years 145,859 204,234 145,859 204,234
Payable later than 5 years 389,819 43,192 389,819 43,192
Total (including GST) 801,033 535,121 801,033 535,121
(c) Operating lease commitments
Operating lease commitments relate to property, IT equipment and light and heavy motor vehicles. Operating lease commitments are not recognised in the fi nancial statements as liabilities. Total operating lease commitments are as follows:
Not later than 1 year 59,635 52,026 59,635 52,026
Later than 1 year and not later than 5 years 113,928 44,071 113,928 44,071
Later than 5 years 71,506 25,218 71,506 25,218
Total (including GST) 245,069 121,315 245,069 121,315
In respect of property leases, the RTA has various lessors with leases that have specifi c lease periods ranging from one year to 20 years.
The property operating lease commitments are as follows:
Not later than 1 year 33,420 19,385 33,420 19,385
Later than 1 year and not later than 5 years 88,458 20,125 88,458 20,125
Later than 5 years 71,506 25,218 71,506 25,218
Total (including GST) 193,384 64,728 193,384 64,728
IT equipment operating leases are existing leases negotiated with Dell Computer Pty Ltd., Fujitsu Australia Ltd. and Macquarie IT Pty Ltd. The RTA changed its policy effective 2007-08, to purchasing rather than leasing IT assets.
The IT operating lease commitments are as follows:
Not later than 1 year 119 645 119 645
Later than 1 year and not later than 5 years - 140 - 140
Total (including GST) 119 785 119 785
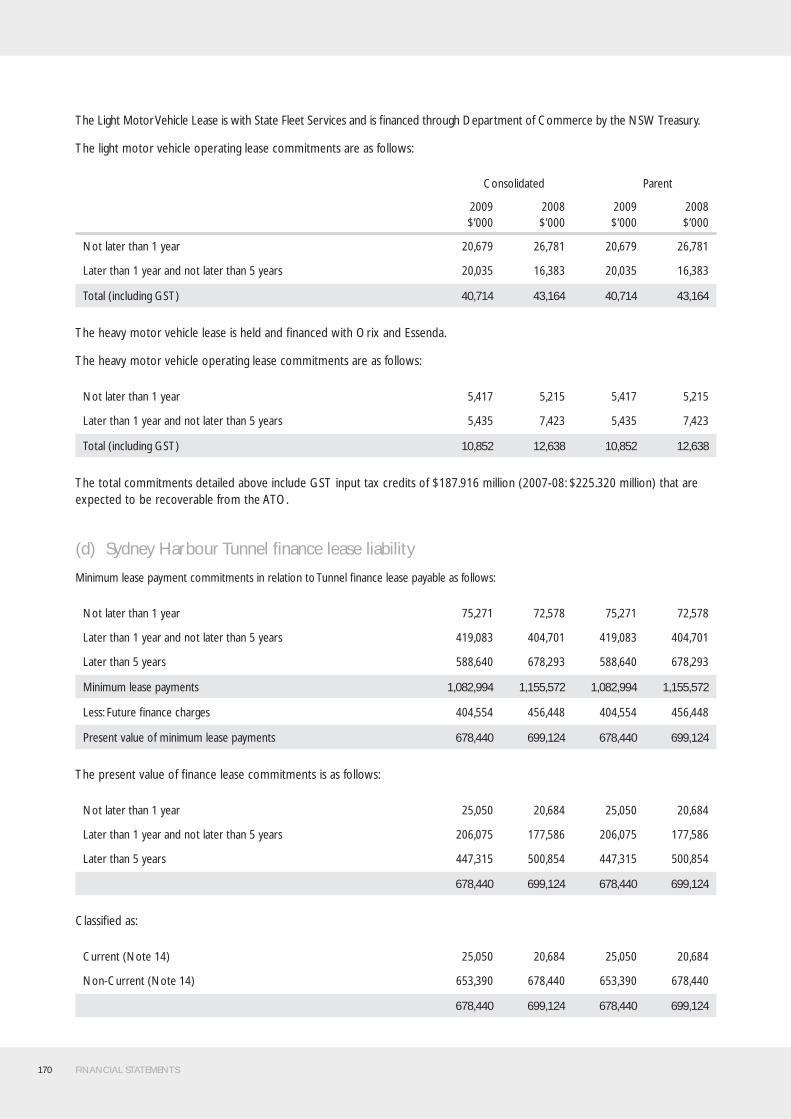
170 FINANCIAL STATEMENTS
The Light Motor Vehicle Lease is with State Fleet Services and is fi nanced through Department of Commerce by the NSW Treasury.
The light motor vehicle operating lease commitments are as follows:
Consolidated Parent
2009$’000
2008$’000
2009$’000
2008$’000
Not later than 1 year 20,679 26,781 20,679 26,781
Later than 1 year and not later than 5 years 20,035 16,383 20,035 16,383
Total (including GST) 40,714 43,164 40,714 43,164
The heavy motor vehicle lease is held and fi nanced with Orix and Essenda.
The heavy motor vehicle operating lease commitments are as follows:
Not later than 1 year 5,417 5,215 5,417 5,215
Later than 1 year and not later than 5 years 5,435 7,423 5,435 7,423
Total (including GST) 10,852 12,638 10,852 12,638
The total commitments detailed above include GST input tax credits of $187.916 million (2007-08: $225.320 million) that are expected to be recoverable from the ATO.
(d) Sydney Harbour Tunnel fi nance lease liability
Minimum lease payment commitments in relation to Tunnel fi nance lease payable as follows:
Not later than 1 year 75,271 72,578 75,271 72,578
Later than 1 year and not later than 5 years 419,083 404,701 419,083 404,701
Later than 5 years 588,640 678,293 588,640 678,293
Minimum lease payments 1,082,994 1,155,572 1,082,994 1,155,572
Less: Future fi nance charges 404,554 456,448 404,554 456,448
Present value of minimum lease payments 678,440 699,124 678,440 699,124
The present value of fi nance lease commitments is as follows:
Not later than 1 year 25,050 20,684 25,050 20,684
Later than 1 year and not later than 5 years 206,075 177,586 206,075 177,586
Later than 5 years 447,315 500,854 447,315 500,854
678,440 699,124 678,440 699,124
Classifi ed as:
Current (Note 14) 25,050 20,684 25,050 20,684
Non-Current (Note 14) 653,390 678,440 653,390 678,440
678,440 699,124 678,440 699,124

FINANCIAL STATEMENTS 171
Sydney Harbour Tunnel
In June 1987 the RTA and SHTC entered into an Ensured Revenue Stream (‘ERS’) Agreement, whereby RTA agreed to make payments to SHTC to enable it to meet its fi nancial obligations arising from the operation and maintenance of the Tunnel and repayment of principal and interest on the funds it borrowed for the design and construction of the Tunnel.
Following the guidelines set out in NSW Treasury Policy Paper 06-08 Accounting for Privately Financed Projects, RTA has accounted for the Sydney Harbour Tunnel and related ERS Agreement as a fi nance lease arrangement in accordance with the requirements of AASB 117 Leases.
The carrying amount of the Sydney Harbour Tunnel fi nance lease liability has been calculated based on the present value of the minimum lease liability, discounted at the interest rate implicit in the ERS Agreement.
Contingent lease payments represent liabilities that were considered contingent at the inception of the lease but have since been confi rmed. Specifi cally, contingent lease payments include increases in the ERS liability resulting from fl uctuations in the weighted index component of the ERS Agreement (e.g. CPI fl uctuations) and adjustments to the amount payable resulting from ERS clause 4.1(a) renegotiations such as GST on the Tunnel tolls. Contingent lease payments are charged as expenses in the period they are incurred and amounted to $3.228 million for the period ending 30 June 2009 (2008: $2.494 million).
21. After balance sheet date event
(a) Road Reclassifi cation Review – Transfer of Roads to/from Councils
The implementation in May 2009 of the NSW Road Re-classifi cation Review will result in the transfer of several roads between the State and Regional road networks.
The written down value of roads and land under roads to be transferred to councils by the RTA as a result of the review is $722.255 million as at 30 June 2009. The RTA also expects to receive approximately $517.401 million of roads and land under roads from councils. These transfers will commence in the 2009-10 Financial Year.
(b) M4 Motorway handover
On 15 December 1989 the RTA and the Minister for Transport entered into an agreement with the Statewide Roads (F4/M4) Pty Ltd (SWR) and Statewide Roads Ltd (the Guarantor) to fi nance, design, construct, operate, maintain and repair the M4 Tollroad. Ownership of the M4 Motorway will revert to the RTA on 15 February 2010.
As at 30 June 2009, no valuation of the assets to be received has been performed at this time. An independent valuation for the M4 Motorway will be performed by December 2009.
22. Contingent assets and contingent liabilitiesAASB 137 Provisions, Contingent Liabilities and Contingent Assets adopts a “prudent” approach and requires disclosure of each class of contingent liabilities and contingent assets.
There are two signifi cant contractual disputes (2008: 1 dispute) with an estimated total contingent liability of $33.000 million (2008:$25.000 million). Compulsory property acquisition matters under litigation have an estimated contingent liability of $54.653 million.
The RTA has certain obligations under contracts with private sector parties with the performance of these obligations guaranteed by the State. The current guarantees outstanding are for the Sydney Harbour Tunnel, the M2 Motorway, The Eastern Distributor, the Cross City Tunnel, the Western Sydney Orbital and the Lane Cove Tunnel. There is no reason to believe that these guarantees are ever to be exercised.
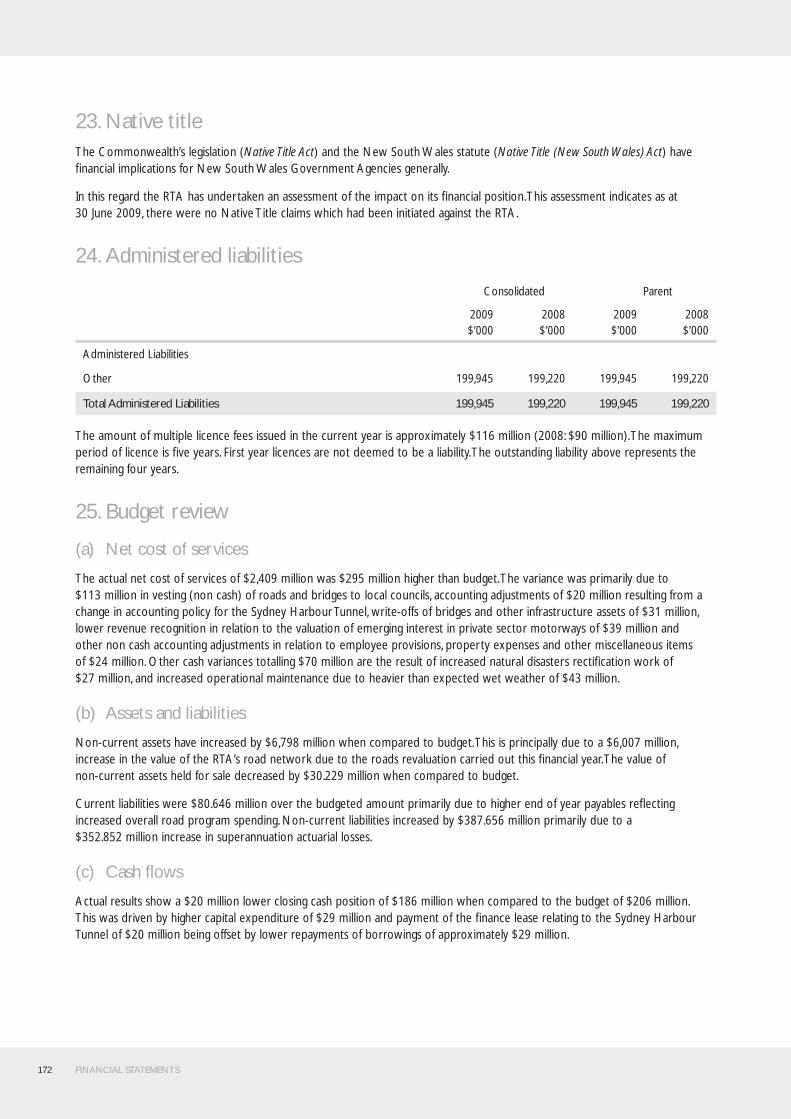
172 FINANCIAL STATEMENTS
23. Native titleThe Commonwealth’s legislation (Native Title Act) and the New South Wales statute (Native Title (New South Wales) Act) have fi nancial implications for New South Wales Government Agencies generally.
In this regard the RTA has undertaken an assessment of the impact on its fi nancial position. This assessment indicates as at 30 June 2009, there were no Native Title claims which had been initiated against the RTA.
24. Administered liabilities
Consolidated Parent
2009$’000
2008$’000
2009$’000
2008$’000
Administered Liabilities
Other 199,945 199,220 199,945 199,220
Total Administered Liabilities 199,945 199,220 199,945 199,220
The amount of multiple licence fees issued in the current year is approximately $116 million (2008: $90 million). The maximum period of licence is fi ve years. First year licences are not deemed to be a liability. The outstanding liability above represents the remaining four years.
25. Budget review
(a) Net cost of services
The actual net cost of services of $2,409 million was $295 million higher than budget. The variance was primarily due to $113 million in vesting (non cash) of roads and bridges to local councils, accounting adjustments of $20 million resulting from a change in accounting policy for the Sydney Harbour Tunnel, write-offs of bridges and other infrastructure assets of $31 million, lower revenue recognition in relation to the valuation of emerging interest in private sector motorways of $39 million and other non cash accounting adjustments in relation to employee provisions, property expenses and other miscellaneous items of $24 million. Other cash variances totalling $70 million are the result of increased natural disasters rectifi cation work of $27 million, and increased operational maintenance due to heavier than expected wet weather of $43 million.
(b) Assets and liabilities
Non-current assets have increased by $6,798 million when compared to budget. This is principally due to a $6,007 million, increase in the value of the RTA’s road network due to the roads revaluation carried out this fi nancial year. The value of non-current assets held for sale decreased by $30.229 million when compared to budget.
Current liabilities were $80.646 million over the budgeted amount primarily due to higher end of year payables refl ecting increased overall road program spending. Non-current liabilities increased by $387.656 million primarily due to a $352.852 million increase in superannuation actuarial losses.
(c) Cash fl ows
Actual results show a $20 million lower closing cash position of $186 million when compared to the budget of $206 million. This was driven by higher capital expenditure of $29 million and payment of the fi nance lease relating to the Sydney Harbour Tunnel of $20 million being offset by lower repayments of borrowings of approximately $29 million.

FINANCIAL STATEMENTS 173
26. Reconciliation of cash fl ows from operating activities to net cost of services
Reconciliation of cash fl ows from operating activities to the net cost of services as reported in the operating statement.
Consolidated Parent
2009$’000
2008$’000
2009$’000
2008$’000
Net Cash used on Operating Activities 2,296,598 1,874,955 2,296,598 1,874,955
Cash Flows from Government/Appropriations (3,723,045) (3,202,029) (3,723,045) (3,202,029)
Adjustments for revenues & expenses not involving cash
Non-cash/Revenue/expenses
Tugun Bypass - 143,949 - 143,949
Net (loss)/gain on sale of plant and equipment 1,213 15,692 1,213 15,692
Right to receive on PSPI 90,686 84,668 90,686 84,668
Roads and bridges transferred to Councils (112,649) (66,086) (112,649) (66,086)
Infrastructure assets written down (Note 6 (a)) (30,997) (157,829) (30,997) (157,829)
Depreciation/amortisation (853,456) (836,429) (853,456) (836,429)
Non cash personnel services - - (352,852) (135,222)
Other (1,542) (6,022) (1,542) (6,022)
(906,745) (822,057) (1,259,597) (957,279)
Adjustments for cash movement in operating assets and liabilities
Increase/(Decrease) in receivables 15,485 20,617 15,485 20,617
Increase/(Decrease) in inventories 470 2,211 470 2,211
(Increase)/Decrease in creditors (68,060) (12,594) (68,060) (12,594)
(Increase)/Decrease in provisions* (23,718) 4,833 (23,718) 4,833
(75,823) 15,067 (75,823) 15,067
Net Cost of Services (as per operating statement) (2,409,015) (2,134,064) (2,761,867) (2,269,286)
* Excludes non-cash adjustments of $352.852 million (2008: $135.222 million) relating to superannuation actuarial losses against employee provisions.
27. Non cash fi nancing and investing activities
Non-cash/Revenue/expenses
Tugun Bypass - 143,949 - 143,949
Right to receive on PSPI 90,686 84,668 90,686 84,668
90,686 228,617 90,686 228,617
Investing and fi nancing transactions which did not result in cash fl ows are the grant given by the Queensland Department of Motor Transport (Tugun Bypass) and the emerging interest of the private sector provided infrastructure (PSPI).
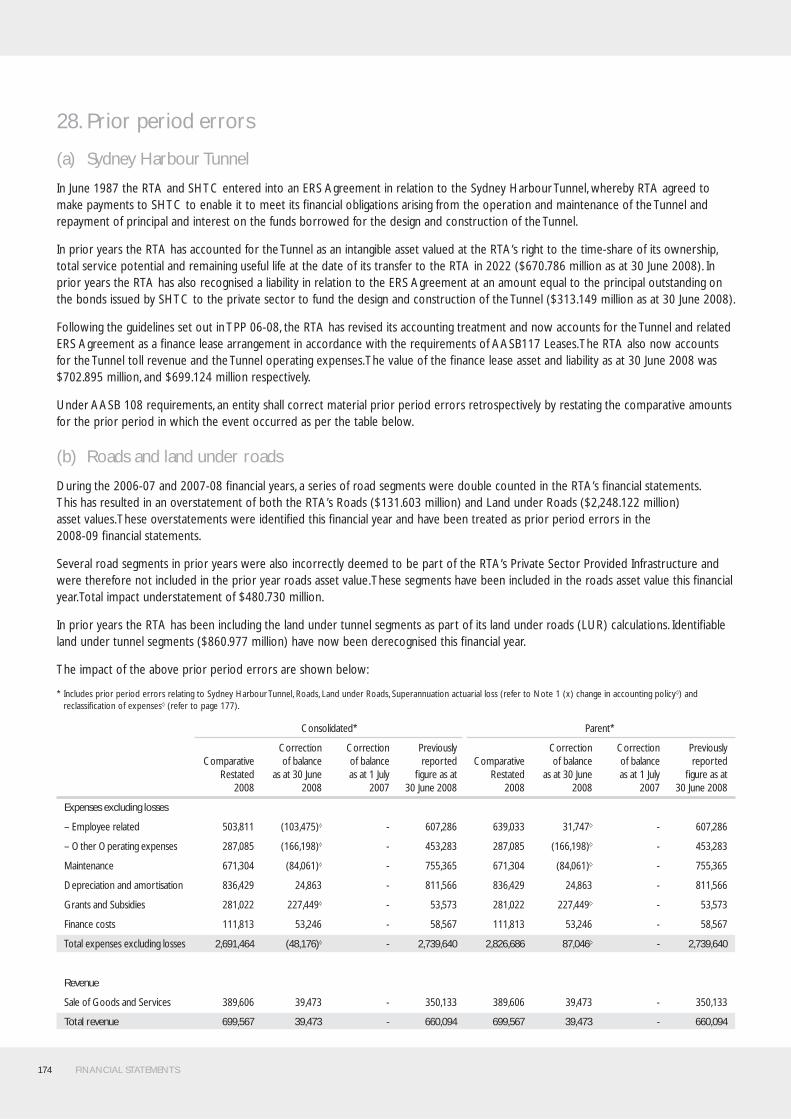
174 FINANCIAL STATEMENTS
28. Prior period errors
(a) Sydney Harbour Tunnel
In June 1987 the RTA and SHTC entered into an ERS Agreement in relation to the Sydney Harbour Tunnel, whereby RTA agreed to make payments to SHTC to enable it to meet its fi nancial obligations arising from the operation and maintenance of the Tunnel and repayment of principal and interest on the funds borrowed for the design and construction of the Tunnel.
In prior years the RTA has accounted for the Tunnel as an intangible asset valued at the RTA’s right to the time-share of its ownership, total service potential and remaining useful life at the date of its transfer to the RTA in 2022 ($670.786 million as at 30 June 2008). In prior years the RTA has also recognised a liability in relation to the ERS Agreement at an amount equal to the principal outstanding on the bonds issued by SHTC to the private sector to fund the design and construction of the Tunnel ($313.149 million as at 30 June 2008).
Following the guidelines set out in TPP 06-08, the RTA has revised its accounting treatment and now accounts for the Tunnel and related ERS Agreement as a fi nance lease arrangement in accordance with the requirements of AASB117 Leases. The RTA also now accounts for the Tunnel toll revenue and the Tunnel operating expenses. The value of the fi nance lease asset and liability as at 30 June 2008 was $702.895 million, and $699.124 million respectively.
Under AASB 108 requirements, an entity shall correct material prior period errors retrospectively by restating the comparative amounts for the prior period in which the event occurred as per the table below.
(b) Roads and land under roads
During the 2006-07 and 2007-08 fi nancial years, a series of road segments were double counted in the RTA’s fi nancial statements. This has resulted in an overstatement of both the RTA’s Roads ($131.603 million) and Land under Roads ($2,248.122 million) asset values. These overstatements were identifi ed this fi nancial year and have been treated as prior period errors in the 2008-09 fi nancial statements.
Several road segments in prior years were also incorrectly deemed to be part of the RTA’s Private Sector Provided Infrastructure and were therefore not included in the prior year roads asset value. These segments have been included in the roads asset value this fi nancial year. Total impact understatement of $480.730 million.
In prior years the RTA has been including the land under tunnel segments as part of its land under roads (LUR) calculations. Identifi able land under tunnel segments ($860.977 million) have now been derecognised this fi nancial year.
The impact of the above prior period errors are shown below:
* Includes prior period errors relating to Sydney Harbour Tunnel, Roads, Land under Roads, Superannuation actuarial loss (refer to Note 1 (x) change in accounting policy ) and reclassifi cation of expenses (refer to page 177).
Consolidated* Parent*
Comparative Restated
2008
Correction of balance
as at 30 June 2008
Correction of balance as at 1 July
2007
Previously reported
fi gure as at 30 June 2008
Comparative Restated
2008
Correction of balance
as at 30 June 2008
Correction of balance as at 1 July
2007
Previously reported
fi gure as at30 June 2008
Expenses excluding losses
– Employee related 503,811 (103,475) - 607,286 639,033 31,747 - 607,286
– Other Operating expenses 287,085 (166,198) - 453,283 287,085 (166,198) - 453,283
Maintenance 671,304 (84,061) - 755,365 671,304 (84,061) - 755,365
Depreciation and amortisation 836,429 24,863 - 811,566 836,429 24,863 - 811,566
Grants and Subsidies 281,022 227,449 - 53,573 281,022 227,449 - 53,573
Finance costs 111,813 53,246 - 58,567 111,813 53,246 - 58,567
Total expenses excluding losses 2,691,464 (48,176) - 2,739,640 2,826,686 87,046 - 2,739,640
Revenue
Sale of Goods and Services 389,606 39,473 - 350,133 389,606 39,473 - 350,133
Total revenue 699,567 39,473 - 660,094 699,567 39,473 - 660,094
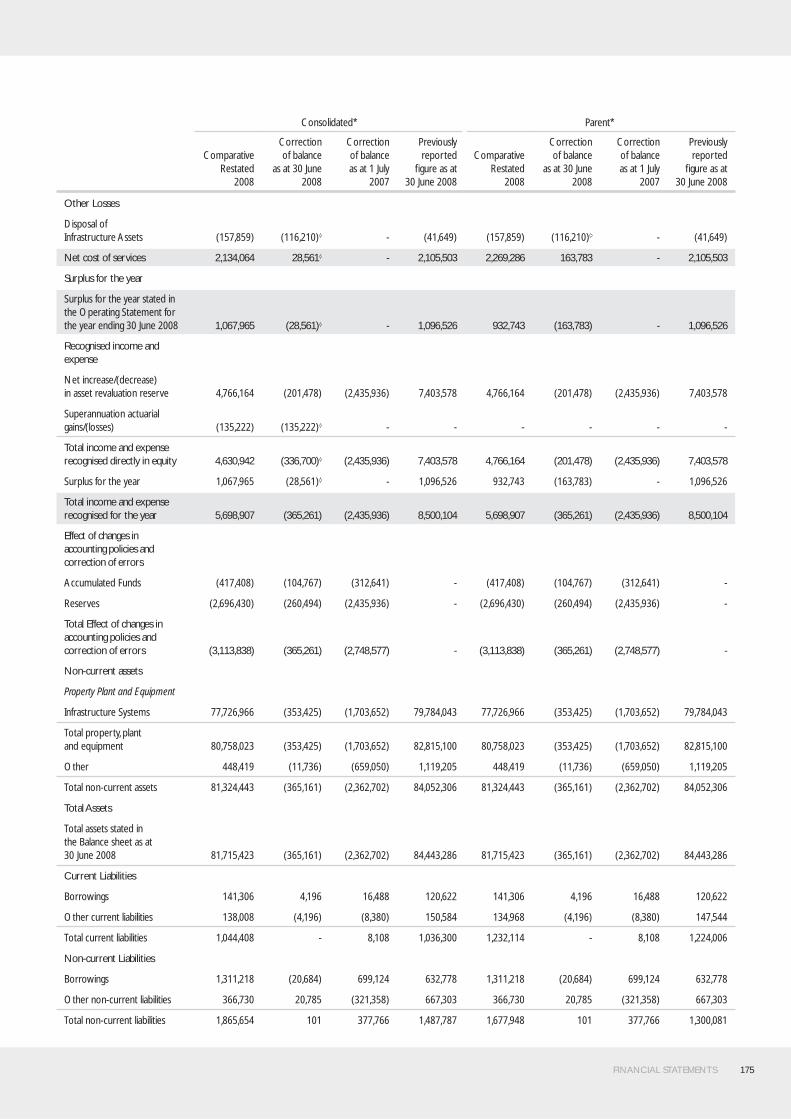
FINANCIAL STATEMENTS 175
Consolidated* Parent*
Comparative Restated
2008
Correction of balance
as at 30 June 2008
Correction of balance as at 1 July
2007
Previously reported
fi gure as at 30 June 2008
Comparative Restated
2008
Correction of balance
as at 30 June 2008
Correction of balance as at 1 July
2007
Previously reported
fi gure as at30 June 2008
Other Losses
Disposal of Infrastructure Assets (157,859) (116,210) - (41,649) (157,859) (116,210) - (41,649)
Net cost of services 2,134,064 28,561 - 2,105,503 2,269,286 163,783 - 2,105,503
Surplus for the year
Surplus for the year stated in the Operating Statement for the year ending 30 June 2008 1,067,965 (28,561) - 1,096,526 932,743 (163,783) - 1,096,526
Recognised income and expense
Net increase/(decrease) in asset revaluation reserve 4,766,164 (201,478) (2,435,936) 7,403,578 4,766,164 (201,478) (2,435,936) 7,403,578
Superannuation actuarial gains/(losses) (135,222) (135,222) - - - - - -
Total income and expense recognised directly in equity 4,630,942 (336,700) (2,435,936) 7,403,578 4,766,164 (201,478) (2,435,936) 7,403,578
Surplus for the year 1,067,965 (28,561) - 1,096,526 932,743 (163,783) - 1,096,526
Total income and expense recognised for the year 5,698,907 (365,261) (2,435,936) 8,500,104 5,698,907 (365,261) (2,435,936) 8,500,104
Effect of changes in accounting policies and correction of errors
Accumulated Funds (417,408) (104,767) (312,641) - (417,408) (104,767) (312,641) -
Reserves (2,696,430) (260,494) (2,435,936) - (2,696,430) (260,494) (2,435,936) -
Total Effect of changes in accounting policies and correction of errors (3,113,838) (365,261) (2,748,577) - (3,113,838) (365,261) (2,748,577) -
Non-current assets
Property Plant and Equipment
Infrastructure Systems 77,726,966 (353,425) (1,703,652) 79,784,043 77,726,966 (353,425) (1,703,652) 79,784,043
Total property, plant and equipment 80,758,023 (353,425) (1,703,652) 82,815,100 80,758,023 (353,425) (1,703,652) 82,815,100
Other 448,419 (11,736) (659,050) 1,119,205 448,419 (11,736) (659,050) 1,119,205
Total non-current assets 81,324,443 (365,161) (2,362,702) 84,052,306 81,324,443 (365,161) (2,362,702) 84,052,306
Total Assets
Total assets stated in the Balance sheet as at 30 June 2008 81,715,423 (365,161) (2,362,702) 84,443,286 81,715,423 (365,161) (2,362,702) 84,443,286
Current Liabilities
Borrowings 141,306 4,196 16,488 120,622 141,306 4,196 16,488 120,622
Other current liabilities 138,008 (4,196) (8,380) 150,584 134,968 (4,196) (8,380) 147,544
Total current liabilities 1,044,408 - 8,108 1,036,300 1,232,114 - 8,108 1,224,006
Non-current Liabilities
Borrowings 1,311,218 (20,684) 699,124 632,778 1,311,218 (20,684) 699,124 632,778
Other non-current liabilities 366,730 20,785 (321,358) 667,303 366,730 20,785 (321,358) 667,303
Total non-current liabilities 1,865,654 101 377,766 1,487,787 1,677,948 101 377,766 1,300,081
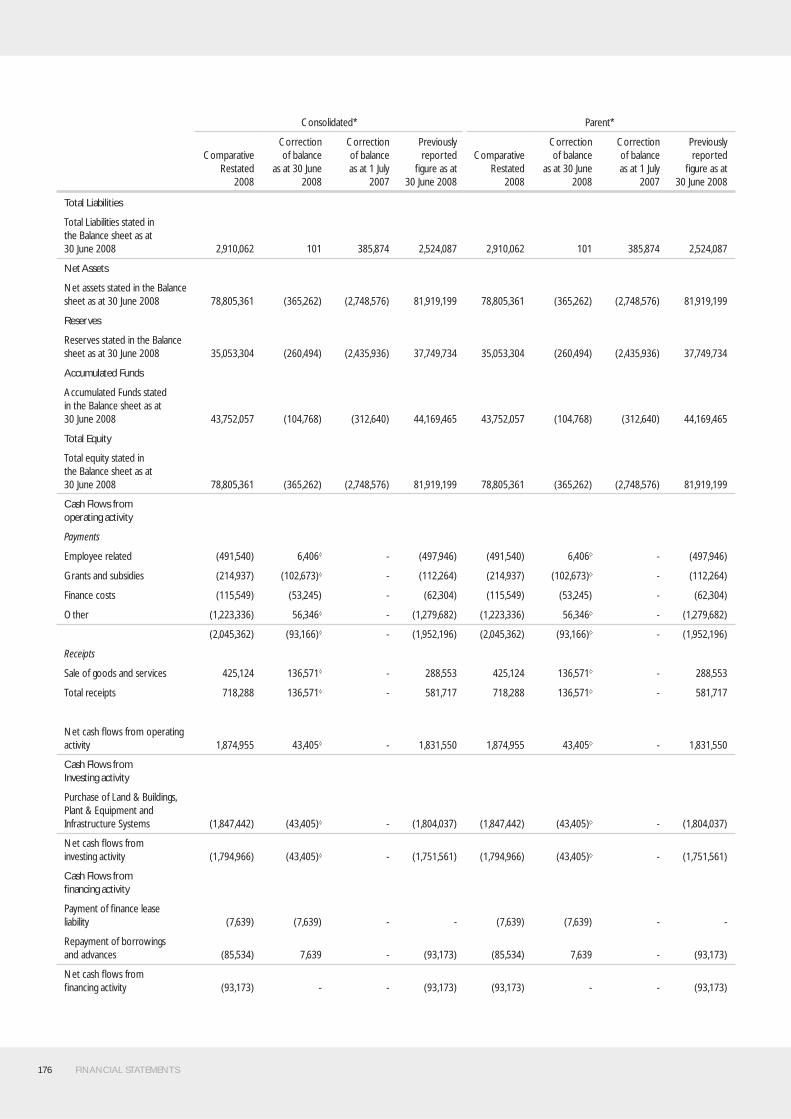
176 FINANCIAL STATEMENTS
Consolidated* Parent*
Comparative Restated
2008
Correction of balance
as at 30 June 2008
Correction of balance as at 1 July
2007
Previously reported
fi gure as at 30 June 2008
Comparative Restated
2008
Correction of balance
as at 30 June 2008
Correction of balance as at 1 July
2007
Previously reported
fi gure as at30 June 2008
Total Liabilities
Total Liabilities stated in the Balance sheet as at 30 June 2008 2,910,062 101 385,874 2,524,087 2,910,062 101 385,874 2,524,087
Net Assets
Net assets stated in the Balance sheet as at 30 June 2008 78,805,361 (365,262) (2,748,576) 81,919,199 78,805,361 (365,262) (2,748,576) 81,919,199
Reserves
Reserves stated in the Balance sheet as at 30 June 2008 35,053,304 (260,494) (2,435,936) 37,749,734 35,053,304 (260,494) (2,435,936) 37,749,734
Accumulated Funds
Accumulated Funds stated in the Balance sheet as at 30 June 2008 43,752,057 (104,768) (312,640) 44,169,465 43,752,057 (104,768) (312,640) 44,169,465
Total Equity
Total equity stated in the Balance sheet as at 30 June 2008 78,805,361 (365,262) (2,748,576) 81,919,199 78,805,361 (365,262) (2,748,576) 81,919,199
Cash Flows from operating activity
Payments
Employee related (491,540) 6,406 - (497,946) (491,540) 6,406 - (497,946)
Grants and subsidies (214,937) (102,673) - (112,264) (214,937) (102,673) - (112,264)
Finance costs (115,549) (53,245) - (62,304) (115,549) (53,245) - (62,304)
Other (1,223,336) 56,346 - (1,279,682) (1,223,336) 56,346 - (1,279,682)
(2,045,362) (93,166) - (1,952,196) (2,045,362) (93,166) - (1,952,196)
Receipts
Sale of goods and services 425,124 136,571 - 288,553 425,124 136,571 - 288,553
Total receipts 718,288 136,571 - 581,717 718,288 136,571 - 581,717
Net cash fl ows from operating activity 1,874,955 43,405 - 1,831,550 1,874,955 43,405 - 1,831,550
Cash Flows from Investing activity
Purchase of Land & Buildings, Plant & Equipment and Infrastructure Systems (1,847,442) (43,405) - (1,804,037) (1,847,442) (43,405) - (1,804,037)
Net cash fl ows from investing activity (1,794,966) (43,405) - (1,751,561) (1,794,966) (43,405) - (1,751,561)
Cash Flows from fi nancing activity
Payment of fi nance lease liability (7,639) (7,639) - - (7,639) (7,639) - -
Repayment of borrowings and advances (85,534) 7,639 - (93,173) (85,534) 7,639 - (93,173)
Net cash fl ows from fi nancing activity (93,173) - - (93,173) (93,173) - - (93,173)
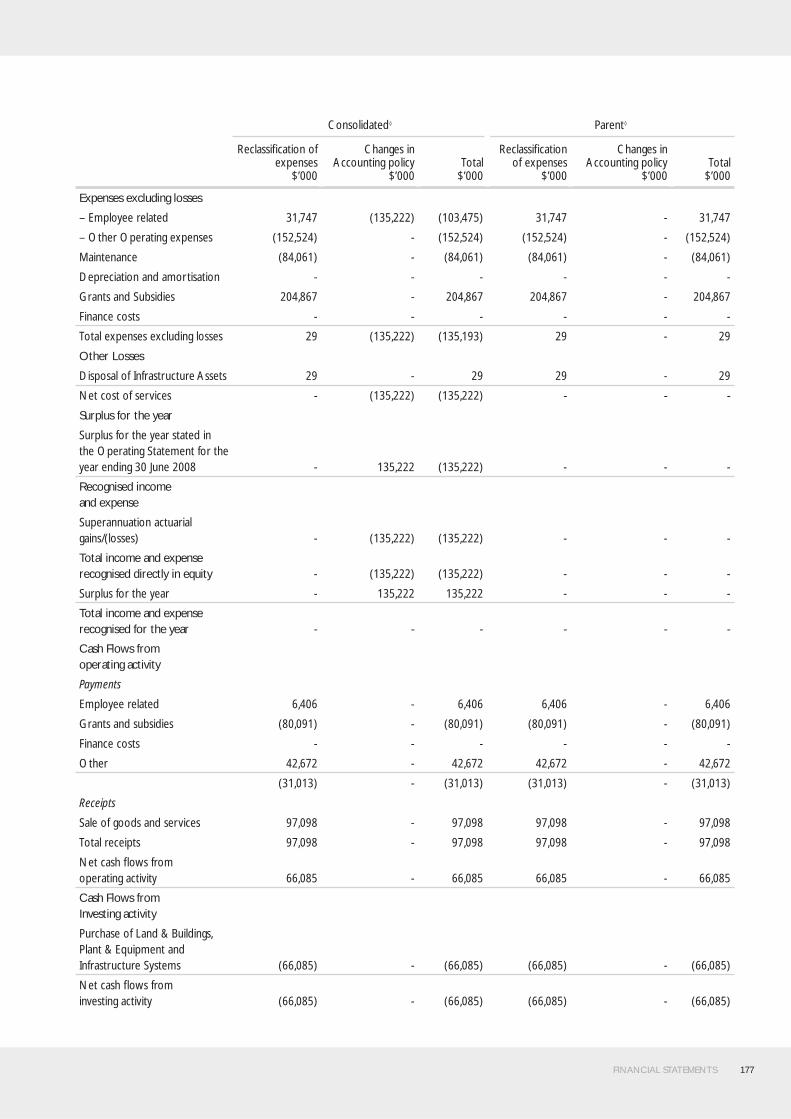
FINANCIAL STATEMENTS 177
Consolidated Parent
Reclassifi cation of expenses
$’000
Changes in Accounting policy
$’000Total
$’000
Reclassifi cation of expenses
$’000
Changes in Accounting policy
$’000Total
$’000
Expenses excluding losses
– Employee related 31,747 (135,222) (103,475) 31,747 - 31,747
– Other Operating expenses (152,524) - (152,524) (152,524) - (152,524)
Maintenance (84,061) - (84,061) (84,061) - (84,061)
Depreciation and amortisation - - - - - -
Grants and Subsidies 204,867 - 204,867 204,867 - 204,867
Finance costs - - - - - -
Total expenses excluding losses 29 (135,222) (135,193) 29 - 29
Other Losses
Disposal of Infrastructure Assets 29 - 29 29 - 29
Net cost of services - (135,222) (135,222) - - -
Surplus for the year
Surplus for the year stated in the Operating Statement for the year ending 30 June 2008 - 135,222 (135,222) - - -
Recognised income and expense
Superannuation actuarial gains/(losses) - (135,222) (135,222) - - -
Total income and expense recognised directly in equity - (135,222) (135,222) - - -
Surplus for the year - 135,222 135,222 - - -
Total income and expense recognised for the year - - - - - -
Cash Flows from operating activity
Payments
Employee related 6,406 - 6,406 6,406 - 6,406
Grants and subsidies (80,091) - (80,091) (80,091) - (80,091)
Finance costs - - - - - -
Other 42,672 - 42,672 42,672 - 42,672
(31,013) - (31,013) (31,013) - (31,013)
Receipts
Sale of goods and services 97,098 - 97,098 97,098 - 97,098
Total receipts 97,098 - 97,098 97,098 - 97,098
Net cash fl ows from operating activity 66,085 - 66,085 66,085 - 66,085
Cash Flows from Investing activity
Purchase of Land & Buildings, Plant & Equipment and Infrastructure Systems (66,085) - (66,085) (66,085) - (66,085)
Net cash fl ows from investing activity (66,085) - (66,085) (66,085) - (66,085)

178 FINANCIAL STATEMENTS
Ro
ad D
evel
opm
ent
Road
Man
agem
ent
Road
Use
M4/
M5
Cas
hbac
k Sc
hem
eTo
tal
Serv
ice G
roup
Sta
tem
ents
Expe
nses
and
Inco
me*
Com
para
tive
Rest
ated
20
08$’
000
Cor
rect
ion
of
balan
ce a
s at
30 Ju
ne 2
008
$’00
0
Prev
ious
ly re
port
ed
fi gur
e as
at
30
June
20
08$’
000
Com
para
tive
Rest
ated
20
08$’
000
Cor
rect
ion
of b
alanc
e as
at 3
0 Ju
ne 2
008
$’00
0
Prev
ious
ly re
port
ed
fi gur
e as
at
30
June
20
08$’
000
Com
para
tive
Rest
ated
20
08$’
000
Cor
rect
ion
of b
alanc
e as
at 3
0 Ju
ne 2
008
$’00
0
Prev
ious
ly re
port
ed
fi gur
e as
at
30
June
20
08$’
000
Com
para
tive
Rest
ated
20
08$’
000
Cor
rect
ion
of b
alanc
e as
at 3
0 Ju
ne 2
008
$’00
0
Prev
ious
ly re
port
ed
fi gur
e as
at
30
June
20
08$’
000
Com
para
tive
Rest
ated
20
08$’
000
Cor
rect
ion
of b
alanc
e as
at 3
0 Ju
ne 2
008
$’00
0
Prev
ious
ly re
port
ed
fi gur
e as
at
30
June
20
08$’
000
Expe
nses
exc
ludi
ng lo
sses
Ope
ratin
g Ex
pens
es
Empl
oyee
relat
ed11
,043
9
,188
1
,855
2
00,3
01
(168
,360
) 3
68,6
61
288
,012
5
1,24
2 2
36,7
70
4,4
55
4,4
55
- 5
03,8
11
(103
,475
) 6
07,2
86
Oth
er O
pera
ting
Expe
nses
- (1
62,5
92)
162
,592
90
,165
4
5 90
,120
1
00,8
02
(4,1
09)
104
,911
96
,118
4
58
95,6
60
287
,085
(1
66,1
98)
453
,283
Main
tena
nce
- -
- 6
71,3
04
(84,
061)
755
,365
-
- -
- -
- 6
71,3
04
(84,
061)
755
,365
Dep
recia
tion
&
Am
ortis
atio
n-
(794
,309
) 7
94,3
09
826
,155
8
18,5
62
7,5
93
10,2
74
610
9
,664
-
- -
836
,429
24
,863
811
,566
Gra
nts &
Sub
sidie
s-
--
270
,953
2
70,9
53
- 10
,069
(4
3,50
4)53
,573
-
- -
281
,022
2
27,4
49
53,5
73
Finan
ce C
osts
- (5
8,56
7)58
,567
1
11,8
13
111
,813
-
- -
- -
- -
111
,813
5
3,24
6 58
,567
Tota
l Exp
ense
s ex
clud
ing
loss
es11
,043
(1
,006
,280
)1,
017,
323
2,17
0,69
1 9
48,9
52
1,22
1,73
9 40
9,15
7 4
,239
4
04,9
18
100
,573
4
,913
95
,660
2,
691,
464
(48,
176)
2,73
9,64
0
Reve
nue
Sale
of g
oods
& se
rvice
s-
(52,
557)
52,5
57
137
,253
(4
5,57
7) 1
82,8
30
252
,353
1
37,6
07
114
,746
-
- -
389
,606
3
9,47
3 3
50,1
33
Inve
stm
ent r
even
ue-
(3,0
68)
3,0
68
3,8
39
(768
) 4
,607
11
,513
3
,836
7
,677
-
- -
15,3
52
- 15
,352
Gra
nts &
subs
idie
s13
,775
(1
62,0
62)
175
,837
1
68,3
07
158
,518
9
,789
8
,252
3
,544
4
,708
-
- -
190
,334
-
190
,334
Oth
er R
even
ue-
(104
,275
)10
4,27
5 10
4,27
5 1
04,2
75
- -
--
--
-10
4,27
5-
104,
275
Tota
l Rev
enue
13,7
75
(321
,962
) 3
35,7
37
413
,674
2
16,4
48
197
,226
2
72,1
18
144
,987
1
27,1
31
- -
- 6
99,5
67
39,
473
660
,094
Gain
/(Los
s) o
n di
spos
al-
(15,
692)
15,6
92
15,6
92
15,
692
- -
- -
-
- -
15,6
92
- 15
,692
Oth
er g
ains/
(loss
es)
- 41
,708
(4
1,70
8)(1
57,8
36)
(157
,836
)-
(23)
(82)
59
- -
- (1
57,8
59)
(116
,210
)(4
1,64
9)
Net
Cos
t of S
ervi
ces
(2,7
32)
(710
,334
) 7
07,6
02
1,8
99,1
61
874
,648
1
,024
,513
1
37,0
62
(140
,666
) 2
77,7
28
100
,573
4
,913
9
5,66
0 2
,134
,064
2
8,56
1 2,
105,
503
Gov
t Con
trib
utio
ns-
- -
- -
- -
- -
- -
- 3,
202,
029
- 3,
202,
029
Net
Exp
endi
ture
(In
com
e) fo
r th
e ye
ar(2
,732
)(7
10,3
34)
707
,602
1
,899
,161
8
74,6
48
1,0
24,5
13
137
,062
(1
40,6
66)
277
,728
1
00,5
73
4,9
13
95,
660
(1,0
67,9
65)
28,
561
(1,0
96,5
26)
End of audited fi nancial statements

FINANCIAL STATEMENTS 179
Independent audit Report (page 1)
180 FINANCIAL STATEMENTS
Independent audit report (page 2)
FINANCIAL STATEMENTS 181
Statement by the Chief Executive and the Director, Finance and Performance
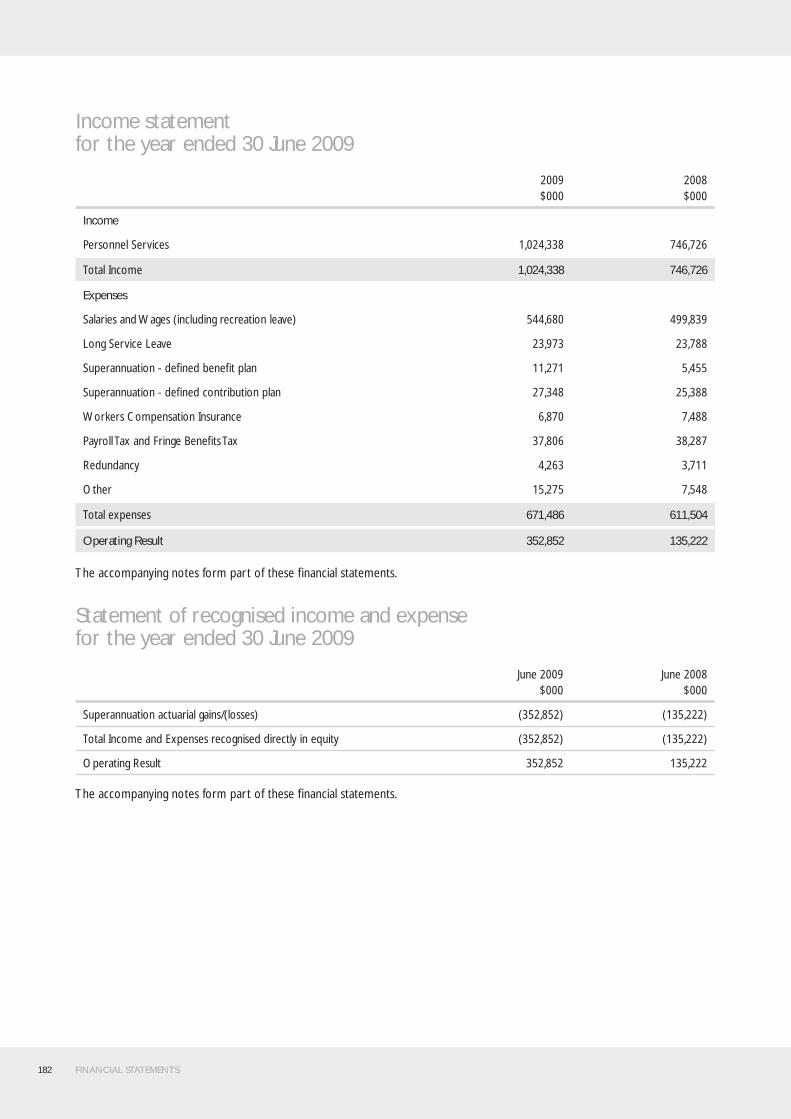
182 FINANCIAL STATEMENTS
Income statementfor the year ended 30 June 2009
2009$000
2008$000
Income
Personnel Services 1,024,338 746,726
Total Income 1,024,338 746,726
Expenses
Salaries and Wages (including recreation leave) 544,680 499,839
Long Service Leave 23,973 23,788
Superannuation - defi ned benefi t plan 11,271 5,455
Superannuation - defi ned contribution plan 27,348 25,388
Workers Compensation Insurance 6,870 7,488
Payroll Tax and Fringe Benefi ts Tax 37,806 38,287
Redundancy 4,263 3,711
Other 15,275 7,548
Total expenses 671,486 611,504
Operating Result 352,852 135,222
The accompanying notes form part of these fi nancial statements.
Statement of recognised income and expensefor the year ended 30 June 2009
June 2009$000
June 2008$000
Superannuation actuarial gains/(losses) (352,852) (135,222)
Total Income and Expenses recognised directly in equity (352,852) (135,222)
Operating Result 352,852 135,222
The accompanying notes form part of these fi nancial statements.

FINANCIAL STATEMENTS 183
Balance sheet as at 30 June 2009
Notes30 June 2009
$00030 June 2008
$000
Assets
Receivables 2(a) 860,201 451,279
Total Assets 860,201 451,279
Liabilities
Current Liabilities
Payables 3(a) 88,256 50,080
Provisions 3(b) 237,469 213,493
Total Current Liabilities 325,725 263,573
Non-current Liabilities
Provisions 3(c) 534,476 187,706
Total Non-current Liabilities 534,476 187,706
Total Liabilities 860,201 451,279
Net Assets - -
Equity
Accumulated Funds - -
Total Equity - -
The accompanying notes form part of these fi nancial statements.
Cash fl ow statementfor the year ended 30 June 2009
Notes2009$000
2008$000
CASH FLOWS FROM OPERATING ACTIVITIES
Payments
Employee Related - -
Total Payments - -
Receipts
Sale of Services - -
Total Receipts - -
NET CASH FLOWS FROM OPERATING ACTIVITIES - -
CASH FLOWS FROM INVESTING ACTIVITIES - -
CASH FLOWS FROM FINANCING ACTIVITIES - -
NET INCREASE / (DECREASE) IN CASH - -
Opening Cash and Cash Equivalents - -
CLOSING CASH AND CASH EQUIVALENTS - -
The accompanying notes form part of these fi nancial statements.
184 FINANCIAL STATEMENTS
Notes to and forming part of the fi nancial statements of the Roads and Traffi c Authority Division for the year ended 30 June 2009
1. Summary of signifi cant accounting policies
(a) Reporting entity
The Roads and Traffi c Authority Division (The Division) is a division of the Government Service of NSW, established pursuant to Part 2 of Schedule 1 of the Public Sector Employment and Management Act 2002 as amended. It is a not-for-profi t entity as profi t is not its principal objective. It is consolidated as part of the NSW Total State Sector Accounts. It is domiciled in Australia and its principal offi ce is at 101 Miller Street, North Sydney, NSW.
The Division’s objective is to provide personnel services to the Roads and Traffi c Authority of NSW (RTA).
These fi nancial statements have been authorised for issue by the Audit Committee on 9 October 2009.
(b) Basis of preparation
The Division’s fi nancial statements represent a general purpose fi nancial report which has been prepared in accordance with:
• applicable Australian Accounting Standards and interpretations (which include Australian equivalents to International Financial Reporting Standards (AEIFRS)); and
• the requirements of the Public Finance and Audit Act 1983 and Regulations.
In the event of any inconsistency between accounting standards and legislative requirements, the latter are given precedence.
Generally, the historical cost basis of accounting has been adopted and the fi nancial report does not take into account changing money values or current valuations. However, certain provisions are measured at fair value. See note 1(g).
Judgements, estimates and associated assumptions about carrying values of assets and liabilities that are not readily apparent from other sources are based on historical experience and various other factors that are believed to be reasonable under the circumstance. Actual results may differ from these estimates. The estimates and underlying assumptions are reviewed on an ongoing basis. Revisions to accounting estimates are recognised in the period in which the estimate is revised. Judgements, estimates and assumptions made by management are disclosed in the relevant notes to the fi nancial statements.
Accounting policies are selected and applied in a manner which ensures that the resulting fi nancial information satisfi es the concepts of relevance and reliability.
Unless otherwise stated all amounts are rounded to the nearest one thousand dollars ($’000) and are expressed in Australian currency.
(c) New accounting standards and interpretation
The Division did not early adopt any new accounting standards that are not yet effective.
The following new Accounting Standards and Interpretations have not yet been adopted and are not effective as at 30 June 2009:

FINANCIAL STATEMENTS 185
AASB & Interpretations AASB Standards & Interpretations
AASB 123 AASB 123 Borrowing Costs and 2007-6 Amendments to Australian Accounting Standards arising from AASB 123 [AASB 1, AASB 101, AASB 107, AASB 111, AASB 116 & AASB 138 and Interpretations 1 & 12] (1 January 2009)
AASB 101 AASB 101 Presentation of Financial Statements, 2007-8 Amendments to Australian Accounting Standards arising from AASB 101 and AASB 2007-10 Further Amendments to Australian Accounting Standards arising from AASB 101 (1 January 2009)
AASB 3 AASB 3 Business Combinations and 2008-3 Amendments to Australian Accounting Standards arising from AASB 3 and AASB 127 and 2008-11 Amendments to Australian Accounting Standard – Business Combinations among Not-for-Profi t Entities [AASB 3] (1 July 2009)
AASB 127 AASB 127 Consolidated and Separate Financial Statements (1 July 2009)
AASB 2008-5 AASB 2008-5 Amendments to Australian Accounting Standards arising from the Annual Improvements Project [AASB 5, 7, 101, 102, 107, 108, 110, 116, 118, 119, 120, 123, 127, 128, 129, 131, 132, 134, 136, 138, 139, 140, 141, 1023 & 1038] (1 January 2009)
AASB 2008-6 AASB 2008-6 Further Amendments to Australian Accounting Standards arising from the Annual Improvements Project [AASB 1 and AASB 5] (1 July 2009)
AASB 2008-8 AASB 2008-8 Amendments to Australian Accounting Standards – Eligible Hedged Items [AASB 139] (1 July 2009)
AASB 2008-13 AASB 2008-13 Amendments to Australian Accounting Standards arising from AASB Interpretation 17 – Distributions of Non-cash Assets to Owners [AASB 5 and AASB 10] (1 July 2009)
Interpretation 18 Interpretation 18 Transfers of Assets from Customers (ending 1 July 2009)
It is considered that the adoption of these Standards and Interpretations in future periods will have no material fi nancial impact on the fi nancial statements of the Division.
(d) Income recognition
Income is measured at the fair value of the consideration received or receivable. Revenue from the rendering of personnel services is recognised when the service is provided and only to the extent that the associated recoverable expenses are recognised.
(e) Receivables
A receivable is recognised when it is probable that the future cash infl ows associated with it will be realised and it has a value that can be measured reliably. It is derecognised when the contractual or other rights to future cash fl ows from it expire or are transferred.
Receivables are recognised initially at fair value, usually based on the transaction cost or face value. Subsequent measurement is at amortised cost using the effective interest method, less an allowance for any impairment of receivables. Short-term receivables with no stated interest rate are measured at the original invoice amount where the effect of discounting is immaterial. An allowance for impairment of receivables is established when there is objective evidence that the entity will not be able to collect all amounts due. The amount of the allowance is the difference between the asset’s carrying amount and the present value of estimated future cash fl ows, discounted at the effective interest rate. Bad debts are written off as incurred.
(f) Payables
Payables include accrued wages, salaries, and related on costs (such as payroll tax, fringe benefi ts tax and workers’ compensation insurance) where there is certainty as to the amount and timing of settlement.
A payable is recognised when a present obligation arises under a contract or otherwise. It is derecognised when the obligation expires or is discharged, cancelled or substituted.
Payables are recognised initially at fair value, usually based on the transaction cost or face value. Subsequent measurement is at amortised cost using the effective interest method. Short-term payables with no stated interest rate are measured at the original invoice amount where the effect of discounting is immaterial.
186 FINANCIAL STATEMENTS
(g) Employee benefi t provisions and expenses
Provisions are made for liabilities of uncertain amount or uncertain timing of settlement.
Employee benefi t provisions represent expected amounts payable in the future in respect of unused entitlements accumulated as at the reporting date. Liabilities associated with, but that are not, employee benefi ts (such as payroll tax) are recognised separately.
Superannuation and leave liabilities are recognised as expenses and provisions when the obligations arise, which is usually through the rendering of service by employees.
Long-term annual leave (i.e. that is not expected to be taken within 12 months) is measured at present value using a discount rate equal to the market yield on government bonds.
Superannuation and long service leave provisions are actuarially assessed at each reporting date and are measured at the present value of the estimated future payments.
All other employee benefi t liabilities (i.e. for benefi ts falling due wholly within 12 months after reporting date) are assessed by management and are measured at the undiscounted amount of the estimated future payments.
The amount recognised for superannuation provision is the net total of the present value of the defi ned benefi t obligation at the reporting date, minus the fair value at that date of any plan assets out of which the obligation are to be settled directly.
The amount recognised in the income statement for superannuation is the net total of current service cost, interest cost, and the expected return on any plan assets. Actuarial gains or losses are recognised outside profi t and loss in the Statement of Recognised Income and Expense in the year they occur.
The actuarial assessment of superannuation provisions uses the Projected Unit Credit Method and refl ects estimated future salary increases and the benefi ts set out in the terms of the plan. The liabilities are discounted using the market yield rate on government bonds of similar maturity to those obligations. Actuarial assumptions are unbiased and mutually compatible and fi nancial assumptions are based on market expectations for the period over which the obligations are to be settled.
In accordance with AASB 101, all annual leave and unconditional long service leave are classifi ed as current liabilities, even where the Division does not expect to settle the liability within 12 months. As this does not necessarily align with the distinction between short-term and long-term employee benefi ts under AASB 119, the Division has disclosed the amount expected to be settled after more than 12 months for each liability line item that combines amounts expected to be settled no more than 12 months after the reporting date and more than 12 months after the reporting date.
(h) Comparative information
Except when an Australian Accounting Standard permits or requires otherwise, comparative information is disclosed in respect of the previous period for all amounts reported in the fi nancial statements.
(i) Change in accounting policy
According with NSW Treasury policy, the entity has changed its policy on the recognition of superannuation actuarial gains and losses. Such actuarial gains and losses are now recognised outside of profi t or loss in the ‘statement of recognised income and expense’. Previously, actuarial gains and losses were recognised through profi t or loss. Both options are permissible under AASB 119 Employee Benefi ts.
The change in policy has been adopted on the basis that recognition outside profi t or loss provides reliable and more relevant information as it better refl ects the nature of actuarial gains and losses. This is because actuarial gains/losses are re-measurements, based on assumptions that do not necessarily refl ect the ultimate cost of providing superannuation.
Recognition outside profi t or loss also harmonises better with the Government Finance Statistics / GAAP comprehensive income presentation for the whole of government and general government sector, required under AASB 1049 Whole of Government and General Government Sector Financial Reporting.
A comprehensive income presentation will also be available at the entity level from 2009-10 under AASB 101 Presentation of Financial Statements.
FINANCIAL STATEMENTS 187
2. Current assets
(a) Receivables
30 June 2009$000
30 June 2008$000
Inter entity receivable – RTA 860,201 451,279
3. Current liabilities/non-current liabilities
(a) Payables
Accrued expenses 5,006 6,015
Payroll Tax 5,049 3,040
GST Payable 78,201 41,025
88,256 50,080
(b) Provisions – current
Annual Leave(i) 40,992 38,686
Long service leave(ii) 188,580 167,168
Employee Related on costs 7,897 7,639
237,469 213,493
(c) Provisions – non-current
Superannuation 499,564 155,495
Long Service Leave 7,858 7,962
Employee related on costs 27,054 24,249
534,476 187,706
(d) Aggregate employee benefi ts and related on-costs
Provisions – current 237,469 213,493
Provisions – non-current 534,476 187,706
Accrued salaries, wages and on-costs 5,006 6,015
776,951 407,214
(i) The value of annual leave, including on costs, expected to be taken within 12 months is $35.300 million (2007-08: $32.832 million) and $18.743 million (2007-08: $17.936 million) after 12 months.
(ii) The value of long service leave expected to be taken within 12 months is $25.108 million (2007-08: $24.059 million) and $193.547 million (2007-08: $171.339 million) after 12 months.
Provision for Superannuation
Superannuation statements include both employer and employee superannuation assets and liabilities as prescribed by AASB 119 Employee Benefi ts.
188 FINANCIAL STATEMENTS
General description of the plan
The Pooled Fund holds in trust the investments of the closed NSW public sector superannuation schemes:
• State Authorities Superannuation Scheme (SASS)
• State Superannuation Scheme (SSS)
• State Authorities Non-contributory Superannuation Scheme (SANCS).
These schemes are all defi ned benefi t schemes – at least a component of the fi nal benefi t is derived from a multiple of member salary and years of membership. All the Schemes are closed to new members.
Actuarial gains and losses are recognised outside of profi t or loss in the year they occur.
The following information has been prepared by the scheme actuary.
Superannuation position for AASB 119 purposes
SASSFinancial year to
30 June 2009$000
SANCS Financial year to
30 June 2009$000
SSS Financial year to
30 June 2009$000
Total$000
Accrued liability 491,663 76,059 908,205 1,475,927
Estimated reserve account balance (407,203) (60,656) (508,504) (976,363)
84,460 15,403 399,701 499,564
Future Service Liability (57,447) (28,749) (35,917) (122,113)
Net (asset)/liability to be recognised in balance sheet 84,460 15,403 399,701 499,564
SASSFinancial year to
30 June 2008$000
SANCS Financial year to
30 June 2008$000
SSS Financial year to
30 June 2008$000
Total$000
Accrued liability 472,399 70,460 740,966 1,283,825
Estimated reserve account balance (457,610) (69,275) (601,445) (1,128,330)
14,789 1,185 139,521 155,495
Future Service Liability (53,716) (24,883) (26,379) (104,978)
Net (asset)/liability to be recognised in balance sheet 14,789 1,185 139,521 155,495
All Fund assets are invested by Superannuation Trustee Corporation at arm’s length through independent fund managers.
Reconciliation of the present value of the defi ned benefi t obligation
SASSFinancial year to
30 June 2009$000
SANCS Financial year to
30 June 2009$000
SSS Financial year to
30 June 2009$000
Total$000
Present value of partly funded defi ned benefi t obligation at the beginning of the year 472,399 70,460 740,966 1,283,825
Current service cost 10,691 3,588 4,457 18,736
Interest cost 29,694 4,365 47,470 81,529
Contributions by Fund participants 6,890 - 6,196 13,086
Actuarial (gains)/losses 5,917 3,540 156,888 166,345
Benefi ts paid (33,928) (5,894) (47,772) (87,594)
Present value of partly funded defi ned benefi t obligation at the end of the year 491,663 76,059 908,205 1,475,927
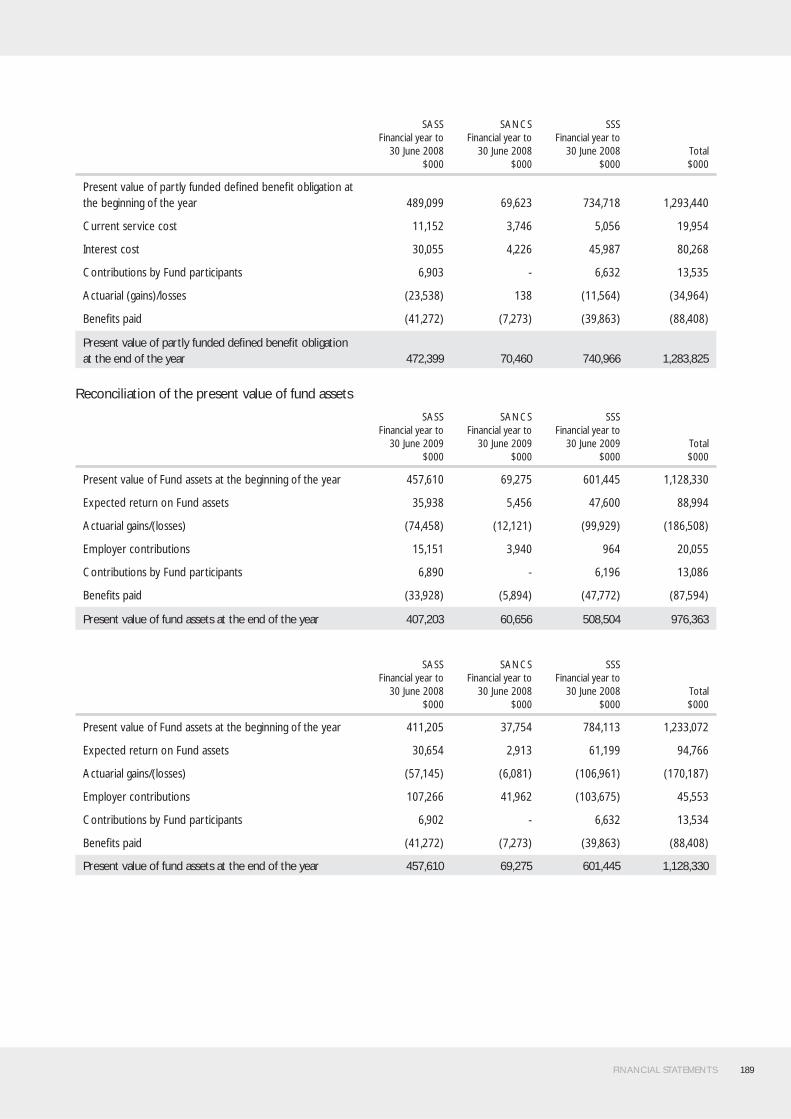
FINANCIAL STATEMENTS 189
SASSFinancial year to
30 June 2008$000
SANCS Financial year to
30 June 2008$000
SSS Financial year to
30 June 2008$000
Total$000
Present value of partly funded defi ned benefi t obligation at the beginning of the year 489,099 69,623 734,718 1,293,440
Current service cost 11,152 3,746 5,056 19,954
Interest cost 30,055 4,226 45,987 80,268
Contributions by Fund participants 6,903 - 6,632 13,535
Actuarial (gains)/losses (23,538) 138 (11,564) (34,964)
Benefi ts paid (41,272) (7,273) (39,863) (88,408)
Present value of partly funded defi ned benefi t obligation at the end of the year 472,399 70,460 740,966 1,283,825
Reconciliation of the present value of fund assets
SASSFinancial year to
30 June 2009$000
SANCS Financial year to
30 June 2009$000
SSS Financial year to
30 June 2009$000
Total$000
Present value of Fund assets at the beginning of the year 457,610 69,275 601,445 1,128,330
Expected return on Fund assets 35,938 5,456 47,600 88,994
Actuarial gains/(losses) (74,458) (12,121) (99,929) (186,508)
Employer contributions 15,151 3,940 964 20,055
Contributions by Fund participants 6,890 - 6,196 13,086
Benefi ts paid (33,928) (5,894) (47,772) (87,594)
Present value of fund assets at the end of the year 407,203 60,656 508,504 976,363
SASSFinancial year to
30 June 2008$000
SANCS Financial year to
30 June 2008$000
SSS Financial year to
30 June 2008$000
Total$000
Present value of Fund assets at the beginning of the year 411,205 37,754 784,113 1,233,072
Expected return on Fund assets 30,654 2,913 61,199 94,766
Actuarial gains/(losses) (57,145) (6,081) (106,961) (170,187)
Employer contributions 107,266 41,962 (103,675) 45,553
Contributions by Fund participants 6,902 - 6,632 13,534
Benefi ts paid (41,272) (7,273) (39,863) (88,408)
Present value of fund assets at the end of the year 457,610 69,275 601,445 1,128,330
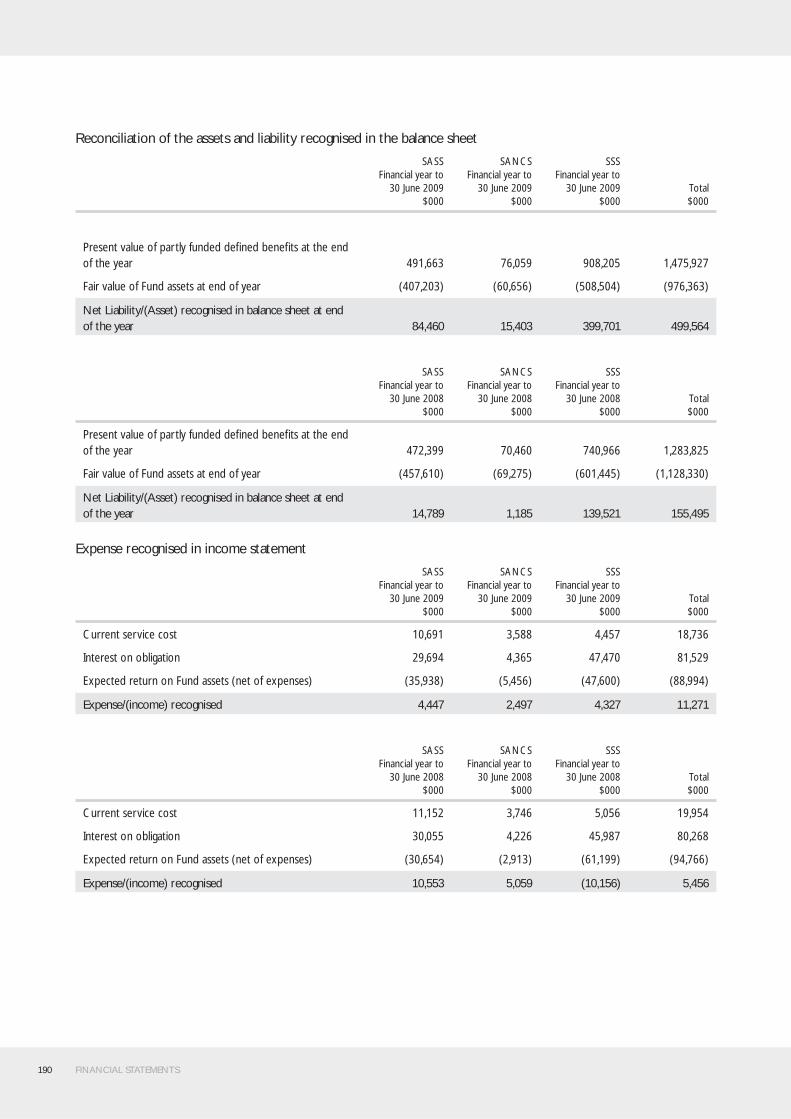
190 FINANCIAL STATEMENTS
Reconciliation of the assets and liability recognised in the balance sheet
SASSFinancial year to
30 June 2009$000
SANCS Financial year to
30 June 2009$000
SSS Financial year to
30 June 2009$000
Total$000
Present value of partly funded defi ned benefi ts at the end of the year 491,663 76,059 908,205 1,475,927
Fair value of Fund assets at end of year (407,203) (60,656) (508,504) (976,363)
Net Liability/(Asset) recognised in balance sheet at end of the year 84,460 15,403 399,701 499,564
SASSFinancial year to
30 June 2008$000
SANCS Financial year to
30 June 2008$000
SSS Financial year to
30 June 2008$000
Total$000
Present value of partly funded defi ned benefi ts at the end of the year 472,399 70,460 740,966 1,283,825
Fair value of Fund assets at end of year (457,610) (69,275) (601,445) (1,128,330)
Net Liability/(Asset) recognised in balance sheet at end of the year 14,789 1,185 139,521 155,495
Expense recognised in income statement
SASSFinancial year to
30 June 2009$000
SANCS Financial year to
30 June 2009$000
SSS Financial year to
30 June 2009$000
Total$000
Current service cost 10,691 3,588 4,457 18,736
Interest on obligation 29,694 4,365 47,470 81,529
Expected return on Fund assets (net of expenses) (35,938) (5,456) (47,600) (88,994)
Expense/(income) recognised 4,447 2,497 4,327 11,271
SASSFinancial year to
30 June 2008$000
SANCS Financial year to
30 June 2008$000
SSS Financial year to
30 June 2008$000
Total$000
Current service cost 11,152 3,746 5,056 19,954
Interest on obligation 30,055 4,226 45,987 80,268
Expected return on Fund assets (net of expenses) (30,654) (2,913) (61,199) (94,766)
Expense/(income) recognised 10,553 5,059 (10,156) 5,456
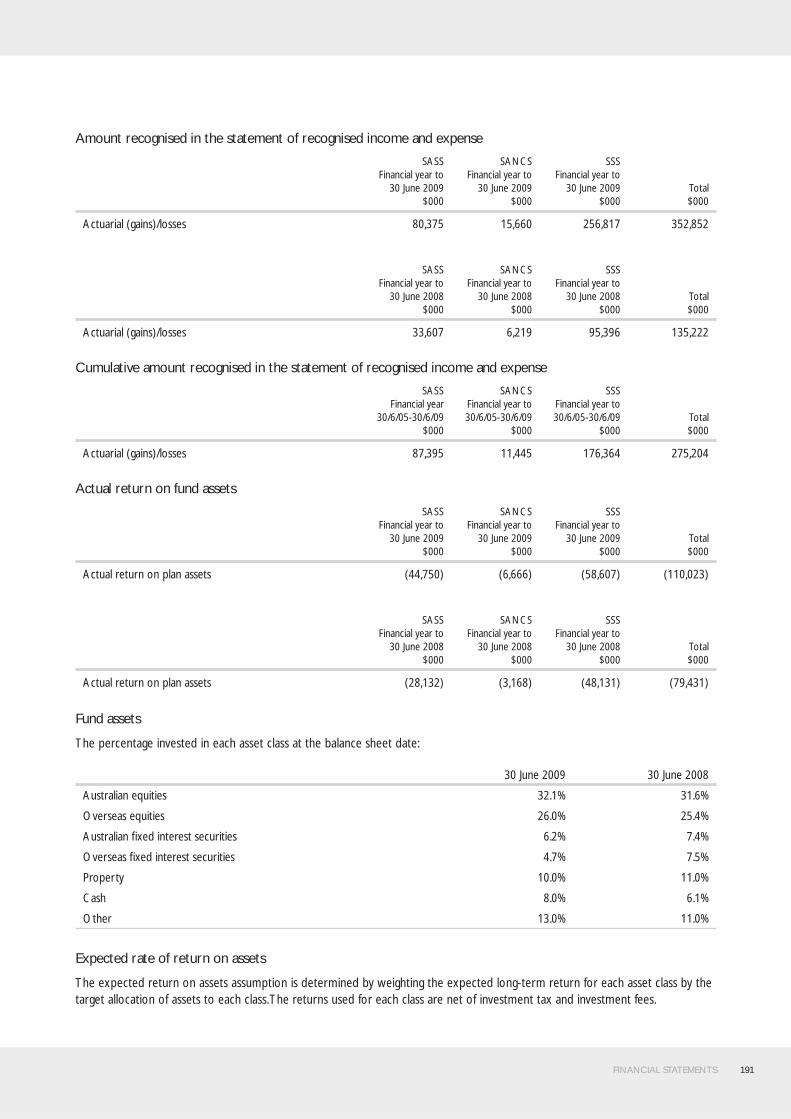
FINANCIAL STATEMENTS 191
Amount recognised in the statement of recognised income and expense
SASSFinancial year to
30 June 2009$000
SANCS Financial year to
30 June 2009$000
SSS Financial year to
30 June 2009$000
Total$000
Actuarial (gains)/losses 80,375 15,660 256,817 352,852
SASSFinancial year to
30 June 2008$000
SANCS Financial year to
30 June 2008$000
SSS Financial year to
30 June 2008$000
Total$000
Actuarial (gains)/losses 33,607 6,219 95,396 135,222
Cumulative amount recognised in the statement of recognised income and expense
SASSFinancial year
30/6/05-30/6/09 $000
SANCS Financial year to 30/6/05-30/6/09
$000
SSS Financial year to 30/6/05-30/6/09
$000Total$000
Actuarial (gains)/losses 87,395 11,445 176,364 275,204
Actual return on fund assets
SASSFinancial year to
30 June 2009$000
SANCS Financial year to
30 June 2009$000
SSS Financial year to
30 June 2009$000
Total$000
Actual return on plan assets (44,750) (6,666) (58,607) (110,023)
SASSFinancial year to
30 June 2008$000
SANCS Financial year to
30 June 2008$000
SSS Financial year to
30 June 2008$000
Total$000
Actual return on plan assets (28,132) (3,168) (48,131) (79,431)
Fund assets
The percentage invested in each asset class at the balance sheet date:
30 June 2009 30 June 2008
Australian equities 32.1% 31.6%
Overseas equities 26.0% 25.4%
Australian fi xed interest securities 6.2% 7.4%
Overseas fi xed interest securities 4.7% 7.5%
Property 10.0% 11.0%
Cash 8.0% 6.1%
Other 13.0% 11.0%
Expected rate of return on assets
The expected return on assets assumption is determined by weighting the expected long-term return for each asset class by the target allocation of assets to each class. The returns used for each class are net of investment tax and investment fees.
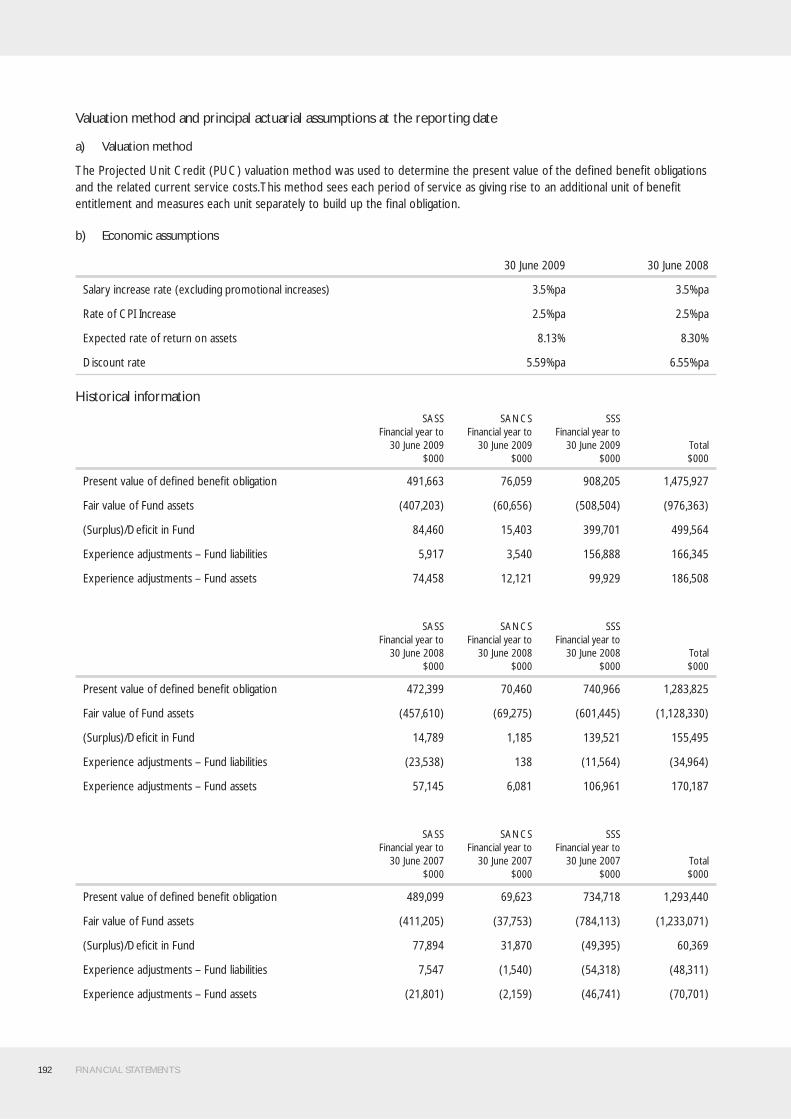
192 FINANCIAL STATEMENTS
Valuation method and principal actuarial assumptions at the reporting date
a) Valuation method
The Projected Unit Credit (PUC) valuation method was used to determine the present value of the defi ned benefi t obligations and the related current service costs. This method sees each period of service as giving rise to an additional unit of benefi t entitlement and measures each unit separately to build up the fi nal obligation.
b) Economic assumptions
30 June 2009 30 June 2008
Salary increase rate (excluding promotional increases) 3.5%pa 3.5%pa
Rate of CPI Increase 2.5%pa 2.5%pa
Expected rate of return on assets 8.13% 8.30%
Discount rate 5.59%pa 6.55%pa
Historical information
SASSFinancial year to
30 June 2009$000
SANCS Financial year to
30 June 2009$000
SSS Financial year to
30 June 2009$000
Total$000
Present value of defi ned benefi t obligation 491,663 76,059 908,205 1,475,927
Fair value of Fund assets (407,203) (60,656) (508,504) (976,363)
(Surplus)/Defi cit in Fund 84,460 15,403 399,701 499,564
Experience adjustments – Fund liabilities 5,917 3,540 156,888 166,345
Experience adjustments – Fund assets 74,458 12,121 99,929 186,508
SASSFinancial year to
30 June 2008$000
SANCS Financial year to
30 June 2008$000
SSS Financial year to
30 June 2008$000
Total$000
Present value of defi ned benefi t obligation 472,399 70,460 740,966 1,283,825
Fair value of Fund assets (457,610) (69,275) (601,445) (1,128,330)
(Surplus)/Defi cit in Fund 14,789 1,185 139,521 155,495
Experience adjustments – Fund liabilities (23,538) 138 (11,564) (34,964)
Experience adjustments – Fund assets 57,145 6,081 106,961 170,187
SASSFinancial year to
30 June 2007$000
SANCS Financial year to
30 June 2007$000
SSS Financial year to
30 June 2007$000
Total$000
Present value of defi ned benefi t obligation 489,099 69,623 734,718 1,293,440
Fair value of Fund assets (411,205) (37,753) (784,113) (1,233,071)
(Surplus)/Defi cit in Fund 77,894 31,870 (49,395) 60,369
Experience adjustments – Fund liabilities 7,547 (1,540) (54,318) (48,311)
Experience adjustments – Fund assets (21,801) (2,159) (46,741) (70,701)

FINANCIAL STATEMENTS 193
SASSFinancial year to
30 June 2006$000
SANCS Financial year to
30 June 2006$000
SSS Financial year to
30 June 2006$000
Total$000
Present value of defi ned benefi t obligation 471,698 70,059 750,583 1,292,340
Fair value of Fund assets (370,708) (34,720) (669,479) (1,074,907)
(Surplus)/Defi cit in Fund 100,990 35,339 81,104 217,433
Experience adjustments – Fund liabilities 979 (4,450) (77,765) (81,236)
Experience adjustments – Fund assets (31,372) (3,807) (54,383) (89,562)
SASSFinancial year to
30 June 2005$000
SANCS Financial year to
30 June 2005$000
SSS Financial year to
30 June 2005$000
Total$000
Present value of defi ned benefi t obligation 301,738 71,750 678,578 1,052,066
Fair value of Fund assets (138,094) (53,818) (454,466) (646,378)
(Surplus)/Defi cit in Fund 163,644 17,932 224,112 405,688
Experience adjustments – Fund liabilities 23,937 4,202 78,885 107,024
Experience adjustments – Fund assets (5,877) (2,681) (21,528) (30,086)
Expected contributions
SASSFinancial year to
30 June 2009$000
SANCS Financial year to
30 June 2009$000
SSS Financial year to
30 June 2009$000
Total$000
Expected employer contributions 7,303 3,387 929 11,619
SASSFinancial year to
30 June 2008$000
SANCS Financial year to
30 June 2008$000
SSS Financial year to
30 June 2008$000
Total$000
Expected employer contributions 19,312 5,077 25,775 50,164

194 FINANCIAL STATEMENTS
Funding arrangements for employer contributions
The following is a summary of the 30 June 2009 fi nancial position of the Fund calculated in accordance with AAS 25 – Financial Reporting by Superannuation Plans.
SASSFinancial year to
30 June 2009$000
SANCS Financial year to
30 June 2009$000
SSS Financial year to
30 June 2009$000
Total$000
Accrued benefi ts 448,930 69,924 671,912 1,190,766
Net market value of Fund assets (407,203) (60,656) (508,504) (976,363)
Net (surplus)/defi cit 41,727 9,268 163,408 214,403
SASSFinancial year to
30 June 2008$000
SANCS Financial year to
30 June 2008$000
SSS Financial year to
30 June 2008$000
Total$000
Accrued benefi ts 468,896 70,757 682,075 1,221,728
Net market value of Fund assets (457,610) (69,275) (601,445) (1,128,330)
Net (surplus)/defi cit 11,286 1,482 80,630 93,398
Recommended contribution rates for the entity are:
SASS SANCS SSS
multiple of member contributions % member salary multiple of member contributions
1.06 2.07% pa 0.15
Funded method
The method used to determine the employer contribution recommendations at the last actuarial review was the Aggregate Funding method. The method adopted affects the timing of the cost to the employer.
Under the Aggregate Funding method, the employer contribution rate is determined so that suffi cient assets will be available to meet benefi t payments to existing members, taking into account the current value of assets and future contributions.
Economic assumptions
The economic assumptions adopted for the current actuarial review of the Fund were:
Weighted-Average Assumptions 2009 2008
Expected rate of return on Fund assets backing current pension liabilities 8.3% pa 7.7% pa
Expected rate of return on Fund assets backing other liabilities 7.3% pa 7.0% pa
Expected salary increase rate 4.0% pa 4.0% pa
Expected rate of CPI increase 2.5% 2.5%
FINANCIAL STATEMENTS 195
Nature of asset/liability
If a surplus exists in the employer’s interest in the Fund, the employer may be able to take advantage of it in the form of a reduction in the required contribution rate, depending on the advice of the Fund’s actuary.
Where a defi ciency exists, the employer is responsible for any difference between the employer’s share of fund assets and the defi ned benefi t obligation
Provision for Long Service Leave (LSL)
Long service leave is measured at present value in accordance with AASB 119 Employee Benefi ts. This is based on the application of the valuation ratio at the Commonwealth Government bond rate at the reporting date to employees with fi ve or more years of service, using current rates of pay. This ratio is determined based on an actuarial review to approximate present value.
The actuarial assessment is based on the accrued long service leave liabilities and employee data of the RTA as at 31 December 2007. Long Service leave accrued at the rate of 4.4 days per annum for the fi rst 10 years of service and then at the rate of 11 days per annum.
Employees who exit with less than fi ve years service get no benefi ts. Those who leave with between fi ve and seven years service have been assumed to only receive benefi ts if exiting due to death, disability or age retirement. Benefi ts are paid in service or on exit after seven years service on a pro rata basis.
Assumptions:
An allowance has been determined for each relevant on-cost separately to the LSL liability, as their accounting treatment and the adoption of liability is different to the LSL liability. The on-costs to LSL present value liabilities are:
Payroll Tax 5.75 %
Superannuation 9.0 %
Superannuation accruing while on LSL 3.6 %
LSL accruing while on LSL 1.6 %
Annual Leave accruing while on LSL 3.0 %
As workers’ compensation is determined without direct reference to salary, and does not accrue while an employee is on long service leave, there is no future workers’ compensation expense that will be incurred when currently accrued LSL is taken during future service, and hence there is no attaching on-cost.
Assumptions about rates of taking leave in service are based on historical details of payments of LSL for calendar years 2005-07 and projected future payments are broadly consistent with this data. It has been assumed that six days of LSL will be taken per year by employees who are eligible.
General salary increases of 4% per annum have been assumed for all future years, consistent with NSW Treasury expectations for the NSW public sector in the medium term.
Promotional salary increases have been assumed at rates based on NSW public sector superannuation scheme rates expected to reasonable refl ect employees’ promotional salary experience.
The rates of resignation, death, age retirement and ill-health retirement assumed have been adopted from superannuation valuations of NSW public servants. Withdrawal rates for those with less than 10 years of service are based on experience from NSW and other superannuation schemes.
The discount rate is based on the 10 year bond rate at 30 June, but adjusted from a semi-annual rate to an annual rate.
196 FINANCIAL STATEMENTS
4 Audit feeDuring 2008-09 an expense of $6,500 (2008: $7,000) excluding GST was incurred by the Division for the audit of the fi nancial statements by The Audit Offi ce of NSW which was fully paid for by the Roads and Traffi c Authority of NSW.
5 Related party transaction
(a) Relationship between RTA and the Division
As a result of the Public Sector Employment Legislation Amendment Act 2006 (PSELAA), from 17 March 2006 previous employees of the RTA are now employees of the RTA Division of the Government Service of New South Wales (the Division).
The Division is a controlled entity of the RTA and its only function is to provide personnel services in the form of employee related activity to the RTA.
(b) Transactions between RTA and the Division
RTA Division provides personnel services to RTA. Information related to personnel services is as follows:
(i) Personnel services provided $1,024,338 million (2007-08: $746,726 million)
(ii) Receivable due from the RTA $860.201 million (2007-08: $451.279 million)
The receivable is unsecured and the consideration to be provided on settlement will be equal to the total payables and provisions of the Division. No provision for doubtful debts relating to the receivable has been raised nor has an expense been recognised during the period in respect of bad or doubtful debts due from the RTA.
6. After balance sheet date eventUnder the Administrative Change Order set out in Public Sector Employment and Management (Departmental Amalgamations) Order 2009, the Department of Transport and Infrastructure is established as a Division of the Government Service. The Director-General of the Department of Premier and Cabinet has to determine the transfer of the groups of staff in the Roads and Traffi c Authority Division to the Department of Transport and Infrastructure.
End of audited fi nancial statements
Appendices

198 APPENDICES
Contents
Appendix 1. Major works 199
Appendix 2. Threatened Species Recovery Plan 204
Appendix 3. Committees and signifi cant advisory groups 208
Appendix 4. Senior executive performance statements 212
Appendix 5. Industrial relations 225
Appendix 6. Equal Employment Opportunity 226
Appendix 7. Ethnic Affairs Priorities Statement and Plan 229
Appendix 8. Disability Plan 230
Appendix 9. Overseas travel by RTA Offi cers 231
Appendix 10. Freedom of Information 233
Appendix 11. Ombudsman 244
Appendix 12. Consumer response 245
Appendix 13. Legal change 246
Appendix 14. Land disposal 251
Appendix 15. Publications 252
Appendix 16. Payments to consultants 260
Appendix 17. Reporting of RTA contracts with third parties 261
Appendix 18. Accounts payment performance 261
Appendix 19. Funds granted to non-government
community organisations 262
Appendix 20. Privacy Management Report 263
Appendix 21. Research and development 268
Appendix 22. Driver and vehicle statistics 270
Appendix 23. Insurance 272
Appendix 24. Compliance Index 274
Section cover image: Photo taken by RTA staff member Stephen Bennett of an inspection of B doubles at the Silverwater heavy vehicle inspection station.
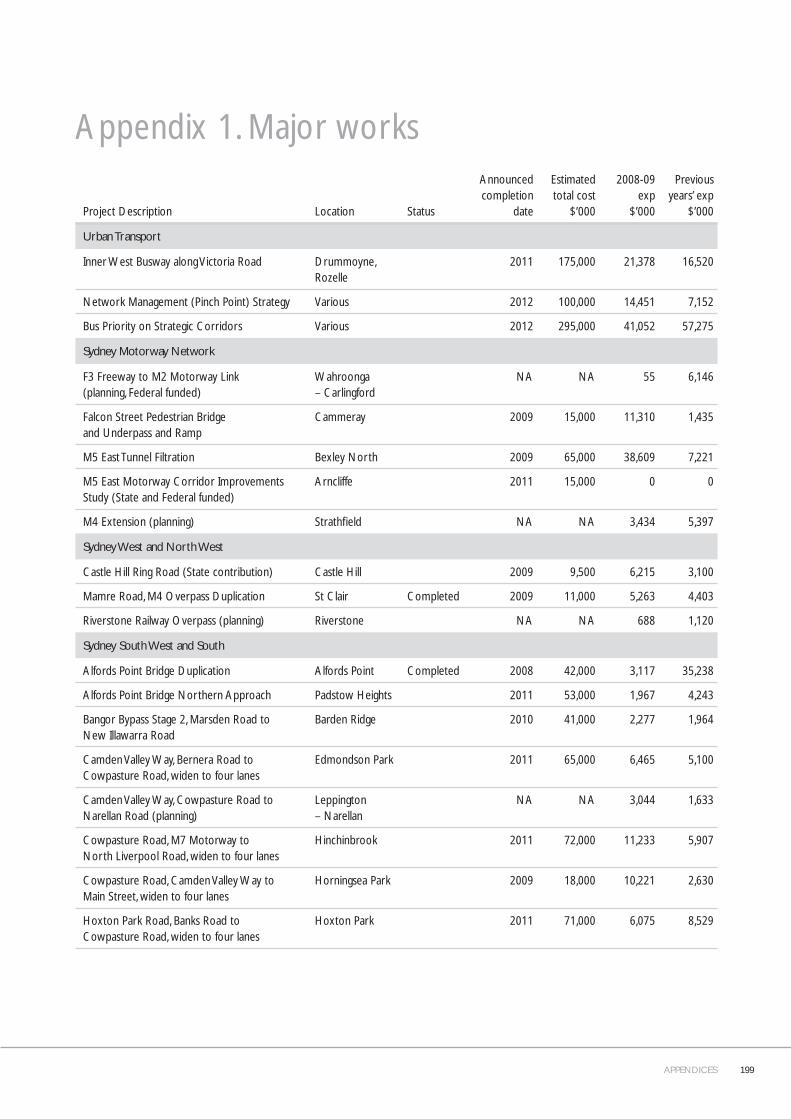
APPENDICES 199
Appendix 1. Major works
Project Description Location Status
Announced completion
date
Estimated total cost
$’000
2008-09exp
$’000
Previous years’ exp
$’000
Urban Transport
Inner West Busway along Victoria Road Drummoyne,Rozelle
2011 175,000 21,378 16,520
Network Management (Pinch Point) Strategy Various 2012 100,000 14,451 7,152
Bus Priority on Strategic Corridors Various 2012 295,000 41,052 57,275
Sydney Motorway Network
F3 Freeway to M2 Motorway Link (planning, Federal funded)
Wahroonga – Carlingford
NA NA 55 6,146
Falcon Street Pedestrian Bridge and Underpass and Ramp
Cammeray 2009 15,000 11,310 1,435
M5 East Tunnel Filtration Bexley North 2009 65,000 38,609 7,221
M5 East Motorway Corridor Improvements Study (State and Federal funded)
Arncliffe 2011 15,000 0 0
M4 Extension (planning) Strathfi eld NA NA 3,434 5,397
Sydney West and North West
Castle Hill Ring Road (State contribution) Castle Hill 2009 9,500 6,215 3,100
Mamre Road, M4 Overpass Duplication St Clair Completed 2009 11,000 5,263 4,403
Riverstone Railway Overpass (planning) Riverstone NA NA 688 1,120
Sydney South West and South
Alfords Point Bridge Duplication Alfords Point Completed 2008 42,000 3,117 35,238
Alfords Point Bridge Northern Approach Padstow Heights 2011 53,000 1,967 4,243
Bangor Bypass Stage 2, Marsden Road to New Illawarra Road
Barden Ridge 2010 41,000 2,277 1,964
Camden Valley Way, Bernera Road to Cowpasture Road, widen to four lanes
Edmondson Park 2011 65,000 6,465 5,100
Camden Valley Way, Cowpasture Road to Narellan Road (planning)
Leppington – Narellan
NA NA 3,044 1,633
Cowpasture Road, M7 Motorway to North Liverpool Road, widen to four lanes
Hinchinbrook 2011 72,000 11,233 5,907
Cowpasture Road, Camden Valley Way to Main Street, widen to four lanes
Horningsea Park 2009 18,000 10,221 2,630
Hoxton Park Road, Banks Road to Cowpasture Road, widen to four lanes
Hoxton Park 2011 71,000 6,075 8,529

200 APPENDICES
Project Description Location Status
Announced completion
date
Estimated total cost
$’000
2008-09exp
$’000
Previous years’ exp
$’000
Sydney North
F3 Sydney to Newcastle Freeway, widening to six lanes between Mt Colah and Cowan (State and Federal funded)
Mount Colah BerowraCowan
2009 104,000 26,569 49,567
Great Western Highway
Woodford to Hazelbrook, Station Street to Ferguson Avenue, widen to four lanes (State and Federal funded)
WoodfordHazelbrook
2012 160,000 13,853 41,299
Lawson, Ferguson Avenue to Ridge Street, widen to four lanes
Lawson 2012 220,000 31,409 30,458
Bullaburra, Ridge Street to Genevieve Road, widen to four lanes (planning)
Bullaburra NA NA 759 602
Bullaburra to Wentworth Falls, Genevieve Road to Tableland Road, widen to four lanes (planning)
Bullaburra – Wentworth Falls
NA NA 1,112 1,804
Wentworth Falls East, Tableland Road to Station Street, widen to four lanes
Wentworth Falls 2012 115,000 10,104 8,788
Leura to Katoomba Stage 2, East View Avenue to Bowling Green Avenue, widen to four lanes
LeuraKatoomba
Completed 2008 25,000 12,980 12,000
Mount Victoria to Lithgow (planning, State and Federal funded)
Mt Victoria, Hartley
NA NA 3,230 727
Hume Highway
F5 Widening, Brooks Road to Narellan Road (State and Federal funded)
Ingleburn – Campbelltown
2011 140,000 13,429 1,964
Hume Highway, Coolac Bypass (Federal funded) Coolac 2009 179,000 61,437 98,103
Hume Highway, Sheahan Bridge Duplication (Federal funded)
Gundagai Completed 2009 78,000 45,016 20,852
Southern Hume Duplication Works (Federal funded)
Sturt Highway – Albury
2009 924,000 403,126 346,607
Tarcutta Bypass (planning, Federal funded) Tarcutta 2011 NA 6,886 1,161
Holbrook Bypass (planning, Federal funded) Holbrook NA NA 1,525 721
Woomargama Bypass (planning, Federal funded)
Woomargama 2011 NA 3,260 1,196

APPENDICES 201
Project Description Location Status
Announced completion
date
Estimated total cost
$’000
2008-09exp
$’000
Previous years’ exp
$’000
Pacifi c Highway
Karuah to Bulahdelah Sections 2 and 3, Dual Carriageway (State and Federal funded)
Bulahdelah 2009 262,000 81,906 135,550
Bulahdelah Bypass, Dual Carriageway (State and Federal funded)
Bulahdelah 2012 NA 28,706 30,259
Failford Road to Tritton Road (planning) Failford NA NA 438 2,062
Coopernook to Moorland, Dual Carriageways (planning, State and Federal funded)
Moorland 2010 190,000 91,073 33,847
Moorland to Herons Creek, Dual Carriageways (State and Federal funded)
Kew 2010 365,000 160,597 114,721
Herons Creek to Stills Road (planning) Herons Creek 2011 NA 3,456 1,256
Oxley Highway to Kempsey (planning) Port Macquarie NA NA 1,475 12,016
Kempsey to Eungai (planning and preconstruction, State and Federal funded)
Kempsey NA NA 7,829 18,271
Warrell Creek to Urunga (planning, State and Federal funded)
Nambucca Heads
NA NA 4,552 17,360
Bonville Bypass, Dual Carriageways (State and Federal funded)
Bonville Completed 2008 233,000 23,735 204,337
Coffs Harbour Bypass (planning, State and Federal funded)
Coffs Harbour NA NA 3,540 24,701
Coffs Harbour (Sapphire) to Woolgoolga Duplication (planning and preconstruction, State and Federal funded)
Woolgoolga 2014 NA 12,619 22,043
Wells Crossing to Iluka Road (planning) Harwood NA NA 2,901 14,233
Iluka Road to Woodburn (planning) Woodburn NA NA 403 4,643
Woodburn to Ballina (planning) Ballina NA NA 5,547 20,404
Ballina Bypass, Dual Carriageways (State and Federal funded)
Ballina 2012 640,000 178,706 109,066
Tintenbar to Ewingsdale (planning and preconstruction, State and Federal funded)
Bangalow NA NA 7,123 26,474
Banora Point Upgrade including Sexton Hill (planning and preconstruction, State and Federal funded)
Banora Point 2012 NA 3,900 9,248
Princes Highway
Lawrence Hargrave Drive Intersection Upgrade Bulli 2011 31,000 4,028 6,209
Wollongong Northern Distributor Extension Bellambi 2009 110,000 43,854 62,242
Oak Flats to Dunmore, Dual Carriageways Dunmore 2009 120,000 42,683 53,857
Kiama Ramps Kiama Completed 2009 13,000 3,564 8,948

202 APPENDICES
Project Description Location Status
Announced completion
date
Estimated total cost
$’000
2008-09exp
$’000
Previous years’ exp
$’000
Gerringong to Bomaderry (planning) Gerringong, Berry, Bomaderry
Preferred route announced
NA NA 5,531 6,115
Forest Road to Jervis Bay Road, widen to four lanes (State and Federal funded)
South Nowra Completed 2008 24,600 10,788 13,784
Conjola Mountain Realignment (State and Federal funded)
Conjola 2010 58,000 21,601 8,042
Victoria Creek Realignment (planning) Central Tilba NA NA 1,215 467
Dignams Creek Realignment (planning) Dignams Creek NA NA 192 100
Illawarra and South Coast
Lanyon Drive, Tompsitt Drive to ACT border (planning)
Jerrabomberra 2011 8,000 262 271
Kings Highway Improvements between Queanbeyan and Bungendore (State and Federal funded)
Queanbeyan – Bungendore
2011 26,300 7,653 853
Nowra to Nerriga Upgrade (State, Federal and local government funded)
Nowra 2010 95,000 23,450 41,618
Central Coast
Avoca Drive, Sun Valley Road to Bayside Drive, widen to four lanes
Green Point 2011 40,000 2,714 4,962
Central Coast Highway, Woy Woy Road Intersection Upgrade (planning)
Kariong 2011 NA 706 723
Central Coast Highway, Brisbane Water Drive, Manns Road Intersection Upgrade (planning)
West Gosford NA NA 2,946 15,188
Central Coast Highway, Carlton Road to Matcham Road (planning and preconstruction)
Erina Heights 2011 NA 8,513 5,107
Central Coast Highway, Matcham Road to Ocean View Drive (planning)
Wamberal NA NA 10,160 1,862
Central Coast Highway, Ocean View Drive to Tumbi Road, widen to four lanes
Wamberal Completed 2008 42,000 40,024
F3 Freeway Incident Management System Wahroonga – Ourimbah
2010 27,700 7,123 5,157
Pacifi c Highway, Tuggerah to Wyong, Anzac Road to Johnson Road, widen to four lanes
Tuggerah 2009 42,000 12,081 23,682
Pacifi c Highway, Lisarow to F3 – Stage 2, Glen Road to Burns Road, widen to four lanes
Ourimbah 2010 52,000 18,174 17,457
Pacifi c Highway, Lisarow to F3, Stage 3, Railway Crescent to Glen Road (planning)
Lisarow NA NA 1,963 646
Pacifi c Highway, Narara to Lisarow upgrade, Manns Road to Railway Crescent (planning)
Narara – Lisarow NA NA 1,434 1,0321
Terrigal Drive Upgrade (planning and preconstruction)
Erina – Terrigal NA NA 1,800 472

APPENDICES 203
Project Description Location Status
Announced completion
date
Estimated total cost
$’000
2008-09exp
$’000
Previous years’ exp
$’000
Hunter
Nelson Bay Road, Replacement of Tourle Street Bridge over the Hunter River
Mayfi eld Completed 2009 44,000 12,662 22,997
Newcastle Inner Bypass, Shortland to Sandgate (planning)
Sandgate NA NA 539 2,070
New England Highway, Weakleys Drive Interchange (Federal funded)
Beresfi eld Completed 2008 51,800 14,222 34,463
Third Hunter River Crossing Maitland 2011 65,000 6,939 8,675
North Coast and Northern NSW
Bruxner Highway, Alstonville Bypass (Federal funded)
Alstonville 2010 101,000 2,538 25,842
New England Highway, Sunnyside Realignment (Federal funded)
Armidale 2010 13,500 3,629 939
Oxley Highway, Upgrade from Wrights Road to the Pacifi c Highway
Port Macquarie 2011 158,000 16,956 12,676
South Western NSW
Barton Highway, duplication ACT to Hume Highway (planning and preconstruction, Federal funded)
Murrumbateman NA NA 275 1,894
Western NSW
Newell Highway, Moree Bypass (Federal funded)
NA 56,200 15,138 23,023

204 APPENDICES
Appendix 2. Threatened Species Recovery PlanThe RTA is required by legislation to report on the cost and progress of threatened species recovery plans in accordance with the Threatened Species Conservation Act 1995.
Measures Action taken to implement measuresEstimated annual cost Status
Acacia pubescens (Downy Wattle) Recovery Plan
Identify existing and potential threats to the A. pubescens population at Beverly Hills/Narwee on the M5 Motorway (north of Windarra Street).
Environmental Services Representative to visit site and identify existing and potential threats to the population.
$580 Site visited and extent of population mapped in 2000.
Sites to be included on the Roadside Corridor Management Plans.
Develop and implement a threat and habitat management program for the A. pubescens population at Beverly Hills/Narwee on the M5 Motorway (north of Windarra Street).
Asset Services to develop a threat and habitat management program to be incorporated into the Maintenance Plan for the F5 Freeway, with advice from Environmental Services Representative.
Sydney Asset Management to ensure that the program is implemented.
N/A Interlink Roads has incorporated threat and habitat management of the species into landscaping management plans for the M5 Motorway.
Monitor the A. pubescens population at Beverly Hills/Narwee on the M5 Motorway (north of Windarra Street) on a regular basis to assess the effectiveness of the threat and habitat management programs.
Environmental Services Representative to conduct regular inspections of the population.
Following each inspection compare inspection records and initiate corrective action if required.
$620 Inspection completed for 2006. Proposed inspection in 2009-10.
Assess development activities with reference to the recovery plan, the Environmental Impact Assessment Guidelines for A. pubescens and future advice from the National Parks and Wildlife Service (NPWS).
Environmental Services Representative to advise project manager of this requirement if aware of the proposed activity before the EIA process.
Project manager to advise EIA consultant of this requirement.
Environmental assessor to ensure that the recovery plan, EIA guidelines and NPWS advice have been considered in all relevant EIAs.
Environmental assessor to take this requirement into account when preparing decision reports.
N/A Environmental Services Representative advised the project managers of the F5 Freeway widening and the M5 Motorway of the potential presence of A. pubescens. A. pubescens was not located within the study area of either of these projects.
Prepare or review any relevant environmental policies or management plans with reference to the recovery plans and any future advice from the NPWS.
Asset Services has added references to the A. pubescens recovery plan in the maintenance Environmental Management Plan (EMP) for the M5 Motorway, with advice from Environmental Services Representative.
N/A Management plans implemented.
Forward to the NPWS information on all planning decisions which affect populations of A. pubescens, including decisions that protect habitat as well as those that lead to reduction of habitat and/or individuals.
Environmental Services Representative to advise project manager of this requirement.
RTA project manager to forward the information to NPWS.
NA No projects required information to be forwarded to NPWS in 2008-09.
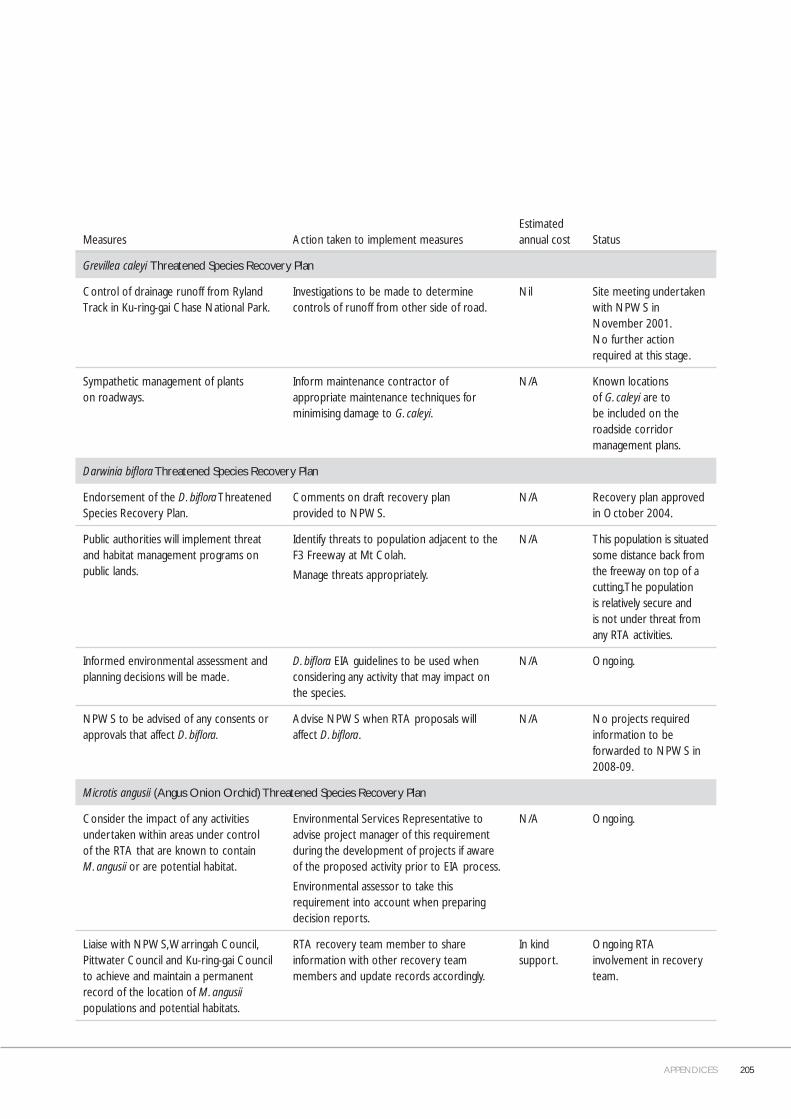
APPENDICES 205
Measures Action taken to implement measuresEstimated annual cost Status
Grevillea caleyi Threatened Species Recovery Plan
Control of drainage runoff from Ryland Track in Ku-ring-gai Chase National Park.
Investigations to be made to determine controls of runoff from other side of road.
Nil Site meeting undertaken with NPWS in November 2001. No further action required at this stage.
Sympathetic management of plants on roadways.
Inform maintenance contractor of appropriate maintenance techniques for minimising damage to G. caleyi.
N/A Known locations of G. caleyi are to be included on the roadside corridor management plans.
Darwinia bifl ora Threatened Species Recovery Plan
Endorsement of the D. bifl ora Threatened Species Recovery Plan.
Comments on draft recovery plan provided to NPWS.
N/A Recovery plan approved in October 2004.
Public authorities will implement threat and habitat management programs on public lands.
Identify threats to population adjacent to the F3 Freeway at Mt Colah.
Manage threats appropriately.
N/A This population is situated some distance back from the freeway on top of a cutting. The population is relatively secure and is not under threat from any RTA activities.
Informed environmental assessment and planning decisions will be made.
D. bifl ora EIA guidelines to be used when considering any activity that may impact on the species.
N/A Ongoing.
NPWS to be advised of any consents or approvals that affect D. bifl ora.
Advise NPWS when RTA proposals will affect D. bifl ora.
N/A No projects required information to be forwarded to NPWS in 2008-09.
Microtis angusii (Angus Onion Orchid) Threatened Species Recovery Plan
Consider the impact of any activities undertaken within areas under control of the RTA that are known to contain M. angusii or are potential habitat.
Environmental Services Representative to advise project manager of this requirement during the development of projects if aware of the proposed activity prior to EIA process.
Environmental assessor to take this requirement into account when preparing decision reports.
N/A Ongoing.
Liaise with NPWS, Warringah Council, Pittwater Council and Ku-ring-gai Council to achieve and maintain a permanent record of the location of M. angusii populations and potential habitats.
RTA recovery team member to share information with other recovery team members and update records accordingly.
In kind support.
Ongoing RTA involvement in recovery team.
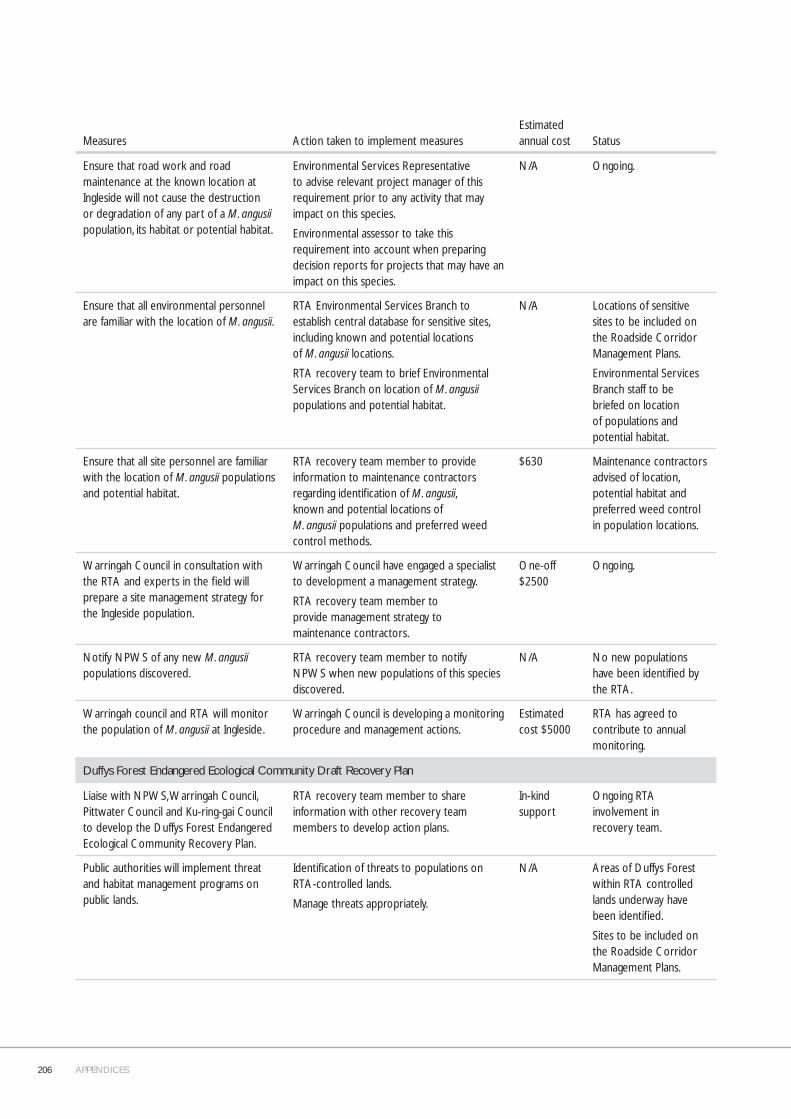
206 APPENDICES
Measures Action taken to implement measuresEstimated annual cost Status
Ensure that road work and road maintenance at the known location at Ingleside will not cause the destruction or degradation of any part of a M. angusii population, its habitat or potential habitat.
Environmental Services Representative to advise relevant project manager of this requirement prior to any activity that may impact on this species.
Environmental assessor to take this requirement into account when preparing decision reports for projects that may have an impact on this species.
N/A Ongoing.
Ensure that all environmental personnel are familiar with the location of M. angusii.
RTA Environmental Services Branch to establish central database for sensitive sites, including known and potential locations of M. angusii locations.
RTA recovery team to brief Environmental Services Branch on location of M. angusii populations and potential habitat.
N/A Locations of sensitive sites to be included on the Roadside Corridor Management Plans.
Environmental Services Branch staff to be briefed on location of populations and potential habitat.
Ensure that all site personnel are familiar with the location of M. angusii populations and potential habitat.
RTA recovery team member to provide information to maintenance contractors regarding identifi cation of M. angusii, known and potential locations of M. angusii populations and preferred weed control methods.
$630 Maintenance contractors advised of location, potential habitat and preferred weed control in population locations.
Warringah Council in consultation with the RTA and experts in the fi eld will prepare a site management strategy for the Ingleside population.
Warringah Council have engaged a specialist to development a management strategy.
RTA recovery team member to provide management strategy to maintenance contractors.
One-off $2500
Ongoing.
Notify NPWS of any new M. angusii populations discovered.
RTA recovery team member to notify NPWS when new populations of this species discovered.
N/A No new populations have been identifi ed by the RTA.
Warringah council and RTA will monitor the population of M. angusii at Ingleside.
Warringah Council is developing a monitoring procedure and management actions.
Estimated cost $5000
RTA has agreed to contribute to annual monitoring.
Duffys Forest Endangered Ecological Community Draft Recovery Plan
Liaise with NPWS, Warringah Council, Pittwater Council and Ku-ring-gai Council to develop the Duffys Forest Endangered Ecological Community Recovery Plan.
RTA recovery team member to share information with other recovery team members to develop action plans.
In-kind support
Ongoing RTA involvement in recovery team.
Public authorities will implement threat and habitat management programs on public lands.
Identifi cation of threats to populations on RTA-controlled lands.
Manage threats appropriately.
N/A Areas of Duffys Forest within RTA controlled lands underway have been identifi ed.
Sites to be included on the Roadside Corridor Management Plans.

APPENDICES 207
Measures Action taken to implement measuresEstimated annual cost Status
Isoodon obesulus (Southern Brown Bandicoot) Threatened Species Recovery Plan
Endorsement of the I. obesulus Threatened Species Recovery Plan.
Formal notifi cation to NPWS. N/A RTA has endorsed plan.
Liaise with NPWS, Hornsby, Warringah, Pittwater and Ku-ring-gai councils to manage areas with known Southern Brown Bandicoot populations.
RTA recovery team member to share information with other recovery team members to develop action plans.
In-kind support
Ongoing RTA involvement in recovery team.
Ensure that Environmental Impact Assessment surveys are conducted between May and October.
Environmental Services Representative to advise relevant project manager of this requirement prior to any activity that may impact on this species.
Project manager to advise EIA consultant of this requirement.
N/A Ongoing.
Litoria aurea (Green and Golden Bell Frog) Draft Management Plan
Review of the I. aurea management plan. Formal notifi cation to NPWS, Sydney Catchment Management Authority (CMA).
N/A Reviewed draft plan.
Liaise with NPWS, Parramatta, Holroyd City and Auburn councils, and Sydney CMA to manage Green and Golden Bell Frog populations.
RTA recovery team member to share information with other recovery team members to develop action plans.
In-kind support
Ongoing RTA involvement in recovery team.
Ensure that Environmental Impact Assessment surveys accommodate signifi cance of original habitat as set out in DECCW guidelines.
Environmental Services Representative to advise relevant project manager of this requirement prior to any activity that may impact on this species.
Project manager to advise EIA consultant of this requirement.
N/A Ongoing.
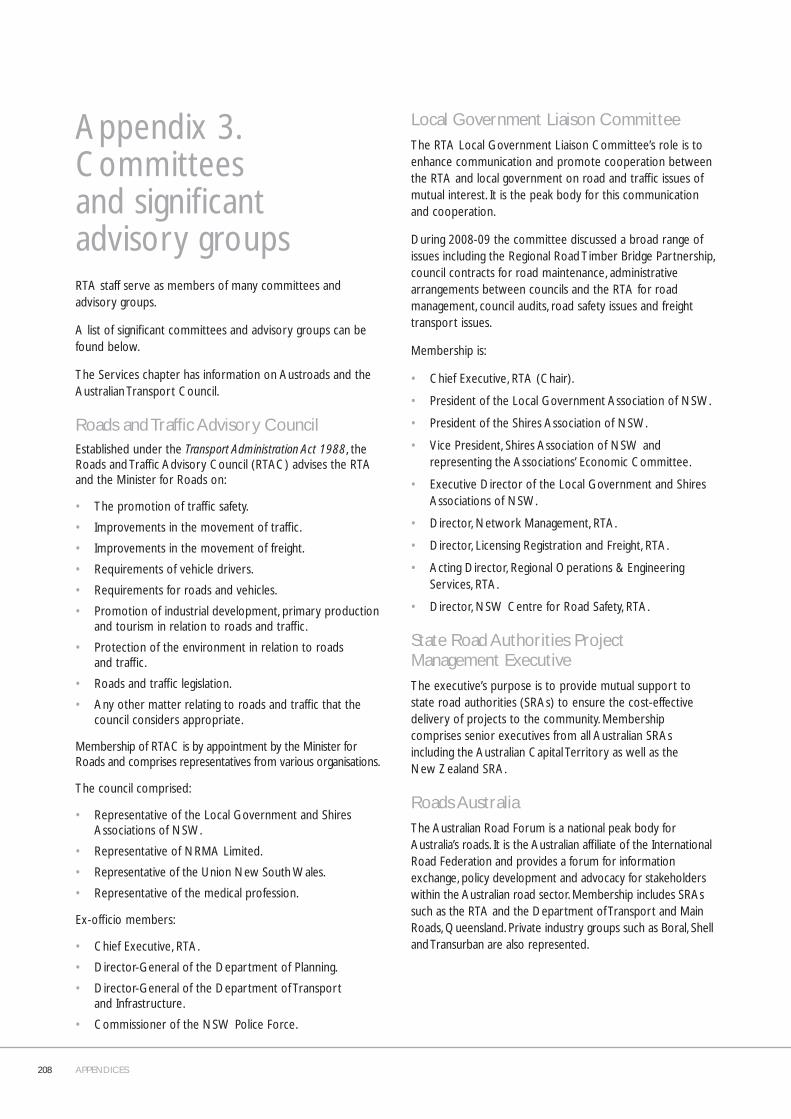
208 APPENDICES
Appendix 3. Committees and signifi cant advisory groupsRTA staff serve as members of many committees and advisory groups.
A list of signifi cant committees and advisory groups can be found below.
The Services chapter has information on Austroads and the Australian Transport Council.
Roads and Traffi c Advisory CouncilEstablished under the Transport Administration Act 1988, theRoads and Traffi c Advisory Council (RTAC) advises the RTA and the Minister for Roads on:
• The promotion of traffi c safety.
• Improvements in the movement of traffi c.
• Improvements in the movement of freight.
• Requirements of vehicle drivers.
• Requirements for roads and vehicles.
• Promotion of industrial development, primary production and tourism in relation to roads and traffi c.
• Protection of the environment in relation to roads and traffi c.
• Roads and traffi c legislation.
• Any other matter relating to roads and traffi c that the council considers appropriate.
Membership of RTAC is by appointment by the Minister for Roads and comprises representatives from various organisations.
The council comprised:
• Representative of the Local Government and Shires Associations of NSW.
• Representative of NRMA Limited.
• Representative of the Union New South Wales.
• Representative of the medical profession.
Ex-offi cio members:
• Chief Executive, RTA.
• Director-General of the Department of Planning.
• Director-General of the Department of Transport and Infrastructure.
• Commissioner of the NSW Police Force.
Local Government Liaison CommitteeThe RTA Local Government Liaison Committee’s role is to enhance communication and promote cooperation between the RTA and local government on road and traffi c issues of mutual interest. It is the peak body for this communication and cooperation.
During 2008-09 the committee discussed a broad range of issues including the Regional Road Timber Bridge Partnership, council contracts for road maintenance, administrative arrangements between councils and the RTA for road management, council audits, road safety issues and freight transport issues.
Membership is:
• Chief Executive, RTA (Chair).
• President of the Local Government Association of NSW.
• President of the Shires Association of NSW.
• Vice President, Shires Association of NSW and representing the Associations’ Economic Committee.
• Executive Director of the Local Government and Shires Associations of NSW.
• Director, Network Management, RTA.
• Director, Licensing Registration and Freight, RTA.
• Acting Director, Regional Operations & Engineering Services, RTA.
• Director, NSW Centre for Road Safety, RTA.
State Road Authorities Project Management ExecutiveThe executive’s purpose is to provide mutual support to state road authorities (SRAs) to ensure the cost-effective delivery of projects to the community. Membership comprises senior executives from all Australian SRAs including the Australian Capital Territory as well as the New Zealand SRA.
Roads AustraliaThe Australian Road Forum is a national peak body for Australia’s roads. It is the Australian affi liate of the International Road Federation and provides a forum for information exchange, policy development and advocacy for stakeholders within the Australian road sector. Membership includes SRAs such as the RTA and the Department of Transport and Main Roads, Queensland. Private industry groups such as Boral, Shell and Transurban are also represented.
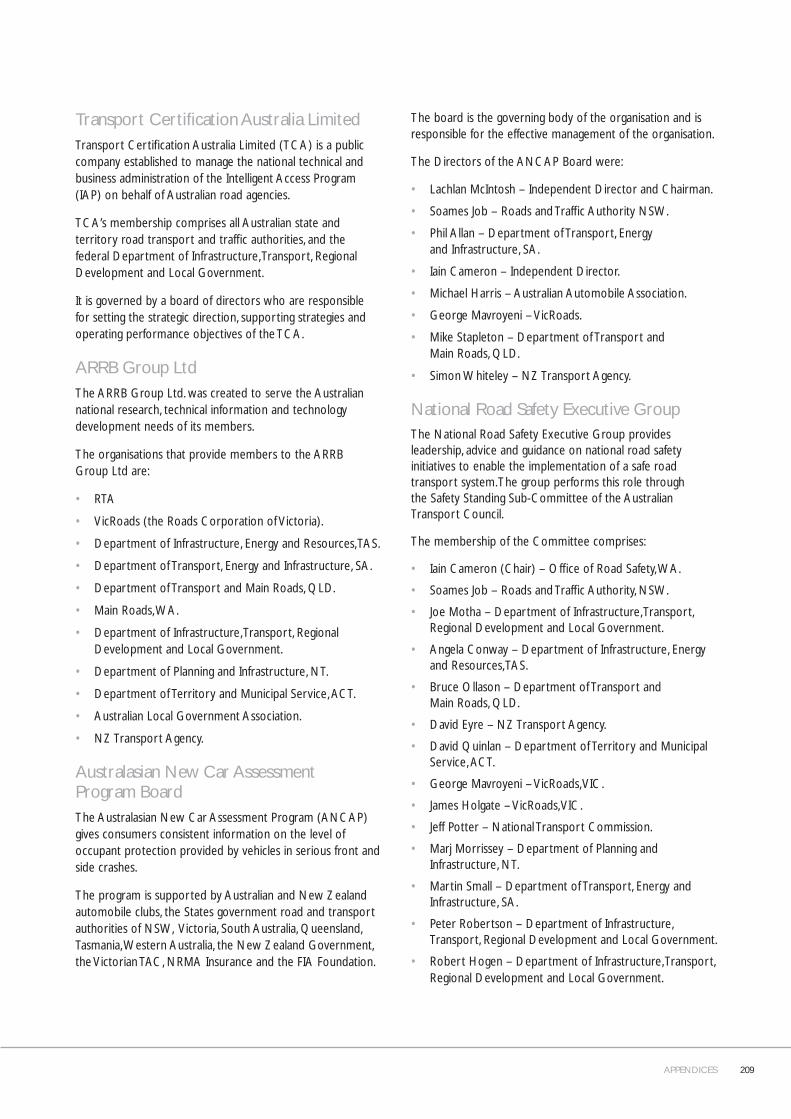
APPENDICES 209
Transport Certifi cation Australia LimitedTransport Certifi cation Australia Limited (TCA) is a public company established to manage the national technical and business administration of the Intelligent Access Program (IAP) on behalf of Australian road agencies.
TCA’s membership comprises all Australian state and territory road transport and traffi c authorities, and the federal Department of Infrastructure, Transport, Regional Development and Local Government.
It is governed by a board of directors who are responsible for setting the strategic direction, supporting strategies and operating performance objectives of the TCA.
ARRB Group LtdThe ARRB Group Ltd. was created to serve the Australian national research, technical information and technology development needs of its members.
The organisations that provide members to the ARRB Group Ltd are:
• RTA
• VicRoads (the Roads Corporation of Victoria).
• Department of Infrastructure, Energy and Resources, TAS.
• Department of Transport, Energy and Infrastructure, SA.
• Department of Transport and Main Roads, QLD.
• Main Roads, WA.
• Department of Infrastructure, Transport, Regional Development and Local Government.
• Department of Planning and Infrastructure, NT.
• Department of Territory and Municipal Service, ACT.
• Australian Local Government Association.
• NZ Transport Agency.
Australasian New Car Assessment Program BoardThe Australasian New Car Assessment Program (ANCAP) gives consumers consistent information on the level of occupant protection provided by vehicles in serious front and side crashes.
The program is supported by Australian and New Zealand automobile clubs, the States government road and transport authorities of NSW, Victoria, South Australia, Queensland, Tasmania, Western Australia, the New Zealand Government, the Victorian TAC, NRMA Insurance and the FIA Foundation.
The board is the governing body of the organisation and is responsible for the effective management of the organisation.
The Directors of the ANCAP Board were:
• Lachlan McIntosh – Independent Director and Chairman.
• Soames Job – Roads and Traffi c Authority NSW.
• Phil Allan – Department of Transport, Energy and Infrastructure, SA.
• Iain Cameron – Independent Director.
• Michael Harris – Australian Automobile Association.
• George Mavroyeni – VicRoads.
• Mike Stapleton – Department of Transport and Main Roads, QLD.
• Simon Whiteley – NZ Transport Agency.
National Road Safety Executive GroupThe National Road Safety Executive Group provides leadership, advice and guidance on national road safety initiatives to enable the implementation of a safe road transport system. The group performs this role through the Safety Standing Sub-Committee of the Australian Transport Council.
The membership of the Committee comprises:
• Iain Cameron (Chair) – Offi ce of Road Safety, WA.
• Soames Job – Roads and Traffi c Authority, NSW.
• Joe Motha – Department of Infrastructure, Transport, Regional Development and Local Government.
• Angela Conway – Department of Infrastructure, Energy and Resources, TAS.
• Bruce Ollason – Department of Transport and Main Roads, QLD.
• David Eyre – NZ Transport Agency.
• David Quinlan – Department of Territory and Municipal Service, ACT.
• George Mavroyeni – VicRoads, VIC.
• James Holgate – VicRoads, VIC.
• Jeff Potter – National Transport Commission.
• Marj Morrissey – Department of Planning and Infrastructure, NT.
• Martin Small – Department of Transport, Energy and Infrastructure, SA.
• Peter Robertson – Department of Infrastructure, Transport, Regional Development and Local Government.
• Robert Hogen – Department of Infrastructure, Transport, Regional Development and Local Government.

210 APPENDICES
NSW Bicycle Advisory CouncilThe Bicycle Advisory Council (BAC) was established to advise the Minister for Roads, through the RTA Chief Executive, on all matters concerning bicycle use, cyclist safety and bicycle facilities.
The NSW BAC is composed of ex-offi cio members with the exception of the Chair :
• Chairman (independent member, also representing local government).
• Bicycle NSW.
• Newcastle Cycleways Movement.
• NSW Police Force.
• A senior offi cer of the RTA.
• A senior offi cer of the Department of Transport and Infrastructure.
The Chair of the BAC is appointed by the Minister for Roads with the right of direct access to the Minister as well as to the Chief Executive of the RTA. The current Chair is Cr Patricia Gould (Albury City Council) who also represents the Local Government and Shires Associations of NSW.
Land Transport Environment Committee (LTEC)The RTA represents NSW on the Land Transport Environment Committee (LTEC).
LTEC was formed by Australia’s National Environment Protection Council and the National Transport Commission to coordinate the development and introduction of initiatives to reduce the environmental impacts of motor vehicles (cars, trucks, buses etc).
LTEC is involved in initiatives such as setting emission standards for new and existing vehicles, developing fuel quality standards and setting Australia’s vehicle noise standards.
Roadside Environment CommitteeThe purpose of the Roadside Environment Committee is to improve and enhance the management of roadsides in NSW through the engagement of community and key stakeholders.
Membership of the committee is formed by representatives of the following organisations:
• RTA, Nature Conservation Council Country Energy, Rural Fire Service, Rail Corp, Institute of Public Works Australia, Local Government Engineers, Shires Association of NSW, Livestock Health and Pest Authorities (LHPA), NSW Department of Environment, Climate Change and Water, NSW Department of Lands, Catchment Management Authorities (supporting member).
RTA Heritage CommitteeThe purpose of the RTA Heritage Committee is to discuss issues relating to strategic heritage management of RTA assets.
The RTA Environment Branch administers the committee and membership is formed by representatives of the Department of Planning, National Trust, Royal Australian Historical Society, Engineers Australia and community representatives with relevant specialist knowledge. The RTA also provides several representatives and manages committee business.

APPENDICES 211
Road Freight Advisory CouncilThe Road Freight Advisory Council (RFAC) assists in identifying and delivering freight solutions that will meet the needs of the NSW and Australian community and economy.
The solutions and strategies identifi ed by the RFAC are built on a foundation of:
• Improving safety management and outcomes in the freight and logistics sector.
• Better integrating road network access and road asset management issues.
• Delivering strong compliance assurances for the benefi t of the community, local government and the road transport and logistics industries.
The council comprises:
• Michael Bushby, Chief Executive, RTA (Chair).
• Alan Evans, President, NRMA.
• Peter Fox, Chairman, Linfox.
• Philip Lovel, Chief Executive Offi cer, Victorian Transport Association.
• Jim Savage, President, Livestock and Bulk Carriers Association.
• Stephen Thacker, Director, Supply Chain, Ingram Micro Pty Ltd.
• Terry Pennington, Chief Technical Offi cer, Truck Industry Council.
• Mark Crosdale, Secretary, Newcastle and Northern Sub-Branch, Transport Workers Union.
• Ron Finemore, Executive Chairman, Ron Finemore Transport.
• Geoff Thomas, National Transport Manager, Woolworths Limited.
• Vicky Leeds, National Industrial Relations Manager, Leighton Holdings Pty Ltd.
• Tony Davidson, Chair, Sea Freight Council of NSW.
• Ingilby Dickson, Vice President, Logistics and Procurement, BlueScope Steel.
• Ann King, Director Licensing Registration and Freight, RTA.
• Peter Collins, Director Network Management, RTA.
• Phillip Halton, General Manager Compliance and Freight Strategy, RTA.
• Trish Grunert, Manager Policy Secretariat and Stakeholders Relations, RTA.
• Hugh McMaster, Secretariat,RTA.
National Motor Vehicle Theft CouncilThe council aims to reduce motor vehicle theft through a collaborative response of industry and government. The RTA’s Ann King, Director, Licensing, Registration and Freight, is a member of the council.
The council comprises:
• Mr Bob Inkster (Chair), Independent, Consumers.
• Elizabeth Darlison, Independent, Consumers.
• Terrence Donkin, Independent, Consumers.
• Ann King, RTA, Government.
• John Hartley, NSW Police Force, Government.
• Gary Campbell, NRMA Motoring & Services, NRMA members.
• John Driscoll, Insurance Council of Australia, Insurance industry and policy holders.
• James McCall, Motor Traders Association, Towing industry and the motor repair industry.
• Joe D’Ermilio, Offi ce of Fair Trading, Consumers.
OtherThe RTA also provides representatives to a number of local and regional committees. These include technical and professional forums and institutions, university advisory boards, research reference groups, Australian standard committees, technology review panels, industry advisory committees, traffi c committees and safety taskforces.
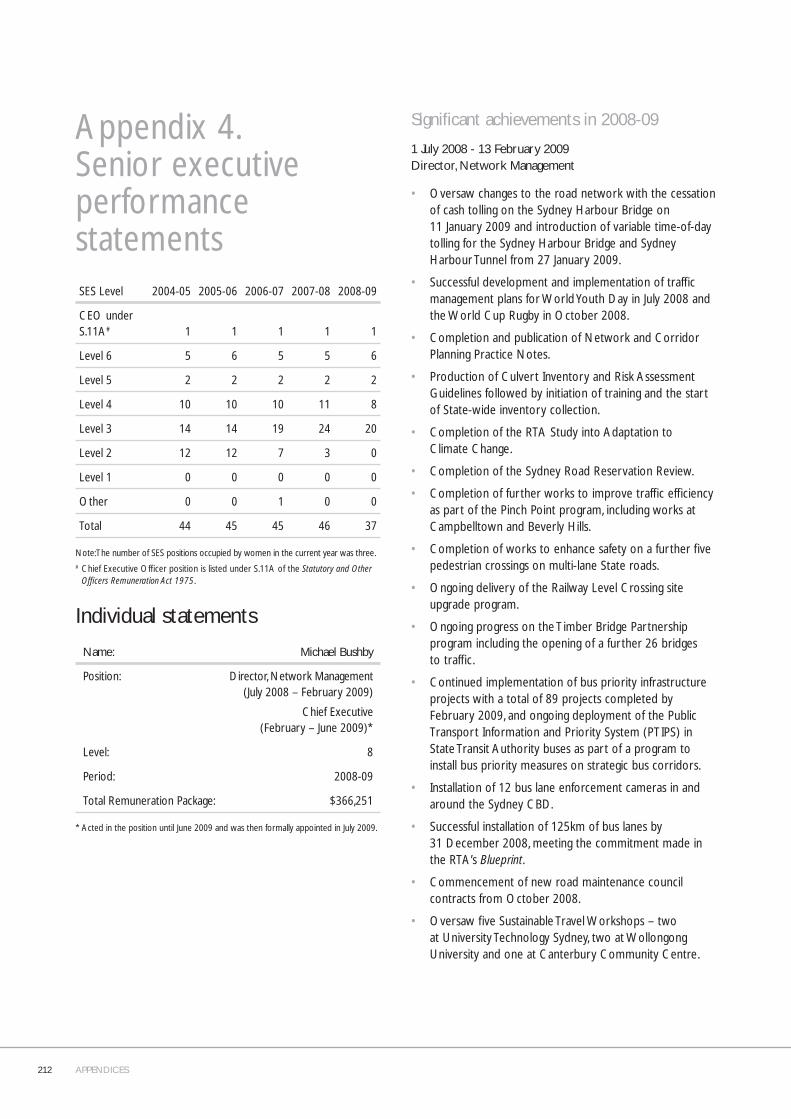
212 APPENDICES
Appendix 4. Senior executive performance statementsSES Level 2004-05 2005-06 2006-07 2007-08 2008-09
CEO under S.11A# 1 1 1 1 1
Level 6 5 6 5 5 6
Level 5 2 2 2 2 2
Level 4 10 10 10 11 8
Level 3 14 14 19 24 20
Level 2 12 12 7 3 0
Level 1 0 0 0 0 0
Other 0 0 1 0 0
Total 44 45 45 46 37
Note: The number of SES positions occupied by women in the current year was three. # Chief Executive Offi cer position is listed under S.11A of the Statutory and Other
Offi cers Remuneration Act 1975.
Individual statements
Name: Michael Bushby
Position: Director, Network Management(July 2008 – February 2009)
Chief Executive(February – June 2009)*
Level: 8
Period: 2008-09
Total Remuneration Package: $366,251
* Acted in the position until June 2009 and was then formally appointed in July 2009.
Signifi cant achievements in 2008-09
1 July 2008 - 13 February 2009 Director, Network Management
• Oversaw changes to the road network with the cessation of cash tolling on the Sydney Harbour Bridge on 11 January 2009 and introduction of variable time-of-day tolling for the Sydney Harbour Bridge and Sydney Harbour Tunnel from 27 January 2009.
• Successful development and implementation of traffi c management plans for World Youth Day in July 2008 and the World Cup Rugby in October 2008.
• Completion and publication of Network and Corridor Planning Practice Notes.
• Production of Culvert Inventory and Risk Assessment Guidelines followed by initiation of training and the start of State-wide inventory collection.
• Completion of the RTA Study into Adaptation to Climate Change.
• Completion of the Sydney Road Reservation Review.
• Completion of further works to improve traffi c effi ciency as part of the Pinch Point program, including works at Campbelltown and Beverly Hills.
• Completion of works to enhance safety on a further fi ve pedestrian crossings on multi-lane State roads.
• Ongoing delivery of the Railway Level Crossing site upgrade program.
• Ongoing progress on the Timber Bridge Partnership program including the opening of a further 26 bridges to traffi c.
• Continued implementation of bus priority infrastructure projects with a total of 89 projects completed by February 2009, and ongoing deployment of the Public Transport Information and Priority System (PTIPS) in State Transit Authority buses as part of a program to install bus priority measures on strategic bus corridors.
• Installation of 12 bus lane enforcement cameras in and around the Sydney CBD.
• Successful installation of 125km of bus lanes by 31 December 2008, meeting the commitment made in the RTA’s Blueprint.
• Commencement of new road maintenance council contracts from October 2008.
• Oversaw fi ve Sustainable Travel Workshops – two at University Technology Sydney, two at Wollongong University and one at Canterbury Community Centre.
APPENDICES 213
• Appointment of additional distributors for the Sydney Coordinated Adaptive Traffi c System (SCATS).
• Release of SCATS version 6.62 and Traffi c Incident Reporting Facility version 2.
• Development of a SCATS prototype website.
• Establishment of a policy and operational procedures for the Sydney to Newcastle Freeway (F3) contra fl ow.
16 February 2008 - 30 June 2009 Acted in the position of Chief Executive until June 2009 and then formally appointed during July 2009.
During the period Mr Bushby continued to focus on delivering a safe, sustainable and effi cient road transport system. He directed a range of signifi cant policy and infrastructure activities in support of the NSW Government priorities and led improvements to the management of the RTA’s internal business operations.
Organisational management
• Oversaw the allocation of the RTA’s resources and budget across programs to achieve RTA results and services for the community and meet government priorities.
• Continued implementation of the RTA Corporate Plan 2008-12: Blueprint, with actions incorporated into the Business Planning Cycle for 2009-10 and reports provided to the Executive.
• Supported the continued implementation of the RTA’s Aboriginal Action Plan 2006-2010.
• Oversaw the implementation of the Commercial Development Committee to provide strategic direction in the pursuit of business opportunities to improve services and generate investment for the road network.
Inter-agency planning and delivery
• Continued to lead the RTA’s contribution to the delivery of the NSW State Plan. As the RTA is lead agency for S7 (Safer Roads), Mr Bushby oversaw submission and Cabinet approval of the S7 package of initiatives. Mr Bushby also oversaw the RTA’s contribution to the delivery of other State Plan Priorities for which it is a ‘partner’ agency and priorities that the RTA was identifi ed by other agencies to contribute to the achievement of particular milestones.
• Continued to oversee the RTA’s contribution to the implementation of the State Infrastructure Strategy, Action for Air and the Metropolitan Strategy and Regional Strategies.
• Led the RTA’s involvement with other NSW transport and planning agencies including the Ministry of Transport, the Department of Planning, the Department of Environment, Climate Change and Water and the Offi ce of the Coordinator General to ensure a whole-of-government focus was applied to the provision of road infrastructure as part of a sustainable and integrated transport and land use system.
• Represented the RTA on a range of high level committees including the Chief Executive’s Committee, the NSW CEO Transport Cluster and the Planning and Approvals Chief Executive Group. At a national level, represented the RTA on the Standing Committee on Transport/Transport Agencies Chief Executives, the Austroads Council, Australian Road Research Board, and the Economic Framework for an Effi cient Transportation Marketplace Ministerial Taskforce.
Road development
• Oversaw the management and delivery of the RTA’s $1.8 billion road development program.
• Oversaw negotiations with the federal Department of Infrastructure, Transport, Regional Development and Local Government resulting in the fi ve-year Nation Building Program and including joint funding of $2.3 billion for the Pacifi c Highway upgrade.
Road management
• Continued to lead the provision of effi cient and safe management of traffi c fl ow on the road network through effective management of the RTA’s Transport Management Centre and the ongoing development of incident management strategies and programs.
• Continued to work with the Ministry of Transport to ensure the delivery of bus priority infrastructure across the Sydney Strategic Bus Corridor network, contributing to the completion of 97 bus priority infrastructure projects, and continued implementation of the PTIPS to State Transit Authority buses.
• Continued to oversee negotiations of alliance partnership contracts on the Lawson Upgrade on the Great Western Highway and the Inner West Busway.
• Continued to oversee works for the Pinch Point program.
• Continued to work with the Department of Environment, Climate Change and Water to drive improvement of environmental initiatives such as the NSW Diesel Retrofi t Program and cleaner vehicle technology.
• Continued implementation of the Auditor General’s Condition of State Roads recommendations.
214 APPENDICES
Road use
• Continued to lead the delivery of a range of road safety programs and initiatives. The combination of road safety programs has resulted in a provisional road toll of 440 for the 12 months ended 30 June 2009. This equates to an estimated 0.66 road fatalities per 100 million vehicle kilometres travelled which meets the 2016 State Plan target of 0.70 fatalities per 100 million vehicle kilometres travelled.
• Continued to oversee the research and implementation of initiatives to address safer people, safer roads, safer vehicles and technology.
• Oversaw a range of road transport legislation including the introduction of point-to-point enforcement targeting heavy vehicle speeding, digital red-light and combined red-light speed cameras, a Graduated Licensing Scheme for motorcycle riders and a review of speeding penalties.
• Completed the rollout of 50 school zone speed cameras in NSW.
• Achieved customer satisfaction results for 2008-09 exceeding the target of 90 per cent with 94 per cent of customers rating motor registry services as very good or good.
• During 2008-09, the RTA provided registration and licensing services in relation to 4.72 million licence holders and 5.33 million registered vehicles in NSW.
• Continued to increase share of the E-tag market with a total of 868,505 RTA E-Toll tags and 680,686 current E-Toll accounts at 30 June 2009.
• Oversaw improvements to customer and business-to-business accessibility to services such as the continued implementation of a business-to-business bulk transaction system for dealers and the establishment and trial of a mobile E-Toll offi ce.
• Oversaw implementation of the Voluntary Green Registration Scheme.
• Continued to improve heavy vehicle compliance with a total of 12,982 kilometres of State roads approved for Higher Mass Limits (HML), representing 93 per cent of the total 14,000 kilometres HML approved State road network.
• Continued to support bicycle and pedestrian facilities and infrastructure.
Name: Les Wielinga
Position: Chief Executive
Level: 8
Period in position: 2008-09
Total remuneration package: $423,150
During the period Mr Wielinga continued to focus on delivering a safe, sustainable and effi cient road transport system. He directed a range of signifi cant policy and infrastructure activities in support of the NSW Government priorities and led improvements to the management of the RTA’s internal business operations.
Signifi cant achievements in 2008-09
1 July 2008 - 13 February 2009
Organisational management
• Oversaw the appropriate allocation of the RTA’s resources and budget across programs to achieve RTA results and services for the community and meet Government priorities.
• Oversaw implementation of the RTA Corporate Plan 2008-2012: Blueprint. Blueprint actions were incorporated into 2008-09 directorate business plans and half yearly reporting mechanisms implemented.
• Oversaw the relocation of RTA head offi ce to Miller Street, North Sydney.
• Managed organisational realignment following announcement of the Government commitment to reduce its Senior Executive Service offi cers by 20 per cent.
Inter-agency planning and delivery
• Continued to lead the RTA’s contribution to the delivery of the NSW State Plan. As the RTA is lead agency for Priority S7: Safer Roads, Mr Wielinga oversaw the development of the Cabinet submission for the S7 package of initiatives. Mr Wielinga also oversaw the RTA’s contribution to the delivery of other State Plan priorities for which it is a ‘partner agency’ and further priorities for which the RTA was identifi ed by other agencies to contribute to the achievement of particular milestones and actions.
• Continued to oversee the RTA’s contribution to the ongoing implementation of the State Infrastructure Strategy, Action for Air and the Metropolitan Strategy.

APPENDICES 215
• Led the RTA’s involvement with other transport and planning agencies including the Ministry of Transport, the Department of Planning, the Department of Environment, Climate Change and Water, and the Offi ce of the Coordinator General to ensure a whole of Government focus was applied to the provision of road infrastructure as part of a sustainable and integrated transport and land use system.
• Represented the RTA on a range of high level committees including the Chief Executive’s Committee, the NSW CEO Transport Cluster, and at the national level – the Standing Committee on Transport/Transport Agencies Chief Executives and the Austroads Council.
• Represented the RTA at the NSW Mobility Forum (Sydney CBD) in October 2008.
Road development
• Oversaw the management and delivery of the RTA’s $1.8 billion Road Development program.
• Oversaw submissions to Infrastructure Australia to secure funding for key projects including the Hunter Expressway and Kempsey Bypass.
• Oversaw negotiations of alliance partnership contracts for the Lawson Upgrade on the Great Western Highway and the Inner West Busway.
Road management
• Oversaw the management of the seamless transition of the Sydney Harbour Bridge to full electronic tolling and the introduction of time-of-day tolling to the Sydney Harbour Bridge and Tunnel.
• Continued to lead the provision of effi cient and safe management of traffi c fl ow on the road network through effective management of the RTA’s Transport Management Centre and the ongoing development of incident management strategies and programs.
• Achieved successful coordination of traffi c management for major events in Sydney including World Youth Day, New Year’s Eve celebrations and other planned events.
• Continued to work with the NSW Ministry of Transport to ensure the delivery of bus priority infrastructure across the Sydney Strategic Bus Corridor network, including completion of 89 projects and the commencement of the rollout of the Public Transport Information and Priority System to State Transit Authority buses.
• Oversaw improvement works for the $100 million Pinch Point program.
• Oversaw the awarding of the construction contract for M5 East Tunnel Filtration.
• Continued to work with the Department of Environment, Climate Change and Water to drive improvements to environmental initiatives such as the NSW Diesel Retrofi t Program and cleaner vehicle technology.
• Continued to oversee the implementation of projects to address the NSW Auditor-General’s recommendations arising from the report on the Condition of State Roads.
Road use
• Continued to lead the delivery of a range of road safety programs and initiatives. The combination of road safety programs has resulted in a road toll of 374 in 2008 (compared to 435 for 2007), representing the lowest annual fi gure since 1944. The fatality rate per 100,000 population has decreased to a fi gure of 5.4 in 2008 (compared to 6.3 in 2007) and an estimated 0.57 fatalities per 100 million vehicle kilometres travelled (compared to 0.69 in 2007).
• Continued to oversee the research and implementation of initiatives to address safer people, safer roads, safer vehicles and technology such as the Intelligent Speed Adaptation trial, the development of a Speed Zone Management system, reforms for Learner, P1 and P2 drivers and public education campaigns on safety.
• Oversaw introduction of a range of new tolling products and payment methods to increase fl exibility for road users such as the Easy Toll Tag and Short Term Tag.
• Improved customer and business-to-business accessibility to services through the introduction of a number of online services and the availability of automated transactions at self service kiosks.
• Oversaw a range of road transport legislation and regulations.
216 APPENDICES
Name: Peter Collins
Position: Director, Regional Operations and Engineering Services
(July 2008 – February 2009)
Acting Director, Network Management(February – June 2009)
Level: 6
Period: 2008-09
Total Remuneration Package: $289,950
Signifi cant achievements in 2008-09
1 July 2008 – 13 February 2009 Director, Regional Operations and Engineering Services
• Core programs of road development, road management and road use delivered to meet community needs across the State. Highlights included:
– Bonville Bypass, Pacifi c Highway (opened to traffi c)
– Ballina Bypass, Pacifi c Highway (detailed design completed)
– Princes Highway, South Nowra – Forest Road to Jervis Bay Road (opened to traffi c)
– Princes Highway, Gerringong to Bomaderry Route Selection (preferred option announced)
– Grubbenbun Creek, Mid Western Highway (bridge works complete and opened to traffi c)
• The fi rst phase of the Government’s school road safety package (School Zone Alert System) for 2008-09 delivered within announced time frames, with installation of 50 fl ashing lights at school zones completed in the fi rst half of the year.
• Key projects under the Pinch Point program for congestion management on Sydney Roads managed, including completion of the Campbelltown Road/Blaxland Road project at Campbelltown.
• Twelve bus priority treatments completed with a remaining 13 under construction.
• Excellent commercial results achieved with Road and Fleet Services recording an above budget income of $339.7 million and surplus of $17.6 million during the period July – December 2008.
• Management of Occupational Health and Safety saw a marked reduction in lost time injuries in Road and Fleet Services during the period July – December 2008.
16 February – 30 June 2009 Acting Director, Network Management
• Coordination of the RTA steering committee for implementation of the recommendations from the Gemell Independent Review of Sydney’s Critical Infrastructure.
• Development of processes to support the implementation of the Road Classifi cation Review following release by the Minister for Roads on 20 May 2009.
• Development and publication of a ‘Policy for the Transfer of Assets and Asset Management Functions between the RTA and other Roads Authorities’.
• Completion of Major Heavy Vehicle Rest Area Strategy for Rural Freight Routes.
• Completion of the design phase and start of implementation of the enhanced alpha-numeric route marking system to assist way fi nding on the road network.
• Delivery of the 2008-09 Infrastructure Asset Management Program.
• Ongoing delivery of the Railway Level Crossing site upgrade program.
• Ongoing progress on the Timber Bridge Partnership program with a total of 34 bridges completed as at 30 June 2009.
• Methodology has been developed and calibrated by the Australian Road Research Board, under contract to the RTA, to derive the remaining life of road pavements.
• Ongoing conduct of training as part of the implementation of the Culvert Inventory Guideline.
• Progress on populating the culvert inventory and continued progress on the inspection of culverts contributing with 15,244 culverts inspected by 30 June 2009.
• Start of fi nal stages of commissioning of the Sydney Coordinated Adaptive Traffi c System (SCATS) website.
• Continued progress on SCATS optimisation software.
• Release of Traffi c Management Interface System 2.1 in June 2009 and continued progress on SCATS 6.7.1.
• Completion of works to enhance safety on a further 13 pedestrian crossings on multi-lane State roads with a total of 49 completed as at 30 June 2009.
• Completion of a further eight bus priority infrastructure projects a total of 97 completed projects as at 30 June 2009.

APPENDICES 217
• Ongoing deployment of the Public Transport Information and Priority System (PTIPS) in STA buses contributing to installation of PITPS in a total of 1365 buses as at 30 June 2009 and work being on track for deployment to a total of 2100 STA buses by October 2009.
• Installation of additional Bus Priority Enforcement sites in the Sydney CBD that are scheduled for commissioning in the near future.
• Completion of further works to improve traffi c effi ciency as part of the Pinch Point program, including works at Woodpark, Engadine, Roselands, Wiley Park, Chatswood, Heathcote and Tempe.
• Online publication of ‘A Handbook for Bicycle Riders’.
• Conduct of a two-day training course in May 2009 to provide planners, engineers and designers with the latest information, resources and techniques to design pedestrian and cycling facilities.
Name: Paul Hesford
Position: Director, Finance and Performance
Level: 6
Period: 2008-09
Total Remuneration Package: $267,901
Signifi cant achievements in 2008-09
Commercialisation
• Commercial Development Committee (CDC) established and started operating from March 2009. The CDC provides strategic direction in the pursuit of business opportunities to improve services and generate investment for the road network.
• Provided advice on the evaluation of the special Number Plates consession as announced in the 2008-09 Mini Budget.
• Partnered with the Tolling Branch to improve fi nancial reporting and the assessment of potential business initiatives.
• Oversaw the implementation of rebranding, new products and pricing structure for the Special Number Plates business.
• Delivered outdoor advertising revenues of $15 million in 2008-09, an increase of 44 per cent from the previous year.
• Oversaw the property sales and rental program where revenues of $84 million exceeded budget by more than $34 million.
Financial management
• Unqualifi ed accounts for 30 June 2008 were signed by the Auditor-General.
• Directed the 2008-09 Mini Budget and 2009-10 Budget negotiations with NSW Treasury and funding allocations across RTA programs.
• Led the introduction of new policies and procedures to appraise and fund business initiatives and non infrastructure asset replacement projects.
• Sponsored a signifi cant program of review of the purchasing framework and commercial contracts manual, and rolled out communication and road shows across the RTA.
• Directed the implementation of the upgrade and enhancements of the Information Management System.
Corporate fi nancial advice
• Managed program of fi nancial advice on private sector infrastructure proposals including refi nancing proposals.
• Sponsored the ongoing annual program of reviews for public private partnerships.

218 APPENDICES
• Annual indexation at December and June implemented for RTA products and services.
• Advice provided on a range of issues relating to the Lane Cove Tunnel, the sale of the Westlink M7 and the transfer of the M4 back into Government hands.
Corporate planning and performance
• Oversaw the corporate, strategic and business planning direction of the RTA.
• Led the RTA’s response to the NSW Job Summit for the Transport and Logistics round table.
• Developed a monitoring process to align the Blueprint agenda to internal planning and reporting, to ensure the successful implementation of the RTA’s Corporate Plan.
• Oversaw coordination of the RTA’s contribution to the NSW State Plan through integrated planning and reporting, including delivery of quarterly performance reports/website updates.
• Managed the coordination and submission of the RTA’s 2009-10 Budget Papers to NSW Treasury.
• Developed and submitted a Proposed Total Asset Management (TAM) approach to NSW Treasury in April 2009 and also developed the Agreed TAM for submission to NSW Treasury in early July.
• Managed the coordination and development of the RTA’s 2009-10 Results and Services Plan which represents a high-level service delivery and funding plan required by NSW Treasury.
Business services (including corporate real estate)
• Delivered the successful relocation and fi t-out of RTA head offi ce at Miller Street, North Sydney.
• Completed a program of works for the relocation and fi t-out of motor registries in Parramatta, City South, St Marys and Warners Bay.
• Cashback processed approximately 760,000 claims totalling $107 million and successfully implemented changes from the Mini Budget.
• Employee self-service extended to include online petty cash claims, travel and non-travel expenses, the ability to cancel leave, change bank accounts, view and print payment summaries.
• Recovered $9.7 million for the three and fi ve year hindsight adjustments on workers compensation.
• Exceeded the Government’s 20 per cent usage target for E10 fuel.
• Strategic procurement generated savings of $1.2 million and procurement accreditation was approved by the State Contract Control Board.
Name: Ann King
Position: Director, Licensing, Registration & Freight
Level: 6
Period in Position: 2008-09 *
Total Remuneration Package: $267,901
* Acted in the position until June 2009 and was then formally appointed.
Signifi cant achievements in 2008-09
12 January 2009 - 30 June 2009
• Introduced time-of-day tolling on the Sydney Harbour Bridge and Tunnel in January 2009.
• Assisted in the facilitation of effi cient traffi c movement across the toll road system with a total of 868,505 RTA E-Toll tags issued to 30 June 2009.
• Successfully implemented the Pilot Prosecution Program, forging stronger relationships with critical external agencies. The program is a valuable intra-agency project involving cooperation and achievement between the RTA, NSW Police Force, State Debt Recovery Offi ce and the Attorney-General’s Department.
• Implemented the Intelligent Access Program as a mandatory requirement for Higher Mass Limits and facilitated the expansion of the Higher Mass Limits network across NSW.
• Successfully trialled Super-B-Doubles within the Port Botany vicinity as part of an investigation into higher productivity vehicles and freight movement.
• Contributed to improved road safety through the implementation of national fatigue and speed laws and incorporated an expansion of chain of responsibility legislation, including extensive pre and post-implementation consultation with industry.
• Conducted successful prosecutions under chain of responsibility legislation resulting in the fi rst ever prohibition order issued against a company director, as well as fi nes and court costs being issued against the company.
• Led the national development of an Electronic Vehicle Identifi cation framework through Austroads.
• Introduced the graduated licensing scheme for motorcycle riders in June 2009.
• Participated in the Austroads feasibility study into options for national harmonisation of registration and licensing practices.
• Delivered a range of online registry services, with 27.6 per cent of services conducted through myRTA.com. Also delivered a range of face-to-face services, including the issue and renewal of approximately 1,546,000 licences and 225,000 driving tests.
• Procured facial recognition software to be used initially for fraud investigation and correct identifi cation of customers in certain high risk transactions.
APPENDICES 219
• Continued to participate in the Commonwealth Document Verifi cation Service both as a verifying agency for driver licences and as a user agency to verify key proof of identity documents presented by customers with the issuing authorities.
• Strengthened the Mobility Parking Scheme by introducing a requirement for driver licensing ‘fi tness to drive’ medical reviews and clearer powers for local council offi cers in confi scating misused cards.
• Completed the National In-Service Emissions 2 Study with the fi nal report submitted to the Commonwealth Department of Environment, Water, Heritage and the Arts ahead of time and within budget.
• Managed registration reforms including:
– Older driver licensing reforms
– Short-term registrations
– Vehicle history checks
– Heavy vehicle registration renewals online
• At June 2009, 11 organisations had signed up to phase four of the NSW Diesel Retrofi t Program and 75 trucks were committed to be fi tted with particle traps to catch emissions from the exhaust.
• Implemented an ongoing communication strategy to promote and broaden participation in the Clean Fleet program, resulting in 57 Clean Fleet participants consisting of 6002 heavy vehicles (including 2061 State Transit Authority buses).
• Developed the world’s fi rst fi xed Engine Brake Noise Camera, which is now operational and being used for educational purposes.
• The introduction of an NGARA (a hand held portable real time sound acquisition system that records the engine brake noise of heavy vehicles) required the design and construction of a prototype trailer to provide a mobile system to record engine brake noise that can be set up at temporary locations throughout the state.
• Rolled out licensing services to the tow truck industry allowing operators to perform basic functions at any motor registry or attend six motor registries offering a wide range of services to conduct many of their towing related transactions.
• Established a new Tow Truck Advisory Council to facilitate consultation between the RTA and key industry stakeholders with a view to providing the people of NSW with safe and effi cient towing services.
• Initiation of the DriveGreen Calculator on 30 June 2009 marked the completion of the Voluntary Green Registration Scheme. This project aims to raise awareness of driving on greenhouse gas emissions.
• Contributed towards road safety initiatives through the installation or upgrade of 57 fi xed digital camera sites (including 11 new school zone cameras completed in February 2009).
• Completed a data integrity review for the DRIVES database.
Name: David Stuart-Watt
Position: Director, Licensing, Registration and Freight
Level: 6
Period in Position: 2008-09
Total Remuneration Package: $319,050
Signifi cant achievements in 2008-091 July 2008 – 11 January 2009
• Transitioned the Sydney Harbour Bridge to full electronic tolling beginning on 11 January 2009.
• Extended E-Toll tag/pass product suite to cater for cash customer conversion. The short-term tag, the interoperable ePass, the EasyToll Account and pensioner accounts were developed and launched by December 2008.
• Participated in the Commonwealth Document Verifi cation Service both as a verifying agency for driver licences and as a user agency to verify key proof of identity documents presented by customers with the issuing authorities.
• Implemented legislation for illegal street racing ‘car hoons’ including increasing penalties for non-compliance. Phase two of legislative amendments effective from September 2008.
• Measured emissions performance for the vehicle fl eet as part of the National In-Service Emissions 2 Study.
• Developed a Cabinet Minute on a Mobility Parking Scheme enhancement package.
• Promoted the use of electronic transactions by providing increased availability to myRTA.com.
• Extended chain of responsibility legislation to heavy vehicle driver fatigue reforms in NSW.
• Began pilots of incremental pricing to improve freight movement.
• Progressed the Intelligent Access Program to manage Higher Mass Vehicle access and compliance through satellite tracking.
• Promoted the use of Performance Based Standards (PBS) and other higher productivity vehicles.
• Secured Government approval to consolidate road transport legislation.
• Managed the Austroads registration and licensing program and taskforce, including delivering and supporting the work programs and participating at a national level in the development of registration and licensing reforms.
• Managed the RTA’s involvement in the Council of Australian Government Road Reform Taskforce.
• Improved engine brake noise detection through testing and software upgrades.
• Managed the tow truck industry framework including the delivery of the Tow Truck Industry Regulation 1999 regulatory impact statement and subsequent amendment of the Tow Truck Industry Regulation 1999.
220 APPENDICES
Name: Rod Tout
Position: Director, Corporate Services
Level: 5
Period in position: 2008-09
Total Remuneration Package: $259,850
Signifi cant achievements in 2008-09
Budget management
• Approved budget was well managed and a saving returned for core business use.
Directorate structural reviews
• Occupational Health and Safety, Information Management and Information Technology and Ministerial and Executive Coordination Branches undertook structural reviews to improve effi ciency.
Occupational Health and Safety (OHS)
• Reductions in both Workplace Compensable Injuries and Lost Time Injuries for employees were signifi cantly better than corporate targets.
• Workplace annual cost of workers compensation claims was 25 per cent better than the year target.
• 1190 employees participated in Alpha One health and fi tness assessments to date; phase four of the fi ve-stage program rolled out in 2008-09.
• EnSafe rolled out and training conducted for users.
• Contractor Safety Forum held in November 2008 with more than 65 participants and seven contracting companies participating in forum to share ‘best practice’ ideas in OHS.
• Working Together Phase 2 Safety Training for Supervisors developed with a pilot program run for Fleet Services Managers.
• Positive Performance Indicators for contractors developed, measured and reported to OHS Steering and Executive committees.
Information and Communications Technology (ICT)
• Development of the RTA ICT strategy and governance arrangements.
• Facilitated the telecommunications and server technology component of the successful Miller Street and Parramatta staff relocations on time and budget.
• Provided IT support for the RTA stand at the Easter Show which won a gold award.
• Completed Integrated Management System stage 1 technical and functional upgrade on time and budget.
• Finalised Voice Over IP rollout across the RTA with the completion of the Sydney Harbour Bridge installation.
• RTA website recorded 22,177,841 million visits in 2008-09 – an increase of 34.8 per cent from 2007-08.
• Implementation of four DRIVES releases on time and budget.
• Continued accreditation to ISO 27001 Information Security Management System.
Workforce capability
• Began implementation of the High Performance Environmental Structure across the RTA.
• Work and Development Plan Workshops rolled out across the RTA.
• Ethical Standards Committee established.
• Women in Engineering initiatives held in conjunction with universities.
• Phase I of the Mental Health Awareness Program conducted.
• Major structural reviews completed across the organisation.
• Implementation of inaugural Executive Talent Review.
• Development and presentation of the Onboarding Strategy.
• Launch of rebranded alumni: the RTA Immortals.
• Successful implementation of the leadership strategy across the organisation and successfully conducted four leader’s forums.
• Completion of the RTA Senior Leaders Initiative for the top 65 in the organisation and to the next layer of organisational leaders.
• Inclusion in the leadership initiative of a 360° feedback process as a structured process for leadership development.
• Negotiation and implementation of cadetship agreements with Newcastle and Wollongong universities.
• Launch of three new paraprofessional programs for Traffi c Operations Offi cers, Computer Systems Offi cers, and Property Offi cers and introduction of the e+ Professional Development program for Level 1 and 2 engineers.
APPENDICES 221
• Identifi cation of four critical skills areas to begin to safeguard the RTA’s technical expertise in the future: Civil Engineering; Road Design; Traffi c and Transport Management and Policy.
• HR Enquiry Service won the Service Excellence RTA Staff Award.
• 40 years’ service award presentation ceremony held in May, with 88 recipients and 71 guests receiving their award from the Minister for Roads and the Chief Executive.
• Implementation of E-learning across the organisation.
• Negotiated new industrial awards and created the Crown Employees (RTA of NSW – Salaried Staff) Award 2008.
• Knowledge continuity project initiated and progressing to mitigate risk of corporate and technical knowledge loss.
Communication
• Prepared approximately 1800 media releases, facilitated around 2600 media inquiries and supported approximately 85 NSW Government media events in 2008-09.
• Provided media support to key campaigns including cashless and time-of-day tolling on the Sydney Harbour Bridge.
• Received a gold award for the RTA stand at the Royal Easter Show, which was seen by more than 600,000 people and staffed by 90 volunteers.
• A pink plate launch event was held at the Sydney Cricket Ground for the RTA and McGrath Foundation partnership (April) and was attended by Glen McGrath and the Minister for Roads. At 30 June 2009, a total of 1605 pink plates had been sold with more than $43,470 raised for the McGrath Foundation.
• Promotion of myAddress and myRego resulting in monthly online transactions increasing from 24.1 per cent in July 2008 to 31.3 per cent in June 2009.
Governance
• Reviewed and redeveloped the RTA Delegations Manual to align with structural changes in the RTA.
• From December 2008 to July 2009, Ministerial & Executive Coordination Branch delivered 650 ministerial briefi ngs, 95 contentious issue/electorate briefi ngs, 430 community cabinet briefi ngs and 100 Cabinet Minute responses.
Procurement
• Achieved RTA-wide accreditation by the State Contracts Control Board for procurement of goods and services.
Vehicle management
• Utilisation of E10 fuels in RTA vehicles better than the Government approved target.
Name: Mike Veysey
Position: Acting Director, Regional Operations and Engineering
Services
Level: 5
Period in Position: 2008-09
Total Remuneration Package: $225,200
Signifi cant achievements in 2008-09
17 February 2009 – 30 June 2009
• Delivered core programs of road development, road management and road use, amounting to $1.7 billion to meet community needs across the State. Highlights included:
– Central Coast Highway between Ocean View Drive and Pitt Road – four lanes constructed and opened to traffi c, three months ahead of schedule.
– New Tourle Street Bridge completed and opened to traffi c, three months ahead of schedule.
– Alstonville Bypass – contract awarded and announced with work beginning in April 2009.
– Sheahan Bridge duplication completed.
– Coolac Bypass opened to traffi c.
– Great Western Highway – reconstruction completed at Tunnel Hill.
– Slope stability project on the historic Bulli Pass successfully completed, reducing the risk to the community and environment.
– Hume Highway reconstruction between Hoxton Park Road and Elizabeth Drive completed.
– Start of works on the Moree Bypass Stage 1 – Mehi River Bridge.
– ‘Protect the peak’ approach to road works to ensure minimal disruption to peak traffi c in Sydney.
• Delivered the second phase of the Government’s school road safety package (School Zone Alert System) for 2008-09 within announced time frames, with installation of 50 fl ashing lights at school zones completed between January and June 2009.
• Continued to deliver key projects under the Pinch Point program including completion of the Richmond Road / St Marys Road project at Berkshire Park.
• Achieved excellent commercial results in the Road and Fleet Services business with a record income of $749.6 million and a surplus of $55.4 million.
• Secured external income of $47.4 million by all business sections of the Directorate.

222 APPENDICES
• Undertook comprehensive speed zone reviews on high profi le roads across the State road network.
• Progressed 40km/h High Pedestrian Activity Area Program across targeted areas in the Sydney metropolitan area (including Mortdale town centre, Glebe Point Road and Cabramatta town centre) and also in Jindabyne.
• Developed incident management plans for key routes on the State road network including the start of the F3 Incident Management Scheme – the fi rst integrated incident management scheme which aims to integrate information technology and decision systems into existing infrastructure with signifi cant topographical challenges; Murray River Crossings Incident Plan and a Winter Operations Plan for the Snowy Mountains Highway and Selwyn Snowfi elds.
• Managed the delivery of bus priority measures with 25 Strategic Bus Corridor treatments completed in 2008-09.
• Enhanced effectiveness of vehicle regulations by constructing additional heavy vehicle inspection sites (Franklin Road, Nungarry, Picton Road and Young), upgrading existing sites (Parkes and Mudgee) and through the implementation of the Heavy Vehicle Driver Fatigue Reform Strategy.
• Continued to achieve excellent results in Occupational Health and Safety with a 20 per cent reduction in Lost Time Injuries in Road and Fleet Services over 2008-09.
• Developed centre of expertise in engineering through the RTA’s technical resources in the Engineering Technology Branch.
• Provided leadership of Aboriginal affairs and results for the RTA through implementation of the Aboriginal Action Plan 2006-10 and launch of the Procedure for Aboriginal Cultural Heritage Consultation and Investigation.
• Maintained strong performance delivery culture through the drive for sharper accountability for results across the Directorate.
Name: Brian Watters
Position: Director, Major Infrastructure
Level: 6
Period in Position 2008–09
Total remuneration package: $292,050
Signifi cant achievements in 2008-09• Led and managed delivery of the RTA’s $1.8 billion Road
Development program.
• Maintained strategic partnerships with the Australian Government, State Government agencies, contractors, consultants and industry associations.
• Managed negotiations with the federal Department of Infrastructure, Transport, Regional Development and Local Government resulting in the fi ve-year Nation Building Program and including joint funding of $2.3 billion for the Pacifi c Highway Upgrade.
• Oversaw and facilitated submissions to Infrastructure Australia to secure funding for key projects including the Hunter Expressway on the New England Highway and Kempsey Bypass on the Pacifi c Highway.
• Oversaw the management of major works on the Pacifi c, Hume, Great Western and the Princes highways.
• Oversaw the planning and the development of the Pacifi c Highway Upgrade and the Southern Hume Highway Duplication.
• Major projects completed under Mr Watters’ leadership and opened to traffi c in 2008-09 included:
– Central Coast Highway: Ocean View Drive to Tumbi Road
– F5 Northbound 4 Lane Widening: Brooks Road to Camden Valley Way
– Hume Highway: Sheahan Bridge Duplication, Gundagai
– Alfords Point Bridge Duplication
– Mamre Road: M4 Overpass Duplication
– Great Western Highway: Leura to Katoomba Stage 2
– Pacifi c Highway: Bonville Bypass
– Princes Highway: South Nowra Duplication, Forest Road – Forest Road to Jervis Bay Road and Kiama Ramps
– New England Highway: Weakleys Drive Interchange
– Nelson Bay Road: New Tourle Street Bridge and approaches
• Oversaw and facilitated the negotiation of alliance partnership contracts on three major projects: the Tarcutta Bypass on the Hume Highway, the Lawson Upgrade on the Great Western Highway and the Inner West Busway.

APPENDICES 223
• Oversaw and facilitated the preliminary work towards introduction of alliance partnership contracts on four other projects: Banora Point, Glenugie Upgrade and the Kempsey Bypass on the Pacifi c Highway and the Hunter Expressway on the New England Highway.
• Oversaw and facilitated the awarding of construction contracts for :
– Inner West Busway along Victoria Road
– Alfords Point Bridge Northern approaches
– Bangor Bypass Stage 2: Marsden Road to New Illawarra Road
– Warringah Freeway pedestrian bridge at Falcon Street
– Cowpasture Road: M7 Motorway to North Liverpool Road
– F5 Widening: Brooks Road to Narellan Road
– Hoxton Park Road: Banks Road to Cowpasture Road
– M5 East Tunnel Filtration
– Great Western Highway: Lawson Upgrade, Ferguson Avenue to Ridge Street and Wentworth Falls East, Tableland Road to Station Street
– Princes Highway: Lawrence Hargrave Drive Intersection and Conjola Mountain Realignment
– MR92 Nowra to Nerriga
– Third Crossing of Hunter River
– Avoca Drive: Sun Valley Road to Bayside Drive
– Bruxner Highway: Alstonville Bypass
– New England Highway: Sunnyside Realignment
– Oxley Highway: Wrights Road to Pacifi c Highway
• Continued to lead and develop improvements to project management within the RTA.
• Continued to lead and manage the RTA’s urban design policy including the 2009 update of RTA urban design policy Beyond the Pavement.
• Oversaw the leadership and management of communications and community involvement activities to support the delivery of road infrastructure development, construction and maintenance programs, including:
– The development and distribution of more than 453 community updates, household notifi cations and displays, as well as more than 173 community meetings, workshops and stakeholder briefi ngs relating to road infrastructure projects.
– The purchase and set up of the RTA second web server in regards to hosting infrastructure projects.
Name: Jack Whelan
Position: Director, Business Coordination, Road Safety and Policy
Level: 6
Period in position: 2008-09
Total Remuneration Package: $292,050
Signifi cant achievements in 2008-09
1 July 2008 – 12 January 2009
* Seconded to Department of Premier and Cabinet for two months from September to November 2008.
Road safety
• Oversaw staffi ng of the NSW Centre for Road Safety since it was established in January 2008, with 75 per cent of staff positions in the centre fi lled by 31 December 2008.
• Oversaw the achievement of further reductions in the NSW road toll with a road toll of 374 fatalities for 2008. This result represents the sixth consecutive annual decrease and the lowest annual total since 1944.
• As the RTA Director responsible for the delivery of the State Plan priority S7: Safer Roads, Mr Whelan led the development of the S7 package of initiatives.
• Supported communications in the continuation of the pinkie Speeding. No one thinks big of you campaign targeting young male drivers.
• Oversaw improvements that have increased the effectiveness of the Enhanced Enforcement Program.
• Received the Gold Premiers Award in November 2008 for delivering better services, for the Speed Management Project.
• Continued the Sober Driver Program and the Roadside Drug Testing Program.
• Continued improvement of alcohol interlock legislation and technology.
• Continued to expand the school zone alert system.
• Oversaw development and completion of the next generation of school resources. The resource Limiting risks, protecting lives – choices for novice drivers and their passengers is an educational package for years 10 and 11 which aims to promote deeper thinking and better decision-making about road safety.
• Refi ned Road Safety Impact Statements to ensure all maintenance and upgrading development projects incorporate and consider road safety benefi ts.
224 APPENDICES
• Progressed the development of the Total Vehicle Safety Scoring System to provide tools to assess and report on vehicle safety.
• Oversaw development of a Speed Zone Management system to record the locations of all speed limit signs and zones in NSW.
• Assisted in the planning and implementation of legislative changes to improve road safety.
Corporate communication
• Managed and prepared media releases, media inquiries, speeches, and briefi ng notes for key NSW Government initiatives and events, including changes to legislation, policy and reforms. This included heavy vehicle fatigue laws and major infrastructure projects, the rollout of fl ashing lights in school zones and school zone speed cameras.
• Prepared and implemented two key strategies for World Youth Day 2008 – a communication and community consultation strategy and a pedestrian awareness campaign.
• Received Bronze award at the Australasian Reporting Awards for the RTA’s 2008 Annual Report.
• Developed a new brand look for the New Year’s Eve event on the Cahill Expressway in Sydney and oversaw the planning leading up to the event.
• Oversaw the planning for the 2008 Staff Awards.
• Instigated improvements to the RTA SpeedBlitz Blues sponsorship program with Cricket NSW that led to road safety events at cricket matches in Sydney and Newcastle for the fi rst time, as well as a signifi cant increase in player appearances to work with the RTA to deliver road safety messages.
• Managed the RTA’s Slow Down Community Road Show which was launched at Macarthur Shopping Centre in September 2008.
• Instigated the RTA’s involvement in the International Motor Show in Sydney in October 2008 with an informative RTA display.
• Drove the development and implementation of the ‘Speeding. No one thinks big of you’ campaign that received a number of awards, including: Gold in the Premier’s Awards and top prize in the State and National Australian Marketing Institute Awards for social marketing.
• The RTA was recognised as a world leader in road safety marketing by Washington State Department of Transportation and presented on the ‘Speeding. No one thinks big of you’ campaign at their US symposium.
• Developed and oversaw the Miller Street relocation internal communication strategy which moved approximately 1000 staff to North Sydney.
Ministerial and executive coordination
• Oversaw the management of complex cross-Directorate policies and projects and continued to provide executive services, including management of national issues and resolution of current and emerging strategic issues.
• Improved management of RTA Ministerial correspondence across all Directorates through the implementation of a new reporting framework, realignment of the ministerial coordination section and building accountability across the organisation through directorate partnering sessions.
Infrastructure communication
• Led the development and distribution of more than 324 community updates, household notifi cations and displays, as well as more than 124 community meetings, workshops and stakeholder briefi ngs relating to road infrastructure projects.
• Oversaw the initiation and development of the brief for the RTA fi rst Multimedia Technology Panel.
• Oversaw the plain English review of the RTA Aboriginal Liaison Protocol.
• Agreed to the development of the RTA Design Excellence publication.
• Approved the ‘RTA Draft Community Involvement and Communications Resource Manual for Staff ’.
• Oversaw the preparation of public information on the RTA and alliance method of project delivery.
• Oversaw the participation of approximately 150 project managers in the infrastructure communications processes workshop.
Corporate planning and performance
• Oversaw the alignment of corporate and business plans with the NSW State Plan and the RTA’s Corporate Framework.
• Oversaw strategies to ensure performance management processes and reporting across the organisation.
• Oversaw coordination of the RTA’s contribution to the NSW State Plan through integrated planning and reporting, including delivery of quarterly performance reports/website updates and the Annual Report.
• Coordinated content and logistics for a PIARC (World Roads Association) Technical Committee conference in Sydney in November 2008. The conference brought together roads related offi cials from fi ve continents to discuss ‘Good governance in roads administration’.
APPENDICES 225
Appendix 5. Industrial relationsAwards/enterprise agreementsThe awards and agreements setting the wages and conditions of employment for all staff expired on 30 June 2008. The Government’s wages policy required the RTA to fund any proposed increases above 2.5 per cent per annum for future awards and agreements through employee-related cost savings. The RTA identifi ed suffi cient cost savings to enable it to negotiate a 4 per cent increase per annum over three years, retrospective to 1 July 2008. New awards were made with all unions covering RTA staff.
Communication and consultationThe Peak Consultative Committee continues to be the primary point of consultation with salaried staff associations about business improvements impacting on staff. The agreed consultative processes to discuss crucial industrial issues with all unions/associations continue. Forums and committees are convened periodically to address specifi c issues. A Single Bargaining Unit continues to be the main negotiation and consultation forum for wages staff.
Movements in salaries, wages and allowancesSalaried and wages staff received a 4 per cent increase in salaries from the fi rst full pay period after 1 July 2008, in line with award provisions.
Industrial Relations CommissionThe RTA was involved in 18 disputes lodged with the Industrial Relations Commission (IRC). Eight were settled by conciliation and eight were discontinued. One dispute was referred for arbitration and another remained unresolved at 30 June 2009. The four disputes that remained unresolved at 30 June 2008 have been fi nalised.
Five unfair dismissal applications were lodged with the IRC. Four were settled by conciliation and one was withdrawn prior to hearing. The two unfair dismissal applications that were unresolved at 30 June 2008 have been fi nalised.
Lost time due to industrial action
583.95 equivalent full-time days were lost due to industrial action.
GREAT appeals – Promotional
Seven promotional appeals were lodged with the Government and Related Employees Appeal Tribunal (GREAT) between 1 July 2008 and 30 June 2009. Five appeals were disallowed and two were withdrawn before hearing.
GREAT appeals – Disciplinary
Three disciplinary appeals were lodged with GREAT. Two were settled before hearing and one appeal remained unresolved at 30 June 2009. One appeal remained unresolved as at 30 June 2008 and it has since been fi nalised.
TABLE 14. TOTAL EFFECTIVE FULL-TIME EMPLOYEES BY CATEGORY
YearSalaried
StaffWages Staff
Casual Staff
Total Staff
2005-06 5150 1750 22 6922
2006-07 5173 1718 33 6924
2007-08 5395 1496 38 6929
2008-09 5359 1743 21 7123

226 APPENDICES
Appendix 6. Equal Employment Opportunity (EEO)
Diversity and equity in the RTAHuman Resource Strategy branch is actively working to ensure RTA staff are representative of the communities we serve. The more diversity we build into our teams, the more creative and innovative our workforce will be, as well as responsive to the challenges ahead.
The RTA’s Diversity & Equity plan has six key focus areas: development of our female staff towards more senior management positions; encouraging women to undertake engineering careers; increasing the employment and development of Aboriginal people at all levels of responsibility (in line with State Plan priority F1); increasing the employment of persons with disability (in line with State Plan priority F2); encouraging our youth towards tertiary studies in engineering and related technical fi elds where there are skill shortages; and continuing the inclusion of skilled migrant workers within our project teams.
Our key philosophy for equity is to ensure that identifi ed target groups are encouraged in their input to the RTA’s key result areas. We use strategy review, policy and project support to increase recruitment, integration, work outcomes and personal development of these groups.
2008-09 actions towards gender equity for womenDuring 2008-09, the participation by women in the RTA workforce remained at 35 per cent. Women now make up 27 per cent of the Executive, however we still need to improve the development and support of women in management.
Targeted recruitment of women in 2008-09 has been enabled through various employment programs including traineeships (50), paraprofessional recruitment (5), civil engineering scholarships (7), engineering cadetships (1) and the RTA Graduate program (14).
Skill development of our female staff has been facilitated by active participation in:
• e+ Chartered status accreditation for Engineers.
• Top Steps programs to establish career pathways and individual development for women in middle management.
• Australian Regional Women’s Network presentations.
• Formal voice training to build confi dence and clarity in verbal communications.
• Seminars, training and networking events by the Institute of Public Administration Australia – including formal certifi ed training in project management.
• Financial assistance and study leave provisions to support female staff in postgraduate study.
Our Spokeswomen’s Program, ‘Spokes 08’, was fully subscribed at all venues across the State, with participation from more than 550 women and excellent evaluation results. Speakers previewed at these events have now been introduced into regular RTA training programs.
The RTA Professional Women’s Network, has continued to offer regular lunch meetings with high profi le speakers for senior female staff across the organisation. RTA has maintained an active membership of NSW Equal Employment Opportunity Practitioner’s Association.
2008-09 actions to increase the number of women in engineeringThe RTA has activated a Women in Engineering strategy. Working in partnership with Engineers Australia and fi ve NSW universities offering civil engineering, the RTA is encouraging greater numbers of female secondary students to consider a career in engineering. In 2008 the RTA recruited three additional female scholars in the third year of their engineering studies.
We have co-sponsored a Women in Engineering calendar that is distributed across NSW secondary schools and TAFE colleges.
The inaugural Women in Engineering (‘So You Think You Can Engineer?’) Summit for Yr 10-12 female secondary students (in conjunction with the University of Wollongong) was run in January 2009 with 94 students in attendance. This event has now been confi rmed as an annual enterprise with an increased sponsorship base.
Teams of RTA graduates and road designers-in-training have designed and presented interactive learning workshops at the University of Technology, Sydney, ‘Hands On Engineering” Day for female students in Years 11 and 12.
These programs have raised awareness of the RTA as an ‘employer of choice’ and increased female participation in engineering scholarships for civil, environmental and telecommunication disciplines.
APPENDICES 227
2008-09 actions to increase the employment and development of Aboriginal peopleThe NSW State Plan and ‘Two Ways Together’ economic development plan identify the need for senior executive performance targets to increase Aboriginal employment. The ‘Making It Our Business’ (MIOB) strategic framework tracks the organisation’s performance against key result areas. The RTA’s Aboriginal Employment Strategy brings together these initiatives and has been the subject of wide consultation.
In 2008-09, the RTA identifi ed and fi lled Aboriginal positions including traineeships, an apprenticeship, cultural and heritage advisors, driver licensing staff and road safety strategy advisors. We have participated in Indigenous jobs fairs and events and have attracted three Aboriginal civil engineering scholars to study at NSW universities.
The RTA secondary scholarship for Aboriginal students, supporting Year 11 and 12 students in maths and science subjects (both engineering prerequisites), has been widely promoted.
We have established an Aboriginal employment contact point ([email protected]) and have been receiving and responding to regular enquiries from individuals and Job Service Centres.
The 2008 Elsa Dixon grant submissions funded the establishment of:
• An Aboriginal Employment Coordinator within Workplace Diversity and Equity.
• An Aboriginal Cultural Heritage Advisor for the South-West Region.
The RTA has also applied for 2009 Elsa Dixon grants to fund three new Aboriginal identifi ed roles.
The RTA is reviewing the RTA Aboriginal Action Plan 2006 – 2010 and, in conjunction with ‘Making It Our Business’ (MIOB), reporting against this plan to the RTA Executive and NSW Department of Premier and Cabinet.
2008-09 actions to increase employment and participation of people with a disabilityPeople who have disclosed a disability represent 9 per cent of the RTA workforce. The RTA has Gold membership of The Australian Employers Network on Disability. The RTA seeks to ensure it is supporting staff with disabilities equitably, building its ‘disability confi dence’ as an employer and facilitating any workplace adjustments that may be required.
The RTA is also building awareness and inclusion strategies for our staff and customers through the establishment of a Disability Steering Committee, team leader training at RTA Contact Centre and participation in the ‘Made You Look’ and ‘Flags Ahoy’ campaigns. We have built our knowledge of the upcoming Access to Premises legislation and are ensuring Transport Access Guides are available to the public for all RTA offi ce locations and metropolitan motor registries. In Disability Week 2009 we will be offering regional events for motorised scooter riders and aged drivers.
2008-09 actions to increase the integration and retention of young people aged under 35 years The RTA’s Employment Programs Unit continued to manage 501 young people involved in the RTA’s entry level programs. This role included student support, tertiary institution liaison and proactive participant placement for the RTA’s range of targeted pathways.
The 2009 paraprofessional program expanded to build career pathways from electrical trades into traffi c network modelling and to develop RTA skills on-the-job in property acquisition/asset management and road design.
The RTA Young Professionals Network has become an active forum for staff under 35 years through a range of social and business networking events in key locations and regular profi les of members via ‘The Young Ones’ regular feature in the Momentum staff newsletter.
2008-09 actions to increase the participation of staff members with a multicultural backgroundThe RTA’s staff come from a wide cross-section of cultural and ethnic backgrounds. The RTA is an active member of the Community Relations Commission and the RTA will undertake an agency review against the revised Ethnic Affairs Priority Statement framework in late 2009.
The RTA, in partnership with Sydney Community College and TAFE, has facilitated short-term work placements for skilled migrant engineers from varied disciplines. These staff have made a valuable contribution and have delivered business outcomes for the RTA. The program has provided local public sector experience for candidates and fostered greater understanding of RTA business needs and skill shortages with training providers.
228 APPENDICES
Key initiatives for workplace diversity and equity in 2009-10• Undertake data collection, analysis and reporting of
EEO Data.
• Support work and development planning, and professional and technical development.
• Encourage employee engagement, through participation, development opportunities and mentoring.
• Implement the RTA Diversity & Equity plan and evaluate outcomes.
• Promote the Aboriginal Employment Strategy and Aboriginal Action Plan and deliver culturally appropriate projects and programs to support the community through road safety, licensing and employment targets.
• Recruit and develop Aboriginal identifi ed roles across a range of levels.
• Develop the RTA Disability Action Plan in consultation with internal and external stakeholder groups.
• Finalise the RTA Reasonable Adjustment policy and support managers and staff in its implementation.
• Provide access to and encourage uptake of fl exible work practices and provisions through a review, and update relevant RTA policies such as fl exible work, job swap/job share, teleworking, reasonable adjustment, special leave provisions and use of fi rst aid rooms for new mothers returning to work.
• Assess women’s participation in sponsored programs, development opportunities, tertiary studies and research projects.
• Provide scholarships targeting female candidates, single parents and mature age tertiary study.
• Review recruitment programs to encourage opportunities and applicants for female apprenticeships and to ensure equitable access for disadvantaged groups including Aboriginal people and people with a disability.
• Establish a ‘Stepping into Engineering’ internship program pilot for fi nal year engineering students with a disability.
TABLE 15. TRENDS IN THE REPRESENTATION OF EEO GROUPS
% of total staff (excludes casual staff)
EEO GROUP Benchmark RTA 2006 RTA 2007 RTA 2008 RTA 2009
Women 50 34 34 35 35
Aboriginal People and Torres Strait Islanders 2 1.8 1.9 1.8 1.7
People Whose Language First Spoken as a Child was not English 20 16 16 16 18
People with a Disability 12 12 11 11 9
People with a Disability Requiring Work-related Adjustment 7 3.5 3.4 3.4 2.9
Distribution Index
EEO GROUP Benchmark RTA 2006 RTA 2007 RTA 2008 RTA 2009
Women 100 86 86 87 87
Aboriginal People & Torres Strait Islanders 100 91 92 94 95
People Whose Language First Spoken as a Child was not English 100 105 107 111 109
People with a Disability 100 91 91 92 98
People with a Disability Requiring Work-related Adjustment 100 92 93 93 98
Distribution index: A distribution index of 100 indicates that the centre of the distribution of the EEO group across salary levels is equivalent to that of other staff. Values less than 100 mean that the EEO group tends to be more concentrated at lower salary levels than is the case for other staff. The more pronounced this tendency is, the lower the index will be. In some cased the index may be more than 100, indicating that the EEO group is less concentrated at lower salary levels. This excludes casual staff.
APPENDICES 229
The RTA meets all requirements of the Ethnic Affairs Priorities Statement and Plan (EAPS) regulations and will report in October 2009 on progress made during 2008-09 and forward strategies as required under the revised Standards Framework.
Key activity areas include:
Planning and evaluationDrawing from the State Plan, Blueprint, the RTA’s Corporate Plan for 2008–12, sets out short and long-term priorities, key result areas and values for the conduct of all RTA interactions, both internally and within the community. These corporate goals are incorporated into Directorate and branch business plans that are reviewed on a quarterly basis. Research, consultation and evaluation of ethnic affairs initiatives and our key values are measured through formal performance agreements and annual leadership feedback surveys.
Program and service deliveryOur external programs, delivery and outcomes are based on detailed research from local and international academic organisations, plus incident reporting and focus group feedback from our key customer groups. Internal program development, delivery and evaluations are devised through project teams, drawing on a diversity of skills, resources and expertise for team contribution. Special needs are resourced and monitored for positive outcomes as required.
Staffi ngOur recruitment strategies encourage applicants from diverse backgrounds, with both short and long-term development opportunities offered across the organisation. Promotion of RTA employment opportunities occurs through intranet, internet, public sector notices, news sheet and selected recruitment agency avenues. All staff training from induction to formal qualifi cation – oriented development is linked to our leadership framework, encouraged by individual work and development planning and accessible to all staff. Community Language Allowance Scheme (CLAS) accredited staff contribute to our customer service, particularly within our motor registry venues.
CommunicationThe RTA authenticates and distributes critical identity and licence documentation on behalf of the Government. The RTA translates key documents and assessment tools into a range of community languages. CLAS offi cers are part of this information and communication network.
Communication channels for road safety messages include written (formal and informal), spoken, and an increasingly wide range of mediums (from billboards to nursery songs) to proactively convey and reinforce safety messages to all road users within the diverse community.
Funded servicesThe RTA contracts service providers through approved Government panels or via public tender processes. Evaluation and appointment of providers is based on the published criteria, including the core knowledge, skills and experience required of the contractor. The RTA requests specifi c cultural diversity outcomes in areas including Aboriginal participation in construction.
Our Diversity & Equity Plan for 2008–12 will be compiled after consultation with key stakeholder groups by our Principal Advisor Workplace Diversity & Equity. Our focus will be on the development and support of our staff in the performance of their duties.
Key targets under Diversity and Equity initiatives include:
• Supporting women in advancing to higher professional levels in the workplace.
• Developing more female engineers and females in non-traditional technical fi elds. Developing career pathways for Aboriginal staff.
• Ensuring access to learning and progression for staff with disabilities to suit their skills and interests.
• Retention of staff on entry level programs.
• Building the diversity of our work teams.
Appendix 7. Ethnic Affairs Priorities Statement and Plan
230 APPENDICES
Appendix 8. Disability Plan Proposed initiatives for the 2009-10 period are listed at page 228.
It is a legal requirement to have disability included in the Diversity & Equity plan, which is described in Appendix 6 (page 226).
APPENDICES 231
Appendix 9. Overseas travel by RTA Offi cersFrom 1 July 2008 to 30 June 2009, offi cers of the RTA travelled overseas on 41 occasions to undertake offi cial duties for the RTA and the Government of NSW.
At no cost to the RTA, overseas visits were made by:
• The Materials Technologist, Pavement Structures, to San Francisco, USA, to present a paper at the International Society of Concrete Pavement 9th Conference.
• The Acting Manager, Road Safety Marketing, to Seattle, USA, to deliver a keynote presentation about road safety marketing at the 2008 National Safety Rest Area Conference.
• The Director, Centre for Road Safety, to Kuala Lumpur, Malaysia, to attend a Global Road Safety Partner Conference.
• The Manager, Environmental Planning and Assessment, to Calgary, Canada, to attend a conference of the International Association for Impact Assessment on assessing and managing cumulative environmental effects.
• The Manager, Network Performance Development, and the Principal Systems Analyst, SCATS, to Whangarei, New Zealand, to attend the annual meeting of the SCATS New Zealand User Group.
• The Manager, Network Performance Development, the Principal Systems Analyst, SCATS, and the Manager, Client Liaison, to Auckland, New Zealand, to provide training to staff of New Zealand Transport Agency’s Auckland Transport Management Unit and to provide technical support for the SCATS Ramp Metering System.
• The Director, Centre for Road Safety, to Washington DC, USA, to attend a training seminar for World Bank Global Road Safety staff in a key leadership role and to provide advice to a range of road safety professionals.
Visits during 2008-09, for which all or part of the costs were met by the RTA, were as follows:
• The General Manager, Corporate Planning and Performance, travelled to Amsterdam, The Netherlands, to attend the World Road Association (PIARC) committee on Good Governance in Roads Administration, as an Austroads representative, English-speaking secretary of the committee and working group leader for one of the three sub-committees.
• A Pavement Engineer travelled to Nottingham, England, to present a paper on Shakedown Analysis on Road Pavement Performance at the International Society for Soil Mechanics and Geotechnical Engineering’s 1st International Conference on Transportation Geotechnics.
• The Director, Licensing, Registration and Freight, the Group General Manager, Driver and Vehicle Services, the Manager, NEVDIS, and the Project Offi cer, Austroads, travelled to Wellington, New Zealand, to attend the Austroads Registration and Licensing Task Force meeting. (The Manager, NEVDIS, also travelled to Auckland for a site visit with the company MotorWeb to view a Vehicle Information Request System project).
• The Acting Senior Research and Policy Analyst travelled to Oslo, Norway; Gothenberg, Sweden; Amsterdam, The Netherlands; Paris, France; and Brussels, Belgium, as a member of the Austroads Young Professionals Study Tour.
• The Bitumen Inspector Fleet travelled to Port Moresby, Mount Hagan, Goroka, Wewak and Kevieng, Papua New Guinea, to test and calibrate bitumen sprayers owned by various companies.
• The Manager, Traffi c Systems Applications, the Manager, Client Liaison, and a Transport Systems Specialist travelled to New York, USA, to present papers and participate in the exhibition at the 15th World Conference on Intelligent Transport Systems.
• A Project Engineer, Bridge Engineering, travelled to Wellington, New Zealand, to present a paper on the current work on the durability of RTA bridges at the Australasia Corrosion Association Conference.
• The Manager, Industrial Relations, and the Operations Services Manager, Ballina Bypass Alliance, travelled to Wellington, New Zealand, to participate in the Executive Masters in Public Administration Course.
• The Bitumen Inspector Fleet again travelled to Port Moresby, Papua New Guinea, to test and calibrate bitumen sprayers.
232 APPENDICES
• The Principal Policy Manager, Light Vehicles, travelled to Auckland, New Zealand, to attend Australian New Car Assessment Program and Used Car Safety Ratings meetings.
• The Project Services Manager, the Senior Project Development Manager and the Operations Liaison Manager, travelled to Auckland, New Zealand, to observe the installation and commissioning of the Quick Movable Barrier System on the Auckland Harbour Bridge.
• The Manager, Business and Commercial Services, travelled to San Francisco, USA, to attend the Managing in an Era of Changing Economic Times seminar organised by the International Bridge, Tunnel and Turnpike Association, and to Seattle, USA, and Halifax, Canada, to meet with a number of toll road operators.
• The Quality Manager, Hume Highway Southern Alliance, travelled to St Louis, USA, to attend the National Conference on Preservation, Repair and Rehabilitation of Concrete Pavements.
• The Acting Manager, Bridge Assets, the Bridge Engineering Branch Principal Bridge Engineer, the Senior Bridge Engineer (Assessment and Evaluation), the Supervising Bridge Engineer (Reviews and External Design), the Senior Bridge Engineer (New Design), the Senior Bridge Engineer (Policy and Specifi cation) and two Project Engineers travelled to Auckland, New Zealand, to attend the Austroads 7th Bridge Conference.
• The General Manager, Corporate Planning and Performance, travelled to Malmo, Sweden, to represent Austroads at the World Road Association (PIARC) technical committee on Good Governance in Road Administration.
• The Assistant Director, National Transport Policy, travelled to Ann Arbour and Washington, USA, to speak at an International Conference on Effi cient, Safe and Sustainable Truck Transportation Systems for the Future – Building the Policy Options Roadmap, and to meet with US Government offi cials from the Federal Motor Carrier Safety Administration, Federal Highways Administration.
APPENDICES 233
Appendix 10. Freedom of InformationDuring 2008-09 the RTA received 2566 requests for information under the Freedom of Information Act 1989 (FOI Act), compared with 1973 in 2007-08. In addition, 197 applications were brought forward from the previous period, making a total of 2763 applications to be processed. At the end of the 2008-09 reporting period 319 applications were not completed. There was a 27 per cent increase in the total applications processed in 2008-09 compared to 2007-08.
The complexity and volume of documents sought from the RTA have increased signifi cantly in the past 12 months. These applications seek access to maps, plans, and proposed and current road works. The use of FOI by insurance and fi nance companies continues to rise. The majority of these applicants use Freedom of Information (FOI) to obtain the identity and address of registered operators of motor vehicles whom they are trying to trace. There has also been a marked increase in the number of applications lodged by the media, opposition members, community groups and solicitors.
Of those requests not granted in full, internal reviews were fi nalised for 26 decisions and six external appeals to the Ombudsman were fi nalised. There were three appeals completed at the Administrative Decisions Tribunal this year. A total of 1521 applications required consultation with 2786 third parties external to the organisation. The estimated operating cost of processing FOI requests was $60,150 ($98,137 in 2007-08) and fees received totalled $51,300 ($91,424 in 2007-08). There were two requests received for amendments to personal records. No requests were received for notations to personal records and no ministerial certifi cates were issued. A total of 727 applications were fi nalised after the statutory processing period. One of the factors contributing to this was the continuing high number of applications and the large volume of documents requested.
In 2008-09 the RTA continued to review the resources available to the area responsible for FOI, privacy and contract reporting. A number of business solutions have been introduced to improve the effi ciency and effectiveness of the FOI process and the area is restructuring a number of business processes. A NSW Ombudsman’s investigation recommended a number of process improvements which are being implemented. The RTA continued with the identifi cation, computerised recording and the provision of policy documents in accordance with the requirements of the FOI Act. The RTA’s Statement and Summary of Affairs are published on its website at www.rta.nsw.gov.au.
FOI appeals to the OmbudsmanDuring 2008-09 six external appeals to the Ombudsman were commenced, continued or concluded. Two of these matters, cases three and four, resulted in the Ombudsman issuing a notice of investigation on 10 July 2008, pursuant to section 16 of the Ombudsman Act. Cases three and four are identical from 10 July 2008, and as such, the investigation and outcome is only recorded in case three.
In the fi rst case, on 1 April 2008 an application was made for documents, including any reports or letters, regarding the applicant’s ability to drive. On 16 April 2008 the RTA determined to grant access in part to some documents held by the agency. The remainder of the documents were considered exempt under Schedule 1 Clause 6(1) and 13(b) of the FOI Act. On 6 May 2008 the applicant lodged a request for internal review. The application for internal review was determined on 17 May 2009 and the initial determination was upheld. The applicant applied to the offi ce of the NSW Ombudsman for external review. Pursuant to 52A(1)(a) of the FOI Act, the Offi ce of the NSW Ombudsman suggested the RTA review its determination. On 3 October 2008, the RTA reviewed the determination and granted partial access to additional documentation.
In the second case, on 29 October 2007 an application was made for documents regarding a matrix and all notes or information regarding the applicant being unsuccessful in obtaining an interview for various job applications. On 10 December 2007 the applicant was forwarded a copy of a matrix relating to the job applications. On 6 January 2008 the applicant sought further additional information such as a copy of the electronic application, the name of the panel members, any documentation advising other applicants as to whether they were culled and the reason and any additional documentation. On 24 January 2008 documents were released to the applicant. On 1 February 2008 the applicant’s father contacted the RTA and stated that ‘other’ documentation was requested, including all applicant resumes for those applicants who were called for interview and a matrix of all applicants who were called for an interview. On 12 March 2008 a request for the advance deposit was sent to the applicant. On 4 April 2008 the applicant requested an internal review of the advance deposit. On 29 April 2008 the internal review determination endorsed the request for advance deposit. On 14 May 2008 the Ombudsman’s offi ce wrote to the RTA notifying of an external review request by the applicant. On 30 May 2008 the RTA determined to refuse to continue dealing with the application as the requested advance deposit was not paid pursuant to section 22(3)(a) and (b) of the FOI Act. On 14 July 2008 the Ombudsman’s offi ce, satisfi ed in the RTA’s handling of the matter, decided not to take any further action regarding the applicant’s complaint.

234 APPENDICES
In the third case, on 19 February 2008 an application was made for documents relating to the average AM and PM peak travel times for seven selected routes to the Sydney CBD. The RTA determined the application on 14 March 2008, refusing access and refunding the application fee on the basis that documents were otherwise available on the NSW Department of Premier and Cabinet website. An application for internal review on the basis that relevant documents were not otherwise available in the level of detail as documents held by the RTA was received on 26 March 2008. The applicant declared a deemed refusal upon the expiration of the statutory deadline for an internal review determination to be made. The applicant applied to the Ombudsman’s offi ce for an external review of the RTA’s FOI determinations on 8 April 2008. The Ombudsman wrote to the RTA on 23 April 2008 making preliminary inquiries pursuant to 13AA of the Ombudsman Act. The RTA responded on 16 May 2008 following further correspondence between the Ombudsman and the RTA. The Ombudsman issued a notice of investigation on 10 July 2008, pursuant to section 16 of the Ombudsman Act. The Ombudsman also conducted 16 hearings pursuant to section 19 of the Ombudsman Act. The Ombudsman wrote to the Chief Executive of the RTA requiring the production of information and documents pursuant to section 18 of the Ombudsman Act on 21 July 2008. The RTA responded on 25 July 2008, providing a signifi cant number of documents. A further notice was issued by the Ombudsman to the RTA under section 18 on 27 August 2008 seeking additional information. The RTA responded on 5 September 2008. A further notice pursuant to section 18 was issued to the RTA on 4 December 2008 and responded to on 24 December 2008. The Ombudsman provided a Statement of Provisional Findings to the Chief Executive on 26 November 2008. The RTA responded on 24 December 2008. On 20 January 2009 a draft report was issued to the Minister for Roads, in accordance with section 25 of the Ombudsman Act. The Final Report under section 26 of the Ombudsman Act, dated 24 February 2009, included the following fi ndings:
1. The practice of the RTA sending draft FOI determinations to the Offi ce of the Minister for Roads is based wholly or partly on improper motives, irrelevant grounds or irrelevant consideration, as set out in section 26(1)(d) of the Ombudsman Act.
2. The practice of the RTA not recording the consultative process with the Offi ce of the Minister of Roads in the fortnightly reports on signifi cant FOI applications, and on documentation which forwards draft determinations to the Minister’s offi ce to be based wholly or partly on improper motives, irrelevant grounds or irrelevant consideration, as set out in section 26(1)(d) and is wrong, as set out in section 26(g) of the Ombudsman Act, in that it attempts to disguise the true process in handling such FOI applications and is inaccurate.
3. With regard to the determinations made by the RTA on the FOI application, the subject of this investigation, the internal review determinations made by the RTA were unreasonable in terms of section 26(1)(b) and were based wholly or partly on improper motives, irrelevant grounds or irrelevant consideration, as set out in section 26(1)(d) of the Ombudsman Act. The decisions at internal review were not made on the merits of the application.
The Ombudsman made 20 recommendations and the RTA has responded to the Ombudsman in relation to his recommendations. The Ombudsman’s fi nal report has been tabled in Parliament.
In the fourth case, on 10 March 2008 an application was received by the RTA for documents relating to the Ride Quality and Pavement Durability fi gures as published in the Auditor-General’s Report. The application further sought approximate timeframes for when signifi cant upgrade projects were scheduled to improve their standard under present funding priorities. On 7 May 2008 the RTA determined that the agency did not hold the documents requested pursuant to Section 28 (1)(b) of the FOI Act. The applicant sought an internal review by letter dated 12 May 2008. The applicant declared a deemed refusal after the expiry of the statutory deadline for an internal review determination to be made. The applicant sought an internal review of the way the RTA determined the application. The Ombudsman notifi ed the RTA on 17 June 2008 that the applicant had sought an external review. The Ombudsman wrote to the RTA on 17 June 2008 making preliminary inquiries pursuant to 13AA of the Ombudsman Act, asking for the FOI fi le, internal review fi le, including reasons why no internal review determination was issued, and detail of the searches undertaken by the RTA in response to the FOI application. At the request of the RTA, an extension was granted until 9 July 2008. The RTA provided the FOI fi le to the Ombudsman on 9 July 2008, but did not provide answers to the questions posed in the 17 June letter. The Ombudsman issued a notice of investigation on 10 July 2008, pursuant to section 16 of the Ombudsman Act.
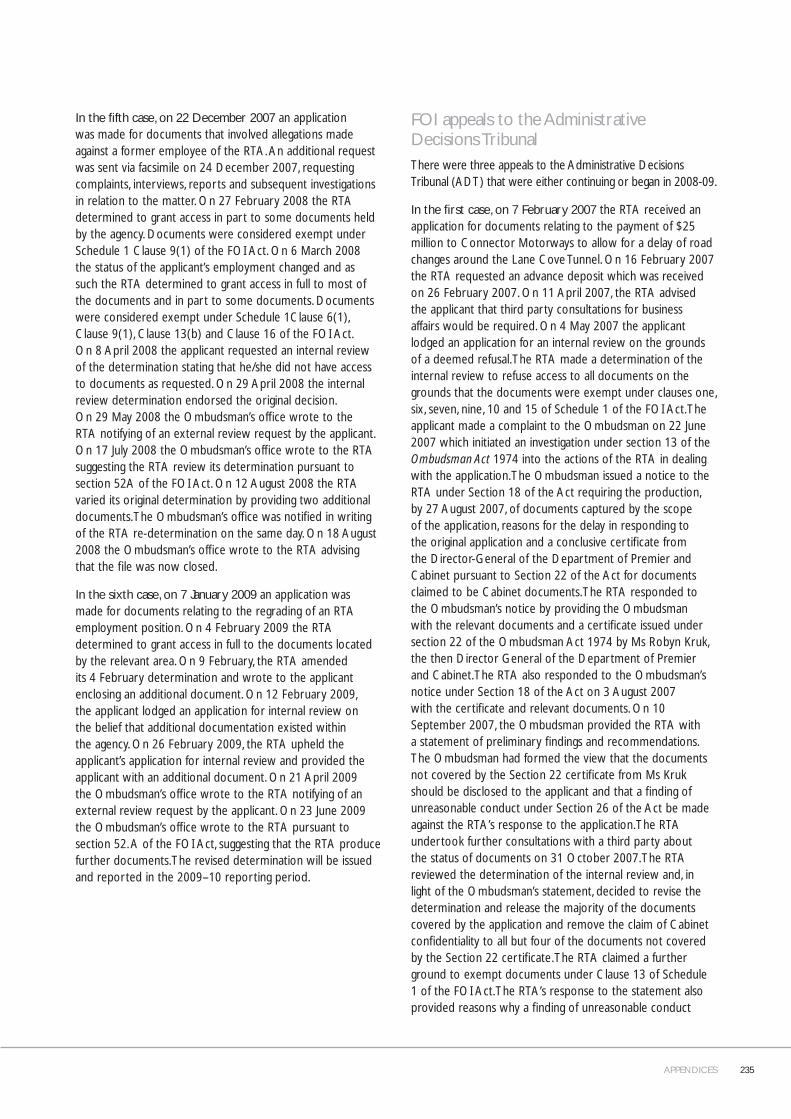
APPENDICES 235
In the fi fth case, on 22 December 2007 an application was made for documents that involved allegations made against a former employee of the RTA. An additional request was sent via facsimile on 24 December 2007, requesting complaints, interviews, reports and subsequent investigations in relation to the matter. On 27 February 2008 the RTA determined to grant access in part to some documents held by the agency. Documents were considered exempt under Schedule 1 Clause 9(1) of the FOI Act. On 6 March 2008 the status of the applicant’s employment changed and as such the RTA determined to grant access in full to most of the documents and in part to some documents. Documents were considered exempt under Schedule 1Clause 6(1), Clause 9(1), Clause 13(b) and Clause 16 of the FOI Act. On 8 April 2008 the applicant requested an internal review of the determination stating that he/she did not have access to documents as requested. On 29 April 2008 the internal review determination endorsed the original decision. On 29 May 2008 the Ombudsman’s offi ce wrote to the RTA notifying of an external review request by the applicant. On 17 July 2008 the Ombudsman’s offi ce wrote to the RTA suggesting the RTA review its determination pursuant to section 52A of the FOI Act. On 12 August 2008 the RTA varied its original determination by providing two additional documents. The Ombudsman’s offi ce was notifi ed in writing of the RTA re-determination on the same day. On 18 August 2008 the Ombudsman’s offi ce wrote to the RTA advising that the fi le was now closed.
In the sixth case, on 7 January 2009 an application was made for documents relating to the regrading of an RTA employment position. On 4 February 2009 the RTA determined to grant access in full to the documents located by the relevant area. On 9 February, the RTA amended its 4 February determination and wrote to the applicant enclosing an additional document. On 12 February 2009, the applicant lodged an application for internal review on the belief that additional documentation existed within the agency. On 26 February 2009, the RTA upheld the applicant’s application for internal review and provided the applicant with an additional document. On 21 April 2009 the Ombudsman’s offi ce wrote to the RTA notifying of an external review request by the applicant. On 23 June 2009 the Ombudsman’s offi ce wrote to the RTA pursuant to section 52. A of the FOI Act, suggesting that the RTA produce further documents. The revised determination will be issued and reported in the 2009–10 reporting period.
FOI appeals to the Administrative Decisions Tribunal There were three appeals to the Administrative Decisions Tribunal (ADT) that were either continuing or began in 2008-09.
In the fi rst case, on 7 February 2007 the RTA received an application for documents relating to the payment of $25 million to Connector Motorways to allow for a delay of road changes around the Lane Cove Tunnel. On 16 February 2007 the RTA requested an advance deposit which was received on 26 February 2007. On 11 April 2007, the RTA advised the applicant that third party consultations for business affairs would be required. On 4 May 2007 the applicant lodged an application for an internal review on the grounds of a deemed refusal. The RTA made a determination of the internal review to refuse access to all documents on the grounds that the documents were exempt under clauses one, six, seven, nine, 10 and 15 of Schedule 1 of the FOI Act. The applicant made a complaint to the Ombudsman on 22 June 2007 which initiated an investigation under section 13 of the Ombudsman Act 1974 into the actions of the RTA in dealing with the application. The Ombudsman issued a notice to the RTA under Section 18 of the Act requiring the production, by 27 August 2007, of documents captured by the scope of the application, reasons for the delay in responding to the original application and a conclusive certifi cate from the Director-General of the Department of Premier and Cabinet pursuant to Section 22 of the Act for documents claimed to be Cabinet documents. The RTA responded to the Ombudsman’s notice by providing the Ombudsman with the relevant documents and a certifi cate issued under section 22 of the Ombudsman Act 1974 by Ms Robyn Kruk, the then Director General of the Department of Premier and Cabinet. The RTA also responded to the Ombudsman’s notice under Section 18 of the Act on 3 August 2007 with the certifi cate and relevant documents. On 10 September 2007, the Ombudsman provided the RTA with a statement of preliminary fi ndings and recommendations. The Ombudsman had formed the view that the documents not covered by the Section 22 certifi cate from Ms Kruk should be disclosed to the applicant and that a fi nding of unreasonable conduct under Section 26 of the Act be made against the RTA’s response to the application. The RTA undertook further consultations with a third party about the status of documents on 31 October 2007. The RTA reviewed the determination of the internal review and, in light of the Ombudsman’s statement, decided to revise the determination and release the majority of the documents covered by the application and remove the claim of Cabinet confi dentiality to all but four of the documents not covered by the Section 22 certifi cate. The RTA claimed a further ground to exempt documents under Clause 13 of Schedule 1 of the FOI Act. The RTA’s response to the statement also provided reasons why a fi nding of unreasonable conduct
236 APPENDICES
by the RTA should not be made. On 28 March 2008 the Deputy Ombudsman issued a report under Section 26 of the Act in which he recommended that all documents be disclosed to the applicant except for those documents covered by the Section 22 certifi cate and also a document which was considered by the Deputy Ombudsman to be exempt for reasons of legal professional privilege. On 27 June 2008 the applicant commenced proceedings against the RTA in the NSW Administrative Decisions Tribunal. On 20 January 2009, the ADT dismissed the proceedings before the matter was heard.
The second case commenced on 30 September 2004 when an application was made for documents relating to the construction and maintenance of rest areas at Mundoonan. On 14 January 2005 a further application was made for documents relating to the cost of the rest area when constructed. Both of these applications followed previous applications that were dealt with separately. The initial determination in respect of the September 2004 application was that the RTA did not hold any documents other than those that had been located in relation to earlier requests. In relation to the January 2005 application, the RTA failed to make a determination. Internal reviews were requested in respect of both applications. The internal review for the September 2004 application upheld the original determination. The internal review for the January 2005 application resulted in the applicant being granted certain documents. However, the applicant was not fully satisfi ed with either internal review, and made an application to the ADT to review the RTA’s determinations. On 4 October 2006 the ADT affi rmed some of the RTA’s determinations in respect of documents held; for others the matter was remitted to the RTA for reconsideration in accordance with certain directions about how the search was to be conducted. The RTA appealed the decision in respect of the orders against it. On 14 June 2007, the Appeal Panel set aside the orders of the ADT that were subject to appeal and remitted the matter to the tribunal. The ADT then remitted the matter to the RTA for reconsideration in light of the Appeal Panel’s decision. The ADT dismissed the proceedings because the applicant withdrew the application to which the proceedings related.
In the third case, on 19 October 2007, an application was made for documents relating to Safe-T-Cam. On 7 December 2007 a determination was made to release documents applied for under the FOI Act, despite a third party objection. The third party objected on the grounds that release of the document would affect its business affairs. The applicant sought an internal review on 30 January 2008. The internal review confi rmed the original determination. The third party applied to have the matter discontinued so that the Ombudsman could investigate. The third party wanted to retain its right to have the application reinstated in the ADT. The ADT sought submissions from both parties, which were provided to the ADT on 20 November 2008.
The ADT decided that referral to the Ombudsman would be appropriate, subject to the consent of the third party. The ADT conducted a planning meeting by teleconference on 19 December 2008 in which the RTA submitted to the President that the matters should be referred to the Ombudsman. The ADT notifi ed the RTA on 4 February 2009 that the Ombudsman’s offi ce had refused to accept the referral of the matter. The RTA attended a planning meeting at the ADT on 9 February 2009, during which a full day was allocated for the hearing on 20 March 2009. The application was withdrawn on 17 March 2009.

APPENDICES 237
FOI 2008-09 Statistics
SECTION A: NUMBER OF NEW FOI APPLICATIONS
Number of FOI applications received, discontinued or completed
Personal Other Total
2007-08 2008-09 2007-08 2008-09 2007-08 2008-09
FOI requests
A1 New 6 23 1967 2543 1973 2566
A2 Brought forward 1 1 196 196 197 197
A3 Total to be processed 7 24 2163 2739 2170 2763
A4 Completed 5 23 1869 2130 1874 2153
A5 Discontinued 1 1 102 290 103 291
A6 Total processed 6 24 1971 2420 1977 2444
A7 Unfi nished (carried forward) 1 0 192 319 193 319
SECTION B: DISCONTINUED APPLICATIONS
Number of discountinued FOI applications
Personal Other Total
2007-08 2008-09 2007-08 2008-09 2007-08 2008-09
Why were FOI applications discontinued?
B1 Request transferred out to another agency (s.20) 3 3 3 3
B2 Applicant withdrew request 1 1 99 149 100 150
B3 Applicant failed to pay advance deposit (s.22) 1 118 112 119 112
B4 Applicant failed to amend a request that would have been an unreasonable diversion of resources to complete (s.25(1)(1a)) 26 26
B5 Total discontinued 2 1 220 290 222 291
SECTION C: COMPLETED APPLICATIONS
Number of completed FOI applications
Personal Other Total
2007-08 2008-09 2007-08 2008-09 2007-08 2008-09
What happened to completed FOI applications?
C1 Granted or otherwise available in full 3 19 1443 1533 1446 1552
C2 Granted or otherwise available in part 1 63 436 63 437
C3 Refused 2 3 170 105 172 108
C4 Documents not held 0 193 56 193 56
C5 Completed 5 23 1869 2130 1874 2153

238 APPENDICES
SECTION D: APPLICATIONS GRANTED OR OTHERWISE AVAILABLE IN FULL
Number of FOI applications (granted or otherwise available in full)
Personal Other Total
2007-08 2008-09 2007-08 2008-09 2007-08 2008-09
How were the documents made available to the applicant?
All document requested were:
D1 Provided to the applicant 3 20 1443 1525 1446 1545
D2 Provided to the applicant’s medical practitioner 2 2
D3 Available for inspection 3 3
D4 Available for purchase
D5 Library material
D6 Subject to deferred access 1 1
D7 Available by a combination of any of the reasons listed in D1-D6 above 1 1
D8 Total granted or otherwiseavailable in full 3 20 1443 1532 1446 1552
SECTION E: APPLICATIONS GRANTED OR OTHERWISE AVAILABLE IN PART
Number of FOI applications
Personal Other Total
2007-08 2008-09 2007-08 2008-09 2007-08 2008-09
How were the documents made available to the applicant?
All document requested were:
E1 Provided to the applicant 0 0 63 424 63 424
E2 Provided to the applicant’s medical practitioner
E3 Available for inspection 8 8
E4 Available for purchase 5 5
E5 Library material
E6 Subject to deferred access
E7 Available by a combination of any of the reasons listed in E1-E6 above
E8 Total granted or otherwise available in full 0 0 63 437 63 437
SECTION F: REFUSED FOI APPLICATIONS
Number of refused FOI applications
Personal Other Total
2007-08 2008-09 2007-08 2008-09 2007-08 2008-09
Why was access to the documents refused?
F1 Exempt 1 3 23 104 24 107
F2 Deemed refused 1 1
F3 Total refused 1 3 23 105 24 108
Documents not held = 56
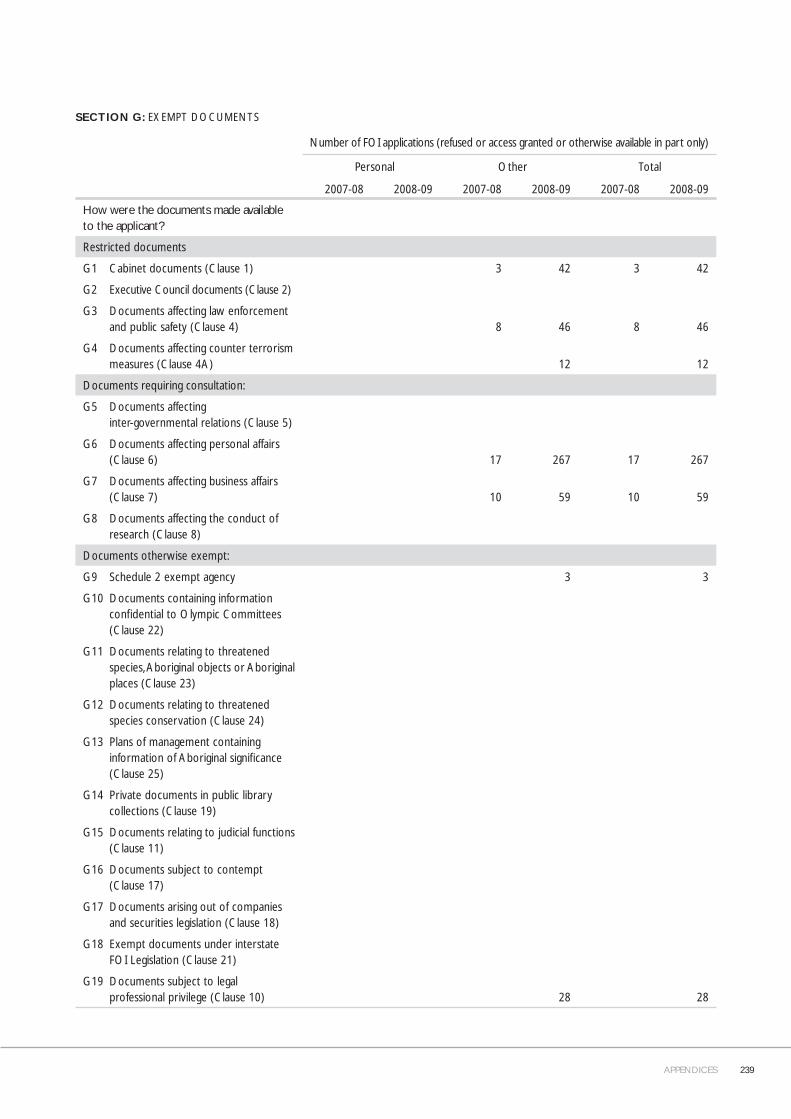
APPENDICES 239
SECTION G: EXEMPT DOCUMENTS
Number of FOI applications (refused or access granted or otherwise available in part only)
Personal Other Total
2007-08 2008-09 2007-08 2008-09 2007-08 2008-09
How were the documents made available to the applicant?
Restricted documents
G1 Cabinet documents (Clause 1) 3 42 3 42
G2 Executive Council documents (Clause 2)
G3 Documents affecting law enforcement and public safety (Clause 4) 8 46 8 46
G4 Documents affecting counter terrorism measures (Clause 4A) 12 12
Documents requiring consultation:
G5 Documents affecting inter-governmental relations (Clause 5)
G6 Documents affecting personal affairs (Clause 6) 17 267 17 267
G7 Documents affecting business affairs (Clause 7) 10 59 10 59
G8 Documents affecting the conduct of research (Clause 8)
Documents otherwise exempt:
G9 Schedule 2 exempt agency 3 3
G10 Documents containing information confi dential to Olympic Committees (Clause 22)
G11 Documents relating to threatened species, Aboriginal objects or Aboriginal places (Clause 23)
G12 Documents relating to threatened species conservation (Clause 24)
G13 Plans of management containing information of Aboriginal signifi cance (Clause 25)
G14 Private documents in public library collections (Clause 19)
G15 Documents relating to judicial functions (Clause 11)
G16 Documents subject to contempt (Clause 17)
G17 Documents arising out of companies and securities legislation (Clause 18)
G18 Exempt documents under interstate FOI Legislation (Clause 21)
G19 Documents subject to legal professional privilege (Clause 10) 28 28
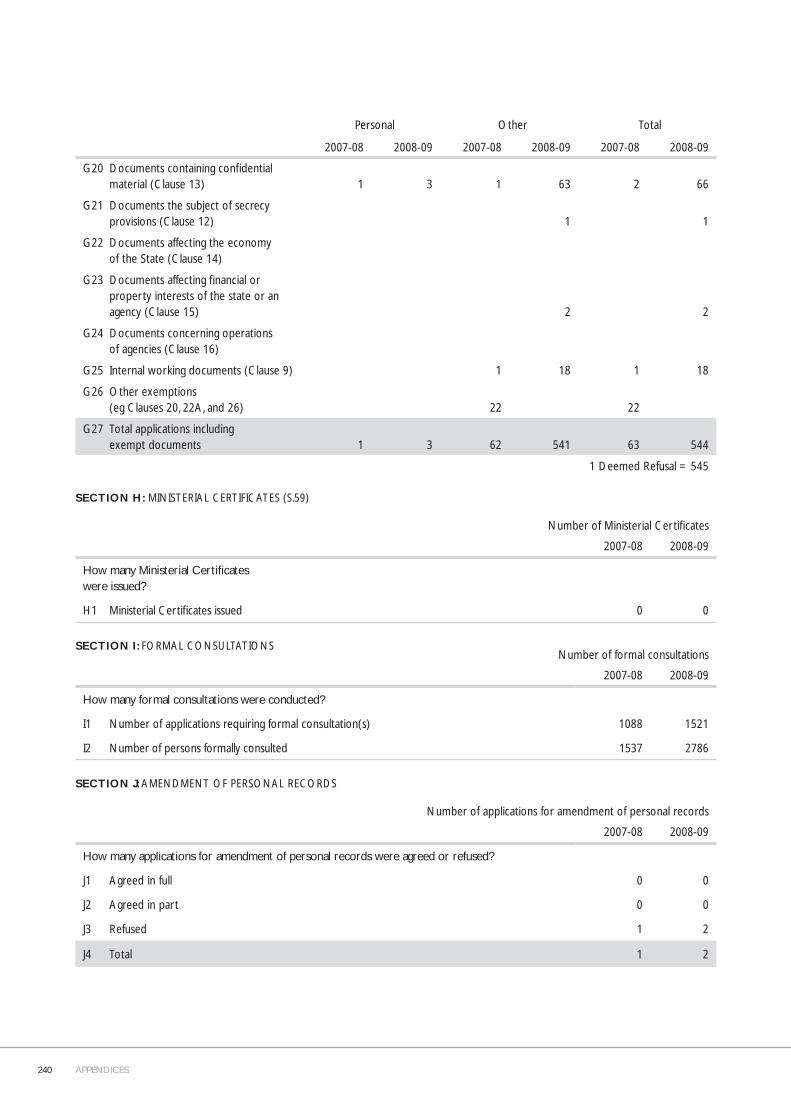
240 APPENDICES
Personal Other Total
2007-08 2008-09 2007-08 2008-09 2007-08 2008-09
G20 Documents containing confi dential material (Clause 13) 1 3 1 63 2 66
G21 Documents the subject of secrecy provisions (Clause 12) 1 1
G22 Documents affecting the economy of the State (Clause 14)
G23 Documents affecting fi nancial or property interests of the state or an agency (Clause 15) 2 2
G24 Documents concerning operations of agencies (Clause 16)
G25 Internal working documents (Clause 9) 1 18 1 18
G26 Other exemptions (eg Clauses 20, 22A, and 26) 22 22
G27 Total applications including exempt documents 1 3 62 541 63 544
1 Deemed Refusal = 545
SECTION H: MINISTERIAL CERTIFICATES (S.59)
Number of Ministerial Certifi cates
2007-08 2008-09
How many Ministerial Certifi cates were issued?
H1 Ministerial Certifi cates issued 0 0
SECTION I: FORMAL CONSULTATIONS Number of formal consultations
2007-08 2008-09
How many formal consultations were conducted?
I1 Number of applications requiring formal consultation(s) 1088 1521
I2 Number of persons formally consulted 1537 2786
SECTION J: AMENDMENT OF PERSONAL RECORDS
Number of applications for amendment of personal records
2007-08 2008-09
How many applications for amendment of personal records were agreed or refused?
J1 Agreed in full 0 0
J2 Agreed in part 0 0
J3 Refused 1 2
J4 Total 1 2
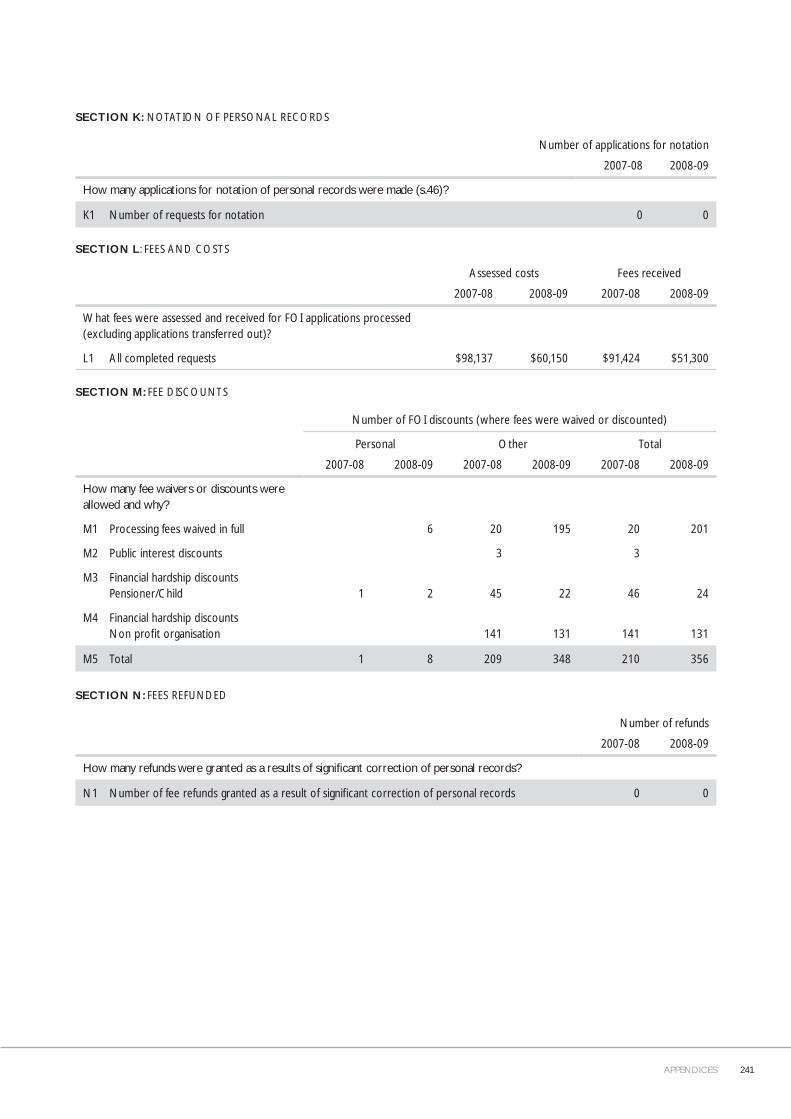
APPENDICES 241
SECTION K: NOTATION OF PERSONAL RECORDS
Number of applications for notation
2007-08 2008-09
How many applications for notation of personal records were made (s.46)?
K1 Number of requests for notation 0 0
SECTION L: FEES AND COSTS
Assessed costs Fees received
2007-08 2008-09 2007-08 2008-09
What fees were assessed and received for FOI applications processed (excluding applications transferred out)?
L1 All completed requests $98,137 $60,150 $91,424 $51,300
SECTION M: FEE DISCOUNTS
Number of FOI discounts (where fees were waived or discounted)
Personal Other Total
2007-08 2008-09 2007-08 2008-09 2007-08 2008-09
How many fee waivers or discounts were allowed and why?
M1 Processing fees waived in full 6 20 195 20 201
M2 Public interest discounts 3 3
M3 Financial hardship discounts Pensioner/Child 1 2 45 22 46 24
M4 Financial hardship discountsNon profi t organisation 141 131 141 131
M5 Total 1 8 209 348 210 356
SECTION N: FEES REFUNDED
Number of refunds
2007-08 2008-09
How many refunds were granted as a results of signifi cant correction of personal records?
N1 Number of fee refunds granted as a result of signifi cant correction of personal records 0 0
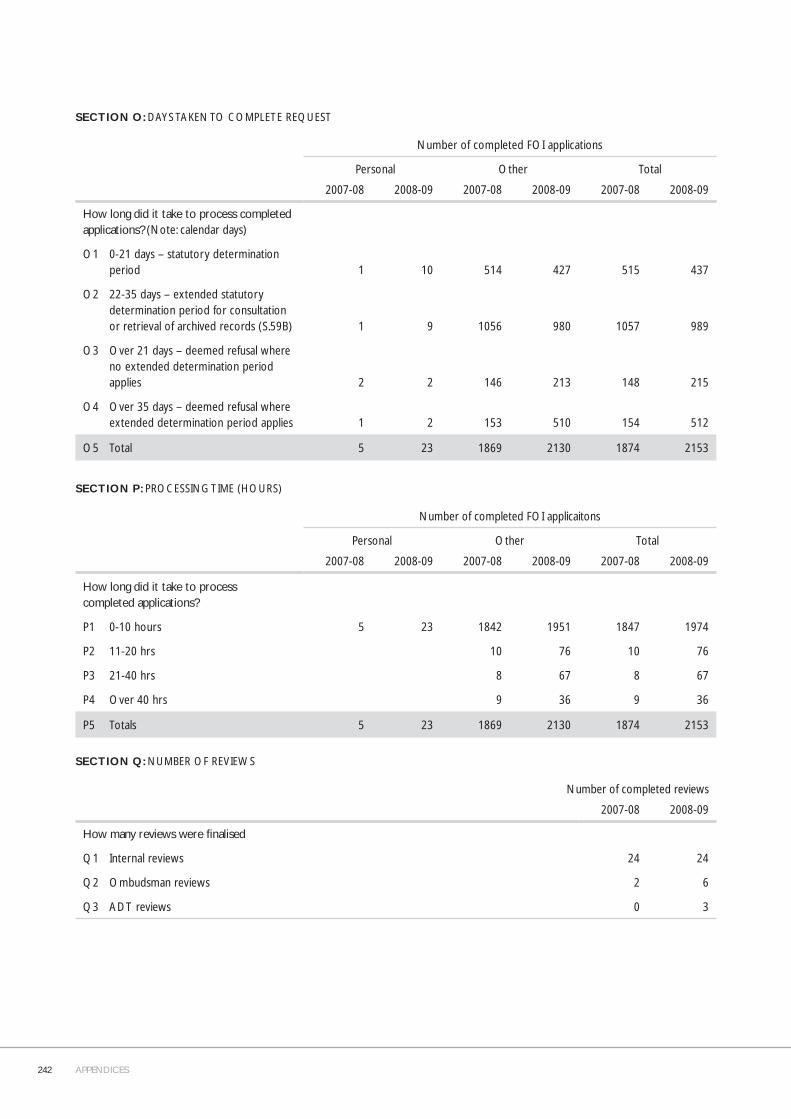
242 APPENDICES
SECTION O: DAYS TAKEN TO COMPLETE REQUEST
Number of completed FOI applications
Personal Other Total
2007-08 2008-09 2007-08 2008-09 2007-08 2008-09
How long did it take to process completed applications? (Note: calendar days)
O1 0-21 days – statutory determination period 1 10 514 427 515 437
O2 22-35 days – extended statutory determination period for consultation or retrieval of archived records (S.59B) 1 9 1056 980 1057 989
O3 Over 21 days – deemed refusal where no extended determination period applies 2 2 146 213 148 215
O4 Over 35 days – deemed refusal where extended determination period applies 1 2 153 510 154 512
O5 Total 5 23 1869 2130 1874 2153
SECTION P: PROCESSING TIME (HOURS)
Number of completed FOI applicaitons
Personal Other Total
2007-08 2008-09 2007-08 2008-09 2007-08 2008-09
How long did it take to process completed applications?
P1 0-10 hours 5 23 1842 1951 1847 1974
P2 11-20 hrs 10 76 10 76
P3 21-40 hrs 8 67 8 67
P4 Over 40 hrs 9 36 9 36
P5 Totals 5 23 1869 2130 1874 2153
SECTION Q: NUMBER OF REVIEWS
Number of completed reviews
2007-08 2008-09
How many reviews were fi nalised
Q1 Internal reviews 24 24
Q2 Ombudsman reviews 2 6
Q3 ADT reviews 0 3
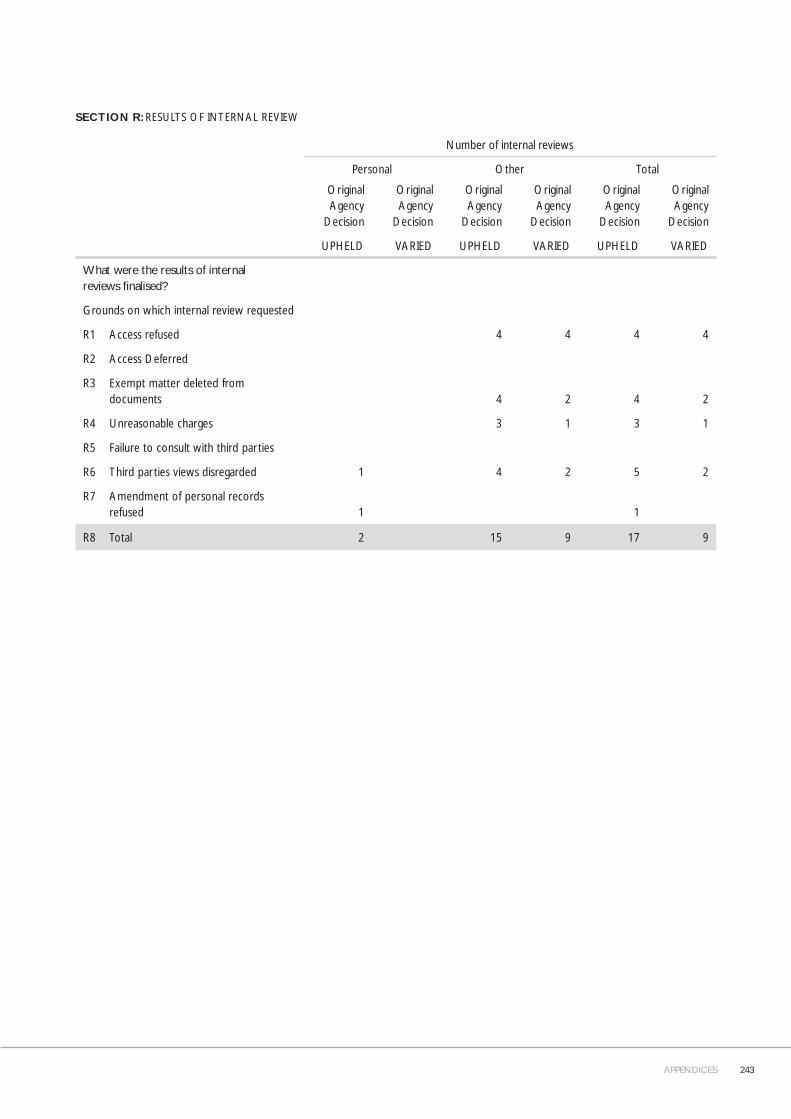
APPENDICES 243
SECTION R: RESULTS OF INTERNAL REVIEW
Number of internal reviews
Personal Other Total
Original Agency
Decision
Original Agency
Decision
Original Agency
Decision
Original Agency
Decision
Original Agency
Decision
Original Agency
Decision
UPHELD VARIED UPHELD VARIED UPHELD VARIED
What were the results of internal reviews fi nalised?
Grounds on which internal review requested
R1 Access refused 4 4 4 4
R2 Access Deferred
R3 Exempt matter deleted from documents 4 2 4 2
R4 Unreasonable charges 3 1 3 1
R5 Failure to consult with third parties
R6 Third parties views disregarded 1 4 2 5 2
R7 Amendment of personal records refused 1 1
R8 Total 2 15 9 17 9

244 APPENDICES
Appendix 11. OmbudsmanDuring 2008-09 fi ve complaints were referred by the Ombudsman to the RTA for investigation. This compares to nine complaints referred for investigation in the previous fi nancial year. The majority of complaints to the Ombudsman are dealt with informally between the Ombudsman and the RTA, or are referred to the RTA to respond directly to the complainant, without the need for further involvement by the Ombudsman. The fi ve complaints referred by the Ombudsman are as follows:
• In July 2008 a complaint was received about the start date of a good behaviour period, elected as an alternative to the suspension of a driver licence. The complainant believed the good behaviour period started on the day the application was made at the RTA motor registry. The RTA informed the Ombudsman that good behaviour election is offered as an alternative to suspension, and therefore the start date of the good behaviour period takes effect on the same date as the suspension period shown on the Notice of Suspension. The Ombudsman raised concerns about the RTA not providing drivers who elect the good behaviour option with clear written advice about the commencement and fi nish dates. The RTA informed the Ombudsman that the Notice of Suspension clearly identifi es the commencement date of the suspension and informs the customer that the good behaviour option is an alternative to the suspension period. The RTA also informed the Ombudsman that it is developing processes to better inform people of the good behaviour option.
• In December 2008 a complaint was received about the RTA’s procedures for dealing with complaints about its subcontractors. The complaint was originally made with the Independent Commission Against Corruption (ICAC) and ICAC referred it to the Ombudsman. This followed an incident where the complainant’s car was damaged when it was struck by a roadwork sign that had not been adequately secured in windy conditions. The RTA advised that the section of road was maintained by a contractor and that any claim for damages should be made with the contractor. The complainant advised that the contractor denied liability. The complainant claims to have then sent a letter to the RTA but did not receive a response. The RTA advised the Ombudsman that it had no record of having received this letter, and answered a number of questions from the Ombudsman, including outlining its complaints’ procedures. The RTA also pointed out a number of issues particular to this case, including the contractor’s claim that the sign was not one used by them.
• Another complaint was received in December 2008 about actions taken by the State Debt Recovery Offi ce (SDRO) in relation to a Penalty Notice and the subsequent effect on the issue of a Notice of Suspension. The SDRO directed the RTA to withdraw the demerit points for an offence committed by the complainant who was serving a good behaviour period and, as a result, the suspension action was also withdrawn. Some months later, the SDRO re-transmitted the offence details to the RTA and, once again, the demerit points limit was exceeded. The complainant again elected to take the good behaviour option. The RTA informed the Ombudsman that it did not consider it was able to back-date a period of good behaviour where the initiating suspension has been withdrawn, however, the RTA did agree in this instance to take into account the number of days the initial good behaviour period was in place before the suspension action was withdrawn and amended the expiry date of the subsequent good behaviour period accordingly.
• In March 2009 the RTA received a complaint about information on the RTA’s website in relation to driver licences which expire before the start of a period of disqualifi cation. The RTA informed the Ombudsman that it is required by law to send a Notice of Suspension not less than 32 days before the suspension takes effect. Where the licence has expired or will expire in the 32 day period, the RTA will refuse the issue of the licence for a period consistent with the mandatory three-month licence suspension. The RTA also informed the Ombusdman that it will review its website in relation to the information on licence suspensions and refusals. However, the RTA stated that it was not prepared to withdraw its decision to refuse the renewal of the driver licence and advised that the complainant had a right to appeal to a court.
• In June 2009 a complaint was received about requests from the RTA for medical reports about the complainant’s suitability to hold a driver licence, despite the fact that they were serving a period of disqualifi cation. The customer originally opted to participate in the alcohol interlock program in lieu of a disqualifi cation imposed by a court but subsequently surrendered the interlock device. This meant that the original court disqualifi cation period should have been re-imposed. However, this information was not relayed to the RTA and, as a consequence, records indicated that the customer was still participating in the interlock program. The Ombudsman was advised that the RTA had initiated medical enquiries because of a medical condition that had been disclosed by the customer. The Ombudsman made a number of suggestions about the content of the RTA’s letter of advice about the medical assessment requirement. The RTA agreed to comply with the suggestions made by the Ombudsman and, as requested, wrote to the customer explaining why a medical assessment was required and outlining the steps required to obtain a driver licence.
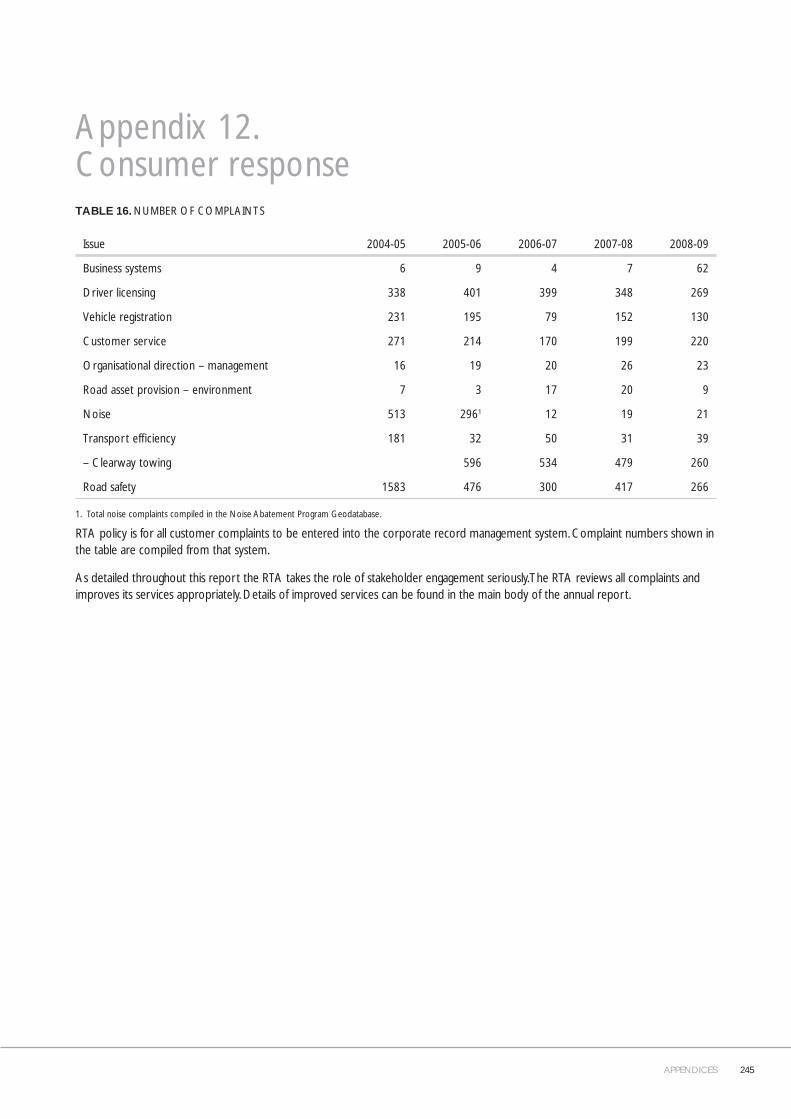
APPENDICES 245
Appendix 12. Consumer responseTABLE 16. NUMBER OF COMPLAINTS
Issue 2004-05 2005-06 2006-07 2007-08 2008-09
Business systems 6 9 4 7 62
Driver licensing 338 401 399 348 269
Vehicle registration 231 195 79 152 130
Customer service 271 214 170 199 220
Organisational direction – management 16 19 20 26 23
Road asset provision – environment 7 3 17 20 9
Noise 513 2961 12 19 21
Transport effi ciency 181 32 50 31 39
– Clearway towing 596 534 479 260
Road safety 1583 476 300 417 266
1. Total noise complaints compiled in the Noise Abatement Program Geodatabase.
RTA policy is for all customer complaints to be entered into the corporate record management system. Complaint numbers shown in the table are compiled from that system.
As detailed throughout this report the RTA takes the role of stakeholder engagement seriously. The RTA reviews all complaints and improves its services appropriately. Details of improved services can be found in the main body of the annual report.
246 APPENDICES
Appendix 13. Legal change
Legislation administered by the Minister for Roads(Act then Regulation)
Campbelltown Presbyterian Cemetery Act 1984 No. 19
Driving Instructors Act 1992 No. 3
Driving Instructors Regulation 2003
Motor Vehicles Taxation Act 1988 No. 111
Motor Vehicles Taxation Regulation 2008
Photo Card Act 2005 No. 20
Photo Card Regulation 2005
Recreation Vehicles Act 1983 No. 136 (Parts 4 and 6)
Road Transport (Driver Licensing) Act 1998 No. 99
Road Transport (Driver Licensing) Regulation 2008
Road Transport (General) Act 2005 No.11
Road Transport (General) Regulation 2005
Road Transport (Mass, Loading and Access) Regulation 2005
Road Transport (Heavy Vehicles Registration Charges) Act 1995 No. 72
Road Transport (Heavy Vehicles Registration Charges) Regulation 2006
Road Transport (Safety and Traffi c Management) Act 1999 No. 20
Road Transport (Safety and Traffi c Management) Regulation 1999
Road Rules 2008
Road Transport (Vehicle Registration) Act 1997 No. 119
Road Transport (Vehicle Registration) Regulation 2007
Roads Act 1993 No. 33 (except parts administered by the Minister for Climate Change and the Environment, Minister for Local Government and Minister for Lands).
Roads Regulation 2008
Sydney Harbour Tunnel (Private Joint Venture) Act 1987 No. 49
Tow Truck Industry Act 1998 No. 111
Tow Truck Industry Regulation 2008
Transport Administration Act 1988 No. 109 (Part)
Transport Administration (General) Regulation 2005 (Part)
Transport Administration (Staff) Regulation 2005 (Part)
New legislation from1 July 2008 – 30 June 2009
New Acts
Road Transport Legislation Amendment Act 2008
This Act was assented to on 1 July 2008 with initial parts of the Act (Schedules 1 and 3) commencing by Proclamation on 1 September 2008 and Schedule 4 by Proclamation on 29 September 2008. The Act amends the Road Transport (Driver Licence) Act 1999, the Roads Act 1993 and the Road Transport (General) Act 2005. The Driver Licence Act 1999 amendments allow for the immediate roadside suspension of a driver licence for excessive speeding offences committed by learner and provisional drivers, the ability to suspend a visiting driver’s licence for an excessive speeding offence, and making it an offence for a learner driver to drive unaccompanied. The Roads Act 1993 amendments streamline toll offence enforcement to make the law consistent with current laws for other road transport offences detected by cameras. The Road Transport (General) Act 2005 amendments incorporate the NTC’s model Heavy Vehicle Driver Fatigue Maintenance Package (which includes the NHVAS business rules and standards and the work diary).
Tow Truck Industry Amendment Act 2008
This Act was assented to on 5 November 2008 and commenced in part on 27 April 2009. The Act amends the Tow Truck Industry Act 1998 to extend the maximum duration of a tow truck operator’s licence or a driver’s certifi cate; to allow the regulations, rather than the RTA, to cap all fees and charges for the towing, storage and salvage of a motor vehicle, as well as for any related or ancillary service; to extend the prohibition on touting and soliciting for work at the scene of an accident; to ensure that an authorised offi cer, police offi cer or emergency services offi cer may direct any certifi ed driver at the scene of an accident and to make it an offence for the driver of a tow truck to allow a person to travel as a passenger in the driver’s tow truck that is proceeding to or from the scene of an accident, except in certain circumstances.
Road Transport Legislation Amendment (Car Hoons) Act 2008
This Act was assented to on 19 March 2008 with initial parts of the Act commencing on 6 June 2008 and the remainder of the Act commencing on 26 September 2008. The Act amended the Road Transport (Safety and Traffi c Management) Act 1999 and the Road Transport (General) Act 2005 regarding the sanctions relating to the detention, impounding and forfeiture of motor vehicles used in connection with street racing and burnout offences.
APPENDICES 247
Road Transport (Driver Licensing) Amendment (Demerit Points System) Act 2008
The Act was assented to on 5 November 2008 and commenced in part on 13 February 2009. It amends the Road Transport (Driver Licensing) Act 1998 to provide for a demerit points system for learner drivers, a more comprehensive demerit points system for provisional drivers and clarifi es the effect of a notice of licence suspension or licence ineligibility issued for incurring demerit points where the driver holds licences for more than one class of vehicle. It also makes certain amendments to the Road Transport (Driver Licensing) Regulation 2008 (clarifying licence ineligibility and making certain speeding offences demerit point offences for learner drivers), and to the Road Transport (General) Regulation 2005 (appeal rights to the Local Court for learner and provisional drivers against certain RTA decisions).
Road Transport Legislation Amendment (Traffi c Offence Detection) Act 2009
This Act received assent on 26 June 2009 and when commenced will amend the Road Transport (Safety and Traffi c Management) Act 1999 and certain other legislation to make further provisions with respect to the detection of speeding offences by heavy vehicles using digital cameras and the detection of certain other traffi c offences. The Act will implement point-to-point speed enforcement targeted at heavy vehicles as well as provisions to enable detection of red light traffi c offences by digital camera technology.
New regulations
Road Transport (Heavy Vehicles Registration Charges) Amendment Regulation 2008
The regulation commenced on 1 July 2008 and varied the annual registration charges payable under Part 2 of the Road Transport (Heavy Vehicles Registration Charges) Act 1995. The regulation applied a 3.5 per cent increase in accordance with advice provided by the National Transport Commission.
Roads Amendment (Penalty Notice Offences) Regulation 2008
The regulation commenced on 1 July 2008 and increased the penalties for offences dealt with by way of a penalty notice issued under section 243 of the Roads Act 1993 in relation to contraventions of certain provisions under the Roads (General) Regulation 2000. The penalty amounts were increased in line with movements in the (Sydney) Consumer Price Index (averaged at 1.94 per cent and rounded to the nearest dollar).
Road Transport (Safety and Traffi c Management) Legislation Amendment (Fee and Tow-away Charge) Regulation 2008
The regulation commenced on 1 July 2008 and increased certain fees in line with the (Sydney) Consumer Price Index (averaged at 1.94 per cent and rounded to the nearest dollar). The fees involved relate to the registration of an applicant as a participant in the Transitional Fatigue Management Scheme for heavy truck drivers and their employers, the fee for the issue of a log book, and the tow-away charge for the removal of unattended motor vehicles or trailers.
Road Transport Legislation Amendment (Penalty Levels and Fees) Regulation 2008
The regulation commenced on 1 July 2008 and increased, in line with the (Sydney) Consumer Price Index (averaged at 1.94 per cent and rounded to the nearest dollar), the 17 penalty levels for penalties for motor vehicle offences that are dealt with by way of penalty notices and the Schedule 1 fees, in the Road Transport (General) Regulation 2005 and fees relating to the issue of Class 1, 2 or 3 permits, any permit under the Division 6 or 7 of Part 2 of the Road Transport (Mass, Loading and Access) Regulation 2005, any permit exempting a person from the operation of any of the provisions of clause 53(1) of the Road Transport (Mass, Loading and Access) Regulation 2005 (relating to the projection of loading or equipment of vehicles), and the fee for any application to be accredited under a Mass Management Accreditation Scheme.
Road Transport (Driver Licensing) Amendment (Fees) Regulation 2008
The regulation commenced on 1 July 2008 and increased, in line with the annual average (Sydney) Consumer Price Index (at 1.94 per cent) and rounded to the nearest dollar), the Schedule 3 fees pertaining to driver licences in the Road Transport (Driver Licensing) Regulation 1999.
Road Transport (Vehicle Registration) Amendment (Fees) Regulation 2008
The regulation commenced on 1 July 2008 and increased, in line with the (Sydney) Consumer Price Index (averaged at 1.94 per cent and rounded to the nearest dollar), Schedule 3 fees in the Road Transport (Vehicle Registration) Regulation 2007 that are payable for services provided by the Roads and Traffi c Authority under the Road Transport (Vehicle Registration) Act 1997.
Driving Instructors Amendment (Fees) Regulation 2008
The regulation commenced on 1 July 2008 and increased, in line with the (Sydney) Consumer Price Index (averaged at 1.94 per cent and rounded to the nearest dollar), the Schedule 1 fees payable in the Driving Instructors Regulation 2003 in connection with the administration of the Driving Instructors Act 1992.
Photo Card Amendment (Fee and Penalty Notice Offences) Regulation 2008
The regulation commenced on 1 July 2008 and increased, in line with the (Sydney) Consumer Price Index (averaged at 1.94 per cent and rounded to the nearest dollar), the fees for the issue of a new Photo Card and for penalties for certain offences dealt with by way of penalty notice in relation to contraventions of the Photo Card Act 2005 and the Photo Card Regulation 2005.
248 APPENDICES
Motor Vehicles Taxation Regulation 2008
This Regulation remade, with minor changes, the Motor Vehicles Taxation Regulation 2003 which was repealed on 1 September 2008 by section 10 (2) of the Subordinate Legislation Act 1989. The Regulation provides for the amount of taxes paid under the Motor Vehicles Taxation Act 1988 that may be refunded on surrender of registration to be calculated on the basis of the number of whole days of registration that are unexpired when the registration is cancelled, or the number of whole days of registration that are unexpired when a vehicle is stolen or damaged in an incident, if the registration is cancelled for one of those reasons.
Road Rules 2008
The Regulation commenced on 1 July 2008 and consolidated in a single instrument the road rules that are applicable in New South Wales, provide for road rules that are based on the Australian Road Rules so as to ensure that the road rules applicable in this State are substantially uniform with road rules applicable elsewhere in Australia, and to provide for other road rules to be observed by road users and other persons in this State in relation to matters that are not otherwise dealt with in the Australian Road Rules.
Road Transport (Driver Licensing) Amendment (Rules Consolidation) Regulation 2008
The Regulation commenced on 1 July 2008 and amended the Road Transport (Driver Licensing) Regulation 1999 to make amendments that were consequential on the consolidation of the road rules applicable in New South Wales in the Road Rules 2008. It also renamed the Road Transport (Safety and Traffi c Management) (Road Rules) Regulation 1999 as the Road Transport (Safety and Traffi c Management) Regulation 1999, and varied and added additional offences to the Schedules of demerit point offences arising from the consolidation of the road rules.
Road Transport (General) Amendment (Rules Consolidation) Regulation 2008
The Regulation commenced on 1 July 2008 and amended the Road Transport (General) Regulation 2005 to make amendments that were consequential on the consolidation of the road rules applicable in New South Wales in the Road Rules 2008 and the renamed the Road Transport (Safety and Traffi c Management) (Road Rules) Regulation 1999 as the Road Transport (Safety and Traffi c Management) Regulation 1999. It also varied and added additional penalty notice offences arising from the consolidation of the road rules and the inclusion of new offences from the Australian Road Rules in that consolidation.
Road Transport (Safety and Traffi c Management) Amendment (Law Revision) Regulation 2008
The Regulation commenced on 1 July 2008 and amended various Acts and Regulations to update certain references that would become incorrect as a result of the consolidation of the road rules applicable in New South Wales in the Road Rules 2008 and the renaming of the Road Transport (Safety and Traffi c Management) (Road Rules) Regulation 1999 as the Road Transport (Safety and Traffi c Management) Regulation 1999.
Tow Truck Industry Regulation 2008
This Regulation commenced on 1 September 2008 and remade, with minor changes, the Tow Truck Industry Regulation 1999 which was repealed on 1 September 2008 by section 10 (2) of the Subordinate Legislation Act 1989. The Regulation made provision for various matters including the inclusion of further particulars in an application for a tow truck operators licence and in an application for a tow truck drivers certifi cate; the payment of application fees for licences and drivers certifi cates; the prescribed offences that disqualify an applicant from holding a licence or drivers’ certifi cate; further grounds on which the Roads and Traffi c Authority may refuse an application for a licence or drivers certifi cate; further licence and drivers certifi cate conditions; an exemption from holding ‘on-hook’ liability insurance in respect of tow trucks used solely for towing vehicles for wrecking purposes and other miscellaneous matters relating to licences and drivers’ certifi cates.
Road Transport (Driver Licensing) Regulation 2008
The Regulation commenced on 1 September 2008 and remade, with some changes, the provisions of the Road Transport (Driver Licensing) Regulation 1999, which was repealed on 1 September 2008 by section 10 (2) of the Subordinate Legislation Act 1989. The Regulation made provision for various matters including the classes of driver licences and the form of those licences; learner licences, provisional licences and heavy vehicle learner licences; the eligibility requirements for the different classes of driver licences; procedures relating to applications for the issue or variation of driver licences; the requirement that holders of driver licences submit to testing of driving ability and knowledge of safe driving practices and road law and undergo medical examinations; the expiration, renewal and surrender of driver licences; the variation, suspension, cancellation and downgrading of driver licences and the offences for which demerit points are incurred; the motorcycle licence riding and testing scheme; interlock driver licences and devices; exemptions of drivers from requirements to hold driver licences and other miscellaneous provisions.

APPENDICES 249
Road Transport (General) Amendment (Driver Licensing) Regulation 2008
The Regulation commenced on 1 September 2009 and amended the Road Transport (General) Regulation 2005 as a consequence of the repeal of the Road Transport (Driver Licensing) Regulation 1999 and its replacement by the Road Transport (Driver Licensing) Regulation 2008.
Road Rules Amendment (Driver Licensing) Regulation 2008
The Regulation commenced on 1 September 2008 and amended the Road Rules 2008 as a consequence of the repeal of the Road Transport (Driver Licensing) Regulation 1999 and its replacement by the Road Transport (Driver Licensing) Regulation 2008.
Road Transport (General) Amendment (Heavy Vehicle Driver Fatigue and Speeding Compliance) Regulation 2008
The Regulation commenced on 29 September 2008 and amended the Road Transport (General) Regulation 2005 to put in place measures for the prevention and management of heavy vehicle and heavy vehicle combination driver fatigue and speeding compliance. The Regulation inserted two new Parts, Part 6 (Heavy vehicle driver fatigue) and Part 7 (Heavy vehicle speeding compliance) into the Road Transport (General) Regulation 2005 to substantially give effect to National Transport Commission model legislation.
Road Transport (Driver Licensing) Amendment (Fatigue and Speeding) Regulation 2008
The Regulation commenced on 29 September 2009 and amended Schedule 2 (Additional demerit point offences) to the Road Transport (Driver Licensing) Regulation 2008 to provide that where a person is convicted by a court of certain new offences in proposed Part 6 (Heavy vehicle driver fatigue) of the Road Transport (General) Regulation 2005 to be inserted by the Road Transport (General) Amendment (Heavy Vehicle Driver Fatigue and Speeding Compliance) Regulation 2008 the person will incur the specifi ed demerit points.
Road Transport (Safety and Traffi c Management) (Driver Fatigue) Repeal Regulation 2008
The Regulation commenced on 29 September 2008 and repealed the Road Transport (Safety and Traffi c Management) (Driver Fatigue) Regulation 1999. The provisions of that Regulation were replaced by Part 6 (Heavy vehicle driver fatigue) that was inserted into the Road Transport (General) Regulation 2005 by the Road Transport (General) Amendment (Heavy Vehicle Driver Fatigue and Speeding Compliance) Regulation 2008.
Road Transport (General) Amendment Regulation 2008
The Regulation commenced on 26 September 2008 and amended the Road Transport (General) Regulation 2005 to provide for the charging of fees with respect to the clamping of vehicles and to make certain amendments that are necessary as a consequence of the commencement of certain amendments made to the Road Transport (General) Act 2005 by the Road Transport Legislation Amendment (Car Hoons) Act 2008.
Road Transport (Safety and Traffi c Management) Amendment (Security Indicators and Device Testing) Regulation 2008
The Regulation commenced on 21 November 2009 and amended the Road Transport (Safety and Traffi c Management) Regulation 1999 to confi rm that approved speed measuring devices of a kind to which the Australian Standard entitled AS 2898.1—2003 (Radar speed detection—Functional requirements and defi nitions) applies are to be tested for reliability in accordance with that Standard while all other approved speed measuring devices are to be tested in accordance with the manufacturer’s recommended calibration method, to prescribe certain character series produced by the SHA-1, SHA-224, SHA-256, SHA-384 or SHA-512 algorithms as security indicators for the purposes of sections 47 (Photographic evidence of speeding offences) and 57B (Photographic evidence of public transport lane offences) of the Road Transport (Safety and Traffi c Management) Act 1999. The regulation also corrected a typographical error.
Road Transport (General) Amendment (No Standing Signs) Regulation 2008
The Regulation commenced on 21 November 2008 and amended Schedule 3 (Penalty notice offences) to the Road Transport (General) Regulation 2005 to make amendments that were consequential on the phasing out of no standing signs. Rule 167–1 (2) of the Road Rules 2008 provides that subrule (1) ceases to have effect on 1 December 2008. Section 71 of the Interpretation Act 1987 (when read with section 5 (3) of that Act) results in rule 167–1 (1) ceasing to have effect at the end of that day. Accordingly, this Regulation commenced at the beginning of 2 December 2008. This Regulation also effects minor law revision by correcting a cross-reference.
Road Transport (Driver Licensing) Amendment (Document Verifi cation Service) Regulation 2009
The Regulation commenced on 30 January 2009 and authorised the Roads and Traffi c Authority to participate in the Document Verifi cation Service (DVS) and to specifi cally authorise the RTA to collect, use and disclose information in the course of its participation in the DVS. The DVS has been established as an element of the National Identity Security Strategy of the Council of Australian Governments for intergovernmental cooperation to strengthen Australia’s personal identifi cation processes.

250 APPENDICES
Road Transport (Safety and Traffi c Management) Amendment (Mobility Parking Scheme) Regulation 2009
This Regulation commenced on 30 January 2009 and empowered an authorised offi cer to inspect a mobility parking scheme authority, request and inspect the identifi cation of the person in charge of the vehicle for the purpose of confi rming that person’s identity, and confi scate the mobility scheme authority if the offi cer had reasonable grounds that it was not being used by its holder or was being used contrary to conditions or had expired.
Road Transport (Driver Licensing) Amendment (Extended Provisional Licence Period) Regulation 2009
The Regulation commenced on 1 March 2009 and enabled the Roads and Traffi c Authority to extend, by six months, the period for which a person is required to hold a provisional driver licence if the person is convicted or found guilty of an offence under section 129 of the Liquor Act 2007 or, if the person is issued with a penalty notice for such an offence, either pays the fi ne or fails to have the matter dealt with by a court. The offence under section 129 of the Liquor Act 2007 involves persons under the age of 18 years using false evidence of age to gain entry to, or to remain in, or to obtain liquor from, licensed premises. The extension of a person’s provisional licence period means that the person will be required to remain on his or her P-plates for a total period of 42 months before being eligible to be issued with an unrestricted licence.
Road Amendment (Filming) Rules 2009
The Rules commenced on 1 May 2009 and exempted heavy vehicles and long vehicles that stop on a length of road in a built up area, in connection with or in a manner ancillary to the carrying out of an approved fi lming from the one-hour time limit for stopping that would otherwise apply to them.
Roads Amendment (Filming) Regulation 2009
The Regulation commenced on 1 May 2009 and prescribed a fi lming project as a road event that may be the subject of a permit under the Roads Regulation 2008.
Road Transport (Driver Licensing) Amendment (Graduated Rider Licensing) Regulation 2009
The Regulation commenced on 1 June 2009 and made new riders of motor bikes and motor trikes subject to a graduated licence scheme similar to that to which new drivers of cars are subject. This is done by the introduction of a two-stage provisional licence scheme that requires a rider to hold a provisional licence for at least three years before being eligible to obtain an unrestricted licence.
Road Transport (General) Amendment (Graduated Rider Licensing) Regulation 2009
The Regulation commenced on 1 June 2009 and provided for penalty notices to be issued to the holder of a provisional P1 licence of class R (a motorcycle licence) who fails to comply with licence conditions imposed by clauses 22 (c) and 28A (1) (b) of the Road Transport (Driver Licensing) Regulation 2008 (as inserted by the Road Transport (Driver Licensing) Amendment (Graduated Rider Licensing) Regulation 2009). The Regulation also simplifi ed Schedule 3 (Penalty notice offences) to the Road Transport (General) Regulation 2005 in respect of the offence of failing to comply with a condition of a conditional licence or provisional licence.
Road Rules Amendment (Graduated Rider Licensing) Regulation 2009
The Regulation commenced on 1 June 2009 and amended the Road Rules 2008 consequential on the Road Transport (Driver Licensing) Amendment (Graduated Rider Licensing) Regulation 2009. That Regulation amended the Road Transport (Driver Licensing) Regulation 2008 to provide that a provisional P1 licence of class R (a motorcycle licence) was subject to a condition that the holder of the licence not carry a passenger. Failure to comply with the condition is an offence.
The following regulation did not commence until 1 July 2009 although it was made by the Governor and was, on 26 June 2009, published on NSW Parliamentary Counsel’s notifi cation website:
Road Transport (Driver Licensing) Amendment (Speeding Offences) Regulation 2009 which altered the number of demerit points incurred at 10, 20, 30 and 45 km/h over the applicable speed limit.
The following seven regulations were published on the NSW Parliamentary Counsel’s notifi cations website on 26 June 2009 and commenced on 1 July 2009. They adjust fees and fi xed penalties payable pursuant to a penalty notice generally in line with movements in the (Sydney) Consumer Price Index (averaged at 4.19 per cent and rounded to the nearest dollar):
1. Photo Card Amendment (Fees and Penalty Notice Offences) Regulation 2009.
2. Roads Amendment (Penalty Notice Offences) Regulation 2009.
3. Road Transport (Driver Licensing) Amendment (Fees) Regulation 2009.
4. Road Transport (Vehicle Registration) Amendment (Fees) Regulation 2009.
5. Road Transport (Safety and Traffi c Management) Amendment (Tow-away Charge) Regulation 2009.
6. Driving Instructors Amendment (Fees) Regulation 2009.
7. Road Transport Legislation Amendment (Penalty Levels and Fees) Regulation 2009.
APPENDICES 251
Appendix 14. Land disposalThe RTA owns property for administrative purposes and acquires property for road construction. Properties that are surplus to requirements are disposed of in accordance with Government policy.
During 2008-09 contracts were brought to account for the sale of 109 properties for a total value of $74 million (net of GST). Of these, 27 properties were valued at more than $0.5 million each, with a total value of $61 million.
Major sales included properties in Willoughby ($28 million), Darling Harbour ($9.4 million), Parramatta ($3.75 million), Rouse Hill ($1.5 million), Enmore ($1.46 million), Dunmore ($1.4 million) and Seaforth ($1.1 million).
No properties were sold to people with a family or business connection between the purchaser and the person responsible for approving the disposal.
Proceeds from property sales are used to improve the State’s road network infrastructure.
All documents relating to the disposal of properties are available under the Freedom of Information Act.
252 APPENDICES
Appendix 15. PublicationsThe RTA produces a wide range of publications to assist customers, to promote road safety and new technology, and to fulfi l statutory requirements under annual reporting, environmental and freedom of information legislation. Past publications on driver licensing, vehicle registration and road safety are available from motor registries.
Technical and AUSTROADS publications are available for sale from the RTA Library Services at Level 3, 27 Argyle Street, Parramatta NSW 2150 (tel 02 8849 2913). The library’s collection of books, journals and CD-ROMs includes extensive coverage in the areas of road and bridge engineering, road safety, environment and management.
The following new or substantially revised titles were issued during 2008-09.
Bicycles• A guide to safe cycling, October 2008 (brochure)
• A handbook for bicycle riders, March 2009
Corporate• Annual Report 2008
• Apprenticeship scheme, June 2009 (brochure)
• Cadet and scholarship programs, June 2009 (brochure)
• Drive your career with the RTA, Civil Engineering fact sheet, March 2009
• Driving your career with the RTA Finance, Economics and Accounting fact sheet, March 2009
• Driving your career with the RTA, Surveying fact sheet, March 2009
• Follow the road to success, March 2009 (postcard)
• Graduate opportunities at the RTA, March 2009 (postcard)
• Graduate Recruitment and Development Program, March 2009 (brochure)
• Paraprofessional program, June 2009 (brochure)
• Traineeship scheme, June 2009 (brochure)
• Walk the road with our mob into an RTA scholarship, June 2009 (postcard)
• Win a match against the RTA SpeedBlitz Blues!, November 2008 (brochure)
Driver and vehicle• A guide to older driver licensing, November 2008
• Buying a used car? Get the full story with a Vehicle History Check (brochure)
• Changes to older driver licensing, November 2008 (brochure)
• City South Motor Registry is moving, December 2008 (fl yer)
• Conditional registration, July 2008 (brochure)
• Demerit points encouraging safe driving, June 2009 (brochure)
• Express yourself with myPlates, March 2009 (brochure)
• EZ Rego. Get a 6-month rego at myRTA.com, September 2009 (fl yer)
• Getting your motorcycle licence, May 2009 (brochure)
• Going Once and Once only. Special number plates rare plate auction invitation, May 2009 (brochure)
• How to prove who you are, January 2009 (brochure)
• Medical and driving tests, November 2008 (brochure)
• Motorcycle riders’ handbook, July 2009
• myPlates product guide fact sheet, May 2009
• myRTA.com Ready when you are, May 2009 (brochure)
• New licence conditions, September 2008 (brochure)
• New St Marys Motor Registry, May 2009 (fl yer)
• Pricing update special plates fact sheet, August 2008
• Special Number Plates term and conditions, May 2009 (brochure)
• YIPEEE Finally, a renewal notice you’ll be happy to receive!, May 2009 (brochure)
• You’re always fi rst in line at myRTA.com, September 2008 (brochure)
Environment• Engine brake noise study, September 2008
(report for internet)
• Oral History Program: Our town now. Three town bypasses revisited Goulburn, Armidale, Karuah, November 2008 (CD)
APPENDICES 253
Heavy vehicles• A truck driver’s guide to the dangers of using drugs to
stay awake, January 2009
• Advanced Fatigue Management Checklist operator update, January 2009 (fact sheet)
• Applying for Basic Fatigue Management operator update, November 2008 (fact sheet)
• Basic Fatigue Management operator update, November 2008 (fact sheet)
• Chain of Responsibility investigation: 2008 Grain harvest industry bulletin, November 2008
• Enrolling in the Intelligent Access Program (IAP) industry fact sheet, March 2009
• Failure to stop at a regulatory stop sign, July 2008 (fl yer)
• Heavy Vehicle Checking Stations (HVCS) compliance data fact sheet, April 2009 and May 2009
• Heavy vehicle driver fatigue reform, September 2008 (fl yer)
• Heavy vehicle driver fatigue reform industry update: New laws for local area heavy vehicle drivers in New South Wales, August 2008
• Heavy vehicle driver fatigue regulation, exemption for livestock carriers industry bulletin, June 2009
• Heavy Vehicle Inspection Scheme (HVIS) compliance data fact sheet, April 2009 and May 2009
• Heavy vehicle restrictions for Botany Road, Botany, May 2009 (brochure)
• Information for primary producers oversize vehicles, May 2009 (fact sheet)
• Intelligent Access Program: Checklist for full enrolment fact sheet, March 2009
• National charging reforms for heavy vehicles and trailers, June 2009 (brochure)
• National Heavy Vehicle Driver Fatigue Law transitional arrangements industry update: Extra time to adjust to the new law, August 2008
• National Heavy Vehicle Driver Fatigue Law work diary industry update: How to use your new work diary, August 2008
• National Heavy Vehicle Driver Fatigue Law industry update: Information for drivers, August 2008
• National Heavy Vehicle Driver Fatigue Law industry update: Information for operators, August 2008
• National Heavy Vehicle Driver Fatigue Law transitional arrangements industry update, October 2008
• National Heavy Vehicle Driver Fatigue Law work diary exemptions industry update, October 2008
• Reduce your heavy vehicle emissions, free TAFE course, May 2009 (brochure)
• Tow truck industry newsletter : Industry news and information, May 2009
Infrastructure• Air fi ltration in the M5 East tunnel Air quality
improvement plan fact sheet, September 2008
• Alfords Point Road community update, August 2008
• Alstonville Bypass community update, September 2008
• Bangor Bypass Stage 2 community update, August 2008
• Barton Highway future duplication frequently asked questions, October 2008
• Better traffi c management on the Sydney Harbour Bridge community update, February 2009
• Bridgeworks concreting, October 2008 (DVD)
• Bus travel more time savings soon, April 2009 (postcard)
• Call for expressions of interest for supply, subcontract and consultancy packages for road, traffi c and bridge construction and maintenance projects June 2009
• Camden Valley Way upgrade Bernera Road, Prestons to Cowpasture Road, Horningsea Park community update, April 2009
• Camden Valley Way upgrade Cowpasture Road to Narellan Road community update, November 2008
• Camden Valley Way upgrade Bernera Road to Cowpasture Road, Horningsea Park community update, August 2008
• Catch a bus and save time, April 2009 (postcard)
• Central Coast better roads, August 2008 (brochure)
• Central Coast Highway/Brisbane Water Drive/Manns Road intersection upgrade, West Oxford community update, March 2009 and June 2009
• Central Coast Highway upgrade at Kariong community update, October 2008
• Central Coast Highway Upgrade: Carlton Road to Matcham Road Review of Environmental Factors, October 2008 (Vol 1 and Vol 2 appendices)
• Central Coast Highway upgrade: Carlton Road, Erina to Matcham Road, Erina Heights community update, October 2008
• Central Coast Highway upgrade: Matcham Road to Ocean View Drive, Review of Environmental Factors, December 2008 (community update, Vol 1 and Vol 2 appendices)
• Central Coast Highway: Brisbane Water Drive/Manns Road intersection upgrade, West Gosford community consultation summary report, March 2009
• Central Coast Highway: Brisbane Water Drive/Manns Road intersection upgrade, West Gosford background information summary, March 2009

254 APPENDICES
• Coolac Bypass, Hume Highway community update, July 2009
• Cowpasture Road and Hoxton Park Road upgrades community update March 2009 and September 2008
• Cross City Tunnel, Summary of contracts, updated with summaries of all contract changes to 30 June 2008 report
• Croudace Street at Mitchell Avenue and Pride Avenue and Chilcott Street, Lambton community update, July 2008
• Culvert inventory collection guideline, January 2009
• Culvert risk assessment guideline, January 2009
• Discharging air from the M5 East tunnel Air quality improvement plan, fact sheet, updated September 2008
• F3 Freeway and road noise in Hornsby Shire, community update, December 2008
• F5 Freeway (Hume Highway) widening between Ingleburn and Blair Athol, community update, February 2009
• F5 Freeway (Hume Highway) widening between Ingleburn and Campbelltown, community update, September 2008
• Falcon Street pedestrian and cyclist facilities, community update, September 2008
• Falcon Street pedestrian and cyclist facilities preferred concept and environmental investigations, Review of Environmental factors supplement, June 2008
• Falcon Street pedestrian and cyclist facilities preferred concept and environmental investigations, Review of Environmental factors proposed revisions to REF Decision Report, June 2008
• Glenmore Park and South Penrith intersection upgrades, community update, August 2008 and December 2008
• Glenmore Park/Regentville and South Penrith intersection upgrades, community update, May 2009
• Holbrook bypass preferred route community update, September 2008
• Intersection upgrade preferred option, West Gosford Central Coast Highway and Brisbane Water Drive/Manns Road community update, December 2008
• M5 East tunnel air fi ltration plant community update, September 2008
• Mamre Road bridge deviation over the M4 Motorway community update, September 2008
• Masters Road and Drummond Street, Mount St Thomas road safety improvements community update, September 2008
• Moree town centre bypass Gwydir Highway interim connection community update, October 2008
• Mulgoa Road-Jamison Road intersection upgrade community update, September 2008
• Northern Distributor extension community update, July 2008, October 2008 and April 2009
• Oxley Highway upgrade community update, June 2009
• Pacifi c Highway upgrade between Lisarow to Ourimbah, March 2009 (fl yer)
• Pacifi c Highway, Wyong options study report, July 2008
• Pacifi c Highway, Wyong preferred option community update, July 2008
• Pedestrian and cycle path Crows Nest to North Ryde, December 2008 (brochure)
• Pedestrian crossing upgrade, Blackheath and other traffi c matters community update, June 2009
• Pedestrian crossing upgrade program, Sydenham Road, Marrickville community update, October 2008
• Repainting of the Darling Harbour bridges community update, February 2009
• Replacement of Adelong Creek Bridges community update, March 2009
• Replacement of Windsor Road Bridge over the Hawkesbury River community update, November 2008
• Review of Environmental Factors for Waterfall Way realignment at Cameron’s Corner, February 2009
• Review of Environmental Factors for Waterfall Way realignment at Marx Hill, December 2008
• Review of Environmental Factors, Pacifi c Highway reconstruction 33.80 km to 34.86 km north of Grafton, NSW (Shark Creek Stage 111), March 2009
• Road safety and traffi c improvements at intersection of the New England Highway (Kelly Street) and Liverpool Street, Scone, community update, September 2008
• Road safety improvements at the junction of Shellharbour Road and Addison Avenue, Lake Illawarra, February 2009 (fl yer)
• RTA Achievement in Road Design, April 2009 (display book)
• Seaforth Oval access, Wakehurst Parkway community update, October 2008
APPENDICES 255
• Sheahan Bridge duplication, Hume Highway community update, May 2009
• St Albans bridge over the Macdonald River community update, January 2009
• Swansea Bridge maintenance community update, July 2008
• Sydney to Newcastle F3 Freeway pavement upgrade Traffi c noise monitoring at 2 Spring Gully Place, Wahroonga, April 2009 (report)
• Tarcutta Bypass preferred route community update, September 2008
• The RTA and alliance contracts fact sheet, April 2009
• Timber Bridge partnership (internet publication with maps), August 2008
• Tom Ugly’s bridge Northbound and Southbound repainting community update, April 2009
• Traffi c fl ow improvement initiatives for the Spit/Military roads corridor report, July 2008
• Traffi c fl ow improvements King Georges Road at Beverly Hills community update, May 2009
• Traffi c fl ows to improve on King Georges Road community update, February 2009
• Traffi c network changes at Gannons Road community update, April 2009
• Traffi c study at Port Hacking Road and Box Road, Sylvania, April 2009 (fl yer)
• Upgrade of Lanyon Drive Monaro Highway to Tompsitt Drive, Queanbeyan community update, June 2009
• Upgrade of the Kings Highway community update, September 2008
• Wangi Road and Dorrington Road, Rathmines community update, November 2008
• Weakleys Drive interchange community update, October 2008
• Wells Crossing to Iluka Road, upgrading of the Pacifi c Highway at Glenugie community update, May 2009
• Wentworth Falls East, Tableland Road to Station Street Vegetation and tree removal community update, June 2009
• Windsor Bridge project community update, June 2009
• Woomargama Bypass preferred route community update, September 2008
• Wymah Ferry review of service community update, December 2008
Great Western Highway upgrade
• An overview Great Western Highway upgrade, September 2008 (brochure)
• Bullaburra East, Ridge Street, Lawson to Genevieve Road, Bullaburra community update, October 2008
• Bullaburra East, Ridge Street, Lawson to Genevieve Road, Bullaburra Review of Environmental Factors, July 2009 (Vol 1 Main Report, Vol 2 Urban Design, Landscape and Visual Assessment Report, Vol 3 appendices and CD)
• Bullaburra East community update, February 2009 and July 2009
• Bullaburra East, Ridge Street, Lawson to Genevieve Road, Bullaburra Report on community consultations, April 2009 (internet)
• Investigating an upgrade for the Great Western Highway between Mt Victoria and Lithgow, July 2008 (fl yer)
• Lawson Ferguson Avenue to Ridge Street community update, February 2009
• Leura to Katoomba Section 2 upgrade Kings Road/East View Avenue Leura to Bowling Green Avenue, Katoomba community update, August 2008
• Mount Victoria and Lithgow community update, August 2008
• Mount Victoria to Lithgow, Corridors in which routes may be feasible community update, November 2008
• Mount Victoria to Lithgow, Crash report, October 2008
• Mount Victoria to Lithgow, Four modifi ed corridors are confi rmed for further investigation, community update, April 2009
• Mount Victoria to Lithgow, Strategic review of a Newnes Plateau corridor, November 2008 (report)
• Mount Victoria to Lithgow Study area investigations and corridors identifi cation, November 2008 (report)
• Mount Victoria to Lithgow submissions report, April 2009
• No widening planned through Blackheath, December 2008 (fl yer)
• Pulpit Hill to Mount Boyce community update, Nov2008
• Upgrade of the Great Western Highway from Mt Victoria to Lithgow, October 2008 (fl yer)
• Wentworth Falls East, Tableland Road to Station Street community update, April 2009

256 APPENDICES
Hume Highway upgrade
• Holbrook Bypass preferred option report, September 2008
• Holbrook Bypass Preliminary Environmental Assessment, October 2008
• Hume Highway Duplication community update, October 2008
• Tarcutta Bypass preferred option report and addendum, September 2008
• Tarcutta Bypass Preliminary Environmental Assessment, November 2008
• Woomargama Bypass preferred option report, September 2008
• Woomargama Bypass Preliminary Environmental Assessment, November 2008
Inner West Busway along Victoria Road
• Community update on noise management, June 2009
• Compliance tracking program, May 2009 (report)
• Construction Environmental Management Plan, May 2009
• Additional temporary construction compounds and work sites fact sheet, April 2009
• Boating on Iron Cove: what to expect during construction fact sheet, April 2009
• Boating on Iron Cove: what to expect on completion fact sheet, April 2009
• Catching a bus: what to expect during construction fact sheet, April 2009
• Catching a bus: what to expect on completion fact sheet, April 2009
• Driving through Drummoyne: what to expect during construction fact sheet, April 2009
• Driving through Drummoyne: what to expect on completion fact sheet, April 2009
• Driving through Rozelle: what to expect during construction fact sheet, April 2009
• Driving through Rozelle: what to expect on completion fact sheet, April 2009
• King George Park: what to expect during construction fact sheet, April 2009
• King George Park: what to expect on completion fact sheet, April 2009
• The Bay Run: what to expect during construction fact sheet, April 2009
• The Bay Run: what to expect on completion fact sheet, April 2009
• The new bridge over Iron Cove: what to expect during construction fact sheet, April 2009
• The new bridge over Iron Cove: what to expect on completion fact sheet, April 2009
• Henley Marine Drive: what to expect during construction fact sheet, April 2009
• Henley Marine Drive: what to expect on completion fact sheet, April 2009
• Heritage management plan, May 2009
• Installation of mitigation measures action plan, May 2009
• Staging plan, May 2009
• Utility relocations action plan, May 2009
• Green light for Inner West Busway community update, April 2009
• Inner West Busway Utility relocation and adjustments Review of Environmental Factors, May 2009
• Inner West Busway, Waterway users interface plan, June 2009 (report)
Princes Highway upgrade
• Conjola Mountain Realignment of the Princes Highway community update, September 2008
• Gerringong to Bomaderry, access value management Workshop Report, December 2008
• Gerringong to Bomaderry, preferred option report, October 2008 (report and CD)
• Gerringong to Bomaderry, preferred option update and Gerringong and Berry options community update, October 2008
• Gerringong to Bomaderry, Route Options Submission Report, September 2008
• Gerringong to Bomaderry, Sustainability Factors, Climate Change and Economic Appraisal Report, September 2008
• Gerringong to Bomaderry, Value management workshop report, August 2008
• Gerringong to Bomaderry, Access option submission summary report, June 2009
• Gerringong to Bomaderry, Finalising the preferred option community update, June 2009
• Gerringong to Bomaderry, Preferred Option Toolijooa Ridge Report, June 2009
• Gerringong to Bomaderry, Preferred Town Access Options Report, June 2009
• Princes Highway and Lawrence Hargrave Drive, Bulli Intersection upgrade approved design community update, May 2009
• Realignment Works at Conjola Mountain, Review of Environmental Factors, December 2007
• South Nowra community update, December 2008
• Victoria Creek community update, Nov2008

APPENDICES 257
Upgrading the Pacifi c Highway
• Ballina Bypass. Modifi cation of the Ballina Bypass Environmental Assessment, August 2008
• Ballina Bypass. Modifi cation of the Ballina Bypass Ross Lane Northern Earthworks Environmental Assessment, August 2008
• Ballina Bypass. Refi ned Design Report, August 2008 (community update, report and CD)
• Ballina Bypass. Refi ned Design Submissions Report, April 2009
• Ballina Bypass. Ross Lane Northern Earthworks Submissions Report, April 2009
• Banora Point, Environmental Assessment Submissions Report, June 2008 (report and CD)
• Banora Point Upgrade Planning approval documents, March 2009
• Bonville Upgrade community update, September 2008
• Coopernook to Herons Creek community update, August 2008
• F3 Freeway to Raymond Terrace, concept design, July 2008 (community update, report and CD)
• Failford Road to Tritton Road determination report, October 2008
• Failford Road to Tritton Road, Review of Environmental Factors Submissions Report, October 2008
• Iluka Road to Woodburn Concept Design Submissions Report, July 2008
• Iluka Road to Woodburn Ecological Assessment Working Paper, July 2008
• Iluka Road to Woodburn Indigenous Heritage Assessment Working Paper, July 2008
• Iluka Road to Woodburn Non-Indigenous Heritage Assessment Working Paper, July 2008
• Iluka Road to Woodburn Preferred Concept Design, July 2008 (community update, report and CD)
• Iluka Road to Woodburn Preliminary Traffi c and Transport Assessment Working Paper, July 2008
• Progress update Coffs Harbour bypass and Luke Bowen footbridge, April 2009 (brochure)
• Sapphire to Woolgoolga upgrade report, January 2009
• Sapphire to Woolgoolga upgrade progress update, February 2009
• Tintenbar to Ewingsdale Bangalow southern bypass discussion paper, June 2009 (hard copy and CD)
• Tintenbar to Ewingsdale, Bangalow southern bypass Q&As community update, June 09
• Tintenbar to Ewingsdale, Environmental Assessment Submissions Report and Preferred Project Report, May 2009 (report and CD)
• Tintenbar to Ewingsdale, community update, August 2008
• Tintenbar to Ewingsdale, Environmental Assessment, August 2008 (Vol 1 Environmental Assessment, Vol 2 Working Papers 1-3, Vol 3 Working Papers 4-6, Vol 4 Working Papers 7-12 and CD)
• Wells Crossing to Iluka Road community update, April 2009
• Wells Crossing to Iluka Road concept design community update, January 2009
• Wells Crossing to Iluka Road concept design report, November 2008
• Wells Crossing to Iluka Road concept design report Cane industry assessment working paper, November 2008
• Wells Crossing to Iluka Road concept design report Terrestrial ecology working paper, November 2008
• Wells Crossing to Iluka Road concept design report Aquatic ecology working paper, November 2008
• Wells Crossing to Iluka Road concept design report Cultural heritage working paper, November 2008
• Wells Crossing to Iluka Road concept design report Hydrology and hydraulics working paper, November 2008
• Wells Crossing to Iluka Road concept design report Water quality working paper, November 2008
• Wells Crossing to Iluka Road concept design report Harwood Bridge options working paper, November 2008
• Wells Crossing to Iluka Road concept design report Cane industry assessment working paper, Terrestrial ecology Wells Crossing to Iluka Road Glenugie upgrade section, Preliminary Environmental Assessment, April 2009
• Wells Crossing to Iluka Road preferred route submissions report, November 2008 (report and CD)
• Working paper, Aquatic ecology working paper, Cultural heritage working paper, Hydrology and hydraulics working paper, Water quality working paper, Harwood Bridge options working paper, November 2008 (CD)
258 APPENDICES
Victoria Road upgrade
• Assessment of options for new bridge over Iron Cove, July 2008
• Assessment of strategic alternatives, July 2008
• Community consultation summary report, July 2008
• Cyclist and pedestrian improvements review of environmental factors, January 2009
• Environmental Assessment, October 2008 (Vol 1, Vol 2, Vol 3, Vol 4 and CD)
• Environmental Assessment and additional information, October 2008 (CD)
• Environmental Assessment community update, October 2008
• Environmental Assessment submissions report, February 2009 (report and CD)
• Environmental Assessment summary, October 2008
• Environmental Assessment Economic Evaluation, September 2008
• Geotechnical and utility investigations, Review of Environmental Factors, December 2008
• Improved access to the Bay Run, Drummoyne, December 2008 (postcard)
• Investigative works within Iron Cove Review of Environmental Factors, October 2008
• King George Park, frequently asked questions, December 2008
• Parking in the swimming pool precinct, November 2008 and February 2009
• Pedestrian and cyclist improvements community update, September 2008
• Predicted bus time savings, October 2008 (fl yer)
• Preferred option for bus lane upgrades for Victoria Road and new bridge crossing, July 2008
• Proposal Project Application Report and Preliminary Environmental Assessment, July 2008
• Proposed construction of a bridge across navigable waters submissions report, April 2009
• Quick summary environmental assessment submission report fact sheet, February 2009
• RTA traffi c briefi ng parked issues, 6 November 2008
• Victoria Road upgrade community update, March 2009
Road safety• 2009 Road Safety Research, Policing and Education
Conference and the 2009 Intelligent Speed Adaptation Conference
• A guide to using motorised wheelchairs, July 2009 (brochure)
• Alcohol Interlock Program: Information for criminal law specialists, June 2009 (report)
• Chain of Responsibility Provisions: Fatigue management, September 2008 (fact sheet)
• Chain of Responsibility Provisions: Speed compliance, September 2008 (fact sheet)
• Drinking and driving: the facts, May 2009 (brochure)
• Driving and medicines, December 2008 (brochure)
• Guidelines for community-based learner driver mentor programs, October 2008
• Information for parents and carers about safety on wheels (The law and safety advice for bicycles, foot scooters, skateboards and rollerblades), April 2009 (brochure)
• Introduction of winter tyre and snow chain regulation discussion paper, September 2008
• Limiting risks, protecting lives. Choices for novice drivers and their passengers – Road Safety Education Program Stages 5 and 6, January 2009 (kit)
• Mobile phones and driving, September 2008 (brochure)
• Move Ahead with Street Sense, Road safety stories and songs, June 2009 (CD set)
• New regulations to manage driver fatigue: Advanced fatigue management, September 2008 (fact sheet)
• New regulations to manage driver fatigue: Basic fatigue management, September 2008 (fact sheet)
• New regulations to manage driver fatigue: Standard hours, September 2008 (fact sheet)
• Newell Highway Safety Review, May 2009 (report)
• NSW speed zoning guidelines, May 2009 (report)
• Paranoia timetable information cards Newcastle late night transport information, October 2008
• Pink your ride, April 2009 (postcard)
• Power-assisted Pedal Cycles Proposal for a new AB vehicle defi nition, May 2009 (internet)
• Revised Alcohol Interlock Information Package for Participants, March 2009
• Road traffi c crashes in NSW Statistical statement year ended 31 December 2007
• Roadside drug testing, September 2008 (brochure)
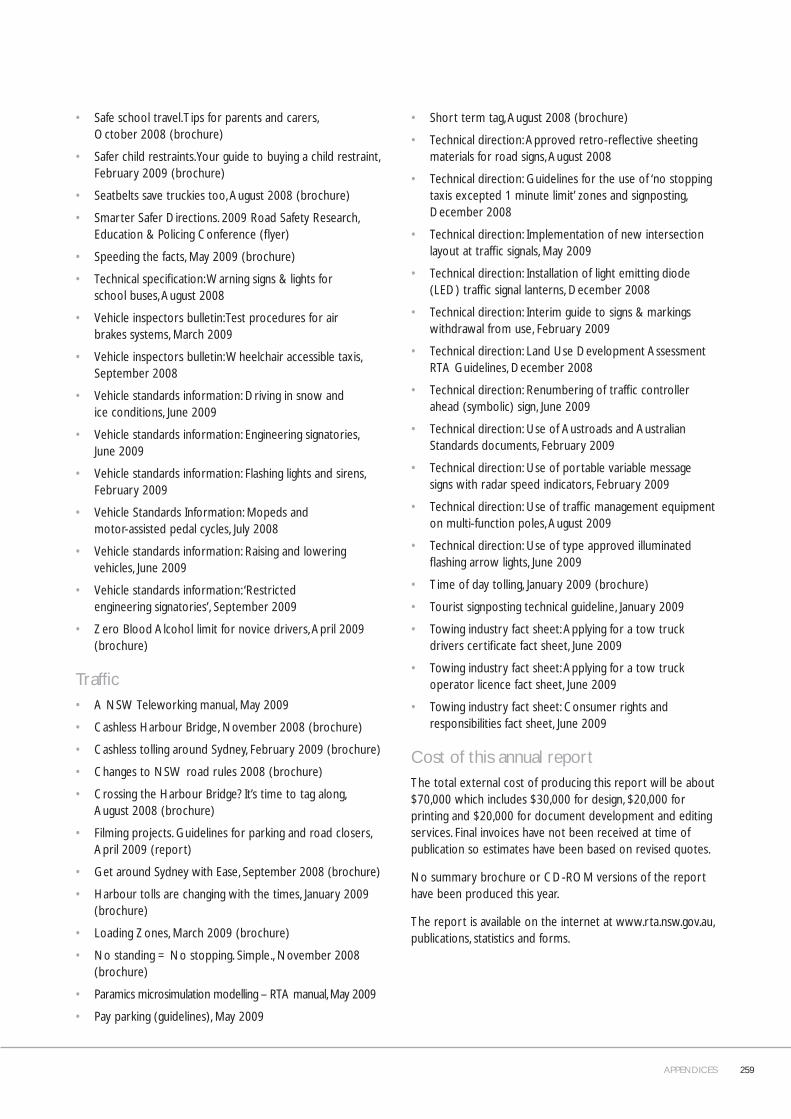
APPENDICES 259
• Safe school travel. Tips for parents and carers, October 2008 (brochure)
• Safer child restraints. Your guide to buying a child restraint, February 2009 (brochure)
• Seatbelts save truckies too, August 2008 (brochure)
• Smarter Safer Directions. 2009 Road Safety Research, Education & Policing Conference (fl yer)
• Speeding the facts, May 2009 (brochure)
• Technical specifi cation: Warning signs & lights for school buses, August 2008
• Vehicle inspectors bulletin: Test procedures for air brakes systems, March 2009
• Vehicle inspectors bulletin: Wheelchair accessible taxis, September 2008
• Vehicle standards information: Driving in snow and ice conditions, June 2009
• Vehicle standards information: Engineering signatories, June 2009
• Vehicle standards information: Flashing lights and sirens, February 2009
• Vehicle Standards Information: Mopeds and motor-assisted pedal cycles, July 2008
• Vehicle standards information: Raising and lowering vehicles, June 2009
• Vehicle standards information: ‘Restricted engineering signatories’, September 2009
• Zero Blood Alcohol limit for novice drivers, April 2009 (brochure)
Traffi c• A NSW Teleworking manual, May 2009
• Cashless Harbour Bridge, November 2008 (brochure)
• Cashless tolling around Sydney, February 2009 (brochure)
• Changes to NSW road rules 2008 (brochure)
• Crossing the Harbour Bridge? It’s time to tag along, August 2008 (brochure)
• Filming projects. Guidelines for parking and road closers, April 2009 (report)
• Get around Sydney with Ease, September 2008 (brochure)
• Harbour tolls are changing with the times, January 2009 (brochure)
• Loading Zones, March 2009 (brochure)
• No standing = No stopping. Simple., November 2008 (brochure)
• Paramics microsimulation modelling – RTA manual, May 2009
• Pay parking (guidelines), May 2009
• Short term tag, August 2008 (brochure)
• Technical direction: Approved retro-refl ective sheeting materials for road signs, August 2008
• Technical direction: Guidelines for the use of ‘no stopping taxis excepted 1 minute limit’ zones and signposting, December 2008
• Technical direction: Implementation of new intersection layout at traffi c signals, May 2009
• Technical direction: Installation of light emitting diode (LED) traffi c signal lanterns, December 2008
• Technical direction: Interim guide to signs & markings withdrawal from use, February 2009
• Technical direction: Land Use Development Assessment RTA Guidelines, December 2008
• Technical direction: Renumbering of traffi c controller ahead (symbolic) sign, June 2009
• Technical direction: Use of Austroads and Australian Standards documents, February 2009
• Technical direction: Use of portable variable message signs with radar speed indicators, February 2009
• Technical direction: Use of traffi c management equipment on multi-function poles, August 2009
• Technical direction: Use of type approved illuminated fl ashing arrow lights, June 2009
• Time of day tolling, January 2009 (brochure)
• Tourist signposting technical guideline, January 2009
• Towing industry fact sheet: Applying for a tow truck drivers certifi cate fact sheet, June 2009
• Towing industry fact sheet: Applying for a tow truck operator licence fact sheet, June 2009
• Towing industry fact sheet: Consumer rights and responsibilities fact sheet, June 2009
Cost of this annual reportThe total external cost of producing this report will be about $70,000 which includes $30,000 for design, $20,000 for printing and $20,000 for document development and editing services. Final invoices have not been received at time of publication so estimates have been based on revised quotes.
No summary brochure or CD-ROM versions of the report have been produced this year.
The report is available on the internet at www.rta.nsw.gov.au, publications, statistics and forms.
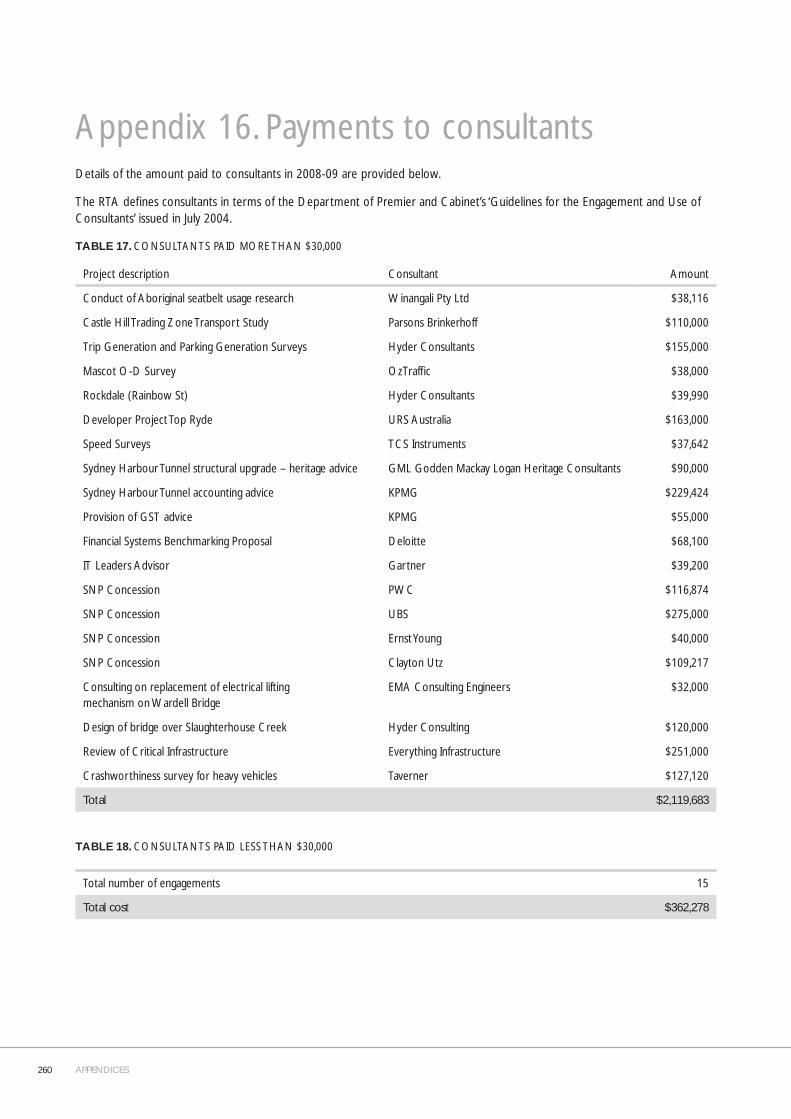
260 APPENDICES
Appendix 16. Payments to consultantsDetails of the amount paid to consultants in 2008-09 are provided below.
The RTA defi nes consultants in terms of the Department of Premier and Cabinet’s ‘Guidelines for the Engagement and Use of Consultants’ issued in July 2004.
TABLE 17. CONSULTANTS PAID MORE THAN $30,000
Project description Consultant Amount
Conduct of Aboriginal seatbelt usage research Winangali Pty Ltd $38,116
Castle Hill Trading Zone Transport Study Parsons Brinkerhoff $110,000
Trip Generation and Parking Generation Surveys Hyder Consultants $155,000
Mascot O-D Survey OzTraffi c $38,000
Rockdale (Rainbow St) Hyder Consultants $39,990
Developer Project Top Ryde URS Australia $163,000
Speed Surveys TCS Instruments $37,642
Sydney Harbour Tunnel structural upgrade – heritage advice GML Godden Mackay Logan Heritage Consultants $90,000
Sydney Harbour Tunnel accounting advice KPMG $229,424
Provision of GST advice KPMG $55,000
Financial Systems Benchmarking Proposal Deloitte $68,100
IT Leaders Advisor Gartner $39,200
SNP Concession PWC $116,874
SNP Concession UBS $275,000
SNP Concession Ernst Young $40,000
SNP Concession Clayton Utz $109,217
Consulting on replacement of electrical lifting mechanism on Wardell Bridge
EMA Consulting Engineers $32,000
Design of bridge over Slaughterhouse Creek Hyder Consulting $120,000
Review of Critical Infrastructure Everything Infrastructure $251,000
Crashworthiness survey for heavy vehicles Taverner $127,120
Total $2,119,683
TABLE 18. CONSULTANTS PAID LESS THAN $30,000
Total number of engagements 15
Total cost $362,278
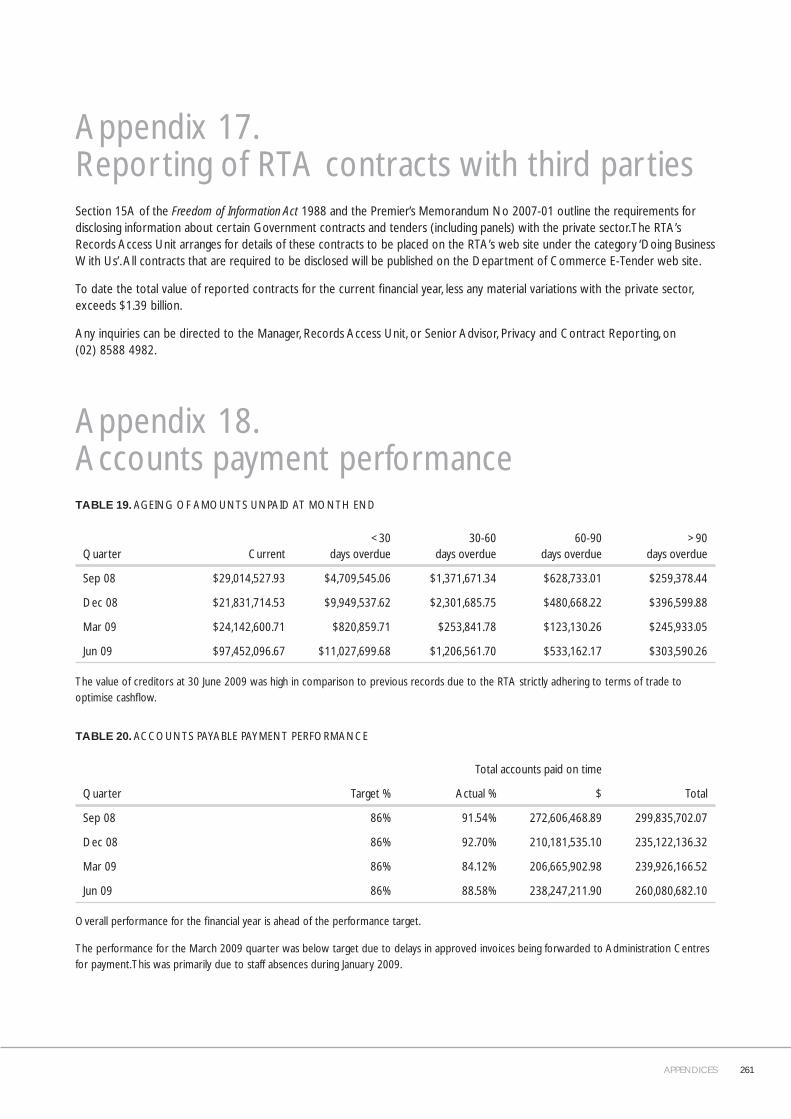
APPENDICES 261
Appendix 17. Reporting of RTA contracts with third partiesSection 15A of the Freedom of Information Act 1988 and the Premier’s Memorandum No 2007-01 outline the requirements for disclosing information about certain Government contracts and tenders (including panels) with the private sector. The RTA’s Records Access Unit arranges for details of these contracts to be placed on the RTA’s web site under the category ‘Doing Business With Us’. All contracts that are required to be disclosed will be published on the Department of Commerce E-Tender web site.
To date the total value of reported contracts for the current fi nancial year, less any material variations with the private sector, exceeds $1.39 billion.
Any inquiries can be directed to the Manager, Records Access Unit, or Senior Advisor, Privacy and Contract Reporting, on (02) 8588 4982.
Appendix 18. Accounts payment performanceTABLE 19. AGEING OF AMOUNTS UNPAID AT MONTH END
Quarter Current<30
days overdue30-60
days overdue60-90
days overdue>90
days overdue
Sep 08 $29,014,527.93 $4,709,545.06 $1,371,671.34 $628,733.01 $259,378.44
Dec 08 $21,831,714.53 $9,949,537.62 $2,301,685.75 $480,668.22 $396,599.88
Mar 09 $24,142,600.71 $820,859.71 $253,841.78 $123,130.26 $245,933.05
Jun 09 $97,452,096.67 $11,027,699.68 $1,206,561.70 $533,162.17 $303,590.26
The value of creditors at 30 June 2009 was high in comparison to previous records due to the RTA strictly adhering to terms of trade to optimise cashfl ow.
TABLE 20. ACCOUNTS PAYABLE PAYMENT PERFORMANCE
Total accounts paid on time
Quarter Target % Actual % $ Total
Sep 08 86% 91.54% 272,606,468.89 299,835,702.07
Dec 08 86% 92.70% 210,181,535.10 235,122,136.32
Mar 09 86% 84.12% 206,665,902.98 239,926,166.52
Jun 09 86% 88.58% 238,247,211.90 260,080,682.10
Overall performance for the fi nancial year is ahead of the performance target.
The performance for the March 2009 quarter was below target due to delays in approved invoices being forwarded to Administration Centres for payment. This was primarily due to staff absences during January 2009.

262 APPENDICES
Appendix 19. Funds granted to non-government community organisations
DirectorateName of recipient organisation
Amount of grant
Program area as per Budget Paper
Nature & purpose of the project including aims and target audience
Environment NSW Wildlife Council
$20,000 Road Use Contribution to assist wildlife care groups manage roadkill
DOES – Western Region Coolah Lions $6,000 Road Use Improvements to Driver Reviver site
DOES – Western Region Parkes Liquor Accord
$3,000 Road Use Support of alternative transport project
DOES – Western Region Moree Liquor Accord
$5,000 Road Use Support of alternative transport project
DOES – Western Region Myall Cycleway $3,750 Road Use Promotion and advertising of Bike Week
Network Management Bicycle NSW $ 316,000 Road Development Bicycle NSW – City of Sydney Spring Cycle
Network Management Bicycle NSW $100,000 Road Development NSW Bike Week
Licensing Registration & Freight
Motorcycle Council of NSW
$20,000 Road Use Motorcycle Awareness Week
Licensing Registration & Freight
National Motor Vehicle Theft Reduction Council Inc
$72,125 Road Use NSW Government funding has been on a 50/50 shared basis by the Police Minister and the RTA since the establishment of the National Motor Vehicle Theft Reduction Council (NMVTRC) in 1999. This shared funding arrangement was endorsed in 1998 by the then Premier and the Treasurer. The NMVTRC is an incorporated not-for-profi t association which works with police, insurers, the motor trades, vehicle manufacturers, registration authorities and justice agencies in implementing theft reduction strategies.
Centre For Road Safety ANCAP $ 510,700 Road Use Contribution to Australasian New Car Assessment Program (ANCAP)
Centre For Road Safety Used Car Safety Rating Partners
$10,000 Road Use Contribution to Used Car Safety Rating Program
Centre For Road Safety Kid Safe NSW $200,000 Road Use Updating child restraint good practice materials targeting parents and carers
Centre For Road Safety Pedestrian Council of Australia
$30,000 Road Use Sponsorship of Walk Safely to School Day 2009
Centre For Road Safety Australian Drug Foundation Inc
$275,000 Road Use Grant for Good Sports Program
Centre For Road Safety Rotary Youth Driver Awareness (RYDA)
$20,000 Road Use Provision of transport costs for young people attending RYDA road safety events

APPENDICES 263
Appendix 20. Privacy Management Report The RTA reports on requests and complaints submitted under the Privacy and Personal Information Protection Act, 1998 (PPIP Act) and the Health Records and Information Privacy Act 2001(HRIP Act).
Statement of action taken by the RTA and results of reviewsSection 33(3) of the PPIP Act requires the RTA to provide a statement of action taken in complying with the requirements of the PPIP Act. The RTA is also required to supply statistical details of any review conducted by it or on behalf of the agency under Part 5 of the PPIP Act.
The RTA statement of action in complying with requirements of the PPIP Act are outlined in its Privacy Management Plan, which is presently in its second edition and available on the RTA website. The RTA also continues to:
• Identify and consider the requirements of the PPIP Act such as principles, codes, public register provisions and internal reviews.
• Identify collections of personal information for which the RTA is responsible.
• Ensure measures are in place to provide an appropriate level of protection for personal information.
• Establish mechanisms to ensure RTA staff are aware of their obligations under the PPIP Act and appropriately trained to apply the information protection principles.
The Records Access Unit has conducted, and is continuing to conduct, face-to-face training sessions for all RTA staff to highlight the principles contained in the PPIP and HRIP Acts. Part of the role of the Records Access Unit is to address the RTA’s responsibilities under the PPIP Act. The Records Access Unit is responsible for investigating and overseeing investigations into any alleged breaches of the PPIP Act and HRIP Act. These investigations are referred to as a ‘review of conduct’ and, under the PPIP Act, must be fi nalised within 60 days.
Forty internal reviews of conduct were investigated between 1 July 2008 and 30 June 2009. This is an increase from the 13 investigations conducted between 1 July 2007 and 30 June 2008. Three matters were carried over from the previous fi nancial year. There are fi ve matters that remain under investigation and one remains before the Administrative Decisions Tribunal. The details are as follows:
Privacy review R07-08/08
On 4 April 2008 and 2 July 2008 an RTA employee requested a review of conduct, alleging the RTA breached his privacy when it faxed a medical certifi cate to a Military Base Commander where the employee was to undertake military reserve training. The employee was on restricted duties with the RTA at the time. It was found that the RTA breached the employee’s privacy by disclosing his medical certifi cate to the Commander and the RTA issued a formal apology.
Privacy review R07-08-12A
On 16 May 2008 a former RTA employee requested a review of conduct, alleging the RTA breached her privacy when a photo of her was issued to RTA-contracted security staff. Although no privacy breach was found, it was recommended that Corporate Policy 42 concerning photo identifi cation and security cards be reviewed and clear guidelines written about where an image is placed with security.
Privacy Review R07-08/13
On 23 June 2008 a customer sought a review of conduct, alleging the RTA released his personal details to a third party without his consent or authority. The customer stated he was contacted by a person of the same name who stated the RTA E-Toll section had disclosed the applicant’s personal information. An error was made by an RTA telephone operator, resulting in an improper disclosure of information. The RTA issued an apology and provided compensation to the customer.
Privacy Review P/2008/01
On 17 July 2008 a customer requested a review of conduct, alleging that an RTA employee improperly accessed and disclosed his information outside the RTA. An audit of accesses to the customer’s information was conducted, showing that there was no evidence to suggest that his information had been improperly accessed, used or disclosed.
Privacy Review P/2008/02
On 11 August 2008 a customer requested a review of conduct, alleging that the RTA breached his privacy by collecting fi ne information from the State Debt Recovery Offi ce (SDRO) and suspending his licences and vehicle registrations as a result of unpaid fi nes. As the Fines Act 1996 allows the SDRO to provide the RTA with personal information regarding fi ne defaulters and may also direct the RTA to cancel or suspend a customer’s licence, there was no evidence to suggest that personal information had been improperly used, disclosed or collected.

264 APPENDICES
Privacy Review P/2008/03
On 12 August 2008 a driving instructor requested a review of conduct, alleging that the RTA driving tester breached his privacy by making comments about his vehicle in front of his client. As the alleged comments did not meet the defi nition of being ‘held’ by the agency the investigation was declined because it did not come under the jurisdiction of the PPIP Act. The matter was referred to the appropriate area of the RTA for consideration.
Privacy Review P/2008/04
On 18 June 2008 an employee requested a review of conduct about the way her personal information had been handled by the RTA. The correspondence was not brought to the attention of the appropriate area of the RTA that deals with privacy issues and an investigation was conducted without, amongst other things, notifi cation of the NSW Privacy Commissioner. On 18 August 2008 the Privacy Commissioner sent the RTA a letter, suggesting the RTA revisit the employee’s review of conduct investigation and provide the employee with detailed fi ndings and discussion of the issues involved, including reference to the relevant Information Privacy Principles and the reasons for the RTA fi ndings. In August 2008 the RTA was served with a notice to appear at the Administrative Decisions Tribunal (ADT). On 23 September 2008 a planning meeting was held at the ADT. The RTA apologised to the administrative decisions tribunal for not following the process as outlined in the PPIP Act. The Member instructed the RTA to undertake a review of conduct, and this was commenced. However, on 1 October 2008 the employee resolved the matters raised in her complaint on a confi dential basis and withdrew her application to the ADT.
Privacy Review P/2008/05
On 8 July 2008 a customer requested a review of conduct, alleging that the RTA had printed two licence cards and multiplied her identity. There was no evidence to support these allegations. There was no evidence to suggest that fraud was committed or that there was a corrupt disclosure or use of her personal information.
Privacy Review P/2008/06
On 8 July 2008 a customer requested a review of conduct, alleging that licence applications submitted in 1997, 1998, 1999 and 2005 were fraudulently made and that her middle name had disappeared from her 1997 application. There was no evidence to support these allegations and no breach of privacy found.
Privacy Review P/2008/07
On 8 July 2008 a customer requested a review of conduct, alleging that a document generated by the RTA showing her name history was deceitful and inaccurate. There was no evidence to support these allegations and no breach of privacy found.
Privacy Review P/2008/08
On 8 July 2008 a customer requested a review of conduct, alleging that her name was incorrectly recorded by the RTA from the change of name certifi cate, issued by the NSW Registry of Births, Deaths and Marriages, and that the RTA failed to show when the previous name ceased to exist. There was no evidence to support these allegations and no breach of privacy found.
Privacy Review P/2008/09
On 29 August 2008 a customer requested a review of conduct, alleging that the RTA changed her name without her authorisation and with no notifi cation or supportive documentation. There was no evidence to support these allegations and no breach of privacy found.
Privacy Review P/2008/10
On 29 August 2008 a customer requested a review of conduct, alleging that someone from the RTA had disclosed his residential address over the telephone to a third party. An audit of accesses to the customer’s information was conducted, showing that there was no evidence to suggest that his information had been improperly accessed or disclosed.
Privacy Review P/2008/11
On 3 September 2008 a NSW Police Offi cer requested a review of conduct, alleging that records of four members of his investigation team may have been improperly accessed and released to members of a criminal syndicate. An audit of accesses to the information of the four members of his investigation team was conducted, showing that there was no evidence to suggest that information had been improperly accessed or disclosed.
Privacy Review P/2008/12
On 12 September 2008 a customer requested a review of conduct, alleging that his licence details may have been unlawfully accessed by an RTA staff member. An audit of accesses to the customer’s information was conducted, showing that there was no evidence to suggest that his information had been improperly accessed or disclosed.
Privacy Review P/2008/13
On 15 September 2008 a customer requested a review of conduct, alleging that a notifi cation concerning the disqualifi cation and cancellation of his licence was sent to the wrong address, which breached his privacy. As the letter was sent to the last address the customer had recorded with the RTA, there was no breach of privacy found. It was also found that Clause 117 of the Road Transport (Driver licence) Regulation 2008 (previously Clause 30 of the Road Transport (Driver licence) Regulation 1999) provides that licence holders bear the onus of notifying the RTA of any change of address.
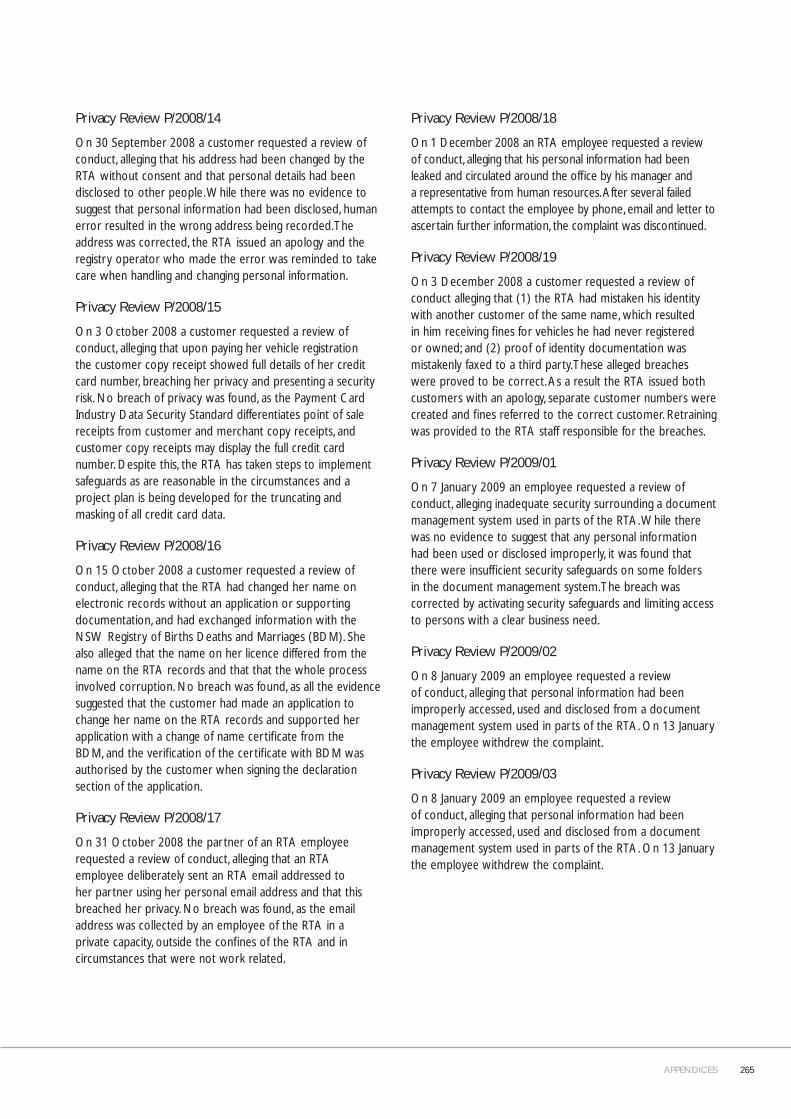
APPENDICES 265
Privacy Review P/2008/14
On 30 September 2008 a customer requested a review of conduct, alleging that his address had been changed by the RTA without consent and that personal details had been disclosed to other people. While there was no evidence to suggest that personal information had been disclosed, human error resulted in the wrong address being recorded. The address was corrected, the RTA issued an apology and the registry operator who made the error was reminded to take care when handling and changing personal information.
Privacy Review P/2008/15
On 3 October 2008 a customer requested a review of conduct, alleging that upon paying her vehicle registration the customer copy receipt showed full details of her credit card number, breaching her privacy and presenting a security risk. No breach of privacy was found, as the Payment Card Industry Data Security Standard differentiates point of sale receipts from customer and merchant copy receipts, and customer copy receipts may display the full credit card number. Despite this, the RTA has taken steps to implement safeguards as are reasonable in the circumstances and a project plan is being developed for the truncating and masking of all credit card data.
Privacy Review P/2008/16
On 15 October 2008 a customer requested a review of conduct, alleging that the RTA had changed her name on electronic records without an application or supporting documentation, and had exchanged information with the NSW Registry of Births Deaths and Marriages (BDM). She also alleged that the name on her licence differed from the name on the RTA records and that that the whole process involved corruption. No breach was found, as all the evidence suggested that the customer had made an application to change her name on the RTA records and supported her application with a change of name certifi cate from the BDM, and the verifi cation of the certifi cate with BDM was authorised by the customer when signing the declaration section of the application.
Privacy Review P/2008/17
On 31 October 2008 the partner of an RTA employee requested a review of conduct, alleging that an RTA employee deliberately sent an RTA email addressed to her partner using her personal email address and that this breached her privacy. No breach was found, as the email address was collected by an employee of the RTA in a private capacity, outside the confi nes of the RTA and in circumstances that were not work related.
Privacy Review P/2008/18
On 1 December 2008 an RTA employee requested a review of conduct, alleging that his personal information had been leaked and circulated around the offi ce by his manager and a representative from human resources. After several failed attempts to contact the employee by phone, email and letter to ascertain further information, the complaint was discontinued.
Privacy Review P/2008/19
On 3 December 2008 a customer requested a review of conduct alleging that (1) the RTA had mistaken his identity with another customer of the same name, which resulted in him receiving fi nes for vehicles he had never registered or owned; and (2) proof of identity documentation was mistakenly faxed to a third party. These alleged breaches were proved to be correct. As a result the RTA issued both customers with an apology, separate customer numbers were created and fi nes referred to the correct customer. Retraining was provided to the RTA staff responsible for the breaches.
Privacy Review P/2009/01
On 7 January 2009 an employee requested a review of conduct, alleging inadequate security surrounding a document management system used in parts of the RTA. While there was no evidence to suggest that any personal information had been used or disclosed improperly, it was found that there were insuffi cient security safeguards on some folders in the document management system. The breach was corrected by activating security safeguards and limiting access to persons with a clear business need.
Privacy Review P/2009/02
On 8 January 2009 an employee requested a review of conduct, alleging that personal information had been improperly accessed, used and disclosed from a document management system used in parts of the RTA. On 13 January the employee withdrew the complaint.
Privacy Review P/2009/03
On 8 January 2009 an employee requested a review of conduct, alleging that personal information had been improperly accessed, used and disclosed from a document management system used in parts of the RTA. On 13 January the employee withdrew the complaint.
266 APPENDICES
Privacy Review P/2009/04
On 21 January 2009 a customer requested a review of conduct, alleging that the RTA requiring drivers aged 75 years and over to have a medical examination and produce a medical report in order to keep their licence was discriminatory, excessive and intrusive. No breach of privacy was found, as the RTA requests the medical report under Clause 44(3)(c) of the Road Transport (Driver Licensing) Regulation 2008, and the medical report form is consistent with Austroads Inc publication titled Assessing Fitness to Drive, which is approved by Australian Transport Council.
Privacy Review P/2009/05
On 2 March 2009 a review of conduct was conducted, concerning why an application fee was collected at the motor registry when a customer submitted a review of conduct investigation. It was found that the customer insisted on providing an application fee despite registry staff informing the customer that no fee was required. The customer also refused to leave the registry until the money was accepted. The money was refunded to the customer explaining that no application fee was required.
Privacy Review P/2009/06
On 23 March 2009 a customer requested a review of conduct, alleging that his employer had telephoned the RTA regarding the customer’s speeding fi nes and that the RTA had breached his privacy in releasing the information. No breach was found, as there was no evidence to suggest the RTA had improperly disclosed his personal information over the telephone or in any other form.
Privacy Review P/2009/07
On 19 March 2009 a customer requested a review of conduct, alleging that an RTA employee had accessed and released his personal information. An audit was conducted that showed no improper access or disclosure of the customers personal information.
Privacy Review P/2009/08
On 14 April 2009 a customer requested a review of conduct, alleging that an employee of the RTA had improperly accessed and disclosed his information. No breach was found, as there was no evidence to suggest his information had been accessed or disclosed.
Privacy Review P/2009/09
On 20 April 2009 a customer requested a review of conduct, alleging that the odometer recording for his vehicle, which is held by the RTA, was incorrect and inaccurate. As odometer numbers are not personal information, the RTA declined to conduct a review of conduct under the PPIP Act, but referred the complaint to the relevant area of the RTA for consideration and action.
Privacy Review P/2009/10
Whilst no formal request for a review of conduct was received, the RTA conducted some enquiries into allegations raised by a number of callers on 2GB radio station, concerning the demerits point disclosure arrangements between the RTA and QBE Insurance. While no breaches of privacy were found it is proposed that aspects of the Demerit Points Disclosure Agreement, which was made in accordance with Clause 109 of the Road Transport (Driver Licensing) Regulation 2008, will be reviewed in accordance with the audit provisions of the agreement.
Privacy Review P/2009/11
On 11 May 2009 a customer requested a review of conduct, alleging that her privacy was breached as a result of providing a Power of Attorney document to act as attorney for her father and that there was insuffi cient security surrounding the retention of this document. After investigating the motor registry procedures and security, it was found there was no breach of privacy, as the RTA has security safeguards that are reasonable in the circumstances; against loss, unauthorised access, use, modifi cation or disclosure, and against all other misuse.
Privacy Review P/2009/12
On 21 May 2009 a customer requested a review of conduct, alleging that a defective camera resulted in him receiving a toll notice for his vehicle. While the RTA had not breached the customer’s privacy, it was found that a human error was made by an employee/contractor of Airport Motorway Limited (AML), resulting in the wrong details being provided to the RTA. The toll notice was withdrawn.
Privacy Review P/2009/13
On 21 May 2009 a customer requested a review of conduct, alleging that her personal information had been improperly accessed. This matter is still under investigation.
APPENDICES 267
Privacy Review P/2009/14
On 4 May 2009 a customer requested a review of conduct, alleging that his privacy had been improperly accessed. This matter remains under investigation.
Privacy Review P/2009/15
On 15 June 2009 a customer requested a review of conduct, alleging that the incorrect address was recorded by the RTA resulting in a fi ne being sent to the wrong address and suspension of licence. This matter remains under investigation.
Privacy Review P/2009/16
On 16 June 2009 a customer requested a review of conduct, alleging that RTA registry staff were unfamiliar with procedures, which resulted in unnecessary delay in booking and completing his knowledge test. As the subject of his complaint did not relate to his personal information, the RTA declined to investigate his complaint because it did not come under the jurisdiction of the PPIP Act, and referred the matter to the customer service area of the RTA for consideration.
Privacy Review P/2009/17
On 18 June 2009 a customer requested a review of conduct, alleging that the RTA improperly disclosed his personal information to Australian National Car Parks Pty Ltd (ANCP), resulting in the ANCP holding his personal information and issuing him with a parking fi ne. This matter remains under investigation.
Privacy Review P/2009/18
On 29 June 2009 a customer requested a review of conduct, alleging that the RTA improperly disclosed her personal information to ANCP, resulting in the ANCP issuing her with a parking fi ne. This matter remains under investigation.
Privacy appeals to the Administrative Decisions Tribunal (ADT)
One appeal to the ADT was continuing in 2008-09.
On 8 May 2007 and 17 September 2007 a former RTA employee commenced two separate sets of proceedings against the RTA in the ADT under the PPIP Act and the HRIP Act. The proceedings are being heard together. The proceedings relate to appeals against seven separate ‘internal review’ decisions made by the RTA. Broadly, the allegations the subject of the proceedings are that the RTA:
• Disclosed the employee’s personal and/or health information to unauthorised third parties without consent.
• Denied the employee access to documents she was entitled to access under the PPIP Act.
• Allowed unauthorised RTA employees to handle medical documentation relating to the employee in the process of forwarding that information to the Records Access Unit, so it could be provided to the employee in response to a request by her.
• Breached the employee’s privacy when the convenor of a selection committee contacted referees supplied by the employee.
• Breached the employee’s privacy when an appeal document the employee had sent to the RTA was left on a fax machine overnight.
• Failed to follow its internal fi le management policies when handling information concerning the employee.
• Used medical documentation provided by the employee for purposes other than those for which they were provided.
• Wrongfully disclosed the employee’s medical information when requesting HealthQuest to conduct a medical assessment of the employee’s fi tness for duties.
The proceedings were adjourned in 2007 at the request of the employee, and reactivated in early 2008. The hearing of various interlocutory matters was set down for 15 to 17 July 2008. On 17 July 2008, the ADT rejected the RTA’s application to have a person appointed to represent the former employee on the basis that she was an ‘incapacitated person’. The remaining interlocutory matters were not resolved on those dates and the hearing continued on 9-11 September 2008, 7 and 11 November 2008, 26 and 27 February 2009 and 14-16 April 2009. The ADT has reserved its decision. Once the interlocutory matters have been determined, the substantive applications will be heard.
268 APPENDICES
Appendix 21. Research and development The RTA has a Research and Development (R&D) Program which identifi es and develops innovative solutions to materials, products, equipment, systems and processes to achieve business improvements as well as range of research projects focussing on road safety. In 2008-09 more than $4 million was devoted to R&D activities throughout the RTA.
Specialist RTA staff undertake the work with some projects being undertaken in collaboration with universities or outsourced to specialist research groups. There has been an increased focus on research into the performance of roads and bridges to assist planning of long term maintenance needs and programs.
The RTA is currently working with the University of Technology to identify a suitable model for prediction of the future condition of bridges based on currently available bridge inspection data. A software platform has been developed to analyse historical data and present deterioration of bridge elements, whole bridges or groups of bridges selected on a route, region, design era, material type, structure type etc. This software will be validated in 2009-10 to assess what further modifi cations are necessary for the software to be a useful tool for bridge asset management in the RTA.
The RTA, working with ARRB, has also made signifi cant progress on the development of a pavement condition model to predict structural performance of NSW road pavements. Pavements are designed on structural principles, but have historically been managed by surface condition. ARRB has recently completed refi nement and calibration of the structural model. The model estimates the remaining structural capacity or life of the road pavement based on strength (defl ection) data. Network wide sampling of pavement defl ection under a fi xed load has begun and will continue into 2009-10. The RTA is planning to trial the latest advance in traffi c speed defl ection technology in late 2009. This is important new research that promises to deliver a continuous automated data stream while avoiding the present occupational health and safety implications of the current stationary measurement.
The RTA also contributes to R&D work by Austroads.
Other projects undertaken in 2008-09 include:
Pavements• Development of heavy duty sprayed seals for high
stress locations.
• Establishment of a design procedure for the use of marginal aggregate sources (for sprayed sealing works).
• Development of guidelines and test methods for emulsion sprayed sealing.
• Trial of a new method to determine the in-fi eld performance of a prime or primer-seal.
• Investigation and review of current methods for initial surfacing treatments for Bound and Unbound pavements.
• Development of warm mix asphalt.
• Development of reinforced asphalt overlays as a means of retarding refl ective cracking.
• Finalisation of an RTA test method for mix workability of manufactured sands for use in concrete and asphalt.
• Investigation of fl exural fatigue characteristics of pavement concrete and review changes in mix charging sequence to improve fatigue performance.
• Development of new test procedures to assess the uniformity of concrete mixing.
• Establishment of design criteria for concrete pavements constructed on fl oodplains and areas of settlement.
• Mix design testing of porous concrete surfacing in preparation for trial in August 2009.
• Further review of foamed bitumen stabilisation as a road maintenance and rehabilitation tool.
• Pavement service life – application of plastic theory and limit analysis to determine shakedown loads on various road types.
• Australian Research Council (ARC) Linkage Project with University of NSW to provide an integrated model to assess the performance of granular materials in a pavement system (third year of three-year project).
• Modelling of horizontal shear force damage to pavements.
• Report on fi nite element analysis to simulate reduced moisture damage in asphalt.
APPENDICES 269
Bridges• Performance review and monitoring of sacrifi cial cathodic
protection systems (CP): discrete anodes, jacket anodes and sprayed zinc system as alternatives to impressed current CP.
• Establishment of trial and monitor chloride extraction process as a corrosion protection tool.
• Assessment of new technologies to monitor fatigue crack growth in steel bridges.
• Development of semi-autonomous grit blasting robotic device for steel bridges (4th year of fi ve-year project).
• Trial and reporting on the use of self-compacting concrete for bridge piles.
• Finalisation of design rules and guidelines for through deck and embedded expansion joint anchors.
Geotechnical• Completion and dissemination of guidelines on the use of
shale in RTA road construction projects.
• Identifi cation and trial systems to manage acid rock materials in earthworks.
• Embankment construction using vacuum consolidation (second year of a three-year Australian Research Council supported project).
• Review of fi bre optic sensing technology to monitor pavement and slope strains.
Road design engineering• Aquaplaning – Quantify the effect of a construction
tolerance and subsequent maintenance defects on the prediction of aquaplaning on road surfaces.
• Road design – Investigate, test and confi rm a vehicle driver’s ability to see and identify an object’s height and size at distance (fi rst year of a two-year project).
• Safety barrier crash testing – Crash testing of various safety barriers to test the limits of safe placement of the barriers relative to the edge of the road formation.
• Acceptance of safety barrier products – Review of proprietary safety barriers by expert panels, both RTA and State Road Authorities, for acceptance of products on the classifi ed road system.
Urban design engineering• Production of a guideline for water sensitive urban design
approach to roads.
Traffi c• Traffi c generation and parking surveys to update data for
the RTA Guide to Traffi c Generating Development.
Safer roadsDevelopment of ongoing research and evidence-based policy development including:
• Rigorous crash reduction model.
• Crash testing of safety barriers and acceptance of safety barrier products.
• Wide centre line trial on the Newell Highway.
• Retro-refl ective delineation products.
• Rural T-Junctions.
• Stereotypical crash rates for rural roads.
Safer vehiclesCrashlab test facility, participated in a range of research and development projects focussing on road safety, including:
• Research into rear seat occupant protection, via an Australian Research Council Linkage Grant with University of NSW.
• Research into performance of motorcycle and pedal cycle helmets via an Australian Research Council Linkage Grant with University of NSW.
• Crash tests to identify and demonstrate/educate safety implications of incorrect child restraint use.
• Crash test program and research study to determine performance of older vehicles and impact of repair methods on crashworthiness.
• Heavy Vehicle Roadworthiness fi eld study, to determine condition of heavy vehicles on-road in NSW.
• Development of a system to provide a total safety score for a vehicle, incorporating crash avoidance, pre-crash safety, crash protection and post-crash safety systems and performance.
• Ongoing involvement in Australian New Car Assessment Program (ANCAP), Australian National Crash In-depth Study and Used Car Safety Ratings.
• Child Restraint Evaluation Program, to compare relative safety performance and ease of use for available child restraints.
• Helmet Evaluation Program, to compare the relative safety performance and rider comfort features of commonly available motorcycle helmets.
• Comparison of the Hybrid III, ANO P Series and ANO Q series anthropomorphic test devices (ATD or crash test dummies) to determine effi cacy in use for child restraint evaluation in current and proposed AS/NZ Standard (1754) testing.
• Continued input to the development of AS/NZ Standards for Child Restraints, motorcycle and bicycle helmets and other road safety related devices.

270 APPENDICES
TABLE 21. NUMBER OF VEHICLES REGISTERED IN NSW AS AT 30 JUNE 2009 BY YEAR OF MANUFACTURE
Year of manufacture No. of vehicles
Pre-1960 8990
60-64 8252
65-69 16,540
70-74 51,025
75-79 98,226
80-84 161,965
85-89 370,159
90-94 600,932
95-99 1,070,599
2000-04 1,457,312
2005 340,336
2006 330,342
2007 358,982
2008 340,172
2009 104,771
Unknown 11
Total 5,318,614
TABLE 22. NUMBER OF VEHICLES REGISTERED IN NSW AS AT 30 JUNE 2009 BY VEHICLE TYPE
Vehicle type No. of vehicles
Passenger vehicles 2,972,916
Off-road passenger vehicles 527,692
Small buses 18,973
Buses 14,490
Mobile homes 4,948
Motorcycles 162,076
Light trucks 715,537
Heavy trucks 78,526
Prime movers 21,067
Light plant 3,987
Heavy plant 7,301
Small trailers 509,490
Trailers 281,482
Other vehicles 129
Total 5,318,614
TABLE 23. NUMBER OF VEHICLES REGISTERED IN NSW AS AT 30 JUNE 2009 BY VEHICLE USAGE
Vehicle usage No. of vehicles
Private 3,676,680
Pensioner concession 671,241
Primary producer concession 97,088
Business general 737,334
Taxi 6,422
Public bus and coach 9,276
FIRS 4,464
Other vehicle usages 116,109
Total 5,318,614
Appendix 22. Driver and vehicle statistics
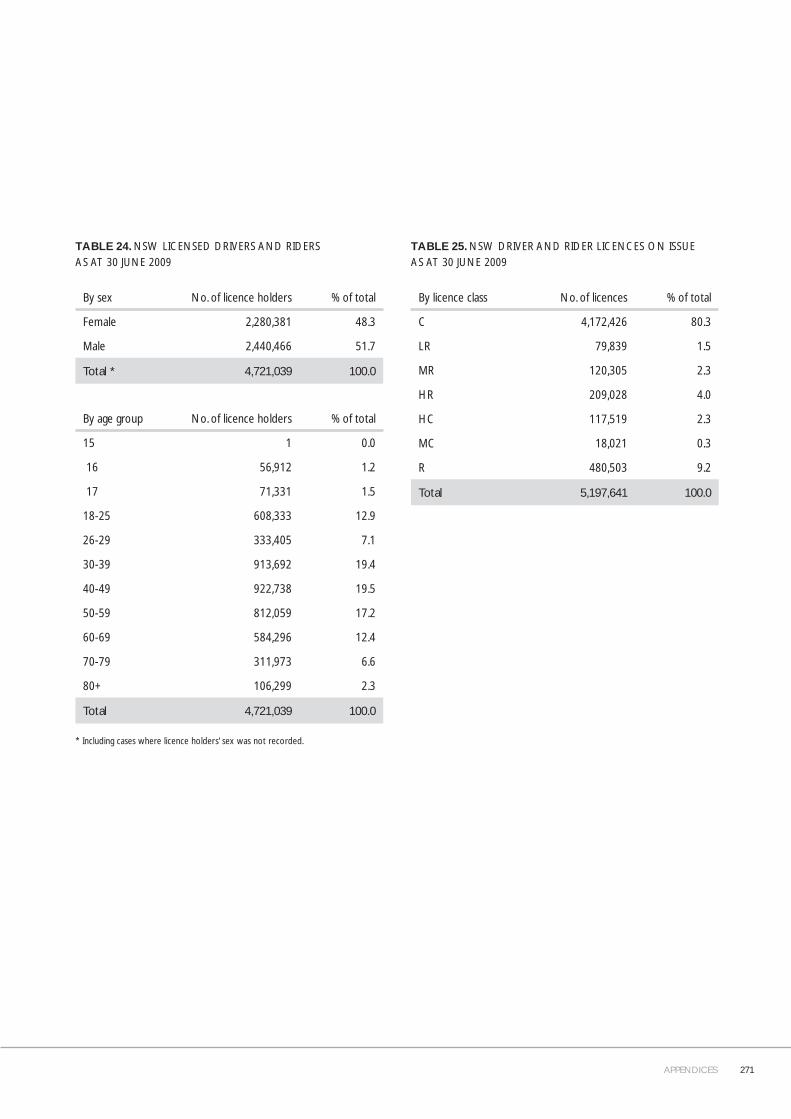
APPENDICES 271
TABLE 24. NSW LICENSED DRIVERS AND RIDERS AS AT 30 JUNE 2009
By sex No. of licence holders % of total
Female 2,280,381 48.3
Male 2,440,466 51.7
Total * 4,721,039 100.0
By age group No. of licence holders % of total
15 1 0.0
16 56,912 1.2
17 71,331 1.5
18-25 608,333 12.9
26-29 333,405 7.1
30-39 913,692 19.4
40-49 922,738 19.5
50-59 812,059 17.2
60-69 584,296 12.4
70-79 311,973 6.6
80+ 106,299 2.3
Total 4,721,039 100.0
* Including cases where licence holders’ sex was not recorded.
TABLE 25. NSW DRIVER AND RIDER LICENCES ON ISSUE AS AT 30 JUNE 2009
By licence class No. of licences % of total
C 4,172,426 80.3
LR 79,839 1.5
MR 120,305 2.3
HR 209,028 4.0
HC 117,519 2.3
MC 18,021 0.3
R 480,503 9.2
Total 5,197,641 100.0
272 APPENDICES
Appendix 23. Insurance Principal Arranged Insurance The RTA continues to provide principal arranged insurance via its broker AON. This program covers contract works, public liability and a new professional indemnity cover for all construction, maintenance and associated activites for roads and bridges. A similar program for real estate is now in place for all building construction, maintenance and repair contracts for contract works and third party liability.
Treasury Managed FundThe Treasury Managed Fund (TMF) is a NSW government arranged indemnity scheme (operated by the NSW Treasury), which provides indemnity cover for workers compensation, motor vehicle, property damage, legal liability, fi delity guarantee and travel.
Workers CompensationThe 2008-09 premium decreased to $7.4m as compared to $7.63m in 2007-08. The frequency of claims per 100 employees is 4.9, which is a reduction in frequency as compared to 8.2 per 100 employees in 2007-08, due to a systematic approach to claims management. In June 2009 the RTA received a hindsight rebate of $6.9m from the 2004-05 policy period. The hindsight premium is not included in the graph.
Motor VehicleThe 2008-09 premium decreased to $1.70m as compared to $1.75m in 2007-08 fund year. Claims per 100 vehicles have decreased to nine as compared to 11.1 per 100 vehicles in 2007-08 fund year.
PropertyThe 2008-09 premium increased to $5.7m as compared to $5m in 2007-08 year. This is due to an increase in the total asset values and in particular, the replacement value of RTA bridges. There has been an increase in incurred claims cost of 2% due to a small increase in reinsurance.
LiabilityThe 2008-09 premium increased to $13.43m as compared to $12.6m in 2007-08 year. After 4 years of a decreasing liability premium, a build up of large claim costs resulted in a 6.58% increase for 2008-09.
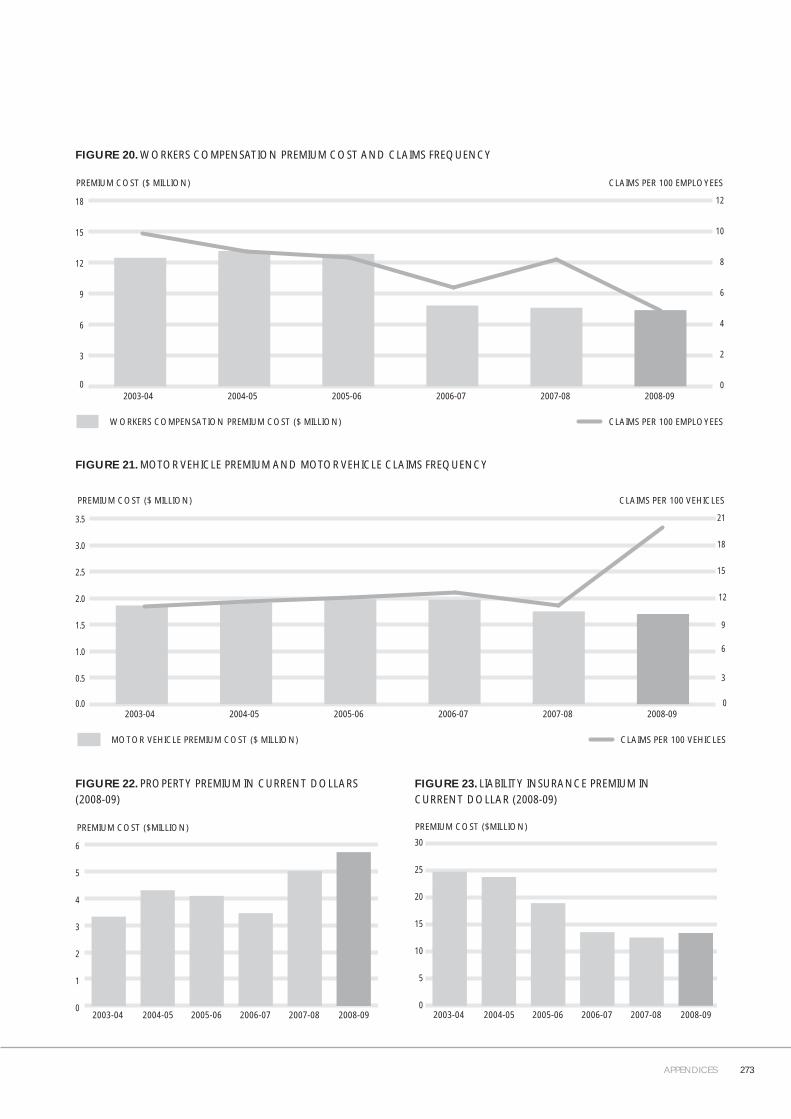
APPENDICES 273
FIGURE 20. WORKERS COMPENSATION PREMIUM COST AND CLAIMS FREQUENCY
PREMIUM COST ($ MILLION)
0
3
6
9
12
15
18
0
2
4
6
8
10
12
CLAIMS PER 100 EMPLOYEESWORKERS COMPENSATION PREMIUM COST ($ MILLION)
CLAIMS PER 100 EMPLOYEES
2008-092003-04 2004-05 2005-06 2006-07 2007-08
FIGURE 21. MOTOR VEHICLE PREMIUM AND MOTOR VEHICLE CLAIMS FREQUENCY
PREMIUM COST ($ MILLION)
0.0
0.5
1.0
1.5
2.0
2.5
3.0
3.5
0
3
6
9
12
15
18
21
CLAIMS PER 100 VEHICLESMOTOR VEHICLE PREMIUM COST ($ MILLION)
CLAIMS PER 100 VEHICLES
2008-092003-04 2004-05 2005-06 2006-07 2007-08
FIGURE 22. PROPERTY PREMIUM IN CURRENT DOLLARS (2008-09)
PREMIUM COST ($MILLION)
0
1
2
3
4
5
6
2008-092007-082006-072005-062004-052003-04
FIGURE 23. LIABILITY INSURANCE PREMIUM IN CURRENT DOLLAR (2008-09)
PREMIUM COST ($MILLION)
0
5
10
15
20
25
30
2008-092007-082006-072005-062004-052003-04

274 APPENDICES
Appendix 24. Compliance IndexThis index lists the legislative requirements set out in the NSW Treasury checklist for public sector annual reporting, and the
pages on which the relevant information can be found. The checklist, including a detailed description of each requirement, is
available at www.treasury.nsw.gov.au (click on ‘Information for agencies’, then ‘Annual reporting’).
Requirement Page
Letter of submission Inside cover
Application for extension of time N/A
Charter 4
Aims and objectives 4-5
Access 279
Management and structure 11-13, 212
Summary review of operations 17-112
Funds granted to non-governmentcommunity organisations
262
Legal change 246-250
Economic or other factors 6-10
Management and activities 2-3, 17-112
Research and development 268-269
Human resources 103-109, 225
Consultants 260
Equal Employment Opportunity 226-228
Disability Plans 227, 230
Land disposal 251
Promotion 231-232, 252-259
Consumer response 245
Guarantee of service 6-10, 84
Payment of accounts 261
Time for payment of accounts 261
Risk management and insurance activities 99, 103, 272-273
Disclosure of controlled entities 126-127
Disclosure of subsidiaries N/A
Ethnic affairs priorities statement 229
Agreements with the Community Relations Commission
227, 229
Requirement Page
Occupational Health and Safety 103-105, 220
Waste 78
Budgets 9-10, 114-196
Financial statements 114-196
Identifi cation of audited fi nancial statements
114-196
Inclusion of unaudited fi nancial statements
N/A
Additional matters for inclusion
List of major assets 4-5, 38-46, 114-196
Code of conduct 108
Privacy management report 263-267
After balance date events 4, 171
Total external costs of report 259
Non-printed formats 279
Internet address of report 279
Investment performance 9, 114-196
Liability management performance 9, 114-196, 272
Exemptions N/A
Performance and numbers of executive offi cers
212-224
Freedom of Information Act 233-243
Implementation of price determination N/A
Heritage management 73-75
Electronic service delivery 88-89
Credit card certifi cation 101
Requirements arising from employment arrangements
N/A
Public availability of annual reports 279
Index
276 RTA AT A GLANCE OVERVIEW
A
Aboriginal Affairs 51, 222
Accommodation 97
Air quality 81, 82, 106, 253, 254
Alternative transport 1, 17, 29, 36, 56, 262
Assets 4, 7, 9, 11, 38, 41, 43, 44, 73, 210, 216, 232, 274
Audit 7, 11, 12, 35, 51, 57, 67-69, 81, 87, 95, 99, 100, 103, 104, 208, 363, 264, 266, 274
Auditor General 10, 41, 43, 46, 213, 215, 217, 234
Awards 55, 77, 94, 97, 109, 110, 111, 221, 224, 225
B
Biodiversity 66, 67, 69, 70-72, 82
Buses 29, 57, 92, 210, 212, 213, 215, 217, 219, 259, 270
Business reform 97
C
Cameras 2, 29, 33, 50, 53, 58, 59, 64, 67, 212, 214, 219, 224, 246, 247
Campaigns 4, 29, 55-57, 59, 62-64, 88, 111, 215, 221, 227
Cashback 10, 98, 218
Central Coast 27, 29, 35, 36, 44, 45, 66, 67, 106, 202, 221, 222, 253, 254
Child safety 62
Code of conduct 108, 274
Committees 5, 64, 94, 95, 99, 198, 208, 211, 213, 215, 220, 225, 231, 239
Community 1-5, 11, 14, 18-20, 22, 24, 27, 29, 30, 31, 33, 39-41, 50-52, 54-56, 59, 67, 70-72, 76, 82, 84, 86, 91, 92, 100, 101, 106, 107, 110, 111, 198, 206, 208, 210-214, 216, 221, 223, 224, 227-229, 233, 253-258, 262, 274
Consumer response 198, 245
Contractors 57, 67, 76, 81, 82, 103, 105, 108, 112, 206, 220, 222, 244
Corporate framework 1, 6, 14, 16, 97, 224
Corporate planning 11, 218, 224, 231, 232
Cycling 18, 30, 36, 217, 252
D
Department of Environment, Climate Change and Water 210, 213, 215DECCW 67-72, 81, 82, 207
Disability 89, 198, 226-228, 230, 274
Drink driving 54, 55, 57, 64
Drivers 4, 5, 11, 48, 52-60, 64, 80, 81, 87, 89, 208, 215, 223, 227, 244, 246-248, 250, 253, 258, 259, 266, 271
Driver and vehicle statistics 198, 270
Drug testing 55, 223, 258
E
Energy 2, 7, 58, 64, 72, 78, 79, 209, 210
Enforcement 11, 12, 29, 36, 49, 50, 52, 57-59, 61, 64, 82, 88, 89, 100, 103, 111, 212, 214, 217, 223, 239, 246, 247
Environment 1-3, 5, 7, 11, 13, 15, 19, 23, 29, 48, 49, 65-69, 72-74, 76, 77, 82, 84, 94, 95, 97, 100, 102, 103, 106-108, 204, 210, 213, 221, 245, 252, 262
Environmental (plans assessments, factors, benefi ts, etc) 4, 7, 11-13, 16, 20, 21, 23, 24, 26, 27, 29, 43, 46, 64, 66-70, 72, 76, 79, 82, 95, 100, 108, 110, 111, 204-208, 213, 215, 220, 226, 231, 252-258, 279
Equal Employment Opportunity 198, 226, 274EEO 226, 228
e-Safety 89
Ethics 100, 108
Ethnic Affairs 198, 227, 229, 274
Executive 2, 12, 13, 48, 68, 74, 94, 95, -97, 103, 106, 198, 208, 209, 212-214, 220-221, 224, 226, 227, 231, 239, 274Chief Executive 3, 12, 19, 48, 49, 59, 94, 97, 109, 208, 210-215, 221, 234
F
F3 Freeway 19, 22, 26, 27, 33, 199, 202, 205, 254, 255, 257
Fatalities 1, 2, 7, 47-50, 52, 54, 57, 59, 214, 215, 223
Financial overview 1, 9
Financial statements 1, 9, 113
Freedom of Information 11, 198, 233, 251, 252, 261, 274FOI 233-242
Freight 1, 4, 11, 12, 14, 16, 18, 38-40, 46, 58, 59, 64, 96, 97, 208, 211, 216, 218, 219, 231, 262
Funding 4, 6, 9, 10, 19, 21, 24, 26, 29-31, 38-41, 43, 45, 46, 52, 62, 71, 81, 82, 91, 96, 97, 101, 213, 215-218, 222, 234, 262
Future challenges 36, 46, 64, 82, 92, 112
Index
Section cover image: Photo taken by RTA staff member Ben Beattie of the Sydney Harbour Bridge.
INDEX 277
HHeavy vehicles 11, 20, 25, 38-40, 46, 50, 51, 57-60, 64, 80, 219,
246, 247, 250, 253, 260, 269
Heritage 4, 7, 11, 23, 67, 73-76, 82, 108, 210, 219, 222, 227, 256, 257, 260, 274
Higher mass limits 214, 218HML 38, 39, 214
Highways 2, 11, 21, 35, 42, 50, 52, 59, 222, 232
Hume Highway 1, 2, 10, 11, 24, 36, 44, 50, 66, 68-71, 76, 77, 102, 200, 203, 221, 222, 232, 254-256
IIncidents 32, 33, 35, 51, 58, 95, 96, 103-105, 112, 279
Industrial Relations 11, 198, 211, 225, 231
Information technology (IT) 11, 99, 220, 222, 260
Infrastructure condition 41Condition of State Roads 10, 41, 42, 46, 213, 215
Insurance 13, 198, 209, 211, 233, 248, 266, 272-274
Intelligent Access Program 38, 39, 209, 218, 219, 253IAP 38, 46, 209, 253
LLane Cove Tunnel 13, 18, 19, 32, 218, 235
Legislation 11, 53, 57, -59, 69, 88, 95, 108, 204, 208, 214, 215, 218, 219, 223, 224, 227, 239, 246-250, 252
Licence 4, 7, 12, 52-55, 59, 67, 84-89, 98, 214, 218, 219, 229, 244, 246-248, 250, 252, 259, 263-267, 271
Local government 5, 13, 31, 39, 45, 46, 52, 56, 64, 71, 72, 104, 202, 208-211, 213, 222, 246Councils 4, 16, 21, 26, 30, 31, 36, 45, 46, 51, 52, 56, 72, 81, 91, 104, 207, 208
MM2 18, 19, 32, 36, 43, 199, 241
M4 6, 10, 19, 22, 29, 32, 35, 51, 199, 218, 222, 241, 254
M5 East 18, 19, 32, 36, 69, 70, 199, 215, 223, 253, 254
Maintenance 1-6, 9, 11-14, 16, 24, 29, 30, 33, 37, 39-41, 43-46, 61, 68, 70, 73, 74, 81, 82, 86, 91, 95, 99, 102-104, 107, 108, 204-206, 208, 212, 223, 236, 246, 253, 255, 268, 269, 272
Minister for Roads 25, 45, 52, 53, 57, 59, 85, 89, 90, 94, 97, 109, 208, 210, 216, 221, 234, 246
Motor registry 2, 84, 85, 89, 99, 214, 219, 229, 244, 252, 266Registries 2, 4, 31, 61, 78, 82, 84, 85, 107, 218, 219, 227, 252
Motorway 11, 13, 18, 19, 22, 32-36, 69, 70, 85, 88, 199, 204, 223, 235, 254, 266
N
Newcastle and Hunter projects 26
Newell Highway 25, 44, 50, 52, 64, 203, 258, 269
New England Highway 26-29, 50, 203, 222, 223, 254
Noise 28, 41, 67, 68, 75, 77, 82, 103, 210, 219, 245, 252, 254-256
Novice drivers 54, 223, 258, 259
NSW Auditor-General 42, 46, 215
NSW Centre for Road Safety 1, 2, 47-51, 53, 60, 63, 74, 111, 208, 223
NSW Police Force 4, 33, 55, 57, 58, 64, 87, 89, 100, 103, 208, 210, 211, 218Police 4, 33, 52, 55-58, 61, 64, 84, 88-90, 100, 103, 208, 210, 211, 218, 246, 262, 264
NSW State Plan 5, 6, 14, 16, 36, 46, 48, 55, 97, 101, 213, 214, 218, 224, 227
O
Occupational health and safety 3, 15, 57, 91, 94, 96, 103, 105, 216, 220, 222, 268, 274OHS 8, 15, 51, 94, 96, 97, 103-105, 108, 112, 220
Ombudsman 198, 233-236, 242, 244
Online services 88, 215
P
Pacifi c Highway 10, 12, 19-21, 26-28, 33-36, 42, 50, 51, 66, 68, 71, 72, 75-77, 110, 111, 201-203, 213, 216, 222, 223, 254, 255, 257
Pedestrians 4, 20, 23, 28, 31, 36, 63
Performance indicators 6, 41, 48, 50, 82, 104, 220
Princes Highway 25, 26, 30, 32, 34, 36, 44, 50, 52, 76, 77, 201, 216, 222, 223, 256
Privacy 11, 198, 233, 261, 263, 264-267, 274
Publications 13, 30, 54, 198, 252, 259, 279

278 INDEX
R
Recruitment 106, 107, 226, 228, 229, 252
Recycling and wasteRecycling 81Waste 15, 57, 67, 78, 81, 100, 274
Region 26, 50, 67, 102, 262, 268, 279Regional 2, 10-13, 16, 26, 31, 34, 36, 38-41, 25, 46, 52, 55, 56, 67, 72, 87, 103, 104, 107, 109, 208, 209, 211, 213, 216, 221, 222, 226, 227Regions 2, 20, 24, 41, 81
Registration 4, 7, 10-12, 21, 39, 58, 59, 84-90, 99, 104, 208, 211, 214, 218, 219, 231, 245 – 248, 250, 252, 262, 263, 265, 282
Risk 11, 13, 15, 41, 43, 44, 49, 52, 54-56, 61, 62, 64, 75, 87, 94-96, 99, 100-105, 112, 212, 218, 221, 223, 254, 258, 274, 265, 274
Road projects 4, 12, 13, 36
Road safety 2, 4, 11-13, 16, 25, 26, 28, 39, 40, 43, 45-60, 62-64, 74, 86, 95, 96, 100, 108, 110, 111, 208, 209, 214-216, 218, 219, 221, 223, 224, 227-229, 231, 245, 252, 254, 258, 259, 262, 268, 269
Road toll 2, 48, 64, 95, 214, 215, 223
Roadside environment 48, 72, 210
RTA Contact Centre 4, 84, 85, 99, 107, 227
RTA Crashlab 4, 63
S
Safe system 2, 4, 13, 48-50, 64
Special events 33, 56
Speed 2, 6, 7, 28, 32, 33, 41, 43, 44, 49-53, 55-60, 64, 67, 103, 111, 112, 214, 215, 218, 222-224, 246, 247, 249, 250, 252, 258-260, 266, 268
Stakeholders 4, 14, 16, 39, 57, 74, 83, 90, 91, 94, 103, 208, 210, 211, 219
Sustainability 16, 46, 78, 81, 82, 256
Sydney Coordinated Adaptive Traffi c System 34, 102, 213, 216, 231SCATS 34, 35, 102, 213, 216, 231
Sydney Harbour Bridge 18, 33, 35, 73, 74, 76, 80, 85, 92, 98, 212, 215, 218-221, 253
Sydney Harbour Tunnel 85, 212, 246, 260, 13
Sydney Orbital Motorway 19
T
Teleworking 31, 36, 106, 228, 259
Threatened species 66, 69-72, 198, 204, 205, 207, 239
Toll 2, 4, 11, 19, 40, 48, 64, 85, 88, 92, 95, 212, 214, 215, 232, 246, 266Tolling 2, 11, 19, 32, 35, 74, 85, 92, 110, 215, 217-219, 221, 223, 259
Traffi c Management Centre 33, 100TMC 33, 44
Training 4, 27, 33, 44, 54, 62, 63, 69, 73, 80, 82, 89, 98, 107, 108, 112, 212, 216, 217, 220, 226, 227, 229, 231, 263, 265
Transitway 4, 29, 35
U
Urban design 2, 15, 36, 68, 75-77, 107, 223, 255, 269
V
Vehicle emissions 11, 15, 80-82, 97, 253
W
Waste management. See also recycling and waste 67, 81
Water 2, 20, 31, 32, 41, 43, 44, 66-69, 71, 75, 80-82, 103, 198, 202, 205-207, 210, 213, 215, 219, 253-258, 269
Westlink M7 218
Workforce capability 11, 15, 94, 96, 106, 109, 220
Y
Young drivers 52, 55

CONTACT DETAILS 279
Contact details General inquiries
13 22 13 (8.30am – 5pm Monday to Friday, 8.30am – noon Saturday)
Traffi c inquiries
132 701 (24 hours)
To report traffi c conditions, incidents and signal faults
131 700 (24 hours)
RTA Sydney and Regional Offi ces
131 782
International callers (outside Australia)
+61 2 4920 4000 (8.30am – 5pm Monday to Friday, 8.30am – noon Saturday AEST)
To minimise environmental and fi nancial impacts, the RTA does not produce many hard copies of its annual report. The report is published on the internet at www.rta.nsw.gov.au (click on Publications, statistics and forms). Your feedback is welcomed via the RTA website under ‘contact us’.
Head offi ce
101 Miller StreetNorth Sydney 2060Locked Bag 928 North Sydney 2059Telephone 131 782Facsimile 02 8588 4105DX 10516
Sydney region
27-31 Argyle St Parramatta 2150PO Box 973 Parramatta CBD 2124Telephone 131 782Facsimile 02 8849 2760DX 28555 Parramatta
Hunter
59 Darby St Newcastle 2300Locked Bag 30Telephone 131 782Facsimile 02 4924 0344DX 7813 Newcastle
Northern
31 Victoria St Grafton 2460PO Box 576Telephone 131 782Facsimile 02 6640 1301DX 7610 Grafton
Southern
Level 4, 90 Crown St Wollongong 2500PO Box 477 Wollongong East 2500Telephone 131 782Facsimile 02 4227 3705DX 5178 Wollongong
South West
1 Simmons St Wagga Wagga 2650PO Box 484Telephone 131 782Facsimile 02 6938 1183DX 5407 Wagga Wagga
Western
51-55 Currajong St Parkes 2870PO Box 334Telephone 131 782Facsimile 02 6861 1414DX 20256 Parkes
Transport Management Centre
25 Garden St Eveleigh 1430PO Box 1625Strawberrry Hills 2012Telephone 02 8396 1400Facsimile 02 8396 1425

Photo taken by RTA staff member Yulia Akerholt of the Anzac Bridge.

Roads and Traffi c Authority
For further enquirieswww.rta.nsw.gov.au | 13 22 13
RTA/Pub. 09.442ISSN 1449 0056
Copyright © 2022 FDOKUMEN