Abstract - arXiv
26
Running head: ADAPTIVE QRS DETECTION 1 An Adaptive QRS Detection Algorithm for Ultra-Long-Term ECG Recordings John Malik 1 , Elsayed Z Soliman 2 , Hau-Tieng Wu 134 1 Department of Mathematics, Duke University, Durham, NC 2 Epidemiological Cardiology Research Center (EPICARE), Department of Epidemiology and Prevention, and Department of Medicine, Cardiology Section, Wake Forest School of Medicine, Winston-Salem, NC 3 Department of Statistical Science, Duke University, Durham, NC 4 Mathematics Division, National Center for Theoretical Sciences, Taipei, Taiwan Abstract Background: Accurate detection of QRS complexes during mobile, ultra-long-term ECG monitoring is challenged by instances of high heart rate, dramatic and persistent changes in signal amplitude, and intermittent deformations in signal quality that arise due to subject motion, background noise, and misplacement of the ECG electrodes. Purpose: We propose a revised QRS detection algorithm which addresses the above-mentioned challenges. Methods and Results: Our proposed algorithm is based on a state-of-the-art algorithm after applying two key modifications. The first modification is implementing local estimates for the amplitude of the signal. The second modification is a mechanism by which the algorithm becomes adaptive to changes in heart rate. We validated our proposed algorithm against the state-of-the-art algorithm using short-term ECG recordings from eleven annotated databases available at Physionet, as well as four ultra-long-term (14-day) ECG recordings which were visually annotated at a central ECG core laboratory. On the database of ultra-long-term ECG recordings, our proposed algorithm
-
Upload
khangminh22 -
Category
Documents
-
view
1 -
download
0
Transcript of Abstract - arXiv
Running head: ADAPTIVE QRS DETECTION 1
An Adaptive QRS Detection Algorithm for Ultra-Long-Term ECG Recordings
John Malik1, Elsayed Z Soliman2, Hau-Tieng Wu134
1Department of Mathematics, Duke University, Durham, NC
2Epidemiological Cardiology Research Center (EPICARE), Department of Epidemiology and
Prevention, and Department of Medicine, Cardiology Section, Wake Forest School of Medicine,
Winston-Salem, NC
3Department of Statistical Science, Duke University, Durham, NC
4Mathematics Division, National Center for Theoretical Sciences, Taipei, Taiwan
Abstract
Background: Accurate detection of QRS complexes during mobile, ultra-long-term ECG
monitoring is challenged by instances of high heart rate, dramatic and persistent changes in
signal amplitude, and intermittent deformations in signal quality that arise due to subject motion,
background noise, and misplacement of the ECG electrodes. Purpose: We propose a revised
QRS detection algorithm which addresses the above-mentioned challenges. Methods and
Results: Our proposed algorithm is based on a state-of-the-art algorithm after applying two key
modifications. The first modification is implementing local estimates for the amplitude of the
signal. The second modification is a mechanism by which the algorithm becomes adaptive to
changes in heart rate. We validated our proposed algorithm against the state-of-the-art algorithm
using short-term ECG recordings from eleven annotated databases available at Physionet, as well
as four ultra-long-term (14-day) ECG recordings which were visually annotated at a central ECG
core laboratory. On the database of ultra-long-term ECG recordings, our proposed algorithm

ADAPTIVE QRS DETECTION 2
showed a sensitivity of 99.90% and a positive predictive value of 99.73%. Meanwhile, the state-
of-the-art QRS detection algorithm achieved a sensitivity of 99.30% and a positive predictive
value of 99.68% on the same database. The numerical efficiency of our new algorithm was
evident, as a 14-day recording sampled at 200 Hz was analyzed in approximately 157 seconds.
Conclusions: We developed a new QRS detection algorithm. The efficiency and accuracy of our
algorithm makes it a good fit for mobile health applications, ultra-long-term and pathological
ECG recordings, and the batch processing of large ECG databases.
Introduction
Many computer algorithms have been developed to automatically detect QRS complexes
from digital ECG tracings [1]. Some of these algorithms are intended to be used at the bedside
to provide real-time monitoring of a patient’s heart rate (HR) and cardiac rhythm. Other
algorithms are intended to be used in post-processing applications, where batches of ECG signals
are analyzed or classified offline. Current algorithms achieve accuracies exceeding 99.9% when
subjects demonstrate normal sinus rhythm and when their ECG recordings are short in duration
and free of noise and motion artifacts. However, there is still a need for improvement in certain
clinical and research situations. For example, in heart rate variability (HRV) analysis,
constructing an accurate normal R-to-R interval time series is critical. A QRS detection
algorithm with even 99.9% accuracy will fail to detect approximately 750 QRS complexes in a
14-day ECG signal (and generate the same number of erroneous detections), and the HRV
analysis result will be deteriorated unless a tedious manual correction is carried out. Needless to
say, ECG recordings are rarely free of noise. In such recordings, the task of automatic QRS
detection is more challenging, and the performance of most algorithms is far from perfect.

ADAPTIVE QRS DETECTION 3
Besides noise, the presence of arrhythmias and intermittent conduction defects (manifested as
irregularly timed heart beats) is another major challenge. Morphologically speaking, pathological
beats rarely resemble normal sinus beats. Within a given recording, the size and polarity of the
QRS complexes may vary significantly. These challenges are more prominent in long-term ECG
recordings, where QRS complex detection is confounded by subject motion and the possibility of
misplaced ECG electrodes. Long-term recordings often resemble a patchwork of markedly
different short recordings (some of which are unreadable), and any algorithm which utilizes
global properties of the recording will likely fail. Low computational complexity is required for
both real-time analysis and the analysis of ultra-long-term signals. In this manuscript, we
propose a revised QRS detection algorithm which addresses the above-mentioned challenges.
Specifically, we built and validated an algorithm for automatic QRS detection suitable for the
analysis of ultra-long-term (≥14 days) and pathological ECG signals. Our validation process
included testing on an annotated database of 14-day ECG recordings and multiple databases of
standard ECG recordings.
Methods
Our proposed algorithm is based on an algorithm proposed by Elgendi [2] with two key
modifications. The first modification is the implementation of local estimates for the amplitude
of the signal. The second modification is a mechanism by which a parameter in Elgendi’s
algorithm adapts to changes in heart rate. Below, we provide the technical details of our
algorithm. In the appendix, we provide the technical details of Elgendi’s original algorithm.
Our QRS Detection Algorithm
Write the raw, single-channel ECG signal as an 𝑛-dimensional vector 𝑥 ∈ ℝ%, where 𝑛 =
⌊𝑓) × 𝑇⌋, 𝑓) is the sampling rate of the signal, and 𝑇 is the duration of the recording in seconds.

ADAPTIVE QRS DETECTION 4
Write the 𝑖-th entry of 𝑥 as 𝑥(𝑖). Begin by applying a 3rd order, bi-directional, Butterworth
bandpass filter with cutoff frequencies 8 Hz and 20 Hz. Denote the filtered signal as 𝑦 ∈ ℝ%.
Form the vector 𝑧 ≔ 𝑦⊙ 𝑦 by squaring the entries of 𝑦. Then, apply three moving-average
filters to 𝑧. The first filter has a window size of 𝑊8, where 𝑊8 is the smallest odd integer greater
than or equal to 0.097 × 𝑓). The third filter has a window size of 𝑊<, where 𝑊< is the smallest
odd integer greater than or equal to 5𝑓). The second filter has a variable window size 𝑊> ∈ ℝ%;
we will discuss how to obtain 𝑊> in the next subsection. Compute 𝑣8 =movmean(𝑧,𝑊8), 𝑧̅ =
movmean(𝑧,𝑊<), and
𝑣>(𝑖) =1
𝑊>(𝑖)D𝑧 E𝑖 −
𝑊>(𝑖) − 12 G +⋯+ 𝑧(𝑖) + ⋯+ 𝑧 E𝑖 +
𝑊>(𝑖) − 12 GJ(1)
averaging over the available samples when near the endpoints of the signal 𝑧. To locally
estimate the baseline noise level in the signal, set 𝛼 = 0.08 × 𝑧̅. To detect QRS complexes in the
recording 𝑥, look for sections of the signal 𝑣8 which exceed the signal 𝑣> + 𝛼 for a duration of at
least 𝑊8 consecutive samples. The search begins by creating a logical vector
𝐿(𝑖) = M1if𝑣8(𝑖) > 𝑣>(𝑖) + 𝛼(𝑖)
0if𝑣8(𝑖) ≤ 𝑣>(𝑖) + 𝛼(𝑖)(2)
and applying a moving-sum filter to 𝐿 with window size 𝑊8; 𝑣< = movsum(𝐿,𝑊8).Finally,
conclude that a QRS complex exists at sample 𝑗 if there exist positive integers 𝑙8 ≤ 𝑗 ≤ 𝑙> such
that all of the following conditions hold.
• 𝑣<(𝑖) = 𝑊8 for all 𝑙8 ≤ 𝑖 ≤ 𝑙>
• 𝑣<(𝑙8 − 1) ≠ 𝑊8 or 𝑙8 = 1
• 𝑣<(𝑙> + 1) ≠ 𝑊8 or 𝑙> = 𝑛
• 𝑗 = argmaxZ[\]\Z^ 𝑣8(𝑖)

ADAPTIVE QRS DETECTION 5
The condition 𝑣<(𝑖) = 𝑊8 means that in the signal 𝐿, the window centered at sample 𝑖 with
width _[`8>
contains only 1’s. The first, second, and third conditions encapsulate the search for
consecutive sections of 𝐿 which are positive. The last condition encapsulates the search for the
exact location 𝑗 for the QRS complex (within the previously identified window).
Adapting to Changes in Heart Rate
In this subsection, we describe the procedure for calculating the entries of the vector 𝑊>.
Broadly speaking, we locally estimate the heart rate using the short-time Fourier transform, and
we use these local estimates to impute the entries of 𝑊>. Choose a discrete window function ℎ ∈
ℝ>bc8 which satisfies ℎ(𝐾 + 1) = 1. We take the Hann window [3], defined as
ℎ(𝑖) =12 D1 − cos E
𝜋(𝑖 − 1)𝐾 GJ(3)
In our implementation, we take the window width to be 𝐾 = ⌊2.5 × 𝑓)⌋. Set 𝑀 = 2𝑓) to be the
number of Fourier modes. For each integer (second) 1 ≤ 𝑡 ≤ 𝑇 and each integer 𝑚 satisfying
3 ≤ 𝑚 ≤ 25, evaluate
𝐺n(𝑚) = o [𝑣8(𝑡𝑓) + 𝑘 − 𝐾 − 1) − 𝜇n]ℎ(𝑘)𝑒`>u](v`8)(w`8)>x
>bc8
vy8
(4)
where 𝑣8(𝑙) ≔ 0 when 𝑙 < 1 or 𝑙 > 𝑛, and
𝜇n =1
2𝐾 + 1 o 𝑣8(𝑡𝑓) + 𝑘 − 𝐾 − 1)>bc8
vy8
(5)
is the mean of 𝑣8 in the 𝑡-th window. Note that 𝐺n(𝑚) is the row-𝑡, column-𝑚 entry of the
discretized time-frequency representation. (Due to speed and memory concerns, we compute
only a submatrix.) To extract the dominant curve 𝑝 in the spectrogram, set the time-1 entry to be
𝑝(1) = argmax<\w\>}|𝐺8(𝑚)|> (6)
ADAPTIVE QRS DETECTION 6
and for each integer 1 < 𝑡 ≤ 𝑇, set the time-𝑡 entry to be
𝑝(𝑡) = argmax<\w\>} �|𝐺n(𝑚)|>
∑ |𝐺n(𝑖)|>}]y<
> − 𝜆�𝑚 − 𝑝(𝑡 − 1)�>�(7)
The constant 𝜆 controls the smoothness of the curve 𝑝 by preventing large jumps in the
frequency axis between consecutive time points. In our implementation, we take 𝜆 = 0.01.
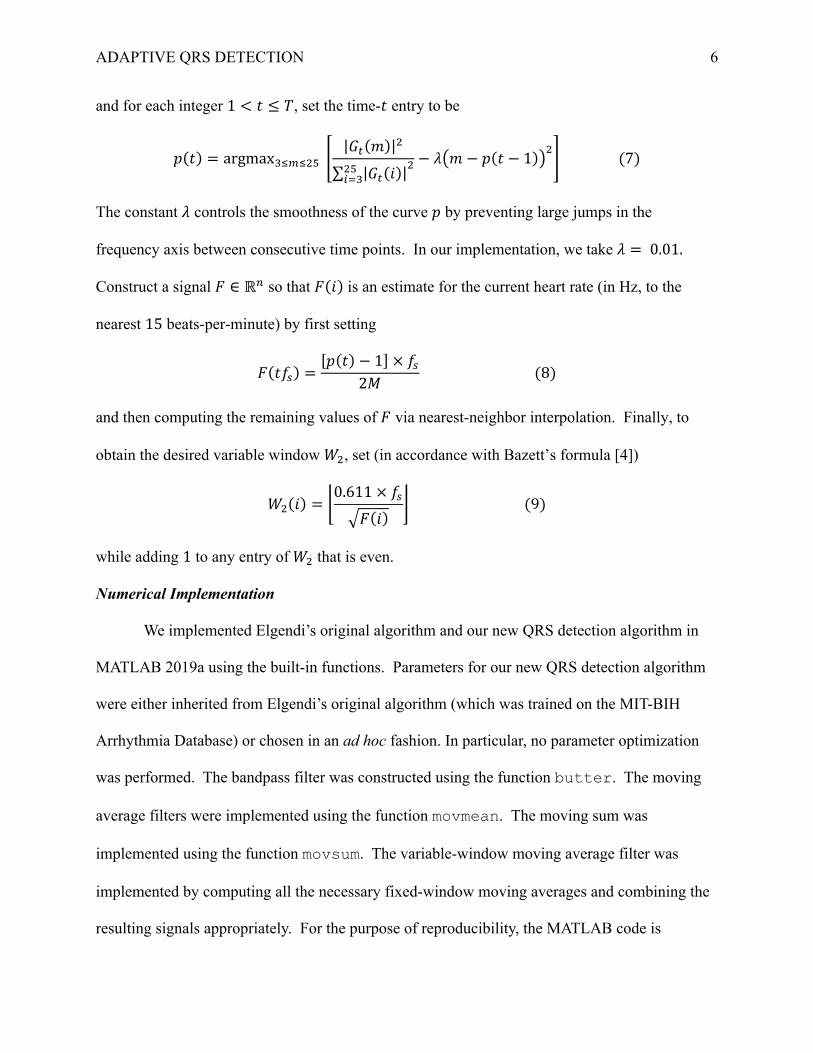
Construct a signal 𝐹 ∈ ℝ% so that 𝐹(𝑖) is an estimate for the current heart rate (in Hz, to the
nearest 15 beats-per-minute) by first setting
𝐹(𝑡𝑓)) =[𝑝(𝑡) − 1] × 𝑓)
2𝑀 (8)
and then computing the remaining values of 𝐹 via nearest-neighbor interpolation. Finally, to
obtain the desired variable window 𝑊>, set (in accordance with Bazett’s formula [4])
𝑊>(𝑖) = �0.611 × 𝑓)�𝐹(𝑖)
�(9)
while adding 1 to any entry of 𝑊> that is even.
Numerical Implementation
We implemented Elgendi’s original algorithm and our new QRS detection algorithm in
MATLAB 2019a using the built-in functions. Parameters for our new QRS detection algorithm
were either inherited from Elgendi’s original algorithm (which was trained on the MIT-BIH
Arrhythmia Database) or chosen in an ad hoc fashion. In particular, no parameter optimization
was performed. The bandpass filter was constructed using the function butter. The moving
average filters were implemented using the function movmean. The moving sum was
implemented using the function movsum. The variable-window moving average filter was
implemented by computing all the necessary fixed-window moving averages and combining the
resulting signals appropriately. For the purpose of reproducibility, the MATLAB code is
ADAPTIVE QRS DETECTION 7
available per request.A real-time implementation of our algorithm would, due to the size and
position of the Hann window used in the short-time Fourier transform, provide QRS complex
locations after a delay of 2.5 seconds.
Validation Databases
Eleven Conventional ECG Databases
Following Elgendi’s procedure [2], we validated our algorithm on eleven annotated
databases available at Physionet [5]. The databases are the AF Termination Challenge Database
[6], the Fantasia Database [7], the Intracardiac Atrial Fibrillation Database, the MIT-BIH
Arrhythmia Database [8], the MIT-BIH Noise Stress Test Database [9], the MIT-BIH Normal
Sinus Rhythm Database [10], the MIT-BIH ST Change Database [11], the MIT-BIH
Supraventricular Arrhythmia Database [12], the QT Database [13], the St. Petersburg Institute of
Cardiological Technics (INCART) 12-lead Arrhythmia Database, and the T-wave Alternans
Challenge Database [14]. The MIT-BIH Normal Sinus Rhythm Database has the largest number
(1,729,629) of annotated QRS complexes. We used the first available lead in all databases. All
databases except the Fantasia Database present recordings with at least two leads (except some in
the MIT-BIH ST Change Database), and in the appendix, we report the performance of both
algorithms on the second lead (when available). The Normal Sinus Rhythm Database was
modified before processing by removing the noise at the end of each recording. Noise removal
was done by removing sections that were at least one second after the last QRS complex
annotation. Contrary to Elgendi’s procedure [2], we did not remove any records from the
Fantasia Database. All records and annotations were imported into MATLAB using the
WaveForm DataBase (WFDB) Toolbox [15].

ADAPTIVE QRS DETECTION 8
Database of Ultra-Long-Term ECG Recordings
To the best of our knowledge, despite the increasing prevalence of ultra-long-term ECG
monitoring [16, 17], an annotated, publicly available database of ultra-long-term and
pathological ECG recordings is lacking. Our new database of single-lead, ultra-long-term ECG
recordings comprises four recordings; each recording is approximately two weeks (14 days) in
length. The data was recorded using the ZIO® Patch cardiac monitor (iRhythm Technologies,
Inc., San Francisco, California, USA) at a sampling rate of 200 Hz. The underlying information
of the subjects was unknown to us [18]. Across the four 14-day recordings, we randomly
selected 1,200 ten-second segments for manual annotation. These segments underwent manual
annotation at the Epidemiological Cardiology Research Center (EPICARE Center, Wake Forest
School of Medicine, Winston Salem, NC). To speed up the annotation process, the ECG core
laboratory was provided with the estimated QRS complex locations generated by our new QRS
detection algorithm. The quality of each ECG segment was also documented as part of the
annotation process. After excluding 16 of the 1,200 ECG segments deemed totally unreadable by
the ECG core laboratory, 1,184 segments with 15,605 QRS complex annotations remained, all of
which were included in our analysis. Of the 15,605 annotated QRS complexes, 1,232 were
labeled as ectopic.
Performance Evaluation
Using the twelve annotated ECG databases described above, we compared our new QRS
detection algorithm with Elgendi’s original algorithm. We used three evaluation metrics:
sensitivity (SE), positive predictive value (PPV), and the F1 score (F1). Most QRS detection
algorithms in the literature rely on metrics defined in terms of true positives (TP), false positives
(FP), and false negatives (FN) [19, 20]. TP is defined as the number of annotations which are

ADAPTIVE QRS DETECTION 9
“matched” to a predicted QRS complex location, FP is defined as the number of predictions
which are not matched to any annotation, and FN is defined as the number of annotations which
are not matched to any prediction. We use the standard grace period of 150 ms [21]. SE and PPV
are then defined as
SE = 100% ×TP
TP + FN PPV = 100% ×TP
TP + FP(10)
The F1 score is the harmonic mean of SE and PPV. All calculations were performed in
MATLAB 2019a on an Intel i7-4790K processor. Our beat-by-beat comparison algorithm is an
implementation of the process described in [21] and is available per request.
Results
Table 1 shows the performance of our new algorithm and Elgendi’s original algorithm on
twelve annotated ECG databases. Recall that SE reflects the probability that a QRS complex
will be detected, and PPV reflects the probability that a predicted QRS complex location actually
corresponds to a true QRS complex. The F1 score is the harmonic mean of SE and PPV. The
performance of our new QRS detection algorithm is comparable with the performance of
Elgendi’s original algorithm on the eleven conventional ECG databases available at Physionet.
The largest SE value in Table 1 is 99.99%, which was achieved by our algorithm on the QTDB.
This result means that for records in the QTDB, only one beat out of every 10,000 beats was
missed by our algorithm. The largest PPV value in Table 1 is 99.83%, which was also achieved
by our algorithm on the QTDB. This result means that out of every 10,000 predictions made by
our algorithm, only 17 did not correspond to true QRS complexes. Excluding the IAFDB, the
largest difference in SE between our new algorithm and Elgendi’s algorithm across the eleven
conventional databases is +0.53% on the AFTDB. On the 14-day ECG database, the difference

ADAPTIVE QRS DETECTION 10
in SE is larger at +0.60%. The significance of this result can be appreciated when we consider
that a 14-day ECG recording will have in excess of 1.5 million beats; a decrease in SE of 0.1%
means the missed detection of 1,500 QRS complexes. The difference in PPV on the 14-day ECG
database is a modest +0.05%. The cost of the improved performance is evidently a doubling in
computation time. Nevertheless, the numerical efficiency of our new algorithm is evident, as a
14-day recording sampled at 200 Hz can be analyzed in approximately 157 seconds (just over
two-and-a-half minutes). Computation time did not include reading of the electrocardiogram
into the workspace, and the reported values in Table 1 were not weighted according to the
sampling rate or length of the records. Note that our reported performance for Elgendi’s original
algorithm is different than the performance reported by Elgendi [2], and this difference could be
the result of different procedures for metric evaluation (a grace period is not specified in [2], nor
is a beat-by-beat comparison algorithm), updates to the conventional databases, a different
choice of lead, or a different signal for the final QRS demarcation.
Visualization of the Adaptive Threshold
We show in Figure 1 a segment of our new database of long-term and pathological
recordings wherein Elgendi’s algorithm fails due to the high heart rate (approximately 180 bpm
in this 7-second extract). In this application of Elgendi’s algorithm, the threshold (shown in red)
is too high because the fixed window size 𝑊> is large relative to the subject’s QT interval length.
The signal 𝑣8 is shown in black. The predicted QRS complex locations are shown in blue, and
one can immediately notice five QRS complexes that were not detected by Elgendi’s algorithm.
After estimating the heart rate during this section of the recording and applying Bazett’s formula
to adjust 𝑊>, the window size reduces from 611 ms to approximately 353 ms. We show in

ADAPTIVE QRS DETECTION 11
Figure 2 the same segment of 𝑣8 with the new adaptive threshold 𝑣> + 𝛼 plotted in red. Notice
that the false negative peaks from Figure 1 are now detected in Figure 2.
Discussion
In this report, we introduced a new QRS detection algorithm which could be a better fit
for mobile, ultra-long-term cardiac ECG monitoring due to its ability to adapt to high heart rates,
adjust to changing amplitudes, and ignore previous noise and motion artifacts. We validated our
algorithm on eleven standard ECG databases and on a new annotated database of ultra-long-term
ECG recordings.
Summary of Previous Work
The algorithm of Pan and Tompkins [19] was one of the first automatic QRS detectors
and remains the most highly cited ECG annotation algorithm in the literature. Since then,
several QRS detection algorithms have been proposed. Below, we summarize these algorithms
to make the novelty of the algorithm that we will propose more apparent.
The Algorithm of Pan and Tompkins
Elements of Pan and Tompkins’ algorithm persist in innovations today. The ECG signal
is first filtered in such a way that noise is attenuated and QRS complexes are emphasized. Then,
QRS complexes are located by finding peaks in the filtered ECG signal. (The value of the
filtered ECG signal at any point in time can be thought of as the probability that a QRS complex
is located there.) The algorithm of Pan and Tompkins features a complicated thresholding
algorithm that attempts to adapt to changes in heart rate by looking at the previous eight detected
heart contractions. As described by Elgendi [2], this method is error-compounding because
incorrectly detected QRS complexes at the beginning of the signal cause succeeding estimates to
also be incorrect.

ADAPTIVE QRS DETECTION 12
Continual Development of QRS Detection Algorithms
Following Pan and Tompkins [19], several algorithms were proposed which demonstrate
higher prediction accuracies. We refer readers to a summary of these works [1], in which the
authors describe a plethora of QRS detection algorithms; they further note the lack of evidence
for automatic QRS detectors being implemented and tested in clinics. Numerous other surveys
have been produced in recent decades [22-27], and we also refer readers with interest to these
publications. In this work, based on our own experience, we consider the state-of-the-art QRS
detector to be the algorithm proposed by Elgendi [2].
Elgendi’s Algorithm
Elgendi’s QRS detection algorithm [2] was designed to be a numerically efficient
alternative to the plethora of recently developed high-accuracy QRS detectors. Such detectors
commonly score in excess of 99% sensitivity and positive predictive value on the MIT-BIH
Arrhythmia Database [1]. Elgendi’s algorithm was validated on the eleven conventional ECG
databases considered in this work. Parameters for his algorithm were trained on the MIT-BIH
Arrhythmia Database. Since the publication of Elgendi’s results, the databases appear to have
changed; for example, records in the MIT Normal Sinus Rhythm Database are now around 24
hours long, but he reported that the longest record was 130 minutes in duration. We mention that
Elgendi’s algorithm does not adapt to changes in heart rate and that it relies on global properties
of the recording. In the appendix, we provide a technical description of Elgendi’s algorithm, on
which our new algorithm is based.
Two Key Modifications
Below, we discuss the two significant differences between our algorithm and Elgendi’s
algorithm. We also discuss two minor technical differences.

ADAPTIVE QRS DETECTION 13
Local Estimates for the Baseline Noise Level
We do not want motion artifacts or large measurement noise in one section of the
recording to affect QRS detection protocol in another section of the recording. In our algorithm,
estimation of the (relative) amplitude is done by the signal 𝑧̅, and estimation of the baseline noise
level is done by the signal 𝛼. The vector 𝛼 is “local” in the sense that 𝛼(𝑖), the estimated
baseline noise level at time 𝑖/𝑓), is calculated using a five-second window surrounding the time
of interest. Large increases in amplitude during other parts of the recording have no effect on
our QRS detection protocol during the central time period.
Adapting to Changes in Heart Rate
As previously discussed, Elgendi’s algorithm does not adapt to changes in heart rate.
While Elgendi’s algorithm performs well on many types of pathological signals, we found that it
possesses a particular weakness; when the subject’s heart rate is very high, Elgendi’s algorithm
fails to detect all of the QRS complexes (see Figure 1). Our algorithm has been designed to
overcome this weakness. Our algorithm succeeds when the parameter 𝑊>(𝑖) is approximately
equal to the expected length of the QT interval (or PT interval) at time 𝑖/𝑓). To estimate the
expected length of the QT interval, we use the fact that QT interval length is inversely related to
instantaneous heart rate [28]. To be specific, our algorithm estimates the instantaneous HR and
then uses this estimate to impute 𝑊>(𝑖). Estimating the instantaneous HR is simple when the
locations of the QRS complexes are known. However, we must estimate the HR without
knowing the locations of the QRS complexes. Hence, we chose to use the short-time Fourier
transform to obtain an estimate for the HR. The discrete Fourier transform could be applied
directly to the signal 𝑥 to obtain an estimate for the average HR observed during the recording.
However, for long-term ECG signals, the HR may change significantly from time to time.
ADAPTIVE QRS DETECTION 14
Consequently, our HR estimate must be made locally. In our implementation of the short-time
Fourier transform, we use a window size of five seconds. The maximum argument of the power
spectrum of this five-second window is approximately one fifth the number of heart beats
occurring during those five seconds.
Minor Modifications
On top of the two significant differences discussed above, there are two minor technical
differences between our algorithm and Elgendi’s algorithm that we should mention. First, our
QRS complex detection criterion is slightly different than the one used by Elgendi (see
Appendix). In our algorithm, the final location 𝑗 of the demarcated QRS complex is chosen from
a smaller range of samples. Second, we note that in Elgendi’s original work, the signal to be
used in the definition of 𝑗 was not specified. Elgendi simply writes,
“The last stage is finding the maximum absolute value within each block, the R peak”
[2].
We have chosen to use 𝑣8 to demarcate the QRS complex because in terms of performance on
the annotated MIT-BIH Arrhythmia Database, this setting for Elgendi’s algorithm was the best
of several options. This choice is further discussed below.
QRS Complex Demarcation
Normal QRS complexes are typically around 80 ms in duration, and any QRS detection
algorithm has the additional task of placing a QRS marker at some point in this short interval.
Small differences in QRS marker position can have a strong effect on secondary ECG analysis
tools such as the R-to-R interval time series. Conventionally, the QRS marker must be placed at
the R peak. In individuals free of cardiac arrhythmias, the R wave is easy to identify. However,
for some non-sinus beats, there is no standard approach to annotating the Q, R, and S waves.
ADAPTIVE QRS DETECTION 15
Hence, when we cannot rule out the possibility of encountering non-sinus beats, we use the
maximum of the signal 𝑣8 to represent the “center” of the QRS complex, or the instance at which
QRS-related spectral energy is the highest. As can be seen in Figure 1, the 𝑣8 maxima do not
always correspond to the highest amplitude peaks in the corresponding QRS complexes. If the
subject is known to demonstrate normal sinus rhythm, then an additional programming step can
identify the R wave using each predicted QRS complex location provided by our algorithm.
(Note that this step has not been applied to the signal in Figure 1).
Signal Quality
Sixteen segments (out of 1,200) in the 14-day ECG database were deemed to be
unreadable by the ECG core laboratory that annotated the database. Our algorithm made QRS
complex predictions in these segments, and these predictions were thrown out before calculating
SE and PPV. Similarly, we found that at the end of each record in the NSRDB are sections of
noise with zero manual QRS complex annotations; we removed all predictions in these poor-
quality ECG segments before calculating our evaluation metrics. Including these segments in the
evaluation would lead to an unfairly low PPV score. The remedy for poor signal quality is of
course ensuring good subject preparation and correct application of the ECG electrodes.
Nevertheless, our QRS complex detection algorithm should be deployed with an accompanying
automatic signal quality classifier. One efficient signal quality index which we have found
works well relies on the fact that when two QRS complex detection algorithms disagree
significantly, the signal is likely of low quality [29]. We would not recommend pairing our new
QRS complex detection algorithm with Elgendi’s algorithm because of the high degree of
similarity. Instead, we recommend an algorithm which employs the first or second derivative of
the signal; changing the definition of 𝑧 ≔ 𝑦⊙ 𝑦 in our algorithm to 𝑧 ≔ 𝑦� ⊙ 𝑦� would be

ADAPTIVE QRS DETECTION 16
sufficient. A suitable signal quality index for ultra-long-term ECG signals will be reported in
future work.
Technical Details
On the technical front, we mention that the adjustment of 𝑊> is done using Bazett’s
formula because of its common use, despite its flaws. To further improve the algorithm, we will
consider other nonlinear relationships between heart rate and QT interval length [28] or adopt an
alternative QT interval correction method in light of the current ECG recommendations [30].
Grace Period
In the literature, the “grace period” for marking the agreement between an annotation and
a prediction is usually a generous 150 ms or is not stated, but a minority of publications choose
100 ms [31-33] or 50 ms [22]. It is not clear whether these publications use a matching approach
to performance evaluation as in the ANSI/AAMI standard [21]. It is important to note that
without the use of a standardized algorithm for matching predicted QRS complex locations to
reference annotations, performance metrics are easily confounded. For example, an algorithm
which makes two predictions for every annotation would achieve perfect scores.
Study Limitations
Our study has limitations. First, due to limited resources, we randomly selected for
annotation only 1,200 ten-second segments from the four 14-day ECG signals. While we do see
some degree of heterogeneity among the segments randomly selected for annotation, a larger
database with more subjects and more annotations is needed to further confirm the performance
and generalizability of our algorithm. To speed up the manual annotation process, initial
estimates for the QRS complex locations (made by our algorithm) were provided to the ECG
core laboratory. While this approach saved time and labor, the reference labels could be biased
ADAPTIVE QRS DETECTION 17
to our proposed algorithm. This limitation has been mitigated by visually analyzing the labeled
ECG segments for any possible bias, but developing reference annotations from scratch is the
approach which avoids this issue. The algorithm was implemented in MATLAB and is available
per request. The authors suspect that a direct implementation of the filter in C or C++ would
speed up the algorithm, which is critical for mobile health applications.
Conclusions
We introduce an adaptive QRS detection algorithm for single-channel ECG which
achieved a sensitivity of 99.90% and a positive predictive value of 99.73% on our newly
annotated database of ultra-long-term and pathological ECG signals. State-of-the-art
performance was also demonstrated on eleven publicly available ECG databases. Features of our
algorithm include adaptations to current heart rate (estimated via the short-time Fourier
transform) and local estimates for the amplitude of the signal. The numerical efficiency of our
algorithm makes it a good fit for mobile health applications and for the batch processing of large
databases of long-term ECG signals. The algorithm is robust to noise (as demonstrated by its
performance on the MIT-BIH Noise Stress Test Database), requires zero human input, and
showed strong performance across a variety of sampling and bit rates. The signal is also not
required to be normalized or to be in units of mV.
Acknowledgements
The authors thank the staff and faculty at EPICARE; especially Dr. Yabing Li and Mr.
Charles Campbell for helping with the annotation and programming of the 14-day ECG dataset.
Disclosures: None

ADAPTIVE QRS DETECTION 18
ADAPTIVE QRS DETECTION 19
References
1. Elgendi, M., et al., Revisiting QRS detection methodologies for portable, wearable, battery-operated, and wireless ECG systems. PLoS One, 2014. 9(1): p. e84018.
2. Elgendi, M., Fast QRS detection with an optimized knowledge-based method: evaluation on 11 standard ECG databases. PLoS One, 2013. 8(9): p. e73557.
3. Harris, F.J., On the use of windows for harmonic analysis with the discrete Fourier transform. Proceedings of the IEEE, 1978. 66(1): p. 51-83.
4. Malik, M., Problems of Heart Rate Correction in Assessment of Drug-Induced QT Interval Prolongation. Journal of Cardiovascular Electrophysiology, 2001. 12(4): p. 411-420.
5. Goldberger, A.L., et al., PhysioBank, PhysioToolkit, and PhysioNet: components of a new research resource for complex physiologic signals. Circulation, 2000. 101(23): p. E215-20.
6. Moody, G.E. Spontaneous termination of atrial fibrillation: a challenge from physionet and computers in cardiology 2004. in Computers in Cardiology, 2004. 2004.
7. Iyengar, N., et al., Age-related alterations in the fractal scaling of cardiac interbeat interval dynamics. Am J Physiol, 1996. 271(4 Pt 2): p. R1078-84.
8. Moody, G.B. and R.G. Mark, The impact of the MIT-BIH arrhythmia database. IEEE Eng Med Biol Mag, 2001. 20(3): p. 45-50.
9. Moody, G.B., W. Muldrow, and R.G. Mark, A noise stress test for arrhythmia detectors. Computers in cardiology, 1984. 11(3): p. 381-384.
10. Goldberger, A., et al., The MIT-BIH normal sinus rhythm database. Circulation. 101(23): p. e215-e220.
11. Albrecht, P., ST segment characterization for long term automated ECG analysis. 1983, Massachusetts Institute of Technology, Department of Electrical Engineering ….
12. Greenwald, S.D., R.S. Patil, and R.G. Mark, Improved detection and classification of arrhythmias in noise-corrupted electrocardiograms using contextual information. 1990: IEEE.
13. Laguna, P., et al. A database for evaluation of algorithms for measurement of QT and other waveform intervals in the ECG. in Computers in cardiology 1997. 1997. IEEE.
14. Moody, G. The physionet/computers in cardiology challenge 2008: T-wave alternans. in 2008 Computers in Cardiology. 2008. IEEE.
15. Silva, I. and G.B. Moody, An open-source toolbox for analysing and processing physionet databases in matlab and octave. Journal of open research software, 2014. 2(1).
16. Barrett, P.M., et al., Comparison of 24-hour Holter Monitoring with 14-day Novel Adhesive Patch Electrocardiographic Monitoring. The American Journal of Medicine, 2014. 127(1): p. 95.e11-95.e17.
17. Yenikomshian, M., et al., Cardiac arrhythmia detection outcomes among patients monitored with the Zio patch system: a systematic literature review. Current Medical Research and Opinion, 2019. 35(10): p. 1659-1670.
18. Wu, H.-T. and E.Z. Soliman, A new approach for analysis of heart rate variability and QT variability in long-term ECG recording. BioMedical Engineering OnLine, 2018. 17(1): p. 54.
ADAPTIVE QRS DETECTION 20
19. Pan, J. and W.J. Tompkins, A real-time QRS detection algorithm. IEEE Trans Biomed Eng, 1985. 32(3): p. 230-6.
20. Kadambe, S., R. Murray, and G.F. Boudreaux-Bartels, Wavelet transform-based QRS complex detector. IEEE Transactions on Biomedical Engineering, 1999. 46(7): p. 838-848.
21. EC57, A.-A., Testing and reporting performance results of cardiac rhythm and ST segment measurement algorithms. Association for the Advancement of Medical Instrumentation, Arlington, VA, 1998.
22. Liu, F., et al., Performance Analysis of Ten Common QRS Detectors on Different ECG Application Cases. Journal of healthcare engineering, 2018. 2018: p. 9050812-9050812.
23. Oweis, R.J. and B.O. Al-Tabbaa, QRS detection and heart rate variability analysis: A survey. 2014.
24. Arzeno, N.M., Z. Deng, and C. Poon, Analysis of First-Derivative Based QRS Detection Algorithms. IEEE Transactions on Biomedical Engineering, 2008. 55(2): p. 478-484.
25. Kohler, B., C. Hennig, and R. Orglmeister, The principles of software QRS detection. IEEE Engineering in Medicine and Biology Magazine, 2002. 21(1): p. 42-57.
26. Friesen, G.M., et al., A comparison of the noise sensitivity of nine QRS detection algorithms. IEEE Transactions on Biomedical Engineering, 1990. 37(1): p. 85-98.
27. Pahlm, O. and L. Sörnmo, Software QRS detection in ambulatory monitoring — a review. Medical and Biological Engineering and Computing, 1984. 22(4): p. 289-297.
28. Malik, M., et al., Relation between QT and RR intervals is highly individual among healthy subjects: implications for heart rate correction of the QT interval. Heart, 2002. 87(3): p. 220-228.
29. Behar, J., et al., ECG signal quality during arrhythmia and its application to false alarm reduction. IEEE Trans Biomed Eng, 2013. 60(6): p. 1660-6.
30. Rautaharju, P.M., B. Surawicz, and L.S. Gettes, AHA/ACCF/HRS recommendations for the standardization and interpretation of the electrocardiogram: part IV: the ST segment, T and U waves, and the QT interval. Journal of the American College of Cardiology, 2009. 53(11): p. 982.
31. Meyer, C., J.F. Gavela, and M. Harris, Combining Algorithms in Automatic Detection of QRS Complexes in ECG Signals. IEEE Transactions on Information Technology in Biomedicine, 2006. 10(3): p. 468-475.
32. Zidelmal, Z., et al., QRS detection based on wavelet coefficients. Computer Methods and Programs in Biomedicine, 2012. 107(3): p. 490-496.
33. Kaur, A., et al., A Novel Approach to ECG R-Peak Detection. Arabian Journal for Science and Engineering, 2019. 44(8): p. 6679-6691.

ADAPTIVE QRS DETECTION 21
Table 1: Evaluation of Algorithm Performance on Twelve Annotated ECG Databases
Database Number of Beats
Algorithm SE (%) PPV (%) F1 (%) Compute Time (ms)
AFTDB 7,590 This work 99.67 99.04 99.35 6.77 Elgendi 99.14 99.08 99.11 4.21 FANTASIADB 285,311 This work 99.89 99.73 99.81 904.63 Elgendi 99.90 99.76 99.83 505.02 IAFDB 7,637 This work 86.96 78.38 82.45 100.60 Elgendi 85.98 79.80 82.77 59.76 MITDB 109,494 This work 99.92 99.62 99.77 320.99 Elgendi 99.88 99.79 99.83 187.64 NSTDB 25,590 This work 96.51 82.82 89.14 327.45 Elgendi 96.44 83.47 89.49 186.40 NSRDB 1,729,629 This work 99.91 99.32 99.61 5,662.07 Elgendi 99.92 99.32 99.62 2,923.07 STDB 76,175 This work 99.92 99.36 99.64 312.26 Elgendi 99.94 99.37 99.65 179.90 SVDB 184,583 This work 99.77 99.65 99.71 132.99 Elgendi 99.69 99.70 99.70 71.11 QTDB 86,995 This work 99.99 99.83 99.91 117.62 Elgendi 99.98 99.79 99.88 68.11 INCARTDB 175,906 This work 98.11 95.08 96.57 237.66 Elgendi 98.24 95.44 96.82 136.14 TWADB 18,991 This work 98.50 94.94 96.68 30.26 Elgendi 98.34 94.92 96.60 18.77 14DAYDB 15,605 This work 99.90 99.73 99.82 156,508.03 Elgendi 99.30 99.68 99.49 77,762.80
Note: The databases are the AF Termination Challenge Database (AFTDB), the Fantasia
Database (FANTASIADB), the Intracardiac Atrial Fibrillation Database (IAFDB), the MIT-BIH
Arrhythmia Database (MITDB), the MIT-BIH Noise Stress Test Database (NSTDB), the MIT-
BIH Normal Sinus Rhythm Database (NSRDB), the MIT-BIH ST Change Database (STDB), the
MIT-BIH Supraventricular Arrhythmia Database (SVDB), the QT Database (QTDB), the St.
Petersburg Institute of Cardiological Technics 12-lead Arrhythmia Database (INCARTDB), the
T-wave Alternans Challenge Database (TWADB), and our ultra-long-term (14-day) ECG
database (14DAYDB). Compute time is reported as the average over all records in the database.
SE is sensitivity and PPV is positive predictive value. The grace period is 150 ms.

ADAPTIVE QRS DETECTION 22
Figure 1. Top: a 7-second ECG segment from our new database of long-term and pathological
recordings; the QRS complex predictions given by Elgendi’s algorithm are shown in blue. The
algorithm fails due to the high heart rate. Bottom: the signals 𝑣8 (black) and 𝑣> + 𝛼𝟏%×8 (red)
are shown (see Appendix); false negative beats arise because the red threshold is too large.

ADAPTIVE QRS DETECTION 23
Figure 2. We plot the intermediate signals 𝑣8 (black) and 𝑣> + 𝛼 (red) obtained by running our
new QRS complex detection algorithm on the ECG signal shown at the top of Figure 1. The
predicted QRS complex locations are shown in blue, and the false negative peaks from Figure 1
are now detected because the red threshold has adapted to the high heart rate.

ADAPTIVE QRS DETECTION 24
Appendix
Elgendi’s Algorithm (Details)
Write the raw, single-channel ECG signal as an 𝑛-dimensional vector 𝑥 ∈ ℝ%, where 𝑛 =
⌊𝑓) × 𝑇⌋, 𝑓) is the sampling rate of the signal, and 𝑇 is the duration of the recording in seconds.
Write the 𝑖-th entry of 𝑥 as 𝑥(𝑖). Begin by applying a 3rd order, bi-directional, Butterworth
bandpass filter with cutoff frequencies 8 Hz and 20 Hz. Denote the filtered signal as 𝑦 ∈ ℝ%.
Form the vector 𝑧 ≔ 𝑦⊙ 𝑦 by squaring the entries of 𝑦. Then, apply two moving-average
filters to 𝑧. Let 𝑊8 be the smallest odd integer greater than or equal to ⌊0.097 × 𝑓)⌋, and let 𝑊>
be the smallest odd integer greater than or equal to ⌊0.611 × 𝑓)⌋. Compute
𝑣8(𝑖) =1𝑊8
�𝑧 �𝑖 −𝑊8 − 12 � +⋯+ 𝑧(𝑖) + ⋯+ 𝑧 �𝑖 +
𝑊8 − 12 ��
𝑣>(𝑖) =1𝑊>
�𝑧 �𝑖 −𝑊> − 12 � +⋯+ 𝑧(𝑖) + ⋯+ 𝑧 �𝑖 +
𝑊> − 12 ��
averaging over the available samples when near the endpoints of the signal 𝑧. Define
𝑧̅ =1𝑛o𝑧(𝑖)
%
]y8
and write 𝛼 = 0.08 × 𝑧.̅ To detect QRS complexes in the recording 𝑥, look for sections of the
signal 𝑣8 which exceed the signal 𝑣> + 𝛼𝟏%×8 for a duration of at least 𝑊8 consecutive samples.
To be specific, if 𝑘8 and 𝑘> are two positive integers such that all of the conditions
• 𝑘> − 𝑘8 + 1 ≥ 𝑊8
• 𝑣8(𝑖) > 𝑣>(𝑖) + 𝛼 for all 𝑘8 ≤ 𝑖 ≤ 𝑘>
• 𝑣8(𝑘8 − 1) ≤ 𝑣>(𝑘8 − 1) + 𝛼 or 𝑘8 = 1
• 𝑣8(𝑘> + 1) ≤ 𝑣>(𝑘> + 1) + 𝛼 or 𝑘> = 𝑛
ADAPTIVE QRS DETECTION 25
hold, then conclude that a QRS complex exists at 𝑥(𝑗), where
𝑗 = argmaxv[\]\v^ 𝑣8(𝑖).
Note that since Elgendi does not specify which signal should be used to identify 𝑗, we took the
liberty of selecting 𝑣8 (see Discussion).
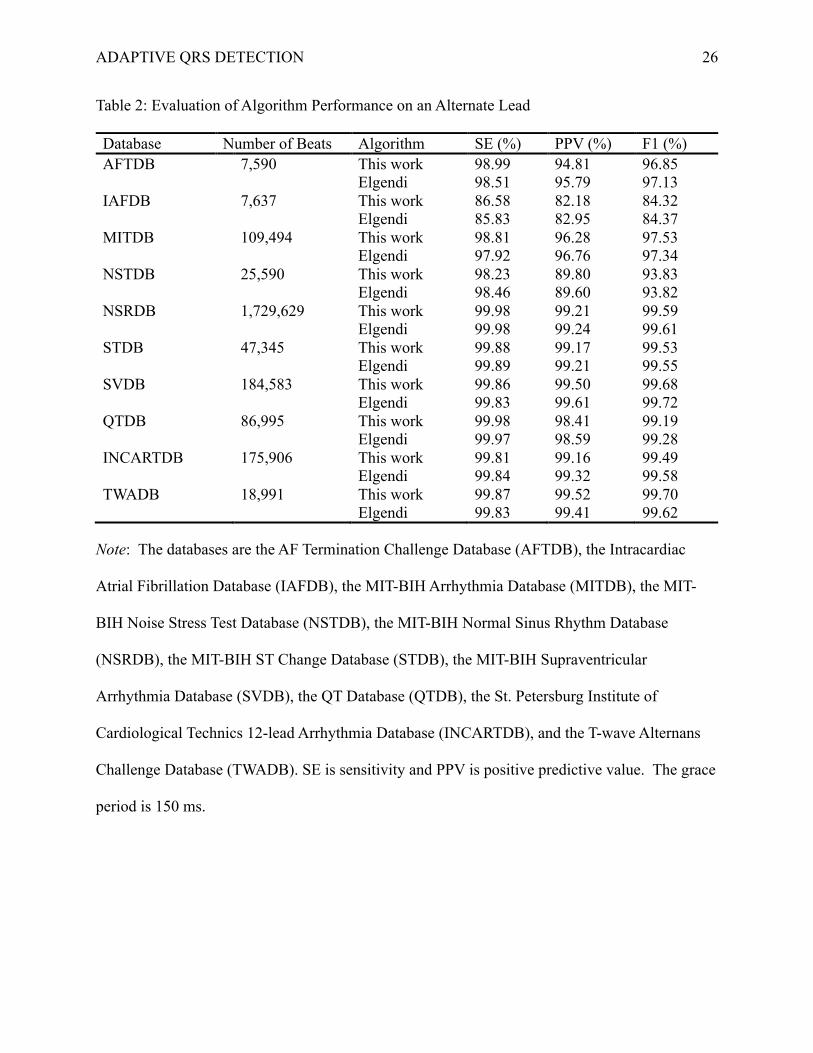
Performance on an Alternate Lead
To provide further comparisons between our algorithm and Elgendi’s algorithm on the
conventional ECG databases from Physionet, we report in Table 2 their performances on the
second lead in each record (when available). Note that the FANTASIADB is a single-lead
database. Since the STDB has some records that are single-lead, the number of beats for this
database is noticeably smaller than the number reported in Table 1. Large differences in F1
score when considering the alternate lead (such as on the AFTDB, the MITDB, the NSTDB, the
INCARTDB, and the TWADB) could be attributed to the responsiveness of the lead type to
ventricular activations, or the choice of lead used by the annotator.
ADAPTIVE QRS DETECTION 26
Table 2: Evaluation of Algorithm Performance on an Alternate Lead
Database Number of Beats Algorithm SE (%) PPV (%) F1 (%) AFTDB 7,590 This work 98.99 94.81 96.85 Elgendi 98.51 95.79 97.13 IAFDB 7,637 This work 86.58 82.18 84.32 Elgendi 85.83 82.95 84.37 MITDB 109,494 This work 98.81 96.28 97.53 Elgendi 97.92 96.76 97.34 NSTDB 25,590 This work 98.23 89.80 93.83 Elgendi 98.46 89.60 93.82 NSRDB 1,729,629 This work 99.98 99.21 99.59 Elgendi 99.98 99.24 99.61 STDB 47,345 This work 99.88 99.17 99.53 Elgendi 99.89 99.21 99.55 SVDB 184,583 This work 99.86 99.50 99.68 Elgendi 99.83 99.61 99.72 QTDB 86,995 This work 99.98 98.41 99.19 Elgendi 99.97 98.59 99.28 INCARTDB 175,906 This work 99.81 99.16 99.49 Elgendi 99.84 99.32 99.58 TWADB 18,991 This work 99.87 99.52 99.70 Elgendi 99.83 99.41 99.62
Note: The databases are the AF Termination Challenge Database (AFTDB), the Intracardiac
Atrial Fibrillation Database (IAFDB), the MIT-BIH Arrhythmia Database (MITDB), the MIT-
BIH Noise Stress Test Database (NSTDB), the MIT-BIH Normal Sinus Rhythm Database
(NSRDB), the MIT-BIH ST Change Database (STDB), the MIT-BIH Supraventricular
Arrhythmia Database (SVDB), the QT Database (QTDB), the St. Petersburg Institute of
Cardiological Technics 12-lead Arrhythmia Database (INCARTDB), and the T-wave Alternans
Challenge Database (TWADB). SE is sensitivity and PPV is positive predictive value. The grace
period is 150 ms.