Statistical Yearbook 2018
86
-
Upload
khangminh22 -
Category
Documents
-
view
0 -
download
0
Transcript of Statistical Yearbook 2018
THE MINISTRY OF FOREIGN AFFAIRS AND INTERNATIONAL COOPERATION
STATISTICAL YEARBOOK 2018
CONTENTS
FOREWORD 5
INTRODUCTION AND METHODOLOGICAL NOTES 7
TABLE OF CONTENTS 10
CHAPTER 1 - ORGANISATION AND RESOURCES 15
CHAPTER 2 - ACTIVITIES AND SERVICES 37
CHAPTER 3 - COMPARISON WITH OTHER COUNTRIES 79

THE MINISTRY OF FOREIGN AFFAIRS AND INTERNATIONAL COOPERATION
STATISTICAL YEARBOOK 2018
5
FOREWORD
The Foreign Ministry’s Statistical Yearbook has come of age this year. Indeed, theMinistry has been publishing the Yearbook since the year 2000 with the aim of illustrating– through figures – the activities of the Ministry of Foreign Affairs and InternationalCooperation (MFAIC), and especially the year’s achievements. Translating its activities intonumbers is no simple task for a Ministry whose mandated duty is to deal with issues ofinternational politics. Indeed, as Albert Einstein said: “Not everything that can be countedcounts, and not everything that counts can be counted.”
The MFAIC’s activities have radically changed over the years, and its political activity hasbeen increasingly supplemented with the provision of services for citizens, companies andthe Country at large, through the Statistical Yearbook, which makes available and sharesinformation, analyses, data and instruments useful to assess and monitor policies and,more generally, the Administration’s decisions. Allow me to particularly point out some ofthe “numerical” goals that we achieved in 2017.
First of all, despite the scarcity of human and financial resources compared to our majorpartners, our offices abroad – in line with our foreign policy priorities – have beenincreased. In 2017, we opened three new Embassies, in Niamey, Conakry and SantoDomingo, and we established the Italian Cultural Institute in Abu Dhabi. This ranks usamong the Countries with the biggest diplomatic and consular network in the world, witha total of 300 offices, including Embassies, Consulates, Multilateral Missions and CulturalInstitutes.
The opening of Embassies in Niger and Guinea and the upcoming opening of an officein Burkina Faso bear witness to Italy’s resolve to establish a new type of partnership, froma multidimensional perspective, with African Countries, especially with the Countries oforigin and transit of migration flows, capable of combining efforts in favour of stability andsecurity, promoting human rights and boosting development cooperation activities andsocio-economic development initiatives.
The figures relative to our Official Development Assistance (ODA) confirm our efforts tohelp Developing Countries, especially in the African continent (with over 40% of the aidfunds disbursed in 2017 allocated to Africa). The ODA percentage of our Gross NationalIncome rose 0.30% in 2017 compared to the 0.27% of the preceding year, a considerableachievement in view of the Agenda 2030 Goals, ranking Italy 4th among the G7 Countries– in percentage terms – after the United Kingdom, Germany and France.
The opening of new offices ran in parallel with a considerable increase in the numberof institutional visits in Italy, which increased 37% in 2017 compared to the previous year,rising from 268 to 367 visits in one year.
These activities went hand in hand with promoting our Country’s internationalisation,which has been the core of our development model ever since the 1950s. In 2017, in syncwith our “Country Network” (diplomatic and consular network, Chambers of Commerceand ICE Agency offices), we informed the Italian economic and productive system ofapproximately 8,000 international tenders and gave an early notice of 500 tenders and big
THE MINISTRY OF FOREIGN AFFAIRS AND INTERNATIONAL COOPERATION
6
contracts. These activities aim to provide diplomatic support and assistance to companies,but have a positive fallout on the entire national economy.
In the field of culture, we considerably boosted all our initiatives abroad through 2017:the MFAIC Network organised a programme with almost 8,000 events in different sectorsof activity, including promoting the Italian language, contemporary art, haute cuisine anddesign. Furthermore, the events organised for the “Week of Italian Language in the World”have been increased by 21%.
This outstanding dynamism proves the great importance that the Foreign Ministryattributes to economic and cultural diplomacy and to the implementation of an integratedpromotion strategy of Brand Italy that also embraces scientific diplomacy, theinternationalisation of the university system and the promotion of the Italian language. Inthis context, the number of visas released in 2017 for study and research purposes rose 7%and 10% respectively. An equal increase was recorded in the number of students enrolledin courses of the Italian language, which now ranks the 4th most studied foreign languagein the world (234,000 students choose Italian as their second foreign language atuniversity).
We have witnessed an equal increase in the Network’s activities at the service of Italiansresiding abroad: the number of Italians listed in Consular Registers has risen 4%, with morethan 5.5 million people registered, and the number of passports issued totalled almost350,000, up 16% from the previous year. In addition, there is a growing number of consularprotection actions for Italians abroad and of the actions taken by the Crisis Unit in specialemergency situations.
Lastly, let me express my great satisfaction at the numbers relative to the ForeignMinistry’s institutional communication activities: almost 12 million people have visited ourWebsite, there are more than 100,000 followers of the Farnesina@ItalyMFA account,bearing witness to our big effort to make greater use of social networks (Facebook, YouTube,Instagram), as an effective instrument to inform the general public of our foreign policychoices and activities. By way of example, in 2017, the “Politica Estera e Storia” (“ForeignPolicy and History”) Portal, co-developed with the Istituto Poligrafico dello Stato, recordedmore than 640,000 hits, up 36% from the previous year, and the Study Hall of our HistoricalArchive received almost 2,000 visits, 21% of which from foreign scholars.
These results have been made possible by the unrelenting commitment of all the MFAICpersonnel who, in collaboration with the staff of other Administrations, serve our Countrywith care and dedication.
September 2018
Elisabetta Belloni
Secretary General
STATISTICAL YEARBOOK 2018
7
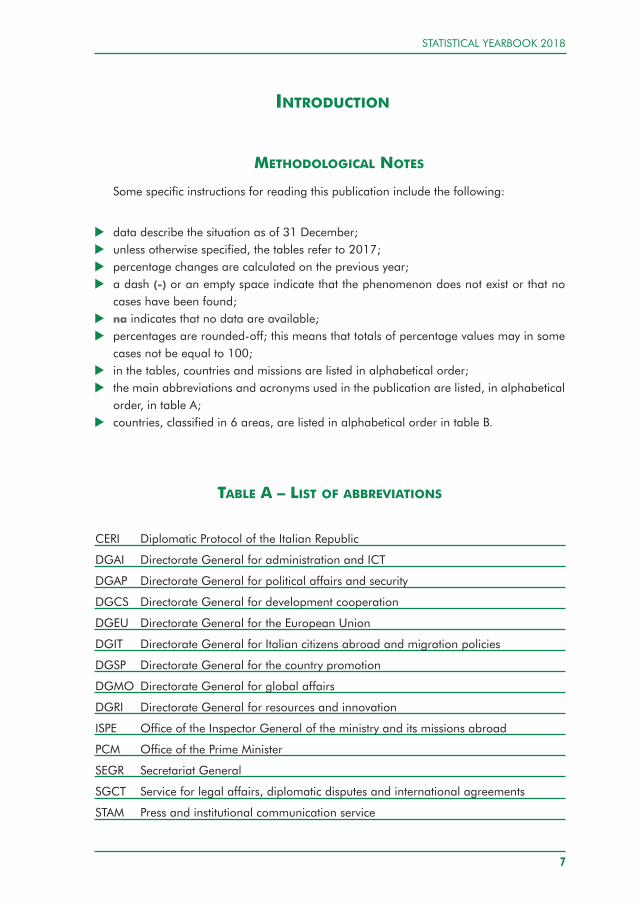
INTRODUCTION
METHODOLOGICAL NOTES
Some specific instructions for reading this publication include the following:
u data describe the situation as of 31 December;u unless otherwise specified, the tables refer to 2017;u percentage changes are calculated on the previous year;u a dash (-) or an empty space indicate that the phenomenon does not exist or that no
cases have been found; u na indicates that no data are available;u percentages are rounded-off; this means that totals of percentage values may in some
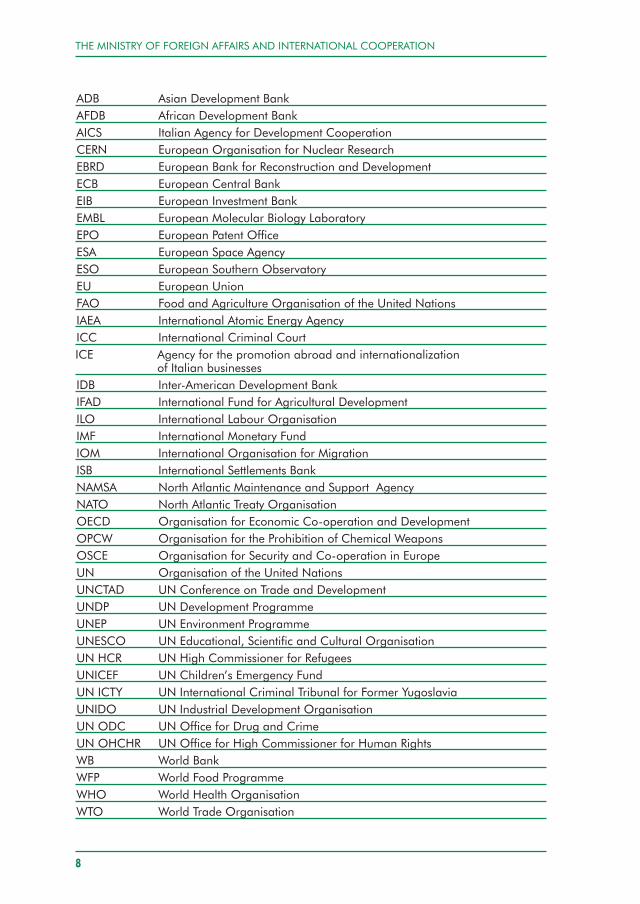
cases not be equal to 100;u in the tables, countries and missions are listed in alphabetical order;u the main abbreviations and acronyms used in the publication are listed, in alphabetical
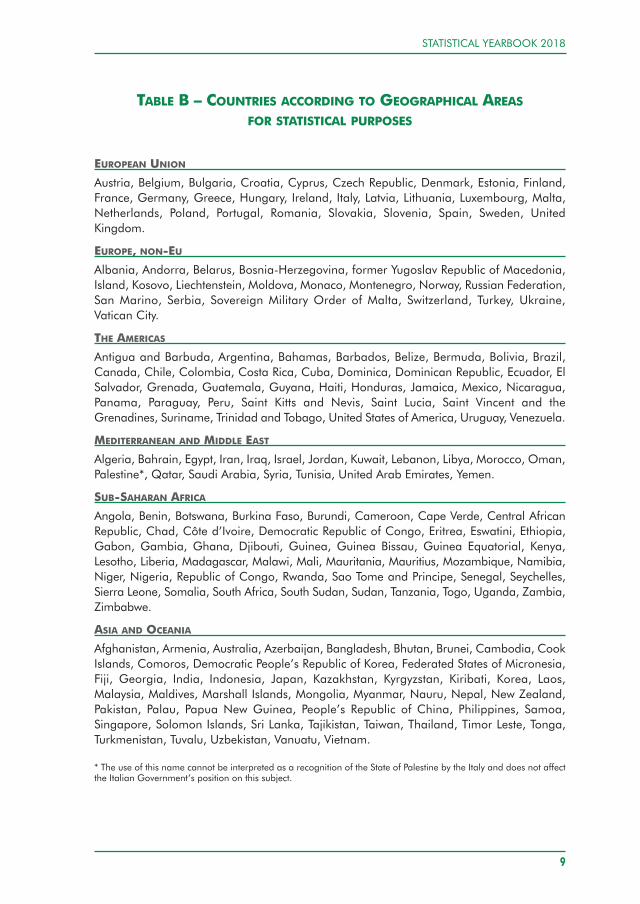
order, in table A;u countries, classified in 6 areas, are listed in alphabetical order in table B.
TABLE A – LIST OF ABBREVIATIONS
CERI Diplomatic Protocol of the Italian Republic
DGAI Directorate General for administration and ICT
DGAP Directorate General for political affairs and security
DGCS Directorate General for development cooperation
DGEU Directorate General for the European Union
DGIT Directorate General for Italian citizens abroad and migration policies
DGSP Directorate General for the country promotion
DGMO Directorate General for global affairs
DGRI Directorate General for resources and innovation
ISPE Office of the Inspector General of the ministry and its missions abroad
PCM Office of the Prime Minister
SEGR Secretariat General
SGCT Service for legal affairs, diplomatic disputes and international agreements
STAM Press and institutional communication service
THE MINISTRY OF FOREIGN AFFAIRS AND INTERNATIONAL COOPERATION
8
ADB Asian Development BankAFDB African Development BankAICS Italian Agency for Development CooperationCERN European Organisation for Nuclear ResearchEBRD European Bank for Reconstruction and DevelopmentECB European Central BankEIB European Investment BankEMBL European Molecular Biology LaboratoryEPO European Patent OfficeESA European Space AgencyESO European Southern ObservatoryEU European UnionFAO Food and Agriculture Organisation of the United NationsIAEA International Atomic Energy AgencyICC International Criminal CourtICE Agency for the promotion abroad and internationalization
of Italian businessesIDB Inter-American Development BankIFAD International Fund for Agricultural DevelopmentILO International Labour OrganisationIMF International Monetary FundIOM International Organisation for MigrationISB International Settlements BankNAMSA North Atlantic Maintenance and Support AgencyNATO North Atlantic Treaty OrganisationOECD Organisation for Economic Co-operation and DevelopmentOPCW Organisation for the Prohibition of Chemical WeaponsOSCE Organisation for Security and Co-operation in EuropeUN Organisation of the United NationsUNCTAD UN Conference on Trade and DevelopmentUNDP UN Development ProgrammeUNEP UN Environment ProgrammeUNESCO UN Educational, Scientific and Cultural OrganisationUN HCR UN High Commissioner for RefugeesUNICEF UN Children’s Emergency FundUN ICTY UN International Criminal Tribunal for Former YugoslaviaUNIDO UN Industrial Development OrganisationUN ODC UN Office for Drug and CrimeUN OHCHR UN Office for High Commissioner for Human RightsWB World BankWFP World Food ProgrammeWHO World Health OrganisationWTO World Trade Organisation
STATISTICAL YEARBOOK 2018
9
TABLE B – COUNTRIES ACCORDING TO GEOGRAPHICAL AREASFOR STATISTICAL PURPOSES
EUROPEAN UNION
Austria, Belgium, Bulgaria, Croatia, Cyprus, Czech Republic, Denmark, Estonia, Finland,France, Germany, Greece, Hungary, Ireland, Italy, Latvia, Lithuania, Luxembourg, Malta,Netherlands, Poland, Portugal, Romania, Slovakia, Slovenia, Spain, Sweden, UnitedKingdom.
EUROPE, NON-EU
Albania, Andorra, Belarus, Bosnia-Herzegovina, former Yugoslav Republic of Macedonia,Island, Kosovo, Liechtenstein, Moldova, Monaco, Montenegro, Norway, Russian Federation,San Marino, Serbia, Sovereign Military Order of Malta, Switzerland, Turkey, Ukraine,Vatican City.
THE AMERICAS
Antigua and Barbuda, Argentina, Bahamas, Barbados, Belize, Bermuda, Bolivia, Brazil,Canada, Chile, Colombia, Costa Rica, Cuba, Dominica, Dominican Republic, Ecuador, ElSalvador, Grenada, Guatemala, Guyana, Haiti, Honduras, Jamaica, Mexico, Nicaragua,Panama, Paraguay, Peru, Saint Kitts and Nevis, Saint Lucia, Saint Vincent and theGrenadines, Suriname, Trinidad and Tobago, United States of America, Uruguay, Venezuela.
MEDITERRANEAN AND MIDDLE EAST
Algeria, Bahrain, Egypt, Iran, Iraq, Israel, Jordan, Kuwait, Lebanon, Libya, Morocco, Oman,Palestine*, Qatar, Saudi Arabia, Syria, Tunisia, United Arab Emirates, Yemen.
SUB-SAHARAN AFRICA
Angola, Benin, Botswana, Burkina Faso, Burundi, Cameroon, Cape Verde, Central AfricanRepublic, Chad, Côte d’Ivoire, Democratic Republic of Congo, Eritrea, Eswatini, Ethiopia,Gabon, Gambia, Ghana, Djibouti, Guinea, Guinea Bissau, Guinea Equatorial, Kenya,Lesotho, Liberia, Madagascar, Malawi, Mali, Mauritania, Mauritius, Mozambique, Namibia,Niger, Nigeria, Republic of Congo, Rwanda, Sao Tome and Principe, Senegal, Seychelles,Sierra Leone, Somalia, South Africa, South Sudan, Sudan, Tanzania, Togo, Uganda, Zambia,Zimbabwe.
ASIA AND OCEANIA
Afghanistan, Armenia, Australia, Azerbaijan, Bangladesh, Bhutan, Brunei, Cambodia, CookIslands, Comoros, Democratic People’s Republic of Korea, Federated States of Micronesia,Fiji, Georgia, India, Indonesia, Japan, Kazakhstan, Kyrgyzstan, Kiribati, Korea, Laos,Malaysia, Maldives, Marshall Islands, Mongolia, Myanmar, Nauru, Nepal, New Zealand,Pakistan, Palau, Papua New Guinea, People’s Republic of China, Philippines, Samoa,Singapore, Solomon Islands, Sri Lanka, Tajikistan, Taiwan, Thailand, Timor Leste, Tonga,Turkmenistan, Tuvalu, Uzbekistan, Vanuatu, Vietnam.
* The use of this name cannot be interpreted as a recognition of the State of Palestine by the Italy and does not affectthe Italian Government’s position on this subject.
THE MINISTRY OF FOREIGN AFFAIRS AND INTERNATIONAL COOPERATION
10
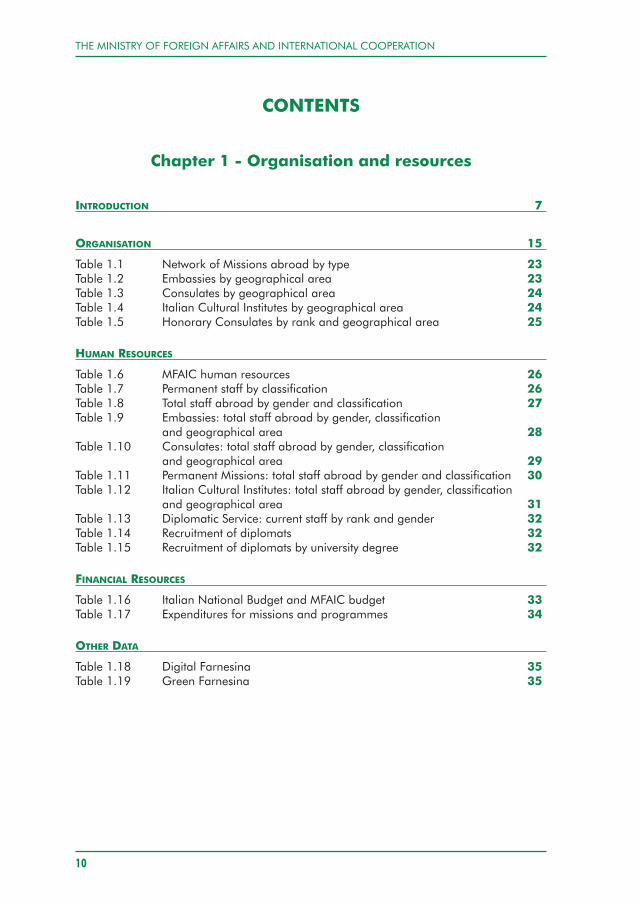
CONTENTS
Chapter 1 - Organisation and resources
INTRODUCTION 7
ORGANISATION 15
Table 1.1 Network of Missions abroad by type 23Table 1.2 Embassies by geographical area 23Table 1.3 Consulates by geographical area 24Table 1.4 Italian Cultural Institutes by geographical area 24Table 1.5 Honorary Consulates by rank and geographical area 25
HUMAN RESOURCES
Table 1.6 MFAIC human resources 26Table 1.7 Permanent staff by classification 26Table 1.8 Total staff abroad by gender and classification 27Table 1.9 Embassies: total staff abroad by gender, classification
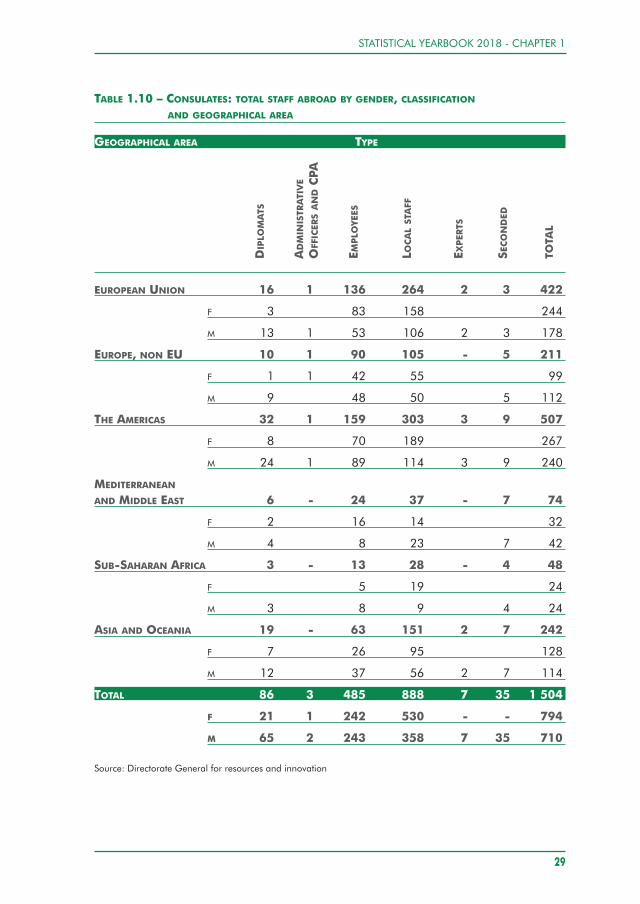
and geographical area 28Table 1.10 Consulates: total staff abroad by gender, classification
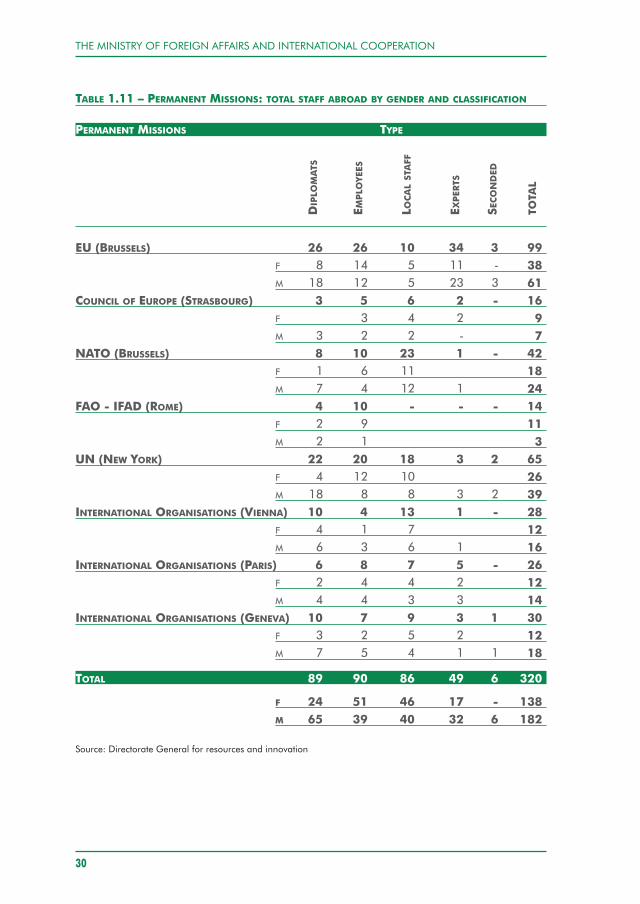
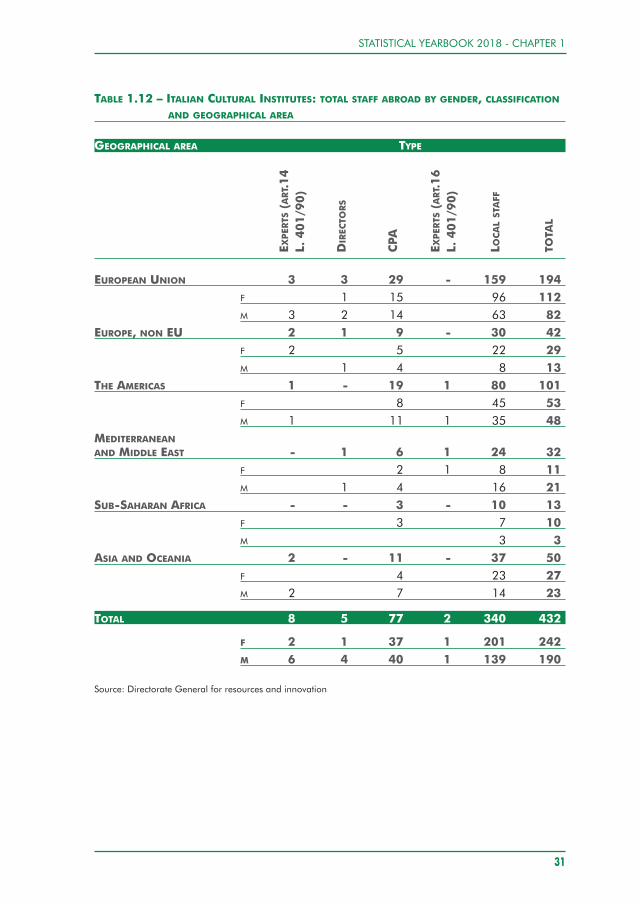
and geographical area 29Table 1.11 Permanent Missions: total staff abroad by gender and classification 30Table 1.12 Italian Cultural Institutes: total staff abroad by gender, classification
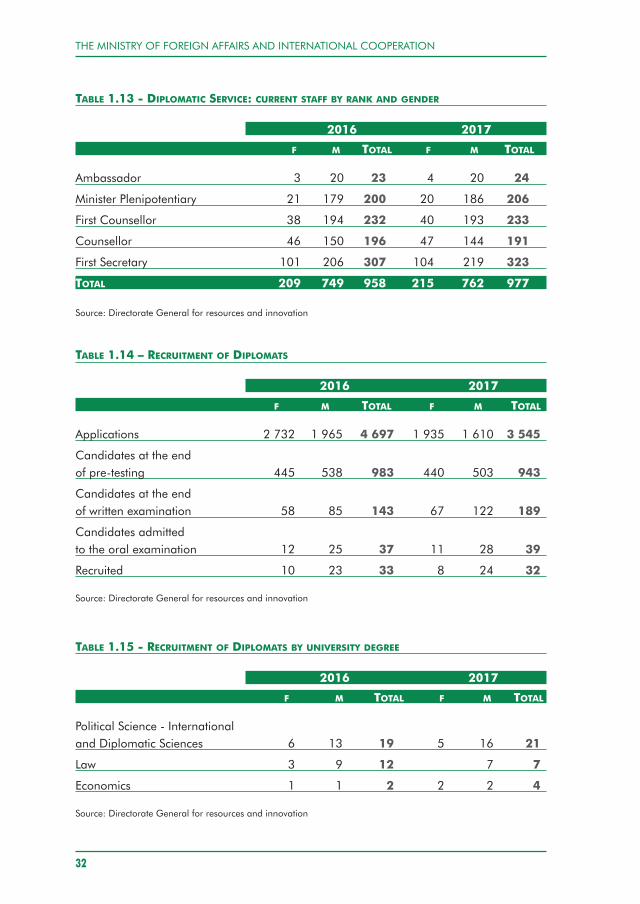
and geographical area 31Table 1.13 Diplomatic Service: current staff by rank and gender 32Table 1.14 Recruitment of diplomats 32Table 1.15 Recruitment of diplomats by university degree 32
FINANCIAL RESOURCES
Table 1.16 Italian National Budget and MFAIC budget 33Table 1.17 Expenditures for missions and programmes 34
OTHER DATA
Table 1.18 Digital Farnesina 35Table 1.19 Green Farnesina 35
STATISTICAL YEARBOOK 2018
11
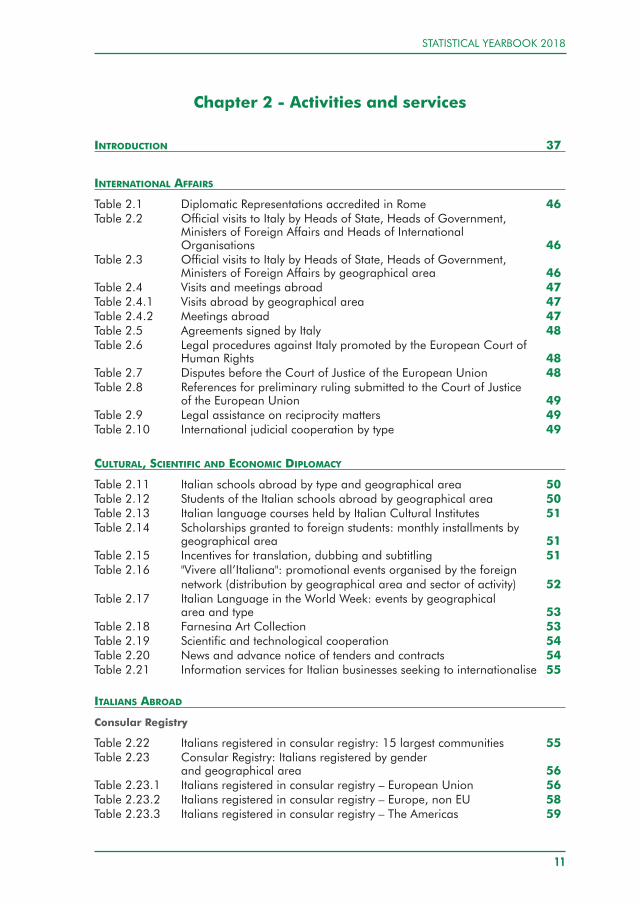
Chapter 2 - Activities and services
INTRODUCTION 37
INTERNATIONAL AFFAIRS
Table 2.1 Diplomatic Representations accredited in Rome 46Table 2.2 Official visits to Italy by Heads of State, Heads of Government,
Ministers of Foreign Affairs and Heads of International Organisations 46
Table 2.3 Official visits to Italy by Heads of State, Heads of Government, Ministers of Foreign Affairs by geographical area 46
Table 2.4 Visits and meetings abroad 47Table 2.4.1 Visits abroad by geographical area 47Table 2.4.2 Meetings abroad 47Table 2.5 Agreements signed by Italy 48Table 2.6 Legal procedures against Italy promoted by the European Court of
Human Rights 48Table 2.7 Disputes before the Court of Justice of the European Union 48Table 2.8 References for preliminary ruling submitted to the Court of Justice
of the European Union 49Table 2.9 Legal assistance on reciprocity matters 49Table 2.10 International judicial cooperation by type 49
CULTURAL, SCIENTIFIC AND ECONOMIC DIPLOMACY
Table 2.11 Italian schools abroad by type and geographical area 50Table 2.12 Students of the Italian schools abroad by geographical area 50Table 2.13 Italian language courses held by Italian Cultural Institutes 51Table 2.14 Scholarships granted to foreign students: monthly installments by
geographical area 51Table 2.15 Incentives for translation, dubbing and subtitling 51Table 2.16 "Vivere all’Italiana": promotional events organised by the foreign
network (distribution by geographical area and sector of activity) 52Table 2.17 Italian Language in the World Week: events by geographical
area and type 53Table 2.18 Farnesina Art Collection 53Table 2.19 Scientific and technological cooperation 54Table 2.20 News and advance notice of tenders and contracts 54Table 2.21 Information services for Italian businesses seeking to internationalise 55
ITALIANS ABROAD
Consular Registry
Table 2.22 Italians registered in consular registry: 15 largest communities 55Table 2.23 Consular Registry: Italians registered by gender
and geographical area 56Table 2.23.1 Italians registered in consular registry – European Union 56Table 2.23.2 Italians registered in consular registry – Europe, non EU 58Table 2.23.3 Italians registered in consular registry – The Americas 59
THE MINISTRY OF FOREIGN AFFAIRS AND INTERNATIONAL COOPERATION
12
Table 2.23.4 Italians registered in consular registry – Mediterranean and Middle East 60
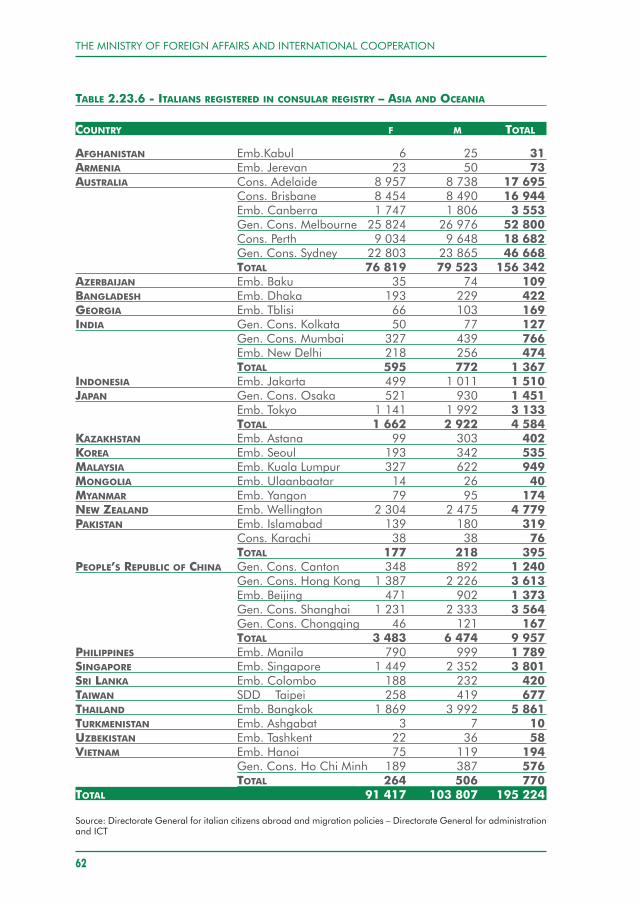
Table 2.23.5 Italians registered in consular registry – Sub-Saharan Africa 61Table 2.23.6 Italians registered in consular registry – Asia and Oceania 62
Main consular services
Table 2.24 Main consular services by type and geographical area 63
Italian prisoners abroad
Table 2.25 Italian prisoners abroad: situation by judicial position and geographical area 63
VISA SERVICES
Table 2.26 Entry visas to Italy: top 20 countries for number of issued visa 64Table 2.27 Entry visas to Italy by geographical area of request 64Table 2.27.1 Entry visas to Italy by geographical area of request: European Union 65Table 2.27.2 Entry visas to Italy by geographical area of request: Europe, non-EU 66Table 2.27.3 Entry visas to Italy by geographical area of request: the Americas 66Table 2.27.4 Entry visas to Italy by geographical area of request: Mediterranean
and Middle East 67Table 2.27.5 Entry visas to Italy by geographical area of request: Sub-Saharan
Africa 67Table 2.27.6 Entry visas to Italy by geographical area of request: Asia
and Oceania 68Table 2.28 Entry visas to Italy according to type of visa 69
DEVELOPMENT COOPERATION
Table 2.29 Resources for development cooperation: top 20 countries in ranking order in terms of commitments 71
Table 2.30 Resources for development cooperation: top 20 countries in ranking order in terms of disbursements 72
Table 2.31 Commitments and disbursements AICS - main intervention areas 73Table 2.32 Bilateral debt restructuring/cancellation agreements 73Table 2.33 Bilateral debt conversion agreements 74Table 2.34 Bilateral agreements on early debt repayment 74Table 2.35 Foreign debt cancelled 74
INSTITUTIONAL COMMUNICATION AND INFORMATION
Table 2.36 Press and Institutional Communication Service 75Table 2.37 Public Information Desk 75Table 2.38 Website and linked sites 76
OTHER DATA
Table 2.39 Library and diplomatic archives users 77Table 2.40 Patronages granted by the MFAIC 77
STATISTICAL YEARBOOK 2018
13
Chapter 3 – Other Countries
INTRODUCTION 79
Table 3.1 Summary overview 82Table 3.2 Network abroad 82Table 3.3 Permanent and other staff 83Table 3.4 Human resources: central headquarters (HQ) and abroad 83Table 3.5 MFA budget, GDP, National budget 84Table 3.6 Official Development Assistance 84Table 3.7 Disbursements of Official Development Assistance: percentage
of Gross National Income 84Table 3.8 Contributions to the UN ordinary budget: percentage
of total UN budget 85Table 3.9 Contributions to the European Union budget 85Table 3.10 Schengen Agreement: visas from member States 85

THE MINISTRY OF FOREIGN AFFAIRS AND INTERNATIONAL COOPERATION
14
STATISTICAL YEARBOOK 2018 - CHAPTER 1
15
ORGANISATION AND RESOURCES
THE MINISTRY OF FOREIGN AFFAIRS AND INTERNATIONAL COOPERATION
16
STATISTICAL YEARBOOK 2018 - CHAPTER 1
17
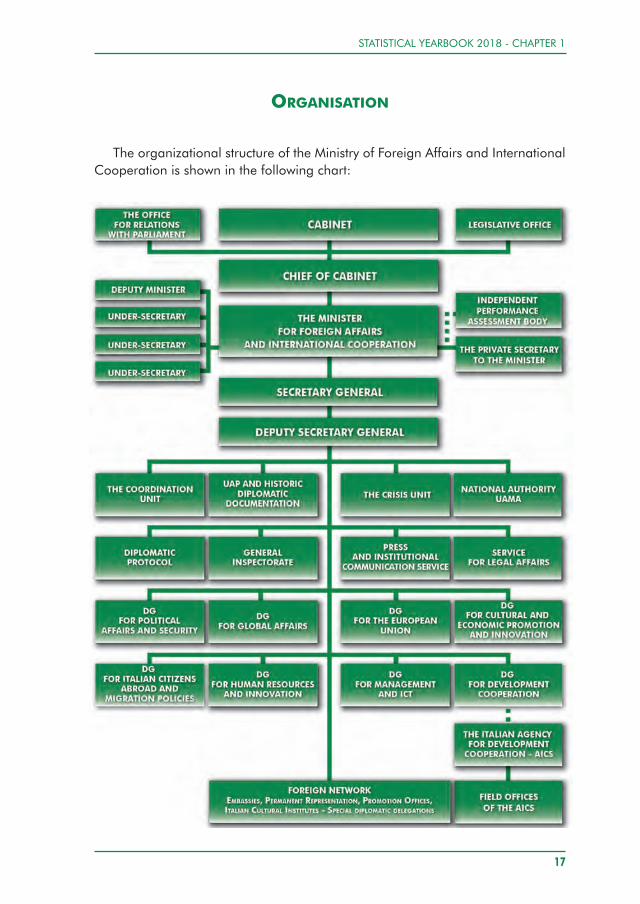
ORGANISATION
The organizational structure of the Ministry of Foreign Affairs and InternationalCooperation is shown in the following chart:
THE MINISTRY OF FOREIGN AFFAIRS AND INTERNATIONAL COOPERATION
18
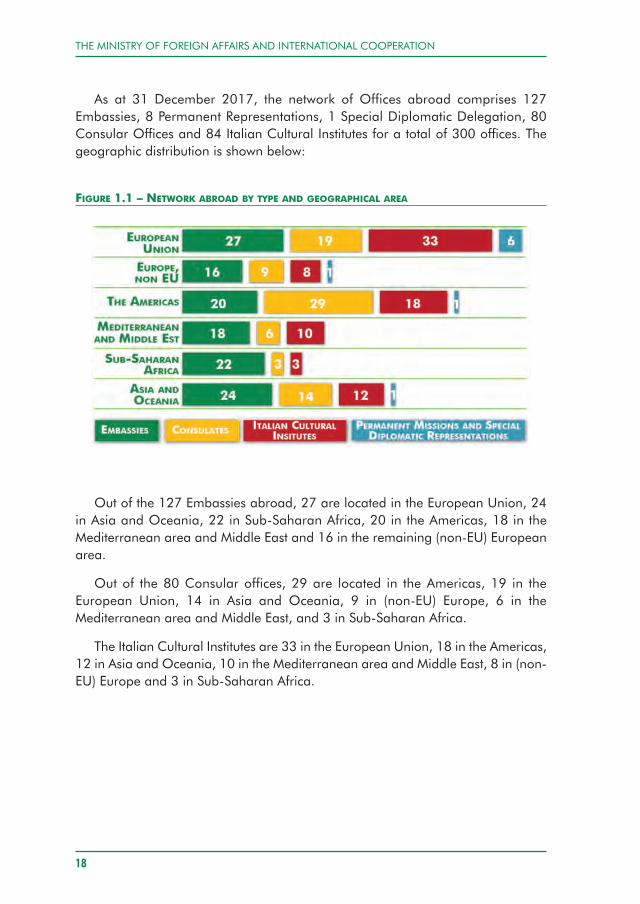
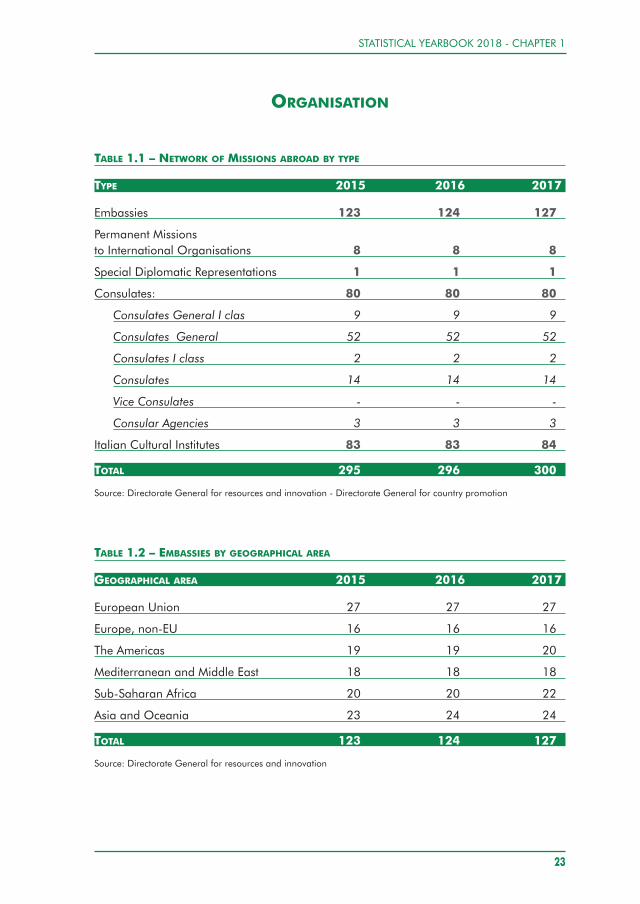
As at 31 December 2017, the network of Offices abroad comprises 127Embassies, 8 Permanent Representations, 1 Special Diplomatic Delegation, 80Consular Offices and 84 Italian Cultural Institutes for a total of 300 offices. Thegeographic distribution is shown below:
FIGURE 1.1 – NETWORK ABROAD BY TYPE AND GEOGRAPHICAL AREA
Out of the 127 Embassies abroad, 27 are located in the European Union, 24in Asia and Oceania, 22 in Sub-Saharan Africa, 20 in the Americas, 18 in theMediterranean area and Middle East and 16 in the remaining (non-EU) Europeanarea.
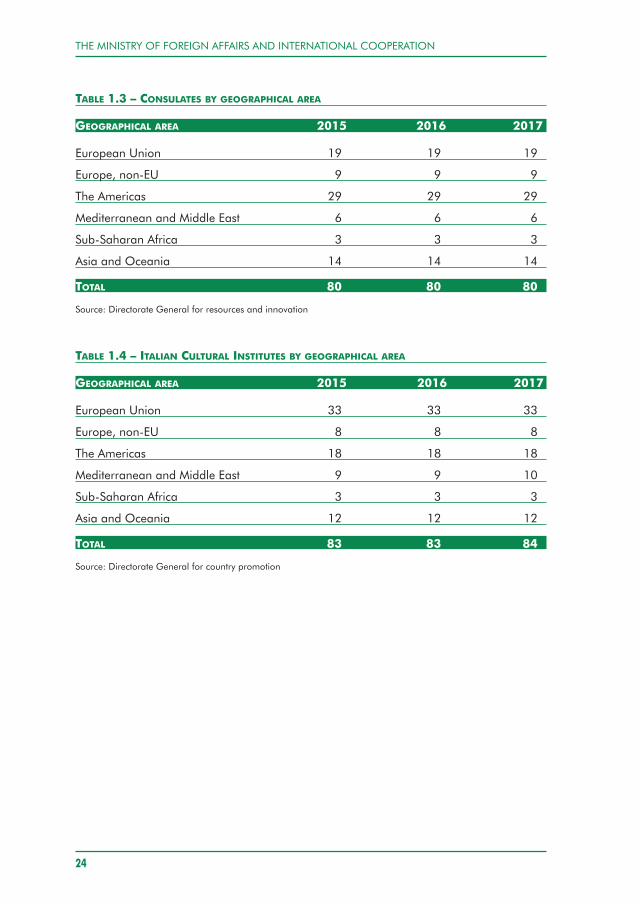
Out of the 80 Consular offices, 29 are located in the Americas, 19 in theEuropean Union, 14 in Asia and Oceania, 9 in (non-EU) Europe, 6 in theMediterranean area and Middle East, and 3 in Sub-Saharan Africa.
The Italian Cultural Institutes are 33 in the European Union, 18 in the Americas,12 in Asia and Oceania, 10 in the Mediterranean area and Middle East, 8 in (non-EU) Europe and 3 in Sub-Saharan Africa.
STATISTICAL YEARBOOK 2018 - CHAPTER 1
19
HUMAN RESOURCES
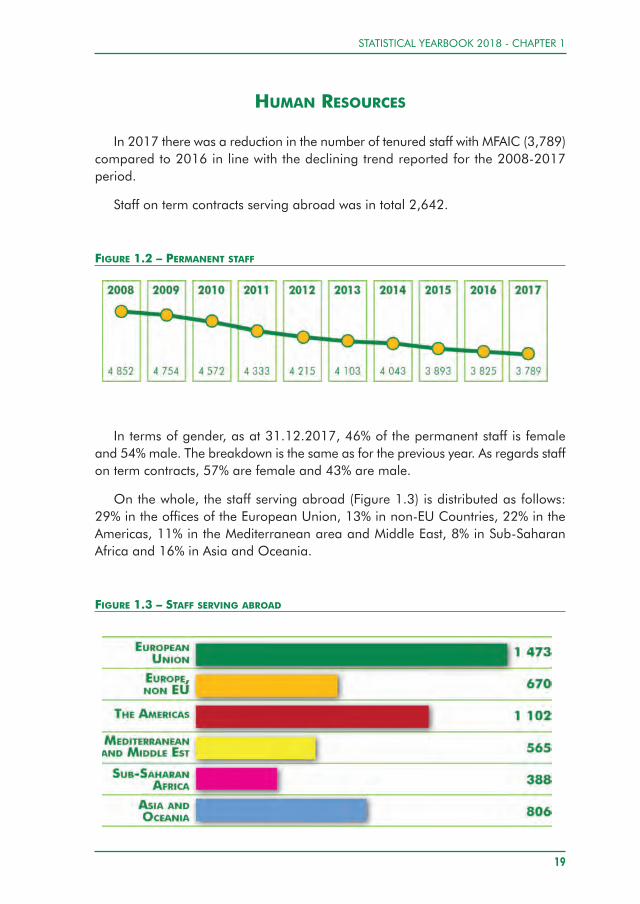
In 2017 there was a reduction in the number of tenured staff with MFAIC (3,789)compared to 2016 in line with the declining trend reported for the 2008-2017period.
Staff on term contracts serving abroad was in total 2,642.
FIGURE 1.2 – PERMANENT STAFF
In terms of gender, as at 31.12.2017, 46% of the permanent staff is femaleand 54% male. The breakdown is the same as for the previous year. As regards staffon term contracts, 57% are female and 43% are male.
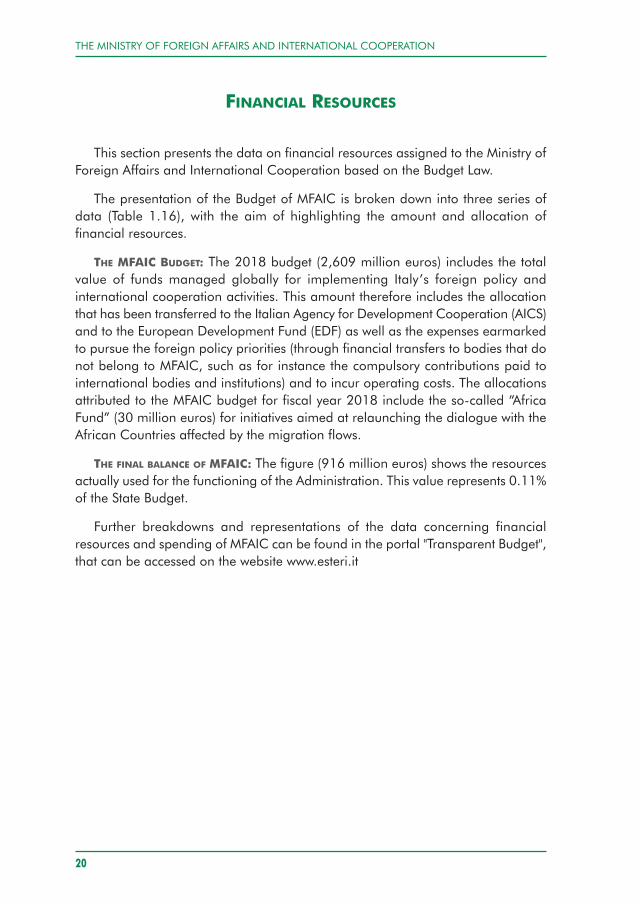
On the whole, the staff serving abroad (Figure 1.3) is distributed as follows:29% in the offices of the European Union, 13% in non-EU Countries, 22% in theAmericas, 11% in the Mediterranean area and Middle East, 8% in Sub-SaharanAfrica and 16% in Asia and Oceania.
FIGURE 1.3 – STAFF SERVING ABROAD
THE MINISTRY OF FOREIGN AFFAIRS AND INTERNATIONAL COOPERATION
20
FINANCIAL RESOURCES
This section presents the data on financial resources assigned to the Ministry ofForeign Affairs and International Cooperation based on the Budget Law.
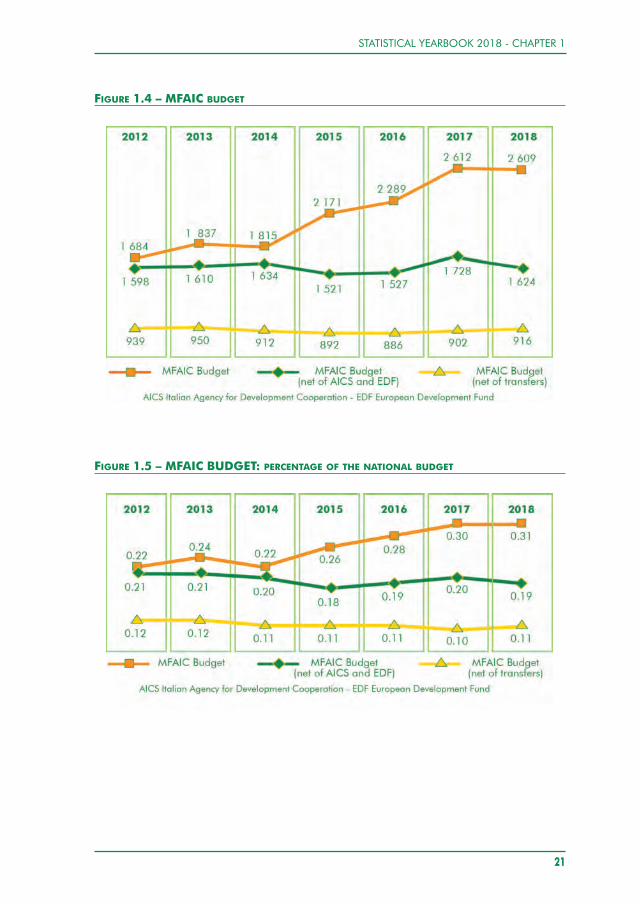
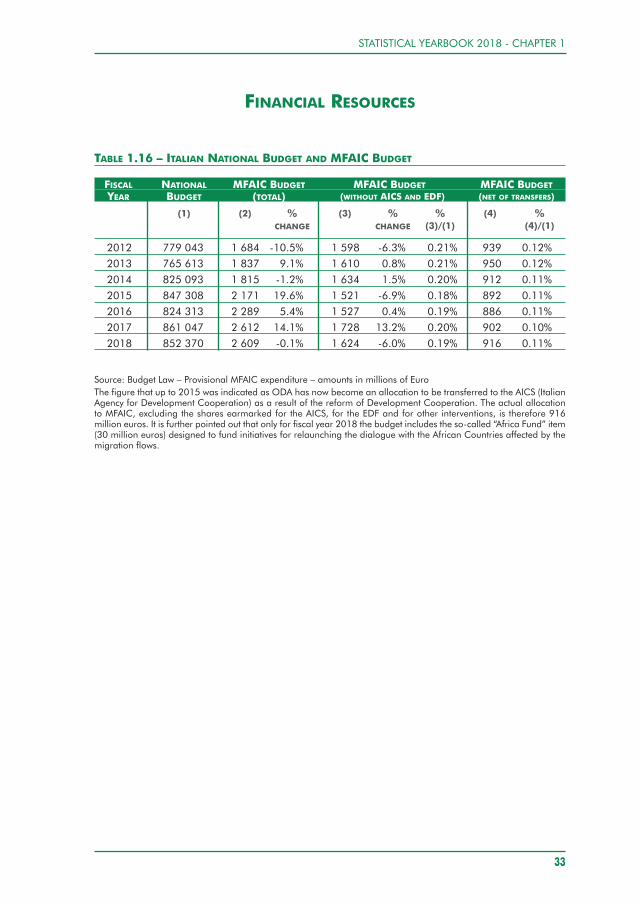
The presentation of the Budget of MFAIC is broken down into three series ofdata (Table 1.16), with the aim of highlighting the amount and allocation offinancial resources.
THE MFAIC BUDGET: The 2018 budget (2,609 million euros) includes the totalvalue of funds managed globally for implementing Italy’s foreign policy andinternational cooperation activities. This amount therefore includes the allocationthat has been transferred to the Italian Agency for Development Cooperation (AICS)and to the European Development Fund (EDF) as well as the expenses earmarkedto pursue the foreign policy priorities (through financial transfers to bodies that donot belong to MFAIC, such as for instance the compulsory contributions paid tointernational bodies and institutions) and to incur operating costs. The allocationsattributed to the MFAIC budget for fiscal year 2018 include the so-called “AfricaFund” (30 million euros) for initiatives aimed at relaunching the dialogue with theAfrican Countries affected by the migration flows.
THE FINAL BALANCE OF MFAIC: The figure (916 million euros) shows the resourcesactually used for the functioning of the Administration. This value represents 0.11%of the State Budget.
Further breakdowns and representations of the data concerning financialresources and spending of MFAIC can be found in the portal "Transparent Budget",that can be accessed on the website www.esteri.it
STATISTICAL YEARBOOK 2018 - CHAPTER 1
21
FIGURE 1.4 – MFAIC BUDGET
FIGURE 1.5 – MFAIC BUDGET: PERCENTAGE OF THE NATIONAL BUDGET
THE MINISTRY OF FOREIGN AFFAIRS AND INTERNATIONAL COOPERATION
22
OTHER DATA
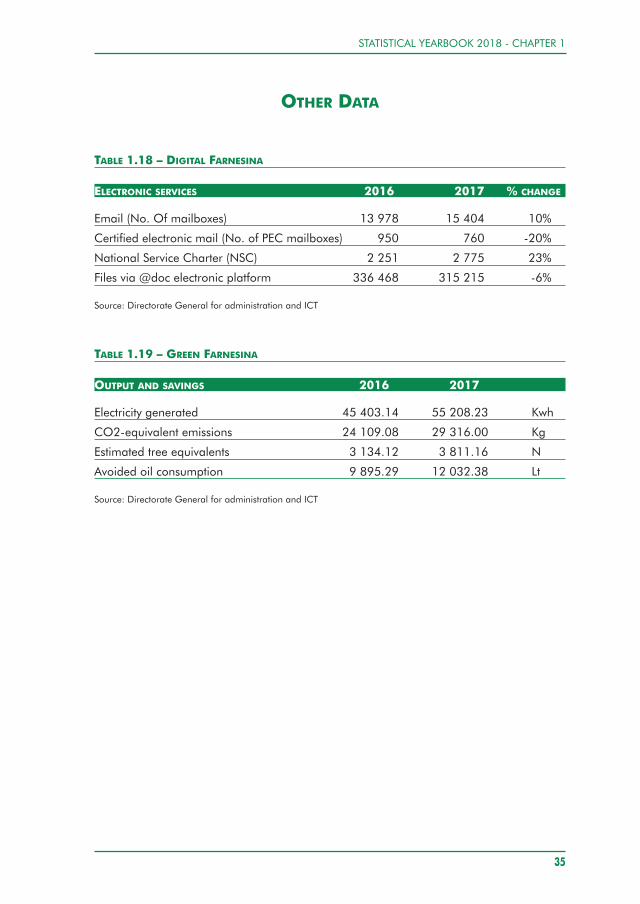
Digital Farnesina
This section presents interesting data on the dematerialization (Table 1.18) of theAdministration (telematics document flows, use of PEC - Certified Electronic Mail,and simplification of external communications).
Green Farnesina
Table 1.19 shows the data on the energy produced by the photovoltaicinstallation on the Farnesina building.
STATISTICAL YEARBOOK 2018 - CHAPTER 1
23
ORGANISATION
TABLE 1.1 – NETWORK OF MISSIONS ABROAD BY TYPE
TYPE 2015 2016 2017
Embassies 123 124 127
Permanent Missionsto International Organisations 8 8 8
Special Diplomatic Representations 1 1 1
Consulates: 80 80 80
Consulates General I clas 9 9 9
Consulates General 52 52 52
Consulates I class 2 2 2
Consulates 14 14 14
Vice Consulates - - -
Consular Agencies 3 3 3
Italian Cultural Institutes 83 83 84
TOTAL 295 296 300
Source: Directorate General for resources and innovation - Directorate General for country promotion
TABLE 1.2 – EMBASSIES BY GEOGRAPHICAL AREA
GEOGRAPHICAL AREA 2015 2016 2017
European Union 27 27 27
Europe, non-EU 16 16 16
The Americas 19 19 20
Mediterranean and Middle East 18 18 18
Sub-Saharan Africa 20 20 22
Asia and Oceania 23 24 24
TOTAL 123 124 127
Source: Directorate General for resources and innovation
THE MINISTRY OF FOREIGN AFFAIRS AND INTERNATIONAL COOPERATION
24
TABLE 1.3 – CONSULATES BY GEOGRAPHICAL AREA
GEOGRAPHICAL AREA 2015 2016 2017
European Union 19 19 19
Europe, non-EU 9 9 9
The Americas 29 29 29
Mediterranean and Middle East 6 6 6
Sub-Saharan Africa 3 3 3
Asia and Oceania 14 14 14
TOTAL 80 80 80
Source: Directorate General for resources and innovation
TABLE 1.4 – ITALIAN CULTURAL INSTITUTES BY GEOGRAPHICAL AREA
GEOGRAPHICAL AREA 2015 2016 2017
European Union 33 33 33
Europe, non-EU 8 8 8
The Americas 18 18 18
Mediterranean and Middle East 9 9 10
Sub-Saharan Africa 3 3 3
Asia and Oceania 12 12 12
TOTAL 83 83 84
Source: Directorate General for country promotion
STATISTICAL YEARBOOK 2018 - CHAPTER 1
25
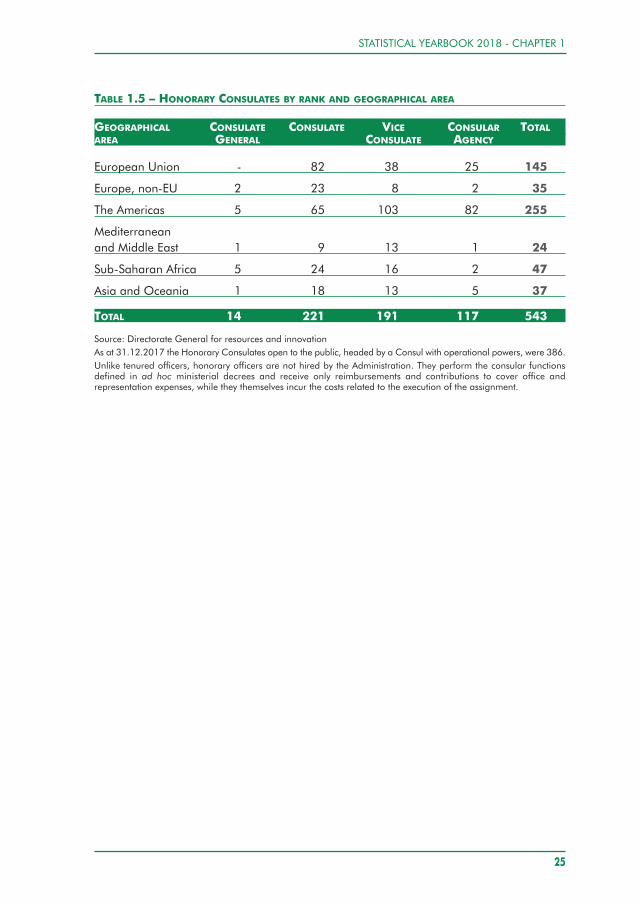
TABLE 1.5 – HONORARY CONSULATES BY RANK AND GEOGRAPHICAL AREA
GEOGRAPHICAL CONSULATE CONSULATE VICE CONSULAR TOTALAREA GENERAL CONSULATE AGENCY
European Union - 82 38 25 145
Europe, non-EU 2 23 8 2 35
The Americas 5 65 103 82 255
Mediterranean and Middle East 1 9 13 1 24
Sub-Saharan Africa 5 24 16 2 47
Asia and Oceania 1 18 13 5 37
TOTAL 14 221 191 117 543
Source: Directorate General for resources and innovationAs at 31.12.2017 the Honorary Consulates open to the public, headed by a Consul with operational powers, were 386.Unlike tenured officers, honorary officers are not hired by the Administration. They perform the consular functionsdefined in ad hoc ministerial decrees and receive only reimbursements and contributions to cover office andrepresentation expenses, while they themselves incur the costs related to the execution of the assignment.
THE MINISTRY OF FOREIGN AFFAIRS AND INTERNATIONAL COOPERATION
26
HUMAN RESOURCES
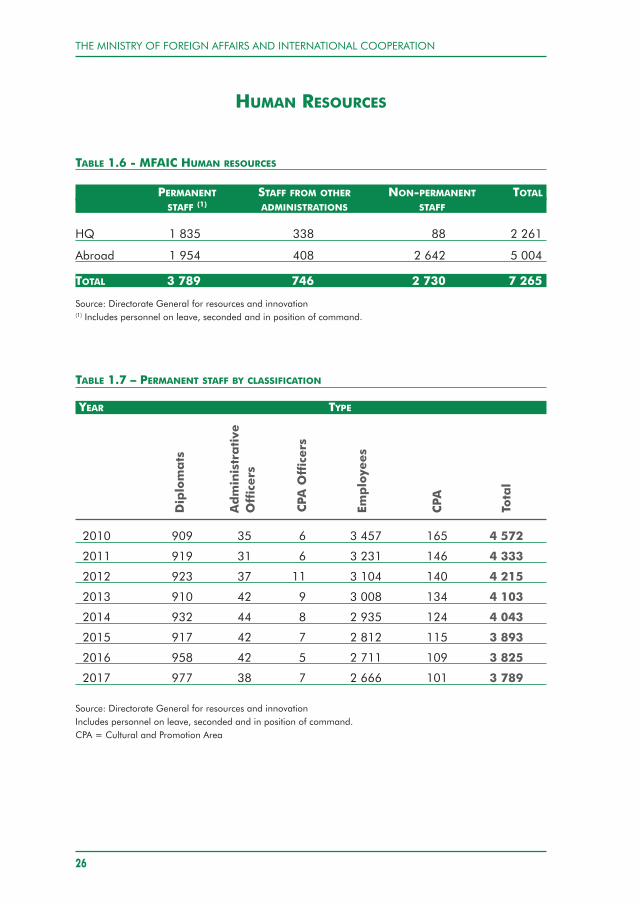
TABLE 1.6 - MFAIC HUMAN RESOURCES
PERMANENT STAFF FROM OTHER NON-PERMANENT TOTALSTAFF (1) ADMINISTRATIONS STAFF
HQ 1 835 338 88 2 261
Abroad 1 954 408 2 642 5 004
TOTAL 3 789 746 2 730 7 265
Source: Directorate General for resources and innovation(1) Includes personnel on leave, seconded and in position of command.
TABLE 1.7 – PERMANENT STAFF BY CLASSIFICATION
YEAR TYPE
2010 909 35 6 3 457 165 4 572
2011 919 31 6 3 231 146 4 333
2012 923 37 11 3 104 140 4 215
2013 910 42 9 3 008 134 4 103
2014 932 44 8 2 935 124 4 043
2015 917 42 7 2 812 115 3 893
2016 958 42 5 2 711 109 3 825
2017 977 38 7 2 666 101 3 789
Source: Directorate General for resources and innovationIncludes personnel on leave, seconded and in position of command.CPA = Cultural and Promotion Area
Diplomats
CPA Total
Administrative
Officers
CPA Officers
Employees
STATISTICAL YEARBOOK 2018 - CHAPTER 1
27
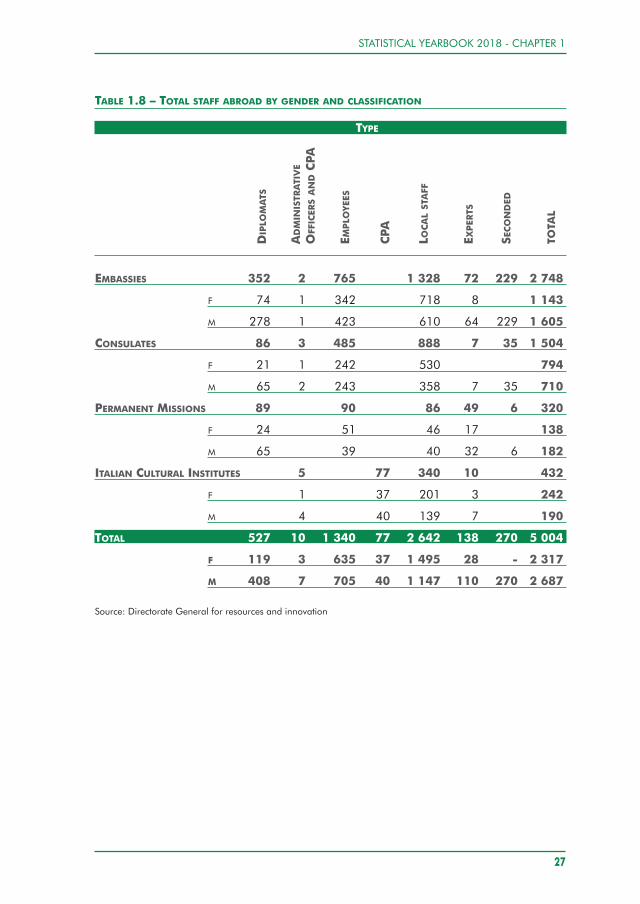
TABLE 1.8 – TOTAL STAFF ABROAD BY GENDER AND CLASSIFICATION
TYPE
EMBASSIES 352 2 765 1 328 72 229 2 748
F 74 1 342 718 8 1 143
M 278 1 423 610 64 229 1 605
CONSULATES 86 3 485 888 7 35 1 504
F 21 1 242 530 794
M 65 2 243 358 7 35 710
PERMANENT MISSIONS 89 90 86 49 6 320
F 24 51 46 17 138
M 65 39 40 32 6 182
ITALIAN CULTURAL INSTITUTES 5 77 340 10 432
F 1 37 201 3 242
M 4 40 139 7 190
TOTAL 527 10 1 340 77 2 642 138 270 5 004
F 119 3 635 37 1 495 28 - 2 317
M 408 7 705 40 1 147 110 270 2 687
Source: Directorate General for resources and innovation
DIPLOMATS
ADMINISTRATIVE
OFFICERSANDCPA
EMPLOYEES
LOCALSTAFF
CPA
EXPERTS
SECONDED
TOTAL
THE MINISTRY OF FOREIGN AFFAIRS AND INTERNATIONAL COOPERATION
28
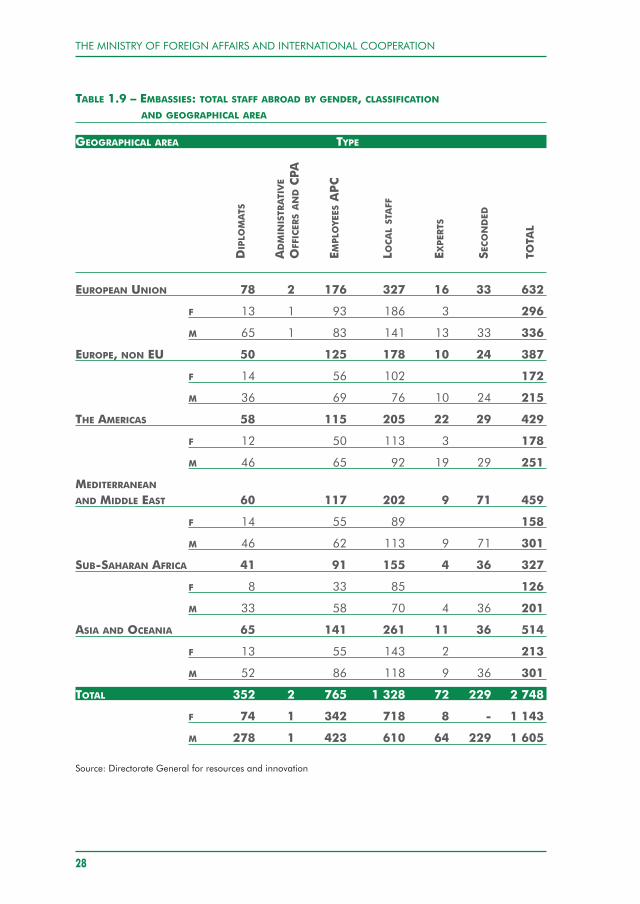
TABLE 1.9 – EMBASSIES: TOTAL STAFF ABROAD BY GENDER, CLASSIFICATION
AND GEOGRAPHICAL AREA
GEOGRAPHICAL AREA TYPE
EUROPEAN UNION 78 2 176 327 16 33 632
F 13 1 93 186 3 296
M 65 1 83 141 13 33 336
EUROPE, NON EU 50 125 178 10 24 387
F 14 56 102 172
M 36 69 76 10 24 215
THE AMERICAS 58 115 205 22 29 429
F 12 50 113 3 178
M 46 65 92 19 29 251
MEDITERRANEAN
AND MIDDLE EAST 60 117 202 9 71 459
F 14 55 89 158
M 46 62 113 9 71 301
SUB-SAHARAN AFRICA 41 91 155 4 36 327
F 8 33 85 126
M 33 58 70 4 36 201
ASIA AND OCEANIA 65 141 261 11 36 514
F 13 55 143 2 213
M 52 86 118 9 36 301
TOTAL 352 2 765 1 328 72 229 2 748
F 74 1 342 718 8 - 1 143
M 278 1 423 610 64 229 1 605
Source: Directorate General for resources and innovation
DIPLO
MATS
ADMIN
ISTR
ATIVE
OFFICER
SANDCPA
EMPLO
YEES
APC
LOCALSTAFF
EXPER
TS
SECONDED
TOTA
L
STATISTICAL YEARBOOK 2018 - CHAPTER 1
TABLE 1.10 – CONSULATES: TOTAL STAFF ABROAD BY GENDER, CLASSIFICATIONAND GEOGRAPHICAL AREA
GEOGRAPHICAL AREA TYPE
EUROPEAN UNION 16 1 136 264 2 3 422
F 3 83 158 244
M 13 1 53 106 2 3 178
EUROPE, NON EU 10 1 90 105 - 5 211
F 1 1 42 55 99
M 9 48 50 5 112
THE AMERICAS 32 1 159 303 3 9 507
F 8 70 189 267
M 24 1 89 114 3 9 240
MEDITERRANEANAND MIDDLE EAST 6 - 24 37 - 7 74
F 2 16 14 32
M 4 8 23 7 42
SUB-SAHARAN AFRICA 3 - 13 28 - 4 48
F 5 19 24
M 3 8 9 4 24
ASIA AND OCEANIA 19 - 63 151 2 7 242
F 7 26 95 128
M 12 37 56 2 7 114
TOTAL 86 3 485 888 7 35 1 504
F 21 1 242 530 - - 794
M 65 2 243 358 7 35 710
Source: Directorate General for resources and innovation
29
DIPLOMATS
ADMINISTRATIVE
OFFICERSANDCPA
EMPLOYEES
LOCALSTAFF
EXPERTS
SECONDED
TOTAL
THE MINISTRY OF FOREIGN AFFAIRS AND INTERNATIONAL COOPERATION
30
TABLE 1.11 – PERMANENT MISSIONS: TOTAL STAFF ABROAD BY GENDER AND CLASSIFICATION
PERMANENT MISSIONS TYPE
EU (BRUSSELS) 26 26 10 34 3 99F 8 14 5 11 - 38M 18 12 5 23 3 61
COUNCIL OF EUROPE (STRASBOURG) 3 5 6 2 - 16F 3 4 2 9M 3 2 2 - 7
NATO (BRUSSELS) 8 10 23 1 - 42F 1 6 11 18M 7 4 12 1 24
FAO - IFAD (ROME) 4 10 - - - 14F 2 9 11M 2 1 3
UN (NEW YORK) 22 20 18 3 2 65F 4 12 10 26M 18 8 8 3 2 39
INTERNATIONAL ORGANISATIONS (VIENNA) 10 4 13 1 - 28F 4 1 7 12M 6 3 6 1 16
INTERNATIONAL ORGANISATIONS (PARIS) 6 8 7 5 - 26F 2 4 4 2 12M 4 4 3 3 14
INTERNATIONAL ORGANISATIONS (GENEVA) 10 7 9 3 1 30F 3 2 5 2 12M 7 5 4 1 1 18
TOTAL 89 90 86 49 6 320
F 24 51 46 17 - 138M 65 39 40 32 6 182
Source: Directorate General for resources and innovation
DIPLOMATS
SECONDED
TOTAL
EMPLOYEES
LOCALSTAFF
EXPERTS
STATISTICAL YEARBOOK 2018 - CHAPTER 1
TABLE 1.12 – ITALIAN CULTURAL INSTITUTES: TOTAL STAFF ABROAD BY GENDER, CLASSIFICATIONAND GEOGRAPHICAL AREA
GEOGRAPHICAL AREA TYPE
EUROPEAN UNION 3 3 29 - 159 194F 1 15 96 112M 3 2 14 63 82
EUROPE, NON EU 2 1 9 - 30 42F 2 5 22 29M 1 4 8 13
THE AMERICAS 1 - 19 1 80 101F 8 45 53M 1 11 1 35 48
MEDITERRANEANAND MIDDLE EAST - 1 6 1 24 32
F 2 1 8 11M 1 4 16 21
SUB-SAHARAN AFRICA - - 3 - 10 13F 3 7 10M 3 3
ASIA AND OCEANIA 2 - 11 - 37 50F 4 23 27M 2 7 14 23
TOTAL 8 5 77 2 340 432
F 2 1 37 1 201 242M 6 4 40 1 139 190
Source: Directorate General for resources and innovation
31
EXPERTS(ART.14
L. 401/90)
E XPERTS(ART.16
L. 401/90)
DIRECTORS
CPA
L OCALSTAFF
TOTAL
THE MINISTRY OF FOREIGN AFFAIRS AND INTERNATIONAL COOPERATION
32
TABLE 1.13 - DIPLOMATIC SERVICE: CURRENT STAFF BY RANK AND GENDER
2016 2017
F M TOTAL F M TOTAL
Ambassador 3 20 23 4 20 24
Minister Plenipotentiary 21 179 200 20 186 206
First Counsellor 38 194 232 40 193 233
Counsellor 46 150 196 47 144 191
First Secretary 101 206 307 104 219 323
TOTAL 209 749 958 215 762 977
Source: Directorate General for resources and innovation
TABLE 1.14 – RECRUITMENT OF DIPLOMATS
2016 2017
F M TOTAL F M TOTAL
Applications 2 732 1 965 4 697 1 935 1 610 3 545
Candidates at the end of pre-testing 445 538 983 440 503 943
Candidates at the end of written examination 58 85 143 67 122 189
Candidates admitted to the oral examination 12 25 37 11 28 39
Recruited 10 23 33 8 24 32
Source: Directorate General for resources and innovation
TABLE 1.15 - RECRUITMENT OF DIPLOMATS BY UNIVERSITY DEGREE
2016 2017
F M TOTAL F M TOTAL
Political Science - International and Diplomatic Sciences 6 13 19 5 16 21
Law 3 9 12 7 7
Economics 1 1 2 2 2 4
Source: Directorate General for resources and innovation
STATISTICAL YEARBOOK 2018 - CHAPTER 1
33
FINANCIAL RESOURCES
TABLE 1.16 – ITALIAN NATIONAL BUDGET AND MFAIC BUDGET
FISCAL NATIONAL MFAIC BUDGET MFAIC BUDGET MFAIC BUDGETYEAR BUDGET (TOTAL) (WITHOUT AICS AND EDF) (NET OF TRANSFERS)
(1) (2) % (3) % % (4) % CHANGE CHANGE (3)/(1) (4)/(1)
2012 779 043 1 684 -10.5% 1 598 -6.3% 0.21% 939 0.12%
2013 765 613 1 837 9.1% 1 610 0.8% 0.21% 950 0.12%
2014 825 093 1 815 -1.2% 1 634 1.5% 0.20% 912 0.11%
2015 847 308 2 171 19.6% 1 521 -6.9% 0.18% 892 0.11%
2016 824 313 2 289 5.4% 1 527 0.4% 0.19% 886 0.11%
2017 861 047 2 612 14.1% 1 728 13.2% 0.20% 902 0.10%
2018 852 370 2 609 -0.1% 1 624 -6.0% 0.19% 916 0.11%
Source: Budget Law – Provisional MFAIC expenditure – amounts in millions of Euro The figure that up to 2015 was indicated as ODA has now become an allocation to be transferred to the AICS (ItalianAgency for Development Cooperation) as a result of the reform of Development Cooperation. The actual allocationto MFAIC, excluding the shares earmarked for the AICS, for the EDF and for other interventions, is therefore 916million euros. It is further pointed out that only for fiscal year 2018 the budget includes the so-called “Africa Fund” item(30 million euros) designed to fund initiatives for relaunching the dialogue with the African Countries affected by themigration flows.
THE MINISTRY OF FOREIGN AFFAIRS AND INTERNATIONAL COOPERATION
34
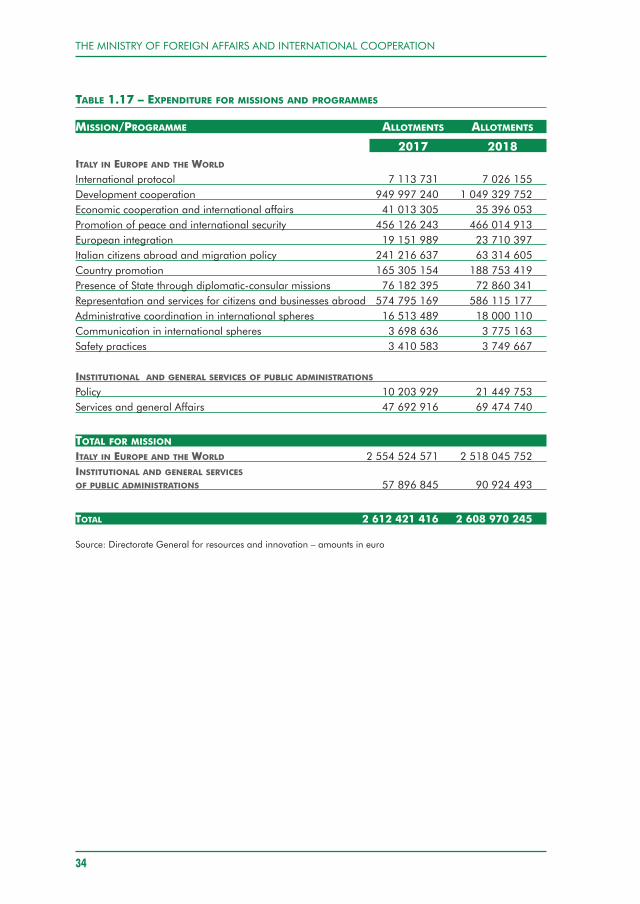
TABLE 1.17 – EXPENDITURE FOR MISSIONS AND PROGRAMMES
MISSION/PROGRAMME ALLOTMENTS ALLOTMENTS
2017 2018ITALY IN EUROPE AND THE WORLDInternational protocol 7 113 731 7 026 155Development cooperation 949 997 240 1 049 329 752Economic cooperation and international affairs 41 013 305 35 396 053Promotion of peace and international security 456 126 243 466 014 913European integration 19 151 989 23 710 397Italian citizens abroad and migration policy 241 216 637 63 314 605Country promotion 165 305 154 188 753 419Presence of State through diplomatic-consular missions 76 182 395 72 860 341Representation and services for citizens and businesses abroad 574 795 169 586 115 177Administrative coordination in international spheres 16 513 489 18 000 110Communication in international spheres 3 698 636 3 775 163Safety practices 3 410 583 3 749 667
INSTITUTIONAL AND GENERAL SERVICES OF PUBLIC ADMINISTRATIONS
Policy 10 203 929 21 449 753Services and general Affairs 47 692 916 69 474 740
TOTAL FOR MISSIONITALY IN EUROPE AND THE WORLD 2 554 524 571 2 518 045 752 INSTITUTIONAL AND GENERAL SERVICESOF PUBLIC ADMINISTRATIONS 57 896 845 90 924 493
TOTAL 2 612 421 416 2 608 970 245
Source: Directorate General for resources and innovation – amounts in euro
STATISTICAL YEARBOOK 2018 - CHAPTER 1
35
OTHER DATA
TABLE 1.18 – DIGITAL FARNESINA
ELECTRONIC SERVICES 2016 2017 % CHANGE
Email (No. Of mailboxes) 13 978 15 404 10%
Certified electronic mail (No. of PEC mailboxes) 950 760 -20%
National Service Charter (NSC) 2 251 2 775 23%
Files via @doc electronic platform 336 468 315 215 -6%
Source: Directorate General for administration and ICT
TABLE 1.19 – GREEN FARNESINA
OUTPUT AND SAVINGS 2016 2017
Electricity generated 45 403.14 55 208.23 Kwh
CO2-equivalent emissions 24 109.08 29 316.00 Kg
Estimated tree equivalents 3 134.12 3 811.16 N
Avoided oil consumption 9 895.29 12 032.38 Lt
Source: Directorate General for administration and ICT

THE MINISTRY OF FOREIGN AFFAIRS AND INTERNATIONAL COOPERATION
36
STATISTICAL YEARBOOK 2018 - CHAPTER 2
37
ACTIVITIES AND SERVICES
THE MINISTRY OF FOREIGN AFFAIRS AND INTERNATIONAL COOPERATION
38
STATISTICAL YEARBOOK 2018 - CHAPTER 2
39
ACTIVITIES AND SERVICES
The second part of the Statistical Yearbook is about the activities and services ofthe Ministry of Foreign Affairs and International Cooperation. The data are brokendown into six sections that reflect some of the areas of intervention:
• INTERNATIONAL AFFAIRS• CULTURAL, SCIENTIFIC AND ECONOMIC DIPLOMACY
• ITALIANS ABROAD
• VISA SERVICES
• DEVELOPMENT COOPERATION• INSTITUTIONAL COMMUNICATION AND INFORMATION
INTERNATIONAL AFFAIRS
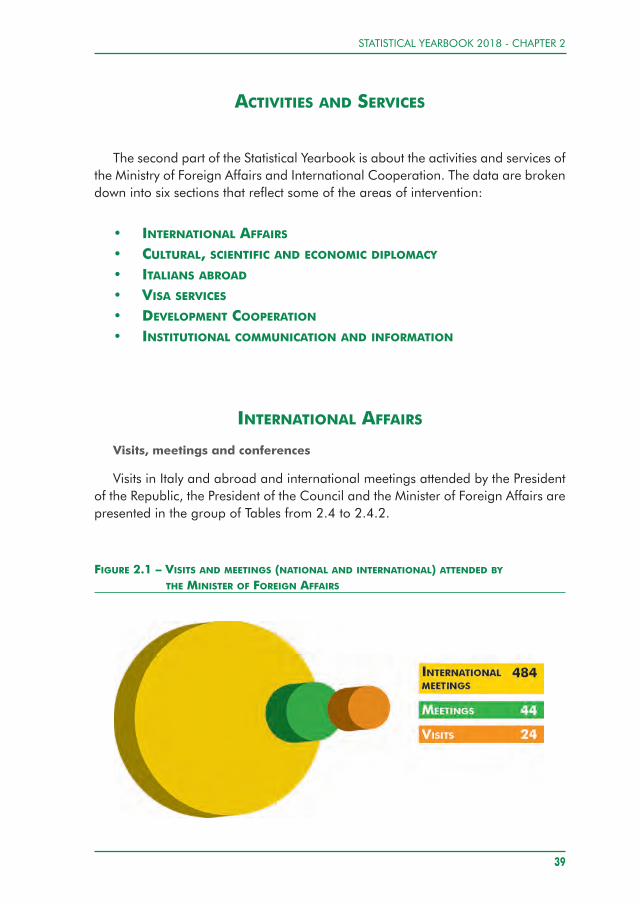
Visits, meetings and conferences
Visits in Italy and abroad and international meetings attended by the Presidentof the Republic, the President of the Council and the Minister of Foreign Affairs arepresented in the group of Tables from 2.4 to 2.4.2.
FIGURE 2.1 – VISITS AND MEETINGS (NATIONAL AND INTERNATIONAL) ATTENDED BY
THE MINISTER OF FOREIGN AFFAIRS
THE MINISTRY OF FOREIGN AFFAIRS AND INTERNATIONAL COOPERATION
40
Agreements, international legal issues and judicial cooperation
Data concerning bilateral and multilateral agreements signed by Italy in 2017and those that entered into force in that same year as well as numerical informationabout international legal disputes are illustrated in Tables 2.5 – 2.9.
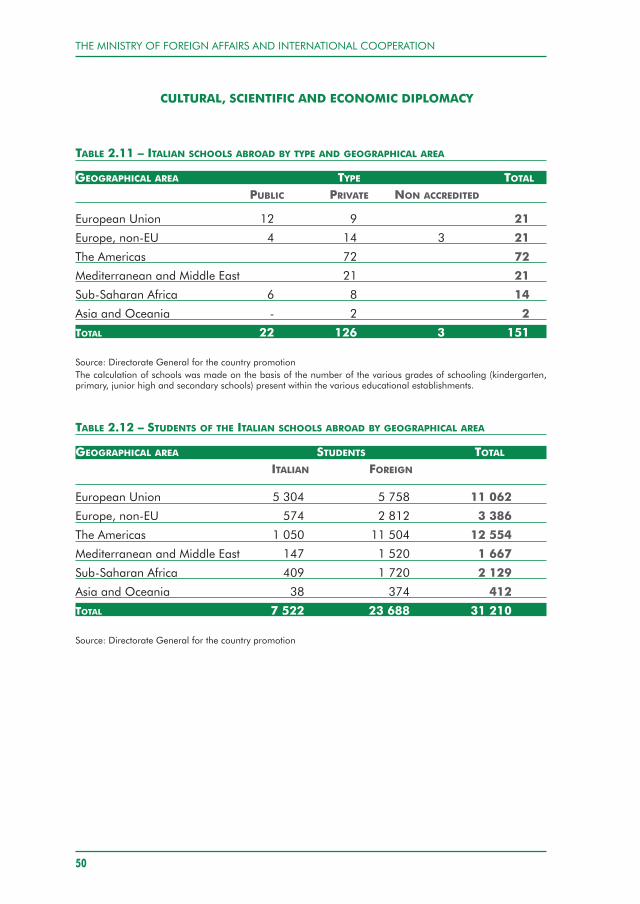
CULTURAL, SCIENTIFIC AND ECONOMIC DIPLOMACY
Italian schools abroad
There was an increase in the number of students who enrolled at Italian schoolsabroad (31,210 in the 2016/2017 school year of whom more than 23,000 wereforeigners).
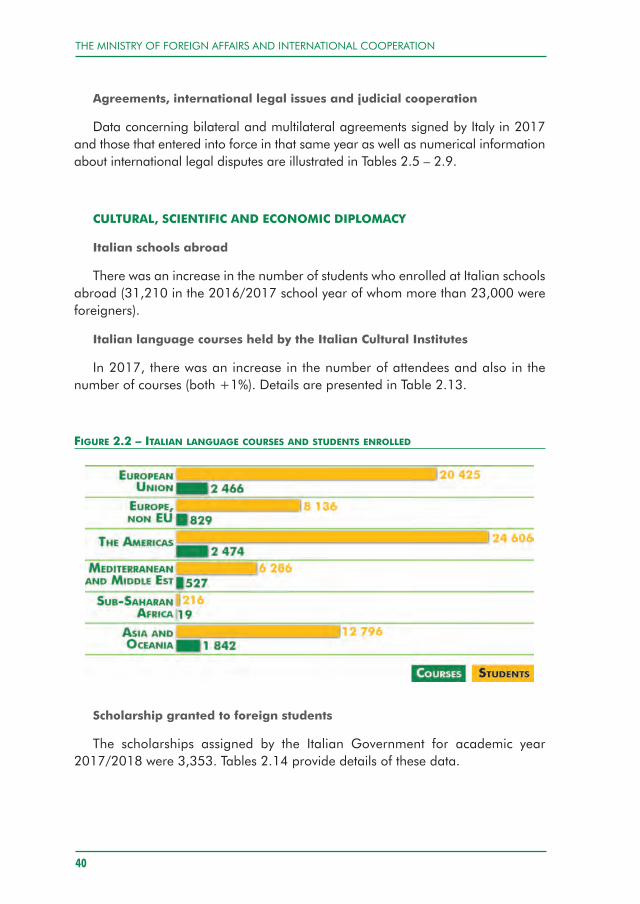
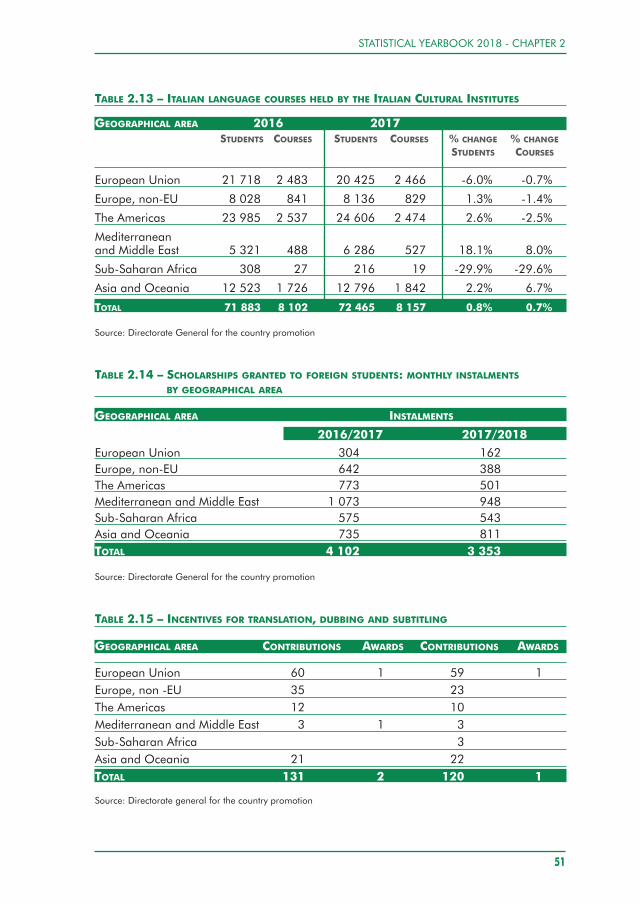
Italian language courses held by the Italian Cultural Institutes
In 2017, there was an increase in the number of attendees and also in thenumber of courses (both +1%). Details are presented in Table 2.13.
FIGURE 2.2 – ITALIAN LANGUAGE COURSES AND STUDENTS ENROLLED
Scholarship granted to foreign students
The scholarships assigned by the Italian Government for academic year2017/2018 were 3,353. Tables 2.14 provide details of these data.
STATISTICAL YEARBOOK 2018 - CHAPTER 2
41
Incentives for translation, dubbing and subtitling
In 2017 a total of 121 incentives were assigned for the translation anddubbing/subtitling of Italian films, in the form of prizes and contributions, deliveredmainly in the European area (Table 2.15).
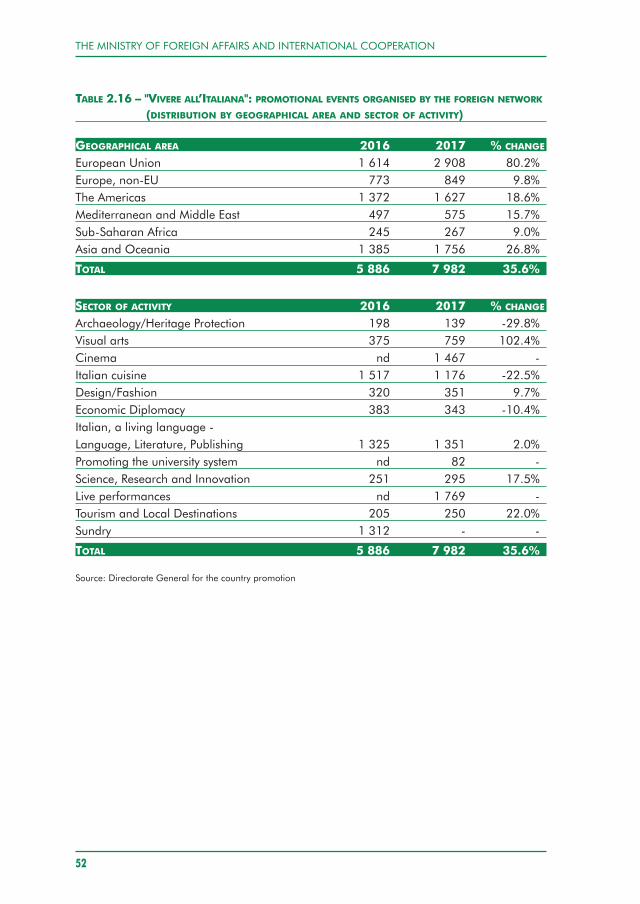
“Vivere all’Italiana”
The MFAIC Network organised a programme with almost 8,000 events indifferent sectors of activity, including promoting the Italian language, contemporaryart, haute cuisine and design (details in table 2.16).
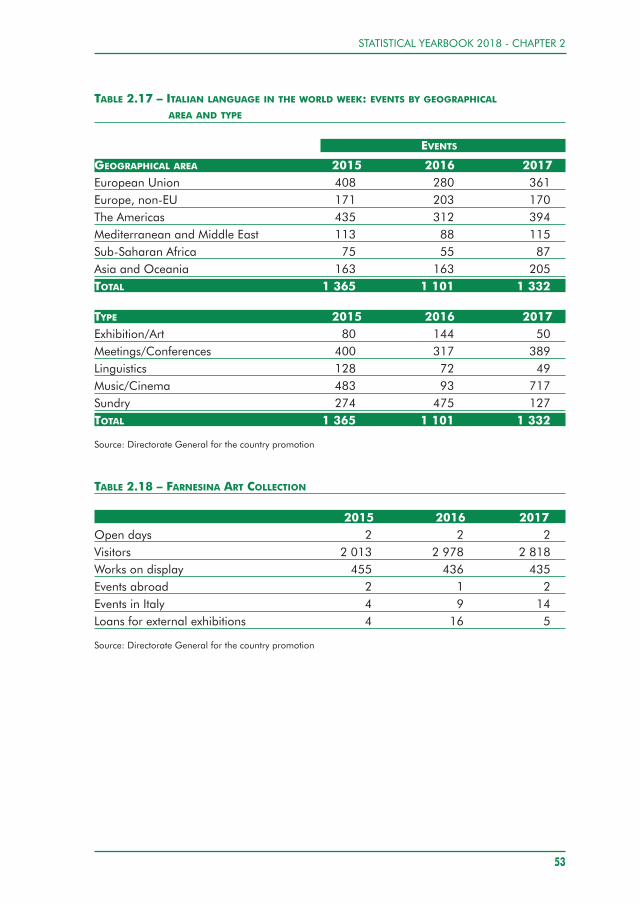
Week of the Italian Language in the World
In the framework of the 2017 Week of the Italian Language in the World, morethan 1,300 initiatives were mounted including exhibitions, meetings andconferences. Europe and America accounts for the highest proportion of eventsorganized followed by the Asian continent.
Farnesina Art Collection
Fourteen exhibitions (displaying more than 400 artworks) and official ribbon-cutting events were organized over the year, as well as 10 “Open Doors” dayswhich attracted almost 3,000 visitors.
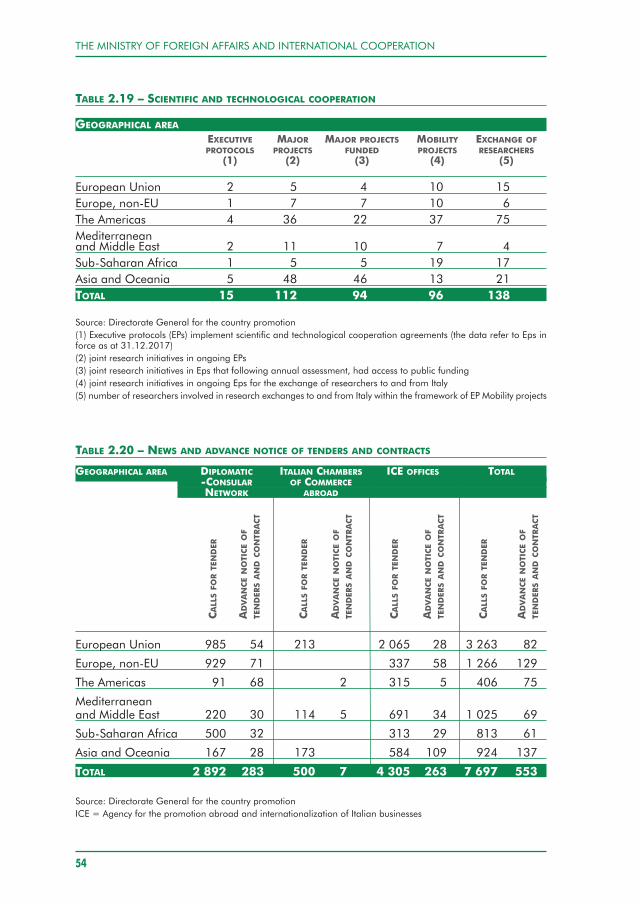
Scientific and technological cooperation
In the area of scientific and technological agreements, relevant is the 10%increase in Mobility Projects involving the exchange of researchers (to and fromItaly), as well as the number of researchers involved in these research exchangeprogrammes.
THE MINISTRY OF FOREIGN AFFAIRS AND INTERNATIONAL COOPERATION
42
Economic Diplomacy
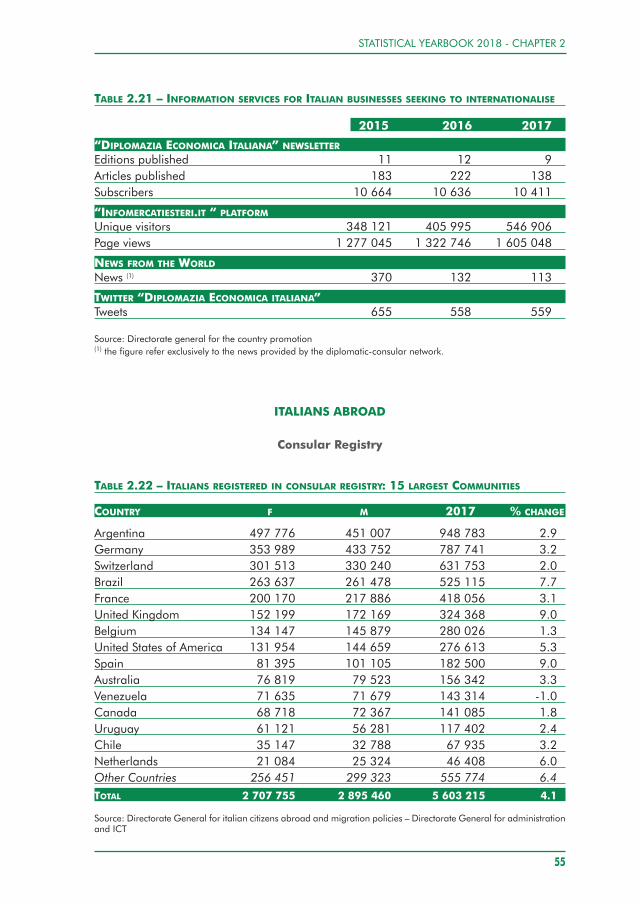
In 2017, Italy’s economic diplomacy announced and advertised 7,697 tendersabroad and made 553 first announcements of tenders and large contracts as aresult of the “Brand Italy” initiative (consular diplomatic network, Agency for thepromotion abroad and internationalization of Italian businesses, Chambers ofCommerce). Among the many information activities in support of theinternationalization of Italian businesses, the particularly successful initiatives werethe dedicated Twitter profile, the “Italian Economic Diplomacy” newsletter and the“Foreign Infomarkets” platform, which recorded a further 35% increase in thenumber of users.
ITALIANS ABROAD
This section includes data concerning the presence of Italian citizens abroad,consular services, protection of and assistance to residents and tourists, interventionsin emergency situations, Italian detainees and the international abduction of minors.
Consular registry and services
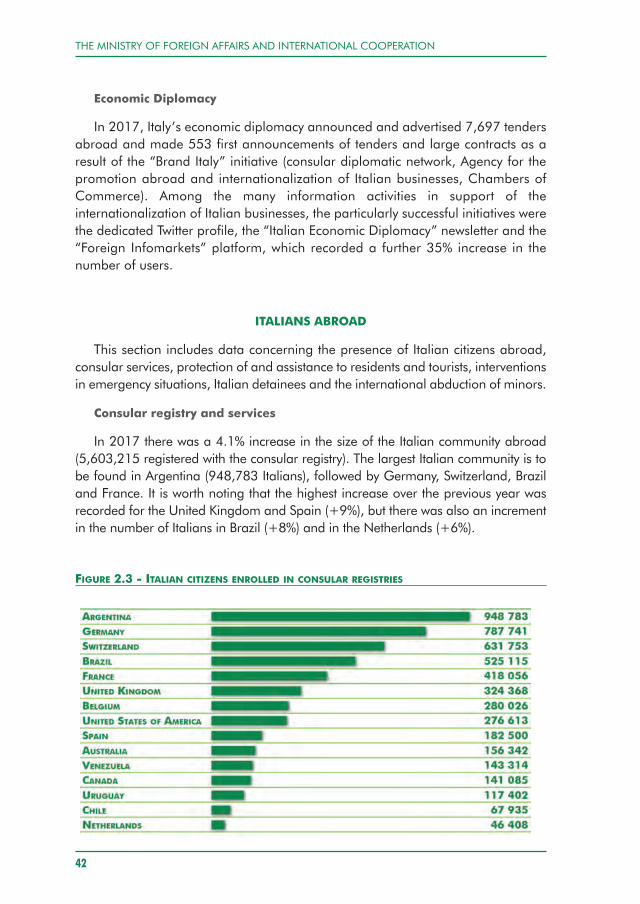
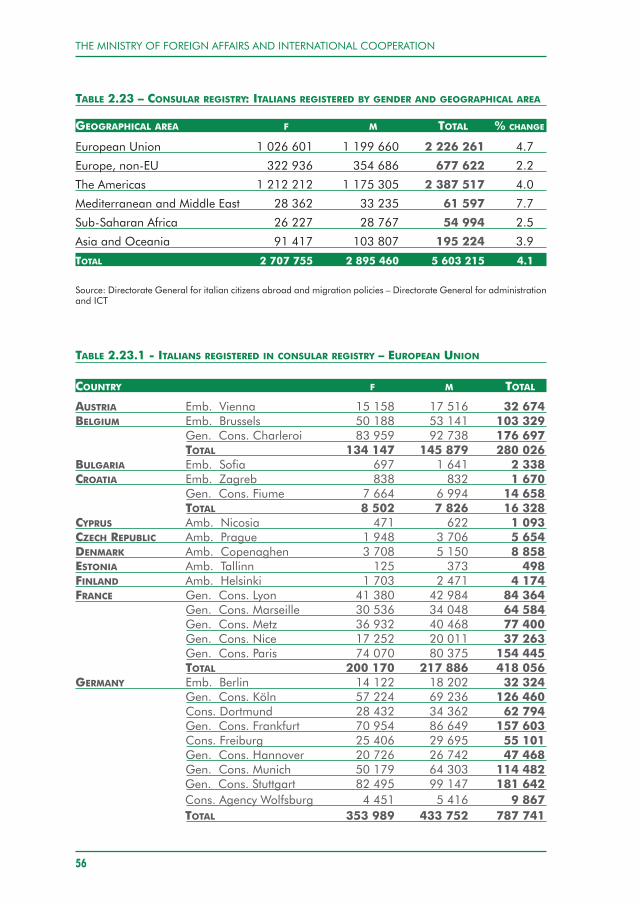
In 2017 there was a 4.1% increase in the size of the Italian community abroad(5,603,215 registered with the consular registry). The largest Italian community is tobe found in Argentina (948,783 Italians), followed by Germany, Switzerland, Braziland France. It is worth noting that the highest increase over the previous year wasrecorded for the United Kingdom and Spain (+9%), but there was also an incrementin the number of Italians in Brazil (+8%) and in the Netherlands (+6%).
FIGURE 2.3 - ITALIAN CITIZENS ENROLLED IN CONSULAR REGISTRIES
STATISTICAL YEARBOOK 2018 - CHAPTER 2
43
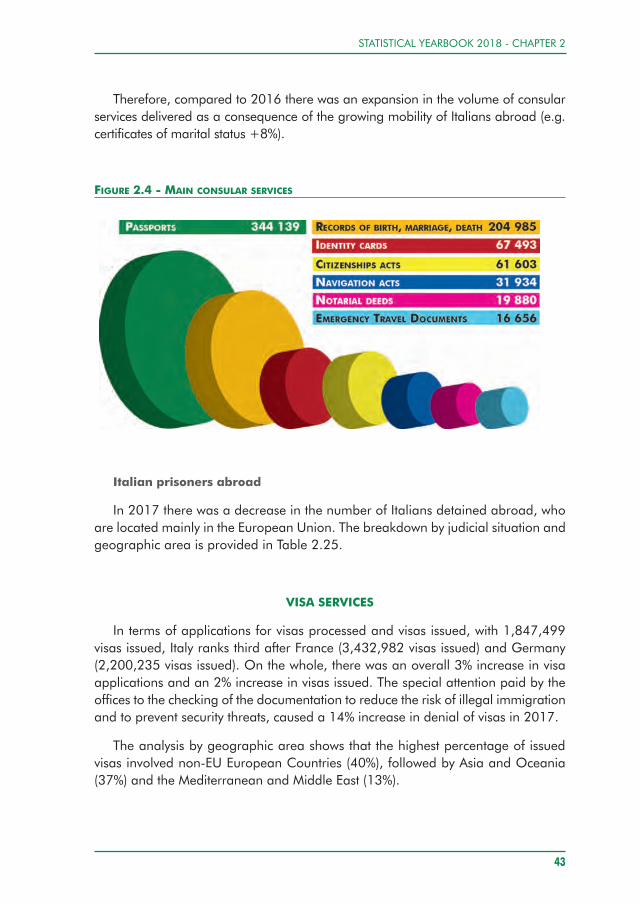
Therefore, compared to 2016 there was an expansion in the volume of consularservices delivered as a consequence of the growing mobility of Italians abroad (e.g.certificates of marital status +8%).
FIGURE 2.4 - MAIN CONSULAR SERVICES
Italian prisoners abroad
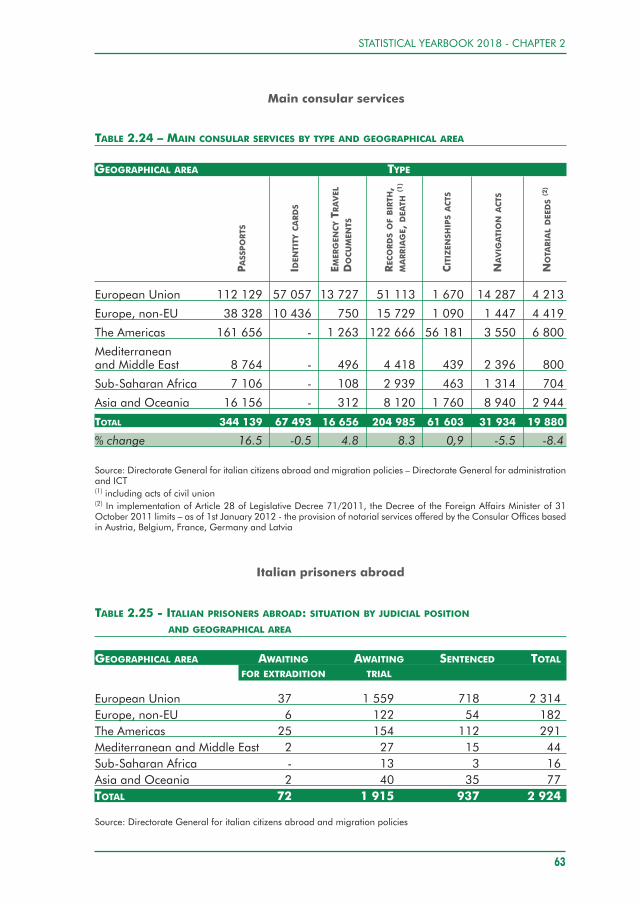
In 2017 there was a decrease in the number of Italians detained abroad, whoare located mainly in the European Union. The breakdown by judicial situation andgeographic area is provided in Table 2.25.
VISA SERVICES
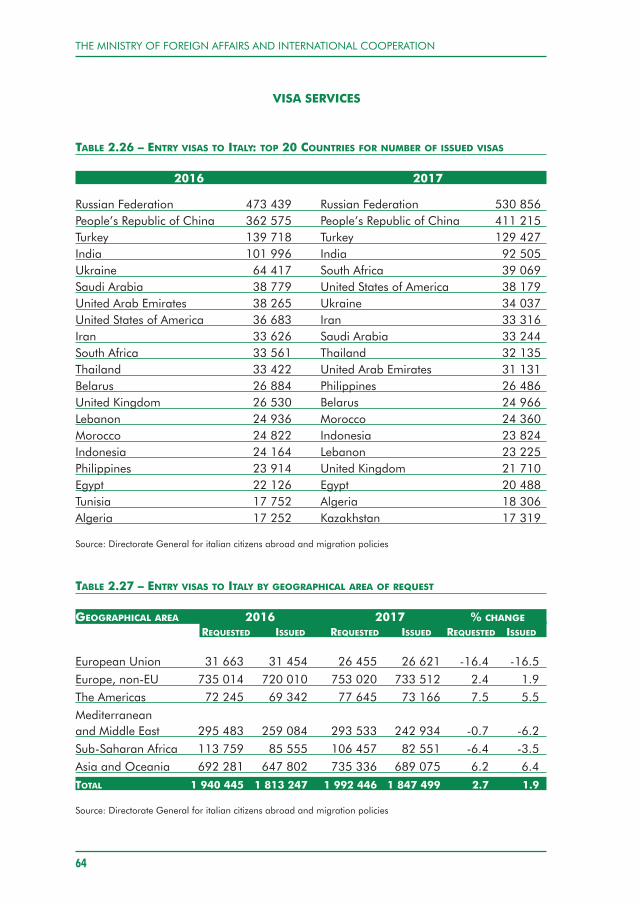
In terms of applications for visas processed and visas issued, with 1,847,499visas issued, Italy ranks third after France (3,432,982 visas issued) and Germany(2,200,235 visas issued). On the whole, there was an overall 3% increase in visaapplications and an 2% increase in visas issued. The special attention paid by theoffices to the checking of the documentation to reduce the risk of illegal immigrationand to prevent security threats, caused a 14% increase in denial of visas in 2017.
The analysis by geographic area shows that the highest percentage of issuedvisas involved non-EU European Countries (40%), followed by Asia and Oceania(37%) and the Mediterranean and Middle East (13%).
THE MINISTRY OF FOREIGN AFFAIRS AND INTERNATIONAL COOPERATION
44
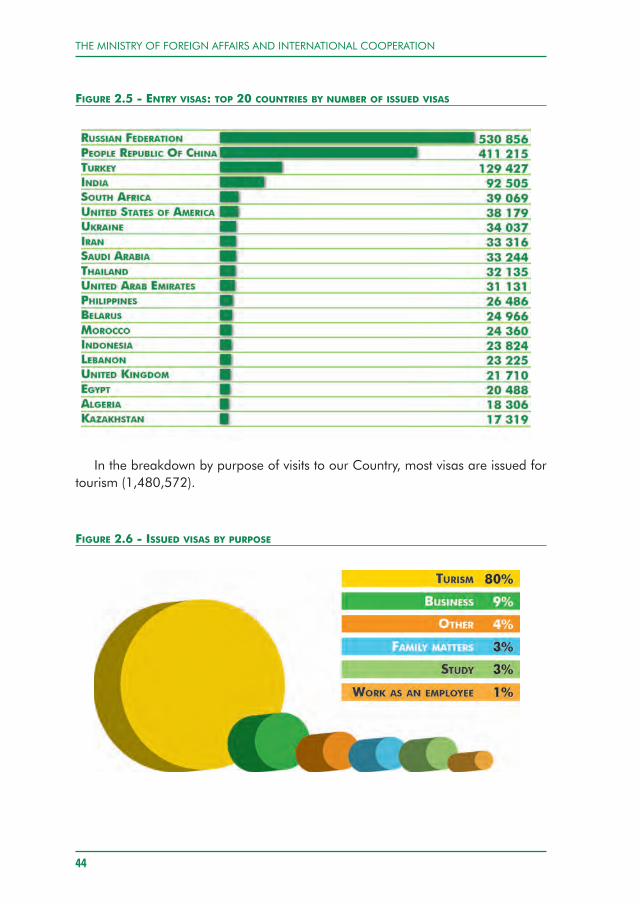
FIGURE 2.5 - ENTRY VISAS: TOP 20 COUNTRIES BY NUMBER OF ISSUED VISAS
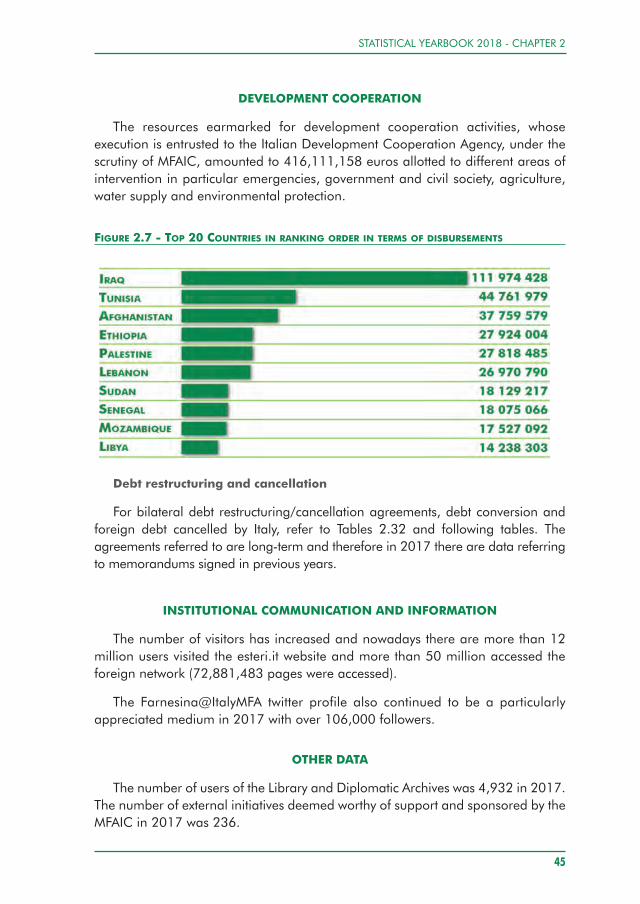
In the breakdown by purpose of visits to our Country, most visas are issued fortourism (1,480,572).
FIGURE 2.6 - ISSUED VISAS BY PURPOSE
STATISTICAL YEARBOOK 2018 - CHAPTER 2
DEVELOPMENT COOPERATION
The resources earmarked for development cooperation activities, whoseexecution is entrusted to the Italian Development Cooperation Agency, under thescrutiny of MFAIC, amounted to 416,111,158 euros allotted to different areas ofintervention in particular emergencies, government and civil society, agriculture,water supply and environmental protection.
FIGURE 2.7 - TOP 20 COUNTRIES IN RANKING ORDER IN TERMS OF DISBURSEMENTS
Debt restructuring and cancellation
For bilateral debt restructuring/cancellation agreements, debt conversion andforeign debt cancelled by Italy, refer to Tables 2.32 and following tables. Theagreements referred to are long-term and therefore in 2017 there are data referringto memorandums signed in previous years.
INSTITUTIONAL COMMUNICATION AND INFORMATION
The number of visitors has increased and nowadays there are more than 12million users visited the esteri.it website and more than 50 million accessed theforeign network (72,881,483 pages were accessed).
The Farnesina@ItalyMFA twitter profile also continued to be a particularlyappreciated medium in 2017 with over 106,000 followers.
OTHER DATA
The number of users of the Library and Diplomatic Archives was 4,932 in 2017.The number of external initiatives deemed worthy of support and sponsored by theMFAIC in 2017 was 236.
45
THE MINISTRY OF FOREIGN AFFAIRS AND INTERNATIONAL COOPERATION
46
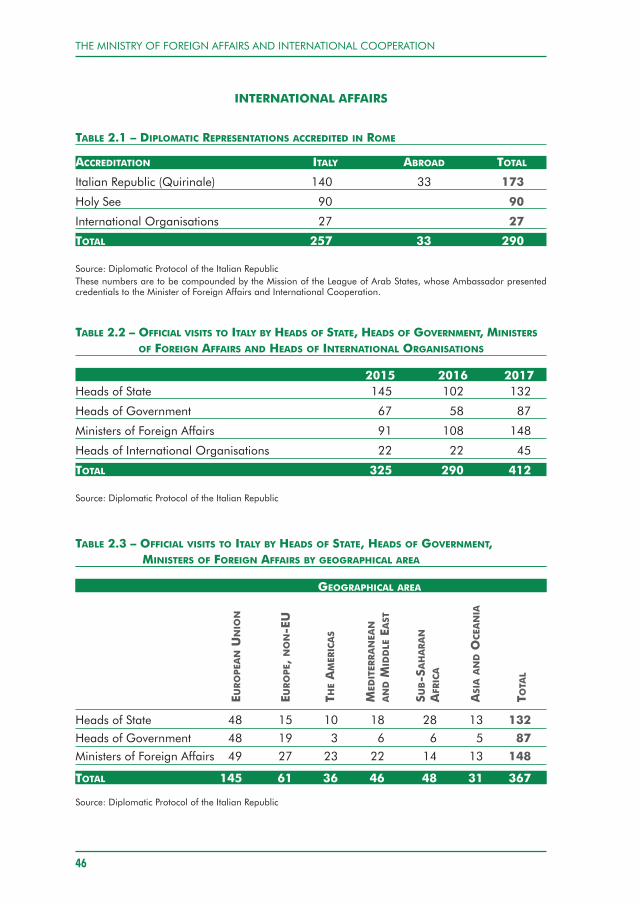
INTERNATIONAL AFFAIRS
TABLE 2.1 – DIPLOMATIC REPRESENTATIONS ACCREDITED IN ROME
ACCREDITATION ITALY ABROAD TOTAL
Italian Republic (Quirinale) 140 33 173
Holy See 90 90
International Organisations 27 27
TOTAL 257 33 290
Source: Diplomatic Protocol of the Italian RepublicThese numbers are to be compounded by the Mission of the League of Arab States, whose Ambassador presentedcredentials to the Minister of Foreign Affairs and International Cooperation.
TABLE 2.2 – OFFICIAL VISITS TO ITALY BY HEADS OF STATE, HEADS OF GOVERNMENT, MINISTERS
OF FOREIGN AFFAIRS AND HEADS OF INTERNATIONAL ORGANISATIONS
2015 2016 2017Heads of State 145 102 132
Heads of Government 67 58 87
Ministers of Foreign Affairs 91 108 148
Heads of International Organisations 22 22 45
TOTAL 325 290 412
Source: Diplomatic Protocol of the Italian Republic
TABLE 2.3 – OFFICIAL VISITS TO ITALY BY HEADS OF STATE, HEADS OF GOVERNMENT, MINISTERS OF FOREIGN AFFAIRS BY GEOGRAPHICAL AREA
GEOGRAPHICAL AREA
Heads of State 48 15 10 18 28 13 132
Heads of Government 48 19 3 6 6 5 87
Ministers of Foreign Affairs 49 27 23 22 14 13 148
TOTAL 145 61 36 46 48 31 367
Source: Diplomatic Protocol of the Italian Republic
EUR
OP
EAN
UN
ION
EUR
OP
E, N
ON
-EU
T HE
AM
ERIC
AS
MED
ITER
RA
NEA
N
AN
DM
IDD
LEEA
ST
SUB-S
AH
AR
AN
AFR
ICA
ASI
AA
ND
OC
EAN
IA
TOTA
L
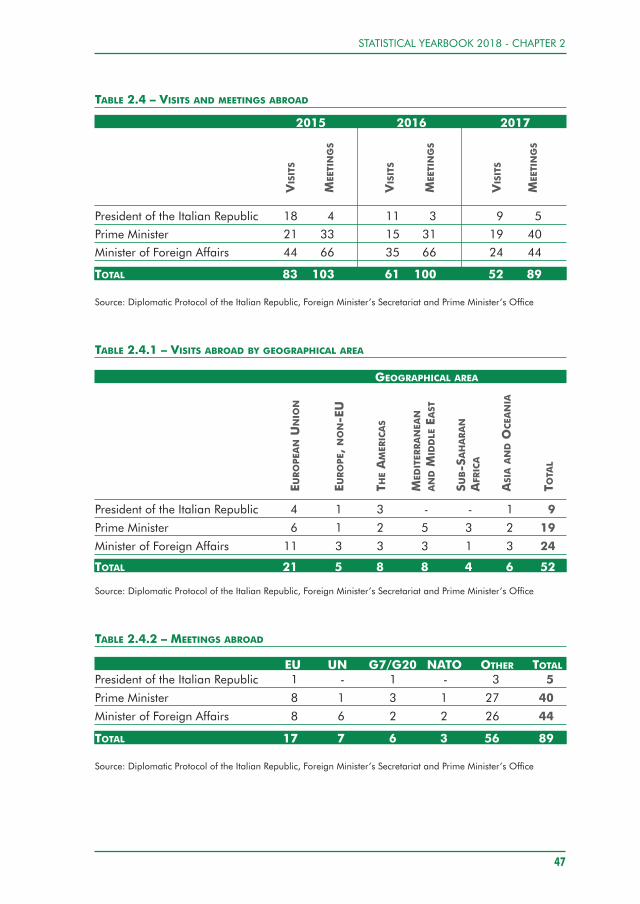
TABLE 2.4 – VISITS AND MEETINGS ABROAD
2015 2016 2017
President of the Italian Republic 18 4 11 3 9 5
Prime Minister 21 33 15 31 19 40
Minister of Foreign Affairs 44 66 35 66 24 44
TOTAL 83 103 61 100 52 89
Source: Diplomatic Protocol of the Italian Republic, Foreign Minister’s Secretariat and Prime Minister’s Office
TABLE 2.4.1 – VISITS ABROAD BY GEOGRAPHICAL AREA
GEOGRAPHICAL AREA
President of the Italian Republic 4 1 3 - - 1 9
Prime Minister 6 1 2 5 3 2 19
Minister of Foreign Affairs 11 3 3 3 1 3 24
TOTAL 21 5 8 8 4 6 52
Source: Diplomatic Protocol of the Italian Republic, Foreign Minister’s Secretariat and Prime Minister’s Office
TABLE 2.4.2 – MEETINGS ABROAD
EU UN G7/G20 NATO OTHER TOTAL
President of the Italian Republic 1 - 1 - 3 5
Prime Minister 8 1 3 1 27 40
Minister of Foreign Affairs 8 6 2 2 26 44
TOTAL 17 7 6 3 56 89
Source: Diplomatic Protocol of the Italian Republic, Foreign Minister’s Secretariat and Prime Minister’s Office
STATISTICAL YEARBOOK 2018 - CHAPTER 2
47
VISITS
MEE
TINGS
VISITS
MEE
TINGS
MEE
TINGS
VISITS
EUROPEA
NUNIO
N
EUROPE, N
ON-EU
THEAMER
ICAS
MED
ITER
RANEA
N
ANDM
IDDLE
EAST
SUB-S
AHARAN
AFR
ICA
ASIA
ANDO
CEA
NIA
TOTA
L
THE MINISTRY OF FOREIGN AFFAIRS AND INTERNATIONAL COOPERATION
48
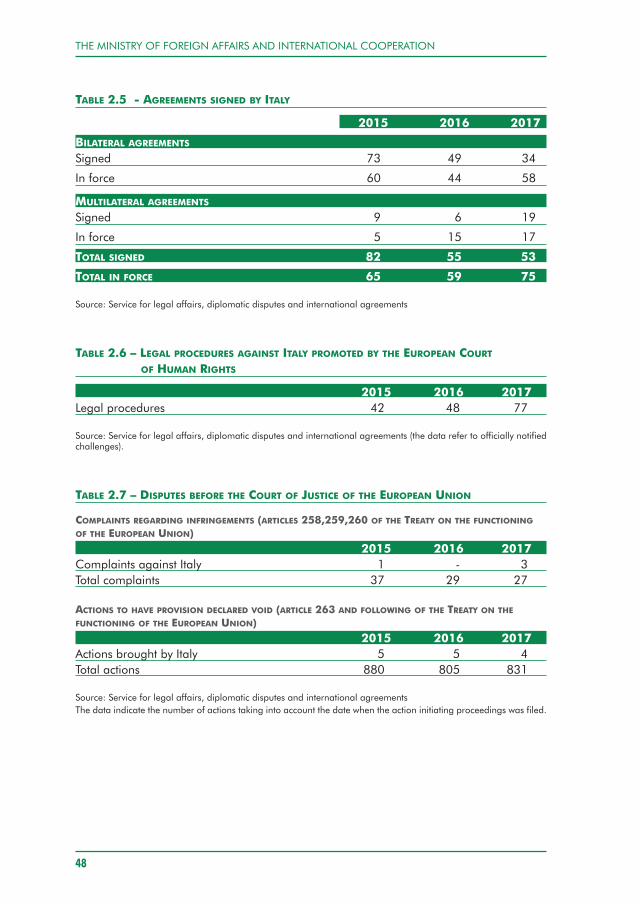
TABLE 2.5 - AGREEMENTS SIGNED BY ITALY
2015 2016 2017
BILATERAL AGREEMENTS
Signed 73 49 34
In force 60 44 58
MULTILATERAL AGREEMENTS
Signed 9 6 19
In force 5 15 17
TOTAL SIGNED 82 55 53
TOTAL IN FORCE 65 59 75
Source: Service for legal affairs, diplomatic disputes and international agreements
TABLE 2.6 – LEGAL PROCEDURES AGAINST ITALY PROMOTED BY THE EUROPEAN COURT
OF HUMAN RIGHTS
2015 2016 2017Legal procedures 42 48 77
Source: Service for legal affairs, diplomatic disputes and international agreements (the data refer to officially notifiedchallenges).
TABLE 2.7 – DISPUTES BEFORE THE COURT OF JUSTICE OF THE EUROPEAN UNION
COMPLAINTS REGARDING INFRINGEMENTS (ARTICLES 258,259,260 OF THE TREATY ON THE FUNCTIONING
OF THE EUROPEAN UNION)2015 2016 2017
Complaints against Italy 1 - 3Total complaints 37 29 27
ACTIONS TO HAVE PROVISION DECLARED VOID (ARTICLE 263 AND FOLLOWING OF THE TREATY ON THE
FUNCTIONING OF THE EUROPEAN UNION)2015 2016 2017
Actions brought by Italy 5 5 4Total actions 880 805 831
Source: Service for legal affairs, diplomatic disputes and international agreementsThe data indicate the number of actions taking into account the date when the action initiating proceedings was filed.
STATISTICAL YEARBOOK 2018 - CHAPTER 2
49
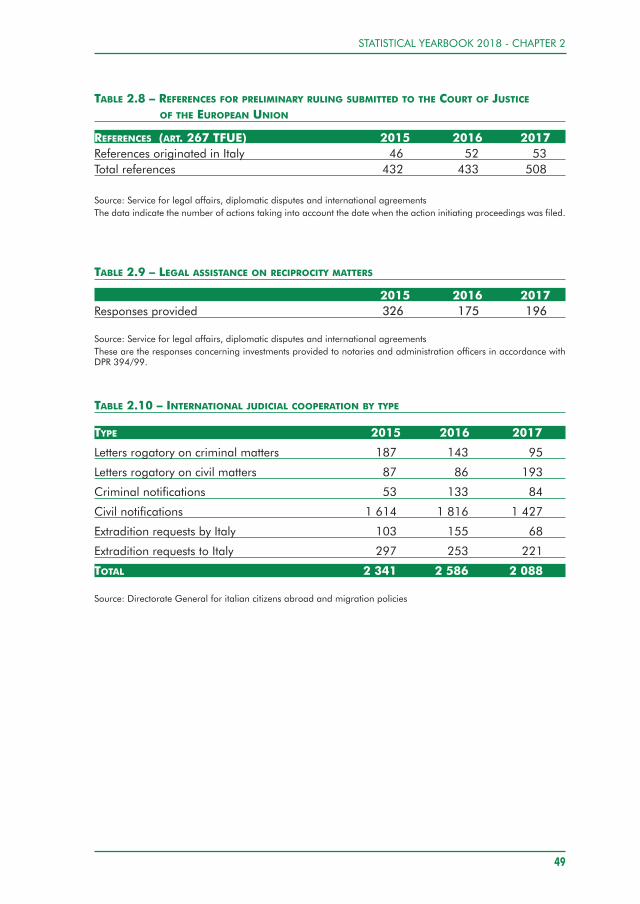
TABLE 2.8 – REFERENCES FOR PRELIMINARY RULING SUBMITTED TO THE COURT OF JUSTICEOF THE EUROPEAN UNION
REFERENCES (ART. 267 TFUE) 2015 2016 2017References originated in Italy 46 52 53Total references 432 433 508
Source: Service for legal affairs, diplomatic disputes and international agreementsThe data indicate the number of actions taking into account the date when the action initiating proceedings was filed.
TABLE 2.9 – LEGAL ASSISTANCE ON RECIPROCITY MATTERS
2015 2016 2017Responses provided 326 175 196
Source: Service for legal affairs, diplomatic disputes and international agreementsThese are the responses concerning investments provided to notaries and administration officers in accordance withDPR 394/99.
TABLE 2.10 – INTERNATIONAL JUDICIAL COOPERATION BY TYPE
TYPE 2015 2016 2017
Letters rogatory on criminal matters 187 143 95
Letters rogatory on civil matters 87 86 193
Criminal notifications 53 133 84
Civil notifications 1 614 1 816 1 427
Extradition requests by Italy 103 155 68
Extradition requests to Italy 297 253 221
TOTAL 2 341 2 586 2 088
Source: Directorate General for italian citizens abroad and migration policies
THE MINISTRY OF FOREIGN AFFAIRS AND INTERNATIONAL COOPERATION
50
CULTURAL, SCIENTIFIC AND ECONOMIC DIPLOMACY
TABLE 2.11 – ITALIAN SCHOOLS ABROAD BY TYPE AND GEOGRAPHICAL AREA
GEOGRAPHICAL AREA TYPE TOTAL
PUBLIC PRIVATE NON ACCREDITED
European Union 12 9 21
Europe, non-EU 4 14 3 21
The Americas 72 72
Mediterranean and Middle East 21 21
Sub-Saharan Africa 6 8 14
Asia and Oceania - 2 2
TOTAL 22 126 3 151
Source: Directorate General for the country promotionThe calculation of schools was made on the basis of the number of the various grades of schooling (kindergarten,primary, junior high and secondary schools) present within the various educational establishments.
TABLE 2.12 – STUDENTS OF THE ITALIAN SCHOOLS ABROAD BY GEOGRAPHICAL AREA
GEOGRAPHICAL AREA STUDENTS TOTAL
ITALIAN FOREIGN
European Union 5 304 5 758 11 062
Europe, non-EU 574 2 812 3 386
The Americas 1 050 11 504 12 554
Mediterranean and Middle East 147 1 520 1 667
Sub-Saharan Africa 409 1 720 2 129
Asia and Oceania 38 374 412
TOTAL 7 522 23 688 31 210
Source: Directorate General for the country promotion
STATISTICAL YEARBOOK 2018 - CHAPTER 2
51
TABLE 2.13 – ITALIAN LANGUAGE COURSES HELD BY THE ITALIAN CULTURAL INSTITUTES
GEOGRAPHICAL AREA 2016 2017STUDENTS COURSES STUDENTS COURSES % CHANGE % CHANGE
STUDENTS COURSES
European Union 21 718 2 483 20 425 2 466 -6.0% -0.7%
Europe, non-EU 8 028 841 8 136 829 1.3% -1.4%
The Americas 23 985 2 537 24 606 2 474 2.6% -2.5%
Mediterranean and Middle East 5 321 488 6 286 527 18.1% 8.0%
Sub-Saharan Africa 308 27 216 19 -29.9% -29.6%
Asia and Oceania 12 523 1 726 12 796 1 842 2.2% 6.7%
TOTAL 71 883 8 102 72 465 8 157 0.8% 0.7%
Source: Directorate General for the country promotion
TABLE 2.14 – SCHOLARSHIPS GRANTED TO FOREIGN STUDENTS: MONTHLY INSTALMENTS
BY GEOGRAPHICAL AREA
GEOGRAPHICAL AREA INSTALMENTS
2016/2017 2017/2018
European Union 304 162Europe, non-EU 642 388The Americas 773 501Mediterranean and Middle East 1 073 948Sub-Saharan Africa 575 543Asia and Oceania 735 811TOTAL 4 102 3 353
Source: Directorate General for the country promotion
TABLE 2.15 – INCENTIVES FOR TRANSLATION, DUBBING AND SUBTITLING
GEOGRAPHICAL AREA CONTRIBUTIONS AWARDS CONTRIBUTIONS AWARDS
European Union 60 1 59 1Europe, non -EU 35 23The Americas 12 10Mediterranean and Middle East 3 1 3Sub-Saharan Africa 3Asia and Oceania 21 22TOTAL 131 2 120 1
Source: Directorate general for the country promotion
THE MINISTRY OF FOREIGN AFFAIRS AND INTERNATIONAL COOPERATION
52
TABLE 2.16 – "VIVERE ALL’ITALIANA": PROMOTIONAL EVENTS ORGANISED BY THE FOREIGN NETWORK
(DISTRIBUTION BY GEOGRAPHICAL AREA AND SECTOR OF ACTIVITY)
GEOGRAPHICAL AREA 2016 2017 % CHANGE
European Union 1 614 2 908 80.2%Europe, non-EU 773 849 9.8%The Americas 1 372 1 627 18.6%Mediterranean and Middle East 497 575 15.7%Sub-Saharan Africa 245 267 9.0%Asia and Oceania 1 385 1 756 26.8%
TOTAL 5 886 7 982 35.6%
SECTOR OF ACTIVITY 2016 2017 % CHANGE
Archaeology/Heritage Protection 198 139 -29.8%Visual arts 375 759 102.4%Cinema nd 1 467 -Italian cuisine 1 517 1 176 -22.5%Design/Fashion 320 351 9.7%Economic Diplomacy 383 343 -10.4%Italian, a living language - Language, Literature, Publishing 1 325 1 351 2.0%Promoting the university system nd 82 -Science, Research and Innovation 251 295 17.5%Live performances nd 1 769 -Tourism and Local Destinations 205 250 22.0%Sundry 1 312 - -
TOTAL 5 886 7 982 35.6%
Source: Directorate General for the country promotion
STATISTICAL YEARBOOK 2018 - CHAPTER 2
53
TABLE 2.17 – ITALIAN LANGUAGE IN THE WORLD WEEK: EVENTS BY GEOGRAPHICAL
AREA AND TYPE
EVENTS
GEOGRAPHICAL AREA 2015 2016 2017European Union 408 280 361Europe, non-EU 171 203 170The Americas 435 312 394Mediterranean and Middle East 113 88 115Sub-Saharan Africa 75 55 87Asia and Oceania 163 163 205TOTAL 1 365 1 101 1 332
TYPE 2015 2016 2017Exhibition/Art 80 144 50Meetings/Conferences 400 317 389Linguistics 128 72 49Music/Cinema 483 93 717Sundry 274 475 127TOTAL 1 365 1 101 1 332
Source: Directorate General for the country promotion
TABLE 2.18 – FARNESINA ART COLLECTION
2015 2016 2017Open days 2 2 2Visitors 2 013 2 978 2 818Works on display 455 436 435Events abroad 2 1 2Events in Italy 4 9 14Loans for external exhibitions 4 16 5
Source: Directorate General for the country promotion
THE MINISTRY OF FOREIGN AFFAIRS AND INTERNATIONAL COOPERATION
54
TABLE 2.19 – SCIENTIFIC AND TECHNOLOGICAL COOPERATION
GEOGRAPHICAL AREA
EXECUTIVE MAJOR MAJOR PROJECTS MOBILITY EXCHANGE OFPROTOCOLS PROJECTS FUNDED PROJECTS RESEARCHERS
(1) (2) (3) (4) (5)
European Union 2 5 4 10 15Europe, non-EU 1 7 7 10 6The Americas 4 36 22 37 75Mediterranean and Middle East 2 11 10 7 4Sub-Saharan Africa 1 5 5 19 17Asia and Oceania 5 48 46 13 21TOTAL 15 112 94 96 138
Source: Directorate General for the country promotion(1) Executive protocols (EPs) implement scientific and technological cooperation agreements (the data refer to Eps inforce as at 31.12.2017)(2) joint research initiatives in ongoing EPs(3) joint research initiatives in Eps that following annual assessment, had access to public funding(4) joint research initiatives in ongoing Eps for the exchange of researchers to and from Italy(5) number of researchers involved in research exchanges to and from Italy within the framework of EP Mobility projects
TABLE 2.20 – NEWS AND ADVANCE NOTICE OF TENDERS AND CONTRACTS
GEOGRAPHICAL AREA DIPLOMATIC ITALIAN CHAMBERS ICE OFFICES TOTAL-CONSULAR OF COMMERCENETWORK ABROAD
European Union 985 54 213 2 065 28 3 263 82
Europe, non-EU 929 71 337 58 1 266 129
The Americas 91 68 2 315 5 406 75
Mediterranean and Middle East 220 30 114 5 691 34 1 025 69
Sub-Saharan Africa 500 32 313 29 813 61
Asia and Oceania 167 28 173 584 109 924 137
TOTAL 2 892 283 500 7 4 305 263 7 697 553
Source: Directorate General for the country promotionICE = Agency for the promotion abroad and internationalization of Italian businesses
CALL
SFO
RTE
NDER
ADVANCENOTICEOF
TENDER
SAND
CONTR
ACT
CALL
SFO
RTE
NDER
ADVANCENOTICEOF
TENDER
SAND
CONTR
ACT
CALL
SFO
RTE
NDER
ADVANCENOTICEOF
TENDER
SAND
CONTR
ACT
CALL
SFO
RTE
NDER
ADVANCENOTICEOF
TENDER
SAND
CONTR
ACT
STATISTICAL YEARBOOK 2018 - CHAPTER 2
55
TABLE 2.21 – INFORMATION SERVICES FOR ITALIAN BUSINESSES SEEKING TO INTERNATIONALISE
2015 2016 2017
“DIPLOMAZIA ECONOMICA ITALIANA” NEWSLETTER
Editions published 11 12 9Articles published 183 222 138Subscribers 10 664 10 636 10 411
“INFOMERCATIESTERI.IT “ PLATFORM
Unique visitors 348 121 405 995 546 906Page views 1 277 045 1 322 746 1 605 048
NEWS FROM THE WORLD
News (1) 370 132 113
TWITTER “DIPLOMAZIA ECONOMICA ITALIANA” Tweets 655 558 559
Source: Directorate general for the country promotion(1) the figure refer exclusively to the news provided by the diplomatic-consular network.
ITALIANS ABROAD
Consular Registry
TABLE 2.22 – ITALIANS REGISTERED IN CONSULAR REGISTRY: 15 LARGEST COMMUNITIES
COUNTRY F M 2017 % CHANGE
Argentina 497 776 451 007 948 783 2.9Germany 353 989 433 752 787 741 3.2Switzerland 301 513 330 240 631 753 2.0Brazil 263 637 261 478 525 115 7.7France 200 170 217 886 418 056 3.1United Kingdom 152 199 172 169 324 368 9.0Belgium 134 147 145 879 280 026 1.3United States of America 131 954 144 659 276 613 5.3Spain 81 395 101 105 182 500 9.0Australia 76 819 79 523 156 342 3.3Venezuela 71 635 71 679 143 314 -1.0Canada 68 718 72 367 141 085 1.8Uruguay 61 121 56 281 117 402 2.4Chile 35 147 32 788 67 935 3.2Netherlands 21 084 25 324 46 408 6.0Other Countries 256 451 299 323 555 774 6.4TOTAL 2 707 755 2 895 460 5 603 215 4.1
Source: Directorate General for italian citizens abroad and migration policies – Directorate General for administrationand ICT
THE MINISTRY OF FOREIGN AFFAIRS AND INTERNATIONAL COOPERATION
56
TABLE 2.23 – CONSULAR REGISTRY: ITALIANS REGISTERED BY GENDER AND GEOGRAPHICAL AREA
GEOGRAPHICAL AREA F M TOTAL % CHANGE
European Union 1 026 601 1 199 660 2 226 261 4.7
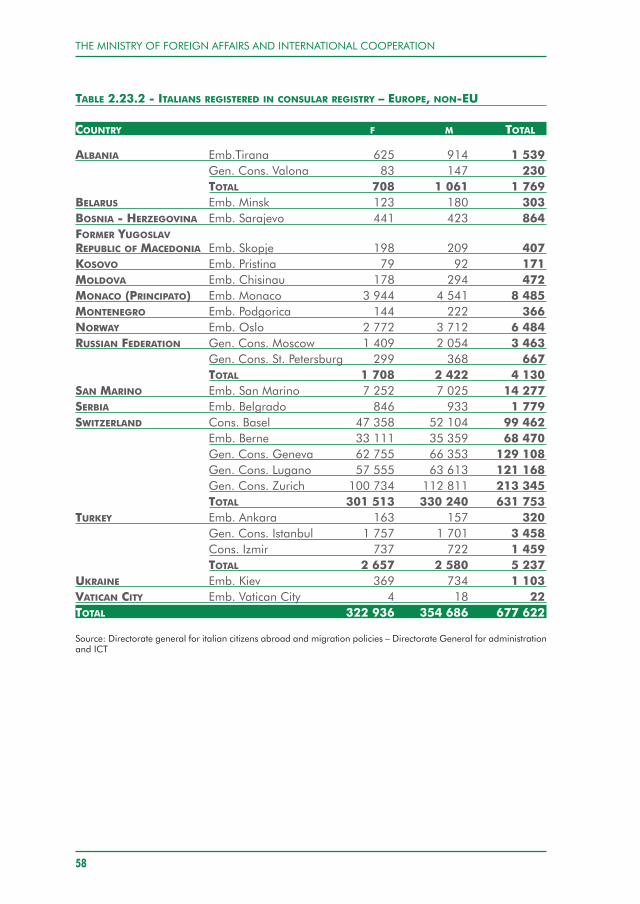
Europe, non-EU 322 936 354 686 677 622 2.2
The Americas 1 212 212 1 175 305 2 387 517 4.0
Mediterranean and Middle East 28 362 33 235 61 597 7.7
Sub-Saharan Africa 26 227 28 767 54 994 2.5
Asia and Oceania 91 417 103 807 195 224 3.9
TOTAL 2 707 755 2 895 460 5 603 215 4.1
Source: Directorate General for italian citizens abroad and migration policies – Directorate General for administrationand ICT
TABLE 2.23.1 - ITALIANS REGISTERED IN CONSULAR REGISTRY – EUROPEAN UNION
COUNTRY F M TOTAL
AUSTRIA Emb. Vienna 15 158 17 516 32 674BELGIUM Emb. Brussels 50 188 53 141 103 329
Gen. Cons. Charleroi 83 959 92 738 176 697TOTAL 134 147 145 879 280 026
BULGARIA Emb. Sofia 697 1 641 2 338CROATIA Emb. Zagreb 838 832 1 670
Gen. Cons. Fiume 7 664 6 994 14 658TOTAL 8 502 7 826 16 328
CYPRUS Amb. Nicosia 471 622 1 093CZECH REPUBLIC Amb. Prague 1 948 3 706 5 654DENMARK Amb. Copenaghen 3 708 5 150 8 858ESTONIA Amb. Tallinn 125 373 498FINLAND Amb. Helsinki 1 703 2 471 4 174FRANCE Gen. Cons. Lyon 41 380 42 984 84 364
Gen. Cons. Marseille 30 536 34 048 64 584Gen. Cons. Metz 36 932 40 468 77 400Gen. Cons. Nice 17 252 20 011 37 263Gen. Cons. Paris 74 070 80 375 154 445TOTAL 200 170 217 886 418 056
GERMANY Emb. Berlin 14 122 18 202 32 324Gen. Cons. Köln 57 224 69 236 126 460Cons. Dortmund 28 432 34 362 62 794Gen. Cons. Frankfurt 70 954 86 649 157 603Cons. Freiburg 25 406 29 695 55 101Gen. Cons. Hannover 20 726 26 742 47 468Gen. Cons. Munich 50 179 64 303 114 482Gen. Cons. Stuttgart 82 495 99 147 181 642Cons. Agency Wolfsburg 4 451 5 416 9 867TOTAL 353 989 433 752 787 741
STATISTICAL YEARBOOK 2018 - CHAPTER 2
57
GREECE Emb. Athens 6 756 5 837 12 593HUNGARY Emb. Budapest 1 528 2 338 3 866IRELAND Emb. Dublin 7 969 9 432 17 401LATVIA Emb. Riga 74 233 307LITHUANIA Emb. Vilnius 94 239 333LUXEMBOURG Emb. Luxembourg 14 688 15 981 30 669MALTA Emb. Valletta 2 364 3 858 6 222NETHERLANDS Emb. The Hague 21 084 25 324 46 408POLAND Emb. Warsaw 2 186 3 903 6 089PORTUGAL Emb. Lisbon 4 220 5 659 9 879ROMANIA Emb. Bucharest 2 398 5 041 7 439SLOVAKIA Emb. Bratislava 556 1 161 1 717SLOVENIA Gen. Cons. Capodistria 1 761 2 065 3 826
Emb. Ljubljana 486 575 1 061TOTAL 2 247 2 640 4 887
SPAIN Gen. Cons. Barcelona 38 184 48 221 86 405Emb. Madrid 43 211 52 884 96 095TOTAL 81 395 101 105 182 500
SWEDEN Emb. Stockholm 6 225 7 918 14 143UNITED KINGDOM Gen. Cons. Edinburgh 8 761 9 936 18 697
Gen. Cons. London 143 438 162 233 305 671TOTAL 152 199 172 169 324 368
TOTAL 1 026 601 1 199 660 2 226 261
Source: Directorate general for italian citizens abroad and migration policies – Directorate General for administrationand ICT
THE MINISTRY OF FOREIGN AFFAIRS AND INTERNATIONAL COOPERATION
58
TABLE 2.23.2 - ITALIANS REGISTERED IN CONSULAR REGISTRY – EUROPE, NON-EU
COUNTRY F M TOTAL
ALBANIA Emb.Tirana 625 914 1 539Gen. Cons. Valona 83 147 230TOTAL 708 1 061 1 769
BELARUS Emb. Minsk 123 180 303BOSNIA - HERZEGOVINA Emb. Sarajevo 441 423 864FORMER YUGOSLAVREPUBLIC OF MACEDONIA Emb. Skopje 198 209 407KOSOVO Emb. Pristina 79 92 171MOLDOVA Emb. Chisinau 178 294 472MONACO (PRINCIPATO) Emb. Monaco 3 944 4 541 8 485MONTENEGRO Emb. Podgorica 144 222 366NORWAY Emb. Oslo 2 772 3 712 6 484RUSSIAN FEDERATION Gen. Cons. Moscow 1 409 2 054 3 463
Gen. Cons. St. Petersburg 299 368 667TOTAL 1 708 2 422 4 130
SAN MARINO Emb. San Marino 7 252 7 025 14 277SERBIA Emb. Belgrado 846 933 1 779SWITZERLAND Cons. Basel 47 358 52 104 99 462
Emb. Berne 33 111 35 359 68 470Gen. Cons. Geneva 62 755 66 353 129 108Gen. Cons. Lugano 57 555 63 613 121 168Gen. Cons. Zurich 100 734 112 811 213 345TOTAL 301 513 330 240 631 753
TURKEY Emb. Ankara 163 157 320Gen. Cons. Istanbul 1 757 1 701 3 458Cons. Izmir 737 722 1 459TOTAL 2 657 2 580 5 237
UKRAINE Emb. Kiev 369 734 1 103VATICAN CITY Emb. Vatican City 4 18 22TOTAL 322 936 354 686 677 622
Source: Directorate general for italian citizens abroad and migration policies – Directorate General for administrationand ICT
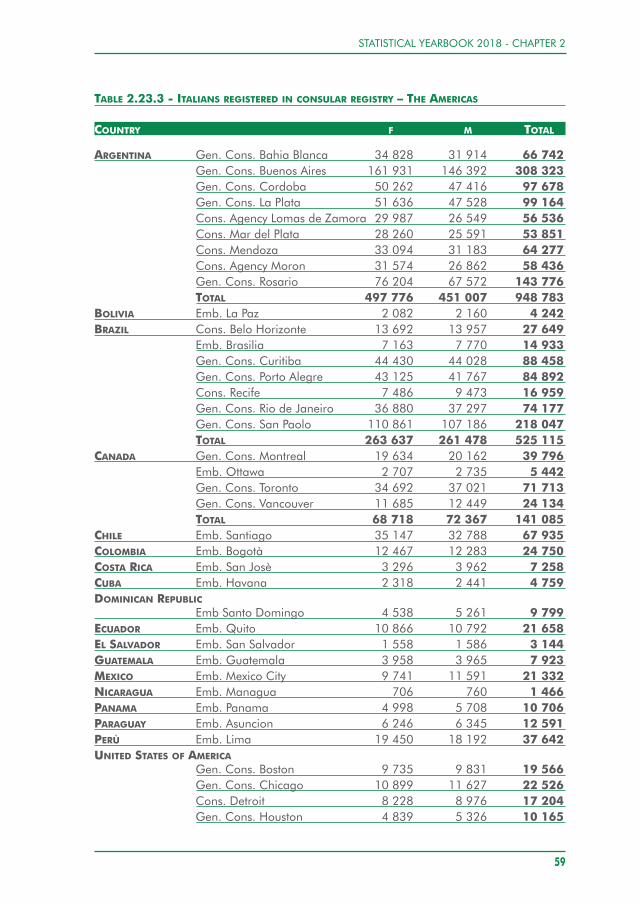
TABLE 2.23.3 - ITALIANS REGISTERED IN CONSULAR REGISTRY – THE AMERICAS
COUNTRY F M TOTAL
ARGENTINA Gen. Cons. Bahia Blanca 34 828 31 914 66 742Gen. Cons. Buenos Aires 161 931 146 392 308 323Gen. Cons. Cordoba 50 262 47 416 97 678Gen. Cons. La Plata 51 636 47 528 99 164Cons. Agency Lomas de Zamora 29 987 26 549 56 536Cons. Mar del Plata 28 260 25 591 53 851Cons. Mendoza 33 094 31 183 64 277Cons. Agency Moron 31 574 26 862 58 436Gen. Cons. Rosario 76 204 67 572 143 776TOTAL 497 776 451 007 948 783
BOLIVIA Emb. La Paz 2 082 2 160 4 242BRAZIL Cons. Belo Horizonte 13 692 13 957 27 649
Emb. Brasilia 7 163 7 770 14 933Gen. Cons. Curitiba 44 430 44 028 88 458Gen. Cons. Porto Alegre 43 125 41 767 84 892Cons. Recife 7 486 9 473 16 959Gen. Cons. Rio de Janeiro 36 880 37 297 74 177Gen. Cons. San Paolo 110 861 107 186 218 047TOTAL 263 637 261 478 525 115
CANADA Gen. Cons. Montreal 19 634 20 162 39 796Emb. Ottawa 2 707 2 735 5 442Gen. Cons. Toronto 34 692 37 021 71 713Gen. Cons. Vancouver 11 685 12 449 24 134TOTAL 68 718 72 367 141 085
CHILE Emb. Santiago 35 147 32 788 67 935COLOMBIA Emb. Bogotà 12 467 12 283 24 750COSTA RICA Emb. San Josè 3 296 3 962 7 258CUBA Emb. Havana 2 318 2 441 4 759DOMINICAN REPUBLIC
Emb Santo Domingo 4 538 5 261 9 799ECUADOR Emb. Quito 10 866 10 792 21 658EL SALVADOR Emb. San Salvador 1 558 1 586 3 144GUATEMALA Emb. Guatemala 3 958 3 965 7 923MEXICO Emb. Mexico City 9 741 11 591 21 332NICARAGUA Emb. Managua 706 760 1 466PANAMA Emb. Panama 4 998 5 708 10 706PARAGUAY Emb. Asuncion 6 246 6 345 12 591PERÙ Emb. Lima 19 450 18 192 37 642UNITED STATES OF AMERICA
Gen. Cons. Boston 9 735 9 831 19 566Gen. Cons. Chicago 10 899 11 627 22 526Cons. Detroit 8 228 8 976 17 204Gen. Cons. Houston 4 839 5 326 10 165
STATISTICAL YEARBOOK 2018 - CHAPTER 2
59
THE MINISTRY OF FOREIGN AFFAIRS AND INTERNATIONAL COOPERATION
60
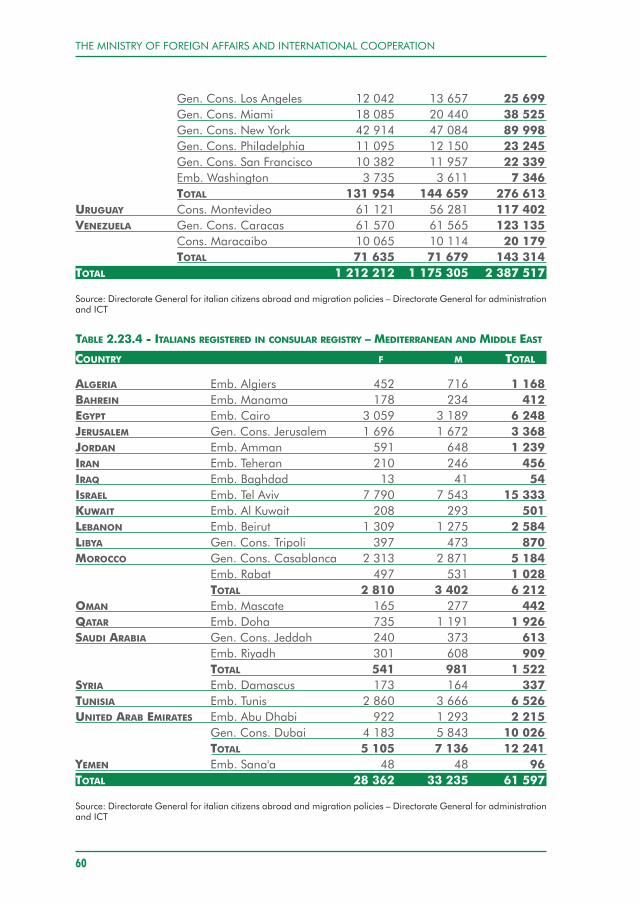
Gen. Cons. Los Angeles 12 042 13 657 25 699Gen. Cons. Miami 18 085 20 440 38 525Gen. Cons. New York 42 914 47 084 89 998Gen. Cons. Philadelphia 11 095 12 150 23 245Gen. Cons. San Francisco 10 382 11 957 22 339Emb. Washington 3 735 3 611 7 346TOTAL 131 954 144 659 276 613
URUGUAY Cons. Montevideo 61 121 56 281 117 402VENEZUELA Gen. Cons. Caracas 61 570 61 565 123 135
Cons. Maracaibo 10 065 10 114 20 179TOTAL 71 635 71 679 143 314
TOTAL 1 212 212 1 175 305 2 387 517
Source: Directorate General for italian citizens abroad and migration policies – Directorate General for administrationand ICT
TABLE 2.23.4 - ITALIANS REGISTERED IN CONSULAR REGISTRY – MEDITERRANEAN AND MIDDLE EAST
COUNTRY F M TOTAL
ALGERIA Emb. Algiers 452 716 1 168BAHREIN Emb. Manama 178 234 412EGYPT Emb. Cairo 3 059 3 189 6 248JERUSALEM Gen. Cons. Jerusalem 1 696 1 672 3 368JORDAN Emb. Amman 591 648 1 239IRAN Emb. Teheran 210 246 456IRAQ Emb. Baghdad 13 41 54ISRAEL Emb. Tel Aviv 7 790 7 543 15 333KUWAIT Emb. Al Kuwait 208 293 501LEBANON Emb. Beirut 1 309 1 275 2 584LIBYA Gen. Cons. Tripoli 397 473 870MOROCCO Gen. Cons. Casablanca 2 313 2 871 5 184
Emb. Rabat 497 531 1 028TOTAL 2 810 3 402 6 212
OMAN Emb. Mascate 165 277 442QATAR Emb. Doha 735 1 191 1 926SAUDI ARABIA Gen. Cons. Jeddah 240 373 613
Emb. Riyadh 301 608 909TOTAL 541 981 1 522
SYRIA Emb. Damascus 173 164 337TUNISIA Emb. Tunis 2 860 3 666 6 526UNITED ARAB EMIRATES Emb. Abu Dhabi 922 1 293 2 215
Gen. Cons. Dubai 4 183 5 843 10 026TOTAL 5 105 7 136 12 241
YEMEN Emb. Sana'a 48 48 96TOTAL 28 362 33 235 61 597
Source: Directorate General for italian citizens abroad and migration policies – Directorate General for administrationand ICT
STATISTICAL YEARBOOK 2018 - CHAPTER 2
61
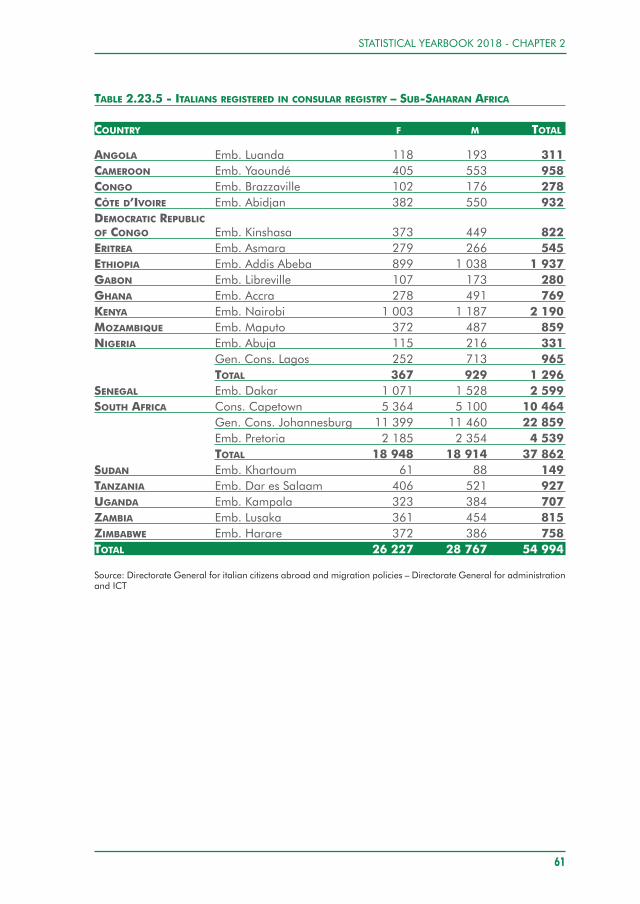
TABLE 2.23.5 - ITALIANS REGISTERED IN CONSULAR REGISTRY – SUB-SAHARAN AFRICA
COUNTRY F M TOTAL
ANGOLA Emb. Luanda 118 193 311CAMEROON Emb. Yaoundé 405 553 958CONGO Emb. Brazzaville 102 176 278CÔTE D’IVOIRE Emb. Abidjan 382 550 932DEMOCRATIC REPUBLICOF CONGO Emb. Kinshasa 373 449 822ERITREA Emb. Asmara 279 266 545ETHIOPIA Emb. Addis Abeba 899 1 038 1 937GABON Emb. Libreville 107 173 280GHANA Emb. Accra 278 491 769KENYA Emb. Nairobi 1 003 1 187 2 190MOZAMBIQUE Emb. Maputo 372 487 859NIGERIA Emb. Abuja 115 216 331
Gen. Cons. Lagos 252 713 965TOTAL 367 929 1 296
SENEGAL Emb. Dakar 1 071 1 528 2 599SOUTH AFRICA Cons. Capetown 5 364 5 100 10 464
Gen. Cons. Johannesburg 11 399 11 460 22 859Emb. Pretoria 2 185 2 354 4 539TOTAL 18 948 18 914 37 862
SUDAN Emb. Khartoum 61 88 149TANZANIA Emb. Dar es Salaam 406 521 927UGANDA Emb. Kampala 323 384 707ZAMBIA Emb. Lusaka 361 454 815ZIMBABWE Emb. Harare 372 386 758TOTAL 26 227 28 767 54 994
Source: Directorate General for italian citizens abroad and migration policies – Directorate General for administrationand ICT
THE MINISTRY OF FOREIGN AFFAIRS AND INTERNATIONAL COOPERATION
62
TABLE 2.23.6 - ITALIANS REGISTERED IN CONSULAR REGISTRY – ASIA AND OCEANIA
COUNTRY F M TOTAL
AFGHANISTAN Emb.Kabul 6 25 31ARMENIA Emb. Jerevan 23 50 73AUSTRALIA Cons. Adelaide 8 957 8 738 17 695
Cons. Brisbane 8 454 8 490 16 944Emb. Canberra 1 747 1 806 3 553Gen. Cons. Melbourne 25 824 26 976 52 800Cons. Perth 9 034 9 648 18 682Gen. Cons. Sydney 22 803 23 865 46 668TOTAL 76 819 79 523 156 342
AZERBAIJAN Emb. Baku 35 74 109BANGLADESH Emb. Dhaka 193 229 422GEORGIA Emb. Tblisi 66 103 169INDIA Gen. Cons. Kolkata 50 77 127
Gen. Cons. Mumbai 327 439 766Emb. New Delhi 218 256 474TOTAL 595 772 1 367
INDONESIA Emb. Jakarta 499 1 011 1 510JAPAN Gen. Cons. Osaka 521 930 1 451
Emb. Tokyo 1 141 1 992 3 133TOTAL 1 662 2 922 4 584
KAZAKHSTAN Emb. Astana 99 303 402KOREA Emb. Seoul 193 342 535MALAYSIA Emb. Kuala Lumpur 327 622 949MONGOLIA Emb. Ulaanbaatar 14 26 40MYANMAR Emb. Yangon 79 95 174NEW ZEALAND Emb. Wellington 2 304 2 475 4 779PAKISTAN Emb. Islamabad 139 180 319
Cons. Karachi 38 38 76TOTAL 177 218 395
PEOPLE’S REPUBLIC OF CHINA Gen. Cons. Canton 348 892 1 240Gen. Cons. Hong Kong 1 387 2 226 3 613Emb. Beijing 471 902 1 373Gen. Cons. Shanghai 1 231 2 333 3 564Gen. Cons. Chongqing 46 121 167TOTAL 3 483 6 474 9 957
PHILIPPINES Emb. Manila 790 999 1 789SINGAPORE Emb. Singapore 1 449 2 352 3 801SRI LANKA Emb. Colombo 188 232 420TAIWAN SDD Taipei 258 419 677THAILAND Emb. Bangkok 1 869 3 992 5 861TURKMENISTAN Emb. Ashgabat 3 7 10UZBEKISTAN Emb. Tashkent 22 36 58VIETNAM Emb. Hanoi 75 119 194
Gen. Cons. Ho Chi Minh 189 387 576TOTAL 264 506 770
TOTAL 91 417 103 807 195 224
Source: Directorate General for italian citizens abroad and migration policies – Directorate General for administrationand ICT
STATISTICAL YEARBOOK 2018 - CHAPTER 2
63
Main consular services
TABLE 2.24 – MAIN CONSULAR SERVICES BY TYPE AND GEOGRAPHICAL AREA
GEOGRAPHICAL AREA TYPE
European Union 112 129 57 057 13 727 51 113 1 670 14 287 4 213
Europe, non-EU 38 328 10 436 750 15 729 1 090 1 447 4 419
The Americas 161 656 - 1 263 122 666 56 181 3 550 6 800
Mediterranean and Middle East 8 764 - 496 4 418 439 2 396 800
Sub-Saharan Africa 7 106 - 108 2 939 463 1 314 704
Asia and Oceania 16 156 - 312 8 120 1 760 8 940 2 944
TOTAL 344 139 67 493 16 656 204 985 61 603 31 934 19 880
% change 16.5 -0.5 4.8 8.3 0,9 -5.5 -8.4
Source: Directorate General for italian citizens abroad and migration policies – Directorate General for administrationand ICT(1) including acts of civil union(2) In implementation of Article 28 of Legislative Decree 71/2011, the Decree of the Foreign Affairs Minister of 31October 2011 limits – as of 1st January 2012 - the provision of notarial services offered by the Consular Offices basedin Austria, Belgium, France, Germany and Latvia
Italian prisoners abroad
TABLE 2.25 - ITALIAN PRISONERS ABROAD: SITUATION BY JUDICIAL POSITIONAND GEOGRAPHICAL AREA
GEOGRAPHICAL AREA AWAITING AWAITING SENTENCED TOTALFOR EXTRADITION TRIAL
European Union 37 1 559 718 2 314Europe, non-EU 6 122 54 182The Americas 25 154 112 291Mediterranean and Middle East 2 27 15 44Sub-Saharan Africa - 13 3 16Asia and Oceania 2 40 35 77TOTAL 72 1 915 937 2 924
Source: Directorate General for italian citizens abroad and migration policies
PASSPORTS
IDENTITYCARDS
EMERGENCYTRAVEL
DOCUMENTS
RECORDSOFBIRTH,
MARRIAGE, DEATH
(1)
CITIZENSHIPSACTS
NAVIGATIONACTS
NOTARIALDEEDS(2)
THE MINISTRY OF FOREIGN AFFAIRS AND INTERNATIONAL COOPERATION
64
VISA SERVICES
TABLE 2.26 – ENTRY VISAS TO ITALY: TOP 20 COUNTRIES FOR NUMBER OF ISSUED VISAS
2016 2017
Russian Federation 473 439 Russian Federation 530 856People’s Republic of China 362 575 People’s Republic of China 411 215Turkey 139 718 Turkey 129 427India 101 996 India 92 505Ukraine 64 417 South Africa 39 069Saudi Arabia 38 779 United States of America 38 179United Arab Emirates 38 265 Ukraine 34 037United States of America 36 683 Iran 33 316Iran 33 626 Saudi Arabia 33 244South Africa 33 561 Thailand 32 135Thailand 33 422 United Arab Emirates 31 131Belarus 26 884 Philippines 26 486United Kingdom 26 530 Belarus 24 966Lebanon 24 936 Morocco 24 360Morocco 24 822 Indonesia 23 824Indonesia 24 164 Lebanon 23 225Philippines 23 914 United Kingdom 21 710Egypt 22 126 Egypt 20 488Tunisia 17 752 Algeria 18 306Algeria 17 252 Kazakhstan 17 319
Source: Directorate General for italian citizens abroad and migration policies
TABLE 2.27 – ENTRY VISAS TO ITALY BY GEOGRAPHICAL AREA OF REQUEST
GEOGRAPHICAL AREA 2016 2017 % CHANGEREQUESTED ISSUED REQUESTED ISSUED REQUESTED ISSUED
European Union 31 663 31 454 26 455 26 621 -16.4 -16.5Europe, non-EU 735 014 720 010 753 020 733 512 2.4 1.9The Americas 72 245 69 342 77 645 73 166 7.5 5.5Mediterranean and Middle East 295 483 259 084 293 533 242 934 -0.7 -6.2Sub-Saharan Africa 113 759 85 555 106 457 82 551 -6.4 -3.5Asia and Oceania 692 281 647 802 735 336 689 075 6.2 6.4TOTAL 1 940 445 1 813 247 1 992 446 1 847 499 2.7 1.9
Source: Directorate General for italian citizens abroad and migration policies
STATISTICAL YEARBOOK 2018 - CHAPTER 2
65
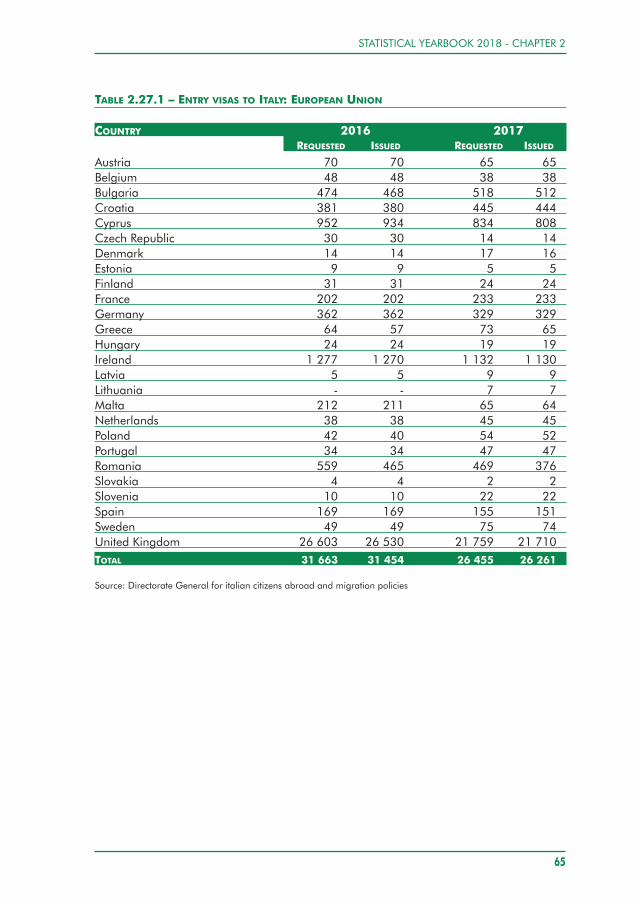
TABLE 2.27.1 – ENTRY VISAS TO ITALY: EUROPEAN UNION
COUNTRY 2016 2017REQUESTED ISSUED REQUESTED ISSUED
Austria 70 70 65 65Belgium 48 48 38 38Bulgaria 474 468 518 512Croatia 381 380 445 444Cyprus 952 934 834 808Czech Republic 30 30 14 14Denmark 14 14 17 16Estonia 9 9 5 5Finland 31 31 24 24France 202 202 233 233Germany 362 362 329 329Greece 64 57 73 65Hungary 24 24 19 19Ireland 1 277 1 270 1 132 1 130Latvia 5 5 9 9Lithuania - - 7 7Malta 212 211 65 64Netherlands 38 38 45 45Poland 42 40 54 52Portugal 34 34 47 47Romania 559 465 469 376Slovakia 4 4 2 2Slovenia 10 10 22 22Spain 169 169 155 151Sweden 49 49 75 74United Kingdom 26 603 26 530 21 759 21 710TOTAL 31 663 31 454 26 455 26 261
Source: Directorate General for italian citizens abroad and migration policies
THE MINISTRY OF FOREIGN AFFAIRS AND INTERNATIONAL COOPERATION
66
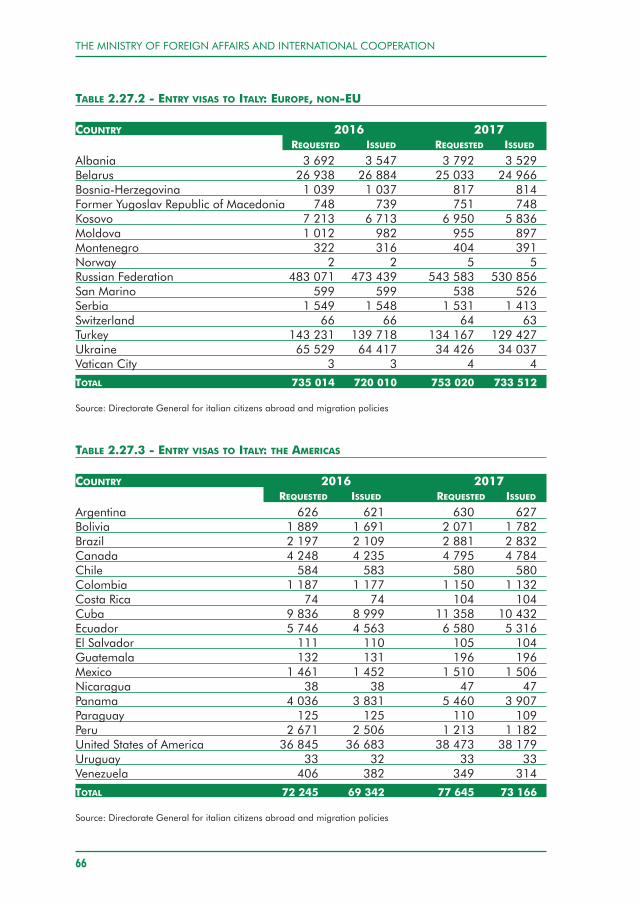
TABLE 2.27.2 - ENTRY VISAS TO ITALY: EUROPE, NON-EU
COUNTRY 2016 2017REQUESTED ISSUED REQUESTED ISSUED
Albania 3 692 3 547 3 792 3 529Belarus 26 938 26 884 25 033 24 966Bosnia-Herzegovina 1 039 1 037 817 814Former Yugoslav Republic of Macedonia 748 739 751 748Kosovo 7 213 6 713 6 950 5 836Moldova 1 012 982 955 897Montenegro 322 316 404 391Norway 2 2 5 5Russian Federation 483 071 473 439 543 583 530 856San Marino 599 599 538 526Serbia 1 549 1 548 1 531 1 413Switzerland 66 66 64 63Turkey 143 231 139 718 134 167 129 427Ukraine 65 529 64 417 34 426 34 037Vatican City 3 3 4 4
TOTAL 735 014 720 010 753 020 733 512
Source: Directorate General for italian citizens abroad and migration policies
TABLE 2.27.3 - ENTRY VISAS TO ITALY: THE AMERICAS
COUNTRY 2016 2017REQUESTED ISSUED REQUESTED ISSUED
Argentina 626 621 630 627Bolivia 1 889 1 691 2 071 1 782Brazil 2 197 2 109 2 881 2 832Canada 4 248 4 235 4 795 4 784Chile 584 583 580 580Colombia 1 187 1 177 1 150 1 132Costa Rica 74 74 104 104Cuba 9 836 8 999 11 358 10 432Ecuador 5 746 4 563 6 580 5 316El Salvador 111 110 105 104Guatemala 132 131 196 196Mexico 1 461 1 452 1 510 1 506Nicaragua 38 38 47 47Panama 4 036 3 831 5 460 3 907Paraguay 125 125 110 109Peru 2 671 2 506 1 213 1 182United States of America 36 845 36 683 38 473 38 179Uruguay 33 32 33 33Venezuela 406 382 349 314
TOTAL 72 245 69 342 77 645 73 166
Source: Directorate General for italian citizens abroad and migration policies
STATISTICAL YEARBOOK 2018 - CHAPTER 2
67
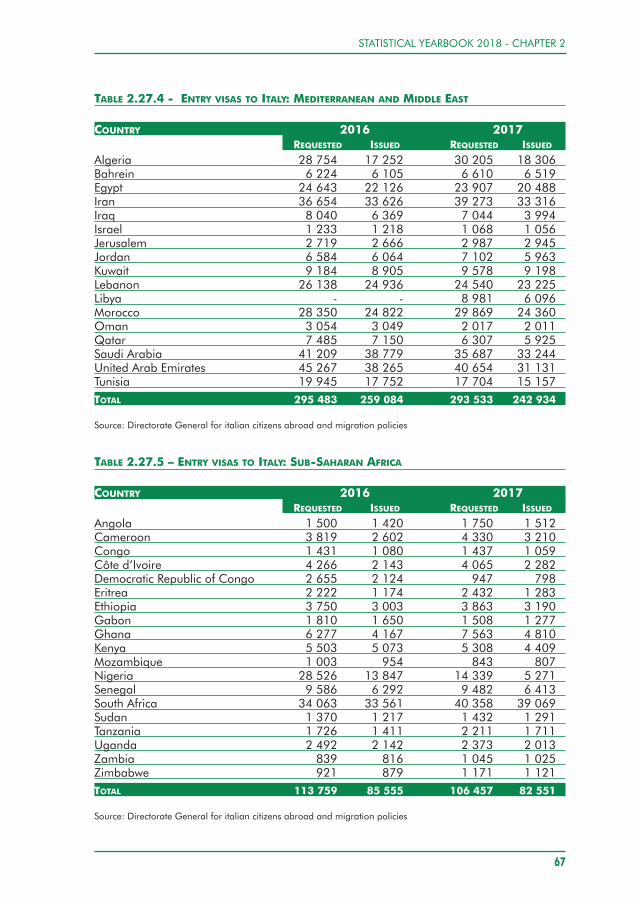
TABLE 2.27.4 - ENTRY VISAS TO ITALY: MEDITERRANEAN AND MIDDLE EAST
COUNTRY 2016 2017REQUESTED ISSUED REQUESTED ISSUED
Algeria 28 754 17 252 30 205 18 306Bahrein 6 224 6 105 6 610 6 519Egypt 24 643 22 126 23 907 20 488Iran 36 654 33 626 39 273 33 316Iraq 8 040 6 369 7 044 3 994Israel 1 233 1 218 1 068 1 056Jerusalem 2 719 2 666 2 987 2 945Jordan 6 584 6 064 7 102 5 963Kuwait 9 184 8 905 9 578 9 198Lebanon 26 138 24 936 24 540 23 225Libya - - 8 981 6 096Morocco 28 350 24 822 29 869 24 360Oman 3 054 3 049 2 017 2 011Qatar 7 485 7 150 6 307 5 925Saudi Arabia 41 209 38 779 35 687 33 244United Arab Emirates 45 267 38 265 40 654 31 131Tunisia 19 945 17 752 17 704 15 157TOTAL 295 483 259 084 293 533 242 934
Source: Directorate General for italian citizens abroad and migration policies
TABLE 2.27.5 – ENTRY VISAS TO ITALY: SUB-SAHARAN AFRICA
COUNTRY 2016 2017REQUESTED ISSUED REQUESTED ISSUED
Angola 1 500 1 420 1 750 1 512Cameroon 3 819 2 602 4 330 3 210Congo 1 431 1 080 1 437 1 059Côte d’Ivoire 4 266 2 143 4 065 2 282Democratic Republic of Congo 2 655 2 124 947 798Eritrea 2 222 1 174 2 432 1 283Ethiopia 3 750 3 003 3 863 3 190Gabon 1 810 1 650 1 508 1 277Ghana 6 277 4 167 7 563 4 810Kenya 5 503 5 073 5 308 4 409Mozambique 1 003 954 843 807Nigeria 28 526 13 847 14 339 5 271Senegal 9 586 6 292 9 482 6 413South Africa 34 063 33 561 40 358 39 069Sudan 1 370 1 217 1 432 1 291Tanzania 1 726 1 411 2 211 1 711Uganda 2 492 2 142 2 373 2 013Zambia 839 816 1 045 1 025Zimbabwe 921 879 1 171 1 121TOTAL 113 759 85 555 106 457 82 551
Source: Directorate General for italian citizens abroad and migration policies
THE MINISTRY OF FOREIGN AFFAIRS AND INTERNATIONAL COOPERATION
68
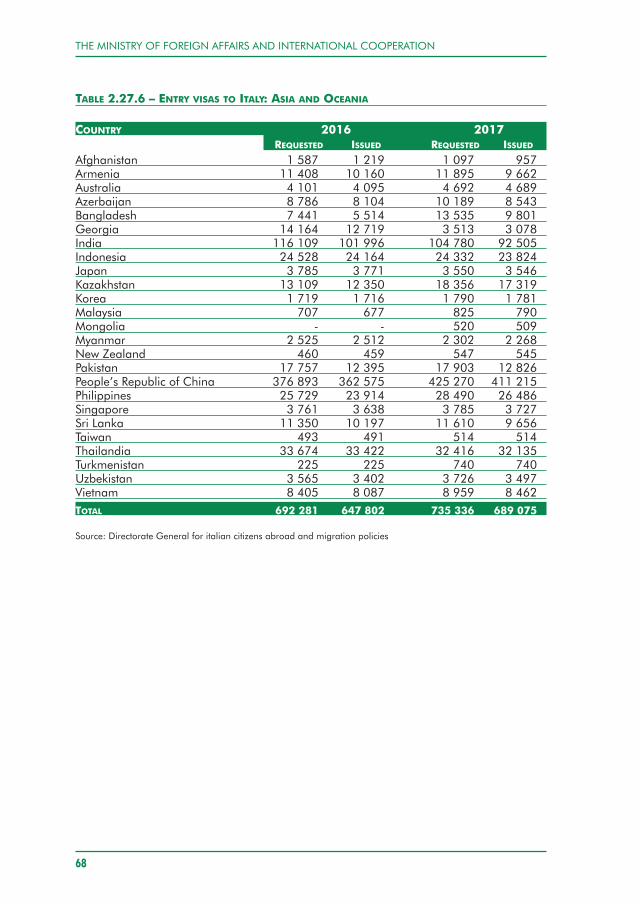
TABLE 2.27.6 – ENTRY VISAS TO ITALY: ASIA AND OCEANIA
COUNTRY 2016 2017REQUESTED ISSUED REQUESTED ISSUED
Afghanistan 1 587 1 219 1 097 957Armenia 11 408 10 160 11 895 9 662Australia 4 101 4 095 4 692 4 689Azerbaijan 8 786 8 104 10 189 8 543Bangladesh 7 441 5 514 13 535 9 801Georgia 14 164 12 719 3 513 3 078India 116 109 101 996 104 780 92 505Indonesia 24 528 24 164 24 332 23 824Japan 3 785 3 771 3 550 3 546Kazakhstan 13 109 12 350 18 356 17 319Korea 1 719 1 716 1 790 1 781Malaysia 707 677 825 790Mongolia - - 520 509Myanmar 2 525 2 512 2 302 2 268New Zealand 460 459 547 545Pakistan 17 757 12 395 17 903 12 826People’s Republic of China 376 893 362 575 425 270 411 215Philippines 25 729 23 914 28 490 26 486Singapore 3 761 3 638 3 785 3 727Sri Lanka 11 350 10 197 11 610 9 656Taiwan 493 491 514 514Thailandia 33 674 33 422 32 416 32 135Turkmenistan 225 225 740 740Uzbekistan 3 565 3 402 3 726 3 497Vietnam 8 405 8 087 8 959 8 462TOTAL 692 281 647 802 735 336 689 075
Source: Directorate General for italian citizens abroad and migration policies
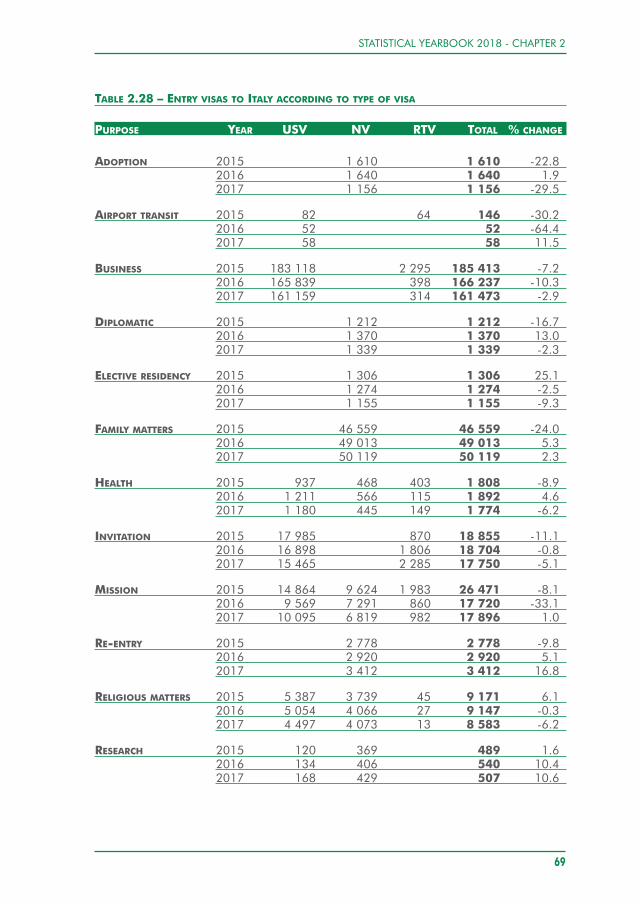
STATISTICAL YEARBOOK 2018 - CHAPTER 2
69
TABLE 2.28 – ENTRY VISAS TO ITALY ACCORDING TO TYPE OF VISA
PURPOSE YEAR USV NV RTV TOTAL % CHANGE
ADOPTION 2015 1 610 1 610 -22.82016 1 640 1 640 1.92017 1 156 1 156 -29.5
AIRPORT TRANSIT 2015 82 64 146 -30.22016 52 52 -64.42017 58 58 11.5
BUSINESS 2015 183 118 2 295 185 413 -7.22016 165 839 398 166 237 -10.3 2017 161 159 314 161 473 -2.9
DIPLOMATIC 2015 1 212 1 212 -16.72016 1 370 1 370 13.02017 1 339 1 339 -2.3
ELECTIVE RESIDENCY 2015 1 306 1 306 25.12016 1 274 1 274 -2.52017 1 155 1 155 -9.3
FAMILY MATTERS 2015 46 559 46 559 -24.02016 49 013 49 013 5.32017 50 119 50 119 2.3
HEALTH 2015 937 468 403 1 808 -8.92016 1 211 566 115 1 892 4.62017 1 180 445 149 1 774 -6.2
INVITATION 2015 17 985 870 18 855 -11.12016 16 898 1 806 18 704 -0.82017 15 465 2 285 17 750 -5.1
MISSION 2015 14 864 9 624 1 983 26 471 -8.12016 9 569 7 291 860 17 720 -33.12017 10 095 6 819 982 17 896 1.0
RE-ENTRY 2015 2 778 2 778 -9.82016 2 920 2 920 5.12017 3 412 3 412 16.8
RELIGIOUS MATTERS 2015 5 387 3 739 45 9 171 6.12016 5 054 4 066 27 9 147 -0.32017 4 497 4 073 13 8 583 -6.2
RESEARCH 2015 120 369 489 1.62016 134 406 540 10.42017 168 429 507 10.6
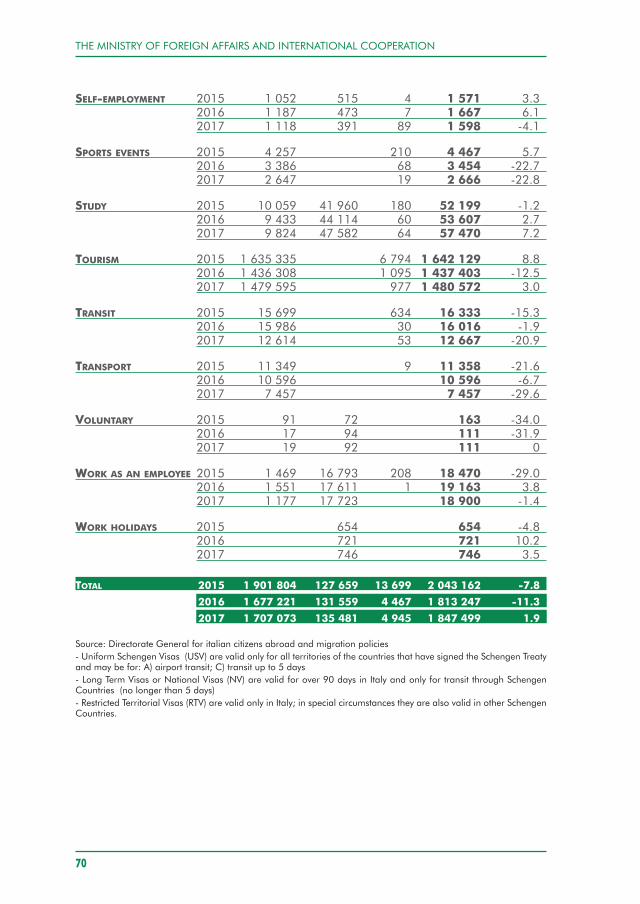
THE MINISTRY OF FOREIGN AFFAIRS AND INTERNATIONAL COOPERATION
70
SELF-EMPLOYMENT 2015 1 052 515 4 1 571 3.32016 1 187 473 7 1 667 6.12017 1 118 391 89 1 598 -4.1
SPORTS EVENTS 2015 4 257 210 4 467 5.72016 3 386 68 3 454 -22.72017 2 647 19 2 666 -22.8
STUDY 2015 10 059 41 960 180 52 199 -1.22016 9 433 44 114 60 53 607 2.72017 9 824 47 582 64 57 470 7.2
TOURISM 2015 1 635 335 6 794 1 642 129 8.82016 1 436 308 1 095 1 437 403 -12.52017 1 479 595 977 1 480 572 3.0
TRANSIT 2015 15 699 634 16 333 -15.32016 15 986 30 16 016 -1.92017 12 614 53 12 667 -20.9
TRANSPORT 2015 11 349 9 11 358 -21.62016 10 596 10 596 -6.72017 7 457 7 457 -29.6
VOLUNTARY 2015 91 72 163 -34.02016 17 94 111 -31.92017 19 92 111 0
WORK AS AN EMPLOYEE 2015 1 469 16 793 208 18 470 -29.02016 1 551 17 611 1 19 163 3.82017 1 177 17 723 18 900 -1.4
WORK HOLIDAYS 2015 654 654 -4.82016 721 721 10.22017 746 746 3.5
TOTAL 2015 1 901 804 127 659 13 699 2 043 162 -7.8
2016 1 677 221 131 559 4 467 1 813 247 -11.3
2017 1 707 073 135 481 4 945 1 847 499 1.9
Source: Directorate General for italian citizens abroad and migration policies- Uniform Schengen Visas (USV) are valid only for all territories of the countries that have signed the Schengen Treatyand may be for: A) airport transit; C) transit up to 5 days - Long Term Visas or National Visas (NV) are valid for over 90 days in Italy and only for transit through SchengenCountries (no longer than 5 days)- Restricted Territorial Visas (RTV) are valid only in Italy; in special circumstances they are also valid in other SchengenCountries.
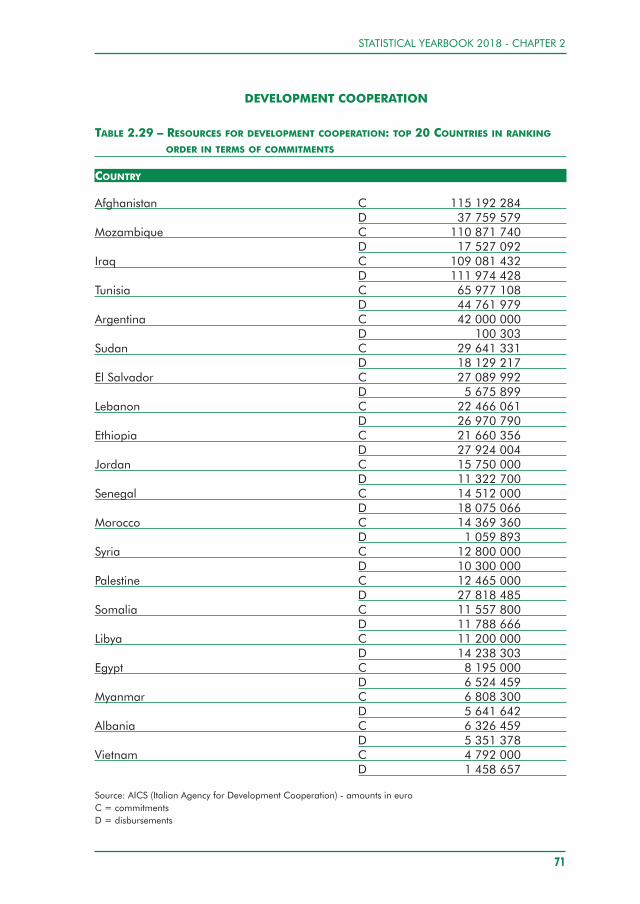
STATISTICAL YEARBOOK 2018 - CHAPTER 2
71
DEVELOPMENT COOPERATION
TABLE 2.29 – RESOURCES FOR DEVELOPMENT COOPERATION: TOP 20 COUNTRIES IN RANKINGORDER IN TERMS OF COMMITMENTS
COUNTRY
Afghanistan C 115 192 284D 37 759 579
Mozambique C 110 871 740D 17 527 092
Iraq C 109 081 432D 111 974 428
Tunisia C 65 977 108D 44 761 979
Argentina C 42 000 000D 100 303
Sudan C 29 641 331D 18 129 217
El Salvador C 27 089 992D 5 675 899
Lebanon C 22 466 061D 26 970 790
Ethiopia C 21 660 356D 27 924 004
Jordan C 15 750 000D 11 322 700
Senegal C 14 512 000D 18 075 066
Morocco C 14 369 360D 1 059 893
Syria C 12 800 000D 10 300 000
Palestine C 12 465 000D 27 818 485
Somalia C 11 557 800D 11 788 666
Libya C 11 200 000D 14 238 303
Egypt C 8 195 000D 6 524 459
Myanmar C 6 808 300D 5 641 642
Albania C 6 326 459D 5 351 378
Vietnam C 4 792 000D 1 458 657
Source: AICS (Italian Agency for Development Cooperation) - amounts in euroC = commitmentsD = disbursements
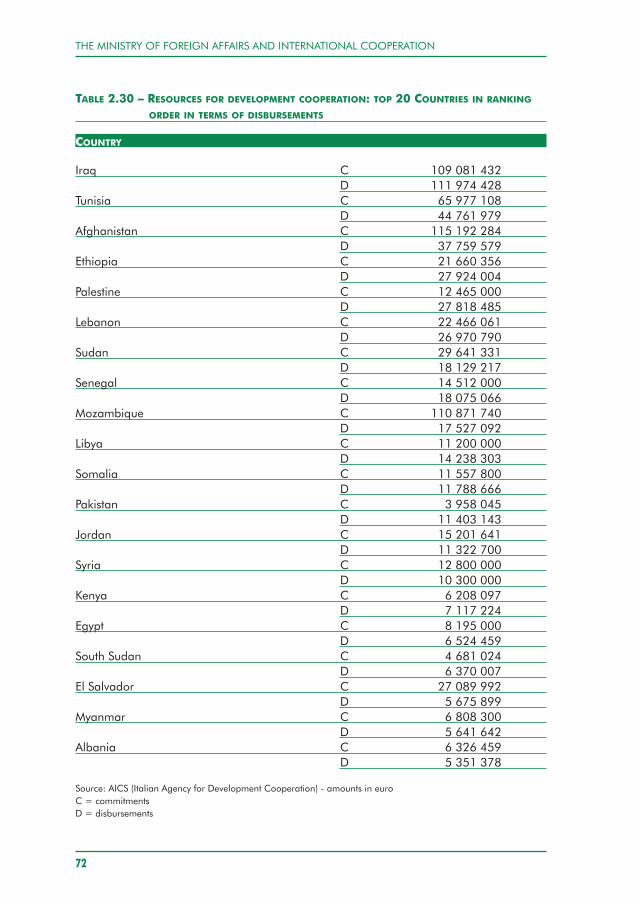
THE MINISTRY OF FOREIGN AFFAIRS AND INTERNATIONAL COOPERATION
72
TABLE 2.30 – RESOURCES FOR DEVELOPMENT COOPERATION: TOP 20 COUNTRIES IN RANKINGORDER IN TERMS OF DISBURSEMENTS
COUNTRY
Iraq C 109 081 432D 111 974 428
Tunisia C 65 977 108D 44 761 979
Afghanistan C 115 192 284D 37 759 579
Ethiopia C 21 660 356D 27 924 004
Palestine C 12 465 000D 27 818 485
Lebanon C 22 466 061D 26 970 790
Sudan C 29 641 331D 18 129 217
Senegal C 14 512 000D 18 075 066
Mozambique C 110 871 740D 17 527 092
Libya C 11 200 000D 14 238 303
Somalia C 11 557 800D 11 788 666
Pakistan C 3 958 045D 11 403 143
Jordan C 15 201 641D 11 322 700
Syria C 12 800 000D 10 300 000
Kenya C 6 208 097D 7 117 224
Egypt C 8 195 000D 6 524 459
South Sudan C 4 681 024D 6 370 007
El Salvador C 27 089 992D 5 675 899
Myanmar C 6 808 300D 5 641 642
Albania C 6 326 459D 5 351 378
Source: AICS (Italian Agency for Development Cooperation) - amounts in euroC = commitmentsD = disbursements
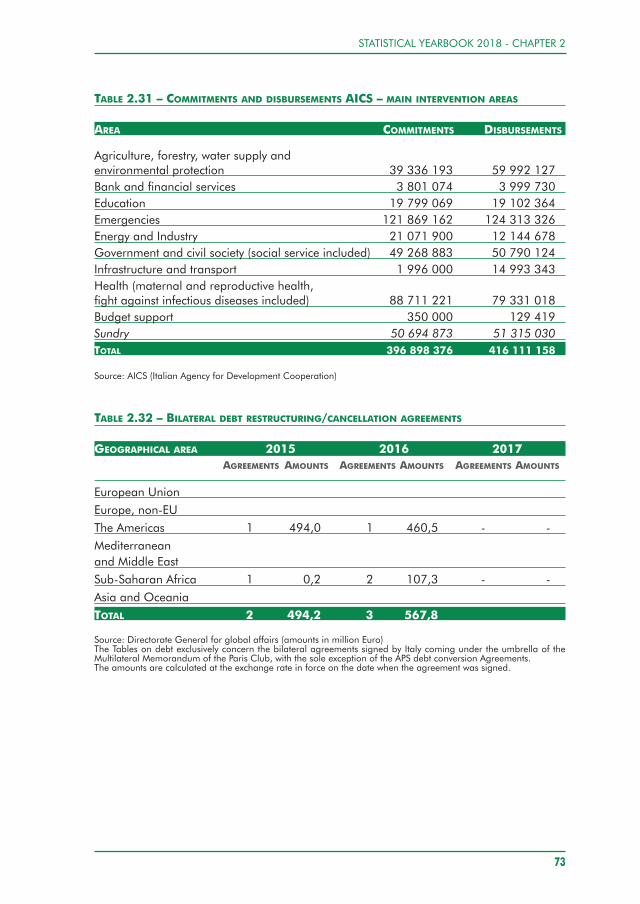
STATISTICAL YEARBOOK 2018 - CHAPTER 2
73
TABLE 2.31 – COMMITMENTS AND DISBURSEMENTS AICS – MAIN INTERVENTION AREAS
AREA COMMITMENTS DISBURSEMENTS
Agriculture, forestry, water supply and environmental protection 39 336 193 59 992 127Bank and financial services 3 801 074 3 999 730Education 19 799 069 19 102 364Emergencies 121 869 162 124 313 326Energy and Industry 21 071 900 12 144 678Government and civil society (social service included) 49 268 883 50 790 124Infrastructure and transport 1 996 000 14 993 343Health (maternal and reproductive health, fight against infectious diseases included) 88 711 221 79 331 018Budget support 350 000 129 419Sundry 50 694 873 51 315 030TOTAL 396 898 376 416 111 158
Source: AICS (Italian Agency for Development Cooperation)
TABLE 2.32 – BILATERAL DEBT RESTRUCTURING/CANCELLATION AGREEMENTS
GEOGRAPHICAL AREA 2015 2016 2017AGREEMENTS AMOUNTS AGREEMENTS AMOUNTS AGREEMENTS AMOUNTS
European UnionEurope, non-EUThe Americas 1 494,0 1 460,5 - -Mediterranean and Middle EastSub-Saharan Africa 1 0,2 2 107,3 - -Asia and OceaniaTOTAL 2 494,2 3 567,8
Source: Directorate General for global affairs (amounts in million Euro)The Tables on debt exclusively concern the bilateral agreements signed by Italy coming under the umbrella of theMultilateral Memorandum of the Paris Club, with the sole exception of the APS debt conversion Agreements. The amounts are calculated at the exchange rate in force on the date when the agreement was signed.
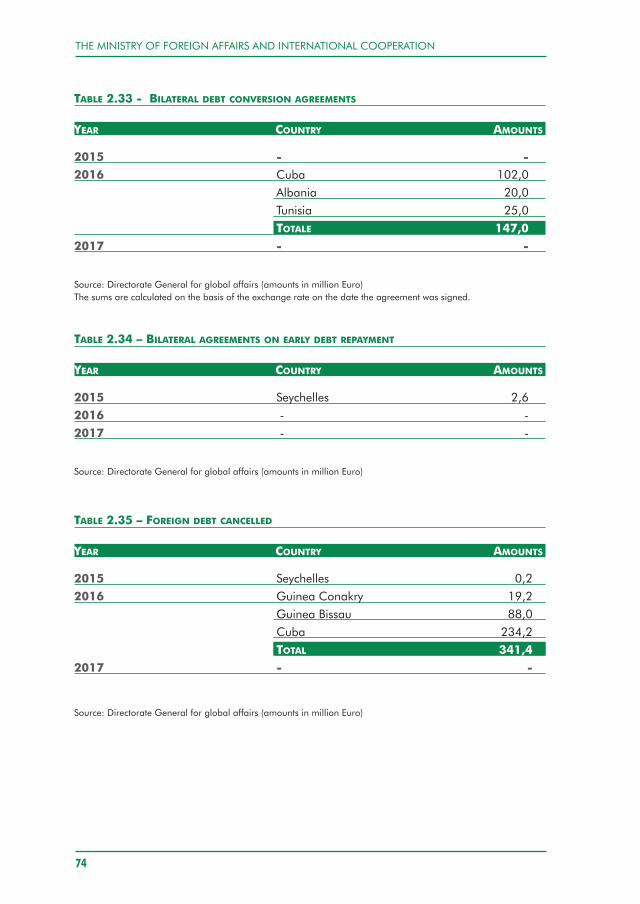
THE MINISTRY OF FOREIGN AFFAIRS AND INTERNATIONAL COOPERATION
74
TABLE 2.33 - BILATERAL DEBT CONVERSION AGREEMENTS
YEAR COUNTRY AMOUNTS
2015 - -2016 Cuba 102,0
Albania 20,0Tunisia 25,0TOTALE 147,0
2017 - -
Source: Directorate General for global affairs (amounts in million Euro)The sums are calculated on the basis of the exchange rate on the date the agreement was signed.
TABLE 2.34 – BILATERAL AGREEMENTS ON EARLY DEBT REPAYMENT
YEAR COUNTRY AMOUNTS
2015 Seychelles 2,62016 - -2017 - -
Source: Directorate General for global affairs (amounts in million Euro)
TABLE 2.35 – FOREIGN DEBT CANCELLED
YEAR COUNTRY AMOUNTS
2015 Seychelles 0,22016 Guinea Conakry 19,2
Guinea Bissau 88,0Cuba 234,2TOTAL 341,4
2017 - -
Source: Directorate General for global affairs (amounts in million Euro)
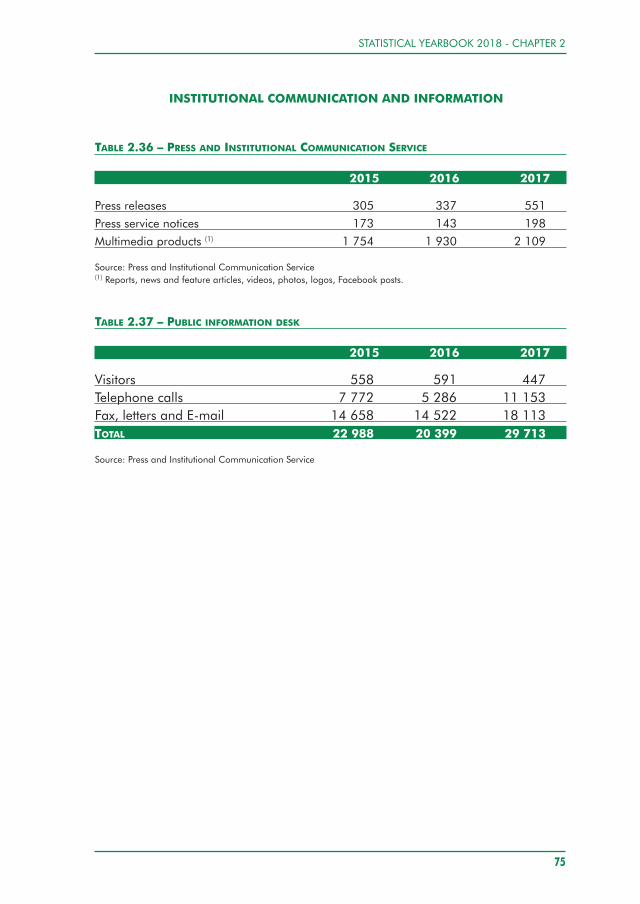
STATISTICAL YEARBOOK 2018 - CHAPTER 2
75
INSTITUTIONAL COMMUNICATION AND INFORMATION
TABLE 2.36 – PRESS AND INSTITUTIONAL COMMUNICATION SERVICE
2015 2016 2017
Press releases 305 337 551Press service notices 173 143 198Multimedia products (1) 1 754 1 930 2 109
Source: Press and Institutional Communication Service(1) Reports, news and feature articles, videos, photos, logos, Facebook posts.
TABLE 2.37 – PUBLIC INFORMATION DESK
2015 2016 2017
Visitors 558 591 447Telephone calls 7 772 5 286 11 153Fax, letters and E-mail 14 658 14 522 18 113TOTAL 22 988 20 399 29 713
Source: Press and Institutional Communication Service
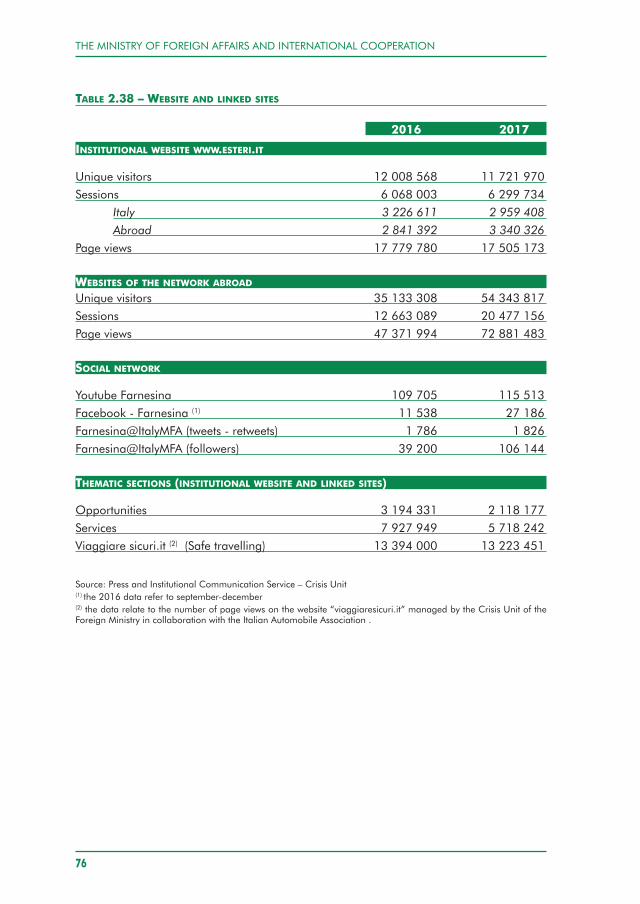
TABLE 2.38 – WEBSITE AND LINKED SITES
2016 2017
INSTITUTIONAL WEBSITE WWW.ESTERI.IT
Unique visitors 12 008 568 11 721 970Sessions 6 068 003 6 299 734
Italy 3 226 611 2 959 408Abroad 2 841 392 3 340 326
Page views 17 779 780 17 505 173
WEBSITES OF THE NETWORK ABROAD
Unique visitors 35 133 308 54 343 817Sessions 12 663 089 20 477 156Page views 47 371 994 72 881 483
SOCIAL NETWORK
Youtube Farnesina 109 705 115 513Facebook - Farnesina (1) 11 538 27 186Farnesina@ItalyMFA (tweets - retweets) 1 786 1 826Farnesina@ItalyMFA (followers) 39 200 106 144
THEMATIC SECTIONS (INSTITUTIONAL WEBSITE AND LINKED SITES)
Opportunities 3 194 331 2 118 177Services 7 927 949 5 718 242Viaggiare sicuri.it (2) (Safe travelling) 13 394 000 13 223 451
Source: Press and Institutional Communication Service – Crisis Unit(1) the 2016 data refer to september-december(2) the data relate to the number of page views on the website “viaggiaresicuri.it” managed by the Crisis Unit of theForeign Ministry in collaboration with the Italian Automobile Association .
THE MINISTRY OF FOREIGN AFFAIRS AND INTERNATIONAL COOPERATION
76
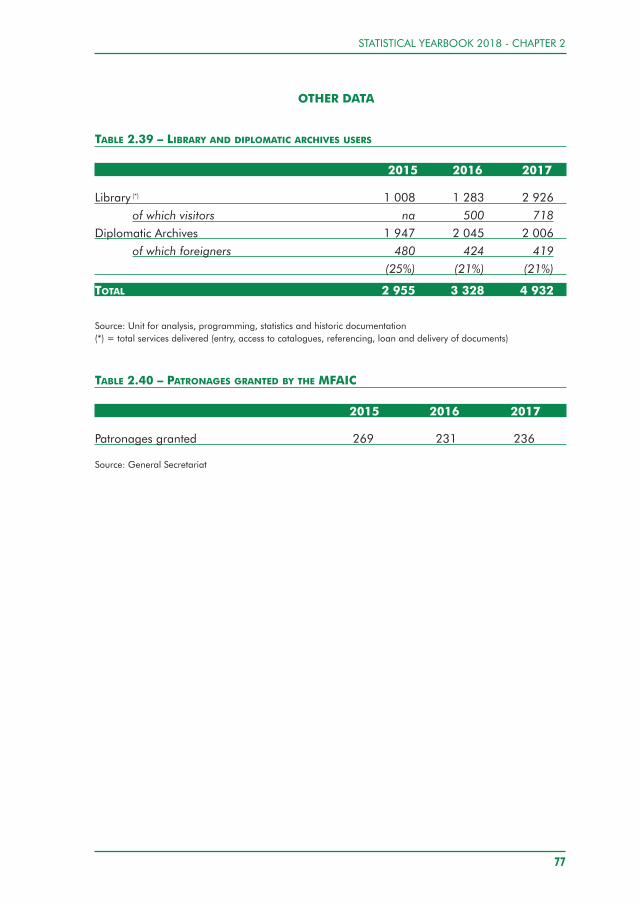
STATISTICAL YEARBOOK 2018 - CHAPTER 2
77
OTHER DATA
TABLE 2.39 – LIBRARY AND DIPLOMATIC ARCHIVES USERS
2015 2016 2017
Library (*) 1 008 1 283 2 926of which visitors na 500 718
Diplomatic Archives 1 947 2 045 2 006of which foreigners 480 424 419
(25%) (21%) (21%)
TOTAL 2 955 3 328 4 932
Source: Unit for analysis, programming, statistics and historic documentation(*) = total services delivered (entry, access to catalogues, referencing, loan and delivery of documents)
TABLE 2.40 – PATRONAGES GRANTED BY THE MFAIC
2015 2016 2017
Patronages granted 269 231 236
Source: General Secretariat

THE MINISTRY OF FOREIGN AFFAIRS AND INTERNATIONAL COOPERATION
78
STATISTICAL YEARBOOK 2018 - CHAPTER 3
COMPARISON WITH OTHER COUNTRIES
79
THE MINISTRY OF FOREIGN AFFAIRS AND INTERNATIONAL COOPERATION
80
STATISTICAL YEARBOOK 2018 - CHAPTER 2
COMPARISON WITH OTHER COUNTRIES
In the third chapter, the Statistical Yearbook illustrates the main elements that theForeign Affairs Ministries of some European Countries (France, Germany, UnitedKingdom and Netherlands) have in common: offices abroad, human and financialresources, development cooperation, contributions to the budgets of the UnitedNations and European Union, and visas issued.
The information compared concerns number of staff (members with andwithout tenure), organisational structure and budget (National Budget and MFABudget).
The source of reference for the data of the national budget and GDP isEUROSTAT, while the data on human and financial resources of the Foreign AffairsMinistries are obtained directly from the local administrations through the Italiandiplomatic offices.
The outcome of the comparison is interesting especially for the size of theabsolute figures. However, it should be pointed out that in reading and making acomparative interpretation of the data one must always bear in mind how complexit is to compare different institutions because of the diversity not only in the form ofState and Government, but also of the methods and procedures applied in nationalaccounting and in the management of human resources.
81
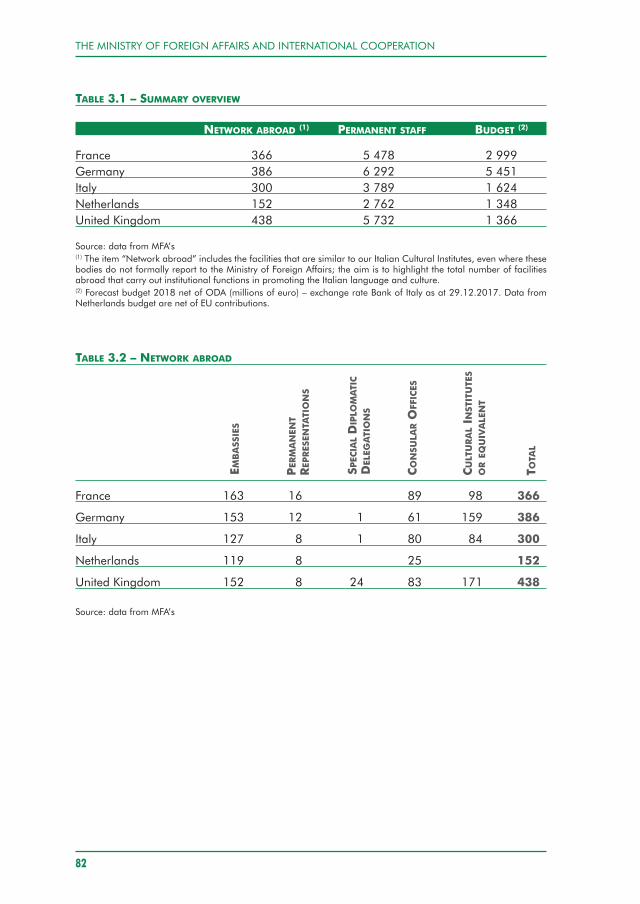
THE MINISTRY OF FOREIGN AFFAIRS AND INTERNATIONAL COOPERATION
82
TABLE 3.1 – SUMMARY OVERVIEW
NETWORK ABROAD (1) PERMANENT STAFF BUDGET (2)
France 366 5 478 2 999Germany 386 6 292 5 451Italy 300 3 789 1 624Netherlands 152 2 762 1 348United Kingdom 438 5 732 1 366
Source: data from MFA’s(1) The item “Network abroad” includes the facilities that are similar to our Italian Cultural Institutes, even where thesebodies do not formally report to the Ministry of Foreign Affairs; the aim is to highlight the total number of facilitiesabroad that carry out institutional functions in promoting the Italian language and culture.(2) Forecast budget 2018 net of ODA (millions of euro) – exchange rate Bank of Italy as at 29.12.2017. Data fromNetherlands budget are net of EU contributions.
TABLE 3.2 – NETWORK ABROAD
France 163 16 89 98 366
Germany 153 12 1 61 159 386
Italy 127 8 1 80 84 300
Netherlands 119 8 25 152
United Kingdom 152 8 24 83 171 438
Source: data from MFA’s
EMBASSIES
CULTURALINSTITUTES
OREQUIVALENT
TOTAL
PERMANENT
REPRESENTATIONS
SPECIALDIPLOMATIC
DELEGATIONS
CONSULAROFFICES
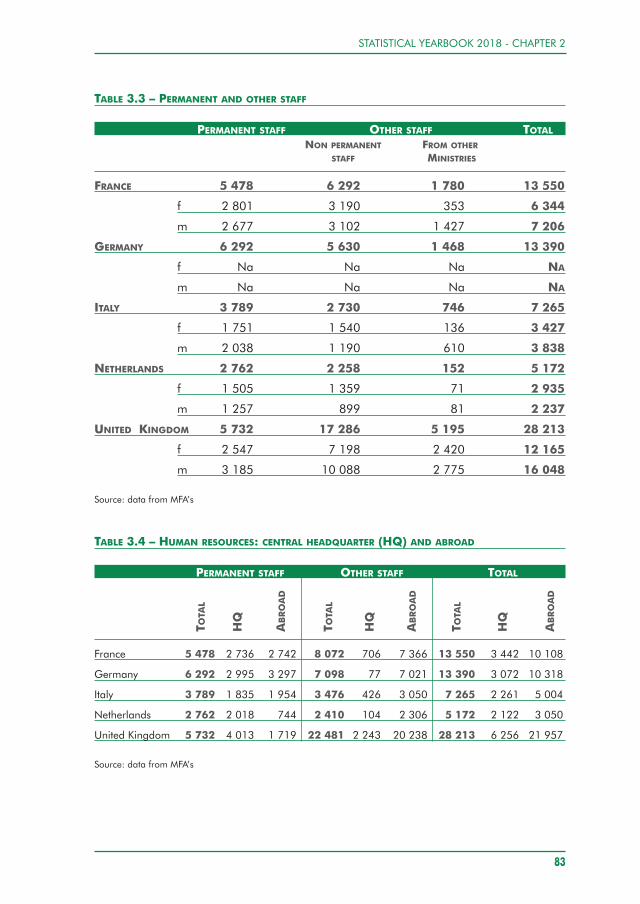
STATISTICAL YEARBOOK 2018 - CHAPTER 2
TABLE 3.3 – PERMANENT AND OTHER STAFF
PERMANENT STAFF OTHER STAFF TOTALNON PERMANENT FROM OTHER
STAFF MINISTRIES
FRANCE 5 478 6 292 1 780 13 550
f 2 801 3 190 353 6 344
m 2 677 3 102 1 427 7 206
GERMANY 6 292 5 630 1 468 13 390
f Na Na Na NA
m Na Na Na NA
ITALY 3 789 2 730 746 7 265
f 1 751 1 540 136 3 427
m 2 038 1 190 610 3 838
NETHERLANDS 2 762 2 258 152 5 172
f 1 505 1 359 71 2 935
m 1 257 899 81 2 237
UNITED KINGDOM 5 732 17 286 5 195 28 213
f 2 547 7 198 2 420 12 165
m 3 185 10 088 2 775 16 048
Source: data from MFA’s
TABLE 3.4 – HUMAN RESOURCES: CENTRAL HEADQUARTER (HQ) AND ABROAD
PERMANENT STAFF OTHER STAFF TOTAL
France 5 478 2 736 2 742 8 072 706 7 366 13 550 3 442 10 108
Germany 6 292 2 995 3 297 7 098 77 7 021 13 390 3 072 10 318
Italy 3 789 1 835 1 954 3 476 426 3 050 7 265 2 261 5 004
Netherlands 2 762 2 018 744 2 410 104 2 306 5 172 2 122 3 050
United Kingdom 5 732 4 013 1 719 22 481 2 243 20 238 28 213 6 256 21 957
Source: data from MFA’s
83
TOTA
L
HQ
ABROAD
HQ
ABROAD
TOTA
L
TOTA
L
HQ
ABROAD
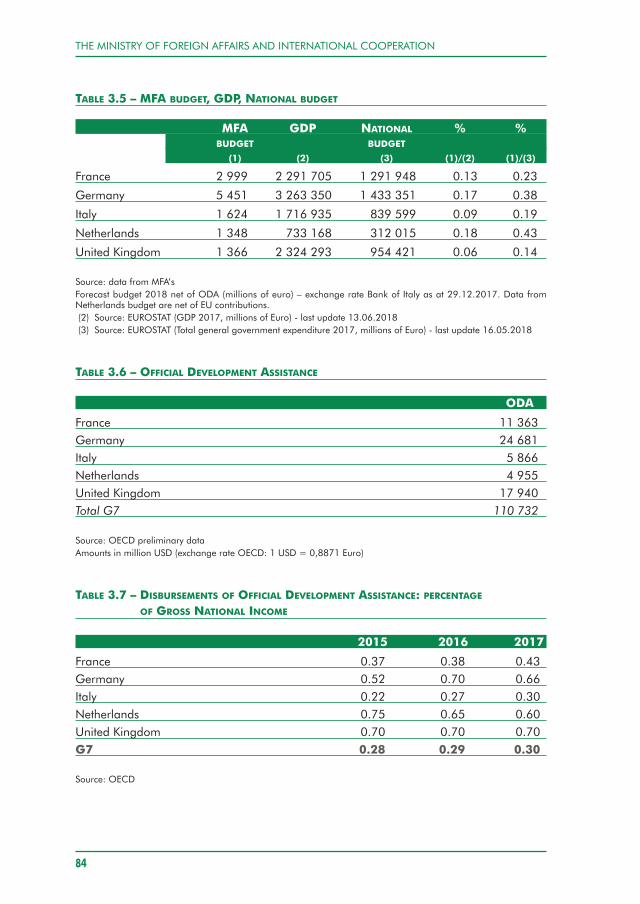
THE MINISTRY OF FOREIGN AFFAIRS AND INTERNATIONAL COOPERATION
84
TABLE 3.5 – MFA BUDGET, GDP, NATIONAL BUDGET
MFA GDP NATIONAL % %BUDGET BUDGET
(1) (2) (3) (1)/(2) (1)/(3)
France 2 999 2 291 705 1 291 948 0.13 0.23
Germany 5 451 3 263 350 1 433 351 0.17 0.38
Italy 1 624 1 716 935 839 599 0.09 0.19
Netherlands 1 348 733 168 312 015 0.18 0.43
United Kingdom 1 366 2 324 293 954 421 0.06 0.14
Source: data from MFA’sForecast budget 2018 net of ODA (millions of euro) – exchange rate Bank of Italy as at 29.12.2017. Data fromNetherlands budget are net of EU contributions.(2) Source: EUROSTAT (GDP 2017, millions of Euro) - last update 13.06.2018(3) Source: EUROSTAT (Total general government expenditure 2017, millions of Euro) - last update 16.05.2018
TABLE 3.6 – OFFICIAL DEVELOPMENT ASSISTANCE
ODA
France 11 363Germany 24 681Italy 5 866Netherlands 4 955United Kingdom 17 940Total G7 110 732
Source: OECD preliminary data Amounts in million USD (exchange rate OECD: 1 USD = 0,8871 Euro)
TABLE 3.7 – DISBURSEMENTS OF OFFICIAL DEVELOPMENT ASSISTANCE: PERCENTAGEOF GROSS NATIONAL INCOME
2015 2016 2017
France 0.37 0.38 0.43Germany 0.52 0.70 0.66Italy 0.22 0.27 0.30Netherlands 0.75 0.65 0.60United Kingdom 0.70 0.70 0.70G7 0.28 0.29 0.30
Source: OECD
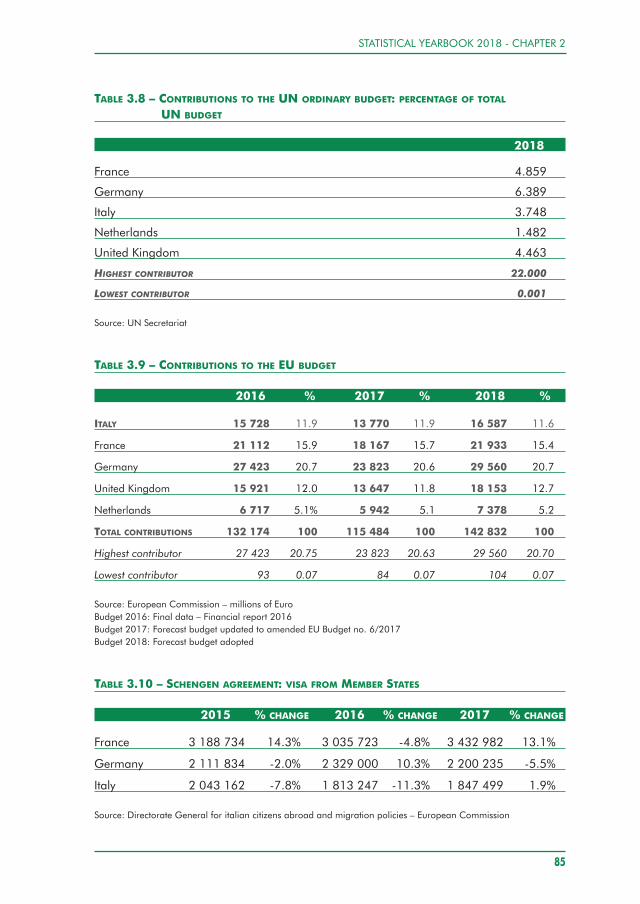
STATISTICAL YEARBOOK 2018 - CHAPTER 2
TABLE 3.8 – CONTRIBUTIONS TO THE UN ORDINARY BUDGET: PERCENTAGE OF TOTALUN BUDGET
2018
France 4.859
Germany 6.389
Italy 3.748
Netherlands 1.482
United Kingdom 4.463
HIGHEST CONTRIBUTOR 22.000
LOWEST CONTRIBUTOR 0.001
Source: UN Secretariat
TABLE 3.9 – CONTRIBUTIONS TO THE EU BUDGET
2016 % 2017 % 2018 %
ITALY 15 728 11.9 13 770 11.9 16 587 11.6
France 21 112 15.9 18 167 15.7 21 933 15.4
Germany 27 423 20.7 23 823 20.6 29 560 20.7
United Kingdom 15 921 12.0 13 647 11.8 18 153 12.7
Netherlands 6 717 5.1% 5 942 5.1 7 378 5.2
TOTAL CONTRIBUTIONS 132 174 100 115 484 100 142 832 100
Highest contributor 27 423 20.75 23 823 20.63 29 560 20.70
Lowest contributor 93 0.07 84 0.07 104 0.07
Source: European Commission – millions of EuroBudget 2016: Final data – Financial report 2016Budget 2017: Forecast budget updated to amended EU Budget no. 6/2017Budget 2018: Forecast budget adopted
TABLE 3.10 – SCHENGEN AGREEMENT: VISA FROM MEMBER STATES
2015 % CHANGE 2016 % CHANGE 2017 % CHANGE
France 3 188 734 14.3% 3 035 723 -4.8% 3 432 982 13.1%
Germany 2 111 834 -2.0% 2 329 000 10.3% 2 200 235 -5.5%
Italy 2 043 162 -7.8% 1 813 247 -11.3% 1 847 499 1.9%
Source: Directorate General for italian citizens abroad and migration policies – European Commission
85
THE MINISTRY OF FOREIGN AFFAIRS AND INTERNATIONAL COOPERATION
86
Unit for analysis, programming, statistics and historic documentation of the Ministry of Foreign Affairs and International Cooperation
Graphics and layout: Press and Institutional Communication Service
The Yearbook is available on the website of the Ministry of Foreign Affairs and International Cooperation
www.esteri.it/mae/it/ministero/pubblicazioni