2019 Philippine Statistical Yearbook (PSY)
628
-
Upload
khangminh22 -
Category
Documents
-
view
0 -
download
0
Transcript of 2019 Philippine Statistical Yearbook (PSY)


Republic of the Philippines
Philippine Statistics Authority SOLID RESPONSIVE WORLD-CLASS

PHILIPPINE STATISTICS AUTHORITY
FOREWORD
Statistics play a vital role in policy making not only in the government but also in the private sector. With this in mind, the Philippine Statistics Authority (PSA) is pleased to release the Philippine Statistical Yearbook (PSY) as its contribution to data-driven and evidence-based policymaking in the country.
PSY is one of the PSA’s flagship publications which aim to be a reliable source of information for strategic planning; policy; program and project formulation; business and investment; decision-making; research and feasibility studies; and news media articles and investigative stories.
The 2019 edition of PSY has 19 chapters that encompass a specific statistical subject area or sector such as: population and housing; income and prices; environment and natural resources; industry; trade; tourism; vital, health, and nutrition statistics; public order; safety and justice; and science and technology, among others. To meet the needs of wide range data users from government, business sector, academe, civil society, and the general public, PSY data and statistics are disaggregated in different dimensions.
PSY contains time-series statistical information about the country’s social and economic environment. These statistics are sourced from the surveys and censuses conducted by statistical agencies, administrative and regulatory records of government agencies, and publications by local and international organizations. Moreover, these data have been generated in accordance with principles, standards, and classifications set by international recommendations and guidelines adapted to local conditions.
The 2018 Domestic Trade Statistics in the Philippines is highlighted and featured in this edition of PSY. This pertains to goods that passed through airports and seaports in the country, whether for government or private use, or for commercial purposes. This administrative-based data on the inflow and outflow values of commodities in the different regions of the country are used to construct inter-regional and inter-industry relation tables.
For this, we at the PSA aspire that readers will find the 2019 PSY serviceable and very informative. Also, we sincerely acknowledge the unwavering support and cooperation of our partner agencies and data sources for providing the needed information, which made this publication possible.
CLAIRE DENNIS S. MAPA, Ph.D. Undersecretary
National Statistician and Civil Registrar General
October 2019

CONTENTS
Foreword Contents The Philippine Statistics Authority Board The Philippine Statistics Authority List of Data Sources Standard Symbols Used Summary of Major Statistical Series Special Feature
iii v vi vii viii ix 1
19
Chapter 1 POPULATION AND HOUSING 1-1Chapter 2 INCOME AND PRICES 2-1Chapter 3 ECONOMIC ACCOUNTS 3-1Chapter 4 ENVIRONMENT AND NATURAL RESOURCES 4-1Chapter 5 AGRICULTURE AND AGRARIAN REFORM 5-1Chapter 6 INDUSTRY 6-1Chapter 7 TRADE 7-1Chapter 8 TOURISM 8-1Chapter 9 VITAL, HEALTH AND NUTRITION STATISTICS 9-1Chapter 10 EDUCATION AND MANPOWER DEVELOPMENT 10-1Chapter 11 LABOR AND EMPLOYMENT 11-1Chapter 12 SOCIAL SERVICES 12-1Chapter 13 TRANSPORTATION AND COMMUNICATION 13-1Chapter 14 ENERGY AND WATER RESOURCES 14-1Chapter 15 PUBLIC ADMINISTRATION 15-1Chapter 16 BANKING AND FINANCE 16-1Chapter 17 PUBLIC ORDER, SAFETY AND JUSTICE 17-1Chapter 18 SCIENCE AND TECHNOLOGY 18-1Chapter 19 INTERNATIONAL STATISTICS 19-1Glossary of Terms Glossary

THE PHILIPPINE STATISTICS AUTHORITY BOARD
Sec. ERNESTO M. PERNIA Chairperson
Secretary of Socioeconomic Planning and Director General National Economic and Development Authority
Usec. LAURA B. PASCUA Vice Chairperson
Department of Budget and Management
MEMBERS of the BOARD
Philippine Statistics Authority Department of Agriculture Department of Agrarian Reform Department of Education Department of Energy Department of Environment and Natural Resources Department of Finance Department of Foreign Affairs Department of Health Department of Information and Communications Technology Department of Interior and Local Government Department of Justice Department of Labor and Employment Department of National Defense Department of Public Works and Highways Department of Science and Technology Department of Social Welfare and Development Department of Trade and Industry Department of Transportation Department of Tourism Bangko Sentral ng Pilipinas Commission on Higher Education Technical Education and Skills Development Authority Governance Commission on GOCCs Philippine Statistical Research and Training Institute Philippine Statistical Association, Inc. Union of Local Authorities of the Philippines Management Association of the Philippines
Usec. Claire Dennis S. Mapa Usec. Evelyn G. Laviña Usec. Emily O. Padilla Usec. Jesus L.R. Mateo Usec. Jesus Cristino P. Posadas Usec. Ernersto D. Adobo, Jr. Usec. Gil S. Beltran Usec. Lourdes O. Yparraguirre Usec. Mario C. Villaverde Usec. Denis F. Villorente Usec. Marivel C. Sacendoncillo Usec. EmmelineAglipay-Villar Usec.Ciriaco A. Lagunzad III Usec. Ricardo A. David, Jr. Usec. Maria Catalina E. Cabral Asec. Maridon O. Sahagun Usec. Florita R. Villar Usec. Ceferino S. Rodolfo Usec. Artemio U. Tuazon, Jr. Usec. Benito C. Bengzon Dep. Gov. Francisco G. Dakila, Jr. Dir. Nelson G. Cainghog Deputy Dir. Gen. Rosanna A. Urdaneta Comm. Michael P. Cloribel Exec. Dir. Josefina V. Almeda Ms. Francisca Nasol-Dayrit Gov. Al Francsis C. Bichara Mr. Amando M. Tetangco, Jr.
i

Republic of the Philippines THE PHILIPPINE STATISTICS AUTHORITY
CLAIRE DENNIS S. MAPA, Ph.D. Undersecretary
National Statistician and Civil Registrar General
Assistant Secretaries/ Deputy National Statisticians
MINERVA ELOISA P. ESQUIVIAS (Officer-in-Charge)
Censuses and Technical Coordination Office
Atty. MAQTAHAR L. MANULON (Officer-in-Charge)
Civil Registration and Central Support Office
ROSALINDA P. BAUTISTA Sectoral Statistics Office
Assistant National Statisticians
SEVERA B. DE COSTO MINERVA ELOISA P. ESQUIVIAS Officer-in-Charge National Censuses Service Standards Service
WILMA A. GUILLEN VIVIAN R. ILARINA Social Sector Statistics Service Macroeconomic Accounts Service
NOEL G. PEREZ FRED S. SOLLESTA Officer-in-Charge Officer-in-Charge Information Technology and Dissemination Service Civil Registration Service
SOCRATES L. RAMORES DIVINA GRACIA L. DEL PRADO Officer-in-Charge Economic Sector Statistics Service Finance and Administrative Service
ii

LIST OF DATA SOURCES
Department of Agriculture (DA) Fertilizer and Pesticide Authority
Department of Budget and Management (DBM) Department of Education (DepEd)
National Education Testing and Research Center Department of Environment and Natural Resources (DENR)
Environmental Management Bureau Forest Management Bureau Mines and Geo-Sciences Bureau National Mapping & Resource Information Authority
Department of Energy (DOE) Department of Finance (DOF)
Bureau of Treasury Insurance Commission
Department of Health (DOH) Food and Drug Administration Dangerous Drug Board
Department of Interior and Local Government (DILG) Bureau of Fire Protection Bureau of Jail Management and Penology Bureau of Local Government Supervision Philippine National Police
Department of Justice (DOJ) Bureau of Corrections Public Attorney’s Office
Department of Labor and Employment (DOLE) Bureau of Labor Relations National Conciliation and Mediation Board National Wages and Productivity Commission Philippine Overseas and Employment Administration Technical Education and Skills Development Authority
Department of National Defense (DND) National Disaster Risk Reduction and Management Council
Department of Public Works and Highways (DPWH) Department of Science and Technology (DOST)
National Computer Center Philippine Atmospheric, Geophysical and Astronomical Services Administration
Department of Social Welfare and Development (DSWD) Department of Trade and Industry (DTI)
Intellectual Property Office Department of Transportation (DOTr)
Civil Aviation Authority of the Philippines Maritime Industry Authority Land Transportation Office National Telecommunications Commission Philippine National Railways
Department of Tourism (DOT) National Economic and Development Authority
Philippine Statistics Authority Government Owned and Controlled Corporation
Bangko Sentral ng Pilipinas Development Bank of the Philippines Government Service and Insurance System Home Development Mutual Fund Local Water Utilities Administration National Electrification Administration National Food Authority National Housing Authority National Irrigation Administration Philippine Deposit Insurance Corporation Philippine Ports Authority Philippine Postal Corporation Social Security System
Other Executive Offices Commission on Higher Education Professional Regulation Commission Securities and Exchange Commission
Supreme Court of the Philippines Constitutional Offices
Civil Service Commission Commission on Audit Commission on Election
iii

STANDARD SYMBOLS USED
SYMBOLS MEANING
CYSYFYn.e.s.n.e.cpr...*-..
ix


Reference Period Value Reference
Period Value
Chapter 1. POPULATION AND HOUSING
1. Population August 01, 2015 100,979,303 May 01, 2010 92,335,113 9.36
2. Population and Regional distribution 100,979,303 92,335,113 9.36
National Capital Region 12,877,253 11,855,975 8.61
Cordillera Administrative Region 1,722,006 1,616,867 6.50
Region I 5,026,128 4,748,372 5.85
Region II 3,451,410 3,229,163 6.88
Region III 11,218,177 10,137,737 10.66
Region IV-A 14,414,774 12,609,803 14.31
Region IV-B 2,963,360 2,744,671 7.97
Region V 5,796,989 5,420,411 6.95
Region VI 4,477,247 4,194,579 6.74
Region VII 6,041,903 5,513,514 9.58
Region VIII 4,440,150 4,101,322 8.26
Region IX 3,629,783 3,407,353 6.53
Region X 4,689,302 4,297,323 9.12
Region XI 4,893,318 4,468,563 9.51
Region XII 4,545,276 4,109,571 10.60
Region XIII 2,596,709 2,429,224 6.89
ARMM 3,781,387 3,256,140 16.13
Negros Island Region 4,414,131 4,194,525 5.24Filipinos in Philippine Embassies/Consulates and Missions Abroad 2,134 2,739 (22.09)
3. Registered Filipino emigrants 2017 2016
Female 46,038 52,318 (12.00)
Male 33,741 37,036 (8.90) 4. Number of households provided with housing unit by the Government 2018 195,055 2017 199,345 (2.15)
Chapter 2. INCOME AND PRICES
1. Average family income (In thousands) 2015 267 2012 235 13.622. Average family expenditure (In thousands) 2015 215 2012 193 11.40
SUMMARY OF MAJOR STATISTICAL SERIES
Statistical SeriesLatest Date Compared to
Percent Change

Reference Period Value Reference
Period Value
SUMMARY OF MAJOR STATISTICAL SERIES
Statistical SeriesLatest Date Compared to
Percent Change
3. Poverty threshold (annual per capita) 2015 21,753 2012 18,935 14.884. Poverty incidence (% among families) 2015 16.5 2012 19.7 (16.24) 5. Poverty incidence (% among populations) 2015 21.6 2012 25.2 (14.29)
6. Consumer price index (2012=100) 2018 117.3 2017 111.5 5.20
Inflation rate 5.2 2.9 79.31
7. Poverty threshold (annual per capita) 2015 2012
Philippines 21,753 18,935 14.88
National Capital Region 25,007 20,344 22.92
Cordillera Administrative Region 21,770 19,483 11.74
Region I 20,488 18,373 11.51
Region II 21,860 19,125 14.30
Region III 23,200 20,071 15.59
Region IV-A 22,121 19,137 15.59
Region IV-B 20,224 17,292 16.96
Region V 21,476 18,257 17.63
Region VI 21,070 18,029 16.87
Region VII 21,914 18,767 16.77
Region VIII 21,304 18,076 17.86
Region IX 20,925 18,054 15.90
Region X 22,345 19,335 15.57
Region XI 22,754 19,967 13.96
Region XII 21,025 18,737 12.21
Region XIII 22,570 19,629 14.98
ARMM 21,563 20,517 5.10
Chapter 3. ECONOMIC ACCOUNTS
1. Gross national income by expenditure shares (In million pesos) 2018 2017
At current prices 20,909,891 19,006,388 10.02
At constant 2000 prices 11,010,252 10,394,346 5.93
Reference Period Value Reference
Period Value
SUMMARY OF MAJOR STATISTICAL SERIES
Statistical SeriesLatest Date Compared to
Percent Change
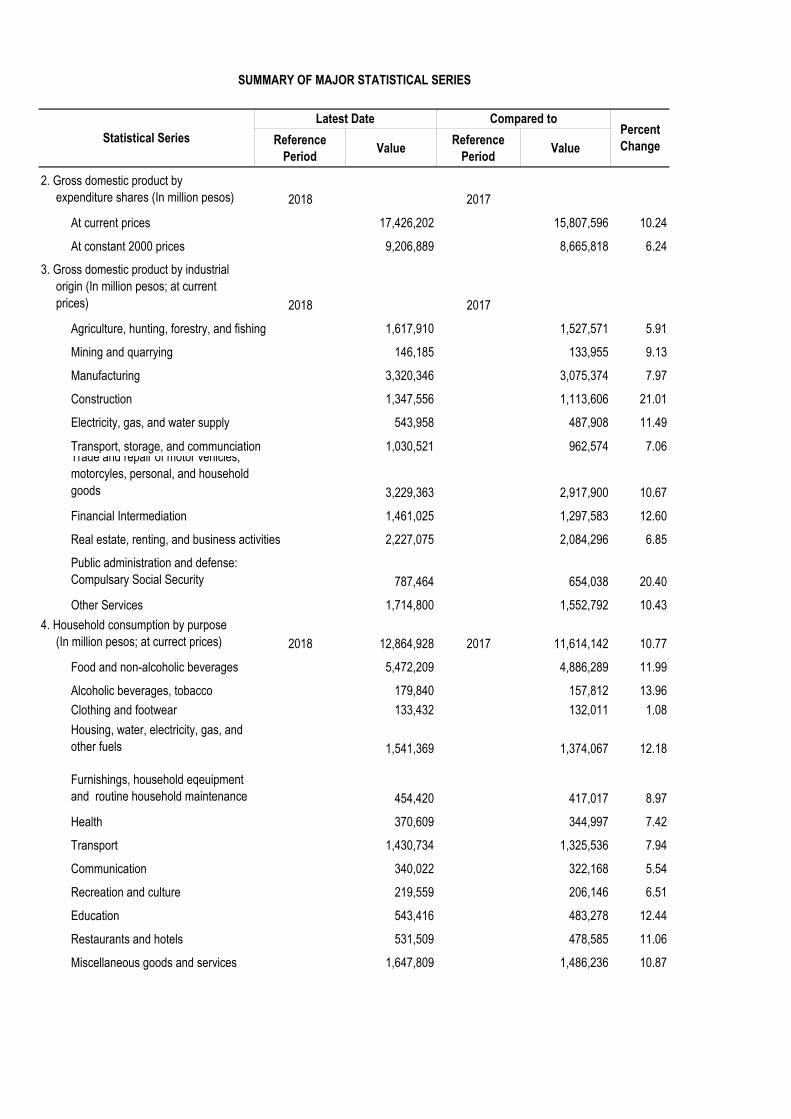
2. Gross domestic product by expenditure shares (In million pesos) 2018 2017
At current prices 17,426,202 15,807,596 10.24
At constant 2000 prices 9,206,889 8,665,818 6.24
3. Gross domestic product by industrial origin (In million pesos; at current prices) 2018 2017
Agriculture, hunting, forestry, and fishing 1,617,910 1,527,571 5.91
Mining and quarrying 146,185 133,955 9.13
Manufacturing 3,320,346 3,075,374 7.97
Construction 1,347,556 1,113,606 21.01
Electricity, gas, and water supply 543,958 487,908 11.49
Transport, storage, and communciation 1,030,521 962,574 7.06Trade and repair of motor vehicles, motorcyles, personal, and household goods 3,229,363 2,917,900 10.67
Financial Intermediation 1,461,025 1,297,583 12.60
Real estate, renting, and business activities 2,227,075 2,084,296 6.85
Public administration and defense: Compulsary Social Security 787,464 654,038 20.40
Other Services 1,714,800 1,552,792 10.434. Household consumption by purpose (In million pesos; at currect prices) 2018 12,864,928 2017 11,614,142 10.77
Food and non-alcoholic beverages 5,472,209 4,886,289 11.99
Alcoholic beverages, tobacco 179,840 157,812 13.96Clothing and footwear 133,432 132,011 1.08Housing, water, electricity, gas, and other fuels 1,541,369 1,374,067 12.18
Furnishings, household eqeuipment and routine household maintenance 454,420 417,017 8.97
Health 370,609 344,997 7.42
Transport 1,430,734 1,325,536 7.94
Communication 340,022 322,168 5.54
Recreation and culture 219,559 206,146 6.51
Education 543,416 483,278 12.44
Restaurants and hotels 531,509 478,585 11.06
Miscellaneous goods and services 1,647,809 1,486,236 10.87

Reference Period Value Reference
Period Value
SUMMARY OF MAJOR STATISTICAL SERIES
Statistical SeriesLatest Date Compared to
Percent Change
5. Gross domestic capital formation in durable equipment by major type (In million pesos) 2018 1,984,236 2017 1,706,394 16.286. Gross regional domestic product (In millions pesos) 2018 2017
At current prices 17,426,203 15,807,596 10.24
At constant 2000 prices 9,206,890 8,665,817 6.247. Per capita gross regional domestic product (In million pesos) 2018 2017
At current prices 163,475 150,661 8.51
At constant 2000 prices 86,370 82,593 4.578. Expenditure on gross regional product (In million pesos) 2018 2017
At current prices 17,426,203 15,807,596 10.24
At constant 2000 prices 9,206,890 8,665,818 6.24
9. Household final consumption expenditure by region (In million pesos) 2018 2017
At current prices 12,864,924 11,614,143 10.77
At constant 2000 prices 6,306,634 5,974,352 5.56
10. Government final consumption expenditure by region (In million pesos) 2018 2017
At current prices 2,078,438 1,776,906 16.97
At constant 2000 prices 1,025,691 907,579 13.01
1. Forest land (In hectare) 2017 2016Forest reserves 3,270,146 3,270,146 0.00Timberland 10,056,020 10,056,020 0.00National parks 1,340,997 1,340,997 0.00Military and naval 126,130 126,130 0.00Civil 165,946 165,946 0.00Fishpond 91,077 91,077 0.00Unclassified 755,009 755,009 0.00
2. Number fo wildlife species 2018 2017Fauna 212 212 0.00
Chapter 4. ENVIRONMENT AND NATURAL RESOURCES
Reference Period Value Reference
Period Value
SUMMARY OF MAJOR STATISTICAL SERIES
Statistical SeriesLatest Date Compared to
Percent Change
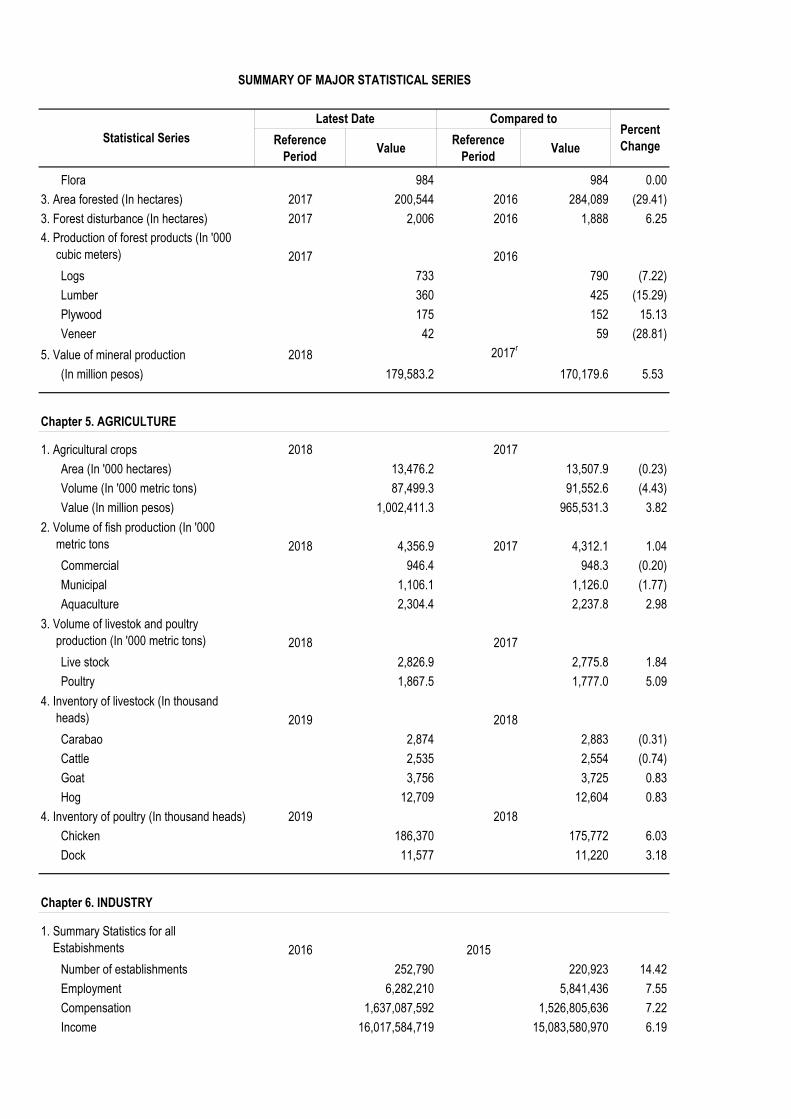
Flora 984 984 0.003. Area forested (In hectares) 2017 200,544 2016 284,089 (29.41) 3. Forest disturbance (In hectares) 2017 2,006 2016 1,888 6.254. Production of forest products (In '000 cubic meters) 2017 2016
Logs 733 790 (7.22) Lumber 360 425 (15.29) Plywood 175 152 15.13Veneer 42 59 (28.81)
5. Value of mineral production 2018 2017r
(In million pesos) 179,583.2 170,179.6 5.53
Chapter 5. AGRICULTURE
1. Agricultural crops 2018 2017Area (In '000 hectares) 13,476.2 13,507.9 (0.23) Volume (In '000 metric tons) 87,499.3 91,552.6 (4.43) Value (In million pesos) 1,002,411.3 965,531.3 3.82
2. Volume of fish production (In '000 metric tons 2018 4,356.9 2017 4,312.1 1.04
Commercial 946.4 948.3 (0.20) Municipal 1,106.1 1,126.0 (1.77) Aquaculture 2,304.4 2,237.8 2.98
3. Volume of livestok and poultry production (In '000 metric tons) 2018 2017
Live stock 2,826.9 2,775.8 1.84Poultry 1,867.5 1,777.0 5.09
4. Inventory of livestock (In thousand heads) 2019 2018
Carabao 2,874 2,883 (0.31) Cattle 2,535 2,554 (0.74) Goat 3,756 3,725 0.83Hog 12,709 12,604 0.83
4. Inventory of poultry (In thousand heads) 2019 2018Chicken 186,370 175,772 6.03Dock 11,577 11,220 3.18
Chapter 6. INDUSTRY
1. Summary Statistics for all Estabishments 2016 2015
Number of establishments 252,790 220,923 14.42Employment 6,282,210 5,841,436 7.55Compensation 1,637,087,592 1,526,805,636 7.22Income 16,017,584,719 15,083,580,970 6.19

Reference Period Value Reference
Period Value
SUMMARY OF MAJOR STATISTICAL SERIES
Statistical SeriesLatest Date Compared to
Percent Change
Expense 13,736,039,870 12,947,585,118 6.09Value output 6,396,866,452 6,170,907,671 3.66Value added 4,965,800,201 4,560,030,731 8.90Change in inventories 90,967,573 69,998,956 29.96Gross addition to fixed assets 527,256,121 472,359,439 11.62Subsidies 39,006,527 35,447,330 10.04
2. Number of Private Construction by Type of Building 2017 2016
Residential 110,942 113,097 (1.91) Non-residential 21,349 17,845 19.64
3. Index of Value of Production of Key Manufacturing Enterprises by Industry 2018 2017
Food 312.3 294.4 6.08Beverage 339.0 264.0 28.41Tobacco 11.4 13.3 (14.29) Textiles 65.9 46.4 42.03Footwear and wearing apparel 61.9 68.8 (10.03) Wood and wood products 64.2 63.3 1.42Furniture and fixtures 69.3 71.8 (3.48) Paper and paper products 116.2 97.8 18.81Publishing and printing 166.9 541.9 (69.20) Leather products 1.2 1.2 0.00Chemical products 236.5 239.5 (1.25) Rubber and rubber products 166.1 163.4 1.65Petroleum products 200.7 136.9 46.60Non-mettalic mineral products 245.2 224.2 9.37Basic metals 384.3 384.9 (0.16) Transport equipment 205.6 207.3 (0.82) Electtrical machinery 150.5 126.6 18.88Miscellaneous manufactures 95.0 83.9 13.23Fabricated metal products 341.5 392.7 (13.04) Machinery except electrical 61.8 54.3 13.81

Reference Period Value Reference
Period Value
SUMMARY OF MAJOR STATISTICAL SERIES
Statistical SeriesLatest Date Compared to
Percent Change
4. Net Foreign Direct Investment (In million US dollar) 2018 9,948.60 2017 10,256.44 (3.00) 5. Paid-up Capital Investment of Newly Registered Business Organizations (In million pesos) 2018 22,583 2017 28,232 (20.01) 6. Paid-up Capital Investment of Newly Registered Domestic Stock Corp. and Partnership (In million pesos) 2017 70,979 2016 58,737 20.84
Chapter 7. TRADE
1. Extrernal Trade (million US dollars) 2017 2016
Exports 68,712.90 57,406.10 19.70Imports 93,093.20 84,108.00 10.68Balance of trade (24,380.30) (26,701.90) (8.69)
2. Total exports (million US dollars) 2018 2017Coconut Products 1,515 2,051 (26.13)
Copra - - - Coconut oil 1,113 1,615 (31.08) Dessicated coconut 283 341 (17.01) Copra meal or cake 71 64 10.94 Others 48 31 54.84
Sugar and sugar products 75 217 (65.44) Centrifugal and refined sugar 41 204 (79.90) Molasses 16 4 300.00 Others 18 9 100.00
Fruits and Vegetables 2,117 1,850 14.43 Canned pineapple 192 274 (29.93) Pineapple juice 4 25 (84.00) Pineapple concentrates 79 82 (3.66) Bananas 1,505 1,129 33.30 Mangoes 18 23 (21.74) Others 319 316 0.95
Other Agro-Based Products 912 1,003 (9.07) 3. Forest products 271 184 47.28
Logs - - - Lumber 141 104 35.58 Plywood 94 55 70.91 Veneer sheets/corestocks 2 13 (84.62) Others 34 12 183.33
Mineral Products 4,033 4,285 (5.88) Copper concentrates 554 370 49.73 Copper metal 1,136 1,270 (10.55) Gold 513 1,117 (54.07)
Reference Period Value Reference
Period Value
SUMMARY OF MAJOR STATISTICAL SERIES
Statistical SeriesLatest Date Compared to
Percent Change
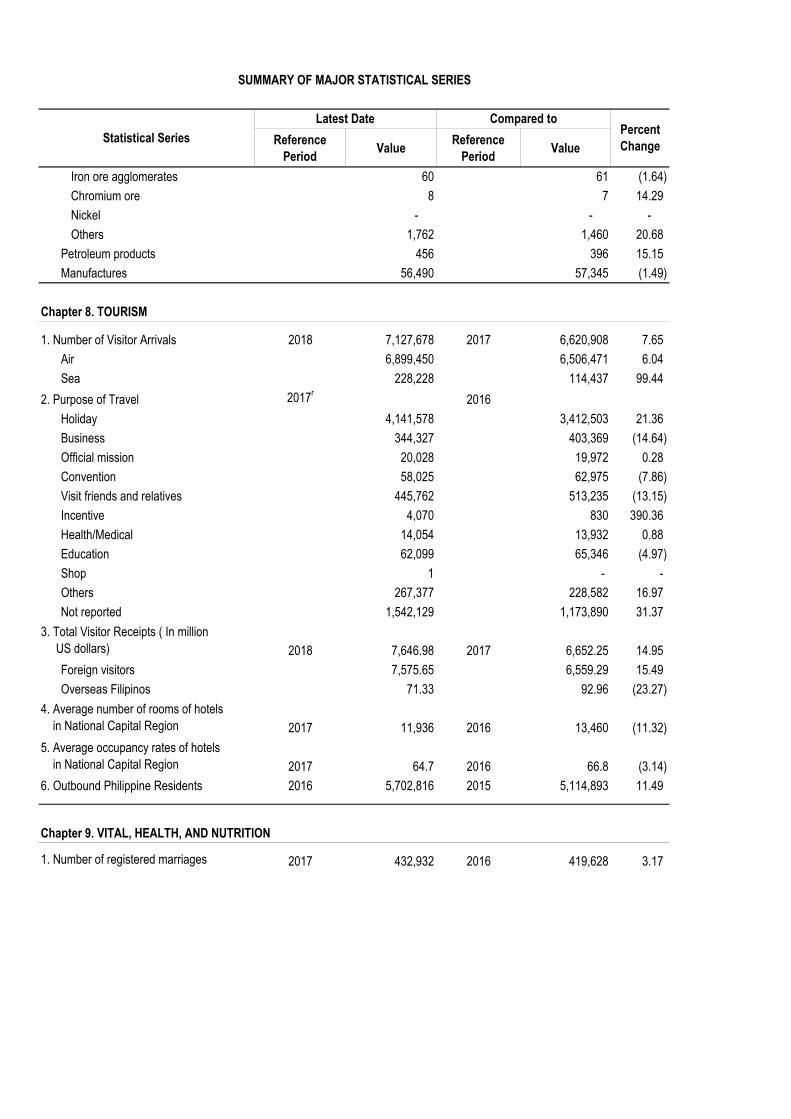
Iron ore agglomerates 60 61 (1.64) Chromium ore 8 7 14.29 Nickel - - - Others 1,762 1,460 20.68
Petroleum products 456 396 15.15 Manufactures 56,490 57,345 (1.49)
Chapter 8. TOURISM
1. Number of Visitor Arrivals 2018 7,127,678 2017 6,620,908 7.65 Air 6,899,450 6,506,471 6.04 Sea 228,228 114,437 99.44
2. Purpose of Travel 2017r 2016Holiday 4,141,578 3,412,503 21.36 Business 344,327 403,369 (14.64) Official mission 20,028 19,972 0.28 Convention 58,025 62,975 (7.86) Visit friends and relatives 445,762 513,235 (13.15) Incentive 4,070 830 390.36 Health/Medical 14,054 13,932 0.88 Education 62,099 65,346 (4.97) Shop 1 - -Others 267,377 228,582 16.97 Not reported 1,542,129 1,173,890 31.37
3. Total Visitor Receipts ( In million US dollars) 2018 7,646.98 2017 6,652.25 14.95
Foreign visitors 7,575.65 6,559.29 15.49 Overseas Filipinos 71.33 92.96 (23.27)
4. Average number of rooms of hotels in National Capital Region 2017 11,936 2016 13,460 (11.32) 5. Average occupancy rates of hotels in National Capital Region 2017 64.7 2016 66.8 (3.14) 6. Outbound Philippine Residents 2016 5,702,816 2015 5,114,893 11.49
Chapter 9. VITAL, HEALTH, AND NUTRITION
1. Number of registered marriages 2017 432,932 2016 419,628 3.17
Reference Period Value Reference
Period Value
SUMMARY OF MAJOR STATISTICAL SERIES
Statistical SeriesLatest Date Compared to
Percent Change
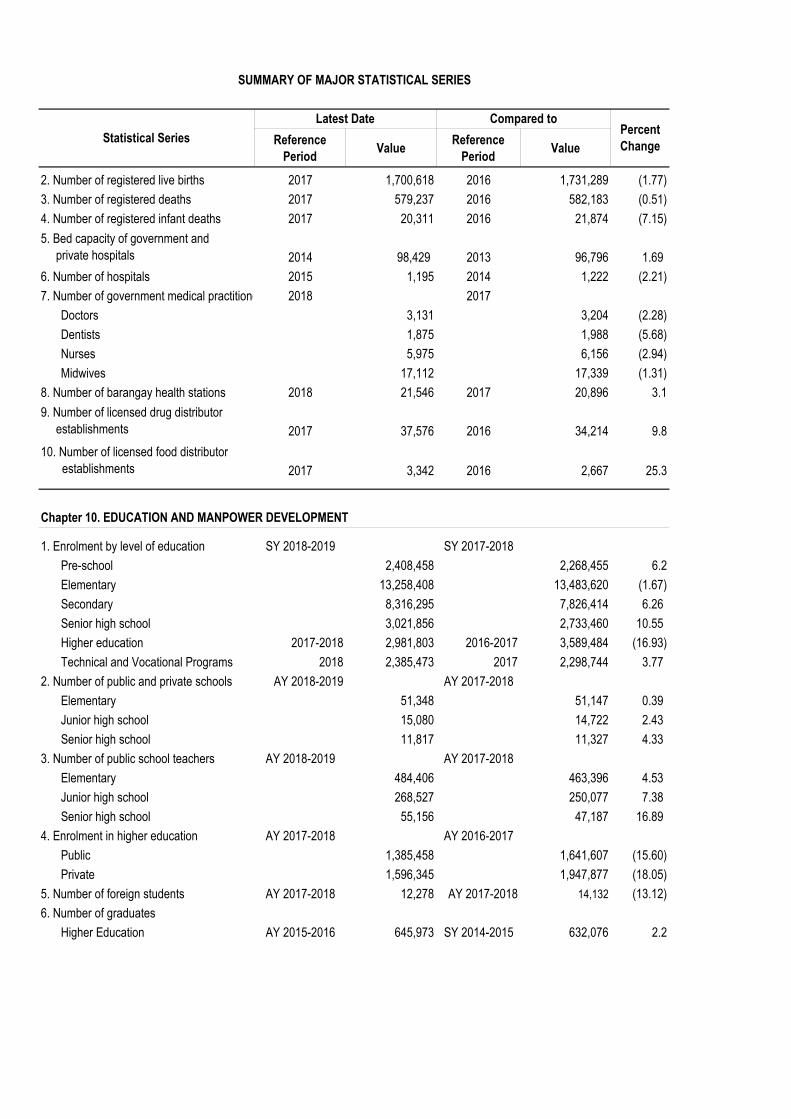
2. Number of registered live births 2017 1,700,618 2016 1,731,289 (1.77) 3. Number of registered deaths 2017 579,237 2016 582,183 (0.51) 4. Number of registered infant deaths 2017 20,311 2016 21,874 (7.15) 5. Bed capacity of government and private hospitals 2014 98,429 2013 96,796 1.69 6. Number of hospitals 2015 1,195 2014 1,222 (2.21) 7. Number of government medical practitione 2018 2017
Doctors 3,131 3,204 (2.28) Dentists 1,875 1,988 (5.68) Nurses 5,975 6,156 (2.94) Midwives 17,112 17,339 (1.31)
8. Number of barangay health stations 2018 21,546 2017 20,896 3.19. Number of licensed drug distributor establishments 2017 37,576 2016 34,214 9.810. Number of licensed food distributor establishments 2017 3,342 2016 2,667 25.3
1. Enrolment by level of education SY 2018-2019 SY 2017-2018Pre-school 2,408,458 2,268,455 6.2Elementary 13,258,408 13,483,620 (1.67) Secondary 8,316,295 7,826,414 6.26 Senior high school 3,021,856 2,733,460 10.55 Higher education 2017-2018 2,981,803 2016-2017 3,589,484 (16.93) Technical and Vocational Programs 2018 2,385,473 2017 2,298,744 3.77
2. Number of public and private schools AY 2018-2019 AY 2017-2018Elementary 51,348 51,147 0.39 Junior high school 15,080 14,722 2.43 Senior high school 11,817 11,327 4.33
3. Number of public school teachers AY 2018-2019 AY 2017-2018Elementary 484,406 463,396 4.53 Junior high school 268,527 250,077 7.38 Senior high school 55,156 47,187 16.89
4. Enrolment in higher education AY 2017-2018 AY 2016-2017Public 1,385,458 1,641,607 (15.60) Private 1,596,345 1,947,877 (18.05)
5. Number of foreign students AY 2017-2018 12,278 AY 2017-2018 14,132 (13.12) 6. Number of graduates
Higher Education AY 2015-2016 645,973 SY 2014-2015 632,076 2.2
Chapter 10. EDUCATION AND MANPOWER DEVELOPMENT

Reference Period Value Reference
Period Value
SUMMARY OF MAJOR STATISTICAL SERIES
Statistical SeriesLatest Date Compared to
Percent Change
Technical and Vocational Programs 2018 2,252,208 2017 2,065,697 9.03 7. Bar Examination 2018 2017
Number of examinees 8,155 6,748 20.85 Number of passers 1,800 1,724 4.41
8. Number of certified skill persons 2018 1,716,967 2017 1,308,277 31.24 9. Number of trained in technical and vocational education and training (TVET) 2018 2,252,208 2017 2,065,697 9.03
Chapter 11. LABOR AND EMPLOYMENT
1. Total labor force (1,000 persons) 2018 2017Employed 41,160 40,334 2.0Unemployed 2,302 2,441 -5.7
2. Unemployment rate (percent) 2018 2017Philippines 5.3 5.7 (7.02) National Capital Region 6.6 7.4 (10.81) Cordillera Administrative Region 4.1 4.3 (4.65) Region I 6.8 8.9 (23.60) Region II 3.0 3.2 (6.25) Region III 5.8 6.6 (12.12) Region IV-A 6.6 7.0 (5.71) Region IV-B 4.7 4.8 (2.08) Region V 4.9 4.6 6.52 Region VI 5.3 5.4 (1.85) Region VII 5.3 4.5 17.78 Region VIII 4.2 4.5 (6.67) Region IX 4.1 4.0 2.50 Region X 4.1 5.3 (22.64) Region XI 4.3 4.9 (12.24) Region XII 3.9 4.0 (2.50) Caraga 4.0 5.1 (21.57) ARMM 3.7 3.5 5.71
Chapter 12. SOCIAL SERVICES
1. Unduplicated number of clients served by DSWD 2017 2016
Children 84,169 82,728 1.74

Reference Period Value Reference
Period Value
SUMMARY OF MAJOR STATISTICAL SERIES
Statistical SeriesLatest Date Compared to
Percent Change
Women 381,907 355,133 7.54Youth 75,119 79,322 (5.30) Persons with disability 9,662 5,761 67.71Senior citizens 71,643 114,278 (37.31) Other needy adults 143,469 132,100 8.61
2. Number of children beneficiaries served 2018 8,698,409 2017 9,503,068 (8.47) 3. Number of institutions/centers involved in the distribution of social services 2017 71 2016 71 - 4. Number of reported cases of child abuse 2017 3,459 2016 3,857 (10.32) 5. Coverage and contributions received by GSIS (In million pesos) 2018 120,705 2017 107,200 12.60 6. Number of GSIS members (In thousand) 2018 1,788 2017 1,712 4.44 7. Amount of claims by GSIS (In million pesos) 2018 105,157 2017 93,967 11.918. Amount of contributions collected by SSS (In million pesos) 2016 144,365 2015 132,615 8.869. Amount of benefits paid by the Social Security System (In million pesos) 2018 180,078 2017 170,684 5.5010. Amount of contributions received by HDMF (In million pesos) 2018 40,272 2017 36,273 11.02
11. Amount of provident benefits paid by HDMF (In million pesos) 2018 13,919 2017 9,507 46.4112. Calamity funds releases (In million pesos) 2018 15,140 2017 11,463 32.08
1. Rail transporta) Metro Rail Transit 2017 2016
Passengers (In million) 140.20 134.00 4.63 Gross Revenues (In million pesos) 2,779.4 2,681.5 3.65
b) Light Rail Transit 2014 2013Passengers (In million) 170.7 171.8 (0.64) Gross Revenues (In million pesos) 2,524.0 2,526.8 (0.11)
c) Megratren 2018 2017Passengers (In million) 67.7 66.0 2.58
Chapter 13. TRANSPORTATION AND COMMUNICATION

Reference Period Value Reference
Period Value
SUMMARY OF MAJOR STATISTICAL SERIES
Statistical SeriesLatest Date Compared to
Percent Change
Gross Revenues (In million pesos) 1,244.5 1,271.5 (2.12) 2. Total number of registered motor vehicles 2014 8,081,224.00 2013 7,690,038 5.09
Private 7,093,059 6,673,815 6.28For hire 912,584 940,073 (2.92) Government 71,696 72,259 (0.78) Diplomatic 3,363 3,376 (0.39) Exempt 522 515 1.36
3. Total number of newly-registered motor vehicles 2017 2,597,150 2016 2,040,176 27.30
Cars 150,557 131,838 14.20Utility vehicles 223,994 186,249 20.27Sport Utility vehicles 131,719 95,579 37.81Trucks 56,857 46,082 23.38Buses 4,252 3,459 22.93Motorcycles/Tricycles 2,012,884 1,568,743 28.31
4. Shipping statistics 2018 2017At berth
Shipcalls 462,986 443,106 4.49Grooss registered tonnage 482,970,620 461,302,059 4.70Length (meters) 21,593,780 20,337,412 6.18
At anchorageShipcalls 5,453 5,902 (7.61) Grooss registered tonnage 40,410,435 42,914,611 (5.84) Length (meters) 446,659 451,955 (1.17)
5. Total cargo throughput (In metric tons) 2018 260,953,472 2017 253,560,516 2.92
Domestic 105,390,180 101,496,604 3.84Foreign 155,563,292 152,063,912 2.30Total passenger traffic 76,798,175 72,438,609 6.02
6. Domestic operating fleet 2018 2017Number 39,110 34,619 12.97Tonnage 4,069,308 3,600,663 13.02
7. Aircraft, cargo, passenger movement 2018 2017Aircraft 809,700 886,619 (8.68) Cargo 518,257,286 889,226,370 (41.72) Passenger 43,788,975 66,829,198 (34.48)
8. National road length by surface 2018 32,933 2017 32,868 0.20Earth 45 54 (16.67) Gravel 1,264 1,779 (28.95)

Reference Period Value Reference
Period Value
SUMMARY OF MAJOR STATISTICAL SERIES
Statistical SeriesLatest Date Compared to
Percent Change
Asphalt 10,100 9,854 2.50 Concrete 21,523 21,181 1.61
9. Number of length of existing bridges (In linear meters) 2018 8,339 2017 8,260 0.96
1. Domestic oil and gas production (In thousand barrels) 2018 2017
Total oil 1,262 1,587 (20.48) Total gas 154,622 138,497 11.64
2. Coal Production 2018 13,054,392 2017 11,932,340 9.403. Number of duly organized water districts 2018 870 2017 869 0.124. Number of household served by water districts 2018 4,567,197 2017 4,352,872 4.92 5. Areas of National Irrigation Systems 2018 2018
irrigated area on dry season 635,115 603,068 5.31 benefited area on dry season 604,892 572,713 5.62
Chapter 15. PUBLIC ADMINISTRATION
1. National Government Cash Budget (In million pesos) 2018 2017
Revenues 2,850,184 2,473,132 15.25Expenditures 3,408,443 2,823,769 20.71Surplus (Deficit) -558,259 -350,637 59.21
2. National Government Revenues (In million pesos)
Tax revenue 2018 2,565,812 2017 2,250,678 14.00Non-tax revenue 284,372 222,454 27.83
3. Outstanding debt of national government (In million pesos) 2018 2017
Domestic 4,974,396 4,638,777 7.24Foreign 2,805,690 2,491,766 12.60
4. Revenue allotment (In million pesos) 2019 575,520.60 2018 522,748.22 10.105. Revenue collection (In million pesos) 2018 1,962,643 2017 1,780,803 10.216. National government expenditures (In mililon pesos) 2018 3,767,000 2017 3,350,003 12.457. Government expenditure program 2019 3,757,022 2018 3,767,000 (0.26)
Chapter 14. ENERGY AND WATER RESOURCES
Reference Period Value Reference
Period Value
SUMMARY OF MAJOR STATISTICAL SERIES
Statistical SeriesLatest Date Compared to
Percent Change
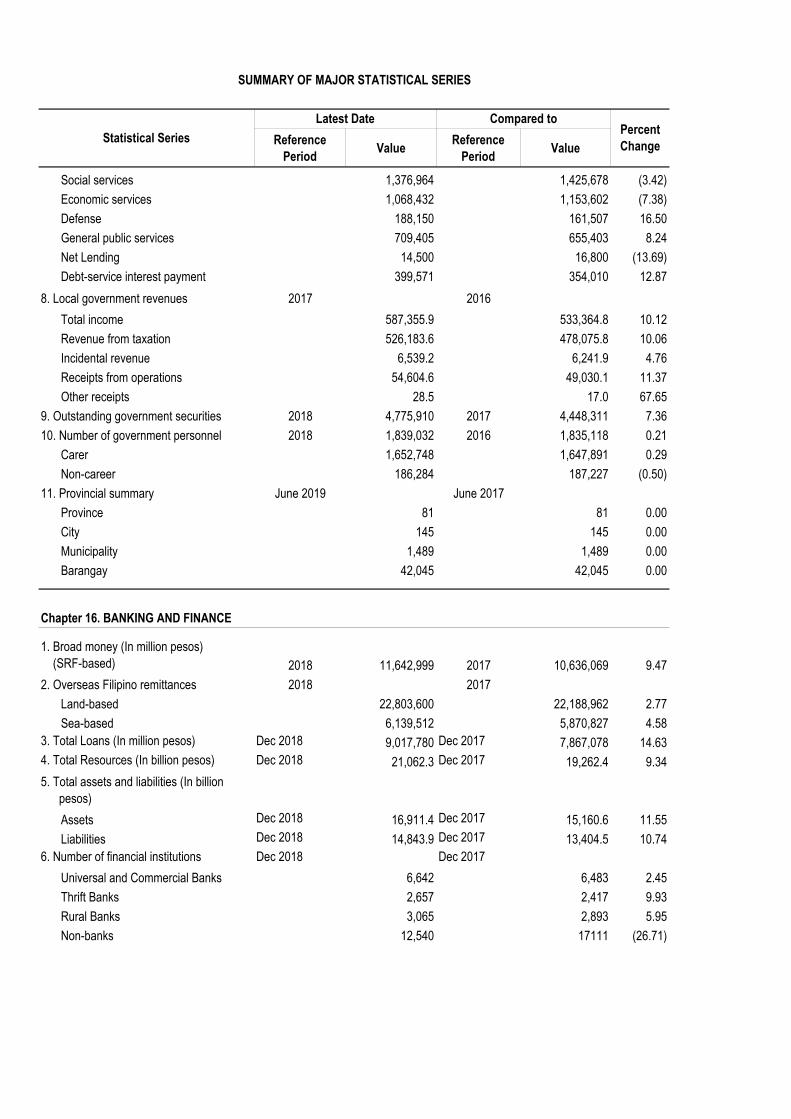
Social services 1,376,964 1,425,678 (3.42) Economic services 1,068,432 1,153,602 (7.38) Defense 188,150 161,507 16.50General public services 709,405 655,403 8.24Net Lending 14,500 16,800 (13.69) Debt-service interest payment 399,571 354,010 12.87
8. Local government revenues 2017 2016Total income 587,355.9 533,364.8 10.12Revenue from taxation 526,183.6 478,075.8 10.06Incidental revenue 6,539.2 6,241.9 4.76Receipts from operations 54,604.6 49,030.1 11.37Other receipts 28.5 17.0 67.65
9. Outstanding government securities 2018 4,775,910 2017 4,448,311 7.3610. Number of government personnel 2018 1,839,032 2016 1,835,118 0.21
Carer 1,652,748 1,647,891 0.29Non-career 186,284 187,227 (0.50)
11. Provincial summary June 2019 June 2017Province 81 81 0.00City 145 145 0.00Municipality 1,489 1,489 0.00Barangay 42,045 42,045 0.00
Chapter 16. BANKING AND FINANCE
1. Broad money (In million pesos) (SRF-based) 2018 11,642,999 2017 10,636,069 9.472. Overseas Filipino remittances 2018 2017
Land-based 22,803,600 22,188,962 2.77Sea-based 6,139,512 5,870,827 4.58
3. Total Loans (In million pesos) Dec 2018 9,017,780 Dec 2017 7,867,078 14.634. Total Resources (In billion pesos) Dec 2018 21,062.3 Dec 2017 19,262.4 9.345. Total assets and liabilities (In billion pesos)
Assets Dec 2018 16,911.4 Dec 2017 15,160.6 11.55Liabilities Dec 2018 14,843.9 Dec 2017 13,404.5 10.74
6. Number of financial institutions Dec 2018 Dec 2017Universal and Commercial Banks 6,642 6,483 2.45Thrift Banks 2,657 2,417 9.93Rural Banks 3,065 2,893 5.95Non-banks 12,540 17111 (26.71)

Reference Period Value Reference
Period Value
SUMMARY OF MAJOR STATISTICAL SERIES
Statistical SeriesLatest Date Compared to
Percent Change
7. Financial condition of GSIS (In million pesos) 2018 2017
Assets 1,135,143 1,123,951 1.00Reserves 1,091,122 1,028,257 6.11Surplus 21,154 23,636 (10.50) Investmens 1,084,125 1,035,427 4.70
8. Total investments of GSIS (In million pesos) 2018 1,084,125 2017 1,035,427 4.70 9. Expenditures of SSS (In million pesos) 2018 189,886.9 2017 180229.1 5.36 10. Total assets of SSS (In million pesos) 2018 473,049.0 2017 471,015.1 0.43 11. Revenues of SSS (In million pesos) 2018 212,552.0 2017 201,605.2 5.43 12. Average peso per U.S. Dollar Rate 2018 52.6614 2017 50.4037 4.48 13. Number of insurance companies 2018 94 2017 98 (4.08)
1. Total crimes 2018 490,393 2017 520,641 (5.81) Index crime 81,413 107,538 (24.29) Non-index crime 408,980 413,103 (1.00)
2. Reported fire incidence 2018 16,675 2017 14,197 17.453. Incidence of human rights violations 2018 1,398 2017 1,362 2.644. Reported cases of drugs/substance abuse 2018 5,037 2017 3,578 40.785. Number of Violations on RA 9165 2018 2017
Operations conducted 36,643 38,830 (5.63) Persons arrested 48,077 75,008 (35.90)
6. Clientele assisted by PAO 2018 13,344,003 2017 11,616,916 14.877. Case inflow 2018 570,140 2017 537,180 6.148. Case outflow 2018 636,813 2017 498,218 27.829. Newly filed cases 2018 486,499 2017 448,392 8.5010. Number of cases resolved 2018 507,109 2017 345,768 46.6610. Jail population 2018 148,659 2017 153,729 (3.30)
Sentenced 8,088 3533 128.93Detained 140,571 150,196 (6.41)
11. Number of escapees and recaptured 2018 2017
Escapees 23 303 (92.41) Recaptured 18 148 (87.84)
Chapter 17. PUBLIC ORDER, SAFETY, AND JUSTICE

Reference Period Value Reference
Period Value
SUMMARY OF MAJOR STATISTICAL SERIES
Statistical SeriesLatest Date Compared to
Percent Change
Chapter 18. SCIENCE AND TECHNOLOGY
1. Patents granted to to applicants 2018 2017Local (Resident) 2,036 1487 36.92Foreign (Non-resident) 3,685 2,119 73.90
2. Trademarks registered 2018 2017Local (Resident) 18,798 16,424 14.45Foreign (Non-resident) 23,968 20,086 19.33


SPECIAL FEATURE


Quantity Value Quantity Value Quantity Value
Philippines 25,782,297 859,660,508 23,404,599 765,381,769 10.2 12.3
W a t e r 25,762,543 858,882,213 23,382,692 764,622,830 10.2 12.3
A i r 19,754 778,295 21,907 758,939 (9.8) 2.6
Note:
Source:
TABLE 1 Quantity and Value of Domestic Trade by Mode of Transport and Commodity Section: 2017 and 2018
Mode of Transport and Commodity Section2018 F 2017 F Growth Rate, %
Quantity Value Quantity Value Quantity Value
(1) (2) (3) (4) (5) (6)
Philippines 25,782,297 859,660,508 23,404,599 765,381,769 10.2 12.3
W a t e r 25,762,543 858,882,213 23,382,692 764,622,830 10.2 12.3
A i r 19,754 778,295 21,907 758,939 (9.8) 2.6
Note:
Source:
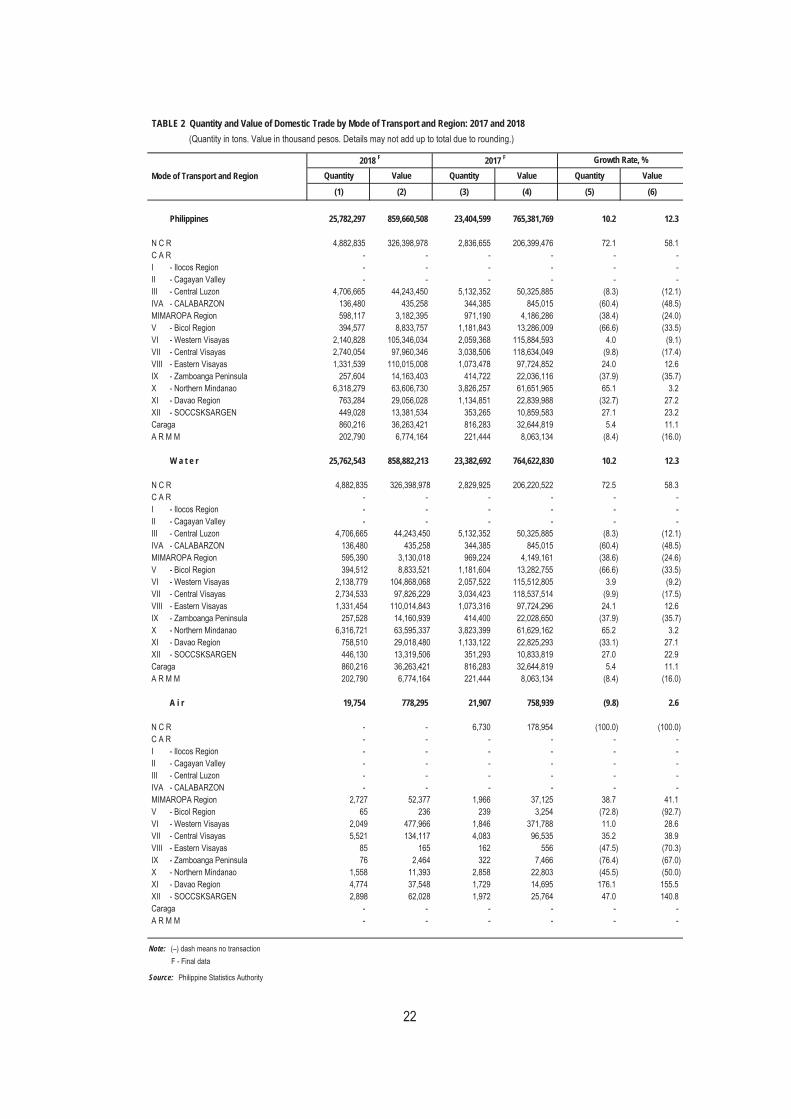
TABLE 2 Quantity and Value of Domestic Trade by Mode of Transport and Region: 2017 and 2018
Mode of Transport and Region2017 F Growth Rate, %2018 F

Outflow Inflow Balance Outflow Inflow Balance Outflow Inflow(1) (2) (3) (4) (5) (6) (7) (8)
Philippines 859,660,508 859,660,508 0 765,381,769 765,381,769 0 12.3 12.3
N C R 326,398,978 91,782,340 234,616,638 206,399,476 90,818,439 115,581,037 58.1 1.1C A R - 10 (10) - - - - n/aI - Ilocos Region - 3,058,098 (3,058,098) - 6,144,855 - - (50.2)II - Cagayan Valley - 380,532 (380,532) - 111,318 - - 241.8III - Central Luzon 44,243,450 3,483,114 40,760,336 50,325,885 2,351,734 47,974,151 (12.1) 48.1IVA - CALABARZON 435,258 15,717,408 (15,282,150) 845,015 24,912,470 (24,067,455) (48.5) (36.9)MIMAROPA Region 3,182,395 24,200,668 (21,018,273) 4,186,286 19,845,450 (15,659,164) (24.0) 21.9V - Bicol Region 8,833,757 9,281,465 (447,708) 13,286,009 9,499,298 3,786,711 (33.5) (2.3)VI - Western Visayas 105,346,034 140,391,863 (35,045,829) 115,884,593 127,839,721 (11,955,128) (9.1) 9.8VII - Central Visayas 97,960,346 169,717,015 (71,756,669) 118,634,049 138,127,262 (19,493,213) (17.4) 22.9VIII - Eastern Visayas 110,015,008 45,619,000 64,396,008 97,724,852 58,613,973 39,110,879 12.6 (22.2)IX - Zamboanga Peninsula 14,163,403 43,299,141 (29,135,738) 22,036,116 50,041,114 (28,004,998) (35.7) (13.5)X - Northern Mindanao 63,606,730 105,353,333 (41,746,603) 61,651,965 86,272,001 (24,620,036) 3.2 22.1XI - Davao Region 29,056,028 51,151,623 (22,095,595) 22,839,988 22,743,528 96,460 27.2 124.9XII - SOCCSKSARGEN 13,381,534 20,570,680 (7,189,146) 10,859,583 7,899,255 2,960,328 23.2 160.4Caraga 36,263,421 132,717,517 (96,454,096) 32,644,819 114,401,613 (81,756,794) 11.1 16.0A R M M 6,774,164 2,936,697 3,837,467 8,063,134 5,759,740 2,303,394 (16.0) (49.0)
W a t e r 858,882,213 858,882,213 0 764,622,830 764,622,830 0 12.3 12.3
N C R 326,398,978 91,087,684 235,311,294 206,220,522 90,310,299 115,910,223 58.3 0.9C A R - - - - - - - -I - Ilocos Region - 3,055,276 (3,055,276) - 6,140,977 (6,140,977) - (50.2)II - Cagayan Valley - 379,851 (379,851) - 111,295 (111,295) - 241.3III - Central Luzon 44,243,450 3,483,114 40,760,336 50,325,885 2,351,734 47,974,151 (12.1) 48.1IVA - CALABARZON 435,258 15,717,408 (15,282,150) 845,015 24,912,470 (24,067,455) (48.5) (36.9)MIMAROPA Region 3,130,018 24,196,717 (21,066,699) 4,149,161 19,841,369 (15,692,208) (24.6) 22.0V - Bicol Region 8,833,521 9,275,671 (442,150) 13,282,755 9,494,194 3,788,561 (33.5) (2.3)VI - Western Visayas 104,868,068 140,381,241 (35,513,173) 115,512,805 127,794,733 (12,281,928) (9.2) 9.8VII - Central Visayas 97,826,229 169,704,079 (71,877,850) 118,537,514 138,031,182 (19,493,668) (17.5) 22.9VIII - Eastern Visayas 110,014,843 45,611,465 64,403,378 97,724,296 58,606,835 39,117,461 12.6 (22.2)IX - Zamboanga Peninsula 14,160,939 43,295,102 (29,134,163) 22,028,650 50,038,291 (28,009,641) (35.7) (13.5)X - Northern Mindanao 63,595,337 105,344,642 (41,749,305) 61,629,162 86,264,987 (24,635,825) 3.2 22.1XI - Davao Region 29,018,480 51,140,111 (22,121,631) 22,825,293 22,686,608 138,685 27.1 125.4XII - SOCCSKSARGEN 13,319,506 20,561,001 (7,241,495) 10,833,819 7,879,433 2,954,386 22.9 160.9Caraga 36,263,421 132,712,453 (96,449,032) 32,644,819 114,398,924 (81,754,105) 11.1 16.0A R M M 6,774,164 2,936,396 3,837,768 8,063,134 5,759,501 2,303,633 (16.0) (49.0)
A i r 778,294 778,294 0 758,939 758,939 0 2.6 2.6
N C R - 694,656 (694,656) 178,954 508,140 (329,186) (100.0) 36.7C A R - 10 (10) - - - - -I - Ilocos Region - 2,822 (2,822) - 3,878 (3,878) - (27.2)II - Cagayan Valley - 681 (681) - 23 (23) - 2,860.9III - Central Luzon - - - - - - - -IVA - CALABARZON - - - - - - - -MIMAROPA Region 52,377 3,951 48,426 37,125 4,081 33,044 41.1 (3.2)V - Bicol Region 236 5,794 (5,558) 3,254 5,104 (1,850) (92.7) 13.5VI - Western Visayas 477,966 10,622 467,344 371,788 44,988 326,800 28.6 (76.4)VII - Central Visayas 134,117 12,936 121,181 96,535 96,080 455 38.9 (86.5)VIII - Eastern Visayas 165 7,535 (7,370) 556 7,138 (6,582) (70.3) 5.6IX - Zamboanga Peninsula 2,464 4,039 (1,575) 7,466 2,823 4,643 (67.0) 43.1X - Northern Mindanao 11,393 8,691 2,702 22,803 7,014 15,789 (50.0) 23.9XI - Davao Region 37,548 11,512 26,036 14,695 56,920 (42,225) 155.5 (79.8)XII - SOCCSKSARGEN 62,028 9,679 52,349 25,764 19,822 5,942 140.8 (51.2)Caraga - 5,064 (5,064) - 2,689 (2,689) - 88.3A R M M - 301 (301) - 239 (239) - 25.9
Note: (–) dash means no transaction F - Final data
Source: Philippine Statistics Authority
TABLE 3 Total Value of Domestic Trade Balances in the Philippines by Mode of Transport and Region: 2017 and 2018(Value in thousand pesos. Details may not add up to total due to rounding.)
Annual Growth Rate (GR)Mode of Transport and Region
2018 F 2017 F
3
Quantity Value Quantity Value Quantity Value(1) (2) (3) (4) (5) (6)
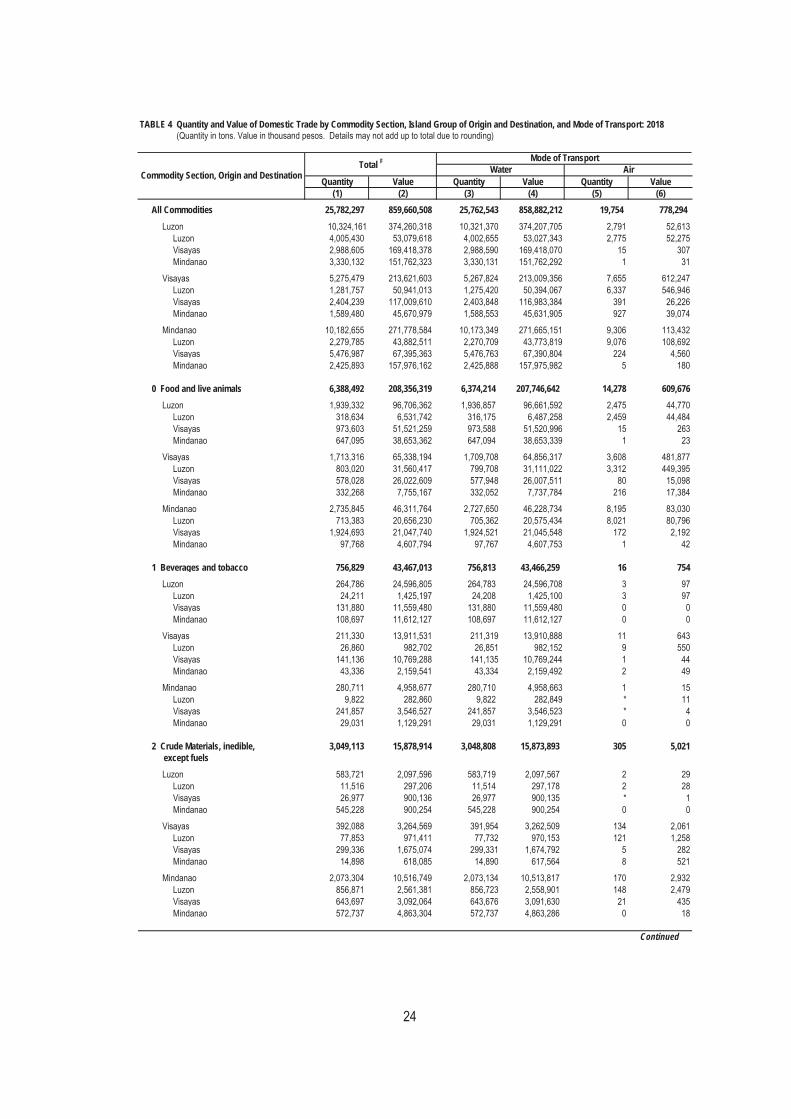
All Commodities 25,782,297 859,660,508 25,762,543 858,882,212 19,754 778,294
0 Food and live animals 6,388,492 208,356,319 6,374,214 207,746,642 14,278 609,676
1 Beverages and tobacco 756,829 43,467,013 756,813 43,466,259 16 754
2 Crude Materials, inedible, 3,049,113 15,878,914 3,048,808 15,873,893 305 5,021except fuels
Continued
TABLE 4 Quantity and Value of Domestic Trade by Commodity Section, Island Group of Origin and Destination, and Mode of Transport: 2018
Total F Mode of TransportWater AirCommodity Section, Origin and Destination
Quantity Value Quantity Value Quantity Value(1) (2) (3) (4) (5) (6)
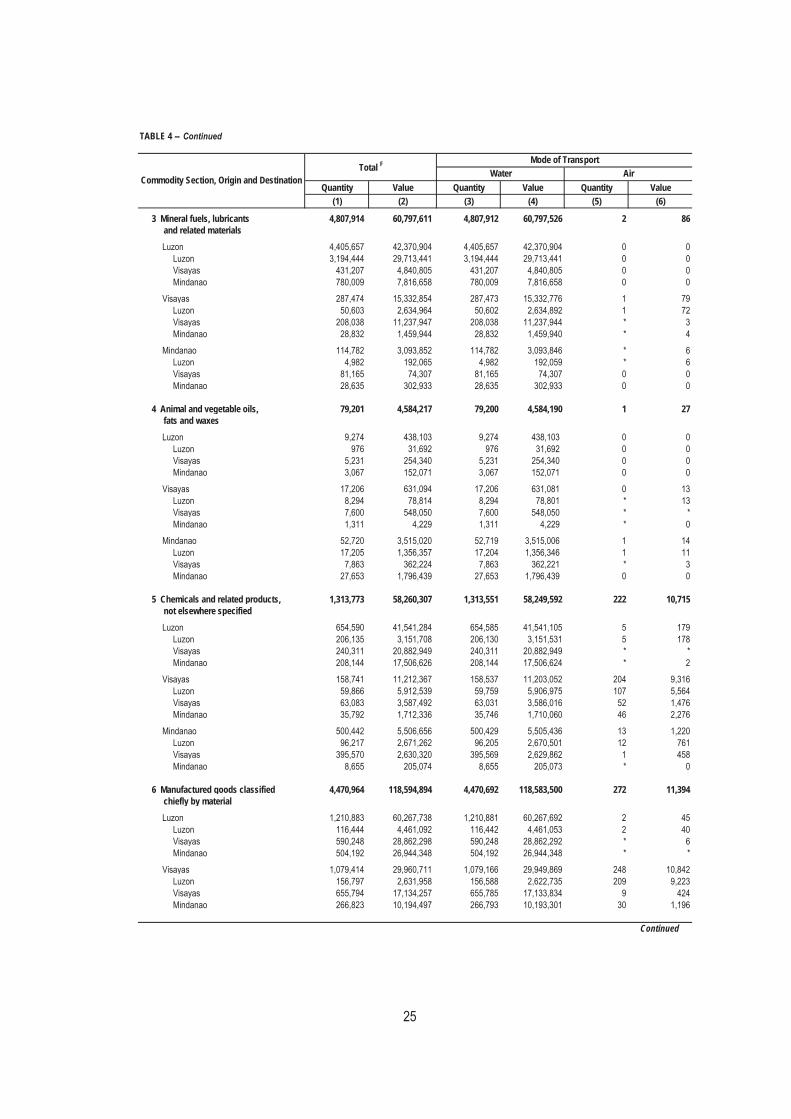
3 Mineral fuels, lubricants 4,807,914 60,797,611 4,807,912 60,797,526 2 86and related materials
4 Animal and vegetable oils, 79,201 4,584,217 79,200 4,584,190 1 27fats and waxes
5 Chemicals and related products, 1,313,773 58,260,307 1,313,551 58,249,592 222 10,715not elsewhere specified
6 Manufactured goods classified 4,470,964 118,594,894 4,470,692 118,583,500 272 11,394chiefly by material
Continued
TABLE 4 -- Continued
Commodity Section, Origin and DestinationTotal F Mode of Transport
Water Air

Quantity Value Quantity Value Quantity Value(1) (2) (3) (4) (5) (6)
7 Machinery and transport 2,519,305 276,062,824 2,518,759 276,015,671 546 47,153equipment
8 Miscellaneous manufactured 1,292,743 55,114,356 1,291,934 55,079,437 809 34,919articles
9 Commodities and transactions 1,103,963 18,544,049 1,100,660 18,485,502 3,303 58,548not elsewhere classified in PSCC
Note :F - Final data* - Quantity Less than 0.5 tons
Source: Philippine Statistics Authority, CFP 2017 and 2018
TABLE 4 -- Concluded
Commodity Section, Origin and DestinationTotal F Mode of Transport
Water Air

T O T A L 27,461,146 20,477,999 30,900,606 39,891,090 22,992,098
NCR 504,770 538,425 568,714 629,654 512,902
I - Ilocos Region -
II - Cagayan Valley -
III - Central Luzon - - - - 27,211
IVA - CALABARZON 8,907,274 5,592,334 10,095,381 16,395,179 437,291
MIMAROPA Region 3,276,000 1,820,157 3,667,831 4,574,876 3,991,653
V - Bicol Region 2,012,964 1,240,750 2,217,117 2,066,818 1,512,697
VI - Western Visayas 3,099,250 3,117,581 2,763,315 4,058,244 3,835,142
VII - Central Visayas 5,226,190 5,202,696 6,918,602 5,690,877 5,799,986
Continued
2 0 1 6 F 2 0 1 7 F
TABLE 5 Number of Passengers by Region of Origin, Port of Origin and Year : 2014 to 2018
2 0 1 8 F
(1) (2) (3) (4) (5)
PORT CODE Region and Port of Origin
2 0 1 4 F 2 0 1 5 F

VIII - Eastern Visayas 1,003,296 786,679 1,319,983 1,986,926 2,604,019
IX - Zamboanga Peninsula 966,627 510,410 830,979 1,275,268 1,365,361
X - Northern Mindanao 1,295,020 730,848 749,087 1,708,598 1,469,055
-
XI - Davao Region - - - - -
XII - SOCCSKSARGEN - - - - 945
Caraga 932,969 718,204 1,444,268 1,236,356 1,265,603
Continued
TABLE 5 -- Continued
PORT CODE Region and Port of Origin
2 0 1 4 F 2 0 1 5 F 2 0 1 6 F 2 0 1 7 F 2 0 1 8 F
(1) (2) (3) (4) (5)

TABLE 5 -- Concluded
ARMM 236,786 219,915 325,329 268,294 170,233
Note:
Source: Philippine Statistics Authority
PORT CODE Region and Port of Origin
2 0 1 4 F 2 0 1 5 F 2 0 1 6 F 2 0 1 7 F 2 0 1 8 F
(1) (2) (3) (4) (5)


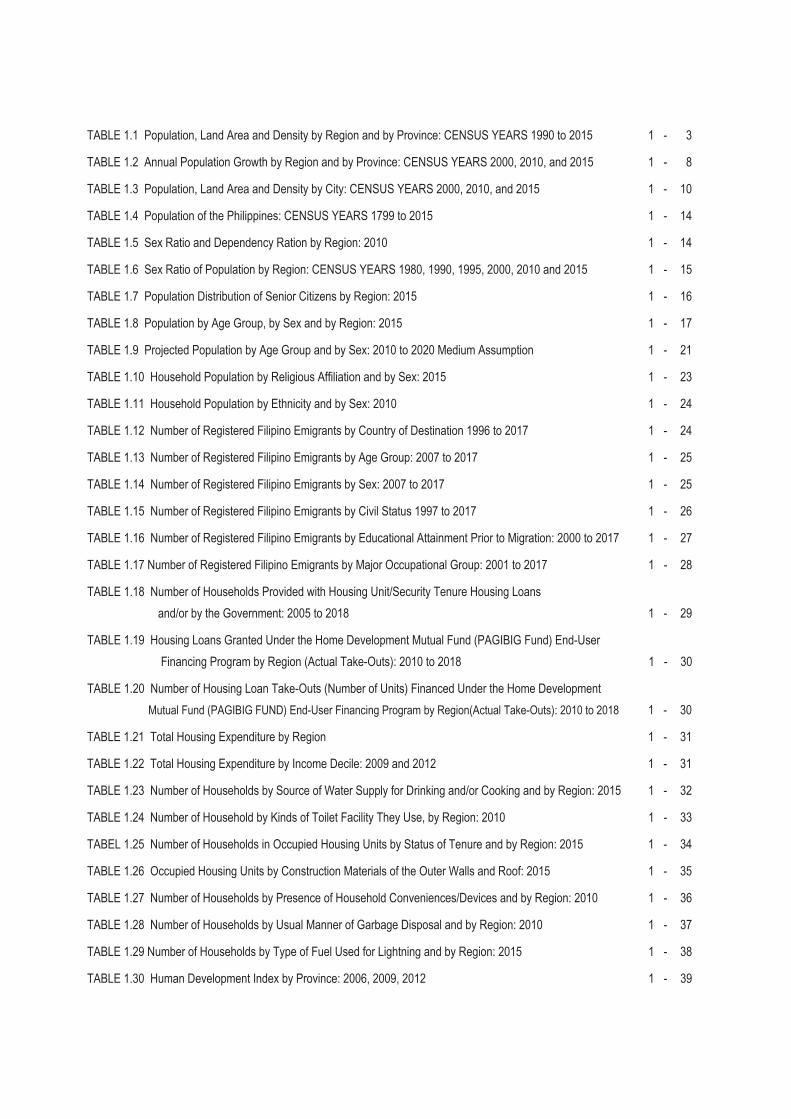
TABLE 1.1 Population, Land Area and Density by Region and by Province: CENSUS YEARS 1990 to 2015 1 - 3
TABLE 1.2 Annual Population Growth by Region and by Province: CENSUS YEARS 2000, 2010, and 2015 1 - 8
TABLE 1.3 Population, Land Area and Density by City: CENSUS YEARS 2000, 2010, and 2015 1 - 10
TABLE 1.4 Population of the Philippines: CENSUS YEARS 1799 to 2015 1 - 14
TABLE 1.5 Sex Ratio and Dependency Ration by Region: 2010 1 - 14
TABLE 1.6 Sex Ratio of Population by Region: CENSUS YEARS 1980, 1990, 1995, 2000, 2010 and 2015 1 - 15
TABLE 1.7 Population Distribution of Senior Citizens by Region: 2015 1 - 16
TABLE 1.8 Population by Age Group, by Sex and by Region: 2015 1 - 17
TABLE 1.9 Projected Population by Age Group and by Sex: 2010 to 2020 Medium Assumption 1 - 21
TABLE 1.10 Household Population by Religious Affiliation and by Sex: 2015 1 - 23
TABLE 1.11 Household Population by Ethnicity and by Sex: 2010 1 - 24
TABLE 1.12 Number of Registered Filipino Emigrants by Country of Destination 1996 to 2017 1 - 24
TABLE 1.13 Number of Registered Filipino Emigrants by Age Group: 2007 to 2017 1 - 25
TABLE 1.14 Number of Registered Filipino Emigrants by Sex: 2007 to 2017 1 - 25
TABLE 1.15 Number of Registered Filipino Emigrants by Civil Status 1997 to 2017 1 - 26
TABLE 1.16 Number of Registered Filipino Emigrants by Educational Attainment Prior to Migration: 2000 to 2017 1 - 27
TABLE 1.17 Number of Registered Filipino Emigrants by Major Occupational Group: 2001 to 2017 1 - 28
TABLE 1.18 Number of Households Provided with Housing Unit/Security Tenure Housing Loans and/or by the Government: 2005 to 2018 1 - 29
TABLE 1.19 Housing Loans Granted Under the Home Development Mutual Fund (PAGIBIG Fund) End-UserFinancing Program by Region (Actual Take-Outs): 2010 to 2018 1 - 30
TABLE 1.20 Number of Housing Loan Take-Outs (Number of Units) Financed Under the Home DevelopmentMutual Fund (PAGIBIG FUND) End-User Financing Program by Region(Actual Take-Outs): 2010 to 2018 1 - 30
TABLE 1.21 Total Housing Expenditure by Region 1 - 31
TABLE 1.22 Total Housing Expenditure by Income Decile: 2009 and 2012 1 - 31
TABLE 1.23 Number of Households by Source of Water Supply for Drinking and/or Cooking and by Region: 2015 1 - 32
TABLE 1.24 Number of Household by Kinds of Toilet Facility They Use, by Region: 2010 1 - 33
TABEL 1.25 Number of Households in Occupied Housing Units by Status of Tenure and by Region: 2015 1 - 34
TABLE 1.26 Occupied Housing Units by Construction Materials of the Outer Walls and Roof: 2015 1 - 35
TABLE 1.27 Number of Households by Presence of Household Conveniences/Devices and by Region: 2010 1 - 36
TABLE 1.28 Number of Households by Usual Manner of Garbage Disposal and by Region: 2010 1 - 37
TABLE 1.29 Number of Households by Type of Fuel Used for Lightning and by Region: 2015 1 - 38
TABLE 1.30 Human Development Index by Province: 2006, 2009, 2012 1 - 39

TABLE 1.1 Population, Land Area and Density by Region and by Province: CENSUS YEARS 1990 to 2015
1990 (May 1)
1995 (Sep 1)
1990 (May 1)
1995 (Sep 1)
2000 (May 1)
2007 (Aug 1)
2010 (May 1)
2015 (Aug 1)
Philippines 60,703,206 68,616,536 76,504,077 b3 88,548,366 c 92,335,113 b2 100,979,303 b1 300,000 202 229 255 295 308 337
National Capital Region (NCR) 7,948,392 9,454,040 9,932,560 11,547,959 11,855,975 12,877,253 619.54 12,830 15,260 16,032 18,669 19,137 20,785 City of Manila* 1,601,234 1,654,761 1,581,082 1,660,714 1,652,171 1,780,148 24.98 64,101 66,243 63,294 66,482 66,140 71,263 Quezon City** 1,669,776 1,989,419 2,173,831 2,679,450 2,761,720 2,936,116 171.71 9,724 11,586 12,660 15,605 16,084 17,099 Caloocan City* 763,415 1,023,159 1,177,604 1,381,610 1,489,040 1,583,978 55.80 13,681 18,336 21,104 24,760 26,685 28,387 Pasay City* 368,366 408,610 354,908 403,064 392,869 416,522 13.97 26,368 29,249 25,405 28,852 28,122 29,815 City of Las Piñas * 297,102 413,086 472,780 532,330 552,573 588,894 32.69 9,088 12,636 14,463 16,284 16,903 18,014 City of Makati * 453,170 484,176 471,379 548,983 529,039 582,602 21.57 21,009 22,447 21,853 26,303 24,527 27,010 City of Malabon** 280,027 347,484 338,855 363,681 353,337 365,525 15.71 17,825 22,119 21,569 23,150 22,491 23,267 City of Mandaluyong * 248,143 286,870 278,474 305,576 328,699 386,276 9.29 26,711 30,879 29,976 32,893 35,382 41,580 City of Marikina * 310,227 357,231 391,170 424,610 424,150 450,741 21.52 14,416 16,600 18,177 19,731 19,710 20,945 City of Muntinlupa* 278,411 399,846 379,310 452,943 459,941 504,509 39.75 7,004 10,059 9,542 11,395 11,571 12,692 City of Navotas* 187,479 229,039 230,403 245,344 249,131 249,463 8.94 20,971 25,620 25,772 27,443 27,867 27,904 City of Parañaque* 308,236 391,296 449,811 552,660 588,126 665,822 46.57 6,619 8,402 9,659 11,867 12,629 14,297 City of Pasig** 397,679 471,075 505,058 627,445 669,773 755,300 48.46 8,206 9,721 10,422 12,948 13,821 15,586 City of San Juan * 126,854 124,187 117,680 125,338 121,430 122,180 5.95 21,320 20,872 19,778 21,065 20,408 20,534 Taguig City* 266,637 381,350 467,375 613,343 644,473 804,915 45.21 5,898 8,435 10,338 13,567 14,255 17,804 City of Valenzuela 340,227 437,165 485,433 568,928 575,356 620,422 47.02 7,236 9,297 10,324 12,100 12,236 13,195 Municipality of Pateros* 51,409 55,286 57,407 61,940 64,147 63,840 10.40 4,943 5,316 5,520 5,956 6,168 6,138Cordillera Administrative Region 1,146,191 1,254,838 1,365,412 1,520,847 1,616,867 1,722,006 19,818.12 58 64 69 78 82 87 Abra 184,743 195,964 209,491 230,953 234,733 241,160 4,199.72 44 47 50 55 56 57 Apayao 74,720 83,660 97,129 103,633 112,636 119,184 4,502.33 17 19 22 23 25 26 Benguet (excluding Baguio City) 302,715 313,833 330,129 372,533 403,944 446,224 2,769.08 109 113 119 135 146 161 Baguio City** 183,142 226,883 252,386 301,926 318,676 345,366 57.51 3,185 3,945 4,389 5,250 5,541 6,005 Ifugao 147,281 149,598 161,623 180,711 191,078 202,802 2,618.01 56 57 62 69 73 77 Kalinga 137,055 154,145 174,023 182,326 201,613 212,680 3,282.04 42 48 53 56 61 65 Mountain Province 116,535 130,755 140,631 148,661 154,187 154,590 2,389.43 50 56 59 53 65 65I - Ilocos Region 3,550,642 3,803,890 4,200,478 4,546,789 4,748,372 5,026,128 12,964.62 274 293 324 350 366 388 Ilocos Norte 461,661 482,651 514,241 547,284 568,017 593,081 3,418.75 135 141 150 160 166 173 Ilocos Sur 519,966 545,385 594,206 632,255 658,587 689,668 2,596.00 200 210 229 244 254 266 La Union 548,742 597,442 657,945 720,972 741,906 786,653 1,499.28 366 399 439 481 495 525 Pangasinan 2,020,273 2,178,412 2,434,086 2,645,395 2,779,862 2,956,726 5,450.59 370 399 447 484 510 542
Continued
2007 (Aug 1)
2015 (Aug 1)
Population 2000
(May 1)2010
(May 1)
Density (persons/sq km)Region and Province
Land area (sq. km.)
a1/a2/a3

TABLE 1.1 ---Continued
1990 (May 1)
1995 (Sep 1)
1990 (May 1)
1995 (Sep 1)
2000 (May 1)
2007 (Aug 1)
2010 (May 1)
2015 (Aug 1)
II - Cagayan Valley 2,340,545 2,536,035 2,813,159 3,051,487 3,229,163 3,451,410 29,836.88 83 90 94 108 108 116 Batanes 15,026 14,180 16,467 15,974 16,604 17,246 203.22 69 65 81 73 82 85 Cagayan 829,867 895,050 993,580 1,072,571 1,124,773 1,199,320 9,398.07 89 96 106 115 120 128 Isabela 1,080,341 1,160,721 1,287,575 1,401,495 1,489,645 1,593,566 13,102.05 87 93 98 113 114 122 Nueva Vizcaya 301,179 334,965 366,962 397,837 421,355 452,287 4,813.88 76 84 76 100 88 94 Quirino 114,132 131,119 148,575 163,610 176,786 188,991 2,319.66 49 56 64 70 76 81III - Central Luzon 6,338,590 7,092,191 8,204,742 9,709,177 10,137,737 11,218,177 21,906.19 288 322 375 441 463 512 Aurora 139,573 159,621 173,797 187,802 201,233 214,336 3,133.40 44 51 55 60 64 68 Bataan 425,803 491,459 557,659 662,153 687,482 760,650 1,372.98 310 358 406 482 501 554 Bulacan 1,505,219 1,784,441 2,234,088 2,826,926 2,924,433 3,292,071 2,783.69 538 638 803 1,009 1,051 1,183 Nueva Ecija 1,312,680 1,505,827 1,659,883 1,853,853 1,955,373 2,151,461 5,689.69 228 262 292 321 344 378 Pampanga (excluding Angeles City) 1,295,929 1,401,756 1,614,942 1,911,951 2,014,019 2,198,110 2,001.22 647 700 807 955 1,006 1,098 Angeles City* 236,686 234,011 267,788 314,493 326,336 411,634 63.37 3,927 3,883 4,226 4,226 5,150 6,496 Tarlac 859,708 945,810 1,068,783 1,243,449 1,273,240 1,366,027 3,046.49 282 310 351 407 418 448 Zambales (excluding Olongapo City) 369,665 389,512 433,542 493,085 534,443 590,848 3,630.35 101 107 119 135 147 163 Olongapo City** 193,327 179,754 194,260 227,270 221,178 233,040 185.00 1,045 972 1,050 1,228 1,196 1,260IV-A CALABARZON 6,349,452 7,750,204 9,320,629 11,757,755 12,609,803 14,414,774 16,576.26 381 466 562 706 761 870 Batangas 1,476,783 1,658,567 1,905,348 2,245,869 2,377,395 2,694,335 3,115.05 474 532 612 720 763 865 Cavite 1,152,534 1,610,324 2,063,161 2,856,765 3,090,691 3,678,301 1,526.28 727 1,016 1,352 1,802 2,025 2,410 Laguna 1,370,232 1,631,082 1,965,872 2,473,530 2,669,847 3,035,081 1,928.23 714 850 1,020 1,290 1,385 1,574 Quezon (excluding Lucena City) 1,221,831 1,359,992 1,482,955 1,646,510 1,740,638 1,856,582 8,743.84 139 155 170 188 199 212 Lucena City (Capital)* 150,624 177,750 196,075 236,390 246,392 266,248 80.21 1,878 2,216 2,445 2,947 3,072 3,319 Rizal 977,448 1,312,489 1,707,218 2,284,046 2,484,840 2,884,227 1,182.65 826 1,110 1,444 1,944 2,101 2,439IV-B MIMAROPA 1,774,074 2,033,271 2,299,229 2,559,791 2,744,671 2,963,360 29,606.25 60 69 78 86 93 100 Marinduque 185,524 199,910 217,392 229,636 227,828 234,521 952.58 195 210 228 241 239 246 Occidental Mindoro 282,593 339,605 380,250 421,952 452,971 487,414 5,851.09 48 58 65 72 77 83 Oriental Mindoro 550,049 608,616 681,818 735,769 785,602 844,059 4,238.38 130 144 161 174 185 199 Palawan (excluding Puerto Princesa City 436,140 510,909 593,500 682,152 771,667 849,469 14,649.73 36 35 41 47 53 58 Puerto Princesa City (Capital)* 92,147 129,577 161,912 210,508 222,673 255,116 2,381.02 … 54 68 88 94 107 Romblon 227,621 244,654 264,357 279,774 283,930 292,781 1,533.45 148 160 172 182 185 191V - Bicol Region 3,910,001 4,325,307 4,686,669 5,106,160 5,420,411 5,796,989 18,114.47 216 238 259 282 299 320 Albay 903,785 1,005,315 1,090,907 1,190,823 1,233,432 1,314,826 2,574.91 354 394 424 465 479 511 Camarines Norte 390,982 439,151 470,654 513,785 542,915 583,313 2,277.93 169 189 207 221 238 256
Continued
Density (persons/sq km) Population Region and province
Land area (sq. km.)
a1/a2/a32015
(Aug 1)2000
(May 1)2007
(Aug 1)2010
(May 1)

TABLE 1.1 ---Continued
1990 (May 1)
1995 (Sep 1)
1990 (May 1)
1995 (Sep 1)
2000 (May 1)
2007 (Aug 1)
2010 (May 1)
2015 (Aug 1)
Camarines Sur 1,305,919 1,432,598 1,693,821 1,822,371 1,952,544 5,511.90 237 260 281 308 331 354 Catanduanes 187,000 202,464 215,356 232,757 246,300 260,964 1,492.16 125 136 144 156 165 175 Masbate 599,355 653,852 707,668 768,939 834,650 892,393 4,138.56 144 157 171 185 202 216 Sorsogon 522,960 591,927 650,535 709,673 740,743 792,949 2,119.01 247 279 307 335 350 374VI - Western Visayas 5,393,333 5,776,938 3,645,315 6,843,643 4,194,579 4,477,247 12,773.46 246 262 285 311 328 351 Aklan 380,497 410,539 451,314 495,122 535,725 574,823 1,760.30 209 225 256 272 304 327 Antique 406,361 431,713 472,822 515,265 546,031 582,012 2,730.67 149 158 173 189 200 213 Capiz 584,091 624,469 654,156 701,664 719,685 761,384 2,594.64 225 241 252 270 277 293 Guimaras 117,990 126,470 141,450 151,238 162,943 174,613 611.87 195 209 231 250 266 285 Iloilo (excluding Iloilo City) 1,337,981 1,415,022 1,559,182 1,691,878 1,805,576 1,936,423 4,997.64 268 283 312 338 361 387 Iloilo City (Capital)* 309,505 334,539 366,391 418,710 424,619 447,992 78.34 3,951 4,270 4,677 5,345 5,420 5,719VII - Central Visayas 4,594,124 5,014,588 4,576,865 6,400,698 5,513,514 6,041,903 10,452.01 351 382 438 495 528 578 Bohol 948,403 994,440 1,139,130 1,230,110 1,255,128 1,313,560 4,772.52 197 206 239 255 263 275 Cebu (excluding Cebu City, Lapu-Lapu 1,709,621 1,890,357 2,160,569 2,439,005 2,619,362 2,938,982 4,943.72 375 382 437 494 530 594 Cebu City (Capital)** 610,417 662,299 718,821 798,809 866,171 922,611 315.00 1,938 2,103 2,282 2,539 2,750 2,929 Lapu-Lapu City* 146,194 173,744 217,019 292,530 350,467 408,112 58.10 2,516 2,990 3,735 5,035 6,032 7,024 Mandaue City** 180,285 194,745 259,728 318,575 331,320 362,654 25.18 7,160 7,734 10,315 12,652 13,158 14,402 Siquijor 73,932 73,756 81,598 87,695 91,066 95,984 337.49 219 219 242 260 270 284Negros Island Region (NIR)1 3,182,180 3,459,433 3,695,811 4,101,670 4,194,525 4,414,131 13,425.40 237 258 275 306 312 329 Negros Occidental (excluding Bacolod City)2 1,892,728 2,031,841 2,136,647 2,370,269 2,396,039 2,497,261 7,844.12 241 259 272 302 305 318 Bacolod City (Capital)*3 364,180 402,345 429,076 499,497 511,820 561,875 160.71 2,266 2,504 2,670 3,108 3,185 3,496 Negros Oriental4 925,272 1,025,247 1,130,088 1,231,904 1,286,666 1,354,995 5,420.57 171 189 208 227 237 250VIII - Eastern Visayas 3,054,490 3,366,917 3,610,355 3,915,140 4,101,322 4,440,150 23,234.78 131 145 155 169 177 191 Biliran 118,012 132,209 140,274 150,031 161,760 171,612 536.01 220 247 262 280 302 320 Eastern Samar 329,335 362,324 375,822 405,114 428,877 467,160 4,617.16 71 78 81 87 93 101 Leyte (excluding Tacloban City) 1,230,925 1,511,251 1,413,697 1,722,036 1,567,984 1,724,679 6,335.44 194 212 223 238 247 272 Tacloban City (Capital)* 136,891 167,310 178,639 218,144 221,174 242,089 201.72 679 829 886 1,081 1,096 1,200 Northern Samar 383,654 454,195 500,639 549,759 589,013 632,379 3,694.96 104 123 135 149 159 171 Samar (Western Samar) 533,733 589,373 641,124 695,149 733,377 780,481 6,048.03 88 97 106 115 121 129 Southern Leyte 321,940 317,565 360,160 390,847 399,137 421,750 1,801.46 179 176 200 217 222 234IX - Zamboanga Peninsula 2,281,064 2,567,651 2,831,412 3,230,094 3,407,353 3,629,783 16,904.03 135 151 167 189 202 215 Zamboanga del Norte 676,862 770,697 823,130 907,238 957,997 1,011,393 7,300.11 93 106 113 124 131 139 Zamboanga del Sur 695,741 766,918 836,217 914,278 959,685 1,010,674 4,484.21 155 170 186 203 214 225
Continued
Population 2000
(May 1)2007
(Aug 1)2010
(May 1)
Density (persons/sq km)Region and province
Land area (sq. km.)
a1/a2/a32015
(Aug 1)

TABLE 1.1 ---Continued
1990 (May 1)
1995 (Sep 1)
1990 (May 1)
1995 (Sep 1)
2000 (May 1)
2007 (Aug 1)
2010 (May 1)
2015 (Aug 1)
Zamboanga City** 442,345 511,139 601,794 774,407 807,129 861,799 1,414.70 313 361 425 547 571 609 Zamboanga Sibugay 407,038 450,340 497,239 546,186 584,685 633,129 3,481.28 117 125 143 151 168 182 City of Isabela (Capital of Basilan)** 59,078 68,557 73,032 87,985 97,857 112,788 223.73 264 306 326 393 437 504X - Northern Mindanao 2,811,646 3,197,059 3,505,708 3,952,437 4,297,323 4,689,302 20,458.51 137 156 171 193 210 229 Bukidnon 843,891 940,403 1,060,415 1,190,284 1,299,192 1,415,226 10,498.59 80 90 101 113 124 135 Camiguin 64,247 68,039 74,232 81,293 83,807 88,478 241.44 270 286 307 342 347 366 Lanao del Norte (excluding Iligan City) 387,524 440,783 473,062 538,283 607,917 676,395 3,354.16 116 132 141 161 181 202 Iligan City** 226,568 273,004 285,061 308,046 322,821 342,618 813.37 279 336 350 379 397 421 Misamis Occidental 424,365 458,965 486,723 531,680 567,642 602,126 2,006.63 206 223 243 259 283 300 Misamis Oriental (excluding Cagayan de Oro City) 525,453 587,551 664,338 748,885 813,856 888,509 3,131.52 168 188 212 239 260 284 Cagayan De Oro City (Capital)** 339,598 428,314 461,877 553,966 602,088 675,950 412.80 823 1,038 1,119 1,342 1,459 1,637XI - Davao Region 2,933,743 3,288,824 3,676,163 4,159,469 4,468,563 4,893,318 20,433.38 144 162 180 204 219 239 Compostela Valley 466,286 520,110 580,244 637,366 687,195 736,107 4,560.09 104 116 127 142 151 161 Davao del Norte 590,015 671,333 743,811 847,440 945,764 1,016,332 3,422.61 172 196 217 247 276 297 Davao del Sur (excluding Davao City) 632,798 677,069 504,289 822,406 574,910 632,588 2,163.98 146 156 233 190 266 292 Davao City* 849,947 1,006,840 1,147,116 1,363,337 1,449,296 1,632,991 2,443.61 348 412 469 559 593 668 Davao Occidental5 254,512 293,780 316,342 2,163.45 118 136 146 Davao Oriental 394,697 413,472 446,191 486,104 517,618 558,958 5,679.64 69 73 79 86 91 98XII - SOCCSKSARGEN (including Cotabato City) 2,399,953 2,846,966 3,222,169 3,830,500 4,109,571 4,545,276 22,786.08 107 127 141 171 180 199 Cotabato (North Cotabato) 763,995 862,666 958,643 1,121,974 1,226,508 1,379,747 9,317.30 85 96 103 125 132 148 Sarangani 283,141 367,006 410,622 475,514 498,904 544,261 3,642.16 80 104 113 135 137 149 South Cotabato (excluding General 539,458 621,155 690,728 767,254 827,200 915,289 3,793.90 137 158 182 195 218 241 General Santos City** 250,389 327,173 411,822 529,542 538,086 594,446 492.86 508 664 836 1,074 1,092 1,206 Sultan Kudarat 435,905 522,187 586,505 675,644 747,087 812,095 5,363.86 82 99 109 128 139 151 Cotabato City** 127,065 146,779 163,849 259,153 271,786 299,438 176.00 722 834 931 1,472 1,544 1,701XIII - Caraga 1,764,297 1,942,687 2,095,367 2,293,346 2,429,224 2,596,709 21,120.56 82 91 99 107 115 123 Agusan del Norte (excluding Butuan City) 237,629 267,411 285,570 314,027 332,487 354,503 2,611.63 89 101 109 117 127 136 Butuan City (Capital)** 227,829 247,074 267,279 298,378 309,709 337,063 816.62 279 303 327 365 379 413 Agusan del Sur 420,763 514,736 559,294 609,447 656,418 700,653 9,989.52 42 52 56 61 66 70 Dinagat Islands 98,865 100,537 106,951 120,813 126,803 127,152 817.47 121 96 131 115 155 156 Surigao del Norte 327,113 341,666 374,465 409,468 442,588 485,088 1,952.62 168 173 192 208 227 248 Surigao del Sur 452,098 471,263 501,808 541,347 561,219 592,250 4,932.70 92 96 102 111 114 120
Continued
2000(May 1)
2007 (Aug 1)
2010(May 1)
Density (persons/sq km)Land area (sq. km.)
a1/a2/a32015
(Aug 1)
Population Region and province
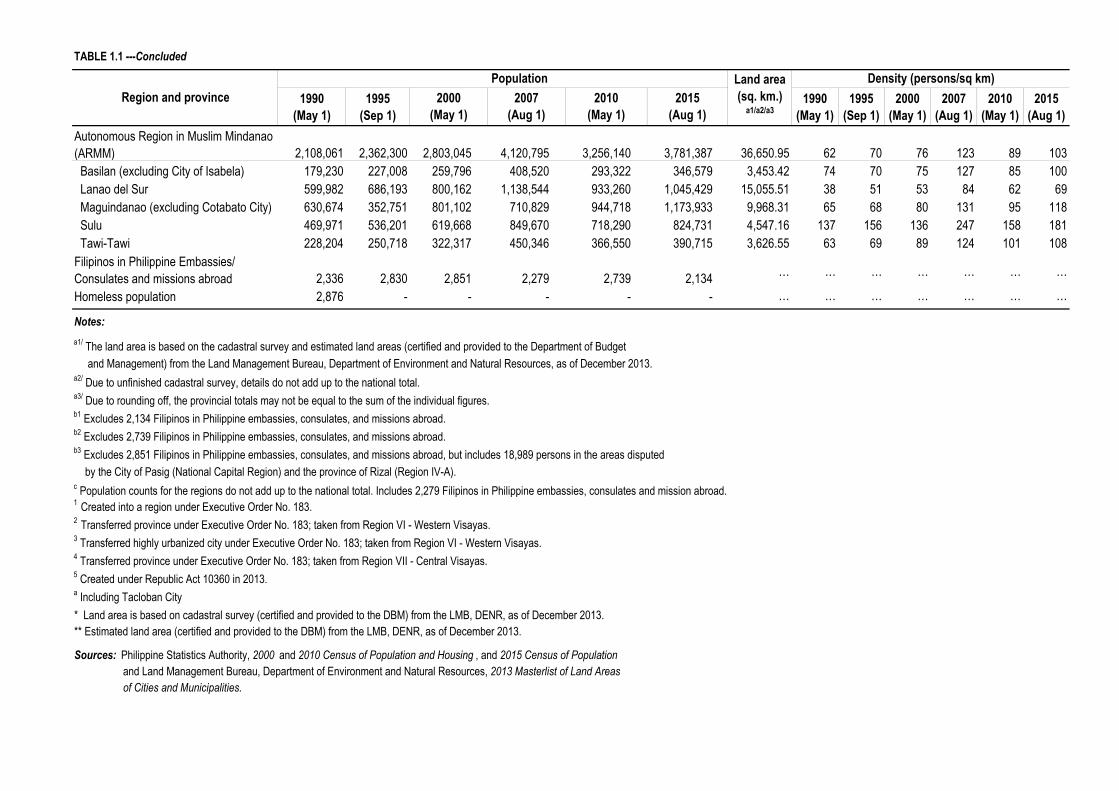
TABLE 1.1 ---Concluded
1990 (May 1)
1995 (Sep 1)
1990 (May 1)
1995 (Sep 1)
2000 (May 1)
2007 (Aug 1)
2010 (May 1)
2015 (Aug 1)
Autonomous Region in Muslim Mindanao (ARMM) 2,108,061 2,362,300 2,803,045 4,120,795 3,256,140 3,781,387 36,650.95 62 70 76 123 89 103 Basilan (excluding City of Isabela) 179,230 227,008 259,796 408,520 293,322 346,579 3,453.42 74 70 75 127 85 100 Lanao del Sur 599,982 686,193 800,162 1,138,544 933,260 1,045,429 15,055.51 38 51 53 84 62 69 Maguindanao (excluding Cotabato City) 630,674 352,751 801,102 710,829 944,718 1,173,933 9,968.31 65 68 80 131 95 118 Sulu 469,971 536,201 619,668 849,670 718,290 824,731 4,547.16 137 156 136 247 158 181 Tawi-Tawi 228,204 250,718 322,317 450,346 366,550 390,715 3,626.55 63 69 89 124 101 108Filipinos in Philippine Embassies/ Consulates and missions abroad 2,336 2,830 2,851 2,279 2,739 2,134 … … … … … … …
Homeless population 2,876 - - - - - … … … … … … …
Notes:a1/ The land area is based on the cadastral survey and estimated land areas (certified and provided to the Department of Budget and Management) from the Land Management Bureau, Department of Environment and Natural Resources, as of December 2013.a2/ Due to unfinished cadastral survey, details do not add up to the national total.a3/ Due to rounding off, the provincial totals may not be equal to the sum of the individual figures.b1 Excludes 2,134 Filipinos in Philippine embassies, consulates, and missions abroad.b2 Excludes 2,739 Filipinos in Philippine embassies, consulates, and missions abroad. b3 Excludes 2,851 Filipinos in Philippine embassies, consulates, and missions abroad, but includes 18,989 persons in the areas disputed by the City of Pasig (National Capital Region) and the province of Rizal (Region IV-A).c Population counts for the regions do not add up to the national total. Includes 2,279 Filipinos in Philippine embassies, consulates and mission abroad.1 Created into a region under Executive Order No. 183.2 Transferred province under Executive Order No. 183; taken from Region VI - Western Visayas.3 Transferred highly urbanized city under Executive Order No. 183; taken from Region VI - Western Visayas.4 Transferred province under Executive Order No. 183; taken from Region VII - Central Visayas.5 Created under Republic Act 10360 in 2013.a Including Tacloban City* Land area is based on cadastral survey (certified and provided to the DBM) from the LMB, DENR, as of December 2013.** Estimated land area (certified and provided to the DBM) from the LMB, DENR, as of December 2013.
Sources: Philippine Statistics Authority, 2000 and 2010 Census of Population and Housing , and 2015 Census of Population and Land Management Bureau, Department of Environment and Natural Resources, 2013 Masterlist of Land Areas of Cities and Municipalities.
Population 2000
(May 1)2007
(Aug 1)2010
(May 1)
Density (persons/sq km)Region and province
Land area (sq. km.)
a1/a2/a32015
(Aug 1)

TABLE 1.2 Annual Population Growth by Region and by Province: CENSUS YEARS 2000, 2010, and 2015
2000-2010 2010-2015 2000-2015
Philippines 1.90 1.72 1.84
National Capital Region (NCR) 1.78 1.58 1.72 City of Manila 0.44 1.43 0.78 City of Mandaluyong 1.67 3.12 2.17 City of Marikina 0.81 1.16 0.93 City of Pasig 2.86 2.31 2.67 Quezon City 2.42 1.17 1.99 City of San Juan 0.31 0.12 0.25 Caloocan City 2.37 1.18 1.96 City of Malabon 0.42 0.65 0.50 City of Navotas 0.78 0.03 0.52 City of Valenzuela 1.71 1.45 1.62 City of Las Piñas 1.57 1.22 1.45 City of Makati 1.16 1.85 1.40 City of Muntinlupa 1.95 1.78 1.89 City of Parañaque 2.72 2.39 2.60 Pasay City 1.02 1.12 1.05 Pateros 1.12 -0.09 0.70 Taguig City 3.26 4.32 3.63Cordillera Administrative Region 1.70 1.21 1.53 Abra 1.14 0.52 0.93 Apayao 1.49 1.08 1.35 Benguet (excluding Baguio City) 2.04 1.91 1.99 Baguio City 2.36 1.54 2.08 Ifugao 1.69 1.14 1.50 Kalinga 1.48 1.02 1.32 Mountain Province 0.92 0.05 0.62I - Ilocos Region 1.23 1.09 1.18 Ilocos Norte 1.00 0.83 0.94 Ilocos Sur 1.03 0.88 0.98 La Union 1.21 1.12 1.18 Pangasinan 1.34 1.18 1.28II - Cagayan Valley 1.39 1.27 1.35 Batanes 0.08 0.72 0.30 Cagayan 1.25 1.23 1.24 Isabela 1.47 1.29 1.41 Nueva Vizcaya 1.39 1.36 1.38 Quirino 1.75 1.28 1.59III - Central Luzon 2.14 1.95 2.07 Aurora 1.48 1.21 1.38 Bataan 2.11 1.94 2.06 Bulacan 2.73 2.28 2.57 Nueva Ecija 1.65 1.84 1.71 Pampanga (excluding Angeles City) 2.23 1.68 2.04 Angeles City 2.00 4.52 2.86 Tarlac 1.76 1.35 1.62 Zambales (excluding Olongapo City) 2.11 1.93 2.05 Olongapo City 1.31 1.00 1.20IV-A CALABARZON 3.07 2.58 2.90 Batangas 2.24 2.41 2.30 Cavite 4.12 3.37 3.86
Continued
Annual Average Growth Rate (In percent)Region and province

TABLE 1.2 ---Continued
2000-2010 2010-2015 2000-2015
Laguna 3.11 2.47 2.89 Quezon (excluding Lucena City) 1.61 1.23 1.48 Lucena City 2.31 1.49 2.02 Rizal 3.82 2.88 3.50IV-B MIMAROPA 1.79 1.47 1.68 Marinduque 0.47 0.55 0.50 Occidental Mindoro 1.76 1.40 1.64 Oriental Mindoro 1.43 1.38 1.41 Palawan (excluding Puerto Princesa City) 2.66 1.84 2.38 Puerto Princesa City 3.24 2.62 3.02 Romblon 0.72 0.59 0.67V - Bicol Region 1.46 1.29 1.40 Albay 1.23 1.22 1.23 Camarines Norte 1.44 1.38 1.42 Camarines Sur 1.62 1.32 1.52 Catanduanes 1.35 1.11 1.27 Masbate 1.66 1.28 1.53 Sorsogon 1.31 1.30 1.31VI - Western Visayas 1.41 1.25 1.36 Aklan 1.73 1.35 1.60 Antique 1.45 1.22 1.37 Capiz 0.96 1.08 1.00 Guimaras 1.42 1.33 1.39 Iloilo (excluding Iloilo City) 1.48 1.34 1.43 Iloilo City 1.49 1.02 1.33VII - Central Visayas 1.88 1.76 1.84 Bohol 0.97 0.87 0.94 Cebu (excluding Cebu City, Lapu-Lapu City, and Mandaue City) 1.94 2.22 2.04 Cebu City 1.88 1.21 1.65 Lapu-Lapu City 4.91 2.94 4.23 Mandaue City 2.46 1.73 2.21 Siquijor 1.10 1.01 1.07Negros Island Region (NIR)1 1.27 0.98 1.17 Negros Occidental (excluding Bacolod City)2 1.15 0.79 1.03 Bacolod City 1.78 1.79 1.78 Negros Oriental3 1.31 0.99 1.20VIII - Eastern Visayas 1.28 1.52 1.36 Biliran 1.43 1.13 1.33 Eastern Samar 1.33 1.64 1.44 Leyte (excluding Tacloban City) 1.04 1.83 1.31 Tacloban City 2.16 1.73 2.01 Northern Samar 1.64 1.36 1.54 Samar (Western Samar) 1.35 1.19 1.30 Southern Leyte 1.03 1.05 1.04IX - Zamboanga Peninsula 1.87 1.21 1.64 Zamboanga del Norte 1.53 1.04 1.36 Zamboanga del Sur 1.39 0.99 1.25 Zamboanga City 2.98 1.26 2.38 Zamboanga Sibugay 1.63 1.53 1.60 City of Isabela 2.97 2.74 2.89
Continued
Region and provinceAnnual Average Growth Rate (In percent)
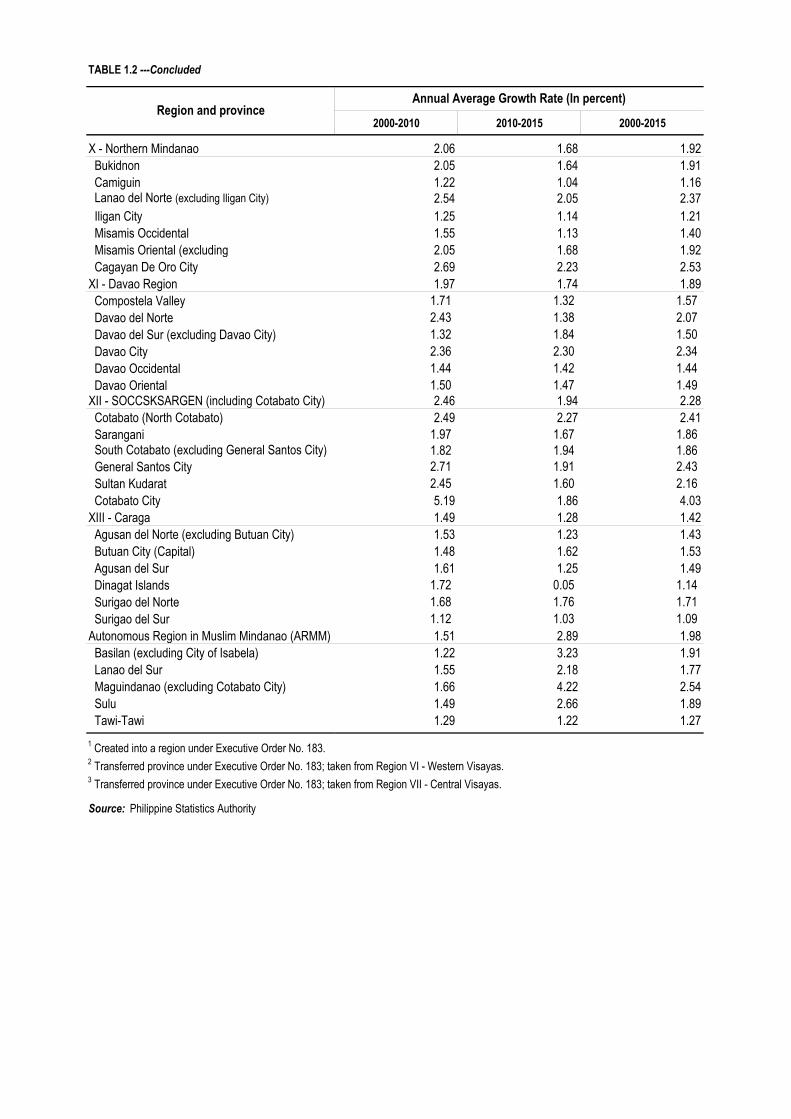
TABLE 1.2 ---Concluded
2000-2010 2010-2015 2000-2015
X - Northern Mindanao 2.06 1.68 1.92 Bukidnon 2.05 1.64 1.91 Camiguin 1.22 1.04 1.16 Lanao del Norte (excluding Iligan City) 2.54 2.05 2.37 Iligan City 1.25 1.14 1.21 Misamis Occidental 1.55 1.13 1.40 Misamis Oriental (excluding 2.05 1.68 1.92 Cagayan De Oro City 2.69 2.23 2.53XI - Davao Region 1.97 1.74 1.89 Compostela Valley 1.71 1.32 1.57 Davao del Norte 2.43 1.38 2.07 Davao del Sur (excluding Davao City) 1.32 1.84 1.50 Davao City 2.36 2.30 2.34 Davao Occidental 1.44 1.42 1.44 Davao Oriental 1.50 1.47 1.49XII - SOCCSKSARGEN (including Cotabato City) 2.46 1.94 2.28 Cotabato (North Cotabato) 2.49 2.27 2.41 Sarangani 1.97 1.67 1.86 South Cotabato (excluding General Santos City) 1.82 1.94 1.86 General Santos City 2.71 1.91 2.43 Sultan Kudarat 2.45 1.60 2.16 Cotabato City 5.19 1.86 4.03XIII - Caraga 1.49 1.28 1.42 Agusan del Norte (excluding Butuan City) 1.53 1.23 1.43 Butuan City (Capital) 1.48 1.62 1.53 Agusan del Sur 1.61 1.25 1.49 Dinagat Islands 1.72 0.05 1.14 Surigao del Norte 1.68 1.76 1.71 Surigao del Sur 1.12 1.03 1.09Autonomous Region in Muslim Mindanao (ARMM) 1.51 2.89 1.98 Basilan (excluding City of Isabela) 1.22 3.23 1.91 Lanao del Sur 1.55 2.18 1.77 Maguindanao (excluding Cotabato City) 1.66 4.22 2.54 Sulu 1.49 2.66 1.89 Tawi-Tawi 1.29 1.22 1.271 Created into a region under Executive Order No. 183.2 Transferred province under Executive Order No. 183; taken from Region VI - Western Visayas.3 Transferred province under Executive Order No. 183; taken from Region VII - Central Visayas.
Source: Philippine Statistics Authority
Region and provinceAnnual Average Growth Rate (In percent)

TABLE 1.3 Population, Land Area and Density by City: CENSUS YEARS 2000, 2010, and 2015
2000 (May 1)
2010 (May 1)
2015 (Aug 1)
2000 (May 1)
2010 (May 1)
2015 (Aug 1)
Alaminos 73,448 85,025 89,708 164.3 447 518 546Angeles 267,788 326,336 411,634 63.37 4,226 5,150 6,496Antipolo 470,866 677,741 776,386 306.10 1,538 2,214 2,536Bacolod 429,076 511,820 561,875 160.71 2,670 3,185 3,496Bacoor1 305,699 520,216 600,609 46.17 6,621 11,267 13,009Bago 141,721 163,045 170,981 371.80 381 439 460Baguio 252,386 318,676 345,366 57.51 4,389 5,541 6,005Bais 68,115 74,722 76,291 319.64 213 234 239Balanga 71,088 87,920 96,061 111.63 637 788 861Batac 47,682 53,542 55,201 161.06 296 332 343Batangas 247,588 305,607 329,874 282.96 875 1,080 1,166Bayawan (Tulong) 101,391 114,074 117,900 699.08 145 163 169Baybay 95,630 102,841 109,432 459.34 208 224 238Bayugan 93,623 99,361 103,202 688.77 136 144 150Biñan 201,186 283,396 333,028 40.27 4,996 7,037 8,270Bislig 97,860 96,578 94,535 331.80 295 291 285Bogo 63,869 69,911 78,120 103.52 617 675 755Borongan 55,141 64,457 69,297 475.00 116 146 147Butuan 267,279 309,709 337,063 816.62 327 379 413Cabadbaran 55,006 69,241 73,639 311.02 177 223 237Cabanatuan 222,859 272,676 302,231 282.75 788 964 1,069Cabuyao2 106,630 248,436 308,745 43.30 2,463 5,738 7,130Cadiz 141,954 151,500 154,723 524.57 271 289 295Cagayan de Oro 461,877 602,088 675,950 412.80 1,119 1,459 1,637Calamba 281,146 389,377 454,486 149.50 1,881 2,605 3,040Calapan 105,910 124,173 133,893 250.06 424 497 535Calbayog 147,187 172,778 183,851 880.74 167 196 209Calookan 1,177,604 1,489,040 1,583,978 55.80 21,104 26,685 28,387Candon 50,564 57,884 60,623 103.28 490 560 587Canlaon 46,548 50,627 54,509 170.93 272 296 319Carcar 89,199 107,323 119,664 116.78 764 919 1,025Catbalogan 84,180 94,317 103,879 274.22 307 344 379Cauayan 103,952 122,335 129,523 336.40 309 364 385Cavite 99,367 101,120 102,806 10.89 9,125 9,286 9,440Cebu 718,821 866,171 922,611 315.00 2,282 2,750 2,929Cotabato 163,849 271,786 299,438 176.00 931 1,544 1,701Dagupan 130,328 163,676 171,271 37.23 3,501 4,396 4,600Danao 98,781 119,252 136,471 107.30 921 1,111 1,272Dapitan 68,178 77,441 82,418 390.53 175 198 211Dasmarinas 379,520 575,817 659,019 90.13 4,211 6,389 7,312Davao 1,147,116 1,449,296 1,632,991 2,443.61 469 593 668Digos 125,171 149,891 169,393 287.10 436 522 590Dipolog 99,862 120,460 130,759 241.13 414 500 542Dumaguete 102,265 120,883 131,377 33.62 3,042 3,596 3,908El Salvador 34,650 44,848 50,204 106.15 326 422 473Escalante 79,098 93,005 94,070 192.76 410 482 488Gapan 89,199 101,488 110,303 164.44 542 617 671General Santos 411,822 538,086 594,446 492.86 836 1,092 1,206General Trias3 107,691 243,322 314,303 90.01 1,196 2,703 3,492Gingoog 102,379 117,908 124,648 568.44 180 207 219Guihulngan 84,607 93,675 95,969 388.56 218 241 247Himamaylan 88,684 103,006 106,880 367.04 242 281 291Ilagan4 119,990 135,174 145,568 1,166.26 103 116 125
Continued
CityPopulation Density (persons/sq km)Land area*
(sq. km.) a1/a2/a3

TABLE 1.3 - - Continued
2000 (May 1)
2010 (May 1)
2015 (Aug 1)
2000 (May 1)
2010 (May 1)
2015 (Aug 1)
Iligan 285,061 322,821 342,618 813.37 350 397 421Iloilo 366,391 424,619 447,992 78.34 4,677 5,420 5,719Imus5 195,482 301,624 403,785 171.66 1,139 1,757 2,352Iriga 88,893 105,919 111,757 137.35 647 771 814Isabela 73,032 97,857 112,788 223.73 326 437 504Kabankalan 149,769 167,666 181,977 699.27 214 240 260Kidapawan 101,205 125,447 140,195 358.47 282 350 391Koronadal 133,786 158,273 174,942 277.00 483 571 632Lamitan 58,709 68,996 74,782 354.45 166 195 211Laoag 94,466 104,904 111,125 116.08 814 904 957Lapu-Lapu (Opon) 217,019 350,467 408,112 58.10 3,735 6,032 7,024Las Piñas 472,780 552,573 588,894 32.69 14,463 16,903 18,014Legazpi 157,010 182,201 196,639 161.61 972 1,127 1,217Ligao 90,603 104,914 111,399 246.75 367 425 451Lipa 218,447 283,468 332,386 209.40 1,043 1,354 1,587Lucena 196,075 246,392 266,248 80.21 2,445 3,072 3,319La Carlota 56,408 63,852 64,469 137.29 411 465 470Maasin 71,163 81,250 85,560 211.71 336 384 404Mabalacat6 171,045 215,610 250,799 82.20 2,081 2,623 3,051Makati 471,379 529,039 582,602 21.57 21,853 24,527 27,010Malabon 338,855 353,337 365,525 15.71 21,569 22,491 23,267Malaybalay 123,672 153,085 174,625 969.19 128 158 180Malolos 175,291 234,945 252,074 67.25 2,607 3,494 3,748Mandaluyong 278,474 328,699 386,276 9.29 29,976 35,382 41,580Mandaue 259,728 331,320 362,654 25.18 10,315 13,158 14,402Manila 1,581,082 1,652,171 1,780,148 24.98 63,294 66,140 71,263Masbate 71,441 85,227 95,389 188.00 380 453 507Marawi 131,090 187,106 201,785 87.55 1,497 2,137 2,305Marikina 391,170 424,150 450,741 21.52 18,177 19,710 20,945Mati 105,908 126,143 141,141 588.63 180 214 240Meycauayan 163,037 199,154 209,083 32.10 5,079 6,204 6,513Muntinlupa 379,310 459,941 504,509 39.75 9,542 11,571 12,692Science City of Muñoz 65,586 75,462 81,483 163.05 402 463 500Naga (Camarines Sur) 137,810 174,931 196,003 77.40 1,780 2,260 2,532Naga (Cebu) 80,189 101,571 115,750 101.97 786 996 1,135Navotas 230,403 249,131 249,463 8.94 25,772 27,867 27,904Olongapo 194,260 221,178 233,040 185.00 1,050 1,196 1,260Ormoc 154,297 191,200 215,031 613.60 251 312 350Oroquieta 59,843 68,945 70,757 237.88 252 290 297Ozamis 110,420 131,527 141,828 169.95 650 774 835Pagadian 142,585 186,852 199,060 378.80 376 493 526Palayan 31,253 37,219 41,041 101.40 308 367 405Panabo 133,950 174,364 184,599 251.23 533 694 735Parañaque 449,811 588,126 665,822 46.57 9,659 12,629 14,297Pasay 354,908 392,869 416,522 13.97 25,405 28,122 29,815Pasig 505,058 669,773 755,300 48.46 10,422 13,821 15,586Passi 69,601 79,663 80,544 251.39 277 317 320Puerto Princesa 161,912 222,673 255,116 2,381.02 68 94 107Quezon City 2,173,831 2,761,720 2,936,116 171.71 12,660 16,084 17,099Roxas 126,352 156,197 167,003 95.07 1,329 1,643 1,757Sagay 129,765 140,740 146,264 330.34 393 426 443Island Garden City of Samal 82,609 95,874 104,123 301.30 274 318 346San Pedro7 231,403 294,310 325,809 24.05 9,622 12,237 13,547San Carlos (Negros Occidental) 118,259 129,981 132,536 451.50 262 288 294
Continued
CityLand area (sq. km.)
a1/a2/a3
Density (persons/sq km)Population
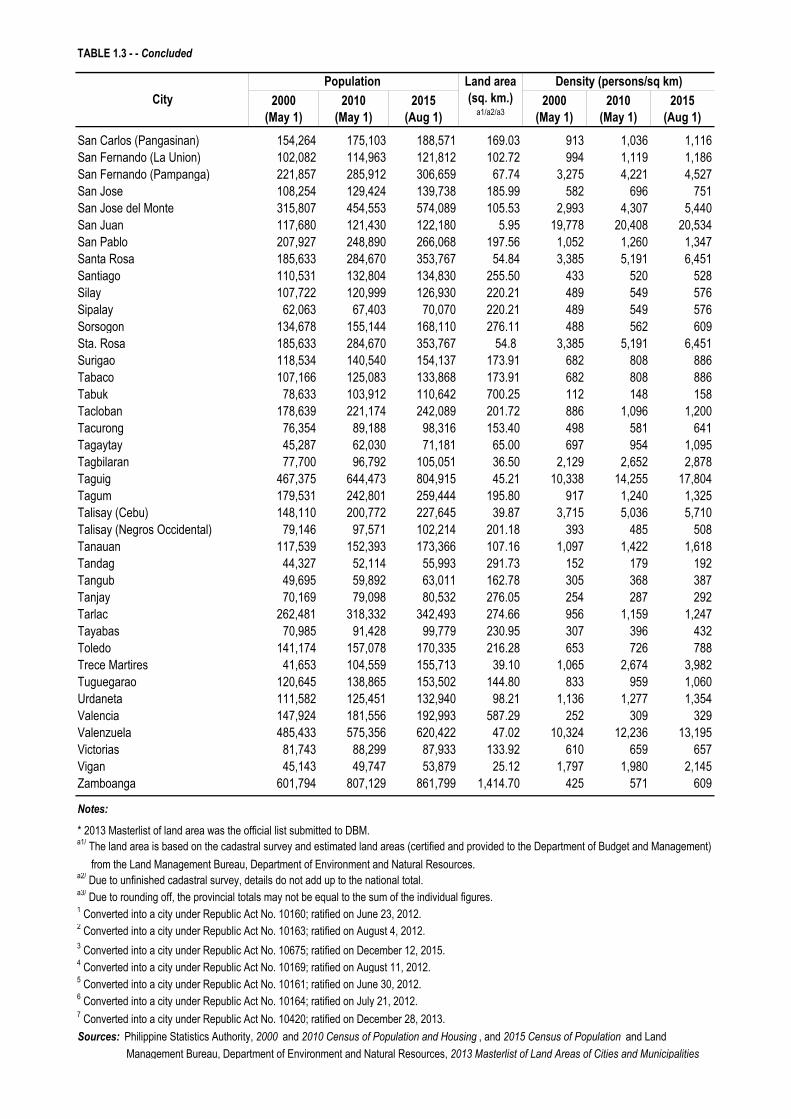
TABLE 1.3 - - Concluded
2000 (May 1)
2010 (May 1)
2015 (Aug 1)
2000 (May 1)
2010 (May 1)
2015 (Aug 1)
San Carlos (Pangasinan) 154,264 175,103 188,571 169.03 913 1,036 1,116San Fernando (La Union) 102,082 114,963 121,812 102.72 994 1,119 1,186San Fernando (Pampanga) 221,857 285,912 306,659 67.74 3,275 4,221 4,527San Jose 108,254 129,424 139,738 185.99 582 696 751San Jose del Monte 315,807 454,553 574,089 105.53 2,993 4,307 5,440San Juan 117,680 121,430 122,180 5.95 19,778 20,408 20,534San Pablo 207,927 248,890 266,068 197.56 1,052 1,260 1,347Santa Rosa 185,633 284,670 353,767 54.84 3,385 5,191 6,451Santiago 110,531 132,804 134,830 255.50 433 520 528Silay 107,722 120,999 126,930 220.21 489 549 576Sipalay 62,063 67,403 70,070 220.21 489 549 576Sorsogon 134,678 155,144 168,110 276.11 488 562 609Sta. Rosa 185,633 284,670 353,767 54.8 3,385 5,191 6,451Surigao 118,534 140,540 154,137 173.91 682 808 886Tabaco 107,166 125,083 133,868 173.91 682 808 886Tabuk 78,633 103,912 110,642 700.25 112 148 158Tacloban 178,639 221,174 242,089 201.72 886 1,096 1,200Tacurong 76,354 89,188 98,316 153.40 498 581 641Tagaytay 45,287 62,030 71,181 65.00 697 954 1,095Tagbilaran 77,700 96,792 105,051 36.50 2,129 2,652 2,878Taguig 467,375 644,473 804,915 45.21 10,338 14,255 17,804Tagum 179,531 242,801 259,444 195.80 917 1,240 1,325Talisay (Cebu) 148,110 200,772 227,645 39.87 3,715 5,036 5,710Talisay (Negros Occidental) 79,146 97,571 102,214 201.18 393 485 508Tanauan 117,539 152,393 173,366 107.16 1,097 1,422 1,618Tandag 44,327 52,114 55,993 291.73 152 179 192Tangub 49,695 59,892 63,011 162.78 305 368 387Tanjay 70,169 79,098 80,532 276.05 254 287 292Tarlac 262,481 318,332 342,493 274.66 956 1,159 1,247Tayabas 70,985 91,428 99,779 230.95 307 396 432Toledo 141,174 157,078 170,335 216.28 653 726 788Trece Martires 41,653 104,559 155,713 39.10 1,065 2,674 3,982Tuguegarao 120,645 138,865 153,502 144.80 833 959 1,060Urdaneta 111,582 125,451 132,940 98.21 1,136 1,277 1,354Valencia 147,924 181,556 192,993 587.29 252 309 329Valenzuela 485,433 575,356 620,422 47.02 10,324 12,236 13,195Victorias 81,743 88,299 87,933 133.92 610 659 657Vigan 45,143 49,747 53,879 25.12 1,797 1,980 2,145Zamboanga 601,794 807,129 861,799 1,414.70 425 571 609
Notes:
* 2013 Masterlist of land area was the official list submitted to DBM.a1/ The land area is based on the cadastral survey and estimated land areas (certified and provided to the Department of Budget and Management) from the Land Management Bureau, Department of Environment and Natural Resources.a2/ Due to unfinished cadastral survey, details do not add up to the national total.a3/ Due to rounding off, the provincial totals may not be equal to the sum of the individual figures.1 Converted into a city under Republic Act No. 10160; ratified on June 23, 2012.2 Converted into a city under Republic Act No. 10163; ratified on August 4, 2012.3 Converted into a city under Republic Act No. 10675; ratified on December 12, 2015.4 Converted into a city under Republic Act No. 10169; ratified on August 11, 2012.5 Converted into a city under Republic Act No. 10161; ratified on June 30, 2012.6 Converted into a city under Republic Act No. 10164; ratified on July 21, 2012.7 Converted into a city under Republic Act No. 10420; ratified on December 28, 2013.Sources: Philippine Statistics Authority, 2000 and 2010 Census of Population and Housing , and 2015 Census of Population and Land Management Bureau, Department of Environment and Natural Resources, 2013 Masterlist of Land Areas of Cities and Municipalities
CityLand area (sq. km.)
a1/a2/a3
Population Density (persons/sq km)

TABLE 1.4 Population of the Philippines: CENSUS YEARS 1799 to 2015
Year Population1 Average annual rate of increase (in percent) Source of data
1799 1,502,574 - Fr. Buzeta1800 1,561,251 3.91 Fr. Zuniga1812 1,933,331 1.80 Cedulas1819 2,106,230 1.23 Cedulas1829 2,593,287 2.10 Church1840 3,096,031 1.62 Local officials1850 3,857,424 2.22 Fr. Buzeta1858 4,290,381 1.34 Bowring1870 4,712,006 0.78 Guia de Manila1877 5,567,685 2.41 Census1887 5,984,727 0.72 Census1896 6,261,339 0.50 Prof. Plehn's estimate based on census records1903 7,635,426 2.87 Census1918 10,314,310 2.03 Census1939 16,000,303 2.11 Census1948 19,234,182 2.07 Census1960 27,087,685 2.89 Census1970 36,684,486 3.08 Census1975 42,070,660 2.78 Census1980 48,098,460 2.71 Census1990 60,703,810 2.35 Census1995 68,616,536 2.32 Census2000 76,506,928 2.36 Census2007 88,566,732 2.04 Census2010 92,337,852 1.55 Census2015 100,981,437 1.72 Census
Notes: Population from 1799 to 1896 excludes non-Christians.1 Includes the household population, homeless population, Filipinos in Philippine Embassies/Consulates and missions abroad and institutional population who are found living in institutional living quarters such as penal insitutions, orphanages, hospitals hospitals, military camp at the time of the census taking.… not availablea 1990 - 2000 Growth rate; b 2000-2010 Growth rateSource: Philippine Statistics Authority
TABLE 1.5 Sex Ratio and Dependency Ration by Region: 2010
Region Sex Ratio Dependency Ratio
Philippines 102.3 57.69NCR 97.8 45.15CAR 104.4 56.76I - Ilocos Region 101.9 58.21II - Cagayan Valley 103.9 55.90III - Central Luzon 102.2 53.53IV-A CALABARZON 100.4 52.12IV-B MIMAROPA 105.3 66.55V - Bicol Region 103.7 70.80VI - Western Visayas 103.0 58.16VII - Central Visayas 102.2 60.59VIII - Eastern Visayas 106.1 66.89IX - Zamboanga Peninsula 104.0 64.54X - Northern Mindanao 104.5 62.35XI - Davao Region 105.7 57.73XII - SOCCSKSARGEN 104.5 61.11XIII - Caraga 106.0 65.87ARMM 99.4 77.95Sex Ratio = (Total males/Total females) x 100Dependency Ratio = (0 to 14 years + 65 years and over)/Total of 15 to 64 years x 100Source: Philippine Statistics Authority
1-12

TABLE 1.6 Sex Ratio of Population by Region: CENSUS YEARS 1980, 1990, 1995, 2000, 2010 and 2015
Male FemaleMales
per 100 Females
Male FemaleMales
per 100 Females
Male FemaleMales
per 100 Females
Male FemaleMales
per 100 Females
Male FemaleMales
per 100 Females
Male FemaleMales
per 100 Females
Philippines 24,128,755 23,969,705 100.7 30,443,187 30,115,929 101.1 34,584,170 34,032,366 101.6 38,524,266 37,979,811 101.4 46,634,257 45,700,856 102.0 51,069,962 49,909,341 102.3
NCR 2,855,712 3,070,172 93.0 3,835,879 4,071,507 94.2 4,617,557 4,836,483 95.5 4,877,842 5,054,718 96.5 5,825,918 6,030,057 96.6 6,368,365 6,508,888 97.8CAR 462,647 451,785 102.4 577,366 563,775 102.4 637,733 617,105 103.3 695,838 669,574 103.9 824,941 791,926 104.2 879,340 842,666 104.4I - Ilocos Region 1,447,791 1,475,101 98.1 1,776,834 1,770,435 100.4 1,910,731 1,893,159 100.9 2,108,238 2,092,240 100.8 2,394,931 2,353,441 101.8 2,536,297 2,489,831 101.9II - Cagayan Valley 978,535 940,556 104.0 1,191,427 1,144,923 104.1 1,294,064 1,241,971 104.2 1,440,762 1,372,397 105.0 1,647,101 1,582,062 104.1 1,758,773 1,692,637 103.9III - Central Luzon 2,462,163 2,447,775 100.6 3,190,244 3,137,544 101.7 3,585,337 3,506,854 102.2 4,135,828 4,068,914 101.6 5,119,101 5,018,636 102.0 5,669,379 5,548,798 102.2IV-A CALABARZON 2,312,034 2,291,401 100.9 3,190,077 3,149,526 101.3 3,889,794 3,860,410 100.8 4,666,291 4,654,338 100.3 6,293,593 6,316,210 99.6 7,221,488 7,193,286 100.4IV-B MIMAROPA 727,764 680,276 107.0 905,312 863,133 104.9 1,043,046 990,225 105.3 1,177,199 1,122,030 104.9 1,411,236 1,333,435 105.8 1,520,129 1,443,231 105.3V - Bicol Region 1,765,624 1,711,358 103.2 1,984,866 1,919,927 103.4 2,194,587 2,130,720 103.0 2,392,601 2,294,068 104.3 2,767,481 2,652,930 104.3 2,951,135 2,845,854 103.7VI - Western Visayas 2,265,780 2,259,835 100.3 2,708,512 2,676,710 101.2 2,910,711 2,866,227 101.6 3,128,863 3,082,175 101.5 3,606,660 3,495,778 103.2 3,830,514 3,705,869 103.4VII - Central Visayas 1,882,242 1,905,132 98.8 2,291,637 2,290,892 100.0 2,515,911 2,498,677 100.7 2,859,723 2,847,230 100.4 3,437,571 3,362,609 102.2 3,743,601 3,653,297 102.50Negros Island Region - - - - - - - - - - - - - - - 2,248,983 2,165,148 103.9VIII - Eastern Visayas 1,423,846 1,375,688 103.5 1,556,966 1,491,888 104.4 1,717,272 1,649,645 104.1 1,844,572 1,765,783 104.5 2,110,199 1,991,123 106.0 2,285,355 2,154,795 106.1IX - Zamboanga Peninsula 926,468 895,283 103.5 1,158,190 1,117,039 103.7 1,306,141 1,261,510 103.5 1,436,686 1,394,726 103.0 1,739,541 1,667,812 104.3 1,850,878 1,778,905 104.0X - Northern Mindanao 1,131,407 1,094,762 103.3 1,423,293 1,382,661 102.9 1,622,546 1,574,513 103.1 1,777,191 1,728,517 102.8 2,193,037 2,104,286 104.2 2,396,000 2,293,302 104.5XI - Davao Region 1,127,105 1,071,578 105.2 1,492,129 1,434,065 104.0 1,679,369 1,609,455 104.3 1,876,881 1,799,282 104.3 2,291,350 2,177,213 105.2 2,514,244 2,379,074 105.7XII - SOCCSKSARGEN 881,784 840,943 104.9 1,223,467 1,172,907 104.3 1,460,794 1,386,172 105.4 1,641,838 1,580,331 103.9 2,103,783 2,005,788 104.9 2,323,144 2,222,132 104.5XIII - Caraga 695,100 676,412 102.8 897,282 863,984 103.9 990,432 952,255 104.0 1,071,249 1,024,118 104.6 1,248,478 1,180,746 105.7 1,336,340 1,260,369 106.0ARMM 782,753 781,648 100.1 1,039,706 1,065,013 97.6 1,206,895 1,155,405 104.5 1,382,971 1,420,074 97.4 1,619,336 1,636,804 98.9 1,884,980 1,896,407 99.4a Household population, excludes 2,876 homeless population and 2,336 Filipinos in Philippine embassies, consulates b Excludes 2,851 Filipinos in Philippine embassies, consulates and mission abroad but includes 18,989 persons in the by the City of Pasig (National Capital Region) and the province of Rizal (Region IVA)c Excludes 2,739 Filipinos in Philippine embassies, consulates and mission abroadd New regional disaggregation for 2010 population
Source: Philippine Statistics Authority
2000b 2010c
Region
20151980 1990a 1995
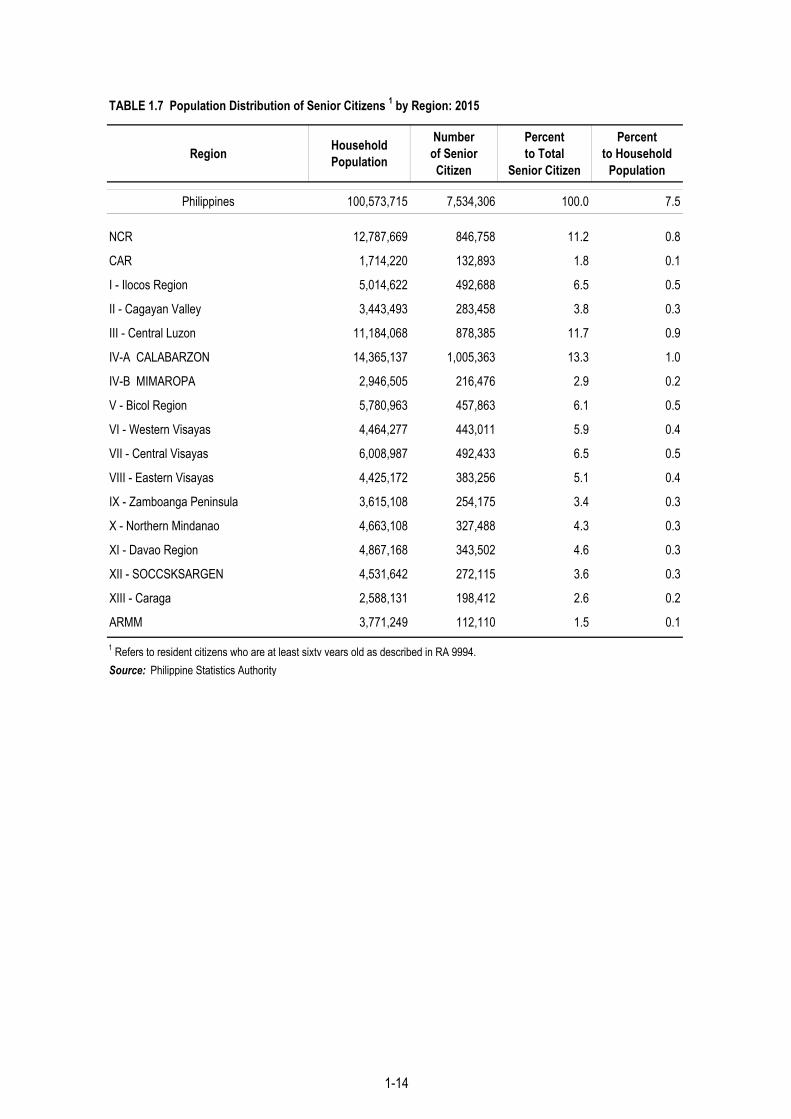
TABLE 1.7 Population Distribution of Senior Citizens 1 by Region: 2015
Region Household Population
Number of Senior Citizen
Percent to Total
Senior Citizen
Percent to Household
Population
Philippines 100,573,715 7,534,306 100.0 7.5
NCR 12,787,669 846,758 11.2 0.8
CAR 1,714,220 132,893 1.8 0.1
I - Ilocos Region 5,014,622 492,688 6.5 0.5
II - Cagayan Valley 3,443,493 283,458 3.8 0.3
III - Central Luzon 11,184,068 878,385 11.7 0.9
IV-A CALABARZON 14,365,137 1,005,363 13.3 1.0
IV-B MIMAROPA 2,946,505 216,476 2.9 0.2
V - Bicol Region 5,780,963 457,863 6.1 0.5
VI - Western Visayas 4,464,277 443,011 5.9 0.4
VII - Central Visayas 6,008,987 492,433 6.5 0.5
VIII - Eastern Visayas 4,425,172 383,256 5.1 0.4
IX - Zamboanga Peninsula 3,615,108 254,175 3.4 0.3
X - Northern Mindanao 4,663,108 327,488 4.3 0.3
XI - Davao Region 4,867,168 343,502 4.6 0.3
XII - SOCCSKSARGEN 4,531,642 272,115 3.6 0.3
XIII - Caraga 2,588,131 198,412 2.6 0.2
ARMM 3,771,249 112,110 1.5 0.1
1 Refers to resident citizens who are at least sixty years old as described in RA 9994.Source: Philippine Statistics Authority
1-14

TABLE 1.8 Population by Age Group, by Sex and by Region: 2015
Region/Age Group Both Sexes Male Female Region/Age Group Both Sexes Male Female
Philippines 100,979,303a 51,069,962 49,909,341 National Capital Region 12,877,253 6,368,365 6,508,888Under 1 2,076,015 1,073,401 1,002,614 Under 1 239,132 124,258 114,874
1-4 8,742,916 4,517,084 4,225,832 1-4 961,311 497,923 463,3885-9 10,842,920 5,596,837 5,246,083 5-9 1,163,719 600,902 562,817
10-14 10,493,942 5,405,418 5,088,524 10-14 1,135,592 583,036 552,55615-19 10,191,185 5,202,239 4,988,946 15-19 1,253,803 618,218 635,58520-24 9,467,494 4,795,772 4,671,722 20-24 1,349,005 661,172 687,83325-29 8,360,447 4,252,817 4,107,630 25-29 1,265,102 626,570 638,53230-34 7,341,894 3,755,963 3,585,931 30-34 1,104,618 555,830 548,78835-39 6,742,687 3,447,349 3,295,338 35-39 963,867 480,592 483,27540-44 5,849,328 2,995,391 2,853,937 40-44 817,789 408,420 409,36945-49 5,284,325 2,680,464 2,603,861 45-49 712,253 347,683 364,57050-54 4,430,547 2,227,579 2,202,968 50-54 591,442 282,371 309,07155-59 3,606,834 1,785,436 1,821,398 55-59 468,406 220,867 247,53960-64 2,761,183 1,325,815 1,435,368 60-64 345,164 158,211 186,95365-69 1,916,125 878,327 1,037,798 65-69 223,238 98,704 124,53470-74 1,220,080 523,237 696,843 70-74 122,964 49,693 73,27175-79 859,098 338,520 520,578 75-79 83,702 30,692 53,010
80 years and over 792,283 268,313 523,970 80-84 76,146 23,223 52,923
Region/Age Group Both Sexes Male Female Region/Age Group Both Sexes Male Female
Cordillera Administrative Region 1,722,006 879,340 842,666 I - Ilocos Region 5,026,128 2,536,297 2,489,831Under 1 34,589 17,657 16,932 Under 1 96,663 49,848 46,815
1-4 144,843 74,533 70,310 1-4 405,449 208,878 196,5715-9 180,804 92,663 88,141 5-9 510,858 265,710 245,148
10-14 176,388 90,553 85,835 10-14 502,318 260,945 241,37315-19 179,349 90,554 88,795 15-19 474,530 246,278 228,25220-24 175,450 89,439 86,011 20-24 438,415 224,792 213,62325-29 150,426 78,417 72,009 25-29 391,660 200,362 191,29830-34 126,185 66,665 59,520 30-34 365,782 186,981 178,80135-39 108,324 56,770 51,554 35-39 336,500 172,499 164,00140-44 90,559 47,483 43,076 40-44 295,564 152,404 143,16045-49 85,083 43,923 41,160 45-49 276,698 141,283 135,41550-54 74,845 38,590 36,255 50-54 237,159 119,702 117,45755-59 62,068 31,440 30,628 55-59 201,337 99,159 102,17860-64 46,194 22,803 23,391 60-64 159,163 74,971 84,19265-69 31,675 15,026 16,649 65-69 123,030 54,649 68,38170-74 21,059 9,310 11,749 70-74 82,362 33,644 48,71875-79 16,591 6,924 9,667 75-79 61,471 22,958 38,513
80 years and over 17,574 6,590 10,984 80 years and over 67,169 21,234 45,935
II Cagayan Valley 3,451,410 1,758,773 1,692,637 III - Central Luzon 11,218,177 5,669,379 5,548,798
Under 1 69,746 35,929 33,817 Under 1 215,714 112,014 103,7001-4 292,963 150,689 142,274 1-4 895,593 465,381 430,2125-9 358,204 185,150 173,054 5-9 1,132,672 586,200 546,472
10-14 337,967 175,039 162,928 10-14 1,111,511 576,203 535,30815-19 332,294 171,484 160,810 15-19 1,102,758 566,621 536,13720-24 318,664 163,209 155,455 20-24 1,049,764 536,909 512,85525-29 279,492 144,020 135,472 25-29 936,666 475,184 461,48230-34 247,474 128,276 119,198 30-34 841,508 425,538 415,97035-39 233,394 120,751 112,643 35-39 792,663 401,340 391,323
Continued

TABLE 1.8 --Continued
Region/Age Group Both Sexes Male Female Region/Age Group Both Sexes Male Female
40-44 205,056 106,846 98,210 40-44 685,221 348,904 336,31745-49 187,765 96,747 91,018 45-49 631,634 319,573 312,06150-54 166,434 84,888 81,546 50-54 523,013 262,967 260,04655-59 138,279 69,547 68,732 55-59 420,021 208,169 211,85260-64 104,998 50,794 54,204 60-64 323,375 154,955 168,42065-69 69,552 32,223 37,329 65-69 231,907 105,790 126,11770-74 43,042 18,488 24,554 70-74 136,968 58,138 78,83075-79 33,989 13,376 20,613 75-79 97,310 37,245 60,065
80 years and over 32,097 11,317 20,780 80 years and over 89,879 28,248 61,631
IV-A CALABARZON 14,414,774 7,221,488 7,193,286 IV-B MIMAROPA 2,963,360 1,520,129 1,443,231
Under 1 284,341 146,230 138,111 Under 1 66,367 34,292 32,0751-4 1,176,349 607,710 568,639 1-4 279,847 144,504 135,3435-9 1,450,150 749,125 701,025 5-9 353,556 182,926 170,630
10-14 1,416,192 730,685 685,507 10-14 344,044 177,648 166,39615-19 1,420,167 723,168 696,999 15-19 313,526 162,072 151,45420-24 1,383,125 693,398 689,727 20-24 257,770 132,461 125,30925-29 1,248,437 622,823 625,614 25-29 217,831 111,454 106,37730-34 1,138,390 568,979 569,411 30-34 197,716 102,194 95,52235-39 1,061,579 533,933 527,646 35-39 182,857 95,887 86,97040-44 884,528 448,371 436,157 40-44 162,145 85,164 76,98145-49 786,730 394,909 391,821 45-49 145,383 75,919 69,46450-54 639,573 317,755 321,818 50-54 123,584 64,560 59,02455-59 518,053 252,980 265,073 55-59 101,579 51,908 49,67160-64 395,471 185,643 209,828 60-64 76,883 38,372 38,51165-69 262,170 116,370 145,800 65-69 54,733 25,914 28,81970-74 152,773 62,497 90,276 70-74 36,722 16,352 20,37075-79 104,806 39,042 65,764 75-79 25,687 10,373 15,314
80 years and over 91,940 27,870 64,070 80 years and over 23,130 8,129 15,001
V - Bicol Region 5,796,989 2,951,135 2,845,854 VI - Western Visayas 7,536,383 3,830,514 3,705,869Under 1 129,356 67,608 61,748 Under 1 145,425 75,123 70,302
1-4 557,274 288,973 268,301 1-4 619,015 321,134 297,8815-9 705,946 365,352 340,594 5-9 786,406 407,139 379,267
10-14 708,763 366,391 342,372 10-14 767,684 396,141 371,54315-19 626,147 326,702 299,445 15-19 747,712 386,425 361,28720-24 487,018 251,588 235,430 20-24 687,080 354,815 332,26525-29 401,138 206,831 194,307 25-29 596,409 311,848 284,56130-34 358,015 184,661 173,354 30-34 522,127 274,691 247,43635-39 339,814 174,463 165,351 35-39 473,384 248,647 224,73740-44 300,568 153,674 146,894 40-44 423,809 220,066 203,74345-49 283,743 144,711 139,032 45-49 399,381 203,980 195,40150-54 240,351 121,684 118,667 50-54 353,754 178,078 175,67655-59 200,418 99,482 100,936 55-59 301,886 148,371 153,51560-64 156,772 74,993 81,779 60-64 240,535 114,257 126,27865-69 116,952 52,799 64,153 65-69 171,973 77,030 94,94370-74 80,762 34,151 46,611 70-74 121,228 50,296 70,93275-79 54,908 21,158 33,750 75-79 91,017 34,203 56,814
80 years and over 49,044 15,914 33,130 80 years and over 87,558 28,270 59,288
Continued

TABLE 1.8 --Continued
Region/Age Group Both Sexes Male Female Region/Age Group Both Sexes Male Female
VII - Central Visayas 7,396,898 3,743,601 3,653,297 VIII - Eastern Visayas 4,440,150 2,285,355 2,154,795
Under 1 162,763 84,315 78,448 Under 1 95,543 49,965 45,5781-4 650,717 336,835 313,882 1-4 403,530 209,055 194,4755-9 805,114 415,422 389,692 5-9 508,998 263,853 245,145
10-14 771,030 397,281 373,749 10-14 513,551 265,458 248,09315-19 728,697 373,778 354,919 15-19 487,753 255,480 232,27320-24 688,915 349,544 339,371 20-24 393,853 206,405 187,44825-29 601,759 307,753 294,006 25-29 313,629 164,589 149,04030-34 521,584 268,783 252,801 30-34 273,749 144,188 129,56135-39 467,901 240,525 227,376 35-39 257,230 134,422 122,80840-44 413,989 211,598 202,391 40-44 236,541 123,477 113,06445-49 372,302 188,493 183,809 45-49 219,637 113,714 105,92350-54 324,721 162,712 162,009 50-54 190,622 98,084 92,53855-59 268,442 132,562 135,880 55-59 161,670 82,247 79,42360-64 216,145 103,263 112,882 60-64 125,877 62,273 63,60465-69 151,067 69,476 81,591 65-69 97,164 45,520 51,64470-74 106,498 46,163 60,335 70-74 70,118 31,281 38,83775-79 75,490 30,249 45,241 75-79 47,737 19,733 28,004
80 years and over 69,764 24,849 44,915 80 years and over 42,948 15,611 27,337
IX - Western Mindanao 3,629,783 1,850,878 1,778,905 X - Northern Mindanao 4,689,302 2,396,000 2,293,302
Under 1 81,826 42,238 39,588 Under 1 103,417 53,602 49,8151-4 347,313 178,874 168,439 1-4 443,717 229,065 214,6525-9 426,976 219,553 207,423 5-9 540,552 278,685 261,867
10-14 407,767 209,593 198,174 10-14 509,950 261,680 248,27015-19 386,524 197,177 189,347 15-19 480,062 245,191 234,87120-24 339,502 172,406 167,096 20-24 436,995 223,150 213,84525-29 277,763 142,400 135,363 25-29 383,203 199,051 184,15230-34 235,015 121,563 113,452 30-34 317,383 165,628 151,75535-39 219,601 113,481 106,120 35-39 292,395 152,163 140,23240-44 198,421 102,086 96,335 40-44 257,235 133,106 124,12945-49 179,642 92,106 87,536 45-49 233,050 119,102 113,94850-54 153,170 78,527 74,643 50-54 199,915 101,440 98,47555-59 121,729 61,581 60,148 55-59 163,434 82,165 81,26960-64 94,589 47,171 47,418 60-64 124,663 61,658 63,00565-69 63,479 30,200 33,279 65-69 81,761 39,270 42,49170-74 42,401 19,544 22,857 70-74 51,845 23,201 28,64475-79 28,307 12,281 16,026 75-79 37,262 15,655 21,607
80 years and over 25,758 10,097 15,661 80 years and over 32,463 12,188 20,275
XI Davao Region 4,893,318 2,514,244 2,379,074 XII SOCCSKSARGEN 4,545,276 2,323,144 2,222,132
Under 1 103,911 53,447 50,464 Under 1 102,506 52,715 49,7911-4 434,443 224,364 210,079 1-4 429,084 221,239 207,8455-9 535,293 276,333 258,960 5-9 525,893 271,269 254,624
10-14 505,296 259,257 246,039 10-14 496,412 254,372 242,04015-19 492,813 250,352 242,461 15-19 478,761 241,798 236,96320-24 467,052 238,285 228,767 20-24 436,120 220,610 215,51025-29 422,657 220,272 202,385 25-29 382,347 197,311 185,03630-34 354,639 187,134 167,505 30-34 321,367 167,039 154,32835-39 319,076 168,880 150,196 35-39 297,171 154,564 142,60740-44 279,180 146,941 132,239 40-44 258,198 134,440 123,758

ContinuedTABLE 1.8 --Concluded
Region/Age Group Both Sexes Male Female Region/Age Group Both Sexes Male Female
45-49 249,553 129,313 120,240 45-49 228,152 118,368 109,78450-54 210,031 107,481 102,550 50-54 178,895 92,083 86,81255-59 174,844 88,389 86,455 55-59 137,943 70,170 67,77360-64 132,471 65,913 66,558 60-64 102,267 50,699 51,56865-69 88,258 42,953 45,305 65-69 69,520 33,265 36,25570-74 54,291 25,338 28,953 70-74 44,900 20,351 24,54975-79 37,507 16,637 20,870 75-79 29,658 12,777 16,881
80 years and over 32,003 12,955 19,048 80 years and over 26,082 10,074 16,008 0-17 1,875,131 964,895 910,236 0-17 1,846,669 948,154 898,515
18 years old and over 3,018,187 1,549,349 1,468,838 18 years old and over 2,698,607 1,374,990 1,323,617
XIII - Caraga 2,596,709 1,336,340 1,260,369 ARMM 3,781,387 1,884,980 1,896,407
Under 1 58,211 30,115 28,096 Under 1 86,505 44,045 42,4601-4 250,840 130,094 120,746 1-4 450,628 227,833 222,7955-9 303,451 157,273 146,178 5-9 554,328 279,282 275,046
10-14 289,914 149,643 140,271 10-14 499,563 251,493 248,07015-19 264,849 137,846 127,003 15-19 421,440 209,095 212,34520-24 232,683 120,596 112,087 20-24 326,083 156,993 169,09025-29 203,151 106,710 96,441 25-29 288,777 137,222 151,55530-34 167,959 88,871 79,088 30-34 248,383 118,942 129,44135-39 151,924 79,714 72,210 35-39 245,007 118,718 126,28940-44 138,453 71,649 66,804 40-44 202,072 100,762 101,31045-49 129,783 66,759 63,024 45-49 163,536 83,881 79,65550-54 113,114 57,813 55,301 50-54 109,924 58,844 51,08055-59 93,732 47,359 46,373 55-59 72,993 39,040 33,95360-64 69,872 34,602 35,270 60-64 46,744 25,237 21,50765-69 49,770 23,596 26,174 65-69 29,876 15,542 14,33470-74 34,587 15,584 19,003 70-74 17,560 9,206 8,35475-79 24,168 10,429 13,739 75-79 9,488 4,788 4,700
80 years and over 20,248 7,687 12,561 80 years and over 8,480 4,057 4,423 0-17 1068131 553344 514787 0-17 1,864,513 938,777 925,736
18 years old and over 1,528,578 782,996 745,582 18 years old and over 1,916,874 946,203 970,671a The 2015 total population excludes Filipinos in Philippine Embassies, Consulates and Mission Abroad numbering 2,134.
Source: Philippine Statistics Authority
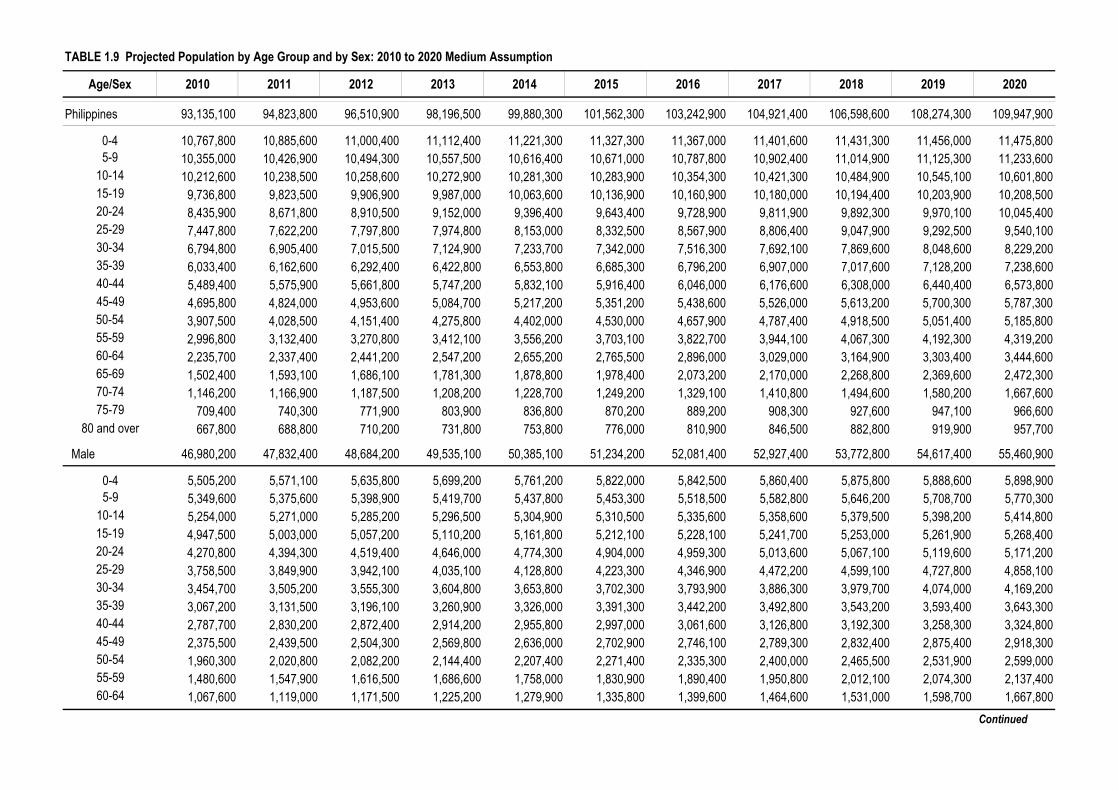
TABLE 1.9 Projected Population by Age Group and by Sex: 2010 to 2020 Medium Assumption
Age/Sex 2010 2011 2012 2013 2014 2015 2016 2017 2018 2019 2020
Philippines 93,135,100 94,823,800 96,510,900 98,196,500 99,880,300 101,562,300 103,242,900 104,921,400 106,598,600 108,274,300 109,947,900
0-4 10,767,800 10,885,600 11,000,400 11,112,400 11,221,300 11,327,300 11,367,000 11,401,600 11,431,300 11,456,000 11,475,8005-9 10,355,000 10,426,900 10,494,300 10,557,500 10,616,400 10,671,000 10,787,800 10,902,400 11,014,900 11,125,300 11,233,600
10-14 10,212,600 10,238,500 10,258,600 10,272,900 10,281,300 10,283,900 10,354,300 10,421,300 10,484,900 10,545,100 10,601,80015-19 9,736,800 9,823,500 9,906,900 9,987,000 10,063,600 10,136,900 10,160,900 10,180,000 10,194,400 10,203,900 10,208,50020-24 8,435,900 8,671,800 8,910,500 9,152,000 9,396,400 9,643,400 9,728,900 9,811,900 9,892,300 9,970,100 10,045,40025-29 7,447,800 7,622,200 7,797,800 7,974,800 8,153,000 8,332,500 8,567,900 8,806,400 9,047,900 9,292,500 9,540,10030-34 6,794,800 6,905,400 7,015,500 7,124,900 7,233,700 7,342,000 7,516,300 7,692,100 7,869,600 8,048,600 8,229,20035-39 6,033,400 6,162,600 6,292,400 6,422,800 6,553,800 6,685,300 6,796,200 6,907,000 7,017,600 7,128,200 7,238,60040-44 5,489,400 5,575,900 5,661,800 5,747,200 5,832,100 5,916,400 6,046,000 6,176,600 6,308,000 6,440,400 6,573,80045-49 4,695,800 4,824,000 4,953,600 5,084,700 5,217,200 5,351,200 5,438,600 5,526,000 5,613,200 5,700,300 5,787,30050-54 3,907,500 4,028,500 4,151,400 4,275,800 4,402,000 4,530,000 4,657,900 4,787,400 4,918,500 5,051,400 5,185,80055-59 2,996,800 3,132,400 3,270,800 3,412,100 3,556,200 3,703,100 3,822,700 3,944,100 4,067,300 4,192,300 4,319,20060-64 2,235,700 2,337,400 2,441,200 2,547,200 2,655,200 2,765,500 2,896,000 3,029,000 3,164,900 3,303,400 3,444,60065-69 1,502,400 1,593,100 1,686,100 1,781,300 1,878,800 1,978,400 2,073,200 2,170,000 2,268,800 2,369,600 2,472,30070-74 1,146,200 1,166,900 1,187,500 1,208,200 1,228,700 1,249,200 1,329,100 1,410,800 1,494,600 1,580,200 1,667,60075-79 709,400 740,300 771,900 803,900 836,800 870,200 889,200 908,300 927,600 947,100 966,600
80 and over 667,800 688,800 710,200 731,800 753,800 776,000 810,900 846,500 882,800 919,900 957,700
Male 46,980,200 47,832,400 48,684,200 49,535,100 50,385,100 51,234,200 52,081,400 52,927,400 53,772,800 54,617,400 55,460,900
0-4 5,505,200 5,571,100 5,635,800 5,699,200 5,761,200 5,822,000 5,842,500 5,860,400 5,875,800 5,888,600 5,898,9005-9 5,349,600 5,375,600 5,398,900 5,419,700 5,437,800 5,453,300 5,518,500 5,582,800 5,646,200 5,708,700 5,770,300
10-14 5,254,000 5,271,000 5,285,200 5,296,500 5,304,900 5,310,500 5,335,600 5,358,600 5,379,500 5,398,200 5,414,80015-19 4,947,500 5,003,000 5,057,200 5,110,200 5,161,800 5,212,100 5,228,100 5,241,700 5,253,000 5,261,900 5,268,40020-24 4,270,800 4,394,300 4,519,400 4,646,000 4,774,300 4,904,000 4,959,300 5,013,600 5,067,100 5,119,600 5,171,20025-29 3,758,500 3,849,900 3,942,100 4,035,100 4,128,800 4,223,300 4,346,900 4,472,200 4,599,100 4,727,800 4,858,10030-34 3,454,700 3,505,200 3,555,300 3,604,800 3,653,800 3,702,300 3,793,900 3,886,300 3,979,700 4,074,000 4,169,20035-39 3,067,200 3,131,500 3,196,100 3,260,900 3,326,000 3,391,300 3,442,200 3,492,800 3,543,200 3,593,400 3,643,30040-44 2,787,700 2,830,200 2,872,400 2,914,200 2,955,800 2,997,000 3,061,600 3,126,800 3,192,300 3,258,300 3,324,80045-49 2,375,500 2,439,500 2,504,300 2,569,800 2,636,000 2,702,900 2,746,100 2,789,300 2,832,400 2,875,400 2,918,30050-54 1,960,300 2,020,800 2,082,200 2,144,400 2,207,400 2,271,400 2,335,300 2,400,000 2,465,500 2,531,900 2,599,00055-59 1,480,600 1,547,900 1,616,500 1,686,600 1,758,000 1,830,900 1,890,400 1,950,800 2,012,100 2,074,300 2,137,40060-64 1,067,600 1,119,000 1,171,500 1,225,200 1,279,900 1,335,800 1,399,600 1,464,600 1,531,000 1,598,700 1,667,800
Continued

TABLE 1.9--Concluded
Age/Sex 2010 2011 2012 2013 2014 2015 2016 2017 2018 2019 2020
65-69 682,400 726,100 770,900 816,800 863,900 912,000 958,800 1,006,600 1,055,400 1,105,300 1,156,10070-74 493,700 502,700 511,700 520,700 529,600 538,500 575,500 613,400 652,300 692,000 732,60075-79 287,000 299,000 311,300 323,700 336,500 349,400 357,300 365,200 373,200 381,300 389,400
80 and over 237,900 245,600 253,400 261,300 269,400 277,500 289,800 302,300 315,000 328,000 341,300
Female 46,154,900 46,991,400 47,826,700 48,661,400 49,495,200 50,328,100 51,161,500 51,994,000 52,825,800 53,656,900 54,487,000
0-4 5,262,600 5,314,500 5,364,600 5,413,200 5,460,100 5,505,300 5,524,500 5,541,200 5,555,500 5,567,400 5,576,9005-9 5,005,400 5,051,300 5,095,400 5,137,800 5,178,600 5,217,700 5,269,300 5,319,600 5,368,700 5,416,600 5,463,300
10-14 4,958,600 4,967,500 4,973,400 4,976,400 4,976,400 4,973,400 5,018,700 5,062,700 5,105,400 5,146,900 5,187,00015-19 4,789,300 4,820,500 4,849,700 4,876,800 4,901,800 4,924,800 4,932,800 4,938,300 4,941,400 4,942,000 4,940,10020-24 4,165,100 4,277,500 4,391,100 4,506,000 4,622,100 4,739,400 4,769,600 4,798,300 4,825,200 4,850,500 4,874,20025-29 3,689,300 3,772,300 3,855,700 3,939,700 4,024,200 4,109,200 4,221,000 4,334,200 4,448,800 4,564,700 4,682,00030-34 3,340,100 3,400,200 3,460,200 3,520,100 3,579,900 3,639,700 3,722,400 3,805,800 3,889,900 3,974,600 4,060,00035-39 2,966,200 3,031,100 3,096,300 3,161,900 3,227,800 3,294,000 3,354,000 3,414,200 3,474,400 3,534,800 3,595,30040-44 2,701,700 2,745,700 2,789,400 2,833,000 2,876,300 2,919,400 2,984,400 3,049,800 3,115,700 3,182,100 3,249,00045-49 2,320,300 2,384,500 2,449,300 2,514,900 2,581,200 2,648,300 2,692,500 2,736,700 2,780,800 2,824,900 2,869,00050-54 1,947,200 2,007,700 2,069,200 2,131,400 2,194,600 2,258,600 2,322,600 2,387,400 2,453,000 2,519,500 2,586,80055-59 1,516,200 1,584,500 1,654,300 1,725,500 1,798,200 1,872,200 1,932,300 1,993,300 2,055,200 2,118,000 2,181,80060-64 1,168,100 1,218,400 1,269,700 1,322,000 1,375,300 1,429,700 1,496,400 1,564,400 1,633,900 1,704,700 1,776,80065-69 820,000 867,000 915,200 964,500 1,014,900 1,066,400 1,114,400 1,163,400 1,213,400 1,264,300 1,316,20070-74 652,500 664,200 675,800 687,500 699,100 710,700 753,600 797,400 842,300 888,200 935,00075-79 422,400 441,300 460,600 480,200 500,300 520,800 531,900 543,100 554,400 565,800 577,200
80 and over 429,900 443,200 456,800 470,500 484,400 498,500 521,100 544,200 567,800 591,900 616,400
Source : Philippine Statistics Authority, 2010 Census-based Population Projections in collaboration with the Inter-Agency Working Group on Population Projections
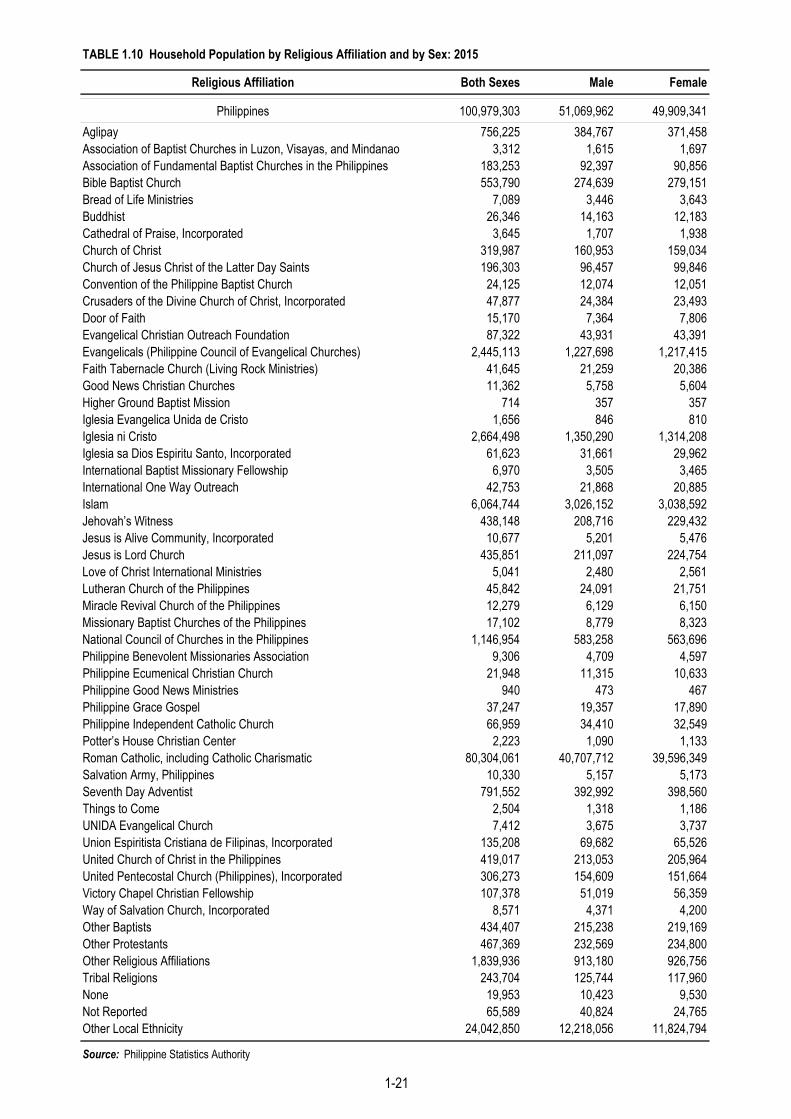
TABLE 1.10 Household Population by Religious Affiliation and by Sex: 2015
Religious Affiliation Both Sexes Male Female
Philippines 100,979,303 51,069,962 49,909,341Aglipay 756,225 384,767 371,458Association of Baptist Churches in Luzon, Visayas, and Mindanao 3,312 1,615 1,697Association of Fundamental Baptist Churches in the Philippines 183,253 92,397 90,856Bible Baptist Church 553,790 274,639 279,151Bread of Life Ministries 7,089 3,446 3,643Buddhist 26,346 14,163 12,183Cathedral of Praise, Incorporated 3,645 1,707 1,938Church of Christ 319,987 160,953 159,034Church of Jesus Christ of the Latter Day Saints 196,303 96,457 99,846Convention of the Philippine Baptist Church 24,125 12,074 12,051Crusaders of the Divine Church of Christ, Incorporated 47,877 24,384 23,493Door of Faith 15,170 7,364 7,806Evangelical Christian Outreach Foundation 87,322 43,931 43,391Evangelicals (Philippine Council of Evangelical Churches) 2,445,113 1,227,698 1,217,415Faith Tabernacle Church (Living Rock Ministries) 41,645 21,259 20,386Good News Christian Churches 11,362 5,758 5,604Higher Ground Baptist Mission 714 357 357Iglesia Evangelica Unida de Cristo 1,656 846 810Iglesia ni Cristo 2,664,498 1,350,290 1,314,208Iglesia sa Dios Espiritu Santo, Incorporated 61,623 31,661 29,962International Baptist Missionary Fellowship 6,970 3,505 3,465International One Way Outreach 42,753 21,868 20,885Islam 6,064,744 3,026,152 3,038,592Jehovah’s Witness 438,148 208,716 229,432Jesus is Alive Community, Incorporated 10,677 5,201 5,476Jesus is Lord Church 435,851 211,097 224,754Love of Christ International Ministries 5,041 2,480 2,561Lutheran Church of the Philippines 45,842 24,091 21,751Miracle Revival Church of the Philippines 12,279 6,129 6,150Missionary Baptist Churches of the Philippines 17,102 8,779 8,323National Council of Churches in the Philippines 1,146,954 583,258 563,696Philippine Benevolent Missionaries Association 9,306 4,709 4,597Philippine Ecumenical Christian Church 21,948 11,315 10,633Philippine Good News Ministries 940 473 467Philippine Grace Gospel 37,247 19,357 17,890Philippine Independent Catholic Church 66,959 34,410 32,549Potter’s House Christian Center 2,223 1,090 1,133Roman Catholic, including Catholic Charismatic 80,304,061 40,707,712 39,596,349Salvation Army, Philippines 10,330 5,157 5,173Seventh Day Adventist 791,552 392,992 398,560Things to Come 2,504 1,318 1,186UNIDA Evangelical Church 7,412 3,675 3,737Union Espiritista Cristiana de Filipinas, Incorporated 135,208 69,682 65,526United Church of Christ in the Philippines 419,017 213,053 205,964United Pentecostal Church (Philippines), Incorporated 306,273 154,609 151,664Victory Chapel Christian Fellowship 107,378 51,019 56,359Way of Salvation Church, Incorporated 8,571 4,371 4,200Other Baptists 434,407 215,238 219,169Other Protestants 467,369 232,569 234,800Other Religious Affiliations 1,839,936 913,180 926,756Tribal Religions 243,704 125,744 117,960None 19,953 10,423 9,530Not Reported 65,589 40,824 24,765Other Local Ethnicity 24,042,850 12,218,056 11,824,794
Source: Philippine Statistics Authority
1-21
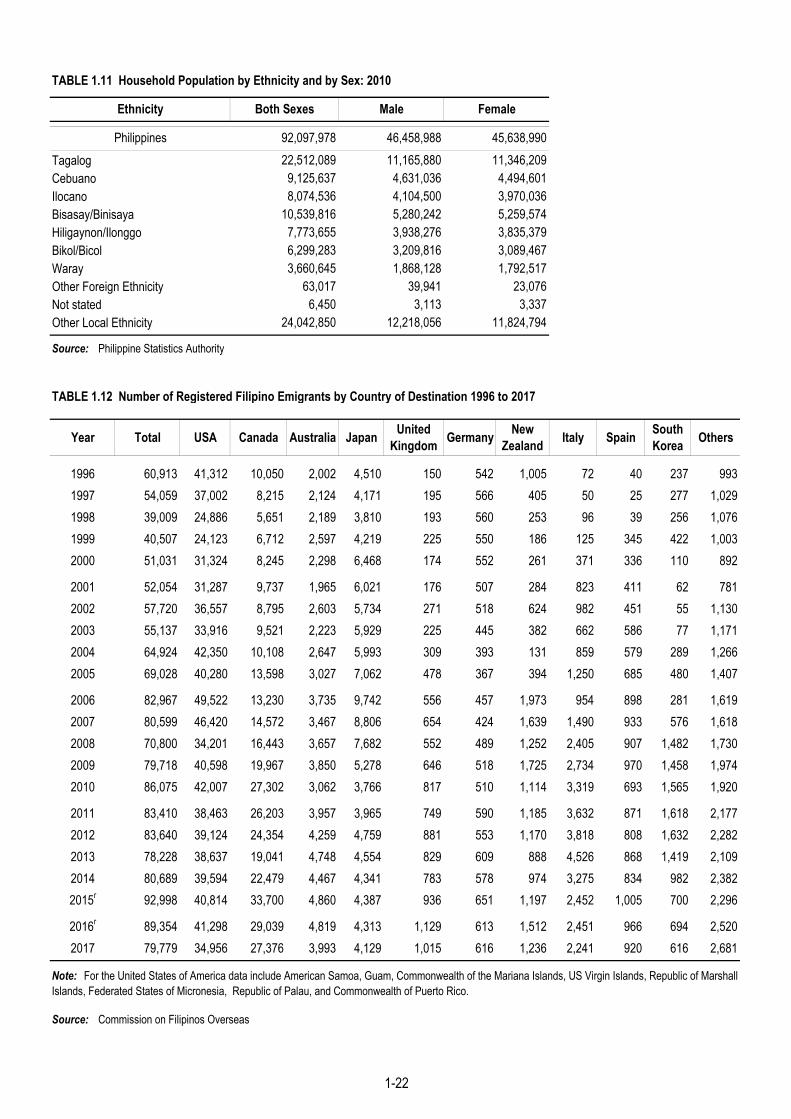
TABLE 1.11 Household Population by Ethnicity and by Sex: 2010
TagalogCebuanoIlocanoBisasay/BinisayaHiligaynon/IlonggoBikol/BicolWarayOther Foreign EthnicityNot statedOther Local Ethnicity
Source: Philippine Statistics Authority
TABLE 1.12 Number of Registered Filipino Emigrants by Country of Destination 1996 to 2017
Year Total USA Canada Australia Japan United Kingdom Germany New
Zealand Italy Spain South Korea Others
1996 60,913 41,312 10,050 2,002 4,510 150 542 1,005 72 40 237 9931997 54,059 37,002 8,215 2,124 4,171 195 566 405 50 25 277 1,0291998 39,009 24,886 5,651 2,189 3,810 193 560 253 96 39 256 1,0761999 40,507 24,123 6,712 2,597 4,219 225 550 186 125 345 422 1,0032000 51,031 31,324 8,245 2,298 6,468 174 552 261 371 336 110 892
2001 52,054 31,287 9,737 1,965 6,021 176 507 284 823 411 62 7812002 57,720 36,557 8,795 2,603 5,734 271 518 624 982 451 55 1,1302003 55,137 33,916 9,521 2,223 5,929 225 445 382 662 586 77 1,1712004 64,924 42,350 10,108 2,647 5,993 309 393 131 859 579 289 1,2662005 69,028 40,280 13,598 3,027 7,062 478 367 394 1,250 685 480 1,407
2006 82,967 49,522 13,230 3,735 9,742 556 457 1,973 954 898 281 1,6192007 80,599 46,420 14,572 3,467 8,806 654 424 1,639 1,490 933 576 1,6182008 70,800 34,201 16,443 3,657 7,682 552 489 1,252 2,405 907 1,482 1,7302009 79,718 40,598 19,967 3,850 5,278 646 518 1,725 2,734 970 1,458 1,9742010 86,075 42,007 27,302 3,062 3,766 817 510 1,114 3,319 693 1,565 1,920
2011 83,410 38,463 26,203 3,957 3,965 749 590 1,185 3,632 871 1,618 2,1772012 83,640 39,124 24,354 4,259 4,759 881 553 1,170 3,818 808 1,632 2,2822013 78,228 38,637 19,041 4,748 4,554 829 609 888 4,526 868 1,419 2,1092014 80,689 39,594 22,479 4,467 4,341 783 578 974 3,275 834 982 2,3822015r 92,998 40,814 33,700 4,860 4,387 936 651 1,197 2,452 1,005 700 2,296
2016r 89,354 41,298 29,039 4,819 4,313 1,129 613 1,512 2,451 966 694 2,5202017 79,779 34,956 27,376 3,993 4,129 1,015 616 1,236 2,241 920 616 2,681
Source: Commission on Filipinos Overseas
Ethnicity Both Sexes Male Female
Note: For the United States of America data include American Samoa, Guam, Commonwealth of the Mariana Islands, US Virgin Islands, Republic of Marshall Islands, Federated States of Micronesia, Republic of Palau, and Commonwealth of Puerto Rico.
Philippines 92,097,97822,512,089
9,125,6378,074,536
10,539,8167,773,6556,299,2833,660,645
63,0176,450
24,042,850
46,458,988 45,638,99011,165,880
4,631,03611,346,209
4,494,6013,970,036
5,280,2423,938,2763,209,8161,868,128
39,9413,113
12,218,056
4,104,500
11,824,794
5,259,5743,835,3793,089,4671,792,517
23,0763,337
1-22
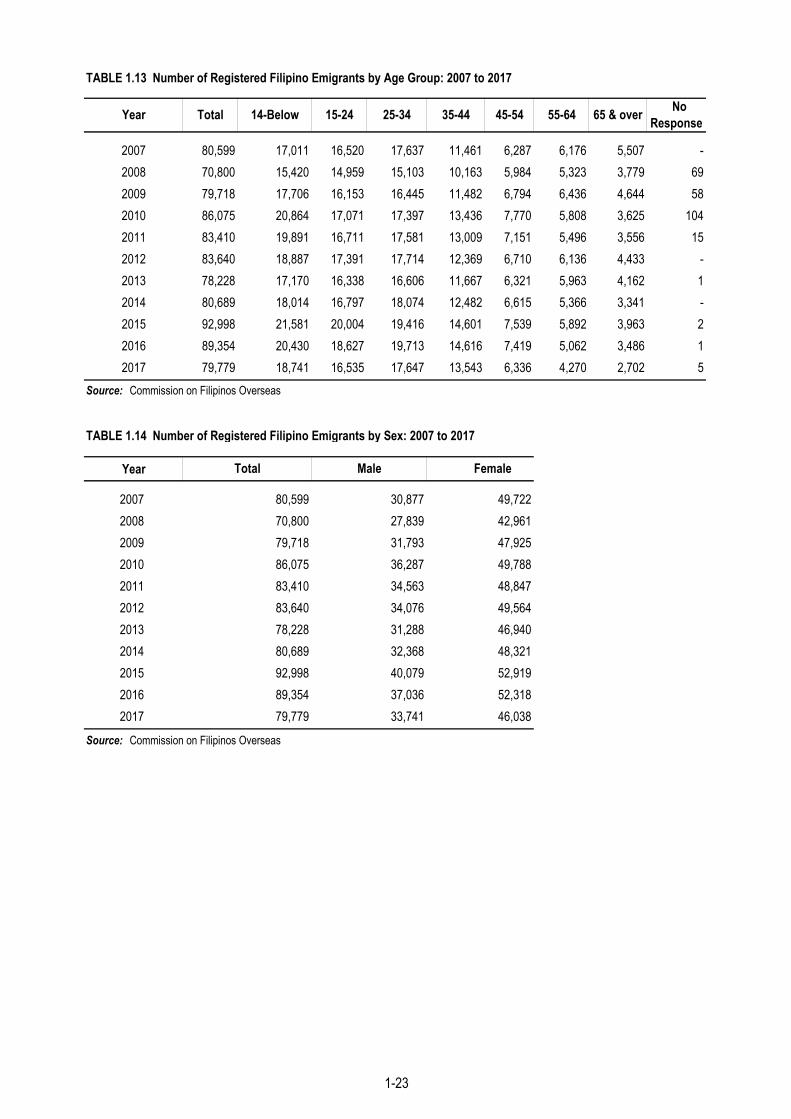
TABLE 1.13 Number of Registered Filipino Emigrants by Age Group: 2007 to 2017
2007 80,599 17,011 16,520 17,637 11,461 6,287 6,176 5,507 -2008 70,800 15,420 14,959 15,103 10,163 5,984 5,323 3,779 692009 79,718 17,706 16,153 16,445 11,482 6,794 6,436 4,644 582010 86,075 20,864 17,071 17,397 13,436 7,770 5,808 3,625 1042011 83,410 19,891 16,711 17,581 13,009 7,151 5,496 3,556 152012 83,640 18,887 17,391 17,714 12,369 6,710 6,136 4,433 -2013 78,228 17,170 16,338 16,606 11,667 6,321 5,963 4,162 12014 80,689 18,014 16,797 18,074 12,482 6,615 5,366 3,341 -2015 92,998 21,581 20,004 19,416 14,601 7,539 5,892 3,963 22016 89,354 20,430 18,627 19,713 14,616 7,419 5,062 3,486 12017 79,779 18,741 16,535 17,647 13,543 6,336 4,270 2,702 5
Source: Commission on Filipinos Overseas
TABLE 1.14 Number of Registered Filipino Emigrants by Sex: 2007 to 2017
Year
2007 80,599 30,877 49,7222008 70,800 27,839 42,9612009 79,718 31,793 47,9252010 86,075 36,287 49,7882011 83,410 34,563 48,8472012 83,640 34,076 49,5642013 78,228 31,288 46,9402014 80,689 32,368 48,3212015 92,998 40,079 52,9192016 89,354 37,036 52,3182017 79,779 33,741 46,038
Source: Commission on Filipinos Overseas
45-54 55-64 65 & over
Total Male Female
No ResponseYear Total 14-Below 15-24 25-34 35-44
1-23

TABLE 1.15 Number of Registered Filipino Emigrants by Civil Status 1997 to 2017
Year Total Single Married Widower Separated Divorced Not Reported
1997 54,059 24,990 26,287 2,341 172 269 -1998 39,009 18,569 18,795 1,415 103 127 -1999 40,507 19,451 19,081 1,661 135 179 -2000 51,031 25,438 23,583 1,657 154 179 20 2001 52,054 24,721 24,959 1,916 233 219 6 2002 57,720 28,118 27,100 2,015 179 306 2 2003 55,137 26,687 26,233 1,804 172 239 2 2004 64,924 32,870 29,577 1,946 208 323 -2005 69,028 34,346 32,056 2,035 239 347 5 2006 82,967 40,505 39,007 2,616 303 536 -2007 80,599 40,200 36,128 3,295 318 656 2 2008 70,800 35,250 32,390 2,341 264 538 17 2009 79,718 41,119 34,700 2,874 347 581 97 2010 86,075 47,143 35,564 2,359 380 609 20 2011 83,410 44,825 35,214 2,439 338 579 15 2012 83,640 43,908 35,776 2,866 401 675 14 2013 78,228 41,388 33,164 2,639 368 623 46 2014 80,689 45,280 32,062 2,307 345 657 38 2015 92,998 52,957 36,238 2,671 350 754 28 2016 89,354 50,236 35,592 2,436 305 703 82 2017 79,779 46,211 30,646 1,813 329 658 122
Source: Commission on Filipinos Overseas
1-24

TABLE 1.16 Number of Registered Filipino Emigrants by Educational Attainment Prior to Migration: 2000 to 2017
Year TotalNot of
Schooling Age
No Formal
Education
Elementary Level
Elementary Graduate
High School Level
High School
Graduate
Vocational Level
Vocational Graduate
College Level
College Graduate
Post Graduate
Level
Post Graduate
Non-Formal
Education
Non-Reported/
No Response
2000 51,031 3,175 331 6,308 1,864 6,475 6,398 854 2,300 8,069 13,619 1,088 518 23 92001 52,054 3,820 428 6,393 2,136 6,205 6,065 744 2,126 7,566 14,785 963 730 56 372002 57,720 4,191 581 6,938 2,283 6,731 6,378 845 2,383 8,181 17,424 791 793 153 482003 55,137 4,373 240 6,344 2,107 6,193 5,986 817 2,175 8,340 16,354 1,090 954 143 212004 64,924 5,541 182 7,659 2,191 7,225 6,937 1,009 2,560 9,817 18,936 1,339 1,294 198 362005 69,028 5,363 126 8,461 2,212 7,569 7,438 948 2,737 10,357 20,561 1,354 1,567 293 422006 82,967 6,374 147 10,278 2,496 8,905 9,176 1,101 3,370 12,489 24,911 1,659 1,747 303 112007 80,599 5,445 157 10,372 2,698 9,493 9,361 1,157 3,774 13,328 21,759 1,215 1,534 297 92008 70,800 4,842 105 8,907 2,314 8,216 8,251 970 3,368 11,852 19,264 1,100 1,564 31 162009 79,718 5,813 92 9,986 2,395 9,218 8,702 1,273 4,092 13,668 21,794 1,071 1,476 46 922010 86,075 7,061 83 10,969 2,194 9,428 8,299 1,421 4,534 14,365 24,834 1,188 1,586 17 962011 83,410 6,658 64 10,359 2,152 9,260 8,401 1,363 4,531 13,809 24,193 1,010 1,484 13 1132012 83,640 6,174 61 10,089 2,424 9,303 8,707 1,414 4,308 14,169 24,183 1,063 1,644 4 972013 78,228 5,661 69 9,129 2,066 8,779 8,444 1,248 4,062 13,472 22,841 943 1,328 8 1782014 80,689 5,842 95 9,225 1,980 8,665 8,422 1,405 4,468 13,913 24,266 931 1,330 - 1472015 92,998 6,162 37 11,272 2,399 10,722 9,473 1,587 4,530 16,699 27,520 954 1,472 6 1652016 89,354 5,999 26 10,943 2,131 10,705 8,912 1,267 4,154 15,911 27,162 689 1,358 - 972017 79,779 5,239 116 9,876 1,861 11,060 7,893 1,191 3,614 12,994 24,063 587 1,116 26 143
Source: Commission on Filipinos Overseas

TABLE 1.17 Number of Registered Filipino Emigrants by Major Occupational Group: 2001 to 2017
OCCUPATIONAL GROUPING 2001 2002 2003 2004 2005 2006 2007 2008 2009 2010 2011 2012 2013 2014 2015 2016 2017
TOTAL 52,054 57,720 55,137 64,924 69,028 82,967 80,599 70,800 79,718 86,075 83,410 83,640 78,228 80,689 92,998 89,354 79,779
A. Employed 15,426 17,536 16,756 19,877 19,607 24,332 20,152 18,191 20,393 22,358 21,744 20,384 18,267 18,680 20,808 19,725 17,025
Professional, Technical and Related Workers 6,932 8,294 7,574 9,540 9,095 12,526 7,816 7,072 6,849 7,932 8,181 7,841 6,499 6,507 7,504 6,781 5,074
Managerial, Executive and Administrative Workers 932 890 928 770 1,025 1,449 1,708 1,553 2,001 2,603 2,176 1,954 2,195 1,905 1,789 1,554 1,258
Clerical Workers 1,480 1,377 1,333 1,450 1,454 1,945 2,153 1,979 2,451 2,596 2,207 1,947 1,915 1,954 1,925 1,878 1,453
Sales Workers 2,291 2,830 2,886 3,426 3,358 3,564 3,576 3,037 3,227 2,950 2,880 2,786 2,129 2,495 2,807 3,018 2,287
Service Workers 992 1,046 1,139 1,338 1,850 1,192 1,035 1,188 1,600 1,688 1,899 2,161 2,333 2,522 2,639 2,754 3,501
Agri, Animal Husbandry, Forestry Workers and Fisherman 965 979 920 1,098 888 1,086 1,201 948 1,217 1,311 1,138 958 906 858 1,151 1,032 920
Production Process, Transport Equipment Operators and Laborers 1,695 1,762 1,759 2,198 1,821 2,260 2,374 2,188 2,801 2,889 2,936 2,562 2,162 2,290 2,708 2,494 2,342
Members of the Armed Forces 139 358 217 57 116 310 289 226 247 389 327 175 128 149 285 214 190
B. Unemployed
Housewives 11,561 12,138 11,418 12,014 13,477 17,701 17,677 14,396 15,283 14,036 13,918 13,647 13,086 13,423 13,723 13,357 11,400
Retirees 2,288 2,207 1,936 2,378 2,325 3,152 4,310 3,322 3,821 3,315 3,020 3,854 3,435 3,105 3,576 2,895 2,322
Students 12,731 13,656 13,098 14,990 16,931 20,465 21,151 18,885 20,897 23,145 21,796 21,507 19,792 20,698 26,667 24,749 23,912
Minors (Below 7 years old) 4,060 4,796 4,688 5,880 5,672 6,692 5,820 4,954 5,831 7,162 6,770 6,172 5,659 5,849 6,159 5,788 4,555
Out of School Youth 371 655 376 677 550 178 307 299 380 457 573 381 739 435 473 1,466 564
No Occupation Reported 5,617 6,732 6,865 9,108 10,466 10,447 11,182 10,753 13,113 15,602 15,589 17,695 17,250 18,499 21,592 21,374 20,001
Source: Commission on Filipinos Overseas

TABLE 1.18 Number of Households Provided with Housing Unit/Security Tenure Housing Loans and/or by the Government: 2005 to 2018
(Amount in million pesos)
No. of HHs Amount No. of HHs Amount No. of HHs Amount No. of HHs Amount No. of HHs Amount
2005 100,323 22,673 43,299 1,719 14,199 722 37,175 15,291 5,650 4,9402006 100,045 28,550 40,808 3,000 13,783 740 33,066 16,195 12,388 8,6152007 123,236 40,992 42,551 2,915 11,819 626 47,367 23,665 21,499 13,7862008 136,561 57,318 48,280 5,343 9,169 513 62,507 34,029 16,605 17,4342009 128,578 68,444 31,183 5,237 10,022 561 74,973 45,702 12,400 16,9442010 116,357 73,583 31,523 3,696 7,109 397 62,041 40,804 15,684 28,6862011 129,778 73,650 46,872 7,480 15,875 982 46,296 31,532 20,735 33,6562012 133,043 83,196 56,221 18,398 9,287 549 46,898 31,821 20,637 32,4282013 177,855 74,642 103,347 20,499 16,085 980 47,562 33,963 10,861 19,2002014 308,467 128,018 204,961 30,322 18,556 1,373 54,026 40,581 30,924 55,7422015 205,461 131,068 94,592 26,187 20,308 2,107 59,409 43,932 31,152 58,8412016 223,924 172,530 94,895 54,284 23,702 2,162 76,247 57,313 29,080 58,7712017 199,345 183,354 82,883 60,523 6,087 1,940 81,700 66,560 28,675 54,3302018 195,055 210,947 38,597 58,649 13,901 1,833 91,064 76,729 51,493 73,737
1 Data refers to resettlement, calamity assistance, core housing, sites and services, AFP-PNP housing and other housing assistance.2 Data refers to the number of residential units financed under the End-User Financing Program of the Home Development Mutual Fund (HDMF) or PAGIBIG.3 Data refers to the number of housing units finances by the Commercial, Thrift and Rural Banks as well as those sold by developers on installment basis and guaranteed by the Home Guaranty Corporation (HGC)).Source: Housing and Urban Development Coordinating Council
SHFC HDMF 2 HGC 3
YearNHA 1Total

TABLE 1.19 Housing Loans Granted Under the Home Development Mutual Fund (PAGIBIG Fund) End-User Financing Program by Region (Actual Take-Outs): 2010 to 2018 (Amount in thousand pesos)
Region 2010 2011 2012 2013 2014 2015 2016 2017 2018
Philippines 40,803,928 31,532,384 31,821,484 33,962,992 40,580,956 43,932,334 57,313,004 65,133,909 75,307,419
NCR 3,986,936 3,273,630 2,831,916 17,072,689 20,013,451 20,317,360 27,202,745 27,677,295 32,743,706CAR 373,625 280,485 229,805 217,347 305,739 279,863 313,329 271,772 319,855I - Ilocos Region 684,377 543,449 464,070 529,740 663,201 720,649 620,607 737,192 616,760II - Cagayan Valley 542,156 582,859 454,055 429,535 601,294 667,342 718,362 847,767 978,634III - Central Luzon 7,378,598 3,916,396 4,317,667 3,960,739 4,839,439 5,480,682 8,091,720 9,490,324 11,159,528IV-Southern Tagalog … … … 3,404,017 3,991,792 4,956,509 … … …IV-A CALABARZON 16,179,420 13,867,579 15,475,851 … … … 5,891,379 8,059,592 10,117,132MIMAROPA 294,403 285,156 193,314 … … … 349,554 515,730 677,156V - Bicol Region 908,066 650,382 527,003 651,804 645,064 698,360 756,498 864,789 1,036,045VI - Western Visayas 1,637,903 699,355 489,748 1,161,030 1,604,018 2,017,496 2,297,173 3,271,962 2,889,720VII - Central Visayas 2,766,197 2,847,160 2,463,711 1,596,541 2,441,610 2,777,573 4,132,428 5,748,314 5,957,877VIII - Eastern Visayas 379,617 335,788 283,028 186,473 115,335 213,270 295,612 316,801 249,052IX - Zamboanga Peninsula 1,114,006 818,016 928,619 1,030,551 1,081,842 1,172,642 1,218,935 1,156,932 1,303,451X - Northern Mindanao 1,474,934 1,145,877 882,962 868,213 811,130 1,114,022 1,442,878 1,282,579 1,505,555XI - Davao Region 1,909,031 999,947 1,061,290 1,553,200 2,183,190 2,251,985 2,464,855 3,085,455 3,005,270XII - SOCCSKSARGEN 539,539 637,387 555,996 722,239 632,315 664,357 875,289 1,077,956 2,031,417XIII - Caraga 521,741 565,168 578,406 578,874 651,536 600,224 641,640 729,449 716,261ARMM 113,379 83,750 84,043 - - - - - -
TABLE 1.20 Number of Housing Loan Take-Outs (Number of Units) Financed Under the Home Development Mutual Fund (PAGIBIG FUND) End-User Financing Program by Region(Actual Take-Outs): 2010 to 2018
Region 2010 2011 2012 2013 2014 2015 2016 2017 2018
Philippines 62,041 46,296 46,898 47,562 54,026 60,533 76,247 80,964 90,375
NCR 3,959 3,423 2,768 24,522 28,134 30,625 40,885 40,185 42,938CAR 440 298 247 209 349 285 201 161 190I - Ilocos Region 911 636 598 614 585 553 494 552 540II - Cagayan Valley 944 1,030 782 674 727 736 718 827 976III - Central Luzon 11,286 5,657 6,142 4,936 5,921 6,258 9,266 10,232 12,472IV-Southern Tagalog … … … 5,026 5,801 7,283 … … …IV-A CALABARZON 25,347 21,023 24,088 … … … 7,932 10,265 13,263 MIMAROPA 499 426 289 … … … 422 629 806V - Bicol Region 1,702 1,156 976 1,144 974 858 1,088 1,235 1,677VI - Western Visayas 2,696 1,000 735 1,518 1,965 2,629 3,434 3,633 3,146VII - Central Visayas 3,537 3,920 3,401 1,795 2,720 2,892 3,957 4,784 4,849VIII - Eastern Visayas 694 604 507 357 153 336 423 398 312IX - Zamboanga Peninsula 1,698 1,158 1,194 1,359 1,185 1,641 1,176 1,134 1,144X - Northern Mindanao 2,567 1,853 1,425 1,323 1,100 1,516 1,856 1,483 1,799XI - Davao Region 3,392 1,739 1,657 2,112 2,820 3,338 2,647 3,420 3,186XII - SOCCSKSARGEN 1,296 1,369 1,128 1,267 918 929 1,065 1,347 2,482XIII - Caraga 830 833 821 706 674 654 683 679 595 ARMM 243 171 140 - - - - - -
Notes:
1. NCR is inclusive of Bulacan, Rizal, Cavite and Laguna provinces. 2. Ilocos Region and Cagayan Valley are inclusive of CAR. 3. Region 9 and 12 are inclusive of ARMM.Source: Home Development Mutual Fund (Pag-IBIG Fund)
1-28

TABLE 1.21 Total Housing Expenditure by Region (Amount in million pesos)
2012 2015 2009 2012 2009 2012 2009 2012
Philippines 4,125,312 4,882,860 431,577 520,349 413,642 499,187 17,835 21,162
NCR 947,599 1,053,215 143,222 164,197 140,967 160,755 2,155 3,442CAR 70,633 84,004 9,964 10,850 9,666 10,650 199 200I - Ilocos Region 175,220 212,525 16,696 19,643 15,212 18,630 1,385 1,013II - Cagayan Valley 107,884 132,063 9,028 10,198 8,278 9,246 651 952III - Central Luzon 503,995 600,095 44,691 56,515 42,495 53,427 2,096 3,088IV-A CALABARZON 748,129 875,400 65,995 96,461 63,617 93,052 2,278 3,409IV-B MIMAROPA 88,215 111,907 7,755 8,938 7,155 8,333 500 605V - Bicol Region 167,256 202,469 16,992 18,330 15,621 17,368 1,271 961VI - Western Visayas 260,971 299,808 24,229 27,501 22,684 25,871 1,445 1,630VII - Central Visayas 258,635 323,434 27,894 32,691 26,193 30,774 1,601 1,917VIII - Eastern Visayas 118,998 151,994 11,780 12,066 10,647 11,236 1,033 830IX - Zamboanga Peninsula 93,829 118,758 8,426 8,311 7,851 7,946 476 364X - Northern Mindanao 139,353 166,005 12,425 14,784 11,357 13,967 969 818XI - Davao Region 167,651 219,680 14,794 16,797 14,010 16,141 684 656XII - SOCCSKSARGEN 138,089 170,863 8,669 11,149 8,026 10,446 542 702XIII - Caraga 63,506 92,243 5,465 4,960 5,008 4,882 356 77ARMM 75,352 68,397 5,151 6,959 4,857 6,462 195 497Source: Philippine Statistics Authority
TABLE 1.22 Total Housing Expenditure by Income Decile: 2009 and 2012 (Amount in million pesos)
2009 2012 2009 2012 2009 2012 2009 2012
Philippines 3,239,186 4,125,312 431,577 520,349 413,642 499,187 17,835 21,162
First Decile 79,908 156,081 8,066 11,206 7,785 10,798 279 407Second Decile 121,855 195,477 11,687 15,690 11,191 15,009 493 681Third Decile 150,370 219,078 14,681 19,597 14,027 18,933 651 664Fourth Decile 179,709 258,953 18,690 26,238 17,777 25,073 909 1,166Fifth Decile 215,012 296,986 23,829 31,049 22,855 30,027 968 1,021Sixth Decile 257,097 344,582 31,236 39,887 29,792 38,081 1,437 1,807Seventh Decile 316,214 420,732 40,471 49,933 38,878 47,972 1,583 1,962Eight Decile 399,337 508,442 52,602 66,082 50,335 63,047 2,255 3,034Ninth Decile 532,072 647,624 73,310 87,336 70,158 83,396 3,136 3,940Tenth Decile 987,612 1,077,357 157,004 173,331 150,844 166,851 6,124 6,480
Source: Philippine Statistics Authority
Year/Income DecileTotal Family Expenditure
Total Housing Expenditure
Rent/Rental Value of House and Lot
Maintenance and Minor Repair
RegionTotal Family Expenditure
Total Housing Expenditure
Rent/Rental Value of House and Lot
Maintenance and Minor Repair
1-29
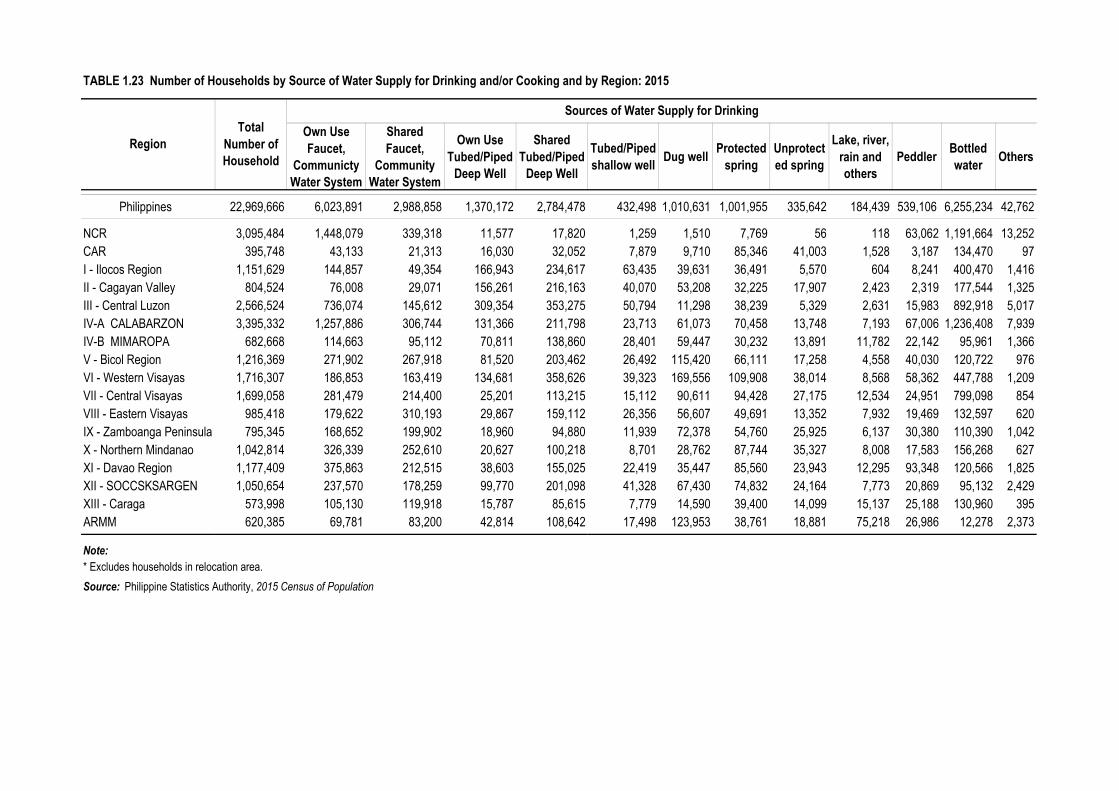
TABLE 1.23 Number of Households by Source of Water Supply for Drinking and/or Cooking and by Region: 2015
Own Use Faucet,
Communicty Water System
Shared Faucet,
Community Water System
Own Use Tubed/Piped
Deep Well
Shared Tubed/Piped
Deep Well
Tubed/Piped shallow well Dug well Protected
springUnprotected spring
Lake, river, rain and others
Peddler Bottled water Others
Philippines 22,969,666 6,023,891 2,988,858 1,370,172 2,784,478 432,498 1,010,631 1,001,955 335,642 184,439 539,106 6,255,234 42,762
NCR 3,095,484 1,448,079 339,318 11,577 17,820 1,259 1,510 7,769 56 118 63,062 1,191,664 13,252CAR 395,748 43,133 21,313 16,030 32,052 7,879 9,710 85,346 41,003 1,528 3,187 134,470 97I - Ilocos Region 1,151,629 144,857 49,354 166,943 234,617 63,435 39,631 36,491 5,570 604 8,241 400,470 1,416II - Cagayan Valley 804,524 76,008 29,071 156,261 216,163 40,070 53,208 32,225 17,907 2,423 2,319 177,544 1,325III - Central Luzon 2,566,524 736,074 145,612 309,354 353,275 50,794 11,298 38,239 5,329 2,631 15,983 892,918 5,017IV-A CALABARZON 3,395,332 1,257,886 306,744 131,366 211,798 23,713 61,073 70,458 13,748 7,193 67,006 1,236,408 7,939IV-B MIMAROPA 682,668 114,663 95,112 70,811 138,860 28,401 59,447 30,232 13,891 11,782 22,142 95,961 1,366V - Bicol Region 1,216,369 271,902 267,918 81,520 203,462 26,492 115,420 66,111 17,258 4,558 40,030 120,722 976VI - Western Visayas 1,716,307 186,853 163,419 134,681 358,626 39,323 169,556 109,908 38,014 8,568 58,362 447,788 1,209VII - Central Visayas 1,699,058 281,479 214,400 25,201 113,215 15,112 90,611 94,428 27,175 12,534 24,951 799,098 854VIII - Eastern Visayas 985,418 179,622 310,193 29,867 159,112 26,356 56,607 49,691 13,352 7,932 19,469 132,597 620IX - Zamboanga Peninsula 795,345 168,652 199,902 18,960 94,880 11,939 72,378 54,760 25,925 6,137 30,380 110,390 1,042X - Northern Mindanao 1,042,814 326,339 252,610 20,627 100,218 8,701 28,762 87,744 35,327 8,008 17,583 156,268 627XI - Davao Region 1,177,409 375,863 212,515 38,603 155,025 22,419 35,447 85,560 23,943 12,295 93,348 120,566 1,825XII - SOCCSKSARGEN 1,050,654 237,570 178,259 99,770 201,098 41,328 67,430 74,832 24,164 7,773 20,869 95,132 2,429XIII - Caraga 573,998 105,130 119,918 15,787 85,615 7,779 14,590 39,400 14,099 15,137 25,188 130,960 395ARMM 620,385 69,781 83,200 42,814 108,642 17,498 123,953 38,761 18,881 75,218 26,986 12,278 2,373
Note:* Excludes households in relocation area.Source: Philippine Statistics Authority, 2015 Census of Population
Total Number of Household
Region
Sources of Water Supply for Drinking
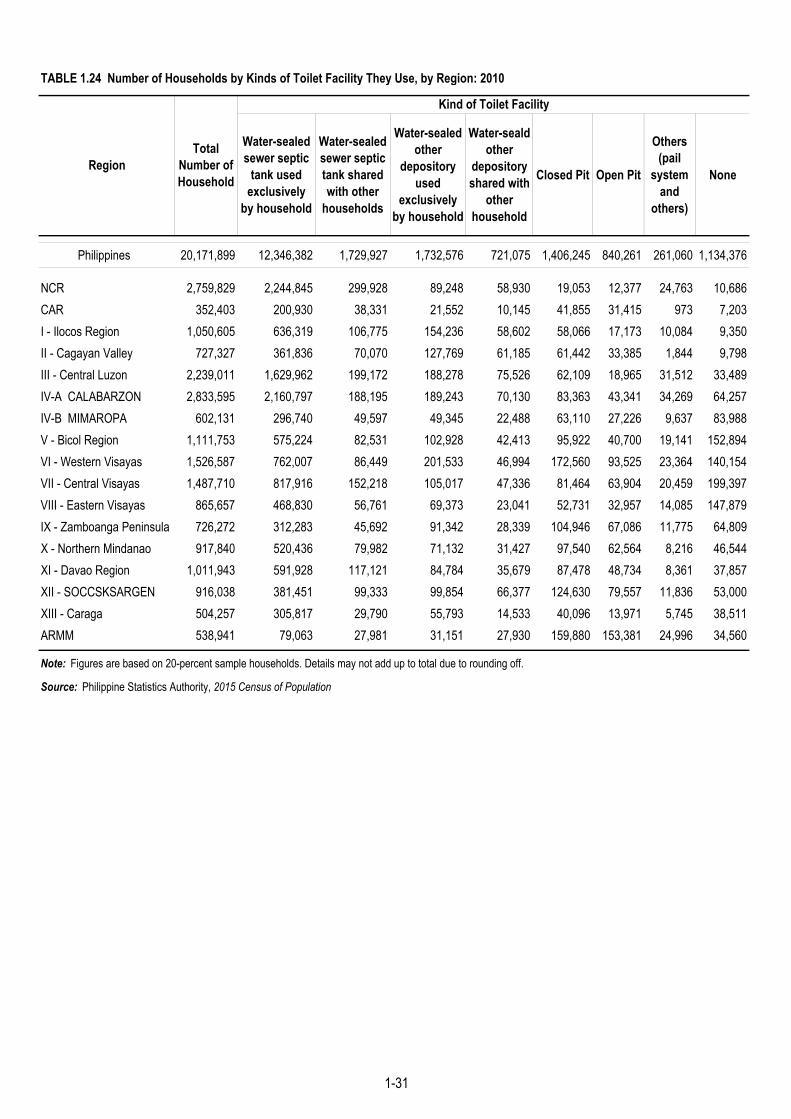
TABLE 1.24 Number of Households by Kinds of Toilet Facility They Use, by Region: 2010
Water-sealed sewer septic
tank used exclusively
by household
Water-sealed sewer septic tank shared with other
households
Water-sealed other
depository used
exclusively by household
Water-seald other
depository shared with
other household
Closed Pit Open Pit
Others (pail
system and
others)
None
Philippines 20,171,899 12,346,382 1,729,927 1,732,576 721,075 1,406,245 840,261 261,060 1,134,376
NCR 2,759,829 2,244,845 299,928 89,248 58,930 19,053 12,377 24,763 10,686CAR 352,403 200,930 38,331 21,552 10,145 41,855 31,415 973 7,203I - Ilocos Region 1,050,605 636,319 106,775 154,236 58,602 58,066 17,173 10,084 9,350II - Cagayan Valley 727,327 361,836 70,070 127,769 61,185 61,442 33,385 1,844 9,798III - Central Luzon 2,239,011 1,629,962 199,172 188,278 75,526 62,109 18,965 31,512 33,489IV-A CALABARZON 2,833,595 2,160,797 188,195 189,243 70,130 83,363 43,341 34,269 64,257IV-B MIMAROPA 602,131 296,740 49,597 49,345 22,488 63,110 27,226 9,637 83,988V - Bicol Region 1,111,753 575,224 82,531 102,928 42,413 95,922 40,700 19,141 152,894VI - Western Visayas 1,526,587 762,007 86,449 201,533 46,994 172,560 93,525 23,364 140,154VII - Central Visayas 1,487,710 817,916 152,218 105,017 47,336 81,464 63,904 20,459 199,397VIII - Eastern Visayas 865,657 468,830 56,761 69,373 23,041 52,731 32,957 14,085 147,879IX - Zamboanga Peninsula 726,272 312,283 45,692 91,342 28,339 104,946 67,086 11,775 64,809X - Northern Mindanao 917,840 520,436 79,982 71,132 31,427 97,540 62,564 8,216 46,544XI - Davao Region 1,011,943 591,928 117,121 84,784 35,679 87,478 48,734 8,361 37,857XII - SOCCSKSARGEN 916,038 381,451 99,333 99,854 66,377 124,630 79,557 11,836 53,000XIII - Caraga 504,257 305,817 29,790 55,793 14,533 40,096 13,971 5,745 38,511ARMM 538,941 79,063 27,981 31,151 27,930 159,880 153,381 24,996 34,560
Note: Figures are based on 20-percent sample households. Details may not add up to total due to rounding off.
Source: Philippine Statistics Authority, 2015 Census of Population
Total Number of Household
Region
Kind of Toilet Facility
1-31

TABEL 1.25 Number of Households in Occupied Housing Units by Status of Tenure and by Region: 2015
Own or owner like
possession of house and lot
Rent house/ room
including lot
Own house rent lot
Own house rent-
free lot with
consent of owner
Own house rent-free
lot without consent of
owner
Rent-free house and
lot with consent of
owner
Rent-free house and lot without consent of
owner
Not Applicable
Not Reported
Philippines 22,969,666 12,693,830 2,770,276 703,643 4,918,665 462,304 1,349,584 67,447 1,033 2,884
NCR 3,095,484 1,382,724 1,156,484 56,152 196,709 105,081 176,145 18,801 866 2,522CAR 395,748 270,764 57,727 2,524 25,647 2,086 36,447 553 - -I - Ilocos Region 1,151,629 801,191 33,574 19,631 206,082 10,631 78,665 1,855 - -II - Cagayan Valley 804,524 594,366 23,524 15,809 120,834 7,469 41,154 1,368 - -III - Central Luzon 2,566,524 1,755,559 275,021 54,044 306,852 34,338 134,192 6,457 - 61IV-A CALABARZON 3,395,332 1,982,870 587,409 74,992 478,539 62,937 198,973 9,594 12 6IV-B MIMAROPA 682,668 386,010 37,159 15,624 181,414 11,285 49,711 1,465 - -V - Bicol Region 1,216,369 598,165 42,852 44,975 432,967 23,423 71,725 2,262 - -VI - Western Visayas 1,716,307 751,032 41,636 76,628 739,546 42,490 62,237 2,733 1 4VII - Central Visayas 1,699,058 948,109 171,307 76,005 386,715 34,388 78,578 3,816 123 17VIII - Eastern Visayas 985,418 458,941 22,316 63,993 376,308 14,532 47,472 1,839 14 3IX - Zamboanga Peninsula 795,345 375,241 38,678 39,965 273,468 16,428 49,160 2,399 1 5X - Northern Mindanao 1,042,814 512,491 70,815 37,067 305,887 22,027 91,277 3,249 1 -XI - Davao Region 1,177,409 635,192 120,820 45,677 253,449 25,246 93,138 3,886 1 -XII - SOCCSKSARGEN 1,050,654 570,440 57,637 29,287 287,624 24,353 77,853 3,447 - 13XIII - Caraga 573,998 279,271 25,245 35,256 182,570 12,566 37,396 1,691 2 1ARMM 620,385 391,464 8,072 16,014 164,054 13,024 25,461 2,032 12 252
Note: Details may not add up to totals due to rounding.
Source: Philippine Statistics Authority
Region
Total Households in Occupied
Housing Units
Status of Tenure
1-32

Galvanized iron/aluminum
Tile/ concrete/ clay tile
Half galvanized
iron and half concrete
Bamboo/ cogon/ nipa/
anahaw
Asbestos
Makeshift/ salvaged/
improvised materials
Trapal Others Not Reported
Philippines 22,421,193 18,002,286 541,411 1,085,559 2,636,544 20,713 72,416 42,309 13,610 6,345
Concrete/brick/stone 11,035,032 10,338,819 462,249 147,452 67,507 12,566 2,111 1,187 2,568 573 Wood 3,909,408 2,979,913 33,244 157,591 705,322 4,884 13,693 10,865 3,638 258 Half concrete/brick/stone and half wood 3,430,114 2,562,328 41,072 709,311 109,100 1,849 4,099 877 1,357 121 Galvanized iron/aluminum 226,647 186,631 3,647 14,513 20,616 63 380 719 73 5 Bamboo/sawali/ cogon/nipa 3,543,338 1,761,059 - 50,839 1,706,086 - 10,053 11,291 3,187 823 Asbestos 11,767 10,089 123 490 - 1,041 - - 24 - Glass 2,517 1,646 473 360 - 33 - - 5 - Makeshift/salvaged/ improvised materials 116,979 54,413 - 1,807 16,199 - 40,495 3,823 240 2 Trapal 40,316 18,471 - - 7,324 - 1,307 13,103 110 1 Others 18,124 13,026 36 127 2,485 9 128 156 2,157 - No walls 4,796 2,950 118 192 959 3 133 274 167 - Not Reported 82,155 72,941 449 2,877 946 265 17 14 84 4,562
TABLE 1.26 Occupied Housing Units by Construction Materials of the Outer Walls and Roof: 2015
Construction Materials of the Outer Walls and
City/Municipality
Total Occupied
Housing Units
Construction Materials of the Roof
Source: Philippine Statistics Authority
1-33

TABLE 1.27 Number of Households by Presence of Household Conveniences/Devices and by Region: 2010
Region Radio/Radio Cassete
Television Set
CD/DVD/ VCD Player
Component/Stereo Set
Landline/Wireless
Telephone
Cellular phone
Personal Computer
Refrigerator/Freezer
Cooking Range
Washing Machine
Car/Jeep/ Van
Motorcycle/Tricycle
Motorized Boat/ Banca
Philippines 20,171,899 18,143,364 12,955,187 14,624,406 10,901,385 4,674,290 1,759,677 14,668,545 2,739,022 7,776,266 5,322,354 6,072,206 1,744,329 3,955,205 618,918 2,028,535
NCR 2,759,829 2,706,439 1,966,131 2,572,597 2,017,459 964,218 700,977 2,460,979 763,366 1,587,720 1,202,149 1,501,050 377,224 316,893 25,053 53,390
CAR 352,403 320,519 261,158 231,444 193,271 60,973 15,883 270,504 53,458 130,503 147,476 109,941 38,942 35,379 1,264 31,884
I - Ilocos Region 1,050,605 987,547 790,435 862,051 574,334 236,983 61,865 813,842 127,303 455,420 300,730 308,693 94,926 313,393 20,761 63,058
II - Cagayan Valley 727,327 664,678 500,779 520,548 416,877 132,694 16,789 507,569 63,391 219,782 137,532 181,923 54,249 186,470 10,150 62,649
III - Central Luzon 2,239,011 2,146,983 1,549,497 1,988,473 1,449,792 562,930 151,197 1,840,437 365,671 1,010,719 855,996 1,147,044 266,650 661,230 36,200 92,028
IV-A CALABARZON 2,833,595 2,708,384 1,900,356 2,462,255 1,827,872 818,025 343,904 2,351,833 548,969 1,449,552 1,121,787 1,287,721 344,962 527,229 62,668 125,211
IV-B MIMAROPA 602,131 501,894 298,380 307,691 247,989 83,696 11,379 378,118 38,458 130,349 75,436 117,321 23,912 132,569 57,274 100,237
V - Bicol Region 1,111,753 935,224 672,738 656,547 466,962 167,860 31,287 688,134 79,900 262,526 146,256 153,780 42,810 189,279 57,950 176,529
VI - Western Visayas 1,526,587 1,356,058 1,019,853 1,005,423 744,302 345,429 91,753 1,043,224 137,170 489,081 260,479 233,616 100,871 259,180 46,445 170,529
VII - Central Visayas 1,487,710 1,296,572 957,156 955,018 729,701 379,474 139,174 995,005 174,618 470,556 292,291 200,503 113,417 313,386 50,327 191,138
VIII - Eastern Visayas 865,657 667,960 381,418 468,326 370,362 158,779 35,769 489,837 54,895 210,945 135,795 110,048 32,991 146,720 53,518 197,697
IX - Zamboanga Peninsula 726,272 573,223 398,608 348,951 260,070 108,146 21,156 414,679 48,756 193,774 82,305 89,639 34,703 143,256 38,413 153,049
X - Northern Mindanao 917,840 778,517 529,129 570,921 424,127 196,449 46,256 591,232 87,105 318,025 141,991 174,393 62,816 165,837 17,929 139,323
XI - Davao Region 1,011,943 880,778 617,409 628,892 456,447 213,484 50,879 667,479 95,645 373,902 193,090 195,652 67,251 216,758 22,522 131,165
XII - SOCCSKSARGEN 916,038 758,783 537,072 504,292 325,637 119,943 20,952 563,526 54,502 255,608 120,137 144,637 43,559 194,141 18,222 157,255
XIII - Caraga 504,257 401,824 220,064 279,041 207,186 88,817 16,129 308,735 33,622 146,997 67,399 77,810 20,241 86,818 23,950 102,433
ARMM 538,941 457,980 355,002 261,935 188,997 36,388 4,327 283,412 12,192 70,808 41,505 38,437 24,804 66,668 76,272 80,961
Source: Philippine Statistics Authority
Househods without any household
convenience/device
Presence of Household Conveniences/Devices
Total Number of
Households
Households with at least
one household convenience/
device
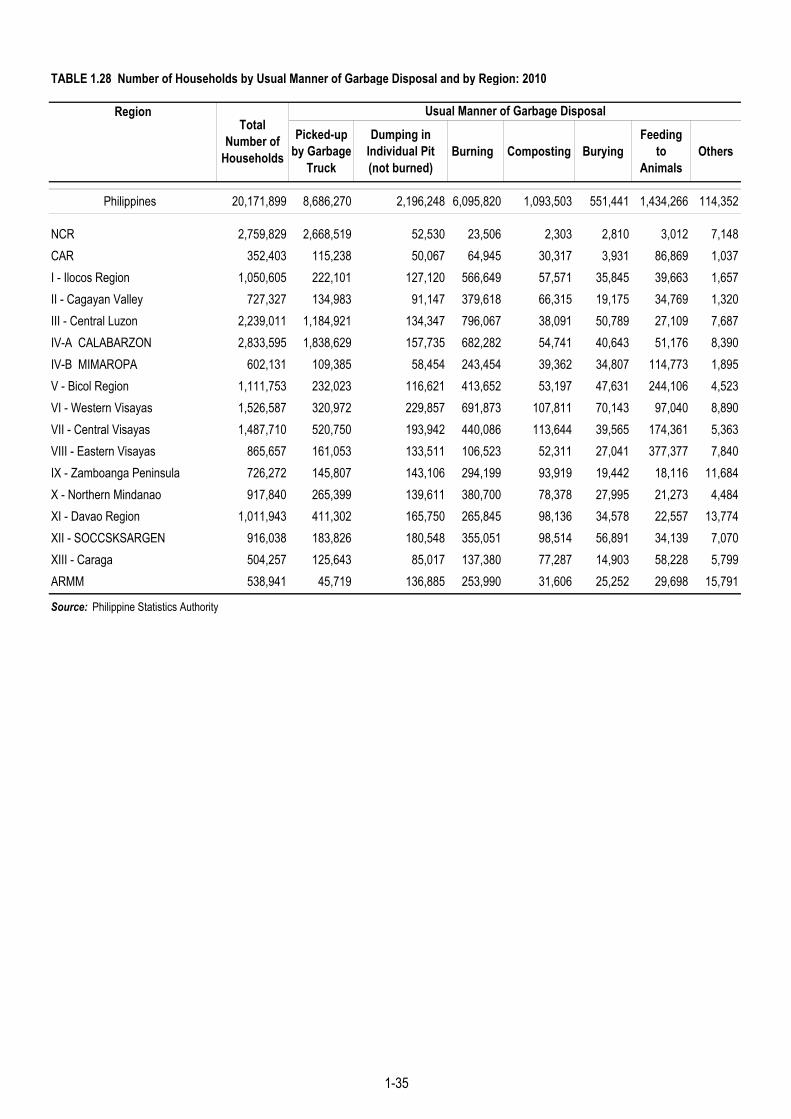
TABLE 1.28 Number of Households by Usual Manner of Garbage Disposal and by Region: 2010
RegionPicked-up
by Garbage Truck
Dumping in Individual Pit (not burned)
Burning Composting BuryingFeeding
to Animals
Others
Philippines 20,171,899 8,686,270 2,196,248 6,095,820 1,093,503 551,441 1,434,266 114,352
NCR 2,759,829 2,668,519 52,530 23,506 2,303 2,810 3,012 7,148CAR 352,403 115,238 50,067 64,945 30,317 3,931 86,869 1,037I - Ilocos Region 1,050,605 222,101 127,120 566,649 57,571 35,845 39,663 1,657II - Cagayan Valley 727,327 134,983 91,147 379,618 66,315 19,175 34,769 1,320III - Central Luzon 2,239,011 1,184,921 134,347 796,067 38,091 50,789 27,109 7,687IV-A CALABARZON 2,833,595 1,838,629 157,735 682,282 54,741 40,643 51,176 8,390IV-B MIMAROPA 602,131 109,385 58,454 243,454 39,362 34,807 114,773 1,895V - Bicol Region 1,111,753 232,023 116,621 413,652 53,197 47,631 244,106 4,523VI - Western Visayas 1,526,587 320,972 229,857 691,873 107,811 70,143 97,040 8,890VII - Central Visayas 1,487,710 520,750 193,942 440,086 113,644 39,565 174,361 5,363VIII - Eastern Visayas 865,657 161,053 133,511 106,523 52,311 27,041 377,377 7,840IX - Zamboanga Peninsula 726,272 145,807 143,106 294,199 93,919 19,442 18,116 11,684X - Northern Mindanao 917,840 265,399 139,611 380,700 78,378 27,995 21,273 4,484XI - Davao Region 1,011,943 411,302 165,750 265,845 98,136 34,578 22,557 13,774XII - SOCCSKSARGEN 916,038 183,826 180,548 355,051 98,514 56,891 34,139 7,070XIII - Caraga 504,257 125,643 85,017 137,380 77,287 14,903 58,228 5,799ARMM 538,941 45,719 136,885 253,990 31,606 25,252 29,698 15,791
Source: Philippine Statistics Authority
Usual Manner of Garbage DisposalTotal
Number of Households
1-35

TABLE 1.29 Number of Households by Type of Fuel Used for Lightning and by Region: 2015
Philippines 22,969,666 20,320,665 1,930,072 53,825 7,957 218,498 313,732 94,983 26,262 3,672
NCR 3,095,484 3,047,198 18,906 10,213 234 2,086 2,674 7,764 3,244 3,165CAR 395,748 360,533 19,865 453 219 5,643 3,031 5,911 93 -I - Ilocos Region 1,151,629 1,102,034 41,627 1,009 168 1,223 1,610 2,711 1,247 -II - Cagayan Valley 804,524 737,953 47,959 530 197 7,253 6,677 3,600 355 -III - Central Luzon 2,566,524 2,477,370 68,445 3,487 358 2,718 3,269 7,979 2,838 60IV-A CALABARZON 3,395,332 3,232,948 100,250 9,606 692 12,169 14,207 20,433 5,016 11IV-B MIMAROPA 682,668 507,417 113,600 758 450 30,989 18,947 9,112 1,390 5V - Bicol Region 1,216,369 1,009,648 173,317 1,733 153 13,996 10,466 5,975 1,081 -VI - Western Visayas 1,716,307 1,504,278 173,893 1,452 244 11,750 17,208 6,378 1,100 4VII - Central Visayas 1,699,058 1,455,330 207,153 796 421 9,291 17,212 6,753 2,088 14VIII - Eastern Visayas 985,418 826,736 128,180 5,998 255 4,777 15,624 2,871 974 3IX - Zamboanga Peninsula 795,345 602,971 164,929 3,333 148 5,277 15,392 1,944 1,335 16X - Northern Mindanao 1,042,814 855,628 159,249 1,277 157 6,259 15,974 2,705 1,565 -XI - Davao Region 1,177,409 965,251 159,719 5,466 825 13,400 26,667 5,594 487 -XII - SOCCSKSARGEN 1,050,654 820,294 165,413 2,521 2,028 17,466 38,943 2,583 1,390 16XIII - Caraga 573,998 488,249 73,366 1,127 211 3,977 4,999 1,424 644 1ARMM 620,385 326,827 114,201 4,066 1,197 70,224 100,832 1,246 1,415 377
Source: Philippine Statistics Authority
Region Number of Households *
Type of Fuel Used for Lighting
Electricity Kerosene (gaas)
Liquefied Petroleum Gas (LPG)
Oil (Vege-table,
animal and others)
Others None Not Reported
Solar Lamp
Solar Panel
1-36

TABLE 1.30 Human Development Index by Province: 2006, 2009, 2012
Region and Province 2006 2009 2012 Region and Province 2006 2009 2012
Philippines 0.598 0.609 0.644 VI Western Visayas Aklan 0.462 0.460 0.598
NCR 0.780 0.805 0.829 Antique 0.424 0.493 0.580 Capiz 0.506 0.522 0.561
CAR Guimaras 0.462 0.512 0.662 Abra 0.463 0.488 0.526 Iloilo 0.611 0.619 0.691 Apayao 0.442 0.509 0.379 Negros Occidental 0.524 0.537 0.584 Benguet 0.827 0.849 0.842 Ifugao 0.454 0.465 0.488 VII Central Visayas Kalinga 0.462 0.540 0.546 Bohol 0.440 0.482 0.574 Mountain Province 0.514 0.432 0.473 Cebu 0.558 0.582 0.636
Negros Oriental 0.442 0.504 0.522I Ilocos Siquijor 0.585 0.471 0.690 Ilocos Norte 0.620 0.641 0.731 Ilocos Sur 0.556 0.582 0.640 VIII Eastern Visayas La Union 0.587 0.615 0.687 Biliran 0.619 0.630 0.568 Pangasinan 0.496 0.556 0.580 Eastern Samar 0.461 0.450 0.389
Leyte 0.522 0.566 0.586II Cagayan Valley Northern Samar 0.428 0.432 0.432 Batanes 0.769 0.789 0.512 Southern Leyte 0.485 0.489 0.533 Cagayan 0.590 0.632 0.626 Western Samar 0.501 0.461 0.452 Isabela 0.584 0.603 0.587 Nueva Vizcaya 0.666 0.678 0.644 IX Western Mindanao Quirino 0.577 0.616 0.549 Zamboanga del Norte 0.405 0.384 0.455
Zamboanga del Sur 0.578 0.590 0.556III Central Luzon Zamboanga Sibugay a 0.506 0.353 0.504 Aurora 0.562 0.630 0.551 Bataan 0.660 0.698 0.729 X Northern Mindanao Bulacan 0.680 0.699 0.705 Bukidnon 0.487 0.494 0.440 Nueva Ecija 0.494 0.511 0.566 Camiguin 0.553 0.510 0.467 Pampanga 0.676 0.634 0.727 Lanao del Norte 0.582 0.537 0.550 Tarlac 0.579 0.573 0.673 Misamis Occidental 0.499 0.477 0.526 Zambales 0.561 0.600 0.542 Misamis Oriental 0.565 0.626 0.661
IV-A CALABARZON XI Southern Mindanao Batangas 0.609 0.632 0.668 Davao del Norte 0.476 0.506 0.524 Cavite 0.713 0.709 0.773 Davao del Sur 0.590 0.602 0.626 Laguna 0.702 0.695 0.721 Davao Oriental 0.384 0.356 0.442 Quezon 0.420 0.482 0.536 Compostela Valley b 0.402 0.461 0.491 Rizal 0.736 0.734 0.805
XII Central MindanaoIV-B MIMAROPA North Cotabato 0.458 0.498 0.454 Marinduque 0.460 0.544 0.612 Sarangani 0.362 0.371 0.438 Occidental Mindoro 0.455 0.529 0.536 South Cotabato 0.541 0.612 0.596 Oriental Mindoro 0.417 0.478 0.559 Sultan Kudarat 0.393 0.448 0.443 Palawan 0.492 0.498 0.572 Romblon 0.357 0.428 0.508 XIII Caraga
Agusan del Norte 0.506 0.541 0.541V Bicol Agusan del Sur 0.398 0.354 0.468 Albay 0.531 0.498 0.541 Surigao del Norte 0.463 0.442 0.478 Camarines Norte 0.445 0.469 0.518 Surigao del Sur 0.475 0.463 0.539 Camarines Sur 0.436 0.491 0.540 Catanduanes 0.463 0.606 0.513 ARMM Masbate 0.372 0.406 0.422 Basilan 0.429 0.460 0.419 Sorsogon 0.435 0.492 0.505 Lanao del Sur 0.408 0.416 0.217
Maguindanao 0.304 0.300 0.309 Sulu 0.266 0.266 0.303 Tawi-Tawi 0.201 0.310 0.403
Notes: Computations made by the Human Development Network (HDN) based on the refined methodology agreed by the then NSCB and HDN with the Task Force on HDI Estimates.a Zamboanga Sibugay was separated from its mother province, Zamboanga del Sur in 2001.b Compostela Valley was separated from its mother province, Davao del Norte in 1998.Source: Philippine Statistics Authority
1-37


2 - 4
2 - 5
2 - 6
2 - 7
2 - 8
2 - 8
2 - 9
2 - 9
2 - 10
2 - 12
2 - 16
2 - 20
2 - 21
2 - 22
2 - 23
2 - 24
2 - 25
2 - 26
2 - 27
2 - 28
2 - 29
2 - 30
2 - 31
2 - 32
2 - 33
2 - 35
TABLE 2.1 Total Number of Families, Total and Average Annual Family Income and Expenditure
by Income Class: 2006, 2009, 2012, and 2015
TABLE 2.2 Number of Families, Average Annual Income and Expenditure by Region: 2006, 2009, 2012, and 2015
TABLE 2.3 Total and Average Annual Family Income and Expenditure by Expenditure Class: 2006, 2009, 2012, and 2015
TABLE 2.4 Average Family Income and Expenditure by Family Size and Income Class: 2003, 2006, 2009, 2012, and 2015
TABLE 2.5 Percentage Distribution of Income Received From Selected Sources
2003, 2006, 2009, 2012, and 2015
TABLE 2.6 Percentage Distribution of Total Family Income By Income Decile
2003, 2006, 2009, 2012, and 2015
TABLE 2.7 Percentage Distribution of Total Family Expenditure by Major Expenditure Group: 2003, 2006, 2009,
2012, and 2015
TABLE 2.8a Gini Coefficient Ratio by Region: 2000, 2003, 2006, 2009, 2012, and 2015
TABLE 2.8b Income Gap, Poverty Gap, and Severity of Poverty by Province: 2012, 2015, and 2018
TABLE 2.9 Annual Per Capita Poverty Thresholds and Incidences Among Families and Population: 2009, 2012, and 2015
TABLE 2.10 Annual Per Capita Food Thresholds and Subsistence of Families and Population: 2009, 2012, and 2015
TABLE 2.11 Consumer Price Index for All Income Households and Inflation Rates: 2008 to 2018
TABLE 2.12 Consumer Price Index for All Income Households by Major Commodity Group, Philippines: 2008 to 2018
TABLE 2.13 Consumer Price Index for All Income Households by Major Commodity Group
National Capital Region: 2008 to 2018
TABLE 2.14 Consumer Price Index for All Income Households by Major Commodity Group Areas Outside
National Capital Region: 2008 to 2018
TABLE 2.15 Consumer Price Index of Food and Non-alcoholic Beverages in the National Capital Region: 2008 to 2018
TABLE 2.16 General Retail Price Index in the National Capital Region: 2008 to 2018
TABLE 2.17 Retail Price Index of Selected Construction Materials: National Capital Region: 2008 to 2018
TABLE 2.18 General Wholesale Price Index, Philippines: 2008 to 2018
TABLE 2.19 General Wholesale Price Index in Luzon: 2008 to 2018
TABLE 2.20 General Wholesale Price Index in Visayas: 2008 to 2018
TABLE 2.21 General Wholesale Price Index in Mindanao: 2008 to 2018
TABLE 2.22 Construction Materials Wholesale Price Index in the National Capital Region: 2008 to 2018
TABLE 2.23 Producer's Price Index for Manufacturing by Major Group: 2008 to 2018
TABLE 2.24 Producer's Price Index for Agriculture by Commodity: 2011 to 2017
TABLE 2.25 Producer's Price Index for Agriculture by Major Commodity Group by Region: 2014 to 2017
TABLE 2.26 Producer's Price Index for Agriculture by Region: 2011 to 2017
2 - 36

TABLE 2.1 Total Number of Families, Total and Average Annual Family Income and Expenditure by Income Class: 2006, 2009, 2012, and 2015
Total (In millions)
Average (In thousands)
Total (In millions)
Average (In thousands)
2006 17,403 3,006,104 173 2,561,437 147
Under 40,000 1,392 41,646 30 45,972 33 40,000 - 59,999 2,355 118,549 50 122,481 52 60,000 - 99,999 4,122 323,754 79 317,382 77
100,000 - 249,999 6,271 985,159 157 896,351 143 250,000 and over 3,264 1,536,996 471 1,179,252 361
2009 18,452 3,804,325 206 3,239,186 176
Under 40,000 759 23,148 31 25,026 33 40,000 - 59,999 1,605 81,514 51 86,158 54 60,000 - 99,999 4,107 327,375 80 328,288 80
100,000 - 249,999 7,571 1,206,777 159 1,112,161 147 250,000 and over 4,409 2,165,511 491 1,687,553 383
2012 21,426 5,026,798 235 4,125,312 193
Under 40,000 676 20,303 30 22,540 33 40,000 - 59,999 1,400 71,530 51 75,188 54 60,000 - 99,999 4,057 325,936 80 320,853 79
100,000 - 249,999 9,065 1,443,751 159 1,307,091 144 250,000 and over 6,228 3,165,277 508 2,399,641 385
2015 22,730 6,068,162 267 4,882,860 215
Under 40,000 355 11,086 31 12,376 35 40,000 - 59,999 901 46,104 51 47,947 53 60,000 - 99,999 3,268 266,410 82 262,096 80
100,000 - 249,999 10,318 1,671,854 162 1,500,018 145 250,000 and over 7,888 4,072,708 516 3,060,424 388
Note : Details may not add up to totals due to rounding.
Source: Philippine Statistics Authority
Income ExpenditureIncome class
Total Number of Families
(In thousands)
2-1

TABLE 2.2 Number of Families, Average Annual Income and Expenditure by Region: 2006, 2009, 2012, and 2015
2006 17,403 173 147 26 2012 21,426 235 193 42
NCR 2,362 311 258 53 2,917 379 325 54 CAR 303 192 151 42 375 257 188 69 I-Ilocos Region 947 142 124 19 1,105 204 159 45 II-Cagayan Valley 620 143 118 25 771 195 140 55 III-Central Luzon 1,909 198 170 27 2,386 259 211 48 IV-A-CALABARZON 2,251 210 186 23 3,082 284 243 41 IV-B-MIMAROPA 545 109 93 16 638 179 138 41 V-Bicol Region 1,010 125 110 15 1,165 162 144 19 VI-Western Visayas 1,370 130 116 14 1,604 202 163 39 VII-Central Visayas 1,293 144 124 21 1,577 209 164 45 VIII-Eastern Visayas 814 126 104 22 902 166 132 34 IX-Zamboanga Peninsula 623 125 99 27 772 162 122 40 X-Northern Mindanao 789 142 117 25 976 190 143 47 XI-Davao Region 841 135 115 18 1,078 194 156 39 XII-SOCCSKSARGEN 749 114 96 18 988 163 140 23 XIII-Caraga 444 118 100 18 532 180 142 38 ARMM 534 89 75 14 557 130 114 16
2009 18,452 206 176 31 2015 22,730 267 215 52
NCR 2,461 356 309 47 3,019 425 349 76 CAR 322 219 174 44 402 282 209 73 I-Ilocos Region 1,005 186 152 35 1,170 238 182 56 II-Cagayan Valley 653 181 141 40 816 237 162 75 III-Central Luzon 2,028 221 189 32 2,507 299 239 60 IV-A-CALABARZON 2,406 249 213 36 3,251 312 269 43 IV-B-MIMAROPA 590 141 121 21 697 222 161 61 V-Bicol Region 1,070 152 137 15 1,262 187 160 27 VI-Western Visayas 1,452 159 143 16 1,699 226 176 50 VII-Central Visayas 1,374 184 152 32 1,672 239 193 46 VIII-Eastern Visayas 865 160 128 32 976 197 156 41 IX-Zamboanga Peninsula 662 144 116 28 824 190 144 46 X-Northern Mindanao 839 165 139 26 1,029 221 161 60 XI-Davao Region 884 166 142 24 1,156 247 190 57 XII-SOCCSKSARGEN 801 154 132 22 1,055 188 162 26 XIII-Caraga 470 149 125 23 579 198 159 39 ARMM 572 113 98 15 616 139 111 28
Note : Details may not add up to totals due to rounding.
Source : Philippine Statistics Authority
Average Income
(In thousands)
Average Expenditure
(In thousands)
Savings (In thousands)Region
Total Number of Families
(In thousands)
Average Income
(In thousands)
Average Expenditure
(In thousands)
Savings (In thousands)
Total Number of Families
(In thousands)
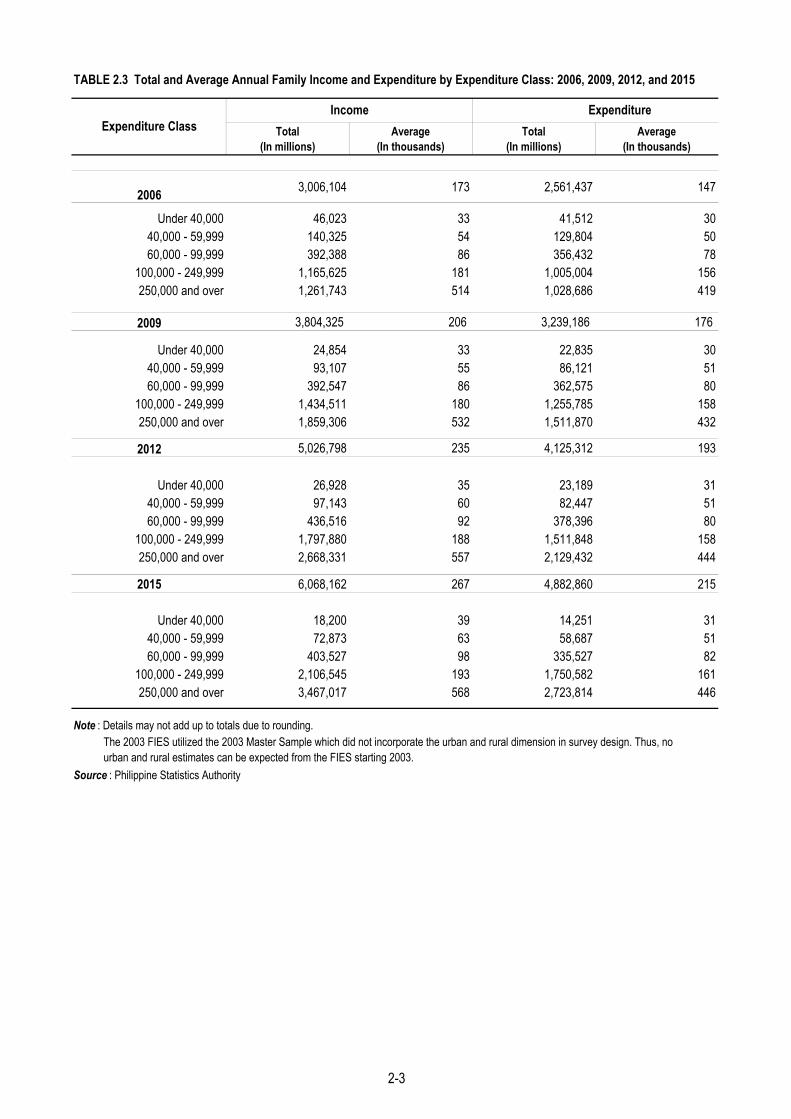
TABLE 2.3 Total and Average Annual Family Income and Expenditure by Expenditure Class: 2006, 2009, 2012, and 2015
Total (In millions)
Average (In thousands)
Total (In millions)
Average (In thousands)
2006 3,006,104 173 2,561,437 147
Under 40,000 46,023 33 41,512 3040,000 - 59,999 140,325 54 129,804 5060,000 - 99,999 392,388 86 356,432 78
100,000 - 249,999 1,165,625 181 1,005,004 156250,000 and over 1,261,743 514 1,028,686 419
2009 3,804,325 206 3,239,186 176
Under 40,000 24,854 33 22,835 3040,000 - 59,999 93,107 55 86,121 5160,000 - 99,999 392,547 86 362,575 80
100,000 - 249,999 1,434,511 180 1,255,785 158250,000 and over 1,859,306 532 1,511,870 432
2012 5,026,798 235 4,125,312 193
Under 40,000 26,928 35 23,189 3140,000 - 59,999 97,143 60 82,447 5160,000 - 99,999 436,516 92 378,396 80
100,000 - 249,999 1,797,880 188 1,511,848 158250,000 and over 2,668,331 557 2,129,432 444
2015 6,068,162 267 4,882,860 215
Under 40,000 18,200 39 14,251 3140,000 - 59,999 72,873 63 58,687 5160,000 - 99,999 403,527 98 335,527 82
100,000 - 249,999 2,106,545 193 1,750,582 161250,000 and over 3,467,017 568 2,723,814 446
Note : Details may not add up to totals due to rounding. The 2003 FIES utilized the 2003 Master Sample which did not incorporate the urban and rural dimension in survey design. Thus, no urban and rural estimates can be expected from the FIES starting 2003.
Source : Philippine Statistics Authority
Income ExpenditureExpenditure Class
2-3

TABLE 2.4 Average Family Income and Expenditure by Family Size and Income Class: 2003, 2006, 2009, 2012, and 2015
Under 40,000
40,000 - 59,999
60,000 - 99,999
100,000 - 249,999
250,000 - and over
Under 40,000
40,000 - 59,999
60,000 - 99,999
100,000 - 249,999
250,000 - and over
2003 2012(Values are in thousands)
Philippines Average income 148 29 50 78 157 459 235 30 51 80 159 508 Ave. expenditure 124 31 50 74 137 339 193 33 54 79 144 385
5 persons or less Average income 137 29 50 78 156 457 215 30 51 80 158 501 Ave. expenditure 114 30 49 73 135 331 176 33 53 77 142 376
6 persons or more Average income 168 32 50 79 157 462 272 36 52 82 161 519 Ave. expenditure 142 37 53 77 140 347 225 51 60 85 149 399
2006 2015(Estimates are in thousands)
Philippines Average income 173 30 50 79 157 471 267 31 51 82 162 516 Ave. expenditure 147 33 52 77 143 361 215 35 53 80 145 388
5 persons or less Average income 160 29 50 78 156 463 245 31 51 81 161 510 Ave. expenditure 135 32 51 76 141 349 197 34 52 78 142 381
6 persons or more Average income 196 33 51 79 158 481 313 35 53 83 165 526 Ave. expenditure 169 42 55 79 147 377 252 61 64 88 152 399
2009(Estimates are in thousands)
Philippines Average income 206 31 51 80 159 491 Ave. expenditure 176 33 54 80 147 383
5 persons or less Average income 193 30 50 79 159 490 Ave. expenditure 163 32 52 78 145 376
6 persons or more Average income 231 34 52 81 160 493 Ave. expenditure 200 42 59 85 150 393
Source : Philippine Statistics Authority
(Estimates are in thousands)
(Estimates are in thousands)
Family Size All Income Classes
All Income Classes
Income Class Income Class
2-4

TABLE 2.5 Percentage Distribution of Income Received From Selected Sources 2003, 2006, 2009, 2012, and 2015
Source of income 2003 2006 2009 2012 2015
Total 100.0 100.0 100.0 100.0 100.0
Wages and salaries 48.7 47.2 47.4 46.7 51.9Entrepreneurial activities 31.1 29.8 27.9 20.5 21.9Other sources of income 20.2 23.0 24.7 32.8 26.1
Note : Final results of the 1988 Family Income and Expenditure Survey (FIES) exclude data for Rizal Province as fire destroyed the accomplished questionnaires of this province.
Source: Philippine Statistics Authority
TABLE 2.6 Percentage Distribution of Total Family Income By Income Decile 2003, 2006, 2009, 2012, and 2015
Income decile 2003 2006 2009 2012 2015
Total 100.0 100.0 100.0 100.0 100.0
First decile 1.8 1.9 2.0 2.9 3.2Second decile 2.9 2.9 3.1 3.9 4.3Third decile 3.8 3.8 3.9 4.6 5.0Fourth decile 4.7 4.7 4.8 5.5 5.9Fifth decile 5.8 5.8 5.9 6.5 6.8Sixth decile 7.2 7.2 7.3 7.8 8.2Seventh decile 9.1 9.1 9.2 9.7 9.7Eighth decile 11.9 11.9 11.9 12.2 12.0Ninth decile 16.6 16.9 16.6 16.3 15.6Tenth decile 36.3 36.0 35.3 30.5 29.5
Source: Philippine Statistics Authority

TABLE 2.7 Percentage Distribution of Total Family Expenditure by Major Expenditure Group: 2003, 2006, 2009, 2012, and 2015
Expenditure group 2003 2006 2009 2012 2015
Total family expenditure (In millions) 2,038,471 2,561,437 3,239,186 4,125,312 4,882,860
Percent to toal expenditure 100.0 100.0 100.0 100.0 100.0
Food expenditure 43.1 41.4 42.6 42.8 41.9 Food consumed at home 37.7 35.5 36.5 35.3 33.7 Food regularly consumed outside the home 5.4 5.8 6.1 7.5 8.2 Alcoholic beverages 0.7 0.7 0.7 0.6 0.5 Tobacco 1.1 0.9 0.8 0.9 1.1 Fuel, light and water 6.5 7.6 7.1 … …Water Electricity Gas and Other Fuels 6.5 7.6 7.1 … 7.9 Housing, water, electricity, gas and other fuels … … … 20.7 …Household furnishings and equipment … … … 2.8 2.5 Household operation 2.2 2.3 2.3 … …Clothing, footwear & other wear 2.9 2.4 2.2 2.4 2.4 Personal care and effects 3.9 3.7 3.8 … …Medical care/Health 2.2 2.9 2.9 3.7 3.7 Transportation & communication 7.3 8.2 7.7 … …Transportation … … … 7.5 6.2 Communication … … … 2.7 2.2 Recreation/Recreation and Culture 0.5 0.5 0.4 1.4 0.8 Education 4.0 4.4 4.3 4.1 3.8 Non-Durable Furnishings 0.2 0.2 0.2 … …Durable Furniture and Equipment 2.6 2.7 2.7 … 2.5 Rent/Rental Value of Occupied Dwelling Unit 13.1 12.7 12.8 … 12.2 House Maintenance and Minor Repairs 0.7 0.5 0.6 … …Taxes paid 2.1 1.6 2.0 … …Miscellaneous expenditures 3.8 4.2 4.1 6.6 6.3 Gifts and contributions to others 1.2 1.4 1.4 … … Special occasions 2.6 2.8 2.7 … 2.5 Other expenditures 2.9 3.0 2.9 3.7 3.1
Source: Philippine Statistics Authority
TABLE 2.8a Gini Coefficient Ratio by Region: 2000, 2003, 2006, 2009, 2012, and 2015
Region 2003 2006 2009 2012 2015
Philippines 0.4605 0.4580 0.4641 0.4605 0.4438
NCR 0.4021 0.3988 0.4081 0.4028 0.3908CAR 0.4296 0.4418 0.4658 0.4675 0.4209I-Ilocos Region 0.3926 0.3953 0.4170 0.4265 0.3977II-Cagayan Valley 0.4410 0.4216 0.4560 0.4096 0.4063III-Central Luzon 0.3515 0.3994 0.3821 0.4084 0.3969IV-A-CALABARZON 0.4036 0.4082 0.4203 0.4186 0.4011IV-B-MIMAROPA 0.4358 0.4106 0.4116 0.4476 0.4564V-Bicol Region 0.4660 0.4428 0.4268 0.4233 0.3960VI-Western Visayas 0.4370 0.4326 0.4309 0.4754 0.4361VII-Central Visayas 0.4707 0.4639 0.4711 0.4712 0.4645VIII-Eastern Visayas 0.4580 0.4828 0.5008 0.4834 0.4647IX-Zamboanga Peninsula 0.5197 0.5054 0.4915 0.4592 0.4359X-Northern Mindanao 0.4817 0.4806 0.4860 0.4844 0.4633XI-Davao Region 0.4574 0.4225 0.4339 0.4330 0.4294XII-SOCCSKSARGEN 0.4774 0.4006 0.4462 0.4570 0.4624XIII-Caraga 0.4303 0.4452 0.4732 0.4397 0.4336ARMM 0.3578 0.3113 0.2991 0.2882 0.2800
Source: Philippine Statistics Authority
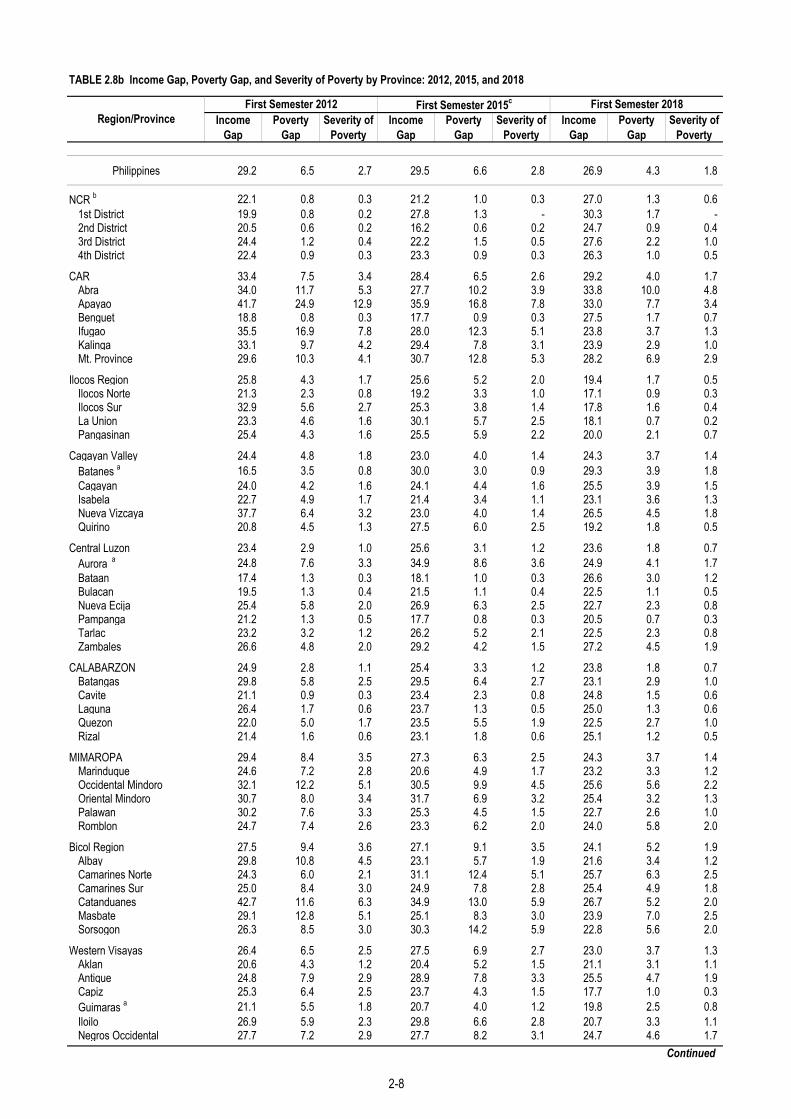
TABLE 2.8b Income Gap, Poverty Gap, and Severity of Poverty by Province: 2012, 2015, and 2018
Income Gap
Poverty Gap
Severity of Poverty
Income Gap
Poverty Gap
Severity of Poverty
Income Gap
Poverty Gap
Severity of Poverty
Philippines 29.2 6.5 2.7 29.5 6.6 2.8 26.9 4.3 1.8
NCR b 22.1 0.8 0.3 21.2 1.0 0.3 27.0 1.3 0.6 1st District 19.9 0.8 0.2 27.8 1.3 - 30.3 1.7 -2nd District 20.5 0.6 0.2 16.2 0.6 0.2 24.7 0.9 0.4 3rd District 24.4 1.2 0.4 22.2 1.5 0.5 27.6 2.2 1.0 4th District 22.4 0.9 0.3 23.3 0.9 0.3 26.3 1.0 0.5
CAR 33.4 7.5 3.4 28.4 6.5 2.6 29.2 4.0 1.7 Abra 34.0 11.7 5.3 27.7 10.2 3.9 33.8 10.0 4.8 Apayao 41.7 24.9 12.9 35.9 16.8 7.8 33.0 7.7 3.4 Benguet 18.8 0.8 0.3 17.7 0.9 0.3 27.5 1.7 0.7 Ifugao 35.5 16.9 7.8 28.0 12.3 5.1 23.8 3.7 1.3 Kalinga 33.1 9.7 4.2 29.4 7.8 3.1 23.9 2.9 1.0 Mt. Province 29.6 10.3 4.1 30.7 12.8 5.3 28.2 6.9 2.9
Ilocos Region 25.8 4.3 1.7 25.6 5.2 2.0 19.4 1.7 0.5 Ilocos Norte 21.3 2.3 0.8 19.2 3.3 1.0 17.1 0.9 0.3 Ilocos Sur 32.9 5.6 2.7 25.3 3.8 1.4 17.8 1.6 0.4 La Union 23.3 4.6 1.6 30.1 5.7 2.5 18.1 0.7 0.2 Pangasinan 25.4 4.3 1.6 25.5 5.9 2.2 20.0 2.1 0.7
Cagayan Valley 24.4 4.8 1.8 23.0 4.0 1.4 24.3 3.7 1.4 Batanes a 16.5 3.5 0.8 30.0 3.0 0.9 29.3 3.9 1.8 Cagayan 24.0 4.2 1.6 24.1 4.4 1.6 25.5 3.9 1.5 Isabela 22.7 4.9 1.7 21.4 3.4 1.1 23.1 3.6 1.3 Nueva Vizcaya 37.7 6.4 3.2 23.0 4.0 1.4 26.5 4.5 1.8 Quirino 20.8 4.5 1.3 27.5 6.0 2.5 19.2 1.8 0.5
Central Luzon 23.4 2.9 1.0 25.6 3.1 1.2 23.6 1.8 0.7 Aurora a 24.8 7.6 3.3 34.9 8.6 3.6 24.9 4.1 1.7 Bataan 17.4 1.3 0.3 18.1 1.0 0.3 26.6 3.0 1.2 Bulacan 19.5 1.3 0.4 21.5 1.1 0.4 22.5 1.1 0.5 Nueva Ecija 25.4 5.8 2.0 26.9 6.3 2.5 22.7 2.3 0.8 Pampanga 21.2 1.3 0.5 17.7 0.8 0.3 20.5 0.7 0.3 Tarlac 23.2 3.2 1.2 26.2 5.2 2.1 22.5 2.3 0.8 Zambales 26.6 4.8 2.0 29.2 4.2 1.5 27.2 4.5 1.9
CALABARZON 24.9 2.8 1.1 25.4 3.3 1.2 23.8 1.8 0.7 Batangas 29.8 5.8 2.5 29.5 6.4 2.7 23.1 2.9 1.0 Cavite 21.1 0.9 0.3 23.4 2.3 0.8 24.8 1.5 0.6 Laguna 26.4 1.7 0.6 23.7 1.3 0.5 25.0 1.3 0.6 Quezon 22.0 5.0 1.7 23.5 5.5 1.9 22.5 2.7 1.0 Rizal 21.4 1.6 0.6 23.1 1.8 0.6 25.1 1.2 0.5
MIMAROPA 29.4 8.4 3.5 27.3 6.3 2.5 24.3 3.7 1.4 Marinduque 24.6 7.2 2.8 20.6 4.9 1.7 23.2 3.3 1.2 Occidental Mindoro 32.1 12.2 5.1 30.5 9.9 4.5 25.6 5.6 2.2 Oriental Mindoro 30.7 8.0 3.4 31.7 6.9 3.2 25.4 3.2 1.3 Palawan 30.2 7.6 3.3 25.3 4.5 1.5 22.7 2.6 1.0 Romblon 24.7 7.4 2.6 23.3 6.2 2.0 24.0 5.8 2.0
Bicol Region 27.5 9.4 3.6 27.1 9.1 3.5 24.1 5.2 1.9 Albay 29.8 10.8 4.5 23.1 5.7 1.9 21.6 3.4 1.2 Camarines Norte 24.3 6.0 2.1 31.1 12.4 5.1 25.7 6.3 2.5 Camarines Sur 25.0 8.4 3.0 24.9 7.8 2.8 25.4 4.9 1.8 Catanduanes 42.7 11.6 6.3 34.9 13.0 5.9 26.7 5.2 2.0 Masbate 29.1 12.8 5.1 25.1 8.3 3.0 23.9 7.0 2.5 Sorsogon 26.3 8.5 3.0 30.3 14.2 5.9 22.8 5.6 2.0
Western Visayas 26.4 6.5 2.5 27.5 6.9 2.7 23.0 3.7 1.3 Aklan 20.6 4.3 1.2 20.4 5.2 1.5 21.1 3.1 1.1 Antique 24.8 7.9 2.9 28.9 7.8 3.3 25.5 4.7 1.9 Capiz 25.3 6.4 2.5 23.7 4.3 1.5 17.7 1.0 0.3 Guimaras a 21.1 5.5 1.8 20.7 4.0 1.2 19.8 2.5 0.8 Iloilo 26.9 5.9 2.3 29.8 6.6 2.8 20.7 3.3 1.1 Negros Occidental 27.7 7.2 2.9 27.7 8.2 3.1 24.7 4.6 1.7
Continued
Region/ProvinceFirst Semester 2012 First Semester 2015c First Semester 2018
2-8

TABLE 2.8b - - Concluded
Income Gap
Poverty Gap
Severity of Poverty
Income Gap
Poverty Gap
Severity of Poverty
Income Gap
Poverty Gap
Severity of Poverty
Central Visayas 32.5 9.4 4.2 35.0 10.0 4.8 26.5 5.0 2.1 Bohol 29.6 9.6 3.8 32.3 8.4 3.8 27.5 5.8 2.3 Cebu 29.7 6.7 2.8 34.1 8.2 4.0 24.1 4.0 1.5 Negros Oriental 38.6 17.5 8.7 38.3 15.6 7.7 31.1 8.1 3.8 Siquijor a 31.4 7.7 3.6 31.1 15.5 6.4 21.1 2.1 0.7
Eastern Visayas 30.1 11.2 4.8 32.1 12.8 5.6 29.7 9.0 4.0 Biliran 23.9 4.9 1.6 21.5 3.5 1.0 22.8 4.1 1.4 Eastern Samar 36.2 21.5 10.2 33.5 14.4 6.3 31.2 13.4 6.0 Leyte 27.9 8.9 3.5 30.9 11.9 5.0 30.3 8.9 4.0 Northern Samar 30.6 13.4 6.1 36.7 19.7 9.4 28.0 8.4 3.4 Southern Leyte 33.2 12.1 5.8 29.1 9.2 3.7 26.0 5.9 2.6 Western Samar 26.8 9.6 3.6 32.3 14.2 6.5 30.3 9.7 4.5
Zamboanga Peninsula 33.8 12.5 5.6 30.1 10.2 4.3 303.0 9.8 4.3 Zamboanga del Norte 36.9 18.6 9.0 36.4 18.8 9.0 31.5 13.0 5.8 Zamboanga del Sur 32.4 9.8 4.2 25.9 6.0 2.3 27.9 7.0 3.0 Zamboanga Sibugay 29.8 11.0 4.5 24.5 9.6 3.2 32.1 11.6 5.3 Isabela City a 25.1 4.9 1.6 16.6 3.4 0.9 34.9 18.3 8.9
Northern Mindanao 32.9 11.7 5.1 33.2 11.9 5.4 26.5 6.7 2.7 Bukidnon 32.8 14.2 6.1 36.7 19.8 9.7 26.1 8.4 3.2 Camiguin a 31.7 11.1 4.6 33.7 13.5 5.5 25.1 5.8 2.2 Lanao Del Norte 37.6 16.0 7.6 34.2 14.4 6.5 25.1 5.9 2.3 Misamis Occidental 28.0 10.2 4.0 27.9 10.3 4.4 28.7 9.3 4.0 Misamis Oriental 31.5 7.9 3.4 27.9 5.1 2.0 26.7 4.9 2.0
Davao Region 30.1 8.6 3.6 27.0 5.8 2.2 25.2 4.5 1.7 Davao del Norte 30.8 9.5 4.1 28.3 7.7 3.2 22.5 3.3 1.2 Davao del Sur 29.0 6.5 2.7 26.1 3.2 1.2 24.6 2.6 1.0 Davao Oriental 34.0 16.3 7.4 23.6 6.6 2.1 25.2 8.2 3.0 Compostela Valley 28.3 10.3 4.1 23.9 7.0 2.4 26.3 6.8 2.6 Davao Occidental - - - 32.9 16.9 7.2 27.8 10.2 4.1
SOCCSKSARGEN 34.9 13.1 6.3 36.8 13.8 6.8 32.2 8.8 4.0 North Cotabato 42.6 18.7 10.4 38.6 16.3 8.2 32.4 8.3 3.7 Saranggani 33.1 15.4 6.5 37.1 19.6 9.6 34.9 14.2 6.9 South Cotabato 32.1 9.0 4.0 30.2 7.1 2.9 28.5 5.4 2.4 Sultan Kudarat 27.8 11.6 4.5 41.6 20.4 11.3 34.0 11.0 5.1 Cotabato City a 31.2 13.0 5.6 32.9 13.1 5.6 31.4 13.3 6.0
Caraga 31.3 10.7 4.7 29.2 10.3 4.2 26.7 7.6 2.9 Agusan del Norte 30.9 9.9 4.3 27.8 7.9 3.2 25.2 5.9 2.2 Agusan del Sur 35.9 13.9 7.0 30.5 13.7 5.8 27.3 8.8 3.4 Surigao del Norte 30.3 10.5 4.4 29.7 9.7 3.8 28.1 9.1 3.6 Surigao del Sur 27.2 8.6 3.3 26.8 8.8 3.4 25.3 6.0 2.2 Dinagat Islands - - - 33.9 15.4 6.6 28.9 10.6 4.5
ARMM 28.5 13.3 5.4 31.2 18.0 7.7 32.9 18.2 8.3 Basilan 16.9 5.5 1.6 21.3 6.1 1.8 35.2 23.0 10.6 Lanao del Sur 36.9 25.4 11.7 40.2 29.7 14.6 36.8 25.0 12.1 Maguindanao 27.7 16.0 6.2 27.7 13.2 5.2 31.2 14.9 6.7 Sulu 18.9 5.7 1.7 28.4 20.4 7.8 29.4 19.3 8.1 Tawi-tawi 21.7 4.5 1.7 24.8 2.7 0.8 27.7 4.8 2.3
Note : a Caution in utilizing the estimate for these provinces due to its very small sample size.
Source: Philippine Statistics Authority
b NCR is grouped into the four districts: 1st District: City of Manila; 2nd District: Mandaluyong City, Marikina City, Pasig City, Quezon City, San Juan City; 3rd District: Caloocan City, Malabon City, Navotas City, Valenzuela City; and 4th District: Las Pinas City, Makati City, Muntinlupa City, Paranaque City, Pasay City, Pateros , and Taguig City. c Food Thresholds are estimated using actual prices collected by PSA for the estimation of the Consumer Price Index (CPI), in accordance with the updating of the market basket for the collection of prices for CPI.
Region/ProvinceFirst Semester 2012 First Semester 2015c First Semester 2018
2-8

TABLE 2.9 Annual Per Capita Poverty Thresholds and Incidences Among Families and Population: 2009, 2012, and 2015
Annual Per Capita Poverty Threshold
(in Pesos)
Poverty Incidence Among Families
(%)
Annual Per Capita Poverty Threshold
(in Pesos)
Poverty Incidence Among Families
(%)
Annual Per Capita Poverty Threshold
(in Pesos)
Poverty Incidence Among Families
(%)
Philippines 16,871 20.5 18,935 19.7 21,753 16.5
NCR d 19,227 2.4 20,344 2.6 25,007 2.71st District b 19,227 3.2 20,344 3.6 25,007 3.52nd District b 19,227 2.2 20,344 1.9 25,007 1.93rd District 19,227 3.2 20,344 2.8 25,007 3.34th District b 19,227 1.5 20,344 3.0 25,007 2.8
CAR 17,243 19.2 19,483 17.5 21,770 14.9Abra 17,852 38.9 19,775 27.2 21,240 19.9Apayao 16,923 39.9 18,623 54.7 20,947 30.9Benguet b 16,217 4.2 19,140 2.8 21,561 2.5Ifugao b 17,321 23.9 20,253 36.0 22,673 26.1Kalinga b 15,939 24.1 17,342 20.9 20,468 30.0Mt. Province b 18,118 39.3 21,138 27.9 23,620 29.5
Ilocos Region 17,595 16.8 18,373 14.0 20,488 9.6Ilocos Norte b 17,990 11.1 18,953 8.4 20,615 3.3Ilocos Sur 18,610 13.4 20,885 13.7 22,535 9.5La Union b 17,724 22.4 18,006 15.3 19,045 9.2Pangasinan 17,043 17.2 17,949 14.9 20,444 11.2
Cagayan Valley 17,330 20.2 19,125 17.0 21,860 11.7Batanes c 21,776 16.7 24,693 18.2 29,118 0.0Cagayan 17,866 22.5 18,741 15.2 21,094 13.3Isabela 17,057 22.6 19,400 19.0 22,547 10.6Nueva Vizcaya b 16,725 10.0 18,709 15.1 22,174 9.1Quirino 16,396 11.1 19,014 15.5 20,941 18.7
Central Luzon 18,188 10.7 20,071 10.1 23,200 8.9Aurora c 14,979 14.7 18,466 27.1 20,458 22.1Bataan b 17,643 5.9 19,383 4.5 24,770 1.6Bulacan b 18,434 4.6 19,910 5.4 21,989 3.3Nueva Ecija 18,732 24.9 20,847 19.6 23,403 18.6Pampanga b 17,399 4.9 19,163 5.4 22,474 3.0Tarlac 17,559 13.7 18,810 13.5 23,008 14.7Zambales b 18,448 11.9 21,885 12.1 26,473 12.3
CALABARZON 17,033 8.8 19,137 8.3 22,121 6.7Batangas b 17,360 12.6 19,437 14.7 21,767 6.8Cavite b 16,677 2.2 19,948 2.6 24,882 4.5Laguna b 17,412 6.2 19,857 4.6 21,770 4.1Quezon b 16,181 22.1 18,081 20.3 20,515 17.1Rizal b 18,397 5.8 20,306 5.0 24,198 3.6
MIMAROPA 15,613 27.2 17,292 23.6 20,224 17.4Marinduque b 15,678 27.4 17,180 23.9 19,722 11.7Occidental Mindoro b 15,937 25.0 17,412 29.8 19,994 30.0Oriental Mindoro 16,710 28.8 17,415 21.5 20,410 15.0Palawan b 14,418 25.3 16,696 20.5 19,435 11.9Romblon b 15,547 32.6 18,464 30.4 21,601 28.1
Bicol Region 16,888 35.3 18,257 32.3 21,476 27.5Albay 17,098 30.2 18,610 33.9 22,081 17.6Camarines Norte 16,675 31.9 18,390 21.7 22,096 29.3Camarines Sur 17,223 39.8 18,717 31.7 22,154 27.1Catanduanes 17,057 22.6 18,303 27.1 21,660 33.6Masbate 16,415 44.4 17,487 40.6 20,406 35.5Sorsogon b 16,484 29.8 17,535 31.3 20,480 31.7
Continued
Region/Province (Among Families)
2009 2012 2015

TABLE 2.9 - - Continued
Annual Per Capita Poverty Threshold
(in Pesos)
Poverty Incidence Among Families
(%)
Annual Per Capita Poverty Threshold
(in Pesos)
Poverty Incidence Among Families
(%)
Annual Per Capita Poverty Threshold
(in Pesos)
Poverty Incidence Among Families
(%)
Western Visayas 15,971 23.6 18,029 22.8 21,070 16.6Aklan 16,758 36.7 17,707 20.4 21,387 10.9Antique b 17,050 34.5 17,160 23.6 20,382 18.4Capiz b 17,248 22.9 20,144 22.3 21,146 7.8Guimaras b, c 16,204 13.4 18,926 16.9 23,136 4.8Iloilo 16,448 19.7 18,827 20.8 22,117 14.9Negros Occidental 14,921 22.9 17,243 24.9 20,464 21.9
Central Visayas 16,662 26.0 18,767 25.7 21,914 23.6Bohol 16,633 36.6 18,847 30.6 20,437 21.7Cebu 17,770 22.3 18,855 18.9 21,740 17.9Negros Oriental 13,625 28.0 18,589 43.9 22,823 38.7Siquijor b, c 16,469 27.2 18,420 24.0 21,675 48.9
Eastern Visayas 16,278 34.5 18,076 37.4 21,304 30.7Biliran 15,350 31.8 17,393 20.9 21,008 17.4Eastern Samar 17,091 49.2 20,237 55.4 22,886 37.4Leyte 16,255 29.8 17,561 31.4 20,807 23.6Northern Samar 16,883 42.8 19,197 43.5 21,574 47.9Southern Leyte b 16,688 30.1 19,431 34.0 23,318 30.2Western Samar b 15,091 34.9 15,891 43.5 20,139 39.5
Zamboanga Peninsula 16,260 39.5 18,054 33.7 20,925 26.0Zamboanga del Norte 17,184 60.3 18,483 48.0 21,725 41.1Zamboanga del Sur b 14,679 26.9 17,961 25.9 20,095 18.6Zamboanga Sibugay 17,046 46.0 17,338 37.0 20,551 24.1Isabela City b, c 16,364 21.4 19,670 15.5 20,617 18.3
Northern Mindanao 16,878 33.3 19,335 32.8 22,345 30.3Bukidnon 17,210 37.0 20,115 41.5 23,682 47.0Camiguin c 16,022 20.4 21,521 41.0 21,678 29.9Lanao Del Norte b 16,393 39.7 18,907 41.4 21,836 36.3Misamis Occidental 15,966 37.9 18,127 33.8 20,376 30.1Misamis Oriental b 17,539 25.0 18,938 19.1 21,299 14.9
Davao Region 17,120 25.5 19,967 25.0 22,754 16.6Davao del Norte b 16,863 27.2 20,841 26.7 24,424 26.1Davao del Sur b 17,046 19.3 19,311 20.0 21,846 12.0Davao Oriental b 16,948 44.3 19,323 37.8 22,210 21.3Compostela Valley 17,788 31.0 20,932 30.7 22,740 22.0
SOCCSKSARGEN 16,405 30.8 18,737 37.1 21,025 30.5North Cotabato 14,862 23.4 18,340 44.8 20,555 34.5Saranggani 16,053 47.5 18,640 46.0 20,753 47.3South Cotabato b 17,141 25.7 19,847 25.8 22,147 19.8Sultan Kudarat b 16,965 41.6 17,597 40.4 20,620 39.2Cotabato City b, c 18,103 29.9 20,568 34.5 21,825 24.7
Caraga 18,309 46.0 19,629 31.9 22,570 30.8Agusan del Norte 18,890 37.3 18,905 27.7 21,535 28.1Agusan del Sur 19,107 53.8 19,634 37.3 22,957 37.0Surigao del Norte 17,595 48.9 20,566 33.8 23,057 26.7Surigao del Sur 17,398 44.1 19,287 28.3 22,759 32.0
ARMM 16,683 39.9 20,517 48.7 21,563 48.2Basilan 16,256 28.8 19,368 32.1 20,678 28.3Lanao del Sur 17,024 48.7 22,665 67.3 22,802 66.3Maguindanao 16,701 43.3 18,873 54.5 21,423 48.8Sulu 17,240 35.5 20,477 40.2 20,778 49.6Tawi-tawi b 14,659 29.4 17,406 21.9 16,586 10.6
Continued
Region/Province (Among Families)
2009 2012 2015

TABLE 2.9 - - Continued
Annual Per Capita Poverty Threshold
(in Pesos)
Poverty Incidence Among
Population (%)
Annual Per Capita Poverty Threshold
(in Pesos)
Poverty Incidence Among
Population (%)
Annual Per Capita Poverty Threshold
(in Pesos)
Poverty Incidence Among
Population (%)
Philippines 16,871 26.3 18,935 25.2 21,753 21.6
NCR d 19,227 3.6 20,344 3.9 25,007 3.91st District b 19,227 5.1 20,344 6.2 25,007 5.12nd District b 19,227 3.3 20,344 2.4 25,007 2.93rd District b 19,227 4.5 20,344 3.8 25,007 4.14th District b 19,227 2.4 20,344 4.8 25,007 4.5
CAR 17,243 25.1 19,483 22.8 21,770 19.7Abra 17,852 48.8 19,775 37.4 21,240 28.9Apayao 16,923 45.7 18,623 61.4 20,947 34.9Benguet 16,217 6.1 19,140 3.7 21,561 3.5Ifugao b 17,321 32.1 20,253 42.4 22,673 32.5Kalinga b 15,939 30.1 17,342 26.8 20,468 34.9Mt. Province b 18,118 52.2 21,138 37.6 23,620 39.0
Ilocos Region 17,595 22.0 18,373 18.5 20,488 13.1Ilocos Norte b 17,990 14.7 18,953 9.9 20,615 5.3Ilocos Sur 18,610 18.1 20,885 17.3 22,535 12.1La Union b 17,724 29.3 18,006 18.5 19,045 12.2Pangasinan 17,043 22.3 17,949 20.4 20,444 15.3
Cagayan Valley 17,330 25.5 19,125 22.1 21,860 15.8Batanes c 21,776 14.4 24,693 33.3 29,118 0.0Cagayan 17,866 27.8 18,741 19.7 21,094 15.9Isabela 17,057 28.9 19,400 24.4 22,547 15.2Nueva Vizcaya 16,725 13.3 18,709 20.7 22,174 13.6Quirino 16,396 15.6 19,014 21.2 20,941 26.5
Central Luzon 18,188 13.7 20,071 12.9 23,200 11.2Aurora c 14,979 18.2 18,466 30.8 20,458 26.3Bataan b 17,643 7.7 19,383 7.1 24,770 2.0Bulacan b 18,434 6.9 19,910 7.3 21,989 4.5Nueva Ecija 18,732 29.9 20,847 25.2 23,403 22.6Pampanga b 17,399 6.9 19,163 7.6 22,474 4.9Tarlac 17,559 17.5 18,810 16.6 23,008 18.1Zambales b 18,448 17.3 21,885 16.0 26,473 16.8
CALABARZON 17,033 11.9 19,137 10.9 22,121 9.1Batangas 17,360 17.1 19,437 19.0 21,767 9.3Cavite b 16,677 3.2 19,948 3.4 24,882 6.8Laguna b 17,412 8.4 19,857 6.4 21,770 5.4Quezon b 16,181 29.8 18,081 27.5 20,515 22.7Rizal b 18,397 8.6 20,306 6.1 24,198 5.4
MIMAROPA 15,613 34.5 17,292 31.0 20,224 24.4Marinduque 15,678 33.6 17,180 32.9 19,722 16.2Occidental Mindoro b 15,937 35.9 17,412 38.1 19,994 41.2Oriental Mindoro 16,710 36.1 17,415 29.3 20,410 21.6Palawan b 14,418 30.9 16,696 26.4 19,435 17.0Romblon 15,547 41.9 18,464 40.5 21,601 36.6
Bicol Region 16,888 44.2 18,257 41.1 21,476 36.0Albay 17,098 36.7 18,610 41.0 22,081 25.2Camarines Norte b 16,675 41.8 18,390 28.7 22,096 36.4Camarines Sur 17,223 47.9 18,717 41.2 22,154 35.2Catanduanes 17,057 29.1 18,303 33.8 21,660 43.4Masbate 16,415 56.3 17,487 51.3 20,406 45.4Sorsogon 16,484 39.3 17,535 40.7 20,480 41.3
Continued
Region/Province (Among Population)
2009 2012 2015

TABLE 2.9 - - Concluded
Annual Per Capita Poverty Threshold
(in Pesos)
Poverty Incidence Among
Population (%)
Annual Per Capita Poverty Threshold
(in Pesos)
Poverty Incidence Among
Population (%)
Annual Per Capita Poverty Threshold
(in Pesos)
Poverty Incidence Among
Population (%)
Western Visayas 15,971 30.8 18,029 29.1 21,070 22.4Aklan 16,758 44.7 17,707 25.0 21,387 14.9Antique b 17,050 44.3 17,160 30.9 20,382 26.0Capiz b 17,248 29.0 20,144 27.8 21,146 12.9Guimaras b, c 16,204 20.7 18,926 25.2 23,136 5.2Iloilo 16,448 26.6 18,827 26.2 22,117 20.0Negros Occidental 14,921 30.4 17,243 32.3 20,464 29.0
Central Visayas 16,662 31.0 18,767 30.2 21,914 27.6Bohol 16,633 43.7 18,847 36.8 20,437 26.0Cebu 17,770 26.8 18,855 22.7 21,740 21.4Negros Oriental 13,625 33.2 18,589 50.1 22,823 45.0Siquijor b, c 16,469 31.0 18,420 32.6 21,675 52.9
Eastern Visayas 16,278 42.6 18,076 45.2 21,304 38.7Biliran 15,350 39.2 17,393 27.5 21,008 21.3Eastern Samar 17,091 56.4 20,237 63.7 22,886 46.3Leyte 16,255 36.3 17,561 39.2 20,807 31.0Northern Samar 16,883 52.1 19,197 50.2 21,574 56.2Southern Leyte b 16,688 43.1 19,431 43.3 23,318 38.0Western Samar b 15,091 42.5 15,891 50.0 20,139 46.9
Zamboanga Peninsula 16,260 45.8 18,054 40.1 20,925 33.9Zamboanga del Norte 17,184 68.5 18,483 54.4 21,725 51.6Zamboanga del Sur b 14,679 31.6 17,961 32.0 20,095 24.8Zamboanga Sibugay 17,046 52.7 17,338 44.8 20,551 31.7Isabela City b, c 16,364 27.4 19,670 22.1 20,617 25.1
Northern Mindanao 16,878 40.1 19,335 39.5 22,345 36.6Bukidnon 17,210 46.0 20,115 49.0 23,682 53.6Camiguin c 16,022 25.5 21,521 53.6 21,678 34.0Lanao Del Norte b 16,393 46.2 18,907 49.1 21,836 44.3Misamis Occidental 15,966 46.5 18,127 42.8 20,376 36.9Misamis Oriental b 17,539 28.9 18,938 23.4 21,299 19.3
Davao Region 17,120 31.4 19,967 30.7 22,754 22.0Davao del Norte b 16,863 32.0 20,841 33.4 24,424 33.2Davao del Sur b 17,046 24.8 19,311 24.4 21,846 15.6Davao Oriental b 16,948 54.4 19,323 45.8 22,210 29.9Compostela Valley 17,788 36.6 20,932 36.7 22,740 28.1
SOCCSKSARGEN 16,405 38.3 18,737 44.7 21,025 37.3North Cotabato 14,862 30.6 18,340 52.4 20,555 41.4Saranggani 16,053 57.7 18,640 53.2 20,753 55.2South Cotabato b 17,141 31.6 19,847 32.0 22,147 24.6Sultan Kudarat 16,965 51.5 17,597 48.5 20,620 48.0Cotabato City b, c 18,103 34.0 20,568 44.3 21,825 31.6
Caraga 18,309 54.4 19,629 40.3 22,570 39.1Agusan del Norte 18,890 45.9 18,905 34.7 21,535 34.9Agusan del Sur 19,107 60.0 19,634 48.1 22,957 47.3Surigao del Norte 17,595 57.9 20,566 41.8 23,057 34.7Surigao del Sur 17,398 53.7 19,287 36.0 22,759 40.1
ARMM 16,683 47.4 20,517 55.8 21,563 53.7Basilan 16,256 36.6 19,368 41.2 20,678 37.0Lanao del Sur 17,024 56.6 22,665 73.8 22,802 71.9Maguindanao 16,701 52.2 18,873 63.7 21,423 57.2Sulu 17,240 41.6 20,477 45.8 20,778 54.9Tawi-tawi b 14,659 35.3 17,406 28.6 16,586 12.6
Source: Philippine Statistics Authority
b Coefficient of variation of 2015 poverty incidence among families is greater than 20 percent.c Caution in utilizing the estimate for these provinces due to its very small sample size.d NCR is grouped into the four districts: 1st District: City of Manila; 2nd District: Mandaluyong City, Marikina City, Pasig City, Quezon City, San Juan City; 3rd District: Caloocan City, Malabon City, Navotas City, Valenzuela City; and 4th District: Las Pinas City, Makati City, Muntinlupa City, Paranaque City, Pasay City, Pateros, and Taguig City.
Region/Province (Among Population)
2009 2012 2015

TABLE 2.10 Annual Per Capita Food Thresholds and Subsistence of Families and Population: 2009, 2012, and 2015
Annual Per Capita Food Threshold
(in Pesos)
Subsistence Among Families
(%)
Annual Per Capita Food Threshold
(in Pesos)
Subsistence Among Families
(%)
Annual Per Capita Food Threshold
(in Pesos)
Subsistence Among Families
(%)
Philippines 11,780 7.9 13,232 7.5 15,189 5.7
NCR d 13,426 0.3 14,206 0.3 17,462 0.41st District b 13,426 0.0 14,206 0.4 17,462 0.92nd District b 13,426 0.3 14,206 0.3 17,462 0.13rd District 13,426 0.7 14,206 0.2 17,462 0.54th District b 13,426 0.1 14,206 0.4 17,462 0.5
CAR 12,033 9.0 13,539 7.1 15,274 4.8Abra 12,458 22.1 13,809 8.7 14,832 7.2Apayao 11,817 23.0 13,005 27.9 14,627 4.9Benguet b 11,306 1.2 13,246 0.5 15,378 0.3Ifugao b 12,088 6.6 14,143 17.7 15,832 12.8Kalinga b 11,097 12.3 12,087 8.8 14,297 11.2Mt. Province b 12,651 18.0 14,761 10.1 16,434 9.2
Ilocos Region 12,205 5.3 12,923 3.9 14,124 2.2Ilocos Norte b 12,547 2.6 13,235 1.3 14,698 0.0Ilocos Sur 12,826 2.8 14,584 6.0 15,736 1.6La Union b 12,398 9.5 12,604 5.2 13,319 3.2Pangasinan 12,003 5.3 12,533 3.7 14,262 2.5
Cagayan Valley 12,084 6.4 13,352 4.3 15,118 1.8Batanes c 15,206 0.0 17,243 9.1 20,333 0.0Cagayan 12,476 7.3 13,076 3.8 14,724 2.7Isabela 11,893 7.0 13,516 4.4 15,751 1.0Nueva Vizcaya b 11,640 2.7 13,090 6.6 15,644 1.6Quirino 11,449 5.3 13,278 0.7 14,623 4.7
Central Luzon 12,864 3.2 14,136 2.7 16,132 2.3Aurora c 10,460 1.8 12,895 8.6 14,286 9.3Bataan b 12,429 0.0 13,517 1.9 16,973 0.0Bulacan b 12,923 0.6 13,932 1.4 15,327 0.8Nueva Ecija 13,136 9.8 14,605 5.1 16,317 4.6Pampanga b 12,040 0.7 13,500 0.9 15,427 0.3Tarlac 12,335 3.8 13,089 3.4 16,105 4.5Zambales b 12,888 5.3 15,556 4.6 18,309 3.4
CALABARZON 11,876 1.9 13,371 2.3 15,303 1.6Batangas b 12,104 4.1 13,538 5.8 15,175 1.6Cavite b 11,592 0.0 13,846 0.4 17,465 0.9Laguna b 12,189 0.8 13,798 1.2 15,130 0.8Quezon b 11,253 5.0 12,672 4.6 14,262 4.9Rizal b 12,839 1.2 14,143 1.3 17,023 0.6
MIMAROPA 10,876 9.8 12,082 8.4 14,092 5.9Marinduque b 10,948 10.4 11,997 6.2 13,772 1.9Occidental Mindoro b 11,134 8.3 12,103 13.6 13,901 15.8Oriental Mindoro 11,720 9.8 12,192 8.1 14,270 6.8Palawan b 10,040 10.4 11,697 6.7 13,545 2.2Romblon b 10,856 9.7 12,893 9.0 15,084 5.7
Bicol Region 11,811 12.8 12,744 12.0 14,994 8.2Albay 11,942 11.6 12,942 15.2 15,470 6.5Camarines Norte 11,629 7.5 12,777 6.6 15,384 8.9Camarines Sur 12,040 15.3 13,080 10.1 15,461 6.5Catanduanes 11,911 9.9 12,781 19.7 15,125 13.0Masbate 11,463 17.4 12,211 14.7 14,250 10.8Sorsogon b 11,516 8.6 12,244 10.3 14,301 9.9
Continued
Region/Province (Among Families)
2009 2012 2015

TABLE 2.10--Continued
Annual Per Capita Food Threshold
(in Pesos)
Subsistence Among Families
(%)
Annual Per Capita Food Threshold
(in Pesos)
Subsistence Among Families
(%)
Annual Per Capita Food Threshold
(in Pesos)
Subsistence Among Families
(%)
Western Visayas 11,277 7.9 12,620 7.7 14,728 4.8Aklan 11,702 16.6 12,365 4.7 14,934 0.6Antique b 11,898 13.6 11,983 10.0 14,261 4.5Capiz b 12,005 10.1 14,068 9.1 14,652 1.3Guimaras b, c 11,315 4.8 13,216 5.6 16,156 0.0Iloilo 11,493 6.0 13,138 7.3 15,450 5.2Negros Occidental 10,455 6.2 12,052 8.0 14,244 6.4
Central Visayas 11,635 11.1 13,048 11.1 15,357 9.8Bohol 11,596 16.6 13,155 12.2 14,249 7.2Cebu 12,360 9.7 13,049 7.0 15,139 6.8Negros Oriental 9,505 11.1 12,999 24.1 15,916 19.5Siquijor b, c 11,500 5.9 12,863 8.7 15,136 18.8
Eastern Visayas 11,379 14.7 12,732 15.3 14,957 12.0Biliran 10,719 9.9 12,187 6.1 14,670 5.3Eastern Samar 11,935 28.2 14,131 30.9 15,981 18.4Leyte 11,334 10.5 12,246 10.3 14,513 6.7Northern Samar 11,759 20.5 13,356 18.8 15,023 23.0Southern Leyte b 11,653 9.6 13,569 16.3 16,283 13.9Western Samar b 10,511 17.2 11,085 17.7 14,073 16.3
Zamboanga Peninsula 11,436 21.1 12,615 14.8 14,737 9.2Zamboanga del Norte 11,990 38.7 12,906 27.8 15,142 19.7Zamboanga del Sur b 10,226 11.9 12,482 8.3 13,949 5.3Zamboanga Sibugay 11,872 22.4 12,046 15.0 14,302 3.7Isabela City b, c 11,335 2.0 13,707 2.6 14,397 2.7
Northern Mindanao 11,764 16.1 13,497 15.9 15,739 13.8Bukidnon 11,979 17.7 14,062 20.2 16,516 26.0Camiguin c 11,021 3.7 14,975 21.0 15,048 7.8Lanao Del Norte b 11,428 19.7 13,160 23.0 15,207 17.7Misamis Occidental 11,155 17.9 12,650 14.1 14,136 8.6Misamis Oriental b 12,224 12.3 13,195 8.4 14,853 4.6
Davao Region 11,925 11.1 13,890 10.1 15,860 5.2Davao del Norte b 11,775 12.8 14,497 9.5 17,073 9.0Davao del Sur b 11,880 8.9 13,410 8.0 15,159 4.5Davao Oriental b 11,827 18.6 13,559 16.9 15,493 4.0Compostela Valley 12,433 10.6 14,573 13.2 15,856 4.5
SOCCSKSARGEN 11,444 12.2 13,006 17.8 14,593 15.5North Cotabato 10,373 9.0 12,791 27.3 14,328 17.7Saranggani 11,221 20.3 13,046 22.1 14,472 26.8South Cotabato b 11,966 12.0 13,801 10.9 15,436 7.8Sultan Kudarat b 11,887 13.3 12,298 15.8 14,403 24.8Cotabato City b, c 12,532 9.6 14,424 7.6 15,137 7.1
Caraga 12,789 24.6 13,661 13.0 15,720 12.0Agusan del Norte 13,130 18.6 13,163 11.1 15,002 11.9Agusan del Sur 13,305 33.1 13,708 18.0 16,013 16.8Surigao del Norte 12,287 25.4 14,265 12.6 16,111 8.1Surigao del Sur 12,112 20.7 13,421 9.6 15,834 11.2
ARMM 11,725 10.8 14,747 19.5 15,421 17.0Basilan 11,335 1.8 13,495 2.2 14,485 4.6Lanao del Sur 11,880 20.2 15,826 41.6 15,920 33.2Maguindanao 11,680 13.3 13,195 19.0 14,982 22.0Sulu 12,040 3.6 14,263 9.2 14,512 5.6Tawi-tawi b 10,237 4.5 12,299 4.3 11,847 0.0
Continued
Region/Province (Among Families)
2009 2012 2015

TABLE 2.10--Continued
Annual Per Capita Food Threshold
(in Pesos)
Subsistence Among
Population (%)
Annual Per Capita Food Threshold
(in Pesos)
Subsistence Among
Population (%)
Annual Per Capita Food Threshold
(in Pesos)
Subsistence Among
Population (%)
Philippines 11,780 10.9 13,232 10.4 15,189 8.1
NCR d 13,426 0.5 14,206 0.5 17,462 0.71st District b 13,426 0.0 14,206 0.5 17,462 1.62nd District b 13,426 0.5 14,206 0.4 17,462 0.33rd District b 13,426 1.2 14,206 0.4 17,462 0.74th District b 13,426 0.2 14,206 0.7 17,462 0.6
CAR 12,033 12.8 13,539 10.0 15,274 7.0Abra 12,458 29.9 13,809 13.5 14,832 8.4Apayao 11,817 29.3 13,005 33.8 14,627 8.4Benguet 11,306 1.9 13,246 0.6 15,378 0.4Ifugao b 12,088 10.7 14,143 22.3 15,832 16.8Kalinga b 11,097 16.8 12,087 13.1 14,297 14.2Mt. Province b 12,651 25.5 14,761 13.7 16,434 14.1
Ilocos Region 12,205 7.8 12,923 5.7 14,124 3.4Ilocos Norte b 12,547 4.2 13,235 1.5 14,698 0.0Ilocos Sur 12,826 4.3 14,584 7.6 15,736 2.0La Union b 12,398 13.2 12,604 7.6 13,319 5.2Pangasinan 12,003 7.8 12,533 5.6 14,262 3.8
Cagayan Valley 12,084 8.9 13,352 5.9 15,118 2.6Batanes c 15,206 0.0 17,243 27.5 20,333 0.0Cagayan 12,476 10.0 13,076 5.4 14,724 3.3Isabela 11,893 9.8 13,516 5.5 15,751 1.6Nueva Vizcaya 11,640 3.9 13,090 9.9 15,644 2.5Quirino 11,449 6.8 13,278 1.2 14,623 7.4
Central Luzon 12,864 4.3 14,136 3.8 16,132 3.0Aurora c 10,460 1.7 12,895 11.7 14,286 14.5Bataan b 12,429 0.0 13,517 2.8 16,973 0.0Bulacan b 12,923 0.8 13,932 1.8 15,327 1.1Nueva Ecija 13,136 12.6 14,605 7.8 16,317 5.9Pampanga b 12,040 1.4 13,500 1.2 15,427 0.6Tarlac 12,335 5.2 13,089 5.2 16,105 5.5Zambales b 12,888 8.6 15,556 6.4 18,309 5.7
CALABARZON 11,876 2.9 13,371 3.2 15,303 2.3Batangas 12,104 5.8 13,538 7.4 15,175 2.4Cavite b 11,592 0.0 13,846 0.5 17,465 1.7Laguna b 12,189 1.1 13,798 1.7 15,130 1.0Quezon b 11,253 7.8 12,672 7.0 14,262 7.0Rizal b 12,839 2.1 14,143 1.6 17,023 0.9
MIMAROPA 10,876 14.0 12,082 12.4 14,092 8.9Marinduque 10,948 14.5 11,997 8.7 13,772 2.8Occidental Mindoro b 11,134 13.9 12,103 20.1 13,901 23.0Oriental Mindoro 11,720 14.1 12,192 11.6 14,270 9.8Palawan b 10,040 13.6 11,697 9.9 13,545 3.5Romblon 10,856 14.5 12,893 13.9 15,084 8.5
Bicol Region 11,811 17.9 12,744 16.8 14,994 11.8Albay 11,942 15.7 12,942 19.6 15,470 10.7Camarines Norte b 11,629 11.8 12,777 9.9 15,384 13.6Camarines Sur 12,040 20.5 13,080 15.1 15,461 8.9Catanduanes 11,911 14.4 12,781 24.3 15,125 16.9Masbate 11,463 24.8 12,211 20.3 14,250 14.8Sorsogon 11,516 12.4 12,244 14.5 14,301 13.6
Continued
Region/Province (Among Population)
2009 2012 2015

TABLE 2.10 - - Concluded
Annual Per Capita Food Threshold
(in Pesos)
Subsistence Among
Population (%)
Annual Per Capita Food Threshold
(in Pesos)
Subsistence Among
Population (%)
Annual Per Capita Food Threshold
(in Pesos)
Subsistence Among
Population (%)
Western Visayas 11,277 11.1 12,620 11.1 14,728 7.3Aklan 11,702 24.2 12,365 5.3 14,934 0.9Antique b 11,898 20.0 11,983 13.0 14,261 7.3Capiz b 12,005 13.1 14,068 12.3 14,652 2.6Guimaras b, c 11,315 8.5 13,216 10.9 16,156 0.0Iloilo 11,493 8.7 13,138 10.0 15,450 7.9Negros Occidental 10,455 9.0 12,052 12.3 14,244 9.4
Central Visayas 11,635 14.6 13,048 13.6 15,357 11.9Bohol 11,596 21.6 13,155 16.0 14,249 9.6Cebu 12,360 12.7 13,049 8.4 15,139 8.0Negros Oriental 9,505 14.6 12,999 29.4 15,916 24.2Siquijor b, c 11,500 6.2 12,863 13.2 15,136 20.5
Eastern Visayas 11,379 19.4 12,732 20.2 14,957 16.5Biliran 10,719 13.5 12,187 8.3 14,670 8.1Eastern Samar 11,935 34.5 14,131 38.1 15,981 24.6Leyte 11,334 13.8 12,246 14.3 14,513 9.7Northern Samar 11,759 27.9 13,356 23.7 15,023 29.3Southern Leyte b 11,653 15.2 13,569 22.5 16,283 19.5Western Samar b 10,511 21.0 11,085 22.5 14,073 21.1
Zamboanga Peninsula 11,436 26.4 12,615 19.1 14,737 13.3Zamboanga del Norte 11,990 46.4 12,906 34.4 15,142 27.9Zamboanga del Sur b 10,226 15.6 12,482 11.4 13,949 7.5Zamboanga Sibugay 11,872 29.3 12,046 20.3 14,302 5.8Isabela City b, c 11,335 2.3 13,707 4.7 14,397 4.0
Northern Mindanao 11,764 21.2 13,497 20.6 15,739 18.1Bukidnon 11,979 24.2 14,062 25.5 16,516 31.5Camiguin c 11,021 5.2 14,975 28.8 15,048 10.9Lanao Del Norte b 11,428 24.8 13,160 29.9 15,207 24.1Misamis Occidental 11,155 25.0 12,650 19.2 14,136 11.5Misamis Oriental b 12,224 15.3 13,195 10.9 14,853 6.9
Davao Region 11,925 14.9 13,890 13.1 15,860 7.5Davao del Norte b 11,775 15.7 14,497 12.6 17,073 12.6Davao del Sur b 11,880 12.5 13,410 10.1 15,159 6.2Davao Oriental b 11,827 25.8 13,559 22.9 15,493 6.6Compostela Valley 12,433 14.0 14,573 16.5 15,856 7.3
SOCCSKSARGEN 11,444 16.7 13,006 23.2 14,593 20.4North Cotabato 10,373 13.2 12,791 32.6 14,328 22.7Saranggani 11,221 27.3 13,046 28.3 14,472 33.4South Cotabato b 11,966 16.0 13,801 15.2 15,436 10.4Sultan Kudarat 11,887 19.0 12,298 22.2 14,403 32.6Cotabato City b, c 12,532 10.4 14,424 10.2 15,137 10.1
Caraga 12,789 30.8 13,661 18.3 15,720 16.8Agusan del Norte 13,130 24.9 13,163 15.9 15,002 15.7Agusan del Sur 13,305 38.4 13,708 26.1 16,013 23.3Surigao del Norte 12,287 32.3 14,265 17.1 16,111 11.8Surigao del Sur 12,112 26.8 13,421 13.1 15,834 16.4
ARMM 11,725 14.2 14,747 25.1 15,421 21.1Basilan 11,335 3.0 13,495 3.6 14,485 7.2Lanao del Sur 11,880 25.9 15,826 49.6 15,920 41.0Maguindanao 11,680 17.7 13,195 25.8 14,982 28.8Sulu 12,040 4.7 14,263 12.3 14,512 7.4Tawi-tawi b 10,237 5.7 12,299 7.4 11,847 0.0
Source: Philippine Statistics Authority
2015
b Coefficient of variation of 2015 poverty incidence among families is greater than 20 percent.c Caution in utilizing the estimate for these provinces due to its very small sample size.d NCR is grouped into the four districts: 1st District: City of Manila; 2nd District: Mandaluyong City, Marikina City, Pasig City, Quezon City, San Juan City; 3rd District: Caloocan City, Malabon City, Navotas City, Valenzuela City; and 4th District: Las Pinas City, Makati City, Muntinlupa City, Paranaque City, Pasay City, Pateros, and Taguig City.
Region/Province (Among Population)
2009 2012
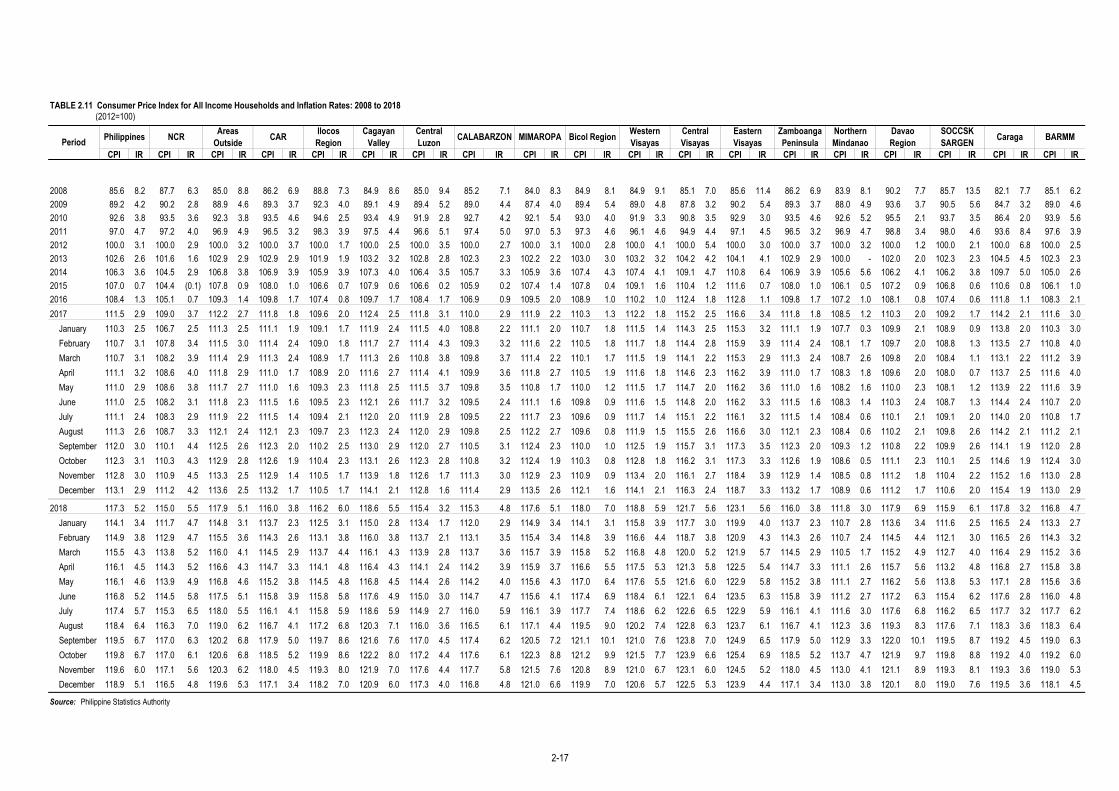
TABLE 2.11 Consumer Price Index for All Income Households and Inflation Rates: 2008 to 2018 (2012=100)
CPI IR CPI IR CPI IR CPI IR CPI IR CPI IR CPI IR CPI IR CPI IR CPI IR CPI IR CPI IR CPI IR CPI IR CPI IR CPI IR CPI IR CPI IR CPI IR
2008 85.6 8.2 87.7 6.3 85.0 8.8 86.2 6.9 88.8 7.3 84.9 8.6 85.0 9.4 85.2 7.1 84.0 8.3 84.9 8.1 84.9 9.1 85.1 7.0 85.6 11.4 86.2 6.9 83.9 8.1 90.2 7.7 85.7 13.5 82.1 7.7 85.1 6.2 2009 89.2 4.2 90.2 2.8 88.9 4.6 89.3 3.7 92.3 4.0 89.1 4.9 89.4 5.2 89.0 4.4 87.4 4.0 89.4 5.4 89.0 4.8 87.8 3.2 90.2 5.4 89.3 3.7 88.0 4.9 93.6 3.7 90.5 5.6 84.7 3.2 89.0 4.6 2010 92.6 3.8 93.5 3.6 92.3 3.8 93.5 4.6 94.6 2.5 93.4 4.9 91.9 2.8 92.7 4.2 92.1 5.4 93.0 4.0 91.9 3.3 90.8 3.5 92.9 3.0 93.5 4.6 92.6 5.2 95.5 2.1 93.7 3.5 86.4 2.0 93.9 5.6 2011 97.0 4.7 97.2 4.0 96.9 4.9 96.5 3.2 98.3 3.9 97.5 4.4 96.6 5.1 97.4 5.0 97.0 5.3 97.3 4.6 96.1 4.6 94.9 4.4 97.1 4.5 96.5 3.2 96.9 4.7 98.8 3.4 98.0 4.6 93.6 8.4 97.6 3.9 2012 100.0 3.1 100.0 2.9 100.0 3.2 100.0 3.7 100.0 1.7 100.0 2.5 100.0 3.5 100.0 2.7 100.0 3.1 100.0 2.8 100.0 4.1 100.0 5.4 100.0 3.0 100.0 3.7 100.0 3.2 100.0 1.2 100.0 2.1 100.0 6.8 100.0 2.5 2013 102.6 2.6 101.6 1.6 102.9 2.9 102.9 2.9 101.9 1.9 103.2 3.2 102.8 2.8 102.3 2.3 102.2 2.2 103.0 3.0 103.2 3.2 104.2 4.2 104.1 4.1 102.9 2.9 100.0 - 102.0 2.0 102.3 2.3 104.5 4.5 102.3 2.3 2014 106.3 3.6 104.5 2.9 106.8 3.8 106.9 3.9 105.9 3.9 107.3 4.0 106.4 3.5 105.7 3.3 105.9 3.6 107.4 4.3 107.4 4.1 109.1 4.7 110.8 6.4 106.9 3.9 105.6 5.6 106.2 4.1 106.2 3.8 109.7 5.0 105.0 2.6 2015 107.0 0.7 104.4 (0.1) 107.8 0.9 108.0 1.0 106.6 0.7 107.9 0.6 106.6 0.2 105.9 0.2 107.4 1.4 107.8 0.4 109.1 1.6 110.4 1.2 111.6 0.7 108.0 1.0 106.1 0.5 107.2 0.9 106.8 0.6 110.6 0.8 106.1 1.0 2016 108.4 1.3 105.1 0.7 109.3 1.4 109.8 1.7 107.4 0.8 109.7 1.7 108.4 1.7 106.9 0.9 109.5 2.0 108.9 1.0 110.2 1.0 112.4 1.8 112.8 1.1 109.8 1.7 107.2 1.0 108.1 0.8 107.4 0.6 111.8 1.1 108.3 2.1 2017 111.5 2.9 109.0 3.7 112.2 2.7 111.8 1.8 109.6 2.0 112.4 2.5 111.8 3.1 110.0 2.9 111.9 2.2 110.3 1.3 112.2 1.8 115.2 2.5 116.6 3.4 111.8 1.8 108.5 1.2 110.3 2.0 109.2 1.7 114.2 2.1 111.6 3.0
January 110.3 2.5 106.7 2.5 111.3 2.5 111.1 1.9 109.1 1.7 111.9 2.4 111.5 4.0 108.8 2.2 111.1 2.0 110.7 1.8 111.5 1.4 114.3 2.5 115.3 3.2 111.1 1.9 107.7 0.3 109.9 2.1 108.9 0.9 113.8 2.0 110.3 3.0 February 110.7 3.1 107.8 3.4 111.5 3.0 111.4 2.4 109.0 1.8 111.7 2.7 111.4 4.3 109.3 3.2 111.6 2.2 110.5 1.8 111.7 1.8 114.4 2.8 115.9 3.9 111.4 2.4 108.1 1.7 109.7 2.0 108.8 1.3 113.5 2.7 110.8 4.0 March 110.7 3.1 108.2 3.9 111.4 2.9 111.3 2.4 108.9 1.7 111.3 2.6 110.8 3.8 109.8 3.7 111.4 2.2 110.1 1.7 111.5 1.9 114.1 2.2 115.3 2.9 111.3 2.4 108.7 2.6 109.8 2.0 108.4 1.1 113.1 2.2 111.2 3.9 April 111.1 3.2 108.6 4.0 111.8 2.9 111.0 1.7 108.9 2.0 111.6 2.7 111.4 4.1 109.9 3.6 111.8 2.7 110.5 1.9 111.6 1.8 114.6 2.3 116.2 3.9 111.0 1.7 108.3 1.8 109.6 2.0 108.0 0.7 113.7 2.5 111.6 4.0 May 111.0 2.9 108.6 3.8 111.7 2.7 111.0 1.6 109.3 2.3 111.8 2.5 111.5 3.7 109.8 3.5 110.8 1.7 110.0 1.2 111.5 1.7 114.7 2.0 116.2 3.6 111.0 1.6 108.2 1.6 110.0 2.3 108.1 1.2 113.9 2.2 111.6 3.9 June 111.0 2.5 108.2 3.1 111.8 2.3 111.5 1.6 109.5 2.3 112.1 2.6 111.7 3.2 109.5 2.4 111.1 1.6 109.8 0.9 111.6 1.5 114.8 2.0 116.2 3.3 111.5 1.6 108.3 1.4 110.3 2.4 108.7 1.3 114.4 2.4 110.7 2.0 July 111.1 2.4 108.3 2.9 111.9 2.2 111.5 1.4 109.4 2.1 112.0 2.0 111.9 2.8 109.5 2.2 111.7 2.3 109.6 0.9 111.7 1.4 115.1 2.2 116.1 3.2 111.5 1.4 108.4 0.6 110.1 2.1 109.1 2.0 114.0 2.0 110.8 1.7 August 111.3 2.6 108.7 3.3 112.1 2.4 112.1 2.3 109.7 2.3 112.3 2.4 112.0 2.9 109.8 2.5 112.2 2.7 109.6 0.8 111.9 1.5 115.5 2.6 116.6 3.0 112.1 2.3 108.4 0.6 110.2 2.1 109.8 2.6 114.2 2.1 111.2 2.1 September 112.0 3.0 110.1 4.4 112.5 2.6 112.3 2.0 110.2 2.5 113.0 2.9 112.0 2.7 110.5 3.1 112.4 2.3 110.0 1.0 112.5 1.9 115.7 3.1 117.3 3.5 112.3 2.0 109.3 1.2 110.8 2.2 109.9 2.6 114.1 1.9 112.0 2.8 October 112.3 3.1 110.3 4.3 112.9 2.8 112.6 1.9 110.4 2.3 113.1 2.6 112.3 2.8 110.8 3.2 112.4 1.9 110.3 0.8 112.8 1.8 116.2 3.1 117.3 3.3 112.6 1.9 108.6 0.5 111.1 2.3 110.1 2.5 114.6 1.9 112.4 3.0 November 112.8 3.0 110.9 4.5 113.3 2.5 112.9 1.4 110.5 1.7 113.9 1.8 112.6 1.7 111.3 3.0 112.9 2.3 110.9 0.9 113.4 2.0 116.1 2.7 118.4 3.9 112.9 1.4 108.5 0.8 111.2 1.8 110.4 2.2 115.2 1.6 113.0 2.8 December 113.1 2.9 111.2 4.2 113.6 2.5 113.2 1.7 110.5 1.7 114.1 2.1 112.8 1.6 111.4 2.9 113.5 2.6 112.1 1.6 114.1 2.1 116.3 2.4 118.7 3.3 113.2 1.7 108.9 0.6 111.2 1.7 110.6 2.0 115.4 1.9 113.0 2.9
2018 117.3 5.2 115.0 5.5 117.9 5.1 116.0 3.8 116.2 6.0 118.6 5.5 115.4 3.2 115.3 4.8 117.6 5.1 118.0 7.0 118.8 5.9 121.7 5.6 123.1 5.6 116.0 3.8 111.8 3.0 117.9 6.9 115.9 6.1 117.8 3.2 116.8 4.7 January 114.1 3.4 111.7 4.7 114.8 3.1 113.7 2.3 112.5 3.1 115.0 2.8 113.4 1.7 112.0 2.9 114.9 3.4 114.1 3.1 115.8 3.9 117.7 3.0 119.9 4.0 113.7 2.3 110.7 2.8 113.6 3.4 111.6 2.5 116.5 2.4 113.3 2.7 February 114.9 3.8 112.9 4.7 115.5 3.6 114.3 2.6 113.1 3.8 116.0 3.8 113.7 2.1 113.1 3.5 115.4 3.4 114.8 3.9 116.6 4.4 118.7 3.8 120.9 4.3 114.3 2.6 110.7 2.4 114.5 4.4 112.1 3.0 116.5 2.6 114.3 3.2 March 115.5 4.3 113.8 5.2 116.0 4.1 114.5 2.9 113.7 4.4 116.1 4.3 113.9 2.8 113.7 3.6 115.7 3.9 115.8 5.2 116.8 4.8 120.0 5.2 121.9 5.7 114.5 2.9 110.5 1.7 115.2 4.9 112.7 4.0 116.4 2.9 115.2 3.6 April 116.1 4.5 114.3 5.2 116.6 4.3 114.7 3.3 114.1 4.8 116.4 4.3 114.1 2.4 114.2 3.9 115.9 3.7 116.6 5.5 117.5 5.3 121.3 5.8 122.5 5.4 114.7 3.3 111.1 2.6 115.7 5.6 113.2 4.8 116.8 2.7 115.8 3.8 May 116.1 4.6 113.9 4.9 116.8 4.6 115.2 3.8 114.5 4.8 116.8 4.5 114.4 2.6 114.2 4.0 115.6 4.3 117.0 6.4 117.6 5.5 121.6 6.0 122.9 5.8 115.2 3.8 111.1 2.7 116.2 5.6 113.8 5.3 117.1 2.8 115.6 3.6 June 116.8 5.2 114.5 5.8 117.5 5.1 115.8 3.9 115.8 5.8 117.6 4.9 115.0 3.0 114.7 4.7 115.6 4.1 117.4 6.9 118.4 6.1 122.1 6.4 123.5 6.3 115.8 3.9 111.2 2.7 117.2 6.3 115.4 6.2 117.6 2.8 116.0 4.8 July 117.4 5.7 115.3 6.5 118.0 5.5 116.1 4.1 115.8 5.9 118.6 5.9 114.9 2.7 116.0 5.9 116.1 3.9 117.7 7.4 118.6 6.2 122.6 6.5 122.9 5.9 116.1 4.1 111.6 3.0 117.6 6.8 116.2 6.5 117.7 3.2 117.7 6.2 August 118.4 6.4 116.3 7.0 119.0 6.2 116.7 4.1 117.2 6.8 120.3 7.1 116.0 3.6 116.5 6.1 117.1 4.4 119.5 9.0 120.2 7.4 122.8 6.3 123.7 6.1 116.7 4.1 112.3 3.6 119.3 8.3 117.6 7.1 118.3 3.6 118.3 6.4 September 119.5 6.7 117.0 6.3 120.2 6.8 117.9 5.0 119.7 8.6 121.6 7.6 117.0 4.5 117.4 6.2 120.5 7.2 121.1 10.1 121.0 7.6 123.8 7.0 124.9 6.5 117.9 5.0 112.9 3.3 122.0 10.1 119.5 8.7 119.2 4.5 119.0 6.3 October 119.8 6.7 117.0 6.1 120.6 6.8 118.5 5.2 119.9 8.6 122.2 8.0 117.2 4.4 117.6 6.1 122.3 8.8 121.2 9.9 121.5 7.7 123.9 6.6 125.4 6.9 118.5 5.2 113.7 4.7 121.9 9.7 119.8 8.8 119.2 4.0 119.2 6.0 November 119.6 6.0 117.1 5.6 120.3 6.2 118.0 4.5 119.3 8.0 121.9 7.0 117.6 4.4 117.7 5.8 121.5 7.6 120.8 8.9 121.0 6.7 123.1 6.0 124.5 5.2 118.0 4.5 113.0 4.1 121.1 8.9 119.3 8.1 119.3 3.6 119.0 5.3 December 118.9 5.1 116.5 4.8 119.6 5.3 117.1 3.4 118.2 7.0 120.9 6.0 117.3 4.0 116.8 4.8 121.0 6.6 119.9 7.0 120.6 5.7 122.5 5.3 123.9 4.4 117.1 3.4 113.0 3.8 120.1 8.0 119.0 7.6 119.5 3.6 118.1 4.5
Source: Philippine Statistics Authority
MIMAROPA Bicol Region Western Visayas
Central VisayasPhilippines NCR Areas
Outside CAR Ilocos Region
Cagayan Valley BARMMPeriod
Eastern Visayas
Zamboanga Peninsula
Northern Mindanao
Davao Region
SOCCSKSARGEN CaragaCentral
Luzon CALABARZON
2-17

TABLE 2.12 Consumer Price Index for All Income Households by Major Commodity Group, Philippines: 2008 to 2018 (2012=100)
2008 85.6 83.7 84.2 86.6 85.1 88.5 86.0 87.9 103.1 94.8 83.3 87.4
2009 89.2 89.0 87.8 89.7 86.5 91.8 90.4 88.9 101.2 95.5 87.4 91.9
2010 92.6 92.5 90.4 92.1 91.0 94.1 93.8 92.2 100.2 96.1 91.3 94.2
2011 97.0 97.6 95.3 95.5 95.6 96.4 96.8 97.8 99.9 97.5 95.6 96.9
2012 100.0 100.0 100.0 100.0 100.0 100.0 100.0 100.0 100.0 100.0 100.0 100.0
2013 102.6 102.5 128.1 103.2 101.8 103.4 102.7 100.0 100.1 104.1 104.1 102.5
2014 106.3 108.5 135.9 106.8 104.4 106.3 105.1 100.5 100.2 107.3 108.7 104.2
2015 107.0 110.5 140.0 109.5 103.1 108.2 107.2 95.1 100.2 108.1 112.8 105.7
2016 108.4 112.3 146.5 111.8 103.6 110.2 109.5 93.8 100.5 109.1 116.2 107.5
2017 111.5 115.7 156.6 114.5 106.4 112.7 112.4 98.5 100.8 110.4 119.1 109.3
January 110.3 114.8 152.0 113.6 104.7 111.6 111.6 97.0 100.6 109.5 117.9 108.4
February 110.7 114.9 153.7 113.8 105.9 111.8 111.8 97.3 100.7 109.7 117.9 108.6
March 110.7 114.3 155.1 114.0 106.5 112.2 112.0 98.0 100.7 109.8 117.9 108.7
April 111.1 114.7 155.3 114.1 107.0 112.4 112.0 98.5 100.7 109.8 117.9 108.7
May 111.0 114.8 155.8 114.3 106.8 112.4 112.1 98.2 100.7 109.9 117.9 108.8
June 111.0 115.3 156.4 114.5 105.4 112.5 112.4 97.8 100.7 110.2 119.7 109.2
July 111.1 115.3 157.1 114.6 105.3 112.9 112.6 97.7 100.7 111.0 120.0 109.4
August 111.3 115.6 157.6 114.8 105.6 113.0 112.6 98.5 100.8 111.0 120.0 109.5
September 112.0 116.3 157.9 114.9 107.0 113.2 112.7 99.3 100.8 110.9 120.0 109.9
October 112.3 116.7 158.7 115.0 107.2 113.3 112.8 99.4 100.8 110.9 120.0 109.9
November 112.8 117.4 159.3 115.2 107.7 113.4 112.9 99.9 100.9 110.9 120.0 110.1
December 113.1 118.1 160.6 115.3 107.5 113.7 112.9 100.6 100.9 111.0 120.0 110.4
2018 117.3 123.6 187.9 117.2 110.6 116.2 116.1 105.0 101.1 112.6 118.1 113.2
January 114.1 119.8 170.5 115.8 107.6 114.0 113.9 101.4 100.9 111.1 120.0 110.8
February 114.9 120.4 179.6 116.1 108.7 114.5 114.2 102.8 100.9 111.2 120.0 111.3
March 115.5 121.0 183.9 116.3 109.6 115.2 114.7 102.5 101.0 111.3 120.0 112.0
April 116.1 121.5 186.3 116.6 110.2 115.5 115.1 103.3 101.0 111.4 120.0 112.4
May 116.1 121.4 187.8 116.8 110.0 115.7 115.2 104.3 101.0 111.5 120.0 112.8
June 116.8 122.3 188.9 117.0 110.2 115.9 115.4 104.7 101.1 111.7 124.5 113.1
July 117.4 123.4 190.9 117.4 111.2 116.6 116.8 105.4 101.2 112.0 115.3 113.5
August 118.4 125.4 191.6 117.5 111.4 116.9 117.1 106.2 101.2 113.8 115.4 113.9
September 119.5 127.6 192.3 117.8 111.9 117.2 117.3 107.2 101.3 114.2 115.4 114.3
October 119.8 127.7 193.0 117.9 112.3 117.5 117.7 108.2 101.3 114.3 115.4 114.5
November 119.6 126.8 194.0 118.3 112.2 117.9 118.0 108.8 101.3 114.4 115.5 115.1
December 118.9 126.0 195.4 118.5 111.9 118.0 118.3 104.6 101.3 114.5 115.5 115.2
Source: Philippine Statistics Authority
Period All items Food and
Non-alcoholic
Beverages
Alcoholic Beverages
and Tobacco
Clothing and
Footwear
Housing, Water,
Electricity, Gas and
Restaurants and Miscellaneous
Goods and Services
Furnishing, Household
Equipment and, Routine
Health Transport Commu-nication
Recreation and Culture
Education
2-18
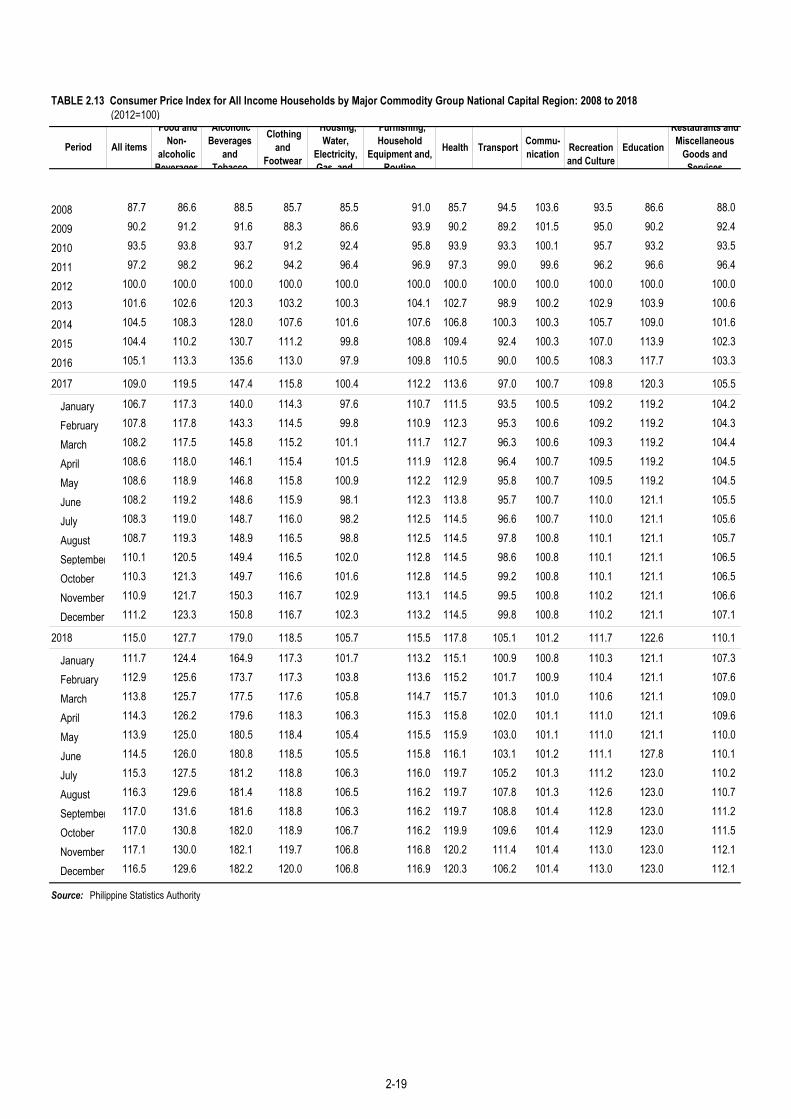
(2012=100)
2008 87.7 86.6 88.5 85.7 85.5 91.0 85.7 94.5 103.6 93.5 86.6 88.0
2009 90.2 91.2 91.6 88.3 86.6 93.9 90.2 89.2 101.5 95.0 90.2 92.4
2010 93.5 93.8 93.7 91.2 92.4 95.8 93.9 93.3 100.1 95.7 93.2 93.5
2011 97.2 98.2 96.2 94.2 96.4 96.9 97.3 99.0 99.6 96.2 96.6 96.4
2012 100.0 100.0 100.0 100.0 100.0 100.0 100.0 100.0 100.0 100.0 100.0 100.0
2013 101.6 102.6 120.3 103.2 100.3 104.1 102.7 98.9 100.2 102.9 103.9 100.6
2014 104.5 108.3 128.0 107.6 101.6 107.6 106.8 100.3 100.3 105.7 109.0 101.6
2015 104.4 110.2 130.7 111.2 99.8 108.8 109.4 92.4 100.3 107.0 113.9 102.3
2016 105.1 113.3 135.6 113.0 97.9 109.8 110.5 90.0 100.5 108.3 117.7 103.3
2017 109.0 119.5 147.4 115.8 100.4 112.2 113.6 97.0 100.7 109.8 120.3 105.5
January 106.7 117.3 140.0 114.3 97.6 110.7 111.5 93.5 100.5 109.2 119.2 104.2
February 107.8 117.8 143.3 114.5 99.8 110.9 112.3 95.3 100.6 109.2 119.2 104.3
March 108.2 117.5 145.8 115.2 101.1 111.7 112.7 96.3 100.6 109.3 119.2 104.4
April 108.6 118.0 146.1 115.4 101.5 111.9 112.8 96.4 100.7 109.5 119.2 104.5
May 108.6 118.9 146.8 115.8 100.9 112.2 112.9 95.8 100.7 109.5 119.2 104.5
June 108.2 119.2 148.6 115.9 98.1 112.3 113.8 95.7 100.7 110.0 121.1 105.5
July 108.3 119.0 148.7 116.0 98.2 112.5 114.5 96.6 100.7 110.0 121.1 105.6
August 108.7 119.3 148.9 116.5 98.8 112.5 114.5 97.8 100.8 110.1 121.1 105.7
September 110.1 120.5 149.4 116.5 102.0 112.8 114.5 98.6 100.8 110.1 121.1 106.5
October 110.3 121.3 149.7 116.6 101.6 112.8 114.5 99.2 100.8 110.1 121.1 106.5
November 110.9 121.7 150.3 116.7 102.9 113.1 114.5 99.5 100.8 110.2 121.1 106.6
December 111.2 123.3 150.8 116.7 102.3 113.2 114.5 99.8 100.8 110.2 121.1 107.1
2018 115.0 127.7 179.0 118.5 105.7 115.5 117.8 105.1 101.2 111.7 122.6 110.1
January 111.7 124.4 164.9 117.3 101.7 113.2 115.1 100.9 100.8 110.3 121.1 107.3
February 112.9 125.6 173.7 117.3 103.8 113.6 115.2 101.7 100.9 110.4 121.1 107.6
March 113.8 125.7 177.5 117.6 105.8 114.7 115.7 101.3 101.0 110.6 121.1 109.0
April 114.3 126.2 179.6 118.3 106.3 115.3 115.8 102.0 101.1 111.0 121.1 109.6
May 113.9 125.0 180.5 118.4 105.4 115.5 115.9 103.0 101.1 111.0 121.1 110.0
June 114.5 126.0 180.8 118.5 105.5 115.8 116.1 103.1 101.2 111.1 127.8 110.1
July 115.3 127.5 181.2 118.8 106.3 116.0 119.7 105.2 101.3 111.2 123.0 110.2
August 116.3 129.6 181.4 118.8 106.5 116.2 119.7 107.8 101.3 112.6 123.0 110.7
September 117.0 131.6 181.6 118.8 106.3 116.2 119.7 108.8 101.4 112.8 123.0 111.2
October 117.0 130.8 182.0 118.9 106.7 116.2 119.9 109.6 101.4 112.9 123.0 111.5
November 117.1 130.0 182.1 119.7 106.8 116.8 120.2 111.4 101.4 113.0 123.0 112.1
December 116.5 129.6 182.2 120.0 106.8 116.9 120.3 106.2 101.4 113.0 123.0 112.1
Source: Philippine Statistics Authority
Health Transport Commu-nication
Recreation and Culture
Education
Restaurants and Miscellaneous
Goods and Services
TABLE 2.13 Consumer Price Index for All Income Households by Major Commodity Group National Capital Region: 2008 to 2018
Period All items
Food and Non-
alcoholic Beverages
Alcoholic Beverages
and Tobacco
Clothing and
Footwear
Housing, Water,
Electricity, Gas and
Furnishing, Household
Equipment and, Routine
2-19

(2012=100)
2008 85.0 83.2 83.4 86.9 85.0 87.6 86.1 86.1 102.9 95.2 82.4 87.1
2009 88.9 88.6 87.1 90.2 86.5 91.0 90.5 88.8 101.1 95.6 86.6 91.6
2010 92.3 92.3 89.9 92.4 90.4 93.5 93.8 91.9 100.2 96.2 90.8 94.5
2011 96.9 97.5 95.2 96.0 95.3 96.2 96.8 97.4 100.0 97.9 95.3 97.1
2012 100.0 100.0 100.0 100.0 100.0 100.0 100.0 100.0 100.0 100.0 100.0 100.0
2013 102.9 102.5 129.7 103.2 102.4 103.2 102.7 100.3 100.1 104.5 104.2 103.2
2014 106.8 108.5 137.5 106.6 105.5 105.8 104.7 100.6 100.2 107.8 108.6 105.2
2015 107.8 110.6 141.9 109.0 104.6 108.1 106.7 95.8 100.1 108.5 112.4 107.02016 112.2 114.9 158.5 114.2 108.9 112.8 112.1 98.9 100.8 110.5 118.7 110.8
2017 109.3 112.1 148.8 111.5 105.9 110.4 109.3 95.0 100.5 109.3 115.7 109.1
January 111.3 114.3 154.5 113.4 107.7 111.9 111.6 98.0 100.7 109.6 117.5 110.1
February 111.5 114.3 155.8 113.6 108.5 112.1 111.7 97.9 100.7 109.8 117.5 110.3
March 111.4 113.7 157.0 113.7 108.7 112.3 111.8 98.5 100.7 109.9 117.5 110.4
April 111.8 114.0 157.2 113.8 109.3 112.5 111.8 99.1 100.7 109.9 117.5 110.4
May 111.7 114.0 157.6 113.9 109.2 112.5 111.9 98.9 100.7 110.0 117.5 110.5
June 111.8 114.5 158.0 114.1 108.4 112.6 112.1 98.4 100.7 110.2 119.2 110.6
July 111.9 114.5 158.8 114.3 108.3 113.0 112.2 98.0 100.7 111.3 119.7 110.9
August 112.1 114.8 159.4 114.4 108.5 113.1 112.2 98.7 100.8 111.3 119.7 111.0
September 112.5 115.4 159.7 114.5 109.1 113.3 112.3 99.5 100.8 111.1 119.7 111.2
October 112.9 115.8 160.5 114.6 109.5 113.4 112.4 99.5 100.8 111.1 119.7 111.2
November 113.3 116.5 161.2 114.8 109.7 113.5 112.5 100.0 100.9 111.1 119.7 111.5
December 113.6 117.0 162.6 115.0 109.7 113.9 112.5 100.8 100.9 111.2 119.7 111.7
2018 117.9 122.8 189.7 116.8 112.6 116.5 115.8 104.9 101.1 112.9 116.6 114.5
January 114.8 118.9 171.6 115.4 110.0 114.2 113.6 101.6 100.9 111.3 119.7 112.1
February 115.5 119.4 180.8 115.8 110.7 114.8 114.0 103.1 100.9 111.4 119.7 112.8
March 116.0 120.0 185.2 116.0 111.2 115.4 114.5 102.8 101.0 111.5 119.7 113.2
April 116.6 120.5 187.7 116.2 111.8 115.6 114.9 103.7 101.0 111.5 119.7 113.5
May 116.8 120.7 189.3 116.4 111.9 115.8 115.1 104.7 101.0 111.6 119.7 113.9
June 117.5 121.5 190.6 116.6 112.2 115.9 115.3 105.2 101.0 111.9 123.4 114.3
July 118.0 122.6 192.9 117.0 113.2 116.8 116.2 105.4 101.1 112.2 112.8 114.8
August 119.0 124.5 193.7 117.2 113.5 117.1 116.5 105.7 101.2 114.2 112.9 115.1
September 120.2 126.8 194.5 117.6 114.2 117.5 116.8 106.7 101.2 114.6 112.9 115.5
October 120.6 127.1 195.2 117.7 114.6 117.9 117.2 107.8 101.3 114.7 112.9 115.7
November 120.3 126.2 196.5 117.9 114.4 118.2 117.5 108.0 101.3 114.8 113.0 116.2
December 119.6 125.3 198.1 118.1 114.0 118.4 117.9 104.1 101.3 114.9 113.0 116.4
Source: Philippine Statistics Authority
Health Transport Commu-nication
Recreation and Culture
Education
Restaurants and
Miscellaneous Goods and
TABLE 2.14 Consumer Price Index for All Income Households by Major Commodity Group Areas Outside National Capital Region: 2008 to 2018
Period All items
Food and Non-
alcoholic Beverages
Alcoholic Beverages
and Tobacco
Clothing and
Footwear
Housing, Water,
Electricity, Gas and
Furnishing, Household
Equipment and, Routine
2-20
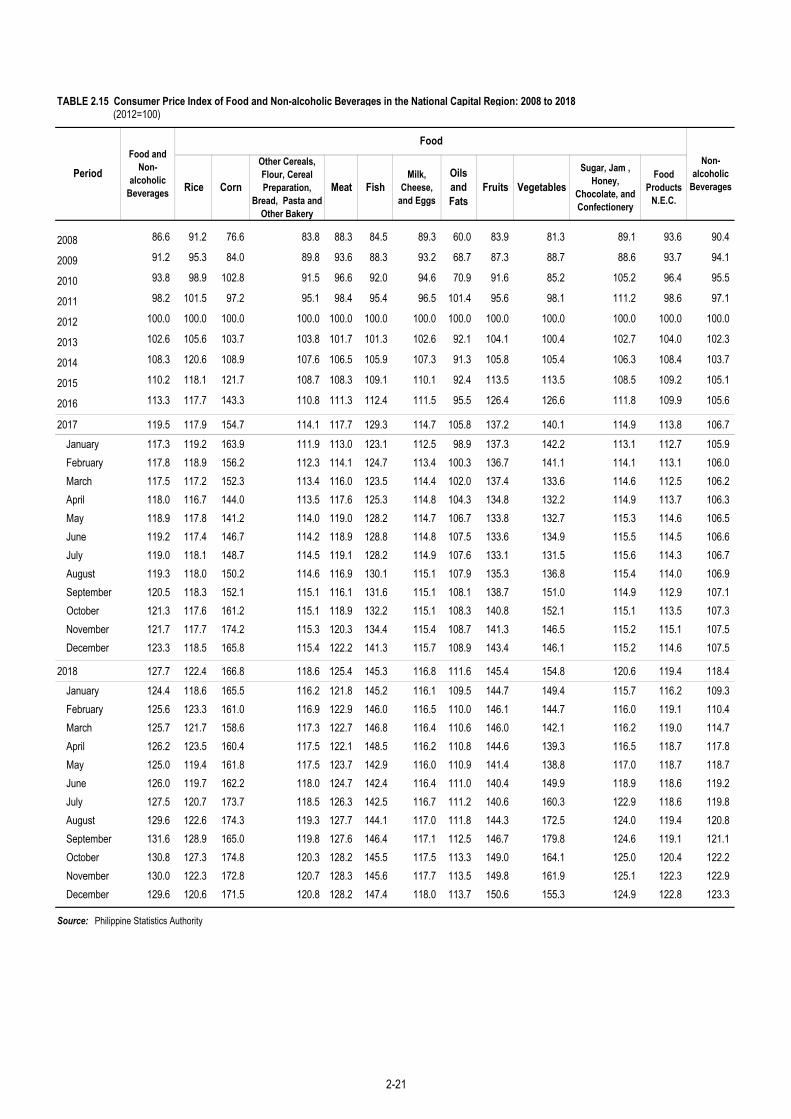
TABLE 2.15 Consumer Price Index of Food and Non-alcoholic Beverages in the National Capital Region: 2008 to 2018 (2012=100)
2008 86.6 91.2 76.6 83.8 88.3 84.5 89.3 60.0 83.9 81.3 89.1 93.6 90.4
2009 91.2 95.3 84.0 89.8 93.6 88.3 93.2 68.7 87.3 88.7 88.6 93.7 94.1
2010 93.8 98.9 102.8 91.5 96.6 92.0 94.6 70.9 91.6 85.2 105.2 96.4 95.5
2011 98.2 101.5 97.2 95.1 98.4 95.4 96.5 101.4 95.6 98.1 111.2 98.6 97.1
2012 100.0 100.0 100.0 100.0 100.0 100.0 100.0 100.0 100.0 100.0 100.0 100.0 100.0
2013 102.6 105.6 103.7 103.8 101.7 101.3 102.6 92.1 104.1 100.4 102.7 104.0 102.3
2014 108.3 120.6 108.9 107.6 106.5 105.9 107.3 91.3 105.8 105.4 106.3 108.4 103.7
2015 110.2 118.1 121.7 108.7 108.3 109.1 110.1 92.4 113.5 113.5 108.5 109.2 105.1
2016 113.3 117.7 143.3 110.8 111.3 112.4 111.5 95.5 126.4 126.6 111.8 109.9 105.6
2017 119.5 117.9 154.7 114.1 117.7 129.3 114.7 105.8 137.2 140.1 114.9 113.8 106.7January 117.3 119.2 163.9 111.9 113.0 123.1 112.5 98.9 137.3 142.2 113.1 112.7 105.9February 117.8 118.9 156.2 112.3 114.1 124.7 113.4 100.3 136.7 141.1 114.1 113.1 106.0March 117.5 117.2 152.3 113.4 116.0 123.5 114.4 102.0 137.4 133.6 114.6 112.5 106.2April 118.0 116.7 144.0 113.5 117.6 125.3 114.8 104.3 134.8 132.2 114.9 113.7 106.3May 118.9 117.8 141.2 114.0 119.0 128.2 114.7 106.7 133.8 132.7 115.3 114.6 106.5June 119.2 117.4 146.7 114.2 118.9 128.8 114.8 107.5 133.6 134.9 115.5 114.5 106.6July 119.0 118.1 148.7 114.5 119.1 128.2 114.9 107.6 133.1 131.5 115.6 114.3 106.7August 119.3 118.0 150.2 114.6 116.9 130.1 115.1 107.9 135.3 136.8 115.4 114.0 106.9September 120.5 118.3 152.1 115.1 116.1 131.6 115.1 108.1 138.7 151.0 114.9 112.9 107.1October 121.3 117.6 161.2 115.1 118.9 132.2 115.1 108.3 140.8 152.1 115.1 113.5 107.3November 121.7 117.7 174.2 115.3 120.3 134.4 115.4 108.7 141.3 146.5 115.2 115.1 107.5December 123.3 118.5 165.8 115.4 122.2 141.3 115.7 108.9 143.4 146.1 115.2 114.6 107.5
2018 127.7 122.4 166.8 118.6 125.4 145.3 116.8 111.6 145.4 154.8 120.6 119.4 118.4January 124.4 118.6 165.5 116.2 121.8 145.2 116.1 109.5 144.7 149.4 115.7 116.2 109.3February 125.6 123.3 161.0 116.9 122.9 146.0 116.5 110.0 146.1 144.7 116.0 119.1 110.4March 125.7 121.7 158.6 117.3 122.7 146.8 116.4 110.6 146.0 142.1 116.2 119.0 114.7April 126.2 123.5 160.4 117.5 122.1 148.5 116.2 110.8 144.6 139.3 116.5 118.7 117.8May 125.0 119.4 161.8 117.5 123.7 142.9 116.0 110.9 141.4 138.8 117.0 118.7 118.7June 126.0 119.7 162.2 118.0 124.7 142.4 116.4 111.0 140.4 149.9 118.9 118.6 119.2July 127.5 120.7 173.7 118.5 126.3 142.5 116.7 111.2 140.6 160.3 122.9 118.6 119.8August 129.6 122.6 174.3 119.3 127.7 144.1 117.0 111.8 144.3 172.5 124.0 119.4 120.8September 131.6 128.9 165.0 119.8 127.6 146.4 117.1 112.5 146.7 179.8 124.6 119.1 121.1October 130.8 127.3 174.8 120.3 128.2 145.5 117.5 113.3 149.0 164.1 125.0 120.4 122.2November 130.0 122.3 172.8 120.7 128.3 145.6 117.7 113.5 149.8 161.9 125.1 122.3 122.9December 129.6 120.6 171.5 120.8 128.2 147.4 118.0 113.7 150.6 155.3 124.9 122.8 123.3
Source: Philippine Statistics Authority
PeriodFood and
Non-alcoholic
Beverages Rice Corn
Other Cereals, Flour, Cereal Preparation,
Bread, Pasta and Other Bakery
Meat Fruits VegetablesSugar, Jam ,
Honey, Chocolate, and Confectionery
Food Products
N.E.C.
Non-alcoholic
Beverages
Food
FishMilk,
Cheese, and Eggs
Oils and Fats
2-21

TABLE 2.16 General Retail Price Index in the National Capital Region: 2008 to 2018 (2000=100)
2008 140.0 141.5 144.7 137.6 264.5 143.2 135.7 126.8 129.8
2009 142.8 149.0 150.1 143.3 224.9 147.3 134.6 126.4 135.0
2010 147.3 154.0 153.2 146.5 251.5 150.5 136.8 130.9 138.3
2011 152.9 162.0 157.5 150.6 292.5 153.4 140.3 133.6 140.0
2012 156.0 164.0 164.8 154.7 294.7 157.2 143.7 137.2 143.4
2013 160.2 166.6 194.0 164.0 296.3 160.0 146.1 140.4 147.6
2014 164.6 174.6 200.7 167.9 294.5 163.1 149.0 141.3 150.1
2015 166.5 181.1 208.3 169.9 242.4 165.4 150.5 140.4 152.3
2016 170.4 191.4 213.4 170.9 229.1 167.1 152.0 140.8 153.3
2017 176.3 202.9 223.6 174.6 254.6 169.7 154.3 141.6 154.4 January 174.8 201.6 216.6 171.6 251.4 167.8 153.0 141.1 153.7February 175.3 201.8 219.1 172.7 256.1 168.5 153.0 141.3 153.9March 174.9 199.7 221.8 173.7 253.5 169.2 153.4 141.7 154.1April 175.0 199.9 222.0 173.8 251.5 169.4 153.7 141.8 154.1May 175.2 200.6 224.0 173.8 248.4 169.4 153.7 141.5 154.3June 175.7 202.0 224.7 173.8 245.1 169.9 154.0 141.6 154.5July 175.8 202.0 224.8 175.6 244.5 170.1 154.1 141.6 154.5August 176.4 203.0 225.3 176.1 249.8 170.2 154.7 141.8 154.5September 177.5 205.7 225.6 176.3 256.0 170.3 154.9 141.7 154.5October 177.8 205.7 225.6 176.1 261.7 170.4 155.3 141.5 154.7November 177.9 205.2 226.1 175.6 267.4 170.4 155.6 141.9 154.7December 179.0 208.1 227.1 175.6 269.2 170.4 155.8 141.9 154.7
2018 183.2 212.3 250.1 178.4 297.4 171.9 157.8 143.8 156.1January 181.0 211.0 238.4 175.9 280.4 170.9 156.0 142.6 155.1February 181.9 211.9 244.9 176.1 286.9 171.1 156.2 143.1 155.4March 182.2 211.5 248.7 176.6 285.6 171.5 157.0 143.5 155.6April 182.0 210.3 250.2 176.7 285.9 171.6 157.5 143.7 155.7May 182.3 209.7 251.0 176.7 300.4 171.7 157.6 143.7 155.9June 183.1 211.4 251.4 177.1 302.7 171.7 158.1 143.7 156.3July 183.2 210.9 252.0 177.8 303.9 172.1 158.3 144.1 156.5August 183.6 212.2 252.3 178.2 305.0 171.9 158.3 144.0 156.5September 185.2 216.3 252.6 178.2 311.7 172.1 158.3 144.2 156.5October 185.0 214.5 253.2 180.8 319.6 172.3 158.5 144.2 156.6November 184.7 214.4 253.3 180.8 304.4 172.7 158.9 144.3 156.8December 183.8 213.3 253.4 186.1 282.8 172.8 158.7 144.7 156.8
Source: Philippine Statistics Authority
Chemicals including Animal
Vegetable Oils and Fats
Manufactured Goods Classified
Chiefly by Materials
Machinery and Transport
Equipment
Miscellaneous Manufactured
ArticlesPeriod All Items Food Beverages
and Tobacco
Crude Materials, Inedible
Except Fuels
Mineral Fuels,
Lubricants and
Related Materials
2-22
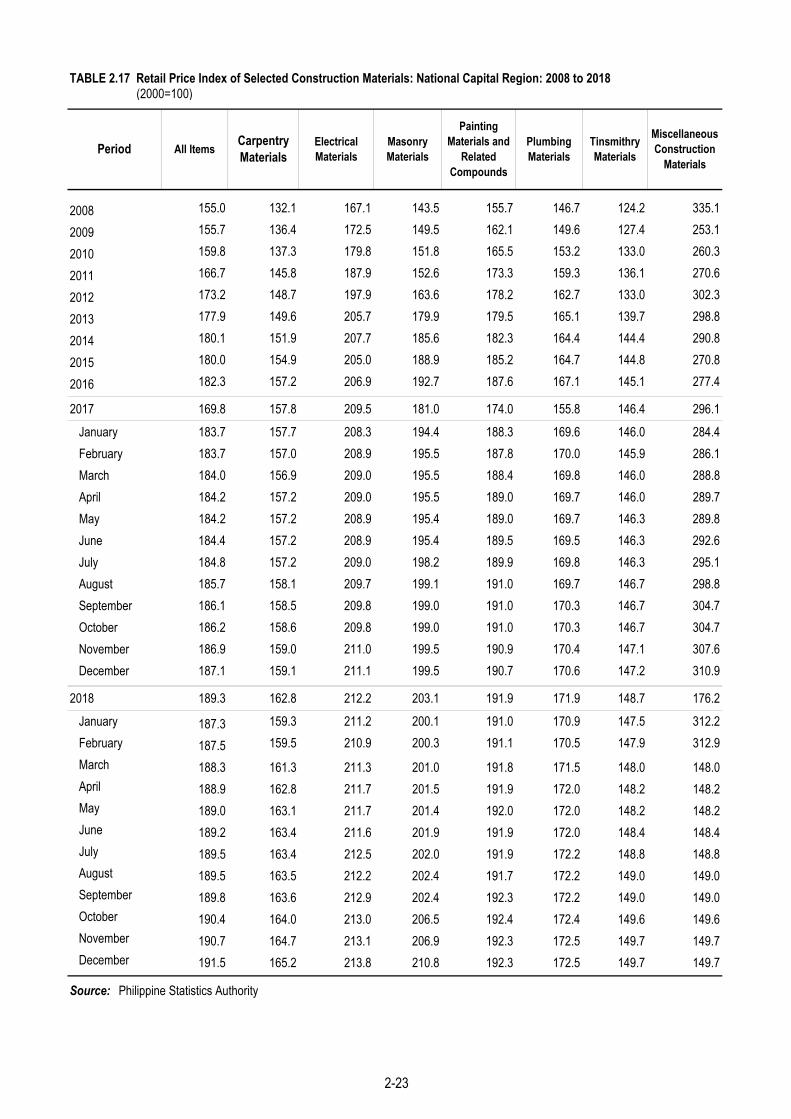
TABLE 2.17 Retail Price Index of Selected Construction Materials: National Capital Region: 2008 to 2018 (2000=100)
2008 155.0 132.1 167.1 143.5 155.7 146.7 124.2 335.1
2009 155.7 136.4 172.5 149.5 162.1 149.6 127.4 253.1
2010 159.8 137.3 179.8 151.8 165.5 153.2 133.0 260.3
2011 166.7 145.8 187.9 152.6 173.3 159.3 136.1 270.6
2012 173.2 148.7 197.9 163.6 178.2 162.7 133.0 302.3
2013 177.9 149.6 205.7 179.9 179.5 165.1 139.7 298.8
2014 180.1 151.9 207.7 185.6 182.3 164.4 144.4 290.8
2015 180.0 154.9 205.0 188.9 185.2 164.7 144.8 270.8
2016 182.3 157.2 206.9 192.7 187.6 167.1 145.1 277.4
2017 169.8 157.8 209.5 181.0 174.0 155.8 146.4 296.1January 183.7 157.7 208.3 194.4 188.3 169.6 146.0 284.4February 183.7 157.0 208.9 195.5 187.8 170.0 145.9 286.1March 184.0 156.9 209.0 195.5 188.4 169.8 146.0 288.8April 184.2 157.2 209.0 195.5 189.0 169.7 146.0 289.7May 184.2 157.2 208.9 195.4 189.0 169.7 146.3 289.8June 184.4 157.2 208.9 195.4 189.5 169.5 146.3 292.6July 184.8 157.2 209.0 198.2 189.9 169.8 146.3 295.1August 185.7 158.1 209.7 199.1 191.0 169.7 146.7 298.8September 186.1 158.5 209.8 199.0 191.0 170.3 146.7 304.7October 186.2 158.6 209.8 199.0 191.0 170.3 146.7 304.7November 186.9 159.0 211.0 199.5 190.9 170.4 147.1 307.6December 187.1 159.1 211.1 199.5 190.7 170.6 147.2 310.9
2018 189.3 162.8 212.2 203.1 191.9 171.9 148.7 176.2January 187.3 159.3 211.2 200.1 191.0 170.9 147.5 312.2February 187.5 159.5 210.9 200.3 191.1 170.5 147.9 312.9March 188.3 161.3 211.3 201.0 191.8 171.5 148.0 148.0April 188.9 162.8 211.7 201.5 191.9 172.0 148.2 148.2May 189.0 163.1 211.7 201.4 192.0 172.0 148.2 148.2June 189.2 163.4 211.6 201.9 191.9 172.0 148.4 148.4July 189.5 163.4 212.5 202.0 191.9 172.2 148.8 148.8August 189.5 163.5 212.2 202.4 191.7 172.2 149.0 149.0September 189.8 163.6 212.9 202.4 192.3 172.2 149.0 149.0October 190.4 164.0 213.0 206.5 192.4 172.4 149.6 149.6November 190.7 164.7 213.1 206.9 192.3 172.5 149.7 149.7December 191.5 165.2 213.8 210.8 192.3 172.5 149.7 149.7
Source: Philippine Statistics Authority
Plumbing Materials
Tinsmithry Materials
Miscellaneous Construction
MaterialsPeriod All Items Carpentry
MaterialsElectrical Materials
Masonry Materials
Painting Materials and
Related Compounds
2-23

Period All Items Food Beverages and Tobacco
Crude Materials
Except Fuel
Mineral Fuels, Lubricants and
Chemicals including Animal
Manufactured Goods
Machinery and Trasnport
Equipment
Miscellaneous Manufactured
Articles
2008 199.9 166.4 156.5 207.1 580.1 176.1 155.0 147.1 179.02009 191.6 174.1 160.7 161.0 447.7 179.2 160.0 146.7 182.32010 202.9 182.0 164.0 193.5 526.2 183.9 161.0 147.8 182.92011 220.5 190.2 174.2 254.0 640.5 196.1 165.9 150.2 189.92012 223.0 194.7 178.5 198.7 652.7 190.8 169.9 153.0 193.32013 226.5 200.3 218.7 185.9 643.6 191.4 172.0 155.2 195.42014 232.7 210.5 230.6 228.4 629.7 202.7 174.6 159.4 197.02015 223.7 221.3 246.0 223.3 454.4 207.5 178.1 161.9 200.82016 226.3 228.9 251.5 265.1 421.3 218.5 179.0 162.1 204.5
2017 236.2 230.9 272.8 291.6 498.0 223.6 180.7 163.3 206.0January 235.3 231.1 259.4 302.2 493.7 222.2 180.3 162.6 205.8February 236.9 232.7 268.4 298.0 499.6 224.1 180.5 162.8 205.9March 235.0 230.9 269.3 288.4 486.6 225.4 180.6 162.9 205.9April 235.0 229.9 272.0 295.0 487.8 224.7 180.5 163.0 206.0May 233.4 227.8 272.1 300.3 475.9 224.9 180.6 163.1 206.0June 231.1 228.1 272.8 301.5 448.2 225.1 180.2 163.1 206.0July 233.0 228.9 273.4 290.1 468.7 225.0 180.5 163.1 206.0August 234.8 229.0 274.5 289.9 490.7 222.2 180.7 163.2 205.9September 236.4 229.8 274.8 283.8 506.7 222.2 180.8 163.5 206.0October 239.3 233.6 275.7 280.0 525.4 222.0 180.9 163.5 206.0November 241.7 234.4 276.1 288.5 544.5 222.6 181.1 164.4 206.1December 242.2 234.2 285.4 281.0 547.7 223.1 181.4 164.4 206.4
2018 252.8 237.5 314.1 238.8 640.9 224.3 185.4 165.4 208.6January 246.7 233.5 296.2 278.9 592.8 223.4 183.4 164.4 207.2February 248.4 235.7 310.2 258.5 596.6 225.4 184.9 164.5 207.7March 247.6 234.0 310.5 245.5 596.8 226.2 185.1 164.7 207.8April 249.8 233.6 311.0 249.6 621.9 226.0 185.5 164.7 207.9May 253.0 235.3 311.0 242.5 653.5 224.5 185.6 164.7 208.7June 253.7 236.3 311.0 227.7 662.8 223.2 185.6 164.8 208.7July 253.9 237.0 311.1 231.0 660.9 223.3 185.7 164.9 208.8August 255.7 241.1 314.2 234.0 661.4 223.3 185.9 165.3 208.8September 259.1 241.7 316.9 232.6 694.2 224.4 185.1 166.6 209.5October 259.7 239.0 325.2 226.7 709.6 224.4 185.4 166.6 209.5November 253.8 238.9 324.8 217.0 643.6 224.1 185.9 166.6 209.5December 251.8 243.6 327.1 221.7 597.0 223.5 186.8 167.4 209.1
TABLE 2.18 General Wholesale Price Index, Philippines: 2008 to 2018 (1998=100)
Source: Philippine Statistics Authority
2-25

(1998=100)
Period All Items Food Beverages and Tobacco
Crude Materials
Except Fuel
Mineral Fuels, Lubricants and
Related Materials
Chemicals including Animal
and Vegetable Oils and Fats
Manufactured Goods
Classified Chiefly by Materials
Machinery and Trasnport
Equipment
Miscellaneous Manufactured
Articles
2008 204.8 162.4 154.3 207.1 623.3 181.1 153.3 145.6 189.92009 194.9 172.9 160.4 157.5 470.1 183.6 158.8 144.2 193.12010 207.2 180.1 164.7 191.9 556.5 189.8 159.8 145.3 193.12011 227.1 189.0 175.7 255.4 685.3 204.6 164.6 146.7 200.62012 229.8 194.6 179.8 194.8 699.4 196.4 168.5 150.2 204.52013 232.0 198.2 217.4 182.3 688.0 196.5 170.0 152.3 206.12014 237.8 207.3 230.5 227.0 671.9 210.1 172.2 157.0 207.42015 227.4 219.5 247.8 220.4 480.6 216.1 176.0 160.0 212.02016 229.9 226.5 253.8 263.8 445.3 230.0 177.2 160.1 216.5
2017 240.4 226.8 274.1 291.8 531.9 235.4 179.1 160.9 218.2January 239.9 227.8 261.3 302.0 526.6 234.8 178.8 160.7 218.0February 241.7 229.7 272.9 297.0 533.2 236.6 179.0 160.7 218.2March 239.6 227.7 273.0 287.9 519.6 237.7 179.1 160.7 218.2April 239.4 226.3 273.7 296.0 521.0 236.8 179.0 160.8 218.2May 237.7 224.2 273.7 301.6 507.8 237.1 179.0 160.8 218.2June 234.8 224.2 274.7 302.6 475.6 237.3 178.6 160.8 218.1July 236.9 225.0 274.7 291.3 499.3 237.1 178.8 160.6 218.1August 238.8 224.8 275.5 291.0 523.9 233.4 179.0 160.6 218.0September 240.4 225.4 275.5 282.7 540.9 233.3 179.1 160.8 218.0October 243.6 229.0 275.7 279.7 562.8 233.1 179.3 160.8 218.0November 245.9 228.7 276.2 289.4 584.2 233.6 179.5 161.8 218.2December 246.4 228.9 281.9 280.9 587.5 233.9 179.7 161.8 218.6
2018 257.6 231.8 309.1 235.4 690.0 233.6 183.8 162.9 220.9January 251.3 227.4 293.0 278.3 638.0 234.1 182.0 161.7 219.5February 253.0 230.0 304.4 257.2 641.8 236.7 183.7 161.8 219.9March 252.0 228.1 304.4 242.4 640.9 237.5 183.9 162.0 220.1April 253.9 226.4 304.5 247.1 668.4 235.6 184.1 162.0 220.2May 257.7 229.2 304.5 239.0 703.4 233.5 184.0 162.0 221.1June 258.5 230.0 304.5 222.4 715.1 231.7 184.0 162.1 221.1July 259.0 231.8 304.5 226.7 712.5 231.8 184.0 162.2 221.1August 260.7 235.4 308.2 230.3 712.6 231.8 184.2 162.6 221.1September 264.4 235.6 311.6 228.5 749.2 233.0 183.1 164.3 221.7October 265.5 233.6 322.3 222.6 765.9 232.9 183.4 164.3 221.7November 259.0 234.2 322.3 212.2 693.0 232.5 184.1 164.4 221.8December 256.5 239.5 325.2 217.5 639.2 231.7 185.2 165.3 221.3
Source: Philippine Statistics Authority
TABLE 2.19 General Wholesale Price Index in Luzon: 2008 to 2018
2-25
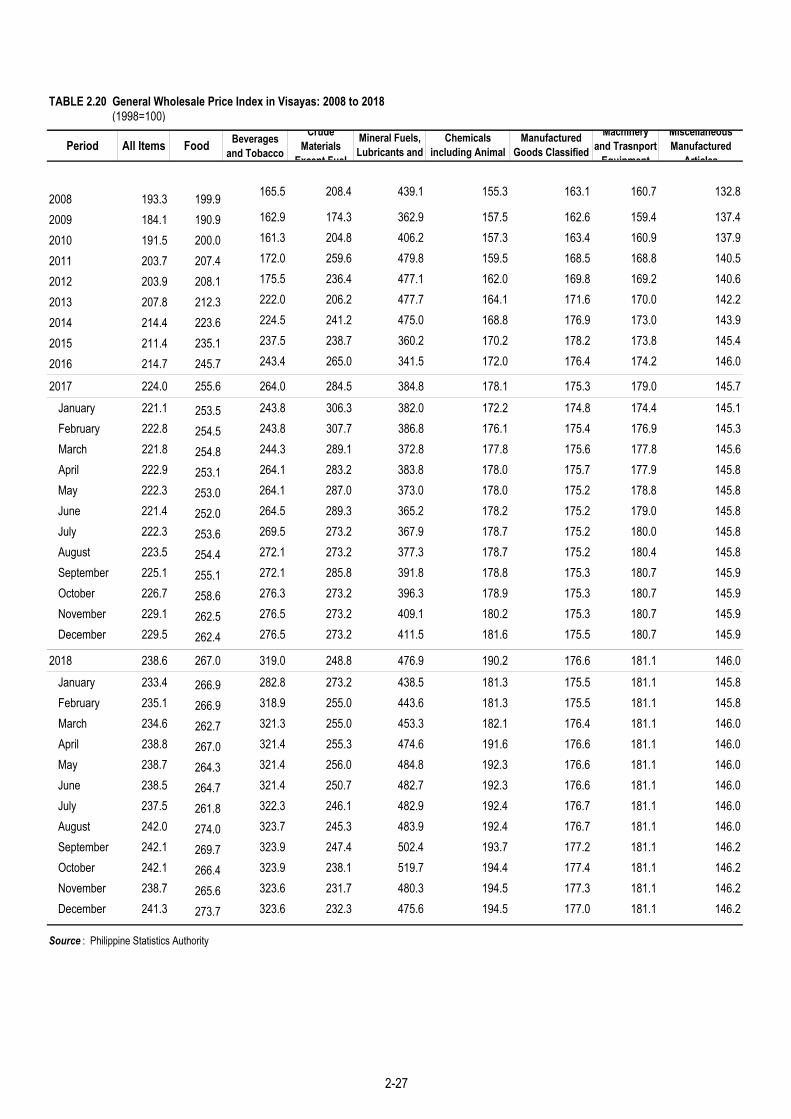
TABLE 2.20 General Wholesale Price Index in Visayas: 2008 to 2018 (1998=100)
Period All Items Food Beverages and Tobacco
Crude Materials
Except Fuel
Mineral Fuels, Lubricants and
Chemicals including Animal
Manufactured Goods Classified
Machinery and Trasnport
Equipment
Miscellaneous Manufactured
Articles
2008 193.3 199.9 165.5 208.4 439.1 155.3 163.1 160.7 132.8
2009 184.1 190.9 162.9 174.3 362.9 157.5 162.6 159.4 137.4
2010 191.5 200.0 161.3 204.8 406.2 157.3 163.4 160.9 137.9
2011 203.7 207.4 172.0 259.6 479.8 159.5 168.5 168.8 140.5
2012 203.9 208.1 175.5 236.4 477.1 162.0 169.8 169.2 140.6
2013 207.8 212.3 222.0 206.2 477.7 164.1 171.6 170.0 142.2
2014 214.4 223.6 224.5 241.2 475.0 168.8 176.9 173.0 143.9
2015 211.4 235.1 237.5 238.7 360.2 170.2 178.2 173.8 145.4
2016 214.7 245.7 243.4 265.0 341.5 172.0 176.4 174.2 146.0
2017 224.0 255.6 264.0 284.5 384.8 178.1 175.3 179.0 145.7January 221.1 253.5 243.8 306.3 382.0 172.2 174.8 174.4 145.1February 222.8 254.5 243.8 307.7 386.8 176.1 175.4 176.9 145.3March 221.8 254.8 244.3 289.1 372.8 177.8 175.6 177.8 145.6April 222.9 253.1 264.1 283.2 383.8 178.0 175.7 177.9 145.8May 222.3 253.0 264.1 287.0 373.0 178.0 175.2 178.8 145.8June 221.4 252.0 264.5 289.3 365.2 178.2 175.2 179.0 145.8July 222.3 253.6 269.5 273.2 367.9 178.7 175.2 180.0 145.8August 223.5 254.4 272.1 273.2 377.3 178.7 175.2 180.4 145.8September 225.1 255.1 272.1 285.8 391.8 178.8 175.3 180.7 145.9October 226.7 258.6 276.3 273.2 396.3 178.9 175.3 180.7 145.9November 229.1 262.5 276.5 273.2 409.1 180.2 175.3 180.7 145.9December 229.5 262.4 276.5 273.2 411.5 181.6 175.5 180.7 145.9
2018 238.6 267.0 319.0 248.8 476.9 190.2 176.6 181.1 146.0January 233.4 266.9 282.8 273.2 438.5 181.3 175.5 181.1 145.8February 235.1 266.9 318.9 255.0 443.6 181.3 175.5 181.1 145.8March 234.6 262.7 321.3 255.0 453.3 182.1 176.4 181.1 146.0April 238.8 267.0 321.4 255.3 474.6 191.6 176.6 181.1 146.0May 238.7 264.3 321.4 256.0 484.8 192.3 176.6 181.1 146.0June 238.5 264.7 321.4 250.7 482.7 192.3 176.6 181.1 146.0July 237.5 261.8 322.3 246.1 482.9 192.4 176.7 181.1 146.0August 242.0 274.0 323.7 245.3 483.9 192.4 176.7 181.1 146.0September 242.1 269.7 323.9 247.4 502.4 193.7 177.2 181.1 146.2October 242.1 266.4 323.9 238.1 519.7 194.4 177.4 181.1 146.2November 238.7 265.6 323.6 231.7 480.3 194.5 177.3 181.1 146.2December 241.3 273.7 323.6 232.3 475.6 194.5 177.0 181.1 146.2
Source : Philippine Statistics Authority
2-27

TABLE 2.21 General Wholesale Price Index in Mindanao: 2008 to 2018 (1998=100)
Period All Items Food Beverages and Tobacco
Crude Materials
Except Fuel
Mineral Fuels, Lubricants and
Related Materials
Chemicals including Animal
and Vegetable Oils and Fats
Manufactured Goods Classified
Chiefly by Materials
Machinery and Trasnport
Equipment
Miscellaneous Manufactured
Articles
2008 169.3 166.6 163.3 205.4 290.3 164.6 161.7 146.2 147.62009 174.1 168.5 160.2 214.7 309.1 172.3 166.8 153.2 150.22010 181.6 180.2 161.5 205.4 342.1 172.0 168.5 154.5 154.42011 186.5 184.1 166.0 207.1 353.0 177.2 173.5 157.9 161.82012 189.6 184.3 171.8 203.6 360.3 183.4 180.9 159.1 165.7
2013 202.8 205.1 224.6 221.5 364.1 186.0 187.4 163.2 171.42014 211.5 222.6 237.0 233.4 362.4 188.8 191.4 164.8 175.02015 207.2 222.5 241.2 255.7 287.0 189.3 193.8 165.1 175.42016 209.8 231.4 243.6 296.5 261.4 189.7 195.0 165.1 177.3
2017 215.5 238.5 272.6 301.3 272.6 192.5 196.8 166.6 178.9
January 213.5 235.6 260.8 298.6 276.3 190.7 195.5 165.3 178.5February 213.7 235.8 260.8 298.6 277.6 191.1 195.4 165.3 178.5March 213.1 233.8 266.9 300.2 271.3 192.8 195.8 165.7 178.5April 212.9 235.2 267.3 300.2 260.0 192.3 195.9 166.0 178.6May 211.9 231.9 267.7 301.8 260.6 192.3 196.7 166.0 178.9June 213.0 235.2 267.9 302.3 258.7 192.6 196.6 166.0 179.0July 213.7 235.9 267.9 302.3 264.6 192.3 197.0 166.0 179.0August 214.8 236.8 270.8 302.2 271.9 192.7 197.3 166.2 179.0September 216.7 239.3 272.6 302.5 280.1 192.8 197.7 167.6 179.1October 218.7 244.3 275.2 302.3 280.7 193.0 197.5 167.6 179.2November 221.4 250.1 275.2 302.3 283.9 193.2 198.0 168.4 179.3December 222.7 247.8 317.7 302.4 286.0 194.0 198.0 168.5 179.1
2018 229.4 252.7 344.0 297.2 314.7 197.8 204.0 169.7 182.5
January 224.7 248.5 331.2 305.0 295.4 195.2 199.4 169.2 179.9February 226.5 249.9 342.4 297.3 299.1 196.3 201.3 169.5 181.1March 226.7 250.4 342.6 296.0 299.6 196.8 201.2 169.1 181.1April 229.9 256.0 346.3 296.0 304.7 197.1 203.2 169.9 182.0May 230.7 254.4 346.5 296.5 323.1 197.6 203.9 169.9 182.2June 231.5 256.4 346.5 296.5 320.4 198.5 204.5 169.9 182.2July 230.3 252.6 346.5 296.7 322.2 198.7 204.9 169.9 182.4August 230.9 253.5 346.6 296.8 326.7 198.6 205.0 169.9 182.5September 234.4 260.3 346.5 296.5 335.7 198.7 205.9 169.9 184.1October 232.2 254.0 346.6 296.5 337.0 198.7 206.0 169.9 184.1November 228.5 248.9 343.2 296.5 313.2 198.7 206.1 169.9 184.1December 226.9 247.2 343.2 296.5 298.8 198.7 206.3 169.9 184.1
Source: Philippine Statistics Authority
2-27

TABLE 2.22 Construction Materials Wholesale Price Index in the National Capital Region: 2008 to 2018 (2012=100)
2008 85.2 81.4 84.2 82.7 82.1 75.5 83.3 83.2 89.5 93.1 92.8 85.5 92.0 87.4 92.0 86.5 74.8 99.72009 86.3 84.3 89.8 92.1 84.2 79.6 90.8 85.5 91.5 95.4 95.7 87.3 93.2 89.0 95.1 69.3 77.2 100.02010 89.6 86.0 91.8 92.6 86.6 87.7 96.1 88.4 92.3 97.4 90.7 88.1 94.2 91.1 96.4 82.8 81.2 100.02011 96.4 92.3 97.0 96.4 95.5 95.7 98.1 95.5 96.1 99.2 96.1 94.5 98.2 95.4 97.7 96.6 93.4 100.02012 100.0 100.0 100.0 100.0 100.0 100.0 100.0 100.0 100.0 100.0 100.0 100.0 100.0 100.0 100.0 100.0 100.0 100.02013 102.4 102.6 102.7 101.5 101.3 102.8 103.1 102.2 104.0 100.8 101.9 102.3 102.6 100.9 101.6 98.2 103.6 100.02014 104.9 107.1 105.2 103.8 104.1 107.7 107.1 103.6 108.4 103.7 103.6 105.5 108.3 102.2 104.5 97.5 103.6 107.52015 106.5 109.8 106.9 105.6 108.3 109.7 108.1 104.5 109.3 104.9 104.7 108.7 114.1 103.3 106.6 83.7 104.2 146.92016 107.4 113.8 109.2 106.4 109.2 109.3 105.3 104.8 108.7 104.9 103.9 109.8 116.8 102.7 106.5 81.6 104.2 146.92017 109.2 116.7 110.4 107.7 108.6 111.9 105.5 107.8 110.1 104.9 106.6 109.7 117.9 103.9 106.4 94.6 104.2 146.9 January 108.4 115.4 109.5 106.9 108.9 110.8 105.3 106.8 109.6 104.9 104.6 109.2 117.4 103.4 105.8 89.8 104.2 146.9 February 108.6 115.7 109.6 107.1 108.7 110.7 105.5 107.0 109.6 104.9 105.5 109.3 117.8 103.6 105.8 90.7 104.2 146.9 March 108.8 116.0 109.8 107.1 108.7 111.9 105.5 107.1 109.6 104.9 105.7 109.5 118.1 103.8 106.5 89.9 104.2 146.9 April 108.8 116.4 109.8 107.2 108.7 111.9 105.5 107.2 109.6 104.9 107.0 109.6 118.1 103.8 106.5 90.4 104.2 146.9 May 108.9 116.7 109.7 107.2 108.6 111.9 105.5 107.3 109.6 104.9 107.0 109.6 118.1 103.8 106.5 90.1 104.2 146.9 June 108.7 116.8 109.7 107.5 108.6 111.4 105.7 106.7 110.1 104.9 107.0 109.7 118.0 103.9 106.6 89.3 104.2 146.9 July 108.6 117.3 109.6 107.5 108.6 111.4 105.5 106.3 110.1 104.9 107.0 109.7 118.0 104.1 106.6 92.2 104.2 146.9 August 109.1 117.4 109.8 108.1 108.6 112.3 105.5 107.4 110.7 104.9 106.7 109.7 117.7 104.2 106.6 96.2 104.2 146.9 September 109.2 117.1 109.7 108.4 108.2 112.3 104.9 108.3 110.7 104.9 107.1 109.9 117.7 104.4 106.6 99.4 104.2 146.9 October 110.2 117.1 111.8 108.2 108.3 112.6 105.4 109.3 110.7 104.9 106.9 109.9 117.8 104.1 106.6 101.1 104.2 146.9 November 110.7 117.1 113.0 108.5 108.5 112.8 105.4 110.0 110.6 104.9 107.2 109.9 117.7 104.2 106.6 102.9 104.2 146.9 December 110.8 117.1 113.2 108.8 109.2 112.9 106.0 110.0 109.9 104.9 107.7 109.9 118.0 104.0 106.6 103.1 104.2 146.92018 114.3 120.7 115.5 113.9 111.7 120.6 107.0 115.6 112.9 104.9 109.7 117.0 119.4 104.7 107.1 117.7 104.2 146.9 January 112.1 117.9 114.0 111.1 110.0 114.0 106.8 112.3 111.3 104.9 107.7 110.9 118.5 104.2 106.6 109.4 104.2 146.9 February 112.6 118.0 114.3 111.7 111.1 116.6 107.5 113.3 111.2 104.9 107.8 111.8 119.1 104.5 106.7 112.1 104.2 146.9 March 113.2 118.3 114.6 112.5 111.1 117.9 107.5 114.4 113.0 104.9 107.8 112.9 118.9 104.5 106.7 112.6 104.2 146.9 April 113.8 118.6 114.6 113.3 111.6 120.0 107.5 115.5 113.0 104.9 110.3 114.9 119.1 104.6 106.7 114.8 104.2 146.9 May 113.8 118.6 114.6 113.3 111.6 120.0 107.4 115.7 113.0 104.9 110.3 116.3 119.1 104.6 106.7 117.4 104.2 146.9 June 113.9 119.5 114.6 113.3 111.8 121.1 106.0 115.8 113.0 104.9 110.3 117.8 119.0 104.5 106.7 119.5 104.2 146.9 July 113.8 119.7 113.7 114.3 111.5 121.9 106.7 115.8 113.2 104.9 110.0 118.9 119.7 104.8 107.1 119.3 104.2 146.9 August 114.1 119.8 113.7 115.1 111.7 122.6 106.9 116.6 113.1 104.9 110.0 119.6 119.7 105.0 107.5 119.8 104.2 146.9 September 114.3 120.0 114.0 115.4 112.5 122.9 106.9 116.8 113.1 104.9 110.0 120.1 119.7 105.1 107.5 123.6 104.2 146.9 October 115.4 125.1 116.3 115.6 112.5 123.2 107.0 116.4 113.6 104.9 110.0 120.0 119.7 105.0 107.5 125.8 104.2 146.9 November 116.9 126.0 120.5 115.6 112.6 123.5 107.1 117.0 113.6 104.9 111.3 120.3 120.0 104.9 107.5 120.4 104.2 146.9 December 117.1 127.3 120.8 115.8 112.1 123.5 107.1 117.2 113.5 104.9 111.4 120.5 120.0 104.9 107.5 117.3 104.2 146.9
Source: Philippine Statistics Authority
Period All Items Sand and Gravel
Concrete Products
and CementHardware Plywood Lumber G.I.
Sheet
Reinforcing and
Structural Steel
TileworksGlass and
Glass Products
Door, Jambs and
Steel Casement
Machinery and
Equipment Rental
Electrical Works
Plumbing, Fixtures &
Accessories/ Waterworks
Painting Works PVC Pipes Fuels and
Lubricants Asphalts

TABLE 2.23 Producer's Price Index for Manufacturing by Major Group: 2008 to 2018 (2000 = 100)
Period Total Manufacturing
Food Manufacturing Beverages Tobacco
Products Textiles Leather Products
Footwear and Wearing Apparel
Wood & Wood
Products
Furniture and Fixtures
Paper and Paper
ProductsPrinting Chemical
ProductsPetroleum Products
Rubber and Plastic Products
Non-metallic Mineral
Miscellaneous Non-metallic
Glass and Glass
ProductsCement Basic
MetalsIron and
Steel
Non-Ferrous
Metal
Fabricated Metal
Products
Machinery Except
Electrical
Electrical Machinery
Transport Equipment
Miscellaneous Manufactures
2008 175.3 176.8 155.6 176.6 147.2 125.3 271.6 98.7 101.4 142.8 249.3 157.6 290.1 166.2 150.0 143.7 188.6 145.8 270.3 301.5 222.8 151.7 152.3 196.5 129.0 100.52009 172.8 172.3 165.4 174.3 166.4 131.9 305.2 119.1 78.4 130.2 264.6 173.0 235.6 158.5 155.7 142.7 177.0 160.3 239.0 236.9 241.6 153.6 155.0 188.7 124.9 93.02010 164.3 175.1 167.0 180.3 166.4 143.4 337.6 119.2 60.0 126.3 273.7 169.6 268.9 162.7 155.0 140.3 153.8 165.8 239.8 210.1 266.5 152.9 129.5 160.2 124.6 87.82011 165.8 185.4 160.6 188.8 174.4 147.1 339.4 119.3 37.8 125.2 273.7 167.6 332.2 171.2 155.0 139.6 164.8 164.1 265.6 218.6 312.8 153.6 131.4 153.6 127.9 79.62012 164.9 197.4 161.2 187.6 173.3 142.2 336.8 107.3 28.9 124.0 285.0 165.0 347.9 177.5 148.9 128.6 142.5 164.4 247.4 212.3 279.0 147.5 131.8 146.2 130.6 72.82013 152.4 180.5 169.9 174.3 175.4 143.6 354.1 109.8 18.5 118.2 316.6 155.7 353.4 156.9 149.9 126.2 124.8 174.6 213.3 202.1 222.4 144.4 116.1 140.7 120.1 76.12014 151.0 188.7 172.2 192.8 177.1 148.1 352.5 112.7 15.1 120.4 316.6 155.6 344.6 160.0 152.6 126.7 119.5 184.3 194.5 194.1 194.7 138.0 106.2 144.0 119.8 74.32015 140.9 189.5 186.5 196.0 179.0 149.0 345.4 91.6 11.0 122.9 311.5 158.3 272.4 156.5 143.8 122.4 114.0 181.1 176.0 180.9 169.9 137.5 106.4 121.3 118.6 75.02016 136.2 192.1 194.4 196.4 176.9 143.4 329.0 88.8 9.0 122.8 310.7 156.6 247.4 150.3 147.6 127.4 113.5 184.4 161.5 172.3 149.7 137.7 91.3 116.7 117.8 79.2
2017 132.9 191.7 192.4 213.9 173.7 120.0 328.6 89.4 7.3 121.6 319.4 154.2 285.6 145.7 138.1 129.2 113.4 156.0 167.5 185.7 149.4 79.8 86.8 115.9 118.0 82.1January 134.1 195.3 193.1 196.5 172.6 133.0 333.6 90.5 7.4 121.7 316.0 155.4 289.0 147.4 137.7 129.0 113.1 155.3 165.7 180.7 150.0 91.3 87.1 114.4 119.2 82.7February 134.2 194.1 192.3 195.3 173.1 134.1 333.3 90.8 7.6 120.6 318.1 155.3 291.9 148.1 138.3 129.6 113.2 156.1 167.5 182.6 151.6 87.0 87.8 115.3 117.5 82.0March 133.9 193.7 191.9 195.8 173.0 133.3 334.6 88.6 7.6 123.4 319.0 156.2 283.9 146.8 137.6 130.1 113.2 153.8 170.2 184.6 154.9 84.9 87.7 114.7 119.0 81.2April 132.7 192.7 191.9 200.1 173.2 130.9 332.4 88.7 7.2 121.9 319.8 155.4 285.0 146.6 137.7 128.8 113.3 155.5 169.2 183.7 153.9 80.2 86.0 115.6 118.0 80.9May 132.7 192.8 189.5 200.1 173.6 113.4 330.4 89.6 7.2 120.8 319.8 155.1 280.1 145.5 140.5 128.9 113.1 162.5 165.3 183.2 147.4 83.9 86.1 115.2 118.1 80.6June 132.6 192.9 191.5 200.1 173.8 114.9 325.8 88.5 7.2 122.5 319.9 153.7 278.5 145.5 140.5 129.1 113.4 161.9 166.0 182.5 149.2 79.6 86.6 116.0 118.5 81.9July 132.5 193.3 192.6 200.1 174.1 116.8 326.0 89.1 7.2 121.0 320.0 153.4 276.8 145.0 136.0 129.1 113.0 151.2 164.6 184.2 145.3 80.7 86.7 116.3 118.8 82.5August 132.7 192.5 192.2 200.1 174.1 120.5 328.0 89.5 7.2 123.4 320.1 154.1 283.1 144.6 137.8 129.6 113.1 155.0 166.6 187.5 146.4 75.9 86.9 116.8 117.9 83.1September 132.4 192.0 192.2 200.1 174.1 109.1 328.5 89.5 7.2 120.2 320.0 152.7 287.1 144.4 137.9 129.2 112.9 155.6 167.9 188.7 147.8 73.5 86.9 116.6 118.7 82.9October 133.1 188.0 193.6 257.0 174.3 111.5 326.2 89.5 7.3 121.1 320.2 152.9 289.7 145.1 138.0 129.5 113.2 155.4 169.7 190.5 149.5 73.8 87.5 117.6 117.8 83.3November 132.1 186.6 193.7 253.8 174.4 111.8 325.3 89.5 7.1 122.1 319.9 154.0 290.4 144.9 137.9 128.9 114.9 155.1 168.8 190.3 148.1 73.2 86.3 116.3 116.3 82.4December 131.9 186.8 193.5 267.2 174.2 110.8 319.5 89.6 7.1 120.3 319.8 152.4 292.2 144.8 137.6 128.5 114.5 155.0 168.9 190.0 148.5 72.9 85.9 115.9 116.2 81.9
2018 133.8 187.0 220.7 301.9 180.8 109.6 323.8 87.2 6.9 123.4 329.9 151.5 332.0 139.1 148.8 139.4 121.3 164.6 175.2 198.0 154.3 73.2 93.9 123.3 116.8 86.0January 134.2 186.2 219.9 298.7 175.1 117.4 316.3 90.2 7.5 122.5 323.2 151.7 345.5 137.4 143.0 132.8 112.6 160.4 174.1 191.9 157.7 74.8 90.9 120.4 115.7 88.0February 134.4 186.5 219.9 299.5 177.4 112.7 322.6 90.5 7.7 122.8 323.2 150.7 319.1 137.4 144.0 133.4 121.4 159.3 175.0 194.8 156.7 73.6 91.1 121.2 117.3 88.3March 133.1 187.0 220.0 299.5 180.3 112.5 320.6 85.8 7.2 118.6 326.0 151.6 318.0 138.0 145.0 133.5 122.0 161.2 175.1 195.6 156.0 72.2 91.4 120.8 116.8 88.7April 133.6 187.8 220.0 299.1 180.3 113.5 320.2 86.5 7.1 119.3 326.0 151.0 336.1 138.0 144.7 133.4 121.8 160.7 178.9 197.7 161.4 73.5 90.8 121.1 116.7 89.3May 134.6 187.5 220.0 299.3 179.3 116.3 326.1 86.4 7.3 121.7 326.0 151.2 331.1 138.2 144.2 135.3 122.0 158.0 178.9 198.5 160.7 73.3 92.1 122.7 117.7 90.6June 133.9 188.4 221.1 303.7 179.9 114.2 321.9 88.8 6.8 124.2 332.7 150.9 333.9 138.4 147.2 135.9 121.7 164.1 174.5 201.6 149.9 71.5 95.2 123.2 117.2 89.6July 133.8 188.3 222.1 303.4 181.9 108.6 315.4 87.8 6.6 125.2 333.6 151.8 334.9 139.4 147.1 134.7 121.7 164.9 175.0 202.0 150.5 71.4 95.2 124.5 117.7 90.5August 133.9 188.4 221.1 303.8 182.0 111.8 326.9 88.4 6.7 124.6 333.6 152.3 333.2 139.5 153.9 147.4 122.2 168.7 175.7 201.4 152.1 71.3 95.6 125.4 116.6 80.5September 134.9 188.2 221.1 303.8 180.1 105.9 332.8 86.6 6.7 125.5 333.6 151.5 343.3 139.9 153.1 147.7 123.1 166.5 175.6 198.7 154.2 73.9 96.7 126.9 117.6 82.4October 134.7 187.6 221.1 303.9 184.7 104.5 331.1 85.7 6.7 125.0 333.6 151.7 341.7 140.3 156.2 146.9 122.6 173.8 174.6 199.3 151.9 74.0 96.2 126.0 117.9 82.0November 132.6 186.3 221.1 303.9 186.3 105.4 329.8 86.2 6.4 125.3 333.6 152.0 327.7 141.4 153.2 145.5 122.0 168.7 176.0 198.3 155.4 74.4 95.2 123.7 115.8 80.9December 132.1 181.8 221.1 303.9 181.7 92.3 322.1 84.0 6.5 126.4 333.6 151.8 319.0 140.7 153.5 146.6 122.0 168.5 169.1 195.9 144.9 74.7 96.7 124.1 114.5 81.9
Source: Philippine Statistics Authority
2-29

TABLE 2.24 Producer's Price Index for Agriculture by Commodity: 2012 to 2018 (2006=100)
2012 2013 2014 2015 2016 2017 2018
137.8 141.0 156.1 147.1 149.8 157.8 166.7
Cereals 151.3 156.1 179.6 157.9 157.6 163.6 185.5Palay, other variety, dry 14% mc 155.4 163.5 192.5 166.0 167.6 174.8 195.9Corngrain, yellow, matured 136.6 127.8 140.0 131.9 129.6 127.2 152.9Corngrain, white, matured 147.9 151.7 151.3 144.5 129.0 146.3 158.1
Vegetables & Legumes 125.2 121.1 123.9 131.1 148.9 146.7 174.7Ampalaya 113.9 115.5 106.4 128.8 137.4 135.8 161.6Asparagus 655.9 663.3 686.2 666.1 474.4 534.0 502.2Banana blossom 187.4 174.4 187.5 142.3 232.5 201.4 191.9Cabbage 113.9 110.8 124.7 166.1 154.0 149.1 210.5Camote tops 131.3 136.3 144.7 157.6 169.5 186.5 203.8Cauliflower 173.6 163.3 168.7 178.5 210.4 164.2 297.4Chayote 122.2 106.4 101.2 150.3 173.8 119.0 234.5Cucumber 118.4 119.2 116.5 129.6 142.9 150.0 160.1Eggplant, long, purple 116.5 108.4 124.3 112.9 124.4 146.6 180.0Garlic 97.9 59.0 125.8 102.5 68.4 119.4 106.1Ginger, Hawaiian 142.3 248.1 619.7 672.2 384.0 233.5 231.1Ginger, native 190.1 201.2 426.3 549.2 368.5 276.3 233.0Habitchuelas 110.9 115.3 116.2 128.5 144.6 139.0 163.5Kangkong 124.9 125.7 143.5 158.1 147.6 182.2 269.9Mongo (Green) Labo 141.7 142.2 154.4 167.1 153.1 162.9 174.6Okra 100.9 117.8 118.9 139.2 134.2 144.0 188.4Onion Leeks/spring 132.3 205.2 166.6 218.8 251.4 201.5 233.8Onion, native (red shallot) 91.4 157.9 124.5 80.7 115.7 154.0 169.9Onion, Red Creole (Bermuda Red) 107.3 71.1 78.8 63.4 126.7 88.5 121.5Patola Baguio 133.4 136.4 138.2 137.6 164.0 175.1 174.7Patola native 149.2 154.8 143.6 166.6 158.5 134.0 185.6Peanut with shell (dry) 146.6 152.5 158.3 173.4 166.9 172.4 181.8Pechay (Baguio) 133.9 138.9 149.9 197.9 160.1 151.3 268.5Pechay native 142.6 152.5 159.9 159.1 180.2 179.4 202.5Pepper Bell 128.2 152.1 124.9 147.1 159.8 138.6 187.4Pepper Black 307.0 238.2 341.0 471.0 462.5 424.6 314.4Pepper finger (Green) 108.2 120.5 114.1 124.3 143.6 156.5 164.8Squash 136.8 127.5 131.5 139.6 142.0 156.2 186.4Stringbeans 114.4 123.6 129.8 144.0 158.5 153.0 195.3Sweet peas, Baguio 104.7 144.6 114.8 109.9 139.5 151.7 130.2Tomato 116.6 120.2 93.2 110.6 128.5 133.2 144.4Upo 149.6 138.1 138.7 144.3 164.0 156.8 185.7
Rootcrops and Tubers 137.9 147.2 131.0 127.1 147.5 163.5 161.5Carrots 107.9 107.3 104.0 145.5 132.6 166.7 165.8Cassava, fresh tubers 137.5 148.7 120.9 105.7 122.1 150.9 141.7Gabi Cebu (for ginataan) 108.8 125.3 148.7 169.7 221.3 162.4 153.1Gabi Tagalog (for sinigang) 187.7 202.6 202.8 210.2 243.2 222.0 216.1Radish 151.7 170.8 162.3 178.3 206.7 190.9 216.3Sweet potato 149.2 153.1 167.0 181.9 188.3 199.5 214.2Turnips 176.3 150.6 169.5 258.2 298.6 250.0 250.9Ube (purple yam) 111.4 87.5 141.3 202.4 178.1 219.4 177.6White potato 135.7 149.6 123.4 109.6 194.7 149.9 160.9
Fruits 142.3 146.9 155.2 160.6 195.2 200.3 209.8Avocado 162.9 98.8 176.4 151.0 183.1 177.0 206.4Banana Bungulan (green) 171.2 180.0 218.3 225.2 303.3 280.4 280.7Banana Lakatan (green) 161.7 190.1 207.6 211.7 233.8 220.1 237.9Banana Latundan (green) 136.4 146.1 164.8 169.1 184.0 175.8 169.0Banana Saba (green) 155.2 184.7 184.4 187.4 216.6 219.0 213.6
Continued
Commodity
All Commodities

TABLE 2.24 - - Concluded
2012 2013 2014 2015 2016 2017 2017
Calamansi 153.2 142.8 159.5 144.3 162.1 139.2 186.4Durian 77.4 78.2 78.2 83.2 95.9 149.4 121.0Guapple 132.3 147.5 155.3 151.3 135.4 153.4 150.2Jackfruit, ripe 111.7 116.5 126.5 129.3 173.3 163.4 182.9Lanzones 153.4 81.2 112.0 97.4 138.4 234.0 158.2Mandarin Szinkom 135.5 135.7 135.6 139.1 146.9 158.3 105.6Mango, Carabao (green) 118.8 110.1 107.0 118.9 157.2 192.6 154.2Mango, Indian (green) 133.6 120.4 124.1 111.8 145.6 134.5 216.6Mango,Piko (green) 127.3 106.2 117.4 133.9 156.3 173.0 159.4Papaya Hawaiian 109.3 105.0 142.3 126.3 87.4 95.7 197.1Papaya native 107.2 84.6 88.6 97.5 106.8 124.8 99.3Papaya solo 167.9 237.7 249.0 248.7 268.3 214.3 124.7Pineapple Hawaiian 169.2 165.2 183.0 188.7 218.2 221.9 169.1Pomelo 127.2 141.1 127.2 148.0 169.3 157.9 231.6Rambutan 118.2 127.5 117.4 124.2 136.1 219.4 160.1Watermelon 128.6 124.1 136.5 150.8 142.1 158.5 150.4
Commercial crops 144.8 138.6 173.5 154.0 177.8 173.1 195.4Abaca 113.9 108.4 124.3 135.5 169.1 184.1 147.5Cacao, dry beans 124.4 107.6 146.2 156.0 175.8 142.2 200.5Coconut green, young buko 249.4 247.9 282.4 298.2 254.0 298.6 139.1Coconut matured 164.9 157.8 210.6 191.6 233.0 253.9 306.6Coffee Arabica, dry beans 137.3 145.6 155.6 187.3 180.9 224.2 182.3Coffee Excelsa, dry beans 147.8 160.0 167.8 180.8 185.5 216.1 231.1Coffee Robusca, dry beans 152.0 148.7 166.8 164.3 170.8 190.8 214.3Pili nut, with hull 129.8 153.7 149.4 143.1 201.3 142.6 180.4Rubber Cuplump 136.6 111.5 71.7 56.3 63.8 79.8 171.8Sugarcane centrifugal, sugar 118.2 120.9 119.7 136.1 144.3 108.4 65.6Tobacco Burley (dry) 181.3 109.3 173.9 177.3 176.8 172.3 120.0Tobacco Native (dry) 106.0 133.4 107.7 106.4 115.6 157.5 181.6Tobacco Virginia (dry) 160.5 138.7 163.9 139.8 152.1 167.4 113.6
Livestock 128.3 138.0 147.1 141.7 138.8 155.1 189.8Carabao for slaughter 134.2 140.4 200.3 150.1 150.3 167.1 167.9Cattle for salughter 126.7 130.8 135.7 138.3 143.5 149.7 183.1Goat for slaughter 146.2 153.2 163.0 165.4 168.9 179.7 161.5Hogs upgraded for slaughter 127.6 138.2 145.0 140.8 136.7 154.2 196.2
Poultry 122.9 124.4 134.1 134.0 133.8 135.1 166.8Chicken broiler, other breed (backyard) 121.6 111.0 113.2 119.1 122.6 116.9 138.6Chicken broiler, other breed (commercial) 115.7 116.4 128.4 120.2 124.1 123.0 128.1
Chicken egg, other breed (backyard) 145.8 149.6 162.7 158.3 163.2 170.1 172.0Chicken egg, other breed (commercial) 125.8 126.9 134.5 135.2 142.2 146.7 140.6Chicken layer, culls 105.4 95.4 135.1 179.0 174.8 169.3 165.8Chicken native, improved 137.2 140.5 144.4 144.7 147.1 152.4 164.7Duck egg ( backyard) 149.5 148.8 163.1 165.8 170.6 179.2 184.8Duck egg ( commercial) 123.7 135.8 138.0 138.7 145.2 149.9 142.5Duck for meat ( backyard) 137.2 142.3 148.1 154.8 159.0 176.9 196.5Duck for meat ( commercial) 113.6 128.5 155.0 136.3 124.2 133.1 133.9
Fishery 126.4 127.6 132.3 129.5 124.7 134.5 147.8Bangus 140.9 137.9 142.7 143.0 137.7 142.9 161.2Seaweed 129.3 147.2 156.9 122.6 100.3 135.4 185.0Tigerprawn 105.4 106.8 108.1 112.4 114.0 124.7 129.4Tilapia 126.0 126.8 132.7 131.7 125.5 131.2 133.8
Source: Philippine Statistics Authority
Commodity

TABLE 2.25 Producer's Price Index for Agriculture by Major Commodity Group by Region: 2015 to 2018 (2006=100)
Philippines CAR Ilocos Region
Cagayan Valley
Central Luzon
CALABARZON
MIMAROPA
Bicol Region
Western Visayas
Central Visayas
Eastern Visayas
Zamboanga
Peninsula
Northern Mindanao
Davao Region
SOCCSKSARGEN Caraga ARMM
2015All Commo 147.1 148.1 139.1 142.2 133.4 138.7 174.2 154.0 156.3 147.1 178.3 138.3 147.9 159.6 145.2 164.9 139.1Cereals 157.9 164.1 150.1 143.3 159.9 149.2 165.2 164.5 168.6 162.6 166.8 161.6 157.0 172.6 154.2 169.2 153.0Vegetables 131.1 153.6 94.0 142.0 87.0 132.7 110.6 142.4 154.0 189.2 204.2 161.6 209.1 176.3 223.8 167.4 123.7Rootcrops 127.1 123.6 164.2 104.5 194.3 129.8 185.1 215.3 227.7 161.1 200.9 189.4 173.0 184.9 111.2 214.8 121.6Fruits 160.6 173.0 121.8 140.9 143.4 188.0 221.7 197.6 196.2 162.5 212.9 136.3 163.2 150.2 167.7 187.3 206.5Commercia 154.0 180.2 144.0 143.6 454.3 193.2 319.6 148.4 149.1 160.6 251.7 112.9 154.5 170.3 120.5 169.4 129.6Livestock 141.7 134.8 135.1 144.8 144.0 134.9 156.1 140.7 149.3 134.3 143.9 152.0 142.9 155.1 139.1 145.2 107.5Poultry 134.0 135.8 159.2 145.7 107.9 129.7 148.3 121.8 137.1 137.4 133.0 144.6 137.6 146.6 120.3 147.6 143.9Fishery 129.5 138.5 140.9 131.5 124.5 131.8 132.9 134.9 141.4 157.6 99.1 125.0 99.5 142.2 154.5 135.6 122.6
2016All Commo 149.8 153.7 143.8 145.1 133.0 140.4 178.5 162.2 157.4 150.8 188.0 143.2 157.8 176.4 148.8 176.7 153.6Cereals 157.6 159.8 153.9 145.9 151.2 150.5 172.3 166.6 167.8 152.7 174.2 162.9 155.1 170.2 153.4 170.0 145.6Vegetables 148.9 146.7 104.9 142.7 121.4 147.4 143.0 154.3 164.3 185.6 172.8 181.9 216.5 187.2 205.1 155.6 178.1Rootcrops 147.5 170.2 172.9 98.6 202.7 137.9 194.7 210.7 245.0 197.1 182.2 209.5 168.3 229.1 104.9 247.1 151.4Fruits 195.2 183.0 143.6 182.4 162.3 193.3 252.7 204.8 219.3 221.4 247.7 148.4 188.7 180.2 175.7 199.4 241.0Commercia 177.8 168.2 146.4 141.2 396.7 227.3 327.5 184.7 151.9 172.8 295.1 122.6 187.5 231.1 138.6 216.9 152.9Livestock 138.8 129.6 131.6 134.7 137.3 129.7 156.3 143.4 143.7 131.2 142.2 154.0 148.1 152.6 139.0 145.3 140.4Poultry 133.8 137.0 158.3 152.1 115.9 133.7 147.4 141.7 140.6 142.3 137.8 147.1 142.8 148.1 126.2 151.0 162.6Fishery 124.7 133.6 143.2 128.7 120.6 125.7 108.5 121.6 148.2 135.8 90.0 104.4 99.7 130.6 165.4 135.3 115.1
2017All Commo 157.8 150.4 152.3 153.2 143.5 151.7 188.5 172.2 157.5 155.7 183.4 161.9 163.3 187.5 158.1 186.0 179.8Cereals 163.6 160.4 159.3 151.6 163.0 160.2 176.2 172.0 170.9 160.6 181.8 169.6 159.8 183.1 157.2 170.6 148.7Vegetables 146.7 133.9 124.3 156.0 96.1 146.1 129.2 164.2 180.4 190.5 177.6 206.4 219.9 200.1 211.6 195.3 192.5Rootcrops 163.5 153.8 168.3 108.9 225.2 159.2 185.6 237.4 245.7 187.7 170.3 196.3 226.0 203.1 181.7 242.9 260.8Fruits 200.3 194.0 164.8 194.4 186.9 227.9 234.1 186.8 243.2 231.9 251.0 189.7 196.3 194.9 169.7 200.2 256.7Commercia 173.1 159.1 154.5 182.6 410.2 250.3 353.5 211.8 119.2 151.6 249.9 150.4 177.3 236.0 147.8 251.5 172.5Livestock 155.1 138.1 144.1 154.3 157.8 149.0 170.4 158.0 182.3 141.4 146.9 158.4 159.9 167.4 158.4 152.2 125.3Poultry 135.1 140.2 159.3 156.2 120.2 135.1 150.5 136.9 151.6 150.6 135.6 161.6 139.6 148.2 149.2 151.1 196.8Fishery 134.5 133.7 147.1 133.0 135.3 133.6 183.6 126.8 151.6 148.1 94.5 125.6 101.6 149.9 138.7 137.4 131.0
2018All Commo 166.7 178.4 169.9 171.0 152.9 150.5 199.2 181.7 180.2 170.1 185.7 161.7 168.8 176.6 158.5 177.4 171.8Cereals 185.0 187.9 179.8 175.1 179.7 182.3 200.8 197.7 204.0 182.0 197.1 186.0 179.4 191.6 173.0 186.5 166.3Vegetables 174.7 217.5 152.5 177.5 129.3 170.8 151.5 197.0 206.9 208.6 207.1 254.4 209.7 205.9 208.4 189.6 234.6Rootcrops 161.5 160.8 204.7 113.3 236.2 194.8 217.7 251.8 275.7 209.6 172.5 201.4 232.4 218.0 163.0 264.8 218.7Fruits 209.8 204.4 208.8 172.7 224.1 239.2 243.2 158.4 255.0 236.3 261.5 176.8 200.2 191.1 180.6 205.2 272.9Commercia 147.5 199.5 165.1 173.4 340.3 157.8 269.0 178.7 133.8 158.6 205.3 119.1 158.1 152.3 114.3 159.1 135.7Livestock 167.9 149.5 152.4 164.4 164.7 152.4 172.0 172.3 203.0 159.9 158.7 183.5 170.8 180.3 172.5 163.5 137.4Poultry 138.6 154.3 162.1 166.2 123.9 133.5 156.3 132.7 156.7 151.9 149.2 151.1 142.2 157.3 126.1 165.8 137.5Fishery 147.8 131.5 157.0 135.6 141.7 144.3 220.2 146.7 179.1 185.8 103.7 163.4 107.0 169.5 150.1 136.5 145.4
Source: Philippine Statistics Authority
Period/Commodity Group

3 ECONOMIC ACCOUNTS
The economic accounts presented in this chapter quantify the magnitude of transactions taking place in the economy especially those relating to the production and consumption of goods and services, the inter-industry linkages, and their transfer of income or capital between sectors of the economy. These accounts are better known as the national accounts and the input-output tables.
National Accounts provide various users with a comprehensive description of the country's economic performance during a given period both at the national and regional levels. First, the statistics gives a measure of economic development for a particular period, both in current and in real terms, the rate of economic growth, and the pace of development given the country’s population growth. Second, they portray whether the country's economic structure is predominantly agricultural or industrial. The accounts indicate which sector of the economy contributes greatly to the Gross National Product and which shows the greatest growth potential. Third, they present to economic planners, business executives, and the populace as a whole, a set of macroeconomic indicators which are essential in planning and decision-making. Fourth, they indicate the various uses of the nation's output by sector, by industry or by household, the distribution of the national income by type and source of income, and the disposition or expenditure of such income by sector. Summing up, the national accounts present insights into the aggregate as well as sectoral performance of the economy for a given period that are necessary for policy formulation, planning, and analytical purposes.
The input-output tables, on the other hand, describe the technological relations between physical inputs and outputs in the production process expressed in money terms. They reflect the total production of each industry as well as the final product of the economy as a whole. For each industry, the amount purchased from other industries is measured in relation to the industry's own production and the allocation of its output to other industries or sectors. The tables are useful for analytical purposes, as in price-cost analysis, and for measuring the input requirements of various industries based on estimates of final demand.
The major responsibility for the preparation of the national income accounts and the input-output tables is lodged with the Philippine Statistics Authority.

TABLE 3.1 Gross National Income and Gross Domestic Product by Expenditure Shares: 2004 to 2018 at current 3 - 4
TABLE 3.2 Gross National Income and Gross Domestic Product by Expenditure Shares: 2004 to 2018 at constant 3 - 5
TABLE 3.3 Gross National Income and Gross Domestic Product by Industrial Origin: 2004 to 2018 at current 3 - 6
TABLE 3.4 Gross National Income and Gross Domestic Product by Industrial Origin: 2004 to 2018 at constant 3 - 7
TABLE 3.5 Per Capita: Gross Domestic Product, Gross National Income and Household Final Consumption
Expenditure: 2004 to 2018 3 - 8
TABLE 3.6 Details of Net Primary Income from the Rest of the World : 2011 to 2018 at current 3 - 9
TABLE 3.7 Details of Net Primary Income from the Rest of the World: 2011 to 2018 at constant 3 - 9
TABLE 3.8 Household Final Consumption Expenditure by Purpose: 2004 to 2018 at current 3 - 10
TABLE 3.9 Household Final Consumption Expenditure by Purpose: 2004 to 2018 at constant 3 - 11
TABLE 3.10 Indicators Derived from the National Accounts: 2017 to 2019 (Q1) 3 - 12
TABLE 3.11 Gross Domestic Capital Formation in Durable Equipment by Major Type: 2004 to 2018 at current 3 - 13
TABLE 3.12 Gross Domestic Capital Formation in Durable Equipment by Major Type: 2004 to 2018 at constant 3 - 14
TABLE 3.13 Gross Value Added in Agriculture, Hunting, Forestry, and Fishing by Industry Group: 2004 to 2018 at current 3 - 15
TABLE 3.14 Gross Value Added in Agriculture, Hunting, Forestry, and Fishing by Industry Group: 2004 to 2018 at constant 3 - 16
TABLE 3.15 Gross Value Added in Mining and Quarrying by Industry Group: 2004 to 2018 at current 3 - 17
TABLE 3.16 Gross Value Added in Mining and Quarrying by Industry Group: 2004 to 2018 at constant 3 - 17
TABLE 3.17 Gross Value Added in Manufacturing by Industry Group: 2006 to 2018 at current 3 - 18
TABLE 3.18 Gross Value Added in Manufacturing by Industry Group: 2006 to 2018 at constant 3 - 19
TABLE 3.19 Gross Value of Construction and Gross Value Added in Construction: 2004 to 2018 at current 3 - 20
TABLE 3.20 Gross Value of Construction and Gross Value Added in Construction: 2004 to 2018 at constant 3 - 20
TABLE 3.21 Gross Value Added in Electricity, Gas, and Water Supply: 2004 to 2018 at current 3 - 21
TABLE 3.22 Gross Value Added in Electricity, Gas, and Water Supply: 2004 to 2018 at constant 3 - 21
TABLE 3.23 Gross Value Added in Transport, Storage, and Communication: 2014 to 2018 at current 3 - 22
TABLE 3.24 Gross Value Added in Transport, Storage, and Communication: 2004 to 2018 at constant 3 - 22
TABLE 3.25 Gross Value Added in Trade, and Repair of Motor Vehicles, Motorcycles, Personal,
and Household Goods: 2004 to 2018 at current 3 - 23

TABLE 3.26 Gross Value Added in Trade, and Repair of Motor Vehicles, Motorcycles, Personal,
and Household Goods: 2004 to 2018 at constant 3 - 23
TABLE 3.27 Gross Value Added in Financial Intermediation by Industry Group: 2004 to 2018 at current 3 - 24
TABLE 3.28 Gross Value Added in Financial Intermediation by Industry Group: 2004 to 2018 at constant 3 - 24
TABLE 3.29 Gross Value Added in Real Estate, Renting, and Business Activities by Industry Group: 2003 to 2017 at current 3 - 25
TABLE 3.30 Gross Value Added in Real Estate, Renting, and Business Activities by Industry Group: 2004 to 2018 at constant 3 - 25
TABLE 3.31 Gross Value Added in Other Services by Industry Group: 2004 to 2018 at current 3 - 26
TABLE 3.32 Gross Value Added in Other Services by Industry Group: 2004 to 2018 at constant 3 - 26
TABLE 3.33 Gross Regional Domestic Product: 2012 to 2018 3 - 27
TABLE 3.34 Gross Value Added in Agriculture, Hunting, Forestry, and Fishing by Region: 2012 to 2018 3 - 28
TABLE 3.35 Gross Value Added in Mining and Quarrying by Region: 2012 to 2018 3 - 29
TABLE 3.36 Gross Value Added in Manufacturing by Region: 2012 to 2018 3 - 30
TABLE 3.37 Gross Value Added in Construction by Region: 2012 to 2018 3 - 31
TABLE 3.38 Gross Value Added in Electricity, Gas, and Water Supply by Region: 2012 to 2018 3 - 32
TABLE 3.39 Gross Value Added in Transportation, Storage, and Communication by Region: 2012 to 2018 3 - 33
TABLE 3.40 Gross Value Added in Trade, and Repair of Motor Vehicles, Motorcycles, Personal and
Household Goods by Region: 2012 to 2018 3 - 34
TABLE 3.41 Gross Value Added in Financial Intermediation by Region: 2012 to 2018 3 - 35
TABLE 3.42 Gross Value Added in Real Estate, Renting and Business Activities by Region: 2012 to 2018 3 - 36
TABLE 3.43 Gross Value Added in Public Administration and Defense; Compulsory Social Security by Region: 2012 to 2018 3 - 37
TABLE 3.44 Gross Value Added in Other Services by Region: 2012 to 2018 3 - 38
TABLE 3.45 Per Capita Gross Regional Domestic Product by Region: 2012 to 2018 3 - 39
TABLE 3.46 Expenditure on Gross Regional Domestic Product by Region: 2012 to 2018 3 - 40
TABLE 3.47 Household Final Consumption Expenditure by Region: 2012 to 2018 3 - 41
TABLE 3.48 Government Final Consumption Expenditure by Region: 2012 to 2018 3 - 42
TABLE 3.49 Gross Value in Construction by Region: 2012 to 2018 3 - 43
TABLE 3.50 Gross Domestic Capital Formation in Durable Equipment by Region: 2012 to 2018 3 - 44
TABLE 3.51 Gross Domestic Capital Formation in Breeding Stocks and Orchards Development by Region: 2012 to 2018 3 - 45

TABLE 3.1 Gross National Income and Gross Domestic Product by Expenditure Shares: 2004 to 2018 (In million pesos: at current prices)
Type of Expenditure 2004 2005 2006 2007 2008 2009 2010 2011 2012 2013 2014 2015 2016 2017r 2018
Household final consumption expenditure 3,814,889 4,259,131 4,677,986 5,064,463 5,739,592 5,993,427 6,442,033 7,132,581 7,837,881 8,463,826 9,163,823 9,825,883 10,672,797 11,614,142 12,864,928
Government consumption 480,420 513,254 575,717 639,985 681,893 791,403 875,291 941,836 1,145,140 1,250,814 1,334,267 1,455,783 1,619,639 1,776,906 2,078,437
Capital formation 1,106,608 1,223,578 1,129,376 1,195,015 1,489,212 1,331,662 1,849,380 1,986,931 1,922,503 2,309,530 2,595,678 2,826,185 3534428 3,973,492 4,694,352
A. Fixed capital 1,014,748 1,103,294 1,235,071 1,343,363 1,518,168 1,526,098 1,847,748 1,819,275 2,068,894 2,380,323 2,611,521 2,929,032 3,568,233 3,953,630 4,663,858
1. Construction 453,819 475,614 545,199 629,940 737,901 785,427 949,406 906,596 1,095,176 1,253,398 1,395,259 1,566,901 1,794,018 1,938,944 2,326,341
2. Durable equipment 439,631 492,099 533,195 547,817 582,028 541,642 692,519 698,745 751,133 902,055 996,622 1,129,826 1,512,204 1,706,394 1,984,236 3. Breeding stock & Orchard development 121,297 135,580 156,676 165,607 171,039 168,960 173,494 178,640 181,022 180,081 165,981 172,474 188,839 216,089 246,991
4. Intellectual property products 26,860 26,644 26,863 28,255 27,199 30,069 32,328 35,293 41,563 44,789 53,659 59,830 73,173 92,202 106,291
B. Changes in inventories 65,000 93,640 -132,558 -176,603 -28,955 -194,436 1,632 167,656 -146,390 -70,793 -14,760 -102,847 -33805 19,862 30,493
Exports 2,487,131 2,619,543 2,920,983 2,981,846 2,849,943 2,587,015 3,133,507 3,109,661 3,254,826 3,232,795 3,652,883 3,782,890 4,069,198 4,904,037 5,521,318
A. Exports of goods 2,167,811 2,232,936 2,404,128 2,298,333 2,152,099 1,799,714 2,259,876 2,034,503 2,120,180 2,104,278 2,392,753 2,295,636 2,334,141 2,835,789 3,169,266
B. Exports of services 319,320 386,607 516,856 683,514 697,845 787,301 873,632 1,075,157 1,134,646 1,128,516 1,260,130 1,487,254 1,735,057 2,068,248 2,352,053
Less : Imports 2,768,613 2,937,757 3,032,905 2,988,588 3,039,737 2,677,363 3,296,732 3,462,678 3,599,262 3,718,554 4,113,553 4,568,699 5,416,117 6,460,981 7,732,833
A. Imports of goods 2,394,981 2,531,763 2,599,680 2,504,379 2,511,963 2,104,793 2,635,752 2,826,136 2,875,855 2,914,119 3,211,852 3,543,032 4,284,122 5,185,850 6,322,435
B. Imports of services 373,632 405,994 433,225 484,209 527,774 572,570 660,980 636,541 723,407 804,435 901,701 1,025,667 1,131,995 1,275,132 1,410,399
Statistical discrepancy 0 0 0 0 0 0 0 0 0 0 0 0 0 0 0
Gross Domestic Product 5,120,435 5,677,750 6,271,157 6,892,721 7,720,903 8,026,143 9,003,480 9,708,332 10,561,089 11,538,410 12,634,187 13,322,041 14479945 15,807,596 17,426,202
Net primary income 1,184,673 1,472,565 1,611,931 1,741,410 1,342,215 1,712,090 1,848,952 1,920,972 2,166,151 2,480,580 2,676,779 2,792,365r 2,950,394 3,198,792 3,483,689
Gross National Income 6,305,108 7,150,315 7,883,088 8,634,132 9,063,118 9,738,233 10,852,432 11,629,304 12,727,240 14,018,990 15,310,966 16,114,406r 17,430,742r 19,006,388 20,909,891
Source: Philippine Statistics Authority

TABLE 3.2 Gross National Income and Gross Domestic Product by Expenditure Shares: 2004 to 2018 (In million pesos: at constant 2000 prices)
Type of Expenditure 2004 2005 2006 2007 2008 2009 2010 2011 2012 2013 2014 2015 2016 2017r 2018
Household final consumption expenditures 3,161,890 3,301,789 3,439,876 3,598,443 3,730,861 3,817,908 3,945,827 4,166,410 4,442,523 4,692,438 4,952,967 5,266,632 5,642,389 5,974,351 6,306,635
Government consumption 408,469 416,869 461,108 492,947 494,370 548,297 570,208 582,099 672,176 705,811 728,905 783,955 854,570 907,580 1,025,691
Capital formation 917,875 945,024 802,113 798,328 984,810 899,333 1,183,650 1,216,884 1,164,718 1,490,196 1,553,029 1,838,432 2,289,675 2,505,449 2,835,865
A. Fixed capital 840,491 861,097 906,773 956,610 1,010,616 992,947 1,182,206 1,159,857 1,285,180 1,437,196 1,525,606 1,800,535 2,270,587 2,484,245 2,804,813
1. Construction 336,414 329,201 354,388 394,319 411,042 417,708 490,659 450,346 528,569 582,828 632,219 701,802 793,470 839,234 953,219
2. Durable equipment 401,871 430,033 443,845 451,872 476,092 452,560 567,833 583,225 624,112 717,980 763,159 938,733 1,292,959 1,431,079 1,609,080
3. Breeding stock & Orchard development 102,205 101,863 108,540 110,420 101,675 98,592 98,928 98,678 100,066 98,568 97,295 99,286 102,845 106,255 111,286
4. Intellectual property products 54,889 61,680 -128,852 -181,421 21,808 24,087 24,785 27,608 32,432 37,819 47,598 60,713 81,313 107,677 131,228
B. Changes in inventories 22,494 22,246 24,192 23,139 -25,807 -93,614 1,444 57,027 -120,462 53,000 12,757 37,897 19087 21,204 31,051
Exports 2,108,406 2,212,822 2,491,585 2,659,711 2,588,548 2,385,812 2,886,133 2,812,968 3,054,291 3,024,646 3,406,560 3,695,428 4,124,942 4,935,700 5,599,149
A. Exports of goods 1,848,912 1,919,241 2,121,278 2,186,925 2,139,309 1,898,753 2,367,520 2,199,355 2,426,493 2,417,822 2,755,017 2,936,403 3,249,966 3,928,434 4,502,207
B. Exports of services 259,493 293,582 370,307 472,786 449,239 487,058 518,613 613,613 627,797 606,824 651,544 759,025 874,976 1,007,266 1,096,942
Less : Imports 2,319,697 2,395,226 2,478,452 2,521,141 2,561,488 2,354,109 2,884,280 2,868,160 3,028,479 3,162,459 3,475,982 3,984,272 4,788,834 5,657,262 6,560,451
A. Imports of goods 2,023,831 2,074,048 2,117,505 2,095,315 2,093,119 1,887,924 2,330,115 2,344,013 2,415,218 2,501,608 2,744,133 3,129,043 3,871,839 4,632,180 5,436,820
B. Imports of services 295,867 321,178 360,947 425,826 468,369 466,185 554,165 524,147 613,261 660,852 740,591 855,229 916,995 1,025,082 1,123,631
Statistical discrepancy 0 1 0 0 0 0 0 0 0 0 0 0 0 0 0
Gross Domestic Product 4,276,941 4,481,279 4,716,231 5,028,288 5,237,101 5,297,240 5,701,539 5,910,201 6,305,229 6,750,631 7,165,478 7,600,175 8122741 8,665,818 9,206,889
Net primary income 985,406 1,148,645 1,195,082 1,247,725 883,864 1,103,425 1,149,599 1,147,835 1,254,283 1,401,578 1,474,725 1,542,980r 1,632,345 1,728,528 1,803,363
Gross National Income 5,262,348 5,629,924 5,911,313 6,276,013 6,120,964 6,400,665 6,851,138 7,058,037 7,559,511 8,152,210 8,640,203 9,143,155r 9,755,087 10,394,346 11,010,252
Source : Philippine Statistics Authority
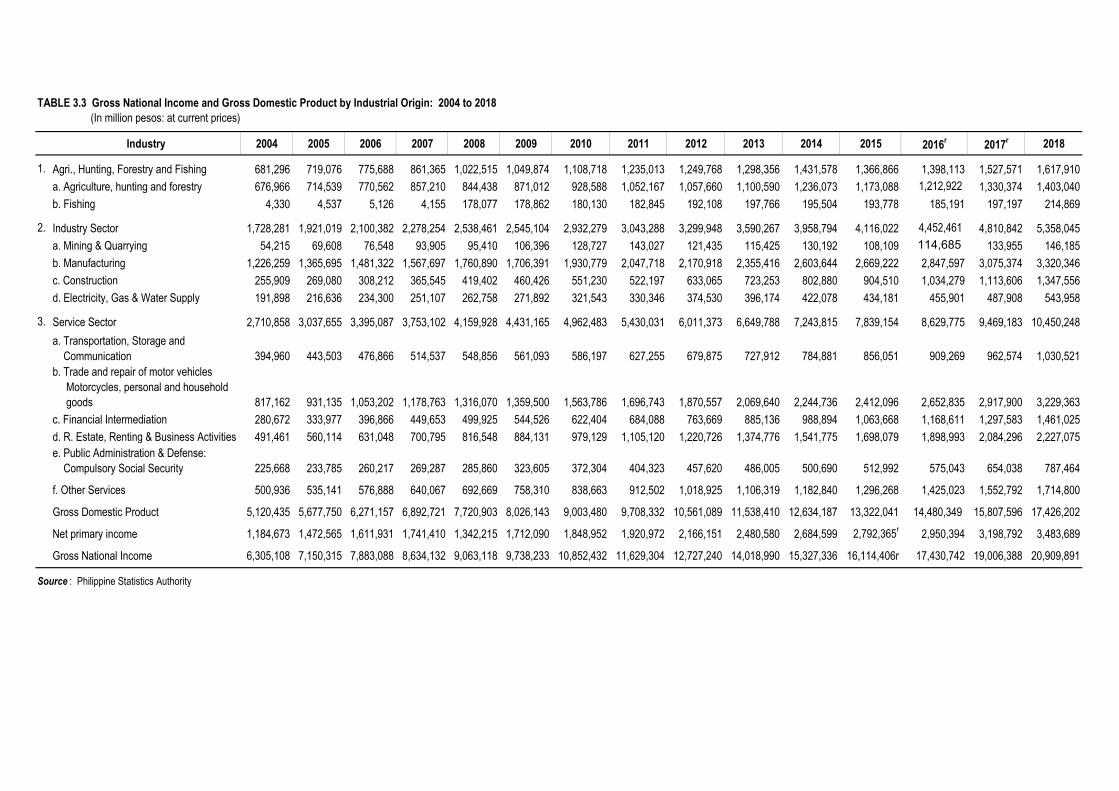
TABLE 3.3 Gross National Income and Gross Domestic Product by Industrial Origin: 2004 to 2018 (In million pesos: at current prices)
Industry 2004 2005 2006 2007 2008 2009 2010 2011 2012 2013 2014 2015 2016r 2017r 2018
1. Agri., Hunting, Forestry and Fishing 681,296 719,076 775,688 861,365 1,022,515 1,049,874 1,108,718 1,235,013 1,249,768 1,298,356 1,431,578 1,366,866 1,398,113 1,527,571 1,617,910a. Agriculture, hunting and forestry 676,966 714,539 770,562 857,210 844,438 871,012 928,588 1,052,167 1,057,660 1,100,590 1,236,073 1,173,088 1,212,922 1,330,374 1,403,040b. Fishing 4,330 4,537 5,126 4,155 178,077 178,862 180,130 182,845 192,108 197,766 195,504 193,778 185,191 197,197 214,869
2. Industry Sector 1,728,281 1,921,019 2,100,382 2,278,254 2,538,461 2,545,104 2,932,279 3,043,288 3,299,948 3,590,267 3,958,794 4,116,022 4,452,461 4,810,842 5,358,045a. Mining & Quarrying 54,215 69,608 76,548 93,905 95,410 106,396 128,727 143,027 121,435 115,425 130,192 108,109 114,685 133,955 146,185b. Manufacturing 1,226,259 1,365,695 1,481,322 1,567,697 1,760,890 1,706,391 1,930,779 2,047,718 2,170,918 2,355,416 2,603,644 2,669,222 2,847,597 3,075,374 3,320,346c. Construction 255,909 269,080 308,212 365,545 419,402 460,426 551,230 522,197 633,065 723,253 802,880 904,510 1,034,279 1,113,606 1,347,556d. Electricity, Gas & Water Supply 191,898 216,636 234,300 251,107 262,758 271,892 321,543 330,346 374,530 396,174 422,078 434,181 455,901 487,908 543,958
3. Service Sector 2,710,858 3,037,655 3,395,087 3,753,102 4,159,928 4,431,165 4,962,483 5,430,031 6,011,373 6,649,788 7,243,815 7,839,154 8,629,775 9,469,183 10,450,248a. Transportation, Storage and Communication 394,960 443,503 476,866 514,537 548,856 561,093 586,197 627,255 679,875 727,912 784,881 856,051 909,269 962,574 1,030,521b. Trade and repair of motor vehicles Motorcycles, personal and household goods 817,162 931,135 1,053,202 1,178,763 1,316,070 1,359,500 1,563,786 1,696,743 1,870,557 2,069,640 2,244,736 2,412,096 2,652,835 2,917,900 3,229,363c. Financial Intermediation 280,672 333,977 396,866 449,653 499,925 544,526 622,404 684,088 763,669 885,136 988,894 1,063,668 1,168,611 1,297,583 1,461,025d. R. Estate, Renting & Business Activities 491,461 560,114 631,048 700,795 816,548 884,131 979,129 1,105,120 1,220,726 1,374,776 1,541,775 1,698,079 1,898,993 2,084,296 2,227,075e. Public Administration & Defense: Compulsory Social Security 225,668 233,785 260,217 269,287 285,860 323,605 372,304 404,323 457,620 486,005 500,690 512,992 575,043 654,038 787,464
f. Other Services 500,936 535,141 576,888 640,067 692,669 758,310 838,663 912,502 1,018,925 1,106,319 1,182,840 1,296,268 1,425,023 1,552,792 1,714,800
Gross Domestic Product 5,120,435 5,677,750 6,271,157 6,892,721 7,720,903 8,026,143 9,003,480 9,708,332 10,561,089 11,538,410 12,634,187 13,322,041 14,480,349 15,807,596 17,426,202
Net primary income 1,184,673 1,472,565 1,611,931 1,741,410 1,342,215 1,712,090 1,848,952 1,920,972 2,166,151 2,480,580 2,684,599 2,792,365r 2,950,394 3,198,792 3,483,689
Gross National Income 6,305,108 7,150,315 7,883,088 8,634,132 9,063,118 9,738,233 10,852,432 11,629,304 12,727,240 14,018,990 15,327,336 16,114,406r 17,430,742 19,006,388 20,909,891
Source : Philippine Statistics Authority

TABLE 3.4 Gross National Income and Gross Domestic Product by Industrial Origin: 2004 to 2018 (In million pesos: at constant 2000 prices)
Industry 2004 2005 2006 2007 2008 2009 2010 2011 2012 2013 2014 2015 2016 2017r 2018
1. Agri., Hunting, Forestry and Fishing 583,629 596,727 618,457 647,687 668,550 663,744 662,665 679,835 698,978 706,957 718,797 719,742 711,001r 739,195 745,781a. Agriculture, hunting and forestry 579,354 592,331 613,298 643,792 535,462 526,622 526,238 549,306 568,946 575,953 588,004 591,269 587,654r 616,963 623,765b. Fishing 4,275 4,396 5,159 3,894 133,088 137,122 136,427 130,529 130,032 131,005 130,794 128,473 123,347 122,232 122,016
2. Industry Sector 1,406,338 1,465,272 1,532,814 1,621,226 1,699,171 1,666,601 1,859,515 1,893,950 2,031,443 2,219,068 2,391,268 2,545,411 2,750,593r 2,945,538 3,142,846a. Mining & Quarrying 37,631 43,624 43,535 51,649 50,926 59,130 65,898 70,509 72,047 72,893 81,695 80,500 83,665r 84,795 85,864b. Manufacturing 1,011,618 1,062,612 1,106,052 1,145,529 1,194,921 1,137,534 1,264,523 1,324,330 1,395,711 1,538,912 1,666,514 1,760,989 1,885,514 2,044,189 2,145,011c. Construction 198,404 198,154 217,637 249,379 266,751 284,994 325,820 294,564 348,262 381,747 409,277 456,932 512,113 538,107 618,294d. Electricity, Gas & Water Supply 158,685 160,882 165,591 174,670 186,572 184,943 203,274 204,547 215,423 225,516 233,781 246,990 269,301 278,447 293,677
3. Service Sector 2,286,974 2,419,280 2,564,959 2,759,375 2,869,379 2,966,895 3,179,359 3,336,416 3,574,808 3,824,606 4,055,413 4,335,022 4,661,781 4,981,084 5,318,262a. Transportation, Storage and Communication 337,039 360,885 376,378 408,076 423,952 423,399 427,766 446,026 476,855 505,415 538,044 581,289 611,902 636,612 670,803 Motorcycles, personal and household goods 698,830 740,311 784,443 851,892 863,732 875,616 948,743 981,022 1,055,672 1,121,102 1,185,810 1,270,526 1,367,438 1,467,006 1,554,868c. Financial Intermediation 232,730 257,301 287,793 317,104 322,672 340,329 374,716 394,371 426,787 480,683 515,484 546,714 590,112 635,139 681,005
d. R. Estate, Renting & Business Activities 392,961 419,523 446,975 482,493 526,116 547,866 588,947 638,244 678,898 739,025 798,081 854,747 930,685 999,420 1,046,693e. Public Administration & Defense: Compulsory Social Security 210,720 212,055 219,563 222,665 227,223 241,009 255,087 259,962 274,870 282,323 293,850 297,449 318,540 346,234 398,859
f. Other Services 414,694 429,205 449,788 477,145 505,683 538,677 584,100 616,791 661,725 696,058 724,144 784,297 843,105 896,674 966,034
Gross Domestic Product 4,276,941 4,481,279 4,716,231 5,028,288 5,237,101 5,297,240 5,701,539 5,910,201 6,305,229 6,750,631 7,165,478 7,600,175 8,123,375r 8,665,818 9,206,889
Net primary income 985,406 1,148,645 1,195,082 1,247,725 883,864 1,103,425 1,149,599 1,147,835 1,254,283 1,401,578 1,476,628 1,542,980r 1,632,345 1,728,528 1,803,363
Gross National Income 5,262,348 5,629,924 5,911,313 6,276,013 6,120,964 6,400,665 6,851,138 7,058,037 7,559,511 8,152,210 8,640,645 9,143,155r 9.755.720r 10,394,346 11,010,252
Source : Philippine Statistics Authority
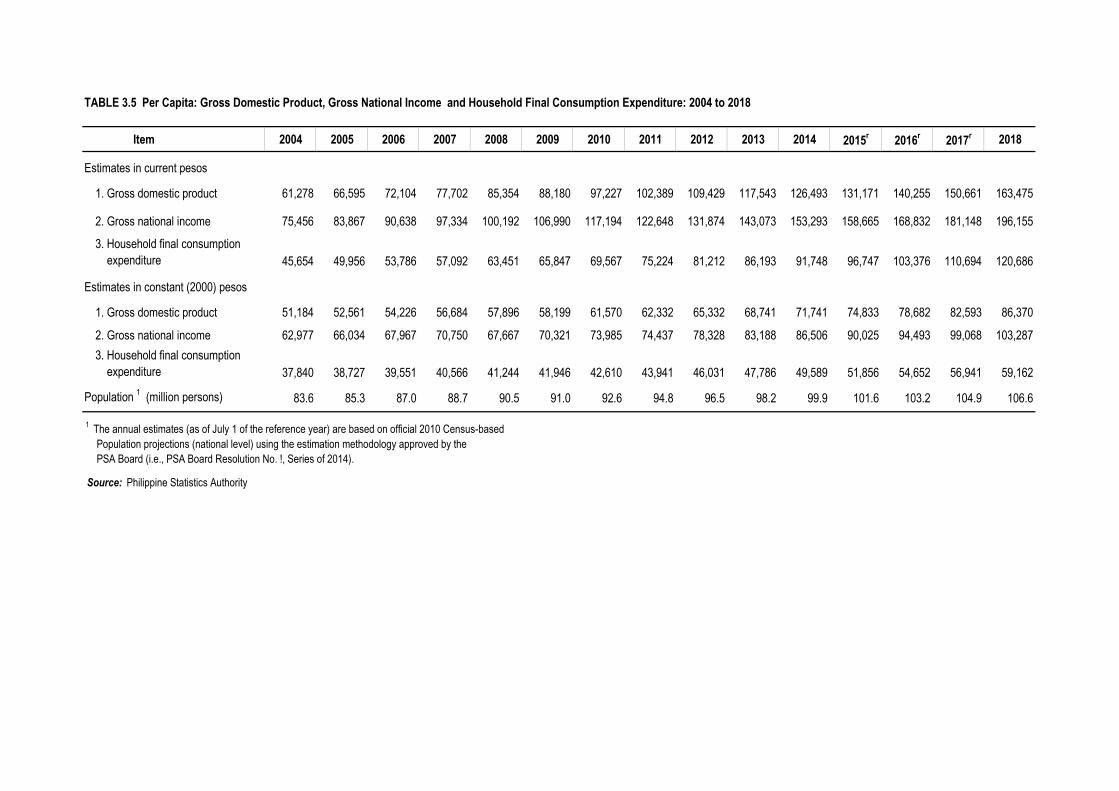
Item 2004 2005 2006 2007 2008 2009 2010 2011 2012 2013 2014 2015r 2016r 2017r 2018
Estimates in current pesos
1. Gross domestic product 61,278 66,595 72,104 77,702 85,354 88,180 97,227 102,389 109,429 117,543 126,493 131,171 140,255 150,661 163,475
2. Gross national income 75,456 83,867 90,638 97,334 100,192 106,990 117,194 122,648 131,874 143,073 153,293 158,665 168,832 181,148 196,155
3. Household final consumption expenditure 45,654 49,956 53,786 57,092 63,451 65,847 69,567 75,224 81,212 86,193 91,748 96,747 103,376 110,694 120,686
Estimates in constant (2000) pesos
1. Gross domestic product 51,184 52,561 54,226 56,684 57,896 58,199 61,570 62,332 65,332 68,741 71,741 74,833 78,682 82,593 86,370
2. Gross national income 62,977 66,034 67,967 70,750 67,667 70,321 73,985 74,437 78,328 83,188 86,506 90,025 94,493 99,068 103,2873. Household final consumption expenditure 37,840 38,727 39,551 40,566 41,244 41,946 42,610 43,941 46,031 47,786 49,589 51,856 54,652 56,941 59,162
Population 1 (million persons) 83.6 85.3 87.0 88.7 90.5 91.0 92.6 94.8 96.5 98.2 99.9 101.6 103.2 104.9 106.6
Source: Philippine Statistics Authority
TABLE 3.5 Per Capita: Gross Domestic Product, Gross National Income and Household Final Consumption Expenditure: 2004 to 2018
1 The annual estimates (as of July 1 of the reference year) are based on official 2010 Census-based Population projections (national level) using the estimation methodology approved by the PSA Board (i.e., PSA Board Resolution No. !, Series of 2014).

TABLE 3.6 Details of Net Primary Income from the Rest of the World : 2011 to 2018 ' (In million pesos: at current prices)
2011 2012 2013 2014 2015 2016 2017r 2018Net Primary Income from the Rest of the World 1,920,972 2,166,151 2,480,580 2,676,779 2,792,365 2,950,394 3,198,792 3,483,689Inflow
Compensation 2,129,027 2,429,426 2,731,846 2,967,821 3,061,611 3,172,964 3,427,760 3,721,266Property Income 77,258 73,178 55,871 60,342 77,284 96,841 133,987 199,672Total 2,206,285 2,502,604 2,787,717 3,028,163 3,138,894 3,269,805 3,561,747 3,920,937
OutflowCompensation - - - - 0 0 0 0Property Expense 285,313 336,453 307,137 351,385 346,529 319,412 362,955 437,248Total 285,313 336,453 307,137 351,385 346,529 319,412 362,955 437,248
Source: Philippine Statistics Authority
TABLE 3.7 Details of Net Primary Income from the Rest of the World: 2011 to 2018 (In million pesos: at constant 2000 prices)
2011 2012 2013 2014 2015 2016 2017r 2018
Net Primary Income from the Rest of the World 1,147,835 1,254,283 1,401,578 1,474,725 1,542,980 1,632,345 1,728,528 1,803,363Inflow
Compensation 1,272,332 1,407,129 1,543,571 1,635,094 1,691,518 1,755,583 1,852,314 1,926,366Property Income 46,150 42,412 31,624 33,222 42,723 53,522 72,310 102,909Total 1,318,482 1,449,540 1,575,195 1,668,316 1,734,241 1,809,105 1,924,624 2,029,275
Outflow Compensation - - - 0 0 0 0 0Property Expense 170,646 195,258 173,616 193,591 191,261 176,760 196,097 225,911Total 170,646 195,258 173,616 193,591 191,261 176,760 196,097 225,911
Source: Philippine Statistics Authority
Net Primary Income
Net Primary Income
3-12

TABLE 3.8 Household Final Consumption Expenditure by Purpose: 2004 to 2018 (In million pesos: at current prices)
Industry/Industry group 2004 2005 2006 2007 2008 2009 2010 2011 2012 2013 2014 2015 2016r 2017r 2018
Household Final Consumption Expenditure
3,814,889 4,259,131 4,677,986 5,064,463 5,739,592 5,993,427 6,442,033 7,132,581 7,837,881 8,463,826 9,163,823 9,825,883 10,672,797 11,614,142 12,864,928
Food and Non-alcoholic beverages 1,545,613 1,712,658 1,873,207 2,019,980 2,400,556 2,543,994 2,709,757 3,053,347 3,343,427 3,602,777 3,870,513 4,139,099 4,498,255 4,886,289 5,472,209
Alcoholic beverages, Tobacco 58,818 62,797 67,025 71,634 79,052 83,773 87,778 91,770 100,930 110,059 126,588 137,400 153,652 157,812 179,840
Clothing and Footwear 71,765 74,442 77,008 80,308 87,259 89,495 94,861 100,886 108,492 116,635 127,205 127,987 127,407 132,011 133,432
Housing, water, electricity, gas and other fuels 449,128 522,961 573,433 657,993 704,698 712,292 805,487 879,328 965,753 1,062,100 1,152,881 1,175,023 1,240,873 1,374,067 1,541,369
Furnishings, household equipment and routine household maintenance 214,457 223,180 243,188 246,892 253,260 257,752 269,882 291,903 310,249 326,101 350,161 366,643 381,635 417,017 454,420
Health 88,508 100,234 110,327 119,600 130,937 141,114 157,089 173,444 199,821 222,833 248,640 276,193 309,404 344,997 370,609
Transport 388,261 472,751 535,238 570,660 620,107 663,622 715,749 770,433 837,569 894,369 995,720 1,107,386 1,229,680 1,325,536 1,430,734
Communication 145,807 167,385 179,633 203,881 213,962 216,702 220,220 225,358 247,946 264,863 276,202 299,742 310,968 322,168 340,022
Recreation and culture 77,473 82,116 89,684 101,430 108,763 112,962 123,048 129,605 142,851 154,391 166,113 184,032 200,614 206,146 219,559
Education 143,340 157,569 174,363 193,463 223,352 239,144 256,817 282,816 302,772 331,844 369,427 399,488 437,986 483,278 543,416
Restaurants and hotels 141,732 152,495 168,557 187,744 210,496 219,280 237,971 263,723 291,460 318,553 345,359 383,402 424,581 478,585 531,509
Miscellaneous goods and services 489,987 530,545 586,323 610,879 707,153 713,296 763,374 869,969 986,611 1,059,301 1,135,124 1,229,488 1,357,741 1,486,236 1,647,809
Source: Philippine Statistics Authority
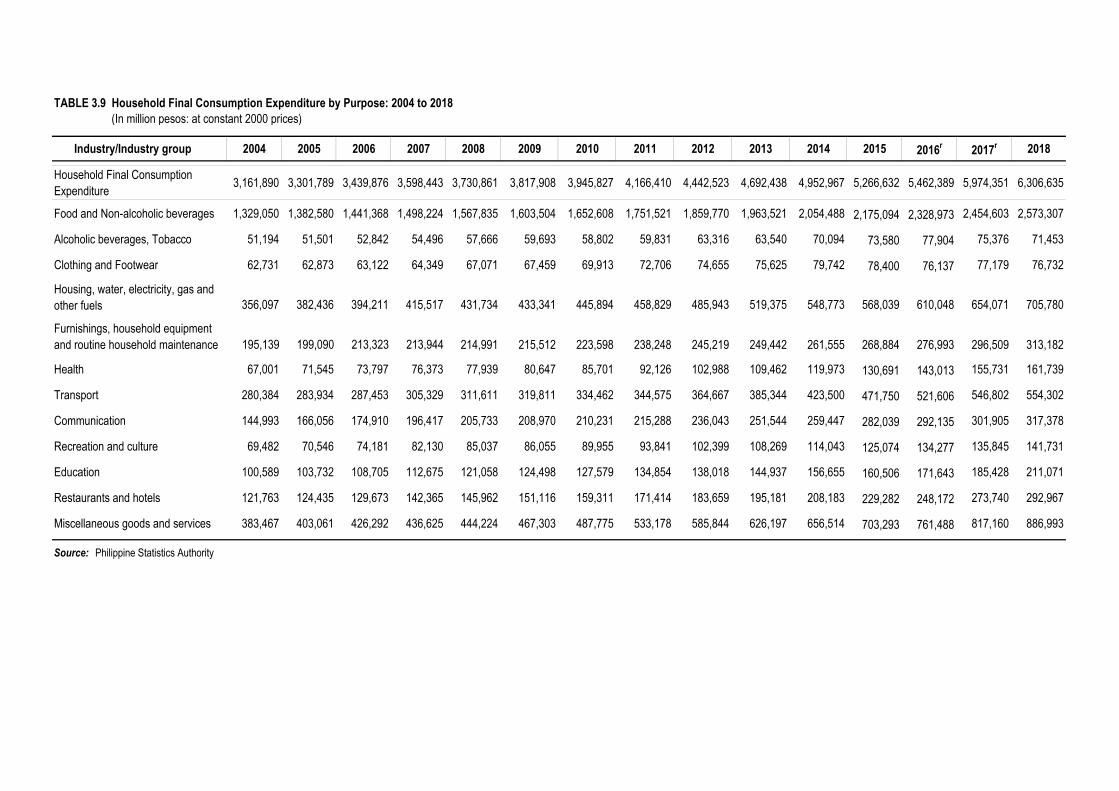
TABLE 3.9 Household Final Consumption Expenditure by Purpose: 2004 to 2018 (In million pesos: at constant 2000 prices)
Industry/Industry group 2004 2005 2006 2007 2008 2009 2010 2011 2012 2013 2014 2015 2016r 2017r 2018
Household Final Consumption Expenditure 3,161,890 3,301,789 3,439,876 3,598,443 3,730,861 3,817,908 3,945,827 4,166,410 4,442,523 4,692,438 4,952,967 5,266,632 5,462,389 5,974,351 6,306,635
Food and Non-alcoholic beverages 1,329,050 1,382,580 1,441,368 1,498,224 1,567,835 1,603,504 1,652,608 1,751,521 1,859,770 1,963,521 2,054,488 2,175,094 2,328,973 2,454,603 2,573,307
Alcoholic beverages, Tobacco 51,194 51,501 52,842 54,496 57,666 59,693 58,802 59,831 63,316 63,540 70,094 73,580 77,904 75,376 71,453
Clothing and Footwear 62,731 62,873 63,122 64,349 67,071 67,459 69,913 72,706 74,655 75,625 79,742 78,400 76,137 77,179 76,732
Housing, water, electricity, gas and other fuels 356,097 382,436 394,211 415,517 431,734 433,341 445,894 458,829 485,943 519,375 548,773 568,039 610,048 654,071 705,780
Furnishings, household equipment and routine household maintenance 195,139 199,090 213,323 213,944 214,991 215,512 223,598 238,248 245,219 249,442 261,555 268,884 276,993 296,509 313,182
Health 67,001 71,545 73,797 76,373 77,939 80,647 85,701 92,126 102,988 109,462 119,973 130,691 143,013 155,731 161,739
Transport 280,384 283,934 287,453 305,329 311,611 319,811 334,462 344,575 364,667 385,344 423,500 471,750 521,606 546,802 554,302
Communication 144,993 166,056 174,910 196,417 205,733 208,970 210,231 215,288 236,043 251,544 259,447 282,039 292,135 301,905 317,378
Recreation and culture 69,482 70,546 74,181 82,130 85,037 86,055 89,955 93,841 102,399 108,269 114,043 125,074 134,277 135,845 141,731
Education 100,589 103,732 108,705 112,675 121,058 124,498 127,579 134,854 138,018 144,937 156,655 160,506 171,643 185,428 211,071
Restaurants and hotels 121,763 124,435 129,673 142,365 145,962 151,116 159,311 171,414 183,659 195,181 208,183 229,282 248,172 273,740 292,967
Miscellaneous goods and services 383,467 403,061 426,292 436,625 444,224 467,303 487,775 533,178 585,844 626,197 656,514 703,293 761,488 817,160 886,993
Source: Philippine Statistics Authority

TABLE 3.10 Indicators Derived from the National Accounts: 2017 to 2019 (Q1) Base Year: 2000
2019Q1 Q2 Q3 Q4 Q1 Q2 Q3 Q4 Q1 Q2 Q3 Q4 Q1
1. Total Labor Productivity (In PhP, constant) 151,092 158,182 158,914 167,596 50,998 55,078 52,127 56,494 51,204 57,580 54,615 60,346 54,572Growth rate (1.7) 4.7 0.5 5.5 10.0 7.6 9.3 7.0 0.4 4.5 4.8 6.8 6.6
Agriculture, Hunting, Forestry and Fishing 55,119 55,352 55,421 57,748 18,162 16,543 16,240 21,079 16,946 17,825 17,534 22,365 20,263Industry 327,378 344,877 342,484 352,214 100,177 100,916 90,463 108,411 97,650 99,433 93,717 109,671 94,734Services 188,130 170,197 172,029 181,002 50,691 57,966 55,163 55,567 52,130 59,870 56,295 59,843 54,013
Labor Productivity Total (GVA/total number of hours worked, in PhP, constant)* 72.5 72.8 74.3 78.7 95.4 105.6 95.2 104.3 100.0 105.3 100.9 108.0 98.3
2. Terms of Trade (in percent) 95.3 95.0 91.6 89.7 88.3 81.1 86.1 93.7 87.5 77.8 81.6 89.1 85.3 3. Trading Gains/Losses (in million PhP, constant) -111,728 -140,621 -243,067 -293,141 -161,571 -271,781 -215,758 -80,785 -192,783 -385,041 -341,920 -162,847 -244,6234. Total Trade Balance (in million pesos, current prices) -90,348 -163,225 -353,017 -344,435 -436,125 -373,873 -334,137 -412,809 -516,331 -605,531 -563,580 -526,073 -639,854
Goods/Merchandise -305,080 -375,876 -791,633 -755,675 -657,628 -667,414 -530,667 -494,352 -817,130 -953,868 -771,818 -610,352 -962,9315. Sectoral Contribution to GNI (constant) Growth by Industrial Origin (in percentage points)
Agriculture, Hunting, Forestry and Fishing (0.1) (0.0) 0.3 0.3 0.4 0.4 0.2 0.2 0.1 0.0 0.0 0.1 0.1 Industry (0.5) 3.0 0.5 1.9 1.7 1.9 2.2 2.1 2.2 1.9 1.6 1.9 1.4Services 1.6 3.3 2.3 3.4 3.1 3.2 3.6 3.2 3.1 3.3 3.3 3.2 3.2NPI 3.6 0.7 (0.0) 1.5 1.0 1.1 1.4 0.5 0.9 0.7 0.9 0.4 0.6
Total GNI 4.6 7.0 3.0 7.1 6.2 6.6 7.4 6.1 6.3 5.9 5.9 5.7 5.26. Share of Top Five Exports to Total Merchandise Exports (in percent, current) 46.3 56.1 55.5 61.1 47.0 60.1 58.4 60.4 47.17. Share of Top Five Imports to Total Merchandise Imports (in percent, current) 47.4 46.1 40.9 47.3 47.5 48.0 44.1 46.2 46.28. Total Exports (in million, current)
PhP 2,587,015 3,133,507 3,109,661 3,254,826 1,217,654 1,163,957 1,311,255 1,211,171 1,345,420 1,332,880 1,479,908 1,363,111 1,397,558US $ (FOB) 54,310 69,485 71,801 77,057 24,360 23,347 25,794 23,784 26,144 25,415 27,637 25,633 26,697Share to GDP (in percent) 32 35 32 31 34.1 29.5 34.3 27.1 34.4 30.7 35.0 27.6 33.2
9. Total Imports (in million, current)PhP 2,677,363 3,296,732 3,462,678 3,599,262 1,653,779 1,537,830 1,645,392 1,623,981 1,861,751 1,938,410 2,043,488 1,889,184 2,037,412US $ (FOB) 56,218 73,167 79,948 85,266 33,085 30,846 32,367 31,890 36,178 36,961 38,161 35,526 38,920Share to GDP (in percent) 33.4 36.6 35.7 34.1 46.4 39.0 43.1 36.3 47.6 44.7 48.4 38.2 48.4
10. Fixed Capital Formation/GNI (in percent, current) 15.7 17.0 15.6 16.3 21.0 20.9 21.0 20.4 21.5 23.0 23.4 21.4 22.211. GNI IPIN (in percent) 152.1 158.4 164.8 168.4 177.8 179.5 183.4 189.9 183.3 185.9 191.6 198.0 187.112. Ratio of NPI to GNI (in percent, current) 17.6 17.0 16.5 17.0 18.1 16.8 17.4 15.3 17.9 16.5 17.4 15.1 17.813. Inflow of Compensation (in million, current)
PhP 1,934,352 2,058,272 2,129,027 2,429,426 844,263.7 845,701.2 869,024.8 868,770.1 909,006.0 929,202.0 947,308.2 935,749.2 970,171.9US $ 40,614 45,631 49,159 57,580 16,890.3 16,963.1 17,095.0 17,060.1 17,663.8 17,717.5 17,690.6 17,596.7 18,650.3Growth Rate (pesos) 27.4 6.4 3.4 14.1 7.1 8.9 10.5 5.8 7.7 9.9 9.0 7.7 4.5Growth Rate (US $) 19.2 12.4 7.7 17.1 1.3 1.6 2.3 2.0 4.6 4.4 3.5 3.1 2.8 Share to GNI (in percent) 19.9 19.0 18.3 19.1 19.4 17.8 18.8 16.4 19.1 17.9 18.5 16.1 18.6Share to GDP (in percent) 24.1 22.9 21.9 23.0 23.7 21.4 22.7 19.4 23.2 21.4 22.4 18.9 22.6
14. (Exports-Imports)/GDP (in percent, current) (1.1) (1.8) (3.6) (3.3) (12.2) (9.5) (8.7) (9.2) (13.2) (13.9) (13.3) (10.6) (15.2)15. (Exports+Imports)/GDP (in percent, current) 65.6 71.4 67.7 64.9 80.5 68.5 77.4 63.4 81.9 75.4 83.4 65.8 81.716. Fixed Capital Formation/GDP (in percent, current) 19.0 20.5 18.7 19.6 25.6 25.1 25.5 24.1 26.2 27.6 28.3 25.2 27.117. HFCE/GDP (in percent, current) 74.7 71.6 73.5 74.2 75.4 72.4 73.0 73.2 75.1 73.0 73.7 73.7 76.718. National Government Debt Service* (in million pesos) 622,287 689,799 722,750 729,774 248,650.0 129,719.0 204,534.6 97,562.8 198,200.0 217,698.0 204,640.0 155,051.0 220,196.019. Debt Service/GDP 7.8 7.7 7.4 6.9 7.0 3.3 5.4 2.2 5.1 5.0 4.8 3.1 5.2
* The Bureau of Treasury reports the National Government Debt Service following the prescribed IMF recommendation on actual amortization.
Source: Philippine Statistics Authority
2016 2017 2018

TABLE 3.11 Gross Domestic Capital Formation in Durable Equipment by Major Type: 2004 to 2018 (In million pesos: at current prices)
Type of equipment 2004 2005 2006 2007 2008 2009 2010 2011 2012 2013 2014 2015 2016r 2017r 2018P
Durable Equipment 439,631 492,099 533,195 547,817 582,028 541,642 692,519 698,745 751,133 885,836 996,623 1,129,827 1,512,204 1,706,394 1,984,235
A. Machinery specialized for Particular industries 155,523 156,984 157,246 147,710 141,629 122,305 162,378 180,345 172,203 176,953 185,694 243,254 327,597 349,753 437,109
1. Agricultural machineries 391 514 584 591 657 811 1,094 1,519 2,231 2,119 2,746 4,234 5,507 8,483 9,0492. Tractor other than steam 319 297 272 353 392 309 283 575 514 515 1,076 1,341 2,621 3,301 3,8053. Mining and construction machineries 4,449 5,808 6,764 8,728 11,008 10,107 11,555 14,993 21,229 23,480 21,243 29,450 35,469 47,390 64,0244. Textile machineries 2,518 2,820 2,150 1,795 1,711 1,498 1,727 2,167 2,246 2,397 2,850 3,752 5,442 6,321 7,4435. Sawmill & logging machineries 10 3 2 19 0.2 3 1 1 0.3 2 10 15 12 0 06. Sugarmill machineries 70 84 546 77 412 62 47 20 39 71 10 55 256 94 1397. Pulp and paper machineries 919 747 758 609 677 470 597 864 1,722 1,585 1,361 1,504 1,963 2,159 2,1278. Metal working machineries 9,222 10,793 8,843 8,340 7,352 5,647 8,801 11,151 12,193 10,718 11,155 17,158 22,489 25,557 32,3259. Telecommunications & sound/reproducing equipment 82,887 82,709 81,543 75,959 69,655 67,809 84,495 92,466 80,519 90,272 95,699 120,125 150,421 169,163 221,46610.Other special industrial machineries 54,738 53,209 55,784 51,239 49,764 35,587 53,779 56,589 51,511 45,794 49,544 65,620 103,416 87,287 96,731
B. General industrial machinery and equipment 71,544 72,579 75,526 77,230 79,895 79,298 92,100 104,867 106,438 117,272 144,514 176,310 234,307 263,583 299,059
1. Aircon & refrigeration equipment 9,999 9,587 8,507 10,817 11,184 10,968 13,029 13,375 14,009 14,541 18,680 24,029 33,232 36,639 43,2372. Pumps and compressor 7,316 6,878 6,483 7,418 7,445 7,253 8,719 10,724 10,522 11,781 10,868 15,399 20,606 21,317 23,0943. Other electrical machinery and apparatus 19,846 22,547 27,089 26,253 24,769 25,016 31,547 36,604 35,033 34,452 39,165 45,041 50,960 60,004 70,3314. Other general industrial machineries 34,384 33,567 33,447 32,743 36,497 36,061 38,805 44,164 46,874 56,498 75,801 91,840 129,509 145,624 162,397
C. Transport equipment 118,877 162,956 183,918 210,573 254,979 233,750 315,766 286,244 367,575 472,642 526,631 534,761 724,725 826,889 962,0271. Road vehicles 115,796 136,280 143,770 167,184 208,731 214,427 270,403 253,181 295,387 309,806 349,749 436,024 605,416 692,323 744,8872. Railway transport 182 319 6,316 176 194 224 260 66 86 52 76 162 9,732 570 1,2803. Air transport 518 24,318 28,168 35,826 34,978 12,305 36,695 23,090 62,748 156,239 168,966 87,495 97,606 122,212 199,2464. Water transport 2,382 2,040 5,663 7,387 11,077 6,793 8,408 9,906 9,354 6,546 7,840 11,080 11,971 11,784 16,615
D. Miscellaneous equipment 93,687 99,580 116,506 112,304 105,525 106,290 122,276 127,289 104,917 118,969 139,784 175,502 225,575 266,168 286,0401. Office machines & data processing 23,272 22,515 28,128 25,395 27,357 29,381 28,250 28,527 27,160 33,784 45,982 67,812 88,729 98,334 98,2112. Other misc. durable equipment 70,415 77,065 88,378 86,909 78,168 76,909 94,026 98,762 77,757 85,185 93,802 107,690 136,846 167,833 187,829
Source: Philippine Statistics Authority
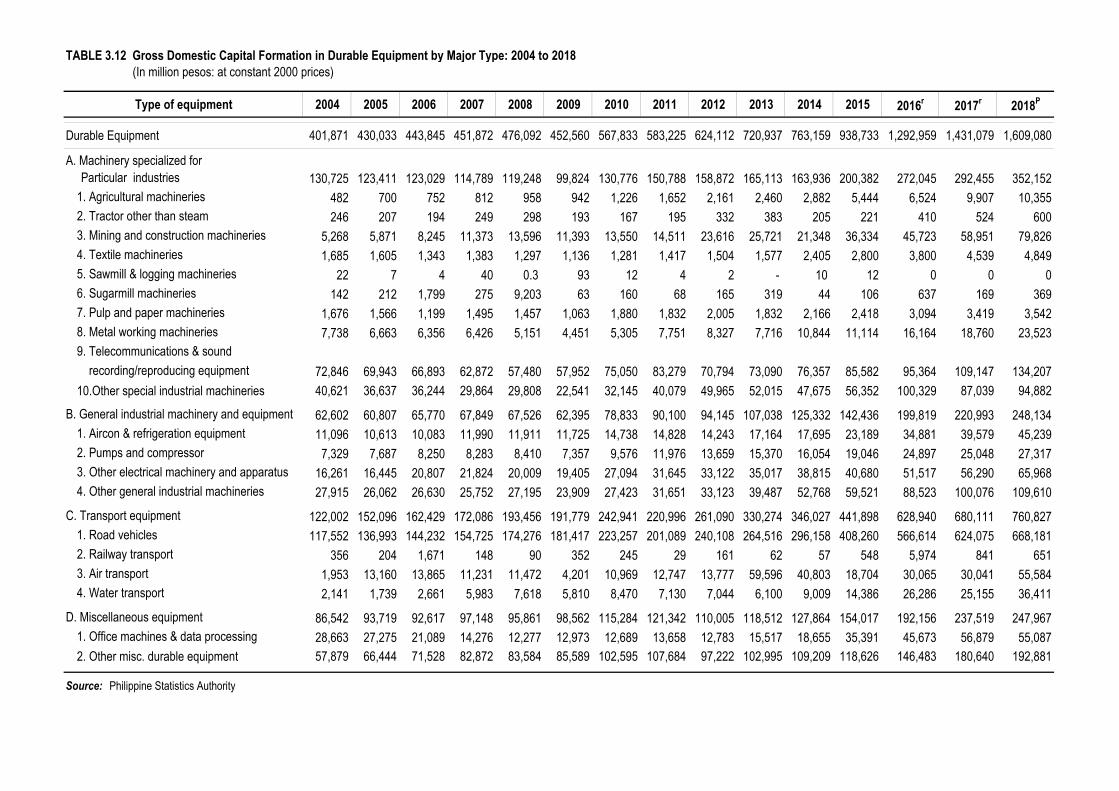
TABLE 3.12 Gross Domestic Capital Formation in Durable Equipment by Major Type: 2004 to 2018 (In million pesos: at constant 2000 prices)
Type of equipment 2004 2005 2006 2007 2008 2009 2010 2011 2012 2013 2014 2015 2016r 2017r 2018P
Durable Equipment 401,871 430,033 443,845 451,872 476,092 452,560 567,833 583,225 624,112 720,937 763,159 938,733 1,292,959 1,431,079 1,609,080
A. Machinery specialized for Particular industries 130,725 123,411 123,029 114,789 119,248 99,824 130,776 150,788 158,872 165,113 163,936 200,382 272,045 292,455 352,152
1. Agricultural machineries 482 700 752 812 958 942 1,226 1,652 2,161 2,460 2,882 5,444 6,524 9,907 10,3552. Tractor other than steam 246 207 194 249 298 193 167 195 332 383 205 221 410 524 6003. Mining and construction machineries 5,268 5,871 8,245 11,373 13,596 11,393 13,550 14,511 23,616 25,721 21,348 36,334 45,723 58,951 79,8264. Textile machineries 1,685 1,605 1,343 1,383 1,297 1,136 1,281 1,417 1,504 1,577 2,405 2,800 3,800 4,539 4,8495. Sawmill & logging machineries 22 7 4 40 0.3 93 12 4 2 - 10 12 0 0 06. Sugarmill machineries 142 212 1,799 275 9,203 63 160 68 165 319 44 106 637 169 3697. Pulp and paper machineries 1,676 1,566 1,199 1,495 1,457 1,063 1,880 1,832 2,005 1,832 2,166 2,418 3,094 3,419 3,5428. Metal working machineries 7,738 6,663 6,356 6,426 5,151 4,451 5,305 7,751 8,327 7,716 10,844 11,114 16,164 18,760 23,5239. Telecommunications & sound recording/reproducing equipment 72,846 69,943 66,893 62,872 57,480 57,952 75,050 83,279 70,794 73,090 76,357 85,582 95,364 109,147 134,20710.Other special industrial machineries 40,621 36,637 36,244 29,864 29,808 22,541 32,145 40,079 49,965 52,015 47,675 56,352 100,329 87,039 94,882
B. General industrial machinery and equipment 62,602 60,807 65,770 67,849 67,526 62,395 78,833 90,100 94,145 107,038 125,332 142,436 199,819 220,993 248,1341. Aircon & refrigeration equipment 11,096 10,613 10,083 11,990 11,911 11,725 14,738 14,828 14,243 17,164 17,695 23,189 34,881 39,579 45,2392. Pumps and compressor 7,329 7,687 8,250 8,283 8,410 7,357 9,576 11,976 13,659 15,370 16,054 19,046 24,897 25,048 27,3173. Other electrical machinery and apparatus 16,261 16,445 20,807 21,824 20,009 19,405 27,094 31,645 33,122 35,017 38,815 40,680 51,517 56,290 65,9684. Other general industrial machineries 27,915 26,062 26,630 25,752 27,195 23,909 27,423 31,651 33,123 39,487 52,768 59,521 88,523 100,076 109,610
C. Transport equipment 122,002 152,096 162,429 172,086 193,456 191,779 242,941 220,996 261,090 330,274 346,027 441,898 628,940 680,111 760,8271. Road vehicles 117,552 136,993 144,232 154,725 174,276 181,417 223,257 201,089 240,108 264,516 296,158 408,260 566,614 624,075 668,1812. Railway transport 356 204 1,671 148 90 352 245 29 161 62 57 548 5,974 841 6513. Air transport 1,953 13,160 13,865 11,231 11,472 4,201 10,969 12,747 13,777 59,596 40,803 18,704 30,065 30,041 55,5844. Water transport 2,141 1,739 2,661 5,983 7,618 5,810 8,470 7,130 7,044 6,100 9,009 14,386 26,286 25,155 36,411
D. Miscellaneous equipment 86,542 93,719 92,617 97,148 95,861 98,562 115,284 121,342 110,005 118,512 127,864 154,017 192,156 237,519 247,9671. Office machines & data processing 28,663 27,275 21,089 14,276 12,277 12,973 12,689 13,658 12,783 15,517 18,655 35,391 45,673 56,879 55,0872. Other misc. durable equipment 57,879 66,444 71,528 82,872 83,584 85,589 102,595 107,684 97,222 102,995 109,209 118,626 146,483 180,640 192,881
Source: Philippine Statistics Authority

TABLE 3.13 Gross Value Added in Agriculture, Hunting, Forestry, and Fishing by Industry Group: 2004 to 2018 (In million pesos: at current prices)
Industry/Industry group 2004 2005 2006 2007 2008 2009 2010 2011 2012 2013 2014 2015 2016r 2017r 2018P
Gross Value Added in Agriculture, Hunting, Forestry and Fishing 681,296 719,076 775,688 861,365 1,022,515 1,049,874 1,108,718 1,235,013 1,249,768 1,297,151 1,431,578 1,366,866 1,398,113 1,527,571 1,617,910
1. Agriculture, Hunting and Forestry 565,612 597,718 640,340 711,845 844,438 871,012 928,588 1,052,167 1,057,660 1,097,830 1,236,073 1,173,088 1,212,922 1,330,374 1,403,040
a. Agriculture 561,282 593,182 635,214 707,690 840,864 867,254 926,153 1,048,296 1,054,422 1,093,074 1,231,345 1,170,256 1,210,438 1,327,952 1,400,390 Palay 125,018 139,488 144,113 166,046 211,814 219,755 221,236 243,603 279,467 301,314 362,506 298,534 291,619 335,279 369,272 Corn 40,040 33,401 46,049 55,615 61,332 65,051 60,577 76,770 82,093 78,379 87,650 80,598 73,838 82,324 94,996 Coconut including copra 48,637 49,653 47,319 56,165 75,771 60,964 76,885 112,512 77,150 77,110 90,104 83,038 94,053 104,553 80,621 Sugarcane 16,480 17,496 20,158 20,551 23,651 19,377 27,351 38,293 29,049 28,101 28,686 30,358 31,458 29,735 27,282 Banana 28,967 35,748 39,153 47,585 61,560 72,737 86,891 83,805 87,852 95,586 106,636 111,229 120,270 120,425 129,462 Mango 15,688 16,299 18,170 16,878 19,251 17,584 17,396 18,079 24,903 18,662 25,880 26,846 30,071 35,762 32,608 Pineapple 8,258 8,636 7,213 9,015 9,939 10,495 9,916 13,126 15,962 16,340 18,124 19,100 21,904 23,540 25,964 Coffee 3,824 4,499 4,764 5,305 5,922 5,280 5,261 5,918 5,869 5,350 5,515 5,421 5,445 5,526 5,320 Cassava 6,501 6,429 9,265 8,944 10,706 11,888 12,098 14,219 17,573 18,221 18,635 16,189 19,531 22,504 20,200 Rubber 6,894 8,039 11,508 16,152 14,992 11,741 22,875 28,846 20,369 16,568 10,753 7,647 8,154 10,575 9,408 Other crops 43,470 44,431 53,058 52,844 61,476 68,196 59,788 71,494 65,410 66,307 70,441 78,773 84,083 86,412 94,217 Livestock 104,655 110,965 111,940 117,159 130,149 141,047 150,329 151,635 152,815 167,010 176,898 179,947 184,475 208,109 229,564 Poultry 68,740 71,732 73,653 78,560 87,902 92,771 101,846 106,906 112,708 118,133 132,453 135,260 140,255 149,036 160,385 Agricultural activities and services 44,110 46,365 48,851 56,871 66,399 70,367 73,707 83,089 83,201 85,994 97,066 97,318 105,281 114,171 121,089b. Forestry 4,330 4,537 5,126 4,155 3,574 3,758 2,435 3,871 3,238 4,756 4,729 2,832 2,485 2,422 2,650
2. Fishing 115,684 121,358 135,348 149,520 178,077 178,862 180,130 182,845 192,108 199,320 195,504 193,778 185,191 197,197 214,869
Source: Philippine Statistics Authority
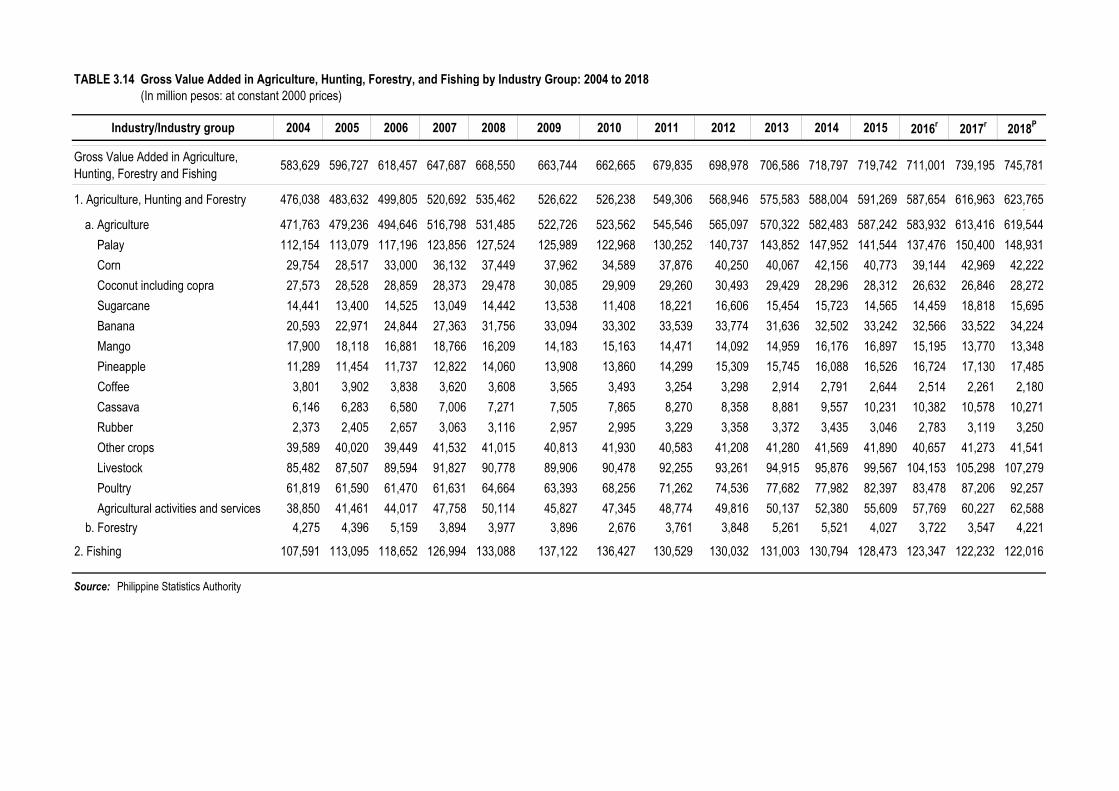
TABLE 3.14 Gross Value Added in Agriculture, Hunting, Forestry, and Fishing by Industry Group: 2004 to 2018 (In million pesos: at constant 2000 prices)
Industry/Industry group 2004 2005 2006 2007 2008 2009 2010 2011 2012 2013 2014 2015 2016r 2017r 2018P
Gross Value Added in Agriculture, Hunting, Forestry and Fishing 583,629 596,727 618,457 647,687 668,550 663,744 662,665 679,835 698,978 706,586 718,797 719,742 711,001 739,195 745,781
1. Agriculture, Hunting and Forestry 476,038 483,632 499,805 520,692 535,462 526,622 526,238 549,306 568,946 575,583 588,004 591,269 587,654 616,963 623,765,a. Agriculture 471,763 479,236 494,646 516,798 531,485 522,726 523,562 545,546 565,097 570,322 582,483 587,242 583,932 613,416 619,544 Palay 112,154 113,079 117,196 123,856 127,524 125,989 122,968 130,252 140,737 143,852 147,952 141,544 137,476 150,400 148,931 Corn 29,754 28,517 33,000 36,132 37,449 37,962 34,589 37,876 40,250 40,067 42,156 40,773 39,144 42,969 42,222 Coconut including copra 27,573 28,528 28,859 28,373 29,478 30,085 29,909 29,260 30,493 29,429 28,296 28,312 26,632 26,846 28,272 Sugarcane 14,441 13,400 14,525 13,049 14,442 13,538 11,408 18,221 16,606 15,454 15,723 14,565 14,459 18,818 15,695 Banana 20,593 22,971 24,844 27,363 31,756 33,094 33,302 33,539 33,774 31,636 32,502 33,242 32,566 33,522 34,224 Mango 17,900 18,118 16,881 18,766 16,209 14,183 15,163 14,471 14,092 14,959 16,176 16,897 15,195 13,770 13,348 Pineapple 11,289 11,454 11,737 12,822 14,060 13,908 13,860 14,299 15,309 15,745 16,088 16,526 16,724 17,130 17,485 Coffee 3,801 3,902 3,838 3,620 3,608 3,565 3,493 3,254 3,298 2,914 2,791 2,644 2,514 2,261 2,180 Cassava 6,146 6,283 6,580 7,006 7,271 7,505 7,865 8,270 8,358 8,881 9,557 10,231 10,382 10,578 10,271 Rubber 2,373 2,405 2,657 3,063 3,116 2,957 2,995 3,229 3,358 3,372 3,435 3,046 2,783 3,119 3,250 Other crops 39,589 40,020 39,449 41,532 41,015 40,813 41,930 40,583 41,208 41,280 41,569 41,890 40,657 41,273 41,541 Livestock 85,482 87,507 89,594 91,827 90,778 89,906 90,478 92,255 93,261 94,915 95,876 99,567 104,153 105,298 107,279 Poultry 61,819 61,590 61,470 61,631 64,664 63,393 68,256 71,262 74,536 77,682 77,982 82,397 83,478 87,206 92,257 Agricultural activities and services 38,850 41,461 44,017 47,758 50,114 45,827 47,345 48,774 49,816 50,137 52,380 55,609 57,769 60,227 62,588b. Forestry 4,275 4,396 5,159 3,894 3,977 3,896 2,676 3,761 3,848 5,261 5,521 4,027 3,722 3,547 4,221
2. Fishing 107,591 113,095 118,652 126,994 133,088 137,122 136,427 130,529 130,032 131,003 130,794 128,473 123,347 122,232 122,016
Source: Philippine Statistics Authority
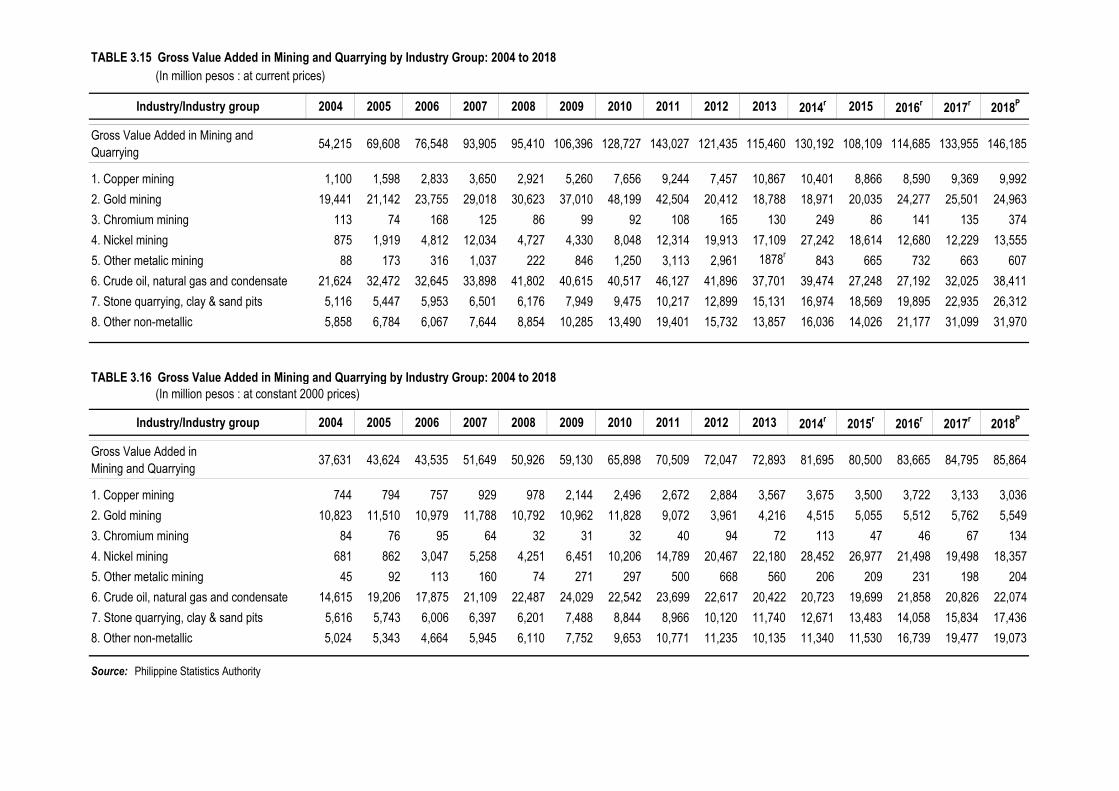
TABLE 3.15 Gross Value Added in Mining and Quarrying by Industry Group: 2004 to 2018 (In million pesos : at current prices)
Industry/Industry group 2004 2005 2006 2007 2008 2009 2010 2011 2012 2013 2014r 2015 2016r 2017r 2018P
Gross Value Added in Mining and Quarrying 54,215 69,608 76,548 93,905 95,410 106,396 128,727 143,027 121,435 115,460 130,192 108,109 114,685 133,955 146,185
1. Copper mining 1,100 1,598 2,833 3,650 2,921 5,260 7,656 9,244 7,457 10,867 10,401 8,866 8,590 9,369 9,9922. Gold mining 19,441 21,142 23,755 29,018 30,623 37,010 48,199 42,504 20,412 18,788 18,971 20,035 24,277 25,501 24,9633. Chromium mining 113 74 168 125 86 99 92 108 165 130 249 86 141 135 3744. Nickel mining 875 1,919 4,812 12,034 4,727 4,330 8,048 12,314 19,913 17,109 27,242 18,614 12,680 12,229 13,5555. Other metalic mining 88 173 316 1,037 222 846 1,250 3,113 2,961 1878r 843 665 732 663 6076. Crude oil, natural gas and condensate 21,624 32,472 32,645 33,898 41,802 40,615 40,517 46,127 41,896 37,701 39,474 27,248 27,192 32,025 38,4117. Stone quarrying, clay & sand pits 5,116 5,447 5,953 6,501 6,176 7,949 9,475 10,217 12,899 15,131 16,974 18,569 19,895 22,935 26,3128. Other non-metallic 5,858 6,784 6,067 7,644 8,854 10,285 13,490 19,401 15,732 13,857 16,036 14,026 21,177 31,099 31,970
TABLE 3.16 Gross Value Added in Mining and Quarrying by Industry Group: 2004 to 2018 (In million pesos : at constant 2000 prices)
Industry/Industry group 2004 2005 2006 2007 2008 2009 2010 2011 2012 2013 2014r 2015r 2016r 2017r 2018P
Gross Value Added in Mining and Quarrying 37,631 43,624 43,535 51,649 50,926 59,130 65,898 70,509 72,047 72,893 81,695 80,500 83,665 84,795 85,864
1. Copper mining 744 794 757 929 978 2,144 2,496 2,672 2,884 3,567 3,675 3,500 3,722 3,133 3,0362. Gold mining 10,823 11,510 10,979 11,788 10,792 10,962 11,828 9,072 3,961 4,216 4,515 5,055 5,512 5,762 5,5493. Chromium mining 84 76 95 64 32 31 32 40 94 72 113 47 46 67 1344. Nickel mining 681 862 3,047 5,258 4,251 6,451 10,206 14,789 20,467 22,180 28,452 26,977 21,498 19,498 18,3575. Other metalic mining 45 92 113 160 74 271 297 500 668 560 206 209 231 198 2046. Crude oil, natural gas and condensate 14,615 19,206 17,875 21,109 22,487 24,029 22,542 23,699 22,617 20,422 20,723 19,699 21,858 20,826 22,0747. Stone quarrying, clay & sand pits 5,616 5,743 6,006 6,397 6,201 7,488 8,844 8,966 10,120 11,740 12,671 13,483 14,058 15,834 17,4368. Other non-metallic 5,024 5,343 4,664 5,945 6,110 7,752 9,653 10,771 11,235 10,135 11,340 11,530 16,739 19,477 19,073
Source: Philippine Statistics Authority
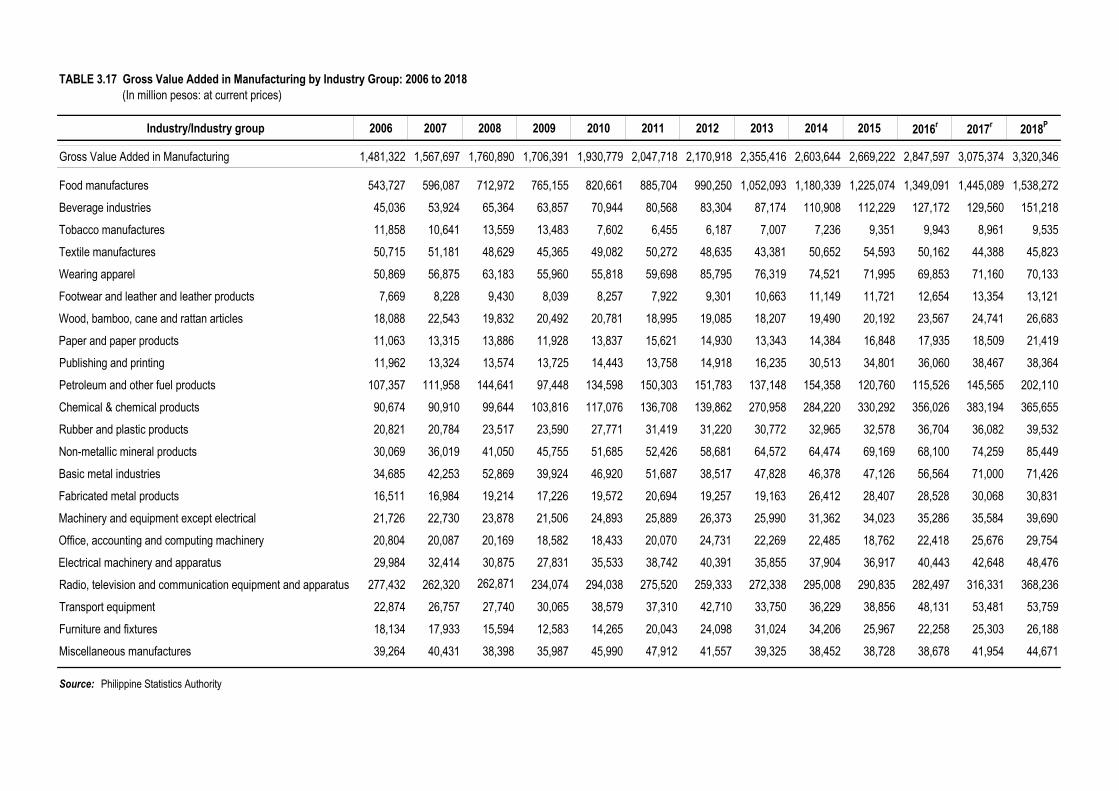
TABLE 3.17 Gross Value Added in Manufacturing by Industry Group: 2006 to 2018 (In million pesos: at current prices)
Industry/Industry group 2006 2007 2008 2009 2010 2011 2012 2013 2014 2015 2016r 2017r 2018P
Gross Value Added in Manufacturing 1,481,322 1,567,697 1,760,890 1,706,391 1,930,779 2,047,718 2,170,918 2,355,416 2,603,644 2,669,222 2,847,597 3,075,374 3,320,346
Food manufactures 543,727 596,087 712,972 765,155 820,661 885,704 990,250 1,052,093 1,180,339 1,225,074 1,349,091 1,445,089 1,538,272Beverage industries 45,036 53,924 65,364 63,857 70,944 80,568 83,304 87,174 110,908 112,229 127,172 129,560 151,218Tobacco manufactures 11,858 10,641 13,559 13,483 7,602 6,455 6,187 7,007 7,236 9,351 9,943 8,961 9,535Textile manufactures 50,715 51,181 48,629 45,365 49,082 50,272 48,635 43,381 50,652 54,593 50,162 44,388 45,823Wearing apparel 50,869 56,875 63,183 55,960 55,818 59,698 85,795 76,319 74,521 71,995 69,853 71,160 70,133Footwear and leather and leather products 7,669 8,228 9,430 8,039 8,257 7,922 9,301 10,663 11,149 11,721 12,654 13,354 13,121Wood, bamboo, cane and rattan articles 18,088 22,543 19,832 20,492 20,781 18,995 19,085 18,207 19,490 20,192 23,567 24,741 26,683Paper and paper products 11,063 13,315 13,886 11,928 13,837 15,621 14,930 13,343 14,384 16,848 17,935 18,509 21,419Publishing and printing 11,962 13,324 13,574 13,725 14,443 13,758 14,918 16,235 30,513 34,801 36,060 38,467 38,364Petroleum and other fuel products 107,357 111,958 144,641 97,448 134,598 150,303 151,783 137,148 154,358 120,760 115,526 145,565 202,110Chemical & chemical products 90,674 90,910 99,644 103,816 117,076 136,708 139,862 270,958 284,220 330,292 356,026 383,194 365,655Rubber and plastic products 20,821 20,784 23,517 23,590 27,771 31,419 31,220 30,772 32,965 32,578 36,704 36,082 39,532Non-metallic mineral products 30,069 36,019 41,050 45,755 51,685 52,426 58,681 64,572 64,474 69,169 68,100 74,259 85,449Basic metal industries 34,685 42,253 52,869 39,924 46,920 51,687 38,517 47,828 46,378 47,126 56,564 71,000 71,426Fabricated metal products 16,511 16,984 19,214 17,226 19,572 20,694 19,257 19,163 26,412 28,407 28,528 30,068 30,831Machinery and equipment except electrical 21,726 22,730 23,878 21,506 24,893 25,889 26,373 25,990 31,362 34,023 35,286 35,584 39,690Office, accounting and computing machinery 20,804 20,087 20,169 18,582 18,433 20,070 24,731 22,269 22,485 18,762 22,418 25,676 29,754Electrical machinery and apparatus 29,984 32,414 30,875 27,831 35,533 38,742 40,391 35,855 37,904 36,917 40,443 42,648 48,476Radio, television and communication equipment and apparatus 277,432 262,320 262,871 234,074 294,038 275,520 259,333 272,338 295,008 290,835 282,497 316,331 368,236Transport equipment 22,874 26,757 27,740 30,065 38,579 37,310 42,710 33,750 36,229 38,856 48,131 53,481 53,759Furniture and fixtures 18,134 17,933 15,594 12,583 14,265 20,043 24,098 31,024 34,206 25,967 22,258 25,303 26,188Miscellaneous manufactures 39,264 40,431 38,398 35,987 45,990 47,912 41,557 39,325 38,452 38,728 38,678 41,954 44,671
Source: Philippine Statistics Authority

TABLE 3.18 Gross Value Added in Manufacturing by Industry Group: 2006 to 2018 (In million pesos: at constant 2000 prices)
Industry/Industry group 2006 2007 2008 2009 2010 2011 2012 2013 2014 2015 2016r 2017r 2018P
Gross Value Added in Manufacturing 1,106,052 1,145,529 1,194,921 1,137,534 1,264,523 1,324,330 1,395,711 1,538,912 1,666,514 1,760,989 1,885,514 2,044,189 2,145,011
Food manufactures 392,028 409,398 447,843 467,301 479,445 494,349 531,704 554,984 593,577 603,249 653,626 686,274 721,159Beverage industries 37,834 44,175 50,102 46,051 50,133 58,743 60,303 58,632 73,080 72,375 79,345 80,481 82,495Tobacco manufactures 9,558 8,632 10,861 10,952 5,968 4,844 4,675 4,349 4,307 5,480 5,854 5,052 4,304Textile manufactures 40,148 40,395 35,392 29,199 31,472 30,763 30,102 26,435 30,428 32,384 29,761 26,195 26,424Wearing apparel 34,310 34,758 37,227 29,346 26,465 27,976 39,554 33,330 31,994 31,258 31,238 31,320 31,390Footwear and leather and leather products 6,876 7,051 7,795 6,036 5,634 5,388 6,269 6,993 7,137 7,478 8,518 8,992 9,325Wood, bamboo, cane and rattan articles 14,709 19,212 16,336 13,984 14,009 12,788 14,316 13,316 13,567 17,366 20,504 21,470 23,800Paper and paper products 9,431 11,160 11,215 10,389 12,347 14,147 13,592 12,708 13,437 15,392 16,430 17,109 19,470Publishing and printing 9,308 9,560 8,890 8,470 8,623 8,140 8,509 8,225 15,308 17,916 18,809 19,389 19,065Petroleum and other fuel products 53,379 55,394 59,751 48,614 55,869 50,806 48,790 43,266 49,683 49,035 49,689 55,023 65,675Chemical & chemical products 70,455 68,547 71,466 67,851 77,406 91,401 95,267 184,363 191,229 220,902 242,753 261,770 251,449Rubber and plastic products 16,166 15,677 16,385 18,399 20,297 21,845 22,516 23,208 24,561 25,398 31,596 32,449 36,782Non-metallic mineral products 21,657 24,926 27,196 29,190 32,058 32,991 38,010 41,392 39,637 43,362 42,089 50,747 56,775Basic metal industries 25,073 28,353 28,154 23,252 26,024 25,869 20,983 31,348 33,218 35,290 49,590 61,138 58,173Fabricated metal products 12,043 12,551 13,528 11,983 13,488 14,391 13,961 14,063 20,335 21,994 21,986 33,277 34,864Machinery and equipment except electrical 16,995 17,692 18,425 16,291 19,752 19,908 20,271 21,426 26,568 31,424 39,328 40,440 42,840Office, accounting and computing machinery 18,290 17,571 17,492 15,821 16,539 17,362 20,940 20,936 23,638 20,342 29,323 34,434 37,435Electrical machinery and apparatus 23,589 25,930 24,575 22,932 30,399 32,515 35,749 33,405 34,476 37,373 42,074 44,586 47,549Radio, television and communication equipment 226,932 218,185 216,505 186,810 243,646 242,616 238,396 262,166 276,537 311,241 305,480 345,165 378,344Transport equipment 18,772 21,257 22,094 24,554 31,580 29,565 33,285 26,845 28,867 31,301 38,926 43,556 44,105Furniture and fixtures 17,560 20,327 18,937 16,875 20,185 39,326 53,346 77,078 94,741 90,378 89,500 104,252 110,935Miscellaneous manufactures 30,940 34,778 34,753 33,235 43,186 48,599 45,176 40,444 40,189 40,050 39,096 41,072 42,652
Source: Philippine Statistics Authority

TABLE 3.19 Gross Value of Construction and Gross Value Added in Construction: 2004 to 2018 (In million pesos: at current prices)
Industry/Industry group 2004 2005 2006 2007 2008 2009 2010 2011 2012 2013 2014 2015 2016 2017r 2018P
Public 108,374 123,158 179,904 196,878 224,055 278,937 301,577 190,830 230,958 283,211 286,647 361,125 457,830r 523,066 661,048
Private 345,445 352,456 365,295 433,062 513,846 506,490 647,829 715,767 864,218 977,918 1,108,612 1,205,776 1,336,187r 1,415,878 1,665,293
Gross Value in Construction 453,819 475,614 545,199 629,940 737,901 785,427 949,406 906,596 1,095,176 1,261,129 1,395,259 1,566,901 1,794,018r 1,938,944 2,326,341
Gross Value Added in Construction 255,909 269,080 308,212 365,545 419,402 460,426 551,230 522,197 633,065 727,378 802,880 904,510 1,034,279 1,113,606 1,347,556
Source: Philippine Statistics Authority
TABLE 3.20 Gross Value of Construction and Gross Value Added in Construction: 2004 to 2018 (In million pesos: at constant prices)
Industry/Industry group 2004 2005 2006 2007 2008 2009 2010 2011 2012 2013 2014 2015 2016 2017r 2018P
Public 78,482 81,894 112,443 117,930 116,752 138,580 144,247 88,267 103,553 122,143 120,424 151,161 190,044r 213,048 254,991
Private 257,933 247,308 241,945 276,388 294,289 279,128 346,413 362,079 425,016 464,588 511,795 550,641 603,425r 626,186 698,228
Gross Value in Construction 336,414 329,201 354,388 394,319 411,042 417,708 490,659 450,346 528,569 586,731 632,219 701,802 793,470r 839,234 953,219
Gross Value Added in Construction 198,404 198,154 217,637 249,379 266,751 284,994 325,820 294,564 348,262 384,108 409,277 456,932 512,113 538,107 618,294
Note: Private Construction includes Built-Operate-Transfer (BOT) Projects which used to be under Public Construction.
Source: Philippine Statistics Authority
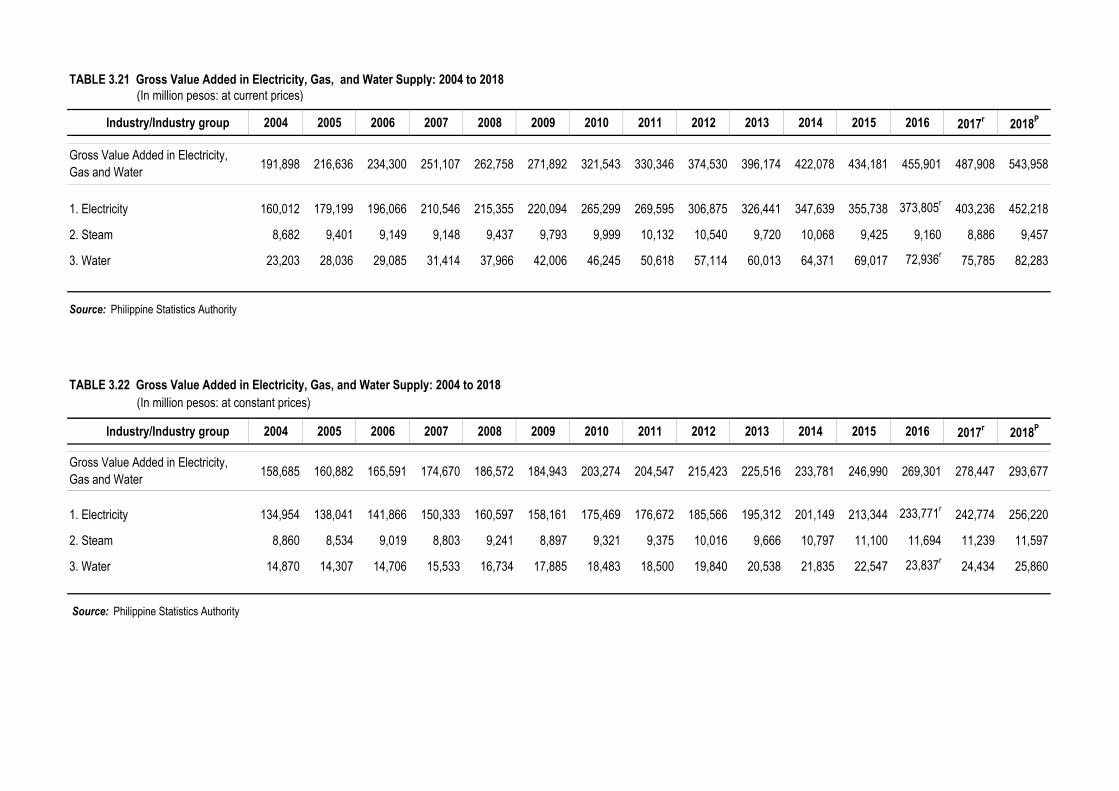
TABLE 3.21 Gross Value Added in Electricity, Gas, and Water Supply: 2004 to 2018 (In million pesos: at current prices)
Industry/Industry group 2004 2005 2006 2007 2008 2009 2010 2011 2012 2013 2014 2015 2016 2017r 2018P
191,898 216,636 234,300 251,107 262,758 271,892 321,543 330,346 374,530 396,174 422,078 434,181 455,901 487,908 543,958
1. Electricity 160,012 179,199 196,066 210,546 215,355 220,094 265,299 269,595 306,875 326,441 347,639 355,738 373,805r 403,236 452,218
2. Steam 8,682 9,401 9,149 9,148 9,437 9,793 9,999 10,132 10,540 9,720 10,068 9,425 9,160 8,886 9,457
3. Water 23,203 28,036 29,085 31,414 37,966 42,006 46,245 50,618 57,114 60,013 64,371 69,017 72,936r 75,785 82,283
Source: Philippine Statistics Authority
TABLE 3.22 Gross Value Added in Electricity, Gas, and Water Supply: 2004 to 2018 (In million pesos: at constant prices)
Industry/Industry group 2004 2005 2006 2007 2008 2009 2010 2011 2012 2013 2014 2015 2016 2017r 2018P
158,685 160,882 165,591 174,670 186,572 184,943 203,274 204,547 215,423 225,516 233,781 246,990 269,301 278,447 293,677
1. Electricity 134,954 138,041 141,866 150,333 160,597 158,161 175,469 176,672 185,566 195,312 201,149 213,344 233,771r 242,774 256,220
2. Steam 8,860 8,534 9,019 8,803 9,241 8,897 9,321 9,375 10,016 9,666 10,797 11,100 11,694 11,239 11,597
3. Water 14,870 14,307 14,706 15,533 16,734 17,885 18,483 18,500 19,840 20,538 21,835 22,547 23,837r 24,434 25,860
Source: Philippine Statistics Authority
Gross Value Added in Electricity, Gas and Water
Gross Value Added in Electricity, Gas and Water

TABLE 3.23 Gross Value Added in Transport, Storage, and Communication: 2014 to 2018 (In million pesos: at current prices)
Industry/Industry group 2004 2005 2006 2007 2008 2009 2010 2011 2012 2013 2014 2015 2016r 2017r 2018P
Gross Value Added in Transport, Storage and Communication
394,960 443503 476,866 514,537 548,856 561,093 586,197 627,255 679875 727912 784881 856051 909,269 962,574 1,030,521
1. Transport and Storage 204,515 225,212 242,108 260,357 277,997 282,869 304,428 337,788 372,332 404,023 449,100 494,265 535,862 575,742 622,503
a. Land 130,410 139,797 152,442 163,563 174,256 177,882 182,959 199,557 221,498 239,541 256,629 280,895 300,170 317,083 333,372
b. Water 20,880 21,658 21,021 20,951 22,068 17,726 18,938 21,151 23,974 23,557 24,658 26,675 28,213 30,310 31,954
c. Air 19,538 21,603 23,945 27,818 29,615 36,257 46,192 49,785 52,347 55,806 65,628 75,545 86,169 93,860 102,784 d. Storage & services incidental to transport 33,687 42,153 44,700 48,025 52,058 51,004 56,339 67,295 74,513 85,118 102,185 111,151 121,311 134,489 154,394
2. Communication 190,445 218,291 234,758 254,180 270,859 278,224 281,769 289,467 307,543 323,889 335,781 361,786 373,407 386,832 408,017
Source: Philippine Statistics Authority
TABLE 3.24 Gross Value Added in Transport, Storage, and Communication: 2004 to 2018 (In million pesos: at constant 2000 prices)
Industry/Industry group 2004 2005 2006 2007 2008 2009 2010 2011 2012 2013 2014 2015 2016r 2017r 2018P
Gross Value Added in Transport, Storage and Communication 337,039 360,885 376,398 408,076 423,952 423,398 427,766 446,026 476,855 505,415 538,044 581,289 611,902 636,612 670,803
1. Transport and Storage 147,349 143,929 147,987 152,644 155,484 152,023 154,089 165,097 178,674 192,469 213,755 231,721 251,526 264,374 279,750
a. Land 95,119 88,046 91,593 91,826 92,311 92,835 89,331 93,051 100,751 108,679 115,891 124,635 134,069 138,141 141,414
b. Water 14,436 13,533 13,169 13,108 13,816 11,059 12,337 13,781 15,617 15,341 16,060 17,399 18,355 19,168 19,657
c. Air 12,934 13,570 14,426 16,037 16,516 16,418 17,978 18,592 19,120 19,700 23,326 26,816 30,491 32,709 35,205 d. Storage & services incidental to transport 24,860 28,780 28,799 31,673 32,841 31,711 34,443 39,673 43,186 48,749 58,478 62,871 68,612 74,357 83,474
2. Communication 189,690 216,956 228,411 255,432 268,468 271,374 273,678 280,929 298,182 312,946 324,289 349,568 360,376 372,238 391,053
Source: Philippine Statistics Authority
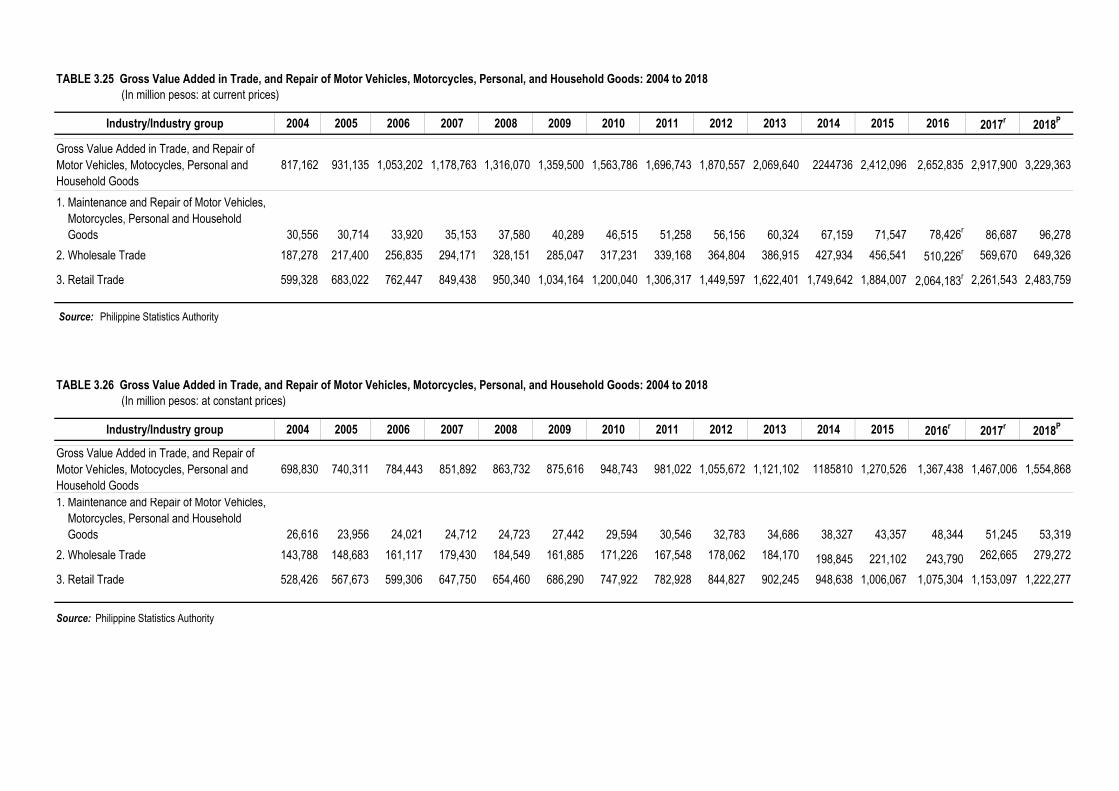
TABLE 3.25 Gross Value Added in Trade, and Repair of Motor Vehicles, Motorcycles, Personal, and Household Goods: 2004 to 2018 (In million pesos: at current prices)
Industry/Industry group 2004 2005 2006 2007 2008 2009 2010 2011 2012 2013 2014 2015 2016 2017r 2018P
Gross Value Added in Trade, and Repair of Motor Vehicles, Motocycles, Personal and Household Goods
817,162 931,135 1,053,202 1,178,763 1,316,070 1,359,500 1,563,786 1,696,743 1,870,557 2,069,640 2244736 2,412,096 2,652,835 2,917,900 3,229,363
1. Maintenance and Repair of Motor Vehicles, Motorcycles, Personal and Household Goods 30,556 30,714 33,920 35,153 37,580 40,289 46,515 51,258 56,156 60,324 67,159 71,547 78,426r 86,687 96,2782. Wholesale Trade 187,278 217,400 256,835 294,171 328,151 285,047 317,231 339,168 364,804 386,915 427,934 456,541 510,226r 569,670 649,326
3. Retail Trade 599,328 683,022 762,447 849,438 950,340 1,034,164 1,200,040 1,306,317 1,449,597 1,622,401 1,749,642 1,884,007 2,064,183r 2,261,543 2,483,759
Source: Philippine Statistics Authority
TABLE 3.26 Gross Value Added in Trade, and Repair of Motor Vehicles, Motorcycles, Personal, and Household Goods: 2004 to 2018 (In million pesos: at constant prices)
Industry/Industry group 2004 2005 2006 2007 2008 2009 2010 2011 2012 2013 2014 2015 2016r 2017r 2018P
Gross Value Added in Trade, and Repair of Motor Vehicles, Motocycles, Personal and Household Goods
698,830 740,311 784,443 851,892 863,732 875,616 948,743 981,022 1,055,672 1,121,102 1185810 1,270,526 1,367,438 1,467,006 1,554,868
1. Maintenance and Repair of Motor Vehicles, Motorcycles, Personal and Household Goods 26,616 23,956 24,021 24,712 24,723 27,442 29,594 30,546 32,783 34,686 38,327 43,357 48,344 51,245 53,3192. Wholesale Trade 143,788 148,683 161,117 179,430 184,549 161,885 171,226 167,548 178,062 184,170 198,845 221,102 243,790 262,665 279,272
3. Retail Trade 528,426 567,673 599,306 647,750 654,460 686,290 747,922 782,928 844,827 902,245 948,638 1,006,067 1,075,304 1,153,097 1,222,277
Source: Philippine Statistics Authority

TABLE 3.27 Gross Value Added in Financial Intermediation by Industry Group: 2004 to 2018 (In million pesos: at current prices)
Industry/Industry group 2004 2005 2006 2007 2008 2009 2010 2011 2012 2013 2014 2015 2016 2017r 2018P
Gross Value Added in Financial Intermediation 280,672 333,977 396,866 449,653 499,925 544,526 622,404 684,088 763,669 885,136 988,894 1,063,668 1,168,611 1,297,583 1,461,025
1. Banking Institutions 111,616 145,188 167,661 187,422 221,012 251,174 291,089 309,114 340,011 392,477 440,913 476,063 530,188r 598,393 680,440
2. Non-bank Financial Intermediation 97,254 111,582 143,922 155,832 165,707 173,734 196,554 223,632 252,654 288,890 322,745 345,478 371,342 407,996 465,251
3. Insurance 54,198 56,629 60,688 78,908 83,241 86,983 99,169 112,946 127,779 153,391 171,605 183,626 203,019r 220,442 237,037
4. Activities Auxiliary to Financial Intermediation 17,605 20,578 24,595 27,491 29,965 32,635 35,592 38,395 43,225 50,377 53,631 58,501 64,063r 70,752 78,296
Source: Philippine Statistics Authority
TABLE 3.28 Gross Value Added in Financial Intermediation by Industry Group: 2004 to 2018 (In million pesos: at constant 2000 prices)
Industry/Industry group 2004 2005 2006 2007 2008 2009 2010 2011 2012 2013 2014 2015 2016 2017r 2018P
Gross Value Added in Financial Intermediation 232,730 257,301 287,793 317,104 322,672 340,329 374,716 394,371 426,787 480,683 515,484 546,714 590,112 635,139 681,005
1. Banking Institutions 92,550 111,856 121,581 132,173 142,588 156,984 175,249 178,218 190,120 213,251 229,945 244,746 267,832r 292,999 317,351
2. Non-bank Financial Intermediation 80,642 85,964 104,367 109,896 106,908 108,584 118,335 128,902 141,200 156,905 168,248 177,584 187,525 199,730 216,853
3. Insurance 44,940 43,628 44,009 55,648 53,704 54,364 59,705 65,120 71,315 83,183 89,338 94,304 102,400r 107,757 110,302
4. Activities Auxiliary to Financial Intermediation 14,598 15,854 17,836 19,387 19,472 20,397 21,428 22,130 24,152 27,344 27,953 30,081 32,355r 34,653 36,499
Source: Philippine Statistics Authority
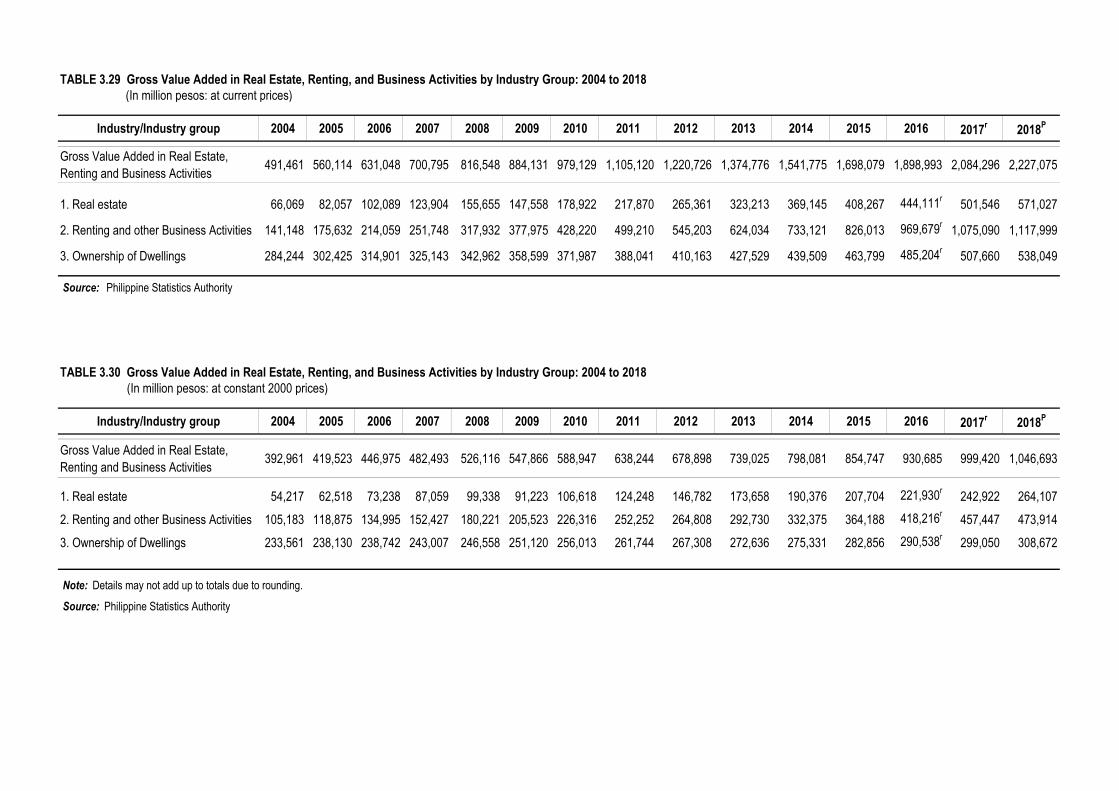
TABLE 3.29 Gross Value Added in Real Estate, Renting, and Business Activities by Industry Group: 2004 to 2018 (In million pesos: at current prices)
Industry/Industry group 2004 2005 2006 2007 2008 2009 2010 2011 2012 2013 2014 2015 2016 2017r 2018P
Gross Value Added in Real Estate, Renting and Business Activities 491,461 560,114 631,048 700,795 816,548 884,131 979,129 1,105,120 1,220,726 1,374,776 1,541,775 1,698,079 1,898,993 2,084,296 2,227,075
1. Real estate 66,069 82,057 102,089 123,904 155,655 147,558 178,922 217,870 265,361 323,213 369,145 408,267 444,111r 501,546 571,027
2. Renting and other Business Activities 141,148 175,632 214,059 251,748 317,932 377,975 428,220 499,210 545,203 624,034 733,121 826,013 969,679r 1,075,090 1,117,999
3. Ownership of Dwellings 284,244 302,425 314,901 325,143 342,962 358,599 371,987 388,041 410,163 427,529 439,509 463,799 485,204r 507,660 538,049 Source: Philippine Statistics Authority
TABLE 3.30 Gross Value Added in Real Estate, Renting, and Business Activities by Industry Group: 2004 to 2018 (In million pesos: at constant 2000 prices)
Industry/Industry group 2004 2005 2006 2007 2008 2009 2010 2011 2012 2013 2014 2015 2016 2017r 2018P
Gross Value Added in Real Estate, Renting and Business Activities 392,961 419,523 446,975 482,493 526,116 547,866 588,947 638,244 678,898 739,025 798,081 854,747 930,685 999,420 1,046,693
1. Real estate 54,217 62,518 73,238 87,059 99,338 91,223 106,618 124,248 146,782 173,658 190,376 207,704 221,930r 242,922 264,107
2. Renting and other Business Activities 105,183 118,875 134,995 152,427 180,221 205,523 226,316 252,252 264,808 292,730 332,375 364,188 418,216r 457,447 473,914
3. Ownership of Dwellings 233,561 238,130 238,742 243,007 246,558 251,120 256,013 261,744 267,308 272,636 275,331 282,856 290,538r 299,050 308,672
Note: Details may not add up to totals due to rounding.
Source: Philippine Statistics Authority

TABLE 3.31 Gross Value Added in Other Services by Industry Group: 2004 to 2018 (In million pesos: at current prices)
Industry/Industry group 2004 2005 2006 2007 2008 2009 2010 2011 2012 2013 2014 2015 2016r 2017r 2018P
Gross Value Added in Other Services 500,936 535,141 576,888 640,067 692,669 758,310 838,663 912,502 1,018,925 1,106,319 1,182,840 1,296,268 1,425,023 1,552,792 1,714,800
1. Education 239,025 249,981 265,445 292,286 312,362 342,114 355,207 385,609 414,058 448,424 468,158 505,223 555,580 615,707 701,369
2. Health and Social Work 71,927 81,412 89,447 97,030 105,639 114,888 125,507 139,675 154,565 170,397 202,658 222,166 246,834 272,898 293,720
3. Hotels and Restaurants 83,185 89,647 98,380 111,305 121,362 129,534 145,237 161,345 178,800 194,167 212,975 233,674 258,680 289,446 321,4444 Sewage and Refuse Disposal Sanitation and Similar Activities 2,344 2,510 2,656 2,782 2,895 3,208 3,647 4,110 4,705 5,147 5,351 5,589 5,875 6,195 6,6425. Recreational, Cultural and Sporting Activities 70,401 76,208 83,863 95,961 105,606 120,743 159,581 170,937 204,399 222,353 224,466 254,968 277,006 281,459 298,372
6. Other Service Activities 34,054 35,383 37,098 40,703 44,805 47,824 49,485 50,826 62,398 65,830 69,231 74,648 81,047 87,087 93,253
Source: Philippine Statistics Authority
TABLE 3.32 Gross Value Added in Other Services by Industry Group: 2004 to 2018 (In million pesos: at constant 2000 prices)
Industry/Industry group 2004 2005 2006 2007 2008 2009 2010 2011 2012 2013 2014 2015 2016r 2017r 2018P
Gross Value Added in Other Services 414,694 429,205 449,788 477,145 505,683 538,677 584,100 616,791 661,725 696,058 724,144 784,297 843,105 896,674 966,034
1. Education 195,808 201,966 212,029 218,994 238,282 256,461 261,796 272,749 277,680 291,476 296,229 316,642 337,934 365,523 412,598
2. Health and Social Work 57,424 62,091 63,924 66,316 67,667 70,952 75,580 81,769 87,873 93,993 111,624 121,706 132,389 143,251 148,112
3. Hotels and Restaurants 73,138 74,643 78,645 86,880 88,563 90,643 98,851 107,216 114,909 119,148 125,073 133,666 145,581 158,067 166,1584 Sewage and Refuse Disposal Sanitation and Similar Activities 1,822 1,813 1,947 2,010 2,085 2,173 2,363 2,568 2,827 3,000 3,028 3,102 3,193 3,292 3,4635. Recreational, Cultural and Sporting Activities 61,276 63,585 67,343 75,450 80,169 88,478 115,336 122,201 142,522 151,645 150,402 169,064 181,163 181,289 188,364
6. Other Service Activities 25,225 25,106 25,900 27,495 28,917 29,969 30,175 30,287 35,914 36,797 37,789 40,117 42,844 45,253 47,338
Note: Details may not add up to totals due to rounding.
Source: Philippine Statistics Authority

TABLE 3.33 Gross Regional Domestic Product: 2012 to 2018 (In million pesos)
2012 2013 2014 2015 2016r 2017r 2018P 2012 2013 2014 2015 2016r 2017r 2018P
Philippines 10,561,089 11,538,410 12,634,187 13,322,040 14,480,349 15,807,596 17,426,203 6,305,229 6,750,631 7,165,478 7,600,175 8,123,375 8,665,817 9,206,890
NCR 3,823,173 4,294,857 4,670,500 5,043,597 5,526,337 6,018,299 6,534,797 2,250,041 2,455,228 2,597,052 2,770,553 2,976,235 3,159,843 3,312,007
CAR 204,142 217,912 231,195 234,583 242,868 272,731 304,301 118,241 124,631 128,688 133,848 136,874 153,612 164,892
I - Ilocos Region 326,607 358,303 393,339 409,098 450,383 487,531 547,523 197,597 211,361 224,979 237,179 257,277 272,128 289,866
II - Cagayan Valley 184,727 210,442 239,160 236,832 251,400 280,531 303,001 113,061 120,474 129,114 134,445 139,549 149,475 154,446
III - Central Luzon 956,804 1,017,496 1,152,125 1,187,307 1,304,053 1,458,209 1,620,342 586,185 612,283 668,918 706,343 773,108 844,038 904,022
IV-A CALABARZON 1,769,268 1,873,053 2,014,215 2,059,548 2,142,922 2,316,606 2,571,284 1,097,790 1,170,575 1,230,372 1,302,297 1,364,737 1,456,341 1,562,497
MIMAROPA 185,559 189,372 214,279 204,849 210,586 236,473 274,305 109,260 110,673 119,911 122,259 125,598 132,096 143,411
V - Bicol Region 222,042 243,880 264,787 282,760 306,539 331,634 374,318 126,495 136,852 142,761 155,449 164,066 172,249 187,600
VI - Western Visayas 429,019 459,901 502,470 549,753 596,221 659,052 739,011 258,189 266,983 280,852 305,503 323,562 351,386 372,868
VII - Central Visayas 672,240 737,738 822,442 867,163 964,908 1,033,389 1,156,592 397,924 427,258 460,281 482,899 524,645 551,684 593,850
VIII - Eastern Visayas 231,078 250,224 258,688 271,915 311,741 320,959 354,551 143,420 150,073 146,477 153,225 171,610 174,651 184,942
IX - Zamboanga Peninsula 222,697 235,373 256,901 277,208 295,106 312,759 342,260 131,731 137,214 146,321 157,641 164,866 168,806 179,377
X - Northern Mindanao 407,705 436,621 485,529 517,648 576,820 625,635 691,656 237,653 250,536 268,424 283,769 304,953 322,565 345,275XI - Davao Region 421,310 459,750 518,707 565,205 641,246 727,446 816,874 241,169 257,386 281,348 304,412 333,405 369,071 400,826
XII - SOCCSKSARGEN 286,554 320,546 351,051 355,960 386,408 426,530 472,663 170,875 185,306 196,770 203,183 213,182 230,776 246,690
XIII - Caraga 124,986 133,641 153,963 159,038 167,565 180,529 194,014 78,100 84,475 92,420 96,588 98,905 102,495 105,771
ARMM 93,178 99,302 104,836 99,576 105,247 119,283 128,711 47,497 49,324 50,789 50,583 50,802 54,601 58,550
Note: Regional levels may not add up to the national totals due to rounding.
Source: Philippine Statistics Authority
RegionAt Current Prices At Constant 2000 Prices

TABLE 3.34 Gross Value Added in Agriculture, Hunting, Forestry, and Fishing by Region: 2012 to 2018 (In million pesos)
2012 2013 2014 2015 2016r 2017r 2018P 2012 2013 2014 2015 2016r 2017r 2018P
Philippines 1,249,768 1,298,356 1,431,578 1,366,866 1,398,116 1,527,569 1,617,909 698,978 706,957 718,797 719,742 711,001 739,198 745,779
NCR 7,923 7,769 9,345 11,169 11,044 11,207 11,020 5,026 4,755 4,953 5,154 5,284 5,321 5,341
CAR 21,829 23,704 25,452 23,001 23,231 23,532 26,216 13,080 13,243 13,200 12,658 12,086 12,699 12,024
I - Ilocos Region 82,633 86,311 95,665 91,212 90,138 97,121 105,183 49,773 50,825 53,190 52,503 51,599 52,848 51,646
II - Cagayan Valley 78,834 85,073 100,259 88,026 87,481 97,307 101,236 46,413 46,778 49,143 48,942 47,472 50,416 46,833
III - Central Luzon 161,186 176,809 207,690 189,198 189,794 212,440 233,411 102,602 108,160 114,652 115,326 116,082 120,590 125,046
IV-A CALABARZON 104,541 110,199 119,239 118,237 125,071 135,670 136,363 68,670 71,173 70,299 72,134 74,623 74,147 74,651
MIMAROPA 49,801 49,268 56,247 54,906 53,606 59,094 67,433 27,305 26,486 27,082 27,829 25,949 26,734 27,417
V - Bicol Region 57,170 62,423 70,547 64,756 67,632 73,344 79,974 32,049 33,435 33,797 33,011 32,961 33,815 34,901
VI - Western Visayas 116,000 118,868 125,955 123,641 123,004 136,366 149,473 65,071 62,815 61,386 60,987 59,913 65,179 64,277
VII - Central Visayas 54,839 53,196 56,470 58,494 59,800 66,895 73,176 28,486 28,396 27,853 28,480 28,472 30,412 30,824
VIII - Eastern Visayas 53,141 51,597 54,424 51,895 54,696 54,369 56,266 32,248 30,145 26,315 25,385 25,987 26,019 25,899
IX - Zamboanga Peninsula 61,713 62,343 63,528 60,749 59,597 65,467 66,971 29,342 29,583 30,438 31,049 29,496 29,381 30,095
X - Northern Mindanao 111,045 112,410 122,481 126,645 140,151 150,845 156,024 58,897 60,802 62,761 65,182 66,754 69,903 70,198
XI - Davao Region 96,484 93,529 104,972 107,228 113,920 120,550 121,048 43,184 39,680 40,700 41,265 40,713 41,395 42,610
XII - SOCCSKSARGEN 101,388 108,871 116,338 104,437 101,172 113,397 121,076 50,891 52,717 55,090 53,903 48,790 53,059 54,363
XIII - Caraga 30,241 31,500 36,841 32,930 34,850 37,263 37,261 16,550 17,821 18,051 16,493 16,237 16,506 17,104
ARMM 61,001 64,486 66,122 60,343 62,929 72,702 75,778 29,391 30,142 29,887 29,440 28,583 30,774 32,550
Notes:1. Regional levels may not add up to the national totals due to rounding.2. GDP series not linked with previous years due to revisions in some sectors.
Source: Philippine Statistics Authority
RegionAt Current Prices At Constant 2000 Prices

TABLE 3.35 Gross Value Added in Mining and Quarrying by Region: 2012 to 2018(In million pesos)
2012 2013 2014 2015 2016r 2017r 2018P 2012 2013 2014 2015 2016r 2017r 2018P
Philippines 121,435 115,425 130,192 108,109 114,685 133,954 146,184 72,047 72,893 81,695 80,500 83,664 84,796 85,864
NCR - - - - - - - - - - - - - -
CAR 7,345 7,609 8,038 6,804 6,979 7,415 6,576 1,743 1,900 2,278 2,188 2,112 2,107 1,790
I - Ilocos Region 4,220 4,816 5,280 5,667 6,424 7,276 8,298 3,343 3,602 3,886 4,114 4,608 4,805 5,215
II - Cagayan Valley 2,135 8,116 10,179 8,077 9,370 12,876 11,392 1,995 3,082 4,025 3,290 3,595 4,100 3,738
III - Central Luzon 4,242 3,826 4,312 2,200 2,543 2,321 2,597 3,069 3,730 3,405 2,071 2,494 1,921 2,052
IV-A CALABARZON 2,162 2,454 2,718 3,251 3,338 3,561 3,815 1,876 2,101 2,287 2,696 2,649 2,676 2,769
MIMAROPA 45,151 40,181 45,906 31,441 29,346 34,641 41,446 26,237 23,959 26,864 24,905 25,214 23,831 25,179
V - Bicol Region 13,042 9,496 7,174 6,529 8,549 8,700 10,166 3,254 3,079 2,492 2,704 2,947 3,109 3,694
VI - Western Visayas 9,748 7,950 10,247 8,670 14,222 21,511 22,132 5,462 5,183 6,325 6,448 8,648 11,818 11,645
VII - Central Visayas 6,225 6,441 7,985 7,412 7,563 7,865 8,669 3,506 3,438 4,403 4,534 4,582 4,330 4,014
VIII - Eastern Visayas 533 275 405 383 478 411 893 285 216 271 317 327 287 530
IX - Zamboanga Peninsula 2,820 2,009 821 568 666 784 598 1,271 1,206 768 623 650 725 494
X - Northern Mindanao 980 1,027 1,214 1,421 1,688 2,055 2,460 869 896 1,046 1,205 1,397 1,544 1,769
XI - Davao Region 3,887 3,517 4,178 4,972 6,027 7,541 8,715 1,669 1,872 2,247 2,821 3,266 3,858 4,179
XII - SOCCSKSARGEN 481 526 595 632 691 878 978 444 463 513 531 569 615 649
XIII - Caraga 18,343 17,053 20,936 19,734 16,437 15,592 16,907 16,914 18,052 20,705 21,750 20,293 18,655 17,744
ARMM 122 126 206 347 364 528 542 110 113 181 303 314 415 403
Note: Regional levels may not add up to the national totals due to rounding.
Source: Philippine Statistics Authority
RegionAt Current Prices At Constant 2000 Prices

TABLE 3.36 Gross Value Added in Manufacturing by Region: 2012 to 2018(In million pesos)
2012 2013 2014 2015 2016 2017r 2018P 2012 2013 2014 2015 2016 2017r 2018P
Philippines 2,170,918 2,355,416 2,603,644 2,669,222 2,847,597 3,075,375 3,320,346 1,395,711 1,538,912 1,666,514 1,760,989 1,885,514 2,044,186 2,145,011
NCR 380,935 485,090 522,904 555,170 592,959 626,744 631,068 242,201 308,151 324,144 346,927 369,695 393,037 379,837
CAR 82,728 81,343 83,130 82,288 86,011 102,456 115,620 50,011 50,694 51,162 53,401 55,454 66,321 72,560
I - Ilocos Region 15,221 16,953 18,989 20,030 21,388 22,111 24,132 9,400 10,453 11,380 11,747 12,061 12,709 12,910
II - Cagayan Valley 2,376 2,677 3,127 3,269 3,960 4,120 4,361 1,494 1,635 1,860 1,906 2,230 2,319 2,315
III - Central Luzon 307,550 303,073 369,082 381,321 445,779 505,559 551,126 194,000 191,425 227,997 243,915 286,596 324,693 342,453
IV-A CALABARZON 918,499 948,000 1,032,097 1,023,292 1,035,873 1,104,929 1,234,193 581,084 620,058 664,103 700,331 726,068 779,712 842,437
MIMAROPA 7,709 7,919 9,248 9,023 8,658 9,185 10,204 4,954 5,233 5,966 5,981 6,491 6,812 7,305
V - Bicol Region 6,313 6,765 8,362 8,608 9,992 10,279 11,090 3,965 4,346 5,173 5,364 6,013 6,215 6,501
VI - Western Visayas 28,171 30,867 34,616 36,717 39,688 41,827 45,462 19,102 21,167 23,353 24,140 25,041 26,060 27,278
VII - Central Visayas 140,594 156,901 178,411 186,224 199,882 207,249 227,301 91,418 104,185 114,612 120,736 127,938 135,005 146,276
VIII - Eastern Visayas 36,097 49,396 37,951 37,193 46,325 52,794 50,813 24,342 32,497 27,283 26,476 31,696 35,910 33,870
IX - Zamboanga Peninsula 49,666 49,933 58,234 61,541 61,508 64,634 68,478 36,083 36,057 39,577 40,803 41,459 42,825 45,041
X - Northern Mindanao 71,070 76,691 83,521 87,981 95,556 100,235 107,376 48,778 53,339 56,453 58,232 61,657 65,056 69,337
XI - Davao Region 64,263 73,697 89,593 100,741 116,441 129,913 140,107 45,322 52,043 61,804 69,468 77,314 86,139 91,622
XII - SOCCSKSARGEN 55,242 61,740 69,371 70,631 77,977 87,505 93,138 40,544 44,649 48,343 48,150 52,189 57,585 61,385
XIII - Caraga 3,599 3,428 4,014 4,123 4,439 4,600 4,537 2,453 2,399 2,704 2,774 2,940 3,089 3,119
ARMM 885 942 995 1,070 1,162 1,235 1,340 560 582 599 637 672 699 765
Note: Regional levels may not add up to the national totals due to rounding.
Source: Philippine Statistics Authority
RegionAt Current Prices At Constant 2000 Prices

TABLE 3.37 Gross Value Added in Construction by Region: 2012 to 2018(In million pesos)
2012 2013 2014 2015 2016 2017r 2018P 2012 2013 2014 2015 2016 2017r 2018P
Philippines 633,065 723,252 802,880 904,510 1,034,279 1,113,605 1,347,555 348,262 381,747 409,277 456,932 512,113 538,108 618,294
NCR 148,203 166,766 164,200 177,264 174,196 149,662 184,704 81,932 88,997 85,199 91,356 88,199 73,872 86,385
CAR 14,245 17,648 19,675 20,659 15,354 19,346 23,527 7,069 8,373 9,072 9,437 6,941 8,560 9,904
I - Ilocos Region 23,759 29,035 33,304 40,393 58,542 66,490 81,053 13,204 15,532 17,183 20,658 29,196 32,568 37,852
II - Cagayan Valley 11,234 13,749 15,263 18,623 20,441 23,138 26,575 6,485 7,603 8,163 9,840 10,584 11,688 12,701
III - Central Luzon 67,831 73,285 80,174 91,701 96,819 121,062 149,975 36,822 38,243 40,542 45,981 47,296 57,697 68,295
IV-A CALABARZON 98,129 109,417 115,341 124,390 127,989 151,136 174,324 52,776 56,508 57,711 61,851 62,484 72,252 79,148
MIMAROPA 11,114 13,358 18,904 18,606 19,119 22,897 30,277 6,075 7,024 9,592 9,357 9,403 11,007 13,876
V - Bicol Region 20,496 24,651 26,133 37,507 40,141 43,202 56,017 11,275 12,982 13,229 18,858 19,897 20,873 25,401
VI - Western Visayas 34,067 40,387 47,972 72,916 82,075 87,083 104,703 18,841 21,353 24,438 36,632 40,286 42,019 48,037
VII - Central Visayas 79,125 85,030 101,486 89,355 126,679 127,800 153,905 44,343 45,298 51,976 45,234 62,578 61,890 70,660
VIII - Eastern Visayas 18,003 20,737 27,699 31,469 45,978 37,671 46,924 10,240 11,244 14,328 16,094 22,917 18,066 21,204
IX - Zamboanga Peninsula 11,985 16,427 20,253 30,997 39,460 36,489 39,372 6,890 9,157 10,955 16,513 20,501 18,524 18,875
X - Northern Mindanao 27,483 30,495 39,909 45,522 59,036 61,567 75,393 14,599 15,440 19,487 22,032 28,144 28,712 33,397
XI - Davao Region 37,580 46,789 50,701 56,733 71,552 101,347 126,037 21,174 25,143 26,120 28,772 35,668 49,194 58,122
XII - SOCCSKSARGEN 17,640 21,732 23,236 26,575 33,725 37,909 45,008 10,044 11,837 12,167 13,789 17,089 18,828 21,384
XIII - Caraga 11,106 12,625 15,859 20,166 21,177 24,721 27,211 5,949 6,464 7,798 9,765 10,012 11,418 11,959
ARMM 1,064 1,120 2,769 1,634 1,996 2,085 2,550 543 550 1,315 764 919 940 1,094
Note: Regional levels may not add up to the national totals due to rounding.
Source: Philippine Statistics Authority
RegionAt Current Prices At Constant 2000 Prices
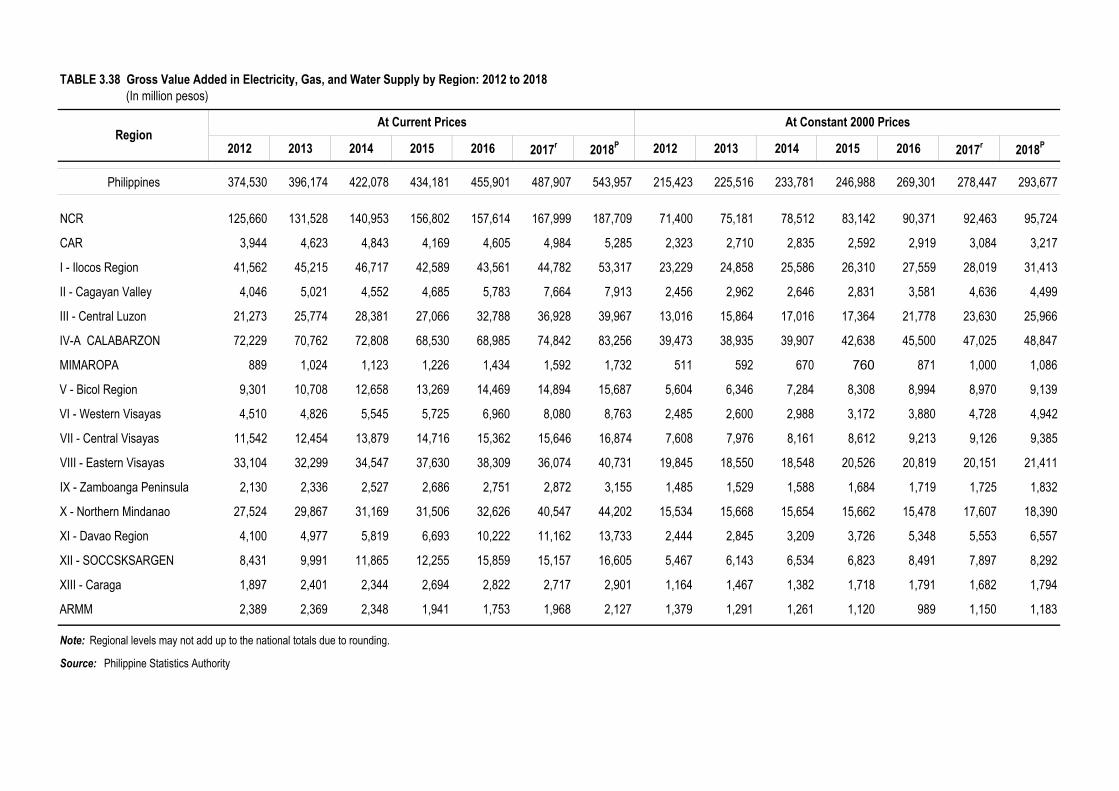
TABLE 3.38 Gross Value Added in Electricity, Gas, and Water Supply by Region: 2012 to 2018(In million pesos)
2012 2013 2014 2015 2016 2017r 2018P 2012 2013 2014 2015 2016 2017r 2018P
Philippines 374,530 396,174 422,078 434,181 455,901 487,907 543,957 215,423 225,516 233,781 246,988 269,301 278,447 293,677
NCR 125,660 131,528 140,953 156,802 157,614 167,999 187,709 71,400 75,181 78,512 83,142 90,371 92,463 95,724
CAR 3,944 4,623 4,843 4,169 4,605 4,984 5,285 2,323 2,710 2,835 2,592 2,919 3,084 3,217
I - Ilocos Region 41,562 45,215 46,717 42,589 43,561 44,782 53,317 23,229 24,858 25,586 26,310 27,559 28,019 31,413
II - Cagayan Valley 4,046 5,021 4,552 4,685 5,783 7,664 7,913 2,456 2,962 2,646 2,831 3,581 4,636 4,499
III - Central Luzon 21,273 25,774 28,381 27,066 32,788 36,928 39,967 13,016 15,864 17,016 17,364 21,778 23,630 25,966
IV-A CALABARZON 72,229 70,762 72,808 68,530 68,985 74,842 83,256 39,473 38,935 39,907 42,638 45,500 47,025 48,847
MIMAROPA 889 1,024 1,123 1,226 1,434 1,592 1,732 511 592 670 760 871 1,000 1,086
V - Bicol Region 9,301 10,708 12,658 13,269 14,469 14,894 15,687 5,604 6,346 7,284 8,308 8,994 8,970 9,139
VI - Western Visayas 4,510 4,826 5,545 5,725 6,960 8,080 8,763 2,485 2,600 2,988 3,172 3,880 4,728 4,942
VII - Central Visayas 11,542 12,454 13,879 14,716 15,362 15,646 16,874 7,608 7,976 8,161 8,612 9,213 9,126 9,385
VIII - Eastern Visayas 33,104 32,299 34,547 37,630 38,309 36,074 40,731 19,845 18,550 18,548 20,526 20,819 20,151 21,411
IX - Zamboanga Peninsula 2,130 2,336 2,527 2,686 2,751 2,872 3,155 1,485 1,529 1,588 1,684 1,719 1,725 1,832
X - Northern Mindanao 27,524 29,867 31,169 31,506 32,626 40,547 44,202 15,534 15,668 15,654 15,662 15,478 17,607 18,390
XI - Davao Region 4,100 4,977 5,819 6,693 10,222 11,162 13,733 2,444 2,845 3,209 3,726 5,348 5,553 6,557
XII - SOCCSKSARGEN 8,431 9,991 11,865 12,255 15,859 15,157 16,605 5,467 6,143 6,534 6,823 8,491 7,897 8,292
XIII - Caraga 1,897 2,401 2,344 2,694 2,822 2,717 2,901 1,164 1,467 1,382 1,718 1,791 1,682 1,794
ARMM 2,389 2,369 2,348 1,941 1,753 1,968 2,127 1,379 1,291 1,261 1,120 989 1,150 1,183
Note: Regional levels may not add up to the national totals due to rounding.
Source: Philippine Statistics Authority
RegionAt Current Prices At Constant 2000 Prices

TABLE 3.39 Gross Value Added in Transportation, Storage, and Communication by Region: 2012 to 2018(In million pesos)
2012 2013 2014 2015 2016 2017r 2018P 2012 2013 2014 2015 2016 2017r 2018P
Philippines 679,875 727,912 784,877 856,050 909,269 962,573 1,030,518 476,855 505,415 538,044 581,288 611,902 636,611 670,804
NCR 184,870 198,126 214,313 239,041 260,830 273,589 295,108 140,720 147,918 156,761 170,359 176,020 179,904 188,360
CAR 9,150 9,461 9,982 10,617 11,029 11,521 12,410 6,629 7,001 7,326 7,841 8,310 8,624 9,214
I - Ilocos Region 32,491 35,324 37,432 40,083 41,954 44,104 45,792 21,716 22,900 24,049 25,715 27,304 28,406 29,465
II - Cagayan Valley 21,903 24,351 25,714 27,922 29,526 31,170 32,661 14,159 15,503 16,242 17,444 18,591 19,419 20,140
III - Central Luzon 89,633 92,844 97,080 104,052 107,169 111,590 117,259 56,620 59,519 62,340 67,103 70,456 73,207 76,608
IV-A CALABARZON 96,286 101,196 109,397 115,234 120,032 125,718 133,338 71,467 75,990 81,016 85,785 91,487 94,912 99,215
MIMAROPA 15,850 16,711 18,065 19,750 20,802 22,622 24,328 10,312 10,842 11,615 12,645 13,543 14,532 15,621
V - Bicol Region 22,080 23,254 24,301 27,343 29,059 31,034 31,628 13,328 14,026 14,576 16,046 17,119 17,803 18,425
VI - Western Visayas 38,493 41,962 46,642 49,759 53,916 57,639 60,489 28,494 29,915 32,590 34,871 37,185 39,359 42,053
VII - Central Visayas 44,245 49,741 54,133 60,659 62,348 68,273 72,970 29,539 32,262 34,733 38,525 40,553 42,673 45,211
VIII - Eastern Visayas 17,525 19,657 21,602 24,460 27,275 28,649 32,172 12,812 13,838 14,709 16,318 17,760 18,175 19,919
IX - Zamboanga Peninsula 15,011 15,187 16,581 17,933 18,301 19,276 21,511 8,933 9,168 9,901 10,698 11,157 11,706 12,173
X - Northern Mindanao 26,704 28,637 30,054 32,880 34,574 37,810 43,074 17,393 18,540 19,390 21,072 22,358 24,043 27,130
XI - Davao Region 26,692 28,322 31,378 34,726 37,376 41,244 44,866 19,372 20,131 21,896 23,965 25,466 27,287 29,501
XII - SOCCSKSARGEN 15,806 17,420 18,638 20,485 21,898 23,402 26,279 11,904 12,624 13,385 14,598 15,259 16,184 17,641
XIII - Caraga 19,378 21,841 25,477 26,764 28,750 30,294 31,367 11,710 13,352 15,546 16,194 17,154 18,113 17,619
ARMM 3,758 3,877 4,088 4,342 4,430 4,638 5,266 1,747 1,886 1,969 2,109 2,181 2,264 2,509
Note: Regional levels may not add up to the national totals due to rounding.
Source: Philippine Statistics Authority
RegionAt Current Prices At Constant 2000 Prices

TABLE 3.40 Gross Value Added in Trade, and Repair of Motor Vehicles, Motorcycles, Personal and Household Goods by Region: 2012 to 2018(In million pesos)
2012 2013 2014 2015 2016 2017r 2018P 2012 2013 2014 2015 2016 2017r 2018P
Philippines 1,870,557 2,069,640 2,244,730 2,412,094 2,652,835 2,917,900 3,229,364 1,055,672 1,121,102 1,185,809 1,270,527 1,367,438 1,467,006 1,554,870
NCR 1,158,966 1,291,579 1,404,480 1,507,770 1,663,369 1,847,604 2,008,451 655,362 698,159 740,552 795,450 860,730 931,377 984,106
CAR 10,769 11,693 12,887 13,863 15,229 16,519 18,661 5,987 6,313 6,828 7,321 7,865 8,491 8,984
I - Ilocos Region 28,775 31,628 34,856 37,301 41,224 44,870 49,644 16,444 17,758 19,059 20,414 22,116 23,792 24,984
II - Cagayan Valley 10,249 11,145 12,662 13,645 14,899 16,254 18,750 5,701 6,043 6,763 7,376 7,860 8,360 8,908
III - Central Luzon 86,893 95,113 97,938 102,555 111,326 119,715 135,377 49,488 52,876 53,577 55,942 59,179 61,964 66,276
IV-A CALABARZON 152,264 161,768 166,896 178,714 192,315 204,644 228,874 87,376 90,596 91,479 97,793 103,733 107,904 114,114
MIMAROPA 9,172 9,718 10,259 11,089 12,331 13,533 15,576 5,190 5,384 5,539 5,998 6,512 7,005 7,492
V - Bicol Region 17,817 20,547 23,308 25,071 27,098 28,762 32,311 10,147 11,312 12,452 13,406 14,306 14,901 15,428
VI - Western Visayas 60,563 66,556 70,972 76,541 83,519 90,194 106,291 34,535 36,633 38,134 40,399 42,908 45,668 49,342
VII - Central Visayas 113,168 125,349 138,804 150,536 163,511 176,528 198,460 62,047 65,579 70,356 75,204 78,934 82,934 87,550
VIII - Eastern Visayas 13,338 14,814 15,100 16,315 17,535 19,035 22,255 7,553 8,064 7,837 8,399 8,883 9,306 9,996
IX - Zamboanga Peninsula 23,875 25,718 28,541 30,777 32,793 34,641 40,513 13,606 13,966 14,917 15,866 16,398 17,030 18,193
X - Northern Mindanao 65,731 71,553 80,906 86,933 97,861 105,945 121,341 35,773 37,153 40,955 43,641 48,172 50,959 54,732
XI - Davao Region 86,483 94,687 104,898 115,040 128,879 144,433 168,288 48,052 50,719 55,109 59,190 63,863 69,389 74,550
XII - SOCCSKSARGEN 25,923 30,495 34,119 37,177 41,196 44,760 52,700 14,926 16,835 18,242 19,823 21,288 22,967 24,999
XIII - Caraga 5,610 6,232 6,944 7,536 8,387 8,990 10,198 3,016 3,210 3,466 3,726 4,064 4,296 4,524
ARMM 960 1,044 1,160 1,231 1,364 1,473 1,674 471 501 544 579 627 663 692
Note: Regional levels may not add up to the national totals due to rounding.
Source: Philippine Statistics Authority
RegionAt Current Prices At Constant 2000 Prices
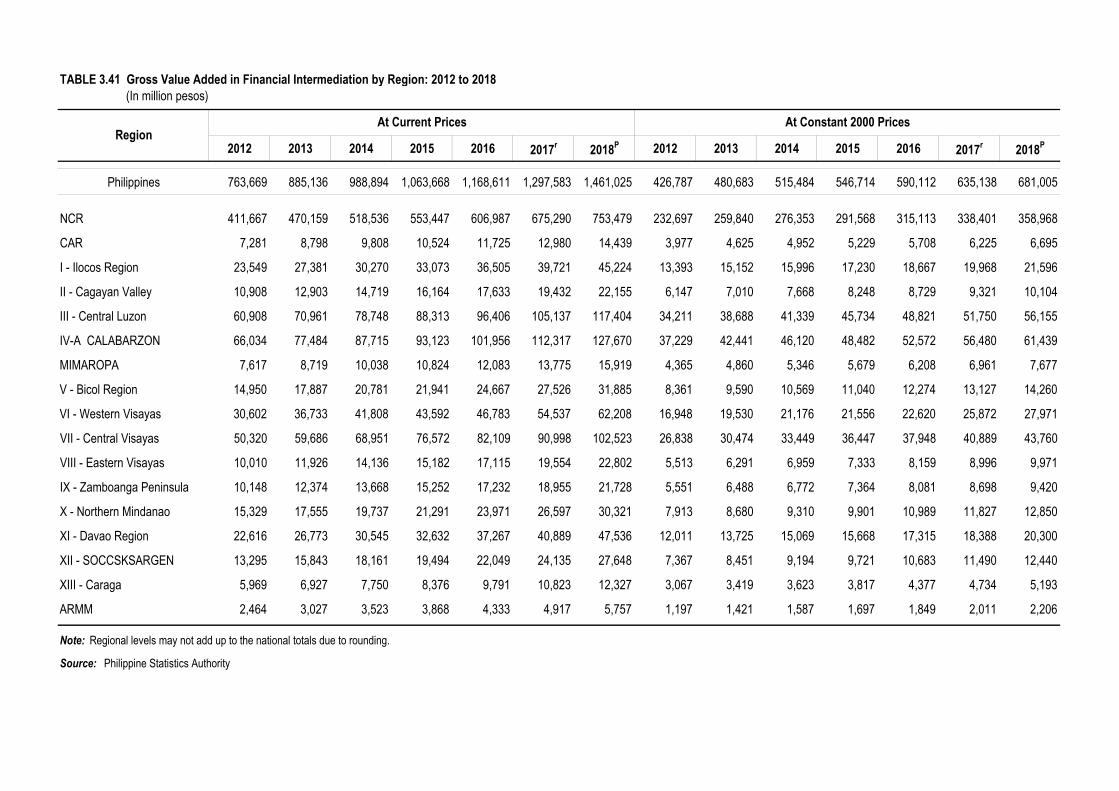
TABLE 3.41 Gross Value Added in Financial Intermediation by Region: 2012 to 2018(In million pesos)
2012 2013 2014 2015 2016 2017r 2018P 2012 2013 2014 2015 2016 2017r 2018P
Philippines 763,669 885,136 988,894 1,063,668 1,168,611 1,297,583 1,461,025 426,787 480,683 515,484 546,714 590,112 635,138 681,005
NCR 411,667 470,159 518,536 553,447 606,987 675,290 753,479 232,697 259,840 276,353 291,568 315,113 338,401 358,968
CAR 7,281 8,798 9,808 10,524 11,725 12,980 14,439 3,977 4,625 4,952 5,229 5,708 6,225 6,695
I - Ilocos Region 23,549 27,381 30,270 33,073 36,505 39,721 45,224 13,393 15,152 15,996 17,230 18,667 19,968 21,596
II - Cagayan Valley 10,908 12,903 14,719 16,164 17,633 19,432 22,155 6,147 7,010 7,668 8,248 8,729 9,321 10,104
III - Central Luzon 60,908 70,961 78,748 88,313 96,406 105,137 117,404 34,211 38,688 41,339 45,734 48,821 51,750 56,155
IV-A CALABARZON 66,034 77,484 87,715 93,123 101,956 112,317 127,670 37,229 42,441 46,120 48,482 52,572 56,480 61,439
MIMAROPA 7,617 8,719 10,038 10,824 12,083 13,775 15,919 4,365 4,860 5,346 5,679 6,208 6,961 7,677
V - Bicol Region 14,950 17,887 20,781 21,941 24,667 27,526 31,885 8,361 9,590 10,569 11,040 12,274 13,127 14,260
VI - Western Visayas 30,602 36,733 41,808 43,592 46,783 54,537 62,208 16,948 19,530 21,176 21,556 22,620 25,872 27,971
VII - Central Visayas 50,320 59,686 68,951 76,572 82,109 90,998 102,523 26,838 30,474 33,449 36,447 37,948 40,889 43,760
VIII - Eastern Visayas 10,010 11,926 14,136 15,182 17,115 19,554 22,802 5,513 6,291 6,959 7,333 8,159 8,996 9,971
IX - Zamboanga Peninsula 10,148 12,374 13,668 15,252 17,232 18,955 21,728 5,551 6,488 6,772 7,364 8,081 8,698 9,420
X - Northern Mindanao 15,329 17,555 19,737 21,291 23,971 26,597 30,321 7,913 8,680 9,310 9,901 10,989 11,827 12,850
XI - Davao Region 22,616 26,773 30,545 32,632 37,267 40,889 47,536 12,011 13,725 15,069 15,668 17,315 18,388 20,300
XII - SOCCSKSARGEN 13,295 15,843 18,161 19,494 22,049 24,135 27,648 7,367 8,451 9,194 9,721 10,683 11,490 12,440
XIII - Caraga 5,969 6,927 7,750 8,376 9,791 10,823 12,327 3,067 3,419 3,623 3,817 4,377 4,734 5,193
ARMM 2,464 3,027 3,523 3,868 4,333 4,917 5,757 1,197 1,421 1,587 1,697 1,849 2,011 2,206
Note: Regional levels may not add up to the national totals due to rounding.
Source: Philippine Statistics Authority
RegionAt Current Prices At Constant 2000 Prices

TABLE 3.42 Gross Value Added in Real Estate, Renting and Business Activities by Region: 2012 to 2018(In million pesos)
2012 2013 2014 2015 2016 2017r 2018P 2012 2013 2014 2015 2016 2017r 2018P
Philippines 1,220,726 1,374,776 1,541,775 1,698,078 1,898,993 2,084,296 2,227,074 678,898 739,025 798,080 854,747 930,685 999,420 1,046,693
NCR 673,567 759,657 872,275 970,210 1,107,595 1,221,759 1,289,483 357,508 391,217 433,354 467,365 519,994 561,705 584,369
CAR 20,090 24,690 27,454 29,804 31,289 33,317 35,729 10,151 12,159 12,985 13,847 14,272 15,115 15,797
I - Ilocos Region 23,787 26,904 29,803 32,758 35,871 38,883 43,159 14,666 15,980 17,088 18,029 19,332 20,684 21,732
II - Cagayan Valley 10,411 12,421 14,317 16,153 17,104 18,125 19,723 6,939 7,920 8,668 9,365 9,528 9,904 10,428
III - Central Luzon 75,199 85,314 91,100 99,650 108,407 119,614 130,185 44,843 49,462 51,241 54,676 57,761 62,044 66,469
IV-A CALABARZON 163,798 186,395 198,912 215,649 234,519 255,699 278,269 93,447 103,128 106,414 113,591 121,736 130,126 137,960
MIMAROPA 12,773 14,301 14,797 14,957 16,466 17,321 18,433 7,714 8,459 8,543 8,515 9,097 9,352 9,606
V - Bicol Region 19,744 23,938 25,600 26,686 28,182 30,559 33,108 12,251 14,361 14,850 15,324 15,616 16,459 16,953
VI - Western Visayas 35,060 35,727 38,138 41,209 43,829 47,547 50,911 21,655 20,885 21,267 22,250 23,069 24,728 26,012
VII - Central Visayas 78,266 87,829 94,712 103,594 115,080 126,910 136,806 44,829 48,029 50,394 53,967 57,786 62,330 65,604
VIII - Eastern Visayas 14,742 12,889 14,462 15,021 16,313 18,254 20,177 9,525 7,782 8,107 8,200 8,700 9,236 9,817
IX - Zamboanga Peninsula 12,372 13,448 14,969 16,472 17,618 18,271 20,558 7,859 8,175 8,586 9,082 9,442 9,607 10,191
X - Northern Mindanao 20,657 23,528 27,755 29,881 31,957 34,608 37,950 11,723 12,630 14,106 14,886 15,627 16,413 17,346
XI - Davao Region 30,655 35,013 39,889 44,642 49,242 54,558 59,917 18,229 20,136 22,118 23,930 25,568 27,293 29,040
XII - SOCCSKSARGEN 14,735 16,405 19,387 21,700 24,460 26,415 28,968 9,197 9,894 10,996 11,931 12,928 13,769 14,382
XIII - Caraga 8,164 9,257 10,410 11,727 12,811 13,764 14,559 4,729 5,037 5,303 5,694 6,046 6,389 6,638
ARMM 6,706 7,062 7,795 7,965 8,250 8,691 9,139 3,634 3,769 4,060 4,095 4,181 4,266 4,349
Note: Regional levels may not add up to the national totals due to rounding.
Source: Philippine Statistics Authority
RegionAt Current Prices

TABLE 3.43 Gross Value Added in Public Administration and Defense; Compulsory Social Security by Region: 2012 to 2018(In million pesos)
2012 2013 2014 2015 2016 2017r 2018P 2012 2013 2014 2015 2016 2017r 2018P
Philippines 457,620 486,005 500,691 512,994 575,043 654,039 787,465 274,870 282,323 293,851 297,449 318,540 346,235 398,858
NCR 239,712 250,401 255,871 260,151 293,925 336,914 408,774 143,962 145,459 150,168 150,843 162,817 178,355 207,048
CAR 7,298 7,712 7,962 8,164 8,991 10,046 11,881 4,385 4,480 4,673 4,734 4,981 5,318 6,018
I - Ilocos Region 14,569 15,364 15,998 16,398 18,222 20,544 24,516 8,752 8,925 9,389 9,508 10,094 10,876 12,418
II - Cagayan Valley 10,927 11,479 11,921 12,221 13,474 15,072 17,845 6,565 6,668 6,996 7,086 7,464 7,979 9,039
III - Central Luzon 23,033 24,840 25,632 26,218 29,012 32,570 38,704 13,837 14,430 15,043 15,202 16,071 17,242 19,604
IV-A CALABARZON 22,945 25,156 25,898 26,423 29,691 33,849 40,845 13,784 14,613 15,199 15,321 16,447 17,919 20,689
MIMAROPA 8,572 9,314 9,643 9,993 11,203 12,742 15,341 5,149 5,410 5,659 5,794 6,206 6,746 7,770
V - Bicol Region 16,428 17,741 18,556 19,263 21,374 24,062 28,672 9,869 10,306 10,891 11,169 11,840 12,738 14,522
VI - Western Visayas 18,513 19,932 20,982 22,082 24,657 27,932 33,492 11,122 11,579 12,314 12,804 13,658 14,786 16,964
VII - Central Visayas 19,879 21,651 22,336 22,916 25,845 29,571 35,813 11,942 12,577 13,109 13,288 14,316 15,654 18,140
VIII - Eastern Visayas 13,431 14,416 15,062 15,592 17,322 19,524 23,293 8,069 8,374 8,840 9,041 9,595 10,336 11,798
IX - Zamboanga Peninsula 11,041 12,039 12,529 13,031 14,613 16,625 20,020 6,633 6,993 7,353 7,556 8,094 8,801 10,140
X - Northern Mindanao 12,953 14,106 14,728 15,308 16,779 18,660 21,964 7,782 8,194 8,644 8,876 9,295 9,878 11,125
XI - Davao Region 11,199 12,081 12,537 13,014 14,300 15,942 18,812 6,728 7,018 7,358 7,546 7,921 8,439 9,528
XII - SOCCSKSARGEN 10,343 11,430 11,907 12,380 13,682 15,340 18,206 6,214 6,640 6,988 7,178 7,579 8,121 9,221
XIII - Caraga 7,515 8,090 8,361 8,612 9,584 10,822 12,933 4,515 4,699 4,907 4,993 5,309 5,729 6,551
ARMM 9,260 10,252 10,768 11,228 12,369 13,824 16,354 5,563 5,956 6,320 6,510 6,852 7,318 8,283
Note: Regional levels may not add up to the national totals due to rounding.
Source: Philippine Statistics Authority
RegionAt Current Prices At Constant 2000 Prices
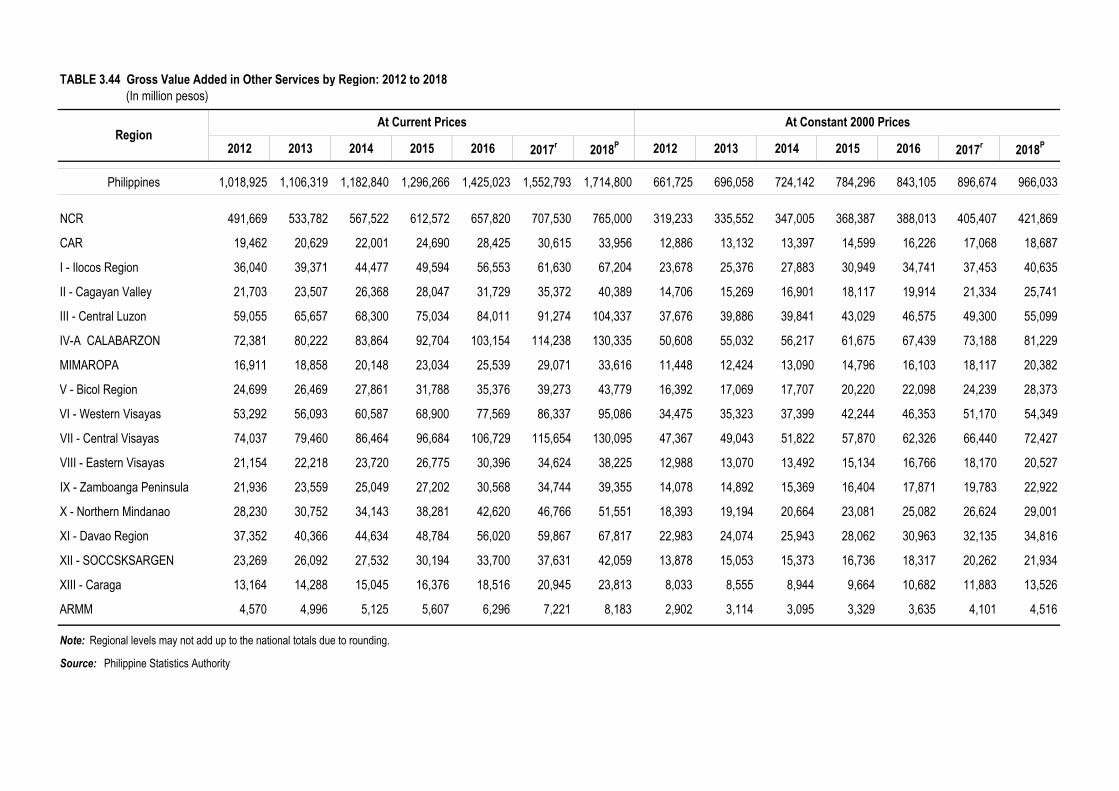
TABLE 3.44 Gross Value Added in Other Services by Region: 2012 to 2018(In million pesos)
2012 2013 2014 2015 2016 2017r 2018P 2012 2013 2014 2015 2016 2017r 2018P
Philippines 1,018,925 1,106,319 1,182,840 1,296,266 1,425,023 1,552,793 1,714,800 661,725 696,058 724,142 784,296 843,105 896,674 966,033
NCR 491,669 533,782 567,522 612,572 657,820 707,530 765,000 319,233 335,552 347,005 368,387 388,013 405,407 421,869
CAR 19,462 20,629 22,001 24,690 28,425 30,615 33,956 12,886 13,132 13,397 14,599 16,226 17,068 18,687
I - Ilocos Region 36,040 39,371 44,477 49,594 56,553 61,630 67,204 23,678 25,376 27,883 30,949 34,741 37,453 40,635
II - Cagayan Valley 21,703 23,507 26,368 28,047 31,729 35,372 40,389 14,706 15,269 16,901 18,117 19,914 21,334 25,741
III - Central Luzon 59,055 65,657 68,300 75,034 84,011 91,274 104,337 37,676 39,886 39,841 43,029 46,575 49,300 55,099
IV-A CALABARZON 72,381 80,222 83,864 92,704 103,154 114,238 130,335 50,608 55,032 56,217 61,675 67,439 73,188 81,229
MIMAROPA 16,911 18,858 20,148 23,034 25,539 29,071 33,616 11,448 12,424 13,090 14,796 16,103 18,117 20,382
V - Bicol Region 24,699 26,469 27,861 31,788 35,376 39,273 43,779 16,392 17,069 17,707 20,220 22,098 24,239 28,373
VI - Western Visayas 53,292 56,093 60,587 68,900 77,569 86,337 95,086 34,475 35,323 37,399 42,244 46,353 51,170 54,349
VII - Central Visayas 74,037 79,460 86,464 96,684 106,729 115,654 130,095 47,367 49,043 51,822 57,870 62,326 66,440 72,427
VIII - Eastern Visayas 21,154 22,218 23,720 26,775 30,396 34,624 38,225 12,988 13,070 13,492 15,134 16,766 18,170 20,527
IX - Zamboanga Peninsula 21,936 23,559 25,049 27,202 30,568 34,744 39,355 14,078 14,892 15,369 16,404 17,871 19,783 22,922
X - Northern Mindanao 28,230 30,752 34,143 38,281 42,620 46,766 51,551 18,393 19,194 20,664 23,081 25,082 26,624 29,001
XI - Davao Region 37,352 40,366 44,634 48,784 56,020 59,867 67,817 22,983 24,074 25,943 28,062 30,963 32,135 34,816
XII - SOCCSKSARGEN 23,269 26,092 27,532 30,194 33,700 37,631 42,059 13,878 15,053 15,373 16,736 18,317 20,262 21,934
XIII - Caraga 13,164 14,288 15,045 16,376 18,516 20,945 23,813 8,033 8,555 8,944 9,664 10,682 11,883 13,526
ARMM 4,570 4,996 5,125 5,607 6,296 7,221 8,183 2,902 3,114 3,095 3,329 3,635 4,101 4,516
Note: Regional levels may not add up to the national totals due to rounding.
Source: Philippine Statistics Authority
RegionAt Current Prices At Constant 2000 Prices

TABLE 3.45 Per Capita Gross Regional Domestic Product by Region: 2012 to 2018(In pesos)
2012 2013 2014 2015 2016r 2017r 2018P 2012 2013 2014 2015 2016r 2017r 2018P
Philippines 109,429 117,503 126,493 131,171 140,255 150,661 163,475 65,332 68,746 71,741 74,833 78,682 82,593 86,370
NCR 308,819 341,130 364,900 398,650 432,155 465,850 500,947 181,748 195,013 202,904 218,987 232,739 244,589 253,893
CAR 121,124 127,240 132,893 131,530 133,791 147,634 161,888 70,156 72,773 73,971 75,048 75,401 83,153 87,722
I - Ilocos Region 66,653 72,294 78,490 79,653 86,608 92,629 102,819 40,325 42,646 44,894 46,180 49,474 51,703 54,434
II - Cagayan Valley 55,251 62,134 69,730 67,707 70,880 78,020 83,158 33,816 35,571 37,645 38,436 39,344 41,571 42,387
III - Central Luzon 90,039 93,986 104,495 106,975 115,769 127,609 139,833 55,163 56,557 60,670 63,641 68,634 73,863 78,016
IV-A CALABARZON 131,450 135,461 141,843 145,786 148,873 158,029 172,310 81,562 84,657 86,644 92,184 94,811 99,346 104,708
MIMAROPA 64,942 65,262 72,741 66,309 66,793 73,520 83,614 38,239 38,141 40,706 39,575 39,837 41,069 43,715
V - Bicol Region 39,499 42,795 45,848 46,876 49,859 52,920 58,600 22,502 24,014 24,719 25,770 26,686 27,487 29,369
VI - Western Visayas 58,388 61,811 66,713 71,356 76,324 83,215 92,043 35,139 35,883 37,289 39,653 41,420 44,368 46,440
VII - Central Visayas 94,708 102,219 112,110 116,448 127,494 134,385 148,067 56,061 59,200 62,743 64,846 69,322 71,743 76,024
VIII - Eastern Visayas 54,540 58,361 59,643 59,930 67,475 68,218 73,996 33,850 35,002 33,771 33,771 37,144 37,121 38,598
IX - Zamboanga Peninsula 62,680 65,186 70,031 73,634 77,045 80,274 86,368 37,077 38,001 39,887 41,873 43,043 43,326 45,265
X - Northern Mindanao 90,653 95,365 104,204 109,981 120,623 128,802 140,224 52,842 54,721 57,609 60,290 63,771 66,408 70,000
XI - Davao Region 90,241 96,806 107,404 113,881 126,772 141,166 155,657 51,657 54,196 58,256 61,335 65,913 71,621 76,378
XII - SOCCSKSARGEN 66,101 72,368 77,594 77,396 82,397 89,228 97,034 39,417 41,835 43,493 44,178 45,459 48,277 50,644
XIII - Caraga 49,586 52,287 59,427 58,541 60,447 63,823 67,228 30,985 33,051 35,672 35,553 35,679 36,235 36,651
ARMM 27,567 28,967 30,163 26,862 27,691 30,610 32,220 14,052 14,388 14,613 13,646 13,366 14,012 14,657
Note: Regional levels may not add up to the national totals due to rounding.
Source: Philippine Statistics Authority
RegionAt Current Prices At Constant 2000 Prices
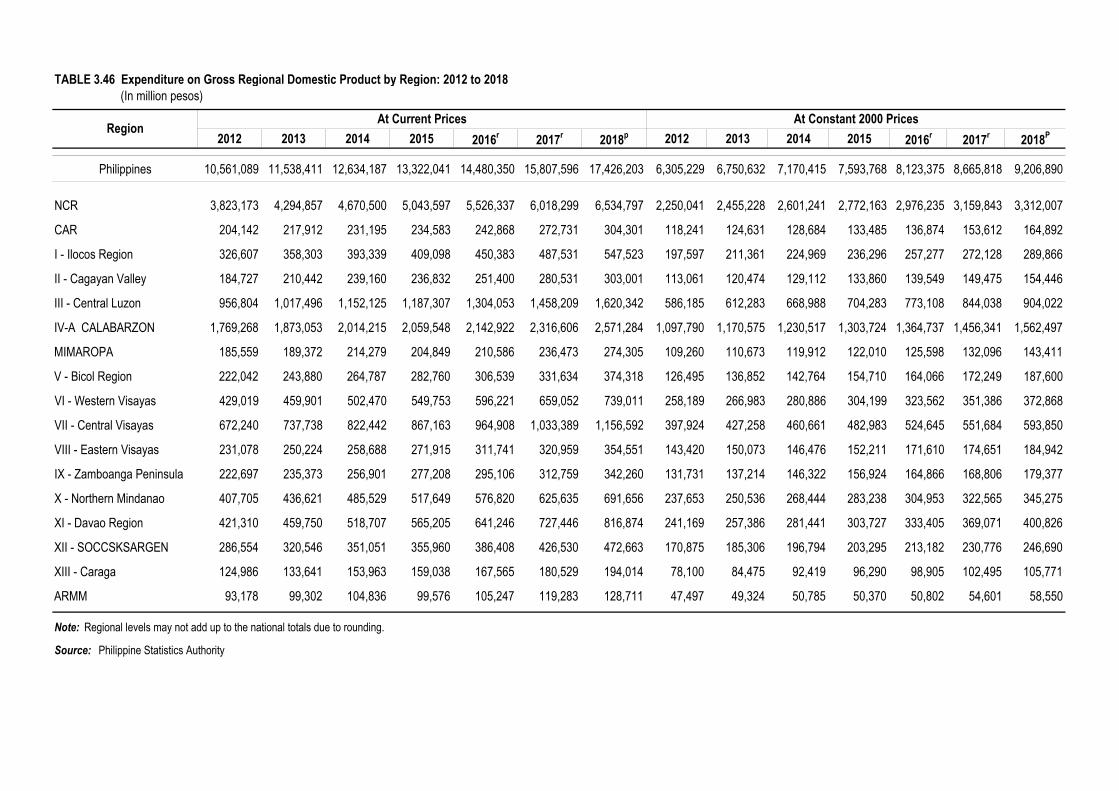
TABLE 3.46 Expenditure on Gross Regional Domestic Product by Region: 2012 to 2018(In million pesos)
2012 2013 2014 2015 2016r 2017r 2018p 2012 2013 2014 2015 2016r 2017r 2018P
Philippines 10,561,089 11,538,411 12,634,187 13,322,041 14,480,350 15,807,596 17,426,203 6,305,229 6,750,632 7,170,415 7,593,768 8,123,375 8,665,818 9,206,890
NCR 3,823,173 4,294,857 4,670,500 5,043,597 5,526,337 6,018,299 6,534,797 2,250,041 2,455,228 2,601,241 2,772,163 2,976,235 3,159,843 3,312,007
CAR 204,142 217,912 231,195 234,583 242,868 272,731 304,301 118,241 124,631 128,684 133,485 136,874 153,612 164,892
I - Ilocos Region 326,607 358,303 393,339 409,098 450,383 487,531 547,523 197,597 211,361 224,969 236,296 257,277 272,128 289,866
II - Cagayan Valley 184,727 210,442 239,160 236,832 251,400 280,531 303,001 113,061 120,474 129,112 133,860 139,549 149,475 154,446
III - Central Luzon 956,804 1,017,496 1,152,125 1,187,307 1,304,053 1,458,209 1,620,342 586,185 612,283 668,988 704,283 773,108 844,038 904,022
IV-A CALABARZON 1,769,268 1,873,053 2,014,215 2,059,548 2,142,922 2,316,606 2,571,284 1,097,790 1,170,575 1,230,517 1,303,724 1,364,737 1,456,341 1,562,497
MIMAROPA 185,559 189,372 214,279 204,849 210,586 236,473 274,305 109,260 110,673 119,912 122,010 125,598 132,096 143,411
V - Bicol Region 222,042 243,880 264,787 282,760 306,539 331,634 374,318 126,495 136,852 142,764 154,710 164,066 172,249 187,600
VI - Western Visayas 429,019 459,901 502,470 549,753 596,221 659,052 739,011 258,189 266,983 280,886 304,199 323,562 351,386 372,868
VII - Central Visayas 672,240 737,738 822,442 867,163 964,908 1,033,389 1,156,592 397,924 427,258 460,661 482,983 524,645 551,684 593,850
VIII - Eastern Visayas 231,078 250,224 258,688 271,915 311,741 320,959 354,551 143,420 150,073 146,476 152,211 171,610 174,651 184,942
IX - Zamboanga Peninsula 222,697 235,373 256,901 277,208 295,106 312,759 342,260 131,731 137,214 146,322 156,924 164,866 168,806 179,377
X - Northern Mindanao 407,705 436,621 485,529 517,649 576,820 625,635 691,656 237,653 250,536 268,444 283,238 304,953 322,565 345,275
XI - Davao Region 421,310 459,750 518,707 565,205 641,246 727,446 816,874 241,169 257,386 281,441 303,727 333,405 369,071 400,826
XII - SOCCSKSARGEN 286,554 320,546 351,051 355,960 386,408 426,530 472,663 170,875 185,306 196,794 203,295 213,182 230,776 246,690
XIII - Caraga 124,986 133,641 153,963 159,038 167,565 180,529 194,014 78,100 84,475 92,419 96,290 98,905 102,495 105,771
ARMM 93,178 99,302 104,836 99,576 105,247 119,283 128,711 47,497 49,324 50,785 50,370 50,802 54,601 58,550
Note: Regional levels may not add up to the national totals due to rounding.
Source: Philippine Statistics Authority
RegionAt Current Prices At Constant 2000 Prices
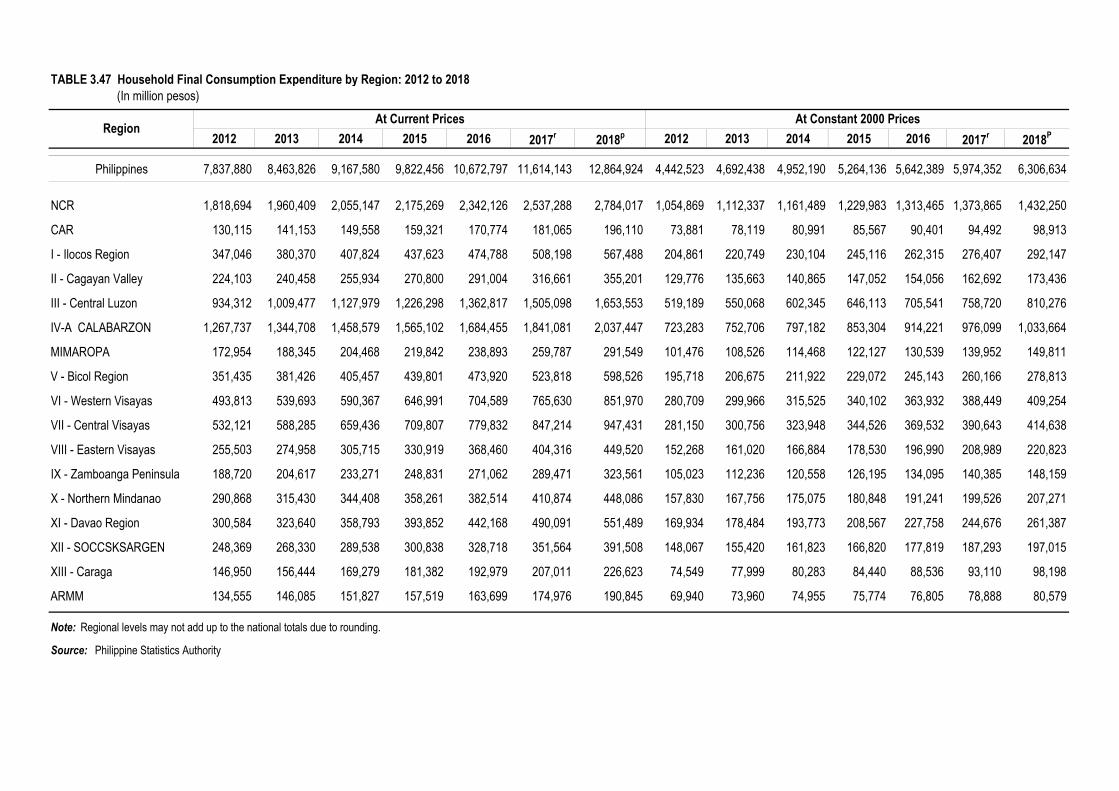
TABLE 3.47 Household Final Consumption Expenditure by Region: 2012 to 2018(In million pesos)
2012 2013 2014 2015 2016 2017r 2018p 2012 2013 2014 2015 2016 2017r 2018P
Philippines 7,837,880 8,463,826 9,167,580 9,822,456 10,672,797 11,614,143 12,864,924 4,442,523 4,692,438 4,952,190 5,264,136 5,642,389 5,974,352 6,306,634
NCR 1,818,694 1,960,409 2,055,147 2,175,269 2,342,126 2,537,288 2,784,017 1,054,869 1,112,337 1,161,489 1,229,983 1,313,465 1,373,865 1,432,250
CAR 130,115 141,153 149,558 159,321 170,774 181,065 196,110 73,881 78,119 80,991 85,567 90,401 94,492 98,913
I - Ilocos Region 347,046 380,370 407,824 437,623 474,788 508,198 567,488 204,861 220,749 230,104 245,116 262,315 276,407 292,147
II - Cagayan Valley 224,103 240,458 255,934 270,800 291,004 316,661 355,201 129,776 135,663 140,865 147,052 154,056 162,692 173,436
III - Central Luzon 934,312 1,009,477 1,127,979 1,226,298 1,362,817 1,505,098 1,653,553 519,189 550,068 602,345 646,113 705,541 758,720 810,276
IV-A CALABARZON 1,267,737 1,344,708 1,458,579 1,565,102 1,684,455 1,841,081 2,037,447 723,283 752,706 797,182 853,304 914,221 976,099 1,033,664
MIMAROPA 172,954 188,345 204,468 219,842 238,893 259,787 291,549 101,476 108,526 114,468 122,127 130,539 139,952 149,811
V - Bicol Region 351,435 381,426 405,457 439,801 473,920 523,818 598,526 195,718 206,675 211,922 229,072 245,143 260,166 278,813
VI - Western Visayas 493,813 539,693 590,367 646,991 704,589 765,630 851,970 280,709 299,966 315,525 340,102 363,932 388,449 409,254
VII - Central Visayas 532,121 588,285 659,436 709,807 779,832 847,214 947,431 281,150 300,756 323,948 344,526 369,532 390,643 414,638
VIII - Eastern Visayas 255,503 274,958 305,715 330,919 368,460 404,316 449,520 152,268 161,020 166,884 178,530 196,990 208,989 220,823
IX - Zamboanga Peninsula 188,720 204,617 233,271 248,831 271,062 289,471 323,561 105,023 112,236 120,558 126,195 134,095 140,385 148,159
X - Northern Mindanao 290,868 315,430 344,408 358,261 382,514 410,874 448,086 157,830 167,756 175,075 180,848 191,241 199,526 207,271
XI - Davao Region 300,584 323,640 358,793 393,852 442,168 490,091 551,489 169,934 178,484 193,773 208,567 227,758 244,676 261,387
XII - SOCCSKSARGEN 248,369 268,330 289,538 300,838 328,718 351,564 391,508 148,067 155,420 161,823 166,820 177,819 187,293 197,015
XIII - Caraga 146,950 156,444 169,279 181,382 192,979 207,011 226,623 74,549 77,999 80,283 84,440 88,536 93,110 98,198
ARMM 134,555 146,085 151,827 157,519 163,699 174,976 190,845 69,940 73,960 74,955 75,774 76,805 78,888 80,579
Note: Regional levels may not add up to the national totals due to rounding.
Source: Philippine Statistics Authority
RegionAt Current Prices At Constant 2000 Prices

TABLE 3.48 Government Final Consumption Expenditure by Region: 2012 to 2018(In million pesos)
2012 2013 2014 2015 2016 2017r 2018p 2012 2013 2014 2015 2016 2017r 2018P
Philippines 1,145,140 1,250,814 1,333,988 1,458,367 1,619,639 1,776,906 2,078,438 672,176 705,811 728,754 785,346 854,570 907,579 1,025,691
NCR 569,478 625,884 645,188 696,769 764,269 828,317 956,600 334,273 353,175 352,463 375,218 403,251 423,075 472,074
CAR 21,787 22,898 24,688 26,799 29,547 32,779 38,052 12,788 12,921 13,487 14,432 15,590 16,743 18,778
I - Ilocos Region 37,381 39,531 45,013 51,035 58,768 64,905 78,694 21,942 22,306 24,590 27,483 31,008 33,151 38,835
II - Cagayan Valley 27,466 28,790 31,986 35,706 40,483 44,679 53,333 16,122 16,246 17,474 19,228 21,360 22,820 26,320
III - Central Luzon 63,394 69,332 77,190 85,787 96,836 107,708 128,012 37,211 39,123 42,169 46,197 51,094 55,013 63,173
IV-A CALABARZON 64,292 68,279 76,241 84,584 95,311 106,208 126,005 37,738 38,529 41,650 45,550 50,289 54,247 62,182
MIMAROPA 22,283 24,682 27,028 29,079 31,774 35,320 40,628 13,080 13,927 14,766 15,660 16,765 18,040 20,050
V - Bicol Region 43,628 46,346 51,043 56,574 63,684 70,462 83,508 25,609 26,152 27,885 30,466 33,601 35,989 41,210
VI - Western Visayas 51,451 54,024 59,992 66,154 74,088 81,543 96,149 30,201 30,485 32,773 35,624 39,091 41,649 47,449
VII - Central Visayas 40,845 46,465 50,843 56,534 63,845 70,964 84,377 23,975 26,220 27,775 30,444 33,686 36,246 41,639
VIII - Eastern Visayas 36,461 38,922 43,192 47,686 53,469 58,927 69,565 21,402 21,963 23,596 25,679 28,212 30,098 34,330
IX - Zamboanga Peninsula 29,054 32,603 35,191 39,175 44,291 49,179 58,540 17,054 18,397 19,225 21,096 23,369 25,119 28,889
X - Northern Mindanao 32,931 35,854 39,502 43,701 49,102 54,535 64,515 19,330 20,232 21,580 23,534 25,908 27,855 31,837
XI - Davao Region 31,450 35,692 37,983 41,597 46,267 51,804 60,666 18,461 20,141 20,750 22,400 24,412 26,459 29,938
XII - SOCCSKSARGEN 28,437 32,014 34,819 38,015 42,152 46,962 54,824 16,692 18,065 19,022 20,471 22,240 23,986 27,055
XIII - Caraga 22,322 24,084 25,922 28,138 31,020 34,455 39,991 13,102 13,590 14,161 15,152 16,367 17,599 19,735
ARMM 22,479 25,413 28,167 31,034 34,734 38,159 44,979 13,195 14,340 15,388 16,712 18,327 19,490 22,197
Note: Regional levels may not add up to the national totals due to rounding.
Source: Philippine Statistics Authority
RegionAt Current Prices At Constant 2000 Prices

TABLE 3.49 Gross Value in Construction by Region: 2012 to 2018(In million pesos)
2012 2013 2014 2015 2016 2017r 2018p 2012 2013 2014 2015 2016 2017r 2018P
Philippines 1,095,176 1,261,129 1,395,259 1,566,901 1,794,018 1,938,946 2,326,341 528,569 582,828 632,219 701,802 793,470 839,235 953,217
NCR 256,386 293,908 282,138 303,093 298,734 260,880 319,334 125,264 136,091 130,630 140,277 136,872 116,842 135,276
CAR 24,644 30,599 32,451 34,212 24,960 31,460 37,947 10,792 12,932 13,423 13,901 9,971 12,324 14,095
I - Ilocos Region 41,102 50,342 57,871 70,297 102,183 116,285 140,598 19,968 23,581 26,283 31,301 44,977 50,401 57,908
II - Cagayan Valley 19,434 23,837 26,188 32,268 35,518 40,211 45,806 9,512 11,296 12,046 14,584 15,731 17,561 18,916
III - Central Luzon 117,345 127,062 142,764 163,143 172,757 216,477 265,989 56,630 59,074 64,806 72,539 75,689 92,888 108,350
IV-A CALABARZON 169,758 192,092 204,746 219,810 226,844 268,665 307,355 81,571 87,592 92,242 99,666 101,779 118,414 128,300
MIMAROPA 19,227 23,160 32,564 32,380 33,368 39,967 52,416 8,962 10,408 14,158 13,964 14,234 16,692 20,762
V - Bicol Region 35,458 42,740 44,924 64,901 69,659 75,022 96,483 16,665 19,415 19,952 28,544 30,201 31,811 38,319
VI - Western Visayas 58,934 70,022 82,667 133,074 150,230 159,701 190,448 28,369 32,471 37,176 59,330 66,191 69,239 78,337
VII - Central Visayas 136,883 147,425 183,580 153,775 218,653 221,121 264,114 67,233 69,543 83,952 68,866 96,777 96,299 108,836
VIII - Eastern Visayas 31,144 35,953 39,335 44,899 66,256 52,828 65,267 14,999 16,667 17,878 20,197 29,494 22,498 26,240
IX - Zamboanga Peninsula 20,733 28,481 34,230 55,651 71,045 63,918 68,405 10,047 13,269 15,488 24,893 31,120 27,914 28,211
X - Northern Mindanao 47,544 52,873 72,736 81,001 105,352 109,973 133,570 22,162 23,757 31,745 34,952 44,934 46,114 52,887
XI - Davao Region 65,012 81,122 88,176 95,833 121,215 171,724 211,816 31,730 38,265 40,575 42,695 53,533 73,213 85,551
XII - SOCCSKSARGEN 30,517 37,680 38,645 44,669 56,849 63,937 75,289 14,765 17,654 17,672 19,810 24,887 27,626 30,937
XIII - Caraga 19,213 21,890 27,454 35,088 36,954 43,174 47,134 9,047 9,943 12,069 15,071 15,605 17,883 18,547
ARMM 1,840 1,941 4,790 2,807 3,440 3,603 4,370 853 871 2,122 1,213 1,476 1,516 1,745
Note: Regional levels may not add up to the national totals due to rounding.
Source: Philippine Statistics Authority
RegionAt Current Prices At Constant 2000 Prices

TABLE 3.50 Gross Domestic Capital Formation in Durable Equipment by Region: 2012 to 2018(In million pesos)
2012 2013 2014 2015 2016 2017r 2018p 2012 2013 2014 2015 2016r 2017r 2018P
Philippines 751,133 902,056 996,622 1,129,826 1,512,204 1,706,395 1,984,237 624,112 718,503 749,705 913,207 1,292,959 1,431,080 1,609,080
NCR 295,335 421,414 477,875 479,248 679,274 884,241 1,028,934 238,671 360,367 335,864 395,423 593,913 727,714 827,764
CAR 20,324 20,667 12,783 14,003 14,189 13,929 16,046 17,472 15,680 9,475 9,916 9,753 11,261 12,384
I - Ilocos Region 2,347 1,657 712 177 1,489 1,588 1,069 4,432 7,871 1,739 342 2,805 3,650 2,376
II - Cagayan Valley 2,047 925 149 117 338 117 360 3,144 725 131 128 389 127 380
III - Central Luzon 43,830 35,486 53,662 82,467 99,221 121,755 121,415 64,787 43,718 71,064 99,011 121,327 146,685 142,437
IV-A CALABARZON 308,302 332,273 315,336 397,012 519,730 489,468 592,702 207,109 205,434 196,426 239,714 313,267 303,178 354,085
MIMAROPA 895 577 1,188 2,726 5,746 6,266 3,611 474 536 941 2,105 4,715 5,018 2,876
V - Bicol Region 452 646 1,082 243 217 283 563 649 385 1,339 379 318 363 701
VI - Western Visayas 5,618 5,341 3,103 7,635 3,419 3,669 2,958 4,403 4,768 4,019 4,839 2,190 3,032 2,481
VII - Central Visayas 37,428 46,009 41,428 45,943 74,351 69,378 86,208 45,034 38,938 47,181 57,080 109,898 93,836 113,490
VIII - Eastern Visayas 3,278 3,292 6,690 6,310 6,324 7,255 7,647 5,149 2,676 7,113 5,517 5,330 6,332 6,750
IX - Zamboanga Peninsula 1,045 877 1,147 1,378 1,402 1,404 1,366 727 809 1,046 2,873 3,698 3,532 3,413
X - Northern Mindanao 8,378 7,029 21,059 29,827 37,668 36,786 40,377 7,514 10,509 18,478 30,639 44,473 43,013 46,653
XI - Davao Region 11,612 13,161 19,940 16,809 14,558 17,888 22,456 15,236 11,927 17,400 19,121 17,408 21,144 25,766
XII - SOCCSKSARGEN 9,459 12,284 39,560 44,698 52,475 51,353 57,411 8,791 12,991 36,746 44,846 61,488 61,027 66,223
XIII - Caraga 610 416 787 1,134 1,383 975 1,087 366 645 707 1,206 1,632 1,136 1,279
ARMM 173 2 122 99 420 40 27 156 524 36 68 355 32 22
Note: Regional levels may not add up to the national totals due to rounding.
Source: Philippine Statistics Authority
RegionAt Current Prices At Constant 2000 Prices

TABLE 3.51 Gross Domestic Capital Formation in Breeding Stocks and Orchards Development by Region: 2012 to 2018(In million pesos)
2012 2013 2014 2015 2016r 2017r 2018p 2012 2013 2014 2015 2016r 2017r 2018P
Philippines 181,022 273,103 165,981 172,474 188,840 216,089 246,992 100,066 98,569 97,297 99,286 102,843 106,255 111,285
NCR 96 93,116 84 84 85 89 95 56 54 54 53 53 53 57
CAR 3,773 4,200 3,975 4,122 4,671 5,024 5,942 2,035 1,989 2,018 2,085 2,074 2,087 2,229
I - Ilocos Region 10,109 9,929 8,952 9,542 10,200 12,182 14,056 4,901 4,798 4,496 4,485 4,578 4,902 5,007
II - Cagayan Valley 7,121 7,818 7,842 7,904 8,739 10,088 11,833 4,313 4,431 4,614 4,611 4,827 5,012 5,130
III - Central Luzon 24,808 26,510 25,835 28,442 28,967 31,745 35,531 17,711 18,523 19,730 21,163 20,712 20,872 20,943
IV-A CALABARZON 43,980 41,859 38,059 37,493 43,389 45,572 52,926 27,536 26,307 24,903 24,383 27,166 26,953 28,739
MIMAROPA 4,154 4,102 4,621 5,092 5,241 5,912 6,794 2,174 2,103 2,180 2,325 2,271 2,280 2,485
V - Bicol Region 6,600 6,825 6,669 6,626 6,791 7,452 8,748 3,539 3,518 3,623 3,600 3,423 3,488 3,689
VI - Western Visayas 13,899 14,459 13,647 13,465 15,106 16,720 18,392 9,097 8,954 9,089 8,734 8,925 8,797 8,789
VII - Central Visayas 11,733 11,709 9,036 11,130 12,481 15,814 19,607 5,665 5,534 4,360 5,242 5,618 6,301 6,878
VIII - Eastern Visayas 5,071 4,434 3,284 3,406 3,914 4,576 4,908 2,254 1,937 1,588 1,544 1,668 1,801 1,844
IX - Zamboanga Peninsula 6,822 6,387 5,695 5,744 6,014 7,618 7,834 2,178 2,073 2,284 2,402 2,380 2,517 2,632
X - Northern Mindanao 14,289 14,715 13,999 14,430 15,919 17,915 21,225 6,859 6,870 7,053 7,073 7,524 7,770 8,283
XI - Davao Region 9,824 9,951 9,169 10,340 11,264 13,583 13,747 4,553 4,507 4,467 4,746 4,775 5,123 5,001
XII - SOCCSKSARGEN 11,016 11,035 9,893 9,032 9,785 14,579 17,825 4,794 4,742 4,760 4,687 4,654 6,224 7,385
XIII - Caraga 3,210 2,565 2,814 3,374 3,752 4,153 4,445 1,167 989 1,110 1,286 1,342 1,278 1,349
ARMM 4,518 3,489 2,406 2,247 2,522 3,066 3,084 1,233 1,240 968 867 853 797 845
Note: Regional levels may not add up to the national totals due to rounding.
Source: Philippine Statistics Authority
RegionAt Current Prices At Constant 2000 Prices

4 - 3
4 - 6
4 - 7
4 - 8
4 - 8
4 - 9
4 - 10
4 - 11
4 - 12
4 - 13
4 - 14
4 - 15
4 - 16
4 - 17
4 - 18
4 - 18
4 - 19
TABLE 4.1 Status of Land Classification by Region and by Province: 2017
TABLE 4.2 Classified and Unclassified Land Area: 1997 to 2017
TABLE 4.3 Number of Households by Land Ownership and by Region: 2010
TABLE 4.4 Number of Threatened Wildlife Species: 2008 to 2018
TABLE 4.5 Status of Known Fauna Species in the Philippines: 2012 to 2018
TABLE 4.6 Forest Disturbance by Cause: 1991 to 2017
TABLE 4.7 Area Forested by the Government and the Private Sectors: 1991 to 2017
TABLE 4.8 Forestry Tenurial Instruments: 1991 to 2017
TABLE 4.9 Production of Logs, Lumber, Plywood and Veneer: 1991 to 2017
TABLE 4.10 Roundwood Production: 1991 to 2017
TABLE 4.11 Production of Selected Non-Timber Forest Products: 1991 to 2017
TABLE 4.12 Imports of Log and Processed Forest Products: 1991 to 2017
TABLE 4.13 Exports of Selected Non-Timber Forest Products: 1991 to 2017
TABLE 4.14 Exports of Roundwood and Processed Wood Products: 1991 to 2017
TABLE 4.15 Mineral Production: 2014 to 2018
TABLE 4.16 Exports of Metallic Minerals: 2014 to 2018
TABLE 4.17 Annual Geometric Mean (g/Ncm) of Total Suspended Particles (TSP) in the Atmosphere
by Ambient Air Quality Monitoring Stations in the National Capital Region: 2009 to 2017
TABLE 4.18 Distribution of Pollutants by Type of Emission in the National Capital Region1990, 2001, 2006, 2009, 2012, and 2015 4 - 20
4 - 21
4 - 21
4 - 22
TABLE 4.19 Annual Average of Dissolved Oxygen (DO) and Biological Oxygen Demand (BOD)
Concentration in the National Capital Region Rivers: 2011 to 2017
TABLE 4.20 Philippine Annual Consumption of Chlorofluorocarbons (CFC): 2005 to 2018
TABLE 4.21 Amount of Rainfall by Month by Selected Station: 2004 to 2017
TABLE 4.22 Historical Climate Data by Selected Station: 2006 to 2017 4 - 25

TABLE 4.1 Status of Land Classification by Region and by Province: 2017 (In hectare)
Total Established Forest Reserves
Established Timberland
National Parks GRBS/WA
Military & Naval Reservation
Civil Reservation Fishpond
Philippines 30,000,000 14,194,675 15,805,325 755,009 15,050,316 3,270,146 10,056,020 1,340,997 126,130 165,946 91,077NCR 63,600 48,232 15,368 14,740 628 - 237 59 - - 332CAR 1,829,368 342,345 1,487,023 8,548 1,478,475 804,795 666,219 6,907 554 - -
Abra 397,555 98,420 299,135 8,105 291,030 258,743 32,230 57 - - -Apayao and Kalinga 704,764 80,679 624,085 - 624,085 374,997 247,750 1,338 - - -Benguet 265,538 89,586 175,952 443 175,509 19,735 149,708 5,512 554 - -Ifugao 251,778 25,409 226,369 - 226,369 28,467 197,902 - - - -Mt. Province 209,733 48,251 161,482 - 161,482 122,853 38,629 - - - -
I - Ilocos Region 1,284,019 810,922 473,097 30,271 442,826 226,846 201,164 12,999 288 923 606Ilocos Norte 339,934 144,948 194,986 - 194,986 193,272 1,374 340 - - -Ilocos Sur 257,958 138,412 119,546 26,176 93,370 10,609 81,141 1,620 - - -La Union 149,309 120,443 28,866 2,513 26,353 90 15,316 10,947 - - -Pangasinan 536,818 407,119 129,699 1,582 128,117 22,875 103,333 92 288 923 606
II - Cagayan Valley 2,687,517 972,822 1,714,695 45,105 1,669,590 209,288 1,423,482 26,388 412 8,931 1,089Batanes 20,928 7,432 13,496 - 13,496 - 13,496 - - - -Cagayan 904,026 360,050 543,976 - 543,976 39,378 497,314 6,195 - - 1,089Isabela 1,066,456 459,666 606,790 - 606,790 31,260 546,005 20,193 412 8,920 -Nueva Vizcaya 390,387 88,921 301,466 45,105 256,361 95,838 160,512 - - 11 -Quirino 305,720 56,753 248,967 - 248,967 42,812 206,155 - - - -
III - Central Luzon 2,147,036 1,204,649 942,387 27,268 915,119 250,902 493,882 36,970 112,819 804 19,742Aurora 323,954 132,008 191,946 26,638 165,308 84,803 76,315 4,190 - - -Bataan 137,291 69,975 67,316 - 67,316 9,279 32,370 25,188 479 - -Bulacan 262,505 185,333 77,172 630 76,542 8,019 64,679 368 - - 3,476Nueva Ecija 528,433 343,257 185,176 - 185,176 84,500 37,333 3,504 59,700 139 -Pampanga 218,068 172,616 45,452 - 45,452 12,484 6,929 3,709 7,452 - 14,878Tarlac 305,345 184,975 120,370 - 120,370 - 83,115 2 36,588 665 -Zambales 371,440 116,485 254,955 - 254,955 51,817 193,141 9 8,600 - 1,388
IV-A CALABARZON 1,622,861 1,051,948 570,913 21,032 549,881 98,825 424,751 20,832 3,688 28 1,757Batangas 316,581 271,167 45,414 7,723 37,691 - 28,784 8,537 51 - 319Cavite 128,755 107,733 21,022 4,147 16,875 - 14,076 - 2,799 - -Laguna 175,973 134,720 41,253 2,275 38,978 3,637 32,313 2,754 274 - -Quezon 870,660 474,439 396,221 6,887 389,334 72,606 305,721 9,541 - 28 1,438Rizal 130,892 63,889 67,003 - 67,003 22,582 43,857 - 564 - -0
Continued
Region/Province Total Land Area
Certified Alienable and
Disposable Land
Forest Land
Total UnclassifiedClassified
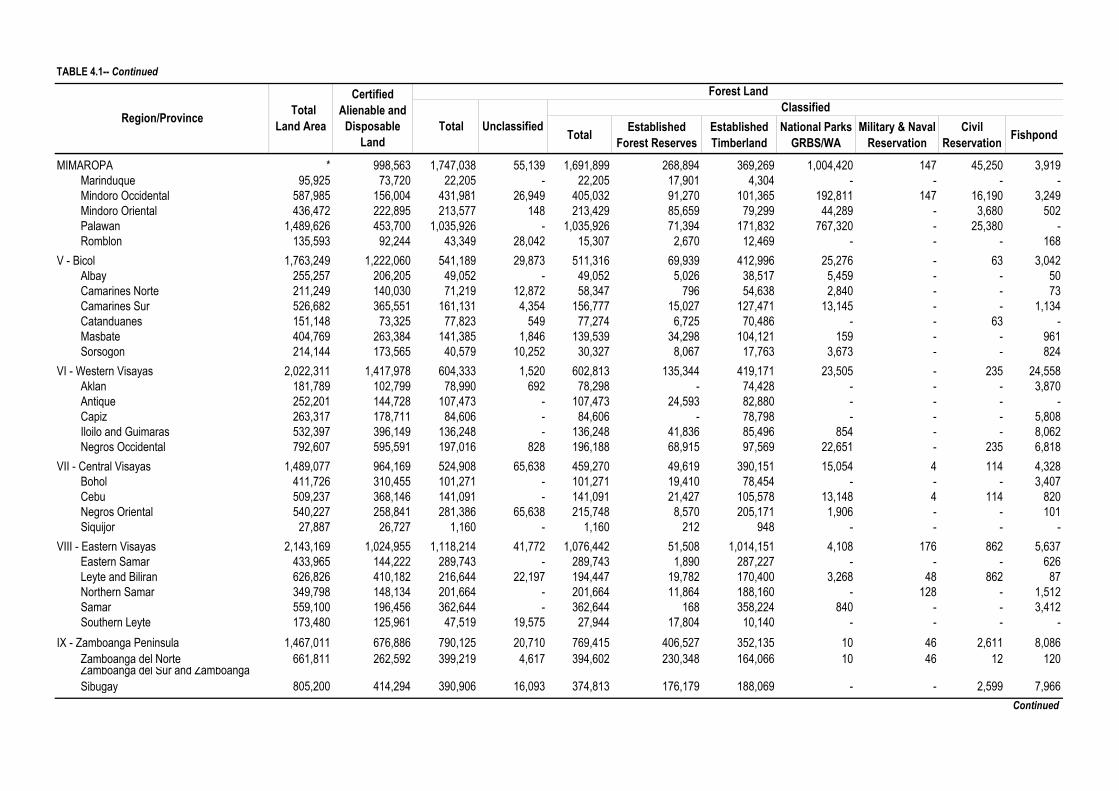
TABLE 4.1-- Continued
Total Established Forest Reserves
Established Timberland
National Parks GRBS/WA
Military & Naval Reservation
Civil Reservation Fishpond
MIMAROPA * 998,563 1,747,038 55,139 1,691,899 268,894 369,269 1,004,420 147 45,250 3,919Marinduque 95,925 73,720 22,205 - 22,205 17,901 4,304 - - - -Mindoro Occidental 587,985 156,004 431,981 26,949 405,032 91,270 101,365 192,811 147 16,190 3,249Mindoro Oriental 436,472 222,895 213,577 148 213,429 85,659 79,299 44,289 - 3,680 502Palawan 1,489,626 453,700 1,035,926 - 1,035,926 71,394 171,832 767,320 - 25,380 -Romblon 135,593 92,244 43,349 28,042 15,307 2,670 12,469 - - - 168
V - Bicol 1,763,249 1,222,060 541,189 29,873 511,316 69,939 412,996 25,276 - 63 3,042Albay 255,257 206,205 49,052 - 49,052 5,026 38,517 5,459 - - 50Camarines Norte 211,249 140,030 71,219 12,872 58,347 796 54,638 2,840 - - 73Camarines Sur 526,682 365,551 161,131 4,354 156,777 15,027 127,471 13,145 - - 1,134Catanduanes 151,148 73,325 77,823 549 77,274 6,725 70,486 - - 63 -Masbate 404,769 263,384 141,385 1,846 139,539 34,298 104,121 159 - - 961Sorsogon 214,144 173,565 40,579 10,252 30,327 8,067 17,763 3,673 - - 824
VI - Western Visayas 2,022,311 1,417,978 604,333 1,520 602,813 135,344 419,171 23,505 - 235 24,558Aklan 181,789 102,799 78,990 692 78,298 - 74,428 - - - 3,870Antique 252,201 144,728 107,473 - 107,473 24,593 82,880 - - - -Capiz 263,317 178,711 84,606 - 84,606 - 78,798 - - - 5,808Iloilo and Guimaras 532,397 396,149 136,248 - 136,248 41,836 85,496 854 - - 8,062Negros Occidental 792,607 595,591 197,016 828 196,188 68,915 97,569 22,651 - 235 6,818
VII - Central Visayas 1,489,077 964,169 524,908 65,638 459,270 49,619 390,151 15,054 4 114 4,328Bohol 411,726 310,455 101,271 - 101,271 19,410 78,454 - - - 3,407Cebu 509,237 368,146 141,091 - 141,091 21,427 105,578 13,148 4 114 820Negros Oriental 540,227 258,841 281,386 65,638 215,748 8,570 205,171 1,906 - - 101Siquijor 27,887 26,727 1,160 - 1,160 212 948 - - - -
VIII - Eastern Visayas 2,143,169 1,024,955 1,118,214 41,772 1,076,442 51,508 1,014,151 4,108 176 862 5,637Eastern Samar 433,965 144,222 289,743 - 289,743 1,890 287,227 - - - 626Leyte and Biliran 626,826 410,182 216,644 22,197 194,447 19,782 170,400 3,268 48 862 87Northern Samar 349,798 148,134 201,664 - 201,664 11,864 188,160 - 128 - 1,512Samar 559,100 196,456 362,644 - 362,644 168 358,224 840 - - 3,412Southern Leyte 173,480 125,961 47,519 19,575 27,944 17,804 10,140 - - - -
IX - Zamboanga Peninsula 1,467,011 676,886 790,125 20,710 769,415 406,527 352,135 10 46 2,611 8,086Zamboanga del Norte 661,811 262,592 399,219 4,617 394,602 230,348 164,066 10 46 12 120Zamboanga del Sur and Zamboanga Sibugay 805,200 414,294 390,906 16,093 374,813 176,179 188,069 - - 2,599 7,966
Continued
Region/Province Total Land Area
Certified Alienable and
Disposable Land
Forest Land
Total UnclassifiedClassified
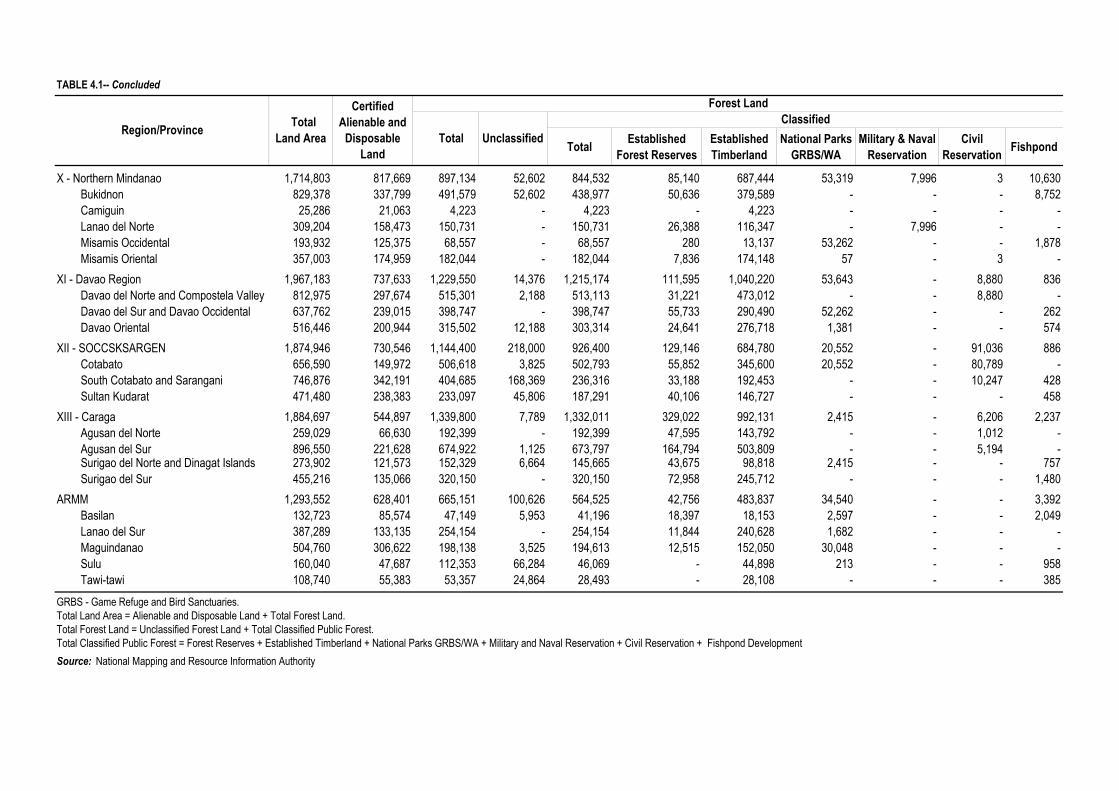
TABLE 4.1-- Concluded
Total Established Forest Reserves
Established Timberland
National Parks GRBS/WA
Military & Naval Reservation
Civil Reservation Fishpond
X - Northern Mindanao 1,714,803 817,669 897,134 52,602 844,532 85,140 687,444 53,319 7,996 3 10,630Bukidnon 829,378 337,799 491,579 52,602 438,977 50,636 379,589 - - - 8,752Camiguin 25,286 21,063 4,223 - 4,223 - 4,223 - - - -Lanao del Norte 309,204 158,473 150,731 - 150,731 26,388 116,347 - 7,996 - -Misamis Occidental 193,932 125,375 68,557 - 68,557 280 13,137 53,262 - - 1,878Misamis Oriental 357,003 174,959 182,044 - 182,044 7,836 174,148 57 - 3 -
XI - Davao Region 1,967,183 737,633 1,229,550 14,376 1,215,174 111,595 1,040,220 53,643 - 8,880 836Davao del Norte and Compostela Valley 812,975 297,674 515,301 2,188 513,113 31,221 473,012 - - 8,880 -Davao del Sur and Davao Occidental 637,762 239,015 398,747 - 398,747 55,733 290,490 52,262 - - 262Davao Oriental 516,446 200,944 315,502 12,188 303,314 24,641 276,718 1,381 - - 574
XII - SOCCSKSARGEN 1,874,946 730,546 1,144,400 218,000 926,400 129,146 684,780 20,552 - 91,036 886Cotabato 656,590 149,972 506,618 3,825 502,793 55,852 345,600 20,552 - 80,789 -South Cotabato and Sarangani 746,876 342,191 404,685 168,369 236,316 33,188 192,453 - - 10,247 428Sultan Kudarat 471,480 238,383 233,097 45,806 187,291 40,106 146,727 - - - 458
XIII - Caraga 1,884,697 544,897 1,339,800 7,789 1,332,011 329,022 992,131 2,415 - 6,206 2,237Agusan del Norte 259,029 66,630 192,399 - 192,399 47,595 143,792 - - 1,012 -Agusan del Sur 896,550 221,628 674,922 1,125 673,797 164,794 503,809 - - 5,194 -Surigao del Norte and Dinagat Islands 273,902 121,573 152,329 6,664 145,665 43,675 98,818 2,415 - - 757Surigao del Sur 455,216 135,066 320,150 - 320,150 72,958 245,712 - - - 1,480
ARMM 1,293,552 628,401 665,151 100,626 564,525 42,756 483,837 34,540 - - 3,392Basilan 132,723 85,574 47,149 5,953 41,196 18,397 18,153 2,597 - - 2,049Lanao del Sur 387,289 133,135 254,154 - 254,154 11,844 240,628 1,682 - - -Maguindanao 504,760 306,622 198,138 3,525 194,613 12,515 152,050 30,048 - - -Sulu 160,040 47,687 112,353 66,284 46,069 - 44,898 213 - - 958Tawi-tawi 108,740 55,383 53,357 24,864 28,493 - 28,108 - - - 385
GRBS - Game Refuge and Bird Sanctuaries.Total Land Area = Alienable and Disposable Land + Total Forest Land.Total Forest Land = Unclassified Forest Land + Total Classified Public Forest.Total Classified Public Forest = Forest Reserves + Established Timberland + National Parks GRBS/WA + Military and Naval Reservation + Civil Reservation + Fishpond DevelopmentSource: National Mapping and Resource Information Authority
Region/Province Total Land Area
Certified Alienable and
Disposable Land
Forest Land
Total UnclassifiedClassified

TABLE 4.2 Classified and Unclassified Land Area: 1997 to 2017 (In hectare)
Established Forest
Reserves
Established Timberland
National Parks &
GRBS/WA
Military & Naval
Reservations
Civil Reservations Fishpond
1997 15,882,756 881,157 3,272,912 10,015,866 1,340,997 130,330 165,946 75,5481998 15,854,973 1,089,169 a 3,272,912 10,227,847 893,221 130,330 165,946 75,5481999 15,854,973 1,089,169 a 3,272,912 10,227,847 893,221 130,330 165,946 75,5482000 15,854,922 1,089,118 3,272,912 10,227,847 893,221 130,330 165,946 75,5482001 15,854,922 1,089,118 3,272,912 10,227,847 893,221 130,330 165,946 75,5482002 15,854,922 1,089,118 3,272,912 10,227,847 893,221 130,330 165,946 75,5482003 15,854,922 1,089,118 3,272,912 10,227,847 893,221 130,330 165,946 75,5482004 15,792,418 755,009 3,222,360 10,090,899 1,340,997 126,130 165,946 91,0772005 15,792,418 753,427 3,222,360 10,090,899 1,342,579 126,130 165,946 91,0772006 15,805,325 755,009 3,270,146 10,056,020 1,340,997 126,130 165,946 91,0772007 15,805,325 755,009 3,270,146 10,056,020 1,340,997 126,130 165,946 91,0772008 15,805,325 755,009 3,270,146 10,056,020 1,340,997 126,130 165,946 91,0772009 15,805,325 755,009 3,270,146 10,056,020 1,340,997 126,130 165,946 91,0772010 15,805,325 755,009 3,270,146 10,056,020 1,340,997 126,130 165,946 91,0772011 15,805,325 755,009 3,270,146 10,056,020 1,340,997 126,130 165,946 91,0772012 15,805,325 755,009 3,270,146 10,056,020 1,340,997 126,130 165,946 91,0772013 15,805,325 755,009 3,270,146 10,056,020 1,340,997 126,130 165,946 91,0772014 15,805,325 755,009 3,270,146 10,056,020 1,340,997 126,130 165,946 91,0772015 15,805,325 755,009 3,270,146 10,056,020 1,340,997 126,130 165,946 91,0772016 15,805,325 755,009 3,270,146 10,056,020 1,340,997 126,130 165,946 91,0772017 15,805,325 755,009 3,270,146 10,056,020 1,340,997 126,130 165,946 91,077
a Adjusted figures Source: National Mapping and Resource Information Authority
Year
Forest Land
Total Unclassified
Classified
4-4

TABLE 4.3 Number of Households by Land Ownership and by Region: 2010
Other Residential
Land/s
Agricultural Land/s
Agricultural Land/s Acquired through CARP
Agrarian Reform Beneficiary
Other Land/s
Philippines 20,171,899 5,809,720 2,196,174 4,169,754 305,892 331,394 14,362,179
NCR 2,759,829 391,720 284,197 151,648 13,304 30,524 2,368,109CAR 352,403 194,896 83,153 162,658 3,895 15,518 157,507I - Ilocos Region 1,050,605 360,266 110,388 295,730 9,950 18,249 690,339II - Cagayan Valley 727,327 395,063 117,586 342,587 15,365 12,926 332,264III - Central Luzon 2,239,011 478,616 181,639 321,042 25,657 22,632 1,760,395IV-A CALABARZON 2,833,595 524,064 273,584 276,327 31,637 35,623 2,309,531IV-B MIMAROPA 602,131 219,209 81,902 164,344 11,269 14,863 382,922V - Bicol Region 1,111,753 324,120 103,131 244,565 23,499 12,934 787,633VI - Western Visayas 1,526,587 414,076 131,239 289,459 49,799 17,666 1,112,511VII - Central Visayas 1,487,710 410,126 171,257 280,641 22,981 26,643 1,077,584VIII - Eastern Visayas 865,657 300,077 92,064 247,505 13,155 12,009 565,580IX - Western Mindanao 726,272 284,363 89,234 219,746 10,740 16,352 441,909X - Northern Mindanao 917,840 315,226 118,504 244,651 12,632 16,611 602,614XI - Southern Mindanao 1,011,943 368,652 118,232 276,436 22,511 17,203 643,291XII - Central Mindanao 916,038 410,492 114,743 342,123 20,018 19,092 505,546XIII - Caraga 504,257 189,664 57,571 148,655 11,806 11,691 314,593ARMM 538,941 229,090 67,750 161,637 7,674 30,858 309,851
Source: Philippine Statistics Authority
Region Total Number of Households
Total Number of Households with at least One Land
Owned
Land OwnershipNumber of
Households with no
other land owned
4-5

TABLE 4.4 Number of Threatened Wildlife Species: 2008 to 2018
Taxonomic Group 2008 2009 2010 2011 2012 2013 2014 2015 2016 2017 2018A. FAUNA* 216 207 207 207 207 207 212 212 212 212 212
Land Mammals 43 42 42 42 42 42 43 43 43 43 43Birds 132 127 127 127 127 127 126 126 126 126 126Reptiles 27 24 24 24 24 24 29 29 29 29 29Amphibians 14 14 14 14 14 14 14 14 14 14 14
B. FLORA** 526 526 526 526 526 526 526 526 526 984*** 984***
***Based on DENR Administrative Order No. 2017-11 re Updated List of Threathened Philippine Plants
TABLE 4.5 Status of Known Fauna Species in the Philippines: 2012 to 2018
WildlifeCategory Total Endemic Resident Migrant Intro-
ducedResident/Migrant
Acci-dental
NearEndemic Vagrant Under-
mined
2012r
Mammals 206 132 68 0 6 0 0 0 0Birds 614 213 197 163 2 21 9 8 1Reptiles 301 196 105 0 - 0 0 0 0Amphibians 116 95 16 0 5 0 0 0 0
2013r
Mammals 207 132 68 0 7 0 0 0 0Birds 616 215 197 163 2 21 9 8 1Reptiles 301 196 105 0 0 0 0 0 0Amphibians 116 95 16 0 5 0 0 0 0
2014r
Mammals 207 132 68 0 7 0 0 0 0Birds 617 216 197 163 2 21 9 8 1Reptiles 303 198 105 0 0 0 0 0 0Amphibians 116 95 16 0 5 0 0 0 0
2015Mammals 207 133 67 0 7 0 0 0 0Birdsr 618 217 197 163 2 21 9 8 1Reptiles 303 198 105 0 0 0 0 0 0Amphibians 115 95 15 0 5 0 0 0 0
2016Mammals 207 133 67 0 7 0 0 0 0Birds 718 230 210 209 2 26 11 8 1 21Reptiles 352 244 108 0 0 0 0 0 0Amphibians 118 98 15 0 5 0 0 0 0
2017Mammals 207 133 67 0 7 0 0 0 0Birds 718 230 210 209 2 26 11 8 1 21Reptiles 352 244 108 0 0 0 0 0 0Amphibians 118 98 15 0 5 0 0 0 0
2018Mammals 207 133 67 0 7 0 0 0 0Birds 718 230 210 209 2 26 11 8 1 21Reptiles 352 244 108 0 0 0 0 0 0Amphibians 118 98 15 0 5 0 0 0 0
Source: Biodivesity Management Bureau
*Based on DENR Administrative Order No. 2004-15 re National List of Threatened Fauna and CITES listed species**Based on DENR Administrative Order No. 2007-01 re National List of Threatened Philippine Plants
4-6

TABLE 4.6 Forest Disturbance by Cause: 1991 to 2017 (In hectares)
Year Total Kaingin Fire Illegal Cutting Others
1991 7,233 759 5,872 72 530 1992 12,806 86 12,720 ... ...1993 17,862 90 15,330 ... 2,442 1994 10,342 1,529 7,720 107 986 1995 24,102 409 10,331 9 13,354 1996 5,186 94 4,558 10 524 1997 24,893 4,693 3,539 93 16,568 1998 39,605 14,430 18,313 2 6,860 1999 4,062 119 3,206 45 692 2000 11,171 875 4,878 4,920 498 2001 1,400 37 776 - 587 2002 7,999 753 2,465 - 4,782 2003 1,042 - 1,042 - - 2004 1,700 11 1,376 - 312 2005 2,716 1 2,715 - - 2006 3,005 - 3,005 - - 2007 2,576 34 903 1,552 87 2008 549 105 77 - 367 2009 1,200 - 1,200 - - 2010 1,561 … 1,561 … …20112012 5,822 … 5,822 … …2013 1,016 … … … …2014 795 … … … …2015 15,702 1,727 2,518 … 11,457 2016 1,888 12 421.5 - 1,454.7 2017 2,006 50 1 - 1,955
Note: 1. Data from 2016 and 2017 covers Plantation Forest Disturbance only. 2. Details may not add up to totals due to rounding.
Source: Department of Environment and Natural Recources
no data
4-7

TABLE 4.7 Area Forested by the Government and the Private Sectors: 1991 to 2017 (In hectares)
Government Sector
Sub-Total DENR Other Agencies Sub-Total PD 1153
1991 93,039 73,602 72,238 1,364 19,437 18,089 a 1,348 - - 1992 40,593 24,304 24,304 - 16,289 11,683 a 4,606 - - 1993 19,211 6,347 6,347 - 12,864 12,692 a 172 - - 1994 49,551 18,032 18,032 - 31,519 9,468 a 18,729 - 3,322 b
1995 65,233 21,841 7,840 14,001 43,392 30,380 c - - 13,012 b
1996 46,096 18,869 18,869 - 27,227 20,005 c - - 7,222 b
1997 66,237 49,301 48,490 811 16,936 14,357 b - - 2,579 1998 42,368 33,219 32,643 576 9,149 8,236 b - - 913 c
1999 42,167 31,184 30,831 353 10,983 6,904 - - 4,079 2000 27,632 21,740 19,059 2,681 5,892 1,989 3,421 - 482 2001 31,444 26,524 26,484 40 4,920 1,410 2,721 - 789 2002 25,620 20,681 9,111 11,570 4,939 564 3,850 - 525 2003 15,088 13,195 6,565 6,630 1,893 842 1,034 - 17 2004 20,338 12,436 12,436 - 7,902 2,836 4,431 - 635 2005 16,498 7,187 7,187 - 9,311 341 6,337 - 2,633 2006 7,223 4,476 4,476 - 2,747 … … - 2,747 2007 27,837 25,024 25,024 - 2,813 … … - 2,813 2008 43,609 27,752 27,752 - 15,857 182 928 - 14,747 2009 54,792 53,842 53,842 - 950 … 950 - …2010 36,877 32,384 32,384 - 4,493 3737 756 - …2011 128,558 d 102,884 82,163 20,721 25,674 - - - 25,674 2012 221,763 d 207,044 132,710 74,334 14,719 - 5 - 14,714 2013 333,160 d 326,106 273,971 52,135 7,054 - - - 7,054 2014 334,302 d 315,278 306,468 8,810 19,024 - - - 19,024 2015 360,357 d 360,357 360,070 287 - - - - - 2016 284,089 d 284,089 284,089 - - - - - - 2017 200,544 d 200,544 200,544 - - - - -
a Including Enrichment Planting of Timber Licensees.b Including accomplishment of IFMA and SIFMA holders.c Private lands and other organizations.d 2011 to 2016 National Greening Program (NGP) Accomplishment involving DENR and other Partners.
IFMA - Integrated Forest Management AgreementSIFMA - Socialized Industrial Forest Management AgreementCBFMA - Community Based Forest Management AgreementTFLA - Tree Farm Lease AgreementPLA - Pasture Lease AgreementITPLA - Industrial Tree Plantation Lease Agreement
Source: Forest Management Bureau
Year Total
Private Sector
Timber Licensees
IFMA/SIFMA CBFMA/TFLAP
LA/ITPLAOthers
4-8

TABLE 4.8 Forestry Tenurial Instruments: 1991 to 2017 (Area in thousand hectares)
Number Area Number Area Number Area Number Area Number Area Number Area Number Area Number Area
1991 1,324 3,759 81 2,917 290 480 953 362 … … … … … … … …1992 1,370 3,240 71 2,317 337 558 962 365 … … … … … … … …1993 1,316 2,637 50 1,717 383 595 883 325 … … … … … … … …1994 1,271 2,541 46 1,627 433 632 792 282 … … … … … … … …1995 1,223 2,510 41 1,600 460 653 722 257 … … … … … … … …1996 1,205 2,433 36 1,564 470 642 699 227 … … … … … … … …1997 5,879 6,382 26 1,310 436 585 588 187 4,829 4,300 … … … … … …1998 4,956 5,779 21 1,036 427 639 541 170 3,967 3,934 … … … … … …1999 5,591 5,685 21 904 415 617 496 153 4,659 4,011 … … … … … …2000 6,499 5,988 20 910 419 658 419 122 4,885 4,276 756 22 … … … …2001 6,760 6,178 20 910 430 725 407 119 4,956 4,396 947 28 … … … …2002 6,839 6,134 18 787 439 806 400 115 4,956 4,396 1,026 30 … … … …2003 7,961 6,532 16 662 449 816 402 114 5,503 4,904 1,591 36 … … … …2004 8,004 6,467 15 584 427 824 399 112 5,503 4,904 1,660 43 … … … …2005 4,431 3,415 18 825 400 819 395 109 1,781 1,622 1,837 40 … … … …2006 4,437 3,335 15 691 352 871 395 111 1,781 1,622 1,803 35 91 5 … …2007 4,432 3,196 11 496 337 925 405 113 1,783 1,622 1,805 35 91 5 … …2008 4,349 3,193 13 587 289 842 370 101 1,783 1,622 1,803 36 91 5 … …2009 4,340 3,038 6 325 290 941 350 97 1,790 1,634 1,813 36 91 5 … …2010 4,354 3,092 4 253 281 1,093 350 100 1,815 1,605 1,813 36 91 5 … …2011 4,310 2,984 3 177 229 1,042 325 90 1,790 1,634 1,872 36 91 5 … …2012 4,307 2,925 3 177 209 1,013 290 79 1,888 1,615 1,551 33 91 5 275 3 2013 3,794 2,912 3 177 204 1,012 259 73 1,884 1,615 1,267 29 7 2 170 4 2014 4,014 2,848 2 120 203 1,012 217 63 1,884 1,615 1,529 32 7 2 172 4 2015 4,036 2,804 2 120 189 968 195 59 1,884 1,616 1,529 32 115 5 122 4 2016 4,106 2,799 2 120 182 968 186 54 1,884 1,616 1,530 32 115 5 207 5 2017 3,952 2,588 2 120 157 734 171 49 1,884 1,615 1,511 32 114 34 113 4
IFMA - Integrated Forest Management Agreement.ITPLA - Industrial Tree Plantation Lease Agreement.SLUP - Special Land Use PermitSPLULA - Special Land Use Lease AgreementFLAgT - Forest Land Use Agreement for Tourism PurposesFLAg - Forest Land Use Agreementa - project areab - Community-Based Forest Management Projectc - Community-Based Forest Management AgreementSource: Forest Management Bureau
Socialized Industrial Forest Management
Agreements
Private Forest Development Agreements
SLUP/SPLULA/ FLAgT/FLAgYear Total Timber Licenses
IFMA/ITPLA/Tree Farm/Agroforestry
Farm Leases
Forest Land Grazing Lease Agreements
& Permits
Community-Based Forest Management Projects/Agreements
4-9

TABLE 4.9 Production of Logs, Lumber, Plywood and Veneer: 1991 to 2017 (In thousand cubic meters)
1991 1,922 726 321 54 1992 1,438 647 331 80 1993 1,022 440 273 65 1994 957 407 258 39 1995 758 286 290 19 1996 771 313 508 82 1997 556 351 484 62 1998 634 222 246 59 1999 730 288 244 89 2000 800 151 286 178 2001 571 197 292 135 2002 403 163 350 172 2003 506 246 351 152 2004 768 339 386 180 2005 841 288 314 133 2006 1,035 432 317 95 2007 881 362 281 124 2008 815 358 235 101 2009 801 304 253 88 2010 557 377 276 136 2011 871 372 300 114 2012 862 218 297 129 2013 1,166 450 199 60 2014 1,102 496 164 40 2015 842 322 146 59 2016 790 425 152 59 2017 733 360 175 42
1 Includes sawlog, veneer log, pulpwood, and poles and piles.
Source: Forest Management Bureau
Year Logs1 Lumber Plywood Veneer
4-10
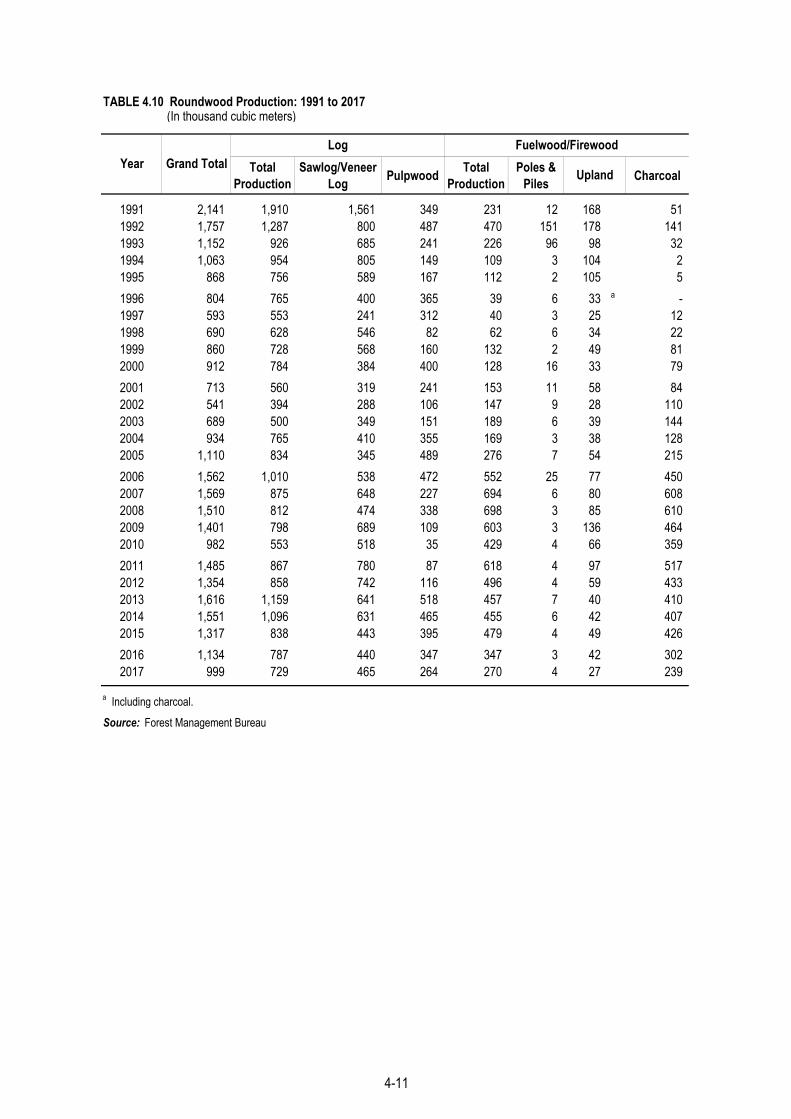
TABLE 4.10 Roundwood Production: 1991 to 2017 (In thousand cubic meters)
Total Production
Sawlog/Veneer Log Pulpwood Total
ProductionPoles &
Piles Charcoal
1991 2,141 1,910 1,561 349 231 12 168 51 1992 1,757 1,287 800 487 470 151 178 141 1993 1,152 926 685 241 226 96 98 32 1994 1,063 954 805 149 109 3 104 2 1995 868 756 589 167 112 2 105 5 1996 804 765 400 365 39 6 33 a - 1997 593 553 241 312 40 3 25 12 1998 690 628 546 82 62 6 34 22 1999 860 728 568 160 132 2 49 81 2000 912 784 384 400 128 16 33 79 2001 713 560 319 241 153 11 58 84 2002 541 394 288 106 147 9 28 110 2003 689 500 349 151 189 6 39 144 2004 934 765 410 355 169 3 38 128 2005 1,110 834 345 489 276 7 54 215 2006 1,562 1,010 538 472 552 25 77 450 2007 1,569 875 648 227 694 6 80 608 2008 1,510 812 474 338 698 3 85 610 2009 1,401 798 689 109 603 3 136 464 2010 982 553 518 35 429 4 66 359 2011 1,485 867 780 87 618 4 97 517 2012 1,354 858 742 116 496 4 59 433 2013 1,616 1,159 641 518 457 7 40 410 2014 1,551 1,096 631 465 455 6 42 407 2015 1,317 838 443 395 479 4 49 426 2016 1,134 787 440 347 347 3 42 302 2017 999 729 465 264 270 4 27 239
a Including charcoal.
Source: Forest Management Bureau
Year Grand TotalLog Fuelwood/Firewood
Upland
4-11
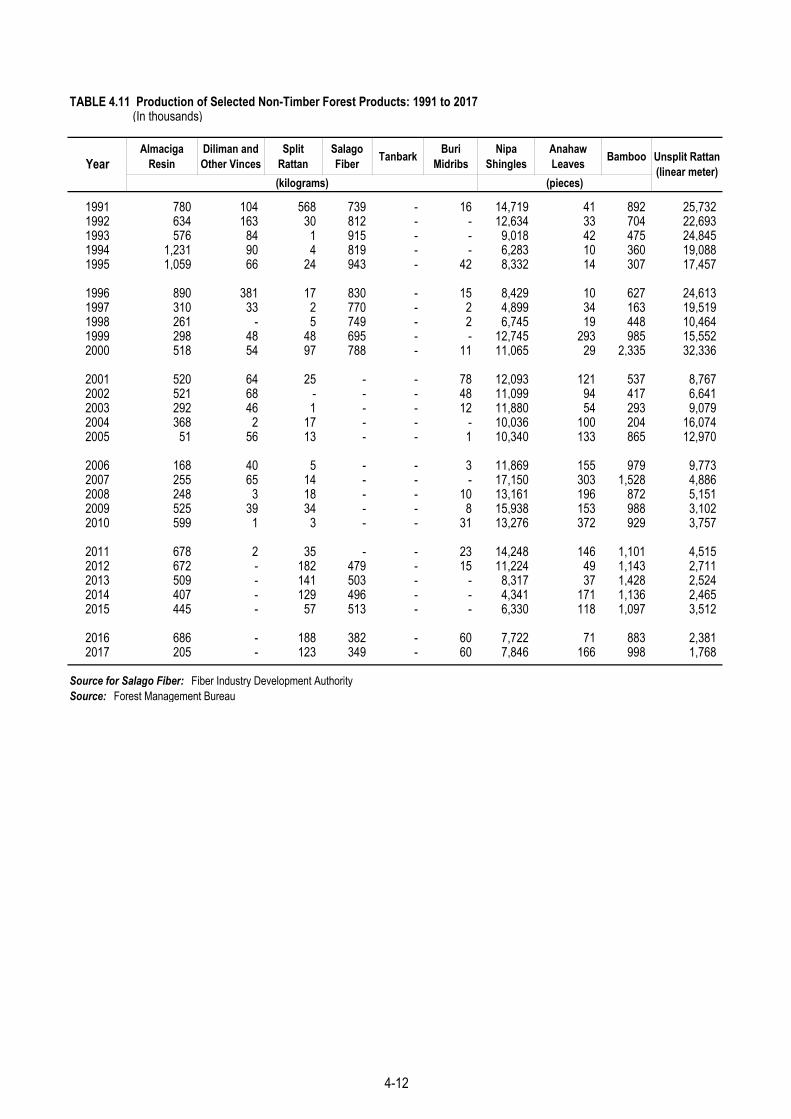
TABLE 4.11 Production of Selected Non-Timber Forest Products: 1991 to 2017 (In thousands)
Almaciga Resin
Diliman and Other Vinces
Split Rattan
Salago Fiber Tanbark Buri
MidribsNipa
ShinglesAnahaw Leaves Bamboo
1991 780 104 568 739 - 16 14,719 41 892 25,732 1992 634 163 30 812 - - 12,634 33 704 22,693 1993 576 84 1 915 - - 9,018 42 475 24,845 1994 1,231 90 4 819 - - 6,283 10 360 19,088 1995 1,059 66 24 943 - 42 8,332 14 307 17,457
1996 890 381 17 830 - 15 8,429 10 627 24,613 1997 310 33 2 770 - 2 4,899 34 163 19,519 1998 261 - 5 749 - 2 6,745 19 448 10,464 1999 298 48 48 695 - - 12,745 293 985 15,552 2000 518 54 97 788 - 11 11,065 29 2,335 32,336
2001 520 64 25 - - 78 12,093 121 537 8,767 2002 521 68 - - - 48 11,099 94 417 6,641 2003 292 46 1 - - 12 11,880 54 293 9,079 2004 368 2 17 - - - 10,036 100 204 16,074 2005 51 56 13 - - 1 10,340 133 865 12,970
2006 168 40 5 - - 3 11,869 155 979 9,773 2007 255 65 14 - - - 17,150 303 1,528 4,886 2008 248 3 18 - - 10 13,161 196 872 5,151 2009 525 39 34 - - 8 15,938 153 988 3,102 2010 599 1 3 - - 31 13,276 372 929 3,757
2011 678 2 35 - - 23 14,248 146 1,101 4,515 2012 672 - 182 479 - 15 11,224 49 1,143 2,711 2013 509 - 141 503 - - 8,317 37 1,428 2,524 2014 407 - 129 496 - - 4,341 171 1,136 2,465 2015 445 - 57 513 - - 6,330 118 1,097 3,512
2016 686 - 188 382 - 60 7,722 71 883 2,381 2017 205 - 123 349 - 60 7,846 166 998 1,768
Source for Salago Fiber: Fiber Industry Development AuthoritySource: Forest Management Bureau
Year Unsplit Rattan (linear meter)
(kilograms) (pieces)
4-12

TABLE 4.12 Imports of Log and Processed Forest Products: 1991 to 2017 (Volume in cubic meters, value in US dollars, CIF)
Volume Value Volume Volume
1991 407,073 32,625,136 395,239 29,959,619 9,974 2,134,607 1,777 467,981 83 62,9291992 573,941 73,032,217 530,026 61,409,369 43,278 11,340,450 308 96,179 329 186,2191993 1,069,716 129,546,105 603,530 82,450,724 462,941 45,239,184 365 526,984 2,880 1,329,2131994 703,932 124,818,847 404,065 56,215,587 298,363 66,589,072 899 473,360 605 1,540,8281995 1,099,546 172,446,718 694,954 82,036,115 378,531 82,225,192 242 127,608 25,819 8,057,8031996 1,540,485 316,482,974 877,585 127,412,566 567,426 161,972,198 923 673,804 94,551 26,424,4061997 1,267,583 258,507,823 768,474 117,821,197 411,657 112,638,911 1,032 478,277 86,420 27,569,4381998 796,401 143,300,081 434,903 54,874,834 296,147 71,187,685 2,034 651,322 63,317 16,586,2401999 1,104,145 227,022,090 583,643 69,450,136 381,235 116,771,575 1,019 551,638 138,248 40,248,7412000 1,063,625 166,311,790 584,759 54,340,693 358,514 79,810,286 1,015 638,864 119,337 31,521,9472001 1,027,965 157,549,856 551,327 44,707,227 370,809 86,270,886 402 201,067 105,427 26,370,6762002 910,416 162,613,427 434,175 40,613,551 401,086 103,885,902 650 198,625 74,505 17,915,3492003 790,085 162,986,331 355,787 33,107,917 338,064 105,403,457 5,091 2,120,825 91,143 22,354,1322004 476,987 119,658,218 177,107 17,877,077 246,685 88,400,636 1,963 1,086,528 51,232 12,293,9772005 595,853 159,796,620 164,959 23,867,765 362,509 117,742,543 3,959 1,473,557 64,426 16,712,7552006 359,187 126,864,909 65,185 19,742,069 261,193 95,719,492 r 6,207 4,067,817 r 26,602 7,335,5312007 285,640 120,268,115 88,735 r 22,490,333 r 174,456 90,702,741 4,348 2,355,433 18,101 4,719,608 r
2008 236,550 78,539,953 72,918 r 16,728,539 r 134,847 52,019,144 1,523 526,994 27,262 r 9,265,276 r
2009 190,864 61,647,682 35,349 r 6,972,798 r 128,754 47,702,732 3,886 1,485,791 22,875 r 5,486,361 r
2010 251,157 108,177,194 27,737 r 6,600,612 r 136,574 55,196,603 61,163 39,558,652 25,683 6,821,3272011 379,456 185,014,735 87,240 18,318,556 159,974 77,311,893 94,231 76,711,777 38,011 12,672,5092012 480,631 216,791,744 107,334 23,671,598 218,607 98,925,060 95,183 72,146,314 59,507 22,048,7722013 584,864 264,288,437 118,988 20,772,261 240,197 123,074,085 195,037 107,813,877 30,642 12,628,2142014 684,142 293,869,047 50,685 8,338,568 207,362 108,932,244 411,269 167,080,385 14,826 9,517,8502015 1,558,692 255,336,140 98,143 15,328,658 1,144,691 80,883,393 292,127 149,922,423 23,732 9,201,6662016 983,249 366,150,220 113,496 25,588,806 326,799 119,764,380 517,702 209,058,417 25,252 11,738,6172017 977,549 311,370,818 66,497 10,287,099 254,200 57,908,305 596,543 223,118,928 60,309 20,056,486
1 Not Included: Treated with paints, stains, creosote or other preservatives (from CY 2007 onwards); and Fuelwood in logs, in billets, in twigs, in faggot or in similar form (in kilograms)2 Plywood consisting solely of sheets of wood from CY 1986-20093 Veneer for plywood manufacture from CY 1986-2007
Sources: Forest Management Bureau and Philippine Statistics Authority
Volume Value Value Value Volume ValueYear
Total Log 1 Lumber Plywood 2 Veneer 3
4-13

TABLE 4.13 Exports of Selected Non-Timber Forest Products: 1991 to 2017 (Volume in thousand kilos, value in thousand US dollars, FOB)
Volume Value Volume Value Volume Value Volume Value Volume Value
1991 363 242 146 251 23 49 * 1 705 5411992 273 164 176 295 15 20 11 * 828 6231993 382 243 330 686 10 6 1 2 746 5231994 387 249 269 464 39 26 1 4 789 5581995 328 252 259 620 9 22 1 4 683 4871996 326 258 353 947 19 43 1 2 723 5061997 381 303 162 436 6 14 … … 714 4931998 355 254 221 448 12 27 * 3 613 4361999 336 247 245 464 4 6 … … 589 4662000 319 242 377 696 19 39 … … 638 5012001 204 161 246 528 30 36 17 18 648 4522002 209 150 272 482 65 28 * * … …2003 199 175 361 528 54 113 1 4 … …2004 230 222 144 193 39 24 * … … …2005 191 154 165 237 74 73 4 9 … …2006 163 136 181 298 66 129 4 50 … …2007 261 306 146 279 47 25 16 6 … …2008 122 172 262 616 47 72 4 24 … …2009 128 171 79 173 45 17 25 1 … …2010 65 90 162 388 30 26 16 13 … …2011 123 226 372 977 6 6 5 6 … …2012 45 79 89 193 106 31 111 95 … …2013 74 96 49 119 24 11 236 278 … …2014 49 40 87 174 62 14 345 634 … …2015 90 83 214 621 35 15 1,349 1,560 … …2016 184 152 370 1,054 23 67 46 58 … …2017 192 269 224 636 39 13 240 227 … …
* - less than 1,000Source: Forest Management BureauSource of Basic Data: Philippine Statistics Authority; Philippine Fiber Industry Development Authority (for Salago Fiber)
YearAlmaciga Resin Elemi Gum Bamboo Rattan Poles Salago Fiber
4-14
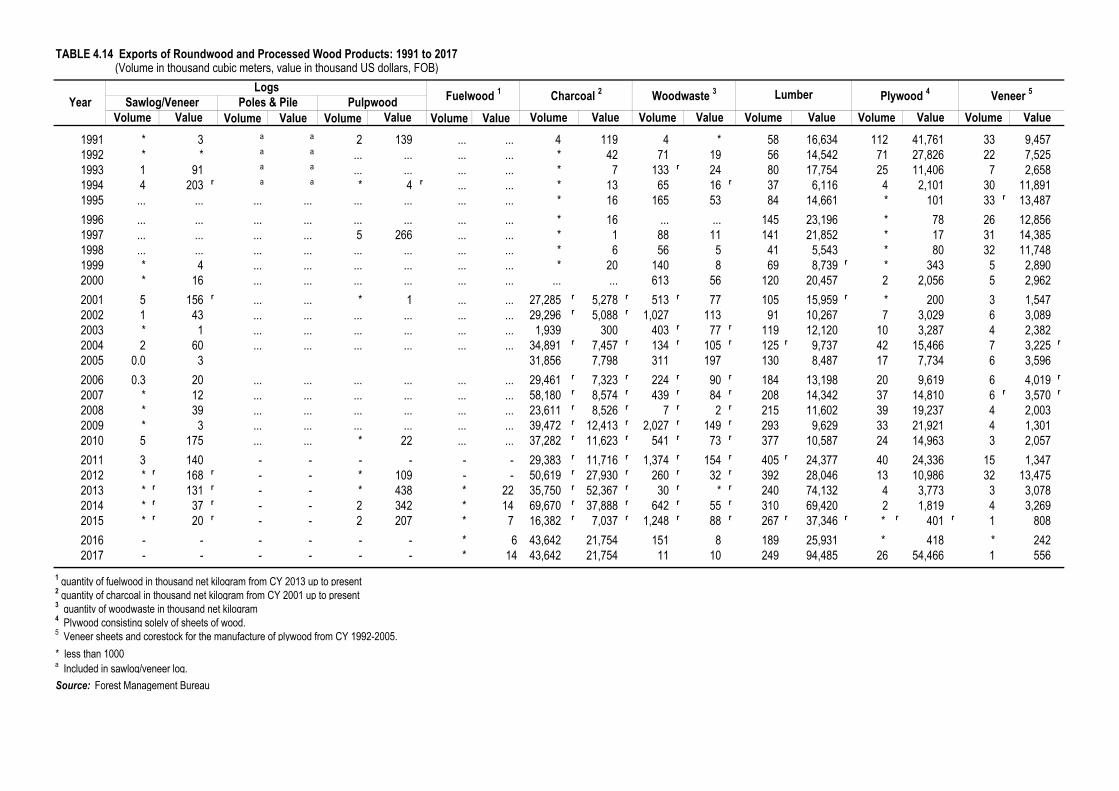
TABLE 4.14 Exports of Roundwood and Processed Wood Products: 1991 to 2017 (Volume in thousand cubic meters, value in thousand US dollars, FOB)
Volume Value Volume Volume Value1991 * 3 a a 2 139 ... ... 4 119 4 * 58 16,634 112 41,761 33 9,457 1992 * * a a ... ... ... ... * 42 71 19 56 14,542 71 27,826 22 7,525 1993 1 91 a a ... ... ... ... * 7 133 r 24 80 17,754 25 11,406 7 2,658 1994 4 203 r a a * 4 r ... ... * 13 65 16 r 37 6,116 4 2,101 30 11,891 1995 ... ... ... ... ... ... ... ... * 16 165 53 84 14,661 * 101 33 r 13,487 1996 ... ... ... ... ... ... ... ... * 16 ... ... 145 23,196 * 78 26 12,856 1997 ... ... ... ... 5 266 ... ... * 1 88 11 141 21,852 * 17 31 14,385 1998 ... ... ... ... ... ... ... ... * 6 56 5 41 5,543 * 80 32 11,748 1999 * 4 ... ... ... ... ... ... * 20 140 8 69 8,739 r * 343 5 2,890 2000 * 16 ... ... ... ... ... ... ... ... 613 56 120 20,457 2 2,056 5 2,962 2001 5 156 r ... ... * 1 ... ... 27,285 r 5,278 r 513 r 77 105 15,959 r * 200 3 1,547 2002 1 43 ... ... ... ... ... ... 29,296 r 5,088 r 1,027 113 91 10,267 7 3,029 6 3,089 2003 * 1 ... ... ... ... ... ... 1,939 300 403 r 77 r 119 12,120 10 3,287 4 2,382 2004 2 60 ... ... ... ... ... ... 34,891 r 7,457 r 134 r 105 r 125 r 9,737 42 15,466 7 3,225 r
2005 0.0 3 31,856 7,798 311 197 130 8,487 17 7,734 6 3,596 2006 0.3 20 ... ... ... ... ... ... 29,461 r 7,323 r 224 r 90 r 184 13,198 20 9,619 6 4,019 r
2007 * 12 ... ... ... ... ... ... 58,180 r 8,574 r 439 r 84 r 208 14,342 37 14,810 6 r 3,570 r
2008 * 39 ... ... ... ... ... ... 23,611 r 8,526 r 7 r 2 r 215 11,602 39 19,237 4 2,003 2009 * 3 ... ... ... ... ... ... 39,472 r 12,413 r 2,027 r 149 r 293 9,629 33 21,921 4 1,301 2010 5 175 ... ... * 22 ... ... 37,282 r 11,623 r 541 r 73 r 377 10,587 24 14,963 3 2,057 2011 3 140 - - - - - - 29,383 r 11,716 r 1,374 r 154 r 405 r 24,377 40 24,336 15 1,347 2012 * r 168 r - - * 109 - - 50,619 r 27,930 r 260 r 32 r 392 28,046 13 10,986 32 13,475 2013 * r 131 r - - * 438 * 22 35,750 r 52,367 r 30 r * r 240 74,132 4 3,773 3 3,078 2014 * r 37 r - - 2 342 * 14 69,670 r 37,888 r 642 r 55 r 310 69,420 2 1,819 4 3,269 2015 * r 20 r - - 2 207 * 7 16,382 r 7,037 r 1,248 r 88 r 267 r 37,346 r * r 401 r 1 808 2016 - - - - - - * 6 43,642 21,754 151 8 189 25,931 * 418 * 242 2017 - - - - - - * 14 43,642 21,754 11 10 249 94,485 26 54,466 1 556
1 quantity of fuelwood in thousand net kilogram from CY 2013 up to present 2 quantity of charcoal in thousand net kilogram from CY 2001 up to present 3 quantity of woodwaste in thousand net kilogram4 Plywood consisting solely of sheets of wood.5 Veneer sheets and corestock for the manufacture of plywood from CY 1992-2005.* less than 1000a Included in sawlog/veneer log.Source: Forest Management Bureau
Volume Value Volume ValuePlywood 4 Veneer 5
Volume ValueSawlog/Veneer Poles & Pile Pulpwood
Volume Value ValueYear
Logs Fuelwood 1 Charcoal 2 Woodwaste 3 Lumber
Volume Value Volume Value

TABLE 4.15 Mineral Production: 2014 to 2018 (Volume in thousands unit used; value in million pesos)
Mineral/Mineral Product Unit Used 2014 2015 2016 2017 r 2018
Volume Value Volume Value Volume Value Volume Value Volume Value
Total 174,753.4 150,206.9 154,250.0 170,179.6 179,583.2Metallics 35,473.5 137,223.6 - 107,614.6 104,006.7 110,429.2 121,941.3 Gold KG 18.4 32,977.1 21.3 35,334.4 23.1 45,522.2 22.7 45,795.7 20.8 44,807.2 Silver KG 23.0 616.4 30.0 651.3 35.2 941.0 31.7 867.0 29.8 790.7 Copper Concentrate DMT 349.3 22,757.5 337.2 18,985.4 355.7 17,759.9 280.4 19,304.8 282.4 20,678.5 Nickel(Direct Shipping Ore) DMT 34,334.9 59,769.3 33,448.1 34,266.3 29,279.1 23,717.3 27,085.8 24,648.5 25,907.5 28,589.0 Nickel Metal Equivalent MT 409.1 - 422.2 - 347.8 - 339.4 - 344.9 - Mixed Nickel-Cobalt Sulfide DMT 87.3 20,311.0 89.5 18,037.0 83.8 15,851.6 87.6 19,641.1 84.5 26,587.2 Nickel Sulfide Metal Equivalent MT 50.7 - 51.8 - 48.4 - 50.6 - 48.6 - Zinc Concentrate DMT 0.0 0.0 0.0 0.0 0.0 0.0 - - - - Metallurgical Chromite Concentrate DMT 47.1 337.0 15.5 113.5 25.8 182.6 20.9 172.0 45.0 488.7 Iron Ore DMT 153.8 455.3 107.1 226.8 17.1 32.0 - - 0.0 -Non-metallics 37,529.8 42,592.3 50,243.3 59,750.4 57,641.9 Bentonite clay MT 3.4 0.9 2.1 1.0 3.4 1.0 2.6 0.7 0.7 0.9 Cement Bags 289,687.7 -22,757.2 407,345.4 -28,009.0 268,264.1 -25,587.6 328,105.6 -30,856.0 253,098.2 -21,316.8 Coal * MT 8,419.3 24,452.5 8,173.1 29,625.4 12,087.3 38,350.1 13,271.9 46,375.8 13,054.4 47,249.7 Marble (unprocessed) Cu. M 6.0 16.6 66.3 14.1 66.9 20.2 89.5 48.6 87.8 32.8 Silica Sand MT 142.8 44.1 361.1 31.8 377.3 49.9 345.8 47.6 1,021.0 308.0 Sand and Gravel Cu. M 13,548.5 2,624.8 12,273.4 2,280.4 12,270.4 2,813.8 17,149.2 3,509.3 29,145.5 4,346.3 Cement Raw Materials Limestone for cement manufacture MT 50,817.1 6,665.5 66,680.2 6,537.2 67,150.6 4,592.6 69,368.2 5,019.6 19,676.1 1,598.1 Shale Clay MT 1,893.9 117.9 2,983.0 155.3 2,894.5 208.0 2,316.2 188.3 2,360.9 173.2 Silica Sand MT 229.7 37.6 77.4 14.9 124.3 30.8 160.9 44.8 206.3 70.3 Others - 3,569.9 - 3,932.3 - 4,177.0 - 4,515.8 - 3,862.6
Note: Details may not add-up to totals due to rounding.Sources: Mines and Geosciences Bureau; * Department of Energy
TABLE 4.16 Exports of Metallic Minerals: 2014 to 2018 (Quantity in thousands; value in thousand US dollars, FOB)
Mineral/Mineral Product Unit Used 2014 2015 2016 2017 r 2018
Quantity Value Quantity Value Quantity Value Quantity Value Quantity Value
Metallics 3,860,718 2,630,098 3,193,967 2,497,331 2,371,480 Precious Metals Gold KG Gold (Large Scale Mines) KG 17 695,060 19 675,312 70 1,690,887 21 837,887 21 810,508 Gold (CB Purchase) KG - - - - - - - - - - Silver KG 24 17,070 24 11,401 31 19,403 29 17,130 40 12 Base Metals . Copper Concentrate DMT 431 838,558 360 605,795 320 444,962 220 457,499 217 317,998 Copper Metal Equivalent MT 102 - 73 - 66 - 50 - 49 - Nickel (Direct Shipping Ore) DMT 28,523 1,625,205 25,147 813,393 23,810 635,302 23,523 639,422 24,099 644,156 Nickel Metal Equivalent MT - - - - - - 286 - 424 - Mixed Nickel-Cobalt Sulfides DMT 87 665,972 84 521,272 86 396,536 88 543,760 82 598,806 Nickel Sulfide Metal Equivalent MT 51 - 49 - 49 - 51 - 48 - Nickel Content Ore MT 332 - 319 - 287 - - - - - Nickel Mixed Sulphides (NMS) DMT - - - - - - - - - - Chromite DMT 42 6,740 10 1,894 32 2,877 11 1,300 - - Iron Ore DMT 598 12,113 349 1,031 100 4,000 190 333 - - Zinc DMT - - - - - - - - - -
Note: Details may not add up to totals due to rounding.Source: Mines and Geosciences Bureau
4-16

TABLE 4.17 Annual Geometric Mean (g/Ncm) of Total Suspended Particles (TSP) in the Atmosphere by Ambient Air Quality Monitoring Stations in the National Capital Region: 2009 to 2017
Valenzuela Municipal Hall, Quezon City 164 162 121 123 143 122 - 97 127 NCR EDSA-NPO, Quezon City 89 152 103 96 112 97 * - - --EDSA-East Avenue BFD Compound East Avenue, Quezon City 90 105 74 72 92 96 97 138 136 Ateneo Manila Observatory, Ateneo University 62 79 58 62 70 50 48 44 55 Mandaluyong City Hall, Maysilo Circle, Plainview, Mandaluyong City 104 138 136 148 - 143 158 144 126 LLDA Compound, Pasig City Hall 126 - - - - - - - --Makati Bureau of Fire Cmpb., Ayala Avenue cor. Buendia St. Belair, Makati City 145 160 128 135 - 130 * 111 122 140 Marikina Sports Complex, Sumulong Highway, Sto. Nino, Marikina City 121 125 125 108 97 81 104 107 95 MRT-Taft Avenue Station EDSA cor. Taft Avenue, Malibay, Pasay City 283 294 219 213 197 216 - - --Dept. of Health, San Lazaro St., Rizal Avenue, Manila 103 132 101 114 115 105 * 109 107 99
AVERAGE 129 150 118 119 118 117 105 108 111 MAXIMUM 283 294 219 213 197 216 158 144 140 MINIMUM 62 79 58 62 70 50 48 44 55
Notes: Guideline values: 90 ug/Ncm for one-year averaging time ; 230 ug/Ncm for 24-hour averaging time. ug - microgram Ncm - Normal cubic meter * - less than 75% data captureSource: Environmental Management Bureau
2014 2015 2016 2017Monitoring Station 2009 2010 2011 2012 2013
4-17

TABLE 4.18 Distribution of Pollutants by Type of Emission in the National Capital Region 1990, 2001, 2006, 2009, 2012 and 2015 (In Percent)
Volatile Organic Compound (VOC)
Carbon Monoxide (CO)
Oxide Nitrogen (NOx)
Oxide of Sulfur (SOx)
Particulate Matter (PM)
38.86 22.18 25.49 3.98 9.5014.52 72.24 8.36 1.20 3.69
7.82 85.40 3.46 1.22 2.0917.63 71.70 7.72 0.25 2.6918.97 67.64 7.81 0.18 5.4018.40 68.62 7.76 0.01 5.22
1.59 3.54 11.75 68.39 14.731.88 5.29 27.36 60.65 4.824.64 24.64 22.29 40.91 7.520.63 0.95 13.25 85.17 0.000.81 4.65 17.70 48.02 28.811.89 19.71 63.76 10.66 3.98
0.38 0.20 0.11 0.00 99.302.25 15.83 78.99 0.42 2.526.50 16.86 33.31 0.20 43.123.25 1.63 1.63 0.10 93.391.56 0.09 0.22 0.00 98.130.05 0.31 0.37 0.00 99.27
Source: Environmental Management Bureau
20012006200920122015
2006200920122015
Area1990
200920122015
Stationary19902001
Year/Type of Emission
Pollutants
Mobile199020012006
4-18
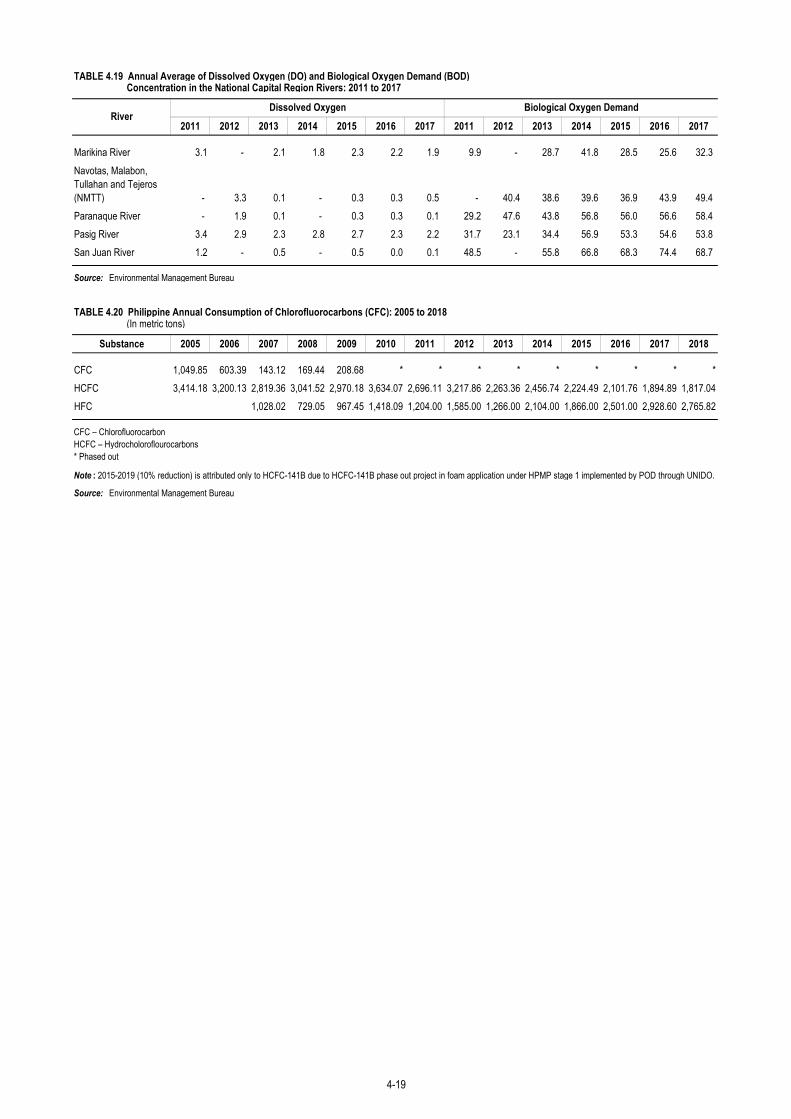
TABLE 4.19 Annual Average of Dissolved Oxygen (DO) and Biological Oxygen Demand (BOD) Concentration in the National Capital Region Rivers: 2011 to 2017
2011 2012 2013 2014 2015 2016 2017 2011 2012 2013 2014 2015 2016 2017
Marikina River 3.1 - 2.1 1.8 2.3 2.2 1.9 9.9 - 28.7 41.8 28.5 25.6 32.3 Navotas, Malabon, Tullahan and Tejeros (NMTT) - 3.3 0.1 - 0.3 0.3 0.5 - 40.4 38.6 39.6 36.9 43.9 49.4 Paranaque River - 1.9 0.1 - 0.3 0.3 0.1 29.2 47.6 43.8 56.8 56.0 56.6 58.4 Pasig River 3.4 2.9 2.3 2.8 2.7 2.3 2.2 31.7 23.1 34.4 56.9 53.3 54.6 53.8 San Juan River 1.2 - 0.5 - 0.5 0.0 0.1 48.5 - 55.8 66.8 68.3 74.4 68.7
Source: Environmental Management Bureau
TABLE 4.20 Philippine Annual Consumption of Chlorofluorocarbons (CFC): 2005 to 2018 (In metric tons)
Substance 2005 2006 2007 2008 2009 2010 2011 2012 2013 2014 2015 2016 2017 2018
CFC 1,049.85 603.39 143.12 169.44 208.68 * * * * * * * * *HCFC 3,414.18 3,200.13 2,819.36 3,041.52 2,970.18 3,634.07 2,696.11 3,217.86 2,263.36 2,456.74 2,224.49 2,101.76 1,894.89 1,817.04HFC 1,028.02 729.05 967.45 1,418.09 1,204.00 1,585.00 1,266.00 2,104.00 1,866.00 2,501.00 2,928.60 2,765.82
CFC – ChlorofluorocarbonHCFC – Hydrocholoroflourocarbons* Phased out
Note : 2015-2019 (10% reduction) is attributed only to HCFC-141B due to HCFC-141B phase out project in foam application under HPMP stage 1 implemented by POD through UNIDO.
Source: Environmental Management Bureau
RiverDissolved Oxygen Biological Oxygen Demand
4-19

TABLE 4.21 Amount of Rainfall by Month by Selected Station: 2004 to 2017 (In millimeter)
Sampling Station Jan Feb Mar Apr May Jun Jul Aug Sep Oct Nov Dec
2004 0.3 -1.0 0.0 0.0 224.7 724.9 133.7 678.5 270.9 10.7 16.9 5.82005 -1.0 0.0 0.4 0.0 139.3 418.0 213.2 521.8 718.9 36.6 13.0 2.22006 24.0 0.0 19.0 0.0 123.6 88.9 835.3 281.4 558.6 60.6 43.3 3.82007 0.2 -2.0 3.8 0.4 245.0 198.3 90.3 1063.7 253.2 62.8 123.7 -1.02008 -1.0 2.0 0.0 0.1 -2.0 36.2 1505.0 821.8 478.1 38.3 68.4 0.02009 0.0 0.0 0.1 200.6 122.7 210.5 1003.5 216.3 355.9 860.4 11.1 0.02010 -1.0 0.0 0.0 37.6 1327.0 292.2 268.5 452.0 341.3 105.9 48.4 -1.02011 16.2 10.4 2.9 -1.0 74.2 275.6 298.9 861.8 895.6 53.4 25.6 21.62012 14.5 0.4 1.2 16.2 170.3 741.3 523.4 906.5 131.7 24.0 -1.0 21.42013 7.6 0.0 0.0 98.6 186.2 203.7 145.4 752.1 376.5 174.6 8.1 41.72014 0.0 4.4 0.0 0.0 0.3 516.8 266.8 325.2 646.2 11.7 4.2 0.02015 Trace 1.6 Trace 10.0 84.5 147.4 601.9 722.0 105.2 … 0.0 24.42016 6.0 4.0 1.6 0.0 181.6 158.6 282.6 1,032.6 360.6 206.1 75.7 11.72017 0.8 0.8 0.0 24.2 232.6 131.2 447.1 352.8 306.0 145.0 18.9 1.82018 3.0 0.0 0.0 0.0 32.4 648.8 433.6 1037.2 336.9 14.8 0.0 0.0
2004 -1.0 88.5 12.2 3.8 332.4 616.4 261.4 1184.0 111.7 37.6 72.5 93.62005 3.8 0.0 5.3 38.5 177.5 279.7 187.8 332.7 324.8 163.3 88.6 21.52006 79.8 0.0 18.9 42.6 53.9 165.7 792.7 546.7 354.1 212.8 105.2 13.32007 6.6 4.0 10.5 64.2 134.1 241.9 237.4 709.9 197.4 142.6 194.8 1.22008 5.0 27.0 47.4 86.2 426.3 208.1 319.3 615.3 371.2 35.9 28.7 0.02009 0.8 0.0 26.1 221.7 285.9 547.0 488.5 394.0 531.9 807.2 3.0 0.02010 0.2 1.0 -1.0 94.1 122.0 278.2 265.2 489.8 164.2 582.2 199.5 4.22011 1.0 12.0 5.6 48.6 309.7 747.2 403.3 826.9 419.3 167.7 101.7 25.02012 4.6 19.5 58.0 44.6 240.1 684.8 640.4 994.6 386.7 49.6 2.3 4.62013 9.2 1.2 71.5 108.8 170.4 135.5 235.2 1135.0 552.2 134.9 13.6 19.72014 0.0 -1.0 1.6 185.0 227.7 441.8 604.3 451.7 870.0 143.1 1.6 23.42015 3.0 TC 19.2 59.6 56.4 246.1 1087.9 352.8 435.3 361.2 0.0 136.42016 3.0 1.4 2.4 77.2 208.3 169.9 424.2 1216.7 342.3 535.0 9.9 33.62017 4.9 3.2 2.7 12.2 183.6 368.1 578.5 512.8 230.1 182.2 140.4 4.82018 1.1 6.4 0.2 114.9 91.2 643.1 1167.8 938.1 491.4 143.0 0.0 8.0
2004 1.2 40.5 0.0 -1.0 225.3 260.2 150.6 426.3 173.3 75.6 152.8 41.32005 9.8 8.9 15.8 -1.0 60.1 312.9 175.1 262.4 328.8 296.0 33.8 87.22006 56.1 17.4 79.9 0.0 50.6 191.5 569.3 246.4 515.4 199.0 63.7 105.92007 1.2 15.0 28.0 27.2 107.3 41.4 186.6 620.2 400.8 212.1 279.9 45.42008 58.5 20.7 19.9 40.1 218.4 233.4 365.0 547.3 388.9 125.1 127.8 54.62009 10.3 26.1 60.9 111.6 294.6 386.9 598.8 307.4 839.2 243.4 64.8 2.22010 6.0 -1.0 6.2 13.7 13.8 348.1 347.3 312.6 362.1 289.4 197.8 65.22011 87.1 0.5 36.1 3.2 201.6 879.3 554.3 512.7 316.0 259.3 212.3 185.92012 36.3 89.5 89.2 24.4 244.6 220.8 591.8 1145.9 665.7 361.2 44.9 58.12013 29.6 70.0 76.5 11.5 74.7 309.6 312.4 777.5 699.4 237.5 112.7 57.02014 -1.0 3.5 19.6 8.8 91.4 123.5 349.2 321.2 468.7 349.1 43.7 140.32015 24.5 2.4 6.5 4.5 112.9 156.5 466.3 307.5 435.5 149.6 42.4 292.32016 2.6 63.9 1.1 0.9 74.8 242.9 393.3 700.5 289.5 161.4 68.3 98.92017 41.2 35.8 5.8 88.2 130.9 178.5 382.8 440.2 519.6 258.4 160.1 83.72018 18.9 1.5 30.3 8.1 59.9 616.5 626.2 453.9 365.0 181.8 22.9 122.4
Legaspi City, Albay2004 230.2 149.4 294.9 73.5 447.6 293.4 171.6 303.8 142.5 236.6 393.5 302.62005 192.2 85.5 111.7 38.3 102.6 231.7 265.9 172.3 681.4 335.4 332.2 1208.12006 453.2 364.9 330.6 151.5 239.2 232.8 135.1 238.1 445.5 197.0 689.6 520.52007 345.4 16.5 233.6 105.2 268.0 90.6 171.8 217.0 531.2 450.7 579.1 599.12008 323.0 1082.0 287.8 516.8 423.7 234.8 261.9 249.9 297.0 256.2 440.6 502.72009 275.1 418.8 282.2 466.0 602.8 263.3 256.7 178.3 244.1 391.8 384.3 150.1
Laoag City, Ilocos Norte
Dagupan City, Pangasinan
Port Area (MCO), Manila
Continued
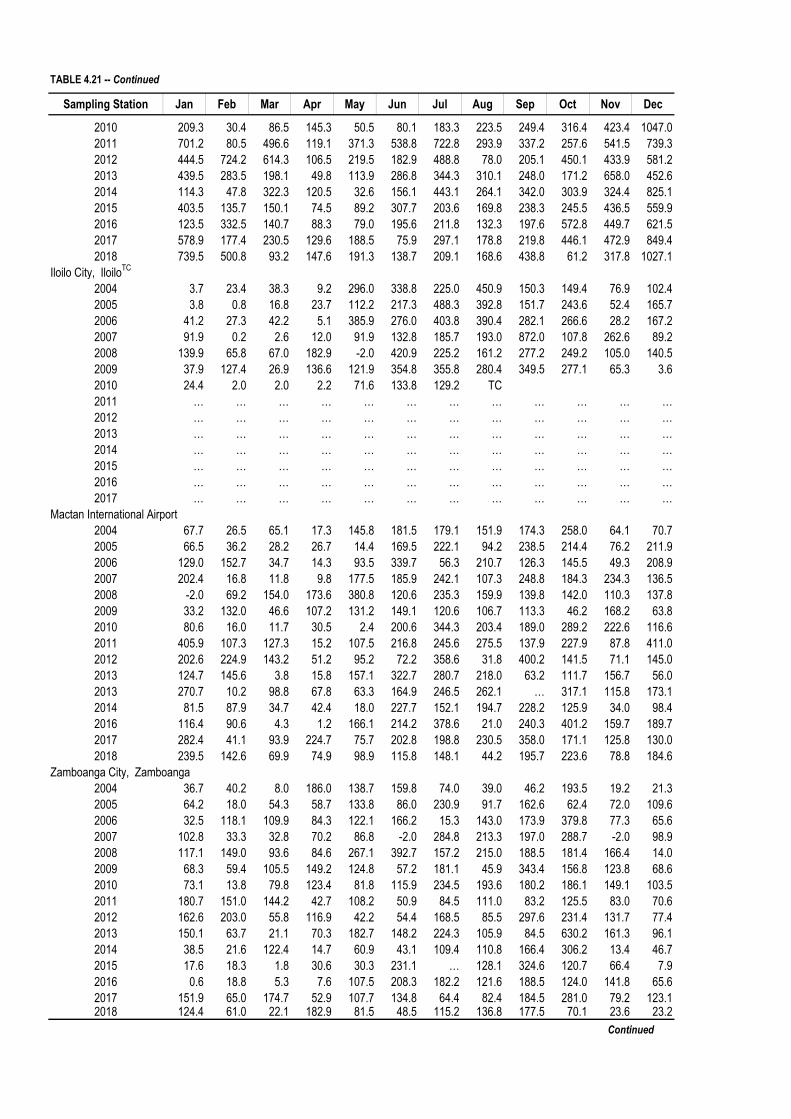
TABLE 4.21 -- Continued
Sampling Station Jan Feb Mar Apr May Jun Jul Aug Sep Oct Nov Dec
2010 209.3 30.4 86.5 145.3 50.5 80.1 183.3 223.5 249.4 316.4 423.4 1047.02011 701.2 80.5 496.6 119.1 371.3 538.8 722.8 293.9 337.2 257.6 541.5 739.32012 444.5 724.2 614.3 106.5 219.5 182.9 488.8 78.0 205.1 450.1 433.9 581.22013 439.5 283.5 198.1 49.8 113.9 286.8 344.3 310.1 248.0 171.2 658.0 452.62014 114.3 47.8 322.3 120.5 32.6 156.1 443.1 264.1 342.0 303.9 324.4 825.12015 403.5 135.7 150.1 74.5 89.2 307.7 203.6 169.8 238.3 245.5 436.5 559.92016 123.5 332.5 140.7 88.3 79.0 195.6 211.8 132.3 197.6 572.8 449.7 621.52017 578.9 177.4 230.5 129.6 188.5 75.9 297.1 178.8 219.8 446.1 472.9 849.42018 739.5 500.8 93.2 147.6 191.3 138.7 209.1 168.6 438.8 61.2 317.8 1027.1
Iloilo City, IloiloTC
2004 3.7 23.4 38.3 9.2 296.0 338.8 225.0 450.9 150.3 149.4 76.9 102.42005 3.8 0.8 16.8 23.7 112.2 217.3 488.3 392.8 151.7 243.6 52.4 165.72006 41.2 27.3 42.2 5.1 385.9 276.0 403.8 390.4 282.1 266.6 28.2 167.22007 91.9 0.2 2.6 12.0 91.9 132.8 185.7 193.0 872.0 107.8 262.6 89.22008 139.9 65.8 67.0 182.9 -2.0 420.9 225.2 161.2 277.2 249.2 105.0 140.52009 37.9 127.4 26.9 136.6 121.9 354.8 355.8 280.4 349.5 277.1 65.3 3.62010 24.4 2.0 2.0 2.2 71.6 133.8 129.2 TC2011 … … … … … … … … … … … …2012 … … … … … … … … … … … …2013 … … … … … … … … … … … …2014 … … … … … … … … … … … …2015 … … … … … … … … … … … …2016 … … … … … … … … … … … …2017 … … … … … … … … … … … …
2004 67.7 26.5 65.1 17.3 145.8 181.5 179.1 151.9 174.3 258.0 64.1 70.72005 66.5 36.2 28.2 26.7 14.4 169.5 222.1 94.2 238.5 214.4 76.2 211.92006 129.0 152.7 34.7 14.3 93.5 339.7 56.3 210.7 126.3 145.5 49.3 208.92007 202.4 16.8 11.8 9.8 177.5 185.9 242.1 107.3 248.8 184.3 234.3 136.52008 -2.0 69.2 154.0 173.6 380.8 120.6 235.3 159.9 139.8 142.0 110.3 137.82009 33.2 132.0 46.6 107.2 131.2 149.1 120.6 106.7 113.3 46.2 168.2 63.82010 80.6 16.0 11.7 30.5 2.4 200.6 344.3 203.4 189.0 289.2 222.6 116.62011 405.9 107.3 127.3 15.2 107.5 216.8 245.6 275.5 137.9 227.9 87.8 411.02012 202.6 224.9 143.2 51.2 95.2 72.2 358.6 31.8 400.2 141.5 71.1 145.02013 124.7 145.6 3.8 15.8 157.1 322.7 280.7 218.0 63.2 111.7 156.7 56.02013 270.7 10.2 98.8 67.8 63.3 164.9 246.5 262.1 … 317.1 115.8 173.12014 81.5 87.9 34.7 42.4 18.0 227.7 152.1 194.7 228.2 125.9 34.0 98.42016 116.4 90.6 4.3 1.2 166.1 214.2 378.6 21.0 240.3 401.2 159.7 189.72017 282.4 41.1 93.9 224.7 75.7 202.8 198.8 230.5 358.0 171.1 125.8 130.02018 239.5 142.6 69.9 74.9 98.9 115.8 148.1 44.2 195.7 223.6 78.8 184.6
2004 36.7 40.2 8.0 186.0 138.7 159.8 74.0 39.0 46.2 193.5 19.2 21.32005 64.2 18.0 54.3 58.7 133.8 86.0 230.9 91.7 162.6 62.4 72.0 109.62006 32.5 118.1 109.9 84.3 122.1 166.2 15.3 143.0 173.9 379.8 77.3 65.62007 102.8 33.3 32.8 70.2 86.8 -2.0 284.8 213.3 197.0 288.7 -2.0 98.92008 117.1 149.0 93.6 84.6 267.1 392.7 157.2 215.0 188.5 181.4 166.4 14.02009 68.3 59.4 105.5 149.2 124.8 57.2 181.1 45.9 343.4 156.8 123.8 68.62010 73.1 13.8 79.8 123.4 81.8 115.9 234.5 193.6 180.2 186.1 149.1 103.52011 180.7 151.0 144.2 42.7 108.2 50.9 84.5 111.0 83.2 125.5 83.0 70.62012 162.6 203.0 55.8 116.9 42.2 54.4 168.5 85.5 297.6 231.4 131.7 77.42013 150.1 63.7 21.1 70.3 182.7 148.2 224.3 105.9 84.5 630.2 161.3 96.12014 38.5 21.6 122.4 14.7 60.9 43.1 109.4 110.8 166.4 306.2 13.4 46.72015 17.6 18.3 1.8 30.6 30.3 231.1 … 128.1 324.6 120.7 66.4 7.92016 0.6 18.8 5.3 7.6 107.5 208.3 182.2 121.6 188.5 124.0 141.8 65.62017 151.9 65.0 174.7 52.9 107.7 134.8 64.4 82.4 184.5 281.0 79.2 123.12018 124.4 61.0 22.1 182.9 81.5 48.5 115.2 136.8 177.5 70.1 23.6 23.2
Zamboanga City, Zamboanga
Mactan International Airport
Continued

TABLE 4.21 -- Concluded
Sampling Station Jan Feb Mar Apr May Jun Jul Aug Sep Oct Nov Dec
2004 100.1 169.2 172.7 171.5 224.2 94.2 184.0 16.2 280.9 181.5 89.0 258.32005 64.0 17.1 22.4 67.7 151.2 183.4 205.2 166.7 137.3 158.1 68.5 247.32006 194.5 143.3 255.4 59.9 195.9 267.5 188.8 168.8 137.9 186.2 107.6 81.32007 152.1 116.6 87.2 72.0 214.4 162.4 153.3 318.5 77.0 249.0 92.0 126.62008 172.6 161.3 226.5 115.9 167.8 391.8 177.8 57.7 324.7 175.8 310.9 68.12009 232.8 175.1 92.6 158.9 185.2 193.9 240.3 175.6 109.0 59.3 137.1 47.02010 157.5 16.0 52.9 124.0 57.3 87.8 251.6 281.8 117.6 179.7 88.0 199.62011 231.8 144.9 97.2 225.7 175.9 243.2 205.1 261.5 304.9 177.6 116.9 160.42012 130.7 204.4 154.4 125.0 155.7 172.4 223.7 211.4 92.0 154.1 126.5 247.62013 430.5 212.0 60.0 124.1 128.9 186.4 129.1 185.6 112.3 357.4 192.6 67.32014 285.3 23.8 235.3 150.5 94.7 134.3 50.1 163.7 175.2 338.9 179.9 122.62015 205.7 36.4 19.0 125.4 164.7 224.2 149.9 45.9 91.5 275.2 93.3 63.32016 14.2 63.8 39.8 41.8 101.3 188.7 68.6 34.6 227.2 387.0 206.4 137.02017 242.2 231.6 170.2 192.2 356.2 222.0 110.3 224.9 280.2 175.3 138.5 327.62018 118.8 57.5 56.3 178.6 254.3 108.0 179.6 214.4 181.8 142.7 60.8 256.6
‘TC - Temporary Closed.Source: Philippine Atmospheric, Geophysical, and Astronomical Services Administration
Davao City, Davao Del Sur
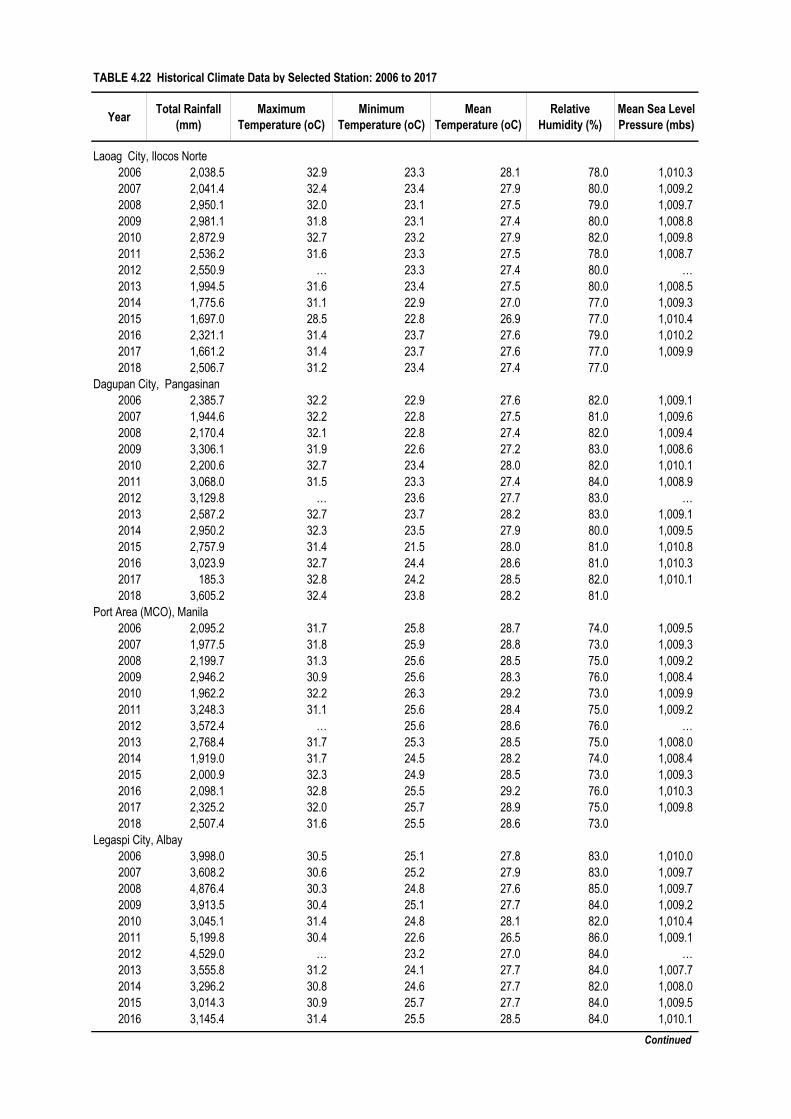
TABLE 4.22 Historical Climate Data by Selected Station: 2006 to 2017
Year Total Rainfall (mm)
Maximum Temperature (oC)
Minimum Temperature (oC)
Mean Temperature (oC)
Relative Humidity (%)
Mean Sea Level Pressure (mbs)
Laoag City, Ilocos Norte2006 2,038.5 32.9 23.3 28.1 78.0 1,010.3 2007 2,041.4 32.4 23.4 27.9 80.0 1,009.2 2008 2,950.1 32.0 23.1 27.5 79.0 1,009.7 2009 2,981.1 31.8 23.1 27.4 80.0 1,008.8 2010 2,872.9 32.7 23.2 27.9 82.0 1,009.8 2011 2,536.2 31.6 23.3 27.5 78.0 1,008.7 2012 2,550.9 … 23.3 27.4 80.0 …2013 1,994.5 31.6 23.4 27.5 80.0 1,008.5 2014 1,775.6 31.1 22.9 27.0 77.0 1,009.3 2015 1,697.0 28.5 22.8 26.9 77.0 1,010.4 2016 2,321.1 31.4 23.7 27.6 79.0 1,010.2 2017 1,661.2 31.4 23.7 27.6 77.0 1,009.9 2018 2,506.7 31.2 23.4 27.4 77.0
Dagupan City, Pangasinan2006 2,385.7 32.2 22.9 27.6 82.0 1,009.1 2007 1,944.6 32.2 22.8 27.5 81.0 1,009.6 2008 2,170.4 32.1 22.8 27.4 82.0 1,009.4 2009 3,306.1 31.9 22.6 27.2 83.0 1,008.6 2010 2,200.6 32.7 23.4 28.0 82.0 1,010.1 2011 3,068.0 31.5 23.3 27.4 84.0 1,008.9 2012 3,129.8 … 23.6 27.7 83.0 …2013 2,587.2 32.7 23.7 28.2 83.0 1,009.1 2014 2,950.2 32.3 23.5 27.9 80.0 1,009.5 2015 2,757.9 31.4 21.5 28.0 81.0 1,010.8 2016 3,023.9 32.7 24.4 28.6 81.0 1,010.3 2017 185.3 32.8 24.2 28.5 82.0 1,010.1 2018 3,605.2 32.4 23.8 28.2 81.0
Port Area (MCO), Manila2006 2,095.2 31.7 25.8 28.7 74.0 1,009.5 2007 1,977.5 31.8 25.9 28.8 73.0 1,009.3 2008 2,199.7 31.3 25.6 28.5 75.0 1,009.2 2009 2,946.2 30.9 25.6 28.3 76.0 1,008.4 2010 1,962.2 32.2 26.3 29.2 73.0 1,009.9 2011 3,248.3 31.1 25.6 28.4 75.0 1,009.2 2012 3,572.4 … 25.6 28.6 76.0 …2013 2,768.4 31.7 25.3 28.5 75.0 1,008.0 2014 1,919.0 31.7 24.5 28.2 74.0 1,008.4 2015 2,000.9 32.3 24.9 28.5 73.0 1,009.3 2016 2,098.1 32.8 25.5 29.2 76.0 1,010.3 2017 2,325.2 32.0 25.7 28.9 75.0 1,009.8 2018 2,507.4 31.6 25.5 28.6 73.0
Legaspi City, Albay2006 3,998.0 30.5 25.1 27.8 83.0 1,010.0 2007 3,608.2 30.6 25.2 27.9 83.0 1,009.7 2008 4,876.4 30.3 24.8 27.6 85.0 1,009.7 2009 3,913.5 30.4 25.1 27.7 84.0 1,009.2 2010 3,045.1 31.4 24.8 28.1 82.0 1,010.4 2011 5,199.8 30.4 22.6 26.5 86.0 1,009.1 2012 4,529.0 … 23.2 27.0 84.0 …2013 3,555.8 31.2 24.1 27.7 84.0 1,007.7 2014 3,296.2 30.8 24.6 27.7 82.0 1,008.0 2015 3,014.3 30.9 25.7 27.7 84.0 1,009.5 2016 3,145.4 31.4 25.5 28.5 84.0 1,010.1
Continued

TABLE 4.22 -- Continued
Year Total Rainfall (mm)
Maximum Temperature (oC)
Minimum Temperature (oC)
Mean Temperature (oC)
Relative Humidity (%)
Mean Sea Level Pressure (mbs)
2017 3,844.9 31.2 25.4 28.3 83.0 1,009.2 2018 4,033.7 31.2 25.2 28.2 83.0
Iloilo City, Iloilo2006 2,316.0 31.7 23.8 27.8 81.0 1,010.1 2007 2,041.7 31.8 23.3 27.6 78.0 1,009.8 2008 2,035.8 30.8 23.0 26.9 77.0 1,009.8 2009 2,137.2 30.6 22.9 26.8 77.0 1,010.2 2010 Temoporariliy Closed2011 … … … … … …2012 … … … … … …2013 … … … … … …2014 … … … … … …2015 … … … … … …2016 … … … … … …2017 … … … … … …
Mactan International Airport2006 1,560.9 30.8 24.9 27.9 86.0 1,010.1 2007 1,757.5 31.1 24.6 27.9 82.0 1,011.1 2008 1,823.3 31.1 24.9 28.0 82.0 1,009.5 2009 1,218.1 31.3 25.1 28.2 82.0 1,009.6 2010 1,706.9 32.2 25.0 28.6 83.0 1,012.0 2011 2,365.7 30.7 24.9 27.8 86.0 1,009.5 2012 1,663.4 … 25.0 28.0 83.0 …2013 1,656.0 31.5 25.3 28.4 81.0 1,007.2 2014 1,790.3 31.2 24.9 27.9 81.0 1,006.8 2015 1,325.5 31.5 25.0 28.2 77.0 1,008.0 2016 1,983.3 32.0 25.3 28.7 77.0 1,010.1 2017 2,134.8 31.4 25.0 28.2 80.0 1,009.5 2018 1,616.6 31.8 25.2 28.5 78.0
Zamboanga City, Zamboanga2006 1,488.0 32.3 24.4 28.3 82.0 2007 1,408.6 32.3 24.5 28.4 81.0 1,010.3 2008 2,012.6 31.7 24.2 27.9 83.0 2009 1,484.0 32.3 25.6 28.2 81.0 1,009.5 2010 1,534.8 33.0 21.6 27.4 81.0 1,010.0 2011 1,235.5 32.7 23.9 28.3 82.0 1,009.5 2012 1,627.0 … 24.5 28.5 82.0 …2013 1,938.4 32.6 24.3 28.5 81.0 1,009.0 2014 1,054.1 33.2 24.1 28.7 81.0 1,009.2 2015 997.4 33.5 23.7 26.1 80.0 1,010.2 2016 1,171.8 33.3 24.4 28.9 78.0 1,010.3 2017 1,501.6 32.7 24.1 28.4 80.0 1,009.7 2018 1,066.8 33.0 23.9 28.5 79.0
Davao City, Davao Del Sur2006 1,987.1 31.7 24.5 28.1 82.0 1,009.1 2007 1,821.1 31.6 24.3 27.9 83.0 1,008.8 2008 2,350.9 31.4 24.0 27.7 84.0 1,008.8 2009 1,806.8 31.9 24.3 28.1 82.0 1,008.8 2010 1,613.8 32.2 24.4 28.3 83.0 1,009.4 2011 2,345.1 31.6 24.2 27.9 85.0 1,008.5 2012 1,750.3 … 24.4 28.1 83.0 …2013 2,186.2 32.1 24.4 28.3 80.0 1,007.4 2014 1,954.3 32.3 24.8 28.5 81.0 1,007.7 2015 1,494.5 32.6 25.0 28.7 78.0 1,008.7
Continued

TABLE 4.22 -- Concluded
Year Total Rainfall (mm)
Maximum Temperature (oC)
Minimum Temperature (oC)
Mean Temperature (oC)
Relative Humidity (%)
Mean Sea Level Pressure (mbs)
2016 1,510.4 33.3 25.2 29.3 77.0 1,010.2 2017 2,671.2 32.1 24.7 28.4 79.0 1,009.5 2018 1,809.4 32.9 25.0 29.0 77.0
Note: Figures for temperature are computed as average of the monthly mean climatic data.Source: Philippine Atmospheric, Geophysical, and Astronomical Services Administration, CAD, CDS


t
O
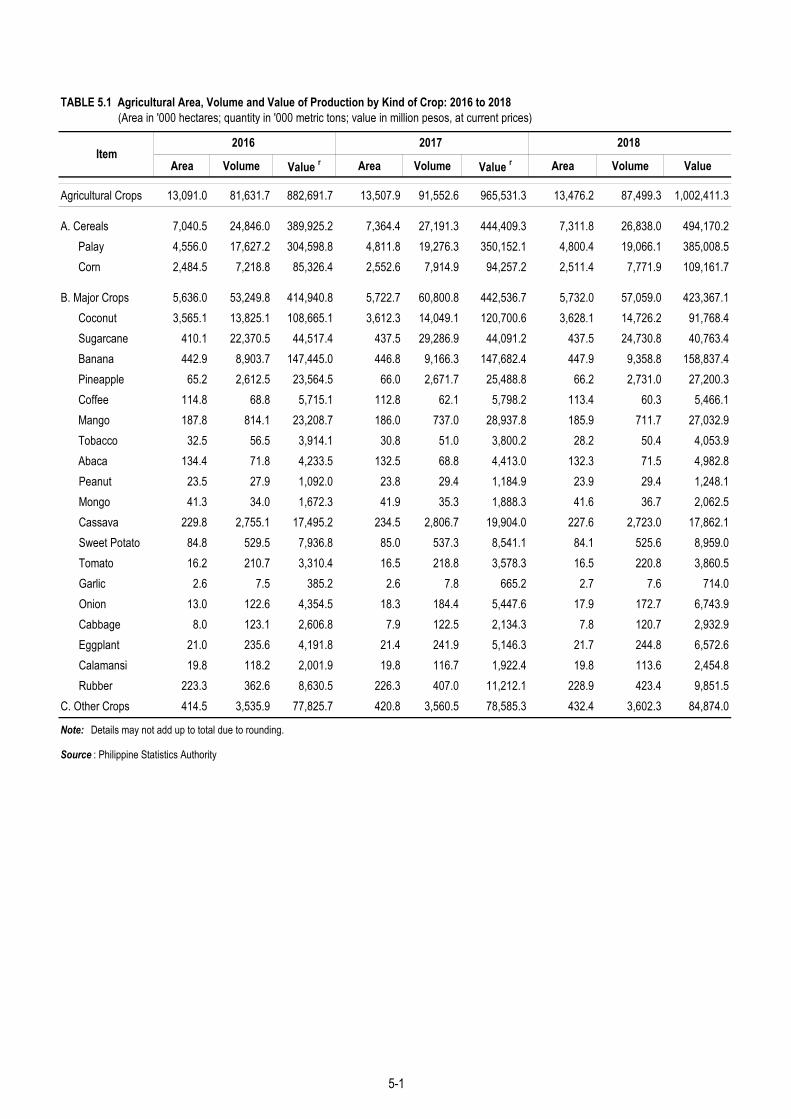
TABLE 5.1 Agricultural Area, Volume and Value of Production by Kind of Crop: 2016 to 2018 (Area in '000 hectares; quantity in '000 metric tons; value in million pesos, at current prices)
Area Volume Value r Area Volume Value r Area Volume Value
Agricultural Crops 13,091.0 81,631.7 882,691.7 13,507.9 91,552.6 965,531.3 13,476.2 87,499.3 1,002,411.3
A. Cereals 7,040.5 24,846.0 389,925.2 7,364.4 27,191.3 444,409.3 7,311.8 26,838.0 494,170.2 Palay 4,556.0 17,627.2 304,598.8 4,811.8 19,276.3 350,152.1 4,800.4 19,066.1 385,008.5 Corn 2,484.5 7,218.8 85,326.4 2,552.6 7,914.9 94,257.2 2,511.4 7,771.9 109,161.7
B. Major Crops 5,636.0 53,249.8 414,940.8 5,722.7 60,800.8 442,536.7 5,732.0 57,059.0 423,367.1 Coconut 3,565.1 13,825.1 108,665.1 3,612.3 14,049.1 120,700.6 3,628.1 14,726.2 91,768.4 Sugarcane 410.1 22,370.5 44,517.4 437.5 29,286.9 44,091.2 437.5 24,730.8 40,763.4 Banana 442.9 8,903.7 147,445.0 446.8 9,166.3 147,682.4 447.9 9,358.8 158,837.4 Pineapple 65.2 2,612.5 23,564.5 66.0 2,671.7 25,488.8 66.2 2,731.0 27,200.3 Coffee 114.8 68.8 5,715.1 112.8 62.1 5,798.2 113.4 60.3 5,466.1 Mango 187.8 814.1 23,208.7 186.0 737.0 28,937.8 185.9 711.7 27,032.9 Tobacco 32.5 56.5 3,914.1 30.8 51.0 3,800.2 28.2 50.4 4,053.9 Abaca 134.4 71.8 4,233.5 132.5 68.8 4,413.0 132.3 71.5 4,982.8
Peanut 23.5 27.9 1,092.0 23.8 29.4 1,184.9 23.9 29.4 1,248.1Mongo 41.3 34.0 1,672.3 41.9 35.3 1,888.3 41.6 36.7 2,062.5Cassava 229.8 2,755.1 17,495.2 234.5 2,806.7 19,904.0 227.6 2,723.0 17,862.1Sweet Potato 84.8 529.5 7,936.8 85.0 537.3 8,541.1 84.1 525.6 8,959.0Tomato 16.2 210.7 3,310.4 16.5 218.8 3,578.3 16.5 220.8 3,860.5Garlic 2.6 7.5 385.2 2.6 7.8 665.2 2.7 7.6 714.0Onion 13.0 122.6 4,354.5 18.3 184.4 5,447.6 17.9 172.7 6,743.9Cabbage 8.0 123.1 2,606.8 7.9 122.5 2,134.3 7.8 120.7 2,932.9Eggplant 21.0 235.6 4,191.8 21.4 241.9 5,146.3 21.7 244.8 6,572.6Calamansi 19.8 118.2 2,001.9 19.8 116.7 1,922.4 19.8 113.6 2,454.8Rubber 223.3 362.6 8,630.5 226.3 407.0 11,212.1 228.9 423.4 9,851.5
C. Other Crops 414.5 3,535.9 77,825.7 420.8 3,560.5 78,585.3 432.4 3,602.3 84,874.0
Note: Details may not add up to total due to rounding.
Source : Philippine Statistics Authority
2016 2017 2018Item
5-1

TABLE 5.2 Volume and Value of Fish Production by Type of Fishing Operation: 1991 to 2018 (Volume in thousand metric tons; value in million pesos, at current prices)
YearVolume Value Volume Value Volume
1991 2,599.0 60,033.3 759.8 15,244.6 1,146.8 22,132.6 692.4 22,656.1 1992 2,625.7 65,443.6 804.9 16,800.7 1,084.4 22,656.4 736.4 25,986.5 1993 2,632.0 70,215.8 824.4 18,021.2 1,014.0 22,031.4 793.6 30,163.2 1994 2,721.0 80,192.1 859.3 20,714.5 992.6 24,474.9 869.1 35,002.7 1995 2,805.9 83,187.3 893.2 23,065.4 972.0 26,463.8 940.6 33,658.1 1996 2,796.0 83,275.2 879.1 24,555.3 909.2 25,373.2 1,007.7 33,346.7 1997 2,793.6 80,617.1 884.7 25,935.3 924.5 27,392.9 984.4 27,288.8 1998 2,829.5 85,133.1 940.5 29,737.1 891.1 28,966.5 997.8 26,429.5 1999 2,923.8 92,322.3 948.8 32,242.1 926.3 31,034.1 1,048.7 29,046.1 2000 2,993.3 98,622.1 946.5 33,878.7 945.9 32,595.6 1,100.9 32,147.9 2001 3,166.5 107,193.8 976.5 36,088.7 969.5 34,221.7 1,220.5 36,883.4 2002 3,369.5 113,258.2 1,042.2 39,681.2 988.9 38,158.9 1,338.4 35,418.2 2003 3,619.3 119,866.3 1,109.6 42,002.9 1,055.1 40,664.3 1,454.5 37,199.1 2004 3,926.2 138,846.4 1,128.4 48,349.3 1,080.8 45,674.9 1,717.0 44,822.3 2005 4,161.9 146,392.9 1,134.0 47,272.7 1,132.0 49,950.4 1,895.8 49,169.8 2006 4,408.5 163,374.4 1,080.7 48,555.9 1,235.5 59,146.6 2,092.3 55,671.9 2007 4,711.3 180,545.1 1,192.1 54,737.5 1,304.4 64,210.4 2,214.8 61,597.3 2008 4,966.9 215,813.5 1,226.2 63,170.1 1,333.0 70,973.9 2,407.7 81,669.5 2009 5,080.0 215,582.1 1,253.9 58,705.0 1,348.6 75,383.7 2,477.4 81,493.4 2010 5,159.5 221,050.8 1,242.1 60,456.9 1,371.4 77,736.5 2,546.0 82,857.5 2011 4,973.6 224,695.1 1,032.8 58,623.0 1,332.6 80,075.6 2,608.1 85,996.4 2012 4,865.1 237,711.5 1,042.3 65,894.2 1,280.8 79,527.4 2,542.0 92,289.9 2013 4,705.4 244,551.7 1,067.6 69,922.5 1,264.4 80,898.0 2,373.4 93,731.2 2014 4,689.1 241,943.8 1,107.2 66,189.8 1,244.3 81,805.0 2,337.6 93,949.0 2015 4,649.3 239,702.4 1,084.6 64,875.3 1,216.5 81,486.2 2,348.2 93,340.9 2016 4,355.8 228,934.1 1,016.9 58,866.6 1,137.9 78,925.6 2,200.9 91,141.9 2017 4,312.1 243,901.8 948.3 r 59,716.3 r 1,126.0 83,478.7 2,237.8 100,706.8 r
2018 4,356.9 265,348.6 946.4 61,044.9 1,106.1 93,974.4 2,304.4 110,329.3
Note: Details may not add up to total due to rounding.1 Includes production from commercial fishing vessels.2 Includes production from capture activities in various marine and inland (fresh) bodies of water such as lakes, rivers, etc.3 Includes production from aquaculture activities such as brackishwater and freshwater fishponds, freshwater and marine fishpens, freshwater and marine fishcages, culture of oysters, mussels and seaweeds.Source: Philippine Statistics Authority
Total
Volume Value Value
Municipal Fishing 2Commercial Fishing 1 Aquaculture 3
5-2

TABLE 5.3 Volume and Value of Fish Production by Type of Environment and Species: 2014 to 2018 (Volume in thousand metric tons; value in million pesos, at current prices)
Volume Value Volume r Value r Volume r Value r Volume r Value r Volume Value
All Types of Environment 2,337.6 93,949.0 2,348.2 93,340.9 2,200.9 91,141.9 2,237.8 100,706.8 2,304.4 110,329.3
Blackishwater fishpond 1 322.7 48,713.7 325.6 50,661.9 340.6 52,110.1 347.5 55,686.4 329.7 59,495.4
Freshwater fishcage/pen 150.4 10,534.9 155.6 10,882.8 154.2 10,375.4 158.5 11,838.5 160.9 12,579.7
Freshwater fishpond 2 148.9 11,138.7 147.6 11,025.6 145.7 10,184.5 156.6 11,672.6 161.6 12,465.4
Marine fishcage/pen 125.0 12,641.7 116.8 12,059.0 117.6 11,890.0 117.8 12,636.5 118.9 14,043.2
Others 3 1,590.6 10,920.0 1,602.6 8,711.6 1,442.8 6,581.9 1,457.4 8,872.8 1,533.3 11,745.6
All Species 2,281.1 74,002.2 2,289.8 71,833.0 2,121.3 69,599.0 2,158.0 78,628.6 2,224.5 87,955.8
Milkfish 390.2 35,606.8 384.4 35,143.5 398.1 35,042.3 411.1 37,623.6 395.1 40,767.8
Tilapia 259.2 19,395.4 261.2 19,390.2 259.0 18,329.4 267.7 20,466.3 277.0 21,541.7
Mud crab 16.2 5,135.3 16.2 5,380.7 16.9 6,255.4 18.1 7,265.9 20.8 9,026.6
Catfish 3.6 344.2 3.6 364.7 3.7 387.9 4.2 446.9 4.4 479.2
Mussel 18.8 222.7 16.0 215.4 18.8 273.8 19.2 311.6 26.3 515.2
Seaweed 1,549.6 10,517.7 1,566.4 8,315.3 1,404.5 6,104.7 1,415.3 8,301.4 1,478.3 10,919.7
Other species 43.5 2,780.1 42.0 3,023.2 20.3 3,205.5 22.4 4,212.9 22.6 4,705.61 Includes blackishwater pen/cage.2 Includes small farm reservoir and rice fish.3 Includes seaweed, mussel, and oyster.Source: Philippine Statistics Authority
TABLE 5.4 Volume and Value of Livestock and Poultry Production by Animal Type: 2014 to 2018 (Volume in thousand metric tons; value in million pesos, at current prices)
Volume Value Volume Value Volume Valuer Volume Valuer Volume Value
Livestock (liveweight) 2,532.5 247,776.2 2,627.1 251,991.3 2,745.4 258,356.3 2,775.8 291,595.4 2,826.9 321,524.3
Carabao 143.0 10,740.4 142.0 11,100.6 144.7 11,333.2 144.4 12,573.8 143.1 13,637.1
Cattle 261.3 23,641.5 266.9 24,594.6 270.4 25,867.9 266.3 26,587.7 263.3 28,351.8
Hog 2,032.3 204,124.5 2,120.3 206,711.3 2,231.7 211,315.9 2,265.0 241,935.2 2,319.8 267,998.9
Goat 76.1 8,648.2 77.5 8,931.9 77.5 9,124.1 77.3 9,689.4 77.0 10,627.1
Dairy 19.7 621.5 20.4 653.0 21.2 715.3 22.8 809.3 23.7 909.4Poultry (liveweight) 1,606.4 147,707.5 1,694.8 148,771.3 1,706.7 152,497.1 1,777.0 159,764.8 1,867.5 174,108.9
Chicken 1,571.8 144,900.7 1,660.8 145,935.9 1,674.5 149,801.2 1,745.9 156,892.0 1,836.7 170,983.8
Duck 34.6 2,806.8 33.9 2,835.4 32.2 2,695.8 31.1 2,872.8 30.8 3,125.1Egg 457.2 43,808.9 487.0 46,473.8 505.9 50,307.0 537.8 55,293.3 580.5 57,806.3
Chicken 415.7 40,147.7 444.6 42,694.9 461.7 46,222.7 492.4 50,923.3 533.9 53,356.4
Duck 41.5 3,661.2 42.4 3,779.0 44.2 4,084.4 45.4 4,370.0 46.6 4,449.9Note: Details may not add up to totals due to rounding.1 Include brackishwater pen/cage2 Include small farm reservoir and rice fish
Source: Philippine Statistics Authority
20182017
2018
2014 2015 2016
2014 2015 2016
Type
Environment/Species2017

TABLE 5.5 Total Inventory of Livestock and Poultry by Type: 2001 to 2019 (In thousand heads)
2001 3,066 2,496 3,215 11,063 115,606 9,9872002 3,112 2,548 3,294 11,653 126,831 9,9112003 3,180 2,557 3,270 12,364 128,515 9,8072004 3,270 2,593 3,358 12,562 122,010 10,2112005 3,327 2,548 3,535 12,140 136,001 10,4392006 3,361 2,520 3,736 13,047 134,333 11,1472007 3,384 2,566 4,049 13,459 135,624 10,1622008 3,339 2,566 4,174 13,701 154,259 10,5082009 3,321 2,586 4,222 13,596 158,663 10,5772010 3,270 2,571 4,178 13,398 158,984 10,2682011 3,075 2,518 3,882 12,303 162,813 10,1262012 2,964 2,493 3,715 11,863 164,192 10,0112013 2,913 2,498 3,694 11,843 166,386 10,1352014 2,847 2,512 3,696 11,802 167,671 9,8862015 2,855 2,534 3,674 12,000 176,469 10,0672016 2,877 2,554 3,663 12,479 178,793 10,5192017 2,882 2,548 3,710 12,428 175,317 10,8422018 2,883 2,554 3,725 12,604 175,772 11,2202019 2,874 2,535 3,756 12,709 186,370 11,577
Source: Philippine Statistics Authority
TABLE 5.6 Total Number of Animals Slaughtered/Dressed for Meat Production: 2001 to 2018
2001 333 780 1,913 18,764 556.4 11.22002 353 780 1,917 19,749 566.0 11.32003 353 772 1,893 20,523 573.3 11.32004 368 765 1,922 20,242 595.0 11.12005 356 737 2,062 22,141 558.4 10.92006 389 714 2,559 23,197 589.4 12.12007 508 759 2,831 23,964 592.7 15.42008 469 786 3,047 23,802 727.6 15.12009 455 808 3,110 24,144 740.4 14.72010 485 831 3,167 24,246 778.0 14.02011 481 836 3,179 24,327 824.1 14.42012 462 831 3,101 24,500 888.9 15.12013 457 844 3,118 24,919 945.1 15.42014 461 859 3,161 25,061 970.0 15.42015 454 877 3,240 25,843 1,033.2 16.12016 465 894 3,266 26,730 1,051.2 16.32017 464r 886 3,273 27,142 1,075.7 15.7r
2018 468 885 3,274 27,713 1,136.2 15.7
1 Consists of dressed broiler, native chicken and culled layers onlyNote: Data includes all animals slaughtered in abattoirs/dressing plants and in backyard and commercial livestock and poultry farms.
Source: Philippine Statistics Authority
Year Livestock (in thousand heads) Poultry (in million birds)Carabao Cattle Goat Hog Chicken 1 Duck
Year Livestock PoultryCarabao Cattle Goat Hog Chicken Duck
5-4

TABLE 5.7 Rice and Corn Stock Inventory and Supply/Use Estimates: 2012 to 2017
Rice Corn Rice Corn Rice Corn Rice Corn Rice Corn Rice Corn
Stocks ('000 MT) Total January 1 2,627.4 166.1 2,524.2 161.3 2,125.5 168.8 2,662.05 183.96 3,198.79 386.96 2,765.12 382.13 July 1 1,915.1 139.4 2,194.1 123.2 2,025.0 161.8 2,568.19 275.40 2,733.64 215.92 2,347.90 683.62
Household January 1 982.1 61.7 1,309.2 61.3 1,267.7 65.2 1,326.15 84.96 1,332.97 103.81 1,269.61 175.06 July 1 762.8 54.5 811.9 42.5 879.6 54.0 952.96 51.93 980.40 47.54 994.83 64.81
Commercial January 1 604.2 104.2 621.7 99.9 583.0 93.3 811.85 97.40 965.37 281.73 948.05 205.78 July 1 561.9 84.7 684.8 77.5 689.2 102.0 840.76 222.49 838.81 168.04 1,198.10 613.27
NFA January 1 1,041.1 0.2 593.3 0.1 274.8 10.4 524.05 1.60 900.45 1.42 547.46 1.29 July 1 590.4 0.2 697.4 3.2 456.2 5.8 774.47 0.98 913.52 0.35 154.96 5.54
Supply-Use ('000 MT) Beginning Stock (Jan. 1) 2,631 166 2,524 161 2,126 169 2,662 184 … … … … Production 11,793 7,407 12,059 7,377 12,405 7,771 11,870 7,519 … … … … Imports 1 1,041 136 398 342 1,074 575 1,478 712 … … … …Total Supply 15,465 7,709 14,981 7,880 15,605 8,515 16,010 8,415 … … … …
Exports a a 1 a 1 1 a a … … … … Seeds 230 52 233 51 232 52 228 51 … … … … Feeds and Waste 767 4,815 784 4,795 806 5,051 772 4,887 … … … … Processing 472 988 482 984 496 1,037 475 1,003 … … … …
Per Capita (Kg.) 119 18 116 19 114 22 112 20 … … … …
Total Demand 1,469 5,855 1,500 5,830 1,535 6,141 11,336 2,087 … … … …
a is Less than 1 thousand metric ton1 Data taken from National Statistics Office.* Less than 1 thousand metric tons.
Source: Philippine Statistics Authority
2017Item
2012 2013 2014 2015 2016
5-5
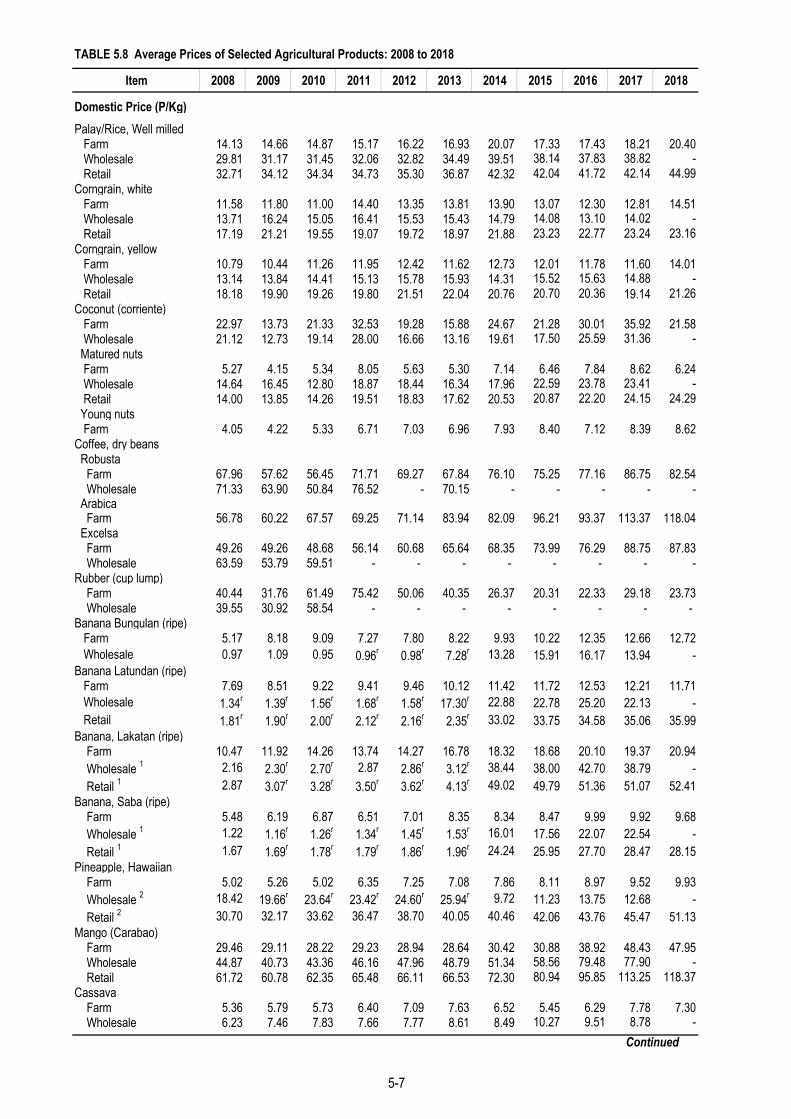
TABLE 5.8 Average Prices of Selected Agricultural Products: 2008 to 2018
Item 2008 2009 2010 2011 2012 2013 2014 2015 2016 2017 2018
Domestic Price (P/Kg)Palay/Rice, Well milled
Farm 14.13 14.66 14.87 15.17 16.22 16.93 20.07 17.33 17.43 18.21 20.40Wholesale 29.81 31.17 31.45 32.06 32.82 34.49 39.51 38.14 37.83 38.82 -Retail 32.71 34.12 34.34 34.73 35.30 36.87 42.32 42.04 41.72 42.14 44.99
Corngrain, whiteFarm 11.58 11.80 11.00 14.40 13.35 13.81 13.90 13.07 12.30 12.81 14.51Wholesale 13.71 16.24 15.05 16.41 15.53 15.43 14.79 14.08 13.10 14.02 -Retail 17.19 21.21 19.55 19.07 19.72 18.97 21.88 23.23 22.77 23.24 23.16
Corngrain, yellowFarm 10.79 10.44 11.26 11.95 12.42 11.62 12.73 12.01 11.78 11.60 14.01Wholesale 13.14 13.84 14.41 15.13 15.78 15.93 14.31 15.52 15.63 14.88 -Retail 18.18 19.90 19.26 19.80 21.51 22.04 20.76 20.70 20.36 19.14 21.26
Coconut (corriente)Farm 22.97 13.73 21.33 32.53 19.28 15.88 24.67 21.28 30.01 35.92 21.58Wholesale 21.12 12.73 19.14 28.00 16.66 13.16 19.61 17.50 25.59 31.36 -
Matured nutsFarm 5.27 4.15 5.34 8.05 5.63 5.30 7.14 6.46 7.84 8.62 6.24Wholesale 14.64 16.45 12.80 18.87 18.44 16.34 17.96 22.59 23.78 23.41 -Retail 14.00 13.85 14.26 19.51 18.83 17.62 20.53 20.87 22.20 24.15 24.29
Young nutsFarm 4.05 4.22 5.33 6.71 7.03 6.96 7.93 8.40 7.12 8.39 8.62
Coffee, dry beans Robusta Farm 67.96 57.62 56.45 71.71 69.27 67.84 76.10 75.25 77.16 86.75 82.54 Wholesale 71.33 63.90 50.84 76.52 - 70.15 - - - - - Arabica Farm 56.78 60.22 67.57 69.25 71.14 83.94 82.09 96.21 93.37 113.37 118.04 Excelsa Farm 49.26 49.26 48.68 56.14 60.68 65.64 68.35 73.99 76.29 88.75 87.83 Wholesale 63.59 53.79 59.51 - - - - - - - -Rubber (cup lump) Farm 40.44 31.76 61.49 75.42 50.06 40.35 26.37 20.31 22.33 29.18 23.73 Wholesale 39.55 30.92 58.54 - - - - - - - -Banana Bungulan (ripe)
Farm 5.17 8.18 9.09 7.27 7.80 8.22 9.93 10.22 12.35 12.66 12.72Wholesale 0.97 1.09 0.95 0.96r 0.98r 7.28r 13.28 15.91 16.17 13.94 -
Banana Latundan (ripe)Farm 7.69 8.51 9.22 9.41 9.46 10.12 11.42 11.72 12.53 12.21 11.71Wholesale 1.34r 1.39r 1.56r 1.68r 1.58r 17.30r 22.88 22.78 25.20 22.13 -Retail 1.81r 1.90r 2.00r 2.12r 2.16r 2.35r 33.02 33.75 34.58 35.06 35.99
Banana, Lakatan (ripe) Farm 10.47 11.92 14.26 13.74 14.27 16.78 18.32 18.68 20.10 19.37 20.94 Wholesale 1 2.16 2.30r 2.70r 2.87 2.86r 3.12r 38.44 38.00 42.70 38.79 - Retail 1 2.87 3.07r 3.28r 3.50r 3.62r 4.13r 49.02 49.79 51.36 51.07 52.41Banana, Saba (ripe) Farm 5.48 6.19 6.87 6.51 7.01 8.35 8.34 8.47 9.99 9.92 9.68 Wholesale 1 1.22 1.16r 1.26r 1.34r 1.45r 1.53r 16.01 17.56 22.07 22.54 - Retail 1 1.67 1.69r 1.78r 1.79r 1.86r 1.96r 24.24 25.95 27.70 28.47 28.15Pineapple, Hawaiian Farm 5.02 5.26 5.02 6.35 7.25 7.08 7.86 8.11 8.97 9.52 9.93 Wholesale 2 18.42 19.66r 23.64r 23.42r 24.60r 25.94r 9.72 11.23 13.75 12.68 - Retail 2 30.70 32.17 33.62 36.47 38.70 40.05 40.46 42.06 43.76 45.47 51.13Mango (Carabao) Farm 29.46 29.11 28.22 29.23 28.94 28.64 30.42 30.88 38.92 48.43 47.95 Wholesale 44.87 40.73 43.36 46.16 47.96 48.79 51.34 58.56 79.48 77.90 - Retail 61.72 60.78 62.35 65.48 66.11 66.53 72.30 80.94 95.85 113.25 118.37Cassava Farm 5.36 5.79 5.73 6.40 7.09 7.63 6.52 5.45 6.29 7.78 7.30 Wholesale 6.23 7.46 7.83 7.66 7.77 8.61 8.49 10.27 9.51 8.78 -
Continued
5-7
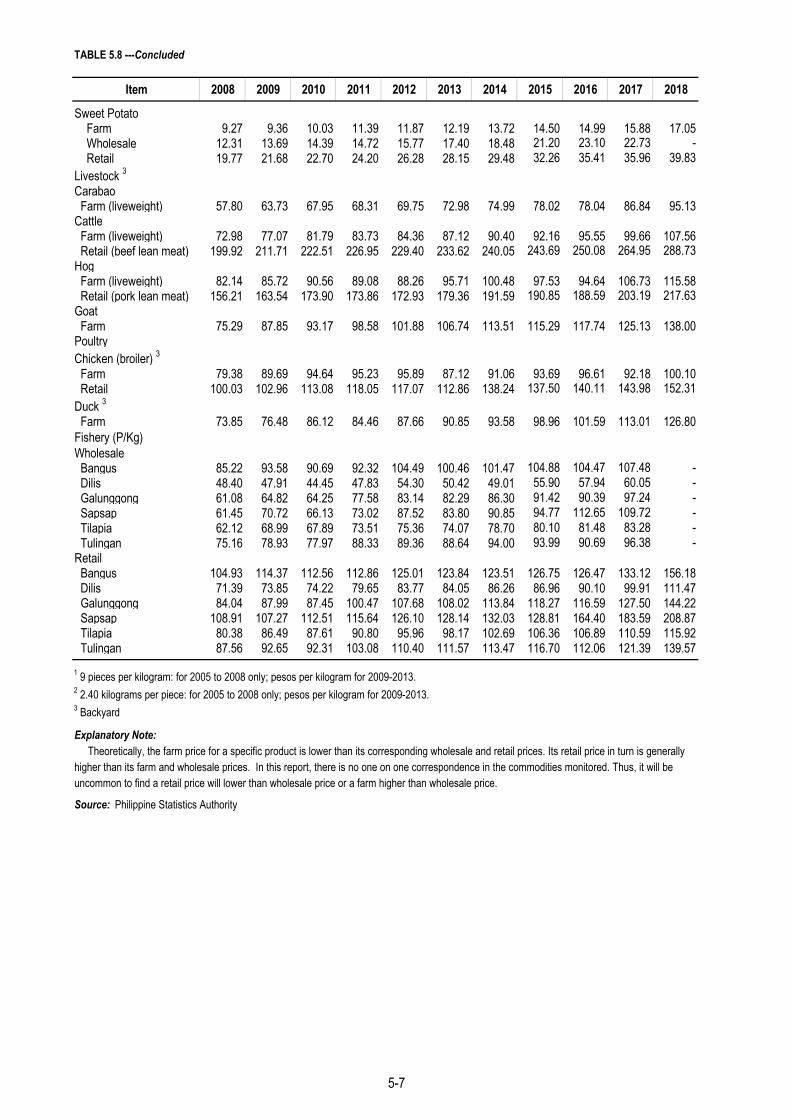
TABLE 5.8 ---Concluded
Item 2008 2009 2010 2011 2012 2013 2014 2015 2016 2017 2018
Sweet Potato Farm 9.27 9.36 10.03 11.39 11.87 12.19 13.72 14.50 14.99 15.88 17.05 Wholesale 12.31 13.69 14.39 14.72 15.77 17.40 18.48 21.20 23.10 22.73 - Retail 19.77 21.68 22.70 24.20 26.28 28.15 29.48 32.26 35.41 35.96 39.83Livestock 3Carabao Farm (liveweight) 57.80 63.73 67.95 68.31 69.75 72.98 74.99 78.02 78.04 86.84 95.13Cattle Farm (liveweight) 72.98 77.07 81.79 83.73 84.36 87.12 90.40 92.16 95.55 99.66 107.56 Retail (beef lean meat) 199.92 211.71 222.51 226.95 229.40 233.62 240.05 243.69 250.08 264.95 288.73Hog Farm (liveweight) 82.14 85.72 90.56 89.08 88.26 95.71 100.48 97.53 94.64 106.73 115.58 Retail (pork lean meat) 156.21 163.54 173.90 173.86 172.93 179.36 191.59 190.85 188.59 203.19 217.63Goat Farm 75.29 87.85 93.17 98.58 101.88 106.74 113.51 115.29 117.74 125.13 138.00PoultryChicken (broiler) 3 Farm 79.38 89.69 94.64 95.23 95.89 87.12 91.06 93.69 96.61 92.18 100.10 Retail 100.03 102.96 113.08 118.05 117.07 112.86 138.24 137.50 140.11 143.98 152.31Duck 3 Farm 73.85 76.48 86.12 84.46 87.66 90.85 93.58 98.96 101.59 113.01 126.80Fishery (P/Kg)Wholesale Bangus 85.22 93.58 90.69 92.32 104.49 100.46 101.47 104.88 104.47 107.48 - Dilis 48.40 47.91 44.45 47.83 54.30 50.42 49.01 55.90 57.94 60.05 - Galunggong 61.08 64.82 64.25 77.58 83.14 82.29 86.30 91.42 90.39 97.24 - Sapsap 61.45 70.72 66.13 73.02 87.52 83.80 90.85 94.77 112.65 109.72 - Tilapia 62.12 68.99 67.89 73.51 75.36 74.07 78.70 80.10 81.48 83.28 - Tulingan 75.16 78.93 77.97 88.33 89.36 88.64 94.00 93.99 90.69 96.38 -Retail Bangus 104.93 114.37 112.56 112.86 125.01 123.84 123.51 126.75 126.47 133.12 156.18 Dilis 71.39 73.85 74.22 79.65 83.77 84.05 86.26 86.96 90.10 99.91 111.47 Galunggong 84.04 87.99 87.45 100.47 107.68 108.02 113.84 118.27 116.59 127.50 144.22 Sapsap 108.91 107.27 112.51 115.64 126.10 128.14 132.03 128.81 164.40 183.59 208.87 Tilapia 80.38 86.49 87.61 90.80 95.96 98.17 102.69 106.36 106.89 110.59 115.92 Tulingan 87.56 92.65 92.31 103.08 110.40 111.57 113.47 116.70 112.06 121.39 139.571 9 pieces per kilogram: for 2005 to 2008 only; pesos per kilogram for 2009-2013.2 2.40 kilograms per piece: for 2005 to 2008 only; pesos per kilogram for 2009-2013.3 Backyard
Explanatory Note: Theoretically, the farm price for a specific product is lower than its corresponding wholesale and retail prices. Its retail price in turn is generallyhigher than its farm and wholesale prices. In this report, there is no one on one correspondence in the commodities monitored. Thus, it will be uncommon to find a retail price will lower than wholesale price or a farm higher than wholesale price.
Source: Philippine Statistics Authority
5-7
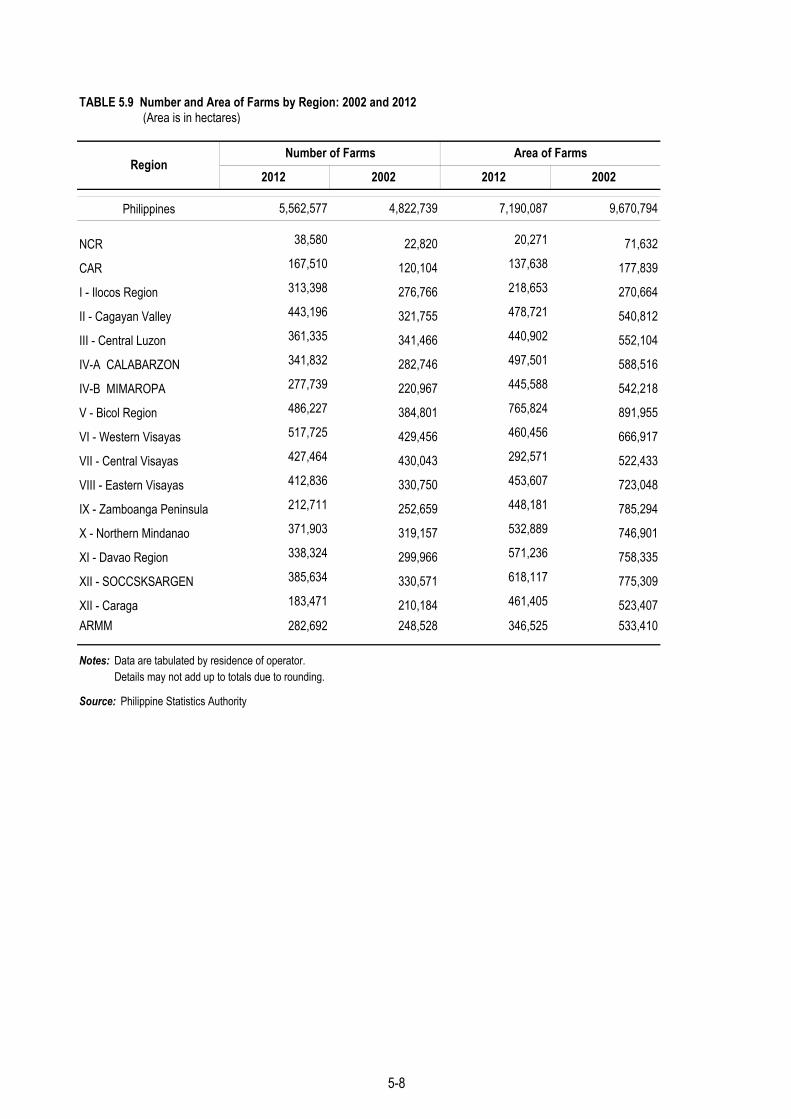
TABLE 5.9 Number and Area of Farms by Region: 2002 and 2012 (Area is in hectares)
Philippines
NCR
CAR
I - Ilocos Region
II - Cagayan Valley
III - Central Luzon
IV-A CALABARZON
IV-B MIMAROPA
V - Bicol Region
VI - Western Visayas
VII - Central Visayas
VIII - Eastern Visayas
IX - Zamboanga Peninsula
X - Northern Mindanao
XI - Davao Region
XII - SOCCSKSARGEN
XII - Caraga ARMM 282,692 248,528 346,525 533,410
Notes: Data are tabulated by residence of operator. Details may not add up to totals due to rounding.
Source: Philippine Statistics Authority
385,634 330,571 618,117 775,309183,471 210,184 461,405 523,407
371,903 319,157 532,889 746,901338,324 299,966 571,236 758,335
412,836 330,750 453,607 723,048212,711 252,659 448,181 785,294
517,725 429,456 460,456 666,917427,464 430,043 292,571 522,433
277,739 220,967 445,588 542,218486,227 384,801 765,824 891,955
361,335 341,466 440,902 552,104341,832 282,746 497,501 588,516
313,398 276,766 218,653 270,664443,196 321,755 478,721 540,812
38,580 22,820 20,271 71,632167,510 120,104 137,638 177,839
5,562,577 4,822,739 7,190,087 9,670,794
RegionNumber of Farms Area of Farms
2012 2002 2012 2002
5-8

TABLE 5.10 Rice Imports by Country of Origin: 2013 to 2017
OMNIBUS
2013 NFA Contracted volume 705,700.0 705,700.0 Total Actual Arrivals 298,036.1 a 47,626.1 345,662.2
2014 Total Authorized Imports 13,000,000.0 187,000.0 163,000.0 1,650,000.0
Int'l Tender Vietnam (800,000MT) 793,360.7 793,360.7CIF-DDU Contracted Arrivals 793,360.7
G-G Vietnam 25% (200,000 MT) 200,000.0 69,424.8 269,424.8CIF,DDU Thailand 25% (300,000 MT) 299,980.0 117,524.7 96,000.0 513,504.7
India 18,000.0 18,000.0Contracted Arrivals 499,980.0 186,949.5 114,000.0 800,929.5
2015 Total Authorized Imports 1,500,000.0 50,000.0 755,200.0 2,305,200.0
Total Contracted Volume 600,000.0(G-G) Thailand 25% (100.000) 99,984.0 99,984.0
CIF,DAP Vietnam 25% (150.000) 150,000.0 150,000.0Thailand 15% (100.000) 99,988.0Vietnam 15% (150.000) 150,000.0Contracted Arrivals 499,972.0 499,972.0Total Contracted Volume 250,000.0Vietnam 25% (1500.000) WMLG 148,862.5Vietnam 25% (300.000) WMLG 99,262.9Contracted Arrivals 248,125.3 248,125.3Total Contracted Volume 750,000.0
(G-G) Vietnam 25% (450.000) WMLG 450,000.0 262,182CIF,DAP Thailand 25% (300.000 300,000.0 32,300.0 210,746
India 400Contracted Arrivals 750,000.0 32,300.0 473,328 1,255,627.9Total Contracted Arrivals 1,498,097.3 32,300.0 473,328 2,003,725.2
2016 Total Authorized Imports
Total Contracted Volume 250,000.0 32,654.00(G-G) Vietnam 25% (150.000) WMLG 150,000.0
CIF,DAP Thailand 25% (100.000) LGWR 100,000.0Contracted Arrivals 250,000.0 32,654.00
Total Contracted Arrivals 250,000.0 32,654.00 282,654.0
2017 Total Authorized Imports
Total Contracted Volume 250,000.0 692,340.0(G-G) Vietnam 25% (150.000) LGWR 225,000.0 666,629.0
CIF,DAP Thailand 25% (100.000) LGWR 25,000.0Contracted Arrivals 249,900.0 656,629.0
Total Contracted Arrivals 249,900.0 665,629.0 916,629.0
Source: National Food Authority
All NFA imports are at 25% brokensa Part of 500,000 MT bidded in early 2013 but for 2014 rice requirement
Country of Origin National Food Authority Private
Minimum Access Volume (MAV)TotalCountry Specific
Quota (CSQ)
5-9

TABLE 5.11 Corn Imports by Country of Origin: 2005 to 2015
2005Argentina 57,750 8 … 57,750
2006 … … 245,021U.S.A … … 42,716Argentina … … 143,631China … … 58,674
2007Argentina 131,800 28 … 131,800
2008 No importation2009 310,906
U.S.A … … 100,597Brazil … … 150,309Thailand … … 43,000Indonesia … … 12,000India … … 5,000
2010 98,160U.S.A … … 1,850Argentina … … 16,000Thailand … … 80,310
2011 74,800U.S.A … … 12,000Argentina … … 19,000Thailand … … 27,800Indonesia … … 8,000India … … 8,000
2012 94,000Thailand … … 94,000
2013 303,461Thailand … … 281,900India … … 7,842Myanmanr … … 13,719
2014 637,301U.S.A … … 47,018Argentina … … 100,244Thailand … … 437,975India … … 7,064Vietnam … … 34,000Indonesia … … 11,000
2015 58,729U.S.A. … … 10,000Argentina … … 48,729
Notes: Details may not add up to totals due to rounding. aCost and frieght1Value not available bMinimum access volume
Source: National Food Authority
Year
Imports
NFA Private 1 Total
Country of OriginVolume Value Volume (metric tons)
(metric tons) (million U.S.$) (metric tons)
5-10
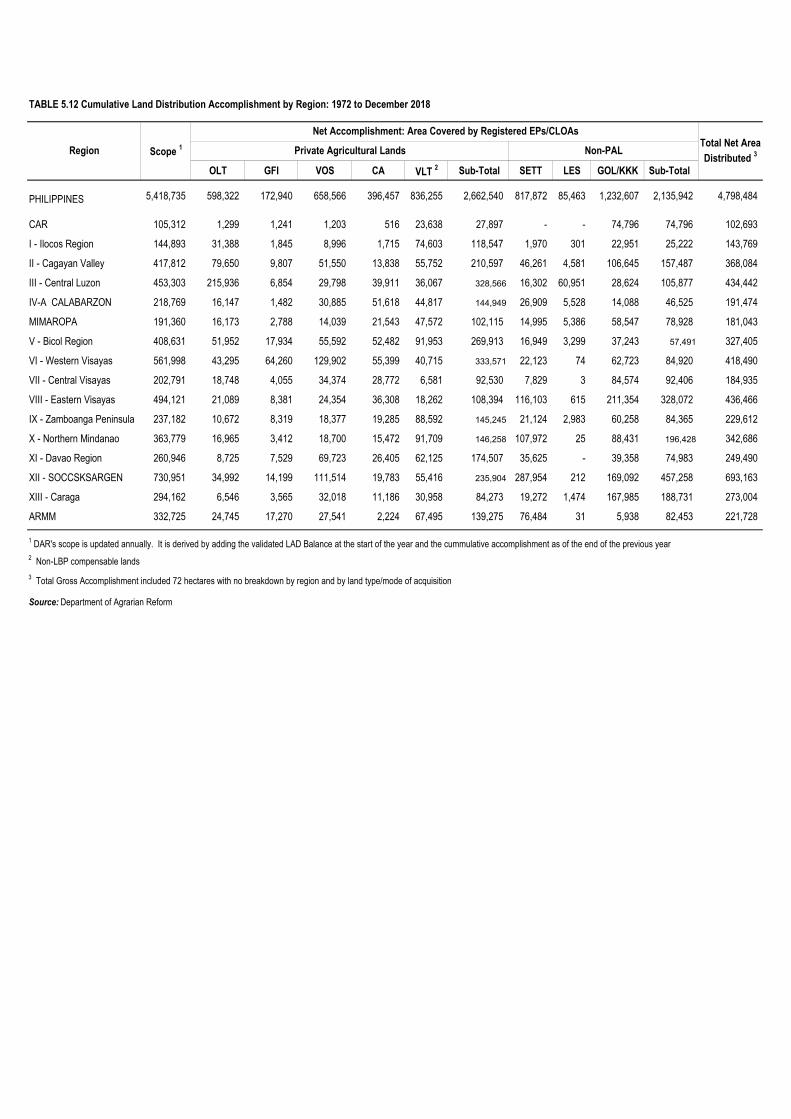
TABLE 5.12 Cumulative Land Distribution Accomplishment by Region: 1972 to December 2018
OLT GFI VOS CA VLT 2 Sub-Total SETT LES GOL/KKK Sub-Total
PHILIPPINES 5,418,735 598,322 172,940 658,566 396,457 836,255 2,662,540 817,872 85,463 1,232,607 2,135,942 4,798,484
CAR 105,312 1,299 1,241 1,203 516 23,638 27,897 - - 74,796 74,796 102,693
I - Ilocos Region 144,893 31,388 1,845 8,996 1,715 74,603 118,547 1,970 301 22,951 25,222 143,769
II - Cagayan Valley 417,812 79,650 9,807 51,550 13,838 55,752 210,597 46,261 4,581 106,645 157,487 368,084
III - Central Luzon 453,303 215,936 6,854 29,798 39,911 36,067 328,566 16,302 60,951 28,624 105,877 434,442
IV-A CALABARZON 218,769 16,147 1,482 30,885 51,618 44,817 144,949 26,909 5,528 14,088 46,525 191,474
MIMAROPA 191,360 16,173 2,788 14,039 21,543 47,572 102,115 14,995 5,386 58,547 78,928 181,043
V - Bicol Region 408,631 51,952 17,934 55,592 52,482 91,953 269,913 16,949 3,299 37,243 57,491 327,405
VI - Western Visayas 561,998 43,295 64,260 129,902 55,399 40,715 333,571 22,123 74 62,723 84,920 418,490
VII - Central Visayas 202,791 18,748 4,055 34,374 28,772 6,581 92,530 7,829 3 84,574 92,406 184,935
VIII - Eastern Visayas 494,121 21,089 8,381 24,354 36,308 18,262 108,394 116,103 615 211,354 328,072 436,466
IX - Zamboanga Peninsula 237,182 10,672 8,319 18,377 19,285 88,592 145,245 21,124 2,983 60,258 84,365 229,612
X - Northern Mindanao 363,779 16,965 3,412 18,700 15,472 91,709 146,258 107,972 25 88,431 196,428 342,686
XI - Davao Region 260,946 8,725 7,529 69,723 26,405 62,125 174,507 35,625 - 39,358 74,983 249,490
XII - SOCCSKSARGEN 730,951 34,992 14,199 111,514 19,783 55,416 235,904 287,954 212 169,092 457,258 693,163
XIII - Caraga 294,162 6,546 3,565 32,018 11,186 30,958 84,273 19,272 1,474 167,985 188,731 273,004
ARMM 332,725 24,745 17,270 27,541 2,224 67,495 139,275 76,484 31 5,938 82,453 221,728
Source: Department of Agrarian Reform
3 Total Gross Accomplishment included 72 hectares with no breakdown by region and by land type/mode of acquisition
Non-PAL
Net Accomplishment: Area Covered by Registered EPs/CLOAs Total Net Area Distributed 3
1 DAR's scope is updated annually. It is derived by adding the validated LAD Balance at the start of the year and the cummulative accomplishment as of the end of the previous year2 Non-LBP compensable lands
Region Scope 1 Private Agricultural Lands

TABLE 5.13 Fertilizer Production, Importation, and Sales: 2015 to 2018 (Volume in metric tons)
Year Production Importation Sales Exportation
Total 1,532,868 10,587,751 2,698,763 103,570
2015 27,405 2,451,784 326,800 9,558
2016 1 261,940 2,397,872 307,418 11,520
2017 2 462,219 3,369,362 784,439 46,492
2018 3 781,304 2,368,733 1,280,106 36,000
1 As of May 20192 As of 25 January 20193 As of 18 March 2019
Source: Fertilizer and Pesticide Authority
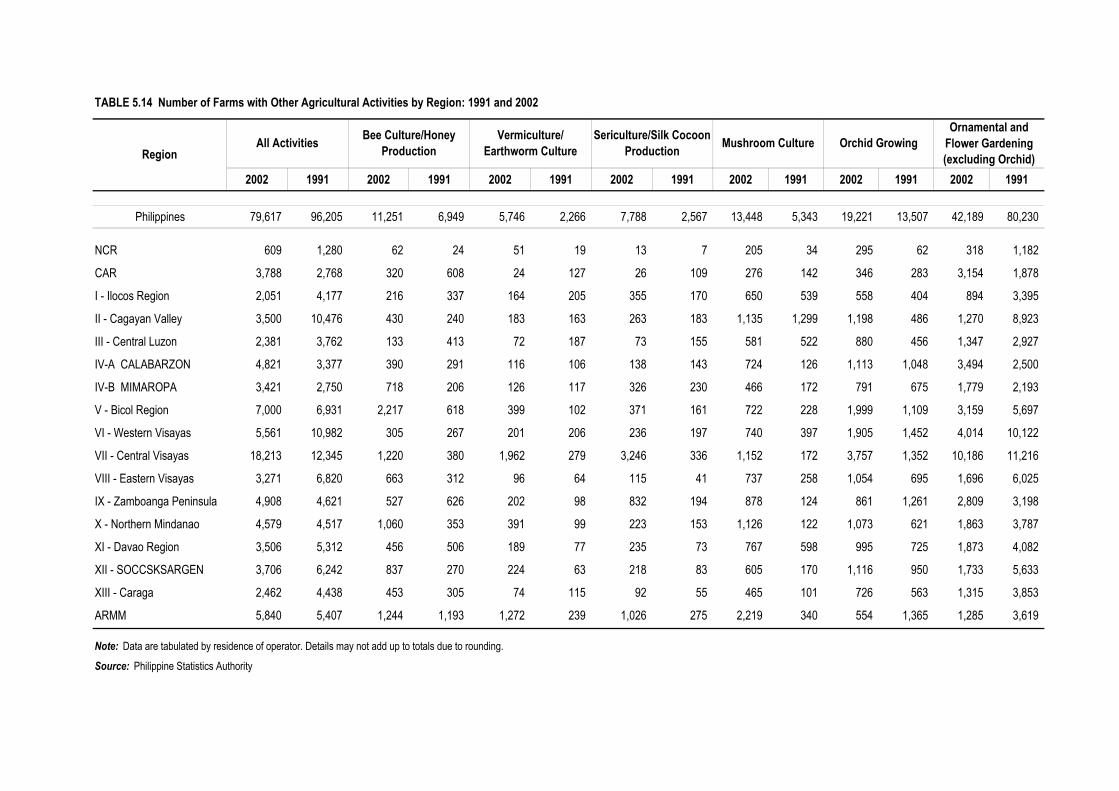
TABLE 5.14 Number of Farms with Other Agricultural Activities by Region: 1991 and 2002
2002 1991 2002 1991 2002 1991 2002 1991 2002 1991 2002 1991 2002 1991
Philippines 79,617 96,205 11,251 6,949 5,746 2,266 7,788 2,567 13,448 5,343 19,221 13,507 42,189 80,230
NCR 609 1,280 62 24 51 19 13 7 205 34 295 62 318 1,182
CAR 3,788 2,768 320 608 24 127 26 109 276 142 346 283 3,154 1,878
I - Ilocos Region 2,051 4,177 216 337 164 205 355 170 650 539 558 404 894 3,395
II - Cagayan Valley 3,500 10,476 430 240 183 163 263 183 1,135 1,299 1,198 486 1,270 8,923
III - Central Luzon 2,381 3,762 133 413 72 187 73 155 581 522 880 456 1,347 2,927
IV-A CALABARZON 4,821 3,377 390 291 116 106 138 143 724 126 1,113 1,048 3,494 2,500
IV-B MIMAROPA 3,421 2,750 718 206 126 117 326 230 466 172 791 675 1,779 2,193
V - Bicol Region 7,000 6,931 2,217 618 399 102 371 161 722 228 1,999 1,109 3,159 5,697
VI - Western Visayas 5,561 10,982 305 267 201 206 236 197 740 397 1,905 1,452 4,014 10,122
VII - Central Visayas 18,213 12,345 1,220 380 1,962 279 3,246 336 1,152 172 3,757 1,352 10,186 11,216
VIII - Eastern Visayas 3,271 6,820 663 312 96 64 115 41 737 258 1,054 695 1,696 6,025
IX - Zamboanga Peninsula 4,908 4,621 527 626 202 98 832 194 878 124 861 1,261 2,809 3,198
X - Northern Mindanao 4,579 4,517 1,060 353 391 99 223 153 1,126 122 1,073 621 1,863 3,787
XI - Davao Region 3,506 5,312 456 506 189 77 235 73 767 598 995 725 1,873 4,082
XII - SOCCSKSARGEN 3,706 6,242 837 270 224 63 218 83 605 170 1,116 950 1,733 5,633
XIII - Caraga 2,462 4,438 453 305 74 115 92 55 465 101 726 563 1,315 3,853
ARMM 5,840 5,407 1,244 1,193 1,272 239 1,026 275 2,219 340 554 1,365 1,285 3,619
Note: Data are tabulated by residence of operator. Details may not add up to totals due to rounding.
Source: Philippine Statistics Authority
Orchid GrowingOrnamental and
Flower Gardening (excluding Orchid)Region
All Activities Bee Culture/Honey Production
Vermiculture/ Earthworm Culture
Sericulture/Silk Cocoon Production Mushroom Culture


TABLE 6.1a Summary Statistics for All Establishments by Major Industry Group: 2013 and 2014 6 - 3
TABLE 6.1b Summary Statistics for All Establishments by Major Industry Group: 2015 and 2016 6 - 5
TABLE 6.2 Summary Statistics for Manufacturing Establishments for All Employment Sizes by Industry Group: 2014 6 - 7
TABLE 6.3 Number, Floor Area and Value of Private Building Construction by Type of Building: 1996 to 2017 6 - 8
TABLE 6.4 Index of Value of Production for Manufacturing Sector by Major Industry Group: 2016 to 2018 6 - 9
TABLE 6.5 Total Approved Investments by Industry: 2012 to 2016 6 - 10
TABLE 6.6 Total Approved Investments by Nationality and by Investments Promotion Agency: 2012 to 2016 6 - 11
TABLE 6.7 Total Approved Foreign Investments by Investment Promotion Agency: 2011 to 2016 6 - 12
TABLE 6.8 Total Approved Foreign Investments by Industry: 2012 to 2016 6 - 12
TABLE 6.9 Total Approved Foreign Investments by Country of Investor: 2012 to 2016 6 - 13
TABLE 6.10 Total Approved Foreign Investments in the Information and Communication Technology
Industry by Sub-Industry: 2012 to 2016 6 - 13
TABLE 6.11 Net Foreign Direct Investment (BPM6 Concept)* by Industry/Sector: 2009 to 2018 6 - 14
TABLE 6.12 Number and Amount of Paid-Up Capital Investments/Contribution of Newly Registered
Business Organizations: 2003 to 2018 6 - 15
TABLE 6.13 Number and Initial Paid-up Capital Investment/Contribution of Foreign Investments in Newly Registered
Domestic Stock Corporations and Partnership by Major Industry Group: 2012 to 2017 6 - 16

TABLE 6.1a Summary Statistics for All Establishments by Major Industry Group: 2013 and 2014 (Value in thousand pesos)
2014 2013 2014 2013 2014 2013 2014 2013 2014 2013 2014 2013
All Establishments 226,682 225,245 5,504,161 5,342,891 5,424,917 5,237,768 1,364,390,393 1,280,964,610 14,283,940,274 13,751,852,937 12,346,664,264 12,009,486,019
Agriculture, Forestry and Fishing 2,690 2,564 163,333 164,445 159,446 161,847 26,557,936 28,554,198 158,292,129 148,416,933 153,346,235 145,779,025Mining and Quarrying 256 253 37,214 35,940 37,104 35,869 12,905,631 10,980,291 205,841,647 178,679,898 131,178,584 116,354,854Manufacturing 25,197 25,149 1,223,577 1,219,330 1,206,064 1,204,360 311,177,640 307,554,624 4,637,607,955 4,465,118,545 4,069,419,542 4,020,405,453Electricity, Gas, Steam, and Air Conditioning Supply 259 253 46,881 46,696 46,881 46,696 32,745,876 34,841,155 780,550,588 799,185,625 653,214,416 663,152,346Water Supply; Sewerage Waste Management and Remediation Activities 975 977 33,823 34,360 33,150 33,404 10,936,340 10,915,110 79,076,303 78,255,549 56,034,723 58,077,694Construction 1,778 1,681 267,583 236,192 267,212 235,660 66,321,706 47,495,773 360,372,318 350,693,540 325,810,282 316,108,857 Wholesale and Retail Trade; Repair of Motor Vehicles and Motorcycles 100,897 99,614 981,310 995,081 970,473 963,634 142,636,270 137,016,431 3,644,689,341 3,665,568,825 3,481,559,292 3,518,170,621Transport and Storage Activities 2,581 2,544 152,688 159,080 151,168 157,063 51,186,382 43,933,438 512,998,893 411,232,862 460,951,171 393,965,319Accommodation and Food Service Activities 28,059 28,188 416,942 409,206 406,136 395,353 51,512,184 58,157,971 397,113,458 405,028,752 342,597,709 343,612,119Information and Communication 2,919 3,274 141,136 143,747 140,299 142,701 77,038,633 78,222,703 547,367,945 542,051,807 442,285,285 442,460,195Financial and Insurance Activities 7,303 7,337 302,792 281,562 294,738 276,342 148,350,349 130,869,234 1,241,099,425 1,218,201,474 837,951,306 810,658,388Real Estate Activities 4,862 4,814 72,711 71,453 72,120 71,166 21,861,242 20,458,991 497,498,670 423,277,533 316,271,539 274,707,982Professional, Scientific and Technical Activities 7,405 7,331 145,923 132,956 142,998 129,272 50,710,963 53,629,773 290,317,479 271,949,699 258,391,883 244,521,988Administrative and Support Service Activities 6,905 6,864 840,392 754,499 838,090 752,204 220,804,288 194,383,307 411,147,803 382,786,306 365,485,990 329,366,907Private education 14,052 13,999 371,787 362,664 363,045 344,464 78,186,279 73,264,812 175,500,962 174,039,726 152,312,277 146,026,005Human Health and Social Work Activities 6,729 6,640 158,166 155,361 153,357 150,663 30,508,456 27,882,969 155,180,612 129,768,554 135,522,354 109,124,406Arts, Entertainment, and Recreation 3,108 3,099 68,936 49,998 67,564 49,258 23,200,222 15,858,298 139,838,472 82,808,588 121,208,008 55,111,448 Other Service Activities 10,707 10,664 78,967 90,321 75,072 87,812 7,749,996 6,945,532 49,446,274 24,788,721 43,123,668 21,882,412
Continued
Total Income Total ExpenseMajor Industry Group
Number of Establishments
Employment (As of November 15) Total Compensation
Total Paid
6-1

TABLE 6.1a - - Concluded
2014 2013 2014 2013 2014 2013 2014 2013 2014 2013
All Establishments 6,025,957,456 5,829,923,566 3,952,077,577 3,805,778,317 232,546,787 135,268,591 492,788,761 555,114,238 41,347,590 57,215,285
Agriculture, Forestry and Fishing 156,541,019 144,736,446 40,565,598 40,729,993 2,702,622 1,994,314 7,805,063 12,418,905 3,221,231 6,327,710Mining and Quarrying 213,800,757 190,512,019 135,585,557 114,151,399 1,611,956 1,037,684 32,405,945 46,981,162 990,596 8,850Manufacturing 4,505,501,799 4,333,566,388 1,162,565,558 1,036,967,158 121,851,452 9,723,578 124,979,974 102,874,521 270,206 912,156Electricity, Gas, Steam, and Air Conditioning Supply 732,175,755 749,021,694 189,180,326 200,591,939 82,593 2,031,442 46,473,599 25,059,629 11,255,185 9,198,820 Water Supply; Sewerage Waste Management and Remediation Activities 65,134,761 67,390,232 42,907,125 43,755,914 192,720 162,337 3,344,131 3,770,912 309,982 195,517 Construction 352,803,365 344,696,787 130,064,154 113,801,550 2,865,329 694,212 7,467,965 7,678,049 1,508,870 5,000 Wholesale and Retail Trade; Repair of Motor Vehicles and Motorcycles … … 361,391,096 340,911,480 52,113,363 61,504,611 26,223,484 20,060,725 4,732,990 2,208,594Transport and Storage Activities … … 156,620,380 132,363,676 -946,252 518,017 36,171,364 44,086,552 178,808 3,804,623Accommodation and Food Service Activities … … 135,223,965 146,806,680 2,220,315 2,584,749 13,483,838 18,916,997 - -Information and Communication … … 235,118,383 257,919,024 -1,862,438 771,673 63,891,574 90,669,949 225,382 182,741Financial and Insurance Activities … … 532,454,821 510,966,356 18,351,317 18,576,220 23,865,930 72,838 6,266,223 6,389,826Real Estate Activities … … 172,894,004 201,588,437 32,375,100 35,111,913 44,322,462 144,236,866 724,106 970,903Professional, Scientific and Technical Activities … … 104,576,388 140,872,645 721,095 337,160 5,291,090 3,217,496 8,322,951 8,449,561Administrative and Support Service Activities … … 286,231,205 279,057,570 483,969 (31,816) 11,444,750 7,290,691 673,904 336,759Private education … … 117,713,605 120,200,425 -44,119 (50,554) 13,027,192 16,661,616 2,173,965 1,197,155Human Health and Social Work Activities … … 65,755,045 61,547,065 190,907 326,779 12,393,273 9,551,372 - -Arts, Entertainment, and Recreation … … 66,250,117 52,293,904 71,315 (121,991) 19,741,163 1,331,891 493,191 17,027,070 Other Service Activities … … 16,980,250 11,253,102 -269,271 98,263 455,964 234,067 - -
Note: Details may not add-up to total due to rounding and/or statistical disclosure control.
Sources: Philippine Statistics Authority
Change in Inventories Gross Addition to Fixed Assets Subsidies
Major Industry GroupValue of Output Value Added
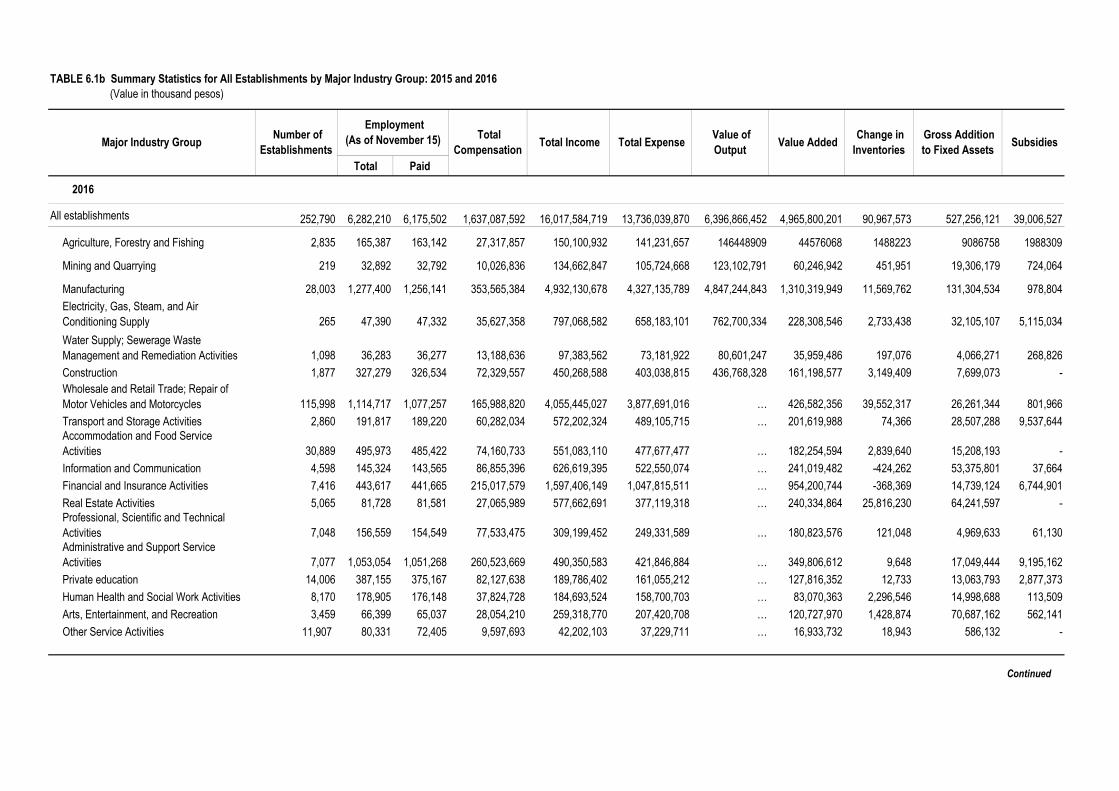
TABLE 6.1b Summary Statistics for All Establishments by Major Industry Group: 2015 and 2016 (Value in thousand pesos)
Total Paid
All establishments 252,790 6,282,210 6,175,502 1,637,087,592 16,017,584,719 13,736,039,870 6,396,866,452 4,965,800,201 90,967,573 527,256,121 39,006,527
Agriculture, Forestry and Fishing 2,835 165,387 163,142 27,317,857 150,100,932 141,231,657 146448909 44576068 1488223 9086758 1988309
Mining and Quarrying 219 32,892 32,792 10,026,836 134,662,847 105,724,668 123,102,791 60,246,942 451,951 19,306,179 724,064
Manufacturing 28,003 1,277,400 1,256,141 353,565,384 4,932,130,678 4,327,135,789 4,847,244,843 1,310,319,949 11,569,762 131,304,534 978,804Electricity, Gas, Steam, and Air Conditioning Supply 265 47,390 47,332 35,627,358 797,068,582 658,183,101 762,700,334 228,308,546 2,733,438 32,105,107 5,115,034Water Supply; Sewerage Waste Management and Remediation Activities 1,098 36,283 36,277 13,188,636 97,383,562 73,181,922 80,601,247 35,959,486 197,076 4,066,271 268,826Construction 1,877 327,279 326,534 72,329,557 450,268,588 403,038,815 436,768,328 161,198,577 3,149,409 7,699,073 -Wholesale and Retail Trade; Repair of Motor Vehicles and Motorcycles 115,998 1,114,717 1,077,257 165,988,820 4,055,445,027 3,877,691,016 … 426,582,356 39,552,317 26,261,344 801,966Transport and Storage Activities 2,860 191,817 189,220 60,282,034 572,202,324 489,105,715 … 201,619,988 74,366 28,507,288 9,537,644Accommodation and Food Service Activities 30,889 495,973 485,422 74,160,733 551,083,110 477,677,477 … 182,254,594 2,839,640 15,208,193 -Information and Communication 4,598 145,324 143,565 86,855,396 626,619,395 522,550,074 … 241,019,482 -424,262 53,375,801 37,664Financial and Insurance Activities 7,416 443,617 441,665 215,017,579 1,597,406,149 1,047,815,511 … 954,200,744 -368,369 14,739,124 6,744,901Real Estate Activities 5,065 81,728 81,581 27,065,989 577,662,691 377,119,318 … 240,334,864 25,816,230 64,241,597 -Professional, Scientific and Technical Activities 7,048 156,559 154,549 77,533,475 309,199,452 249,331,589 … 180,823,576 121,048 4,969,633 61,130Administrative and Support Service Activities 7,077 1,053,054 1,051,268 260,523,669 490,350,583 421,846,884 … 349,806,612 9,648 17,049,444 9,195,162Private education 14,006 387,155 375,167 82,127,638 189,786,402 161,055,212 … 127,816,352 12,733 13,063,793 2,877,373Human Health and Social Work Activities 8,170 178,905 176,148 37,824,728 184,693,524 158,700,703 … 83,070,363 2,296,546 14,998,688 113,509Arts, Entertainment, and Recreation 3,459 66,399 65,037 28,054,210 259,318,770 207,420,708 … 120,727,970 1,428,874 70,687,162 562,141Other Service Activities 11,907 80,331 72,405 9,597,693 42,202,103 37,229,711 … 16,933,732 18,943 586,132 -
Continued
Change in Inventories
Gross Addition to Fixed Assets Subsidies
2016
Major Industry Group Number of Establishments
Employment (As of November 15) Total
Compensation Total Income Total Expense Value of Output Value Added

TABLE 6.1b - - Concluded
Total Paid
2015All establishments 220,923 5,841,436 5,750,967 1,526,805,636 15,083,580,970 12,947,585,118 6,170,907,671 4,560,030,731 69,998,956 472,359,439 35,447,330
Agriculture, Forestry and Fishing 2,646 162,669 159,889 25,002,725 153,384,333 150,200,911 150,312,424 37,028,709 1,826,192 8,338,503 3,090,783Mining and Quarrying 228 32,249 32,091 11,442,312 158,957,847 115,779,084 149,244,112 80,041,835 3,511,248 21,848,365 231Manufacturing 24,496 1,293,811 1,272,855 335,097,757 4,676,134,065 4,162,045,210 4,575,786,669 1,175,834,632 -30,651,672 114,919,728 2,196,373
Electricity, Gas, Steam, and Air Conditioning Supply 261 46,650 46,650 34,646,773 794,486,150 657,665,812 751,384,214 206,273,128 1,316,361 31,548,743 10,999,401Water Supply; Sewerage Waste Management and Remediation Activities 993 33,990 33,880 12,045,873 88,170,522 61,622,181 81,889,939 46,066,822 171,999 3,805,714 474,954Construction 1,796 299,842 299,328 68,863,030 474,419,777 376,798,341 462,290,313 210,354,730 5,312,841 9,030,169 -Wholesale and Retail Trade; Repair of Motor Vehicles and Motorcycles 98,674 1,008,174 979,214 156,030,908 3,811,952,791 3,603,467,143 … 430,064,865 47,784,666 24,786,772 3,774,172Transport and Storage Activities 2,680 180,547 178,881 56,339,696 591,876,657 511,246,913 … 207,313,908 -434,405 33,978,829 9,545,738Accommodation and Food Service Activities 27,028 433,260 425,094 63,775,233 471,265,318 395,254,608 … 170,056,628 2,177,765 24,254,367 -Information and Communication 2,823 148,507 147,759 86,826,885 571,825,524 483,435,021 … 227,682,826 -892,951 68,163,694 618,318Financial and Insurance Activities 7,172 338,163 335,384 186,427,086 1,448,814,371 966,939,089 … 759,026,802 862,963 29,393,075 2,151,428Real Estate Activities 4,826 74,300 73,126 26,252,170 534,541,567 353,240,240 … 221,274,288 38,218,776 40,947,498 27,886Professional, Scientific and Technical Activities 7,097 154,232 152,387 60,164,013 289,274,300 220,882,595 … 163,809,588 2,446 4,695,957 143,615Administrative and Support Service Activities 6,712 952,862 951,880 256,216,262 458,259,948 409,791,385 … 329,348,324 23,057 13,733,193 130,613Private education 13,819 373,336 365,690 80,938,855 189,907,079 160,845,016 … 126,356,098 11,842 13,262,992 1,930,949
Human Health and Social Work Activities 6,603 168,889 165,781 34,348,556 169,813,105 147,235,064 … 73,710,506 891,756 12,702,999 53,970
Arts, Entertainment, and Recreation 3,004 62,374 60,766 24,804,550 158,904,040 133,299,047 … 81,397,663 171,228 16,557,441 308,899
Other Service Activities 10,065 77,581 70,312 7,582,952 41,593,576 37,837,458 … 14,389,379 -305,156 391,400 -
Source : Philippine Statistics Authority, 2016 Annual Survey of Philippine Business and Industry
Subsidies Major Industry Group Number of Establishments
Employment (As of November 15) Total
Compensation Total Income Total Expense Value of Output Value Added Change in
Inventories Gross Addition to Fixed Assets

TABLE 6.2 Summary Statistics for Manufacturing Establishments for All Employment Sizes by Industry Group: 2014 (Value in thousand pesos)
Total Paid Employees
C Manufacturing 25,197 1,223,574 1,206,067 311,177,642 4,637,607,954 3,879,286,717
C101 to 1C08 Food products 10,240 277,563 268,701 65,809,661 1,027,667,802 889,390,758C110 Beverages 2,537 23,924 22,424 9,064,116 191,158,848 138,109,938C120 Tobacco 18 6,383 6,379 7,119,518 124,448,184 124,721,233C131 to C139 Textile 397 25,307 25,189 3,995,297 27,142,698 21,742,925C141 to C143 Wearing apparel 1,796 112,764 111,294 17,881,280 69,350,629 48,378,720C151 to C152 Leather and leather products 303 23,966 23,573 2,871,087 24,922,963 19,792,294C161 to C162 Wood and wood products 536 20,220 19,639 2,640,821 40,864,722 34,147,680C170 Paper and paper products 354 24,578 24,557 5,023,713 81,434,814 71,872,979C181 to C182 Printing and reproduction
of recorded media 1,610 26,730 26,466 3,555,910 29,087,434 23,546,004C192 to C199 Petroleum products 24 2,683 2,675 4,466,993 526,210,059 526,447,130C201-C203 Chemicals and chemical products 641 32,296 32,158 13,626,547 280,349,496 232,166,465C210 Pharmaceutical products 117 13,752 13,721 8,193,800 69,307,456 45,824,831C221 Rubber products 165 11,845 11,775 2,972,881 25,807,086 23,560,870C222 Plastic products 837 52,720 52,603 10,410,794 102,267,781 90,712,291C231 Glass and glass products 94 4,683 4,542 1,579,706 16,060,175 14,082,920C239 Non-metallic mineral products 723 29,444 28,994 7,386,188 161,394,662 120,480,134C241 Iron and steel 282 14,649 14,614 4,640,008 132,923,230 133,088,061C242 Basic precious and non-ferrous 32 2,756 2,753 1,576,119 81,096,629 71,290,121C243 Metal casting 70 4,294 4,282 929,014 11,718,650 10,726,181C251-C259 Fabricated metal products, except
machinery and equipment 1,200 55,577 55,219 13,275,012 108,649,146 89,972,307C261-C268 Computer, electronic and optical 307 242,617 241,421 69,564,412 724,658,327 561,182,602C271-C279 Electrical equipment 223 33,699 33,668 8,793,716 119,980,878 97,865,336C281-C282 Machinery and equipment, n.e.c. 251 16,164 16,116 5,099,477 59,366,547 44,030,929C291-C309 Transport equipment 320 94,036 93,853 26,839,424 518,961,230 384,442,049C310 Furniture & fixtures 1,035 29,161 28,835 4,408,254 31,300,272 25,747,928C321-C329 Other manufacturing industries 390 24,309 24,048 5,149,834 34,506,993 24,849,504
Repair and installation of machineryC331-C332 and equipment 695 17,454 16,568 4,304,060 16,971,243 11,114,527
Note : Details may not add-up to total due to rounding and/or statistical disclosure control.
Source : Philippine Statistics Authority, 2014 Annual Survey of Philippine Business and Industry
Total Costs2009 PSIC Code Industry Description Number of
Establishments
Employment (As of November 15) Total
Compensation Total
Revenues
6-4

TABLE 6.3 Number, Floor Area and Value of Private Building Construction by Type of Building: 1996 to 2017 (Value in thousand pesos; area in thousand square meters)
Number 1 Value Number 1Floor Area Value Number 1
Floor Area Value Number 1
Floor Area Value
1996 93,631 16,774 102,184,592 67,251 7,042 31,166,502 10,776 8,717 63,205,254 15,604 1,015 7,812,8361997 115,567 17,665 123,455,669 85,541 7,045 33,403,498 11,137 9,678 80,027,645 18,889 942 10,024,5261998 82,971 11,493 69,163,210 59,059 5,486 25,278,434 7,984 5,367 36,990,382 15,928 639 6,894,3941999 78,869 11,511 69,591,014 53,454 5,814 26,880,115 8,728 5,122 35,863,518 16,687 575 6,847,3812000 70,436 10,621 69,862,726 47,911 4,989 24,597,453 7,647 5,115 37,108,460 14,878 517 8,156,813
2001 74,220 11,084 67,929,851 50,369 5,901 28,881,840 8,222 4,566 29,940,212 15,629 617 9,107,7992002 91,471 12,781 85,916,828 63,516 7,080 36,376,565 10,441 5,090 41,277,943 17,514 611 8,262,3202003 95,890 13,608 82,213,125 66,308 7,968 42,082,559 10,715 5,032 31,130,194 18,867 608 9,000,3722004 102,641 14,878 99,493,473 71,918 8,543 49,948,139 11,187 5,747 40,032,078 19,536 588 9,513,2562005 129,670 17,427 113,197,400 91,207 10,559 63,498,400 14,143 6,229 39,316,000 24,320 639 10,383,000
2006 110,563 16,607 122,211,300 75,932 9,105 58,454,500 15,580 6,600 54,268,300 19,051 902 9,488,5002007 85,878 15,648 127,582,600 61,308 7,737 53,566,800 11,054 7,029 64,183,200 13,516 882 9,832,6002008 106,076 17,365 143,762,740 79,064 9,845 74,892,765 11,850 6,851 55,930,704 15,162 669 12,939,2702009 112,102 16,611 143,529,498 84,626 10,060 80,108,885 13,280 5,918 51,295,024 14,196 633 12,125,5872010 113,230 22,144 200,297,164 86,185 12,196 102,943,619 13,237 9,273 82,722,312 13,808 675 14,631,231
2011 112,881 21,323 212,975,571 81,537 11,674 100,220,969 14,881 8,875 89,952,721 16,463 773 22,801,8802012 121,051 25,995 261,828,308 87,347 13,687 125,864,536 15,952 11,295 112,083,457 17,752 1,012 23,880,3132013 120,775 24,637 293,136,032 87,767 13,672 133,783,612 14,622 10,279 135,163,094 18,386 687 24,189,3252014 126,875 28,669 366,551,523 90,201 14,936 152,755,734 15,191 12,812 184,873,176 21,483 921 28,922,6132015 132,006 29,267 331,592,415 97,174 15,724 160,065,906 16,126 12,793 143,221,467 18,706 750 28,305,042
2016 147,998 32,527 r 378,895,886 113,097 17,592 187,599,731 17,845 14,421 162,517,347 17,056 513 28,778,8092017 152,012 31,884 333,214,520 110,942 16,301 164,153,250 21,349 15,036 143,315,470 19,721 547 25,745,800
1 Refers to the number of building construction permits issued2 Refers to floor area of addition to existing structures onlyNote : Details may not add up to total due to rounding
Source: Philippine Statistics Authority
YearTotal Residential Non-residential Additions, Alterations and/or
Repairs
Floor Area
6-5

TABLE 6.4 Index of Value of Production for Manufacturing Sector by Major Industry Group: 2016 to 2018
Year
2016 187.9 275.4 262.8 14.9 66.1 86.9 56.9 64.6 94.2 451.7 1.2 462.1 192.3 118.6 199.1 262.1 181.2 119.5 82.8 326.0 52.8
January 153.3 253.9 249.2 10.2 60.3 70.4 46.0 79.5 89.2 532.6 1.1 175.5 177.4 90.2 191.2 185.6 149.2 129.2 73.7 314.6 42.4February 161.9 267.8 226.6 10.6 60.9 76.1 48.7 67.3 91.8 570.3 1.1 232.6 179.0 83.7 196.8 218.5 158.4 122.9 79.9 398.3 48.6March 173.3 283.3 260.1 13.6 73.6 80.5 59.5 93.1 96.4 414.4 1.1 288.3 193.0 87.4 203.5 274.9 139.7 131.3 79.7 342.1 52.7April 172.8 271.3 258.4 11.4 61.4 89.8 53.9 58.9 100.3 385.1 1.1 332.9 199.5 78.0 206.2 284.5 165.0 120.1 91.4 328.8 52.8May 178.3 274.7 264.4 13.0 67.1 83.8 55.5 60.9 96.5 385.5 1.1 383.1 199.9 99.9 206.8 290.1 172.7 109.7 93.7 304.2 54.3June 183.3 232.4 294.2 17.0 66.4 88.1 58.1 67.2 85.8 495.2 1.1 448.1 204.0 120.1 210.3 282.6 206.3 111.3 88.3 295.4 63.8July 186.6 253.8 256.1 17.2 67.2 96.1 58.8 56.3 90.2 467.2 1.0 477.1 205.4 132.1 203.5 273.9 189.4 116.0 82.4 282.1 50.1August 189.2 251.3 249.0 17.0 65.2 89.2 56.6 57.2 90.0 410.2 1.1 513.3 215.0 129.4 203.5 273.5 188.5 116.9 81.2 344.0 55.3September 197.2 255.9 273.6 16.0 77.4 84.1 60.7 52.8 93.1 417.5 1.2 575.9 206.7 144.4 204.2 272.5 189.3 121.8 80.2 277.0 52.8October 206.0 293.0 263.8 18.1 64.8 90.1 58.9 59.4 98.5 445.9 1.3 635.9 179.4 142.9 186.3 265.8 205.7 110.3 84.0 326.2 52.8November 220.0 322.0 275.3 18.1 65.5 84.9 57.9 62.7 98.4 456.6 1.4 702.5 192.5 152.5 189.8 258.8 214.1 119.7 83.6 295.9 55.7December 232.5 345.9 282.9 17.2 63.5 110.1 68.4 60.3 100.6 440.5 1.2 780.3 155.6 162.5 186.9 264.2 195.7 124.2 75.0 403.5 52.2
2017 185.6 294.4 264.0 13.3 46.4 68.8 63.3 71.8 97.8 541.9 1.2 239.5 163.4 136.9 224.2 384.9 207.3 126.6 83.9 392.7 54.3January 174.3 305.2 230.5 8.8 43.0 71.1 102.6 75.5 88.3 408.5 1.1 195.8 162.8 159.3 200.9 298.4 215.2 113.4 83.3 298.5 44.6February 175.4 293.0 220.7 13.1 43.7 62.4 57.0 65.5 87.5 443.6 1.2 209.0 164.5 155.6 219.6 353.7 188.8 114.5 80.7 328.3 51.4March 193.8 312.2 254.8 11.4 45.6 74.4 45.9 69.6 99.3 476.5 1.3 247.2 172.5 160.2 229.7 412.8 217.6 129.2 87.7 396.4 56.8April 170.0 289.3 240.9 11.0 45.3 68.2 53.9 69.6 93.6 417.7 1.1 196.9 150.9 94.7 200.6 403.9 196.7 119.9 75.9 351.7 41.7May 178.6 277.9 272.4 17.8 52.5 68.4 55.1 68.2 100.6 526.3 1.2 234.2 158.9 82.8 237.5 426.5 209.1 122.7 89.9 392.1 56.5June 179.5 267.2 282.1 18.8 50.6 73.6 67.6 68.6 98.0 541.9 1.2 237.6 159.8 99.5 227.7 391.7 233.0 129.0 88.4 366.1 55.5July 175.4 252.1 255.3 20.6 48.4 77.8 53.7 73.0 99.1 578.3 1.1 216.6 159.7 128.9 223.9 345.1 214.5 135.0 80.5 357.2 55.2August 189.0 293.4 251.4 14.2 47.6 71.2 62.3 79.1 97.2 578.6 1.2 252.0 162.9 132.4 230.3 382.3 219.0 134.3 78.1 472.4 54.8September 185.1 276.2 293.9 12.1 44.8 67.2 58.1 68.6 99.6 591.7 1.3 225.0 176.6 131.8 224.7 381.4 190.3 134.4 82.3 490.1 55.2October 193.7 302.7 280.1 10.8 47.2 64.6 60.1 72.7 103.6 597.4 1.4 238.4 167.5 143.8 230.7 391.6 206.1 130.3 85.2 565.6 60.9November 196.6 310.5 277.9 9.5 44.3 64.8 67.3 72.4 99.7 587.3 1.3 252.0 170.0 170.0 235.7 406.3 211.9 129.7 87.2 338.1 63.9December 216.1 353.0 307.7 11.9 44.2 62.0 76.3 79.1 106.8 755.4 1.1 369.9 154.6 183.2 228.7 425.6 185.9 126.4 87.0 356.5 54.6
2018 200.5 312.3 339.0 11.4 65.9 61.9 64.2 69.3 116.2 166.9 1.2 236.5 166.1 200.7 245.2 384.3 205.6 150.5 95.0 341.5 61.8January 193.3 327.4 309.1 9.3 57.9 60.2 98.9 69.8 115.9 189.0 1.2 206.7 154.6 192.1 230.2 405.7 186.2 131.1 79.2 329.0 56.2February 202.7 370.9 271.3 10.3 57.1 58.8 54.4 64.1 107.7 153.8 1.2 220.4 152.6 175.0 239.2 412.6 201.2 151.4 81.7 312.5 60.8March 214.3 390.6 350.7 11.0 62.1 64.7 54.3 67.1 110.9 139.5 1.2 235.6 162.1 198.0 246.5 407.4 193.9 148.6 88.3 349.7 64.0April 207.3 370.8 355.3 14.6 62.5 54.0 58.5 56.3 109.5 158.1 1.2 232.5 165.4 187.7 234.9 396.6 208.8 141.3 88.7 316.5 61.2May 205.6 363.7 353.7 12.4 68.2 59.1 51.4 76.2 119.8 150.1 1.3 261.1 162.3 119.6 254.8 437.0 199.4 152.2 95.2 323.6 63.8June 199.8 301.4 r 348.0 14.3 67.7 66.0 59.8 73.0 114.9 157.2 1.2 230.1 r 165.9 178.9 234.6 422.5 206.2 158.7 96.5 354.5 r 66.3 r
July 195.7 r 264.9 r 344.6 11.1 68.1 61.4 47.6 59.1 119.2 184.9 1.2 221.3 r 176.0 229.1 248.0 378.5 r 211.4 155.4 r 100.8 328.9 61.8 r
August 197.6 r 269.0 r 350.7 9.2 69.7 66.6 r 66.4 87.2 120.5 191.2 1.2 241.4 r 175.9 r 227.6 244.4 r 311.9 r 219.0 r 159.2 r 101.3 r 371.0 66.0 r
September 191.6 r 255.3 r 333.6 r 9.2 68.4 r 65.3 r 57.6 65.2 115.5 r 167.6 r 1.2 237.1 r 165.2 r 212.3 240.4 338.6 r 218.3 r 158.3 r 97.1 r 352.3 r 63.3 r
October 200.5 r 263.5 r 337.2 r 11.7 71.2 r 62.1 r 66.6 r 66.7 122.1 r 185.3 r 1.2 240.6 r 181.4 r 244.4 264.2 r 324.4 r 228.6 r 162.1 r 113.7 r 396.9 r 66.8 r
November 201.3 r 272.5 r 347.5 r 12.8 r 68.1 r 60.6 r 68.9 r 75.2 r 120.9 r 163.4 r 1.2 r 245.2 r 169.7 r 230.7 r 252.1 r 420.8 r 220.5 r 154.4 r 109.2 r 337.1 r 59.1 r
December 195.9 297.1 366.0 10.6 69.4 64.1 85.7 71.3 117.1 162.6 1.2 265.5 162.5 213.1 253.4 355.4 173.7 133.8 88.0 326.0 52.4
Source : Philippine Statistics Authority, Monthly Integrated Survey of Selected Industries
Total Manufac-turing Food Beverage Tobacco
Products Textiles
Footwear and
Wearing Apparel
Wood and Wood
Products
Furniture and
Fixtures
Paper and Paper
ProductsPrinting Leather
productsChemical Products
Miscellaneous Manufactures
Fabricated Metal
Products
Machinery except
electrical
Rubber and Plastic
Products
Petroleum Products
Non-metallic Mineral
Products
Basic Metals
Transport Equipment
Electrical Machinery

TABLE 6.5 Total Approved Investments by Industry: 2012 to 2018 (In million pesos)
2012 2013 2014 2015 2016 2017 2018
Total 698,246.9 754,032.5 755,911.7 686,866.0 686,004.8 105,745.5 178,967.3
Agriculture, forestry and fishing 8,697.3 4,023.0 3,756.4 10,497.5 6,170.6 1,038.5 211.4
Mining and quarrying 12,199.4 2,550.9 1,208.2 741.9 683.9 - 235.1
Manufacturing 203,827.6 107,347.3 186,144.7 170,900.0 136,531.3 55,005.1 85,124.8
Electricity, gas, steam and air conditioning supply 156,828.8 345,656.3 213,498.6 256,189.6 215,913.9 5,213.8 30,048.2
Water supply; sewerage, waste management and remediation activities 5,136.7 2,376.0 317.4 337.5 25,324.1
43.5 -
Construction 18,786.4 575.7 80,850.7 2,092.8 79.5 527.6 8,807.7
Wholesale and retail trade; repair of motor vehicles and motorcycles 981.0 1,032.8 5,674.6 2,981.9 3,780.4
870.3 5,468.0
Transportation and storage 84,151.2 77,604.1 25,048.6 27,486.5 103,151.8 1,440.9 3,781.1
Accommodation and food service activities 39,516.6 64,450.1 18,167.2 26,759.2 14,317.0 1,622.5 554.9
Information and communication 27,997.4 4,447.7 9,382.3 10,768.8 4,957.0 2,737.9 3,115.5
Financial and insurance activities 84.3 69.1 89.0 244.0 300.4 620.6 476.0
Real estate activities 120,046.0 114,731.4 172,567.9 137,417.2 143,584.2 22,420.9 20,055.2
Professional, scientific and technical activities 218.1 740.9 117.5 2,974.7 1,244.7 151.2 687.3
Administrative and support service activities 18,030.3 26,117.5 36,197.0 28,392.0 26,965.3 13,943.8 20,118.1
Public administration and defense; compulsory social security 164.5 31.6 47.2 - 52.4
0.9 -
Education 1,011.7 460.4 90.9 4.6 18.1 37.5 181.8
Human health and social work activities 14.0 574.5 2,695.9 947.5 2,859.6 0.6 10.9
Arts, entertainment and recreation 431.1 1,153.0 20.0 7,646.0 17.4 68.1 87.0
Other service activities 124.5 90.1 37.5 484.3 53.2 1.9 4.2
Note : Data submissions from AFAB and BOI-ARMM started in 2010 only. Caution is advised in the analysis of the time series.
Sources : Board of Investments , Clark Development Corporation , Philippine Economic Zone Authority,
IndustryYear
Subic Bay Metropolitan Authority, Authority of the Freeport Area of Bataan, Board of Investment ARMM and Cagayan Economic Zone Authority
6-7

TABLE 6.6 Total Approved Investments by Nationality and by Investments Promotion Agency: 2012 to 2018 (In million pesos)
2012 2013 2014 2015 2016 2017 2018
Authority of the Freeport Area of Bataan (AFAB) 12,793.1 2,199.6 85,708.9 6,228.4 5,832.6 2,063.9 5,980.1
Filipino 12,402.5 78.8 85,302.8 5,768.8 5,671.2 1,633.5 4,307.1
Foreign 390.6 2,120.7 406.0 459.6 161.4 430.2 1,673.0
Board of Investment (BOI) 360,348.1 466,032.4 354,757.8 366,742.2 442,045.0 616,783.1 914,960.4
Filipino 286,283.3 345,386.1 317,869.5 307,235.1 352,649.1 595,046.6 810,993.2
Foreign 74,064.8 120,646.3 36,888.4 59,507.0 89,395.9 21,736.5 103,967.2
Board of Investment ARMM (BOI ARMM) 569.0 1,545.0 3,867.7 6,575.1 2,111.4 3,234.5 2,254.6
Filipino 142.3 1,223.0 3,288.1 3,356.3 1,071.4 2,509.8 2,019.5
Foreign 426.8 322.0 579.6 3,218.7 1,040.1 724.7 235.1
Clark Development Corporation (CDC) 8,252.8 3,392.5 13,040.9 12,598.5 8,107.9 7,270.5 866.3
Filipino 3,748.3 1,406.5 4,053.5 2,896.7 5,812.3 3,351.8 5,897.9
Foreign 4,504.4 1,986.0 8,987.3 9,701.8 2,295.6 3,918.7 2,768.4
Cagayan Economic Zone Authority (CEZA) 757.3 1,153.4 619.0 5,481.9 333.6 277.1 7,456.4
Filipino 628.4 553.6 277.1 4,886.2 191.8 194.5 6,258.1
Foreign 128.9 599.8 341.9 595.7 141.7 82.5 1,198.3
Philippine Economic Zone Authority (PEZA) 311,908.9 276,126.9 279,477.3 285,029.6 218,176.6 237,570.3 140,242.1
Filipino 102,532.3 128,456.1 151,997.7 116,104.3 96,960.8 159,292.1 71,920.7
Foreign 209,376.5 147,670.8 127,479.7 168,925.3 121,215.8 78,278.3 68,321.4
Subic Bay Metropolitan Authority (SBMA) 3,617.7 3,582.8 18,440.1 4,210.5 9,345.4 41,545.4 4,592.5
Filipino 2,965.4 2,914.8 6,162.9 1,403.0 4,557.4 40,971.1 3,788.6
Foreign 652.3 668.0 12,277.2 2,807.5 4,788.1 574.3 803.9
Note : Data submissions from AFAB and BOI-ARMM started in 2010 only. Caution is advised in the analysis of thetime series.
Sources : Board of Investments, Clark Development Corporation, Philippine Economic Zone Authority,
Investment Promotion Agency/NationalityYear
Subic Bay Metropolitan Authority, Authority of the Freeport Area of Bataan, Board of Investment ARMM and Cagayan Economic Zone Authority
6-8
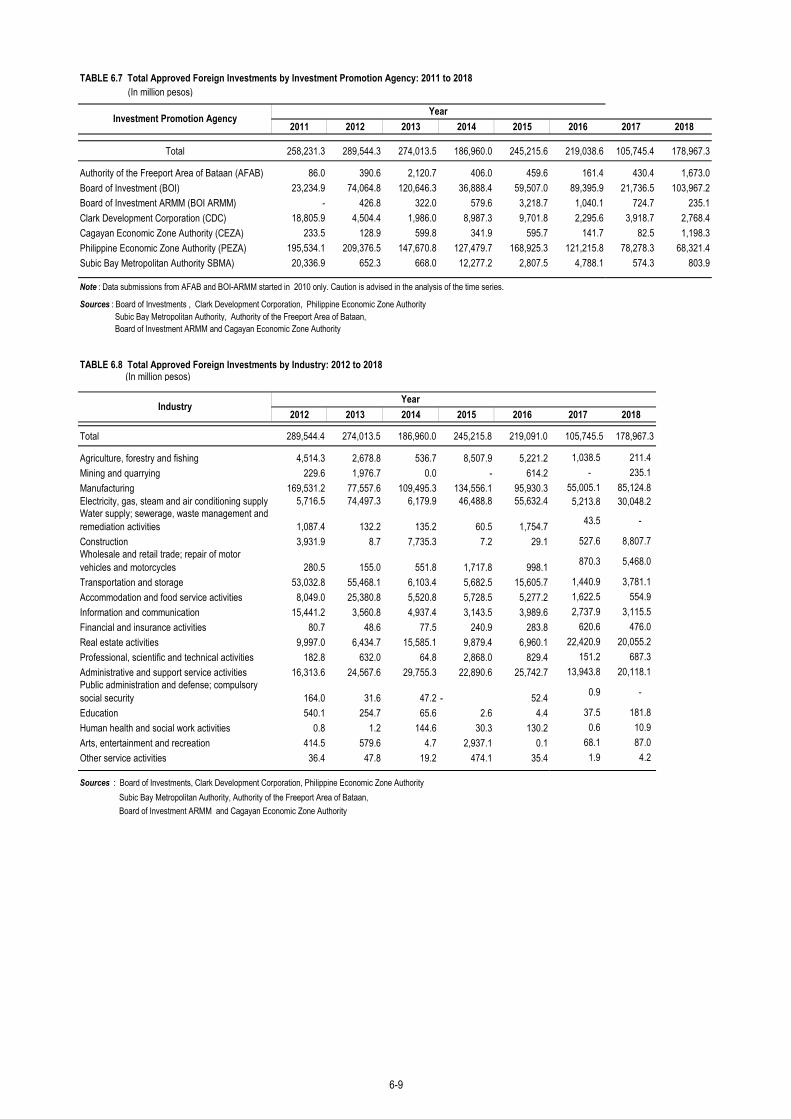
TABLE 6.7 Total Approved Foreign Investments by Investment Promotion Agency: 2011 to 2018 (In million pesos)
2011 2012 2013 2014 2015 2016 2017 2018
Total 258,231.3 289,544.3 274,013.5 186,960.0 245,215.6 219,038.6 105,745.4 178,967.3
Authority of the Freeport Area of Bataan (AFAB) 86.0 390.6 2,120.7 406.0 459.6 161.4 430.4 1,673.0Board of Investment (BOI) 23,234.9 74,064.8 120,646.3 36,888.4 59,507.0 89,395.9 21,736.5 103,967.2Board of Investment ARMM (BOI ARMM) - 426.8 322.0 579.6 3,218.7 1,040.1 724.7 235.1Clark Development Corporation (CDC) 18,805.9 4,504.4 1,986.0 8,987.3 9,701.8 2,295.6 3,918.7 2,768.4Cagayan Economic Zone Authority (CEZA) 233.5 128.9 599.8 341.9 595.7 141.7 82.5 1,198.3Philippine Economic Zone Authority (PEZA) 195,534.1 209,376.5 147,670.8 127,479.7 168,925.3 121,215.8 78,278.3 68,321.4Subic Bay Metropolitan Authority SBMA) 20,336.9 652.3 668.0 12,277.2 2,807.5 4,788.1 574.3 803.9
Note : Data submissions from AFAB and BOI-ARMM started in 2010 only. Caution is advised in the analysis of the time series.
Subic Bay Metropolitan Authority, Authority of the Freeport Area of Bataan, Board of Investment ARMM and Cagayan Economic Zone Authority
TABLE 6.8 Total Approved Foreign Investments by Industry: 2012 to 2018 (In million pesos)
2012 2013 2014 2015 2016 2017 2018
Total 289,544.4 274,013.5 186,960.0 245,215.8 219,091.0 105,745.5 178,967.3
Agriculture, forestry and fishing 4,514.3 2,678.8 536.7 8,507.9 5,221.2 1,038.5 211.4 Mining and quarrying 229.6 1,976.7 0.0 - 614.2 - 235.1 Manufacturing 169,531.2 77,557.6 109,495.3 134,556.1 95,930.3 55,005.1 85,124.8 Electricity, gas, steam and air conditioning supply 5,716.5 74,497.3 6,179.9 46,488.8 55,632.4 5,213.8 30,048.2 Water supply; sewerage, waste management and remediation activities 1,087.4 132.2 135.2 60.5 1,754.7 43.5 -
Construction 3,931.9 8.7 7,735.3 7.2 29.1 527.6 8,807.7 Wholesale and retail trade; repair of motor vehicles and motorcycles 280.5 155.0 551.8 1,717.8 998.1 870.3 5,468.0
Transportation and storage 53,032.8 55,468.1 6,103.4 5,682.5 15,605.7 1,440.9 3,781.1 Accommodation and food service activities 8,049.0 25,380.8 5,520.8 5,728.5 5,277.2 1,622.5 554.9 Information and communication 15,441.2 3,560.8 4,937.4 3,143.5 3,989.6 2,737.9 3,115.5 Financial and insurance activities 80.7 48.6 77.5 240.9 283.8 620.6 476.0 Real estate activities 9,997.0 6,434.7 15,585.1 9,879.4 6,960.1 22,420.9 20,055.2 Professional, scientific and technical activities 182.8 632.0 64.8 2,868.0 829.4 151.2 687.3 Administrative and support service activities 16,313.6 24,567.6 29,755.3 22,890.6 25,742.7 13,943.8 20,118.1 Public administration and defense; compulsory social security 164.0 31.6 47.2 - 52.4 0.9 -
Education 540.1 254.7 65.6 2.6 4.4 37.5 181.8 Human health and social work activities 0.8 1.2 144.6 30.3 130.2 0.6 10.9 Arts, entertainment and recreation 414.5 579.6 4.7 2,937.1 0.1 68.1 87.0 Other service activities 36.4 47.8 19.2 474.1 35.4 1.9 4.2
Sources : Board of Investments, Clark Development Corporation, Philippine Economic Zone Authority
Board of Investment ARMM and Cagayan Economic Zone Authority
Investment Promotion Agency Year
Sources : Board of Investments , Clark Development Corporation, Philippine Economic Zone Authority
Industry Year
Subic Bay Metropolitan Authority, Authority of the Freeport Area of Bataan,
6-9

TABLE 6.9 Total Approved Foreign Investments by Country of Investor: 2012 to 2018 (In million pesos)
2012 2013 2014 2015 2016 2017 2018
Total 289,544.3 274,013.6 186,960.1 245,265.9 219,038.6 105,745.5 178,967.3
Australia 1,151.5 4,482.4 2,449.3 538.3 32,439.8 3,956.5 2,140.8 British Virgin Islands 3,721.7 92,780.9 7,328.3 5,625.7 4,520.6 2,074.8 16,165.5 Canada 956.3 2,721.3 357.9 329.7 1,395.6 843.2 479.2 Cayman Islands 7,018.8 7,298.5 15,444.8 4,428.6 3,656.4 728.6 231.5 China, People's Republic of 1,988.3 1,240.9 11,476.4 1,455.1 1,519.4 2,333.9 50,692.6 Denmark 327.9 607.2 788.0 20.8 6.4 394.2 10.6 France 1,355.5 379.8 554.7 21.5 444.3 99.3 2,561.0 Germany 1,911.8 3,046.3 6,845.1 3,064.7 4,904.6 1,386.2 541.3 Hong Kong 1,261.2 584.4 1,116.4 2,134.1 1,401.2 1,630.5 1,780.1 India 104.4 583.7 648.8 1,760.5 1,595.6 410.9 511.8 Indonesia 30.5 51.5 7,385.7 96.0 22.3 - - Italy 259.2 246.4 8.0 136.3 180.6 - - Japan 69,037.0 44,784.4 35,659.9 54,711.1 27,058.7 31,989.8 19,727.8 Korea 9,795.0 8,527.3 4,155.1 23,165.6 16,134.5 3,370.8 1,884.6 Malaysia 1,598.8 862.0 351.1 2,904.3 1,084.5 473.2 14,653.7 Netherlands 104,743.3 24,807.7 32,784.0 82,726.6 49,445.9 9,636.9 4,053.3 Singapore 12,951.6 9,242.1 13,944.8 16,817.2 24,056.0 10,155.8 21,181.3 Sweden 76.3 42.6 339.9 0.6 240.8 - - Switzerland 878.1 366.1 2,175.3 918.6 412.0 100.7 463.7 Taiwan 2,472.1 3,140.3 2,977.4 5,457.7 1,608.4 10,833.5 4,201.1 Thailand 6,582.6 107.7 246.4 448.9 2,567.2 363.6 56.6 United Kingdom 6,768.8 1,471.5 7,067.3 4,129.2 4,733.9 4,983.6 3,810.9 United States of America 39,996.7 55,343.6 17,423.0 21,740.6 31,427.8 8,741.1 12,858.5 Others 14,556.9 11,295.0 15,432.5 12,634.2 8,182.1 11,238.5 20,961.3 , , Note : Data may not add up to totals due to rounding.
Sources : Clark Development Corporation, Philippine Economic Zone Authority, Subic Bay Metropolitan Authority, Authority of the Freeport Area of Bataan, Board of Investment ARMM, and Cagayan Economic Zone Authority
TABLE 6.10 Total Approved Foreign Investments in the Information and Communication Technology Industry by Sub-Industry: 2012 to 2018 (In million pesos)
2012 2013 2014 2015 2016 2017 2018
Total 34,782.1 28,649.7 33,241.0 28,270.8 28,986.2 17,624.5 22,633.7
Manufacturing 3,069.9 120.6 0.0 1,479.7 8.5 726.5 23.1 Trade 0.5 0.0 0.1 24.0 1.6 337.8 28.5Information and communication 15,441.2 3,328.3 3,792.4 3,615.3 3,414.5 2,694.8 3,115.4Information Technology Services 16,270.5 25,200.8 29,448.5 23,151.8 25,561.6 13,865.5 19,466.7
Sources : Board of Investments, Clark Development Corporation, Philippine Economic Zone Authority, Subic Bay Metropolitan Authority , Authority of the Freeport Area of Bataan, Board of Investment, ARMM and Cagayan Economic Zone Authority
CountryYear
Sub-industryYear
6-10
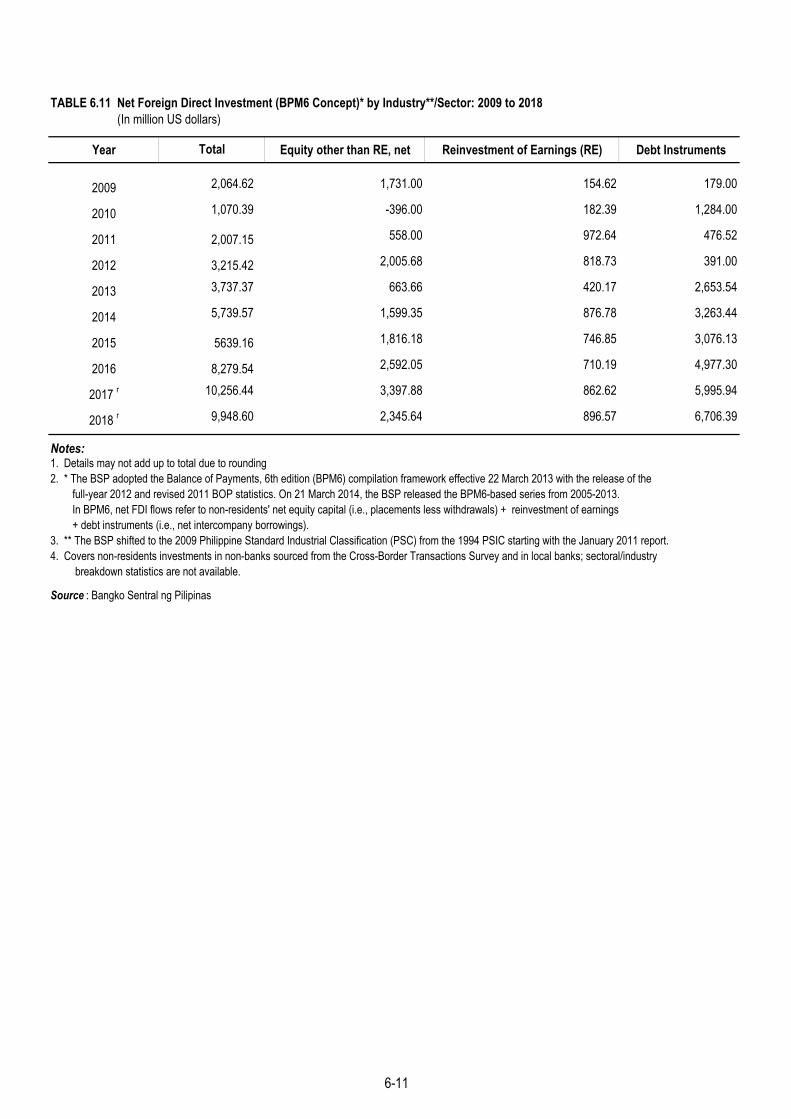
TABLE 6.11 Net Foreign Direct Investment (BPM6 Concept)* by Industry**/Sector: 2009 to 2018 (In million US dollars)
Year Equity other than RE, net Reinvestment of Earnings (RE) Debt Instruments
2009 2,064.62 1,731.00 154.62 179.00
2010 1,070.39 -396.00 182.39 1,284.00
2011 2,007.15 558.00 972.64 476.52
2012 3,215.42 2,005.68 818.73 391.00
2013 3,737.37 663.66 420.17 2,653.54
2014 5,739.57 1,599.35 876.78 3,263.44
2015 5639.16 1,816.18 746.85 3,076.13
2016 8,279.54 2,592.05 710.19 4,977.30
2017 r 10,256.44 3,397.88 862.62 5,995.94
2018 r 9,948.60 2,345.64 896.57 6,706.39
Notes:
Source : Bangko Sentral ng Pilipinas
breakdown statistics are not available.
2. * The BSP adopted the Balance of Payments, 6th edition (BPM6) compilation framework effective 22 March 2013 with the release of the
Total
1. Details may not add up to total due to rounding
full-year 2012 and revised 2011 BOP statistics. On 21 March 2014, the BSP released the BPM6-based series from 2005-2013.In BPM6, net FDI flows refer to non-residents' net equity capital (i.e., placements less withdrawals) + reinvestment of earnings+ debt instruments (i.e., net intercompany borrowings).
3. ** The BSP shifted to the 2009 Philippine Standard Industrial Classification (PSC) from the 1994 PSIC starting with the January 2011 report.4. Covers non-residents investments in non-banks sourced from the Cross-Border Transactions Survey and in local banks; sectoral/industry
6-11

TABLE 6.12 Number and Amount of Paid-Up Capital Investments/Contribution a of Newly Registered Business Organizations: 2003 to 2018 (Amount in million pesos)
NumberAmount of Paid-up
Capital/Contribution
Number Amount of Paid-up Capital Number Amount of
Contribution
2003 13,575 10,849 11,213 9,913 2,362 9362004 15,705 16,042 12,871 14,979 2,834 1,0632005 13,775 12,640 12,045 11,986 1,730 653
2006 13,035 11,419 11,081 10,725 1,954 6932007 14,397 35,160 12,285 34,341 2,112 8192008 15,843 11,720 13,470 10,751 2,373 9702009 13,469 12,193 11,065 11,092 2,404 1,1002010 13,933 14,492 11,714 13,573 2,219 918
2011 20,420 33,883 17,495 32,538 2,925 1,3452012 21,723 38,408 18,515 36,898 3,208 1,5102013 23,702 44,251 20,231 42,478 3,471 1,7732014 24,592 48,362 21,066 46,002 3,526 2,360
2015 r 24,527 32,149 21,068 30,153 3,459 1,996
2016 r 25,284 52,907 21,735 50,864 3,549 2,043 2017 r 28,232 73,465 24,370 70,408 3,862 3,057 2018 p 22,583 84,258 20,092 81,658 2,491 2,600
Notes : Data from 1999 onwards reflects the updated investments generated from SEC registered entities.a Includes foreign paid-up capital and contribution
Source : Securities and Exchange Commission
Year
Total Domestic Stock Corporations Domestic Partnerships
6-12

TABLE 6.13 Number and Initial Paid-up Capital Investment/Contribution a of Foreign Investments in Newly Registered Domestic Stock Corporations and Partnership by Major Industry Group: 2012 to 2017
(Amount in million pesos)
No. Contribu-tion No. Contribu-
tion No. Contribu-tion No. Contribu-
tion No. Contribu-tion No. Contribu-
tion
All Industries 21,723 38,408 23,702 44,251 24,592 48,363 24,794 61,062 25,253 58,737 28,043 70,979
Agriculture, Fishery And Forestry 412 303 528 723 511 655 511 1,027 504 1,264 607 1,265
Industry Sector
Mining and Quarrying 229 760 220 1,340 144 681 115 871 85 1,254 82 207
Manufacturing 1,181 2,352 1,298 3,659 1,240 4,394 1,250 3,237 1,281 4,091 1,237 5,186Electricity, Gas and Water Supply 202 391 272 1,080 309 1,006 367 4,128 391 989 349 1,361Construction 1,077 1,865 1,433 2,426 1,573 4,066 1,576 3,380 1,796 5,344 2,087 6,356
Service Sector
Wholesale and Retail Trade; Repair of Motor Vehicles, Motorcycles and Personal and Household Goods 4,917 4,544 5,825 6,842 5,674 5,533 5,973 7,996 6,274 8,175 6,104 9,130
Hotels and Restaurants 1,523 2,808 1,703 2,363 1,681 2,084 1,891 2,954 2,173 3,660 2,414 3,635Transportation, Storage and Communications 837 956 1,073 1,523 1,089 1,294 1,184 2,307 1,268 2,516 1,237 2,118
Financial Intermediation 1,511 11,540 1,470 8,522 1,425 8,935 1,510 14,534 1,513 10,563 2,406 10,060Public Administration and Defense; Compulsory Social Security 57 53 65 79 58 56 64 70 68 114 76 106Real Estate, Renting and Business Activities 6,856 10,139 6,012 11,851 6,686 13,198 6,407 14,726 6,057 13,196 6,157 21,290
Education 357 400 392 324 409 587 448 1,044 520 1,020 520 848
Health and Social Work 262 252 352 499 334 593 345 470 352 950 327 993Other Community, Social and Personal Service Activities 2,280 2,034 3,033 2,888 3,431 5,256 3,138 4,303 2,954 5,564 4,427 8,366
NEC (Not Elsewhere Classified) 22 11 26 132 28 25 15 15 17 37 13 58
a Includes foreign paid-up capital and contribution.b May not add up due to rounding off
Source : Securities and Exchange Commission
2017r, b
Industry Group2012r 2013r 2014r 2015r, b 2016r, b
6-13

5

TABLE 7.1 Foreign Trade: 1990 to 2017 (F.O.B. value in million U.S. dollars)
Value Percent to Total Trade
Average Exchange Rate 1
(P/US$)Value Percent to
Total Trade
Average Exchange Rate 2
(P/US$)
1990 20,392.2 8,186.0 40.1 24.2 12,206.2 59.9 24.4 (4,020.1)1991 20,890.9 8,839.5 42.3 27.3 12,051.4 57.7 27.3 (3,211.9)1992 24,344.1 9,824.3 40.4 25.3 14,518.9 59.6 25.3 (4,694.6)
1993 28,972.2 11,374.8 39.3 26.7 17,597.4 60.7 27.3 (6,222.6)1994 34,815.5 13,482.9 38.7 26.2 21,332.6 61.3 26.8 (7,849.7)1995 43,984.8 17,447.2 39.7 25.5 26,537.6 60.3 26.0 (9,090.4)1996 52,969.5 20,542.6 38.8 26.1 32,426.9 61.2 26.5 (11,884.4)1997 61,161.5 25,227.7 41.2 29.3 35,933.8 58.8 29.8 (10,706.1)1998 59,156.2 29,496.4 49.9 40.6 29,659.9 50.1 41.3 (163.5)1999 65,779.4 35,036.9 53.3 38.8 30,742.5 46.7 39.5 4,294.42000r 72,569.1 38,078.3 52.5 43.7 34,490.9 47.5 44.5 3,587.42001r 65,207.4 32,150.2 49.3 50.7 33,057.2 50.7 51.6 (907.0)2002r 74,444.7 35,208.2 47.3 51.2 39,236.5 52.7 52.1 (4,028.4)2003r 76,701.7 36,231.2 47.2 53.8 40,470.5 52.8 54.7 (4,239.3)2004r 83,719.7 39,680.5 47.4 55.8 44,039.2 52.6 56.8 (4,358.7)2005 88,672.9 41,254.7 46.5 54.8 47,418.2 53.5 55.3 (6,163.5)2006 99,183.8 47,410.1 47.8 51.1 51,773.7 52.2 51.6 (4,363.6)2007 105,979.5 50,465.7 47.6 46.0 55,513.7 52.4 46.3 (5,048.0)2008 105,823.6 49,077.5 46.4 44.2 56,746.1 53.6 44.8 (7,668.5)2009 81,527.3 38,435.8 47.1 47.3 43,091.5 52.9 48.0 (4,655.7)2010 106,430.4 51,497.5 48.4 44.9 54,932.9 51.6 45.4 (3,435.4)2011 108,800.8 48,304.9 44.4 43.1 60,495.8 55.6 43.6 (12,190.9)2012 114,228.1 52,099.5 45.6 42.0 62,128.6 54.4 42.5 (10,029.1)2013 119,108.5 56,697.9 47.6 42.4 62,410.6 52.4 42.9 (5,712.7)2014 127,499.6 62,101.6 48.7 44.2 65,398.0 51.3 44.7 (3,296.4)2015 129,894.5 58,827.2 45.3 45.2 71,067.2 54.7 45.7 (12,240.0)2016 141,514.2 57,406.1 40.6 47.4 84,108.0 59.4 47.9 (26,701.9)2017 161,806.1 68,712.9 42.5 50.2 93,093.2 57.5 50.7 (24,380.3)
Notes:
1. Details may not add up to totals due to rounding. 2. Exports include domestic exports and re-exports.3. Starting August 4, 1992, the average exchange rate refers to the weighted average rate under the Philippine Dealing System (PDS). 1 BSP buying rate2 BSP selling rate
Sources: Philippine Statistics Authority and Bangko Sentral ng Pilipinas
2003 73,197,96 35,750.13 48.84 - 37,447.83 51.16 - (1,697.70) -
Balance of Trade Favorable
(Unfavorable)Year Total Trade
Exports Imports
7-1

TABLE 7.2 Direction of Trade: 2013 to 2017(F.O.B. value in thousand U.S. dollars)
Exports Imports Exports Imports Exports Imports Exports Imports Exports Imports
56,697,865 62,410,570 62,101,619 65,397,985 58,827,235 71,067,228 57,406,124 84,108,044 68,712,897 96,093,235
Asia 38,790,910 42,831,569 33,938,272 31,616,363 39,104,681 34,527,973 38,590,997 65,148,006 46,437,616 75,174,444ASEAN 8,844,159 13,551,268 9,211,673 15,650,855 8,750,865 17,954,258 8,646,756 22,061,977 10,127,780 25,273,172
Brunei Darussalam 8,618 894 9,319 76,320 11,755 4,494 8,275 20,627 7,582 42,789Cambodia 8,729 11,532 82,672 21,391 9,116 11,859 16,489 20,560 32,778 58,622Indonesia 835,131 2,789,127 759,659 3,037,574 650,478 3,030,619 627,586 4,607,686 724,212 6,352,164Lao PDR 800 11 110 451 1,116 346 687 2,399 1,366 2,524Malaysiaa 1,375,270 2,295,992 1,160,737 3,131,191 1,204,119 3,440,536 1,207,925 3,389,988 1,713,750 3,785,170Myanmar, Union (Burma) 23,727 23,067 19,306 14,680 35,113 16,864 16,991 19,096 27,303 21,419Singapore 4,142,004 4,235,571 4,451,152 4,591,926 3,800,875 5,005,452 3,823,986 5,464,135 3,972,764 5,598,782Thailand 1,909,021 3,385,325 2,353,096 3,481,412 2,329,892 4,944,181 2,183,860 6,578,221 2,740,779 6,758,848Viet Nam 540,859 809,749 375,624 1,295,911 708,402 1,499,906 760,955 1,959,266 907,246 2,652,853
East Asia 28,998,253 24,300,241 32,886,941 26,314,354 29,304,230 30,175,486 28,967,994 38,691,170 34,679,178 44,646,100China 7,025,215 8,072,328 8,467,435 9,869,762 6,174,784 11,470,735 6,372,524 15,564,900 8,017,132 17,463,603Japanb 12,048,496 5,224,449 13,901,345 5,252,182 12,300,521 6,368,503 11,670,284 9,881,768 10,853,051 10,911,831Hong Kong 4,541,473 1,298,324 5,511,728 1,660,328 6,390,930 1,840,146 6,616,697 2,491,834 9,024,144 2,715,397Korea, Republic of 3,399,765 4,821,727 2,560,595 5,083,129 2,426,365 4,657,431 2,181,823 5,567,893 4,333,976 8,465,298Taiwan 1,983,304 4,883,412 2,445,837 4,448,953 2,011,629 5,838,672 2,126,667 5,184,775 2,450,876 5,089,971
South Asia 367,515 787,925 383,110 1,087,065 498,537 1,162,703 423,072 1,642,891 670,729 1,930,516Bangladesh 10,181 12,546 10,149 20,195 23,194 25,679 15,526 32,267 13,511 38,152India 298,365 712,375 299,264 978,921 381,628 1,064,464 322,096 1,482,794 576,595 1,664,007Nepal 1,457 8 2,615 243 1,641 14 1,676 66 1,316 45Pakistan 36,247 55,732 49,120 69,627 63,828 53,014 51,186 110,292 55,816 211,516Sri Lanka 21,265 7,264 21,962 18,079 28,246 19,532 32,588 17,472 23,491 16,796
Middle East 580,983 4,192,135 648,916 4,200,264 551,049 3,172,921 553,175 2,751,969 959,928 3,324,656Bahrain 6,158 10,742 8,558 10,791 9,340 2,380 7,558 2,322 7,354 35,689Iran 54,683 94,492 69,293 10,318 64,459 22,916 47,917 1,546 102,586 90,736Israel 84,070 93,054 62,752 61,836 46,234 103,986 57,145 132,396 67,442 142,281Jordan 7,671 11,120 2,900 7,233 2,193 4,308 3,833 4,192 9,655 4,108Kuwait 46,553 82,518 49,774 31,572 36,671 677,262 41,684 975,408 34,661 1,048,036Saudi Arabia 79,489 2,831,736 90,731 3,231,122 79,031 1,840,691 85,455 1,052,575 80,204 1,172,605United Arab Emirates 302,360 1,068,474 364,908 847,391 313,122 521,377 309,583 583,531 658,028 831,202
America 9,360,058 8,151,993 9,924,903 6,835,793 10,262,408 8,640,768 10,140,514 8,913,885 11,114,315 9,523,907North America 8,856,637 7,477,011 9,253,118 6,061,512 9,614,810 7,902,545 9,379,974 7,992,438 10,199,635 8,452,214
USAc 8,318,181 7,019,911 8,660,778 5,738,340 9,022,514 7,468,019 8,851,330 7,575,919 9,661,029 7,783,676Canada 538,456 457,100 592,340 323,172 592,297 434,527 528,644 416,520 538,606 668,539
Central America 249,423 99,666 411,555 75,060 413,643 94,195 548,839 102,776 626,514 129,201Mexico 249,423 99,666 411,555 75,060 413,643 94,195 548,839 102,776 626,514 129,201
South America 253,998 575,316 260,231 699,221 233,955 644,028 211,701 818,670 288,167 942,492Argentina 52,290 348,758 47,102 480,241 49,893 230,016 78,301 328,084 106,372 300,474Brazil 159,318 176,299 156,766 162,011 129,370 385,528 91,877 452,672 127,413 495,027Colombia 21,596 10,700 30,384 10,600 19,494 9,684 10,551 11,903 18,428 12,884Peru 16,862 39,133 21,208 46,255 31,772 18,461 29,500 25,928 35,146 134,013Venezuela 3,932 426 4,770 115 3,426 339 1,472 83 808 94
Continued
Countries
Total
2013 2014 2015 2016 2017
7-3

TABLE 7.2 --Concluded
Exports Imports Exports Imports Exports Imports Exports Imports Exports Imports
Europe 6,548,798 7,714,325 6,699,464 8,798,940 6,744,724 7,188,975 6,915,667 7,064,331 8,818,596 7,386,322Western Europe 5,136,122 4,984,839 5,467,379 5,965,347 5,569,583 5,020,842 5,695,596 4,569,343 6,783,063 4,527,759
Austria 159,011 61,932 100,452 74,641 101,792 99,425 68,635 126,765 56,853 130,888Belgium 296,983 327,401 246,013 228,589 293,874 500,247 405,005 542,545 357,457 481,999France 308,287 1,615,119 331,635 2,240,220 433,399 1,043,947 734,927 954,177 807,626 924,806Germany 2,338,880 2,349,647 2,657,351 2,717,515 2,632,405 2,600,517 2,329,271 2,027,950 2,675,620 1,971,777Luxembourg 7,532 2,615 7,106 1,250 6,237 1,470 5,470 4,286 5,892 8,195Netherlands 1,748,698 293,191 1,876,449 374,559 1,839,437 429,850 1,743,325 515,230 2,517,544 619,474Switzerland 276,731 334,934 248,373 328,574 262,439 345,387 408,964 398,390 362,072 390,621
Northern Europe 896,608 744,500 743,862 1,066,866 651,602 955,165 664,643 1,259,936 710,451 1,208,150Denmark 34,375 81,049 38,179 123,038 41,826 101,709 36,666 128,278 35,980 149,689Finland 65,384 99,276 48,680 131,826 27,078 148,094 27,113 291,801 41,869 183,389Ireland 33,961 143,748 33,365 278,042 55,319 147,974 72,233 154,151 67,600 172,887Norway 21,243 26,864 12,141 41,840 7,501 35,612 5,493 54,542 6,468 45,121Sweden 163,885 92,073 150,768 106,501 20,290 123,114 22,083 121,983 36,325 135,459United Kingdom 577,761 301,489 460,729 385,619 499,589 398,661 501,056 509,182 522,209 521,606
Southern Europe 407,560 679,249 369,253 762,948 418,538 810,701 422,940 1,015,327 1,089,315 1,091,013Greece 9,080 5,179 5,865 10,137 7,397 8,396 5,419 11,628 6,010 8,313Italy 225,413 347,253 188,912 359,503 189,697 427,500 202,767 549,321 317,212 587,609Portugal 17,221 5,198 11,172 6,929 20,786 5,363 25,543 13,830 503,256 11,217Spain 153,551 316,272 159,622 375,011 194,154 356,209 182,512 422,928 252,656 453,634Yugoslavia (Macedonia) 74 190 24 22 39 510 133 119 183 409Slovenia 1,368 4,636 2,267 6,878 4,604 7,693 4,636 16,814 7,162 23,075Croatia 854 521 1,389 4,468 1,862 5,030 1,929 686 2,834 6,755
Eastern Europe 108,507 1,305,737 118,970 1,003,778 105,002 402,267 132,488 219,726 235,767 559,400Poland 40,136 16,259 51,387 23,091 58,691 26,969 82,660 35,302 166,213 60,596Russian Federation 68,371 1,289,478 67,583 980,688 46,312 375,298 49,828 184,424 69,554 498,804
Oceania 606,673 1,649,976 993,144 1,292,674 544,404 1,428,965 606,238 1,524,615 551,257 2,567,756Australia 519,150 989,280 823,037 799,946 459,572 870,904 520,372 924,184 453,253 1,728,634Guam 13,006 1,963 18,933 1,059 16,374 1,284 17,247 3,882 13,646 2,016Nauru 33 1 118 - 9 2 - 223 0 0New Zealand 49,683 469,842 127,718 425,295 50,313 432,085 50,406 427,066 55,715 489,012Papua New Guinea 24,803 188,892 23,338 66,374 18,137 124,690 18,212 169,261 28,643 348,094
Africa 299,543 94,874 132,074 62,815 164,777 95,302 134,482 82,495 132,874 88,654Egypt 17,807 5,082 13,017 3,815 13,689 4,375 7,878 19,234 9,871 31,388Nigeria 8,644 1,526 12,004 14,090 6,750 43,542 7,432 22,393 3,873 946South Africa 273,092 88,266 107,053 44,910 144,339 47,385 119,172 40,868 119,130 56,321
Others 1,091,883 1,967,832 10,413,762 16,791,399 2,006,241 19,185,245 1,018,226 1,374,712 1,791,113 1,440,806
aIncludes Sabah and SarawakbIncludes OkinawacIncludes Alaska and Hawaii
Source: Philippine Statistics Authority
2015 2016 2017Countries
2013 2014
7-3

TABLE 7.3 Philippine Exports by Major Commodity Group: 2012 to 2018 (F.O.B. value in million U.S. dollars)
2012 2013 2014 2015 2016 2018
Agro-Based Products 2,771 3,300 3,535 2,842 3,123 4,117 3,708Coconut products 1,392 1,471 1,613 1,404 1,437 2,051 1,515 Copra 1 0.3 1 1 - - - Coconut oil 1,041 1,006 1,203 1,129 1,152 1,615 1,113 Desiccated coconut 197 199 254 160 210 341 283 Copra meal or cake 125 211 112 70 52 64 71 Others 28 56 43 45 23 31 48Sugar and sugar products 177 300 141 32 105 217 75 Centrifugal & refined sugar 109 273 108 22 99 204 41 Molasses 21 23 11 3 - 4 16 Others 46 3 22 7 6 9 18Fruits and vegetables 1,202 1,529 1,781 1,406 1,581 1,850 2,117 Canned pineapple 220 176 182 345 369 274 192 Pineapple juice 51 51 58 57 83 25 4 Pineapple concentrates 43 42 40 46 20 82 79 Bananas 647 963 1,130 658 730 1,129 1,505 Mangoes 15 13 24 16 13 23 18 Others 227 284 346 285 365 316 319
Other Agro-Based Products 808 948 1,125 845 864 1,013 r 912 Fish, fresh or preserved of which: Shrimps & Prawns 420 478 583 406 478 555 r 422 Coffee raw, not roasted 0 0 0 0 0 3 110 Abaca fibers 6 5 15 16 20 36 32 Tobacco, unmanufactured 76 92 122 101 75 109 152 Natural rubber 62 74 79 62 37 99 76 Ramie fibers, raw or processed 0 1 0 0 - 92 322 Seaweeds, dried 31 43 51 16 9 8 9 Rice 0 0 0 0 0 374 214 Others 213 254 276 244 245 205 222
Forest products 1 58 92 86 48 28 184 271 Logs 4 3 1 - - - - Lumber 29 59 80 46 27 104 141 Plywood 11 3 2 1 0 55 94 Veneer sheets/corestocks 0 0 0 0 0 13 2 Others 14 26 4 1 0 12 34
Mineral products 2,337 3,412 4,038 2,853 2,350 4,285 4,033 Copper concentrates 244 443 569 599 527 370 554 Copper metal 505 642 462 381 125 1,270 1,136 Gold 2 108 67 34 110 3 1,117 513 Iron ore agglomerates 86 113 119 117 107 61 60 Chromium ore 8 15 6 4 6 7 8 Nickel 0 0 - - - 65 - Others 1,386 2,131 2,850 1,643 1,582 1,460 1,762
Petroleum products 465 843 446 314 282 396 456Manufactures 44,260 47,025 51,607 50,808 49,702 57,336 r 56,490
Elect. & elect'l equipment/parts & telecom 25,037 20,121 29,767 32,066 32,243 36,536 37,569 Garments 1,573 1,580 1,854 1,459 1,099 2,000 r 928 Textile yarn/fabrics 170 188 247 199 189 235 200 Footwear 16 34 35 33 49 80 103 Travel goods and handbags 60 176 266 429 472 485 582 Wood manufactures 2,159 3,086 2,963 2,805 2,714 1,204 351 Furniture and fixtures 180 251 370 324 265 337 310 Chemicals 1,937 2,852 2,754 1,878 1,722 1,786 1,366 Non-metallic mineral manufactures 145 204 327 176 151 202 226 Machinery & transport equipment 5,310 3,763 5,318 5,150 4,276 5,093 5,087 Processed food and beverages 1,104 1,482 1,449 1,163 1,076 1,395 1,244 Iron and steel 253 159 108 99 122 131 115 Baby carr., toys, games and sporting goods 239 329 291 321 235 214 270 Basketwork, wickerwork & other articles of planting materials 43 50 49 57 48 43 34 Misc. manufactured articles, nes 1,534 558 688 603 746 729 1,018 Others 4,500 5,659 5,121 4,044 4,296 4,571 4,212
SPECIAL TRANSACTIONS 1,401 1,077 1,265 1,116 1,057 1,382 r 1,618RE-EXPORTS 369 194 282 143 224 290 r 282TOTAL EXPORTS 52,100 56,698 62,102 58,827 57,406 68,713 67,489
Note: Details may not add up to totals due to rounding.1Quantity in '000 cubic meters; price in US$/cu.m2Quantity in '000 ounces; prices in US$/oz
Source: Philippine Statistics Authority
Commodity Group 2017
7-4

TABLE 7.4 Exports and Imports by Port: 2015 to 2017 (F.O.B. value in thousand U.S. dollars)
Value Percent Share Value Percent
Share Value Percent Share Value Percent
Share Value Percent Share Value Percent
Share
58,827,235 100.00 71,067,228 100.00 57,406,124 100.00 84,108,044 100.00 68,712,897 100.00 96,093,235 100
Luzon 49,324,701 83.85 63,515,180 89.37 49,024,131 85.40 73,991,977 87.97 55,823,945 81.24 83,936,127 87.35Aparri, Cagayan 464 0.00 1,248 0.00 17 0.00 5,315 0.01 47 0.00 270 0.00Claveria, Cagayan 0 0.00 0 0.00 - - - - 0 0.00 0 0.00Bicobian (Palanan), Isabela 0 0.00 0 0.00 - - - - 0 0.00 0 0.00Casambalangan (Irene), Cagayan 0 0.00 0 0.00 - - 408 0.00 0 0.00 0 0.00Dinapiqui Point, San Mariano, Isabela 0 0.00 0 0.00 - - - - 0 0.00 0 0.00Maconacon, Isabela 0 0.00 47 0.00 - - - - 0 0.00 0 0.00Currimao, Ilocos Norte 636 0.00 3,456 0.00 - - - - 0 0.00 0 0.00Gabut Port Badoc, Ilocos Norte 0 0.00 9 0.00 - - - - 0 0.00 0 0.00Cabugao, Ilocos Sur 0 0.00 0 0.00 - - - - 0 0.00 0 0.00Narvacan, Ilocos Sur 0 0.00 0 0.00 - - - - 0 0.00 0 0.00San Fernando, La Union 376,709 0.64 96,773 0.14 135,169 0.24 104,110 0.12 428,710 0.62 122,629 0.13Atlantic Gulf & Pacific Co.,Ltd.,San Fernando, La Union 0 0.00 360 0.00 - - - - 0 0.00 0 0.00Government Pier, Poro Point San Fernando, La Union 0 0.00 8 0.00 - - - - 0 0.00 0 0.00Philex Mining Corporation Conveyor Pier, San Fernando, La Union 0 0.00 0 0.00 - - - - 0 0.00 0 0.00Bolinao, Pangasinan 0 0.00 0 0.00 - - - - 0 0.00 0 0.00Sual, Pangasinan 3,836 0.01 147,375 0.21 - - - - 0 0.00 0 0.00Dagupan City, Pangasinan 0 0.00 0 0.00 - - - - 0 0.00 0 0.00Baguio Export Processing Zone, Baguio City, Benguet 898,490 1.53 143,500 0.20 - - - - 0 0.00 0 0.00Special Export Processing Zone (SEPZ), San Miguel, Tarlac 0 0.00 0 0.00 - - - - 0 0.00 0 0.00San Miguel, Tarlac 0 0.00 0 0.00 - - - - 0 0.00 0 0.00Subic Area Free Port, SBMA, Olongapo City 1,738,592 2.96 2,456,455 3.46 - - - - 1,800,477 2.62 2,281,207 2.37Luisita Industrial Parks(LIP) Special Export Processing Zone, Hacienda Luisita, San Miguel, Tarlac 278,533 0.47 366,826 0.52 - - - - 92,002 0.13 0 0.00Clark Special Economic Zone, Pampanga 3,734,582 6.35 1,974,493 2.78 - - - - 1,523,231 2.22 316,889 0.33Masinloc, Zambales 15,050 0.03 154,029 0.22 750 0.00 328,058 0.39 15,495 0.02 265,166 0.28Acoje Mining Company Balitoc, Santa Cruz, Zambales 0 0.00 0 0.00 - - - - 0 0.00 0 0.00Subic, Zambales 43,061 0.07 19,775 0.03 - - - - 0 0.00 0 0.00Subic Shipyard and Engineering,Inc. SEPZ Enterprise,Cabangaan PT. Bo.Cawag,Subic Zambales 48 0.00 94,726 0.13 4,513 0.01 - - 0 0.00 0 0.00Angeles Industrial Park (AIP) SEPZ, Bacolor, Pampanga 137,507 0.23 60,886 0.09 - - - - 0 0.00 0 0.00Limay, Bataan 339,245 0.58 3,593,214 5.06 245,471 0.43 2,286,593 2.72 544,895 0.79 443,168 0.46Mariveles, Bataan 169,780 0.29 272,652 0.38 134,601 0.23 0 0.00 433 0.00 0 0.00Bataan Export Processing Zone,Mariveles, Bataan 0 0.00 0 0.00 - - - - 0 0.00 0 0.00Benguet Corporation, Subic (Matain) Zambales 0 0.00 0 0.00 - - - - 0 0.00 0 0.00Bataan Shipyard and Eng'g. Co., Inc. (BASECO) - - - - 8,356 0.01 268,818 0.28Bataan Export Processing Zone,Mariveles, Bataan 192 0.00 409,067 0.58 - - - - 0 0.00 0 0.00Bataan Shipyard and Eng'g. Co., Inc. ,Mariveles, Bataan 2 0.00 0 0.00 - - - - 0 0.00 0 0.00Olongapo City, Zambales 43,061 0.07 19,775 0.03 - - - - 0 0.00 0 0.00Santa Cruz, Zambales 0 0.00 0 0.00 - - - - 0 0.00 0 0.00Manila (North Harbor) 0 0.00 0 0.00 - - - - 11 0.00 0 0.00Manila (South Harbor) 1,560,599 2.65 6,977,765 9.82 6,000,947 10.45 8,600,073 10.23 2,169,349 3.16 8,102,050 8.43Pier 3, Manila (South Harbor) 0 0.00 0 0.00 - - - - 0 0.00 0 0.00Pier 9, Manila (South Harbor) 0 0.00 0 0.00 - - - - 0 0.00 0 0.00E-Square(ITP) Information Technology Park SEPZ, Fort Bonifacio, Taguig City 667 0.00 1,526 0.00 - - - - 0 0.00 0 0.00SEPZ, Taguig MM 0 0.00 0 0.00 - - - - 0 0.00 0 0.00Tala, Kaloocan City 0 0.00 0 0.00 - - - - 0 0.00 0 0.00
Continued
Ports in the Philippines
2016Exports Imports
Total
2017Exports Imports
2015Exports Imports

TABLE 7.4--Continued
Value Percent Share Value Percent
Share Value Percent Share Value Percent
Share Value Percent Share Value Percent
Share
SEPZ, Kaloocan City,MM 0 0.00 0 0.00 - - - - 0 0.00 0 0.00Manila International Container Port 8,098,893 13.77 14,666,150 20.64 6,388,947 11.13 20,688,370 24.60 13,078,358 19.03 28,590,360 29.75Eastwood City Cyberpark Libis, Quezon City 262 0.00 8,287 0.01 289 0.00 2,018 - 0 0.00 0 0.00Batangas City, Batangas 953,116 1.62 7,278,240 10.24 - - - - 0 0.00 0 0.00Bauan, Batangas 0 0.00 0 0.00 - - - - 0 0.00 0 0.00Batangas Bay Terminal, Incorporated Bo. Bolo, Bauan, Batangas 0 0.00 0 0.00 - - - - 0 0.00 0 0.00Calaca, Batangas 0 0.00 0 0.00 - - - - 0 0.00 0 0.00Mabini, Batangas 0 0.00 0 0.00 - - - - 0 0.00 0 0.00San Pascual, Batangas 0 0.00 0 0.00 - - - - 0 0.00 0 0.00Sto. Tomas, Batangas 0 0.00 0 0.00 - - - - 0 0.00 0 0.00Tabangao, Batangas 0 0.00 0 0.00 - - - - 0 0.00 0 0.00SEZ, Tabangao, Batangas 0 0.00 0 0.00 - - - - 0 0.00 0 0.00Pinamucan, Batangas City 0 0.00 0 0.00 - - - - 0 0.00 0 0.00SPEZ Batangas City, Batangas 0 0.00 0 0.00 - - - - 0 0.00 0 0.00Tanauan, Batangas 0 0.00 0 0.00 - - - - 0 0.00 0 0.00Laguna Technopark Inc. SEPZ, Binan, Laguna 0 0.00 0 0.00 - - - - 159 0.00 0 0.00CarmelRay Industrial Park SEPZ, Canlubang, Laguna 0 0.00 0 0.00 - - - - 11 0.00 0 0.00Lima Technology Center Special Phil. Economic Zone 0 0.00 0 0.00 - - - - 0 0.00 0 0.00Mogpog,Marinduque 0 0.00 0 0.00 - - - - 0 0.00 0 0.00Santa Cruz, Marinduque 0 0.00 0 0.00 - - - - 0 0.00 0 0.00Romblon, Romblon 0 0.00 0 0.00 - - - - 0 0.00 0 0.00Calapan, Oriental Mindoro 0 0.00 0 0.00 - - - - 0 0.00 0 0.00Cavite Export Processing Zone, Cavite 6,373,533 10.83 2,100,383 2.96 5,995,299 10.44 4,492,783 5.34 849,989 1.24 0 0.00General Trias, Cavite 0 0.00 0 0.00 - - - - 0 0.00 0 0.00SEPZ Bay, General Trias, Cavite 0 0.00 0 0.00 - - - - 0 0.00 0 0.00SEPZ, Dasmariñas, Cavite 0 0.00 0 0.00 - - - - 88 0.00 0 0.00SEPZ, Carmona, Cavite 0 0.00 0 0.00 - - - - 340 0.00 0 0.00SEPZ, Silang, Cavite 0 0.00 0 0.00 - - - - 0 0.00 0 0.00SEPZ, Biñan, Laguna 0 0.00 0 0.00 - - - - 0 0.00 0 0.00SEPZ, Cabuyao, Laguna 0 0.00 0 0.00 - - - - 346 0.00 0 0.00Calamba, Laguna 0 0.00 0 0.00 - - - - 29 0.00 0 0.00Calamba Premiere Industrial Park, Calamba, Laguna 0 0.00 0 0.00 - - - - 2 0.00 0 0.00Sta. Rosa, Laguna 0 0.00 0 0.00 - - - - 0 0.00 0 0.00SEPZ, Sta. Rosa, Laguna 0 0.00 0 0.00 - - - - 0 0.00 0 0.00SEPZ, Canlubang, Laguna 0 0.00 0 0.00 - - - - 11 0.00 0 0.00Makiling Tech. Export Processing Zone 0 0.00 0 0.00 - - - - 0 0.00 0 0.00Balabac, Palawan 0 0.00 0 0.00 - - - - 0 0.00 0 0.00Bataraza, Palawan 0 0.00 0 0.00 - - - - 0 0.00 0 0.00Teresa, Narra, Palawan 0 0.00 0 0.00 - - - - 0 0.00 0 0.00Puerto Princesa City, Palawan 398,794 0.68 91,364 0.13 258,245 0.45 127,214 0.15 469,838 0.68 24,576 0.03Quezon, Palawan 0 0.00 0 0.00 - - - - 0 0.00 0 0.00San Vicente, Palawan 0 0.00 0 0.00 - - - - 0 0.00 0 0.00Dingalan, Aurora 0 0.00 0 0.00 - - - - 0 0.00 0 0.00Atimonan, Quezon 0 0.00 0 0.00 - - - - 0 0.00 0 0.00Gumaca, Quezon 0 0.00 0 0.00 - - - - 0 0.00 0 0.00Siain, Quezon 960 0.00 307,872 0.43 18,791 0.03 332,379 0.40 15,453 0.02 32,419 0.03Baler, Aurora 0 0.00 0 0.00 - - - - 0 0.00 0 0.00Jose Panganiban, Camarines Norte 0 0.00 1 0.00 - - 836 0.00 0 0.00 0 0.00Lagonoy,Camarines Norte 0 0.00 0 0.00 - - - - 0 0.00 0 0.00Pasacao, Camarines Norte 0 0.00 0 0.00 - - - - 0 0.00 0 0.00Bicol Export Processing, Rapu-Rapu, Albay 0 0.00 0 0.00 - - - - 0 0.00 0 0.00Legaspi City, Albay 165,842 0.28 41,352 0.06 84,412 0.15 42,393 0.05 342,696 0.50 12,536 0.01Albay, Rapu-Rapu Bicol Export Processing 105 0.00 0 0.00 - - - - 0 0.00 0 0.00Tabaco, Albay 39,671 0.07 488 0.00 189 0.00 0 0.00 0 0.00 0 0.00Arimbay, Legaspi City 0 0.00 0 0.00 - - - - 0 0.00 0 0.00Bulan, Sorsogon 0 0.00 0 0.00 - - - - 0 0.00 0 0.00Sorsogon, Sorsogon 0 0.00 0 0.00 - - - - 0 0.00 0 0.00Virac, Catanduanes 0 0.00 0 0.00 - - - - 0 0.00 0 0.00
Continued
Ports in the Philippines
2015 2016 2017Exports Imports Exports Imports Exports Imports
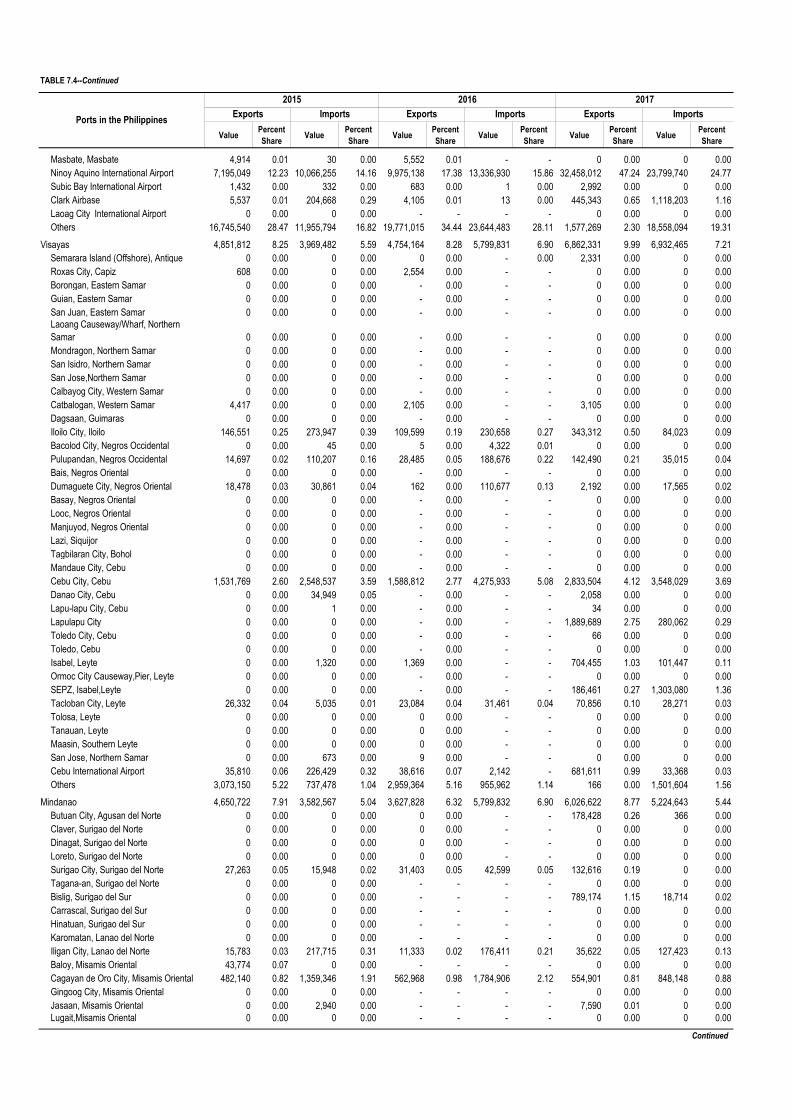
TABLE 7.4--Continued
Value Percent Share Value Percent
Share Value Percent Share Value Percent
Share Value Percent Share Value Percent
Share
Masbate, Masbate 4,914 0.01 30 0.00 5,552 0.01 - - 0 0.00 0 0.00Ninoy Aquino International Airport 7,195,049 12.23 10,066,255 14.16 9,975,138 17.38 13,336,930 15.86 32,458,012 47.24 23,799,740 24.77Subic Bay International Airport 1,432 0.00 332 0.00 683 0.00 1 0.00 2,992 0.00 0 0.00Clark Airbase 5,537 0.01 204,668 0.29 4,105 0.01 13 0.00 445,343 0.65 1,118,203 1.16Laoag City International Airport 0 0.00 0 0.00 - - - - 0 0.00 0 0.00Others 16,745,540 28.47 11,955,794 16.82 19,771,015 34.44 23,644,483 28.11 1,577,269 2.30 18,558,094 19.31
Visayas 4,851,812 8.25 3,969,482 5.59 4,754,164 8.28 5,799,831 6.90 6,862,331 9.99 6,932,465 7.21Semarara Island (Offshore), Antique 0 0.00 0 0.00 0 0.00 - 0.00 2,331 0.00 0 0.00Roxas City, Capiz 608 0.00 0 0.00 2,554 0.00 - - 0 0.00 0 0.00Borongan, Eastern Samar 0 0.00 0 0.00 - 0.00 - - 0 0.00 0 0.00Guian, Eastern Samar 0 0.00 0 0.00 - 0.00 - - 0 0.00 0 0.00San Juan, Eastern Samar 0 0.00 0 0.00 - 0.00 - - 0 0.00 0 0.00Laoang Causeway/Wharf, Northern Samar 0 0.00 0 0.00 - 0.00 - - 0 0.00 0 0.00Mondragon, Northern Samar 0 0.00 0 0.00 - 0.00 - - 0 0.00 0 0.00San Isidro, Northern Samar 0 0.00 0 0.00 - 0.00 - - 0 0.00 0 0.00San Jose,Northern Samar 0 0.00 0 0.00 - 0.00 - - 0 0.00 0 0.00Calbayog City, Western Samar 0 0.00 0 0.00 - 0.00 - - 0 0.00 0 0.00Catbalogan, Western Samar 4,417 0.00 0 0.00 2,105 0.00 - - 3,105 0.00 0 0.00Dagsaan, Guimaras 0 0.00 0 0.00 - 0.00 - - 0 0.00 0 0.00Iloilo City, Iloilo 146,551 0.25 273,947 0.39 109,599 0.19 230,658 0.27 343,312 0.50 84,023 0.09Bacolod City, Negros Occidental 0 0.00 45 0.00 5 0.00 4,322 0.01 0 0.00 0 0.00Pulupandan, Negros Occidental 14,697 0.02 110,207 0.16 28,485 0.05 188,676 0.22 142,490 0.21 35,015 0.04Bais, Negros Oriental 0 0.00 0 0.00 - 0.00 - - 0 0.00 0 0.00Dumaguete City, Negros Oriental 18,478 0.03 30,861 0.04 162 0.00 110,677 0.13 2,192 0.00 17,565 0.02Basay, Negros Oriental 0 0.00 0 0.00 - 0.00 - - 0 0.00 0 0.00Looc, Negros Oriental 0 0.00 0 0.00 - 0.00 - - 0 0.00 0 0.00Manjuyod, Negros Oriental 0 0.00 0 0.00 - 0.00 - - 0 0.00 0 0.00Lazi, Siquijor 0 0.00 0 0.00 - 0.00 - - 0 0.00 0 0.00Tagbilaran City, Bohol 0 0.00 0 0.00 - 0.00 - - 0 0.00 0 0.00Mandaue City, Cebu 0 0.00 0 0.00 - 0.00 - - 0 0.00 0 0.00Cebu City, Cebu 1,531,769 2.60 2,548,537 3.59 1,588,812 2.77 4,275,933 5.08 2,833,504 4.12 3,548,029 3.69Danao City, Cebu 0 0.00 34,949 0.05 - 0.00 - - 2,058 0.00 0 0.00Lapu-lapu City, Cebu 0 0.00 1 0.00 - 0.00 - - 34 0.00 0 0.00 Lapulapu City 0 0.00 0 0.00 - 0.00 - - 1,889,689 2.75 280,062 0.29Toledo City, Cebu 0 0.00 0 0.00 - 0.00 - - 66 0.00 0 0.00Toledo, Cebu 0 0.00 0 0.00 - 0.00 - - 0 0.00 0 0.00Isabel, Leyte 0 0.00 1,320 0.00 1,369 0.00 - - 704,455 1.03 101,447 0.11Ormoc City Causeway,Pier, Leyte 0 0.00 0 0.00 - 0.00 - - 0 0.00 0 0.00SEPZ, Isabel,Leyte 0 0.00 0 0.00 - 0.00 - - 186,461 0.27 1,303,080 1.36Tacloban City, Leyte 26,332 0.04 5,035 0.01 23,084 0.04 31,461 0.04 70,856 0.10 28,271 0.03Tolosa, Leyte 0 0.00 0 0.00 0 0.00 - - 0 0.00 0 0.00Tanauan, Leyte 0 0.00 0 0.00 0 0.00 - - 0 0.00 0 0.00Maasin, Southern Leyte 0 0.00 0 0.00 0 0.00 - - 0 0.00 0 0.00San Jose, Northern Samar 0 0.00 673 0.00 9 0.00 - - 0 0.00 0 0.00Cebu International Airport 35,810 0.06 226,429 0.32 38,616 0.07 2,142 - 681,611 0.99 33,368 0.03Others 3,073,150 5.22 737,478 1.04 2,959,364 5.16 955,962 1.14 166 0.00 1,501,604 1.56
Mindanao 4,650,722 7.91 3,582,567 5.04 3,627,828 6.32 5,799,832 6.90 6,026,622 8.77 5,224,643 5.44Butuan City, Agusan del Norte 0 0.00 0 0.00 0 0.00 - - 178,428 0.26 366 0.00Claver, Surigao del Norte 0 0.00 0 0.00 0 0.00 - - 0 0.00 0 0.00Dinagat, Surigao del Norte 0 0.00 0 0.00 0 0.00 - - 0 0.00 0 0.00Loreto, Surigao del Norte 0 0.00 0 0.00 0 0.00 - - 0 0.00 0 0.00Surigao City, Surigao del Norte 27,263 0.05 15,948 0.02 31,403 0.05 42,599 0.05 132,616 0.19 0 0.00Tagana-an, Surigao del Norte 0 0.00 0 0.00 - - - - 0 0.00 0 0.00Bislig, Surigao del Sur 0 0.00 0 0.00 - - - - 789,174 1.15 18,714 0.02Carrascal, Surigao del Sur 0 0.00 0 0.00 - - - - 0 0.00 0 0.00Hinatuan, Surigao del Sur 0 0.00 0 0.00 - - - - 0 0.00 0 0.00Karomatan, Lanao del Norte 0 0.00 0 0.00 - - - - 0 0.00 0 0.00Iligan City, Lanao del Norte 15,783 0.03 217,715 0.31 11,333 0.02 176,411 0.21 35,622 0.05 127,423 0.13Baloy, Misamis Oriental 43,774 0.07 0 0.00 - - - - 0 0.00 0 0.00Cagayan de Oro City, Misamis Oriental 482,140 0.82 1,359,346 1.91 562,968 0.98 1,784,906 2.12 554,901 0.81 848,148 0.88Gingoog City, Misamis Oriental 0 0.00 0 0.00 - - - - 0 0.00 0 0.00Jasaan, Misamis Oriental 0 0.00 2,940 0.00 - - - - 7,590 0.01 0 0.00Lugait,Misamis Oriental 0 0.00 0 0.00 - - - - 0 0.00 0 0.00
Continued
Imports Exports Imports Exports ImportsPorts in the Philippines
2015 2016 2017Exports

TABLE 7.4--Concluded
Value Percent Share Value Percent
Share Value Percent Share Value Percent
Share Value Percent Share Value Percent
Share
Medina Causeway/Wharf, Misamis Oriental 0 0.00 0 0.00 - - - - 0 0.00 0 0.00Opol,Misamis Oriental 0 0.00 0 0.00 - - - - 0 0.00 0 0.00Tagoloan Causeway/Wharf, Misamis Oriental 296,035 0.50 0 0.00 147,116 0.26 - - 1,697 0.00 0 0.00Ozamis City, Misamis Occidental 323,561 0.55 11,417 0.02 204,131 0.36 70,913 0.08 490,146 0.71 6,798 0.01Tangub Causeway/Landing, Misamis Occidental 0 0.00 0 0.00 - - - - 0 0.00 0 0.00Jimenez, Misamis Occidental 0 0.00 0 0.00 - - - - 0 0.00 0 0.00Dipolog City, Zamboanga del Norte 0 0.00 0 0.00 - - - - 0 0.00 0 0.00Katipunan, Zamboanga del Norte 0 0.00 0 0.00 - - - - 0 0.00 0 0.00Roxas, Zamboanga del Norte 1 0.00 0 0.00 - - - - 0 0.00 0 0.00Ipil Causeway (Offshore), Zamboanga del Sur 0 0.00 0 0.00 - - - - 0 0.00 0 0.00Calug Point, Busan Bay (Offshore), Zamboanga del Sur 0 0.00 0 0.00 - - - - 0 0.00 0 0.00Pagadian, Zamboanga del Sur 0 0.00 0 0.00 - - - - 0 0.00 0 0.00Baliwasan, Zamboanga City, Zamboanga del Sur 0 0.00 0 0.00 - - - - 0 0.00 0 0.00Zamboanga City, Zamboanga del Sur 41,458 0.07 25,337 0.04 49,982 0.09 18,629 0.02 62,735 0.09 23,628 0.02Jolo, Sulu 0 0.00 0 0.00 - - - - 0 0.00 0 0.00Dadiangas, Gen. Santos City, South Cotabato 0 0.00 0 0.00 - - - - 0 0.00 587,294 0.61General Santos City, South Cotabato 0 0.00 0 0.00 - - - - 1,126,885 1.64 587,294 0.61Cotabato City,Maguindanao 0 0.00 0 0.00 - - - - 0 0.00 0 0.00Parang, Maguindanao 0 0.00 22,965 0.03 - - 30,632 0.04 22 0.00 2,449 0.00Davao City, Davao del Sur 1,432,410 2.43 1,479,308 2.08 1,311,490 2.28 1,591,878 1.89 2,189,718 3.19 2,039,699 2.12Mati, Davao Oriental 0 0.00 1,033 0.00 - - 944 - 23 0.00 0 0.00Panabo, Davao del Norte 0 0.00 0 0.00 - - - - 0 0.00 0 0.00Davao International Airport 61,602 0.10 2,821 0.00 24,384 0.04 5,323 0.01 84,038 0.12 4,908 0.01Gen. Santos International Airport 0 0.00 0 0.00 - - - - 2,418 0.00 0 0.00Masao, Agusan del Norte 0 0.00 0 0.00 - - - - 0 0.00 0 0.00General Santos City, South Cotabato 0 0.00 0 0.00 - - - - 0 0.00 0 0.00Others 1,926,695 3.28 443,739 0.62 1,285,021 2.24 2,077,595 2.47 370,609 0.54 977,922 1.02
Notes: 1. Details may not add up to totals due to rounding. 2. Exports include domestic exports and re-exports.
Source: Philippine Statistics Authority
ImportsPorts in the Philippines
2015 2016 2017Exports Imports Exports Imports Exports

TABLE 7.5 Regional Commodity Flow in the Philippines via Air Mode of Transport: 2016 to 2017 (Value in thousand pesos)
N C R CAR Ilocos Region
Cagayan Valley
Central Luzon CALABARZON MIMAROPA Bicol
RegionWestern Visayas
Central Visayas
Eastern Visayas
Zamboanga Peninsula
Northern Mindanao
Davao Region
SOCCSKSARGEN Caraga ARMM
2017All commodities 758,939 508,139 (1) 3,878 22 (1) (1) 4,080 5,104 44,988 96,079 7,130 2,823 7,022 56,920 19,821 2,688 238
NCR 178,954 - * 760 - - - 16 24 34,585 80,209 26 8 21 48,141 15,009 148 8CAR - - - - - - - - - - - - - - - - - -I-Ilocos Region - - - - - - - - - - - - - - - 0II-Cagayan Valley - - - - - - - - - - - - - - - - 0III-Central Luzon - - - - - - - - - - - - - - - - 0IV-A-CALABARZON - - - - - - - - - - - - - - - - 0MIMAROPA 37,125 37,084 - 1 - - - 1 - 13 - - 1 12 9 4 - 0V-Bicol Region 3,254 3,033 - 9 3 - - 20 - 41 50 3 27 25 35 7 3 2VI-Western Visayas 371,788 336,187 - 3,006 5 - - 2,253 4,951 394 12,149 4,356 2,255 1,200 609 3,117 1,095 211VII-Central Visayas 96,535 66,890 - 67 14 - - 596 108 8,563 154 2,727 472 5,758 8,075 1,656 1,439 14VIII-Eastern Visayas 556 473 - - - - - - 2 4 74 - - - 2 - 1 0IX-Zamboanga Peninsula 7,466 6,680 - 1 - - - 14 3 730 6 4 - 1 6 18 1 1X-Northern Mindanao 22,803 18,659 - 24 - - - 1,169 1 24 2,861 6 3 - 44 11 - 3XI-Davao Region 14,695 14,636 - - - - - - 2 2 54 1 1 - - - - 0XII-SOCCSKSARGEN 25,764 24,498 - 11 1 - - 12 14 633 523 8 57 6 - - 2 0XIII-Caraga - - - - - - - - - - - - - - - - - 0ARMM - - - - - - - - - - - - - - - - - 0
2016All commodities 3,021,510 618,173 10 20,086 95 - - 1,423 4,096 477,081 1,037,116 9,166 2,090 16,445 567,780 255,676 11,670 604
NCR 2,341,934 - 10 17,260 85 - - 49 219 465,833 1,022,078 535 553 11,483 562,307 252,173 9,077 273CAR - - - - - - - - - - - - - - - - - 0I-Ilocos Region - - - - - - - - - - - - - - - - - 0II-Cagayan Valley - - - - - - - - - - - - - - - - - 0III-Central Luzon - - - - - - - - - - - - - - - - - 0IV-A-CALABARZON - - - - - - - - - - - - - - - - - 0MIMAROPA 14,443 14,442 - - - - - - - - 1 - - - - - - 0V-Bicol Region 12,064 11,302 - 10 3 - - 25 - 437 130 14 7 9 100 19 2 7VI-Western Visayas 545,255 506,110 - 2,717 3 - - 1,231 3,776 829 14,700 5,701 1,239 2,668 1,372 3,273 1,321 314VII-Central Visayas 68,499 52,610 - 75 - - - 21 27 4,903 53 2,852 254 2,255 3,986 194 1,259 9VIII-Eastern Visayas 3,415 3,412 - - - - - - - - 2 - 1 - - - - 0IX-Zamboanga Peninsula 21,314 16,693 - 15 5 - - 42 58 4,305 96 50 - 12 16 16 6 2X-Northern Mindanao 2,793 2,793 - - - - - - - - - - - - - - - 0XI-Davao Region - - - - - - - - - - - - - - - - - 0XII-SOCCSKSARGEN 11,793 10,811 - 9 - - - 55 16 773 56 14 36 19 - - 5 0XIII-Caraga - - - - - - - - - - - - - - - - - 0ARMM - - - - - - - - - - - - - - - - - -
Note: Details may not add up to totals due to rounding.* - value less than P0.500
Source: Philippine Statistics Authority.
Region of Origin TOTALRegion of Destination

TABLE 7.6. Regional Commodity Flow in the Philippines via Water Mode of Transport: 2016 to 2017 (Value in thousand pesos)
NCR CAR Ilocos Region
Cagayan Valley
Central Luzon CALABARZON MIMAROPA Bicol Region Western
VisayasCentral Visayas
Eastern Visayas
Zamboanga Peninsula
Northern Mindanao
Davao Region
SOCCSKSARGEN Caraga ARMM
2017All Commodities 764,622,830 90,310,299 6,140,977 111,295 2,351,734 24,912,470 19,841,369 9,494,194 127,794,833 138,030,650 58,607,203 50,037,888 86,264,986 22,686,609 7,879,497 114,398,944 5,759,888
- NCR 206,220,522 27 - - - - 8,155 14,533,619 61,614 50,990,123 58,368,442 6,352,018 10,600,111 35,427,521 16,715,856 5,545,223 7,617,812 - I-Ilocos Region - - - - - - - - - - - - - - - - - II-Cagayan Valley - - - - - - - - - - - - - - - - - - III-Central Luzon 50,325,885 22,403,947 - 1,738,885 9,000 1,637,850 6,219,061 1,678,276 231,708 2,542,057 3,591,317 1,081,057 1,383,351 3,650,676 1,729,376 1,332,230 1,001,873 95,224IV-A-CALABARZON 845,015 8,623 - 20 - - - 791,621 9,247 1,237 8,037 6,542 5,304 12,306 - - 2,077 - IV-B-MIMAROPA 4,149,161 654,704 - - 40,300 - 2,543,052 676,635 - 67,065 138,498 - 1,401 360 1,200 21,747 1,000 3,200V-Bicol Region 13,282,755 176,350 - - - 3,707 140,800 52,315 3,880,671 286,565 177,733 6,412,900 61,997 1,587,114 301,316 102,218 99,070 - VI-Western Visayas 115,512,805 25,253,616 4,384,022 61,995 414,119 12,045,039 1,732,483 1,664,257 58,586,805 4,449,842 1,076,811 1,938,964 3,329,686 513,800 61,323 43 - VII-Central Visayas 118,537,514 8,923,428 - 6,050 - 4,551 44,826 20,522 2,337,616 5,920,921 33,319,058 22,673,835 12,887,135 22,227,274 2,372,605 557,467 7,204,159 38,067VIII-Eastern Visayas 97,724,296 478,347 - - - 67,406 126,619 - 36,995 55,514 3,116,280 684,772 258,247 2,501,039 49,290 - 90,349,785 - IX-Zamboanga Peninsula 22,028,650 2,133,409 - - - - - 10,624 102 212,305 1,180,813 816 14,124,921 26,896 520,476 223,337 6,712 3,588,241X-Northern Mindanao 61,629,162 6,359,282 - 12,000 - 213,700 3,514,619 334,774 1,271,984 6,195,813 20,134,387 1,421,730 1,612,216 17,119,663 409,764 23,320 1,248,412 1,757,498XI-Davao Region 22,825,293 11,609,237 - - - - - - - 2,449,924 7,168,711 2,000 1,481,167 11,512 72,426 12,597 17,719 - XII-SOCCSKSARGEN 10,833,819 7,535,500 - - - - 48,732 - - 373,890 2,309,810 - 565,387 - 500 - - - XIII-Caraga 32,644,819 3,118,598 - - - 10,400 221,566 10,500 - 50,102 2,254,667 18,894,722 704,993 370,939 - - 6,850,282 158,051MIMAROPA 8,063,134 1,655,231 - - - - - - - 62,512 1,813,055 - 4,412,694 - - 35 - 119,607
2016All Commodities 868,648,071 110,243,673 - 5,612,016 622,852 1,486,660 22,945,566 25,521,861 10,055,572 144,685,132 172,191,383 62,717,170 47,207,040 102,501,118 28,148,343 10,355,921 116,422,955 4,276,338
NCR 273,298,841 42 - - - 99 2,705 14,228,738 23,081 64,038,418 83,905,039 2,166,641 16,947,298 53,634,625 20,855,543 5,969,021 9,759,500 217,133I-Ilocos Region 1,520 - - - 1,520 - - - - - - - - - - - - - II-Cagayan Valley - - - - - - - - - - - - - - - - - - III-Central Luzon 51,330,984 26,812,190 - 1,461,702 128,598 870,588 6,431,385 1,799,429 177,452 2,143,876 3,744,886 802,544 1,409,667 1,971,273 1,109,088 1,024,580 1,255,241 127,229IV-A-CALABARZON 811,166 11,873 - - - - 100 764,642 - 1,143 9,029 7,729 6,482 8,183 - - 1,985 - MIMAROPA 11,306,219 1,739,556 - 2,795 75 - 3,157,464 5,044,621 - 378,114 534,665 51 133,522 271,565 - 33,304 10,487 - V-Bicol Region 11,002,284 382,202 - - 27,596 230,815 408,883 127,053 4,016,296 999,589 410,593 3,689,200 107,670 567,285 - - 35,100 - VI-Western Visayas 115,771,110 22,492,715 - 4,061,340 465,063 56,514 10,511,816 2,216,834 1,358,917 61,808,241 4,903,256 1,185,855 2,007,016 4,248,214 391,600 38,779 14,293 10,658VII-Central Visayas 141,585,123 9,769,116 - 15,620 - 1,490 217,043 148,078 3,673,355 6,635,879 37,464,996 27,915,504 18,756,735 23,225,321 4,451,328 1,812,489 7,260,065 48,319VIII-Eastern Visayas 93,974,765 232,023 - - - 78,106 64,916 - 10,400 - 1,156,047 286,105 302,990 1,197,820 167,123 - 90,461,234 18,000IX-Zamboanga Peninsula 8,681,265 2,608,039 - - - - - 74,753 - 114,048 762,329 5,847 79,451 4,915 357,237 150,210 20,000 2,713,347X-Northern Mindanao 68,791,421 7,735,507 - 70,559 - 105,664 1,957,302 1,117,713 651,988 7,702,046 25,062,599 3,092,295 1,571,747 15,887,250 756,170 13,395 2,296,160 709,645XI-Davao Region 34,205,404 24,501,993 - - - - - - - 555,842 6,087,633 6,200 1,725,961 - 13,633 1,314,142 - - XII-SOCCSKSARGEN 14,989,244 10,033,763 - - - 32,480 - - - 201,300 3,552,839 - 1,088,599 51,969 28,294 - - - XIII-Caraga 38,111,893 3,158,825 - - - 110,905 193,951 - 144,085 82,667 3,226,365 23,559,198 740,353 1,432,698 18,327 - 5,308,889 135,631ARMM 4,786,832 765,829 - - - - - - - 23,970 1,371,108 - 2,329,548 - - - - 296,377
Note: Details may not add up to totals due to rounding.
Source: Philippine Statistics Authority.
Region of Origin TOTALRegion of Destination


8 - 3
8 - 5
8 - 7
8 - 10
8 - 12
8 - 13
8 - 14
8 - 17
8 - 18
TABLE 8.1 Visitor Arrivals by Country of Residence: 2011 to 2018
TABLE 8.2 Visitor Arrivals by Country of Residence and Mode of Travel: 2016 to 2018
TABLE 8.3 Air Visitor Arrivals by Country of Residence and Age Group: 2001 to 2017
TABLE 8.4 Air Visitor Arrivals by Country of Residence and Purpose of Travel: 2005 to 2018
TABLE 8.5 Number of Visitor Arrivals, Average Daily Expenditure, Average Length of Stay
and Amount of Visitor Receipts: 2002 to 2018
TABLE 8.6 Average Number of Rooms and Occupancy Rates of Hotels in the National Capital Region
by Hotel Category: 1998 to 2017
TABLE 8.7 Outbound Philippine Residents by Port of Disembarkation: 2009 to 2016
TABLE 8.8 Outbound Philippine Residents by Nationality: 1999 to 2016
TABLE 8.9 Outbound Philippine Residents by Age Group: 1998 to 2016
TABLE 8.10 Outbound Philippine Residents by Purpose of Travel: 1998 to 2016 8 - 19
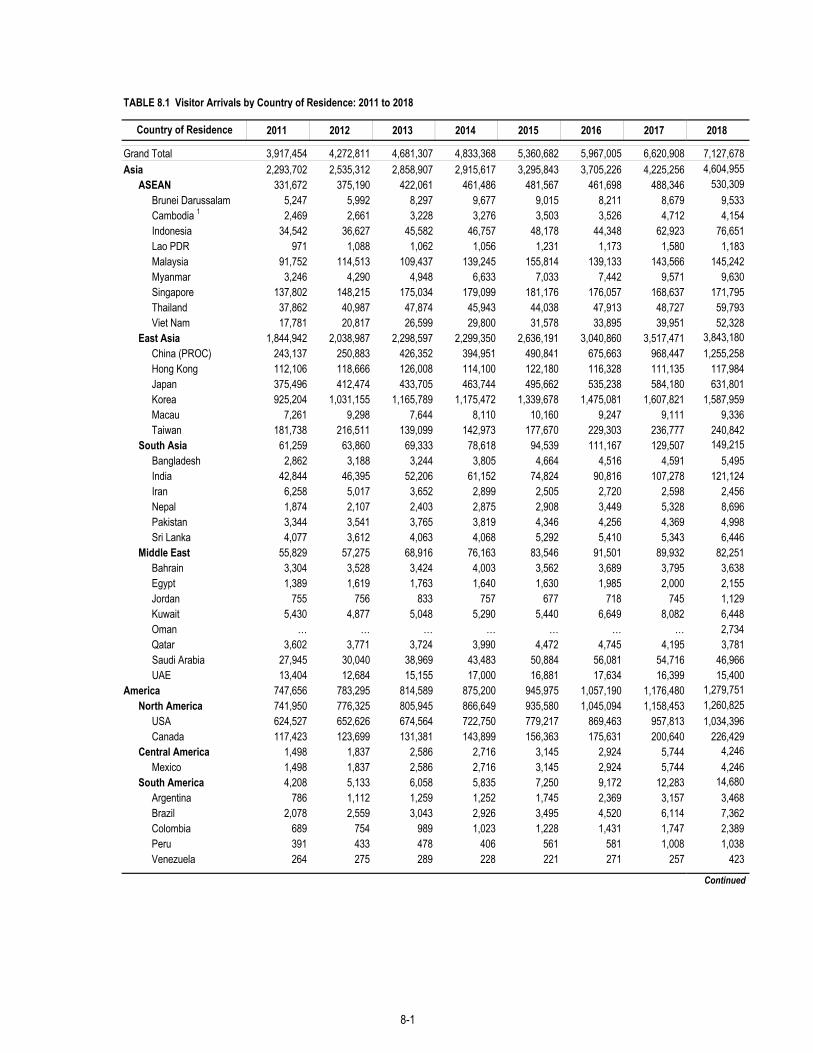
TABLE 8.1 Visitor Arrivals by Country of Residence: 2011 to 2018
2011 2012 2013 2014 2015 2016 2017 2018
Grand Total 3,917,454 4,272,811 4,681,307 4,833,368 5,360,682 5,967,005 6,620,908 7,127,678 Asia 2,293,702 2,535,312 2,858,907 2,915,617 3,295,843 3,705,226 4,225,256 4,604,955
ASEAN 331,672 375,190 422,061 461,486 481,567 461,698 488,346 530,309 Brunei Darussalam 5,247 5,992 8,297 9,677 9,015 8,211 8,679 9,533 Cambodia 1 2,469 2,661 3,228 3,276 3,503 3,526 4,712 4,154 Indonesia 34,542 36,627 45,582 46,757 48,178 44,348 62,923 76,651 Lao PDR 971 1,088 1,062 1,056 1,231 1,173 1,580 1,183 Malaysia 91,752 114,513 109,437 139,245 155,814 139,133 143,566 145,242 Myanmar 3,246 4,290 4,948 6,633 7,033 7,442 9,571 9,630 Singapore 137,802 148,215 175,034 179,099 181,176 176,057 168,637 171,795 Thailand 37,862 40,987 47,874 45,943 44,038 47,913 48,727 59,793 Viet Nam 17,781 20,817 26,599 29,800 31,578 33,895 39,951 52,328
East Asia 1,844,942 2,038,987 2,298,597 2,299,350 2,636,191 3,040,860 3,517,471 3,843,180 China (PROC) 243,137 250,883 426,352 394,951 490,841 675,663 968,447 1,255,258 Hong Kong 112,106 118,666 126,008 114,100 122,180 116,328 111,135 117,984 Japan 375,496 412,474 433,705 463,744 495,662 535,238 584,180 631,801 Korea 925,204 1,031,155 1,165,789 1,175,472 1,339,678 1,475,081 1,607,821 1,587,959 Macau 7,261 9,298 7,644 8,110 10,160 9,247 9,111 9,336 Taiwan 181,738 216,511 139,099 142,973 177,670 229,303 236,777 240,842
South Asia 61,259 63,860 69,333 78,618 94,539 111,167 129,507 149,215 Bangladesh 2,862 3,188 3,244 3,805 4,664 4,516 4,591 5,495 India 42,844 46,395 52,206 61,152 74,824 90,816 107,278 121,124 Iran 6,258 5,017 3,652 2,899 2,505 2,720 2,598 2,456 Nepal 1,874 2,107 2,403 2,875 2,908 3,449 5,328 8,696 Pakistan 3,344 3,541 3,765 3,819 4,346 4,256 4,369 4,998 Sri Lanka 4,077 3,612 4,063 4,068 5,292 5,410 5,343 6,446
Middle East 55,829 57,275 68,916 76,163 83,546 91,501 89,932 82,251Bahrain 3,304 3,528 3,424 4,003 3,562 3,689 3,795 3,638 Egypt 1,389 1,619 1,763 1,640 1,630 1,985 2,000 2,155 Jordan 755 756 833 757 677 718 745 1,129 Kuwait 5,430 4,877 5,048 5,290 5,440 6,649 8,082 6,448 Oman … … … … … … … 2,734 Qatar 3,602 3,771 3,724 3,990 4,472 4,745 4,195 3,781 Saudi Arabia 27,945 30,040 38,969 43,483 50,884 56,081 54,716 46,966 UAE 13,404 12,684 15,155 17,000 16,881 17,634 16,399 15,400
America 747,656 783,295 814,589 875,200 945,975 1,057,190 1,176,480 1,279,751 North America 741,950 776,325 805,945 866,649 935,580 1,045,094 1,158,453 1,260,825
USA 624,527 652,626 674,564 722,750 779,217 869,463 957,813 1,034,396 Canada 117,423 123,699 131,381 143,899 156,363 175,631 200,640 226,429
Central America 1,498 1,837 2,586 2,716 3,145 2,924 5,744 4,246 Mexico 1,498 1,837 2,586 2,716 3,145 2,924 5,744 4,246
South America 4,208 5,133 6,058 5,835 7,250 9,172 12,283 14,680 Argentina 786 1,112 1,259 1,252 1,745 2,369 3,157 3,468 Brazil 2,078 2,559 3,043 2,926 3,495 4,520 6,114 7,362 Colombia 689 754 989 1,023 1,228 1,431 1,747 2,389 Peru 391 433 478 406 561 581 1,008 1,038 Venezuela 264 275 289 228 221 271 257 423
Continued
Country of Residence
8-1

TABLE 8.1 - - Concluded
2011 2012 2013 2014 2015 2016 2017 2018
Europe 402,073 442,686 479,472 498,923 548,969 629,273 675,399 736,421Western Europe 169,515 177,831 186,479 189,188 202,793 231,804 244,172 267,275
Andorra 12,250 7,333 4,840 1,371 329 364 357 273Austria 11,603 11,718 12,106 12,410 12,267 13,087 13,524 14,192Belgium 10,959 11,649 11,454 12,236 12,825 14,477 15,703 17,283France 29,591 33,709 39,042 38,946 45,505 55,384 64,777 74,389Germany 61,193 67,023 70,949 72,801 75,348 86,363 85,431 92,090Luxembourg 555 647 586 640 687 833 722 930Netherlands 21,029 22,195 22,595 25,236 28,632 31,876 33,821 37,047Switzerland 22,335 23,557 24,907 25,548 27,200 29,420 29,837 31,071
Northern Europe 164,205 181,978 196,441 208,691 234,630 261,891 275,755 297,839Denmark 13,004 13,556 13,618 14,298 15,269 18,049 18,445 17,877Finland 4,780 5,399 5,906 5,667 6,548 6,318 6,958 7,216Ireland 6,023 8,362 10,576 12,354 14,050 16,557 18,051 20,051Norway 17,959 19,572 20,625 20,846 20,968 21,606 21,890 23,571Sweden 17,973 21,807 22,957 21,861 23,206 26,062 27,703 28,085United Kingdom 104,466 113,282 122,759 133,665 154,589 173,299 182,708 201,039
Southern Europe 33,531 35,935 38,239 43,080 50,356 63,524 74,745 88,310Greece 1,855 1,834 1,879 2,063 2,386 2,483 3,165 3,453Italy 15,798 16,740 17,668 19,865 21,620 25,945 30,437 35,178Portugal 1,230 1,466 1,566 1,799 2,206 2,999 4,189 5,549Spain 14,648 15,895 17,126 19,353 24,144 32,097 36,954 44,130
Eastern Europe 27,171 37,916 46,907 44,887 43,408 47,445 54,873 54,039Poland 3,263 4,187 5,653 5,911 8,030 8,893 10,786 12,568Russian Federation 20,185 28,270 35,404 32,087 25,278 28,210 33,279 29,961Commonwealth of Independent States 3,723 5,459 5,850 6,889 10,100 10,342 10,808 11,510
East Mediterranean Euro 7,651 9,026 11,406 13,077 17,782 24,609 25,854 28,958Israel 4,990 5,895 7,675 8,776 11,756 16,725 17,446 20,343Turkey 2,661 3,131 3,731 4,301 6,026 7,884 8,408 8,615
Oceania 228,144 252,711 276,722 287,013 302,958 321,061 333,179 354,037Australia 170,736 191,150 213,023 224,784 241,187 251,098 259,433 279,821Guam 41,013 42,695 42,204 38,016 35,262 38,777 36,637 32,357Nauru 19 40 44 28 20 17 16 38New Zealand 12,782 14,100 15,783 17,704 20,579 23,431 28,983 33,340Papua New Guinea 3,594 4,726 5,668 6,481 5,910 7,738 8,110 8,481
Africa 4,193 5,163 5,515 5,319 6,000 6,606 8,029 9,644Nigeria 972 1,472 1,536 1,713 1,430 1,489 1,558 2,104South Africa 3,221 3,691 3,979 3,606 4,570 5,117 6,471 7,540
Others and UnspecifiedResidences 34,534 37,701 42,490 43,392 49,074 57,226 61,954 71,000
Sub-Total 3,710,302 4,056,868 4,477,695 4,625,464 5,148,819 5,776,582 6,480,297 7,055,808
Overseas Filipinos 1 207,152 215,943 203,612 207,904 211,863 190,423 140,611 71,870
1 Philippine Passport holders permanently residing abroad; exclude Overseas Filipino Workers
Source: Department of Tourism
Country of Residence
8-2

TABLE 8.2 Visitor Arrivals by Country of Residence and Mode of Travel: 2016 to 2018
Total Air Sea Total Air Sea Total Air Sea
Grand Total 5,967,005 5,894,634 72,371 6,620,908 6,506,471 114,437 7,127,678 6,899,450 228,228Asia 3,705,226 3,665,158 40,068 4,225,256 4,147,420 77,836 4,604,955 4,419,024 185,931
ASEAN 461,698 447,555 14,143 488,346 467,230 21,116 530,309 500,630 29,679Brunei Darussalam 8,211 8,188 23 8,679 8,668 11 9,533 9,516 17Cambodia 1 3,526 3,523 3 4,712 4,709 3 4,154 4,131 23Indonesia 44,348 39,815 4,533 62,923 54,752 8,171 76,651 62,851 13,800Lao PDR 1,173 1,172 1 1,580 1,579 1 1,183 1,183 0Malaysia 139,133 138,201 932 143,566 141,105 2,461 145,242 140,407 4,835Myanmar 7,442 3,982 3,460 9,571 5,160 4,411 9,630 5,617 4,013Singapore 176,057 175,951 106 168,637 168,458 179 171,795 171,514 281Thailand 47,913 47,064 849 48,727 47,844 883 59,793 58,745 1,048Viet Nam 33,895 29,659 4,236 39,951 34,955 4,996 52,328 46,666 5,662
East Asia 3,040,860 3,022,981 17,879 3,517,471 3,471,662 45,809 3,843,180 3,706,314 136,866China (PROC) 675,663 661,483 14,180 968,447 930,813 37,634 1,255,258 1,135,077 120,181Hongkong 116,328 116,239 89 111,135 109,034 2,101 117,984 111,433 6,551Japan 535,238 534,585 653 584,180 583,723 457 631,801 629,969 1,832Korea 1,475,081 1,473,254 1,827 1,607,821 1,605,490 2,331 1,587,959 1,585,784 2,175Macau 9,247 9,246 1 9,111 9,044 67 9,336 9,053 283Taiwan 229,303 228,174 1,129 236,777 233,558 3,219 240,842 234,998 5,844
South Asia 111,167 103,228 7,939 129,507 118,645 10,862 149,215 129,874 19,341Bangladesh 4,516 4,161 355 4,591 4,243 348 5,495 4,974 521India 90,816 84,488 6,328 107,278 100,039 7,239 121,124 108,744 12,380Iran 2,720 2,717 3 2,598 2,598 - 2,456 2,450 6Nepal 3,449 3,412 37 5,328 3,404 1,924 8,696 3,967 4,729Pakistan 4,256 4,138 118 4,369 4,263 106 4,998 4,874 124Sri Lanka 5,410 4,312 1,098 5,343 4,098 1,245 6,446 4,865 1,581
Middle East 91,501 91,394 107 89,932 89,883 49 82, 251 82, 006 45Bahrain 3,689 3,689 - 3,795 3,793 2 3,638 3,638 -Egypt 1,985 1,878 107 2,000 1,959 41 2,155 2,119 36Jordan 718 718 - 745 743 2 1,129 1,122 7Lebanon - - - - - - 6,448 6,448 -Kuwait 6,649 6,649 - 8,082 8,078 4 6,448 6,448 -Oman - - - - - - 2,734 2,734 0Qatar 4,745 4,745 - 4,195 4,195 - 3,781 3,780 1Saudi Arabia 56,081 56,081 - 54,716 54,716 - 46,966 46,966 -United Arab Emirates 17,634 17,634 - 16,399 16,399 - 15,400 15,399 1
America 1,057,190 1,052,776 4,414 1,176,480 1,165,696 10,784 1,279,751 1,267,409 12,342North America 1,045,094 1,040,972 4,122 1,158,453 1,150,760 7,693 1,260,825 1,249,283 11,542
Canada 175,631 174,732 899 200,640 198,306 2,334 226,429 223,854 2,575U.S.A. 869,463 866,240 3,223 957,813 952,454 5,359 1,034,396 1,025,429 8,967
Central America 2,924 2,814 110 5,744 3,707 2,037 4,246 4,071 175Mexico 2,924 2,814 110 5,744 3,707 2,037 4,246 4,071 175
South America 9,172 8,990 182 12,283 11,229 1,054 14,680 14,055 625Argentina 2,369 2,333 36 3,157 3,029 128 3,468 3,413 55Brazil 4,520 4,451 69 6,114 5,785 329 7,362 7,002 360Colombia 1,431 1,403 28 1,747 1,539 208 2,389 2,298 91Peru 581 543 38 1,008 642 366 1,038 935 103Venezuela 271 260 11 257 234 23 423 407 16
Continued
2018Country of Residence 2016 2017
8-4

TABLE 8.2 - - Concluded
Total Air Sea Total Air Sea Total Air SeaEurope 629,273 610,630 18,643 675,399 656,587 18,812 736,421 714,097 22,324
Western Europe 231,804 227,148 4,656 244,172 239,267 4,905 267,275 261,613 5,662Andorra 364 364 0 357 357 0 273 272 1Austria 13,087 12,803 284 13,524 13,212 312 14,192 14,032 160Belgium 14,477 14,340 137 15,703 15,468 235 17,283 17,129 154France 55,384 54,937 447 64,777 64,211 566 74,389 73,905 484Germany 86,363 83,597 2,766 85,431 82,558 2,873 92,090 88,354 3,736Luxembourg 833 792 41 722 710 12 930 916 14Netherlands 31,876 31,538 338 33,821 33,419 402 37,047 36,392 655Switzerland 29,420 28,777 643 29,837 29,332 505 31,071 30,613 458
Northern Europe 261,891 255,041 6,850 275,755 270,591 5,164 297,839 291,158 6,681Denmark 18,049 17,687 362 18,445 17,985 460 17,877 17,711 166Finland 6,318 6,252 66 6,958 6,890 68 7,216 7,137 79Ireland 16,557 16,470 87 18,051 17,935 116 20,051 19,896 155Norway 21,606 21,382 224 21,890 21,621 269 23,571 23,303 268Sweden 26,062 25,821 241 27,703 27,113 590 28,085 27,246 839United Kingdom 173,299 167,429 5,870 182,708 179,047 3,661 201,039 195,865 5,174
Southern Europe 63,524 62,782 742 74,745 73,737 1,008 88,310 85,701 2,609Greece 2,483 2,282 201 3,165 2,792 373 3,453 3,003 450Italy 25,945 25,678 267 30,437 30,098 339 35,178 33,309 1,869Portugal 2,999 2,875 124 4,189 4,087 102 5,549 5,427 122Spain 32,097 31,947 150 36,954 36,760 194 44,130 43,962 168
Eastern Europe 47,445 41,329 6,116 54,873 47,759 7,114 54,039 47,224 6,815Poland 8,893 8,141 752 10,786 10,182 604 12,568 12,065 503Russian Federation 3 28,210 26,401 1,809 33,279 30,659 2,620 29,961 27,961 2,000Commonwealth of Independent States 10,342 6,787 3,555 10,808 6,918 3,890 11,510 7,198 4,312
East Mediterranean Europe 24,609 24,330 279 25,854 25,233 621 28,958 28,401 557Israel 16,725 16,721 4 17,446 17,098 348 20,343 20,285 58Turkey 7,884 7,609 275 8,408 8,135 273 8,615 8,116 499
Oceania 321,061 315,416 5,645 333,179 331,108 2,071 354,037 351,131 2,906Australia 251,098 245,786 5,312 259,433 257,581 1,852 279,821 277,142 2,679Guam 38,777 38,777 - 36,637 36,637 - 32,357 32,357 -Nauru 17 17 - 16 16 - 38 38 -New Zealand 23,431 23,105 326 28,983 28,764 219 33,340 33,120 220Papua New Guinea 7,738 7,731 7 8,110 8,110 - 8,481 8,474 7
Africa 6,606 6,331 275 8,029 7,660 369 9,644 9,284 360Nigeria 1,489 1,489 - 1,558 1,558 - 2,104 2,104 -South Africa 5,117 4,842 275 6,471 6,102 369 7,540 7,180 360
Others and UnspecifiedResidences 57,226 53,900 3,326 61,954 57,389 4,565 71,000 66,635 4,365
Sub-Total 5,776,582 5,704,211 72,371 6,480,297 6,365,860 114,437 7,055,808 6,827,580 228,228Overseas Filipinos 4 190,423 190,423 - 140,611 140,611 - 71,870 71,870 -1 Philippine Passport holders permanently residing abroad; exclude Overseas Filipino Workers2 Prior to July 2006, arrivals from Russian Federation were lumped under CIS3 Prior to April 2003, statistics from the country includes Slovenia, Croatia, Bosnia and Macedonia4 Prior to April 2008, statistics from this country were lumped under "Union of Serbia and Montenegro"5 Grouping from UNWTO; prior to 2009, statistics from Israel was lumped under "Middle East" and statistics from Turkey was lumped under "Others"6 Prior to April 2018, statistics from this country was lumped under "Others"8 Prior to April 2012, statistics from Macau and Andorra were lumped under "Others"
Source: Department of Tourism
2017 2018Country of Residence 2016
8-4

TABLE 8.3 Air Visitor Arrivals by Country of Residence and Age Group: 2001 to 2017
Total Under 15 15-19 20-24 25-34 35-44 45-54 55-64 65 and above
2001 1,770,211 152,808 40,541 75,018 360,976 428,964 381,606 193,444 104,333 32,521 2002 1,904,891 166,429 43,447 79,536 378,261 450,081 410,184 225,248 121,235 30,470 2003 1,880,067 159,273 44,341 77,694 356,950 441,638 408,275 237,674 123,741 30,481 2004 2,260,235 200,557 57,820 95,841 418,807 518,682 482,515 296,471 154,296 35,246 2005 2,586,367 223,174 68,503 112,091 497,121 585,651 544,291 343,900 177,361 34,275 2006 2,807,234 241,343 75,390 119,841 520,638 634,827 597,203 383,422 194,877 37,344 2007 3,041,872 255,243 82,309 136,108 573,734 686,734 637,873 415,450 214,127 40,294 2008 3,084,753 251,680 86,176 143,485 588,220 687,368 640,274 425,098 223,225 39,227 2009 2,960,282 237,187 81,771 145,609 567,550 647,490 604,479 411,598 223,369 41,229 2010 3,461,007 286,945 95,475 173,836 702,964 745,782 681,068 462,494 248,993 63,450 2011 3,884,055 313,520 104,127 202,598 835,909 836,744 746,258 515,190 277,228 52,481 2012 4,237,934 340,819 114,941 230,764 906,034 909,987 809,258 563,563 312,607 49,961 2013 4,636,326 379,807 126,457 252,810 1,010,662 989,737 871,582 609,613 348,214 47,444 2014 4,773,185 91,794 31,603 70,918 263,409 264,870 239,709 175,953 112,550 3,522,379 2015 5,290,880 7,063 2,665 6,505 30,424 26,336 18,482 7,275 3,061 5,189,069 2016 5,894,634 7,865 2,646 3,627 33,125 37,148 23,132 10,075 5,794 5,771,222 2017 … … … … … … … … … …
Asia 3,665,158 1,004 463 813 7,279 3,809 2,039 799 258 3,648,694 ASEAN 447,555 161 53 7 1,793 640 228 7 6 444,660 Brunei Darussalam 8,188 - - - - - - - 8,188 Cambodia 1 3,523 - - - - - - - - 3,523 Indonesia 39,815 18 5 - 188 72 25 1 2 39,504 Lao PDR 2 1,172 - - - - - - - - 1,172 Malaysia 138,201 21 4 1 300 107 44 1 3 137,720 Myanmar 2 3,982 - - - 3 1 1 - - 3,977 Singapore 175,951 120 41 5 1,291 459 156 4 1 173,874 Thailand 47,064 2 - 1 8 1 2 1 - 47,049 Viet Nam 3 29,659 - 3 - 3 - - - - 29,653 East Asia 3,022,981 711 379 796 3,905 2,543 1,609 790 250 3,011,998 China 661,483 60 18 19 451 179 69 30 7 660,650 Hongkong 116,239 14 9 - 132 58 19 3 2 116,002 Japan 534,585 6 4 1 92 45 27 5 11 534,394 Korea 1,473,254 40 9 33 148 105 59 30 9 1,472,821 Macau 9,246 1 - - 7 2 2 - - 9,234 Taiwan 228,174 590 339 743 3,075 2,154 1,433 722 221 218,897 South Asia 103,228 130 30 9 1,577 625 197 - - 100,660 Bangladesh 4,161 - - - 6 1 - - - 4,154 India 84,488 124 30 9 1,529 605 190 - - 82,001 Iran 2,717 - - - 1 - - - - 2,716 Nepal 3,412 1 - - 1 1 - - - 3,409 Pakistan 4,138 - - - 3 1 1 - - 4,133 Sri Lanka 4,312 5 - - 37 17 6 - - 4,247 Middle East 91,394 2 1 1 4 1 5 2 2 91,376 Bahrain 3,689 1 1 - - - 1 - 1 3,685 Egypt 1,878 - - - - - - - - 1,878 Jordan 718 - - - - - - - - 718 Kuwait 6,649 - - - 1 - - - 1 6,647 Qatar 4,745 - - - - - - - - 4,745 Saudi Arabia 56,081 - - - 2 1 4 1 - 56,073 United Arab Emirates 17,634 1 - 1 1 - - 1 - 17,630
Continued
Year/ Country of Residence Age Group
Not Stated

TABLE 8.3---Continued
Total Under 15 15-19 20-24 25-34 35-44 45-54 55-64 65 and above
America 1,052,776 139 48 18 1,021 362 148 19 10 1,051,011 North America 1,040,972 137 48 18 1,015 356 147 19 10 1,039,222 Canada 174,732 12 1 3 84 30 14 7 1 174,580 USA 866,240 125 47 15 931 326 133 12 9 864,642 Central America 2,814 - - - 1 1 - - - 2,812 Mexico 2,814 - - - 1 1 - - - 2,812 South America 8,990 2 - - 5 5 1 - - 8,977 Argentina 2,333 1 - - 4 3 1 - - 2,324 Brazil 4,451 - - - - - - - - 4,451 Colombia 1,403 - - - 1 - - - - 1,402 Peru 543 1 - - - 1 - - - 541 Venezuela 260 - - - - 1 - - - 259 Europe 610,630 351 84 14 3,562 1,423 446 13 13 604,724 Western Europe 227,148 154 37 7 1,565 644 180 3 4 224,554 Andorra 364 - - - - - - - - 364 Austria 12,803 2 - - 13 10 1 1 - 12,776 Belguim 14,340 14 3 - 125 58 12 1 - 14,127 France 54,937 8 1 - 92 36 12 - 1 54,787 Germany 83,597 80 17 2 857 354 90 1 1 82,195 Luxembourg 792 - - - - - - - - 792 Netherlands 31,538 30 8 1 250 103 34 - - 31,112 Switzerland 28,777 20 8 4 228 83 31 - 2 28,401 Northern Europe 255,041 177 45 6 1,865 709 244 8 9 251,978 Denmark 17,687 10 2 4 84 30 14 - 1 17,542 Finland 6,252 3 - - 9 7 2 - - 6,231 Ireland 16,470 10 2 - 72 28 8 - - 16,350 Norway 21,382 25 8 - 258 87 36 2 - 20,966 Sweden 25,821 6 3 - 141 47 16 - - 25,608 United Kingdom 167,429 123 30 2 1,301 510 168 6 8 165,281 Southern Europe 62,782 12 2 1 120 53 19 1 - 62,574 Greece 2,282 - - - 1 1 - - - 2,280 Italy 25,678 7 2 1 82 35 13 1 - 25,537 Portugal 2,875 - - - 6 2 - - - 2,867 Spain 31,947 5 - - 31 15 6 - - 31,890 Union of Serbia
Montenegro 5 - - - - - - - - - - Montenegro, Rep.6* - - - - - - - - - - Serbia, Rep.6* - - - - - - - - - - Eastern Europe 41,329 7 - - 11 15 3 1 - 41,292 Comm. of Ind. States 6,787 - - - - 2 - - - 6,785 Poland 8,141 - - - 2 - - - - 8,139 Russian Federation 3 26,401 7 - - 9 13 3 1 - 26,368 East Mediterranean Europe 24,330 1 - - 1 2 - - - 24,326 Israel 16,721 1 - - 1 1 - - - 16,718 Turkey 7,609 - - - - 1 - - - 7,608 Oceania 315,416 209 44 - 2,148 830 247 10 4 311,924 Australia 245,786 190 37 - 1,935 750 221 8 4 242,641 Guam 38,777 - - - - - - - - 38,777 Nauru 17 - - - - - - - - 17 New Zealand 23,105 19 7 - 213 80 26 1 - 22,759 Papua New Guinea 7,731 - - - - - - 1 - 7,730 Africa 6,331 - - - 3 - - - - 6,328 Nigeria 1,489 - - - - - - - - 1,489 South Africa 4,842 - - - 3 - - - - 4,839
Continued
Year/ Country of Residence Age Group
Not Stated
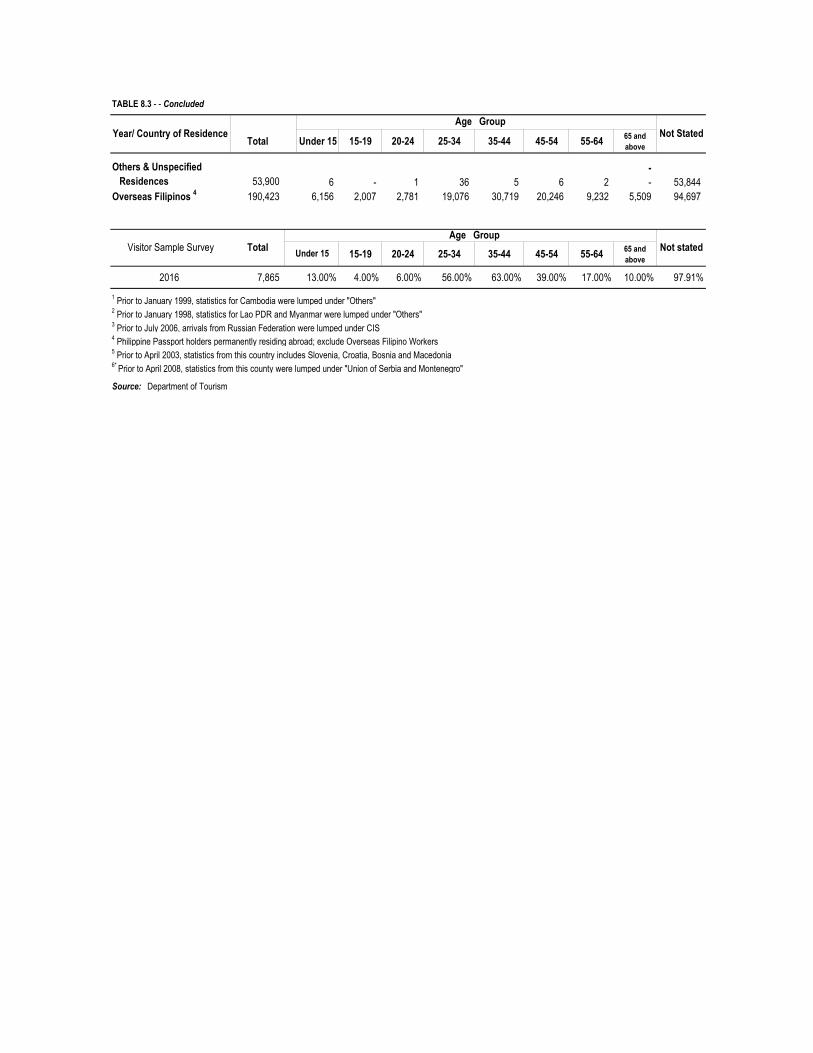
TABLE 8.3 - - Concluded
Total Under 15 15-19 20-24 25-34 35-44 45-54 55-64 65 and above
Others & Unspecified - Residences 53,900 6 - 1 36 5 6 2 - 53,844 Overseas Filipinos 4 190,423 6,156 2,007 2,781 19,076 30,719 20,246 9,232 5,509 94,697
15-19 20-24 25-34 35-44 45-54 55-64 65 and above
2016 7,865 13.00% 4.00% 6.00% 56.00% 63.00% 39.00% 17.00% 10.00% 97.91%1 Prior to January 1999, statistics for Cambodia were lumped under "Others"2 Prior to January 1998, statistics for Lao PDR and Myanmar were lumped under "Others"3 Prior to July 2006, arrivals from Russian Federation were lumped under CIS4 Philippine Passport holders permanently residing abroad; exclude Overseas Filipino Workers5 Prior to April 2003, statistics from this country includes Slovenia, Croatia, Bosnia and Macedonia6* Prior to April 2008, statistics from this county were lumped under "Union of Serbia and Montenegro"
Source: Department of Tourism
Year/ Country of Residence Age Group
Not Stated
Visitor Sample Survey Total Age Group
Not statedUnder 15

TABLE 8.4 Air Visitor Arrivals by Country of Residence and Purpose of Travel: 2005 to 2018
Total Holiday Business Official Mission
Conven-tion
Visit Friends and
RelativesIncentive Health
Medical Education Shop Others Not Reported
2005 2,586,367 1,173,578 331,648 2,521 31,082 693,583 385 … … … 128,240 225,3302006 2,807,234 1,319,080 370,084 3,012 35,803 748,406 509 2,258 … … 137,918 190,1642007 3,041,872 1,439,261 410,604 3,239 36,634 778,503 406 6,455 … … 155,664 211,1062008 3,084,753 1,439,339 425,307 3,361 35,912 790,523 312 7,517 14,234 159 157,910 210,1792009 2,960,282 1,327,030 371,056 3,406 33,198 757,781 341 6,442 20,634 46 158,196 282,1522010 3,461,007 860,776 172,283 5,412 16,701 261,348 94 4,615 22,507 - 81,699 2,035,5722011 3,884,055 1,578,072 366,427 3,628 32,839 361,763 206 6,061 18,444 - 152,522 1,364,0932012 4,237,935 2,364,346 432,991 2,699 45,635 147,168 146 8,427 14,584 - 169,898 1,052,0412013 4,637,026 2,762,718 457,361 2,907 45,737 134,686 213 8,694 13,253 - 166,259 1,045,1982014 r 6,899,449 4,141,578 344,327 20,028 58,025 445,762 4,070 14,054 62,099 - 267,377 1,542,1292015 5,290,880 2,982,394 401,342 21,384 60,860 465,366 2,498 14,316 63,389 - 195,964 1,083,3672016 5,894,634 3,412,503 403,369 19,972 62,975 513,235 830 13,932 65,346 - 228,582 1,173,8902017 6, 899, 450 4,141,578 344, 327 20, 028 58, 025 445,762 4,070 14,054 62,099 1 267,377 1,542,129
Asia 4,416,290 2,778,327 235,413 11,468 41,068 124,383 2,002 2,735 49,298 1 158,287 1,013,308ASEAN 500,630 212,174 80,771 3,009 18,581 25,018 1,057 863 13,177 - 33,482 112,498
Brunei 9,516 6,115 249 92 295 570 - 2 148 - 511 1,534 Cambodia 4,131 1,455 147 213 341 212 - 7 326 - 328 1,102 Indonesia 62,851 23,092 5,997 650 2,797 2,656 85 107 2,809 - 6,875 17,783 Laos 1,183 318 40 114 204 41 - 4 96 - 96 270 Malaysia 140,407 65,031 17,727 392 4,170 5,903 358 251 1,968 9,238 35,369 Myanmar 5,617 2,124 251 140 337 267 6 7 368 - 424 1,693 Singapore 171,514 71,724 42,857 445 6,345 10,982 582 364 1,371 - 6,504 30,340 Thailand 58,745 22,835 9,760 700 2,869 2,696 10 83 2,134 - 5,350 12,308 Vietnam 46,666 19,480 3,743 263 1,223 1,691 16 38 3,957 - 4,156 12,099
East Asia 3,706,314 2,484,082 136,494 6,395 18,874 89,703 562 1,340 26,913 1 110,436 831,514 China 1,135,077 745,779 16,944 1,552 4,058 19,808 302 257 3,436 - 38,544 304,397Hong Kong 111,433 58,285 14,029 102 1,939 7,233 108 114 650 - 4,516 24,457Japan 629,969 384,370 59,858 1,792 7,164 21,060 29 345 7,130 - 23,956 124,265Korea 1,585,784 1,154,475 33,028 2,515 3,416 33,753 109 565 13,050 1 30,547 314,325Macau 9,053 5,380 371 5 126 412 4 5 71 - 366 2,313Taiwan 234,998 135,793 12,264 429 2,171 7,437 10 54 2,576 - 12,507 61,757
South Asia 129,874 37,966 15,998 1,846 3,334 5,339 376 202 8,413 - 11,539 44,861 Bangladesh 4,974 1,463 179 227 241 233 3 4 207 - 403 2,014 India 108,744 30,956 14,953 1,169 2,421 4,188 351 177 7,408 - 9,763 37,358 Iran 2,450 1,060 72 28 10 146 - 1 110 - 179 844 Nepal 3,967 1,303 103 167 239 237 6 4 375 - 322 1,211 Pakistan 4,874 1,518 455 77 192 286 4 5 91 - 532 1,714 Sri Lanka 4,865 1,666 236 178 231 249 12 11 222 - 340 1,720
Middle East 79,472 44,105 2,150 218 279 4,323 7 330 795 - 2,830 24,435 Bahrain 3,638 1,945 62 7 12 276 - 10 29 - 88 1,209 Egypt 2,119 844 115 20 16 114 - 5 24 - 137 844 Jordan 1,122 491 47 8 17 64 - 1 9 - 49 436 Qatar 6,448 3,137 128 22 23 419 2 9 40 - 254 2,414 Kuwait 3,780 2,161 124 17 14 315 - 5 15 - 122 1,007 Saudi Arabia 46,966 26,771 775 103 87 1,613 5 277 591 - 1,690 15,054 United Arab
Emirates 15,399 8,756 899 41 110 1,522 - 23 87 - 490 3,471 America 1,267,409 701,104 42,642 5,105 5,921 188,178 657 4,738 4,375 - 56,652 258,037
North America 1,249,283 690,044 41,603 5,029 5,597 187,502 642 4,721 4,229 - 55,612 254,304 Canada 223,854 134,676 4,304 333 741 31,123 92 261 352 - 9,034 42,938U S A 1,025,429 555,368 37,299 4,696 4,856 156,379 550 4,460 3,877 - 46,578 211,366
Central America 4,071 2,146 459 26 92 156 2 6 40 - 361 783 Mexico 4,071 2,146 459 26 92 156 2 6 40 - 361 783
South America 14,055 8,914 580 50 232 520 13 11 106 - 679 2,950 Argentina 3,413 2,558 78 7 33 100 8 2 15 - 77 535 Brazil 7,002 4,279 368 15 127 274 5 8 50 - 351 1,525 Colombia 2,298 1,323 92 25 48 78 - - 31 - 158 543 Peru 935 519 23 1 22 47 - - 8 - 62 253 Venezuela 407 235 19 2 2 21 - 1 2 - 31 94
Continued
Year/Travel Market
8-8

TABLE 8.4 - - Concluded
Total Holiday Business Official Mission
Conven-tion
Visit Friends and
RelativesIncentive Health
Medical Education Shop Others Not Reported
Europe 714,097 409 39,529 1,750 5,122 58,470 956 724 3,093 - 27,949 167,120Western Europe 261,613 152,535 15,429 650 1,917 21,485 345 253 1,281 - 10,461 57,257
Andorra 272 96 9 6 11 13 - 1 4 - 33 99 Austria 14,032 7,787 613 43 86 1,555 9 11 58 - 566 3,304 Belgium 17,129 9,438 831 50 129 1,726 35 15 74 - 711 4,120 France 73,905 47,692 4,307 178 527 3,431 38 65 536 - 3,012 14,119 Germany 88,354 48,470 5,376 217 647 8,844 201 106 369 - 3,451 20,673 Luxembourg 916 560 47 2 8 104 1 - 1 - 26 167 Netherlands 36,392 20,213 2,869 61 299 3,052 34 42 154 - 1,577 8,091 Switzerland 30,613 18,279 1,377 93 210 2,760 27 13 85 - 1,085 6,684
Northern Europe 291,158 162,445 15,026 542 1,850 30,686 494 293 766 - 10,614 68,442 Denmark 17,711 10,590 1,262 28 95 1,425 6 18 101 - 550 3,636 Finland 7,137 4,632 410 9 54 543 5 8 14 - 231 1,231 Ireland 19,896 10,666 1,063 64 123 1,687 31 25 41 - 922 5,274 Norway 23,303 12,897 863 47 82 2,936 126 15 82 - 689 5,566 Sweden 27,246 17,156 932 45 138 2,610 83 23 105 - 702 5,452 United Kingdom 195,865 106,504 10,496 349 1,358 21,485 243 204 423 - 7,520 47,283
Southern Europe 85,701 49,581 5,109 189 776 3,993 69 98 304 - 3,460 22,122 Greece 3,003 1,247 545 7 52 140 1 5 16 - 167 823 Italy 33,309 18,302 2,411 77 414 1,903 27 38 112 - 1,386 8,639 Portugal 5,427 3,460 313 9 49 179 2 13 25 - 205 1,172 Spain 43,962 26,572 1,840 96 261 1,771 39 42 151 - 1,702 11,488
Eastern Europe 47,224 28,618 1,568 278 365 1,406 45 49 644 - 2,449 11,802 Commonwealth of Independent States 7,198 3,557 398 95 161 270 8 14 132 - 656 1,907 Poland 12,065 8,089 684 25 62 362 6 5 63 - 297 2,472 Russian Federation 27,961 16,972 486 158 142 774 31 30 449 - 1,496 7,423 East Mediterranean Eur 28,401 16,205 2,397 91 214 900 3 31 98 - 965 7,497 Israel 20,285 12,098 1,744 56 103 541 - 19 29 - 457 5,238 Turkey 8,116 4,107 653 35 111 359 3 12 69 - 508 2,259
Oceania 351,131 173,133 22,279 989 3,677 60,740 409 4,347 1,981 0 14,930 68,646Australia 277,142 137,430 18,971 767 2,602 49,894 341 458 1,185 - 11,401 54,093 Guam 32,357 16,628 644 80 177 3,861 1 3,541 186 - 1,322 5,917 Nauru 38 9 3 2 11 - - - 2 - 2 9 New Zealand 33,120 15,536 2,064 70 438 6,465 67 54 138 - 1,367 6,921 Papua New Guinea 8,474 3,530 597 70 449 520 - 294 470 - 838 1,706
Africa 9,284 4,374 653 51 214 474 4 17 493 - 646 2,358 Nigeria 2,104 463 74 24 62 94 - 7 429 - 194 757 South Africa 7,180 3,911 579 27 152 380 4 10 64 - 452 1,601
Others & Unspecified Residences 69,369 36,617 3,442 598 1,883 3,402 38 1,105 2,535 - 3,531 16,218 Overseas Filipinos 1 71,870 38,639 369 67 140 10,115 4 388 324 - 5,382 16,442
1 Philippine Passport holders permanently residing abroad, exclude Overseas Filipino Workers
Source: Department of Tourism
Year/Travel Market
8-9

TABLE 8.5 Number of Visitor Arrivals, Average Daily Expenditure, Average Length of Stay and Amount of Visitor Receipts: 2002 to 2018
NumberAverage Daily Expenditure
(in US$)
Average Length of
Stay (nights)
Total Receipts (in million
US$)Number
Average Daily Expenditure
(in US$)
Average Length of
Stay (nights)
Total Receipts (in million
US$)
Total Visitor Receipts (in million US$)
2002 1,848,923 102.89 8.78 1,675.64 83,754 52.67 17.38 64.41 1,740.052003 1,806,902 89.45 8.91 1,441.62 100,324 48.49 17.74 81.05 1,522.672004 2,187,610 91.63 8.92 1,900.44 103,742 51.77 17.68 90.37 1,990.812005 2,497,689 84.06 8.41 2,151.55 125,395 39.76 21.47 84.49 2,236.052006 2,696,980 84.70 10.98 3,116.86 146,365 55.78 48.02 194.73 2,753.112007 2,911,254 85.79 9.72 4,541.52 180,739 50.36 22.82 218.30 2,957.002008 2,944,135 75.31 9.25 2,275.66 195,287 44.37 20.44 153.03 2,428.692009 2,819,178 75.89 8.65 2,080.40 197,921 68.65 17.31 155.52 2,235.922010 3,292,026 84.08 7.83 2,257.14 228,445 79.57 13.70 233.09 2,490.232011 3,710,302 92.46 7.94 2,822.97 207,152 42.72 16.64 171.42 2,993.972012 4,056,868 93.64 9.43 3,621.60 215,943 40.47 23.42 196.17 3,817.782013 4,477,695 101.89 9.44 4,223.96 203,612 38.48 18.84 173.15 4,397.102014 4,625,464 104.18 10.54 4,646.30 207,904 55.99 17.02 192.06 4,838.372015 5,148,819 107.78 9.84 4,851.99 211,863 52.30 18.20 150.43 5,002.412016 5,776,582 101.85 9.08 5,444.08 190,423 53.74 13.91 128.50 5,572.582017 6,480,297 129.80 9.04 6,559.29 140,611 30.78 19.18 92.96 6,652.25
2018 7,055,808 109.65 9.05 7,575.65 71,870 29.91 14.30 71.33 7,646.98
January 724,586 127.51 9.10 742.53 7,920 20.93 17.30 2.87 745.40February 668,630 127.23 9.36 793.32 5,201 16.03 20.00 1.67 794.99March 635,485 104.72 9.10 587.77 7,272 7.00 20.00 1.02 588.79April 583,996 124.16 9.26 594.76 7,141 24.91 14.40 2.55 597.31May 531,175 106.25 9.67 510.67 6,568 35.56 17.42 4.07 514.74June 523,246 93.85 8.86 416.68 5,501 17.50 22.00 4.56 421.24July 594,356 93.02 9.68 555.92 6,966 38.42 16.33 6.27 562.19August 537,948 101.04 8.63 417.32 4,302 31.82 5.50 3.75 421.07September 508,373 106.38 8.71 480.68 3,867 64.28 11.50 3.58 484.26October 513,580 104.25 9.03 484.23 4,782 35.58 7.00 4.50 488.73November 554,356 111.18 8.85 577.52 4,701 13.55 8.50 4.62 582.14December 680,077 114.51 8.32 711.10 7,649 114.51 8.32 7.29 718.39
Source: Department of Tourism
Year/Month
Foreign Visitors Overseas Filipinos
8-10

TABLE 8.6 Average Number of Rooms and Occupancy Rates of Hotels in the National Capital Region by Hotel Category: 1998 to 2017
Economy
Average number of rooms1998 13,320 6,771 2,578 2,946 1,0251999 13,035 7,046 2,474 2,969 5462000 13,063 7,056 2,520 3,080 4072001 11,784 6,874 1,779 2,770 3612002 11,878 6,645 1,328 3,291 6142003 12,212 7,255 885 3,367 7052004 12,494 7,617 885 3,567 4252005 12,842 7,796 889 3,727 4302006 14,200 8,103 1,668 3,855 5742007 14,149 7,839 1,770 3,996 5442008 14,048 7,744 1,818 3,852 6342009 14,415 8,086 1,824 3,827 6782010 15,141 8,363 1,821 4,247 7102011 15,567 8,887 1,332 4,423 9252012 16,145 8,965 1,545 4,747 8882013 15,971 8,916 1,599 4,632 8242014 15,371 8,426 1,620 5,042 2862015 16,352 8,770 1,661 5,435 4862016 13,460 7,458 964 4,598 4402017 11,936 7,070 707 3,834 325
Average occupancy rate (in percent)1998 56.9 60.4 54.6 53.3 50.51999 59.2 65.9 52.4 53.2 36.12000 58.8 65.3 50.8 53.1 38.02001 55.9 58.4 54.2 52.5 41.12002 59.9 62.7 59.9 55.9 51.32003 60.1 61.2 59.9 59.0 54.12004 68.2 71.0 65.8 64.3 54.12005 72.0 74.0 70.2 67.9 65.92006 72.0 73.6 72.3 70.3 58.42007 73.1 73.8 75.9 71.8 61.82008 69.8 70.1 69.0 70.8 62.32009 64.8 64.6 60.3 67.4 64.62010 67.6 70.5 62.4 65.7 59.02011 67.7 72.4 62.1 67.3 58.62012 67.3 71.5 58.0 64.8 53.42013 67.2 70.8 60.1 65.3 52.22014 67.2 71.1 58.8 64.0 59.72015 67.3 71.6 59.1 62.5 62.62016 66.8 68.3 58.6 64.7 57.62017 64.7 69.1 51.2 60.4 58.1
Source: Department of Tourism
Year TotalHotel Category
De Luxe First Class Standard
8-11

TABLE 8.7 Outbound Philippine Residents by Port of Disembarkation: 2009 to 2016
Port of Disembarkation 2009 2010* 2011 2012 2013 2014 2015 2016
Total 3,186,122 2,606,114 2,864,146 2,822,326 3,488,022 5,114,893 5,702,816
Abu Dhabi 81,263 97,118 126,119 114,645 168,923 132,963 124,005Addis Ababa - - - - - 5,222 18,871Amsterdam 47,917 31,292 25,361 24,398 37,419 59,654 55,593Ankara 45 - - - - - -Atlanta, GA - - - - - - -Athens - - - - - - -Bahrain 109,276 53,779 52,841 30,168 50,363 38,924 33,894Baltimore, MD - - - - - - 736Bandar Seri Begawan 22,043 24,833 27,936 29,241 32,277 51,233 55,705Bangkok 161,015 131,254 153,191 147,770 120,904 165,263 166,143Batumi - - - 12 - - -Beijing 14,437 23,263 23,407 27,269 32,569 76,133 94,774Beijing (Peking) - 35 - 6 124 - 106Bishkek - - - - - - -Bombay - - - - - - -Brisbane - 31 - 925 13,106 13,188 6,946Brussels - - - - - - -Busan 10,667 10,142 11,252 27,921 28,594 - -Cairo - - - - - - -Carajas, PA - - - 7 - - -Cheju - - - - - - -Chengdu - - 2 - - - -Chicago - - - - - - -Chongoing - - 24 - - - -Culiacan - - - - - - -Damascus - - - 56 - - -Darwin, Nt - 2,506 3,562 4,881 957 - 17,874Denpasar-Bali - - 1,113 11,531 18,376 33,140 35,915Dhangsha - - - 1 - - -Dharan 1,179 6,335 7,533 9,278 32,522 51,496 53,745Dhaka - - - - - - -Dili 129 - 1,103 1,403 1,615 - -Doha 144,210 91,791 100,490 92,837 105,957 132,048 151,414Dubai 147,539 125,872 128,148 163,360 250,619 238,427 244,818Frankfurt - - - - 18,444 - -Fukuoka 8,291 4,941 5,424 11,356 - 30,257 33,013Ganzhou, Pr - - - - - - -Geneva - - - - - - -Guam 25,724 16,047 15,553 18,449 32,104 71,633 90,693Guangzhou 11,811 21,578 27,386 40,886 30,507 92,246 130,685Hamburg - - - - - - -Hangzhou 279 - 13 23 88 - 4Hanoi 63 - 4,235 5,524 7,433 16,520 16,867Heathrow, London PR - - - 474 13,492 23,948 18,986Hiroshima - - - - - - -Hawaii 20,897 - - - - - -Ho Chi Minh City 30,409 36,395 39,556 30,099 37,843 67,631 71,935
Continued

TABLE 8.7 ---Continued
Port of Disembarkation 2009 2010* 2011 2012 2013 2014 2015 2016
Hong Kong 805,672 627,788 692,173 526,952 543,238 752,299 790,035Honolulu - - - - - 26,847 23,773Hua Hin 55 - - - - - -Huron, Sd - - - - - - -Istanbul - - - - - 7,695 24,169Jakarta 15,045 14,349 17,187 29,773 32,447 37,395 42,511Jeddha 49,569 44,362 45,449 18,663 40,363 52,410 46,348Kandahar - - - - - - -Kaoshoung 7,795 3,716 4,228 6,846 9,920 14,124 18,767Karachi - - - - - - -Khabarovsk - - - - - - -Khost - - - 9 - - -Kitakyushu - - - 3 - - -Koror 1,504 722 994 452 210 447 3,927Kota Kinabalu 26,650 12,672 14,595 9,841 21,513 38,116 38,703Kuala Lumpur 69,704 69,585 97,900 111,701 151,454 288,816 304,730Kunming, P R 72 - - - - - -Kuwait 36,197 19,222 20,937 21,987 28,974 39,739 45,298Kwangju - - - - - - -Kwethluk, AK - 99 - - 55 - -Lahore - 4 - - - - -London 454 239 - 59 - - -Los Angeles 61,732 33,385 31,060 34,601 49,558 49,072 36,921Macau 66,022 46,466 50,766 46,790 58,992 91,399 89,444Malta - - - - 1,004 - -Manado 48 - - - - - -Melbourne 6,162 675 1,077 2,319 885 6,463 19,395Miri - - - - 1 - -Misawa - - - - - - -Monrovia 138 - - - - - -Moscow 50 2 - - 2 - -Muscat - - - - 1,131 32,048 35,779Nagoya 49,050 31,803 36,888 38,977 65,371 59,496 83,736Nagpur - - - - - - -Nanchang - 59 - - - - -Nanning - - 58 - - - -Narita 6,345 44,957 47,729 47,509 58,110 93,192 155,201Nauru - - - - - - -Nevada 135 - - - - - -New Delhi - 1,073 - - - - -Ningbo - - - 1 - - -Noumea 1,116 96 219 - - - -New York - - - - - - -Okinawa - - - - - - -Osaka 26,141 15,851 20,406 32,968 55,578 94,368 111,555Papeete, Tahiti 1 - - - - - -Paris - - - - 3 - -Perth 68 - - - - - -Phnom Penh - 4 2,516 44 - - 6,763
Continued

TABLE 8.7 - - Concluded
Port of Disembarkation 2009 2010* 2011 2012 2013 2014 2015 2016
Phuket - - - - 2,173 6,459 5,025 5,832Pomala - 49 - - - 42 -Popondetta - - - - - - -Port Moresby 6,130 7,652 11,928 14,538 11,411 21,412 27,980Port-Au-Prince 155 - - - - - -Prague - - 3 - 189 - -Puerto Deseado, Sc - - - - - - -Pusan - - - - - 57,294 92,068Riyadh 47,891 37,836 36,395 41,753 76,444 61,083 68,549Rome - - - - - - -Saipan, Mariana Is - - - - 71 - 4,248San Diego - - - - - - -San Francisco 41,721 22,538 20,810 25,812 33,674 35,951 33,639San'a 64 - - - - - -Santa Maria, RS - 3 1 - - - -Savannah, GA - - - - - - -Seattle - - - - - - -Seoul 111,371 80,717 88,300 162,804 206,808 432,638 514,082Shanghai 28,361 26,490 28,338 32,532 47,943 101,101 108,244Siem Reap - - 4,173 13,856 11,792 22,139 15,486Singapore 507,798 592,640 616,056 526,704 548,623 742,333 752,950Sydney 28,750 19,960 21,275 30,749 49,563 88,079 85,976Taegu - - - - - - -Taipei 101,525 71,039 75,929 94,787 105,408 155,235 247,533Takamatsu - - - - - - -Tashkent - - - - 394 - -Tianjin, PR - - - - - - -Tokyo 126,502 39,860 46,686 65,759 111,692 273,967 260,135Toronto - - - 361 - 126 -Tripoli - - - - - - -US Hawaii - 10,955 11,183 15,577 23,033 - -Vancouver 32,156 17,259 17,565 20,196 43,677 45,339 36,644Vladivostok - - 29 - - - -Vientiane 1 103 - - - - - -Washington D.C. 2 - - - - - -Wellington - - - - - - -Wuhan - - - - - - -Xiamen 29,789 25,593 30,781 43,603 55,005 88,915 107,337Yuzhno-Sakhalinsk - - - - - - -Zurich 62 - - - - - -Others 58,832 9,182 16,263 9,107 2,791 362 42,336
1 Prior 2009, statistics from Ventiane was lumped under "Others".* Data not available
Source: Department of Tourism

TABLE 8.8 Outbound Philippine Residents by Nationality: 1999 to 2016
American British Chinese Indian Japanese Spanish Others
1999 1,754,936 1,724,941 2,358 606 21,063 1,498 605 123 3,7422000 1,670,040 1,647,366 1,944 465 14,880 1,499 598 89 3,1992001 1,787,157 1,765,737 1,732 481 14,272 1,316 492 79 3,0482002 1,968,554 1,942,316 1,956 659 17,809 1,570 552 101 3,5912003 1,803,013 1,780,454 2,074 693 13,538 1,709 666 125 3,7542004 1,919,945 1,902,877 1,520 550 11,028 968 386 133 2,4832005 2,143,671 2,127,103 1,403 431 11,102 977 355 95 2,2052006 2,745,191 2,719,326 2,229 768 16,849 1,764 504 186 3,5652007 3,065,597 3,033,295 2,920 961 20,283 2,217 822 180 4,9192008 3,354,857 3,322,996 2,383 997 20,443 2,314 759 156 4,8092009 3,188,131 3,157,274 2,505 1,121 18,948 1,786 743 170 5,5842010 … … … … … … … … …2011 2,606,114 2,581,521 1,814 811 15,370 1,418 578 150 4,4522012 2,864,146 2,838,340 1,436 649 17,637 1,355 468 151 4,1102013 2,822,326 2,803,421 930 256 13,023 1,395 278 83 2,9402014 3,488,022 3,485,530 217 46 1,377 156 52 13 6312015 5,114,893 5,114,294 19 7 371 33 14 1 1542016 5,702,816 5,702,110 79 17 402 18 15 5 170
January 473,995 473,951 0 1 31 2 0 0 10February 389,942 389,886 0 0 41 2 0 0 13March 478,427 478,300 31 7 54 2 2 0 31April 505,016 504,878 38 7 63 5 5 1 19May 587,061 587,011 4 0 30 0 3 1 12June 491,161 491,122 0 0 29 1 2 1 6July 454,731 454,695 0 1 26 0 1 0 8August 473,222 473,196 1 0 17 1 0 1 6September 405,374 405,326 1 0 30 0 1 0 16October 429,283 429,218 2 1 31 2 0 1 28November 447,380 447,351 1 0 22 0 0 0 6December 567,224 567,176 1 0 28 3 1 0 15
Source: Department of Tourism
Year/Month Total Philippine Nationals
Foreign Nationals
8-15
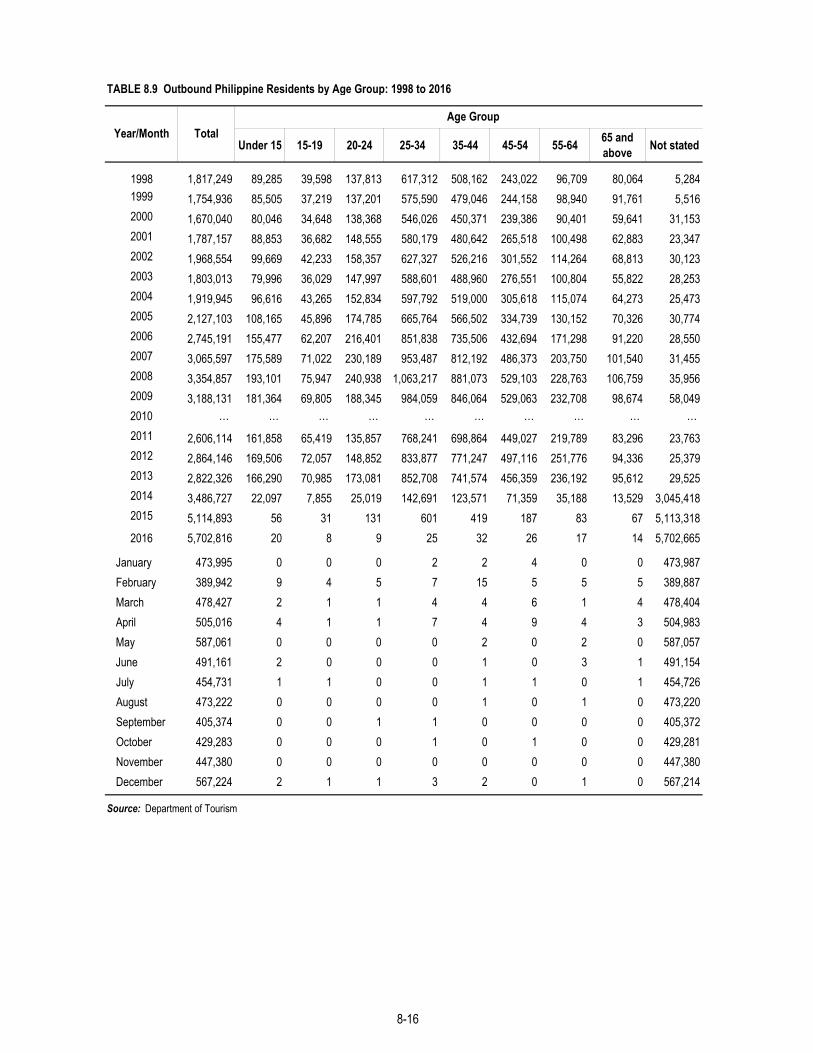
TABLE 8.9 Outbound Philippine Residents by Age Group: 1998 to 2016
Under 15 15-19 20-24 25-34 35-44 45-54 55-64 65 and above Not stated
1998 1,817,249 89,285 39,598 137,813 617,312 508,162 243,022 96,709 80,064 5,2841999 1,754,936 85,505 37,219 137,201 575,590 479,046 244,158 98,940 91,761 5,5162000 1,670,040 80,046 34,648 138,368 546,026 450,371 239,386 90,401 59,641 31,1532001 1,787,157 88,853 36,682 148,555 580,179 480,642 265,518 100,498 62,883 23,3472002 1,968,554 99,669 42,233 158,357 627,327 526,216 301,552 114,264 68,813 30,1232003 1,803,013 79,996 36,029 147,997 588,601 488,960 276,551 100,804 55,822 28,2532004 1,919,945 96,616 43,265 152,834 597,792 519,000 305,618 115,074 64,273 25,4732005 2,127,103 108,165 45,896 174,785 665,764 566,502 334,739 130,152 70,326 30,7742006 2,745,191 155,477 62,207 216,401 851,838 735,506 432,694 171,298 91,220 28,5502007 3,065,597 175,589 71,022 230,189 953,487 812,192 486,373 203,750 101,540 31,4552008 3,354,857 193,101 75,947 240,938 1,063,217 881,073 529,103 228,763 106,759 35,9562009 3,188,131 181,364 69,805 188,345 984,059 846,064 529,063 232,708 98,674 58,0492010 … … … … … … … … … …2011 2,606,114 161,858 65,419 135,857 768,241 698,864 449,027 219,789 83,296 23,7632012 2,864,146 169,506 72,057 148,852 833,877 771,247 497,116 251,776 94,336 25,3792013 2,822,326 166,290 70,985 173,081 852,708 741,574 456,359 236,192 95,612 29,5252014 3,486,727 22,097 7,855 25,019 142,691 123,571 71,359 35,188 13,529 3,045,4182015 5,114,893 56 31 131 601 419 187 83 67 5,113,3182016 5,702,816 20 8 9 25 32 26 17 14 5,702,665
January 473,995 0 0 0 2 2 4 0 0 473,987February 389,942 9 4 5 7 15 5 5 5 389,887March 478,427 2 1 1 4 4 6 1 4 478,404April 505,016 4 1 1 7 4 9 4 3 504,983May 587,061 0 0 0 0 2 0 2 0 587,057June 491,161 2 0 0 0 1 0 3 1 491,154July 454,731 1 1 0 0 1 1 0 1 454,726August 473,222 0 0 0 0 1 0 1 0 473,220September 405,374 0 0 1 1 0 0 0 0 405,372October 429,283 0 0 0 1 0 1 0 0 429,281November 447,380 0 0 0 0 0 0 0 0 447,380December 567,224 2 1 1 3 2 0 1 0 567,214
Source: Department of Tourism
Year/Month Total Age Group
8-16
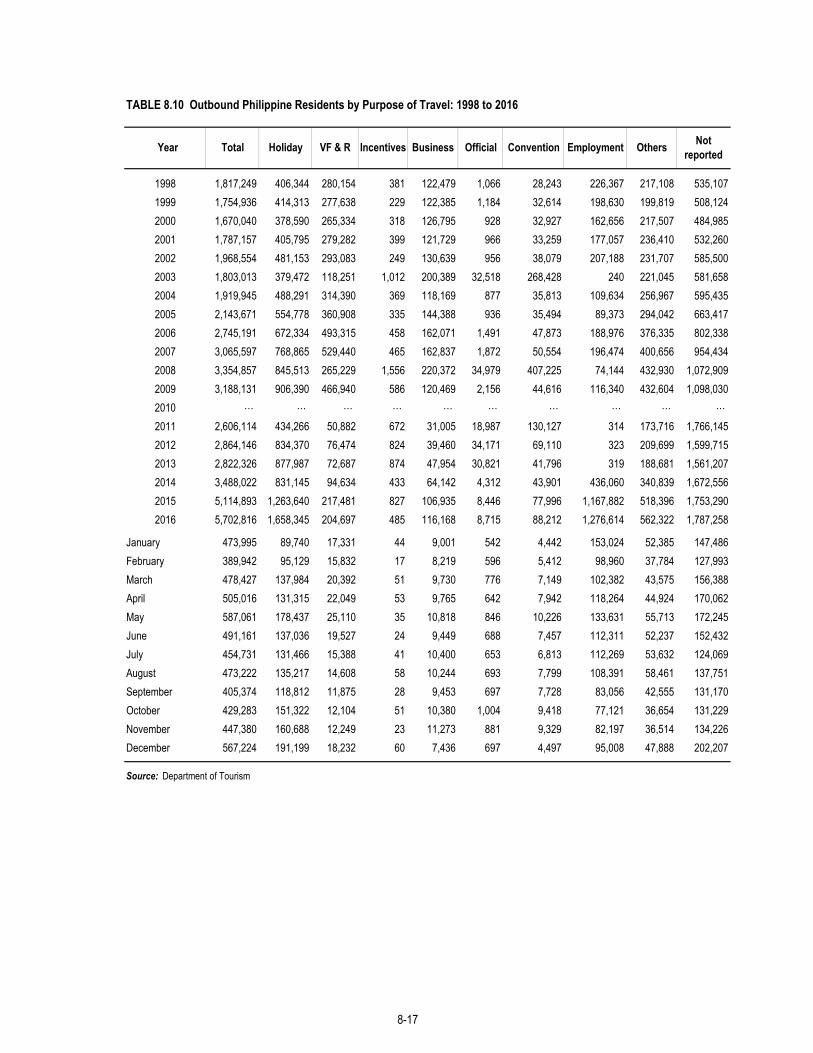
TABLE 8.10 Outbound Philippine Residents by Purpose of Travel: 1998 to 2016
1998 1,817,249 406,344 280,154 381 122,479 1,066 28,243 226,367 217,108 535,1071999 1,754,936 414,313 277,638 229 122,385 1,184 32,614 198,630 199,819 508,1242000 1,670,040 378,590 265,334 318 126,795 928 32,927 162,656 217,507 484,9852001 1,787,157 405,795 279,282 399 121,729 966 33,259 177,057 236,410 532,2602002 1,968,554 481,153 293,083 249 130,639 956 38,079 207,188 231,707 585,5002003 1,803,013 379,472 118,251 1,012 200,389 32,518 268,428 240 221,045 581,6582004 1,919,945 488,291 314,390 369 118,169 877 35,813 109,634 256,967 595,4352005 2,143,671 554,778 360,908 335 144,388 936 35,494 89,373 294,042 663,4172006 2,745,191 672,334 493,315 458 162,071 1,491 47,873 188,976 376,335 802,3382007 3,065,597 768,865 529,440 465 162,837 1,872 50,554 196,474 400,656 954,4342008 3,354,857 845,513 265,229 1,556 220,372 34,979 407,225 74,144 432,930 1,072,9092009 3,188,131 906,390 466,940 586 120,469 2,156 44,616 116,340 432,604 1,098,0302010 … … … … … … … … … …
2011 2,606,114 434,266 50,882 672 31,005 18,987 130,127 314 173,716 1,766,1452012 2,864,146 834,370 76,474 824 39,460 34,171 69,110 323 209,699 1,599,7152013 2,822,326 877,987 72,687 874 47,954 30,821 41,796 319 188,681 1,561,2072014 3,488,022 831,145 94,634 433 64,142 4,312 43,901 436,060 340,839 1,672,5562015 5,114,893 1,263,640 217,481 827 106,935 8,446 77,996 1,167,882 518,396 1,753,2902016 5,702,816 1,658,345 204,697 485 116,168 8,715 88,212 1,276,614 562,322 1,787,258
January 473,995 89,740 17,331 44 9,001 542 4,442 153,024 52,385 147,486February 389,942 95,129 15,832 17 8,219 596 5,412 98,960 37,784 127,993March 478,427 137,984 20,392 51 9,730 776 7,149 102,382 43,575 156,388April 505,016 131,315 22,049 53 9,765 642 7,942 118,264 44,924 170,062May 587,061 178,437 25,110 35 10,818 846 10,226 133,631 55,713 172,245June 491,161 137,036 19,527 24 9,449 688 7,457 112,311 52,237 152,432July 454,731 131,466 15,388 41 10,400 653 6,813 112,269 53,632 124,069August 473,222 135,217 14,608 58 10,244 693 7,799 108,391 58,461 137,751September 405,374 118,812 11,875 28 9,453 697 7,728 83,056 42,555 131,170October 429,283 151,322 12,104 51 10,380 1,004 9,418 77,121 36,654 131,229November 447,380 160,688 12,249 23 11,273 881 9,329 82,197 36,514 134,226December 567,224 191,199 18,232 60 7,436 697 4,497 95,008 47,888 202,207
Source: Department of Tourism
Year Total Holiday VF & R Incentives Business Official Convention Employment Others Not reported
8-17

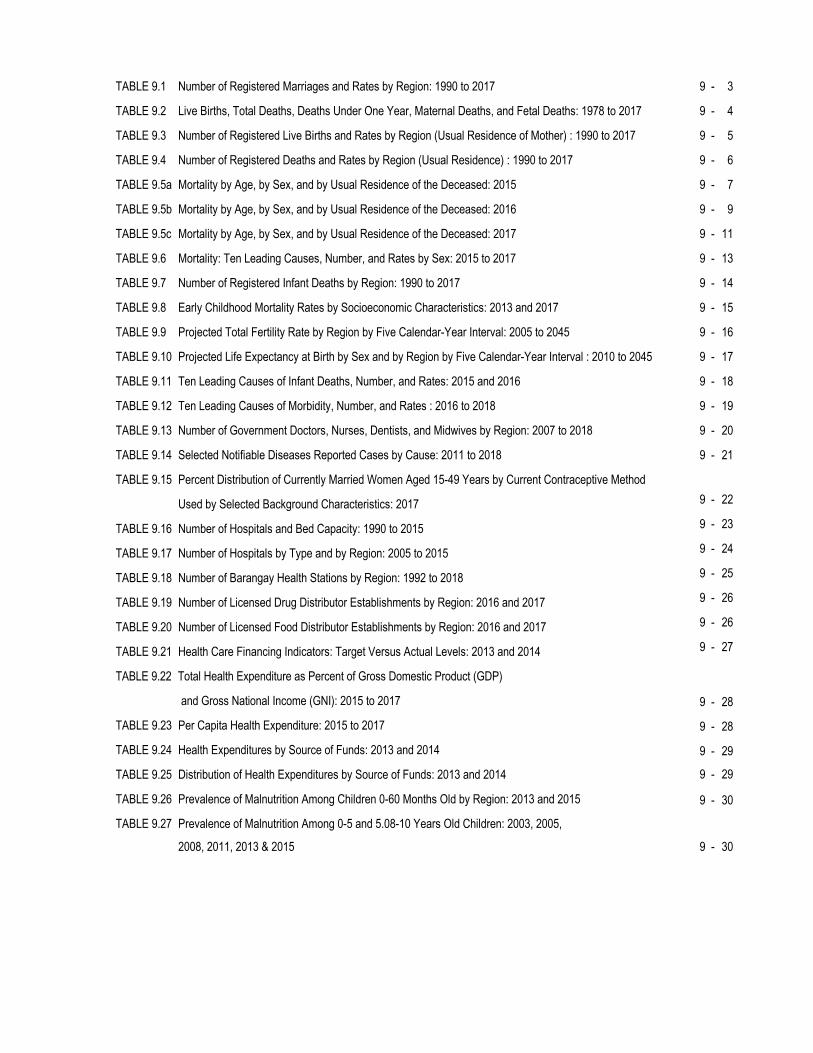
TABLE 9.1 Number of Registered Marriages and Rates by Region: 1990 to 2017 9 - 3
TABLE 9.2 Live Births, Total Deaths, Deaths Under One Year, Maternal Deaths, and Fetal Deaths: 1978 to 2017 9 - 4
TABLE 9.3 Number of Registered Live Births and Rates by Region (Usual Residence of Mother) : 1990 to 2017 9 - 5
TABLE 9.4 Number of Registered Deaths and Rates by Region (Usual Residence) : 1990 to 2017 9 - 6
TABLE 9.5a Mortality by Age, by Sex, and by Usual Residence of the Deceased: 2015 9 - 7
TABLE 9.5b Mortality by Age, by Sex, and by Usual Residence of the Deceased: 2016 9 - 9
TABLE 9.5c Mortality by Age, by Sex, and by Usual Residence of the Deceased: 2017 9 - 11
TABLE 9.6 Mortality: Ten Leading Causes, Number, and Rates by Sex: 2015 to 2017 9 - 13
9 - 14
9 - 15
9 - 16
9 - 17
9 - 18
9 - 19
9 - 20
9 - 21
9 - 22
9 - 23
9 - 24
9 - 25
9 - 26
9 - 26
9 - 27
9 - 28
9 - 28
9 - 29
9 - 29
9 - 30
TABLE 9.7 Number of Registered Infant Deaths by Region: 1990 to 2017
TABLE 9.8 Early Childhood Mortality Rates by Socioeconomic Characteristics: 2013 and 2017
TABLE 9.9 Projected Total Fertility Rate by Region by Five Calendar-Year Interval: 2005 to 2045
TABLE 9.10 Projected Life Expectancy at Birth by Sex and by Region by Five Calendar-Year Interval : 2010 to 2045
TABLE 9.11 Ten Leading Causes of Infant Deaths, Number, and Rates: 2015 and 2016
TABLE 9.12 Ten Leading Causes of Morbidity, Number, and Rates : 2016 to 2018
TABLE 9.13 Number of Government Doctors, Nurses, Dentists, and Midwives by Region: 2007 to 2018
TABLE 9.14 Selected Notifiable Diseases Reported Cases by Cause: 2011 to 2018
TABLE 9.15 Percent Distribution of Currently Married Women Aged 15-49 Years by Current Contraceptive Method
Used by Selected Background Characteristics: 2017
TABLE 9.16 Number of Hospitals and Bed Capacity: 1990 to 2015
TABLE 9.17 Number of Hospitals by Type and by Region: 2005 to 2015
TABLE 9.18 Number of Barangay Health Stations by Region: 1992 to 2018
TABLE 9.19 Number of Licensed Drug Distributor Establishments by Region: 2016 and 2017
TABLE 9.20 Number of Licensed Food Distributor Establishments by Region: 2016 and 2017
TABLE 9.21 Health Care Financing Indicators: Target Versus Actual Levels: 2013 and 2014
TABLE 9.22 Total Health Expenditure as Percent of Gross Domestic Product (GDP)
and Gross National Income (GNI): 2015 to 2017
TABLE 9.23 Per Capita Health Expenditure: 2015 to 2017
TABLE 9.24 Health Expenditures by Source of Funds: 2013 and 2014
TABLE 9.25 Distribution of Health Expenditures by Source of Funds: 2013 and 2014
TABLE 9.26 Prevalence of Malnutrition Among Children 0-60 Months Old by Region: 2013 and 2015
TABLE 9.27 Prevalence of Malnutrition Among 0-5 and 5.08-10 Years Old Children: 2003, 2005,
2008, 2011, 2013 & 2015 9 - 30

TABLE 9.1 Number of Registered Marriages and Rates by Region: 1990 to 2017 (Rates per 1,000 population)
Number Rate Number Rate Number Rate Number Rate Number Rate Number Rate Number Rate Number Rate Number Rate Number Rate Number Rate Number Rate Number Rate Number Rate Number Rate Number Rate Number Rate Number Rate1990 422,041 6.8 84,502 10.4 6,260 5.4 25,607 7.0 15,460 6.5 54,192 8.4 46,399 7.1 10,493 5.8 22,907 5.7 32,651 5.9 32,499 6.9 15,521 5.0 13,401 5.9 17,757 6.2 19,482 6.5 11,029 4.8 11,817 6.6 2,064 0.9
1991 445,526 7.0 89,478 10.8 7,217 6.0 27,066 7.3 16,451 6.7 52,944 8.0 63,472 9.5 - 0.0 26,602 6.5 34,058 6.0 33,332 6.9 16,329 5.1 14,502 6.2 24,332 8.2 29,422 9.5 8,766 3.7 - 0.0 1,555 0.6
1992 454,155 7.0 89,786 10.5 7,432 6.0 27,375 7.2 16,069 6.4 53,848 7.9 52,225 7.6 12,844 6.7 27,447 6.5 36,592 6.3 34,154 6.9 17,716 5.4 13,960 5.8 18,767 6.2 19,604 6.2 12,516 5.1 11,906 6.2 1,913 0.8
1993 474,407 7.1 93,300 10.7 8,445 6.7 28,773 7.4 16,453 6.4 56,228 8.0 55,477 7.8 14,213 7.3 27,616 6.4 37,422 6.3 35,423 7.0 17,890 5.3 14,219 5.7 20,202 6.5 20,421 6.3 13,380 5.2 13,004 6.6 1,941 0.8
1994 490,164 7.1 101,391 11.4 9,974 7.7 27,965 7.1 17,504 6.6 58,223 8.1 56,653 7.8 13,948 7.0 27,407 6.2 38,537 6.4 35,178 6.8 18,573 5.4 14,597 5.7 19,908 6.2 21,926 6.5 14,000 5.3 12,589 6.3 1,771 0.7
1995 504,300 7.4 98,144 10.4 9,459 7.6 30,727 8.1 19,457 7.7 60,359 8.5 60,836 7.9 13,960 6.9 29,282 6.8 38,681 6.7 36,506 7.3 19,904 5.9 13,876 5.6 20,905 6.6 22,633 6.9 14,566 5.4 12,967 6.7 2,038 0.8
1996 525,555 7.5 105,639 11.0 10,081 7.9 32,019 8.3 21,522 8.4 66,729 9.2 63,496 8.0 14,470 7.0 27,057 6.2 39,660 6.8 37,647 7.4 18,094 5.3 14,901 5.8 22,276 6.8 23,194 6.9 15,639 5.6 13,001 6.5 2,127 0.8
1997 562,808 7.9 108,883 11.1 10,162 7.8 33,358 8.5 21,518 8.1 69,439 9.4 72,633 8.9 15,612 7.4 30,259 6.7 41,952 7.0 41,856 8.0 20,290 5.8 15,376 5.9 23,783 7.1 25,153 7.3 16,318 5.7 13,708 6.7 2,508 0.9
1998 549,265 7.5 100,805 10.1 10,192 7.6 33,192 8.3 22,060 8.2 66,817 8.8 71,066 8.4 15,589 7.2 32,823 7.2 41,365 6.8 40,551 7.6 20,484 5.7 15,621 5.8 22,808 6.7 24,520 7.0 14,947 5.1 14,399 6.9 2,026 0.7
1999 551,445 7.4 100,288 9.8 10,736 7.8 31,684 7.8 22,729 8.2 64,563 8.4 68,817 7.8 15,454 7.0 30,124 6.5 43,939 7.1 43,010 7.9 19,967 5.4 16,464 6.0 23,640 6.8 26,220 7.3 16,816 5.6 14,783 6.9 2,211 0.8
2000 577,387 7.6 105,548 10.2 10,816 9.7 33,838 8.1 24,203 8.6 69,492 8.8 75,296 8.5 16,362 7.3 32,606 6.9 42,925 6.8 43,355 7.8 21,169 5.7 16,941 6.0 23,172 6.5 25,896 7.0 18,892 6.1 14,624 6.7 2,264 0.8
2001 559,162 7.2 97,484 9.2 10,093 7.0 33,732 8.0 24,207 8.4 71,521 8.9 75,296 8.2 15,944 6.9 31,138 6.4 42,614 6.6 40,915 7.2 19,201 5.0 15,656 5.4 23,472 6.4 24,809 6.6 17,300 5.4 13,770 6.2 2,010 0.7
2002 583,167 7.3 100,698 9.4 10,657 7.3 35,071 8.2 25,441 8.7 74,161 9.1 76,418 8.1 16,002 6.8 31,771 6.5 43,832 6.7 42,097 7.3 19,409 5.0 15,625 5.3 32,122 8.6 25,692 6.7 18,255 5.5 13,588 5.9 2,328 0.8
2003 593,553 7.3 100,665 9.2 10,822 7.4 35,857 8.2 25,884 8.7 75,738 9.1 78,466 8.1 16,527 6.9 33,905 6.8 43,122 6.5 43,060 7.3 22,178 5.6 16,312 5.4 27,329 7.2 27,876 7.1 19,980 5.9 13,774 5.9 2,058 0.7
2004 582,281 7.0 92,921 8.4 10,868 7.1 36,022 8.1 27,281 9.0 72,861 8.6 76,800 7.7 17,684 7.3 35,881 7.1 37,089 5.5 42,975 7.2 24,823 6.1 18,399 5.9 26,612 6.8 26,496 6.6 19,165 5.5 13,780 5.8 2,624 0.9
2005 518,595 6.2 82,830 7.4 9,708 6.2 32,356 7.2 24,145 7.8 67,605 7.8 67,042 6.6 14,119 5.7 28,295 5.5 39,171 5.7 37,961 6.2 16,333 3.9 15,440 4.9 28,282 7.1 23,600 5.8 17,521 4.9 11,623 4.8 2,564 0.8
2006 492,666 5.7 80,154 7.3 9,774 6.3 30,404 6.4 23,599 7.5 62,779 6.7 62,928 5.8 14,451 5.3 25,079 4.7 38,086 5.4 36,796 5.7 15,469 3.8 13,783 4.4 25,853 6.5 22,764 5.6 17,991 5.1 10,298 4.4 2,458 0.7
2007 490,054 5.5 72,584 6.5 9,977 6.3 30,730 6.3 24,358 7.6 61,942 6.5 62,299 5.6 15,030 5.4 25,869 4.8 39,568 5.5 36,235 5.5 17,303 4.1 14,403 4.5 24,187 5.9 23,625 5.7 17,657 4.9 11,677 4.8 2,610 0.7
2008 486,514 5.4 76,821 6.8 9,797 6.0 28,256 5.7 22,908 7.0 59,333 6.1 60,605 5.3 13,068 4.6 25,454 4.6 39,534 5.4 34,741 5.1 14,763 3.5 15,048 4.6 27,116 6.5 25,127 6.0 19,393 5.2 12,171 5.0 2,379 0.6
2009 492,254 5.3 71,447 6.3 10,107 6.1 28,403 5.6 22,799 6.9 59,327 6.0 59,438 5.1 16,404 5.6 31,598 5.6 39,730 5.3 34,476 5.0 16,014 3.7 18,905 5.7 22,913 5.4 27,864 6.5 18,875 5.0 12,551 5.0 1,403 0.4
2010 482,480 5.1 66,653 5.8 9,926 5.9 28,923 5.6 24,213 7.2 57,637 5.7 59,414 5.0 14,036 4.7 28,898 5.1 40,037 5.3 34,756 4.9 18,551 4.2 16,238 4.8 24,484 5.6 27,397 6.3 17,200 4.4 13,369 5.2 748 0.2
2011 476,408 5.0 67,358 5.6 11,181 6.7 27,761 5.7 24,101 7.3 55,610 5.3 57,609 4.4 15,198 5.3 26,249 4.7 39,979 5.5 34,944 5.0 15,060 3.6 16,373 4.7 24,979 5.7 26,180 5.7 20,174 4.8 12,308 4.9 1,344 0.4
2012 482,399 5.0 68,210 5.6 10,620 6.3 28,841 5.8 23,321 7.0 56,726 5.4 60,419 4.5 14,772 5.1 28,118 4.9 40,110 5.4 36,273 5.1 18,120 4.2 15,104 4.2 22,928 5.1 26,040 5.6 19,251 4.4 12,462 4.9 1,084 0.3
2013 442,900 4.5 57,418 4.6 9,817 5.7 27,395 5.5 22,168 6.5 52,786 4.9 55,420 4.1 14,540 4.9 25,671 4.4 38,277 5.1 33,483 4.6 15,861 3.6 13,321 3.7 22,025 4.8 23,340 4.9 18,231 4.1 12,274 4.7 873 0.2
2014 429,723 4.3 60,238 4.8 9,377 5.4 26,155 5.2 21,117 6.1 51,408 4.7 55,080 4.0 12,805 4.2 22,602 3.8 34,982 4.6 34,149 4.7 12,962 2.9 14,129 3.8 20,605 4.4 22,496 4.6 18,022 4.0 12,786 4.8 810 0.2
2015 439,424 4.3 61,094 4.8 8,984 5.0 25,409 4.9 20,743 5.9 50,606 4.6 55,835 4.0 13,571 4.4 23,882 4.0 36,097 4.7 35,934 4.8 16,159 3.6 15,281 4.1 21,025 4.5 22,431 4.5 17,560 3.8 13,105 4.8 1,708 0.5
2016 419,628 4.1 53,153 4.2 8,779 4.8 25,559 4.9 20,304 5.7 49,595 4.4 54,401 3.8 12,461 4.0 24,309 4.0 35,546 4.6 34,192 4.5 15,852 3.4 15,435 4.0 19,327 4.0 20,818 4.1 16,271 3.5 12,107 4.4 1,519 0.4
2017 434,932 4.1 55,570 4.3 9,053 4.9 25,970 4.9 19,111 5.3 51,027 4.5 58,152 4.0 13,548 4.2 24,993 4.0 36,143 4.6 36,776 4.8 16,085 3.4 13,574 3.5 21,184 4.4 21,865 4.2 18,196 3.8 11,508 4.1 2,177 0.6
Notes: 1. Prior to 1990, population figures used as denominator were based on the Series 2 population projections using the 1980 CPH as base year. 2. Starting 1990, population figures used as denominator were based on the Series 2 population projections using the 1990 CPH as base year. 3. Starting 1995, population figures used as denominator were based on the Series 2 population projections using the 1995 CPH as base year. 4. Starting 2000, population figures used as denominator were based on the Series 2 population projections using the 2000 CPH as base year. 5. Starting 2011, population figures used as denominator were based on the Population projections using the 2010 CPH as base year. 6. Figures for CAR and ARMM were made available starting 1990 while figures for Region XIII (Caraga) started in 1996. 7. Totals may not add up due to unspecified/not stated cases.
Source: Philippine Statistics Authority
Region IV-A MIMAROPA Region VPhilippines NCR CAR Region I Region II Region III Region XII Caraga ARMMYear
Region VI Region VII Region VIII Region IX Region X Region XI

TABLE 9.2 Live Births, Total Deaths, Deaths Under One Year, Maternal Deaths, and Fetal Deaths: 1978 to 2017
1978 1,387,588 297,034 73,640 1,734 14,3651979 1,429,814 306,427 71,772 1,634 14,5861980 1,456,860 298,006 65,700 1,609 13,9651981 1,461,204 301,117 64,415 1,542 13,3431982 1,474,491 308,758 61,665 1,425 13,4651983 1,506,356 327,260 64,267 1,502 14,7801984 1,478,205 313,359 56,897 1,379 11,8841985 1,437,154 334,663 54,613 1,489 8,9481986 1,493,995 326,749 52,263 1,573 8,4001987 1,582,469 335,254 50,803 1,611 10,5151988 1,565,372 325,098 47,187 1,745 10,6411989 1,565,254 325,621 43,026 1,579 11,4231990 1,631,069 313,890 39,633 1,307 11,9151991 1,643,296 298,063 34,332 1,144 10,7761992 1,684,395 319,579 36,814 1,394 8,6311993 1,680,896 318,546 34,673 1,548 9,3381994 1,645,011 321,440 31,073 1,791 9,2911995 1,645,043 324,737 30,631 1,488 9,7311996 1,608,468 344,363 30,550 1,557 9,6931997 1,653,236 339,400 28,061 1,513 9,7061998 1,632,859 352,992 28,196 1,579 6,2321999 1,613,335 347,989 25,168 1,348 9,8412000 1,766,440 366,931 27,714 1,698 10,3602001 1,714,093 381,834 26,129 1,768 9,6252002 1,666,773 396,297 23,778 1,801 9,3412003 1,669,442 396,331 22,844 1,798 8,9862004 1,710,994 403,191 22,557 1,833 8,9352005 1,688,918 426,054 21,674 1,732 10,3512006 1,663,029 441,036 21,764 1,721 8,4582007 1,749,878 441,956 21,720 1,672 8,1912008 1,784,316 461,581 22,351 1,731 8,3062009 1,745,585 480,820 21,659 1,599 8,0432010 1,782,981 488,265 22,476 1,719 8,0952011 1,746,684 498,486 22,283 1,469 8,1732012 1,790,367 514,745 22,254 1,447 7,8622013 1,761,602 531,280 21,992 1,522 7,4742014 1,748,857 536,999 21,108 1,570 7,6642015 1,744,767 560,605 20,750 1,721 7,6762016 1,731,289 582,183 21,874 1,483 8,0202017 1,700,618 579,237 20,311 1,484 7,709
Source: Philippine Statistics Authority
Year Live Births Total Deaths Deaths under 1 year Maternal Deaths Fetal Deaths
9-2

TABLE 9.3 Number of Registered Live Births and Rates by Region (Usual Residence of Mother) : 1990 to 2017 (Rate per 1,000 population)
Foreign Unde-fined
Not reported
Number Rate Number Rate Number Rate Number Rate Number Rate Number Rate Number Rate Number Rate Number Rate Number Rate Number Rate Number Rate Number Rate Number Rate Number Rate Number Rate Number Rate Number Rate Number Number Number
1990 1,537,339 24.8 269,044 33.1 28,695 24.5 98,606 27.0 66,163 27.6 185,394 28.6 184,987 28.5 47,871 26.4 109,316 27.4 115,931 21.0 139,660 29.7 58,150 18.6 57,045 25.2 82,210 28.6 79,248 26.5 51,353 22.2 45,662 25.4 11,537 4.9 229 … …1991 1,550,386 24.3 275,259 33.1 29,628 24.7 98,798 26.5 66,442 27.0 183,288 27.5 190,335 28.4 48,960 26.3 112,817 27.6 114,554 20.3 136,577 28.4 57,229 17.9 58,301 24.9 81,105 27.5 79,405 25.8 54,471 22.7 43,757 23.6 12,177 5.1 193 … …1992 1,684,395 25.8 284,199 33.4 30,674 24.9 101,437 26.7 66,389 26.3 184,193 27.0 198,757 28.9 51,771 27.1 116,969 27.9 119,558 20.7 140,633 28.5 59,272 18.0 59,638 24.8 82,228 27.1 78,098 24.6 54,178 21.9 43,951 23.0 12,273 5.0 177 … …1993 1,680,896 25.1 283,445 32.5 30,583 24.2 100,458 25.9 63,912 24.7 183,007 26.2 201,668 28.5 52,302 26.7 118,303 27.6 119,081 20.2 139,026 27.6 60,178 17.9 60,814 24.5 81,055 26.0 75,656 23.2 54,856 21.5 43,256 22.1 13,124 5.2 172 … …1994 1,645,011 24.0 278,076 31.2 29,706 22.9 96,386 24.4 61,267 23.1 181,974 25.4 199,976 27.5 49,368 24.6 116,640 26.6 116,179 19.3 140,785 27.3 59,063 17.1 56,338 22.1 78,400 24.5 73,526 21.9 52,541 19.9 40,535 20.1 12,843 5.0 … 1,408 …1995 1,645,043 24.1 290,890 30.9 29,592 23.7 95,477 25.2 62,488 24.7 184,467 26.1 205,729 26.7 46,901 23.1 109,334 25.4 116,686 20.3 142,140 28.4 58,272 17.4 55,078 22.1 75,115 23.6 72,519 22.1 49,169 18.3 37,530 19.4 12,499 4.9 266 891 …1996 1,608,468 23.0 294,393 30.6 28,319 22.1 93,546 24.2 58,583 22.7 185,252 25.6 209,546 26.3 44,684 21.6 105,428 24.0 108,508 18.5 134,602 26.4 57,150 16.6 51,863 20.3 71,567 21.9 69,511 20.7 47,773 17.2 35,420 17.8 11,337 4.3 237 … 7491997 1,653,236 23.1 303,513 30.9 29,093 22.2 96,494 24.5 57,287 21.7 192,450 26.0 222,397 27.2 45,243 21.4 107,853 24.0 112,201 18.7 139,330 26.7 57,325 16.3 51,447 19.6 71,510 21.4 69,860 20.3 48,937 17.1 35,960 17.7 12,170 4.6 166 … …1998 1,632,859 22.3 289,425 28.9 30,256 22.5 95,627 23.9 57,271 21.2 190,466 25.2 223,241 26.5 45,498 21.0 111,215 24.3 110,455 18.1 139,932 26.3 57,229 15.9 49,418 18.4 69,761 20.4 69,166 20.6 46,117 15.7 35,386 17.0 12,284 4.5 112 … …1999 1,613,335 21.6 286,571 28.1 30,497 22.2 94,047 23.1 55,908 20.3 187,678 24.3 221,944 25.1 43,642 19.7 107,698 23.1 109,434 17.6 140,385 25.8 55,862 15.2 49,510 17.9 66,676 19.0 68,804 19.1 46,764 15.5 34,985 16.4 12,808 4.7 122 … …2000 1,766,440 23.1 303,631 29.2 33,017 23.5 101,310 24.4 59,585 21.2 204,532 26.0 245,792 27.7 49,909 22.1 117,979 24.8 123,299 19.5 153,080 27.6 61,873 16.5 53,766 19.0 73,839 20.6 76,251 20.6 52,637 16.9 39,616 18.1 16,210 5.8 114 … …2001 1,714,093 22.0 291,309 27.6 32,539 22.7 97,897 23.2 58,940 20.5 200,090 24.9 240,595 26.3 47,799 20.8 115,174 23.8 118,817 18.4 148,174 26.2 57,759 15.1 51,273 17.7 72,766 19.9 74,467 19.7 52,100 16.3 38,008 17.0 16,255 5.7 131 … …2002 1,666,773 21.0 287,882 26.8 31,613 21.6 98,341 23.0 57,950 19.8 195,781 23.9 239,035 25.4 44,245 18.9 111,959 22.8 112,529 17.2 146,439 25.4 55,543 14.2 48,949 16.5 67,729 18.1 71,343 18.5 49,906 21.8 34,293 15.0 13,124 4.5 112 … …2003 1,669,442 20.6 281,063 25.8 32,218 21.5 97,373 22.4 58,940 19.8 194,795 23.4 236,363 24.5 43,912 18.4 113,932 22.8 112,111 16.8 148,459 25.3 57,213 14.4 50,205 16.5 70,993 18.6 72,994 18.6 50,043 14.8 33,998 14.5 14,730 5.0 100 … …2004 1,710,994 20.7 278,588 25.2 32,404 21.2 99,710 22.5 60,165 19.8 198,222 23.3 245,923 24.8 44,978 18.5 117,016 23.0 109,195 16.1 154,714 25.9 59,801 14.7 54,601 17.6 77,342 19.9 75,890 18.9 51,654 14.9 35,353 14.8 15,350 5.1 91 … …2005 1,688,918 20.0 259,359 23.1 32,250 20.7 99,851 22.2 61,017 19.8 196,722 22.7 242,633 23.8 44,897 18.1 114,016 22.1 115,891 16.8 153,785 25.3 60,454 14.6 53,958 17.0 77,647 19.5 75,257 18.4 51,958 14.6 34,384 14.1 14,765 4.9 74 … …2006 1,663,029 19.1 250,306 22.9 31,881 20.4 96,250 20.1 60,378 19.2 193,674 20.6 243,810 22.4 43,582 16.0 110,985 21.0 114,648 16.3 149,048 23.0 59,875 14.6 51,846 16.1 77,764 19.4 75,561 18.5 54,539 14.6 33,162 14.0 15,608 4.8 112 … …2007 1,749,878 19.7 269,825 24.3 33,608 21.1 101,394 20.8 63,803 20.0 203,359 21.2 257,852 23.1 45,895 16.4 114,058 21.2 122,066 17.1 155,000 23.4 62,412 14.9 52,089 16.3 79,886 19.5 77,829 18.7 58,736 16.2 35,249 14.6 16,249 4.5 568 … …2008 1,784,316 19.7 267,766 23.8 34,127 21.0 100,791 20.3 66,489 20.5 205,626 21.0 262,502 23.0 47,326 16.5 116,273 21.2 123,291 16.9 157,371 23.3 67,582 15.8 55,430 17.0 82,268 19.7 81,354 19.3 63,108 17.0 36,498 14.9 16,094 4.4 420 … …2009 1,745,584 18.9 285,515 25.0 33,761 20.3 97,510 19.2 65,138 19.7 202,039 20.3 250,461 21.5 47,024 16.0 115,550 20.6 121,181 16.3 145,506 21.1 63,691 14.6 46,779 14.0 80,747 19.0 84,309 19.6 61,881 16.3 36,667 14.7 7,263 1.9 … … …2010 1,782,981 19.0 279,719 24.2 34,150 20.2 97,237 18.8 65,265 19.4 202,658 19.9 248,185 20.8 48,339 16.0 121,771 21.3 125,376 16.5 152,499 21.7 69,722 15.7 56,372 16.2 86,511 19.9 85,743 19.7 65,580 16.1 38,060 14.9 5,794 1.6 … … …2011 1,746,684 18.4 246,011 20.4 33,530 20.2 94,117 19.3 65,044 19.8 197,646 19.0 258,715 19.8 47,965 16.9 120,567 21.6 123,459 17.0 148,996 21.4 69,160 16.4 58,985 16.8 83,183 18.9 85,400 18.6 67,341 15.9 33,530 13.4 7,695 2.3 … … …2012 1,790,367 18.6 246,994 20.2 34,000 20.1 92,180 18.7 65,222 19.5 204,510 19.3 264,571 19.9 49,606 17.1 120,791 21.2 126,333 17.1 154,872 21.9 69,932 16.3 59,649 16.7 86,483 19.3 87,124 18.6 75,146 17.4 39,572 15.5 13,382 3.9 … … …2013 1,761,602 17.9 243,626 19.7 33,329 19.4 89,948 18.0 63,620 18.7 197,294 18.3 260,463 19.2 48,530 16.4 119,727 20.6 123,987 16.5 150,534 20.9 69,292 15.8 58,106 16.0 87,676 19.2 82,150 17.2 80,983 18.3 39,254 15.1 13,004 3.7 79 … …2014 1,748,857 17.5 239,736 19.2 32,263 18.4 87,883 17.3 62,320 18.1 196,409 18.0 257,461 18.6 48,170 15.9 115,772 19.6 119,231 15.7 152,542 20.8 72,423 16.3 60,729 16.4 86,143 18.6 86,463 17.8 76,119 16.9 40,335 15.2 14,783 4.1 75 … …2015 1,744,767 17.2 231,766 18.3 30,873 17.3 85,871 16.7 60,511 17.3 196,217 17.7 260,339 18.4 50,122 16.2 115,210 19.1 118,788 15.4 148,319 19.9 76,771 16.9 58,109 15.4 87,155 18.5 90,009 18.1 77,479 16.8 42,304 15.6 14,784 4.0 140 … …2016 1,731,289 16.8 219,936 17.2 29,285 16.1 82,206 15.8 58,490 16.5 191,245 17.0 251,344 17.5 48,888 15.5 116,092 18.9 114,774 14.7 145,550 19.2 74,725 16.2 63,556 16.6 89,359 18.7 90,828 18.0 78,919 16.8 44,135 15.9 31,067 8.2 890 … …2017 1,700,618 16.2 217,480 16.8 28,297 15.3 79,842 15.2 56,636 15.8 191,394 16.7 248,401 16.9 47,655 14.8 112,512 18.0 110,367 13.9 144,603 18.8 69,385 14.7 59,169 15.2 89,350 18.4 87,621 17.0 78,152 16.3 43,444 15.4 35,702 9.2 608 … …
Notes: 1. Prior to 1990, population figures used as denominator were based on the Series 2 population projections using the 1980 CPH as base year. 2. Starting 1990, population figures used as denominator were based on the Series 2 population projections using the 1990 CPH as base year. 3. Starting 1995, population figures used as denominator were based on the Series 2 population projections using the 1995 CPH as base year. 4. Starting 2000, population figures used as denominator were based on the Population projections using the 2000 CPH as base year. 5. Starting 2011, population figures used as denominator were based on the Population projections using the 2010 CPH as base year. 6. Totals may not add up due to unspecified/not stated cases.Source: Philippine Statistics Authority
Region III Region IV-A MIMAROPA Region V Region VI Region VIIYear Philippines NCR CAR Region I Region II ARMMRegion VIII Region IX Region X Region XI Region XII Caraga
9-3

TABLE 9.4 Number of Registered Deaths and Rates by Region (Usual Residence) : 1990 to 2017 (Rate per 1,000 population)
Foreign
Number Rate Number Rate Number Rate Number Rate Number Rate Number Rate Number Rate Number Rate Number Rate Number Rate Number Rate Number Rate Number Rate Number Rate Number Rate Number Rate Number Rate Number Rate Number
1990 298,053 4.8 45,161 5.6 4,342 3.7 24,822 6.8 12,592 5.3 33,502 5.2 38,673 6.0 8,279 4.6 22,316 5.6 31,275 5.7 28,008 6.0 15,569 4.2 8,736 3.9 12,789 4.5 11,002 3.7 6,442 2.8 7,431 4.1 2,824 1.2 1271991 282,734 4.4 45,983 5.5 3,839 3.2 23,495 6.3 11,732 4.8 32,314 4.9 35,136 5.2 7,766 4.2 21,621 5.3 29,767 5.3 24,778 5.1 15,486 4.3 6,886 2.9 12,299 4.2 11,110 3.6 5,758 2.4 7,456 4.0 2,530 1.1 1071992 304,304 4.7 47,961 5.6 4,144 3.4 24,821 6.5 12,597 5.0 33,868 5.0 40,015 5.8 8,304 4.3 23,549 5.6 30,149 5.2 28,354 5.8 16,373 5.0 8,459 3.5 12,137 4.0 11,968 3.8 7,829 3.2 6,881 3.6 2,080 0.8 901993 302,445 4.5 48,018 5.5 4,262 3.4 25,272 6.5 12,780 4.9 34,024 4.9 39,219 5.5 8,494 4.3 22,385 5.2 31,650 5.4 26,990 5.3 15,375 4.6 8,077 3.3 12,031 3.9 12,173 3.7 7,697 3.0 7,509 3.8 2,492 1.0 981994 305,492 4.5 47,383 5.3 4,354 3.4 24,646 6.2 11,553 4.4 33,691 4.7 39,602 5.4 8,751 4.4 23,828 5.4 32,799 5.4 28,083 5.4 16,889 4.9 8,355 3.3 12,119 3.8 12,331 3.7 7,820 3.0 7,644 3.8 2,039 0.8 991995 324,737 4.8 49,108 5.2 4,486 3.6 24,765 6.5 12,002 4.8 34,024 4.8 41,453 5.4 8,349 4.1 23,294 5.4 32,421 5.6 27,848 5.6 15,981 4.8 8,322 3.3 12,633 4.0 12,853 3.9 8,223 3.1 7,121 3.7 1,734 0.7 1201996 335,600 4.8 52,919 5.5 4,304 3.4 25,764 6.7 12,163 4.7 37,229 5.1 43,910 5.5 8,763 4.2 24,381 5.5 34,415 5.9 30,085 5.9 16,772 4.9 8,420 3.3 12,971 4.0 13,599 4.0 8,413 3.0 7,422 3.7 2,317 0.9 5161997 330,661 4.6 52,614 5.4 4,529 3.5 25,756 6.5 11,420 4.3 38,566 5.2 43,883 5.4 8,739 4.1 22,242 5.0 33,956 5.7 29,082 5.6 15,787 4.5 8,206 3.1 12,842 3.8 13,365 3.9 8,619 3.0 7,190 3.5 2,478 0.9 1261998 344,121 4.7 53,840 5.4 4,712 3.5 27,433 6.8 13,339 4.9 40,224 5.3 45,814 5.4 8,871 4.1 23,151 5.1 35,715 5.9 29,741 5.6 15,281 4.3 8,853 3.3 12,914 3.8 13,897 3.9 9,258 3.1 7,230 3.5 2,585 1.0 1341999 339,162 4.5 54,023 5.3 4,873 3.5 27,098 6.6 12,990 4.7 39,643 5.1 45,387 5.1 8,827 4.0 23,574 5.1 33,598 5.4 28,688 5.3 15,421 4.2 8,805 3.2 12,616 3.6 13,762 3.8 8,768 2.9 7,349 3.4 2,439 0.9 1282000 357,908 4.7 56,791 5.5 4,988 3.6 26,722 6.4 13,387 4.8 42,555 5.4 49,408 5.6 9,023 4.0 25,121 5.3 35,709 5.6 29,258 5.3 16,421 4.4 9,157 3.2 13,179 3.7 14,579 3.9 9,592 3.1 7,943 3.6 2,981 1.1 1172001 372,090 4.8 58,079 5.5 5,489 3.8 27,895 6.6 13,531 4.7 43,388 5.4 52,130 5.7 9,744 4.2 26,557 5.5 36,809 5.7 31,280 5.5 18,001 4.7 9,630 3.3 13,988 3.8 14,907 4.0 9,870 3.1 7,839 3.5 2,570 0.9 1272002 396,297 5.0 58,226 5.4 5,484 3.7 28,583 6.7 14,563 5.0 45,778 5.6 54,125 5.8 10,020 4.3 26,016 5.3 38,516 5.9 33,532 5.8 18,396 4.7 10,079 2.5 14,778 4.0 16,151 4.2 10,795 3.2 8,298 3.6 2,820 1.0 1372003 396,331 4.9 57,644 5.3 5,496 3.7 28,508 6.5 14,300 4.8 45,253 5.4 53,667 5.6 10,058 4.2 26,122 5.2 38,571 5.8 32,971 5.6 18,508 4.6 10,365 3.4 14,918 3.9 16,861 4.3 11,463 3.4 8,644 3.7 2,851 1.0 1312004 403,191 4.9 58,513 5.3 5,461 3.6 29,208 6.6 14,376 4.7 46,858 5.5 55,813 5.6 10,145 4.2 26,845 5.3 38,580 5.7 32,488 5.4 18,620 4.6 10,511 3.4 15,550 4.0 17,063 4.3 11,580 3.3 8,554 3.6 2,864 1.0 1622005 426,054 5.1 61,826 5.5 5,906 3.8 29,902 6.7 15,505 5.0 49,467 5.7 58,670 5.8 10,792 4.4 28,834 5.6 41,847 6.1 35,327 5.8 18,955 4.6 11,099 3.5 16,315 4.1 18,117 4.5 11,744 3.3 8,767 3.6 2,785 0.9 1962006 441,036 5.1 62,466 5.7 5,999 3.8 30,361 6.4 15,880 5.1 50,135 5.3 61,317 5.6 11,433 4.2 30,232 5.7 42,357 6.0 36,456 5.6 21,156 5.2 11,258 3.6 17,358 4.3 19,288 4.7 12,562 3.5 9,613 4.1 3,005 0.9 1602007 441,956 5.0 63,302 5.7 5,960 3.7 30,194 6.2 15,661 4.9 51,552 5.4 62,269 5.6 11,351 4.1 29,881 5.5 42,370 5.9 36,257 5.5 19,099 4.6 11,664 3.6 17,150 4.2 19,989 4.8 12,961 3.6 9,494 3.9 2,605 0.7 1972008 461,581 5.1 64,687 5.7 6,199 3.8 31,771 6.4 16,783 5.2 53,222 5.4 63,483 5.6 11,816 4.1 29,574 5.4 46,345 6.4 38,697 5.7 19,775 4.6 12,433 3.8 18,673 4.5 21,487 5.1 13,770 3.7 10,107 4.1 2,570 0.7 1892009 480,820 5.2 67,031 5.9 6,763 4.1 32,193 6.3 17,242 5.2 56,290 5.6 66,916 5.7 12,189 4.1 31,399 5.6 47,195 6.3 40,201 5.8 20,603 4.7 13,035 3.9 19,937 4.7 22,817 5.3 14,537 3.8 10,231 4.1 1,582 0.4 6592010 488,265 5.2 68,559 5.9 6,440 3.8 32,815 6.3 17,979 5.3 57,164 5.6 69,272 5.8 12,530 4.2 31,400 5.5 46,374 6.1 41,286 5.9 20,224 4.5 13,271 3.9 19,910 4.6 23,711 5.4 15,197 3.9 10,623 4.2 1,251 0.3 2592011 498,486 5.3 68,490 5.7 6,740 4.1 32,439 6.7 18,203 5.5 58,143 5.6 70,205 5.4 13,154 4.6 32,948 5.9 46,413 6.4 40,787 5.9 21,575 5.1 14,517 4.1 21,028 4.8 24,537 5.4 16,084 3.8 11,580 4.6 1,431 0.4 2132012 514,745 5.3 70,018 5.7 7,373 4.4 33,050 6.7 18,977 5.7 60,164 5.7 72,434 5.4 13,424 4.6 33,064 5.8 47,731 6.5 41,521 5.9 22,255 5.2 14,749 4.1 22,146 4.9 25,953 5.5 18,036 4.2 11,906 4.7 1,610 0.5 3342013 531,280 5.4 71,050 5.7 7,349 4.3 32,983 6.6 19,374 5.7 60,409 5.6 75,743 5.6 13,907 4.7 33,751 5.8 48,990 6.5 43,500 6.0 25,689 5.9 15,469 4.3 22,845 5.0 25,895 5.4 19,965 4.5 12,535 4.8 1,484 0.4 3422014 536,999 5.4 72,235 5.8 7,654 4.4 34,060 6.7 19,298 5.6 62,297 5.7 78,326 5.7 14,288 4.7 35,253 6.0 49,460 6.5 44,358 6.1 21,927 4.9 15,105 4.1 22,504 4.9 25,782 5.3 19,101 4.2 13,415 5.0 1,634 0.5 3022015 560,605 5.5 74,530 5.9 7,909 4.4 34,190 6.7 20,212 5.8 65,540 5.9 80,778 5.7 15,012 4.9 35,086 5.8 49,711 6.5 47,096 6.3 23,658 5.2 16,573 4.4 24,551 5.2 27,549 5.6 20,547 4.5 14,387 5.3 2,938 0.8 3382016 582,183 5.6 76,839 6.0 8,329 4.6 35,666 6.9 20,952 5.9 68,757 6.1 82,764 5.7 16,105 5.1 36,228 5.9 51,256 6.6 47,937 6.3 23,821 5.2 17,457 4.6 26,070 5.5 29,260 5.8 22,115 4.7 14,939 5.4 3,236 0.9 4522017 579,237 5.5 75,187 5.8 8,176 4.4 34,427 6.5 21,115 5.9 67,980 5.9 84,971 5.8 15,489 2.5 37,052 5.9 50,701 6.4 47,575 6.2 23,721 5.0 17,123 4.4 26,065 5.4 29,415 5.7 21,693 4.5 14,928 5.3 3,036 0.8 583
Notes: 1. Prior to 1990, population figures used as denominator were based on the Series 2 population projections using the 1980 CPH as base year. 2. Starting 1990, population figures used as denominator were based on the Series 2 population projections using the 1990 CPH as base year. 3. Starting 1995, population figures used as denominator were based on the Series 2 population projections using the 1995 CPH as base year. 4. Starting 2000, population figures used as denominator were based on the Series 2 population projections using the 2000 CPH as base year. 5. Starting 2011, population figures used as denominator were based on the Population projections using the 2010 CPH as base year. 6. Figures for CAR and ARMM were made available starting 1990 while figures for Region 13 (Caraga) started in 1996. 7. Data for 2014 was revised due to inclusions of late registration. 8. Totals may not add up due to unspecified/not stated cases.
Source: Philippine Statistics Authority
ARMMRegion VIII Region IX Region X Region XI Region XII CaragaRegion III Region IV-A MIMAROPA Region V Region VI Region VIIPhilippines NCR CAR Region I Region IIYear
9-4
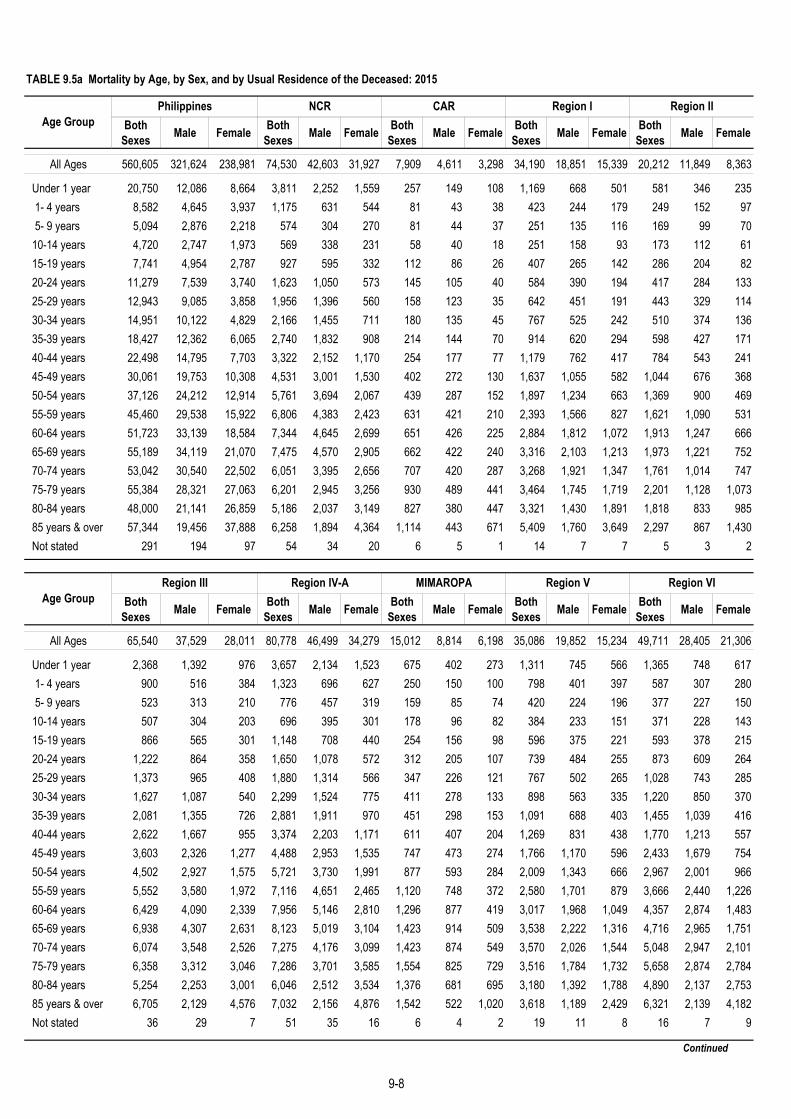
TABLE 9.5a Mortality by Age, by Sex, and by Usual Residence of the Deceased: 2015
Both Sexes Male Female Both
Sexes Male Female Both Sexes Male Female Both
Sexes Male Female Both Sexes Male Female
All Ages 560,605 321,624 238,981 74,530 42,603 31,927 7,909 4,611 3,298 34,190 18,851 15,339 20,212 11,849 8,363
Under 1 year 20,750 12,086 8,664 3,811 2,252 1,559 257 149 108 1,169 668 501 581 346 235 1- 4 years 8,582 4,645 3,937 1,175 631 544 81 43 38 423 244 179 249 152 97 5- 9 years 5,094 2,876 2,218 574 304 270 81 44 37 251 135 116 169 99 70 10-14 years 4,720 2,747 1,973 569 338 231 58 40 18 251 158 93 173 112 61 15-19 years 7,741 4,954 2,787 927 595 332 112 86 26 407 265 142 286 204 82 20-24 years 11,279 7,539 3,740 1,623 1,050 573 145 105 40 584 390 194 417 284 133 25-29 years 12,943 9,085 3,858 1,956 1,396 560 158 123 35 642 451 191 443 329 114 30-34 years 14,951 10,122 4,829 2,166 1,455 711 180 135 45 767 525 242 510 374 136 35-39 years 18,427 12,362 6,065 2,740 1,832 908 214 144 70 914 620 294 598 427 171 40-44 years 22,498 14,795 7,703 3,322 2,152 1,170 254 177 77 1,179 762 417 784 543 241 45-49 years 30,061 19,753 10,308 4,531 3,001 1,530 402 272 130 1,637 1,055 582 1,044 676 368 50-54 years 37,126 24,212 12,914 5,761 3,694 2,067 439 287 152 1,897 1,234 663 1,369 900 469 55-59 years 45,460 29,538 15,922 6,806 4,383 2,423 631 421 210 2,393 1,566 827 1,621 1,090 531 60-64 years 51,723 33,139 18,584 7,344 4,645 2,699 651 426 225 2,884 1,812 1,072 1,913 1,247 666 65-69 years 55,189 34,119 21,070 7,475 4,570 2,905 662 422 240 3,316 2,103 1,213 1,973 1,221 752 70-74 years 53,042 30,540 22,502 6,051 3,395 2,656 707 420 287 3,268 1,921 1,347 1,761 1,014 747 75-79 years 55,384 28,321 27,063 6,201 2,945 3,256 930 489 441 3,464 1,745 1,719 2,201 1,128 1,073 80-84 years 48,000 21,141 26,859 5,186 2,037 3,149 827 380 447 3,321 1,430 1,891 1,818 833 985 85 years & over 57,344 19,456 37,888 6,258 1,894 4,364 1,114 443 671 5,409 1,760 3,649 2,297 867 1,430 Not stated 291 194 97 54 34 20 6 5 1 14 7 7 5 3 2
Both Sexes Male Female Both
Sexes Male Female Both Sexes Male Female Both
Sexes Male Female Both Sexes Male Female
All Ages 65,540 37,529 28,011 80,778 46,499 34,279 15,012 8,814 6,198 35,086 19,852 15,234 49,711 28,405 21,306
Under 1 year 2,368 1,392 976 3,657 2,134 1,523 675 402 273 1,311 745 566 1,365 748 617 1- 4 years 900 516 384 1,323 696 627 250 150 100 798 401 397 587 307 280 5- 9 years 523 313 210 776 457 319 159 85 74 420 224 196 377 227 150 10-14 years 507 304 203 696 395 301 178 96 82 384 233 151 371 228 143 15-19 years 866 565 301 1,148 708 440 254 156 98 596 375 221 593 378 215 20-24 years 1,222 864 358 1,650 1,078 572 312 205 107 739 484 255 873 609 264 25-29 years 1,373 965 408 1,880 1,314 566 347 226 121 767 502 265 1,028 743 285 30-34 years 1,627 1,087 540 2,299 1,524 775 411 278 133 898 563 335 1,220 850 370 35-39 years 2,081 1,355 726 2,881 1,911 970 451 298 153 1,091 688 403 1,455 1,039 416 40-44 years 2,622 1,667 955 3,374 2,203 1,171 611 407 204 1,269 831 438 1,770 1,213 557 45-49 years 3,603 2,326 1,277 4,488 2,953 1,535 747 473 274 1,766 1,170 596 2,433 1,679 754 50-54 years 4,502 2,927 1,575 5,721 3,730 1,991 877 593 284 2,009 1,343 666 2,967 2,001 966 55-59 years 5,552 3,580 1,972 7,116 4,651 2,465 1,120 748 372 2,580 1,701 879 3,666 2,440 1,226 60-64 years 6,429 4,090 2,339 7,956 5,146 2,810 1,296 877 419 3,017 1,968 1,049 4,357 2,874 1,483 65-69 years 6,938 4,307 2,631 8,123 5,019 3,104 1,423 914 509 3,538 2,222 1,316 4,716 2,965 1,751 70-74 years 6,074 3,548 2,526 7,275 4,176 3,099 1,423 874 549 3,570 2,026 1,544 5,048 2,947 2,101 75-79 years 6,358 3,312 3,046 7,286 3,701 3,585 1,554 825 729 3,516 1,784 1,732 5,658 2,874 2,784 80-84 years 5,254 2,253 3,001 6,046 2,512 3,534 1,376 681 695 3,180 1,392 1,788 4,890 2,137 2,753 85 years & over 6,705 2,129 4,576 7,032 2,156 4,876 1,542 522 1,020 3,618 1,189 2,429 6,321 2,139 4,182 Not stated 36 29 7 51 35 16 6 4 2 19 11 8 16 7 9
Continued
Age GroupPhilippines NCR CAR Region I Region II
Age GroupRegion III Region IV-A MIMAROPA Region V Region VI
9-8
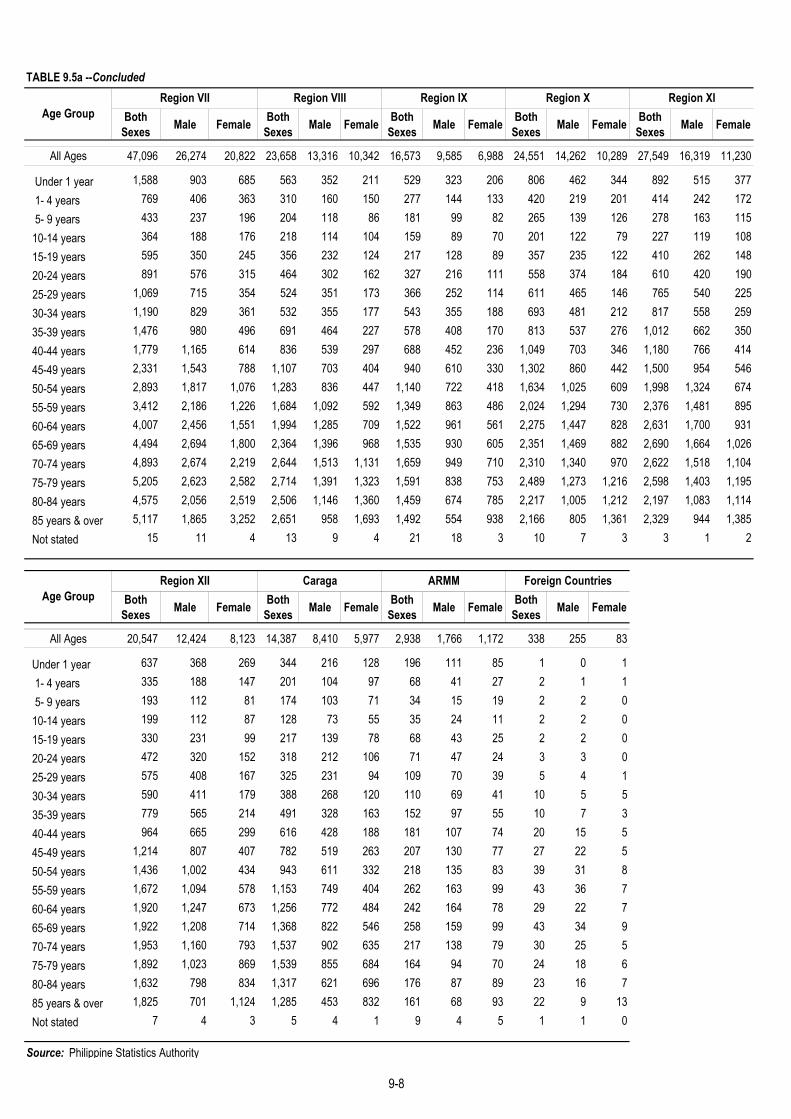
TABLE 9.5a --Concluded
Both Sexes Male Female Both
Sexes Male Female Both Sexes Male Female Both
Sexes Male Female Both Sexes Male Female
All Ages 47,096 26,274 20,822 23,658 13,316 10,342 16,573 9,585 6,988 24,551 14,262 10,289 27,549 16,319 11,230
Under 1 year 1,588 903 685 563 352 211 529 323 206 806 462 344 892 515 377 1- 4 years 769 406 363 310 160 150 277 144 133 420 219 201 414 242 172 5- 9 years 433 237 196 204 118 86 181 99 82 265 139 126 278 163 115 10-14 years 364 188 176 218 114 104 159 89 70 201 122 79 227 119 108 15-19 years 595 350 245 356 232 124 217 128 89 357 235 122 410 262 148 20-24 years 891 576 315 464 302 162 327 216 111 558 374 184 610 420 190 25-29 years 1,069 715 354 524 351 173 366 252 114 611 465 146 765 540 225 30-34 years 1,190 829 361 532 355 177 543 355 188 693 481 212 817 558 259 35-39 years 1,476 980 496 691 464 227 578 408 170 813 537 276 1,012 662 350 40-44 years 1,779 1,165 614 836 539 297 688 452 236 1,049 703 346 1,180 766 414 45-49 years 2,331 1,543 788 1,107 703 404 940 610 330 1,302 860 442 1,500 954 546 50-54 years 2,893 1,817 1,076 1,283 836 447 1,140 722 418 1,634 1,025 609 1,998 1,324 674 55-59 years 3,412 2,186 1,226 1,684 1,092 592 1,349 863 486 2,024 1,294 730 2,376 1,481 895 60-64 years 4,007 2,456 1,551 1,994 1,285 709 1,522 961 561 2,275 1,447 828 2,631 1,700 931 65-69 years 4,494 2,694 1,800 2,364 1,396 968 1,535 930 605 2,351 1,469 882 2,690 1,664 1,026 70-74 years 4,893 2,674 2,219 2,644 1,513 1,131 1,659 949 710 2,310 1,340 970 2,622 1,518 1,104 75-79 years 5,205 2,623 2,582 2,714 1,391 1,323 1,591 838 753 2,489 1,273 1,216 2,598 1,403 1,195 80-84 years 4,575 2,056 2,519 2,506 1,146 1,360 1,459 674 785 2,217 1,005 1,212 2,197 1,083 1,114 85 years & over 5,117 1,865 3,252 2,651 958 1,693 1,492 554 938 2,166 805 1,361 2,329 944 1,385 Not stated 15 11 4 13 9 4 21 18 3 10 7 3 3 1 2
Both Sexes Male Female Both
Sexes Male Female Both Sexes Male Female Both
Sexes Male Female
All Ages 20,547 12,424 8,123 14,387 8,410 5,977 2,938 1,766 1,172 338 255 83
Under 1 year 637 368 269 344 216 128 196 111 85 1 0 1 1- 4 years 335 188 147 201 104 97 68 41 27 2 1 1 5- 9 years 193 112 81 174 103 71 34 15 19 2 2 0 10-14 years 199 112 87 128 73 55 35 24 11 2 2 0 15-19 years 330 231 99 217 139 78 68 43 25 2 2 0 20-24 years 472 320 152 318 212 106 71 47 24 3 3 0 25-29 years 575 408 167 325 231 94 109 70 39 5 4 1 30-34 years 590 411 179 388 268 120 110 69 41 10 5 5 35-39 years 779 565 214 491 328 163 152 97 55 10 7 3 40-44 years 964 665 299 616 428 188 181 107 74 20 15 5 45-49 years 1,214 807 407 782 519 263 207 130 77 27 22 5 50-54 years 1,436 1,002 434 943 611 332 218 135 83 39 31 8 55-59 years 1,672 1,094 578 1,153 749 404 262 163 99 43 36 7 60-64 years 1,920 1,247 673 1,256 772 484 242 164 78 29 22 7 65-69 years 1,922 1,208 714 1,368 822 546 258 159 99 43 34 9 70-74 years 1,953 1,160 793 1,537 902 635 217 138 79 30 25 5 75-79 years 1,892 1,023 869 1,539 855 684 164 94 70 24 18 6 80-84 years 1,632 798 834 1,317 621 696 176 87 89 23 16 7 85 years & over 1,825 701 1,124 1,285 453 832 161 68 93 22 9 13 Not stated 7 4 3 5 4 1 9 4 5 1 1 0
Source: Philippine Statistics Authority
Region XI
Age GroupRegion XII Caraga ARMM Foreign Countries
Age GroupRegion VII Region VIII Region IX Region X
9-8

TABLE 9.5b Mortality by Age, by Sex, and by Usual Residence of the Deceased: 2016
Both Sexes Male Female Both
Sexes Male Female Both Sexes Male Female Both
Sexes Male Female Both Sexes Male Female
All Ages 582,183 334,678 247,505 76,839 44,455 32,384 8,329 4,875 3,454 35,666 19,819 15,847 20,952 12,292 8,660
Under 1 year 21,874 12,566 9,308 3,687 2,126 1,561 250 137 113 1,205 662 543 604 355 249 1- 4 years 9,130 4,905 4,225 1,050 567 483 68 42 26 427 250 177 245 139 106 5- 9 years 5,395 2,944 2,451 560 327 233 78 49 29 255 142 113 152 91 61 10-14 years 4,637 2,708 1,929 512 296 216 67 37 30 242 140 102 157 98 59 15-19 years 7,922 5,121 2,801 965 593 372 103 67 36 420 289 131 290 203 87 20-24 years 11,583 8,043 3,540 1,677 1,172 505 150 112 38 583 408 175 444 326 118 25-29 years 13,641 9,765 3,876 2,126 1,592 534 172 125 47 627 453 174 450 330 120 30-34 years 15,659 10,957 4,702 2,361 1,678 683 184 139 45 780 551 229 535 397 138 35-39 years 19,439 13,190 6,249 3,043 2,126 917 256 168 88 1,023 679 344 678 473 205 40-44 years 23,348 15,500 7,848 3,582 2,464 1,118 271 184 87 1,141 792 349 800 549 251 45-49 years 31,066 20,549 10,517 4,818 3,256 1,562 373 254 119 1,577 1,065 512 1,043 718 325 50-54 years 38,786 25,329 13,457 5,804 3,779 2,025 475 331 144 2,086 1,393 693 1,387 953 434 55-59 years 45,860 29,879 15,981 6,789 4,352 2,437 574 382 192 2,439 1,584 855 1,758 1,167 591 60-64 years 53,206 34,113 19,093 7,354 4,709 2,645 712 467 245 2,876 1,876 1,000 1,916 1,217 699 65-69 years 57,687 35,595 22,092 7,582 4,580 3,002 817 511 306 3,443 2,160 1,283 1,999 1,275 724 70-74 years 55,132 31,660 23,472 6,277 3,450 2,827 805 484 321 3,441 2,013 1,428 1,876 1,092 784 75-79 years 56,419 29,107 27,312 6,407 3,179 3,228 860 468 392 3,728 1,913 1,815 2,138 1,072 1,066 80-84 years 50,596 22,055 28,541 5,422 2,133 3,289 875 407 468 3,627 1,521 2,106 2,062 944 1,118 85 years & over 60,514 20,493 40,021 6,773 2,042 4,731 1,236 509 727 5,739 1,924 3,815 2,413 891 1,522 Not stated 289 199 90 50 34 16 3 2 1 7 4 3 5 2 3
Both Sexes Male Female Both
Sexes Male Female Both Sexes Male Female Both
Sexes Male Female Both Sexes Male Female
All Ages 68,757 39,354 29,403 82,764 47,357 35,407 16,105 9,420 6,685 36,228 20,566 15,662 51,256 29,203 22,053
Under 1 year 2,480 1,424 1,056 3,727 2,124 1,603 693 411 282 1,517 866 651 1,383 775 608 1- 4 years 986 545 441 1,417 756 661 276 144 132 861 436 425 625 342 283 5- 9 years 527 290 237 809 451 358 189 113 76 395 203 192 430 229 201 10-14 years 489 311 178 606 349 257 151 83 68 382 209 173 400 224 176 15-19 years 889 596 293 1,041 665 376 269 175 94 589 367 222 601 398 203 20-24 years 1,313 958 355 1,614 1,085 529 328 213 115 761 509 252 888 623 265 25-29 years 1,486 1,021 465 1,930 1,381 549 390 268 122 864 561 303 1,116 819 297 30-34 years 1,711 1,198 513 2,328 1,580 748 444 302 142 908 618 290 1,227 883 344 35-39 years 2,197 1,471 726 2,949 2,012 937 516 332 184 1,122 737 385 1,454 999 455 40-44 years 2,600 1,690 910 3,473 2,243 1,230 689 456 233 1,351 882 469 1,854 1,271 583 45-49 years 3,732 2,424 1,308 4,628 3,029 1,599 797 518 279 1,766 1,119 647 2,495 1,709 786 50-54 years 4,701 3,023 1,678 5,892 3,824 2,068 1,028 691 337 2,251 1,474 777 3,116 2,088 1,028 55-59 years 5,580 3,625 1,955 7,208 4,743 2,465 1,150 771 379 2,655 1,706 949 3,620 2,483 1,137 60-64 years 6,549 4,115 2,434 8,007 5,185 2,822 1,469 997 472 3,069 1,999 1,070 4,483 2,975 1,508 65-69 years 7,243 4,521 2,722 8,573 5,274 3,299 1,484 933 551 3,466 2,168 1,298 4,976 3,159 1,817 70-74 years 6,744 3,926 2,818 7,423 4,120 3,303 1,560 950 610 3,688 2,160 1,528 5,159 2,994 2,165 75-79 years 6,570 3,405 3,165 7,412 3,728 3,684 1,572 843 729 7,417 2,247 5,170 5,611 2,868 2,743 80-84 years 5,656 2,489 3,167 6,265 2,523 3,742 1,481 684 797 1,609 529 1,080 5,222 2,251 2,971 85 years & over 7,255 2,291 4,964 7,417 2,247 5,170 3,250 1,465 1,785 3,661 1,212 2,449 6,577 2,101 4,476 Not stated 49 31 18 45 38 7 10 7 3 21 14 7 19 12 7
Continued
NCR CAR Region I Region IIAge Group
Philippines
Age GroupRegion III Region IV-A MIMAROPA Region V Region VI
9-10

TABLE 9.5b --Concluded
Both Sexes Male Female Both
Sexes Male Female Both Sexes Male Female Both
Sexes Male Female Both Sexes Male Female
All Ages 47,937 26,911 21,026 23,821 13,482 10,339 17,457 10,202 7,255 26,070 15,245 10,825 29,260 17,197 12,063
Under 1 year 1,828 1,048 780 682 376 306 594 340 254 1,000 610 390 1,000 598 402 1- 4 years 944 503 441 368 201 167 248 137 111 404 199 205 485 262 223 5- 9 years 539 266 273 252 142 110 156 88 68 286 150 136 333 172 161 10-14 years 393 220 173 228 145 83 166 107 59 238 152 86 249 138 111 15-19 years 637 406 231 364 213 151 246 165 81 407 252 155 424 298 126 20-24 years 892 616 276 449 272 177 358 262 96 548 375 173 699 492 207 25-29 years 1,126 816 310 472 313 159 391 283 108 684 483 201 718 528 190 30-34 years 1,207 837 370 574 387 187 446 298 148 785 548 237 865 610 255 35-39 years 1,473 980 493 670 421 249 573 383 190 861 600 261 1,022 710 312 40-44 years 1,809 1,212 597 811 516 295 744 476 268 1,080 714 366 1,251 812 439 45-49 years 2,465 1,627 838 1,083 748 335 952 586 366 1,358 877 481 1,637 1,072 565 50-54 years 2,890 1,845 1,045 1,448 922 526 1,189 758 431 1,724 1,108 616 1,964 1,262 702 55-59 years 3,416 2,142 1,274 1,640 1,072 568 1,357 876 481 2,119 1,371 748 2,402 1,508 894 60-64 years 4,075 2,491 1,584 2,041 1,325 716 1,629 1,062 567 2,476 1,559 917 2,836 1,782 1,054 65-69 years 4,562 2,731 1,831 2,334 1,395 939 1,779 1,070 709 2,570 1,579 991 2,842 1,731 1,111 70-74 years 4,901 2,760 2,141 2,594 1,501 1,093 1,708 970 738 2,384 1,380 1,004 2,721 1,600 1,121 75-79 years 4,869 2,456 2,413 2,667 1,419 1,248 1,778 983 795 2,549 1,358 1,191 2,793 1,493 1,300 80-84 years 4,688 2,054 2,634 2,528 1,166 1,362 1,548 719 829 2,251 1,026 1,225 2,408 1,112 1,296 85 years & over 5,208 1,891 3,317 2,605 942 1,663 1,591 636 955 2,342 902 1,440 2,607 1,013 1,594 Not stated 15 10 5 11 6 5 4 3 1 4 2 2 4 4 0
Both Sexes Male Female Both
Sexes Male Female Both Sexes Male Female Both
Sexes Male Female
All Ages 22,115 13,335 8,780 14,939 8,667 6,272 3,236 1,971 1,265 452 327 125
Under 1 year 666 381 285 345 205 140 209 125 84 4 3 1 1- 4 years 343 171 172 268 150 118 112 58 54 3 3 0 5- 9 years 204 109 95 176 99 77 51 22 29 3 1 2 10-14 years 191 106 85 128 71 57 37 22 15 1 0 1 15-19 years 353 227 126 265 168 97 55 37 18 4 2 2 20-24 years 469 332 137 337 240 97 63 40 23 10 8 2 25-29 years 615 442 173 380 281 99 81 58 23 13 11 2 30-34 years 727 526 201 439 308 131 124 88 36 14 9 5 35-39 years 893 627 266 527 370 157 167 91 76 15 11 4 40-44 years 1,076 729 347 613 386 227 178 109 69 25 15 10 45-49 years 1,287 870 417 798 501 297 221 145 76 36 31 5 50-54 years 1,583 1,063 520 947 622 325 259 160 99 42 33 9 55-59 years 1,744 1,157 587 1,109 725 384 254 178 76 46 37 9 60-64 years 2,032 1,316 716 1,329 814 515 296 184 112 57 40 17 65-69 years 2,196 1,367 829 1,497 926 571 283 182 101 41 33 8 70-74 years 2,055 1,216 839 1,501 846 655 245 165 80 50 33 17 75-79 years 2,029 1,101 928 1,517 802 715 238 135 103 30 23 7 80-84 years 1,744 833 911 1,386 634 752 162 80 82 21 14 7 85 years & over 1,895 749 1,146 1,373 517 856 178 77 101 35 20 15 Not stated 13 13 0 4 2 2 23 15 8 2 0 2
Source: Philippine Statistics Authority
Caraga ARMM
Region XIAge Group
Age GroupForeign Countries
Region VII Region VIII Region IX Region X
Region XII
9-10

TABLE 9.5c Mortality by Age, by Sex, and by Usual Residence of the Deceased: 2017
Both Sexes Male Female Both
Sexes Male Female Both Sexes Male Female Both
Sexes Male Female Both Sexes Male Female
All Ages 579,237 332,517 246,720 75,187 43,100 32,087 8,176 4,748 3,428 34,427 19,244 15,183 21,115 12,398 8,717
Under 1 year 20,311 11,760 8,551 3,357 1,933 1,424 205 133 72 1,136 668 468 590 347 243 1- 4 years 8,573 4,612 3,961 1,034 544 490 68 37 31 396 215 181 242 122 120 5- 9 years 5,095 2,895 2,200 603 335 268 64 41 23 260 165 95 188 101 87 10-14 years 4,594 2,713 1,881 532 300 232 65 42 23 246 136 110 175 110 65 15-19 years 8,072 5,362 2,710 934 616 318 123 89 34 460 301 159 281 200 81 20-24 years 11,392 7,903 3,489 1,610 1,124 486 142 107 35 565 405 160 415 298 117 25-29 years 13,174 9,404 3,770 1,934 1,405 529 159 115 44 644 468 176 434 318 116 30-34 years 15,066 10,449 4,617 2,179 1,550 629 169 124 45 721 513 208 563 414 149 35-39 years 18,647 12,566 6,081 2,821 1,946 875 225 159 66 949 650 299 697 465 232 40-44 years 22,693 14,866 7,827 3,325 2,216 1,109 295 193 102 1,175 805 370 831 577 254 45-49 years 30,808 20,277 10,531 4,569 3,014 1,555 321 213 108 1,620 1,098 522 1,124 781 343 50-54 years 38,570 25,147 13,423 5,582 3,605 1,977 468 322 146 1,985 1,334 651 1,412 946 466 55-59 years 46,151 29,749 16,402 6,712 4,298 2,414 610 385 225 2,521 1,659 862 1,619 1,082 537 60-64 years 55,504 35,433 20,071 7,610 4,781 2,829 729 480 249 2,941 1,882 1,059 2,043 1,340 703 65-69 years 57,660 35,939 21,721 7,543 4,658 2,885 735 464 271 3,264 2,075 1,189 2,077 1,349 728 70-74 years 56,172 32,299 23,873 6,633 3,701 2,932 734 424 310 3,478 2,018 1,460 1,907 1,097 810 75-79 years 55,506 28,651 26,855 6,125 2,978 3,147 934 505 429 3,468 1,765 1,703 1,989 1,042 947 80-84 years 51,396 22,408 28,988 5,457 2,159 3,298 890 407 483 3,323 1,410 1,913 2,092 922 1,170 85 years & over 59,677 19,954 39,723 6,600 1,920 4,680 1,238 506 732 5,271 1,674 3,597 2,431 883 1,548 Not stated 176 130 46 27 17 10 2 2 0 4 3 1 5 4 1
Both Sexes Male Female Both
Sexes Male Female Both Sexes Male Female Both
Sexes Male Female Both Sexes Male Female
All Ages 67,980 38,656 29,324 84,971 48,735 36,236 15,489 9,046 6,443 37,052 21,071 15,981 50,701 29,045 21,656
Under 1 year 2,314 1,346 968 3,546 2,078 1,468 653 378 275 1,364 760 604 1,321 773 548 1- 4 years 877 469 408 1,399 765 634 230 113 117 824 436 388 626 343 283 5- 9 years 558 310 248 741 424 317 158 97 61 366 187 179 395 220 175 10-14 years 447 267 180 658 395 263 128 81 47 387 231 156 361 217 144 15-19 years 912 618 294 1,124 733 391 263 167 96 650 416 234 622 439 183 20-24 years 1,288 918 370 1,683 1,150 533 360 266 94 783 508 275 844 592 252 25-29 years 1,388 996 392 1,879 1,318 561 343 228 115 831 559 272 1,039 763 276 30-34 years 1,670 1,153 517 2,263 1,542 721 412 275 137 927 608 319 1,215 865 350 35-39 years 2,197 1,457 740 2,952 1,931 1,021 474 308 166 1,106 730 376 1,489 1,073 416 40-44 years 2,588 1,622 966 3,541 2,314 1,227 621 374 247 1,322 847 475 1,800 1,246 554 45-49 years 3,724 2,392 1,332 4,794 3,160 1,634 789 537 252 1,777 1,155 622 2,440 1,652 788 50-54 years 4,672 2,997 1,675 6,070 3,961 2,109 980 670 310 2,303 1,492 811 3,071 2,084 987 55-59 years 5,619 3,560 2,059 7,295 4,688 2,607 1,157 798 359 2,670 1,746 924 3,639 2,432 1,207 60-64 years 6,795 4,220 2,575 8,710 5,570 3,140 1,397 940 457 3,172 2,123 1,049 4,588 3,014 1,574 65-69 years 7,180 4,454 2,726 8,662 5,414 3,248 1,427 910 517 3,587 2,274 1,313 4,905 3,101 1,804 70-74 years 6,919 3,994 2,925 7,987 4,552 3,435 1,519 912 607 3,784 2,230 1,554 4,997 2,864 2,133 75-79 years 6,319 3,231 3,088 7,435 3,785 3,650 1,429 770 659 3,848 2,017 1,831 5,569 2,881 2,688 80-84 years 5,587 2,494 3,093 6,625 2,700 3,925 1,524 666 858 3,473 1,474 1,999 5,364 2,353 3,011 85 years & over 6,897 2,135 4,762 7,569 2,228 5,341 1,623 555 1,068 3,867 1,270 2,597 6,406 2,125 4,281 Not stated 29 23 6 38 27 11 2 1 1 11 8 3 10 8 2
Continued
Age GroupPhilippines NCR CAR Region I Region II
Age GroupRegion III Region IV-A MIMAROPA Region V Region VI
9-12

TABLE 9.5c --Concluded
Both Sexes Male Female Both
Sexes Male Female Both Sexes Male Female Both
Sexes Male Female Both Sexes Male Female
All Ages 47,575 26,807 20,768 23,721 13,331 10,390 17,123 9,882 7,241 26,065 15,055 11,010 29,415 17,478 11,937
Under 1 year 1,632 938 694 547 307 240 483 289 194 959 563 396 988 561 427 1- 4 years 843 448 395 344 180 164 251 130 121 448 242 206 428 245 183 5- 9 years 435 225 210 225 143 82 181 101 80 256 139 117 276 170 106 10-14 years 392 227 165 220 135 85 157 89 68 241 149 92 241 129 112 15-19 years 606 365 241 369 241 128 258 180 78 410 281 129 460 315 145 20-24 years 824 549 275 397 245 152 338 231 107 583 404 179 654 470 184 25-29 years 1,083 781 302 501 327 174 384 271 113 664 491 173 790 567 223 30-34 years 1,130 766 364 540 353 187 442 289 153 745 535 210 840 576 264 35-39 years 1,373 897 476 602 394 208 536 356 180 805 549 256 984 661 323 40-44 years 1,690 1,114 576 772 480 292 692 432 260 988 615 373 1,261 816 445 45-49 years 2,294 1,502 792 1,099 714 385 941 584 357 1,377 879 498 1,589 1,044 545 50-54 years 2,885 1,844 1,041 1,363 870 493 1,227 818 409 1,729 1,102 627 2,032 1,275 757 55-59 years 3,433 2,181 1,252 1,703 1,094 609 1,359 851 508 2,133 1,310 823 2,436 1,565 871 60-64 years 4,341 2,731 1,610 2,081 1,339 742 1,608 1,027 581 2,632 1,647 985 2,925 1,866 1,059 65-69 years 4,604 2,812 1,792 2,370 1,441 929 1,721 1,048 673 2,656 1,631 1,025 2,970 1,859 1,111 70-74 years 4,757 2,688 2,069 2,735 1,549 1,186 1,702 990 712 2,380 1,381 999 2,848 1,691 1,157 75-79 years 5,061 2,600 2,461 2,656 1,392 1,264 1,648 869 779 2,523 1,337 1,186 2,729 1,485 1,244 80-84 years 4,773 2,145 2,628 2,573 1,172 1,401 1,577 705 872 2,290 983 1,307 2,504 1,203 1,301 85 years & over 5,406 1,982 3,424 2,617 950 1,667 1,612 618 994 2,242 815 1,427 2,457 977 1,480 Not stated 13 12 1 7 5 2 6 4 2 4 2 2 3 3 0
Both Sexes Male Female Both
Sexes Male Female Both Sexes Male Female Both
Sexes Male Female
All Ages 21,693 13,112 8,581 14,928 8,590 6,338 3,036 1,793 1,243 583 426 157
Under 1 year 630 369 261 386 206 180 193 108 85 7 3 4 1- 4 years 298 161 137 185 120 65 79 42 37 1 0 1 5- 9 years 204 135 69 146 81 65 36 20 16 3 1 2 10-14 years 184 109 75 131 78 53 27 18 9 2 0 2 15-19 years 320 230 90 222 135 87 52 32 20 6 4 2 20-24 years 519 360 159 321 226 95 53 40 13 13 10 3 25-29 years 600 448 152 389 273 116 93 62 31 19 14 5 30-34 years 661 480 181 454 311 143 118 81 37 17 14 3 35-39 years 797 565 232 484 328 156 133 76 57 23 21 2 40-44 years 973 676 297 616 406 210 170 106 64 33 27 6 45-49 years 1,353 905 448 753 493 260 200 122 78 44 32 12 50-54 years 1,599 1,041 558 926 602 324 218 145 73 48 39 9 55-59 years 1,787 1,183 604 1,166 722 444 236 156 80 56 39 17 60-64 years 2,201 1,426 775 1,380 817 563 284 176 108 67 54 13 65-69 years 2,114 1,284 830 1,485 936 549 290 175 115 70 54 16 70-74 years 1,991 1,172 819 1,474 855 619 277 147 130 50 34 16 75-79 years 1,953 1,035 918 1,566 807 759 207 121 86 47 31 16 80-84 years 1,690 836 854 1,452 680 772 175 84 91 27 15 12 85 years & over 1,814 694 1,120 1,391 514 877 191 79 112 45 29 16 Not stated 5 3 2 1 0 1 4 3 1 5 5 0
Source: Philippine Statistics Authority
Region XI
Age GroupRegion XII Caraga ARMM Foreign Countries
Age GroupRegion VII Region VIII Region IX Region X
9-12

TABLE 9.6 Mortality: Ten Leading Causes, Number, and Rates by Sex: 2015 to 2017
Total Male Female
1. Ischaemic heart diseases 68,572 41,284 27,288 67.52. Neoplasms 58,715 28,984 29,731 57.83. Cerebrosvascular diseases 58,310 32,393 25,917 57.44. Pneumonia 49,595 24,603 24,992 48.85. Hypertensive diseases 34,506 18,922 15,584 34.06. Diabetes Mellitus 34,050 16,953 17,097 33.57. Other heart diseases 31,729 16,442 15,287 31.28. Respiratory tuberculosis 24,644 17,385 7,259 24.39. Chronic lower respiratory infections 23,760 16,478 7,282 23.410. Assault 11,096 10,028 1,068 10.9
Total Male Female
1. Ischaemic heart diseases 74,134 44,472 29,662 71.82. Neoplasms 60,470 29,516 30,954 58.63. Pneumonia 57,809 28,993 28,816 56.04. Cerebrosvascular diseases 56,938 31,675 25,263 55.15. Hypertensive diseases 33,452 17,901 15,551 32.46. Diabetes Mellitus 33,295 16,384 16,911 32.27. Other heart diseases 28,641 14,992 13,649 27.78. Respiratory tuberculosis 24,462 17,288 7,174 23.79. Chronic lower respiratory infections 24,365 17,049 7,316 23.610. Assault 14,869 13,662 1,207 14.4
Total Male Female
1. Ischaemic heart diseases 84,120 50,503 33,617 80.22. Neoplasms 64,125 30,800 33,325 61.13. Cerebrosvascular diseases 59,774 33,610 26,164 57.04. Pneumonia 57,210 28,375 28,835 54.55. Diabetes Mellitus 30,932 15,164 15,768 29.56. Hypertensive diseases 26,471 14,061 12,410 25.27. Chronic lower respiratory infections 24,818 17,633 7,185 23.78. Respiratory tuberculosis 22,523 15,689 6,834 21.59. Other heart diseases 22,134 11,672 10,462 21.110.Remainder of diseases of the genitourinary system 15,717 9,196 6,521 15.0
Sources: Department of Health, Philippine Health Statistics Philippine Statistics Authority
Diseases2017
Number Rate
Diseases2016
NumberRate
Diseases2015
NumberRate
9-13

TOTAL 9.7 Number of Registered Infant Deaths by Region: 1990 to 2017
Year Philippines NCR CAR I II III IV-A MIMAROPA V VI VII VIII IX X XI XII Caraga ARMM Foreign Countries
1990 39,633 7,712 438 2,742 1,771 3,468 6,063 … 2,749 3,306 3,764 1,567 1,338 1,891 2,035 622 … 167 … 1991 34,332 6,636 402 2,488 1,546 3,228 5,473 … 2,490 2,679 2,774 1,403 944 1,750 1,831 557 … 131 … 1992 36,814 7,097 404 2,480 1,577 3,233 6,311 … 2,737 2,909 3,353 1,558 1,060 1,609 1,835 604 … 47 … 1993 34,673 7,033 438 2,447 1,427 2,850 5,819 … 2,550 2,701 3,079 1,453 914 1,538 1,701 582 … 141 … 1994 31,073 6,372 374 2,245 1,139 2,708 5,261 … 2,151 2,475 2,779 1,355 878 1,375 1,419 511 … 31 … 1995 30,631 6,182 440 2,111 1,052 2,674 5,302 … 2,194 2,475 2,757 1,256 888 1,359 1,455 455 … 29 21996 30,550 7,386 343 1,986 1,006 2,738 5,128 … 2,090 2,230 2,587 1,171 755 842 1,262 384 548 27 671997 28,061 6,698 372 1,941 813 2,625 4,893 … 1,784 2,255 2,449 1,034 643 676 990 351 437 34 661998 28,196 6,798 341 2,017 857 2,621 5,002 … 1,796 2,214 2,285 941 743 721 1,066 366 403 23 21999 25,168 7,191 359 1,803 731 2,225 4,131 … 1,494 1,681 1,988 798 580 599 856 327 390 14 12000 27,007 7,126 339 1,815 757 2,782 4,258 … 1,859 1,901 2,109 976 647 805 705 471 372 84 12001 26,129 6,610 318 1,847 625 2,539 4,932 … 1,722 1,804 1,972 838 605 593 991 338 361 32 22002 23,778 5,883 310 1,633 592 2,267 3,851 608 1,462 1,717 2,024 739 598 737 604 386 317 47 32003 22,844 5,545 281 1,580 582 2,121 3,587 627 1,475 1,700 1,783 873 503 735 606 459 316 69 22004 22,557 5,318 300 1,618 534 2,094 3,629 575 1,425 1,618 1,809 872 567 792 611 425 301 66 32005 21,674 4,858 297 1,569 507 2,079 3,528 622 1,360 1,558 1,842 787 619 758 556 405 256 65 82006 21,764 4,782 325 1,488 591 2,066 3,486 606 1,416 1,508 1,881 808 557 796 661 429 300 60 42007 21,720 4,889 299 1,532 595 2,111 3,575 606 1,350 1,577 1,738 657 558 745 681 449 289 65 42008 22,351 4,910 297 1,464 558 2,164 3,702 602 1,501 1,618 1,863 671 632 810 750 459 261 83 62009 21,659 4,532 350 1,417 557 2,126 3,477 666 1,363 1,609 1,819 769 535 817 847 453 270 49 32010 22,476 4,787 274 1,471 600 2,177 3,739 609 1,460 1,543 1,851 768 535 761 1,120 454 289 35 32011 22,283 4,482 292 1,431 610 2,342 3,847 596 1,431 1,392 1,702 746 605 811 1,126 481 347 40 22012 22,254 4,542 304 1,342 638 2,176 3,875 635 1,356 1,480 1,905 766 463 848 1,007 557 316 33 112013 21,992 4,430 302 1,299 659 2,182 3,771 678 1,509 1,496 1,794 759 514 777 883 556 339 42 22014 21,108 4,221 294 1,185 654 2,143 3,726 613 1,463 1,346 1,556 641 542 759 889 635 349 91 12015 20,750 3,811 257 1,169 581 2,368 3,657 675 1,311 1,365 1,588 563 529 806 892 637 344 196 12016 21,874 3,687 250 1,205 604 2,480 3,727 693 1,517 1,383 1,828 682 594 1,000 1,000 666 345 209 42017 20,311 3,357 205 1,136 590 2,314 3,546 653 1,364 1,321 1,632 547 483 959 988 630 386 193 7
Notes: 1. Figures for MIMAROPA, Caraga, and Foreign Countries were made available starting 2001, 1996 and 1994, respectively 2. Starting 2000, the new regional configuration was used
Source: Philippine Statistics Authority
9-14

TABLE 9.8 Early Childhood Mortality Rates by Socioeconomic Characteristics: 2013 and 2017
2017 2013 2017 2013 2017 2013
RegionNCR 8 16 2 6 11 22CAR 8 16 3 9 11 25I - Ilocos Region 26 23 3 4 29 26II - Cagayan Valley 19 20 6 2 24 21III - Central Luzon 14 23 5 8 19 31IV-A CALABARZON 18 19 3 4 21 23MIMAROPA 28 36 5 6 33 43V - Bicol Region 30 21 8 12 38 33VI - Western Visayas 38 25 9 6 46 30VII - Central Visayas 25 26 4 8 29 34VIII - Eastern Visayas 27 19 5 13 32 32IX - Zamboanga Peninsula 20 27 7 8 26 35X - Northern Mindanao 26 25 6 24 32 49XI - Davao Region 17 26 7 12 24 37XII - SOCCSKSARGEN 29 37 19 16 48 52XIII - Caraga 24 33 4 6 28 39BARMM 37 32 19 24 55 55
ResidenceUrban 18 19 6 7 23 25Rural 23 28 7 11 30 38
Mother's EducationNo Education -43 -37 -17 -25 -59 -61Grades 1-6 31 36 16 17 47 53Grades 7-10 23 23 3 7 26 30Grade 11 … … … … … …Post-secondary 22 … 9 … 31 …College 12 12 1 4 13 16
Wealth quintileLowest 31 … 12 … 42 …Second 23 … 7 … 29 …
Middle 26 … 5 … 31 …Fourth 11 … 2 … 12 …Highest 9 … 2 … 11 …
Source: Philippine Statistics Authority, National Demographic and Health Survey
Background CharacteristicInfant Mortality Rate Child Mortality Rate Under-five Mortality Rate
9-15

TABLE 9.9 Projected Total Fertility Rate by Region by Five Calendar-Year Interval: 2005 to 2045 (Number of children per woman; Medium Assumption)
Region 2005-2010 2010-2015 2015-2020 2020-2025 2025-2030 2030-2035 2035-2040 2040-2045
PhilippinesLow Series 3.07 2.92 2.56 2.24 1.97 1.72 1.51 1.32Medium Series 3.18 3.00 2.77 2.56 2.37 2.18 2.02 1.86High Series 3.25 3.04 2.87 2.71 2.56 2.42 2.29 2.16
NCR 2.48 2.40 2.20 2.02 1.90 1.78 1.66 1.52CAR 3.40 2.88 2.64 2.42 2.22 2.02 1.89 1.75I - Ilocos Region 3.38 2.98 2.74 2.51 2.30 2.09 1.90 1.75II - Cagayan Valley 3.05 2.97 2.72 2.50 2.29 2.08 1.89 1.75III - Central Luzon 2.81 2.61 2.40 2.20 2.01 1.89 1.76 1.62IV-A CALABARZON 2.83 2.71 2.49 2.28 2.09 1.90 1.78 1.64MIMAROPA 4.48 3.87 3.55 3.26 2.98 2.72 2.46 2.21V - Bicol Region 3.91 3.81 3.50 3.21 2.94 2.68 2.42 2.18VI - Western Visayas 3.59 2.99 2.74 2.51 2.30 2.10 1.90 1.76VII - Central Visayas 3.22 3.00 2.75 2.52 2.31 2.10 1.91 1.76VIII - Eastern Visayas 4.09 3.66 3.36 3.08 2.82 2.57 2.33 2.09IX - Zamboanga Peninsula 3.76 3.20 2.94 2.69 2.46 2.25 2.03 1.83X - Northern Mindanao 3.40 3.08 2.83 2.59 2.37 2.16 1.96 1.76XI - Davao Region 2.83 3.19 2.93 2.69 2.46 2.24 2.03 1.82XII - SOCCSKSARGEN 3.77 3.16 2.90 2.66 2.43 2.22 2.01 1.80XIII - Caraga 3.68 3.61 3.74 3.45 3.19 2.94 2.72 2.51ARMM 3.78 4.05 3.31 3.04 2.78 2.53 2.30 2.06
Source: Philippine Statistics Authority, 2010 Census-Based National, Regional, and Provincial Population Projections
9-16
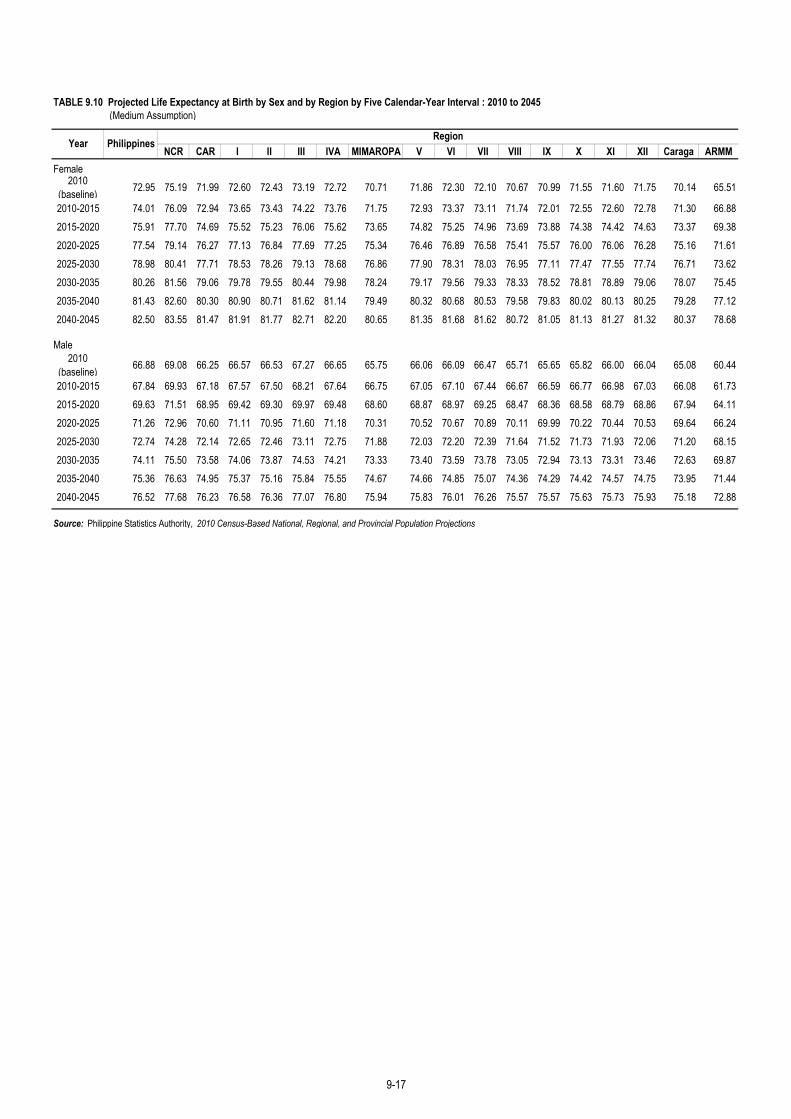
TABLE 9.10 Projected Life Expectancy at Birth by Sex and by Region by Five Calendar-Year Interval : 2010 to 2045 (Medium Assumption)
NCR CAR I II III IVA MIMAROPA V VI VII VIII IX X XI XII Caraga ARMMFemale
2010 (baseline) 72.95 75.19 71.99 72.60 72.43 73.19 72.72 70.71 71.86 72.30 72.10 70.67 70.99 71.55 71.60 71.75 70.14 65.51
2010-2015 74.01 76.09 72.94 73.65 73.43 74.22 73.76 71.75 72.93 73.37 73.11 71.74 72.01 72.55 72.60 72.78 71.30 66.882015-2020 75.91 77.70 74.69 75.52 75.23 76.06 75.62 73.65 74.82 75.25 74.96 73.69 73.88 74.38 74.42 74.63 73.37 69.382020-2025 77.54 79.14 76.27 77.13 76.84 77.69 77.25 75.34 76.46 76.89 76.58 75.41 75.57 76.00 76.06 76.28 75.16 71.612025-2030 78.98 80.41 77.71 78.53 78.26 79.13 78.68 76.86 77.90 78.31 78.03 76.95 77.11 77.47 77.55 77.74 76.71 73.622030-2035 80.26 81.56 79.06 79.78 79.55 80.44 79.98 78.24 79.17 79.56 79.33 78.33 78.52 78.81 78.89 79.06 78.07 75.452035-2040 81.43 82.60 80.30 80.90 80.71 81.62 81.14 79.49 80.32 80.68 80.53 79.58 79.83 80.02 80.13 80.25 79.28 77.122040-2045 82.50 83.55 81.47 81.91 81.77 82.71 82.20 80.65 81.35 81.68 81.62 80.72 81.05 81.13 81.27 81.32 80.37 78.68
Male2010
(baseline) 66.88 69.08 66.25 66.57 66.53 67.27 66.65 65.75 66.06 66.09 66.47 65.71 65.65 65.82 66.00 66.04 65.08 60.44
2010-2015 67.84 69.93 67.18 67.57 67.50 68.21 67.64 66.75 67.05 67.10 67.44 66.67 66.59 66.77 66.98 67.03 66.08 61.732015-2020 69.63 71.51 68.95 69.42 69.30 69.97 69.48 68.60 68.87 68.97 69.25 68.47 68.36 68.58 68.79 68.86 67.94 64.112020-2025 71.26 72.96 70.60 71.11 70.95 71.60 71.18 70.31 70.52 70.67 70.89 70.11 69.99 70.22 70.44 70.53 69.64 66.242025-2030 72.74 74.28 72.14 72.65 72.46 73.11 72.75 71.88 72.03 72.20 72.39 71.64 71.52 71.73 71.93 72.06 71.20 68.152030-2035 74.11 75.50 73.58 74.06 73.87 74.53 74.21 73.33 73.40 73.59 73.78 73.05 72.94 73.13 73.31 73.46 72.63 69.872035-2040 75.36 76.63 74.95 75.37 75.16 75.84 75.55 74.67 74.66 74.85 75.07 74.36 74.29 74.42 74.57 74.75 73.95 71.442040-2045 76.52 77.68 76.23 76.58 76.36 77.07 76.80 75.94 75.83 76.01 76.26 75.57 75.57 75.63 75.73 75.93 75.18 72.88
Source: Philippine Statistics Authority, 2010 Census-Based National, Regional, and Provincial Population Projections
Year Philippines Region
9-17

TABLE 9.11 Ten Leading Causes of Infant Deaths, Number, and Rates: 2015 and 2016 (Rate per 1,000 live births)
1. Pneumonia2. Respiratory distress of newborn3. Bacterial sepsis of newborn4. Congenital malformations of the heart5. Diarrhea and gastroenteritis of infectious origin6. Disorders related to short gestation and low birth weight, not elsewhere classified7. Other respiratory conditions of newborn8. Other congenital malformations9. Intrauterine hypoxia and birth asphyxia10. Remainder of diseases of the respiratory system
1. Pneumonia2. Respiratory distress of newborn3. Bacterial sepsis of newborn4. Congenital malformations of the heart5. Disorders relating to length gestation and fetal growth6. Other respiratory conditions of newborn7. Other congenital malformations8. Diarrhea and gastroenteritis of presumed infectious origin9. Intrauterine hypoxia and birth asphyxia10. Septicaemia
Source: Department of Health, Philippine Health Statistics
749 0.4
1,030 0.6824 0.5802 0.5
2,157 1.2
1,292 0.71,228 0.7
Leading Causes of Infant Deaths2015
Number Rate
2,370 1.4
1,000 0.6832 0.5780 0.5
1,407 0.8
1,202 0.71,196 0.7
Leading Causes of Infant Deaths2016
Number Rate
2,885 1.72,263 1.3
1,328 0.8
2,276
1,398 0.8
1.3
2,136 1.2
9-18

TABLE 9.12 Ten Leading Causes of Morbidity, Number, and Rates : 2016 to 2018 (Rate per 100,000 population)
Rate
Acute Respiratory Infection 3,080,343 2,970.1 Hypertension 886,203 854.5 ALTRI & Pneumonia 786,085 758.0 Urinary Tract Infection 288,588 278.3 Influenza 216,074 208.3 Bronchitis 200,176 193.0 Acute Watery Diarrhea 139,770 134.8 TB Respiratory 87,422 84.3 Acute Bloody Diarrhea 57,647 55.6 Dengue Fever 56,487 54.5
Rate
1. Acute upper respiratory infection 2,382,122 2,270.43. Hypertension 994,707 948.12. ALTRI and Pneumonia 481,561 459.04. Urinary tract infection 360,938 344.05. Bronchitis 170,085 162.16. Influenza 154,672 147.47. Acute watery diarrhea 132,783 126.68. Asthma all forms 72,520 69.18. TB respiratory 59,277 56.510. Acute Fibrile Illness 55,652 53.0
Rate
1. Acute Respiratory Infection 1,209,821 1,139.5 2. Hypertension 602,811 567.8 3. ALTRI & Pneumonia 503,884 474.6 4. Urinary Tract Infection 280,687 264.4 5. Bronchitis 130,057 122.5 6. Acute Watery Diarrhea 112,543 106.0 7. Influenza 91,681 86.4 8. Diseases of the Heart 66,688 62.8 9. Dengue Fever 51,361 48.4 10. TB respiratory 39,923 37.6
Source: Department of Health, Field Health Service Information System
Disease of Morbidity 2017Number of Cases
Disease of Morbidity 2018Number of Cases
Disease of Morbidity 2016Number of Cases
9-19

TABLE 9.13 Number of Government Doctors, Nurses, Dentists, and Midwives by Region: 2007 to 2018
NCR a CAR I b II b III b IV-A MIMAROPA V b VI VII VIII b IX b X XI XII b Caraga BARMM
2007 Doctors 3,047 606 81 158 289 275 253 77 157 248 206 152 89 110 69 111 88 78Dentists 1,894 542 29 98 75 198 192 64 94 120 87 94 37 64 63 53 54 30Nurses 4,577 686 141 233 359 427 437 128 275 461 289 210 181 194 118 194 122 122Midwives 16,821 1,067 602 1,043 876 1,610 1,787 523 1,117 1,760 1,275 874 612 963 768 845 621 478
2008 Doctors 2,838 590 89 159 97 278 238 83 157 234 177 155 100 138 75 113 79 76Dentists 1,891 498 40 105 65 176 189 68 85 123 117 94 44 74 69 56 58 30Nurses 4,576 723 131 259 196 441 472 142 273 401 328 201 203 241 127 194 114 130Midwives 17,437 1,135 637 1,014 839 1,662 1,818 555 1,072 1,775 1,534 904 697 1,052 743 878 615 507
2009 Doctors 2,901 638 86 155 100 278 247 85 160 234 227 145 97 139 86 70 79 75Dentists 1,991 551 36 97 65 183 228 60 85 122 120 96 47 83 75 57 57 29Nurses 4,729 837 145 222 186 442 488 132 258 397 393 200 193 255 156 199 107 119Midwives 16,611 1,134 631 589 816 1,581 1,748 588 1,049 1,753 1,291 860 701 1,012 806 867 680 505
2010 Doctors 2,682 413 95 152 110 283 274 82 155 239 260 145 99 116 0 104 81 74Dentists 1,718 345 53 102 71 181 219 60 90 121 132 85 40 68 0 60 61 30Nurses 4,495 545 147 205 224 491 550 142 262 406 441 204 186 221 0 228 124 119Midwives 16,875 932 623 1,430 849 1,641 1,838 615 1,098 1,757 1,542 861 620 1,041 0 909 599 520
2011 Doctors 2,944 613 82 154 104 296 256 86 160 258 261 153 101 124 77 71 76 72Dentists 1,912 502 39 105 74 179 184 63 87 127 143 90 47 70 64 51 58 29Nurses 5,294 885 133 205 219 497 520 142 272 444 537 223 226 255 194 263 159 120Midwives 17,514 1,151 607 1,048 821 1,633 1,764 600 1,048 1,816 1,614 869 720 1,079 756 870 596 522
2012 Doctors 2,983 619 88 152 113 302 279 87 176 259 265 168 104 70 73 77 81 70Dentists 2,072 498 30 98 77 185 194 59 93 121 125 101 43 259 56 50 58 25Nurses 5,596 904 144 212 261 572 552 150 270 444 535 250 214 259 144 373 159 153Midwives 16,948 1,138 643 979 875 1,660 1,808 588 1,090 1,803 1,572 933 654 1,054 707 919 0 525
2013 Doctors 2,927 632 87 162 111 316 283 91 166 254 223 159 80 85 89 119 0 70Dentists 1,823 507 28 102 74 185 218 55 82 122 115 103 43 48 61 55 0 25Nurses 5,632 866 190 230 233 570 621 154 264 456 529 250 210 289 165 452 0 153Midwives 16,875 1,166 667 960 867 1,678 1,939 577 1,004 1,764 1,564 963 574 1,059 725 843 0 525
2014 Doctors 3,002 632 94 162 109 299 235 86 173 250 257 161 92 101 81 118 82 70Dentists 1,788 509 28 108 71 178 167 55 74 125 118 88 43 50 53 60 36 25Nurses 6,061 866 227 295 239 585 580 165 271 465 620 290 234 286 126 531 128 153Midwives 17,151 1,208 689 994 839 1,638 1,489 592 1,048 1,740 1,577 913 671 901 735 981 611 525
2015 Doctors 3,182 701 101 172 101 336 265 81 166 251 274 167 97 101 79 119 86 85Dentists 1,922 616 32 112 62 196 199 52 95 130 69 83 39 50 57 53 31 46Nurses 6,520 1,009 280 285 204 648 738 164 288 443 649 555 159 286 141 387 158 126Midwives 17,649 1,230 672 1,036 795 1,849 1,814 546 1,046 1,729 1,747 987 528 901 693 979 497 600
2016 Doctors 3,177 718 102 169 105 304 264 131 162 262 233 159 89 127 78 121 86 67Dentists 1,953 597 32 103 61 180 205 57 81 143 121 78 41 60 58 52 59 25Nurses 6,009 1,103 331 329 230 600 784 233 287 465 385 219 144 215 147 289 152 96Midwives 17,200 1,248 716 1,030 813 1,652 2,016 623 1,002 1,719 1,481 848 483 982 669 885 628 405
2017 Doctors 3,204 642 98 173 100 358 350 88 165 267 211 166 94 132 94 120 68 78Dentists 1,988 501 29 94 64 209 232 52 126 140 126 94 51 71 76 52 26 45Nurses 6,156 1,014 323 408 253 538 745 161 324 595 444 224 198 281 146 250 99 153Midwives 17,339 1,193 640 1,072 801 1,883 1,728 625 1,000 1,724 1,529 845 646 1,046 720 920 413 554
2018 Doctors 3,131 657 93 187 103 306 314 90 149 263 248 164 93 122 78 121 67 76Dentists 1,875 515 29 119 60 177 190 54 95 139 135 81 41 66 61 51 17 45Nurses 5,975 1,013 161 434 227 561 715 201 336 439 504 286 209 216 152 286 99 136Midwives 17,112 1,217 683 1,191 842 1,518 1,697 585 1,006 1,656 1,700 922 662 970 670 838 413 542
a Combination of retained medical personnel at the Regional Health Office (RHOs) and devolved health personnel in the local government units (LGUs)b Devolved/absorbed health personnel by the LGUs
Source: Department of Health
PhilippinesRegion
9-20
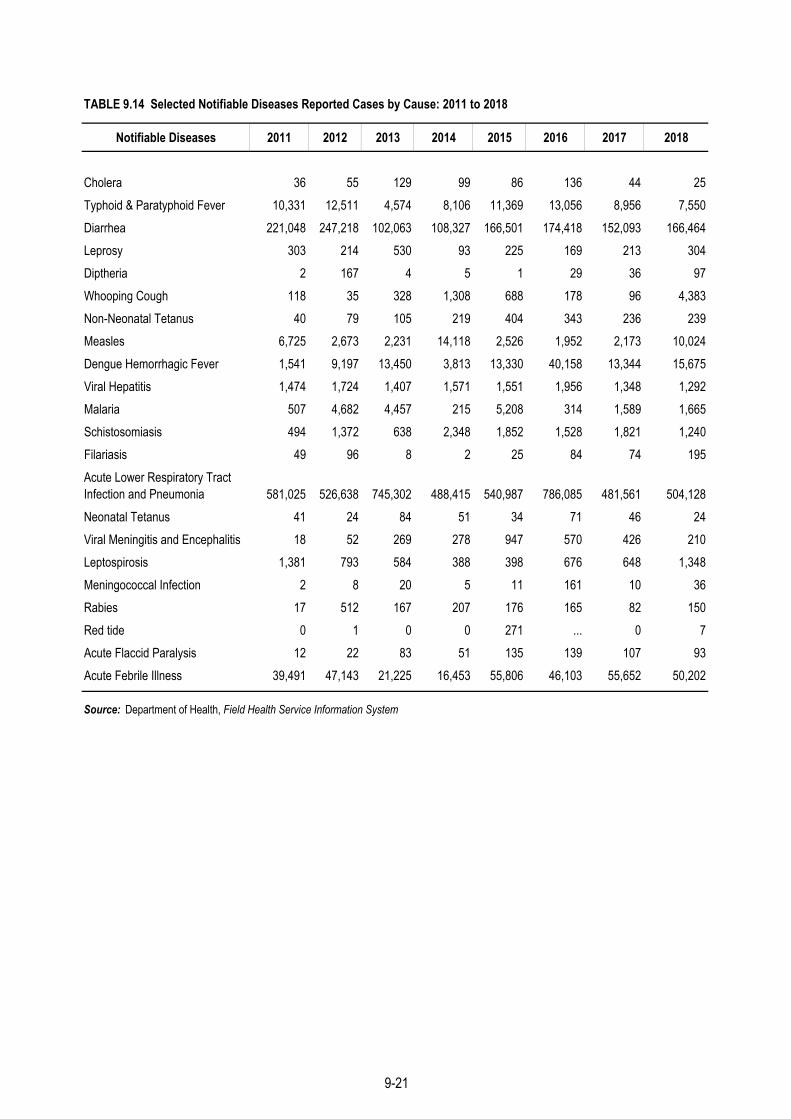
TABLE 9.14 Selected Notifiable Diseases Reported Cases by Cause: 2011 to 2018
Notifiable Diseases 2011 2012 2013 2014 2015 2016 2017 2018
Cholera 36 55 129 99 86 136 44 25Typhoid & Paratyphoid Fever 10,331 12,511 4,574 8,106 11,369 13,056 8,956 7,550Diarrhea 221,048 247,218 102,063 108,327 166,501 174,418 152,093 166,464Leprosy 303 214 530 93 225 169 213 304Diptheria 2 167 4 5 1 29 36 97Whooping Cough 118 35 328 1,308 688 178 96 4,383Non-Neonatal Tetanus 40 79 105 219 404 343 236 239Measles 6,725 2,673 2,231 14,118 2,526 1,952 2,173 10,024Dengue Hemorrhagic Fever 1,541 9,197 13,450 3,813 13,330 40,158 13,344 15,675Viral Hepatitis 1,474 1,724 1,407 1,571 1,551 1,956 1,348 1,292Malaria 507 4,682 4,457 215 5,208 314 1,589 1,665Schistosomiasis 494 1,372 638 2,348 1,852 1,528 1,821 1,240Filariasis 49 96 8 2 25 84 74 195Acute Lower Respiratory Tract Infection and Pneumonia 581,025 526,638 745,302 488,415 540,987 786,085 481,561 504,128Neonatal Tetanus 41 24 84 51 34 71 46 24Viral Meningitis and Encephalitis 18 52 269 278 947 570 426 210Leptospirosis 1,381 793 584 388 398 676 648 1,348Meningococcal Infection 2 8 20 5 11 161 10 36Rabies 17 512 167 207 176 165 82 150Red tide 0 1 0 0 271 ... 0 7Acute Flaccid Paralysis 12 22 83 51 135 139 107 93Acute Febrile Illness 39,491 47,143 21,225 16,453 55,806 46,103 55,652 50,202
Source: Department of Health, Field Health Service Information System
9-21

TABLE 9.15 Percent Distribution of Currently Married Women Aged 15-49 Years by Current Contraceptive Method Used by Selected Background Characteristics: 2017
Any Modern Method
Female sterilization
Male sterilization
IUD (Intrauterine
Device)Injectables Implants Pill Male
condom SDM LAMAny
Traditional Method
Rhythm/ Periodic
AbstinenceWithdrawal Others
54.3 40.4 7.4 0.0 3.5 5.0 1.1 20.9 1.7 0.1 0.5 13.9 3.5 10.3 1.0 45.7 15,016
53.3 38.1 8.1 0.1 2.9 4.4 1.1 18.9 1.7 0.0 1.0 15.3 3.7 11.5 0.1 46.7 6,76955.0 42.2 6.9 0.0 4.0 5.6 1.2 22.6 1.6 0.1 0.2 12.8 3.3 9.4 0.1 45.0 8,247
b. By RegionNCR 54.7 39.9 8.4 0.1 2.3 4.8 1.1 19.0 1.8 0.1 2.3 14.8 3.6 11.2 0.0 45.3 2,133CAR 50.0 43.5 9.1 0.2 2.6 8.8 0.3 21.2 1.0 0.1 0.1 6.5 2.0 4.5 0.0 50.0 222I - Ilocos Region 60.1 43.9 15.2 0.1 2.2 6.8 0.4 17.7 1.2 0.0 0.2 16.2 1.5 14.6 0.1 39.9 721II - Cagayan Valley 62.6 57.0 8.7 0.0 3.9 6.6 0.6 36.1 1.1 0.0 0.0 5.6 0.2 5.3 0.0 37.4 559III - Central Luzon 53.1 38.2 13.0 0.0 0.4 4.6 0.6 17.8 1.4 0.0 0.4 14.9 1.4 13.5 0.0 46.9 1,509IV-A CALABARZON 54.0 36.4 7.5 0.1 2.6 3.9 0.7 19.4 2.0 0.0 0.1 17.5 3.3 14.3 0.0 46.0 2,489MIMAROPA 50.8 43.6 5.1 0.0 2.3 8.6 1.7 24.6 0.6 0.0 0.5 7.2 2.5 4.5 0.1 49.2 398V - Bicol Region 51.3 32.2 4.3 0.0 1.3 4.6 0.9 18.6 2.3 0.1 0.2 19.1 4.7 14.3 0.0 48.7 944VI - Western Visayas 56.9 39.9 5.7 0.1 3.3 4.5 1.2 23.2 1.5 0.0 0.5 16.9 6.1 10.8 0.0 43.1 924VII - Central Visayas 52.1 36.7 4.7 0.0 7.1 3.2 1.3 18.0 2.1 0.1 0.2 15.4 7.6 7.5 0.3 47.9 939VIII - Eastern Visayas 58.8 40.9 6.7 0.0 5.4 6.1 2.0 18.6 1.7 0.2 0.1 17.9 3.8 14.0 0.1 41.2 611IX - Zamboanga Peninsula 49.5 42.0 3.6 0.1 5.5 5.6 2.3 21.9 1.9 0.4 0.7 7.4 3.6 3.1 0.7 50.5 513X - Northern Mindanao 53.5 44.9 5.7 0.0 10.4 3.5 0.7 22.5 1.7 0.3 0.2 8.6 3.8 4.8 0.0 46.5 634XI - Davao Region 62.2 48.9 6.5 0.0 5.9 4.2 2.1 28.1 1.9 0.0 0.1 13.2 4.3 9.0 0.0 37.8 822XII - SOCCSKSARGEN 58.9 50.8 5.5 0.0 4.0 8.4 3.4 27.6 1.4 0.0 0.4 8.0 3.4 4.4 0.2 41.1 719XIII - Caraga 54.8 46.8 5.2 0.1 8.4 5.8 0.4 25.1 1.4 0.2 0.2 8.0 3.4 4.4 0.2 45.2 425ARMM 26.3 18.7 1.5 0.0 1.2 5.6 0.6 9.7 0.2 0.0 0.0 7.6 0.5 6.3 0.8 73.7 453
Source: Philippine Statistics Authority
Modern Method
Background Characteristics
Any Method
Traditional MethodNot
Currently Using
Number of Currently Married Women
Philippinesa. Residence Urban Rural

TABLE 9.16 Number of Hospitals and Bed Capacity: 1990 to 2015
1990 1,733 598 1,135 87,133 49,273 37,860 14.4 a
1991 1,663 562 1,101 81,647 46,338 35,309 12.8 b
1992 1,742 639 1,103 89,822 53,023 36,799 13.7 b
1993 1,632 537 1,095 71,865 35,629 36,236 10.7 b
1994 1,571 503 1,068 75,099 38,696 36,403 10.9 b
1995 1,700 589 1,111 80,800 43,229 37,571 11.8 a
1996 1,738 600 1,138 81,789 43,582 38,207 11.7 c
1997 1,817 645 1,172 81,905 42,070 39,835 11.4 c
1998 1,713 616 1,097 81,200 42,877 38,323 11.1 c
1999 1,794 648 1,146 83,521 43,507 40,014 11.2 c
2000 1,712 623 1,089 81,016 42,384 38,632 10.6 a
2001 1,708 640 1,068 79,444 40,202 39,242 10.1 d
2002 1,739 662 1,077 85,191 45,420 39,771 10.6 d
2003 1,719 662 1,057 84,861 45,405 39,456 10.4 d
2004 1,725 657 1,068 82,880 41,933 40,947 9.9 d
2005 1,838 702 1,136 87,136 43,739 43,397 10.2 d
2006 1,921 719 1,202 93,183 47,897 45,286 10.7 d
2007 1,781 701 1,080 92,561 47,141 45,420 10.5 d
2008 1,784 711 1,073 94,199 47,889 46,310 10.4 d
2009 1,821 723 1,098 97,430 49,093 48,337 10.6 d
2010 1,812 730 1,082 98,155 49,372 48,783 10.6 a
2011 1,819 732 1,087 101,914 51,317 50,597 10.7 e
2012 1,825 730 1,095 101,366 49,557 51,809 10.5 e
2013 1,454 542 912 96,796 46,054 50,742 9.9 e
2014 1,222 452 770 98,429 48,384 50,045 9.9 e
2015 1,195 423 772 - - - -a Population used in the computation was actual census count, Census of Population and Housing (CPH).b Population used in the computation was based on the 1990 CPH medium assumption population projection.c Population used in the computation was based on the 1995 CPH medium assumption population projection.d Population used in the computation was based on the 2000 CPH medium assumption population projection.e Population used in the computation was based on the 2010 CPH population projection.Source: Department of Health and Philippine Statistics Authority
YearNumber of Hospitals Bed Capacity Bed capacity
per 10,000 populationTotal Government Private Total Government Private
9-23

TABLE 9.17 Number of Hospitals by Type and by Region: 2005 to 2015
NCR CAR I II III IV-A MIMAROPA V VI VII VIII IX X XI XII XIII ARMM
2005 Total 1,838 216 57 124 72 202 238 57 124 89 108 75 71 105 111 108 54 27 Government 702 59 37 39 35 58 66 34 50 60 60 48 29 34 16 25 32 20 Private 1,136 157 20 85 37 144 172 23 74 29 48 27 42 71 95 83 22 7
2006 Total 1,921 222 57 123 91 201 259 64 123 86 110 79 75 104 138 104 57 28 Government 719 56 38 40 40 61 67 35 51 62 60 49 31 32 19 25 33 20 Private 1,202 166 19 83 51 140 192 29 72 24 50 30 44 72 119 79 24 8
2007 Total 1,781 183 56 118 84 201 233 60 117 85 107 72 72 108 108 103 55 19 Government 701 51 37 40 38 60 65 35 50 61 60 48 31 36 19 26 33 11 Private 1,080 132 19 78 46 141 168 25 67 24 47 24 41 72 89 77 22 8
2008 Total 1,784 178 55 121 87 197 232 63 116 86 107 70 75 109 107 103 57 21 Government 711 50 36 41 43 59 64 37 50 62 60 46 33 36 19 27 35 13 Private 1,073 128 19 80 44 138 168 26 66 24 47 24 42 73 88 76 22 8
2009 Total 1,821 195 51 121 89 198 236 65 114 86 106 74 72 109 112 106 58 29 Government 723 51 34 41 43 60 67 38 48 62 60 50 31 36 20 27 35 20 Private 1,098 144 17 80 46 138 169 27 66 24 46 24 41 73 92 79 23 9
2010 Total 1,812 183 57 123 91 198 234 64 109 86 105 76 69 109 110 106 59 33 Government 730 51 38 41 45 60 67 37 48 62 59 51 29 37 20 28 35 22 Private 1,082 132 19 82 46 138 167 27 61 24 46 25 40 72 90 78 24 11
2011 Total 1,819 184 57 119 92 199 240 66 109 87 105 78 66 108 108 107 58 36 Government 732 51 38 41 43 58 68 38 50 63 59 50 28 37 20 28 34 26 Private 1,087 133 19 78 49 141 172 28 59 24 46 28 38 71 88 79 24 10
2012 Total 1,825 186 55 119 92 201 242 67 110 89 105 77 65 108 108 105 59 37 Government 730 50 38 41 43 56 70 38 52 63 60 49 27 37 18 27 35 26 Private 1,095 136 17 78 49 145 172 29 58 26 45 28 38 71 90 78 24 11
2013 a Total 1,454 182 55 81 71 173 212 64 110 59 50 42 40 106 105 49 18 37 Government 542 48 38 36 32 53 58 36 52 34 18 22 12 37 20 10 10 26 Private 912 134 17 45 39 120 154 28 58 25 32 20 28 69 85 39 8 11
2014 a Total 1,222 162 54 83 58 167 211 21 54 61 53 42 41 65 50 51 17 32 Government 452 47 37 36 26 50 55 11 23 34 19 22 12 23 11 11 9 26 Private 770 115 17 47 32 117 156 10 31 27 34 20 29 42 39 40 8 6
2015 Total 1,195 160 23 86 59 168 208 23 51 62 57 43 44 65 54 56 17 19 Government 423 48 12 36 27 49 56 13 22 34 21 22 13 23 12 12 9 14 Private 772 112 11 50 32 119 152 10 29 28 36 21 31 42 42 44 8 5 a General and Specialty hospitalsSource: Department of Health
Year PhilippinesRegion
9-24

TABLE 9.18 Number of Barangay Health Stations by Region: 1992 to 2018
NCR CAR I II III IV IV-A MIMAROPA V VI VII VIII IX X XI XII Caraga ARMM
1992 11,423 7 417 827 554 1,301 1,538 … … 861 1,222 948 663 460 827 757 362 … 6791993 11,072 2 460 813 544 1,181 1,324 … … 742 1,274 983 708 612 807 815 428 … 3791994 11,498 2 496 819 544 1,203 1,463 … … 742 1,282 1,099 718 617 831 822 508 … 3521995 11,646 2 516 819 544 1,206 1,486 … … 742 1,277 1,099 718 615 526 793 524 427 3521996 17,090 - 873 1,267 725 1,901 2,544 … … 1,130 1,811 1,407 911 783 771 1,167 731 577 4921997 13,096 6 510 1,308 717 1,554 1,952 … … 884 1,298 1,101 263 637 728 763 570 453 3521998 14,267 411 383 913 686 1,368 1,932 … … 954 1,410 1,265 735 616 1,274 907 611 446 3561999 14,416 55 558 873 770 1,464 2,444 … … 1,007 1,426 1,267 785 689 655 930 690 480 3232000 15,204 40 534 890 790 2,100 2,483 … … 1,023 1,422 1,330 794 720 711 930 604 500 3332001 15,107 44 576 914 793 1,673 2,524 … … 945 1,442 1,374 774 731 803 1,008 648 528 3302002 15,283 14 591 893 834 1,786 … 2,001 562 1,015 1,536 1,624 800 660 792 656 654 506 3592003 14,490 15 551 428 873 1,733 … 2,050 590 1,048 1,578 1,288 826 695 931 656 869 … 3592004 15,099 12 574 911 878 1,733 … 2,006 742 1,096 1,566 1,246 816 674 931 656 899 … 3592005 15,436 20 549 915 986 1,681 … 2,174 753 1,096 1,594 1,298 805 674 940 656 936 … 3592006 16,191 20 564 978 939 1,866 … 2,112 686 1,115 1,604 1,381 813 642 949 656 911 547 4082007 16,219 19 580 1,016 724 1,811 … 2,156 682 1,107 1,623 1,479 835 661 948 656 943 582 3972008 17,018 12 599 992 1,001 1,795 … 2,199 689 1,123 1,685 1,622 883 698 1,028 703 957 432 6002009 9,813 449 612 642 - 1,773 … 2,022 - 1,103 1,732 - - - 1,035 - - - 445 2010 17,297 456 639 807 1,106 1,901 … 2,086 763 1,134 1,776 1,658 809 681 1,026 - 987 845 623 2011 18,396 465 651 1,018 1,158 1,948 … 2,153 706 1,145 1,766 1,742 819 699 1,063 982 991 649 441 2012 18,673 467 704 1,021 1,131 1,907 … 2,166 795 1,134 1,790 1,764 819 711 1,036 1,053 1,017 717 441 2013 18,581 469 706 1,217 1,135 1,897 … 2,568 782 1,183 1,776 1,751 865 651 1,085 1,026 1,019 - 451 2014 21,048 470 647 3,267 1,128 1,923 … 2,011 882 1,164 1,942 1,779 865 612 1,085 1,009 1,063 750 451 2015 19,622 477 639 1,160 1,240 1,969 … 2,248 836 1,158 2,059 1,877 831 702 1,085 1,023 1,115 782 421 2016 20,232 587 690 1,256 1,289 2,007 … 2,248 835 1,198 2,050 1,787 820 679 1,115 1,061 1,119 808 683 2017 20,896 476 674 1,268 1,276 2,212 … 2,689 873 1,285 1,979 1,845 831 768 1,168 1,001 1,126 683 742 2018 21,546 474 706 1,379 1,289 1,916 … 2,576 896 1,435 2,038 2,241 842 770 1,212 1,115 1,148 683 826
Notes: 1. Data for Region IV (Southern Tagalog) was made available starting 1992 but discontinued in 2001 when the region was partitioned into CALABARZON, and MIMAROPA in May 2002. 2. Data for Caraga were made available starting 1995 only.
Source: Department of Health, Field Health Service Information System
Year PhilippinesRegion
9-25

TABLE 9.19 Number of Licensed Drug Distributor Establishments by Region: 2016 and 2017
Classification Total NCR CAR I II III IV V VI VII VIII IX X XI XII XIII ARMM
2017 37,576 10,014 757 1,994 1,501 4,202 6,181 1,332 2,135 2,646 1,091 799 1,131 1,921 1,048 579 245
Exporter 13 7 - - - 2 1 - - 3 - - - - - - -Exporter/Wholesaler 12 11 - - - 1 - - - - - - - - -Importer 880 735 1 1 1 31 60 4 3 33 - 2 2 7 - - -Importer/Exporter 21 18 - - - 1 2 - - - - - - - - - -Imp/Exp/Wholesaler 32 28 - - - 2 - - - 1 - - - 1 - - -Importer/Wholesaler 505 420 4 1 - 16 32 2 3 15 - - 3 7 - 2Wholesaler 5,215 1,558 95 241 230 396 663 262 394 354 169 144 181 322 109 93 4Botika ng Barangay - - - - - - - - - - - - - - - - -Drugstore 29,479 6,455 642 1,738 1,266 3,659 5,151 1,041 1,710 2,169 917 647 940 1,508 916 483 237Retail Outlet for Non-Prescription Drugs 1,419 782 15 13 4 94 272 23 25 71 5 6 5 76 23 1 4
2016 34,214 9,231 696 1,894 1,388 3,757 5,541 1,232 1,914 2,354 1,016 714 1,032 1,741 956 532 216
Exporter 7 3 - - - 1 1 - - 2 - - - - - - -Exporter/Wholesaler 10 10 - - - - - - - - - - - - - - -Importer 809 681 1 1 - 26 55 3 2 30 - 2 2 6 - - -Importer/Exporter 19 17 - - - 1 1 - - - - - - - - - -Imp/Exp/Wholesaler 19 17 - - - 1 - - - 1 - - - - - - -Importer/Wholesaler 455 387 4 1 - 13 24 2 3 11 - - 3 6 - 1 -Wholesaler 4,871 1,481 88 217 214 355 618 248 366 333 156 131 170 305 102 83 4Botika ng Barangay - - - - - - - - - - - - - - - - -Drugstore 27,190 6,116 593 1,669 1,172 3,334 4,708 967 1,532 1,941 859 577 853 1,376 834 448 211Retail Outlet for Non-Prescription Drugs 834 519 10 6 2 26 134 12 11 36 1 4 4 48 20 - 1
Source: Food and Drugs Administration
TABLE 9.20 Number of Licensed Food Distributor Establishments by Region: 2016 and 2017
NCR CAR I II III IV V VI VII VIII IX X XI XII XIII ARMM
2017 3,342 2,512 8 10 22 115 232 24 52 168 14 21 29 109 15 7 4
Importer 1,859 1,529 2 1 4 57 116 3 2 99 1 14 7 18 1 1 4Exporter 95 70 - 1 - 9 14 1 - - - - - - - - -Wholesaler 725 364 4 8 18 24 53 19 48 55 13 5 21 76 13 4 -Importer/Exporter 57 47 - - - 3 4 - - 1 - 1 - 1 - - -Importer/Wholesaler 435 365 2 - - 9 28 1 2 12 - 1 1 11 1 2 -Exporter/Wholesaler 56 46 - - - 1 8 - - - - - - 1 - - -Imp/Exp/Wholesaler 115 91 - - - 12 9 - - 1 - - - 2 - - -
2016 2,667 2,099 5 10 12 82 160 12 41 129 11 14 18 59 10 3 2
Importer 1,622 1,351 2 2 2 50 89 3 2 88 2 8 3 14 3 1 2Exporter 74 59 - 1 - 6 8 - - - - - - - - - -Wholesaler 551 324 3 7 10 17 34 9 36 36 9 6 15 38 6 1 -Importer/Exporter 33 27 - - - 2 3 - 1 - - - - - - - -Importer/Wholesaler 264 230 - - - 4 15 - 2 4 - - - 7 1 1 -Exporter/Wholesaler 55 47 - - - 1 6 - - 1 - - - - - - -
Source : Food and Drugs Administration
Classification TotalRegion
9-26
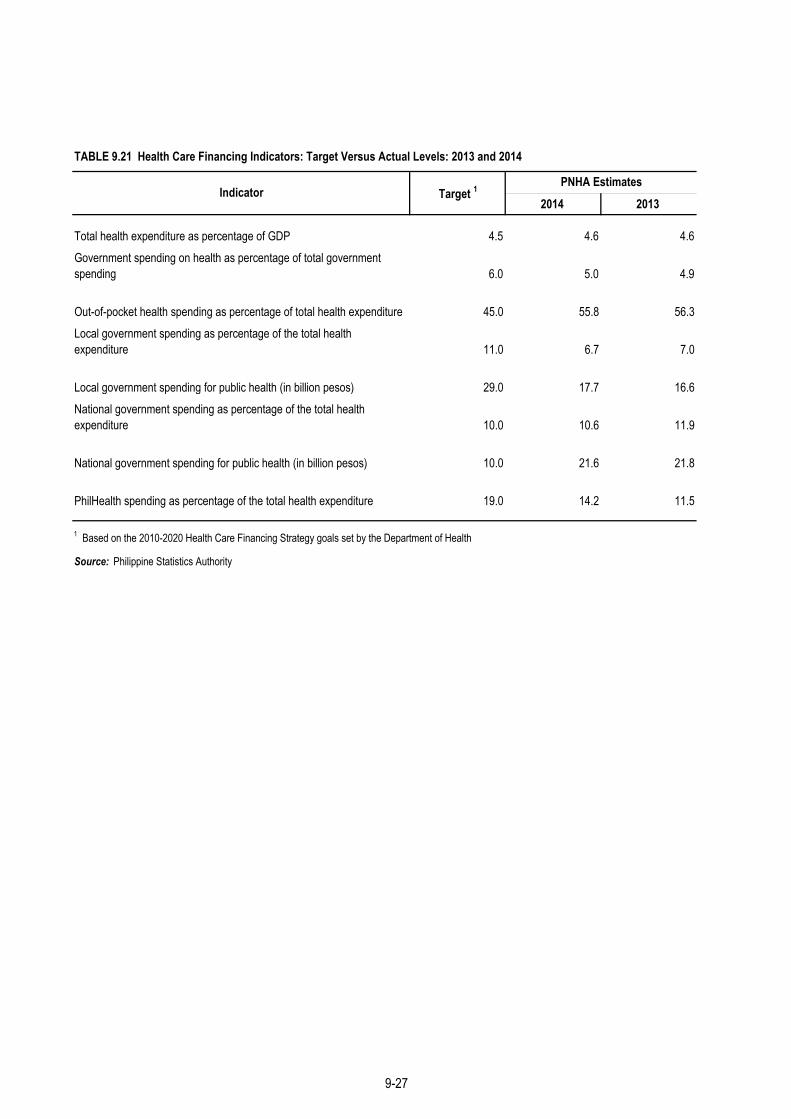
TABLE 9.21 Health Care Financing Indicators: Target Versus Actual Levels: 2013 and 2014
2014 2013
Total health expenditure as percentage of GDP 4.5 4.6 4.6Government spending on health as percentage of total government spending 6.0 5.0 4.9
Out-of-pocket health spending as percentage of total health expenditure 45.0 55.8 56.3Local government spending as percentage of the total health expenditure 11.0 6.7 7.0
Local government spending for public health (in billion pesos) 29.0 17.7 16.6National government spending as percentage of the total health expenditure 10.0 10.6 11.9
National government spending for public health (in billion pesos) 10.0 21.6 21.8
PhilHealth spending as percentage of the total health expenditure 19.0 14.2 11.5
1 Based on the 2010-2020 Health Care Financing Strategy goals set by the Department of Health
Source: Philippine Statistics Authority
Indicator Target 1PNHA Estimates
9-27

TABLE 9.22 Total Health Expenditure as Percent of Gross Domestic Product (GDP) and Gross National Income (GNI): 2015 to 2017
a National Accounts of the Philippines, Philippine Statistics Authority, May 2015.
Source: Philippine Statistics Authority
TABLE 9.23 Per Capita Health Expenditure: 2015 to 2017
2016-2017 2015-2016
6.3 9.5
3.3 8.1
1.6 1.6
a Derived using the consumer price index (CPI) for all items, 2012=100.b Annual population estimates were based on the official 2010 census-based population projections.
Source: Philippine Statistics Authority
Population (in millions) b 104.9
Gross National Income (GNI, in billion pesos, at current prices) a
Health Expenditure as % of GDP
Health Expenditure as % of GNI
Per Capita Health Expenditure (in pesos, at current prices) 6,791
Per Capita Health Expenditure (in pesos, at constant 2006 prices) a 6,090
17,430.7
Indicator 2015r 2016r 2017
Total Health Expenditure (in billion pesos, at current prices)Gross Domestic Product (GDP, in billion pesos, at current prices) a
13,322.0
592.8
14,480.3
712.3
Growth RateIndicator2015r 2016r 2017
Amount
19,006.4
15,807.6
4.5
659.3
5,834.3
5,452.6
101.6
6,389
5,894
103.2
16,114.4
9-28

TABLE 9.24 Health Expenditures by Source of Funds: 2013 and 2014
2014 2013 r
All Sources 585,307 530,283 10.4
Government 101,137 103,467 (2.3) National Government 61,816 66,915 (7.6) Local Government 39,321 36,552 7.6
Social Insurance 83,324 60,373 38.0 National Health Insurance Program 83,281 60,299 38.1
Employees' Compensation 43 74 (42.0)
Private Sources 395,343 359,207 10.1 Private Out-of-Pocket 326,787 296,502 10.2 Private Insurance 10,111 9,228 9.6 Health Maintenance Organizations 40,443 36,814 9.9 Private Estalishments 12,819 11,752 9.1 Private Schools 5,183 4,911 5.5
Rest of the World 5,503 7,235 (23.9) Grants 5,503 7,235 (23.9)
Source: Philippine Statistics Authority
TABLE 9.25 Distribution of Health Expenditures by Source of Funds: 2013 and 2014
2014 2013r
Government 17.3 19.5 National Government 10.6 12.6 Local Government 6.7 6.9
Social Insurance 14.2 11.4 National Health Insurance Program 14.2 11.4 Employees' Compensation1 - -
Private Sources 67.5 67.7 Private Out-of-Pocket 55.8 55.9 Private Insurance 1.7 1.7 Health Maintenance Organizations 6.9 6.9 Private Establishments 2.2 2.2 Private Schools 0.9 0.9
Rest of the World 0.9 1.4 Grants 0.9 1.4All Sources 100.0 100.0
1 Less than 0.02 in 2013 - 2014Source: Philippine Statistics Authority, Philippine National Health Account
Source of FundsAmount
(in million pesos, at current prices) Growth Rate
Source of FundsPercent Share
9-29

TABLE 9.26 Prevalence of Malnutrition Among Children 0-60 Months Old by Region: 2013 and 2015
2015 2013 2015 2013 2015 2013 2015 2013
Philippines 21.6 19.9 33.5 30.3 7.1 7.9 3.8 5.0
NCR 15.2 12.9 25.2 22.4 6.4 6.4 6.0 6.5CAR 16.8 16.5 36.8 32.4 4.4 5.9 3.2 6.1I - Ilocos Region 19.4 21.4 31.5 27.4 6.7 9.8 3.2 5.4II - Cagayan Valley 19.9 20.6 28.8 26.9 7.1 7.9 3.8 5.7III - Central Luzon 16.7 17.7 22.9 23.1 7.5 8.3 5.9 6.2IV-A CALABARZON 19.0 18.1 27.7 25.3 7.6 8.7 4.9 6.6IV-B MIMAROPA 31.6 27.5 40.7 35.6 9.6 9.8 3.2 5.5V - Bicol Region 28.5 24.6 40.2 39.8 8.1 7.4 2.6 3.8VI - Western Visayas 26.5 26.0 39.9 36.9 6.3 8.9 3.3 4.6VII - Central Visayas 22.8 23.1 37.7 34.6 6.9 7.9 2.6 3.6VIII - Eastern Visayas 30.0 21.7 42.1 36.8 8.4 7.8 2.3 3.2IX - Zamboanga Peninsula 21.5 24.5 38.1 38.7 7.1 8.0 2.6 2.6X - Northern Mindanao 20.8 17.7 37.0 33.6 3.9 7.0 1.9 4.8XI - Davao Region 20.8 18.8 31.6 29.8 6.5 7.5 2.7 3.4XII - SOCCSKSARGEN 26.0 23.8 40.2 36.3 6.9 6.7 2.7 3.5XIII - Caraga 23.9 19.8 36.3 34.3 8.1 7.5 1.6 3.7ARMM 25.0 21.9 45.0 39.0 8.2 8.5 4.1 3.9
Source: Department of Science and Technology, National Nutrition Survey and Updating Survey of Food and Nutrition Research Institute* weight-for-height
TABLE 9.27 Prevalence of Malnutrition Among 0-5 and 5.08-10 Years Old Children: 2003, 2005, 2008, 2011, 2013, and 2015
2003 2005 2008 2011 2013 2015
0-5 years old
Underweight 20.7 20.2 20.7 20.2 19.9 21.6Stunting 33.9 33.1 32.3 33.6 30.3 33.5Wasting* 6.0 5.8 6.9 7.3 7.9 7.1Overweight-for-Height* 2.4 2.5 3.3 4.3 5.0 3.8
5.08-10 years old
Underweight 32.1 30.9 32.4 32.0 29.1 31.2Stunting 36.4 34.0 33.9 33.6 29.9 31.1Wasting** 7.4 6.5 8.1 8.5 8.6 8.4Overweight/Obese** 5.8 6.8 6.6 7.5 9.1 8.6
*weight-for-height
**BMI-for-age
Source: Department of Science and Technology, National Nutrition Survey and Updating Survey of Food and Nutrition Research Institute
Nutritional Status
RegionForm of Malnutrition (in percent)
Underweight Stunting Wasting* Overweight*
9-30

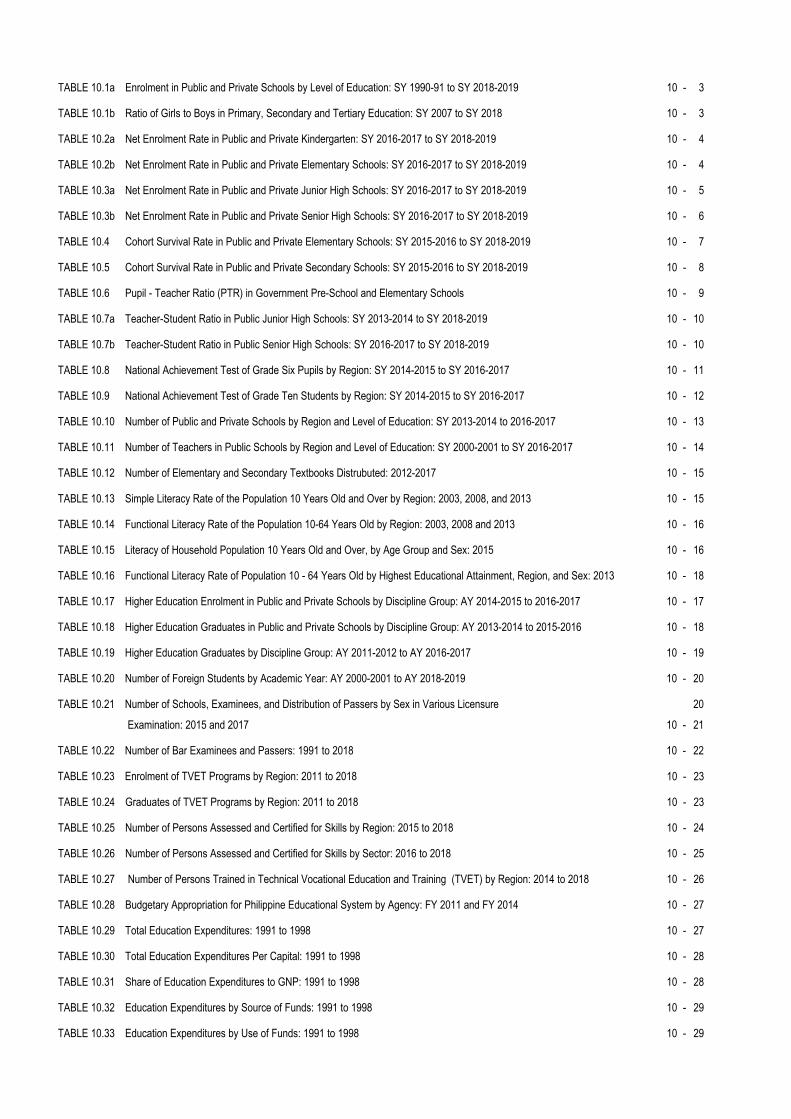
TABLE 10.1a Enrolment in Public and Private Schools by Level of Education: SY 1990-91 to SY 2018-2019 10 - 3
TABLE 10.1b Ratio of Girls to Boys in Primary, Secondary and Tertiary Education: SY 2007 to SY 2018 10 - 3
TABLE 10.2a Net Enrolment Rate in Public and Private Kindergarten: SY 2016-2017 to SY 2018-2019 10 - 4
TABLE 10.2b Net Enrolment Rate in Public and Private Elementary Schools: SY 2016-2017 to SY 2018-2019 10 - 4
TABLE 10.3a Net Enrolment Rate in Public and Private Junior High Schools: SY 2016-2017 to SY 2018-2019 10 - 5
TABLE 10.3b Net Enrolment Rate in Public and Private Senior High Schools: SY 2016-2017 to SY 2018-2019 10 - 6
TABLE 10.4 Cohort Survival Rate in Public and Private Elementary Schools: SY 2015-2016 to SY 2018-2019 10 - 7
TABLE 10.5 Cohort Survival Rate in Public and Private Secondary Schools: SY 2015-2016 to SY 2018-2019 10 - 8
TABLE 10.6 Pupil - Teacher Ratio (PTR) in Government Pre-School and Elementary Schools 10 - 9
TABLE 10.7a Teacher-Student Ratio in Public Junior High Schools: SY 2013-2014 to SY 2018-2019 10 - 10
TABLE 10.7b Teacher-Student Ratio in Public Senior High Schools: SY 2016-2017 to SY 2018-2019 10 - 10
TABLE 10.8 National Achievement Test of Grade Six Pupils by Region: SY 2014-2015 to SY 2016-2017 10 - 11
TABLE 10.9 National Achievement Test of Grade Ten Students by Region: SY 2014-2015 to SY 2016-2017 10 - 12
TABLE 10.10 Number of Public and Private Schools by Region and Level of Education: SY 2013-2014 to 2016-2017 10 - 13
TABLE 10.11 Number of Teachers in Public Schools by Region and Level of Education: SY 2000-2001 to SY 2016-2017 10 - 14
TABLE 10.12 Number of Elementary and Secondary Textbooks Distrubuted: 2012-2017 10 - 15
TABLE 10.13 Simple Literacy Rate of the Population 10 Years Old and Over by Region: 2003, 2008, and 2013 10 - 15
TABLE 10.14 Functional Literacy Rate of the Population 10-64 Years Old by Region: 2003, 2008 and 2013 10 - 16
TABLE 10.15 Literacy of Household Population 10 Years Old and Over, by Age Group and Sex: 2015 10 - 16
TABLE 10.16 Functional Literacy Rate of Population 10 - 64 Years Old by Highest Educational Attainment, Region, and Sex: 2013 10 - 18
TABLE 10.17 Higher Education Enrolment in Public and Private Schools by Discipline Group: AY 2014-2015 to 2016-2017 10 - 17
TABLE 10.18 Higher Education Graduates in Public and Private Schools by Discipline Group: AY 2013-2014 to 2015-2016 10 - 18
TABLE 10.19 Higher Education Graduates by Discipline Group: AY 2011-2012 to AY 2016-2017 10 - 19
TABLE 10.20 Number of Foreign Students by Academic Year: AY 2000-2001 to AY 2018-2019 10 - 20
TABLE 10.21 Number of Schools, Examinees, and Distribution of Passers by Sex in Various Licensure 20
Examination: 2015 and 2017 10 - 21
TABLE 10.22 Number of Bar Examinees and Passers: 1991 to 2018 10 - 22
TABLE 10.23 Enrolment of TVET Programs by Region: 2011 to 2018 10 - 23
TABLE 10.24 Graduates of TVET Programs by Region: 2011 to 2018 10 - 23
TABLE 10.25 Number of Persons Assessed and Certified for Skills by Region: 2015 to 2018 10 - 24
TABLE 10.26 Number of Persons Assessed and Certified for Skills by Sector: 2016 to 2018 10 - 25
TABLE 10.27 Number of Persons Trained in Technical Vocational Education and Training (TVET) by Region: 2014 to 2018 10 - 26
TABLE 10.28 Budgetary Appropriation for Philippine Educational System by Agency: FY 2011 and FY 2014 10 - 27
TABLE 10.29 Total Education Expenditures: 1991 to 1998 10 - 27
TABLE 10.30 Total Education Expenditures Per Capital: 1991 to 1998 10 - 28
TABLE 10.31 Share of Education Expenditures to GNP: 1991 to 1998 10 - 28
TABLE 10.32 Education Expenditures by Source of Funds: 1991 to 1998 10 - 29
TABLE 10.33 Education Expenditures by Use of Funds: 1991 to 1998 10 - 29
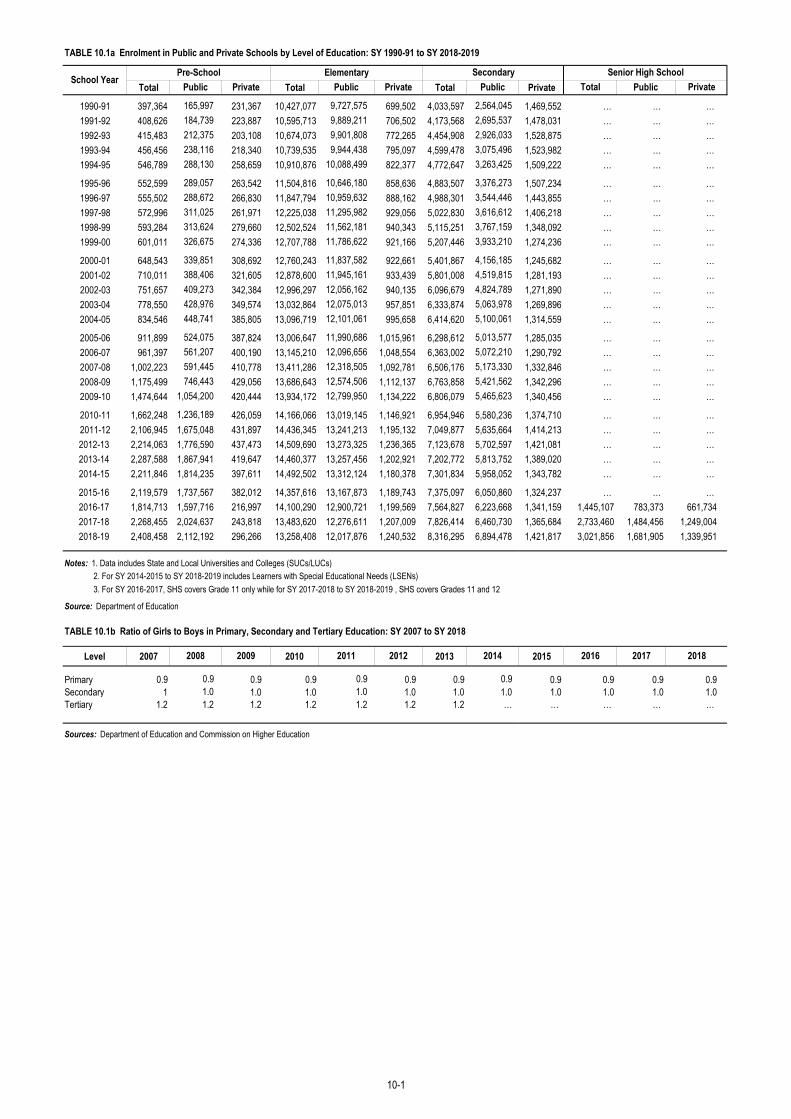
TABLE 10.1a Enrolment in Public and Private Schools by Level of Education: SY 1990-91 to SY 2018-2019
Total Total Total Private
1990-91 397,364 231,367 10,427,077 699,502 4,033,597 1,469,552 … … …1991-92 408,626 223,887 10,595,713 706,502 4,173,568 1,478,031 … … …1992-93 415,483 203,108 10,674,073 772,265 4,454,908 1,528,875 … … …1993-94 456,456 218,340 10,739,535 795,097 4,599,478 1,523,982 … … …1994-95 546,789 258,659 10,910,876 822,377 4,772,647 1,509,222 … … …
1995-96 552,599 263,542 11,504,816 858,636 4,883,507 1,507,234 … … …1996-97 555,502 266,830 11,847,794 888,162 4,988,301 1,443,855 … … …1997-98 572,996 261,971 12,225,038 929,056 5,022,830 1,406,218 … … …1998-99 593,284 279,660 12,502,524 940,343 5,115,251 1,348,092 … … …1999-00 601,011 274,336 12,707,788 921,166 5,207,446 1,274,236 … … …
2000-01 648,543 308,692 12,760,243 922,661 5,401,867 1,245,682 … … …2001-02 710,011 321,605 12,878,600 933,439 5,801,008 1,281,193 … … …2002-03 751,657 342,384 12,996,297 940,135 6,096,679 1,271,890 … … …2003-04 778,550 349,574 13,032,864 957,851 6,333,874 1,269,896 … … …2004-05 834,546 385,805 13,096,719 995,658 6,414,620 1,314,559 … … …
2005-06 911,899 387,824 13,006,647 1,015,961 6,298,612 1,285,035 … … …2006-07 961,397 400,190 13,145,210 1,048,554 6,363,002 1,290,792 … … …2007-08 1,002,223 410,778 13,411,286 1,092,781 6,506,176 1,332,846 … … …2008-09 1,175,499 429,056 13,686,643 1,112,137 6,763,858 1,342,296 … … …2009-10 1,474,644 420,444 13,934,172 1,134,222 6,806,079 1,340,456 … … …
2010-11 1,662,248 426,059 14,166,066 13,019,145 1,146,921 6,954,946 5,580,236 1,374,710 … … …2011-12 2,106,945 1,675,048 431,897 14,436,345 13,241,213 1,195,132 7,049,877 5,635,664 1,414,213 … … …2012-13 2,214,063 1,776,590 437,473 14,509,690 13,273,325 1,236,365 7,123,678 5,702,597 1,421,081 … … …2013-14 2,287,588 1,867,941 419,647 14,460,377 13,257,456 1,202,921 7,202,772 5,813,752 1,389,020 … … …2014-15 2,211,846 1,814,235 397,611 14,492,502 13,312,124 1,180,378 7,301,834 5,958,052 1,343,782 … … …
2015-16 2,119,579 1,737,567 382,012 14,357,616 13,167,873 1,189,743 7,375,097 6,050,860 1,324,237 … … …2016-17 1,814,713 1,597,716 216,997 14,100,290 12,900,721 1,199,569 7,564,827 6,223,668 1,341,159 1,445,107 783,373 661,7342017-18 2,268,455 2,024,637 243,818 13,483,620 12,276,611 1,207,009 7,826,414 6,460,730 1,365,684 2,733,460 1,484,456 1,249,0042018-19 2,408,458 2,112,192 296,266 13,258,408 12,017,876 1,240,532 8,316,295 6,894,478 1,421,817 3,021,856 1,681,905 1,339,951
Notes: 1. Data includes State and Local Universities and Colleges (SUCs/LUCs) 2. For SY 2014-2015 to SY 2018-2019 includes Learners with Special Educational Needs (LSENs) 3. For SY 2016-2017, SHS covers Grade 11 only while for SY 2017-2018 to SY 2018-2019 , SHS covers Grades 11 and 12
Source: Department of Education
Level 2007 2010 2013 2015
Primary 0.9 0.9 0.9 0.9 0.9 0.9 0.9 0.9 0.9Secondary 1 1.0 1.0 1.0 1.0 1.0 1.0 1.0 1.0Tertiary 1.2 1.2 1.2 1.2 1.2 … … … …
Sources: Department of Education and Commission on Higher Education
Public PrivateTotalSenior High School
2016 2017 2018
1.0 1.0 1.01.2 1.2 …
2008 2009 2011 2012 2014
0.9 0.9 0.9
TABLE 10.1b Ratio of Girls to Boys in Primary, Secondary and Tertiary Education: SY 2007 to SY 2018
1,236,189
746,443 12,574,506 5,421,5621,054,200 12,799,950 5,465,623
561,207 12,096,656 5,072,210591,445 12,318,505 5,173,330
448,741 12,101,061 5,100,061
524,075 11,990,686 5,013,577
409,273 12,056,162 4,824,789428,976 12,075,013 5,063,978
339,851 11,837,582 4,156,185388,406 11,945,161 4,519,815
313,624 11,562,181 3,767,159326,675 11,786,622 3,933,210
288,672 10,959,632 3,544,446311,025 11,295,982 3,616,612
288,130 10,088,499 3,263,425
289,057 10,646,180 3,376,273
212,375 9,901,808 2,926,033238,116 9,944,438 3,075,496
165,997 9,727,575 2,564,045184,739 9,889,211 2,695,537
School YearPre-School Elementary Secondary
Public Private Public Private Public
10-1
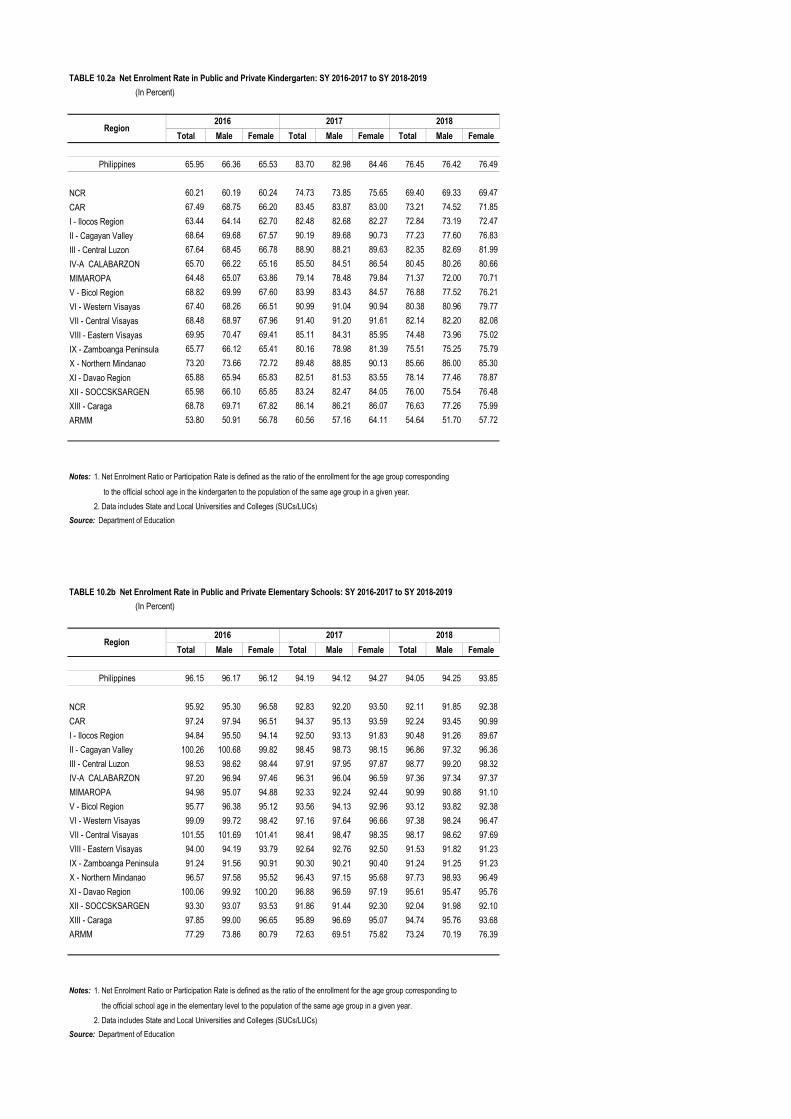
TABLE 10.2a Net Enrolment Rate in Public and Private Kindergarten: SY 2016-2017 to SY 2018-2019
Total Male Female Total Male Female Total Male Female
Philippines 65.95 66.36 65.53 83.70 82.98 84.46 76.45 76.42 76.49
NCR 60.21 60.19 60.24 74.73 73.85 75.65 69.40 69.33 69.47CAR 67.49 68.75 66.20 83.45 83.87 83.00 73.21 74.52 71.85I - Ilocos Region 63.44 64.14 62.70 82.48 82.68 82.27 72.84 73.19 72.47II - Cagayan Valley 68.64 69.68 67.57 90.19 89.68 90.73 77.23 77.60 76.83III - Central Luzon 67.64 68.45 66.78 88.90 88.21 89.63 82.35 82.69 81.99IV-A CALABARZON 65.70 66.22 65.16 85.50 84.51 86.54 80.45 80.26 80.66MIMAROPA 64.48 65.07 63.86 79.14 78.48 79.84 71.37 72.00 70.71V - Bicol Region 68.82 69.99 67.60 83.99 83.43 84.57 76.88 77.52 76.21VI - Western Visayas 67.40 68.26 66.51 90.99 91.04 90.94 80.38 80.96 79.77VII - Central Visayas 68.48 68.97 67.96 91.40 91.20 91.61 82.14 82.20 82.08VIII - Eastern Visayas 69.95 70.47 69.41 85.11 84.31 85.95 74.48 73.96 75.02IX - Zamboanga Peninsula 65.77 66.12 65.41 80.16 78.98 81.39 75.51 75.25 75.79X - Northern Mindanao 73.20 73.66 72.72 89.48 88.85 90.13 85.66 86.00 85.30XI - Davao Region 65.88 65.94 65.83 82.51 81.53 83.55 78.14 77.46 78.87XII - SOCCSKSARGEN 65.98 66.10 65.85 83.24 82.47 84.05 76.00 75.54 76.48XIII - Caraga 68.78 69.71 67.82 86.14 86.21 86.07 76.63 77.26 75.99ARMM 53.80 50.91 56.78 60.56 57.16 64.11 54.64 51.70 57.72
to the official school age in the kindergarten to the population of the same age group in a given year. 2. Data includes State and Local Universities and Colleges (SUCs/LUCs)Source: Department of Education
TABLE 10.2b Net Enrolment Rate in Public and Private Elementary Schools: SY 2016-2017 to SY 2018-2019
Total Male Female Total Male Female Total Male Female
Philippines 96.15 96.17 96.12 94.19 94.12 94.27 94.05 94.25 93.85
NCR 95.92 95.30 96.58 92.83 92.20 93.50 92.11 91.85 92.38CAR 97.24 97.94 96.51 94.37 95.13 93.59 92.24 93.45 90.99I - Ilocos Region 94.84 95.50 94.14 92.50 93.13 91.83 90.48 91.26 89.67II - Cagayan Valley 100.26 100.68 99.82 98.45 98.73 98.15 96.86 97.32 96.36III - Central Luzon 98.53 98.62 98.44 97.91 97.95 97.87 98.77 99.20 98.32IV-A CALABARZON 97.20 96.94 97.46 96.31 96.04 96.59 97.36 97.34 97.37MIMAROPA 94.98 95.07 94.88 92.33 92.24 92.44 90.99 90.88 91.10V - Bicol Region 95.77 96.38 95.12 93.56 94.13 92.96 93.12 93.82 92.38VI - Western Visayas 99.09 99.72 98.42 97.16 97.64 96.66 97.38 98.24 96.47VII - Central Visayas 101.55 101.69 101.41 98.41 98.47 98.35 98.17 98.62 97.69VIII - Eastern Visayas 94.00 94.19 93.79 92.64 92.76 92.50 91.53 91.82 91.23IX - Zamboanga Peninsula 91.24 91.56 90.91 90.30 90.21 90.40 91.24 91.25 91.23X - Northern Mindanao 96.57 97.58 95.52 96.43 97.15 95.68 97.73 98.93 96.49XI - Davao Region 100.06 99.92 100.20 96.88 96.59 97.19 95.61 95.47 95.76XII - SOCCSKSARGEN 93.30 93.07 93.53 91.86 91.44 92.30 92.04 91.98 92.10XIII - Caraga 97.85 99.00 96.65 95.89 96.69 95.07 94.74 95.76 93.68ARMM 77.29 73.86 80.79 72.63 69.51 75.82 73.24 70.19 76.39
the official school age in the elementary level to the population of the same age group in a given year. 2. Data includes State and Local Universities and Colleges (SUCs/LUCs)Source: Department of Education
(In Percent)
Region2016 2017 2018
Notes: 1. Net Enrolment Ratio or Participation Rate is defined as the ratio of the enrollment for the age group corresponding
(In Percent)
Region2016 2017 2018
Notes: 1. Net Enrolment Ratio or Participation Rate is defined as the ratio of the enrollment for the age group corresponding to

TABLE 10.3a Net Enrolment Rate in Public and Private Junior High Schools: SY 2016-2017 to SY 2018-2019
Total Male Female Total Male Female Total Male FemalePhilippines 74.19 68.79 79.94 75.99 70.88 81.42 81.41 77.24 85.82
NCR 83.37 78.70 88.33 84.76 80.22 89.56 88.74 85.04 92.64CAR 78.72 72.37 85.50 79.77 74.31 85.57 83.64 79.40 88.13I - Ilocos Region 84.85 80.86 89.18 85.56 81.77 89.64 87.81 85.14 90.68II - Cagayan Valley 78.97 73.82 84.53 80.89 75.91 86.24 84.76 80.78 89.01III - Central Luzon 82.78 78.39 87.52 82.84 78.54 87.46 85.01 81.44 88.83IV-A CALABARZON 81.41 76.69 86.46 82.51 78.09 87.21 86.38 83.01 89.97MIMAROPA 73.48 68.10 79.26 75.71 70.72 81.04 79.74 75.79 83.95V - Bicol Region 72.78 66.68 79.33 75.88 70.27 81.86 82.97 78.71 87.51VI - Western Visayas 74.20 68.02 80.81 76.41 70.54 82.66 84.54 80.14 89.21VII - Central Visayas 76.58 69.90 83.73 78.51 71.91 85.53 87.64 82.27 93.34VIII - Eastern Visayas 70.89 64.90 77.28 74.21 68.24 80.55 79.27 74.33 84.51IX - Zamboanga Peninsula 62.18 55.73 69.02 65.44 59.49 71.71 73.88 68.79 79.20X - Northern Mindanao 65.08 59.33 71.11 68.09 62.55 73.86 75.27 70.83 79.85XI - Davao Region 70.57 64.16 77.38 74.27 68.28 80.60 82.25 77.01 87.76XII - SOCCSKSARGEN 65.00 58.99 71.36 68.08 62.26 74.20 74.49 69.11 80.14XIII - Caraga 71.07 65.50 76.97 74.54 69.50 79.83 80.70 76.74 84.84ARMM 32.03 26.05 38.09 30.37 25.18 35.62 35.76 30.22 41.36
the official school age in the elementary level to the population of the same age group in a given year. 2. Data includes State and Local Universities and Colleges (SUCs/LUCs)
Source: Department of Education
(In Percent)
Region 2016 2017 2018
Notes: 1. Net Enrolment Ratio or Participation Rate is defined as the ratio of the enrollment for the age group corresponding to

TABLE 10.3b Net Enrolment Rate in Public and Private Senior High Schools: SY 2016-2017 to SY 2018-2019(In Percent)
Total Male Female Total Male Female Total Male Female
Philippines 37.38 31.03 44.14 46.12 39.20 53.48 51.24 44.21 58.72
NCR 55.32 47.90 63.06 62.74 55.67 70.11 68.63 61.17 76.42CAR 40.16 31.85 49.00 49.55 40.26 59.45 53.64 44.61 63.31I - Ilocos Region 51.11 44.40 58.42 60.39 53.26 68.15 64.06 57.48 71.24II - Cagayan Valley 43.41 36.37 51.07 51.49 44.08 59.56 56.21 48.96 64.13III - Central Luzon 47.96 42.01 54.35 55.99 49.75 62.70 60.19 54.46 66.35IV-A CALABARZON 45.61 39.51 52.07 53.90 47.62 60.55 58.33 52.00 65.05MIMAROPA 35.09 28.95 41.66 43.27 36.37 50.67 48.14 41.29 55.51V - Bicol Region 28.35 22.19 34.98 39.63 32.16 47.68 45.80 37.74 54.49VI - Western Visayas 32.54 25.49 40.11 44.17 36.17 52.77 49.74 41.38 58.72VII - Central Visayas 35.90 27.91 44.43 47.21 37.99 57.06 53.28 43.97 63.24VIII - Eastern Visayas 28.15 21.95 34.79 38.02 30.70 45.87 43.20 35.74 51.20IX - Zamboanga Peninsula 23.92 18.34 29.84 30.40 23.87 37.34 36.04 28.98 43.56X - Northern Mindanao 28.97 22.33 36.00 37.31 29.78 45.29 41.87 34.42 49.74XI - Davao Region 30.11 23.54 37.03 38.26 31.09 45.80 45.74 37.99 53.90XII - SOCCSKSARGEN 26.90 21.02 33.12 35.84 29.22 42.84 41.50 34.83 48.58XIII - Caraga 28.04 22.25 34.25 38.11 31.67 45.02 44.36 37.76 51.42ARMM 6.02 3.98 8.08 8.70 6.19 11.24 11.04 8.06 14.05
the official school age in the senior high school to the population of the same age group in a given year. 2. Data includes State and Local Universities and Colleges (SUCs/LUCs)
Source: Department of Education
Region2016 2017 2018
Notes: 1. Net Enrolment Ratio or Participation Rate is defined as the ratio of the enrollment for the age group corresponding to
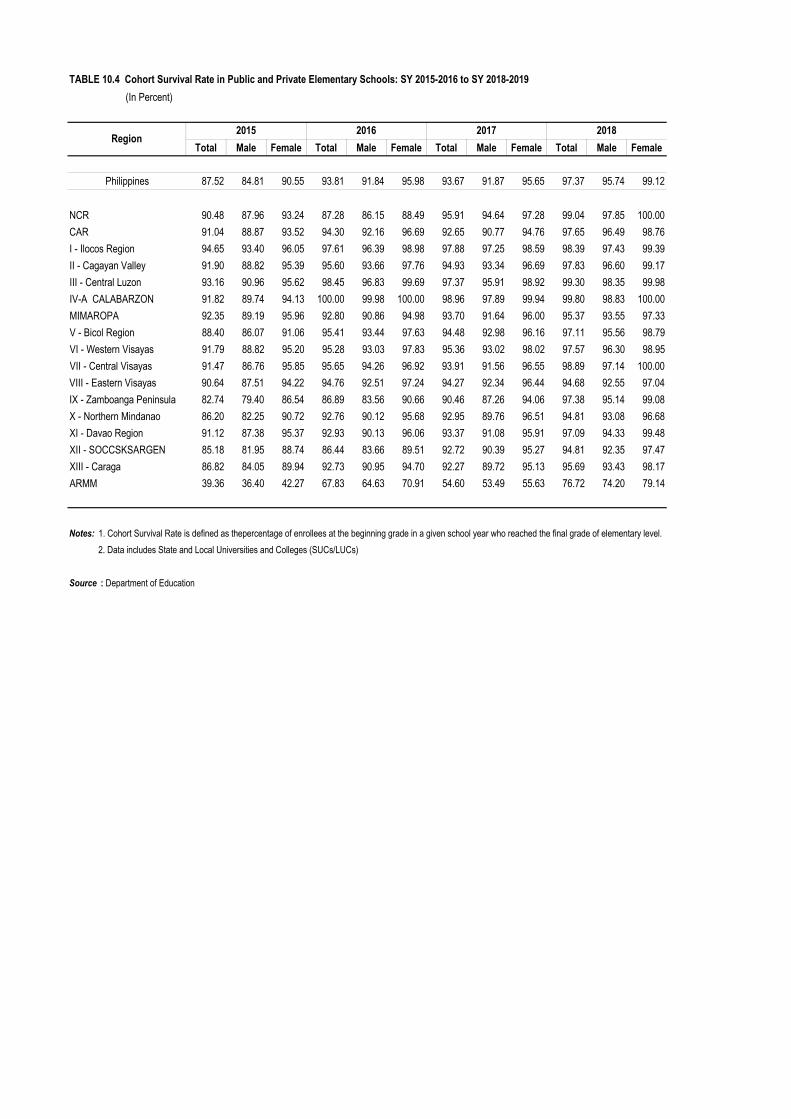
TABLE 10.4 Cohort Survival Rate in Public and Private Elementary Schools: SY 2015-2016 to SY 2018-2019 (In Percent)
Total Male Female Total Male Female Total Male Female Total Male Female
Philippines 87.52 84.81 90.55 93.81 91.84 95.98 93.67 91.87 95.65 97.37 95.74 99.12
NCR 90.48 87.96 93.24 87.28 86.15 88.49 95.91 94.64 97.28 99.04 97.85 100.00CAR 91.04 88.87 93.52 94.30 92.16 96.69 92.65 90.77 94.76 97.65 96.49 98.76I - Ilocos Region 94.65 93.40 96.05 97.61 96.39 98.98 97.88 97.25 98.59 98.39 97.43 99.39II - Cagayan Valley 91.90 88.82 95.39 95.60 93.66 97.76 94.93 93.34 96.69 97.83 96.60 99.17III - Central Luzon 93.16 90.96 95.62 98.45 96.83 99.69 97.37 95.91 98.92 99.30 98.35 99.98IV-A CALABARZON 91.82 89.74 94.13 100.00 99.98 100.00 98.96 97.89 99.94 99.80 98.83 100.00MIMAROPA 92.35 89.19 95.96 92.80 90.86 94.98 93.70 91.64 96.00 95.37 93.55 97.33V - Bicol Region 88.40 86.07 91.06 95.41 93.44 97.63 94.48 92.98 96.16 97.11 95.56 98.79VI - Western Visayas 91.79 88.82 95.20 95.28 93.03 97.83 95.36 93.02 98.02 97.57 96.30 98.95VII - Central Visayas 91.47 86.76 95.85 95.65 94.26 96.92 93.91 91.56 96.55 98.89 97.14 100.00VIII - Eastern Visayas 90.64 87.51 94.22 94.76 92.51 97.24 94.27 92.34 96.44 94.68 92.55 97.04IX - Zamboanga Peninsula 82.74 79.40 86.54 86.89 83.56 90.66 90.46 87.26 94.06 97.38 95.14 99.08X - Northern Mindanao 86.20 82.25 90.72 92.76 90.12 95.68 92.95 89.76 96.51 94.81 93.08 96.68XI - Davao Region 91.12 87.38 95.37 92.93 90.13 96.06 93.37 91.08 95.91 97.09 94.33 99.48XII - SOCCSKSARGEN 85.18 81.95 88.74 86.44 83.66 89.51 92.72 90.39 95.27 94.81 92.35 97.47XIII - Caraga 86.82 84.05 89.94 92.73 90.95 94.70 92.27 89.72 95.13 95.69 93.43 98.17ARMM 39.36 36.40 42.27 67.83 64.63 70.91 54.60 53.49 55.63 76.72 74.20 79.14
Notes: 1. Cohort Survival Rate is defined as thepercentage of enrollees at the beginning grade in a given school year who reached the final grade of elementary level. 2. Data includes State and Local Universities and Colleges (SUCs/LUCs)
Source : Department of Education
Region2015 2016 2017 2018

TABLE 10.5 Cohort Survival Rate in Public and Private Secondary Schools: SY 2015-2016 to SY 2018-2019(In Percent)
Total Male Female 2015 Male Female Total Male Female Total Male FemalePhilippines 81.56 77.33 85.87 83.06 78.65 87.44 85.65 81.91 89.38 89.47 85.40 93.55
NCR 85.88 82.26 89.62 82.65 78.77 86.54 91.38 87.87 94.91 92.80 89.49 96.13CAR 82.80 75.26 90.64 82.42 76.01 88.84 82.30 76.69 88.06 88.06 82.13 94.20I - Ilocos Region 82.86 78.70 87.31 87.72 83.23 92.47 89.58 86.15 93.20 91.66 88.30 95.19II - Cagayan Valley 82.07 77.06 87.24 83.30 79.25 87.36 85.55 81.42 89.75 89.58 85.47 93.65III - Central Luzon 80.52 76.66 84.57 86.74 82.84 90.75 87.04 83.17 91.04 90.74 87.17 94.35IV-A CALABARZON 86.93 83.83 90.09 91.05 87.16 95.01 91.43 88.43 94.47 93.66 90.31 96.71MIMAROPA 82.65 77.87 87.56 81.02 76.91 85.09 85.29 81.26 89.36 84.59 80.36 88.91V - Bicol Region 77.08 71.21 83.16 79.02 73.11 84.84 85.02 80.69 89.29 87.73 82.52 92.99VI - Western Visayas 81.07 76.20 86.21 83.77 78.47 89.16 86.14 81.74 90.60 89.27 85.58 93.01VII - Central Visayas 83.11 78.58 87.68 80.78 74.89 86.69 85.47 80.62 90.37 92.59 88.29 95.88VIII - Eastern Visayas 77.27 71.70 83.08 77.61 72.34 82.87 81.25 76.21 86.31 83.69 78.58 88.83IX - Zamboanga Peninsula 79.62 74.19 84.89 75.17 69.91 80.11 79.73 75.30 83.97 84.04 78.13 89.79X - Northern Mindanao 77.89 73.02 82.72 81.54 76.56 86.36 80.86 76.10 85.51 86.30 82.20 90.32XI - Davao Region 79.95 75.40 84.42 80.87 76.54 85.03 81.53 77.59 85.36 85.22 79.64 90.77XII - SOCCSKSARGEN 77.38 74.18 80.51 76.37 73.24 79.37 81.31 77.91 84.60 82.98 78.53 87.32XIII - Caraga 77.00 73.62 80.36 79.16 76.51 81.78 84.36 81.99 86.68 86.67 82.61 90.80ARMM 73.66 71.80 75.08 80.88 79.16 82.20 63.17 63.26 63.15 94.65 93.55 94.49
Notes: 1. Cohort Survival Rate is defined as thepercentage of enrollees at the beginning grade in a given school year who reached the final grade of secondary level. 2. Data includes State and Local Universities and Colleges (SUCs/LUCs)Source: Department of Education
Region 2015 2016 2017 2018
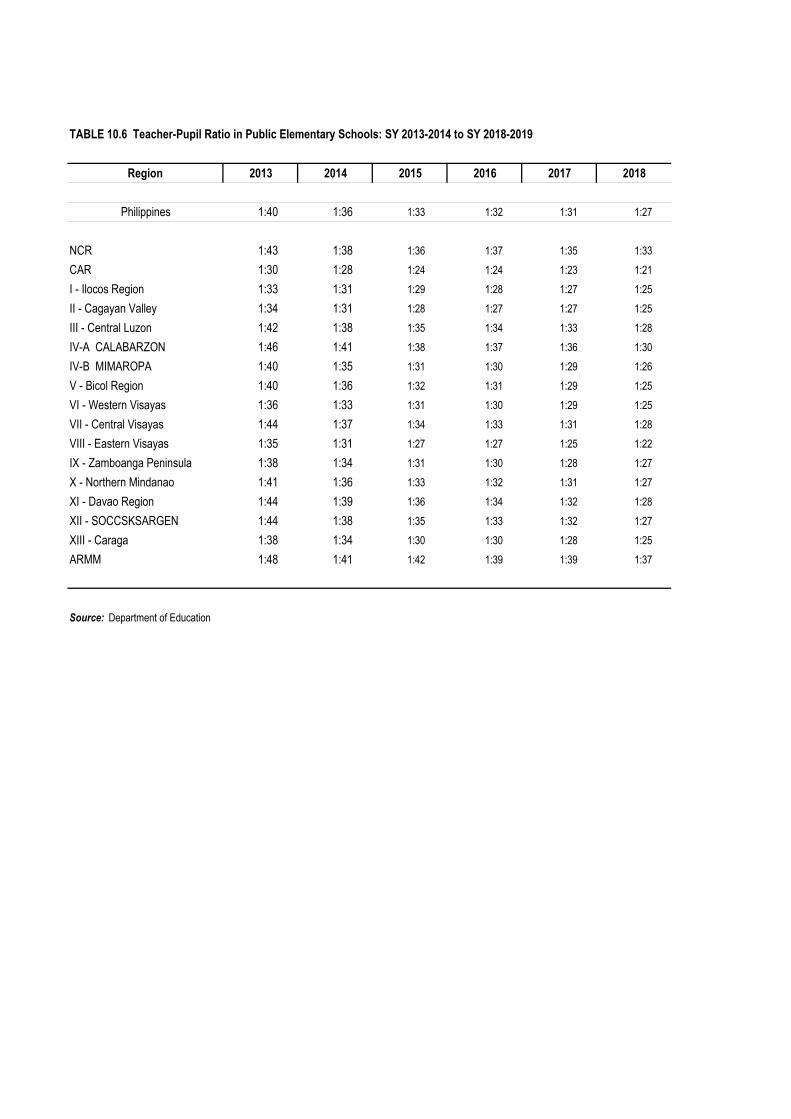
TABLE 10.6 Teacher-Pupil Ratio in Public Elementary Schools: SY 2013-2014 to SY 2018-2019
Region 2013 2014 2015 2016 2017 2018
Philippines 1:40 1:36 1:33 1:32 1:31 1:27
NCR 1:43 1:38 1:36 1:37 1:35 1:33CAR 1:30 1:28 1:24 1:24 1:23 1:21I - Ilocos Region 1:33 1:31 1:29 1:28 1:27 1:25II - Cagayan Valley 1:34 1:31 1:28 1:27 1:27 1:25III - Central Luzon 1:42 1:38 1:35 1:34 1:33 1:28IV-A CALABARZON 1:46 1:41 1:38 1:37 1:36 1:30IV-B MIMAROPA 1:40 1:35 1:31 1:30 1:29 1:26V - Bicol Region 1:40 1:36 1:32 1:31 1:29 1:25VI - Western Visayas 1:36 1:33 1:31 1:30 1:29 1:25VII - Central Visayas 1:44 1:37 1:34 1:33 1:31 1:28VIII - Eastern Visayas 1:35 1:31 1:27 1:27 1:25 1:22IX - Zamboanga Peninsula 1:38 1:34 1:31 1:30 1:28 1:27X - Northern Mindanao 1:41 1:36 1:33 1:32 1:31 1:27XI - Davao Region 1:44 1:39 1:36 1:34 1:32 1:28XII - SOCCSKSARGEN 1:44 1:38 1:35 1:33 1:32 1:27XIII - Caraga 1:38 1:34 1:30 1:30 1:28 1:25ARMM 1:48 1:41 1:42 1:39 1:39 1:37
Source: Department of Education

TABLE 10.7a Teacher-Student Ratio in Public Junior High Schools: SY 2013-2014 to SY 2018-2019
Region 2013 2014 2015 2016 2017 2018
Philippines 1:34 1:27 1:25 1:26 1:26 1:25
NCR 1:31 1:26 1:24 1:25 1:25 1:24CAR 1:28 1:22 1:21 1:22 1:21 1:22I - Ilocos Region 1:31 1:26 1:24 1:25 1:25 1:25II - Cagayan Valley 1:30 1:24 1:23 1:24 1:24 1:23III - Central Luzon 1:38 1:28 1:25 1:26 1:26 1:25IV-A CALABARZON 1:38 1:28 1:26 1:27 1:27 1:26IV-B MIMAROPA 1:35 1:27 1:25 1:27 1:26 1:25V - Bicol Region 1:34 1:27 1:25 1:26 1:27 1:26VI - Western Visayas 1:31 1:26 1:25 1:26 1:26 1:26VII - Central Visayas 1:37 1:27 1:24 1:25 1:25 1:26VIII - Eastern Visayas 1:34 1:28 1:24 1:26 1:26 1:24IX - Zamboanga Peninsula 1:32 1:27 1:23 1:26 1:27 1:27X - Northern Mindanao 1:35 1:27 1:25 1:26 1:27 1:27XI - Davao Region 1:34 1:28 1:26 1:29 1:28 1:27XII - SOCCSKSARGEN 1:35 1:28 1:24 1:26 1:26 1:26XIII - Caraga 1:32 1:25 1:23 1:25 1:25 1:24ARMM 1:44 1:33 1:32 1:29 1:29 1:29
Source: Department of Education
TABLE 10.7b Teacher-Student Ratio in Public Senior High Schools: SY 2016-2017 to SY 2018-2019
Region 2016 2017 2018
Philippines 1:20 1:30 1:29
NCR 1:9 1:28 1:26CAR 1:17 1:24 1:36I - Ilocos Region 1:25 1:28 1:29II - Cagayan Valley 1:25 1:27 1:26III - Central Luzon 1:19 1:26 1:26IV-A CALABARZON 1:15 1:28 1:28IV-B MIMAROPA 1:21 1:27 1:26V - Bicol Region 1:25 1:38 1:31VI - Western Visayas 1:25 1:32 1:28VII - Central Visayas 1:20 1:36 1:36VIII - Eastern Visayas 1:26 1:28 1:29IX - Zamboanga Peninsula 1:19 1:34 1:31X - Northern Mindanao 1:23 1:31 1:31XI - Davao Region 1:19 1:27 1:28XII - SOCCSKSARGEN 1:24 1:26 1:28XIII - Caraga 1:22 1:27 1:27ARMM 1:15 1:44 1:72
Source: Department of Education

TABLE 10.8 National Achievement Test of Grade Six Pupils by Region: SY 2014-2015 to SY 2016-2017
Mathematics English Science Mathematics English Science Mathematics English Science
Philippines 69.10 69.71 71.80 67.19 41.45 36.63 39.80 35.97 39.95 34.75 40.37 30.94
NCR 58.05 54.74 60.58 56.29 45.32 38.35 43.74 39.76 45.32 38.46 47.01 34.84CAR 69.79 70.60 74.42 67.16 47.90 43.99 47.77 41.87 45.39 40.17 48.39 35.35I - Ilocos Region 70.12 72.35 73.30 67.36 39.71 35.33 37.78 33.98 38.48 33.91 37.85 29.89II - Cagayan Valley 72.70 74.68 75.29 69.73 42.96 39.42 40.66 36.13 39.99 35.09 39.90 30.67III - Central Luzon 73.39 74.45 75.69 72.06 40.76 34.47 38.28 35.05 40.01 34.16 39.38 30.69IV-A CALABARZON 57.89 55.53 59.73 54.82 42.55 36.16 39.75 36.17 42.42 35.78 42.36 32.08MIMAROPA 75.93 77.80 77.48 73.96 41.49 36.11 38.07 34.96 39.28 32.63 37.65 29.78V - Bicol Region 67.95 68.94 69.64 65.21 38.68 33.87 35.60 32.64 37.67 32.06 36.72 28.75VI - Western Visayas 73.80 74.15 76.44 73.15 43.38 39.11 41.49 37.95 38.86 33.66 39.51 30.48VII - Central Visayas 72.15 74.07 77.14 69.51 46.27 43.23 46.53 40.53 40.30 35.49 43.17 31.39VIII - Eastern Visayas 77.06 80.05 78.99 75.91 41.93 39.30 40.74 36.50 38.07 34.54 38.34 29.80IX - Zamboanga Peninsula 74.84 77.81 77.92 73.67 38.24 35.41 37.22 33.48 35.30 31.93 35.63 27.88X - Northern Mindanao 72.23 74.73 75.64 71.05 39.88 35.81 39.35 34.99 37.75 33.73 39.05 29.82XI - Davao Region 73.73 74.56 76.67 73.70 41.40 37.02 40.31 36.08 38.00 33.07 38.90 29.82XII - SOCCSKSARGEN 76.12 78.70 78.43 75.03 39.78 35.61 38.44 34.83 37.91 34.46 37.54 30.17XIII - Caraga 79.58 83.39 82.15 78.42 39.40 36.04 38.34 35.04 36.90 33.87 37.28 29.16ARMM 59.64 60.84 64.86 55.42 44.94 46.12 45.21 41.28 38.25 38.17 38.60 31.62NIR … … … … 41.58 36.63 40.38 36.91 … … … …Unknown … … … … 39.64 34.90 38.45 34.71 … … … …
Note: The National Achievement Test measures the desired learning competencies in the areas where the medium is English. The test determines the progress of the pupils after ten months of study in the grade level. The score is in Mean Percentage Score.
Source: Department of Education, National Educational Testing and Research Center
Overall Subject Area Overall Subject AreaRegionSY 2014-2015 SY 2015-2016 SY 2016-2017
Overall Subject Area

TABLE 10.9 National Achievement Test of Grade Ten Students by Region: SY 2014-2015 to SY 2016-2017
Mathematics English Science Mathematics English Science Mathematics English Science
Philippines 49.48 47.37 46.45 46.56 44.66 35.55 51.97 32.17 44.08 37.30 46.01 35.68
NCR 49.28 44.37 46.08 45.12 47.05 37.26 56.00 33.42 48.28 39.91 51.41 39.17CAR 49.73 45.51 47.73 46.69 na na na na 47.09 39.82 50.98 38.16I - Ilocos Region 43.31 39.51 40.81 40.11 na na na na 41.38 35.47 42.18 33.39II - Cagayan Valley 49.36 48.92 46.64 47.00 na na na na 43.11 37.24 44.55 34.54III - Central Luzon 48.89 45.81 46.05 46.13 na na na na 42.29 35.70 43.44 34.00IV-A CALABARZON 44.45 36.74 41.13 39.47 41.80 33.09 48.01 30.18 44.68 36.93 46.30 35.41MIMAROPA 52.10 52.11 46.71 48.96 na na na na 43.09 36.28 42.77 34.29V - Bicol Region 46.90 43.49 42.28 43.69 na na na na 42.64 35.52 43.15 33.99VI - Western Visayas 52.98 53.43 50.23 51.52 48.94 39.75 57.76 35.18 44.51 37.73 47.35 36.64VII - Central Visayas 52.80 53.21 49.37 49.89 na na na na 45.44 38.18 48.82 36.89VIII - Eastern Visayas 53.07 54.30 50.10 51.98 na na na na 45.09 39.29 47.36 37.82IX - Zamboanga Peninsula 54.28 58.52 51.73 53.20 na na na na 40.68 35.95 42.33 33.18X - Northern Mindanao 51.52 51.62 49.34 50.22 na na na na 43.21 37.52 45.59 35.32XI - Davao Region 51.57 50.54 48.89 49.92 na na na na 43.74 36.53 45.85 35.34XII - SOCCSKSARGEN 52.44 54.61 49.32 50.59 41.23 33.01 45.78 30.69 41.62 36.48 42.79 33.99XIII - Caraga 61.40 67.79 59.45 61.16 na na na na 43.61 39.02 45.27 36.50ARMM 41.07 43.13 41.54 37.02 na na na na 37.15 35.24 39.73 31.46NIR … … … … na na na na … … … …Unknown … … … … … … … … … … … …
Note: The National Achievement Test measures the desired learning competencies in the areas where the medium is English. The test determines the progress of the students after ten months of study in the grade level. The score is in Mean Percentage Score. na - Not administered
Source: Department of Education, National Educational Testing and Research Center
RegionSY 2014-2015 SY 2015-2016 SY 2016-2017
OverallSubject Area
OverallSubject Area
OverallSubject Area

TABLE 10.10 Number of Public and Private Schools by Region and Level of Education: SY 2015-2016 to 2018-2019
Philippines NCR CAR Ilocos Region
Cagayan Valley
Central Luzon CALABARZON MIMAROPA Bicol
RegionWestern Visayas
Central Visayas
Eastern Visayas
Zamboanga Peninsula
Northern Mindanao
Davao Region
SOCCSK SARGEN Caraga ARMM
Elementary 49,630 2,172 1,727 2,883 2,558 4,417 5,232 2,066 3,590 4,365 3,614 3,848 2,300 2,566 2,135 2,089 1,827 2,241Public 38,694 519 1,531 2,404 2,202 2,998 2,737 1,854 3,148 3,399 2,940 3,636 2,106 2,095 1,630 1,714 1,633 2,148Private 10,936 1,653 196 479 356 1,419 2,495 212 442 966 674 212 194 471 505 375 194 93
Secondary 13,688 1,090 429 846 538 1,385 1,963 514 853 973 1,240 644 507 644 510 659 501 392Public 8,196 260 297 550 397 677 687 395 667 662 823 519 404 369 304 469 406 310Private 5,492 830 132 296 141 708 1,276 119 186 311 417 125 103 275 206 190 95 82
Elementary 50,525 2,459 1,732 2,886 2,560 4,462 5,410 2,087 3,610 4,406 3,655 3,868 2,328 2,592 2,206 2,124 1,889 2,251Public 38,845 518 1,531 2,406 2,200 3,003 2,740 1,860 3,149 3,404 2,941 3,642 2,125 2,098 1,669 1,746 1,665 2,148Private 11,680 1,941 201 480 360 1,459 2,670 227 461 1,002 714 226 203 494 537 378 224 103
Junior High School 14,463 1,225 437 869 545 1,469 2,060 548 887 1,033 1,312 661 515 655 582 695 523 447Public 8,528 281 300 558 402 702 702 415 682 691 852 532 408 383 350 497 419 354Private 5,935 944 137 311 143 767 1,358 133 205 342 460 129 107 272 232 198 104 93
Senior High School 10,557 852 260 715 426 1,100 1,295 344 818 739 1,013 486 302 533 489 504 461 220Public 6,184 178 169 480 294 490 464 252 623 498 677 373 181 319 298 343 377 168Private 4,373 674 91 235 132 610 831 92 195 241 336 113 121 214 191 161 84 52
Elementary 51,147 2,638 1,736 2,893 2,569 4,495 5,449 2,100 3,624 4,420 3,721 3,873 2,348 2,624 2,235 2,182 1,912 2,328Public 38,956 518 1,531 2,407 2,203 3,005 2,749 1,865 3,152 3,405 2,946 3,646 2,127 2,104 1,678 1,800 1,668 2,152Private 12,191 2,120 205 486 366 1,490 2,700 235 472 1,015 775 227 221 520 557 382 244 176
Junior High School 14,722 1,254 441 879 557 1,489 2,060 549 903 1,021 1,349 673 521 673 627 746 518 462Public 8,756 283 304 566 412 710 712 424 698 688 880 548 412 408 387 550 418 356Private 5,966 971 137 313 145 779 1,348 125 205 333 469 125 109 265 240 196 100 106
Senior High School 11,327 927 289 752 441 1,190 1,355 348 855 863 1,079 515 393 558 524 531 478 229Public 6,718 206 183 509 305 545 478 252 640 617 731 400 273 335 321 364 392 167Private 4,609 721 106 243 136 645 877 96 215 246 348 115 120 223 203 167 86 62
Elementary 51,348 2,658 1,737 2,896 2,588 4,508 5,444 2,136 3,626 4,412 3,746 3,868 2,365 2,684 2,244 2,205 1,915 2,316Public 39,067 517 1,533 2,410 2,209 3,016 2,758 1,892 3,153 3,407 2,947 3,643 2,129 2,157 1,687 1,810 1,673 2,126Private 12,281 2,141 204 486 379 1,492 2,686 244 473 1,005 799 225 236 527 557 395 242 190
Junior High School 15,080 1,260 449 887 569 1,520 2,076 574 914 1,055 1,367 689 531 737 689 779 530 454Public 9,085 281 312 573 422 743 735 444 707 721 895 562 421 467 441 576 431 354Private 5,995 979 137 314 147 777 1,341 130 207 334 472 127 110 270 248 203 99 100
Senior High School 11,817 972 317 785 461 1,232 1,403 374 888 887 1,118 538 450 580 547 547 480 238Public 7,033 214 204 539 321 572 495 272 663 638 751 419 327 345 335 371 393 174Private 4,784 758 113 246 140 660 908 102 225 249 367 119 123 235 212 176 87 64
Note: Data includes State and Local Universities and Colleges (SUCs/LUCs)
Source: Department of Education
SY 2015-2016
SY 2016-2017
SY 2017-2018
SY 2018-2019
Level of Education

TABLE 10.11 Number of Teachers in Public Schools by Region and Level of Education: SY 2000-2001 to SY 2018-2019
Level of Education Philippines NCR CAR Ilocos Region
Cagayan Valley
Central Luzon CALABARZON MIMAROPA Bicol
RegionWestern Visayas
Central Visayas
Eastern Visayas
Zamboanga Peninsula
Northern Mindanao
Davao Region
SOCCSK SARGEN Caraga ARMM
Elementary2000-01 331,827 27,540 7,227 20,593 13,767 30,879 44,184 * 25,839 31,527 24,052 20,489 16,622 13,257 21,468 12,058 10,842 11,4832001-02 331,549 27,293 7,322 20,605 13,839 30,861 44,021 * 25,841 31,517 24,052 20,475 16,523 13,215 21,480 12,066 10,811 11,6282002-03 336,140 27,829 7,430 20,673 14,084 32,287 32,615 11,872 26,034 31,758 24,214 20,723 15,706 17,134 16,040 13,693 10,965 13,0832003-04 336,956 28,303 7,484 20,839 14,080 32,337 32,621 11,812 25,973 31,869 24,334 20,704 15,716 16,966 16,017 13,769 11,000 13,1322004-05 340,273 28,782 7,553 20,869 14,156 32,621 33,202 11,927 25,905 31,983 24,459 20,944 15,739 17,165 16,135 14,023 11,097 13,713
2005-06 341,809 29,050 7,590 20,999 14,277 32,757 33,283 12,015 26,081 32,070 24,655 21,014 15,792 17,258 16,257 14,090 11,137 13,4842006-07 343,646 28,909 7,612 21,078 14,340 33,143 33,793 12,091 26,127 32,217 24,886 21,105 15,931 17,312 16,305 14,215 11,220 13,3622007-08 348,028 29,628 7,695 21,142 14,437 33,474 34,584 12,416 26,081 32,300 25,155 21,331 15,984 17,553 16,686 14,459 11,313 13,7902008-09 353,280 30,683 7,743 21,374 14,556 34,266 36,009 12,438 26,431 32,540 25,415 21,344 16,255 17,724 16,787 14,847 11,441 13,4272009-10 358,078 31,042 7,822 21,493 14,604 34,631 36,832 12,665 26,780 32,641 25,830 21,869 16,363 17,855 17,009 15,248 11,543 13,851
2010-11 361,564 31,314 7,848 21,604 14,728 34,952 37,190 12,900 27,056 32,774 25,940 21,860 16,604 17,999 17,148 15,761 11,569 14,3172011-12 363,955 31,640 7,999 21,790 14,521 35,418 37,501 13,215 27,299 33,046 26,232 22,003 16,800 18,188 17,233 16,019 11,947 13,1042012-13 377,831 33,103 8,278 22,235 15,284 36,417 39,513 13,622 28,136 33,766 27,307 22,736 17,217 18,831 17,832 16,794 12,358 14,4022013-14 401,913 32,206 8,747 22,779 16,038 38,774 43,299 14,826 29,740 35,340 30,381 24,490 18,543 20,681 19,368 18,898 13,213 14,5902014-15 417,848 35,824 8,904 23,071 16,435 39,972 45,219 15,516 30,781 35,854 31,667 25,099 19,077 21,078 20,256 19,633 13,813 15,649
2015-16 448,966 36,995 9,890 24,138 17,857 43,501 49,264 17,279 33,833 37,888 34,015 28,030 20,803 22,845 21,764 21,475 15,210 14,1792016-17 450,134 35,993 9,838 24,237 18,098 43,342 49,530 16,982 33,594 38,203 34,372 27,765 20,879 22,996 22,184 21,705 15,055 15,3612017-18 463,396 36,545 10,079 24,689 18,367 44,516 51,170 17,397 21,604 34,500 38,936 35,801 28,869 24,007 23,525 22,425 15,802 15,1642018-19 484,406 36,632 10,349 25,737 19,289 48,160 55,041 17,946 35,681 40,507 37,766 30,034 21,505 24,781 24,489 24,097 16,529 15,863
Junior High School2000-01 109,845 15,423 2,178 7,711 4,074 9,985 14,849 * 8,205 11,507 6,456 5,183 4,594 3,747 7,636 3,770 2,948 1,5792001-02 112,059 15,976 2,208 7,776 4,234 10,219 15,150 * 8,378 11,777 6,514 5,225 4,667 3,786 7,744 3,775 3,005 1,6252002-03 113,997 13,297 2,490 7,998 4,718 11,172 11,801 4,149 8,424 12,240 6,741 5,756 4,597 5,054 5,750 4,630 3,326 1,8542003-04 120,720 16,490 2,651 8,290 4,755 11,114 11,959 4,176 9,219 12,621 7,112 5,855 4,845 5,055 5,879 5,128 3,388 2,1832004-05 122,989 16,900 2,654 8,359 4,845 11,472 12,363 4,250 8,882 12,782 7,426 6,031 4,738 5,197 5,970 5,028 3,504 2,588
2005-06 124,950 17,181 2,617 8,462 4,946 11,900 12,539 4,378 8,987 12,810 7,947 6,080 4,927 5,343 6,072 5,271 3,599 1,8912006-07 128,191 16,738 2,581 8,573 5,111 12,307 13,204 4,444 9,259 13,019 8,298 6,265 5,118 5,461 6,046 5,322 3,731 2,7142007-08 131,865 17,143 2,726 8,702 5,285 12,573 13,815 4,636 9,424 13,163 8,756 6,546 5,188 5,570 6,244 5,450 3,875 2,7692008-09 138,058 18,263 2,910 8,914 5,546 13,420 15,171 4,726 9,805 13,487 9,105 6,646 5,403 5,752 6,285 5,633 4,022 2,9702009-10 142,518 18,583 2,978 8,952 5,734 13,969 16,045 4,690 10,125 13,645 9,571 7,092 5,504 5,943 6,521 5,856 4,172 3,138
2010-11 146,269 19,210 2,967 9,032 5,855 14,534 16,193 4,953 10,513 13,859 9,866 7,352 5,703 5,979 6,619 6,031 4,271 3,3322011-12 150,516 19,588 3,044 9,271 5,945 14,832 17,445 5,134 10,744 14,218 10,202 7,547 5,820 6,123 6,756 6,320 4,323 3,2042012-13 169,743 22,439 3,301 10,022 6,614 16,710 19,439 5,748 12,170 15,479 12,026 9,099 6,491 6,873 7,543 6,921 5,161 3,7072013-14 201,651 25,250 3,951 11,431 7,764 20,539 24,588 7,016 14,544 17,710 14,693 10,364 7,631 8,420 9,017 8,553 6,314 3,8662014-15 219,710 26,746 4,239 12,116 8,079 23,113 27,409 7,676 15,829 18,638 16,756 11,324 8,258 9,125 9,750 9,325 6,854 4,473
2015-16 243,321 27,833 4,539 13,311 8,771 25,852 30,632 8,447 17,746 19,878 19,211 13,527 9,788 10,231 10,768 10,873 7,637 4,2772016-17 237,083 26,617 4,447 13,006 8,670 25,270 29,975 8,083 17,142 19,539 18,940 12,907 9,170 10,300 10,520 10,446 7,323 4,7282017-18 250,077 27,916 4,587 13,642 9,052 26,250 31,626 8,801 17,929 20,344 20,753 13,574 9,573 10,481 11,669 11,105 8,005 4,7702018-19 268,527 29,540 4,733 13,916 9,564 28,299 34,583 9,430 19,481 21,956 21,089 15,195 10,517 11,271 13,149 12,108 8,731 4,965
Senior High School2016-17 36,788 3,692 645 2,082 1,246 4,011 4,942 1,471 2,634 3,127 2,858 1,994 1,310 1,564 1,609 1,598 1,071 9342017-18 47,187 2,462 842 3,594 2,276 5,415 5,152 2,159 3,363 4,639 3,272 3,454 1,399 2,027 2,123 2,707 1,703 6002018-19 55,156 3,266 668 3,899 2,715 6,068 5,951 2,444 4,662 5,701 3,756 3,774 1,928 2,367 2,566 2,894 2,104 393
Note: Data from SY 2012-13 onwards includes SPED Teacher I. * Still part of CALABARZONSource: Department of Education

TABLE 10.12 Number of Elementary and Secondary Textbooks Distributed: 2012-2018
2012 r 2013 r 2014 r 2015 r 2016 r 2017 2018
Philippines 49,057,312 23,144,400 12,104,404 27,248,310 4,392,186 48,370,112 32,399,113
NCR 3,898,311 1,716,992 1,181,720 2,536,803 527,526 4,443,144 2,991,088CAR 2,432,784 989,937 556,922 1,323,846 212,162 2,414,884 512,867I - Ilocos Region 1,808,747 778,386 382,227 912,387 271,102 1,667,550 1,510,020II - Cagayan Valley 4,670,236 2,208,879 1,164,247 2,768,874 385,375 5,106,895 1,070,898III - Central Luzon 866,014 321,103 187,764 448,056 124,410 812,784 3,237,969IV-A CALABARZON 5,915,253 2,233,428 1,490,425 3,409,833 462,134 6,157,236 3,987,401IV-B MIMAROPA 1,681,386 686,457 417,655 1,019,640 150,104 1,777,128 1,160,139V - Bicol Region 3,793,518 1,439,840 842,955 2,111,184 410,455 3,741,753 2,353,230VI - Western Visayas 1,906,807 1,365,801 466,560 1,113,426 187,600 3,918,676 2,543,350VII - Central Visayas 2,643,261 2,041,257 757,380 1,772,712 314,887 3,881,732 2,504,882VIII - Eastern Visayas 3,318,250 2,003,698 652,910 1,502,250 224,290 2,657,982 1,693,580Negros Island Region 2,297,408 1,653,265 588,730 1,378,626 282,224 a a
IX - Zamboanga Peninsula 2,075,088 861,470 567,548 1,139,108 147,712 1,923,696 1,404,814X - Northern Mindanao 2,295,031 1,029,157 622,655 1,315,307 177,802 2,242,976 1,654,451XI - Davao Region 2,486,694 1,025,972 646,790 1,376,682 177,126 2,337,079 1,655,951XII - SOCCSKSARGEN 2,491,410 956,465 625,154 1,278,702 181,658 2,197,239 1,600,720XIII - Caraga 1,521,934 591,802 386,134 806,631 68,166 1,422,043 1,014,147ARMM 2,955,180 1,240,491 566,628 1,034,243 87,453 1,667,315 1,503,606
a Provinces of Negros Island Region were reverted to Central and Eastern Visayas.
Source: Bureau of Learning Resources, Department of Education
TABLE 10.13 Simple Literacy Rate of the Population 10 Years Old and Over by Region: 2003, 2008, and 2013 (In percent)
Total Male Female Total Male Female Total Male Female
93.4 92.6 94.3 95.6 95.1 96.1 96.5 96.1 97.0
NCR 99.0 98.9 99.1 99.2 99.0 99.4 99.5 99.4 99.7CAR 91.6 92.0 91.1 94.8 95.2 94.3 94.9 94.8 94.9I - Ilocos Region 97.4 97.6 97.3 98.2 98.1 98.2 98.2 98.2 98.2II - Cagayan Valley 92.7 92.1 93.5 95.0 94.5 95.6 97.9 97.4 98.4III - Central Luzon 96.9 96.8 96.9 97.8 97.7 97.8 98.2 98.0 98.4IV-A CALABARZON 97.2 96.8 97.5 98.0 97.7 98.2 98.4 98.1 98.6IV-B MIMAROPA 91.2 91.4 91.0 95.1 94.4 95.9 93.8 92.8 94.8V - Bicol Region 95.0 93.8 96.3 96.6 96.1 97.1 96.0 94.7 97.4VI - Western Visayas 92.8 91.6 94.0 94.5 93.2 95.8 95.4 95.0 95.9VII - Central Visayas 92.4 91.5 93.2 95.1 94.6 95.6 96.2 95.5 96.9VIII - Eastern Visayas 90.1 87.0 93.3 93.6 92.2 95.0 a a a
IX - Zamboanga Peninsula 88.9 86.8 90.9 94.0 93.3 94.8 96.0 96.1 96.0X - Northern Mindanao 91.8 90.1 93.5 93.9 92.6 95.3 95.4 94.5 96.2XI - Davao Region 90.3 88.0 92.7 93.7 93.1 94.3 95.2 94.1 96.4XII - SOCCSKSARGEN 87.3 85.9 88.8 92.1 91.9 92.3 90.8 90.8 90.9XIII - Caraga 92.1 89.5 94.6 94.7 93.2 96.3 96.2 95.5 97.0ARMM 70.2 71 69.4 81.5 82.8 80.3 86.1 84.9 87.3
a Provinces from Region VIII were excluded due to the devastation brought about by typhoon Yolanda.
Source: Philippine Statistics Authority, Functional Literacy, Education and Mass Media Survey
Region
Characteristics 2003 2008 2013
Philippines
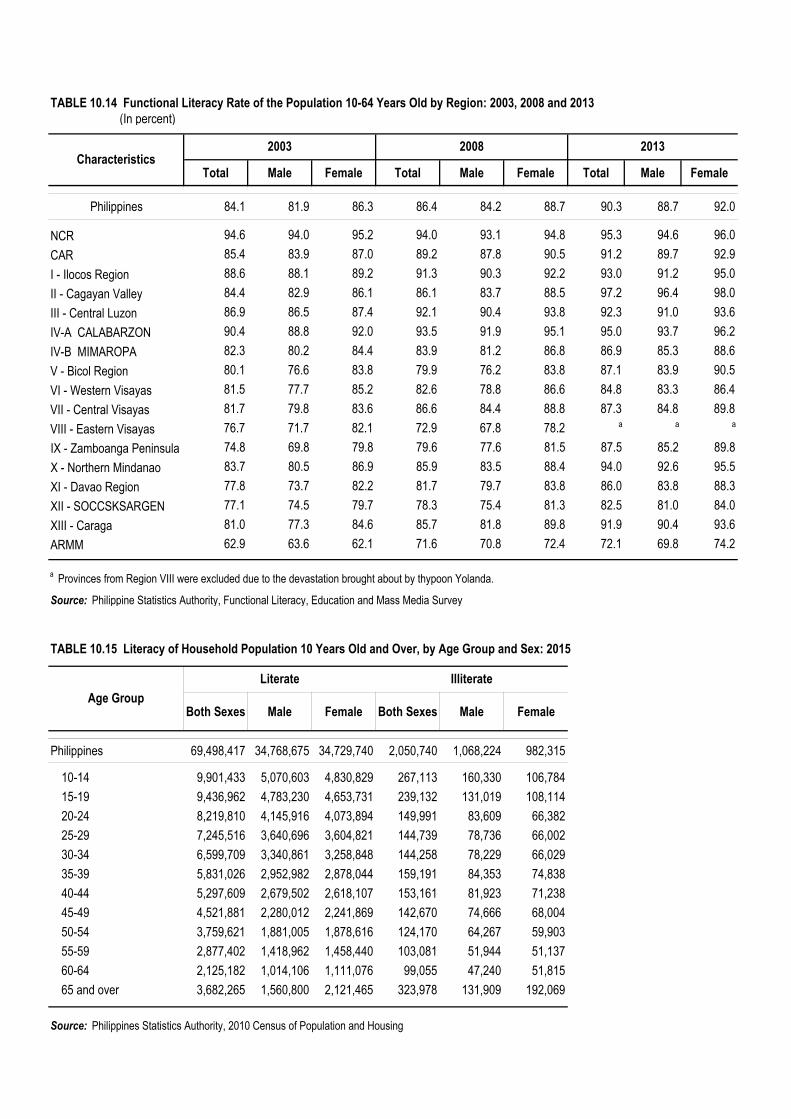
TABLE 10.14 Functional Literacy Rate of the Population 10-64 Years Old by Region: 2003, 2008 and 2013 (In percent)
Total Male Female Total Male Female Total Male Female
Philippines 84.1 81.9 86.3 86.4 84.2 88.7 90.3 88.7 92.0
NCR 94.6 94.0 95.2 94.0 93.1 94.8 95.3 94.6 96.0CAR 85.4 83.9 87.0 89.2 87.8 90.5 91.2 89.7 92.9I - Ilocos Region 88.6 88.1 89.2 91.3 90.3 92.2 93.0 91.2 95.0II - Cagayan Valley 84.4 82.9 86.1 86.1 83.7 88.5 97.2 96.4 98.0III - Central Luzon 86.9 86.5 87.4 92.1 90.4 93.8 92.3 91.0 93.6IV-A CALABARZON 90.4 88.8 92.0 93.5 91.9 95.1 95.0 93.7 96.2IV-B MIMAROPA 82.3 80.2 84.4 83.9 81.2 86.8 86.9 85.3 88.6V - Bicol Region 80.1 76.6 83.8 79.9 76.2 83.8 87.1 83.9 90.5VI - Western Visayas 81.5 77.7 85.2 82.6 78.8 86.6 84.8 83.3 86.4VII - Central Visayas 81.7 79.8 83.6 86.6 84.4 88.8 87.3 84.8 89.8VIII - Eastern Visayas 76.7 71.7 82.1 72.9 67.8 78.2 a a a
IX - Zamboanga Peninsula 74.8 69.8 79.8 79.6 77.6 81.5 87.5 85.2 89.8X - Northern Mindanao 83.7 80.5 86.9 85.9 83.5 88.4 94.0 92.6 95.5XI - Davao Region 77.8 73.7 82.2 81.7 79.7 83.8 86.0 83.8 88.3XII - SOCCSKSARGEN 77.1 74.5 79.7 78.3 75.4 81.3 82.5 81.0 84.0XIII - Caraga 81.0 77.3 84.6 85.7 81.8 89.8 91.9 90.4 93.6ARMM 62.9 63.6 62.1 71.6 70.8 72.4 72.1 69.8 74.2
a Provinces from Region VIII were excluded due to the devastation brought about by thypoon Yolanda.
Source: Philippine Statistics Authority, Functional Literacy, Education and Mass Media Survey
TABLE 10.15 Literacy of Household Population 10 Years Old and Over, by Age Group and Sex: 2015
Both Sexes Male Female Both Sexes Male Female
Philippines 69,498,417 34,768,675 34,729,740 2,050,740 1,068,224 982,315
10-14 9,901,433 5,070,603 4,830,829 267,113 160,330 106,78415-19 9,436,962 4,783,230 4,653,731 239,132 131,019 108,11420-24 8,219,810 4,145,916 4,073,894 149,991 83,609 66,38225-29 7,245,516 3,640,696 3,604,821 144,739 78,736 66,00230-34 6,599,709 3,340,861 3,258,848 144,258 78,229 66,02935-39 5,831,026 2,952,982 2,878,044 159,191 84,353 74,83840-44 5,297,609 2,679,502 2,618,107 153,161 81,923 71,23845-49 4,521,881 2,280,012 2,241,869 142,670 74,666 68,00450-54 3,759,621 1,881,005 1,878,616 124,170 64,267 59,90355-59 2,877,402 1,418,962 1,458,440 103,081 51,944 51,13760-64 2,125,182 1,014,106 1,111,076 99,055 47,240 51,81565 and over 3,682,265 1,560,800 2,121,465 323,978 131,909 192,069
Source: Philippines Statistics Authority, 2010 Census of Population and Housing
2013
Literate Illiterate
Characteristics
Age Group
2003 2008

TABLE 10.16 Functional Literacy Rate of Population 10 - 64 Years Old by Highest Educational Attainment, Region, and Sex: 2013 (In percent)
Region/Sex Population 10-64 years old
No Grade Completed
Elementary Level
Elementary Graduate
High School Level
High School Graduate or Higher
Philippines 90.3 2.7 71.4 85.5 91.3 100.0
NCR 95.3 31.9 80.4 83.1 89.0 100.0CAR 91.2 0.0 76.4 85.3 92.2 100.0I - Ilocos Region 93.0 0.0 74.7 84.9 90.6 100.0II - Cagayan Valley 97.2 7.0 92.6 96.5 98.6 100.0III - Central Luzon 92.3 4.7 74.1 86.0 90.0 100.0IV-A CALABARZON 95.0 3.6 80.4 91.8 94.1 100.0IV-B MIMAROPA 86.9 3.8 68.9 87.2 93.5 100.0V - Bicol Region 87.1 2.9 62.4 81.9 91.4 100.0VI - Western Visayas 84.8 1.5 60.2 71.8 84.1 100.0VII - Central Visayas 87.3 5.4 68.8 85.2 87.6 100.0VIII - Eastern Visayas a a a a a a
IX - Zamboanga Peninsula 87.5 0.0 72.2 84.9 91.4 100.0X - Northern Mindanao 94.0 0.0 80.2 96.9 98.5 100.0XI - Davao Region 86.0 4.1 64.7 85.4 90.3 100.0XII - SOCCSKSARGEN 82.5 0.4 64.3 82.1 94.9 100.0XIII - Caraga 91.9 0.0 78.8 92.5 94.4 100.0ARMM 72.1 1.7 56.9 75.5 89.0 100.0
SexMale 88.7 2.7 69.3 84.8 90.3 100.0Female 92.0 2.7 74.5 86.4 92.3 100.0
a Provinces from Region VII were excluded due to the devastation brought by typhoon Yolanda.
Source: Philippines Statistics Authority, Functional Literacy, Education and Mass Survey
10-10

TABLE 10.17 Higher Education Enrolment in Public and Private Schools by Discipline Group: AY 2015-2016 to 2017-2018
Public Private Total Public Private Total Public Private Total
Total 1,884,984 2,219,857 4,104,841 1,641,607 1,947,877 3,589,484 1,385,458 1,596,345 2,981,803
Agriculture, Forestry, Fisheries 128,853 14,329 143,182 113,652 13,635 127,287 97,362 3,560 100,922Architecture and Town Planning 17,727 27,856 45,583 15,517 24,721 40,238 13,165 20,274 33,439Business Administration and Related 422,467 644,172 1,066,639 367,026 554,298 921,324 317,107 458,698 775,805Education Science and Teacher Training 444,883 346,401 791,284 407,933 332,780 740,713 353,221 285,842 639,063Engineering and Tech 319,641 197,369 517,010 276,498 172,052 448,550 227,205 143,505 370,710Fine and Applied Arts 7,845 20,210 28,055 6,253 10,071 16,324 5,377 10,978 16,355General 1,817 6,608 8,425 2,975 4,639 7,614 2,148 2,721 4,869Home Economics 6,957 618 7,575 5,256 704 5,960 4,387 489 4,876Humanities 28,408 20,074 48,482 22,867 17,886 40,753 20,107 16,225 36,332IT-Related Disciplines 206,331 254,531 460,862 177,827 220,938 398,765 140,280 175,414 315,694Law and Jurisprudence 6,505 15,186 21,691 6,274 16,965 23,239 6,601 16,821 23,422Maritime 12,558 143,529 156,087 8,309 111,078 119,387 6,979 75,226 82,205Mass Communication and Documentation 18,578 26,208 44,786 16,068 20,459 36,527 12,967 16,147 29,114Mathematics 16,310 1,937 18,247 12,555 1,554 14,109 10,429 1,385 11,814Medical and Allied 33,568 194,969 228,537 26,952 176,609 203,561 24,743 151,789 176,532Natural Science 31,019 14,050 45,069 22,677 12,246 34,923 19,307 10,000 29,307Other Disciplines 93,424 147,038 240,462 80,453 132,256 212,709 64,298 107,101 171,399Religion and Theology - 10,233 10,233 - 8,351 8,351 7,628 7,628Service Trades 21,973 63,898 85,871 19,142 54,763 73,905 15,380 40,291 55,671Social and Behavioral Sciences 65,328 70,593 135,921 52,962 61,872 114,834 44,177 52,251 96,428Trade, Craft and Industrial 792 48 840 411 - 411 218 218
Note: 1. Data as compiled by OPRKM-Knowledge Management Division 2. Includes pre-baccalaureate up to baccalaureate programs 3. Based on the submission of higher education institutions as of April 15, 2019
Source: Commission on Higher Education
Discipline Group AY 2015-2016 AY 2016-2017 AY 2017-2018
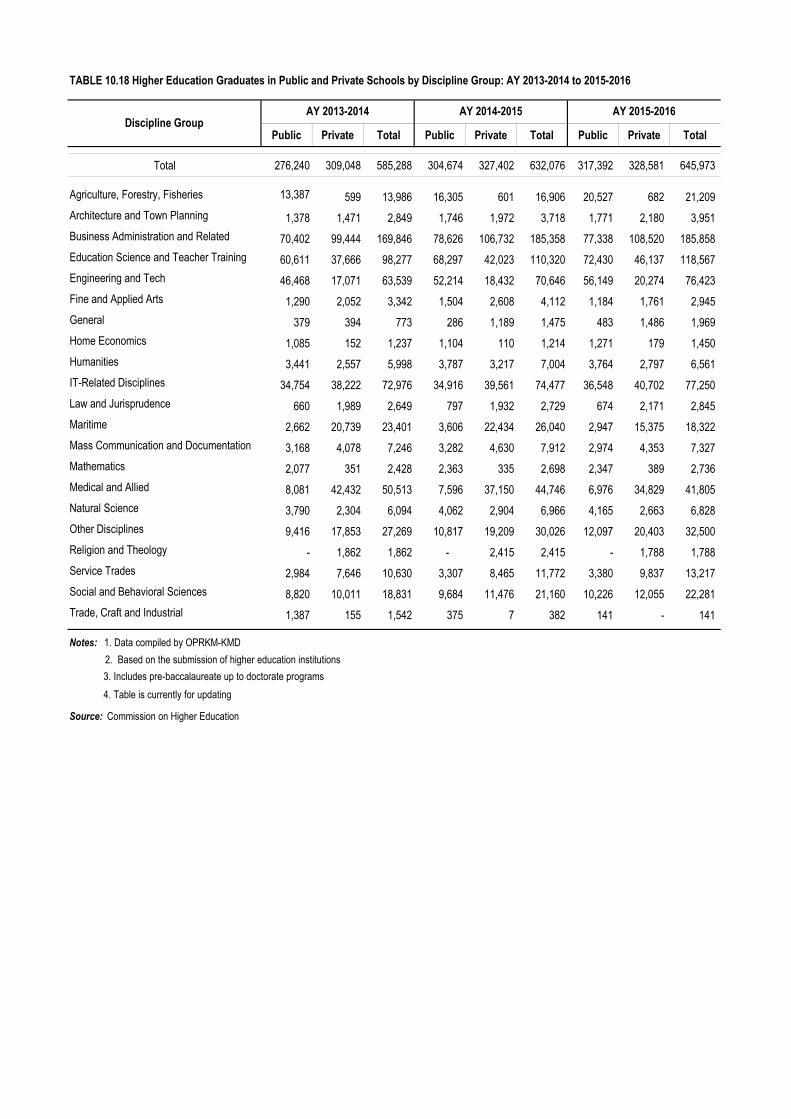
TABLE 10.18 Higher Education Graduates in Public and Private Schools by Discipline Group: AY 2013-2014 to 2015-2016
Public Private Total Public Private Total Public Private Total
Total 276,240 309,048 585,288 304,674 327,402 632,076 317,392 328,581 645,973
Agriculture, Forestry, Fisheries 13,387 599 13,986 16,305 601 16,906 20,527 682 21,209 Architecture and Town Planning 1,378 1,471 2,849 1,746 1,972 3,718 1,771 2,180 3,951 Business Administration and Related 70,402 99,444 169,846 78,626 106,732 185,358 77,338 108,520 185,858 Education Science and Teacher Training 60,611 37,666 98,277 68,297 42,023 110,320 72,430 46,137 118,567 Engineering and Tech 46,468 17,071 63,539 52,214 18,432 70,646 56,149 20,274 76,423 Fine and Applied Arts 1,290 2,052 3,342 1,504 2,608 4,112 1,184 1,761 2,945 General 379 394 773 286 1,189 1,475 483 1,486 1,969 Home Economics 1,085 152 1,237 1,104 110 1,214 1,271 179 1,450 Humanities 3,441 2,557 5,998 3,787 3,217 7,004 3,764 2,797 6,561 IT-Related Disciplines 34,754 38,222 72,976 34,916 39,561 74,477 36,548 40,702 77,250 Law and Jurisprudence 660 1,989 2,649 797 1,932 2,729 674 2,171 2,845 Maritime 2,662 20,739 23,401 3,606 22,434 26,040 2,947 15,375 18,322 Mass Communication and Documentation 3,168 4,078 7,246 3,282 4,630 7,912 2,974 4,353 7,327 Mathematics 2,077 351 2,428 2,363 335 2,698 2,347 389 2,736 Medical and Allied 8,081 42,432 50,513 7,596 37,150 44,746 6,976 34,829 41,805 Natural Science 3,790 2,304 6,094 4,062 2,904 6,966 4,165 2,663 6,828 Other Disciplines 9,416 17,853 27,269 10,817 19,209 30,026 12,097 20,403 32,500 Religion and Theology - 1,862 1,862 - 2,415 2,415 - 1,788 1,788 Service Trades 2,984 7,646 10,630 3,307 8,465 11,772 3,380 9,837 13,217 Social and Behavioral Sciences 8,820 10,011 18,831 9,684 11,476 21,160 10,226 12,055 22,281 Trade, Craft and Industrial 1,387 155 1,542 375 7 382 141 - 141
Notes: 1. Data compiled by OPRKM-KMD 2. Based on the submission of higher education institutions 3. Includes pre-baccalaureate up to doctorate programs 4. Table is currently for updating
Source: Commission on Higher Education
Discipline GroupAY 2013-2014 AY 2014-2015 AY 2015-2016

TABLE 10.19 Higher Education Graduates by Discipline Group: AY 2011-2012 to AY 2016-2017
Discipline Group 2011-2012 2012-2013 2013-2014 2014-2015 2015-2016 2016-2017
Total 564,769 564,769 585,288 632,076 645,973 703,327
Agricultural, Forestry, Fisheries, and Vet. Med. 13,796 13,796 13,986 16,906 21,209 24,210Architectural and Town Planning 2,624 2,624 2,849 3,718 3,951 4,828Business Admin. and Related 164,541 164,541 169,846 185,358 185,858 202,895Education Science and Teacher Training 86,903 86,903 98,277 110,320 118,567 138,496Engineering and Technology 59,399 59,399 63,539 70,646 76,423 82,794Fine and Applied Arts 2,813 2,813 3,342 4,112 2,945 4,100General 1,211 1,211 773 1,475 1,969 1,468Home Economics 966 966 1,237 1,214 1,450 1,236Humanities 6,577 6,577 5,998 7,004 6,561 6,877Information Technology 72,879 72,879 72,976 74,477 77,250 73,646Law and Jurisprudence 2,705 2,705 2,649 2,729 2,845 2,613Maritime 23,506 23,506 23,401 26,040 18,322 21,561Mass Communication and Documentation 6,475 6,475 7,246 7,912 7,327 8,230Mathematics 2,984 2,984 2,428 2,698 2,736 3,034Medical and Allied 57,427 57,427 50,513 44,746 41,805 43,012Natural Science 6,626 6,626 6,094 6,966 6,828 7,160Religion and Theology 1,442 1,442 1,862 2,415 1,788 1,746Service Trades 8,629 8,629 10,630 11,772 13,217 15,205Social and Behavioral Science 15,953 15,953 18,831 21,160 22,281 22,324Trade, Craft, and Industrial 374 374 1,542 382 141 93Other Disciplines 26,939 26,939 27,269 30,026 32,500 37,799
Notes : 1. Data as compiled by OPRKM-Knowledge Management Division includes pre-baccalaureate to baccalaureate programs 2. Based on the submission of higher education institutions as of June 30, 2019
Source: Commission on Higher Education
TABLE 10.20 Number of Foreign Students by Academic Year: AY 2000-2001 to AY 2018-2019
Academic Year
2000-2001 2,323
2001-2002 2,8362002-2003 4,7602003-2004 2,1612004-2005 4,8362005-2006 6,899
2006-2007 2,3032007-2008 7,3152008-2009 6,9672009-2010 4,9622010-2011 6,917
2011-2012 8,2072012-2013 7,3932013-2014 5,7062014-2015 6,4182015-2016 8,2022016-2017 14,1322017-2018 12,278
Source: Commission on Higher Education
Number of Foreign Students

TABLE 10.21 Number of Schools, Examinees, and Distribution of Passers by Sex in Various Licensure Examination: 2017 and 2018
2018 2017 2018 2017 Total Female Male Total Female Male 2018 2017
Total 9,736 8,870 587,693 545,900 221,349 144,396 76,593 200,302 130,221 70,081 37.66 36.69
Aeronautical Engineers 8 7 361 376 185 34 151 235 40 195 51.25 62.50Agricultural Engineers 61 58 1,502 1,304 851 378 473 630 273 357 56.66 48.31Agriculturist 239 278 4,428 10,475 1,689 889 800 3,810 2,034 1,776 38.14 36.37Architects 95 96 5,132 4,274 2,904 1,330 1,574 2,409 1,068 1,341 56.59 56.36Certified Public Accountants 534 521 24,185 24,458 6,459 4,303 2,156 7,900 5,262 2,638 26.71 32.30Chemical Engineers 40 40 1,679 1,503 1,033 562 471 937 509 428 61.52 62.34Chemists 59 56 1,101 1,195 496 281 215 526 294 232 45.05 44.02Civil Engineers 295 268 21,481 19,445 9,000 3,083 5,917 8,589 2,895 5,694 41.90 44.17Criminologists 624 593 63,219 57,323 21,631 6,539 15,092 18,227 5,371 12,856 34.22 31.80Customs Brokers 78 80 2,478 2,093 1,266 765 501 1,114 639 475 51.09 53.23Dentists (Practical only) 31 30 1,426 1,171 1,295 988 307 1,157 867 290 90.81 98.80Electronics Engineers 240 219 7,363 7,287 3,534 1,234 2,300 3,268 1,066 2,202 48.00 44.85Environmental Planners 582 332 4,729 1,739 1,891 903 988 739 355 384 39.99 42.50Fisheries Technologists 92 90 1,773 1,399 502 273 229 479 282 197 28.31 34.24Foresters 75 77 1,776 1,482 1,048 604 444 721 419 302 59.01 48.65Geodetic Engineers 35 42 847 750 451 183 268 372 153 219 53.25 49.60Geologists 7 7 556 453 328 154 174 183 74 109 58.99 40.40Guidance Counselors 139 132 468 393 307 243 64 256 203 53 65.60 65.14Interior Designers 21 26 452 473 251 212 39 113 91 22 55.53 23.89Landscape Architects 5 3 86 71 40 23 17 37 20 17 46.51 52.11Librarians 99 91 951 904 466 380 86 545 454 91 49.00 60.29Mechanical Engineers 182 161 7,067 7,000 4,025 593 3,432 4,600 585 4,015 56.95 65.71Medical Technologists 149 126 9,714 8,877 7,366 5,550 1,816 7,199 5,340 1,859 75.83 81.10Metallurgical Engineers 3 3 68 96 49 28 21 82 36 46 72.06 85.42Midwives 323 340 4,623 5,509 2,021 1,940 81 2,409 2,271 138 43.72 43.73Mining Engineers 13 11 326 317 282 109 173 281 102 179 86.50 88.64Naval Architecture & Marine Engineers 5 5 129 117 52 19 33 51 13 38 40.31 43.59Nurses 537 505 21,904 24,045 9,137 7,191 1,946 9,757 7,645 2,112 41.71 40.58Nutritionists-Dietitians 53 61 1,288 2,326 813 671 142 1,671 1,388 283 63.12 71.84Occupational Therapists 20 21 519 480 348 283 65 343 268 75 67.05 71.46Optometrists 9 9 222 168 188 141 47 138 104 34 84.68 82.14Pharmacists 99 84 7,268 8,811 4,622 3,887 735 5,210 4,357 853 63.59 59.13Physical Therapists 88 86 2,396 2,133 1,519 1,007 512 1,314 845 469 63.40 61.60Physicians 51 53 6,143 5,381 4,784 2,903 1,881 4,153 2,490 1,663 77.88 77.18Psychologist 40 41 189 148 127 96 31 96 67 29 67.20 64.86Psychometricians 312 297 8,453 8,701 4,035 3,331 704 4,957 4,106 851 47.73 59.97Radiologic Technologists 102 97 4,353 4,195 2,056 1,253 803 1,945 1,182 763 47.23 46.36Registered Electrical Engineers 219 201 7,220 6,673 4,450 758 3,692 3,801 650 3,151 61.63 56.96Respiratory Therapists 325 21 1,018 974 740 521 219 597 408 189 72.69 61.29Sanitary Engineers 13 15 253 250 157 83 74 142 72 70 62.06 56.80Social Workers 151 116 5,020 5,997 2,508 2,048 460 3,951 3,263 688 49.96 65.88Teachers-Elementary level 1,470 1,434 149,067 134,422 32,183 27,216 4,967 26,798 22,788 4,010 21.59 19.94Teachers-Secondary level 2,155 2,082 203,252 179,602 83,739 61,115 22,624 68,108 49,621 18,487 41.20 37.92Veterinarians 23 25 950 862 455 250 205 391 220 171 47.89 45.36X-Ray Technologists 35 29 258 248 66 42 24 61 31 30 25.58 24.60
Note: Only CHED monitored licensure examinations are included, statistics for special examinations conducted abroad are not included.
Source: Professional Regulation Commission
Licensure ExaminationSchools Examinees
Passers Overall2018 2017 Passing Rate
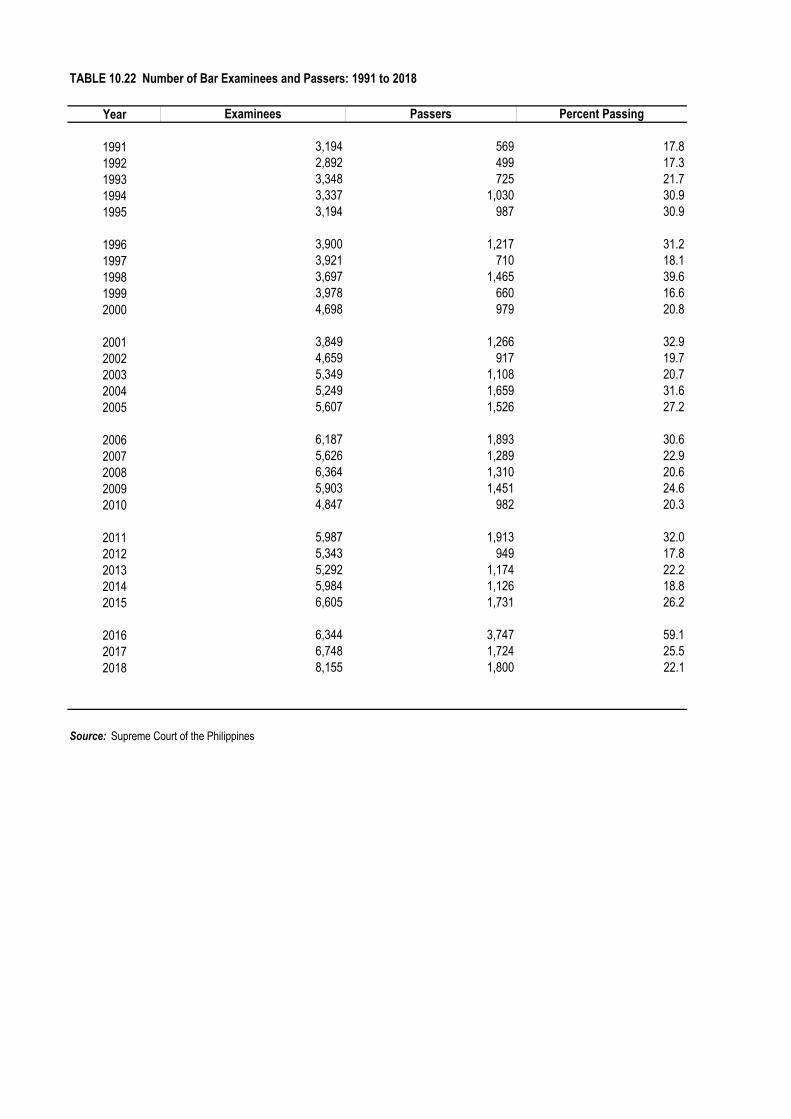
TABLE 10.22 Number of Bar Examinees and Passers: 1991 to 2018
Year
19911992199319941995
19961997199819992000
20012002200320042005
20062007200820092010
20112012201320142015
201620172018
Source: Supreme Court of the Philippines
Examinees Passers Percent Passing
3,194 569 17.82,892 499 17.33,348 725 21.73,337 1,030 30.93,194 987 30.9
3,900 1,217 31.23,921 710 18.13,697 1,465 39.63,978 660 16.64,698 979 20.8
3,849 1,266 32.94,659 917 19.75,349 1,108 20.75,249 1,659 31.65,607 1,526 27.2
6,187 1,893 30.65,626 1,289 22.96,364 1,310 20.65,903 1,451 24.64,847 982 20.3
5,987 1,913 32.05,343 949 17.85,292 1,174 22.25,984 1,126 18.86,605 1,731 26.2
6,344 3,747 59.16,748 1,724 25.58,155 1,800 22.1
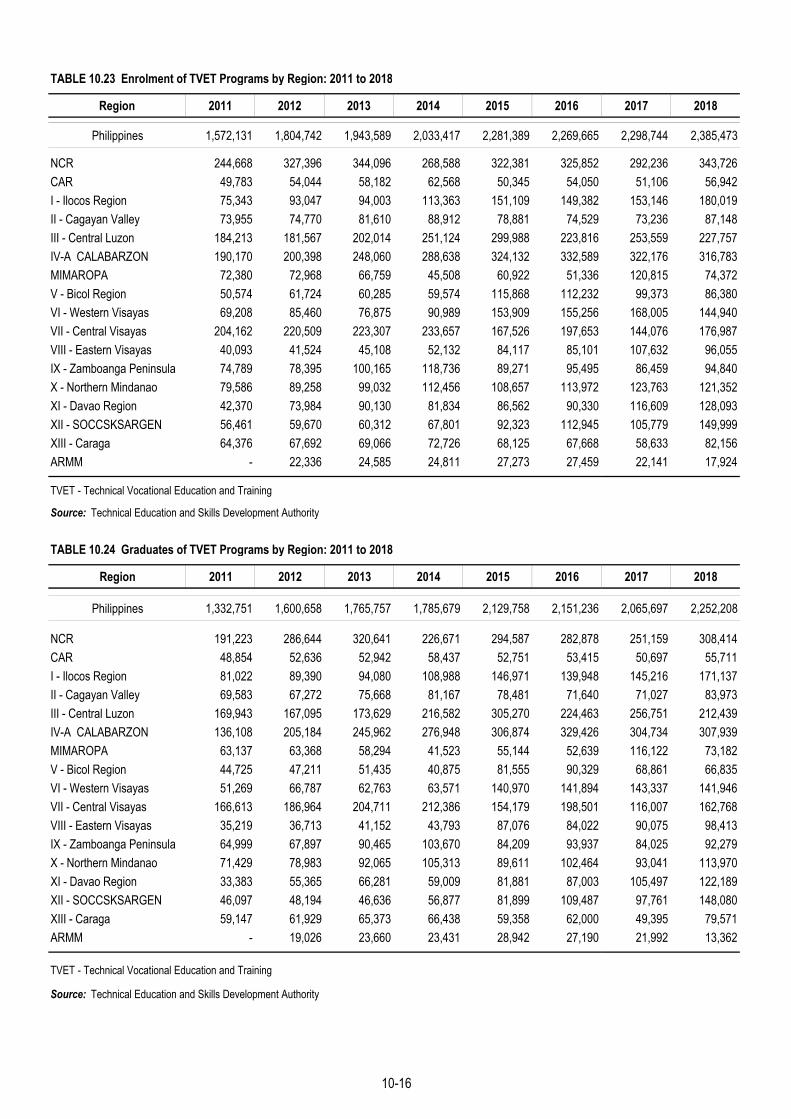
TABLE 10.23 Enrolment of TVET Programs by Region: 2011 to 2018
Region 2011 2012 2013 2014 2015 2016 2017 2018
Philippines 1,572,131 1,804,742 1,943,589 2,033,417 2,281,389 2,269,665 2,298,744 2,385,473
NCR 244,668 327,396 344,096 268,588 322,381 325,852 292,236 343,726CAR 49,783 54,044 58,182 62,568 50,345 54,050 51,106 56,942I - Ilocos Region 75,343 93,047 94,003 113,363 151,109 149,382 153,146 180,019II - Cagayan Valley 73,955 74,770 81,610 88,912 78,881 74,529 73,236 87,148III - Central Luzon 184,213 181,567 202,014 251,124 299,988 223,816 253,559 227,757IV-A CALABARZON 190,170 200,398 248,060 288,638 324,132 332,589 322,176 316,783MIMAROPA 72,380 72,968 66,759 45,508 60,922 51,336 120,815 74,372V - Bicol Region 50,574 61,724 60,285 59,574 115,868 112,232 99,373 86,380VI - Western Visayas 69,208 85,460 76,875 90,989 153,909 155,256 168,005 144,940VII - Central Visayas 204,162 220,509 223,307 233,657 167,526 197,653 144,076 176,987VIII - Eastern Visayas 40,093 41,524 45,108 52,132 84,117 85,101 107,632 96,055IX - Zamboanga Peninsula 74,789 78,395 100,165 118,736 89,271 95,495 86,459 94,840X - Northern Mindanao 79,586 89,258 99,032 112,456 108,657 113,972 123,763 121,352XI - Davao Region 42,370 73,984 90,130 81,834 86,562 90,330 116,609 128,093XII - SOCCSKSARGEN 56,461 59,670 60,312 67,801 92,323 112,945 105,779 149,999XIII - Caraga 64,376 67,692 69,066 72,726 68,125 67,668 58,633 82,156ARMM - 22,336 24,585 24,811 27,273 27,459 22,141 17,924
TVET - Technical Vocational Education and Training
Source: Technical Education and Skills Development Authority
TABLE 10.24 Graduates of TVET Programs by Region: 2011 to 2018
Region 2011 2012 2013 2014 2015 2016 2017 2018
Philippines 1,332,751 1,600,658 1,765,757 1,785,679 2,129,758 2,151,236 2,065,697 2,252,208
NCR 191,223 286,644 320,641 226,671 294,587 282,878 251,159 308,414CAR 48,854 52,636 52,942 58,437 52,751 53,415 50,697 55,711I - Ilocos Region 81,022 89,390 94,080 108,988 146,971 139,948 145,216 171,137II - Cagayan Valley 69,583 67,272 75,668 81,167 78,481 71,640 71,027 83,973III - Central Luzon 169,943 167,095 173,629 216,582 305,270 224,463 256,751 212,439IV-A CALABARZON 136,108 205,184 245,962 276,948 306,874 329,426 304,734 307,939MIMAROPA 63,137 63,368 58,294 41,523 55,144 52,639 116,122 73,182V - Bicol Region 44,725 47,211 51,435 40,875 81,555 90,329 68,861 66,835VI - Western Visayas 51,269 66,787 62,763 63,571 140,970 141,894 143,337 141,946VII - Central Visayas 166,613 186,964 204,711 212,386 154,179 198,501 116,007 162,768VIII - Eastern Visayas 35,219 36,713 41,152 43,793 87,076 84,022 90,075 98,413IX - Zamboanga Peninsula 64,999 67,897 90,465 103,670 84,209 93,937 84,025 92,279X - Northern Mindanao 71,429 78,983 92,065 105,313 89,611 102,464 93,041 113,970XI - Davao Region 33,383 55,365 66,281 59,009 81,881 87,003 105,497 122,189XII - SOCCSKSARGEN 46,097 48,194 46,636 56,877 81,899 109,487 97,761 148,080XIII - Caraga 59,147 61,929 65,373 66,438 59,358 62,000 49,395 79,571ARMM - 19,026 23,660 23,431 28,942 27,190 21,992 13,362
TVET - Technical Vocational Education and Training
Source: Technical Education and Skills Development Authority
10-16

TABLE 10.25 Number of Persons Assessed and Certified for Skills by Region: 2015 to 2018
Assessed Certified Percent Certified Assessed Certified Percent
Certified Assessed Certified Percent Certified Assessed Certified Percent
Certified
Philippines 1,424,814 1,297,927 91.1 1,521,530 1,398,780 91.9 1,407,897 1,308,277 92.9 1,857,920 1,716,967 92.4
NCR 386,352 369,228 95.6 454,625 439,471 96.7 416,121 407,635 98.0 462,553 450,333 97.4CAR 29,730 25,831 86.9 34,158 30,647 89.7 37,392 33,881 90.6 45,014 41,341 91.8I - Ilocos Region 95,874 87,943 91.7 97,574 88,366 90.6 85,741 79,032 92.2 115,449 104,131 90.2II - Cagayan Valley 30,278 27,518 90.9 34,905 32,434 92.9 35,243 32,530 92.3 54,681 49,755 91.0III - Central Luzon 171,897 158,135 92.0 122,656 111,390 90.8 120,631 110,990 92.0 158,753 145,787 91.8IV-A CALABARZON 169,157 150,169 88.8 204,527 180,680 88.3 189,307 172,480 91.1 200,885 185,581 92.4MIMAROPA 33,550 29,294 87.3 37,346 33,766 90.4 54,129 50,649 93.6 57,086 50,899 89.2V - Bicol Region 72,809 56,902 78.2 83,269 67,875 81.5 70,646 58,567 82.9 91,786 77,703 84.7VI - Western Visayas 60,787 51,808 85.2 62,587 54,781 87.5 65,340 59,464 91.0 111,854 99,354 88.8VII - Central Visayas 82,192 75,179 91.5 82,935 77,617 93.6 75,755 71,011 93.7 112,165 103,968 92.7VIII - Eastern Visayas 57,314 54,868 95.7 58,883 56,713 96.3 51,335 45,400 88.4 70,193 65,863 93.8IX - Zamboanga Peninsula 44,828 38,965 86.9 44,528 38,514 86.5 38,710 34,941 90.3 49,810 43,975 88.3X - Northern Mindanao 41,864 38,343 91.6 41,766 38,183 91.4 36,410 33,576 92.2 83,998 78,020 92.9XI - Davao Region 73,443 68,767 93.6 72,326 69,026 95.4 57,906 54,024 93.3 101,326 94,203 93.0XII - SOCCSKSARGEN 44,040 39,223 89.1 51,558 46,615 90.4 46,178 41,318 89.5 89,338 81,007 90.7XIII - Caraga 22,169 18,472 83.3 25,539 22,293 87.3 22,551 18,950 84.0 35,822 29,913 83.5ARMM 8,530 7,282 85.4 12,348 10,409 84.3 4,502 3,829 85.1 15,232 13,457 88.3CO (Onsite) - - - - - - - - - 1,327 1,088 82.0CO (RLA) - - - - - - - - - 648 589 91.0
Source: Technical Education and Skills Development Authority
Region2015 2016 2017 2018
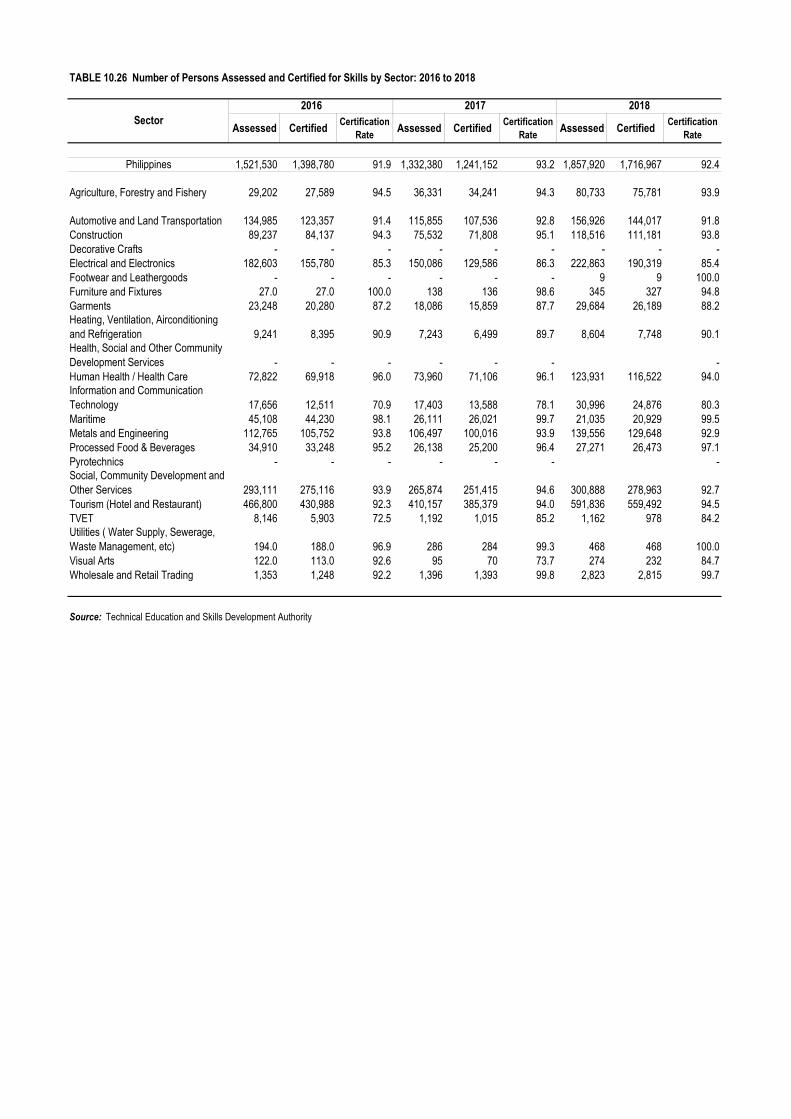
TABLE 10.26 Number of Persons Assessed and Certified for Skills by Sector: 2016 to 2018
Assessed Certified Certification Rate Assessed Certified Certification
Rate Assessed Certified Certification Rate
Philippines 1,521,530 1,398,780 91.9 1,332,380 1,241,152 93.2 1,857,920 1,716,967 92.4
Agriculture, Forestry and Fishery 29,202 27,589 94.5 36,331 34,241 94.3 80,733 75,781 93.9
Automotive and Land Transportation 134,985 123,357 91.4 115,855 107,536 92.8 156,926 144,017 91.8Construction 89,237 84,137 94.3 75,532 71,808 95.1 118,516 111,181 93.8Decorative Crafts - - - - - - - - -Electrical and Electronics 182,603 155,780 85.3 150,086 129,586 86.3 222,863 190,319 85.4Footwear and Leathergoods - - - - - - 9 9 100.0Furniture and Fixtures 27.0 27.0 100.0 138 136 98.6 345 327 94.8Garments 23,248 20,280 87.2 18,086 15,859 87.7 29,684 26,189 88.2Heating, Ventilation, Airconditioning and Refrigeration 9,241 8,395 90.9 7,243 6,499 89.7 8,604 7,748 90.1Health, Social and Other Community Development Services - - - - - - -Human Health / Health Care 72,822 69,918 96.0 73,960 71,106 96.1 123,931 116,522 94.0Information and Communication Technology 17,656 12,511 70.9 17,403 13,588 78.1 30,996 24,876 80.3Maritime 45,108 44,230 98.1 26,111 26,021 99.7 21,035 20,929 99.5Metals and Engineering 112,765 105,752 93.8 106,497 100,016 93.9 139,556 129,648 92.9Processed Food & Beverages 34,910 33,248 95.2 26,138 25,200 96.4 27,271 26,473 97.1Pyrotechnics - - - - - - -Social, Community Development and Other Services 293,111 275,116 93.9 265,874 251,415 94.6 300,888 278,963 92.7Tourism (Hotel and Restaurant) 466,800 430,988 92.3 410,157 385,379 94.0 591,836 559,492 94.5TVET 8,146 5,903 72.5 1,192 1,015 85.2 1,162 978 84.2Utilities ( Water Supply, Sewerage, Waste Management, etc) 194.0 188.0 96.9 286 284 99.3 468 468 100.0Visual Arts 122.0 113.0 92.6 95 70 73.7 274 232 84.7Wholesale and Retail Trading 1,353 1,248 92.2 1,396 1,393 99.8 2,823 2,815 99.7
Source: Technical Education and Skills Development Authority
Sector2016 2017 2018
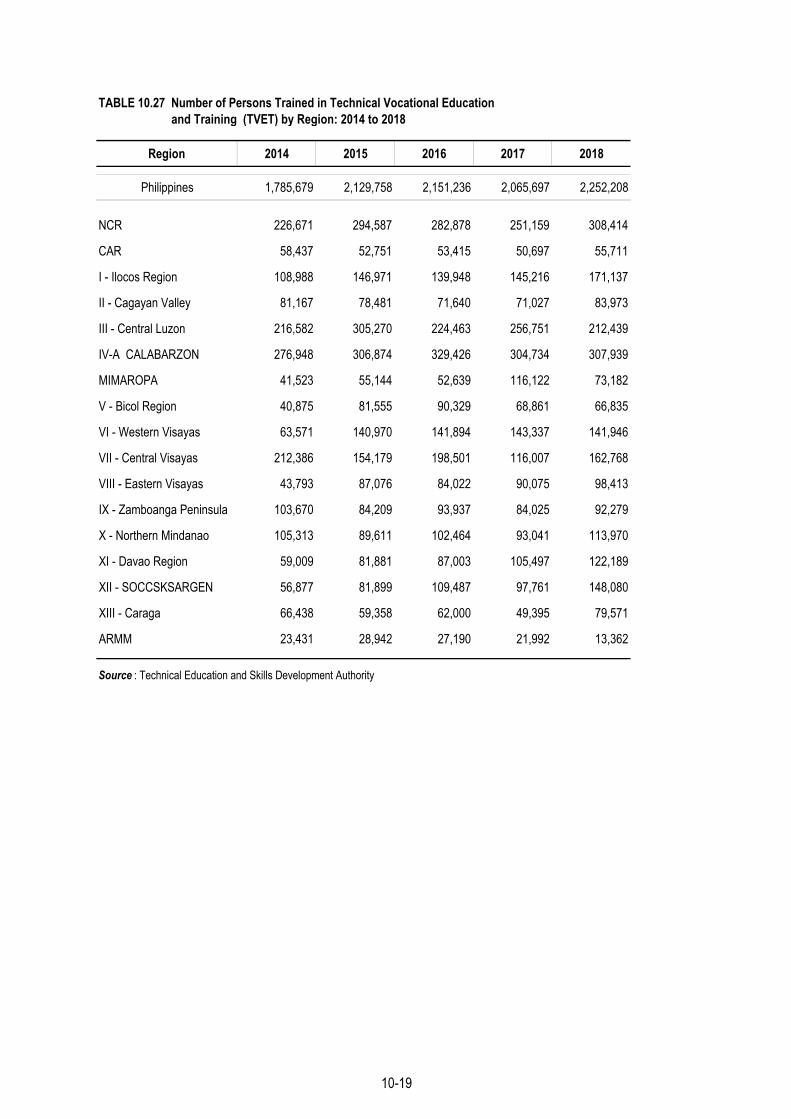
TABLE 10.27 Number of Persons Trained in Technical Vocational Education and Training (TVET) by Region: 2014 to 2018
Region 2014 2015 2016 2017 2018
Philippines 1,785,679 2,129,758 2,151,236 2,065,697 2,252,208
NCR 226,671 294,587 282,878 251,159 308,414
CAR 58,437 52,751 53,415 50,697 55,711
I - Ilocos Region 108,988 146,971 139,948 145,216 171,137
II - Cagayan Valley 81,167 78,481 71,640 71,027 83,973
III - Central Luzon 216,582 305,270 224,463 256,751 212,439
IV-A CALABARZON 276,948 306,874 329,426 304,734 307,939
MIMAROPA 41,523 55,144 52,639 116,122 73,182
V - Bicol Region 40,875 81,555 90,329 68,861 66,835
VI - Western Visayas 63,571 140,970 141,894 143,337 141,946
VII - Central Visayas 212,386 154,179 198,501 116,007 162,768
VIII - Eastern Visayas 43,793 87,076 84,022 90,075 98,413
IX - Zamboanga Peninsula 103,670 84,209 93,937 84,025 92,279
X - Northern Mindanao 105,313 89,611 102,464 93,041 113,970
XI - Davao Region 59,009 81,881 87,003 105,497 122,189
XII - SOCCSKSARGEN 56,877 81,899 109,487 97,761 148,080
XIII - Caraga 66,438 59,358 62,000 49,395 79,571
ARMM 23,431 28,942 27,190 21,992 13,362
Source : Technical Education and Skills Development Authority
10-19

TABLE 10.28 Budgetary Appropriation for Philippine Educational System by Agency: FY 2011 to FY 2014 (In Thousand Pesos)
Particulars
Total
Department of Education
Commission on Higher Education (CHED)
Technical Education and Skills Development Authority (TESDA)
Note: Only selected agencies were covered to represent each level of education.
Source: Department of Budget and Management, BESF 2013
TABLE 10.29 Total Education Expenditures: 1991 to 1998
Indicator 1991 1992 1993 1994 1995 1996 1997 1998
Total Education Expenditures (in million pesos, at current prices) 81,054 87,181 102,319 117,000 1,39,290 162,940 209,543 243,190
Education Expenditure Growth Rate (%) at current prices 7.6 17.4 14.3 19.1 17.0 28.6 16.1
Total Education Expenditures (in million pesos, at 1985 prices) 47,693 47,256 51,856 54,731 60,332 64,704 78,606 83,159
Education Expenditure Growth Rate (%) at 1985 prices (0.9) 9.7 5.5 10.2 7.2 21.5 5.8
Source: Philippine Statistics Authority
3,459,324 4,725,843 3,096,474 4,219,078
2,003,008 2,019,054 3,604,497 3,888,249
257,113,222 308,653,992
219,069,279 240,583,982 250,412,251 300,546,665
FY 2011 Actual FY 2012 Actual FY 2013 Adjusted FY 2014 Proposed
224,531,611 247,328,879
10-20
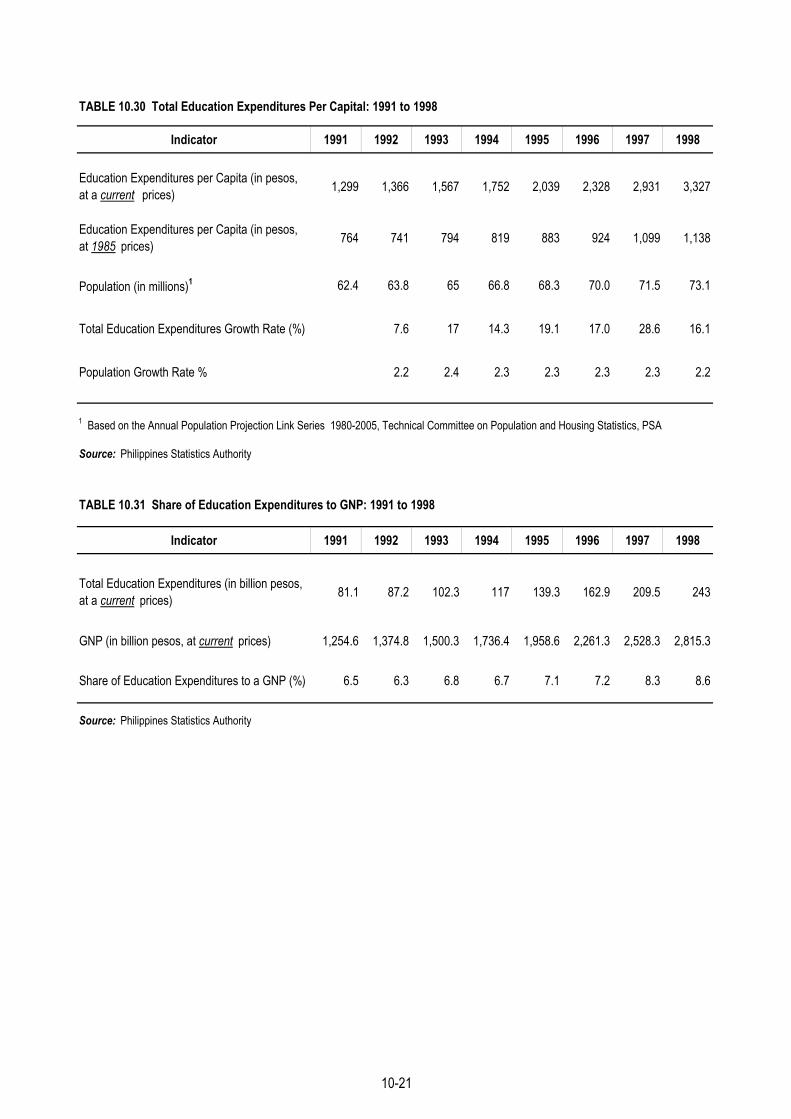
TABLE 10.30 Total Education Expenditures Per Capital: 1991 to 1998
Indicator 1991 1992 1993 1994 1995 1996 1997 1998
Education Expenditures per Capita (in pesos, at a current prices) 1,299 1,366 1,567 1,752 2,039 2,328 2,931 3,327
Education Expenditures per Capita (in pesos, at 1985 prices) 764 741 794 819 883 924 1,099 1,138
Population (in millions)1 62.4 63.8 65 66.8 68.3 70.0 71.5 73.1
Total Education Expenditures Growth Rate (%) 7.6 17 14.3 19.1 17.0 28.6 16.1
Population Growth Rate % 2.2 2.4 2.3 2.3 2.3 2.3 2.2
Source: Philippines Statistics Authority
TABLE 10.31 Share of Education Expenditures to GNP: 1991 to 1998
Indicator 1991 1992 1993 1994 1995 1996 1997 1998
Total Education Expenditures (in billion pesos, at a current prices) 81.1 87.2 102.3 117 139.3 162.9 209.5 243
GNP (in billion pesos, at current prices) 1,254.6 1,374.8 1,500.3 1,736.4 1,958.6 2,261.3 2,528.3 2,815.3
Share of Education Expenditures to a GNP (%) 6.5 6.3 6.8 6.7 7.1 7.2 8.3 8.6
Source: Philippines Statistics Authority
1 Based on the Annual Population Projection Link Series 1980-2005, Technical Committee on Population and Housing Statistics, PSA
10-21

TABLE 10.32 Education Expenditures by Source of Funds: 1991 to 1998 (In million pesos)
1991 1992 1993 1994 1995 1996 1997 1998
81,054 87,181 102,319 117,000 139,290 162,940 209,543 243,190
General Government 39,506 39,217 46,037 50,888 63,454 73,118 101,097 116,997Department of Education 32,187 31,636 34,489 38,905 49,091 55,386 75,263 85,115Other National Gov't Agencies 5,949 4,820 7,638 7,933 9,985 12,307 18,484 23,137Local Government Units 736 1,869 3,069 3,366 4,149 4,934 6,707 8,237Government of the Philippines 601 856 797 610 155 131 184 300Countryside Development Fund 34 37 44 75 74 360 459 208
Households 35,547 42,346 49,673 58,827 67,401 78,629 94,296 111,381Financial Corporations 1,167 1,370 1,844 2,105 2,013 3,818 5,345 5,900
Private Pre-Need and Insurance Corporations 348 429 587 788 1,143 1,734 2,587 3,360Financial Government Owned and Controlled Corporations 34 41 67 68 145 153 332 73Other Financial Corporations 785 899 1,190 1,249 725 1,931 2,425 2,467
Non-Financial Corporations 4,465 3,687 4,396 4,503 5,335 6,587 7,905 8,306Private Educational Institutions 216 279 338 379 472 545 669 750Non-Financial Government Owned and Controlled Corporations 2,171 1,193 1,393 1,113 942 1,146 1,502 1,827Other Non-Financial Corporations 2,078 2,216 2,665 3,010 3,921 4,895 5,734 5,729
Non-Profit Institutions Serving Households 53 52 10 101 112 157 109 118Rest of the world 316 509 359 576 975 631 792 487
Grants 32 8 10 16 9 167 121 294Loans 283 502 349 561 966 464 670 193
Source: Philippine Statistics Authority
TABLE 10.33 Education Expenditures by Use of Funds: 1991 to 1998 (In million pesos)
1991 1992 1993 1994 1995 1996 1997 1998
39,874 39,778 46,400 51,540 64,524 73,893 101,988 117,586
21,584 24,886 30,928 35,588 46,314 47,356 70,620 83,3631,056 1,178 1,327 1,148 1,665 2,464 2,397 3,1162,254 2,099 2,093 3,780 3,950 7,474 9,947 9,0241,192 640 1,090 888 1,502 1,479 1,614 1,130
10,905 6,930 7,954 7,369 9,173 12,810 15,230 19,1362,882 4,045 3,008 2,767 1,920 2,310 2,181 1,818
1 Only includes expenditures with disaggregation by use of funds.
Source: Philippine Statistics Authority
HigherJob-relatedAncillaryOther uses
Source of Funds
All Sources
Use of Funds
Total 1
BasicMiddle level
10-22


TABLE 11.1 Household Population 15 Years Old and Over by Employment Status and Region: 2010 to 2018 11 - 4
TABLE 11.2 Household Population 15 Years Old and Over by Age Group, Highest Grade Completedand Region, Philippines: 2014 to 2018 11 - 6
TABLE 11.3 Labor Force Participation Rate and Employment Status: 2002 to 2018 11 - 7
TABLE 11.4 Labor Force by Age Group, Highest Grade Completed and Region, Philippines: 2014 to 2018 11 - 8
TABLE 11.4A Labor Force Participation Rate by Age Group, Highest Grade Completed and Region, Philippines: 2014 to 2018 11 - 9
TABLE 11.5 Employed Persons by Major Occupation Group and Sex: January 2016 to October 2018 11 - 10
TABLE 11.6 Employed Persons by Major Industry Group and Sex: January 2016 to October 2018 11 - 11
TABLE 11.7 Employed Persons by Age Group, Philippines: 2014 to 2018 11 - 13
TABLE 11.8 Employed Persons by Major Industry Group and Major Occupation Group, 11 - 14
Philippines: 2015 to 2017
TABLE 11.9 Employed Persons by Region and Major Industry Group, Philippines: 2016 to 2018 11 - 17
TABLE 11.10 Employed Persons by Region and Major Occupation Group, Philippines: 2015- 2018 11 - 27
TABLE 11.11 Employed Persons by Region and Major Occupation Group, Philippines: 2017 and 2018 11 - 33
TABLE 11.12 Employed Persons by Region and Class of Worker, Philippines: 2014 to 2018 11 - 38
TABLE 11.13 Employed Persons by Major Industry Group and Class of Worker, Philippines: 2014 to 2017 11 - 42
TABLE 11.14 Employed Persons by Major Industry Group and Hours Worked During the Past Week,Philippines: 2015 to 2018 11 - 46
TABLE 11.15 Employed Persons by Major Occupation Group and Hours Worked During the Past Week,Philippines: 2013 to 2017 11 - 51
TABLE 11.16 Employed Persons by Class of Worker and Hours Worked During the Past Week,Philippines: 2014 to 2018 11 - 53
TABLE 11.17 Employed Persons by Region and Highest Grade Completed Philippines: 2014 to 2018 11 - 55
TABLE 11.18 Unemployed Persons by Sex, Age Group and Highest Grade Completed: 2012 to 2018 11 - 64
TABLE 11.19 Underemployed and Visibly Underemployed Persons As Percent to Total Employed,Philippines: 1987 to 2018 11 - 65
TABLE 11.20 Underemployed Persons and Underemployment Rate by Region, Philippines: 2013 to 2017 11 - 69
TABLE 11.21 Underemployed Persons by Highest Grade Completed, Philippines: 2013 to 2017 11 - 72

TABLE 11.22 Underemployed Persons by Major Industry Group and Hours Worked During the Past Week,
Philippines: 2015 to 2017 11 - 73
TABLE 11.23 Underemployed Persons by Class of Worker and Hours Worked During the Past Week,
Philippines: 2013 to 2017 11 - 75
TABLE 11.24 Minimum Wage Rates by Sector and Region, Philippines: As of 15 May 2019 11 - 76
TABLE 11.25 Average Monthly Wage Rates in Selected Industries of Time-Rate Workers on Full-time Basis
in Selected Industries and Occupations, Philippines: As of July 2016 11 - 82
TABLE 11.26 Number of Workers with Contracts Processed by Type: 1997 to 2016 11 - 93
TABLE 11.27 Deployed Overseas Filipino Workers by Type: 1997 to 2016 11 - 93
TABLE 11.28 Deployed Land-Based Overseas Filipino Workers by Major World Groupings: 1997 to 2016 11 - 94
TABLE 11.29 Number of Overseas Filipino Workers by Age Group and Sex: 2015 to 2018 11 - 95
TABLE 11.30 Number of Establishments that Resorted to Permanent/Retrenchment to Economic Reasons
and Displaced Workers by Region: 2012 to 2014 11 - 95
TABLE 11.31 Number of Strikes/Lockout Notices Filed, Actual Strikes, Workers Involved
and Man-Days Lost: 1991 to 2018 11 - 96
TABLE 11.32 Number of Membership of Enterprise-Based Unions by Region: 2004 to 2017 11 - 97
TABLE 11.33 Collective Bargaining Agreements Filed and Workers Covered by Region: 2004 to 2018 11 - 98
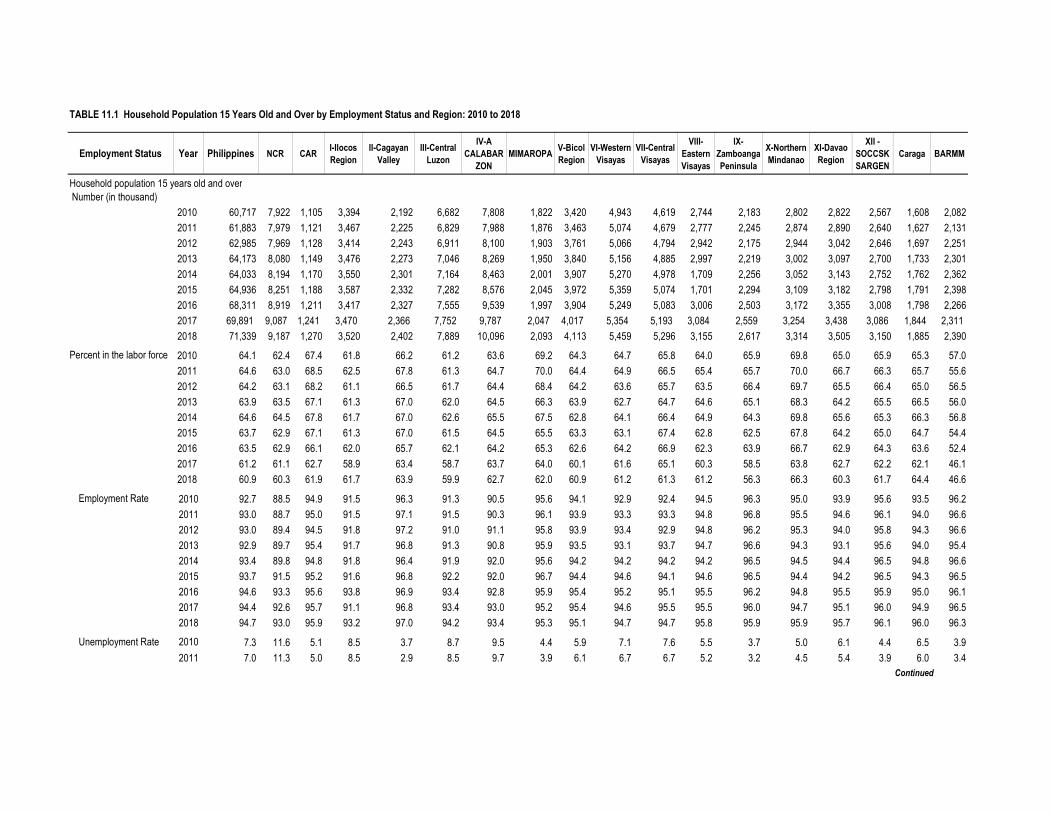
Employment Status Year Philippines NCR CARI-Ilocos Region
II-Cagayan Valley
III-Central Luzon
IV-A CALABAR
ZONMIMAROPA
V-Bicol Region
VI-Western Visayas
VII-Central Visayas
VIII-Eastern Visayas
IX-Zamboanga Peninsula
X-Northern Mindanao
XI-Davao Region
XII - SOCCSKSARGEN
Caraga BARMM
2010 60,717 7,922 1,105 3,394 2,192 6,682 7,808 1,822 3,420 4,943 4,619 2,744 2,183 2,802 2,822 2,567 1,608 2,082
2011 61,883 7,979 1,121 3,467 2,225 6,829 7,988 1,876 3,463 5,074 4,679 2,777 2,245 2,874 2,890 2,640 1,627 2,131
2012 62,985 7,969 1,128 3,414 2,243 6,911 8,100 1,903 3,761 5,066 4,794 2,942 2,175 2,944 3,042 2,646 1,697 2,251
2013 64,173 8,080 1,149 3,476 2,273 7,046 8,269 1,950 3,840 5,156 4,885 2,997 2,219 3,002 3,097 2,700 1,733 2,301
2014 64,033 8,194 1,170 3,550 2,301 7,164 8,463 2,001 3,907 5,270 4,978 1,709 2,256 3,052 3,143 2,752 1,762 2,362
2015 64,936 8,251 1,188 3,587 2,332 7,282 8,576 2,045 3,972 5,359 5,074 1,701 2,294 3,109 3,182 2,798 1,791 2,398
2016 68,311 8,919 1,211 3,417 2,327 7,555 9,539 1,997 3,904 5,249 5,083 3,006 2,503 3,172 3,355 3,008 1,798 2,266
2017 69,891 9,087 1,241 3,470 2,366 7,752 9,787 2,047 4,017 5,354 5,193 3,084 2,559 3,254 3,438 3,086 1,844 2,311
2018 71,339 9,187 1,270 3,520 2,402 7,889 10,096 2,093 4,113 5,459 5,296 3,155 2,617 3,314 3,505 3,150 1,885 2,390
Percent in the labor force 2010 64.1 62.4 67.4 61.8 66.2 61.2 63.6 69.2 64.3 64.7 65.8 64.0 65.9 69.8 65.0 65.9 65.3 57.0
2011 64.6 63.0 68.5 62.5 67.8 61.3 64.7 70.0 64.4 64.9 66.5 65.4 65.7 70.0 66.7 66.3 65.7 55.6
2012 64.2 63.1 68.2 61.1 66.5 61.7 64.4 68.4 64.2 63.6 65.7 63.5 66.4 69.7 65.5 66.4 65.0 56.5
2013 63.9 63.5 67.1 61.3 67.0 62.0 64.5 66.3 63.9 62.7 64.7 64.6 65.1 68.3 64.2 65.5 66.5 56.0
2014 64.6 64.5 67.8 61.7 67.0 62.6 65.5 67.5 62.8 64.1 66.4 64.9 64.3 69.8 65.6 65.3 66.3 56.8
2015 63.7 62.9 67.1 61.3 67.0 61.5 64.5 65.5 63.3 63.1 67.4 62.8 62.5 67.8 64.2 65.0 64.7 54.4
2016 63.5 62.9 66.1 62.0 65.7 62.1 64.2 65.3 62.6 64.2 66.9 62.3 63.9 66.7 62.9 64.3 63.6 52.4
2017 61.2 61.1 62.7 58.9 63.4 58.7 63.7 64.0 60.1 61.6 65.1 60.3 58.5 63.8 62.7 62.2 62.1 46.1
2018 60.9 60.3 61.9 61.7 63.9 59.9 62.7 62.0 60.9 61.2 61.3 61.2 56.3 66.3 60.3 61.7 64.4 46.6
Employment Rate 2010 92.7 88.5 94.9 91.5 96.3 91.3 90.5 95.6 94.1 92.9 92.4 94.5 96.3 95.0 93.9 95.6 93.5 96.2
2011 93.0 88.7 95.0 91.5 97.1 91.5 90.3 96.1 93.9 93.3 93.3 94.8 96.8 95.5 94.6 96.1 94.0 96.6
2012 93.0 89.4 94.5 91.8 97.2 91.0 91.1 95.8 93.9 93.4 92.9 94.8 96.2 95.3 94.0 95.8 94.3 96.6
2013 92.9 89.7 95.4 91.7 96.8 91.3 90.8 95.9 93.5 93.1 93.7 94.7 96.6 94.3 93.1 95.6 94.0 95.4
2014 93.4 89.8 94.8 91.8 96.4 91.9 92.0 95.6 94.2 94.2 94.2 94.2 96.5 94.5 94.4 96.5 94.8 96.6
2015 93.7 91.5 95.2 91.6 96.8 92.2 92.0 96.7 94.4 94.6 94.1 94.6 96.5 94.4 94.2 96.5 94.3 96.5
2016 94.6 93.3 95.6 93.8 96.9 93.4 92.8 95.9 95.4 95.2 95.1 95.5 96.2 94.8 95.5 95.9 95.0 96.1
2017 94.4 92.6 95.7 91.1 96.8 93.4 93.0 95.2 95.4 94.6 95.5 95.5 96.0 94.7 95.1 96.0 94.9 96.5
2018 94.7 93.0 95.9 93.2 97.0 94.2 93.4 95.3 95.1 94.7 94.7 95.8 95.9 95.9 95.7 96.1 96.0 96.3
Unemployment Rate 2010 7.3 11.6 5.1 8.5 3.7 8.7 9.5 4.4 5.9 7.1 7.6 5.5 3.7 5.0 6.1 4.4 6.5 3.9
2011 7.0 11.3 5.0 8.5 2.9 8.5 9.7 3.9 6.1 6.7 6.7 5.2 3.2 4.5 5.4 3.9 6.0 3.4Continued
TABLE 11.1 Household Population 15 Years Old and Over by Employment Status and Region: 2010 to 2018
Household population 15 years old and over Number (in thousand)

TABLE 11.1 - - Concluded
Employment Status Year Philippines NCR CARI-Ilocos Region
II-Cagayan Valley
III-Central Luzon
IV-A CALABAR
ZONMIMAROPA
V-Bicol Region
VI-Western Visayas
VII-Central Visayas
VIII-Eastern Visayas
IX-Zamboanga Peninsula
X-Northern Mindanao
XI-Davao Region
XII - SOCCSKSARGEN
XII - Caraga
BARMM
2012 7.0 10.6 5.5 8.2 2.8 9.0 8.9 4.2 6.1 6.6 7.1 5.2 3.8 4.7 6.0 4.2 5.7 3.4
2013 7.1 10.3 4.6 8.3 3.2 8.7 9.2 4.1 6.5 6.9 6.3 5.3 3.4 5.7 6.9 4.4 6.0 4.6
2014 6.6 10.2 5.2 8.2 3.6 8.1 8.0 4.4 5.8 5.8 5.8 5.8 3.5 5.5 5.6 3.5 5.2 3.4
2015 6.3 8.5 4.9 8.4 3.2 7.8 8.0 3.3 5.6 5.4 5.9 5.4 3.5 5.6 5.8 3.5 5.7 3.5
2016 5.4 6.7 4.4 6.2 3.1 6.6 7.2 4.1 4.6 4.8 4.9 4.5 3.8 5.2 4.5 4.1 5.0 3.9
2017 5.7 7.4 4.3 8.9 3.2 6.6 7.0 4.8 4.6 5.4 4.5 4.5 4.0 5.3 4.9 4.0 5.1 3.5
2018 5.3 6.6 4.1 6.8 3.0 5.8 6.6 4.7 4.9 5.3 5.3 4.2 4.1 4.1 4.3 3.9 4.0 3.7
Underemployment Rate 2010 18.7 11.9 15.7 14.8 14.7 9.1 17.4 23.7 36.8 26.7 16.4 20.9 21.6 28.0 19.9 20.8 22.2 13.5
2011 19.3 14.6 14.6 18.3 15.1 11.1 17.9 21.6 35.4 23.1 18.4 24.1 21.9 27.1 16.5 20.5 26.0 13.3
2012 20.0 14.4 15.5 19.5 12.6 13.0 17.9 22.6 34.4 21.9 20.7 25.0 27.7 28.6 17.9 23.2 24.1 12.7
2013 19.3 12.1 14.1 20.0 12.9 14.5 17.9 23.4 37.3 22.7 15.1 25.1 21.8 25.7 17.3 22.7 27.1 12.4
2014 18.4 10.8 13.1 15.3 11.6 14.3 18.6 19.6 32.0 21.4 17.7 31.2 20.1 24.7 19.1 20.8 25.0 11.7
2015 18.5 10.0 20.8 16.9 11.1 13.5 18.2 20.8 31.6 21.3 18.4 31.8 18.5 24.9 19.0 23.2 26.2 11.1
2016 18.3 8.7 23.1 17.4 12.8 16.1 15.6 21.8 30.2 19.3 14.7 29.9 22.5 27.9 16.8 23.7 28.0 13.5
2017 16.1 9.3 14.8 19.8 13.6 11.5 14.0 23.7 27.5 16.7 17.6 22.6 17.3 18.5 17.7 17.9 23.1 7.0
2018 16.4 7.2 15.2 22.1 19.5 11.4 13.4 20.6 29.6 18.6 17.8 21.4 18.9 20.8 15.4 17.0 25.4 8.4
Notes : 1. Details may not add up to totals due to rounding.
2. Rates were computed based on actual figures.
3. The province of Leyte was not covered in January and April 2015 LFS. Data for July 2015 and onwards already include the province of Leyte.
4. Annualized data for 2015 refer to the average of the four survey rounds that exclude Leyte. These should not be compared with the 2014 annualized
data as the latter exclude the January round. The use of the 4 survey rounds for the 2015 annualized data was based on the results of a referendum conducted among members of the IAC on Labor and Productivity Statistics.
5. Starting April 2016 round, the Labor Force Survey (LFS) adopted the 2013 Master Sample Design as well as the population projections based on the
2010 Census of Population and Housing (2010 CPH) while previous survey rounds were derived using the 2000 CPH population projections.
6. Data for Negros Island Region (NIR) is reflected starting October 2016. The NIR which consist of Negros Occidental and Oriental is created by virtue of
Executive Order 183, S. 2015. However, computation for the 2016 LFS annualized has lumped the said provinces back to the original regions where they came from.
7. Annualized data for 2016 was computed as the average of the four survey rounds using the January 2016 that were based on the 2010 CPH population projections.
Source of basic data : Philippine Statistics Authority, Labor Force Survey
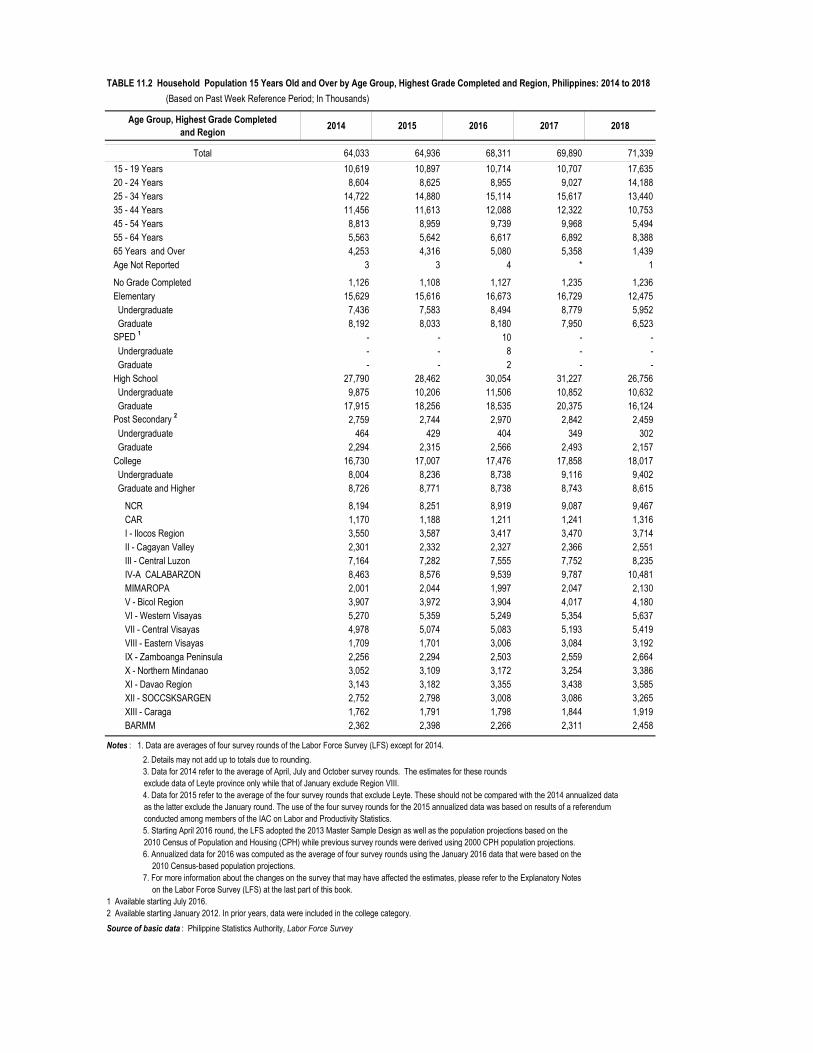
Age Group, Highest Grade Completed and Region
2014 2015 2016 2017 2018
Total 64,033 64,936 68,311 69,890 71,339
15 - 19 Years 10,619 10,897 10,714 10,707 17,635 20 - 24 Years 8,604 8,625 8,955 9,027 14,188 25 - 34 Years 14,722 14,880 15,114 15,617 13,440 35 - 44 Years 11,456 11,613 12,088 12,322 10,753 45 - 54 Years 8,813 8,959 9,739 9,968 5,494 55 - 64 Years 5,563 5,642 6,617 6,892 8,388 65 Years and Over 4,253 4,316 5,080 5,358 1,439 Age Not Reported 3 3 4 * 1
No Grade Completed 1,126 1,108 1,127 1,235 1,236 Elementary 15,629 15,616 16,673 16,729 12,475 Undergraduate 7,436 7,583 8,494 8,779 5,952 Graduate 8,192 8,033 8,180 7,950 6,523 SPED 1 - - 10 - - Undergraduate - - 8 - - Graduate - - 2 - - High School 27,790 28,462 30,054 31,227 26,756 Undergraduate 9,875 10,206 11,506 10,852 10,632 Graduate 17,915 18,256 18,535 20,375 16,124 Post Secondary 2 2,759 2,744 2,970 2,842 2,459 Undergraduate 464 429 404 349 302 Graduate 2,294 2,315 2,566 2,493 2,157 College 16,730 17,007 17,476 17,858 18,017 Undergraduate 8,004 8,236 8,738 9,116 9,402 Graduate and Higher 8,726 8,771 8,738 8,743 8,615
NCR 8,194 8,251 8,919 9,087 9,467CAR 1,170 1,188 1,211 1,241 1,316I - Ilocos Region 3,550 3,587 3,417 3,470 3,714II - Cagayan Valley 2,301 2,332 2,327 2,366 2,551III - Central Luzon 7,164 7,282 7,555 7,752 8,235IV-A CALABARZON 8,463 8,576 9,539 9,787 10,481MIMAROPA 2,001 2,044 1,997 2,047 2,130V - Bicol Region 3,907 3,972 3,904 4,017 4,180VI - Western Visayas 5,270 5,359 5,249 5,354 5,637VII - Central Visayas 4,978 5,074 5,083 5,193 5,419VIII - Eastern Visayas 1,709 1,701 3,006 3,084 3,192IX - Zamboanga Peninsula 2,256 2,294 2,503 2,559 2,664X - Northern Mindanao 3,052 3,109 3,172 3,254 3,386XI - Davao Region 3,143 3,182 3,355 3,438 3,585XII - SOCCSKSARGEN 2,752 2,798 3,008 3,086 3,265XIII - Caraga 1,762 1,791 1,798 1,844 1,919BARMM 2,362 2,398 2,266 2,311 2,458
Notes : 1. Data are averages of four survey rounds of the Labor Force Survey (LFS) except for 2014.
2. Details may not add up to totals due to rounding.3. Data for 2014 refer to the average of April, July and October survey rounds. The estimates for these rounds
exclude data of Leyte province only while that of January exclude Region VIII.4. Data for 2015 refer to the average of the four survey rounds that exclude Leyte. These should not be compared with the 2014 annualized data
as the latter exclude the January round. The use of the four survey rounds for the 2015 annualized data was based on results of a referendum conducted among members of the IAC on Labor and Productivity Statistics.
5. Starting April 2016 round, the LFS adopted the 2013 Master Sample Design as well as the population projections based on the 2010 Census of Population and Housing (CPH) while previous survey rounds were derived using 2000 CPH population projections.
6. Annualized data for 2016 was computed as the average of four survey rounds using the January 2016 data that were based on the2010 Census-based population projections.
7. For more information about the changes on the survey that may have affected the estimates, please refer to the Explanatory Notes on the Labor Force Survey (LFS) at the last part of this book.
1 Available starting July 2016.2 Available starting January 2012. In prior years, data were included in the college category.
Source of basic data : Philippine Statistics Authority, Labor Force Survey
TABLE 11.2 Household Population 15 Years Old and Over by Age Group, Highest Grade Completed and Region, Philippines: 2014 to 2018
(Based on Past Week Reference Period; In Thousands)

Year/Area
Number Percent Number Percent
Philippines
2002 67.4 33,936 30,062 88.6 3,874 11.4
2003 66.7 34,571 30,635 88.6 3,936 11.4
2004 67.5 35,862 31,613 88.2 4,249 11.8
2005 64.7 35,286 32,539 92.2 2,748 7.8
2006 64.2 35,464 32,636 92.0 2,829 8.0
2007 64.0 36,213 33,560 92.7 2,653 7.3
2008 63.6 36,805 34,089 92.6 2,716 7.4
2009 64.0 37,892 35,061 92.5 2,831 7.5
2010 64.1 38,893 36,035 92.6 2,859 7.4
2011 64.6 40,006 37,192 93.0 2,814 7.0
2012 64.2 40,426 37,600 93.0 2,826 7.0
2013 63.9 41,022 38,118 92.9 2,905 7.1
2014 64.6 41,379 38,651 93.4 2,728 6.6
2015 63.7 41,342 38,741 93.7 2,958 6.3
2016 63.5 43,361 40,998 94.6 2,363 5.4
2017 61.2 42,775 40,334 94.3 2,441 5.7
2018 60.9 43,462 41,160 94.7 2,302 5.3
Notes : 1. Details may not add up to totals due to rounding.2. Rates were computed based on actual figures.3. The province of Leyte was not covered in January and April 2015 LFS. Data for July 2015 and onwards already include the province
of Leyte.4. Annualized data for 2015 refer to the average of the four survey rounds that exclude Leyte. These should not be compared with the 2014
annualized data as the latter exclude the January round. The use of the 4 survey rounds for the 2015 annualized data was based on the results of a referendum conducted among members of the IAC on Labor Productivity Statistics.
5. Starting April 2016 round, the Labor Force Survey (LFS) adopted the 2013 Master Sample Design as well as the population projection based on tthe 2010 Census of Population and Housing (2010 CPH) while previous survey rounds were derived using the 2000 CPH population projections.
6. Annualized data for 2016 was computed as the average of the four survey rounds using the January 2016 that were based on the 2010 CPH population projections.
7. The annual estimates were based on the final results of the 2017 LFS, and January and April rounds of 2018 LFS and preliminary results of the July and October rounds of 2018 LFS
Source : Philippine Statistics Authority
Labor Force Participation Rate
(Percent)
Total Labor Force
Labor Force by Employment Status
Employed Unemployed
TABLE 11.3 Labor Force Participation Rate and Employment Status: 2002 to 2018(Number in thousands)

TOTAL 41,379 41,342 43,361 42,775 43,460
15 - 24 Years 8,859 8,531 8,402 7,919 7,647 25 - 34 Years 11,032 11,128 11,284 11,501 11,791 35 - 44 Years 9,127 9,187 9,601 9,486 9,744 45 - 54 Years 7,021 7,099 7,733 7,677 7,841 55 - 64 Years 3,793 3,833 4,483 4,488 4,617 65 Years and Over 1,546 1565 1,857 1,704 1,821 Age Not Reported 1 * * - 0
No Grade Completed 602 586 590 614 603 Elementary 11,088 10,896 11,451 11,043 10,638 Undergraduate 5,366 5,376 5,944 5,931 5,320 Graduate 5,722 5,520 5,508 5,112 5,318 SPED 1 - - 2 - - Undergraduate - - 1 - - Graduate - - 1 - - High School 17,006 17,079 18,041 17,763 .. Undergraduate 5,192 5,129 5,512 5,447 .. Graduate 11,814 11,950 12,529 12,316 .. Junior High School .. .. .. .. 16,876 Undergraduate .. .. .. .. 5,144 Graduate .. .. .. .. 11,732 Senior High School .. .. .. .. 350 Undergraduate .. .. .. .. 174 Graduate .. .. .. .. 176 Post Secondary 2 2,061 2,039 2,214 2,111 1,681 Undergraduate 325 295 283 250 199 Graduate 1,736 1,744 1,931 1,860 1,482 College 10,622 10,741 11,063 11,244 11,007 Undergraduate 3,842 3,898 4,205 4,517 4,807 Graduate and Higher 6,781 6,843 6,858 6,727 6,200
NCR 5,281 5,193 5,613 5,552 5,171CAR 793 797 800 778 754I - Ilocos Region 2,191 2,199 2,119 2,045 2,025II - Cagayan Valley 1,542 1,562 1,529 1,499 1489III - Central Luzon 4,484 4,476 4,693 4,548 4,450IV-A CALABARZON 5,542 5,528 6,125 6,235 5,913MIMAROPA 1,351 1,340 1,305 1,309 1,237V - Bicol Region 2,454 2,515 2,444 2,414 2,381VI - Western Visayas 3,378 3,379 3,369 3,297 3,165VII - Central Visayas 3,304 3,418 3,401 3,378 3,075VIII - Eastern Visayas 1,109 1,069 1,874 1,860 1,851IX - Zamboanga Peninsula 1,451 1,434 1,600 1,496 1,414X - Northern Mindanao 2,132 2,107 2,115 2,076 2,107XI - Davao Region 2,061 2,043 2,111 2,157 2,022XII - SOCCSKSARGEN 1,798 1,820 1,933 1,919 1,867XIII - Caraga 1,169 1,159 1,143 1,145 1,165ARMM 1,341 1,304 1,187 1,066 1,071- -
Notes : 1. Data are averages of four survey rounds of the Labor Force Survey (LFS) except for 2014.
2. Details may not add up to totals due to rounding. 3. Data for 2014 refer to the average of April, July and October survey rounds. The estimates for these rounds
exclude data of Leyte province only while that of January exclude Region VIII. 4. Data for 2015 refer to the average of the four survey rounds that exclude Leyte. These should not be compared with the 2014 annualized data
as the latter exclude the January round. The use of the four survey rounds for the 2015 annualized data was based on results of a referendum conducted among members of the IAC on Labor and Productivity Statistics.
5. Starting April 2016 round, the LFS adopted the 2013 Master Sample Design as well as the population projections based on the 2010 Census of Population and Housing (CPH) while previous survey rounds were derived using 2000 CPH population projections.
6. Annualized data for 2016 was computed as the average of four survey rounds using the January 2016 data that were based on the 2010 Census-based population projections.
7. For more information about the changes on the survey that may have affected the estimates, please refer to the Explanatory Notes on the Labor Force Survey (LFS) at the last part of this book.
8. The use of the average estimates of the four-quarter rounds of the 2018 LFS data was based on PSA Board Resolution No. 01, Series of 2017-151- Approving and Adopting the Official Methodology for Generating Annual Labor and Employment Estimates.
* Less than 500.1 Available starting July 2016.2 Available starting January 2012. In prior years, data were included in the college category.
Source of basic data : Philippine Statistics Authority, Labor Force Survey
TABLE 11.4 Labor Force by Age Group, Highest Grade Completed and Region, Philippines: 2014 to 2018 (Based on Past Week Reference Period; In Thousands)
Age Group, Highest Grade Completed and Region
2017 20182014 2015 2016
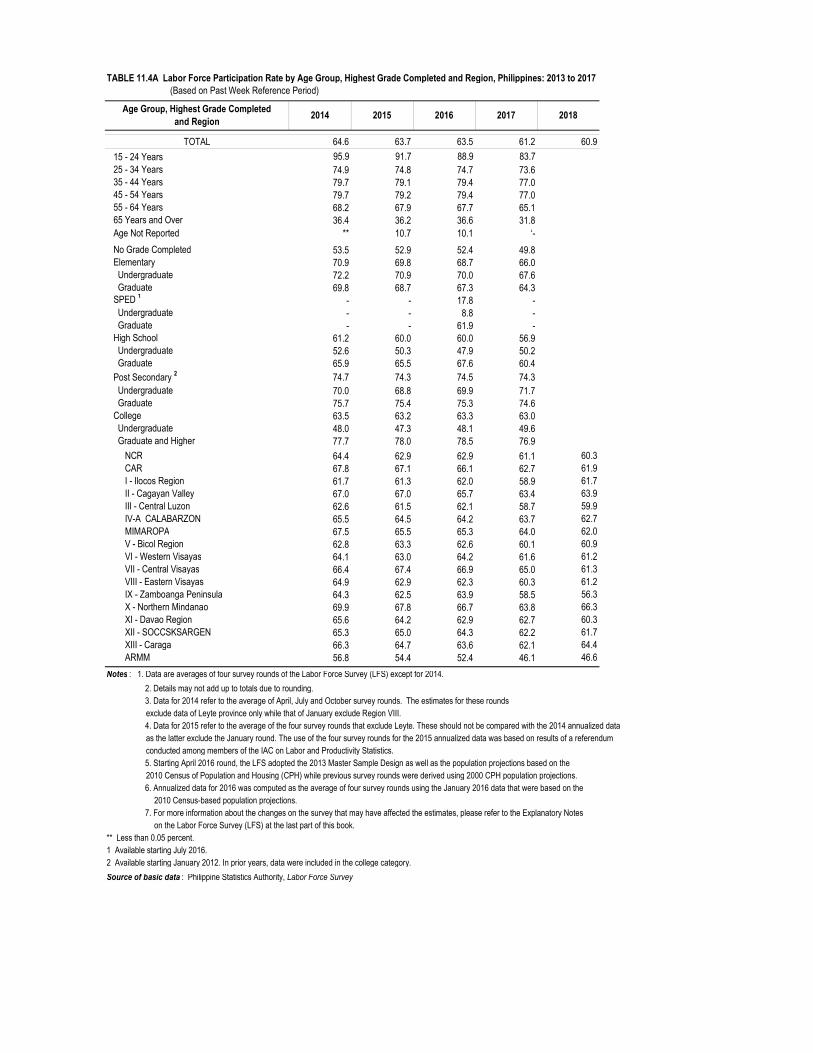
TOTAL 64.6 63.7 63.5 61.2 60.9
15 - 24 Years 95.9 91.7 88.9 83.7 25 - 34 Years 74.9 74.8 74.7 73.6 35 - 44 Years 79.7 79.1 79.4 77.0 45 - 54 Years 79.7 79.2 79.4 77.0 55 - 64 Years 68.2 67.9 67.7 65.1 65 Years and Over 36.4 36.2 36.6 31.8 Age Not Reported ** 10.7 10.1 ‘-
No Grade Completed 53.5 52.9 52.4 49.8 Elementary 70.9 69.8 68.7 66.0 Undergraduate 72.2 70.9 70.0 67.6 Graduate 69.8 68.7 67.3 64.3 SPED 1 - - 17.8 - Undergraduate - - 8.8 - Graduate - - 61.9 - High School 61.2 60.0 60.0 56.9 Undergraduate 52.6 50.3 47.9 50.2 Graduate 65.9 65.5 67.6 60.4 Post Secondary 2 74.7 74.3 74.5 74.3 Undergraduate 70.0 68.8 69.9 71.7 Graduate 75.7 75.4 75.3 74.6 College 63.5 63.2 63.3 63.0 Undergraduate 48.0 47.3 48.1 49.6 Graduate and Higher 77.7 78.0 78.5 76.9
NCR 64.4 62.9 62.9 61.1 60.3CAR 67.8 67.1 66.1 62.7 61.9I - Ilocos Region 61.7 61.3 62.0 58.9 61.7II - Cagayan Valley 67.0 67.0 65.7 63.4 63.9III - Central Luzon 62.6 61.5 62.1 58.7 59.9IV-A CALABARZON 65.5 64.5 64.2 63.7 62.7MIMAROPA 67.5 65.5 65.3 64.0 62.0V - Bicol Region 62.8 63.3 62.6 60.1 60.9VI - Western Visayas 64.1 63.0 64.2 61.6 61.2VII - Central Visayas 66.4 67.4 66.9 65.0 61.3VIII - Eastern Visayas 64.9 62.9 62.3 60.3 61.2IX - Zamboanga Peninsula 64.3 62.5 63.9 58.5 56.3X - Northern Mindanao 69.9 67.8 66.7 63.8 66.3XI - Davao Region 65.6 64.2 62.9 62.7 60.3XII - SOCCSKSARGEN 65.3 65.0 64.3 62.2 61.7XIII - Caraga 66.3 64.7 63.6 62.1 64.4ARMM 56.8 54.4 52.4 46.1 46.6
Notes : 1. Data are averages of four survey rounds of the Labor Force Survey (LFS) except for 2014.
2. Details may not add up to totals due to rounding. 3. Data for 2014 refer to the average of April, July and October survey rounds. The estimates for these rounds
exclude data of Leyte province only while that of January exclude Region VIII. 4. Data for 2015 refer to the average of the four survey rounds that exclude Leyte. These should not be compared with the 2014 annualized data
as the latter exclude the January round. The use of the four survey rounds for the 2015 annualized data was based on results of a referendum conducted among members of the IAC on Labor and Productivity Statistics.
5. Starting April 2016 round, the LFS adopted the 2013 Master Sample Design as well as the population projections based on the 2010 Census of Population and Housing (CPH) while previous survey rounds were derived using 2000 CPH population projections.
6. Annualized data for 2016 was computed as the average of four survey rounds using the January 2016 data that were based on the 2010 Census-based population projections.
7. For more information about the changes on the survey that may have affected the estimates, please refer to the Explanatory Notes on the Labor Force Survey (LFS) at the last part of this book.
** Less than 0.05 percent.1 Available starting July 2016.2 Available starting January 2012. In prior years, data were included in the college category.
Source of basic data : Philippine Statistics Authority, Labor Force Survey
TABLE 11.4A Labor Force Participation Rate by Age Group, Highest Grade Completed and Region, Philippines: 2013 to 2017 (Based on Past Week Reference Period)
Age Group, Highest Grade Completed and Region
2014 2015 2016 2017 2018
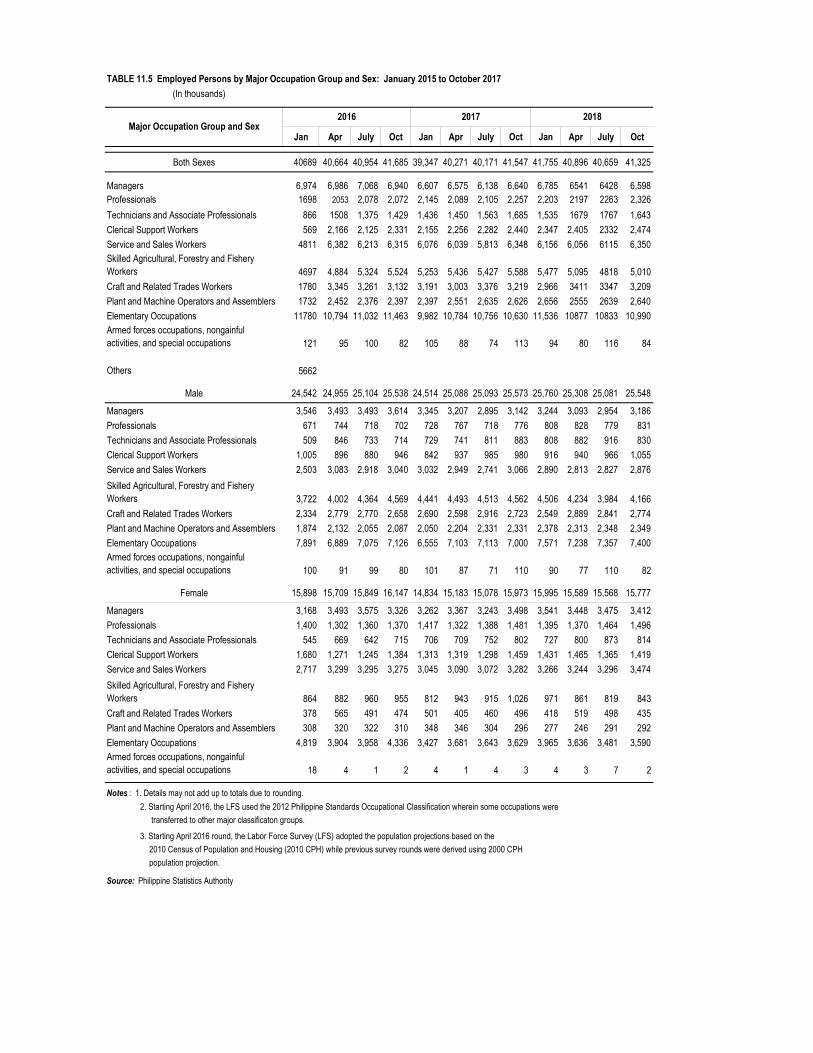
TABLE 11.5 Employed Persons by Major Occupation Group and Sex: January 2015 to October 2017
(In thousands)
Jan Apr July Oct Jan Apr July Oct Jan Apr July Oct
Both Sexes 40689 40,664 40,954 41,685 39,347 40,271 40,171 41,547 41,755 40,896 40,659 41,325
Managers 6,974 6,986 7,068 6,940 6,607 6,575 6,138 6,640 6,785 6541 6428 6,598Professionals 1698 2053 2,078 2,072 2,145 2,089 2,105 2,257 2,203 2197 2263 2,326
Technicians and Associate Professionals 866 1508 1,375 1,429 1,436 1,450 1,563 1,685 1,535 1679 1767 1,643
Clerical Support Workers 569 2,166 2,125 2,331 2,155 2,256 2,282 2,440 2,347 2,405 2332 2,474
Service and Sales Workers 4811 6,382 6,213 6,315 6,076 6,039 5,813 6,348 6,156 6,056 6115 6,350Skilled Agricultural, Forestry and Fishery Workers 4697 4,884 5,324 5,524 5,253 5,436 5,427 5,588 5,477 5,095 4818 5,010
Craft and Related Trades Workers 1780 3,345 3,261 3,132 3,191 3,003 3,376 3,219 2,966 3411 3347 3,209
Plant and Machine Operators and Assemblers 1732 2,452 2,376 2,397 2,397 2,551 2,635 2,626 2,656 2555 2639 2,640
Elementary Occupations 11780 10,794 11,032 11,463 9,982 10,784 10,756 10,630 11,536 10877 10833 10,990Armed forces occupations, nongainful activities, and special occupations 121 95 100 82 105 88 74 113 94 80 116 84
Others 5662
Male 24,542 24,955 25,104 25,538 24,514 25,088 25,093 25,573 25,760 25,308 25,081 25,548
Managers 3,546 3,493 3,493 3,614 3,345 3,207 2,895 3,142 3,244 3,093 2,954 3,186
Professionals 671 744 718 702 728 767 718 776 808 828 779 831
Technicians and Associate Professionals 509 846 733 714 729 741 811 883 808 882 916 830
Clerical Support Workers 1,005 896 880 946 842 937 985 980 916 940 966 1,055
Service and Sales Workers 2,503 3,083 2,918 3,040 3,032 2,949 2,741 3,066 2,890 2,813 2,827 2,876
Skilled Agricultural, Forestry and Fishery Workers 3,722 4,002 4,364 4,569 4,441 4,493 4,513 4,562 4,506 4,234 3,984 4,166
Craft and Related Trades Workers 2,334 2,779 2,770 2,658 2,690 2,598 2,916 2,723 2,549 2,889 2,841 2,774
Plant and Machine Operators and Assemblers 1,874 2,132 2,055 2,087 2,050 2,204 2,331 2,331 2,378 2,313 2,348 2,349
Elementary Occupations 7,891 6,889 7,075 7,126 6,555 7,103 7,113 7,000 7,571 7,238 7,357 7,400Armed forces occupations, nongainful activities, and special occupations 100 91 99 80 101 87 71 110 90 77 110 82
Female 15,898 15,709 15,849 16,147 14,834 15,183 15,078 15,973 15,995 15,589 15,568 15,777
Managers 3,168 3,493 3,575 3,326 3,262 3,367 3,243 3,498 3,541 3,448 3,475 3,412
Professionals 1,400 1,302 1,360 1,370 1,417 1,322 1,388 1,481 1,395 1,370 1,464 1,496
Technicians and Associate Professionals 545 669 642 715 706 709 752 802 727 800 873 814
Clerical Support Workers 1,680 1,271 1,245 1,384 1,313 1,319 1,298 1,459 1,431 1,465 1,365 1,419
Service and Sales Workers 2,717 3,299 3,295 3,275 3,045 3,090 3,072 3,282 3,266 3,244 3,296 3,474
Skilled Agricultural, Forestry and Fishery Workers 864 882 960 955 812 943 915 1,026 971 861 819 843
Craft and Related Trades Workers 378 565 491 474 501 405 460 496 418 519 498 435
Plant and Machine Operators and Assemblers 308 320 322 310 348 346 304 296 277 246 291 292
Elementary Occupations 4,819 3,904 3,958 4,336 3,427 3,681 3,643 3,629 3,965 3,636 3,481 3,590Armed forces occupations, nongainful activities, and special occupations 18 4 1 2 4 1 4 3 4 3 7 2
Notes : 1. Details may not add up to totals due to rounding.
2. Starting April 2016, the LFS used the 2012 Philippine Standards Occupational Classification wherein some occupations were
transferred to other major classificaton groups.
3. Starting April 2016 round, the Labor Force Survey (LFS) adopted the population projections based on the
2010 Census of Population and Housing (2010 CPH) while previous survey rounds were derived using 2000 CPH
population projection.
Source: Philippine Statistics Authority
2016 2017 2018Major Occupation Group and Sex

TABLE 11.6 Employed Persons by Major Industry Group and Sex: January 2015 to October 2017 (In thousands)
Jan Apr July Oct Jan Apr July Oct Jan Apr July Oct
Both Sexes 40,689 40,664 40,954 41,685 39,347 40,271 40,171 41,547 41,755 40,896 40,659 41,325Agriculture, hunting and forestry 9,618 9,087 9,895 10,605 8,871 9,271 8,909 9,214 9,842 8,688 8,119 8,850
Fishing and aquaculture 1,291 1,303 1,261 1,196 1,157 1,242 1,219 1,159 1,027 1,103 1,273 1,104
Mining and quarrying 214 215 227 219 179 223 204 208 215 215 205 188
Manufacturing 3,388 3,476 3,374 3,378 3,280 3,533 3,497 3,615 3,549 3644.00 3,639 3,669
supply 87 97 104 77 87 75 71 86 102 101 73 74
and remediation activities 59 75 71 65 74 57 80 64 46 64 77 60
Construction 3,088 3,528 3,503 3,391 3,215 3,544 3,863 3,525 3,640 4,012 3,894 3,913Wholesale and retail, repair of motor vehicles and motorcycles 7,672 8,337 8,100 8,048 7,909 7,882 7,564 8,244 8,273 7,909 7,803 7,993
Transportation and storage 3,045 2,960 3,094 3,052 3,070 3,095 3,078 3,267 3,314 3,176 3,222 3,164
Accommodation and food service activities 1819 1,766 1,723 1,802 1,679 1,708 1,730 1,842 1,717 1642 1693 1,859
Information and communication 390 382 362 333 367 423 408 388 366 433 417 399
Financial and insurance activities 490 524 517 524 499 504 496 526 492 562 579 531
Real estate activities 234 204 171 163 169 170 197 208 211 185 221 197
Professional, scientific and technical activities 226 231 199 194 246 249 232 262 228 300 280 290
Administrative and support service activities 1,261 1,371 1,337 1,515 1,458 1,487 1,402 1,553 1,587 1,589 1,594 1,573Public administration and defense; compulsory social security 2,306 2,171 2,119 2,187 2,367 2,245 2,543 2,478 2,414 2,511 2,625 2,687
Education 1,385 1,216 1,318 1,297 1,222 1,131 1,195 1,270 1,187 1,103 1235 1,256
Human health and social work activities 516 497 483 510 502 482 468 486 484 543 527 515
Arts, entertainment and recreation 431 371 301 342 314 345 292 351 360 395 352 343
Other service activities 3,165 2,848a 2,791a 2,787a 2,680 2,602 2,723 2,799 2,697 2,716 2,829 2,655 Activities of households as employers; undifferentiated goods and services-producing activities of households for own use a a a a 6 - - - - - - -
Activities of extraterritorial organizations and bodies 4 5 3 1 1 2 1 3 4 4 2 4
Male 24542 24,955 25,104 25,538 24514 25,088 25,093 25,573 25,760 25308 25089 25,548
Agriculture, hunting and forestry 7,017 6,644 7,221 7,657 6,775 6,875 6,719 6,892 7,338 6,553 6,166 6,728
Fishing and aquaculture 1,189 1,178 1,168 1,106 1,066 1,178 1,146 1,064 960 1,049 1,192 1,013
Mining and quarrying 196 200 211 193 168 209 190 192 200 194 191 170
Manufacturing 1,848 2,021 1,923 1,916 1,985 2,098 2,096 2,127 2,151 2,166 2,219 2,244Electricity, gas, steam, and air conditioning supply 70 80 80 63 72 64 51 71 81 90 64 65
and remediation activities 43 63 58 53 62 49 64 51 37 56 61 46
Construction 2,982 3,458 3,417 3,306 3,141 3,492 3,797 3,467 3,576 3,941 3,807 3,848Wholesale and retail, repair of motor vehicles and motorcycles 2,992 3,369 3,247 3,281 3,203 3,121 2,964 3,269 3,185 2,969 2,923 2,993
Transportation and storage 2,866 2,864 2,989 2,921 2,996 2,999 2,993 3,162 3,216 3,060 3,128 3,089
Accommodation and food service activities 759 777 728 813 776 810 783 885 771 743 756 867
Information and communication 236 249 228 213 234 276 250 254 232 290 268 264
Financial and insurance activities 216 240 229 226 217 222 219 235 209 243 269 238
Real estate activities 103 86 78 74 71 73 99 92 103 86 107 96
Professional, scientific and technical activities 110 126 96 91 116 115 124 133 111 159 138 151
Administrative and support service activities 755 926 867 968 965 973 949 982 994 976 1,006 994Public administration and defense; compulsory social security 1,249 1,223 1,211 1,213 1,267 1,221 1,352 1,297 1,259 1,330 1,397 1,355
Education 381 334 354 345 312 333 329 341 312 308 330 316
Continued
Major Industry Group and Sex2016 2017 2018

TABLE 11.6 --Concluded
Major Industry Groupand Sex Jan Apr July Oct Jan Apr July Oct Jan Apr July Oct
Human health and social work activities 166 149 145 163 182 173 143 144 184 182 179 190Arts, entertainment and recreation 246 227 179 209 195 193 175 216 206 227 189 197Other service activities 729a 740a 673a 727a 709 614 650 697 636 685 692 683 Activities of households as employers; undifferentiated goods and services-producing activities of households for own use a a a a 1 - - - - - - -
Activities of extraterritorial organizations and bodies 1 1 2 * 1 0 0 2 1 1 0 0
Female 16,147 15,709 15,849 16,147 14,834 15,183 15,078 15,973 15,995 15,588 15,569 15,777Agriculture, hunting and forestry 2,491 2,442 2,674 2,948 2,096 2,397 2,190 2,322 2,504 2,135 1,944 2,122Fishing and aquaculture 116 125 93 89 91 64 74 95 67 54 77 91Mining and quarrying 19 15 16 26 11 14 14 15 15 21 16 19Manufacturing 1,449 1,456 1,451 1,462 1,295 1,435 1,401 1,488 1,398 1,479 1,419 1,425Electricity, gas, steam, and air conditioning supply 17 17 23 15 15 11 20 15 21 11 9 9Water supply; sewerage, waste management and remediation activities 15 12 13 12 13 8 15 13 8 8 15 14Construction 62 70 86 85 75 52 66 58 63 73 88 65Wholesale and retail, repair of motor vehicles and motorcycles 4,561 4,968 4,853 4,766 4,706 4,762 4,600 4,975 5,088 4,935 4,883 5,000Transportation and storage 111 96 105 131 74 96 85 105 99 117 97 75Accommodation and food service activities 1,029 989 995 989 903 898 947 957 946 902 933 992Information and communication 147 133 134 120 134 147 158 134 134 144 148 135Financial and insurance activities 271 284 287 298 283 282 277 291 283 319 308 293Real estate activities 112 118 93 89 99 98 98 116 108 99 114 101Professional, scientific and technical activities 110 105 103 104 130 134 108 130 117 141 143 139Administrative and support service activities 478 445 470 547 493 514 453 571 593 610 584 579Public administration and defense; compulsory social security 1,002 948 908 974 1,100 1,024 1,191 1,181 1,155 1,181 1,228 1,332Education 1,000 882 964 953 911 798 866 929 876 795 909 940Human health and social work activities 346 349 338 347 319 309 325 341 300 361 349 326Arts, entertainment and recreation 172 144 123 132 118 153 116 135 155 169 163 146Other service activities 2,387a 2,108a 2,118a 2,060a 1,964 1,988 2,072 2,102 2,061 2,032 2,137 1,972
Activities of households as employers; undifferentiated goods and services-producing activities of households for own use 5 5 a a 5 - - - - - - -
Activities of extraterritorial organizations and bodies 3 4 1 1 1 1 0 1 3 3 2 4
Notes : 1. Details may not add up to totals due to rounding.2. Industry classification is based on the 2009 Philippine Standard Industrial Classification (PSIC).3. Province of Leyte was not covered in the January and April 2015 rounds of LFS. However, data for July 2015 and onwards
already include the Province of Leyte.4. Starting April 2016 round, the Labor Force Survey (LFS) adopted the 2013 Master Sample Design as well as the population projections
based on the 2010 Census of Population and Housing.a Starting July 2015 LFS, Activities of households as employers; undifferentiated goods and services-producing activities of household for own use isincluded in other service activities.
Source: Philippine Statistics Authority
2016 2017 2018

Age Group 2018All Age Group 38,651 38,741 40,998 40,334 41,157
15 - 19 Years 7,508 7,254 7,265 6,780 6,62025 - 34 Years 10,199 10,326 10,592 10,783 11,08535 - 44 Years 8,858 8,918 9,346 9,223 9,46845 - 54 Years 6,848 6,938 7,561 7,485 7,66455 - 64 Years 3,709 3,756 4,398 4,376 4,51465 Years and Over 1,528 1,548 1,834 1,686 1,805Age Not Reported 1 * * * 1
Notes : 1. Data are averages of four survey rounds of the Labor Force Survey except for 2014.
2. Details may not add up to totals due to rounding.
3. Data for 2014 refer to the average of April, July and October survey rounds.
The estimates for these rounds exclude data of Leyte province while that of January exclude Region VIII.
4. Data for 2015 refer to the average of the four survey rounds that exclude Leyte. These should not be compared with the 2014
annualized data as the latter exclude the January round. The use of the four survey rounds for the 2015 annualized data was based
on results of a referendum conducted among members of the IAC on Labor and Productivity Statistics.
6. Starting April 2016 round, the Labor Force Survey (LFS) adopted the 2013 Master Sample design as well as the population projections
based on the 2010 Census of Population and Housing (2010 CPH) while previous survey rounds were derived using the 2000 CPH
population projections. 7. Annualized data for 2016 was computed as the average of four survey rounds using the January 2016 data that were based on the
2010 Census-based population projections.
8. For more information about the changes on the survey that may have affected the estimates, please refer to the Explanatory Notes
on the Labor Force Survey (LFS) at the last part of this book.
* Less than 500.
Source of basic data : Philippine Statistics Authority, Labor Force Survey (Public Use Files)
TABLE 11.7 Employed Persons by Age Group, Philippines: 2014 to 2018 (Based on Past Week Reference Period; In Thousands)
2014 2015 2016 2017

TABLE 11.8 Employed Persons by Major Industry Group and Major Occupation Group, Philippines: 2015 to 2017
MAJOR INDUSTRY GROUP All Occupations Managers ProfessionalsTechnicians and
Associate Professionals
Clerical Support Workers
Service and Sales Workers
Skilled Agricultural, Forestry and
Fishery Workers
Craft and Related Trades Workers
Plant and Machine
Operators and Assemblers
Elementary Occupations
Armed forces occupations, nongainful
activities, and special
occupations
2015 All Industries 38,741 6292 1990 1030 2492 4926 5,750 2592 2084 12,738 113Agriculture, hunting and forestry 9,973 330 1 6 10 2 4989 5 28 5918 -Fishing and aquaculture 1,321 44 * 1 1 * 751 4 1 519 -Mining and quarrying 235 28 2 2 5 2 - 36 21 138 -Manufacturing 3,209 577 66 98 136 34 9 860 638 768 -Electricity, gas, steam, and air conditioning supply 83 8 11 6 18 * * 27 9 6 -Water supply; sewerage, waste management and remediation activities 52 4 3 2 11 - - 8 8 12 1Construction 2,697 102 54 16 31 3 - 1,279 42 1,169 -Wholesale and retail, repair of motor vehicles and motorcycles 7,313 2,627 45 77 373 2,511 - 214 105 1,336 25Transportation and storage 2,781 1,298 10 17 90 63 - 14 996 292 -Accommodation and food service activities 1,716 325 8 16 116 871 - 10 12 357 -Information and communication 381 85 73 62 99 6 - 27 4 20 -Financial and insurance activities 498 79 47 63 278 1 - * 4 23 -Real estate activities 184 77 4 58 20 2 - 2 2 17 -Professional, scientific and technical activities 208 31 66 45 46 3 - 4 1 7 -Administrative and support service activities 1,139 76 57 20 483 402 - 3 9 84 *Public administration and defense; compulsory social security 2,096 360 178 264 427 455 1 35 56 234 87Education 1,282 54 1018 81 62 11 - 3 5 46 -Human health and social work activities 494 17 278 66 65 33 - 2 4 29 -Arts, entertainment and recreation 343 33 20 33 183 12 - 1 2 57 -Other service activities 2,733 165 38 93 36 513 - 50 132 1706 *Activities of households as employers; undifferentiated goods and services-producing activities of households for own use a a a a a a - a a a a
Activities of extraterritorial organizations and bodies 3 * * 1 1 - - - * * -Agriculture, hunting and forestry 9,801 348 4 6 6 5085 8 34 5562 - 2Fishing and aquaculture 1,263 41 1 1 2 722 2 2 493 - -
Continued
(Based on Past Week Reference Period; In Thousands)

TABLE 11.8 --Continued
MAJOR INDUSTRY GROUP All Occupations Managers ProfessionalsTechnicians and
Associate Professionals
Clerical Support Workers
Service and Sales Workers
Skilled Agricultural, Forestry and
Fishery Workers
Craft and Related Trades Workers
Plant and Machine
Operators and Assemblers
Elementary Occupations
Armed forces occupations, nongainful
activities, and special
occupations
2016 All Industries 29,935 6,644 1,968 1,287 5,925 21 2,870 2,205 5,704 100 1,415Mining and quarrying 219 18 3 2 3 - 12 50 118 - 9Manufacturing 3,404 530 92 188 68 17 1,053 579 584 - 180Electricity, gas, steam, and air conditioning supply 91 5 13 11 3 - 33 3 8 - 3Water supply; sewerage, waste management and remediation activities 68 3 2 8 4 - 7 6 25 * 4Construction 3,378 97 63 63 10 - 1,281 47 1,544 - 249Wholesale and retail, repair of motor vehicles and motorcycles 8,039 3,295 65 138 2,836 * 283 143 827 8 285Transportation and storage 3,038 1,429 8 24 78 - 13 1,102 298 * 25Accommodation and food service activities 1,777 408 16 21 958 - 13 11 219 - 95Information and communication 366 77 70 53 35 - 35 3 9 - 25Financial and insurance activities 514 71 43 90 8 - 1 5 18 - 30Real estate activities 193 58 7 65 16 - 4 3 5 - 9Professional, scientific and technical activities 213 23 65 50 3 - 5 5 8 - 15Administrative and support service activities 1,371 48 39 28 593 * 6 12 51 - 149Public administration and defense; compulsory social security 2,196 386 172 265 516 4 33 61 205 92 152Education 1,304 52 987 46 53 * 3 7 24 - 91Human health and social work activities 502 13 251 81 65 - 2 5 15 - 31Arts, entertainment and recreation 361 31 28 29 37 - 4 4 67 - 14Other service activities 2,898 100 44 124 639 - 82 159 1,679 * 48Activities of households as employers; undifferentiated goods and services-producing activities of households for own useActivities of extraterritorial organizations and bodies 3 * * 1 - - * * - - 1
2017 All Industries 25,530 4,108 232 483 471 3,021 5,422 2,990 998 7,806 0Agriculture, hunting and forestry 9,066 201 3 10 15 5 4,621 7 32 4,174 0Fishing and aquaculture 1,194 59 0 1 1 2 772 1 3 356 0Mining and quarrying 203 8 4 5 6 2 0 5 44 130 0Manufacturing 3,481 411 89 213 181 77 30 1,209 725 548 0Electricity, gas, steam, and air conditioning supply 80 6 10 12 12 1 0 26 6 6 0
Continued
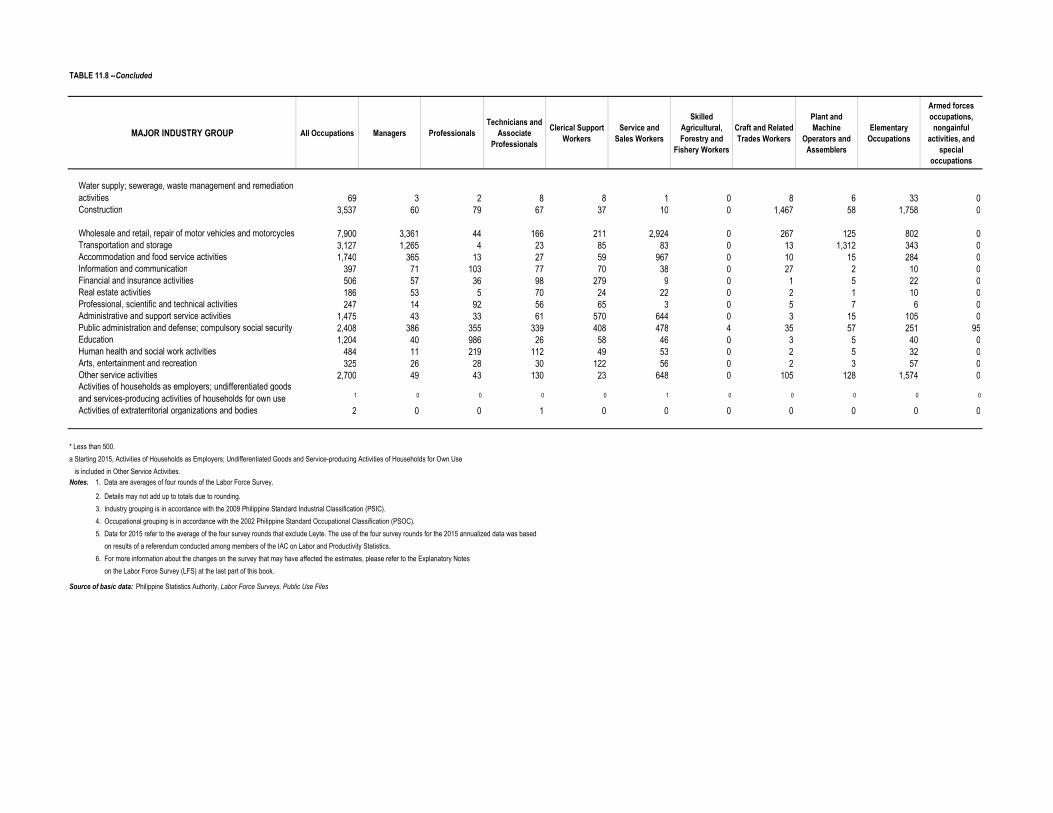
TABLE 11.8 --Concluded
MAJOR INDUSTRY GROUP All Occupations Managers ProfessionalsTechnicians and
Associate Professionals
Clerical Support Workers
Service and Sales Workers
Skilled Agricultural, Forestry and
Fishery Workers
Craft and Related Trades Workers
Plant and Machine
Operators and Assemblers
Elementary Occupations
Armed forces occupations, nongainful
activities, and special
occupations
Water supply; sewerage, waste management and remediation activities 69 3 2 8 8 1 0 8 6 33 0Construction 3,537 60 79 67 37 10 0 1,467 58 1,758 0
Wholesale and retail, repair of motor vehicles and motorcycles 7,900 3,361 44 166 211 2,924 0 267 125 802 0Transportation and storage 3,127 1,265 4 23 85 83 0 13 1,312 343 0Accommodation and food service activities 1,740 365 13 27 59 967 0 10 15 284 0Information and communication 397 71 103 77 70 38 0 27 2 10 0Financial and insurance activities 506 57 36 98 279 9 0 1 5 22 0Real estate activities 186 53 5 70 24 22 0 2 1 10 0Professional, scientific and technical activities 247 14 92 56 65 3 0 5 7 6 0Administrative and support service activities 1,475 43 33 61 570 644 0 3 15 105 0Public administration and defense; compulsory social security 2,408 386 355 339 408 478 4 35 57 251 95Education 1,204 40 986 26 58 46 0 3 5 40 0Human health and social work activities 484 11 219 112 49 53 0 2 5 32 0Arts, entertainment and recreation 325 26 28 30 122 56 0 2 3 57 0Other service activities 2,700 49 43 130 23 648 0 105 128 1,574 0Activities of households as employers; undifferentiated goods and services-producing activities of households for own use 1 0 0 0 0 1 0 0 0 0 0
Activities of extraterritorial organizations and bodies 2 0 0 1 0 0 0 0 0 0 0
* Less than 500.
a Starting 2015, Activities of Households as Employers; Undifferentiated Goods and Service-producing Activities of Households for Own Use
is included in Other Service Activities.Notes: 1. Data are averages of four rounds of the Labor Force Survey.
2. Details may not add up to totals due to rounding.
3. Industry grouping is in accordance with the 2009 Philippine Standard Industrial Classification (PSIC).
4. Occupational grouping is in accordance with the 2002 Philippine Standard Occupational Classification (PSOC).
5. Data for 2015 refer to the average of the four survey rounds that exclude Leyte. The use of the four survey rounds for the 2015 annualized data was based
on results of a referendum conducted among members of the IAC on Labor and Productivity Statistics.
6. For more information about the changes on the survey that may have affected the estimates, please refer to the Explanatory Notes
on the Labor Force Survey (LFS) at the last part of this book.
Source of basic data: Philippine Statistics Authority, Labor Force Surveys, Public Use Files
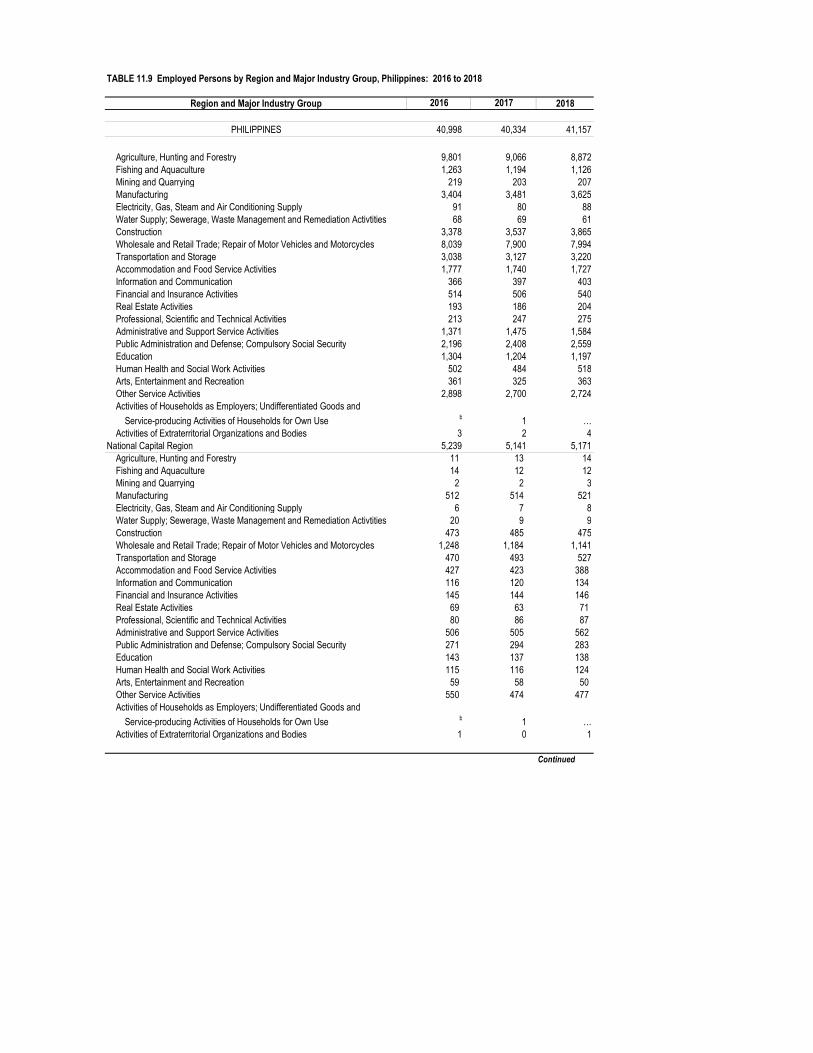
TABLE 11.9 Employed Persons by Region and Major Industry Group, Philippines: 2016 to 2018
Region and Major Industry Group 2018
PHILIPPINES 40,998 40,334 41,157
Agriculture, Hunting and Forestry 9,801 9,066 8,872Fishing and Aquaculture 1,263 1,194 1,126Mining and Quarrying 219 203 207Manufacturing 3,404 3,481 3,625Electricity, Gas, Steam and Air Conditioning Supply 91 80 88Water Supply; Sewerage, Waste Management and Remediation Activtities 68 69 61Construction 3,378 3,537 3,865Wholesale and Retail Trade; Repair of Motor Vehicles and Motorcycles 8,039 7,900 7,994Transportation and Storage 3,038 3,127 3,220Accommodation and Food Service Activities 1,777 1,740 1,727Information and Communication 366 397 403Financial and Insurance Activities 514 506 540Real Estate Activities 193 186 204Professional, Scientific and Technical Activities 213 247 275Administrative and Support Service Activities 1,371 1,475 1,584Public Administration and Defense; Compulsory Social Security 2,196 2,408 2,559Education 1,304 1,204 1,197Human Health and Social Work Activities 502 484 518Arts, Entertainment and Recreation 361 325 363Other Service Activities 2,898 2,700 2,724Activities of Households as Employers; Undifferentiated Goods and
Service-producing Activities of Households for Own Use b 1 …Activities of Extraterritorial Organizations and Bodies 3 2 4
National Capital Region 5,239 5,141 5,171Agriculture, Hunting and Forestry 11 13 14Fishing and Aquaculture 14 12 12Mining and Quarrying 2 2 3Manufacturing 512 514 521Electricity, Gas, Steam and Air Conditioning Supply 6 7 8Water Supply; Sewerage, Waste Management and Remediation Activtities 20 9 9Construction 473 485 475Wholesale and Retail Trade; Repair of Motor Vehicles and Motorcycles 1,248 1,184 1,141Transportation and Storage 470 493 527Accommodation and Food Service Activities 427 423 388 Information and Communication 116 120 134 Financial and Insurance Activities 145 144 146 Real Estate Activities 69 63 71 Professional, Scientific and Technical Activities 80 86 87 Administrative and Support Service Activities 506 505 562 Public Administration and Defense; Compulsory Social Security 271 294 283 Education 143 137 138 Human Health and Social Work Activities 115 116 124 Arts, Entertainment and Recreation 59 58 50 Other Service Activities 550 474 477 Activities of Households as Employers; Undifferentiated Goods and
Service-producing Activities of Households for Own Use b 1 …Activities of Extraterritorial Organizations and Bodies 1 0 1
Continued
2016 2017

Region and Major Industry Group 2018
Cordillera Administrative Region 765 745 754Agriculture, Hunting and Forestry 334 313 315Fishing and Aquaculture 1 2 1Mining and Quarrying 27 15 28Manufacturing 20 24 24Electricity, Gas, Steam and Air Conditioning Supply 2 1 2Water Supply; Sewerage, Waste Management and Remediation Activtities 1 1 1Construction 59 62 61Wholesale and Retail Trade; Repair of Motor Vehicles and Motorcycles 93 94 90Transportation and Storage 33 33 34Accommodation and Food Service Activities 26 26 26Information and Communication 7 5 6Financial and Insurance Activities 5 4 5Real Estate Activities 1 2 2Professional, Scientific and Technical Activities 3 3 5Administrative and Support Service Activities 18 22 21Public Administration and Defense; Compulsory Social Security 58 64 65Education 36 33 32Human Health and Social Work Activities 10 10 11Arts, Entertainment and Recreation 3 3 2Other Service Activities 29 27 22Activities of Households as Employers; Undifferentiated Goods and
Service-producing Activities of Households for Own Use b 0 …Activities of Extraterritorial Organizations and Bodies * 0 0
Region I - Ilocos Region 1,988 1,864 2,025Agriculture, Hunting and Forestry 545 467 506Fishing and Aquaculture 52 46 33Mining and Quarrying 7 10 12Manufacturing 123 106 113Electricity, Gas, Steam and Air Conditioning Supply 4 4 4Water Supply; Sewerage, Waste Management and Remediation Activtities 2 2 3Construction 183 203 240Wholesale and Retail Trade; Repair of Motor Vehicles and Motorcycles 412 367 418Transportation and Storage 142 141 125Accommodation and Food Service Activities 70 67 82Information and Communication 17 16 12Financial and Insurance Activities 22 14 24Real Estate Activities 3 5 4Professional, Scientific and Technical Activities 8 5 10Administrative and Support Service Activities 37 37 40Public Administration and Defense; Compulsory Social Security 105 110 129Education 73 74 73Human Health and Social Work Activities 24 24 24Arts, Entertainment and Recreation 17 14 20Other Service Activities 143 151 151Activities of Households as Employers; Undifferentiated Goods and
Service-producing Activities of Households for Own Use b 0 …Activities of Extraterritorial Organizations and Bodies - 0 -
Continued
TABLE 11.9 ---Continued
2016 2017

Region and Major Industry Group 2018
Region II - Cagayan Valley 1,482 1,452 1,489Agriculture, Hunting and Forestry 745 646 695Fishing and Aquaculture 9 11 12Mining and Quarrying 6 1 2Manufacturing 42 60 53Electricity, Gas, Steam and Air Conditioning Supply 2 4 3Water Supply; Sewerage, Waste Management and Remediation Activtities 1 1 1Construction 98 112 117Wholesale and Retail Trade; Repair of Motor Vehicles and Motorcycles 227 221 214Transportation and Storage 76 94 84Accommodation and Food Service Activities 31 31 41Information and Communication 6 6 6Financial and Insurance Activities 13 11 10Real Estate Activities 1 1 1Professional, Scientific and Technical Activities 2 6 6Administrative and Support Service Activities 10 16 12Public Administration and Defense; Compulsory Social Security 81 99 102Education 44 41 40Human Health and Social Work Activities 10 14 12Arts, Entertainment and Recreation 10 8 10Other Service Activities 69 68 68Activities of Households as Employers; Undifferentiated Goods and
Service-producing Activities of Households for Own Use b 0 …Activities of Extraterritorial Organizations and Bodies - 0 -
Region III - Central Luzon 4,383 4,247 4,450Agriculture, Hunting and Forestry 612 545 576Fishing and Aquaculture 47 41 75Mining and Quarrying 18 11 16Manufacturing 554 562 557Electricity, Gas, Steam and Air Conditioning Supply 12 8 8Water Supply; Sewerage, Waste Management and Remediation Activtities 12 13 8Construction 394 475 498Wholesale and Retail Trade; Repair of Motor Vehicles and Motorcycles 972 908 968Transportation and Storage 430 406 446Accommodation and Food Service Activities 228 220 203Information and Communication 45 56 48Financial and Insurance Activities 57 60 63Real Estate Activities 20 23 20Professional, Scientific and Technical Activities 21 28 32Administrative and Support Service Activities 146 162 162Public Administration and Defense; Compulsory Social Security 211 197 215Education 144 146 135Human Health and Social Work Activities 63 52 58Arts, Entertainment and Recreation 77 49 63Other Service Activities 317 286 300Activities of Households as Employers; Undifferentiated Goods and
Service-producing Activities of Households for Own Use b 0 …Activities of Extraterritorial Organizations and Bodies * 0 -
Continued
TABLE 11.9 - - Continued
2016 2017

Region and Major Industry Group 2018
Region IV-A - CALABARZON 5,687 5,800 5,913Agriculture, Hunting and Forestry 497 467 456Fishing and Aquaculture 57 69 70Mining and Quarrying 6 10 7Manufacturing 957 928 983Electricity, Gas, Steam and Air Conditioning Supply 15 19 22Water Supply; Sewerage, Waste Management and Remediation Activtities 8 15 13Construction 578 542 603Wholesale and Retail Trade; Repair of Motor Vehicles and Motorcycles 1,168 1,286 1,221Transportation and Storage 502 484 517Accommodation and Food Service Activities 332 336 328Information and Communication 73 77 84Financial and Insurance Activities 87 87 105Real Estate Activities 60 50 62Professional, Scientific and Technical Activities 45 58 62Administrative and Support Service Activities 258 286 314Public Administration and Defense; Compulsory Social Security 246 260 267Education 179 180 184Human Health and Social Work Activities 84 89 85Arts, Entertainment and Recreation 80 92 101Other Service Activities 455 466 429Activities of Households as Employers; Undifferentiated Goods and
Service-producing Activities of Households for Own Use b 0 …Activities of Extraterritorial Organizations and Bodies 1 1 1
MIMAROPA 1,252 1,247 1,237Agriculture, Hunting and Forestry 431 406 354Fishing and Aquaculture 115 89 84Mining and Quarrying 7 7 7Manufacturing 60 67 74Electricity, Gas, Steam and Air Conditioning Supply 4 3 3Water Supply; Sewerage, Waste Management and Remediation Activtities 1 1 1Construction 99 106 123Wholesale and Retail Trade; Repair of Motor Vehicles and Motorcycles 195 201 206Transportation and Storage 75 75 82Accommodation and Food Service Activities 44 45 45Information and Communication 3 3 4Financial and Insurance Activities 9 8 8Real Estate Activities 1 2 2Professional, Scientific and Technical Activities 2 3 4Administrative and Support Service Activities 13 21 19Public Administration and Defense; Compulsory Social Security 78 92 91Education 38 39 41Human Health and Social Work Activities 7 7 10Arts, Entertainment and Recreation 8 6 9Other Service Activities 63 67 69Activities of Households as Employers; Undifferentiated Goods and
Service-producing Activities of Households for Own Use b 0 …Activities of Extraterritorial Organizations and Bodies - 0 -
Continued
TABLE 11.9 - - Continued
2016 2017

Region and Major Industry Group 2018
Region V - Bicol Region 2,331 2,303 2,381Agriculture, Hunting and Forestry 705 581 629Fishing and Aquaculture 136 117 112Mining and Quarrying 21 23 21Manufacturing 127 152 147Electricity, Gas, Steam and Air Conditioning Supply 6 4 7Water Supply; Sewerage, Waste Management and Remediation Activtities 4 2 2Construction 210 231 255Wholesale and Retail Trade; Repair of Motor Vehicles and Motorcycles 454 482 486Transportation and Storage 137 149 154Accommodation and Food Service Activities 72 69 75Information and Communication 9 11 9Financial and Insurance Activities 22 19 18Real Estate Activities 5 5 4Professional, Scientific and Technical Activities 5 7 9Administrative and Support Service Activities 31 32 28Public Administration and Defense; Compulsory Social Security 126 168 165Education 83 69 77Human Health and Social Work Activities 17 18 20Arts, Entertainment and Recreation 18 17 14Other Service Activities 141 147 148Activities of Households as Employers; Undifferentiated Goods and
Service-producing Activities of Households for Own Use b 0 …Activities of Extraterritorial Organizations and Bodies - 0 -
Region VI - Western Visayas 3,208 3,119 3,165Agriculture, Hunting and Forestry 975 904 864Fishing and Aquaculture 128 121 106Mining and Quarrying 9 5 13Manufacturing 144 170 180Electricity, Gas, Steam and Air Conditioning Supply 11 6 5Water Supply; Sewerage, Waste Management and Remediation Activtities 5 6 3Construction 248 252 271Wholesale and Retail Trade; Repair of Motor Vehicles and Motorcycles 563 578 601Transportation and Storage 205 232 220Accommodation and Food Service Activities 154 122 137Information and Communication 16 21 17Financial and Insurance Activities 31 33 30Real Estate Activities 10 7 7Professional, Scientific and Technical Activities 7 12 13Administrative and Support Service Activities 78 79 92Public Administration and Defense; Compulsory Social Security 181 196 218Education 105 93 87Human Health and Social Work Activities 43 35 42Arts, Entertainment and Recreation 16 14 20Other Service Activities 278 232 239Activities of Households as Employers; Undifferentiated Goods and
Service-producing Activities of Households for Own Use b 0 …Activities of Extraterritorial Organizations and Bodies - 0 0
Continued
TABLE 11.9 - - Continued
2016 2017

Region and Major Industry Group 2018
Region VII - Central Visayas 3,234 3,224 3,075Agriculture, Hunting and Forestry 816 769 560Fishing and Aquaculture 125 142 114Mining and Quarrying 14 13 10Manufacturing 297 303 316Electricity, Gas, Steam and Air Conditioning Supply 7 8 3Water Supply; Sewerage, Waste Management and Remediation Activtities 4 7 4Construction 305 320 364Wholesale and Retail Trade; Repair of Motor Vehicles and Motorcycles 607 566 589Transportation and Storage 197 235 227Accommodation and Food Service Activities 126 122 139Information and Communication 26 28 31Financial and Insurance Activities 29 33 40Real Estate Activities 9 7 12Professional, Scientific and Technical Activities 14 11 18Administrative and Support Service Activities 121 133 147Public Administration and Defense; Compulsory Social Security 157 166 191Education 91 87 93Human Health and Social Work Activities 31 27 33Arts, Entertainment and Recreation 20 18 27Other Service Activities 238 230 247Activities of Households as Employers; Undifferentiated Goods and
Service-producing Activities of Households for Own Use b 0 …Activities of Extraterritorial Organizations and Bodies - 0 -
Region VIII - Eastern Visayas 1,790 a 1,778 a 1,851Agriculture, Hunting and Forestry 573 524 535Fishing and Aquaculture 117 98 91Mining and Quarrying 9 8 11Manufacturing 81 91 93Electricity, Gas, Steam and Air Conditioning Supply 3 3 4Water Supply; Sewerage, Waste Management and Remediation Activtities 1 3 4Construction 155 150 164Wholesale and Retail Trade; Repair of Motor Vehicles and Motorcycles 345 339 368Transportation and Storage 100 116 118Accommodation and Food Service Activities 37 46 41Information and Communication 8 7 5Financial and Insurance Activities 11 15 13Real Estate Activities 1 2 2Professional, Scientific and Technical Activities 3 4 3Administrative and Support Service Activities 20 27 25Public Administration and Defense; Compulsory Social Security 124 150 178Education 58 57 54Human Health and Social Work Activities 15 16 15Arts, Entertainment and Recreation 7 7 7Other Service Activities 121 117 119Activities of Households as Employers; Undifferentiated Goods and
Service-producing Activities of Households for Own Use b 0 …Activities of Extraterritorial Organizations and Bodies 1 0 1
Continued
TABLE 11.9 - - Continued
2016 2017

Region and Major Industry Group 2018
Region IX - Zamboanga Peninsula 1,540 1,437 1,414Agriculture, Hunting and Forestry 584 510 662Fishing and Aquaculture 100 102 124Mining and Quarrying 5 8 10Manufacturing 72 70 93Electricity, Gas, Steam and Air Conditioning Supply 2 1 2Water Supply; Sewerage, Waste Management and Remediation Activtities 1 2 2Construction 92 94 144Wholesale and Retail Trade; Repair of Motor Vehicles and Motorcycles 270 246 270Transportation and Storage 96 108 148Accommodation and Food Service Activities 32 26 30Information and Communication 3 5 7Financial and Insurance Activities 13 14 14Real Estate Activities 1 1 1Professional, Scientific and Technical Activities 1 2 5Administrative and Support Service Activities 14 17 23Public Administration and Defense; Compulsory Social Security 99 121 186Education 55 30 28Human Health and Social Work Activities 13 9 15Arts, Entertainment and Recreation 5 5 5Other Service Activities 82 66 82Activities of Households as Employers; Undifferentiated Goods and
Service-producing Activities of Households for Own Use b 0 …Activities of Extraterritorial Organizations and Bodies - 0 -
Region X - Northern Mindanao 2,004 1,966 2,107Agriculture, Hunting and Forestry 691 701 719Fishing and Aquaculture 38 32 29Mining and Quarrying 9 5 4Manufacturing 104 122 135Electricity, Gas, Steam and Air Conditioning Supply 6 5 5Water Supply; Sewerage, Waste Management and Remediation Activtities 3 2 2Construction 155 166 181Wholesale and Retail Trade; Repair of Motor Vehicles and Motorcycles 385 355 411Transportation and Storage 146 132 139Accommodation and Food Service Activities 55 47 54Information and Communication 14 11 14Financial and Insurance Activities 19 21 22Real Estate Activities 3 5 4Professional, Scientific and Technical Activities 4 5 5Administrative and Support Service Activities 33 36 43Public Administration and Defense; Compulsory Social Security 117 123 133Education 66 61 57Human Health and Social Work Activities 19 22 20Arts, Entertainment and Recreation 10 6 7Other Service Activities 128 106 123Activities of Households as Employers; Undifferentiated Goods and
Service-producing Activities of Households for Own Use b 0 …Activities of Extraterritorial Organizations and Bodies - 0 -
Continued
TABLE 11.9 - - Continued
2016 2017

Region and Major Industry Group 2018
Region XI - Davao Region 2,016 2,052 2,022Agriculture, Hunting and Forestry 650 628 597Fishing and Aquaculture 45 40 36Mining and Quarrying 36 42 27Manufacturing 118 126 135Electricity, Gas, Steam and Air Conditioning Supply 4 3 5Water Supply; Sewerage, Waste Management and Remediation Activtities 2 1 4Construction 141 138 175Wholesale and Retail Trade; Repair of Motor Vehicles and Motorcycles 381 407 381Transportation and Storage 144 158 163Accommodation and Food Service Activities 71 84 73Information and Communication 11 14 14Financial and Insurance Activities 24 21 21Real Estate Activities 7 10 8Professional, Scientific and Technical Activities 10 8 9Administrative and Support Service Activities 46 58 49Public Administration and Defense; Compulsory Social Security 109 111 110Education 56 52 62Human Health and Social Work Activities 23 19 20Arts, Entertainment and Recreation 17 19 15Other Service Activities 123 114 116Activities of Households as Employers; Undifferentiated Goods and
Service-producing Activities of Households for Own Use b 0 …Activities of Extraterritorial Organizations and Bodies - 0 0
Region XII - SOCCSKSARGEN 1,854 1,843 1,867Agriculture, Hunting and Forestry 726 739 720Fishing and Aquaculture 49 64 55Mining and Quarrying 4 4 5Manufacturing 117 119 136Electricity, Gas, Steam and Air Conditioning Supply 3 3 3Water Supply; Sewerage, Waste Management and Remediation Activtities 2 1 2Construction 89 91 114Wholesale and Retail Trade; Repair of Motor Vehicles and Motorcycles 352 321 322Transportation and Storage 145 135 140Accommodation and Food Service Activities 47 52 44Information and Communication 9 11 7Financial and Insurance Activities 16 13 13Real Estate Activities 2 2 3Professional, Scientific and Technical Activities 3 5 5Administrative and Support Service Activities 22 24 32Public Administration and Defense; Compulsory Social Security 100 102 111Education 56 55 52Human Health and Social Work Activities 16 17 19Arts, Entertainment and Recreation 9 6 7Other Service Activities 88 80 78Activities of Households as Employers; Undifferentiated Goods and
Service-producing Activities of Households for Own Use b 0 …Activities of Extraterritorial Organizations and Bodies * 0 0
Continued
TABLE 11.9 - - Continued
2016 2017

Region and Major Industry Group 2018
Caraga 1,086 1,087 1,165Agriculture, Hunting and Forestry 342 354 357Fishing and Aquaculture 54 48 43Mining and Quarrying 38 36 30Manufacturing 55 54 71Electricity, Gas, Steam and Air Conditioning Supply 4 1 2Water Supply; Sewerage, Waste Management and Remediation Activtities 1 1 2Construction 69 80 87Wholesale and Retail Trade; Repair of Motor Vehicles and Motorcycles 205 202 223Transportation and Storage 65 66 64Accommodation and Food Service Activities 22 19 25Information and Communication 6 4 8Financial and Insurance Activities 10 7 11Real Estate Activities 1 1 1Professional, Scientific and Technical Activities 3 3 3Administrative and Support Service Activities 10 14 15Public Administration and Defense; Compulsory Social Security 86 94 106Education 41 31 33Human Health and Social Work Activities 9 7 9Arts, Entertainment and Recreation 5 4 8Other Service Activities 60 58 67Activities of Households as Employers; Undifferentiated Goods and
Service-producing Activities of Households for Own Use b 0 …Activities of Extraterritorial Organizations and Bodies * 0 -
Autonomous Region in Muslim Mindanao 1,140 1,029 1,071Agriculture, Hunting and Forestry 565 500 486Fishing and Aquaculture 176 159 160Mining and Quarrying 2 3 3Manufacturing 20 14 26Electricity, Gas, Steam and Air Conditioning Supply 1 0 0Water Supply; Sewerage, Waste Management and Remediation Activtities * 0 0Construction 28 29 36Wholesale and Retail Trade; Repair of Motor Vehicles and Motorcycles 161 143 166Transportation and Storage 75 70 73Accommodation and Food Service Activities 4 4 7Information and Communication 1 0 0Financial and Insurance Activities 1 1 2Real Estate Activities - 0 0Professional, Scientific and Technical Activities * 1 0Administrative and Support Service Activities 6 7 10Public Administration and Defense; Compulsory Social Security 47 61 58Education 34 20 21Human Health and Social Work Activities 4 3 4Arts, Entertainment and Recreation * 0 0Other Service Activities 13 12 15Activities of Households as Employers; Undifferentiated Goods and
Service-producing Activities of Households for Own Use b 0 …Activities of Extraterritorial Organizations and Bodies * 0 -
Continued
2016 2017
TABLE 11.9 - - Continued

TABLE 11.9 - - Concluded
Notes : 1. Data are averages of four survey rounds of the Labor Force Survey except for 2014 wherein data for this year
refer to the average of April, July and October survey rounds.
2. Details may not add up to totals due to rounding.
3. Industry grouping is in accordance with the 2009 Philippine Standard Industrial Classification (PSIC).
4. Data for 2014 refer to the average of April, July and October survey rounds.
The estimates for these rounds exclude data of Leyte province while that of January exclude Region VIII.
5. Data for 2015 refer to the average of the four survey rounds that exclude Leyte. These should not be compared with the 2014
annualized data as the latter exclude the January round. The use of the four survey rounds for the 2015 annualized data was based
on results of a referendum conducted among members of the IAC on Labor and Productivity Statistics.
6. Starting April 2016 round, the Labor Force Survey (LFS) adopted the 2013 Master Sample design as well as the population projections
based on the 2010 Census of Population and Housing (2010 CPH) while previous survey rounds were derived using the 2000 CPH
population projections. 7. Annualized data for 2016 was computed as the average of four survey rounds using the January 2016 data that were based on the 2010
Census-based population projections.
8. For more information about the changes on the survey that may have affected the estimates, please refer to the
Explanatory Notes on the Labor Force Survey (LFS) at the last part of this book.
* Less than 500.a Excludes data of Leyte Province.b Starting 2015, Activities of Households as Employers; Undifferentiated Goods and Service-producing Activities of Households for Own Use
is included in Other Service Activities.
Source of basic data : Philippine Statistics Authority, Labor Force Survey

PHILIPPINES 38,741 a 40,340 40,334 41,157Officials of Government and Special-Interest
Organizations, Corporate Executives, Managers,Managing Proprietors and Supervisors 6,292 6,855 6,490 6,588
Professionals 1,989 2,049 2,149 2,243Technicians and Associate Professionals 1,030 1,323 1,533 1,663Clerks 2,492 2,304 2,283 2,389Service Workers and Shop and Market Sales Workers 4,925 5,966 6,069 6,171Farmers, Forestry Workers and Fishermen 5,000 5,000 5,426 5,096Trades and Related Workers 2,592 3,090 3,197 3,230Plant and Machine Operators and Assemblers 2,083 2,330 2,552 2,623Laborers and Unskilled Workers 12,223 11,325 10,538 11,060Special Occupations 114 99 95 94
National Capital Region 4,752 5,167 5,141 5,171Officials of Government and Special-Interest
Organizations, Corporate Executives, Managers,Managing Proprietors and Supervisors 897 935 844 861
Professionals 378 396 388 418Technicians and Associate Professionals 223 293 322 366Clerks 641 671 650 656Service Workers and Shop and Market Sales Workers 726 1,034 1,055 1,011Farmers, Forestry Workers and Fishermen 15 10 14 13Trades and Related Workers 423 480 495 466Plant and Machine Operators and Assemblers 393 435 457 474Laborers and Unskilled Workers 1,041 902 903 898Special Occupations 15 10 11 7
Cordillera Administrative Region 759 764 745 754Officials of Government and Special-Interest
Organizations, Corporate Executives, Managers,Managing Proprietors and Supervisors 97 98 90 91
Professionals 43 51 57 55Technicians and Associate Professionals 22 22 24 26Clerks 34 31 29 26Service Workers and Shop and Market Sales Workers 66 74 76 74Farmers, Forestry Workers and Fishermen 164 166 183 180Trades and Related Workers 38 39 36 35Plant and Machine Operators and Assemblers 22 40 36 36Laborers and Unskilled Workers 270 238 209 227Special Occupations 4 4 4 3
Region I - Ilocos Region 2,014 2,018 1,864 2,025Officials of Government and Special-Interest
Organizations, Corporate Executives, Managers,Managing Proprietors and Supervisors 280 286 276 307
Professionals 89 103 98 108
Continued
2018
TABLE 11.10 Employed Persons by Region and Major Occupation Group, Philippines: 2015 to 2018 (Based on Past Week Reference Period; In Thousands)
Region and Major Industry Group 2015 2016 2017
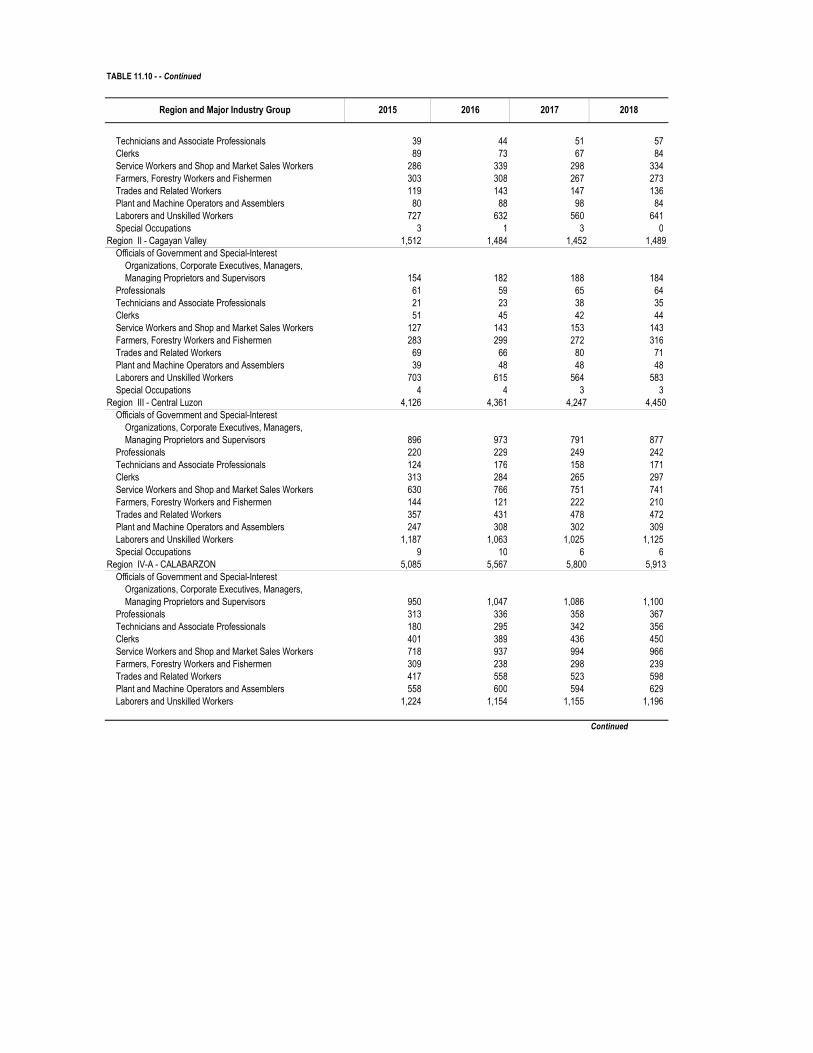
TABLE 11.10 - - Continued
Technicians and Associate Professionals 39 44 51 57Clerks 89 73 67 84Service Workers and Shop and Market Sales Workers 286 339 298 334Farmers, Forestry Workers and Fishermen 303 308 267 273Trades and Related Workers 119 143 147 136Plant and Machine Operators and Assemblers 80 88 98 84Laborers and Unskilled Workers 727 632 560 641Special Occupations 3 1 3 0
Region II - Cagayan Valley 1,512 1,484 1,452 1,489Officials of Government and Special-Interest
Organizations, Corporate Executives, Managers,Managing Proprietors and Supervisors 154 182 188 184
Professionals 61 59 65 64Technicians and Associate Professionals 21 23 38 35Clerks 51 45 42 44Service Workers and Shop and Market Sales Workers 127 143 153 143Farmers, Forestry Workers and Fishermen 283 299 272 316Trades and Related Workers 69 66 80 71Plant and Machine Operators and Assemblers 39 48 48 48Laborers and Unskilled Workers 703 615 564 583Special Occupations 4 4 3 3
Region III - Central Luzon 4,126 4,361 4,247 4,450Officials of Government and Special-Interest
Organizations, Corporate Executives, Managers,Managing Proprietors and Supervisors 896 973 791 877
Professionals 220 229 249 242Technicians and Associate Professionals 124 176 158 171Clerks 313 284 265 297Service Workers and Shop and Market Sales Workers 630 766 751 741Farmers, Forestry Workers and Fishermen 144 121 222 210Trades and Related Workers 357 431 478 472Plant and Machine Operators and Assemblers 247 308 302 309Laborers and Unskilled Workers 1,187 1,063 1,025 1,125Special Occupations 9 10 6 6
Region IV-A - CALABARZON 5,085 5,567 5,800 5,913Officials of Government and Special-Interest
Organizations, Corporate Executives, Managers,Managing Proprietors and Supervisors 950 1,047 1,086 1,100
Professionals 313 336 358 367Technicians and Associate Professionals 180 295 342 356Clerks 401 389 436 450Service Workers and Shop and Market Sales Workers 718 937 994 966Farmers, Forestry Workers and Fishermen 309 238 298 239Trades and Related Workers 417 558 523 598Plant and Machine Operators and Assemblers 558 600 594 629Laborers and Unskilled Workers 1,224 1,154 1,155 1,196
Continued
Region and Major Industry Group 2015 2016 2017 2018
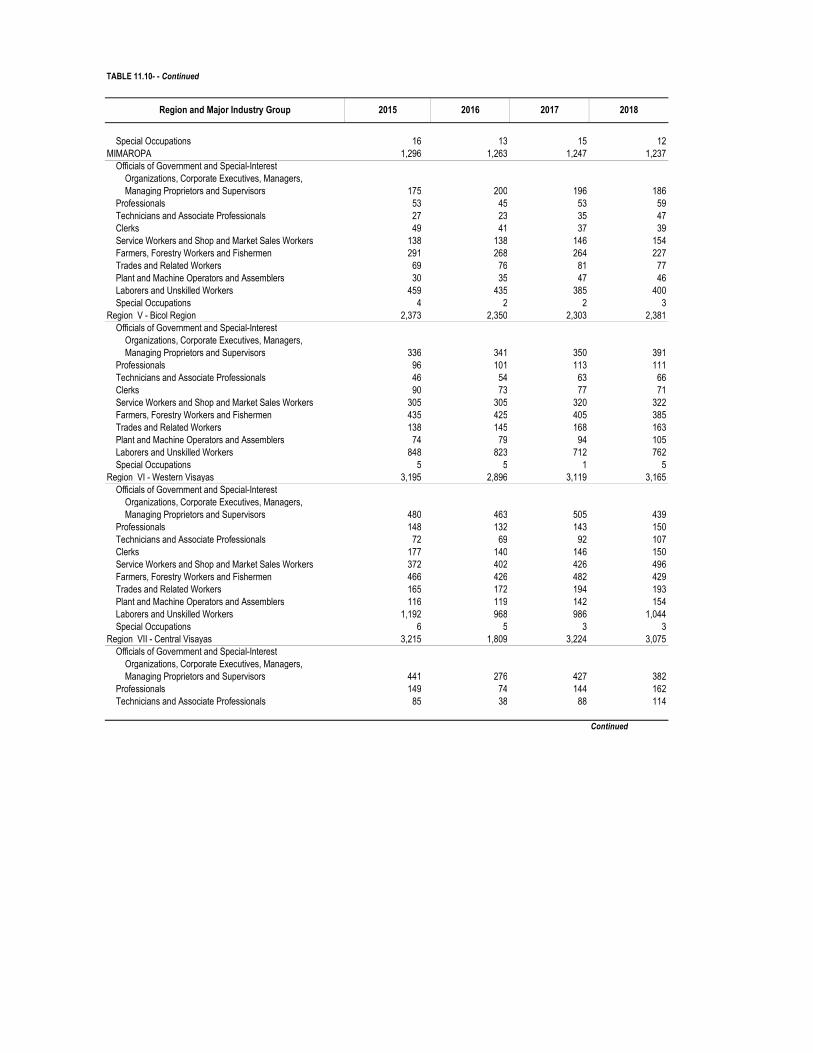
TABLE 11.10- - Continued
Special Occupations 16 13 15 12MIMAROPA 1,296 1,263 1,247 1,237
Officials of Government and Special-Interest Organizations, Corporate Executives, Managers,Managing Proprietors and Supervisors 175 200 196 186
Professionals 53 45 53 59Technicians and Associate Professionals 27 23 35 47Clerks 49 41 37 39Service Workers and Shop and Market Sales Workers 138 138 146 154Farmers, Forestry Workers and Fishermen 291 268 264 227Trades and Related Workers 69 76 81 77Plant and Machine Operators and Assemblers 30 35 47 46Laborers and Unskilled Workers 459 435 385 400Special Occupations 4 2 2 3
Region V - Bicol Region 2,373 2,350 2,303 2,381Officials of Government and Special-Interest
Organizations, Corporate Executives, Managers,Managing Proprietors and Supervisors 336 341 350 391
Professionals 96 101 113 111Technicians and Associate Professionals 46 54 63 66Clerks 90 73 77 71Service Workers and Shop and Market Sales Workers 305 305 320 322Farmers, Forestry Workers and Fishermen 435 425 405 385Trades and Related Workers 138 145 168 163Plant and Machine Operators and Assemblers 74 79 94 105Laborers and Unskilled Workers 848 823 712 762Special Occupations 5 5 1 5
Region VI - Western Visayas 3,195 2,896 3,119 3,165Officials of Government and Special-Interest
Organizations, Corporate Executives, Managers,Managing Proprietors and Supervisors 480 463 505 439
Professionals 148 132 143 150Technicians and Associate Professionals 72 69 92 107Clerks 177 140 146 150Service Workers and Shop and Market Sales Workers 372 402 426 496Farmers, Forestry Workers and Fishermen 466 426 482 429Trades and Related Workers 165 172 194 193Plant and Machine Operators and Assemblers 116 119 142 154Laborers and Unskilled Workers 1,192 968 986 1,044Special Occupations 6 5 3 3
Region VII - Central Visayas 3,215 1,809 3,224 3,075Officials of Government and Special-Interest
Organizations, Corporate Executives, Managers,Managing Proprietors and Supervisors 441 276 427 382
Professionals 149 74 144 162Technicians and Associate Professionals 85 38 88 114
Continued
Region and Major Industry Group 2015 2016 2017 2018
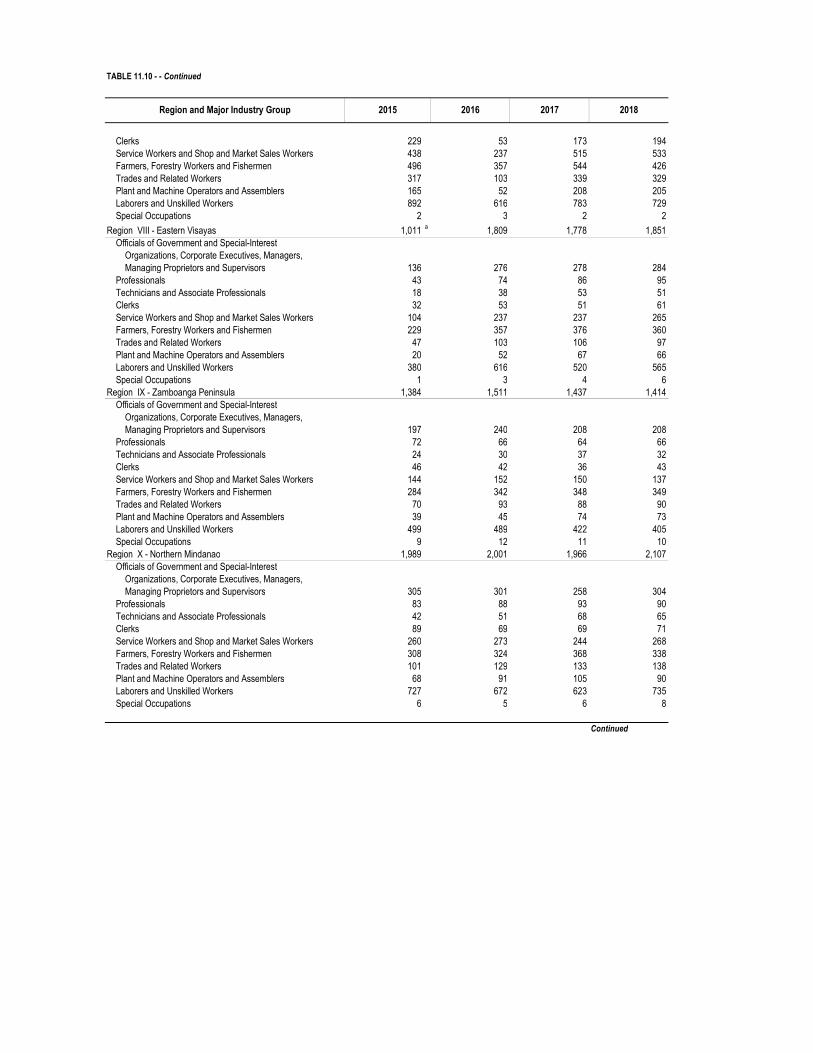
TABLE 11.10 - - Continued
Clerks 229 53 173 194Service Workers and Shop and Market Sales Workers 438 237 515 533Farmers, Forestry Workers and Fishermen 496 357 544 426Trades and Related Workers 317 103 339 329Plant and Machine Operators and Assemblers 165 52 208 205Laborers and Unskilled Workers 892 616 783 729Special Occupations 2 3 2 2
Region VIII - Eastern Visayas 1,011 a 1,809 1,778 1,851Officials of Government and Special-Interest
Organizations, Corporate Executives, Managers,Managing Proprietors and Supervisors 136 276 278 284
Professionals 43 74 86 95Technicians and Associate Professionals 18 38 53 51Clerks 32 53 51 61Service Workers and Shop and Market Sales Workers 104 237 237 265Farmers, Forestry Workers and Fishermen 229 357 376 360Trades and Related Workers 47 103 106 97Plant and Machine Operators and Assemblers 20 52 67 66Laborers and Unskilled Workers 380 616 520 565Special Occupations 1 3 4 6
Region IX - Zamboanga Peninsula 1,384 1,511 1,437 1,414Officials of Government and Special-Interest
Organizations, Corporate Executives, Managers,Managing Proprietors and Supervisors 197 240 208 208
Professionals 72 66 64 66Technicians and Associate Professionals 24 30 37 32Clerks 46 42 36 43Service Workers and Shop and Market Sales Workers 144 152 150 137Farmers, Forestry Workers and Fishermen 284 342 348 349Trades and Related Workers 70 93 88 90Plant and Machine Operators and Assemblers 39 45 74 73Laborers and Unskilled Workers 499 489 422 405Special Occupations 9 12 11 10
Region X - Northern Mindanao 1,989 2,001 1,966 2,107Officials of Government and Special-Interest
Organizations, Corporate Executives, Managers,Managing Proprietors and Supervisors 305 301 258 304
Professionals 83 88 93 90Technicians and Associate Professionals 42 51 68 65Clerks 89 69 69 71Service Workers and Shop and Market Sales Workers 260 273 244 268Farmers, Forestry Workers and Fishermen 308 324 368 338Trades and Related Workers 101 129 133 138Plant and Machine Operators and Assemblers 68 91 105 90Laborers and Unskilled Workers 727 672 623 735Special Occupations 6 5 6 8
Continued
Region and Major Industry Group 2015 2016 2017 2018

TABLE 11.10 - - Continued
Region XI - Davao Region 1,925 1,993 2,052 2,022Officials of Government and Special-Interest
Organizations, Corporate Executives, Managers,Managing Proprietors and Supervisors 295 320 327 306
Professionals 84 86 75 85Technicians and Associate Professionals 41 49 75 69Clerks 119 109 104 100Service Workers and Shop and Market Sales Workers 248 266 305 295Farmers, Forestry Workers and Fishermen 260 275 315 301Trades and Related Workers 109 140 134 148Plant and Machine Operators and Assemblers 87 83 102 112Laborers and Unskilled Workers 676 657 610 602Special Occupations 7 7 5 5
Region XII - SOCCSKSARGEN 1,756 1,826 1,843 1,867Officials of Government and Special-Interest
Organizations, Corporate Executives, Managers,Managing Proprietors and Supervisors 280 351 310 328
Professionals 71 71 81 84Technicians and Associate Professionals 33 40 45 50Clerks 67 55 52 53Service Workers and Shop and Market Sales Workers 182 202 212 200Farmers, Forestry Workers and Fishermen 324 297 358 340Trades and Related Workers 74 96 109 113Plant and Machine Operators and Assemblers 57 72 89 90Laborers and Unskilled Workers 657 633 577 600Special Occupations 12 9 12 9
Region XIII - Caraga 1,092 1,087 1,087 1,165Officials of Government and Special-Interest
Organizations, Corporate Executives, Managers,Managing Proprietors and Supervisors 227 217 191 181
Professionals 53 51 48 56Technicians and Associate Professionals 23 24 33 40Clerks 47 41 38 42Service Workers and Shop and Market Sales Workers 131 147 135 155Farmers, Forestry Workers and Fishermen 138 164 197 208Trades and Related Workers 59 66 64 69Plant and Machine Operators and Assemblers 44 48 53 53Laborers and Unskilled Workers 364 325 324 355Special Occupations 6 3 4 6
Autonomous Region in Muslim Mindanao 1,259 1,171 1,029 1,071Officials of Government and Special-Interest
Organizations, Corporate Executives, Managers,Managing Proprietors and Supervisors 148 191 166 160
Professionals 32 35 35 30Technicians and Associate Professionals 11 10 9 11Clerks 17 13 12 9
Continued
Region and Major Industry Group 2015 2016 2017 2018

TABLE 11.10 - - Concluded
Service Workers and Shop and Market Sales Workers 51 62 51 77Farmers, Forestry Workers and Fishermen 551 485 513 501Trades and Related Workers 20 26 24 35Plant and Machine Operators and Assemblers 46 25 36 50Laborers and Unskilled Workers 380 320 178 193Special Occupations 4 5 4 5
Notes: 1. Data are averages of four survey rounds of the Labor Force Survey except for 2014 wherein data for this year
refer to the average of April, July and October survey rounds.
2. Details may not add up to totals due to rounding.
3. Occupational grouping is in accordance with the 2002 Philippine Standard Occupational Classification (PSOC).
4. Data for 2014 refer to the average of April, July and October survey rounds.
The estimates for these rounds exclude data of Leyte province while that of January exclude Region VIII.
5. Data for 2015 refer to the average of the four survey rounds that exclude Leyte. These should not be compared with the 2014
annualized data as the latter exclude the January round. The use of the four survey rounds for the 2015 annualized data was based
on results of a referendum conducted among members of the IAC on Labor and Productivity Statistics.
6. For more information about the changes on the survey that may have affected the estimates, please refer to the
Explanatory Notes on the Labor Force Survey (LFS) at the last part of this book.
a Excludes data of Leyte province.
Source of basic data: Philippine Statistics Authority, Labor Force Survey
Region and Major Industry Group 2015 2016 2017 2018

Philippines 41,157 40,334Managers 6,588 6,490Professionals 2,243 2,149Technicians and Associate Professionals 1,663 1,533Clerical Support Workers 2,389 2,283Service and Sales Workers 6,171 6,069Skilled Agricultural, Forestry and Fishery Workers 5,096 5,426Craft and Related Trade Workers 3,230 3,198Plant and Machine Operators and Assemblers 2,623 2,552Elementary Occupations 11,060 10,538Armed Forces Occupations and Special Occupations 94 95Others … -
National Capital Region 5,171 5,141Managers 861 844Professionals 418 388Technicians and Associate Professionals 366 322Clerical Support Workers 656 650Service and Sales Workers 1,011 1,055Skilled Agricultural, Forestry and Fishery Workers 13 14Craft and Related Trade Workers 466 495Plant and Machine Operators and Assemblers 474 457Elementary Occupations 898 903Armed Forces Occupations and Special Occupations 7 11Others … -
Cordillera Administrative Region 754 745Managers 91 90Professionals 55 57Technicians and Associate Professionals 26 24Clerical Support Workers 26 29Service and Sales Workers 74 76Skilled Agricultural, Forestry and Fishery Workers 180 183Craft and Related Trade Workers 35 36Plant and Machine Operators and Assemblers 36 36Elementary Occupations 227 209Armed Forces Occupations and Special Occupations 3 4Others … -
Region I - Ilocos Region 2,025 1,864Managers 307 276Professionals 108 98Technicians and Associate Professionals 57 51Clerical Support Workers 84 67Service and Sales Workers 334 298Skilled Agricultural, Forestry and Fishery Workers 273 267Craft and Related Trade Workers 136 147
Continued
TABLE 11.11 Employed Persons by Region and Major Occupation Group, Philippines: 2017 and 2018 (Based on Past Week Reference Period; In Thousands)
Region and Major Industry Group 2018 2017
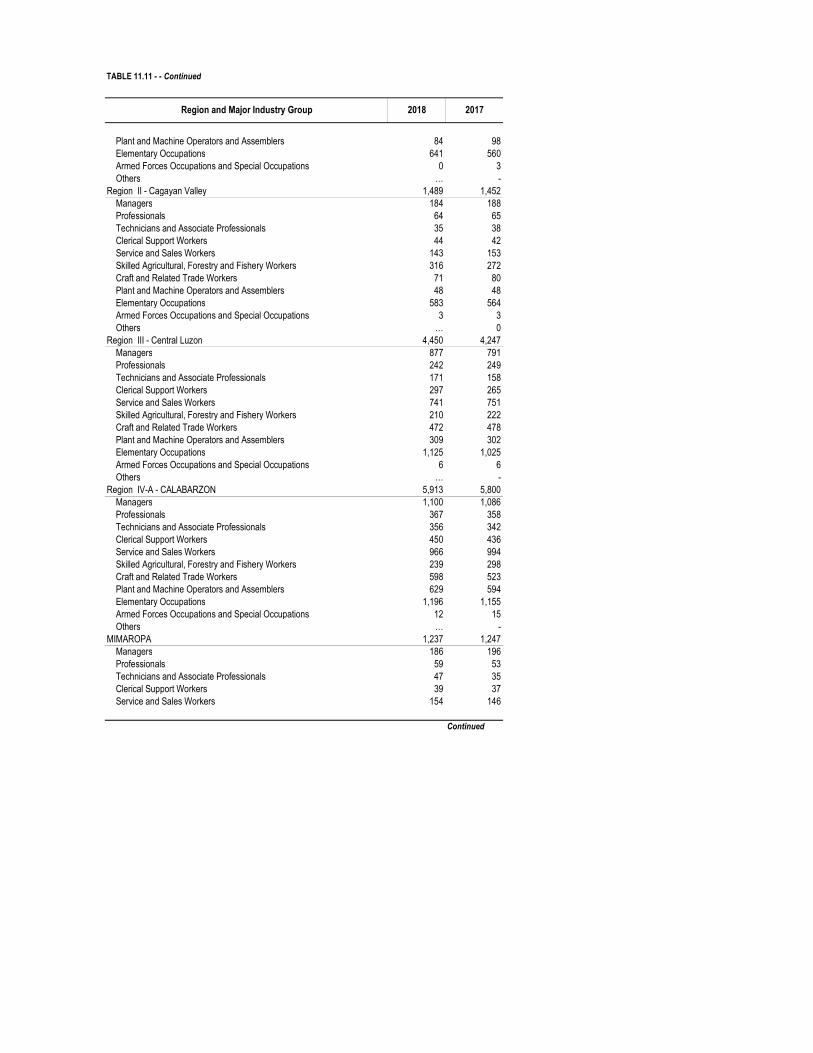
TABLE 11.11 - - Continued
Plant and Machine Operators and Assemblers 84 98Elementary Occupations 641 560Armed Forces Occupations and Special Occupations 0 3Others … -
Region II - Cagayan Valley 1,489 1,452Managers 184 188Professionals 64 65Technicians and Associate Professionals 35 38Clerical Support Workers 44 42Service and Sales Workers 143 153Skilled Agricultural, Forestry and Fishery Workers 316 272Craft and Related Trade Workers 71 80Plant and Machine Operators and Assemblers 48 48Elementary Occupations 583 564Armed Forces Occupations and Special Occupations 3 3Others … 0
Region III - Central Luzon 4,450 4,247Managers 877 791Professionals 242 249Technicians and Associate Professionals 171 158Clerical Support Workers 297 265Service and Sales Workers 741 751Skilled Agricultural, Forestry and Fishery Workers 210 222Craft and Related Trade Workers 472 478Plant and Machine Operators and Assemblers 309 302Elementary Occupations 1,125 1,025Armed Forces Occupations and Special Occupations 6 6Others … -
Region IV-A - CALABARZON 5,913 5,800Managers 1,100 1,086Professionals 367 358Technicians and Associate Professionals 356 342Clerical Support Workers 450 436Service and Sales Workers 966 994Skilled Agricultural, Forestry and Fishery Workers 239 298Craft and Related Trade Workers 598 523Plant and Machine Operators and Assemblers 629 594Elementary Occupations 1,196 1,155Armed Forces Occupations and Special Occupations 12 15Others … -
MIMAROPA 1,237 1,247Managers 186 196Professionals 59 53Technicians and Associate Professionals 47 35Clerical Support Workers 39 37Service and Sales Workers 154 146
Continued
Region and Major Industry Group 2018 2017

TABLE 11.11 - - Continued
Skilled Agricultural, Forestry and Fishery Workers 227 264Craft and Related Trade Workers 77 81Plant and Machine Operators and Assemblers 46 47Elementary Occupations 400 385Armed Forces Occupations and Special Occupations 3 2Others … -
Region V - Bicol Region 2,381 2,303Managers 391 350Professionals 111 113Technicians and Associate Professionals 66 63Clerical Support Workers 71 77Service and Sales Workers 322 320Skilled Agricultural, Forestry and Fishery Workers 385 405Craft and Related Trade Workers 163 168Plant and Machine Operators and Assemblers 105 94Elementary Occupations 762 712Armed Forces Occupations and Special Occupations 5 1Others … -
Region VI - Western Visayas 3,165 3,119Managers 439 505Professionals 150 143Technicians and Associate Professionals 107 92Clerical Support Workers 150 146Service and Sales Workers 496 426Skilled Agricultural, Forestry and Fishery Workers 429 482Craft and Related Trade Workers 193 194Plant and Machine Operators and Assemblers 154 142Elementary Occupations 1,044 986Armed Forces Occupations and Special Occupations 3 3Others … -
Region VII - Central Visayas 3,075 3,224Managers 382 427Professionals 162 144Technicians and Associate Professionals 114 88Clerical Support Workers 194 173Service and Sales Workers 533 515Skilled Agricultural, Forestry and Fishery Workers 426 544Craft and Related Trade Workers 329 339Plant and Machine Operators and Assemblers 205 208Elementary Occupations 729 783Armed Forces Occupations and Special Occupations 2 2Others … -
Region VIII - Eastern Visayas 1,851 1,778Managers 284 278Professionals 95 86Technicians and Associate Professionals 51 53
Continued
Region and Major Industry Group 2018 2017

TABLE 11.11 - - Continued
Clerical Support Workers 61 51Service and Sales Workers 265 237Skilled Agricultural, Forestry and Fishery Workers 360 376Craft and Related Trade Workers 97 106Plant and Machine Operators and Assemblers 66 67Elementary Occupations 565 520Armed Forces Occupations and Special Occupations 6 4Others … -
Region IX - Zamboanga Peninsula 1,414 1,437Managers 208 208Professionals 66 64Technicians and Associate Professionals 32 37Clerical Support Workers 43 36Service and Sales Workers 137 150Skilled Agricultural, Forestry and Fishery Workers 349 348Craft and Related Trade Workers 90 88Plant and Machine Operators and Assemblers 73 74Elementary Occupations 405 422Armed Forces Occupations and Special Occupations 10 11Others … -
Region X - Northern Mindanao 2,107 1,966Managers 304 258Professionals 90 93Technicians and Associate Professionals 65 68Clerical Support Workers 71 69Service and Sales Workers 268 244Skilled Agricultural, Forestry and Fishery Workers 338 368Craft and Related Trade Workers 138 133Plant and Machine Operators and Assemblers 90 105Elementary Occupations 735 623Armed Forces Occupations and Special Occupations 8 6Others … -
Region XI - Davao Region 2,022 2,052Managers 306 327Professionals 85 75Technicians and Associate Professionals 69 75Clerical Support Workers 100 104Service and Sales Workers 295 305Skilled Agricultural, Forestry and Fishery Workers 301 315Craft and Related Trade Workers 148 134Plant and Machine Operators and Assemblers 112 102Elementary Occupations 602 610Armed Forces Occupations and Special Occupations 5 5Others … -
Region XII - SOCCSKSARGEN 1,867 1,843Managers 328 310
Continued
Region and Major Industry Group 2018 2017

TABLE 11.11 - - Concluded
Professionals 84 81Technicians and Associate Professionals 50 45Clerical Support Workers 53 52Service and Sales Workers 200 212Skilled Agricultural, Forestry and Fishery Workers 340 358Craft and Related Trade Workers 113 109Plant and Machine Operators and Assemblers 90 89Elementary Occupations 600 577Armed Forces Occupations and Special Occupations 9 12Others … -
Region XIII - Caraga 1,165 1,087Managers 181 191Professionals 56 48Technicians and Associate Professionals 40 33Clerical Support Workers 42 38Service and Sales Workers 155 135Skilled Agricultural, Forestry and Fishery Workers 208 197Craft and Related Trade Workers 69 64Plant and Machine Operators and Assemblers 53 53Elementary Occupations 355 324Armed Forces Occupations and Special Occupations 6 4Others … -
Autonomous Region in Muslim Mindanao 1,071 1,029Managers 160 166Professionals 30 35Technicians and Associate Professionals 11 9Clerical Support Workers 9 12Service and Sales Workers 77 51Skilled Agricultural, Forestry and Fishery Workers 501 513Craft and Related Trade Workers 35 24Plant and Machine Operators and Assemblers 50 36Elementary Occupations 193 178Armed Forces Occupations and Special Occupations 5 4Others … -
Notes: 1. Data are averages of four survey rounds of the Labor Force Survey.
2. Details may not add up to totals due to rounding.
3. Occupational grouping is in accordance with the 2012 Philippine Standard Occupational Classification (PSOC)
which was adopted in the LFS starting April 2016 round.
4. Starting April 2016 round, the Labor Force Survey (LFS) adopted the 2013 Master Sample design as well as the
population projections based on the 2010 Census of Population and Housing (2010 CPH) while previous survey
rounds were derived using the 2000 CPH population projections. 5. Annualized data for 2016 was computed as the average of four survey rounds using the January 2016 data that
were based on the 2010 Census-based population projections.
6. For more information about the changes on the survey that may have affected the estimates, please refer to the
Explanatory Notes on the Labor Force Survey (LFS) at the last part of this book.
Source of basic data: Philippine Statistics Authority, Labor Force Survey
Region and Major Industry Group 2018 2017

2014 2015 2016 2017 2018
38,651 38,741 40,998 40,334 41,15722,407 22,960 25,240 25,209 26,257
1,925 1,981 2,096 1,925 1,94517,319 17,669 19,694 19,776 20,609
Worked with pay in own family-operated farm business 120 112 132 119 1293,043 3,197 3,317 3,388 3,574
10,869 10,705 11,097 11,198 11,090Employer in own family-operated farm or business 1,210 1,212 1,376 1,491 1,489
4,166 3,863 3,285 2,437 2,320National Capital Region 4,743 4,752 5,239 5,141 5,171
3,655 3,709 4,181 4,181 4,213382 377 394 326 326
2,896 2,942 3,389 3,446 3,497 Worked with pay in own family-operated farm business 28 22 25 24 19
349 368 372 385 372847 834 817 797 797
Employer in own family-operated farm or business 122 100 113 94 90120 109 128 69 70
Cordillera Administrative Region 752 759 765 745 754312 339 380 388 393
19 18 18 15 15221 242 274 283 282
Worked with pay in own family-operated farm business 1 1 1 1 172 78 87 89 95
245 236 239 231 234Employer in own family-operated farm or business 15 19 21 40 37
180 166 125 86 89Region I - Ilocos Region 2,012 2,014 1,988 1,864 2,025
1,139 1,156 1,167 1,183 1,28087 96 90 93 101
882 881 900 908 972 Worked with pay in own family-operated farm business 6 5 5 4 5
164 174 172 178 202587 571 546 456 481
Employer in own family-operated farm or business 79 85 108 134 147206 202 167 91 117
Region II - Cagayan Valley 1,485 1,512 1,482 1,452 1,489816 847 853 863 862
52 50 50 52 50643 678 677 668 669
Worked with pay in own family-operated farm business 3 2 3 2 2118 117 123 141 141242 246 263 286 318
Employer in own family-operated farm or business 228 219 231 191 198200 200 135 112 111
Continued
Worked for private household Worked for private establishment
Worked for government/government corporationSelf-employed without any paid employee
Without pay in own family-operated farm or business
Worked for private household Worked for private establishment
Worked for government/government corporationSelf-employed without any paid employee
Without pay in own family-operated farm or business
Wage and Salary Workers
Worked for private household Worked for private establishment
Worked for government/government corporationSelf-employed without any paid employee
Without pay in own family-operated farm or business
Wage and Salary Workers
Worked for private household Worked for private establishment
Worked for government/government corporationSelf-employed without any paid employee
Without pay in own family-operated farm or business
Wage and Salary Workers
Worked for private household Worked for private establishment
Worked for government/government corporationSelf-employed without any paid employee
Without pay in own family-operated farm or business
Wage and Salary Workers
TABLE 11.12 Employed Persons by Region and Class of Worker, Philippines: 2014 to 2018 (Based on Past Week Reference Period; In Thousands)
Region and Class of Worker
PhilippinesWage and Salary Workers
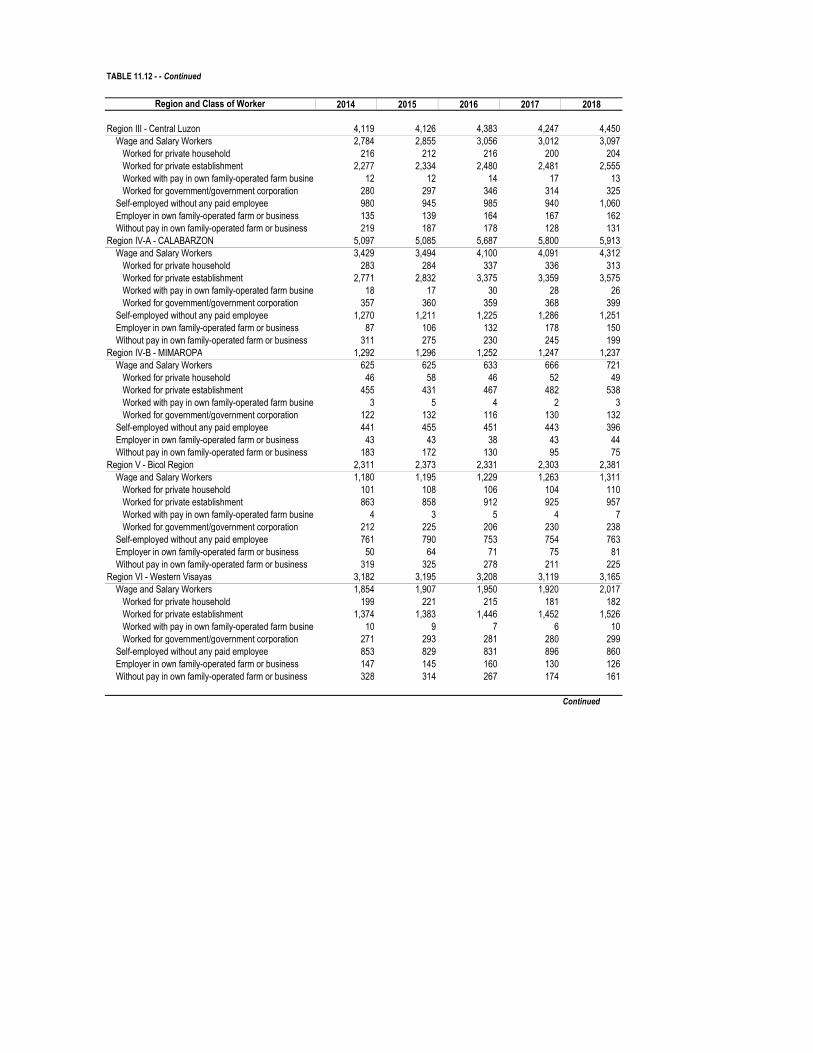
TABLE 11.12 - - Continued
2014 2015 2016 2017 2018
Region III - Central Luzon 4,119 4,126 4,383 4,247 4,4502,784 2,855 3,056 3,012 3,097
216 212 216 200 2042,277 2,334 2,480 2,481 2,555
Worked with pay in own family-operated farm business 12 12 14 17 13280 297 346 314 325980 945 985 940 1,060
Employer in own family-operated farm or business 135 139 164 167 162219 187 178 128 131
Region IV-A - CALABARZON 5,097 5,085 5,687 5,800 5,9133,429 3,494 4,100 4,091 4,312
283 284 337 336 3132,771 2,832 3,375 3,359 3,575
Worked with pay in own family-operated farm business 18 17 30 28 26357 360 359 368 399
1,270 1,211 1,225 1,286 1,251Employer in own family-operated farm or business 87 106 132 178 150
311 275 230 245 199Region IV-B - MIMAROPA 1,292 1,296 1,252 1,247 1,237
625 625 633 666 72146 58 46 52 49
455 431 467 482 538 Worked with pay in own family-operated farm business 3 5 4 2 3
122 132 116 130 132441 455 451 443 396
Employer in own family-operated farm or business 43 43 38 43 44183 172 130 95 75
Region V - Bicol Region 2,311 2,373 2,331 2,303 2,3811,180 1,195 1,229 1,263 1,311
101 108 106 104 110863 858 912 925 957
Worked with pay in own family-operated farm business 4 3 5 4 7212 225 206 230 238761 790 753 754 763
Employer in own family-operated farm or business 50 64 71 75 81319 325 278 211 225
Region VI - Western Visayas 3,182 3,195 3,208 3,119 3,1651,854 1,907 1,950 1,920 2,017
199 221 215 181 1821,374 1,383 1,446 1,452 1,526
Worked with pay in own family-operated farm business 10 9 7 6 10271 293 281 280 299853 829 831 896 860
Employer in own family-operated farm or business 147 145 160 130 126328 314 267 174 161
Continued
Wage and Salary Workers Worked for private household Worked for private establishment
Worked for government/government corporationSelf-employed without any paid employee
Without pay in own family-operated farm or business
Wage and Salary Workers Worked for private household Worked for private establishment
Worked for government/government corporationSelf-employed without any paid employee
Without pay in own family-operated farm or business
Wage and Salary Workers Worked for private household Worked for private establishment
Worked for government/government corporationSelf-employed without any paid employee
Without pay in own family-operated farm or business
Wage and Salary Workers Worked for private household Worked for private establishment
Worked for government/government corporationSelf-employed without any paid employee
Without pay in own family-operated farm or business
Wage and Salary Workers Worked for private household Worked for private establishment
Worked for government/government corporationSelf-employed without any paid employee
Without pay in own family-operated farm or business
Region and Class of Worker

TABLE 11.12 - - Continued
2014 2015 2016 2017 2018
Region VII - Central Visayas 3,114 3,215 3,234 3,224 3,0751,764 1,836 1,864 1,945 2,014
184 188 190 184 1911,341 1,392 1,436 1,521 1,558
Worked with pay in own family-operated farm business 10 10 7 7 10229 247 231 233 255945 980 1,011 995 853
Employer in own family-operated farm or business 36 34 38 64 57368 365 321 221 150
Region VIII - Eastern Visayas 1,045 1,011 1,790 1,778 1,851449 477 932 916 973
42 47 94 91 92302 313 653 613 643
Worked with pay in own family-operated farm business 2 1 4 4 7103 116 181 208 232398 371 634 647 647
Employer in own family-operated farm or business 14 16 36 58 55184 146 188 157 176
Region IX - Zamboanga Peninsula 1,400 1,384 1,540 1,437 1,414645 653 724 687 693
50 51 61 47 43454 452 510 486 482
Worked with pay in own family-operated farm business 2 2 2 4 3139 147 151 151 165460 456 550 557 538
Employer in own family-operated farm or business 47 38 46 39 61247 237 219 153 122
Region X - Northern Mindanao 2,015 1,989 2,004 1,966 2,1071,019 1,063 1,135 1,110 1,182
82 92 86 73 87777 806 868 856 902
Worked with pay in own family-operated farm business 2 4 5 4 7158 161 177 178 185622 593 610 620 615
Employer in own family-operated farm or business 48 45 43 57 82327 288 217 179 229
Region XI - Davao Region 1,946 1,925 2,016 2,052 2,0221,112 1,166 1,281 1,268 1,301
76 79 87 71 76886 926 1,020 1,037 1,057
Worked with pay in own family-operated farm business 9 8 11 7 5140 153 163 153 163564 527 546 614 580
Employer in own family-operated farm or business 75 74 79 79 75195 157 110 92 65
Continued
Without pay in own family-operated farm or business
Without pay in own family-operated farm or business
Wage and Salary Workers Worked for private household Worked for private establishment
Worked for government/government corporationSelf-employed without any paid employee
Without pay in own family-operated farm or business
Wage and Salary Workers Worked for private household Worked for private establishment
Worked for government/government corporationSelf-employed without any paid employee
Without pay in own family-operated farm or business
Wage and Salary Workers Worked for private household Worked for private establishment
Worked for government/government corporationSelf-employed without any paid employee
Without pay in own family-operated farm or business
Wage and Salary Workers Worked for private household Worked for private establishment
Worked for government/government corporationSelf-employed without any paid employee
Region and Class of Worker
Wage and Salary Workers Worked for private household Worked for private establishment
Worked for government/government corporationSelf-employed without any paid employee

TABLE 11.12 - - Concluded
2014 2015 2016 2017 2018
Region XII - SOCCSKSARGEN 1,735 1,756 1,854 1,843 1,867850 877 963 945 1,013
55 49 56 50 51659 686 755 744 800
Worked with pay in own family-operated farm business 5 5 4 3 5132 137 148 149 157597 590 618 643 656
Employer in own family-operated farm or business 48 50 59 71 51240 238 214 184 147
Region XIII - Caraga 1,108 1,092 1,086 1,087 1,165546 544 564 559 615
46 44 42 41 45376 372 393 392 429
Worked with pay in own family-operated farm business 2 4 3 3 4122 125 126 123 137362 357 368 379 378
Employer in own family-operated farm or business 23 26 22 34 37177 165 133 116 135
Autonomous Region in Muslim Mindanao 1,295 1,259 1,140 1,029 1,071228 217 228 212 258
5 7 9 8 9144 140 139 125 169
Worked with pay in own family-operated farm business 3 3 1 0 175 67 78 80 78
695 715 651 656 662Employer in own family-operated farm or business 12 10 17 38 33
361 316 245 123 117
Notes: 1. Data are averages of four survey rounds of the Labor Force Survey except for 2014 wherein data for this year
refer to the average of April, July and October survey rounds.
2. Details may not add up to totals due to rounding.3. Data for 2014 refer to the average of April, July and October survey rounds.
The estimates for these rounds exclude data of Leyte province while that of January exclude Region VIII.
4. Data for 2015 refer to the average of the four survey rounds that exclude Leyte. These should not be compared with the 2014
annualized data as the latter exclude the January round. The use of the 4 survey rounds for the 2015 annualized data was based
on results of a referendum conducted among members of the IAC on Labor and Productivity Statistics.
5. Starting April 2016 round, the Labor Force Survey (LFS) adopted the 2013 Master Sample design as well as the population projections
based on the 2010 Census of Population and Housing (2010 CPH) while previous survey rounds were derived using the 2000 CPH
population projections.
6. Annualized data for 2016 was computed as the average of the four survey rounds using the January 2016 round that were based on
the 2010 CPH population projections.
7. For more information about the changes on the survey that may have affected the estimates, please refer to the
Explanatory Notes on the Labor Force Survey (LFS) at the last part of this book.
Source of basic data: Philippine Statistics Authority, Labor Force Survey, Public Use Files
Self-employed without any paid employee
Without pay in own family-operated farm or business
Self-employed without any paid employee
Without pay in own family-operated farm or business
Wage and Salary Workers Worked for private household Worked for private establishment
Worked for government/government corporation
Self-employed without any paid employee
Without pay in own family-operated farm or business
Wage and Salary Workers Worked for private household Worked for private establishment
Worked for government/government corporation
Region and Class of Worker
Wage and Salary Workers Worked for private household Worked for private establishment
Worked for government/government corporation

2014 2015 2016 2017
38,651 38,741 40,998 40,344Wage and Salary Workers 22,407 22,960 25,240 25,209
Worked for private household 1,925 1,981 2,096 1,925Worked for private establishment 17,319 17,669 19,693 19,776Worked with pay in own family-operated farm or business 120 112 132 119Worked for government/government corporation 3,043 3,197 3,317 3,388
Self-employed without any paid employee 10,869 10,705 11,097 11,198Employer in own family-operated farm or business 1,210 1,212 1,376 1,491Without pay in own family-operated farm or business 4,166 3,863 3,285 2,437
Agriculture, Hunting and Forestry 10,405 9,973 9,801 9,066Wage and Salary Workers 3,220 3,153 3,254 2,891
Worked for private household - - 1 0Worked for private establishment 3,202 3,131 3,235 2,870Worked with pay in own family-operated farm or business 18 22 16 21Worked for government/government corporation - * 1 0
Self-employed without any paid employee 3,967 3,816 3,890 3,969Employer in own family-operated farm or business 679 686 754 831Without pay in own family-operated farm or business 2,538 2,318 1,904 1,376
Fishing and Aquaculture 1,396 1,321 1,263 1,194Wage and Salary Workers 318 294 316 262
Worked for private household - - - 0Worked for private establishment 313 288 311 258Worked with pay in own family-operated farm or business 5 6 5 4Worked for government/government corporation - - - 0
Self-employed without any paid employee 794 763 726 796Employer in own family-operated farm or business 27 30 34 32Without pay in own family-operated farm or business 257 233 187 104
Mining and Quarrying 239 235 219 203Wage and Salary Workers 185 177 186 171
Worked for private household - - - 0Worked for private establishment 184 176 185 169Worked with pay in own family-operated farm or business 1 * 2 2Worked for government/government corporation * - - 0
Self-employed without any paid employee 39 46 24 28Employer in own family-operated farm or business 4 3 2 3Without pay in own family-operated farm or business 11 9 7 0
Manufacturing 3,212 3,209 3,404 3,481Wage and Salary Workers 2,481 2,496 2,709 2,879
Worked for private household - - - 0Worked for private establishment 2,460 2,480 2,686 2,863Worked with pay in own family-operated farm or business 21 16 22 17Worked for government/government corporation * * * 0
Self-employed without any paid employee 493 476 482 427Employer in own family-operated farm or business 72 75 87 100Without pay in own family-operated farm or business 167 162 126 75
Electricity, Gas, Steam and Air Conditioning Supply 86 83 91 80Wage and Salary Workers 86 83 91 0
Continued
TABLE 11.13 Employed Persons by Major Industry Group and Class of Worker, Philippines: 2014 to 2017 (Based on Past Week Reference Period; In Thousands)
Major Industry Group and Class of Worker
All Industries

TABLE 11.13 - - Continued
2014 2015 2016 2017
Worked for private household - - - 0Worked for private establishment 74 74 82 73Worked with pay in own family-operated farm or business - - - 0Worked for government/government corporation 11 10 9 7
Self-employed without any paid employee - * - 0Employer in own family-operated farm or business * - * 0Without pay in own family-operated farm or business - - - 0
Water Supply; Sewerage, Waste Management and Remediation Activities 51 52 68 69Wage and Salary Workers 49 49 67 69
Worked for private household - - - 0Worked for private establishment 31 32 49 51Worked with pay in own family-operated farm or business - 1 * 0Worked for government/government corporation 18 16 18 18
Self-employed without any paid employee 1 3 * 0Employer in own family-operated farm or business * * * 0Without pay in own family-operated farm or business - * * 0
Construction 2,578 2,697 3,378 3,537Wage and Salary Workers 2,506 2,647 3,310 3,489
Worked for private household - - 1 0Worked for private establishment 2,501 2,644 3,306 3,485Worked with pay in own family-operated farm or business 5 3 3 5Worked for government/government corporation - - * 0
Self-employed without any paid employee 45 27 38 16Employer in own family-operated farm or business 23 19 26 28Without pay in own family-operated farm or business 4 3 4 3
Wholesale and Retail Trade; Repair of Motor Vehicles and Motorcycles 7,248 7,313 8,039 7,900Wage and Salary Workers 2,723 2,821 3,169 3,104
Worked for private household - - - 0Worked for private establishment 2,679 2,789 3,121 3,058Worked with pay in own family-operated farm or business 44 32 47 46Worked for government/government corporation - - * 0
Self-employed without any paid employee 3,338 3,335 3,693 3,751Employer in own family-operated farm or business 224 231 295 317Without pay in own family-operated farm or business 964 926 882 728
Transportation and Storage 2,686 2,781 3,038 3,127Wage and Salary Workers 1,457 1,490 1,624 1,658
Worked for private household - - - 0Worked for private establishment 1,445 1,477 1,609 1,649Worked with pay in own family-operated farm or business 4 5 7 5Worked for government/government corporation 7 8 7 4
Self-employed without any paid employee 1,182 1,247 1,363 1,427Employer in own family-operated farm or business 35 32 41 34Without pay in own family-operated farm or business 12 12 11 8
Accommodation and Food Service Activities 1,694 1,716 1,777 1,740Wage and Salary Workers 1,028 1,069 0 0
Worked for private household - - - 0Worked for private establishment 1,016 1,057 1,198 1,228Worked with pay in own family-operated farm or business 11 12 21 13Worked for government/government corporation - - - 0
Continued
Major Industry Group and Class of Worker

TABLE 11.13 - - Continued
2014 2015 2016 2017
Self-employed without any paid employee 428 424 350 289Employer in own family-operated farm or business 68 65 75 92Without pay in own family-operated farm or business 171 158 133 118
Information and Communication 352 381 366 397Wage and Salary Workers 272 304 294 337
Worked for private household - * - 0Worked for private establishment 271 301 292 335Worked with pay in own family-operated farm or business 1 2 1 0Worked for government/government corporation * 1 * 1
Self-employed without any paid employee 54 55 55 45Employer in own family-operated farm or business 12 9 8 6Without pay in own family-operated farm or business 14 13 10 9
Financial and Insurance Activities 491 498 514 506Wage and Salary Workers 470 475 491 491
Worked for private household - - - 0Worked for private establishment 454 455 474 468Worked with pay in own family-operated farm or business * 1 - 1Worked for government/government corporation 16 19 17 23
Self-employed without any paid employee 18 17 18 12Employer in own family-operated farm or business 3 3 2 1Without pay in own family-operated farm or business 1 2 3 2
Real Estate Activities 168 184 193 186Wage and Salary Workers 106 113 143 143
Worked for private household - - - 0Worked for private establishment 106 112 143 142Worked with pay in own family-operated farm or business * 1 - 0Worked for government/government corporation - * * 1
Self-employed without any paid employee 58 63 47 42Employer in own family-operated farm or business 2 5 2 1Without pay in own family-operated farm or business 4 5 4 0
Professional, Scientific and Technical Activities 209 208 213 247Wage and Salary Workers 169 165 178 223
Worked for private household - - - 0Worked for private establishment 166 163 176 222Worked with pay in own family-operated farm or business 1 1 2 1Worked for government/government corporation 2 1 1 0
Self-employed without any paid employee 26 30 24 21Employer in own family-operated farm or business 10 8 6 2Without pay in own family-operated farm or business 4 5 4 1
Administrative and Support Service Activities 1,085 1,139 1,371 1,475Wage and Salary Workers 1,040 1,096 1,347 1,451
Worked for private household - - - 0Worked for private establishment 1,039 1,095 1,346 1,450Worked with pay in own family-operated farm or business 1 2 1 1Worked for government/government corporation - - * 0
Self-employed without any paid employee 28 27 14 14Employer in own family-operated farm or business 12 9 7 7Without pay in own family-operated farm or business 5 7 2 3
Continued
Major Industry Group and Class of Worker
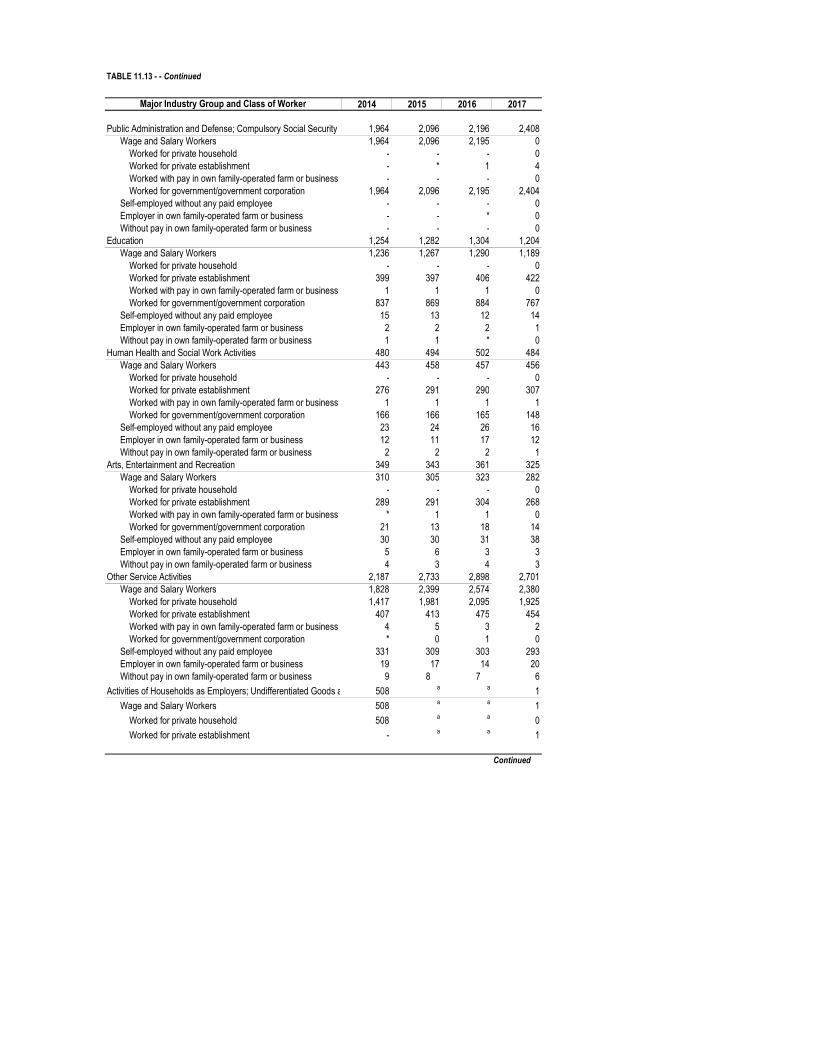
TABLE 11.13 - - Continued
2014 2015 2016 2017
Public Administration and Defense; Compulsory Social Security 1,964 2,096 2,196 2,408Wage and Salary Workers 1,964 2,096 2,195 0
Worked for private household - - - 0Worked for private establishment - * 1 4Worked with pay in own family-operated farm or business - - - 0Worked for government/government corporation 1,964 2,096 2,195 2,404
Self-employed without any paid employee - - - 0Employer in own family-operated farm or business - - * 0Without pay in own family-operated farm or business - - - 0
Education 1,254 1,282 1,304 1,204Wage and Salary Workers 1,236 1,267 1,290 1,189
Worked for private household - - - 0Worked for private establishment 399 397 406 422Worked with pay in own family-operated farm or business 1 1 1 0Worked for government/government corporation 837 869 884 767
Self-employed without any paid employee 15 13 12 14Employer in own family-operated farm or business 2 2 2 1Without pay in own family-operated farm or business 1 1 * 0
Human Health and Social Work Activities 480 494 502 484Wage and Salary Workers 443 458 457 456
Worked for private household - - - 0Worked for private establishment 276 291 290 307Worked with pay in own family-operated farm or business 1 1 1 1Worked for government/government corporation 166 166 165 148
Self-employed without any paid employee 23 24 26 16Employer in own family-operated farm or business 12 11 17 12Without pay in own family-operated farm or business 2 2 2 1
Arts, Entertainment and Recreation 349 343 361 325Wage and Salary Workers 310 305 323 282
Worked for private household - - - 0Worked for private establishment 289 291 304 268Worked with pay in own family-operated farm or business * 1 1 0Worked for government/government corporation 21 13 18 14
Self-employed without any paid employee 30 30 31 38Employer in own family-operated farm or business 5 6 3 3Without pay in own family-operated farm or business 4 3 4 3
Other Service Activities 2,187 2,733 2,898 2,701Wage and Salary Workers 1,828 2,399 2,574 2,380
Worked for private household 1,417 1,981 2,095 1,925Worked for private establishment 407 413 475 454Worked with pay in own family-operated farm or business 4 5 3 2Worked for government/government corporation * 0 1 0
Self-employed without any paid employee 331 309 303 293Employer in own family-operated farm or business 19 17 14 20Without pay in own family-operated farm or business 9 8 7 6
Activities of Households as Employers; Undifferentiated Goods and Service-producing Activities of Households for Own Use508 a a 1
Wage and Salary Workers 508 a a 1
Worked for private household 508 a a 0
Worked for private establishment - a a 1
Continued
Major Industry Group and Class of Worker

TABLE 11.13 - - Concluded
2014 2015 2016 2017
Worked with pay in own family-operated farm or business - a a 0
Worked for government/government corporation - a a 0
Self-employed without any paid employee - a a 0
Employer in own family-operated farm or business - a a 0
Without pay in own family-operated farm or business - a a 0Activities of Extraterritorial Organizations and Bodies 7 3 3 2
Wage and Salary Workers 7 3 3 2Worked for private household - - - 0Worked for private establishment 7 3 3 2Worked with pay in own family-operated farm or business - - - 0Worked for government/government corporation - - - 0
Self-employed without any paid employee - - - 0Employer in own family-operated farm or business - - - 0Without pay in own family-operated farm or business - - - 0
Notes: 1. Data are averages of four survey rounds of the Labor Force Survey except for 2014.
2. Details may not add up to totals due to rounding.
3. Industry grouping is in accordance with the 2009 Philippine Standard Industrial Classification (PSOC).
4. Data for 2014 refer to the average of April, July and October survey rounds.
The estimate for these rounds exclude data of Leyte province while that of January exclude Region VIII.
5. Data for 2015 refer to the average of the four survey rounds that exclude Leyte. These should not be compared with the 2014
annualized data as the latter exclude the January round. The use of the 4 survey rounds for the 2015 annualized data was based
on results of a referendum conducted among members of the IAC on Labor and Productivity Statistics.
6. Starting April 2016 round, the Labor Force Survey (LFS) adopted the 2013 Master Sample design as well as the population projections
based on the 2010 Census of Population and Housing (2010 CPH) while previous survey rounds were derived using the 2000 CPH
population projections.
7. Annualized data for 2016 was computed as the average of the four survey rounds using the January 2016 round that were based on
the 2010 CPH population projections. 8. For more information about the changes on the survey that may have affected the estimates, please refer to the Explanatory
Notes on the Labor Force Survey (LFS) at the last part of this book.* Less than 500.a Starting 2015, Activities of Households as Employers, Undifferentiated Goods, and Service-producing Activities of Households for Own Use
Service Activities is included in Other Service Activities.
Source: Philippine Statistics Authority, Labor Force Survey
Major Industry Group and Class of Worker

Major Industry Group and Hours Worked 2015 2016 2017 2018
All Industries 38,741 40,998 40,334 41,157 Under 20 Hours 5,477 5,298 5,577 5,307 20-29 Hours 4,331 4080 4,138 3,752 30-39 Hours 4,064 3,984 3,935 3,602 40 Hours and Over 24,407 27,239 26,314 28,141 Did Not Work/Not Reported 461 398 370 354
Agriculture, Hunting and Forestry 9,973 9,801 9,066 8,872 Under 20 Hours 2,630 2,454 2,545 2,318 20-29 Hours 2,114 2,003 1,889 1,671 30-39 Hours 1,902 1,818 1,642 1,490 40 Hours and Over 3,195 3,386 2,902 3,305 Did Not Work/Not Reported 132 141 88 88
Fishing and Aquaculture 1,321 1,263 1,194 1,126 Under 20 Hours 256 222 264 203 20-29 Hours 274 218 211 198 30-39 Hours 270 253 241 202 40 Hours and Over 493 554 449 506 Did Not Work/Not Reported 28 16 29 17
Mining and Quarrying 235 219 203 207 Under 20 Hours 19 16 25 15 20-29 Hours 19 19 18 14 30-39 Hours 26 26 23 18 40 Hours and Over 168 157 135 157 Did Not Work/Not Reported 3 2 3 3
Manufacturing 3,209 3,404 3,481 3,625 Under 20 Hours 281 241 270 255 20-29 Hours 255 213 246 229 30-39 Hours 250 233 243 232 40 Hours and Over 2,386 2,694 2,692 2,883 Did Not Work/Not Reported 37 22 31 26
Electricity, Gas, Steam and Air Conditioning Supply 83 91 80 88 Under 20 Hours 2 3 1 2 20-29 Hours 2 1 2 4 30-39 Hours 2 3 2 2 40 Hours and Over 76 84 74 80 Did Not Work/Not Reported 1 1 0 0
Water Supply; Sewerage, Waste Management and Remediation Activities 52 68 69 61 Under 20 Hours 2 3 4 5 20-29 Hours 3 3 6 5 30-39 Hours 4 4 3 3 40 Hours and Over 43 57 55 47 Did Not Work/Not Reported * 1 1 1
Construction 2,697 3,378 3,537 3,865 Under 20 Hours 158 149 196 182 20-29 Hours 179 182 234 199 30-39 Hours 152 147 206 176 40 Hours and Over 2,173 2,871 2,866 3,277
Continued
TABLE 11.14 Employed Persons by Major Industry Group and Hours Worked During the Past Week,Philippines: 2015 to 2018(Based on Past Week Reference Period; In Thousands)
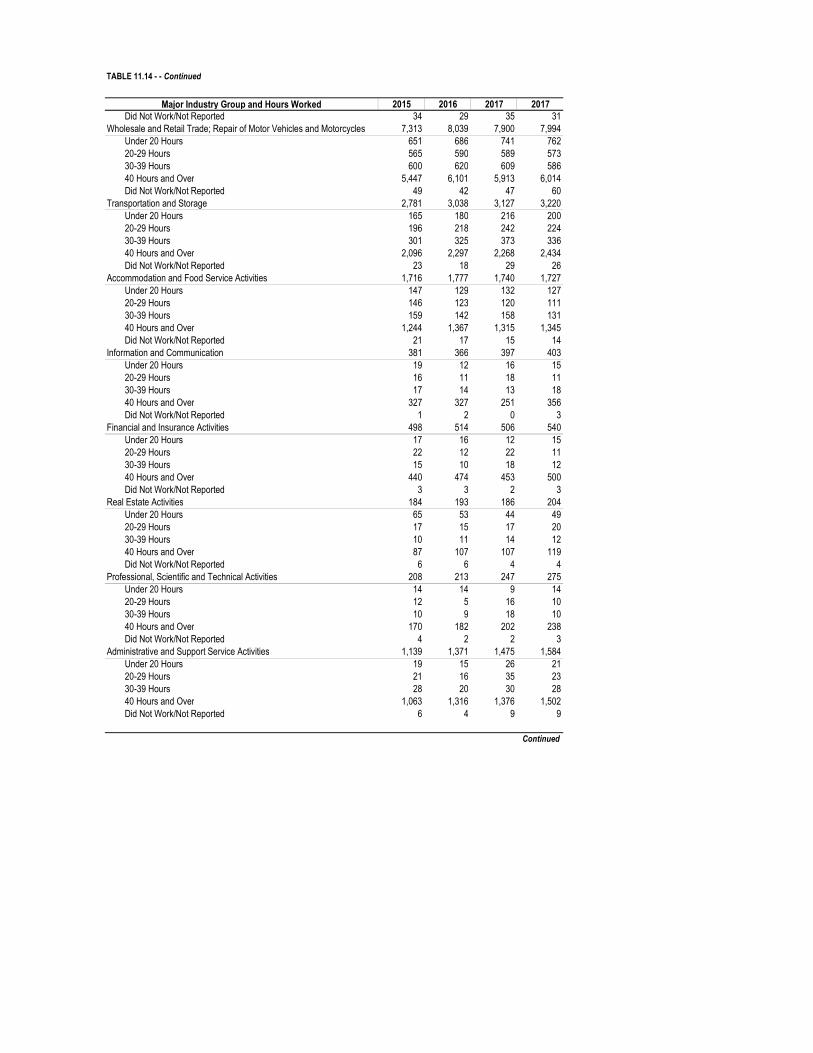
TABLE 11.14 - - Continued
Major Industry Group and Hours Worked 2015 2016 2017 2017 Did Not Work/Not Reported 34 29 35 31
Wholesale and Retail Trade; Repair of Motor Vehicles and Motorcycles 7,313 8,039 7,900 7,994 Under 20 Hours 651 686 741 762 20-29 Hours 565 590 589 573 30-39 Hours 600 620 609 586 40 Hours and Over 5,447 6,101 5,913 6,014 Did Not Work/Not Reported 49 42 47 60
Transportation and Storage 2,781 3,038 3,127 3,220 Under 20 Hours 165 180 216 200 20-29 Hours 196 218 242 224 30-39 Hours 301 325 373 336 40 Hours and Over 2,096 2,297 2,268 2,434 Did Not Work/Not Reported 23 18 29 26
Accommodation and Food Service Activities 1,716 1,777 1,740 1,727 Under 20 Hours 147 129 132 127 20-29 Hours 146 123 120 111 30-39 Hours 159 142 158 131 40 Hours and Over 1,244 1,367 1,315 1,345 Did Not Work/Not Reported 21 17 15 14
Information and Communication 381 366 397 403 Under 20 Hours 19 12 16 15 20-29 Hours 16 11 18 11 30-39 Hours 17 14 13 18 40 Hours and Over 327 327 251 356 Did Not Work/Not Reported 1 2 0 3
Financial and Insurance Activities 498 514 506 540 Under 20 Hours 17 16 12 15 20-29 Hours 22 12 22 11 30-39 Hours 15 10 18 12 40 Hours and Over 440 474 453 500 Did Not Work/Not Reported 3 3 2 3
Real Estate Activities 184 193 186 204 Under 20 Hours 65 53 44 49 20-29 Hours 17 15 17 20 30-39 Hours 10 11 14 12 40 Hours and Over 87 107 107 119 Did Not Work/Not Reported 6 6 4 4
Professional, Scientific and Technical Activities 208 213 247 275 Under 20 Hours 14 14 9 14 20-29 Hours 12 5 16 10 30-39 Hours 10 9 18 10 40 Hours and Over 170 182 202 238 Did Not Work/Not Reported 4 2 2 3
Administrative and Support Service Activities 1,139 1,371 1,475 1,584 Under 20 Hours 19 15 26 21 20-29 Hours 21 16 35 23 30-39 Hours 28 20 30 28 40 Hours and Over 1,063 1,316 1,376 1,502 Did Not Work/Not Reported 6 4 9 9
Continued

TABLE 11.14 - - Continued
Major Industry Group and Hours Worked 2015 2016 2017 2017
Public Administration and Defense; Compulsory Social Security 2,096 2,196 2,408 2,559 Under 20 Hours 306 337 333 358 20-29 Hours 141 113 149 141 30-39 Hours 73 72 88 90 40 Hours and Over 1,561 1,655 1,819 1,952 Did Not Work/Not Reported 17 18 19 19
Education 1,282 1,304 1,204 1,197 Under 20 Hours 73 58 53 56 20-29 Hours 65 52 53 36 30-39 Hours 42 47 44 41 40 Hours and Over 1,029 1,099 1,022 1,041 Did Not Work/Not Reported 74 48 33 23
Human Health and Social Work Activities 494 502 484 518 Under 20 Hours 18 15 21 17 20-29 Hours 16 12 16 13 30-39 Hours 19 22 20 16 40 Hours and Over 438 447 424 467 Did Not Work/Not Reported 3 6 4 4
Arts, Entertainment and Recreation 343 361 325 363 Under 20 Hours 52 59 52 59 20-29 Hours 48 47 40 42 30-39 Hours 34 29 23 29 40 Hours and Over 205 223 207 230 Did Not Work/Not Reported 4 4 2 3
Other Service Activities 2,733 2,898 2,700 2,724 Under 20 Hours 581 636 618 632 20-29 Hours 221 228 215 217 30-39 Hours 151 179 169 170 40 Hours and Over 1,764 1,837 1,683 1,686 Did Not Work/Not Reported 16 17 16 19
Activities of Households as Employers; Undifferentiated Goods and Service-producing Activities of Households for Own Use a a 1 -
Under 20 Hours a a 0 -
20-29 Hours a a 1 -
30-39 Hours a a 0 -
40 Hours and Over a a 1 -
Did Not Work/Not Reported a a 0 -Activities of Extraterritorial Organizations and Bodies 3 3 2 4
Under 20 Hours * - 0 0 20-29 Hours - - 0 0 30-39 Hours * - 0 0 40 Hours and Over 3 3 2 3 Did Not Work/Not Reported - - 0 0
Notes: 1. Data are averages of four survey rounds of the Labor Force Survey except for 2014. Continued
2. Details may not add up to totals due to rounding.
3. Industry grouping is in accordance with the 2009 Philippine Standard Industrial Classification (PSIC).
4. Data for 2014 refer to the average of April, July and October survey rounds.
The estimates for these rounds exclude data of Leyte province while that of January exclude Region VIII.

TABLE 11.14 - - Concluded
5. Data for 2015 refer to the average of the four survey rounds that exclude Leyte. These should not be compared with the 2014
annualized data as the latter exclude the January round. The use of the 4 survey rounds for the 2015 annualized data was based
on results of a referendum conducted among members of the IAC on Labor and Productivity Statistics.
6. Starting April 2016 round, the Labor Force Survey (LFS) adopted the 2013 Master Sample design as well as the population projections
based on the 2010 Census of Population and Housing (2010 CPH) while previous survey rounds were derived using the 2000 CPH
population projections.
7. Annualized data for 2016 was computed as the average of the four survey rounds using the January 2016 round that were based on
the 2010 CPH population projections. 8. For more information about the changes on the survey that may have affected the estimates, please refer to the
Explanatory Notes on the Labor Force Survey (LFS) at the last part of this book.
* Less than 500.
a Starting 2015, Activities of Households as Employers; Undifferentiated Goods and Service-producing Activities of Households for Own Use
is included in Other Service Activities
Source of basic data: Philippine Statistics Authority, Labor Force Survey, Public Use Files
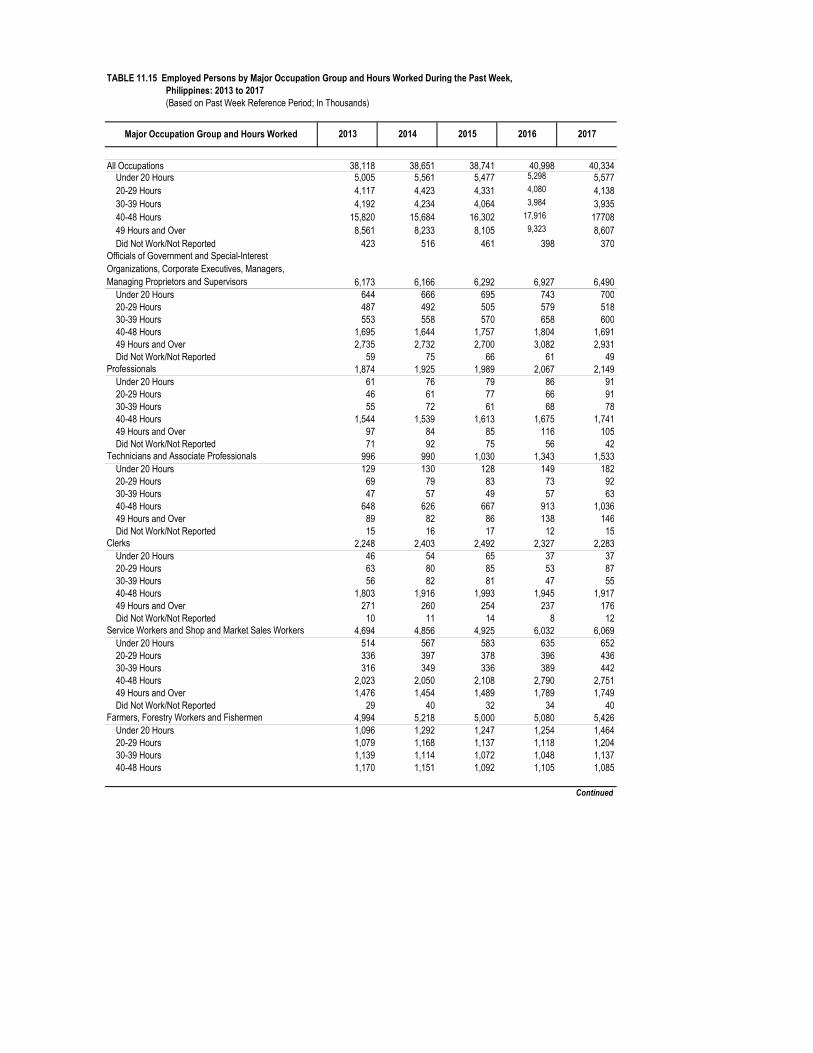
All Occupations 38,118 38,651 38,741 40,998 40,334Under 20 Hours 5,005 5,561 5,477 5,298 5,57720-29 Hours 4,117 4,423 4,331 4,080 4,13830-39 Hours 4,192 4,234 4,064 3,984 3,93540-48 Hours 15,820 15,684 16,302 17,916 1770849 Hours and Over 8,561 8,233 8,105 9,323 8,607Did Not Work/Not Reported 423 516 461 398 370
Officials of Government and Special-Interest Organizations, Corporate Executives, Managers, Managing Proprietors and Supervisors 6,173 6,166 6,292 6,927 6,490
Under 20 Hours 644 666 695 743 70020-29 Hours 487 492 505 579 51830-39 Hours 553 558 570 658 60040-48 Hours 1,695 1,644 1,757 1,804 1,69149 Hours and Over 2,735 2,732 2,700 3,082 2,931Did Not Work/Not Reported 59 75 66 61 49
Professionals 1,874 1,925 1,989 2,067 2,149Under 20 Hours 61 76 79 86 9120-29 Hours 46 61 77 66 9130-39 Hours 55 72 61 68 7840-48 Hours 1,544 1,539 1,613 1,675 1,74149 Hours and Over 97 84 85 116 105Did Not Work/Not Reported 71 92 75 56 42
Technicians and Associate Professionals 996 990 1,030 1,343 1,533Under 20 Hours 129 130 128 149 18220-29 Hours 69 79 83 73 9230-39 Hours 47 57 49 57 6340-48 Hours 648 626 667 913 1,03649 Hours and Over 89 82 86 138 146Did Not Work/Not Reported 15 16 17 12 15
Clerks 2,248 2,403 2,492 2,327 2,283Under 20 Hours 46 54 65 37 3720-29 Hours 63 80 85 53 8730-39 Hours 56 82 81 47 5540-48 Hours 1,803 1,916 1,993 1,945 1,91749 Hours and Over 271 260 254 237 176Did Not Work/Not Reported 10 11 14 8 12
Service Workers and Shop and Market Sales Workers 4,694 4,856 4,925 6,032 6,069Under 20 Hours 514 567 583 635 65220-29 Hours 336 397 378 396 43630-39 Hours 316 349 336 389 44240-48 Hours 2,023 2,050 2,108 2,790 2,75149 Hours and Over 1,476 1,454 1,489 1,789 1,749Did Not Work/Not Reported 29 40 32 34 40
Farmers, Forestry Workers and Fishermen 4,994 5,218 5,000 5,080 5,426Under 20 Hours 1,096 1,292 1,247 1,254 1,46420-29 Hours 1,079 1,168 1,137 1,118 1,20430-39 Hours 1,139 1,114 1,072 1,048 1,13740-48 Hours 1,170 1,151 1,092 1,105 1,085
Continued
TABLE 11.15 Employed Persons by Major Occupation Group and Hours Worked During the Past Week, Philippines: 2013 to 2017 (Based on Past Week Reference Period; In Thousands)
Major Occupation Group and Hours Worked 2013 2014 2015 2016 2017

TABLE 11.15 - - Concluded
49 Hours and Over 436 404 369 467 472Did Not Work/Not Reported 74 88 82 88 64
Trades and Related Workers 2,600 2,626 2,592 3,113 3,198Under 20 Hours 168 197 195 194 25920-29 Hours 175 187 196 190 24630-39 Hours 168 191 178 185 22340-48 Hours 1,682 1,675 1,684 2,070 2,03749 Hours and Over 379 331 307 446 401Did Not Work/Not Reported 28 44 32 27 31
Plant and Machine Operators and Assemblers 2,027 2,001 2,083 2,352 2,552Under 20 Hours 68 75 74 93 12520-29 Hours 89 98 107 107 14330-39 Hours 128 137 149 163 21740-48 Hours 985 959 1,041 1,155 1,23649 Hours and Over 742 716 695 820 808Did Not Work/Not Reported 16 16 17 14 24
Laborers and Unskilled Workers 12,403 12,348 12,223 11,500 10,538Under 20 Hours 2,272 2,495 2,400 2,080 2,06420-29 Hours 1,766 1,855 1,756 1,476 1,31930-39 Hours 1,725 1,665 1,562 1,353 1,11740-48 Hours 4,217 4,059 4,287 4,342 4,16949 Hours and Over 2,306 2,142 2,094 2,155 1,778Did Not Work/Not Reported 119 132 125 93 91
Special Occupations 108 119 114 99 95Under 20 Hours 8 8 10 3 320-29 Hours 7 6 7 3 230-39 Hours 7 9 7 3 240-48 Hours 53 65 60 56 4549 Hours and Over 30 29 28 32 41Did Not Work/Not Reported 2 1 2 2 2
Notes: 1. Data are averages of four survey rounds of the Labor Force Survey except for 2014.
2. Details may not add up to totals due to rounding.
3. Occupational grouping is in accordance with the 1992 Philippine Standard Occupational Classification (PSOC).
4. Data for 2014 refer to the average of April, July and October survey rounds.
The estimates for these rounds exclude data of Leyte province while that of January exclude Region VIII.
5. Data for 2015 refer to the average of the four survey rounds that exclude Leyte. These should not be compared with the 2014
annualized data as the latter exclude the January round. The use of the four survey rounds for the 2015 annualized data was based
on results of a referendum conducted among members of the IAC on Labor and Productivity Statistics.
6. For more information about the changes on the survey that may have affected the estimates, please refer to the Explanatory Notes on
the Labor Force Survey (LFS) at the last part of this book.
Source of basic data: Philippine Statistics Authority, Labor Force Survey, Public Use Files
Major Occupation Group and Hours Worked 2013 2014 2015 2016 2017

All Classes of Wrokers 38,651 38,741 40,998 40,334 41,157 Under 20 Hours 5,561 5,477 5,298 5,577 5,307 20-29 Hours 4,423 4,331 4,080 4,138 3,752 30-39 Hours 4,234 4,064 3,984 3,935 3,602 40 Hours and Over 23,917 24,407 27,239 26,314 28,141 Did Not Work/Not Reported 516 461 398 370 354Wage and Salary Workers 22,407 22,960 25,240 25,209 26,257 Under 20 Hours 2,041 2,095 2,107 2,218 2,237 20-29 Hours 1,661 1,667 1,579 1,755 1,560 30-39 Hours 1,534 1,481 1,487 1,566 1,506 40 Hours and Over 16,882 17,458 19,857 19,448 20,759 Did Not Work/Not Reported 290 258 210 222 195Worked for Private Household 1,925 1,981 2,096 1,925 1,945 Under 20 Hours 322 352 401 392 403 20-29 Hours 121 130 139 130 136 30-39 Hours 84 92 107 96 106 40 Hours and Over 1,388 1,400 1,439 1,298 1,290 Did Not Work/Not Reported 10 7 11 8 10 Worked for Private Establishment 17,319 17,669 19,694 19,776 20,609 Under 20 Hours 1,387 1,379 1,330 1,444 1,423 20-29 Hours 1,371 1,346 1,288 1,429 1,243 30-39 Hours 1,326 1,277 1,267 1,340 1,271 40 Hours and Over 13,042 13,491 15,670 15,393 16,525 Did Not Work/Not Reported 193 176 139 170 146Worked with Pay in Own Family-Operated Farm or Business 120 112 132 119 129 Under 20 Hours 10 13 9 15 18 20-29 Hours 12 10 9 12 13 30-39 Hours 13 13 12 14 13 40 Hours and Over 85 75 102 77 82 Did Not Work/Not Reported 1 * * 2 3Worked for Government/Government Corporation 3,043 3,197 3,317 3,388 3,574 Under 20 Hours 323 351 367 367 394 20-29 Hours 156 180 143 184 167 30-39 Hours 111 100 102 116 116 40 Hours and Over 2,368 2,492 2,645 2,680 2,862 Did Not Work/Not Reported 86 74 61 42 36Self-Employed Without Any Paid Employee 10,869 10,705 11,097 11,198 11,090 Under 20 Hours 1,989 1,941 1,935 2,250 1,913 20-29 Hours 1,702 1,680 1,676 1,711 1,558 30-39 Hours 1,703 1,684 1,681 1,747 1,556 40 Hours and Over 5,315 5,254 5,673 5,490 5,948 Did Not Work/Not Reported 159 146 132 0 115Employer in Own Family-Operated Farm or Business 1,210 1,212 1,376 1,491 1,489 Under 20 Hours 227 240 257 306 297 20-29 Hours 186 187 201 226 218 30-39 Hours 205 191 211 227 211 40 Hours and Over 571 577 681 732 747 Did Not Work/Not Reported 22 18 27 0 17
Continued
TABLE 11.16 Employed Persons by Class of Worker and Hours Worked During the Past Week, Philippines: 2014 to 2018 (Based on Past Week Reference Period; In Thousands)
Class of Worker and Hours Worked 2014 2015 2016 2017 2018

TABLE 11.16 - - Concluded
Without Pay in Own-Family Operated Farm or Business 4,166 3,863 3,285 2,437 2,320 Under 20 Hours 1,304 1,202 999 951 859 20-29 Hours 874 797 624 446 416 30-39 Hours 792 708 605 395 329 40-48 Hours 1,150 1,118 1,029 645 687 Did Not Work/Not Reported 45 39 29 0 28
Notes: 1. Data are averages of four survey rounds of the Labor Force Survey except for 2014.
2. Details may not add up to totals due to rounding.
3. Data for 2014 refer to the average of April, July and October survey rounds.
The estimates for these rounds exclude data of Leyte province while that of January exclude Region VIII.
4. Data for 2015 refer to the average of the four survey rounds that exclude Leyte. These should not be compared with the 2014
annualized data as the latter exclude the January round. The use of the four survey rounds for the 2015 annualized data was based
on results of a referendum conducted among members of the IAC on Labor and Productivity Statistics.
5. Starting April 2016 round, the Labor Force Survey (LFS) adopted the 2013 Master Sample design as well as the population
projections based on the 2010 Census of Population and Housing (2010 CPH) while previous survey rounds were derived using
the 2000 CPH population projections.
6. Annualized data for 2016 was computed as the average of the four survey rounds using the January 2016 round that were based on
the 2010 CPH population projections. 7. For more information about the changes on the survey that may have affected the estimates, please refer to the
Explanatory Notes on the Labor Force Survey (LFS) at the last part of this book.
Source of basic data: Philippine Statistics Authority, Labor Force Survey, Public Use Files
Class of Worker and Hours Worked 2014 2015 2016 2017 2018

TABLE 11.17 Employed Persons by Region and Highest Grade Completed Philippines: 2014 to 2018 (Based on Past Week Reference Period; In Thousands)
Phillippines 38,651 a 38,741 a 40,998 40,334 41,157No Grade Completed 592 577 574 599 603Elementary 10,766 10,582 11148 10717 10,638
Undergraduate 5,225 5,227 5,793 5763 5,320Graduate 5,541 5,356 5355 4954 5,318
SPED 1 NA NA 2 - -Undergraduate NA NA 1 - -Graduate NA NA 1 2 -
High School 15,823 15,918 17,030 - -Undergraduate 4,901 4,841 5,240 - -Graduate 10,922 11,078 11,790 - -
Junior School - - - 16,588 16,876Undergraduate - - - 5,164 5,144Graduate - - - 11,424 11,732
Senior School - - - 105 350Undergraduate - - - 100 174Graduate - - - 5 176
Post Secondary 2 1,836 1,830 2,013 1,907 1,681Undergraduate 294 264 255 226 199Graduate 1,542 1,566 1,759 1,682 1,482
College 9,635 9,833 10,232 10,419 1,107Undergraduate 3,466 3,558 3,877 4,171 4,807Graduate and Higher 6,168 6,275 6,354 6,248 6,200
National Capital Region 4,743 4,752 5,239 5,141 5,171No Grade Completed 5 7 7 19 18Elementary 457 461 496 495 443
Undergraduate 139 154 185 206 153Graduate 318 307 311 289 290
SPED 1 … … - - -Undergraduate … … - - -Graduate … … - - -
High School 2,030 2,030 2,282 2,243 -Undergraduate 392 406 430 441 -Graduate 1,638 1,624 1,852 1,801 -
Junior School - - - 2,240 2,226Undergraduate - - - 435 398Graduate - - - 1,805 1,828
Senior School - - - 3 13Undergraduate - - - 2 5Graduate - - - 0 8
Post Secondary 2 284 287 276 284 243Undergraduate 33 35 28 37 35Graduate 251 251 248 247 208
College 1,967 1,968 2,178 2,100 2,228Undergraduate 653 668 772 846 1,042Graduate and Higher 1,314 1,300 1,407 1,254 1,186
Continued
Region and Highest Grade Completed 2014 2015 2016 2017 2018
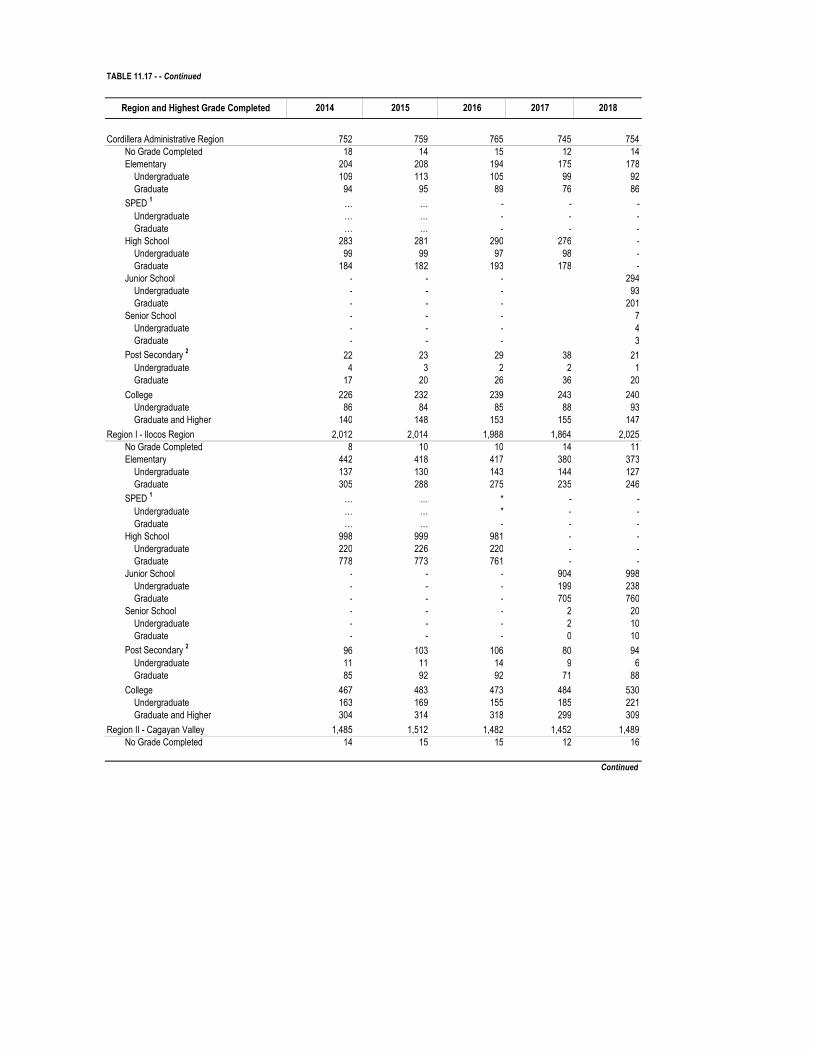
TABLE 11.17 - - Continued
Cordillera Administrative Region 752 759 765 745 754No Grade Completed 18 14 15 12 14Elementary 204 208 194 175 178
Undergraduate 109 113 105 99 92Graduate 94 95 89 76 86
SPED 1 … … - - -Undergraduate … … - - -Graduate … … - - -
High School 283 281 290 276 -Undergraduate 99 99 97 98 -Graduate 184 182 193 178 -
Junior School - - - 294Undergraduate - - - 93Graduate - - - 201
Senior School - - - 7Undergraduate - - - 4Graduate - - - 3
Post Secondary 2 22 23 29 38 21Undergraduate 4 3 2 2 1Graduate 17 20 26 36 20
College 226 232 239 243 240Undergraduate 86 84 85 88 93Graduate and Higher 140 148 153 155 147
Region I - Ilocos Region 2,012 2,014 1,988 1,864 2,025No Grade Completed 8 10 10 14 11Elementary 442 418 417 380 373
Undergraduate 137 130 143 144 127Graduate 305 288 275 235 246
SPED 1 … … * - -Undergraduate … … * - -Graduate … … - - -
High School 998 999 981 - -Undergraduate 220 226 220 - -Graduate 778 773 761 - -
Junior School - - - 904 998Undergraduate - - - 199 238Graduate - - - 705 760
Senior School - - - 2 20Undergraduate - - - 2 10Graduate - - - 0 10
Post Secondary 2 96 103 106 80 94Undergraduate 11 11 14 9 6Graduate 85 92 92 71 88
College 467 483 473 484 530Undergraduate 163 169 155 185 221Graduate and Higher 304 314 318 299 309
Region II - Cagayan Valley 1,485 1,512 1,482 1,452 1,489No Grade Completed 14 15 15 12 16
Continued
Region and Highest Grade Completed 2014 2015 2016 2017 2018
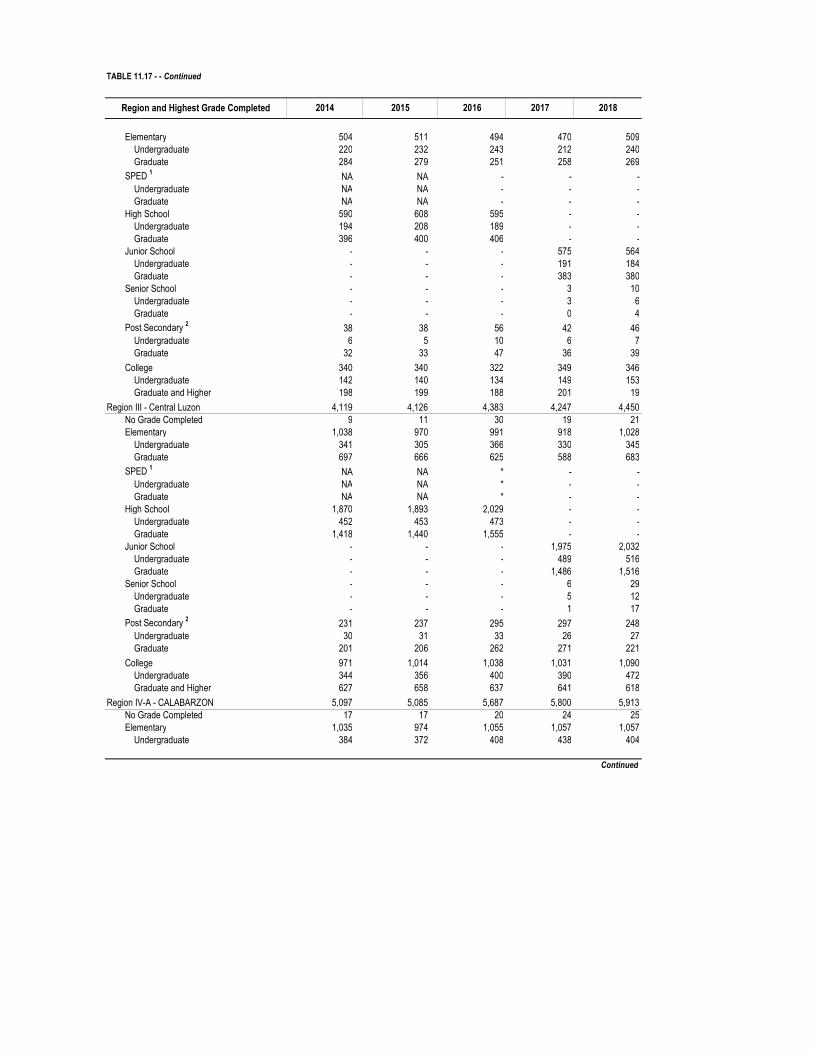
TABLE 11.17 - - Continued
Elementary 504 511 494 470 509Undergraduate 220 232 243 212 240Graduate 284 279 251 258 269
SPED 1 NA NA - - -Undergraduate NA NA - - -Graduate NA NA - - -
High School 590 608 595 - -Undergraduate 194 208 189 - -Graduate 396 400 406 - -
Junior School - - - 575 564Undergraduate - - - 191 184Graduate - - - 383 380
Senior School - - - 3 10Undergraduate - - - 3 6Graduate - - - 0 4
Post Secondary 2 38 38 56 42 46Undergraduate 6 5 10 6 7Graduate 32 33 47 36 39
College 340 340 322 349 346Undergraduate 142 140 134 149 153Graduate and Higher 198 199 188 201 19
Region III - Central Luzon 4,119 4,126 4,383 4,247 4,450No Grade Completed 9 11 30 19 21Elementary 1,038 970 991 918 1,028
Undergraduate 341 305 366 330 345Graduate 697 666 625 588 683
SPED 1 NA NA * - -Undergraduate NA NA * - -Graduate NA NA * - -
High School 1,870 1,893 2,029 - -Undergraduate 452 453 473 - -Graduate 1,418 1,440 1,555 - -
Junior School - - - 1,975 2,032Undergraduate - - - 489 516Graduate - - - 1,486 1,516
Senior School - - - 6 29Undergraduate - - - 5 12Graduate - - - 1 17
Post Secondary 2 231 237 295 297 248Undergraduate 30 31 33 26 27Graduate 201 206 262 271 221
College 971 1,014 1,038 1,031 1,090Undergraduate 344 356 400 390 472Graduate and Higher 627 658 637 641 618
Region IV-A - CALABARZON 5,097 5,085 5,687 5,800 5,913No Grade Completed 17 17 20 24 25Elementary 1,035 974 1,055 1,057 1,057
Undergraduate 384 372 408 438 404
Continued
Region and Highest Grade Completed 2014 2015 2016 2017 2018
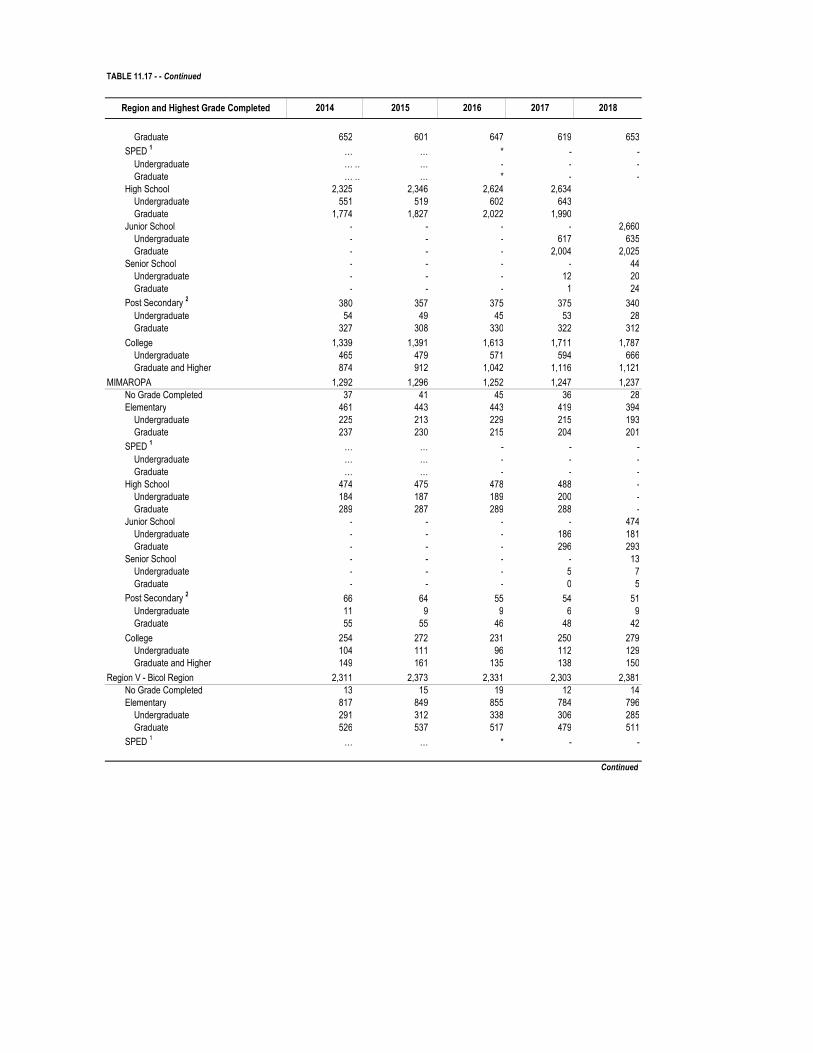
TABLE 11.17 - - Continued
Graduate 652 601 647 619 653
SPED 1 … … * - -Undergraduate …… … - - -Graduate …… … * - -
High School 2,325 2,346 2,624 2,634Undergraduate 551 519 602 643Graduate 1,774 1,827 2,022 1,990
Junior School - - - - 2,660Undergraduate - - - 617 635Graduate - - - 2,004 2,025
Senior School - - - - 44Undergraduate - - - 12 20Graduate - - - 1 24
Post Secondary 2 380 357 375 375 340Undergraduate 54 49 45 53 28Graduate 327 308 330 322 312
College 1,339 1,391 1,613 1,711 1,787Undergraduate 465 479 571 594 666Graduate and Higher 874 912 1,042 1,116 1,121
MIMAROPA 1,292 1,296 1,252 1,247 1,237No Grade Completed 37 41 45 36 28Elementary 461 443 443 419 394
Undergraduate 225 213 229 215 193Graduate 237 230 215 204 201
SPED 1 … … - - -Undergraduate … … - - -Graduate … … - - -
High School 474 475 478 488 -Undergraduate 184 187 189 200 -Graduate 289 287 289 288 -
Junior School - - - - 474Undergraduate - - - 186 181Graduate - - - 296 293
Senior School - - - - 13Undergraduate - - - 5 7Graduate - - - 0 5
Post Secondary 2 66 64 55 54 51Undergraduate 11 9 9 6 9Graduate 55 55 46 48 42
College 254 272 231 250 279Undergraduate 104 111 96 112 129Graduate and Higher 149 161 135 138 150
Region V - Bicol Region 2,311 2,373 2,331 2,303 2,381No Grade Completed 13 15 19 12 14Elementary 817 849 855 784 796
Undergraduate 291 312 338 306 285Graduate 526 537 517 479 511
SPED 1 … … * - -
Continued
Region and Highest Grade Completed 2014 2015 2016 2017 2018

TABLE 11.17 - - Continued
Undergraduate … … - - -Graduate … … * - -
High School 939 967 939 - -Undergraduate 370 373 379 - -Graduate 569 593 560 - -
Junior School - - - - 973Undergraduate - - - 375 383Graduate - - - 566 590
Senior School - - - - 33Undergraduate - - - 13 19Graduate - - - 0 14
Post Secondary 2 104 96 80 87 81Undergraduate 28 17 14 10 7Graduate 75 78 66 76 74
College 438 447 437 466 484Undergraduate 152 161 159 168 205Graduate and Higher 287 286 278 298 279
Region VI - Western Visayas 3,182 3,195 3,208 3,119 3,165No Grade Completed 50 47 41 43 38Elementary 985 981 950 889 886
Undergraduate 569 566 577 555 513Graduate 416 415 373 334 373
SPED 1 … … - - -Undergraduate … … - - -Graduate … … - - -
High School 1,247 1,243 1,275 - -Undergraduate 429 416 448 - -Graduate 818 827 827 - -
Junior School - - - - 1,258Undergraduate - - - 433 403Graduate - - - 812 855
Senior School - - - - 29Undergraduate - - - 9 13Graduate - - - 0 16
Post Secondary 2 220 207 229 190 146Undergraduate 30 31 29 33 25Graduate 189 176 200 157 121
College 682 717 713 743 807Undergraduate 215 229 244 309 330Graduate and Higher 466 488 469 434 477
Region VII - Central Visayas 3,114 3,215 3,234 3,224 3,075No Grade Completed 42 44 38 45 36Elementary 1,106 1,106 1,144 1,159 986
Undergraduate 649 663 692 754 568Graduate 457 443 452 405 418
SPED 1 … … - - -Undergraduate … … - - -Graduate … … - - -
Continued
Region and Highest Grade Completed 2014 2015 2016 2017 2018

TABLE 11.17 - - Continued
High School 1,134 1,191 1,248 1,226 -Undergraduate 413 418 457 470 -Graduate 722 773 791 755 -
Junior School - - - - 1,135Undergraduate - - - 446 391Graduate - - - 772 744
Senior School - - - - 33Undergraduate - - - 7 11Graduate - - - 0 22
Post Secondary 2 82 97 81 81 77Undergraduate 16 12 7 8 6Graduate 66 85 74 73 71
College 749 778 722 713 807Undergraduate 261 287 285 296 373Graduate and Higher 489 491 438 418 434
Region VIII - Eastern Visayas 1,045 a 1,011 a 1,790 1,778 1,851No Grade Completed 22 20 38 35 30Elementary 445 426 722 701 699
Undergraduate 258 258 432 446 429Graduate 187 168 290 256 270
SPED 1 … … * - -Undergraduate … … - - -Graduate … … * - -
High School 368 350 644 613 -Undergraduate 171 158 287 298 -Graduate 197 193 356 315 -
Junior School - - - - 641Undergraduate - - - 274 284Graduate - - - 330 357
Senior School - - - - 28Undergraduate - - - 9 15Graduate - - - 0 13
Post Secondary 2 19 18 37 37 40Undergraduate 3 4 5 4 7Graduate 16 14 32 33 33
College 190 196 349 391 414Undergraduate 79 74 136 151 153Graduate and Higher 112 122 213 241 261
Region IX - Zamboanga Peninsula 1,400 1,384 1,540 1,437 1,414No Grade Completed 40 37 37 46 44Elementary 537 543 616 559 561
Undergraduate 323 321 389 363 341Graduate 214 222 227 196 220
SPED 1 … … - - -Undergraduate … … - - -Graduate … … - - -
High School - - - 492 -Undergraduate - - - 240 -
Continued
Region and Highest Grade Completed 2014 2015 2016 2017 2018

TABLE 11.17 - - Continued
Graduate 250 262 297 251 -Junior School - - - - 468
Undergraduate - - - 226 218Graduate - - - 261 250
Senior School - - - - 6Undergraduate - - - 240 2Graduate - - - 251 4
Post Secondary 2 43 42 99 70 40Undergraduate 9 6 11 5 7Graduate 34 36 88 65 33
College 313 297 249 270 295Undergraduate 121 110 132 137 154Graduate and Higher 192 188 117 133 141
Region X - Northern Mindanao 2,015 1,989 2,004 1,966 2,107No Grade Completed 16 18 24 29 31Elementary 645 626 669 639 655
Undergraduate 359 360 400 390 385Graduate 286 266 269 249 270
SPED 1 … … - - -Undergraduate … … - - -Graduate … … - - -
High School 835 831 824 805 -Undergraduate 340 322 335 341 -Graduate 495 509 489 463 -
Junior School - - - - 880Undergraduate - - - 316 353Graduate - - - 480 527
Senior School - - - - 27Undergraduate - - - 8 16Graduate - - - 0 11
Post Secondary 2 50 50 50 51 50Undergraduate 13 13 11 5 5Graduate 37 37 38 47 45
College 469 465 438 442 464Undergraduate 186 192 192 198 226Graduate and Higher 283 273 246 244 238
Region XI - Davao Region 1,946 1,925 2,016 2,052 2,022No Grade Completed 37 28 28 32 33Elementary 612 586 638 626 624
Undergraduate 347 334 364 359 343Graduate 265 252 274 267 281
SPED 1 … … - - -Undergraduate … … - - -Graduate … … - - -
High School 762 767 796 831 -Undergraduate 291 284 306 326 -Graduate 471 483 490 505 -
Junior School - - - - 826
Continued
Region and Highest Grade Completed 2014 2015 2016 2017 2018
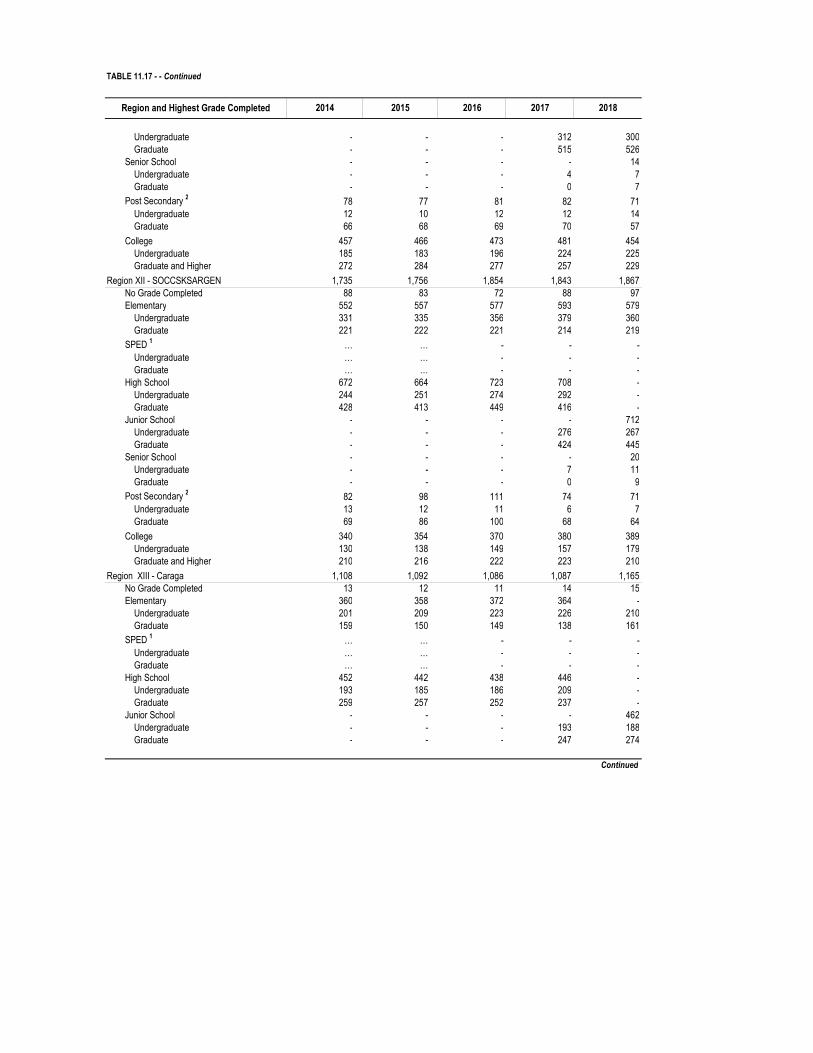
TABLE 11.17 - - Continued
Undergraduate - - - 312 300Graduate - - - 515 526
Senior School - - - - 14Undergraduate - - - 4 7Graduate - - - 0 7
Post Secondary 2 78 77 81 82 71Undergraduate 12 10 12 12 14Graduate 66 68 69 70 57
College 457 466 473 481 454Undergraduate 185 183 196 224 225Graduate and Higher 272 284 277 257 229
Region XII - SOCCSKSARGEN 1,735 1,756 1,854 1,843 1,867No Grade Completed 88 83 72 88 97Elementary 552 557 577 593 579
Undergraduate 331 335 356 379 360Graduate 221 222 221 214 219
SPED 1 … … - - -Undergraduate … … - - -Graduate … … - - -
High School 672 664 723 708 -Undergraduate 244 251 274 292 -Graduate 428 413 449 416 -
Junior School - - - - 712Undergraduate - - - 276 267Graduate - - - 424 445
Senior School - - - - 20Undergraduate - - - 7 11Graduate - - - 0 9
Post Secondary 2 82 98 111 74 71Undergraduate 13 12 11 6 7Graduate 69 86 100 68 64
College 340 354 370 380 389Undergraduate 130 138 149 157 179Graduate and Higher 210 216 222 223 210
Region XIII - Caraga 1,108 1,092 1,086 1,087 1,165No Grade Completed 13 12 11 14 15Elementary 360 358 372 364 -
Undergraduate 201 209 223 226 210Graduate 159 150 149 138 161
SPED 1 … … - - -Undergraduate … … - - -Graduate … … - - -
High School 452 442 438 446 -Undergraduate 193 185 186 209 -Graduate 259 257 252 237 -
Junior School - - - - 462Undergraduate - - - 193 188Graduate - - - 247 274
Continued
Region and Highest Grade Completed 2014 2015 2016 2017 2018
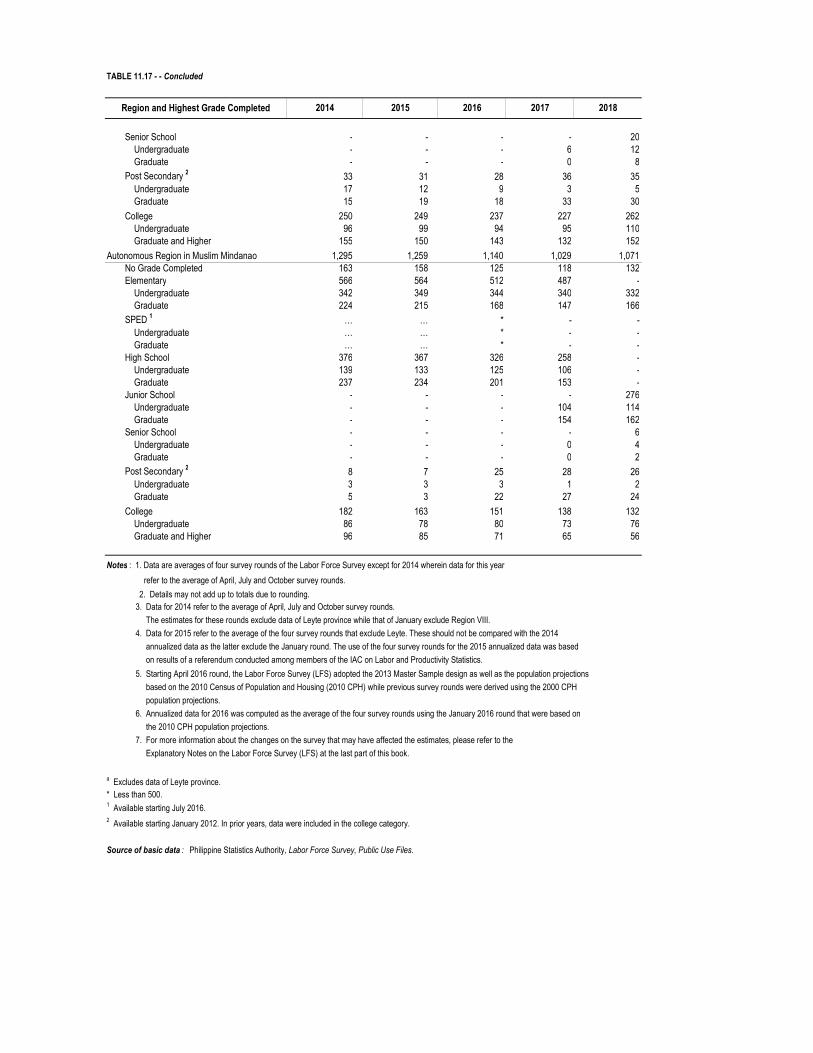
TABLE 11.17 - - Concluded
Senior School - - - - 20Undergraduate - - - 6 12Graduate - - - 0 8
Post Secondary 2 33 31 28 36 35Undergraduate 17 12 9 3 5Graduate 15 19 18 33 30
College 250 249 237 227 262Undergraduate 96 99 94 95 110Graduate and Higher 155 150 143 132 152
Autonomous Region in Muslim Mindanao 1,295 1,259 1,140 1,029 1,071No Grade Completed 163 158 125 118 132Elementary 566 564 512 487 -
Undergraduate 342 349 344 340 332Graduate 224 215 168 147 166
SPED 1 … … * - -Undergraduate … … * - -Graduate … … * - -
High School 376 367 326 258 -Undergraduate 139 133 125 106 -Graduate 237 234 201 153 -
Junior School - - - - 276Undergraduate - - - 104 114Graduate - - - 154 162
Senior School - - - - 6Undergraduate - - - 0 4Graduate - - - 0 2
Post Secondary 2 8 7 25 28 26Undergraduate 3 3 3 1 2Graduate 5 3 22 27 24
College 182 163 151 138 132Undergraduate 86 78 80 73 76Graduate and Higher 96 85 71 65 56
Notes : 1. Data are averages of four survey rounds of the Labor Force Survey except for 2014 wherein data for this year
refer to the average of April, July and October survey rounds.
2. Details may not add up to totals due to rounding. 3. Data for 2014 refer to the average of April, July and October survey rounds.
The estimates for these rounds exclude data of Leyte province while that of January exclude Region VIII.
4. Data for 2015 refer to the average of the four survey rounds that exclude Leyte. These should not be compared with the 2014
annualized data as the latter exclude the January round. The use of the four survey rounds for the 2015 annualized data was based
on results of a referendum conducted among members of the IAC on Labor and Productivity Statistics.
5. Starting April 2016 round, the Labor Force Survey (LFS) adopted the 2013 Master Sample design as well as the population projections
based on the 2010 Census of Population and Housing (2010 CPH) while previous survey rounds were derived using the 2000 CPH
population projections.
6. Annualized data for 2016 was computed as the average of the four survey rounds using the January 2016 round that were based on
the 2010 CPH population projections.
7. For more information about the changes on the survey that may have affected the estimates, please refer to the
Explanatory Notes on the Labor Force Survey (LFS) at the last part of this book.
a Excludes data of Leyte province.* Less than 500.1 Available starting July 2016.2 Available starting January 2012. In prior years, data were included in the college category.
Source of basic data : Philippine Statistics Authority, Labor Force Survey, Public Use Files.
Region and Highest Grade Completed 2014 2015 2016 2017 2018

(In thousands)
Total 2,826 2,905 2,728 2,602 2,363 2,441 2,303 Male 1,767 1,818 1,728 1,656 1,486 1,601 1,456 Female 1,059 1,087 1,000 945 877 840 847
All Age Groups 2,826 2,905 2,728 2,602 2,363 2,441 2,303
15 - 24 years 1,412 1,409 1,351 1,276 1,137 1,139 1,027 25 -34 years 821 882 833 802 692 718 706 35 - 44 years 287 307 269 270 255 263 276 45 - 54 years 190 186 173 162 172 191 177 55 - 64 years 96 100 84 76 85 112 102 65 years and over 21 20 18 16 23 18 16 Age not reported - - - - - - -
Total 2,826 2,905 2,728 2,602 2,363 2,441 2,303
No grade completed 14 15 10 9 16 16 20 Elementary 373 379 322 314 305 326 307 Undergraduate 164 172 141 150 151 168 152 Graduated 209 207 181 164 153 159 155 High School 1,275 1,289 1,183 1,161 1,011 1,070 - Undergraduate 334 335 292 289 273 295 - Graduated 941 954 891 872 738 774 - Junior School - - - - - - 925 Undergraduate - - - - - - 259 Graduated - - - - - - 667 Senior School - - - - - - 56 Undergraduate - - - - - - 13 Graduated - - - - - - 42 Post Secondary 233 231 224 210 200 203 143 Undergraduate 66 50 31 31 28 24 14 Graduated 167 181 193 178 172 179 129 College 931 991 988 908 831 825 851 Undergraduate 378 401 375 341 328 346 367 Graduated 554 590 612 568 504 479 485 Not reported - - - - - - -
Notes : 1. The methodology for the computation of annual estimates of labor and employment indicators is based on NSCB Resolution No. 9.
2. The province of Leyte was not covered in the April, July and October 2014; January and April 2015 Labor Force Survey (LFS)
Data for July 2015 and onwards already include the province of Leyte.
3. Annualized data for 2014 refer to the average of estimates for April, July and October rounds. The estimates for these
as the latter exclude data of Leyte province only while that of January exclude Region VIII.
4. Annuliazed data for 2015 refer to the average of the four survey rounds that exclude Leyte. These should not
be compared with the 2014 annualized data as the latter exclude the January round. The use of the 4 survey
rounds for the 2015 annualized data was based on the results of a referendum conducted among members
of the IAC on Labor and Productivity Statistics.
5. For 2015, the annual estimates do not include estimates from Leyte of Region VIII or Eastern Visayas.6. Starting April 2016 round, the LFS adopted the 2013 Master Sample Design as well as the
population projections based on the 2010 Census of Population and Housing (2010 CPH) while the previous survey
round used the 2000 CPH as population projection benchmark.
7. Annualized data for 2016 was computed as the average of four survey rounds using the January 2016 data that
were based on the 2010 Census-based population projections.
6. Details may not add up to totals due to rounding.
Sources of data: Philippine Statistics Authority, Labor Force Survey
2018
TABLE 11.18 Unemployed Persons by Sex, Age Group and Highest Grade Completed: 2012 to 2018
Indicator 2012 2013 2014 2015 2016 2017

Number Percent to Employed Number Percent to Employed
1987 Average 5,312 26.5 2,514 12.5July 5,595 26.8 2,690 12.9October 5,029 24.2 2,337 11.2
4,985 23.5 2,487 11.7January 4,968 23.9 2,581 12.4April 4,979 23.6 2,523 11.9July 4,983 23.3 2,349 11.0October 5,009 23.3 2,496 11.6
5,091 23.2 2,408 11.0January 5,022 23.3 2,296 10.7April 5,282 23.6 2,648 11.9July 4,979 22.7 2,249 10.3October 5,080 23.3 2,440 11.2
4,964 22.4 2,332 10.5January 5,075 23.2 2,573 11.7July 4,832 21.8 2,078 9.4October 4,986 22.1 2,344 10.4
5,161 22.5 2,556 11.1January 5,020 22.3 2,513 11.2April 5,560 23.6 2,872 12.2
July 1 4,987 22.1 2,377 10.5October 5,077 22.1 2,460 10.7
4,866 20.0 2,463 10.4January 4,636 20.1 2,202 9.6April 5,134 21.4 2,850 11.9July 4,948 20.7 2,422 10.1October 4,748 19.8 2,377 9.9
5,282 21.7 2,680 10.9January 5,000 20.9 2,540 10.3April 5,479 22.3 2,871 11.7July 5,416 22.1 2,592 10.6October 5,232 21.4 2,718 11.1
5,353 21.4 2,652 10.6January 5,724 23.2 2,917 11.8April 5,355 20.9 2,808 11.0July 5,079 20.5 2,272 9.2October 5,254 20.9 2,613 10.4
5,137 20.0 2,614 10.2January 4,686 18.6 2,182 8.7April 5,225 20.3 2,964 11.5July 5,554 21.3 2,791 10.7
Continued
TABLE 11.19 Underemployed and Visibly Underemployed Persons As Percent to Total Employed, Philippines: 1987 to 2018 (Based on Past Week Reference Period; In Thousands Except Percent)
Year and Survey MonthUnderemployed Persons 15 Years Old Visibly Underemployed Persons
1988 Average
1989 Average
1990 Average
1991 Average 1
1992 Average
1993 Average
1994 Average
1995 Average 2

TABLE 11.19 - - Continued
Number Percent to Employed Number Percent to Employed
October 2 5,083 19.8 2,517 9.85,719 21.0 3,042 11.2
January 5,561 21.0 2,891 10.9April 6,086 22.2 3,596 13.1July 5,904 21.5 2,919 10.6October 5,326 19.4 2,763 10.1
1997 Average 5,773 21.9 2,821 10.7January 5,424 20.9 2,805 10.8April 6,199 23.2 3,088 11.6July 5,981 22.8 2,662 10.1October 5,488 20.7 2,727 10.3
1998 Average 5,758 21.6 3,073 11.5January 5,657 21.4 3,070 11.6April 5,496 20.7 3,084 11.6July 5,530 20.8 2,827 10.6October 6,347 23.5 3,309 12.3
6,127 22.1 3,238 11.7January 5,945 21.9 3,208 11.8April 6,347 22.5 3,419 12.1July 6,129 22.0 3,256 11.7October 6,088 21.9 3,070 11.1
5,955 21.7 3,040 11.1January 5,818 21.0 3,169 11.4April 6,721 24.7 3,315 12.2July 5,752 21.2 2,704 10.0October 5,528 19.9 2,970 10.7
5,006 17.2 3,202 11.0January 4,744 16.9 2,779 9.9April 5,092 17.5 3,427 11.8July 5,188 17.7 3,321 11.3October 5,000 16.6 3,282 10.9
5,109 17.0 3,322 11.1January 4,724 15.9 3,212 10.8April 5,922 19.6 3,784 12.5July 5,161 17.1 3,274 10.9October 4,627 15.3 3,019 10.0
5,221 17.0 3,229 10.5January 4,849 16.1 3,251 10.8April 4,733 15.6 3,190 10.5July 6,314 20.7 3,397 11.2October 4,989 15.8 3,076 9.7
Continued
Year and Survey MonthUnderemployed Persons 15 Years Old Visibly Underemployed Persons
1996 Average
1999 Average
2000 Average
2001 Average
2002 Average
2003 Average

TABLE 11.19 - - Continued
Number Percent to Employed Number Percent to Employed
5,575 17.6 3,472 11.0January 5,522 17.5 3,282 10.4April 5,839 18.5 3,882 12.3July 5,573 17.6 3,357 10.6October 5,364 16.9 3,365 10.6
6,785 21.0 4,082 12.6January 5,098 16.1 3,286 10.4April 8,421 26.1 4,568 14.2July 6,660 20.5 4,228 13.0October 6,962 21.2 4,247 12.9
7,371 22.6 4,532 13.9January 6,774 21.1 4,260 13.3April 8,309 25.4 5,056 15.5July 7,718 23.4 4,519 13.9October 6,681 20.3 4,291 13.2
6,757 20.1 4,043 12.0January 7,214 21.5 4,320 12.9April 6,378 18.9 4,389 13.0July 7,327 22.0 3,803 11.4October 6,109 18.1 3,660 10.9
6,579 19.3 4,018 11.8January 6,368 18.9 4,024 11.9April 6,625 19.8 4,025 12.0July 7,293 21.1 4,183 12.1October 6,029 17.5 3,841 11.1
6,692 19.1 4,135 11.8January 6,238 18.2 3,985 11.6April 6,621 18.9 4,335 12.4July 7,036 19.8 3,949 11.1October 6,876 19.4 4,272 12.0
6,762 18.8 4,015 11.1January 7,107 19.7 4,173 11.6April 6,297 17.8 3,904 11.0July 6,502 17.9 3,875 10.7October 7,141 19.6 4,109 11.3
7,163 19.3 4,340 11.7January 7,050 19.4 4,443 12.2April 7,127 19.4 4,402 12.0July 7,095 19.1 4,069 11.0October 7,381 19.1 4,447 11.5
7,514 20.0 4,489 11.9January 7,018 18.8 4,292 11.5April 7,313 19.3 4,851 12.8
Continued
Year and Survey MonthUnderemployed Persons 15 Years Old Visibly Underemployed Persons
2004 Average
2005 Average
2006 Average
2007 Average
2008 Average
2009 Average
2010 Average
2011 Average
2012 Average

TABLE 11.19 - - Concluded
Number Percent to Employed Number Percent to Employed
July 8,565 22.8 4,677 12.5October 7,160 19.0 4,138 11.0
7,371 19.3 4,321 11.3January 7,934 20.9 4,498 11.9April 7,251 19.2 4,055 10.7July 7,340 19.2 4,271 11.2October 6,961 18.1 4,459 11.6
7,118 18.4 4,365 11.3January 7,103 19.5 4,358 12.0April 7,027 18.2 4,470 11.6July 7,049 18.3 4,374 11.4October 7,278 18.7 4,250 10.9
7,180 18.5 4,222 10.9January 6,883 17.9 4,318 11.2April 6,983 17.8 4,545 11.6
July 3 8,220 21.0 4,235 10.8
October 3 7,020 17.6 4,011 10.17,513 18.3 4,149 10.1
January 7,881 19.7 4,140 10.3April 7,431 18.3 4,288 10.5July 7,134 17.4 3,965 9.7October 7,510 18.0 4,153 10.0
6,506 16.1 3,739 9.3January 6,398 16.3 3,839 9.8April 6,468 16.1 4,027 10.0July 6,541 16.3 3,440 8.6October 6,616 15.9 3,652 8.8
6,734 16.4 3,580 8.8 January 7,498 18.0 4,416 10.5 April 6934 17.0 3,742 9.0 July 7005 17.2 3,296 8.1
October 5,502 13.3 3,203 7.7
Notes : 1. Percentages were computed based on rounded figures.
2. Details may not add up to totals due to rounding. 3. Data for 2015 refer to the average of the four survey rounds that exclude Leyte. These should not be compared with the
2014 annualized data as the latter exclude the January round. The use of the four survey rounds for the 2015 annualized data
was based on results of a referendum conducted among members of the IAC on Labor and Productivity Statistics. July and
October 2015 rounds reflected already include Leyte which were not used for computing the average.
4. Starting April 2016 round, the Labor Force Survey (LFS) adopted the 2013 Master Sample design as well as the 2010 Census of Population
and Housing (CPH) while previous survey rounds were derived using the 2000 CPH population projections.
5. Annualized data fo 2016 were computed as the average of four survey rounds using the January 2016 that were based on the 2010 CPH
population projections.
6. For more information about the changes on the survey that may have affected the estimates, please refer to the
Explanatory Notes on the Labor Force Survey (LFS) at the last part of this book.
1 Excludes data from Zambales for July round.2 Excludes data from Pampanga for October round.
3 Includes Leyte.
Source of basic data : Philippine Statistics Authority, Labor Force Survey.
Year and Survey Month
2017 Average
2018 Average
Underemployed Persons 15 Years Old Visibly Underemployed Persons
2013 Average
2014 Average
2015 Average
2016 Average

Region 2013 2015 2016 2017
PhilippinesUnderemployed 7,371 7,118 a 7,180 7,513 6,506Underemployment Rate 19.3 18.4 a 18.5 18.3 16.1
Visibly Underemployed 4,321 4,365 a 4,222 4,149 3,739Percent to Employed 11.3 11.3 a 10.9 10.1 9.3
National Capital Region Underemployed 556 513 474 458 479Underemployment Rate 12.1 10.8 10.0 8.7 9.3
Visibly Underemployed 210 215 198 171 198Percent to Employed 4.6 4.5 4.2 3.3 3.9
Cordillera Administrative RegionUnderemployed 104 99 158 177 110Underemployment Rate 14.1 13.1 20.8 23.1 14.8
Visibly Underemployed 58 61 74 81 52Percent to Employed 7.9 8.1 9.7 10.6 7.0
Region I - Ilocos RegionUnderemployed 391 309 340 346 370Underemployment Rate 20.0 15.3 16.9 17.4 19.8
Visibly Underemployed 243 208 226 220 215Percent to Employed 12.4 10.3 11.2 11.1 11.6
Region II - Cagayan ValleyUnderemployed 190 172 168 190 197Underemployment Rate 12.9 11.6 11.1 12.8 13.6
Visibly Underemployed 136 130 122 124 143Percent to Employed 9.2 8.7 8.1 8.3 9.8
Region III - Central LuzonUnderemployed 579 587 555 706 485Underemployment Rate 14.5 14.3 13.5 16.1 11.5
Visibly Underemployed 285 283 295 328 238Percent to Employed 7.2 6.9 7.1 7.5 5.6
Region IV-A - CALABARZONUnderemployed 867 948 925 887 810Underemployment Rate 17.9 18.6 18.2 15.6 14.0
Visibly Underemployed 447 529 472 430 412Percent to Employed 9.2 10.4 9.3 7.6 7.1
Region IV-B - MIMAROPAUnderemployed 290 253 269 273 296Underemployment Rate 23.4 19.6 20.8 21.8 23.7
Visibly Underemployed 198 183 188 171 192Percent to Employed 16.0 14.1 14.5 13.6 15.4
Region V - Bicol Region
Continued
TABLE 11.20 Underemployed Persons and Underemployment Rate by Region, Philippines: 2013 to 2017(Based on Past Week Reference Period; In Thousands Except Rates)
2014

TABLE 11.20 -- Continued
Region 2013 2015 2016 2017
Underemployed 855 739 749 705 637Underemployment Rate 37.3 32.0 31.5 30.2 27.5
Visibly Underemployed 537 496 471 453 398Percent to Employed 23.4 21.5 19.9 19.4 17.3
Region VI - Western VisayasUnderemployed 682 681 681 618 521Underemployment Rate 22.7 21.4 21.3 19.3 16.7
Visibly Underemployed 441 466 428 360 314Percent to Employed 14.7 14.6 13.4 11.2 10.1
Region VII - Central VisayasUnderemployed 448 550 592 477 566Underemployment Rate 15.1 17.7 18.4 14.7 17.5
Visibly Underemployed 234 326 314 260 269Percent to Employed 7.9 10.5 9.8 8.0 8.3
Region VIII - Eastern VisayasUnderemployed 460 326 a 321 535 403Underemployment Rate 25.1 31.2 a 31.7 29.9 22.6
Visibly Underemployed 300 218 a 201 331 272Percent to Employed 16.4 20.9 a 19.8 18.5 15.3
Region IX - Zamboanga PeninsulaUnderemployed 304 281 256 346 249Underemployment Rate 21.8 20.1 18.5 22.5 17.3
Visibly Underemployed 189 207 181 199 174Percent to Employed 13.6 14.7 13.1 12.9 12.1
Region X - Northern MindanaoUnderemployed 497 498 496 559 365Underemployment Rate 25.7 24.7 24.9 27.9 18.5
Visibly Underemployed 321 319 324 326 249Percent to Employed 16.6 15.8 16.3 16.3 12.7
Region XI - Davao RegionUnderemployed 319 372 365 339 365Underemployment Rate 17.3 19.1 18.9 16.8 17.7
Visibly Underemployed 196 220 206 157 176Percent to Employed 10.6 11.3 10.7 7.8 8.6
Region XII - SOCCSKSARGENUnderemployed 384 360 407 440 331Underemployment Rate 22.7 20.8 23.2 23.7 18.0
Visibly Underemployed 243 231 248 266 214Percent to Employed 14.4 13.3 14.1 14.3 11.1
Region XIII - CaragaUnderemployed 293 277 286 304 251Underemployment Rate 27.1 25.0 26.2 28.0 23.1
Visibly Underemployed 178 164 172 183 171
Continued
2014

TABLE 11.20 - - Concluded
Region 2013 2015 2016 2017
Percent to Employed 16.4 14.8 15.7 16.8 14.9Autonomous Region in Muslim Mindanao
Underemployed 152 152 140 154 72Underemployment Rate 12.4 11.7 11.1 13.5 7.0
Visibly Underemployed 104 110 103 91 51Percent to Employed 8.5 8.5 8.2 8.0 5.0
Notes : 1. Data are averages of four (4) survey rounds of the Labor Force Survey except for 2014.
2. Details may not add up to totals due to rounding.
3. Data for 2014 refer to the average of April, July and October survey rounds.
The estimates for these rounds exclude data of Leyte province while that of January exclude Region VIII.
4. Data for 2015 refer to the average of the four survey rounds that exclude Leyte. These should not be compared with the 2014
annualized data as the latter exclude the January round. The use of the four survey rounds for the 2015 annualized data was based
on results of a referendum conducted among members of the IAC on Labor and Productivity Statistics.
5. Starting April 2016 round, the Labor Force Survey (LFS) adopted the 2013 Master Sample design as well as the population projections
based on the 2010 Census of Population and Housing (2010 CPH) while previous survey rounds were derived using the 2000 CPH
population projections. 6. Annualized data for 2016 was computed as the average of four survey rounds using the January 2016 data that were based on the
2010 Census-based population projections.
7. For more information about the changes on the survey that may have affected the estimates, please refer to the Explanatory Notes
on the Labor Force Survey (LFS) at the last part of this book.
a Excludes data of Leyte province
Source of basic data : Philippine Statistics Authority, Labor Force Survey.
2014

TABLE 11.21 Underemployed Persons by Highest Grade Completed, Philippines: 2013 to 2017 (Based on Past Week Reference Period; In Thousands)
2013 2014 2015 2016 2017
7,371 7,118 7,180 7,513 6,506No Grade Completed 122 118 119 118 103Elementary 2,684 2,523 2,500 2,610 2,142 Undergraduate 1,378 1,299 1,307 1,410 1,190 Graduate 1,307 1,224 1,193 1,200 952
SPED 1 - - - 1 1 Undergraduate - - - * - Graduate - - - * 1High School 3,104 3,054 3,117 3,240 2,838 Undergraduate 1,126 1,076 1,069 1,174 1,042 Graduate 1,979 1,978 2,049 2,066 1,795
Post Secondary 2 303 299 303 322 266 Undergraduate 85 56 51 49 41 Graduate 218 243 252 273 225College 1,157 1,124 1,142 1,222 1,156 Undergraduate 549 520 530 584 580 Graduate and Higher 609 604 612 637 576
Notes : 1. Data are averages of the four survey rounds of the Labor Force Survey except for 2014.
2. Details may not add up to totals due to rounding.
3. Data for 2014 refer to the average of April, July and October survey rounds.
The estimates for these rounds exclude data of Leyte province while that of January exclude Region VIII.
4. Data for 2015 refer to the average of the four survey rounds that exclude Leyte. These should not be compared with the 2014
annualized data as the latter exclude the January round. The use of the four survey rounds for the 2015 annualized data was
based on results of a referendum conducted among members of the IAC on Labor and Productivity Statistics.
5. Starting April 2016 round, the Labor Force Survey (LFS) adopted the 2013 Master Sample design as well as the population
projections based on the 2010 Census of Population and Housing (2010 CPH) while previous survey rounds were derived
using the 2000 CPH population projections. 6. Annualized data for 2016 was computed as the average of four survey rounds using the January 2016 data that were based
on the 2010 Census-based population projections.
7. For more information about the changes on the survey that may have affected the estimates, please refer to the
Explanatory Notes on the Labor Force Survey (LFS) at the last part of this book.
1 Available starting July 2016.2 Available starting January 2012. In prior years, data were included in the college category.
* Less than 500.
Source of basic data : Philippine Statistics Authority, Labor Force Survey, Public Use Files.
Highest Grade Completed
Total

Major Industry Group and Hours Worked 2015 2016 2017
All Industries 7,180 7,513 6,506
Worked Less Than 40 Hours 4,222 4,149 3,739 Worked 40 Hours and Over 2,958 3,364 2,766Agriculture, Hunting and Forestry 2,558 2,504 1,910 Worked Less Than 40 Hours 1,950 1,836 1,493 Worked 40 Hours and Over 608 668 417Fishing and Aquaculture 348 358 276 Worked Less Than 40 Hours 264 252 218 Worked 40 Hours and Over 84 107 58Mining and Quarrying 66 55 44 Worked Less Than 40 Hours 30 25 24 Worked 40 Hours and Over 36 29 20Manufacturing 576 548 545
Worked Less Than 40 Hours 254 220 231 Worked 40 Hours and Over 322 329 314Electricity, Gas, Steam and Air Conditioning Supply 10 16 8 Worked Less Than 40 Hours 2 2 1 Worked 40 Hours and Over 8 13 7Water Supply; Sewerage, Waste Management and Remediation Activities 9 8 12 Worked Less Than 40 Hours 3 3 5 Worked 40 Hours and Over 6 6 6Construction 610 734 686 Worked Less Than 40 Hours 241 255 285 Worked 40 Hours and Over 369 479 401Wholesale and Retail Trade; Repair of Motor Vehicles and Motorcycles 993 1,124 1,003 Worked Less Than 40 Hours 467 508 472 Worked 40 Hours and Over 526 616 531Transportation and Storage 502 546 522 Worked Less Than 40 Hours 212 235 250 Worked 40 Hours and Over 289 311 272Accommodation and Food Service Activities 242 251 220 Worked Less Than 40 Hours 119 108 90 Worked 40 Hours and Over 123 144 130Information and Communication 41 44 38 Worked Less Than 40 Hours 13 10 9 Worked 40 Hours and Over 29 33 29Financial and Insurance Activities 41 42 39 Worked Less Than 40 Hours 11 7 8 Worked 40 Hours and Over 30 36 30Real Estate Activities 21 24 24 Worked Less Than 40 Hours 14 15 12 Worked 40 Hours and Over 7 9 12
Continued
TABLE 11.22 Underemployed Persons by Major Industry Group and Hours Worked During the Past Week, Philippines: 2015 to 2017 (Based on Past Week Reference Period; In Thousands)

TABLE 11.22 - - Concluded
Major Industry Group and Hours Worked 2015 2016 2017
Professional, Scientific and Technical Activities 22 26 31 Worked Less Than 40 Hours 9 9 12 Worked 40 Hours and Over 13 17 19Administrative and Support Service Activities 104 122 141 Worked Less Than 40 Hours 18 16 20 Worked 40 Hours and Over 85 105 121Public Administration and Defense; Compulsory Social Security 326 357 323 Worked Less Than 40 Hours 160 170 156 Worked 40 Hours and Over 166 187 167Education 116 117 101 Worked Less Than 40 Hours 42 36 31 Worked 40 Hours and Over 74 81 70Human Health and Social Work Activities 48 47 45 Worked Less Than 40 Hours 13 14 11 Worked 40 Hours and Over 34 33 35Arts, Entertainment and Recreation 71 74 56 Worked Less Than 40 Hours 48 48 38 Worked 40 Hours and Over 23 27 18Other Service Activities 475 514 482 Worked Less Than 40 Hours 349 380 373 Worked 40 Hours and Over 1226 134 109Activities of Households as Employers; Undifferentiated Goods and Services-producing Activities of Households for Own Use a a 1
Worked Less Than 40 Hours a a 1
Worked 40 Hours and Over a a -
Activities of Extra-Territorial Organizations and Bodies * 1 - Worked Less Than 40 Hours * 0 - Worked 40 Hours and Over * 1 -
Notes : 1. Data are averages of the four survey rounds of the Labor Force Survey except for 2014.
2. Details may not add up to totals due to rounding.
3. Industry grouping is in accordance with the 2009 Philippine Standard Industrial Classification (PSIC).
4. Data for 2014 refer to the average of April, July and October survey rounds. The estimates for these rounds
exclude data of Leyte province while that of January exclude Region VIII.
5. Data for 2015 refer to the average of the four survey rounds that exclude Leyte. These should not be compared with the 2014
annualized data as the latter exclude the January round. The use of the four survey rounds for the 2015 annualized data was based
on results of a referendum conducted among members of the IAC on Labor and Productivity Statistics.
6. Starting April 2016 round, the Labor Force Survey (LFS) adopted the 2013 Master Sample design as well as the population projections
based on the 2010 Census of Population and Housing (2010 CPH) while previous survey rounds were derived using the 2000 CPH
population projections. 7. Annualized data for 2016 was computed as the average of four survey rounds using the January 2016 data that were based on the
2010 Census-based population projections.
8. For more information about the changes on the survey that may have affected the estimates, please refer to the
Explanatory Notes on the Labor Force Survey (LFS) at the last part of this book.
* Less than 500.a Activities of Households as Employers; Undifferentiated Goods and Services- producing Activities of Households for Own Use is included
in Other Service Activities.
Source of basic data : Philippine Statistics Authority, Labor Force Survey, Public Use Files.

Class of Worker and Hours Worked 2013 2014 2015 2016 2017
All Classes of Workers 7,371 7,118 7,180 7512.54 6,506
Worked Less Than 40 Hours 4,321 4,365 4,222 4,149 3,739Worked 40 Hours and Over 3,051 2,754 2,958 3,364 2,766
Wage and Salary Workers 4,100 3,899 3,998 4,325 3,921Worked Less Than 40 Hours 2,028 2,023 1,966 1,998 1,882Worked 40 Hours and Over 2,072 1,876 2,032 2,327 2,038
Worked for Private Household 284 260 271 301 281Worked Less Than 40 Hours 196 187 190 220 216Worked 40 Hours and Over 88 73 81 81 65
Worked for Private Establishment 3,383 3,235 3,297 3,569 3,224Worked Less Than 40 Hours 1,649 1,654 1,583 1,581 1,487Worked 40 Hours and Over 1,734 1,581 1,714 1,987 1,737
Worked With Pay in Own Family-Operated Farm or Business 19 16 17 15 17Worked Less Than 40 Hours 10 9 10 8 10Worked 40 Hours and Over 9 8 7 7 7
Worked for Gov't/Gov't Corporation 413 387 412 440 399Worked Less Than 40 Hours 173 173 182 188 169Worked 40 Hours and Over 240 214 230 252 230
Self-Employed Without Any Paid Employee 2,336 2,317 2,324 2,407 2,027Worked Less Than 40 Hours 1,580 1,629 1,599 1,578 1,433Worked 40 Hours and Over 756 688 726 829 594
Employer in Own Family-Operated Farm or Business 203 175 179 209 227Worked Less Than 40 Hours 134 122 120 133 151Worked 40 Hours and Over 68 53 59 76 76
Without Pay in Own Family-Operated Farm or Business (Unpaid Family Workers) 733 728 680 572 331Worked Less Than 40 Hours 578 591 538 440 273Worked 40 Hours and Over 155 137 141 132 57
Notes : 1. Data are averages of the four survey rounds of the Labor Force Survey except for 2014.
2. Details may not add up to totals due to rounding.
3. Data for 2014 refer to the average of April, July and October survey rounds.
The estimates for these rounds exclude data of Leyte province while that of January exclude Region VIII.
4. Data for 2015 refer to the average of the four survey rounds that exclude Leyte. These should not be compared with the 2014
annualized data as the latter exclude the January round. The use of the four survey rounds for the 2015 annualized data was based
on results of a referendum conducted among members of the IAC on Labor and Productivity Statistics.
5. Starting April 2016 round, the Labor Force Survey (LFS) adopted the 2013 Master Sample design as well as the population projections
based on the 2010 Census of Population and Housing (2010 CPH) while previous survey rounds were derived using the 2000 CPH
population projections. 6. Annualized data for 2016 was computed as the average of four survey rounds using the January 2016 data that were based
on the 2010 Census-based population projections.
7. For more information about the changes on the survey that may have affected the estimates, please refer to the
Explanatory Notes on the Labor Force Survey (LFS) at the last part of this book.
Source of basic data : Philippine Statistics Authority, Labor Force Survey, Public Use Files.
TABLE 11.23 Underemployed Persons by Class of Worker and Hours Worked During the Past Week,Philippines: 2013 to 2017(Based on Past Week Reference Period; In Thousands)

TABLE 11.24 Minimum Wage Rates by Sector and Region, Philippines: As of 15 May 2019 (In pesos)
Wage Order No. NCR-22 (Effective November 22, 2018)
Agriculture (Plantation and Non Plantation)
Wage Order No. RB-CAR-19 (Effective: August 20, 2018)Baguio City and
La Trinidad
320.00 310.00
Covers the Provinces of Mt. Province, Abra, Benguet, Ifugao, Kalinga and Apayao and the City of Baguio.
(Wage Order No. RB 1-20 Effective:April 30, 2019)
Non-Agriculture30 or more employees10-29 employees1-9 employees (category above 3M-15M)
AgriculturePlantation Non-Plantation
Chartered Cities and First Class MunicipalitiesOther Municipalities
(Wage Order No. RTWPBII-19 Effective 25 November 2018 ) a/
AgricultureRetail/Service Establishments
Employing not more than 10
Continued
a/includes COLA
Industry/Sector/Region Minimum Wage Rates/Effectvity Date
National Capital Region Non-Agriculture 537.00
500.00 Retail/Service Establishments
Employing 15 workers or less 500.00 Manufacturing Establishments regularly employing 500.00
Monthly Minimum Wage Rates for Domestic Workers₱3,500.00
Cordillera Administrative Region Tabuk City, Bangued, Bontoc, Lagawe,
Banawe, Bugias, Bauko, Sagada & Other Areas in the Region
All Industries/Sectors employing 11 or more 315.00 300.00 All Industries/Sectors employing 10 or less 305.00 300.00
Grants the following:
₱20.00-₱30.00/day basic wage increase
Integration of ₱15.00 COLA under the previous wage order into the basic pay.
Monthly Minimum Wage Cities and first class municipalities ₱4,000Other municipalities ₱3,000
Ilocos Region
340.00 310.00 282.00
1-9 employees (category 3M and below) 273 (upon effectivity)282 (after 6 months from effectivity)
295.00
Monthly Minimum Wage Rates for Domestic Workers 282.00
4,5003,500
Cagayan Valley
Non Agriculture; and Retail/Service Establishments 360.00340.00
320.00Monthly Minimum Wage Rates for Domestic Workers
All cities and municipalities regardless of income 3,500
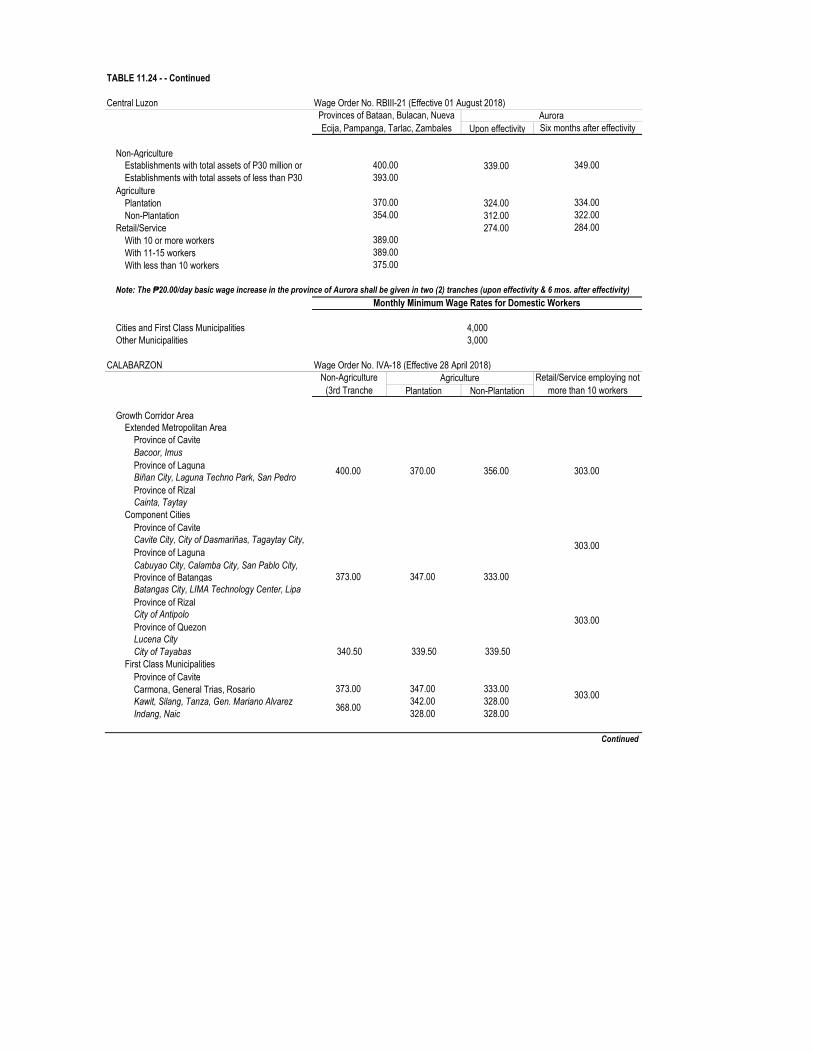
TABLE 11.24 - - Continued
Wage Order No. RBIII-21 (Effective 01 August 2018)
Upon effectivity
Non-Agriculture339.00
Agriculture
Plantation 324.00Non-Plantation 312.00
Retail/Service 274.00With 10 or more workersWith 11-15 workersWith less than 10 workers
Note: The ₱20.00/day basic wage increase in the province of Aurora shall be given in two (2) tranches (upon effectivity & 6 mos. after effectivity)
Cities and First Class MunicipalitiesOther Municipalities
Wage Order No. IVA-18 (Effective 28 April 2018)
Plantation Non-Plantation
Growth Corridor Area
Province of Cavite
Province of Laguna
Province of Rizal
Province of Cavite
Province of Laguna
Province of Batangas
Province of Rizal
Province of Quezon
340.50 339.50 339.50
Province of CaviteCarmona, General Trias, Rosario 373.00 347.00 333.00
342.00 328.00328.00 328.00
Continued
Central LuzonProvinces of Bataan, Bulacan, Nueva Ecija, Pampanga, Tarlac, Zambales
AuroraSix months after effectivity
Establishments with total assets of P30 million or 400.00 349.00Establishments with total assets of less than P30 393.00
370.00 334.00354.00 322.00
284.00389.00389.00375.00
Monthly Minimum Wage Rates for Domestic Workers
4,0003,000
CALABARZONNon-Agriculture
(3rd Tranche Agriculture Retail/Service employing not
more than 10 workers
Extended Metropolitan Area
400.00 370.00 356.00 303.00
Bacoor, Imus
Biñan City, Laguna Techno Park, San Pedro
Cainta, TaytayComponent Cities
373.00 347.00 333.00
303.00Cavite City, City of Dasmariñas, Tagaytay City,
Cabuyao City, Calamba City, San Pablo City,
Batangas City, LIMA Technology Center, Lipa
303.00City of Antipolo
Lucena CityCity of Tayabas
First Class Municipalities
303.00Kawit, Silang, Tanza, Gen. Mariano Alvarez
368.00Indang, Naic

TABLE 11.24 - - Continued
Plantation Non-PlantationAlfonso 368.00 328.00 328.00 Province of Laguna
373.00 347.00 333.00Province of Batangas
328.00326.00
San Juan 328.00 328.00Province of Rizal
328.00326.00
Pililla 328.00 328.00Province of Quezon
342.00 326.00Tiaong 328.00 328.00
340.00 339.00 339
Province of CaviteMaragondon, Noveleta 333.00 303.00 303.00Province of Laguna
344.00 318.00 318.00333.00 303.00 303.00
Province of Batangas308.00318.00
Taysan 339.00333.00
Province of RizalMorong 344.00 318.00 318.00Teresa 339.00Cardona 333.00Province of Quezon
337.50 327.50 327.50336.00 336.00 336.00
Province of CaviteTernate 327.00
317.00Province of LagunaPaete, Pakil 327.00
317.00Province of Batangas
317.00Province of Rizal
317.00Province of Quezon
Continued
Non-Agriculture(3rd Tranche
Agriculture Retail/Service employing not more than 10 workers
303.00
Los Baños, Sta. Cruz
Bauan, San Pascual, Santo Tomas368.00
342.00Balayan, Calaca, Lemery, Mabini, Nasugbu,
Rodriguez (Montalban),Tanay368.00
342.00Angono, Binangonan, San Mateo
Candelaria, Sariaya368.00
Atimonan, Calauag, Catanauan, General
Emerging Growth AreaSecond & Third Class Municipalities
303.00
Bay, Calauan, Nagcarlan, SiniloanAlaminos, Cavinti, Kalayaan, Lumban,
Calatagan344.00 318.00
Ibaan, Malvar, Padre Garcia
303.00 303.00Laurel, Lian, Lobo, Taal, Talisay, Tuy
303.00 303.00
Lucban, San Francisco (Aurora)Guinayangan, Polilio, San Narciso
Resource Based AreaFourth, Fifth & Sixth Class Municipalities
303.00303.00 303.00
Amadeo, Gen. Emilio Aguinaldo, Magallanes,
Famy, Liliw, Luisiana, Mabitac, Magdalena,
Agoncillo, Alitagtag, Balete, Cuenca, Mataas na
Baras, Jala-Jala

TABLE 11.24 - - Continued
Province of Quezon327.00 327.00 327.00
Growth Corridor Area Emerging Growth Area and Resource Based Area
All Sectors
Establishment with less than 10 workers
Other Municipalities
Other Municipalities
Non-Agriculture/Industrial/CommercialEmploying more than 10 workersEmploying 10 workers and below
AgriculturePlantationNon-Plantation
Cities and first class municipalitiesOther Municipalities
Class A Class B Class C
Cities of Carcar, Cebu, Danao, Lapulapu, Mandaue, Naga, Talisay and Municipalities of Compostela, Consolacion, Cordova, Liloan, Minglanilla, San Fernando, or Expanded Metro Cebu
Cities of Toledo, Bogo, and the rest of Municipalities in Cebu Province except Bantayan and Camotes Islands
Cities and Municipalities in Bohol and Negros Oriental Provinces
Non-AgricultureEmploying 10 Workers & Above 386.00 348.00 338.00
a/ includes COLA Continued
TABLE 11.24 - - Continued
Employing Less Than 10 Workers 376.00 343.00 333.00Agriculture 368.00 328.00 313.00
Chartered Cities and First Class MunicipalitiesOther Municipalities
Non-Agriculture (including sugar mills)Cottage/HandicraftRetail/Service
Employing 11 up to 30 workers Employing 10 workers and below
Agdangan, Alabat, Buenavista, Burdeos, Monthly Minimum Wage Rates for Domestic Workers
3,5003,000
MIMAROPA Wage Order No. RB-MIMAROPA-09 (Effective 27 November 2018)
Establishment with 10 workers and above 320.00294.00
Monthly Minimum Wage Rates for Domestic Workers
Chartered Cities and First Class Municipalities 2,500
Bicol Region Wage Order No. RBV-19 (Effective September 21, 2018)New Minimum Wage upon effectivity New Minimum Wage
Establishments employing 10 workers and above 305.00310.00
Establishments employing 1 to 9 workers 295.00Monthly Minimum Wage Rates for Domestic Workers
Chartered Cities and First Class Municipalities 3,0002,500
Western Visayas Wage Order No. RB VI-24 (Effective 12 July 2018) a/
365.00295.00
295.00
Monthly Minimum Wage Rates for Domestic Workers
4,000
Central Visayas Wage Order No. ROVII-21 (Effective August 3, 2018)Class D
Municipalities in Siquijor Province & Municipalities in Bantayan and Camotes Islands.
323.00
318.00313.00
Monthly Minimum Wage Rates for Domestic Workers 3,0002,500
Wage Order No. RB VIII-20 (Effective 25 June 2018)
305.00275.00
305.00275.00

Agriculture
Chartered Cities and First Class MunicipalitiesOther Municipalities
Wage Order No. RIX-20 (Effective 30 July 2018)Non-Agricultural
Chartered Cities and First Class MunicipalitiesOther Municipalities
Wage Order No. RX-20 (Effective 01 November 2018)
Wage Category I Wage Category II Wage Category III
Non-Agriculture 365.00 358.00 350.00Agriculture 353.00 346.00 338.00
Chartered Cities and First Class MunicipalitiesOther Municipalities
Wage Order No. RTWPB-XI-20 (Effective 16 August 2018)
Non-Agriculture
AgricultureRetail/Service
Employing not more than 10 workers
Cities and First Class MunicipalitiesOther Municipalities
Continued
275.00
Eastern VisayasMonthly Minimum Wage Rates for Domestic Workers
2,5002,000
Zamboanga Peninsula
(Includes private hospitals, educational institutions, 316.00Agricultural/Retail/ Service Establishments
303.00(Includes rubber-based plantations/Agricultural Plantation and Non-Plantation; Micro Enterprises; and Retail/Service establishments employing not more than 30 workers)
Monthly Minimum Wage Rates for Domestic Workers 2,5002,000
Northern Mindanao
Wage Category IV
343.00331.00
Monthly Minimum Wage Rates for Domestic Workers 3,0002,000
Davao RegionUpon Effectivity Effective 16 February 2019
Industrial/Commercial and Retail/Service 370.00 396.00365.00 391.00
355.00 381.00Monthly Minimum Wage Rates for Domestic Workers
3,0002,000

TABLE 11.24 - - Concluded
Wage Order No. RB XII-20 (Effective 11 May 2018)Non-AgricultureAgriculture/Retail/Service Establishment
Cities and First Class MunicipalitiesOther Municipalities
Wage Order No. RXIII-16 (Effective May 01, 2019) a/Non-Agriculture
Plantation Non- Plantation
Retail/ServiceEmploying 10 or less
Chartered Cities and First Class MunicipalitiesOther Municipalities
Wage Order No. ARMM-17 (Effective 15 June 2018)Non-Agriculture
Plantation Non- Plantation
a/ includes COLA
SOCCSKSARGEN311.00290.00
Monthly Minimum Wage Rates for Domestic Workers 2,5002,000
CARAGA
320.00
Agriculture
Monthly Minimum Wage Rates for Domestic Workers
3,0002,500
ARMM
Industrail/Manufacturing/Construction/Commercial/ 280.00Agriculture
270.00

TABLE 11.25 Average Monthly Wage Rates in Selected Industries of Time-Rate Workers on Full-time Basis in Selected Industries and Occupations, Philippines: As of July 2016 (In pesos)
Average of Selected Occupations 15,375 a
Crop and Animal Production, Hunting and Related Service Activities; Forestry and LoggingField Crop Farm Workers 7,893Forestry Workers 7,461Loggers 7,942Farm/Plantation Supervisors 14,949Forest Supervisors 13,255Accounting and Bookkeeping Clerks 11,044Unskilled Workers except Janitors, Messengers and Freight Handlers 7,739
Fishing and AquacultureAqua-Farm Cultivators 7,516Accounting and Bookkeeping Clerks 12,070Inland and Coastal Waters Fishermen 9,877Deep-Sea Fishermen 10,675Unskilled Workers except Janitors, Messengers and Freight Handlers 10,971
Production Supervisors and General Foremen 14,203Geologists 36,427Mining Engineers 25,261Accounting and Bookkeeping Clerks 13,348Miners and Quarry Workers 9,734Mining Plant Operators 10,792Stone Processing Plant Operators 8,965Well Drillers and Borers and Related Workers 6,826Unskilled Workers except Janitors, Messengers and Freight Handlers 6,920
Mining of Metal Ores Production Supervisors and General Foremen 22,625Geologists 39,138Mining Engineers and Metallurgists 32,006Mining and Metallurgical Engineering Technicians 12,185Accounting and Bookkeeping Clerks 17,439Miners 12,763Shotfirers and Blasters 11,628Mining Plant Operators 14,855Mineral Ore Processing Plant Operators 11,103Unskilled Workers except Janitors, Messengers and Freight Handlers 7,574
Manufacture of Food Products and BeveragesFood Processing and Related Trades Workers 10,637Food and Related Products Machine Operators 13,737Production Supervisors and General Foremen 21,172Food Technologists 19,099Chemical Engineering Technicians 19,000Quality Inspectors 14,271Accounting and Bookkeeping Clerks 14,547
Industry/Occupation Average Monthly Wage Rates
Mining of Coal and Lignite; Extraction of Crude Petroleum and Natural Gas; and Other Mining and Quarrying
Continued
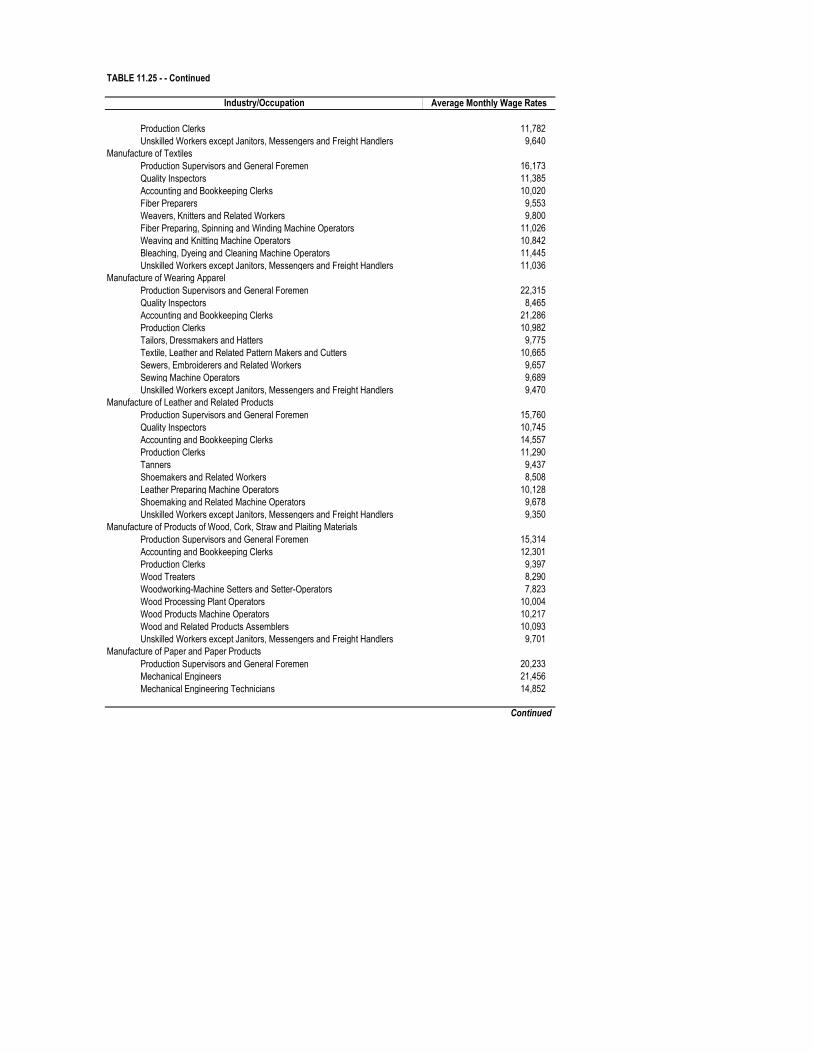
TABLE 11.25 - - Continued
Production Clerks 11,782Unskilled Workers except Janitors, Messengers and Freight Handlers 9,640
Manufacture of TextilesProduction Supervisors and General Foremen 16,173Quality Inspectors 11,385Accounting and Bookkeeping Clerks 10,020Fiber Preparers 9,553Weavers, Knitters and Related Workers 9,800Fiber Preparing, Spinning and Winding Machine Operators 11,026Weaving and Knitting Machine Operators 10,842Bleaching, Dyeing and Cleaning Machine Operators 11,445Unskilled Workers except Janitors, Messengers and Freight Handlers 11,036
Manufacture of Wearing ApparelProduction Supervisors and General Foremen 22,315Quality Inspectors 8,465Accounting and Bookkeeping Clerks 21,286Production Clerks 10,982Tailors, Dressmakers and Hatters 9,775Textile, Leather and Related Pattern Makers and Cutters 10,665Sewers, Embroiderers and Related Workers 9,657Sewing Machine Operators 9,689Unskilled Workers except Janitors, Messengers and Freight Handlers 9,470
Manufacture of Leather and Related Products Production Supervisors and General Foremen 15,760Quality Inspectors 10,745Accounting and Bookkeeping Clerks 14,557Production Clerks 11,290Tanners 9,437Shoemakers and Related Workers 8,508Leather Preparing Machine Operators 10,128Shoemaking and Related Machine Operators 9,678Unskilled Workers except Janitors, Messengers and Freight Handlers 9,350
Manufacture of Products of Wood, Cork, Straw and Plaiting MaterialsProduction Supervisors and General Foremen 15,314Accounting and Bookkeeping Clerks 12,301Production Clerks 9,397Wood Treaters 8,290Woodworking-Machine Setters and Setter-Operators 7,823Wood Processing Plant Operators 10,004Wood Products Machine Operators 10,217Wood and Related Products Assemblers 10,093Unskilled Workers except Janitors, Messengers and Freight Handlers 9,701
Manufacture of Paper and Paper ProductsProduction Supervisors and General Foremen 20,233Mechanical Engineers 21,456Mechanical Engineering Technicians 14,852
Industry/Occupation Average Monthly Wage Rates
Continued

TABLE 11.25 - - Continued
Accounting and Bookkeeping Clerks 17,128Production Clerks 11,906Paper Pulp Plant Operators 11,060Papermaking Plant Operators 13,210Paperboard and Related Products Assemblers 11,567Unskilled Workers except Janitors, Messengers and Freight Handlers 12,305
Printing and Reproduction of Recorded MediaProduction Supervisors and General Foremen 17,423Mechanical Engineers 13,424Journalists and Other Writers 13,318Accounting and Bookkeeping Clerks 14,220Proofreaders and Copymarkers 17,125Compositors, Typesetters and Related Workers 11,832Stereotypers and Electrotypers 12,766Printing Engravers and Etchers 11,867Bookbinders and Related Workers 11,281Pressman Letterpress and Related Workers 11,821Unskilled Workers except Janitors, Messengers and Freight Handlers 12,381
Manufacture of Coke and Refined Petroleum ProductsProduction Supervisors and General Foremen 17,594Chemical Engineers 29,522Chemical Engineering Technicians 16,961Accounting and Bookkeeping Clerks 17,530Production Clerks 12,962Industrial Machinery Mechanics and Fitters 15,805Crushing, Grinding and Chemical-Mixing Machinery Operators 18,494Petroleum Refining Plant Operators 14,870Unskilled Workers except Janitors, Messengers and Freight Handlers 9,130
Manufacture of Chemicals and Chemical ProductsProduction Supervisors and General Foremen 31,623Chemical Engineers 30,005Chemical Engineering Technicians 20,384Accounting and Bookkeeping Clerks 15,489Crushing, Grinding and Chemical-Mixing Machinery Operators 13,326Chemical Heat-Treating Plant Operators 12,150Chemical Filtering and Separating Equipment Operators 15,071Unskilled Workers except Janitors, Messengers and Freight Handlers 12,145
Manufacture of Basic Pharmaceutical Products and Pharmaceutical PreparationProduction Supervisors and General Foremen 22,034Pharmaceutical Chemists 17,903Chemical Engineers 28,096Chemical Engineering Technicians 11,676Accounting and Bookkeeping Clerks 15,215Pharmaceutical and Toiletry Products Machine Operators 11,426Unskilled Workers except Janitors, Messengers and Freight Handlers 11,763
Manufacture of Rubber Products
Industry/Occupation Average Monthly Wage Rates
Continued

TABLE 11.25 - - Continued
Production Supervisors and General Foremen 20,573Mechanical Engineers 17,367Chemical Engineers 19,391Chemical Engineering Technicians 11,832Quality Inspectors 12,291Accounting and Bookkeeping Clerks 14,371Production Clerks 13,012Rubber Products Machine Operators 12,228Unskilled Workers except Janitors, Messengers and Freight Handlers 11,071
Manufacture of Plastic ProductsProduction Supervisors and General Foremen 18,844Mechanical Engineers 24,384Chemical Engineers 25,920Chemical Engineering Technicians 14,698Quality Inspectors 12,753Accounting and Bookkeeping Clerks 15,664Production Clerks 11,974Plastic Products Machine Operators 11,624Unskilled Workers except Janitors, Messengers and Freight Handlers 11,001
Manufacture of Other Non-Metallic Mineral ProductsPotters, Glass-Makers and Related Trades Workers 11,162Glass, Ceramics and Related Plant Operatos 10,304Production Supervisors and General Foremen 22,645Mechanical Engineers 34,730Quality Inspectors 18,580Accounting and Bookkeeping Clerks 15,245Production Clerks 13,561Cement and Other Mineral Products Machine Operators 16,431Unskilled Workers except Janitors, Messengers and Freight Handlers 10,847
Manufacture of Basic MetalsProduction Supervisors and General Foremen 22,537Accounting and Bookkeeping Clerks 15,236Metal Molders and Core Makers 11,543Sheet-Metal Workers 10,479Ore and Metal Furnace Operators 16,030Metal Melters, Casters and Rolling-Mill Operators 12,651Metal Heat Treating Plant Operators 12,811Metal Drawers and Extruders 12,438Unskilled Workers except Janitors, Messengers and Freight Handlers 10,288
Manufacture of Fabricated Metal Products except Machinery and EquipmentProduction Supervisors and General Foremen 18,580Quality Inspectors 13,248Accounting and Bookkeeping Clerks 14,695Welders and Flamecutters 11,268Structural Metal Preparers 11,506Blacksmiths, Hammersmiths and Forging Press Operators 11,321
Industry/Occupation Average Monthly Wage Rates
Continued

TABLE 11.25 - - Continued
Machine-Tool Setters and Setters-Operators 11,116Machine Tool Operators 11,065Unskilled Workers except Janitors, Messengers and Freight Handlers 10,459
Manufacture of Computer, Electronic and Optical ProductsProduction Supervisors and General Foremen 28,499
Electronicsand Telecommunications Engineers 27,413
Electronicsand Telecommunications Engineering Technicians 17,365
Quality Inspectors 11,781
Accounting and Bookkeeping Clerks 20,090
Production Clerks 11,706Electronics Filters 15,161Electronic Equipment Assemblers 13,254Unskilled Workers except Janitors, Messengers and Freight Handlers 12,706
Manufacture of Electrical EquipmentProduction Supervisors and General Foremen 22,936Electrical Engineers 20,548Electrical Engineering Technicians 13,556Quality Inspectors 12,588Accounting and Bookkeeping Clerks 19,365Production Clerks 15,124Electrical Mechanics and Fitters 14,909Electrical Equipment Assemblers 10,182Unskilled Workers except Janitors, Messengers and Freight Handlers 10,379
Manufacture of Machinery and Equipment, n.e.c.Production Supervisors and General Foremen 25,278Mechanical Engineers 24,544Quality Inspectors 13,988Accounting and Bookkeeping Clerks 20,092Production Clerks 12,869Welders and Flamecutters 13,376Tool Makers and Related Workers 21,517Agricultural or industrial Machinery Mechanics and Filters 14,593Mechanical Machinery Assemblers 12,908Unskilled Workers except Janitors, Messengers and Freight Handlers 10,522
Manufacture of Motor Vehicles, Trailers and Semi-TrailersProduction Supervisors and General Foremen 34,648Mechanical Engineers 27,121Mechanical Engineering Technicians 17,678Quality Inspectors 14,624Accounting and Bookkeeping Clerks 22,124Sheet-Metal Workers 21,001Motor Vehicle Mechanics and Related Trades Workers 31,505Mechanical Machinery Assemblers 13,376Unskilled Workers except Janitors, Messengers and Freight Handlers 10,324
Building of Ships and BoatsProduction Supervisors and General Foremen 21,355
Industry/Occupation Average Monthly Wage Rates
Continued

TABLE 11.25 - - Continued
Marine Engineers 22,623Quality Inspectors 15,342Accounting and Bookkeeping Clerks 14,967Production Clerks 18,754Plumbers, Pipe Fitters and Other Related Workers 10,587Welders and Flamecutters 10,525Structural Metal Preparers, Erectors and Related Workers 10,831Riggers and Cable Splicers 11,031Marine Crafts Mechanics 10,939Unskilled Workers except Janitors, Messengers and Freight Handlers 9,753
Manufacture of FurnitureProduction Supervisors and General Foremen 16,364Quality Inspectors 12,442Decorators and Commercial Designers 12,058Accounting and Bookkeeping Clerks 13,505Production Clerks 11,493Cabinet/Furniture Makers and Related Workers 9,297Rattan, Bamboo and Other Wicker Furniture Workers 9,375Upholsterers and Related Workers 10,015Wood Products Machine Operators 9,703Unskilled Workers except Janitors, Messengers and Freight Handlers 10,287
Electricity, Gas, Steam and Air Conditioning SupplyProduction Supervisors and General Foremen 47,101Electrical Engineers 36,019Electrical Engineering Technicians 33,299Accounting and Bookkeeping Clerks 21,395Debt Collectors and Related Workers 32,319Customer Service Representatives/Associates (in call centers) 22,668Electrical Mechanics and Fitters 24,048Lineman, Line Installers and Cable Splicers 24,384Power-Production Plant Operators 30,887Unskilled Workers except Janitors, Messengers and Freight Handlers 11,605
Water Collection, Treatment and SupplyProduction Supervisors and General Foremen 32,205Civil Engineers 68,957Civil Engineering Technicians 18,957Quality Inspectors 23,965Accounting and Bookkeeping Clerks 21,282Debt Collectors and Related Workers 17,607Customer Service Representatives/Associates (in call centers) 20,039Plumbers, Pipe Fitters and Other Related Operators 13,667Water-Treatment and Related Plant Operators 18,280Unskilled Workers except Janitors, Messengers and Freight Handlers 9,131
ConstructionProduction Supervisors and General Foremen 20,029Civil Engineers 23,232
Industry/Occupation Average Monthly Wage Rates
Continued
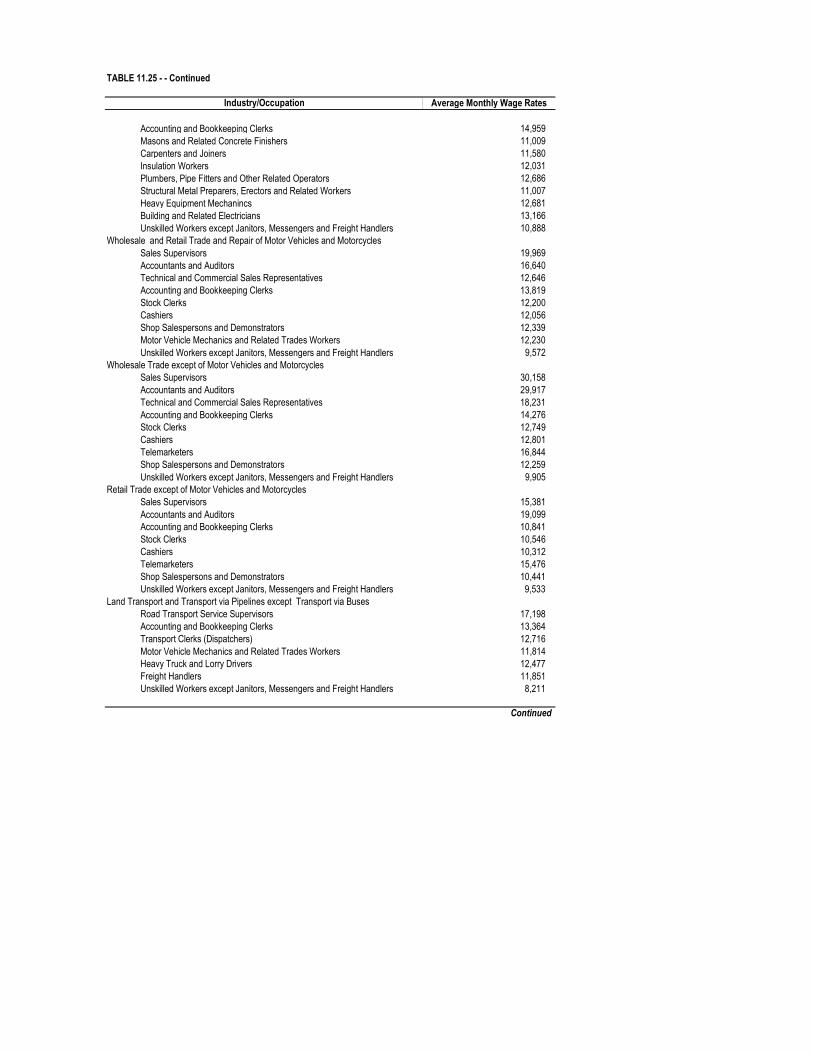
TABLE 11.25 - - Continued
Accounting and Bookkeeping Clerks 14,959Masons and Related Concrete Finishers 11,009Carpenters and Joiners 11,580Insulation Workers 12,031Plumbers, Pipe Fitters and Other Related Operators 12,686Structural Metal Preparers, Erectors and Related Workers 11,007Heavy Equipment Mechanincs 12,681Building and Related Electricians 13,166Unskilled Workers except Janitors, Messengers and Freight Handlers 10,888
Wholesale and Retail Trade and Repair of Motor Vehicles and MotorcyclesSales Supervisors 19,969Accountants and Auditors 16,640Technical and Commercial Sales Representatives 12,646Accounting and Bookkeeping Clerks 13,819Stock Clerks 12,200Cashiers 12,056Shop Salespersons and Demonstrators 12,339Motor Vehicle Mechanics and Related Trades Workers 12,230Unskilled Workers except Janitors, Messengers and Freight Handlers 9,572
Wholesale Trade except of Motor Vehicles and MotorcyclesSales Supervisors 30,158Accountants and Auditors 29,917Technical and Commercial Sales Representatives 18,231Accounting and Bookkeeping Clerks 14,276Stock Clerks 12,749Cashiers 12,801Telemarketers 16,844Shop Salespersons and Demonstrators 12,259Unskilled Workers except Janitors, Messengers and Freight Handlers 9,905
Retail Trade except of Motor Vehicles and Motorcycles Sales Supervisors 15,381Accountants and Auditors 19,099Accounting and Bookkeeping Clerks 10,841Stock Clerks 10,546Cashiers 10,312Telemarketers 15,476Shop Salespersons and Demonstrators 10,441Unskilled Workers except Janitors, Messengers and Freight Handlers 9,533
Land Transport and Transport via Pipelines except Transport via Buses Road Transport Service Supervisors 17,198Accounting and Bookkeeping Clerks 13,364Transport Clerks (Dispatchers) 12,716Motor Vehicle Mechanics and Related Trades Workers 11,814Heavy Truck and Lorry Drivers 12,477Freight Handlers 11,851Unskilled Workers except Janitors, Messengers and Freight Handlers 8,211
Industry/Occupation Average Monthly Wage Rates
Continued

TABLE 11.25 - - Continued
Transport via Buses Road Transport Service Supervisors 12,746Accounting and Bookkeeping Clerks 17,821Transport Clerks (Dispatchers) 13,444Ticket Clerks 12,615Bus Conductors 11,333Bus Inspectors 13,220Motor Vehicle Mechanics and Related Trades Workers 12,717Bus Drivers 11,686Unskilled Workers except Janitors, Messengers and Freight Handlers 9,005
Water TransportMaritime Transport Service Supervisors 21,352Ship's Engineers 40,784Ships' Deck Officers and Pilots 26,852Accounting and Bookkeeping Clerks 14,092Transport Clerks 16,673Ticket Clerks 10,309Travel Attendants and Travel Stewards 12,161Marine Crafts Mechanics 13,683Ships' Deck Crews and Related Workers 14,067Freight Handlers 12,248
Unskilled Workers except Janitors, Messengers and Freight Handlers 7,437 r
Air TransportAir Transport Service Supervisors 29,615Aircraft Pilots, Navigators and Flight Engineers 116,714Accounting and Bookkeeping Clerks 14,281Transport Clerks 19,212Ticket Clerks 17,441Travel Attendants and Travel Stewards 15,110Aircraft Engine Mechanics and Fitters 36,840Freight Handlers 18,339Unskilled Workers except Janitors, Messengers and Freight Handlers 12,807
Warehousing and Support Activities for Transportation Clearing and Forwarding Agents 15,571Accounting and Bookkeeping Clerks 18,077Heavy Truck and Lorry Drivers 14,234Freight Handlers 11,213Unskilled Workers except Janitors, Messengers and Freight Handlers 12,163
Accommodation and Food Service ActivitiesAccountants and Auditors 21,885Accounting and Bookkeeping Clerks 13,705Receptionists and Information Clerks 11,560Service Crew 10,841Housekeepers and Related Workers 10,906Cooks 12,470Waiters, Waitresses and Bartenders 10,953
Industry/Occupation Average Monthly Wage Rates
Continued
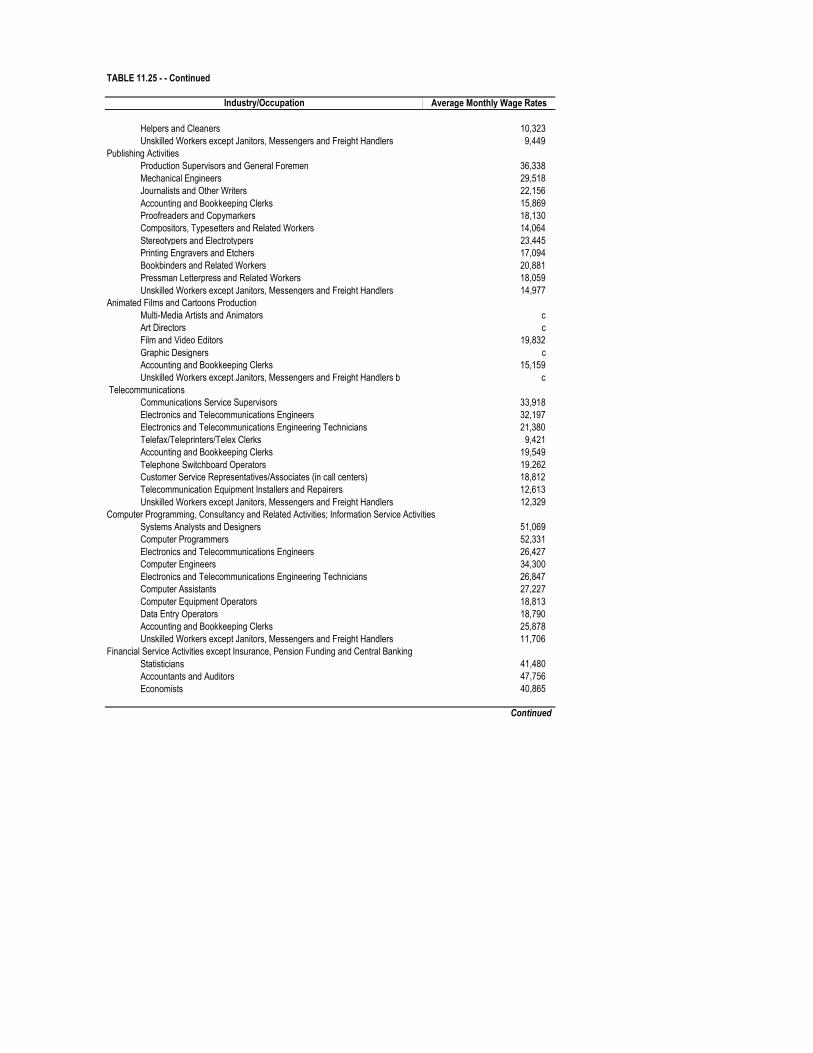
TABLE 11.25 - - Continued
Helpers and Cleaners 10,323Unskilled Workers except Janitors, Messengers and Freight Handlers 9,449
Publishing ActivitiesProduction Supervisors and General Foremen 36,338Mechanical Engineers 29,518Journalists and Other Writers 22,156Accounting and Bookkeeping Clerks 15,869Proofreaders and Copymarkers 18,130Compositors, Typesetters and Related Workers 14,064Stereotypers and Electrotypers 23,445Printing Engravers and Etchers 17,094Bookbinders and Related Workers 20,881Pressman Letterpress and Related Workers 18,059Unskilled Workers except Janitors, Messengers and Freight Handlers 14,977
Animated Films and Cartoons ProductionMulti-Media Artists and Animators cArt Directors cFilm and Video Editors 19,832Graphic Designers cAccounting and Bookkeeping Clerks 15,159Unskilled Workers except Janitors, Messengers and Freight Handlers b c
TelecommunicationsCommunications Service Supervisors 33,918Electronics and Telecommunications Engineers 32,197Electronics and Telecommunications Engineering Technicians 21,380Telefax/Teleprinters/Telex Clerks 9,421Accounting and Bookkeeping Clerks 19,549Telephone Switchboard Operators 19,262Customer Service Representatives/Associates (in call centers) 18,812Telecommunication Equipment Installers and Repairers 12,613Unskilled Workers except Janitors, Messengers and Freight Handlers 12,329
Computer Programming, Consultancy and Related Activities; Information Service ActivitiesSystems Analysts and Designers 51,069Computer Programmers 52,331Electronics and Telecommunications Engineers 26,427Computer Engineers 34,300Electronics and Telecommunications Engineering Technicians 26,847Computer Assistants 27,227Computer Equipment Operators 18,813Data Entry Operators 18,790Accounting and Bookkeeping Clerks 25,878Unskilled Workers except Janitors, Messengers and Freight Handlers 11,706
Financial Service Activities except Insurance, Pension Funding and Central BankingStatisticians 41,480Accountants and Auditors 47,756Economists 40,865
Industry/Occupation Average Monthly Wage Rates
Continued

TABLE 11.25 - - Continued
Securities and Finance Dealers and Brokers 89,831Bookkeepers 17,006Accounting and Bookkeeping Clerks 13,781Statistical and Finance Clerks 14,581Tellers 17,008Debt Collectors and Related Workers 12,885Customer Service Representatives/Associates (in call centers) 19,206Unskilled Workers except Janitors, Messengers and Freight Handlers 8,351
Insurance, Reinsurance and Pension Funding except Compulsory Social Security Actuaries 60,477Statisticians 33,589Computer Programmers 50,674Accountants and Auditors 45,717Insurance Representatives 21,282Appraisers and Valuers 28,981Accounting and Bookkeeping Clerks 20,168Statistical and Finance Clerks 20,021Debt Collectors and Related Workers 23,492Customer Service Representatives/Associates (in call centers) 29,351Unskilled Workers except Janitors, Messengers and Freight Handlers 14,370
Real Estate ActivitiesReal Estate Agents 17,002Accounting and Bookkeeping Clerks 15,312Unskilled Workers except Janitors, Messengers and Freight Handlers 9,497
Accounting, Bookkeeping and Auditing Activities; Tax ConsultancyAccountants and Auditors 22,752Bookkeepers 15,863Data Entry Operators 18,284Accounting and Bookkeeping Clerks 13,801Unskilled Workers except Janitors, Messengers and Freight Handlers 11,999
Architectural and Engineering Activities and Related Technical ConsultancyGeologists 34,676Architects 27,463Civil Engineers 30,478Electrical Engineers 30,676Geodetic Engineers 32,181Civil Engineering Technicians 12,510Electrical Engineering Technicians 15,078Draftsmen 15,707Accounting and Bookkeeping Clerks 18,922Unskilled Workers except Janitors, Messengers and Freight Handlers 13,480
Travel Agency, Tour Operator, Reservation Service and Related ActivitiesTravel Consultants and Organizers 19,878Accounting and Bookkeeping Clerks 17,100Travel Agency Clerks and Related Workers 19,845Travel Guides 13,852
Continued
Industry/Occupation Average Monthly Wage Rates

TABLE 11.25 - - Concluded
Unskilled Workers except Janitors, Messengers and Freight Handlers 15,000Call Center Activities (Voice)
Computer Programmers 37,865Computer Engineers 49,335Computer Assistants 22,559Accounting and Bookkeeping Clerks 22,507Customer Service Representatives/Associates 19,356Unskilled Workers except Janitors, Messengers and Freight Handlers 14,072
Medical Transcription ActivitiesComputer Programmers 17,423Computer Engineers 18,305Computer Assistants 18,326Medical Transcriptionists 13,129Accounting and Bookkeeping Clerks 14,936Unskilled Workers except Janitors, Messengers and Freight Handlers 11,129
Education except Public Education College, University and Higher Education Teaching Professionals 25,453Technical and Vocational Instructors/Trainers 18,244General Secondary Education Teaching Professionals 15,344Science and Mathematics Teaching Professionals 16,373Vocational Education Teaching Professionals 17,315General Elementary Education Teaching Professionals 15,634Science and Mathematics Elementary Education Teaching Professionals 17,553Pre-Elementary Education Teaching Professionals 15,406Accounting and Bookkeeping Clerks 15,222Unskilled Workers except Janitors, Messengers and Freight Handlers 9,096
Human Health Activities except Public Health ActivitiesMedical Doctors 35,640Dentists 23,526Nutritionists-Dietitians 15,022Medical Technologists 14,115Physiotherapists 12,860Professional Nurses 12,662Professional Midwives 11,678Medical Equipment Operators 12,834Accounting and Bookkeeping Clerks 12,441Unskilled Workers except Janitors, Messengers and Freight Handlers 9,701
Notes: 1. Agricultural and non-agricultural establishments employing 20 and over. Wage rates refer to the sum of the basic pay
and regular/guaranteed cash allowances.
2. Basic pay refers to pay for nominal/regular working time before deductions for employees' social security contributions and
withholding taxes. It excludes overtime, night shift differential and other premium pay; commissions, tips and share of
employees in service change; and payment in kind.
3. Allowances refer to regular/guaranteed cash payments. These inlcude living allowance but exclude reimbursements
for travel, entertainment, meals and other expenses, etc. incurred in conducting the business of the employer, cost of
uniform/clothes; bonuses and gratitudes; family allowances.a The data refers to the average monthly wage rate across the selected occupations in the selected industries. b No report.
Source: Philippine Statistics Authority
Industry/Occupation Average Monthly Wage Rates

TABLE 11.26 Number of Workers with Contracts Processed by Type: 1997 to 2016
Year Total Land-based Sea-based
1997 755,350 552,440 202,9101998 740,157 535,171 204,9861999 791,989 586,200 205,7892000 733,995 524,413 209,582
2001 692,081 469,313 222,7682002 817,734 595,159 222,5752003 855,993 568,649 287,3442004 867,009 638,181 228,8282005 1,204,862 898,565 306,297
2006 1,232,390 877,061 355,3292007 1,306,327 916,720 389,6072008 1,464,295 1,005,538 458,7572009 1,479,070 1,043,555 435,5152010 1,644,439 1,205,734 438,705
2011 1,850,463 1,384,094 466,3692012 2,083,223 1,629,867 453,3562013 2,241,854 1,773,939 467,9152014 2,391,152 1,873,180 517,9722015 2,343,692 1,823,715 519,9772016 2,552,879 2,051,874 501,005
Source: Philippine Overseas Employment Administration
TABLE 11.27 Deployed Overseas Filipino Workers by Type: 1997 to 2016
Year Total Land-based Sea-based
1997 747,696 559,227 188,4691998 831,643 638,343 193,3001999 837,020 640,331 196,6892000 841,628 643,304 198,324
2001 867,599 662,648 204,9512002 891,908 682,315 209,5932003 867,969 651,938 216,0312004 933,588 704,586 229,0022005 988,615 740,632 247,983
2006 1,062,567 788,070 274,4972007 1,077,623 811,070 266,5532008 1,236,013 974,399 261,6142009 1,422,586 1,092,162 330,4242010 1,470,826 1,123,676 347,150
2011 1,687,831 1,318,727 369,1042012 1,802,031 1,435,166 366,8652013 1,836,345 1,469,179 367,1662014 1,832,668 1,430,842 401,8262015 1,844,406 1,437,875 406,5312016 2,112,331 1,669,511 442,820
Source: Philippine Overseas Employment Administration

TABLE 11.28 Deployed Land-Based Overseas Filipino Workers by Major World Groupings: 1997 to 2016
1990 334,883 1,273 90,768 6,853 218,110 942 9,557 7,380 - 1991 489,260 1,964 132,592 13,156 302,825 1,374 13,373 11,409 - 1992 549,655 2,510 134,776 14,590 340,604 1,669 12,319 11,164 - 1993 550,872 2,425 168,205 13,423 302,975 1,507 12,228 8,890 - 1997 486,631 3,517 235,129 12,626 221,047 1,970 7,058 5,280 41998 638,343 5,538 307,261 26,422 279,767 2,524 9,152 7,677 21999 640,331 4,936 299,521 30,707 287,076 2,424 9,045 6,622 02000 643,304 4,298 292,067 39,296 283,291 2,386 7,624 7,421 6,921
2001 661,639 4,943 285,051 43,019 297,533 2,061 10,679 6,823 11,5302002 678,108 6,919 288,481 45,363 306,939 1,917 11,532 6,075 10,8822003 651,631 8,750 255,287 37,981 285,564 1,698 11,049 5,023 46,2792004 704,417 8,485 266,609 55,116 352,314 3,023 11,692 7,177 12005 740,360 9,103 259,209 52,146 394,419 2,866 14,886 7,596 135
2006 788,070 9,450 222,940 59,313 462,545 5,126 21,976 6,481 2392007 811,070 13,126 218,983 45,613 487,878 10,691 28,019 6,674 862008 974,399 16,434 219,598 51,795 631,828 15,030 31,916 5,461 2,3372009 1,092,162 18,967 260,995 47,409 669,042 13,297 31,146 5,134 46,1722010 1,123,676 25,207 280,808 48,185 684,060 12,341 25,696 3,107 44,272
2011 1,318,727 28,531 415,224 57,880 764,586 19,492 27,679 4,236 1,0992012 1,435,166 25,194 476,021 47,070 825,402 27,391 29,553 3,682 8532013 1,469,179 26,294 476,422 38,204 863,152 31,237 29,191 4,317 3622014 1,430,842 22,240 420,106 29,950 885,541 21,311 27,615 3,867 20,2122015 1,437,875 18,226 399,361 29,029 913,958 18,850 17,234 4,777 36,4402016 1,669,511 15,759 488,615 24,419 1,058,514 18,488 16,315 5,748 41,653
a Based on the report of POEA's Labor Assistance Center on the actual departure of OFWs at the international airports,
NAIA Cabin Crews and POEA Regional Extension Units.
Source: Philippine Overseas Employment Administration
Oceania Americas Trust Territories UnspecifiedYear Total a Africa Asia Europe Middle East
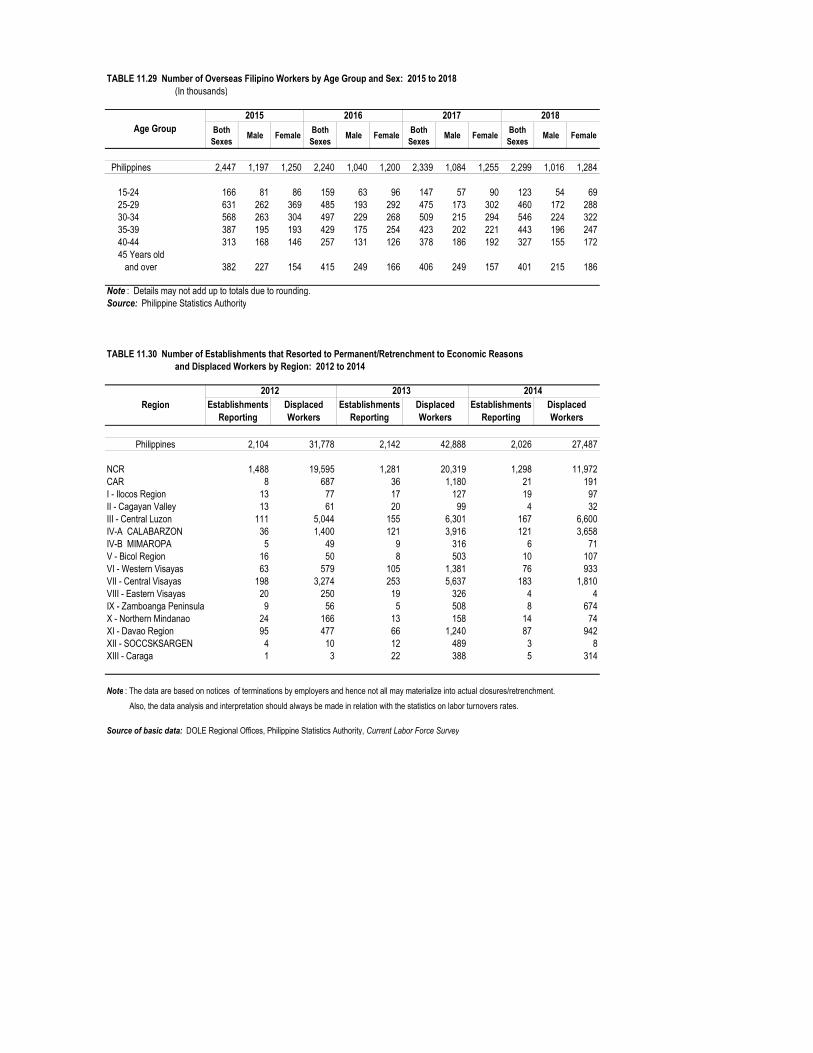
TABLE 11.29 Number of Overseas Filipino Workers by Age Group and Sex: 2015 to 2018 (In thousands)
Both Sexes
Male FemaleBoth
SexesMale Female
Both Sexes
Male FemaleBoth
SexesMale Female
Philippines 2,447 1,197 1,250 2,240 1,040 1,200 2,339 1,084 1,255 2,299 1,016 1,284
15-24 166 81 86 159 63 96 147 57 90 123 54 69 25-29 631 262 369 485 193 292 475 173 302 460 172 288 30-34 568 263 304 497 229 268 509 215 294 546 224 322 35-39 387 195 193 429 175 254 423 202 221 443 196 247 40-44 313 168 146 257 131 126 378 186 192 327 155 172
45 Years old and over 382 227 154 415 249 166 406 249 157 401 215 186
Note : Details may not add up to totals due to rounding. Source: Philippine Statistics Authority
TABLE 11.30 Number of Establishments that Resorted to Permanent/Retrenchment to Economic Reasons and Displaced Workers by Region: 2012 to 2014
Philippines 2,104 31,778 2,142 42,888 2,026 27,487
NCR 1,488 19,595 1,281 20,319 1,298 11,972CAR 8 687 36 1,180 21 191I - Ilocos Region 13 77 17 127 19 97II - Cagayan Valley 13 61 20 99 4 32III - Central Luzon 111 5,044 155 6,301 167 6,600IV-A CALABARZON 36 1,400 121 3,916 121 3,658IV-B MIMAROPA 5 49 9 316 6 71V - Bicol Region 16 50 8 503 10 107VI - Western Visayas 63 579 105 1,381 76 933VII - Central Visayas 198 3,274 253 5,637 183 1,810VIII - Eastern Visayas 20 250 19 326 4 4IX - Zamboanga Peninsula 9 56 5 508 8 674X - Northern Mindanao 24 166 13 158 14 74XI - Davao Region 95 477 66 1,240 87 942XII - SOCCSKSARGEN 4 10 12 489 3 8XIII - Caraga 1 3 22 388 5 314
Note : The data are based on notices of terminations by employers and hence not all may materialize into actual closures/retrenchment.
Also, the data analysis and interpretation should always be made in relation with the statistics on labor turnovers rates.
Source of basic data: DOLE Regional Offices, Philippine Statistics Authority, Current Labor Force Survey
Age Group2015 2016 2017 2018
Region2012 2013 2014
Establishments Reporting
Displaced Workers
Establishments Reporting
Displaced Workers
Establishments Reporting
Displaced Workers

TABLE 11.31 Number of Strikes/Lockout Notices Filed, Actual Strikes, Workers Involved
Actual Strikes
Total With Notices Without NoticesWorkers
Involved ('000)Man-days Lost
('000)
1991 1,345 182 162 20 55 1,1401992 1,209 136 120 16 48 7241993 1,146 122 109 13 35 7101994 1,089 93 84 9 49 5681995 904 97 91 6 54 584
1996 833 88 82 6 32 5191997 932 93 82 11 52 6731998 809 92 80 12 34 5571999 849 58 … … 16 2292000 734 60 … … 21 319
2001 623 43 … … 8 2062002 752 39 … … 18 3582003 606 38 … … 10 1502004 558 25 … … 11 532005 465 26 … … 8 123
2006 365 12 … … 1 442007 384 6 … … 1 122008 406 5 … … 1 392009 327 4 4 … 2 72010 325 8 5 3 3 34
2011 240 2 … … 4 42012 184 3 … … 0.2 12013 149 1 … … 0.4 12014 159 2 … … 0.1 12015 194 5 4 1 0.7 4
2016 175 15 12 3 3 1162017 148 9 7 2 1 2392018 202 14 13 1 8 161
Source: National Conciliation and Mediation Board
and Man-Days Lost: 1991 to 2018
YearStrikes/Lockout
Notice Filed

TABLE 11.32 Number of Membership of Enterprise-Based Unions by Region: 2004 to 2017
No.Membership
('000)No.
Membership ('000)
No.Membership
('000)No.
Membership ('000)
No.Membership
('000)No.
Membership ('000)
No.Membership
('000)
2004 15,193 1,301,585 8,684 742,968 106 13,689 132 11,614 53 14,162 1,065 94,569 1,831 151,7442005 15,526 1,627,480 8,867 1,053,686 107 13,689 131 11,624 53 14,162 1,054 98,280 1,887 155,3962006 15,101 1,563,118 9,025 1,043,439 52 6,667 85 7,772 45 13,580 954 90,223 1,915 157,0352007 15,293 1,294,436 9,119 751,136 53 9,677 80 6,023 46 13,563 973 91,985 1,948 165,7282008 15,501 1,308,417 9,243 756,517 54 9,812 80 6,023 46 13,563 986 93,201 1,974 168,8962009 15,835 1,328,776 9,399 766,679 55 9,812 83 6,186 48 13,605 1,009 94,786 2,033 172,1232010 16,132 1,353,017 9,571 776,092 56 9,919 84 6,343 48 13,605 1,027 95,722 2,085 176,0422011 16,385 1,375,973 9,714 788,391 57 10,855 84 6,343 48 13,605 1,037 97,133 2,103 177,8492012 16,541 1,387,437 9,841 792,640 60 11,296 84 6,230 48 13,605 1,044 96,574 2,112 179,1352013 16,707 1,407,712 9,934 804,595 61 11,311 82 6,250 47 13,605 1,080 102,352 2,126 180,5442014 16,880 1,426,858 10,038 810,689 62 11,743 82 6,250 47 13,605 1,101 105,093 2,152 184,5762015 17,066 1,438,096 10,142 815,737 63 11,743 82 6,250 47 13,605 1,129 107,269 2,174 186,4232016 17,246 1,478,905 10,255 850,771 63 11,743 82 6,250 47 13,605 1,152 109,828 2,191 188,1072017 17,424 1,543,514 10,328 856,182 64 11,779 83 6,250 48 13,627 1,203 141,599 2,211 210,438
No.Membership
('000)No.
Membership ('000)
No.Membership
('000)No.
Membership ('000)
No.Membership
('000)No.
Membership ('000)
No.Membership
('000)
2004 40 1,852 285 14,789 581 41,764 839 47,336 212 11,411 168 13,249 306 31,7802005 26 1,065 285 14,790 629 44,014 865 49,413 214 11,515 172 13,827 323 33,3702006 23 1,080 142 7,447 537 36,025 881 50,088 202 11,285 108 10,171 316 32,0782007 24 1,080 135 8,993 563 38,401 899 51,850 204 11,330 108 9,884 319 35,1912008 24 1,080 139 9,141 563 38,401 913 52,502 205 11,365 108 9,884 329 36,7682009 24 1,080 145 9,331 592 40,090 931 53,742 209 11,502 111 10,072 336 36,9722010 24 1,080 145 9,331 595 40,327 941 54,046 210 11,642 111 10,072 343 39,1122011 24 1,080 152 9,530 611 40,921 950 55,173 212 11,764 112 10,092 350 39,8722012 25 1,148 155 9,619 613 40,981 965 58,541 214 11,939 112 10,092 356 40,5702013 25 1,148 161 9,839 621 41,166 965 57,999 217 12,211 109 9,930 364 41,3902014 25 1,148 164 9,957 622 41,199 973 61,812 217 12,211 108 9,720 367 41,5332015 25 1,148 168 9,989 628 41,334 981 62,162 218 12,422 108 9,720 369 42,1492016 25 1,148 168 9,989 643 41,877 985 62,604 218 12,422 111 9,929 370 42,1672017 25 1,148 169 10,017 643 41,877 1,003 66,366 220 12,477 113 9,985 370 42,167
No.Membership
('000)No.
Membership ('000)
No.Membership
('000)No.
Membership ('000)
No.Membership
('000)
2004 455 52,467 169 36,477 107 18,721 14 1,908 146 1,0852005 469 53,684 175 37,269 112 19,046 14 1,908 143 7422006 388 47,115 176 33,262 93 13,049 16 2,022 143 7802007 403 47,577 174 34,923 92 14,296 16 2,022 137 7772008 407 47,750 180 35,303 97 15,412 16 2,022 137 7772009 425 49,067 181 35,303 101 15,627 16 2,022 137 7772010 449 51,901 186 38,625 104 16,288 16 2,022 137 8482011 472 53,533 197 40,397 109 16,565 16 2,022 137 8482012 478 54,998 200 40,634 109 16,565 16 2,022 109 8482013 479 49,375 214 46,824 109 16,526 21 2,414 92 2332014 493 51,328 215 46,924 108 16,450 21 2,414 85 2062015 503 52,151 215 46,924 108 16,450 21 2,414 85 2062016 507 52,471 215 46,924 108 16,450 21 2,414 85 2062017 514 52,689 216 47,843 108 16,450 21 2,414 85 206
Note : 1. As a result of administrative cancellation of non-existing federations, the number of unions may not be consistent with the other data released
by the Bureau, particularly those statistics that require back tracking of union data prior to 2004.
2. Data decreased in 2006 due to administrative cancellation of non-existing unions.1 Regional location and number of members for verification in DOLE-Regional offices.
YearPhilippines NCR CAR Region I Region II Region III Region IV-A
YearMIMAROPA Region V Region VI Region VII Region VIII Region IX Region X
YearRegion XI Region XII Region XIII ARMM Not Indicated 1
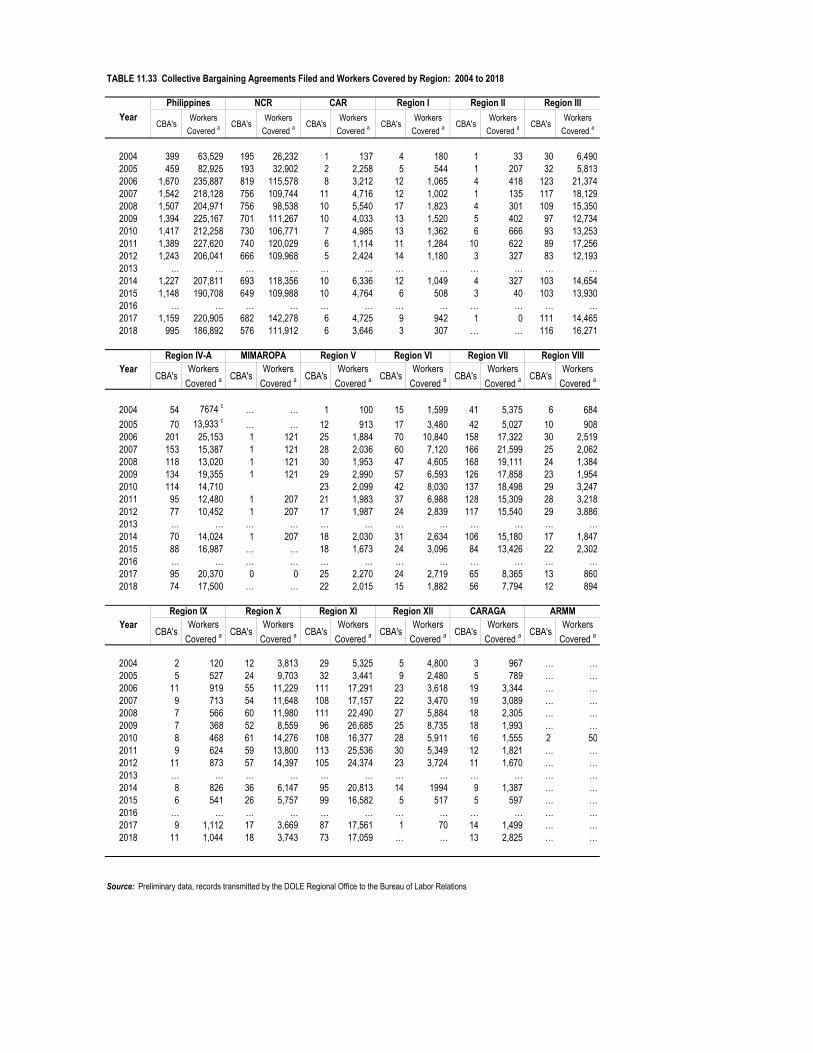
TABLE 11.33 Collective Bargaining Agreements Filed and Workers Covered by Region: 2004 to 2018
CBA'sWorkers
Covered aCBA's
Workers
Covered aCBA's
Workers
Covered aCBA's
Workers
Covered aCBA's
Workers
Covered aCBA's
Workers
Covered a
2004 399 63,529 195 26,232 1 137 4 180 1 33 30 6,4902005 459 82,925 193 32,902 2 2,258 5 544 1 207 32 5,8132006 1,670 235,887 819 115,578 8 3,212 12 1,065 4 418 123 21,3742007 1,542 218,128 756 109,744 11 4,716 12 1,002 1 135 117 18,1292008 1,507 204,971 756 98,538 10 5,540 17 1,823 4 301 109 15,3502009 1,394 225,167 701 111,267 10 4,033 13 1,520 5 402 97 12,7342010 1,417 212,258 730 106,771 7 4,985 13 1,362 6 666 93 13,2532011 1,389 227,620 740 120,029 6 1,114 11 1,284 10 622 89 17,2562012 1,243 206,041 666 109,968 5 2,424 14 1,180 3 327 83 12,1932013 … … … … … … … … … … … …2014 1,227 207,811 693 118,356 10 6,336 12 1,049 4 327 103 14,6542015 1,148 190,708 649 109,988 10 4,764 6 508 3 40 103 13,9302016 … … … … … … … … … … … …2017 1,159 220,905 682 142,278 6 4,725 9 942 1 0 111 14,4652018 995 186,892 576 111,912 6 3,646 3 307 … … 116 16,271
CBA'sWorkers
Covered aCBA's
Workers
Covered aCBA's
Workers
Covered aCBA's
Workers
Covered aCBA's
Workers
Covered aCBA's
Workers
Covered a
2004 54 7674 c … … 1 100 15 1,599 41 5,375 6 684
2005 70 13,933 c … … 12 913 17 3,480 42 5,027 10 9082006 201 25,153 1 121 25 1,884 70 10,840 158 17,322 30 2,5192007 153 15,387 1 121 28 2,036 60 7,120 166 21,599 25 2,0622008 118 13,020 1 121 30 1,953 47 4,605 168 19,111 24 1,3842009 134 19,355 1 121 29 2,990 57 6,593 126 17,858 23 1,9542010 114 14,710 23 2,099 42 8,030 137 18,498 29 3,2472011 95 12,480 1 207 21 1,983 37 6,988 128 15,309 28 3,2182012 77 10,452 1 207 17 1,987 24 2,839 117 15,540 29 3,8862013 … … … … … … … … … … … …2014 70 14,024 1 207 18 2,030 31 2,634 106 15,180 17 1,8472015 88 16,987 … … 18 1,673 24 3,096 84 13,426 22 2,3022016 … … … … … … … … … … … …2017 95 20,370 0 0 25 2,270 24 2,719 65 8,365 13 8602018 74 17,500 … … 22 2,015 15 1,882 56 7,794 12 894
CBA'sWorkers
Covered aCBA's
Workers
Covered aCBA's
Workers
Covered aCBA's
Workers
Covered aCBA's
Workers
Covered aCBA's
Workers
Covered a
2004 2 120 12 3,813 29 5,325 5 4,800 3 967 … …2005 5 527 24 9,703 32 3,441 9 2,480 5 789 … …2006 11 919 55 11,229 111 17,291 23 3,618 19 3,344 … …2007 9 713 54 11,648 108 17,157 22 3,470 19 3,089 … …2008 7 566 60 11,980 111 22,490 27 5,884 18 2,305 … …2009 7 368 52 8,559 96 26,685 25 8,735 18 1,993 … …2010 8 468 61 14,276 108 16,377 28 5,911 16 1,555 2 502011 9 624 59 13,800 113 25,536 30 5,349 12 1,821 … …2012 11 873 57 14,397 105 24,374 23 3,724 11 1,670 … …2013 … … … … … … … … … … … …2014 8 826 36 6,147 95 20,813 14 1994 9 1,387 … …2015 6 541 26 5,757 99 16,582 5 517 5 597 … …2016 … … … … … … … … … … … …2017 9 1,112 17 3,669 87 17,561 1 70 14 1,499 … …2018 11 1,044 18 3,743 73 17,059 … … 13 2,825 … …
Source: Preliminary data, records transmitted by the DOLE Regional Office to the Bureau of Labor Relations
Region I
Year
Region II
MIMAROPA Region V
Region III
Year
Philippines
CARAGA
Region VII Region VIII
ARMM
Region VIRegion IV-A
Region XIIYear
Region IX Region X Region XI
NCR CAR

"Pantawid Pamilyang Pilipino Program" 5 8
6
6 7

TABLE 12.1a Household Population and Number of Persons with Disability by Region: 2010
RegionHousehold
Population (in '000)
Household Population with
Disability (in '000)
Proportion of Population with
Disability to the Household
Population (in percent)
Philippines 92,101 1,444 26.9
NCR 11,797 167 1.41
CAR 1,612 26 1.63
I - Ilocos Region 4,743 78 1.64
II - Cagayan Valley 3,226 56 1.72
III - Central Luzon 10,118 139 1.38
IV-A CALABARZON 12,583 193 1.53
MIMAROPA 2,732 50 1.85
V - Bicol Region 5,412 100 1.85
VI - Western Visayas 7,090 138 1.95
VII - Central Visayas 6,785 109 1.60
VIII - Eastern Visayas 4,090 72 1.75
IX - Zamboanga Peninsula 3,398 46 1.35
X - Northern Mindanao 4,285 67 1.56
XI - Davao Region 4,453 71 1.60
XII - SOCCSKSARGEN 4,103 59 1.43
XIII - Caraga 2,425 38 1.58
ARMM 3,249 35 1.07
Source: Philippine Statistics Authority
12-1
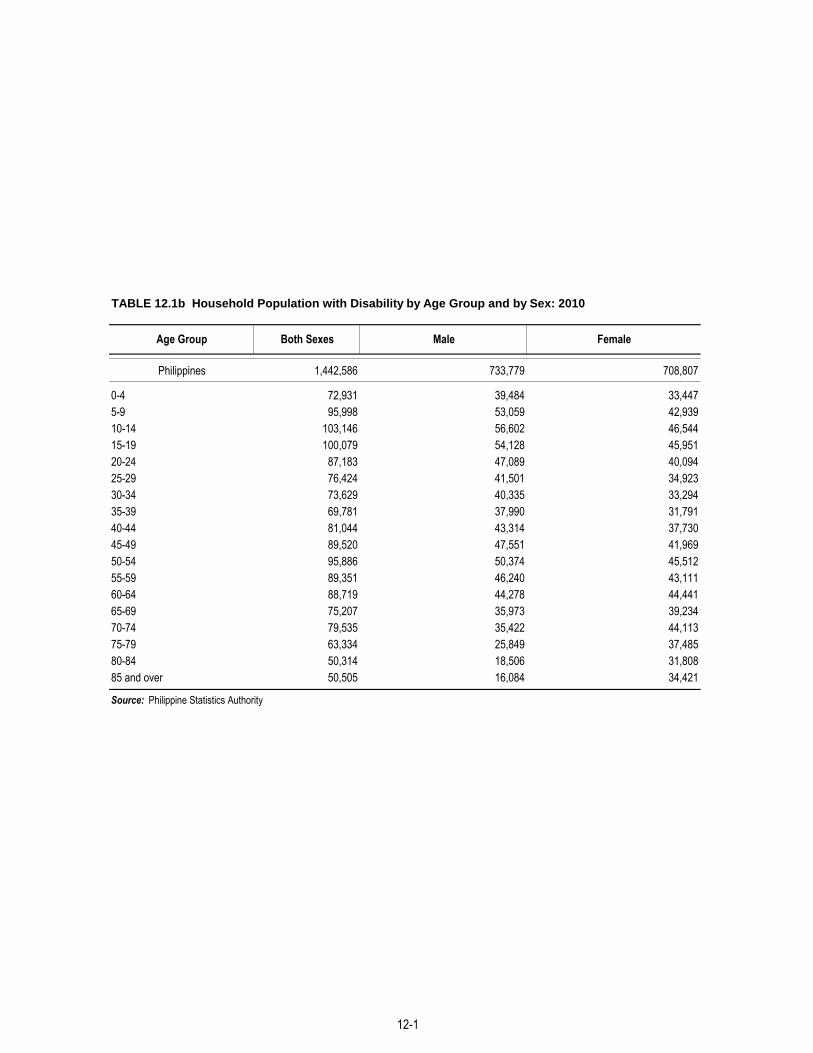
TABLE 12.1b Household Population with Disability by Age Group and by Sex: 2010
Philippines 1,442,586 733,779 708,807
0-4 72,931 39,484 33,447
5-9 95,998 53,059 42,939
10-14 103,146 56,602 46,544
15-19 100,079 54,128 45,951
20-24 87,183 47,089 40,094
25-29 76,424 41,501 34,923
30-34 73,629 40,335 33,294
35-39 69,781 37,990 31,791
40-44 81,044 43,314 37,730
45-49 89,520 47,551 41,969
50-54 95,886 50,374 45,512
55-59 89,351 46,240 43,111
60-64 88,719 44,278 44,441
65-69 75,207 35,973 39,234
70-74 79,535 35,422 44,113
75-79 63,334 25,849 37,485
80-84 50,314 18,506 31,808
85 and over 50,505 16,084 34,421
Source: Philippine Statistics Authority
Age Group Both Sexes Male Female
12-1

TABLE 12.2 Unduplicated Number of Clients Served by the Department of Social Welfare and Development
Male Female Male Female Male Female
Total 41,018 43,124 39,824 - 42,904 - 375,835 355,133 30,180 44,939 32,489 46,749
NCR 8,662 7,564 8,497 7,229 111,633 144,474 2,228 3,253 2,676 4,260
CAR 701 933 1,580 2,110 3,692 3,737 1,393 3,617 1,271 3,641
I - Ilocos Region 14,312 14,154 9,419 9,372 13,940 15,048 3,135 2,988 3,476 2,176
II - Cagayan Valley 576 691 5,309 5,973 17,514 15,148 2,618 3,542 3,401 4,750
III - Central Luzon 3,769 4,323 2,120 2,546 25,718 23,052 5,343 7,599 4,030 6,313
IV-A CALABARZON 2,891 3,374 4,537 5,266 49,178 20,858 1,231 1,746 904 892
MIMAROPA 2,249 2,542 1,694 1,950 4,182 3,576 505 865 500 787
V - Bicol Region 582 673 498 637 15,646 13,726 3,455 6,515 3,039 5,902
VI - Western Visayas 1,145 1,493 1,102 1,339 19,058 27,968 293 401 594 582
VII - Central Visayas 2,464 3,156 554 785 12,134 19,111 1,258 1,463 2,329 3,591
VIII - Eastern Visayas 289 555 477 880 17,592 7,284 3,202 6,212 2,536 4,484
IX - Zamboanga Peninsula 1,555 1,187 1,574 1,563 14,801 10,347 2,629 2,648 3,980 3,624
X - Northern Mindanao 639 926 1,151 1,587 6,934 7,584 721 1,040 1,872 2,943
XI - Davao Region 621 783 504 633 28,985 24,149 1,136 1,682 937 1,310
XII - SOCCSKSARGEN 357 426 526 675 21,292 8,728 243 347 533 723
XIII - Caraga 206 344 282 359 13,536 1,084 578 699 411 608
ARMM - - - - - 9,259 212 322 - 163
2017 2016
Male Female Male Female Male Female Male Male
Total 4,391 5,271 2,913 2,848 24,174 47,469 38,104 76,174 143,469 132,100
NCR 2,806 3,599 1,773 1,933 10,989 21,296 14,538 33,803 34,322 42,303
CAR 52 44 0 0 43 73 66 110 1,351 530
I - Ilocos Region 376 255 486 371 4,229 6,279 6,137 9,320 5,447 7,690
II - Cagayan Valley 56 57 56 57 491 1,399 927 2,353 6,262 5,902
III - Central Luzon 161 167 107 67 1,844 3,261 1,808 3,934 12,371 8,878
IV-A CALABARZON 329 475 38 56 1,459 3,943 1,506 3,122 16,461 7,631
MIMAROPA 84 82 42 39 103 215 183 453 1,426 1,178
V - Bicol Region 45 78 13 12 297 924 645 2,030 5,061 3,891
VI - Western Visayas 60 67 25 30 359 1,264 1,474 4,720 7885 9,731
VII - Central Visayas 111 109 147 133 870 1,688 5,477 6,470 5,624 7,725
VIII - Eastern Visayas 8 7 2 2 355 767 437 907 6,612 2,888
IX - Zamboanga Peninsula 64 52 88 69 632 1,390 1,029 1,740 6,350 9,616
X - Northern Mindanao 71 111 26 3 177 407 560 1,302 2,945 2,940
XI - Davao Region 39 52 34 20 1,335 2,274 1,881 3,210 14,139 11,904
XII - SOCCSKSARGEN 93 69 74 33 536 1,216 478 1,118 9,832 4,278
XIII - Caraga 36 47 2 23 455 1,073 82 125 5,109 386
ARMM - - - - 876 1,457 2,272 4,629
Source: Department of Social Welfare and Development
Male Female
Region
Persons with Disability Senior Citizens Other Needy Adults
2017 2016 2017 2016
by Region: 2016 and 2017
Region
Children Women Youth
2017 20162017 2016
2017 2016
Male Female
12-2
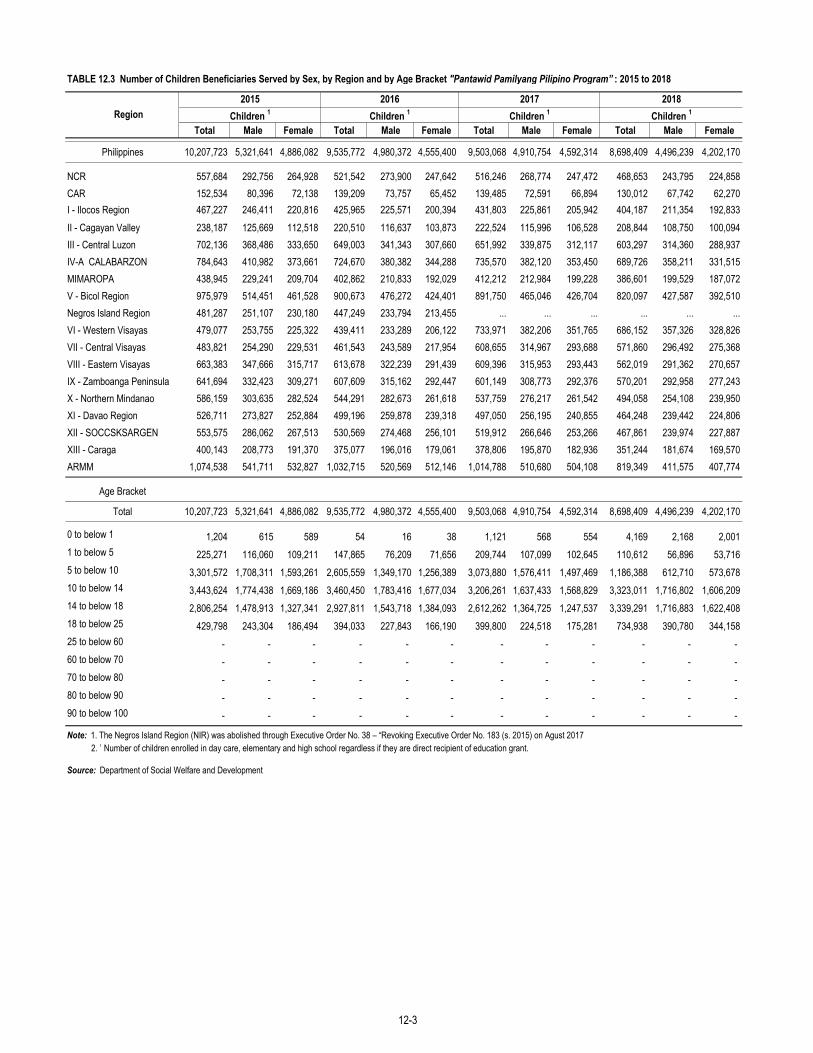
TABLE 12.3 Number of Children Beneficiaries Served by Sex, by Region and by Age Bracket "Pantawid Pamilyang Pilipino Program” : 2015 to 2018
Total Male Female Total Male Female Total Male Female Total Male Female
Philippines 10,207,723 5,321,641 4,886,082 9,535,772 4,980,372 4,555,400 9,503,068 4,910,754 4,592,314 8,698,409 4,496,239 4,202,170
NCR 557,684 292,756 264,928 521,542 273,900 247,642 516,246 268,774 247,472 468,653 243,795 224,858
CAR 152,534 80,396 72,138 139,209 73,757 65,452 139,485 72,591 66,894 130,012 67,742 62,270
I - Ilocos Region 467,227 246,411 220,816 425,965 225,571 200,394 431,803 225,861 205,942 404,187 211,354 192,833
II - Cagayan Valley 238,187 125,669 112,518 220,510 116,637 103,873 222,524 115,996 106,528 208,844 108,750 100,094
III - Central Luzon 702,136 368,486 333,650 649,003 341,343 307,660 651,992 339,875 312,117 603,297 314,360 288,937
IV-A CALABARZON 784,643 410,982 373,661 724,670 380,382 344,288 735,570 382,120 353,450 689,726 358,211 331,515
MIMAROPA 438,945 229,241 209,704 402,862 210,833 192,029 412,212 212,984 199,228 386,601 199,529 187,072
V - Bicol Region 975,979 514,451 461,528 900,673 476,272 424,401 891,750 465,046 426,704 820,097 427,587 392,510
Negros Island Region 481,287 251,107 230,180 447,249 233,794 213,455 ... ... ... ... ... ...
VI - Western Visayas 479,077 253,755 225,322 439,411 233,289 206,122 733,971 382,206 351,765 686,152 357,326 328,826
VII - Central Visayas 483,821 254,290 229,531 461,543 243,589 217,954 608,655 314,967 293,688 571,860 296,492 275,368
VIII - Eastern Visayas 663,383 347,666 315,717 613,678 322,239 291,439 609,396 315,953 293,443 562,019 291,362 270,657
IX - Zamboanga Peninsula 641,694 332,423 309,271 607,609 315,162 292,447 601,149 308,773 292,376 570,201 292,958 277,243
X - Northern Mindanao 586,159 303,635 282,524 544,291 282,673 261,618 537,759 276,217 261,542 494,058 254,108 239,950
XI - Davao Region 526,711 273,827 252,884 499,196 259,878 239,318 497,050 256,195 240,855 464,248 239,442 224,806
XII - SOCCSKSARGEN 553,575 286,062 267,513 530,569 274,468 256,101 519,912 266,646 253,266 467,861 239,974 227,887
XIII - Caraga 400,143 208,773 191,370 375,077 196,016 179,061 378,806 195,870 182,936 351,244 181,674 169,570
ARMM 1,074,538 541,711 532,827 1,032,715 520,569 512,146 1,014,788 510,680 504,108 819,349 411,575 407,774
Age Bracket
Total 10,207,723 5,321,641 4,886,082 9,535,772 4,980,372 4,555,400 9,503,068 4,910,754 4,592,314 8,698,409 4,496,239 4,202,170
0 to below 1 1,204 615 589 54 16 38 1,121 568 554 4,169 2,168 2,001
1 to below 5 225,271 116,060 109,211 147,865 76,209 71,656 209,744 107,099 102,645 110,612 56,896 53,716
5 to below 10 3,301,572 1,708,311 1,593,261 2,605,559 1,349,170 1,256,389 3,073,880 1,576,411 1,497,469 1,186,388 612,710 573,678
10 to below 14 3,443,624 1,774,438 1,669,186 3,460,450 1,783,416 1,677,034 3,206,261 1,637,433 1,568,829 3,323,011 1,716,802 1,606,209
14 to below 18 2,806,254 1,478,913 1,327,341 2,927,811 1,543,718 1,384,093 2,612,262 1,364,725 1,247,537 3,339,291 1,716,883 1,622,408
18 to below 25 429,798 243,304 186,494 394,033 227,843 166,190 399,800 224,518 175,281 734,938 390,780 344,158
25 to below 60 - - - - - - - - - - - -
60 to below 70 - - - - - - - - - - - -
70 to below 80 - - - - - - - - - - - -
80 to below 90 - - - - - - - - - - - -
90 to below 100 - - - - - - - - - - - -
Note: 1. The Negros Island Region (NIR) was abolished through Executive Order No. 38 – “Revoking Executive Order No. 183 (s. 2015) on Agust 2017
2. 1
Number of children enrolled in day care, elementary and high school regardless if they are direct recipient of education grant.
Source: Department of Social Welfare and Development
Region
2015 2016 2017 2018
Children 1
Children 1
Children 1
Children 1
12-3

TABLE 12.4 Number of Women in Especially Difficult Circumstances (WEDC) Served by the Department of Social Welfare and Development by Case Category and by Region: 2016
Case Category Philippines NCR CAR Region I Region II Region III Region IV-A MIMAROPA Region V Region VI Region VII Region VIII Region IX Region X Region XI Region XII Caraga
Total 1,749 625 37 38 38 76 38 0 55 13 193 21 396 126 45 26 22
Sexually Abused 157 33 26 12 10 21 2 0 2 2 11 5 10 13 7 1 2
Physically Abused/Maltreated 399 15 9 19 13 24 8 0 6 5 77 6 119 81 10 4 3
Victims of Illegal Recruitment 219 132 1 0 4 2 8 0 0 6 0 0 56 9 0 0 1
Sexually Exploited 274 260 1 2 0 0 1 0 0 0 3 5 0 0 1 0 1
Victims of Trafficking 439 185 0 5 7 24 18 0 1 0 2 0 157 13 0 12 15
Victims of Armed Conflict 2 0 0 0 0 0 1 0 0 0 0 0 0 0 0 1 0
Psychologically/Emotionally Abused 259 0 0 0 4 5 0 0 46 0 100 5 54 10 27 8 0
In Detention 0 0 0 0 0 0 0 0 0 0 0 0 0 0 0 0 0
Source: Department of Social Welfare and Development

TABLE 12.5 Number of Institutions/Centers/Facilities Involved in the Distribution of Social Services: 2011 to 2017
2011 2012 2013 2014 2015 2016 2017
59 71 71 71 71 71 71
Child Caring Institutions 28 28 28 28 28 28 28
Youth Centers/Facilities 16 16 15 15 15 15 15
Facilities for Disabled/Elderly Persons and Special Groups 12- 12 13 13 13 13 13
Substitute Homes for Women in Especially Difficult
Cirscumtances 15 15 15 15 15 15 15
Source: Department of Social Welfare and Development
Institutions/Centers/Facilities
Total

TABLE 12.6 Number of Reported Cases of Child Abuse Served by the DSWD by Type of Abuse and Sex: 2016 and 2017
Total Male Female Total Male Female
Total 3,533 1,083 2,502 4,002 1,228 2,764
Abandoned 637 320 317 740 392 348
Neglected 948 498 450 1,302 630 672
Sexually Abused 985 15 970 1,045 32 1,013
Rape 487 9 478 525 19 506
Incest 427 1 426 453 6 447
Acts of Lasciviousness 71 5 66 67 7 60
Sexually Exploited 104 5 99 149 25 124
Victims of Pedophilia 41 0 0 4 4 0
Victims of Prostitution 0 0 41 40 0 40
Victims of Pornography 28 3 25 30 6 24
Victims of Cyber Pornography 57 2 55 61 6 55
Physically Abused/ Maltreated 14 84 101 230 99 131
Victims of Child Labor 185 24 42 31 5 16
Victims of Illegal Recruitment 26 0 26 26 0 26
Victims of Child Trafficking 321 37 284 301 23 278
Victims of Armed Conflict 153 85 68 17 2 15
Involved 14 2 12 0 0 0
Affected 139 83 56 17 2 15
Others1
34 10 24 26 4 22
1 Includes emotionally abused, sexually abused, molested, exploited children, and others
Source: Department of Social Welfare and Development
Type of Abuse2017 2016
12-5
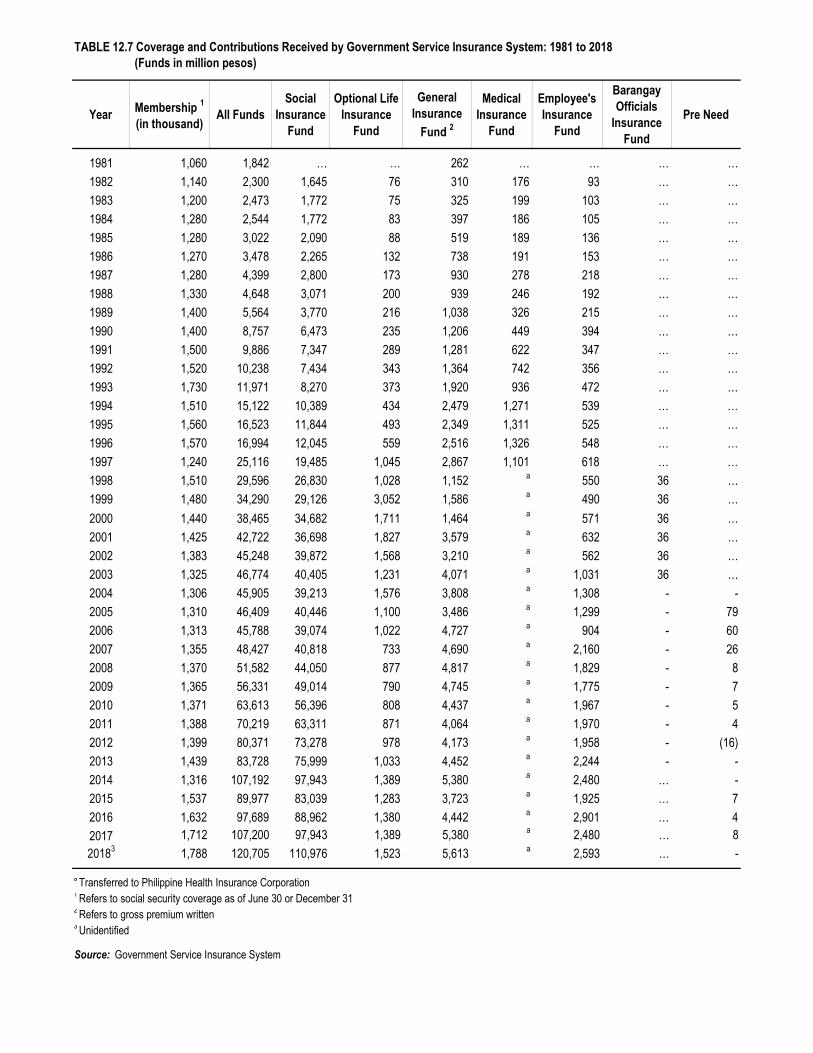
TABLE 12.7 Coverage and Contributions Received by Government Service Insurance System: 1981 to 2018 (Funds in million pesos)
Year Membership 1
(in thousand)All Funds
Social Insurance
Fund
Optional Life Insurance
Fund
General Insurance
Fund 2
Medical Insurance
Fund
Employee's Insurance
Fund
Barangay Officials
Insurance Fund
Pre Need
1981 1,060 1,842 … … 262 … … … …
1982 1,140 2,300 1,645 76 310 176 93 … …
1983 1,200 2,473 1,772 75 325 199 103 … …
1984 1,280 2,544 1,772 83 397 186 105 … …
1985 1,280 3,022 2,090 88 519 189 136 … …
1986 1,270 3,478 2,265 132 738 191 153 … …
1987 1,280 4,399 2,800 173 930 278 218 … …
1988 1,330 4,648 3,071 200 939 246 192 … …
1989 1,400 5,564 3,770 216 1,038 326 215 … …
1990 1,400 8,757 6,473 235 1,206 449 394 … …
1991 1,500 9,886 7,347 289 1,281 622 347 … …
1992 1,520 10,238 7,434 343 1,364 742 356 … …
1993 1,730 11,971 8,270 373 1,920 936 472 … …
1994 1,510 15,122 10,389 434 2,479 1,271 539 … …
1995 1,560 16,523 11,844 493 2,349 1,311 525 … …
1996 1,570 16,994 12,045 559 2,516 1,326 548 … …
1997 1,240 25,116 19,485 1,045 2,867 1,101 618 … …
1998 1,510 29,596 26,830 1,028 1,152 a 550 36 …
1999 1,480 34,290 29,126 3,052 1,586 a 490 36 …
2000 1,440 38,465 34,682 1,711 1,464 a 571 36 …
2001 1,425 42,722 36,698 1,827 3,579 a 632 36 …
2002 1,383 45,248 39,872 1,568 3,210 a 562 36 …
2003 1,325 46,774 40,405 1,231 4,071 a 1,031 36 …
2004 1,306 45,905 39,213 1,576 3,808 a 1,308 - -
2005 1,310 46,409 40,446 1,100 3,486 a 1,299 - 79
2006 1,313 45,788 39,074 1,022 4,727 a 904 - 60
2007 1,355 48,427 40,818 733 4,690 a 2,160 - 26
2008 1,370 51,582 44,050 877 4,817 a 1,829 - 8
2009 1,365 56,331 49,014 790 4,745 a 1,775 - 7
2010 1,371 63,613 56,396 808 4,437 a 1,967 - 5
2011 1,388 70,219 63,311 871 4,064 a 1,970 - 4
2012 1,399 80,371 73,278 978 4,173 a 1,958 - (16)
2013 1,439 83,728 75,999 1,033 4,452 a 2,244 - -
2014 1,316 107,192 97,943 1,389 5,380 a 2,480 … -
2015 1,537 89,977 83,039 1,283 3,723 a 1,925 … 7
2016 1,632 97,689 88,962 1,380 4,442 a 2,901 … 4
2017 1,712 107,200 97,943 1,389 5,380 a 2,480 … 8
20183 1,788 120,705 110,976 1,523 5,613 a 2,593 … -
a Transferred to Philippine Health Insurance Corporation1 Refers to social security coverage as of June 30 or December 312 Refers to gross premium written3 Unidentified
Source: Government Service Insurance System
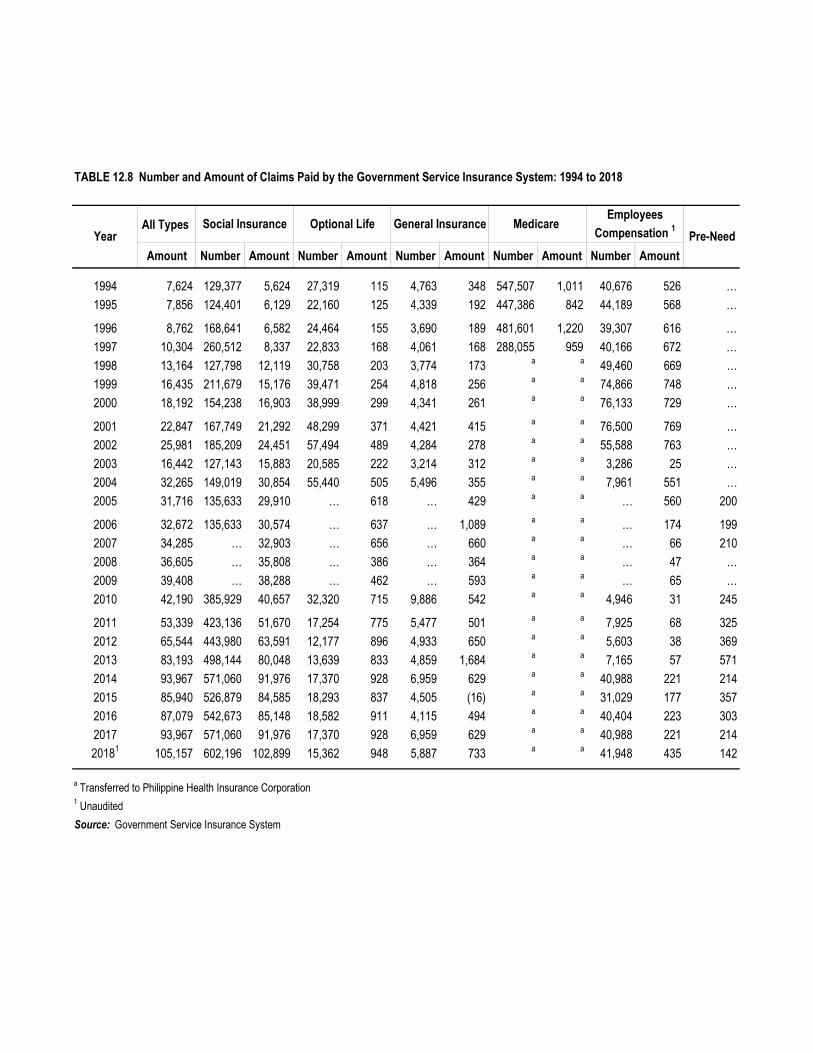
TABLE 12.8 Number and Amount of Claims Paid by the Government Service Insurance System: 1994 to 2018
All Types
Amount Number Amount Number Amount Number Amount Number Amount Number Amount
1994 7,624 129,377 5,624 27,319 115 4,763 348 547,507 1,011 40,676 526 …
1995 7,856 124,401 6,129 22,160 125 4,339 192 447,386 842 44,189 568 …
1996 8,762 168,641 6,582 24,464 155 3,690 189 481,601 1,220 39,307 616 …
1997 10,304 260,512 8,337 22,833 168 4,061 168 288,055 959 40,166 672 …
1998 13,164 127,798 12,119 30,758 203 3,774 173 a a 49,460 669 …
1999 16,435 211,679 15,176 39,471 254 4,818 256 a a 74,866 748 …
2000 18,192 154,238 16,903 38,999 299 4,341 261 a a 76,133 729 …
2001 22,847 167,749 21,292 48,299 371 4,421 415 a a 76,500 769 …
2002 25,981 185,209 24,451 57,494 489 4,284 278 a a 55,588 763 …
2003 16,442 127,143 15,883 20,585 222 3,214 312 a a 3,286 25 …
2004 32,265 149,019 30,854 55,440 505 5,496 355 a a 7,961 551 …
2005 31,716 135,633 29,910 … 618 … 429 a a … 560 200
2006 32,672 135,633 30,574 … 637 … 1,089 a a … 174 199
2007 34,285 … 32,903 … 656 … 660 a a … 66 210
2008 36,605 … 35,808 … 386 … 364 a a … 47 …
2009 39,408 … 38,288 … 462 … 593 a a … 65 …
2010 42,190 385,929 40,657 32,320 715 9,886 542 a a 4,946 31 245
2011 53,339 423,136 51,670 17,254 775 5,477 501 a a 7,925 68 325
2012 65,544 443,980 63,591 12,177 896 4,933 650 a a 5,603 38 369
2013 83,193 498,144 80,048 13,639 833 4,859 1,684 a a 7,165 57 571
2014 93,967 571,060 91,976 17,370 928 6,959 629 a a 40,988 221 214
2015 85,940 526,879 84,585 18,293 837 4,505 (16) a a 31,029 177 357
2016 87,079 542,673 85,148 18,582 911 4,115 494 a a 40,404 223 303
2017 93,967 571,060 91,976 17,370 928 6,959 629 a a 40,988 221 214
20181 105,157 602,196 102,899 15,362 948 5,887 733 a a 41,948 435 142
a Transferred to Philippine Health Insurance Corporation1 Unaudited
Source: Government Service Insurance System
Employees
Compensation 1 Pre-NeedYearSocial Insurance Optional Life General Insurance Medicare

TABLE 12.9 Coverage and Amount of Contributions Collected by the Social Security System: 2000 to 2016
Workers Employers TotalSocial Security
1
2000 22,621 600 30,321 29,886 435
2001 23,523 633 31,372 30,912 460
2002 24,309 668 34,188 33,702 486
2003 25,051 703 39,420 38,635 786
2004 25,666 735 43,936 43,084 852
2005 26,228 758 47,483 46,596 887
2006 26,711 782 52,544 51,633 910
2007 27,241 803 61,829 60,769 1,060
2008 27,761 830 68,879 67,668 1,211
2009 28,218 850 72,351 71,167 1,184
2010 28,766 880 79,273 77,957 1,316
2011 29,269 889 85,972 84,603 1,369
2012 29,457 602 94,210 92,727 1,483
2013 30,721 912 103,009 101,403 1,605
2014 32,142 921 120,650 118,939 1,711
2015 33,622 914 132,615 130,786 1,829
2016 34,889 935 144,365 142,451 1,914
1 Contributions from both workers and employers
2 Contributions from Employers only
Source: Social Security System
Year
Coverage (In thousands) Amount (in million pesos)
Employees
Compensation 2
12-8

TABLE 12.10 Number and Amount of Benefits Paid by the Social Security System: 2000 to 2018
(Amount in million pesos)
Number Amount Number Amount Number Amount
2000 1,762,405 33,889 1,686,686 32,735 75,719 1,154
2001 1,866,351 39,016 1,775,995 37,814 90,356 1,202
2002 1,908,481 40,872 1,823,822 39,566 84,659 1,305
2003 1,938,998 42,806 1,858,917 41,623 80,081 1,183
2004 1,974,232 44,883 1,901,848 43,743 72,384 1,139
2005 2,094,193 46,270 2,022,110 45,181 72,083 1,089
2006 2,012,410 52,122 1,949,269 51,052 63,141 1,070
2007 2,094,330 60,747 2,036,440 59,665 57,890 1,081
2008 2,249,110 67,917 2,188,807 66,820 60,303 1,097
2009 2,303,493 72,050 2,248,327 70,964 55,166 1,086
2010 2,483,879 77,174 2,528,253 76,088 55,626 1,086
2011 2,619,315 82,760 2,563,831 81,683 55,484 1,077
2012 2,625,916 84,173 2,573,838 83,147 52,078 1,026
2013 2,620,663 91,401 2,572,810 90,417 47,853 984
2014 2,819,596 102,599 2,772,506 101,502 47,090 1,097
2015 3,048,021 112,561 3,000,191 111,489 47,830 1,072
2016 3,060,756 132,979 3,016,421 131,884 44,335 1,095
2017 3,438,975 170,684 3,386,735 169,534 52,240 1,150
2018 3,681,447 180,078 3,627,682 178,357 53,765 1,721
Source: Social Security System
YearAll Types Social Security
Employees'
Compensation
12-8

TABLE 12.11 Number of Contributors and Amount of Contributions Receivedby the Home Development Mutual Fund: 2002 to 2018
TABLE 12.12 Number of Beneficiaries and Amount of Provident Benefits Paid by the Home Development Mutual Fund by Type of Benefit: 2006 to 2018
(Amount in million pesos)
Number Amount Number Amount Number Amount Number Amount Number Amount Number Amount Number Amount Number Amount
2006 124,662 6,514 37,575 1,938 32,286 1,498 32,895 2,394 14,219 400 4,182 170 2,368 71 1,137 432007 118,409 3,944 41,098 1,354 23,638 662 31,053 1,468 15,642 284 3,741 106 2,153 43 1,084 272008 117,924 4,045 44,593 1,549 20,904 588 29,982 1,430 15,771 301 3,586 109 2,035 41 1,053 272009 125,193 4,592 48,378 1,825 19,100 535 34,277 1,704 16,936 347 3,346 108 1,970 41 1,186 32
2010 129,529 4,994 49,515 1,938 23,094 763 31,725 1,693 17,956 375 3,829 133 2,210 51 1,200 41
2011 133,866 5,377 54,203 2,369 23,016 762 29,949 1,613 19,521 412 3,859 133 2,390 58 928 302012 143,083 5,934 59,143 2,663 25,391 853 32,547 1,782 19,483 435 3,372 117 2,324 56 823 282013 157,549 6,951 67,191 3,343 28,485 936 35,500 2,010 20,354 464 2,958 111 2,206 55 855 322014 180,877 8,054 78,923 3,946 33,498 1,093 39,942 2,271 21,099 502 3,080 120 3,292 85 1,043 37
2015 242,352 10,588 94,302 3,531 34,076 1,161 82,365 5,008 23,485 522 3,357 129 3,863 90 904 32
2016 236,792 10,890 88,118 3,729 35,058 1,216 76,029 4,758 23,033 561 3,465 134 3,461 90 853 292017 208,876 9,507 85,388 3,553 29,675 1,052 64,410 4,132 21,603 523 3,098 117 3,827 102 875 282018 298,398 13,919 115,851 4,764 59,956 2,343 84,575 5,733 28,135 743 3,690 152 5,349 152 842 32
Notes: 1) 2015 is exclusive of 115 million residual claims
2) Optional withdrawal - Allowed for members who registered under R.A. No. 7742 as well as members who voluntarily joined the fund
under E. O. No. 90
- Partial withdrawal of savings maybe made after 10 or 15 years of continous membership from January 1995;
- For members who registered under R.A. No. 9679 shall have the option to withdraw their total Accumulated Value (TAV) on the
year of continous membership;
- Provided a member has no outstanding loan with the Fund. This option may be exercised only once during the membership term
3) Total amount is inclusive of residual claims while claimants under residual claims is exclusive in the total.
4) 2016 and 2017 breakdown by reason does not tally with the total releases; breakdown is exclusive of data from various areas since the implementaion
of new program facility in line with HSP. 5) Claimants under residual claims is excluded in the total.
Source: Home Development Mutual Fund
Optional Withdrawal
Membership Maturity
Death
15,889,339 30,713
2017 … 36,273
Separation Due to Health
a Adjusted figures
Source: Home Development Mutual Fund
YearAll Types
2014 14,760,890 28,072
RetirementPermanent Departure
2013 13,486,851
Disability/ Insanity
2016 17,267,701 32,780
2015
2018 … 40,272
2011 10,214,746 21,893
2012 12,092,738 24,103
2008 7,271,117 16,517
26,134
2009 7,470,209 17,382
2010 8,777,060 19,859
2006 6,480,158 13,931
2007 6,848,255 15,107
5,339,698a 11,127
2004 5,700,020 11,977
2005 6,036,145 12,978
2003
Year Number of ContributorsTotal Contribution (in million pesos)
2002 5,072,849a 9,968

TABLE 12.13 Calamity Funds Releases by Region and by Provinces: 2015 to 2018
Philippines 12,943,906,261 42,414,428,857 11,463,315,940 15,140,195,547
National Capital Region - - 102,458,221 -
Cordillera Administrative Region 302,927,405 3,086,680,864 2,476,653,718 640,740,000
Abra 130,826,000 1,656,018,000 748,348,718 275,500,000
Apayao - 19,448,764 - 59,000,000
Benguet 19,970,300 14,322,773 - 207,000,000
Ifugao 103,025,105 16,812,000 - -
Kalinga 9,555,000 1,298,475,460 496,018,000 99,240,000
Mt. Province 39,551,000 81,603,868 1,232,287,000 -
Region I - Ilocos Region 139,388,417 772,687,440 - 201,371,000
Ilocos Norte 5,897,361 665,078,000 - 26,312,000
Ilocos Sur - - - 81,800,000
La Union 133,491,056 15,755,000 - ..
Pangasinan - 91,854,440 - 93,259,000
Region II - Cagayan Valley - 385,502,752 1,413,620,000 1,215,979,000
Batanes - 96,022,155 - ..
Cagayan - 135,230,246 - 113,115,000
Isabela - 47,503,000 756,790,000 1,056,583,000
Nueva Vizcaya - 46,100,000 656,830,000 46,281,000
Quirino - 60,647,351 - -
Region III - Central Luzon 1,856,325,393 2,532,041,641 - 963,758,665
Aurora 8,997,000 238,560,368 - -
Bataan - - - -
Bulacan 396,044,000 132,100,000 - -
Nueva Ecija 89,983,458 264,661,273 - -
Pampanga 413,468,141 673,334,000 - 793,060,665
Tarlac 476,093,793 1,183,386,000 - 130,600,000
Zambales 471,739,000 40,000,000 - 40,098,000
Region IV-A CALABARZON 137,873,485 140,817,000 105,854,056 -
Batangas 20,000,000 16,411,000 105,854,056 -
Cavite - - - -
Laguna 5,783,000 12,206,000 - -
Quezon 96,690,484 112,200,000 - -
Rizal 15,400,000 - - -
MIMAROPA 209,751,630 1,188,750,000 - 152,290,000
Marinduque - - - 8,945,000
Occidental Mindoro - 55,395,000
Oriental Mindoro 37,056,000 317,000,000 - 87,950,000
Palawan 16,004,530 - - -
Romblon 156,691,000 871,750,000 - -
Region V - Bicol Region 1,021,826,121 2,705,052,701 1,800,500,047 4,100,365,898
Albay 458,187,800 1,692,868,701 974,994,804 2,818,379,000
Camarines Norte - - - -
Camarines Sur 113,535,000 872,020,000 - 612,283,000
Catanduanes 55,296,000 - - 669,703,898
Masbate 360,953,500 140,164,000 - -
Sorsogon 33,853,821 - 825,505,243 -
Continued
Region/Province 2015 2016 2017 2018
12-10

TABLE 12.13 ---Continued
Region VI - Western Visayas 306,120,669 8,892,357 - 100,312,388
Aklan 136,697,342 - - -
Antique 156,150,000 - - -
Capiz - - - -
Guimaras - - - -
Iloilo 13,273,327 8,892,357 - -
Negros Occidental - - - 100,312,388
Region VII - Central Visayas 267,733,654 343,183,000 28,790,000 -
Bohol - - 28,790,000 -
Cebu 267,733,654 343,183,000 - -
Negros Oriental - - - -
Siquijor - - - -
Region VIII - Eastern Visayas 918,954,270 1,525,851,956 82,681,991 236,166,872
Biliran - - - 150,000,000
Eastern Samar 431,616,802 521,967,372 - -
Leyte 96,330,468 865,773,384 - 71,166,872
Northern Samar 102,500,000 2,036,700 82,681,991 15,000,000
Samar (Western) 161,898,000 130,607,000 - -
Southern Leyte 126,609,000 5,467,500 - -
Region XI - Zamboanga Peninsula 729,576,972 - - -
Zamboanga del Norte - - - -
Zamboanga del Sur 729,576,972 - - -
Zamboanga Sibugay - - - -
Region X - Northern Mindanao 870,525,400 24,530,000 162,402,000 -
Bukidnon 11,980,000 - - -
Camiguin - - - -
Lanao del Norte 700,000,000 - - -
Misamis Occidental - - - -
Misamis Oriental 158,545,400 24,530,000 162,402,000 -
Region XI - Davao Region - - - -
Compostela Valley - - - -
Davao del Norte - - - -
Davao del Sur - - - -
Davao Oriental - - - -
Region XII - SOCCSKSARGEN 36,650,000 - - 50,000,000
North Cotabato - - - 30,000,000
Saranggani - - - 20,000,000
South Cotabato 36,650,000 - - -
Sultan Kudarat - - - -
Region XIII - Caraga 622,328,000 - - 123,486,200
Agusan del Norte 97,732,000 - - -
Agusan del Sur 437,647,000 - - -
Dinagat Island 39,757,000 - - -
Surigao del Norte - - - 123,486,200
Surigao del Sur 47,192,000 - - -
ARMM 16,573,005 - 3,808,811,662 4,178,965,244
Basilan - - - -
Lanao del Sur 16,573,005 - 3,808,811,662 4,718,965,244
Maguindanao - - - -
Sulu - - - -
Tawi..Tawi - - - -
Continued
Region/Province 2015 2016 2017 2018
12-11

TABLE 12.13 ---Concluded
NGA's 5,507,351,841 29,700,439,146 1,481,544,245 2,693,760,280
DSWD 3,285,977,644 10,091,942,825 1,481,544,245 1,325,000,000
DA 1,375,931,893 6,868,481,439 - 355,499,280
PVAO 2,358,116 - - -
DENR - 270,943,000 - -
NIA - 1,100,164,293 - -
DepEd - 699,988,980 - -
NEA 803,980,000 509,414,488 - -
NHA - 7,400,000,000 - -
PBS - 3,428,023 - -
HLURB - 9,000,000 - -
CHED 39,104,188 540,540,000 - -
DPWH - - - 1,000,000,000
DOTr - 15,426,918 - -
DOT - 330,133,000 - -
DOLE - 51,839,500 - -
TESDA - 262,308,198 - -
DOST - 77,545,297 - -
NCIP - 82,240,000 - -
DTI - 935,413,539 - -
OCD,INSARAG - - - 6,261,000
PMA - - - 7,000,000
DILG - 451,629,647 - -
Note: Data as of December 31, 2018
Source: National Disaster Risk Reduction and Management Council
Region/Province 2015 2016 2017 2018
12-11

TABLE 12.14 Damages Caused by Major Natural Disasters and by Man-made Disasters: 2018
Dead Injured Missing Families Persons Families Persons Totally Partially
2018
Grand Total 383 317 1,580 54 72,539 355,021 54,787 255,171 94 1,472 1,503 218,222
A. Natural Incidents
Continuous Rains 1 0 0 0 0 0 208 1,055 0 0 0 -
Drought 0 0 0 0 0 0 0 0 0 0 0 -
Earthquake 23 1 0 0 27 173 0 0 0 4 23 -
Earthquake-Induced Landslide 6 0 0 0 0 0 0 0 0 0 0 -
Flashflood/ Flooding incident 27 5 0 0 49,382 251,290 33,932 165,409 4 27 93 13,407
Forest/ Grassfire 1 0 0 0 0 0 0 0 0 0 0 -
El Nino 0 0 0 0 0 0 0 0 0 0 0 -
Ground Movement 3 0 0 0 0 558 0 0 0 0 0 -
Rain-Induced Landslide 6 1 0 0 149 602 12 31 1 0 0 -
Intertropical Convergence Zone (ITCZ) 1 0 0 0 0 0 4,289 21,445 0 0 0 -
La Nina 0 0 0 0 0 0 0 0 0 0 0 -
Lighting Incident 10 16 52 0 18 65 0 0 0 0 0 -
Northeast Monsoon 1 0 0 0 14 36 0 0 0 0 0 -
Tail-end of a Cold Front 1 0 0 4 197 924 0 0 0 0 0 -
Tornado/Destructive Winds 14 0 0 0 874 2,689 0 0 0 34 251 1,960
Southwest Monsoon 0 0 0 0 0 0 0 0 0 0 0 -
Sinkhole 0 0 0 0 0 0 0 0 0 0 0 …
Low Pressure Area 1 0 0 0 0 0 11 0 0 0 0 …
Volcanic Activity 0 0 0 0 0 0 0 0 0 0 0 …
Sub-Total 95 23 52 4 50,661 256,337 38,452 187,940 5 65 367 15,367
B. Human induced Incidents
Air Accident 0 0 0 0 0 0 0 0 0 0 0 …
Ambush/ Shooting Incident 17 30 52 0 1,351 6,847 67 290 2 0 0 …
Armed Conflict 33 33 70 0 8,170 38,357 12,996 53,605 40 0 0 …
Aviation Incident 3 10 12 0 0 0 0 0 0 0 0
Civil Disturbance 5 0 0 0 42 231 0 0 0 0 0 …
Collapsed Structure 2 8 4 0 0 0 0 0 0 0 0 …
Disease Outbreak 7 5 419 0 0 69 0 0 0 0 0 …
Drowning 19 18 2 6 0 0 0 0 0 0 0 …
Fire Incidents 104 41 85 0 11,743 52,881 3,272 13,336 24 1,407 1,136 202.755
Food Poisoning 5 0 40 0 0 0 0 0 0 0 0 …
Grenade/Bomb Explosion 15 11 95 24 0 0 0 0 0 0 0 …
Pest Infestation 3 0 21 0 0 255 0 0 23 0 0 …
Maritime Accident 17 11 14 20 0 44 0 0 0 0 0 0.100
Electrocution 1 1 0 0 0 0 0 0 0 0 0 …
Oil/Chemical Leak 5 0 1 0 572 0 0 0 0 0 0 …
Caving Incident 0 0 0 0 0 0 0 0 0 0 0 …
Vehicular Accident 52 126 713 0 0 0 0 0 0 0 0 …
Sub-Total 288 294 1,528 50 21,878 98,684 16,335 67,231 89 1,407 1,136 202.855
Source: National Disaster Risk Reduction and Management Council
No. of
Evacuation
Centers
House Damaged Cost of
Damages
(in million
pesos)
DisasterNumber of
Incidents
Casualties Affected Evacuated
12-12


TABLE 13.1 Number of Passengers and Revenues by Railways: 2013 to 2017
Passengers Carried
Passenger Revenues (Pesos)
Passengers Carried
Passenger Revenues (Pesos)
Passengers Carried
Passenger Revenues (Pesos)
2013 19,483,122 227,192,340 485,663 7,196,952 19,968,785 234,389,292
2014 24,200,480 303,406,806 471,474 8,073,641 24,671,954 311,480,447
2015
January 2,045,831 25,929,905 37,003 619,235 2,082,834 26,549,140
February 2,045,250 27,718,224 35,626 627,828 2,080,876 22,346,052
March 2,242,059 28,068,389 41,085 718,792 2,283,143 28,787,181
April 1,816,498 23,013,244 33,110 617,044 1,849,608 23,630,288
May 191,787 2,504,156 43,685 777,273 235,472 3,281,429
June - - 39,777 696,060 39,777 696,060
July 428,522 5,272,106 43,685 716,974 472,207 5,989,080
August 1,725,538 21,387,804 32,246 715,034 1,757,784 22,102,838
September 2,000,541 24,551,298 36,796 817,981 2,037,337 25,369,279
October 1,883,469 23,307,900 37,865 870,973 1,921,334 24,178,873
November 2,152,924 26,986,435 37,558 873,235 2,190,382 27,859,670
December 2,204,582 27,999,700 - - 2,204,582 27,999,700
2016
January 2,183,082 26,939,363 32,659 783,254 2,215,741 27,722,617
February 2,074,240 25,477,249 32,213 762,866 2,106,453 26,240,115
March 1,893,439 23,272,213 30,805 748,604 1,924,244 24,020,817
April 1,863,989 22,797,976 31,993 796,089 1,895,982 23,594,065
May 1,769,511 22,098,860 38,577 973,700 1,808,088 23,072,560
June 1,773,193 21,935,608 50,597 713,259 1,823,780 22,648,867
July 1,699,727 21,124,309 40,390 516,509 1,740,117 21,640,818
August 1,678,684 20,790,587 35,283 442,376 1,713,967 21,232,963
September 1,690,225 20,987,408 36,293 469,347 1,726,518 21,456,755
October 1,810,060 22,756,627 33,887 421,357 1,843,947 23,177,984
November 1,629,295 20,472,835 34,196 423,262 1,663,491 20,896,097
December 1,347,282 17,375,209 33,343 422,470 1,380,625 17,797,679
2017
January 1,422,461 18,197,957 33,783 420,365 1,456,244 18,618,322
February 1,392,304 17,646,532 38,989 510,773 1,431,293 18,157,305
March 1,537,631 19,368,158 50,547 682,099 1,588,178 20,050,257
April 1,142,957 14,680,138 36,718 505,942 1,179,675 15,186,080
May 1,351,035 16,514,771 43,290 612,456 1,394,325 17,127,167
June 1,261,059 15,283,025 43,322 573,810 1,304,381 15,856,835
July 1,518,483 22,786,789 48,554 615,665 1,567,037 23,402,454
August 1,500,580 24,245,192 39,089 506,976 1,539,669 24,752,168
September 1,313,758 22,361,486 47,490 639,498 1,361,248 23,000,984
October 1,341,745 23,044,654 43,617 570,408 1,385,362 23,615,062
November 1,117,615 19,238,569 39,472 643,362 1,157,087 19,881,931
December 1,047,971 18,296,840 35,564 1,083,535 579,748 18,876,588
Source: Philippine National Railways
Philippine National Railways
Year
Metro South Commuter Train Bicol Commuter Train Total All Commuter Train

TABLE 13.2 Number of Passengers, Load Factor and Revenues of Metro Rail Transit, Light Rail Transit, and Megatren: 2010 to 2018
Total Number of
Passengers(in million)
Load Factor (%)
Revenues(in million
pesos)
Total Number of
Passengers(in million)
Peak Hour Load Factor
(%)
Gross Revenue
Collection(in million
pesos)
Total Number of
Passengers (in million)
Peak Hour Load Factor
(%)
Gross Revenue
Collection(in million
pesos)
2010 153.1 94.0 1,904.2 155.9 69.0 2,228.2 63.2 39.9 857.32011 158.8 50.5 1,956.8 156.9 77.3 2,285.6 63.8 39.0 856.82012 174.5 50.5 2,136.6 170.7 90.2 2,514.0 70.3 48.0 943.02013 176.1 87.9 2,172.4 171.8 94.7 2,526.8 71.4 60.0 949.92014 167.7 92.0 2,020.9 170.7 96.0 2,524.0 72.9 60.0 973.42015 118.2 68.9 2,316.2 … … … 62.2 59.1 1,252.12016 134.0 81.3 2,681.5 … … … 67.0 57.1 1,307.8
January 9.8 72.9 195.4 … … … 5.8 59.8 113.7February 10.0 81.8 200.0 … … … 5.7 59.2 111.6March 9.6 82.3 194.6 … … … 5.2 56.8 101.5April 10.4 72.0 210.5 … … … 5.0 42.6 97.8May 10.5 71.6 213.0 … … … 4.9 46.9 97.1June 10.8 74.2 216.3 … … … 5.2 49.2 101.1July 11.5 82.4 232.7 … … … 5.6 56.2 109.1August 12.2 81.2 243.1 … … … 5.9 57.8 113.7September 11.9 88.9 237.4 … … … 6.1 59.2 117.7October 12.2 88.8 243.3 … … … 6.1 65.7 117.1November 12.3 88.4 244.0 … … … 5.9 66.4 104.6December 12.7 91.2 251.3 … … … 5.9 63.7 122.8
2017 140.2 91.0 2,779.4 … … … 66.0 61.2 1,271.5January 12.4 88.1 247.9 … … … 5.9 67.0 114.8February 11.7 90.1 233.2 … … … 5.6 67.2 107.9March 13.0 88.1 257.4 … … … 6.2 63.1 118.1April 10.1 86.8 200.3 … … … 4.3 56.7 83.6May 12.1 91.7 240.1 … … … 5.2 60.8 100.7June 11.2 86.8 220.8 … … … 5.0 66.4 96.5July 12.0 85.9 238.0 … … … 5.5 59.5 106.2August 12.3 90.6 243.8 … … … 5.7 56.7 109.8September 11.9 90.3 235.7 … … … 5.8 62.2 112.0October 12.3 91.8 242.8 … … … 5.8 58.4 111.6November 10.5 99.7 207.7 … … … 5.2 55.6 100.2December 10.7 102.5 211.6 … … … 5.7 60.7 110.3
2018 … … … … … … 67.7 63.9 1,244.5January … … … … … … 5.8 65.0 111.7February … … … … … … 5.4 74.8 105.2March … … … … … … 5.2 61.2 100.3April … … … … … … 4.9 60.7 94.8May … … … … … … 5.0 57.2 96.4June … … … … … … 4.9 59.8 93.3July … … … … … … 5.4 62.3 108.7August … … … … … … 5.8 72.1 111.4September … … … … … … 5.6 65.1 106.7October … … … … … … 6.0 62.6 115.0November … … … … … … 5.5 64.6 105.3December … … … … … … 5.3 61.6 101.8
Source: Department of Transportation and Communication
Year
Metro Rail Transit (Metrostar) Light Rail Transit Megatren (LRT Line 2/Blue Line)

TABLE 13.3 Number of Motor Vehicles Registered by Type of Vehicle: 2007 to 2014
Type of Vehicle 2007 2008 2009 2010 2011 2012 2013 2014
Total Motor Vehicles 5,530,052 5,891,272 6,220,433 6,634,855 7,138,942 7,463,393 7,690,038 8,081,224
Private 4,558,727 4,908,332 5,216,646 5,631,377 6,096,423 6,417,809 6,673,815 7,093,059 r
Cars 700,384 713,175 732,659 759,683 788,372 808,968 830,131 …
Utility vehicles 1,534,634 1,535,003 1,609,698 1,707,705 1,764,865 1,821,527 1,892,080 …
Buses 6,696 6,184 7,045 7,753 8,769 5,653 7,429 …
Trucks 255,522 269,367 281,282 288,427 298,789 308,644 325,412 …
Motorcycles/
Tricycles 2,039,850 2,360,304 2,559,997 2,841,646 3,206,255 3,440,777 3,584,848 …
Trailers 21,641 24,299 25,965 26,163 29,373 32,240 33,915 …
For hire 887,023 899,211 931,048 934,176 970,946 969,784 940,073 912,584
Cars 37,648 35,342 39,812 41,787 33,131 36,426 31,625 …
Utility vehicles 215,585 215,929 217,967 217,338 229,330 220,114 209,359 …
Buses 23,142 23,032 25,519 26,566 25,262 27,298 23,743 …
Trucks 16,919 17,941 21,435 21,373 21,786 23,867 23,807 …
Motorcycles/
Tricycles 591,254 604,238 623,663 624,078 658,466 658,675 647,554 …
Trailers 2,475 2,729 2,652 3,034 2,971 3,404 3,985 …
Government 70,528 73,307 68,230 65,060 67,324 72,204 72,259 7,1696 r
Cars 6,798 6,591 3,684 3,355 3,326 3,653 2,878 …
Utility vehicles 38,406 39,586 37,910 36,660 37,959 39,900 39,272 …
Buses 275 487 442 590 403 613 474 …
Trucks 8,687 8,813 8,779 7,974 8,734 8,994 9,159 …
Motorcycles/
Tricycles 16,159 17,754 17,301 16,415 16,728 17,230 18,256 …
Trailers 203 76 114 66 174 1,814 2,220 …
Diplomatic 2,406 4,884 3,591 3,591 3,597 3,060 3,376 3,363
Exempt 11,368 5,538 651 651 652 536 515 522
Source: Land Transportation Office
Others

TABLE 13.4a Number of Private Motor Vehicles Registered by Type, Status, and by Region: 2016 to 2017
New Renewal New Renewal New Renewal New Renewal New Renewal New Renewal New Renewal New Renewal
2017 2,597,150 6,761,470 150,551 851,922 233,944 1,623,311 131,719 433,392 56,857 323,247 4,252 9,494 2,012,884 3,477,825 6,943 42,279
NCR 617,291 1,787,949 84,003 364,441 108,215 454,020 77,467 191,915 19,548 54,939 3,719 163 320,983 702,878 3,356 19,593CAR 23,269 112,968 181 10,534 1,087 46,976 581 9,223 2 6,215 0 163 21,416 39,726 2 131I-Ilocos Region 168,982 337,966 2,849 35,876 3,228 77,290 2,806 15,785 158 13,080 67 222 159,570 194,985 304 728II-Cagayan Valley 140,512 222,144 1,609 15,171 2,627 55,235 1,767 10,480 62 16,285 0 350 134,322 121,860 125 2,763III-Central Luzon 294,307 813,998 11,780 110,333 23,957 203,675 12,632 49,679 20,718 42,636 0 151 223,570 401,935 1,650 5,589IV-A-CALABARZON 265,259 924,868 16,088 142,897 14,995 227,218 11,367 49,547 997 23,217 141 120 221,619 480,026 52 1,843IV-B-MIMAROPA 64,851 91,268 729 3,971 749 17,020 399 3,179 44 3,958 0 399 62,930 62,716 0 25V-Bicol Region 100,261 245,680 3,000 14,514 2,829 37,296 1,718 6,857 73 10,819 0 170 92,641 175,548 0 476VI-Western Visayas 170,551 339,740 5,088 32,826 7,401 90,348 4,816 19,631 131 31,754 2 94 153,111 163,956 2 1,131VII-Central Visayas 180,688 568,054 14,102 44,137 19,209 123,762 8,571 26,363 2,862 22,794 36 159 135,852 347,918 56 2,921VIII-Eastern Visayas 59,492 156,579 1,751 6,268 3,151 30,133 603 5,252 92 10,958 5 185 53,674 103,348 216 435IX-Zamboanga Peninsula 99,276 234,645 693 11,120 11,177 48,853 547 7,222 2,278 15,661 235 1,451 84,167 149,771 179 567X-Northern Mindanao 90,550 255,584 3,113 17,115 4,829 63,367 3,183 11,385 104 19,959 10 570 79,310 141,633 1 1,555XI-Davao Region 137,971 315,381 3,278 20,599 7,151 60,848 3,448 12,550 488 17,120 21 5,088 123,347 197,161 238 2,015XII-SOCCSKSARGEN 114,877 256,070 1,294 17,115 20,238 64,007 1,211 10,291 8,991 26,055 16 46 82,383 136,444 744 2,112XIII-Caraga 69,013 98,576 993 5,005 3,101 23,263 603 4,033 309 7,797 0 163 63,989 57,920 18 395
2016 2,040,176 6,205,880 131,838 804,066 186,249 1,539,194 95,579 394,682 46,082 307,983 3,459 6,565 1,568,743 3,115,569 8,226 37,821
NCR 472,184 1,732,651 77,099 366,572 83,558 452,705 57,461 185,664 13,564 55,674 3,067 2,613 233,795 651,435 3,640 17,988CAR 16,391 98,673 115 9,496 736 41,482 294 7,680 3 5,686 0 75 15,243 34,151 0 103I-Ilocos Region 148,122 309,132 2,611 31,833 3,124 73,010 2,112 14,144 356 12,428 131 142 139,057 176,955 731 620II-Cagayan Valley 157,090 196,893 757 12,730 1,671 51,504 1,027 8,456 63 16,083 0 91 153,339 105,447 233 2,582III-Central Luzon 200,416 749,869 9,118 100,513 18,905 192,270 8,630 43,911 18,617 39,453 0 1,011 143,267 367,517 1,879 5,194IV-A-CALABARZON 205,675 815,339 15,199 124,828 14,046 207,901 8,390 42,509 1,039 21,845 193 553 166,761 416,157 47 1,546IV-B-MIMAROPA 14,557 83,068 282 3,419 246 16,001 168 2,701 5 3,840 1 75 13,855 57,005 0 27V-Bicol Region 83,620 222,531 2,751 13,146 1,556 34,829 960 5,663 55 9,944 1 172 78,297 158,364 0 413VI-Western Visayas 131,476 310,717 3,980 30,804 5,823 84,600 3,581 17,295 140 29,940 2 252 117,950 146,838 0 988VII-Central Visayas 163,007 514,856 11,577 39,200 14,232 114,643 6,045 22,634 2,445 22,092 26 183 128,490 313,640 192 2,464VIII-Eastern Visayas 54,680 137,693 1,294 5,082 3,016 26,722 330 4,467 211 9,880 6 75 49,315 91,107 508 360IX-Zamboanga Peninsula 73,675 218,847 538 11,167 8,313 47,413 432 7,159 1,499 14,425 2 146 62,854 138,000 37 537X-Northern Mindanao 78,387 206,037 2,392 13,557 4,104 52,750 2,502 9,249 161 16,736 15 100 69,213 112,489 0 1,156XI-Davao Region 110,188 282,909 2,369 19,511 5,113 56,780 2,587 11,008 354 17,429 15 894 99,734 175,569 16 1,718XII-SOCCSKSARGEN 97,103 243,188 1,186 17,723 20,928 65,074 857 8,881 7,568 25,835 0 116 65,621 123,728 943 1,831XIII-Caraga 33,605 83,477 570 4,485 878 21,510 203 3,261 2 6,693 0 67 31,952 47,167 0 294
Note: No data provided for ARMM
Motorcycle include without side car, with side car, and non-conventional
Source: Land Transportation Office
Buses Motorcycles/Tricycles TrailersYear / Region
Total Cars Utility Vehicles Sport Utility Vehicles Trucks
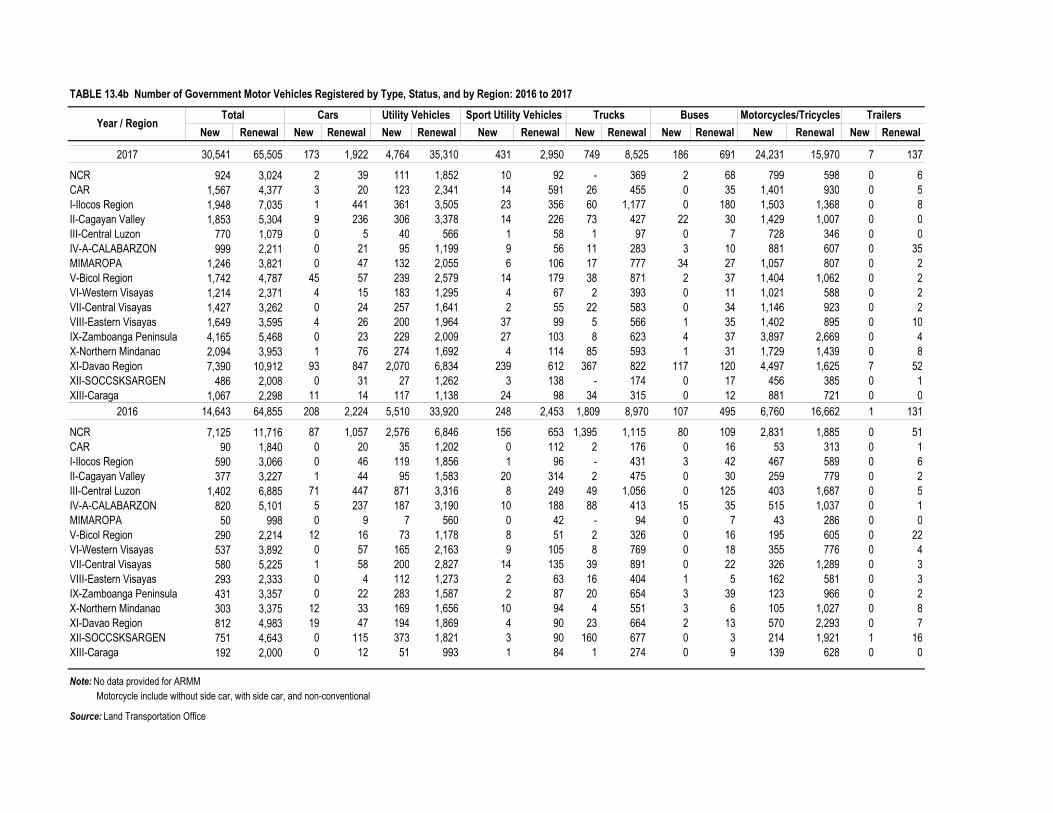
TABLE 13.4b Number of Government Motor Vehicles Registered by Type, Status, and by Region: 2016 to 2017
New Renewal New Renewal New Renewal New Renewal New Renewal New Renewal New Renewal New Renewal
2017 30,541 65,505 173 1,922 4,764 35,310 431 2,950 749 8,525 186 691 24,231 15,970 7 137
NCR 924 3,024 2 39 111 1,852 10 92 - 369 2 68 799 598 0 6CAR 1,567 4,377 3 20 123 2,341 14 591 26 455 0 35 1,401 930 0 5I-Ilocos Region 1,948 7,035 1 441 361 3,505 23 356 60 1,177 0 180 1,503 1,368 0 8II-Cagayan Valley 1,853 5,304 9 236 306 3,378 14 226 73 427 22 30 1,429 1,007 0 0III-Central Luzon 770 1,079 0 5 40 566 1 58 1 97 0 7 728 346 0 0IV-A-CALABARZON 999 2,211 0 21 95 1,199 9 56 11 283 3 10 881 607 0 35MIMAROPA 1,246 3,821 0 47 132 2,055 6 106 17 777 34 27 1,057 807 0 2V-Bicol Region 1,742 4,787 45 57 239 2,579 14 179 38 871 2 37 1,404 1,062 0 2VI-Western Visayas 1,214 2,371 4 15 183 1,295 4 67 2 393 0 11 1,021 588 0 2VII-Central Visayas 1,427 3,262 0 24 257 1,641 2 55 22 583 0 34 1,146 923 0 2VIII-Eastern Visayas 1,649 3,595 4 26 200 1,964 37 99 5 566 1 35 1,402 895 0 10IX-Zamboanga Peninsula 4,165 5,468 0 23 229 2,009 27 103 8 623 4 37 3,897 2,669 0 4X-Northern Mindanao 2,094 3,953 1 76 274 1,692 4 114 85 593 1 31 1,729 1,439 0 8XI-Davao Region 7,390 10,912 93 847 2,070 6,834 239 612 367 822 117 120 4,497 1,625 7 52XII-SOCCSKSARGEN 486 2,008 0 31 27 1,262 3 138 - 174 0 17 456 385 0 1XIII-Caraga 1,067 2,298 11 14 117 1,138 24 98 34 315 0 12 881 721 0 0
2016 14,643 64,855 208 2,224 5,510 33,920 248 2,453 1,809 8,970 107 495 6,760 16,662 1 131
NCR 7,125 11,716 87 1,057 2,576 6,846 156 653 1,395 1,115 80 109 2,831 1,885 0 51CAR 90 1,840 0 20 35 1,202 0 112 2 176 0 16 53 313 0 1I-Ilocos Region 590 3,066 0 46 119 1,856 1 96 - 431 3 42 467 589 0 6II-Cagayan Valley 377 3,227 1 44 95 1,583 20 314 2 475 0 30 259 779 0 2III-Central Luzon 1,402 6,885 71 447 871 3,316 8 249 49 1,056 0 125 403 1,687 0 5IV-A-CALABARZON 820 5,101 5 237 187 3,190 10 188 88 413 15 35 515 1,037 0 1MIMAROPA 50 998 0 9 7 560 0 42 - 94 0 7 43 286 0 0V-Bicol Region 290 2,214 12 16 73 1,178 8 51 2 326 0 16 195 605 0 22VI-Western Visayas 537 3,892 0 57 165 2,163 9 105 8 769 0 18 355 776 0 4VII-Central Visayas 580 5,225 1 58 200 2,827 14 135 39 891 0 22 326 1,289 0 3VIII-Eastern Visayas 293 2,333 0 4 112 1,273 2 63 16 404 1 5 162 581 0 3IX-Zamboanga Peninsula 431 3,357 0 22 283 1,587 2 87 20 654 3 39 123 966 0 2X-Northern Mindanao 303 3,375 12 33 169 1,656 10 94 4 551 3 6 105 1,027 0 8XI-Davao Region 812 4,983 19 47 194 1,869 4 90 23 664 2 13 570 2,293 0 7XII-SOCCSKSARGEN 751 4,643 0 115 373 1,821 3 90 160 677 0 3 214 1,921 1 16XIII-Caraga 192 2,000 0 12 51 993 1 84 1 274 0 9 139 628 0 0
Note: No data provided for ARMM Motorcycle include without side car, with side car, and non-conventional
Source: Land Transportation Office
Buses Motorcycles/Tricycles TrailersYear / Region
Total Cars Utility Vehicles Sport Utility Vehicles Trucks

TABLE 13.4c Number of Diplomat Motor Vehicles Registered by Type, Status, and by Region: 2016 to 2017
New Renewal New Renewal New Renewal New Renewal New Renewal New Renewal
2017 182 2,661 6 36 48 384 5 92 123 2,149 0 0
NCR 182 2,383 6 36 48 381 5 92 123 1,874 0 0
CAR 0 0 0 0 0 0 0 0 - - 0 0
I-Ilocos Region 0 0 0 0 0 0 0 0 - - 0 0
II-Cagayan Valley 0 0 0 0 0 0 0 0 - - 0 0
III-Central Luzon 0 0 0 0 0 0 0 0 - - 0 0
IV-A-CALABARZON 0 272 0 0 0 3 0 0 - 269 0 0
MIMAROPA 0 0 0 0 0 0 0 0 - - 0 0
V-Bicol Region 0 0 0 0 0 0 0 0 - - 0 0
VI-Western Visayas 0 0 0 0 0 0 0 0 - - 0 0
VII-Central Visayas 0 1 0 0 0 0 0 0 - 1 0 0
VIII-Eastern Visayas 0 0 0 0 0 0 0 0 - - 0 0
IX-Zamboanga Peninsula 0 0 0 0 0 0 0 0 - - 0 0
X-Northern Mindanao 0 4 0 0 0 0 0 0 - 4 0 0
XI-Davao Region 0 0 0 0 0 0 0 0 - - 0 0
XII-SOCCSKSARGEN 0 0 0 0 0 0 0 0 - - 0 0
XIII-Caraga 0 1 0 0 0 0 0 0 - 1 0 0
2016 250 2,822 2 62 55 401 2 94 191 2,265 0 0
NCR 250 2,546 2 36 55 401 2 94 191 2,015 0 0
CAR 0 0 0 0 0 0 0 0 0 0 0 0
I-Ilocos Region 0 0 0 0 0 0 0 0 0 0 0 0
II-Cagayan Valley 0 0 0 0 0 0 0 0 0 0 0 0
III-Central Luzon 0 0 0 0 0 0 0 0 0 0 0
IV-A-CALABARZON 0 267 0 25 0 0 0 0 0 242 0 0
MIMAROPA 0 0 0 0 0 0 0 0 0 0 0 0
V-Bicol Region 0 0 0 0 0 0 0 0 0 0 0 0
VI-Western Visayas 0 0 0 0 0 0 0 0 0 0 0 0
VII-Central Visayas 0 2 0 0 0 0 0 0 0 2 0 0
VIII-Eastern Visayas 0 0 0 0 0 0 0 0 0 0 0 0
IX-Zamboanga Peninsula 0 1 0 1 0 0 0 0 0 0 0 0
X-Northern Mindanao 0 6 0 0 0 0 0 0 0 6 0 0
XI-Davao Region 0 0 0 0 0 0 0 0 0 0 0 0
XII-SOCCSKSARGEN 0 0 0 0 0 0 0 0 0 0 0 0
XIII-Caraga 0 0 0 0 0 0 0 0 0 0 0 0
Note: No data provided for ARMM
Source: Land Transportation Office
USAFYear / Region
Total CM DC CC OEV
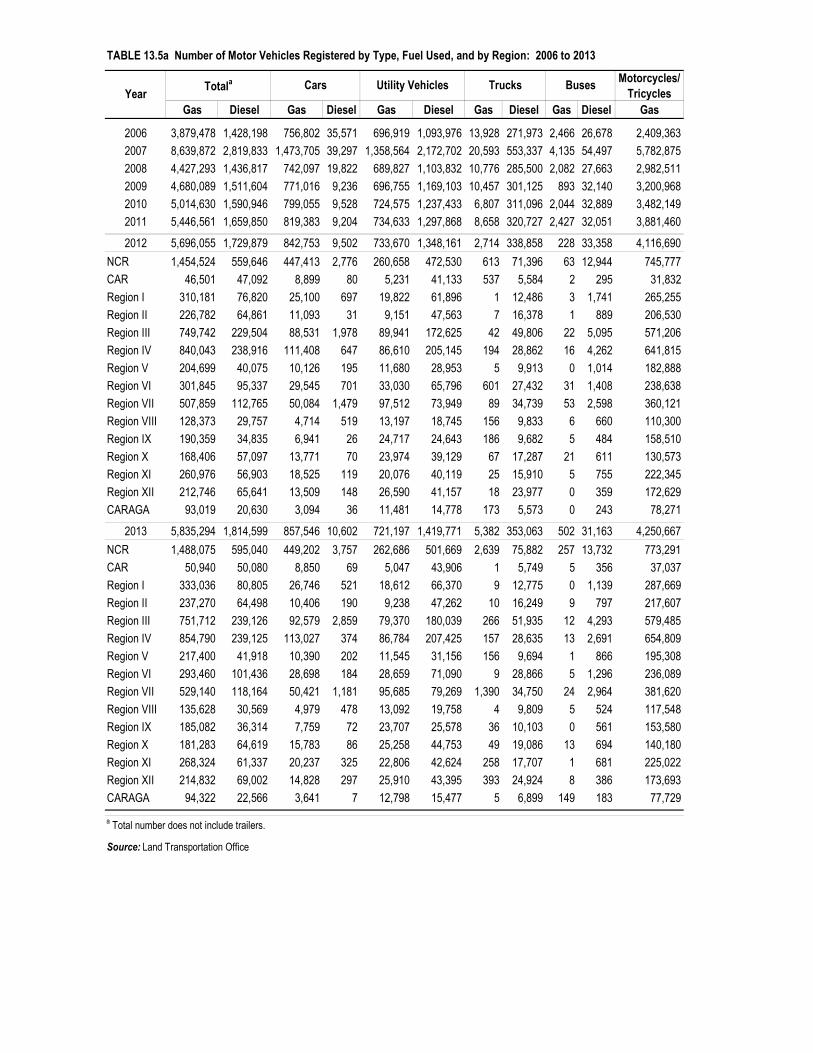
Motorcycles/ Tricycles
Gas Diesel Gas Diesel Gas Diesel Gas Diesel Gas Diesel Gas
2006 3,879,478 1,428,198 756,802 35,571 696,919 1,093,976 13,928 271,973 2,466 26,678 2,409,363
2007 8,639,872 2,819,833 1,473,705 39,297 1,358,564 2,172,702 20,593 553,337 4,135 54,497 5,782,875
2008 4,427,293 1,436,817 742,097 19,822 689,827 1,103,832 10,776 285,500 2,082 27,663 2,982,511
2009 4,680,089 1,511,604 771,016 9,236 696,755 1,169,103 10,457 301,125 893 32,140 3,200,968
2010 5,014,630 1,590,946 799,055 9,528 724,575 1,237,433 6,807 311,096 2,044 32,889 3,482,149
2011 5,446,561 1,659,850 819,383 9,204 734,633 1,297,868 8,658 320,727 2,427 32,051 3,881,460
2012 5,696,055 1,729,879 842,753 9,502 733,670 1,348,161 2,714 338,858 228 33,358 4,116,690
NCR 1,454,524 559,646 447,413 2,776 260,658 472,530 613 71,396 63 12,944 745,777
CAR 46,501 47,092 8,899 80 5,231 41,133 537 5,584 2 295 31,832
Region I 310,181 76,820 25,100 697 19,822 61,896 1 12,486 3 1,741 265,255
Region II 226,782 64,861 11,093 31 9,151 47,563 7 16,378 1 889 206,530
Region III 749,742 229,504 88,531 1,978 89,941 172,625 42 49,806 22 5,095 571,206
Region IV 840,043 238,916 111,408 647 86,610 205,145 194 28,862 16 4,262 641,815
Region V 204,699 40,075 10,126 195 11,680 28,953 5 9,913 0 1,014 182,888
Region VI 301,845 95,337 29,545 701 33,030 65,796 601 27,432 31 1,408 238,638
Region VII 507,859 112,765 50,084 1,479 97,512 73,949 89 34,739 53 2,598 360,121
Region VIII 128,373 29,757 4,714 519 13,197 18,745 156 9,833 6 660 110,300
Region IX 190,359 34,835 6,941 26 24,717 24,643 186 9,682 5 484 158,510
Region X 168,406 57,097 13,771 70 23,974 39,129 67 17,287 21 611 130,573
Region XI 260,976 56,903 18,525 119 20,076 40,119 25 15,910 5 755 222,345
Region XII 212,746 65,641 13,509 148 26,590 41,157 18 23,977 0 359 172,629
CARAGA 93,019 20,630 3,094 36 11,481 14,778 173 5,573 0 243 78,271
2013 5,835,294 1,814,599 857,546 10,602 721,197 1,419,771 5,382 353,063 502 31,163 4,250,667
NCR 1,488,075 595,040 449,202 3,757 262,686 501,669 2,639 75,882 257 13,732 773,291
CAR 50,940 50,080 8,850 69 5,047 43,906 1 5,749 5 356 37,037
Region I 333,036 80,805 26,746 521 18,612 66,370 9 12,775 0 1,139 287,669
Region II 237,270 64,498 10,406 190 9,238 47,262 10 16,249 9 797 217,607
Region III 751,712 239,126 92,579 2,859 79,370 180,039 266 51,935 12 4,293 579,485
Region IV 854,790 239,125 113,027 374 86,784 207,425 157 28,635 13 2,691 654,809
Region V 217,400 41,918 10,390 202 11,545 31,156 156 9,694 1 866 195,308
Region VI 293,460 101,436 28,698 184 28,659 71,090 9 28,866 5 1,296 236,089
Region VII 529,140 118,164 50,421 1,181 95,685 79,269 1,390 34,750 24 2,964 381,620
Region VIII 135,628 30,569 4,979 478 13,092 19,758 4 9,809 5 524 117,548
Region IX 185,082 36,314 7,759 72 23,707 25,578 36 10,103 0 561 153,580
Region X 181,283 64,619 15,783 86 25,258 44,753 49 19,086 13 694 140,180
Region XI 268,324 61,337 20,237 325 22,806 42,624 258 17,707 1 681 225,022
Region XII 214,832 69,002 14,828 297 25,910 43,395 393 24,924 8 386 173,693
CARAGA 94,322 22,566 3,641 7 12,798 15,477 5 6,899 149 183 77,729
a Total number does not include trailers.
Source: Land Transportation Office
TABLE 13.5a Number of Motor Vehicles Registered by Type, Fuel Used, and by Region: 2006 to 2013
YearTotala Cars Utility Vehicles Trucks Buses

TABLE 13.5b Number of Motor Vehicles Registered by Type, Fuel Used, and by Region: 2014
Gas DieselCompressed Natural Gas
Liquified Petroleum Gas
Light Electric Vehicle
Others Gas DieselCompressed Natural Gas
LPGLight Electric
VehicleOthers Gas Diesel
Compressed Natural Gas
LPGLight Electric
VehicleOthers
Total 6,131,471 1,907,762 263 235 145 32 898,313 15,519 1 174 10 7 738,574 1,505,791 226 59 68 11NCR 1,585,349 617,578 4 116 60 27 455,833 6,948 0 91 5 3 273,819 525,867 2 25 53 10CAR 59,574 48,713 251 6 0 0 8,962 289 1 6 0 0 7,111 42,420 216 0 0 0I-Ilocos Region 344,289 86,107 0 1 0 0 29,811 314 0 0 0 0 20,009 71,349 0 1 0 0II-Cagayan Valley 300,819 69,154 0 3 0 0 11,191 70 0 1 0 0 9,476 51,396 0 2 0 0III-Central Luzon 726,197 274,680 0 0 0 0 101,328 4,145 0 0 0 0 78,675 206,689 0 0 0 0IV-A-CALABARZON 776,671 226,012 0 0 74 0 120,443 491 0 0 0 0 76,740 199,136 0 0 14 0MIMAROPA 84,872 18,239 0 0 0 0 2,862 114 0 0 0 0 6,461 13,721 0 0 0 0V-Bicol Region 230,044 44,555 0 0 0 3 11,816 374 0 0 0 3 10,920 33,851 0 0 0 0VI-Western Visayas 316,278 110,565 6 60 2 1 31,312 342 0 50 1 1 27,964 78,826 6 10 1 0VII-Central Visayas 564,074 113,906 2 19 4 0 51,387 891 0 5 4 0 99,691 79,371 2 14 0 0VIII-Eastern Visayas 129,982 30,081 0 0 0 0 4,784 510 0 0 0 0 11,895 19,360 0 0 0 0IX-Zamboanga Peninsula 206,863 41,232 0 0 0 0 8,724 52 0 0 0 0 23,009 30,122 0 0 0 0X-Northern Mindanao 198,973 65,680 0 1 0 0 17,120 130 0 0 0 0 25,999 46,024 0 1 0 0XI-Davao Region 282,229 65,822 0 25 4 0 21,063 531 0 20 0 0 24,628 46,602 0 3 0 0XII-SOCCSKSARGEN 229,159 72,488 0 3 0 0 17,643 247 0 1 0 0 32,230 45,280 0 2 0 0XIII-Caraga 96,098 22,950 0 1 1 1 4,034 71 0 0 0 0 9,947 15,777 0 1 0 1
Gas DieselCompressed Natural Gas
Liquified Petroleum Gas
Light Electric Vehicle
Others Gas DieselCompressed Natural Gas
LPGLight Electric
VehicleOthers Gas Diesel
Compressed Natural Gas
LPGLight Electric
VehicleOthers
Total 5,283 359,248 36 2 2 0 794 27,048 0 0 0 0 4,488,507 156 0 0 65 14NCR 2,569 72,595 2 0 2 0 53 12,168 0 0 0 0 853,075 0 0 0 0 14CAR 7 5,725 34 0 0 0 3 232 0 0 0 0 43,491 47 0 0 0 0I-Ilocos Region 1 13,574 0 0 0 0 1 870 0 0 0 0 294,467 0 0 0 0 0II-Cagayan Valley 16 17,099 0 0 0 0 7 589 0 0 0 0 280,129 0 0 0 0 0III-Central Luzon 236 59,988 0 0 0 0 8 3,858 0 0 0 0 545,950 0 0 0 0 0IV-A-CALABARZON 369 24,658 0 0 0 0 10 1,727 0 0 0 0 579,109 0 0 0 60 0MIMAROPA 14 4,137 0 0 0 0 14 267 0 0 0 0 75,521 0 0 0 0 0V-Bicol Region 94 9,324 0 0 0 0 39 1,006 0 0 0 0 207,175 0 0 0 0 0VI-Western Visayas 2 30,053 0 0 0 0 12 1,250 0 0 0 0 256,988 94 0 0 0 0VII-Central Visayas 314 32,463 0 0 0 0 40 1,180 0 0 0 0 412,642 1 0 0 0 0VIII-Eastern Visayas 1 9,570 0 0 0 0 63 641 0 0 0 0 113,239 0 0 0 0 0IX-Zamboanga Peninsula 279 10,502 0 0 0 0 6 556 0 0 0 0 174,845 0 0 0 0 0X-Northern Mindanao 907 18,895 0 0 0 0 46 631 0 0 0 0 154,901 0 0 0 0 0XI-Davao Region 306 17,480 0 2 0 0 2 1,209 0 0 0 0 236,230 0 0 0 4 0XII-SOCCSKSARGEN 91 26,396 0 0 0 0 1 551 0 0 0 0 179,194 14 0 0 0 0XIII-Caraga 77 6,789 0 0 0 0 489 313 0 0 0 0 81,551 0 0 0 1 0
Note: No data provided for ARMM a Total number does not include trailers.
Source: Land Transportation Office
YearTotal a Cars Utility Vehicles/Sports Utility Vehicles
Year
Trucks Buses Motorcycles/Tricycles

Total Manila/North
Luzon Southern
Luzon Visayas
Northern Mindanao
Southern Mindanao
Total Manila/North
Luzon Southern
Luzon Visayas
Northern Mindanao
Southern Mindanao
2014 Shipcalls 358,141 16,126 95,855 143,310 53,274 49,576 4,853 1,471 1,930 197 691 564
Domestic 350,145 12,505 94,411 142,812 52,754 47,663 3,178 958 1,617 67 53 483Foreign 7,996 3,621 1,444 498 520 1,913 1,675 513 313 130 638 81
Gross Registered Tonnage314,887,261 91,741,539 79,010,782 66,039,421 37,480,676 40,614,843 41,965,841 9,411,344 7,301,704 3,925,909 20,086,299 1,240,585Domestic 189,541,883 26,340,282 52,884,874 61,505,554 31,896,568 16,914,605 2,137,311 543,080 933,037 175,985 56,214 428,995Foreign 125,345,378 65,401,257 26,125,908 4,533,867 5,584,108 23,700,238 39,828,530 8,868,264 6,368,667 3,749,924 20,030,085 811,590
Length (meters) 15,578,234 1,449,828 4,207,621 5,828,512 2,300,254 1,792,019 406,613 109,435 109,140 29,148 121,455 37,435Domestic 14,357,557 877,168 4,001,626 5,770,854 2,236,699 1,471,210 134,872 40,971 58,339 5,247 3,262 27,053Foreign 1,220,677 572,660 205,995 57,658 63,555 320,809 271,741 68,464 50,801 23,901 118,193 10,382
2015 Shipcalls 390,428 17,474 111,422 152,279 57,864 51,389 4,667 1,328 1,918 199 700 522
Domestic 381,710 13,466 109,809 151,769 57,313 49,353 3,187 891 1,676 118 56 446Foreign 8,718 4,008 1,613 510 551 2,036 1,480 437 242 81 644 76
Gross Registered Tonnage357,244,119 104,046,272 93,062,746 71,967,480 38,842,016 49,325,605 37,588,310 7,370,181 6,666,632 2,454,388 19,361,967 1,735,142Domestic 211,777,006 29,369,133 61,107,350 67,771,535 33,957,348 19,571,640 2,182,319 465,074 1,114,001 149,634 81,104 372,506Foreign 145,467,113 74,677,139 31,955,396 4,195,945 4,884,668 29,753,965 35,405,991 6,905,107 5,552,631 2,304,754 19,280,863 1,362,636
Length (meters) 17,193,702 1,615,731 4,847,908 6,345,978 2,496,749 1,887,336 383,588 93,263 110,014 24,536 118,879 36,896Domestic 15,874,181 967,079 4,612,342 6,289,904 2,432,153 1,572,703 149,282 37,062 72,839 10,144 3,961 25,276Foreign 1,319,521 648,652 235,566 56,074 64,596 314,633 234,306 56,201 37,175 14,392 114,918 11,620
2016 Shipcalls 428,133 20,263 121,374 173,025 62,983 50,488 5,447 1,408 2,270 298 929 542
Domestic 417,461 15,261 119,410 172,234 62,426 48,130 3,804 1,017 1,991 110 259 427Foreign 10,672 5,002 1,964 791 557 2,358 1,643 391 279 188 670 115
Gross Registered Tonnage425,164,058 127,293,853 110,374,723 86,704,958 42,644,623 58,145,902 40,314,717 6,206,749 6,401,680 5,780,224 20,079,251 1,846,814Domestic 241,507,422 31,968,023 70,915,562 78,488,418 37,351,846 22,783,574 2,686,061 464,948 1,466,544 202,306 202,607 349,656Foreign 183,656,636 95,325,830 39,459,161 8,216,540 5,292,778 35,362,328 37,628,656 5,741,800 4,935,135 5,577,918 19,876,644 1,497,158
Length (meters) 19,217,899 1,886,510 5,345,783 7,360,681 2,653,967 1,970,958 430,859 91,900 121,395 43,295 133,782 40,487
Continued
TABLE 13.6 Shipping Statistics by Port Management Office: 2014 to 2018
Particulars At Berth At Anchorage

TABLE 13.6---Concluded
Total Manila/North
Luzon Southern
Luzon Visayas
Northern Mindanao
Southern Mindanao
Total Manila/North
Luzon Southern
Luzon Visayas
Northern Mindanao
Southern Mindanao
Domestic 17,564,891 1,064,769 5,052,892 7,260,025 2,587,266 1,599,939 171,649 40,127 85,677 7,982 13,548 24,314Foreign 1,653,009 821,741 292,891 100,656 66,701 371,019 259,209 51,773 35,718 35,313 120,234 16,173
2017 Shipcalls 443,106 19,936 125,937 180,485 65,093 51,655 5,902 1,642 2,365 322 946 627
Domestic 432,805 15,221 124,066 179,710 64,552 49,256 4,249 1,140 2,104 160 311 534Foreign 10,301 4,715 1,871 775 541 2,399 1,653 502 261 162 635 93
Gross Registered Tonnage461,302,059 133,638,709 124,221,348 96,509,283 44,658,462 62,274,256 42,914,611 9,226,630 6,082,073 5,646,622 20,290,302 1,668,984Domestic 268,461,746 33,696,859 83,426,392 87,742,331 38,701,956 24,894,209 2,418,922 482,432 1,165,140 108,846 229,338 433,166Foreign 192,840,312 99,941,850 40,794,956 8,766,953 5,956,506 37,380,047 40,495,690 8,744,198 4,916,933 5,537,776 20,060,964 1,235,819
Length (meters) 20,337,412 1,918,789 5,743,176 7,841,983 2,773,715 2,059,748 451,955 111,955 120,504 40,234 134,977 44,285Domestic 18,679,225 1,107,256 5,451,430 7,741,546 2,703,359 1,675,634 185,682 44,350 85,672 9,073 15,770 30,816Foreign 1,658,187 811,532 291,746 100,438 70,356 384,114 266,274 67,604 34,833 31,161 119,207 13,468
2018 Shipcalls 462,986 19,932 132,340 185,146 69,603 55,965 5,453 925 2,454 340 730 1,004
Domestic 453,247 15,751 130,292 184,454 69,030 53,720 3,801 478 2,162 184 204 773Foreign 9,739 4,181 2,048 692 573 2,245 1,652 447 292 156 526 231
Gross Registered Tonnage482,970,620 133,021,942 137,795,594 101,226,554 48,654,386 62,272,144 40,410,435 8,360,272 6,215,104 5,353,411 16,602,051 3,879,597Domestic 286,968,319 33,960,313 91,653,833 93,443,809 42,109,502 25,800,861 2,774,098 352,936 1,327,605 106,161 202,404 784,991Foreign 196,002,301 99,061,629 46,141,761 7,782,745 6,544,884 36,471,283 37,636,337 8,007,335 4,887,498 5,247,250 16,399,647 3,094,606
Length (meters) 21,593,780 1,871,840 6,291,223 8,138,238 3,016,438 2,276,042 446,659 87,278 127,268 38,087 111,313 82,713Domestic 19,996,246 1,128,168 5,965,794 8,049,005 2,942,030 1,911,249 186,821 25,956 89,873 9,325 13,039 48,629Foreign 1,597,534 743,672 325,429 89,233 74,407 364,793 259,838 61,322 37,395 28,763 98,274 34,084
Note: 2018 port statistics may still change due to on-going data validation.
Source: Philippine Statistics Authority
Particulars At Berth At Anchorage

TABLE 13.7 Shipping Statistics: Cargo and Passenger: 2011 to 2018
2011 r 2012 2013 2014 2015 2016 2017 r 2018
Total Cargo Throughput(in metric tons) 178,278,562 193,775,320 202,058,707 214,812,620 223,672,070 243,757,529 253,560,516 260,953,472
Domestic 74,171,940 75,876,305 77,961,028 79,713,233 89,051,207 94,364,460 101,496,604 105,390,180Inward 38,994,124 38,394,428 39,733,605 41,757,673 50,040,886 52,909,351 57,376,145 59,574,429Outward 35,177,816 37,481,877 38,227,423 37,955,560 39,010,321 41,455,109 44,120,459 45,815,751
Foreign 104,106,622 1 117,899,015 124,097,679 135,099,387 134,620,863 149,393,069 152,063,912 155,563,292Import 53,354,108 57,540,469 60,880,181 66,633,058 73,765,548 85,031,591 89,612,379 100,793,335Export 50,752,514 60,358,546 63,217,498 68,466,329 60,855,315 64,361,478 62,451,533 54,769,957
Total Passenger Traffic 49,485,001 49,998,292 53,869,097 55,990,029 62,762,732 68,951,205 72,438,609 76,798,175
Disembarked 25,217,885 25,441,132 27,659,956 28,746,341 32,194,820 35,634,255 37,227,215 39,297,414Embarked 24,267,116 24,557,160 26,209,141 27,243,688 30,567,912 33,316,950 35,100,855 37,049,698Cruise Ships - - - - - - 110,539 451,063
Note: 2018 port statistics may still change due to on-going data validation.
Source: Philippine Statistics Authority, 2018 Annual Statistical Report (ASR)
TABLE 13.8 Number and Tonnage of Domestic Operating Fleet: 2015 to 2018
2015 2016 2017 2018 2015 2016 2017 2018
Total 25,063 30,854 34,619 39,110 2,942,244 3,380,939 3,600,663 4,069,308
Merchant Fleet 12,021 14,336 16,935 19,901 2,521,363 2,907,104 3,105,450 3,547,727
Passenger 7,387 9,056 11,135 13,165 414,891 498,961 546,831 621,668 Cargo 3,476 3,926 4,186 4,606 1,710,982 1,954,871 2,065,058 2,309,427 Tanker 257 290 297 335 271,261 308,151 315,259 383,333 Tug 722 775 802 850 85,275 95,590 99,950 106,477 Dredger 34 37 41 47 14,521 18,653 20,077 23,400 Speed Boat 26 39 45 53 101 134 174 268 Special Purpose Ship 20 31 108 245 3,816 6,027 10,555 21,014 Miscellaneous Ship 99 147 179 221 20,516 21,449 21,622 36,865 No information - 30 32 32 0 565 635 635 Others - 5 110 347 0 2,703 25,290 44,639Fishing 13,042 16,518 17,684 19,209 420,881 473,835 495,213 521,581
Source: Maritime Industry Authority
Type of VesselNumber Total Gross Tonnage

TABLE 13.9 Airports by Classification, by Location: As of May 2019
International Principal Class 1 Principal Class 2
Clark - Authority Butuan Antique Alabat Jomalig
Davao Cagayan Baguio Allah Valley Lingayen
General Santos Cotabato Basco Bagabag Lubang
Iloilo Dipolog Busuanga Baler Maasin
Kalibo Dumaguete Calbayog Bantayan Malabang
Laoag Laguindingan Camiguin Bulan Mamburao
Mactan, Cebu - Authority Legazpi Catarman Biliran Mati
NAIA - Authority Naga Caticlan Bislig Ozamis
Puerto Princesa Pagadian Cuyo Borongan Palanan
Subic - Authority Roxas Jolo Cagaya de Sulu Plaridel
Zamboanga San Jose Marinduque Calapan Pinamalayan
Silay Masbate Catbalogan Rosales
Tacloban Ormoc Cauayan San Fernando - BCDA-PPMC
Romblon Daet Siocon
Sanga-Sanga Hilongos Siquijor
Siargao Iba Sorsogon
Surigao Ipil Ubay
Tandag Iligan Vigan
Virac Itbayat Wao (operational)
Liloy Wasig
Source: Civil Aviation Authority of the Philippines
Community

TABLE 13.10a Aircraft, Cargo, and Passenger Movement by Airport Location: 2017 and 2018
Aircraft Cargo Passenger Aircraft Cargo Passenger
Philippines 809,700 518,257,286 43,434,830 886,551 889,226,370 66,829,198
NCR
Domestic 75,199 131,470,480 11,346,407 149,371 245,134,500 21,064,913
General Aviation 16,258 - 119,432 26,925 - 172,306
International 56,381 106,776,280 5,970,681 108,995 417,122,490 20,957,571
CAR
Baguio 1,266 - 2,145 1,254 254,658 1,722
I-Ilocos Region
Laoag (International) 1,515 11,544 1,594 1,224 118,143 14,059
Laoag (Domestic) 3,371 3,277,172 150,214 3,483 2,945,989 146,960
Lingayen 63,902 - 31,036 46,254 - 22,835
Vigan 23,436 12,254 47,856 18,100 32,270 39,733
II-Cagayan Valley
Bagabag 622 174 1,714 194 2,090 809
Basco 3,538 1,519,766 151,093 2,702 1,299,048 104,089
Cauayan 9,300 1,975,089 222,591 5,936 968,919 103,011
Itbayat 66 2,242 438 4 - 6
Tuguegarao (Int'l) - - - - - -
Tuguegarao (Dom) 8,666 4,331,203 384,819 4,235 2,856,975 209,358
Palanan 5,602 740,045 27,820 2,920 338,784 13,771
III-Central Luzon
Iba 19,927 - 16,861 15,275 - 15,932
Plaridel 68,367 - - 99,601 - -
Subic - - - - - -
IV-CALABARZON & MIMAROPA
Baler 956 - 1,423 1,546 - 2,040
Busuanga 12,082 6,785,438 676,823 10,119 5,359,011 525,044
Calapan 1,346 - 3,460 1,326 - 3,052
Cuyo 1,132 139,939 4,482 1,543 216,061 5,255
Jomalig 30 - - 2 - -
Lubang 33,666 - 69,237 43,072 - 85,573
Mamburao 554 - 1,357 446 - 1,206
Marinduque 186 - 202 - - -
Pinamalayan 148 100 196 56 - -
Puerto Princesa (Int'l) 683 13,029 99,722 155 833,190 22,958
Puerto Princesa (Dom) 19,404 16,955,042 2,046,628 15,682 16,173,990 1,767,157
Romblon 447 141,062 19,303 416 120,210 19,839
San Jose 4,531 38,172 47,838 3,746 93,660 50,846
San Vicente 1,137 432,933 7,632 - - -
V-Bicol Region
Legazpi 6,384 2,188,179 569,535 6,928 2,480,141 621,474
Masbate 1,556 32,600 75,572 1,542 62,266 65,627
Naga 2,020 146,788 94,175 3,038 310,736 143,618
Virac 773 46,076 67,936 662 76,642 53,265
Continued
Airport Location2018 2017
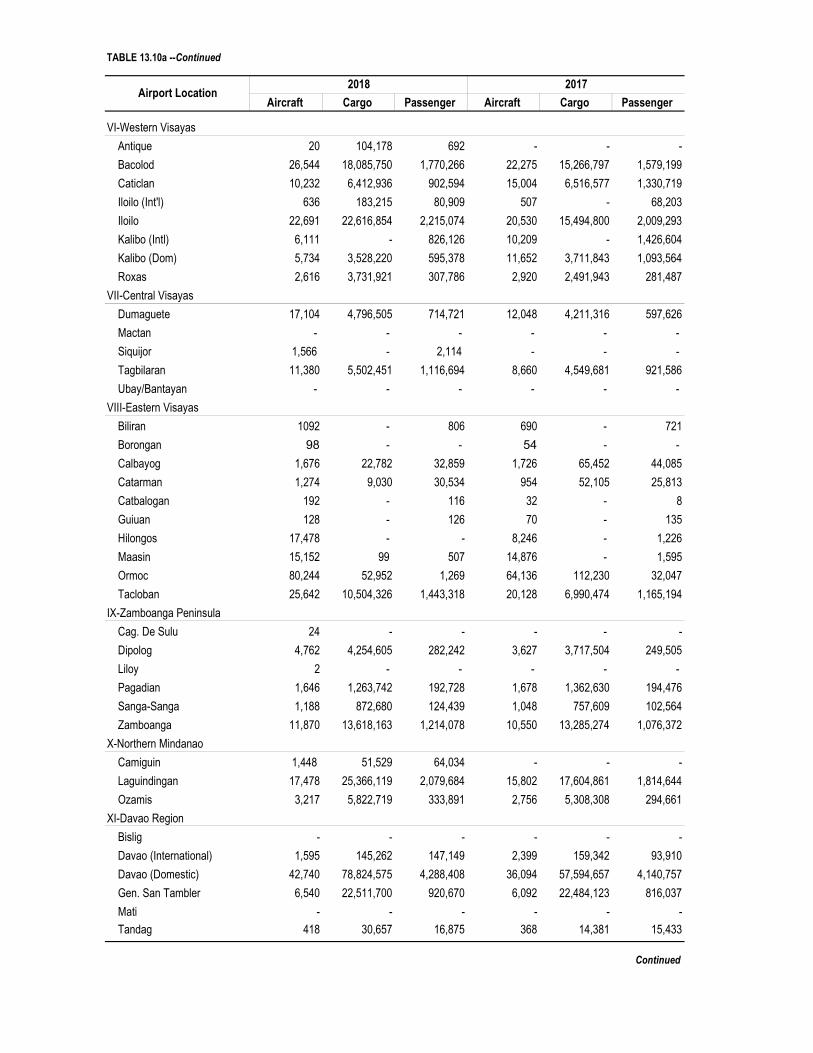
TABLE 13.10a --Continued
Aircraft Cargo Passenger Aircraft Cargo Passenger
VI-Western Visayas
Antique 20 104,178 692 - - -
Bacolod 26,544 18,085,750 1,770,266 22,275 15,266,797 1,579,199
Caticlan 10,232 6,412,936 902,594 15,004 6,516,577 1,330,719
Iloilo (Int'l) 636 183,215 80,909 507 - 68,203
Iloilo 22,691 22,616,854 2,215,074 20,530 15,494,800 2,009,293
Kalibo (Intl) 6,111 - 826,126 10,209 - 1,426,604
Kalibo (Dom) 5,734 3,528,220 595,378 11,652 3,711,843 1,093,564
Roxas 2,616 3,731,921 307,786 2,920 2,491,943 281,487
VII-Central Visayas
Dumaguete 17,104 4,796,505 714,721 12,048 4,211,316 597,626
Mactan - - - - - -
Siquijor 1,566 - 2,114 - - -
Tagbilaran 11,380 5,502,451 1,116,694 8,660 4,549,681 921,586
Ubay/Bantayan - - - - - -
VIII-Eastern Visayas
Biliran 1092 - 806 690 - 721
Borongan 98 - - 54 - -
Calbayog 1,676 22,782 32,859 1,726 65,452 44,085
Catarman 1,274 9,030 30,534 954 52,105 25,813
Catbalogan 192 - 116 32 - 8
Guiuan 128 - 126 70 - 135
Hilongos 17,478 - - 8,246 - 1,226
Maasin 15,152 99 507 14,876 - 1,595
Ormoc 80,244 52,952 1,269 64,136 112,230 32,047
Tacloban 25,642 10,504,326 1,443,318 20,128 6,990,474 1,165,194
IX-Zamboanga Peninsula
Cag. De Sulu 24 - - - - -
Dipolog 4,762 4,254,605 282,242 3,627 3,717,504 249,505
Liloy 2 - - - - -
Pagadian 1,646 1,263,742 192,728 1,678 1,362,630 194,476
Sanga-Sanga 1,188 872,680 124,439 1,048 757,609 102,564
Zamboanga 11,870 13,618,163 1,214,078 10,550 13,285,274 1,076,372
X-Northern Mindanao
Camiguin 1,448 51,529 64,034 - - -
Laguindingan 17,478 25,366,119 2,079,684 15,802 17,604,861 1,814,644
Ozamis 3,217 5,822,719 333,891 2,756 5,308,308 294,661
XI-Davao Region
Bislig - - - - - -
Davao (International) 1,595 145,262 147,149 2,399 159,342 93,910
Davao (Domestic) 42,740 78,824,575 4,288,408 36,094 57,594,657 4,140,757
Gen. San Tambler 6,540 22,511,700 920,670 6,092 22,484,123 816,037
Mati - - - - - -
Tandag 418 30,657 16,875 368 14,381 15,433
Continued
Airport Location2018 2017

TABLE 13.10a --Concluded
Aircraft Cargo Passenger Aircraft Cargo Passenger
XII-SOCCSKSARGEN
Allah Valley 6 - - 32 - -
Cotabato 2,889 3,036,681 298,345 2,656 1,934,413 289,229
CARAGA
Butuan 7,148 9,486,076 757,842 6,880 8,439,477 716,344
Siargao 11,786 97,959 332,309 2,491 22,127 127,943
Surigao 1,464 - 50,400 1,496 2,400 59,945
ARMM
Jolo 1,418 287,993 29,625 1,113 276,273 24,244
Source: Civil Aviation Authority of the Philippines
Airport Location2018 2017

TABLE 13.10b Aircraft, Cargo, and Passenger Movement by Region and Airline Operator: 2017 and 2018
Aircraft Cargo Passenger Aircraft Cargo Passenger
809,700 518,257,286 43,434,830 886,551 889,226,370 66,829,198
NCR
International 56,381 106,776,280 5,970,681 108,995 417,122,490 20,957,571
Domestic 75,199 131,470,480 11,346,407 149,371 245,134,500 21,064,913
General Aviation 16,258 … 119,432 26,925 ... 172,306
CAR
General Aviation 752 … 824 950 7,893 880
Military 514 … 1,321 304 246,765 842
I-Ilocos Region
Aeroflite aviation 66 … … ... ... ...
All asia aviation 98 … … ... ... ...
Airtrade agriculture 54 … … ... ... ...
Cebu Pacific … … … 12 11,406 1,181
China Eastern … … … 156 118,143 14,059
China Express … … … 2 ... ...
China Southern Airline … … … 2 ... ...
General Aviation 88,951 5,284 77,732 66,165 31,670 62,320
Glen Gorospe 697 … … ... ... ...
HK Express 72 … … 310 ... ...
Hongkong Airlines 478 … … 742 ... ...
Military 456 … 371 428 ... 153
Philippine Airlines 1,196 3,277,172 150,214 1,224 2,934,583 145,757
Platinum Skies 106 6,970 789 8 600 117
Royal Air Charter 50 11,544 1,594
HK Bellawing Jet LTD … … 12 ... ...
II-Cagayan Valley
AirJuan 2 125 15 4 1,112 32
Airswift 344 105,727 11,905 142 46,366 5,137
Asian Aerospace … … … 2 ... 1
Cebu Pacific 3,714 4,300,575 506,896 1,988 2,503,504 231,139
Cyclone 4,292 447,098 16,138 2,438 216,237 8,050
Cyclone Airways 5,138 513,984 19,652 3,656 276,628 11,414
Cyclone Flying 1,442 ... 1,387 942 ... 956
Fliteline 133 4,843 749 ... ... ...
General Aviation 3,632 96,250 6,829 824 34,618 2,425
Lion Air 2 ... 11 ... ... ...
Military 558 21,562 2,466 215 55,297 1,984
North Sky Air 2,117 414,019 20,401 1,327 241,595 7,458
Philippine Airlines 912 639,382 60,432 512 557,022 45,945
PAL Express 954 361,152 58,053 894 431,873 47,449
Royal Star 2 80 45 ... ... ...
Sky Jet 658 627,748 46,146 648 519,239 39,925
WCC/Skypasada 3,894 1,035,974 37,350 2,397 582,325 29,087
Platinum Skies … … … 2 ... 42
III-Central Luzon
General Aviation 88,294 ... 16,861 114,876 ... 15,932Continued
Region2017
Philippines
2018

TABLE 13.10b --Continued
2017
Aircraft Cargo Passenger Aircraft Cargo Passenger
III-Central Luzon
General Aviation 88,294 ... 16,861 114,876 ... 15,932
IV-CALABARZON & MIMAROPA
Air Asia/Zest Air 5,708 4,420,204 829,574 4,182 5,775,818 622,408
Air Juan 3,162 685,408 15,288 2,078 58,278 13,075
Airswift 850 60,837 18,512 ... ... ...
Cebgo 3,002 2,175,168 215,822 3,480 2,137,527 235,631
Cebu Pacific 5,889 7,327,370 813,695 6,158 5,989,433 829,868
Easter Jet Com 128 ... 21,706 ... ... ...
General Aviation 45,191 747,482 93,153 53,469 390,155 109,932
Military 611 ... 1,478 254 ... 751
Okay Airways 14 ... ... ... ... ...
Philippine Airlines 749 52,737 94,439 236 885,393 35,077
PAL Express 7,931 6,855,927 709,099 5,358 5,847,755 503,793
Seair … ... ... 56 ... ...
Skyjet 2,096 2,178,305 159,456 1,918 1,711,763 126,487
HNZ … … … 375 ... 2,534
Waisco 54 … 358 ... ... ...
World Aviation 845 2,277 5,279 471 ... 2,965
World Juan 72 ... 444 74 ... 449
V-Bicol Region
Cebgo 1,342 66,274 75,271 1,426 74,433 83,757
Cebu Pacific 4,947 1,129,000 527,498 5,560 1,900,555 588,214
General Aviation 1,120 33,675 1,508 1,411 11,550 1,465
Military 652 20,341 1,500 911 19,500 635
PAL Express 1,478 1,103,394 153,444 1,060 771,006 136,627
Philippine Airlines 1,194 60,959 47,997 1,802 152,741 73,286
VI-Western Visayas
Air Asia/Zest 7,978 3,558,392 764,385 9,111 3,057,830 1,312,226
Air Juan 646 2,321 2,788 500 868 1,849
Air Busan 32 ... 5,052 26 ... 5,514
Air Seoul 238 ... 35,072 12 ... 1,362
Airswift 392 171,214 15,104 442 145,678 13,012
Cebu Pacific 27,985 28,307,241 3,205,242 26,333 20,009,425 3,505,344
Cebgo 5,999 942,172 243,684 4,874 580,831 228,878
China Eastern Air 16 … 1,753 … … …
China M … … … 164 … 19,126
General Aviation 4,655 109,295 5,344 14,329 4,500 9,217
Military 653 4,800 1,082 1,166 ... 2,469
Philippine Airlines 10,878 11,124,475 1,265,054 19,160 17,162,572 2,063,591
Pan Pacific 1,032 … 89,291 608 ... 62,357
PAL Express 12,360 10,257,591 866,121 4,330 2,268,587 399,097
Seair/Tiger Air 128 … 15,033 386 … 42,577
Silkair 112 … 7,044 344 … 18,935
Skyjet 278 182,412 18,807 1,010 251,669 53,443
HongKong Express … … … 180 … 25,833
Continued
Region2018

TABLE 13.10b --Continued
2017
Aircraft Cargo Passenger Aircraft Cargo Passenger
Jin Air 232 … 35,534 14 ... 1,802
June Jao Air 206 … 27,612 106 ... 12,458
OK Airlines 328 … 50,293 70 ... 9,979
Xiamen Air 166 … 24,013 ... ... ...
Royal Air 134 3,161 3,708 ... ... ...
Sichuan 66 … 10,844 ... ... ...
Tiger Sccot 70 … 5,965 ... ... ...
VII-Central Visayas
Cebu Pacific 6,044 5,523,452 785,148 5,706 5,134,449 703,757
Cebgo 928 195,636 55,776 ... ... 705
General Aviation 15,656 143,074 8,739 8,764 ... 1,952
Military 82 ... ... 274 ... 16
Philippine Airlines 3,286 1,949,428 391,358 2,274 1,809,514 270,667
PAL Express 1,890 1,464,201 259,421 1,458 1,185,090 201,889
Zest Air 2,164 1,023,165 333,087 2,232 631,944 340,226
VIII-Eastern Visayas
Air Juan 8,696 53,051 1,356 356 ... 404
Air Asia/Zest Air 6,976 1,720,580 491,109 4,652 768,735 360,604
Cebu Pacific 16,780 4,518,460 565,392 9,820 2,950,685 517,951
General Aviation 99,492 ... 1,931 80,874 ... 13,263
Military 1,916 ... 306 7,380 ... 128
Philippine Airlines 592 250,659 40,254 76 66,135 5,006
PAL Express 8,524 4,046,439 409,187 7,754 3,434,706 373,468
IX-Zamboanga Peninsula
Cebu Pacific 10,578 13,412,231 1,417,417 9,386 12,849,852 1,296,430
Cebgo 754 478,350 45,135 582 237,476 34,769
General Aviation 3,144 7,057 5,827 2,074 7,581 4,576
Military 1,569 … 322 2,016 … 1,896
PAL Express 2,494 5,927,055 322,296 2,193 5,993,725 269,255Platinum Skies 953 184,497 22,490 652 34,383 15,991
X-Northern Mindanao
Air Asia 518 … 77,342 … … …Cebgo 5,356 566,614 295,478 4,512 567,516 244,807
Cebu Pacific 8,359 16,226,978 1,258,485 8,286 11,892,951 1,150,690
General Aviation 78 … 416 16 … 358
PAL Express 6,458 11,641,278 710,782 5,028 8,273,032 622,257
Military 2 … 40 … … …
Philippine Airlines 1,372 2,805,497 135,066 716 2,179,670 91,193
XI-Davao RegionAir Asia/Zest Air 5,877 9,911,402 865,727 4,214 9,941,781 886,681
Cathay Dragon 82 7,251 11,067 … … …
Cebgo 1,982 204,990 114,015 1,922 159,085 93,972
Cebu Pacific 15,194 39,386,160 2,726,237 15,280 36,271,615 2,651,518
General Aviation 10,514 ... 22,151 7,713 ... 15,981
Military 5,819 ... 466 5,474 ... 98
Philippine Airlines 4,550 27,472,916 793,673 3,478 22,299,961 585,991
Continued
Region2018

TABLE 13.10b --Concluded
2017
Aircraft Cargo Passenger Aircraft Cargo Passenger
PAL Express 6,319 24,432,097 769,984 5,889 11,446,593 764,378
Silk Air 912 97,378 68,744 960 133,468 67,518
Xiamen Air 44 … 1,038 23 ... ...
XII-SOCCSKSARGENCebu Pacific 1,510 2,047,900 195,235 1,434 1,276,207 180,284
General Aviation 401 … 526 250 ... 143
Military 290 … 3,890 308 ... 7,545
Philippine Airlines 568 884,037 80,207 12 10,105 1,742
PAL Express 120 104,744 18,487 684 648,101 99,515
XIII-CaragaCebgo 2,320 258,064 115,947 4,202 875,631 219,753
Cebu Pacific 9,012 7,508,667 659,360 3,060 6,110,158 461,189
General Aviation 1,308 300 1,992 539 1,000 2,983
Military 154 … 215 170 … 178
PAL Express 2,064 1,767,786 186,657 1,734 1,463,370 161,344
Philippine Airlines 4,228 11,358 131,664 588 1,201 22,960
SkyJet 1,312 37,860 44,716 574 12,644 35,825
ARMMGeneral Aviation 62 18,900 867 142 384 1,459
Military 696 114,000 11,988 526 273,000 11,300
Platinum skies 660 155,093 16,770 445 2,889 11,485
Source: Civil Aviation Authority of the Philippines
Region2018

TABLE 13.11 National Road Length by Surface Type: 1998 to 2018
Year All types Earth Gravel Asphalt Concrete
1998 27,893 380 11,486 6,733 9,2941999 28,523 387 11,512 6,882 9,7412000 29,056 612 11,424 6,684 10,336
2001 29,878 684 11,050 6,815 11,3292002 30,030 736 10,335 7,048 11,9112003 26,572 198 7,607 6,944 11,8232004 27,853 189 7,896 7,282 12,4862005 28,664 110 8,416 7,375 12,764
2006 28,978 90 8,417 7,501 12,9702007 29,370 76 8,287 7,629 13,3782008 29,709 80 7,947 7,868 13,8142009 29,898 87 7,343 8,282 14,1872010 31,242 106 7,010 8,701 15,425
2011 31,359 64 6,461 8,894 15,9412012 31,598 69 6,085 9,124 16,3202013 32,227 58 5,396 9,596 17,1772014 32,527 52 4,658 9,793 18,0232015 32,633 77 3,637 9,756 19,163
2016 32,770 67 2,694 9,612 20,3982017 32,868 54 1,779 9,854 21,1812018 32,933 45 1,264 10,100 21,523
Note: Total for the years 2003 and 2004 does not include other and unspecified national roads
Source: Department of Public Works and Highways
TABLE 13.12 Number and Length of Existing National Bridges in the Philippines: 1996 to 2018 (Length in linear meters)
Year
1996 7,347 261,0151997 7,380 261,9891998 7,400 266,8331999 7,523 273,2852000 7,306 271,293
2001 … 283,0002002 … 294,1302003 7,165 277,5862004 7,324 282,9602005 7,560 296,102
2006 7,512 301,3652007 7,743 314,4532008 7,758 327,7212009 7,793 330,0892010 8,024 345,056
2011 7,949 345,5482012 7,928 348,5752013 8,030 355,6432014 8,131 364,6932015 8,166 364,724
2016 8,161 364,1622017 8,260 367,8642018 8,339 372,166
Source: Department of Public Works and Highways
Number of Bridges Length of Bridges
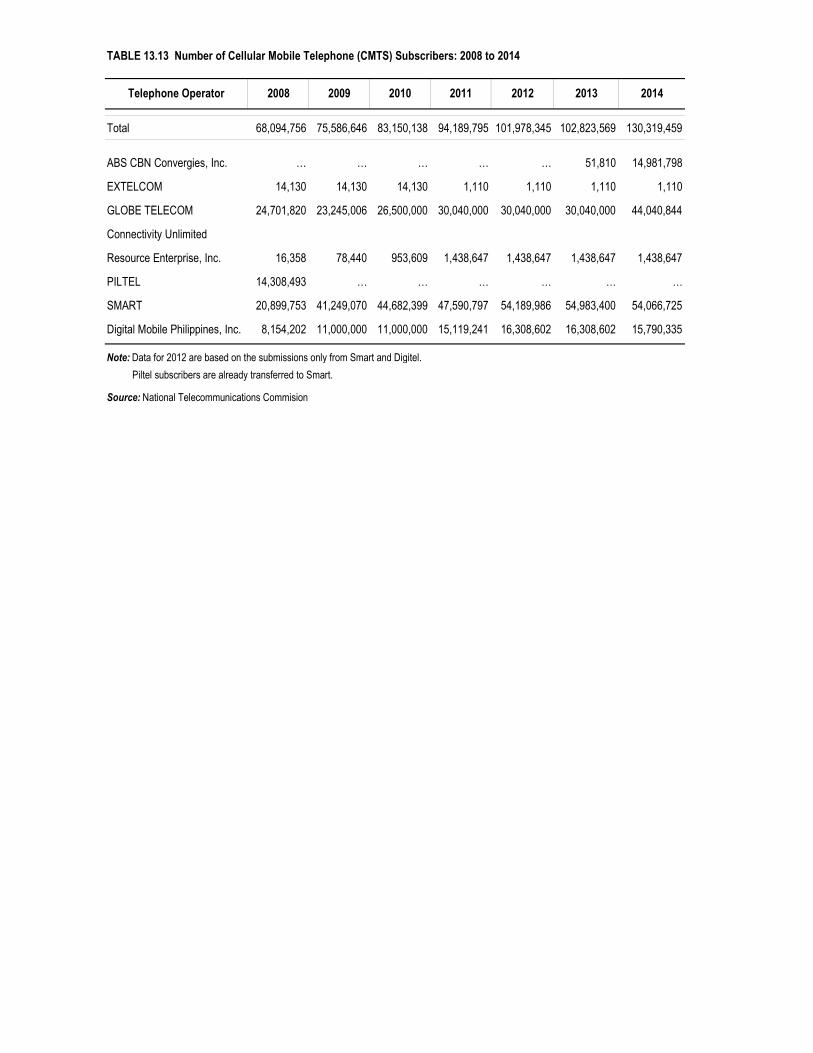
TABLE 13.13 Number of Cellular Mobile Telephone (CMTS) Subscribers: 2008 to 2014
Total 68,094,756 75,586,646 83,150,138 94,189,795 101,978,345 102,823,569 130,319,459
ABS CBN Convergies, Inc. … … … … … 51,810 14,981,798
EXTELCOM 14,130 14,130 14,130 1,110 1,110 1,110 1,110
GLOBE TELECOM 24,701,820 23,245,006 26,500,000 30,040,000 30,040,000 30,040,000 44,040,844
Connectivity Unlimited
Resource Enterprise, Inc. 16,358 78,440 953,609 1,438,647 1,438,647 1,438,647 1,438,647
PILTEL 14,308,493 … … … … … …
SMART 20,899,753 41,249,070 44,682,399 47,590,797 54,189,986 54,983,400 54,066,725
Digital Mobile Philippines, Inc. 8,154,202 11,000,000 11,000,000 15,119,241 16,308,602 16,308,602 15,790,335
Note: Data for 2012 are based on the submissions only from Smart and Digitel.
Piltel subscribers are already transferred to Smart.
Source: National Telecommunications Commision
2013 2014Telephone Operator 2008 2009 2010 2011 2012

TABLE 13.14 Telephone Subscribers by Region: 2010 to 2014
Lines Subscribed
2010 6,783,372 3,335,398 92,338 7.22 3.552011 6,753,696 3,555,951 95,984 7.04 3.702012 6,765,459 3,493,164 97,594 6.93 3.58
2013 6,340,777 3,148,835 99,384 6.38 3.17
NCR 3,708,272 1,754,223 11,953 31.02 14.68
CAR 74,287 41,286 1,799 4.13 2.30
I-Ilocos Region 176,988 81,126 5,473 3.23 1.48
II-Cagayan Valley 41,842 28,366 3,537 1.18 0.80
III-Central Luzon 426,102 214,992 10,738 3.97 2.00
IV-Southern Tagalog 778,671 320,256 15,906 4.90 2.01
V-Bicol Region 137,366 62,798 6,051 2.27 1.04
VI-Western Visayas 122,798 177,354 8,022 1.53 2.21
VII-Central Visayas 188,041 136,729 7,456 2.52 1.83
VIII-Eastern Visayas 31,372 20,658 4,726 0.66 0.44
IX-Zamboanga Peninsula 41,839 44,593 3,700 1.13 1.21
X-Northern Mindanao 173,552 88,694 4,620 3.76 1.92
XI-Davao Region 205,850 92,723 4,570 4.50 2.03
XII-SOCCSKSARGEN 88,926 48,633 4,347 3.29 1.80
XIII-Caraga 127,827 33,957 2,700 3.38 0.90
ARMM 17,044 2,447 3,787 0.14 0.02
2014 5,940,741 3,196,747 101,175 5.87 3.16
NCR 3,707,822 1,827,859 12,087 30.68 15.12
CAR 68,958 41,371 1,834 3.76 2.26
I-Ilocos Region 105,226 62,508 5,573 1.89 1.12
II-Cagayan Valley 32,380 23,596 3,594 0.90 0.66
III-Central Luzon 304,600 190,563 10,931 2.79 1.74
IV-Southern Tagalog 617,656 329,301 16,233 3.80 2.03
V-Bicol Region 108,061 57,566 6,165 1.75 0.93
VI-Western Visayas 122,798 180,465 8,170 1.50 2.21
VII-Central Visayas 188,041 146,367 7,599 2.47 1.93
VIII-Eastern Visayas 31,372 20,826 4,819 0.65 0.43
IX-Zamboanga Peninsula 41,839 46,403 3,771 1.11 1.23
X-Northern Mindanao 173,552 88,360 4,710 3.69 1.88
XI-Davao Region 205,850 95,190 4,640 4.44 2.05
XII-SOCCSKSARGEN 87,715 50,021 4,435 1.98 1.13
XIII-Caraga 127,827 33,873 2,750 4.65 1.23
ARMM 17,044 2,478 3,865 0.44 0.06
aper 100 population.bPopulation based on actual census year including population on embassies
Notes: 1. PLDT installed lines are as of September 2010; no new data submitted for installed lines
2. Bayantel, ETPI/TTPE, Innove, PT&T & majority independent LECs did not submit report for 2010
3. Population source for 2011 is from the 2010 Census of Population and Housing
Source: National Telecommunications Commission
Region Installed Lines Subscribers Population ('000)TeleDensitya

TABLE 13.15 Number of Existing Radio Stations by Region: 2007 to 2013
Region 2007 2008 2009 2010 2011 2012 2013
Philippines 192,935 185,086 203,718 195,233 222,061 213,352 357,398
NCR 51,947 35,612 39,731 39,731 39,731 39,731 162,412
CAR 3,751 3,751 3,689 3,689 3,689 3,244 3,244
I-Ilocos Region 5,401 2,769 2,836 4,556 3,852 4,198 5,644
II-Cagayan Valley 3,484 3,398 3,252 4,945 6,629 6,289 12,412
III-Central Luzon 27,435 28,540 34,945 36,344 37,428 3,578 4,013
IV-Southern Tagalog 35,712 39,566 42,021 30,685 33,182 34,846 42,845
V-Bicol Region 5,723 5,737 5,845 6,260 6,970 7,579 8,856
VI-Western Visayas 7,577 8,133 9,107 9,783 9,820 12,099 13,393
VII-Central Visayas 15,919 19,338 19,338 18,786 28,817 28,817 28,817
VIII-Eastern Visayas 2,393 2,841 2,900 3,115 3,744 4,668 5,368
IX-Zamboanga Peninsula 2,974 2,998 5,668 793 825 17,313 17,313
X-Northern Mindanao 15,361 15,412 16,081 17,122 26,198 21,805 23,277
XI-Davao Region 9,636 10,906 11,832 12,436 13,506 18,368 17,829
XII-SOCCSKSARGEN 3,918 4,276 4,536 4,901 4,901 8,048 8,048
XIII-Caraga 1,704 1,809 1,937 2,087 2,769 2,769 3,927
Source: National Telecommunications Commission
TABLE 13.16 Number of Broadcast and CATV Stations by Region: As of December 2015
Region AM FM TV CATV TV Relay TV Translator
DTU/DBS MMDS
Philippines 411 1,014 436 1,457 51 54 6 5
NCR 32 25 23 55 0 0 2 3
CAR 12 27 11 20 4 6 0 0
I-Ilocos Region 38 58 24 116 5 2 0 0
II-Cagayan Valley 21 64 29 70 3 4 0 1
III-Central Luzon 16 41 23 193 2 9 3 0
IV-Southern Tagalog 38 116 47 298 7 3 1 0
V-Bicol Region 38 111 48 150 6 7 0 0
VI-Western Visayas 39 87 38 99 3 2 0 0
VII-Central Visayas 29 73 26 112 4 7 0 0
VIII-Eastern Visayas 24 64 18 108 8 0 0 0
IX-Zamboanga Peninsula 22 66 29 48 3 6 0 0
X-Northern Mindanao 29 69 35 46 0 2 0 0
XI-Davao Region 21 66 18 27 2 0 0 1
XII-SOCCSKSARGEN 23 79 33 48 2 1 0 0
XIII-Caraga 19 54 26 59 2 5 0 0
ARMM 10 14 8 8 0 0 0 0
Source: National Telecommunications Commission
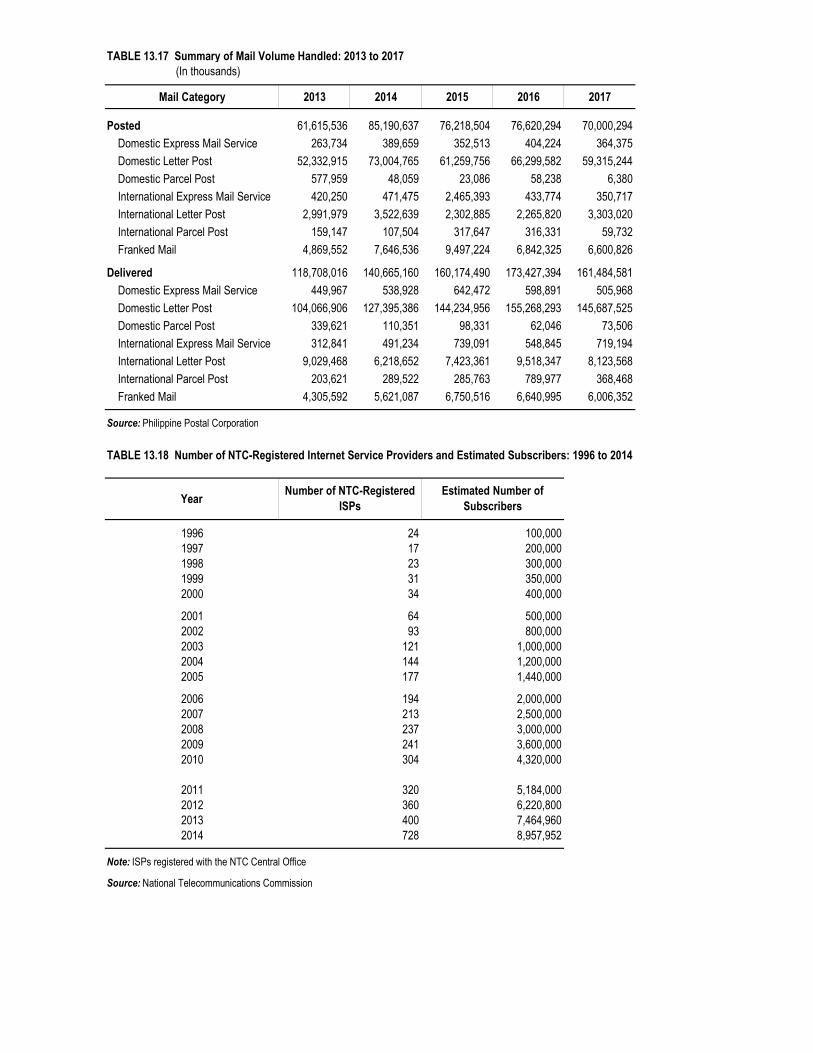
TABLE 13.17 Summary of Mail Volume Handled: 2013 to 2017 (In thousands)
Mail Category 2013 2014 2015 2016 2017
Posted 61,615,536 85,190,637 76,218,504 76,620,294 70,000,294
Domestic Express Mail Service 263,734 389,659 352,513 404,224 364,375
Domestic Letter Post 52,332,915 73,004,765 61,259,756 66,299,582 59,315,244
Domestic Parcel Post 577,959 48,059 23,086 58,238 6,380
International Express Mail Service 420,250 471,475 2,465,393 433,774 350,717
International Letter Post 2,991,979 3,522,639 2,302,885 2,265,820 3,303,020
International Parcel Post 159,147 107,504 317,647 316,331 59,732
Franked Mail 4,869,552 7,646,536 9,497,224 6,842,325 6,600,826
Delivered 118,708,016 140,665,160 160,174,490 173,427,394 161,484,581
Domestic Express Mail Service 449,967 538,928 642,472 598,891 505,968
Domestic Letter Post 104,066,906 127,395,386 144,234,956 155,268,293 145,687,525
Domestic Parcel Post 339,621 110,351 98,331 62,046 73,506
International Express Mail Service 312,841 491,234 739,091 548,845 719,194
International Letter Post 9,029,468 6,218,652 7,423,361 9,518,347 8,123,568
International Parcel Post 203,621 289,522 285,763 789,977 368,468
Franked Mail 4,305,592 5,621,087 6,750,516 6,640,995 6,006,352
Source: Philippine Postal Corporation
TABLE 13.18 Number of NTC-Registered Internet Service Providers and Estimated Subscribers: 1996 to 2014
Year
1996 24 100,0001997 17 200,0001998 23 300,0001999 31 350,0002000 34 400,000
2001 64 500,0002002 93 800,0002003 121 1,000,0002004 144 1,200,0002005 177 1,440,000
2006 194 2,000,0002007 213 2,500,0002008 237 3,000,0002009 241 3,600,0002010 304 4,320,000
2011 320 5,184,0002012 360 6,220,8002013 400 7,464,9602014 728 8,957,952
Note: ISPs registered with the NTC Central Office
Source: National Telecommunications Commission
Number of NTC-Registered ISPs
Estimated Number of Subscribers
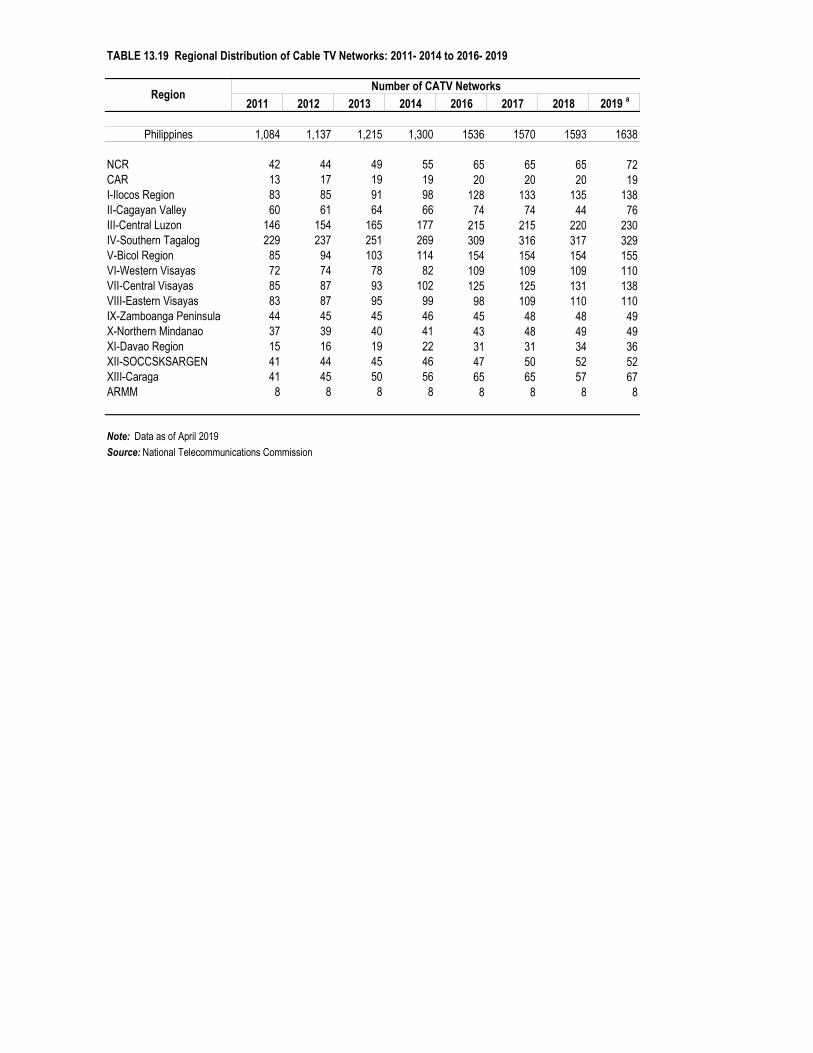
TABLE 13.19 Regional Distribution of Cable TV Networks: 2011- 2014 to 2016- 2019
2011 2012 2013 2014 2016 2017 2018 2019 a
Philippines 1,084 1,137 1,215 1,300 1536 1570 1593 1638
NCR 42 44 49 55 65 65 65 72CAR 13 17 19 19 20 20 20 19I-Ilocos Region 83 85 91 98 128 133 135 138II-Cagayan Valley 60 61 64 66 74 74 44 76III-Central Luzon 146 154 165 177 215 215 220 230IV-Southern Tagalog 229 237 251 269 309 316 317 329V-Bicol Region 85 94 103 114 154 154 154 155VI-Western Visayas 72 74 78 82 109 109 109 110VII-Central Visayas 85 87 93 102 125 125 131 138VIII-Eastern Visayas 83 87 95 99 98 109 110 110IX-Zamboanga Peninsula 44 45 45 46 45 48 48 49X-Northern Mindanao 37 39 40 41 43 48 49 49XI-Davao Region 15 16 19 22 31 31 34 36XII-SOCCSKSARGEN 41 44 45 46 47 50 52 52XIII-Caraga 41 45 50 56 65 65 57 67ARMM 8 8 8 8 8 8 8 8
Note: Data as of April 2019
Source: National Telecommunications Commission
RegionNumber of CATV Networks

TABLE 13.20 Comparative Statistics on Maritime Accidents: 2001 to 2014
Year
Number of Accidents Monitored/ Reported
Number of Search and
Rescue Mission
Number of Casualties/
Bodies Recovered
Number of Persons Missing
Number of Lives Saved and Provided
Assistance
Number of Vessels
Provided Assistance
2001 168 88 59 74 1,969 163
2002 152 65 73 146 1,178 146
2003 255 63 74 232 2,903 211
2004 198 84 144 116 4,893 248
2005 122 108 25 47 2,920 118
2006 123 53 62 94 5,121 113
2007 101 72 54 71 2,337 97
2008 238 57 416 912 3,742 182
2009 375 286 49 163 13,965 361
2010 488 408 37 172 15,305 263
2011 459 166 14 162 13,661 323
2012 475 141 38 108 19,984 461
2013 569 155 180 215 17,721 569
2014 709 1,540 132 148 8,732 902
Note: Most of the incidents are attributed to the elements of nature (bad weather disturbances).
Sources: Department of Transportation and Communication/Philippine Coast Guard

TABLE 13.21 Comparative Statistics on Road Traffic Accidents: 2001 to 2014
Fatal Non-fatal Total
627 1,399 2,026714 3,034 3,748800 4,177 4,977
1,054 3,860 4,914578 3,779 4,357
674 3,767 4,441718 3,569 4,287508 4,354 4,862
1,117 7,570 8,6871,262 6,408 7,670
1,399 5,664 7,0631,129 4,904 6,0331,362 7,817 9,1791,252 9,347 10,599
Source: Department of Transportation and Communication
TABLE 13.22 Comparative Statistics on Aircraft Accidents: 2008 to 2014
Year 2008 2009 2010 2011 2012 2013 2014
Number of accidents (cases) 17 18 16 24 20 17 25
Number of deaths … … … 19 6 0 4
Number of injured persons … … … 6 2 0 7
Source: Civil Aviation Authority of the Philippines/AAIIB, Department of Transportation and Communication
2013 8,1692014 15,195
2011 11,5742012 9,153
2008 9,9322009 15,7502010 17,979
2006 10,6232007 7,267
2003 11,4412004 9,2882005 7,068
YearNumber of Accident Damage to Property
(number of vehicles)
2001 6,6962002 9,623


TABLE 14.1a Energy Supply Mix By Source: 2009 to 2017 (In million tons of oil equivalent, MTOE)
Energy Source 2009 2010 2011 2012 2013 2014 2015 2016 2017
Total 39.90 41.05 41.85 43.52 44.99 46.99 51.27 54.59 57.92 I. Indigenous Energy 24.59 24.72 25.71 26.25 25.47 26.61 26.88 29.40 29.50
Oil 0.96 0.92 0.84 0.70 0.68 0.85 0.71 0.70 0.62 Coal 2.47 3.51 3.65 3.87 3.75 4.01 3.89 5.92 6.30 Hydro 2.44 1.94 2.41 2.55 2.49 2.27 2.16 2.02 2.39 Geothermal 8.88 8.54 8.55 8.81 8.26 8.86 9.50 9.52 8.83 Natural Gas 3.21 3.03 3.27 3.13 2.89 3.04 2.85 3.27 3.23 Biomass (Bagasseand other RE) 6.50 6.68 6.87 7.03 7.24 7.36 7.43 7.49 7.63 Solar and Wind 0.01 0.01 0.01 0.01 0.01 0.01 0.08 0.18 0.20 CME 0.11 0.10 0.10 0.11 0.12 0.13 0.16 0.18 0.17 Ethanol 0.01 0.01 0.00 0.02 0.04 0.07 0.09 0.13 0.13
II. Imported Energy 15.31 16.32 16.15 17.28 19.52 20.38 24.39 25.19 28.42 Oil 11.69 12.69 11.95 12.91 13.07 13.57 16.50 17.84 19.03 Coal 3.59 3.52 4.08 4.21 6.26 6.63 7.72 7.17 9.18 Ethanol 0.03 0.11 0.12 0.16 0.19 0.18 0.18 0.17 0.21 Self-sufficiency (%) 61.62 60.24 61.42 60.31 56.61 56.62 52.43 53.86 50.93
Note : Details may not add up to totals due to rounding.
Source : Department of Energy
TABLE 14.1b Energy Consumption By Sector: 2009 to 2017 (In million tons of oil equivalent, MTOE)
Sector 2009 2010 2011 2012 2013 2014 2015 2016 2017
Total 23.93 25.09 25.18 25.77 27.30 28.51 30.99 33.53 35.461. Industry 5.37 5.95 5.95 5.81 6.31 6.53 6.75 7.45 7.94
a. Manufacturing 5.08 5.64 5.57 5.38 5.85 6.06 6.23 6.93 7.36b. Mining 0.15 0.21 0.26 0.31 0.34 0.34 0.36 0.30 0.33c. Construction 0.14 0.10 0.12 0.12 0.12 0.13 0.15 0.22 0.25
2. Transport 7.74 8.04 7.98 8.36 8.78 9.13 10.56 11.42 11.813. Residential 7.63 7.88 7.99 8.17 8.39 8.49 8.73 9.03 9.174. Commercial 2.41 2.66 2.74 2.83 3.04 3.40 3.37 3.86 4.405. AFF 0.50 0.35 0.30 0.32 0.35 0.35 0.40 0.45 0.526. Others, Non-Energy Use 0.27 0.22 0.22 0.28 0.43 0.60 1.18 1.31 1.61
Note : Details may not add up to totals due to rounding.Source : Department of Energy

TABLE 14.2 Domestic Oil and Gas Production: 2010 to 2018In Billion Barrel
Source 2010 2012 2013 2014 2015 2016 2017 2018
Total Oil (In MBBLS) 30,039,395 2,325,590 1,637,548 1,883,834 3,078,684 2,409,746 2,013,556 1,586,608 1,262 Nido 86,516 74,858 73,720 84,463 79,114 71,147 53,646 56,164 52 Matinloc 69,643 51,485 70,631 66,279 69,827 70,716 72,745 67,490 43 North Matinloc 18,780 16,105 10,533 10,029 8,865 8,362 9,122 2,102 … West Linapacan … … … … … … … … … Malampaya … … … … … … … … … Galoc 2,683,610 2,183,142 1,482,664 1,723,063 2,290,878 2,259,521 1,878,043 1,460,852 1,167
Tindalo 180,846 r … … … … … … … …Total Gas (Million Cubic Feet of Gas) 130,008 140,368 134,491 123,866 130,316 122,527 140,398 138,497 154,622 Libertad … … 72 72 72 72 72 … … San Antonio … … … … … … … … … Malampaya 130,008 140,368 134,491 123,866 130,316 122,527 140,398 138,497 154,622
Note : Details may not add up to totals due to rounding.MBBLS - Thousand barrelsSource : Department of Energy
TABLE 14.3 Coal Production by Major Area: 2010 to 2018 (MT at 10,000 Btu/lb.)
Areas 2010 2012 2013 2014 2015 2016 2017 2018
Total 6,650,362 6,911,460 7,339,968 7,100,041 7,601,269 7,601,269 11,211,265 11,932,340 13,054,392
Semirara Mining and Power Corp. (Antique) 6,318,484 6,471,327 6,910,516 6,813,003 7,344,869 7,168,446 11,084,260 11,839,025 12,949,363Bicol Region 31,217 17,390 17,942 22,849 20,874 28,095 16,203 12,123 13,363Samaju Corp. (Albay) - - - - - - - - 8,435 SAMAJU (Albay) - - - - - - - - 4,928 Guidance Management Corp. (Northern Cebu) 33,133 52,268 23,816 38,926 20,301 8,160 10,472 4,614 458Central Cebu 131 - 347 270 - - - - -Adlaon (Southern Cebu) 34,006 31,077 35,521 27,048 23,304 21,020 24,797 8,534 6,048Guidance Management (Negros Occidental) 1,122 1,586 58 - - - - 495 120Polillo (Quezon) 5 6 7 8 9 10 11 12 -Smart Mining and Resources Development Corp. (Surigao del Sur) 2,869 23,473 20,873 52,118 49,676 28,169 21,167 23,253 29,758Small Scale Mines (Bicol) - - - - - - - - 1,848Small Scale Mines (Cebu) - - - - - - - - 20,938Small Scale Mines (Surigao del Sur) - - - - - - - - 21,610Small Scale Mines Zamboanga del Sur) - - - - - - - - 10,886
Note : Details may not add up to totals due to rounding.Btu/lb - British thermal unit/pound
Source : Department of Energy
2011
2011

TABLE 14.4 Coal Importation By Origin: 2008 to 2017 (In Metric Tons, MT)
Country of Origin 2008 2009 2010 2011 2012 2013 2014 2015 2016 2017
Total 9,077,828 7,026,718 10,965,819 10,962,502 11,895,483 14,414,593 15,182,165 17,278,803 20,029,716 22,267,794 Australia 330,000 - 65,000 - 195,000 201,454 - 305,722 1,309,689 1,401,036 China 1,170,000 527,183 18,018 - - - - - - - Indonesia 7,124,813 6,381,423 10,602,291 10,894,333 11,700,438 13,963,937 14,975,355 16,672,707 17,988,102 19,663,226 Vietnam 393,015 118,112 277,517 68,169 45 249,202 191,410 168,074 270,191 219,377 South Africa - - - - - - - - - - South Korea - - - - - - - - 27,524 87 Russia 60,000 15,400 77,300 - 984,068 Taiwan - - - - - - - - - - USA - - 2,993 - Others - - - - - - - 55,000 434,210 -
Data includes actual coal arrivals & Certificate of Compliance (COC) application issued.Source : Department of Energy
TABLE 14.5 Coal Consumption By Major User: 2009 to 2017 (In Metric Tons)
Sector 2009 2010 2011 2012 2013 2014 2015 2016 2017
Total 11,493,959 13,320,716 14,638,626 15,317,364 18,951,519 20,163,227 22,006,401 24,794,267 29,319,610 Cement 2,449,894 3,118,233 3,126,608 2,799,256 3,155,911 3,203,431 3,348,362 3,892,836 4,423,330Power Generation 8,416,496 9,643,067 10,961,180 11,937,266 14,790,549 15,587,493 17,553,854 19,386,130 23,326,829Industrial/Direct Processes 627,569 559,416 550,838 580,842 1,005,059 1,372,304 1,104,185 1,515,301 1,569,451
Note : Details may not add up to totals due to rounding.Source : Department of Energy
TABLE 14.6 Total Crude Oil Supply: 2009 to 2017 (In Thousand Barrels)
Source 2009 2010 2011 2012 2013 2014 2015 2016 2017
Total 52,982 69,609 71,782 65,200 58,070 67,941 80,321 80,651 78,549 Imported 50,061 66,599 69,456 63,562 56,186 64,862 77,911 78,637 76,963 Domestic 2,920 3,010 2,326 1,638 1,884 3,079 2,410 2,014 1,587
Note : Details may not add up to totals due to rounding.Source : Department of Energy
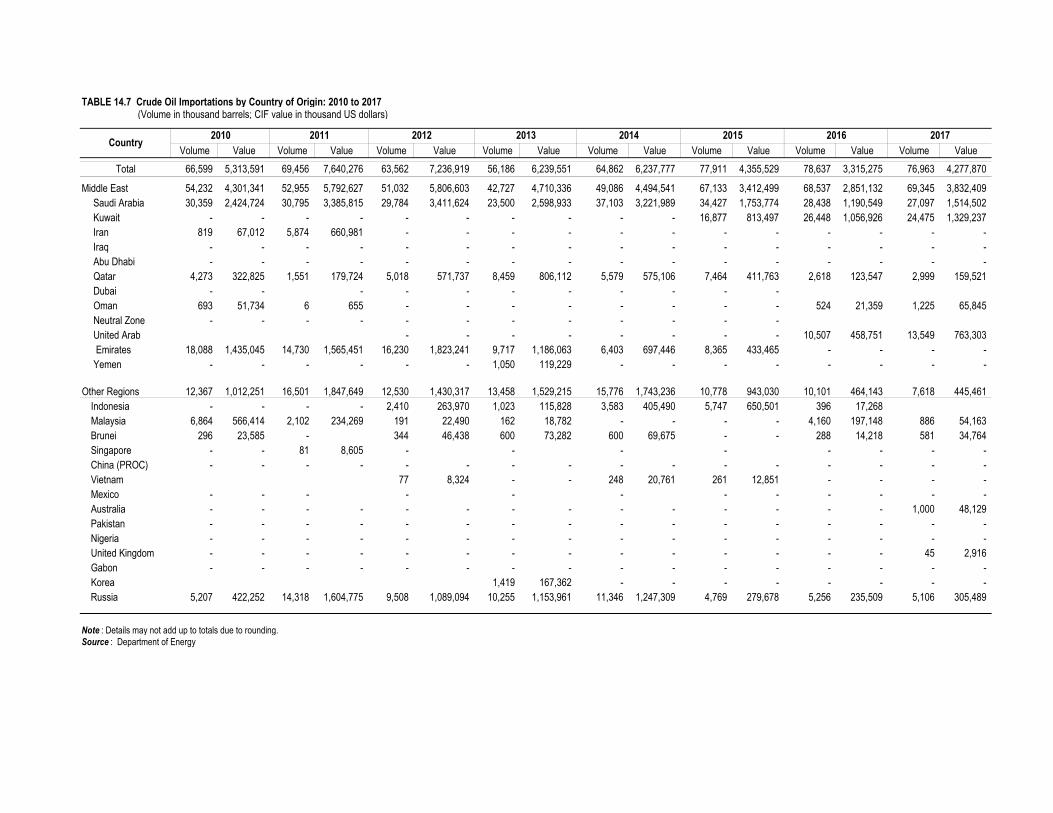
TABLE 14.7 Crude Oil Importations by Country of Origin: 2010 to 2017 (Volume in thousand barrels; CIF value in thousand US dollars)
Volume Value Volume Value Volume Value Volume Value Volume Value Volume Value Volume Value Volume ValueTotal 66,599 5,313,591 69,456 7,640,276 63,562 7,236,919 56,186 6,239,551 64,862 6,237,777 77,911 4,355,529 78,637 3,315,275 76,963 4,277,870
Middle East 54,232 4,301,341 52,955 5,792,627 51,032 5,806,603 42,727 4,710,336 49,086 4,494,541 67,133 3,412,499 68,537 2,851,132 69,345 3,832,409 Saudi Arabia 30,359 2,424,724 30,795 3,385,815 29,784 3,411,624 23,500 2,598,933 37,103 3,221,989 34,427 1,753,774 28,438 1,190,549 27,097 1,514,502 Kuwait - - - - - - - - - - 16,877 813,497 26,448 1,056,926 24,475 1,329,237 Iran 819 67,012 5,874 660,981 - - - - - - - - - - - - Iraq - - - - - - - - - - - - - - - - Abu Dhabi - - - - - - - - - - - - - - - - Qatar 4,273 322,825 1,551 179,724 5,018 571,737 8,459 806,112 5,579 575,106 7,464 411,763 2,618 123,547 2,999 159,521 Dubai - - - - - - - - - - - Oman 693 51,734 6 655 - - - - - - - - 524 21,359 1,225 65,845 Neutral Zone - - - - - - - - - - - - United Arab - - - - - - - - 10,507 458,751 13,549 763,303 Emirates 18,088 1,435,045 14,730 1,565,451 16,230 1,823,241 9,717 1,186,063 6,403 697,446 8,365 433,465 - - - - Yemen - - - - - - 1,050 119,229 - - - - - - - -
Other Regions 12,367 1,012,251 16,501 1,847,649 12,530 1,430,317 13,458 1,529,215 15,776 1,743,236 10,778 943,030 10,101 464,143 7,618 445,461Indonesia - - - - 2,410 263,970 1,023 115,828 3,583 405,490 5,747 650,501 396 17,268Malaysia 6,864 566,414 2,102 234,269 191 22,490 162 18,782 - - - - 4,160 197,148 886 54,163Brunei 296 23,585 - 344 46,438 600 73,282 600 69,675 - - 288 14,218 581 34,764Singapore - - 81 8,605 - - - - - - - - China (PROC) - - - - - - - - - - - - - - - - Vietnam 77 8,324 - - 248 20,761 261 12,851 - - - - Mexico - - - - - - - - - - - - Australia - - - - - - - - - - - - - - 1,000 48,129 Pakistan - - - - - - - - - - - - - - - - Nigeria - - - - - - - - - - - - - - - - United Kingdom - - - - - - - - - - - - - - 45 2,916 Gabon - - - - - - - - - - - - - - - - Korea 1,419 167,362 - - - - - - - - Russia 5,207 422,252 14,318 1,604,775 9,508 1,089,094 10,255 1,153,961 11,346 1,247,309 4,769 279,678 5,256 235,509 5,106 305,489
Note : Details may not add up to totals due to rounding. Source : Department of Energy
Country 2014 2015 2016 20172010 2011 2012 2013

TABLE 14.8 Refinery Production: 2010 to 2017 (In thousand barrels)
Areas 2010 2011 2012 2013 2014 2015 2016 2017
Total 65,909 69,288 62,391 57,712 61,372 77,478 79,016 77,193
Aviation Turbo 6,103 6,087 5,387 5,001 5,970 7,191 7,922 7,097 Premium Leaded GasolinePremium Unleaded 8,609 9,147 8,624 4,364 4,406 9,174 10,467 9,342 Regular Gasoline 2,818 3,672 3,382 6,306 6,668 7,915 8,474 9,215 Kerosene 1,087 780 717 675 461 472 523 410 Diesel Oil 22,957 25,204 22,631 21,332 22,111 28,974 29,137 27,762 Fuel Oil 12,900 13,202 11,477 10,624 11,364 6,332 5,170 6,467 LPG 4,210 4,495 4,083 3,654 3,427 5,293 5,353 5,196 AsphaltsHydro/Solvents 27 (3) 11 12 0 (0) (6) - Naphtha 1,492 1,379 1,183 2,083 2,127 2,677 2,235 1,744 Reformate - - - - - - - 1 Aviation GasolineMixed Xylene 1,108 1,057 938 638 841 974 1,007 959 BasestocksSecondary ProductsWaxesSulphur 152 211 137 89 296 3,582 3,959 3,687 Others 2,151 2,144 1,724 1,268 1,629 3,166 3,872 4,103
Total Marketable Products 63,614 67,375 60,293 56,047 59,301 75,751 78,113 75,982
Add: In-Process and Intermediate 0 0 0 0 0 0 0 0Refinery Fuel (RF) & Loss (L) 2,295 1,913 2,098 1,665 2,071 1,726 903 1,211
Thousand Barrels/Calendar Day 181 190 368 158 168 212 216 211
RF & L as % of Total Output 3.5 2.8 3.4 2.9 3.4 2.2 1.1 1.6
Note : Details may not add up to totals due to rounding.
Source : Department of Energy

TABLE 14.9 Petroleum Products Importation; 2010 to 2017 (In thousand barrels)
Products 2010 2011 2012 2013 2014 2015 2016 2017
Total 54,607 46,671 54,780 62,517 69,658 77,934 86,108 97,879
Aviation gasoline 27 38 34 32 21 34 28 39Aviation turbo/Jet A-1 3,519 4,800 5,894 6,417 6,558 5,688 6,809 8,889Premium gasolineUnleaded premium 11,318 10,385 11,435 13,952 14,828 15,148 15,705 17,627Regular gasoline 1,257 863 944 647 0 0 0 0Kerosene 289 247 228 1,490 430 199 252 317Diesel 22,368 18,672 24,941 26,464 30,343 28,375 35,345 40,105IFO/Fuel Oil 5,660 2,287 1,876 2,685 4,901 10,129 7,162 6,921LPG 8,758 8,599 8,218 9,074 9,299 9,691 11,613 13,910Solvents - - - - - - - - Asphalts 432 496 951 741 1,524 389 914 879Naptha/Reformate - - - - 1,187 6,678 7,700 8,914 Heavy Vacuum Gas Oil - - - - - - - - Condensate 979 285 260 1,015 567 1,603 580 280 Lubes/Additives - - - - - - - - Stop Oil - - - - - - - - Feedstock - - - - - - - - Basestocks - - - - - - - - Alkylate 0 0 0 0 0 0 0 0Others 1 - - - 1,756 3,279 8,670 9,194 10,073
Note : Details may not add up to totals due to rounding.IFO - Industrial Fuel Oil1 Data included in Aviation turbo/Jet A-1.
Source : Department of Energy
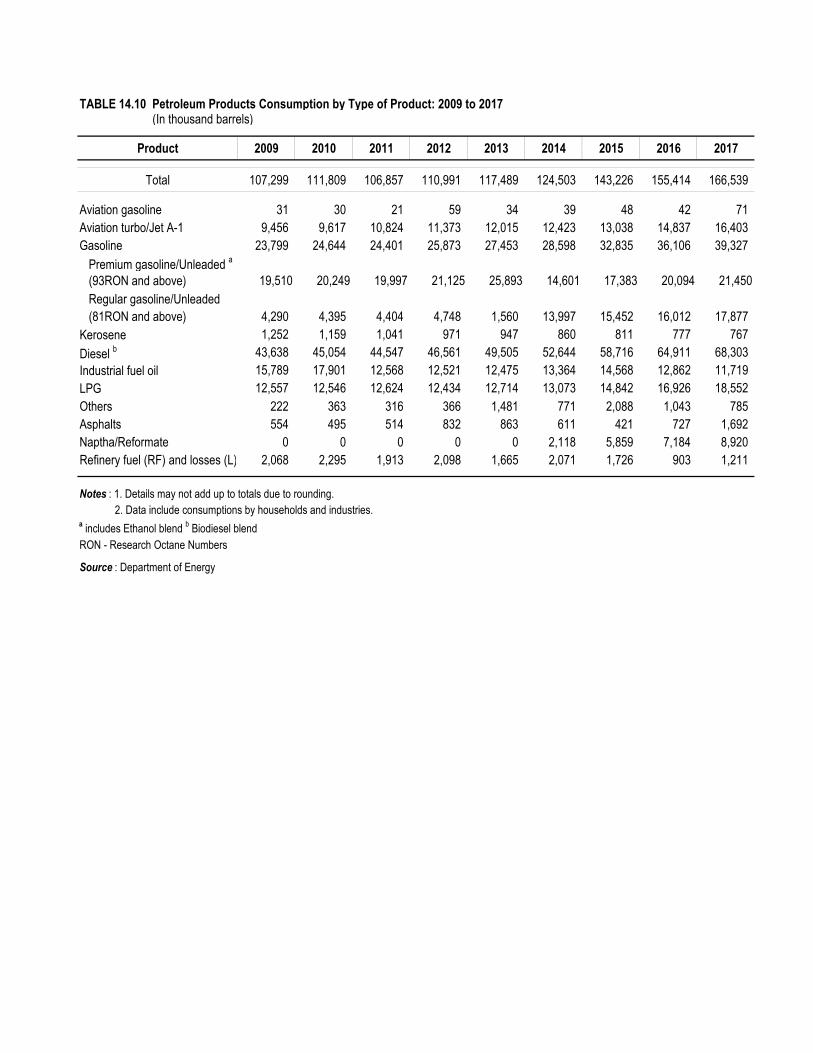
TABLE 14.10 Petroleum Products Consumption by Type of Product: 2009 to 2017 (In thousand barrels)
Product 2009 2010 2011 2012 2013 2014 2015 2016 2017
Total 107,299 111,809 106,857 110,991 117,489 124,503 143,226 155,414 166,539
Aviation gasoline 31 30 21 59 34 39 48 42 71Aviation turbo/Jet A-1 9,456 9,617 10,824 11,373 12,015 12,423 13,038 14,837 16,403Gasoline 23,799 24,644 24,401 25,873 27,453 28,598 32,835 36,106 39,327 Premium gasoline/Unleaded a (93RON and above) 19,510 20,249 19,997 21,125 25,893 14,601 17,383 20,094 21,450 Regular gasoline/Unleaded (81RON and above) 4,290 4,395 4,404 4,748 1,560 13,997 15,452 16,012 17,877Kerosene 1,252 1,159 1,041 971 947 860 811 777 767Diesel b 43,638 45,054 44,547 46,561 49,505 52,644 58,716 64,911 68,303Industrial fuel oil 15,789 17,901 12,568 12,521 12,475 13,364 14,568 12,862 11,719LPG 12,557 12,546 12,624 12,434 12,714 13,073 14,842 16,926 18,552Others 222 363 316 366 1,481 771 2,088 1,043 785Asphalts 554 495 514 832 863 611 421 727 1,692Naptha/Reformate 0 0 0 0 0 2,118 5,859 7,184 8,920Refinery fuel (RF) and losses (L) 2,068 2,295 1,913 2,098 1,665 2,071 1,726 903 1,211
Notes : 1. Details may not add up to totals due to rounding. 2. Data include consumptions by households and industries.a includes Ethanol blend b Biodiesel blendRON - Research Octane Numbers
Source : Department of Energy

TABLE 14.11 Petroleum Products Consumption By Industry: 2010 to 2017 (In thousand barrels)
2010 2011 2012 2013 2014 2015 2016 2017
102,096.9 97,251.5 101,529.6 108,256.2 115,428.9 132,925.2 143,476.2 154,197.0
Manufacturing 8,513.1 7,600.0 7,017.9 6,831.0 6,294.5 7,276.1 7,839.3 7,466.6Beverages 1,188.5 938.7 779.2 657.6 584.9 431.6 560.9 257.4Tobacco 178.8 157.5 140.1 78.5 76.8 61.9 42.6 27.8Coconut and vegetable oil 86.8 76.5 80.7 81.8 60.4 29.8 34.8 22.1Sugar 210.5 200.1 143.6 134.7 105.3 139.5 188.5 224.2Other food processing 1,675.3 1,738.9 1,570.0 1,492.6 1,250.9 1,256.4 1,600.6 1,146.1Textiles/Apparel 132.3 94.5 97.8 74.0 72.8 99.5 74.6 83.7Wood products/Furniture 78.5 76.3 67.5 76.1 71.8 121.0 112.8 105.6Paper products/Printing 164.5 110.5 91.1 75.9 61.0 44.3 40.8 33.9Chemicals except ferilizer 1,128.4 986.8 820.8 780.5 1,172.2 1,423.2 1,343.6 1,603.1Fertilizer 95.9 93.0 96.6 75.0 23.3 7.4 20.8 13.7Rubber/Rubber products 22.6 25.5 24.1 14.4 10.4 7.7 9.4 21.8Glass/Glass products 566.3 577.4 526.5 497.7 433.0 405.5 475.5 412.6Cement 804.5 540.7 520.0 545.0 496.2 934.1 885.6 1,180.0Lube refining a 0.0 0.2 0.2 0.0 0.0 0.0 22.3 0.0Other non-metallic minerals 193.3 190.0 236.4 279.0 159.3 153.5 143.6 49.0Basic metals 798.6 671.2 638.3 694.1 735.6 846.1 817.1 878.4Machinery/Equipment 887.4 802.1 735.6 749.5 804.7 1,138.2 1,252.7 1,301.3Others 301.0 320.2 449.4 524.6 176.2 176.4 213.1 105.8
Mining 1,171.2 1,548.3 1,871.6 2,110.3 2,109.3 2,224.0 1,696.5 1,905.8Construction 625.4 738.0 758.1 785.9 819.9 1,027.9 1,510.5 1,756.5Transport 71,115.1 71,531.9 74,567.7 77,984.7 79,996.1 91,890.9 99,455.8 105,147.7
Railway 18.0 34.7 52.2 69.2 85.7 12.5 14.3 16.0Road transport 55,060.9 54,309.5 57,184.7 60,104.0 61,510.0 70,999.9 77,911.2 81,050.3Water transport 6,389.5 6,342.7 5,898.7 5,762.1 5,937.9 7,792.1 6,651.2 7,607.7Air transport 9,646.6 10,845.0 11,432.2 12,049.4 12,462.5 13,086.4 14,879.2 16,473.7
Commercial 7,719.7 8,004.6 7,893.5 9,162.8 11,640.6 10,692.0 13,455.7 17,356.9Wholesale trade 7,226.7 7,474.6 7,384.7 8,354.4 10,730.4 9,743.4 12,780.5 16,895.6Finance and housing 8.3 37.1 30.5 33.8 35.4 40.0 35.5 23.3Private services 483.4 486.9 474.7 771.1 873.8 907.9 535.0 426.5P.I. Government 1.3 6.0 3.6 3.4 1.0 0.7 104.7 11.7
Agriculture 1,631.4 1,390.1 1,376.0 1,428.6 1,305.6 1,470.8 1,730.8 2,201.9Fishery/Fishing Trade 1,464.2 1,216.0 1,165.9 1,171.2 1,069.6 1,209.7 1,417.4 1,757.3Agricultural crop products 133.3 144.6 183.8 250.2 231.6 259.2 261.5 401.0Livestock/Poultry 0.7 2.7 1.4 0.2 0.0 0.4 48.3 1.3Agricultural services 23.7 20.4 20.4 4.3 0.0 0.0 2.3 0.0Forestry 9.4 6.4 4.7 2.7 4.4 1.4 1.3 42.2
Power Generation 10,463.2 5,608.4 6,846.7 7,608.2 9,762.0 9,975.9 8,833.5 6,964.8National Power Corporation 3,527.0 1,993.6 1,608.5 1,050.6 779.2 1,915.3 1,151.0 999.9Other private power generators 6,936.1 3,614.8 5,238.2 6,557.6 8,982.7 8,060.6 7,682.5 5,964.9
Others, n.e.c. 858.0 830.2 1,198.0 2,344.7 3,501.1 8,367.7 8,954.1 11,396.6
Refinery fuel/losses 2,068.0 2,294.5 1,913.2 2,098.5 1,664.8 2,071.5 1,726.5 902.6
Notes:
2. Includes consumption of ethanol and biodiesel3. Details may not add up to totals due to rounding.a Lube refining: less IFO sales by PPC to NPC.
Source : Department of Energy.
Industry
Total
1. Power generation includes Automotive Diesel Oil (ADO) and Industrial Fuel Oil (IFO) import for National Power Corporation (NPC) and IFO sales by Power Producing Cooperatives (PPC) to NPC.

TABLE 14.12 Power Generation by Source: 2009 to 2017 (In gigawatt hours )
Plant Type 2009 2010 2011 2012 2013 2014 2015 2016 2017
Total 61,934 67,743 69,176 72,922 75,266 77,261 82,413 90,798 94,370
Oil-Based 5,381 7,101 3,398 4,254 4,491 5,708 5,886 5,661 3,787 Oil-Thermal 909 1,364 512 695 438 463 80 245 282 Diesel 3,771 4,532 2,762 3,332 3,805 4,730 5,521 4,722 3,100 Gas Turbines 62 3 0 0 0 0 10 0 0 Combined-Cycle 639 1,202 124 227 247 515 276 694 405Hydro 9,788 7,803 9,698 10,252 10,019 9,137 8,665 8,111 9,611Geothermal 10,324 9,929 9,942 10,250 9,605 10,308 11,044 11,070 10,270Coal 16,476 23,301 25,342 28,265 32,081 33,054 36,686 43,303 46,847Wind/Solar 66 63 89 77 67 169 887 2,072 2,295Natural gas 19,887 19,518 20,591 19,642 18,791 18,690 18,878 19,854 20,547Biomass 14 27 115 183 212 196 367 726 1,013
Note : Details may not add up to totals due to rounding.Source : Department of Energy
TABLE 14.13 Power Generation By Utility: 1996 to 2017(In gigawatt hours )
National Power
Corporations
Rural Electric
Companies
Private Utilities
Manila Electric
Company 1996 36,708 23,816 11,788 93 138 872 - …1997 39,797 23,202 15,500 82 97 916 - …1998 41,578 24,541 15,143 273 766 857 - …1999 41,432 39,257 - 123 1,220 832 - …2000 45,290 40,978 - 73 1,026 3,213 - …2001 47,049 42,302 - 67 967 3,712 - …2002 48,467 38,269 - 78 1,075 9,046 - …2003 52,941 39,385 - 55 2,146 11,354 - …2004 55,957 41,958 - 58 2,276 11,664 - …2005 56,568 40,497 - 36 2,048 13,986 - …2006 56,784 17,299 23,173 121 1,883 14,309 - …2007 59,612 15,588 26,156 48 3,406 14,413 - …2008 60,821 13,191 27,972 - - - - 19,6582009 61,934 10,219 27,400 - - - - 24,3152010 67,221 4,054 14,725 - - - - 48,4422011 69,176 5,685 9,536 - - - - 53,9552012 72,922 5,707 9,875 … … … … 57,3402013 75,266 5,458 8,912 … … … … 60,8952014 77,261 5,109 8,382 … … … … 63,7702015 82,413 4,164 8,747 … … … … 69,5012016 90,798 3,155 7,223 … … … … 80,4202017 94,370 3,346 7,378 … … … … 83,646
Note : Details may not add up to totals due to rounding.*Non-NPC include MERALCO and REC embedded generator
Source : Department of Energy
Year TotalNational Power
Corporation
Independent Power Producers Self Generating Industries
Non-NPC *
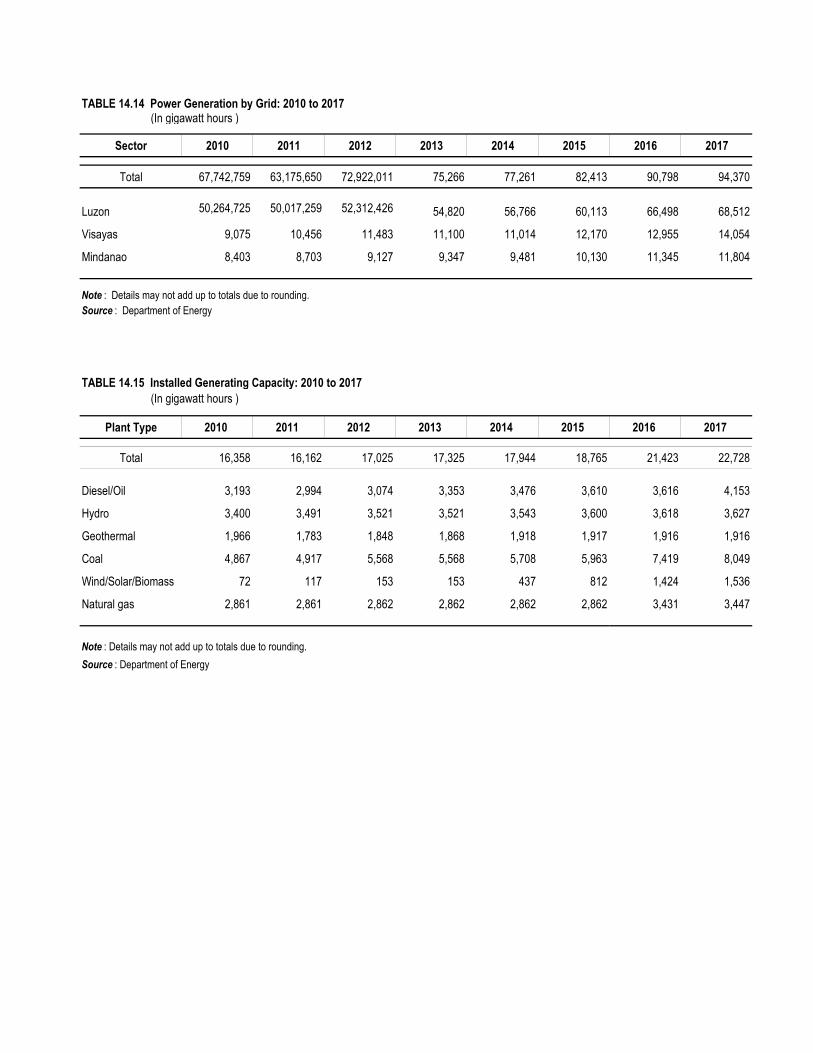
TABLE 14.14 Power Generation by Grid: 2010 to 2017 (In gigawatt hours )
Sector 2010 2011 2012 2013 2014 2015 2016 2017
Total 67,742,759 63,175,650 72,922,011 75,266 77,261 82,413 90,798 94,370
Luzon 50,264,725 50,017,259 52,312,426 54,820 56,766 60,113 66,498 68,512
Visayas 9,075 10,456 11,483 11,100 11,014 12,170 12,955 14,054
Mindanao 8,403 8,703 9,127 9,347 9,481 10,130 11,345 11,804
Note : Details may not add up to totals due to rounding.Source : Department of Energy
TABLE 14.15 Installed Generating Capacity: 2010 to 2017 (In gigawatt hours )
Plant Type 2010 2011 2012 2013 2014 2015 2016 2017
Total 16,358 16,162 17,025 17,325 17,944 18,765 21,423 22,728
Diesel/Oil 3,193 2,994 3,074 3,353 3,476 3,610 3,616 4,153
Hydro 3,400 3,491 3,521 3,521 3,543 3,600 3,618 3,627
Geothermal 1,966 1,783 1,848 1,868 1,918 1,917 1,916 1,916
Coal 4,867 4,917 5,568 5,568 5,708 5,963 7,419 8,049
Wind/Solar/Biomass 72 117 153 153 437 812 1,424 1,536
Natural gas 2,861 2,861 2,862 2,862 2,862 2,862 3,431 3,447
Note : Details may not add up to totals due to rounding.Source : Department of Energy

TABLE 14.16 Electric Energy Consumption by Sector: 1996 to 2017 (In million kilowatt hours)
Year Total Residential Commercial Industrial Transport Agriculture Utilities Own Use Power Losses
1996 36,708 9,150 7,072 11,851 27 1,140 1,340 6,128
1997 39,797 10,477 8,013 12,531 29 1,239 1,471 6,037
1998 41,578 11,936 8,725 12,543 29 905 1,590 5,849
1999 41,432 11,875 8,901 12,444 30 891 1,536 5,754
2000 45,290 12,894 9,512 13,191 55 902 2,390 6,345
2001 47,049 13,547 10,098 14,452 55 987 2,196 5,713
2002 48,468 13,715 10,172 13,628 58 1,052 3,873 5,970
2003 52,941 15,357 11,106 15,188 37 1,032 3,410 6,810
2004 55,957 15,920 11,785 15,012 67 1,292 4,654 7,227
2005 56,568 16,031 12,245 15,705 91 1,086 4,591 6,817
2006 56,784 15,830 12,679 15,888 97 1,178 4,227 6,885
2007 59,612 16,376 13,470 16,522 107 1,534 3,994 7,608
2008 60,821 16,644 14,136 17,031 110 1,283 3,935 7,680
2009 61,934 17,504 14,756 17,084 111 1,413 3,524 7,542
2010 67,743 18,833 16,261 18,576 109 1,487 4,677 7,800
2011 69,176 18,694 16,624 19,334 111 1,335 5,398 7,680
2012 72,922 19,695 17,777 20,071 117 1,551 5,351 8,360
2013 75,266 20,614 18,304 20,677 112 1,859 5,959 7,741
2014 77,261 20,969 18,761 21,429 111 2,075 6,646 7,270
2015 82,413 22,747 20,085 22,514 98 2,364 7,124 7,481
2016 90,798 25,631 21,770 24,119 102 2,532 8,357 8,286
2017 94,370 26,782 22,768 25,573 112 2,558 8,316 8,262
Note : Details may not add up to totals due to rounding.
Source : Department of Energy

TABLE 14.17 Status of Energization (EC Coverage Area) As of March 31, 2019
MunicipalitiesCoverage/ Energized Potential Coverage/
Energized Unenergized Potential Served
Philippines 1,475 36,065 36,057 8 15,416,144 12,966,469
CAR 73 1,113 1,113 0 416,008 371,503
I - Ilocos Region 116 3,029 3,029 0 1,089,617 1,038,855
II - Cagayan Valley 96 2,369 2,369 0 892,466 805,831
III - Central Luzon 100 2,236 2,236 0 1,567,645 1,501,593
IV-A CALABARZON 71 1,946 1,945 1 858,791 792,322
MIMAROPA 70 1,435 1,435 0 737,923 596,867
V - Bicol Region 111 3,388 3,388 0 1,239,293 999,200
VI - Western Visayas 132 3,871 3,870 1 1,728,179 1,498,117
VII - Central Visayas 121 2,713 2,713 0 1,202,350 1,086,845
VIII - Eastern Visayas 142 4,372 4,372 0 1,034,864 887,091
IX - Zamboanga Peninsula 72 1,865 1,865 0 779,936 536,538
X - Northern Mindanao 85 1,843 1,843 0 835,567 736,588
XI - Davao Region 44 896 896 0 692,842 500,289
XII - SOCCSKSARGEN 55 1,231 1,231 0 1,035,950 742,432
XIII - Caraga 73 1,311 1,311 0 699,827 669,829
BARMM 114 2,447 2,441 6 604,886 202,569
Note: Data includes only the Electric Cooperatives coverage areas only.Source: National Electrification Administration
RegionsBarangays Connections

TABLE 14.18 Number of Duly Organized Water Districts by Region: 2009 to 2018
Region 2009 2010 2011 2012 2013 2014 2015 2016 2017 2018
Philippines 800 859 861 864 865 868 869 869 869 870
CAR 29 34 35 35 35 35 35 35 35 35
I - Ilocos Region 64 68 68 68 68 68 68 68 68 68
II - Cagayan Valley 67 69 69 69 69 69 69 69 69 69
III - Central Luzon 109 111 112 112 112 112 112 112 112 112
IV-A CALABARZON … … … … … … … … … 69
MIMAROPA 95 96 96 96 96 97 97 97 97 28
V - Bicol Region 56 59 59 59 59 60 60 60 60 60
VI - Western Visayas 98 100 100 100 100 100 100 100 100 100
VII - Central Visayas 30 33 33 33 33 34 33 33 33 33
VIII - Eastern Visayas 57 63 63 63 63 63 65 65 65 66
IX - Zamboanga Peninsula 35 35 35 36 36 36 36 36 36 36
X - Northern Mindanao 21 22 34 34 34 34 34 34 34 35
XI - Davao Region 37 39 39 40 40 40 40 40 40 26
XII - SOCCSKSARGEN 15 19 15 15 15 15 15 15 15 18
XIII - Caraga 37 39 39 39 39 39 39 39 39 40
BARMM 50 72 64 65 66 66 66 66 66 75
Source: Local Water Utilities Administration
TABLE 14.19 Number of Households Served by Water Districts by Region: 2011 to 2018
Region 2011 2012 2013 2014 2015 2016 2017 2018
Philippines 3,107,551 3,292,272 3,470,378 3,710,078 3,895,631 4,109,785 4,352,872 4,567,197
CAR 56,637 59,196 61,167 63,220 64,854 68,180 70,302 73,688
I - Ilocos Region 162,940 172,983 180,990 195,603 208,996 226,867 245,213 259,746
II - Cagayan Valley 75,266 80,960 86,325 92,252 98,542 104,442 110,851 117,632
III - Central Luzon 686,038 749,510 788,913 847,337 906,614 948,203 984,792 1,058,586
IV-A CALABARZON … … … … … … … 813,172
MIMAROPA 634,972 682,766 738,780 766,499 790,432 825,178 865,186 74,308
V - Bicol Region 212,016 202,008 210,775 230,091 240,526 255,276 268,554 284,877
VI - Western Visayas 214,019 226,172 238,588 259,082 273,842 284,155 299,862 326,802
VII - Central Visayas 229,160 247,115 255,564 276,377 297,941 310,498 345,161 337,143
VIII - Eastern Visayas 89,388 91,312 83,616 101,899 104,448 119,235 140,204 133,048
IX - Zamboanga Peninsula 92,495 93,702 99,025 104,522 107,637 112,220 116,800 122,242
X - Northern Mindanao 167,734 175,279 183,808 193,713 201,537 214,958 226,264 243,841
XI - Davao Region 291,677 305,303 323,422 346,008 354,815 379,029 308,352 323,967
XII - SOCCSKSARGEN 48,782 52,170 55,634 59,764 63,377 68,147 201,476 122,991
XIII - Caraga 96,341 102,240 111,237 118,295 124,367 132,641 143,062 153,070
BARMM 50,086 51,556 52,534 55,416 57,703 60,756 26,793 122,084
Source: Local Water Utilities Administration

TABLE 14.20 Irrigated and Benefited Areas of National Irrigation Systems: 2001 to 2018 (Area in hectares)
Wet Season Dry Season Wet Season Dry Season
2001 689,010 503,223 474,620 439,369 450,736
2002 689,113 482,381 469,032 439,920 420,272
2003 689,732 493,064 460,520 457,918 400,072
2004 690,239 486,238 480,227 455,975 442,472
2005 695,774 496,242 476,450 463,702 441,052
2006 704,746 485,351 479,359 423,056 441,043
2007 706,377 489,228 480,694 457,703 448,354
2008 729,546 547,192 541,706 499,901 486,076
2009 746,337 545,632 531,599 433,006 495,974
2010 751,787 546,363 556,031 437,810 455,208
2011 488,378 556,910 551,657 445,207 507,061
2012 793,638 569,582 568,826 516,010 536,318
2013 804,540 569,969 558,706 503,149 512,339
2014 821,598 569,969 558,706 503,149 512,339
2015 831,986 569,467 551,150 463,774 506,998
2016 836,055 567,173 555,379 451,425 497,316
2017 848,617 630,330 603,068 600,591 570,713
2018 859,948 654,497 635,115 611,913 604,892
Note : Wet season is for the months of May to October of current year while dry season is from November to previous year to April of current year.
1 Service Area (at the beginning of the year) or the area of an irrigation system after the project completion and turnover for operationthat is already provided with irrigation and drainage facilities where irrigation and drainage service could alreadybe rendered. (MC #12 S., 2015)
2 Irrigated area refers to the area within the operational area of an irrigation system served during the respective cropping session namely,wet season, dry season and third crop. (MC #12 S., 2015)
3 Benefited area refers to the actual portion of the irrigated area system planted to crops during the respective cropping sessions namely,wet season, dry season and third crop and where reasonable harvest (40 cavans per hectare and above) was made. (MC #12 S., 2015)
Source : National Irrigation Administration
Year Service Area 1Irrigated Area 2 Benefited Area 3

TABLE 14.21 Generated Area of National Communal Irrigation Systems/Projects: 2001 to 2018 (Area in hectares)
Year Total National Communal
2001 21,050 11,604 9,4462002 28,148 14,841 13,3072003 20,761 12,535 8,2262004 10,539 4,581 5,9582005 12,127 6,972 5,155
2006 8,989 3,273 5,7162007 15,037 8,673 6,3642008 13,481 9,023 4,4582009 9,909 6,299 3,6102010 6,603 4,358 2,245
2011 23,923 16,451 7,4722012 55,500 22,834 32,6662013 58,632 21,092 37,5402014 34,097 12,684 21,4132015 35,616 19,822 15,794
2016 18,081 11,002 7,0792017 19,679 5,445 14,2342018 31,872 9,918 21,954
Source : National Irrigation Administration
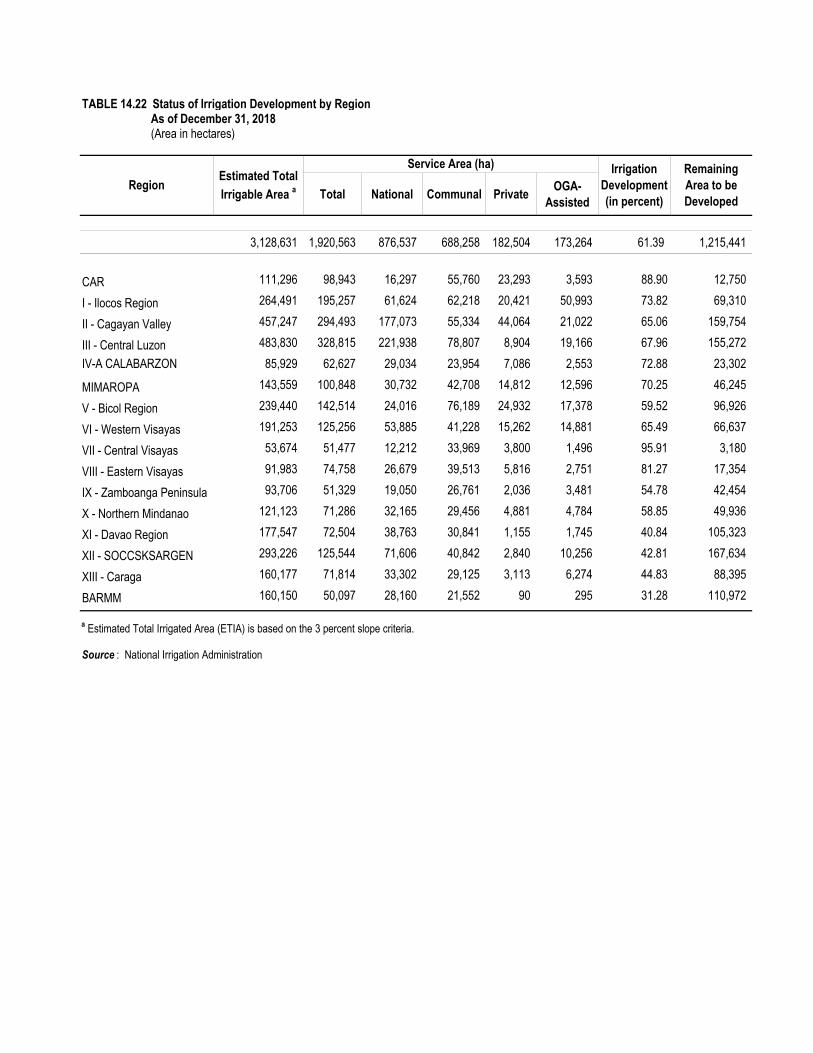
TABLE 14.22 Status of Irrigation Development by Region As of December 31, 2018 (Area in hectares)
Total National Communal Private OGA-Assisted
3,128,631 1,920,563 876,537 688,258 182,504 173,264 61.39 1,215,441
CAR 111,296 98,943 16,297 55,760 23,293 3,593 88.90 12,750
I - Ilocos Region 264,491 195,257 61,624 62,218 20,421 50,993 73.82 69,310
II - Cagayan Valley 457,247 294,493 177,073 55,334 44,064 21,022 65.06 159,754
III - Central Luzon 483,830 328,815 221,938 78,807 8,904 19,166 67.96 155,272IV-A CALABARZON 85,929 62,627 29,034 23,954 7,086 2,553 72.88 23,302
MIMAROPA 143,559 100,848 30,732 42,708 14,812 12,596 70.25 46,245
V - Bicol Region 239,440 142,514 24,016 76,189 24,932 17,378 59.52 96,926
VI - Western Visayas 191,253 125,256 53,885 41,228 15,262 14,881 65.49 66,637
VII - Central Visayas 53,674 51,477 12,212 33,969 3,800 1,496 95.91 3,180
VIII - Eastern Visayas 91,983 74,758 26,679 39,513 5,816 2,751 81.27 17,354
IX - Zamboanga Peninsula 93,706 51,329 19,050 26,761 2,036 3,481 54.78 42,454
X - Northern Mindanao 121,123 71,286 32,165 29,456 4,881 4,784 58.85 49,936
XI - Davao Region 177,547 72,504 38,763 30,841 1,155 1,745 40.84 105,323
XII - SOCCSKSARGEN 293,226 125,544 71,606 40,842 2,840 10,256 42.81 167,634
XIII - Caraga 160,177 71,814 33,302 29,125 3,113 6,274 44.83 88,395
BARMM 160,150 50,097 28,160 21,552 90 295 31.28 110,972
a Estimated Total Irrigated Area (ETIA) is based on the 3 percent slope criteria.
Source : National Irrigation Administration
RegionEstimated Total Irrigable Area a
Service Area (ha) Irrigation Development (in percent)
Remaining Area to be Developed

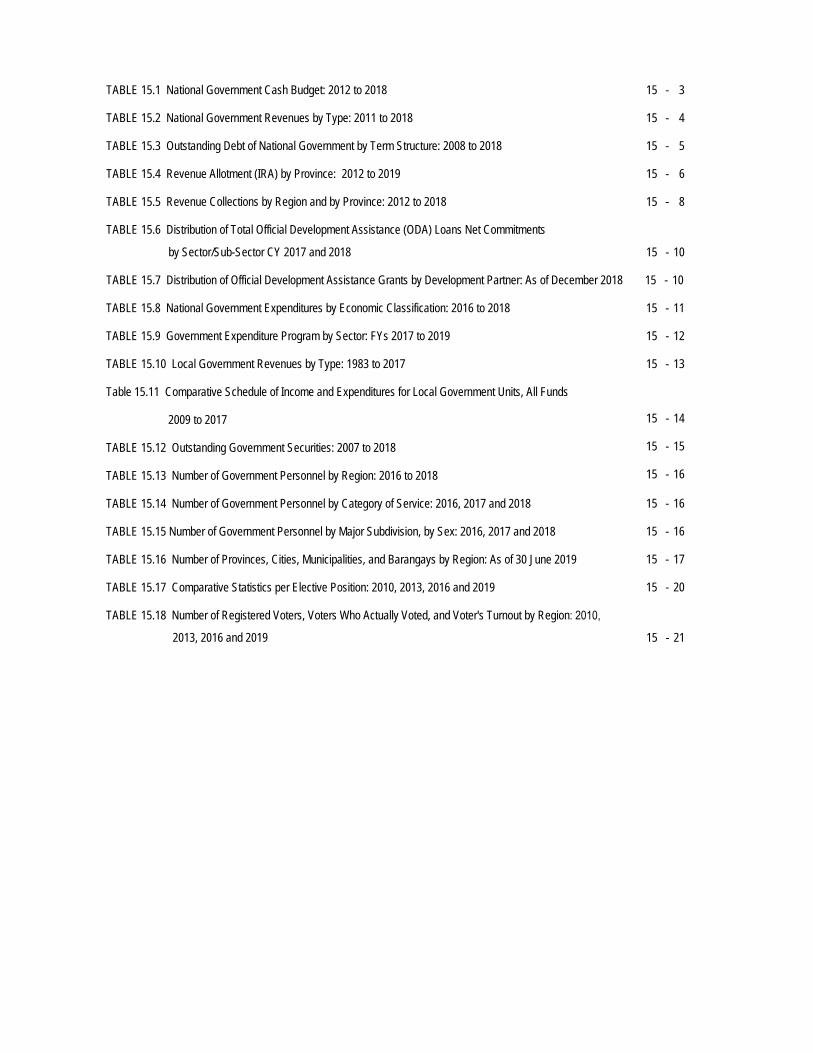
15 - 3
15 - 4
15 - 5
15 - 6
15 - 8
TABLE 15.1 National Government Cash Budget: 2012 to 2018
TABLE 15.2 National Government Revenues by Type: 2011 to 2018
TABLE 15.3 Outstanding Debt of National Government by Term Structure: 2008 to 2018
TABLE 15.4 Revenue Allotment (IRA) by Province: 2012 to 2019
TABLE 15.5 Revenue Collections by Region and by Province: 2012 to 2018
TABLE 15.6 Distribution of Total Official Development Assistance (ODA) Loans Net Commitments
by Sector/Sub-Sector CY 2017 and 2018 15 - 10
TABLE 15.7 Distribution of Official Development Assistance Grants by Development Partner: As of December 2018 15 - 10
15 - 11
15 - 12
15 - 13
15 - 14
15 - 15
15 - 16
15 - 16
15 - 16
15 - 17
15 - 20
TABLE 15.8 National Government Expenditures by Economic Classification: 2016 to 2018
TABLE 15.9 Government Expenditure Program by Sector: FYs 2017 to 2019
TABLE 15.10 Local Government Revenues by Type: 1983 to 2017
Table 15.11 Comparative Schedule of Income and Expenditures for Local Government Units, All Funds
2009 to 2017
TABLE 15.12 Outstanding Government Securities: 2007 to 2018
TABLE 15.13 Number of Government Personnel by Region: 2016 to 2018
TABLE 15.14 Number of Government Personnel by Category of Service: 2016, 2017 and 2018
TABLE 15.15 Number of Government Personnel by Major Subdivision, by Sex: 2016, 2017 and 2018
TABLE 15.16 Number of Provinces, Cities, Municipalities, and Barangays by Region: As of 30 June 2019
TABLE 15.17 Comparative Statistics per Elective Position: 2010, 2013, 2016 and 2019
TABLE 15.18 Number of Registered Voters, Voters Who Actually Voted, and Voter's Turnout by Region: 2010,
2013, 2016 and 2019 15 - 21

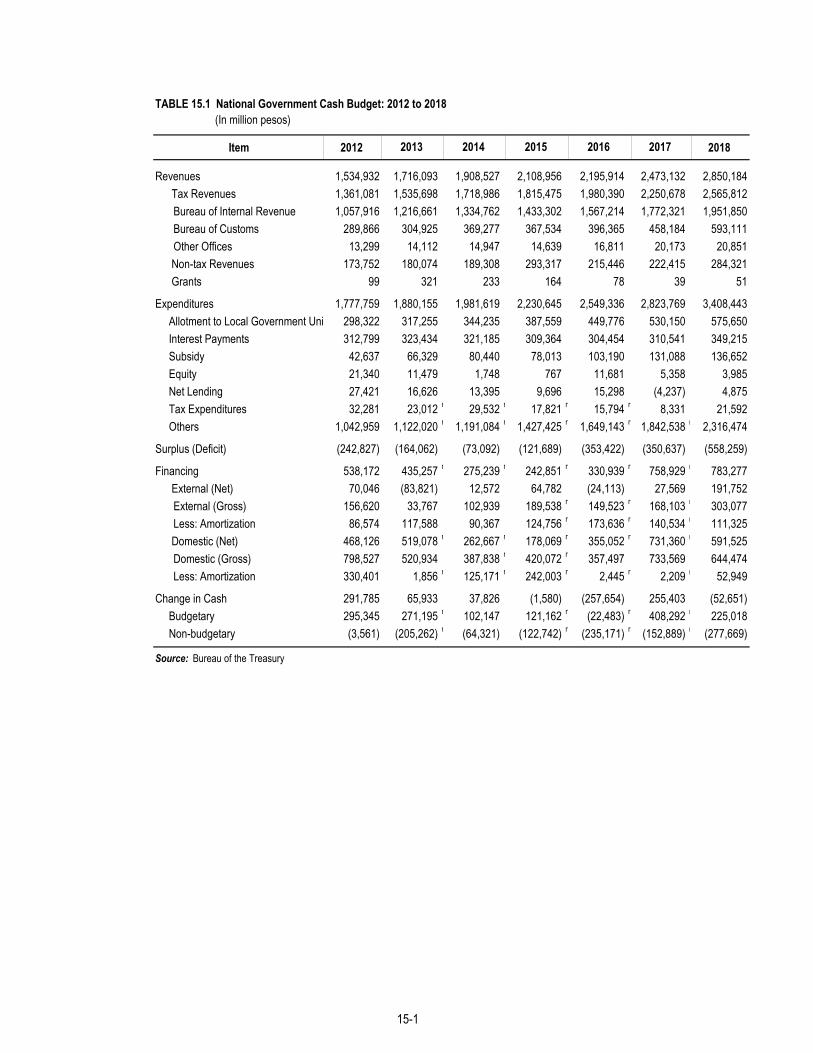
TABLE 15.1 National Government Cash Budget: 2012 to 2018 (In million pesos)
Item 2012 2018
Revenues 1,534,932 1,716,093 1,908,527 2,108,956 2,195,914 2,473,132 2,850,184 Tax Revenues 1,361,081 1,535,698 1,718,986 1,815,475 1,980,390 2,250,678 2,565,812
Bureau of Internal Revenue 1,057,916 1,216,661 1,334,762 1,433,302 1,567,214 1,772,321 1,951,850Bureau of Customs 289,866 304,925 369,277 367,534 396,365 458,184 593,111Other Offices 13,299 14,112 14,947 14,639 16,811 20,173 20,851
Non-tax Revenues 173,752 180,074 189,308 293,317 215,446 222,415 284,321 Grants 99 321 233 164 78 39 51
Expenditures 1,777,759 1,880,155 1,981,619 2,230,645 2,549,336 2,823,769 3,408,443 Allotment to Local Government Uni 298,322 317,255 344,235 387,559 449,776 530,150 575,650 Interest Payments 312,799 323,434 321,185 309,364 304,454 310,541 349,215 Subsidy 42,637 66,329 80,440 78,013 103,190 131,088 136,652 Equity 21,340 11,479 1,748 767 11,681 5,358 3,985 Net Lending 27,421 16,626 13,395 9,696 15,298 (4,237) 4,875 Tax Expenditures 32,281 23,012 r 29,532 r 17,821 r 15,794 r 8,331 21,592 Others 1,042,959 1,122,020 r 1,191,084 r 1,427,425 r 1,649,143 r 1,842,538 r 2,316,474
Surplus (Deficit) (242,827) (164,062) (73,092) (121,689) (353,422) (350,637) (558,259)
Financing 538,172 435,257 r 275,239 r 242,851 r 330,939 r 758,929 r 783,277 External (Net) 70,046 (83,821) 12,572 64,782 (24,113) 27,569 191,752
External (Gross) 156,620 33,767 102,939 189,538 r 149,523 r 168,103 r 303,077Less: Amortization 86,574 117,588 90,367 124,756 r 173,636 r 140,534 r 111,325
Domestic (Net) 468,126 519,078 r 262,667 r 178,069 r 355,052 r 731,360 r 591,525Domestic (Gross) 798,527 520,934 387,838 r 420,072 r 357,497 733,569 644,474Less: Amortization 330,401 1,856 r 125,171 r 242,003 r 2,445 r 2,209 r 52,949
Change in Cash 291,785 65,933 37,826 (1,580) (257,654) 255,403 (52,651) Budgetary 295,345 271,195 r 102,147 121,162 r (22,483) r 408,292 r 225,018 Non-budgetary (3,561) (205,262) r (64,321) (122,742) r (235,171) r (152,889) r (277,669)
Source: Bureau of the Treasury
2016 2017201520142013
15-1

TABLE 15.2 National Government Revenues by Type: 2011 to 2018 (In million pesos)
Item 2011 2012 2013 2014 2015 2016 2017 2018
Total Revenues 1,359,942 1,534,932 1,716,093 1,908,527 2,108,956 2,195,914 2,473,132 2,850,184
1. Tax revenue 1,202,066 1,361,081 1,535,698 1,718,986 1,815,475 1,980,390 2,250,678 2,565,812 Taxes on net income and profits 571,947 642,501 718,361 784,859 846,091 921,216 1,025,244 1,035,383 Taxes on property 2,487 3,626 3,275 5,450 5,633 6,636 7,462 7,151 Transfer taxes 2,487 3,626 3,275 5,450 5,633 6,636 7,462 7,151 Taxes on goods and services 298,086 354,512 429,812 470,515 504,656 554,850 646,267 752,308 General sales, turnover or value added taxes 182,936 229,594 250,149 278,727 287,786 326,216 360,555 347,658 Selective taxes on goods 68,026 72,346 118,856 135,315 157,964 163,506 209,111 290,612 Selective taxes on services 46,478 51,958 60,274 55,881 58,377 64,623 76,036 113,786 Taxes on use of goods or permissions to perform activities and others 646 614 533 592 529 505 565 252 Taxes on international trade and transactions 265,108 289,866 304,925 369,277 367,534 396,365 458,184 593,111 Import duties & taxes 265,108 289,866 304,925 369,277 367,534 396,365 458,184 593,111 Others - - - - - - - - Other taxes 64,438 70,576 79,325 88,885 91,561 101,323 113,521 177,858 Stamps taxes 47,802 52,455 60,356 69,018 72,072 80,151 85,912 139,157 Others 16,636 18,121 18,969 19,867 19,489 21,172 27,609 38,701
2. Non-tax revenue 157,876 173,851 180,395 189,541 293,481 215,524 222,454 284,372 Non-tax revenue proper 156,691 165,404 177,138 187,362 230,534 214,789 221,585 268,666 Capital revenue 930 8,348 2,936 1,946 62,783 657 830 15,655 Grants 255 99 321 233 164 78 39 51
Source: Bureau of the Treasury
15-2
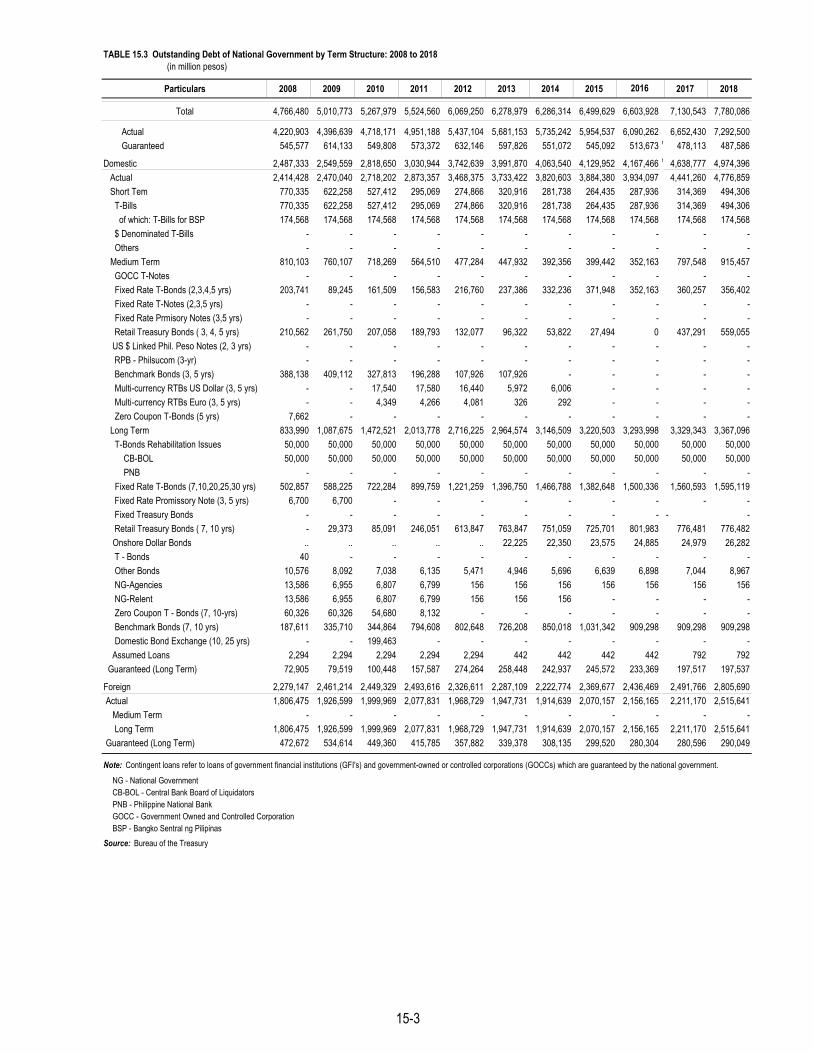
TABLE 15.3 Outstanding Debt of National Government by Term Structure: 2008 to 2018 (in million pesos)
Particulars 2008 2009 2010 2011 2012 2013 2014 2015 2017 2018
Total 4,766,480 5,010,773 5,267,979 5,524,560 6,069,250 6,278,979 6,286,314 6,499,629 6,603,928 7,130,543 7,780,086
Actual 4,220,903 4,396,639 4,718,171 4,951,188 5,437,104 5,681,153 5,735,242 5,954,537 6,090,262 6,652,430 7,292,500Guaranteed 545,577 614,133 549,808 573,372 632,146 597,826 551,072 545,092 513,673 r 478,113 487,586
Domestic 2,487,333 2,549,559 2,818,650 3,030,944 3,742,639 3,991,870 4,063,540 4,129,952 4,167,466 r 4,638,777 4,974,396 Actual 2,414,428 2,470,040 2,718,202 2,873,357 3,468,375 3,733,422 3,820,603 3,884,380 3,934,097 4,441,260 4,776,859 Short Tem 770,335 622,258 527,412 295,069 274,866 320,916 281,738 264,435 287,936 314,369 494,306 T-Bills 770,335 622,258 527,412 295,069 274,866 320,916 281,738 264,435 287,936 314,369 494,306 of which: T-Bills for BSP 174,568 174,568 174,568 174,568 174,568 174,568 174,568 174,568 174,568 174,568 174,568 $ Denominated T-Bills - - - - - - - - - - - Others - - - - - - - - - - - Medium Term 810,103 760,107 718,269 564,510 477,284 447,932 392,356 399,442 352,163 797,548 915,457 GOCC T-Notes - - - - - - - - - - - Fixed Rate T-Bonds (2,3,4,5 yrs) 203,741 89,245 161,509 156,583 216,760 237,386 332,236 371,948 352,163 360,257 356,402 Fixed Rate T-Notes (2,3,5 yrs) - - - - - - - - - - - Fixed Rate Prmisory Notes (3,5 yrs) - - - - - - - - - - - Retail Treasury Bonds ( 3, 4, 5 yrs) 210,562 261,750 207,058 189,793 132,077 96,322 53,822 27,494 0 437,291 559,055 US $ Linked Phil. Peso Notes (2, 3 yrs) - - - - - - - - - - - RPB - Philsucom (3-yr) - - - - - - - - - - - Benchmark Bonds (3, 5 yrs) 388,138 409,112 327,813 196,288 107,926 107,926 - - - - - Multi-currency RTBs US Dollar (3, 5 yrs) - - 17,540 17,580 16,440 5,972 6,006 - - - - Multi-currency RTBs Euro (3, 5 yrs) - - 4,349 4,266 4,081 326 292 - - - - Zero Coupon T-Bonds (5 yrs) 7,662 - - - - - - - - - - Long Term 833,990 1,087,675 1,472,521 2,013,778 2,716,225 2,964,574 3,146,509 3,220,503 3,293,998 3,329,343 3,367,096 T-Bonds Rehabilitation Issues 50,000 50,000 50,000 50,000 50,000 50,000 50,000 50,000 50,000 50,000 50,000 CB-BOL 50,000 50,000 50,000 50,000 50,000 50,000 50,000 50,000 50,000 50,000 50,000 PNB - - - - - - - - - - - Fixed Rate T-Bonds (7,10,20,25,30 yrs) 502,857 588,225 722,284 899,759 1,221,259 1,396,750 1,466,788 1,382,648 1,500,336 1,560,593 1,595,119 Fixed Rate Promissory Note (3, 5 yrs) 6,700 6,700 - - - - - - - - - Fixed Treasury Bonds - - - - - - - - - - - Retail Treasury Bonds ( 7, 10 yrs) - 29,373 85,091 246,051 613,847 763,847 751,059 725,701 801,983 776,481 776,482
Onshore Dollar Bonds .. .. .. .. .. 22,225 22,350 23,575 24,885 24,979 26,282 T - Bonds 40 - - - - - - - - - - Other Bonds 10,576 8,092 7,038 6,135 5,471 4,946 5,696 6,639 6,898 7,044 8,967 NG-Agencies 13,586 6,955 6,807 6,799 156 156 156 156 156 156 156 NG-Relent 13,586 6,955 6,807 6,799 156 156 156 - - - - Zero Coupon T - Bonds (7, 10-yrs) 60,326 60,326 54,680 8,132 - - - - - - - Benchmark Bonds (7, 10 yrs) 187,611 335,710 344,864 794,608 802,648 726,208 850,018 1,031,342 909,298 909,298 909,298 Domestic Bond Exchange (10, 25 yrs) - - 199,463 - - - - - - - - Assumed Loans 2,294 2,294 2,294 2,294 2,294 442 442 442 442 792 792 Guaranteed (Long Term) 72,905 79,519 100,448 157,587 274,264 258,448 242,937 245,572 233,369 197,517 197,537
Foreign 2,279,147 2,461,214 2,449,329 2,493,616 2,326,611 2,287,109 2,222,774 2,369,677 2,436,469 2,491,766 2,805,690 Actual 1,806,475 1,926,599 1,999,969 2,077,831 1,968,729 1,947,731 1,914,639 2,070,157 2,156,165 2,211,170 2,515,641 Medium Term - - - - - - - - - - - Long Term 1,806,475 1,926,599 1,999,969 2,077,831 1,968,729 1,947,731 1,914,639 2,070,157 2,156,165 2,211,170 2,515,641 Guaranteed (Long Term) 472,672 534,614 449,360 415,785 357,882 339,378 308,135 299,520 280,304 280,596 290,049
Note: Contingent loans refer to loans of government financial institutions (GFI's) and government-owned or controlled corporations (GOCCs) which are guaranteed by the national government.
NG - National GovernmentCB-BOL - Central Bank Board of LiquidatorsPNB - Philippine National BankGOCC - Government Owned and Controlled CorporationBSP - Bangko Sentral ng Pilipinas
Source: Bureau of the Treasury
2016
15-3

TABLE 15.4 Revenue Allotment (IRA) by Province1: 2012 to 2019 (In million pesos)
Province 2012 a 2013 a 2014 a 2015 a 2016 a 2017 2018 2019
Philippines 2 77,500 84,818 95,074 108,286 118,366 134,255 144,034 158,424
NCR 3 13,264.2 13,934.4 15,274.4 17,413.1 19,094.1 21,297.9 22,857.3 25,152.0CAR 2,761.8 3,041.3 3,419.5 3,891.0 4,255.2 4,779.3 5,125.1 5,633.9 Abra 515.4 563.2 635.0 723.3 792.3 885.5 950.0 1,044.8 Apayao 456.5 504.2 569.3 649.4 709.0 800.5 859.5 946.3 Benguet 522.6 580.1 647.9 737.2 806.9 915.3 981.5 1,078.9 Ifugao 424.7 466.3 524.4 595.9 651.5 731.0 783.5 860.7 Kalinga 458.3 507.2 570.2 647.7 708.0 793.6 850.4 934.0 Mt. Province 384.3 420.3 472.8 537.5 587.6 653.3 700.2 769.3I - Ilocos Region 3,628.7 3,989.6 4,490.4 5,107.0 5,582.9 6,199.5 6,647.1 7,305.8 Ilocos Norte 634.6 695.7 783.6 891.8 976.8 1,085.1 1,163.7 1,279.2 Ilocos Sur 650.2 711.3 798.6 906.1 990.5 1,096.2 1,174.1 1,288.6 La Union 622.7 678.4 763.4 868.0 950.1 1,056.5 1,132.6 1,244.5 Pangasinan 1,721.3 1,904.2 2,144.8 2,441.1 2,665.6 2,961.6 3,176.8 3,493.5II - Cagayan Valley 3,856.6 4,262.9 4,804.5 5,471.5 5,982.7 6,726.1 7,216.0 7,936.8 Batanes 221.2 241.3 271.7 309.1 335.9 378.1 405.6 445.9 Cagayan 1,156.3 1,276.5 1,439.6 1,640.4 1,799.6 2,017.7 2,164.8 2,381.3 Isabela 1,422.9 1,579.3 1,779.6 2,026.2 2,212.9 2,490.2 2,671.6 2,938.6 Nueva Vizcaya 604.2 667.0 751.7 856.1 934.0 1,051.5 1,128.2 1,241.0 Quirino 452.0 498.8 562.0 639.7 700.3 788.6 845.8 929.9III - Central Luzon 6,774.1 7,465.5 8,399.3 9,564.3 10,480.3 11,908.8 12,775.8 14,051.7 Aurora 438.7 484.6 546.9 623.7 683.4 769.6 826.0 908.9 Bataan 582.4 638.0 718.6 817.9 895.7 1,019.3 1,093.2 1,201.8 Bulacan 1,669.3 1,828.1 2,046.8 2,331.4 2,577.9 2,964.8 3,180.6 3,498.3 Nueva Ecija 1,338.3 1,489.7 1,680.5 1,915.4 2,093.2 2,383.3 2,558.0 2,815.1 Pampanga 1,202.6 1,332.1 1,500.5 1,707.8 1,865.0 2,109.4 2,262.8 2,488.4 Tarlac 921.6 1,002.3 1,129.3 1,285.6 1,403.4 1,570.9 1,685.3 1,853.5 Zambales 621.2 690.7 776.7 882.5 961.7 1,091.5 1,170.1 1,285.7IV-A - CALABARZON 7,177.3 8,070.2 9,101.8 10,371.9 11,375.0 13,336.9 14,311.1 15,744.7 Batangas 1,396.8 1,555.4 1,754.5 1,999.6 2,194.5 2,554.2 2,740.8 3,015.4 Cavite 1,594.7 1,810.4 2,043.3 2,330.0 2,558.2 3,111.6 3,339.8 3,675.6 Laguna 1,451.6 1,640.6 1,849.1 2,105.8 2,310.0 2,698.4 2,894.7 3,183.6 Quezon 1,424.9 1,578.5 1,777.2 2,021.9 2,216.4 2,475.9 2,654.8 2,917.9 Rizal 1,309.3 1,485.3 1,677.7 1,914.6 2,096.1 2,496.8 2,681.1 2,952.2MIMAROPA 3,453.9 3,831.3 4,318.2 4,917.6 5,375.7 6,051.7 6,492.4 7,141.0 Marinduque 359.6 388.2 437.0 497.1 543.5 603.3 646.8 710.8 Occidental Mindoro 690.3 764.9 862.0 981.4 1,071.0 1,207.1 1,295.0 1,424.4 Oriental Mindoro 753.3 837.1 943.8 1,075.2 1,178.7 1,324.1 1,420.5 1,562.4 Palawan 1,227.9 1,382.5 1,560.5 1,779.6 1,944.5 2,210.3 2,372.9 2,612.2 Romblon 422.8 458.6 514.9 584.3 638.2 707.0 757.3 831.2V - Bicol Region 4,454.0 4,934.4 5,556.6 6,322.8 6,922.7 7,737.0 8,296.6 9,120.2 Albay 881.6 967.7 1,091.0 1,242.8 1,362.7 1,519.3 1,629.9 1,792.6 Camarines Norte 563.1 621.1 699.3 795.4 867.1 973.3 1,043.9 1,147.6 Camarines Sur 1,174.1 1,316.3 1,485.2 1,693.1 1,858.0 2,074.5 2,226.1 2,449.2 Catanduanes 414.4 453.1 506.8 572.9 624.1 695.6 743.9 815.1 Masbate 769.0 860.9 970.1 1,104.5 1,210.5 1,355.8 1,454.2 1,599.0 Sorsogon 651.8 715.2 804.4 914.2 1,000.4 1,118.4 1,198.6 1,316.8VI - Western Visayas 5,069.3 5,560.7 6,234.8 7,092.4 7,761.1 8,628.4 9,251.7 10,168.8 Aklan 533.3 593.8 668.0 759.1 830.8 930.9 997.8 1,096.3 Antique 587.3 648.3 729.4 829.3 907.7 1,015.1 1,088.2 1,195.7 Capiz 678.7 738.1 822.9 935.2 1,023.3 1,138.2 1,219.9 1,340.0 Guimaras 296.1 327.1 369.5 421.5 461.5 519.4 557.6 613.8 Iloilo 1,265.2 1,408.8 1,583.8 1,799.2 1,962.0 2,192.5 2,350.1 2,582.0 Negros Occidental 1,708.7 1,844.5 2,061.2 2,347.8 2,575.8 2,832.3 3,038.2 3,341.2
Continued
15-5

TABLE 15.4 - - Concluded
Province 2012 a 2013 a 2014 a 2015 a 2016 a 2017 2018 2019
VII - Central Visayas 3,989.2 4,403.5 4,925.9 5,602.1 6,111.4 6,888.9 7,387.5 8,121.2 Bohol 1,017.5 1,106.3 1,246.5 1,417.2 1,549.2 1,713.5 1,838.3 2,021.9 Cebu 1,625.5 1,821.4 2,033.3 2,312.7 2,524.2 2,911.1 3,122.1 3,432.5 Negros Oriental 1,076.8 1,182.6 1,319.3 1,499.2 1,634.9 1,812.9 1,943.4 2,135.5 Siquijor 269.3 293.2 326.8 371.0 403.0 451.5 483.8 531.4VIII - Eastern Visayas 4,064.8 4,466.9 5,021.6 5,704.5 6,232.0 7,005.4 7,507.7 8,247.0 Biliran 298.4 329.1 370.9 422.3 461.7 517.6 555.2 610.5 Eastern Samar 640.6 705.0 792.0 899.2 979.2 1,104.7 1,183.8 1,300.3 Leyte 1,143.9 1,251.4 1,405.4 1,595.0 1,745.3 1,974.4 2,115.1 2,322.0 Northern Samar 663.5 734.4 824.9 936.4 1,024.0 1,147.7 1,229.5 1,349.9 Southern Leyte 486.7 528.8 594.3 674.8 737.6 822.1 880.8 967.2 Samar 831.7 918.2 1,034.1 1,176.9 1,284.2 1,438.8 1,543.3 1,697.1IX - Zamboanga Peninsula 2,493.5 2,756.3 3,093.4 3,521.7 3,850.6 4,302.6 4,615.3 5,075.5 Zamboanga del Norte 999.7 1,104.5 1,243.2 1,414.1 1,549.3 1,727.4 1,852.0 2,035.3 Zamboanga del Sur 867.2 955.3 1,064.0 1,211.1 1,320.4 1,468.0 1,574.8 1,732.0 Zamboanga Sibugay 626.5 696.5 786.2 896.6 980.9 1,107.3 1,188.6 1,308.2X - Northern Mindanao 3,384.5 3,791.5 4,274.1 4,868.3 5,324.0 6,016.5 6,455.0 7,100.4 Bukidnon 1,257.4 1,413.9 1,596.3 1,820.9 1,991.1 2,255.6 2,421.7 2,666.1 Camiguin 250.3 273.2 308.0 350.8 383.3 430.4 461.7 507.8 Lanao del Norte 614.6 696.1 783.1 890.2 974.3 1,109.3 1,189.1 1,306.5 Misamis Occidental 560.6 621.1 698.9 794.7 866.1 966.2 1,036.0 1,138.8 Misamis Oriental 701.6 787.2 887.8 1,011.6 1,109.1 1,255.0 1,346.6 1,481.3XI - Davao Region 2,940.1 3,288.4 3,713.2 4,236.3 4,472.5 5,577.6 5,987.5 6,590.8 Compostela Valley 698.5 780.9 883.0 1,008.8 1,107.9 1,246.4 1,338.6 1,474.4 Davao del Norte 745.7 851.5 962.7 1,099.5 1,207.5 1,357.4 1,457.8 1,605.4 Davao del Sur 792.2 876.7 988.5 1,126.2 1,058.7 1,000.3 1,072.4 1,178.6 Davao Oriental 703.6 779.2 879.0 1,001.8 1,098.4 1,239.2 1,329.6 1,462.8 Davao Occidental .. .. .. .. .. 734.3 789.1 869.8XII - SOCCSKSARGEN 3,261.2 3,652.1 4,122.2 4,701.2 5,147.3 5,866.1 6,296.8 6,930.6 North Cotabato 1,150.4 1,295.3 1,462.8 1,669.1 1,825.4 2,098.8 2,253.6 2,481.4 Saranggani 596.8 657.7 741.9 845.6 923.2 1,045.0 1,121.6 1,234.3 South Cotabato 751.1 839.1 946.3 1,078.3 1,182.3 1,346.6 1,444.9 1,589.4 Sultan Kudarat 762.9 860.0 971.2 1,108.2 1,216.3 1,375.7 1,476.8 1,625.7XIII - Caraga 2,778.3 3,279.0 3,694.8 4,206.8 4,608.5 5,173.1 5,548.5 6,101.0 Agusan del Norte 497.2 546.8 614.5 697.9 762.9 854.7 915.8 1,005.7 Agusan del Sur 963.6 1,072.0 1,210.5 1,380.9 1,515.8 1,706.8 1,832.1 2,016.4 Dinagat Islands 0.0 324.3 367.3 420.3 461.0 514.4 552.8 609.3 Surigao del Norte 614.5 567.0 636.3 721.8 788.5 889.9 953.1 1,046.0 Surigao del Sur 703.1 768.9 866.2 986.0 1,080.3 1,207.3 1,294.8 1,423.6BARMM 4,148.5 4,089.9 4,629.3 5,293.5 5,810.5 6,759.0 7,262.4 8,003.1 Basilan 533.7 527.0 594.8 678.3 743.5 864.2 927.5 1,020.8 Lanao del Sur 1,268.8 1,282.8 1,452.9 1,662.4 1,828.6 2,096.3 2,252.8 2,483.1 Maguindanao 1,112.2 1,047.6 1,186.6 1,357.7 1,493.1 1,796.2 1,930.2 2,127.5 Sulu 676.2 666.5 754.4 862.5 943.6 1,099.3 1,181.3 1,302.1 Tawi-Tawi 557.6 566.0 640.7 732.6 801.7 903.1 970.5 1,069.7 1 Excludes amount accruing directly to the municipalities and cities in the province.2 Total includes NCR3 Amount accruing directly to the municipalities and cities in the NCR.a 2014 Budget of Expenditures and Sources of Financing, DBM
Source: Department of Budget and Management
15-5

TABLE 15.5 Revenue Collections by Region and by Province: 2012 to 2018 (In million pesos)
Province 2012 2013 2014 2015 2016 2017 2018
Philippines 1,060,256.0 1,217,509.5 1,335,488.9 1,442,060.5 1,575,783.9 1,780,802.8 1,962,642.5NCR 863,437.1 999,368.0 1,087,767.0 1,162,629.9 1,270,357.0 1,426,373.1 1,630,613.4CAR 3,368.3 3,774.7 4,325.8 4,868.7 5,743.5 6,712.0 5,202.1 Abra 237.8 245.9 241.6 317.9 436.6 489.1 356.0 Apayao 1 0.0 0.0 0.0 - - - - Benguet 2,460.0 2,726.6 3,284.3 3,656.5 4,196.5 4,775.8 3,854.2 Ifugao 170.1 193.2 178.9 228.2 263.6 335.8 227.3 Kalinga 330.1 402.0 388.4 449.1 565.0 754.7 513.7 Mt. Province 170.3 206.9 232.7 217.1 281.8 356.6 251.0I - Ilocos Region 7,213.7 8,051.5 8,845.5 9,898.1 11,943.0 14,688.2 12,477.3 Ilocos Norte 963.5 1,090.5 1,210.9 1,385.2 1,629.9 1,890.4 1,505.7 Ilocos Sur 1,006.1 1,091.7 1,209.6 1,293.3 1,589.8 1,936.9 1,792.5 La Union 1,474.9 1,757.7 1,873.4 2,129.6 2,725.2 3,360.5 2,574.6 Pangasinan 3,769.3 4,111.6 4,551.6 5,090.0 5,998.2 7,500.5 6,604.5II - Cagayan Valley 4,551.3 5,860.0 6,498.7 7,583.8 8,936.2 9,958.8 8,283.2 Batanes 2 0.0 0.0 0.0 - - - - Cagayan 1,906.6 2,582.3 3,129.1 3,766.3 4,482.7 5,044.8 3,369.7 Isabela 543.2 790.9 2,453.5 2,788.5 3,248.4 3,417.4 3,800.8 Nueva Vizcaya 1,901.9 2,274.2 692.1 780.0 903.8 1,100.6 831.4 Quirino 199.6 212.7 224.1 248.9 301.3 395.9 281.4III - Central Luzon 20,823.6 25,097.8 29,402.3 31,022.8 35,816.4 43,277.5 40,104.5 Aurora 199.7 226.7 232.5 273.2 344.1 413.5 323.2 Bataan 1,432.2 2,828.7 1,915.0 2,071.6 2,536.9 4,692.1 2,905.6 Bulacan 5,483.3 6,768.4 8,648.3 8,858.9 9,730.0 11,825.2 11,764.0 Nueva Ecija 2,349.0 2,560.4 2,968.3 3,352.7 3,861.1 4,586.9 3,897.7 Pampanga 6,821.1 7,578.6 9,801.9 10,884.2 12,750.3 14,279.4 14,183.7 Tarlac 1,509.5 1,747.1 2,253.2 2,270.7 2,867.0 3,414.1 3,380.6 Zambales 3,028.8 3,387.7 3,583.1 3,311.6 3,727.0 4,066.4 3,649.8IV-A - CALABARZON 31,965.0 36,778.8 42,437.5 48,074.7 54,621.3 64,913.6 61,866.3 Batangas 5,713.5 6,974.7 8,136.1 9,266.7 10,748.3 12,655.3 12,608.0 Cavite 8,762.9 10,564.5 11,897.0 13,898.3 15,774.9 20,216.9 19,135.6 Laguna 12,402.5 13,745.6 16,196.4 17,614.5 20,387.0 22,956.3 22,280.3 Quezon 2,352.3 2,661.4 2,983.7 3,316.1 3,693.8 4,050.7 3,262.3 Rizal 2,733.9 2,832.6 3,224.3 3,979.2 4,017.3 5,034.3 4,580.1MIMAROPA 2,775.4 3,252.8 3,690.5 4,307.2 5,387.8 6,221.4 5,397.2 Marinduque 192.6 212.2 222.1 266.4 263.3 345.0 228.6 Occidental Mindoro 353.1 400.3 485.0 485.1 607.8 733.8 551.2 Oriental Mindoro 747.3 823.0 905.4 1,061.9 1,283.4 1,592.6 1,350.6 Palawan 1,250.6 1,550.7 1,811.3 1,996.5 2,858.0 3,092.1 3,004.8 Romblon 231.9 266.6 266.6 497.4 375.3 458.0 262.0V - Bicol Region 5,530.5 6,397.0 6,955.5 7,766.1 9,223.7 10,801.3 7,700.2 Albay 1,883.2 2,162.9 2,358.2 2,630.8 3,075.4 3,744.2 2,477.8 Camarines Norte 482.8 541.4 593.3 729.0 790.0 881.1 648.6 Camarines Sur 1,911.6 2,223.8 2,381.9 2,596.7 3,189.5 3,595.0 2,880.6 Catanduanes 325.6 366.4 363.5 394.2 448.9 566.4 399.8 Masbate 419.5 491.4 551.2 637.7 738.8 880.3 598.6 Sorsogon 507.9 610.8 707.4 777.6 981.2 1,134.4 694.8VI - Western Visayas 11,265.0 12,478.2 14,573.8 16,118.9 18,684.4 20,848.1 16,778.8 Aklan 1,136.9 1,077.7 1,179.3 1,408.8 1,605.0 2,271.9 1,483.4 Antique 381.6 426.1 487.3 502.8 621.3 728.5 559.4 Capiz 701.5 763.2 898.3 1,016.2 1,179.9 1,300.1 1,062.0 Guimaras 3 - - - - - - - Iloilo 4,264.0 4,968.3 6,110.9 6,183.4 7,319.4 8,003.3 6,339.0 Negros Occidental 4,781.1 5,242.9 5,898.1 7,007.8 7,958.8 8,544.3 7,335.0
Continued
15-7

TABLE 15.5 - - Concluded
Province 2012 2013 2014 2015 2016 2017 2018
VII - Central Visayas 16,489.3 18,883.0 23,361.0 28,077.5 61,919.1 64,746.7 62,768.5 Bohol 1,235.5 1,431.0 1,609.0 1,784.4 2,148.3 2,488.9 2,175.7 Cebu 13,744.4 15,854.2 19,919.6 24,184.1 24,643.1 25,115.9 25,888.4 Negros Oriental 1,509.3 1,597.8 1,832.4 2,109.1 2,356.3 2,652.8 1,973.8 Siquijor 4 - - - - - - - Large Taxpayers District Office - Cebu 18,013.5 21,191.5 27,259.2 34,830.5 32,771.4 34,489.2 32,730.6VIII - Eastern Visayas 4,747.8 5,019.5 5,198.4 6,524.6 7,836.6 9,067.4 6,222.3 Biliran 5 - - - - - - - Eastern Samar 384.4 433.2 401.6 541.4 686.9 781.2 471.9 Leyte 2,934.7 3,089.6 3,140.8 4,031.2 4,742.1 5,560.2 3,932.1 Northern Samar 435.2 449.5 487.8 600.3 716.4 813.9 533.1 Southern Leyte 380.9 419.0 444.3 505.0 604.0 699.2 478.1 Western Samar 612.6 628.2 723.9 846.8 1,087.2 1,213.0 807.2IX - Zamboanga Peninsula 3,626.2 4,028.6 4,349.1 4,858.9 5,861.4 6,493.6 4,725.3 Zamboanga del Norte 825.8 974.2 1,044.0 1,141.4 1,383.3 1,558.0 1,280.9 Zamboanga del Sur 2,800.3 3,054.4 3,305.1 3,717.5 4,478.1 4,303.6 3,035.6 Zamboanga Sibugay 6 - - - - - 632.0 408.9X - Northern Mindanao 7,121.7 8,156.3 9,638.2 10,281.3 11,950.5 12,368.6 9,214.5 Bukidnon 1,027.3 1,144.0 1,321.0 1,497.1 1,699.2 1,986.4 1,714.6 Camiguin 7 - - - - - - - Lanao del Norte 1,131.7 1,385.6 1,472.9 1,536.3 1,682.1 1,731.8 1,305.4 Misamis Occidental 663.0 726.4 807.2 896.2 1,009.4 1,163.8 911.8 Misamis Oriental 4,299.8 4,900.3 6,037.1 6,351.7 7,559.8 7,486.7 5,282.8XI - Davao Region 9,195.4 10,945.7 12,422.6 14,336.3 16,884.5 30,478.2 32,848.0 Compostela Valley 8 - - - - - - - Davao del Norte 1,767.4 2,021.0 2,305.8 2,713.6 3,117.5 3,546.7 2,837.0 Davao del Sur 7,049.8 8,457.0 9,579.7 11,013.0 13,105.3 13,956.4 13,293.7 Davao Oriental 378.2 467.7 537.1 609.7 661.8 721.3 482.9
Large Taxpayers District Office - Davao 12,253.9 16,234.4XII - SOCCSKSARGEN 4,150.4 4,480.6 6,332.9 7,643.5 8,801.5 9,023.3 6,468.0 North Cotabato 661.2 786.5 927.5 1,231.8 1,446.2 1,629.7 1,122.0 Sarangani 9 - - - - - - - South Cotabato 2,507.6 2,826.1 3,440.9 4,221.0 4,872.3 5,043.6 3,960.5 Sultan Kudarat 678.4 696.5 862.3 1,080.4 1,242.7 1,107.1 797.3 Cotabato City 303.1 171.5 1,102.2 1,110.3 1,240.3 1,243.0 588.3XIII - Caraga 3,269.4 3,445.4 3,806.5 4,285.0 5,238.6 5,950.2 4,302.7 Agusan del Norte 1,303.6 1,499.5 1,624.7 1,930.2 2,466.9 2,793.4 1,879.4 Agusan del Sur 612.7 638.0 715.3 746.6 894.6 1,008.3 790.1 Surigao del Norte 666.5 698.3 781.2 820.1 989.1 1,196.5 957.8 Surigao del Sur 686.7 609.6 685.4 788.1 887.9 952.0 675.5BARMM 1,763.0 2,307.4 1,397.0 1,612.4 1,642.0 2,165.0 1,723.2 Basilan 117.7 140.8 159.6 223.5 238.4 338.5 109.9 Lanao del Sur 388.7 477.6 473.3 470.8 490.8 666.4 438.0 Maguindanao 1,092.1 1,446.5 400.6 406.1 457.5 697.4 745.6 Sulu 71.0 99.5 141.3 255.0 231.3 260.3 104.6 Tawi-Tawi 93.5 143.0 222.2 257.0 224.0 202.3 325.2
RDO - Regional District Office; RRO - Revenue Regional Offic 6 Collections reported to RDO in Zamboanga City1 Collections reported to RDO in Tabuk, Kalinga 7 Collections reported to RDO in Cagayan de Oro City2 Collections reported to RDO in Tuguegarao, Cagayan 8 Collections reported to RDO in Tagum, Davao del Norte particularly to RRO in Davao City3 Collections reported to RDO in Iloilo City 9 Collections reported to RDO in Digos, Davao del Sur particularly to RRO in Davao City City4 Collections reported to RDO in Dumaguete City particularly to RRO in Bacolod City5 Collections reported to RDO in Tacloban CitySource: Bureau of Internal Revenue
15-7

TABLE 15.6 Distribution of Total Official Development Assistance (ODA) Loans Net Commitments by Sector/Sub-Sector: CY 2017 and 2018 * (In million US dollar)
CY 2018*
14,442.73 12,301.73 r 2,140.99 14.82Agriculture, Agrarian Reform and Natural Resources 1,568.89 1,688.23 (119.34) (0.83)
Agriculture and Agrarian Reform 1,411.64 1,487.65 (76.02) (0.53)Environment and Natural Resources 157.25 200.58 (43.33) (0.30)
Governance and Institutions Development 1,943.69 1,191.88 r 751.80 5.21Economic Governance 900.00 300.00 600.00 4.15Political Governance 119.25 367.75 r (248.50) (1.72)Public Safety and Disaster Management 924.44 524.13 400.31 2.77
Infrastructure 8,329.05 6,420.52 r 1,908.53 13.21Energy, Power and Electrification 40.24 40.24 0.00 0.00Transportation 6,708.57 4,779.13 r 1,929.44 13.36Urban Infrastructure - 219.81 0.00 0.00Water Resources 1,580.24 1,381.33 r 198.90 1.38
Social Reform and Community Development 2,601.10 3,001.10 (400.00) (2.77)Education and Manpower Development 600.00 600.00 r 0.00 0.00Education Infrastructure 300.00 300.00 0.00 0.00Social Welfare and Community Development 1,701.10 2,101.10 (400.00) (2.77)
* Generated on 25 March 2019** The USD equivalent of the net commitment for closed non-USD denominated loans are based on the average foreign exchange rate (BSP data) during the last reported quarter when the loan is active. Meanwhile for non-USD denominated loans which are newly signed, newly effective or ongoing as of December 2018, the USD equivalent is based on the Q4 2018 foreign exchange rates.
Source: National Economic and Development Authority
TABLE 15.7 Distribution of Official Development Assistance Grants by Development Partner: As of December 2018* (Grant Amount In million US dollar)
Development Partner Grant Count Rank
Total 328 2,400.92 100.00
USA 57 886.47 36.92 1 Australia 53 476.19 19.83 2 UN System** 124 347.61 14.48 3 EU 6 148.74 6.20 4 Japan 11 106.76 4.45 5 China 2 91.18 3.80 6 Korea 12 83.70 3.49 7 ADB 15 74.64 3.11 8 Germany 7 73.12 3.05 9 Canada 17 55.80 2.32 10 WB 10 33.43 1.39 11 New Zealand 3 8.32 0.35 12 Spain 6 8.10 0.34 13 Italy 2 5.55 0.23 14 France 3 1.31 0.05 15
* Grants are updated on a semestral basis. Generated on 25 April 2019.** UN System is composed of FAO, IFAD, ILO, IOM, UN HABITAT, UN WOMEN, UNDP, UNFPA, UNICEF, UNIDO, UNOPS, WFP, and WHO
Source : National Economic and Development Authority
% ShareGrant Amount (USDM)
Sector/Sub-sector Increase/Decrease (in USD)
Increase/Decrease (%)
Total
Net Commitments **
CY 2017r
15-8

TABLE 15.8 National Government Expenditures by Economic Classification: 2016 to 2018 (In million pesos)
Type of Expenditure 2016 (Actual) 2017 (Adjusted) 2018 (Proposed)
National Government Expenditures 2,682,814.9 3,350,000.0 3,767,000.0
A. Current Operating Expense 2,077,443.4 2,556,566.8 2,754,771.9
1. Personnel expenses* 758,157.7 990,480.3 1,074,833.2
2. Maintenance and other operating expenses 1,013,225.1 1,229,228.1 1,324,284.9Travelling expenses 13,147.3 17,792.2 17,056.3Training and scholarship expenses 27,877.4 32,071.8 33,624.0Supplies and materials expenses 72,350.7 88,165.0 94,721.2Utility expenses 11,535.0 13,820.5 14,675.8Communication expenses 5,071.1 9,648.9 8,649.6Awards/Rewards and prizes 574.9 676.8 730.7Survey, research, exploration and development 798.7 1,203.3 1,151.3Demolition/Relocation and desilting/dredging 24.3 85.2 87.3Generation, transmission and distribution 4.0 3.0 0.1Confidential, intelligence and extraordinary 5,483.3 6,685.7 7,368.5Professional services 23,984.3 27,647.0 33,826.2General services 10,514.6 13,506.1 11,290.8Repairs and maintenance 28,869.7 37,478.7 38,667.7Repairs and maintenance of leased assets 987.2 1,000.2 5,795.6Financial assistance/subsidy 729,527.6 887,370.4 972,001.5Taxes, insurance premiums and other fees 31,109.7 22,259.8 23,298.7Labor and wages 1,384.8 1,484.0 1,648.7Other maintenance and operating expenses 49,980.5 68,329.5 59,690.9
3. Financial expenses 306,060.6 336,858.4 355,653.8Interest expenses 304,606.2 335,105.2 354,131.9Bank charges 810.3 1,050.3 818.5Other financial charges 644.1 702.9 703.4
B. Capital Outlays 605,378.1 793,436.0 1,012,228.0Investment 14,332.0 7,544.2 13,585.5Loans 15,958.0 17,525.2 19,300.0Investment Property 568.5 6.9 …Property, plant and equipment 573,141.8 767,562.3 978,204.1Biological assets 180.7 252.3 398.1Intangible assets 1,197.1 545.1 740.3
* - Includes civilian and military/uniformed personnel. Source: Department of Budget and Management, 2016 Budget Expenditures as Source Financing

TABLE 15.9 Government Expenditure Program by Sector: FYs 2017 to 2019
2017a
(Actual)2018a
(Program)2019b
(Proposed)2017a
(Actual)2018a
(Program)2019b
(Proposed)
Total 3,315,326 3,767,000 3,757,022 100.00 100.00 100.00
Social Services 1,211,452 1,425,678 1,376,964 36.54 37.85 36.65 Education, Culture, and Manpower Development 559,565 760,226 693,771 16.88 20.18 18.47 Health 160,439 179,368 149,781 4.84 4.76 3.99 Social Security, Welfare and Employment 269,304 284,075 314,966 8.12 7.54 8.38 Housing and Community Development 39,393 5,874 2,860 1.19 0.16 0.08 Land Distribution - 100 100 0.00 0.00 0.00 Other Social Services 2,604 2,618 2,544 0.08 0.07 0.07 Subsidy to Local Government Units 180,147 193,417 212,943 5.43 5.13 5.67
Economic Services 1,077,395 1,153,602 1,068,432 32.50 30.62 28.44 Agriculture and Agrarian Reform 112,420 142,740 137,138 3.39 3.79 3.65 Natural Resources and Environment 30,305 27,889 26,411 0.91 0.74 0.70 Trade and Industry 11,804 12,440 9,171 0.36 0.33 0.24 Tourism 5,099 6940 4,073 0.15 0.18 0.11 Power and Energy 8,393 7,635 5,676 0.25 0.20 0.15 Water Resources Development and Flood Control 83,113 85,190 72,859 2.51 2.26 1.94 Communications, Roads, and Other Transport 618,162 658,437 578,104 18.65 17.48 15.39 Other Economic Services 37,688 29,369 33,567 1.14 0.78 0.89 Subsidy to Local Government Units 170,410 182,962 201,432 5.14 4.86 5.36
Defense 156,348 161,507 188,150 4.72 4.29 5.01
General Public Services 559,590 655,403 709,405 16.88 17.40 18.88 General Administration 174,754 221,887 218,688 5.27 5.89 5.82 Public Order and Safety 197,442 239,304 286,077 5.96 6.35 7.61 Other General Public Services 51,066 47,842 43,494 1.54 1.27 1.16 Subsidy to Local Government Units 136,328 146,369 161,146 4.11 3.89 4.29
Net Lending - 16,800 14,500 0.00 0.45 0.39
Debt-Service-Interest Payments 310,541 354,010 399,571 9.37 9.40 10.64
a Obligation-basedb Cash-basedNote : Figures may not add-up due to rounding-off
Source: Department of Budget and Management, Budget of Expenditures and Sources of Financing (BESF)
SectorsPercent DistributionLevel
15-10
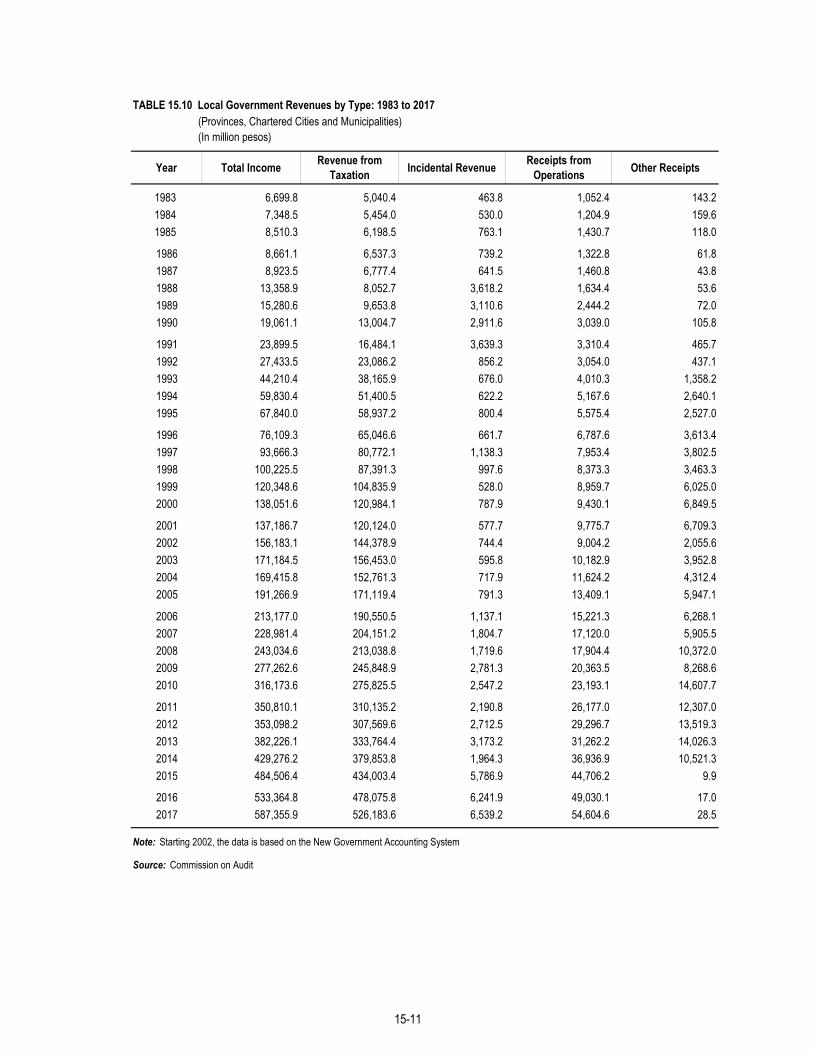
TABLE 15.10 Local Government Revenues by Type: 1983 to 2017 (Provinces, Chartered Cities and Municipalities) (In million pesos)
Year Total Income Revenue from Taxation Incidental Revenue Receipts from
Operations Other Receipts
1983 6,699.8 5,040.4 463.8 1,052.4 143.21984 7,348.5 5,454.0 530.0 1,204.9 159.61985 8,510.3 6,198.5 763.1 1,430.7 118.0
1986 8,661.1 6,537.3 739.2 1,322.8 61.81987 8,923.5 6,777.4 641.5 1,460.8 43.81988 13,358.9 8,052.7 3,618.2 1,634.4 53.61989 15,280.6 9,653.8 3,110.6 2,444.2 72.01990 19,061.1 13,004.7 2,911.6 3,039.0 105.8
1991 23,899.5 16,484.1 3,639.3 3,310.4 465.71992 27,433.5 23,086.2 856.2 3,054.0 437.11993 44,210.4 38,165.9 676.0 4,010.3 1,358.21994 59,830.4 51,400.5 622.2 5,167.6 2,640.11995 67,840.0 58,937.2 800.4 5,575.4 2,527.0
1996 76,109.3 65,046.6 661.7 6,787.6 3,613.41997 93,666.3 80,772.1 1,138.3 7,953.4 3,802.51998 100,225.5 87,391.3 997.6 8,373.3 3,463.31999 120,348.6 104,835.9 528.0 8,959.7 6,025.02000 138,051.6 120,984.1 787.9 9,430.1 6,849.5
2001 137,186.7 120,124.0 577.7 9,775.7 6,709.32002 156,183.1 144,378.9 744.4 9,004.2 2,055.62003 171,184.5 156,453.0 595.8 10,182.9 3,952.82004 169,415.8 152,761.3 717.9 11,624.2 4,312.42005 191,266.9 171,119.4 791.3 13,409.1 5,947.1
2006 213,177.0 190,550.5 1,137.1 15,221.3 6,268.12007 228,981.4 204,151.2 1,804.7 17,120.0 5,905.52008 243,034.6 213,038.8 1,719.6 17,904.4 10,372.02009 277,262.6 245,848.9 2,781.3 20,363.5 8,268.62010 316,173.6 275,825.5 2,547.2 23,193.1 14,607.7
2011 350,810.1 310,135.2 2,190.8 26,177.0 12,307.02012 353,098.2 307,569.6 2,712.5 29,296.7 13,519.32013 382,226.1 333,764.4 3,173.2 31,262.2 14,026.32014 429,276.2 379,853.8 1,964.3 36,936.9 10,521.32015 484,506.4 434,003.4 5,786.9 44,706.2 9.9
2016 533,364.8 478,075.8 6,241.9 49,030.1 17.02017 587,355.9 526,183.6 6,539.2 54,604.6 28.5
Note: Starting 2002, the data is based on the New Government Accounting System
Source: Commission on Audit
15-11

Table 15.11 Comparative Schedule of Income and Expenditures for Local Government Units, All Funds: 2009 to 2017 (In million pesos)
2009 2010 2011 2012 2013 2014 2015 2016 2017
Income 277,262 316,174 350,810 353,098 382,226 429,276 484,506 533,365 587,356
Tax Revenue 245,848.9 275,825.6 310,135.2 307,569.6 333,764.4 379,853.8 434,003.4 478,075.8 526,183.6
Operating & miscellaneous revenues 20,363.5 23,193.1 26,177.0 29,296.7 31,262.2 36,936.9 44,706.2 49,030.1 54,604.6Capital Revenue - - - - - - - - -Grants 2,781.3 2,547.2 2,190.8 2,712.5 3,173.2 1,964.3 5,786.9 6,241.9 6,539.2
Extraordinary income 8,268.6 14,607.7 12,307.0 13,519.3 14,026.3 10,521.3 9.9 17.0 28.5
Borrowings 1/ 1/ 1/ 1/ 1/ 1/ 1/ 1/ 1/
Expenditures 203,203.1 233,659.4 258,452.8 273,558.8 290,447.2 306,128.8 330,929.0 387,895.7 420,692.9
Personal Services 98,357.3 111,886.3 123,993.7 131,956.5 141,870.5 143,234.9 145,319.4 158,403.3 167,735.3
Maintenance and otheroperating expenses 104,845.8 121,773.1 134,459.1 141,602.3 148,576.7 162,893.9 180,935.2 194,707.3 213,278.4
Non-cash Expenses … … … … … … 4,674.4 29,926.6 35,026.4
Financial Expenses .. .. .. .. .. .. .. 4,858.5 4,652.8
Capital Outlay 1/ 1/ 1/ 1/ 1/ 1/ 1/ 1/ 1/
1/ Based on the New Government Accounting System, no data is available.
Source : Commission on Audit
Income and Expenditure
15-12
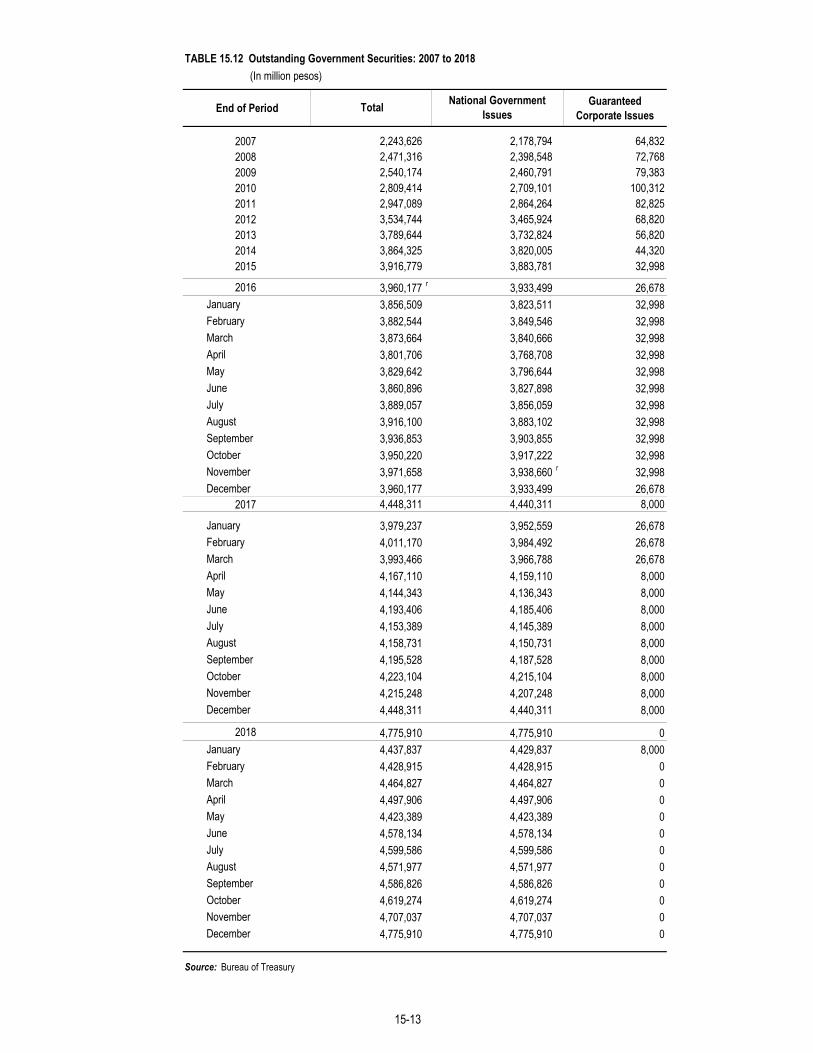
TABLE 15.12 Outstanding Government Securities: 2007 to 2018 (In million pesos)
End of Period Guaranteed Corporate Issues
2007 2,243,626 2,178,794 64,8322008 2,471,316 2,398,548 72,7682009 2,540,174 2,460,791 79,3832010 2,809,414 2,709,101 100,3122011 2,947,089 2,864,264 82,8252012 3,534,744 3,465,924 68,8202013 3,789,644 3,732,824 56,8202014 3,864,325 3,820,005 44,3202015 3,916,779 3,883,781 32,998
2016 3,960,177 r 3,933,499 26,678 January 3,856,509 3,823,511 32,998 February 3,882,544 3,849,546 32,998 March 3,873,664 3,840,666 32,998 April 3,801,706 3,768,708 32,998 May 3,829,642 3,796,644 32,998 June 3,860,896 3,827,898 32,998 July 3,889,057 3,856,059 32,998 August 3,916,100 3,883,102 32,998 September 3,936,853 3,903,855 32,998 October 3,950,220 3,917,222 32,998 November 3,971,658 3,938,660 r 32,998 December 3,960,177 3,933,499 26,678
2017 4,448,311 4,440,311 8,000
January 3,979,237 3,952,559 26,678 February 4,011,170 3,984,492 26,678 March 3,993,466 3,966,788 26,678 April 4,167,110 4,159,110 8,000 May 4,144,343 4,136,343 8,000 June 4,193,406 4,185,406 8,000 July 4,153,389 4,145,389 8,000 August 4,158,731 4,150,731 8,000 September 4,195,528 4,187,528 8,000 October 4,223,104 4,215,104 8,000 November 4,215,248 4,207,248 8,000 December 4,448,311 4,440,311 8,000
2018 4,775,910 4,775,910 0 January 4,437,837 4,429,837 8,000 February 4,428,915 4,428,915 0 March 4,464,827 4,464,827 0 April 4,497,906 4,497,906 0 May 4,423,389 4,423,389 0 June 4,578,134 4,578,134 0 July 4,599,586 4,599,586 0 August 4,571,977 4,571,977 0 September 4,586,826 4,586,826 0 October 4,619,274 4,619,274 0 November 4,707,037 4,707,037 0 December 4,775,910 4,775,910 0
Source: Bureau of Treasury
Total National Government Issues
15-13

TABLE 15.13 Number of Government Personnel by Region: 2016 to 2018
Region
Philippines
NCR 386,514 403,134CAR 43,447 48,712I-Ilocos Region 84,822 85,823II-Cagayan Valley 68,675 73,508III-Central Luzon 147,433 153,788IV-Southern Tagalog 216,517 236,927V-Bicol Region 89,490 98,580VI-Western Visayas 107,346 131,128VII-Central Visayas 100,853 90,053VIII-Eastern Visayas 86,611 101,415IX-Zamboanga Peninsula 46,750 60,730X-Northern Mindanao 77,858 84,608XI-Davao Region 64,587 72,626XII-SOCCSKSARGEN 63,593 76,944XIII-Caraga 54,391 61,270BARMM 67,142 59,786
Note: FY 2017 and FY 2018 exclusive of third level
TABLE 15.14 Number of Government Personnel by Category of Service: 2016 to 2018
Total NGA GOCC LGU SUC LWD
Total 1,706,029 1,835,118 1,839,032 1,273,083 75,130 409,716 63,436 17,667
Career 1,526,450 1,647,891 1,652,748 1,225,568 65,140 289,450 57,941 14,649Non-Career 179,579 187,227 186,284 47,515 9,990 120,266 5,495 3,018
TABLE 15.15 Number of Government Personnel by Major Subdivision, by Sex: 2016 to 2018
Male Female Male Female Male Female Total 679,740 1,026,289 539,489 900,385 722,643 1,116,389
NGA 401,029 755,606 452,229 818,265 435,319 837,764GOCC 35,947 37,819 35,428 39,083 35,771 39,359LGU 201,885 195,444 29,541 33,500 29,713 33,723SUC 28,373 32,643 12,710 4,765 12,863 4,804LWD 12,506 4,777 9,581 4,772 208,977 200,739
Note: 1. Major Subdivision is composed of career and non-career service. 2. Only non-career personnel sex-disaggregated data for each major subdivision is available in 2010.
A total of 489,258 male and 772,027 female career service personnel can be attributed to the major subdivision.a Estimate based on 2010 IGP as updated by accession-separation datab As of 01 July 2016c As of 31 August 2017Source: Civil Service Commission
2017 c 2018 c
Category of Service 2016 b 2017 a
Major Subdivision 2016 b
2016 b 2017 c 2018 c
1,835,118
428,62748,703
75,335
85,13373,500
150,980233,36894,709
119,402
59,82359,824
1,839,0321,706,029
2018 c
89,93696,94860,64284,57573,613
15-14

TABLE 15.16 Number of Provinces, Cities, Municipalities, and Barangays by Region: As of 30 June 2019
NumberProvince City Municipality Barangay
Philippines 81 145 1,489 42,045
NCR - 16 1 1,710 CAR 6 2 75 1,177 Abra - 27 303 Apayao - 7 133 Benguet - 13 140 Baguio City 1 - 129 Ifugao - 11 176 Kalinga 1 7 152 Mountain Province - 10 144 I Ilocos Region 4 9 116 3,267 Ilocos Norte 2 21 559 Ilocos Sur 2 32 768 La Union 1 19 576 Pangasinan 4 44 1,364 II Cagayan Valley 5 4 89 2,311 Batanes - 6 29 Cagayan 1 28 820 Isabela 3 34 1,055 Nueva Vizcaya - 15 275 Quirino - 6 132 III Central Luzon 7 14 116 3,102 Aurora a - 8 151 Bataan 1 11 237 Bulacan 3 21 569 Nueva Ecija 5 27 849 Pampanga 2 19 505 Angeles City 1 - 33 Tarlac 1 17 511 Zambales - 13 230 Olongapo City 1 - 17 IV-A CALABARZON 5 19 123 4,019 Batangas 3 31 1,078 Cavite 7 16 829 Laguna 6 24 681 Quezon 1 39 1,209 Lucena City 1 - 33 Rizal 1 13 189 MIMAROPA 5 2 71 1,460 Marinduque - 6 218 Occidental Mindoro - 11 164 Oriental Mindoro 1 14 426 Palawan - 23 367 Puerto Princesa City (Capital) 1 - 66 Romblon - 17 219
Continued
Region

TABLE 15.16 --Continued
NumberProvince City Municipality Barangay
V Bicol Region 6 7 107 3,471 Albay 3 15 720 Camarines Norte - 12 282 Camarines Sur 2 35 1,063 Catanduanes - 11 315 Masbate 1 20 550 Sorsogon 1 14 541 VI Western Visayas 6 16 117 4,051 Aklan - 17 327 Antique - 18 590 Capiz 1 16 473 Guimaras - 5 98 Iloilo 1 42 1,721 Iloilo City (Capital) 1 - 180
Negros Occidental 12 19 601 Bacolod City (Capital) 1 - 61 VII Central Visayas 4 16 116 3,003 Bohol 1 47 1,109 Cebu 6 44 1,066 Cebu City (Capital) 1 - 80 Lapu-lapu City (Opon) 1 - 30 Mandaue City 1 - 27 Siquijor - 6 134
Negros Oriental 6 19 557 VIII Eastern Visayas 6 7 136 4,390 Biliran - 8 132 Eastern Samar 1 22 597 Leyte 2 40 1,503 Tacloban City 1 - 138 Northern Samar - 24 569 Southern Leyte 1 18 500 Samar (Western Samar) 2 24 951 IX Zamboanga Peninsula 3 5 67 1,904 Zamboanga del Norte 2 25 691 Zamboanga del Sur 1 26 681 Zamboanga City 1 - 98 Zamboanga Sibugay - 16 389 City of Isabela 1 - 45 X Northern Mindanao 5 9 84 2,022 Bukidnon 2 20 464 Camiguin - 5 58 Lanao del Norte - 22 462 Iligan City 1 - 44 Misamis Occidental 3 14 490 Misamis Oriental 2 23 424 Cagayan de Oro City (Capital) 1 - 80
Continued
Region
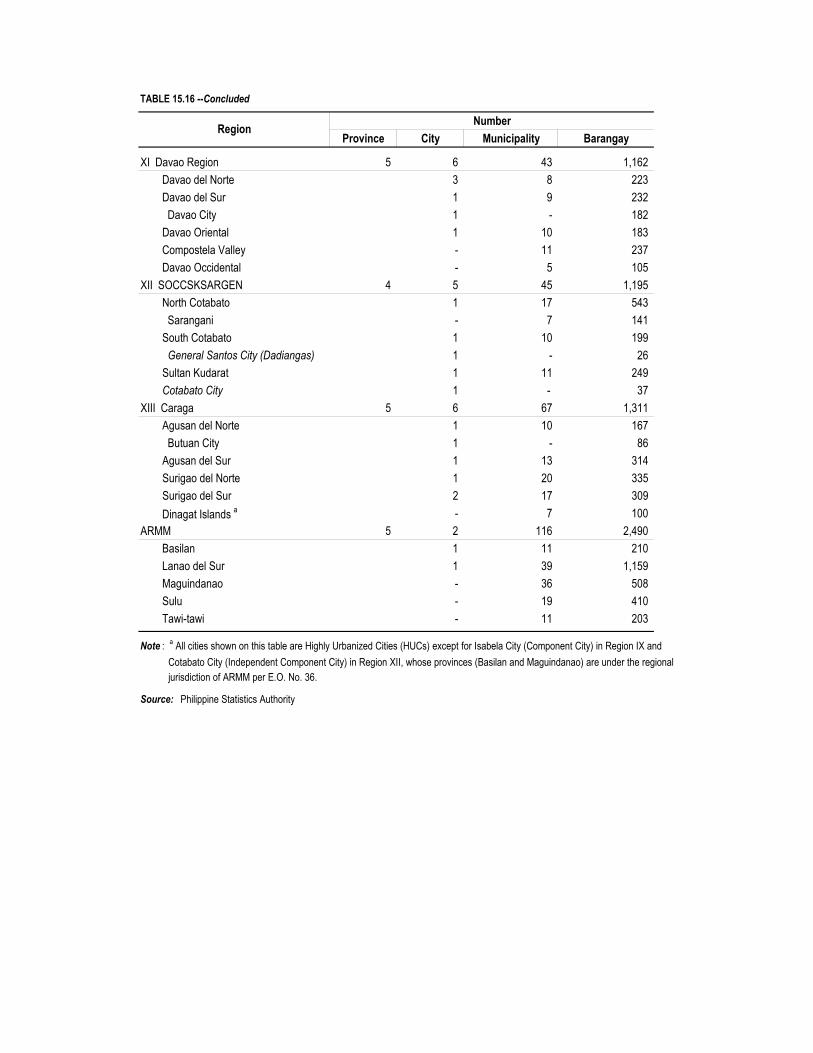
TABLE 15.16 --Concluded
NumberProvince City Municipality Barangay
XI Davao Region 5 6 43 1,162 Davao del Norte 3 8 223 Davao del Sur 1 9 232 Davao City 1 - 182 Davao Oriental 1 10 183 Compostela Valley - 11 237 Davao Occidental - 5 105 XII SOCCSKSARGEN 4 5 45 1,195 North Cotabato 1 17 543 Sarangani - 7 141 South Cotabato 1 10 199 General Santos City (Dadiangas) 1 - 26 Sultan Kudarat 1 11 249 Cotabato City 1 - 37 XIII Caraga 5 6 67 1,311 Agusan del Norte 1 10 167 Butuan City 1 - 86 Agusan del Sur 1 13 314 Surigao del Norte 1 20 335 Surigao del Sur 2 17 309 Dinagat Islands a - 7 100 ARMM 5 2 116 2,490 Basilan 1 11 210 Lanao del Sur 1 39 1,159 Maguindanao - 36 508 Sulu - 19 410 Tawi-tawi - 11 203
Note : a All cities shown on this table are Highly Urbanized Cities (HUCs) except for Isabela City (Component City) in Region IX and Cotabato City (Independent Component City) in Region XII, whose provinces (Basilan and Maguindanao) are under the regional jurisdiction of ARMM per E.O. No. 36.
Source: Philippine Statistics Authority
Region

TABLE 15.17 Comparative Statistics per Elective Position: 2010, 2013, 2016 and 2019 (National and local elections)
2010 2013
Seats Candidates Elected Seats Candidates Elected Seats Candidates Elected Seats Candidates Elected
Total 17,996 50,268 17,747 18,054 44,478 17,911 18,083 44,872 18,024 18,071 43,554 13
President 1 9 1 - - - 1 6 1 - - -
Vice-President 1 8 1 - - - 1 6 1 - - -
Senator 12 61 12 12 33 12 12 50 12 12 62 13
Party-List 57 187 … 58 123 … 59 115 … 61 134*
Representative 229 801 229 234 630 234 238 634 238 244 633
Governor 80 291 80 80 202 80 81 275 81 81 273
Vice-Governor 80 241 80 80 191 80 81 206 81 81 185
Board Member 766 2,041 765 766 1,755 766 776 1,813 776 780 1,733
City/Municipal Mayor 1,634 4,534 1,619 1,634 3,923 1,627 1,634 4,158 1,634 1,634 3,986
City/Municipal Vice-Mayor 1,634 4,337 1,618 1,634 3,823 1,627 1,634 3,796 1,634 1,634 3,618
City/Municipal Councilor 13,502 37,758 13,342 13,530 33,704 13,459 13,540 33,737 13,540 13,544 33,064
ARMM Regional Governor - - - 1 6 1 1 4 1 - -
ARMM Regional Vice - -
Governor - - - 1 8 1 1 4 1 - -
ARMM Regional - -
Assemblyman - - - 24 80 24 24 68 24 - -
* The total for both sexes excludes the number of Party-List
Source: Commission on Elections
Elective Positions2016 2019
15-18

TABLE 15.18 Number of Registered Voters, Voters Who Actually Voted, and Voter's Turnout by Region: 2007, 2010, 2013, and 2016 (National and local elections)
2010 2013 2016 2019 2010 2013 2016 2019 2010 2013 2016 2019 2010 2013 2016 2019
Philippines 76,347 77,829 92,509 85,786 50,899,154 52,014,648 54,363,844 61,843,750 38,169,500 40,214,324 44,549,848 21,435,609 74.99 77.31 81.95 82.38
NCR 7,555 7,509 9,271 8,298 6,178,966 5,995,904 6,253,249 7,074,603 4,267,563 4,220,571 4,916,589 2,217,969 69.07 70.39 78.62 78.97
CAR 1,785 1,828 1,983 1,861 905,010 924,751 906,162 1,013,418 691,152 718,902 755,772 382,601 76.37 77.74 83.40 83.65
I-Ilocos Region 4,560 4,623 5,376 4,996 2,808,712 2,865,115 2,950,775 3,331,394 2,277,651 2,364,308 2,525,358 1,246,423 81.09 82.52 85.58 85.62
II-Cagayan Valley 3,097 3,114 3,594 3,384 1,833,137 1,871,822 1,920,952 2,194,418 1,386,611 1,475,903 1,594,813 799,129 75.64 78.85 83.02 83.13
III-Central Luzon 7,640 7,903 9,511 8,654 5,675,830 5,822,678 6,056,392 6,829,661 4,330,837 4,544,930 4,989,374 2,367,048 76.30 78.06 82.38 82.68
IV-A-CALABARZON 9,318 9,858 12,074 11,097 6,771,140 7,205,067 7,619,272 8,674,351 4,922,361 5,197,200 5,928,566 2,735,612 72.70 72.13 77.81 78.29
MIMAROPA 2,346 2,421 2,832 2,697 1,475,268 1,552,520 1,589,326 1,831,328 1,110,730 1,198,683 1,294,666 631,765 75.29 77.21 81.46 81.82
V-Bicol Region 4,767 4,880 5,695 5,411 2,874,126 3,037,795 3,121,662 3,647,711 2,309,242 2,489,711 2,644,179 1,273,334 80.35 81.96 84.70 85.06
VI-Western Visayas 6,406 6,465 7,658 7,109 3,939,551 4,049,640 4,242,153 4,808,839 3,105,590 3,318,423 3,583,332 1,067,499 78.83 81.94 84.47 85.29
VII-Central Visayas 5,561 5,742 7,048 6,503 3,942,460 4,114,046 4,375,756 4,946,354 3,119,638 3,358,840 3,726,874 1,458,966 79.13 81.64 85.17 86.23
VIII-Eastern Visayas 5,110 5,173 5,754 5,503 2,441,324 2,576,229 2,698,880 3,051,649 1,957,000 2,146,545 2,310,252 1,158,379 80.16 83.32 85.60 85.82
IX-Zamboanga Peninsula 2,854 2,968 3,410 3,142 1,861,565 1,981,427 1,931,795 2,193,033 1,299,848 1,439,050 1,498,007 733,576 69.83 72.63 77.54 77.97
X-Northern Mindanao 3,624 3,701 4,341 4,037 2,425,957 2,458,123 2,541,331 2,855,792 1,851,263 1,948,303 2,108,036 1,041,445 76.31 79.26 82.95 83.98
XI-Davao Region 3,431 3,501 4,108 3,777 2,570,106 2,660,156 2,659,704 3,026,393 1,786,807 1,886,823 2,154,052 1,072,841 69.52 70.93 80.99 81.71
XII-SOCCSKSARGEN 2,769 2,807 3,438 3,207 1,995,877 1,985,062 2,086,112 2,431,265 1,375,269 1,501,294 1,669,116 845,929 68.91 75.63 80.01 80.78
XIII-Caraga 2,145 2,212 3,669 2,486 1,383,595 1,445,729 1,547,093 1,760,582 1,097,718 1,196,095 1,318,722 659,513 79.34 82.73 85.24 85.47
ARMM 3,379 3,124 3,747 3,624 1,816,530 1,468,584 1,863,230 2,172,959 1,280,220 1,208,743 1,532,140 749,409 70.48 82.31 82.23 82.85
Negros Island Region … … … … … … … … … … … 994,171 … … … 84.12
Source: Commission on Elections
Number of Registered VotersRegion
Voters Who Actually Voted Voters' Turn-Out (%)Number of Clustered Precincts


TABLE 16.1 Broad Money Liabilities and its Origin (SRF-Based) : 2014 to 2018 16 - 3
TABLE 16.2 Factors Affecting Broad Money Liabilities(SRF-Based): 2014 to 2018 16 - 4
TABLE 16.3 Broad Money Liabilities and its Composition: 2014 to 2018 16 - 5
TABLE 16.4 Total Liabilities of Depository Corporations by Composition (SRF-Based): 2015 to 2018 16 - 6
TABLE 16.5 Overseas Filipino's Remittances by Country of Source: 2014 to 2018 16 - 7
TABLE 16.6 Total Loans, Non-Performing Loans, and Loan Loss Provisions: 2010 to 2018 16 - 10
TABLE 16.7 Total Resources of the Philippine Financial System: 2011 to 2018 16 - 11
TABLE 16.8 Total Assets and Total Liabilities of the Philippines Banking System: 2007 to 2018 16 - 12
TABLE 16.9 Number of Financial Institutions: 2010 to 2018 16 - 13
TABLE 16.10 Number of Closed and Merged Banks: 2006 to 2015 16 - 14
TABLE 16.11 Financial Performance of the Philippine Deposit Insurance Corporation: 2004 to 2018 16 - 14
TABLE 16.12 Status of Claims Settlement Operations in Closed Banks: 2011 to 2018 16 - 15
TABLE 16.13 Financial Condition of the Government Service Insurance System: 1996 to 2018 16 - 16
TABLE 16.14 Statement of Loans and Equities Approved and Total Resources of the Development Bank of the Philippines: 2000 to 2018 16 - 17
TABLE 16.15 Investments of the Government Service Insurance System: 1982 to 2018 16 - 18
TABLE 16.16 Cash Receipts and Disbursement of the Government Service Insurance System: 1981 to 2017 16 - 19
TABLE 16.17 Expenditures of the Social Security System by Fund: 1987 to 2018 16 - 20
TABLE 16.18 Assets, Investments and Earnings of the Social Security System: 1987 to 2018 16 - 21
TABLE 16.19 Revenues of the Social Security System by Fund: 1987 to 2018 16 - 22
TABLE 16.20 Revenues, Expenditures, and Trust Fund Generated from the Operations
of the Social Security System: 1986 to 2017 16 - 23
TABLE 16.21 Investments Portfolio of the Social Security System: 1987 to 2018 16 - 24
TABLE 16.22 Balance of Payments: 2015 to 2018 16 - 25
TABLE 16.23 Peso per U.S. Dollar Rate: January 2008 to December 2018 16 - 26
TABLE 16.24 Selected Domestic Interest Rates: 2003 to 2018 16 - 27
TABLE 16.25 Number of Insurance Companies Authorized to Transact Business in the Philippines: 2009 to 2018 16 - 28

TABLE 16.1 Broad Money Liabilities and its Origin (SRF-Based) : 2014 to 2018 1
(In million pesos)
End of Period
2014 7,396,350 3,752,168 7,052,978 1,119,053 5,933,925 1,346,841 1,754,3832015 8,067,273 3,998,783 7,861,026 1,261,692 6,599,334 1,458,789 1,971,0922016 9,505,978 4,309,018 9,199,882 1,603,047 7,596,834 1,708,583 2,294,3392017
January 9,381,195 4,422,871 9,143,867 1,575,908 7,567,959 1,708,225 2,477,319February 9,448,067 4,458,354 9,249,725 1,615,498 7,634,226 1,730,029 2,529,982March 9,544,733 4,378,067 9,404,991 1,664,605 7,740,386 1,743,458 2,494,866April 9,543,670 4,352,209 9,311,421 1,516,928 7,794,493 1,729,260 2,390,700May 9,652,819 4,368,600 9,449,790 1,548,710 7,901,081 1,759,908 2,405,663June 9,898,176 4,416,268 9,622,838 1,614,796 8,008,042 1,760,226 2,380,705 July 10,004,460 4,472,256 9,752,201 1,651,513 8,100,688 1,798,255 2,421,742 August 10,106,549 4,589,856 9,868,583 1,638,341 8,230,242 1,853,823 2,498,067 September 10,173,648 4,499,979 10,037,141 1,638,918 8,398,223 1,878,868 2,484,603 October 10,293,991 r 4,592,066 r 10,110,933 r 1,655,212 r 8,455,721 r 1,875,693 r 2,533,314 r
November 10,380,239 r 4,425,023 r 10,249,987 r 1,654,611 r 8,595,376 r 1,888,787 r 2,405,984 r
December 10,636,069 r 4,403,326 r 10,476,875 r 1,635,469 r 8,841,406 r 1,850,580 r 2,393,462 r
2018January 10,600,467 4,369,140 10,427,841 1,628,883 8,798,958 1,917,591 2,548,923 February 10,735,994 4,665,685 10,562,139 1,671,016 8,891,123 1,921,371 2,570,460 March 10,919,092 4,621,732 10,792,733 1,778,049 9,014,684 1,876,384 2,618,990 April 10,905,992 4,533,656 10,874,463 1,710,350 9,164,113 1,874,286 2,627,841 May 11,039,096 4,604,137 11,077,473 1,810,669 9,266,804 1,897,036 2,745,478 June 11,067,458 4,539,316 11,204,026 1,816,195 9,387,831 1,894,138 2,781,746 July 11,117,680 4,479,128 11,352,613 1,853,982 9,498,631 1,932,205 2,781,857 August 11,169,660 4,531,896 11,378,380 1,779,931 9,598,449 1,920,492 2,820,124 September 11,179,447 4,460,019 11,540,062 1,825,736 9,714,327 1,954,015 2,866,620 October 11,173,516 4,360,860 11,672,602 1,846,338 9,826,264 1,972,391 2,887,556 November 11,286,149 4,284,245 11,770,598 1,860,819 9,909,779 1,964,290 2,804,403 December 11,642,999 4,460,945 12,034,990 1,911,110 10,123,880 1,967,342 2,885,595
1 SRF - Based on the Standardized Report Forms (SRFs), a unified framework for reporting monetary and financial statistics to the International Monetary Fund (IMF).2 M3 may also be derived as Net Foreign Assets + Domestic Claims, net of Liabilities excluded from broad money and transferable and other deposits in foreign currency
(FCSDs-Residents).Source: Bangko Sentral ng Pilipinas
Transferable & Other Deposits in Foreign
Currency of Residents
Liabilities Excluded from Broad Money
Broad Money (M3)2
Net Foreign Assets
Domestic Claims
Net Claims on Central
Government
Claims on Other Sectors
16-1
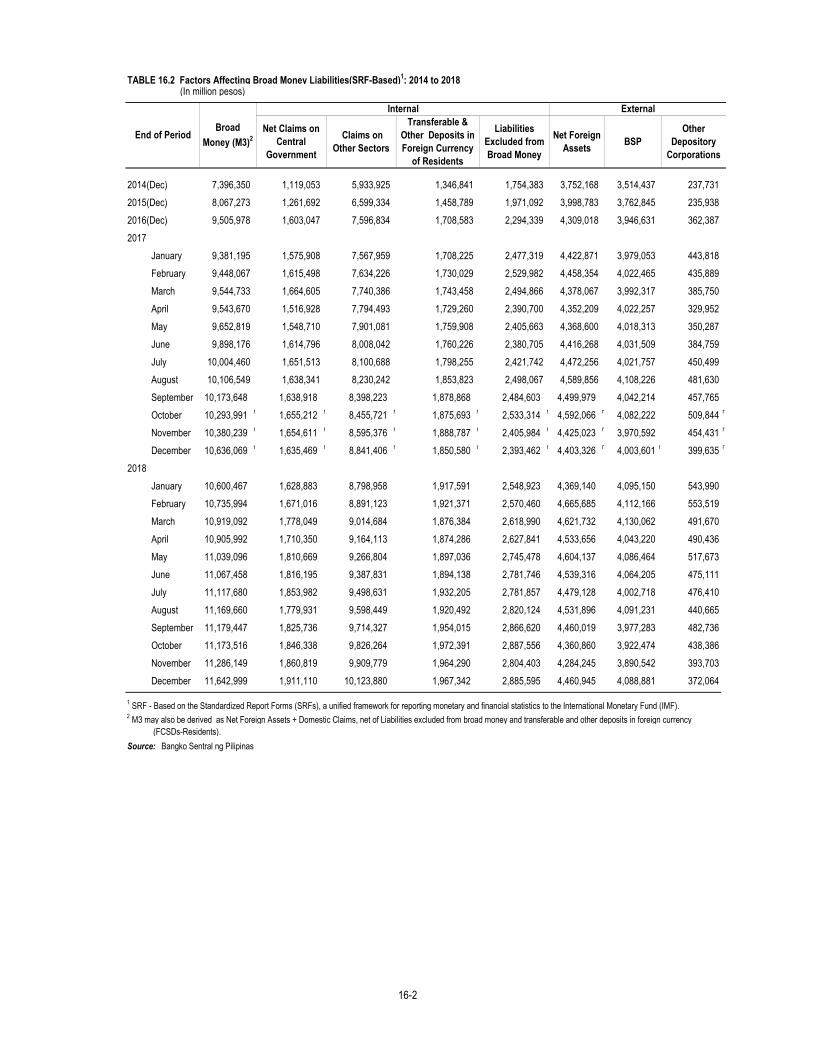
TABLE 16.2 Factors Affecting Broad Money Liabilities(SRF-Based)1: 2014 to 2018 (In million pesos)
2014(Dec) 7,396,350 1,119,053 5,933,925 1,346,841 1,754,383 3,752,168 3,514,437 237,7312015(Dec) 8,067,273 1,261,692 6,599,334 1,458,789 1,971,092 3,998,783 3,762,845 235,9382016(Dec) 9,505,978 1,603,047 7,596,834 1,708,583 2,294,339 4,309,018 3,946,631 362,3872017
January 9,381,195 1,575,908 7,567,959 1,708,225 2,477,319 4,422,871 3,979,053 443,818February 9,448,067 1,615,498 7,634,226 1,730,029 2,529,982 4,458,354 4,022,465 435,889March 9,544,733 1,664,605 7,740,386 1,743,458 2,494,866 4,378,067 3,992,317 385,750April 9,543,670 1,516,928 7,794,493 1,729,260 2,390,700 4,352,209 4,022,257 329,952May 9,652,819 1,548,710 7,901,081 1,759,908 2,405,663 4,368,600 4,018,313 350,287June 9,898,176 1,614,796 8,008,042 1,760,226 2,380,705 4,416,268 4,031,509 384,759July 10,004,460 1,651,513 8,100,688 1,798,255 2,421,742 4,472,256 4,021,757 450,499August 10,106,549 1,638,341 8,230,242 1,853,823 2,498,067 4,589,856 4,108,226 481,630September 10,173,648 1,638,918 8,398,223 1,878,868 2,484,603 4,499,979 4,042,214 457,765October 10,293,991 r 1,655,212 r 8,455,721 r 1,875,693 r 2,533,314 r 4,592,066 r 4,082,222 509,844 r
November 10,380,239 r 1,654,611 r 8,595,376 r 1,888,787 r 2,405,984 r 4,425,023 r 3,970,592 454,431 r
December 10,636,069 r 1,635,469 r 8,841,406 r 1,850,580 r 2,393,462 r 4,403,326 r 4,003,601 r 399,635 r
2018January 10,600,467 1,628,883 8,798,958 1,917,591 2,548,923 4,369,140 4,095,150 543,990February 10,735,994 1,671,016 8,891,123 1,921,371 2,570,460 4,665,685 4,112,166 553,519March 10,919,092 1,778,049 9,014,684 1,876,384 2,618,990 4,621,732 4,130,062 491,670April 10,905,992 1,710,350 9,164,113 1,874,286 2,627,841 4,533,656 4,043,220 490,436May 11,039,096 1,810,669 9,266,804 1,897,036 2,745,478 4,604,137 4,086,464 517,673June 11,067,458 1,816,195 9,387,831 1,894,138 2,781,746 4,539,316 4,064,205 475,111July 11,117,680 1,853,982 9,498,631 1,932,205 2,781,857 4,479,128 4,002,718 476,410August 11,169,660 1,779,931 9,598,449 1,920,492 2,820,124 4,531,896 4,091,231 440,665September 11,179,447 1,825,736 9,714,327 1,954,015 2,866,620 4,460,019 3,977,283 482,736October 11,173,516 1,846,338 9,826,264 1,972,391 2,887,556 4,360,860 3,922,474 438,386November 11,286,149 1,860,819 9,909,779 1,964,290 2,804,403 4,284,245 3,890,542 393,703December 11,642,999 1,911,110 10,123,880 1,967,342 2,885,595 4,460,945 4,088,881 372,064
1 SRF - Based on the Standardized Report Forms (SRFs), a unified framework for reporting monetary and financial statistics to the International Monetary Fund (IMF).2 M3 may also be derived as Net Foreign Assets + Domestic Claims, net of Liabilities excluded from broad money and transferable and other deposits in foreign currency
(FCSDs-Residents).Source: Bangko Sentral ng Pilipinas
Liabilities Excluded from Broad Money
Net Foreign Assets BSP
Internal External
Other Depository
Corporations
End of PeriodBroad
Money (M3)2Net Claims on
Central Government
Claims on Other Sectors
Transferable & Other Deposits in Foreign Currency
of Residents
16-2

TABLE 16.3 Broad Money Liabilities and its Composition: 2014 to 2018 (In million pesos)
End of PeriodSecurities Other than
Shares Included in Broad Money
2014 (Dec) 713,718 1,602,642 3,191,752 1,888,238 307,5722015 (Dec) 791,431 1,876,179 3,586,873 1,812,790 362,6562016 (Dec) 920,954 2,148,505 4,100,820 1,970,167 365,5322017
December 1,047,576 r 2,503,254 r 4,409,286 r 2,242,187 r 433,766 r
2018January 982,200 2,560,905 4,374,520 2,248,255 434,587 February 991,916 2,589,446 4,426,578 2,289,748 438,306 March 1,056,668 2,609,525 4,477,067 2,337,510 438,322 April 1,053,850 1,667,834 4,437,022 2,307,888 439,398 May 1,059,495 2,693,366 4,551,981 2,274,783 459,471 June 1,050,494 2,684,582 4,580,356 2,301,068 450,959 July 1,029,224 2,698,333 4,628,570 2,290,988 470,565 August 1,041,619 2,641,765 4,700,772 2,311,539 473,965 September 1,065,917 2,650,034 4,691,890 2,299,266 472,340 October 1,092,742 2,622,385 4,670,112 2,290,000 498,277 November 1,124,409 2,648,731 4,629,172 2,375,736 508,101 December 1,231,841 2,657,204 4,672,532 2,518,617 562,804
Source: Bangko Sentral ng Pilipinas
Currency Outside Depository
Corporations
Transferable Deposits Included in
Broad MoneySavings Deposit Time Deposit
16-3

TABLE 16.4 Total Liabilities of Depository Corporations by Composition (SRF-Based)1: 2015 to 2018 (In million pesos)
2015 9,888,718 8,429,929 1,876,179 r 1,971,0922016 11,214,561 9,505,978 1,708,583 2,294,3392017
January 11,089,420 9,381,195 1,708,225 2,477,319February 11,178,096 9,448,067 1,730,029 2,529,982March 11,288,191 9,544,733 1,743,458 2,494,866April 11,272,930 9,543,670 1,729,260 2,390,700May 11,412,727 9,652,819 1,759,908 2,405,663June 11,658,402 9,898,176 1,760,226 2,380,705July 11,802,715 10,004,460 1,798,255 2,421,742August 11,960,372 10,106,549 1,853,823 2,498,067September 12,052,517 10,173,648 1,878,868 2,484,603October 12,169,685 r 10,293,991 r 1,875,693 r 2,533,314 r
November 12,269,026 r 10,380,239 r 1,888,787 r 2,405,984 r
December 12,486,649 r 10,636,069 r 1,850,580 r 2,393,462 r
2018January 12,518,058 10,600,467 1,917,591 2,548,923February 12,657,365 10,735,994 1,921,371 2,570,460March 12,795,476 10,919,092 1,876,384 2,618,990April 12,780,278 10,905,992 1,874,286 2,627,841May 12,936,132 11,039,096 1,897,036 2,745,478June 12,961,596 11,067,458 1,894,138 2,781,746July 13,049,885 11,117,680 1,932,205 2,781,857August 13,090,152 11,169,660 1,920,492 2,820,124September 13,133,461 11,179,447 1,954,015 2,866,620October 13,145,906 11,173,516 1,972,391 2,887,556November 13,250,440 11,286,149 1,964,290 2,804,403December 13,610,341 11,642,999 1,967,342 2,885,595
1 SRF - Standardized Report Forms, a unified framework for reporting monetary and financial statistics to the International Monetary Fund.
Source: Bangko Sentral ng Pilipinas
PeriodM4 M3 Broad Money Transferable & Other Deposits in
Foreign Currency of Residents
Liabilities Excluded from Broad Money
Liquidity Aggregates
16-4

TABLE 16.5 Overseas Filipino's Remittances by Country of Source: 2014 to 2018
Total Landbased Seabased Total Landbased Seabased Total Landbased Seabased Total Landbased Seabased Total Landbased Seabased
24,628,058 19,124,879 5,503,179 25,606,830 19,814,372 5,792,459 26,899,840 21,327,692 5,572,148 28,059,789 22,188,962 5,870,827 28,943,112 22,803,600 6,139,512Asia 4,419,481 3,579,196 840,284 4,575,602 3,546,725 1,028,877 4,913,365 3,851,780 1,061,584 5,273,268 3,971,760 1,301,508 5,924,413 4,529,486 1,394,927
Afghanistan 820 820 - 295 295 - 896 896 - 967 967 - 1,203 1,203 0Bangladesh 237 123 113 254 254 - 626 615 11 855 789 67 1,023 1,017 6Bhutan 2 2 - 21 21 - 15 15 - 15 15 - 19 19 0Brunei 16,965 16,460 505 30,942 30,611 330 13,131 12,853 278 3,796 3,333 463 29,489 29,114 375China (Mainland) 32,463 30,622 1,840 51,416 48,843 2,572 169,654 166,425 3,229 70,245 66,121 4,124 48,214 44,040 4,174Hong Kong 914,374 666,745 247,628 909,089 647,370 261,719 759,293 582,016 177,277 735,198 495,021 240,177 845,147 569,618 275,529India 3,430 2,623 807 6,461 6,155 306 7,604 7,508 96 8,197 8,185 12 12,032 11,978 53Indonesia 15,632 13,959 1,673 18,445 16,740 1,705 31,063 29,737 1,326 24,440 22,870 1,570 23,833 23,117 715Japan 1,418,547 1,125,097 293,450 1,222,533 894,093 328,440 1,362,645 996,976 365,669 1,468,878 1,006,171 462,707 1,514,207 1,078,385 435,821Cambodia 1,159 1,092 66 1,002 972 30 2,019 1,850 169 1,875 1,864 11 2,020 2,020 0Korea, North - - - 1 1 - 2 2 - 56 2 53 6 4 2Korea, Rep. of 179,762 134,720 45,042 219,889 164,822 55,067 220,512 167,090 53,422 220,512 218,641 64,289 339,859 293,756 46,102Laos 458 458 - 674 674 - 1,463 1,463 - 1,624 1,624 - 1,883 1,865 17Macau 2,654 2,474 180 15,145 15,048 96 25,273 25,241 32 104,633 104,608 25 120,262 120,257 6Malaysia 196,264 172,397 23,867 335,102 284,779 50,323 311,447 259,421 52,026 343,630 306,969 36,662 453,071 401,508 51,563Maldive Islands 302 301 1 842 823 18 2,202 2,120 82 1,712 1,712 - 1,556 1,540 16Mongolia 190 190 - 409 409 - 615 615 - 835 835 - 1,202 1,137 65Myanmar 2 2 - 8 8 - 378 378 - 534 534 - 1,053 1,053 0Nepal 100 100 - 327 327 - 503 503 - 491 491 - 940 939 1Pakistan 341 316 25 202 176 27 685 672 13 505 505 - 280 275 4East Timor 776 774 2 640 620 20 172 172 - 22 22 - 10 10 0Singapore 1,401,731 1,187,394 217,002 1,505,896 1,188,461 317,435 1,657,003 1,255,192 401,812 1,754,209 1,268,682 485,527 1,848,863 1,285,007 563,856Sri Lanka 1,382 1,159 223 2,209 1,984 225 1,939 1,844 95 1,227 1,227 - 775 775 0Taiwan 213,300 207,955 5,345 235,964 230,228 5,736 319,844 317,100 2,745 401,163 398,502 2,661 583,844 572,313 11,531Thailand 13,343 9,082 4,261 11,285 7,026 4,259 12,246 9,963 2,283 52,547 50,110 2,436 76,996 72,938 4,058Viet nam 5,250 4,330 920 6,550 5,983 567 12,136 11,115 1,021 11,405 10,681 724 16,630 15,597 1,033
Middle East 6,589,408 6,558,260 31,148 6,702,463 6,666,448 36,015 7,552,569 7,513,600 38,969 7,810,148 7,763,920 46,228 6,617,315 6,576,641 40,674Bahrain 172,342 172,320 22 144,202 144,144 58 175,129 174,865 264 229,025 228,440 585 234,142 233,292 850Iran - - - 15 15 - 23 23 - 2 2 - 20 9 11Iraq 163 163 - 362 362 - 355 355 - 356 356 - 434 434 0Israel 53,271 53,271 0 81,682 81,680 2 125,665 125,653 12 134,192 134,186 5 68,645 68,293 352Jordan 4,692 4,692 - 41,155 41,155 - 57,126 57,126 - 59,288 59,285 2 52,064 52,059 4Kuwait 455,353 452,111 3,243 617,614 611,456 6,158 856,715 853,278 3,437 806,484 801,856 4,628 689,614 685,713 3,901Saudi Arabia 2,843,293 2,840,028 3,265 2,844,001 2,837,385 6,617 2,630,650 2,626,393 4,258 2,508,948 2,504,024 4,924 2,230,055 2,226,223 3,832
Continued
2018 Country /Source 2014 2015 2016 2017
Grand Total1

TABLE 16.5 - - Continued
Total Landbased Seabased Total Landbased Seabased Total Landbased Seabased Total Landbased Seabased Total Landbased SeabasedUnited Arab Emirates 2,224,598 2,200,048 24,550 2,030,137 2,008,571 21,566 2,155,800 2,126,816 28,985 2,540,480 2,506,260 34,219 2,035,298 2,006,212 29,086Others 835,696 835,627 69 943,295 941,680 1,615 1,551,106 1,549,092 2,014 4,071,853 4,035,771 36,084 1,307,043 1,304,406 2,638
Americas 8,748,394 5,942,469 2,805,924 9,378,786 6,567,278 2,811,507 9,732,710 7,148,030 2,584,680 10,298,024 7,662,428 2,635,596 11,296,425 8,704,425 2,592,000Canada 1,202,090 1,189,419 12,671 791,630 760,140 31,490 572,820 542,502 30,319 644,754 610,283 34,470 976,767 941,821 34,946USA 7,403,533 4,650,600 2,752,933 8,408,590 5,697,746 2,710,844 8,931,269 6,520,639 2,410,630 9,422,310 6,979,620 2,442,690 9,986,393 7,670,364 2,316,029Mexico 1,677 1,677 - 356 356 - 547 405 143 354 354 - 700 697 3Argentina 30 30 - 42 29 14 77 77 - 92 92 - 142 142 0Brazil 2,234 266 1,968 430 423 7 648 617 31 316 311 5 441 429 12Colombia 67 67 - 149 146 4 179 179 - 47 46 1 158 120 38Peru 149 149 - 107 107 - 195 195 - 136 136 - 147 146 1Venezuela 17 13 5 2,217 1,067 1,150 210 151 59 1,225 61 1,164 80 44 36Others 138,707 99,602 39,105 175,265 107,266 67,998 226,764 83,266 143,498 228,790 71,525 157,266 331,597 90,662 240,935
Europe 4,164,423 2,360,412 1,804,011 4,150,684 2,286,612 1,864,072 3,801,658 1,994,434 1,807,224 3,857,187 2,079,451 1,777,736 4,153,281 2,195,744 1,957,536Austria 37,794 37,668 126 25,581 24,934 647 21,870 21,116 754 13,920 13,711 209 7,500 6,902 598Belgium 51,296 32,988 18,308 57,537 28,274 29,263 55,130 29,049 26,081 54,949 30,231 24,718 61,587 38,429 23,158France 130,270 84,213 46,057 127,556 66,807 60,749 109,211 56,274 52,937 122,480 65,802 56,678 105,638 65,513 40,125Germany 600,447 217,728 382,719 688,582 238,468 450,115 706,275 268,364 437,911 763,916 270,153 493,762 859,884 298,904 560,980Luxembourg 2,980 2,798 182 11,204 2,793 8,412 12,475 4,242 8,233 10,307 2,009 8,298 11,117 2,203 8,913Netherlands 145,239 51,782 93,457 241,811 119,900 121,911 154,842 30,296 124,547 227812 51,676 176,136 309,442 50,319 259,123Switzerland 96,492 67,343 29,149 140,722 80,941 59,782 158,726 69,408 89,318 127725 58,277 69,449 136,170 58,468 77,702Denmark 62,122 16,000 46,122 55,825 16,386 39,439 58,781 17,505 41,276 64163 20,824 43,339 62,719 7,638 55,081Finland 7,031 2,260 4,771 7,393 2,079 5,314 8,627 2,194 6,433 9,178 2,344 6,835 9,427 2,409 7,017Ireland 65,070 62,482 2,588 67,238 66,003 1,235 37,120 35,601 1,519 50,174 49,116 1,058 42,952 38,706 4,246Norway 358,414 73,429 284,985 243,857 67,790 176,066 185,387 59,186 126,202 141,568 49,506 92,062 172,550 56,573 115,978Sweden 15,836 5,386 10,450 14,158 5,046 9,112 21,181 6,371 14,811 31,849 18,585 13,264 15,517 4,218 11,300United Kingdom 1,564,278 1,088,811 475,467 1,515,376 972,199 543,177 1,423,909 917,426 506,483 1,356,826 988,424 368,403 1,497,575 1,166,346 331,229Greece 354,253 64,243 290,010 265,459 36,007 229,451 216,308 15,267 201,041 204,913 18,904 186,009 186,655 11,678 174,977Italy 251,379 210,518 40,861 313,621 277,149 36,472 238,849 203,558 35,290 282,387 225,209 57,179 286,303 220,572 65,731Portugal 1,351 513 838 821 734 87 930 906 24 2,595 1,031 1,563 4,218 1,124 3,094Spain 94,756 93,263 1,493 76,960 76,451 508 70,806 70,332 474 83,798 81,309 2,489 81,442 79,452 1,989Poland 758 750 8 1,425 1,312 114 672 655 17 1,353 1,340 13 1,079 1,079 0Russian Federation 29,499 29,271 228 43,990 43,977 13 43,023 43,023 - 39,522 39,424 98 26,383 26,187 196Others 295,160 218,967 76,193 251,567 159,361 92,206 277,536 143,662 133,874 307,274 131,000 176,272 275,123 59,024 216,099
Oceania 679,547 668,924 10,623 737,304 717,497 19,807 802,631 769,374 33,257 706,078 657,449 48,629 804,027 733,122 70,905Australia 596,181 587,290 8,891 623,836 614,192 9,644 639,840 629,656 10,184 500,006 489,675 10,330 441,667 432,912 8,754
Continued
2018 Country /Source 2014 2015 2016 2017

TABLE 16.5 - - Concluded
Total Landbased Seabased Total Landbased Seabased Total Landbased Seabased Total Landbased Seabased Total Landbased Seabased
Solomon Islands 907 749 158 647 543 104 696 657 39 567 525 41 1,010 968 42Nauru - - - - - - - - - 3 3 - 34 34 0New Zealand 67,683 67,568 115 83,775 83,768 7 120,921 120,782 139 143,018 143,002 16 239,564 239,137 427Papua New Guinea 12,373 12,299 75 16,794 16,708 86 8,709 8,488 221 19,240 19,030 211 51,394 51,148 246Others 2,483 1,004 1,479 12,253 2,286 9,967 32,466 9,792 22,674 43,244 5,214 38,031 70,358 8,923 61,436
Africa 26,805 15,617 11,188 61,992 29,812 32,180 96,907 50,473 46,434 115,084 53,955 61,129 147,651 64,182 83,469Angola 2,992 2,956 36 9,234 9,207 27 11,351 11,256 95 10,948 9,735 1,213 22,244 14,607 7,637Nigeria 3,772 3,720 52 6,260 5,971 289 9,889 9,492 397 8,580 8,303 277 10,890 10,594 296South Africa 5,532 2,682 2,850 3,582 2,580 1,003 5,742 2,310 3,432 3,051 2,772 279 1,554 1,500 55Others 14,509 6,260 8,249 42,916 12,054 30,861 69,925 27,415 42,510 92,505 33,145 59,360 112,963 37,481 75,481
1 Details may not add up to total due to rounding.
Notes: There are some limitations on the remittance data by source. A common practice of remittance centers in various cities abroad is to course remittances through correspondent banks mostly located in the U.S. On the other hand, remittances coursed through money couriers cannot be disaggregated into their actual country Canada would show up to be
source and are lodged under the country where the main offices are located,which, in many cases is in Canada. Therefore, the most immediate source.
Source: Bangko Sentral ng Pilipinas
2017 Country /Source 2014 2015 2016 2017

TABLE 16.6 Total Loans, Non-Performing Loans, and Loan Loss Provisions 1: 2010 to 2018 (In million pesos)
Universal Banks
Commercial Banks Government 3 Foreign 4
Universal Banks
Commercial Banks Government 3 Foreign 4
Universal Banks
Commercial Banks Government 3 Foreign 4
2010 2,801,711 1,855,929 199,505 341,733 404,544 80,215 55,180 11,720 10,312 3,003 95,040 62,619 9,898 14,326 8,1972011 3,221,775 2,193,785 228,991 449,510 349,489 71,938 46,052 12,279 10,183 3,424 90,903 56,771 8,467 15,694 9,971 2012 3,650,760 2,612,797 172,936 444,960 420,067 100,610 75,588 9,231 12,276 3,515 128,464 93,379 8,559 16,832 9,6932013 4,256,963 3,200,610 167,075 446,749 442,529 90,509 66,775 7,952 12,959 2,823 130,440 95,520 7,825 17,396 9,6992014 5,117,884 3,928,969 177,782 625,554 385,579 93,055 65,379 8,278 12,336 7,062 132,542 96,125 7,408 16,879 12,1302015 5,719,665 4,359,050 210,111 740,570 409,934 91,598 65,245 8,720 13,009 4,624 129,220 93,608 7,787 17,020 10,8052016 6,706,311 5,177,610 264,026 760,630 504,045 93,801 68,240 9,124 11,982 4,455 135,699 100,649 9,043 17,254 8,7532017 7,867,078 6,040,965 309,762 968,276 548,075 97,531 71,978 8,707 12,514 4,332 145,835 108,100 9,190 19,269 9,276 January 6,614,952 5,086,343 259,289 764,815 504,505 95,172 69,383 8,904 12,476 4,409 136,929 101,620 9,143 17,248 8,918 February 6,678,654 5,183,758 271,065 728,432 495,399 98,456 72,206 8,653 13,197 4,400 137,620 102,688 8,839 17,127 8,966 March 6,751,129 5,188,936 264,777 772,284 525,133 99,712 72,946 8,657 13,728 4,382 138,546 103,372 8,837 17,277 9,060 April 6,744,785 5,192,182 274,169 755,237 523,198 101,189 73,984 8,608 14,262 4,336 139,798 104,597 8,658 17,447 9,095 May 6,946,566 5,364,978 277,664 774,029 529,894 100,318 72,621 8,813 14,152 4,732 138,755 103,295 8,714 17,585 9,160 June 7,089,734 5,442,672 280,173 852,870 514,019 101,006 72,735 8,627 15,266 4,378 139,280 104,059 8,694 17,859 8,668 July 7,065,113 5,431,988 272,678 831,905 528,543 104,034 74,803 8,695 16,161 4,375 140,766 105,073 8,772 18,206 8,716 August 7,130,701 5,497,433 274,766 817,231 541,270 104,213 75,831 8,778 15,214 4,390 142,584 106,773 8,892 18,173 8,746 September 7,435,519 5,701,442 282,850 887,761 563,466 105,360 76,335 8,771 15,339 4,915 143,486 107,116 8,902 18,536 8,931 October 7,362,900 5,690,307 286,485 866,511 519,597 107,691 78,817 8,778 15,144 4,952 144,945 108,268 8,900 18,572 9,205 November 7,596,863 5,876,838 305,153 869,337 545,535 106,712 78,616 8,887 14,355 4,854 147,024 109,894 9,036 18,826 9,268 December 7,867,078 6,040,965 309,762 968,276 548,075 97,531 71,978 8,707 12,514 4,332 145,835 108,100 9,190 19,269 9,2762018 January 7,827,247 6,019,713 323,712 927,196 556,626 101,391 76,054 8,748 12,854 3,735 148,978 109,424 9,557 19,814 10,183 February 7,806,012 6,032,827 301,422 944,246 527,517 106,401 79,681 9,151 13,354 4,213 154,615 114,514 9,629 20,306 10,167 March 7,996,321 6,142,550 305,492 1,008,656 539,622 104,400 76,714 9,199 14,295 4,192 159,597 118,991 9,794 20,634 10,178 April 8,053,595 6,204,221 309,165 992,258 547,950 106,408 77,717 9,329 15,249 4,114 160,884 119,936 9,823 20,916 10,210 May 8,146,968 6,291,608 319,744 992,655 542,961 109,176 79,878 9,490 15,605 4,203 158,478 117,326 9,877 21,034 10,240 June 8,331,361 6,380,790 314,590 1,066,631 569,349 110,606 80,337 9,561 16,540 4,168 158,846 116,584 10,702 21,281 10,278 July 8,353,021 6,386,630 331,102 1,047,159 588,130 112,296 82,240 9,252 16,678 4,126 160,699 118,492 10,428 21,355 10,424 August 8,405,688 6,409,457 341,645 1,037,986 616,600 112,936 82,393 9,497 16,848 4,198 161,301 118,471 10,786 21,620 10,423 September 8,658,774 6,532,880 348,141 1,169,818 607,935 112,762 82,420 9,208 16,906 4,229 155,904 113,192 10,724 22,662 9,326 October 8,721,418 6,571,919 355,736 1,175,291 618,472 114,472 83,726 9,478 17,007 4,261 157,607 114,757 10,925 22,680 9,245 November 8,781,253 6,626,459 349,374 1,164,040 641,379 117,929 87,341 9,570 16,750 4,269 158,563 115,705 11,111 22,458 9,288 December 9,017,780 6,881,280 345,120 1,196,382 594,998 113,518 84,136 9,490 15,559 4,332 148,339 104,501 11,534 22,907 9,3961 Includes transactions of local banks' foreign offices but excludes banks under liquidation.2 Starting September 2002 for supervisory purposes, computation on NPL was based on BSP Cirular No. 351 which defines total loans as gross of allowance for probable losses and interbank loans less loans classified as loss.3 Consist of Land Bank, DBP and Al-Amanah Islamic Bank4 Consist of 14 foreign banks, excludes four foreign banks' subsidiariesSource: Bangko Sentral ng Pilipinas
Loan Loss ProvisionsYear Total
Total LoansTotal
Gross Non-Performing Loans 2Total

TABLE 16.7 Total Resources of the Philippine Financial System1: 2011 to 2018 (In billion pesos)
TotalUniversal and Commercial
Banks 2Thrift Banks 2 Rural Banks
2011 9,645.6 9,645.6 6,833.0 623.6 186.8 2,002.22012 10,622.3 9,645.6 6,833.0 623.6 186.8 2,002.22013 12,833.6 10,476.0 7,486.7 681.6 187.6 2,120.12014 14,267.7 10,476.0 7,486.7 681.6 187.6 2,120.12015 15,492.6 12,406.3 11,159.2 1,034.1 213.0 3,086.32016 17,242.8 13,914.2 12,560.5 1,122.0 231.7 3,328.6 r
2017 January 17,318.9 13,849.9 12,482.9 1,128.6 238.3 3,469.1 February 17,340.7 13,871.6 12,499.5 1,133.8 238.3 3,469.1 March 17,587.1 14,118.0 12,730.2 1,149.5 238.3 3,469.1 April 17,574.7 14,153.5 12,760.7 1,148.6 244.2 3,421.2 May 17,630.7 14,209.5 12,801.6 1,163.7 244.2 3,421.2 June 17,998.6 14,577.4 13,150.5 1,182.6 244.2 3,421.2 July 18,064.8 r 14,609.4 13,170.8 1,187.8 250.7 3,455.4 r
August 18,233.7 r 14,778.3 13,341.8 1,185.8 250.7 3,455.4 r
September 18,415.2 r 14,959.8 13,532.6 1,176.5 250.7 3,455.4 r
October 18,714.5 r 14,976.4 13,520.4 1,199.5 256.5 3,738.1 r
November 18,887.2 r 15,149.1 13,396.8 1,195.7 256.5 3,738.1 r
December 19,262.4 r 15,524.3 14,053.8 1,213.9 256.5 3,738.1 r
2018 January 19,176.2 15,409.7 13,942.7 1,208.1 258.9 3,766.5 February 19,259.0 15,492.5 14,023.0 1,210.6 258.9 3,766.5 March 19,442.6 15,676.1 14,202.8 1,214.4 258.9 3,766.5 April 19,462.1 15,704.5 14,226.6 1,216.4 261.5 3,757.6 May 19,678.6 15,921.0 14,436.1 1,223.3 261.5 3,757.6 June 19,810.2 16,052.7 14,554.5 1,236.6 261.5 3,757.6 July 19,881.2 16,099.1 14,586.5 1,243.5 269.2 3,782.1 August 20,067.9 16,285.9 14,769.9 1,246.8 269.2 3,782.1 September 20,245.3 16,463.2 14,940.0 1,254.0 269.2 3,782.1 October 20,571.2 16,767.5 15,241.9 1,251.7 273.9 3,803.7 November 20,527.6 16,723.8 15,176.6 1,273.3 273.9 3,803.7 December 21,062.3 17,258.6 15,691.5 1,293.2 273.9 3,803.7
1 Excludes the Bangko Sentral ng Pilipinas but includes allowance for probable loses.2 Data for Universal and Commercial Banks (U/KBs), Thrift Banks (TBs) and Rural Banks (RBs) up to February 2008 are based on CSOC which valued asset gross of allowance for probable losses and net of amortization and depreciation. Data from March 2008 onwards are the Consolidated Statement of Condition based on the International Monetary Fund Standardized Report Form compilation of Monetary and Financial Statistics, which valued asset gross of amortization, depreciation and allowance for probable losses.3 Includes Investment Houses, Finance Companies, Investment Companies, Securities Dealers/Brokers, Pawnshops, Lending Investors,
also includes Private and Government Insurance Companies (i.e., SSS and GSIS).
Note: Details may not add up to total due to rounding off.
Source: Bangko Sentral ng Pilipinas, Department of Economic Statistics
Period
Banks
Non - Banks 3
Non-Stock Savings and Loan Assns., Venture Capital Corps., and Credit Card Companies which are under BSP supervision;
Grand Total
16-8

TABLE 16.8 Total Assets and Total Liabilities of the Philippines Banking System 1: 2007 to 2018 (In billion pesos)
Total Liabilities
2007 5,134.12 4,532.32 4,488.28 3,965.03 485.59 429.43 160.24 137.862008 5,675.68 5,076.70 5,034.95 4,513.98 481.77 428.31 158.96 134.412009 6,192.28 5,504.32 5,483.54 4,884.42 536.12 474.44 172.62 145.452010 6,918.33 6,109.82 6,131.76 5,420.21 606.45 539.67 180.13 149.932011 7,335.62 6,414.35 6,541.43 5,726.73 607.43 533.02 186.77 154.602012 8,049.72 6,998.27 7,193.82 6,256.77 666.17 585.09 189.74 156.422013 9,970.84 8,845.03 8,997.13 7,993.56 771.38 685.81 202.33 165.662014
March 10,105.27 8,933.92 9,104.85 8,060.13 791.01 701.81 209.41 r 171.98 June 10,279.70 r 9,074.61 r 9,251.19 8,176.13 r 819.10 726.50 206.86 168.41 September 10,419.96 9,178.56 9,377.86 8,271.60 831.38 736.06 210.72 170.90 December 11,168.98 9,802.70 10,069.63 8,852.82 880.97 772.18 218.38 177.70
2015 March 11,096.22 9,851.35 10,016.80 8,927.00 861.12 748.05 218.30 176.30 June 11,202.22 r 9,770.66 r 10,058.84 r 8,790.13 r 925.08 804.22 192.33 156.39 September 11,583.13 10,246.42 10,448.29 9,270.68 939.52 816.88 195.32 158.86 December 12,085.68 r 10,682.88 r 10,895.18 r 9,656.95 r 995.18 r 867.07 r 198.79 161.56
2016 March … … … … … … 202.52 161.56 June 12,542.38 11,019.39 11,317.19 9,960.13 1,022.67 894.60 1,077.54 941.66 September … … … … … … 206.54 167.22 December 13,585.81 12,038.17 12,301.73 10,929.30 1,077.54 941.66 211.93 217.88
2017 March … … … … … … 217.88 176.81 June 14,236.38 12,544.50 12,881.52 11,372.04 1,136.98 995.65 223.70 181.59 September … … … … … … 229.17 184.90 December 15,160.64 13,404.54 13,763.28 12,198.06 1,168.20 1,021.58 234.69 189.73
2018 March … … … … … … 235.98 189.66 June 15,706.44 13,766.45 14,280.64 12,541.30 1,187.76 1,034.07 238.04 191.09 September … … … … … … 245.59 196.55 December 16,911.43 14,843.92 15,421.15 13,564.46 1,244.69 1,082.91 … …
1 Excludes the Bangko Sentral ng Pilipinas; Amount is adjusted to net off the account2 Inclusive of branches of foreign banks with universal banking license, after foreign bank branches and subsidiaries, and three government banks: DBP, LBP and Amanah Islamic Bank "Due to head office of branches of foreign banks" and allowance for probable lossesNote: Details may not add up to total due to rounding off.
Source: Bangko Sentral ng Pilipinas
Universal and Commercial Banks 1/ 2/
Total Assets Total Liabilities Total Assets Total
Liabilities
Thrift Banks
Total AssetsEnd of Period
Rural Banks
Total Assets
Total
Total Liabilities
16-9

Savings and Mortgage
Banks
Private Development
Banks
Stock Savings and Loan
Associations
Micro Finance Banks
2010 24,870 4,679 939 313 140 27 2,771 16,0012011 26,170 4,857 979 344 141 27 2,702 17,1202012 27,189 5,145 1,052 385 154 28 2,646 17,779 r
2013 28,047 5,461 1,199 432 168 29 2,646 18,1122014
March 28,065 5,514 1,219 437 171 29 2,650 18,045June 28,094 5,583 1,242 432 175 29 2,659 17,974September 28,128 5,738 1,248 440 154 31 2,596 17,921December 28,232 5,833 1,280 444 165 31 2,608 17,871
2015March 28,331 5,901 1,317 408 171 31 2,628 17,875June 28,319 5,946 1,386 416 180 31 2,569 17,791September 28,370 5,969 1,410 417 195 31 2,593 17,755December 28,469 6,060 1,517 338 200 31 2,610 17,713
2016March 27,502 6,094 1,545 355 199 31 2,625 16,663June 27,657 6,133 1,548 363 182 31 2,679 16,721September 27,889 6,147 1,562 404 184 30 2,697 16,865December 28,394 6,237 1,585 402 183 6 2,765 17,216 r
2017March 28,536 6,286 1,618 405 184 4 2,781 17,258 r
June 28,547 6,331 1,649 409 184 4 2,816 17,154September 28,711 6,403 1,728 414 184 4 2,838 17,140December 28,904 6,483 1,817 418 178 4 2,893 17,111
2018March 29,050 6,527 1,849 420 179 5 2,956 17,014June 20,832 6,569 1,920 421 179 5 2,972 8,764September 24,145 6,610 1,944 426 187 5 2,976 11,995December 24,906 6,642 2,029 435 188 5 3,065 12,540
1 Refers to the number of financial establishments which includes the head offices and branches; excludes the Bangko Sentral ng Pilipinas.2 Includes Investment Houses, Finance Companies, Investment Companies, Securities Dealers/Brokers, Pawnshops, Lending Investors, Non-Stock Savings and Loan Associations, Mutual Building and Loan Assn., Venture Capital Corp., Credit Card Companies and others; also includes Private and Government Insurance Companies(I.e. SSS and GSIS). Private Insurance Companies only cover the head offices and their foreign branches.
Source: Bangko Sentral ng Pilipinas
TABLE 16.9 Number of Financial Institutions 1: 2010 to 2018
Year Total
Banks 1
Non-banks 2Universal and Commercial
Banks
Thrift BanksRural Banks
16-10

TABLE 16.10 Number of Closed and Merged Banks: 2006 to 2015
Merged Closed Merged Closed Merged Closed Merged Closed2006 2 0 3 1 3 10 8 112007 1 0 0 2 2 15 3 172008 1 0 0 2 3 23 4 252009 1 0 0 2 2 29 3 312010 0 0 2 1 3 24 5 252011 1 0 0 4 4 25 5 292012 2 1 1 0 5 35 8 36 March 0 0 0 0 1 4 1 4 June 1 1 0 0 2 11 3 12 September 0 0 0 0 0 7 0 7 December 1 0 1 0 2 13 4 132013 6 24 March 1 0 0 0 1 6 2 6 June 0 0 0 0 2 6 2 6 September 0 0 0 0 1 6 1 6 December 0 0 1 0 0 6 1 62014 11 23 March 0 0 0 1 3 3 3 4 June 0 0 1 1 1 6 2 7 September 2 0 0 0 1 5 3 5 December 2 0 0 0 1 7 3 72015 March 0 0 0 0 0 2 0 2
Source: Bangko Sentral ng Pilipinas
TABLE 16.11 Financial Performance of the Philippine Deposit Insurance Corporation: 2004 to 2018 (Amount in thousand pesos)
Year
2004 127,620,852 86,008,035 41,612,817 93,6532005 126,437,571 78,872,445 47,565,126 306,8652006 137,977,103 88,592,490 49,384,613 445,2172007 131,643,030 77,377,098 54,265,932 1,229,2542008 142,316,520 81,854,811 60,461,709 569,0562009 150,052,899 89,783,812 60,269,087 402,4742010 156,729,081 92,075,563 64,653,518 2,469,7822011 160,904,548 85,230,982 75,673,566 2,719,5722012 154,425,164 68,688,129 85,737,035 3,336,9342013 155,969,204 66,929,059 89,040,145 4,385,8592014 161,785,916 61,682,662 100,103,254 7,355,0672015 177,223,024 64,518,571 112,704,453 4,549,7932016 194,983,104 65,228,007 129,755,097 5,322,4502017 214,857,091 67,706,905 147,150,186 5,688,5972018 236,361,429 71,931,270 164,430,159 6,454,552
Note: Year 2000 to 2017 is based on Audited Financial Statements. Year 2018 is unaudited.Source: Philippine Deposit Insurance Corporation
Year Commercial Banks Thrift Banks Rural Banks Total
Total Assets Total Liabilities Deposit Insurance Fund Net Income
16-11
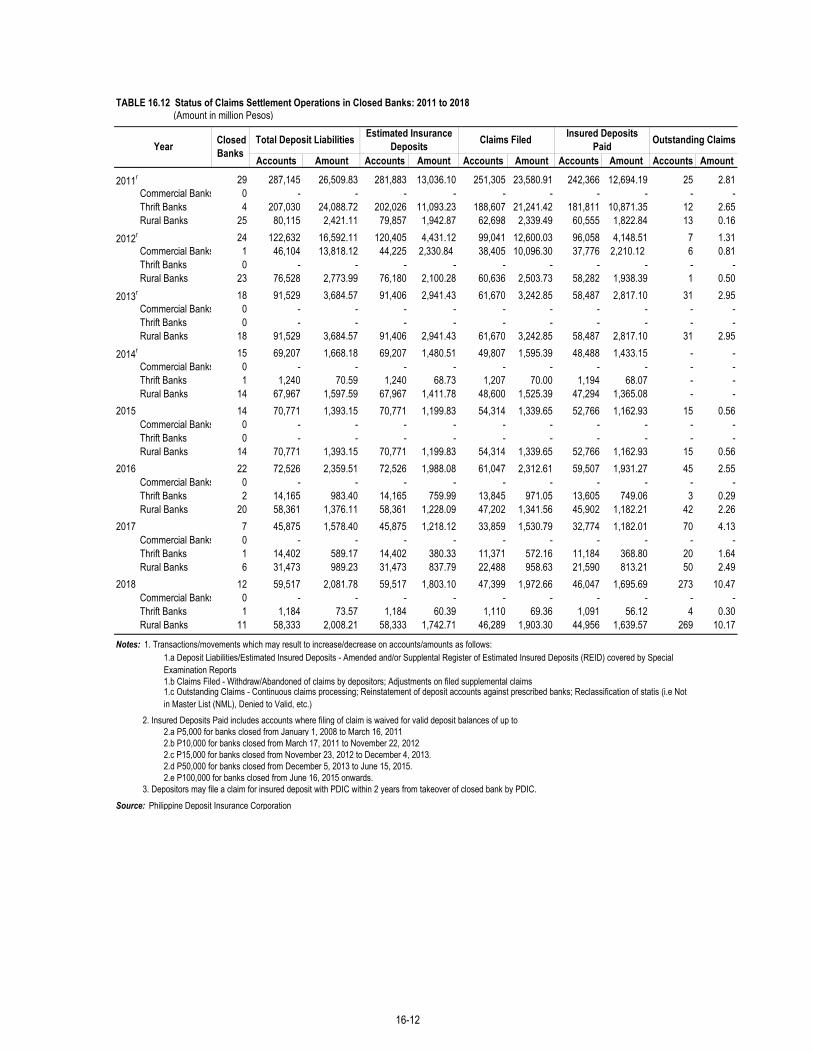
TABLE 16.12 Status of Claims Settlement Operations in Closed Banks: 2011 to 2018 (Amount in million Pesos)
Accounts Amount Accounts Amount Accounts Amount Accounts Amount Accounts Amount
2011r 29 287,145 26,509.83 281,883 13,036.10 251,305 23,580.91 242,366 12,694.19 25 2.81Commercial Banks 0 - - - - - - - - - -Thrift Banks 4 207,030 24,088.72 202,026 11,093.23 188,607 21,241.42 181,811 10,871.35 12 2.65Rural Banks 25 80,115 2,421.11 79,857 1,942.87 62,698 2,339.49 60,555 1,822.84 13 0.16
2012r 24 122,632 16,592.11 120,405 4,431.12 99,041 12,600.03 96,058 4,148.51 7 1.31Commercial Banks 1 46,104 13,818.12 44,225 2,330.84 38,405 10,096.30 37,776 2,210.12 6 0.81Thrift Banks 0 - - - - - - - - - -Rural Banks 23 76,528 2,773.99 76,180 2,100.28 60,636 2,503.73 58,282 1,938.39 1 0.50
2013r 18 91,529 3,684.57 91,406 2,941.43 61,670 3,242.85 58,487 2,817.10 31 2.95Commercial Banks 0 - - - - - - - - - -Thrift Banks 0 - - - - - - - - - -Rural Banks 18 91,529 3,684.57 91,406 2,941.43 61,670 3,242.85 58,487 2,817.10 31 2.95
2014r 15 69,207 1,668.18 69,207 1,480.51 49,807 1,595.39 48,488 1,433.15 - -Commercial Banks 0 - - - - - - - - - -Thrift Banks 1 1,240 70.59 1,240 68.73 1,207 70.00 1,194 68.07 - -Rural Banks 14 67,967 1,597.59 67,967 1,411.78 48,600 1,525.39 47,294 1,365.08 - -
2015 14 70,771 1,393.15 70,771 1,199.83 54,314 1,339.65 52,766 1,162.93 15 0.56Commercial Banks 0 - - - - - - - - - -Thrift Banks 0 - - - - - - - - - -Rural Banks 14 70,771 1,393.15 70,771 1,199.83 54,314 1,339.65 52,766 1,162.93 15 0.56
2016 22 72,526 2,359.51 72,526 1,988.08 61,047 2,312.61 59,507 1,931.27 45 2.55Commercial Banks 0 - - - - - - - - - -Thrift Banks 2 14,165 983.40 14,165 759.99 13,845 971.05 13,605 749.06 3 0.29Rural Banks 20 58,361 1,376.11 58,361 1,228.09 47,202 1,341.56 45,902 1,182.21 42 2.26
2017 7 45,875 1,578.40 45,875 1,218.12 33,859 1,530.79 32,774 1,182.01 70 4.13Commercial Banks 0 - - - - - - - - - -Thrift Banks 1 14,402 589.17 14,402 380.33 11,371 572.16 11,184 368.80 20 1.64Rural Banks 6 31,473 989.23 31,473 837.79 22,488 958.63 21,590 813.21 50 2.49
2018 12 59,517 2,081.78 59,517 1,803.10 47,399 1,972.66 46,047 1,695.69 273 10.47Commercial Banks 0 - - - - - - - - - -Thrift Banks 1 1,184 73.57 1,184 60.39 1,110 69.36 1,091 56.12 4 0.30Rural Banks 11 58,333 2,008.21 58,333 1,742.71 46,289 1,903.30 44,956 1,639.57 269 10.17
Notes: 1. Transactions/movements which may result to increase/decrease on accounts/amounts as follows:
1.b Claims Filed - Withdraw/Abandoned of claims by depositors; Adjustments on filed supplemental claims
2. Insured Deposits Paid includes accounts where filing of claim is waived for valid deposit balances of up to2.a P5,000 for banks closed from January 1, 2008 to March 16, 20112.b P10,000 for banks closed from March 17, 2011 to November 22, 20122.c P15,000 for banks closed from November 23, 2012 to December 4, 2013.2.d P50,000 for banks closed from December 5, 2013 to June 15, 2015.2.e P100,000 for banks closed from June 16, 2015 onwards.
3. Depositors may file a claim for insured deposit with PDIC within 2 years from takeover of closed bank by PDIC.Source: Philippine Deposit Insurance Corporation
Outstanding Claims
1.a Deposit Liabilities/Estimated Insured Deposits - Amended and/or Supplental Register of Estimated Insured Deposits (REID) covered by Special Examination Reports
1.c Outstanding Claims - Continuous claims processing; Reinstatement of deposit accounts against prescribed banks; Reclassification of statis (i.e Not in Master List (NML), Denied to Valid, etc.)
Year Closed Banks
Total Deposit Liabilities Estimated Insurance Deposits Claims Filed Insured Deposits
Paid
16-12
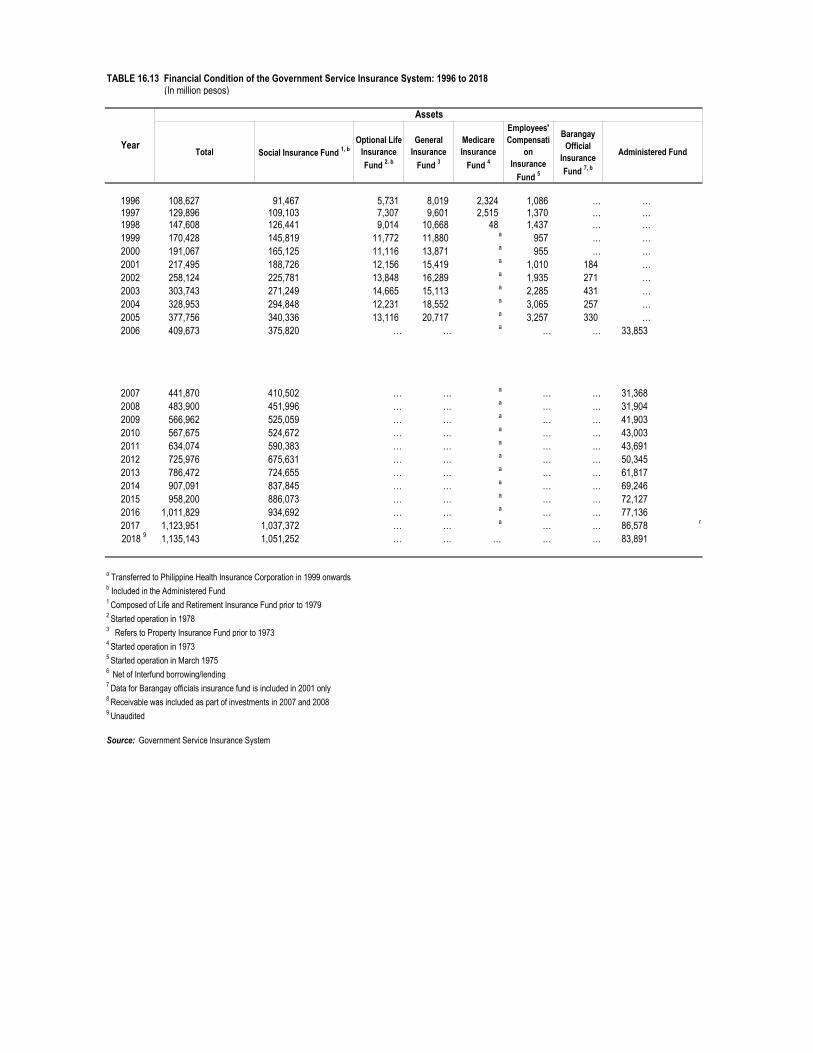
TABLE 16.13 Financial Condition of the Government Service Insurance System: 1996 to 2018 (In million pesos)
Optional Life Insurance Fund 2. b
General Insurance
Fund 3
Medicare Insurance
Fund 4
Employees' Compensati
on Insurance
Fund 5
Barangay Official
Insurance Fund 7, b
1996 108,627 91,467 5,731 8,019 2,324 1,086 … …1997 129,896 109,103 7,307 9,601 2,515 1,370 … …1998 147,608 126,441 9,014 10,668 48 1,437 … …1999 170,428 145,819 11,772 11,880 a 957 … …2000 191,067 165,125 11,116 13,871 a 955 … …2001 217,495 188,726 12,156 15,419 a 1,010 184 …2002 258,124 225,781 13,848 16,289 a 1,935 271 …2003 303,743 271,249 14,665 15,113 a 2,285 431 …2004 328,953 294,848 12,231 18,552 a 3,065 257 …2005 377,756 340,336 13,116 20,717 a 3,257 330 …2006 409,673 375,820 … … a … … 33,853
2007 441,870 410,502 … … a … … 31,3682008 483,900 451,996 … … a … … 31,9042009 566,962 525,059 … … a … … 41,9032010 567,675 524,672 … … a … … 43,0032011 634,074 590,383 … … a … … 43,6912012 725,976 675,631 … … a … … 50,3452013 786,472 724,655 … … a … … 61,8172014 907,091 837,845 … … a … … 69,2462015 958,200 886,073 … … a … … 72,1272016 1,011,829 934,692 … … a … … 77,1362017 1,123,951 1,037,372 … … a … … 86,578 r
2018 9 1,135,143 1,051,252 … … … … … 83,891
a Transferred to Philippine Health Insurance Corporation in 1999 onwardsb Included in the Administered Fund1 Composed of Life and Retirement Insurance Fund prior to 19792 Started operation in 19783 Refers to Property Insurance Fund prior to 19734 Started operation in 19735 Started operation in March 19756 Net of Interfund borrowing/lending7 Data for Barangay officials insurance fund is included in 2001 only8 Receivable was included as part of investments in 2007 and 20089 Unaudited
Source: Government Service Insurance System
Year
Assets
Total Social Insurance Fund 1, b Administered Fund
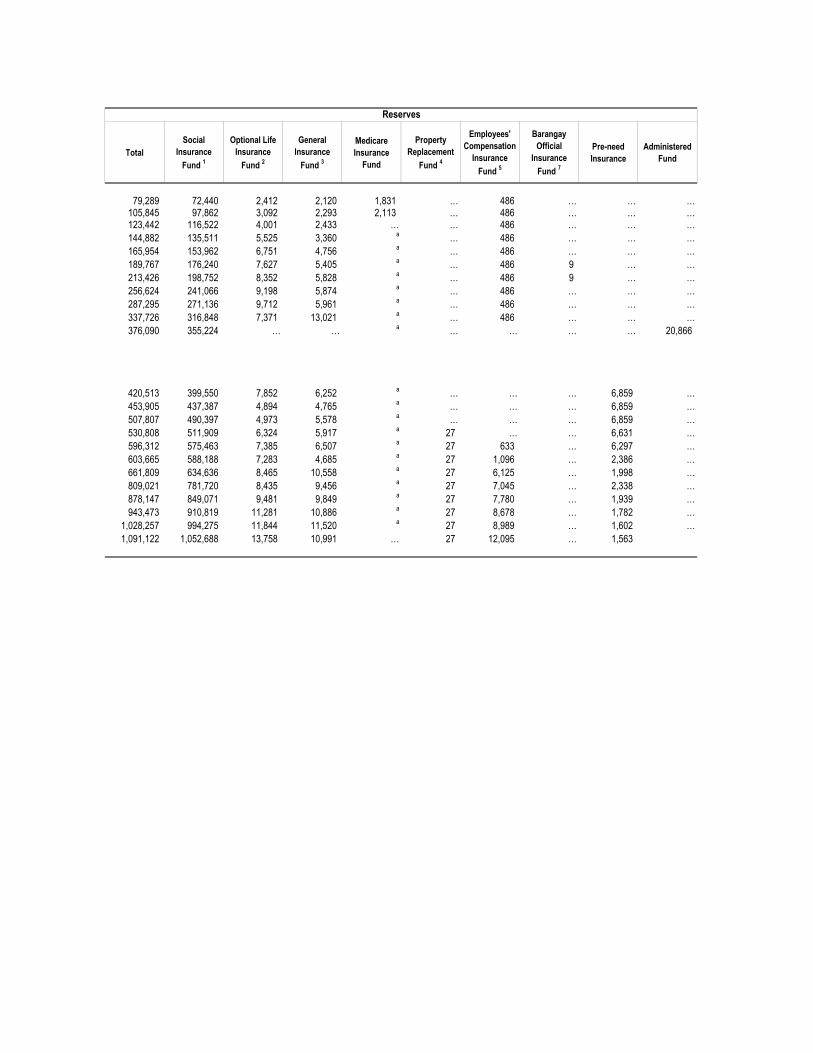
Total Social
Insurance Fund 1
Optional Life Insurance
Fund 2
General Insurance
Fund 3
Medicare Insurance
Fund
Property Replacement
Fund 4
Employees' Compensation
Insurance Fund 5
Barangay Official
Insurance Fund 7
Pre-need Insurance
Administered Fund
79,289 72,440 2,412 2,120 1,831 … 486 … … …105,845 97,862 3,092 2,293 2,113 … 486 … … …123,442 116,522 4,001 2,433 … … 486 … … …144,882 135,511 5,525 3,360 a … 486 … … …165,954 153,962 6,751 4,756 a … 486 … … …189,767 176,240 7,627 5,405 a … 486 9 … …213,426 198,752 8,352 5,828 a … 486 9 … …256,624 241,066 9,198 5,874 a … 486 … … …287,295 271,136 9,712 5,961 a … 486 … … …337,726 316,848 7,371 13,021 a … 486 … … …376,090 355,224 … … a … … … … 20,866
420,513 399,550 7,852 6,252 a … … … 6,859 …453,905 437,387 4,894 4,765 a … … … 6,859 …507,807 490,397 4,973 5,578 a … … … 6,859 …530,808 511,909 6,324 5,917 a 27 … … 6,631 …596,312 575,463 7,385 6,507 a 27 633 … 6,297 …603,665 588,188 7,283 4,685 a 27 1,096 … 2,386 …661,809 634,636 8,465 10,558 a 27 6,125 … 1,998 …809,021 781,720 8,435 9,456 a 27 7,045 … 2,338 …878,147 849,071 9,481 9,849 a 27 7,780 … 1,939 …943,473 910,819 11,281 10,886 a 27 8,678 … 1,782 …
1,028,257 994,275 11,844 11,520 a 27 8,989 … 1,602 …1,091,122 1,052,688 13,758 10,991 … 27 12,095 … 1,563
Reserves

Social Insurance
Fund
General Insurance
Fund
Employees' Compensati
on Insurance
Fund
Barangay Official
Insurance Fund 7
Adminis-tered Fund
17,344 10,775 2,569 3,921 127 (49) … …8,354 384 2,829 5,173 397 (429) … …8,228 349 2,810 5,844 29 (804) … …8,414 340 4,233 5,617 a (1,776) … …6,130 353 2,667 5,370 a (2,260) … …6,182 346 3,285 5,260 a (2,691) (18) …
11,686 356 4,468 6,833 a 39 (10) …7,486 327 4,663 5,882 a (3,401) 15 …
29,453 20,521 5,355 5,200 a (1,619) (4) …23,636 16,519 5,571 2,856 a (1,288) (22) …21,154 15,056 … … a … … 6,098
Investment in Joint Venture
378,649 128,165 217,964 … 32,520370,449 125,520 209,936 … 34,993471,336 168,629 267,746 … 34,961474,067 155,232 286,208 … 32,627959,146 251,689 641,185 0 66,272643,871 202,465 411,626 1,165 28,614696,923 211,567 454,197 … 31,159821,324 230,490 558,815 … 32,019876,220 250,082 567,667 … 58,471955,541 251,689 641,185 … 62,667
1,035,427 r 261,224 r 707,932 r … 66,272 r
1,084,125 297,376 685,577 … 2,066 99,105
Surplus 6
Total Optional Life Insurance Fund Medicare Insurance Fund
TotalTotal Investments 8
Loans and Receivable Financial Assets Investment Properties

TABLE 16.14 Statement of Loans and Equities Approved and Total Resources of the Development Bank of the Philippines: 2000 to 2018 (Amount in million pesos)
Total
2000 85,659.1 850.0 16,179.0 2,564.4 2,525.9 505.4 63,034.4 b - - 135,267.0 c
2001 24,133.2 440.4 6,678.1 a 170.7 1,086.8 202.7 15,554.5 - - 138,911.02002 13,258.7 932.6 7,002.6 533.7 4,157.8 632.0 0.0 - - 148,643.02003 14,832.8 646.7 11,590.7 277.0 1,940.4 378.1 0.0 - - 148,755.02004 23,851.6 758.9 14,408.6 6,692.9 1,396.2 595.0 0.0 - - 206,078.02005 8,048.8 377.1 h 5,130.0 i 257.3 1,526.0 k 380.6 105.4 - 272.4 213,797.02006 17,940.4 352.9 h 14,517.4 i 467.8 2,193.3 k 365.2 43.8 - 0.0 244,745.6 d
2007 13,659.7 662.1 h 10,655.4 i 392.4 1,032.2 392.4 125.2 - 400.0 f 243,039.2 d
2008 13,527.7 348.7 h 8,702.6 i 528.1 2,101.7 k 323.6 23.0 - 1,500.0 e 263,252.42009 64,111.7 4,020.4 h 47,854.0 i 3,121.5 7,503.9 k 467.7 1,144.2 - 200.0 f 291,745.52010 119,754.2 1,309.8 h 61,772.8 i 9,006.8 6,080.4 k 1,194.5 40,390.0 - 500.0 f 297,093.02011 154,788.8 1,119.0 h 91,122.9 i 3,143.7 11,424.5 k 594.7 47,384.0 - 16.3 g 339,987.52012 203,221.7 2,106.2 76,643.9 15,664.9 82,970.4 2,652.3 23,184.0 m - 132.0 g 351,729.0 1
2013 152,902.5 1,932.0 97,867.5 12,419.5 2,611.5 895.0 37,177.1 2,358.6 14,780.0 436,729.9 2
2014 142,880.0 1,357.7 h 97,011.9 i 4,265.5 j 16,140.3 k 1,310.5 l 22,794.1 m 2,593.0 n 12,470.0 o 475,359.0 3
2015 86,711.2 1,217.8 53,470.5 12,236.7 5,194.3 1,759.9 12,832.1 438.1 … 504,058.0 a/
2016 47,409.9 1,256.9 25,238.2 6,973.7 6,548.6 1,129.8 6,262.7 187.2 … 536,283.0 b/
2017 151,361.2 2,367.8 101,958.3 3,163.3 29,402.5 3,777.2 10,692.1 131.1 … 592,355.0 a/
2018 343,709.8 33,140.2 208,915.8 26,579.0 37,784.0 4,071.2 33,219.5 994.5 … 669,745.0 c/
a Includes public utility, medical health, prof/business, trading, tourism, financeb Includes banking and non-banking institutionsc Net of FX revaluation on loans/borrowings with FX risk cover by National Government as required by BSP effective Nov. 2001d Based on Audited Financial Statementse Al Amanah Islamic Investment Bankf DBP Leasing Corporationg Additional capital in LGUGC and new acquisition in Bancneth Agricultural loans include Agricultural, Hunting, Forestry and Fishingi Industrial loans include Mining and Quarrying, Manufacturing, Electricity, Gas and Water Supply, Construction, Wholesale and Retail Trade, Hotels and Restaurants, Transport, Storage and Communications, and Health and Social Workj Real Estate Loans include Real Estate, Renting and Business Activitiesk Government loans include Public Administration and Defensel Educational Assistance Loans include educationm Financial Loans include Financial Intermediationn Others include Community, Social and Personal Service Activities and Private Households with Employed Personso Equities and other Investments include P14,500M of PNB (Purchase on Notes & Bonds) and P280M capital infusion in DBP Leasing with approvals on 8 May 2013 and 8 October 2013 of DBP Board and BSP, respectively, actual release on 17 June 2014* There are no additional equities and other investments from 2015 to 20181, a/ Restated2, b/ Audited3, c/ Unaudited
Source: Development Bank of the Philippines
Financial Rehabilitation
LoansOthers
Equities and Other
Investment *
Year
Loans and Equities ApprovedTotal
ResourcesAgricultural Loans
Industrial Loans
Real Estate Loans
Government Loans
Educational Assistance
Loans
16-14

TABLE 16.15 Investments of the Government Service Insurance System: 1982 to 2018 (In million pesos)
Total Others a
1982 9,324 1,416 736 1,110 3,744 2,3181983 9,903 1,517 821 997 3,525 3,0441984 10,899 1,804 913 909 4,251 3,0231985 11,858 1,945 1,027 820 4,840 3,2251986 12,747 2,440 1,121 679 5,459 3,0481987 14,798 3,219 1,184 778 5,992 3,6251988 19,166 5,196 1,298 2,362 6,672 3,6391989 22,189 6,282 1,383 2,649 7,501 4,3741990 26,871 7,757 1,626 2,833 9,887 4,7691991 29,452 7,984 1,908 3,299 11,820 4,4411992 34,920 7,472 2,298 4,131 15,150 5,8681993 36,969 7,950 2,718 5,059 14,647 6,5951994 47,642 10,163 3,133 6,091 19,803 8,4521995 46,933 12,895 3,619 6,666 13,188 10,5661996 63,545 14,822 4,310 7,494 26,977 9,9431997 72,902 16,568 5,156 8,488 30,957 11,7351998 89,178 19,238 6,047 9,793 41,709 12,3911999 113,673 26,242 7,075 10,862 58,491 11,0032000 135,426 38,938 7,477 10,856 65,321 12,8342001 157,435 51,859 10,016 10,661 72,880 12,0202002 181,457 56,110 11,457 12,079 87,971 13,8392003 219,055 52,277 12,006 15,162 115,677 23,9322004 244,794 67,915 13,541 20,843 120,093 22,4022005 267,713 57,809 14,485 11,074 113,892 70,4552006 215,681 57,699 16,134 10,999 110,386 20,4632007 206,448 30,341 16,832 10,499 128,312 20,4632008 335,456 75,507 16,410 12,780 120,817 109,9422009 433,722 101,573 20,573 18,223 186,023 107,3302010 441,440 100,820 21,273 19,195 218,171 81,9812011 523,429 128,194 18,927 18,829 326,406 31,0722012 643,870 137,448 20,097 17,486 388,770 80,0692013 696,923 145,722 20,695 17,337 433,244 79,9242014 821,324 156,441 20,883 18,463 526,191 99,3462015 876,220 176,988 22,291 17,795 529,997 129,1492016 955,541 185,256 21,571 13,985 587,458 147,2712017 1,035,427 r 196,983 r 21,244 r 14,001 r 670,962 r 132,2372018 b 1,084,125 219,594 23,478 12,202 636,173 192,678
a Includes educational assistance loans, backpay certificates, other loans, investment property and other investmentsb Unaudited
Source: Government Service Insurance System
Year Salary Loans Policy Loans Real Estate Stocks, Bonds, and Notes
16-15

TABLE 16.16 Cash Receipts and Disbursement of the Government Service Insurance System: 1981 to 2018 (In million pesos)
Receipts Insuracen Premiums
Receipts from
InvestmentsOthers
Claims and Benefits
PaymentsInvestments
Operating Expenses and Other
Others
1981 148 2,224 1,634 383 4,388 794 2,710 242 639 4,3851982 4 2,313 1,497 384 4,197 923 2,310 285 671 4,1891983 9 2,495 2,245 531 5,278 1,025 2,480 332 1,410 5,2471984 31 2,446 2,201 384 5,062 1,062 2,823 285 845 5,0151985 46 2,842 2,185 514 5,586 1,470 2,727 491 900 5,588
1986 (2) 3,051 3,148 578 6,776 1,567 3,773 606 654 6,6001987 176 4,093 5,684 518 10,471 1,817 7,317 454 789 10,3771988 95 4,367 10,499 836 15,797 1,997 12,315 554 762 15,6281989 169 5,120 15,017 1,354 21,660 2,757 17,711 726 403 21,5971990 563 7,081 30,888 1,758 40,290 3,546 35,662 687 638 40,533
1991 1,767 b 9,413 9,750 2,847 23,777 5,284 13,156 809 751 19,9991992 3,778 7,569 15,810 3,762 30,919 6,118 19,882 983 1,179 28,1621993 2,586 10,331 26,010 4,207 43,134 7,254 24,966 886 2,314 35,4201994 7,842 10,279 22,674 5,283 46,078 7,243 26,941 1,101 8,285 43,5701995 2,986 12,781 17,050 3,572 36,388 7,590 23,825 1,569 2,016 35,000
1996 1,389 13,189 25,594 4,427 44,599 8,794 29,092 1,893 1,837 41,6161997 2,983 13,924 29,122 4,867 50,896 10,046 33,535 2,035 1,749 47,3651998 3,531 27,351 26,143 3,641 60,667 12,077 38,211 3,493 3,355 57,1351999 3,439 34,503 39,511 1,864 79,317 15,251 50,590 2,143 1,905 69,8892000 11,681 35,737 46,823 2,987 97,228 16,495 71,040 2,624 1,750 91,909
2001 5,319 38,612 55,198 2,531 101,660 21,407 69,104 3,069 2,669 96,2492002 5,385 44,461 64,449 3,419 117,714 23,211 74,447 3,165 3,903 104,7262003 13,012 46,045 96,026 13,007 168,090 28,847 113,763 8,740 11,752 163,1022004 4,988 42,727 127,210 7,264 182,189 27,132 137,154 4,866 5,783 174,9352005 7,255 44,241 94,756 28,599 174,851 30,440 116,830 … 15,327 162,597
2006 12,254 44,811 126,385 39,146 222,596 37,403 139,322 … 14,519 191,2442007 31,352 48,022 164,400 11,289 255,063 34,975 192,916 5,968 10,431 244,2902008 10,773 49,566 246,848 10,530 317,717 32,734 220,461 6,504 8,177 267,8762009 49,841 54,171 327,030 3,674 434,716 40,646 345,798 4,824 2,347 393,6152010 41,101 62,052 217,375 5,237 325,765 48,860 211,898 6,363 3,906 271,027
2011 54,738 68,866 206,628 6,482 336,713 58,847 228,566 4,715 4,089 296,2172012 40,496 75,652 160,778 13,176 290,102 63,368 183,549 3,793 3,953 254,6642013 35,438 80,094 175,643 13,022 304,196 81,064 189,566 3,183 4,805 278,6182014 25,578 82,321 173,509 23,491 304,899 88,262 157,413 4,156 10,119 259,9502015 44,949 86,727 221,248 9,579 362,503 86,128 227,248 4,392 5,762 323,5302016 38,973 95,389 270,176 2,561 407,099 86,687 295,215 4,804 4,715 391,4212017 a 15,678 106,073 292,944 3,025 417,720 95,105 287,380 4,454 5,718 392,6582018 a 25,062 120,238 404,202 3,474 552,976 104,522 423,593 4,804 3,850 536,769
Note: Account Receivables and Interests were included in 'Others'.
a Unauditedb Include the time deposit reclassified as Cash Bank Actc Administrative and operating expenses
Source: Government Service Insurance System
Year Cash Balance Beginning
Cash ReceiptsTotal Cash Available
Disbursements Total Cash Disburseme
nts

TABLE 16.17 Expenditures of the Social Security System by Fund: 1987 to 2018 (In million pesos)
Employees Compensation
1987 2,420.0 2,185.1 234.9 221.6 13.31988 3,489.5 3,181.2 308.3 293.6 14.71989 4,237.0 3,817.5 419.5 400.0 19.51990 5,658.2 5,162.0 496.2 475.7 20.51991 7,533.3 6,880.4 652.9 627.4 25.51992 9,913.2 9,092.7 820.5 788.5 32.01993 13,154.9 12,236.9 918.0 883.0 35.01994 16,722.4 15,522.5 1,199.9 1,126.4 73.51995 18,470.5 16,948.8 1,521.7 1,398.3 123.41996 20,257.3 18,278.1 1,979.2 1,825.6 153.61997 22,933.0 20,584.7 2,348.3 2,176.4 171.91998 28,125.6 24,879.2 3,246.4 3,058.5 187.91999 32,764.6 28,770.8 3,993.8 3,731.5 262.32000 38,091.3 33,889.2 4,202.1 4,016.4 185.72001 43,462.5 39,015.1 4,447.4 4,211.6 235.82002 45,357.3 40,871.6 4,485.7 4,340.5 145.22003 47,583.0 42,806.4 4,776.6 4,644.8 131.82004 50,209.8 44,882.5 5,327.3 5,192.0 135.32005 51,908.2 46,269.8 5,638.4 5,505.9 132.52006 58,501.9 52,122.0 6,379.9 6,249.1 130.82007 67,565.9 60,746.6 6,819.3 6,697.9 121.42008 74,663.0 67,917.4 6,745.6 6,636.3 109.32009 79,124.5 72,050.0 7,074.6 6,967.8 106.82010 84,288.6 77,174.2 7,114.4 7,014.1 100.32011 90,282.2 82,759.8 7,522.3 7,424.5 97.82012 91,899.1 84,172.8 7,726.3 7,632.0 94.32013 99,039.1 91,400.7 7,638.3 7,555.8 82.52014 110,712.4 102,598.7 8,113.6 8,026.8 86.82015 121,407.2 112,560.8 8,846.4 8,762.3 84.02016 142,456.2 132,978.8 9,477.4 9,399.7 77.72017 180,229.1 r 170,683.6 9,545.5 r 9,481.7 r 63.82018 189,886.9 180,078.5 9,808.4 9,714.3 94.1
Note : Details may not add up to totals due to rounding off.
Source: Social Security System
Year Consolidated Benefit Payments
Operating ExpensesConsolidated Expenditures Consolidated Social Security
16-17

TABLE 16.18 Assets, Investments and Earnings of the Social Security System: 1987 to 2018 (In million pesos)
Annual Increase (percent)
1987 31,092.0 18.9 29,900.3 18.2 3,854.2 (3.0)1988 36,241.1 16.6 35,425.4 18.5 4,394.0 14.01989 42,974.2 18.6 41,781.2 17.9 5,503.0 25.21990 51,518.6 19.9 50,112.1 19.9 7,672.2 39.41991 62,925.4 22.1 60,680.5 21.1 10,538.1 37.41992 72,435.1 15.1 70,036.6 15.4 10,016.9 (4.9)1993 84,212.9 16.3 81,023.5 15.7 11,335.8 13.21994 93,155.7 10.6 88,285.0 9.0 11,368.1 0.31995 101,419.7 8.9 95,909.2 8.6 12,228.8 7.61996 112,580.0 11.0 105,286.1 9.8 12,346.8 1.01997 128,550.9 14.2 125,975.4 19.7 14,114.0 14.31998 143,603.1 11.7 135,615.5 7.7 16,287.7 15.41999 159,688.2 11.2 151,801.8 11.9 17,125.8 5.12000 163,325.7 2.3 149,226.1 (1.7) 10,217.2 (40.3)2001 144,823.8 (11.3) 134,521.0 (9.9) 12,390.1 21.32002a 143,098.4 (1.2) 130,967.2 (2.6) 9,901.2 (20.1)2003a 150,618.9 5.3 138,909.2 6.1 11,335.6 14.52004a 158,007.4 4.9 143,304.7 3.2 7,197.9 (36.5)2005 177,719.6 12.5 166,535.0 16.2 10,607.4 47.42006 205,878.6 15.8 187,759.5 12.7 10,781.1 1.62007 224,928.6 9.3 211,167.9 12.5 16,637.4 54.32008 209,535.8 (6.8) 192,653.8 (8.8) 26,781.4 61.02009 247,891.3 18.3 233,214.3 21.1 21,354.8 (20.3)2010 271,267.5 9.4 252,630.6 10.4 26,705.2 25.12011 294,775.8 8.7 276,746.0 9.5 28,339.3 6.12012 333,583.9 b 13.1 317,475.9 b 14.6 32,482.6 b 14.52013 354,324.3 b 6.2 339,280.8 b 6.9 30,817.4 b (5.1)2014 395,750.4 b 11.7 377,178.0 b 11.2 33,214.1 b 7.82015 411,275.2 b 3.9 r 378,064.1 c 0.2 27,517.6 c (17.2)2016 441,833.5 r 7.4 r 406,396.8 7.5 27,672.7 0.62017a 471,015.1 r 6.6 r 433,784.7 r 6.7 r 38,619.5 r 39.6 r
2018 473,049.0 0.4 442,818.8 2.1 27,898.4 (27.8)
Note: Excludes Employees' Compensation; Includes Mortgage Insurance Fund1 As of December2 Earnings from investments onlya Restatedb Revised Includes Flexi Fundc Revised Includes Flexi and Peso Fund
Source: Social Security System
YearYear-end Assets1
Annual Increase (percent)
Year-end Investments1
Annual Increase (percent)
Yearly Earnings 2
16-18

TABLE 16.19 Revenues of the Social Security System by Fund: 1987 to 2018 (In million pesos)
Employees' Compensation
1987 7,905.0 3,611.9 4,275.6 3,837.1 438.5 17.5 17.1 0.41988 9,498.8 4,556.0 4,933.7 4,385.2 548.5 9.1 8.8 0.31989 11,681.1 5,419.7 6,232.1 5,476.0 756.1 29.3 27.0 2.31990 15,370.0 6,576.9 8,763.9 7,643.4 1,120.5 29.2 28.8 0.41991 19,974.9 8,151.4 11,759.2 10,474.8 1,284.4 64.3 63.3 1.01992 21,172.9 9,556.3 11,540.3 9,941.5 1,598.8 76.3 75.4 0.91993 24,337.7 11,435.2 12,824.0 11,258.7 1,565.3 78.5 77.1 1.41994 26,979.0 13,893.4 12,991.2 11,275.3 1,715.9 94.4 92.8 1.61995 30,050.9 16,022.6 13,901.3 12,104.7 1,796.6 127.0 124.1 2.91996 32,493.2 18,480.4 13,826.4 12,162.6 1,663.8 186.4 184.3 2.11997 38,010.8 22,346.1 15,424.5 13,876.2 1,548.3 240.2 237.8 2.41998 43,102.0 24,983.9 17,970.5 16,143.1 1,827.4 147.6 144.6 3.01999 46,161.1 27,186.1 18,862.2 17,013.0 1,849.2 112.8 112.8 0.02000 42,661.8 30,320.5 12,303.7 10,165.9 2,137.8 37.6 51.4 (13.8)2001 45,610.7 r 31,371.8 14,162.7 12,315.3 1,847.4 77.9 76.5 1.42002a 45,892.7 34,187.7 11,705.0 9,901.2 1,803.8 - - -2003a 52,183.5 39,420.4 12,763.1 11,694.6 1,068.5 - - -2004a 52,789.1 43,935.8 8,161.8 7,197.9 963.9 691.5 332.2 359.32005 59,919.5 47,602.1 11,746.3 10,608.4 1,137.9 571.1 264.5 306.62006 64,651.5 52,543.6 11,509.0 10,781.1 727.9 598.8 171.9 426.92007 79,699.1 61,829.1 17,060.3 16,637.4 422.9 809.8 480.4 329.32008 97,968.3 r 68,879.3 27,592.0 r 26,355.5 r 1,236.5 1,497.1 r 1,493.0 r 4.12009 95,336.5 72,350.9 22,350.9 21,354.8 996.1 634.8 633.5 1.32010 107,120.8 79,272.9 27,536.3 26,705.0 831.3 311.6 311.4 0.22011 115,836.9 85,971.5 29,639.8 28,339.3 1,300.5 225.6 224.2 1.42012 128,100.1 94,209.5 33,686.7 32,482.6 b 1,204.1 203.8 203.7 b 0.22013 137,396.3 103,008.6 31,493.7 30,817.4 b 676.3 2,893.9 2,893.3 b 0.72014 155,180.8 120,650.2 33,964.4 33,214.1 b 750.3 566.2 562.4 b 3.72015 162,101.9 132,615.0 28,542.9 27,517.6 c 1,025.3 944.0 942.2 c 1.72016 174,461.1 144,364.9 29,248.9 27,672.7 1,576.1 847.4 845.0 2.42017a 201,605.2 r 159,724.0 40,723.8 r 38,619.5 r 2,104.3 1,157.4 1,154.5 r 2.82018 212,552.0 181,917.3 29,656.8 27,898.4 1,758.5 977.9 974.7 3.2
Note: Details may not add up to totals due to rounding off.1 2002 Earnings includes other income2 Includes Mortgage Insurance Funda Restatedb Revised; includess Flexi Fundsc Revised; includess Flexi and PESO Funds
Source: Social Security System
Employees' Compensation
Earnings 1
ConsolidatedYear
Others
Social Security 2
Social Security 2
Consolidated Revenue
Consolidated Contributions Consolidated
16-19

TABLE 16.20 Revenues, Expenditures, and Trust Fund Generated from the Operations of the Social Security System: 1987 to 2018 (In million pesos)
Employees' Compensation
Employees' Compensation
1987 7,905.0 7,209.5 695.5 2,420.0 2,318.0 102.0 5,485.0 4,891.5 593.51988 9,498.8 8,681.6 817.2 3,489.5 3,345.9 143.6 6,009.3 5,335.7 673.61989 11,681.1 10,625.0 1,056.1 4,237.0 4,064.0 173.0 7,444.1 6,561.0 883.11990 15,370.0 13,935.1 1,434.9 5,658.2 5,447.8 210.4 9,711.8 8,487.3 1,224.51991 19,974.9 18,360.4 1,614.5 7,533.2 7,291.8 241.4 12,441.7 11,068.6 1,373.11992 21,172.9 19,197.5 1,975.4 9,913.2 9,594.1 319.1 11,259.7 9,603.4 1,656.31993 24,337.7 22,322.3 2,015.4 13,154.9 12,744.1 410.8 11,182.8 9,578.2 1,604.61994 26,979.0 24,718.8 2,260.2 16,722.4 16,053.1 669.3 10,256.6 8,665.7 1,590.91995 30,050.9 27,628.0 2,422.9 18,470.6 17,647.2 823.4 11,580.3 9,980.8 1,599.51996 32,493.1 30,398.9 2,094.2 20,257.3 19,362.4 894.9 12,235.8 11,036.5 1,199.31997 38,010.8 36,152.1 1,858.7 22,933.0 21,915.9 1,017.1 15,077.8 14,236.2 841.61998 43,102.0 40,804.7 2,297.3 28,125.6 27,033.4 1,092.2 14,976.4 13,771.3 1,205.11999 46,161.1 43,934.3 2,226.8 32,764.6 31,475.9 1,288.7 13,396.5 12,458.4 938.12000 42,661.8 r 40,102.8 r 2,559.0 r 38,091.3 36,751.5 1,339.8 4,570.3 3,351.2 1,219.12001 45,610.7 43,302.1 2,308.6 43,462.4 42,025.1 1,437.3 2,148.3 1,277.0 871.32002 a 45,892.7 43,603.4 2,289.3 45,357.3 43,906.8 1,450.5 535.4 (303.4) 838.82003 a 52,183.5 50,329.3 1,854.2 47,583.0 46,267.7 1,315.3 4,600.5 4,061.6 538.92004 a 52,789.1 50,613.6 2,175.5 50,209.9 48,935.3 1,274.6 2,579.2 1,678.3 900.92005 59,919.5 r 57,587.9 2,331.5 51,908.2 50,686.7 1,221.5 8,011.2 6,901.2 1,110.02006 64,651.5 62,586.4 2,065.1 58,501.9 57,300.7 1,201.2 6,149.6 5,285.8 863.92007 79,699.1 77,887.3 1,811.8 67,565.9 66,363.2 1,202.6 12,133.2 11,524.0 609.22008 97,968.3 95,516.6 2,451.7 74,663.0 73,456.7 1,206.3 23,305.3 21,481.3 1,245.42009 95,336.5 r 93,155.3 2,181.3 r 79,124.5 77,931.7 1,192.9 16,212.0 15,224.8 987.12010 107,120.8 104,973.4 2,147.4 84,288.6 83,102.2 1,186.3 22,832.2 21,871.4 961.02011 115,836.9 113,166.4 2,670.5 90,282.2 89,107.4 1,174.8 25,554.7 24,059.0 1,495.72012 128,100.1 125,413.4 r, b 2,686.7 91,899.1 90,779.0 1,120.1 36,201.0 36,634.4 r 1,566.62013 137,396.3 135,114.2 r, b 2,282.1 99,039.1 97,972.6 1,066.5 38,357.2 37,141.6 r 1,215.62014 155,180.8 152,715.5 b 2,465.3 110,712.4 109,528.6 1,183.7 44,468.4 43,186.9 r 1,281.62015 162,101.9 159,246.2 c 2,855.7 121,407.2 120,251.5 1,155.7 40,694.7 38,994.7 1,700.02016 174,461.1 170,969.0 3,492.1 142,456.2 141,283.3 1,172.8 32,005.0 29,685.7 2,319.32017 a 201,605.2 r 197,390.6 r 4,214.7 180,229.1 r 179,015.3 r 1,213.7 21,376.2 r 18,375.2 r 3,000.92018 212,552.0 208,539.2 4,012.9 189,886.9 188,071.0 1,815.9 22,665.1 20,468.2 2,196.9
Note: Excludes Employees' Compensation; Includes Mortgate Insurance Fund.1 Includes Mortgage Insurance Funda Restatedb Revised; includess Flexi Fundsc Revised; includess Flexi and PESO Funds
Source: Social Security System
Employees' Compensation Consolidated
Social Security 1
ConsolidatedSocial
Security 1
Revenues
Year
Expenditures Net Revenues
Social Security 1Consolidated
16-21

TABLE 16.21 Investments Portfolio of the Social Security System: 1987 to 2018 (In million pesos)
1987 33,408.2 29,900.3 22,617.2 1,060.0 1,953.9 4,269.2 3,507.91988 39,684.0 35,425.3 23,619.3 3,428.6 2,721.9 5,655.5 4,258.71989 46,944.2 41,781.2 25,033.9 5,277.5 4,377.9 7,091.9 5,163.01990 56,490.4 50,112.2 31,040.4 6,277.8 4,076.3 8,717.7 6,378.2
1991 68,264.9 60,680.5 32,984.2 8,914.4 6,216.4 12,565.5 7,584.41992 79,279.3 70,036.6 34,445.1 10,882.7 7,647.7 17,061.1 9,242.71993 91,885.6 81,023.5 39,127.1 11,449.9 6,848.3 23,598.2 10,862.11994 100,719.2 88,285.0 30,500.0 16,635.2 11,231.2 29,918.6 12,434.21995 109,793.1 95,909.2 31,481.2 20,496.3 12,137.7 31,794.0 13,883.9
1996 119,244.1 105,286.1 37,562.1 22,405.6 12,536.6 32,781.8 13,958.01997 140,810.3 125,975.4 42,196.3 25,981.2 14,557.6 43,240.3 14,834.91998 151,183.6 135,615.5 41,268.6 36,930.3 12,687.2 44,729.4 15,568.11999 168,336.8 151,801.8 29,191.9 60,223.5 16,982.3 45,404.1 16,535.02000 166,183.0 149,226.1 22,176.0 60,175.3 20,590.4 46,284.4 16,956.9
2001 151,015.0 134,521.0 11,966.7 53,561.1 22,853.8 46,139.4 16,494.02002 a 149,211.0 130,967.2 12,062.6 50,324.1 24,336.3 44,244.2 18,243.82003 a 155,939.7 138,909.2 11,623.5 51,015.2 26,160.8 50,109.7 17,030.52004 a 160,500.4 143,328.1 16,450.0 56,284.0 26,483.0 44,111.1 17,172.32005 188,257.8 166,566.1 29,248.4 68,212.0 26,812.2 42,293.5 21,691.7
2006 210,414.6 188,153.0 35,650.9 88,436.1 29,323.4 34,742.6 22,261.72007 234,252.6 211,441.1 60,363.2 85,772.5 31,356.1 33,949.2 22,811.62008 218,478.1 199,786.4 82,107.9 49,556.5 35,117.4 33,004.5 23,542.02009 257,890.6 233,214.3 74,717.9 88,995.3 38,661.5 30,839.6 24,676.3
2010 b 280,029.9 253,842.5 89,055.1 98,003.2 36,119.4 30,664.7 26,187.4
2011 b 306,178.4 278,614.7 108,787.3 104,110.0 38,005.2 27,712.1 27,563.7 2012 b 347,056.8 317,979.7 r 134,100.7 c 111,254.7 c 44,707.8 27,916.5 29,077.0 2013 b 370,987.1 340,821.0 r 141,640.2 c 116,490.2 c 53,274.6 29,416.0 30,166.1 2014 b 409,926.5 378,682.4 r 158,631.6 c 135,806.1 c 54,904.4 29,340.2 31,244.0 2015 b 426,664.3 393,845.8 175,832.2 c 127,528.6 d 59,990.7 30,494.3 32,818.5 2016 b 458,723.0 r 424,486.6 r 187,460.1 r 138,908.9 r 67,791.7 30,325.9 34,236.5
2017 a,b 495,862.5 r 458,590.7 r 200,853.0 r 141,371.6 r 72,136.5 44,229.5 r 37,271.8 2018 b 495,305.7 457,322.5 188,752.7 143,731.9 77,613.3 47,224.6 r 37,983.2
Note: Details may not add up to totals due to rounding off.1 Includes Mortgage Insurance Funda Restatedb Includes savings/time/special savings deposits/current accountsc Revised; includess Flexi Fundd Revised; includess Flexi and PESO Funds
Source: Social Security System
Year Consolidated Investments
Employees' CompensationGovernment
Sector Private SectorTotal Member Loans Others
Social Security 1
16-21

TABLE 16.22 Balance of Payments: 2015 to 2018 (Value in million U.S. dollars)
CURRENT ACCOUNT 7,266 (1,199) (2,143) r (7,879) Exports 105,851 108,905 124,126 r 128,818 Imports 98,585 110,104 126,269 r 136,697 Goods, Services and Primary Income (15,997) (25,926) (28,295) r (34,699) Exports 81,765 83,494 97,229 r 101,211 Imports 97,762 109,420 125,525 r 135,910 Goods and Services (17,854) (28,506) (31,522) r (38,543) Exports 72,262 73,938 86,646 r 89,142 Imports 90,117 102,444 118,168 r 127,686 Goods (23,309) (35,549) (40,215) r (49,036) Exports 43,197 42,734 51,814 r 51,674 Imports 66,506 78,283 92,029 r 100,710 Services 5,455 7,043 8,693 r 10,493 Exports 29,065 31,204 34,832 r 37,469 Imports 23,610 24,160 26,139 r 26,976 Primary Income 1,857 2,579 3,226 r 3,844 Receipts 9,503 9,556 10,583 r 12,068 Payments 7,646 6,977 7,357 r 8,224 Secondary Income 23,263 24,728 26,153 r 26,820 Receipts 24,086 25,411 26,897 r 27,607 Payments 823 684 745 r 787 Capital Account 84 62 69 r 65 Receipts 99 77 103 r 103 Payments 15 15 34 38 Financial Account 2,301 175 (2,798) r (7,832) Net Acquisition of Financial Assets 6,139 5,658 6,717 r 6,038 Net Incurrence of Liabilities 3,838 5,483 9,515 r 13,870 Direct Investment (100) (5,883) (6,952) r (5,854) Net Acquisition of Financial Assets 5,540 2,397 3,305 r 3,948 Net Incurrence of Liabilities 5,639 8,280 10,256 r 9,802 Portfolio Investment 5,471 1,480 2,454 r 858 Net Acquisition of Financial Assets 3,343 1,216 1,658 r 4,224 Net Incurrence of Liabilities (2,128) (264) (796) 3,366 Financila Derivatives 6 (32) (51) 53 Net Acquisition of Financial Assets (531) (701) (503) (1,466) Net Incurrence of Liabilities (537) (669) (453) (1,413) Other Investment (3,076) 4,610 1,750 r (2,783) Net Acquisition of Financial Assets (2,213) 2,746 2,257 r (669) Net Incurrence of Liabilities 864 (1,864) 508 r 2,114NET UNCLASSIFIED ITEMS (2,433) 274 r (1,588) r (2,324)OVERALL BOP POSITION 2,616 (1,038) r (863) (2,306) Change in Reserve Assets 2,616 (1,038) r (862) (2,305) Change in Reserve Liabilities (0) 0 1 1Memo Items: … … … …Change in Net Foreign Assets (NFA) of Deposit-taking corporations (1,065) 1,381 433 r (484)Change in Commercial Banks' (KBs) NFA (1,165) 1,421 400 r (471)Change in Thrift Banks' (TBs) NFA 168 (166) 58 (26)Change in Offshore Banking Units' (OBUs) NFA (68) 126 (26) 12Personal Remittances 28,308 29,706 31,288 32,213of which: OF Cash Remittances channeled thru the banking 25,607 26,900 28,060 28,943Notes: Details may not add up to total due to rounding.1. Balance of Payments Statistics from 2005 onwards are based on the IMF's Balance of Payments and International Investment Position Manual, 6th Edition.2. Financial Account, including Reserve Assets, is calculated as the sum of net acquisitions of financial assets less net incurrence of liabilities.3. Balances in the current and capital accounts are derived by deducting debit entries from credit entries.4. Balances in the financial account are derived by deducting net incurrence of liabilities from net acquisition of financial assets.5. Negative values of Net Acquisition of Financial Assets indicate withdrawal/disposal of financial assets; negative values of Net Incurrence of Liabilities indicate repayment of liabilities.6. Overall BOP position is calculated as the change in the country's net international reserves (NIR), less non-economic transactions (revaluation and gold monetization/demonetization). Alternatively, it can be derived by adding the current and capital account balances less financial account plus net unclassified items.7. Net unclassified items is an offsetting account to the overstatement or understatement in either receipts or payments of the recorded BOP components vis-à-vis the overall BOP position.8. Data on Deposit-taking corporations, except the central bank, consist of transactions of commercial and thrift banks and offshore banking units (OBUs).
Source: Bangko Sentral ng Pilipinas
Item 2015 2018p2017 2016
16-22

TABLE 16.23 Peso per U.S. Dollar Rate: January 2008 to December 2018
Period 2008 2009 2010 2011 2012 2013 2014 2015 2016 2017 2018
Monthly Averages
January 40.9381 47.2072 46.0276 44.1722 43.6191 40.7295 44.9266 44.6044 47.5111 49.7363 50.5087 February 40.6711 47.5846 46.3116 43.7031 42.6608 40.6723 44.8950 44.2214 47.6361 49.9614 51.7856 March 41.2524 48.4580 45.7425 43.5160 42.8574 40.7127 44.7916 44.4457 46.7240 50.2752 52.0676 April 41.8196 48.2165 44.6266 43.2402 42.6998 41.1422 44.6416 44.4136 46.2845 49.8626 52.0986 May 42.9020 47.5242 45.5971 43.1307 42.8515 41.2976 43.9236 44.6106 46.8023 49.8603 52.1948 June 44.2806 47.9053 46.3027 43.3657 42.7765 42.9069 43.8175 44.9831 46.4645 49.8501 53.0476 July 44.9563 48.1460 46.3203 42.8088 41.9054 43.3559 43.4665 45.2649 47.0581 50.6382 53.4329 August 44.8769 48.1607 45.1825 42.4209 42.0452 43.8639 43.7673 46.1420 46.6809 50.8747 53.2735 September 46.6922 48.1394 44.3137 43.0256 41.7490 43.8318 44.0751 46.7504 47.4294 51.0094 53.9419 October 48.0252 46.8513 43.4449 43.4514 41.4521 43.1825 44.7979 46.3609 48.3482 51.3433 54.0086 November 49.1862 47.0324 43.4918 43.2745 41.1222 43.5546 44.9514 47.0067 49.1550 51.0384 52.8083 December 48.0942 46.4211 43.9548 43.6486 41.0067 44.1043 44.6878 47.2303 49.8156 50.3947 52.7691
Average 44.4746 47.6372 45.1097 43.3131 42.2288 42.4462 44.3952 45.5028 47.4925 50.4037 52.6614
End-of-Period
January 40.6500 47.0760 46.7430 44.0880 42.9460 40.6530 45.1550 44.1320 47.8230 49.8140 51.4210 February 40.3600 48.2360 46.2580 43.8370 42.8640 40.7360 44.6560 44.0870 47.5600 50.2670 52.0340 March 41.8680 48.4190 45.2200 43.4320 43.0000 40.9380 44.9960 44.7960 46.1080 50.1940 52.2070 April 42.1920 48.7040 44.6440 43.0180 42.4360 41.1610 44.4630 44.2500 46.7730 49.6990 51.9650 May 43.8820 47.5480 46.2120 43.2910 43.4510 42.3760 43.9270 44.6500 46.7750 49.8670 52.6890 June 44.7560 48.3080 46.3100 43.4940 42.2830 43.3070 43.7800 45.2000 46.9600 50.4660 53.5220 July 44.1400 48.1210 45.8130 42.2270 41.9070 43.4020 43.4210 45.6180 47.0850 50.5820 53.2630 August 45.6850 48.9060 45.1790 42.5070 42.3150 44.6350 43.6480 46.7050 46.4670 51.1660 53.4340 September 46.9170 47.5920 43.8960 43.6360 41.8800 43.3090 44.9660 46.9260 48.2570 51.0730 54.2510 October 48.7460 47.7320 43.1820 43.0280 41.2630 43.1790 44.8760 46.8900 48.5150 51.7990 53.6060 November 48.8800 46.7520 44.2550 43.8100 40.8830 43.7360 44.9160 47.0690 49.7770 50.3650 52.6080 December 47.4850 46.3560 43.8850 43.9280 41.1920 44.4140 44.6170 47.1660 49.8130 49.9230 52.7240
Note: Figures are weighted average rate under the Philippine Dealing System starting 04 August 1992.
Source: Bangko Sentral ng Pilipinas
16-23

TABLE 16.24 Selected Domestic Interest Rates: 2003 to 2018 (Weighted averages in percent per annum)
60-Day
2003 5.6 9.8 8.7 7.3 9.5 6.0 7.0 7.5 6.7 7.0 7.02004 7.1 9.5 10.4 8.1 10.1 7.3 8.3 9.2 8.1 6.8 7.02005 6.2 8.9 9.9 7.1 10.1 6.4 7.7 8.7 7.5 7.1 7.32006 6.0 8.1 9.3 6.8 9.7 5.4 6.1 7.0 6.2 7.6 7.82007 4.9 8.3 8.6 6.2 8.7 3.4 4.2 4.9 4.2 7.2 r 6.92008 4.4 7.5 7.7 5.3 8.8 5.4 6.2 6.5 6.4 5.7 r 5.42009 4.4 7.3 7.5 5.3 8.5 4.2 4.4 4.6 4.5 4.4 r 4.82010 4.0 6.9 7.0 4.8 7.7 3.7 4.0 4.3 4.0 4.1 r 4.22011 3.8 6.7 6.8 4.8 6.6 r 1.4 r 1.7 r 2.3 r 1.9 4.6 r 4.62012 3.4 r 5.3 r 4.9 r 3.9 r 5.7 1.3 1.8 2.0 1.8 3.9 r 4.12013 1.8 2.5 2.8 r 2.0 5.8 0.3 0.5 0.7 0.6 r 3.5 2.22014 ... ... ... ... 5.5 1.2 1.6 r 1.8 r 1.5 r 3.7 2.22015 ... ... ... ... 5.6 1.8 1.9 2.1 1.9 4.0 2.52016 ... ... ... ... 5.6 1.5 1.6 1.8 1.6 ... 2.52017 ... ... ... ... 5.6 2.1 2.5 2.9 2.4 ... 2.72018 ... ... ... ... 6.1 3.5 4.5 5.1 4.4 ... 3.71 Refer to New MRRs computed based on promisory notes and time deposit transactions of sample commercial banks pursuant to Circular 1911 dated November 23, 1988 effective January 13, 1989. Per BSP Circular No. 846, the generation and publication of MRR rates will be discounted effected 17 September 2014. 2 Monthly rates reflect the annual percentage equivalent of all commercial banks' actual monthly interest income on their peso-denominated loans, bills discounted, mortgage contract receivables restructured loans.
Source: Bangko Sentral ng Pilipinas
364-Day All Maturities
Treasury Bill Rates Reverse RP Term
RatesPeriod
Manila Reference Rates 1 Interbank Call Loan
Rates90-Day 180-Day All Maturities
Bank Average Lending Rates 2
91-Day 182-Day
16-24

TABLE 16.25 Number of Insurance Companies Authorized to Transact Business in the Philippines: 2009 to 2018
2009 2010 2011 2012 2013 2015 2016 2018
Total 120 119 116 110 101 98 r 99 98 98 r 94
Direct Writing 119 118 115 109 100 97 r 98 97 97 r 93
Life 32 30 30 29 26 26 r 27 27 29 r 28Domestic 24 22 22 22 20 19 r 20 18 18 17Foreign 8 8 7 7 6 7 r 7 9 9 9Branch - - 1 - - - - - - -
Servicing 2
Non-life 84 84 81 76 70 67 67 66 64 r 60Domestic 76 76 73 69 63 60 60 58 51 43Foreign 5 5 5 5 4 4 7 8 7 11Branch 3 3 3 2 3 3 - - - -
Servicing 6 6
Composite 3 4 4 4 4 4 4 4 4 r 5Domestic 2 3 3 3 3 3 3 3 3 r 3Foreign 1 1 1 1 1 1 1 1 1 2Branch
Professional Reinsurers 1 1 1 1 1 1 1 1 1 1Domestic 1 1 1 1 1 1 1 1 1 1ForeignBranch
Source: Insurance Commission
2014 2017
16-25

17 - 4
17 - 5
17 - 6
17 - 7
17 - 8
17 - 9
17 - 10
17 - 11
17 - 15
17 - 16
17 - 17
17 - 18
17 - 19
17 - 20
TABLE 17.1 Reported Index Crimes by Region and by Type of Crime: 2016 to 2018
TABLE 17.2 Reported Non-Index Crimes by Region and by Type of Crime: 2016 to 2018
TABLE 17.3 Reported Index and Non-Index Crimes by Region: 2016 to 2018
TABLE 17.4 Average Monthly Crime Rate and Total Crime Solved by Region: 2016 to 2018
TABLE 17.5 Ratio of Policemen and Firemen to Population: 1996 to 2014
TABLE 17.6 Number of Kidnap for Ransom Incidents by Status of Victims, by Status of Suspects,
Ransom Paid, Status of Case, and by Region: 2014
TABLE 17.7 Service of Warrants of Arrest by Region, by Status, and by Rate of Efficiency: 2013 and 2014
TABLE 17.8 Causes of Fire Incidence by Region: 2015 to 2018
TABLE 17.9 Number of Highway Traffic Accidents: 2010 to 2014
TABLE 17.10 Incidence of Alleged Human Rights Violations Filed with the CHR by Region: 2013 to 2018
TABLE 17.11 Reported Cases of Violence Against Women by Classification of Offense: 2008 to 2014
TABLE 17.12 Reported Crimes Committed Against Children by Classification of Offense: 2008 to 2014
TABLE 17.13 Profile of Drug Abusers: 2013 to 2018
TABLE 17.14 Distribution of Reported Cases of Drug/Substance Abuse by Sex
and by Type of Drug/Substance of Abuse: 2016 to 2018
TABLE 17.15 Reported Cases of Drug/Substance Abuse by Type of Patient Confined in VariousRehabilitation Centers: 2008 to 2018 17 - 20
TABLE 17.16 Number of Operations Conducted and Persons Arrested for Violation of RA 9165: 2008 to 2018 17 - 20
17 - 21
17 - 22
17 - 22
17 - 23
17 - 23
17 - 24
17 - 24
17 - 25
17 - 25
TABLE 17.17 Clientele Assisted by the Public Attorney's Office by Activities/Services: 2014 to 2018
TABLE 17.18 Case Inflow by Type of Court: 2015 to 2018
TABLE 17.19 Case Outflow by Type of Court: 2015 to 2018
TABLE 17.20 Number of Newly Filed Cases by Type of Court: 2015 to 2018
TABLE 17.21 Number of Cases Decided/Resolved by Type of Court: 2015 to 2018
TABLE 17.22 Number of Revived/Reopened Cases by Type of Court: 2015 to 2018
TABLE 17.23 Number of Archived Cases by Type of Court: 2015 to 2018
TABLE 17.24 Court-Case Disposition Rate by Type of Court: 2011 to 2014
TABLE 17.25 Number of Judicial Positions, Incumbent Judges, and Vacancies
in the First and Second Level Courts: 2011 to 2013
TABLE 17.26 Inmate Profile by Prison Facility: As of March 2019 17 - 26
TABLE 17.27 Jail Population by Classification/Status of Inmates, by Sex, and by Region: 2014 to 2018 17 - 28
TABLE 17.28 Number of Escapees and Escapees Recaptured by Region: 2014 to 2018 17 - 29
TABLE 17.29 Congestion Rate of Jails by Region: 2014 to 2018 17 - 30
TABLE 17.30 Number of Inmates Benefitted in Inmates Welfare Development Program: 2014 17 - 31
TABLE 17.31 Number of Actions Taken by the "Katarungang Pambarangay": 2018 17 - 32
TABLE 17.32 Damages Caused by Major Natural Disasters by Type of Damage Caused: 2012 to 2014 17 - 33
TABLE 17.33 Budgetary Appropriation for Criminal Justice System by Pillar and by Agency: 2012 to 2014 17 - 34

TABLE 17.1 Reported Index Crimes by Region and by Type of Crime: 2016 to 2018
Murder Homicide Physical Injuries Rape Total Robbery Theft Car-
nappingCattle
Rustling Total
2016 139,577 11,379 2,336 35,826 9,384 58,925 21,218 49,634 9,334 466 80,652
2017 107,538 8,826 2,592 30,691 8,158 50,267 16,076 34,435 6,476 284 57,271
NCR 17,788 1,514 423 4,462 906 7,305 3,025 6,454 1,004 0 10,483CAR 1,674 60 42 556 173 831 224 542 71 6 843I - Ilocos Region 3,712 322 77 1,328 463 2,190 362 963 176 21 1,522II - Cagayan Valley 2,716 261 144 1,101 197 1,703 318 502 183 10 1,013III - Central Luzon 8,640 731 154 1,977 981 3,843 1,550 2,294 934 19 4,797IV-A CALABARZON 11,462 1,342 229 2,855 1,199 5,625 1,627 3,115 1,095 0 5,837MIMAROPA 1,718 167 42 564 297 1,070 276 270 92 10 648V - Bicol Region 7,226 426 84 2,037 522 3,069 951 2,860 311 35 4,157VI - Western Visayas 11,053 477 258 4,622 700 6,057 1,139 3,562 282 13 4,996VII - Central Visayas 12,295 620 128 3,299 691 4,738 2,098 4,929 500 30 7,557VIII - Eastern Visayas 3,022 360 115 1,097 273 1,845 296 794 79 8 1,177IX - Zamboanga Peninsula 4,936 366 66 1,236 337 2,005 865 1,753 299 14 2,931X - Northern Mindanao 6,859 442 97 1,735 347 2,621 1,130 2,664 412 32 4,238XI - Davao Region 5,020 656 180 1,276 539 2,651 778 1,320 260 11 2,369XII - SOCCSKSARGEN 6,299 318 451 1,607 278 2,654 1,095 1,925 576 49 3,645XIII - Caraga 1,890 333 62 586 204 1,185 252 373 77 3 705ARMM 1,228 431 40 353 51 875 90 115 125 23 353
2018 81,413 6,895 2,140 22,427 7,579 39,041 11,349 25,949 4,924 150 42,372
NCR 14,650 730 276 3,521 1,072 5,599 2,538 5,574 939 0 9,051CAR 1,159 73 41 398 121 633 144 321 60 1 526I - Ilocos Region 2,910 233 66 984 334 1,617 302 814 152 25 1,293II - Cagayan Valley 2,389 217 75 913 341 1,546 227 436 167 13 843III - Central Luzon 6,688 461 123 1,546 957 3,087 1,085 1,858 643 15 3,601IV-A CALABARZON 8,312 999 184 1,928 1,036 4,147 1,159 2,272 734 0 4,165MIMAROPA 1,427 165 48 456 295 964 166 205 88 4 463V - Bicol Region 4,934 417 88 1,211 390 2,106 698 1,896 221 13 2,828VI - Western Visayas 5,030 468 190 2,036 367 3,061 605 1,236 118 10 1,969VII - Central Visayas 13,637 692 141 3,637 658 5,128 1,858 6,094 544 13 8,509VIII - Eastern Visayas 2,894 324 83 1,033 401 1,841 266 706 75 6 1,053IX - Zamboanga Peninsula 4,213 330 74 990 350 1,744 563 1,636 259 11 2,469X - Northern Mindanao 3,266 359 96 1,028 323 1,806 445 807 194 14 1,460XI - Davao Region 3,791 546 95 958 422 2,021 549 962 255 4 1,770XII - SOCCSKSARGEN 3,331 229 479 872 267 1,847 435 683 354 12 1,484XIII - Caraga 1,856 294 46 600 212 1,152 254 393 56 1 704ARMM 926 358 35 316 33 742 55 56 65 8 184
Notes:
Source: Philippine National Police
2. Reported crime incidents were based on PNP blotter only.1. 2018 data were updated as of 29 March 2019.
RegionAgainst Persons Against Property
1 Refer to crimes that are serious in nature and occur with sufficient frequency and regularity for them to serve as index in crime analysis.
Total Index
Crimes 1
17-2

TABLE 17.2 Reported Non-Index Crimes by Region and by Type of Crime: 2016 to 2018
Homicide Physical Injuries
Damage to Property
2016 445,306 6,373 84,102 159,211 126,939 68,681
2017 413,103 6,277 78,918 164,019 108,406 55,483
NCR 123,550 403 14,173 81,240 14,988 12,746CAR 6,699 87 1,367 2,825 1,200 1,220I - Ilocos Region 23,981 430 5,516 7,771 6,896 3,368II - Cagayan Valley 10,136 426 3,025 2,867 2,194 1,624III - Central Luzon 39,265 771 10,223 12,666 10,649 4,956IV-A CALABARZON 36,180 787 6,737 11,333 13,775 3,548MIMAROPA 4,534 203 729 454 2,430 718V - Bicol Region 24,942 366 6,140 7,065 6,639 4,732VI - Western Visayas 32,694 483 6,184 9,619 9,896 6,512VII - Central Visayas 42,493 466 9,388 14,208 13,272 5,159VIII - Eastern Visayas 7,001 227 1,799 1,242 2,875 858IX - Zamboanga Peninsula 10,921 233 2,836 3,297 2,911 1,644X - Northern Mindanao 14,912 453 3,039 3,422 5,398 2,600XI - Davao Region 13,999 305 2,043 1,798 8,060 1,793XII - SOCCSKSARGEN 13,820 365 4,225 3,117 3,651 2,462XIII - Caraga 6,278 223 1,216 990 2,796 1,053ARMM 1,698 49 278 105 776 490
2018 408,980 6,363 73,670 156,058 128,690 44,199
NCR 130,419 372 15,616 78,727 26,614 9,090CAR 6,021 99 1,293 2,910 1,026 693I - Ilocos Region 28,320 495 4,939 6,732 11,509 4,645II - Cagayan Valley 9,197 455 2,443 2,300 2,522 1,477III - Central Luzon 36,315 783 8,797 11,699 11,320 3,716IV-A CALABARZON 38,741 753 6,078 11,313 17,589 3,008MIMAROPA 5,368 181 649 291 3,706 541V - Bicol Region 20,501 373 5,175 6,910 5,333 2,710VI - Western Visayas 22,870 538 4,953 7,981 6,423 2,975VII - Central Visayas 50,780 414 10,690 15,363 16,428 7,885VIII - Eastern Visayas 7,390 274 1,636 1,268 3,166 1,046IX - Zamboanga Peninsula 9,523 241 2,439 2,501 2,959 1,383X - Northern Mindanao 10,287 400 2,216 2,342 3,896 1,433XI - Davao Region 9,772 300 1,340 1,268 5,665 1,199XII - SOCCSKSARGEN 14,551 392 3,719 2,909 6,423 1,108XIII - Caraga 7,492 244 1,489 1,479 3,362 918ARMM 1,433 49 198 65 749 372
Notes:
Source: Philippine National Police
1. 2018 data were updated as of 29 March 2019.
1 Refer to crimes that are serious in nature and occur with sufficient frequency and regularity for them to serve as index in crime analysis.
2. Reported crime incidents were based on PNP blotter only.
RegionReckless Imprudence Resulting in Violation of
Special LawsOther Non-
Index CrimesTotal Non-Index 1
Crimes
17-3

TABLE 17.3 Reported Index and Non-Index Crimes by Region: 2016 to 2018
Total ClearedCrime
Clearance Efficiency
(%)
Total ClearedCrime
Clearance Efficiency
(%)
Total ClearedCrime
Clearance Efficiency
(%)
2016 139,577 63,147 45.24 445,306 344,338 77.33 584,883 407,485 69.67
2017 107,538 55,599 51.70 413,103 332,555 80.50 520,641 388,154 74.55
NCR 17,788 11,582 65.11 123,550 110,556 89.48 141,338 122,138 86.42CAR 1,674 1,210 72.28 6,699 5,489 81.94 8,373 6,699 80.01I - Ilocos Region 3,712 2,445 65.87 23,981 21,342 89.00 27,693 23,787 85.90II - Cagayan Valley 2,716 1,608 59.20 10,136 8,807 86.89 12,852 10,415 81.04III - Central Luzon 8,640 5,135 59.43 39,265 32,633 83.11 47,905 37,768 78.84IV-A CALABARZON 11,462 6,276 54.75 36,180 20,984 58.00 47,642 27,260 57.22MIMAROPA 1,718 1,317 76.66 4,534 3,877 85.51 6,252 5,194 83.08V - Bicol Region 7,226 3,724 51.54 24,942 20,945 83.97 32,168 24,669 76.69VI - Western Visayas 11,053 4,461 40.36 32,694 21,153 64.70 43,747 25,614 58.55VII - Central Visayas 12,295 5,974 48.59 42,493 36,417 85.70 54,788 42,391 77.37VIII - Eastern Visayas 3,022 1,291 42.72 7,001 5,049 72.12 10,023 6,340 63.25IX - Zamboanga Peninsula 4,936 1,816 36.79 10,921 7,502 68.69 15,857 9,318 58.76X - Northern Mindanao 6,859 2,890 42.13 14,912 10,201 68.41 21,771 13,091 60.13XI - Davao Region 5,020 2,715 54.08 13,999 12,439 88.86 19,019 15,154 79.68XII - SOCCSKSARGEN 6,299 1,851 29.39 13,820 9,637 69.73 20,119 11,488 57.10XIII - Caraga 1,890 1,022 54.07 6,278 4,434 70.63 8,168 5,456 66.80ARMM 1,228 282 22.96 1,698 1,090 64.19 2,926 1,372 46.89
2018 81,413 54,277 66.67 408,980 363,315 88.83 490,393 417,592 85.15
NCR 14,650 11,105 75.80 130,419 120,192 92.16 145,069 131,297 90.51CAR 1,159 836 72.13 6,021 4,996 82.98 7,180 5,832 81.23I - Ilocos Region 2,910 2,005 68.90 28,320 26,397 93.21 31,230 28,402 90.94II - Cagayan Valley 2,389 2,052 85.89 9,197 8,921 97.00 11,586 10,973 94.71III - Central Luzon 6,688 5,398 80.71 36,315 33,340 91.81 43,003 38,738 90.08IV-A CALABARZON 8,312 6,350 76.40 38,741 34,492 89.03 47,053 40,842 86.80MIMAROPA 1,427 1,210 84.79 5,368 4,931 91.86 6,795 6,141 90.38V - Bicol Region 4,934 2,519 51.05 20,501 16,915 82.51 25,435 19,434 76.41VI - Western Visayas 5,030 3,783 75.21 22,870 19,277 84.29 27,900 23,060 82.65VII - Central Visayas 13,637 7,155 52.47 50,780 42,160 83.02 64,417 49,315 76.56VIII - Eastern Visayas 2,894 2,642 91.29 7,390 6,975 94.38 10,284 9,617 93.51IX - Zamboanga Peninsula 4,213 1,882 44.67 9,523 7,454 78.27 13,736 9,336 67.97X - Northern Mindanao 3,266 2,042 62.52 10,287 8,308 80.76 13,553 10,350 76.37XI - Davao Region 3,791 2,219 58.53 9,772 9,037 92.48 13,563 11,256 82.99XII - SOCCSKSARGEN 3,331 1,599 48.00 14,551 12,136 83.40 17,882 13,735 76.81XIII - Caraga 1,856 1,204 64.87 7,492 6,794 90.68 9,348 7,998 85.56ARMM 926 276 29.81 1,433 990 69.09 2,359 1,266 53.67
Notes:
Source: Philippine National Police
2. Reported crime incidents were based on PNP blotter only.
Region
Index Crimes Non-Index Crimes Total Crime Volume
1. 2018 data were updated as of 29 March 2019.
17-1

TABLE 17.4 Average Monthly Crime Rate and Total Crime Solved by Region: 2016 to 2018
Average Monthly
Crime Rate
Total Crime Solved
Crime Solution
Efficiency (%)
Average Monthly
Crime Rate
Total Crime Solved
Crime Solution
Efficiency (%)
Average Monthly
Crime Rate
Total Crime Solved
Crime Solution
Efficiency (%)
Philippines 47.14 333,531 57.03 41.57 318,172 61.11 39.15 364,934 74.42
NCR 89.05 87,873 81.95 88.40 90,890 64.31 90.73 114,963 79.25CAR 59.68 7,442 57.41 39.16 5,863 70.02 33.58 5,285 73.61I - Ilocos Region 49.12 22,351 74.33 44.38 19,807 71.52 50.04 23,962 76.73II - Cagayan Valley 35.89 10,017 64.34 29.99 8,671 67.47 27.04 6,767 75.67III - Central Luzon 40.30 33,631 61.27 34.39 31,269 65.27 30.87 32,428 75.41IV-A CALABARZON 28.64 19,219 39.61 26.62 20,810 43.68 26.29 35,640 75.74MIMAROPA 19.21 3,704 52.30 16.99 4,074 65.16 18.47 5,032 74.05V - Bicol Region 52.24 19,165 50.38 44.69 17,526 54.48 35.34 14,838 58.34VI - Western Visayas 57.38 30,863 56.24 46.75 24,925 56.98 29.82 21,919 78.56VII - Central Visayas 65.66 39,434 65.74 59.65 40,269 73.50 70.14 48,539 72.25VIII - Eastern Visayas 21.38 6,377 54.12 18.18 5,627 56.14 18.65 7,681 74.69IX - Zamboanga Peninsula 44.89 9,424 47.22 35.18 7,983 50.34 30.48 8,124 59.14X - Northern Mindanao 40.51 9,631 41.18 37.39 11,245 51.65 23.28 8,823 65.10XI - Davao Region 42.32 17,451 68.68 31.39 13,661 71.83 22.39 10,130 74.69XII - SOCCSKSARGEN 44.88 10,240 41.33 35.65 9,670 48.06 31.69 12,560 70.24XIII - Caraga 30.73 5,534 55.17 25.33 4,683 57.33 28.99 7,240 77.45ARMM 9.86 1,175 26.43 6.38 1,199 40.98 5.14 1,003 42.52
Notes:
1. 2018 data were updated as of 29
Source: Philippine National Police
2. Reported crime incidents were based on PNP blotter only.
2016
Region
2017 2018
17-4
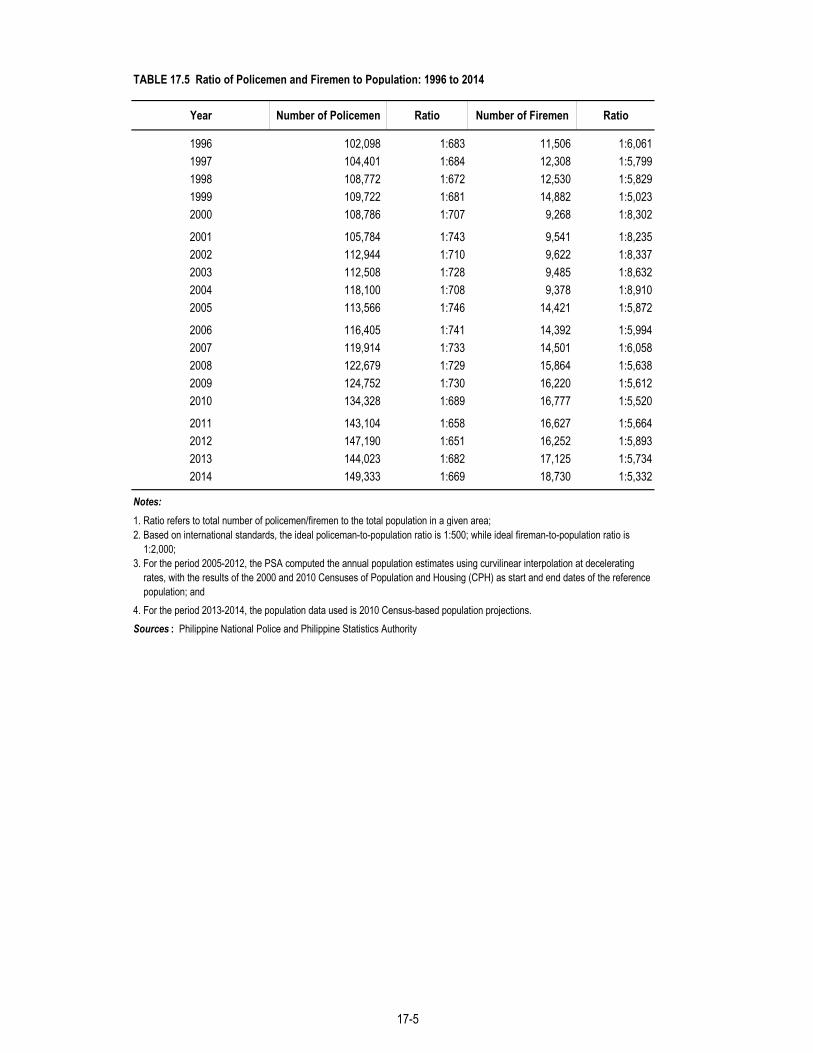
TABLE 17.5 Ratio of Policemen and Firemen to Population: 1996 to 2014
Year Number of Policemen Ratio Number of Firemen Ratio
1996 102,098 1:683 11,506 1:6,0611997 104,401 1:684 12,308 1:5,7991998 108,772 1:672 12,530 1:5,8291999 109,722 1:681 14,882 1:5,0232000 108,786 1:707 9,268 1:8,302
2001 105,784 1:743 9,541 1:8,2352002 112,944 1:710 9,622 1:8,3372003 112,508 1:728 9,485 1:8,6322004 118,100 1:708 9,378 1:8,9102005 113,566 1:746 14,421 1:5,872
2006 116,405 1:741 14,392 1:5,9942007 119,914 1:733 14,501 1:6,0582008 122,679 1:729 15,864 1:5,6382009 124,752 1:730 16,220 1:5,6122010 134,328 1:689 16,777 1:5,520
2011 143,104 1:658 16,627 1:5,6642012 147,190 1:651 16,252 1:5,8932013 144,023 1:682 17,125 1:5,7342014 149,333 1:669 18,730 1:5,332
Notes: 1. Ratio refers to total number of policemen/firemen to the total population in a given area;
4. For the period 2013-2014, the population data used is 2010 Census-based population projections.
2. Based on international standards, the ideal policeman-to-population ratio is 1:500; while ideal fireman-to-population ratio is 1:2,000; 3. For the period 2005-2012, the PSA computed the annual population estimates using curvilinear interpolation at decelerating rates, with the results of the 2000 and 2010 Censuses of Population and Housing (CPH) as start and end dates of the reference population; and
Sources : Philippine National Police and Philippine Statistics Authority
17-5

TABLE 17.6 Number of Kidnap for Ransom Incidents by Status of Victims, by Status of Suspects, Ransom Paid, Status of Case, and by Region: 2014
Philippines 54 50 7 7 8 6 78 51 4 266 31,249,000 20 15 20
NCR 13 13 1 2 0 1 17 23 1 35 7,588,000 5 3 5CAR 0 0 0 0 0 0 0 0 0 0 - 0 0 0I - Ilocos Region 1 1 0 0 0 0 1 1 0 1 720,000 1 0 1II - Cagayan Valley 2 0 1 1 0 0 2 3 0 1 465,000 2 0 2III - Central Luzon 6 5 2 0 0 0 7 2 3 14 1,968,000 2 1 2IV-A CALABARZON 7 4 1 2 0 2 9 12 0 16 711,000 3 2 3IV-B MIMAROPA 1 0 0 0 2 0 2 0 0 4 - 0 1 0V - Bicol Region 0 0 0 0 0 0 0 0 0 0 - 0 0 0VI - Western Visayas 0 0 0 0 0 0 0 0 0 0 - 0 0 0VII - Central Visayas 0 0 0 0 0 0 0 0 0 0 - 0 0 0VIII - Eastern Visayas 0 0 0 0 0 0 0 0 0 0 - 0 0 0IX - Zamboanga Peninsula 7 7 0 0 0 2 9 4 0 55 8,252,000 3 3 3X - Northern Mindanao 4 4 1 0 0 0 5 4 0 24 1,600,000 2 1 2XI - Davao Region 1 0 1 0 0 0 1 1 0 0 - 1 0 1XII - SOCCSKSARGEN 1 1 0 0 0 0 1 0 0 11 - 0 1 0XIII - Caraga 0 0 0 0 0 0 0 0 0 0 - 0 0 0ARMM 11 15 0 2 6 1 24 1 0 105 9,945,000 1 3 1
Source: Philippine National Police
Region Number of Incidents
Status of Victims
Total SolvedReleased Rescued Killed Still Held Captive Escaped Cleared Under-
investigation
Ransom Paid ('000
Pesos)
Status of Case
Killed At Large
Status of Suspects
Arrested
17-6
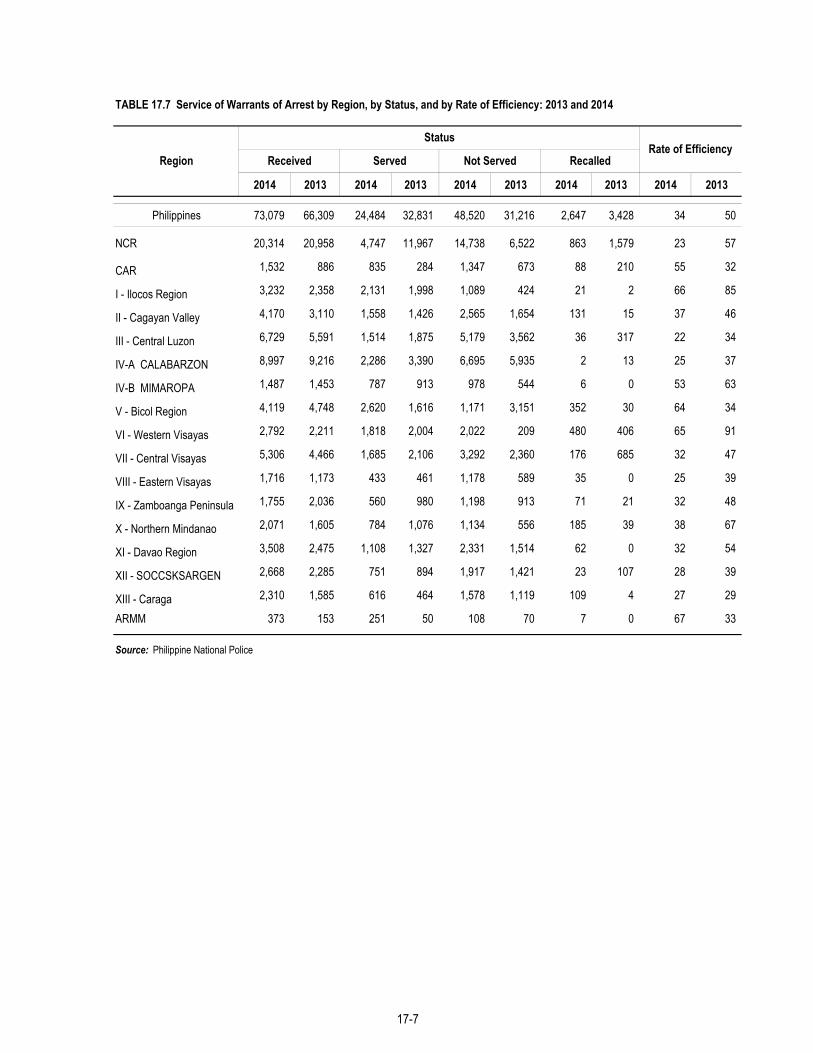
TABLE 17.7 Service of Warrants of Arrest by Region, by Status, and by Rate of Efficiency: 2013 and 2014
2014 2013 2014 2013 2014 2013 2014 2013 2014 2013
Philippines 73,079 66,309 24,484 32,831 48,520 31,216 2,647 3,428 34 50
NCR 20,314 20,958 4,747 11,967 14,738 6,522 863 1,579 23 57
CAR 1,532 886 835 284 1,347 673 88 210 55 32
I - Ilocos Region 3,232 2,358 2,131 1,998 1,089 424 21 2 66 85
II - Cagayan Valley 4,170 3,110 1,558 1,426 2,565 1,654 131 15 37 46
III - Central Luzon 6,729 5,591 1,514 1,875 5,179 3,562 36 317 22 34
IV-A CALABARZON 8,997 9,216 2,286 3,390 6,695 5,935 2 13 25 37
IV-B MIMAROPA 1,487 1,453 787 913 978 544 6 0 53 63
V - Bicol Region 4,119 4,748 2,620 1,616 1,171 3,151 352 30 64 34
VI - Western Visayas 2,792 2,211 1,818 2,004 2,022 209 480 406 65 91
VII - Central Visayas 5,306 4,466 1,685 2,106 3,292 2,360 176 685 32 47
VIII - Eastern Visayas 1,716 1,173 433 461 1,178 589 35 0 25 39
IX - Zamboanga Peninsula 1,755 2,036 560 980 1,198 913 71 21 32 48
X - Northern Mindanao 2,071 1,605 784 1,076 1,134 556 185 39 38 67
XI - Davao Region 3,508 2,475 1,108 1,327 2,331 1,514 62 0 32 54
XII - SOCCSKSARGEN 2,668 2,285 751 894 1,917 1,421 23 107 28 39
XIII - Caraga 2,310 1,585 616 464 1,578 1,119 109 4 27 29
ARMM 373 153 251 50 108 70 7 0 67 33
Source: Philippine National Police
Region
StatusRate of Efficiency
Received Served Not Served Recalled
17-7

TABLE 17.8 Causes of Fire Incidence by Region: 2015 to 2018
Neglected Cooking/
Stove
Cigarette Butt
Torch/ "Sulo"
Candle/ "Gasera"
Matchstick/Lighter
Direct Flame Contact/Static
Electricity
2015
Philippines 17,138 4,011 837 1,180 1,440 637 394 25 137 456 88 80 111 446 61 0 18 3,567 3,650NCR 4,374 1,940 168 622 227 123 64 0 33 125 17 72 5 25 16 0 4 623 310CAR 389 34 14 30 4 22 14 0 5 11 1 0 3 0 5 0 0 109 137I - Ilocos Region 1,252 118 46 72 33 21 21 0 15 15 4 2 8 10 20 0 10 242 615II - Cagayan Valley 209 53 23 3 2 13 14 0 3 14 2 0 6 3 2 0 0 51 20III - Central Luzon 1,751 162 30 44 1 43 12 0 10 21 5 0 16 20 5 0 0 248 1,134IV-A CALABARZON 1,986 212 39 56 982 120 19 15 21 41 11 1 2 7 2 0 1 377 80IV-B MIMAROPA 164 6 4 2 3 4 3 0 0 3 0 0 1 0 0 0 0 138 0V - Bicol Region 457 106 65 18 0 26 6 0 6 16 2 2 3 1 3 0 0 169 34VI - Western Visayas 1,580 395 98 58 5 40 46 0 11 37 7 0 10 6 4 0 0 618 245VII - Central Visayas 1,245 368 95 98 16 84 114 2 16 48 11 2 22 30 2 0 2 126 209VIII - Eastern Visayas 283 22 23 5 35 11 9 0 0 11 1 0 3 5 0 0 0 157 1IX - Zamboanga Peninsula 475 80 48 27 4 25 12 0 0 24 1 0 2 1 0 0 0 126 125X - Northern Mindanao 933 187 60 19 13 35 8 1 0 21 8 1 7 7 0 0 0 188 378XI - Davao Region 1,042 251 72 106 95 50 30 7 16 47 16 0 12 11 0 0 0 18 311XII - SOCCSKSARGEN 719 62 37 17 19 14 18 0 0 18 2 0 7 320 2 0 0 170 33XIII - Caraga 171 13 11 2 0 5 4 0 0 2 0 0 3 0 0 0 1 123 7ARMM 108 2 4 1 1 1 0 0 1 2 0 0 1 0 0 0 0 84 11
Others
Incendiary Device/
Mechanism or Ignited
Flammable Liquid
Sponta- neous
Combustion
Pyro-technics
Bomb Explosion Lightning
Under Investigation/
UnknownRegion Total
Faulty Electrical Wiring/
Connection
Unattended Open flame
LPG Related
Neglected Electrical
Appliances/Devices
Electrical Machineries Chemicals
Continued

TABLE 17.8 -- Continued
Neglected Cooking/
Stove
Cigarette Butt
Torch/ "Sulo"
Candle/ "Gasera"
Matchstick/Lighter
Direct Flame Contact/Static
Electricity
2016
Philippines 19,292 4,947 838 1,571 1,119 648 581 32 130 461 66 135 138 603 30 3 14 4,102 3,874NCR 5,121 2,641 162 666 144 117 98 0 20 128 11 119 10 52 7 1 4 661 280CAR 401 45 34 25 10 8 37 0 6 6 1 0 4 1 1 0 0 104 119I - Ilocos Region 943 117 28 41 7 19 17 0 11 18 1 1 7 85 6 0 1 217 367II - Cagayan Valley 227 47 17 11 2 20 16 0 3 12 4 0 8 0 0 0 0 55 32III - Central Luzon 1,339 225 31 137 2 47 9 0 14 28 6 2 10 22 2 0 0 213 591IV-A CALABARZON 1,579 209 41 25 657 66 8 24 22 44 6 1 1 6 3 0 0 392 74MIMAROPA 463 5 1 0 0 1 2 0 0 1 0 0 1 0 0 0 1 440 11V - Bicol Region 501 97 57 31 9 23 18 0 2 27 5 3 7 8 0 0 1 148 65VI - Western Visayas 2,145 430 121 200 5 37 117 0 9 24 10 2 12 17 1 0 2 639 519VII - Central Visayas 842 245 58 71 15 41 102 7 16 36 0 5 5 9 4 0 3 118 107VIII - Eastern Visayas 230 25 18 3 6 12 5 0 2 9 2 0 2 1 0 0 0 145 0IX - Zamboanga Peninsula 565 100 34 45 6 22 20 0 2 18 3 0 13 2 0 0 0 104 196X - Northern Mindanao 1,618 228 60 31 14 135 11 0 2 17 5 0 16 8 1 1 2 281 806XI - Davao Region 1,424 277 65 183 208 46 31 1 13 60 5 0 7 5 0 0 0 18 505XII - SOCCSKSARGEN 1,004 69 41 53 3 14 74 0 2 10 4 0 17 333 1 0 0 333 50XIII - Caraga 169 19 20 2 1 8 2 0 0 2 1 0 5 5 0 0 0 96 8ARMM 70 6 2 0 2 1 4 0 0 2 0 0 1 0 0 1 0 48 3Negros Island Region 651 162 48 47 28 31 10 0 6 19 2 2 12 49 4 0 0 90 141
Sponta- neous
Combustion
Pyro-technics
Bomb Explosion LightningRegion Total
Faulty Electrical Wiring/
Connection
Unattended Open flame
LPG Related
Neglected Electrical
Appliances/Devices
Electrical Machineries Chemicals
Incendiary Device/
Mechanism or Ignited
Flammable Liquid
Continued
Under Investigation/
UnknownOthers

TABLE 17.8 -- Continued
Neglected Cooking/
Stove
Cigarette Butt
Torch/ "Sulo"
Candle/ "Gasera"
Matchstick/Lighter
Direct Flame Contact/Static
Electricity
2017
Philippines 14,197 4,872 711 1,002 427 463 320 45 124 412 82 137 139 228 25 1 7 3,401 1,801NCR 4,645 2,656 166 500 101 107 64 4 27 129 9 131 13 33 12 0 1 554 138CAR 289 38 24 14 2 10 13 0 8 5 3 0 4 0 0 0 1 106 61I - Ilocos Region 754 107 27 30 3 19 23 0 8 17 3 1 2 25 0 0 1 175 313II - Cagayan Valley 179 40 12 8 0 13 4 0 1 22 1 2 5 3 0 0 1 50 17III - Central Luzon 1,258 215 34 178 6 32 14 0 7 39 2 1 19 16 0 0 1 194 500IV-A CALABARZON 1,334 250 35 38 229 55 21 25 20 43 7 0 11 97 2 0 0 324 177MIMAROPA 205 7 1 1 1 1 2 0 0 0 0 0 0 0 0 0 0 190 2V - Bicol Region 429 109 64 6 5 32 9 0 10 22 3 0 2 6 4 0 0 124 33VI - Western Visayas 1,243 444 78 59 7 31 22 0 6 25 10 0 1 1 2 0 1 435 121VII - Central Visayas 622 236 44 49 1 38 69 5 6 25 0 2 12 9 1 0 0 96 29VIII - Eastern Visayas 202 14 18 1 3 12 2 0 1 9 3 0 3 0 0 0 0 135 1IX - Zamboanga Peninsula 282 94 33 10 6 18 8 0 2 9 1 0 6 3 0 0 0 74 18X - Northern Mindanao 754 209 58 19 14 33 13 0 4 11 4 0 11 9 0 0 0 184 185XI - Davao Region 760 220 51 44 41 36 32 9 11 37 34 0 31 13 0 1 1 92 107XII - SOCCSKSARGEN 348 10 1 1 0 5 9 0 2 2 1 0 7 2 1 0 0 307 0XIII - Caraga 252 43 29 3 3 5 3 0 4 6 1 0 0 0 1 0 0 136 18ARMM 67 9 1 0 2 2 1 0 1 1 0 0 1 0 0 0 0 48 1Negros Island Region 574 171 35 41 3 14 11 2 6 10 0 0 11 11 2 0 0 177 80
Region TotalFaulty
Electrical Wiring/
Connection
Unattended Open flame
LPG Related
Neglected Electrical
Appliances/Devices
LightningElectrical Machineries Chemicals
Incendiary Device/
Mechanism or Ignited
Flammable Liquid
Sponta- neous
Combustion
Pyro-technics
Bomb Explosion
Continued
Under Investigation/
UnknownOthers

TABLE 17.8 -- Concluded
Neglected Cooking/
Stove
Cigarette Butt
Torch/ "Sulo"
Candle/ "Gasera"
Matchstick/Lighter
Direct Flame Contact/Static
Electricity
2018
Philippines 16,675 5,319 877 1,128 858 521 439 69 104 432 110 93 138 370 22 2 14 3,821 2,358NCR 4,742 2,804 188 544 93 114 120 19 19 108 14 80 4 52 8 0 4 460 111CAR 385 34 28 16 24 13 18 0 3 5 1 0 1 0 1 0 0 166 75I - Ilocos Region 826 103 40 51 22 26 17 0 12 9 2 0 2 24 7 0 0 249 262II - Cagayan Valley 239 75 19 9 9 16 10 0 4 21 3 2 0 1 1 0 0 52 17III - Central Luzon 1,507 353 53 219 13 46 68 0 11 36 1 2 26 34 2 0 1 113 529IV-A CALABARZON 1,745 263 50 20 475 58 21 37 11 41 10 1 7 156 0 1 0 360 234MIMAROPA 193 6 5 1 2 2 4 0 0 1 0 1 5 0 0 0 1 161 4V - Bicol Region 461 114 53 20 9 19 19 0 6 26 3 0 8 2 0 1 0 121 60VI - Western Visayas 1,622 447 65 62 16 46 19 0 9 34 9 1 10 10 0 0 1 705 188VII - Central Visayas 1,005 287 96 56 28 54 38 4 10 36 3 3 13 15 2 0 0 213 147VIII - Eastern Visayas 273 33 15 0 0 9 3 0 0 7 0 0 2 2 0 0 0 198 4IX - Zamboanga Peninsula 400 128 56 10 6 21 12 0 4 7 3 0 2 1 0 0 2 114 34X - Northern Mindanao 989 227 72 35 14 32 32 0 4 19 3 0 9 9 0 0 5 221 307XI - Davao Region 1,177 319 79 66 92 46 43 9 11 67 52 2 36 39 1 0 0 101 214XII - SOCCSKSARGEN 462 18 9 1 0 4 4 0 0 2 0 1 8 3 0 0 0 407 5XIII - Caraga 558 92 44 17 50 12 10 0 0 9 5 0 3 22 0 0 0 132 162ARMM 91 16 5 1 5 3 1 0 0 4 1 0 2 0 0 0 0 48 5
Source: Bureau of Fire Protection
Under Investigation/
UnknownOthersChemicals
Incendiary Device/
Mechanism or Ignited
Flammable Liquid
Sponta- neous
Combustion
Pyro-technics
Bomb Explosion Lightning
Neglected Electrical
Appliances/Devices
Electrical MachineriesRegion Total Electrical
Connections
Unattended Open flame
LPG Related

TABLE 17.9 Number of Highway Traffic Accidents: 2010 to 2014
2010 2011 2012 2013 2014
Number of Persons Involved 25,649 18,637 15,186 17,348 25,794 Fatal 1,262 1,399 1,129 1,362 1,252 Non-Fatal 6,408 5,664 4,904 7,817 9,347 Damage to Property 17,979 11,574 9,153 8,169 15,195
Time of Occurrence of Accident 18,810 14,755 9,740 12,875 15,572 Daytime 8,089 6,848 4,807 6,663 8,807 Night time 10,721 7,907 4,933 6,212 6,765
Cause of Accident 18,810 14,755 9,740 12,875 15,572 a. Human Error 13,906 10,824 7,286 9,800 12,572 Driver's Error 10,099 7,840 5,591 8,099 10,627 Bad Overtaking 3,666 2,757 1,539 1,995 3,052 Bad Turning 2,839 2,092 1,634 2,592 3,565 Overspeeding 3,149 2,227 1,856 2,716 2,871 Self Accident 445 764 562 796 1,139 Drunk Driving 792 662 375 519 498 Using Cellular while Driving 608 509 173 178 128 Hit and Run 1,166 899 745 738 1,002 Overloading 1,241 914 402 266 317 b. Mechanical Defect 2,340 1,666 971 1,330 1,401 c. Road Condition 1,829 1,407 780 996 922 d. Others (animal crossing, calamity related, etc. 735 858 703 749 677
Place of Occurrence 18,810 14,755 9,740 12,875 15,571 National Road 6,153 3,815 2,493 3,785 4,690 Expressway 3,021 3,238 2,635 2,914 4,191 Provincial Road 2,399 2,089 992 992 881 City Road 3,434 2,285 1,197 1,727 2,871 Municipal Road 1,809 1,494 841 1,013 963 Barangay Road 1,977 1,654 1,189 1,585 1,737 Star Tollway 17 180 393 859 238
Number of Pedestrian involved in Accident 874 575 479 1,241 859
Types of Motor Vehicles involved in Accident 23,592 17,945 13,752 16,955 20,197 Bus 2,692 1,707 1,316 1,038 1,082 Truck 3,099 2,422 1,770 2,615 2,773 Automobile 10,457 6,973 5,428 6,035 8,000 Jeep 1,864 1,316 879 871 1,030 Tricycle 1,578 1,389 925 1,516 1,261 Motorcycle 3,543 3,665 3,112 4,616 5,720 Other 359 473 322 264 331
Source: Headquarter Highway Patrol Group, Philippine National Police
Characteristics
17-12

TABLE 17.10 Incidence of Alleged Human Rights Violations Filed with the CHR by Region: 2013 to 2018
Region 2013 2014 2015 2016 2017 2018
Philippines 1,383 1,087 1,166 1,744 1,353 1,372
NCR 57 53 167 160 83 130
CAR 24 24 20 41 23 38
I - Ilocos Region 44 38 31 67 67 34
II - Cagayan Valley 69 76 80 115 79 69
III - Central Luzon 65 94 106 281 183 188IV-A CALABARZON 189 189 116 167 224 346
MIMAROPA .. .. .. .. 9 3
V - Bicol Region 62 96 105 106 60 36
VI - Western Visayas 71 84 81 107 73 81
VII - Central Visayas 47 46 53 66 59 53
VIII - Eastern Visayas 51 47 56 69 61 34
IX - Zamboanga Peninsula 468 102 138 140 102 94
X - Northern Mindanao 48 64 44 95 123 83
XI - Davao Region 92 88 119 195 120 74
XII - SOCCSKSARGEN 69 64 32 48 22 33
XIII - Caraga 27 22 18 87 65 76
Source: Commission on Human Rights
17-13

TABLE 17.11 Reported Cases of Violence Against Women by Classification of Offense: 2008 to 2014
Classification of Offense 2008 2009 2010 2011 2012 2013 2014
Total 7,864 10,482 15,789 13,974 17,659 25,430 49,883
Rape 811 770 1,053 832 1,030 1,259 2,010 Incestuous rape 28 27 19 23 33 26 36 Attempted rape 204 167 272 201 256 317 635 Acts of lasciviousness 445 485 749 625 721 1,035 1,871 Physical injuries/Wife battering 1,307 1,498 2,031 1,588 1,744 3,564 7,727 Sexual harassment 18 54 83 63 41 196 103 R.A. 9208 34 152 193 62 41 45 238 R.A. 9262 3,599 5,285 10,000 9,021 11,531 16,517 31,937 Threats 220 208 375 213 240 426 1,297 Seduction 19 19 25 15 10 8 35 Concubinage 109 99 160 128 146 199 349 Abduction/Kidnapping 28 18 25 22 20 23 49 Unjust vexation 83 703 184 155 156 250 499 Other Related Crimes Neglect/Abandonment 75 107 41 89 122 75 131 Homicide 76 60 37 64 84 36 37 Slander 39 18 18 50 29 21 55 Murder 57 57 37 78 63 59 70 Attempted murder 14 14 15 8 10 14 24 Frustrated murder 50 45 30 28 37 52 41 Oral defamation 104 100 91 98 79 90 311 Parricide 73 52 33 63 50 53 45 Illegal recruitment 7 34 3 5 16 0 2 Non-gender Crimes Malicious mischief 22 17 9 15 12 48 93 Theft 115 103 95 102 192 191 421 Estafa 21 7 3 14 18 5 58 Hold-up 39 71 41 71 128 132 168 Others 267 312 167 341 850 789 1,641
Source: Philippine National Police
17-14
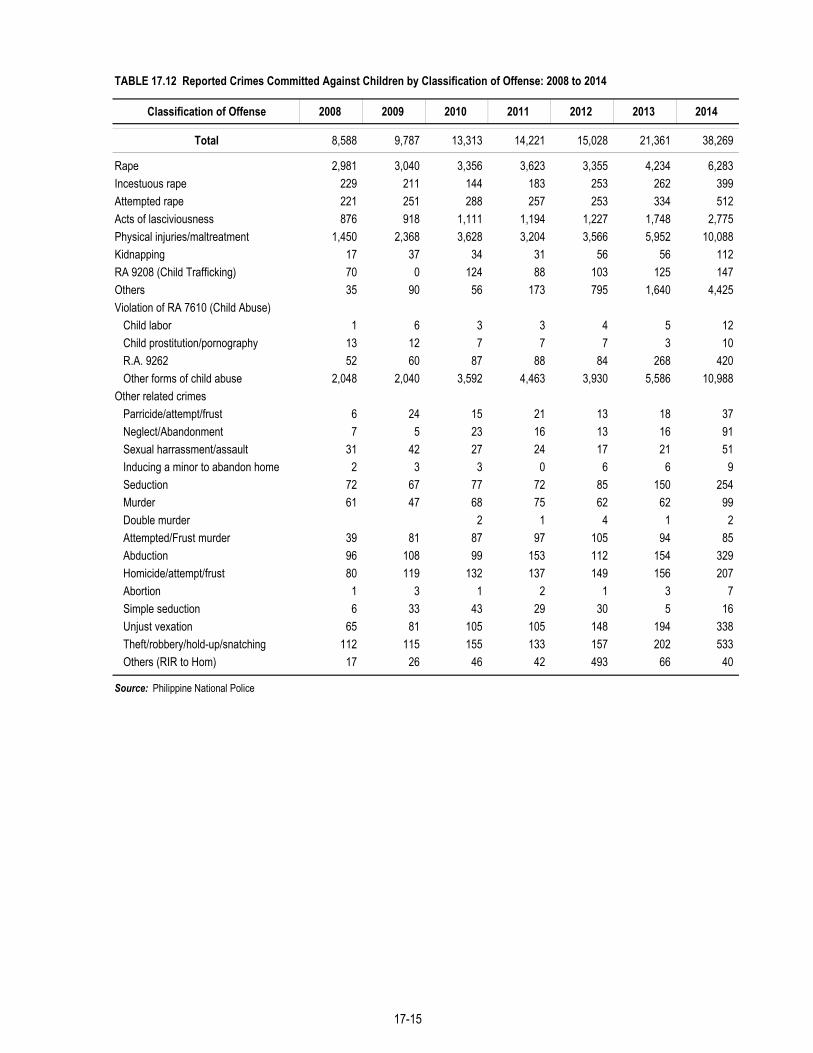
TABLE 17.12 Reported Crimes Committed Against Children by Classification of Offense: 2008 to 2014
Classification of Offense 2008 2009 2010 2011 2012 2013 2014
Total 8,588 9,787 13,313 14,221 15,028 21,361 38,269
Rape 2,981 3,040 3,356 3,623 3,355 4,234 6,283Incestuous rape 229 211 144 183 253 262 399Attempted rape 221 251 288 257 253 334 512Acts of lasciviousness 876 918 1,111 1,194 1,227 1,748 2,775Physical injuries/maltreatment 1,450 2,368 3,628 3,204 3,566 5,952 10,088Kidnapping 17 37 34 31 56 56 112RA 9208 (Child Trafficking) 70 0 124 88 103 125 147Others 35 90 56 173 795 1,640 4,425Violation of RA 7610 (Child Abuse) Child labor 1 6 3 3 4 5 12 Child prostitution/pornography 13 12 7 7 7 3 10 R.A. 9262 52 60 87 88 84 268 420 Other forms of child abuse 2,048 2,040 3,592 4,463 3,930 5,586 10,988Other related crimes Parricide/attempt/frust 6 24 15 21 13 18 37 Neglect/Abandonment 7 5 23 16 13 16 91 Sexual harrassment/assault 31 42 27 24 17 21 51 Inducing a minor to abandon home 2 3 3 0 6 6 9 Seduction 72 67 77 72 85 150 254 Murder 61 47 68 75 62 62 99 Double murder 2 1 4 1 2 Attempted/Frust murder 39 81 87 97 105 94 85 Abduction 96 108 99 153 112 154 329 Homicide/attempt/frust 80 119 132 137 149 156 207 Abortion 1 3 1 2 1 3 7 Simple seduction 6 33 43 29 30 5 16 Unjust vexation 65 81 105 105 148 194 338 Theft/robbery/hold-up/snatching 112 115 155 133 157 202 533 Others (RIR to Hom) 17 26 46 42 493 66 40
Source: Philippine National Police
17-15
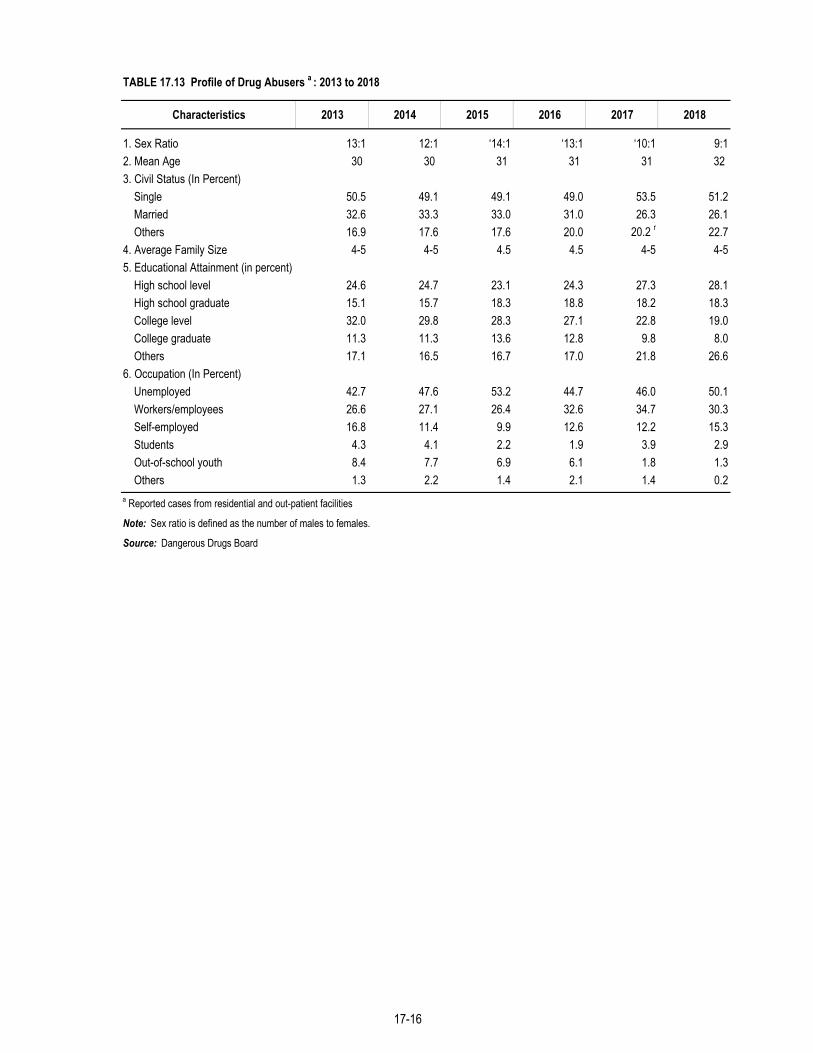
TABLE 17.13 Profile of Drug Abusers a : 2013 to 2018
Characteristics 2013 2014 2015 2016 2017 2018
1. Sex Ratio 13:1 12:1 ‘14:1 ‘13:1 ‘10:1 9:12. Mean Age 30 30 31 31 31 323. Civil Status (In Percent)
Single 50.5 49.1 49.1 49.0 53.5 51.2Married 32.6 33.3 33.0 31.0 26.3 26.1Others 16.9 17.6 17.6 20.0 20.2 r 22.7
4. Average Family Size 4-5 4-5 4.5 4.5 4-5 4-55. Educational Attainment (in percent)
High school level 24.6 24.7 23.1 24.3 27.3 28.1High school graduate 15.1 15.7 18.3 18.8 18.2 18.3College level 32.0 29.8 28.3 27.1 22.8 19.0College graduate 11.3 11.3 13.6 12.8 9.8 8.0Others 17.1 16.5 16.7 17.0 21.8 26.6
6. Occupation (In Percent)Unemployed 42.7 47.6 53.2 44.7 46.0 50.1Workers/employees 26.6 27.1 26.4 32.6 34.7 30.3Self-employed 16.8 11.4 9.9 12.6 12.2 15.3Students 4.3 4.1 2.2 1.9 3.9 2.9Out-of-school youth 8.4 7.7 6.9 6.1 1.8 1.3Others 1.3 2.2 1.4 2.1 1.4 0.2
a Reported cases from residential and out-patient facilities
Note: Sex ratio is defined as the number of males to females.
Source: Dangerous Drugs Board
17-16
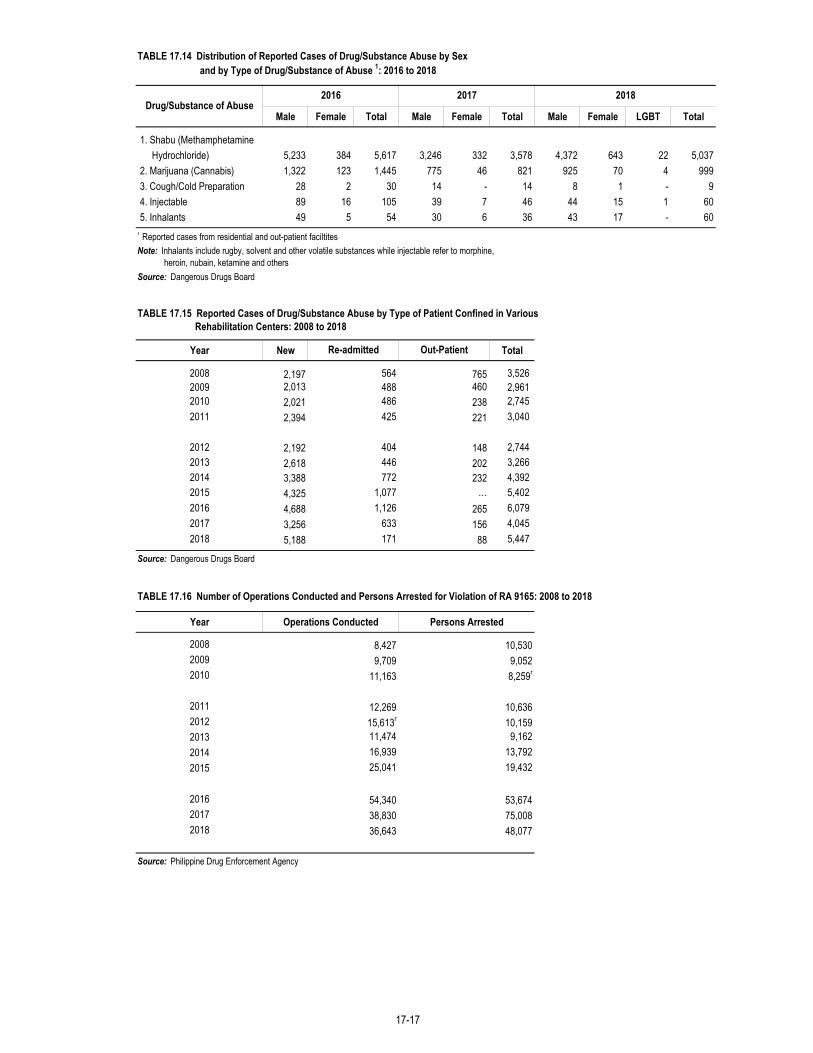
TABLE 17.14 Distribution of Reported Cases of Drug/Substance Abuse by Sex and by Type of Drug/Substance of Abuse 1: 2016 to 2018
Male Female Total Male Female Total Male Female LGBT Total
1. Shabu (Methamphetamine Hydrochloride) 5,233 384 5,617 3,246 332 3,578 4,372 643 22 5,037 2. Marijuana (Cannabis) 1,322 123 1,445 775 46 821 925 70 4 999 3. Cough/Cold Preparation 28 2 30 14 - 14 8 1 - 9 4. Injectable 89 16 105 39 7 46 44 15 1 60 5. Inhalants 49 5 54 30 6 36 43 17 - 601 Reported cases from residential and out-patient faciltitesNote: Inhalants include rugby, solvent and other volatile substances while injectable refer to morphine,
heroin, nubain, ketamine and othersSource: Dangerous Drugs Board
TABLE 17.15 Reported Cases of Drug/Substance Abuse by Type of Patient Confined in Various Rehabilitation Centers: 2008 to 2018
Year New Total
2008 2,197 564 765 3,5262009 2,013 488 460 2,9612010 2,021 486 238 2,7452011 2,394 425 221 3,040
2012 2,192 404 148 2,7442013 2,618 446 202 3,2662014 3,388 772 232 4,3922015 4,325 1,077 … 5,4022016 4,688 1,126 265 6,0792017 3,256 633 156 4,0452018 5,188 171 88 5,447
Source: Dangerous Drugs Board
TABLE 17.16 Number of Operations Conducted and Persons Arrested for Violation of RA 9165: 2008 to 2018
Year Operations Conducted Persons Arrested
2008 8,427 10,5302009 9,709 9,0522010 11,163 8,259r
2011 12,269 10,6362012 15,613r 10,1592013 11,474 9,1622014 16,939 13,7922015 25,041 19,432
2016 54,340 53,6742017 38,830 75,0082018 36,643 48,077
Source: Philippine Drug Enforcement Agency
2018
Re-admitted Out-Patient
Drug/Substance of Abuse2016 2017
17-17

TABLE 17.17 Clientele Assisted by the Public Attorney's Office by Activities/Services: 2014 to 2018
Type of Activities/Services 2014 2015 2016 2017 2018
Indigent Persons Served 1 7,514,325 7,747,735 8,839,742 11,616,916 13,344,003Judicial Services 1,885,978 1,965,315 1,500,073 1,592,323 1,886,409 Regular Services 638,652 848,516 850,298 906,251 975,610 Criminal 428,627 468,138 535,138 640,094 735,430 Civil 47,237 48,551 34,341 41,004 45,243 Adminstrative cases 11,985 17,874 12,842 13,807 12,043 Prosecution 69,108 72,217 68,838 64,033 58,447 Labor 81,695 83,205 84,924 44,630 34,727 Appealed cases 14,812 15,658 16,289 17,054 19,498 Women clients (Victims of R.A. 9262) 74,388 75,684 52,724 36,067 20,635 Children in conflict with law 34,965 35,927 22,136 24,153 23,377 Special Legal Services (Pursuant to Sec. 14-A of R.A. 9406 and MOAs) 20,752 31,262 23,066 25,409 26,210
Limited Services 1,102,409 1,116,799 649,775 686,072 910,799 Arraignment 182,502 185,030 172,847 133,109 123,904 Pre-trial 171,693 173,355 71,998 84,957 91,615 Promulgation 72,230 73,762 26,787 61,339 33,346 Others 675,984 684,652 378,143 406,667 661,934
Quasi-Judicial Services 451,061 457,168 252,244 337,850 304,145 Mediation and Conciliation 450,998 467,138 252,185 337,831 304,113 Investigation (R.A. 9475 or Anti-Torture Law) 63 30 59 19 32
Non-Judicial Services 4,999,283 5,137,925 6,860,389 9,450,427 10,969,112 Instant/Outreach Services 4,347,934 4,408,925 6,015,749 8,409,045 9,962,248 Legal Documentation 1,247,280 1,201,109 1,549,827 2,087,554 2,273,721 Clients Counselled 1,839,419 1,918,631 2,577,636 3,488,920 4,087,608 Oaths Administered 1,261,235 1,289,185 1,888,286 2,832,571 3,600,919 Inquest Activities 651,349 729,000 844,640 1,041,382 1,006,864 Custodian/Inquest investigation 138,498 190,433 200,493 252,169 199,709 Jail visitation 512,851 538,567 644,147 789,213 807,155Prisoners interviewed 253,700 254,298 301,319 346,772 349,960Prisoners provided assistance 259,151 284,269 342,828 442,441 457,195Forensic Services 24 144 329 589 2,184Barangay Outreach 148,973 153,177 198,863 199,500 143,745PAO - Central Office Legal and Medical
Visitation and Decongestion Program 9,007 10,272 4,788 7,396 5,981Office of the Chief Public Attorney 19,999 23,734 23,056 28,831 32,427Global Pinoy Center - - - - -
1 Judicial and Quasi-judicial cases
Source: Public Attorney's Office
17-18

TABLE 17.18 Case Inflow by Type of Court: 2015 to 2018
2015-2016 2016-2017 2017-2018
Total 473,881 537,082 537,180 570,140 11.8 - 5.8
2nd Level Courts 263,497 317,778 313,469 309,652 17.1 (1.4) (1.2) Regional Trial Courts 263,461 317,725 313,404 309,576 17.1 (1.4) (1.2) Shari'a District Courts 36 53 65 76 32.1 18.5 14.5 1st Level Courts 210,384 219,304 223,711 260,488 4.1 2.0 14.1 Metropolitan Trial Courts 76,350 80,528 79,288 86,409 5.2 (1.6) 8.2 Municipal Trial Courts in Cities 84,959 86,880 91,137 112,407 2.2 4.7 18.9 Municipal Trial Courts 24,750 25,975 26,213 30,847 4.7 0.9 15.0 Municipal Circuit Trial Courts 23,603 25,013 26,134 29,694 5.6 4.3 12.0 Shari'a Circuit Courts 722 908 939 1,131 20.5 3.3 17.0
Note: Case outflow refers to the summation of cases decided/resolved cases, archived cases and cases transferred to other salas/courts during the reference period.
Source: Supreme Court of the Philippines, Office of the Court Administrator
TABLE 17.19 Case Outflow by Type of Court: 2015 to 2018
2015-2016 2016-2017 2017-2018
Total 432,479 452,445 498,218 636,813 4.4 9.2 21.8
2nd Level Courts 214,600 222,414 266,066 372,197 3.5 16.4 28.5 Regional Trial Courts 214,567 222,393 266,034 372,147 3.5 16.4 28.5 Shari'a District Courts 33 21 32 50 (57.1) 34.4 36.01st Level Courts 217,879 230,031 232,152 264,616 5.3 0.9 12.3 Metropolitan Trial Courts 80,854 84,671 82,561 85,900 4.5 (2.6) 3.9 Municipal Trial Courts in Cities 87,136 92,044 92,871 114,414 5.3 0.9 18.8 Municipal Trial Courts 25,772 26,834 28,513 33,092 4.0 5.9 13.8 Municipal Circuit Trial Courts 23,391 25,630 27,444 30,304 8.7 6.6 9.4 Shari'a Circuit Courts 726 852 763 906 14.8 (11.7) 15.8
Note: Case outflow refers to the summation of cases decided/resolved cases, archived cases and cases transferred to other salas/courts during the reference period.
Source: Supreme Court of the Philippines, Office of the Court Administrator
Growth Rates
Court 2015 2016 2017 2018Growth Rates
Court 2015 2016 2017 2018
17-19
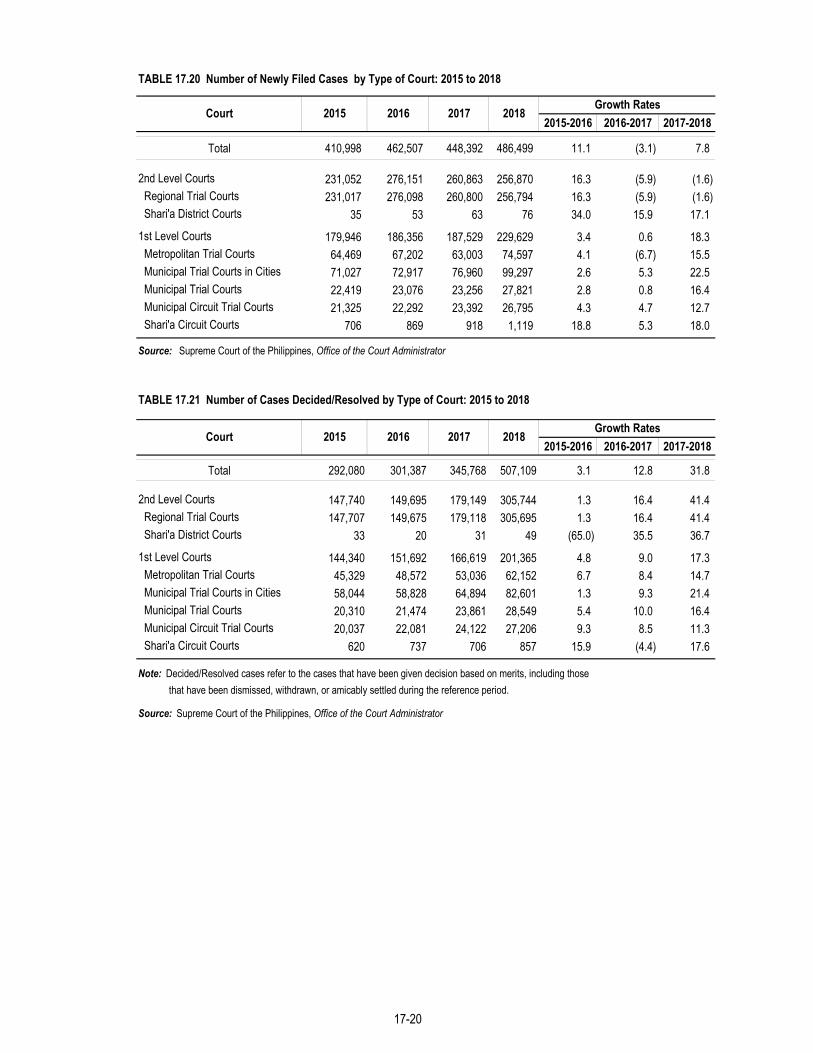
2015-2016 2016-2017 2017-2018
Total 410,998 462,507 448,392 486,499 11.1 (3.1) 7.8
2nd Level Courts 231,052 276,151 260,863 256,870 16.3 (5.9) (1.6) Regional Trial Courts 231,017 276,098 260,800 256,794 16.3 (5.9) (1.6) Shari'a District Courts 35 53 63 76 34.0 15.9 17.11st Level Courts 179,946 186,356 187,529 229,629 3.4 0.6 18.3 Metropolitan Trial Courts 64,469 67,202 63,003 74,597 4.1 (6.7) 15.5 Municipal Trial Courts in Cities 71,027 72,917 76,960 99,297 2.6 5.3 22.5 Municipal Trial Courts 22,419 23,076 23,256 27,821 2.8 0.8 16.4 Municipal Circuit Trial Courts 21,325 22,292 23,392 26,795 4.3 4.7 12.7 Shari'a Circuit Courts 706 869 918 1,119 18.8 5.3 18.0
Source: Supreme Court of the Philippines, Office of the Court Administrator
2015-2016 2016-2017 2017-2018
Total 292,080 301,387 345,768 507,109 3.1 12.8 31.8
2nd Level Courts 147,740 149,695 179,149 305,744 1.3 16.4 41.4 Regional Trial Courts 147,707 149,675 179,118 305,695 1.3 16.4 41.4 Shari'a District Courts 33 20 31 49 (65.0) 35.5 36.71st Level Courts 144,340 151,692 166,619 201,365 4.8 9.0 17.3 Metropolitan Trial Courts 45,329 48,572 53,036 62,152 6.7 8.4 14.7 Municipal Trial Courts in Cities 58,044 58,828 64,894 82,601 1.3 9.3 21.4 Municipal Trial Courts 20,310 21,474 23,861 28,549 5.4 10.0 16.4 Municipal Circuit Trial Courts 20,037 22,081 24,122 27,206 9.3 8.5 11.3 Shari'a Circuit Courts 620 737 706 857 15.9 (4.4) 17.6
Note: Decided/Resolved cases refer to the cases that have been given decision based on merits, including those that have been dismissed, withdrawn, or amicably settled during the reference period.
Source: Supreme Court of the Philippines, Office of the Court Administrator
Growth Rates
TABLE 17.21 Number of Cases Decided/Resolved by Type of Court: 2015 to 2018
TABLE 17.20 Number of Newly Filed Cases by Type of Court: 2015 to 2018
Court 2015 2016 2017 2018Growth Rates
Court 2015 2016 2017 2018
17-20

TABLE 17.22 Number of Revived/Reopened Cases by Type of Court: 2015 to 2018
Court 2015 2016 2017 2018
Total 42,046 42,864 45,121 44,996
2nd Level Courts 19,576 19,180 20,851 21,492 Regional Trial Courts 19,575 19,180 20,849 21,492 Shari'a District Courts 1 0 2 0
1st Level Courts 22,470 23,684 24,270 23,504 Metropolitan Trial Courts 9,095 9,629 10,444 8,879 Municipal Trial Courts in Cities 9,979 9,742 9,389 10,288 Municipal Trial Courts 1,842 2,308 2,419 2,195 Municipal Circuit Trial Courts 1,538 1,966 1,999 2,130 Shari'a Circuit Courts 16 39 19 12
Source: Supreme Court of the Philippines, Office of the Court Administrator
TABLE 17.23 Number of Archived Cases by Type of Court: 2015 to 2018
Court 2015 2016 2017 2018
Total 113,682 110,873 100,949 94,474
2nd Level Courts 52,701 46,141 50,112 37,765 Regional Trial Courts 52,701 46,140 50,111 37,764 Shari'a District Courts 0 1 1 1
1st Level Courts 60,981 64,732 50,837 56,709 Metropolitan Trial Courts 28,422 28,018 20,705 21,764 Municipal Trial Courts in Cities 24,684 28,622 22,736 28,220 Municipal Trial Courts 4,762 4,916 4,335 3,998 Municipal Circuit Trial Courts 3,007 3,061 3,005 2,678 Shari'a Circuit Courts 106 115 56 49
Source: Supreme Court of the Philippines, Office of the Court Administrator
17-21

TABLE 17.24 Court-Case Disposition Rate by Type of Court: 2011 to 2014 (In percent)
Court
Appelate Courts 2.9 2.7 2.3 1.9Court of Appeals 0.0 0.0 0.0 0.0Sandiganbayan 15.1 8.7 5.7 4.4Court of Tax Appeals 24.6 29.7 28.4 23.8
2nd Level Courts 23.1 22.8 22.0 18.4Regional Trial Courts 23.1 22.8 22.0 18.4Shari'a District Courts 27.4 36.0 14.6 35.4
1st Level Courts 32.9 33.0 33.6 30.4Metropolitan Trial Courts 28.2 27.7 31.3 32.5Municipal Trial Courts in Cities 35.9 36.8 35.4 29.0Municipal Trial Courts 31.8 32.9 32.6 28.9Municipal Circuit Trial Courts 39.1 36.4 36.2 30.3Shari'a Circuit Courts 47.5 47.0 30.5 27.0
Note: Court-case disposition rate is the ratio of total cases decided/resolved over total cases filed in a year. Source: Supreme Court of the Philippines, Office of the Court Administrator
TABLE 17.25 Number of Judicial Positions, Incumbent Judges, and Vacanciesin the First and Second Level Courts: 2011 to 2013
2011 2012 2013 2011 2012 2013 2011 2012 2013
Total 2,147 2,161 2,163 1,574 1,612 1,675 573 549 488
Regional Trial Courts 967 981 983 761 793 820 206 188 163Metropolitan Trial Courts 106 106 106 62 71 74 44 35 32Municipal Trial Courts in Cities 229 229 233 177 180 189 52 49 44Municipal Trial Courts 375 375 371 271 266 263 104 109 108Municipal Circuit Trial Courts 465 465 465 303 302 329 162 163 136Shari'a Circuit Courts 5 5 5 - - - 5 5 5
Source: Supreme Court of the Philippines, Office of the Court Administrator
2011 2012 2013 2014
CourtTotal Judicial Positions Total Incumbent Judges Total Vacancies
17-22

TABLE 17.26 Inmate Profile by Prison Facility: As of March 2019
Male Female
By Age Group 58 27,719 3,154 2,874 5,927 446 1,874 1,994 1,903 45,949 18 years old and below - 7 2 - 7 - 1 - - 17 19-21 - 776 19 17 49 12 22 3 71 969 22-39 25 13,519 988 1,165 3,052 230 808 607 990 21,384 40-59 33 11,830 1,687 1,370 2,461 192 914 1,183 769 20,439 60-and above - 1,587 452 267 346 12 125 167 73 3,029 Unknown - - 6 55 12 - 4 34 - 111By Civil Status 58 27,719 3,154 2,874 5,927 446 1,874 1,994 1,903 45,949 Single 17 11,688 891 1,737 3,185 175 888 731 729 20,041 Married 19 12,044 992 1,083 2,535 217 904 555 672 19,021 Widow/Widower - 421 279 54 207 52 54 46 51 1,164 Others 22 3,566 992 - - 2 28 662 451 5,723By Educational Attainment 58 27,719 3,154 2,874 5,927 446 1,874 1,994 1,903 45,949 Illiterate 6 1,207 52 200 191 3 143 117 64 1,983 Elementary Level 3 8,570 500 1,125 2,246 60 800 806 863 14,973 Elementary Graduate - 6,304 134 502 1,046 42 123 307 186 8,644 High School Level 10 3,924 818 539 785 124 377 434 431 7,442 High School Graduate 23 4,576 696 363 841 93 181 233 210 7,216 College Level 11 2,091 466 95 630 55 187 75 80 3,690 College Graduate 5 700 438 29 133 67 57 13 43 1,485 Vocational/Others - 347 50 21 55 2 6 9 26 516By Selected Occupation 58 27,719 3,154 2,874 5,927 446 1,874 1,994 1,903 45,949
Businessman/woman - 2 463 54 78 33 45 30 47 752 Farmer/Gardener 14 10,232 25 736 1,973 13 590 466 866 14,915
Government Employee - 2 52 3 83 8 13 40 20 221Health Professionals 39 34 3 - 1 1 3 - 81Laborer/Const. Worker/Carpenter - 1 2 725 1,825 40 269 - 53 2,915
Trade and Industry 7 2,394 - - 118 2 6 - 4 2,531 Defense and Security 13 1,201 1 68 168 1 89 - 27 1,568 Administrative 7 512 4 - 59 6 2 - 1 591 Trans. and Communication 6 2,582 34 369 797 - 237 - - 4,025 Crafts and Trade 7 7,566 - 4 103 18 2 - 3 7,703 Infra., Arts and Recreation 4 1,015 - - 99 9 5 - 44 1,176 Others - 2,173 2,539 912 624 315 615 1,455 838 9,471By Religion 58 27,719 3,154 2,874 5,927 446 1,874 1,994 1,903 45,949 Roman Catholic 32 22,300 2,413 2,367 4,362 238 1,339 1,661 1,747 36,459 Protestant 10 698 13 84 233 3 25 69 12 1,147 Islam - 1,014 199 86 441 110 345 50 - 2,245 Iglesia ni Cristo 11 2,720 217 172 312 17 50 97 39 3,635 Others 5 987 312 165 579 78 115 117 105 2,463By Nationality 58 27,719 3,154 2,874 5,927 446 1,874 1,994 1,903 45,949 Filipino 58 27,428 3,128 2,869 5,913 443 1,872 1,991 1,899 45,601 Foreigners - 291 26 5 14 3 2 3 4 348
Continued
Characteristics
Prison Facility
PMANational Bilibid Prison
San Ramon Prison and Penal Farm
Sablayan Prison and Penal Farm
Correctional Institution for
Women
Iwahig Prison and Penal
Farm
TotalDavao Prison
and Penal Farm Leyte Regional Prison
17-24

TABLE 17.26---Concluded
Male Female
Total 58 27,719 3,154 2,874 5,927 446 1,874 1,994 1,903 45,949 NCR 8 10,486 1,654 565 32 7 19 490 17 13,278 CAR 10 680 98 52 3 - 3 29 - 875 Region I 14 2,602 181 152 9 - 8 121 7 3,094 Region II 10 804 73 74 8 1 11 59 7 1,047 Region III 4 1,729 221 158 6 5 25 141 9 2,298 Region IV 3 3,349 341 896 10 - 20 343 - 4,962 Region V 4 2,207 102 226 15 - 27 256 23 2,860 Region VI - 1,320 134 285 27 - 27 233 15 2,041 Region VII - 1,945 287 248 63 13 61 142 530 3,289 Region VIII 1 1,490 27 73 28 - 19 72 1,283 2,993 Region IX - 450 22 26 21 52 1,351 25 - 1,947 Region X 4 98 7 37 2,110 194 137 34 - 2,621 Region XI - 371 5 22 1,659 106 2 23 - 2,188 Region XII - 68 1 16 1,031 28 116 11 7 1,278 Caraga - 88 1 24 753 31 11 8 3 919 ARMM - 31 - 15 152 9 37 4 1 249 Unknown - 1 - 5 - - - 3 1 10By Crime Committed 58 27,719 3,154 2,874 5,927 446 1,874 1,994 1,903 45,949 Crimes Against National Security
of the Law of the Nations 3 295 4 44 - 1 6 1 12 366 Crimes Against the Fundamental
Laws of the State - 0 - - - - 1 - 4 5 Crimes Against Public Order - 0 4 - 1 - 6 38 - 49 Crimes Against Public Interest - 0 - - 9 - - 6 - 15 Crimes Relative to Opium and
Other Prohibited Drugs - 7,999 1,983 236 1,120 293 534 220 327 12,712 Crimes Against Public Morals - 0 2 - 3 - - 5 1 11 Crimes Committed
by Public Officers - 22 18 - 19 2 2 1 - 64 Crimes Against Persons 53 8,985 389 2,096 2,569 69 486 877 990 16,514 Crimes Against Personal
Liberty and Security - 522 63 37 136 11 7 27 11 814 Crimes Against Property 2 3,039 689 374 661 56 86 287 183 5,377 Crimes Against Chastity 5,852 - 63 1,360 8 174 532 355 8,344 Crimes Against the Civil
Status of Persons - 0 - - 1 - 2 - 9 12 Crimes Against Honor - 0 - - 1 1 - - 2 4 Others - 1,005 2 24 47 5 570 - 9 1,662By Security Classification 58 27,719 3,154 2,874 5,927 446 1,874 1,994 1,903 45,949 Maximum - 20,003 2,489 312 1,912 206 760 89 1,241 27,012 Medium - 7,102 594 1,708 3,182 206 846 687 606 14,931 Minimum 58 614 71 854 833 34 268 1,218 56 4,006
Source : Bureau of Corrections
Characteristics
Prison Facility
TotalPMA
National Bilibid Prison
Correctional Institution for
Women
San Ramon Prison and Penal Farm
Sablayan Prison and Penal Farm
Leyte Regional Prison
Iwahig Prison and Penal
Farm
Davao Prison and Penal Farm
17-24

TABLE 17.27 Jail Population by Classification/Status of Inmates, by Sex, and by Region: 2014 to 2018
Male Female Male Female Male Female Male Female
2014 62,903 6,512 411 25 69,851 2,163 159 - - 2,322 863 73,0362015 89,224 9,713 323 38 99,298 1,983 148 - - 2,131 - 101,4292016 115,315 14,115 406 46 129,882 2,699 245 - - 2,944 - 132,8262017 132,058 18,034 96 8 150,196 3,225 308 - - 3,533 - 153,7292018 124,427 16,071 69 4 140,571 6,471 1,617 - - 8,088 - 148,659
NCR 32,531 5,376 - - 37,907 1,490 810 - - 2,300 - 18,395CAR 1,171 158 6 1 1,336 11 15 - - 26 - 1,007I - Ilocos Region 4,260 477 1 - 4,738 59 7 - - 66 - 2,098II - Cagayan Valley 2,476 275 1 - 2,752 63 9 - - 72 - 1,899III - Central Luzon 9,478 1,492 - - 10,970 140 66 - - 206 - 6,550IV-A CALABARZON 19,104 2,511 - - 21,615 1,282 264 - - 1,546 - 10,004MIMAROPA 1,555 144 1 - 1,700 66 8 - - 74 - 769V - Bicol Region 2,572 253 1 - 2,826 306 24 - - 330 - 2,476VI - Western Visayas 8,004 792 - - 8,796 443 78 - - 521 - 5,993VII - Central Visayas 17,658 1,966 1 - 19,625 1,110 163 - - 1,273 - 7,801VIII - Eastern Visayas 2,754 190 2 - 2,946 80 8 - - 88 - 1,712IX - Zamboanga Peninsu 5,199 500 - - 5,699 134 9 - - 143 - 3,409X - Northern Mindanao 4,112 458 2 1 4,573 750 100 - - 850 - 2,962XI - Davao Region 5,778 690 - - 6,468 278 36 - - 314 - 3,213XII - SOCCSKSARGEN 4,851 517 47 1 5,416 243 17 - - 260 - 3,155XIII - Caraga 2,794 257 5 1 3,057 11 3 - - 14 - 1,337ARMM 130 15 2 - 147 5 - - - 5 - 256
Note: Classification of inmates is either adult (18 years old and above) or minor (below 18 years old) while status refers to detained (those who are on trial) or sentenced (those who are already convicted).
Source: Bureau of Jail Management and Penology
Year/RegionDetained Sentenced
Grand TotalAdult Minor Total Adult PNP Jail
PopulationTotalMinor
17-25
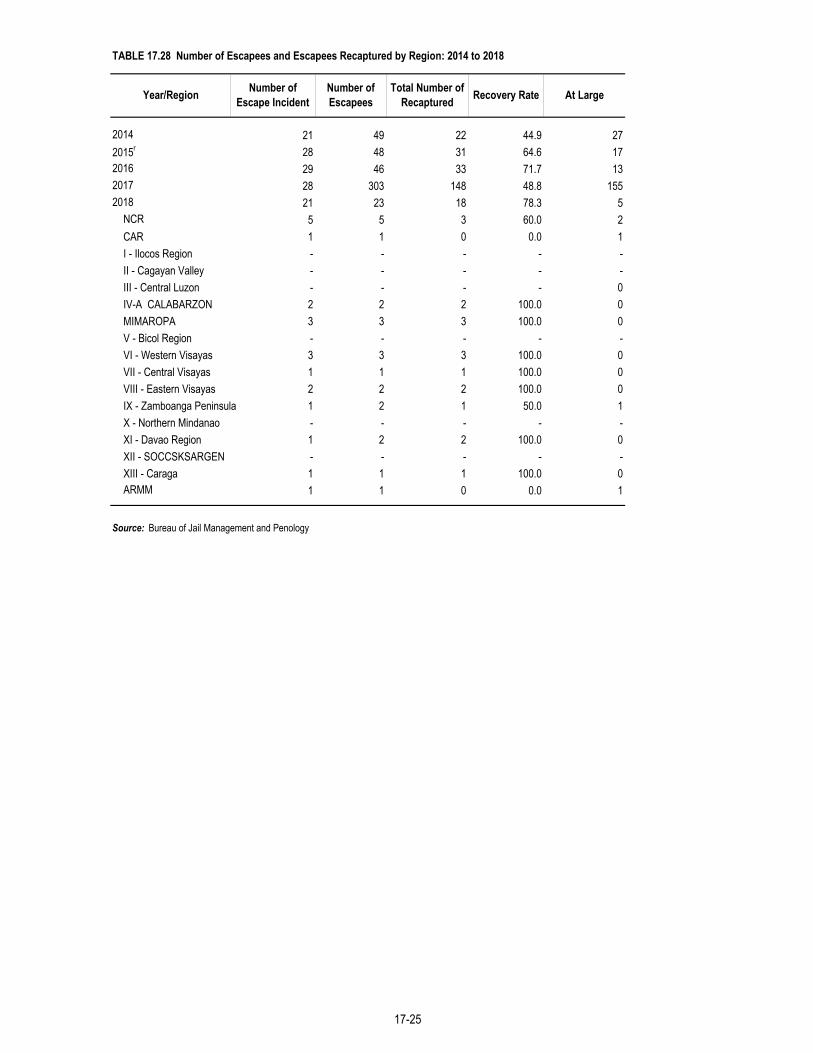
TABLE 17.28 Number of Escapees and Escapees Recaptured by Region: 2014 to 2018
2014 21 49 22 44.9 272015r 28 48 31 64.6 172016 29 46 33 71.7 132017 28 303 148 48.8 1552018 21 23 18 78.3 5
NCR 5 5 3 60.0 2CAR 1 1 0 0.0 1I - Ilocos Region - - - - -II - Cagayan Valley - - - - -III - Central Luzon - - - - 0IV-A CALABARZON 2 2 2 100.0 0MIMAROPA 3 3 3 100.0 0V - Bicol Region - - - - -VI - Western Visayas 3 3 3 100.0 0VII - Central Visayas 1 1 1 100.0 0VIII - Eastern Visayas 2 2 2 100.0 0IX - Zamboanga Peninsula 1 2 1 50.0 1X - Northern Mindanao - - - - -XI - Davao Region 1 2 2 100.0 0XII - SOCCSKSARGEN - - - - -XIII - Caraga 1 1 1 100.0 0ARMM 1 1 0 0.0 1
Source: Bureau of Jail Management and Penology
At LargeYear/Region Number of Escape Incident
Number of Escapees
Total Number of Recaptured Recovery Rate
17-25

TABLE 17.29 Congestion Rate of Jails by Region: 2014 to 2018
2014 460 172,286 94,879 20,188 73,583 259.02015 464 169,885 88,742 18,881 96,120 409.02016 466 187,751 97,632 20,773 126,946 511.02017 481 185,452 97,070 20,653 146,302 612.02018 476 199,136 118,759 25,268 136,314 439.5
NCR 43 52,514 24,612 5,237 36,035 588.0CAR 27 4,381 1,987 423 1,214 187.0I - Ilocos Region 20 5,852 5,101 1,085 4,364 302.0II - Cagayan Valley 20 6,620 3,082 656 2,771 323.0III - Central Luzon 38 13,727 7,276 1,548 10,035 548.0IV-A CALABARZON 57 22,872 13,747 2,925 21,128 622.0MIMAROPA 19 3,566 2,369 504 1,627 223.0V - Bicol Region 36 5,857 3,692 785 2,882 267.0VI - Western Visayas 37 26,203 19,887 4,231 9,056 114.0VII - Central Visayas 38 17,832 12,525 2,665 19,751 641.0VIII - Eastern Visayas 38 4,898 2,589 551 2,804 409.0IX - Zamboanga Peninsula 20 5,567 3,601 766 5,709 645.0X - Northern Mindanao 25 8,809 4,467 950 4,633 387.0XI - Davao Region 13 7,975 5,022 1,069 6,253 485.0XII - SOCCSKSARGEN 17 6,085 4,276 910 5,064 457.0XIII - Caraga 12 5,284 4,042 860 2,845 231.0ARMM 16 1,094 484 103 143 39.0
y ( )Formula: Actual JP-Ideal Capacy / Ideal Capacity * 100
Source: Bureau of Jail Management and Penology
Ideal Capacity @4.7 sq.m.
Jail Population*
Percent of CongestionYear/Region Number of
JailsFloor Area
(sq.m.)Cell Area (sq.m.)
17-26
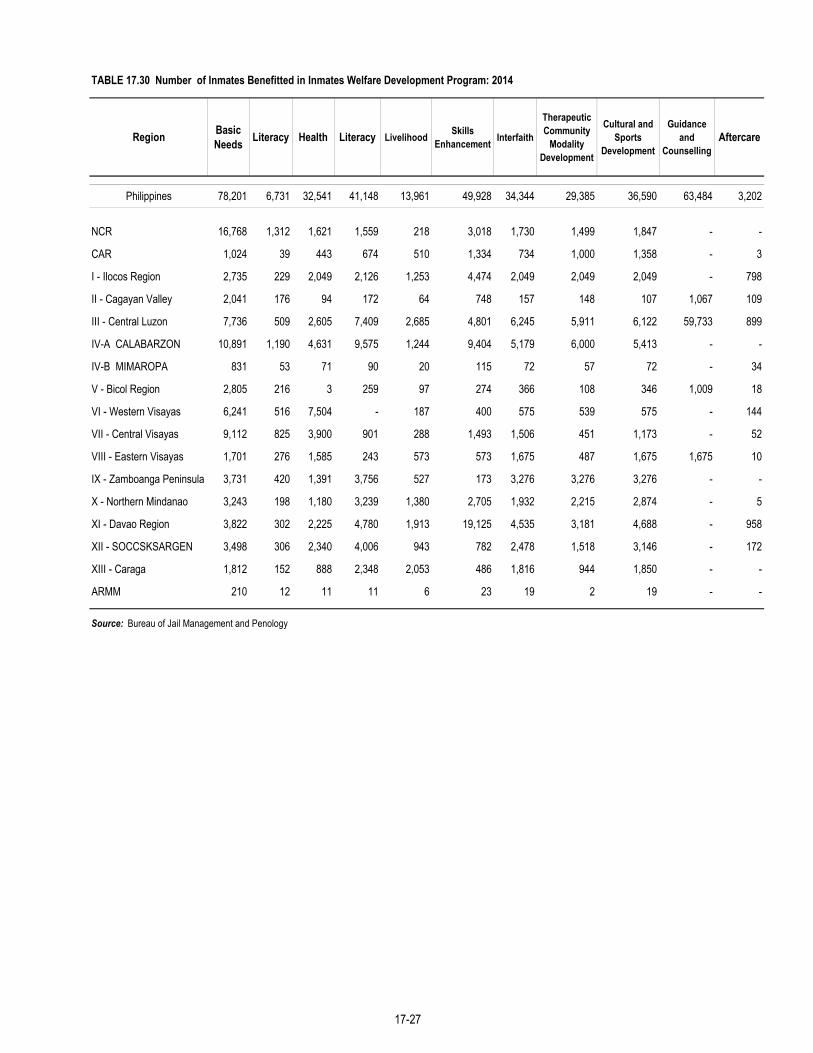
TABLE 17.30 Number of Inmates Benefitted in Inmates Welfare Development Program: 2014
Region Basic Needs Literacy Health Literacy Livelihood Skills
Enhancement Interfaith
Therapeutic Community
Modality Development
Cultural and Sports
Development
Guidance and
CounsellingAftercare
Philippines 78,201 6,731 32,541 41,148 13,961 49,928 34,344 29,385 36,590 63,484 3,202
NCR 16,768 1,312 1,621 1,559 218 3,018 1,730 1,499 1,847 - -
CAR 1,024 39 443 674 510 1,334 734 1,000 1,358 - 3
I - Ilocos Region 2,735 229 2,049 2,126 1,253 4,474 2,049 2,049 2,049 - 798
II - Cagayan Valley 2,041 176 94 172 64 748 157 148 107 1,067 109
III - Central Luzon 7,736 509 2,605 7,409 2,685 4,801 6,245 5,911 6,122 59,733 899
IV-A CALABARZON 10,891 1,190 4,631 9,575 1,244 9,404 5,179 6,000 5,413 - -
IV-B MIMAROPA 831 53 71 90 20 115 72 57 72 - 34
V - Bicol Region 2,805 216 3 259 97 274 366 108 346 1,009 18
VI - Western Visayas 6,241 516 7,504 - 187 400 575 539 575 - 144
VII - Central Visayas 9,112 825 3,900 901 288 1,493 1,506 451 1,173 - 52
VIII - Eastern Visayas 1,701 276 1,585 243 573 573 1,675 487 1,675 1,675 10
IX - Zamboanga Peninsula 3,731 420 1,391 3,756 527 173 3,276 3,276 3,276 - -
X - Northern Mindanao 3,243 198 1,180 3,239 1,380 2,705 1,932 2,215 2,874 - 5
XI - Davao Region 3,822 302 2,225 4,780 1,913 19,125 4,535 3,181 4,688 - 958
XII - SOCCSKSARGEN 3,498 306 2,340 4,006 943 782 2,478 1,518 3,146 - 172
XIII - Caraga 1,812 152 888 2,348 2,053 486 1,816 944 1,850 - -
ARMM 210 12 11 11 6 23 19 2 19 - -
Source: Bureau of Jail Management and Penology
17-27

TABLE 17.31 Number of Actions Taken by the "Katarungang Pambarangay": 2018
Criminal Civil Others Total Mediation Conciliation Arbitration Total Repudiated Withdrawn Pending Dismissed CertifiedReferred to concerned Agencies
Total
Philippines 156,447 217,498 94,737 468,682 282,477 64,570 8,345 355,392 2,878 8,949 42,425 31,968 21,563 7,856 115,639
NCR 24,718 43,310 10,126 78,154 34,639 14,219 543 49,401 160 2,091 11,457 7,542 7,115 388 28,753CAR 2,077 3,308 1,013 6,398 4,255 376 61 4,692 1 84 723 335 301 263 1,707I - Ilocos Region 3,368 7,739 5,511 16,618 12,245 2,483 290 15,018 45 182 400 265 190 138 1,220II - Cagayan Valley 1,996 4,443 2,669 9,108 6,560 840 133 7,533 29 121 528 993 179 237 2,087III - Central Luzon 16,054 32,201 14,468 62,723 36,937 10,730 2,059 49,726 356 1,245 4,982 4,882 2,355 1,118 14,938IV-A CALABARZON 36,818 44,354 18,609 99,781 48,578 19,634 2,973 71,185 434 2,189 10,486 7,951 5,191 2,107 28,358MIMAROPA 4,230 6,806 3,930 14,966 10,876 1,250 256 12,382 15 697 321 225 - 1,326 2,584V - Bicol Region 7,938 10,372 7,290 25,600 18,340 2,182 360 20,882 186 431 1,600 1,215 1,057 441 4,930VI - Western Visayas 7,439 6,132 5,773 19,344 14,302 1,310 416 16,028 29 137 1,415 927 511 297 3,316VII - Central Visayas 12,766 15,482 5,337 33,585 23,802 3,584 322 27,708 111 330 3,173 2,020 1,414 144 7,192VIII - Eastern Visayas 6,451 7,929 4,833 19,213 14,289 1,380 184 15,853 129 242 1,096 792 463 580 3,302IX - Zamboanga Peninsula 4,740 6,925 4,462 16,127 10,729 1,103 185 12,017 38 100 2,100 1,300 467 105 4,110X - Northern Mindanao 14,429 10,078 5,449 29,956 17,526 2,431 217 20,174 1,176 237 1,475 1,930 644 371 5,833XI - Davao Region 5,131 5,544 792 11,467 8,413 762 36 9,211 19 195 994 369 518 8 2,103XII - SOCCSKSARGEN 4,099 6,334 2,858 13,291 11,654 1,200 256 13,110 113 385 1,102 811 711 205 3,327XIII - Caraga 4,193 6,541 1,617 12,351 9,332 1,086 54 10,472 37 283 573 411 447 128 1,879
Note: Data are gathered from the accomplishment report of the Katarungang Pambarangay Compliance Report.
Source: Department of Finance, Bureau of Local Government Finance
Unsettled Cases
Region
Nature of Disputes Settled Cases
17-28
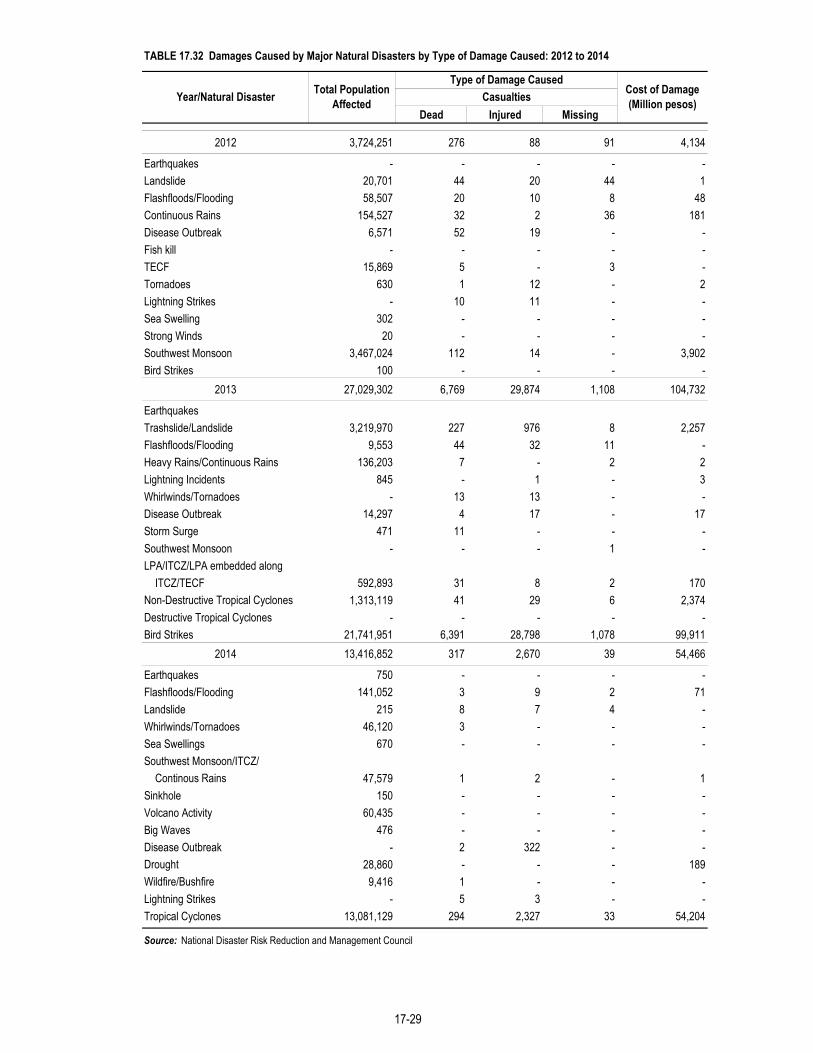
TABLE 17.32 Damages Caused by Major Natural Disasters by Type of Damage Caused: 2012 to 2014
Dead Injured Missing
2012 3,724,251 276 88 91 4,134
Earthquakes - - - - -Landslide 20,701 44 20 44 1Flashfloods/Flooding 58,507 20 10 8 48Continuous Rains 154,527 32 2 36 181Disease Outbreak 6,571 52 19 - -Fish kill - - - - -TECF 15,869 5 - 3 -Tornadoes 630 1 12 - 2Lightning Strikes - 10 11 - -Sea Swelling 302 - - - -Strong Winds 20 - - - -Southwest Monsoon 3,467,024 112 14 - 3,902Bird Strikes 100 - - - -
2013 27,029,302 6,769 29,874 1,108 104,732
EarthquakesTrashslide/Landslide 3,219,970 227 976 8 2,257Flashfloods/Flooding 9,553 44 32 11 -Heavy Rains/Continuous Rains 136,203 7 - 2 2Lightning Incidents 845 - 1 - 3Whirlwinds/Tornadoes - 13 13 - -Disease Outbreak 14,297 4 17 - 17Storm Surge 471 11 - - -Southwest Monsoon - - - 1 -LPA/ITCZ/LPA embedded along
ITCZ/TECF 592,893 31 8 2 170Non-Destructive Tropical Cyclones 1,313,119 41 29 6 2,374Destructive Tropical Cyclones - - - - -Bird Strikes 21,741,951 6,391 28,798 1,078 99,911
2014 13,416,852 317 2,670 39 54,466
Earthquakes 750 - - - -Flashfloods/Flooding 141,052 3 9 2 71Landslide 215 8 7 4 -Whirlwinds/Tornadoes 46,120 3 - - -Sea Swellings 670 - - - -Southwest Monsoon/ITCZ/
Continous Rains 47,579 1 2 - 1Sinkhole 150 - - - -Volcano Activity 60,435 - - - -Big Waves 476 - - - -Disease Outbreak - 2 322 - -Drought 28,860 - - - 189Wildfire/Bushfire 9,416 1 - - -Lightning Strikes - 5 3 - -Tropical Cyclones 13,081,129 294 2,327 33 54,204
Source: National Disaster Risk Reduction and Management Council
Year/Natural Disaster Total Population Affected
Type of Damage CausedCost of Damage (Million pesos)Casualties
17-29
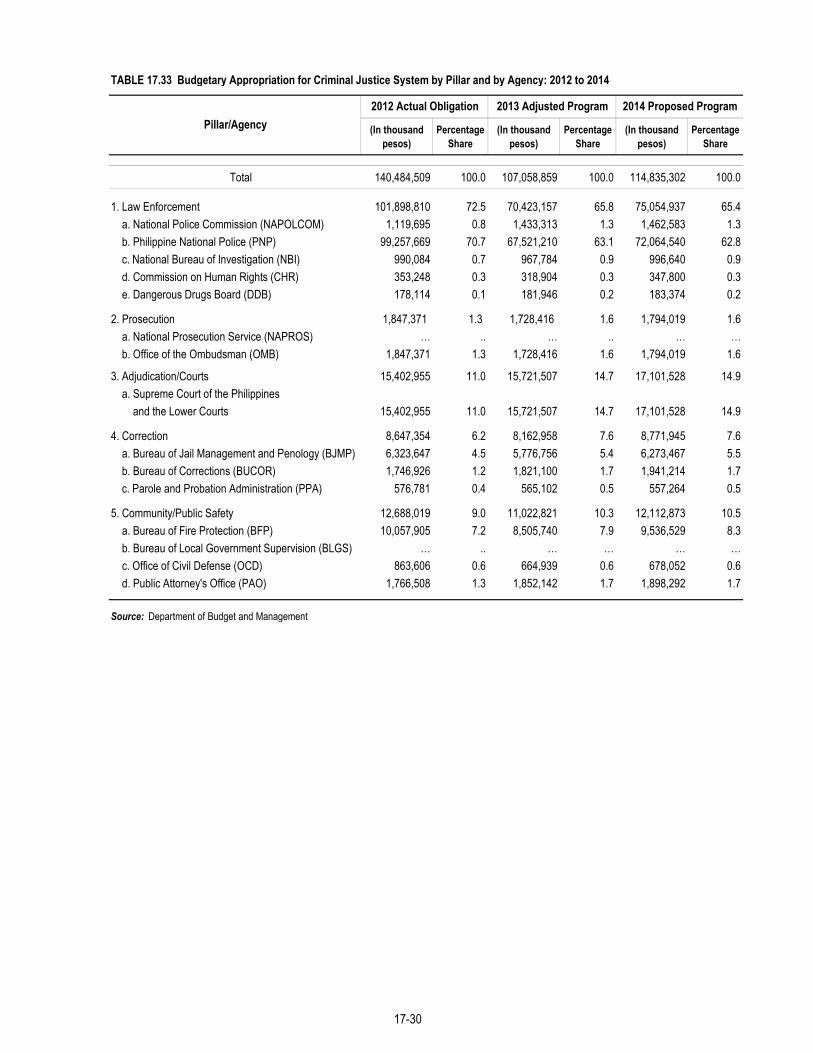
TABLE 17.33 Budgetary Appropriation for Criminal Justice System by Pillar and by Agency: 2012 to 2014
(In thousand pesos)
Percentage Share
(In thousand pesos)
Percentage Share
(In thousand pesos)
Percentage Share
Total 140,484,509 100.0 107,058,859 100.0 114,835,302 100.0
1. Law Enforcement 101,898,810 72.5 70,423,157 65.8 75,054,937 65.4a. National Police Commission (NAPOLCOM) 1,119,695 0.8 1,433,313 1.3 1,462,583 1.3b. Philippine National Police (PNP) 99,257,669 70.7 67,521,210 63.1 72,064,540 62.8c. National Bureau of Investigation (NBI) 990,084 0.7 967,784 0.9 996,640 0.9d. Commission on Human Rights (CHR) 353,248 0.3 318,904 0.3 347,800 0.3e. Dangerous Drugs Board (DDB) 178,114 0.1 181,946 0.2 183,374 0.2
2. Prosecution 1,847,371 1.3 1,728,416 1.6 1,794,019 1.6a. National Prosecution Service (NAPROS) … .. … .. … …b. Office of the Ombudsman (OMB) 1,847,371 1.3 1,728,416 1.6 1,794,019 1.6
3. Adjudication/Courts 15,402,955 11.0 15,721,507 14.7 17,101,528 14.9a. Supreme Court of the Philippines
and the Lower Courts 15,402,955 11.0 15,721,507 14.7 17,101,528 14.9
4. Correction 8,647,354 6.2 8,162,958 7.6 8,771,945 7.6a. Bureau of Jail Management and Penology (BJMP) 6,323,647 4.5 5,776,756 5.4 6,273,467 5.5b. Bureau of Corrections (BUCOR) 1,746,926 1.2 1,821,100 1.7 1,941,214 1.7c. Parole and Probation Administration (PPA) 576,781 0.4 565,102 0.5 557,264 0.5
5. Community/Public Safety 12,688,019 9.0 11,022,821 10.3 12,112,873 10.5a. Bureau of Fire Protection (BFP) 10,057,905 7.2 8,505,740 7.9 9,536,529 8.3b. Bureau of Local Government Supervision (BLGS) … .. … … … …c. Office of Civil Defense (OCD) 863,606 0.6 664,939 0.6 678,052 0.6d. Public Attorney's Office (PAO) 1,766,508 1.3 1,852,142 1.7 1,898,292 1.7
Source: Department of Budget and Management
Pillar/Agency2012 Actual Obligation 2013 Adjusted Program 2014 Proposed Program
17-30


TABLE 18.1a Distribution of Patents Granted to Local Applicants by Category: 2002 to 2018Total
Number % Number % Number % Number %
2002 591 100 12 2 227 38 352 602003 863 100 13 2 393 46 457 532004 682 100 18 3 335 49 329 482005 726 100 4 1 296 41 426 592006 580 100 5 1 282 49 293 512007 1,185 100 2 715 60 468 392008 939 100 41 4 405 43 493 532009 646 100 20 3 317 49 309 482010 663 100 13 2 326 49 324 492011 641 100 6 1 332 52 303 472012 1,016 100 18 2 403 40 595 592013 1,293 100 29 2 472 37 792 612014 1,332 100 23 2 570 43 739 552015 962 100 24 2 492 51 446 462016 1,102 100 31 3 555 50 516 472017 1,487 100 18 1 504 34 965 652018 2,036 100 29 1 1,052 52 955 47
Source: Intellectual Property Office of the Philippines
TABLE 18.1b Distribution of Patents Granted to Foreign Applicants by Category: 2002 to 2018Total Utility Model Industrial Design
Number % Number % Number % Number %
2002 1,668 100.0 1,112 66.7 26 1.6 530 31.82003 1,727 100.0 1,160 67.2 23 1.3 544 31.52004 1,495 100.0 1,434 95.9 16 1.1 45 3.02005 1,984 100.0 1,638 82.6 14 .7 332 16.72006 1,515 100.0 1,191 78.6 18 1.2 306 20.22007 2,708 100.0 1,785 65.9 58 2.1 865 31.92008 1,570 100.0 797 50.8 52 3.3 721 45.92009 1,925 100.0 1,661 86.3 51 2.6 213 11.12010 1,507 100.0 1,140 75.6 49 3.3 318 21.12011 1,554 100.0 1,129 72.7 63 4.1 362 23.32012 1,938 100.0 1,385 71.5 22 1.1 531 27.42013 2,544 100.0 2,037 80.1 22 .9 485 19.12014 2,482 100.0 1,998 80.5 27 1.1 457 18.42015 2,500 100.0 2,004 80.2 38 1.5 458 18.32016 2,467 100.0 1,967 79.7 35 1.4 465 18.82017 2,119 100.0 1,519 72.0 27 1.0 573 27.02018 3,685 100.0 2,653 72.0 61 2.0 971 26.0
Source: Intellectual Property Office of the Philippines
TABLE 18.2 Distribution of Patents Granted by Category: 2014 to 2018Total Utility Model Industrial Design
Resident Non-Resident Resident Non-Resident Resident Non-Resident Resident Non-Resident
2014 1,332 2,482 23 1998 570 27 739 4572015 962 2,500 24 2004 492 38 446 4582016 1,102 2,467 31 1967 555 35 516 4652017 1,487 2,119 18 1519 504 27 965 5732018 2,036 3,685 29 2653 1052 61 955 971
Source: Intellectual Property Office of the Philippines
Industrial DesignUtility ModelPatent
Patent
Patent
Year
Year
Year
18-1

TABLE 18.3a Distribution of Trademarks Registered to Local Applicants by Type of Mark: 2008 to 2018
Not Specified
Registered % Registered % Registered % Registered % Registered % Registered % Registered %
2008 6,591 100.0 - - 907 13.8 774 11.7 4,515 68.5 395 6.0 - - 2009 5,375 100.0 - - 642 11.9 745 13.9 3,680 68.5 308 5.7 - - 2010 5,966 100.0 1 0.02 34 0.6 944 15.8 4,708 78.9 279 4.7 - - 2011 6,548 99.9 1 0.02 9 0.1 1,325 20.2 4,896 74.8 311 4.7 6 - 2012 11,111 100.0 - - - - 3,453 31.1 7,658 68.9 - - - - 2013 9,957 100.0 - - - - 2,983 30.0 6,974 70.0 - - - - 2014 12,602 100.0 - - - - 3,862 30.6 8,740 69.4 - - - - 2015 14,413 100.0 - - - - 4,444 30.8 9,969 69.2 - - - - 2016 19,907 100.0 - - - - 6,703 33.7 13,204 66.3 - - - - 2017 16,424 100.0 - - - - 5,613 34.0 10,811 66.0 - - 16,424 - 2018 18,798 100.0 - - - - 6,781 36.0 12,017 64.0 - - 18,798 -
Source: Intellectual Property Office of the Philippines
TABLE 18.3b Distribution of Trademarks Registered to Foreign Applicants by Type of Mark: 2008 to 2018
Not Specified
Registered % Registered % Registered % Registered % Registered % Registered % Registered %
2008 7,291 100.0 - - 880 12.1 561 7.7 5,684 78.0 166 2.3 - - 2009 11,175 100.0 - - 1,281 11.5 1,276 11.4 8,193 73.3 425 3.8 - - 2010 6,221 100.0 3 - 34 0.5 508 8.2 5,538 89.0 138 2.2 - - 2011 7,072 99.9 - - 8 0.1 745 10.5 6,191 87.5 124 1.8 4 - 2012 13,370 100.0 - - - - 3,155 23.6 10,215 76.4 - - - - 2013 11,493 100.0 - - - - 2,718 23.6 8,775 76.4 - - - - 2014 17,592 100.0 - - - - 4,247 24.1 13,345 75.9 - - - - 2015 21,478 100.0 - - - - 5,355 24.9 16,123 75.1 - - - - 2016 24,856 100.0 - - - - 6,690 26.9 18,166 73.1 - - - - 2017 20,086 100.0 - - - - 5,456 27.0 14,630 73.0 - - 20,086 - 2018 23,968 100.0 - - - - 6,717 28.0 17,251 72.0 - - 23,968 -
Source: Intellectual Property Office of the Philippines
TABLE 18.4 Distribution of Trademarks Registered to Investors by Type: 2013 to 2018
Source: Intellectual Property Office of the Philippines
Year
2013
2017 21,955 11,173
Total Resident Non-Resident
Combination of Trademark and Service Mark
10,7822018 25,248 12,508 12,740
10,1192015 11,84412,94312,9912016
21,96325,934
Year
7,17010,321
YearInternet Domain
201413,87019,206
6,7008,885
Combination of Trademark and Service Mark
Service Mark Trademark TradenameTotal
Total Internet Domain Service Mark Trademark Tradename
18-2

TABLE 18.5 Research and Development by Category and by Sector: 2011 and 2013
2013 2011 2013 2011 Total Public Private Total Public Private 2013 2011 2013 2011
Total 36,517 18,110 3,774 3,082 10,189 7,647 2,542 8,285 6,311 1,974 227 125 22,327 6,618
By involvementFull-time 26,333 9,765 2,713 1,960 4,654 4,012 642 2,173 1,674 499 125 47 18,841 5,585
By sexMale 20,150 9,196 1,771 1,499 4,428 3,280 1,148 3,552 2,693 859 92 37 13,859 4,108 Female 16,367 8,914 2,003 1,583 5,761 4,367 1,394 4,733 3,618 1,115 135 88 8,468 2,510
By positionResearchers 26,495 14,169 2,965 2,391 9,508 7,144 2,364 7,559 5,675 1,884 179 85 13,843 4,134 Technicians 3,377 1,484 278 354 181 153 28 220 210 10 15 21 2,903 889 Auxiliary personnel 6,378 2,454 501 337 487 337 150 506 426 80 32 19 5,358 1,592 Not classified 267 3 30 - 13 13 - - - - 1 - 223 3
By field of research work … …Natural sciences … … 651 590 2,243 1,806 437 1,785 1,366 419 72 8 … …Engineering and technology … … 611 613 1,438 909 529 1,195 909 286 10 4 … …Agricultural sciences … … 1,825 1,178 1,531 1,512 19 1,893 1,856 37 36 14 … …Medical sciences … … 378 265 868 612 256 475 219 256 24 42 … …Social sciences … … 278 334 2,664 1,964 700 2,210 1,399 811 80 47 … …Humanities … … 31 4 987 783 204 218 129 89 5 - … …Others, n.e.c … … - 98 458 61 397 509 433 76 - 10 … …
Source : Department of Science and Technology, R & D Survey
a Data source: Philippine Statistics Authority, Annual Survey of Philippine
Private Non-Profit
Private Business aHigher Education Higher EducationCategory
Total Government2013 2011
18-3

TABLE 18.6 Research and Development Personnel by Sector: 2002, 2003, 2005, 2007, 2009, 2011, and 2013
Sector 2002 2003 2005 2007 2009 2011 2013
Total Expenditure 9,325 13,488 14,087 14,649 16,673 18,110 36,517
Government 1 3,054 3,425 3,539 3,198 3,063 3,082 3,774Higher Education 1
4,093 4,423 5,262 6,103 7,185 8,285 10,189Public HEIs 3,134 3,399 3,631 4,110 5,493 6,311 7,647Private HEIs 959 1,024 1,631 1,993 1,693 1,974 2,542
Private Non-Profit 1 242 293 180 199 387 125 227Private Business 2 1,936 5,347 5,106 5,150 6,038 6,618 22,327
TABLE 18.7 Number of Scientist and Engineers by Sector: 1996, 2002, 2003, and 2005
Sector 1996 2002 2003 2005
Total 11,215 7,203 8,866 10,690
Government 4,740 2,339 2,557 2,797Higher Education 5,645 3,513 3,712 4,591Public HEIs 5,250 2,693 2,856 3,185Private HEIs 395 820 856 1,406Private Non-Profit 385 131 169 112Private Business 445 1,220 2,428 3,190
Sources: 1 Department of Science and Technology, R&D Survey 2 Philippine Statistics Authority, Annual Survey of Philippine Business and Industry
(Base on headcount)
18-4

TABLE 18.8 Research and Development Expenditure by Socio-Economic Objective and by Sector: 2011 and 2013 (In thousand pesos)
2013 2011 Total Public Private Total Public Private 2013 2011
Total Expenditure 1,370,695 8,390,561 1,236,494 655,072 581,422 8,344,476 3,403,442 4,941,034 134,201 46,086
Exploration and exploitation of the earth 19,239 3,004,095 19,239 8,018 11,221 3,004,095 1,024,433 1,979,661 - - Infrastructure and general planning of land use 49,662 288,450 48,641 44,594 4,047 285,291 12,067 273,224 1,021 3,159 Control and care of the environment 224,421 1,422,967 154,555 53,906 100,649 1,422,414 635,471 786,943 69,866 553 Protection and improvement of human health 118,517 747,612 114,673 71,984 42,689 744,414 446,561 297,854 3,845 3,198 Production, distribution & rational utilization of energy 41,620 119,709 41,620 37,040 4,580 119,709 75,443 44,266 - - Agricultural production and technology 70,587 1,800,849 46,185 38,515 7,670 1,795,678 805,040 990,638 24,403 5,171 Industrial production and technology 138,189 129,042 133,685 129,569 4,116 126,376 53,604 72,772 4,503 2,666 Social structures and relationships 250,073 341,776 235,490 188,067 47,423 324,268 142,981 181,287 14,584 17,508 Exploration and exploitation of space 824 1,346 824 824 - 1,346 106 1,240 - - Defense 136 94 136 136 - 94 - 94 - - Access to information and knowledge 405,186 199,948 397,558 61,323 336,234 198,982 112,983 85,999 7,628 966 Others, n.e.c. 52,240 334,675 43,888 21,096 22,793 321,810 94,754 227,057 8,352 12,865 Not classified - - - - - - - - - -
Note : National total is not shown since the Private Business data is not available
Source: Department of Science and Technology
TABLE 18.9 Research and Development Expenditures by Sector: 2002, 2003, 2005, 2007, 2009, 2011, and 2013 (At current prices; in million pesos)
Sector 2002 2003 2005 2007 2009 2011 2013
Total Expenditure 5,664.8 5,909.7 6,326.7 7,556.4 8,779.2 11,384.0 14,792.2
Government 1 975.6 1,129.7 1,175.3 1,333.9 1,392.7 1,749.3 3,449.5Higher Education 1 657.4 657.4 1,350.1 1,756.9 2,112.7 4,058.5 5,522.5
Public HEIs 455.1 455.1 1,092.9 1,326.4 1,745.3 3,403.4 4,941.0Private HEIs 202.4 202.4 257.2 430.5 367.3 655.1 581.4
Private Non-Profit 1 121.7 104.6 96.2 162.2 228.4 46.1 134.2Private Business 2 3,910.1 4,018.1 3,705.1 4,303.3 5,045.4 5,530.0 5,686.1a Estimates
Sources: 1 Department of Science and Technology, R & D Survey 2 Philippine Statistics Authority, Annual Survey of Philippine Business and Industry
Private Non-Profit InstitutionsCategory
Government2013 2011
Higher Education Higher Education
18-5

TABLE 18.10 Research and Development Expenditures in Private Establishments: 2003, 2005, 2006, 2008, 2009, 2010, 2012, 2013 and 2014 (In thousand pesos)
Major Industry 2003 a 2005 a 2006 b 2008 a 2009 a
Total 4,018,085 3,705,095 3,993,083 7,376,075 5,045,369
A - Agriculture, Hunting and Forestry 34,382 58,849 18,519 44,689 38,865 B - Fishing 43 2,841 1,034 1,272 276 C - Mining and Quarrying 8,274 4,959 212,979 8,941 69,503 D - Manufacturing 3,279,598 2,314,377 2,756,726 5,766,530 3,482,472 E - Electricity, Gas and Water Supply 174,373 33,545 102,467 98,500 126,566 F - Construction 10,220 - 61,446 61,355 17,754 G - Wholesale and Retail Trade 159,075 - 91,126 109,360 187,938 H - Hotels and Restaurants 26,795 29,589 38,907 34,902 30,674 I - Transport, Storage and Communications 6,131 704,062 46,093 36,287 - J - Financial Intermediation 28,284 89,425 82,159 408,196 217,515 K - Real Estate 178,540 359,295 433,443 482,995 699,197 M - Health and Social Work 37,996 52,977 84,113 33,063 61,417 y Services 74,374 55,176 64,071 289,985 113,192
Major Industry 2010 a 2012 b 2013a 2014a
Total 5,701,194 5,399,924 9,589,467 4,719,964
A - Agriculture, Forestry and Fishing 36,053 39,984 57,355 99,585 B - Mining and Quarrying 31,525 34,732 350,731 5,170 C - Manufacturing 2,905,092 3,552,909 3,756,549 3,371,483 D - Electricity, Gas, Steam and Air Conditioning Supply 67,827 49,783 46,978 50,972 E - Water Supply; Sewerage, Waste Management and Remediation Activities 41,072 41,086 4,064,631 24,172 F - Construction 38,769 77,635 25,290 38,020 G - Wholesale and Retail Trade; Repair of Motor Vehicles and Motorcycles 185,458 5,596 - - H - Transport and Storage - - - - I - Accommodation and Food Service Activities 69,544 63,616 9,528 24,607 J - Information and Communication 421,033 112,557 14,765 81,914 K - Financial and Insurance Activities 719,557 652,190 929,803 417,351 L - Real Estate Activities - 22,362 7,179 7,602 Activities 707,296 492,793 231,956 156,629 N - Administrative and Support Service Activities 314,242 87,845 19,820 11,814 O - Education** … … 215,879 323,260 P - Human Health and Social Work Activities 147,720 161,804 67,836 98,033 R - Arts, Entertainment, and Recreation 6,447 4,379 2,894 5,528 S - Other Service Activities 9,559 653 4,152 3,824
** Data on Private EducationNote: Industry Sector "M"(Education) is not included since this covered by DOST R&D Surveys
Sources:a Philippine Statistics Authority, Annual Survey of Philippine Business and Industry b Philippine Statistics Authority, Census of Philippine Business and Industry
18-6
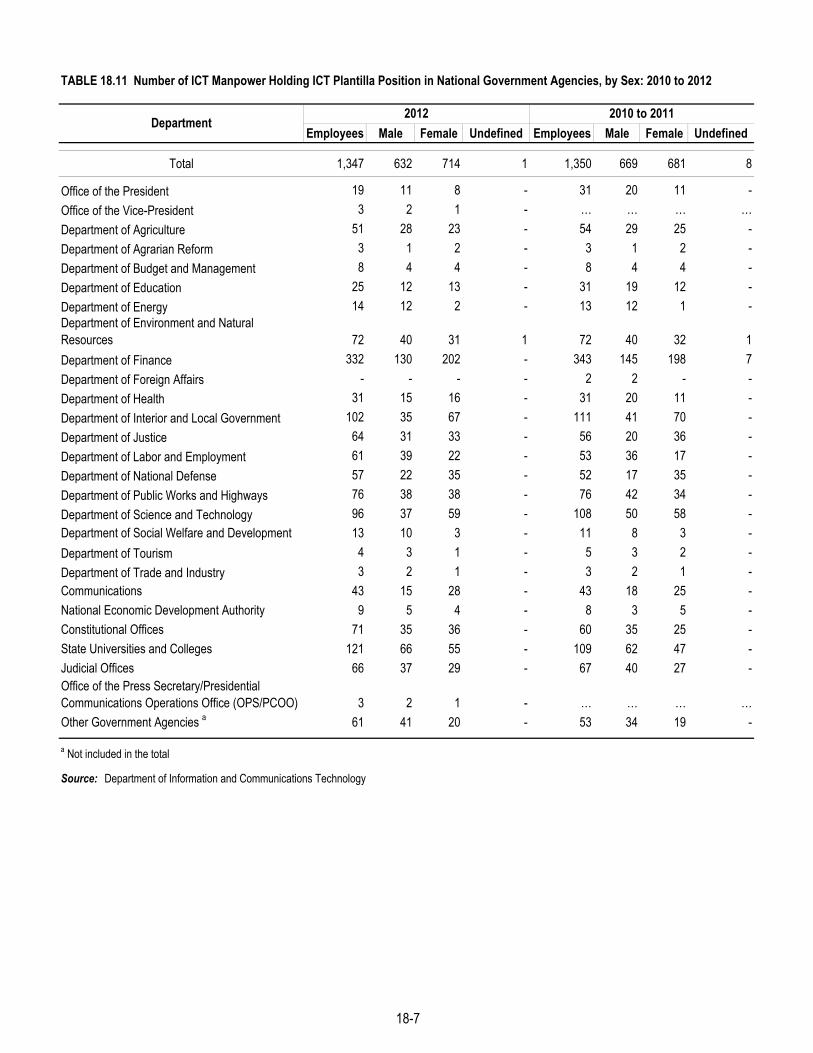
TABLE 18.11 Number of ICT Manpower Holding ICT Plantilla Position in National Government Agencies, by Sex: 2010 to 2012
Employees Male Female Undefined Employees Male Female Undefined
Total 1,347 632 714 1 1,350 669 681 8
Office of the President 19 11 8 - 31 20 11 - Office of the Vice-President 3 2 1 - … … … … Department of Agriculture 51 28 23 - 54 29 25 - Department of Agrarian Reform 3 1 2 - 3 1 2 - Department of Budget and Management 8 4 4 - 8 4 4 - Department of Education 25 12 13 - 31 19 12 - Department of Energy 14 12 2 - 13 12 1 - Department of Environment and Natural Resources 72 40 31 1 72 40 32 1 Department of Finance 332 130 202 - 343 145 198 7 Department of Foreign Affairs - - - - 2 2 - - Department of Health 31 15 16 - 31 20 11 - Department of Interior and Local Government 102 35 67 - 111 41 70 - Department of Justice 64 31 33 - 56 20 36 - Department of Labor and Employment 61 39 22 - 53 36 17 - Department of National Defense 57 22 35 - 52 17 35 - Department of Public Works and Highways 76 38 38 - 76 42 34 - Department of Science and Technology 96 37 59 - 108 50 58 - Department of Social Welfare and Development 13 10 3 - 11 8 3 - Department of Tourism 4 3 1 - 5 3 2 - Department of Trade and Industry 3 2 1 - 3 2 1 - Communications 43 15 28 - 43 18 25 - National Economic Development Authority 9 5 4 - 8 3 5 - Constitutional Offices 71 35 36 - 60 35 25 - State Universities and Colleges 121 66 55 - 109 62 47 - Judicial Offices 66 37 29 - 67 40 27 - Office of the Press Secretary/Presidential Communications Operations Office (OPS/PCOO) 3 2 1 - … … … … Other Government Agencies a 61 41 20 - 53 34 19 -
a Not included in the total
Source: Department of Information and Communications Technology
Department2012 2010 to 2011
18-7
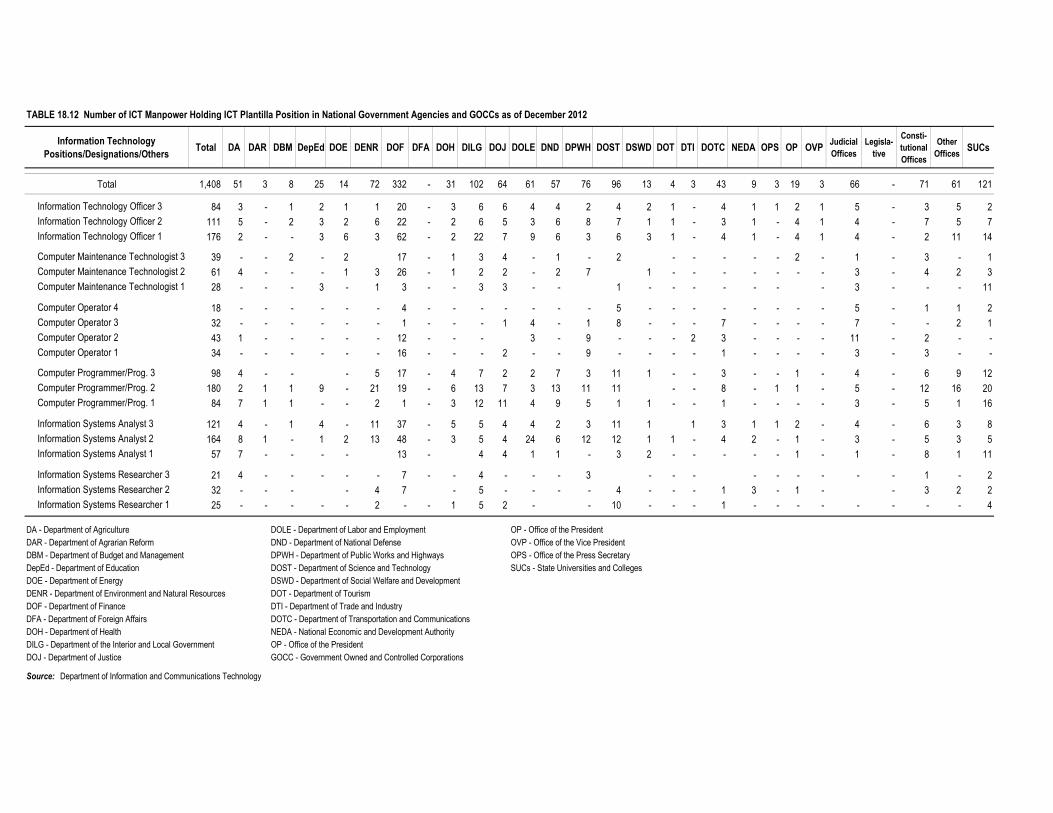
TABLE 18.12 Number of ICT Manpower Holding ICT Plantilla Position in National Government Agencies and GOCCs as of December 2012
Information Technology Positions/Designations/Others Total DA DAR DBM DepEd DOE DENR DOF DFA DOH DILG DOJ DOLE DND DPWH DOST DSWD DOT DTI DOTC NEDA OPS OP OVP Judicial
Offices Legisla-
tive
Consti-tutional Offices
Other Offices SUCs
Total 1,408 51 3 8 25 14 72 332 - 31 102 64 61 57 76 96 13 4 3 43 9 3 19 3 66 - 71 61 121
Information Technology Officer 3 84 3 - 1 2 1 1 20 - 3 6 6 4 4 2 4 2 1 - 4 1 1 2 1 5 - 3 5 2 Information Technology Officer 2 111 5 - 2 3 2 6 22 - 2 6 5 3 6 8 7 1 1 - 3 1 - 4 1 4 - 7 5 7 Information Technology Officer 1 176 2 - - 3 6 3 62 - 2 22 7 9 6 3 6 3 1 - 4 1 - 4 1 4 - 2 11 14
Computer Maintenance Technologist 3 39 - - 2 - 2 17 - 1 3 4 - 1 - 2 - - - - - 2 - 1 - 3 - 1 Computer Maintenance Technologist 2 61 4 - - - 1 3 26 - 1 2 2 - 2 7 1 - - - - - - - 3 - 4 2 3 Computer Maintenance Technologist 1 28 - - - 3 - 1 3 - - 3 3 - - 1 - - - - - - - 3 - - - 11
Computer Operator 4 18 - - - - - - 4 - - - - - - - 5 - - - - - - - - 5 - 1 1 2 Computer Operator 3 32 - - - - - - 1 - - - 1 4 - 1 8 - - - 7 - - - - 7 - - 2 1 Computer Operator 2 43 1 - - - - - 12 - - - 3 - 9 - - - 2 3 - - - - 11 - 2 - - Computer Operator 1 34 - - - - - - 16 - - - 2 - - 9 - - - - 1 - - - - 3 - 3 - -
Computer Programmer/Prog. 3 98 4 - - - 5 17 - 4 7 2 2 7 3 11 1 - - 3 - - 1 - 4 - 6 9 12 Computer Programmer/Prog. 2 180 2 1 1 9 - 21 19 - 6 13 7 3 13 11 11 - - 8 - 1 1 - 5 - 12 16 20 Computer Programmer/Prog. 1 84 7 1 1 - - 2 1 - 3 12 11 4 9 5 1 1 - - 1 - - - - 3 - 5 1 16
Information Systems Analyst 3 121 4 - 1 4 - 11 37 - 5 5 4 4 2 3 11 1 1 3 1 1 2 - 4 - 6 3 8 Information Systems Analyst 2 164 8 1 - 1 2 13 48 - 3 5 4 24 6 12 12 1 1 - 4 2 - 1 - 3 - 5 3 5 Information Systems Analyst 1 57 7 - - - - 13 - 4 4 1 1 - 3 2 - - - - - 1 - 1 - 8 1 11
Information Systems Researcher 3 21 4 - - - - - 7 - - 4 - - - 3 - - - - - - - - - 1 - 2 Information Systems Researcher 2 32 - - - - 4 7 - 5 - - - - 4 - - - 1 3 - 1 - - 3 2 2 Information Systems Researcher 1 25 - - - - - 2 - - 1 5 2 - - 10 - - - 1 - - - - - - - - 4
DA - Department of Agriculture DOLE - Department of Labor and Employment OP - Office of the PresidentDAR - Department of Agrarian Reform DND - Department of National Defense OVP - Office of the Vice PresidentDBM - Department of Budget and Management DPWH - Department of Public Works and Highways OPS - Office of the Press SecretaryDepEd - Department of Education DOST - Department of Science and Technology SUCs - State Universities and Colleges DOE - Department of Energy DSWD - Department of Social Welfare and DevelopmentDENR - Department of Environment and Natural Resources DOT - Department of TourismDOF - Department of Finance DTI - Department of Trade and IndustryDFA - Department of Foreign Affairs DOTC - Department of Transportation and CommunicationsDOH - Department of Health NEDA - National Economic and Development AuthorityDILG - Department of the Interior and Local Government OP - Office of the PresidentDOJ - Department of Justice GOCC - Government Owned and Controlled Corporations
Source: Department of Information and Communications Technology
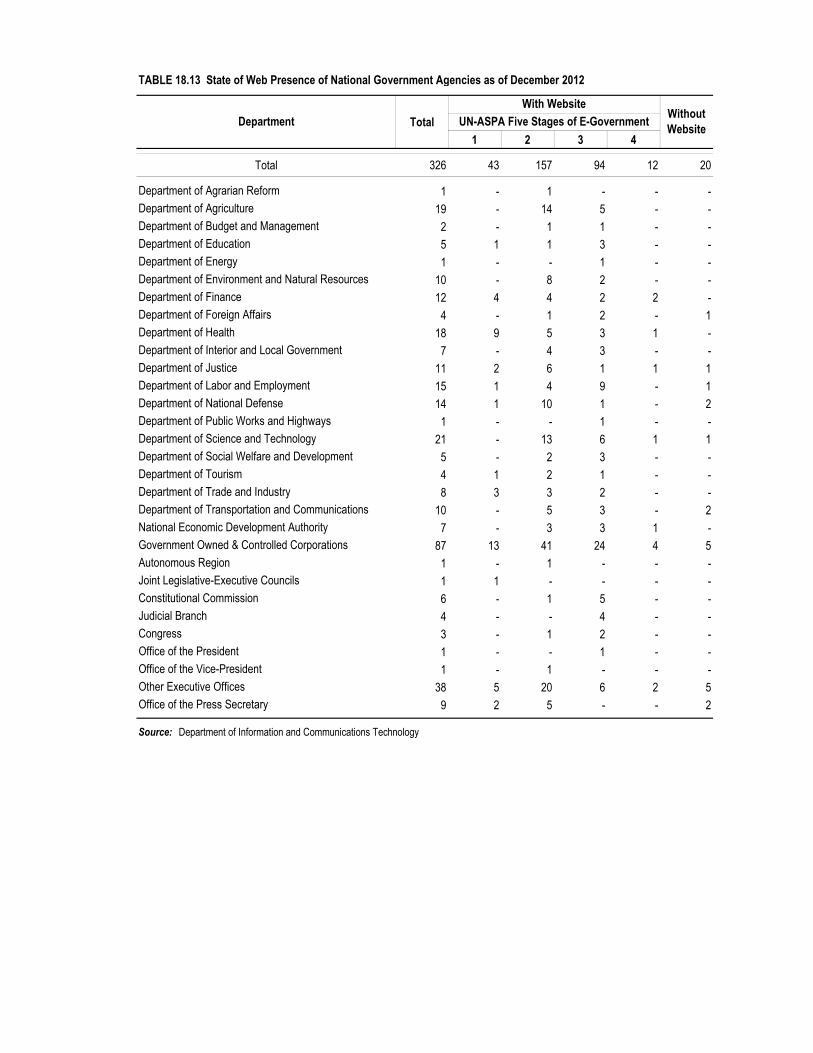
TABLE 18.13 State of Web Presence of National Government Agencies as of December 2012
Total1 2 3 4
Total 326 43 157 94 12 20
Department of Agrarian Reform 1 - 1 - - - Department of Agriculture 19 - 14 5 - - Department of Budget and Management 2 - 1 1 - - Department of Education 5 1 1 3 - - Department of Energy 1 - - 1 - - Department of Environment and Natural Resources 10 - 8 2 - - Department of Finance 12 4 4 2 2 - Department of Foreign Affairs 4 - 1 2 - 1 Department of Health 18 9 5 3 1 - Department of Interior and Local Government 7 - 4 3 - - Department of Justice 11 2 6 1 1 1 Department of Labor and Employment 15 1 4 9 - 1 Department of National Defense 14 1 10 1 - 2 Department of Public Works and Highways 1 - - 1 - - Department of Science and Technology 21 - 13 6 1 1 Department of Social Welfare and Development 5 - 2 3 - - Department of Tourism 4 1 2 1 - - Department of Trade and Industry 8 3 3 2 - - Department of Transportation and Communications 10 - 5 3 - 2 National Economic Development Authority 7 - 3 3 1 - Government Owned & Controlled Corporations 87 13 41 24 4 5 Autonomous Region 1 - 1 - - - Joint Legislative-Executive Councils 1 1 - - - - Constitutional Commission 6 - 1 5 - - Judicial Branch 4 - - 4 - - Congress 3 - 1 2 - - Office of the President 1 - - 1 - - Office of the Vice-President 1 - 1 - - - Other Executive Offices 38 5 20 6 2 5 Office of the Press Secretary 9 2 5 - - 2
Source: Department of Information and Communications Technology
DepartmentWith Website
Without WebsiteUN-ASPA Five Stages of E-Government

TABLE 18.14 Information Technology Resources of Selected Government Agencies as of June 2011
Agency Workstation Printer Notebook/ Laptop Server
DEPARTMENT OF AGRARIAN REFORM Office of the Secretary 560 1,459 50 20
DEPARTMENT OF AGRICULTURE National Dairy Authority 78 42 7 6
DEPARTMENT OF ENERGY Office of the Secretary 494 249 9 14
DEPARTMENT OF ENVIRONMENT AND NATURAL RESOURCES Office of the Secretary 1,792 2,608 243 National Mapping and Resource Information Authority 277 37 19 15
DEPARTMENT OF FINANCE Bureau of Internal Revenue 6,324 2,649 175 72 Insurance Commission 172 125 50 7 Bureau of the Treasury 430 226 8 15
DEPARTMENT OF FOREIGN AFFAIRS Office of the Secretary 444 785 28 -
DEPARTMENT OF HEALTH Dangerous Drugs Board 35 29 3 4 Philippine Health Insurance Corporation 2,822 1,488 63 13
DEPARTMENT OF INTERIOR AND LOCAL GOVERNMENT Philippine National Police 3,628 2,832 136 79
DEPARTMENT OF JUSTICE Office of the Secretary 561 24 29 3 Office of the Solicitor General 194 36 178 7 Bureau of Corrections 242 163 2 2
DEPARTMENT OF LABOR AND EMPLOYMENT Employees Compensation Commission 49 37 - 1 National Conciliation and Mediation Board 123 103 - 4 National Wages and Productivity Commission 113 48 8 12
DEPARTMENT OF TRADE AND INDUSTRY Office of the Secretary 2,102 1,150 299 96 Board of Investments 250 141 37 - Center for International Trade Expositions and Missions 146 74 10 6 Philippine International Trading Corporation 34 59 8 -
DEPARTMENT OF SCIENCE AND TECHNOLOGY Office of the Secretary 385 324 145 57 Metals Industry Research and Development Center 140 80 26 6 Philippine Textile Research Institute 70 54 8 5 Philippine Council for Agriculture, Forestry and Natural Resources Research and Development 142 113 18 14 Philippine Council for Industry and Energy Research and Development 56 21 25 8 Food and Nutrition Research Institute 163 159 23 - Science and Technology Information Institute 89 53 2 9
DEPARTMENT OF TOURISM Office of the Secretary - 298 - 31
Continued

TABLE 18.14 ---Concluded
Agency Workstation Printer Notebook/ Laptop Server
DEPARTMENT OF TRANSPORTATION AND COMMUNICATIONS Land Transportation Franchising Regulatory Board 204 196 24 26 Land Transportation Office 20 3 - 24
OFFICE OF THE PRESIDENT Commission on Filipinos Overseas 35 29 3 4 Energy Regulatory Commission 164 59 18 10 Housing and Land Use Regulatory Board 117 88 36 - National Anti-Poverty Commission 76 34 5 2 National Library 287 72 13 25 National Security Council - 32 - - National Water Resources Board 64 40 12 9 Professional Regulation Commission 210 99 - 15
NATIONAL ECONOMIC DEVELOPMENT AUTHORITY Office of the Secretary 1,105 - 84 - Pilippine Statistical Research and Training Institute 40 4 2 2
OFFICE OF THE VICE-PRESIDENT Office of the Secretary 64 47 9 -
GOVERNMENT OWNED AND CONTROLLED CORPORATIONS Development Academy of the Philippines 201 80 69 85 Home Development Mutual Fund 1,218 1,307 85 74 Home Guaranty Corporation 172 82 20 5 National Home Mortgage Finance Corporation 164 167 12 3 National Power Corporation 1,598 678 201 - National Transmission Corporation 2,085 913 516 83 Philippine Charity Sweepstakes Office 405 205 15 31 Philippine Crop Insurance Corporation 76 64 18 - Philippine Ports Authority 1,975 1,526 - 31 Philippine Reclamation Authority 98 46 11 4 Philippine Retirement Authority 50 20 7 - Quedan and Rural Credit Guarantee Corporation 673 433 11 79 Subic Bay Metropolitan Authority 748 217 22 -
Source: Department of Information and Communications Technology


19 - 3
19 - 4
19 - 4
19 - 5
19 - 5
19 - 6
19 - 6
19 - 7
19 - 7
19 - 8
19 - 8
19 - 9
19 - 9
19 - 10
19 - 10
19 - 11
19 - 12
19 - 12
19 - 13
19 - 14
19 - 14
TABLE 19.1 Population, Rate of Increase, Birth and Death Rates, Surface Area and Density for the World,
Major Areas and Regions in Selected Years
TABLE 19.2 Index Numbers of Total Agricultural and Food Production in Selected Continents of the
World: 2007 to 2016
TABLE 19.3 Land Use in Selected Asian Countries
TABLE 19.4 Gross Domestic Product of Selected Asian Countries: 2013 to 2019
TABLE 19.5 Per Capita Gross Domestic Product of Selected Asian Countries: 2013 to 2019
TABLE 19.6 Gross Domestic Capital Formation of Selected Asian Countries: 2005, 2010, 2014 to 2017
TABLE 19.7 Gross Domestic Savings of Selected Asian Countries: 2010 to 2017
TABLE 19.8 Inflation Rate of Selected Asian Countries: 2013 to 2019
TABLE 19.9 Me chandise Exports of Selected Asian Countries: 2013 to 2019
TABLE 19.10 Merchandise Imports of Selected Asian Countries: 2013 to 2019
TABLE 19.11 Current Account Balance of Selected Asian Countries: 2013 to 2019
TABLE 19.12 Rates of Discounts of Central Banks in Selected Asian Countries: 2011 to 2016
TABLE 19.13 Fiscal Balance of Central Government: 2013 to 2017
TABLE 19.14 Foreign Direct Investment (Net Inflows): 2011 to 2017
TABLE 19.15 Exchange Rates in Selected Asian Countries: 2015 to 2017
TABLE 19.16 Demographic indicators of Selected Asian Countries: Selected Years
TABLE 19.17 Internet Usage in Selected Asian Countries: 2011 to 2016
TABLE 19.18 Mobile Cellular Telephone Subscribers in Selected Asian Countries: 2012 to 2017
TABLE 19.19 Fixed Broadband Subscriptions in Selected Asian Countries: 2012 to 2017
TABLE 19.20 Carbon Dioxide (CO2) Emission Estimates in Selected Asian Countries from Fossil Fuel Combustion,
Cement Production and Gas Flared: 2007 to 2014
TABLE 19.21 Numbers of Threatened Animal and Plant Species in Selected Asian Countries: 2018
TABLE 19.22 International Tourist Arrivals in Selected Asian Countries: 2011 to 2017 19 - 15

TABLE 19.1 Population, Rate of Increase, Birth and Death Rates, Surface Area and Density for the World, Major Areas and Regions in Selected Years
CrudeBirthRate
CrudeDeathRate
Surface Area (km2)
(000's)
2013 2015 2016 2017 2010-2015 2015 2018
World Total 7,162.1 7,383.0 7,416.3 7,536.0 7,632.8 1 1.2 19.0 7.0 136,162.0 58.7 1
Africa 1,110.6 1,194.4 1,203.0 1,250.0 1,287.91
2.6 35.0 9.0 30,311.0 43.41
Eastern Africa 373.2 399.5 394.0 422.0 433.61
2.8 36.0 8.0 7,005.0 65.01
Middle Africa 135.8 153.7 157.0 163.0 168.51
2.7 42.0 10.0 6,613.0 25.91
Northern Africa 210.0 225.1 229.0 230.0 237.81
1.7 26.0 6.0 7,880.0 30.61
Southern Africa 60.4 63.4 64.0 65.0 66.01
0.8 22.0 9.0 2,675.0 24.91
Western Africa 331.3 352.6 359.0 371.0 382.01,
2 2.7 38.0 11.0 6,138.0 63.01,2
Northern America 355.4 356.0 360.0 362.0 363.81,
3 0.8 12.0 9.0 21,776.0 19.51,3
Latin America 616.6 632.4 637.0 643.0 652.01
1.1 17.0 6.0 20,546.0 32.41
Caribbean 42.5 43.3 43.0 43.0 44.21
0.7 17.0 8.0 234.0 195.41
Central America 167.4 172.6 175.0 177.0 179.61
1.4 19.0 5.0 2,480.0 73.21
South America 406.7 416.4 419.0 423.0 428.21
1.0 16.0 6.0 17,832.0 24.51
Asia 4,298.7 4,419.9 4,437.0 4,494.0 4,545.11
1.0 17.0 7.0 31,915.0 146.51
Eastern Asia 1,620.8 1,635.2 1,614.0 1,625.0 1,653.91
0.5 12.0 7.0 11,799.0 143.11
South Central Asia 1,813.4 1,892.0 1,929.0 1,956.0 1,963.31
1.3 21.0 6.0 10,791.0 190.11
Southeastern Asia 618.8 634.6 633.0 644.0 655.61
1.2 18.0 7.0 4,495.0 151.01
Western Asia 245.7 258.1 261.0 269.0 272.31
1.9 21.0 5.0 4,831.0 56.71
Europe 742.5 740.8 739.0 745.0 742.71
0.1 10.0 11.0 23,049.0 33.61
Eastern Europe 294.2 293.2 293.0 293.0 292.01
-0.3 11.0 12.0 18,814.0 16.21
Northern Europe 100.4 103.1 103.0 104.0 104.81
0.5 11.0 9.0 1,810.0 61.51
Southern Europe 155.8 152.4 150.0 153.0 151.91
0.2 8.0 10.0 1,317.0 117.31
Western Europe 192.1 192.0 193.0 195.0 194.11
0.2 10.0 10.0 1,108.0 178.91
Oceania 38.3 39.5 40.3 40.9 41.31
1.5 17.0 7.0 8,564.0 4.91
Australia and New Zealand 27.8 28.4 28.8 29.3 29.51
1.3 25.0 14.0 8,012.0 3.71
Melanesia 9.3 9.9 10.4 10.5 10.51
2.0 … … 541.0 19.91
Micronesia 0.5 0.5 0.5 0.5 0.51
0.9 22.0 6.0 3.0 167.81
Polynesia 0.7 0.7 0.6 0.6 0.71,
4 0.7 14.0 5.0 8.0 85.51,4
and Turks and Caicos Islands.
Source : Population Reference Bureau, 2017 and 2018 World Population Data Sheet ; and United Nations, Statistical Yearbook, 61 st issue
2 Including Saint Helena.3 Including Bermuda, Greenland, and Saint Pierre and Miquelon.4 Including Anguilla, Bonaire, Sint Eustatius and Saba, British Virgin Islands, Cayman Islands, Dominica, Montserrat, Saint Kitts and Nevis, Sint Maarten (Dutch part)
1 Projected estimate (medium fertility variant).
Major Areas and Regions
Population (Mid-Year Estimates)
(In millions)
Annual Rate of Increase (in percent)
Density per 1,000 Population
20182018
19-1

TABLE 19.2 Index Numbers of Total Agricultural and Food Production in Selected Continents of the World: 2007 to 2016
Countries 2007 2008 2009 2011 2015 2016
A. Total Agricultural Production
World 105 109 110 113 117 118 122 125 r 126 127
Africa 103 109 111 117 118 123 127 129 131 130
Americas 106 109 107 111 112 118 118 121 r 122 124
Asia 109 113 115 118 r 124 127 130 r 132 134 136
Europe 97 103 103 100 r 105 100 106 r 109 r 109 110
Oceania 98 102 103 98 r 108 114 r 114 110 r 111 109B. Food Production
World 105 110 111 113 117 118 123 r 125 r 126 128
Africa 103 110 111 118 119 124 127 r 130 r 132 131
Americas 106 109 109 112 113 120 119 r 122 r 123 125
Asia 109 113 115 119 124 127 r 131 r 132 134 136
Europe 97 103 103 101 r 105 101 r 106 110 r 109 111
Oceania 99 104 104 100 r 108 113 r 113 r 111 111 109
Note: Index base: 2004 -2006 = 100
Source: United Nations, Statistical Yearbook, 57 th , 59 th to 61 st issue
2010 2012 2013 2014
19-2

ASEAN
Brunei DarussalamCambodia r
Indonesia r
Lao PDR r
Malaysia r
Myanmar r r
Philippines r
Singapore r
Thailand r
Viet Nam r r r
Other Asian countries
Bangladesh r r
China 1 r r r
Republic of Korea r r
1 For statistical purposes, the data for China do not include those for the Hong Kong Special Administrative Region
Source : United Nations, Statistical Yearbook, 61 st issue
938,821 119,000 16,000 208,3219,748 1,465 215 6,184
13,017 7,764 830 1,429
51,089 16,810 4,500 16,39931,007 6,998 4,070 14,773
29,817 5,590 5,350 8,04071 1 -0 16
32,855 954 6,600 22,19565,308 10,879 1,550 29,041
181,157 23,500 22,500 91,01023,080 1,525 169 18,761
Arable Land Permanent Crops
527 5 6
(Hong Kong SAR), Macao Special Administrative Region (Macao SAR) and Taiwan Province of China.
TABLE 19.3 Land Use in Selected Asian Countries As of 2015
CountriesLand Use, (thousand hectares)
Forest Cover
38017,652 3,800 155 9,457
Total Land
19-2
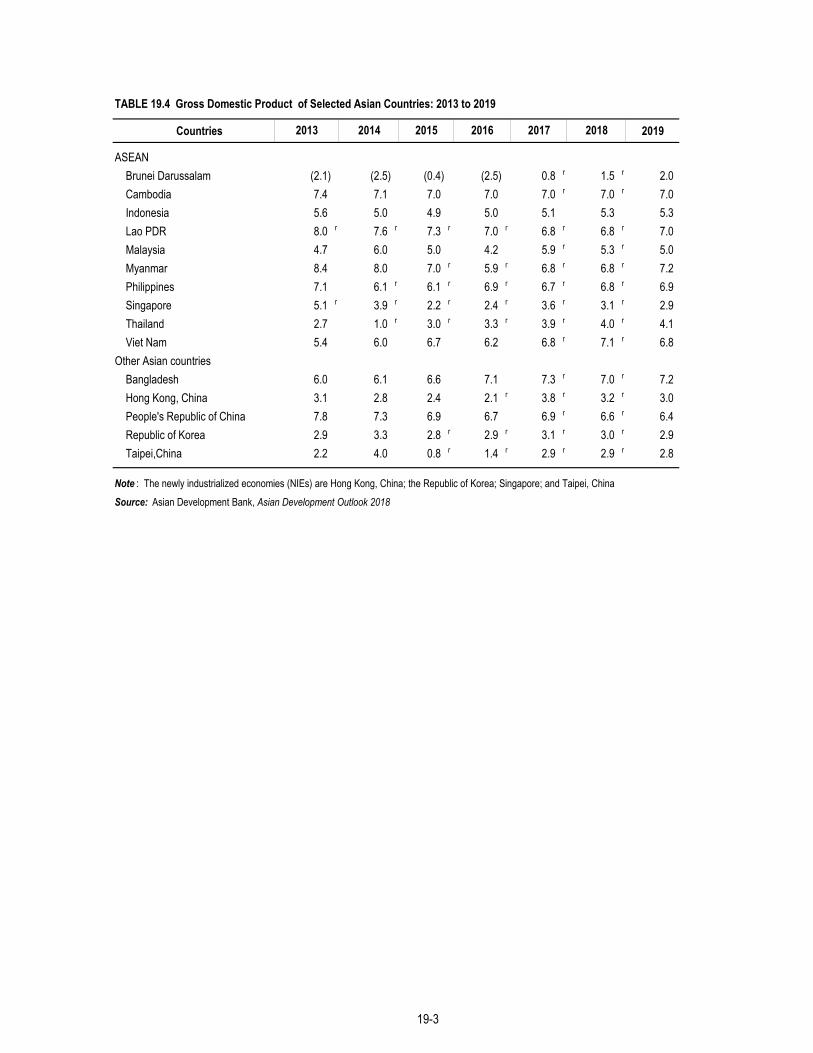
TABLE 19.4 Gross Domestic Product of Selected Asian Countries: 2013 to 2019
Countries 2019
ASEANBrunei Darussalam (2.1) (2.5) (0.4) (2.5) 0.8 r 1.5 r 2.0Cambodia 7.4 7.1 7.0 7.0 7.0 r 7.0 r 7.0Indonesia 5.6 5.0 4.9 5.0 5.1 5.3 5.3Lao PDR 8.0 r 7.6 r 7.3 r 7.0 r 6.8 r 6.8 r 7.0Malaysia 4.7 6.0 5.0 4.2 5.9 r 5.3 r 5.0Myanmar 8.4 8.0 7.0 r 5.9 r 6.8 r 6.8 r 7.2Philippines 7.1 6.1 r 6.1 r 6.9 r 6.7 r 6.8 r 6.9Singapore 5.1 r 3.9 r 2.2 r 2.4 r 3.6 r 3.1 r 2.9Thailand 2.7 1.0 r 3.0 r 3.3 r 3.9 r 4.0 r 4.1Viet Nam 5.4 6.0 6.7 6.2 6.8 r 7.1 r 6.8
Other Asian countriesBangladesh 6.0 6.1 6.6 7.1 7.3 r 7.0 r 7.2Hong Kong, China 3.1 2.8 2.4 2.1 r 3.8 r 3.2 r 3.0People's Republic of China 7.8 7.3 6.9 6.7 6.9 r 6.6 r 6.4Republic of Korea 2.9 3.3 2.8 r 2.9 r 3.1 r 3.0 r 2.9Taipei,China 2.2 4.0 0.8 r 1.4 r 2.9 r 2.9 r 2.8
Note : The newly industrialized economies (NIEs) are Hong Kong, China; the Republic of Korea; Singapore; and Taipei, ChinaSource: Asian Development Bank, Asian Development Outlook 2018
201820172013 2014 2015 2016
19-3

TABLE 19.5 Per Capita Gross Domestic Product of Selected Asian Countries: 2013 to 2019 (Growth rate: percent per year)
Countries 2013 2014 2015 2016 2017 2018 2019
ASEANBrunei Darussalam (3.5) r (4.0) r (1.8) r (3.9) r (0.6) r 0.3 r 0.8Cambodia 5.6 r 5.4 r 5.3 r 5.3 r 5.3 r 5.4 r 5.5Indonesia 3.1 r 3.7 r 4.5 r 3.7 3.8 r 4.1 r 4.0Lao PDR 6.5 6.1 r 5.7 r 5.5 r 5.3 r 5.3 r 5.5Malaysia 2.7 r 3.6 3.0 r 2.7 r 4.5 r 3.5 r 3.2Myanmar 7.5 r 10.1 6.1 r 4.9 r 5.9 r 5.9 r 6.3Philippines 5.2 r 4.4 4.9 r 4.6 r 5.0 r 5.1 r 5.2Singapore 3.4 r 2.5 r 1.0 r 1.1 r 3.5 r 1.9 r 2.0Thailand 2.2 r 0.5 r 2.1 r 3.0 r 3.4 r 3.5 r 3.6Viet Nam 4.3 r 4.9 5.5 5.1 5.8 r 6.1 r 5.8
Other Asian countriesBangladesh 4.6 r 4.6 5.1 5.7 6.0 r 5.7 r 5.8 Hong Kong, China 2.7 r 2.0 1.5 1.5 r 3.0 r 2.4 r 2.3 People's Republic of China 7.2 r 6.8 6.4 6.1 r 6.3 r 6.1 r 5.9 Republic of Korea 2.4 r 2.7 2.2 r 2.5 r 2.7 r 2.6 r 2.6
Taipei,China 1.8 r 3.8 r 0.5 r 1.2 r 2.7 r 2.9 r 2.7
Note : The newly industrialized economies (NIEs) are Hong Kong, China; the Republic of Korea; Singapore, and Taipei; China.
Source : Asian Development Bank, Asian Development Outlook 2018
19-3

TABLE 19.6 Gross Domestic Capital Formation of Selected Asian Countries: 2005, 2010 and 2014 to 2017 (Percentage of GDP)
Countries 2005 2010 2014 2015 2016 2017
ASEANBrunei Darussalam 11.4 23.7 27.5 35.2 34.6 34.8Cambodia 18.5 17.4 22.0 22.4 ... 22.9Indonesia 25.1 32.9 34.7 34.6 34.3 33.4Lao PDR … … ... … ... …Malaysia 22.4 23.4 25.0 25.1 26.1 25.5Myanmar 13.2 23.2 35.3 34.9 34.4 31.4Philippines 21.6 20.5 20.9 20.6 24.3 25.1Singapore 21.4 28.2 r 27.6 26.3 25.3 27.6Thailand 30.4 25.4 24.1 24.1 22.0 22.8Viet Nam 33.8 35.7 26.8 27.7 26.6 26.6
Other Asian countriesBangladesh 24.5 26.2 28.9 29.7 29.7 30.5Hong Kong, China 21.1 23.9 21.7 21.9 21.9 22.3People's Republic of China 41.4 r 47.6 r 44.9 44.3 44.3 43.6Republic of Korea 32.2 32.0 28.5 29.2 29.2 31.1Taipei,China 24.5 25.0 20.8 20.8 20.8 20.3
Source : Asian Development Bank, Key Indicators for Asia and the Pacific 2017 and 2018 issues
19-4

TABLE 19.7 Gross Domestic Savings of Selected Asian Countries: 2010 to 2017 (Percent of GDP)
Countries 2010 2011 2012 2013 2014 2015 2016 2017
ASEANBrunei Darussalam 39.4 42.5 34.9 25.0 35.7 r 19.9 ... …Cambodia 12.4 11.1 16.0 r 17.9 r 19.4 r 19.8 r 20.4 23Indonesia 34.8 35.5 34.4 33.7 33.4 32.9 r 32.7 r 33.6Lao PDR … ... ... ... ... … ... …Malaysia 39.3 38.8 36.5 34.5 34.3 32.8 r 32.6 r 32.5Myanmar 32.7 37.0 36.6 33.8 32.6 31.8 26.7 …Philippines 18.7 16.8 14.9 15.8 17.0 15.2 15.1 r 15.2Singapore 54.3 54.2 53.3 r 53.1 r 53.4 52.9 r 53.2 r 51.9Thailand 32.0 r 28.5 30.0 r 31.3 r 31.8 r 34.9 r 36.9 r 37.4Viet Nam 27.4 27.7 29.6 28.4 27.9 25.7 24.9 25.2
Other Asian countriesBangladesh 20.8 20.6 21.2 22.0 22.1 22.2 25.0 25.3Hong Kong, China 29.8 28.0 26.4 24.6 24.0 23.9 r 23.8 r 23.2People's Republic of China 51.3 r 49.4 49.9 r 49.8 r 49.5 r 48.9 r 46.6 r 45.5Republic of Korea 35.2 34.5 33.8 34.1 34.5 35.7 r 36.2 r 36.6Taipei,China 31.7 30.4 28.8 30.7 32.2 r 33.5 r 32.9 r 32.9
Source : Asian Development Bank, Key Indicators for Asia and the Pacific 2017 and 2018 issues
19-4

TABLE 19.8 Inflation Rate of Selected Asian Countries: 2013 to 2019 (Percent per year)
Countries 2014 2015 2017 2018 2019
ASEANBrunei Darussalam 0.4 (0.2) (0.4) -0.7 -0.2 r 0.1 0.1Cambodia 3.0 3.9 1.2 3.0 2.9 r 3.2 r 3.5Indonesia 6.4 6.4 6.4 3.5 3.8 r 3.8 r 4.0Lao PDR 6.4 4.1 r 1.3 1.6 0.8 r 2.0 r 2.5Malaysia 2.1 3.1 2.1 2.1 3.8 r 2.6 r 1.8Myanmar 5.7 5.1 r 10.0 r 6.8 r 5.3 r 6.2 r 6.0Philippines 2.9 4.1 1.4 1.8 3.2 r 4.0 r 3.9Singapore 2.4 1.0 (0.5) (0.5) 0.6 r 0.9 r 1.4Thailand 2.2 1.9 (0.9) 0.2 0.7 r 1.2 r 1.3Viet Nam 6.6 4.1 0.6 2.7 3.5 r 3.7 r 4.0
Other Asian countriesBangladesh 6.8 7.3 6.4 5.9 5.4 r 6.1 r 6.3Hong Kong, China 4.3 4.4 3.0 2.4 1.5 r 2.2 r 2.1People's Republic of China 2.6 2.0 1.4 2.0 1.6 r 2.4 r 2.3Republic of Korea 1.3 1.3 0.7 1.0 1.9 r 1.9 r 2.0Taipei,China 0.8 1.2 (0.3) 1.4 0.6 r 1.1 r 1.1
Note: The newly industrialized economies (NIEs) are Hongkong, China; the Republic of Korea; Singapore; and Taipei, China.
Source: Asian Development Bank, Asian Development Outlook 2018
2013 2016
19-5

TABLE 19.9 Mechandise Exports of Selected Asian Countries: 2013 to 2019 (Growth rate: percent per year)
Countries 2019
ASEANBrunei Darussalam (8.1) (6.1) (44.9) (16.4) r 16.0 r 5.0 r 5.0Cambodia 22.4 r 17.0 r 17.1 r 10.1 r 9.3 r 12.0 r 13.0Indonesia (2.8) (3.7) (14.9) (3.1) 16.9 r 5.8 r 5.2Lao PDR 5.4 r 22.8 r (12.9) r 17.0 r 16.1 r 4.3 r 10.2Malaysia (3.1) 2.5 (15.9) r (5.2) r 13.7 r 5.0 r 5.6Myanmar 8.9 (7.8) r (8.5) r (0.3) r 15.0 r 11.0 r 12.0Philippines (4.0) 11.9 (13.3) (1.1) r 12.8 r 6.8 r 6.3Singapore 1.1 r (1.7) r (12.7) r (5.5) r 9.3 r 5.8 r 6.5Thailand (0.1) (0.4) r (5.6) 0.1 r 9.7 r 9.0 r 10.0Viet Nam 15.3 13.8 7.9 8.9 r 21.1 r 15.0 r 12.0
Other Asian countriesBangladesh 10.7 12.1 3.1 8.9 1.7 r 7.0 r 9.0Hong Kong, China 8.0 1.6 (2.4) 0.0 r 7.2 r 7.0 r 7.2People's Republic of China 8.9 4.4 (4.5) (7.2) 11.4 r 5.0 r 4.5Republic of Korea 2.4 (0.8) (11.4) (5.7) 12.8 r 9.0 r 8.0Taipei, China (1.6) (0.8) (11.1) (8.0) r 12.9 r 10.2 r 9.2
Source: Asian Development Bank, Asian Development Outlook 2018
2017 2018201520142013 2016
19-5
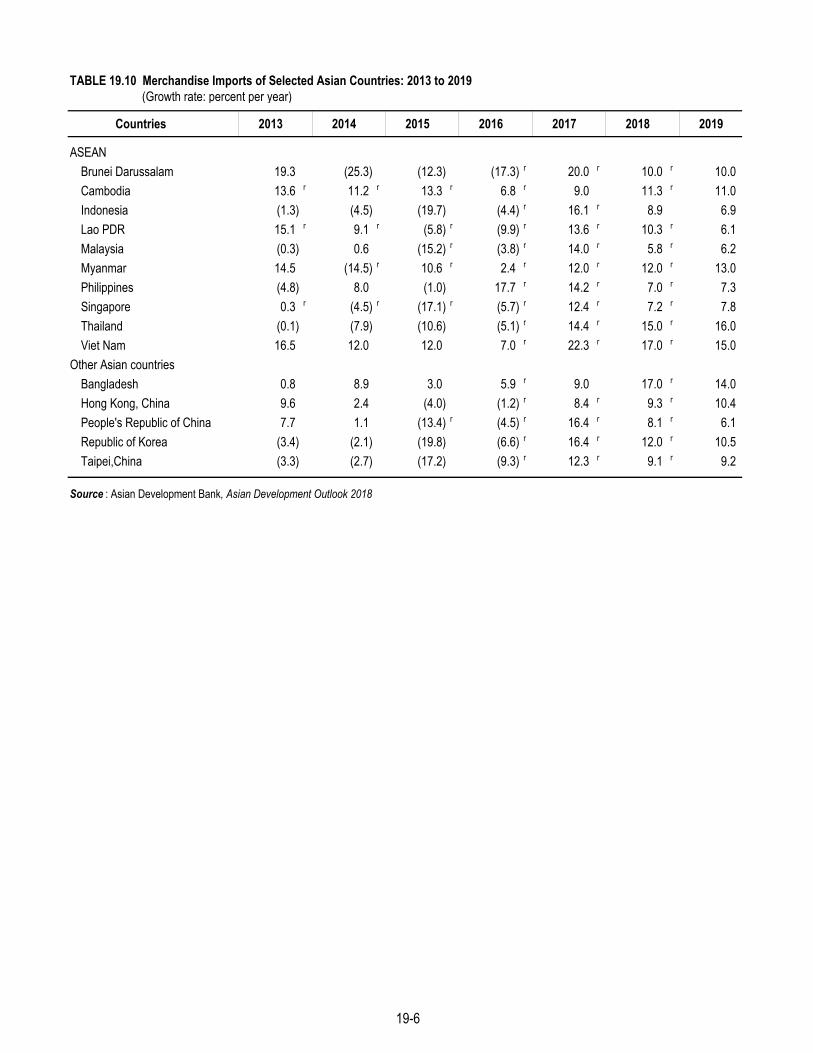
TABLE 19.10 Merchandise Imports of Selected Asian Countries: 2013 to 2019 (Growth rate: percent per year)
Countries 2013 2014 2015 2016 2017 2018 2019
ASEANBrunei Darussalam 19.3 (25.3) (12.3) (17.3) r 20.0 r 10.0 r 10.0Cambodia 13.6 r 11.2 r 13.3 r 6.8 r 9.0 11.3 r 11.0Indonesia (1.3) (4.5) (19.7) (4.4) r 16.1 r 8.9 6.9Lao PDR 15.1 r 9.1 r (5.8) r (9.9) r 13.6 r 10.3 r 6.1Malaysia (0.3) 0.6 (15.2) r (3.8) r 14.0 r 5.8 r 6.2Myanmar 14.5 (14.5) r 10.6 r 2.4 r 12.0 r 12.0 r 13.0Philippines (4.8) 8.0 (1.0) 17.7 r 14.2 r 7.0 r 7.3Singapore 0.3 r (4.5) r (17.1) r (5.7) r 12.4 r 7.2 r 7.8Thailand (0.1) (7.9) (10.6) (5.1) r 14.4 r 15.0 r 16.0Viet Nam 16.5 12.0 12.0 7.0 r 22.3 r 17.0 r 15.0
Other Asian countriesBangladesh 0.8 8.9 3.0 5.9 r 9.0 17.0 r 14.0Hong Kong, China 9.6 2.4 (4.0) (1.2) r 8.4 r 9.3 r 10.4People's Republic of China 7.7 1.1 (13.4) r (4.5) r 16.4 r 8.1 r 6.1Republic of Korea (3.4) (2.1) (19.8) (6.6) r 16.4 r 12.0 r 10.5Taipei,China (3.3) (2.7) (17.2) (9.3) r 12.3 r 9.1 r 9.2
Source : Asian Development Bank, Asian Development Outlook 2018
19-6

TABLE 19.11 Current Account Balance of Selected Asian Countries: 2013 to 2019 (Percent of GDP)
Countries 2013 2014 2015 2016 2017 2018 2019
ASEANBrunei Darussalam 20.9 30.7 16.7 r 15.5 r 19.0 r 14.0 r 14.0Cambodia (16.8) r (13.6) r (11.9) r (11.2) r (10.9) r (11.1) r (10.8)Indonesia (3.2) (3.1) (2.0) (1.8) (1.7) (2.2) r (2.2)Lao PDR (28.4) r (20.0) r (18.0) r (14.1) r (13.0) r (14.9) r (13.7)Malaysia 3.5 4.4 3.0 2.4 r 3.0 r 2.4 r 2.1Myanmar (4.9) (2.2) r (5.1) r (3.9) r (5.0) r (5.4) r (5.5)Philippines 4.2 3.8 2.5 (0.4) r (0.8) r (1.0) r (1.4)Singapore 16.5 r 18.7 r 18.6 r 19.0 18.8 r 19.0 r 19.0Thailand (1.2) 3.7 8.0 r 11.7 r 10.8 r 8.0 r 7.5Viet Nam 4.5 4.9 0.5 3.0 r 2.9 r 2.5 2.0
Other Asian countriesBangladesh 1.6 0.8 1.8 r 1.9 r (0.6) r (2.2) r (1.9)Hong Kong, China 1.5 1.4 3.3 4.0 r 4.2 r 3.9 r 3.5People's Republic of China 1.5 2.3 r 2.7 r 1.8 r 1.4 r 1.3 r 1.2Republic of Korea 6.2 6.0 7.7 7.0 r 5.1 r 4.9 r 4.8Taipei,China 10.0 11.5 r 14.3 13.7 r 14.7 r 10.0 r 9.0
Source: Asian Development Bank, Asian Development Outlook 2018
19-6

TABLE 19.12 Rates of Discounts of Central Banks in Selected Asian Countries: 2011 to 2016 (Percent per annum, end of period)
Countries 2011 2013 2014 2015 2016
ASEANBrunei Darussalam ... ... ... ... ... ...Cambodia ... ... ... ... ... ...Indonesia 1 6.0 … … … … …Lao PDR ... … … … … …Malaysia 3.0 … … … … …Myanmar 1 12.0 10.0 10.0 10.0 10.0 10.0Philippines 4.4 r 3.9 r 3.6 4.1 4.1 3.9Singapore 0.2 … … … … …Thailand 3.8 3.3 2.8 2.5 2.0 2.0Viet Nam 2 15.0 … … … … …
Other Asian countriesBangladesh 5.0 5.0 … … … …China 1 3.3 3.3 3.3 3.3 2.9 2.9Hong Kong, China 0.5 0.5 0.5 0.5 0.8 1.0Republic of Korea 1.5 1.3 1.0 1.0 0.8 0.5
1 Central bank rate2 Reference rate
Source : United Nations, Statistical Yearbook, 57th issue; and United Nations Statistics Division (Monthly Bulletin of Statistics Online)
2012
19-7
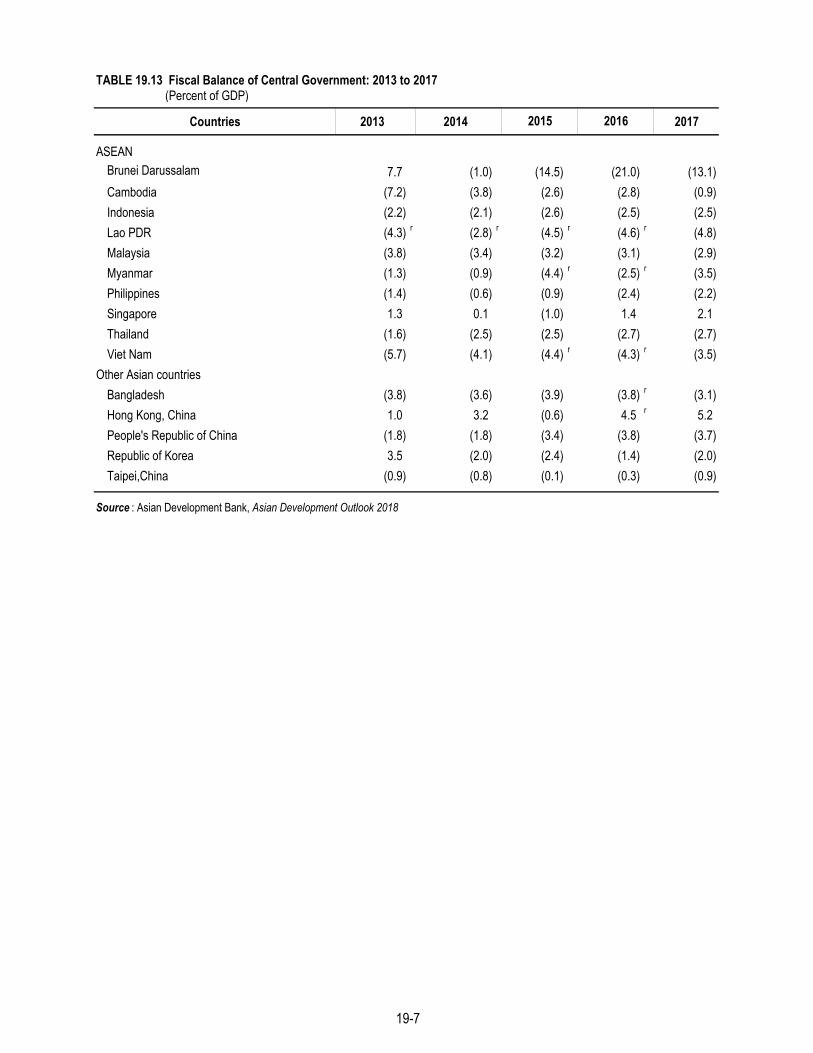
TABLE 19.13 Fiscal Balance of Central Government: 2013 to 2017 (Percent of GDP)
Countries 2013 2014 2017
ASEANBrunei Darussalam 7.7 (1.0) (14.5) (21.0) (13.1)Cambodia (7.2) (3.8) (2.6) (2.8) (0.9)Indonesia (2.2) (2.1) (2.6) (2.5) (2.5)Lao PDR (4.3) r (2.8) r (4.5) r (4.6) r (4.8)Malaysia (3.8) (3.4) (3.2) (3.1) (2.9)Myanmar (1.3) (0.9) (4.4) r (2.5) r (3.5)Philippines (1.4) (0.6) (0.9) (2.4) (2.2)Singapore 1.3 0.1 (1.0) 1.4 2.1Thailand (1.6) (2.5) (2.5) (2.7) (2.7)Viet Nam (5.7) (4.1) (4.4) r (4.3) r (3.5)
Other Asian countriesBangladesh (3.8) (3.6) (3.9) (3.8) r (3.1)Hong Kong, China 1.0 3.2 (0.6) 4.5 r 5.2People's Republic of China (1.8) (1.8) (3.4) (3.8) (3.7)Republic of Korea 3.5 (2.0) (2.4) (1.4) (2.0)Taipei,China (0.9) (0.8) (0.1) (0.3) (0.9)
Source : Asian Development Bank, Asian Development Outlook 2018
2015 2016
19-7

TABLE 19.14 Foreign Direct Investment (Net Inflows): 2011 to 2017 (In US$ million)
Countries 2017
ASEANBrunei Darussalam 691 r 865 776 568 171 r (151) ...Cambodia 795 1,835 r 1,872 r 1,720 r 1,701 2,287 ...Indonesia 20,565 21,201 23,282 25,121 r 19,779 r 4,542 r 22,078Lao PDR 301 294 427 913 1,421 r 997 ...Malaysia 15,119 8,896 11,296 10,619 9,857 r 13,470 9,512Myanmar 2,520 1,334 2,255 2,175 r 4,084 r 3,278 4,685Philippines 2,007 3,215 3,737 5,740 r 5,639 r 8,280 r 10,049Singapore 48,329 r 56,189 r 64,482 r 69,543 r 70,595 r 74,253 r 63,633Thailand 2,468 12,899 r 15,936 r 4,975 r 8,928 r 3,063 9,101Viet Nam 7,430 8,368 8,900 9,200 11,800 12,600 14,100
Other Asian countriesBangladesh 1,265 r 1,584 2,603 2,539 2,831 r 2,327 r 2,151Hong Kong, China 96,135 74,887 76,857 129,847 181,047 r 133,259 r 122,401People's Republic of China 280,072 r 241,214 290,928 268,097 242,489 r 174,750 r 168,224Republic of Korea 9,773 9,496 12,767 9,274 4,104 r 12,104 r 17,053Taipei,China (1,957) 3,207 3,598 2,828 r 2,391 r 9,261 r 3,287
Source: Asian Development Bank, Key Indicators for Asia and the Pacific 2017 and 2018
20162011 2012 2013 2014 2015
19-8

TABLE 19.15 Exchange Rates in Selected Asian Countries: 2015 to 2017 (Annual Average, National Currency per US Dollar)
Country/Monetary Unit Currency 2017
ASEANBrunei Darussalam Brunei dollar 1.4 1.4 1.4Cambodia Riel 4,063.0 r 4,051.3 4,045.0Indonesia Rupiah 13,389.4 13,308.7 13,380.8Lao PDR Kip 8,113.0 r 8,130.0 8,235.0Malaysia Ringgit 3.9 4.1 4.3Myanmar Kyat 1,218.9 r 1,259.2 1,357.4Philippines Peso 45.5 47.5 50.4Singapore Singapore dollar 1.4 1.4 1.4Thailand Baht 34.3 35.3 33.9Viet Nam Dong 21,675.6 21,931.0 22,370.3
Other Asian countriesBangladesh Taka 77.7 78.3 79.1China, People's Rep. of Yuan 6.2 6.7 6.7China, Hong Kong Hong Kong dollar 7.8 7.8 7.8Republic of Korea Won 1,133.1 1,163.3 1,122.3
Source : Asian Development Bank, Asian Development Outlook 2018
2015 2016
19-8
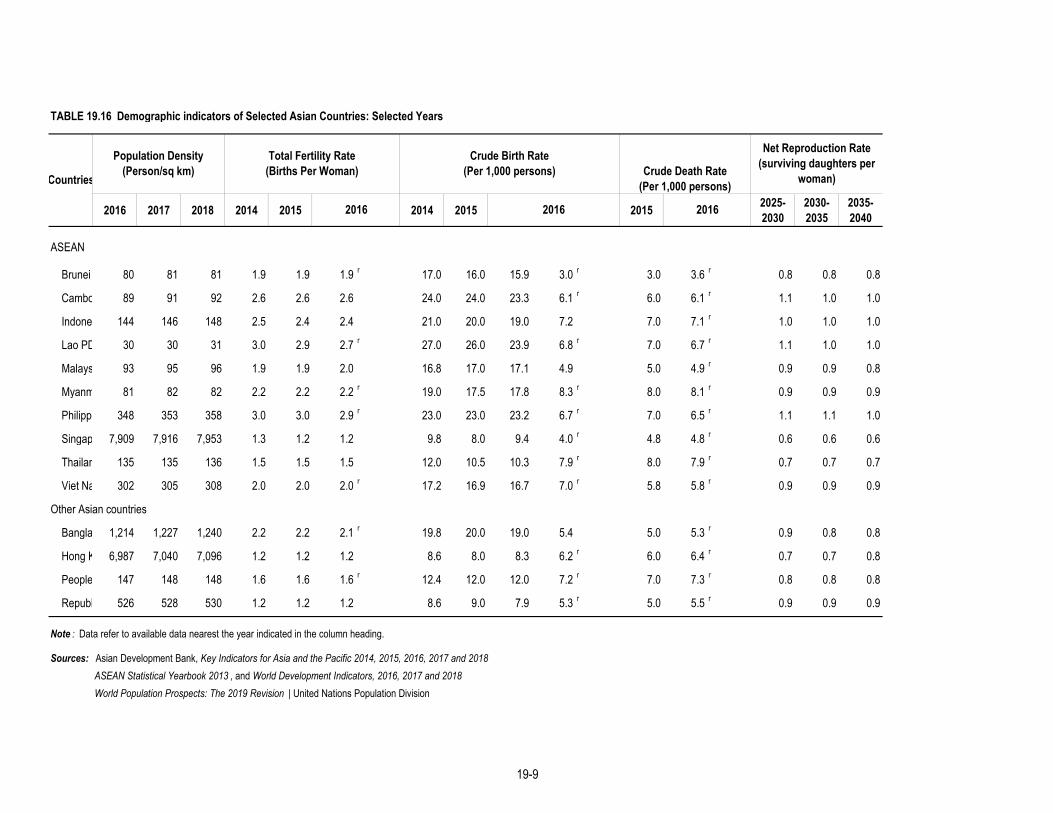
TABLE 19.16 Demographic indicators of Selected Asian Countries: Selected Years
2016 2017 2018 2014 2015 2014 2015 2015 2025-2030
2030-2035
2035-2040
ASEAN
Brunei 80 81 81 1.9 1.9 1.9 r 17.0 16.0 15.9 3.0 r 3.0 3.6 r 0.8 0.8 0.8
Cambo 89 91 92 2.6 2.6 2.6 24.0 24.0 23.3 6.1 r 6.0 6.1 r 1.1 1.0 1.0
Indone 144 146 148 2.5 2.4 2.4 21.0 20.0 19.0 7.2 7.0 7.1 r 1.0 1.0 1.0
Lao PD 30 30 31 3.0 2.9 2.7 r 27.0 26.0 23.9 6.8 r 7.0 6.7 r 1.1 1.0 1.0
Malays 93 95 96 1.9 1.9 2.0 16.8 17.0 17.1 4.9 5.0 4.9 r 0.9 0.9 0.8
Myanm 81 82 82 2.2 2.2 2.2 r 19.0 17.5 17.8 8.3 r 8.0 8.1 r 0.9 0.9 0.9
Philipp 348 353 358 3.0 3.0 2.9 r 23.0 23.0 23.2 6.7 r 7.0 6.5 r 1.1 1.1 1.0
Singap 7,909 7,916 7,953 1.3 1.2 1.2 9.8 8.0 9.4 4.0 r 4.8 4.8 r 0.6 0.6 0.6
Thailan 135 135 136 1.5 1.5 1.5 12.0 10.5 10.3 7.9 r 8.0 7.9 r 0.7 0.7 0.7
Viet Na 302 305 308 2.0 2.0 2.0 r 17.2 16.9 16.7 7.0 r 5.8 5.8 r 0.9 0.9 0.9
Other Asian countries
Bangla 1,214 1,227 1,240 2.2 2.2 2.1 r 19.8 20.0 19.0 5.4 5.0 5.3 r 0.9 0.8 0.8
Hong K 6,987 7,040 7,096 1.2 1.2 1.2 8.6 8.0 8.3 6.2 r 6.0 6.4 r 0.7 0.7 0.8
People 147 148 148 1.6 1.6 1.6 r 12.4 12.0 12.0 7.2 r 7.0 7.3 r 0.8 0.8 0.8
Republ 526 528 530 1.2 1.2 1.2 8.6 9.0 7.9 5.3 r 5.0 5.5 r 0.9 0.9 0.9
Sources: Asian Development Bank, Key Indicators for Asia and the Pacific 2014, 2015, 2016, 2017 and 2018ASEAN Statistical Yearbook 2013 , and World Development Indicators, 2016, 2017 and 2018World Population Prospects: The 2019 Revision | United Nations Population Division
Crude Birth Rate(Per 1,000 persons) Crude Death Rate
(Per 1,000 persons)
Net Reproduction Rate (surviving daughters per
woman)
Note : Data refer to available data nearest the year indicated in the column heading.
Countries
Population Density(Person/sq km)
20162016
Total Fertility Rate(Births Per Woman)
2016
19-9
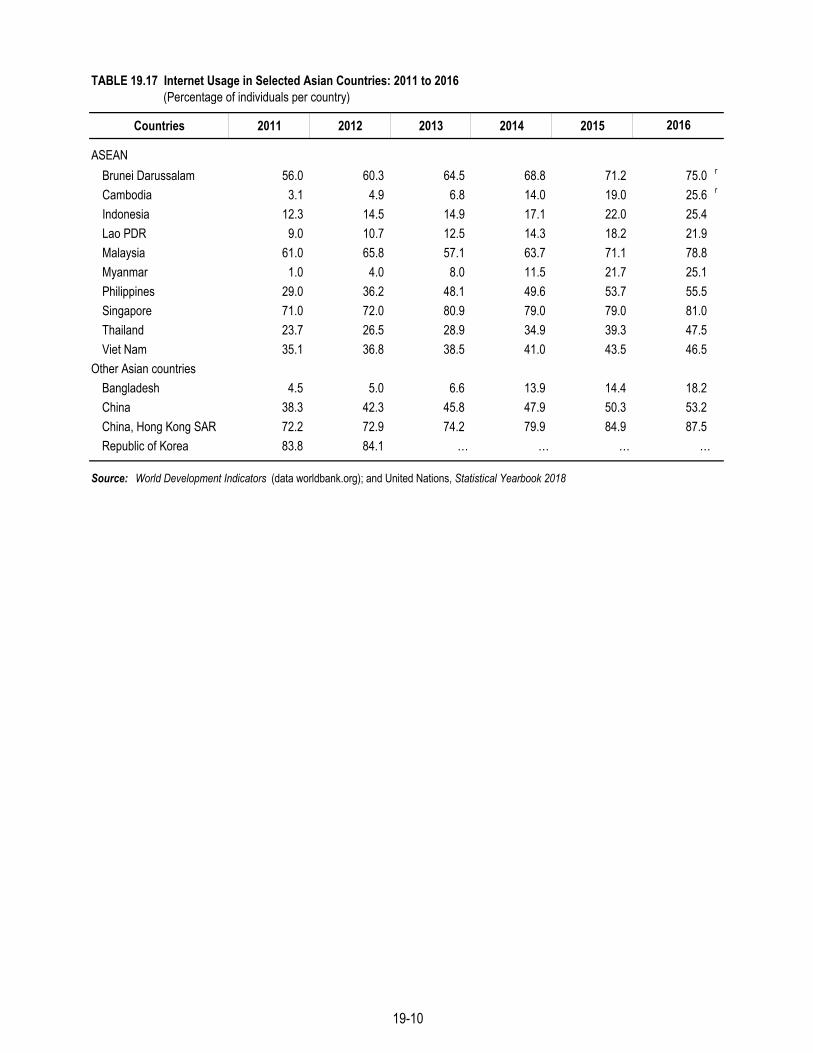
TABLE 19.17 Internet Usage in Selected Asian Countries: 2011 to 2016 (Percentage of individuals per country)
Countries 2011 2012 2013 2014 2015
ASEANBrunei Darussalam 56.0 60.3 64.5 68.8 71.2 75.0 r
Cambodia 3.1 4.9 6.8 14.0 19.0 25.6 r
Indonesia 12.3 14.5 14.9 17.1 22.0 25.4Lao PDR 9.0 10.7 12.5 14.3 18.2 21.9Malaysia 61.0 65.8 57.1 63.7 71.1 78.8Myanmar 1.0 4.0 8.0 11.5 21.7 25.1Philippines 29.0 36.2 48.1 49.6 53.7 55.5Singapore 71.0 72.0 80.9 79.0 79.0 81.0Thailand 23.7 26.5 28.9 34.9 39.3 47.5Viet Nam 35.1 36.8 38.5 41.0 43.5 46.5
Other Asian countriesBangladesh 4.5 5.0 6.6 13.9 14.4 18.2China 38.3 42.3 45.8 47.9 50.3 53.2China, Hong Kong SAR 72.2 72.9 74.2 79.9 84.9 87.5Republic of Korea 83.8 84.1 … … … …
Source: World Development Indicators (data worldbank.org); and United Nations, Statistical Yearbook 2018
2016
19-10
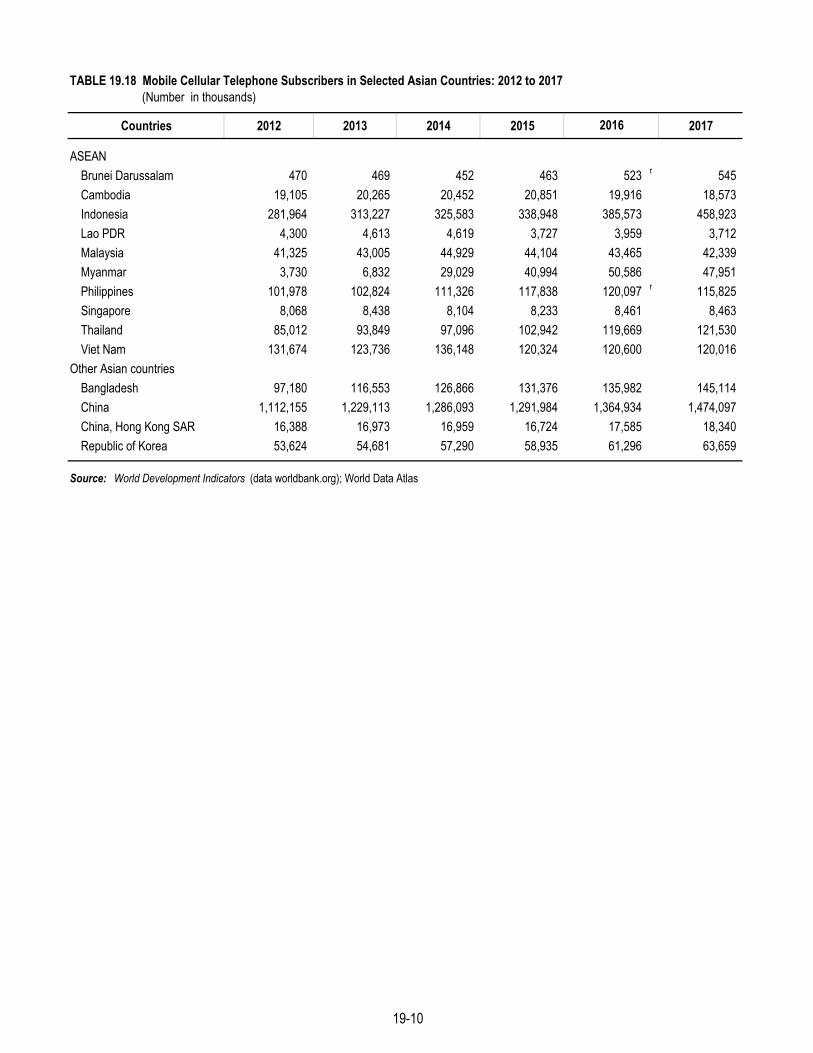
TABLE 19.18 Mobile Cellular Telephone Subscribers in Selected Asian Countries: 2012 to 2017 (Number in thousands)
Countries 2012 2013 2014 2015 2017
ASEANBrunei Darussalam 470 469 452 463 523 r 545Cambodia 19,105 20,265 20,452 20,851 19,916 18,573Indonesia 281,964 313,227 325,583 338,948 385,573 458,923Lao PDR 4,300 4,613 4,619 3,727 3,959 3,712Malaysia 41,325 43,005 44,929 44,104 43,465 42,339Myanmar 3,730 6,832 29,029 40,994 50,586 47,951Philippines 101,978 102,824 111,326 117,838 120,097 r 115,825Singapore 8,068 8,438 8,104 8,233 8,461 8,463Thailand 85,012 93,849 97,096 102,942 119,669 121,530Viet Nam 131,674 123,736 136,148 120,324 120,600 120,016
Other Asian countriesBangladesh 97,180 116,553 126,866 131,376 135,982 145,114China 1,112,155 1,229,113 1,286,093 1,291,984 1,364,934 1,474,097China, Hong Kong SAR 16,388 16,973 16,959 16,724 17,585 18,340Republic of Korea 53,624 54,681 57,290 58,935 61,296 63,659
Source: World Development Indicators (data worldbank.org); World Data Atlas
2016
19-10

TABLE 19.19 Fixed Broadband Subscriptions in Selected Asian Countries: 2012 to 2017
Countries Item 2012 2013 2014 2017
Number ('000) 20 28 30 34 36 41Per 100 inhabitants 5.0 6.8 7.3 8.2 8.5 9.6Number ('000) 30 33 66 84 98 134Per 100 inhabitants 0.2 0.2 0.4 0.5 0.6 0.8Number ('000) 2,983 3,252 3,400 3,983 5,227 6,216Per 100 inhabitants 1.2 1.3 1.3 1.5 2.0 2.4Number ('000) 8 9 11 12 r 24 27Per 100 inhabitants 0.1 0.1 0.2 0.2 r 0.4 0.4Number ('000) 2,921 2,939 3,061 3,064 r 2,719 2,688Per 100 inhabitants 10.0 9.9 10.1 10.0 r 8.7 8.5Number ('000) ... ... ... 33 90 112Per 100 inhabitants ... ... ... 0.1 0.2 0.2Number ('000) 2,147 2,573 2,900 2,900 r 2,985 r 3,399Per 100 inhabitants 2.2 2.6 2.9 2.9 r 2.9 3.2Number ('000) 1,433 1,493 1,474 1,486 1,461 1,476Per 100 inhabitants 27.2 27.9 27.1 26.8 26.0 25.8Number ('000) 4,519 5,192 5,440 6,229 7,219 8,208Per 100 inhabitants 6.7 7.6 8.0 9.1 10.5 11.9Number ('000) 4,775 5,153 6,001 7,658 9,089 11,270Per 100 inhabitants 5.3 5.6 6.5 8.2 9.6 11.8
Number ('000) 600 1,525 3,093 4,893 6,592 7,301Per 100 inhabitants 0.4 1.0 1.9 3.0 4.0 4.4Number ('000) 175,183 188,909 200,483 277,046 322,597 394,190Per 100 inhabitants 12.7 13.7 14.4 19.8 23.0 28.0Number ('000) 2,255 2,235 2,281 2,348 2,626 2,658Per 100 inhabitants 31.7 31.3 31.7 32.4 36.0 36.1Number ('000) … … … … … …Per 100 inhabitants 36.5 37.3 38.1 39.6 40.5 41.6
Source : World Development Indicators (data worldbank.org)
Republic of Korea
Myanmar
Philippines
Singapore
Thailand
Viet Nam
Other Asian countries
China, Hong Kong SAR
2015 2016
Bangladesh
China
Malaysia
ASEAN
Brunei Darussalam
Cambodia
Indonesia
Lao PDR
19-11

TABLE 19.20 Carbon Dioxide (CO2) Emission Estimates in Selected Asian Countries from Fossil Fuel Combustion, Cement Production and Gas Flared: 2007 to 2014
(Thousand metric tons of carbon dioxide)
Countries 2007 2008 2009 2010 2011 2012 2013 2014ASEAN
Brunei Darussalam 9,054 10,029 8,573 8,203 9,696 9,652 7,785 9,109Cambodia 3,484 3,975 4,133 5,013 5,207 5,456 5,574 6,685Indonesia 375,545 412,387 453,106 428,760 573,379 599,540 479,365 464,176Lao PDR 939 979 986 1,639 1,624 2,160 2,175 1,955Malaysia 188,124 208,238 203,951 218,476 220,405 218,707 236,510 242,821Myanmar 12,636 9,028 10,389 12,515 14,298 12,934 12,603 21,632Philippines 69,669 75,944 74,785 84,920 85,584 91,319 98,239 105,654Singapore 18,196 23,487 23,832 43,945 38,327 54,627 50,557 56,373Thailand 265,062 264,754 279,403 288,589 290,342 305,223 303,118 316,213Viet Nam 113,930 127,465 140,769 147,340 161,887 158,231 152,624 166,911
Other Asian countriesBangladesh 46,886 49,582 52,790 59,992 63,571 67,480 68,951 73,190China 6,791,805 7,035,444 7,692,211 8,767,878 9,724,591 10,020,745 10,249,463 10,291,927China, Hong Kong SAR 39,963 38,573 36,996 40,759 43,795 43,447 44,994 46,223Republic of Korea 495,676 507,590 508,862 566,717 589,401 584,080 592,499 587,156
Source: United Nations, Statistical Yearbook, 2012 edition, 57 th issue, 2016 edition, 59 th issue and 2017 edition, 60 th issue
19-12

TABLE 19.21 Numbers of Threatened Animal and Plant Species in Selected Asian Countries: 2018
Countries Total Vertebrates
Invertebrates Plants
ASEANBrunei Darussalam 207 82 9 116 Cambodia 261 145 79 37Indonesia 1,295 572 287 436Lao PDR 224 149 21 54Malaysia 1,257 280 265 712Myanmar 325 187 77 61Philippines 785 302 238 245Singapore 300 67 173 60Thailand 621 255 211 155Viet Nam 661 278 152 231
Other Asian countries Bangladesh 154 125 7 22China a 1,095 431 76 588China, Hong Kong SAR 65 49 8 8Republic of Korea 118 78 8 32
a Does not include those for the Hong Kong Special Administrative Region, Macao Special Administrative Region, and Taiwan Province of China
Source: United Nations, Statistical Yearbook, 2018 edition, 61 st issue
19-12

TABLE 19.22 International Tourist Arrivals in Selected Asian Countries: 2011 to 2017 (In thousands)
Countries 2011 2012 2017
ASEANBrunei Darussalam 242 209 225 201 218 219 259Cambodia 2,882 3,584 4,210 4,503 4,775 5,012 5,602Indonesia 7,650 8,044 8,802 9,435 9,963 r 11,072 ...Lao PDR 1,786 2,140 2,700 r 3,164 3,543 3,315 …Malaysia 24,714 25,033 25,715 27,437 25,721 26,757 25,948Myanmar 391 1,059 2,044 3,081 4,681 2,907 ...Philippines 3,917 4,273 4,681 4,833 5,361 5,967 6,621Singapore 10,390 11,098 11,898 11,864 r 12,052 12,914 r 13,906Thailand 19,230 22,354 26,547 24,810 r 29,923 r 32,588 35,381Viet Nam 6,251 6,848 7,572 7,874 7,944 10,013 12,922
Other Asian countriesBangladesh … 125 148 125 … … …China 57,581 57,725 55,686 55,622 56,886 59,270 60,740Hong Kong, China 22,316 23,770 25,661 27,770 26,686 26,553 27,885Republic of Korea 9,795 11,140 12,176 14,202 13,232 17,242 13,336
Sources : Asian Development Bank, Key Indicators for Asia and the Pacific 2016, 2017 and 2018 issues
2015 20162013 2014
19-13


- the growing field crops, fruits, nuts, seeds, tree nurseries (except those of forest trees), bulb vegetables and flowers, both in the open and under glass; and the production of coffee, tea, cocoa, rubber; and the production of livestock and livestock products, honey rabbits, fur-bearing animals, silkworm, cocoons, etc. Forestry and fishery activities carried on as an ancillary activity on an agricultural holding is also considered as agricultural production.
sector of fisheries that includes the rearing or raising under controlled conditions of aquatic products such as fish, oysters, mussels, sea weeds and other aquatic resources in sea, lakes and rivers. Examples are fishponds, fish pens and fish cages.
sector of fisheries that includes the catching of fish in marine waters with the use of fishing boat of more than three (3) gross tons.
sector of fisheries that includes the catching of fish in marine and inland waters with the use of fishing boat of three (3) gross tons or less, or using gear not requiring the use of boats.
- are economic resources that are controlled by the company/entity and whose cost at the time of acquisition could be objectively measured.
systematically summarizes for a specific period, the economic transaction of an economy’s residents with the rest of the world.
- interest bearing certificates of indebtedness.
divided into two main categories: the capital account and the financial account. The capital account covers all transactions that involve the receipt/payment of capital transfers and acquisition/disposal of non-produced, non-financial assets. The financial account covers all transactions associated with changes of ownership in the foreign financial assets and liabilities of the economy. Such changes include the creation and liquidation of claims on, or by, the rest of the world.
a positive entry represents an increase in foreign liabilities of the commercial banks and or decrease in their foreign assets. Conversely, a negative entry represents an increase in the holdings of foreign assets of commercial banks and/or a net payment of their foreign liabilities.
- any corporation which, in addition to the general powers incident to corporations, shall have all such powers as shall be necessary to carry on the business of commercial banking, by accepting drafts and issuing letters of credits, by discounting and negotiating promissory notes, drafts, bills of exchange, and other evidences of debts, by receiving deposits, by buying and selling foreign exchange and gold or silver bullion, and by lending money against securities consisting of personal property or first mortgage on improved real estates and the insured improvements thereon.
consists of the aggregate balance of goods, services and transfers. This account measures the net transfer of real resources between the domestic economy and the rest of the world.
- all Philippine notes and coins issued or circulating in accordance with the provisions of the Central Bank Act.
- an alternative form of obtaining funds from the public, other than deposits, through the issuance, endorsement, of acceptance of debt instruments for the borrower’s own account, for the purpose of re-lending or purchasing of receivables and their obligations.
otherwise known as current or checking accounts, subject to withdrawal by check and are non-interest bearing. These are sub-divided into demand-deposits of private firms and individuals, banks, the government and Trust Department of Banks.
- consists of money supply, savings and time deposits and deposit substitutes of the monetary system.
- amount reserved for compensation claim against employment-connected injury, sickness, disability or death in the form of adequate cash income benefits, medical or related services and rehabilitation services.
amount determined on an annual basis and reflects the best estimate as to adequacy of reserve against future losses. It is intended to adequately cover anticipated losses from member banks identified to have great probabilities of closure where insurance payments may exceed recovery of assets during liquidation.
- collections derived from the repayment of loans and advances made by the government as well as from other non-recurring sources.
- means by which a government provides financial resources to cover a budget deficit or allocated financial resources arising from a budget surplus.
- evidences of indebtedness of the Republic of the Philippines or its instrumentalities, government-owned and/or controlled corporations, or the Central Bank and must be freely negotiable and regularly serviced.
- contributions of the account of employees whether made by themselves or their employers for social security arrangements.
- amount of money or other resources measured in terms of money placed on activities or other forms of assets for the purpose of earning profits.
include availments of foreign loans with original maturities of more than one year by the public and private non-bank sectors, including loans of the banking sector relent to specific non-bank end-users. These also include medium-and long-term loans contracted by the BSP.
- consists of currency in circulation plus peso demand deposits.
represents the transformation of gold purchased by the Bangko Sentral ng Pilipinas (BSP) from domestic gold producers into financial assets, which eventually become part of its official reserves.
- defined under M.B. Res. No. 404 dated February 14, 1975 as consisting of domestic credits of the Bangko Sentral ng Pilipinas, (net of National Government deposits with the Bangko Sentral ng Pilipinas, Treasury IMF Account and Bangko Sentral ng Pilipinas loans and advances to deposit money banks) and domestic credits of deposit money banks (net of National Government deposits).
- refers to the difference between foreign assets and foreign liabilities of the Bangko Sentral ng Pilipinas and of the deposit money.
- advances by the national government for the servicing of government guaranteed corporate debt during the year, net of repayments on such advance. Includes loans outlays or proceed from program loans relent to government corporations.

- refer to the accounts of the Bangko Sentral ng Pilipinas and deposit money banks which are not classified elsewhere. The net other accounts represent the difference between the miscellaneous liabilities and capital accounts on one hand, and miscellaneous assets, on the other.
- refer to the total quasi-money, marginal deposits and deposit substitutes of local government, semi-government entities and residents with deposit money banks.
is an offsetting account to the overstatement or understatement of the recorded BOP components, either receipts or payments. Since data sources on which BOP entries are based may be incomplete, inaccurate or inconsistent with one another, the account is included to bring the statement into balance. A positive entry denotes the understatement of receipts and/or an overstatement of payments. Conversely, a negative entry denotes an overstatement of receipts and/or understatement of payments.
results from the sum of the current, capital and financial and other BOP accounts. A surplus arises when inflows are greater than outflows while a deficit is incurred when outflows exceed inflows. Overall BOP is also measured by the change in the net international reserves of the BSP.
refers to the total capital provided by the National Government by virtue of R.A. 3591, As Amended. The full capitalization was reached in 1994 with the conversion to equity of the National Government the P977.8 million obligation of PDIC to the then Central Bank of the Philippines.
- includes “managers’ and cashiers’ checks” as well as the volume of deposits automatically transferred from savings to demand deposits but excludes holdings of demand deposits by the National Government and commercial banks’ holdings of “checks and cash items”.
– refers to the guiding rate for the exchange of one US dollar (the country’s intervention currency) for pesos and is computed as the weighted average of all foreign exchange transactions done through the Philippine Dealing System (PDS) during the preceding day pursuant to Circular Letter dated July 30, 1992. The PDS allows authorized dealers of participating commercial banks and the BSP to deal in spot and forward exchange trading using computer terminal right in the premises for 9:00 A.M. to 12 noon and from 2:30 to 4:00 P.M. daily.
- a loan on the security of the policy which shall not exceed 50 percent of the net cash value for regular membership policy, or 90 percent of the net cash value for optional policy.
- a group of quasi-private development banks promoted by the DBP to provide medium and long term credits to both the agricultural and industrial sectors. Designed to supplement the short-term credits of the Rural Banks and are able to accept only savings and time deposits.
- investments in stocks of private corporations.
- loans secured by real estate properties mortgaged with the system.
- government-sponsored/assisted banks which are privately managed and largely privately owned that provide credit facilities to farmers and merchants, or to cooperatives of such farmers or merchants at reasonable terms and in general; to the people of the rural community.
- any corporation organized for the purpose of accumulating the small savings of depositors and investing them, together with its capital, in bonds or in loans secured by bonds, real estate mortgage, and other forms of security, as hereinafter provided, or in loans for personal finance and long-term financing for home building and home development.
- these include all interest-bearing deposits which are withdrawals upon presentation of an accomplished withdrawal slip together with the passbook. These are subdivided
into savings deposits of private firms, individuals, banks, the government and trust department of banks.
include transactions involving the performance of services such as freight, insurance, travel, including labor services provided by Filipino workers abroad. Also included are receipts/payments of interest, profits and dividends.
- amount set aside for the payment of social insurance benefits like retirement insurance, disability retirement, death and life insurance benefits.
- investments in shares of stock, common or preferred, traded, subsidiaries, non subsidiaries.
- these represent deposits which are interest bearing with specific maturity dates and evidenced by certificates issued by the bank in the name of the depositor. These are subdivided into time deposits of private firms, individuals, banks, the government and trust department of banks.
– refer to unilateral transfers or donations. The two main categories are Private and Central Government transfers Private transfers cover personal and institutional remittances from abroad including donations to voluntary relief agencies, migrants’ transfers and taxes paid to the Philippine government by Filipino residents abroad. Central Government transfers refer to the U.S. Veterans Administration pensions, aids and grants received from the U.S. Agency for International Development (USAID), UN agencies and other foreign governments. Outflows represent the Philippines’ contributions to various international organizations and its counterpart funding for foreign assistance programs.
valuation of transactions, wherein the influence of price changes from the base year to the current year has been removed.
- Sum of the final uses of goods and services in the economy. Final uses refer to the values at purchaser’s prices of goods and services used for the final consumption of households and non-profit institutions, general government as well as those used for gross fixed capital formation, exports (net of imports) to/from the rest of the world
- Consists of two major components: gross fixed capital formation andchange in stocks.
Gross fixed capital formation refers to outlays on construction, durable equipment and breeding stocks, orchard development and intellectual property products. Change in stocks refers to the difference between ending and beginning inventories. Inventories or stocks consists of finished goods, work-in-progress, and raw materials, which have been produced or purchased but not yet sold or consumed as intermediate inputs during the accounting period.
the value of all goods and services produced domestically; the sum of gross value added of all resident institutional units engaged in production (plus any taxes, and minus any subsidies, on products not included in the values of their outputs).
- aggregate of the gross value added or income from each industry or economic activity of the regional economy.
the Gross Domestic Product adjusted with the net primary income from/to the rest of the world. It refers to the primary income consisting of compensation and property income receivable from abroad less compensation and property income payable abroad.
– the difference between gross output and intermediate consumption. Gross outputs of a production unit during a given period is equal to the gross value of the goods and

services produced during the period and recorded at the moment they are produced, regardless of whether or not there is a change of ownership. Intermediate consumption refers to the value of goods and services used in the production process during the accounting period.
- Concerned with the structural interdependence of economic activities; also referred to as analysis of inter-industry relations or that of inter-industry flows. (Source: 1993 SNA)
Provides a statistical description of the inputs (costs) and outputs (production) of the different sectors of the economy during a particular period of time. (Source: 1993 SNA)
- consist of actual and imputed expenditures of households for the purpose of acquiring individual consumption goods and services.
1993 System of National Accounts
the ability to read and write with understanding simple messages in any language or dialect. (
the percentage of enrollees at the beginning grade or year in a given school year who reached the final grade or year of the elementary/secondary level Resolution
the first stage of free and compulsory, formal education primarily concerned with providing basic education and usually corresponding to six and seven grades. Elementary education can likewise be attained through alternative learning system.
total number of pupils/students who register/enlist in a school year
represents a significantly higher level literacy which includes not only reading and writing skills but also numeracy skills. This skill must be sufficiently advanced to enable the individual to participate fully and effectively in activities commonly occurring in his life situation that require a reasonable capability of communicating by written language. (
the stage of formal education requiring secondary and post-secondary education covering the programs on: (a) all courses of study leading to bachelor’s degree and (b) all degree courses of study beyond bachelor’s degree level.
- the percentage of the population 10 years old and over, who can read, write and understand simple messages in any language or dialect
- the ratio of the enrolment for the age group corresponding to the official school age in the elementary/secondary level to the population of the same age group in a given year. Also known as Net Enrolment Ratio (NER)
- the stage of formal education following the secondary level covering non-degree programs that have varying duration from three (3) months to three (3) years, concerned primarily with developing strong and appropriately trained middle-level skilled manpower possessing capabilities supportive of national development.
- a school that admits students who are not old enough to enter the first level of education. These pupils are usually from 4 to 5 years of age. ( )
school primarily concerned with providing basic education and usually corresponding to the first four grades of elementary education. ( )
- educational institutions maintained and administered by private individuals or groups.
– educational institutions established by law and administered by the government.
- training done in schools.
an educational institution offering secondary education usually consisting of a four-year general secondary curricula. ( )
- the stage of formal education following the elementary level concerned primarily with continuing basic education and expanding it to include the learning of employable gainful skills, usually corresponding to four years of high school.
the prescribed period of time, when schools offer daily instruction broken by short intermission periods (e.g., Christmas and summer vacations and holidays).
– the education process designed at post-secondary and tertiary levels, officially recognized as non-degree programs aimed at preparing technicians, para-professionals and other categories of middle-level workers by providing them with a broad range of general education, theoretical, scientific, artistic and technological studies, social services and related job skills training.
Refers to any electric cooperative, private corporation, government-owned utility or existing local government unit which has an exclusive franchise to operate a distribution system in accordance with the Electricity Industry Reform Act of 2000.
Refers to any person or entity requiring the supply and delivery of electricity for its own use.
Refers to the high voltage backbone system of interconnected transmission lines, substations and generating plants.
Refers to an entity which generates power for its own use.
– solid product obtained from the destructive distillation and/or thermal degradation of wood. ( )
– refers to land with an area of more than 0.5 hectare and tree crown cover (or equivalent stocking level) of more than 10 percent. The trees should be able to reach a minimum height of 5 meters at maturity in situ. It consists either of closed forest formations where trees of various storeys and undergrowth cover a high proportion of the ground or open forest formations with a continuous vegetation cover in which tree crown cover exceeds 10 percent. Young natural stands and all plantations established for forestry purposes, which have yet to reach a crown density of more than 10 percent or tree height of 5 meters are included under forest.
These are normally forming part of the forest area, which are temporarily unstocked as a result of human intervention or natural causes but which are expected to revert to forest. It includes forest nurseries and seed orchards that constitute an integral part of the forest; forest roads, cleared tracts, firebreaks and other small open areas; forest within protected areas; windbreaks and shelter belts of trees with an area of more than 0.5 hectare and width of more than 20 meter; plantations

primarily used for forestry purposes, including rubber wood plantations. It also includes bamboo, palm and fern formations (except coconut and oil palm).
– includes the public forest, the permanent forest or forest reserves, and forest reservations. ( )
- all usable raw materials yielded by the forest including the associated water, fish, game, scenic, historical, recreational and geologic resources. ( )
- felled trees bucked into convenient length of at least 1.5 meters, with at least 15 cm. in diameter. It may either be poles, piles, pulpwood, sawlog or veneer log. (
)
- solid wood not further manufactured other than sawing, resawing and passing lengthwise through a standard planing machine crosscut to length. ( )
– refers to a forest reservation essentially of primitive or wilderness character which has been withdrawn from settlement or occupancy and set aside as such exclusively to preserve the scenery, the natural and historic objects and the wild animals or plants therein, and to provide enjoyment of these features in such a manner as will leave them unimpaired for future generations. ( )
- includes all forest products except timber; also known as minor forest product. ( )
- an assembled product made of layers of veneer held together by an adhesive, the chief characteristic of which is the alternate cross layers, distributing the longitudinal wood strength. It consists of three or more layers of veneer, firmly glued together with the grain direction of the middle layer at right angles to that of the two parallel outer layers. ( )
– logs for use as electric post, pier piling, railroad ties, sleepers and the like. ()
– any wood commercially used for the manufacture of any type of pulp. ()
(mm) - the amount of precipitation (rain, hail, etc.) expressed in millimeter depth, of the layer of water which has fallen. (
)
- wood in its natural state as felled or otherwise harvested, with or without bar, round, split roughly squared or other forms (e.g. roots, stumps). It may also be impregnated (e.g. telegraph poles) or roughly shaped or pointed. It comprises all wood obtained from the forest such as sawlogs/veneer logs, pulpwood, fuelwood and other industrial roundwood. (
)
– refers to land of the public domain which has been the subject of the present system of land classification determined to be needed for forest purposes. Eventually, these lands will be proclaimed as forest reserves by the President. ( )
– highland; ground elevation above the lowlands along rivers or between hills. ()
- thin sheets of wood of uniform thickness, rotary cut, sliced or sawn for use in the manufacture of plywood. ( )
- the difference between the export earnings and import payments of all goods or merchandise trade transacted by a country. (

- export for goods grown, mined, cultured or manufactured in the Philippines.
- all goods leaving the country which are properly cleared through the Customs. (
- the value of the goods free on board the carrier at the frontier of the exporting country. It includes inland freight, export duty and other expenses. Ocean freight, insurance and consular fee are, however, excluded. (
- all goods entering any of the seaports or airports of entry of the Philippines properly cleared through the Customs or remaining under Customs control, whether the goods are for direct consumption, for merchanting, for warehousing or for further processing. (
- export goods whose value did not exceed US$5 million in 1968 and which have undergone a significant degree of processing. (
- exports of imported goods which do not undergo physical and/or chemical transformation in the Philippines. (
- export goods whose value exceed US$5 million in 1968 and which have undergone a significant degree of processing.
– Indicator of the change in the average prices of a fixed basket of goods and services commonly purchased by households relative to a base year.
- is a measure of inflation that aims to capture the permanent component of the inflationary process that can be influenced by monetary policy.
– is a group of persons usually living together and composed of the head and other persons related to the head by blood, marriage and adoption. A single person living alone is considered a separate family.
– refers to the expenses or disbursements made by the family purely for personal consumption during the reference period. They exclude all expenses in relation to farm or business operations, investment ventures, purchase of real property and other disbursements which do not involve personal consumption. Gifts, support, assistance or relief in goods and services received by the family from friends, relatives, etc. and consumed during the reference period are included in the family expenditures. Value consumed from net share of crops, fruits and vegetables produced or livestock raised by other households, family sustenance and entrepreneurial activities are also considered as family expenditures. (
– includes primary income and receipts from other sources received by all family members during the calendar year as participants in any economic activity or as recipients of transfers, pensions, grants, etc. (Primary income includes:
Salaries and wages from employment.Commissions, tips, bonuses, family and clothing allowance, transportation and representationallowance and honoraria.Other forms of compensation and net receipts derived from the operation of family-operatedenterprises/activities and the practice of profession or trade.

Income from other sources include: Imputed rental values of owner-occupied dwelling units.Interests.Rentals including land owner’s share of agricultural productsPensionsSupport and value of food and non-food items received as gifts by the family (as well as theimputed value of services rendered free of charge to the family).Receipts from family sustenance activities, which are not considered as family operatedenterprise.
– the minimum income/expenditure required for a family/individual to meet the basic food needs, which satisfies the nutritional requirements for economically necessary and socially desirable physical activities.
- the ratio of the area between the Lorenz curve and the diagonal (the line of perfect equality) to the area below the diagonal.
Notes: It is a measure of the extent to which the distribution of income/ expenditure among families/individuals deviates from a perfectly equal distribution, with limits 0 for perfect equality and 1 for perfect inequality.
- measures changes in the cost of living based on movements in the prices of a specified basket of major commodities. It refers to the annual rate of change or the year-on-year change in the Consumer Price Index (CPI). (
is the average income shortfall (expressed in proportion to the poverty line) of those below the threshold (
- the annual rate of change or the year-on-year change in the Consumer Price Index.
- the number of families or the population whose annual per capita income falls below the poverty threshold.
the total income/ expenditure shortfall (expressed in proportion to the poverty threshold) of families/ individuals with income/ expenditure below the poverty threshold, divided by the total number of families/ individuals.
- the proportion of families/individuals with per capita income / expenditure less than the per capita poverty threshold to the total number of families/individuals.
– the minimum income/expenditure required for a family/individual to meet the basic food and non-food requirements.
Notes: Basic food requirements are currently based on 100% adequacy for the Recommended Energy and Nutrient Intake (RENI) for protein and energy equivalent to an average of 2000 kilocalories per capita, and 80% adequacy for other nutrients. On the other hand, basic non-food requirements, indirectly estimated by obtaining the ratio of food to total basic expenditures from a reference group of families, cover expenditure on: 1) clothing and footwear; 2) housing; 3) fuel, light, water; 4) maintenance and minor repairs; 5) rental of occupied dwelling units; 6) medical care; 7) education; 8) transportation and communication; 9) non-durable furnishings; 10) household operations; and 11) personal care & effects.
- statistical measure of the average changes in average prices of a basket of goods as they leave the establishment of the producers relative to a base period.
- statistical measure of the average changes in average farmgate prices of a basket of goods relative to a base period.
- a measure of the real value of the peso in a given period relative to a chosen reference period. It is computed by getting the reciprocal of the CPI and multiplying the result by 100

- the price at which a commodity is sold for spot in small quantities for consumption.
– statistical measure of the changes in the prices at which retailers dispose of their goods to consumers or end-users relative to a base year.
– the total of the squared income/expenditure shortfall (expressed in proportion to the poverty threshold) of families/ individuals with income/expenditure below the poverty threshold, divided by the total number of families/ individuals.
Notes: This is equal to the Foster-Greer-Thorbecke (FGT) family of measures with alpha = 2. It is a poverty measure, which is sensitive to the income/ expenditure distribution among the poor – the worse this distribution is, the more severe poverty is.
- the proportion of families/individuals with per capita income/ expenditure less than the per capita food threshold to the total number of families/ individuals.
– the average price of a commodity transacted in bulk for further resale or processing.
- statistical measure of average changes over time in the wholesale prices of commodities relative to a base year.
- represent the amount of contribution or share of nonresidents in investment projects within the Philippine economic territory as approved by investment promotion agencies such as the Board of Investments, Philippine Economic Zone Authority, Subic Bay Metropolitan Authority and the Clark Development Corporation, and other government entities as may be created for the same purpose. Approved foreign direct investments do not represent actual investments generated but rather investment commitments, which may or may not be realized immediately or in the future. These consist of equity, loans and reinvested earnings.
- arrived at by dividing the total employment during the pay periods, earest the middle of each quarter (Feb. 15, May 15, Aug. 15, and Nov. 15) by four quarters. (
– include cost of acquisition of new and used fixed assets, fixed assets produced by the establishment for its own use, major alterations, additions and improvements to fixed assets, whether done by others, or done on own account. (
– the additional funds put into the capital stock of existing business firms.
– the amount of capital invested by a newly registered organization whether a corporation, partnership or single proprietorship.
– the retirement and/or redemption of capital funds of business firms.
- represents the difference between the value of output and the total costs of materials and supplies consumed, fuels purchased, electricity purchased, industrial services done by others and goods purchased and resold
- all expenses whether paid or payable incurred during the year including interest expenses and indirect taxes and other charges. Valuation is usually at market price, net of discounts, rebates, returns and allowances. (
- an incorporated enterprise in which a foreign investor owns 10 percent or more of the ordinary shares or voting power for an incorporated enterprise or an unincorporated enterprise in which a foreign investor has equivalent ownership. Ownership of 10 percent of the ordinary shares or voting stock is the guideline for determining the existence of a direct investment relationship. An “effective voice in the management”, as evidenced by an ownership of at least 10 percent, implies that the direct investor is able to influence, or participate in, the management of an enterprise; absolute control by the foreign investor is not required.
– an economic unit which engages in one or predominantly one kind of economic activity at a fixed single physical location. (
– the category of international investment made by a resident entity in one economy (direct investor) with the objective of establishing/obtaining a lasting interest in an enterprise resident in an economy other than that of the investor (direct investment enterprise). ”Lasting interest” implies the existence of a long-term relationship between the direct investor and the enterprise and a significant degree of influence by the direct investor on the management of the direct investment enterprise. Direct investment involves both the initial transaction between the two entities and all subsequent transactions between them and among affiliated enterprises, both incorporated and unincorporated.
- all equity investments by nonresidents in the Philippines, except equity securities transacted through the stock exchange that do not exceed 10 percent of the total shares of the resident enterprise. It is assumed that a nonresident investor has a significant influence in management and expresses lasting interest in or relationship with the resident enterprise in which they invest. These include the following major investment:
– comprises: (i) equity in branches; (ii) all shares in subsidiaries and associates (except nonparticipating, preferred shares that are treated as debt securities and included under direct investment, other capital); and (iii) other capital contributions of foreign investors in a direct investment enterprise.
- comprised of foreign direct investors’ shares in proportion to equity held, of earnings that foreign subsidiaries and associated enterprises do not distribute as dividends (reinvested earnings), and earnings that branches and other unincorporated enterprises do not remit to foreign direct investors (undistributed branch profits).
- covers the borrowing or lending of funds between foreign direct investors and subsidiaries, branches, and associates - including debt securities, suppliers’ credit, and nonparticipating, preferred shares (which are treated as debt securities).
- amount of money or other resources measured in terms of money placed on activities or other forms of assets for the purpose of earning profits.
- person working for and receiving pay from an establishment; includes the full time or part-time employee on paid leaves, e.g. paid vacation, maternity holiday or sick leave. Excludes consultants, home workers, workers receiving commissions and workers on indefinite leave. (
- refer to original/initial and additional paid-up capital investments and contributions by non-residents as single proprietors as approved by the Department of Trade and Industry, or as incorporators and/or stockholders in newly-registered and existing domestic stock corporations and domestic partnerships as approved by the Securities and Exchange Commission. These include acquisition of shares in other SEC-registered companies by newly-registered and/or existing domestic stock corporations and domestic partnerships and exclude inter-company loans and statutory inward remittances and security deposits required from foreign corporations or multinational firms that have been licensed to operate in the Philippines.
- an entity that has a center of economic interest in the economic territory of a country usually indicated by a one-year stay in that economy. The one-year period is suggested only as a guideline and not as an inflexible rule.
- payments in cash or in kind prior to deductions for employees’ contribution to SSS/GSIS, withholding tax, etc. to all employees. Included are total basic pay, overtime pay and other benefits. (
- the sale or inter-plant transfer of finished products from an establishment. (
- investments in shares of stock, common or preferred, traded, subsidiaries, and non-subsidiaries. ( )
– that portion of the authorized capital which has been underwritten by the stockholders. ( )
– includes the value/cash received and receivables for products shipped, goods sold and transferred and industrial and non-industrial services rendered to others. (
- represents the total value of products sold, receipts from contract work and industrial services done for others, receipts from goods bought and sold in same conditions, fixed assets produced on own-account and change in inventories (ending less beginning of finished products, work-in process and goods for release). (
- any temporary stoppage of work by the concerted action of the employees as a result of an industrial or labor dispute. This may include slow down, boycott, sit-down, mass leave, attempts to damage, destroy or sabotage plant equipment and facilities and similar activities:
- concerted action by employees and their union to refrain from working with theestablishment
- concerted work stoppage where the union or the workers avail en masse oftheir paid leaves under their Collective Bargaining Agreement (CBA) or by law or where saidworkers/union go on massive Absence Without Official Leave (AWOL)
- concerted work stoppage where workers refuse to work inside a factory orestablishment after punching their time cards
– the negotiated contract between a legitimate labor organization and the employer concerning wages, hours of work, and all other terms and conditions of employment in a bargaining unit, including mandatory provisions for grievance and arbitration machinery.
– recruited worker who leaves for an overseas job with the pre-condition that employment/travel documentation papers are processed by Philippine Overseas Employment Administration (POEA) and his/her departure is actually recorded at the Labor Assistance Center at the Ninoy Aquino International Airport. (
- Include all persons 15 years old and over as of their last birthday and during the basic survey reference period are reported as either:
Those who do any work even for one hour during the reference period for pay orprofit, or work without pay on the farm or business enterprise operated by a member ofthe same household related by blood, marriage, or adoption;

Those who have a job or business but are not at workbecause of temporary illness/injury, vacation, or other reasons. Likewise, persons whoexpect to report for work or to start operation of a farm or business enterprise within twoweeks from the date of the enumerator's visit, are considered employed.
- Percentage of the total number of employed persons to the total number of persons in the labor force.
an aggregate of persons, generally but not necessarily bound by ties of kinship, which live together under the same roof and eat together or share in common the household food. Members comprise the head of the household, relatives living with him and other persons who share the community life for reasons of work or other consideration. A person who lives alone is considered a separate household. (
– the population 15 years old and over whether employed or unemployed who contribute to the production of goods and services in the country (
– Percentage of the total number of persons in the labor force to the total population 15 years old and over.
– a contract worker other than a seaman including workers engaged in offshore activities whose occupation requires that majority of his working/gainful hours are spent on land. (
– total number of man-days lost due to strikes or lockouts declared. It is computed by multiplying the number of workers involved in the strike or lockout by the total number of working days lost or made idle due to the strike/lockout. (
- the lowest basic wage rate that an employer can pay his/her workers as fixed by the Regional Tripartite Wages and Productivity Board (RTWPB), which is not lower than the applicable statutory minimum wage rate. This includes mandated Cost of Living Allowance (COLAs), if any. (
– the notification filed by an employer with the appropriate National Conciliation and Mediation Board (NCMB) regional branch about its intention to temporarily cease its operation because of the allegations by a duly registered labor union of unfair labor practice act/s or because of a deadlock in collective bargaining negotiations (
– the notification filed by a duly registered labor union with the appropriate NCMB regional branch about its intention to go on strike because of alleged commission by the employer of unfair labor practice act/s or because of a deadlock in collective bargaining negotiations. (
- any individual who was or presently engaged in gainful employment in a foreign country, covered by a specific “contract of employment” defining the terms and conditions of that employment and the employer-employee relationship, provided that the herein referred contract was approved for implementation/application by the Philippine Overseas Employment Administration (POEA) and the deployment/mobilization having been authorized by the POEA and provided further that the corresponding Welfare Fund Contribution having been paid at the time of employment processing at POEA or at any time thereafter as in the case of legitimized overseas contract worker, the latter gaining recognition thru the process of latent legitimacy in accordance with applicable rules and policies in applicable case/s. The OCW may be landbased or seabased
– a Filipino worker who is to be engaged, is engaged, or has been engaged in a remunerated activity in a country of which he/she is not a legal resident. (
– recruited worker whose contract and travel documents have been verified and validated through the Contract Processing Department of the POEA and is to be deployed for a specific period of time. (
– the minimum wage deflated by the current Consumer Price Index (CPI). (
– an area not falling under any of the classifications of an urban area. (
– any person employed in a vessel engaged in maritime navigation. Also called a seaman. (
– any temporary stoppage of work by the concerted action of the employees as a result of an industrial or labor dispute. Includes actual strike (with or without notice) filed at appropriate NCMB regional branches. (
– Include employed persons who express the desire to have additional hours of work in their present job or an additional job, or to have a new job with longer working hours
– Percentage of the total number of underemployed persons to the total employed persons
- The unemployed include all persons who are 15 years old and over as of their last birthday and are reported as:
had no job or business during the basic survey reference period; AND currently available for work, i.e., were available and willing to take up work in paid employment or self employment during the basic survey reference period, and/or would be available and willing to take up work in paid employment or self employment within two weeks after the interview date; AND
had taken specific steps to look for a job or establish a business during the basic survey reference period; OR
: (a) tired/believe no work available, i.e., the discouraged workers who looked for work within the last six months prior to the interview date; (b) awaiting results of previous job application; © temporary illness/disability; (d) bad weather; and (e) waiting for rehire/job recall.
– Percentage of the total number of unemployed persons to the total number of persons in the labor force.
– any registered group or association of employees that exist in whole or in part for the purpose of collective bargaining or of dealing with employers concerning terms and conditions of employment. A union may be formed in the private or public sector.
- those who worked for less than 40 hours during the reference period and want additional hours of work
- a social unit consisting of a person living alone or a group of persons who sleep in the same housing unit and have a common arrangement in the preparation and consumption of food.
- a structurally separate and independent place of abode which, by the way it has been constructed, converted or arranged is intended for habitation by one household. Structures or parts of structures which are not intended for habitation such as commercial, industrial, and cultural buildings or natural and man-made shelters such as caves, boats, abandoned trucks, culverts, and others, but which are used as living quarters by households.

- a measure of how well a country has performed, not only in terms of real income growth, but also in terms of social indicators of people’s ability to lead a long and healthy life, to acquire knowledge and skills, and to have access to the resources needed to afford a decent standard of living.
– represents the average number of years remaining to a person who survives to the beginning of a given age or age interval x.
– is defined as the number of years a newborn child can be expected to live under a given mortality condition of an area in a given year
- status of an individual in relation to marriage, classified as follows: a) Single - A person who has never been married; b) Married - A couple living together as husband and wife, legally or consensually; c) Divorced - A person whose bond of matrimony has been dissolved legally and who therefore can remarry; d) Separated - A person separated legally or not from his/her spouse because of marital discord or misunderstanding; and e) Widowed - A person whose bond of matrimony has been dissolved by death of his/her spouse.
- moderate fertility decline and moderate mortality decline
- the movement of people across a specific boundary for the purpose of establishing a new or semi-permanent residence. Two distinct types are international migration (migration between countries) and internal migration (migration within a country).
- total number of individuals in a territory at a specified time. It covers both nationals and aliens, native and foreign-born persons, internees, refugees and any other group physically present within the borders of a country at a specified time. In assembling national demographic statistics for publication, the basic aim has been to obtain data for the physically present (or “de facto”) population rather than for the legally established resident (or “de jure”) inhabitants.
- refers to the number of persons per unit of land area (usually in square kilometers). This measure is more meaningful if given as population per unit of arable land.
- the patterns of settlement and dispersal of a population.
– indicates how fast a population increases or decreases as a result of the interplay of births, deaths, and migration during a given period of time. Where the population is closed, meaning no migration, the population growth rate is the same as the rate of natural increase, i.e., the difference between the number of births and the number of deaths during a specified period oftime. The three methods for computing the rate of growth based on the assumption with respect to thechange are: arithmetic change, geometric change and exponential change.
- computation of future changes in population numbers, given certain assumptions about future trends in the rates of fertility, mortality and migration. Demographers often publish high, medium, and low projections of the same population based on different assumptions of how these rates will change in the future.
- the number of males per 100 females in a population.
– the average number of children that would be born alive to a woman (or group of women) during her lifetime if she were to pass through her childbearing years conforming to the age specific fertility rates of a given time period.
- the smallest political unit into which cities and municipalities in the Philippines are divided. It is the basic unit of the Philippine political system. It consists of less than 1,000 inhabitants residing within the territorial limit of a city or municipality and administered by a set of elective officials, headed by a barangay chairman (punong barangay).
- amount budgeted for the purchase of goods and services for the conduct of normal government operations within the budget year. It includes goods and services that will be used or consumed during the budget year.
- amount budgeted for the purchase of goods and services, the benefit of which extend beyond the budget year and which add to the assets of the government. Also includes equity investments in the capital stock of government owned or controlled corporation.
- resources realized from the sale of fixed or capital assets, such as building, equipment, machine and intangibles
- there are three classes of cities in the Philippines: the highly urbanized, the independent component cities which are independent of the province, and the component cities which are part of the provinces where they are located and subject to their administrative supervision.
- excess of revenues over expenditures.
- the sum of loan repayments, interest payments, commitment fees and other charges on foreign and domestic borrowings.
- this covers expenditures for military and para-military services for use against external aggression and suppression of subversion and other organized movement to overthrow the government
- shortfall/deficiency of revenues over expenditures of the government.
- collections derived from the repayment of loans and advances made by the government as well as from other non-recurring sources.
- means of funding government expenditure consisting of domestic and external borrowing less amortization and changes in government holding of cash to cover the differences between total revenue and total expenditures of the national government.
- this covers expenditures for services which are indispensable to the existence of an organized state and cannot be allocated to specific sectors or subsectors. This includes executive and legislative services; overall financial and fiscal services; civil services; planning; conduct of foreign affairs; general research, public order and safety and centralized services.
- bills issued by the Bureau of Treasury as agent of the government.
- all non-repayable transfers received from other levels of government or from private individuals, or institutions including reparations and gifts given for particular projects or programs, or for general budget support.
– is a political corporate body which is endowed with the facilities of a municipal corporation, exercised by and through the municipal government in conformity with law. It is a subsidiary of the province which consists of a number of barangays within its territorial boundaries, one of which is the seat of government found at the town proper (poblacion).
- advances by the national government for the servicing of government guaranteed corporate debt during the year, net of repayments on such advances. Includes loans outlays or proceeds from program loans relent to government corporations.

- revenue collected from sources other than compulsory tax levies. Includes those collected in exchange for direct services rendered by government agencies to the public, or those arising from the government’s regulatory and investment activities.
- provisions for the payment of salaries, wages and other compensation (e.g., merit, salary increase, cost of living allowances, honoraria and commutable allowances) of permanent, temporary, contractual and casual employees of the government.
- the largest unit in the political structure of the Philippines. It consists, in varying numbers, of municipalities and, in some cases, of component cities. Its functions and duties in relation to its component cities and municipalities are generally coordinative and supervisory.
- consists of the National Government, local governments, government-owned or controlled corporations and government monetary institutions
- a cash inflow which does not increase the liability of the government.
- this categorize the purpose of government expenditure. The classification focuses on the purposes for which outlays are made, irrespective of the agency of government through which they were made
- taxes levied on the domestic production, sale or transfer, leasing, use or delivery of goods, and rendering of services.
- taxes imposed on all taxable income earned or received by a taxpayer whether an individual, partnership, or corporation, during a particular period of time, usually lasting one year.
- the sum of import and customs duties, and other international trade-related tax collections of the national government.
- taxes imposed on the ownership of wealth or immovable properties and on the transfer of real or personal properties, both tangible and intangible.
Source:
- is the act and omission punishable by law; it is also referred to as .
is the total number of crime incidents committed in a given area over a period of time; it is also referred to as
- refer to crimes that are serious in nature and occur with sufficient frequency and regularity for them to serve as index in crime analysis. These include the following: (a) crimes against persons; and (b) crimes against property.
- refer to crimes that do not fall under index crimes.
- is the number of crime incidents committed per 100,000 population.
- is an indicator that measures the adequacy of the police force in its task of promoting peace and order, and of providing security to the people and property. It is computed by dividing the total population by the total number of policemen.
- is an indicator that measures the adequacy of the firefighting manpower to safeguard the people and property. It is computed by dividing the total population by the total number of firemen.

- is the misuse of any chemical, licit or illicit, which results in an individual’s physical, mental/emotional or social impairment.
- refers to any basic right or freedom to which all human beings are entitled, and in whose exercise a government may not interfere (including rights to life and liberty as well as freedom of thought and expression, and equality before the law).
- refers to the summation of cases newly filed, cases revived/reopened, and cases received from other salas/courts during the reference period.
- refers to the summation of cases decided/resolved, cases archived, cases transferred to other salas/courts, and cases with proceedings suspended during the reference period.
- refers to the summation of cases pending at the end of the preceding period, and of case inflow during the current period.
- refer to the cases that have been given decision based on merits, including those that have been dismissed, withdrawn, or amicably settled during the reference period.
- refers to the total number of pending cases, i.e., those that have not been disposed of at the end of the reference period. It is derived by subtracting case outflow from court caseload.
- refers to the ratio of total cases decided/resolved in a year over total cases filed. A ratio of less than one indicates an increasing backlog; greater than one, decreasing backlog; and equal to one means that the backlog is being maintained.
- refers to any sudden event produced by nature that causes great damage to the people and property such as typhoon, earthquake, volcanic eruption, etc.
– any project fully or partially financed by a Department of Science and Technology (DOST) Council or any private establishment/entity and undertaken by any of the DOST Research and Development Institutes.
– any new, useful machine or device manufactured product or substance, process or any improvement thereof, that involves inventive act of degree more than the skills of expertise, artisan or mechanic; Any technical solution of a problem in any filed of human activity which is new, involves an inventive step and is industrially applicable.
– any composition of lines or colors or any three-dimensional form, whether or not associated with lines or colors. Provided that, such composition or form should give a special appearance to and can serve as pattern for an industrial product or handicraft that are new or original.
– any project fully or partially financed by a Department of Science and Technology (DOST) Council or any private establishment/entity and undertaken by any of the DOST Research and Development Institutes.
– any visible sign capable of distinguishing the goods (trademark) or services (service mark) of an enterprise and shall include a stamped or marked container of goods.
– is a grant issued by the Philippine government giving an inventor the right to exclude others from making, using, selling or importing the product of his invention within the Philippine in exchange for his patentable information or disclosure.

Completed – projects completed at various stages of the R&D spectrum, namely: basicresearch, applied research, experimental development, and pilot testing.
Supported/Assisted – projects funded by DOST Councils or by DOST-Office of theSecretary (OSEC). These are projects given technical support by R & D Institutes.
Implemented – projects implemented by R & D performing institutes like InformationTechnology Development Institute (ITDI) and Food and Nutrition Research Institute (FNRI).
– projects requested by private industries to R&D Institutes.
- includes scholarships given by DOST Councils, SEI, PHSS, FPRDI, PAGASA, DOST, NRCP, and ESEP.
– technologies that are adopted and used already.
Technologies Commercialized (New) - technologies that are used for the first time.
Technologies Commercialized (Existing) – technologies that have been adopted and arealready being used.
– technologies disseminated through trainings, demonstration, and techno packages.
Technologies Diffused (new) – technologies disseminated for the first time throughtrainings, demonstration, and techno packages.
Technologies Diffused (existing) - technologies already disseminated or given throughtrainings, demonstrations, and techno packages.
- Includes individual names and surnames, firm names, tradenames, devices or words used by one to identify his business, vocation, or occupation.
- Includes any word, name, symbol, emblem, sign, or device or any combination thereof used to identify one’s goods and distinguish them from those of others.
- unilateral payments made by the government to households, non-profit institutions, other government and government corporation (these are in the form of grants, subsidies and contributions, awards and indemnities, retirement benefits and other claims).
– any technical solution of a problem in any field of human activity which is new and industrially applicable.
- fund set aside for payment of claims of members against hospitalization, surgical and medical expenses.
- this covers expenditures for education, health, social security, labor and employment, housing and community development and other social activities.

Women in Especially Difficult Circumstances
– an act of inflicting physical harm on a woman resulting to physical and psychological/emotional distress preventing her from doing what she wishes or forcing her to behave in a manner that is unacceptable to her.
- refers to victims who were recruited usually for a fee for various forms of local or foreign employment but ended up being victimized, i.e., no job placement were effected or who actually job-placed but under exploitative/oppressive conditions (low salaries, long hours of work, etc.) and have lost their jobs.
- refers to victims who were recruited for various forms of employment such as receptionists, waitresses, entertainers, dancers, household help who are later on forced into prostitution.
– an act, which is sexual in nature, committed against a woman without her consent. Sexual abuses include but are not limited to the following: rape, sexual harassment, acts of lasciviousness; treating a woman as a sex object; making demeaning and sexually suggestive remarks; physically attacking the sexual parts of her body; forcing her to watch pornographic video shows or see pornographic materials; catching the husband having sex with another woman in the marital bedroom; forcing the wife and mistress to sleep with the husband in the same room.
- the act of recruiting and transporting a woman within and across national borders for work or services by means of violence or threat of violence, abuse of authority or dominant position, debt-bondage, deception or other forms of coercion.
- acts that are lascivious in nature, which include but are not limited to intentional touching, either direct or through clothing, of the genitalia, anus, groin, breast, inner thigh or buttocks; or the introduction of any object into the genitalia, anus or mouth of any child whether of the same or opposite sex with an intent to abuse, humiliate, harass, degrade, or arouse or gratify the sexual desire of any person; bestiality; masturbation; lascivious exhibition of the genital or pubic area of a person, etc.
- the illegal employment of children below 15 years old, or those below 18 years old in hazardous occupation.
- a practice where children, whether male or female, who for money, profit, or any other consideration, or due to the coercion or influence of any adult, syndicate or group, indulge in sexual intercourse or lascivious conduct.
- the employment, use, persuasion, inducement, enticement, or coercion of a child to engage in or assist another person to engage in sexual intercourse or lascivious conduct, or the molestation, prostitution, or incest with children.
- the act of trading or dealing with children, including but not limited to, the buying and selling of children for money, or for any other consideration, or barter.
- children who are: a) members of displaced families as a result of armed conflict; b) physically weakened, orphaned or disabled as a result of armed conflict; c) combatants and those mobilized for other armed conflict-related activities; and d) disrupted from schooling due to armed conflict.
- sexual abuse committed against a child by a person who is related to her/him within fourth degree of consanguinity or affinity and who exercises influence, authority or moral ascendancy over her/him.
- failure to provide, for reasons other than poverty, adequate food, clothing, shelter, basic education or medical care so as to seriously endanger the physical, mental, social and emotional growth and development of the child.
– an act of psycho-sexual perversion deriving gratification from child sexual abuse.
- an act committed:
By a man who shall have carnal knowledge of a child under any of the following circumstances:
through force, threat or intimidation;when the child is deprived of reason, or otherwise unconscious;by means of fraudulent machination or grave abuse of authority; andwhen the offended party is under 12 years of age or is demented, even though none of thecircumstances mentioned above be present.
By any person who, under any of the circumstances mentioned in par. 1 hereof, shall commit an act of sexual assault by inserting the penis into a child’s mouth or anal orifice, or any instrument, object, or any other part of the body such as fingers or toes into the genital or anal orifice of a child.
– any establishment, which on a regular basis, provides for a fee facilities for overnight stays as its main business. It includes not only hotels and similar traditional forms of accommodation but also non-traditional forms of accommodation such as resorts, tourist complexes, camping sites, youth hostels, private apartments, villas and furnished rooms in private houses, and the likes.
– A room in an accommodation establishment available for sale on a given day.
– Average consumption expenditure made by a visitor for one day of stay at a destination.
consists of the country where she/he has lived for most of the past year (12 months), or for a shorter period if she/he intends to return within 12 months to live there.
visitors who arrive to and depart from the Philippines on the same ship.
- tourism of resident visitors within the economic territory of the country of reference.
temporary visitor staying less than twenty-four hours in the country visited.
- tourism of non-resident visitors within the economic territory of the country of reference.
– the sale of an available room in an accommodation establishment in a given day.
– the proportion of occupancy to available rooms in an accommodation establishment over a period of time.
covers the departures of Filipinos who are permanent residents of the Philippines as well as aliens and naturalized citizens of the Philippines with permanent residence in the country.
- tourism of resident visitors outside the economic territory of the country of reference.
Filipino nationals residing permanently abroad who are visiting the Philippines for a period not exceeding one year.

– the motivation for or objective of the trip in the absence of which the trip would not have taken place.
– an institutional unit is resident in a country when it has a center of economic interest in the economic territory of that country.
– it is said to have a center of economic interest when there exist some location-dwelling, place of production or other premises – within the economic territory on, or from, which it engages, and intends to continue to engage, in economic activities and transactions on a significant scale either indefinitely or over a finite but long period of time.
- A room in an accommodation establishment available for occupancy by a visitor or guest for a specified period of time.
- Comprises the activities of persons traveling to and staying in places outside their usual environment for not more than one consecutive year for leisure, business and other purposes not related to the exercise of an activity remunerated from within the place visited.
- visitor who stays one or more nights in the place visited.
the receipts of a country in the form of consumption expenditures or payments for goods and services made by foreign visitors out of foreign currency resources.
– corresponds to the geographical boundaries within which an individual displaces himself/herself within his/her regular routine of life; consists of the direct vicinity of his/her home and place of work or study and other places frequently visited.
includes tourist, excursionists, aliens entering the country for a temporary stay not exceeding one year and for purposes other than immigration, permanent residence or employment for remuneration in the country and Filipino nationals residing permanently abroad on temporary stay in the Philippines not exceeding one year. This excludes the following: a) transit visitors and change-plan passengers who remain in the premises of the port of entry terminal; b) aliens with pre-arranged employment for remuneration in the Philippines, even if length of stay is less than 59 days; c) Filipinos living abroad, regardless of length of stay overseas who are not permanent residents abroad; d) immigrants or aliens with permanent residence in the Philippines; e) Filipino overseas contract workers on home visits; and f) returning residents of the Philippines.
- the price paid to a ship owner for the transportation of goods or merchandise by sea from one specific port to another. The word "freight" is also used to denote goods which are in the process of being transported from one place to another.
- dispatches of correspondence and other objects tendered by and intended for delivery by means of the postal service.
- a sheltered harbor where marine terminal facilities are provided, consisting of piers or wharves at which ships berth/dock while loading or unloading cargo, transit sheds and other storage areas where ships may discharge incoming cargo, and warehouses where goods may be stored for longer periods while awaiting distribution or sailing.
- one or more transmitters or receivers or a combination of transmitters and receivers including the accessory equipment, necessary at one location for carrying on a radio communication

service. Each station shall be classified by the service in which it operates permanently or temporarily.
– the ratio of the number of telephones to total population at a given date. It is expressed as the number of telephone main stations per 100 persons.
- the primary health care facility at the barangay level where basic health services are delivered. (1998 Compendium of Social Statistics in the Philippines)
- the probability of dying between exact age one and age five, expressed as the number of deaths of children from exact age one to less than age five during a given period per 1,000 children surviving to age 12 months at the beginning of the period.
- the proportion of currently married women in the reproductive ages of 15-49 years reporting current use of any contraceptive method.
– the ratio of the number of deaths occurring within one year to the mid-year population expressed per 1,000 population.
– the ratio of the number of fetal deaths in a population occurring within a given period to the total number of live births and fetal deaths occurring within the same period, expressed per 1,000. Fetal Death (deadborn fetus) - death prior to the complete expulsion or extraction from its mother of a product of conception, irrespective of the duration of pregnancy. (WHO)
– the ratio of hospital beds to the population, usually expressed as the number of available hospital beds for every 1,000 population.
- the number of in-patient hospital beds occupied divided by the average number of hospital beds, expressed in percent.
- the rate at which new cases of a disease occur in the population. The numerator is the number of new cases of a disease that occur during a given period (usually a year), and the denominator is the number of the population at risk of experiencing the disease during the same period, usually expressed as the number of new cases per 100,000 persons.
– the probability of dying between birth and age one, expressed as the number of infant deaths or deaths occurring before reaching 12 months of life in a given period per 1,000 live births.
– the frequency of disease and illness, injuries, and disabilities in a population.
– the total number of persons who have an attribute or disease at a particular point in time divided by the size of the population at risk of having the attribute or disease at this point in time (or midway through the period), usually expressed as the number of cases per 100,000 persons.
- the probability of dying between birth and age five, expressed as the number of deaths below age five per 1,000 live births during a given period.

PSA Complex, East Avenue, Diliman, Quezon City, Philippines 1101 Telephone: (632) 938-5267 www.psa.gov.ph
Republic of the Philippines
Philippine Statistics Authority
B