
CONFERENCE SUPPORTERS - American University of Beirut
339
CONFERENCE SUPPORTERS BEAM International Murex Sytems Telus Technology Strategy Touch Veolia Water Solutions and Technologies
-
Upload
khangminh22 -
Category
Documents
-
view
0 -
download
0
Transcript of CONFERENCE SUPPORTERS - American University of Beirut

CONFERENCE SUPPORTERS
BEAM International
Murex Sytems
Telus Technology Strategy
Touch
Veolia Water Solutions and Technologies

Copyright and reprint permission // This publication may not be reproduced, stored in a retrieval system, or transmitted in any form or by any means, electronic, mechanical, or otherwise, without the prior permission of the American University of Beirut. The findings, interpretations, and conclusions expressed in this proceeding are entirely those of the authors and should not be attributed to the American University of Beirut, to its affiliated organizations, or to members of its Board of Trustees. For permission to reprint a page or more of this publication, submit a Permission Reprint request form available by fax at 00961-1-361-091 or e-mail [email protected] All rights reserved. ©2013 American University of Beirut.
Faculty of Engineering and Architecture // American University of Beirut // P.O. Box: 11-0236 // Beirut-Lebanon
Editor // Prof. Mariette Awad Creative direction and production // Mayda Freije MakdessiCover art and production// Christina Atik – Jamal Saleh – Anastasia Matar

The Twelfth FEA Student and Alumni ConferenceAmerican University of BeirutMay 8 and 9, 2013Beirut, Lebanon
12TH FEASACPROCEEDINGS

4

12TH FEASAC
Faculty Members
Moukalled, Fadl // chair
Suidan, Makram
Awad, Mariette // editor
Azizi, Fouad
Freije Makdessi, Mayda // design
Liermann, Matthias
Masri, Wassim
Naoum-Sawaya, Joe
Saad, George
Shorto, Sylvia
Students
Abou Chakra, Bachar
Hannaoui, Mark
Merhi, Hassan
Alumni Representative
Traboulsi, Samir
FEA Staff Members
Deeb, Haneen
Haidar, Mohamed // web
Khoury, Ibrahim
Kobeisse, Suzanne
Moufarrej, Nadia // career development center
Valerik, Vassili
Graphic Design
Atik, Christina
Matar, Anastasia
Saleh, Jamal
ORGANIZING COMMITTEE
5

6
I would like to welcome you to the Twelfth Annual FEA Student
and Alumni Conference at the American University of Beirut
(AUB). Yes, this year we added the word alumni in the conference
title to reflect on the role and importance of alumni participation
in this conference. Not only do we showcase our current students,
we also showcase the achievements of our alumni who represent
the best testament to the quality of education at FEA. This annual
event was initiated by Dean Ibrahim Hajj twelve years ago and has
become a tradition. I hope it will be sustained indefinitely. This
conference provides our students with a forum to further enhance
their writing and presentation skills while sharing their research and
design work.
The format of the conference has again been slightly altered this
year. The conference has four half-day sessions with a session
dedicated to each of Mechanical Engineering, Electrical and
Computer Engineering, Civil and Environmental Engineering, and
Architecture and Design. Each session opens with a 30-minute
presentation by a distinguished alumnus, followed by three 15-
minute presentations by FEA students. We then have a 30-minute
coffee break where the conference attendees will have a chance to
visit a poster session that features the work of selected students.
After the poster session, there is a 30-minute presentation by a
distinguished young alumnus, which is followed by three 15-minute
presentations by FEA students. Each session concludes with a
30-minute presentation by a faculty member from the discipline
WELCOME TO THE 12TH FEASAC

WELCOME TO THE 12TH FEASAC
of the session. This way we showcase the accomplishments of our
alumni, our students, and our faculty. There will be a reception at the
FEA Terrace on Thursday at 7:30 p.m. where monetary awards will
be given to the best student presentation and the best poster in
each session.
Let me give you a very brief overview of the work done since the
last conference. Our Ph.D. programs are doing well, and we have
reached an undergraduate enrollment of over 1,950 students. Our
masters degrees in Chemical and Construction Engineering are
pending approval in New York and a new undergraduate degree
in Industrial Engineering has been approved and we will start
admitting students to that program in the fall of 2014. This new
program is in response to market demand and our effort to provide
a diverse set of disciplines for our students. We are in the process
of preparing a proposal for a new undergraduate program in
Petroleum Engineering.
Finally, construction on the new Oxy-Irani building is scheduled for
completion in August of 2013. The building will be used to house
our research and teaching laboratories and doctoral student offices.
Many thanks also to the FEASAC organizing committee, the FEA
students, the FEA faculty members, and the FEA staff members, for
their dedicated work throughout the year to make this conference
a successful one.
Makram T. Suidan, Dean
7

CONTENT
8
2013 FEA Distinguished Alumni
10 Making It Big in a Time of Change MR. AYAD ITANI
12 Paychecks, Pizza and Solid Waste MR. FADEL DARWISH
16 Automated Language Understanding and Mining Solutions DR. SALIM ROUKOS
18 Creating an Entrepreneurial Revolution in the Arab World MR. HABIB HADDAD
22 My Professional Journey MR. AYMAN TAJI
24 Multi-Disciplinary Approach to Advance Research and Teaching in Sustainable Infrastructure Systems DR. CAROL MENASSA
28 In Search of a Voice DR. NADINE CHAHINE
30 The Specific and the Composite in the Post-Digital Age MR. NICOLAS FAYAD

9
Faculty
14 Nicotine, Gasoline, Ventoline: A Tour of the Nervous World of Our Air PROF. ALAN SHIHADEH
20 From the Touchable to the Untouchable: A Soft Transition PROF. ALI CHEHAB
26 From and Back to AUB: A Professional and Academic Journey PROF. MUTASEM EL FADEL
32 Public Lives and Private Places PROF. SYLVIA SHORTO
Departments
35 Department of Architecture and Design
73 Department of Civil and Environmental Engineering
195 Department of Electrical and Computer Engineering
255 Department of Mechanical Engineering
303 Engineering Management Program
335 Author Index

BIOGRAPHY // Ayad Itani graduated from the International
College in 1989 with honors. He earned his BE in Mechanical
Engineering from the AUB in 1993 with high honors. While pursuing
his undergraduate studies, he received the Hariri Foundation
Scholarship for his distinguished academic work. He graduated and
started his first job at Khatib and Alami where he gained essential
experience in the engineering field. Ayad earned his Master’s degree
in Mechanical Engineering from AUB in 1998.
Towards the end of 1998, he wished to expand his knowledge in
engineering, so he started working for UNECO in the field of
contracting. After four years with UNECO, he decided to venture
into his own business in the field of contracting. He partnered with
his fellow college friend and engineer Ahmad Al Hajj, and together
they founded their company EM Tech in August 2001. The company
began with small contracted jobs, but soon enough Ayad and Ahmad
established a good name in the market due to their hard work and
professional ethics. In 2012, EM Tech started operating offshore, and
is currently undertaking projects in Nigeria and Erbil, in addition
to its continuous activities in Lebanon. EM Tech currently enjoys a
workforce in excess of 500 employees with a project portfolio over
150 million US dollars.
Ayad got married to Lama Tamim in 2007 (a fellow AUB graduate)
and has two young children Ahmad, who is 4 years old, and Ghaydaa,
who is 1 year old.
AYAD ITANIThe FEA Distinguished Alumnus Award is presented to Mr. Ayad Itaniin recognition of his outstanding career in, and contribution to, electro-mechanical advancement in the engineering and contractingindustry.
10

ABSTRACT // Living in a country and time where the main
constant factors are instability, change and emerging challenges,
you need to have strong weapons to make it through: loving parents,
true friends, high sense of values, pro-activeness, perseverance, hard
work and strong commitment. Focus on your blessings, be grateful
and give back! However, if you wish to distinguish yourself, don’t
be afraid of taking the risk others won’t! Trust yourself and put your
faith in God, for WHO dreams big and intends to make a positive
difference in the world will surely find the way.
Making it Big in a Timeof Change
11

FADEL DARWISHThe FEA Distinguished Young Alumnus Award is presented toMr. Fadel Darwish in recognition of his successful achievements asa leading engineer in petro-chemical projects.
BIOGRAPHY // From an early age, Fadel showed deep interest in
science and technology. He excelled at school and ranked amongst
the top ten students in national exams. In 2006, he graduated with
distinction from the Department of Mechanical Engineering at AUB.
He kicked off his career as a Rotating Equipment Engineer with
Petrofac where he demonstrated strong potential and leadership.
Fadel was rewarded with a fast track career path as a Project
Engineer taking on many challenging assignments in UAE, Italy and
Algeria. In 2012, he shifted to GE Oil & Gas to manage the account
of Qatar as a Lead Services Project Manager. Fadel is a certified
Project Management Professional. Fadel has always had a profound
passion for innovation, energy, and the environment. In 2010, he
collaborated on a business plan to introduce a new model of small
waste-to-energy installations. Fadel represented the team in many
business plan competitions in the Middle East and the U.S. during
which he won prizes and gained recognition. His business plan
was promoted in Lebanon in the 2012 Keep Walking Project which
showcased pioneering ideas that could shape the future. In March
2013, Fadel took a bold decision by resigning his position at GE to
focus on starting companies in digital media and management of
electronic waste. Fadel currently lives with his wife in the U.S. In his
free time, he practices portrait and backlighting photography, and
enjoys cooking, hiking, and kayaking.
12

ABSTRACT // The presentation will provide a brief overview
of Fadel Darwish’s professional experience and thoughts about
entrepreneurship for starting a business. Following graduation, Fadel
took a fast track Project Engineer career path at Petrofac for showing
strong potential and leadership. In 2012, he joined GE Oil & Gas as a
Lead Services Project Manager managing the account of Qatar. Fadel
has always had a profound passion for innovation, energy, and the
environment. Since 2010, he collaborated on an innovative waste-to-
energy process and system. He participated in many global business
plan competitions winning prizes and gaining tremendous exposure.
In March 2013, Fadel embarked on a new journey and resigned his
position at GE to focus on starting companies in management of
electronic waste, digital media and travel. The presentation will
include a discussion of career expectations for fresh graduates,
corporate culture and what it is like to start a business. Ideas are
abundant among people, but making them happen requires certain
skills, leadership and lots of perseverance. The presentation will
finally touch on the career-versus-entrepreneurship decision making
process from a personal perspective.
Paychecks, Pizza and Solid Waste
13

ALAN SHIHADEHIn recognition of his scholarly contribution to the Department ofMechanical Engineering in research and the advancement of knowledge.
BIOGRAPHY // Alan Shihadeh, Professor of Mechanical
Engineering at AUB, founded and directs the Aerosol Research
Lab, which is dedicated to policy-driven science of airborne particle
pollutants and to developing devices and methods needed to
support its conduct. He currently studies atmospheric particle
pollution, including primary and secondary organic aerosols,
and human exposure to it in urban settings. He is internationally
recognized for his empirical studies of narghile waterpipe tobacco
smoke and its health effects, and works closely with behavioral
scientists, chemists, biologists, engineers and public health
researchers to comprehensively address this fast-spreading form
of tobacco use. Dr. Shihadeh has published numerous studies on
this subject and serves as a scientific expert to the World Health
Organization Study Group on Tobacco Product Regulation. He
joined AUB in 2000 after teaching at Birzeit University in Palestine.
He has industrial experience in the area of power plant design. He
earned a B.S. in Mechanical Engineering from the University of Texas
at Austin, MS degrees in Technology and Policy and in Mechanical
Engineering at MIT in 1994, and a doctor of science in Mechanical
Engineering from MIT in 1998.
14

ABSTRACT // Somewhere in Beirut at this moment someone
is riding a bus to work, walking by a burning a tire, or sucking a
cigarette while caught in some nerve-shredding traffic. Someone
somewhere is holding a strained conversation with a lover over the
din of a construction site. Nearby, children play football in the plume
of a generator or on a highway, or both. Somewhere a pharmacist
advises a worried parent how to handle his toddler’s croup. She tells
him summer has come early while he glances in the distance at the
haze hiding the mountains. Nicotine, gasoline, ventoline: join me on
a tour of the nervous world of our air.
Nicotine, Gasoline, Ventoline: A Tour Of The Nervous World Of Our Air
15

SALIM ROUKOSThe FEA Distinguished Alumnus Award is presented to Dr. Salim Roukosin recognition of outstanding research and technical achievementsthroughout his career in the natural language processing and machinetranslation areas.
BIOGRAPHY // Salim Roukos is Chief Technology Officer
(CTO) for Translation Technologies at the IBM T. J. Watson Research
Center in New York. Dr. Roukos received his B.E. from AUB in
1976, and his M.Sc. and Ph.D. from the University of Florida in 1978
and 1980, respectively, all in Electrical Engineering. He joined Bolt
Beranek and Newman from 1980 to 1989, where he was a Senior
Scientist in charge of projects in speech compression, speaker
identification, and spoken language understanding. He was an
Adjunct Professor at Boston University in 1988 before joining IBM
in 1989. Dr. Roukos has served as Chair of the IEEE Digital Signal
Processing Committee in 1988.
Salim Roukos currently leads a group of scientists at IBM T.J.
Watson research Center that focuses on using machine learning
techniques for natural language processing. The group pioneered
new statistical methods for natural language understanding,
statistical machine translation, and machine translation evaluation
metrics (BLEU metric). Roukos lead the group that introduced the
first commercial statistical language understanding system for
conversational telephony systems (IBM ViaVoice Telephony) in
2000 and the first statistical machine translation product for Arabic-
English translation in 2003. He has recently lead the effort to create
IBM’s offering of Real-Time Translation Services (RTTS) platform for
enabling real-time translation applications in 30 language-pairs for
multilingual chat and on-demand document translation. Roukos has
over 150 publications and over two dozen patents in the speech and
language areas.
16

ABSTRACT // The last two decades have seen a tremendous
revolution in the field of Natural Language Processing, namely
the introduction of Statistical Models for processing human
language. I will outline my journey at the intersection of Electrical
Engineering, Machine Learning, and Linguistics and survey some
of the major accomplishments in the field. I will discuss the use of
statistical models to develop effective machine translation systems
for numerous language pairs including Arabic-English translation.
I will also give a brief overview of the methods used for building
such systems and show demonstrations of text-to-text and speech-
to-speech translation. Finally, I will discuss the emergent area of
unstructured information management including applications of text
mining in healthcare. I will also describe how machines can extract
information from a patient’s electronic health record (EHR) and
enable applications such as creating billing codes and improving
medical care based on the patient’s EHR.
Automated Language Understanding and Mining Solutions
17

HABIB HADDADThe FEA Distinguished Young Alumnus Award is presented toMr. Habib Haddad in recognition of his tech entrepreneurship and forward looking inventions in Arabic linguistic technologies, and for his valuable investment in building the entrepreneurship ecosystem in the Arab world.
BIOGRAPHY // Habib is an entrepreneur and early stage
investor. He is the CEO of Wamda, a platform that accelerates
entrepreneurship in the emerging markets through a media arm,
and through early stage funds and products. He founded Yamli,
the leading Arabic transliteration and smart search engine, which
is used by millions of users and empowers many organizations
including Yahoo!. In 2009, the World Economic Forum recognized
Habib as a Young Global Leader, and the Arabian Business named
him one of the most influential Arabs. Habib was also named as
a top innovator under 35 (TR35) by the MIT Technology review.
He currently serves on the Global Agenda Council on fostering
entrepreneurship and advises several startups and non-profits.
He received his BE in Computer and Communications Engineering
from AUB in 2002 and an ME in Electrical Engineering from the
University of Southern California in 2004.
18

ABSTRACT // Entrepreneurship has been a key factor in job
and wealth creation in Lebanon and around the region. With the
current turmoils, the way we invent the future and adapt to it has
been increasing in importance and that’s what entrepreneurship is
all about. But what do we need to do to set the foundations of a
strong ecosystem that will allow startups to flourish and grow?
Creating an EntrepreneurialRevolution in the Arab World
The FEA Distinguished Young Alumnus Award is presented toMr. Habib Haddad in recognition of his tech entrepreneurship and forward looking inventions in Arabic linguistic technologies, and for his valuable investment in building the entrepreneurship ecosystem in the Arab world.
19

ALI CHEHABIn recognition of his scholarly contribution to the Department ofElectrical and Computer Engineering in research and the advancementof knowledge.
BIOGRAPHY // Ali Chehab received his Bachelor’s degree in
Electrical Engineering from AUB in 1987, the Master’s degree in
Electrical Engineering from Syracuse University in 1989, and the
PhD degree in Electrical and Computer Engineering (ECE) from the
University of North Carolina at Charlotte, in 2002. From 1989 to 1998,
he was a lecturer in the ECE Department at AUB. He rejoined the
ECE Department at AUB as an Assistant Professor in 2002 and
became an Associate Professor in 2008. He received the AUB
Teaching Excellence Award in 2007. Prof. Chehab teaches courses
in Programming, Electronics, Digital Systems Design, Computer
Organization, Cryptography, and Digital Systems Testing. His
research interests include: Wireless Communications Security,
Cloud Computing Security, Multimedia Security, Trust in Distributed
Computing, Low Energy VLSI Design, and VLSI Testing. Prof. Chehab
has about 120 publications. He is a senior member of IEEE and a
member of ACM.
20

ABSTRACT // In the presentation, Prof. Chehab will describe
his research path since he joined AUB in 2002. He will present
the two main research areas that he is currently involved in and
the corresponding research groups he is part of. The first area is
related to Networking, Communication, and Security and the
corresponding research group is named “Networking and Security”
in which he collaborates with Profs. Ayman Kayssi and Imad Elhajj.
The second area is related to Stochastic Processing for Error-Tolerant
Applications, Hardware Design for Communications Systems, Low
Energy VLSI Design, and VLSI Testing. The research group is called
“Hardware Design” in which he collaborates with Profs. Ayman
Kayssi and Mohammad Mansour. Prof. Chehab will describe the
current research funds, the corresponding research projects he is
co-supervising in both research groups, and the graduate as well
as undergraduate students working on these projects. He will also
describe the available research opportunities for students who are
interested in joining any of the two research groups.
From the Touchable to the Untouchable: A Soft Transition
21

AYMAN TAJIThe FEA Distinguished Alumnus Award is presented to Mr. Ayman Taji in recognition of his many achievements as a leading engineer, contractor,and administrator.
BIOGRAPHY // Ayman Taji was born in 1945 at Ramallah,
Palestine. He earned his BE in Civil Engineering from AUB in
1966, and an ME in Engineering Administration from George
Washington University in 1972. He started his career path
with McGauhy, Marshall & McMillan at Rome, Italy, in 1966,
and then joined Mansour and Abdullah Construction in Kuwait
in 1967. In 1968, while pursuing his Master degree on a part-
time basis, Ayman worked as a full-time employee in Deweberry,
Nealon & Davis at Fairfax, Virginia, until 1971. In 1972, he joined
Consolidated Contractors Company in Abu Dhabi as a Cost Control
and Materials Site Engineer where he was later promoted as a
Site Manager. In 1975, he founded Target Engineering Construction
Company LLC with Mr. Youssef Samaha. The company was first run
by 10 employees experienced in the area of civil construction. Today,
Target has 10,000 employees with four divisions: (1) Civil, (2) marine,
(3) mechanical oil and gas, and (4) power and instrumentation, and a
turnover for the past six years of over 300 million US dollars per year.
22

ABSTRACT // I will share with AUB students and alumni the
benefits I got from attending AUB, and the positive effect it had on
my professional life. I learned at AUB the importance of teamwork
and a broad knowledge base. We used to hate summer courses and
their lab work, but the basic knowledge of mixing concrete, carpentry
and assembling an engine in the Machine Shop, in addition to Judo
classes and music appreciation, gave us familiarity and confidence
in our future life as well as a sense of group work. I will share what
I learned about the ingredients of success from doing things rightly
but not perfectly to protecting one’s own group, manifesting one’s
strengths, making the right decisions, negotiating and searching
for alternative solutions, fighting worthy battles, viewing life events
positively, overcoming hardships, and enjoying work.
23
My Professional Journey

CAROL MENASSAThe FEA Distinguished Young Alumnus Award is presented toDr. Carol Menassa in recognition of her outstanding technicalachievements and her continued help to the Department of Civil and Environmental Engineering at AUB.
BIOGRAPHY // Dr. Menassa is a faculty member at the
Department of Civil and Environmental Engineering-University of
Wisconsin-Madison. She earned her BS and MS degrees in Civil
Engineering from AUB, and her PhD in Civil and Environmental
Engineering and MS in Finance from the University of Illinois at
Urbana-Champaign. Dr. Menassa’s research focuses on sustainability
and energy performance of buildings and on project management.
Her research is funded by the National Science Foundation, the
Construction Industry Institute, the Wisconsin Alumni Research
Foundation and the Wisconsin Energy Research Consortium. Her
research is published in highly ranked journals like Energy and
Building, Automation in Construction and Building and Environment.
She is an active member of the American Society of Civil Engineers,
the Construction Research Congress and the Construction Industry
Institute. Dr. Menassa has experience in the engineering and
construction industry, working with Dar Al Handasah (Shair and
Partners) in Beirut, Lebanon, as a structural engineer; and with CRA
International’s Economic, Financial, and Business Management
Group in Boston, Massachusetts, as an associate.
24

ABSTRACT // High oil prices, diminishing natural resources,
and global warming are causing nations to investigate innovative
solutions to reduce demand for natural resources and curb the
growth of green house gas emissions. Multi-disciplinary research and
education will play an important role in developing transformative
solutions to how we design, construct and operate our infrastructure
systems; as well as, developing the next generation of engineers.
In this presentation, I will highlight how my research group uses
innovative methods like agent based modeling from social sciences
and financial engineering from business to develop decision making
frameworks to guide sustainable building design, construction and
operation. I will focus on the agent-based model we developed
to evaluate the impact of occupancy-focused interventions on
reduction of energy use in commercial buildings given various
building occupancy profiles. I will conclude the presentation by
emphasizing the importance of introducing multi-disciplinary topics
in the curricula with focus on classes that I teach at the University of
Wisconsin-Madison.
Multi-Disciplinary Approach to Advance Research and Teaching in Sustainable Infrastructure Systems
25

MUTASEM EL FADELIn recognition of his scholarly contribution to the Department of Civil and Environmental Engineering in research and the advancement of knowledge.
BIOGRAPHY // Dr. Mutasem El-Fadel received his BE in
Civil Engineering from AUB, MS in Environmental Engineering,
MS in Water Resources Engineering, and PhD in Environmental
Engineering all from Stanford University. He is currently a Professor
and Chairman of the Department of Civil and Environmental
Engineering at AUB. He is also a senior consultant to the World Bank
on environmental safeguards in the MENA region. Prior to joining
AUB, Prof. El-Fadel was a Consulting Professor at Stanford and
worked in US-based consulting firms for over a decade primarily for
corporations, law firms, insurance companies, and various counties
and city boards. Since joining AUB, he has been an expert advisor
throughout the MENA region for international organizations such as
the EU, UN ESCWA, WHO, UNDP, and UNEP, IDRC Canada, USAID,
USDA, SIDA Sweden, amongst others. In 2006, he was awarded the
prestigious Dar Al-Handasah (Shair and Partners) Endowed Chair in
Engineering, which constitutes the highest academic recognition
at AUB and a culmination of an outstanding research performance.
During a leave of absence from AUB (2007-2008), he was appointed
as Chair Professor and Head of the Environment Research Division at
the University of Southampton, home of one of the leading schools
in Civil Engineering and the Environment in the UK, for the academic
year 2007-2008, in recognition of international stature of academic
achievements. In June 2012, he was honored by the Lebanese
National Council for Scientific Research for contributing to research
excellence and publications in the region in environmental and
water resources studies and was granted the award of distinguished
research record.
26

ABSTRACT // Dr. El-Fadel will present highlights of his journey
since he was an undergraduate student at the Department of Civil
and Environmental Engineering at AUB till chairing the very same
Department. He will shed light on a few of his past and on-going
professional and research programs including the collaborative
approach towards Integrated Water Resources Management in the
Litani river basin with opportunities for climate change adaptation
and socio-economic growth; Climate change impact on salt water
intrusion along the Eastern Mediterranean with vulnerability and
adaptation socio-economics; Biotechnology advancement through
thermophilic anaerobic digestion of organic waste and simulations of
mixing determinants; Concerted sharing: Development of a regional
water economy model in the Jordan river basin; and the comparative
approach for improving water and sanitation in poor urban clusters,
and determinants of in-vehicle exposure to automotive emissions
with emphasis on the self-pollution potential, amongst others.
From and Back to AUB:A Professional andAcademic Journey
27

NADINE CHAHINEThe FEA Distinguished Alumnus Award is presented to Dr. Nadine Chahinein recognition of her achievements in the field of Arabic Type Design.
BIOGRAPHY // Dr. Nadine Chahine is an award winning
Lebanese type designer working as the Arabic Specialist at Monotype.
She studied Graphic Design at AUB, has an MA in Typeface Design
from the University of Reading, UK, and a PhD from Leiden University,
The Netherlands. In 2005, she joined Linotype, Germany, as the
Arabic specialist and has been living in Germany since then. Nadine’s
research focus is on legibility studies for the Arabic script. She has won
several awards including an Award for Excellence in Type Design from
the Type Directors Club in New York in 2008 and 2011. Her typefaces
include: the best-selling Frutiger Arabic, Neue Helvetica Arabic,
Univers Next Arabic, Palatino and Palatino Sans Arabic, Koufiya,
and BigVesta Arabic. Nadine’s work has been featured in the 5th
edition of Megg’s History of Graphic Design, and in 2012 she was
selected by Fast Company as one of its 100 Most Creative People
in Business.
28

ABSTRACT // From the hallways at AUB to the departure gates
at Frankfurt Airport, this talk documents a journey of typographic
investigation. What is the state of Arabic Typography today and
how can we improve it? That was Nadine’s research question in the
year 2000, and since her graduation from AUB, she has dedicated
her efforts into the exploration of Arabic typographic design. The
original research question grew over time to encompass the cultural
and political background of Arabic type design and the role of
typography in building cultural dialogue. What is the purpose
of Arabic type design? What is the source of inspiration for new
typefaces? How do we address the relationship of Arabic and Latin
when they sit together on a page? What role do typefaces play
within the overall context of the Arab world today? A lot of questions
to answer, and many more typefaces to show!
In Search of a Voice
29

NICOLAS FAYADThe FEA Distinguished Young Alumnus Award is presented toMr. Nicolas Fayad in recognition of a brilliant career launch andof pushing the boundaries of architectural design.
BIOGRAPHY // Nicolas Fayad completed his Bachelor of
Architecture at AUB. He earned a Master of Architecture with
distinction from the Harvard University Graduate School of Design,
where he won the James Templeton Kelley Prize, offered by the
Boston Society of Architects, for the best graduating project of the
year 2010. His research focuses on architecture which rises from
political, social and physical constraints. Fayad joined Morphosis
Architects in 2010 as a senior project designer and has been involved
in the design and construction of large scale projects such as the Tour
Phare in Paris and the Cornell University Tech Campus in New York
City. His work has been exhibited at the Harvard Graduate School of
Design, the Venice Biennale, and the Abu Dhabi Ministry of Culture.
His work was published in several international magazines. Fayad
was recently recognized by Forbes as one of the ‘30 Under 30’ in the
Art and Design category and has been chosen as the key speaker at
the Envision Arabia Summit 2012 at New York University.
30

ABSTRACT // I believe in the role of design as a form of constructed
imagination that incorporates ethical and political dimensions. The
work I have produced over the past years was an open laboratory
experiment in search of new architectural models that rethink a new
developing intersection between technology, material and form with
society and culture. My education emphasized the importance of
experimentally-based research which combines knowledge gained
from the political, social and physical contexts with the newest
technology in design and computation. I believe that by selectively
indexing programmatic and physical infrastructures of the site, one
can create architecture that works at many different levels: the local,
permanent, ephemeral, historical and ecological levels. In that
sense, I am interested in architecture which emerges from contextual
constraints, simultaneously striving for programmatic resilience. For
the past fifteen years, the new digital design media has pulled
architecture into an uncharted territory of opportunity, ranging from
simulation, construction, rendering and parametric performance. The
question here is whether the exploration of these new contingencies
can be directed towards offering new architectural solutions, while
maintaining authorial control. From the moment digitalization took
command, we have been faced with the challenge of pursuing
an architecture which sits halfway between a generic mode of
development and more specific adaptations and constraints
required by site, program and personal desires. My presentation will
explore the productive space between disciplinary advancement
and cultural and social aspirations. It will amalgamate the most
salient research and design initiative I have pursued through my
academic and professional experiences.
The Specific and the Compositein the Post-Digital Age
31

SYLVIA SHORTOIn recognition of her scholarly contribution to the Department of Architecture and Design in research and the advancement of knowledge.
BIOGRAPHY // Sylvia Shorto, Associate Professor in the
Department of Architecture and Design, researches and teaches
about issues that relate to hybrid material culture across different
scales, from urban environments to individual artefacts, both in North
Indian cities and in other postcolonial contexts including Lebanon.
She has a PhD in the History of Art and Archaeology (2003) from
the Institute of Fine Arts, New York University, and a post-graduate
certificate in curatorial studies from the Metropolitan Museum of Art.
Her dissertation, Public Lives, Private Places: British Houses in Delhi,
1803-1853, explored hybrid spatial and social interactions in both
appropriated and newly-built domestic architecture in that city, and
will be published in 2013 by Boydell and Brewer as part of their Worlds
of the East India Company series. The book has been supported
by a Paul Mellon Senior Fellowship and a Mellon Publication Grant.
Other published work includes “A Tomb of One’s Own: Governor’s
House, Lahore,” in Vikramaditya Prakash and Peter Scriver, eds.,
Colonial Modernities: Building, Dwelling and Architecture in British
India and Ceylon (London: Routledge Architext Series, 2007) and
“Building for the Business of Bermuda”, Traditional Buildings and
Settlements Review (vol. xvii, #ii, Spring 2006), as well as a recent
monograph on continuity of tradition in the houses of the Lebanese
architect, Simone Kosremelli.
32

ABSTRACT // The objects of material culture have lives with
multiple meanings, but those meanings often go unnoticed.
A private house, for example, is an extension of the body. It
delineates a boundary of the self, and can help reveal the underlying
values and belief systems of the individuals who commissioned and
lived in it and, by extension, of the larger cultural groups to which
those individuals belonged.
Focusing on the city of Delhi in the first half of the 19th century, my
talk will examine ways that living space might be used to expand the
historical narratives of colonisation. I look at the specific encounters
of a group of East India Company officials in that city through the
lens of their private tastes and choices - the decisions they made
about where and how to build their houses, and the possessions
they owned, used and displayed in these houses. I compare the
different ways that individuals both related to and resisted the
pre-existing spatial inscription of the city, and how this would
change over time. Paradoxically, Delhi then also becomes a site
where we can begin to further explore, through the material
traces left by the British, an India beyond “British India”. Unofficial
histories, private papers and visual representations from the period,
as well as the extant houses, are used as primary sources to also
demonstrate how a methodological dialogue between surviving
texts and material culture can be transposed to other times and
other places.
Public Lives and Private Places
33

34

9045
DEPARTMENT OF ARCHITECTURE AND DESIGN

36

37
38 Becoming an Architect DINA MNEIMNEH
46 Lebanese Green Building Council Partnerships LOULWA ACHKAR
49 The Verbal and its Visual Disentanglement MELISSA ZAKHARIA
55 Three Edges of a Triangle JANA ARIDI
65 Yarzeh: The Widows’ Hill MAYSSA JALLAD
CONTENT

38
Becoming an Architect: A Look at Architectural Education at the American University of Beirut.
Dina H. MneimnehDepartment of Architecture and Design
American University of BeirutBeirut, Lebanon
[email protected] / [email protected]
ABSTRACT
The Architecture program was first introduced at the Ameri-can University of Beirut in 1963. Since then, it had known vari-ous changes. The paper attempts to look at these modifications throughout the decades and provides an insight about today’s program and how it is shaping the different generations of grad-uating architects.
What is architecture? It is 80% butter paper and 20% origi-nality. But it is this 20 that makes the architects the cream of the engineers, or shall we say the Sundae. After all, dont they spend their «week-end» at the School»? - AUB Campus 1968.
I. INTRODUCTION
Becoming an architect is an ongoing process of discovery, research and experimentation. It basically starts at the level of the academic institution where a meaningful number of courses, both theoretical and practical, in addition to various hands-on tasks and exercises are taught. It is a first step that equips the student with a necessary yet basic knowledge in architecture and its wide perspectives, preparing them to the real world of prac-ticing architecture.
Developments in the international and national discourses of architecture, in addition to political and social modifications highly influenced architectural education throughout the years. These changes did not only affect the curricula but also had a great impact on the architect’s role in society and in the work-place.
The American University of Beirut (AUB) started its architec-ture program in 1963. Since then, the curriculum knew various changes corresponding to the evolution of the field in Lebanon and in the world. An evolution that reshaped the role of the ar-chitect.
This paper attempts to retrace the changes that occurred to the curricula by taking a close look at the list of courses offered by the program in addition to interviewing architects who graduated from AUB to talk about their experience as architecture students or teachers. The interviews tackled varied issues of the past and present: courses they took as students at AUB, ideas, teachers or projects that affected them in a way or another, how they were prepared to enter the practical world of the architecture, their experience as architects and/or as teachers, in addition to
the evaluation of the current education of architecture and its impact on the currently enrolled students and future architects.
II. THE EVOLUTION OF ARCHITECTURAL EDUCATION AT AUB
The 1950’s: Architecture, an Area of Specialization
The curriculum dating back to 1955 consisted of a four-year program in the School of Engineering at AUB, leading to a de-gree of Bachelor of Architectural Engineering.
It was a program «open to practicing engineers of the area who may wish more specialized training or who wish to study the most recent developments in the various engineering fields» (AUB catalogue of 1954-1955).
Thus, studying architecture was part of the engineering pro-gram with a first common year to all students. Those of them who wished to specialize in the area of architecture could do so for the remaining three years of the program.
As soon as students made their choice (summer of first year), courses in topics and techniques of the architectural field are taught: mainly a sequence of architectural design courses and graphics courses. This sequence of design courses, offered ev-ery semester, tackles specific design issues per course: munici-pal buildings, adaptation of a building to a site, housing develop-ments, etc.
These architectural courses find a small place among the in-tensive engineering courses: structures, concrete, fluid mechan-ics, among many other courses given along the four years of the program.
Sabah Abi-Hanna is an AUB graduate of 1959 with a Bach-elor of Architectural Engineering. He sees that architectural education at AUB back then, allowed the students to be well prepared to the practical world of architecture.
Although the courses taken to complete the degree in Archi-tectural Engineering were mostly oriented towards engineering, they allowed him as a student to be exposed to the various di-mensions of an architectural project and look at it in a multidis-ciplinary fashion.
The rigorous program of AUB at that time led to the educa-tion of the “Architect-Engineer” capable of dealing with a given project from its different perspectives: structural, mechanical, electrical, detailing, etc.

39
Abi Hanna stresses on the good relationship students had with their professors mainly Assem Salam, and Raymond Ghosn who played a major role in advising him and setting him for his career choices. Abi-Hanna found himself upon graduation in Kuwait designing large scale projects and playing a major role in the construction boom of the country during the 1960’s.
AUB’s rigorous program in Architectural Engineering, major-ly oriented towards engineering left little time for researching architectural issues, developing the student’s own interests and conceptualizing topics. Essential notions such as understanding proportions and classical aesthetics were omitted due to the ab-sence of courses related to the history of classical art and archi-tecture. Moreover, the constant presence of engineers is quali-fied of “risky” since it blurs the distinction between the role of an architect and that of the engineer.
1963: Beginning of the five-year Architecture Program
The previous program of Architectural Engineering was grad-ually reshaped and enriched with more architecture courses to fulfill the requirements of a distinct architecture program. It was approved in January 1963 and started in October of the same year, admitting the first 22 students of the program (in compari-son to 10 students of the Architectural Engineering program of the previous year). President Norman Burns’s report of 1961-1965 (Appendix 1) states that these changes were essential to cater for the new needs of the profession in Lebanon and in the world.
The new program requires five years and four summers of practical architectural training. A total of 26 new courses were introduced. Theoretical courses in specific relation with the ar-chitectural discourse such as Philosophy of Architecture, Man’s Cultural Evolution, History of Architectural and Engineering Works, are now taught (AUB Catalogue of 1963-1964).
This step comes in accordance with the changes of architec-tural education in the US and in Europe, making AUB one the few universities in Lebanon offering a proper architectural edu-cation adopting the Bauhaus school model.
“It is hoped that this program will prove to be an attempt or a step towards a humanized preparation for men who will partici-pate in the shaping of our physical surroundings” (Al-Kulliyah, 1964).
The 1960’s: A Rigorous Education of the Architect
During the 1960’s, the architecture program was still at its early beginning. The lacking architecture related courses in the previous program were added. Courses in theory and representa-tion were introduced and technical courses were adapted to serve the formation of an architect with specific interests (AUB Cata-logue of 1963-1964).
Diran Harmadayan, an AUB graduate of 1971 and currently practicing architect, describes the program as a heavy one incor-porating a large variety of technical and practical courses. Wood work, steel detailing were courses given by craftsmen exposing students to the hands-on understanding of different materials.
The “Architectural Philosophy” sequence of courses was of great interest to students, according to Harmandayan. They pro-vided a meticulous understanding of design issues (elements of a house, structural methods, and architectural composition) in addition to the detailed study of “work of the Masters” such as Frank Lloyd Wright, Oscar Niemeyer and the Bauhaus.
Such courses are major in the formation of an architect; they provide him or her with the necessary culture to understand the built environment around them: “architecture is culture”.
However, this large influence of the modern discourse of ar-chitecture rendered the approach to teaching very dogmatic and highly guided by the teachers: creativity wasn’t given its total freedom, especially in design courses.
Figure 1 - Architectural Engineering class of 1959 at their drawing tables.
Figure 2 - Graduating class of 1959 at the Commencent Ceremony.Abi - Hanna is the second to the left.

40
The 1970’s: A dogmatic approach to teaching architecture
Even though the curriculum of 1978 shows a large variety in technical and theoretical courses, architectural theory in terms of thinking about ideas and architectural history weren’t stressed (AUB Catalogue of 1978-1979).
Maha Nasrallah graduated as an architect from AUB in 1983 and came back years later as a teacher. She argues that the dogmatic approach to design continued during the years of her education where teachers were mostly «mimicking styles» (post-modernism at the time), in the sense that students were not encouraged to “think out of the box”. Another negative side of the architectural education of the 1970’s was the lack of re-sources: books, periodicals, magazines leading to a lack of ex-posure to the international discourse of architecture happening at the time. In addition to this, the difficult political situations in Lebanon (mainly the civil war in 1975) made it even harder for teachers and students to come regularly to classes. However, students opted to constantly work in the studios at AUB. Shar-ing feedbacks and comments on each other’s projects became a beneficial experience and an additional learning opportunity in such a difficult situation (Nasrallah).
The 1980’s: a more “ mature” program of architecture
Although the curriculum reached a balance between theory and practice courses, the tough political conditions in Lebanon at that time, rendered the learning process quite difficult. Stu-dents often had to take courses off-campus; the war in Beirut made transportation impossible at many times, resulting in a limited number of students able to pursue their education.
According to Aram Yeretzian (an AUB graduate of 1989 and currently a teacher in the Architecture Department), this balance was manifested in a thorough sequence of building construction courses, along with structural and mechanical courses in parallel with the theory and history courses that were of a great interest to students. Therefore, the program prepared students very well to their final year project in terms of choice of topics, conceptu-alization and execution drawings.
Yeretzian mentions the “exceptional” group of inspiring and influential teachers who were present to help students in their design projects and encourage them to be critical thinkers: Rag-ette, Romanos, Khalil Khoury, Gregoire Serof and Jad Tabet.
Due to the tough situation in Lebanon, Yeretzian went to France and continued his FYP with Gregoire Serof and Raul Verney as advisors. He describes his final year project as an “un-conventional” project; it consisted of a series of museums along the Nahr Ibrahim River exhibiting the products of evolution of the different geologic eras.
Yeretzian came back in 1989 to present it and get his diploma without a graduation ceremony.
Figure 3 - Maha Nasrallah’s Final year Project “Souk El Khan - Khan El Hiraf”It is a crafts market in the South of Lebanon where a ‘khan’ used to exist. The
project aims at reviving arts and crafts. Local materials and techniques of build-ing were researched and implemented.
Figure 4 - Khalil Koury Figure 5 - Friedrich RagetteFriedrich Ragette and Khalil Khoury are two recurrent names that were
brought up by the interviewed architects. They were among the most appreciated teachers who marked their students due to their unique approach to teaching.
Friendrich Ragette gave the course “Regional Architecture” which was a re-search about the traditional architecture in the area, requiring a lot of field work.
Maha Nasrallah mentions this course as being an “eye-opener” that taught the students how to understand materials, spatial compositions and vernacular architecture.
Khalil Khoury taught drawing and representation courses. Many generations of architects (among which Diran Harmandayan and Aram Yeretzian) stood amazed in front of his personal drawing skills and his methodology in teaching.

41
The 1990’s: a new “breath” in the department
In the mid-1990’s, new modifications were introduced to the architecture department at AUB. According to Karim Nad-er (graduate of 1999 and currently a teacher), a “new breath” brought more innovative experimentations and theoretical cours-es to the program, encouraging students to plunge in the world of architectural ideas. Theory has now become a tool leading to design. Appendix 2 shows an example of the role of theory as a design inspiration.
Teachers such as Marwan Ghandour, John Biln and Mirjana Lozanyska affected Nader and taught him to think about archi-tecture by adopting a more experimental and theoretical ap-proach to it.
It was also during this time that vertical design studios started in the department: thematic design studios taken by 3rd and 4th year students. Students were allowed to choose the topic that most interested them and designed accordingly.
In this sense, more freedom was given to students to choose their elective courses related to architecture in the field and topic that mostly interested them.
III. WHAT ARCHITECTURE TODAY?
The interview of architects graduating from AUB in the past decades allowed not only to retrace the evolution of architectural education at AUB but also to take a look at it from a teacher’s perspective: most of the interviewed architects came back to AUB as teachers.
Some comments were common between them, targeting many topics: structures, theory, lack of some courses and the actual ap-proach of students to design. Positive and negative aspects of the current education were discussed.
“With what you have, you should be geniuses!” - Maha Nasrallah
Many characteristics make the department of architecture and design at AUB a place where creativity can be pushed to its limits (Nader). The varied student body and the freedom exhib-ited on campus make AUB a place of where mixity and freedom come together to allow many students to express themselves be-yond limits.
Architectural education at AUB is a quite solid one formed of an interesting combination of practical and theoretical courses that provide enough basics of a good preparation to the practical world of architecture. (Abi-Hanna).
In addition to that, students are well exposed to the field of architecture due to the presence of practising architects teach-ing, the numerous references and books they have access to and the series of lectures the department organizes every semester. These elements are key to the exposure of students to the inter-national discourse.
Although some may argue that education at AUB has the ten-dency to be “too philosophized”, the embediment of architec-tural education in theory is essential to build up the culture of
students and expose them to international ideas about topics that are of interest and could lead to a potential design proposal.
Nasrallah argues that the past linear approach to design, that consisted of the choice of site, choice of program, then design sequentially, was replaced by a more “dynamic and diversified” approach to design. Students are now inspired by many things: ideas, theory, images, visions which widens the horizons of the design approach. Consequently, teachers should be able to listen to what students are proposing and encourage them to push their aspirations to their maximum potential.
However, this reality could have many negative aspects: it could lead to an “emptied-out” architecture, an architecture that only responds to the desires of the student described as the “ little creator cherishing his little masterpiece” by Harmandayan.
The presence or lack of freedom in thinking and designing is not the sole factor affecting the attitude of students in the depart-ment.
Nader notices “more relaxed” and sometimes “not motivated” students who are not always pushing themselves to their maxi-mum and need a lot of encouragement from the teachers.
This reality could be explained by the fact that most students in the department can afford its costs, in opposition to the past where many students were granted scholarships and therefore pushed to working hard. Other reasons may explain this fact, students may simply not truly interested in architecture for in-stance. And here, the program’s admission criteria are to be questioned.
Nader argues that students should be always be inspired, very interested and driven to exploration and experimentation in or-der to live up to their own aspirations.
Working in the studio, drawing by hand , not being isolated in front of computer screens are all issues that should be taking into consideration in order to live the experience of being an architecture student in a beneficial and positive way.
More negative aspects emerge in the current curriculum mainly related to its structure and sequence of courses, where a weakness is present in relation to the organization of the build-ing construction and structure courses.
They are too condensed during the first 2 years in addition to the theoretical courses. Therefore, students can not make the best use of them during their later years or final year project (Yeretzian).
On the other hand, teaching structures should be made more interesting to architecture students, providing them with a thorough understanding of structural systems, not necessarily through intensive calculations. It should be taught in a way that serves their design purposes in order to make their adequate and coherent structural concepts choices.

42
Figure 6 - Structural Analysis exam taken by Sabah Abi-Hanna in 1959 Figure 7 - Analysis and Design of Structures exam taken by Dina Mneimneh in 2009
Figure 8 - Stair Section drawn by hand by Sabah Abi-Hanna in 1957 Figure 9 - Stair section drawn on the computer by Ali Khodor, architecture student, class of 2015

43
Appendix 1 - Table appearing in the President Norman Burns’report showing the changes that were introduced to the previous Architecural Engineering program and resulting in the creation of an independant Architecture Program - january 1963.

44
Representation of the sensesIn this first part, I’ll try to investigate representation as a phenomenon that is perceived sensorially, i.e. how it creates affects upon the body, affects that actually similar to ones that are created by the spatial experience of the object. This is where representation gains autonomy and folds to the side of the object.
Appendix 2 - Excerpt from a paper written by Karim Nader for the course: Recent Discourse in Architecture taught by John Biln.
The issue of representation in architecture is what the paper attempting to con-vey through a layering over of visuals (drawings, collages, paintings and pic-tures) and text.This stems from Nader’s personal interest in drawing as a representation tech-nique that he carried over till the maximum by developing his final year thesis and project on this concept. “Can you draw me a house?” was the title of the project where theory investiga-tion was a major design tool that led to the proposal of an architectural product: a house for a real client.

45
CONCLUSION
Looking back at the evolution of architectural education is an interesting research that sheds light at the “golden age” of the program that is relatively defined by each generation of archi-tects. Teachers, courses and anecdotes that marked them is key to the understanding of the general direction architectural educa-tion was taking.
To some of them, the intensive practical courses offered pre-pared them very well to the reality of the field. To others, it is the embodiment of theory in the program that gave it a new more interesting “breath”.
One could look at all of these opposing perspectives of evalu-ating architectural education as a building-up process that leads to the current model of education in the department and to the possible future modifications.
The role of the architect is constantly being reshaped due to the different social, political and economic factors. Architectural education should make sure that students are aware of the role they will be playing in their future careers and understand their responsibilities and rights vis a vis the different parties involved in the process of planning and building. Therefore, architectural education should cater for these ongoing changes and be re-shaped as well.
REFERENCES
[1] AUB Undergraduate Catalogue of 1954-1955 [2] AUB Undergraduate Catalogue of 1963-1964[3] AUB Undergraduate Catalogue of 1977-1978[4] AUB UNdergraduate Catalogue of 1984-1985[5] AUB Undergraduate Catalogue of 1994-1995[6] AUB Campus 1968[7] Aub starts its Architecture Program. (1964). Al Kulliyah[8] President’s report (Norman Burns), 1961-1965

46
Lebanese Green Building Council Partnerships Loulwa Achkar
Department of Architecture and Design American University of Beirut
Beirut, Lebanon [email protected]
Abstract- This paper will attempt to tackle the Lebanese Green Building Council partnership aspect. With the continuous pattern of the absence of a permanent government in Lebanon, environmental issues have been hard to deal with on a long-term basis. The ARZ rating system, still relatively new and seemingly broad, already expresses its wish to create partnerships with all kinds of groups, such as governmental institutions, real estate developers and brokers, building owners, construction firms, engineering firms and engineers, architects, NGOs and educational and scientific institutions [1]. The essay will hence be arguing for collaboration between the LGBC and other Non-Governmental Organizations that are already engaged in the field. By developing strong ties, such relationships could make up for the lack of proper governmental initiatives and could boost the LGBC’s efforts.
Either way, a private sector solution to the problems that the government is incapable of looking after is perhaps better than no solution at all, regardless of the costs. Two predominant organizations have been selected as examples and will thoroughly be described and discussed: Greenpeace and the Lebanese Solar Energy Society. The relationship to these NGOs will respectively be linked to two ARZ components: Operation and Management (dealing with waste and water) and Energy (dealing with HVAC systems).
Greenpeace has been actively involved in environmental issues in the country, notably that of the seacoast. Although the organization deals with a bigger scope than that of individual buildings, it would be interesting to see how its viewpoints relate to that of the ARZ rating system. This knowledge could be used to expand on the ARZ guidelines. Also, Greenpeace is an organization that recognizes and awards individual and collective efforts, another commonality with ARZ.
Another environmental organization that has been active in Lebanon is the Lebanese Solar Energy Society. The society has already drafted guidelines on the design of solar water heaters in the country, the lessons drawn from installation mistakes and the sizing of solar water heaters. When it comes to the ARZ rating system, the section dedicated to Thermal Energy is a small and broad paragraph which merely states that “building with equipment to reduce heat loss and minimize mechanical cooling will receive a high score under this component” [1]. As with Greenpeace, ARZ would be benefitting from an organization that already has strong knowledge and training bases to implement its ideologies since the government has yet again been unable to follow through its promises.
I. INTRODUCTION
In “Beirut 2015: An Unsustainable Future”, author Karah Byrns laments that foreign aid agencies such as the Japanese International Cooperation Agency and the Gesellschaft fur Internationale Zusammenarbeit have begun to view Lebanon as a “hopeless case” and are leaving the country due to the lack of government follow-up [2].
With the gradual abandonment by foreign aid and with an incapable government, it appears that the coming together of different NGOs in the country is a viable proposition for the survival of a strong and unified ‘green’ cause. With the LGBC and ARZ rating system being relatively new on the mainstream, collaboration with already existing NGOs operating in the country could be a way to introduce ARZ to the Lebanese people and to bring different organizations and goals under one umbrella. In that way, the LGBC would operate as an organization that delegates the already existing tasks of other NGOs in relation to its own ARZ components.
II. GREENPEACE
A. Operation and Management: Waste and Water To begin with, Greenpeace is one organization that has
been actively involved in environmental issues in the country, notably that of the seacoast. In 2009, the organization carried out a scientific survey that highlighted the biodiversity present in Byblos. The report was a product of several interviews with the Lebanese fishing communities [3].
Despite all the valuable information that the organization has been able to gather, the Ministry of Environment has been unresponsive; as a matter of fact, the minister in charge at the time is no longer in office- bringing about an important point raised by Byrns in her article “Beirut 2015: an Unsustainable Future;” the author cleverly states that “these issues need to be tackled on a long-term basis and the ministry cannot do this when it’s changing every four years” [2]. Nevertheless, gathered information is undeniably valuable and would be beneficial for the LGBC.
Although Greenpeace deals with a bigger scope than that of individual buildings, it would be interesting to see how its viewpoints relate to that of the ARZ rating system. A major problem in Lebanon has been the dumping of solid waste into the sea, including that of human feces. So far, ARZ has dealt with this problem at the commercial building level, requiring

47
that such a building minimizes its solid wastes through the use of recycled paper and the adoption of waste segregation [1]. By doing so, the polluted water being dumped into our seas (an aspect that seems far from being dealt with and beyond the scope of this essay) could be less toxic.
Another very important component that Greenpeace has dealt with is oil consumption, considered a generation of solid waste as oil products are being dumped into our seas as well. Although the ARZ rating system does not refer to oil consumption specifically, it does stress on “how well a building minimizes its environmental impact through its on-going operations” [1]. A guide list drawn by Greenpeace to inform Lebanese citizens on how to reduce oil consumption advises people to carpool, cycle or use public transportation, to choose products packaged without plastic, to recycle or re-use containers, to buy organic fruits and vegetables, to use non-disposable items in meals, to quit bottled water, etc. [4]. This knowledge could be used to expand on the ARZ guidelines. Also, Greenpeace is an organization that recognizes and awards individual and collective efforts, another commonality with ARZ.
B. Certification System For the past two years, Greenpeace Mediterranean has
partnered up with Olive Branch (created and led by Greenpeace supporter Ricardo Karam) to acknowledge Arab achievements through awards to individuals and institutions, with the first awarding ceremony actually having been held in Beirut in March 2010 [4].
According to Shadi Ghrawi in the Greenpeace Mediterranean issue 44, “Olive Branch utilizes a meticulous and strict framework for its candidate selection process… [and is] based upon certified screening criteria” [4]. With ARZ being a rating system meant for certification and recognition, perhaps the collaboration of Greenpeace and the LGBC could come to be a morphing or adaptation of Olive Branch, focusing more specifically on Lebanon.
It is undeniable that Greenpeace is an internationally acclaimed and praised organization. Yet, it continues to face implementation problems in the country. Therefore, a symbiotic relationship between the LGBC and Greenpeace would be an important achievement, with an international organization benefiting from a local organization, while the latter could boost its popularity and knowledge through collaboration with an internationally recognized organization.
III. THE LEBANESE SOLAR ENERGY SOCIETY
A. Thermal Energy Another environmental organization that has been active
in Lebanon is the Lebanese Solar Energy Society. In 2006, the LSES, like Greenpeace, conducted a survey to collect data from companies, products and applications of solar thermal systems “to establish a standard for Lebanese solar thermal systems and to assess the Lebanese market supply capabilities. The survey [was] the first step of a project between the United
Nations Development Program (UNDP) and the Ministry of Energy and Water (MEW)” [5].
With the accumulation of a 92 page document, the society was able to draft guidelines on the design of solar water heaters in the country, the lessons drawn from installation mistakes and the sizing of solar water heaters. When it comes to the ARZ rating system, the section dedicated to Thermal Energy is a small paragraph which broadly states that “building with equipment to reduce heat loss and minimize mechanical cooling will receive a high score under this component” [1].
The American University of Beirut’s ARZ presentation on April 11 2011 by LGBC’s President Dr. Samir Traboulsi does list main sub-modules that qualify under the Thermal Systems section (such as chilled water systems and solar water heaters), yet a detailed proposal of these elements is absent [6]. The LGBC and the ARZ rating system could therefore greatly benefit from collaboration with the LSES.
Even more appealing is the fact that LSES members constantly have workshops and undergo training organized with the United Nations Development Program, making the society a strong entity in the field [5]. As with Greenpeace, ARZ would be benefitting from an organization that already has strong knowledge and training bases to implement its ideologies since the government has yet again been unable to follow through its promises.
IV. PLANNYC
As foreign aid agencies give up on the Lebanese case, it appears that the coming together of different NGOs in the country is a viable proposition for the survival of a strong and unified cause. Interesting to look at and compare to is the PlanNYC effort, aimed at “A Greener, Greater New York.” As asserted by renowned Lebanese architect and urban planner Habib Debs, “Beirut is not unique in its problems. Other cities have had these problems and solved them” [7].
Noteworthy in the PlanNYC strategy is its dedication to a holistic approach, where “choices in one area had unavoidable impacts in another” [8]. Although New York and Lebanon are different, “the scale, intricacy, and interdependency of the physical challenges we face” are universal, which is why collaboration and coming together of different organizations under one ‘governing body’ is vital.
The PlanNYC vision has managed to create links between a wide range of 25 different organizations and bodies such as the SMART Financing Authority, the new City Brownfields office and the new Interagency Best Management Practices Task Force, to address topics of housing and neighborhoods, parks and public spaces, brownfields, waterways, water supply, transportation, energy, air quality, solid waste, climate change, public health, food, natural systems, green buildings, waterfront, economic opportunity and public engagement [9].
Although these links are mainly with governmental organizations and self-created offices, it is clear that each entity has its own assigned task, which eventually ties back to a

48
larger image falling under PlanNYC. Started in 2006, “the Office coordinates with all other City agencies to develop, implement, and track the progress of PlanNYC and other issues of infrastructure and the environment which cut across multiple City departments. Released in 2007 and updated in 2011, PlanNYC is an unprecedented effort undertaken by Mayor Bloomberg to prepare the city for one million more residents, strengthen our economy, enhance the quality of life for all New Yorkers, and deal with climate change” [9]. Thanks to its delegating organizational method, PlanNYC was able to launch over 97% of its 127 initiatives within one year of its release and almost two-thirds of its 2009 milestones were achieved or mostly achieved [9].
Again, with the absence of an efficient Lebanese government, different local NGOs will have to play the role of New York’s governmental organizations, departments, and PlanNYC’s multiple offices. The LGBC, like PlanNYC, would no longer be viewed as an actual organization, but as the congregation of different organizations coming together to synthesize a unified green vision.
V. CONCLUSION
According to Dr. Samir Traboulsi, it must be kept in mind that the LGBC does not seek to ‘preach’ its name; during his AUB presentation in 2011, he argued that if the Lebanese population was to choose to follow, for example, LEED guidelines correctly instead of ARZ guidelines, this would already be a step forward.
Hence, by collaborating with Greenpeace and the LSES, the LGBC would not be taking over those organizations, but merely attempting to boost its wish for a greener Lebanon under a more organized and cooperative framework, where the different NGOs could now operate in relation to one another. As interestingly articulated by Lady Yvonne Sursock-Cochrane from the Association for Protecting Natural Sites and Old Buildings in Lebanon (APSAD), “the problem is that if each one wants to be the head of a small organization, there are too many… and the power is divided. If everyone would work together, we could do more” [6].
ACKNOWLEDGMENT
The author would like to thank Mr. Matthew Thomas, an ex-visiting professor who taught the ARCH 064 (“Code Green”) course during the 2010-2011 academic year at the American University of Beirut.
REFERENCES
[1] Lebanon Green Building Council. ARZ Green Rating System. Brochure. 2011. pp.8- 12.
[2] Byrns, Karah. Beirut 2015: An Unsustainable Future. Executive Magazine. April 2011. Online Edition., pp.4-6.
[3] Greenpeace Mediterranean. 43(2010). pp. 5. [4] "Byblos Marine Reserve Still Awaits Official Declaration." Greenpeace
Mediterranean. 44 (2011). pp.12-16.
[5] "Lebanese Solar Energy Society." Global Solar Thermal Energy Council.28/12/2009. 30 May 2011. <http://www.solarthermalworld.org/taxonomy/term/3114>.
[6] Traboulsi, Samir Dr. "ARZ Building Rating System." Bechtel Engineering Department. International Finance Corporation. American University of Beirut, Beirut, Lebanon. 11/04/2011. Lecture.
[7] Byrns, Karah. Beirut Under Destruction. Executive Magazine. April 2011. pp.2-8.
[8] City of New York. PlanNYC. 2007. pp.10-14. [9] "PLANYC." NYC.gov. 8 Apr 2013.
<http://www.nyc.gov/html/planyc2030/html/theplan/the-plan.shtml>.

49
The Verbal and its Visual DisentanglementMelissa Zakharia
Department of Architecture and DesignAmerican University of Beirut
Riad El Solh, Beirut 1107 2020, [email protected]
Abstract - My paper explores the many facets of the relationship between text and image. It considers its inherent tension in the fields of philosophy,history, language and art. The main purpose of such a study is an attempt to convey the instability of a text and deny its claim as a carrier of a purely fixed meaning. Thus my research serves as the theoretical basis by which I may create a visual translation of a text that acts as a commentary rather than a direct depiction of the original form. This in turn seeks to prove the efficiency and ability of the visual tools of design in critiquing a text.
I. INTRODUCTION
To visually translate a written text into visual form is to endeavor an interpretation. My research in view of a design project aims to assess this endeavor on two levels. First, by analyzing a variety of translational interrelations between a written text and a visual form. Second, by looking at the challenges of such an endeavor when applied to the domain of western philosophy. To do so, I will attempt a translation of a philosophical text into visual form, which in turn will constitute a visual text. The intention of this work is not to make a dense text easier to comprehend through the use of visuals. Rather, it attempts to expand the written text and open it to interpretation, thus questioning the actual process and function of translation.
The text I have chosen to visually translate is Plato’s “The Simile of the Cave” (see Figure 1) . In this text Plato lays out the deceitful nature of imagery as representation through a metaphor of prisoners trapped in a cave, whose vision is controlled by “shadow puppets”. I argue that the choice of this text is essential for my project as it is a fundamental theory in the history of the troubled relationship between text and image. This will allow me to create a translation that functions on three levels. First, as a means of exposing the underlying structures of a seemingly authoritative text. Second, as a way to revisit and reconsider the tensions and imbalances between text and image. Third, to provide Plato’s theory with a translation quite distinct from its available and common visualizations.
This endeavor and its accompanying research will convey the ability of graphic design to critique existing forms of visual interpretation, convert a text/image theoretical framework into a methodological design approach and ultimately question the process of translation as a whole. It is also significant as such investigations into the history of image-text relations question the actual structure of our linguistic system and conventions that may seem as pre-existing forms of representation.
II. BETRAYAL
“The labor of translation and its deeds are often coupled with “treason” as an attribute even when described as beautiful”.
Depending upon audience and purpose, a translator may serve as an invisible intermediary between a written text and a visual text. A different approach would posit the translator as more apparent, someone who allows his/her own ideologies to affect the work of translation. This will inevitably lead to a piece with a multitude of interpretations. This can be said to be a betrayal of the original text. I believe this notion of betrayal is vital for my project, the act of translation itself can be considered a betrayal as there is always an element in the text that is lost or added once it has been translated. In the case of Plato's Cave it may also be viewed as an intentional betrayal as I will be visually representing a theory that argues against representation. Such connotations of the act of translation with the idea of betrayal are touched upon in Bassam Hajjar’s text “In Praise of treason”. He speaks of the translation of poetry into another language as being “inherently treasonous” and the role of translators as critics (even if they don’t intend on doing so). Thus such an attempt becomes ultimately subjective.
Each mode of representation carries with it a specific library of references. Upon translating a text, these references are also transformed thus hiding and revealing different meanings. Rather than a direct visualization, betrayal will give rise to a translation that uncovers meanings that may have been concealed in its original form. A translational betrayal of Plato's text may question his role and authority as an author of an original and fixed text.
III. A SYNOPSIS OF PLATO'S CAVE
“The Republic” was written in 380 BC by Plato in the form of a series of dialogues between Socrates and himself. It touches upon ideas of Justice and the characteristics of a just city-state and a just man. It Consists of Book I to XI, “The Allegory of the Cave” is present at the beginning of Book VII. In his allegory Plato begins with a detailed description of a cave containing prisoners who have lived there since birth, never able to venture further than this underground space as they are chained in a single position. This specific position constrains their vision so as whatever they saw, or where made to see, would inevitably seem like the truth. Behind these prisoners, on a higher level of the cave, are a group of men and between the men and the backs of the prisoners is a fire. Thus with a variety of objects
1. Hajjar, Bassam (1997) In Praise of Treason, Page 1.
1

50
made from different materials, that represented things such as people and animals, these men create “Shadow puppets” that are projected on the wall of the cave directly in front of the prisoners. Unaware of these puppeteers and the false nature of their forms, the prisoners believe that the shadows are representative of reality. They are even made to name these shadows in the correct sequence and if they successfully did so they would be rewarded. Plato then argues that if a prisoner ever managed to escape and was made to see the actual constructs that created the shadows, he would be in too much pain and awe to actually believe that what he had seen his whole life was false. Yet with time his eyes would adapt to the blaze of the sun and he would then realize that this light controlled all elements of nature that he saw before him. After this enlightenment, he would then pity his fellow prisoners that were still trapped in the cave. Even if he attempted to return underground and continue naming the shadows as he used to, it would be difficult for him to do so as his eyes were no longer accustomed to the darkness. This would then infuriate the other prisoners to the point of violence, as they would think the sunlight had hazed his perceptions.
There are a variety of interpretations of this scenario, one of which is that the passage to the world of sunlight represents the minds' transition into a stage of enlightenment and knowledge. Such a world would reveal the true form of “the good” and upon its discovery one is then given the capacity to think morally, rationally and intelligibly. The prisoners in the cave may represent the ignorance of our current society, where the puppeteer’s are the hegemonic class who claim to know truth yet have never actually seen it. Thus only individuals who have passed through this stage of enlightenment are eligible legislators.
IV. VISUAL TRANSLATION IN PHILOSOPHY
A. Literal TranslationsThe first stage of my research comprised of exploring pictorial
translations of philosophical texts. I looked at examples of publications and posters that attempted to explain or simplify such texts through the use of visuals. They each contain different modes of visualizing and representing philosophy yet they have a number of common issues concerning the function of their imagery (see Figures 2-5). Firstly the images serve as visual accessories rather than tools that aid in the understanding of the text. In an effort to design the philosophical concepts, the result is a graphic element that narrows down the content of these theories into basic generalizations. Also, the fact that all the theories are visualized with the same graphic approach somehow looses from the uniqueness of each concept, lending them all a standardized look that does not allow for each text to reflect its own specific character. Another recurrent theme I came to notice is the use of a style of graphics that embodies a certain time period. Despite the fact that the context reflected may indeed be the location of the origin of the theory, I believe graphics that attempt to do so confine philosophical thought to the past, when actually it is constantly occurring, and will continuously do so (see Figures 4-5). Also, in terms of visual appeal it seems
to be a cliché generalization that is exerting too much effort to resemble the mood of philosophy and in turn generalizes the subject to an unfamiliar audience. For my interpretation I would not like to refer to any historical/cultural context so the visuals may become elements that are universally understood.
These case studies revealed patterns of image functioning as a simplification, generalization and literal representation. Could translation perhaps carry another function in relation to the text? Rather than the dependence of the image on the text, could they somehow be complementary? Such examples come to prove that even if unintentionally, visualization inherently betrays its text either by contribution or reduction. At certain instances when the translator’s presence is more revealed (when the visual is not a direct replica) the text becomes more open to interpretation and ultimately more interesting.
B. Form as ContentA chief concern I have with the examples I have discussed
so far is their treatment of typography in relation to the visuals. Image and text rarely coincide as they are treated as separate elements on the page, each containing its own private space. I believe that all the stylistic and functional elements that comprise a page, no matter how minute they seem, exist to be employed and elaborated.
In my visualization I will utilize such components in order to create a layout where the actual structure of the composition may generate meaning and reflect the feel of the subject matter.For example, in a spread of a magazine created by Andrew Brawl (see Figure 6), all the elements of the layout are used in order to create a certain mood with their specific arrangement. In this sense at many instances the text is treated as an image and manipulated according to the content of the subject matter. A visualization of Plato's theory conveys the same approach, in “Plato, The Republic, Book VII, 524A” (see Figure 7) the designer uses the same quote yet prints it using several different techniques. He attempts to translate one of the interpretations of the cave rather than its setting.This interpretation relates to Plato's theory of forms , the idea that for all the forms we encounter on earth, there exists a perfect form that they are copying. For example all the tables on earth are a copy of a singular and unchanging divine table. This visualization becomes a commentary on the theory by revealing the variety of forms the quotes may have, which is the true one?
C. Moving ImagesConsidering the cinematography and mise-en-scène of
motion pictures related to the subject of philosophy provided me with an alternate insight into translation, as such a field has also undergone the trouble of visualization when it comes to using any textual source as a script for a movie. “The waking life” is an animated philosophical documentary (see Figure 8), it is yet another example of form following content as the central theme envelops into the stylistic approach of the film. The fluidity and inexactness of the characters contours, their manner of speech and the fragmented flow of the narrative all contribute to one

51
of the main ideas in the film, that it is set in the main characters dream.
V. A HISTORY OF TENSION
“Images are dangerous, they may captivate the onlooker and steal the soul”
The troubled interplay between text and image has been subject to various forms of debate throughout history. Referring back to the beginning of the life span of text-image tensions one gets caught in a whirlwind of contrasting beliefs and terminologies. The terms text and image deviate into other wordings such as picture, representation, object, word and language. The allegory of Plato’s cave is a significant theory in this relationship as it has influenced Western philosophy with mistrust in imagery.We then see this same mistrust in the manifesto of the “Situationists International” in 1957 who attempted to emancipate themselves from a society governed by representation and in a1988 humanities report in the United States, claiming that images may even have the power to further widen the gap between social classes. We find ourselves now in the 21st century to be a culture so captivated by the image that we must write books and theorize methods by which we may dissect them. (Such as the study of semiotics, which analyzes the various means by which signs can construct meaning in images). Yet Images are not the only elements of this binary to have been put under scrutiny. When we put into question the reliability of a text to depict the truth, there is also some doubt. Theories of textual interpretation, philosophies of language and deconstructionism all strive to uncover a text’s hidden obscurities.
Image and text should not always be seen as two separate binaries, they also may work in relation to each other. An Image may become textualized, such as in the case of Egyptian priests who used ideograms and In turn, text may act as an image. In his book “Picture Theory”, W.J.T Mitchell argues that all representations are heterogeneous, containing both verbal and visual modes of experience and never one in its pure form. I agree with Mitchell’s point as there seems to be a constant interaction between these two forms, each containing its own system of references but at times they overlap and exchange their diverse modes of significations. I also believe that we can trust neither as a homogenous form of truth, rather the effectiveness of their usage and meanings they create can only be analyzed in terms of their cultural/historical context. The constant transformation of text into image and vice versa may serve as a beneficial tool in my own critique of Plato’s text.
VI. LANGUAGE & ART
During the end of the 20th century artists began to create works of art which became defined by their theoretical framework rather than aesthetic appeal. This gave rise to conceptual art. My concern is with such artistic developments that occurred in light of the conceptual framework of image-text relations. Text was first incorporated into imagery in the beginning of
the 20th century with the visual experimentations of various avant-garde movements such as futurism and Dadaism. In the 1920’s and 30’s René Magritte questioned this relationship with his word and image explorations. Later during the century experimentations with art and language became more common among young American artists such as Robert Morris, Joseph Kosuth, Jasper Johns, William Anastasi and John Baldessari. Such experimentations include image-text composites, tautologies and installations. Their work also characterizes the period of post modernity as a revolt against the “visual purity” of modernism that attempted to remove any form of textuality from art.
Firstly it is important to mention Saussure and his contribution to semiology as many of the artists I had mentioned refer to this notion in their work. His diagram (see Figure 9) reveals the relationship between a signifier and a signified. A signifier is a spoken term such as “Tree”, shown here whereas a signified is the concept that the word “Tree” refers to. This reveals the inherent arbitrary relation between a signifier and signified, thus the “emptiness” of a sign, which carries no meaning when it is taken out of context. René Magritte’s paintings are constantly referring to this issue (see Figure 10). He explored the different ways that text and image could be handled in order to convey meaning and also probed the idea that these meanings where never entirely fixed, and could provide endless significations. He also questioned the stringent ways language and representations are taught to us in educational institutions.
The work of the American conceptual artists in the 60’s explores some of the same ideas but with more of a variety of mediums and methodologies. They used installations and tautologies, often creating language games with them. Joseph Kosuth’s work entitled “One and three chairs” (see Figure 12)shows three different representations of a chair : a photograph of a chair, an actual chair and a dictionary definition of it. It is actually a commentary on Plato's theory of forms that I had mentioned earlier. The object implies that it is impossible for such a perfect form to exist when each object can contain only so many ways of being represented. Kosuth also uses tautologies in his work, which is a recurrent theme among these artists (see Figure 11). A tautological statement is one of self-denotation; it simply describes what it is. Its interesting as it resists semiotic analysis as its signifier and signified become one, also its candid nature invites the viewer to over-interpret the work. This also becomes a commentary on the idea of captions, labels and titles that usually accompany an image. Magritte claims that the caption constricts the viewer, leaving no room for any interpretation. It also allows us to question the trust we may instinctively have in an image or text if it appears to us in a legitimate format.
Semiotic analysis, deconstruction, and language theories have given these artists the necessary tools to create works of art that may speak, question and engage, even in a subtle undertone, rather than only function on an aesthetic level. They reveal how a text-image theoretical framework can be visually translated into a work of art. This is significant because it also reveals conceptual art developed in light of Plato’s theory and the distinct
2. Mitchell, WJT (1994) Picture Theory: Essays on verbal and visual
representation, University of Chicago Press, London. Page 2.
2

52
approaches adopted to question and critique it rather than simply describe. These artistic responses take the relationship of text and image to a variety of levels, further emphasizing the anxiety and disruption that exist between the two.
VII. DECONSTRUCTION
In 1967 with French philosopher Jacques Derrida’s book, “Of Grammatology” came the birth of the term deconstruction. It describes the methods by which Derrida dissects the underlying meanings present within a text. Rather than assessing a text in respect to its content he does so through the “linguistic and institutional systems that frame the production of text”. Derrida’s works also tackle issues of authorship and the originality of the text. As my translation functions as a critique such studies provide me with the proper tools to question and expose Plato’s simile and his authorship.
Roland Barthes also touches upon this subject in his essay “The death of the author”, where he describes a sentence as “a multi dimensional space in which a variety of writings, none of them original, blend and clash”. Thus implying that a text is simply a culmination of diverse writings coming from different contexts and denying the author the role of a creator of an original fixed meaning. In terms of artistic practice, Mitchell characterizes it as a phenomenon of post modernism that occurred with the attempt to fuse the visual with the verbal. “The de- purifying of artistic opticality has been accompanied by a de-throning of the notion of the artist as the creator of an original image, a novel visual gestalt that bursts fully formed from the mind of the artist to dazzle and fixate the spectator”.
Jacque Derrida’s “Glas”, which has been described as an “Anti-book”, proves to be a visual translation of this concept(see Figure 13) It also makes the distinction between using the theoretical framework of deconstruction to guide a design approach as opposed to using the elements of deconstruction simply in terms of a stylistic approach.“Glas” consists of two columns of text on each page with two contrasting styles of writing; the left column is the work of the philosopher Hegel whereas the right column is a fictional narrative by Jean Genet. Derrida questions ideas of the ownership of the content, identity of the author and originality of the text through approaches such as juxtaposing texts from different sources, subtly placing his signature between various layouts, inserting quotes that continue for many pages, fragmenting the text with unequal margins, misplacing footnotes and using heterogeneous typefaces. At instances Derrida even forms different structures with the text such as capitals, pyramids and pillars. This allows text to become an image thus merging the visual with the verbal. In Hal Foster’s “anti aesthetic” he describes some of the analogies Derrida uses in “Of Grammatology” such as “collage/montage writing” as a “bisexual writing” .Therefore “Glas” seems to visualize this notion of a duality with its plurality of interpretation as Derrida provides us with a linear, more critical, reading of the text.
VIII. THEORETICAL VISUALIZATIONS
In the late 1980’s the term deconstruction had slowly started to become stripped of its theoretical framework to stand as a reference to describe the use of specific stylistic elements and purely formal methodologies. This could be seen in a variety of fields such as graphic design, architecture and fashion. Ellen Lupton and J.Abott Miller describe this phenomenon in their essay “Deconstruction and Graphic Design” published in “Design writing research”. They argue that deconstruction, rather than embody a stylistic period, should be representative of a method by which one may question established forms and institutional systems that generate presupposed truthful meanings. They describe an instance in 1978 where deconstruction made its way into the aesthetic field as both a theoretical practice and stylistic approach in the Cranbrook Academy of Art. Student’s incorporated works by Jacques Derrida, Hall Foster, Roland Barthes and other post structuralist theoreticians into visual practice. They proved the power of graphic design as a means of critique through the rejection of the formal means of communication. They questioned the authority of conventional formulas that structured a text such as the Swiss rationalistic approach to typography. Thus challenging the functions of elements such as grids, footnotes and spacing (see Figure 14).
Typography then proves to be a crucial instrument for designers working around Derrida’s framework. He describes how the phonetic system contains certain graphic elements that subtly dictate the entire structure of the text. Yet they cannot even be considered symbols as they carry empty connotations. These elements include the space between two words, the negative space between letters, punctuation marks, framing, numbers, mathematical symbols, roman/italic type styles, uppercase/lowercase settings, dingbats, footnotes etc…. The design of typography culminates the use of these graphic elements and their organization into a coherent layout. Thus through typography one can challenge their authority. Sam Winston is a notable figure to mention in light of considering the functions typography may carry other than readability (see Figure 15).
Containing no purely fixed meaning, a text is in constant referral to other texts, which in turn are referrals to a variety of different texts. This notion carries the act of visual translation to another level. Thus using the typographic elements of deconstruction, not as empty stylistic elements, but as graphic forms carrying allusions to Derrida’s theories while simultaneously considering the visualizations of the imbalance between text and image, one may give rise to a visual translation that may unfold the text rather than substantiate it.
ACKNOWLEDGMENT
I would like to thank Professor Walid Sadek for encouraging me to drift through the seams of unfamiliar texts. Yet, never too far as to loose my initial premise.
3. Lupton, Ellen & Miller, J.Abbott (1999) Design Writing Research: Writing on Graphic Design, Phaidon Press limited, London. Page 3.4. Barthes, Roland (1977) Image, Music, Text, Fontana Press, London. Page 146.5. Mitchell, WJT (1994) Page 245. 6. Foster, Hall (1983) The Anti-aesthetic: Essays on Postmodern Culture, Bay Press, Washington. Page 90.
3
4
5
Figure 1 : Illustration of Plato's Cave, "Great Dialogues of Plato" (Warmington and Rouse, eds.) New York: 1999. p. 316.
6

53
REFERENCES
B. Gilman, Ernest (1980) “Word and Image in Quarles' Emblems”(eds.)
(1980) The Language of Images, University of Chicago Press, London,
pp.385-410.
Barthes, Roland (1977) Image, Music, Text, Fontana Press, London.
Derrida, Jacques (1974) Glas, Editions Gallile, Paris.
Desmond, Lee (2007) Plato -The Republic, The Penguin Group, London.
Foster, Hall (1983) The Anti-aesthetic: Essays on Postmodern Culture,
Bay Press, Washington.
Hajjar, Bassam (1997) In Praise of Treason - Excerpts translated by Walid
Sadek, Arab Cultural Center, Beirut.
Images of Resemblance: Magritte’s Semiotic Explorations, http://courses.
washington.edu/hypertxt/cgi-bin/book/wordsinimages/magritte.html,
18/11/2012,George L.Dilon.
Lupton, Ellen & Miller, J.Abbott (1999) Design Writing Research: Writing
on Graphic Design, Phaidon Press limited, London.
Mitchell, WJT (1994) Picture Theory: Essays on verbal and visual
representation, University of Chicago Press, London.
FIGURES
[1]
[2]
[3]
[4]
[5]
[6]
[7]
[8]
[9]
Figure 2 : Gennis Carreras, "Philographics", 2011.
Figure 3 : "The Philosophy Book", 2011.
Figure 4 : "3 minutes pour comprendre les 50 plus grandes theories philisophiques", 2011.
Figure 1 : Illustration of Plato's Cave, "Great Dialogues of Plato" (Warmington and Rouse, eds.) New York: 1999. p. 316.
Figure 5 : "Aristotle - A graphic guide", 2010.
Figure 6 : Andrew Brawl, "Cyberhaze", 2009.

54
Figure 12 : Joseph Kosuth, "One and three chairs", 1965.
Figure 11 : Joseph Kosuth, "Box, Cube, Empty, Clear, Glass ", 1965. Figure 15 : Sam Winston, Sketches and spreads from
"A Dictionary Story ", 2001.
Figure 9: Ferdinand de Saussure, Saussurean Diagram, 1910.
Figure 10 : René Magritte, Left : The Interpretation of Dreams,1927/
Right : The Palace of Curtains, 1928.
Figure 14 : Allen Hori, "Typography as Discourse", 1989.
Figure 13 : Jacques Derrida, "Glas", 1974.
Figure 8 : Scene from film, "The Waking Life", 2001.
Figure 7 : Joa Neves, “Plato, The Republic, Book VII, 524A”, 2012.

55
Three Edges of a TriangleJana Aridi
Department of Architecture and DesignAmerican University of Beirut
Beirut, [email protected]
Abstract- The urban fabric of Beirut has been the site of many transformations which have left it in a state of an exquisite marriage of old and new, heritage and modern, large scale complexes and rural-like neighborhoods. However, in the light of the ongoing transformations of the city triggered by urban growth and its subsequent effects, how do the road plans on one hand and the pledge for the protection of heritage homes on the other intersect? Nostalgia and passion and attachment to heritage are not enough to construct a conclusive city. Nevertheless, heritage buildings are standing –until now- proof of our culture, history and ancestors’ lives. Most road plans have been drawn several years ago. Today, who manages them and who decides on their conduction –and how? What can be done efficiently so that on the one hand heritage is preserved and on the other, problems that lead to the construction of roads and bridges are solved? This paper will deal with the road planning process on the one hand from the point of its initiation, the studies and more importantly, the organizations that are involved in the decision-making and execution procedure. On the other hand, it will tackle heritage and the different laws that have been initiated as small projects throughout the years –and failed to succeed. At the end, everything is interconnected; the more we build, the more houseswe lose –because of the roads themselves or the high rises that replace them. It is important to the city of Beirut to develop and solve its problems, but it is also important to remember.
Beirut is a city of constant change. Maps of the city throughoutthe decades show numerous stages of development –not necessarily improvement. The French mandate during the twentieth century introduced urban planning to a city which never had a plan. Various masterplans were drawn for Beirut, and yet not one was approved. The earliest masterplan was done by the Danger brothers in 1932, known as the Danger Plan. In 1943, the French sought after architect and urban planner Michel Ecochard for the second masterplan which was also rejected. Egli in 1950 proposed a reincarnation of Ecochard’s plan with minor adjustments, but this too was dismissed. All three plans sought to create axes of the major arteries to the city from the North to the South, as well as zoning the different areas. Ecochard introduced the importance of the BCD (Beirut Central District) and planned the roads accordingly. He also zoned different areas according to function. After the independence, the urban fabric of Beirut was a chaos. Lebanon was left without any framework or guiding structure, with establishments that were “based mainly on allegiances and loyalty to the mandatory power.”1 Therefore,
1 Salam, Assem. Projecting Beirut: The Role of Government in Shaping the Built Environment. Edited by: Rowe, P & Sarkis H. p. 123. Prestel 1998
the problems we are facing today with the city, the road network, the building law and public spaces –to name a few-were actually present in the 1950s. in 1977, APUR attempted to plan the city, it put Dar Al Handasa in charge of the infrastructure with Lebanese architects and planners (Khalil Khoury, Alp Saadedine, Asaad Raad and Pierre el Khoury). This was the first plan that wanted to maintain the urban fabric when possible and reinitiate the BCD to its original energy as well as create a metro line linking the airport to the port through the center, which was possible given the destruction that had occurred. This plan too was rejected. In 1991, Dar al Handasa was commissioned to do a masterplan for the revival of BCD again but it was also rejected. Lebanon was left to aply the 1952 plan. The new road projects are mere suggestions that were drawn on separate pieces of paper. However, today, how are those plans implemented and what governs their decision? How do these plans intersect with heritage? And how can one preserve this history without being tangled up in nostalgia that would only hold him/her back from moving forward? As is the case of human beings in their everyday lives, buildings have lives too. They breathe, take air and release it, take light, grow life, and if unattended, decay. However, as architects and active members of the community, their lives are up to us. In order to further explain the procedures, I will follow a narration of events confining my argument to three tips of a triangle. The three interrelated points are: 1)Heritage buildings and the laws governing their preservation which is at the tip of the triangle –being directly affected by the other two. 2) Road plans –which go hand in hand with the building law. 3) Public transportation systems and parking. However, and in order to reach a better understanding of events, I will be starting backwards.
Road PlanningAs mentioned before, Lebanon and more specifically Beirut had been the subject of many planning proposals, all of which had been rejected without presenting alternatives. Due to accumulation of events, we ended up with an unplanned, improvised and most importantly plan-it-as-we-go road network. It is very important to know the different administrations that are involved in the decision making process for there is no one single source that is responsible. Before 1977, Lebanon used to have the Ministry of Planning which dealt with all sorts of city planning projects. When the ministry was cancelled in 1977, the Council for Development and Reconstruction (CDR) was initiated. The CDR handles large-scaled projects (scales similar
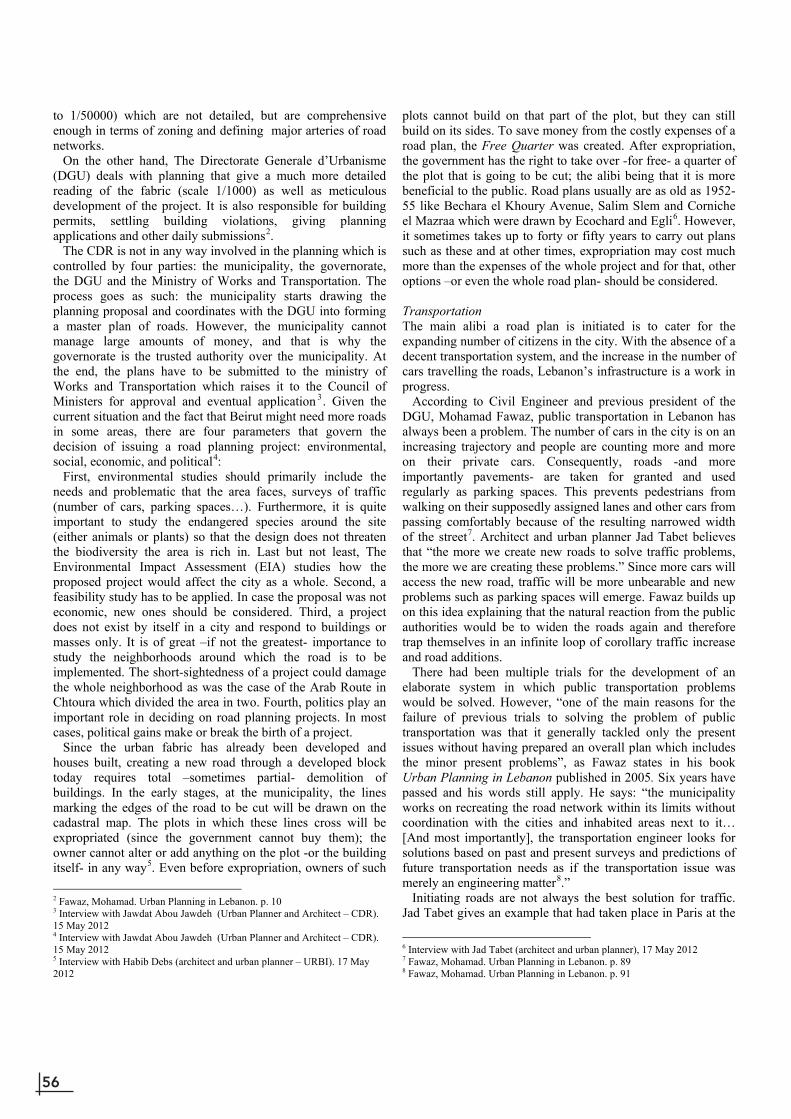
56
to 1/50000) which are not detailed, but are comprehensive enough in terms of zoning and defining major arteries of road networks. On the other hand, The Directorate Generale d’Urbanisme (DGU) deals with planning that give a much more detailed reading of the fabric (scale 1/1000) as well as meticulous development of the project. It is also responsible for building permits, settling building violations, giving planning applications and other daily submissions2. The CDR is not in any way involved in the planning which is controlled by four parties: the municipality, the governorate, the DGU and the Ministry of Works and Transportation. The process goes as such: the municipality starts drawing the planning proposal and coordinates with the DGU into forming a master plan of roads. However, the municipality cannotmanage large amounts of money, and that is why the governorate is the trusted authority over the municipality. At the end, the plans have to be submitted to the ministry of Works and Transportation which raises it to the Council of Ministers for approval and eventual application 3. Given the current situation and the fact that Beirut might need more roads in some areas, there are four parameters that govern the decision of issuing a road planning project: environmental, social, economic, and political4: First, environmental studies should primarily include the needs and problematic that the area faces, surveys of traffic (number of cars, parking spaces…). Furthermore, it is quite important to study the endangered species around the site (either animals or plants) so that the design does not threaten the biodiversity the area is rich in. Last but not least, The Environmental Impact Assessment (EIA) studies how the proposed project would affect the city as a whole. Second, a feasibility study has to be applied. In case the proposal was not economic, new ones should be considered. Third, a project does not exist by itself in a city and respond to buildings or masses only. It is of great –if not the greatest- importance to study the neighborhoods around which the road is to be implemented. The short-sightedness of a project could damage the whole neighborhood as was the case of the Arab Route in Chtoura which divided the area in two. Fourth, politics play an important role in deciding on road planning projects. In most cases, political gains make or break the birth of a project. Since the urban fabric has already been developed and houses built, creating a new road through a developed block today requires total –sometimes partial- demolition of buildings. In the early stages, at the municipality, the lines marking the edges of the road to be cut will be drawn on the cadastral map. The plots in which these lines cross will be expropriated (since the government cannot buy them); the owner cannot alter or add anything on the plot -or the building itself- in any way5. Even before expropriation, owners of such 2 Fawaz, Mohamad. Urban Planning in Lebanon. p. 10 3 Interview with Jawdat Abou Jawdeh (Urban Planner and Architect – CDR). 15 May 2012 4 Interview with Jawdat Abou Jawdeh (Urban Planner and Architect – CDR). 15 May 20125 Interview with Habib Debs (architect and urban planner – URBI). 17 May 2012
plots cannot build on that part of the plot, but they can still build on its sides. To save money from the costly expenses of a road plan, the Free Quarter was created. After expropriation, the government has the right to take over -for free- a quarter of the plot that is going to be cut; the alibi being that it is more beneficial to the public. Road plans usually are as old as 1952-55 like Bechara el Khoury Avenue, Salim Slem and Corniche el Mazraa which were drawn by Ecochard and Egli6. However, it sometimes takes up to forty or fifty years to carry out plans such as these and at other times, expropriation may cost much more than the expenses of the whole project and for that, other options –or even the whole road plan- should be considered.
TransportationThe main alibi a road plan is initiated is to cater for the expanding number of citizens in the city. With the absence of a decent transportation system, and the increase in the number of cars travelling the roads, Lebanon’s infrastructure is a work in progress. According to Civil Engineer and previous president of the DGU, Mohamad Fawaz, public transportation in Lebanon has always been a problem. The number of cars in the city is on anincreasing trajectory and people are counting more and more on their private cars. Consequently, roads -and more importantly pavements- are taken for granted and used regularly as parking spaces. This prevents pedestrians from walking on their supposedly assigned lanes and other cars from passing comfortably because of the resulting narrowed width of the street7. Architect and urban planner Jad Tabet believes that “the more we create new roads to solve traffic problems, the more we are creating these problems.” Since more cars willaccess the new road, traffic will be more unbearable and new problems such as parking spaces will emerge. Fawaz builds up on this idea explaining that the natural reaction from the public authorities would be to widen the roads again and therefore trap themselves in an infinite loop of corollary traffic increase and road additions. There had been multiple trials for the development of an elaborate system in which public transportation problems would be solved. However, “one of the main reasons for the failure of previous trials to solving the problem of public transportation was that it generally tackled only the present issues without having prepared an overall plan which includes the minor present problems”, as Fawaz states in his book Urban Planning in Lebanon published in 2005. Six years have passed and his words still apply. He says: “the municipality works on recreating the road network within its limits without coordination with the cities and inhabited areas next to it… [And most importantly], the transportation engineer looks for solutions based on past and present surveys and predictions of future transportation needs as if the transportation issue was merely an engineering matter8.” Initiating roads are not always the best solution for traffic. Jad Tabet gives an example that had taken place in Paris at the
6 Interview with Jad Tabet (architect and urban planner), 17 May 20127 Fawaz, Mohamad. Urban Planning in Lebanon. p. 898 Fawaz, Mohamad. Urban Planning in Lebanon. p. 91

57
beginning of the 1960s when a traffic expressway along the Sienne river bank was constructed. Time showed that instead of it diminishing traffic, it only created more traffic and the construction of this expressway prevented the public pedestrians from walking along the river banks. Consequently, a decision was made to cancel this route –in spite of the traffic engineers’ disagreement. Experiments during the different seasons showed that even if this road was closed, traffic was redistributed along the other roads. Today, the expressway is closed completely the river bank has been reclaimed to the pedestrians and cyclists. Around 15 years ago, the IAURIF (Institut d'Amènagement et d'Urbanism de la Région d'île-de-France), in collaboration with Habib Debs, started a plan that distributes the public transportation system throughout the city and recently discussions were made with the minister of Works and Public Transportation about actually putting it into use9. Nevertheless, public transportation systems had never been fully practical in Lebanon. Even in the presence of tramways or buses, the situation was not as it should have been. Cars trespassed onto the lanes of the tramways and created traffic forcing the tramway driver to ring his bell. “Dedicated lanes are constructed so cars cannot pass in front of the tramway and intersect its route”, says Jad Tabet, now settled in France where the municipality of Paris had installed dedicated lanes for the buses ten years ago. Debs offered another option for encouraging the use of public transportation by giving London as an example. Incertain parts of London, one has to pay a quite expensive tax in order to enter by car. However, in order to enforce any rule governing the use of public transportation over the private facilities, the public authorities have to provide for a complete public transportation system. Debs explains that “the problem in Beirut is that we do not have this option. Of course there are the service and the taxis which are always on the roads moving between the different areas, but they are not as efficient as the bus.” He continues that “one bus is the equivalent of forty cars. If people took the bus instead of their cars for transportation, traffic would automatically decrease. However, for the bus not to fall into the same problems as the car, it is mandatory that it has dedicated lanes which would make its transportation faster.” He defined the BRT (rapid bus transport) which is found in some countries such as those in Europe or the United States where instead of having a metro, the BRT is a dedicated bus lane along the city that has its own management times and its own route that is never interrupted. With this system, a bus can travel throughout the city faster, more economically and more sustainably than cars.
HeritageAfter the introduction about road planning and public transportation in relation to the urban environment, it is very important to understand how the two concepts of “urban planning” and “land use” greatly affect transportation, and in
9 Interview with Habib Debs (architect and urban planner – URBI). 17 May 2012
turn how both directly affect heritage buildings in Lebanon. Having already explained briefly road planning –which is a major part of urban planning- land use has been managed by the Lebanese building law. Unfortunately, in Lebanon areas are zoned according to a certain FAR governing each zone. The height of buildings depends on the width of the roads directly surrounding each plot. This gives great control to the developers and creates chaos in areas where existing low-rise average buildings are clashing with the new high rise towers. The building law had been amended numerous times. Nabil Itani, the architect who is responsible for the CHUD (Cultural Heritage and Urban Development Project) at CDR, explains that the old building law used to respect the old morphology and traditional buildings where it stated that not more than three floors were permitted around them and it stressed on the continuity of the fabric10. He also clarifies that when Lebanon was formed as a country, the building law was subjected to numerous adjustments according to the public benefit without creating in parallel any boundaries which generated random building investments with no respect to the surrounding. The Building law was created just for investment and development; each plot owner believes that it is his/her right to build. Tabet refuses to acknowledge that fact which is taken for granted in Lebanon. According to him, “building is not a given right, the government gives you the right to build according to specified terms which might change if the public right requires. The land is yours but the way you use it is not set by you.” He adds, “in France –and everywhere else-, the law states that lands are not investments, unless the law allows it according to specified terms.” He then continues to acknowledge the reason behind the real-estate boom as due to the fact that in Lebanon there is no human economy, plantation, or manufacturing –to name a few- and so at the end everything is real estate. This constant construction boom that Lebanon witnesses is closely related to how the Lebanese perceive their heritage and how the related administrations that govern both construction and heritage interact. Likewise, in the absence of a clear law that protects heritage buildings in Lebanon and compensates for their owners, owners believe it is their right to benefit from the land instead of keeping the house, empty and dying. There is no one defined specific law that is responsible for providing guidelines to the preservation of heritage buildings or neighborhoods in Beirut, let alone the rest of Lebanon. In 1935, the first law for the preservation of old buildings was issued in Lebanon. It was taken from the French law of Antiquities. It ran in both Syria and Lebanon and still needed the approval of the council of ministers of Lebanon. The 1935 law, known as the 1933 law, considered as antiquities all that was produced by human activity, from any civilization it belonged to, prior to the year 1700 (1107 AH)11. It tackled both the mobile and immobile “antiquities” without relating the immobile parts to the traditional houses of Beirut; immobile antiquities merely constituted of tells, ancient walls partially buried and such. This law was never modified to fit into the valuable constituents of the Lebanese culture and unfortunately 10Interview with Nabil Itani (CHUD - CDR). 30 May 2012 11 Réglement sur les Antiquités 1933

58
it is the law that we adhere to today. Itani explains that during the late 1990s, and through the Cultural Heritage Project, the World Bank asked the Ministry of Culture for three main points. First, to strengthen the ministry by introducing more employees and updating the regulations; transferring the DGA to the Ministry of Culture from the Ministry of Tourism and strengthening it independently (today the DGA includes only two architects that are responsible for the survey of all Lebanese buildings). Second, to define Cultural Heritage and updating the 1935 law. Third, to classify heritage and specify tools for its preservation. However, only regulations dealing with the institutions were dealt with while heritage buildings were not tackled. In 1995, villa Trad on Salim Bustros Street was demolished overnight with no permit. Michel Edde, the minister of Culture at the time decided it was time to act and asked the APSAD for a complete list of the heritage buildings of Beirut12. APSAD assigned four architects to do the job. These architects were: Hana Alamuddine, Fadlallah Dagher, Habib Debs, and Abdul Halim Jabr. The buildings tackled were defined to be those dating to before 1945 that carried certain architectural qualities such as the traditional central halls, late Ottoman style or the early modern style in the areas constituting the old fabric of the city. It was considered that after 1945, the modern movement had started which changed the layout, style and shape of the houses. Four maps were made for Zokak el Blat, Ain Mreisseh, Achrafieh and Gemmayze (Appendix A) Around 1996, APSAD studied the file and presented its first report concerning the buildings around the city center since in that area, the buildings had already been demolished during the war and it was considered that they became in the hands of Solidere. “We worked on the vicinity of downtown and the whole area, but we did not finish this survey”, says Dagher. “After the first phase, we were asked to stop everything as it was considered enough. It is worthy to note that this study did not survey every single house that was worth keeping but it only showed what we found: beautiful buildings, unstable buildings and interesting neighborhoods. We focused on two things: either the clusters because they held a certain interesting character, or special buildings (exceptional garden, state, environment…). At that point we also discovered that some buildings had a road planning passing through them and we decided it was mandatory for the plans to be revisited and modified accordingly in order to preserve the clusters these buildings belonged to. Minister Edde asked for these buildings to be preserved, but since most of them were in a bad state and there was no way they could be preserved, most people revolted against this decision. Shortly after, a new ministry was elected and the new minister let most of these buildings go.” In 1998, the new Council of Ministers decided that the study done by the group of architects through APSAD was not scientific enough and re-assigned the job to Khatib & Alami13. They had to survey 459 buildings out of the 1300 surveyed by the previous group. In the Introduction to their report, they state that some buildings were going to be “liberated from the 12 Interview with Fadlallah Dagher (architect), 5 June 201213 Interview with Jad Tabet (architect and urban planner), 17 May 2012
list of properties” presented to them14. It is worthy to note that buildings were merely surveyed from the outside15, therefore completely dismissing the internal spaces, decorative motifs and other valuable heritage elements that used to constitute important features of the previous decades. Khatib & Alami classified those buildings into five ranks –copied with the same words mentioned in their own 1998 report:A: Applies to properties associated with events or lives of persons related to history or embodying distinctive architectural characteristics and high artistic values or both. Usually these buildings are well preserved, constructed on large pieces of land, and require minimal renovation. B: Applies to properties that are not related to historic events, but possess all the architectural qualities for conservation. Most of these buildings require financial support for upgrading. C: Applies to properties with similar architectural characteristics of rank B, but are damaged either due to war, lack of maintenance or an extension has been added to the original design that has distorted the proportions and the volumes. These buildings require substantial financial support for restoration. D: Applies to properties that might not have highly sophisticated characteristics in design, but express specific features related to a period or school of architecture, and might require financial support for upgrading.E: Applies to properties that their integrity is questionable [for several reasons]. The firm clearly defined its criteria for conservation in its report, and stated that apart from the General Standards (building type, number of floors, cadastral finishes…), it tackled the Design ( form, plan, space, structure, surface materials…), Methods of Construction (vernacular, safety structure…), Setting (relationship to the surrounding…) and Landscaping (site includes gardens and parks). However, and as stated before, the buildings had never been entered which contradicts parts of the Design criterion. Furthermore and according to Tabet, “their approach took one building at a time at the time when the concept is quite the opposite. What’s the point of keeping an individual building and then allowing for a tower to appear next to it? The point is keeping a whole coherent neighborhood16.” In addition, since politics govern applications in Lebanon,
political pressure played –and still does- an important role in freeing classified buildings and consequently, approving demolition permits. In parallel, around years 1999-2000, and while Ghassan Salame was minister of Culture, Architects Jad Tabet and Amine Bizri collaborated for the production of a new heritage law. This law aimed at: 1) Preserving heritage buildings of value 2) Preserving gardens and green spaces of value 3) Undertaking a special law for the new buildings in those 14 Conservation of the Architectural Heritage of Beirut Central District Vicinity, Khatib and Alami 199815 Conservation of the Architectural Heritage of Beirut Central District Vicinity, Khatib and Alami 1998. p.2 16 Interview with Jad Tabet (architect and urban planner), 17 May 2012

59
neighborhoods so that the general scale of the area is maintained coherently 4) Transfer of air rights – maybe issue a bank for air rights- to areas that are capable of absorbing such development and height. With this law, Bizri and Tabet aimed at giving a more contemporary view on heritage seen not as individual buildings but as neighborhoods that have their own directional planning. This proposal today lies in the archives of the ministry of Works and Transportation and the drawers of the parliament. In 2006, after Tarek Mitri was assigned the minister of Culture, he tried issuing another law to preserve heritage buildings. Though not perfect, it included interesting ideas that we still hear of today. It called, among many things, for a final compilation of the plots to be protected according to a specified committee as well as the freedom given to the protected buildings to adjust the FAR and other adjacent building requirements into what is appropriate with the general atmosphere of the area17.
Petro TradAs explained before, Lebanon has had many master planning proposals, which none was applied. Architect Fadlallah Dagher explains that “none of the master plans that had been made for Beirut since the 1940s ever acknowledged the old fabric of the city… They considered themselves to be planning the perfect city without acknowledging what is already there. Consequently, we ended up with plans cutting through the city from all directions. Some have been implemented during the sixties and the seventies and the others are still on hold on paper. But have you ever seen a plan being cancelled?” Even if the law actually states that an unimplemented plan is automatically cancelled after approximately 25-30 years, an alibi is always found to renew its date even if it is not going to be executed directly18. This is the case of the Petro Trad road plan which was created during the 1950s by Ecochard. It extends from the Aadlieh intersection Pierre Gemayel-Elias el Hrawi, joining Habib Bacha el Saad street, cutting through Nasra behind Sodeco Square joining Petro Trad, cutting through a cluster of houses to create an intersection with Rue Dahdah, crosses again through a cluster to intersect with Rue Huvelin and from there all the way to Georges Haddad Street. Originally, those roads that the plan reaches -Habib Bacha el Saad and George Haddad- were part of the line drawn as the Petro Trad road plan (Appendix B&C). Only the area in the middle was not realized, and today, the Beirut Municipality is aiming at making that happen. According to Bilal Hamad, the mayor of Beirut, this road plan will release the area from the weight of traffic and suffocation it is witnessing today19. The Petro Trad road planning had been studied closely, with site visits done to the location. This plan –if executed- will be
17 Law Project for the Protection of Heritage Buildings and Sites, 2006. Pp. 2-3 18 Interview with Fadlallah Dagher (architect), 5 June 2012 19 Interview with Bilal Hamad (Civil Engineer, mayor in the municipality of Beirut). 29 February 2012
the cause of the demolition of a total of 12 heritage houses(Appendix C). Not only will it cause houses to be demolished, it will also be responsible for cutting the Achrafieh area in two disconnecting the Yasouhieh from Furn el Hayek, repeating the same mistake that had happened between Ras el Nabeh and Basta el Fawka. More importantly, the plan passes through the Sodeco graveyard which combines four sects (Jews, Protestant and German from WWII, and Syrian Catholic) and then again through the Maronites’ and Catholic sects’ graveyards. Apart from it being a cemetery, graveyards are considered essential to the greening of the cityscape. With their loss, or as Hamad proposed, having a bridge extend over them20, we can consider the burial of the only green space on Sodeco. Looking closely at the area right after Sodeco, one is faced with high rise buildings –some are now adding the final touches to their construction- around a set of four heritage houses. The reason for the birth of these towers is that they gained their permit according to the fact that someday, an autostrad is going to replace the houses in the middle. Due to that, they were able to build higher using a gabarit of a road that is not there and taking into consideration the required setback. That is why today, the municipality’s alibi for actually executing this plan is that the houses stand in the way of the autostrad and the towers are there (Appendix D .fig 5).Logically –and professionally-, the towers should not have gotten their permit unless the road was physically there. I’ve had the chance to interview Antoine Samaha -one of the owners of the old houses in which the road plan passes. He is the owner of plot 5 (Appendix D. figs 1, 2) the second house after Petro Trad. While the house dates back to the 1920s -if not before-, it is beautifully situated in the middle of a small garden. Towards the back of the house, the kitchen has a more than 5 meters high vaulted ceiling with small windows between the spaces. However, water is left to drip onto the walls and into the sandstones. Stones are left to fall out of the walls and squatters are living in the first floor. There, the ornamental motifs that once decorated the tops of the doors are gone, probably sold. The balconies are left to collapse and the paint is peeling off. This is a perfect example of how owners themselves are harming their houses so that they can get a demolition permit. After talking to the owner, he seemed insistent on getting rid of the house while trying to give illogical alibis for the demolition21, such as: the windows open on to the neighbors –as is the case in every building in Beirut-, the house is neither lit nor ventilated properly –which is irrational since with the high ceiling all old buildings have, the smart location of the window openings and triple arches which always face north-offer both the best light as well as the coolest ventilation to the interior. Samaha also tried offering solutions like moving VillaMezher (Appendix D.fig.4) four houses in which the plan cuts completely. It is a beautiful unique villa, not traditional, but has the values of a central hall house. Clear ornamental lines
20 Interview with Bilal Hamad (Civil Engineer, mayor in the municipality of Beirut). 29 February 2012 21 Interview with Antoine Samaha (architect, ALBA), owner of plot 5. 21 March 2012

60
define its aesthetic, apart from the simple geometric fer forge which only add to its splendor. Unfortunately, it is even classified E by the Khatib and Alami report. In other cases, even if the plan does not pass right through the house, plot owners take this perfect opportunity to sell their property to investors who will surely turn it into a high rise benefiting from the autostrad’s width and location, as will probably be the case of Plot 5 whose owner is currently looking for a potential buyer. Plot 242 is the Tabet Palace (Appendix D. figs 6&7), the biggest plot on this plan. The Palace is known for its magnificent garden which allows for the area to breathe and gives it a green touch. The plan will also take out a portion of the left side of the garden. The palace is one of its kind in the area with its three-sided roof and beautiful openings. It is classified B; however its garden is not classified at all which puts it in the danger of being erased with time. After this brief overview over some of the victims of the Petro Trad Road Plan –which is an example of many others all over Beirut- it is mandatory to acknowledge the danger we are facing. Our history is being erased little by little because of our mismanagement and chaos in administrative facilities. Young people have been trying through different NGOs, like Save Beirut Heritage, Nahnou and others to preserve our heritage and promote for green spaces in the city. However, it is not enough. Tackling one building at a time whenever it is in danger is just a temporary solution and a stall to the eventual fate of the building. The solution would be re-instating a clear law that governs the preservation of buildings through clear definitions such as:
- Surveying the buildings from the interior as well as the exterior, clearly defining each type
- Introducing private gardens and green spaces as part of the preserved items (as was done in Paris in 2005)even if it was a loss for the owner, but it is mandatory to keep in mind that the public good is more important and viable than the individual’s own desires22
- Giving great importance to what is left of the clusters of buildings. Even if one is not up to the level of the rest, it is mandatory for the survival of the fabric
- Rereading the Lebanese laws and the international heritage laws and reinstating them according to the Lebanese condition
- Redefining the taxes law that governs such buildings, either exempting the owners of heritage buildings of taxes towards the government, and transferring it to high rises, in a way yet to be studied. Therefore the money could be used as a bank for the restoration of those buildings that are in need.
- Transfer of air rights into areas that are capable of handling more growth
- Stating a special law to new buildings that are being constructed next to old ones, taking into consideration height, style transition between the old and the new.
22 Interview with Jad Tabet (architect and urban planner), 17 May 2012
These solutions, to name a few, have been proposed over and over again by numerous architects and heritage appreciators. In parallel, it is mandatory to come up with a road plan, integrating with it a clear public transportation system that would release the roads of the suffocation of vehicles, help in greening Beirut and consequently, benefit in preserving a larger number of heritage buildings. On the other hand, it is time to finalize a clear law that preserves heritage away from political benefits. There is an ongoing project taking place along Damascus road, being prepared by URBI which aims at greening Beirut and encouraging people to use non-vehicular means of transportation such as bicycles and providing decent sidewalks for walking. Liaison Douce was a competition issued by the Isle de France a couple of years ago and was won by URBI that is now preparing the second phase of the project. If this project is realized, we will witness something that was never done before in Lebanon and will allow for the public to appreciate outdoor spaces, leftover plots that are turned into public areas, and enjoying the sight of beautiful buildings and greenery. Perhaps this could be a portal for initiating other motives for bettering our city.
ACKNOWLEDGMENT
George Arbid (Architecture Professor at AUB) who was giving the course and was available for help throughout the process. Jawdat Abou Jawdeh, (architect and urban planner at CDR), Nabil Itani (architect at CDR), Jad Tabet (architect and urban planner), Habib Debs (architect and urban planner), Fadlallah Dagher (architect) and AbdelHalim Jabr (architect) for their help in constructing interviews for this paper. Cyril Haddad, Joana Hamour and Giorgio Guy Tarraf for their help with site visits, photos and the independent interviews.
REFERENCES
Interviews for the paper:Abou Jawdeh, Jawdat (Urban Planner and Architect – CDR). 15 May 2012Dagher, Fadlallah. (Architect). 5 June 2012Debs, Habib (architect and Urban Planner – URBI). 17 May 2012Itani, Nabil (architect –CHUD- CDR). 30 May 2012Tabet, Jad (Architect and Urban Planner) 17 May 2012Interviews that were made before the paper and then integrated:Hamad, Bilal (Civil Engineer. Majoy of Beirut). 29 February 2012Samaha, Antoine (architect and owner of plot 5). 21 March 2012Conservation laws:Réglement sur les Antiquités 1933 FConservation of the Architectural Heritage of Beirut Central District Vicinity, Khatib and Alami 1998Law Project for the Protection of Heritage Buildings and Sites, 2006. Pp. 2-3Book:Fawaz, Mohamad. Urban Planning in Lebanon. ALBA 2005

61
appendix a
preliminary Survey of Heritage Clusters (Yasouieh- Furn el Hayek) - Hana alamuddine -Fadlallah dagher - Habib debs - abdul Halim Jabr
Buildings that are of value, by virtue of being landmarks or being part of a cluster
areas that have not reached for development potential and hence need some kind of protection
areas that reached full development
areas next to wide streets and large plots. They can recieve more development (20 -35 %)

62
appendix B
Type a: Landmark buildings with historic backgroud and/or distinctive architectural values, contributing to the cultural heritage of Lebanon.
Type B: Buildings possessing high architectural values, illustrating a type, period or method of construction, requiring financial support for upgrading
RanKinG deFiniTiOn
Type C: Buildings with similar characteristics of type B, but severely damaged or distorted, requiring substantial finantial support for restoration.
Type D: Buildings with specific features, illustrating a period and method of construction, requiring finantial support for upgrading.
Type e: Buildings that are not eligible aesthetically and do not convey sense of historic and architectural environment.
Classification of Petro Trad Buildings according to Khatib & Alami (copied exactly as is from the classification document)

63
appendix C
petro
Tra
d R
oad
plan
petro
Tra
d R
oad
plan
petro
Tra
d R
oad
plan
to b
e co
nstru
cted
alre
ady
cons
truct
ed

64
appendix d
Figure 1 and 2. plot 5 (Sodeco)
Figure 5. plot 26 Villa Mezher (Sodeco). The tower that was erected next to it according to the upcoming -still unaccomplished- autostrad
Figure 6 & 7. plot 242 Tabet palace (Rue de Liban)
Figure 4. plot 26 Villa Mezher (Sodeco)

65
1
Yarzeh, the Widows’ Hill: An Ageing Modern Suburb
Mayssa JalladDepartment of Architecture and Design
American University of [email protected]
I. IDENTITY: “WHERE ARE YOU FROM?”
I never knew my grandfather. He passed away in 1982, a few years before I was born. I never heard the tone of his voice, nor observed what he ate for breakfast, but I understood from those who knew him that he was an exceptional figure, highly esteemed and very clever. Although I did not know Jeddo Rafic, he had left a few clues behind: his company M. Ezzat Jallad Co., his villa in Yarzeh, his four children Rachid (my father), Raya, Omar and Ayman, and last but not least my grandmother Zafira Sultan, one of the widows of the Yarzeh hill. Today, this stagnant balance since he left has been shaken. My grandmother passed away in January, the house in Yarzeh has been abandoned for 6 years and her children, constantly at odds, want to sell the villa. And so I have decided, faced with the risk of losing whatever memory remains of both my grandparents, to document it and attempt to understand who they were. If the inhabitants have disappeared, can modern architecture inform you about someone’s identity? Can a neighborhood inform you about past lives? I find myself entering the realm of modern archeology, digging into the unknown dust and blurry memories of a 50s modern home and its neighborhood.
My grandfather Rafic and his company, which he named after his father.
“Where are you from?” is not a question I can answer easily. Although I am a Beiruti at heart, I am not from the city. My father is originally Syrian, but was born in Sanayeh, Beirut. On “paper”, my Identification Card reads a curious “Baabda”. The truth of the matter is my grandfather settled in Lebanon in the 40s, as his company’s Caterpillar (tractors and motors)franchise was expanding. He lived in Beirut for about 20 years, first in Sanayeh, then Verdun until he bought a plot of land in Yarzeh in 1957 in the kaza of Baabda, an eastern suburb of Beirut. As Baabda is my “paper” origin, the modern Yarzeh villa is the closest day’aa (“village”) house I will ever have. But far from being a village, Yarzeh is a luxurious, suburban
residential compound developed in the town of Baabda in the 50s. Unlike a traditional, organic village, Yarzeh was one of the first examples of a luxurious, planned, private development, similar to Rabieh (1956-1958)i, Faqra, or even the recently controversial Beit Misk.
Yarzeh, originally a 700 hectareii virgin hill scattered with pine trees, was bought by Henri Pharaon and Michel Chiha “in the late 30s”iii perhaps from Druze families who owned many lands in Baabdaiv. The two were very important figures in modern Lebanon, having both had a role in the Lebanese independence (Chiha made significant contributions to the Lebanese constitutionv while Pharaon was one of the creators of the Lebanese flag vi ). They were also business partners linked by the old family alliance of the Banque Pharaon et Chiha established in 1871vii. Henri Pharaon was an avid art collector, who started refurbishing his palace in Beirut with the help of French archeologist-architect Lucien Cavro, who had become by then an expert in Arab antiques. According to his architect son Alain Cavro, whom I contacted through his grandson Michel, it was Lucien who advised Pharaon to purchase and develop lands on the hill of Yarzeh which he envisioned to be a luxurious residential suburb. As Pharaon was first skeptical about the idea, Cavro agreed to become one of its first investors. Cavro was also appointed to be its master planner: he drew its parcels and roads following the topography and in exchange was offered a percentage of land (perhaps 10%) viii . “The operation was an absolute financial success. A journalist noted in 1957 that the benefit created by Yarzé surpassed the yearly budget of the Government.”ix
Lucien Cavro (1905-75), Master planner of Yarzeh. Michel Chiha (1891-54)and Henri Pharaon (1903-1993), developers of Yarzeh.
Cavro went on to design quite some projects in Yarzeh such as the villa of Mme Jidejian, my grandmother’s very close friend. In fact my grandparents’ neighbors have quite impressive houses. The Amyunis’ was designed by Umberto

66
2
Turati and the Trads’ by Henri Edde with Karol Schayer extensions. The private patronage of significant foreign and local architects was at its prime. Acquiring land in Yarzeh by my grandfather is therefore not a coincidence. In addition to it being an escape from the hectic city, it is a testament of his will to associate himself and his family with other prominent Lebanese families. He was a great business man and his sense of business followed him home, establishing connections within the “elite” Yarzeh community, and eventually receiving Lebanese citizenship with a “Baabda” origin in 1966.
II. THE RAFIC AND MOUNIR JALLAD HOUSES(ARCHITECT: ANTOUN TABET - BUILT: 1954
TO 1957)
Two houses were built by the Jallads in Yarzeh on the same plot number 1825: the one on the corner of the road for the Rafic Jallad family and the one next to it for the Mounir Jallad family. As this was quite a collaborative project, the brothers hired the same architect: Antoine Tabet, a pioneer in the thirties, once intern of Auguste Perret, and one of the “designers” of the St George Hotel x . When I asked my father why his parents chose Antoine Tabet to be the architect, he replied that he was puzzled about that himself: he had interviewed “Antoun” during his Polical Sciences studies because the latter was a prominent member of the Lebanese Communist Party’s Central Committee. However Rafic was definitely a capitalist, as brought up by his trader father Ezzat. Perhaps my grandfather was not limited by his political affiliations? Or perhaps Antoun was too good to refuse.
Original 1956 drawings of the Rafic Jallad Villa, South and East Facades, Baabda Registry
Original 1956 drawings of the Mounir Jallad Villa, South and West Facades, Baabda Land Registry
Some nuances help me underline the differences between Rafic and Mounir as clients. Since the villas are “also” siblings from the same “father” (the architect), and were constructed at the same time under the vigilant 4-year supervision of Zafira and Amira, are they identical or fraternal
twins? Although the villas share the same North-West/South-East sun orientation, the conditions of their plots are different. Rafic’s is at a turn and on the main road, requiring the front garden to be much larger and more protective. Mounir’s is the first of a series of houses aligned at a secondary dead end road or “impasse”. It has no garden at the front, but the backyard is much larger and more comfortable. Overall it seems Raficopted for exposure to the main road while Mounir for introversion into the back-garden. In terms of facades, the entrance and right veranda are similar, as well as the materials, which are either relief stone walls, or flat and smooth stone walls (both using the “chemise” technique of an indoor 10cm concrete wall aligned with thick stone from the outside) . The columns and slabs are concrete. However Mounir’s façade is more colorful and fragmented while Rafic’s more monumental and sleek. I find out from Mme Jidejian that Rafic and Zafira were more outgoing than Mounir and Amira, who were shyer and more reserved, which seems to go hand in hand with the houses’ disposition and form.
Mounir’s house was sold to the Doumet family after he passed away in the 70s, and it is now inhabited by Mr Alfred Doumet’s widow who kindly but suspiciously let me inside her warm colorful home, a drastic contrast with my grandmother’s abandoned villa. She seems quite exhausted and shivery and it difficult for her to communicate with me. She lets me into one of her three living rooms, which is very different from my grandmother’s unified salon. The house follows the same organization except for some differences some due to original design such as the absence of pilotis in the basement floor since there is ample space in the backyard and some due to its renovation by the Doumets on the hands of Michel Harmouch (decorator) and Alfred Matta (contractor)xi: no glass balcony on the reception floor as well as no pilotis or exposed columns since there is ample space in the backyard. The North façade is flush and climbing plants have invaded it. Also there is an easily distracting door linking the office to the main “Dar” which must not have been present at my “workaholic” Jeddo’s house. Mounir’s house has been renovated and some changes have been made: Partitions have been added to the “Dar”, which makes it seem smaller but perhaps less intimidating and an added wooden spiral staircase connects the house’s guests to the lowest floor, which in the other case was only accessible from the service stair or from the West side outside the house. Overall the two houses have different characters although they look very much alike. They are identical twins, but have separated at birth and have gone through different pathways in life right from their very site specific installment. I realize Mounir’s house is more interesting compositionally; it is less symmetrical, more playful. It is as if Rafic’s was the first draft while the architecture was improved in Mounir’s. Perhaps the former was built before? Or perhaps Mounir and Amira wanted something more playful rather that the pragmatism of Rafic and Zafira’s villa, which strikes me more as a no-nonsense type of outlook towards architecture (and/or life). Imagine my thrill when I found the original Antoine Tabet drawings of both villas in the same file at the Baabda registry. What a discovery: the villas were truly twins!

67
3
When I speak to the shaken Mme Doumet, sheexpresses her concern towards the new “illegal” construction “ruining” Yarzeh today. She tells me my grandmother would have been appalled by these new developments. I realize after visiting Mme Doumet that I could learn a lot about my grandparents through their neighbors. Meeting prominent Lebanese families was indeed one of my grandfather’s intentions in moving to Yarzeh. I find out my grandparents were very good friends with 3 other couples in Yarzeh: The Amyunis, the Trads and the Jidejians. I realize then that all my grandmother’s friends had become widows around the time she had.
III. FRIENDS OF THE JALLADS: THE OTHER WIDOWS OF YARZEH HILL
1. Villa Amyuni (Architect: Umberto Turati- Built: 1947 to 1953)
The Amyuni villa is hidden at the tip of the dead end which starts with Mme Doumet’s Villa. As you go through the open gate, there is a deep sense of privacy conveyed by the bushes which hide most of the ground floor. I hold my breath and ring the doorbell. A tall, calm woman answers and as I explain to her why I am here, she tells me she is Rima the painter, daughter of Mona and Fouad Amyuni, and lets me into her home. As you enter, a beautiful northern light overwhelms the space and there are paintings of Rima all over. There are very large glass windows in the main living room where we sat for a coffee. The openness of the living area clearly contrasts with the closed, very sheltered south façade to the street. Rima tells me her parents came to Yarzeh 60 years ago to flee Ashrafieh’s hustle and bustle. People started saying they were out to live “with the wolves and foxes”. She loves the house; it is her “root”, where she grew up. She loves the light and the garden, as many of her paintings depict moments inside and outside the villa. The latter has three floors and a mezzanine above part of the 1st floor, currently used as her atelier and bedroom. The basement is occupied by her sister Raya and her nephew, and the third floor houses Mme Mona. When I ask if she would change anything, her answer is about the lack of space in her mezzanine atelier: she would much rather have a bigger one on the ground floor, for easy access to the garden.
Mme Mona Amyuni arrives shortly after, dynamic and smiling, she welcomes me very warmly as she discovers I am Zafira’s granddaughter. As soon as she knows I am writing a paper about Yarzeh she calls Nena Trad, my grandparents’ neighbor, and Nina Jidejian, my grandmother’s best friend, to ask them if I could come over for a visit. I am touched by her immediate trust as she agrees to answer some of my questions: she has been a teacher at the Civilization Sequence department at AUB since 1968xii . She tells me the area was a virgin land not yet known as Yarzeh when its developers took it over. Herhusband Fouad bought the land in 1947 after looking around for the right spot with Michel Chiha and the architect Umberto Turati. The latter was the husband of Fouad’s aunt and advised him to pick that particular spot because the slope was so steep
that no one could block the view. It was very good advice a Mr Amyuni told the architect he wanted to feel immersed by the landscape while sitting indoors. The house was built in 1953, during the 1st year of Mona and Fouad’s marriage. Later additions such as the room for the gardener and a depot were designed by Elie Sehnaoui.
Mona has very fond memories of my grandparents. My grandfather was a lovely man. Both couples used to take long walks to Notre Dame de Jamhour in the afternoons. The Jallads were also looking for a quiet and lovely place outside the city and they were ones of the very few Muslims who moved to Yarzeh. My grandfather was very special and bright, a pioneer who introduced mechanized agriculture to farmers in Syria. My grandmother came from Aleppo from a family of landowners. As they moved into the house, they placed two gold coins in the earth to bless it. They did the same for their offices in Zouk. Rafic was a great gentleman who had many connections: the Lebanese Forces even protected the offices in Zouk during the war. Grandmother was very charitable and visited many poor families before during Ramadan. The 1st
white and fuchsia bougainvillea in Lebanon came as a gift to Rafic from a customer in Africa. He sold the seed to a hot-housing company.
Rima remembers they used to visit my grandmother for “high tea” in the afternoon. She also remembers somber memories of hiding in Zafira’s basement during the 1989 shelling, and also holding condolences for Mr Amyuni’s death in my grandmother’s large living room. These extremely personal memories suggest a deep friendship with the Jallads and the use of their villa in times of trauma is an indicator of the safety of the house and its ability to host many people. The Jallads were close to their neighbors and did not hesitate to help out in times of need: my grandmother must have shared her grief with Mona, who had become a widow then, too.
2. Villa Trad (Architect: Henri Edde with Schayer extension - Built: 1950s)
As I enter Nena Trad’s house, the smell reminds me of my grandmother’s living room. Perhaps the vertical wooden strips covering parts of the house emanate the same odor than those next to Zafira’s stair. I enter through the kitchen, where I find a beautiful spiral staircase. The main living room is a longitudinal volume with drop beams spanning across the width and a wooden frame around its sides. Mme Trad is immediately very protective and does not want to be interviewed or any parts of her interior to be photographed. She is insecure about her health and also that her house’s paint is chipping from the walls. She explains to me that her house was the most hit during the war, and shows me smoky remnants of a bomb that had hit the living room ceiling. I sit with her for a coffee while we discuss. She tells me Henri Edde built the house but it was continued by Karol Schayer. Apparently, Edde built the house for himself but ran out of money and had to give it up for a smaller house in Yarzehxiii. Since Nena knew his wife Roselyne, the deal was sealed. What was most interesting for Nena is its Pied-au-jardin

68
4
concept, as there is no threshold between the house and its garden. She was also attracted by the house being modern: it was not a Lebanese house but rather a glass house open to the garden with a few screens and musharabiehs. She says she wishes there were more stone walls in the house, as one’s need for warmth increases with age. She also added a sliding grill for security on the glass façade on the west of her living room. Her husband Nicolas also passed away a while ago and her son lives with her in the “pavilion”: he saw me wandering through the garden and thought I was intruding. His living quarters are only connected to his mother’s through a continuous canopy wrapping around the houses.
She did not speak of my grandparents much, although she asked about my family a lot. She thought I was my sister Lamia at first, as the latter lived in my grandparents’ house for a while during the war and used to sit in her garden. It seems they were immediate neighbors but not very close. My father tells me their used to be a feud between the late Nicolas Trad and Mr Philippides, who charged the former of killing his beloved but ferocious Dalmatian. Was there tension between the Trads and other neighbors, such as the Jallads or is it just time which fades relationships away?
3. Mrs Nina Jidejian (Architect: Lucien Cavro - Built:1947-1948)
Mrs Jidejian’s driveway to the house is by far the most exciting. You enter a gate next to which are hung two different signs: the first reads “Dr Y. Jidejian”, the second menaces “CHIEN MECHANT”. The driveway slopes down then up as you cruise through an archway of trees. Not a building in site. Then a white house appears, with vaulted arches and a flowergarden. In front of the main entrance is a porch with a small garden in the middle. Above it is an open skylight which allows rain onto the plants. Mme Jidejian, an 88 year old archeologist with a very bright face welcomed me with open arms as we sat in her cozy but spacious living room. High ceilings and rectangular picture windows “from Italy” framed views to the garden. Her husband bought the villa in 1949 from Norman Nairn, a New Zealander who founded the Nairn transport company which shipped goods from Beirut to Baghdadxiv in the 40s. Nairn was an “idealist” who had gone through the trouble of customizing many pieces of furniture such as Swedish wooden doors and Scottish Adams fireplaces (Neoclassical designs). Then he divorced his American wife, which led him to sell the house to Dr Yervant Jidejian, a renowned surgeon at the AUB Hospital, who lived on campus. He bought the house for 250 thousand LL, when the land cost a mere 2.5 LL per meter square. Today, one square meter is worth $3000 to $4000. Designed by Lucien Cavro, with Avedian as an engineer, Nairn was involved with all details of the house, which was on a hill overlooking Beirut with a 7500 square meter garden.
Once a year the Jidejians would organize a gathering at the house for all medical staff at AUB hospital. They too entertained many guests. When asked if she liked the house, she replied “Yes!” with a big smile. She has been living there
since she was 24, as it is the 1st villa in Yarzeh to be constantly lived in. “Henri Edde always said that this house has not aged.” Her husband also would not abandon his home, even with the traumatic civil war events and until his death in 1989. xv “I have seen the good days of Lebanon and Lebanon has made me,” Dr. Jidejian used to say. I discover from Mme Jidejian that he was a free-mason, perhaps just like my grandfather. Could Yarzeh have been a network of free-masons which connected themselves to the most powerful and influential people in the world?
“Zafira called me her sister. She used to love sitting on her front porch. Her driver would drop her off to visit me from time to time, until she hired a new one who did not know my house…and she had forgotten how to get there” It is hard to believe how much her health and memory declined compared to her glory days in Yarzeh. Her parties were always a success. She even brought Saj women to bake bread and make barbeques in the garden. Yervant was a very good friend of mygrandfather. They used to play tric-trac and both couples used to go to the beach in Sarba where my grandparents were members at a swimming club. Rafic was quite athletic. He was also very tolerant: as their company established its headquarters in Zouk, a dominantly Christian quarter, he decided to entitle the company M. Ezzat Jallad instead of Mohammad Ezzat Jallad on its main façade to the highway so as not to upset anyone or sound imposing. He was very delicate and open minded, very modern, as was Zafira, always inquisitive and bright. She used to stand up in the crowd during lectures at AUB and ask questions.
Right before Rafic passed away, Yervant used to bring news of him when he was at hospital. At that time, there happened a fire in Yarzeh because of the shelling which hit the woods and my grandmother had to stay at the hospital so she told Nina to look over the house for her. Years later when my grandmother fell ill and the house was not inhabited anymore, my father Rachid wanted to turn it into a cultural center. His siblings did not agree as they inherited the business-minded gene from their father.
IV. SUBURBAN WAR ZONE (SOUNDS EERILY FAMILIAR): THE TRIANGLE OF DEATH
It is quite a surprise that a luxurious suburb such as Yarzeh has endured so much torment during the Lebanese civil war. It makes you wonder whether these women survived their husbands because of a higher life expectancy or because of the traumatizing set of events that the working businessmen could

69
5
not endure in times of war. My grandfather died in 1982 during the Israeli invasion from heart complications due to a minor operation. Mme Amyuni’s husband perished in 1989 from shrapnel which hit his head while he was in the bathroom. Mme Jidejian’s husband also died the same year which was known as the “Aoun War” period when the Syrians struck the Presidential Palace as Aoun was fleeing it to France. These exceptional men passed away at critical moments of the war… Could the widows of Yarzeh hill be considered widows of the war?
As pristine, as architecturally beautiful, as private and as sacred as these houses are, they could not avoid the horror of war and are impregnated with painful histories. This is due to a “not so amusing” irony: the Ministry of Defense, the Presidential Palace of Baabda and the former American Embassy moved to that area on account of its prestigious status, but contributed to the biggest part in the endangerment of its inhabitants during the Lebanese Civil war. This “triangle of Death” as Mrs Jidejian calls it did not spare anyone from feeling threatened in their own home. After all Yarzeh’s strategic hill topography is a double edged sword: on one hand it is ideal for peaceful views onto the city (the original intention of its master-planner and developers) and on the other a strategic military location which ensures control and supervision over key institutions. It is for the latter reason that the Syrian army settled in Yarzeh since October 1990 and organized checkpoints along its streets for 15 years. Mme Jidejian also spoke to me of an incident where lost French soldiers entered her estate because they found the French sign “CHIEN MECHANT” outside her home. The trees around the villa saved Mme Jidejian from many bombs, although that did not prevent a Grad (multiple rocket launcher) from hitting a small bedroom upstairs. No one was fortunately hurt but the bomb made a big hole and revealed a 50cm chemise wall (40cm stone, 10cm concrete).
These houses carry the memory of a war which, in the optimistic minds of the planners and inhabitants of Yarzeh, was never supposed to occur. Add to that the forest which surrounds the project and which, in times of war, becomes a dangerous fire hazard. This reminds me of a recurrent theme I have picked up while studying the Holiday Inn, another modern building in Beirut: the optimism and humanism of these visionary modern architects and developers has backfired with the arrival of war. Does the modernist belief in the greatness of man apply in times of war, when man infringes progress with his own hands? Is war the antithesis of modernism or is it the affirmation of Man’s ability to “rule the world”, obtaining power by any means? In my opinion modernism is a synonym for order and a harmony between different entities to achieve a whole, with the absence of any mysticism. The war was a counter reaction to modernism and order as these two components could not provide some leaders with the power they needed, hence the need to create a civil war through chaos and intolerable religious fervor (mysticism). Therefore the absence of modernism in thought contributed in the gradual disappearance of modernism in practice: since the end of the civil war, different types of buildings started
sprouting up, some illegally, others disrespectfully, ruining the modern landscape of Yarzeh.
V. THE NEW YARZEH: AN EXPANSION OF THE CITY
After the war, and the withdrawal of the Syrian army from Yarzeh since 2005, a new type of construction started occurring, especially in the past few years. The law was manipulated to allow multi-story buildings to be erected, such as these already existing in Baabda. New individual villas are becoming the exception rather than following the norm that used to be. There are 4 main concerns expressed by the ladies of Yarzeh when I ask them about the new construction occurring in the town.
First, Mme Jidejian talks about the “podium”, which is closing off the 1st two stories of a building so as to monumentalize it and elevate it. The result is a very opaque and heavy base which blocks the view and ventilation on the ground floor. It is president Hrawi who issued a decree which permitted such high story construction in Yarzeh, perhaps to profit from his own home’s construction not far from Mme Jidejians’. The growing need for this podium comes from the practice of providing parking spaces for residential buildings, and since you are building on a slope in Yarzeh you cannot but expose these blind walls on the lower road. Apparently this practice is illegal, as usually you have to allow for what they call the “etage Murr” which is a more transparent ground floor, which sits on columns and is open from one side. This has become a cloned typology disregarding context or inhabitants, so far removed from the custom made villas we have discussed.
The Second issue is the disregard to nature. The architects (if there are any) are completely missing the point of locating these buildings in area such as Yarzeh, where there is no question, according to all the ladies, that nature is the main protagonist. Even according to the law you must plant a tree to replace each one you cut down. Some architects are so concerned with enlarging the building footprint for maximum exploitation that they are forgetting to allocate space for any trees or gardens at all... Some 4 story high projects are envisioned on very steep slopes, which creates a frightening and insensitive excavation. Mme Amyuni recalls “They do not care about the landscape. The architect used to “feel” the place. Architects today follow their own financial benefit rather than the clients’ or the environments’.”
The third issue is the disregard of new buildings to one’s neighbor. There is today a new building in front of my grandmother’s house, blocking her 1st floor view from the veranda. When you read the panels of this project it is as if it’s been parachuted from the sky: there is a total ego-centrism and disregard to one’s context. Mme Nena Trad is also struggling with this building as it is infringing the law and proposing five floors! In an existing modernist architecture with a maximum of two to three floors, imagine how alien the project is.
The fourth issue was raised by Mia Khoury, daughter of Abdallah, whom I met at her pink neoclassical Mediterranean style villa (the only villa the Amyunis appreciate out of all new

70
6
construction). She is currently struggling with two back to back construction sites of 4 story high buildings right in front of her main entrance. The logic behind these constructions is that the pink villa offers a guaranty that no building higher than them will come up in front of their view. There is also a threat of new construction blocking her view towards Beirut, but she will surely not let them get away with it. She tells me the problem’s main source was the selling of lands by the Pharaons to less than trust-worthy developers such as Chahine and Johnny Abdo. After a 30-year freeze in the pricing of its lots, land cost suddenly escalated as the area became tempting for developers. Where are the architects in this equation? It seems they have no more control as they used to. Mia is today part of an association called Insha’ wa I’’mar AlYarzeh (Yarzeh Promotion and Development) along with many of its inhabitants. Their main goal is to monitor and limit the construction of illegal and unethical buildings.
A fifth issue I will raise is concerning the renovation of modern buildings. You cannot imagine how frustrating it was for me to enter an the Umberto Turati designed villa (same architect as the Amyunis’) which is the Societe des Ciments (formerly villa Hanna Saleme) to discovered it was mutilated by a tasteless renovation with unnecessary decoration. I could tell the place was a jewel because of its high ceilings and glass block skylight which provide wonderful lighting for what used to be the main living space. Today as the building has shifted its function, a lot of its architectural charm has faded, replaced by gypsum board false ceilings and ornamented fer forgé indoor gates…
I think it is necessary to raise awareness about these important issues which are underestimated or totally neglected in the eyes of public opinion. Yarzeh is in my opinion the 1st
real estate development which actually works architecturally. Some would think “poor little rich Yarzeh” and move on to solving more pressing social issues, but I would like to denounce the general lack of architectural quality in new suburban and even rural projects today which disregard “the other”, produce generic “copy-paste” buildings, take no real care in the issue of scale and produce permanent scars in the environment. We are slowly but surely exporting the city to where it should never go.
VI. THE WIDOW: A CONCLUSION
Is Yarzeh itself a Widow whose visionaries have passed away? Can the hill sustain its character? Or can the widows of Yarzeh protect its dignity? I realize that these women are extremely bright and cultured. They have special skills and opinions which enable them to play a true role in the preservation of Yarzeh. They have persevered to maintain their villas even after the “pillar” of their life had passed away. When I asked each who would take care of the house later on, they all had an answer: Mme Jidejian had faith that her daughter Denise would as she is very attached to the house and its garden. As for Mme Amyuni it is clear Rima and Raya have adopted the house as their permanent home. What will become of the Jallad home?
Whatever happens, I must say it was truly inspiring delving into the lives of friends my grandparents knew. It was an emotional journey, as I could not contain my tears after reconstructing this part of my grandfather’s identity. He has become an invisible idol of mine, a delicate and intelligent man and a memory of him exists in me today thanks to this research. Instead of fully figuring out my own identity, I have made new friends… which we have seen is what identity is mostly about. This started as a paper about imagined sad black widows isolated on a hill but ended with a portrait of exceptional women. These women have inspired me with extreme drive and thirst for life and beauty. They are artists, writers, socialites, scholars. They do not live in a dusty past, but in an always hopeful future. Despite all that they have been through, they are still idealists. They are forever young, forever modern.
ACKNOWLEDGEMENTS:
Thank you to the lovely ladies who let me into their home and had a coffee with me: Mrs Mona Amyuni and MrsRima Amyuni, Mrs Nena Trad, Mrs Nina Jidejian and Mrs Mia Khoury.
Thank you to Professor George Arbid for his valuable knowledge and encouragement and for the coincidence which started it all: finding my grandparents’ house in his database of Modern Buildings.
Thank you to my father, who passionately delved into his abandoned past. Finding the “origin” is something I have discovered to have inherited from him.
All information about the Jallad house, unless cited, has been furnished by my father Rachid. All photographs, unless mentioned, by Mayssa Jallad i George Arbid, Beirut Modern Course, Building Activity Chapterii Al Mouhandess 8, December 1966.iii ibidiv Mme Jidejianv http://www.michelchiha.org/biographies.asp?mn=1vi http://www.michelpharaon.com/la-famille-pharaon/vii ibidviii Mme Jidejian told me his wife Mme Cavro would visit Yarzeh once in a while to sell some lands.ix Nicolas Abou Samah, “L’expérience de Yarzé a créé une plus-value supérieure au budget de l’Etat libanais,” Magazine (Beirut), 20 June 1957.x George Arbid, Beirut Modern Course, Activism: Antoine Tabet and the building of a nationxi George Arbid, Modern Architecture in Lebanon Databasexii http://www.aub.edu.lb/php/aubpress/site/amyni.htmlxiii Nina Jidejianxiv http://www.sant.ox.ac.uk/mec/MEChandlists/Nairn-Transport-Company.pdfxv http://staff.aub.edu.lb/~webmgate/spring2006/profile.htm

71
7
Appendix
1926 cadastral map of the Yarzeh area: 700 hectares of Virgin land
Current cadastral map of Yarzeh: master planning and plots. Circled are the houses of my grandparents and their friends with main road.
Rafic Jallad Villa front façade
Empty seats in my grandmother’s glazed tea-room
The Mounir Jallad Villa front facade
Villa Amyuni front entrance

72
8
Villa Amyuni living room. View from the stairs.
Villa Trad entrance. The garden is adjacent to the living space.
Indoor view of Villa Trad. Notice the wood details. Courtesy George Arbid
Villa Jidejian front façade.
Entrance to the house with garden and skylight.
New Yarzeh construction: buildings instead of villas, closed ground floor“podium”, Murr floor.

3030
158
715
DEPARTMENT OF CIVIL AND ENVIRONMENTAL ENGINEERING

76 A Comparative Study between Precast and Cast in Place RC Buildings using 5D Simulation Techniques FAISAL AL AWAR – OMAR Z. ARIDI – WEAM ARIDI – JAD EID – ADEL MAWLA
82 A Solution to Water Shortage in the Greater Beirut Area GHIDA ADRA – SIBYLLE AOUAD – ANDREA TESSA MOUZANNAR – JOE NEHME – PATRICK OBEID
88 Concrete Canoe ABKAR ABKARIAN – KHEIREDDINE EL BAWAB – MOHAMMAD HAJJAR – CHAALAN MOURAD – PIERRE SLIM
96 Deep Soil Mixed Columns NADIRA ABSI – GEORGES EL-HASSROUNI – JAD JARI – YOUSSEF KANAAN – OMAR MALAEB
102 Developing and Agricultural Technical School within the Town of Marwahine ATAYA ELTIBI – YASMIN FANSA – ADNAN GHOTMI – PAUL KHAULI – FUAD SLEIMAN
108 Earthquake Shake Table YARA ABBAS – JADE DIMIEN – CHIRINE EL CHARTOUNI – NANCY RAZZOUK – TAREK SOUBRA
114 Effects of Pipe Diameter Variation in Geothermal Pavement Systems IBRAHIM DEEB – HAMMAD EL JISR – ISMAIL ALAMIN HOTAIT – ABDALLAH NAJDI – EMILE ZANKOUL
121 Evaluating Road Design and Traffic Engineering Elements Using a Driving Simulator FUAD AL ALEM – AMRO BAASSIRI – PAUL SAMAHA
127 Fiat Steel Bridge MARIANA ABOU DIWAN – MONA DARWICH – SALMAN FARAJ – ROBA OLABI – RABIE RAMADAN
133 Geogrid Reinforced Concrete ZAHWA AL AYYASH – NOURA SIRINE KAHIL – ANGELA KARAKACHIAN – MAHA MRAD – ROUBA ONAISSI
CONTENT
74

75 75
139 High Rise Construction in Lebanon: Innovative Construction Methods and Formwork System ABDUL AZIZ ABU KAR – FATHI AL ASSIR – GEORGE JREIG – MAZEN AL RIFAI – SAMIR EL KHODARI
145 Inception Report Wave Energy RANIA ASSAF – ANWAR EL CHAMI – FIRAS HAIDAR – EMMANUEL MAALOUF – CAMILLE SALEM
151 Providing Existing Buildings with Additional Basements for Parking ABDULLAH A. BEYDOUN – EDREES N. ELRACHIDI – KHALED B. KAROUT – HANI F. TAHA – RAYANE K. ZAHREDDINE
157 Revitalizing Beirut Transport Corridors: Multi-modal Facilities and Alternatives to Old Steel Bridges CARINE CHOUBASSI – ISSAM KAYSSI – MARWAN SARIEDDINE – CHRISTOPHER SASSINE – CHRISTINA TEOKARI
165 Seismic Geo-hazards and Site Response Analysis: Mapping the Greater Beirut Area MOSTAPHA MOSTAPHA – YASSIN MOSTAPHA – NABIL ATALLAH – TAHER MASALKHI FARSHOUKH – MOHAMAD MELHEM
172 Soil Improvement HALA AL JAMMAL – JOSEPH KORBAN – JEAN SABA – ALEXANDER TARAZI
177 Strengthening of Existing Structures: “Grand Theatre” Case Study HAYA AL DOORI – KRYSTEL ANTOUN – PAUL F. CODOUNI – JONATHAN EL-SOUEIDI – MARIE VALERIE SADAKA
183 Upgrading of a Deprived Community: The Case of Al-Hay Al-Gharbi WEAM AL-AWAR – AMAL KHAWAJA – MAHER SAID – NOURA SINNO – ZEINA WAFA
189 Wastewater Treatment at AUB YARA ACHKOUTI – SOUMAR AOUN – RIKI KARIM DAMIANI – ZEINA HABIB – TALINA ZEIDAN

76
A Comparative Study between Precast and Cast in Situ RC Buildings using 5D Simulation Techniques
Faisal Al Awar¹, Omar Z. Aridi², Weam Aridi³, Jad Eid 4, Adel Mawla5
ABSTRACT
Reinforced concrete is the most traditionally used construction material in the Middle East. The advent of construction technologies extended the range by which concrete can be designed, manufactured and installed. Precast concrete construction has been competing with traditional construction on project cost, quality and time. Comparing the two construction methods enables engineers, builders and owners to select the most efficient construction technique. The purpose of this paper is to compare and evaluate project cost, time and quality under each construction method for a 12,000 m2 pre-cast industrial factory in Lebanon. The methodology of work includes sketching two structural models of the factory (Precast vs. Cast in Situ) in 3D, and superimposing a schedule to evaluate the 4th dimension of the study which is time. A 5D Simulation will be performed at the end of the study to analyze the cash flows retrieved from the cost and schedule data of both models. This study will hopefully provide engineers, builders, and owners a stepping stone towards selecting one method over the other in order to achieve the most efficient, lean and sustainable production system under certain conditions.
Key Words:
Cast in Situ, Construction Planning, Precast Concrete, (3D, 4D, 5D) Simulation.
I. INTRODUCTION
Engineers strive to design and build the ultimate and most efficient systems by striking balance between cost, time and quality. In this endeavor, engineers deploy their learned skills to make the best use of available resources. That is why engineering projects set defined objectives to be completed within budget, time and safe serviceability. Reinforced concrete is probably the most widely used construction material; it yields itself to many construction methods and techniques. The advent of computer technology extended the possibilities of using concrete: modeling, design, construction and planning. The objective of this
project is to evaluate and compare cost, time and quality of two construction methods of concrete structures; cast-in-situ and pre-cast. There is little published research – if any – on such a comparison in Lebanon and the MENA region. The project under study is an industrial factory in Bchamoun, Lebanon. The factory is fully constructed from pre-cast concrete elements, and the total built-up area is equal to 12,000 m2. The investigation of the structural systems, construction methods & management, cost & planning together with the environmental aspects of the two methods will assist engineers, builders, and owners in selecting one construction method over the other to achieve the previously stated engineering objectives. This paper evaluates the two different concrete structures based on four disciplines which are: Structural, Time/Schedule, Financial and Environmental.
II. LITERATURE REVIEW
In order to compare the two construction methods, Christine Pasquire, Alistair Gibb and Nick Blismas devised the IMMPERST toolkit [5] which contains parameters extracted from different disciplines (cost, safety, sustainability, and time). These parameters help decision makers in choosing between the two construction methods. Some of those parameters are listed below:
Construction and Manufacturing Costs: material, labor, plant’s equipment, transportation and complex construction costs (e.g. rectification and rework costs)
Project Costs: health & welfare facilities, on-site logistics, overhead, professional and complex project costs (example: environmentally related)
Project Life Cycle Costs: capital, opportunity, finance, operation, maintenance, salvage and residual costs
Time (measured in hours, days or weeks): The duration of offsite and on-site activities

77
Quality: level of quality, defects and damages, customer requirements and information management flow
Safety and Health Benefit: housekeeping, noxious material exposure risk, persons working in difficult or dangerous conditions
III. STRUCTURAL DISCIPLINE
After acquiring the drawings and plans from the owners of the factory, a 3D model of the factory was drawn using ETABS software.
1) Lateral Displacement under Lateral Loading
Four corner points per floor were selected to base the comparisons upon.
Fig. 1, 3D Model of the factory before and after lateral Displacement (exaggerated scale)
The lateral displacement of each corner was computed by ETABS. The ratios of Pre-cast Factory displacements to that of Cast-in-situ were calculated for each floor section. Below is a sample of the generated values taken for floor 1.
Table 1: Ratios of Pre-cast Factory Displacement to that of Cast-in-situ under lateral displacement
| ∆ Pre-cast Factory | / | ∆ Cast-in-situ Factory | First Floor EQ-X EQ-Y WIND-X WIND-Y Corner 1 82 17 31 12 Corner 2 79 17 34 12 Corner 3 78 127 37 25 Corner 4 82 125 33 25
As can be noticed from table 1 above, the ratio of lateral displacement of the pre-cast factory to that of the cast-in-situ factory is huge. This is because the members of the cast-in-situ factory have larger cross-sections, and hence, have larger moments of inertia. Furthermore, the self-weight of the cast-in-situ factory is approximately 1.5 times that off the pre-cast factory. The self-weight of each structure was approximately calculated by summing up the vertical reactions at the footings due to self-weight only. The calculations were also done in ETABS.
Table 2: Calculated values of Self-weight and the overall Resultant Ratio
Self-weight (Tons) Ratio Cast-in-situ 8,208.45 1.5 Pre-cast 5,327.42
Even though pre-cast structures have more tendencies to sway than cast-in-situ structures, the damage inflicted by seismic loads on the pre-cast structure is less severe. This is due to the fact that the connections between structural elements in pre-cast structures are not fully rigid, and hence, tolerate some deflection, as opposed to the rigid connections in reinforced concrete members. It should be noted though; excessive lateral deformations in structures will result in significant Force-Displacement (P-∆) effects which could lead to collapse if not accounted for. This means that the overall stability of precast structures is less than that of cast-in-situ structures.
2) CONCRETE DESIGN
2.1Footing Design
Provided the dimensions of the footings for the pre-cast factory, along with an estimate of the applied service loads and moments at the footings (computed in ETABS), the bearing capacity of soil was calculated. It was relatively high but reasonable, since the soil in Bchamoun is mostly sandstone and limestone. This enabled calculation of the footing dimensions of cast-on-site factory using SAFE software. The results came as follows:
Pre-cast factory footings required less reinforcement than those of the cast in situ factory.
The footing dimensions of the cast in situ factory are larger than those of the pre-cast factory
Following are snapshots illustrating the reinforcement requirements for both scenarios:
Fig. 2, Required reinforcement (Finite Element Based) for pre-cast factory footings
Fig. 3, Required reinforcement (Finite Element Based) for cast-in-situ factory footings

78
The difference in color intensity is an indicator of reinforcement requirement for the footings.
IV. FINANCIAL DISCIPLINE
Cost Estimation
To perform an accurate cost estimate of each factory, a proper quantity takeoff (QTO) had to be done. Both factories were modeled in REVIT Structure to perform the QTO. Fig. 4 below is a snapshot of the REVIT model. The steel reinforcement was also modeled in REVIT. Sketching the steel bars in REVIT allows accurate QTO of the reinforcement required.
Fig. 4, Factory Model in REVIT
Below is a snapshot from the REVIT model displaying the reinforcement for a typical column and footing of the cast-in-situ factory.
Fig. 5, Steel Reinforcement using REVIT Structure
VICO office was chosen for performing the cost estimate. In order to feed the REVIT 3D building information model (BIM) into VICO Office, the model was exported into what is known as an Industry Foundation Classes (IFC) file to ease the exchange of models between various BIM tools. Take-off items were generated in VICO office e.g. Columns, beams, slabs, and footings; and the quantities associated with these take-off items were linked to the 3D model. As a side note, contractors could save serious amounts of time in estimating projects if they utilize the power of BIM as the team has done in this project. Some might argue that BIM applications are powerful drafting tools rather than engineering tools. This is true; however, accuracy in detailing and 3D element modeling is a key player that helps
in reducing construction costs that arise from constructability issues. Fig. 6 illustrates the quantity takeoff performed to both models which enabled the team to generate the overall cost estimate.
Fig. 6, QTO of the Structure Using VICO Office
After importing the quantities, the results of the cost estimate are summarized in table 3.
Table 3: Total cost estimation generated from both factories
Percentage Difference: 20%
Cast-in-Situ FactoryPre-Cast FactoryTotal Cost
2,302,906$ 1,918,782$
From the results obtained, the cast-in-situ factory turned out to be cheaper in terms of material cost. This could be contributed to the fact that the prices for pre-cast concrete elements are expensive in Lebanon, as there are only three pre-cast concrete suppliers, which means there is minimal competition in the market. This might not be the case for countries in the MENA region or even worldwide, where there are cheaper prices for pre-cast elements. Moreover, post-tensioning the cast-in-situ slabs reduced the amounts of steel and concrete required and hence reduced the cost for cast-in-situ factory. Note that the footings for the cast-in-situ factory cost almost twice as much as those of the pre-cast factory; this is because there is more dead load (due to self-weight) on the footings of the cast-in-situ as compared to the pre-cast factory.
2) Cash flow Analysis
Along with productivity rates, the unit costs of each activity were also incorporated into the schedule. Hence, two cash flows were generated using VICO Control for each construction method. In order to compare the two cash flows, they must have the same time span. Knowing that pre-cast construction finishes much earlier than cast-in-situ

79
construction, it was assumed that once the pre-cast factory is completed, it will start generating revenue. The approximate amount of revenue was given to the team by the factory owner in Lebanon.
Using the present worth analysis (the interest rate was assumed to be 7 % for both cash flows), the net present worth of each cash flow was calculated:
Table 4: Net present worth of each factory
From the above comparison, it can be concluded that pre-cast construction is cheaper than traditional construction because the time savings on construction lead to an early return on investment. However, it should be noted that this type of analysis is case specific for each project.
V. ENVIRONMENTAL DISCIPLINE
1) Material Consumption
As discussed before, pre-cast structures tend to be lighter in weight than traditional RC structures. This means that pre-cast structures require less concrete than traditional structures. Below are quantities of concrete and steel reinforcements for each factory that were obtained from the 3D model, sketched in REVIT.
Table 5: Quantities of Concrete and Steeel Reinforcements forboth models (Pre-cast vs. Traditional)
When it comes to precast structures, a reduction in concrete usage also means a reduction in CO2 emissions that result from concrete production. CO2 is a greenhouse gas which
greatly contributes to global warming, a worldwide problem. According to a study done by Bremner (Environmental Aspects of Concrete: Problems and Solutions) approximately 450 kg of CO2 are emitted per m3 of concrete.
Fig. 7, Histogram showing the quantities of CO2 emissions based on Portland Cement quantities used for each factory
The histogram above displays the quantity of CO2 emitted in tons for producing the quantities of Portland cement required for constructing each factory.
2) Construction Waste
According to some studies, major contributors to construction waste are last minute design changes by the client [1],[2], and [3] . Other significant causes of construction waste are the off-cuts from cutting material [4]. Altering designs that have been prefabricated is not a common act because doing such would be too costly. Other major contributors to construction waste included wet trades such as plastering, almost equal to 20% of the total waste (Poon, et al., 2008). Pre-cast concrete construction decreased timber form waste, and wet concrete waste by 80% and 55% respectively (Poon, et al., 2008). Pre-cast concrete construction could be considered a much cleaner process than cast-in-situ concrete construction because the concrete elements are fabricated in a well-controlled environment which results in higher quality control as compared to traditional construction sites. Moreover, less temporary material are used on site in pre-cast construction, and approximately all concrete entering the site (pre-cast construction) is dry, which means there will be minimal or no concrete spilling. This does not mean that traditional cast-in-situ construction sites end up to be full of wastes, because proper waste management strategies could be applied to reduce the construction waste, however, such waste management strategies are minimal in pre-cast construction sites, and hence, reflect as lower managerial costs and burdens.
Net Present Worth ($) Pre-Cast Factory Cast-in-situ Factory
1,725,670.89 1,879,214.92

80
3) Construction Noise
Sawing, vibrations, and noise from cement mixers and pumps, and other noise-causing activities that are part of the traditional concrete pouring process are eliminated on site when pre-cast concrete is used because all of this noise is transferred to the prefabrication factory. Furthermore, pre-cast hollow core slabs and wall panels offer better sound insulation as compared to traditional solid concrete slabs and walls (http://www.pci.org/view_file.cfm?file=AS-08WI-2.pdf – PCI Acoustics). This results in significantly quitter construction sites and neighborhoods.
4) Recyclability/Re-usability
Pre-cast concrete members could be dismantled and installed in another site. This is possible because the connections between pre-cast members are in many cases bolted or pin-connected. Furthermore, the light weight of the concrete elements facilitates their transport. Cutting and re-installing cast-in-situ concrete elements are not common practices. It is too costly to cut through a solid slab since it would require the use expensive cutting equipment; moreover, lifting and transporting the heavy weight solid slabs would involve expensive cranes and huge trailers that could transport these heavy loads. Not to mention also that such an action does not insure structural integrity when re-installing the cast-in-situ elements.
VI. SCHEDULING DISCIPLINE
1) Project Duration
In order to calculate the project duration under each construction method, productivity rates were adopted from Lebanese contractors. The project schedule was built using VICO Control, a component of the VICO Office package. The Location Based Management System (LBMS) was the scheduling method used. The LBMS method requires dividing the project into several locations both horizontally and vertically. Tasks and activities were distributed according to the following locations: (1) Base (includes footings and slab on grade (SOG)), (2) Ground Floor, (3) First Floor, (4) Second Floor, (5) Roof, (6) Top of Roof. The quantities were exported from VICO Office to VICO Control. Each task was linked to the corresponding take-off-quantity and productivity rate, consequently, VICO Control calculated the duration of each task. The tasks were then linked to each other based on logical relationships e.g. Finish-to-start, and Start-to-start relationships, etc.
When it comes to resources, five types of crews were assigned to their corresponding tasks: (1) Concrete Crew, (2) Formwork Crew, (3) Post-tensioning Crew, (4) Steel Crew, and (5) Excavation Crew. The resultant project duration under each construction method is shown in the table 6 below:
Table 6: Project duration for each factory
Project Duration (months) Pre-cast Factory Cast-in-situ Factory
12 28 Percentage Difference: 233 %
The two main reasons that make pre-cast-concrete construction faster than traditional in-situ construction are: (1) all concrete elements are cast in a phase that overlaps with the beginning of construction or design. On the other hand, traditional reinforced concrete requires that the elements be sequentially cast in their place. This dictates that there has to be some lags between certain concrete activities so that the compressive strength of concrete reaches a certain value. For example, pre-fabrication of concrete elements runs in parallel with site development and foundations, whereas, the cast-in-situ elements require site development and foundations to be complete prior to construction. In other words, pre-cast construction is a start to start process along with site development and foundations. This saves major construction time and thus results in a shorter time period. (2) The productivity rates of casting and installing pre-cast concrete elements are much higher than those of the cast-in-place concrete elements. The cast-in-situ model requires a larger number of crews per task. Not to also mention that the tasks involved in traditional construction require more work and effort. The concrete works in a traditionally cast-in-situ structure for example, includes installing forms, reinforcement, concrete pouring, casting and curing as well as dismantling forms again. In contrast, precast structures consist of short tasks that require a few resources like the mere installation and mantling of concrete elements.
Fig. 8, Typical phases of pre-cast construction
Fig. 9, Typical phases of site built construction

81
2) Flexibility in Response to Variations during Construction
A setback in pre-cast construction is that variation orders are too costly of clients. For example, in a case where a client decides to stop construction, and the pre-cast structural elements were already manufactured, someone has to pay the price. Normally it depends on the contract between the client and the pre-cast concrete supplier, however, most of the times; the client will have to bear the cost. This is not the case for traditionally cast-in-situ structures where construction is a gradual and step by step process and thus a change might not be as severe as compared to the previously mentioned case (pre-cast construction). Moreover, after casting an in-situ slab, the scaffolds and props used to support the freshly cast slab will have to stay for a while until the concrete has gained the required compressive strength. Furthermore, the props and scaffolds would crowd the floor beneath the freshly cast slab, and would hence delay the masonry works until these props and scaffolds are removed. However, in pre-cast structures, the issue of props is not of great importance because the hollow-core slabs have sufficient strength to support themselves. This does not mean that no props are used at all. However, the number of props is minimal and does not crowd the site, and this in turn does not delay the masonry works as much as traditional cast-in-situ construction does. Each construction method presents different advantages and disadvantages; however, the significance of these advantages and disadvantages is always case specific and thus differs from one project to another.
VII. CONCLUSION
Pre-cast construction is a fast track method that is proven to be safer, and environmental friendlier than traditional construction methods. There is no splitting edge that determines whether pre-cast construction is better than traditional cast-in-situ construction, and hence, the evaluation of each construction method is case specific. Pre-cast concrete elements require less reinforcement than those of the cast-in-situ elements, and are smaller in cross section as compared to those of the cast-in-situ elements. As for the cast-in-situ factory, it was calculated to be the cheaper in terms of dry cost i.e. labor, material, and equipment cost. However, when the 5th dimension of time was introduced to the analysis, it turned out that pre-cast construction was cheaper by about 10%.
From a structural perspective, excessive lateral deformations in structures will result in significant Force-Displacement (P-∆) effects which could lead to collapse if not accounted for. This means that the overall stability of cast-in-place structures is firmer than that of pre-cast structures. Furthermore, damage triggered by seismic loads on a pre-cast structure is less severe than that inflicted on a cast-in-situ structure since the connections between structural elements in pre-cast structures are not fully rigid, and hence, tolerate some deflection, as opposed to the rigid connections in reinforced concrete members.
On another note, variation orders may be one drawback in pre-cast structures since a change in any structural element might require manufacturing new elements according to the altered design; however, this issue remains case specific.
The study was conducted one on an industrial factory, and thus cannot be applied to any project type e.g. residential. However, the study is an approach that enables analysts and engineers to assess and better understand which construction method is more efficient for their project.
ACKNOWLEDGMENTS
The research done required a lot of efforts from the team, however, the continuous consultancy of the team’s advisor Dr. Farook Hamzeh, and his help raised the standards of the team’s performance and motivated to look further to find all possible answers of our questions. Moreover, special thanks to the Chairperson, Dr. Mutassem Fadel, whose follow ups and reminders of deadlines are much appreciated.
REFERENCES [1] C. Poon and L. Jallion, “A Guide for Minimizing Construction
and Demolition Waste at the Design Stage” Department of Civil and Structural Engineering, The Hong Kong Polytechnic University, 2002.
[2] M. Osmani, J. Glass, and A. Price, “Architects' perspectives on construction waste reduction by design” in Waste Management, vol. 28, Newyork, 2008, pp. 1147-1158.
[3] C. Poon, L. Jallion, and T Yu Ann, “Reducing building waste at construction sites in Hong Kong” in Construction Management and Economics, vol. 22, 2004, pp. 461-470.
[4] C. Poon, L. Jallion, and Y. Chiang, “Quantifying the waste reduction potential of using prefabrication in building construction in Hong Kong” in Waste Management, vol. 29, 2008, pp. 309-320
[5] C. Pasquire, A. Gibb, and N. Blismas, “What should you really measure if you want to compare pre-fabrication with traditional construction”, in 13th International Group for Lean Construction Conference: Proceedings, Sidney, 2005, pp. 481-492

82
A Solution to Water Shortage in the Greater Beirut Area
Ghida Adra, Sibylle Aouad, Andrea Tessa Mouzannar, Joe Nehme, Patrick Obeid
Civil and Environmental Engineering American University of Beirut
P.O Box 11-0236/ Civil and Environmental Engineering Riad El-Solh/ Beirut 1107 2020
[email protected], [email protected], [email protected], [email protected], [email protected]
Abstract- Scarcity of fresh water supplies in urban areas is
one of Lebanon’s major environmental challenges. The domestic, touristic and industrial water demand exceeds current supply causing water shortages especially during the dry period. As a result, fresh water supply by the government is unable to meet the domestic demands and inhabitants are forced to supplement this shortage by digging wells or buying water cisterns. The high dependency on wells coupled with unsustainable pumping, particularly in coastal urban areas, is causing an increase in the water salinity of groundwater. In this paper, the fresh water supply to the Greater Beirut Area (GBA) will be studied with the objective of satisfying the demand with the least dependence on wells, thus decreasing the salt water intrusion.
Optimum design scenarios are initially studied at three different scales: macro scale, community scale and building scale. For the purpose of this submittal, our focus will be solely on the macro scale. On this scale, the water supply is increased by installing a seawater reverse osmosis (RO) system at the Dbayeh water treatment plant (DWTP) and design feasibilities are explored.
I. INTRODUCTION
The scarcity of fresh water in Lebanon is becoming a critical threat to the healthcare and welfare of all the Lebanese population. In this paper, a thorough comparison between the current demand (residential, industrial and touristic) and the water supply to the GBA is examined in an attempt to quantify the current shortage. As a result, the GBA inhabitants are forced to supplement this shortage by digging wells or buying water cisterns. However, the problem with the first solution is the unsustainable and uncontrolled pumping that has led to the high groundwater salinity along the coastline due to salt water intrusion. In order to solve this issue, a long term feasible and sustainable solution is needed. It has to incorporate and maintain a dependable and secure energy-water future that is cost effective, environmentally sound and that supports socio-economic growth and development. Different alternatives will be presented before selecting the most suitable one. The original study includes design feasibilities at three different scales. On a macro (GBA) scale, the water supply needs to be increased by installing a reverse osmosis system at the DWTP. On the community scale a RO system is proposed to treat the water delivered from the elevated tanks. Lastly, at the building scale, the water is treated at the building level. However, due to the large extent of the study area, design feasibilities are thoroughly presented on the macro scale. After the design is complete, other recommendations will be given in order to optimize the use of the extra water supplied and to increase the efficiency of the overall system.
II. AREA OF STUDY
The Greater Beirut Area is of 230 Km². It is limited by Dbayeh-Nahr el Kalb in the North and extends to Damour River in the South. It is also limited from the east side by all regions whose altitudes are lower than 400 m above mean sea level.
Figure 1: Greater Beirut Area
III. DEMAND AND SUPPLY
The water demand is subdivided into two categories: the domestic and industrial demand, and the tourists’ demand. Several sources showing different demands are shown in table I.
TABLE I DOMESTIC, INDUSTRIAL AND TOURISTS DEMAND
Source Comair2010
MOEW 2010
MEOW 2010
MEOW2010
El Hassan,
2010 Domestic and
industrial Demand
(L/capita/day)
200 200 220 250 150
Tourists demand (L/capita/day) 350 400 450 400
In this study, the per capita domestic and industrial demand is taken as 200 L/day and the tourists’ demand as 400 L/capita/day.
GBA
Mediterranean Sea

83
The region receives water from the DWTP, Damour plant and governmental wells. However, for practicality, only water supplied by the DWTP will be considered, given that the other sources are negligible. The supply will be taken equal to 430,000 m3/day.
TABLE 1 DEMAND, SUPPLY AND SHORTAGE
a The growth factor is equal to 0.7% (World Bank, 2009) b Assuming 200 L/capita/day for citizens, 400 L/capita/day for tourists with average 7 days stay and 100 L/capita/day for refugees) c Assuming 60% [3] efficiency net supply = 430,000*0.6 = 258,000 m³/day
IV. DIFFERENT ALTERNATIVES
In this section, the advantages and the disadvantages of the several processes that can remedy the issue are presented.
TABLE 2
THE DIFFERENT ALTERNATIVES' ADVANTAGES AND DISADVANTAGES
Artificial Groundwater is more costly and harder to execute than surface water storage [6]. However, it still has a lot of potential when it comes to the reduction in evaporative losses especially under warm weather when compared to the traditional surface storage. UNDP is currently conducting several studies on the hydro-geology in Lebanon in order to find optimal locations to implement artificial groundwater schemes. These potential projects will definitely result in better protecting the different aquifers from saltwater intrusion [6]. However, this option was found to be a better solution in regions outside the GBA. It was thus eliminated as an option in our project due to its high cost of implementation and the scarcity of lands in our highly congested area of study. Reuse of wastewater is mainly used for agricultural and irrigation purposes. Since these practices are not common in GBA and there is not much space allocated for these activities in Beirut, this technology can be thus eliminated. In Lebanon, currently only about 4-8% of wastewater is treated and none of it is reused [6]. Rainwater harvesting has the main advantage of being very cheap in price, especially as compared to alternative solutions for fresh water scarcity such as extracting/desalinating other water sources. The required catchment area is usually compared to the size of the collection area, and their ratio depends on the aridity of the region [7]. Since the GBA is relatively very populated, the catchment areas needed to supply such a high amount of water are very rare. In addition, this technology proves to be not dependable on such a large area of study. The implementation scale of rainwater harvesting is on the household and small community level [8]. After exploring the different options, it was found that the two most feasible and potential options on a macro scale are the thermal systems and RO systems since they both offer a sustainable solution that incorporates a dependable energy-water future that is cost efficient and environmentally sound. A cost analysis between the two different processes will be presented in the next section in order to determine the most suitable solution.
V. THERMAL VS. RO
A. Thermal systems Thermal systems are based on the addition of a certain
energy source that will lead to the separation of the pure water from the saline. Pure water is produced after evaporation and steam condensation. The heat of condensation is usually recovered to preheat the feed stream or vapor to evaporate again. The main energy sources are: thermal solar energy, exhaust steam from a power plant, solar photovoltaic energy, wind power, geothermal energy and ocean energy. Although the Solar desalination alternative seems tempting and offers great economies of scale, it cannot be applied in the GBA due to the limited space constraint in the capital and the lack of reliability on the solar energy. One of the renewable energy strategies is the integration of power plant with the distillation process. This process is when heat (the exhaust steam) from power plants is used as an energy source to desalinate water. Since in Lebanon, the steam from the power plant located in Zouk
2010 2020 2030 2040 2050 2060
Populationa (Million) 1.40 1.50 1.61 1.73 1.85 1.98
Tourists (Million) 1.80[1] 1.80 1.80 1.80 1.80 1.80
Refugees (1000s) 600[2] 600 600 600 600 600
Demandb (1000m³/day) 354 374 396 419 444 471
Net Supplyc (1000m³/day) 258 258 258 258 258 258
Net Shortage (1000m³/day) 96 116 138 161 186 213
Different Alternatives
Definition Advantages Disadvantages
Artificial Groundwater Recharge
Hydrologic process where water moves downward from surface water to groundwater.
- Reduction in seawater intrusion due to the fresh water barriers
- Decrease in the absorption rate of the soil due to steep slopes in Lebanon - Groundwater contamination due to the subsurface limestone
Rainwater harvesting
Rainwater collected before its infiltration in the soil
- Cheap to implement
- Large catchment and storage areas required
Reuse of wastewater
Recycling of large volumes of water[4]
- Decrease in the amount of water to be extracted from natural water bodies[4] - Crops irrigation[4]
- Degradation of the environment due to chemical contaminants and pathogens in the discharged effluents[4]
Thermal systems
Separation of the pure water from the saline by evaporation
- Less possibility of bacterial contamination and pollution - Possibility of integrated power plant - distillation process (huge economies of scale)
- Limited availability of electricity in Lebanon
Reverse Osmosis
Separation process to purify water from its contaminants
- Low cost when used in a standalone process - Low energy requirement
-Susceptible to fouling on the long-term[5]
- Limited availability of electricity in Lebanon[5]

84
is unused, it might be a good idea to leverage this steam into a useful process.
Thermal desalination processes can be divided into evaporation processes and flashing processes. Evaporation processes include mainly multiple-effect distillation (MED) and vapor compression (VC). Flashing processes include multi-stage flash (MSF). The VC system operates exclusively on electric power and is the process that is the least used. MSF and MED processes are usually constructed in a dual plant where water and power are formed. This presents a great economic advantage as the two systems necessitate low pressure heating steam which can be extracted from the surrounding power plant resulting in great savings [9].
B. RO systems Osmosis is a material transport process where the solvent molecules move through a membrane from a low to a highly concentrated solution. The concentration gradient drives this process in the absence of external energy. The membrane is semi-permeable and allows the passage of solvent but not of solute. When the saline solution is pressurized to a point higher than the osmotic pressure (73-1200 psi varying with the water source), the direction of osmotic flow is reversed. This phenomenon going against the concentration gradient is called reverse osmosis. It separates the dissolved salts from the solvent. Usually, pre-treatment of the stream feed is necessary to prevent fouling and to extend the life span of the membrane. It includes the removal of turbidity, chlorine and other impurities [10].
Figure 2: Osmosis vs. Reverse Osmosis
One of the main advantages of RO is that it is an ambient temperature process, thus limiting the energy requirement. The recovery of such a process could be as high as 80 %. Another important advantage is that it does not pollute the environment and it does not consume the oxygen of the treated water. Finally, an important factor in our highly populated area of study is the high space production capacity ratio of this technology that varies between 25000 to 60000 L/day/m2 . On the other side, it also presents a lot of disadvantages that are mainly related to the energy requirements of this system. The reason it is not much applied in Lebanon is the limited availability of electricity. In addition, another environmental disadvantage is the deleterious impact on marine eco systems when disposing of brine efflux into the sea.
C. Cost analysis Seawater desalination methods such as evaporation and
distillation are usually energy-intensive processes. Thus, they have a strong impact on the environment.
Recovering fresh water by desalination requires huge amount of energy. In this section, a thorough analysis of the two main constituents of the cost structure will be examined:
1. Energy costs 2. Unit desalination costs
Different references show a great variation on the energy requirements for each of the different processes. This is mainly due to the variation in the unit sizes and configuration, the advances in technology and the feed stream quality that is being treated.
TABLE 4
ENERGY-OUTPUT RATIO (KJ/KG FRESH WATER)
Ref MSF MED VC Seawater RO
Brackish RO
[11] 290 100-120 23-30
[12] 216-288 18-22 11
[13] 25-43 11
[14] 95-252 107-132 22-29
[15] 14 7.2
Despite the variations, the following can be concluded:
1. From the different thermal process, MSF is the less efficient ( requires more energy), followed by MED and then VC
2. RO processes are more energy efficient than any of the thermal processes
3. Brackish RO is more energy efficient than the Seawater RO
In the following table, the unit cost of operating the different systems is presented. It includes the direct and indirect costs.
TABLE 5 UNIT COSTS OF DESALINATION ($/M3 FRESH WATER)
MSF MED VC Seawater RO Brakish RO 1.10-1.50[16] 0.46-0.85[16] 0.87-0.92[16] 0.45-0.92[16] 0.20-0.35[16]
0.80[17] 0.45[17] 0.72-0.93[17] 1.35[18] 1.06[18] 0.70-0.75[14] 0.45-0.85[19] 0.25-0.60[14]
Despite the cost variations, the following can be concluded:
1. Great economic advantage for RO in treating brackish waters
2. An economic advantage for RO over MSF in treating seawater
3. MED is cost competitive with RO
Thermal processes are generally used in places where energy costs are low or where there is availability of waste heat source. This can explain why thermal processes are the most common in oil-rich countries such as the Persian Gulf. After all, the energy availability is the most critical factor as it
Osmosis Reverse Osmosis

85
dictates which methods to use. In Lebanon, the costs of energy supply are already really high and are gradually increasing. This has lead to designing a RO process. The cost analysis was not enough In order to choose between brackish RO and seawater RO. Even though brackish RO processes have lower unit costs, it is still overexploiting the ground surface water leading to even higher salt water intrusion especially at the source. Seawater RO was chosen to remedy the problem.
VI. REVERSE OSMOSIS COSTS
A. Capital Cost
The following figure shows the capital cost of a reverse osmosis plant as a function of the capacity.
Figure 3: Capital Cost in function of the Capacity
These values are based on a 10 year life time, including interest rate and depreciation costs. Considering an efficiency of the network of 60 %, the additional water that need to be supplied in order to meet the expected demand in 2060 is equal to: 213,000/0.6 = 355,000 m³/day. Based on figure 3, the capital cost of such a plant is equal to 1050$/m³.
A. Operation Costs
The total operation cost of fresh water is a function of salinity. It increases as the salinity increases.
Figure 3: Fresh water cost ($/m3) [23]
For a total salinity of 38,000 ppm, the operation cost is 1.00$/m3. This value is compliant with the ones found in table 5.
This operation cost is divided as follows:
Figure 4: Repartition of the indirect costs [24]
VII. WATER TREATMENT
A. Pre-treatment
Fouling degrades the RO membrane. Therefore, the following appropriate pre-treatment processes have to be designed in order to avoid the different kinds of fouling.
TABLE 6 FOULING TYPES, CAUSES, AND SOLUTIONS [24]
950
1,000
1,050
1,100
1,150
1,200
1,250
0 200,000 400,000 600,000
Cap
ital c
ost (
$/m
³)
Plant Capacity (m³/day)
Source 1
Source 2
Source 3
0.980.99
11.011.021.031.041.05
35000 37000 39000 41000 43000 45000
Tot
al u
nit c
ost (
$/m
³)
Salinity (ppm)
38%
10%13%19%
20%Energy
Chemicals
Supervision and LaborMembrane ReplacementMaintenance and Parts
Types of Fooling
Causes Pre-treatment process
Biological Fooling
Growth and activity of living organisms found in water (microorganisms, viruses, algae…)
Pre-chlorination
Particle Fooling
Presence of particles in the water (sand and clay)
Pre-filtration
Colloidal fouling
Aggregation of colloidal particles as well as the presence of organic and inorganic complexes and micro-algae
Coagulation, flocculation, sedimentation and filtration
Organic fouling
Organic Matters (NOMs) (humic and fulvic acids)
Coagulation, filtration, and activated carbon adsorption
Mineral fouling
Presence of calcium, sulfates, and carbonates in the water
Antiscalant dosing and acidification
Oxidant fouling
Presence of chlorine, ozone, as well as KMnO4 in water
Oxidant scavenger dosing with Sodium meta bisulfite or granulated activated carbon
[20] [21] [22]

86
B. Reverse Osmosis System
Reverse osmosis system has been designed using the Toray Design System 2011. It is composed of the following items:
- Number of banks: 1 - Membrane type: TM820L-400 - Elements per vessels: 8 - Pressure vessels: 3922
The membrane TM820L-400 has the characteristics listed below:
- Salt rejection: 99.8% - Permeate flow: 46.18 m³/d - Test pressure: 55.2 bar - Membrane area: 37.16 m² - Test recovery: 8% - Test solution: 32,000 ppm NaCl
* Based on a study in Beirut Littoral Area between March 2005 and February 2006 [25] ** 14791.67 m³/hr = 355,000 m³/d (expected shortage). The value has been rounded up to account for the different losses and inaccuracies.
C. Post-treatment
i. Neutralization / Re-mineralization Low mineralized water can cause health related issues and has a high corrosion potential. Therefore, water obtained from the RO system has to be post-treated.
Several processes can be used as re-mineralization processes:
- Blending the water with clarified feed water, then neutralizing the pH
- Addition of CO2, percolation of Calcite Limestone, and addition of Sodium Carbonate
- Addition of CO2, percolation of Dolomite Limestone, and addition of Sodium Carbonate
- Addition of Calcium Chloride as well as Sodium Hydrogen Carbonate [26]
ii. Chlorination As any other water treatment system, the water coming from a RO system has to be chlorinated in order to prevent the contamination by micro-organisms during the distribution.
VIII. PROJECT LIMITATIONS
A. General Limitations There were diverse sources of information stating different values for the parameters needed such as the population growth rate, pipelines’ efficiency, water flow rate in the pipes, etc. An average of the values found was therefore chosen. Moreover, there was a lack of information on the exact water demand and supply in the region. Hence several assumptions had to be made to get the most accurate estimation of these values.
B. Capacity Limitations Given that the capacity of the RO system is of 355,000 m3/ day, we have noticed that if implemented, it would be larger than the biggest RO plant in the world having a capacity of 330,000 m3/ day, and situated in Israel [27]. In order to decrease the capacity of the plant, a solution could be replacing the pipelines by new ones having a higher efficiency, and thus delivering more of the water supplied to the population.
C. Brine Disposal The brine with a salinity of 75,511.4 ppm has to be disposed in the sea. Since this value is approximately twice the salinity of the Mediterranean Sea, impact studies have to be conducted. Hence, the effect on the sea salinity is still of our concern on the long run.
D. Location of the RO system The location of the property needed to build the RO system was also considered. It should be located next to the DWTP so that the water being treated gets routed directly to the pipelines originating from the plant. A property next to the DWTP therefore needs to be acquired by the government for this purpose.
IX. RECOMMENDATION
After comparing the different alternatives that could be used in order to compensate the water shortage, we found that using RO systems is the best solution. Only the macro scale was designed for the purpose of this submittal. However, another alternative solution for the water shortage would be implementing the RO technology on a building scale. Each building would therefore treat the brackish water coming from its well. In this case, it is not the seawater to be treated but the brackish water due to practical reasons (no water transport from the sea) and economic ones (the membrane and system are cheaper for brackish water treatment and more water is supplied due to higher recovery). However this alternative has the following limitations:
- It does not solve the problem of Salt Water Intrusion since groundwater is still being overexploited.
Figure 5: Design Parameters and Software Output Values

87
- The sustainability problem would not be addressed, but rather treated since people would still be using wells.
- It favors certain households over others since it is privately funded. In fact, implementing the solution on a building scale would favor the portion of the population that is more financially capable over others since the cost of such a system is high (>$15,000). This issue cannot be resolved unless a government supplemental program helps in funding it on the country level.
- Brine treatment and/or disposal would be a major problem; dealing with a single system at Dbayeh is easier than coping with thousands of small systems.
The building scale solution could be therefore used in
case the macro scale design was not implemented, but it is not the optimal solution.
Although the macro scale RO system was designed taking into consideration the low efficiency of the current pipes present, changing the piping system in the area is also recommended. According to figure 7, most of the pipeline is outdated. Increasing the efficiency of the network will result in an increase in the amount of water actually delivered to the region, thus decreasing the required capacity of the plant.
Figure 6: Age of Networks, 2010 [3]
Furthermore, in order to better control the flow of fresh water, installing pressure meters at several locations is suggested:
- At the outlet of the DWTP in order to measure actual quantities supplied by the plant to the different regions in the GBA
- At the outlet of the government wells located in the GBA and supplying water to the population in order to quantify their capacities
- At the pipes entering each region in the GBA in order to quantify the amount of water that is actually delivered and thus the losses.
Finally, and for the population to better appreciate the
value and importance of the water used, we would recommend pricing the water in $/liter instead of having a fixed price irrespective of the quantities consumed.
ACKNOWLEDGMENT
Our team members Ghida Adra, Sibylle Aouad, Andrea Mouzannar, Joe Nehme and Patrick Obeid would like to thank our advisor, Dr. Majdi Abou Najm, as well as Dr. Mutasem Fadel and Dr. Mahmoud Hindi who provided us with information and advised us in the design of the RO system.
REFERENCES [1] El Hassan, Z. (2010). Water Resources. State of the
Environment. [2] Federal Research Division – Library of Congress, 1987 [3] Gebran Bassil. (2012). National Water Sector Strategy. Ministry
of Energy and Water, Lebanese Government, Resolution No. 2, 09/03/2012.
[4] Fischer T et al. (2004). “New directions for a diverse planet”. Proceedings for the 4th International Crop Science Congress, Brisbane, Australia, 26 September – 1 October 2004.
[5] Abbas, N., and Adesoye, K., “Carrier-Gas Enhanced Atmospheric Pressure Desalination (Dewvaporation): Economic Analysis and Comparison to Reverse Osmosis and Thermal Evaporation”. University of Oklahoma , April 2007
[6] Hoff, H. GIZ, Regional Technical Cooperation Programme. (2012). Mainstreaming climate change adaptation. Retrieved from website: www.giz.de
[7] Prinz, D. (2002). The Role of Water Harvesting in Alleviating Water Scarcity in Arid Areas. Keynote Lecture, Proceedings, International Conference on Water Resources Management in Arid Regions. 23-27 March, 2002, Kuwait
[8] United Nations Environment Programme (UNEP) Division of Technology, Industry and Economics. Sourcebook of Alternative Technologies for Freshwater Augumentation in Some Countries in Asia. Retrieved March 16, 2013, from http://www.unep.or.jp/ietc/publications/techpublications/techpub-8e/fog.asp
[9] El-Dessouky, H.T., and Ettouney, H.M., Fundamentals of Salt Water Desalination, Elsevier, New York, USA, 2002
[10] Y. Moran, E. Schreiber, J. Skelly, D. Volpe. (2010). “Green reverse osmosis pretreatment for shipboard desalination”. (Master's thesis, Faculty of Worcester Polytechnic Institute)
[11] Puretec industrial water. (2012). Retrieved from http://puretecwater.com/contact-us.html
[12] K.S. Spiegler and Y.M. El-Sayed, A Desalination Primer, Balaban Desalination Publications, Santa Maria Imbaro, Italy (1994).
[13] K.E. Thomas, (1997) NREL report TP-440-22083. [14] O.K. Buros, “The ABCs of Desalting, Second ed.” International
Desalination Association, Topsfield, Mass, 2000. [15] H.M. Ettouney, H.T. El-Dessouky, I. Alatiqi, “Chemical
engineering progress”. September 1999. [16] P. Glueckstern, A. Thoma, M. Priel, “The impact of R&D on
new technologies, novel design concepts and advanced operating procedures on the cost of water desalination”, European Conference on Desalination and the Environment: Water Shortage, Lemesos, Cyprus, May 28-31, 2001.
[17] R.Semiat, “Cost of desalination processes” (2000). [18] Bednarski, J., Minamide, M., Morin, O. J. (1997). Proc. of IDA
World Congress on Desalination and Water Science, Madrid. 1:227.
[19] Hess, G., Morin, O. J. and Carrigan, W. V. (1992). “Seawater desalting for southern California: technical and economic considerations”, USA, vol. 87, pp. 55-68.
[20] Seawater Reverse Osmosis Desalination Plant Costs, Volume 10, Issue 11, (2009) .
[21] Sustainable water integrated management, Support mechanism. [22] Seawater desalinating capital costs, Desalting handbook for
planners. [23] Al-Karaghouli, A. and Kasmerski, L., “Economic and technical
analysis of a reverse osmosis water desalination plant using DEEP-3.2 software”, National Renewable Energy Laboratory Golden, Colorado 80401
[24] Banat, F. (2007). “Economic and technical assessment of desalination technologies”. Jordan University of Science and Technology, Geneva, 6-8 June, 2007.
[25] Reverse Osmosis Pretreatment. (2012). Retrieved March 24, 2013, from Water Treatment Solutions Lenntech: http://www.lenntech.com/ro/ro-pretreatment.htm.
[26] Reverse Osmosis Post-treatment: Neutralization / Remineralization. (2012). Retrieved March 24, 2013, from Water Treatment Solutions Lenntech: http://www.lenntech.com/ro/bwro-remineralization.htm.
[27] Water-technology projects: Ashkelon, Israel. Retrieved from: http://www.water-technology.net/projects/israel/

88
Concrete Canoe Abkar Abkarian
Kheireddine El Bawab
Mohammad Hajjar
Chaalan Mourad
Pierre Slim
Department of Civil & Environmental Engineering
American University of Beirut, Bliss Street, Hamra-Beirut
Abstract: Throughout the past centuries, canoes were known to be wooden products or even plastic, but never concrete. The purpose of this final year project is not only to design but also to construct a concrete canoe. The feasibility of replacing conventional canoes with concrete ones was studied throughout this year. After many years of theoretical learning, it is time to invest those theories in an actual project. The prediction of a structure’s behavior must always be enhanced and sharpened by graphical and numerical modeling and a smart design followed by the optimum construction techniques. In this project a six-meter long canoe is designed to accommodate five paddlers. A hull design was performed first to properly shape the canoe taking into account buoyancy and fluid dynamics. Then a structural analysis was done and the necessary thickness was determined to resist the applied stresses. Moreover, several concrete mix designs were investigated and the optimal materials were chosen carefully with the right proportions to satisfy the strength requirements and the constructability of the canoe. Consequently, like any other civil engineering project, the construction phase is the last and possibly the most challenging one. The sustainability of the canoe must be well defined. Solutions shall be provided for an alternative use of the concrete materials once the canoe’s life expectancy is expired. Maintenance could be an option; the use of materials for abrasion resistance is another.
I. INTRODUCTION The “Concrete Canoe Competition” held by the American
Society of Civil Engineers is one that grasps the interest of civil engineers from all around the world each year, for what this project includes of multidisciplinary challenges. No university in Lebanon has ever attempted the execution of this project before, so it was the time for the American University of Beirut to step ahead and prove its ability to compete, if not in the competition, but at least in the construction of a strong, well-performing and efficient concrete canoe.
The Concrete Canoe project necessitates the compiling of all acquired academic knowledge and technical experiences for it to succeed. This includes structural design and analysis, formwork design, selection of appropriate materials, designing a case-specific concrete mix, pro-active project management and finally strong construction know-how. The team encountered many new challenges along the phases of the project, which increased its engineering judgment and solution finding capabilities. The canoe was modeled using DELFTship, a professional software tool for designing boats and canoes hull shapes, and then the design was structurally analyzed using SAP2000 to examine its strength and ability to float. The canoe is 6 meters long, 40 centimeters deep and having 80 centimeters maximum width, designed to carry the loads of the team’s five members, estimated to be 80Kg per person, multiplied by a safety factor (1.3), spread equidistantly along the length, in addition to its own dead weight. The canoe is supposed to float and stay 13 centimeters above water level, meaning that the canoe’s draught would be equal to approximately 27 centimeters. Optimal materials with careful proportions are needed for the canoe concrete mix design; this obliged the team to invest in new materials in the market and get to know their technical data, in addition to following up on the new technologies and innovations in the civil industry. Thorough understanding of the materials interaction in the mix, their combinations and their proportions is accomplished, as different mixes were designed and tested against the required structural requirements in order to choose the best mix meeting with the project’s needs and specifications. Upon finalizing the concrete mix design, the team investigated the best construction method. Constructability is an essential criterion considering the steep slopes of the canoe’s sides all along its length and the need to have the concrete’s slump appropriate, meaning it has to be workable and strong at the

89
same time. Thus, more iterative mix design trials were conducted to satisfy both the structural and slump requirements. The different construction procedures considered are tested on specimens representing similar conditions of the actual canoe construction, especially layering the required concrete thickness on slopes. Self-handling materials and necessary construction tools upgraded the team’s technical and craftsmanship skills. In addition to the technical challenges faced, the team has managerial decisions to take and execute. Failing to professionally manage the project jeopardizes its completion or at least its success. Procedural and administrative duties were set early in the project’s planning phase, drawing an estimated life cycle and setting an acceptable maximum budget. Actual performance and progress were measured regularly and compared to the estimated plan and schedule, budget and minimum quality levels, and actions were taken accordingly. Material procurement was given high importance in order not to have delays and having sufficient time for testing of these materials. Each team member is confidently aware of his responsibilities, and mutual respect colored their professional relationships.
II. HULL DESIGN Similar to all engineering projects in the world, the first
phase in this project is to plan for a preliminary concept based on a set of given needs to obtain the desired end product. The end product in this project is a concrete canoe that accommodates a maximum of five people, which is comfortably used by the ultimate users without jeopardizing the efficiency of any of its major functionalities. Therefore, a conceptual dimensioning was done for the canoe to float and withstand the weight of five paddlers plus its own weight without sinking in water, using a preliminary dimensioning excel sheet prepared by the team members. The excel sheet is based on “Force Equilibrium” concept along the Z-direction between the applied downward forces and the hydrostatic upward pressures.
The excel sheet, shown in the Appendix, is prepared in such a way that it allows a back-calculation process, where many “input parameters” are inserted, such as total depth, submerged depth, total width, base width, thickness of the canoe and the unit weight of the concrete itself, and the equalizing applied load is obtained per meter run. This was done until the weight of an average person multiplied by a certain safety factor is achieved using an iterative process. The preliminary dimensions of the canoe are obtained to be as a length of approximately 6 meters, a maximum total width of 1 meter and a total depth of 45 centimeters.
Moreover, as it is the hull shape of the canoe that dictates its performance on water and behavior during “races”, it is crucial to conduct a careful “Hull Design” for the canoe to demonstrate considerably high top speed on straight lines, ease of maneuverability on horizontal curves and a firm stability against toppling. Therefore, special watercraft conception software, DELFTship, was used to model the canoe for this project based on the parameters obtained from the conceptual preliminary dimensioning. Several models were generated using DELFTship by varying the characteristics of the canoe one at a time. These characteristics include its length, beam widths along the centerline at multiple intervals, thickness of the outward shell and its density, smoothness of the bends and curves at different cross sections, shape of the bow and stern, the draught (water-level) of the canoe, and finally its total depth. This investigation allowed the team members to identify the impact of every modification on the canoe in terms of stability, maneuverability, top speed, water resistance, own weight, freeboard and water displacement that directly corresponds to the loading capacity. It is obvious that this is one major part of the design stage since a minor change in shape and dimensions can alter the performance of the canoe radically. Thus, significant effort was spent throughout this phase by every one of the team members. Out of the process mentioned above, 5 different models were nominated that take into consideration different, and yet at times, extreme assumptions and assignments of all the characteristics mentioned above. After a thorough study, the final model of the canoe was chosen with an overall length of 6.000 meters, a maximum beam width of 0.770 meters, a total depth of 0.400 meters, and a design draught of 0.270 meters that corresponds to a water displacement of 719 Kgs. Finally, the model obtained from DELFTship is exported to AutoCAD in 3D for the later phases of the project, namely “Structural Analysis” and “Formwork Construction”. The following shows the final model generated by DELFTship.
Figure 1: Final model on DELFTship

90
III. CONCRETE MIX DESIGN & TESTING The team had two main goals for the mix design. The first
was to produce a concrete with adequate strength and appropriate workability, and the second was to make the unit weight of this concrete as low as possible. After conducting thorough research regarding this matter, a compressive strength of 10 MPa was found to be a good strength for the mix. An extensive study about materials that could be used to produce lightweight concrete was done, and expanded clay was found as a light material available in Lebanon. This material is provided by TA group and its density is 450 Kg/m3. The smallest available size of this material ranges from 3 to 8mm. Lab testing started with different concrete mixes containing expanded clay instead of coarse aggregates with the necessary proportions of sand, cement, silica fume and water. The first mix, denoted as mix 1, contained a large quantity of expanded clay. After mixing was done, these particles floated on top of concrete and caused heterogeneity in the mix, hence the mix was disregarded. Fig. 2 below shows concrete samples with expanded clay floating on the surface.
Figure 2: Expanded clay floating on top of concrete
The team moved into the second mix, mix 2, which contains a smaller proportion of expanded clay than mix 1. But the same problem persisted with this mix. At that point the team decided to crush expanded clay and try it in a new mix 3. When coarse aggregates are crushed into fines it becomes easier for the cement bond to hold all the particles in the mix together. This mix looked successful since it provided a high strength and low density. However, another mix (mix 4) was done with higher proportions of crushed expanded clay instead of sand in order to obtain a lower density of concrete. Yet, due to the large percentage of fine particles present a high quantity of water was required and as a result the mix provided lower density than mix 3 and a much lower strength. Therefore mix
3 was chosen as the most suitable mix to be used for the canoe. Since large quantities of expanded clay should be crushed for usage in the whole canoe, the team ordered a roller to come to AUB and crush the required quantity of expanded clay, as shown in fig. 3.
Figure 3: Roller crushing expanded clay
To make sure that concrete will stick on the formwork, a trial was made with the chosen mix 3 and it was found that it does not stick on vertical surfaces of foam. A new mix was done (mix 5) with a slightly higher percentage of fines than mix 3. Mix 5 was a compromise between mix 3 and mix 4 such that the density and the strength of the mix are somewhere in between that of mixes 3 and 4. Also, the concrete stuck well on the vertical surface when it was tested. Consequently, the team decided to use mix 5 for the construction of the canoe. Table 1 shows the proportions of each mix along with its compressive strength.
Table 1: Proportions for 1 m3 of concrete
Mix 1 Mix2 Mix 3 Mix 4 Mix 5 Cement (Kg) 550 550 483 405 470 Silica fume (Kg)
66 66 58 71 70
Sand (Kg) 550 550 483 377 385 Expanded clay (Kg)
358 220 0 0 0
Crushed expanded clay (Kg)
0 0 295 653 325
Water (L) 189 220 204 354 270 Hyper plasticizer (L)
31 19 15.8 14.15 11.5
28-days Compressive strength (MPa)
7.7 9 20 14 18
Density (Kg/m3)
1400 1550 1850 1520 1750

91
After agreeing on the mix to be used for the construction process, some further lab testing was done to find the properties of the mix. The mix was repeated on a large scale with the addition of STUCCO-BOND, a homopolymer polypropylene monofilament fibrous reinforcement, also provided by TA group. The fibers provide a mini-reinforcing system to a more cohesive, inner supported much that functions as plastic shrinkage reinforcement intended to reduce the formation of shrinkage crack prior to initial concrete set. This type of fiber is used in mortar for plastering which allow more adhesion of concrete to vertical surfaces which is essential in the case of concrete sticking to the foam. The fibers were used with the same proportion given in the data sheet provided along with the fibers, 1kg of fibers per 1 m3 of concrete. Three cylinders were tested again for compressive strength and another three cylinders for tension tests (Brazilian Tensile Test) in order to reveal the tension capacity of the concrete alone without reinforcement. Furthermore, plates with dimensions of 30x30 cm and thickness of 1.5 cm were tested to determine the flexural strength of the concrete. Three types of plates were tested; the first one contains only concrete without reinforcement, the second one contains concrete with a reinforcing steel mesh of 1 mm thickness and the third one contains a reinforcement with 2 mm thickness. The flexure tests also helped in determining the necessary dimensions of the steel mesh to use for the canoe. All the results obtained from testing on mix 5 are summarized in table 2 shown below.
Table 2: Structural properties of mix 5
Mix 5 Testing Results 28-days
compressive Strength
(MPa)
18.00
28-days tensile
Strength (MPa)
2.59
Flexural Strength
(MPa)
1.5 cm Plate
without Reinforce-
ment
1.5 cm Plate with 1mm Steel Mesh Reinforce-
ment
1.5 cm Plate with 2mm Steel
Mesh Reinforce-
ment 3.43 3.43 5.15
From the above testing, the compressive and tensile strength gotten will be used to determine whether the mix can withstand the applied stresses due to the most critical loading cases found by finite element analysis on the canoe. However,
the flexure results imply that plates with no reinforcement have the same strength like plates with 1mm reinforcement which infers that the 1mm steel mesh has no foreseen effect in increasing the flexure capacity. While 2mm steel mesh reinforcement shows 1.72 MPa increase in the flexural capacity; therefore, the necessary reinforcement to use shall be at least 2mm steel mesh thickness. The Appendix shows some photos of lab testing.
IV. STRUCTURAL ANALYSIS The main objectives of the analysis are to determine the
maximum stress values that will result under the most critical loading scenario. The optimal dimensions of structural elements for a predetermined hull thickness of 1.5cm were used in the analysis. The first step is to define the most critical loading cases the canoe could be subjected to. Four scenarios were studied: (1) only one paddler, (2) two paddlers, (3) five paddlers, (4) Lifting the Canoe. The canoe 3D-Model is meshed into 640 shells and exported from DELFTship program to AutoCAD, and then from AutoCAD to SAP 2000 for the finite element analysis. Based on concrete mix designs and testing, the concrete properties to be used in the SAP 2000 are as follows:
1. Density equal to 1750Kg/m3 2. Modulus of elasticity of 180123.0 Kg/cm2 3. 28-days compressive strength of 18MPa
The self-weight of the canoe was determined by DELFTship software to be 184Kg, and factored weights of 105kg per paddler would be used in the analysis procedure. The first load case is modeled with the first paddler entering at the center of the canoe in a standing position before sitting. The load exerted by the paddler is distributed on an area of around 0.06m2, an approximate area of the paddler feet. The second and third load cases were used to model two paddlers sitting at the ends of the canoe, and five paddlers sitting at an average of 45 cm clear distance between two consecutive paddlers, respectively. Weight of a paddler is distributed on an average area of around 0.12m2 that corresponds to the minimum area required for a paddler to sit. The final loading case models the lifting process of the canoe. The canoe should be carried by eight persons in a well distributed orientation. The transportation method is not considered between the loading scenarios since the canoe will be placed on a moving table which will not provide a critical load situation. For the first three loading scenarios, the forces present are the downward forces due to the weight of the canoe and the paddlers and the upward forces due to water pressure. For each case, the dead and live forces were calculated and the displacement of the canoe under water was hence determined using DELFTship software to obtain a rough starting value of the hydrostatic force. Through an iterative process and by

92
applying equilibrium of forces between upward and downward forces, the upward hydrostatic force was determined. The best way to model such a situation is to have two hinges at the ends of the canoe and the reactions at those supports will be equal to zero because the forces applied balance each other. For the last loading scenario, the canoe will be modeled under its self-weight acting downward with eight supports that represents the people who will lift the canoe. The supports will be distributed in a uniform way around the canoe hull. Some of the stress distribution results as obtained from analysis are shown in the Appendix. Table 3 below shows the maximum tensile and compressive stress results on the canoe for each of the four loading scenarios.
Table 3: Stress results from SAP
Loading Scenario
Absolute Maximum Tension Stress (MPa)
Absolute Maximum Compression Stress (MPa)
1 1.91 1.64 2 1.46 1.43 3 1.32 1.31 4 0.97 0.74
From the above table, it can be deduced that the most critical loading scenario is load case 1. Absolute maximum tensile and compressive stresses obtained by the analysis software were compared with the 28-days strength results achieved on testing the concrete mix used for the analysis for tension and compression. Table 4 below displays the critical stresses and the 28-days mix properties.
Table 4: Critical stresses vs. strength
Critical Stress SAP Stress (MPa)
28 Day mix Properties(MPa)
Maximum Tensile Stress
1.91 2.59
Maximum Compressive
Stress
1.64 18.00
From the results above we can deduce that the concrete without any reinforcement should be capable of withstanding all compressive and tensile stresses. However, from an engineering perspective for safety issues the group will provide the minimum of 2mm steel mesh reinforcement at the center of the of the concrete section as a backup in case a tensile crack would arise; and the maximum load of a canoe paddler should not exceed 105 Kg to stay within the maximum stress limit established by structural analysis.
V. CONSTRUCTION The construction method adopted to build the canoe is to
assemble the formwork taking the shape of its inner surface and placing it upside down, then concrete will cover this surface. The material chosen to be used for the formwork is Blue Extruded Polystyrene foam. CNC machine is the best choice for cutting the foams; this is due to accurate shapes and smooth surfaces that this machine can make. The foam boards are chosen due to their easiness in cutting and manipulating. The standard dimensions of the foam boards are: 120x60x5 cm. With the help of the cutting tools in SRB shop, these boards were cut to form 50x60x5 cm, then each pair glued together to form a thickness of 10 cm. The construction of the canoe requires well studied steps and good planning. First, the 3D design made on DELFTship was imported to Autocad 3D. The canoe is cut symmetrically along its centerline and thus design for only one side was needed. As stated before, the size of the foam board that will be cut cannot exceed 10 cm thickness, so each side of the canoe is separated into layers of 10 cm each. This gives a total of 4 layers, along the depth. Then, for each layer, the canoe is cut into pieces of 50x60 cm along the length and width respectively. This will end up in dividing the canoe into 3D surfaces that will be uploaded to the CNC software to cut. The reason behind taking 10 extra centimeters on the width is to allow for the clips of CNC to fix the board from each side (5cm on left and 5 cm on right). In summary, the number of pieces to cut is: For each side:
12 pieces along the length (600cm/50) 12x4layers= 48 pieces
In total, 96 pieces (48x2) will be cut then glued together to form the desired formwork. Every 4 pieces along the depth were first glued together to form a block. Then every 2 symmetric blocks along the width were glued. Finally, the blocks were assembled all together along the length to form the necessary formwork. With the formwork constructed, it is time to pour. But to make sure the concrete pouring will be easy and does not slip or segregate on the board surface, a trial was made to anticipate the behavior of concrete on such surfaces and to solve any problems that may arise during casting. It was concluded that the concrete should be placed from bottom of the formwork where steep slopes are present to its top surface. In this way the concrete holds itself and does not slip. In addition to that, roughening of the formwork surface is done to increase its ability to bond with the concrete. Once, steep slopes are overcome, the remaining surfaces are somehow horizontal so no problem will be faced.

93
Before the construction process is launched, a mold releasing agent was sprayed on the formwork so that after concrete settles, no problems will arise while removing the canoe. To achieve the stated concrete thickness of 1.5cm, the canoe will be casted such that its thickness will exceed the requirement. The desired thickness will then be adjusted using sand-papers to ensure that the canoe will have a uniform thickness. Pins were used during construction to ensure that a 1.5cm section thickness was accomplished. Regarding the reinforcement, 2mm steel wire mesh reinforcement layer was placed to support tension forces, with a concrete cover of 6mm. The reason behind using steel wire mesh is its small diameter, flexibility and ease of installation when covering concrete. In addition, the openings of the mesh (1x1 cm) allow the concrete to enter through them and create additional stability for the paste. After the construction process is over, the canoe was cured three times throughout a day for one week. The curing method was done by spraying water excessively, then covering the canoe with wet burlap to prevent the canoe from drying. The formwork will be removed, sandpapers will then be used to make sure the concrete surface is smooth and a uniform section of 1.5 cm thickness is attained. Any voids found will be filled with grout, and any cracks will be closed by epoxy. Finally, the canoe will be polished with a layer of waterproofing agent before applying another layer of paint and testing it on the beach. The casted canoe is shown in fig. 4.
Figure 4: Constructed canoe
VI. FEASIBILITY ASSESSMENT After concrete gains its strength the canoe will be tested
for its performance in water, and as designed it’s supposed to float and maneuver easily. So until now it can be said that this project demonstrated the feasibility of constructing a successful concrete canoe. In terms of safety and serviceability this canoe is as good as conventional canoes; however, what still remain is to conduct a cost analysis. To calculate the cost of this canoe the cost of materials used for
testing is excluded. Also the formwork used for this canoe can provide approximately around 10 canoes. Therefore, the cost of the formwork will be divided by 10 when deriving the cost of a single concrete canoe. Table 5 shows the cost distribution of the canoe.
Table 5: Cost calculation of the canoe
Item Quantity Unit cost Cost ($) Cement 67 Kg $100 per
Ton 6.7
Silica fume 10 Kg $450 per Ton
4.5
Sand 0.025 m3 $22 per m3 0.55 Expanded Clay 46 Kg $1000 per
Ton 46
Water 38 L $1 per m3 0.038 Steel Reinforcement
12 m $5 per m 60
Formwork - - 70 Paint & water proof
100
Total cost $288 After searching for the prices of canoes on the web, and after asking several canoes’ suppliers available in Beirut, it was found that the average price of a traditional canoe which fits 5 persons is around $1500. This shows that concrete could become in the future as the main material for canoes’ construction instead of wood and plastic.
VII. CONCLUSION The concrete canoe project was as exciting and
challenging as it can get. It questions the team’s abilities to design engineering solutions and find mitigations for the different constraints involved in it. In addition to upgrading the theoretical and analytical skills of the members, the project also developed their construction craftsmanship and their experience with the different construction procedures, tools and equipment.
ACKNOWLEDGMENT The team would like to thank: the advisor Dr. Chehab for
his continuous help and support to the team throughout the whole project, Mr. Helmi Khatib for his assistance to the team regarding the concrete mix developments and canoe construction. Also, Mr. Joseph Zoulikian for the formwork preparation, and everyone who provided assistance for the team.
REFERENCES [1] NCCC Design Papers 2000-Present http://canoe.slc.engr.wisc.edu/designpapers/index.htm [2] Satish Chandra & Leif Berntsson (2003): Lightweight Aggregate Concrete; Science, Technology and Applications, Building Materials Series

94
APPENDIX
Figure 5: Excel sheet
Figure 6: Plates testing
Figure 7: Load scenario 1 results
Figure 8: Load scenario 2 results
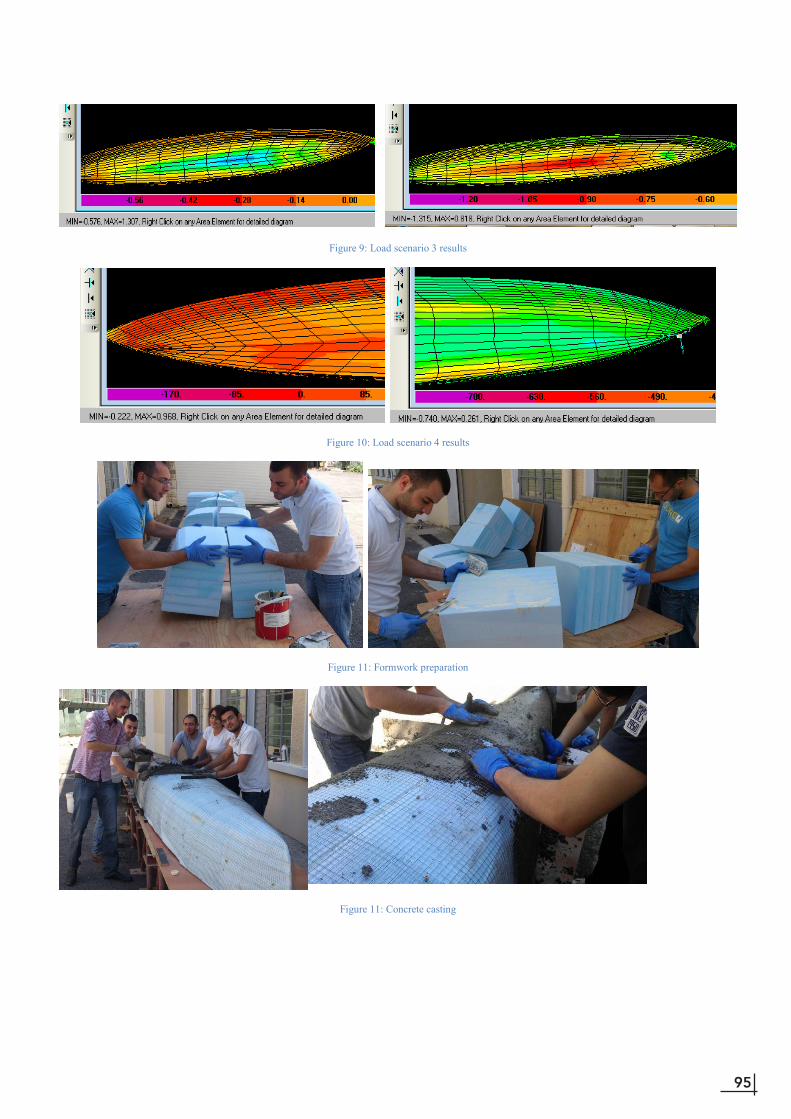
95
Figure 9: Load scenario 3 results
Figure 10: Load scenario 4 results
Figure 11: Formwork preparation
Figure 11: Concrete casting

96
Deep Soil Mixed Columns Lab Experiment
Nadira Absi, Georges El-Hassrouni, Jad Jari, Youssef Kanaan, Omar Malaeb
Department of Civil and Environmental Engineering American University of Beirut
Beirut, Lebanon Emails: [email protected], [email protected], [email protected], [email protected], [email protected]
Abstract
Deep soil mixed (DSM) columns is a state-of-the-art soil improvement technique which may provide a more economical and improved performance alternative to some traditional ground improvement methods. The technique consists of blending soil with cementitious and/or other reagent materials at a specific depth to improve the in-situ soil properties. It provides a safe method of construction, allows for the ability to construct large diameter soil columns in a cleaner environment, induces very low vibrations and thus reduces the potential impact to nearby utilities and/or structures, omits the need for deep soil replacement and reduces off-site disposal problems. In addition, it permits an accelerated construction schedule and provides a reliable way of satisfying a difficult set of technical constraints. This paper presents an experimental laboratory procedure for the preparation of DSM columns. It explores the effect of the variation of water-to-cement ratio (w/c), cement content, rate of mixing, mixing tool, and the percentage of fines in the sand on the compressive strength and uniformity of DSM. As such, an efficient mixing method that allows the monitoring of the above mentioned parameters is developed. DSM column samples are tested for compressive strength using the Rock/Concrete cube compression ASTM C170 and accordingly the results are analyzed. Optimum parameters are recorded and recommended to improve soil properties using DSM columns. The laboratory experimentation performed allows further exploration of the mixing method of deep soil columns and the understanding of the effect of the various parameters involved in the mixing method on soil properties. Thus, the project aims to encourage further research in DSM columns and actual implementation of this feasible and cost effective technique in Lebanon and the Middle East.
I. INTRODUCTION
Soil mixing was first developed in the United States by Intrusion-Prepakt, Inc. of Cleveland Ohio in the 1950’s as “Intrusion Grout Mixed-in-Place Piles”. In the late 1960’s and early 1970’s Swedish contractors used a mixed-in-place lime stabilization process. In the 1970’s, 1980’s up till today, Japanese and Scandinavians companies continue to refine soil mixing technology in various foundation applications. Soil mixing was re-introduced into the United States by Geo-Con, Inc. in the late 1980’s where it was used for liquefaction mitigation, steel reinforced retaining walls, groundwater cutoff walls, and stabilization of contaminated soils [1]. Today,
applications of this technique have been further expanded to include settlement control, slope stabilization, and the formation of composite gravity structures in soft, loose and unstable soils. The following paper describes an experimental procedure for the construction of DSM columns in the laboratory. The sample columns were prepared using sandy soil. In order to study the effect of the variation of the w/c ratio, cement content, rate of mixing, mixing tool, and the percentage of fines in the sand on the compressive strength and uniformity of DSM columns, 21 samples were prepared . The laboratory plan went as follows: 10 DSM columns were prepared using a w/c ratio that varies in the range of 0.7 to 1.1 and a mixing rate of 3cm/min and 5cm/min; 8 DSM columns were prepared using a cement content that varied in the range of 2% to 8% using two mixing tools of different configurations; 3 DSM columns were prepared using sand with 30% fines and w/c ratios of 0.8, 0.9, and 1.0. The 21 columns were tested for compressive strength, and the results were recorded. In what follows, section II presents a laboratory procedure conducted by George Filz in which design equations for the preparation of DSM samples are defined, section III describes the methodology used in our experiment, section IV entails the laboratory procedures and observations, section V explains the results obtained, and section VI presents conclusions and recommendations.
II. LITERATURE REVIEW
Case study: Standardized Definitions and Laboratory Procedures for Soil-Cement Specimens Applicable to the Wet Method of Deep Mixing The paper “Standardized Definitions and Laboratory Procedures for Soil-Cement Specimens Applicable to the Wet Method of Deep Mixing” by G. M. Filz, D. K. Hodges, D. E. Weatherby and W. A. Marr aims to “define terms used to quantify mix proportions and establish relationships among these terms, describe a laboratory procedure for preparing, curing, and testing soil-cement specimens, and present the results of tests on five soils using the proposed laboratory procedure. The unconfined compressive strengths of the mixtures are plotted versus several different measures of mix proportions.”(Source: Filz, G. M)) [1]

97
This paper gives preliminary estimates of the mix proportions needed to achieve a desired mixture strength. It proposes the use of a set of well-defined terms:
a) volume ratio b) cement factor c) cement factor in-place d) cement content e) water-to-cement ratio of the slurry f) total-water to-cement ratio of the mixture
Figure 1 below shows phase diagrams for the: 1. soil prior to mixing 2. cement-water slurry prior to mixing 3. final soil-cement mixture.
Figure1: Phase diagrams for the wet method of deep mixing
The following symbols and definitions were adopted in this paper: Water-to-cement ratio of the slurry,
(dimensionless) (1) Volume Ratio,
(dimensionless) (2)
Cement factor, (kg/ or pcf) (3)
Cement factor in-place,
(kg/ or pcf) (4)
Cement content on a dry-weight basis, (percent) (5)
Total-water-to-cement ratio,
(dimensionless) (6) Dry unit weight of the slurry,
(7)
Where = the specific gravity of the cement = and = the unit weight of water. The values of VR to achieve target values of , , , or are given by: VR =
(for any value of S) (8)
Where S represents the degree of saturation of the unimproved soil,
VR =
(for S=1) (9a)
VR =
(for any value of S) (9b)
Where w represents the water content of the unimproved soil,
and represents the specific gravity of the soil
solids,
VR =
(for any value of S) (10)
Where represents the dry unit weight of the unimproved soil,
VR =
(for any value of S) (11)
Filz et al. (2005) developed a laboratory procedure for relatively easily mixed soils: sands, silty sands, silty/clayey sands, sandy silts, and sandy lean clays. A key characteristic of the procedure was that a high level of laboratory mixing energy was employed. After plotting the results of the 28-day unconfined compressive strength versus “as cured” values of the cement factor, the cement factor in-place, cement content, and total water to cement ratio, as shown in figure 2, it was found that the best correlation is the trend for decreasing strength with increasing total-water-to-cement ratio. Figure 3 shows this result for five inorganic soils.
Figure 2: Unconfined compressive strength versus as-cured (a) cement factor, (b) dosage rate, (c) cement content, and (d) total-water-to-cement ratio, with
the symbol legend shown on Figure 3 (Source: Filz, G. M)

98
Figure 3: Unconfined compressive strength of laboratory mixed soil-cement
specimens with varying total-water-to-cement ratios (Source: Filz, G. M)
This paper concluded with the finding that for easily mixed soils, the total water to cement ratio has the strongest correlation to the unconfined compressive strength of the deep mixed element.
III. SAMPLE CALCULATIONS
A. Experiment 1 and 3 Our objective is to prepare columns with heights of 15 cm and diameters of 7 cm. The target Unconfined Compressive Strength is 1000 kilopascals..
Figure 4: Total-Water-to-Cement Ratio for 1000 kilopascal
We find the Total-Water-to-Cement Ratio which will produce the required strength. Using figure 4, for a strength of 1000 kilopascals, the Total-Water-to-Cement ratio is approximately 2.7 using Fig.3. We will use a Water-to-Cement ratio of 1.0 (by weight) for this sample calculation. We find the Dry Unit Weight of the Slurry using the equation:
. (1) The Specific Gravity of the Cement Gc = 3.15. The Dry Unit Weight of the Slurry = (3.15 x 1000) / (1 + (1.0 x 3.15)) = 760 kg / m3. We find the Dry Unit Weight of the soil using the equation:
. (2) The Specific Gravity of the Solids Gs = 2.64. The Water Content, w = 15% (By Weight).
The Dry Unit Weight of the Soil = (2.64 x 1000) / (1 + (0.15 x 2.64)) = 1890 kg / m3. We find the Volume Ratio using the equation: VR =
. (3)
VR = (0.15 x 1890) / ((2.7 - 1.0) x 760) = 0.22. We find the Cement Factor α from the Volume Ratio and the Dry Unit Weight of the Slurry, VR =
. (4)
= 0.22 x 760 = 167.2 kg / m3. The Volume of the Soil Column VSoil Column is: VSoil Column = (π x d2 x h) / 4 = (π x 72 x 15) / 4 = 577.26 cm3. We find the Volume of the Slurry using the equation:
. (5) VSlurry = 0.22 x 577.26 = 127 cm3. We find the Weight of Cement Wc using the equation:
. (6)
Wc = (167.2 x 577.26) / 106 = 0.0965 kg = 96.5 g. We find the Weight of Water in the Slurry Ww, Slurry using the equation:
. (7)
Ww, Slurry = 1.0 x 96.5 = 96.5 g. B. Experiment 2 In this experiment, we opted to change the cement content of the DSM column by weight for a fixed water-to-cement ratio of 0.9. So, we found the weight of a single soil column and multiplied by the desired percentage to find the weight of cement, then ,ultiplied by the water-to-cement ratio to find the weight of water. VSoil Column = (π x d2 x h) / 4 = (π x 72 x 15) / 4 = 577.26 cm3
WSoil Column = VSoil Column x = 577.26 x 10-6 x 1890 = 1.09 kg For a cement content of 2%: Wc = 0.02 x 1.09 = 0.0218 kg = 21.8 g Ww = w/c x Wc = 0.9 x 21.8 = 19.62 g In our experiments, we followed this sample calculation for all our trials by changing the required parameters. In order to facilitate the calculation process, we designed a VBA/Excel program that takes the different parameters as input and then outputs the values for the mix design.
IV. LAB PROCEDURE AND OBSERVATIONS
C. Material Preparation The soil type used in the experiment is oven dried sand of specific gravity of 2.64 and percentage fines of 10% and 30%. A model is built to represent soil mixing on site. The materials used for constructing this model are: a box in which DSM columns are constructed, a mixer rod attached to a drill that mixes the cement with the soil, syringes that pump the cement into the soil and a tube which is attached to the top of the drill allowing the cement to reach the depths required. The dimensions of the box used are: length 56 centimeters, width 43 centimeters and height 20 centimeters. The box

99
fits up to 12 columns separated by a diameter each and half a diameter from the edges, so that the columns would not interfere with each other during mixing. The box is filled up to a height of 18 centimeters, so that a buffer layer of 3 centimeters prevents overflow of soil during mixing. Two mixing rods were designed to have a length of 30 centimeters and a thickness of 10 millimeters. The mixing blades are of 2 centimeters width and 6 centimeters length with configurations as shown in figure 4. The rods are marked at different heights so that the rate of mixing is monitored as such: a rate of 5 centimeters per minute means that the soil column will be mixed with grout for 3 minutes and the 15 centimeters length rod will have 4 markings: at 3centimeters of distance from the blade then a mark for each 5 centimeters upwards.
Figure 5: Mixing tool 1 (left) and mixing tool 2 (right) inserted in drill
The mixing rod is inserted in a 2800 revolutions per minute drill with a rated power of 450 watts. A 1.5 centimeters diameter tube is attached to the drill such that the grout is pumped by syringes into the tube and out to be mixed with the soil.
D. Trials Twenty-one DSM columns were done in three trials that are summarized in the tables below: Trial 1: 10 columns were prepared using sand with 10% fines and mixed using mixing tool 1. These columns were used to study the effect of the variation of w/c ratio and mixing rate.
Sample W/C Ratio
Mixing Rate (cm/min)
1 1.1 3 2 1 3 3a 0.9 3 3b 0.9 3 4 0.8 3
Sample W/C Ratio
Mixing Rate (cm/min)
5 0.7 3 6 1.1 5 7 1 5 8a 0.9 5 8b 0.9 5 9 0.8 5
10 0.7 5 Table 1: Parameters for first experiment
Trial 2: 8 DSM columns were prepared using sand with 10% fines and water-to-cement ratio of 0.9. These samples were used to study the effect of the variation of the cement content and mixing tool.
Sample Cement Content (%) Mixing Rate (cm/min)
Mixing Tool
1 2 5 1 1a 2 5 2 2 4 5 1 2a 4 5 2 3 6 5 1 3a 6 5 2 4 8 5 1 4a 8 5 2
Table 2: Parameters for second experiment
Trial 3: 3 DSM columns were prepared using sand with 30% fines and mixed using mixing tool 1. These samples were used to study the effect of increasing the percentage of fines.
Sample W/C
Ratio Mixing Rate
(cm/min) 1 1 5 2 0.9 5 3 0.8 5 Table 3: Parameters for third experiment
E. Pouring and Mixing In each of the three trials the same mixing procedure was followed: the locations of the columns were marked on the soil making sure columns do not interfere with each other when mixed. The drill is dipped 3 centimeters within the soil so that disturbance of the surface soil particles is avoided when the drill is turned on. Once the drill is on, the mixer rod is moved till it hits the bottom. The rotating mixer will give way for the brass tube to reach the bottom. The system is now ready for pouring of cement into the syringes down the tube and into the soil to be mixed by the rotating blades. The syringe opening is inserted within the tube and the cement grout quantity is injected while mixing upwards. The mixing rod is pulled up at the chosen mixing rate by keeping an eye on the markings and timing the mixing duration. A stop watch is used to pull the mixer rod to the mark at each minute. Because the grout is found to permeate easily through the syringe-tube system, it was decided to pour either a fifth or a third of the total grout quantity approximately, depending whether the rate

100
chosen is 3 or 5 centimeters per minute, respectively. When the last marking is reached, a distance that is equivalent to the column height of 15centimeters is covered. Cement pouring is stopped, and the mixer is pulled through the buffer layer till the top out of the box.
F. Observation after Mixing
After completing the mixing process, the samples were left for a week to harden within the soil and then were carved out of the soil medium. The resulting DSM columns turned out to have a height of 8 centimeters to 13 centimeters and a diameter 7.5 centimeters to 8centimeters. Experimental errors mainly include the use of a very powerful drill i.e. a very high mixing energy. In addition, the columns seemed to have a strong top due to the presence of more cement than the loose and weak bottom of the columns, which led to a slight variation of results within specimens of the same sample.
V. RESULTS AND DISCUSSION
For experiments 1 and 2, the resulting columns had average lengths and diameters of 11 and 8 centimeters. With an average length to diameter ratio of around 1.4, which is low, it was decided to test the mixes for compression after trimming them into cubes.
Sample Length (cm) Diameter (cm) L/D
1 10.5 8 1.48 2 12 8 1.37 3 10.5 7.9 1.33 4 10 8.5 1.18 5 8 8 1.00 6 13 7.5 1.73 7 13 8 1.63 8 11 8 1.38 9 12.5 7 1.37
10 12 8 1.49 Averages 11.22 7.90 1.39
Table 4: Original column characteristics for experiment 1
Sample Length (cm) Diameter (cm) L/D 1 5.00 7.50 0.67 2 10.50 8.00 1.31 3 14.50 7.50 1.93 4 14.00 7.50 1.87 5 7.50 7.00 1.07 6 10.00 8.50 1.18 7 12.50 7.50 1.67 8 13.50 7.50 1.80
Averages 10.94 7.63 1.44 Table 5: Original column characteristics for experiment 2
VI. COMPRESSION TESTS
A. Experiment 1
In experiment 1, the parameters that were varied were the water-to-cement ratio and the rate of mixing.
Sample W/C Ratio
Mixing Rate (cm/min)
28-day Strength (kg/cm2)
Average 28-day
Strength (kg/cm2)
1 1.1 3 8.40 8.40 2 1 3 4.00 4.00 3a 0.9 3 4.56 3.88 3b 0.9 3 3.20 4 0.8 3 8.13 8.13 5 0.7 3 10.81 10.81 6 1.1 5 18.13 18.13 7 1 5 2.58 2.58 8a 0.9 5 4.54 4.15 8b 0.9 5 3.77 9 0.8 5 9.75 9.75
10 0.7 5 14.97 14.97 Table 6: Results of experiment 1 cube compression tests
Figure 6: Variation of water-to-cement ratio and rate of mixing for a fixed total water-to-cement ratio of 2.7
The samples tested all have a total water to cement ratio of 2.7, which correspond to a target 28-day strength of 1000 kilopascals. To compare our values with the target strength, the results were normalized to 28-day compressive strengths by using figure 7 below.
Figure 7: Strength gain curve by days [3]
By projecting the ordinate of 10 days on the curve, we get 75% of the 28-day strength and a corresponding value of 88% for an ordinate of 14 days [3]. Referring to table 6, our range of strength values in experiment 1 becomes approximately260 to 1800 kilopascals, which is a dispersed range showing the effect of changing the water-to-cement ratio on the resulting compressive strength. Taking an average of 1030 kilopascals, the discrepancy between the expected and actual value is
0.00
5.00
10.00
15.00
20.00
0.6 0.7 0.8 0.9 1 1.1 1.2
28-d
ay C
ompr
essi
ve
Stre
ngth
(kg/
cm2)
Water-to-Cement Ratio
Rate=5cm/min
Rate=3cm/min

101
around 3%, which is satisfactory. Note that the difference between each of the highest value (1800 kilopascals) and the lowest value (260 kilopascals) compared to the target (1000 kilopascals) is rather significant. This is due to the dispersed range of water-to-cement ratio chosen. B. Experiment 2
In experiment 2, the parameters under study were the cement content by weight of the soil column and the mixing tool, for a fixed water-to-cement ratio of 0.9.
Number Cement content (%) Mixing tool
28-day Strength (kg/cm2)
Average 28-day Strength
(kg/cm2) 1 2 1 1.15 1.15 2 4 1 1.20 1.20 3 6 1 5.26 5.26 4a 8 1 8.29 7.91 4b 8 1 7.53 5 2 2 0.54 0.54 6 4 2 1.75 1.75 7 6 2 2.84 2.84 8a 8 2 3.66 4.49 8b 8 2 5.32 9 2 - 1.59 1.59
10 4 - 3.39 3.39 11 6 - 7.32 7.32 12 8 - 12.03 12.03
Table 7: Results of experiment 2 cube compression tests
Figure 8: Variation of cement content and type of mixing for a fixed water-to-
cement ratio of 0.9
The graphing of results in figure 8 showed a reasonable trend in which the strength increased with the increase of cement content. The results show more efficiency for the flat mixing tool (1), with an average efficiency of 60%, as opposed to the alternative (2), with a corresponding value of 40%. More importantly, the ideal hand mixed samples gave the highest results.
C. Experiment 3
In experiment 3, the same parameters of experiment 1 were re-used to compare with corresponding samples in a soil with 20-30% fines content.
Number W/C Ratio
Mixing Rate
(cm/min)
28-day Strength (kg/cm2)
Average 28-day
Strength (kg/cm2)
1 0.8 5 8.18 8.18 2 0.9 5 9.12 9.12 3a 1.0 5 4.45 5.05 3b 1.0 5 5.65
Table 8: Results of experiment 3 cube compression tests
Figure 9: Variation of water-to-cement ratio and fines content of soil for a
fixed total water-to-cement ratio of 2.7
The results in figure 9 showed higher strength values for the soil with hgiher fine content, with the exception of the first sample with water-to-cement ratio of 0.8.
VII. CONCLUSIONS AND RECOMMENDATIONS
In conlusion, our results showed that for the same total water-to-cement ratio, the strength decreases with increase of water-to-cement ratio until a value of around 1.1 where the trend reverses, not to mention higer values for the lower higher mixing rate. Also, higher cement contents give higher strength values. Moreover, flat mixing tools showed higher mixing efficiency as opposed to irregular ones. Finally, the strength of DSM columns was greater in soils with higher fine contents.
ACKNOWLEDGMENT
We would like to thank out advisors Dr. Salah Sadek and Dr. Shadi Najjar for their vital encouragement and support in the field of materials. We would also like to thank Dr. Helmi El Khatib, Soil Mechanics Laboratory Manager and Mr. Jamil Bashir, Soil Mechanics Laboratory Technician who have offered us solutions for whatever problems we encountered. Also, Mr. Abdel Rahman El Sheikh, Senior Technician in Structural and Materials Laboratory and Mr. Bashir Asyala, Technician in Structural and Materials Laboratory were most helpful in the implementation of the project in the laboratory.
REFERENCES [1] Stabilization Of Soft Soils By Soil Mixing. Kenneth B. Andromalos,
Yasser A. Hegazy, Brian H. Jasperse. April 2001. April 2001, Soft Ground Technology., pp. 194-205.
[2] Filz, G. M., et al. Standardized definitions and laboratory procedures for soil-cement specimens applicable to the wet method of deep mixing. Innovations in Grouting and Soil Improvement (2005).
[3] Camp, C. CIVL 1101 – Properties of Concrete
0.00
5.00
10.00
15.00
0 2 4 6 8 10
28-d
ay C
ompr
essiv
e St
reng
th (k
g/cm
2)
Cement Content (%)
Mixing Tool1
Mixing Tool2
Hand Mixing(Ideal)
0.002.004.006.008.00
10.0012.00
0.7 0.8 0.9 1.0 1.1
28-d
ay C
ompr
essi
ve
Stre
ngth
(kg/
cm2)
Water-to-Cement Ratio
20-30% FinesContent
10-15% FinesContent

102
Managing Water Resources and Developing Agriculture in Marwaheen
Ataya Eltibi,Yasmin Fansa, Adnan Ghotmi,Paul Khauli,Fuad Sleiman
Department of Civil and Environmental Engineering American University of Beirut
American University of Beirut, Bliss street, Beirut, Lebanon P.O.Box 11-0236 / (Department)
Riad El-Solh / Beirut 1107 2020 Lebanon [email protected], [email protected], [email protected], [email protected], [email protected]
Abstract: This Study presents a comprehensive study of the town of Marwaheen in terms of available water resources and agricultural development. The study aims at implementing an intervention in which the town can increase captured rainfall runoff through rehabilitating traditional methods and introducing modern sustainable practices. The study will analyze the possibility of and design a hydraulic channel network surrounding the towns existing rehabilitated water catchment pond after analyzing previous works conducted in this field. Furthermore the study examines sustainable means of implementing an agricultural training center in the town to promote modern cultivation techniques to promote economic vitality. The study will be integrated into a GIS context which involves Marwaheen and the surrounding towns to study the possibility of implementing similar interventions in the entire region allowing it to thrive as a sustainable and modern agricultural community.
I. INTRODUCTION
Implementing a development process within the town of Marwaheen and the surrounding villages within the Sour Caza that triggers economic vitality through agricultural sustainability will require adequate management of South Lebanon’s most abundant but poorly managed resource, which is water. The current economic activity in the Marwaheen area focuses on cultivating tobacco which is a seasonal crop not requiring water catchment for irrigation , and is subsidized by the government. Hence, the local farmers limit their agricultural activity to tobacco harvesting, which corrodes the soil, harms the health of farmers, and does not produce any substantial financial profit for the region, due to the government’s subsidizing policy. A large part of the land remains uncultivated .
Figure 1:Pie chart showing land use in the Marwaheen
Previous work conducted in Marwaheen by the Center for Civic Engagement and Community Service ( CCECS) and a previous FYP group in the department of Civil and Environmental engineering in 2011 proved that rehabilitating
traditional water catchment techniques would trigger agricultural diversification within the sector in the town. This process consisted of rehabilitating the traditional water collection pond within the town in addition to introducing a channel with liners to improve catchment. Today the town’s pond collects a substantial marginal increase of rainfall and greenhouses harvesting various crops are visible throughout the town. Furthermore the developmental activity is reaching the surrounding towns which collect water from the Marwaheen pond themselves.
This study aims at continuing this developmental process through developing a new intervention drafted by the CCECS at AUB. This intervention aims at enhancing the water catchment process through connecting the town watersheds to the pond which is expected to substantially increase water collection to meet the irrigation demand of the agricultural sector .It aims to take full advantage of the yearly runoff within the town watersheds through utilizing the pond and/or constructing any needed complementary facilities. Furthermore the development plan aims at introducing a modern agricultural training center within Marwaheen which will promote modern cultivation techniques and provide the needed training for local farmers. Of course, given limited resources from private funding, the process has to be self sustainable in terms of construction, planning, and interdependency. This report will present a hydraulic channel network to increase the water catchment of the pond in addition to analyzing the impact that this marginal increase will have on the agricultural activity of the town. Furthermore the report will provide sustainable design recommendations for the training center while benefiting from the introduced water catchment system, in addition to assessing the possibility of integrating a similar development process in neighboring towns having the Marwaheen project as a prototype.

103
Figure 2:Areal photograph of Marwaheen showing the
existing pond
II. METHODOLOGY
A. LITERATURE SURVEY:
As the core component of this study is designing a water catchment network surrounding the pond, selecting the adequate hydrological modeling system for the watershed in Marwaheen had to be done in a manor which could cater the specific topography of the area. Furthermore as the development plan within Marwaheen Is meant to serve as a prototype for the neighboring towns, it was critical that an efficient system that can be easily applicable in the neighboring towns was to be used with the limited resources and time frame imposed. Hence methods of hydrological terrain modeling were examined. A conference paper by Stuart, Neil, and Christopher stocks in the 1993 IAHS conference for the application of geographical information systems in hydrological modeling and water resource management, presented using a GIS platform for the region as a feasible and efficient methodology of work. GIS can provide a single environment in which hydrologists can conduct their modeling with access to spatial, geotechnical, and infrastructural data, which greatly facilitates the tasks at hand and improves the accuracy of the response (Stuart, Stocks, 1993). Using a GIS platform would allow obtaining all the needed data for the hydrologic modeling from one fully integrating spatio-analytical database which would include the needed information for Marwaheen and the surrounding region, proving to be ideal for the studies purposes. With the limited water resources available in the town of Marwaheen, the system of channels that are to be designed within the scope of this project must create an efficient distribution system for the scarce resource. According to Code 582 of the Conservation Practice Standard, the location and design of the open channels must adhere to careful considerations of the Marwaheen landscape (NRCS,2). With the necessity to lessen the unavoidable losses to wildlife habitat, and to simultaneously protect the locations of planting, the placement of the channels should remain cautious of the surrounding landscape. Moreover, the code states the need to develop a complementary conservation and resource plan for the channel right-of-way and adjacent lands. In particular, the code calls for the consideration of urban and other developments of high-value through which the channel is to be
constructed (NRCS,2). Furthermore the code stresses on the stability of the constructed channels, and their protection from erosion through introducing the appropriate liners. The importance of lining the open channel with material lies in its ability to transmit water at high velocities at a reduced construction cost. Additionally, lining leads to a decrease in channel seepage, a reduction in operation and maintenance costs, and a greater stability of the channel section. Generally, the types of channel linings come in two forms: rigid and flexible (Akan, 158). Rigid lining materials consist of concrete, asphaltic concrete, riprap, or soil cement. These materials can typically withstand high shear stresses and have the capability of providing a higher passage capacity for an equivalent cross-sectional size and slope than can a flexible lining, which is not the case for flexible linings which include fiberglass, vegetation and gravel (Akan, 158). Moreover, water passing through a lined channel will not pick up harmful salts from the soil through which it flows, a factor particularly important to Marwaheen’s case, which contains soil abundant in minerals and vegetation chemicals. Lining the channel also prevents the growth of weeds, thus leading to the saving of expenditure acquired by weed removal. Therefore, with the stated benefits of having a rigid lining, and its ability to withstand Marwaheen’s calculated rate of discharge, focus shall be placed on this type of channel lining and the design method will proceed accordingly.
Surveying adequate techniques for hydrological modeling and hydraulic channel design served to build the framework of analysis and design for the water resource management network. The next step involved assessing sustainable materials and design practices which could be used for the agricultural training center. As harvesting rainfall runoff is the core around which this study is building the development process, the possibility of implementing a pervious pavement system surrounding the center to supply extra harvested water for usage was assessed. Pervious pavements are permeable pavements that allow water to infiltrate through the pavement structure into underlying soils. The addition of pervious pavements, to the design of the Agricultural Technical School coincides directly with the objectives of this project. While the pond and rainwater collection basins will be the primary sources of water collection, pervious pavements will, too, contribute to the reclamation of water. Pervious pavements not only capture water and help in the management of runoff, but they collaborate to its filtration, rendering it ready for use by the community. The water is collected in a system of pipes lying within the open-graded base, and then transmitted to a particular discharge point. (Prokopy, 5).
B. Site Examination/GIS database Given the results of the Literature Survey , it was evident that prior to commencing with the modeling and design, it was quintessential to obtain all the needed data for the planned activities and integrate them into a comprehensive database. The platform used for this integration was ESRI Arc GIS which provided an optimized combination of spatial visualization and data integration analysis. The first step was conducting the necessary site visits to meet with the involved

104
parties and obtain the needed information. This included real estate maps, photographs, irrigation water demand, topographic data, and land use. A second site visit was also conducted during a storm to observe and record the intensity and direction of runoff surrounding the artificial pond. The data obtained from the site visits was combined with areal images, digitized population, infrastructure, land use, and weather data which were obtained from local consultants to construct a GIS database which included information for the town of Marwaheen and the surrounding towns of Jebbine, Em el Toute, Yarine, Darya, and Zalloutiya. The GIS platform served to provide the needed terrain parameters needed for the Hydrological modeling process such as the infiltration, slope, area, and geometry in addition to the agricultural land use and built up area within the town. GIS was also used to calculate distance buffers surrounding the pond, school and channel network area.
Figure 3: GIS generate map showing the configuration of the planned hydraulic facilities
C. Hydrologic Modeling: For the hydrologic modeling, the Catchment area and locations of the channels represented by reaches was determined using 3D visualization techniques through Digital elevation models in Arc GIS. This lead to the conclusion that the basin area could be divided into 3 sub basins with separate hydrological activity to be used in the model. Analyzing the Site during a storm and observing the flow of runoff combined with topographical calculations with GIS indicated that for optimum catchment , 3 channels are to be introduced into the watershed as highlighted in blue in the Arc GIS map shown above. The basin image generated in GIS was then inputted into HEC HMS.
Figure 4: HEC HMS modeling basin with 3 sub basins
Then the software HEC-HMS is used using the Soil Conservation Service (SCS) loss method. This method accounts for the loss in infiltration, and initial abstraction during precipitation. The transform is to be used in order to calculate the direct runoff from the excess rainfall as calculated above. This method is applied by creating a unit hydrograph (as shown below) based on some of the sub-basin characteristics and the SCS curve number.
Figure 5: SCS Hydrograph
The peak flow is calculated from the Hydrograph D. Channel Design and lining Selection
After Visiting the Site during a storm and examining the topography, constructing 3 channel Routes was proposed. For the hydraulic design of the channels, Manning’s equation is to be used, which required inputting the peak flow, roughness coefficient(n), and a preliminary dimension. The flow obtained from the hydrologic modeling will be used as the flow in Manning’s equation. The procedure is as follows. First, the channel roughness (n) is based on the type of material to be used, which is concrete in this case. Second, the slope will be calculated by dividing the difference in altitude by the length of the path using GIS. The maximum allowable freeboard is 23cm. Finally, an assumption for the width for the channel is made, and the concept of trial and error is used to calculate the depth of the channel. (For practicality a minimum width of 20cm is considered). Selecting the material to be used for the channels and linings was deduced through conducting the literature survey on channel design and materials for construction.
E. Development analysis and sustainability. The first mode of action was to examine the proposed site of the training center which was done through the

105
constructed GIS model. Techniques of water efficiency and site suitability analysis were analyzed using the United States Green Building Council(USGBC) Leadership in Energy and Environmental Design (LEED) design standards for the future implementation of the Training Center. The school contains several components which shall be designed differently.
Figure 6:The proposed layout of the technical center
The first component is the separate entity for offices and conference rooms. This will be a reinforced concrete structure, made up of 1 story and has an area of 40 square meters. The second component is the Greenhouse which is a 7 by 24 meter chapel shaped greenhouse made up of double-layered polyethylene. The third component consists of four plastic houses. They will have vertical sides with curved roofs. The fifth component is the parking space. It will consist of a 220 square meter area and will employ a pervious pavement system for water catchment Fig 6.
Figure 7: Location of site (in red) with respect to town, river, and roads
Furthermore the location of the site with respect to infrastructure, water resources, and community connectivity was analyzed through GIS in the image portrayed below where the site is outlined in red on the left side of the map , away from the town center.
Figure 7 displays the site in red , the main town with the pond, the rivers in blue, and the roads outlined in the Google image. In order to assess the sustainability of the site the following parameters were considered:
The site must not be a farmland, species habitat, or a natural source of water. If the development is to take place on an undeveloped lot it must compensate by providing adequate vegetation and green spaces.
The lot should be within a 800 meter radius from residential areas and service facilities.
Site development, the land must be developed to promote ecological growth, in addition to maximizing open space.
Quality and quantity control of storm water management and increasing on site infiltration.
Reduce Heat Island effect. The Site was found to be in accordance with these parameters under the LEED 2009 design standards. A summary of these results is provided in the next section.
III. RESULTS AND DISCUSSION
A. Increased Water Catchment The following Section provides the total annual rainfall for each sub basin and for the pond for 3 cases. Case 1 is the Catchment provided without the introduction of any channels which is presented by the following basin configuration.
Figure 8: Sub basin for catchment before pond rehabilitation
Case two is the catchment provided by introducing a main channel and a secondary channel which increased the catchment for sub basin 1 and introduced a secondary sub basin 2. This methodology was employed by the previous FYP group that performed the analysis.

106
Figure 9: Sub basins 1 and 2 for catchment after 2011 intervention
The final case is that in which 3 sub basins are active due to the introduction of the 3 channels described in the methodology section (See Figs 3 and 4).. The yearly runoff for each case was simulated using HEC HMS and the results are presented in the table below.
Table 1 Peak yearly flow results
Case Yearly Runoff (m3/year)
1 5850 2 65,944 3 108,864
It is evident that the intervention presented by this study substantially increases the harvested rainfall. However the volume of the existing pond is 12,770 m3 and the Average irrigation water demand for all agricultural purposes in the town is 13,000 m3/ year. Hence it is evident that introducing the three lined channels to harvest the rainfall would produce a large excess of rainfall runoff per year even before conducting the necessary water balance equations to account for infiltration and evaporation. Hence it is necessary to examine the yearly runoff for each sub basin within case 3. Table 2: Peak flow results for each sub basin of the new intervention
Sub basin Yearly Runoff (m3/year) 1 51840 2 4763 3 52261
These Results show that introducing either the channel to accommodate rainfall runoff in sub basin 1 or 2 would be more than sufficient to fill the capacity of the pond. Furthermore introducing a storage unit at the intersection point of the channels would be necessary to regulate the flow of water into the pond. Introducing such a unit would make it possible to have all three channels operational without having problems concerning overflow. Otherwise the suggested number and configuration of the channels with the current storage situation would not be sufficient. The storage unit is highlighted in light blue in the image below.
Figure 10: GIS map showing the introduction of a
manhole/storage unit in te network
The storage unit design dimensions must be determined according to the selected channel network. The location of the unit must be selected between the pond and the channel intersection point ( in all cases). The unit must be underground with concrete walls and lining, and connected to the pond through a complementary channel.
B. Channel Configuration and design A detailed design of the channels ( sections, reinforcements) will not be outlined in this report . The section will present the configuration and characteristics of the channels. The following table presents a brief summary of the channel parameters. The channel Ids are based on their configuration as reaches in GIS and HEC HMS in accordance with Figure 4. Table 3: summary of channel design parameters
Channel
Length(m)
width(m)
depth(m)
n Flow (m3/s)
1 670 0.2 0.3 0.03 0.1 2 190 0.2 0.3 0.03 0.03 3 701 0.2 0.3 0.03 0.04
As deduced from the literature Survey the channel linings in all cases were selected to be concrete. Of course as deduced by the hydrological modeling constructing all 3 channels would not be feasible at this stage of the development process and proper cost estimations and water management forecasting as part of the larger development plan involving the entire region must be conducted in order to decide on the number of channels to be used and on the need to establish the control reservoir unit.
C. Sustainability Analysis of Technical School and Development Plan:

107
Table 4: Summary of LEED parameters compliance
Site description
LEED SS1 The site is located on an undeveloped lot which is not a farmland or a habitat. The invasive nature of the construction is minimal and green spaces will make up a large part of the project.
Location LEED SS2 The site is within a 800 m radius from residential areas and public roads.
Ecological growth promotion
LEED SS5.1, SS5.2
The project is to be an agricultural center with green houses and cultivation spaces, hence it satisfies this requirement.
Storm water management
LEED SS6.1, SS6.2, WE1
The site will host a pervious pavement parking with a water reservoir and water shall be made abundant from the pond and channel system.
Heat Island LEED SS 7.1 Minimal Heat Island due to Green spaces available
It can be inferred that this project, through the nature of its functionality satisfies the modules of site selection and water efficiency in the LEED 2009 design standards. This alone if applied properly in the design process would grant the site 35 points on the rating system rendering it 5 points away from certification considering that the other modules are not taken into account. In reality the project would also score substantial points on the materials and resources section in addition to the indoor environmental quality and Energy and the Atmosphere. This is very probable as the construction operations are not invasive and most of the structures involved are prefabricated green and plastic houses in addition to stone retaining walls which can be built by local craftsmen and utilize on site materials.
IV. RECOMMENDATIONS AND CONCLUSION
The Study concludes with the following: In terms of channel construction, introducing one large channel in the sub basin 1 area would be sufficient for the current pond configuration to accommodate for the agricultural irrigation demand. Constructing the planned network would require introducing an additional storage unit for runoff control, even though this is dependent on storm frequency of occurrence. Furthermore the study recommends that the technical center be designed for the LEED standards as its nature easily permits so. The methodology of work implemented in Marwaheen through rehabilitating traditional catchment methods and integrating
data into GIS for enhanced management, can be applied similarly to neighboring towns. The study also constructed GIS databases for the neighboring towns which have a similar structure. This includes traditional Catchment basins which need rehabilitation. The 2011 study confirmed that making water available would trigger agricultural diversification. This Study enhanced this water availability which will continue to promote this economic vitality, and confirmed that the plan in action is both sustainable and applicable to the entire region.
V. ACKNOWLEDGMENTS
This study could not have been completed without the guidance and assistance provided by the following persons: Dr. Mounir Mabsout,Dr. Majdi Abou Najm ,Mr. Rabih Shibli,Mr. Mohammad El Obeid,Mr. Ali Basma, Mr. Mohammad Dbouk ,Mr. Samer Fawwaz
REFERENCES
[1] Avila, Marcelino. Participatory policy development for . Rome: Food and Agriculture Organization of the United Nations, 2005. [2] Broviak, Pam. "Public Works." Public Works. 136.1 (2005): 34-36,38-39. Web. 11 Nov. 2012. [3]Prokopy, Jenni. "Environmental Design Construction." Environmental Design Construction. 11.9 (2008): n. page. Web. 11 Nov. 2012. [4]World Bank. (2011). World Development Indicators, Retrieved July 31, 2012, from http://data.worldbank.org/indicator/NV.AGR.TOTL.ZS [5] Center for Civic Engagement and Community Service, .Building an Agricultural Technical School in Marwaheen. American University of Beirut, 2012. Print [6] Stuart, Neil, and Christopher Stocks. "Hydrological Modeling within GIS: an integrated approach ." Application of Geographic Information Systems in Hydrology and Water Resources IAHS, 1993 [7] Akan, A. Osman. Open Channel Hydraulics. Amsterdam: Elsevier/BH, 2006. eBook Collection (EBSCOhost). Web. 24 Apr. 2013 [8] Bou Lahdou, Hraoui , Omeiche, Saadeh, Rached “ Reclaiming Traditional Water Conservation Practices in Rural South Lebanon”, American University of Beirut, 2011. Print. [9] Natural Resources Conservation Service Conservation Practice Standard, code 582. USDA, NRCS Wisconsin Field Office Technical Guide, Section IV, Conservation Practice Standards and Specifications.

108
Design and Construction of an Earthquake Shake Table
Yara Abbas, Jade Dimien, Chirine El Chartouni, Nancy Razzouk, Tarek Soubra
Department of Civil and Environmental Engineering American University of Beirut
P.O.Box 11-0236 Riad El-Solh / Beirut 1107 2020
Lebanon [email protected], [email protected], [email protected], [email protected], [email protected]
This report details the design and construction of an earth-quake shake table. It also provides the methodology for several earthquake simulations done on two structurally different steel models.
I. INTRODUCTION
From high death tolls to damages or even total collapse of
buildings and infrastructure, the impact of earthquakes cannot be ignored. The costs incurred due to the aftermath, whether tangible or not, are of great importance. Past earthquakes have demonstrated that it usually costs less to prepare for earthquakes in advance than to repair the damages afterwards [1]. For this matter, it is crucial for engineers to develop a clear understanding of the earthquake dynamics and the failure mode of structures due to the lateral loads caused by the shak-ing. Even though earthquakes are unfortunate events, engi-neers learn from them in order to widen their knowledge in this field.
A shake table is one of the essential equipments needed in earthquake engineering research. It simulates the ground mo-tions caused by an earthquake. It also allows testing a scaled model of a structural system, seeing how it will react to the excitation and understanding how structural failure will occur. These simulators are often described according to their de-grees of freedom, capacity (the mass of the model that it can hold), maximum displacement, acceleration and velocity. Their most basic form of construction is to have a platform that moves along a rail, powered by a motor and controlled through a digital interface. The components of a shake table can be divided into two main categories. On one hand, there is the table hardware, and on the other, the control equipment. Both components will be thoroughly explained in further sec-tions.
II. LITERATURE SURVEY
A. Historical Review
The world‟s first shake table was designed in 1893 by Fu-sakichi Omori and John Milne, professors at the University of Tokyo. They operated it using a hand power to drive a wheel mechanism.
However, it allowed them to understand the ground motion but the simulation was not accurate because of the manual operation. Therefore, this experiment was not able to clearly show how structures behave during earthquakes. The next model was developed at Stanford University by F.J. Rogers who was motivated by the major earthquakes that hit San Francisco in the early 20th century [2]. The progress of re-search at Stanford has led to the introduction of a new concept of shake tables, consisting of a platform powered by a DC electric motor that caused movement along a horizontal axis [3].
After World War II (WWII), these simulators progressed rapidly into the type that we are familiar with nowadays. Technological advancements in the field of digital computa-tion allowed engineers to develop a new generation of tables that operate on real-time control, either to precisely mimic the motion of a previous earthquake, or to take input from the user and produce the shaking he desires.
B. World’s Largest Shake Table
The world‟s largest shake table is that developed by the Earth Defense facility in Miki City, Japan. It holds the record for both its size and capacity. It is used to test real life mod-els, which can be either built outdoors then rolled inside to be mounted on the table or directly assembled on it [3]. The con-struction of this simulator was initiated in 2005, motivated by the devastating earthquake of Kobe in 1995. It has the follow-ing characteristics [4]:
- Acceleration: 0.9g horizontally and 1.5g vertically - Velocity: 2m/s horizontally and 0.7m/s vertically - Displacement: ±1m horizontally and ±0.5m verti-
cally - Degrees of freedom: 3 (horizontal, vertical and ro-
tation) - 24 actuators: 10 horizontally and 14 vertically,
each providing 4410KN. - Capacity: 12MN - Cost : $400 Million
The largest test conducted on it was a 7-story wood framed apartment building subjected to an earthquake of magnitude 7.5 on Richter‟s scale.

109
III. THE SHAKE TABLE
A. Dimensions and Design Procuring the adequate parts in their right size is very cru-
cial for the success of such a project. We aimed to maintain a simplistic yet reliable design.
The dimensions of the table are 1.5m by 1m, just enough to allow for the ability to test simultaneously two models side by side for comparison purposes, without making the table too bulky. It stands at a height of 70cm, which permits a clear sight of the models during simulations as well as a comforta-ble access to install and remove them. Furthermore, it is able to carry models that weigh in total 50kg.
The table is fundamentally made of two parts: a stationary bottom part that acts as a base as well as a connecting place for the hardware, and a top part that slides horizontally.
The steel legs of the base have a square cross-sectional area of 4cm by 4cm and hence will remain stable and steady during simulations. This permits the elimination of errors stemming from the shaking of the table itself. The legs are also equipped with pieces at their bottoms that allow in slight changes in their elevation. Spirit levels are installed at the top of the table to ensure that the table remains perfectly flat after adjusting the elevations of the legs.
The upper platform is made of a 1.25mm thick steel sheet that rest on an 18mm thick wood layer. The choice of materi-al is not aimless. On one hand, wood minimizes any deflec-tion that might be cause by the loads applied to the platform. On another hand, steel adds rigidity, stiffness and protection to the wood layer. Finally, the platform is perforated at incre-ments of 10cm, center to center, in both the x-axis and y-axis. Nuts are fixed under each hole to accommodate 6mm bolts used to fix the models to the table. This type of fixation per-mits a modular way of testing.
The mechanical and electrical equipment are installed on a lower steel shelf at the edge of the table.
The moving platform is connected to a ball screw at one fixed point, which can jeopardize its stability. For this matter, gliders were installed on each end of the 1.5m axis. They help carry the load of the table with minimal friction and without hampering the smoothness or the velocity at which the ball screw moves.
Finally, the table shaking range is +/- 5cm chosen for simu-lation and scaling purposes.
B. Performance of the Mechanical and Electrical Hardware
A considerable and essential part of the functioning of a shake table entails mechanical and electrical engineering ex-pertise. The help of professionals in the field was crucial in order to avoid any instability that might occur if the dimen-sions were inadequate or if the inputs and outputs of the hard-ware are erroneous.
The main idea that governs the movement of the table is that a power regulator is needed to provide low voltage power from a power socket to the motor, which take its commands from a controller linked to a computer. The motor‟s rotational
movement is then translated into linear motion in one axis with the aid of a ball-screw.
Besides the table‟s dimensions and its maximum capacity, two additional parameters are needed in order to determine the specifications of the mechanical and electrical components (e.g the motor‟s output): the maximum linear velocity and the maximum acceleration at which the table is expected to move.
To obtain these two factors, the team chose to model the behavior of El Centro earthquake that hit Southern California in 1940 with a magnitude of 6.9 on Richter‟s scale. The nu-merical computing software MATLAB was used to convert a data set of 1,559 acceleration recordings spaced at 0.02 se-conds into velocity. The final result showed that the maxi-mum linear velocity of such an earthquake was 0.4m/s.
Achieving such a velocity on the table constructed will jeopardize its stability because the bearings used are unable to support the force resulting from a speed bigger than 0.1 m/s. Furthermore, it will also exceed the tight budget available. A stepper motor was used to create a back and forth movement and obtain a velocity of 2.3 cm/s at a feed of 135. Therefore, the velocity is scaled down by 20, same as the scale factor used to scale down the models.
In order to mimic the earthquake, one should be able to con-trol the motor. This can be done by using a software called Mach03. In allows the control of the motor by taking as in-puts distance and motor feed. Since the table is only moving in the x-direction, the other axes were disabled. This software operates on M-codes and G-codes. For the sake of the project, a G-code was used to give instructions to the table on where to move, what distance to cross and how fast to go. It follows a numerical control programming language. Two codes are used to control the table.
The specifications of the mechanical and electrical compo-
nents of the shake table are listed below:
TABLE I SPECIFICATIONS OF THE HARDWARE
Hardware Specs and function Power supply 13.8V/10A
Input: 220V Output: 13.8V current with an intensity of 10A.
Motor Drive
The drive helps control the rotational speed of the motor. The speed the motor runs at is proportionate to the frequency it gets from the drive. The drive takes the constant power from the power supply and sends a new frequency to the motor depending on the desired speed.
The Stepper Motor 2 Phase, 8 Wire, 3.6V 4A
This motor has a very high starting torque that can simulate the abrupt and high speed start of earth-quakes. It can also rotate forward and backwards and changes directions at any desired time. The use of a software called Mach03 helps control the motor and change its rotational speed in a way similar to the fluctuations of El Centro earthquake.
The Controller
The controller is the link between the end user and the motor. It is connected to the computer and takes commands from Mach03. It then processes the com-mand and transmits it as a frequency to the drive, allowing us to control both the speed and the direction of the motor.

110
TABLE I (cont‟d) SPECIFICATIONS OF THE HARDWARE
The Ball-screw
It is the tool that converts the motor‟s rotational movement into linear movement. It is connected to the arm of the motor by a 10mm connection. It is 30 cm long and has a diameter of 15.5mm, thick enough to withstand the pressure of the weight of the object without affecting its speed. The balls glide over the screw as it turns, making the sliding movement possi-ble.
Fig.1 below is a picture of the shake table. The base and plat-form can be clearly seen as well as some of the mechanical components.
Figure 1. Half-framed steel model.
IV. SIMULATION USING STEEL MODELS
A. Design of the Models
We chose to represent a typical frame used in buildings. The maximum column-to-column distance in most cases does not exceed 6m, typically ranging between 4 to 5m. In addi-tion, the typical floor height is 3m. In order for our model to be adequately representative of the structure, we chose a scale of 1:20.
The model consists of a frame with one bay on each direc-tion. The distance between columns is 30 cm on one axis and 20 cm on the other, which respectively converts to a 6m and 4m distance between columns. In addition, the floor height is 15 cm. The columns are angular and both vertical and hori-zontal legs have a length of 1.5cm. Furthermore, rectangular elements of a depth equal to 1.5cm were used as bracing for the structure. They are laser-cut from a 0.5mm thick mild steel plate, also known as ASTM 36. All elements are assem-bled using 4mm bolts. The tightened bolt connection repre-sents a rigid connection and allows the model to act as an in-determinate system. The columns act as a continuous entity throughout the floors, the latter being rigidly connected to the beams. Furthermore, each floor is constructed separately and is connected to the next one with bolts. There are 15 floors in total; therefore the structure can reach a height of 2.25m.
The unframed model is formed of columns, beams and slabs, whereas the bracing elements of the framed model are added diagonally to form „X‟s. In Fig.2 below, the model is shown with half of the frames set in their appropriate place.
Figure 2. Half-framed steel model.
In addition, an exact replica of the model is cut from a 1mm thick mild steel plate. This allows us to visualize how differ-ent stiffness affects structural performance.
B. SAP2000 Analysis
The structure modeled on SAP2000 is a beam-slab 3D frame. It is made ASTM 36 steel to represent the material of the real model and has one bay in the x and y direction. The floor height is 15cm and there are 10 floors, resulting in a 1.5m high frame. The beams and columns are angular with the following dimensions:
- Beams: height of 20mm for the vertical leg and of 15mm for the horizontal leg; width of 0.5mm
- Columns: height of 15mm for both the vertical and horizontal legs; width of 0.5mm
- Bracing elements: height of 15mm and a width of 0.5mm
Hinged connections were selected for the modeling. The SAP analysis conducted aims to identify the differences
in performance between framed and unframed structures when hit by an earthquake. We selected the El Centro earthquake because it is famed for its large magnitude and destructive-ness.
A static analysis was first performed. The force that the un-framed structure will be subjected to is directly proportional to its weight. According to SAP, the total weight is 13.38N and the total mass is 1.4kg. The total shear force at the base of the structure is equal to the mass multiplied by the acceleration, or 4.06N. For simplicity, it is assumed that the mass is equally distributed along the floors. The weight per floor is multiplied by the cumulative height h, taken from ground level. Finally, to obtain the distributed earthquake load applied on each floor in the x-axis direction, F is divided by 0.2m. The earthquake load caused a maximum displacement of the top node equal to 0.1mm.
To obtain more accurate results, a dynamic analysis was conducted. The accelerogram of El Centro was inputted as time history function. The same model was then subject to a dynamic load. The maximum displacement obtained was 0.4mm: 4 times more than the displacement resulting from the static load analysis. However, both are very minute defor-mation. This is primarily due to the lightweight structure and to the stiff angular connections.

111
At first, braces were used in the y-direction to observe their influence. It was noticed that after subjecting the structure to the same dynamic load as the unframed model, the maximum displacement remained 0.4 mm. The earthquake is moving in the x-direction, therefore, bracing in the opposite direction, i.e. parallel to the y-axis, did not have an influence in resisting the earthquake. Hence, we can draw the conclusion that bracing is needed in the direction parallel to the earthquake to create sufficient depth to resist the force.
The second bracing was done parallel to the earthquake. They were heavily braced as each panel was divided into two smaller panels each with an “X” framing. This model was also subject to the dynamic load of El Centro. In this case, the maximum displacement at the top node was 0.03013mm, which translates to 92% less than the case of the unframed model. Such a large difference shows the importance of brac-ing in making the structure earthquake resistant. Therefore, in earthquake-prone regions, such as Lebanon, shear walls and other bracing elements are important in creating resistant buildings that are able to stay structurally sound after being subjected to an earthquake.
However, since the cost of bracing is high, we eliminated half the braces to monitor the difference of performance be-tween the fully braced and the half-braced model. When the half-framed model is subjected to the El Centro load, the max-imum displacement at the top node was 0.03025mm. It is a mere 0.4% difference from the maximum displacement of the fully braced model.
The displacement of all three models was plotted against time as can be seen in Fig.3. From it, we can deduce that the un-braced model performs poorly in comparison to the other braced models. In addition, the braced and half-braced models have an identical performance faced with the earthquake. This shows that over-engineering and excessively safe design do not always add value to the design. If both of these structures were to be built in reality, one will cost twice as much as the other and will consume twice the time to be completed, yet they will both perform similarly when hit by an earthquake.
Figure 3. Displacement of all 3 models as a function of time.
In addition, it is noticed that only some framing is needed to ensure the building is earthquake-enduring.
C. Comparison Experiments Several experiments will be conducted form compassion
purposes. A double-sided tape was used to attach an iPhone and iPad to the table and models in order to measure their ac-celerations.
The following parts offer an analysis of the actual behavior of the models. In addition, we will use the “half-braced” mod-el as braced because it has been proven to perform identical to the fully braced model on SAP.
Braced Structure: Swaying The table input was to move from 0 to 0.5cm and back with
a feed of 120, that is a velocity of 2m/s. SAP analysis was performed to visualize the theoretical movement of the braced model. The maximum acceleration on SAP at the top of the model is 1.26m/s2 and at its bottom 1 m/s2. Since the model is framed, the acceleration at the top is close to that at the bot-tom. This shows that a braced structure can resist the acceler-ation caused by the earthquake. This is due to the increased moment of inertia resisting the load which adds stiffness and therefore the structure resists deflection and bending better. As a first experiment, we measured the acceleration of the table and at the top of a 10-storey-high braced model in order to check if the top of the building is moving in a different way than the bottom. From the data obtained, the maximum accel-eration of the table is 1.02m/s2 and that of the model is 2.10m/s2. The top of the model has a higher acceleration than its bottom throughout the shaking. This causes the structure to sway creating large shear force in the columns, especially at the base. Such large force can cause failure by crushing or by buckling depending on the slenderness ratio.
The maximum acceleration in reality is 67% more than the one obtained in SAP. This is because the elements are con-nected with 4mm bolts. The stiffness of such a connection is less than that done in real construction. In addition, the bolts connecting the base to the table were attached to springs to mimic the unpredictable behavior of structures on soil. Though the bolts were tightened and the springs had minimal effect, it is believed that a perfect hinged connection was not achieved in the experiment.
Un-braced vs. Braced The maximum acceleration obtained on SAP at the top of
the model is 1.26 m/s2 for the braced model and 1.6 m/s2 for the un-braced model. In other words, the un-braced model shakes 27% more than the braced one. An un-braced and braced model of 10 floors were tested. The table input was to move from 0 to 0.5cm and back repeatedly with a feed of 120. As predicted, the braced model performed better than the un-braced model. The maximum acceleration of the braced mod-el is 2.3m/s2 and that of the un-braced 4 m/s2. The un-braced model shakes 74% more than the braced model. The actual results are different from the theoretical results due to the rea-sons mentioned before.
Un-braced Structure: Tall vs. Short Short buildings face fewer vibrations than medium to tall
ones when subjected to an earthquake. We placed two models
-0.6
-0.4
-0.2
0
0.2
0.4
0 1 2 3 4 5 6
disp
lace
men
t (m
m)
time (s)
un-braced

112
simultaneously on the shake table: one is 5 stories high and the other is 10. The table movement was the same as in the previ-ous case. We placed an accelerometer at the top of each mod-el to monitor the maximum acceleration of each and compare them. The input was to move from 0 to 0.5cm with a feed of 135 (velocity of 2.3cm/s) in order to better visualize the dif-ference between both. The shorter model has a maximum acceleration of 3.1 m/s2 and the longer one of 4.4 m/s2. This verifies that shorter buildings are subject to less shaking in an earthquake and therefore are subject to less structural damage.
Tall Un-braced Structure: 0.5 mm thick vs. 1 mm thick
Stiffness represents the rigidity of an object, which is its ability to resist to displacement. In case of an earthquake, the stiffness of the columns is to be considered in the absence of proper bracing.
At first, the stiffness is calculated in case of tension or com-pression, such that it depends on the cross sectional area. The deflection and spring constant are taken into consideration. In both cases, E and L are identical. However, the cross section-al area of the 1mm thick model is twice as much as that of the 0.5mm model. Therefore its stiffness is twice as much as the stiffness of the 0.5mm model. The larger the stiffness the bet-ter the model can resist deformation; therefore, the 1mm mod-el deforms less than the 0.5mm model when subjected to the same force and therefore performs better structurally than the thinner model.
Second, the stiffness is calculated in case of bending, such that it depends on the area moment of inertia I. In this case I1, the moment of inertia of the 1mm model is equal to 282.4mm4, and I0.5 is equal to 140.8mm4 which is half of the previous values. Therefore, the 1mm model also has a better resistance to bending than the 0.5mm model.
Finally, the table moved repeatedly from 0 to 0.5cm and back under a constant feed of 120. The maximum acceleration at the top of the 0.5mm model is 4.1m/s2 and that at the top of the 1mm model is 1.5m/s2. The stiffer model resisted the earthquake load much better than the other model because it deforms less when subjected to the same load.
Braced structure with weights vs. without weights A concrete block weighing 3126.7g is added to each of 10
floors of the braced model to create uniform load on the slab. After this addition, the maximum acceleration decreased on SAP by 13% from 1.26 to 1.1m/s2.
The block‟s dimensions are 29.5cm by 19.5cm by 2.1 cm. Therefore, the density of the block is 2588kg/m3. Force is equal to the mass multiplied by the acceleration. The table‟s acceleration is constant. The structural elements (columns and beams) used in both models are identical. As a result, we ex-pect to see larger movement in the heavy structure than in the light one because it is subject to a larger force.
The total weight added is 31.3kgs. The heavier structure faces a larger risk of failure as the shear at its base is increased proportionally to the added mass.
After plotting the accelerogram of the 10 floor braced struc-ture with and without the weights, it was noticed that remark-ably, though the structural members have the same stiffness,
the lighter model shook in a more violent matter than the heavy one. This could be because of the natural resonance frequency of each mode.
According to SAP, the natural frequency of the light model is 20Hz whereas that of the heavy model is 7.5Hz. The fre-quency of the table was done through observation. The testing was done at a feed of 120, which represents velocity of 2cm/s, and the table was requested to move from 0 to 0.5cm back to 0 repeatedly. Each back and forth movement represents a cycle. To traverse this cycle of a total distance of 1cm, the table needs 0.5s. Therefore, T, the period, is equal to 0.5s and the frequency to 2Hz.
Both structures have a natural frequency different from that of the table therefore they could not have resonated. Howev-er, the natural frequency of the lighter model is a multiplier of 10 of the table‟s frequency. Every 0.5s both frequencies coin-cide, leading to an increase in the amplitude of the accelera-tion of the first model as it shakes. In this case, the table‟s frequency can be considered as a fundamental frequency for the lighter model.
V. FUTURE OPTIMIZATION
After conducting the above mentioned experiments on the table, several suggestions have come up in order to better op-timize the shake table.
First, the table hits when it wants to change direction so it loses energy. Therefore, though it's moving with the same input and distance, the results obtained from the accelerometer showed that the acceleration is not sinusoidal.
A motor with a larger power could be used in order to out-put higher accelerations.
When it comes to the design of the table, the rails should be longer. While testing, it came to the attention that the table has the tendency to cross the rails limit which increases its probability to break. Stainless steel should be replaced by a different material such as aluminum, which is easier to handle and which is lighter.
The dimensions of the table are advised to be close to 0.8m by 0.5m with a height of 50cm maximum for practicality pur-pose. In fact, due to its large size, the table was heavy and was difficult to control. Its performance was not consistent as well because it faced losses of energy due to its size. Vibra-tions should also be eliminated in order to reduce the energy losses.
A more professional software than Mach3 could be used. It will minimize the time spent calibrating and reduce possible errors.
The table could be constructed to work in 2 or 3 degrees of freedom which simulate a more representative motion of earthquakes.
Finally, the table has a range of 5cm, yet it moves at a ve-locity of 2cm/s. Therefore, it takes 2.5sec to move from right to left and during that time the load on the model will no long-er be considered dynamic, it will become static. To simulate an earthquake, the frequency of the movement is the one that matters to maintain a dynamic load. For the experiments, the

113
displacement used was 0.5cm. However, for a future model, the maximum displacement allowed should be a maximum of 1cm.
ACKNOWLEDGMENT
We would like to thank Dr. George Saad for guiding us through this process and helping us find the best way to im-plement our project; Mr. Ghassan Dib for helping us under-stand how to work with some of the mechanical parts and Mr Issam Kaaki for his advice on which parts to choose and his assistance in manufacturing the table.
REFERENCES
[1] Wang, Lisa. Illustration of Shake Table Experiments in Structural Engi-neering Curriculum. 2002.
[2] Russel S. Mills, Helmut Krawlinkler, James M. Gere. Model Tests on Earthquake Simulators – Development and Implementation of Experi-mental Procedures. S.I.: Department of Civil and Environmental Engi-neering Stanford University, 1979.
[3] Reitherman, Robert K.; Earthquakes and Engineers: An International History. S.I.: ASCE, 2012.
[4] Jacobs, Derek and Johnson, Julia. Shake Tables.

114
Effects of Pipe Diameter Variation in Geothermal Pavement Systems
Ibrahim Deeb, Hammad El Jisr, Ismail Alamin Hotait, Abdallah Najdi, Emile Zankoul
Civil and Environmental Engineering Department American University of Beirut
Lebanon, Beirut, Hamra, Bliss Street [email protected], [email protected], [email protected], [email protected], [email protected]
Abstract- The objective of this research is to assess the effect of copper pipe diameters in geothermal pavements on the pavement temperature. A full cycle without running water was first tested to check if the setup replicates the behavior of asphalt subjected to solar radiation. Several temperatures were monitored in the pavement at different depths as well as the pipe and water temperature. Results were fine and the temperatures predicted from literature at depths 2 cm and 8 cm were 1-2oC lower than the actual temperatures. A finite element model was also developed to validate the results. The model predicted the surface temperature directly above the pipe accurately with deviation from the experimental results not exceeding 8%. For the water and 8 cm depth temperatures, deviation from the measured values was high (4-6oC). The finite element model agreed with the experimental results that showed a significant decrease in the surface temperature from 57oC to 51oC, 49oC and 48oC for samples 16, 19 and 22 mm respectively. However, the impact of changing the diameter size was minor. The surface temperature decreased slightly with an increase in the pipe diameter. As for the water temperature they were quite close for all samples due to the high heat capacity of water with a maximum of 31oC. The temperature for both the copper pipe and the tank water was highest for sample 22 mm and lowest for sample 16 mm.
I. INTRODUCTION
Most of the traditional energy resources are harmful to the environment and are causing global warming to worsen. It is indisputable that the temperature in the urban areas is continuously increasing, a phenomenon known as “the urban heat island effect”. Therefore, finding alternative renewable and environment friendly resources, as well as ways to decrease the cities’ temperatures is a necessity.
A suggested solution is Geothermal Pavements which consist of pipes embedded in the asphalt of hot countries’ roads. The water flowing in these pipes would absorb the heat caused from solar radiation. The advantages are water heating, decreasing the temperature at the surface and cooling down asphalt which would elongate the material's lifespan by reducing thermal cracking and rutting.
Designing this system will require finding the optimum parameters. Those parameters include the pipe material, depth, diameter and spacing. Our focus will be the effect of pipe diameters.
Several aspects of Geothermal Pavements have already been studied and discussed in papers by different authors. Mallick et al. [1] tested the effect of different asphalt mixes on the efficiency of the system by trying aggregates with different
conductivities as well as trying to paint them with acrylic paint to check the increased absorptivity. In another article, Kadhum [2] performed a study aiming to assess the effect of geothermal pavements on the reduction of asphalt pavements rutting and thus on the increase of the pavement’s lifespan. Another benefit of these engineering systems was highlighted by Bao-Liang Chen [3], which consists in the reduction of heat-island effect and again, in the extension of the asphalt’s lifespan. Finally, a complete different type of benefits was exposed in Youngguk Seo et al.’s paper [4] which aims at studying the system’s optimum design parameters to reach the most efficient snow melting system. In all of the mentioned papers the methodology mainly adopted was actual testing on many small scale samples and few bigger scale slabs. Also, in some of the papers finite element modeling and simulations were conducted.
II. SCOPE
The objective of this paper is to study the effects of pipe diameter changes. In order to do so, three asphalt samples are prepared, each consist of a pipe of different diameter embedded in it. An experimental setup is made where water will be flowing in the pipe and where the sun’s radiation will be simulated through infrared lamps. Temperature at different points will be saved through a data acquisition system and comparisons were made. A finite element model was used to verify the results and generalize the effect of changing the diameter size.
III. THEORY
Radiation heat transfer is the transfer of energy by electromagnetic waves. Heat energy is transferred between 2 or more surfaces. Moreover, the emitted radiation intensity form the pavement to the surroundings can be expressed as follows [1]: (1)
qr is the emitted radiation, is the emissivity of the pavement and is the Stefan-Boltzmann constant

115
Therefore a reduction of the asphalt temperature by a few degrees leads to a reduction in the emitted radiation and accordingly a reduction in the urban heat island effect.
The asphalt pavement was assumed to be a gray body [1]; that is, its emissivity and absorptivity are independent of the wavelength. In this case the transmissivity is 0 as the pavement was insulated with wood from the bottom. Moreover, infrared heat lamps were used as a source of thermal radiation. Accordingly, the reflectivity was also taken to be 0, since the asphalt does not reflect infrared radiation. It is important to note that in reality solar radiation consists of both visible and infrared radiation and thus the reflectivity (albedo) which is dependent on the surface color should be taken into account. A fraction of the total radiation is absorbed by the asphalt pavement. However, since the color of the pavement is not of concern in this experiment, and for simplification purposes, the surface of the asphalt pavement was exposed to only infrared radiation.
Heat transfer occurs by the transfer of radiation to the asphalt, convection between the air and the asphalt, convection between the water domain and the asphalt, and conduction in the asphalt and water domains. The equations below show the heat transfer in the sample [3].
Boundary condition on surface of asphalt pavement (2)
Governing equation (asphalt domain)
(3)
Governing equation (water domain)
(4)
Boundary condition (interface between asphalt and water) (5)
Boundary condition (water inlet) (6)
Boundary condition (water outlet) (7)
Boundary condition of asphalt pavement below pipe: (8)
G = irradiance, h = heat transfer coefficient, = thermal conductivity of asphalt pavement, = ambient temperature, ε = emissivity of asphalt pavement, α = absorptivity of asphalt pavement, σ = Stefan Boltzmann constant, = temperature of asphalt pavement surface, = density of asphalt pavement, = specific heat of asphalt pavement, = gradient, t = time, = temperature of asphalt pavement, = density of water, = specific heat of water, = temperature of water, = initial temperature of water, = thermal conductivity of water, = velocity of water in y direction.
IV. METHODOLOGY
A. Apparatus
Firstly, limestone aggregates and asphalt binder were required to prepare the mix that will be used for the three samples to be tested. In order to cast these mixes, 2 cm thick wooden forms of dimensions 30 cm x 15 cm x 10 cm were utilized. In each sample, 40 cm long copper pipes of thickness 0.4 mm were to be embedded. The pipes’ outer diameters are the following: 16, 19 and 22 mm.
For the water to flow, rubber and PVC pipes linked each sample to a 14 L water tank and to a pump with a constant flow (21 L/min). Additionally, two 200 W infrared lamps were used to simulate the sun’s radiation. Finally, six Resistance Temperature Detectors (RTDs) with 4 USB data acquisition systems along with two laptops were added to record temperature variation at different points.
Copper pipes were chosen because of their high thermal conductivity of 401W/m-oC when compared to other metals such as steel (16 W/m-oC). Moreover, the liquid chosen, water, has a high volumetric heat capacity Cv of 4.18 J/cm3-oC and therefore is suitable for cooling the pavement. B. Procedure
In each of the forms, a round hole for the copper pipe was drilled 4 cm from the top. Fig. 1 shows the 3 samples with different pipe diameters.
First, the required limestone gradation was obtained by sieving. Proper batching was then performed and mixed with hot asphalt at 190oC. Table I is a detailed description of the mix design proportions. Each sample consists of two batches.
TABLE Ib MIX DESIGN
Weight of Batch 5448.33 grams %Asphalt Concrete 3.80% 207.0 %Aggregates 96.20% 5241.3
Mix Gradation of aggregates
Sieve Size % Retained Mass Retained
Coarse
1" 0.0 0.0 3/4" 1.8 94.3 1/2" 2.5 131.0 3/8" 10.1 529.4 #4 37.1 1944.5
Fine
#8 12.9 676.1 #16 12.2 639.4 #30 6.6 345.9 #50 5.6 293.5
#100 3.5 183.4 #200 2.7 141.5
Filler Pan 5.0 262.1
Total 100 5241.3
Figure 1: The Asphalt Samples

116
The Hot-Mix Asphalt Concrete (HMAC) was poured in the samples up to a height of 5 cm and compacted with 80 blows (Marshall Method). The pipes were then inserted, asphalt was re-poured and compacted with 160 blows. Finally, the samples were allowed to cool for a few hours. After that 6 holes were drilled in the forms and asphalt at different locations for the insertion of the RTDs. Fig. 2 shows the exact locations of those RTDs.
The experiment was conducted indoors at a temperature of 27oC due to the relatively low solar radiation at the time of the experiment (March).
Solar radiation data collected in Beirut on the 21th of August 2012 using a pyranometer ranged between 730and 864 W/m2 for the 5 peak hours during the day “unpublished” [5]. Accordingly the heat flux from the infrared lamps was calibrated to give a reasonable value. Two 200 W infrared lamps 42 cm edge to edge apart were placed 45 cm above the asphalt. The heat flux distribution was measured using a pyranometer at different points on the surface. Fig. 3 shows those results.
Next, a 14 L insulated water tank was connected to each
sample with insulated rubber pipes. A constant-flow pump of 21L/min was inserted. Fig. 4 shows the complete experimental setup. For simplification, the flow was assumed to be incompressible.
The experiment was divided into 2 separate parts. The first part consisted of monitoring the asphalt temperature of one of the samples (19 mm) without allowing the flow of water in the pipe. A full cycle was performed; that is the pavement was heated until an equilibrium temperature was obtained and then allowed to cool back. This was done to check if the behavior of the pavement temperature was similar to that occurring outside.
The RTDs were inserted in the samples, connected to a
computer and the temperatures were measured in 5 min intervals.
A comparison was done between the actual values at 2 cm and 8 cm and those predicted using the following empirical equation proposed by Solaimanian and Kennedy [6]: T(d) = T(surface)(1 – 0.063d + 0.007d2 – 0.0004d3) (9)
T(d) is the temperature in F at depth d (in)
A check for water insulation was also done by circulating water in the system for three hours without any external heat source.
The second part consisted of testing the three samples under the same conditions as the first part but this time a constant flow was allowed into the pipe. The pavement was heated until equilibrium was reached. Comparisons were made between the temperatures of different diameter samples with circulating water, the temperatures of the sample that was tested without water, and the predicted temperatures. Furthermore, the amount of heat energy absorbed per unit volume by the water in each samples was calculated by the following equation [7]:
q = CvDT (10)
Cv is the volumetric heat capacity of water (4.18 J/cm3-oC) and T (oC) the change in temperature over a certain time period. C. Finite Element Modeling
A 2-D Finite Element Model (FEM) was developed for each case to validate the results that were obtained at steady state and generalize the effect of diameter variation. The thermal properties of each material, obtained from previous laboratory tests are shown in Table II.
The convective heat transfer coefficient for the flow of water was varied according to the following equation proposed by Gnielinsky (1976) [8]:
(11)
Figure 2: Location of RTDs (Sample Front View) Dimensions in mm
Figure 3: Heat Flux on the Samples' Surface
Figure 4: Experimental Setup (1) Infrared Lamps (2) Asphalt Sample (3) Insulated Pumps
(4) Water Tank (5) Pump (6) RTDs Wires
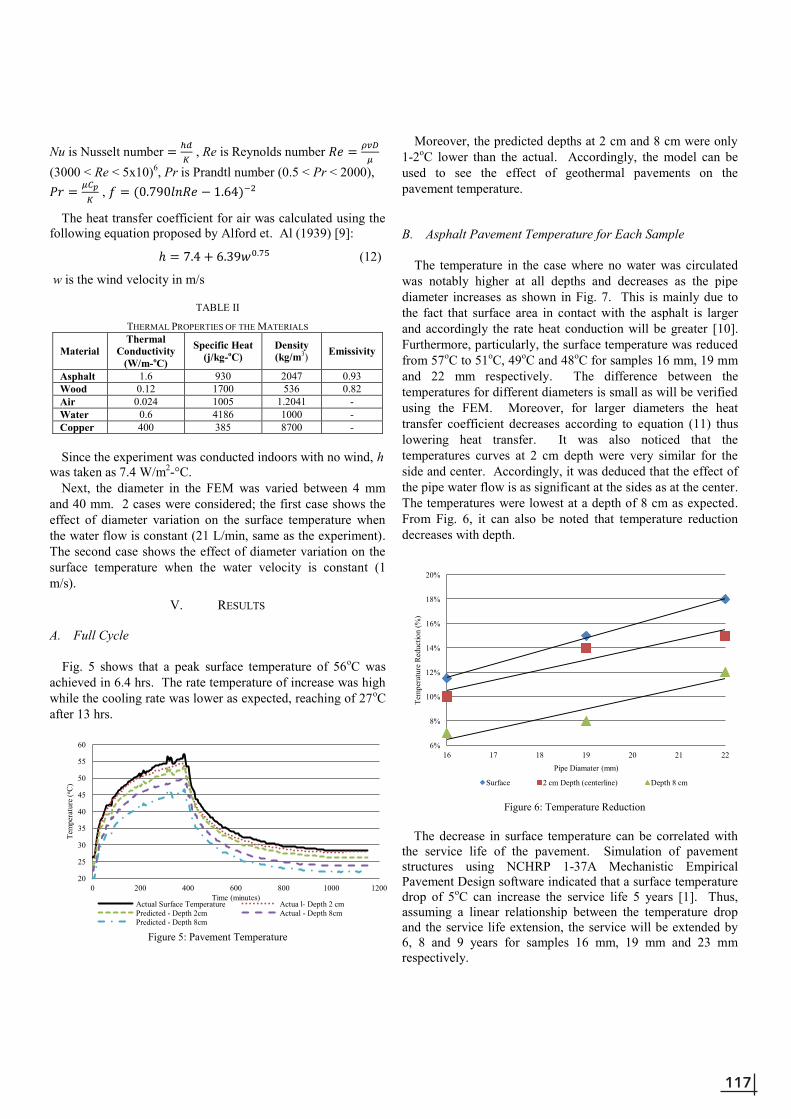
117
Nu is Nusselt number , Re is Reynolds number
(3000 < Re < 5x10)6, Pr is Prandtl number (0.5 < Pr < 2000),
,
The heat transfer coefficient for air was calculated using the following equation proposed by Alford et. Al (1939) [9]:
(12)
w is the wind velocity in m/s
TABLE II
THERMAL PROPERTIES OF THE MATERIALS
Material Thermal
Conductivity (W/m-oC)
Specific Heat (j/kg-oC)
Density (kg/m3) Emissivity
Asphalt 1.6 930 2047 0.93 Wood 0.12 1700 536 0.82 Air 0.024 1005 1.2041 - Water 0.6 4186 1000 - Copper 400 385 8700 - Since the experiment was conducted indoors with no wind, h
was taken as 7.4 W/m2-°C. Next, the diameter in the FEM was varied between 4 mm
and 40 mm. 2 cases were considered; the first case shows the effect of diameter variation on the surface temperature when the water flow is constant (21 L/min, same as the experiment). The second case shows the effect of diameter variation on the surface temperature when the water velocity is constant (1 m/s).
V. RESULTS
A. Full Cycle
Fig. 5 shows that a peak surface temperature of 56oC was achieved in 6.4 hrs. The rate temperature of increase was high while the cooling rate was lower as expected, reaching of 27oC after 13 hrs.
Figure 5: Pavement Temperature
Moreover, the predicted depths at 2 cm and 8 cm were only 1-2oC lower than the actual. Accordingly, the model can be used to see the effect of geothermal pavements on the pavement temperature. B. Asphalt Pavement Temperature for Each Sample
The temperature in the case where no water was circulated was notably higher at all depths and decreases as the pipe diameter increases as shown in Fig. 7. This is mainly due to the fact that surface area in contact with the asphalt is larger and accordingly the rate heat conduction will be greater [10]. Furthermore, particularly, the surface temperature was reduced from 57oC to 51oC, 49oC and 48oC for samples 16 mm, 19 mm and 22 mm respectively. The difference between the temperatures for different diameters is small as will be verified using the FEM. Moreover, for larger diameters the heat transfer coefficient decreases according to equation (11) thus lowering heat transfer. It was also noticed that the temperatures curves at 2 cm depth were very similar for the side and center. Accordingly, it was deduced that the effect of the pipe water flow is as significant at the sides as at the center. The temperatures were lowest at a depth of 8 cm as expected. From Fig. 6, it can also be noted that temperature reduction decreases with depth.
]
The decrease in surface temperature can be correlated with the service life of the pavement. Simulation of pavement structures using NCHRP 1-37A Mechanistic Empirical Pavement Design software indicated that a surface temperature drop of 5oC can increase the service life 5 years [1]. Thus, assuming a linear relationship between the temperature drop and the service life extension, the service will be extended by 6, 8 and 9 years for samples 16 mm, 19 mm and 23 mm respectively.
20
25
30
35
40
45
50
55
60
0 200 400 600 800 1000 1200
Tem
pera
ture
(o C)
Time (minutes) Actual Surface Temperature Actua l- Depth 2 cm Predicted - Depth 2cm Actual - Depth 8cm Predicted - Depth 8cm
6%
8%
10%
12%
14%
16%
18%
20%
16 17 18 19 20 21 22
Tem
pera
ture
Red
uctio
n (%
)
Pipe Diamater (mm)
Surface 2 cm Depth (centerline) Depth 8 cm
Figure 6: Temperature Reduction

118
(a) Surface Temperature
(b) Temperature at 2 cm Depth (2 cm from side)
(c) Temperature at 2 cm Depth (centerline)
(d) Temperature at 8 cm Depth
Figure 7: Asphalt Temperature at Different Locations
C. Water Temperature For each Sample Fig. 8 shows that the water temperature increases with
increasing diameter. Similar to conduction, the convection rate increases as the surface area increases and accordingly the more heat will be transferred to the water [10]. Sample 22 mm had the fastest rate of heating with the temperature increasing from 22 oC to 31.2 oC after 300 min. For samples 16 mm and 19 mm the water temperatures reached 30oC and 30.6oC respectively. The temperature difference was low mainly due to the fact that water has a high heat of capacity. By neglecting the heat generated due to head losses, and since proper insulation was ensured, the total energy absorbed by each sample can be calculated using equation (10) as shown in Table III.
The heat absorbed by water in sample 22 mm was calculated to be 7% higher than that of sample 19 mm which is in turn 7.5% higher than that of sample 16 mm.
TABLE III HEAT ENERGY ABSORBED BY THE WATER IN DIFFERENT SAMPLES
T0 (oC) Tf (oC)at 300 min q (J/cm3) Q (KJ)
16 mm 22 30 33.44 468.16 19 mm 22 30.6 35.95 503.27 22 mm 22 31.2 38.46 538.38
Figure 8: Water Temperature
D. Pipe temperature for each sample
Fig. 9 shows that the pipe temperature increases with the
increase of pipe diameter.
Figure 9: Pipes Temperature
20
25
30
35
40
45
50
55
60
0 50 100 150 200 250 300 350
Tem
pera
ture
(°C
)
Time (minutes) 16 mm 19 mm 22 mm No Water
25
30
35
40
45
50
55
60
0 50 100 150 200 250 300
Tem
pera
ture
(°C
)
Time (minutes) 16 mm 19 mm 22 mm No Water
25
30
35
40
45
50
55
60
0 50 100 150 200 250 300
Tem
pera
ture (°C
)
Time (minutes) 16 mm 19 mm 22 mm No Water
25
30
35
40
45
50
55
60
0 50 100 150 200 250 300
Tem
pera
ture
(°C
)
Time (minutes) 16 mm 19 mm 22 mm No Water
20
22
24
26
28
30
32
0 50 100 150 200 250 300
Tem
pera
ture
(°C
)
Time (minutes) 16 mm 19 mm 22 mm
25 27 29 31 33 35 37 39 41 43
0 50 100 150 200 250 300
Tem
pera
ture
(° C
)
Time (minutes) 16 mm 19 mm 22 mm

119
The pipe of sample 22 mm was heated the most rapidly, starting form 27oC and reaching 41oC. For samples 16 mm and 19 mm the temperatures were 36oC, 38.5oC respectively. The larger surfaces area provides greater surface area in contact with the asphalt thus the copper pipe with greater diameter and larger contact surface area results in harvesting more heat energy from the pavement by conduction between the copper pipe and the pavement. This also explains why the heat absorbed by the water is the highest for sample 22 mm and lowest for sample 16 mm.
E. FEM Results
Fig. 10 below shows that the pavement temperature decreases in the presence of the pipes with flowing water.
Figure 10: FEMs for the different samples
The temperature at the center of the surface directly above the pipe was quite close to the actual temperature measured experimentally as shown in Table IV.
TABLE IV PERCENTAGE DEVIATION OF THE PREDICTED FROM THE ACTUAL
TEMPERATURE IN °C
Actual Measured
Temperature FEM predicted Temperature % Deviation
No pipe 57 57.8 1.4% 16 mm 51 46.87 8.1% 19 mm 49 46.46 5.2% 22 mm 48 46.14 3.9%
Moreover, the temperatures at 2 cm depth deviated 2-4oC from the actual temperatures measured experimentally. The water temperature in the model as well as the temperature at 8 cm, were 5-6 oC lower than the measured values. Accordingly, the FEM developed can only be used to accurately predict the surface temperature for different diameters.
It was also noted that contrary to the experimental results, the percentage reduction in asphalt temperature increased with depth. The main reason behind this discrepancy is due to the relatively uniform temperature of the asphalt layer with no pipe in the FEM developed as shown in Fig. 10. In reality however, the asphalt temperature must decrease with depth.
After validating the FEM for the surface temperature above the pipe, the surface temperature was plotted vs. several diameters (4 mm, 6 mm, 10 mm, 13 mm, 16 mm, 19 mm, 22 mm, 25 mm, 30 mm, 35 mm and 40 mm) for both a constant flow of 21 L/min and a constant velocity of 1 m/s as seen in Fig. 11.
Figure 11: Predicted FEM Surface Temperatures vs. Diameter
It was expected that for a constant flow the reduction in surface temperature is less than that for a constant velocity. This is because according to Gnielinsky’s, equation (11), the convective heat transfer coefficient decreases significantly with decreasing velocity and therefore increasing diameter. Consequently, the larger reduction in surface temperature resulting from a greater surface area for larger diameters is counteracted by the smaller reduction in surface temperature resulting from the decrease in the heat transfer coefficient. However, this difference between the 2 curves is negligible and increases slightly with the diameter as seen in Fig. 11.
It can also be noted that the surface temperature reduction is highest initially and decreases with increasing temperature.
A power function was approximated from the plotted data. The degree of determination R2, was very high for the constant flow and the constant velocity with values of 0.974 and 0.999 respectively.
At a pipe depth of 4 cm, the surface temperature directly above the pipe can be expressed empirically as follows:
(A) For a constant flow of 21L/min
(B) For a constant velocity of 1 m/s
Ts is the surface temperature above the pipe in oC and D is the pipe outer diameter in mm. The pipe thickness is 4 mm.
VI. CONCLUSIONS
The geothermal pavement system was proven to be efficient in decreasing the temperatures of the asphalt pavement with a higher decrease as the pipe diameter increases. Both experimental and FEM results showed that the surface temperature is not significantly dependent on the diameter size. Furthermore, the pavement service life can be estimated to increase between 6-9 years depending on the diameter used. Accordingly, the choice of diameter will have to depend on other factors such as price and constructability. The results also showed that the water temperature is not much affected by the pipe diameters. Moreover, the system used was not very efficient in heating water. Lower flow rates and water volume must be used in order to achieve higher water temperatures. Finally, further studies need to be conducted to obtain the optimum flow rates and water volume and develop a geothermal pavement system that can harvest maximum energy and extend the service life of the pavement.
y = 53.676x-0.047 R² = 0.974 y = 55.512x-0.063
R² = 0.999
44
45
46
47
48
49
50
51
0 5 10 15 20 25 30 35 40 45
Tem
pera
ture
(° C
)
Diameter (mm) Constant Flow (21 L/min) Constant Velocity (1 m/s)
16 mm 19 mm
22 mm No Pipe

120
ACKNOWLEDGMENT
We would like to thank our advisers Dr. Ghassan Chehab and Dr. George Saad for their continuous guidance. We would also like to thank Mr. Hussein Kassem for his support and help mainly in the laboratory work and the finite element modeling.
REFERENCES
[1] Capturing Solar Energy from Asphalt Pavements. Mallick, et al. 2008. [2] Khadum, Saly Evaluation of the Effect of Flowing Water through
Embedded Pipe on Rutting of Pavements s.l. : WPI, 2011. [3] Reduction of Urban Heat Island Effect. Rajib, B Mallick, Bao-Liang,
Chen and Sankha, Bhowmick. s.l. : Worcester Polytechnic Institute, 2008.
[4] Development of a Geothermal Snow Melting System for Highway Overlays and its Performance Validations. Seo, Youngguk, Seo, Unjong and Eum, Juyong. 4, 2011, Journal of Testing and Evaluation, Vol. 39.
[5] Jammal, Jihad M, Chehab, Ghassan R and Saad, George. Geothermal Pavements: A Finite Element Approach. 2012.
[6] Predicting Maximum Pavement Surface Temperature Using Maximum Air Temperature and Hourly Solar Radiation. Solaimanian, M and Kennedy, T.W. s.l. : Transportation Research, 1991.
[7] Zumdahl, Steven S and Zumdahl, Susan A. Chemistry. 8th. s.l. : Brooks Cole, 2013.
[8] New heat equations for heat and mass transfer in turbulent pipe and channel flow. Gnielinski, V. s.l. : Int Chemical Engineering, 1976, Vol. 1, pp. 359-368.
[9] Effect of Heat Storage and Variation in Outdoor Temperature and Solar Intensity on Heat Transfer Through Walls. Alford, J S, Ryan, J E and Urban, P O. 45, s.l. : Ashve Transaction, 1939, Vol. 369.
[10] Schmidt, et al. Introduction to Thermal Sciences: Thermodynamics, Fluid Dynamics, Heat Transfer. s.l. : John Wiley and Sons, 1993.

121
Distractions Affecting Driving Behavior
Al Alem, Fuad; Baassiri, Amro; Samaha, Paul Department of Civil & Environmental Engineering
American University of Beirut Riad El-Solh / Beirut 1107 2020, Lebanon
[email protected];[email protected] ;[email protected]
Abstract- In this paper, the main objective is to study the effects of drivers’ distraction on driving performance by conducting several experiments in which driving performance and physiological indicators are analyzed. Data is collected and evaluated using a high-fidelity driving simulator in order to examine a driver’s response under different circumstances. The type of distraction that is applied in the scenarios consists of receiving and sending text messages on a cell phone or having billboards act as the distraction. The experiment includes 60 drivers who have to deal with specific distractions (Treatment Group) and another 20 drivers that are asked to drive under regular circumstances without distractions (Control Group). The scenarios are 10 minutes long, which includes traffic lights and intersections. Each participant is given a 5-minute practice drive in order to adapt to the simulator environment. After the practice drive, the driver faces a series of actions such as cars & pedestrians pulling out unexpectedly to the driver’s lane forcing him/her either to brake or crash. Both groups of drivers drive these scenarios but the treatment group faces the same scenario while receiving and sending text messages or getting information from billboards. The output examined includes values for acceleration, braking intensity, lane variability, distances, etc. that are recorded at intervals of 0.1 seconds. Using the Photoelectric Plethysmograph (PPG) sensor provided by AUB, the blood volume pulse height and heart rate are monitored enabling us to study the physiological changes due to different circumstances in the scenario. Collecting the output data from the simulator enables the comparison of the results that both groups generate and the evaluation of their driving performance. The results may be used to inform decision makers about the effect of certain distractions in order to stress on executing new laws regarding distractions and eventually reduce road accidents resulting from distractions.
I. INTRODUCTION
Driving is a multitasking operation that involves many motor and cognitive tasks. At the same time, drivers tend to regularly perform non-driving activities that distort their attention and ability to focus on driving. This may include drivers’ interaction with in-vehicle controls or engaging in mental activities. In both cases, the activity performed may enhance the likelihood of crash occurrence. For instance, a driver replying to a text, or simply trying to read a billboard would cause much difficulty for him\her to focus on them while simultaneously maneuvering the vehicle. These are just a few of many activities that would lead to a diversion of a driver’s attention. Clearly, driving distraction has become a major concern to the Lebanese community. Therefore, there has been greater concern related to texting while driving and many awareness campaigns have been effective whether on television commercials or highway billboards. One could say
that electronic billboards are also a risk for the driver since they are eye catching and distracting for the driver with their colorful and attractive advertising. Table 1 illustrates the cumulative number of accidents in Lebanon obtained from the Lebanese Red Cross website. Ref. [4] shows that the total number of accidents is gradually increasing every year as more distractions are introduced into the market such as cell phones, GPS systems, LED screens and more advanced technologies. In this paper, an experiment is designed to study the effects of distractions on driving behavior such as braking, speed, collisions, etc. Data is collected and assessed using a high-fidelity driving simulator (shown in Figure 1) in order to examine the driver’s response under fixed distractions. In addition, Photoelectric Plethysmograph (PPG) sensors are used in order to examine the driver’s physiological condition along with monitoring the blood volume pulse wave; the pulse wave height decreases when a driver is under stress or distracted, indicating vasoconstriction. The remainder of this paper is organized as follows. Section II presents a brief literature review on distraction while driving. Section III describes the experimental methodology and illustrates the data collection process. Section IV shows and analyzes data obtained from the experiment. Finally, Section V presents a brief summary and provides some conclusions and recommendations.
Figure 1 Driving simulator at AUB

122
TABLE 1 CUMULATIVE NUMBER OF ACCIDENTS IN LEBANON (LEBANESE RED CROSS)
Years Number of Accidents
2005 7148
2006 8115
2007 9546
2008 10630
2009 10649
2010 10965
2011 11161
II. LITERATURE REVIEW
Different types of experiments have been conducted to test the effects of distraction in different transportation laboratories. For example, Ref. [3] elaborated on the effect of text messaging on young novice driving performance. Using an eye-movement sensor and a total speed analysis, they concluded that drivers spend 400% more time with their eyes off the road when they are texting. Ref. [1] is about a study on the effects of entertainment devices, an iPod in their case, on driving performance. The iPod tasks that required significant manual manipulation of the device resulted in significant decrements in lane-keeping performance; it also resulted in significant increases in speed variability throughout the driving scenario. Ref. [2] describes the major concerns of traffic safety advocates, which led to many studies using different data sources to gain knowledge about crash occurrence due to distracted driving.
III. EXPERIMENTAL DESIGN AND DATA COLLECTION
A. Recruitment of Drivers The enrollment of the subject drivers for the simulator experiment was done by posting flyers in Bechtel, the engineering building located in AUB, but the members of the FYP group personally invited most of the subjects that showed up. The experiment focuses on student drivers thus having little driving experience and great fascination for technology making them a perfect sample for testing distraction effects and reducing its severity. Therefore, the age range of all participants was between 18 and 24 and they were of both genders. Twenty-nine percent of all the participants were females and seventy-one percent were males. All subjects had to fill in a screening form in order to participate in the experiment. Also a consent form was provided that explains the purpose of the research study and an overview of participation including potential risks and benefits. A total number of ninety subjects volunteered to participate; the data for 10 subjects was disregarded due to several reasons such as unreasonable driving that could affect the accuracy of the findings, and dizziness. Sixty drivers were chosen to drive while dealing with specific distractions (Treatment Group) and the other twenty to drive under regular circumstances (Control Group).
B. The Experiment For each subject, the experiment involves the following four phases. In the first phase, the subject is presented with the experiment he/she is undertaking and is asked to fill out a screening form in order to make sure that he/she is eligible to participate. This was decided by whether the subject had dizziness problems, motion sickness, sleep deprivations, eye and ear problems, etc. In the second phase, each subject is given a 5-minute practice drive, in order to adapt to the simulator environment. In the third phase, a sensor is attached to the subject’s non-dominant finger to monitor the blood volume pulse wave and the subject drives through his/her assigned scenarios. Finally, in the fourth phase, the subject is required to complete a survey form after completing the drive. The experiment is composed of four different experimental conditions: twenty subjects per condition, to which they were randomly assigned. All conditions involve the same type of terrain and the same route leading to a designated destination, which in this experiment is designed as AUB. All drivers face the same series of actions; First, a few hundred meters after the starting point a parked car pulls out unexpectedly into the driver’s lane forcing him/her either to brake or crash. The traffic in the opposing direction was designed in such a way that makes the passing maneuver almost impossible since the gaps between successive cars were very short. After that the driver is obliged to take a right turn where in few hundred meters pedestrian will cross the road forcing the driver to stop or run them over depending on the vehicle’s speed and the driver’s perception-reaction time. Following the pedestrian the driver reaches the first signalized intersection which is the location where the distractions start to take place. This setup is repeated twice in each scenario in order to be able to compare results within the same subject before and after distractions. In experimental condition 1, a control group of 20 subjects complete the above experiment without any distraction in order to estimate base values that are later used for comparison with the treatment group. In experimental condition 2, 20 subjects from the treatment group drive while receiving and sending text messages, thus inducing them to be distracted (Treatment Group-1). In experimental condition 3, the type of distraction used is changed from messaging to reading billboards that are located at specific stretches along the route. At the appearance of a specified billboard, a car pulls out unexpectedly or a pedestrian crosses. Twenty subjects are assigned to this experimental condition (Treatment Group-2). Experimental condition 4 is planned to be precisely similar to condition 2, except that the data collected is to be used for traffic signal design purposes since the only difference is that traffic signals are introduced with a 3-second yellow light interval after a red interval so as to alert distracted drivers that a green interval is about to start so that they do not delay other following drivers at the start of green. This will allow studying the drivers’ reaction to the modified traffic signal, in particular the reduction in their delay at proceeding through the intersection at the start of green. By analyzing their data, a new design system for the traffic light can be implemented, thus reducing the delay time and enhancing the flow rate of the road. Figure 3 shows a plan view of the road stretches and events in the experiment.

123
Figure 2 Scenario plan view Table 2 describes the different stretches and control points used in the experiment.
TABLE 2 STRETCHES DESCRIPTION
Stretch Description
1 A parked car pulls out unexpectedly into the driver’s lane at a specified point before applying any distractions
2 A group of pedestrians, standing on the sidewalk, cross the street to test the driver’s behavior before applying the distractions
3 Similar to stretch 1 but after applying distractions. 4 Similar to stretch 2 but after applying distraction. 5 A long stretch that includes stop and go traffic.
Control Point
Description
1 1st traffic light, before applying the distractions. 2 2nd traffic light, after applying the distractions. 3 3rd traffic light, after applying the distractions.
IV. RESULTS & ANALYSIS
The results will be divided into two categories that cover two different disciplines and a design aspect. The disciplines covered include transportation engineering and physiological characteristics.
A. Transportation Engineering This section shows the results that are obtained from five different stretches that include pop-out events such as cars and pedestrians pulling out and three control points being signalized traffic intersections. These stretches and control points are defined in Figure 3. The first four stretches are used
to compare and contrast different measures of performance reflecting a driver’s behavior with and without being distracted. The measures of performance include braking intensity, stopping distance, velocity, acceleration, lateral movement variation, headway distance, red light violations and perception-reaction time at traffic signals. Stretch 5 used to obtain the braking intensity and headway distance during stop and go traffic. The data are analyzed using the difference in differences method (DID). This is done by comparing the results (e.g. braking intensity) due to two similar events in the control group (e.g. first and second instances of cars pulling out) and then reducing this difference from the difference obtained in comparing the same two events in treatment groups. Difference in differences is used to compute the treatment effect (on the treatment group while netting out changes in the performance measures that are not due to the treatment (e.g. simulator effect).
5.1. Braking Intensity
Braking intensity measures the intensity of the driver’s foot pressure on the brake pedal with 1 being the highest and 0 being the lowest. It’s anticipated that distracted drivers should have higher braking intensity due to the fact that they usually have less time to react to different events. Table 3 shows the maximum braking intensity in each stretch. Table 3 shows that the braking intensity, while applying distractions, is reduced by 14.5 % for treatment group-1 and 11 % for treatment group-2. The results are opposite to what we have anticipated however, the percentage of reduction is relatively small and is thought to be due to the adaptation of the driver with the braking pedal.
TABLE 3 SUMMUARY OF BRAKING INTENSITY
Performance Measure
Group
Stretch 1 2 3 4
Braking intensity
Control Group
0.48
0.63 0.70
0.54
Average before applying
distraction
Average after applying
distraction 0.55 0.62
Treatment group -1
0.54 0.70
0.77
0.44
Average before applying
distraction
Average after applying
distraction 0.62
0.60
Difference in Differences -0.09
Treatment group -2
0.47
0.58
0.61 0.47
Average before applying
distraction
Average after applying
distraction 0.52 0.54
Difference in Differences -0.06

124
5.2. Stopping Distance
Stopping distance is the distance measured upon the appearance of a car/pedestrian from the driver’s position until the driver stops braking. Stopping distance is dependent on the original velocity as well as the reaction time. Stopping distance is equal to braking distance plus perception-reaction distance. Therefore we anticipate that the stopping distance for distracted drivers should be larger since they have higher perception-reaction time. Table 4 summarizes the average results obtained for stopping distance. Stopping distance shows an increase of 375% for treatment group-1 and 140% for treatment group-2. This is due to the fact that the distracted drivers (especially texting) were driving at very low velocities.
5.3. Collisions This section analyzes the effect of distractions on drivers’ safety in terms of the average number of collisions per driver summarized in Table 5. Although the difference between the three groups, when pertaining to the braking intensity, was very small a much larger variation between the groups was seen when it comes to the number of collisions. The average number of collisions was found to be 34% greater in the first treatment group with respect to the control group and 166% in the second treatment group. This displays the effect of distractions on driving behavior.
TABLE 4
SUMMUARY OF STOPPING DISTANCE (m)
Performance Measure
Group Stretch 1 2 3 4
Stopping Distance
(m)
Control Group
20.2 33.7 33.1
39.8
Average before applying
distraction
Average after applying
distraction 26.9 36.4
Treatment group -1
25.6 34.7
106.2
47.1
Average before applying
distraction
Average after applying
distraction 30.1 153.3
Difference in Differences 113.6
Treatment group -2
23.2
27.4
98.7 41.7
Average before applying
distraction
Average after applying
distraction 25.3 70.2
Difference in Differences 35.4
TABLE 5 SUMMUARY OF AVERAGE NUMBER OF COLLISIONS
Performance Measure
Group
Stretch 1 2 3 4
Total Number of Collisions
Control Group
0.1 0 0.2
0
Average before applying
distraction
Average after applying
distraction 0.05 0.1
Treatment group -1
0.25 0.05
0.5
0
Average before applying
distraction
Average after applying
distraction 0.15 0.25 Difference in Differences
0.05
Treatment group -2
0
0.15
0.35 0.15
Average before applying
distraction
Average after applying
distraction 0.08 0.25 Difference in Differences
0.13
5.4. Velocity
The average velocity is obtained in each stretch. From daily observation it’s expected that distracted drivers tend to drive at a lower speed than others in order to maintain their control on the vehicle. Table 6 summarizes the results obtained. Results show that the average velocity for treatment group-1 is reduced by 15% and by 11% for treatment group-2.
TABLE 6 VELOCITY SUMMARY (m/s)
Performance Measure
Group Stretch
1 2 3 4
Velocity (m/s)
Control Group
12.33 10.99 6.77 11.08 Average before
applying distraction
Average after applying
distraction 11.66 8.93
Treatment group -1
13.48 12.16 6.80
9.59
Average before applying
distraction
Average after applying
distraction 12.82 8.19 Difference in Differences
-1.90
Treatment group -2
11.76 12.41
6.92 9.13
Average before applying
distraction
Average after applying
distraction 12.08 8.02 Difference in Differences
-1.32

125
5.5. Variation in Lateral Movement
This section studies the effect of distractions on lateral movement variation. This is obtained by calculating the standard deviation of the lane position. It’s predicted that the variation of distracted people should be higher. Table 7 summarizes the results obtained. The results obtained for lateral movement variation are somewhat inconsistent in which the variation decreased by 22% for treatment group-1 and increased by 160% for treatment group-2.
TABLE 7 LATERAL MOVEMENT VARIATION SUMMARY
Performance Measure
Group Stretch 1 2 3 4
Lateral Movement Variation
Control Group
0.19 0.14 0.05 0.04 Average before
applying distraction
Average after applying
distraction 0.16 0.046
Treatment group -1
0.27 0.30 0.16
0.05
Average before applying
distraction
Average after applying
distraction 0.28 0.10 Difference in Differences
-0.06
Treatment group -2
0.12 0.02
0.02 0.12
Average before applying
distraction
Average after applying
distraction 0.073 0.072 Difference in Differences
0.12
5.6. Texting at Stop and Go Traffic
Since not all people text and drive while driving at high speed, a stretch of a stop and go traffic was designed to study the effects of texting in such situations. Most people think that texting and driving in such situations is safe since the velocity is minimal. Table 8 summarizes the results obtained in this stretch. The results show that distracted drivers tend to have higher braking intensity and higher headway distance which is the distance between the participant’s vehicle to the vehicle in front of it. Treatment group-2 results are not calculated in this section due to the absence of billboards in his stretch.
TABLE 8 SUMMARY OF STRETCH 5 RESULTS
Stretch 5
Braking Intensity Headway Distance (meters) Control group 0.09
11.09
Treatment Group-1
0.13
11.64
Difference 0.04 0.55
5.7. Red Light Violation
The scenario contained three signalized traffic intersections whereby the lights are red when the driver reaches them; two of these intersections are identical in their environment. The comparison in this section is done by comparing the average of red light violations in each condition at the first and second traffic signals. It’s anticipated that red light violation is a behavioral issue and is not that much affected by distraction. However, Table 9 shows that red light violations increase for treatment groups-1and 2 by 133% and 120% respectively.
TABLE 9 RED LIGHT VIOLATION SUMMARY
Red Light Violations 1st traffic signal 2nd traffic signal
Control Group 0.45 0.25
Treatment Group -1 0.30 0.50 Difference in Differences
0.40
Treatment Group -2 0.25 0.35 Difference in Differences
0.30 Moreover, the data obtained showed that five participants of treatment group-1 missed the designated road to AUB by taking a wrong turn in comparison to the control group in which no participants missed the road.
B. Design Aspect Perception-reaction time at a green light contributes to start-up the delay time at the start of the green interval of the traffic signal. In this experiment, perception-reaction time is measured as the time elapsed from the second the traffic light turns green until the car starts accelerating. Perception-reaction time at a green light of traffic signal is an important characteristic; it affects the number of vehicles passing in a certain phase hence affecting the flow rate and the level of service. Due to the increase of distractions while driving, the perception-reaction time has been significantly increasing. The objective of our design aspect is to reduce the perception-reaction time by designing a new system of traffic signals. This system introduces a three-second yellow light following the red light. The idea is that this yellow interval would alert drivers that a green interval is about to start thus reducing their start-up delay at the start of green. Table 10 summarizes the average perception-reaction time for drivers participating in this specific scenario. The results for distracted groups are opposite to our anticipation and did not show an increase in the delay time at the green phase of the traffic light. However, the purpose of the design which is to reduce the delay time by adding a 3-second yellow light was successful since the delay time of treatment group-3 was about 40% less than that of treatment group-1.

126
TABLE 10 PERCEPTION-REACTION TIME ANALYSIS
Perception-Reaction Time (s)
1st Traffic Signal
2nd Traffic Signal
3rd Traffic Signal
Control Group
2.13 2.02 1.75
Treatment Group-1
4.05 3.80 2.96
Difference in Differences -0.14 -0.98 Treatment Group-2
2.10 2.03 2.38
Difference in Differences 0.04 0.39 Treatment Group-3
1.88 1.94 2.22
Percent change in
Delay Time
-54% -49% -16% Average
-40%
C. Physiological Characteristics
In this section, we discuss the physiological condition for each driver from the data obtained using the PPG sensor. The main focus of the study concentrated on the heart-rate pulse height. The output results were displayed in 60-second time intervals. These data recording intervals of the sensors were synchronized with the timing of data collection from the driving simulator with an error up to three seconds. Furthermore, the maximum standard deviation of the heart rate was obtained for every driver. Analyzing the data for each participant individually showed that about 65% of maximum standard deviation values occur at events such as accidents or unforeseen conditions. Table 11 summarizes the average results obtained.
Table 11 HEART RATE ANALYSIS
Group Average Maximum Standard
Deviation Control Group 31.55
Treatment Group-1 37.56 Treatment Group-2 35.34 Treatment Group-3 34.48
The table shows that treatment group-1 has a higher standard deviation than that of the control group followed by treatment goup-2. This means that both treatment groups have less concentration while driving and thus are more surprised with the events than the control group. This is due to the fact that they had less time available to react because of the distraction.
V. CONCLUSION
This study was conducted at the transportation lab at AUB to study the effects of distractions on drivers’ responses to events that appear on a daily basis. The results showed the severity of distractions on the drivers’ safety as well as its effects on the velocity thus reducing the road’s level of service. The result show high increase in the number of collisions, red light violations, and stopping distance thus reducing the safety of the drivers. Furthermore, the results show that distractions reduce the average velocity with a considerable amount therefore
reducing the road’s level of service. In this experiment some of the limitations are faced some of which are related to the sample representation and some have to deal with the accuracy of the results. 80 AUB students participated in this experiment which is considered small sample and might not represent all the components of the society. Furthermore, the accuracy of the data might be slightly effected due the fact the simulator might cause some dizziness. Our results and analysis may be useful to decision makers such as municipalities and transportation engineering departments in the country for the purpose of implementing the modified traffic signal settings to reduce the start-up delay time at the green light, thus enhancing the level of service of the road (LOS) and reducing driver’s frustration. Furthermore, we would like to point out that the results of this experiment show that billboards and texting are considered as severe distractions. Therefore, it is important that more studies take place before the installment of new billboards, focusing on aspects such as their location, size, and content. Moreover, we sincerely hope that the government and local authorities work diligently in order to enforce the laws, regarding texting while driving that would ensure the safety of our community.
ACKNOWLEDGMENT
Many thanks to our technical advisor, Dr. Maya Abou Zeid who was supportive with us, answered all our questions and misunderstandings, gave us wonderful ideas and finally supplied us with dozens of studies to help us in our project. Beyond this we would like to thank Mazen Danaf, a Masters student whose thesis is about driving simulator, who offered to help us learn the program and anything related to the simulator software. Last but not least we would like to thank the Civil & Environmental Engineering Department at the American University of Beirut for allowing us to conduct the experiment at the transportation lab as well as giving us the privilege to use the new bought sensors, which will support our project.
REFERENCES
[1]. Crisler, M., Brooks, J., Ogle, J., Guirl, C., Dixon, K., 2008. Effect of
Wireless Communication and Entertainment Devices on Simulated Driving Performance.
[2]. Singh, S., “Distracted Driving and Driver, Roadway, and Environmental
Factors,” U.S Department of Transportation, (Report # DOT HS 811 380), 2010.
[3]. Simon, H., Young, K.., Regan, M., 2006. The Effect of Text Messaging
on Young Novice Driver Performance [4]. Yearly Statistics Car Accidents. 2012. http://www.kunhadi.org/, Beirut.
Web. 10 Nov 2012.

127
Fiat Steel Bridge Mariana Abou Diwan, Mona Darwich, Salman Faraj, Roba Olabi, Rabie Ramadan
Civil and Environmental Engineering Department American University of Beirut
Riad el Solh [email protected], [email protected], [email protected], [email protected], [email protected]
Abstract- This paper presents the results of the sustainability
study carried out on the Fiat Steel Bridge. The sustainability study consists of the analysis of the Fiat Bridge in structural, transportation and economic aspects. The structural integrity of the bridge was assessed using SAP 2000, in accordance with AASHTO LRFD standards. The Level of Service (LOS) of the bridge was determined using Synchro and its usefulness as a transportation unit was evaluated. According to the structural and transportation results, the measures required to enhance the sustainability of the bridge were proposed. The economic implications of the aforementioned proposed bridge works are used to determine the preferable corrective measures
I. INTRODUCTION
Fiat Bridge is a steel bridge located in Beirut area, at
Corniche Al-Naher. It was constructed in 1983 as a temporary overpass and still stands today. The bridge has survived several wars and earthquakes and is currently subjected to heavy loads from trucks and traffic jams almost every day of the year. The Fiat Bridge is part of the Pierre Gemayel road near Burj Hammoud that connects many establishments in the area. The bridge is categorized as a ladder deck type bridge with a central girder beam. It is almost 288 m in length and 13.4 m in width with two traffic lanes in each direction.
The structural integrity of the bridge will be evaluated and more sustainable and safe designs/solutions will be proposed. The bridge connects the major areas of Beirut between Ashrafiyeh and Burj Hammoud thus the impact of increasing the LOS of the bridge may boost the region’s economy.
Our study aims to facilitate the traffic network passing through Pierre Gemayel road to ensure that the bridge can withstand oncoming traffic today, and traffic projected for the coming years.
The first objective lies in obtaining the dimensions of the bridge, modeling it using SAP2000, analyzing it using finite element analysis, and creating the load patterns according to the LRFD regulations from AASHTO. The second objective is to conduct a transportation analysis using Synchro of the intersections along the bridges length to determine the gravity of the traffic congestion and the steps needed to improve its LOS. The third objective pertains to the economic aspect in terms of bridge upkeep and rehabilitation, in addition to the economic impact on the user community.
The SAP analysis will provide basis for the next step to be taken, whether the bridge structure requires maintenance and rehabilitation of its members or redesign of a new steel overpass structure.
II. STRUCTURAL ANALYSIS The drawings of the Fiat Bridge were unavailable therefore
we had to measure the dimensions of the bridge on site. The bridge was modeled on AutoCAD and placed on SAP to carry out a structural analysis on the infrastructure. Fig. 1 below shows the AutoCAD model of the bridge.
A. Deflection Limitation
High deflections under live loads are not accepted for bridges in most countries. This is due to the fact that deflection increases vibrations in the spans and may deteriorate the concrete deck. According to ASSHTO-LRFD, the deflection of highway bridges consisting of simple or continuous spans must not exceed 1/800 of the span length. Those limitations are checked for in order to prove that the bridges performance is acceptable throughout its service life. Fig. 2 shows the span deflection results from SAP.
Table I below shows a summary of span deflections resulted from SAP:
TABLE I SPAN DEFLECTION SUMMARY
All the spans did not exceed the limitation in deflection
except span number 8. Two major parts of the bridge are to be redesigned: Girder section at span number 8- Excessive Deformation, and Girder section Span number 4- Even though its deflection did not cross the limit, it must be redesigned for safety in case the bridge is subjected to heavier truck loads than usually permitted causing more deflections, as there is minimal control in Lebanon over the allowable truck load. The new dimensions of the girders are placed in table II below.
TABLE II NEW HEIGHT OF GIRDERS
Span Number
Span Length (m)
Max. Allowable Deflection L/800
Actual Max. Deflection
Acceptable/ Not Acceptable
1 15.0 18.75 mm 8.95 mm Acceptable 2 20.0 25 mm 13.67 mm Acceptable 3 25.0 31.25 mm 21.18 mm Acceptable 4 32.5 40.625 mm 37.19 mm Acceptable 5 25.0 31.25 mm 21.56 mm Acceptable 6 25.0 31.25 mm 21.15 mm Acceptable 7 25.0 31.25 mm 21.70 mm Acceptable
8 35.0 43.75 mm 45.06 mm Not Acceptable
9 25.0 31.25 mm 21.73 mm Acceptable 10 25.0 31.25 mm 20.82 mm Acceptable 11 20.0 25 mm 13.43 mm Acceptable 12 15.0 18.75 mm 8.99 mm Acceptable
Target Span Length of span (m) Old height New height Exterior girders - span 4 32.5 1(m) 1.01(m) Interior girder - span 4 32.5 1.4 (m) 1.41(m) Exterior girders - span 8 35 1(m) 1.02 (m) Interior girder -span 8 35 1.4(m) 1.42 (m)

128
The extra depth is added by bolting 1 and 2 cm steel sheets of the same thickness of the bottom flange (which is 2cm). The number of required bolts is shown in table III below.
TABLE III NUMBER OF BOLTS REQUIRED
Girder Bolt Diameter (in)
Bolt Spacing (cm)
Total Number of Bolts
Exterior girders - span 4 ¾ 17.5 372 Interior girder - span 4 ¾ 17.5 372 Exterior girders - span 8 ¾ 17.5 400 Interior girder -span 8 ¾ 16 438
B. Service Life Discrepancies Geometric deficiencies and unexpected increase in traffic on
the bridge are major concerns in reducing the service life of the bridge.
Fiat Bridge is facing a main problem in the drainage system and the coating works. Rainwater is able to pass through the asphalt surface through the concrete deck to the coating system seeping to the steel girders as shown in Fig. 3. The concrete deck is affected by corrosion of its reinforcing bars due to water penetration as shown in Fig. 4, this results in delamination and spalling of the concrete as shown in Fig. 5. The coating and drainage systems are to be rehabilitated to repair according to specifications and prevent future occurrence.
Figure 1: AutoCAD drawing Showing Bridge Dimensions
Figure 2: SAP Span Deflections
Figure 5: Concrete Deck Spalling (Revealing Steel Reinforcement)
Figure 4: Steel Corrosion Figure 3: Rainwater Leakage Causing Concrete Deterioration

129
III. TRANSPORTATION ANALYSIS
A model of hourly traffic flow during peak hour through each route across the length of the Fiat Bridge was analyzed on Synchro. This was done to quantify the level of performance in terms of LOS (level of service according to HCM – Highway Capacity Manual standards) and the average delays of vehicles traversing the roads.
Traffic simulation and queuing analysis were carried out on Synchro for two cases, case 1 with the bridge, and case 2 where the bridge is removed. This was done in order to evaluate the usefulness of the bridge.
For Case 2 (where the bridge is removed), the number of lanes was adjusted and traffic flow values in each route was adjusted accordingly. Also, signalized intersections (with traffic controls) were utilized in order to facilitate conflicting traffic movements and avoid crashes.
The flow values of vehicles per hour, LOS, and average delay of a vehicle in seconds are shown in the figures below for both cases.
A. Case 1: Synchro results with the bridge
B. Case 2: Synchro results without the bridge
The first case with the Fiat Bridge experienced less average
delays and better LOS than the case where the bridge was removed. The reasons are obvious as the flow pattern of traffic passing straight along the Pierre Gemayel road are separated from traffic joining and leaving the road along the 2 intersections under the bridge.
C. Flow Fuel Delay
The transportation sector is a primary consumer of fossil fuels and is a major contributor to air pollution. A main target is to conserve energy and mitigate the environmental impact. The flow fuel delays for both cases are incurred from Synchro in Liters per hour in table IV and V below.
TABLE IV FLOW FUEL DELAY - CASE 1
Left Intersection Fuel (L/hr) Right Intersection Fuel (L/hr) East bound right 14 West bound through 23 West bound through 25 South bound right 7 West bound left 17 North bound left 130 North bound through 137 North bound right 6 SUM 56 SUM 303 TOTAL 359
Figure 6: Flow Values in (veh/hr) - Case 1
Figure 7: LOS - Case 1
Figure 8: Average Vehicle Delay (s) - Case 1
Figure 9: Flow values (veh/hr) - Case 2
Figure 10: LOS - Case 2
Figure 11: Average Vehicle Delay (s) - Case 2

130
TABLE V
FLOW FUEL DELAY - CASE 2 Left Intersection Fuel (L/hr) Right Intersection Fuel (L/hr) East bound right 363 East bound through 735 East bound through 541 West bound through 606 West bound through 39 South bound right 245 West bound left 353 North bound left 372 North bound through 370 North bound right 6 SUM 1296 SUM 2334 TOTAL 3630
In Case 1, the total average hourly fuel consumption in peak
hour due to delays across the length of the bridge (crossing the 2 intersections) is 359 Liters per hour, whereas in Case 2 it was 3,630 Liters. Case 1 is much more conservative than Case 2 by 3,271 Liters which saves on user travel cost and drastically decreases polluting emissions.
D. Discussion of Results
Most routes along the highway experience a really good LOS of A and a smaller number of routes experience LOS F. The ratio of LOS A to LOS F is much better in Case 1 than Case 2. The maximum delay in case 1 is 164 seconds whereas in Case 2 it reached a maximum of 513 seconds. Overall the Fiat Highway Bridge proves to be a very valuable transportation unit along the Pierre Gemayel road.
IV. ECONOMIC ANALYSIS
Since financial resources are a governing factor in any type
of project, it is important to conduct an economic analysis through which we will determine two main values:
1. The current worth of the bridge (material wise). 2. The financial savings implicated with the existence of
the bridge. A. Current Worth of the Bridge:
The volume of concrete, steel, and asphalt is found using the AutoCAD drawings. The concrete used here is pre-cast post tension blocks that were fitted onto the deck of the bridge (No formwork). The total volume of steel was found to be 76 m3 and the density of steel is 8000Kg/ m3, therefore the total mass is 608 Tons. As for Asphalt, the density is taken to be 2000 Kg/m3 hence the total mass is 925 Tons. Table VI below shows the quantities of all the components with their total price.
The current materials worth of the bridge is estimated to be 624,610$. This current worth value will be compared to the cost of rehabilitation measures on the bridge. If the current worth of the materials is close to the cost of rehabilitation, it is more economically feasible to reconstruct the bridge so as to increase its service life and decrease long-term maintenance costs if constructed well according to current updated building standards.
However, prior to comparing the rehabilitation costs to the estimated current materials costs, the cost of user savings must be considered from a transportation aspect for both cases (with and without the bridge). This is discussed in section B below.
TABLE VI
SUMMARY OF VOLUMES AND PRICES OF BRIDGE COMPONENTS
Material Unit No Length Width Height Area Volume of one component Total Volume Price
Concrete m3 287.5 13.4 0.25 N/A N/A 963.125 28893.75
Steel
Cap Beams m3 13 13.4 N/A N/A 0.546 7.098
Outside Girders m3 2 287.5 N/A N/A 0.0372 10.695 21.39
Middle Girder m3 1 287.5 N/A N/A 0.0452 12.995 12.995
Cross Beams m3 89 13.4 N/A N/A 0.0242 0.32428 28.86092
Abutments m3 6 N/A N/A 1.1 0.07068 0.077748 0.466488
Piers m3 2 N/A N/A 1.55 0.07068 0.109554 0.219108
Piers m3 2 N/A N/A 2.7 0.07068 0.190836 0.381672
Piers m3 2 N/A N/A 3.8 0.07068 0.268584 0.537168
Piers m3 2 N/A N/A 4.35 0.07068 0.307458 0.614916
Piers m3 2 N/A N/A 4.4 0.07068 0.310992 0.621984
Piers m3 2 N/A N/A 4.5 0.07068 0.31806 0.63612
Piers m3 2 N/A N/A 4.6 0.07068 0.325128 0.650256
Piers m3 2 N/A N/A 4.3 0.07068 0.303924 0.607848
Piers m3 2 N/A N/A 3.4 0.07068 0.240312 0.480624
Piers m3 2 N/A N/A 2.2 0.07068 0.155496 0.310992
Piers m3 2 N/A N/A 1.25 0.07068 0.08835 0.1767
Total Steel Volume: 76.047796
517125.0128
Asphalt m3 N/A 287.5 13.4 0.12 N/A N/A 462.3 78591
Total Price: 624609.7628

131
B. The Financial Savings Implicated with the Existence of the Bridge
As aforementioned, the Fiat Bridge plays an important role in facilitating traffic on Pierre Gemayel road. The results obtained from the transportation analysis section III shows that delays drastically increase upon removal of the bridge. This
difference in delay is used to compute the cost saved by users due to the existence of the bridge.
The delay per vehicle and the flow on the different routes at peak hour are shown in table VII below (See Figures 6, 8, 9, 11 for delay and flow values).
TABLE VII
PEAK HOUR TOTAL DELAY COMPUTATION
With The Bridge Without The Bridge Routes on the
intersections below the Bridge
Delay per vehicle (seconds/veh)
Flows (vehicles)
Delay on each Route
(seconds)
Routes on the intersections
Delay per vehicle
(seconds/veh)
Flows (vehicles)
Delay on each Route
(seconds) Left intersection
West bound through 3 1296 3888 Left intersection West bound through 3 2808 8424
Left intersection West bound left 2 1124 2248 Left intersection
West bound left 359 1224 439416
Left intersection East bound right 4 1152 4608 Left intersection East
bound through 262 2232 584784
Right intersection South bound right 1 720 720 Left intersection East
bound right 357 1152 411264
Right intersection West bound through 10 576 5760 Right intersection
South bound right 400 720 288000
Right intersection North bound left 161 1124 180964 Right intersection
West bound through 329 2088 686952
Right intersection North bound right 164 504 82656 Right intersection
East bound through 380 2232 848160
Right intersection North bound right 0 432 0 Right intersection
North bound left 513 1224 627912
Total Delay
280844s Or 78.012hrs
Right intersection North bound through 500 504 252000
Right intersection North bound right 0 432 0
Total Delay
4146912s Or 1151.92hrs
The difference in delay is 1,151.92 – 78.012 = 1,073.91 hrs.
Peak hour traffic is considered to occur twice a day (at 7:30 to 8:30am and at 1:00 to 2:00pm), considering there is no or minimal delay during the day aside from peak hours, so the delay difference per day is 2,147.8 hrs. The value of time is averaged to be 15$/hr so the savings on the users amounts to 2,147.8 × 15 = 32,217.23$ per day. The yearly savings on the users is 10,051,776.8$.
Another aspect to be considered is the difference in fuel consumption under the two different scenarios: with the bridge or without it. From Synchro, the fuel consumption turned out to be 359 Liters at peak hour when the bridge is present. While the fuel consumption turned out to be 3630 Liters at peak hour without the bridge. Therefore, the difference in fuel consumption per year is obtained in the same manner as the yearly savings (difference equals 2,041,104L). The fuel is taken to be gasoline since the majority of the traffic is cars and the price of diesel does not vary much from gasoline. The price of gasoline is currently 1.27$/L. Therefore the difference in the cost of the fuel consumed yearly is 1.27 × 2041104 = 2,592,202.08$.
When it comes to the rehabilitation costs of the added steel sheets and bolts to the bottom flanges, the cost of one steel sheet on span 4 is 221$, and the cost of one steel sheet on span 8 is 238$. The sheets are transported in sections (since each one has a greater span than 30 meters). The best way to install them is to close down the bridge for a few hours on one night where there is minimal traffic and install the sheets using bolts. The cost of installation, transportation, certified steel labor,
bolts and all the necessary equipment is a small value compared to worth of the bridge materials (an estimate of around 60,000$).
V. CONCLUSION
From the values obtained earlier it is seen that the bridge
influence on delay is as follows: 1) the user experiences less delay time and hence more savings 2) the user spends less fuel traversing the road. The removal and reconstruction of a new bridge requires a long period of time which inflicts great traffic delays and costs on users. These values lead to say that even if the bridge’s rehabilitation costs turned out to be high it is a drawback to shut down the bridge for the purpose of new design and reconstruction. It is more economically feasible to rehabilitate the bridge rather than reconstruct it in order to avoid long periods of bridge closure. Given the rehabilitation costs and delay results, the best option to take is to rehabilitate the bridge whilst trying to achieve the minimum closure time.
ACKNOWLEDGMENT
We would like to thank the Civil and Environmental Engineering Department faculty for their support and help throughout the project work. Special thanks to Dr. Elie Hantouche, Dr. Mutasem Fadel, Dr. Bilal Hamad, Dr. Isam Kayssi, Dr. Maya Abou Zeid, and Dr. Ghassan Chehab for their assistance.

132
REFERENCES
[1] Mannering. (2008). Principles of highway engineering and traffic analysis. (4 ed.). [2] AASHTO LRFD Bridge Design Specifications. American Association of State Highway and Transportation Offocials, Washington, D.C., 2004 [3] Manual of Steel Construction, LRFD, 3rd Edition, American Institute of Steel Construction, Chicago, 2003. [4] Qaqish, D. M., Fadda, D. E., & Akawwi, D. E. (2008). Design of t-beam bridge by finite element method and AASHTO specification . KMITL Sci. J., 8(1), Retrieved from http://www.kmitl.ac.t [5] Mrad, H. (2013, March 31). Interview by M Darwich [Personal Interview]. Prices of construction materials

133
Geogrid Reinforced Concrete
Zahwa Al Ayyash, Noura Sirine Kahil, Angela Karakachian, Maha Mrad, Rouba Onaissi Department of Civil and Environmental Engineering
American University of Beirut Beirut, Lebanon
[email protected], [email protected], [email protected], [email protected], [email protected]
Abstract- This research evaluates the performance of
Portland cement concrete elements reinforced with geogrids. Laboratory testing is undertaken along with a finite element analysis using ADINA. The use of geogrids in concrete is addressed in three different applications: confinement of columns, resistance to thermal cracking and flexure. The experimental work and FEM results are finally presented.
I. INTRODUCTION
Steel has been conventionally used as the main reinforcing material in Portland cement concrete (PCC). Nonetheless, several constraints inhibit the use of steel bars and limit their effectiveness and durability. Such constraints include corrosion concerns, construction complexities and placement of bars in thin sections. This study focuses on the use of geogrids as an alternative reinforcing material in PCC. Geogrids are a special type of geosynthethics made of intersecting ribs that can be manufactured from different materials, with openings called apertures. Depending on their aperture shape geogrids can be uniaxial, biaxial or triaxial. They may be further classified into different categories according to the material used for manufacturing and the junction-bonding method. The geogrids used in this research are punched uniaxial and biaxial geogrids.
Previous studies have shown the effectiveness of geogrids in multiple applications such as in pavements construction and soil stabilization techniques [2] [3]. As little research has been done on the use of geogrid as a reinforcing medium in PCC, this research investigates the concrete/geogrid interaction and points out its benefits and drawbacks.
II. SCOPE OF WORK
The research is divided into two components: experimental work and numerical modeling. The experimental program encompasses three main applications of geogrids in concrete. Beams are tested for thermal cracking, cylinders for confinement and slabs for flexure. Different parameters are explored such as geogrid types (uniaxial and biaxial) and number of layers. A pullout test is also conducted to determine the tensile strength of the geogrid. Analysis using ADINA is carried out to model the beam specimens subjected to thermal cracking. Theoretical calculations are also presented. The following table summarizes the three main applications.
TABLE I SUMMARY TABLE OF ALL THE APPLICATIONS
a W stands for width, H for height, L for length
Specimen tested Beams Cylinders Slabs
Dimensions (cm) 8(W)×4(H) ×40(L) a Radius=10 Height=50 60(W)*60(L)*4(H) a
Testing Machine Freeze-thaw modified machine MTS machine MTS machine
Variables tested Type of geogrids -Type of geogrids -Number of geogrid layers
-Type of geogrids - Number of layers
- Position of the geogrid
Num
ber
of r
eplic
ates
Control (Plain) 2 3 3
Geo
grid
s-re
info
rced
Uniaxial 1 layer
Rib 3 3 3
Junction 3 2 layers - 3 -
Biaxial 1 layer
Rib 3 3 3 Junction
2 layers - 3 - Steel-reinforced 3 3 -
Measurements
-Strain using strain gauges on geogrids
-Monitoring temperature using a thermal probe and a data
acquisition system
-Axial Load and deflection using machine LVDT
- Strain in geogrids using strain gauges
-Axial strain and stress using LVDT
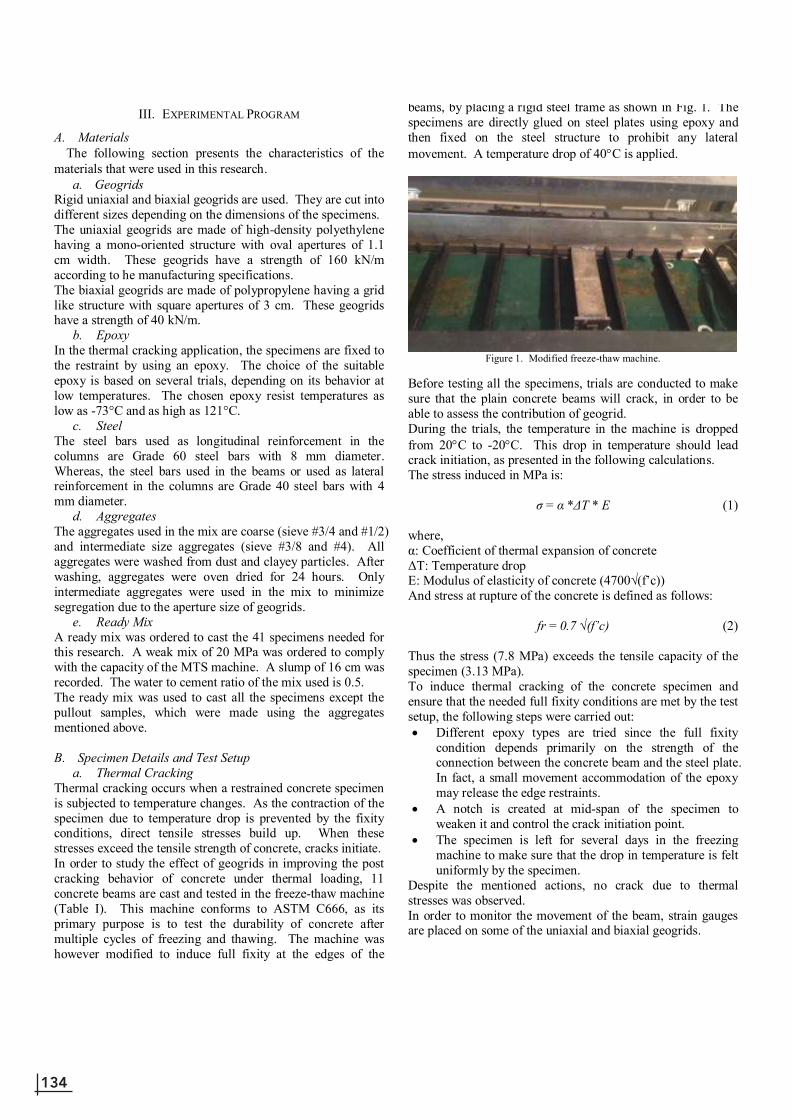
134
III. EXPERIMENTAL PROGRAM
A. Materials The following section presents the characteristics of the
materials that were used in this research. a. Geogrids
Rigid uniaxial and biaxial geogrids are used. They are cut into different sizes depending on the dimensions of the specimens. The uniaxial geogrids are made of high-density polyethylene having a mono-oriented structure with oval apertures of 1.1 cm width. These geogrids have a strength of 160 kN/m according to he manufacturing specifications. The biaxial geogrids are made of polypropylene having a grid like structure with square apertures of 3 cm. These geogrids have a strength of 40 kN/m.
b. Epoxy In the thermal cracking application, the specimens are fixed to the restraint by using an epoxy. The choice of the suitable epoxy is based on several trials, depending on its behavior at low temperatures. The chosen epoxy resist temperatures as low as -73°C and as high as 121°C.
c. Steel The steel bars used as longitudinal reinforcement in the columns are Grade 60 steel bars with 8 mm diameter. Whereas, the steel bars used in the beams or used as lateral reinforcement in the columns are Grade 40 steel bars with 4 mm diameter.
d. Aggregates The aggregates used in the mix are coarse (sieve #3/4 and #1/2) and intermediate size aggregates (sieve #3/8 and #4). All aggregates were washed from dust and clayey particles. After washing, aggregates were oven dried for 24 hours. Only intermediate aggregates were used in the mix to minimize segregation due to the aperture size of geogrids.
e. Ready Mix A ready mix was ordered to cast the 41 specimens needed for this research. A weak mix of 20 MPa was ordered to comply with the capacity of the MTS machine. A slump of 16 cm was recorded. The water to cement ratio of the mix used is 0.5. The ready mix was used to cast all the specimens except the pullout samples, which were made using the aggregates mentioned above.
B. Specimen Details and Test Setup
a. Thermal Cracking Thermal cracking occurs when a restrained concrete specimen is subjected to temperature changes. As the contraction of the specimen due to temperature drop is prevented by the fixity conditions, direct tensile stresses build up. When these stresses exceed the tensile strength of concrete, cracks initiate. In order to study the effect of geogrids in improving the post cracking behavior of concrete under thermal loading, 11 concrete beams are cast and tested in the freeze-thaw machine (Table I). This machine conforms to ASTM C666, as its primary purpose is to test the durability of concrete after multiple cycles of freezing and thawing. The machine was however modified to induce full fixity at the edges of the
beams, by placing a rigid steel frame as shown in Fig. 1. The specimens are directly glued on steel plates using epoxy and then fixed on the steel structure to prohibit any lateral movement. A temperature drop of 40C is applied.
Figure 1. Modified freeze-thaw machine.
Before testing all the specimens, trials are conducted to make sure that the plain concrete beams will crack, in order to be able to assess the contribution of geogrid. During the trials, the temperature in the machine is dropped from 20C to -20C. This drop in temperature should lead crack initiation, as presented in the following calculations. The stress induced in MPa is: σ = α *ΔT * E (1) where, α: Coefficient of thermal expansion of concrete ΔT: Temperature drop E: Modulus of elasticity of concrete (4700√(f’c)) And stress at rupture of the concrete is defined as follows: fr = 0.7 √(f’c) (2) Thus the stress (7.8 MPa) exceeds the tensile capacity of the specimen (3.13 MPa). To induce thermal cracking of the concrete specimen and ensure that the needed full fixity conditions are met by the test setup, the following steps were carried out: Different epoxy types are tried since the full fixity
condition depends primarily on the strength of the connection between the concrete beam and the steel plate. In fact, a small movement accommodation of the epoxy may release the edge restraints.
A notch is created at mid-span of the specimen to weaken it and control the crack initiation point.
The specimen is left for several days in the freezing machine to make sure that the drop in temperature is felt uniformly by the specimen.
Despite the mentioned actions, no crack due to thermal stresses was observed. In order to monitor the movement of the beam, strain gauges are placed on some of the uniaxial and biaxial geogrids.

135
b. Confinement Concrete cylinders are cast in PVC pipes of 20 cm diameter and 50 cm length, with a longitudinal reinforcement of six steel bars of 8 mm diameter. A cover of 2 cm is provided. Plain concrete specimens as well as steel reinforced specimens confined with uniaxial and biaxial geogrids as well as circular steel hoops are prepared. The parameters considered are the aperture shape and the number of layers. 16 steel hoops of 4 mm diameter are needed to provide a confinement force equivalent to that of one uniaxial geogrid strip of 50 cm length (80 kN). However, only nine hoops were placed to provide an adequate spacing of 5 cm. The cylinders are loaded in compression until failure using the Material Testing System (MTS) machine. The MTS machine is a closed loop servo-hydraulic machine with a capacity of 110 tons. The specifications of the specimens and the test setup are presented in Table I.
c. Flexure Thin concrete pavements are sometimes used as an alternative to asphalt pavements. The behavior of geogrid reinforced thin concrete slabs subjected to flexural failure is examined. Twelve specimens are prepared to investigate different parameters (Table I). The position of the junction in uniaxial geogrids is considered; as such some specimens have ribs at mid-span while others have a junction. Flexural behavior of the slab is expected to be affected by this parameter since ribs and junctions have different tensile strengths. Steel reinforcement is not considered since steel is not usually used as a flexural reinforcement medium in ultra thin concrete pavements. At the time of writing this paper, testing was undergone for two slabs. The testing setup is summarized as follows: A 60 cm x 60 cm simply supported slab is prepared as
shown in Fig. 2. A wooden strip is placed on top and at the center of the
slab. Since the MTS machine is sensitive to the application of
low loads, i.e. it may not be able to sense loads less than 5 kN, and since the slabs are expected to have a low flexural capacity, a span of 30 cm is set.
d. Pullout In order to test the pullout strength of the geogrids, two cylinders containing biaxial geogrids and two others containing uniaxial geogrids are cast. The four cylinders described above have a diameter of 15 cm and a height of 30 cm. The embedment length of all the geogrids is equal to 20 cm and their width is equal to 7 cm. The specimens were tested using the Tinius Olsen machine. In addition, samples of uniaxial and biaxial geogrids as well as a steel bar of 4 mm diameter are tested in tension.
IV. EXPERIMENTAL RESULTS AND ANALYSIS
A. Thermal The results of this application will be reported in the full report of the final year project. B. Confinement All of the cast columns are tested on the MTS machine. The machine pressure and position are monitored, and the stress and strain are calculated. The results of 16 tested specimens were analyzed, excluding two outliers. Since five specimens were tested at 14 days and the rest at 28 days, comparison in terms of values was made between specimens tested on the same day. Conclusions about ductility and post peak behavior can however be drawn from the results of the two sets. The function of lateral confinement is to increase the peak strength of the column and its ductility. Yet the main focus of the analysis is on the post-peak behavior of the concrete cylinders because no increase in peak strength was observed in the geogrid-confined specimens, unlike the case of steel confined columns. This problem is attributed to the effect of segregation. The criteria used for comparison between specimens are the following: Modulus of elasticity obtained from the linear range of
the load strain curve. Axial load and strain at peak. Strain at yield, considered as the limit between elastic
and plastic ranges on stress-strain curve. Strain at failure (taken as 50% of peak load) and k which
is the ratio of the strain at failure to the yield strain, which is an indicator of ductility.
Strain in geogrids was recorded using strain gauges for the specimens listed in Table II. As can be seen in Fig. 2, the geogrid starts elongating when the cover spalls off and relaxes when the core starts failing. Uniaxial Geogrids (Fig. 3) exhibited much greater strain values than steel (Fig. 4) and biaxial geogrids which relates to a higher ductility. The use of two layers for reinforcement decreased the strain felt by the geogrid layer as indicated by the lower strain at peak in specimen U-2L-3.
Figure 2. Load vs. Strain curve for biaxial and plain specimens

136
Figure 3. Load vs. Strain curve for uniaxial specimens
Figure 4. Load vs. Strain curve for steel specimens
TABLE II CRITERIA FOR COMPARISON OF STRAIN IN GEOGRIDS
B-1L-2 S-1L-1 U-1L-2 U-1L-3 U-2L-3
Max strain in geogrid (%) 0.1765 0.1166 1.7017 1.6522 1.0096
Axial load at max strain in geogrid (KN)
170.95 128.99 199.386 261.917 222.243
Strain in geogrid at peak
load (%) 0.0570 0.0298 0. 3333 0.2099 0.1366
Strain in geogrid at failure (%)
0.1096 0.1017 1.6989 1.4370 0.9130
The following deductions can be made: As expected, the plain concrete specimens (P-1 and P-3)
exhibited a brittle failure. Ductility is minimal. The curves decay right after the highest stress is achieved (Fig. 2 and Fig. 4).
Specimens with geogrids exhibit a lower modulus of elasticity than plain and steel confined specimens.
Steel confinement increased the axial capacity of the columns as expected. Specimens confined with geogrids have however a lower peak load than steel confined and plain specimens due to segregation between core and cover. The small spacing between ribs didn’t allow a uniform distribution and resulted in a weaker cover. No clear correlation was established between the ultimate load and the number of layers or the type of geogrid used.
Specimens confined with biaxial geogrids had the largest values of yield strain (0.22 to 0.24 %).
The columns confined with biaxial (B-1L and B-2L) and one layer-uniaxial geogrids (U-1L) exhibited post peak behavior similar to that of the steel confined columns. This implies that geogrids can be compared to steel in terms of post cracking behavior.
S-1L and U-2L specimens exhibited the most ductile behavior according to the large values of k and strain at failure.
Uniaxial geogrids (Fig. 5) have larger values of strain at failure than biaxial geogrids, but increasing the number of layers increased the strain at failure and thereby the ductility of both confined specimens.
The cylinders confined with 2 layers of uniaxial geogrids (U-2L-1) showed the highest post-peak ductility. The specimens maintained a high load plateau of around 200 kN after failure, as can be seen from the flat slope of the
U-2L-1 graph and U-2L-3 (Fig. 3).
Figure 5. Column Reinforced with Uniaxial Geogrid
Inaccuracies in the results may be attributed to different sources of error. The recorded strains are higher than actual due to machine compliance. In addition, results may be affected by the concrete quality and pouring. Another probable error could relate to moment generated due to the point of load application which might not fall exactly at the center of the column.
C. Flexure As mentioned earlier, two slabs were tested; a plain concrete slab and a uniaxial geogrid reinforced slab. The remaining slabs’ results will be presented in the full report. A load-control testing system was undergone based on analytical calculations. The input to the system includes the maximum and minimum load values for loading and unloading respectively on one cycle. The maximum load inputted for the geogrid-reinforced specimen was 6.8 kN. The plain specimen’s maximum load input was 5 kN which is the minimum load that the machine detects. The testing proceeds for certain number of cycles until the slab fails.

137
Experimental results and observations can be summarized as follows: Crack initiation: A crack is initiated at the middle bottom
of the slab. The more the cycles, the deeper it propagates and the longer it extends along the width of the slab.
Brittle vs. ductile behavior: The crack opening for geogrid-reinforced slab was delayed compared to the plain concrete slab. The latter exhibited a brittle failure after several cycles. On the other hand, the geogrid-reinforced specimen was held in place even after cracking.
D. Pullout The four cylinders are tested using the pullout machine. Table III summarizes the obtained results.
TABLE III
PULLOUT TEST RESULTS Type Strain at failure (%) Force (N) Failure mode
Biaxial 1 15. 625 4670. 63 at junction Biaxial 2 15. 151 4893. 04 at junction
Uniaxial 1 76. 923 10008. 49 at junction and rib Uniaxial 2 73. 770 11342. 96 at junction and rib It is observed that the failure in the uniaxial geogrids occurs under much higher forces than in biaxial geogrids. Moreover, the strain at failure of the biaxial geogrids is much less than the strain at failure of the uniaxial geogrids. This indicates that the uniaxial geogrids are more flexible and they undergo very large deformations before failing completely. It is important to mention that the geogrids did not pull out from the concrete cylinder.
V. NUMERICAL MODELING
Thermal Cracking The thermal cracking of the cast specimen was modeled using ADINA. Two materials and element groups were defined: concrete modeled using the data-fitted concrete option in ADINA and geogrid modeled as isotropic linear- elastic. Full fixity boundary conditions were applied to the edges of the 40 cm specimen. A 25degree temperature load was applied using a 100 step time function to simulate the cooling of the concrete specimen (0.25C per time step). The geometry of the beam simulated the notch at the middle of the specimens used in the experimental part. The geogrid reinforcement was modeled as a surface at the equatorial plane of the beam which was divided into two volumes. The surface was meshed as a 3D plane membrane element group of specified thickness. For the plain concrete specimen, ADINA results predict a crack initiation at the center of the created weakness at a temperature drop of 3C. More cracks appear at the fixed boundary (Fig. 6).
Figure 6. ADINA cracked model.
VI. ANALYTICAL PREDICTIONS
A. Confinement Several studies have been conducted to investigate the effect of active hydrostatic fluid pressure on the compressive behavior of concrete specimens. Most of the models are based on the confinement model derived experimentally by Richart et al. [4] which is represented below:
cc co( fl
f co
) (4)
Where f’cc and εcc are the confined compressive strength and strain respectively of the concrete specimen; f’co and εco are the unconfined compressive strength and strain respectively of the concrete specimen; is the lateral hydrostatic pressure; and are empirical values where ; =4. 1, . Mander et al. [5] proposed a model to evaluate the axial strength of concrete subjected to uniaxial compressive loading, confined with transverse reinforcement. Mander et al. [5] studied the effect of different types of transverse reinforcement: spiral, circular, or rectangular hoops. The effect of strain rate and the type of loading (monotonic or cyclic) were also studied. The model proposed by Mander et al. [5] is the following:
√
(5)
where is the effective lateral pressure. is given to be equal to:
(6) And,
(7) Where is the yield strength of the transverse reinforcement; is the ratio of the volume of transverse confining reinforcement to the volume of confined concrete core; and are effectiveness coefficients. for circular sections
(3)

138
and
and
. is the clear spacing
between the confining reinforcement; is the area of the confined core and is the area of longitudinal reinforcement. Accordingly, the axial strength of the concrete cylinders is predicted and can be computed equal to:
( )
(8)
The following table represents the predicted and measured results for all the specimens.
TABLE V CONFINEMENT PREDICTIONS VS. MEASURED
Transverse reinforcement type Predicted (tons) Measured (tons)
Steel 62.2 56.2 55.4
Uniaxial One Layer 64.5 42.3 47.4
Biaxial One Layer 56.0 48.8 47.5
Uniaxial Two Layers 72.1 45.8 47.6
Biaxial Two Layers 57.0 45.9 47.3
Briefly, the difference in the results between predicted and measured values can be attributed to the uncertainty in the materials’ properties (concrete compressive strength, yield strength of reinforcement material) and uncertainty in the experimental setup. B. Flexure Preliminary analytical analyses are undergone in order to determine the load under which the slabs fail in flexure. Despite that, the slabs are tested cyclically and in order to know how much every slab will attain in terms of flexural capacity, the ultimate load is calculated as:
Where,
( )
Ag: cross sectional area of reinforcement per layer Fc
’” compressive strength of concrete L: length of slab fy: yield stress of reinforcement d: distance from the outermost compression fiber to the centroid of the tension reinforcement
Accordingly, the ultimate load is 6.9 kN.
CONCLUSIONS AND RECOMMENDATIONS
Geogrids have exhibited a comparable behavior to steel in concrete, in terms of ductility and strength. However, some aspects of geogrid reinforced concretes need to be further investigated such as its durability and bonding effects. Some of the disadvantages associated with the use of geogrids in concrete that were faced during the experiments are the following: Segregation: It is due to the small aperture size of
geogrids (especially in the case of uniaxial geogrids) which does not allow a uniform distribution of the aggregates which lead to a weaker cover (in the case of confinement).
Bond between geogrid and concrete: Poor bonding between geogrids and concrete was observed in both flexure and confinement applications. This could be due to the smooth surface texture of the geogrid which resulted in a poor interlock between the concrete and the reinforcing layer. Roughening the surface of the geogrid shall be considered in the future for better bonding.
Further investigation on the behavior of geogrids in normal strength concrete needs to be done. A different behavior of geogrids in normal strength concrete is expected since higher stresses would be felt by the confining layers. Geogrids exhibit a plastic behavior and high strains at high tensile loading. In fact, the load applied in the tests was too low and no confinement rupture was observed.
ACKNOWLEDGMENT
The authors would like to thank Dr. Ghassan Chehab and Dr. George Saad for their support and guidance throughout the research, also, Mr. Helmi El Khatib for dedicating his time to this research.
REFERENCES [1] KOERNER, R. M. Designing with Geosynthetics. Pearson Prentice
Hall. 2005. [2] LING, Hoe I. et LIU, Zheng. Performance of geosynthetic-reinforced
asphalt pavements. Journal of geotechnical and geoenvironmental engineering, 2001, vol. 127, no 2, p. 177-184.
[3] DIXON, J. et HALL, C. New geogrid technology for ground stabilisation. Engineering Sustainability, 2010, vol. 163, no 2, p. 65.
[4] RICHART, F. E. , BRANDTZAEG, A. , and BROWN, R. L. , The failure of plain and spirally reinforced concrete in compression, Bulletin 190, Univ. of Illinois, 1929.
[5] MANDER, J. B. , PRIESTLEY, M. J. N. , and PARK, R. , Theoretical stress-strain model for confined concrete, J. Struct. Eng. , 114(8), 1804–1826, 1988.

139
and
and
. is the clear spacing
between the confining reinforcement; is the area of the confined core and is the area of longitudinal reinforcement. Accordingly, the axial strength of the concrete cylinders is predicted and can be computed equal to:
( )
(8)
The following table represents the predicted and measured results for all the specimens.
TABLE V CONFINEMENT PREDICTIONS VS. MEASURED
Transverse reinforcement type Predicted (tons) Measured (tons)
Steel 62.2 56.2 55.4
Uniaxial One Layer 64.5 42.3 47.4
Biaxial One Layer 56.0 48.8 47.5
Uniaxial Two Layers 72.1 45.8 47.6
Biaxial Two Layers 57.0 45.9 47.3
Briefly, the difference in the results between predicted and measured values can be attributed to the uncertainty in the materials’ properties (concrete compressive strength, yield strength of reinforcement material) and uncertainty in the experimental setup. B. Flexure Preliminary analytical analyses are undergone in order to determine the load under which the slabs fail in flexure. Despite that, the slabs are tested cyclically and in order to know how much every slab will attain in terms of flexural capacity, the ultimate load is calculated as:
Where,
( )
Ag: cross sectional area of reinforcement per layer Fc
’” compressive strength of concrete L: length of slab fy: yield stress of reinforcement d: distance from the outermost compression fiber to the centroid of the tension reinforcement
Accordingly, the ultimate load is 6.9 kN.
CONCLUSIONS AND RECOMMENDATIONS
Geogrids have exhibited a comparable behavior to steel in concrete, in terms of ductility and strength. However, some aspects of geogrid reinforced concretes need to be further investigated such as its durability and bonding effects. Some of the disadvantages associated with the use of geogrids in concrete that were faced during the experiments are the following: Segregation: It is due to the small aperture size of
geogrids (especially in the case of uniaxial geogrids) which does not allow a uniform distribution of the aggregates which lead to a weaker cover (in the case of confinement).
Bond between geogrid and concrete: Poor bonding between geogrids and concrete was observed in both flexure and confinement applications. This could be due to the smooth surface texture of the geogrid which resulted in a poor interlock between the concrete and the reinforcing layer. Roughening the surface of the geogrid shall be considered in the future for better bonding.
Further investigation on the behavior of geogrids in normal strength concrete needs to be done. A different behavior of geogrids in normal strength concrete is expected since higher stresses would be felt by the confining layers. Geogrids exhibit a plastic behavior and high strains at high tensile loading. In fact, the load applied in the tests was too low and no confinement rupture was observed.
ACKNOWLEDGMENT
The authors would like to thank Dr. Ghassan Chehab and Dr. George Saad for their support and guidance throughout the research, also, Mr. Helmi El Khatib for dedicating his time to this research.
REFERENCES [1] KOERNER, R. M. Designing with Geosynthetics. Pearson Prentice
Hall. 2005. [2] LING, Hoe I. et LIU, Zheng. Performance of geosynthetic-reinforced
asphalt pavements. Journal of geotechnical and geoenvironmental engineering, 2001, vol. 127, no 2, p. 177-184.
[3] DIXON, J. et HALL, C. New geogrid technology for ground stabilisation. Engineering Sustainability, 2010, vol. 163, no 2, p. 65.
[4] RICHART, F. E. , BRANDTZAEG, A. , and BROWN, R. L. , The failure of plain and spirally reinforced concrete in compression, Bulletin 190, Univ. of Illinois, 1929.
[5] MANDER, J. B. , PRIESTLEY, M. J. N. , and PARK, R. , Theoretical stress-strain model for confined concrete, J. Struct. Eng. , 114(8), 1804–1826, 1988.
High Rise Construction in Lebanon: Innovative Construction Methods and Formwork System
Abdul Aziz Abu Kar1, Fathi Al Assir2, George Jreig3, Mazen Al Rifai4, Samir El Khodari5
Civil & Environmental Engineering American University of Beirut
Beirut, Lebanon ama1231, faa452, ggj003,msa824,[email protected]
Abstract- Beirut’s limited free land spaces imposed the current trend of high rise construction taking over the city to cater for the continually increasing residential demands. High rise construction is often associated with constructability issues and complexities. Consequently, time delays and cost overruns are not unusual on such projects. The need arises for finding innovative construction methods and strategies to reduce the risk of delays and cost overruns. This study investigates optimized construction methods and focuses on the application of innovative self-climbing hydraulic formwork systems that are not very common to Lebanese contracting practices. Current construction methods applied on Beirut’s tallest superstructure (SAMA Beirut) are analyzed and compared to other proposed optimized systems. A detailed schedule analysis is provided to highlight time and budget variations. Thereby, the research contributes toward identifying construction methods that successfully increase construction efficiency and enhance constructability to aid contractors, mainly Lebanese contractors, in delivering the project within the set time frame and budget.
I. INTRODUCTION
The need to cater for the increased residential demand with Beirut’s limited free land spaces calls for the construction of high rise structures as opposed to medium to smaller size residential units. SAMA Beirut outperforms other projects by being the highest structure in Lebanon at 195m above ground level. To be able to reach such a great height, innovative construction methods had to be adopted with advanced formwork systems being the most crucial ones. For SAMA Beirut’s luxurious high rise tower, formwork planning challenges included taking into account assembly at an offsite location, an extremely tight construction schedule, and coping with heavy steel reinforcements (anti seismic design).
A proper analysis of the proposed formwork ahead of construction may help the planner at selecting materials and methods which prove to be most economical for the project. Moreover, formwork efficiencies can accelerate construction speed increasing the likelihood of the project to end on budget and within the proposed schedule. Improved technologies in hydraulics as well as material enhancements had led to a better use of automation (hydraulic systems) in core construction. Also, the convenience of floor formwork systems, which can be easily lifted to subsequent floors up the building, greatly minimized slab construction time [6].
According to the general contractor on SAMA Beirut’s site, hydraulic operated self climbing system (Doka SKE 50) was adopted as it was the most suitable choice to reduce tower crane dependency and decrease core jump cycle times. To speed up slab construction, a table formwork system was adopted which can be lifted to the next floor with the help of a “transport fork” attached to a crane, thereby, greatly minimizing slab construction time. This paper, however, attempts to find better enhancements to the construction processes in the Lebanese high rise construction industry by investigating a relatively newer formwork system, Double Jump System – Grocon.
The construction process starts with constructing the core
wall followed by the post tension slabs. Even though the core walls are built faster than the slabs, an average of 3 floors is kept between them. The model this paper proposes speeds up the construction process at the core allowing it to rise at much higher rates than the slabs while maintaining its structural integrity. Based on a comparison of the adopted and proposed formwork system, it will be determined whether the current construction system is worth changing or not.
II. LITERATURE REVIEW
Many design challenges faced during early design phases divert attention away from the constructability of the project. The president of the firm Cary Kopczynski & Company believes that it is during these phases that constructability thinking can have the biggest rewards [5]. A structural engineer has to be aware that there exists an important relationship between a building’s structural design and its forming system. Giving thought to formwork when laying out a structure may be troublesome but it will ensure formwork compatibility which in turn helps a project meet its budget and schedule goals. In the paper “Improved productivity using a modified table formwork system for high-rise building in Korea”, the authors mention that one of the best uses of formwork systems is for high rise buildings which enhance construction productivity [3]. To meet the needs of the modern construction industry, modifications of formwork for high rise building is worth noting since increased efficiencies accelerate the construction schedule and minimizes costs. It is worth mentioning that formwork is one of the largest cost

140
components of a concrete building’s structural frame and constitute up to 35-60% of the costs of the structural frame. This is why companies specializing in prefabricated formwork are ever advancing their formwork systems to meet the demands of the ever growing construction industry.
An example of these modern formwork systems is the Doka
SKE 100 automatic climbing system and trapezoidal windshield used for the first time in the 48-storey Beetham Tower in the UK. To meet the project requirements, Doka created a forming machine that can meet the deadline imposed by the subcontractor and maintain the highest level of safety for the workers under adverse weather conditions [1]. Hannes Stolzlechner, project manager, is confident that “Doka’s automatic climbing system ensures that formwork operation can be carried out quickly with maximum levels of safety at all stages of the process. The system is always fixed to the concrete ensuring a controlled lifting process even in high winds. The formwork is lifted as a single unit, so the absence of any edges eliminates the risk of workers falling [1]. Moreover, the whole level of an external floor for one core can be raised in around one hour. The large platforms provide ample of access and space for storing materials. Pat Boyle, senior contract manager for MPB, states that “Doka automatic climbing system enabled us to meet tight schedules” and that “wider platforms make it easier for us to operate the equipment”. Doka’s Uk technical manager mentions that some Doka systems make use of stripping corners which significantly decrease the time needed to construct shafts since the formwork doesn’t have to be disassembled between each pour [7].
Another example of modern formwork systems is the one
manufactured by Grocon used in the construction of the 330m Rose Tower in Dubai. This system provides high labor efficiency and high strength enabling it to operate in high wind environments. It ensures fast performance providing a consistent 3 day cycle for lift cores and 4 day cycles for perimeter systems. The highlight of the Grocon formwork system is its patented double jump-form technology allowing two floors to be built simultaneously doubling the efficiency. Grocon explains that a “150 storey tower will be built as it were only 75 floors, allowing two floors of the core to be formed and poured at the same time”. They can do so by offering a 6 day cycle for 2 floors per pour or a 3 day cycle for a single floor. This technology cuts by half key operations like steel fixing, form working, concreting and reinforcement splicing. Joints in the concrete and reinforcement are reduced by half providing more strength and robustness for the structure [4].
III. RESEARCH METHODOLOGY
The study intends to investigate the possibility of implementing new formwork systems uncommon to the
Lebanese contracting practice at SAMA Beirut. Thereby, it will determine the effect of implementing Grocon double jump formwork system for the core wall elements paired with the Grocon table formwork system for the surrounding slabs. For the purpose of providing a thorough comparison between current and proposed systems, the research first investigates current formwork systems put to use in SAMA Beirut. The investigation entailed data collection pertaining to SAMA Beirut’s Doka SKE 50 formwork system, labor size and distribution, and the respective structural works schedule from the main contractor on site.
As for the proposed enhanced formwork system, working
mechanisms behind the system were examined in order to extrapolate optimized activity sequencing and durations. Activity durations for formwork independent activities were obtained from actual contractor data logs. Durations for Grocon formwork related activities were extrapolated from the sub tasks pertaining to the formwork’s working mechanism. Activity durations assume the availability of the same labor size and distribution as the one currently available on site. The activities were used to prepare a typical floor module on Primavera P6 scheduling software. The module was then extrapolated and interlinked to reproduce a fully comprehensive schedule for the 52 floors.
The activities were classified in an area based work
breakdown structure. Activities were classified into being either core or floor related. Core activities were further classified into the 26 cycles/jumps needed to finish the core. Floor activities were further divided into each of the 52 floors and two zones within each floor. The final output was used to compare the optimized schedule to the original schedule put to use at SAMA Beirut. As such, the project start milestone for the optimized schedule was chosen as that of the structural works schedule at January 11th, 2011 (date of initiation of ground floor structural works). It is important to note that for the purpose of our analysis, foundation works and basement levels were not considered.
IV. RESULTS AND ANALYSIS
A. Doka SKE 50 Formwork System Site investigation and contractor data revealed the
following about the Doka SKE 50 system. The SKE automatic climbing system is at SAMA Beirut comprised of a 3 level platform:
Level 1: Pouring Platform o Used for reinforcement and concrete placing
work Level 0: Working Platform
o Used for manipulating formwork elements Level -1: Suspended Platform
o Used for manipulating the automatic climber system.

141
Figure 1 and Figure 2 provide representations of the actual SKE 50 automatic climbing system used on SAMA Beirut as well as schematic of the system respectively.
Figure 1 - SKE 50 Automatic Climbing System at SAMA Beirut
Figure 2 - Automatic Climbing System Platforms Schematics Level -1 platform includes all the elements of the hydraulic
climbing system used to lift the three level platform one level at a time. This ring-main system is based on a stationary hydraulic unit which provides uniform and simultaneous drives for the automatic climbers. The number of automatic climbers which can be raised together is dependent on the construction work flow. The platform doesn’t have to be lifted as one entity and as such different sections of the platform can be lifted at different times.
Doka supplied the hydraulic unit to SAMA Beirut’s site
ready for operation. The hydraulic unit comes with cooling and heating systems and is controlled by an operator using a remote controller. The hydraulic system creates pressure which is delivered to the hydraulic cylinders through a series of tubes. These cylinders rise lifting the platforms to the next level. The platforms move along a rail system attached to the core wall system. Before the platforms can “climb” to the next level, the railway system has to “climb” to the new level through the use of the hydraulic system. Once the railway has been installed on the newly poured concrete wall, the safety pin is removed and
the platform moves along the railway and rises to the next level. Level 0 platform includes the elements of the formwork system. The shutters of the formwork system can be moved back and forth by sliding on horizontal rails anchored to the ground of the level 0 platform. The shutters are moved manually through rotating a travelling unit clockwise or anticlockwise depending on the desired direction of movement. The upper platform (level 1) is used for reinforcement and concrete placing works. The workers standing on this platform lower the steel bars and the workers standing on level 0 platform receive them and fix them in place. When it comes to concrete pouring, a boom is used and concrete is delivered from level 1 platform to the bottom of level 0.
With the Doka SKE 50 system paired with the Dokaflex table formwork system for the surrounding floors, the contractor speculates a total duration of about 18 months spanning from January 11, 2012 to July 13, 2013 for completion of structural works of the 52 floors. B. Grocon Double Jump System
Investigations pertained to the innovative Grocon system revealed the following. The 4 level platform system allows two levels of the core to be formed and poured simultaneously and up to 25 levels ahead of the floor construction. Since the core is constructed ahead of the floors, the lift motor room can be installed early on in the project. The lifts can be used as material hoists reducing the dependence on cranes. The work area is enclosed by cladding which provides a safe work environment protecting workers from external weather conditions. From the outside there appears to be no sign of construction as there are no external builders, lifts or scaffolds. The formwork and platform system and rams are attached to overhead truss assemblies so that with each lift the whole system rises simultaneously. The system is supported on columns and walls which have been previously concreted and as such the system pushes itself from walls and columns which have already been cast [4].
As for the working mechanisms of the system, the following
steps must be abided by [2]:
1. Adjustment and plumbing of the internal shutters. 2. Install required Steel Reinforcement. 3. External shutters are rolled into position. 4. System is braced and locked and is ready for pouring. 5. Super strength concrete is poured. 6. Wait for concrete to harden. 7. Form shutters are stripped and rolled back (after 1
day). 8. Clean formwork and platforms. 9. Long heavy duty hydraulic rams are used to raise the
system from jacking beams keyed in pre molded pockets cast into the walls.
10. Shear key feet on upper beams retract.

142
11. System is raised on the hydraulic rams to the next working area which is 2 floors above (taken an hour).
12. When Shear key beams reach the higher level, the key slides into the newly formed pockets in the concrete wall.
13. The hydraulic rams then retract to raise the jacking beams into their new position.
14. Repeat for next climbing phase.
As such, two floors of the core structure can be built at once.
This has the potential of reducing the number of core construction cycles at SAMA Beirut by a factor of two (from 52 cycles to 26 cycles); thereby providing considerable cost and time reductions. The trailing work platform allows internal lifts to be installed on the same cycle of core wall construction allowing the lift to provide access to the top deck. On the other hand, SAMA Beirut currently has an external lift which reaches the level just before the multi stage platform (3 levels below). The Grocon system provides better access with a safer lift enclosed from the elements. Moreover, it allows faster vertical, lateral and horizontal adjustments to the formwork interfaces.
The list of structural work activities were derived as provided
in Table 1 after examining the sub tasks entailed in a typical two floor jump system and given the current labor distribution on site presented in Table 2.
Table 1 - Structural Activities Distribution
ID
Area Activity Name
Duration (days)
Predecessors
Altered D
uration
A
Core
Reinforcement for Vertical Element "Core Wall" 3 - - B Embedded MEP Services "Core Wall" 2 FF A - C Formwork for Vertical Element "Core Wall" 1 FF A, FF B - D Concrete Casting "Core Wall" 1 FS C - E
Floor Zone 1 F/R/C to Vertical Elements Columns & Walls 3 - 2
F Embedded MEP Services for Columns & Walls 3 SS E 2 G Formwork for Slab and Beams 2 SS(2) E 1 H Reinforcement and Post Tension Strands for Slab
and Beams 3 SS(1) G 2
I Embedded MEP Services in Slab 3 SS H 2 J Concrete Casting for Slab and Beams 1 FS H, FS I 1 K Pulling PT Strands in Slab 2 FS(5) J 2 L Strike Shutter to Slab 3 FS K 2 M
Floor Zone 2
F/R/C to Vertical Elements Columns & Walls 3 SS(1) E 2 N Embedded MEP Services for Columns & Walls 3 SS M 2 O Formwork for slab and beams tower 2 SS(2) M 1 P Reinforcement and Post Tension Strands for Slab
and Beams 3 SS(1) O 2
Q Embedded MEP Services in Slab 3 SS P 2 R Concrete Casting for Slab and Beams 1 FS P, FS Q 1 S Pulling PT Strands in Slab 2 FS(5) R 2 T Strike Shutter to Slab 3 FS S 2
Table 2 - Labor distribution at SAMA Beirut Area Nature of Work Work force Core Steel Works 25
Carpentry 18 MEP 5
Floor Steel Works 20 Carpentry 10
MEP 6
C. Primavera P6 Simulation for Optimized Formwork System
The determined structural work activities, their relative
durations, and relationships for the newly proposed system were inputted into Primavera P6 scheduling software. Running the model, the structural part of the project will have a total duration of 456 calendar days which is 93 days less than that of the original schedule (549 calendar days).
Furthermore, it was found that the construction rate of the core will have a faster rate than that of the floors. The results of the durations and milestones for each of the core and floors are revealed in Table 3. A 248 calendar day difference is clearly shown between the end date of the core and that of the last floor. In other words, the core will reach the 52nd level (the last) while the slab is still at the 24th level.
Table 3 - Durations and Milestone Dates for Core and Floor Construction
Using Double Jump Formwork System
Area Start Date End Date Total Duration (Calendar Days) Core 11-Jan-12 6-Aug-12 208 Floor 31-Jan-12 11-Apr-13 436 Total 11-Jan-12 11-Apr-13 456
This, in turn, allows for two alternatives upon the
completion of the core; either dismiss the laborers working on the core element and consequently save money or reallocate the labor from the core area to that of floor and have a higher floor production rate. If the second option is chosen, reallocating the steel, carpentry and MEP workers from the core to the floor zone would mean at least doubling their number (Table 2). Based on the contractor’s feedback, such a labor distribution will allow for minimizing the durations of the activities by a maximum of 50%. The detailed updated durations with reductions are listed in the “altered durations” column in Table 1.
As such, by adjusting the activity durations and the
relative activity relationships for floors 24 to 52, a new schedule was modeled using Primavera P6. The results, tabulate in Table 4, show that the structural part of the project can be executed in 390 calendar days which is 159 days less than that of the original schedule and 66 days less than that proposed in this paper without reallocation (labor dismissal).
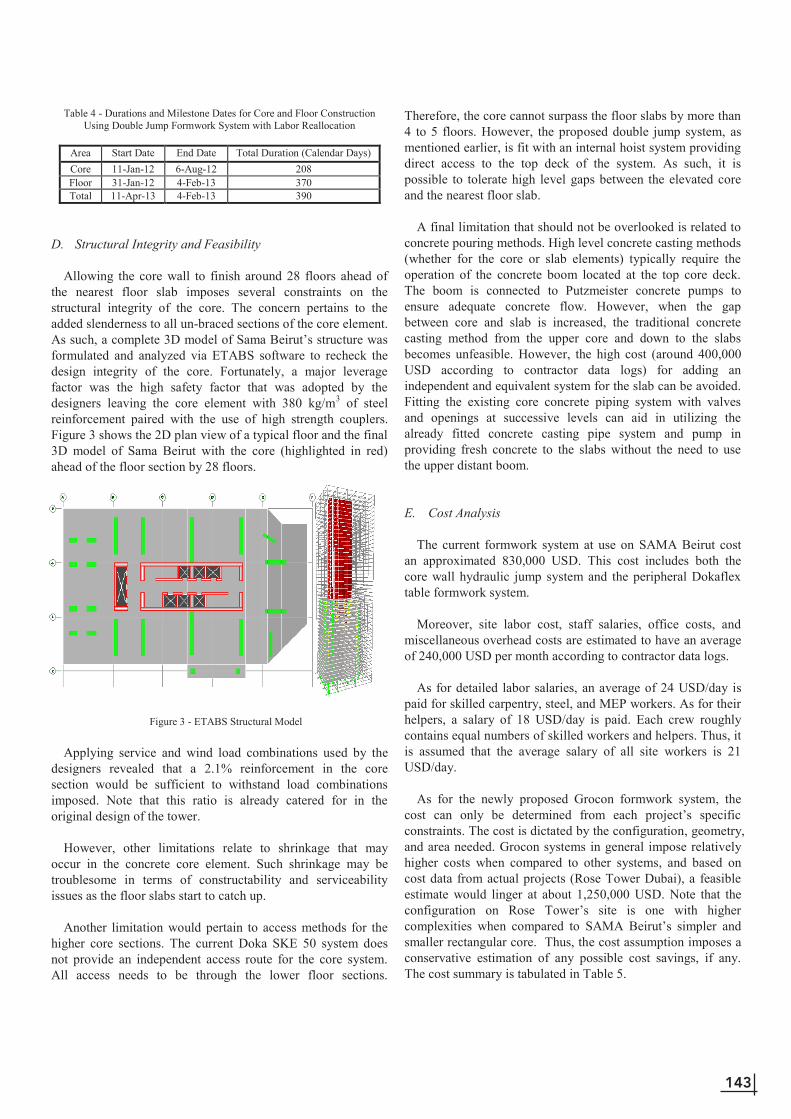
143
Table 4 - Durations and Milestone Dates for Core and Floor Construction Using Double Jump Formwork System with Labor Reallocation
Area Start Date End Date Total Duration (Calendar Days) Core 11-Jan-12 6-Aug-12 208 Floor 31-Jan-12 4-Feb-13 370 Total 11-Apr-13 4-Feb-13 390
D. Structural Integrity and Feasibility Allowing the core wall to finish around 28 floors ahead of
the nearest floor slab imposes several constraints on the structural integrity of the core. The concern pertains to the added slenderness to all un-braced sections of the core element. As such, a complete 3D model of Sama Beirut’s structure was formulated and analyzed via ETABS software to recheck the design integrity of the core. Fortunately, a major leverage factor was the high safety factor that was adopted by the designers leaving the core element with 380 kg/m3 of steel reinforcement paired with the use of high strength couplers. Figure 3 shows the 2D plan view of a typical floor and the final 3D model of Sama Beirut with the core (highlighted in red) ahead of the floor section by 28 floors.
Figure 3 - ETABS Structural Model
Applying service and wind load combinations used by the
designers revealed that a 2.1% reinforcement in the core section would be sufficient to withstand load combinations imposed. Note that this ratio is already catered for in the original design of the tower.
However, other limitations relate to shrinkage that may
occur in the concrete core element. Such shrinkage may be troublesome in terms of constructability and serviceability issues as the floor slabs start to catch up.
Another limitation would pertain to access methods for the
higher core sections. The current Doka SKE 50 system does not provide an independent access route for the core system. All access needs to be through the lower floor sections.
Therefore, the core cannot surpass the floor slabs by more than 4 to 5 floors. However, the proposed double jump system, as mentioned earlier, is fit with an internal hoist system providing direct access to the top deck of the system. As such, it is possible to tolerate high level gaps between the elevated core and the nearest floor slab.
A final limitation that should not be overlooked is related to
concrete pouring methods. High level concrete casting methods (whether for the core or slab elements) typically require the operation of the concrete boom located at the top core deck. The boom is connected to Putzmeister concrete pumps to ensure adequate concrete flow. However, when the gap between core and slab is increased, the traditional concrete casting method from the upper core and down to the slabs becomes unfeasible. However, the high cost (around 400,000 USD according to contractor data logs) for adding an independent and equivalent system for the slab can be avoided. Fitting the existing core concrete piping system with valves and openings at successive levels can aid in utilizing the already fitted concrete casting pipe system and pump in providing fresh concrete to the slabs without the need to use the upper distant boom.
E. Cost Analysis The current formwork system at use on SAMA Beirut cost
an approximated 830,000 USD. This cost includes both the core wall hydraulic jump system and the peripheral Dokaflex table formwork system.
Moreover, site labor cost, staff salaries, office costs, and
miscellaneous overhead costs are estimated to have an average of 240,000 USD per month according to contractor data logs.
As for detailed labor salaries, an average of 24 USD/day is
paid for skilled carpentry, steel, and MEP workers. As for their helpers, a salary of 18 USD/day is paid. Each crew roughly contains equal numbers of skilled workers and helpers. Thus, it is assumed that the average salary of all site workers is 21 USD/day.
As for the newly proposed Grocon formwork system, the
cost can only be determined from each project’s specific constraints. The cost is dictated by the configuration, geometry, and area needed. Grocon systems in general impose relatively higher costs when compared to other systems, and based on cost data from actual projects (Rose Tower Dubai), a feasible estimate would linger at about 1,250,000 USD. Note that the configuration on Rose Tower’s site is one with higher complexities when compared to SAMA Beirut’s simpler and smaller rectangular core. Thus, the cost assumption imposes a conservative estimation of any possible cost savings, if any. The cost summary is tabulated in Table 5.

144
Table 5 - Cost Summary
Labor/Item Cost
Carpenter 21 USD/day Steel Fixer 21 USD/day MEP Laborer 21 USD/day Doka SKE 50 + Dokaflex 830,000 USD Grocon Double Jump System 1,250,000 USD Miscellaneous Staff and Overhead Costs 240,000 USD/month
Proceeding with the first option of dismissing core labor
force upon completion of the core structure, the 93 day (3 months) time reduction translates into a cost reduction of 720,000 USD. In addition, labor dismissal after core wall completion translates into a 249,984 USD cost reduction (48 workers with a daily salary 21 USD/worker dismissed for a period of 248 days). Thus, a total cost reduction of 969,984 USD is achieved when compared the scheme currently utilized. As such, the cost reduction can finance the additional 420,000 USD needed to purchase the Grocon system while maintaining a total project cost saving of 549,984 USD and a total project time reduction of 93 days.
Proceeding with the second option entailing resource
reallocation from core wall to the floor sections, the increased 159 day reduction translates into a cost reduction of 1,272,000 USD. As such, the cost reduction can finance the additional 420,000 USD needed to purchase the Grocon system while maintaining a total project saving of 852,000 USD and a total project time reduction of 159 days. Summary of results in terms of time and cost is tabulated in Table 6.
Table 6 - Summary of Results in Terms of Time and Cost
Option Time Reduction Cost Reduction
Grocon + Labor Dismissal 16.9 % 549,984 USD Grocon + Labor Reallocation 29.0 % 852,000 USD
V. CONCLUSION AND RECOMMENDATIONS
It is obvious that the double jump system can have considerable effects on reducing the total duration of the project. In case the core wall workers are dismissed upon completion of the core, a 16.9% time reduction can be achieved. However, if those workers were reallocated to the slab area, a higher time reduction of 29% will be achieved. Both options showed that the consequent cost savings from such time reductions can finance the additional costs needed for the purchase of the double jump formwork system. The labor reallocation option, however, had higher total cost reductions than that of the dismissal option. Accordingly, its recommended to use the double jump formwork system with labor reallocation as it shows both higher time and cost reductions when compared to the single jump system or to the double jump system with labor dismissal.
Having a stand-alone core of 28 floors ahead of 24 slabs
showed to be structurally stable, serviceable, and safe. This, in turn, acknowledges the recommendation mentioned earlier and substantiates its feasibility.
Conversely, there are some limitations that cannot be
disregarded. The operation of the Grocon system may require skilled and trained labor not readily available in the Lebanese contracting practice. This may prove to be a setback in abiding by the simulated P6 schedule that assumes the availability of such a labor force. Another limitation is present in terms of calculating the exact cost of the Grocon system. However, we can safely assume that the cost savings from the significant time reductions may easily finance Grocon’s double jump and table form systems in favor of the less efficient and expensive Doka SKE 50 system.
ACKNOWLEDGMENT
The realization of this report would not have been possible without the guidance of our advisor Dr. Farook Hamzeh who devoted his time and expertise to ensure that the completion of this research is thorough. We would also like to give a special thanks to the construction team at SAMA Beirut for providing us with information related to our project.
REFERENCES [1] Doka' tall order. Building And Construction (2006).,434(6582), 30-31.
Retrieved from: http://search.proquest.com/docview/223640466?accountid=8555
[2] Grocon. Construction Systems [Brochure].(n.d).N.P.:n.p. [3] Gwang-Hee, K., SungHoon, A., Hun-Hee , C., & Deok-Seok , S. (2005).
Improved productivity using a modified table formwork system for high-rise building in korea. Building and Environment,40(11), 1472-1478. Retrieved from: http://www.sciencedirect.com/science/article/pii/S0360132304003397
[4] Grocon. Construction Systems [Brochure].(n.d).N.P.:n.p. [5] Kopczynski, C. (2008). Formwork efficiencies. Concrete International,
41-43. Retrieved from: http://search.proquest.com/docview/198706777?accountid=8555.
[6] Peurifoy, R. & Oberlender, G. (2011). Formwork for concrete structures. New York: McGraw-Hill, 280-282
[7] Seers , R. (2005). Doka rises to the challenge of leeds' tallest tower. Engineering--Civil Engineering, Building And Construction, 39(5), 14-16. Retrieved from: http://search.proquest.com/docview/204115399?accountid=8555

145
Harvesting Wave Energy
Rania Assaf, Anwar El Chami, Firas Haidar, Emmanuel Maalouf, Camille Salem
Faculty of Engineering and Architecture Department of Civil and Environmental Engineering
American University of Beirut Beirut, Lebanon.
Emails: [email protected], [email protected], [email protected], [email protected], [email protected]
Abstract – Wind generated waves have been identified as an
extremely abundant and promising source of energy. Substantial opportunities exist in extracting wave energy, namely that of converting the mechanical motion of waves into electrical energy. This area of study has the potential of contributing to global energy needs. On a more local scale, we believe this study would be beneficial to Lebanon, where the energy shortage has become an alarming reality. By investing in more sustainable and renewable energy, such as wave energy, Lebanon would be able to solve this crisis while developing a more diverse national energy plan. This paper presents the fundamentals of wave energy and wave theory, and introduces the research that is being conducted at the American University of Beirut. The purpose of our project is to manufacture a pump mechanism prototype that harnesses forces of buoyancy and gravity to convert the waves’ kinetic energy into a potential water head. A hydroelectric pump will in turn use this potential energy to generate enough power to light up a 40-Watt light bulb. The success of our endeavor would serve as a testament that our technology has the capacity to expand into a nation-wide energy solution. Our study also intends to serve as a stepping-stone into wave energy for the Lebanese community, in particular engineers and scientists with interest in renewable energy.
I. INTRODUCTION
According to EDL (Electricité Du Liban), which supplies over 90 % of Lebanon’s electricity consumption, the shortage of electricity in Lebanon is increasing and is affecting a lot of houses. On average, the Beirut region suffers from 3 hours of daily electricity shortage whereas other regions in the outer Beirut area suffer from up to 10 hours of shortage a day. This alarming shortage of energy reaches 18 hours in isolated mountainous areas. The main reason behind this electricity shortage we experience in Lebanon is the low capacity and high inefficiency of generators, which were designed to serve a lower population size back then [1].
This suggests that the energy challenges faced in Lebanon need to be followed by a diversification of the national energy resource plan. Shifting to effective, clean and renewable energy, such as wave energy, would be beneficial for Lebanon. In fact, when looking into harvesting wave energy, it has been found that waves have considerable advantages over other forms of sustainable energy such as solar and wind energy. The reason is that waves, although seasonal, are present in higher densities and more constantly, enabling energy converters to extract more
power at a smaller scale and lower cost [2]. Indeed, wave energy is a concentrated form of solar and wind energy as it is formed by the heating of the Earth’s surface water, which creates the winds, and it is the wind that produces the waves.
Ocean wave energy converters can be classified into four main categories: oscillating water column, attenuator, overtopping, and point absorber [2]. What is explored in this study is the feasibility of point absorbers as they are smaller in size and consist of a simpler mechanism relying on a single up-and-down motion. Point absorbers are cylindrical devices containing a central column that moves upward and downward with the waves while filling the device with water. The motion is then converted into electricity. More specifically, this study will be based on a certain type of point absorber known as Searaser. The latter is built on a simple design and uses cheap components compared to the vast majority of other wave power devices. [3]
The goal of this project is to manufacture a pump mechanism prototype that harnesses forces of buoyancy and gravity to convert the waves’ kinetic energy into a potential water head. A hydroelectric pump will in turn use this potential energy to generate enough power to light up a 40-Watt light bulb. In order to complete the design of the prototype, data was collected from the Lebanese Republic Ministry of Public Works and Transport (Department of Meteorology), showing characteristics of waves on the Lebanese coast, such as wave height and period, for several years. Based on the wave characteristics obtained, the design of the pump mechanism was completed and the model is in its manufacturing phase.
This paper presents an overview of the wave theories relevant to this study, the different existing wave harvesting methods and the design considerations for the project. Finally, after discussing the different possible designs in the last section of the paper, one alternative is chosen as the optimum design of the pump mechanism prototype.
II. STUDY AREA
The study area of the project is the Tripoli coast. In order to complete the design of the pump mechanism, data was gathered from the Lebanese Republic Ministry of Public Works and Transport, Department of Meteorology, showing characteristics of waves along the Tripoli coast. Unfortunately, following the

146
tragic events of 2006, the data related to the Beirut coast was lost and as a result, the Tripoli coast has been set as the area of study. The data obtained consisted in measurements of the waves’ heights and periods, for several years.
III. METHODS
A. Theoretical framework
A survey of the wave theories is needed in order to be able to describe the design wave and to decide on the depth of placement of the prototype. Waves are classified by wave period T, the time required to travel a distance of one wavelength. The wave that is relevant to our discussion is the gravity wave (i.e. a wave generated in a fluid medium or at the interface between two media like the atmosphere and the ocean) with T that ranges from 5 to 15 seconds since it has the largest amount of energy.
The wave theories that are discussed were developed based on the inviscid flow assumption, assuming that gravity pressure and inertia forces are dominant over viscous forces that only play a significant role at the two boundary layers of the bottom and water surface. Over past centuries, many theories have tried to describe this phenomenon, and have succeeded within acceptable limits. However, complete concurrence between the theoretical results and physical observations is not always found. This is due to the high degree of nonlinearity, three-dimensional characteristics and apparent random behavior of waves, which makes it complex and difficult to describe mathematically [4]
Linear theory is based on the assumption that no energy is lost due to either friction or turbulence. Furthermore, it assumes that the wave height H is much smaller than the wavelength L and water depth d. The governing assumptions of the Linear theory are the two-dimensional and irrotational oscillatory wave in a frictionless and incompressible fluid, bounded by a free surface from the top and an impermeable bed at the bottom. The governing equation would be the Laplace equation, the solution of which is a combination of sin, cos, sinh, cosh that leads to the velocity potential (refer to Fig.1).
Figure 1. Water profile in the linear theory model
Mathematical manipulation of the velocity potential obtained produces the water surface profile η which is a sinusoidal function of value zero at the sea water level (SWL), the horizontal and vertical wave velocities (u and w) and accelerations (ax and az) and other variables such as displacement.
Finite amplitude wave theory can be thought of as an extension of the linear wave theory whereby the wave height is not required to be small. One finite amplitude theory called Stoke’s theory assumes small H/d and finite H/L and is used primarily for steep deep-water waves. Other theories such as the Cnoidal and solitary wave theories assume small H/L and finite H/d and can be used for shallow water waves [4].
Although finite-amplitude theories yield more precise results, linear theory will be used because it is much less tedious to apply as a model compared to finite amplitude theories and enables the application of the superposition principle.
Wave statistics
Knowledge of the wave climate is essential to any coastal related engineering design. Wave climate is acquiring a representative wave height and period at the potential design site based on statistical analysis of historic data.
The wave histogram method was employed by plotting of percentage of occurrence of wave heights that can be modeled by a Rayleigh distribution. This method enables the determination of the significant wave height that will be used in design. In Table I below, Hs is the significant wave height in cm i.e. the average of the highest 1/3 of the waves. H1/p is the average of the highest 1/p of the waves (that is for Hs, p=3, for H1/50, p=50) and H1/50 is the average of highest 1/50 of the waves in cm and so on) and Tavg is the average wave period.
TABLE I Wave Data Analysis
(Department of Meteorology, Lebanon)
Havg (Sec) Hs (Sec) H1/50 (Sec) H1/100 (Sec) Tavg (sec)
62.259 99.3762 155.03 165.96 4.7245
Wave transformation
Three wave transformation phenomena are taken into consideration in this study: Wave shoaling, Wave refraction and Wave reflection. Wave shoaling occurs when the waves approach the shoreline and their interaction with the seabed starts having a significant effect on their wave height and length. Wave refraction occurs to align the approaching waves with the shoreline when the sea bed has a somewhat irregular bathymetry. And finally, when the waves meet a structure wave reflection occurs.
When waves reach the shallow waters head on (i.e. parallel to the shoreline), they interact with the underlying bathymetry -the seabed topography- which can cause significant changes in wave height. The model that will be used to study shoaling assumes

147
that the bottom contours are parallel to the shoreline and that no wave energy loss will occur. The latter assumption implies that the energy flux between two points does not change. Taking one point to be in deep water and another to be at the (near shore) point of interest allows the derivation of an equation that produces a wave shoaling factor ks that, when multiplied with the deep water wave height, provides a prediction of the wave height at the point of interest.
When the general direction of deep water waves is not perpendicular to the bathymetry, the waves “turn” to the direction of the shore. This is due to a speed differential between points along the wave crest as these points will be located at different depths and subsequently have different speeds. The points that are located at larger depths move faster than the rest of the wave. The model used to study this phenomenon is taken from optics; it uses Snell’s law to predict the change in the angle of approach of the wave as it travels towards the shore and yields a wave refraction factor kr that predicts the change in wave height due to refraction at the point of interest [4]. An illustration of these two phenomena is to be found in figure 2 below.
The last transformation, wave reflection, is the reversal of the wave when it hits a barrier. This phenomenon largely depends on the surface and slope of that barrier. By taking the barrier properties into consideration a coefficient of reflection can be calculated [4].
The above discussions on wave transformations implies that the significant wave height (see wave statistics) that will be used for design has to be multiplied by three factors, one for each type of wave transformation that was mentioned.
B. Wave Energy Converters
Existing studies and researches have been conducted over harvesting wave energy from seas, oceans and rivers. Although
having the same function of generating electricity, wave energy devices or converters operate in various forms. There are four general categories of ocean wave energy converters (WEC): oscillating water column (OWC), attenuator, overtopping, and point absorber:
1) Oscillating water column (OWC): An OWC is a large cylindrical shaped concrete structure that has an opening at its bottom while at its closed top there’s a turbine. The moving water at the bottom of the OWC, plays the role of a piston that compresses and decompresses. Air is forced out of the column when wave rises while water fills the lower part of the column. This makes the turbine spin and generate electricity. When wave falls, water retreats and air is rushes back into the column making the turbine spin even more. Examples: Oceanlinx, Wavegen, Ocean Energy.
2) Attenuator: Attenuators are devices that are oriented perpendicular or collinear with the wave front. Attenuators have a serpent shape-like structure. It’s divided into several moving nodes that give the structure flexibility to move along with the wave and other tubes where the energy conversion takes place. The moving nodes, which are often called power modules, are connected to each other via tubes. The basic structure is a repetitive connection of module-tube-module. The conversion happens inside each tube using hydraulic rams, hydraulic motors and electrical generators. Waves cause the modules and tubes to move in relation to each other. This motion is resisted by hydraulic rams that are inside the tubes and that act like pistons. The compressions and decompressions of these rams pump high-pressure oil through the hydraulic motor which in turn drive electrical generators to produce electricity. Examples: Pelamis Wave Power, Wavestar.
3) Overtopping: Overtopping devices are large devices that float on the surface of the water. They are circular in shape, having in the middle a cylinder-like reservoir that is surrounded by inclined ramps. These devices are mainly composed of two parts: curved reflectors and a central reservoir above sea level. Reflectors are inclined ramps that allow the water to overtop and make its way through the reservoir. The central reservoir has a hole in the middle where a turbine is placed. Both reflectors gather seawater into a central receiving part, where they are allowed to flow up a ramp and make it into the raised reservoir. Water is then returned back to the sea via a number of low-head turbines. Examples: Wave Dragon, Wave Plane and WAVEnergy. [5]
4) Point absorber: Point absorbers are circular shaped devices that float on the surface of the water. Their surface area is very small in comparison to the wavelength of ocean waves. The buoy is free to follow the movement of the wave and accept wave energy from any direction. It can be anchored to the seabed so that it is submerged and moved by the pressure of the wave passing overhead, or it can float on the surface and track or ‘heave’ with the movement of the sea surface. Examples:
Figure 2. Shoaling and Refraction

148
Columbia Power Technologies, Ocean Power Technologies, Wavebob, Archimedes Wave Swing, Fred Olsen and Finavera.
C. Design considerations
The design of the pump was undertaken in a backward manner by setting as a goal a 40-watt power output that will be enough to light up a small led light. The concept of the pump mechanism works on buoyancy and gravity forces to pump water in an up-and-down motion through a pipe to a certain height, thus accumulating potential energy. The pump is illustrated in Fig.3. Three basic design mechanisms were considered:
1. Upward Action Piston (2 valves) 2. Downward Action Piston (2 valves) 3. Double Action Piston (4 valves)
For simplicity, it is assumed that there are no losses of the square order of magnitude. The design concept assumes that water is pumped from the under water tank to a storage tank placed at a height h with an inflow Q1 and then dropped with an outflow Q2 from the storage tank into a turbine, which transforms the kinetic energy of water to electric power lighting up the led lamp. The following equation is used to calculate the power produced by the turbine in terms of flow and height of the water.
Pturbine = ηQγh (1) Where Pturbine is the power generated by the turbine in Watts, η the efficiency of the turbine, Q the flow coming into the turbine (m3/s), and h the height of the water above the turbine in (m).
Setting a power output of 40 Watts, a turbine efficiency η and a height h at which the storage tank will be located, we can calculate Q form the above equation. This will give us the value of the required outflow Q2 form the storage tank to the turbine. To eliminate uncertainty, the design will account for a positive storage, which implies that the inflow Q1 from the pump to the storage tank will be greater than the outflow Q2 from the storage tank into the turbine. Therefore, the value of Q1 can be obtained by setting Q2 as a fraction of Q1. On another hand, according to the continuity theorem, the flow of water coming from the under water tank into the storage tank through pipes is constant. Therefore, Q1 can be calculated by the ratio of the tank volume Vtank expressed in m3, to the wave period T expressed in seconds.
Q1 = Vtank/T (2) Since Q1 can be obtained by selecting a value smaller than Q2,
which is calculated from (1) and the period of the waves T was obtained from the data of the Department of Meteorology of Lebanon, the volume of the tank Vtank can therefore be calculated from equation (2). Equations 3 and 4 relate the volume of the cylindrical under water tank with its radius r and the wave height H.
Vtank = A* H (3) A = πr2 (4)
Where A is the area of the cylindrical under water tank which is a function of the radius r, and H is the design wave height or
expected height of accumulation of water in the tank. H is considered to be 50 cm in order to cater for high and low waves through a certain season. Substituting equations 2,3 and 4 in equation 1 yields to:
Pturbine = (ηπr2 Hγh)/T (5)
The below graph is a variation of the volume of the under water tank with respect to the head required by the turbine evaluated at different power outputs. Variation of h and r are evaluated at different values of power P at a specific wave height H and T and γ weight of water.
The next step of the design is to find density and volume of the piston head, which will operate the system by gravity when the wave drops and by buoyancy when the wave rises. When the wave hits the pump with a period T, the piston operates in two phases, which are the upward and downward motion of the piston. During the two phases, the forces acting on the piston are the downward force Fdown, which pushes the piston downward, and Fbuoyancy, which pushes the piston upwards. One should note that these forces remain equal, maintaining the piston in equilibrium, while it is the wave that drives the piston up-and-down when it hits the under water tank. The above implies the following:
Fdown = Fbuoyancy (6)
Input Design Parameters Design wave height 50 cm Design wave period 4 sec Efficiency 40 %
Figure 4. Variation of the head required by the turbine for different power outputs with respect to the radius of the water tank
Gravity: Water level drops and piston head drops due to gravity
Buoyancy: Water covers the piston head and causes the piston to rise.
Figure 3. Pump Mechanism Schematic

149
IV. RESULTS AND DISCUSSION
After mastering the complex wave theories and design involved in this study, three different but familiar design concepts were attained. A comparison of the three was conducted in order to finally choose one design alternative to adopt for the manufacturing of the wave energy converter model.
TABLE II Design Alternatives
Key FB: Buoyant force of water (N) WPIS: Weight of piston in Newton (N) FW: Weight of water (N)
Upward Action Piston 2 Valves
!
Phase 1 (Left Sketch) Water Pull: The departing wave drops the level of the water to a certain level of the piston head and as a result of the downward force a negative pressure is created pulling the water into the storage tank.
Phase 2 (Right Sketch) Water Push: The approaching wave lifts the piston head up creating enough buoyancy to counteract the weight of the water and the weight of the piston and a result pushing the water into the storage tank.
Downward Action Piston 2 Valves
!
Phase 1 (Left Sketch) Water Pull: The approaching wave lifts the piston head due to buoyancy creating a negative pressure in the underwater tank allowing the water to enter to the tank through the one way valve.
Phase 2 (Right Sketch) Water Push: The departing wave drops the level of the water to a certain level of the piston head creating enough weight to counteract the weight of the water and as a result push the water into the storage tank.
Double Action Piston 4 Valves
!
Phase 1 (Left Sketch) Piston Ascent: The approaching wave lifts the piston head to a certain level creating enough buoyancy aided by the hydrostatic pressure exerted by water being pulled into the tank to counteract the weight of the water above and the weight of the piston and as a result pushes the water into the storage tank.
Phase 2 (Right Sketch) Water Push: The departing wave drops the level of the water to a certain level of the piston head and as a result of the downward force; a negative energy is created in the upper part of the tank pulling the water into the storage tank and increasing the downward force. In the same time the downward force counteracts the weight of the water in the bottom part of the tank and pushes the water upwards into the storage tank.
The third design alternative was chosen for prototyping because of its efficiency in pumping more water in the same time period. In order to illustrate the concept of efficiency in the three designs, a fixed volume V was assumed for all three design mechanisms. For the first two designs, the pump is filling a volume V in a half wave period T/2, and is then pumping out all the volume V in the subsequent half-period. This implies that during a wave period T, the first two designs effectively pump a volume V, whereas the third design pumps a volume of 2V. Table III and Table IV below present the volume of water pumped during each half-wave period for the three design alternatives.
TABLE III
Volume pumped in a half-period interval for designs1&2
Time Period Volume Pumped
T/2 0
T/2 V
TABLE IV
Volume pumped in a half-period interval for design 3
Time Period Volume Pumped
T/2 V
T/2 V
This implies that the effective flow Q1&2= (V)/T for the first two designs. On the other hand, the third design pumps a volume V in each half a period T/2. This implies double the flow Q3= 2V/T=2Q1&2.
Since the majority of wave heights received are relatively small, then any losses due to buoyancy or gravity can have a major effect on the pump mechanism decreasing its efficiency in harvesting waves and as such design number 3 which is the 4 valve double action piston has a minimal wave height loss due to buoyancy and gravity.
CONCLUSION
This paper presents a broad overview of wave energy theories and existing technologies, and introduces the research being conducted at the American University of Beirut. The design of the model has been completed; dimensions of the tank and weight of the piston are calculated for different power outputs, depending on the scale desired for manufacturing. Currently, the model is being manufactured on a small scale and testing will take place subsequently. However, limitations are faced with regards to the material used in the manufacturing, the capacity of the model to withstand sea waves and the costs of implementation of the project. These limitations are related to the research and could therefore be solved by testing of the model. In

150
conclusion, wave energy is abundant along the Lebanese coast and can play an important role in the diversification of the national energy plan and even more in establishing independence in green energy in Lebanon. The study of wave energy along the Lebanese coast has been encouraging so far and the project is currently under development for future implementation.
ACKNOWLEDGMENT
The authors of this paper would like to gratefully acknowledge the strong collaborative support and guidance of our advisor Dr. Majdi Abou Najm.
REFERENCES [1] EDL, E. d. (2012). http://www.edl.gov.lb. [2] Brekken, T. K., Jouanne, A. v., & Han, H. Y. Ocean Wave Energy Overview
and Research at Oregon State (U.S. Army Corps of Engineers, 2002) University. Oregon State University, School of Electrical Engineering and Computer Science
[3] Smith, A. (2007). Patent No. GB 2445951. UK [4] U.S. Army Corps of Engineers. (2002). Engineer Manual 1110-2-1100,
Coastal Engineering Manual. In Part II, Hydrodynamics. U.S. Army Corps of Engineers, Washington, DC.
[5] Bevilacqua, G., & Zanuttigh, B. Overtopping Wave Energy Converters: general aspects and stage of development. Università di Bologna.

151
Providing Existing Buildings with Additional Basements for Parking
The case of lot 1687
Abdullah A. Beydoun, Edrees N. Elrachidi, Khaled B. Karout, Hani F. Taha and Rayane K. Zahreddine Department of Civil and Environmental Engineering
American University of Beirut P.O. Box 11-0236, Riad El-Solh, Beirut 1107 2020, Lebanon
[email protected], [email protected], [email protected], [email protected] and [email protected]
Abstract- Beirut’s old residential buildings typically lack park-
ing facilities and leave it for their inhabitants to cope with the city’s parking crisis. This paper proposes increasing the parking supply for such buildings by providing them with one or more additional basements for parking. This comprises underpinning an existing structure by installing micropiles in its existing foun-dations, excavating space for new basements with proper shoring techniques to reach a new foundation level, create a new founda-tion system and construct the basement to serve as parking. This paper examines the safe implementation of the proposed solution on an example residential building (lot 1687). The solution’s feasibility and scalability are assessed from the economical, ge-otechnical and structural aspects together with its construction and impact assessment. The paper studies whether or not this uncommon project can be a feasible solution for parking deficit in congested residential areas, and a benefit for the community.
I. INTRODUCTION AND METHODOLOGY
Renown for its congested streets and high car ownership rate, Beirut is facing a parking crisis due to a high parking demand being met with a shy parking supply. Much of the available parking lots are turning into residential and commer-cial projects, aggravating the problem. This paper studies the technical and financial feasibilities of using micropiles to pro-vide existing buildings with basements for parking, a much-needed solution for a country whose urban environment is facing a parking crisis that would escalate in the near future.
To delve into this project, information from the literature and international case studies was consulted. Local contrac-tors who have successfully undertaken this approach were also contacted. The paper is centered on the case study of lot 1687, a residential building situated in the congested Hamra district, where the need and the desire for additional parking supply are present based on parking studies and surveys, respectively. The underpinning (structural support) and shoring schemes were designed based on data from building plans and subsur-face investigations. The parking facility itself was then de-signed. The construction and impact assessment of this case were studied to test the feasibility and scalability of this pro-ject and its potential to solve the parking crisis in Beirut.
II. MICROPILES BACKGROUND
Structural underpinning (i.e. supporting buildings) in urban environments often employs micropiles. These are small-
diameter – usually less than 30 centimeters – grouted piles [1] that transfer loads to deeper levels. Because of the availability of special micropile-drilling and excavation equipment for low headroom and access-restrictive conditions, micropiles are a solid option for the scope of this project. In addition, they can be installed in difficult, variable or unpredictable geologic conditions for all types of subsurface conditions. Furthermore, their installation causes minimal noise and vibrations, posing no damage to neighboring structures. Micropiles are used when projects have no alternatives due to physical, geological and environmental factors, making them cost-effective [1]. For the scope of the proposed project, although underpinning is devised for an uncommon purpose – supporting the building while excavating below it – the above conditions favor using micropiles. Local design and contracting firms who have suc-cessfully undergone such projects confirmed this.
III. CASE STUDY DESCRIPTION
Lot 1687, shown in Figure 1, is located near the American University of Beirut Medical Center in the Hamra district. It consists of a 554-square meter piece of land within which lies a 230-square meter building. Bound to the North by Souraty Street, the lot is bordered by three buildings (lot 2165 to the West, lot 2168 to the South and lot 149 to the South-East) and an open land (lot 144 to the East). The building in lot 1687 is an old, unoccupied residential four-story building with a front garden. Each of its floors serves as one apartment.
Figure 1. Lot 1687 on Souraty Street in Hamra.

152
Lot 1687 displays both need and desire for the project, mak-ing it suitable for a case study representing the Hamra district. The latter suffers from a parking deficit that reaches an esti-mated 886 spaces at midday (between 11 a.m. and 3 p.m.) [2]. In particular, the lot corresponds to a traffic analysis zone with a parking deficit of 109 spaces at midday (between 11 a.m. and 3 p.m.) and 209 spaces in the evening (between 6 p.m. and 8 p.m.) [2]. The higher demand in the evening comes mostly from residents who have commuted back home from work, which justifies providing parking spaces primarily for building residents. In addition, surveys conducted in the area showed that residents suffer from parking problems and are responsive to the idea of providing their buildings with basements for parking [3]. Out of the 17 residents interviewed in Hamra, 82% said that they always have difficulties finding a parking spot. In addition, 47% are willing to undergo this project, while 30% have reservations about it due to safety concerns.
IV. RESULTS AND FINDINGS
Lot 1687’s micropile, shoring, foundations and parking de-sign were carried out as to illustrate the proposed solution and to study its construction process, feasibility and scalability.
A. Geotechnical Site Investigation For the design to be safe and accurate, a robust geotechnical
investigation (soil and rock, water and site properties) is re-quired at the start. According to the geological map of Beirut, the building lies on quaternary deposits and displays no signs of folds or faults. Since the selected case study is an old build-ing, acquiring specific data regarding subsurface conditions was difficult. However, due to its proximity to lot 1973, which is under development, it was assumed that both sites have sim-ilar geotechnical properties. The soil report for lot 1973 by OESC was obtained and its subsurface profile, soil and rock properties and water table elevation were used in the design process. The soil profile consists of a 4.5 meter-deep layer of heterogeneous fill (described as brown clayey sand and brown sandy to slightly calcareous clay with cobbles of limestone) followed by a 16 meter-deep layer of limestone (described as moderately strong light to brownish grey very closely frac-tured limestone interbedded with thick layers of marl) and a 9 meter-deep layer of marl (described as friable white marl with cobbles of limestone) [4]. Table I resumes the soil and rock properties of the site [4]. The water table was established at an elevation of about 19 meters above mean sea level [4], or approximately 30 meters below the ground level at lot 1687.
B. Structural Layout In addition to a professional subsurface investigation, a
good structural assessment of the building is crucial to the project as both are the basis of a sound micropile design. Since the building is old, its maps and drawings were not available. Therefore, a structural survey of the building was necessary. As a result, the building dimensions were measured and the column layout was determined. However, not all structural data could be measured, and to be able to proceed with the
project, some dimensions had to be based on assumptions. For example, the survey showed that the structure’s frame consisted of columns and load bearing walls, as was the prac-tice at the time of construction of the building. However, it was assumed that the building frame consisted of a one-way slab supported by beams and columns. In fact, this would be the most common structural system for buildings that would undergo this project. Using AutoCAD, a floor plan was drawn and some column and beam locations were assumed and their dimensions were designed, with the input and confirmation of structural engineering professor, Dr. Mohammad Harajli. The solid slab thickness was assumed to be 25 centimeters and the clear height was measured as 4.6 meters. After importing the drawing into ETABS, the structure was analyzed and the as-sumed dimensions were adjusted to satisfy design considera-tions. The structure contained 21 columns of varying sections (from circular 30 centimeter-diameter columns to square 30 centimeter-wide columns to a rectangular 30 centimeter-wide by 80 centimeter-long column). The following assumptions were used in the analysis: a concrete compressive strength of 21 MPa, a residential live load of 0.4 T/m2 and a superim-posed dead load of 0.3 T/m2. Load factors of 1.4 and 1.7 were used for the dead load and the live load, respectively.
C. Foundation Design For the foundation design, columns were assumed to be ax-
ially loaded and a factor of safety of 3 was taken. Design of existing foundations: The survey showed that
one-meter deep footings were placed on the ground level, with the possibility of tie beams between them. It was however assumed that the foundation system of the building consisted of single footings embedded one meter below the ground, as this would be the case with most acceptable old buildings that require this project in Beirut. The isolated footings in the fill layer were accordingly designed using the general bearing capacity equation with Meyerhof’s bearing capacity, shape and depth factors and checked for punching shear. With ser-vice column loads ranging from 26 to 200 Tons, the dimen-sions ranged from square 1.2 meters-wide footings to rectan-gular 1.8 meters-wide by 3.7 meters-long.
Design of new foundations: It was decided that two base-ments would make the project more feasible as they would increase the number of parking spots thus reducing the con-struction costs per spot. Therefore, two basements with a 539-
TABLE I SOIL AND ROCK PROPERTIES
Layer Unit weight (kN/m3)
Cohesion (kPa)
Angle of internal friction (°)
Unconfined Compressive Strength (MPa)
Rock Qual-ity Desig-nation (%)
Fill 18 10 30 - - Limestone 23 70 40 7.3 0
Marl 20 - 30 - 9 Obtained from OESC soil report for lot 1973

153
square meter area and 3-meter clear heights were added to the ETABS model shown in Figure 2 to represent the parking and to evaluate the new structure’s loads. The area of these base-ments is larger than that of the building’s footprint, which is possible because of the presence of the garden. The basement live load was taken as 0.25 T/m2, with no superimposed dead load, which is typical for parking structures. Some columns had to be adjusted and their sections were increased in the basements. To support the basement edges, 25 centimeter-wide bearing walls were designed all around the site boundary. As for the columns, new footings were designed to be embed-ded one meter in the limestone layer, for general shear failure. As the limestone layer is closely fractured, it cannot provide resistance to shear failure and so its cohesion was neglected.
Based on lot 1973’s soil report recommendation, the limit-ing bearing capacity was 265 kPa for square footings and 239 kPa for rectangular ones [4]. With service column loads rang-ing from 35 to 266 Tons, the newly designed one meter-thick footings ranged from square 1.25 meters-wide footings to rec-tangular 2.9 meters-wide by 3.8 meters-long. However, based on contractor recommendations, a one meter-thick raft solu-tion was chosen, as it would require simpler steel detailing and less execution time, taking into consideration the difficult site environment. The raft would also limit differential settlement.
D. Shoring Design Installing piles for shoring utilizing conventional methods
in the scope of this project is not possible due to lack of space. Therefore, micropiles can replace piles for the shoring of the excavation, especially since all the specialized equipment will already be mobilized, thus making the project more feasible. As lot 2165 (located West of lot 1687) has six basements, it is assumed that shoring on the West side of the lot need not be implemented. Knowing that an excavation of 6.5 meters is planned, a shoring scheme is needed for the remaining sides of lot 1687. Based on an analysis on Wallap, a soldier pile sys-tem consisting of 25 centimeter-micropiles spaced at 0.75 me-ters center-to-center and embedded 8.5 meters in the ground is suggested. The micropiles diameter is 25 centimeters, as this is readily available on the market. A row of anchors spaced at 2.25 meters and penetrating 10 meters at 30° is also needed at
a depth of 2 meters. A shotcrete layer spread homogeneously on the excavated surrounding, serves as a skin for the loose soil. A steel mesh is placed before the shotcreting process.
E. Micropiles Design The micropile design was based on guidelines by the Feder-
al Highway Administration and on consultations with design experts and contractors in the field. Depending on the loads and soil properties, it will ultimately determine all of the num-ber, location, steel reinforcement and penetrating depth of the micropiles. A design-build approach is always recommended for this project, since experienced specialty contractors are needed to optimize the system [1].
The engineering behavior of micropiles is governed by a structural component and a geotechnical one. The geotech-nical load capacity of the micropile: The whole design back-ground is based on the fact that skin friction in the grout-to-ground interface will solely determine the load capacity; the end bearing contribution is not even taken into consideration. This is so because of the high grout-to-ground bond capacities that can be attained, the fact that the area available for skin friction is considerably larger than that available for end bear-ing and because the micropile movement needed to mobilize frictional resistance is significantly less than that needed to mobilize end bearing. The structural load capacity and stiff-ness of the micropile: It depends mainly on the reinforcement ratio, dimensions and materials of the pile section [1].
A typical micropile consists of steel reinforcement and ce-ment grout with a water/cement ratio of 0.45 and a minimum compressive strength of f’c,grout=30 MPa [1]. The use of pres-sure grouting in micropile construction compacts the soil around the micropile, increasing the grout-to-ground bond capacity. However, since this benefit does not occur in rocky profiles like the one in lot 1687, Type A micropiles, which entail gravity grouting, shall be used. It was decided that 25-centimeter diameter micropiles would be used in this project, as typical equipment used for the underpinning process in low headroom conditions (4.6 meters in lot 1687, and lower in other buildings) executes micropiles this size. The micropiles shall be cased in their upper 4.5 meters (fill) and uncased elsewhere since the subsurface properties (limestone) do not need casing support. A factor of safety of F.S.=2.5 shall be used in the design, as recommended for non-seismic load groups (the underpinning system is a temporary one and needs not be designed for seismic loads) [1].
Geotechnical design: The Service Load Design (SLD) method was used to determine the bond length of the micro-piles, which is the length of the portion of micropiles that will be embedded in the limestone after excavations are done. The grout-to-ground bond nominal strength that will be used is α=500 kPa for the closely fractured limestone [1]. This value should only be used for preliminary micropile design. An ex-perienced contractor should do the final design since the grout-to-ground bond values are substantially influenced by the ground type, the grouting technique and the drilling meth-od [1]. Using (1), and assigning 4 or 6 micropiles to carry each
Figure 2. ETABS Model of the building with two basements for parking.

154
existing footing, the bonded length of micropiles was found to be 3 meters. However, a 4 meter-deep bond length shall be executed for safety considerations.
Pallowable = (απDmicropileLmicropile) ⁄ (F.S.) (1) The total micropile length is the sum of the excavation
depth (6.5 meters) and the bond length of the micropiles (4 meters), which yields 10.5 meters.
Structural design: The Load Factor Design (LFD) method was used to check the ultimate capacity of each micropile, using (2).
Pultimate = 0.75 [0.85f’c,groutAgrout + fyAsteel] (2) It should be noted that to be safe and conservative, the con-
tribution of the steel reinforcement (4T20 bars with ϕ8 spiral reinforcement as recommended by local contractors) to the pile capacity was neglected, considering that the execution and grouting of the micropiles 10.5 meters below the ground can-not always produce straight piles of sound sections. Also to be conservative and to account for uncertainties in execution, the compressive strength of the grout was reduced from 30 to 25 MPa in the calculations. The designed micropiles were found to have an ultimate capacity of about 85 Tons, which exceeds the applied load from the building and the basement slabs. It is noteworthy to state that the micropiles are distrib-uted in such a way that their group effect can be neglected, since for Type A micropiles further examination is needed to assess its impact on pile capacity [1]. The micropile layout is shown in Figure 3.
Elastic shortening: The actual settlement Se can be comput-ed as the sum of Se1, Se2 and Se3, where Se1 is the settlement due to the pile material, Se2 is the settlement due to the load at the pile tip (taken as zero since tip resistance is not considered) and Se3 is the settlement due to the load along the pile shaft. These values were calculated along the bond length of the micropiles then added to the elastic shortening along the ex-posed 6.5-meter long section of the pile. The maximum total settlement obtained was an acceptable 0.53 centimeters.
Pile cap design: To transfer the loads of the existing struc-ture to the micropile system, a concrete pile cap of 70 centi-meters shall be poured on the roughened existing footing and column. It is designed as a corbel supporting an upward force
and connected to the column using epoxy dowelling ranging from 8T25 to 30T25, taking into account shear friction. Also, 10T25 dowels will connect the pile cap to the footing.
F. Parking Design North American standards were used in the design of the
parking facility; the parking spaces were designed to be 2.7 meters wide and 5.6 meters long, moreover the turning radii of at least 4 meters were designed. As for the ramps, they had 15° slopes in accordance with the Lebanese law. The parking was first drawn in two dimensions using AutoCAD then, using Revit, the design was extruded into a three-dimensional one. Revit helped in identifying conflicts and clashes in the design, which aren’t easily identifiable in two-dimensional plans. The design was rendered using 3Dmax, which provides a near-realistic vision of the end product, shown in Figure 4.
G. Construction The construction phases were obtained from senior structur-
al engineer Mr. Elie Turk. They start with executing tempo-rary underpinning and shoring micropiles, which can be done simultaneously or sequentially. The basements construction process follows a bottom-up sequence. (1) Underpinning mi-cropiles | Access for the existing isolated footings is cleared by partial or full destruction of the existing slab followed by an excavation process, in case of embedment, to reach their level. Isolated footings are cored according to the design layout, to reach the desired micropile depth. Casings shall be used in the fill layer to prevent caving. Epoxy-coated bars are dowelled in the existing footings and columns, which are roughened where concrete shall be poured. Steel detailing and splicing are prepared for the pile caps and the micropiles along with the formwork for the pile caps. Gravity grout is cast in situ, connecting the micropile/footing/pile cap systems. (2) Shor-ing micropiles | This starts with drilling micropiles around the parking footprint. Casings in the fill layer are required. After steel detailing is placed, gravity grout is cast in situ. (3) Exca-vation | When the grout acquires enough strength, the soil/rock between the micropiles is excavated until the new foundation
Figure 4. Parking facility section and top views for each basement.
Figure 3. Shoring and underpinning micropile distribution (in red)

155
depth is reached. To prevent the buckling of the micropiles, steel belts are installed around those of the same footing at 2-meter increments along the depth. In addition, shotcreting is executed on the shoring system along the depth, and a row of anchors is executed with a wailer beam when at least half a meter below their designed depth is reached. The shoring sys-tem should be coated with a waterproofing membrane after the shotcrete dries. (4) New foundation | Upon reaching the nec-essary excavation depth, a layer of lean concrete for blinding is placed. The steel reinforcement for the raft foundation is placed taking precautions to go around the underpinning mi-cropiles (sometimes a special detailing is used). The micro-piles length in contact with the raft foundation is wrapped with Styrofoam to ensure the inactivity of the micropiles upon completion of the project. Starter bars for columns and bear-ing walls are placed. The raft concrete is poured. (5) Second basement | Steel reinforcement for the new columns and bear-ing walls is installed, extending at least 40 centimeters above the new slab level. The new columns and bearing walls are then poured around the edges of the basement floors. Bearing walls for the ramps are also built. The steel detailing for the new solid slab is placed. The new slab is propped then poured. (6) First basement | Bearing walls are reinforced and cast, tak-ing special precaution to release the anchors beforehand. To connect the last new columns to the existing micro-pile/footing/pile cap systems, the vertical reinforcement of the new columns needs to be dowelled with epoxy at least 30 cen-timeters into the existing footings, with additional 50-centimeter epoxy-coated dowels embedded at 25 centimeters to resist lateral forces. The new columns are then formed and cast through holes in the existing footings/pile caps systems, using dry pack, non-shrink grout, self-consolidating concrete or Sikadur to close the gaps between them. The new structural slabs’ steel detailing is placed and they are poured at least 10 centimeters on top of the pile caps. After 28 days, the new columns reach their strength and the underpinning micropiles can be broken, as well as the existing foundations and pile caps excesses. The loads are thus transferred to the new col-umns. (7) Ramps | The ramps can be constructed at any phase of the process, but are usually left till the end, taking into ac-count that the anchors should be released when the supporting walls are built. (8) Finishing | This includes painting the park-ing facility, coating the floors with special epoxy to serve as a ground for moving vehicles, adding the required utilities and reworking the original ground floor of the building.
H. Feasibility Study
Before implementing such a project, it is recommended to check if it is feasible, not only beneficial. Consequently, the economic feasibility of this project was studied. Conservative prices were obtained from several contractors to generate a bill of quantities, shown in Table II. The cost of providing two basements for parking, including overhead and mobilization expenses, was found to be around $537,000.
The parking lot contains nine parking spaces per floor and a 19-square meter storage area. Upon contacting professionals in the market, it was found that 1 square meter in a basement is worth around $1,250. Consequently, the cost per parking space was calculated by subtracting $23,750 from the total project cost and dividing the remainder by the number of park-ing spaces, 18, which yields $28,500. In the Lebanese market, a parking space is worth $25,000 if found. Therefore provid-ing existing buildings with basements for parking is feasible.
A comparison between renting a parking space and buying one is made to verify the project’s feasibility. Surveys were conducted in our area of interest, and it was found that Leba-nese people spend at least $100 per month for parking sub-scriptions [3]. Moreover, the inflation rate in Lebanon is at least 6% [5]. Having this data, the graph in Figure 5 was gen-erated. It depicts the cumulative parking yearly rental charges versus the constant amount paid to buy a parking spot from the constructed basements. As demonstrated in the graph both lines intersect at 15 years, marking the 15th year the break-even point, after which buying a parking spot proves to be more economical. A return on investment after 15 years is very reasonable, and professionals in the market estimated the price of owning a parking spot then time to double, which will
Figure 5. Return on investment of the project.
TABLE II BILL OF QUANTITIES
Amount Cost per unit ($)
Total Cost ($)
Underpinning micropiles 86 with 10.5 linear meter depth 80 72,240
Shoring micropiles 93 with 8.5 linear meter depth 80 63.240
Excavation (fill material) 2,426 m3 10 24,260 Excavation (Rock material) 1,078 m3 20 21,560 RC works: raft, columns, bearing walls, beams, slabs, shotcrete, ramps and ramp walls
520+22+149+16.4 +267.5+2.7+52.5 = 1,030 m3
150 154,500
Lump sum basement finishes 1,000 m2 130 130,000 Steel belts 63 units 150 9,450 Parking control equipment 2 units 600 1,200 Metal staircase with rails 1 units 2,000 2,000 Epoxy coating for parking floor 1,000 m2 43 43,000
Anchors 27 units embed-ded 10 meters 55 15,000

156
generate definite profit to the buyer. As the building resi-dents’ need would be satisfied with eight parking spots (as-suming each household owns two cars as this was the most encountered number in the surveys [3]), the additional parking spots could be sold, leased or rented out to other neighborhood residents, allowing more people to benefit from additional parking and saving costs for the residents.
I. Scalability The parking deficit crisis in Beirut justifies the need for
parking. Out of the 87 residents interviewed in Beirut, about 60% said that they always have difficulties finding a parking spot. In addition, 45% are willing to undergo this project, while 34% have reservations about it due to safety concerns, making them potential candidates for accepting the project upon proving its safety [3]. The solution’s scalability is thus possible, especially as the project could be implemented for higher buildings, inhabited buildings, low accessibility build-ings, sites with high water tables and all other soil profiles.
V. IMPACT ASSESSMENT
During construction, micropile installation causes minimum disturbance to adjacent structures, soil and the environment, meaning that the construction can even take place while the building is occupied. Moreover, the addition of bearing walls in the basements, which, in case the basements area is equal to that of the building footprint, could be a base for future seis-mic retrofitting of the building. The tree in the front garden would however need to be removed as its roots run deep into the ground and will be affected by the excavation. After com-pletion of the project, those who have acquired parking spots would no longer need to cruise for parking, thus reducing car-bon emissions and congestion on the streets. More on-street parking spots will be available for others to park in. This can reduce illegal parking activities near the building. It should also be noted that for this case in specific, the implementation of this solution will not only be conserving the heritage of this traditional building, but it will also conserve its front garden which might have otherwise been used for parking.
VI. PROJECT LIMITATIONS
For lot 1687, since the building was unoccupied and the owners not accessible, it was assumed that the general trend observed in the surveys done in Hamra would apply to this lot, although ideally their acceptance of the idea should be as-sessed [3]. In addition, no information was available about the infrastructure at the site. Usually, some utility realignment has to be done but since the building is old, its utilities would need maintenance or replacement regardless of the project construc-tion. It was assumed that no cavities are present in the lime-stone and marl layers but cavity probing should be done for the site and cavities should be filled. For old residential buildings, those that generally fit the scope of the project, the lack of plans dictates that a structural survey be done to achieve as-built drawings. The authors tried to be as accurate
as possible with their measurements and assumptions for this lot. It is in fact crucial to have a structural layout that is as accurate as possible and so professionals should handle this task if this project is to be implemented. For the project as a whole, tackling the supply side of a parking deficit crisis should not reach a point where it encourages the use of more cars. It should only be a solution where it is crucially needed. Also, since experienced contractors in the field are not many and generally follow a design-build approach for such projects, the costs are usually high and pose a feasibility problem. A solution would be scaling the project and making expertise and equipment available and less costly due to economies of scale. In fact, the 87 surveys conducted [3] show that resi-dents in need of parking and willing to go through the projects are ready to pay $21,100 on average per parking spot.
VII. CONCLUSION
In this paper, based on geotechnical and structural infor-mation specific to the site at hand, a full-fledged scheme was devised to provide the building in lot 1687 with two base-ments for parking purposes. Shoring and underpinning using micropiles were designed in accordance with the available guidelines and with the assistance and recommendations of local specialty contractors in the field. The designed parking facility yielded 18 parking spots and a storage area, rendering the project not only technically feasible, but financially feasi-ble as well. The case study of lot 1687 only illustrates the extent of this project, which has proved to be scalable to Bei-rut, making it a firm solution for the parking crisis in the city.
ACKNOWLEDGMENT
The authors thank Dr. Maya Abou Zeid and Dr. Isam Kaysi for their help in the transportation aspect of this paper, Dr. Mohammad Harajli and Dr. Mounir Mabsout for their help in the structural aspect of this paper, Mr. Khalil Zahreddine for his help in finding a case study, Mr. Georges Abdo of Bauer Lebanon, Mr. Jihad Abdel Ahad of Nabil F. Azar Builders Design Consultants and Mr. Elie Turk of Serhal Consulting Office for their input on underpinning design and local con-struction practices, Nermin Halaseh for her help in 3D model-ing and rendering, Dr. Farook Hamzeh for his input in the fea-sibility study, Dr. Mutasem El-Fadel for coordinating the pro-ject and finally Dr. Shadi Najjar and Dr. Salah Sadek for their guidance throughout the course of the project.
REFERENCES
[1] T. Armour et al., Micropile Design and Construction Guidelines Imple-mentation Manual by the US Department of Transportation Federal Highway Administration Priority Technologies Program, FHWA, 2000.
[2] M. Abou Zeid, unpublished. [3] A. Beydoun et al., A Survey of the acceptance of providing existing build-
ings with parking lots by 87 residents of the Greater Beirut Area, un-published.
[4] A. Hajj, “Geotechnical Report on LOT 1973-Beirut,”OESC, Beirut, 2011. [5] “Lebanon this Week,” Byblos Bank Economic Research & Analysis De-
partment., Beirut, 2012.

157
Revitalizing Beirut Transport Corridors: Multi-modal Facilities and Alternatives to Old Steel Bridges
Carine Choubassi1; Issam Kayssi2, Marwan Sarieddine3, Christopher Sassine4, Christina Teokari5
Department of Civil and Environmental Engineering American University of Beirut Bliss Street, Beirut, Lebanon
1 [email protected], [email protected], [email protected], [email protected], [email protected]
Abstract A nation’s transportation system plays a pivotal role in its
socio-economic proliferation. However, congestion and delays impede a nation’s economic progress. With an estimated population of 4.29 million in 2004, Lebanon has one third of its population residing in the Greater Beirut Area. The road network in the country suffers from inadequate maintenance, low capacity, and consequently high travel times, congestion, and poor safety.
One main corridor to be examined in the capital is that which runs from Qoreitem to the Sodeco Area. Long-term changes to the corridor’s cross-section will be considered including facilities for sustainable modes such as bike lanes and dedicated public transport lanes. Moreover, two problematic intersections encompassed by this corridor will be focused on as they include two old steel bridges that the Beirut Municipality has been reconsidering. The project utilizes traffic simulation software (Synchro 7) to model intersection performance and level of service in order to compare proposed changes at these two intersections to already established road capacity. Subsequently, proposed alternatives are evaluated by a multi-criteria analysis to assess the most feasible based on traffic, environmental, and socio-economic criteria. A cross-section adjustment for the corridor has been proposed that includes a bike lane to encourage modal variety on the corridor. Moreover, alternatives have been recommended based on a sensitivity analysis of the multi-criteria analysis.
I. INTRODUCTION
An adequate transportation network is crucial for a country’s economic and national growth. Unsafe transportation systems and delays caused by congestion deter a nation’s progress. Congested intersections in urban areas account for major traffic delays (delaying access to markets and resources) and result in elevated overall levels of stress, increased crash rates, and pedestrian fatalities. Studies quantifying the extent of these adverse effects are thus important.
At 4.2 million in 2004, Lebanon’s resident population is unevenly distributed: one third of the population resides in the Greater Beirut Area (GBA). Lebanon’s road network suffers from inadequate maintenance, low capacity, high travel times, and congestion. The rate of car ownership was 3 persons for every car in 2001 but has been decreasing since. It has been suggested that in 2010 the average trip time in GBA includes a significant 50-70% delay [2].
Beirut’s rising congestion problem has become a major threat to the city’s economic growth; as a result, relieving congestion at major intersections is of great importance. The relatively close proximity of the intersections results in their sharing percentages of the same traffic [1]. Thus arises the need to study proximate intersections when seeking methods to relieve congestion.
Consequently, the study presented in this paper involves one of the most congested Beirut corridors, encompassing 20 intersections, in agreement with the Municipality and suggested by several traffic experts, to be assessed with respect to several criteria such that a feasible alternative is reached. The proposed solution was chosen based on a multi-criteria analysis (MCA) framework, whereby criteria of a quantifiable and non-quantifiable nature were combined. Synchro 7, a traffic modeling software, was used to model each proposed alternative and deduce the expected delay. Due to the current traffic circulations resulting from other on-going road construction projects, current on-field data was considered unrepresentative, and thus data used in the modeling of the current and proposed networks relied highly on traffic counts obtained from previous years.
The paper includes a revision of the Beirut Urban Transport Project (BUTP) and establishes its importance. The following sections include the choice of the corridor to be studied and a description of the suggested alternatives at the intersection level. The choice of MCA criteria is also presented and a weight assignment methodology is described. Finally a sensitivity analysis is undertaken to analyze the results and come up with appropriate conclusions. At the corridor level, a section on the soft movement study is integrated.
II. BEIRUT URBAN TRANSPORT PROJECT (1998)
The BUTP, developed by TEAM International consultants and other traffic specialists in 1998, addressed the issue of congestion through a study consisting of the following components: improving modern traffic signal systems, resolving the problem of parking deficits, and proposing grade separation to resolve congestion at certain corridors. An Origin Destination-Matrix was developed for the Greater Beirut Area (GBA) and then calibrated to the base year 1998 [4].

158
The targets of the project were the corridors with the worst level of service in GBA. After failed attempts at resolving congestion problems through mere signalization, grade separation enhancements were proposed including underpasses and overpasses that were expected to decrease projected delay for year 2010 significantly. Only two of the proposed alternatives were implemented thus far (Mathaf and Adlieh) and another is currently under construction (Bechara El Khoury).
The forecasted intersection delay for the Mathaf underpass alternative for year 2010 was expected to decrease 2010-projected intersection delay for the Do-Nothing scenario by thousands of seconds. Current turning movement counts performed at the intersection in February 2013 yielded a similar average delay per vehicle, indicating accuracy in the values expected by the BUTP. Consequently, the success and effectiveness of such congestion-relief studies is justified, highlighting the importance of performing similar studies on other highly congested and problematic intersections in Beirut.
III. CHOICE OF CORRIDOR
The current Mayor of Beirut, Dr. Bilal Hamad, pointed out that the Municipality has been receiving complaints about the two steel bridges overpassing the intersection of Independence Street and Bourj Abi Haidar Street and the intersection of Independence Street and Basta Street. These intersections will be referred to as Intersection 1 (Int. 1) and Intersection 2 (Int. 2) respectively for the remainder of this paper. Complaints mainly targeted the aesthetics of the bridges, their safety and serviceability, as well as their proximity to adjacent buildings. Moreover, the obvious congestion in the area was undeniable.
According to several other meetings held with TEAM International, one of the primary consultants of the BUTP, it was confirmed that, in fact, the whole corridor of Independence Street extending from the Concorde-Verdun-Qoreitem intersection to Bechara el Khoury (shown in Fig. 1 of Appendix I), and passing through Int. 1 and Int. 2, is suffering from major congestion delays at all its intersections. Problems in traffic law enforcement and the highly residential and commercial nature of the neighborhoods it is adjacent to, such as Mar Elias and Aicha Bakkar, are mainly to blame. Moreover, the corridor’s right of way in such links has been exhausted, leaving minimal room for simple geometric improvements. A decision was therefore made to focus the study on the above-mentioned corridor through the proposition of alternatives for the current corridor cross-section and intersection alignments (Int. 1 and 2 in specific) in an aim to arrive at the best alternatives based on a set of criteria.
IV. SELECTION OF ALTERNATIVES AT THE INTERSECTIONS
For the two intersections under study, several alternatives were proposed to be assessed and incorporated in the multi-criteria analysis. The changes shown in Table 1 constituted four major categories and a set of attributes that were combined interchangeably to form sub-categories of alternatives. The major categories that were considered were:
1. Do-nothing (keep the two steel bridges), 2. Remove bridges, 3. Replace the two bridges with a cantilever 1 bridge that extends over the two intersections, and 4. Replace the two bridges with an underpass extending from Int. 1 to Int. 2. Currently, the bridges are composed of two lanes each, one in each direction, Int. 1 of one lane in each direction, and Int. 2 of one lane in the East-bound (EB) and West-bound (WB) approaches and 2 lanes in the North-bound (NB) approach. A parking lane currently exists on the SB approach of Int. 1 and the EB, WB, and NB approaches of Int. 2.The list of attributes that were considered consisted of: 1. Prohibiting on-street parking on the South-bound (SB) approach of Int. 1 resulting in a two-lane road, and 2. Blocking Int. 1 and providing an alternative u-turn near the Dennawi Station for the WB left, and SB through and right of the formerly mentioned intersection shown in Fig. 2 of Appendix I.
TABLE 1
DESCRIPTION OF ALTERNATIVES
Rem
ove
Brid
ges
Rep
lace
bri
dges
w
ith c
antil
ever
br
idge
Rep
lace
bri
dges
w
ith u
nder
pass
Proh
ibit
pa
rkin
g on
SB
appr
oach
of
Int.
1 Clo
se In
t. 1
and
prov
ide
u-tu
rn
Alt.1 a) Alt. 1 b) X Alt. 2 a) X Alt. 2 b) X X Alt. 2 c) X X X Alt. 3 a) X Alt. 3 b) X X Alt. 4 a) X Alt. 4 b) X X
V. CHOICE OF INTERSECTION CRITERIA
Several criteria were assessed through a scoring system that assigns a score, from 1 to 5, for each corresponding criterion, and then a total score equivalent to the sum of all scores. The alternatives were then ranked from highest to lowest total score. The individual criteria scores for each intersection were assigned based on a local or a global scale (1: worst, 5: best) and linear interpolation, then a total weighted score was obtained for both intersections. The four main criteria used were the following: costs, traffic, environmental, and social. Environmental criteria were divided into air quality and noise levels whereas social criteria were split into aesthetics and pedestrian comfort.
One sub-criterion, construction cost, was considered for the capital cost criterion. The construction cost estimate of each alternative was obtained by summing up the estimated costs of
1 Cantilever bridge allows the design of one pier at each span cross-section.

159
each attribute it is made up of (such as demolition of bridge, paving of a new lane, and the installation of “no parking” signs). Estimated cost values, based on similar previous projects, market rates, and personal experience, were assigned for each attribute.
The resulting construction costs obtained indicate a huge difference among alternatives. While alternatives involving the replacement of the bridges with an at-grade intersection projected values ranging from $250,000 to $280,000, alternatives involving the replacement of the bridges with a single cantilever bridge or an underpass had construction costs ranging from $2,300,000 to $4,000,000. This difference in costs calls forth for a sensitivity analysis based on the inclusion and exclusion of construction cost in the MCA as it might overshadow certain positive (or negative) impacts and lead to an over-estimation (or under-estimation) in the ranking of alternatives. Results of the sensitivity analysis will be described in later sections of the paper.
Traffic criteria consisted of only one sub-criterion as well, intersection delay. The intersections of the different alternatives were modeled using the Synchro 7 software by inputting traffic volumes based on counts taken in September 2012, along with the splits of the different traffic signals and performing optimization to the network cycle length. The average intersection delay per vehicle for each alternative was obtained in seconds and observed average delays per vehicle ranged from 5.6 to 57.7 seconds on Int. 1 and 11.2 to 30.4 seconds on Int. 2 for the different alternatives. The intersection delay values were scored based on a global scale with 10 s having the highest score and 80s having the lowest score.
In urban settings where buildings are in close proximity to major roads residents suffer from several sources of air pollution and traffic noise, two environmental criteria were considered. The Traffic Noise Model (TNM) developed by the Federal Highway Administration (FHWA) was used to assess noise levels at the two intersections under study [3]. Each intersection was drawn in the model software, inputting the respective lane widths, peak-hour volumes (PHV) and average speeds on the respective approaches. A virtual receiver representing a neighboring house to each intersection was positioned to measure the level of noise reaching it in dB(A).
At the first intersection, the noise level from the bridge is slightly higher than the noise at grade. The range of dB from 55 to 60 results in serious annoyance, sleep disturbance and reduced cognitive ability. However, removing the bridges will result in a noise level exceeding 60 dB in alternatives 2-a, 2-b, and 2-c, leading to severe adverse health effects on nearby residents as well as cognitive disability. Alternatives 3a, 3b, 4a and 4b will have a noise level very close to the one resulting from the base case. Int. 2 mirrors the pattern of Int. 1; however, the noise levels vary between the two.
Considering air quality assessment, emissions from mobile sources on each proposed alternative were compared. The emissions from mobile sources lead to air pollution that causes severe health consequences and respiratory problems for the neighboring residents. Air emission factors were obtained based on the “Automotive Emissions in Developing Countries:
Traffic Management and Technological Control Measures” study, which relies on the US Environmental Protection Agency (EPA) Mobile 5B air emission model to simulate the emission inventory in the future central business district of Beirut City [5]. In the latter study, average speeds, vehicle fleet characteristics, ambient conditions and trip duration distribution were inputted to calibrate the model to estimate emission factors over a trip of a given length based on (1) and (2) where EF is the emission factor measured in g/vehicle-mile, and S is the speed in mph.
EF (HC) =35.492*S-0.9406 . (1)
EF (CO) =330.37*S-1.0411. (2)
The total emissions for HC and CO were calculated for each intersections based on the relative PHV for each alternative. A weight of 50% was assumed for each of the pollutatns (HC and CO) and an aggregated value for total emissions was obtained. A final weighted score was then obtained for both intersections. Since air emission factors are mainly dependent on speed, as idling would cause more emissions, then the alternatives with relatively higher speed (such as the case of a cantilever bridge and an underpass) resulted in lower total emissions. Consequently, the alternatives involving the construction of a cantilever bridge (alternatives 3-a and 3-b) yielded the lowest air emission values on Int. 1 while the alternatives involving the construction of an underpass (alternative 4-a and 4-b) were the more environmentally friendly on Int. 2.
The social criterion encompassed two sub-criteria: aesthetics and pedestrian comfort. As mentioned earlier, the aesthetical impact of the current steel bridges on the neighborhood was a major concern of the municipality. Scoring for this sub-criterion was based on five other sub-criteria which were: variation/ rhythm, impact on adjacent land use, vegetation, view of road/visibility, and accessibility for pedestrians. Alternatives which were considered well-integrated with the at-grade nature of the surrounding intersections in the area, attained a higher score than those that involved grade separation. Impact on adjacent land use was assessed according to the impact of each alternative on the residential function of the neighborhood being studied. Vegetation was mainly assessed based on the presence of a median (such as that separating EB from WB in Alternative 2) where vegetation can be added. Assuming the removal of on-street parking may allow a slight expansion of the sidewalk, alternatives involving the removal of a parking lane on the SB approach of Int. 1 scored higher on this sub-sub-criterion. The view factor, when assessed, favored alternatives which do not involve any bridges that may block the view of neighboring residents. As for the accessibility of pedestrians factor, then it was scored based on the existence of a refuge island separating the EB from the WB approach, as it is assumed to create a more comfortable and accessible environment for pedestrians of all ages. Each sub-criterion was given a score from 1 to 5 and then an average score was obtained for each alternative.

160
The pedestrian comfort scoring was done according to the ratio of time to cross the EB/WB approach for pedestrians over the green time available for them, assumed equivalent to the green time of minor approaches (SB and NB at Int. 1 and Int. 2 respectively). The green times of the two approaches were also obtained from Synchro 7 which provides the total split based on an optimized network cycle length. For a constant pedestrian crossing time, a lower ratio indicates a more comfortable crossing environment. Ratios varied between 0.5 and 1 for Int. 1 and 0.6 and 1.3 for Int. 2
VI. WEIGHT ASSIGNMENT
Assigning weights to each criterion and sub-criterion in an MCA is a relatively subjective process based on the different stakeholders’ preferences. In this case, the different criteria weights were mostly shifted towards the traffic criterion with a 40% weight, as it is the main target of this study, i.e. relieving congestion. Capital cost is weighed at 20% since it is a public project that is fully funded by the public funding of the government and so cost is a main concern. The environmental criterion and the social criterion were each given a weight of
20% (10% for each sub-criterion). The results of the MCA are tabulated in Table 2 below. It can be concluded from the total scores and the respective rankings that alternative 2-b (remove bridges and prohibit parking on SB approach of Int. 1) seems to be the most feasible out of the suggested alternatives. The second best alternative is -b (Prohibit parking on SB approach of Int. 1) while the worst alternative is 4-a (Replace bridges with underpass).
Case 5 involved the exclusion of construction cost from the MCA completely and the weights for the other criteria were adjusted to remain equivalent to those in the base case. As mentioned earlier, the high difference in construction costs solicits a sensitivity analysis to assess the alternatives disregarding their costs. Consequently, such an analysis would result in the best alternative in terms of traffic, environmental, and social influences. The municipality can then resort to the highest ranking alternative within a proposed monetary budget. The results for the rankings of the alternatives in each case are presented in Table 4.
TABLE 2 Results of MCA
Costs Traffic Environmental Social
Alternative Construction Cost
Intersection Delay Air Quality Noise Levels Aesthetics Pedestrian Comfort
Total Score
Rank
0.2 0.4 0.1 0.1 0.1 0.1
1 a) 5.000 3.703 4.036 2.297 2 2.705 3.585 7
1 b) 4.990 3.983 4.677 2.298 2 2.705 3.759 2
2 a) 4.743 3.550 1.986 1.782 4.2 5.000 3.666 4
2 b) 4.733 4.619 2.149 1.794 4.2 1.820 3.790 1
2 c) 4.715 4.873 1.926 1.582 3.8 1.000 3.723 3
3 a) 2.646 4.874 4.916 2.301 2.2 1.906 3.611 5
3 b) 2.636 4.937 4.848 2.233 2.2 1.601 3.590 6
4 a) 1.010 4.133 4.952 2.487 3.2 1.000 3.019 9
4 b) 1.000 4.286 4.152 2.231 3.2 3.094 3.182 8
VII. SENSITIVITY ANALYSIS
The weights that were chosen for each category in the MCA were done subjectively; therefore the sensitivity of the results with respect to the change in weights is necessary. Changing the weights of the main criteria used in the MCA altered the rankings of the alternatives, and the choice of the best alternative was thus affected. Five sensitivity cases were evaluated whereby each had an alteration in the weights of one or more of the criteria or the sub-criteria. The different cases with their corresponding weights are presented in Table 3.
TABLE 3 SENSITIVITY ANALYSIS CRITERIA
Case Con
st. C
ost
Int.
Del
ay
Air
Qua
lity
Noi
se L
evel
s
Aes
thet
ics
Ped.
C
omfo
rt
Base 0.2 0.4 0.1 0.1 0.1 0.1 1 0.2 0.3 0.15 0.15 0.1 0.1 2 0.2 0.3 0.1 0.1 0.15 0.15 3 0 0.5 0.125 0.125 0.125 0.125

161
TABLE 4
SENSITIVITY OF RANKING OF ALTERNATIVES
Alt. Base Case
Case 1
Case 2
Case 3
1 a) 7 2 5 9 1 b) 2 1 3 7 2 a) 4 4 1 8 2 b) 1 3 2 4 2 c) 3 7 4 6 3 a) 5 5 6 1 3 b) 6 6 7 2 4 a) 9 9 9 5 4 b) 8 8 8 3
Increasing the weights of the environmental criteria by 10% at the expense of the traffic criterion (Case 1), led to significant advancements in ranking of some of the alternatives that involve less idling such as the Do-Nothing alternative (Alt. 1) and the recession of alternatives with a higher idling volume (Alt.2c) while Alt. 3 and Alt. 4 remained relatively unchanged. Applying a similar weight adjustment to the social criteria (Case 2), led to the advancement of Alt. 2a which imposed the lowest ratio for pedestrian crossing time. As for the exclusion of construction cost completely and considering it as a budget proposed by stakeholders rather than a criterion (Case 3), major shifts in ranking were observed. Alt. 3 and Alt. 4 were highly advanced in the ranking making their construction cost the main reason for their previously low rankings. It can therefore be concluded that Alt. 1 and Alt. 2 are highly affected by the weights of the environmental and social criteria respectively while Alt. 3 and Alt. 4 are mainly affected by the construction cost criterion.
VIII. ADJUSTMENT OF CORRIDOR CROSS-SECTION
On the corridor level, a cross-section adjustment has been performed that includes the introduction of soft-movement (multi-modal) lanes which also promote the above-mentioned traffic, environmental, and social criteria. The proposed improvements are to be applied on both directions of the corridor, Independence street and Algeria street, extending from Int. 2 to the Concorde-Verdun-Qoreitem intersection. The streets are currently composed of six signalized intersections and two non-signalized intersections and have an average width of 15 m with two 3.5-m traffic lanes and 2-m lanes of parking on each side as well as relatively spacious sidewalks (Fig. 3 Appendix II). The traffic on this road is usually hindered due to double parking, pedestrians crossing haphazardly, and weaving motorcyclists.
A study conducted by SITRAM and egis in 2012 titled “Soft Movement Plan for Beirut City” tackles the issue of road cross-sections along Algeria Street [6]. It is considered to be a contemporary transportation proposition which aims at encouraging a sustainable environment, a more accessible city, and an efficient, balanced and spread transportation system. The study’s proposition for Algeria Street is presented and
discussed in the following section in addition to further input that aims to develop the study further.
The soft movement study proposes that the two traffic lanes as well as the two parking lanes on both sides of Algeria Street are maintained with the addition of a 4-m integrated bus-and-bike lane that would offer preferential treatment to both bikes and public transport. The soft movement study specifies the minimum lane width in Lebanon to be 2.5 m for traffic lanes, 1.8 m for parking lanes, and 1.2 m for sidewalks [6]. Due to the lack of space in the 15 m wide cross-section, the minimum width measurements are used in the new proposed alternative as shown in Fig. 4 of Appendix II. However, the provision of 2.5 m travel lanes may prove to be problematic as vehicles will be traveling in close proximity to one another thus reducing the drivers’ comfort and the vehicles’ travel speeds. In addition, the narrow travel lanes will also impact prevent motorcyclists from maneuvering freely between vehicles. The study can also be further adjusted to account for other characteristics along Algeria Street. The shared lane’s traffic can be extended to include taxis, thus separating all the public transportation modes that require continuous stopping, and that usually create congestion. This will result in two middle lanes that can better cater for fast-moving through traffic
The previous configuration suggested by the soft movement study and extended in this paper can be applied to the parallel road, Independence Avenue, which is around 16.7m wide. The road is currently composed of two traffic lanes as well as intermittent parking lanes on both sides. However, it was noticed through field observations that a lot of the traffic on this road is mainly caused by double parking on both sides of the street due to the presence of several retail stores along the road.
These proposed configurations seem to be advantageous as they have low construction costs as well as low operation and maintenance costs. However, in limited spaces such as that of Algeria Street, the implementation of the shared lane would decrease the other lane widths. In addition to the narrow lane widths discussed earlier, another concern is the sidewalks. Today, the area under study is a highly pedestrian area, with crowded sidewalks, and therefore, compromising its nature would lead to an uncomfortable facility for pedestrians. It should be noted that the proposed configuration, which encourages soft modal options, would not work efficiently without proper law enforcement on the designated lanes. Fines should be imposed on private vehicles using the dedicated lanes as well as on buses using the travel lanes. Moreover the shared lane cannot be compromised by allowing parking on it. If efficiently handled, this lane would encourage long term investments in the public transportation sector, especially in buses. Similarly, a well-controlled and safe shared lane may encourage the use of bicycles. This is a very significant aim as sustainable modes are, until today, not catered for in Lebanon and are generally excluded from road cross-sections.
An improvement that builds on the soft movement study and the consequent analysis and critique presented above recommends an alternative configuration with a different cross section. This cross section will be composed of one 3 m traffic

162
lane, a 2 m parking lane, two 2.65 m sidewalks on both sides, and a 1.2m motorcycle/bike lane adjacent to a 3.5m transit lane (Fig. 5 Appendix II). The transit lane will accommodate buses and vans as well as taxis and jitneys; however, it is preferable for buses to have specified stops integrated in the sidewalks so that they can stop without impeding the traffic. This will incentivize the use of buses as a mode of transport if timely and organized stops were to be implemented. This configuration is expected to result in a fast moving traffic lane that will not be slowed down or hindered by public transport modes. Moreover, the 1.2 m lane will be introduced to cater for motorcycles and bicycles, but is aimed to ultimately motivate the use of the latter. The proposed configuration eliminates a parking lane that is currently being used on the corridor by around 70 vehicles on Algeria Street; therefore, parking should be provided to account for the removal of the lane. To overcome this deficiency in parking, a parking lot located at the intersection of Mar Elias and Independence can be procured by the Municipality, and possibly developed into a multi-story parking, to adequately supply alternative parking spots. Moreover, the promotion of alternative modes of transportation is expected to reduce use of vehicles thus decreasing the demand for on-street parking by a certain percentage.
It is important to emphasize the importance of strict enforcement in the implementation of this configuration. Each vehicle type should adhere to its dedicated lane else the result would be an unorganized corridor jeopardizing the safety of the bicyclists. In addition, double parking, which is a prominent feature along the corridor, must be prohibited in order to ensure free-flowing travel.
A similar configuration to the above can be adopted on Independence Street where the cross section of the road is 3 m wider than that of Algeria Street and can therefore accommodate an extra traffic lane.
IX. CONCLUSION
The importance of performing up-to-date traffic planning studies in congested cities such as Beirut is undeniable. An MCA based on a variety of quantifiable and non-quantifiable criteria results in the most feasible, well-rounded alternative that can satisfy society’s needs on a variety of scales. Moreover, such studies are flexible and can be easily extended and tailored to fit the needs of studies for many types of corridors and road networks. Based on an MCA performed to assess alternatives for the two steel bridges in the vicinity of the Basta area in Beirut, the removal of the aforementioned bridges, as well as some minor road geometry adjustments is recommended (Alt. 2-b). This alternative is expected to better serve the area in terms of congestion, aesthetics, and other environmental and social factors.
However, such studies are often faced with a number of limitations. Data acquisition, for example, is often a difficult process in countries such as Lebanon, where updated statistics are not always available. Moreover, current conditions highly affect the representation of traffic counts which should reflect the peak-hour daily conditions on the road. In this study,
current traffic counts could not be performed due to the temporary change in geometry of a consecutive road network, which has decreased the current traffic volume on the studied road greatly, rendering it unrepresentative.
Moreover, in such subjective studies, the choice of criteria and their corresponding weights is of great importance. Oftentimes, the number of criteria chosen is confined by data and tools available. For instance, the models used to evaluate the measures of effectiveness need to be calibrated to current conditions in the study area. This may not be possible with the lack of proper data to perform the calibration. Other limitations include the lack of well-developed, reliable models for their assessment. In this study, the absence of relevant data related to accident rates as well as a well-calibrated model for measuring intersection safety for the case of Lebanon, a social sub-criterion measuring the relative safety of each alternative in terms of reduction in crash rates and fatality rates, was disregarded and assumed the same for all alternatives.
Addressing the demand on corridors is vital in plans that target for sustainability. Studies that aim to relieve congestion on corridors must take into account sustainable alternatives that promote public transport and incentivize soft movement modes. The cross sections of existing roads can thus be altered to accommodate for new modes and enhance the level of service of environmentally friendly transportation facilities.
In conclusion, it is advisable to resort to frameworks such as the MCA when seeking improvements to urban road networks as they comprehend all types of criteria and allow for flexibility to account for changes in values held by stakeholders. The proposition of alternative sustainable transport development can also play a complementary role in such studies as it targets the improvement of the area in terms of similar measures of effectiveness.
ACKNOWLEDGMENT
The authors would like to thank Dr. Isam Kaysi and Dr. Maya Abou Zeid for their guidance and support. In addition, the authors would like to thank Dr. Tammam Naccache, Eng. Zaher Massaad, Eng. Nabil Wahidi, and Eng. Hani Naghi for their help in obtaining and managing the data used in this project.
REFERENCES [1] Abdel Aty, M., & Wang, X. (2006). Crash Estimation at Signalized Intersections Along Corridors. Transportation Research Record , 98-111.
[2] Aoun, A. (2010). Transport Reform in Beirut, Lebanon. Berkeley.
[3] FHWA. (2011). Highway Traffic Noise.
[4] Reconstruction, L. R. (1998). Beirut Urban Transport Project Preparation Study. Beirut: Team International: Engineering & Management Consultants.
[5] Sbayti, H., El-Fadel, M., Kaysi, I., & Baaj, H. (2001). Automotive Emissions in Developing Countries: Traffic Management and Technological Control Measures. Environmental Engineering Science , 347-358.
[6] SITRAM Consultants, egis. (2012). خطةالتنقل السلس لمدينة بيروت. Beirut.

163
APPENDIX I
Figure 1: Location of Chosen Corridor with Int. 1 and 2 circled.
Figure 2: Location of Dennawi Station U-Turn

164
APPENDIX II
Figure 3: Algeria Street Current Lane Configuration Figure 4: Algeria Street Proposed Combined Lane Configuration
Figure 5: Algeria Street Adjusted Bike Lane Configuration

165
1 of 7
Seismic Geo-hazards and Site Response Analysis: Mapping the Greater Beirut Area
Mostapha Mostapha, Yassin Mostapha, Nabil Atallah, Taher Masalkhi Farshoukh, Mohamad Melhem
Civil and Environmental Engineering American University of Beirut
Riad El-Solh / Beirut 1107 2020, Lebanon [email protected], [email protected], [email protected], [email protected], [email protected]
Abstract-Due to Lebanon’s location on one of the clearly defined fault systems, it is important to investigate the risks that are inherent to the seismic activity in the eastern Mediterranean. That is, the country witnessed several devastating earthquakes in the past two thousand years. These earthquakes contributed to the destruction of many areas on the Lebanese shoreline including Beirut city.
The study area (i.e. Greater Beirut Area; GBA) is characterized by its highly variable geology, stratigraphy and structural features which make it interesting and complicated to investigate. To illustrate, the variation in topology, presence of rivers and GBA’s location on the coast increase the risks associated with seismic geo-hazards. In this study, we focused on the three seismic geo-hazards: ground motion amplification, liquefaction and landslide hazards.
As for the structures in GBA, mostly they are old and not designed to resist earthquakes. However, during the last decade the area has witnessed a significant reconstruction and development. This trend raises the urge for a high level study for the soil-structure interaction in different zones in GBA. As such, the designers will have a preliminary conception about the local site conditions and decide on the level of seismic reinforcement.
This paper presents the adopted methodologies and the results of mapping the seismic geo-hazards (i.e. the three listed above) in Greater Beirut Area (GBA) that could arise from a potential seismic activity. Also, it tackles the response of typical structures in GBA to this seismic activity based on base shear caclulations. The data that are pertinent to the study are collected and incorporated to a GIS-based framework in order to perform the needed analysis and generate the maps.
I. INTRODUCTION
The location of Lebanon in a seismically active zone promotes serious studies that help engineers in alleviating the catastrophic consequences of potential earthquakes. The country lies to the east of the Mediterranean Sea and across one of the major boundaries between the Arabian and the African plates [1]. Also, it has a wide variation of geological formations that include basalts, marls, limestones, sandstones and dolomites. Add to that the variation in cohesionless soils (loose to stiff), clays (soft to medium stiff to stiff), sand dunes and alluvial deposits [2].
As a result of the recent seismic activity recorded in Lebanon and the surrounding countries, civil engineers have focused their efforts in an attempt to assess the implications of a devastating earthquake that could hit in the coming years. In addition, the recent discovery of a new offshore fault raised the
need to update past studies and design considerations related to seismicity in Lebanon.
GBA reflects the geological variability of Lebanon in spite of its small area (i.e. about 238 km2) and this is shown in Figure 1. It covers the coastal area that stretches from Nahr-el-Damour south to Nahr-el-Kalb north. From east, it is bounded by the 400m contour slopes and plateaux [3]. We restricted our study to Greater Beirut Area (GBA) given its vital importance to the country and given the concentration of residents, development, economic, industrial and other activities.
The main focus of this paper is the methodology and results of creating the maps for ground motion amplification, liquefaction potential and susceptibility of landslide. Also it sheds the light on the calculations of base shear that is felt by a structure during seismic events.
Figure 1. The geological formations all over Greater Beirut Area
II. DEFINITIONS AND METHODOLOGIES ADOPTED
A. Ground Amplification Maps When an earthquake occurs, the acceleration that is felt on
earth’s surface is different (either amplified or de-amplified) from that of the bedrock. The amplification of bedrock’s

166
2 of 7 acceleration depends on the characteristics of the overlaying soil, particularly the geological formation and thickness.
The first step in generating ground amplification maps is getting the geological formation of different zones in GBA. Then, every formation is assigned an amplification factor according to the considered peak ground acceleration (pga) of bedrock. Seed and Idriss [4] noted that almost all soils amplify peak ground accelerations that are less than 0.1g with sand, soft and medium stiff clays being the types that amplify the most. Later, Idriss [5] improved the amplification factors for the soft clays and noted that de-amplification occurs for pga’s greater than 0.4g.
Table 1 shows the soil categories that correspond to different geological formations. Also, it shows the amplification factors for these categories according to different values of pga [6].
TABLE 1 SOIL CATEGORIES AND AMPLIFICATION FACTORS FOR DIFFERENT
GEOLOGICAL FORMATIONS
Geological Formationa
Soil Category
Shaking Intensity pga
0.1g 0.2g 0.3g 0.4g 0.5g c2b, c3, c4, c6,
m1, j4-j7 A 1.0 1.0 1.0 1.0 1.0
c1, c2a, c2b, q3, qd, ad, mcg B 1.2 1.2 1.1 1.0 1.0
c2a, q1, q2, q3, qd, ad C 1.6 1.4 1.2 1.1 1.0
q4, a D1 2.5 1.7 1.2 0.9 0.9
a D2 2.0 1.6 1.2 0.6 0.9 aSome geological formations can fit to more than one soil category
Referring to Table 1, some of the geological formations do not contribute to amplification (i.e. amplification factor is 1.0). Those formations were ignored in mapping for ground amplification. As for the rest of the formations, the amplification factors were determined and then multiplied by the bedrock’s pga in order to get the amplified pga of the earth’s surface.
It is important to note that the amplification factors given by [6] are valid as long as the overlaying soil is thick enough (i.e. 30 m) to induce this amplification. However, some of the zones in GBA do not comply with this condition. As such, the amplified pga’s that are calculated according to Table 1 should be modified in a way that takes into account the actual thickness of the layer.
B. Liquefaction Hazard Maps Liquefaction is a phenomenon that occurs in cohesionless
soils during an earthquake where they lose almost all their shear resistance and act like liquids [7]. Generally, liquefaction susceptibility depends on the geological formations. The susceptible formations are q1, q3, q4, qd, a, ad and mcg. On the other hand, the non- susceptible ones are q2, m1, j4-j7, c1, c2a, c2b, c3, c4 and c6.
The method used in assessing the liquefaction potential is the one given by Youd et al. [8]. The stress that is generated by
an earthquake is represented by the cyclic stress ratio (CSR) and it is given by (1).
CSR = 0.65(amax/g).(σvo/σ’vo).rd (1)
where amax is the peak horizontal acceleration at the ground surface generated by the earthquake; g is the acceleration of gravity; σvo and σ’vo are the total and effective vertical overburden stresses respectively; and rd is the stress reduction coefficient. The resistance of the soil is represented by the cyclic resistance ratio (CRR7.5) and it is given by the graph shown in Figure 2.
Figure 2. The cyclic resistance ratio is given as a function of fines content and
corrected blow count (N1)60.
The factor of safety against liquefaction is given by (2) where CSR and CRR7.5 as defined above.
FS = (CRR7.5/CSR).MSF.Kσ (2)
where MSF is the magnitude scaling factor and Kσ is the correction for overburden pressure calculated as specified in [8]. If the factor of safety (FS) turns out to be less than 1 then there is potential for liquefaction else there is not. The liquefaction Hazard map shows this FS for different zones across GBA. The liquefaction analysis is only restricted to the susceptible formations.
C. Landslide Hazard Maps The landslides occur in the form of soil masses movement
along a shear failure plane where the shear stresses are larger than shear resistance. The sliding soil masses behave as one unit and their volumes can reach millions of cubic meters. Landslides can develop flow if no equilibrium occurs at the toe

167
3 of 7 of the slope. Basically there are two types of landslides: rotational and translational.
In creating the landslide hazard mapping for GBA, we followed the heuristic approach that depends on the evaluation of experts. We consulted Dr. Salah Sadek [2] in order to establish the weights for the causal factors and the susceptibility for different categories of each causal factor as shown in Table 2. The causal factors that we focused on are lithology, slope, precipitation, proximity to faults, and proximity to roads. A part of the weights is defined by overlaying the geology coverage, elevation contours, and survey of real landslides. After defining all the weights, we developed a hazard score that assesses the landslide susceptibility in different regions according to their properties. The landslide susceptibility index is divided into five classes: very low, low, medium, high and very high. It is important to note that we followed this approximate method due to the lack of shear wave velocity measurements and other relevant data for the GBA. The hazard score model is given by the susceptibility index (SI) in (3).
SI = ∑5
i=1 Weight(i).Susceptibility(j,i) (3) where i is the individual causal factor and j is the category in each causal factor.
TABLE 2 THE SUSCEPTIBILITY FACTORS AND WEIGHTS OF THE STUDIED LANDSLIDE
DRIVERS
Causal Factor Susceptibility Weight
Slope (degrees)
<8 0
3 8-15 0
15-25 0 25-35 0.25 >35 0.75
Proximity to Faults
(km)
<3 0.375
2 3-6 0.625
6-10 0 10-15 0 >15 0
Proximity to Major
Roads (km)
<1 0
1 1-2 0 2-3 0.21 3-4 0.26 >4 0.53
Geology
c1 0.254
7
c2 0.204 c3 0.141
c4-c5 0.203 c6 0
j4, j5-7 0.192 Littoral sands 0
m2 0 mcg 0
Recent Alluvium 0 Red soils 0
Elevation (m)
<100 0.028
4
100-250 0.059 250-500 0.093 500-750 0.264
750-1000 0.186 >1000 0.37
D. Base Shear Calculation During an earthquake, the soil beneath the structures shakes
causing them to shake too. Since structures are not infinitely rigid they will take time to react thus causing a differential shear. The differential shear between the first floor and the foundations is the base shear and it usually acts on the columns of the foundation.
The base shear is calculated according to 1997 Uniform Building Code (UBC) [9]. UBC 1997 classifies the PGA into four seismic zones from 1 to 4. Zone 1 has the lowest intensity and the intensity increases as we move up with the zone number. Each zone is assigned an approximate value of PGA in terms of g as stated in UBC 1997 Table 16-I. As for the soil profile types, they are categorized according to their description, shear wave velocity, standard penetration test and undrained shear strength in UBC 1997 Table 16-J. Table 3 shows the soil formations in GBA with their corresponding UBC soil profile types.
TABLE 3 MATCHING BETWEEN THE GENERAL CLASSIFICATION OF SOIL AND UBC SOIL
PROFILE CATEGORIES
Geological Formation Category UBC Soil Profile
q1, q2, ad C SD
q3, qd, c2a B-C SD
q4 D1 SE
a D1-D2 SE
m1, c2b A-B SC
mcg, c1 B SC
j4-j7, c3, c4, c6 A SB
After determining the soil profile and seismic zone, UBC
1997 introduces Ca and Cv, the seismic coefficients that depend on the soil and seismic conditions explained above. These coefficients are needed in the calculation of the design, minimum and maximum base shear. Ca and Cv values are expressed in UBC 1997 Tables 16-Q and 16-R respectively. Equation (4) dictates the design value of the base shear (V in tons) that the structure will feel under specific soil and seismic conditions. V = (Cv.I.W) / (R.T) (4)
where I is the importance factor and it depends on the occupancy and is function of the structure (Table 16-K); W is the total seismic dead load as defined in section (1630.1.1); R is a numerical coefficient that reduces the design of shear walls and steel rebars from elastic to plastic phase taken as 4.5; T is the elastic fundamental period of the structure (in seconds). Also, UBC imposes a maximum and a minimum for the base shear value given by (5) and (6) respectively. Vmax = (2.5 Ca.I.W) / R (5)
Vmin = 0.11 Ca.I.W (6)

168
4 of 7
TABLE 4 GEOLOGICAL FORMATIONS AND THEIR PROPERTIES ACROSS GBA
III. DATA AND GIS-BASED FRAMEWORK
After having all the methodologies set, it is needed to collect the data for the different parameters. The data compiled are related to soil type and properties, geology, peak ground accelerations, levels of water table, slopes, faults, major roads and elevations. In order for the data to be manipulated in the GIS-based framework they should be converted into layers first. All the data were collected from different researches done in the American University of Beirut.
The geological formations that are found in GBA are presented in Table 4 along with their properties [2].
A. Ground Amplification Maps
The data that are needed for the ground motion amplification are restricted to the geological formation and the thickness of the considered zone in GBA. The geological formation for every zone is obtained from 1:50,000 geological maps that were produced by the geologist Dubertret [10]. The geological maps were introduced to the framework as a layer. For the database that is setting behind the geology layer, each zone’s geological formation will be assigned a thickness according to Table 4. Note that the resulted GIS geology map was scaled to 1:20,000. Additional information about the rocks and soil were obtained from [3].
After the discovery of Mount Lebanon thrust, the seismic studies in Lebanon were updated. The seismic hazard in Lebanon was classified as moderate to high with a pga of 0.25g. This number corresponds to 10 percent probability of exceedance in 50 years [11]. Also, the latest Lebanese safety regulations that were issued in 2013 impose a minimum value of 0.25g.
In the GIS-based framework, a specific code was written to identify the geological formation of different zones then get an amplification factor according to Table 1. The generated amplified pga’s (pgaamplified) are then modified in accordance to thickness of the geological formation as illustrated in (7).
pgaweighted = [T*pgaamplified + (30-T)*0.25]/30 (7)
where T is the thickness of the considered zone.
B. Liquefaction Hazard Maps The data for the geological formations that are susceptible to
liquefaction are mainly the corrected number of SPT blows (N1)60, fines content, and saturated unit weight. These are presented in Table 5 after consulting with Dr. Salah Sadek [2]. The depth to water table was obtained from a contour map at 10m intervals.
TABLE 5 CORRECTED SPT, FINES CONTENT AND SATURATED UNIT WEIGHTS FOR THE
GEOLOGICAL FORMATIONS IN GBA Geological Formation (N1)60
Fines Content (%)
Sat. unit weight (KN/m3)
q1 10 25-40 18 q3 10-15 15-25 18 q4 15 10-20 19 qd 15-30 <5 21 a 10-20 15-30 18
ad 10-15 <5 19 mcg 15-30 15-20 20
In the framework, the liquefaction analysis is done only for
the susceptible formations as illustrated. Before performing the analysis, the geotechnical base map for GBA should be prepared and have in it all the parameters needed to calculate the factor of safety against liquefaction. The base map is
Geological Formation Description Approximate
Thickness (m) Friction Angle (°)
Cohesion (kN//m2)
Unit Weight (kN/m3)
Soil Formations q1 Clayey Silty Sand 0-5 10-30 10-20 17-18 q2 Silty clay 15-30 30 10-30 17 q3 Marly sand 20-40 20-25 10-50 17-18 q4 Silty sand 10-20 30-35 0 18 qd Beach rock (ramleh) / Partly cemented dune sand 15-20 25-30 30-50 21 a Alluvium 15-30 25-30 10-30 17
ad Dune Sand 10-15 30-35 0 18 m1 Marly limestones and marls 30 25-30 50-100 21 mcg Marly conglomerates 30 25 30-50 19-20
Rock Formations j4 Limestone or dolomitic limestone >30 33 100-300 22 j5 Clastic limestone 30-40 33 100 21 j6 Limestone >30 33 100 21 j7 Oolitic limestone >30 33 100 21 c1 Sandstone 20 30 50-100 20 c2a Clastic limestone 70-250 30 100 21 c2b Limestone with shales >30 25 50-100 21 c3 Marly/shaly limestone >30 25 30-80 20 c4 Limestone, dolomitic limestone, cherty limestone >30 30 100-300 21 c6 Chalky limestone >30 20-25 50-150 19-20

169
4 of 7
TABLE 4 GEOLOGICAL FORMATIONS AND THEIR PROPERTIES ACROSS GBA
III. DATA AND GIS-BASED FRAMEWORK
After having all the methodologies set, it is needed to collect the data for the different parameters. The data compiled are related to soil type and properties, geology, peak ground accelerations, levels of water table, slopes, faults, major roads and elevations. In order for the data to be manipulated in the GIS-based framework they should be converted into layers first. All the data were collected from different researches done in the American University of Beirut.
The geological formations that are found in GBA are presented in Table 4 along with their properties [2].
A. Ground Amplification Maps
The data that are needed for the ground motion amplification are restricted to the geological formation and the thickness of the considered zone in GBA. The geological formation for every zone is obtained from 1:50,000 geological maps that were produced by the geologist Dubertret [10]. The geological maps were introduced to the framework as a layer. For the database that is setting behind the geology layer, each zone’s geological formation will be assigned a thickness according to Table 4. Note that the resulted GIS geology map was scaled to 1:20,000. Additional information about the rocks and soil were obtained from [3].
After the discovery of Mount Lebanon thrust, the seismic studies in Lebanon were updated. The seismic hazard in Lebanon was classified as moderate to high with a pga of 0.25g. This number corresponds to 10 percent probability of exceedance in 50 years [11]. Also, the latest Lebanese safety regulations that were issued in 2013 impose a minimum value of 0.25g.
In the GIS-based framework, a specific code was written to identify the geological formation of different zones then get an amplification factor according to Table 1. The generated amplified pga’s (pgaamplified) are then modified in accordance to thickness of the geological formation as illustrated in (7).
pgaweighted = [T*pgaamplified + (30-T)*0.25]/30 (7)
where T is the thickness of the considered zone.
B. Liquefaction Hazard Maps The data for the geological formations that are susceptible to
liquefaction are mainly the corrected number of SPT blows (N1)60, fines content, and saturated unit weight. These are presented in Table 5 after consulting with Dr. Salah Sadek [2]. The depth to water table was obtained from a contour map at 10m intervals.
TABLE 5 CORRECTED SPT, FINES CONTENT AND SATURATED UNIT WEIGHTS FOR THE
GEOLOGICAL FORMATIONS IN GBA Geological Formation (N1)60
Fines Content (%)
Sat. unit weight (KN/m3)
q1 10 25-40 18 q3 10-15 15-25 18 q4 15 10-20 19 qd 15-30 <5 21 a 10-20 15-30 18
ad 10-15 <5 19 mcg 15-30 15-20 20
In the framework, the liquefaction analysis is done only for
the susceptible formations as illustrated. Before performing the analysis, the geotechnical base map for GBA should be prepared and have in it all the parameters needed to calculate the factor of safety against liquefaction. The base map is
Geological Formation Description Approximate
Thickness (m) Friction Angle (°)
Cohesion (kN//m2)
Unit Weight (kN/m3)
Soil Formations q1 Clayey Silty Sand 0-5 10-30 10-20 17-18 q2 Silty clay 15-30 30 10-30 17 q3 Marly sand 20-40 20-25 10-50 17-18 q4 Silty sand 10-20 30-35 0 18 qd Beach rock (ramleh) / Partly cemented dune sand 15-20 25-30 30-50 21 a Alluvium 15-30 25-30 10-30 17
ad Dune Sand 10-15 30-35 0 18 m1 Marly limestones and marls 30 25-30 50-100 21 mcg Marly conglomerates 30 25 30-50 19-20
Rock Formations j4 Limestone or dolomitic limestone >30 33 100-300 22 j5 Clastic limestone 30-40 33 100 21 j6 Limestone >30 33 100 21 j7 Oolitic limestone >30 33 100 21 c1 Sandstone 20 30 50-100 20 c2a Clastic limestone 70-250 30 100 21 c2b Limestone with shales >30 25 50-100 21 c3 Marly/shaly limestone >30 25 30-80 20 c4 Limestone, dolomitic limestone, cherty limestone >30 30 100-300 21 c6 Chalky limestone >30 20-25 50-150 19-20
5 of 7 obtained by merging the geological, lithological and hydrological maps of GBA.
C. Landslide Hazard The assessment of the landslide hazard is done using a
heuristic approach in which a hazard score equation is developed as explained in the methodology section. This equation assigns different weights to the causal factors depending on the importance of each. The causal factors that are considered in this study are: proximity to faults, proximity to major roads, slopes, geology and elevation. The default weights shown in Table 2 are obtained from frequency analysis and from a study done in Southern California [12]. Since the weights of the above causal factors can change from one region to the other, we developed a VBA form that gives the user the luxury of varying the weights of these factors the way they like.
D. Base Shear Calculation In order to calculate the base shear applied on any structure
in GBA based on the UBC 1997 methodology, we developed a VBA interface within the GIS-based framework. Only rasterized coverage of the GBA geology is needed to classify the soil formation into seismic soil profile suggested by UBC 1997 [9]. A toolbar is created for this sake and it is dedicated to guide the user through the process of base shear calculation. First, the user needs to specify on the geologic map the location of the site of interest then the tool will automatically identify the seismic soil profile based on the conversions shown in Table 3. In addition, the user needs to enter the seismic zone factor (PGA), occupancy category, weight and height of the building. The VBA tool will calculate accordingly the design base shear and compare against the imposed minimum and maximum values of the base shear.
IV. RESULTS AND GENERATED MAPS
A. Ground Amplification Maps Referring to Figure 2, the amplified pga’s range between
0.25g (i.e. no amplification) up to 0.32g. The geological formations c2b, c3, c4, c6, m1 and j4-j7 are categorized as A and they are strong enough to transfer the bedrock acceleration to the surface with no change. That is, the amplification factor is 1. The q1 formation is classified as soil category C and it should amplify the bedrock pga. However, due to its small thickness (i.e. mean of 2.5m) it did not contribute too much to amplification. As for qd and ad formations that belong to soil category B, their amplified pga’s range between 0.26g and 0.27g. It is important to note that the mean thicknesses of these formations range between 12.5m and 17.5m and this contributed much to decreasing the amplification after weighting by thickness. The third bin of amplified pga’s that ranges between 0.28g and 0.30g involves the soil categories B, C and D1. The geological formations c1, c2b, q2, q4 and mcg have their mean thicknesses vary between 12.5m to as high as 30m. Regarding
the bin that has the highest range of amplified pga’s (between 0.31g and 0.32g) across GBA, the soil categories that contribute to this amplification are C, D1 and D2. Also, the mean thicknesses of q2, q3, a and C2a formations are relatively on the high side and vary between 22.5m and 30m.
Figure 2. The amplification map of pga = 0.25g across GBA
B. Liquefaction Hazard Maps After generating liquefaction hazard maps at 5, 10, 15 and
20m depth using the GIS-based framework, it was noticed that at depth of 10m liquefaction occurs the most. Figure 3 shows the liquefaction potential across GBA for an interest depth of 10m and earthquake magnitude Mw of 7.5. Mainly, liquefaction is expected to happen in some coastal areas in GBA. It is important to note that the formations that are prone to liquefaction have an average (N1)60 between 12.5 and 15 and an average fines content (FC) between 2.5 and 25. Also, the average water table level in these formations ranges between 2m and 7m. On the stress side that is coming from the earthquake, the amplified pga’s are relatively high and vary from 0.27g up to 0.32g. The reclaimed lands (i.e. hatched by green) raise the need for site-specific investigations especially that some are next to areas that are expected to liquefy.
C. Landslide Hazard Maps Figure 4 shows the GIS-based landslide hazard mapping that
is done using the susceptibility factors and weights shown in Table 2. As illustrated in this map, the coastal area that is characterized by flat slopes and low elevations has very low to low susceptibility to landslides. The area of Ras Beirut has one of the weakest geological formations, in terms of strength, which makes it prone to landslides. However, the low elevations of this area diminish the potential of landslides. On the other hand, the mountainous area that extends along the eastern boundary of the GBA has medium to very high

170
6 of 7 susceptibility to landslides. This result is expected because all the factors that favor the initiation of landslides are found there. These factors are: high elevations, steep slopes and weak geological formations.
Figure 3. The liquefaction hazard map at depth of 10m across GBA
Figure 4. The landslide hazard map of the GBA
D. Base Shear Calculations Figure 5 shows the VBA interface that helps the user calculate the base shear of any type of buildings after locating its position in the GBA. We chose to locate our site in the American University of Beirut vicinity. The software
automatically identified the seismic soil profile as “SB”. The occupancy category of the building is chosen as “Essential Facilities”. The height of the 3-story building excluding basements (i.e. superstructure) is assumed to be 10 m and the weight of the building is estimated to be 518 tons. As mentioned earlier, the base peak ground acceleration that governs the GBA is taken as 0.25g. These numbers are plugged into the user form and using “Calculate Base Shear” button the base shear turns out to be about 90 tons.
Figure 5. Base shear calculator VBA user interface
V. CONCLUSION
The strongest geological formations are the ones categorized as A and as we move to categories D1 and D2 the strength decreases thus the amplification factor increases (i.e. for pga of 0.25g). Nevertheless, the results have shown that it is not only the categorization that governs the amplification it is more the combination of both the category and mean thickness of a given formation.
In the light of liquefaction hazard maps’ results, several factors govern the susceptibility of liquefaction. For example, one of the geological formations that are prone to liquefaction (at depth of 10m) have relatively high (N1)60 and FC but the earthquake stress is over its capacity and the water table is situated at shallow depths. Also, the liquefaction hazard maps can be used as a preliminary investigation tool for site improvement schemes.
In order to assess the reliability of the landslide hazard map, coverage of real landslide incidents (i.e. the green triangles in Figure 4) is overlaid on top of the hazard mapping. This coverage contains 62 real landslide occurrences. The produced map predicted that 57 out of these 62 landslides fall within the medium to very high susceptibility range. Hence, the reliability of the landslide hazard mapping is about 92%.
ACKNOWLEDGMENT
We would like to acknowledge both Prof. Salah Sadek and Prof. Mohammad Harajli for their time and effort spent in guiding us throughout the whole project.

171
7 of 7
REFERENCES [1] Z. R. Beydoun, “The Levantine Countries; the Geology of Syria
and Lebanon (Maritime Regions)” in The Ocean Basins and Margins, vol. 4A, pp 319-353, 1977.
[2] Sadek, S. and Harajli, M. and Asbahan, R. “A GIS-based framework for the evaluation of seismic geo-hazards in the greater Beirut area”, 2010.
[3] J. N. Ghannam, “The geotechnical map of Greater Beirut Area”, Masters Thesis, Geology Program, American University of Beirut, Beirut, Lebanon, 1987.
[4] H. B. Seed, and I. M. Idriss, Ground Motion and Soil Liquefaction during Earthquakes, Earthquake Engineering Research Institute, 1982.
[5] I. M. Idriss, “Response of Soft Soil Sites during Earthquakes” in Memorial Symposium Proceedings, H. Bolton Seed, vol. 2, pp. 273-289, May 1990.
[6] W. D. Liam Finn, “Characterization of Site Effects and Soil- Structure Interaction for Seismic Design Codes”, in Seismic Soil/Structure Interaction Seminar, Vancouver, British Columbia, May 29 1993.
[7] S. L. Kramer, Geotechnical Earthquake Engineering, Prentice-Hall Inc., UK, London, 1996.
[8] Youd, T.L., Idriss, I.M., Andrus, R.D., Arango, I., Castro, G., Christian, J.T., Dobry,R., Liam Finn, W.D., Harder, L.F. Jr., Hynes, M.E., Ishihara, K., Koester,J.P., Laio S.S.C., Marcuson W.R. III., Martin, G.R., Mitchell, J.K., Morwaki, Y., Power, M.S., Robertson P.K., Seed, R.B., Stokoe, K.H. II. “Liquefaction Resistance of Soils: Summary Report from the 1996 NCEER and 1998 NCEER/NSF Workshops of Evaluation of Liquefaction Resistance of Soils.” ASCE, Journal of Geotech. and Geoevir. Engrg., Vol. 127, No. 4, pp. 297-313, 2001
[9] Officials, I. C. (1997-04). Uniform Building Code 1997: Structural Engineering Design Provisions. Prentice Hall. 1997.
[10] L. Dubertret, “Geological Map of Lebanon at a scale of 1/200,000, with explanatory note” (in French), Carte géologique du Liban au 1/200,000, avec notice explicative, Ministry of Public Works, Beirut, 1955.
[11] Huijer, C. E. “Implications of the recent mapping of the offshore thrust fault system on the seismic hazard of Lebanon”, 2010.
[12] He, Y. and Beighley, R. “GIS-based regional landslide susceptibility mapping: a case study in southern California”. Earth Surface Processes and Landforms, 33, 380-393, (2008). Retrieved November 3, 2012.

172
Clay Reinforcement Using Natural Hemp Fibers
Hala Al Jammal Joseph Korban
Jean Saba Alexander Tarazi
Civil and Environmental Engineering American University of Beirut
Riad El-Solh Beirut [email protected], [email protected], [email protected], [email protected]
Abstract In this paper we are looking to study the effects of incorporating hemp fibers into clay soil. Hemp fibers, being sustainable and of a reasonably high strength are expected to act as a good soil reinforcement that will hopefully improve the stress-strain response as well as shear strength of clayey soils, which is of crucial importance for many geotechnical applications like slope stability foundation. Our objective is to study the improvement in stress-strain response of the hemp-clay by varying the lengths and weight percentages of the hemp in the clay samples. Using our results we will find the proper confining factors that will yield best strength. Unconsolidated undrained compression triaxial tests (UU tests) were used in an attempt to find the proper factors. By finding the optimum water content of the soil in order to obtain the maximum dry density, a standard proctor compaction test was performed, after which variations in the hemp weight and length were tested. We will be using a sample size of 14.2cm x 7.1cm. The hemp will also be cut up into lengths of 3cm and 5cm. Also different hemp to clay weight ratios of 0.5%, 0.75%, 1.00%, and 1.25% will be used.
I. INTRODUCTION
In the past decade, the world has become increasingly aware of the environmental crisis caused by human activity. It is therefore our roles as engineers to find solutions in order to minimize harmful effects on our planet and to protect our environment. Steel fibers are often used for soil improvement all around the world, however recent studies have shown that a more environmental friendly solution exists. Natural fibers also have a tendency to increase strength in concrete blocks and soil and could eventually replace non-natural fibers. The fiber of particular interest is hemp, which is normally used for industrial purposes such as paper, textiles, clothing, biodegradable plastics, health food and bio-fuel. Hemp is legally planted in different countries across the world such as Spain, China, Japan, France and Lebanon and grows relatively fast. Using this type of fiber in improving soil strength would encourage farmers to grow hemp plants, which doesn’t need pesticides or chemical fertilizers. Moreover, studies show that hemp replenishes the soil with nutrients and nitrogen and can therefore be beneficial to our environment. Hemp would also be a cheap alternative to reinforcing soil strength: “Preliminary feasibility studies done by the UNDP and the Lebanese ministry of agriculture show that the cost to produce industrial hemp is 79$ per donum (1000 m2 and non-irrigated lands) and the corresponding products value is 192$” (Elie Awwad, 2011).
The testing program for this study comprises conducting several unconsolidated undrained compression triaxial tests (otherwise known as UU tests) on samples of clay in order to determine the change in stress-strain behavior and understand the effects of hemp fibers on soil strength.
II. Literary Survey In order to begin with our experiments on testing the effect of hemp reinforced soils, we read several published papers on which helped us better understand which experiments to use and what to expect: Properties of hemp fibers from Elie Awwad research: During his research on Hempcrete, Dr. Elie Awwad and his colleagues have studied the properties of hemp fibers and how to use these fibers in order to reinforce concrete blocks. The results showed specific improvement and are prone to further studies on the topic. Information regarding the hemp fibers and how they were used are as follows:
A small quantity was imported from Stemergy renewable fiber technologies, Canada.
The hemp fibers were mainly imported from the Hemp-Traders, LA, USA although local hemp fibers were used.
The hemp fibers were imported as long fibers but were then cut manually to 3cm pieces before being used.
Hemp fibers have a modulus of elasticity ranging from 38–58 GPa and a tensile strength of 591–857 MPa (Sedan, 2008).
Fiber lengths and diameters varied and were on the average 30 mm and 0.6 mm, respectively.
The hemp fibers have a density of about 1400 kg/m3. This density was used to calculate the weight of the fibers during the experiment.

173
Other natural fibers were also used such as banana and palm industrial fibers however hemp fibers showed the best results regarding to strength.
The hemp fibers were treated and soaked in a sodium hydroxide solution (NaOH) at 6% by weight for 48 hr. After soaking, the fibers were washed with water and left to dry. Based on the literature review, the use of natural fibers in cement or concrete paste was not effective unless treated to remove all organic impurities. Whether this procedure could benefit the use of hemp in soil is yet to be seen.
The variables in the testing program included the fiber type used, the volumetric percentage ratio of the added fibers, and the reduction in the amount of coarse aggregates measured as a percentage of the volume of concrete.
All test samples were replicated three times for better statistical representation.
Further studies on articles involving reinforced clay gave us results, which further progressed our understanding of this method of reinforcement. We will base our expectations on the following conclusions from other researchers:
Reinforcing improves the mechanical properties of
soil, which means the existence of geotextiles increases the peak strength, axial strain at failure and decreases strength loss after the peak strength. The improvement of mechanical properties increases as the number of fibers increases (R. Noorzad et al, 20120).
The unconfined compressive strength increased with the inclusion of polyester fibers of 0.5–2% of 3 mm size. The increase in strength was about 50–68% (Arvind Kumar et al, 2006).
In all cases of loading, an improvement in strength is
noticed in reinforced silty clay soil. The benefit can reach an average value around 20% under confinement. A fiber-reinforcement of 0.6% permits to increase strength-limiting values of 100% in tension (Arvind Kumar et al, 2006).
The initial Young modulus of the silty clay increases
in all cases, giving a more rigid material (Arvind Kumar et al, 2012).
In general, synthetic fibers increased the cohesion values. The internal friction angle value of each reinforced sample increased in a non-linear way (Saut Akbulut et al, 2007).
III. Scope of Work
Below is a step-by-step process of the tasks that we
have done in order to test our samples.
Crushing the clay clumps and filtering it through
the no.10 sieve.
Cutting the hemp fibers into the two sizes that we
used: 3cm and 5cm.
Finding optimum water content, diameter and
size of the sample (14.2cm by 7.1cm).
Determining the energy needed for compaction.
Determining the 9 different samples we need by
varying the hemp content and size, using hemp to
clay weight ratios of 0.5%, 0.75%, 1.00% and
1.25%
Mixing the 3 ingredients (hemp, water and clay)
Preparing the PVC tube for compaction.
Manually compacting the sample and preparing it
for tri-axial testing.
Performing unconsolidated undrained
compression triaxial tests on our samples.
IV. Sample Preparation
We first brought a large amount of clay and dried it in the oven for several days. We then crushed the clay by putting it in the crushing machine. The next step was to use a number 10 sieve in order to get fine particles that could be used for our triaxial tests. In order to find the optimum water content, we took 5 different samples with different water contents (7%, 10%, 13%, 16% and 19%). Each sample was compacted, and then weighed before and after drying in the oven. Using the wet and dry weights, the new water content was determined and plotted against the graph of the dry density. The optimum water content was found to be approximately 22%. While finding the optimum water content, the mold used had a diameter of 10cm and a height of 20cm and had to be compacted with 26 blows. However, in our design phase we opted to use a PVC tube with a 7.1mm diameter and a 14.2mm height that we would manually compact. This method was found to be more convenient for tri-axial testing. We also had to find the number of drops that would give us the same total energy as that delivered by compaction machine for the standard 10x20cm mold. The required compactive effort using our selected hammer is determined as:

174
E = number of layers*number of blows*weight of hammer*height of drop/Volume of mold => 3 layers*25 blows*5.5lb*1ft/917.7cm3 = 3layers*new number of blows*10lb*1.5ft/732 cm3
We a obtained a number 8 of blows from our calculations but their was an experimental loss of energy using PVC tubing rather than a metallic mold. After we conversed with our professors and prepared a few trial compactions, we observed that 15 blows gave us a better compactive effect. We decided the most efficient way to see how the hemp is performing was to vary the size and the content in 9 different samples. The first sample was a control sample that didn’t have any hemp, 8 other samples included 3cm and 5cm long hemp but varied with the percent of hemp used by weight (0.5%, 0.75%, 1%, 1.25%). Once we added an appropriate amount of water to the dry clay in order for it to reach the optimum water content, we add the hemp fibers manually and mixed the soil and fibers in order to obtain an isotropic distribution as shown in Fig 1.
Figure 1: Wet Soil Mixed with Hemp Fibers For each sample, we compacted three layers of soil mixed with hemp using the PVC tube. The PVC tube was cut into to semi-circular halves that were bound together with tape and metallic rings in order to handle the compactive energy of the hammer. Oil was added to the inner sides of the tube in order to facilitate the extraction of the sample.
Figure 2: PVC Tube
Each sample was then trimmed to approximately 14 cm, then measured and weighed, while using the trimmings to determine the actual water content. We then conducted the unconsolidated undrained triaxial tests (UU triaxial test) on all of our samples in order to obtain the stress strain relationships.
Figure 3: UU Triaxial Testing
V. Results and Analysis
To help us prove the strength improving effect of hemp, we tested two clay samples without hemp at two different water contents. We then compared these samples with the hemp-reinforced samples. The results of the triaxial tests helped us understand the improvements of the hemp at both the optimum and wet of the optimum water content.
Table 1: Water content per sample
Sample Water Content Sample Water Content Control Clay 1 23% 3cm, 1.25% 27.7% Control Clay 2 29% 5cm, 0.5% 25.6% 3cm, 0.5% 31% 5cm, 0.75% 31.8% 3cm, 0.75% 31.6% 5cm, 1% 25% 3cm, 1% 32.6% 5cm, 1.25% 33.4%
We graphed the triaxial test results according to these water
contents. According to our previous readings and research we
found that the expected effect of the hemp was to increase not only the strength of the clay samples but also their ductility. We also determined that the longer 5cm lengths of hemp should give us stronger samples due to their ability to better

175
arrest the shearing failure plane during tri-axial testing. Also, we assumed that the more percentage of hemp by weight the stronger the sample, this being due to the fact that there will be more hemp arresting the shearing failure plane.
According to the graphed results we were able to
analyze the effects of the hemp on the clay. Firstly, it is evident that the slopes of the samples with hemp are steeper than those without hemp, meaning that they have an improved modulus of elasticity that results in less deformation under and increasing load. Secondly, in Fig. 6 we found a clear increase in total load bearing capacity due to the ability of the hemp to arrest the shearing failure plane as mentioned before.
The main determining factor in our testing was the
water content. The large variation in the different sample’s water contents caused a large variation in the way the samples behaved. The higher the water contents the lower the maximum load bearing capacity and vice versa. This meant that we could only compare samples with approximately the same water content. For this reason we prepared two clay only samples with different water contents.
Figure 4: Stress-Strain of 3cm, 0.75% and 1.25%
Figure 5: Stress-Strain of 3cm, 0.5% and 1%
In Fig. 4 our expected results were evidently shown in the 1.25% 3cm length sample. However, the 0.75% sample did not perform as predicted due to its higher water content.
In Fig. 5 we could not replicate the exact results as the
water contents varied greatly from the clay control sample, however the modulus of elasticity is still greater than the clay sample.
Figure 6: Stress-Strain of 5cm, 0.5% and 1%
Figure 7: Stress-Strain of 5cm, 0.75% and 1.25%
In Fig. 6 the water contents of the samples were
roughly equal we were able to clearly analyze the graph. Strength gains as well as very good examples of increased ductility are evident. The improvement of ductility was caused by the hemp fibers holding or arresting the shear plane not allowing the clay to completely fail.
In Fig. 7 we also had varying water contents that
caused a decrease in strength even though the samples remain quite ductile.

176
VI. Conclusion
The main experimental error we had was trying to
exact the water content of all the samples. Different samples with dissimilar water contents could not be compared. From the results we have obtained we found that there were strength gains as well as a very good improvement in ductility of the samples. On the other hand, at a water content wet of the optimum we did not see many positive outcomes. Continued research on this topic at a larger scale could give us better and more accurate results.
ACKNOWLEDGMENT
We would like to thank Dr. Shadi Najjar for his continued help and guidance during our experimental research and thank Dr. Helmi Khatib for his advice and assistance in the soil mechanics laboratory.
REFERENCES [1] Suat Akbulut, Seracettin Arasan, Ekrem Kalkan, Modification of clayey soils using scrap tire rubber and synthetic fibers, Applied Clay Science, Volume 38, Issues 1–2, December 2007, Pages 23-32, ISSN 0169-1317, 10.1016/j.clay.2007.02.001. (http://www.sciencedirect.com/science/article/pii/S0169131707000336) [2] Arvind Kumar, Baljit Singh Walia, Jatinder Mohan, Compressive strength of fiber reinforced highly compressible clay, Construction and Building Materials, Volume 20, Issue 10, December 2006, Pages 1063-1068, ISSN 0950-0618, 10.1016/j.conbuildmat.2005.02.027. (http://www.sciencedirect.com/science/article/pii/S095006180500125X) [3] Awwad, E. (2011) “Sustainable building systems: alternative construction materials”. [4] Awwad, E., Mabsout, M., Hamad, B., Farran, M., Khatib, H.(2012).” Studies on fiber-reinforced concrete using industrial hemp fibers”. (http://dx.doi.org/10.1016/j.conbuildmat.2012.04.119 [5] R. Noorzad, S.H. Mirmoradi, Laboratory evaluation of the behavior of a geotextile reinforced clay, Geotextiles and Geomembranes, Volume 28, Issue 4, August 2010, Pages 386-392, ISSN 0266-1144, 10.1016/j.geotexmem.2009.12.002. (http://www.sciencedirect.com/science/article/pii/S0266114409001289)

177
Strengthening of Existing Structures: “Grand Theatre” Case Study
Haya Al Doori, Krystel Antoun, Paul F. Codouni, Jonathan El-Soueidi, Marie Valerie Sadaka
Civil and Environmental Engineering American University of Beirut Riad El Solh, Beirut, Lebanon
[email protected], [email protected], [email protected], [email protected], [email protected]
Abstract- Rehabilitation of a structure necessitates strengthening of its columns, beams, footings and all structural elements that allow the building to safely carry larger loads and stresses without failing. Strengthening can be done by means of several methods that include both conventional and advanced techniques. This project aims at comparing these different techniques and recommending one or more suitable techniques for use in the rehabilitation of Grand Theatre, an old hotel in Downtown Beirut. The aim of rehabilitation is to preserve this historical building which, in addition to its unique architecture, has its own role in the legacy of Downtown Beirut. The scope of this project is a comparative study of the rehabilitation of specific members in the structure, namely (1) a typical column supporting the dome, (2) a typical beam element supporting the balcony and (3) a beam typical of those bordering slabs. The method of study used is outlined below: First, the paper summarizes an analysis of the existing members. In addition to the dimensions of the members under analysis, information about the current state of materials (such as the strength of concrete) is presented. The dimensions were obtained on site and from a recent architectural survey of the building and other information was obtained on site following conventional methods of measuring these. Secondly, a comparison of different techniques for rehabilitation of Grand Theatre is undertaken. The method studied are (1) strengthening by steel work and consolidation, (2) strengthening of reinforced concrete by enlarging sections, (3) use of fiber reinforced polymers. Each of these is presented with its advantages and disadvantages with respect to the structure under analysis. Both the analysis of the existing structure and the design for rehabilitation will be done both manually and through modeling on ETABS, a computer program around the world for structural analysis. Lastly, a feasibility study will be undertaken, comparing these options to each other and to the do-nothing option. As usual with such construction projects, the criteria for this study will be cost, quality and timeliness. For this project, rehabilitation using FRP proved most suitable because of its strengthening properties and the fact that it strengthens without affecting the architecture of the building.
I. INTRODUCTION
Much of Beirut’s legacy lies in its historic buildings, which were so noteworthy that they allowed Beirut to be dubbed “The Paris of the East”. Built in the 1930’s, Grand Theatre Hotel in downtown Beirut had its own part to play in Beirut’s legacy.
Grand Theatre Hotel was so highly damaged during Lebanon’s Civil War that retiring its use was obvious to all. A few decades later, Solidere is looking to renovate it – adding to its long list of renovated structures in Beirut.
A survey was conducted to assess the current structural status of the building.
Renovating this structure can be done in many different ways – this paper aims at comparing the different rehabilitation methods in terms of their effectiveness in this specific case. Effectiveness is measured by the ability of the method to fulfill code requirements that pertain to the safety and serviceability of the structure. Building design code has changed greatly since the time when Grand Theatre Hotel was built. One of the major changes includes the requirement of all buildings in Beirut to be built to resist seismic hazards – Beirut is classified as a Zone III area (the classification pertaining to the highest risk) with regard to its vulnerability to earthquakes.
The different methods are compared by applying these to typical columns in the structure. The parameters needed for were obtained from different sources. For example:
Dimensions: Recent architectural survey Bending moment (bmd), shear (sfd) and axial force
(afd) diagrams: Part of the building was modeled using ETABS software to obtain these diagrams. (see fig. 1 below)
II. LITERATURE SURVEY
A. Consolidation: Consolidation has four levels:
Safeguarding: Provides safety and prevents partial or total collapse of building
Repairing: Mainly concerned with repairing damages caused by weather and time
Reinforcing: Process by which old structure is
Figure 1 Shear Force Diagram from ETABS

178
modified in order satisfy requirements that are no longer satisfied due to one of 3 reasons:
1. Code was updated 2. Increase in service loads 3. Faulty design or errors in execution
Reconstruction: Process by which the structure or part of the structure is removed and reconstructed. The different types of reconstruction are:
1. Gutting: The façade is left intact but the rest of the building is reconstructed
2. Insertion: Introduction of new structural elements within the existing structure (e.g. new intermediate floors)
3. Addition: Introduction or enlarging of elements beyond the limits of the additional structure (e.g. addition of a story at the top of the building)
B. Traditional Methods of Rehabilitation Bracing:
Steel braces are bolted between elements in order to reduce the maximum moments these elements resist by decreasing their span. Effective in protecting elements from buckling. These often used in the rehabilitation of a structure in resisting seismic loads. Steel Jacketing:
Steel plates are placed along the surface area of columns and beams in order to increase the capacity of this column or beam by confining it (and thus increasing the effectiveness of unconfined element) and allowing it to resist buckling and/or bulging of reinforcing steel bars. These plates also help in bearing axial and shear loads (leading to a reduction in the maximum moment this column or beam feels). Concrete Jacketing:
Concrete jacketing is basically the enlarging of a concrete element. This is done by adding steel bars and formwork and then pouring or shotcreted into the formwork (as shown in fig. 2 below). It acts similarly but less effectively to steel jacketing.
C. Advanced Method of Rehabilitation: Fiber Reinforced Polymers
The advanced method that will be studied is the use of Fiber Reinforced Polymers (FRP) in strengthening.
According to [2]: “FRP can be defined as a layer (or layers) of fibers embedded in a matrix of epoxy resin and bounded to (into) the concrete.”
The main advantages of using FRP are: High strength to weight ratio – FRP has a high tensile
strength and is virtually weightless Ease of use: it is easy to apply to elements High Resistibility to corrosion
There are three different types of FRP used in strengthening are carbon (laminate and sheet), glass and aramid. They differ in their E-Modulus and the strain they can bear. See Table I at the top of this page.
FRP can be used in many different applications. Applications differ in:
The type of structural element itself (beam, column or slab)
The strengthening requirements (improvement of confinement, shear, flexure, axial load, ductility and durability).
The above factors help in determining the direction and method of wrapping, in addition to the number of wraps of FRP must be determined.
Shear Strengthening:
The shear strength of existing concrete members can be increased either by wrapping or partially wrapping the members. The additional shear strength provided by the FRP system is affected by several factors that include the geometry of beams or columns, scheme of wrapping and the existing concrete strength. See fig. 3 below for different wrapping schemes for FRP.
Flexural Strengthening:
To increase flexural strength, fibers oriented along the length of the element are added. The design of this application urges the use of assumptions:
TABLE I PROPERTIES OF DIFFERENT FIBER REINFORCED POLYMER
Modulus (GPa) Ultimate Strain (%) Carbon (laminate) 165-215 1.3-1.4 Carbon (sheet) 240-640 0.4-1.6 Glass (sheet) 65-75 4.3-4.5 Aramid (sheet) 120 2.5
Figure 3: Typical wrapping schemes for shear strengthening using FRP
Figure 2 Concrete Jacketing

179
Design calculations are based on the actual
dimensions, internal reinforcing steel arrangement, and material properties of the existing member being strengthened.
The maximum usable compressive strain in the concrete is 0.003;
The tensile strength of concrete is neglected; and The FRP reinforcement has a linear elastic stress-
strain relationship to failure. Three factors are important in the design of flexural
strengthening: strength level, strain level and stress level.
III. SITE INVESTIGATION
Current Structural Status of Grand Theatre Hotel: Visual inspection with a prominent civil engineer and Elie
Hantouche, PhD revealed the following: The condition of the structure is far from usable: Flights of stairs are completely torn down. Honeycombing in walls In slabs: bottom cover non-existent exposing
bottom steel Within columns spalling of concrete is apparent
revealing steel which bulged out. Steel reinforcement bars used were smooth rather
than Cold Twisted Deformed as currently required by building code
Steel appeared to be corroded Aggregates used were rounded stones (River gravel)
– Also does not comply to regulations
History of Renovation: This structure went through several attempts at renovation
since it was destroyed. Find below the renovations already performed in the 1990’s:
Excavation was performed to install micropiles. Footings were enlarged. However, these were not backfilled in and are visible to the naked eye.
To safeguard the structure for proper rehabilitation, slabs were removed in order to reduce dead load of the structure.
Steel braces were installed between columns at midspan
Some columns were jacketed with concrete. This is obvious because of the quality of the concrete here.
IV. ETABS MODEL
A. Loads and dimesions: Loads:
LL = 3.5 T/m2
DL = 1.5 T/m2
Dimensions: Lower Balcony Beam: 40×20 cm Other beams: 40×15 cm Square Columns: 60×60 cm Circular Columns: 40 cm diameter
B. Earthquake Loading: Loads at nodes between columns and slabs: (in x-direction and y-direction)
As in [4], the following formula was used: 𝑽𝑽 𝒁𝒁 𝑰𝑰 𝑫𝑫𝒔𝒔 𝒔𝒔 𝒘𝒘
V= total design base shear along any of the two principal direction of the structure Z = seismic zonation factor I = occupancy and importance factor Ds =structural dynamic behavior depending on the structural system used S = soil coefficient β = spectral coefficient w= weight of the structure
𝜷𝜷 𝟏𝟏 𝟐𝟐𝟑𝟑𝑻𝑻𝟎𝟎 𝟕𝟕
T= fundamental period of vibration of the structure 𝑻𝑻 𝜶𝜶𝑯𝑯𝟑𝟑 𝟒𝟒
α= 0.085 for steel moment-resisting frames = 0.07 for reinforced concrete moment-resisting frames = 0.05 for other building H= total height of structure (m) V=7.55 T per node in each direction
V. STRENGTHENING BY CONVENTIONAL METHODS
A. Column Strengthening:
The design of a typical circular column could be performed by reinforced concrete jacketing or steel jacketing. In accordance, the following procedure should be carried out. This first involves roughening the surface to 5mm amplitude, constructing a cage with lateral ties and finally casting concrete from a hole in the top slab. Moreover, the area of jacket is calculated such that the entire jacketed column is able to resist the total axial load upon load increase. Pu= capacity of existing column + capacity of new jacket (1) where, Pu=ultimate axial load (tons) 𝒄𝒄𝒂𝒂𝒑𝒑𝒂𝒂𝒄𝒄𝒊𝒊𝒕𝒕𝒚𝒚 𝒐𝒐𝒇𝒇 𝒏𝒏𝒆𝒆𝒘𝒘 𝒋𝒋𝒂𝒂𝒄𝒄𝒌𝒌𝒆𝒆𝒕𝒕 𝟎𝟎 𝟖𝟖∅𝒇𝒇𝒄𝒄′ 𝑨𝑨𝒏𝒏𝒆𝒆𝒘𝒘 𝟎𝟎 𝟖𝟖∅𝝆𝝆𝒇𝒇𝒚𝒚𝑨𝑨𝒏𝒏𝒆𝒆𝒘𝒘 (2) where, ∅= strength reduction factor ρ= actual ratio of tension steel to effective concrete area f’
c= specified compressive strength of concrete (kg/cm2) fy=specified yield strength of non prestressed concrete (kg/cm2) Anew= new cross-sectional area (cm2)

180
𝑨𝑨𝒏𝒏𝒆𝒆𝒘𝒘𝝅𝝅𝑫𝑫𝒏𝒏𝒆𝒆𝒘𝒘𝟐𝟐
𝟒𝟒 − 𝝅𝝅𝑫𝑫𝒐𝒐𝒍𝒍𝒅𝒅𝟐𝟐
𝟒𝟒 (3) where, Anew= new cross-sectional area (cm2) Dnew= new diameter/width of the cross section (cm) Dold= old diameter/ width of the cross section (cm)
For typical column of diameter 60 cm, lower rectangular
column, 40cm in diameter for mid and upper circular column. The capacity of the new jacket is found to be 881.4 tons for the lower rectangular column, 731.4 tons for mid circular column and 591.4 tons for upper circular column by using (2). Based on the above calculation the new area Anew for the lower rectangular column are 4888 cm2, 4056 cm2 for the mid circular column and 3278 cm2 for the upper circular column by using (3). Therefore, the width of the new rectangular column is 90cm, while the diameter of the mid circular column is 60cm; upper circular column is 50cm by referring to (3). B. Flexural Strengthening
Jacketing using cement based composites The main purpose behind jacketing is to increase the strength
of the beam. Considering the design of a typical beam, the following calculations should be performed. Starting with calculating the ultimate applied load as well as the ultimate moment capacity using the following formulas: 𝑾𝑾𝒖𝒖 𝟏𝟏 𝟒𝟒 𝑫𝑫𝑳𝑳 𝟏𝟏 𝟕𝟕 𝑳𝑳𝑳𝑳 (4) where, Wu= ultimate axial load (T/m) DL=dead load (T/m) LL=live load (T/m) 𝑴𝑴𝒖𝒖𝒄𝒄𝒂𝒂𝒑𝒑𝒂𝒂𝒄𝒄𝒊𝒊𝒕𝒕𝒚𝒚 ∅𝑨𝑨𝒔𝒔𝒇𝒇𝒚𝒚 𝒅𝒅 − 𝒂𝒂 𝟐𝟐 (5) where, Mu= ultimate moment capacity (T.m) fy= specified yield strength of non prestressed steel (kg/cm2) d= depth of section to neutral axis(cm) 𝒂𝒂 𝑨𝑨𝒔𝒔𝒇𝒇𝒚𝒚
𝟎𝟎 𝟖𝟖𝟓𝟓𝒃𝒃𝒇𝒇𝒄𝒄′ (6)
where, As= area of steel (cm2) b= width of the section (cm) f’c=specified compressive strength of concrete (kg/cm2) The design for a typical lower balcony beam is as follows. The ultimate load Wu=6.56 T/m based on (4) and the moment Mu=16.3 T.m Accordingly, the moment capacity Mu= 9.0 T by using (5) and Asnew= 5 cm2 based on (7).
The ultimate moment capacity 𝑴𝑴𝒖𝒖𝒄𝒄𝒂𝒂𝒑𝒑𝒂𝒂𝒄𝒄𝒊𝒊𝒕𝒕𝒚𝒚 calculated should be less than the beam’s ultimate moment Mu to allow redesign of the larger section As new using the formula below: 𝑴𝑴𝒖𝒖𝟎𝟎 𝟗𝟗 𝑨𝑨𝒔𝒔 𝒐𝒐𝒍𝒍𝒅𝒅 ∗ 𝒇𝒇𝒚𝒚 ∗ 𝟎𝟎 𝟗𝟗 𝒅𝒅𝒐𝒐𝒍𝒍𝒅𝒅 𝑨𝑨𝒔𝒔 𝒏𝒏𝒆𝒆𝒘𝒘 ∗ 𝒇𝒇𝒚𝒚 ∗ 𝟎𝟎 𝟗𝟗 𝒅𝒅𝒏𝒏𝒆𝒆𝒘𝒘 (7) where, Mu= ultimate moment at section (T.m) Asold= old area of steel (cm2) dold= old diameter of the cross section (cm) Asnew= new area of steel (cm2) dnew= new diameter of the cross section (cm) fy= specified yield strength of non prestressed steel (kg/cm2) Finally, calculating the new ultimate moment Mu based on the averaged value of dnew and dold. Where dnew= 50cm and dold= 15cm averaging both would give a new ultimate moment Munew=17.6 T.m
Shear Strengthening Various methods of shear strengthening can be applied. However, we will be considering conventional stirrups with concrete jackets such that: 𝑽𝑽𝒄𝒄 𝟐𝟐 𝒇𝒇𝒄𝒄′ 𝒃𝒃𝒘𝒘𝒅𝒅 (8) where, Vc= nominal shear strength provided by concrete with steel flexural reinforcement (tons) f’c=specified compressive strength of concrete (kg/cm2) bw =web width or diameter of section (cm) d= depth of section (cm) 𝑽𝑽𝒖𝒖 𝒅𝒅 𝒂𝒂𝒘𝒘𝒂𝒂𝒚𝒚
𝑾𝑾𝒖𝒖 𝑳𝑳−𝟐𝟐𝒅𝒅 𝟐𝟐 (9)
where, Vu @ d away= ultimate shear strength at distance d (tons) Wu= ultimate axial load (T/m) L= clear span of the beam (m) d= depth of the beam (cm) 𝑨𝑨𝒗𝒗𝒔𝒔 𝒏𝒏𝒆𝒆𝒘𝒘 𝑨𝑨𝒗𝒗𝒔𝒔 𝒆𝒆𝒙𝒙𝒊𝒊𝒔𝒔𝒕𝒕𝒊𝒊𝒏𝒏𝒈𝒈 𝑨𝑨𝒗𝒗𝒔𝒔 𝒎𝒎𝒊𝒊𝒏𝒏 10)
where, Av= area of shear reinforcement (cm2) s= spacing between steel stirrups (cm) Accordingly, Vc=5 Tons before jacketing by using (8) and (9) respectively. Hence, dnew=40cm. For safety reasons Vc is assumed not to increase in value by the additional concrete jacketing and the new Vu at d away= 12.0 Tons. Therefore (Av/s)new=0.042 where the new width bw=50cm. As a result the stirrups used will be in the form of ∅𝟏𝟏𝟎𝟎 𝟒𝟒𝟎𝟎𝒄𝒄𝒎𝒎 by referring to (10)

181
VI. STRENGTHENING USING ADVANCED METHOD (FRP) Strengthening can be performed using advanced methods such as Fiber Reinforced Polymer. In fact, whether carbon, glass or aramid, the FRP is used for strengthening of concrete structures in flexure, shear and axial compression. The fiber used is generally bonded to the concrete using epoxy resin.
A. Column Strengthening : The FRP confinement increases the axial strength of columns by preventing buckling of the longitudinal steel. Since the FRP method still needs further research in order to increase axial strength of rectangular column, (11), (12) and (13) are only used for circular columns as mentioned in the ACI committee 440. 𝑷𝑷𝒖𝒖 𝟎𝟎 𝟖𝟖𝟓𝟓 ∅ 𝟎𝟎 𝟖𝟖𝟓𝟓 𝟎𝟎 𝟗𝟗𝟓𝟓 𝒇𝒇′𝒄𝒄𝒄𝒄 𝑨𝑨𝒈𝒈 − 𝑨𝑨𝒔𝒔𝒕𝒕 𝑨𝑨𝒔𝒔𝒕𝒕 𝒇𝒇𝒚𝒚 (11) where, Pu= ultimate axial load at section (Ton) ∅= strength reduction factor 𝒇𝒇′ 𝒄𝒄𝒄𝒄 =apparent compressive strength of confined concrete(kg/cm2) And
𝒇𝒇′𝒄𝒄𝒄𝒄 𝒇𝒇′𝒄𝒄 −𝟏𝟏 𝟐𝟐𝟓𝟓𝟒𝟒 𝟐𝟐 𝟐𝟐𝟓𝟓𝟒𝟒 𝟏𝟏 𝟕𝟕 𝟗𝟗𝟒𝟒𝒇𝒇𝒍𝒍𝒇𝒇′ 𝒄𝒄
− 𝟐𝟐 𝒇𝒇𝒍𝒍𝒇𝒇′ 𝒄𝒄
(12)
where, fl= confining pressure due to FRP jacket (kg/cm2) ∅= strength reduction factor And 𝒇𝒇𝒍𝒍
𝟐𝟐 𝒏𝒏𝒇𝒇 𝒕𝒕𝒇𝒇 𝑬𝑬𝒇𝒇𝑫𝑫 ∈𝒇𝒇𝒆𝒆 (13)
where, fl= confining pressure due to FRP jacket (kg/cm2) nf=number of layers tf= nominal thickness of one ply of the FRP reinforcement (cm) Ef= tensile modulus of elasticity of FRP (kg/cm2) ∈𝒇𝒇𝒆𝒆= effective strain level in FRP reinforcement; strain level attained at section failure (cm/cm) 𝑫𝑫= diameter of column (cm) When computing the above calculations for circular columns of 50 cm diameter, the multiple iterations yields to the placement of 4 layers of cFR. Note that the cFRP used has a nominal thickness of 0.2mm and a tensile modulus of elasticity of 2.3*106 kg/cm2. B. Flexural Strengthening : Bond failure between the FRP sheet and the concrete can occur, and so two conditions are required to be checked:
the strain in the FRP at nominal flexural strength must be compared to the strain in the FRP at ultimate flexural strength :
∈𝒇𝒇 ∈𝒇𝒇𝒖𝒖
the increase in strength due to FRP must be limited: ∅𝑴𝑴𝒏𝒏 ≥ 𝟏𝟏 𝟐𝟐𝑴𝑴𝑫𝑫𝑳𝑳 𝟎𝟎 𝟖𝟖𝟓𝟓𝑴𝑴𝑳𝑳𝑳𝑳
In order to do so, below are the sample calculations for a rectangular reinforced concrete cross-section. First, we will consider the following which is at equilibrium: 𝑨𝑨𝒔𝒔 𝒇𝒇𝒚𝒚 𝑬𝑬𝒇𝒇 ∈𝒇𝒇𝒆𝒆
𝒕𝒕𝒇𝒇𝒍𝒍𝒂𝒂𝒚𝒚𝒆𝒆𝒓𝒓 𝒏𝒏𝒇𝒇 𝒘𝒘𝒇𝒇 𝟎𝟎 𝟖𝟖𝟓𝟓 𝒇𝒇′𝒄𝒄 𝒃𝒃 𝜷𝜷𝟏𝟏 𝒄𝒄 (14)
Then c must be found to be able to calculate the Nominal Moment which yields to (15). 𝑴𝑴𝒏𝒏 𝑨𝑨𝒔𝒔 𝒇𝒇𝒚𝒚 𝒅𝒅 − 𝜷𝜷𝟏𝟏
𝒄𝒄𝟐𝟐 𝟎𝟎 𝟖𝟖𝟓𝟓 𝒏𝒏𝒇𝒇 𝒕𝒕𝒇𝒇 𝒘𝒘𝒇𝒇 𝑬𝑬𝒇𝒇 ∈𝒇𝒇𝒆𝒆 𝒉𝒉 −
𝜷𝜷𝟏𝟏𝒄𝒄𝟐𝟐 (15)
where, As= area of steel (cm2) fy= specified yield strength of non prestressed steel (kg/cm2) Ef= tensile modulus of elasticity of FRP (kg/cm2) ∈𝒇𝒇𝒆𝒆= effective strain level in FRP reinforcement; strain level attained at section failure (cm/cm) tf= nominal thickness of one ply of the FRP reinforcement (cm) nf=number of layers wf= width of the FRP reinforcing plies (cm) f’c=specified compressive strength of concrete (kg/cm2) b= width of the section (cm) β1 = ratio of the depth of the equivalent rectangular stress block to the depth of the neutral axis f’c=specified compressive strength of concrete (kg/cm2) c= distance from extreme compression fiber to the neutral axis (cm) h= overall thickness of a member (cm) After trial and error computations, it was found that 2 layers of FRP are enough to achieve ultimate moment strength of 25 T.m which is greater than the ultimate moment capacity. C. Shear Strengthening: Whether the members are completely wrapped or 3-sided wrapped (aka U-wrap), shear strengthening using FRP is very simple.
𝑨𝑨𝒗𝒗𝒇𝒇𝒔𝒔𝒇𝒇
𝟐𝟐 𝒏𝒏𝒇𝒇 𝒕𝒕𝒇𝒇 (16)
And 𝒇𝒇𝒇𝒇𝒆𝒆 𝑬𝑬𝒇𝒇 ∈𝒇𝒇𝒆𝒆 (17) where, Avf= area of FRP shear reinforcement with spacing s (cm2) sf= spacing FRP shear reinforcing (cm) nf=number of layers tf= nominal thickness of one ply of the FRP reinforcement (cm) ffe= effective stress in the FRP; stress level attained at section failure (kg/cm2) Ef= tensile modulus of elasticity of FRP (kg/cm2) ∈𝒇𝒇𝒆𝒆= effective strain level in FRP reinforcement; strain level

182
attained at section failure (cm/cm) Nevertheless, the strain varies depending on the wrap type as followed: For completely wrapped members: ∈𝒇𝒇𝒆𝒆 𝟎𝟎 𝟎𝟎𝟎𝟎𝟒𝟒 ≤ 𝟎𝟎 𝟕𝟕𝟓𝟓 ∈𝒇𝒇𝒖𝒖 (18) For 3-sided wrap: ∈𝒇𝒇𝒆𝒆 𝑲𝑲𝒗𝒗 ∈𝒇𝒇𝒖𝒖≤ 𝟎𝟎 𝟎𝟎𝟎𝟎𝟒𝟒 (19)
With 𝑲𝑲𝒗𝒗
𝑲𝑲𝟏𝟏𝑲𝑲𝟐𝟐𝑳𝑳𝒆𝒆𝟏𝟏𝟏𝟏𝟗𝟗𝟎𝟎𝟎𝟎∈𝒇𝒇𝒖𝒖
(20)
𝑳𝑳𝒆𝒆𝟐𝟐𝟑𝟑𝟑𝟑𝟎𝟎𝟎𝟎
𝒏𝒏𝒇𝒇𝒕𝒕𝒇𝒇𝑬𝑬𝒇𝒇 𝟎𝟎 𝟓𝟓𝟖𝟖 (21)
𝑲𝑲𝟏𝟏𝒇𝒇′ 𝒄𝒄𝟐𝟐𝟕𝟕 𝑴𝑴𝒑𝒑𝒂𝒂 𝟐𝟐 𝟑𝟑 (22)
𝑲𝑲𝟐𝟐𝒅𝒅𝒇𝒇−𝑳𝑳𝒆𝒆𝒅𝒅𝒇𝒇
(23)
where, ∈𝒇𝒇𝒖𝒖=design rupture strain of FRP reinforcement (cm/cm) Kv= bond-dependent coefficient for shear K1 = modification factor applied to Kv to account for the concrete strength K2 = modification factor applied to Kv to account for the wrapping scheme Le = active bond length of FRP laminate (cm) df= depth of FRP shear reinforcement (cm)
And finally,
𝒔𝒔𝒇𝒇 𝑨𝑨𝒗𝒗𝒇𝒇 𝒇𝒇𝒇𝒇𝒆𝒆𝒅𝒅𝒇𝒇𝒗𝒗𝒇𝒇
where, sf= spacing FRP shear reinforcing (cm) Avf= area of FRP shear reinforcement with spacing s (cm2) ffe= effective stress in the FRP; stress level attained at section failure (kg/cm2) df= depth of FRP shear reinforcement (cm) vf= nominal shear strength provided by FRP stirrups (kg) When using the U-wrap, the number of layers needed is 3 with a spacing of 15cm, while 2 layers are needed when using continuous U-wraps.
VII. FEASIBILITY STUDY
One of the prime objectives of this project is to provide a cost-effective solution for structural concrete elements rehabilitation while comparing the three different strengthening techniques considered in this study. The efficiency is a function of the increase in strength and the construction cost which accounts for the cost of materials, equipment needed during construction and labor. As mentioned before, the technique using FRP is the best one as far as strengthening is concerned, since it provides the highest increase in strength while preserving the original design. It doesn’t require a change in the sections of the structural elements; therefore it is more preferred from an architectural point of view where space is a major design constraint, in addition to the aesthetic advantage that this technique offers over the others. Moreover, the FRP method is faster in construction which makes it a more attractive solution
for time limited projects. Finally, this technique fails in terms of price competitiveness, being the most expensive technique. But after weighing its advantages and disadvantages, it can be considered as a feasible solution for this project.
ACKNOWLEDGMENT
This group would like to acknowledge the assistance and supervision of Dr. Elie Hantouche. Bureau Rodolphe Matar also gave valuable input about the site and existing conditions.
REFERENCES [1] Refurbishment by Steelwork. (n.d.). Retrieved from Arcelor Mittal:
http://www.arcelormittal.com/sections/fileadmin/redaction/pdf/Brochures/refurbishement_en.pdf
[2] Irwin, R., & Rahman, A. (2002). “FRP strengthening of concrete structures-design constraints and practical effects on construction detailing.”
[3] ACI Committee 440. “Guide for the Design and Construction of Externally Bonded FRP Systems for Strengthening Concrete Structures”. 2002.
[4] Harajli, Mohamed H. “Seismic Hazard Assessment of Lebanon: Zonation Maps, and Structural Seismic Design Regulations”. Oct 15, 1994.

183
Upgrading of a Deprived Community The Case of Al-Hay Al-Gharbi
Weam Al-Awar Amal Khawaja Maher Said Noura Sinno Zeina Wafa
Civil and Environmental Engineering Department American University of Beirut
(wea03, atk05, mns29, nms41, zww00) @aub.edu.lb
Abstract- This paper discusses a community based project in Al
Hay Al Gharbi in Sabra. The area is extremely deprived and lacks the basic necessities of a decent living. The two main targets are to intervene at the communal level and to propose a modification for a medical clinic in the area belonging to an NGO named Tahaddi. The Tahaddi health services have been offered in Al Hay Al Gharbi since the year 2011. Until recently, the clinic was serving approximately one thousand families, most medical help being offered by American University Hospital volunteer doctors. Due to the growth in population of Al Hay Al Gharbi, improving the clinic to accommodate this increase in demand is necessary. The paper includes short term improvements for the clinic’s existing floor and long term propositions of adding a second floor to further expand the clinic’s capacity. On the community level, the team proposes modifications to a model house on several levels: floors, roofs and greening. This process can be replicated to encompass the community as a whole.
I. INTRODUCTION The Civil and Environmental Engineering (CEE) Final Year
Project (FYP) group number eight of the class of 2013 opted for a community project based in Sabra in the suburbs of the capital city of Beirut. Initially, the project encompassed a comprehensive refurbishment plan of the community of Al Hay Al Gharbi in the Sabra area in such a way that would uplift the community socially, environmentally and health-wise. However, intervention in such an intricate community proved to be a complicated and costly process which involves a multitude of factors, an example of which is the unbiased and fair selection of houses to be renovated. As the team acquired more information regarding the feasibility of a large-scale intervention, the scope of the project gradually evolved from a direct massive communal scale to a process of addressing needs by priority after meticulous consideration of legal and ethical ramifications. Such an outcome is reached through proper need assessment and non-biased selection of houses to upgrade given the budget constraints. However, the fact that upgrading comes at a cost – especially for those having to pay more rent for their improved houses – the scope of the project was further modified to encompass the renovation of the Tahaddi clinic without a complete obliteration of the communal aspect of the project as shown in this paper.
The short-term scope of the clinic modification portion of the project encompasses structurally and functionally changing a number of rooms in the clinic in order to optimize the use of space and hence improve the clinic’s serving capacity. For this purpose, the team obtained the necessary measurements of the clinic dimensions as well as the concrete strength and reinforcement details of the structural. On the other hand, the
long-term scope for this aspect of the project would be to add a second floor to the clinic – through legally and financially feasible means – for administrative and social use. The implantation of the former would precipitate a change in the functional use of the rooms on the lower floor but would not, however, lead to a second structural alteration.
As for the communal aspect, intervention on the broad scale is not possible due to the overwhelming and constant increase in number of housing units. Therefore, a single housing unit is selected to serve as a prototype of the team’s vision. The proposed changes to this unit can then be extrapolated to the community as a whole.
This paper details the process of the community intervention plan at the level of flooring, roofing and greening presenting a sample improved house. Moreover, the Tahhadi clinic short-term and long-term renovations are explained with supporting drawings on both AutoCAD and Revit along with the structural calculations for flexural and shear design. The paper is then concluded with a cost analysis that shows an estimate of the costs for all the aspects of this project.
The following figure represents the location of the area in question within the city of Beirut.
Figure 1. Al Hay Al Gharbi within the Suburbs of Beirut.
Source: Google Maps
II. COMMUNITY INTERVENTION PLAN
A. Intervention Elements Given that this project is first and foremost a community-
based initiative, the intervention cannot be confined to the remodeling of the Tahaddi clinic but has to extend and have a significant effect on the community as well.
Beirut
Al Hay Al Gharbi

184
The proposed areas of intervention at the level of housing are floors, roofs and greenery. There are three scenarios to this refurbishment plan – all common in principle – varying in the scale of implementation: individual-based, cluster-based and community-based.
1) Floors: Given that space is a scarce commodity in Al Hay
Al Gharbi, the challenge lies in being able to ‘create’ it. Therefore, and as a means of making houses inaccessible from the ground level by water and rodents, the concept of ‘false floors’ – analogous to false ceilings – is proposed. False floors are floors elevated roughly 10 cm off the ground. The elevated flooring can be accomplished by planting micro-piles into the ground beneath the house. The pressure on the ground can be reduced by increasing the number of micro-piles/supports underneath the plywood sheet that mounts them as the ‘new’ flooring.
2) Roofs: Water is not available in the neighborhood due to
the absence of utilities. Therefore, residents have no water for domestic use. Residents simultaneously suffer from water seepage and ponding during the rainy season. The cheapest and most common form of roofing in the area is the use of corrugated metal sheets. These sheets – when not perforated – can be employed to serve as a water harvesting system. Consequently, one element of the intervention plan would be to replace the old run-down roofs with new corrugated metal sheets that are whole and can be slanted so that rainwater can slide on them into an installed pipe at their ends. Based on the scale of intervention, the collection system will differ: single tank under the elevated floor for individual-based intervention, shared barrels for cluster-based intervention and a common ‘well’ – to which collected water is delivered through a piping network – for community-based intervention.
3) Greening: Since there is a lot of concrete rubble in the
area, abandoned hollow blocks in the neighborhood can be used for greening. The blocks, when filled with soil and planted with colorful shrubs, not only add to the aesthetics of the area but also emit oxygen and purify the air. Furthermore, light vertical greening can be implemented on the walls of individual housing units and Tahaddi centers through spraying moss which is mixed with water, milk and water-retaining material.
B. Improved House
To implement the previously proposed intervention plan on a house, the team chose a run-down housing unit with a rather irregular shape so that extrapolation to other housing units does not need a lot of adjustments.
Fig.2 shows the house in its current state as modeled using Revit, while Fig.3 reflects the changes implemented on the original house so that it becomes a more comfortable and healthier medium for living.
Figure 2. Community house before improvement (Revit)
Figure 3. Community house after improvement (Revit)
The view in Fig.3 shows the new slanted corrugated metal roofs – collection pipe at their ends – installed door, instead of the void which currently serves as an entrance, and the greening around the house, using concrete hollow blocks.
III. TAHADDI CLINIC RENOVATION
A. Short-Term Clinic Renovations The clinic consists of one floor, four clinic rooms – some
used for medical purposes, others for counseling – one waiting area, one kitchen, one private toilet, one public toilet, one storage area and large front and back spaces.
Currently, and because of the massive Syrian refugees movement towards Lebanon, and particularly into Al Hay Al Gharbi – Syrians currently comprising 80% of the inhabitants – the need arises for extending the Tahaddi clinic to serve the growing demand.
In the short term, Tahaddi wishes to apply some modifications to the clinic in order to rearrange rooms and make more space for the patients. Fig.4 represents the different areas of intervention in the clinic, which involves the removal of certain elements and the addition of others.
Figure 4. Clinic renovation plan

185
The plan – in relation to the numbering in the Figure 8 – entails the following: 1. Remove the block partition wall: The block wall is
considered to be purely partitional (i.e. it carries no loads). Hence, removing the wall is a safe process.
2. Replace the old entrance door with a window: As this process only requires installing partition blocks from the ground up to partially fill the gap which currently forms the door, no structural adjustments/rehabilitation are required. The steel frame of the door needs to be removed delicately and with caution in order to avoid any damage to the adjacent blocks.
3. Change window to an entrance door: The window can be safely removed to provide room for the installation of the door. A steel beam is to be installed above the prospective door in order to provide additional support to the partition blocks above. Note that the old entrance door that was removed in step 2 could be the door installed in this step.
4. Add a window: This step entails a complicated installation process since the partition blocks above the top window level are unsupported. Thus, partition blocks some 20 cm above such a level should be braced. Once braced, the blocks directly beneath the bracing are removed providing room to either install a steel beam or pour a concrete beam. Once the beam is installed the window and its frame can be installed.
5. Replace the small window with a door (This step is similar to step 3).
6. Add a window: The window removed from step 5 can be used in this step. Adding the window is not a complicated process in this case and no strengthening is needed since the slab is of small dimensions.
7. Change direction of the door. 8. Add a gypsum partition wall between kitchenette and
toilet. 9. Add a gypsum partition wall for the new clinic that will be
added.
B. Long-Term Clinic Renovation The team’s vision for the second floor of the clinic is best
portrayed through the following CAD layout.
Figure 5. Tahaddi clinic second floor layout
The second floor serves as an administrative and recreational space for the Tahaddi volunteers and visitors – with a major focus on open spaces and greenery – as well as a green hub that will invite the people of the neighborhood to become more environmentally proactive.
Given that the second floor serves as a social and administrative space, the first floor’s functional use will have to be altered in order to maximize the number of medical spaces and facilities to better serve the community’s needs. Hence, the kitchen and toilet, along with the meeting/training room – previously downstairs – are to be relocated to the upper floor leaving room for more clinics/surgical rooms to take their place. On that floor, the toilet is strategically located on the west side of the clinic – where the septic tank is located – so that plumbing works are not extensive when extending the sewage pipes from the upper floor as shown in Fig.6 below.
Figure 6. Tahaddi clinic first floor layout as a result of the second floor
construction
This proposed change of use will provide the clinic with an optimum use of space on the ground floor with four clinics and a surgical room, not to mention a spacious entrance, a waiting room and greenery at the east side. The surgical room is provided with an exclusive door – other than the main entrance door – for cases of emergency.
The public toilet is preserved in the modified layout of the first floor because of the team’s understanding of the absence of toilet facilities in the neighborhood. Hence, this toilet can still be used by the visitors of the center as well as the people of the neighborhood.
The stairs is located at the southern side of the clinic so as not to interfere with the visitors’ circulation in and out of the clinic. It is not located as an internal element since there is no sufficient space for internal erection.
Furthermore, wavy shaped greenery is proposed, dictating path of circulation and adding aesthetic appeal to the clinic.
Windows are abundantly placed on the northern side of the clinic to make maximum use of the sunlight during the day without having to heavily rely on electrical/artificial lighting, given the absence of resources.
As evident from the figure above, the number of green spaces is maximized to facilitate the rainwater harvesting

186
procedure, by layering the soil in such a way that water drains and filters through the layers and is then relayed, using a pipe, to a collection system.
The roof of the new clinic is a green roof with lots of plantations and walkways and will play host to the already available generator and water tank.
The generator is to be placed on northwestern side of the clinic so that its emissions – although controlled – are not directed towards the greenery.
The water tank is to be placed on the southern side of the clinic. In the roof slab, pipes will have to be embedded to convey water from the water tank to the toilets and kitchen facilities in the northwestern side of the clinic.
Water from the rainwater harvesting can be occasionally used to recharge the water tank, thereby reducing water purchase costs.
A spiral staircase connects the upper west greenery to the roof.
All exposed spaces are equipped with rails so as to ensure individual safety on the roof. Fig.7 below shows a 3D modeling of the innovated health center.
Figure 7. View of the health center from the west (Revit)
C. Structural Calculation The existing columns and slab are to be checked for shear
and steel reinforcements to identify the need for strengthening. Fig.8 presents the existing slab and the beams to be added whose widths are determined after several iterations for values of b using (1).
Figure 8. GF roof slab with beams (AutoCAD)
The existing slab has a thickness of 12cm. The governing equation to be used to check the steel reinforcement is,
(1)
where: ∙ Mu = ultimate factored moment ∙ = 0.9, b = width of the element ∙ d = distance from top of the concrete to the center of
steel rebars ∙ = steel reinforcement ratio ∙ fy = steel yield length ∙ f’c = concrete compressive strength ∙ As = area of reinforcing steel.
The current slabs are assumed to have T12 bars (i.e. steel bars of diameter equal to 12cm) with a center-to-center spacing of 15cm. Using (1), Table I shows the live loads that each slab can carry (wu = ultimate load; wLL = live load).
TABLE 1 LIVE LOAD CARRIED BY SLABS 1, 2, 3 AND 4
Slab Width (m) wu (T/m2) wLL (T/m2) 1 3.67 1.37 0.31 2 3.46 1.54 0.41 3 3.56 1.46 0.36 4 3.79 1.29 0.26
Slabs 2 and 3 are the most critical slabs as they carry most of
the load. Thus, 2 I-steel beams will be installed to limit deflections. The steel beams, designed to be A36 Carbon Steel (fy = 36 ksi), are found to have a total height of 30.2cm, web thickness of 0.76cm, flange width of 8cm and thickness of 1.27cm. These beams have an area of 76.2cm2.
The existing slab, considered as one way slab, should be supported on beams, thus the need to construct new beams before adding the new floor. Table II below shows the flexural steel reinforcement in the new beams.
TABLE II STEEL REINFORMCENT IN BEAMS
Beam Length (m)
Width (cm)
Height (cm)
Steel Reinforcement
1 4.05 20 40 4T14 2 4.55 25 50 5T16 3 4.71 20 45 4T14 4 4.55 25 50 5T16 5 4.71 20 45 4T14 6 3.50 20 40 3T12
Equations (2) and (3) below are used to check for shear:
(2)
where: ∙ Vu= ultimate shear at the critical section ∙ Wu=ultimate factored load, ∙ L=span length and d as defined for equation (1).
Critical Column

187
(3) where: ∙ Vc= shear strength of concrete
∙ bw= width of beam ∙ f’c, and d as defined in equation (1).
The beams were checked for shear and minimum steel should be provided i.e. 2-leg 6 at 20.0 cm.
Concerning the second floor slab, it is proposed to design a
one way hourdis slab with thickness 23cm as shown in Fig.9.
Figure 9. First floor new roof (AutoCAD)
The one way slab is supported by 3 main beams shown in pink and 5 double ribbed beams shown in blue. Similar to the solid slab, after several iterations, the width of the ribbed beams was determined to be 45 cm and that of the main beams 50 cm. However, it is important to note that the width of the main beams turned out to be 30 cm by calculation and based on engineering judgment and Dr. Mabsout’s advice, a width of 50 cm is taken to have shallow beams with b>2d. Based on that, the quantities of steel for flexure are calculated, and shear reinforcement is checked for the new floor.
Table III below shows the results for the required flexural steel for the slabs. As for the shear reinforcement, it turns out that the slabs are safe without it. However, minimum steel should be provided which is T6 at 10 cm till L/5 of each span and then the rest of the slab will have T6 at 25cm.
TABLE III STEEL REINFORCEMENT FOR SLABS 1 AND 2
Slab Length (m)
Wu (T/m)
Bottom Steel
Top Steel
1 2.96 0.754 2T10 2T10 2 3.44 0.754 2T12 2T10
Tables IV and V below show the results for the required
flexural steel for all the beams.
TABLE IV STEEL REINFORCEMENT FOR BEAMS 1, 2 AND 3
Beam Span length (m)
Wu (T/m)
Bottom Steel
Top Steel
1
4.71 2.25 4T16 5T16 4.55 2.25 4T16 5T16
2
4.71 2.25 4T16 5T16 4.55 4.36 5 T20 6T20
3 3.50 2.43 4 T12 4T14 TABLE V
STEEL REINFORCEMENT FOR THE DOUBLE RIBBED BEAMS
Rib Span Length (m) Steel a 2.96 5T12 b 2.96 5T16 c 2.96 5T12 d 3.44 4T12 e 3.44 4T12
All the beams were also checked for shear and minimum
steel should be provided i.e. 2-leg 6 at 10 cm. The current columns contain 4T12 steel bars. Equation (4)
is used to check their axial capacities.
(4) Where Pu= ultimate load carried by a column, Ag= gross area of the column section, and, f’c and fy as previously defined.
Based on the results and using PcaColumn, the most critical column, circled in Fig. 12 cannot support the combination of Pu= 124.2T and Mu= 0.924T-m because this point lies outside the graph as shown below.
Figure 10. Results using PCAcol
Adding to that, this column does not pass the punching shear criteria. The Etabs outputs confirm this result. The reinforcement ratio within the columns is 1%. Hence, the area of steel required to carry the weight is 8cm2 per column. Such a reinforcement area is not catered for by the available 4T12 bars. Therefore, it is proposed to use 8T12 bars or 4T16 bars along with steel jacketing of the ground floor columns in order to cater for the increase in the load due to the second floor addition. The concrete strength is assumed to be 20MPa and

188
the yield steel strength 340MPa based on the Schmidt hammer tests done on site.
The jacketing process will lead to an increase in the capacity of the column. First, props should be provided to carry the loads temporarily instead of the columns. Then, dowels should be added to connect the column to the foundation. The plaster is cleaned and the concrete is roughened. Then, steel connectors are added into the existing columns by making holes 3-4mm larger than the diameter of the steel bars and 10-15cm deep since the depth should be equal to 10*diameter of steel bar = 10*12mm=12cm. These holes are then filled with epoxy material and the steel connectors are inserted. As for the concrete, formwork is placed and concrete is poured through a hole made in the slab above the existing column.
IV. COST ESTIMATION
For the housing units, the BOQ shown in Table III was developed to reflect a rough estimate of cost of the modifications to be carried out at the community level.
TABLE III BOQ FOR COMMUNITY HOUSE
Elements Description Price Roof TOT ribbed roof with steel
frame and pipe at its end $50/m2
Rainwater Storage System
Small tank with all the necessary pipe extensions for water relay
$700
Hollow Blocks If not available as rubble on site (6cm width)
$0.3 /block
Wood Flooring 15mm thick $50/m2 The area of each housing unit is (5m x 4m) on average.
Thus, improving one unit would incur $1,000 TOT, $700 rainwater harvesting/storage system, $13.5 hollow blocks, and $1,000 wood. The approximate cost per unit would then be $2,714. As for the estimating the cost at the community level, it is an intricate process with no clear guidelines given the continuous, if not daily, growth of housing units in the area. However, knowing that the Tahaddi clinic serves 1000 families, this serves as a rough estimate to be able to extrapolate the cost to the level of the concerned community which turns out to be $2,714,000. It is important to note that in reality - when the work is to be executed on site - there will actually be more housing units thus increasing the cost at the same rate of $2,714/housing unit since many families are not registered at the clinic and for the aforementioned reason of continuous growth in the area. It is noteworthy that some elements of the intervention plan – such as type of roofing or wood flooring – can be replaced with cheaper – but lower quality – alternatives to reduce the cost of intervention per house.
As for the short term improvements in the clinic, the scope of work is on a rather small-scale; therefore pricing the works on a unit price basis seems unreasonable. Such a scope would be awarded to a selected contractor on a lump sum basis. It is expected that the works cost $4000-$5000 in order to rearrange the rooms to better serve the visitors of the clinic.
However, the long term scope involves works that are at a much larger magnitude than those in the short-term scope. Thus, a bill of quantities (BOQ) should be set up in order to inventory the items needed to deliver the second floor. This BOQ would then be distributed to selected contractors in order for them to provide a quotation of the works. The lowest responsible bidder would then be awarded the project and the works would commence. It is important to note here that a permit needs to be obtained from the concerned authorities to ensure that construction is not interrupted later on due to ‘illegal’ building.
A fair estimate of the cost of the works would be $1000/m2-$1500/m2 (rule of thumb in this area) and since the area of the second floor is roughly 60m2, the total cost would be around $80,000 without the steel staircases, and around $100,000 turn-key.
V. CONCLUSION
In conclusion, this is a community based project in an ethnically and politically sensitive area. The scope changed numerous times over the course of the project due to social, political, ethical, economic and environmental constraints. However, the final scope of the project, which includes both communal work and renovation of the Tahaddi health clinic in the area, is expected to properly address the needs voiced by the community and the NGO.
The proposed rainwater harvesting and waterproofing mechanisms tackle the issue of improper water management given the scarcity of water in the area. However, this part of the scope faces quite a number of limitations including the need for fundraising, the painstaking selection of houses to serve as prototypes, the issue of hauling the construction material onto the site and the attainment of the necessary permits to carry out the works. The other part of the scope involves expanding the current Tahaddi clinic capacity to better serve the community. The short term portion of this initiative is not expected to pose a lot of difficulties as it entails the structural renovation of the existing clinic to better utilize the current space. The long term part, however, involves the addition of a second floor, a task which requires obtaining permits to legalize the works.
It is noteworthy that works on either part of the scope are pending the security of sufficient funds and the consent of the concerned authorities.
ACKNOWLEDGMENTS
The team would like to acknowledge all of the following who greatly helped in the progress of the project:
- Dr. Mounir Mabsout (team adviser) - Dr. Rabih Shibli (Landscape Architecture professor) - Dr. Mohammad Harajli (Civil Engineering professor) - Dr. Majdi Abou Najm (Civil Engineering professor) - Dr. Mona Fawwaz (Urban Planning professor) - Ms. Nadia Khoury (Tahaddi NGO representative in Sabra) - Mr. Rami Saab (Architecture student) - Ms. Diana Jaber (Landscape Architecture student)

189
Wastewater Treatment at the American University of Beirut
Yara Achkouti, Soumar Aoun, Riki Karim Damiani, Zeina Habib and Talina Zeidan
Civil and Environmental Engineering Department American University of Beirut
Riad El Solh / Beirut 1107 2020 [email protected], [email protected], [email protected], [email protected], [email protected]
Abstract – The Wastewater Treatment at the American University of Beirut (AUB) project proposes a plan that will enable the university to treat its wastewater in order to reduce the environmental pollution load on the area. Moreover, the recycled wastewater will be used for irrigation purposes to lower AUB’s water financial expenditures on the long run. The study evaluated four types of treatment units and two potential locations. The optimal solution was to implement Membrane Biofilm Bioreactor (MBBR) units at two different locations. The first one, Location A, will be in the Charles Hostler Center underground parking and would treat nearly 366m3/day. The second, Location B, will be in the Olayan Business School (OSB) underground parking and would receive around 393m3/day.
I. INTRODUCTION
At the American University of Beirut, and with the advent of the greening process, wastewater treatment is one of the major components to be looked into. AUB is a prime university in Lebanon; hence it should set the standards and be an example for other institutions to follow.
Furthermore, according to the Lebanese Department of Economy, the cost of water per meter cube has been relatively high and has been inflating at a rate of 0.2% in the past few years due to the limited availability of fresh water in the region. On the other hand, the number of students at the American University of Beirut (AUB) has been increasing at an annual rate of 1.5 % [1]. Hence, a sharper water shortage as well as an increase in the water financial expenditures at AUB is predicted.
A. Objectives The main objective of the project is to provide AUB with a
wastewater treatment system that will significantly reduce the pollution loads on the projected Quarantine treatment plant that will be catering for North Beirut area and its suburbs. Hence the AUB “Green Campus” slogan can be reinforced and AUB will be a more environmental friendly community. In addition, the proposed project will recycle part of the wastewater on-campus to reuse it for irrigation purposes (both on and off campus, i.e. the Corniche), reducing both water deficiency and financial expenditures on the long run.
Finally, the project will serve as a research unit for the environmental research center at AUB and will induce cooperation between universities for research and studies.
B. Limitation and Social Constraint The American University of Beirut Medical Center
(AUBMC) largely contributes to the pollution load generated by the AUB community. Unfortunately, the AUBMC wastewater contains medical waste that cannot be treated by the MBBR. Also, some antibiotics might compromise the effectiveness of the treatment as it can degrade the bio-membrane present in the system. Hence, chemical treatment should be considered in order to treat AUBMC’s wastewater.
Moreover, a very common misbelieve is that a Wastewater Treatment System (WWTS) will release unpleasant odors, which will make walking around campus irritating. However, one should know that aerobic reactions do not produce any odors. In fact, many foreign universities have an on campus wastewater treatment plant. For example, the Water Reclamation Facility at the University of Florida (UF) treats the houses’ and dorms’ wastewater, as well as academic and auxiliary buildings’ wastewater present on the three square miles of the University of Florida main campus [2]. It is worth noting that the Water Reclamation Facility is located in middle of the campus without causing any nuisance to the surrounding buildings (Fig. 1).
Figure 1 Water Reclamation Facility at the University of Florida

190
II. MATERIALS AND METHODS
The physical plant at AUB provided the team with access to the university maps, the sewage network map and the data about water supply/day/building (10 readings over 2 years).
A. Wastewater Flow Averaging the water supply data provided an estimate of the
water demand/day/building and the sewage outflow of each building was calculated by assuming that the sewage outflow is 85% of the water demand. Then, each building was located on the sewer network map in order to identify the outlet it is linked to. Finally, the flow at each of the seven outlets was calculated by adding each building’s discharge flow. The results of the computations are given in Table 1 bellow. A map showing the location of the seven outlets is attached in Appendix A.
TABLE 1 OUTFLOW AT EACH OF THE SEVEN OUTLETS
Outlets according to the map
Average outflow (m3/day)
Maximum outflow (m3/day)
Outlet 1 20.35 30.52 Outlet 2 137.25 153.63 Outlet 3 197.21 214.77 Outlet 4 10.81 17.02 Outlet 5 34.23 49.58 Outlet 6 187.41 214.77 Outlet 7 171.19 216.66
Total 758.45 896.95
B. Wastewater Quality The water quality should comply with the international
standards to be able to reuse the treated wastewater for irrigation. The U.S. Environmental Protection Agency (EPA) recommends secondary treatment, filtration and disinfection for urban reuse water (i.e. all types of landscape irrigation, which reflects AUB’s case). Any secondary treatment could be used; however it should produce effluent in which both the BOD and TSS do not exceed 30 mg/l [3]. Furthermore, the EPA sets limits for the reclaimed water quality. Table 2 summarizes the relevant information.
TABLE 2 EPA STANDARDS FOR RECLAIMED IRRIGATION WATER
Indicator Recommended value
pH 6
TDS 500 – 2000 mg/l
BOD5 < 10 mg/l
TSS < 5 mg/l
Free Chlorine Residual < 1 mg/l
In order to evaluate the characteristics of the wastewater, samples were taken from a borehole adjacent to the engineering faculty. Sampling was done during dry days, to avoid dilution of the wastewater which could falter the results. Every month for four month, with the help of the physical plant team, a sample was taken and was handed to the Environmental Engineering Research Center where a series of tests were run to obtain the level of pH, BOD, COD, Suspended Solids, Dissolved Solids and Volatile Solids. Table 3 below shows the results obtained.
TABLE 3
WATER SAMPLES FOR QUALITY ASSESSMENT Water Quality Variable 1 2 3 4 Average
pH 8.46 7.61 8.04 7.66 7.9425 BOD 5 (mg/L) 180 372 270 382 301 COD (mg/L) 525 930 680 836 742.75 TSS (mg/L) 102 656 482 314 388.5 VSS (mg/L) 86 253 408 288 258.75 FSS (mg/L) 16 403 74 26 129.75
TDS (mg/L) 1270 774 823 862 932.25
C. Irrigation Water Quantity AUB approximately holds 9000 people including students,
faculty, staff and residents and has an expected average wastewater flow generation of 758m3/day or 748,450L/day, which roughly corresponds to 84L/per capita/day. After adequate treatment, the wastewater will be reused to irrigate 10 acres of land on campus, which represents 1/6 of the total campus area. In order to get the annual landscape water use needed for 10 acres, the annual irrigation factor and irrigation system efficiency was needed. The US Department of Energy’s Federal Energy Management Program (FEMP) estimated landscaping water requirements for 36 cities across the US, which represents a variety of climatic models [4]. Taking Los Angeles, CA as the best approximation for Beirut’s climate and assuming moderate water requirements, average density plant spacing and open microclimate, the annual irrigation factor is 11.75 gal/sqft/year, or 1,937,487 L/acre/year. Assuming medium efficiency in irrigation, or 65% efficiency as suggested by the FEMP report, the annual amount of water needed to irrigate 10 acres is equal to the following: Annual landscape water use = (Annual irrigation factor * Irrigation Area)/Irrigation system Efficiency Annual landscape water use = (1,937,487 L/acre/year * 10 acres)/0.65 = 29,807,492 L/year = 81,664 L/day Moreover, summer irrigation peak factor is found to be 4 times that of the rest of the year [5]. Taking into consideration peak demands for irrigation will result in a demand of 326,656L/day or approximately 327m3/day.

191
It is clear that water reuse for on-campus irrigation will not consume all of the treated effluent from the proposed treatment facility. Therefore, AUB will have a source of treated water suitable for irrigation that can be used to irrigate two kilometers of the Corniche median. The latter has an area of 2.47acres (2km x 5m) and the following can be calculated: Annual landscape water use for corniche = (Annual irrigation factor * Irrigation Area)/Irrigation system Efficiency =(1,937,487 L/acre/year * 2.47 acres)/0.65 =7,362,451 L/year =20,171 L/day Regarding summer period, the demand will result in 4*20,171L/day = 80,684 L/day, or around 81m3/day. Therefore, the total irrigation water quantity needed in a peak period of summer is around 408m3/day.
D. Optimal Location The first alternative was to collect all AUB sewage in one
location, next to outlet 5 (Appendix A), in order to treat it. However this proved to be inefficient since it will require a lot of earthwork and a pumping station to get the wastewater to the treatment unit. Thus the second alternative was to have two distinct treatment units: one receiving outflows from outlets 1 through 4 and the other from outlets 5 through 7. Hence each plant would be respectively receiving an average flow of 366m3/day and 393m3/day (Sum of Table 3 results). As for the location of the plants, both would be placed indoors: one in the Charles Hostler Center underground parking near outlet 4, and the second in the OSB underground parking next to outlet 5.
E. Minimal Footprint The limited available space in the underground parking
forms a major constraint for the project. Several wastewater treatment units needed to be studied in order to assess the one with the smaller footprint and, eventually, the lower cost. Hence quotation requests were sent to several companies, asking for details about the treatment units they could offer to treat around 400m3/d. Three responses were of most interest: the Sequencing Batch Reactor (SBR), the Bioshaft, and the Microbial Biofilm Bioreactor (MBBR), as their footprint is small relative to the flow to be treated.
F. MBBR Cost Estimation The received quotation for the MBBR described units that
would treat a flow of 1500m3, for $156000. However, the Wastewater Treatment at AUB project plans on implementing MBBR units at two different locations, each with a capacity of 400m3/day. Thus, based on the received information, cost estimation was done in order to approximate the price of the two packages.
One package will provide biological treatment (i.e. secondary treatment) and the treated water will be discharged into the municipal sewage network, while the other package will include tertiary treatment since water will be recycled for irrigation. Hence, the first package would cost approximately $40,000 (1/4 of the total cost) and the second one $45,000 since it provides tertiary treatment. Therefore, cost would add up to $85,000. Adding a shipping cost of 30% and a contingency of 15 % to account for all the assumptions made, an estimate of the treatment plant cost would be $123,250.
In addition to that, if the project is to be executed, a more detailed study and laboratory tests are to be conducted, considered here as 5 % of the total cost, thus around $6,160. Therefore an estimated first cost for the MBBR would be roughly $129400.
Additional cost from earthwork, piping, the addition of 8 manholes and a lifting station will be incurred in order to redirect the flow into the treatment plants. Using data of previous similar projects, prices of manholes and pipes were approximated. Table 4 below shows the expected costs of the network rerouting process.
TABLE 4 COST OF NETWORK REROUTING
Description Unit Unit Price ($) Quantity Subtotal ($)
Manhole Each 3,000 8 24,000 Adding pipes (150 mm) and required earthwork
M 90 430 38,700
Adding pipes (200 mm) and required earthwork
M 100 110 11,000
Lift station Each 15,000 1 15,000
Total ($) 88,700
The network rerouting process will cost $88,700. Therefore,
the total project will roughly have a capital cost of $218,100.
G. Social Consent Since the concept of water reuse is still unfamiliar in the
country, it is generally not accepted by the Lebanese community due to their lack of knowledge on the subject. Therefore the team conducted a survey to understand the AUB community’s opinion on implementing a WWTS on campus. The survey was done on campus as well as on social networking sites. In total, around 5% of AUB students (i.e. 400 participants) answered the survey. The results are summed up in Appendix B. Surprisingly, more than half of the participants are unaware of the water shortage problem that AUB is facing and around 25% think that AUB treats its wastewater before discharging it, either in a nearby wastewater treatment plant or in an on-campus wastewater treatment

192
facility. Furthermore, around 50% of the participants think that bad odor is a disadvantage in having a wastewater treatment plant on campus.
Therefore, the team organized a campaign to raise awareness amongst people about wastewater treatment systems and convince them that WWTS do not produce odors nor cause any disturbance to the surrounding environment if implemented correctly. Also, the benefits that will result from having such a plant at AUB were highlighted.
III. DESIGN AND CONCLUSION
The optimal solution was to implement Membrane Biofilm Bioreactor (MBBR) units at two different locations:
• Location A: in the Charles Hostler Center underground parking. It would treat nearly 366m3/day;
• Location B: in the Olayan Business School (OSB) underground parking. It would receive around 393m3/day.
MBBR has the lowest cost and can treat the water to reach
the required quality. Moreover, this treatment technique is sludge-free; in other words no refuse will come out of the plant which avoids further treatment of the sludge. Compared to the other treatment units, MBBR has the smallest footprint. It can also be placed underground, which can be an alternative for placing the units in the underground parking.
A roughly estimated first cost for the project would be around $129,400. The network rerouting process, consisting of adding manholes, pipes, and a lift station, will cost $88,700. Therefore, the total project will have a capital cost of $218,100. An additional cost for maintenance should be taken into account. It can be approximated to 10% of the total cost per year, since no specific amount was provided in the quotation
As previously mentioned, part of the water treated will be reused for irrigation. The quantity needed was determined to be around 82m3/day for on campus irrigation and 20m3/day for the Corniche irrigation. Furthermore, a total of 408m3/day was estimated for both the on-campus and the Corniche landscape in order to account for peak demands in summer periods. In this case, the prospects for financial contribution from the part of the municipality should be investigated.
Another use for the treated wastewater would be for water-
cooled air conditioning systems. First, it would be required to implement such systems in the new buildings on campus, allowing the wastewater treatment plant to supply the water to those systems.
The remaining treated water will be discharged into the
municipal sewage network to dilute the present pollution and cause less harm to the ecology and environment.
In conclusion, the Wastewater Treatment at AUB project will prevent AUB from discharging its pollution in the sea, which will radically contribute to the university’s greening process. Also, it will allow AUB to have its own wastewater treatment system in order to use the recycled water for irrigation, cutting down on the water financial expenditures of AUB. Finally, it will strengthen research by serving as a research unit for faculty members.
ACKNOWLEDGMENT
The team conducting this Final Year Project sought assistance from its technical Advisor, Dr. George Ayoub. Furthermore, Dr. Chady Najjar and Dr. Darine Salam provided the group with helpful feedback after reviewing the proposal. The team would also like to thank the Physical Plant team for their assistance while conducting the sampling, Dr. Lucy Semerjian for her insightful advices, the Environmental Engineering Research Center for testing the samples and Fadi Abd El Samad – representative of Bioshaft, for the detailed information provided about the technology.
REFERENCES
[1] Interview with Dr. Ahmad Dallal - AUB Provost [2] Wastewater Treatment Introduction Water Reclamation Facility,
University of Florida. http://www.ufwrf.com/wrfintro.html [3] Guidelines for Water Reuse Washington, DC. U.S. Agency for
International Development2004 [4] US Department of Energy Office of ScienceGuidelines for Estimating
Unmetered Landscaping Water Use Federal Energy Management Program http://www1.eere.energy.gov/femp/pdfs/est_unmetered_landscape_wtr.pdf
[5] City of OntarioRecycled water master plan City of Ontario http://www.ci.ontario.ca.us/modules/showdocument.aspx?documentid=7307

193
APPEN
DIX
A - M
AP S
HO
WIN
G TH
E DIFFER
ENT S
EWA
GE O
UTLETS A
T AU
B
1 2
3 4
5 6
7

194
APPENDIX B – “WASTEWATER TREATMENT AT AUB” SURVEY

90
DEPARTMENT OF ELECTRICAL AND COMPUTER ENGINEERING

196

197
CONTENT
197
198 A Dynamic Faulty Node Detection Scheme Using Adaptive Sleep Scheduling for Wireless Sensor Networks that Employ Data Aggregation TAREK AL CHOIKANI – BASEL AL AROUDAKI – HAZAR ASHOURI
203 A Fair Genetic Algorithm for an Intelligent Carpooling Scheduling System CARL MICHAEL BOUKHATER – OUSSAMA DAKROUB – FAYEZ LAHOUD
211 AAHA: ARDUINO/ANDROID HOME AUTOMATION KIM BARAKA – MARC GHOBRIL – SAMI MALEK
217 Design of a Windmill Permanent Magnet Generator ALI EZZEDDINE – ABDALLAH AL SHARIF – HAYYAN HARB – RIHAM GINZARLY
223 Elderly Smart Walker MARIA BALADI – JOE BERBARI – JOSEPH KHAYAT
229 Energy Boots ZIAD RAJEH – RAMI GHAZALI – RIMA GHAZALI
235 Improving the Presentation Experience with an Intelligent Gesture Based Interface AHMAD BARRAGE – HASAN JAMIL – HASHEM RAMADAN
240 Minimum Power Wireless Broadcast Trees REBAL S. AL-JURDI – HAWRAA SALAMI – GHADI SAYEGH
245 Precise Taint Analysis to Prevent Information Leaks in Applications FIRAS ABOU CHACRA – DANA NAOUS – SAM SLEIMAN
251 Talk To The Hand: A Tool For Lebanese Sign Language Recognition FARAH HARIRI – ZEINA SINNO – AHMAD EL SHAFEI

198
A Dynamic Faulty Node Detection Scheme Using Adaptive Sleep Scheduling for Wireless Sensor
Networks that Employ Data Aggregation Tarek Al Choikani, Basel Al Aroudaki, Hazar Ashouri
American University of Beirut Department of Electrical and Computer Engineering
(tha07, baa37, hma70)@aub.edu.lb
Abstract— This paper presents a distributed faulty node detection approach for wireless sensor networks that employ aggregation of measurement data on their way toward the sink. The approach is based on the idea of commanding nodes to go into sleep mode in accordance with a schedule that tries to keep the network connected and whose objective is to detect faulty nodes through a process of elimination. The algorithm is run at the sink which monitors the received readings from active nodes and looks for deviations from the expected range, and uses them as triggering events. The implementation was developed using the NS2 network simulator, where performance results were collected, and showed the reliability of the approach and its ability to keep overhead traffic within limits.
Keywords— aggregation; wireless sensor networks; faulty nodes
I. INTRODUCTION Wireless Sensor Networks (WSN) are low cost wireless
nodes which are deployed in certain areas to collect specific data. These nodes might be implemented in forests or other regions not easily accessible by humans. Thus, it is of critical importance to be able to identify faulty nodes and separate them from the rest of the network, so that the acquired data remains reliable and indicative of what is actually occurring in the sensed environment. Our approach is based on trying to detect faulty sensor nodes without burdening the network with dividing it into sub networks (i.e., partitions), assigning zones and zone master, or using complex structures like clustering. The suggested design method depends on the idea that, as some nodes go to sleep mode, the sink will keep on receiving readings from the active nodes, and by making intersections between data received at different time frames, when different nodes were sleeping, a conclusion can be drawn from the variations in the data as to which nodes are possibly faulty and are sending untrue readings.
The remainder of the paper is organized as follows. Related work in the field of WSN faulty node detection is discussed in section 2, and then the detection scheme is introduced and elaborated in section 3. The experimental evaluation is presented in section 4, followed by the conclusions and description of ongoing work in Section 5.
II. RELATED WORK Faulty node detection in WSNs has been discussed in
many research papers, and several solutions were proposed. To start with [1], classifies fault detection techniques in WSNs into centralized and distributed methods.
In [2], checking for communication error is done by dividing the network into zones, each with a zone master, and comparing the throughput of each zone to a threshold value. If the read throughput is less than the threshold value, then the zone master divides its zone into four subzones. It repeats this until it detects the error. The work in [3] also depends on dividing the topology into sections. The method works over three stages: 1. Map division, where the map is divided into a number of subareas named faces based on the topology of the network 2. Detection sequence mapping, where a number of events that appear in the monitored region are detected by the sensor nodes. 3. Fault detection, where after a sufficient number of mappings become available, a blacklist is obtained by analyzing the inconsistencies between the detected sequences and the estimated sequences. Similarly, in [4], detection depends on dividing nodes into clusters. A clusterhead detects failure in its cluster members based on the notion that sensed values in a cluster should be very similar. The method can detect faulty clusterheads by having a pair of nodes in a cluster check whether one or both can detect a failure in the clusterhead. If this occurs, a third cluster member performs checking, where a clusterhead will be considered faulty if the third node agrees that a failure does exist.
The work in [5] presents a probability-based fault detection algorithm to elect sensor nodes as probe stations. The method is applied on the network using the LEACH protocol where clusterheads are changed every period of time. The method handles electing probes randomly at first and then according to the detected events, probes are increased in certain clusters according to a probability function. As for methods that work in a distributed manner, the algorithm in [6] uses a similarity test to compute the correlation degree between neighboring nodes. By doing so, some error free nodes can be determined then the states of other nodes are determined by dissemination of decisions made at the nodes. On the other hand, the scheme in [7] uses Principal Component Analysis (PCA) to divide data into two different spaces: one with normal readings and the other containing the residual. If the residual vector indicates great variation in some of its variables, the system detects the path containing the anomaly by selecting these variables. Another distributed detection method which relies on history data is described in [8]. Each sensor generates tests for all of its neighbors by computing a measurement at two different times and comparing it with a threshold value. The node generates a tendency value based upon its neighboring sensors test values. Each sensor sends its tendency value to

199
all its neighbours, and the number of the likely-to-be-good sensors with coincident test results determines whether the sensors are good or faulty. The method in [9] discusses an approach based on a finite state machines (FSM) model. The current state is determined by the historical states of the system. The fault detectors use local evidences on each sensor node as inputs. Each state can be seen as an intermediate diagnosis decision, and if the local evidences support certain conditions on the current state, the algorithm transits the detector to the corresponding new state. If a node detects a fault, it creates a new fault detector, and then broadcasts the current state to its neighbours.
Finally, a combination of three diverse methods are discusses in [10]: rule-based methods, which are based on domain and expert knowledge to define heuristic rules for identifying and classifying faults, estimation methods that predict normal sensor behavior by leveraging sensor readings correlation, and learning-based methods that are able to statistically identify and classify classes of faults. Upon getting a data point, the system applies the set of rules developed to identify inconsistent data.
Malicious node detection algorithms share similarities with faulty node detection schemes. For this we briefly discuss the approach in [11], which uses a monitoring mechanism to detect malicious nodes. When a node A sends readings to node B, A monitors the readings B sends to other nodes, and compares them with threshold. Accordingly, node A marks the suspicious nodes.
As for sink placement [12] studies random, geographic, intelligent, and genetic sink placement algorithms and the advantages and disadvantages of each algorithm.
Table1 concludes this section by comparing the methods found in the literature, which are classified as centralized and distributed, to our proposed method, along several measures.
TABLE I. DETECTION METHODS ANALYSIS
III. DETECTION SCHEME Wireless Sensor Networks are battery driven, thus, they
have low power capabilities, making energy consumption a very important factor in designing a fault detection algorithm. We target our solution to WSNs that use data aggregation in nodes along the path to the sink instead of simply forwarding the data packets. Obviously, the motivation behind this is to conserve residual battery energy. Through aggregation, network traffic is reduced and the network lifetime is increased [13]. Packets forwarding in a network that uses aggregation is shown in figure 1. On the other hand, most if not all other detection techniques assume that individual data readings are sent directly to the sink, and this is the main enabler behind their high detection rate. However, while detection is rather trivial when all data readings are forwarded to the sink, it becomes much more complicated with data aggregation. For this reason, our method is not expected to perform as good as the other schemes whose detection rate is reportedly close to 100 percent. However, our approach is deemed more practical and realistic since it assumes that data aggregation is employed which would be typical in WSN environments that attempt to maximize the network lifetime. We illustrate this by comparing the cumulative traffic in our system versus that in the other techniques where individual sensor measurements are transmitted to the sinks. Finally, it is worthwhile mentioning that our detection algorithm is more computationally complex since the sink will be receiving aggregated readings and will not be able to directly discern the contributions of the sending nodes in the received values. A. Definitions and Assumptions
We refer to a critical node as every node that cannot go to sleep without causing partitions in the network. For example, in the network topology shown in figure 1, nodes 2, 5, 8, 9, and 10 are critical nodes. That is, if node 8 sleeps, nodes 6 and 7 will not be able to send their data to the sink, and if node 5 sleeps, nodes 1, 2, 3 and 4 will not be able to send their data to the sink. Thus, a node can go to sleep mode if it is not a critical node; that is, if all of its neighbors are covered by other nodes. Critical nodes will be allowed to go to sleep only after all other nodes have been in sleep mode, that is, have been tested for faults. All non-critical nodes are called regular nodes.
Fig. 1. Network topology
Centralized [1] Distributed [2] Our method
Energy consumption
High due to the Many calculations and comparisons of the throughput
Distributed algorithms takes energy burden off the base station
Low since nodes do not perform extra tasks and calculations are made at the sink
Traffic
Low traffic since the nodes only send data to the responsible zone master
High traffic. Nodes periodically sends data to all neighbours
Limited to the sleeping requests and the sleeping confirmations
Delay
High due to the division of the network with calculation done in each of zone
Delay limited to computation of similarity coefficient and sending of data
Does not introduce Additional delays in the network
Applicability to dense/
sparse network
Dense networks preferable, for availability of sleeping nodes near suspect nodes
Only efficient in dense networks. It assumes neighboring nodes have similar data readings
Applies to sparse & dense networks. No dependency on neighbor nodes with similar readings
Memory
Take considerable memory space in zone masters: grid, registration and information tables
Nodes maintain data vectors, neighbor’s state, and result of the similarity test
Doesn’t take extra memory space in the nodes. All used memory is in the sink
Success Rate
According to the paper, success rate almost 100% when 4 nodes out of 60 are faulty
According to the paper, has a very high success rate when the % of faulty nodes is (5-10%)
Ranging from 89% with 5% faulty nodes to 81% with 40% faulty nodes

200
The sleeping duration of the nodes will be set to 3 times the maximum time needed for a data reading to be sent, thus at least three readings will be generated while the node is in sleep mode. Finally, in terms of the data the sink has to maintain, the sink will have four tables updated on a regular basis. These are as follows:
1. A table containing NodeID and Neighbors fields. 2. A table containing NodeID, State (1 for active and 0 for
sleeping), number of times the node slept (NTS), and a faulty flag (0 or1).
3. A table containing NodeID, data results, and time stamp fields.
4. A table containing the ids of suspicious nodes and time stamp fields.
The following is an example of a single entry in each of these four tables in the case of temperature sensors, where node 1 was in sleep mode:
TABLE II. NEIGHBORS TABLE Node ID Neighbors
2 1,5
TABLE III. STATE TABLE Node ID State #Times-Slept Faulty
2 2 0 0
TABLE IV. DATA TABLE Node ID Data Results Time-Stamp
2 25 4:55:32:289
TABLE V. SUSPICIOUS NODES TABLE
The literature does not specifically discuss a method for
determining the suitable number of nodes per sink even though many papers handled the issue of sink placement as described in the literature in [12]. However, National Instrument suggested 36 nodes per sink which is the parameter we used in our design [14]. As for the sink placement we chose it to be random in order for our detection method to be applicable on any network. B. Algorithm Description The algorithm comprises three phases: Initialization
When the network is first deployed or when the algorithm is implemented for the first time in an already deployed network, nodes are randomly assigned to one or more of the sinks in the network. Each sink will request from the nodes it covers information about the node ID and list of neighbors. These nodes send the requested data with time differences from the other nodes to avoid package loss on the path to the sink. The transmission of these packets it also done using aggregation as each aggregating node waits for a dwell time before it forwards its packets to the next hop on the path to the sink. Once the sink receives this information, it has to store the received data in the tables. For each node, the State field is initialized to 1, number of times-slept (NTS) to 0, and the faulty flag to 0. It is assumed that sinks share their
collected data and nodes readings through the monitoring station.
Regular Nodes Testing
After initialization, the nodes start sending their readings to their assigned sinks. The readings are aggregated on the path and stored in the results table with the timestamps. Each nodes in the network has to sleep (Ttotal/Tsleep)/N times. In order for the nodes to go to sleep mode, each sink finds the list of nodes whose NTS is less than (Ttotal/Tsleep)/N (N being the number of nodes, Ttotal the simulation time, and Tsleep the sleeping duration), State=1, and Faulty=0. From intersecting this list with the list of neighbors of each node, the list of regular nodes is obtained. The sink randomly chooses a random number of these nodes to go into sleep mode, and sends sleep-request packets containing the Node ID and the sleeping duration to them. Each one of these nodes replies to the sink with a sleep-confirmation packet containing Node ID and a timestamp for the sink to know when exactly the node will go into sleep and when it becomes active again. The sending of the sleep-confirmation packet is done in promiscuous mode; that is, the node’s neighbors process the packets even if they are not the destination. This will be helpful in detecting malicious nodes as a node’s neighbors will be able to tell if a node is malicious when it sends a sleep-confirmation message but keeps on sending its data. While these nodes are sleeping, the sink will be comparing current readings with earlier ones, and if changes were found, the currently sleeping nodes are added to the suspicious list. A node is considered to be faulty if it appears in the suspicious list (Ttotal/Tsleep)/N times. That is, every time the nodes slept, it was added to the suspects list. This operation will be continuously repeated until all regular nodes have slept (Ttotal/Tsleep)/N times and in different random combinations. Critical Nodes Testing
After all regular nodes have slept (Ttotal/Tsleep)/N times, and if an error is still present in the readings, critical nodes will have to be tested for faults. Critical nodes can now go into sleep mode even if they cause network partitions, because if some regular nodes could not get their data to the sink, it will not be a problem since faulty regular nodes would have been detected in the Regular Nodes Testing Phase. Critical nodes are identified at this stage by being the nodes with NTS=0. The sink randomly sends them into sleep mode while monitoring the changes in aggregated data readings. The criterion used for discovering faulty critical nodes is the same as in discovering regular faulty nodes.
C. Alternative design
Another approach we explored in designing the fault detection scheme is to consider asking the nodes to stop sending readings instead of sending them into sleep mode. This would be very beneficial in terms of dealing with the critical nodes problem by avoiding possible network partitions. By stopping only the node’s readings, the node can still function as an ad hoc node. The absence of a node’s reading for a predefined period of time will permit the sink to
Suspicious Nodes Time-Stamp 1 4:55:32:289

201
identify whether it is a suspect node while still permitting its neighboring nodes to send their readings to the sink.
The problem with this design however, is that it does not allow for easily detecting malicious nodes. As was mentioned earlier, our simple malicious detection method is based on the notion that malicious nodes are discovered when a node is asked by the sink to go to sleep mode but keeps on sending its data, even after sending a sleep-confirmation packet. If the node did not have to go to sleep but only stop its readings as suggested in this alternative design, it will be able to aggregate its readings with the other nodes’ readings, or even manipulate the aggregated readings without being detected.
IV. SIMULATION RESULTS
The design of our fault detection system was implemented using the network simulator NS2. The simulated network consisted of 100 nodes each with a transmission range of 10 meters distributed in an area of 100×100 m2. For now, we only dealt with the detection of faulty nodes, and did not consider malicious ones. The test experiments which were performed were meant to measure the detection rate, false-negative detections, false positive-detections, detection delay, and overall traffic in the system. The objective of the last measure was to illustrate the cost of the introduced algorithm relative to the technique employed by other schemes which call for nodes to send their measurement data directly to the sinks (i.e., no aggregation). Below, is Table VI, which presents a list of the key simulation parameters and their corresponding values.
TABLE VI. NS2 SIMULATION PARAMETERS
Simulation Parameter Default Value Simulation time 2000 sec Network size 100100 m2
Node transmission range (r0) 10 m Number of nodes 100 Node mobility model Static Reading Send Rate 5 sec
Figure 2 shows the trend of detection performance with
respect to changes in the number of faulty nodes. It is obvious that as the percentage of faulty nodes increases the detection rate decreases. Moreover, false positives and false negatives increase, but it should be noted that false negatives are more critical than false positives, because it is better to wrongly shut down a healthy node than wrongly identify a faulty node as a healthy one. In this regard, the system only results in a low percentage of around 6% at 40% faulty nodes as shown in figure 3. When the readings are not aggregated, the sink is able to identify with more accuracy the faulty nodes obviously because it knows which nodes are sending what readings. For this we also included in the graphs the performance of such a scheme, like the one in [9]. It was not surprizing to observe a better detection performance, but it comes at a considerable cost in terms of delay and traffic, as illustrated in Figure 4, and more critically in Figure 5.
As for the graph in Figure 4, we notice that our method (aggregation-based) introduces lower delays, in part because
there is significantly less traffic in the wireless network, which reduces contention. As for the traffic, the overhead traffic is limited to sleep requests and confirmations packets, whereas the nodes that stop their readings reduce the amount of generated traffic, and hence, contribute to the reduced delays.
In general, the previous simulation results were based on one randomly placed sink. To study the impact of number of sinks on our method, we have varied the number of sinks and measured the detected rate, delay, traffic and false detection. For simplicity, we have taken faulty nodes percentage to be always 20%.
Figure 6, shows that as the number of sinks increase, the detection rate increases; this is mainly because sinks cooperate in detecting a faulty node. A node that is said to be faulty multiple times in different sinks is more likely to be faulty than a node that has been reported in one sink to be faulty and another to be healthy. Increasing the number of sinks, increases the coverage and overlaps achieving higher cooperation. This also proves lower false detection as shown in figure 7.
Of course, the drawback of multiple sinks is traffic and delay. As the number of sinks increase, traffic increases due to the fact that some nodes maybe assigned to more than one sink. This also impacts the delay directly. Figures 8 and 9 show almost an 18% increase in delay and 33% increase in traffic when the number of sinks is increased from 1to 5.
Fig. 2. % detected faults vs. change in % of faulty nodes
Fig. 3. False detection vs. change in % of faulty nodes
Fig. 4. Delay vs. change in % of faulty nodes

202
Fig. 5. Traffic vs. change in % of faulty nodes
Fig. 6. % detected faults vs. change in # of sinks
Fig. 7. False detection vs. change in # of sinks
Fig.8. Delay vs. change in # of sinks
Fig. 9. Traffic vs. change in # of sinks
V. CONCLUSION AND FUTURE WORK
This paper presented a fault detection algorithm in WSNs
based on observing changes in collected aggregated readings by sending subsets of the nodes into sleep. The method applies to WSN environments that implement data aggregation in data transfer, which significantly reduces traffic and energy consumption. The method was found to offer high detection accuracy and low false positives. Future work will look into detecting malicious nodes that do not cooperate in the network.
ACKNOWLEDGMENT
Special thanks to Professor Hassan Artail for his guidance.
REFERENCES [1] M. Khan, M. Merabti, B. Askwith, "Design consideration
for fault management in wireless sensor networks," Proc. of PGNet 2009.
[2] K. Pradhan, A. Taleb, T. Kocak, "A technique to identify and substitute faulty nodes in wireless sensor networks", in Proc. 3rd Int. Conf. Sensor Technologies and Applications, 2009.
[3] S. Guo, Z Zhong, T. He, "FIND: faulty node detection for wireless sensor networks, " in UB CSE 708 seminar archive and discussion platform, 2011.
[4] S. Dastgheib, H. Oulia, H. Gholamishiri, A. Ebrahimi, "A proposed fuzzy method to detect faulty nodes in wireless sensor network clustering structure", Int. J. on Technical and Physical Problems of Engineering, v. 4, n. 2, pp. 71-75, 2012.
[5] R. Huang, X. Qiu, L. Ye, "Probability-based fault detection in wireless sensor networks", Int. Conf. in Network and Service Management (CNSM), 2010.
[6] C. Zhang, J. Ren, C. Gao, Z. Yan, L. Li, "Sensor Fault Detection in Wireless Sensor Networks", IET Int. Comm. Conf. on Wireless Mobile and Computing, 2009.
[7] V. Chatzigiannakis, S. Papavassiliou, "Diagnosing Anomalies and Identifying Faulty Nodes in Sensor Networks", IEEE Sensors Journal, v. 7, n. 5, pp. 637-645, 2007.
[8] J. Chen, S. Kher, A. Sumani, "Distributed Fault Detection of Wireless Sensor Networks", Proc. workshop on Dependability issues in wireless ad hoc networks and sensor networks, 2006.
[9] K. Liu, Q. Ma, X. Zhao, Y. Liu, "Self-Diagnosis for Large Scale Wireless Sensor Networks", IEEE INFOCOM, 2011.
[10] Ullah Warriach, K. Tei, T. Ann Nguyen, M. Aiello, "Fault Detection in Wireless Sensor Networks: A Hybrid Approach", Int. conf. Information Processing in Sensor Networks, 2012.
[11] T. Zia, A. Zomaya, "Malicious Node Detection by a Monitoring Mechanism in Wireless Sensor Networks", In Proc. Int. Conf. Network Security and Workshop, 2007.
[12] W. Yipoe, J. Schmitt, "Minimizing the Maximum Delay in Wireless Sensor Networks by Intelligent Sink Placement", Tech. Rep. 362, 2007.
[13] N. Patil, P. Patil, "Data Aggregation in Wireless Sensor Networks" Int IEEE Int. Conf. on Computational Intelligence and Computing Research, 2010.

203
Abstract —Because existing public transportation cannot be adapted in a timely manner to address the daunting traffic and parking congestion in urban environments, researchers are investigating some “social” solutions, such as carpooling, where a driver and one or more passengers having semi-common routes share a private vehicle. Although many carpooling systems have been proposed, most of them lack various levels of automation, functionality, practicality, and solution quality. While Genetic Algorithms (GAs) have been successfully adopted for solving combinatorial optimization problems, their use is still rare in carpooling problems. Motivated to propose a solution for the many to many carpooling scenario, we present in this paper a GA with a customized fitness function that searches for the solution with minimal travel distance, efficient ride matching, timely arrival, and maximum fairness while taking into account the riding preferences of the carpoolers. The computational results and simulations based on real user data show the merits of the proposed method and motivate follow on research.
Keywords— carpooling; genetic algorithm; intelligent transportation
I. INTRODUCTION
The constant population and economical growth has caused an enormous increase in the number of private cars in cities worldwide. This phenomenon has lead to traffic congestions, parking problems, inordinate fuel consumption, and excessive pollution. While the average capacity in a car is 4 passengers, cars are often observed with one rider. In fact 78% of Americans drive alone to work [1]. Because existing public transportation systems cannot be adapted in a timely manner or without major capital investments to address the growing needs of populations, developing some “social” solutions, such as carpooling, where a driver and one or more passengers having common or partly common routes share a private vehicle would be a green as well as a cost effective public solution to the daunting problem of traffic congestions. Carpooling stands out as an effective and social approach to exploit available transportation resources, i.e. fill the empty seats in private vehicles. It allows people to share a ride when their departure and destination locations are similar.
Figures 1, 2, and 3 below show some relevant statistical trends compiled from [2]. Carpooling presents many benefits. From a financial perspective, it saves money on gas, parking fees, and wear and tear on the vehicle. With an increase in the adoption of carpooling, roads would become considerably less congested, and parking spots would become more available. Moreover, carpooling is very eco-friendly. If four
people share one ride, the amount of fuel used to transport these individuals would roughly be reduced by a factor of 4. As can be seen in Fig. 3, highway and off-highway vehicles contribute to roughly 80% of the total carbon monoxide emissions. Additionally, there are also some social benefits to carpooling: less stress from riding, new friendships can be formed during ride time, and riders can read or snooze before reaching their destinations. Also, carpooling would enhance a sense of responsibility with those who tend to be late as they would become more dependable and accountable to the other commuters. Finally, leaving a car at home allows other family members to use it if the need arises. Unfortunately, with all the aforementioned benefits, carpoolers hardly constitute 15% out of all car passengers and drivers according to Fig. 2.
Carpooling problems are classified as either a Daily Carpooling Problem (DCPP) or a Long-term Carpooling Problem (LTCPP) [3]. In the first class of problems, each day a set of users declare themselves as drivers for that day. The
An Intelligent Carpooling App for a Green Social Solution to Traffic and Parking Congestions
Carl Michael Boukhater, Oussama Dakroub, Fayez Lahoud Department of Electrical and Computer Engineering
American University of Beirut Beirut, Lebanon
Emails: {cab14, ohd01, fal00}@aub.edu.lb
Fig 1. The average costs of owning and operating an automobile
and of a US gasoline gallon. Fig 2.
Fig 2. Percentages of lone drivers and carpoolers among people using
automobiles to commute to work.

204
challenge is to efficiently assign passengers to these drivers to ensure the lowest cost routes while respecting the users’ schedules. The LTCPP is more challenging, as it is NP-Complete [4]. Users in this problem can be drivers on certain days and passengers on others. It is up for the system to effectively and fairly assign roles for the different days of carpooling. As before, the aim is to assign passengers to drivers and minimize the individual and total travel distance, while respecting users’ schedules and maintaining overall fairness.
Existing carpooling activity relies on direct communication and arrangements between users who know each other or social websites designed for this purpose. Motivated to take carpooling to the next level and develop a more complete and practical system that positively affects traffic and parking congestions, this paper proposes an automated carpooling system based on a genetic algorithm (GA) with a customized fitness function. The system exploits all existing resources to ensure an easy and low-cost implementation. An application running on a 3G/GPS enabled smartphone provides communication between every subscriber and the main system server to provide all functionalities such as user registration, ride scheduling and synchronization, and driver tracking. The system will ensure minimized travel distance, efficient ride matching, timely arrival of all users, and fairness in driver selection and additional driven distance.
The remaining of this paper is organized as follows: Section II presents related research, while Section III introduces the proposed model. Section IV presents the GA behind the scheduler. Section V contains the computational and simulation results, whereas Section VI concludes the paper and discusses future work.
II. LITERATURE REVIEW Several research projects have tackled the carpooling problem and proposed various solutions. Starting with the work in [5], a Distributed Algorithm was proposed to map the driver having the earliest departure time to his destination and one or more passengers through a low cost path. The process is repeated until the pool of drivers becomes empty. While this algorithm is simple and adapts easily to newcomers, the solution is suboptimal, since the highest percentage of picked up passengers was reported to be 80%. Also, the fairness component was neglected.
Another solution is based on the Dijkstra Algorithm [6]. The network of users is subdivided into small areas centered on a driver. A check is done on each passenger to see if a car with empty seats passes near him or her, and the assignment is performed incrementally. This solution has a fast runtime as compared to other carpooling solutions, but it is globally optimal and thus it will not be fair when considering incremental driven distances.
The Adaptive Genetic Algorithm is another studied approach to solve the LTCPP with a little knowledge about the search space [7]. The GA chromosomes contain pools of several users, half of which are inserted using a greedy insertion method while the other half is randomly inserted. Drawbacks of this approach are the sacrifice of individual fairness to reach a near-optimal solution and the difficulty of adaption to sudden changes in the system.
A clustering ant colony algorithm was proposed in [8] to solve the carpooling problem. The constraints posed by the model are used as preferences (pheromones). The ants will trace a path depending on these preferences and other attractiveness formulas. The algorithm is self-adaptive and includes preferences using numerical weights for each, and takes into account both time and distance costs. Near-optimal results can be achieved if the preferences and attractiveness formulas are suitable for the problem. As with most proposed approaches, the main disadvantage is the lack of the fairness component.
In addition to the above, a Lagrangian relaxation method was proposed based on a network flow technique that models the drivers and passengers’ routes and schedules [9]. For a large network, the number of variables, constraints, and the complexity of the problem increase. Lagrangian relaxation solves the model by finding a lower bound for the problem, which associates a great cost to every unmet constraint. The upper bound for the optimal solution ensures fairness for the drivers over time. Reported results show that this method is fast and efficient for small populations, but it degraded quickly as the population grew larger. Another drawback is that the traveling cost is reduced to monetary cost, i.e. paying the driver.
In [10] and [11] the many-to-one scheme is discussed earlier, and is easier to handle than the many-to-many problem this paper deals with. In [10], two methods based on two integer-programming formulations are proposed. The heuristic method yields a valid upper bound, which allows a feasible solution out of the Lagrangian lower bound solution. The exact method combines three lower bounds derived from the problem. In [11], two algorithms are presented: DCA solves the carpooling problem while DCA-Branch and Bound globalizes the obtained solution.
In [12], an integrated system is presented to organize the carpooling services using the web, GIS, and SMS. The carpooling problem itself is solved by an optimization algorithm, which solves the routing problem heuristically. Nevertheless, their definition of carpooling services is based on the idea that car owners share rides to the same destination. Users without cars and multiple destinations are excluded in their carpooling services.
Fig 3. The various factors contributing to carbon monoxide emissions

205
One attempt to solve the LTCPP is based on savings functions [13]. Automatic and heuristic data processing routines were developed by the authors to allow efficient matching of rides for passengers and riders. According to the published results, this approach yields more than 50 percent average savings in car traveled distances compared to having no carpooling system.
Another attempt at solving the LTCPP is the Multi-Matching System [14], where an optimized matching model was devised to intelligently match the passengers and the riders in the carpooling scheme. The core algorithm is based on Lagrangian relaxation with sub-gradient methods and focuses on the fairness aspect of the carpooling problem, by considering driving distances along with the frequency of being a driver when computing fairness.
Another work that addressed fairness is that of [15], whose research introduces the fair share concept. Their algorithm determined the set of drivers among a group of carpooling participants for a particular day while attempting to secure fairness. In spite of the fact that they accounted for the fairness aspect in carpooling, they do not consider the distance traveled or the participants’ schedules.
Differently from the previously mentioned research, our work puts forward an efficient solution that builds on the strong points and improves the insufficiently addressed issues, such as fairness and user preferences, which are major criteria that affect the willingness of a user to participate in a carpooling system. Our solution insures that all participants secure a ride and allow the participation of users who do not own cars. Another disregarded issue in previous works is user preferences, which we do account for.
III. PROPOSED MODEL This section introduces the server and client sides of the
system and provides the definition and the mathematical formulation necessary for the understanding of the LTCPP. As stated earlier, the model serves a scheme that allows for multiple origins and multiple destinations. Fig. 4 illustrates the system architecture.
A. Server The server side of the system has two main
functionalities: it runs the carpooling scheduler and stores all users and rides information. After collecting all the needed information from the different subscribers, the scheduler is daily allocated a six hour time window to run starting 10PM. As discussed earlier, matching between passengers and drivers is done and all the rides are determined for the upcoming day. The server then communicates all the rides to the respective drivers and passengers. As for the server database, implemented using SQLite, it stores information such as usernames and hashed passwords of the subscribers, users’ profiles and preferences, and history of all rides. The database model is shown in Fig. 5.
B. Client The client side consists of a smartphone application
developed for the Android OS. It is the user’s portal to the system. The application allows a new user to register providing all the required information such as full name, date of birth, gender, and car details. When the user logins, a main screen appears allowing the user to add rides or view their status. To add a ride, a user specifies the origin and destination by typing the name of the location or using the map to pinpoint it. Viewing the status of an existing ride displays information about the ride timing and details about the driver and the route to be taken. The smartphone needs 3G connectivity to exchange data with the server, as well as GPS capability to feed its coordinates into the system. Screenshots of the client application are shown in Fig. 6.
C. Scheduler To ensure that all participants secure a ride, we assume
that the number of cars on a certain day is enough to accommodate all the users who wish to carpool on that day. The model also necessitates that all participants provide their requested rides before-hand. This data includes the car capacity, the origin and destination of the user for each trip, the desired departure and arrival times, and personal preferences. These preferences include desired number of
Fig 5. Server database model
Fig 4. Carpooling system architecture

206
users to ride with, smoking permission, and a blacklist. In addition to the aforementioned user data, other metrics are needed to run the model. These are: the geographical coordinates of all the users and destinations, and the distance and travel time between every two nodes of the network.
Our model can be viewed as a graph G = (PD ∪ SR, A), where:
PD is the set of potential drivers who own cars and can participate as drivers. Each potential driver pd∈ PD is associated with an origin and a destination
SR is the set of strictly riders who don’t have cars and can only participate as passengers. Each strictly rider sr∈ SR is associated with an origin and a destination
A = {arc(i, j) / i, j ∈ (PD ∪ SR)} is the set of arcs connecting any two different nodes from PD and SR. Each arc has a distance cost, and a time cost to be discussed later.
A sample ride is illustrated in Fig. 7 below.
Defining a ride R of n users where n ≤ Q, the vehicle’s
maximum capacity, each ride will have a driver pd and some passengers from the pool PD ∪ SR. The driver starts the ride from his/her origin, picks up the passengers and drops them off to their destination(s), following the least cost path. The driver’s and the passengers’ departure and arrival times should be respected. The total cost for this ride will be the sum of the penalties incurred by every passenger in this ride as will be further clarified in the following section.
Given all the users’ requirement and constraints, the model aims to solve the LTCPP by minimizing the number of operating cars, assigning the role of driver or passenger for every pd while conserving individual fairness, associating passengers with each vehicle, and finding the least cost route for every ride. The objective function, which helps achieve all these goals, is now discussed.
Assuming the following variables:
OCi: origin coordinates of user i DCi: destination coordinates of user i TD(i): departure time window for user i range [tLD(i),
tHD(i)] TA(i): arrival time window for user i of range [tLA(i),
tHA(i)] Ci: fairness counter for user i (i ∈ PD), incremented
by one if i drives, and decremented by one if i doesn’t drive
Qi: user i’s maximum car capacity
The evaluation of the quality of a ride R is based on the following three costs:
1) Distance Cost
Dk: original distance driven for the driver of car k Wj: waypoint j that car k has to pass through (a
passenger’s origin or destination) Dk’: extra distance travelled by the driver when in
pool k Dk’ =
dk: ratio representing extra distance driven by the driver of pool k
k
kk D
'Ddf(D) (1)
Fig 6. Client application screens
Fig 7. Illustration of a many-to-many car-pooling scenario

207
2) Time Cost
TA(i)’: the time of arrival of passenger i at his
destination TA(i)
’ =
Vavg being an average speed depending on the road type (e.g. 80km/h for highways; 40km/h for side roads)
is the traffic condition that is affected by time of day, weather conditions, and special events
is a security rounding factor to ensure timely arrival
f(TA(i)’): arrival time penalty for passenger i
f(TA(i)’)= (2)
3) Fairness Cost
f(Ci): fairness penalty for user i f(Ci) = (3)
The fairness cost will account for the number of days and the amount of extra distance a user drives.
4) Preferences Cost
Pi: set of preferences of user i with their relative priority, e.g. {(Smoking, 1), (Only 3 passengers, 3)}.
Cost (preference) =
f(P) = (4)
The total preference cost is the summation of the preference costs of every user in the ride.
The smaller the sum of these four costs, the higher the quality of the ride R. Hence, the objective function (OF) of the model is the following:
OF = (5)
IV. GENETIC ALGORITHM FOR CARPOOLING
A. Overview
GAs are adaptive search algorithms based on natural selection and survival of the fittest concept. GA uses a population of individuals that undergoes solution selection under the influence of mutation and/or crossover operators. A fitness function is then used to evaluate individuals, and survivability of each individual depends on its fitness, which fits well the car-pooling problem. A standard GA follows the workflow described in Fig. 8.
The algorithm that is used in the system maintains the general structure of a GA but has been modified to improve convergence – which is sometimes an issue with standard GA. GA convergence time is decreased due to an initial solution that roughly selects the early population instead of a
randomly initialized one. Since one of the objectives is to minimize the number of drivers, and a population has a fixed number of drivers, the GA will be run in parallel over different population sizes, and each thread will be checked for survivability.
B. Initial Solution
The initial solution algorithm is a fairly simple algorithm that forms the starting point of the GA. The purpose is to decrease the GA convergence time.
The main components of this algorithm are the arrival and departure times of the user and the extra distance driven by the driver. The initial solution will produce a set of solutions with a varied number of drivers for each solution. Initially, the drivers are randomly selected from PD. To assign passengers to vehicles, the algorithm performs three checks. The first one is the existence of at least one empty seat in the driver’s car. The second is the evaluation of the ratio of the extra distance to be driven if the pickup takes place to the original distance to be driven without pickup. This ratio must be less than or equal to the average of the ratios computed for all pairs of drivers and unassigned passengers. The third check is if the pickup does not affect the driver’s desired arrival time. If the last check does not succeed for the unassigned passengers, the offset from the driver’s arrival time is evaluated. It must be smaller or equal to the average of the offsets computed for all pairs of drivers and unassigned passengers.
C. Population Encoding
Each chromosome will represent a ride and the genes will be the car occupants. The set of all chromosomes belonging to a thread represents a solution, i.e. the number of possible solutions examined is equal to the number of threads running in parallel. Within a thread and after every evolution, the genes will be swapped and/or mutated to obtain better rides. The number of drivers will then be bound to the number of chromosomes in the population. A sample chromosome is shown in Fig. 9.
Fig 9. Sample chromosome
Fig 16. Genetic Algorithm workflow

208
A driver can be alone or share his/her car with one or
more passengers, up to the maximum car capacity. The passengers as listed in Fig. 8, are not in the order of pickup. Instead the path is computed using the origin and destination coordinates of each user in the chromosome, and fitness evaluations are based on these calculations.
D. Fitness and Operators
The fitness of a chromosome should reflect the quality of the ride and its probability to be the final solution. Therefore, it should include measures about distance, travel time and fairness. Hence, the fitness function (FF) is proposed to be:
(6)
The FF attributes different weights to the four costs:
1) f(D) ranges between 0 and 100; any value greater than 100 is clamped.
2) f(T(i)) has a value of 0 for a solution in the time window, and a value of 100 for exceeding the time limit. This gives the same importance for the time constraints and gives a very low fitness for a chromosome that doesn’t respect constraints.
3) f(Ci) is an exponent of a constant. The greater the number of days a user has to drive, the faster this function grows, and its effect will become more significant.
4) f(P) is a small integer reflecting the priority that a user attributes to his preferences, e.g. priority of 3 for prohibition of smoking.
GA standard operators have also been modified and one
was created as shown below to better suit the requirements of the car-pooling model:
1) Crossover operator: given two chromosomes, two random indexes are computed to determine the crossover positions, and then swap the contents of these chromosomes. A check is performed to test if the first position is still a driver. The change will be committed only in case the resulting two chromosomes are better than their parents. Fig. 10 illustrates this.
2) Mutation operator: The mutation is actually a swap
but between two different chromosomes because a user can’t be completely removed from the solution. Therefore, the
mutation exchanges two genes between different chromosomes. As for the crossover operator, a check on the driver is made, and the same operations apply. Afterwards, the resulting two new chromosomes are evaluated against their latter and if the sum of their new fitness is greater than their old one, the mutation is kept and the population is updated. This is illustrated in Fig. 11.
Fig. 11. Sample mutation operation between two chromosomes
3) DriverSwitch operator: This operator was been added
because the driver in the chromosome might not be the best driver to take the passengers of this ride, and one of the passengers could hold a higher fitness for this chromosome. This operator randomly switches the driver in a chromosome with another potential driver from the genes. If the resulting chromosome turns out to be better than the previous one, changes will be saved; otherwise, they will not be retained. Fig. 12 shows this “within chromosome swapping”.
Fig. 12. Sample DriverSwitch operation in a chromosome
V. SIMULATION RESULTS In order to test the proposed model on real world
scenarios, we performed multiple tests using real user data consisting of 119 students wishing to carpool to four different university campuses in Lebanon. To build the model and the solution algorithm, the Java computer language was used. The tests were performed on an Intel Core i7-3632QM CPU @ 2.20GHz and 6 GB of RAM in the environment of Microsoft Windows 8.
A. Carpooling Survey
The survey was answered by 150 adults. The results showed that 89.33% are willing to participate in an efficient carpooling system. Moreover, they are willing to pay an average of $2.38 per ride. Regarding preferences, 50.6% of the users wish to participate in non-smoking rides, 24% prefer to carpool with people of the same age group, and 75.86% desire a maximum car capacity of four individuals, including the driver. The survey results also showed that 55.33% do not mind leaving between 15 to 60 minutes prior to their planned departure time while 41.33% prefer not to exceed the 15 minute time window. When asked about late arrivals, 45.33% of the users do not accept arriving late while 41.33% can tolerate up to 15 minutes in lateness.
B. Advantage of the Initial Solution Algorithm
This test is run with the full population consisting of 119 users and four destinations. Users are students who wish to commute in the morning to their respective universities and provided their actual schedules and constraints. Case A runs
Fig 17. Genetic Algorithm workflow Sample crossover
operation between two chromosomes

209
the proposed model as described in this paper. Case B runs the GA without initializing the population using the initial solution algorithm, i.e. using a standard GA for original solution encoding. The results are summarized in Table I where:
Fitness: fitness score of the chromosome as shown in (6).
Increase in distance (%): percentage of extra driving distance incurred by the driver when picking up the passengers.
# Late arrivals: number of users who did not arrive on time.
Fairness: fairness score as calculated by the fairness cost function shown in (3).
# Used cars: number of operating cars, i.e. the number of rides.
# Solo drivers: number of cars occupied solely by the driver
The results confirm the usefulness of adding the proposed custom initial solution to the GA. Case A exhibits a higher fitness score. The number of operating cars is 32 versus 39 for case B. Also, no driver rides alone in the scenario of case A whereas there are 5 solo drivers in the other. Moreover, as shown in Fig. 13, case A converges much faster than case B. The average fitness value of 85.1 is reached in 286 iterations for case A, compared to 83.8 in 453 iterations for B.
C. Sparse versus Clustered Distribution of Users
To study the effect of users’ geographical distribution on the carpooling scheme, a second test was conducted using two extreme cases: a very sparse population and a highly clustered one. Although real life data show that populations in general do not fall into either of these categories, but somewhere in between, it is important to check that the model produces acceptable results irrespective of population distribution. Table II shows the results of two cases:
Case A is for a population of 8 clusters of 20 users each.
Case B is for a very sparse population of 160 users.
Both scenarios produced very good results: the average fitness of case A is 84.4 and that of case B is 79.7. In both scenarios, the average increase in driven distance does not
exceed 10%. Moreover, all the users’ schedules are respected and no late arrivals occurred. The number of used cars is 41 which translates to 4 users/car on average. These test cases reflect well the advantages of carpooling: the car occupancy is increased to 4 while the cost incurred on the drivers is acceptable.
Another advantage of the proposed approach is that it allows for a global solution rather than a strictly local one. This concept is illustrated in Fig. 14, which is a representation of a ride taken from case A. The nodes and path illustrations were done using Google Maps JavaScript API v3 [16]. In Fig. 15, driver A picks up passenger B from his cluster. Then on his way to destination E, A picks up passengers C and D from a second cluster before dropping everyone off at the final destination.
D. Impact of Carpooler Riding Preferences
The aim of this test is to assess the effectiveness of including the preferences cost function in the evaluation of the solution quality. The population is the same as that of the first test: 119 users going to four different destinations. Case A has a fitness function which does not account for user preferences whereas case B has the complete fitness function shown in (6). The results are illustrated in Table III.
Three new metrics are shown in this test, these are:
Smoking (%): percentage of users whose smoking preferences are not met.
Fig 13. Average fitness score versus number of generations for cases A and B
TABLE I. IMPACT OF INITIAL SOLUTION
Metrics Cases
A (with initial solution)
B (without initial solution)
Min/Max/Avg Fitness 71.4/98.8/85.1 50/98.9/83.8 Min/Max/Avg Increase
in Distance (%) 0/28.6/7.2 0/14.3/4.1 Min/Max/Avg
Fairness 0/1.49/0.93 0/1.47/0.68
# Late Arrivals 0 0
# Used Cars 32 39
# Solo Drivers 0 5
TABLE II. TEST RESULTS FOR DIFFERENT POPULATION DISTRIBUTIONS
Metrics Cases A (clustered) B (sparse)
Min/Max/Avg Fitness 50/99/84.4 50/97.4/79.7 Min/Max/Avg Increase
in Distance (%) 0/23/6.4 0/35.7/9.9 Min/Max/Avg
Fairness 0/5.01/2.34 0/1.51/0.89
# Late Arrivals 0 0
# Used Cars 41 41
# Solo Drivers 1 1

210
Age Group (%): percentage of users whose age group
preferences are not met.
Car Capacity (%): percentage of users whose car capacity preferences are not met.
Based on the survey results, the preferences were given different priorities which specify their impact on the solution quality. Smoking has the highest priority (3), followed by car capacity (2) and age group (1). When preferences were taken into consideration, only 11.77% of the users had their smoking preferences unmet, versus 21.01% for case A. Moreover, 16.8% were unsatisfied with the age group, versus 26.05% for case A. The car capacity numbers are close: 11.43% for case A versus 18.75% for case B. This can be linked to the fact that there are three additional operating cars in case A amongst which one solo driver. This decreases the average number of riders per car in scenario A which is reflected in a lower percentage of unmet car capacity preferences.
VI. CONCLUSION In this paper, a new automated carpooling system is
proposed. The objective is to develop an intelligent and reliable transportation solution that reduces travel costs, traffic and parking congestions, and pollution while securing fairness, satisfying carpoolers’ preferences, and incurring minimal costs among all participants. The presented approach is based on a customized GA coupled with a structured initial solution that takes into consideration preferences of the carpoolers. Preliminary tests have been performed to assess the efficiency of the model in different scenarios. The simulation results based on real data show that the model provides a high quality solution in a reasonable amount of time. Implementing a user rating system will be the subject of future work. Future research will also involve enhancements to the algorithm to allow for sudden change of schedules.
REFERENCES [1] G. Eason, B. Noble, and I. N. Sneddon, “On certain integrals of
Lipschitz-Hankel type involving products of Bessel functions,” Phil. Trans. Roy. Soc. London, vol. A247, pp. 529–551, April 1955. (references)
[2] Online:http://www.rita.dot.gov/bts/sites/rita.dot.gov.bts/files/publications/national_transportation_statistics/index.html. (2013)
[3] Varrentrapp, K., Maniezzo, V., Stutzle, T.: The Long Term Carpooling Problem: On the Soundness of the Problem Formulation and Proof of NP-completeness. Technische Universitat Darmstadt (2002)
[4] Maniezzo, V., Carbonaro, A., Hildmann, H.: An ANTS heuristic for the long-term carpooling problem. In: New Optimization Techniques in Engineering, pp. 411–430 (2004)
[5] Son, Ta Anh, Le Thi Hoai An, Pham Dinh Tao, and Djamel Khadraoui. "A Distributed Algorithm Solving Multiobjective Dynamic Carpooling Problem." International Conference on Computer & Information Science. 2012.
[6] Sghair, Manel, Hayfa Zgaya, Slim Hammandi, and Christian Tahon. "A Distributed Dijkstra's Algorithm For The Implementation Of A Real Time Carpooling Service With An Optimized Aspect On Siblings." IEEE Annual Conference on Intelligent Transportation Systems. Madeira Island, Portugal, 2010.
[7] Guo, Yuhan - Goncalves, Gilles - Hsu, Tienté. A Multi-agent Based Self-adaptive Genertic Algorithm for the Long-term Carpooling Problem. Springer Science Business Media B.V. 2012, 2011.
[8] Guo, Yuhan, Gilles Goncalves, and Tienté Hsu. "A Clustering Ant Colony Algorithm for the Long-term Carpooling Problem." International conference on swarm interlligence. Lille, France, 2011.
[9] Yan, Shangyao, Chun-Ying Chen, and Yu-Fang Lin. "A Model With a Heuristic Algorithm for Solving the Long-term Many-to-Many Carpooling Problem." IEEE TRANSACTIONS ON INTELLIGENT TRANSPORTATION SYSTEMS, 2011.
[10] Baldacci R., Maniezzo V. and Mingozzi A.: An Exact Method for the Carpooling Problem Based on Lagrangean Column Generation. Oper. Res. 52(3) (June 2004) 422-439
[11] Ta Anh Son, Le T hi Hoai An, Gerald Arnould, Djamel Khadraoui and Pharn Dinh Tao: Solving Carpooling Problem using DCA, Global Information Infrastructure Symposium (GIlS), Danang 4-6 Aug. 2011, pp.I-6.
[12] Calvo R. W., Luigi F. L., Haastrup P. and Maniezzo V: A distributed geographic information system for the daily carpooling problem, Computers and Operations Research, 31 (2004) 2263-2278
[13] E. Ferrari, R. Manzini. The carpooling problem: heuristic algorithms based on savings functions. Journal of Advanced Transportation, 37(3):243-272, 2003.
[14] Y. Lin. Matching Model and Heuristic Algorithm for Fairness in the Carpool Problem. Doctoral Thesis of National Central University, Taiwan, 2009.
[15] Williams, & Fagin. (1983). A Fair Carpool Scheduling Algorithm. IBM Journal of Research, 133-139.
[16] Google maps api family. (n.d.). Retrieved from h https://developers.google.com/map
TABLE III. TEST RESULTS FOR DIFFERENT FITNESS FUNCTIONS
Metrics Cases A (no preferences) B (with preferences)
Min/Max/Avg Fitness 50/96.62/85.6 71.4/98.8/85.1 Min/Max/Avg
Increase in Distance (%) 0/20.2/4.8 0/28.6/7.2
Min/Max/Avg Fairness 0/1.45/0.82 0/1.49/0.93
# Late Arrivals 0 0
# Used Cars 35 32
# Solo Drivers 1 0
Smoking (%) 21.01 11.77
Age Group (%) 26.05 16.8
Car Capacity (%) 11.43 18.75
Fig 14. Pick-ups from two clusters to a common destination

211
Low cost Arduino/Android-based Energy-Efficient Home Automation System with Smart
Task Scheduling
Kim Baraka, Marc Ghobril and Sami Malek Department of Electrical and Computer Engineering
American University of Beirut Riad El Solh, Beirut, Lebanon
[email protected], [email protected], [email protected]
Abstract - Energy management is nowadays becoming a
critical problem in our lives; and the solution starts at home. Automation, on the other hand, is becoming more and more popular, often at the trade-off of energy consumption. In this paper, we make use of Home Automation techniques to design and implement a remotely controlled, energy-efficient, highly scalable and user-friendly Smart Home with basic features that safeguard the residents' comfort and security (turning appliances ON/OFF, dimming the lights, controlling the temperature, and more). Our system consists of a house network which includes both sensors and appliance actuators to respectively get information from and control the house environment. As a central controller, we used an Arduino microcontroller that communicates through a Web Server with an Android application, our user interface. Our system brings together in the house network both wireless Zigbee and wired X10 technologies, thus making it a cost-efficient hybrid system. On the software side, events can be programmed to be triggered under specific conditions, and this can have a great role in reducing the total energy consumed by some appliances. On the other hand, the system can suggest smart task scheduling. The scheduling algorithm we present is a heuristic for the Resource-constrained-scheduling problem (RCPSP) with hybrid objective function merging both resource-levelling and weighted completion time considerations. The constraints to be met are an instantaneous power limit as well an overall cost target that the user specifies.
I. INTRODUCTION
In a world which is becoming increasingly automated, Home Automation is acquiring more attention from the households around the world. While many industrial facilities have moved to almost fully automated systems, there are only a few house that are smartly automated, because of the high cost of such systems. Home Automation should be more accessible since it does not require an incredibly advanced technology and can usually be implemented with off-the-shelf devices. As devices get smarter, a lot of effort is aimed at automating many of our day-to-day activities in a relatively easy way. A new Home Automation field is emerging with the incorporation of the mobile communications technologies into the automation systems, to control appliances either via the existing electrical wiring of the house, or using a wireless network. Indeed, users are using mobile applications on their phones to control their houses from distance. Trivial examples are turning on the air conditioning system 30 minutes before the resident's arrival, or opening the door lock using a mobile
phone. In addition, exploiting such technologies may contribute to a greener planet; and if by a "Smart" Home we mean one that is energy-efficient and that will be able to appropriately manage its energy resources, then this feature is essential for a safer and healthier future. The objective of our project is to design and implement a remotely controlled and energy-efficient Smart Home. We will be using in our system a low-cost Android tablet as the user interface, and an Arduino microcontroller to offer connectivity with the electronic devices of the house network. The tablet device is the component on which we will develop a user-friendly application, the portal to the house network (either remotely or locally through direct wireless connection to local base). Our house network makes use of both wireless Zigbee and wired X10 technologies, making it a hybrid and flexible system. Zigbee ensures the reliability of the system and X10 allows the integration of low cost controllers to optimize the overall cost of the system (X10 actuators being the cheapest, although not the most reliable). By the appropriate use of sensors, the user can monitor his house in real-time (displays for energy consumption, water level, indoor temperature...). This environmental information is also used by the system to trigger events that the user customizes for smart energy management and reduction in wasted energy. Furthermore, some houses running on standalone generators or renewable energy sources may be subject to constraining limits for instantaneous power. This is where automatic task scheduling can play a role in meeting instantaneous power targets, but also cost targets (if prices of energy vary at different times of the day). We will present a heuristic algorithm to the scheduling problem under hand which is an instance of the general resource-constrained project-scheduling problem (RCPSP). The rest of the paper is organised as follows. Section II presents current works related to our system as a whole, as well as each of its individual components. In section III, we present our design. Finally, Section IV discusses some implementation details.
II. RELATED WORK A. General Home Automation Products
Numerous Home Automation products exist on the market. Most of them are functional only for products within the brand

212
that sells the system as a whole, but some are compatible with other existing "standard" technologies like X10, KNX, Insteon, Z-wave, etc. the main difference between these products is the interface between user and central controller. Some systems require a software running on PC, other are Web-compatible, making it easy to control your home from any mobile or non-mobile device with Internet connectivity. Most of the systems available on the market have a central controller, which is exactly the role that our Arduino board will play, and that communicates with all appliance controllers within the house. To cite a few of the systems on the market, Belkin's Wemo allows the control of almost anything through an App. It also can make use of sensors to activate custom events in the house, or use the Web to notify of events happening in the house using the IFTTT (If This Then That) service (for instance, sending an email every time the cat visits the litter box) [1]. The magDomus system is another solution for Home Automation; this one is compatible with most existing technologies, which is very practical. The most popular computer software for general Home Automation applications (an open-source software) is MisterHouse, which is customizable, very flexible and compatible with most technologies. [2]. However, it runs only on Windows and Linux and is not compatible with Arduino.
B. Central controller (or brain of the system)
Some Home Automation projects have been designed for sending commands within the home only. For this purpose, commands may be received from a short range wireless technology like Bluetooth. This is the case in [3], where the commands are sent from a Smartphone through Bluetooth to an Arduino Mega board as a central controller. Another option is to connect the microcontroller to the Internet to be able to communicate with it from any device that has Internet-connectivity. This can be achieved by the presence of a Web server. The Web Server can run directly on the microcontroller, or on a separate PC with connectivity to the microcontroller, as depicted in [4] or on a router running OpenWrt,. One other option is to use cloud services like Cosm (previously called Pachube), whose services (storage of sensor data on cloud servers) can relieve the microcontroller's memory and computational power.The Cosm server converts messages sent from a Smartphone to messages that the Arduino board understands. In our project, we may use Cosm to use the real-time information collected by the house sensors for instance, but Cosm services in themselves only give access to raw data and do not offer computing power for processing or running decision algorithms. This is why other more general cloud services may be used, if not for extra computing power, at least for data backup. The idea is to take advantage of the Internet connectivity of the microcontroller to use the cloud.
C. Communication protocols between Home Automation devices
(brawn of the system)
When designing a Smart Home Automation environment, one of the essential concerns is to decide on the
communication protocol (or standard) that will link the “brain” to the different devices of the system. We distinguish three kinds of protocols. Direct connection
The most basic approach is to use a direct connection of the devices to the microcontroller, like in [4]. Such a procedure is very undesirable in our case, since the Arduino board represents our central unit and not a gateway between central unit and devices like in this project. This would offer very low scalability (limited to the pinout of the Arduino) and would need extra infrastructure or rewiring. Wired protocols
X10 is one of the most popular protocols in the Home Automation business, with millions of homes using it around the world, mainly due to the cheap accessibility of its components. Furthermore, most of its units are really easy to set up (it is “plug and play”). In [5], X10 devices are controlled from an Arduino board, making use of the built-in X10 Arduino libraries to send X10 messages through output pins. The X10 protocol strength lies in its easiness of use and compatibility with Arduino. However, in [6] the restrictions of X10 are presented. First, collisions may appear if one is using several controllers or repeaters, and X10 doesn’t possess the capacity to detect such collisions. This may sometimes lead to altering the status of several devices for no reason. Second, the protocol is considered to be relatively slow. Third, the X10 signal may experience attenuation when there is electrical noise, which occurs very frequently in a country like Lebanon. As a result, one of the devices can be accidentally switched on. As a conclusion, X10 should be used for applications that are error- tolerant like lighting for instance, but not for applications like security. Wireless protocols
Since most RF devices that work on a remote control operate at a frequency of 433 MHz (European Standard), some DIYers have considered the option to reverse-engineer the ASK modulation scheme used to create Arduino libraries that emulate the functioning of the remote control. A system with this capability can mostly control sockets, plus it is not very flexible and its scalability is questionable. Some have even considered using the actual remote control connected to the Arduino board to send RF signals in an easy way. Although very practical, there is a serious scalability issue since most remote controls support up to 8 devices.
Other wireless options that are "cleaner" (no hacks involved) include the wireless standard that has succeeded to the old X10 wired technology, which is called Z-Wave. Since it is relatively new, no low cost projects have been found using this technology and it is nowadays mostly integrated in market solutions or products development. Z-Wave is not a completely license-free protocol and may be quite expensive compared to other wireless options.
Another option for a wireless communication within the house network is the well-known Zigbee protocol, like in [6]. Their system uses a mesh-network topology for greater robustness, by making use of the capability of the nodes to

213
self-organize themselves into a mesh network. As a wireless protocol, Zigbee provides one of the most efficient ways to integrate a large number of wireless nodes in a Home Automation setting.
D. Energy Management
People nowadays are aware of the necessity to manage their energy consumption in a more reasonable way but efforts to succeed in doing so remain not as easy as we think they are. Sometimes, we may have the desire to live "ecologically" but don't really know how. Home Automation can solve this issue and make a significant impact concerning an improved energy organization [7] [8]. There exist several aspects of our houses that we can improve using Home Automation technologies [8]. If we consider the house’s lighting, for example, dimming the lights or making their intensity adjustable according to the activity carried out, can yield a considerable reduction in the amount of electricity payment. The same applies for the heating and cooling systems. Home Automation can also help monitoring the water consumption, especially when it comes to the watering of the plants.
E. Scheduling Algorithm
The general RCPSP can be formulated as follows: given n tasks {T1,...,Tn} sharing a common resource with resource utilization {U1,...,Un}, durations {D1,...Dn} and weights {W1,...,Wn}, we want to find a schedule {S1,...,Sn} (where Si is the starting time of task Ti), such that the objective function is optimized, under the constraint that the total resource usage U[t]<U at all time slots t. [12]. The objective function to be minimized can vary depending on the application and may be the total weighted completion time, the total weighted tardiness, the variance in resource utilization or other non-regular objective functions [10]. The tasks may also have release dates hence the need for an online algorithm. Pre-emption (stopping a task while it is executing) as well as precedence between tasks may or may not be allowed. In our case, we will assume that all tasks are known ahead of time and that no precedence relation exists between tasks. We will be looking for a non-preemptive offline solution to minimize both the variance in resource usage and the weighted completion time.
It has been proven in [11] that the RCPSP problem is NP-hard. Optimal solutions to this problem have been found using dynamic programming [13] and branch-and-bound [14] approaches. Some heuristics have been devised for the RCPCSP with weighted completion time as the objective function. These include: priority-rule based methods, truncated branch-and-bound or integer programming methods [15].
III. DESIGN A. Central Controller
A central controller (our Arduino board) receives user commands to execute. It has Internet connectivity through an
Ethernet shield mounted on the Arduino. On the user side, a mobile device provides interface with the system as a whole through a user-friendly application. The mobile device can be either wired to the central controller (through USB cable for instance), or communicates with it wirelessly. Within the scope of the home, wireless connectivity can be achieved using an Ethernet shield on the central controller. This way, we would be able to access the controller either locally or remotely through the Internet.
In our case, the client-server architecture is the one to opt for, since the central controller acts as a fixed entity that responds to clients' (mobile devices) requests (and eventually sends them notifications as well). Hence the need for a server (at the application level, i.e. a piece of code that is able to respond to client requests) closely tied to the central controller. We will use a simple Web server application running on the Arduino, and that communicates through the HTTP protocol with our Web-based Android application.
B. End-nodes
End-nodes within the house network can be categorized into two separate types: they are either sensors that send environmental information (temperature, luminosity, motion, humidity, ...) or actuators that perform specific tasks (switching, dimming, ...). These nodes constitute a network that can be wired, wireless, or hybrid. Topologies can vary and have to be wisely chosen to optimize traffic load and reliability. Figure 1 below shows all the necessary components in our system. Each project component or group of components can be designed and implemented in many different ways. Figure 2 below shows a functional block diagram of our system. It embodies the main operations that will be performed by the distributed software on the mobile device/central controller/house network nodes.
For the communication protocol, we used a combination of ZigBee and the simple X10 (specific) protocol which gives our system more flexibility and increases its scalability. Indeed, ZigBee, unlike Z-wave, INSTEON, and other IP-based solutions were designed for general purposes. The Xbee chips will constitute the main nodes in our wireless network.
Figure 1: Functional diagram of the system

214
In our project, communication between two end-nodes is not
crucial. In fact, by nature, the home automation framework is highly centralized. We may have conditional actions between two end-nodes for instance (for example switch the light on when someone is approaching), but since the central controller has to have knowledge about the status of each end-node, hopping to the Coordinator node is inevitable. This is why we chose to implement a tree topology, where routing nodes have the role of hopping information to faraway end nodes, and possibly, aggregating sensor data coming from different sensors to send them in a single packet (and hence reduce traffic load in the network).
C. Scheduling algorithm
Now we turn our attention to our scheduling algorithm. Take {Ti}, {Ui}, {Di}, {Wi} and {Si} as mentioned above. We will refer to Ui as the power rating of task Ti and Wi as its priority value where Wi {1,2,3,4,5}. We assume that the electricity pricing is in $/kWh regardless of the instantaneous power usage; we also assume different day and night tariffs.
C.1 Input
The input to our algorithm is summarized as follows: -{Ti} : list of tasks -{Ui}: list of power ratings of Ti -{Di}: list of durations of Ti (in number of time slots needed) -{Wi}: list of priorities of Ti -{Forecast[t]}: Power usage forecast for the day -C(day); C(night): Electricity pricing (in $/kWh) during the
day and night, respectively -Targ: Daily cost target (in $/day) We assume that the algorithm will attempt to schedule the
Ti's in the 24 hours following the time the algorithm is run. Time is divided into intervals of length Δt. We take Δt=15 min. Forecast[t] is an estimate of the baseline of power usage at time t. It is obtained as follows. The user labels every appliance in the house by either a permanent tag or a variable tag. These can appliances that are always ON like the fridge or the security system, or may vary during the day with pseudo-regular patterns (on the short run) like the air conditioning system or the water heater. Assuming each permanent appliance has a power sensor measuring its consumption, Forecast[t] is obtained by adding all power values of
permanent appliances at time t, based on history (let's say the day before).
C.2 Objective function and constraints
Let WC denote the total weighted completion time ( .) Let σ2 denote the variance in power consumption throughout one day ( where Xi[t] is an indicator variable indicating if task Ti is scheduled or not at time slot t. Xi[t] equals1 if Si≤t<Si+Di and equals 0 otherwise). The objective function (to be minimized) is a weighted sum of WC and σ2: α.WC+(1- α).β.σ2, where α is a parameter set by the user to give more or less importance to the early finish of higher-priority tasks (the lower α is, the more importance will be given for the maximization of the smoothness of the power usage curve or minimization of the σ2 term in the objective function. β, on the other hand, is a normalizing parameter to make WC and σ2 compatible, these quantities having different units (β is chosen such that, setting α to 0.5, we obtain a balanced emphasis on both WC and σ2
. β can be thought of as the cost of sacrificing one unit of WC for one unit of σ2.). The power and cost constraints are summarized as follows. The overall cost must be under the value of Targ inputted
by the user. The power usage in any time slot t should never exceed
the hard limit U. C.3 Procedure
Next, we present the suggested heuristic for solving approximately the problem stated above. Although the problem is not greedy in nature (and this is why it is NP-hard), we believe a greedy approach is a reasonable option for an approximate solution to our problem, especially that the objective function is a combination of two terms with possibly opposite gradients (one may increase when the other decreases).
The procedure goes as follows:
1. First schedule tasks with Wi=5 starting with task with highest Pi and going to the lowest Pi value, by identifying the first slot that can accommodate Pi. If two tasks have the same Pi, prefer longer tasks.
2. Sort remaining tasks by decreasing order of Pi, and iteratively schedule individual tasks as follows: for each Ti, temporarily assign a start date Si and compute the resulting objective function. Repeat for all possible Si values (from 0 to 95, since we considered a 24 hours time span divided into 15 minutes slots), and schedule Ti at Si
* which results in lowest value of the objective function, and such that the power limit condition is not violated. Terminate with negative output if a point is reached when a given Ti cannot be scheduled.
3. If a feasible schedule is found, compute its overall cost C and compare to Targ. If C>Targ, shift tasks with the lowest priority to the night period by rerunning the
Figure 2: High-level Schematic

215
algorithm in this time period, starting with tasks requiring the highest amount of energy DiPi.
C.4 Simulation results
In the actual system , Δt=15 min and the number of time slots for scheduling is 96; however, for the sake of illustration, in our simulation, these parameters will be respectively set to 30 min and 14.
Table 1: Sample list of task to be scheduled
Task ID
Task Description Duration (time slots)
Priority (1-5)
Power rating (W)
1 Well Pump 3 5 800 2 Water Heater 5 4 540 3 Clothes Dryer 2 3 420 4 Dehumidifier 4 2 350 5 Dishwasher 2 4 1200 6 Weed Eater 2 1 500 7 Iron 1 2 1100 8 Vacuum Cleaner 1 3 600
As our power baseline ({Forecast[t]}), we took the following permanent tasks: Fridge: Always ON with a power rating of 200 W - Room Air Conditioning: ON from slot 3 to 7 with a power rating of 1,100 W - Laptop: ON from 1 to 10 with a power rating of 100W.
Table 2 shows the schedule obtained after running the algorithm. Note how tasks 1,2 and 3 where rescheduled when to meet the new power constraint U=2,000 W. In Figure 3, the power baseline and the overall power after scheduling are plotted.
Table 2:Obtained schedule for two values of power limit U
Task 1 2 3 4 5 6 7 8 U=2,500 W
Starting Slot 0 5 7 7 10 13 12 13
Ending Slot 2 9 8 10 11 14 12 13
U=2,000 W Starting Slot 7 0 0 4 10 13 12 13
Ending Slot 9 4 1 7 11 14 12 13
Figure 3: Power curves for the simulated scenario with power limit
U=2,000W
IV. IMPLEMENTATION AND RESULTS We built a prototype of our design described in section III. In this prototype we combined the different building blocks on the physical and application layers. Specifically, we implemented an Android application from the user perspective. We also implemented a Zigbee network on the appliances side controlled by the Arduino through the application interface. We tested the overall design point-to-point communication between two Xbees as well as the overall network connectivity.
A. Android Application
An Android application (Figure 4) was programmed to allow the user to set up a network of appliances actuators and sensors. The application supports both X10 and ZigBee protocols, in accordance with our design decision. In addition, we did not limit the application functionality for Home Automation, but rather for any kind of Network, thus increasing its scalability. The figure below illustrates a sample snapshot of the device configuration page in our application.
Figure 4: Snapshot of the Android Application. The application allows user to add elements to the network,
for example sensors in the figure above, and assign addresses as well as choose the type of the network element.
B. Arduino programming and electronics
For our prototype (Figure 5), we used an Arduino MEGA board with Ethernet shield to provide local network connectivity (Android tablet connected on the same network wirelessly). We programmed the Arduino and the Xbees to enable the following scenario.
1. The user sends commands from the Android tablet to the Arduino board.
2. The Arduino, in turn, transmits the instructions to a network of Xbees formed by a router, a coordinator node and an end node.
3. Xbees send sensor readings from the appliances to via the Arduino.
0
500
1000
1500
2000
1 2 3 4 5 6 7 8 9 10 11 12 13 14
Pow
er (W
atts
)
Slots
Overall Power Curve after Scheduling (U=2000W)
Power Baseline (prior to scheduling)
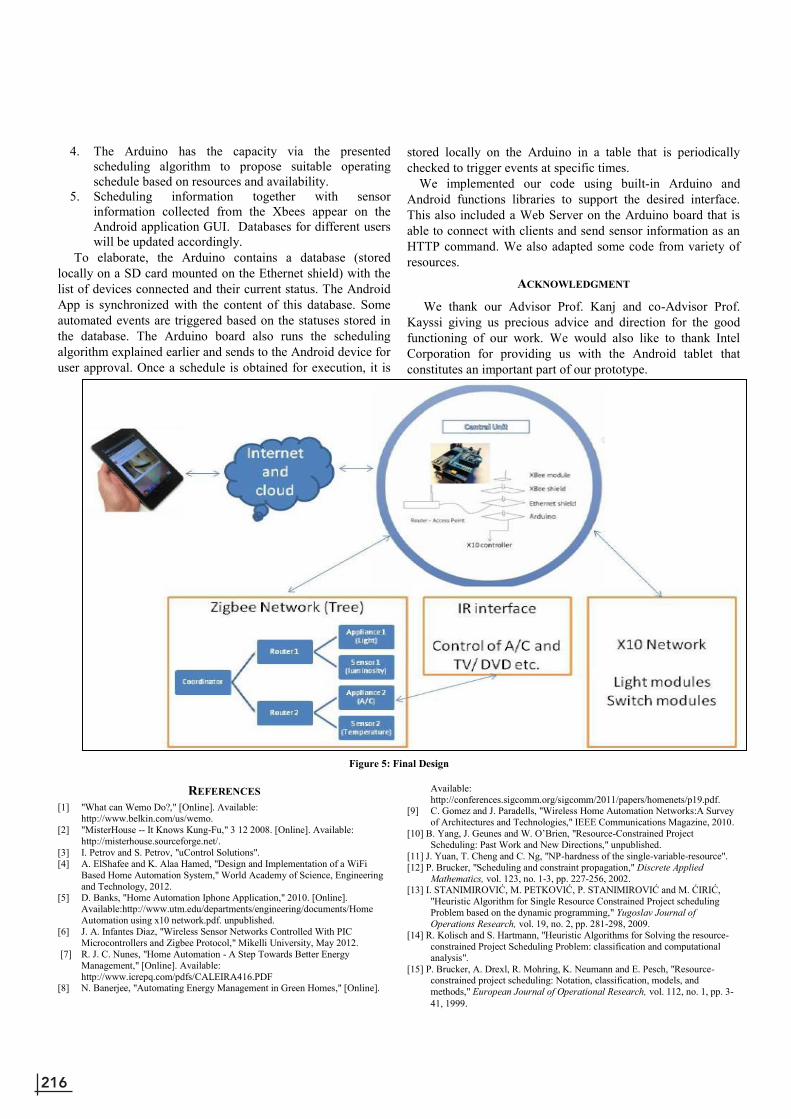
216
4. The Arduino has the capacity via the presented scheduling algorithm to propose suitable operating schedule based on resources and availability.
5. Scheduling information together with sensor information collected from the Xbees appear on the Android application GUI. Databases for different users will be updated accordingly.
To elaborate, the Arduino contains a database (stored locally on a SD card mounted on the Ethernet shield) with the list of devices connected and their current status. The Android App is synchronized with the content of this database. Some automated events are triggered based on the statuses stored in the database. The Arduino board also runs the scheduling algorithm explained earlier and sends to the Android device for user approval. Once a schedule is obtained for execution, it is
stored locally on the Arduino in a table that is periodically checked to trigger events at specific times.
We implemented our code using built-in Arduino and Android functions libraries to support the desired interface. This also included a Web Server on the Arduino board that is able to connect with clients and send sensor information as an HTTP command. We also adapted some code from variety of resources.
ACKNOWLEDGMENT
We thank our Advisor Prof. Kanj and co-Advisor Prof. Kayssi giving us precious advice and direction for the good functioning of our work. We would also like to thank Intel Corporation for providing us with the Android tablet that constitutes an important part of our prototype.
Figure 5: Final Design
REFERENCES [1] "What can Wemo Do?," [Online]. Available:
http://www.belkin.com/us/wemo. [2] "MisterHouse -- It Knows Kung-Fu," 3 12 2008. [Online]. Available:
http://misterhouse.sourceforge.net/. [3] I. Petrov and S. Petrov, "uControl Solutions". [4] A. ElShafee and K. Alaa Hamed, "Design and Implementation of a WiFi
Based Home Automation System," World Academy of Science, Engineering and Technology, 2012.
[5] D. Banks, "Home Automation Iphone Application," 2010. [Online]. Available:http://www.utm.edu/departments/engineering/documents/Home Automation using x10 network.pdf. unpublished.
[6] J. A. Infantes Diaz, "Wireless Sensor Networks Controlled With PIC Microcontrollers and Zigbee Protocol," Mikelli University, May 2012.
[7] R. J. C. Nunes, "Home Automation - A Step Towards Better Energy Management," [Online]. Available: http://www.icrepq.com/pdfs/CALEIRA416.PDF
[8] N. Banerjee, "Automating Energy Management in Green Homes," [Online].
Available: http://conferences.sigcomm.org/sigcomm/2011/papers/homenets/p19.pdf.
[9] C. Gomez and J. Paradells, "Wireless Home Automation Networks:A Survey of Architectures and Technologies," IEEE Communications Magazine, 2010.
[10] B. Yang, J. Geunes and W. O’Brien, "Resource-Constrained Project Scheduling: Past Work and New Directions," unpublished.
[11] J. Yuan, T. Cheng and C. Ng, "NP-hardness of the single-variable-resource". [12] P. Brucker, "Scheduling and constraint propagation," Discrete Applied
Mathematics, vol. 123, no. 1-3, pp. 227-256, 2002. [13] I. STANIMIROVIĆ, M. PETKOVIĆ, P. STANIMIROVIĆ and M. ĆIRIĆ,
"Heuristic Algorithm for Single Resource Constrained Project scheduling Problem based on the dynamic programming," Yugoslav Journal of Operations Research, vol. 19, no. 2, pp. 281-298, 2009.
[14] R. Kolisch and S. Hartmann, "Heuristic Algorithms for Solving the resource-constrained Project Scheduling Problem: classification and computational analysis".
[15] P. Brucker, A. Drexl, R. Mohring, K. Neumann and E. Pesch, "Resource-constrained project scheduling: Notation, classification, models, and methods," European Journal of Operational Research, vol. 112, no. 1, pp. 3-41, 1999.

217
Design of a Windmill Permanent Magnet Generator Ali Ezzeddine, Abdallah Al Sharif, Hayyan Harb, Riham Ginzarly
Electrical & Computer Engineering Department American University of Beirut
P.O. Box 11-0236, Riad El Solh/Beirut 1107 2020-Lebanon [email protected], [email protected], [email protected], [email protected]
Abstract- In our global societies; the current power sector relies heavily on fossil fuels. Our energy needs for heating to electricity, lighting and transportation are highly dependent nowadays on coal, oil and natural gas. However, these sources are limited and exposed to scarcity and depletion. The high cost of fossil fuels, the risk of depletion in the long term and the alarming side effects from environment pollution to global warming from CO2 diffusion have now shifted the global focus towards new technologies and management process that will take advantage of renewable and environmentally friendly sources of energy such as sun, wind and hydro power.
The term permanent magnet machine is used to include all electromagnetic energy conversion devices in which the field excitation is supplied by a permanent magnet. The purpose of our project is to design a windmill permanent magnet generator capable of supplying 15 KW power for household application. The PM generator is built and optimized using the finite element package MagNet software which enables us to iterate different types of design alternatives concerning the size, material and types of magnets used in the PM generator. Moreover, we are able to compare the PM generator performance to that of a conventional induction machine regarding voltage induced at certain wind speeds. The simulation using Magnet enables us to pick the best design which will ensure enhanced efficiency as well as viable economic cost. The utilization of the windmill PM generator leads to a wide spread use of wind generation since the wind speed requirements are lower.
I. INTRODUCTION
The world is getting hotter, by 1°C on land over the last 100 years, and the overwhelming agreement of scientific opinion is that human activities, particularly the emission of greenhouse gases, are the cause. The biggest emitter of these gases in the world is the energy sector, which makes it clear that if we want to solve this issue, we need to move away from burning limited fossil fuel reserves to more sustainable and renewable energy sources of energy. In addition to being environmentally friendly, these sustainable sources of energy are economically beneficial as they reduce the world’s dependency on oil and gas imports- improving the balance of payments while also increasing energy supply security.
The windmill system is described in “figure 1” below. First
the wind turns the blades, spinning the shaft and thus generating electricity. An inverter is essential to convert electricity from DC to AC. Electricity is connected directly to the main power or connected to a battery bank. In some cases, licensed systems can be connected to the energy grid.
This paper is organized as follows: Section II includes the literature review for types of windmills, generators and
magnets. Section III describes the design aspects and parameters of the PMG and conventional IG ratings. Section IV targets the numerical modeling needed for the design. Section V displays results and optimization measures. Section VI shows the modeled PMG on Finite element package Magnet and consequent modeling results. Then we will conclude our work in section VII.
Figure 1. Windmill Power System
II. LITERATURE REVIEW
A. Types of Windmills We have two types of windmills, the Horizontal Axis Wind
Turbines (HAWT) and the Vertical Axis Wind Turbines (VAWT). Most modern systems are horizontal axis systems since in this configuration the total area swept by the blades compared to the actual blade area is greater; thus creating a more solid turbine. Moreover, horizontal Axis Wind Turbines can be mounted on a tower, thereby putting the turbine in a higher speed wind regime. In other words, the tall tower base allows access to stronger wind in sites with wind shear. Horizontal Axis Wind Turbines have a high efficiency since the blades always move perpendicularly to the wind, receiving power through the whole rotation. In contrast Vertical Axis Wind Turbines create drag when rotating into the wind; as well as, the high air flow near the ground which create turbulent flow that introduces issues of vibration, noise and bearing wear that increase the maintenance and shorten the service life of the Vertical Axis Wind Turbine.

218
B. Types of Generators We consider in our paper two important types of generators,
the Surface Mounted Permanent Magnet Generator (SMPMG) and the conventional Induction Generator (IG).
When the induction motor is driven at a speed greater than
nsync by an external prime mover, the direction of its induced torque will reverse and it will act as a generator, thus producing electrical power. As the torque applied to its shaft by the prime mover increases, the amount of power reduces. If a prime mover applies a torque greater than the pushover torque to the shaft of an induction generator, the generator will over-speed. As a generator, the induction generator has several limitations. Since it lacks a separate field circuit, an induction generator cannot produce reactive power. In fact, it consumes reactive power and an external source of reactive power must be connected to it at all times to maintain its stator magnetic field. However, a great advantage of an induction generator is its simplicity. Moreover, power factor correction can be provided by means of capacitors and the generator’s terminal voltage can be controlled by the external power system.
Permanent magnet (PM) machines are a well-known class of
rotating and linear electric machines used in both motoring and generating modes. PM machines have been used for many years in applications where simplicity of structure and a low initial cost were of primary importance. More recently, PM machines have been applied to more demanding applications, primarily as a result of the availability of the low-cost power electronic control devices and the improvement of permanent magnet characteristics. In general, modern PM machines are competitive both in performance and cost with many types of machines. The term permanent magnet machine is sued to include all electromagnetic energy conversion devices in which the magnetic excitation is supplied by a permanent magnet. [4]
The surface-mounted PM machine has magnets at the air gap
surface and is liable to damage at high speeds or even in the assembly and fabrication process. The rotor structure for an interior PM rotor will tend to have a smooth rotor design similar or better than induction machines. Thus, windage losses will be equal to or lower than those of conventional induction machines. The merits of permanent-magnet synchronous machines over electrically excited machines can be as follows: No additional power supply for the magnet field excitation, no sliding contacts, so it requires less maintenance, higher reliability due to the absence of mechanical components like slip rings and no field winding or field copper loss. The demerits of PMSM are as follows: The power factor of operation cannot be controlled due to the absence of the field winding and demagnetization of PM occurring at high temperatures.
C. Types of Magnets We have three types of magnets for the permanent magnet
generator: 1. Neodymium iron boron (Nd-Fe-B) magnets 2. Samarium Cobalt (Sm-Co) Magnets 3. Ferrite Magnets
In table 1 below, we have the residual magnetic flux density (Br) and cost characteristics of the three types of magnets. From the table below, we realize that the ferrite Magnets have least cost (3$/Kg) compared to Neodymium iron boron magnets (50$/Kg) and Samarium cobalt magnets (120$/Kg). However, they have the least Residual magnetic flux density ranging between 0.3 and 0.5T relative to the Neodymium iron boron magnets (1.1-1.5T) and the Samarium Cobalt Magnets (1.1-2T).
From a theoretical point of view, Neodymium iron boron
magnets seem to be the most technically and economically feasible alternative since they give the highest residual magnetic flux density and have moderate costs compared to Samarium cobalt magnets and Ferrite magnets whose high cost and low residual magnetic flux density respectively eliminate them from being the optimal choice. [6]
Table 1 Characteristics of three types of Magnets
Magnet Relative Residual Flux Density Br (T)
Cost ($/Kg)
Neodymium iron boron magnets
1.1-1.5 50 ($/Kg)
Samarium Cobalt Magnets
1-1.2 120 ($/Kg)
Ferrite Magnets 0.3-0.5 3 ($/Kg)
III. DESIGN PARAMETERS
The following tables describe the design aspects and parameters for our 15KW system that we will use in our comparison between the permanent magnet generator and the induction generator as well as design modeling and analysis. We should note that the area of slot (As) in SMPMG is variable according to the type of magnet.
Table 2 Parameters of SMPMG and IG
Parameters SMPMG IG Stator outer diameter, Ds 235 mm 235 mm Rotor Diameter, Dr 145 mm 145 mm Effective air gap length, lg 0.35 mm 0.35 mm Number of poles, P 12 12 Number of phases 3 3 Magnet Length, lm 8.5 mm -

219
Area of slot, As Variable 163.4 mm2 Machine active length, la 135 mm 135 mm Filling factor, Kf 0.34 0.34 Number of turns per phase 165 turns 165 turns Winding Factor, Kw 0.96 0.96
Table 3 Induction Generator Ratings
Rated Power 15 Kw Rated Voltage 220V Rated Current 29.5A Torque 101.4 N.m Speed in rpm 515 rpm
Each type of magnet has its own distinct relative magnetic density Br. We also take the following assumptions:
1. Neodymium iron boron magnets Br=1.2T 2. Samarium Cobalt Magnets Br=1.01T 3. Ferrite Magnets Br=0.42T
IV. NUMERICAL MODELING
The below equations are described in figure 2 and are crucial for our design and optimization process. [3]
Peak Air Gap Flux Density (1)
Magnetic Loading
(2)
Tooth Pitch (3)
Tooth Width (4)
Back Iron Depth
(5)
Diameter D1 & D2
(6) (7)
Slot Depth
(8)
Slot Side ab & cd (9) (10)
Slot Area
(11)
Electric Loading
(12)
Such that: J is assumed to be 15 A/mm2 Torque
(13)
Induced Voltage (14)
Figure 2: Section of the laminated sheet of permanent magnet generator

220
V. RESULTS AND OPTIMIZATION
A. COMPARISON RESULTS First results are prior to optimization iterations, they are used
to compare between the Induction Generator and the Permanent Magnet Generator. Using Excel and Equations (1) to (14), we summarize our parameter calculation results in the following table:
Table 4 Calculation Parameter Results
Parameters Bmax=1.6T (maximum flux density saturation) Neodymium iron boron magnets
Samarium Cobalt Magnets
Ferrite Magnets
Peak Air Gap Flux Density, Bp
1.15T 0.96T 0.4 T
Magnetic Loading, Bav
0.732T 0.62 T 0.256 T
Electric Loading, Qrms
65.89 A/mm 65.89 A/mm 65.89 A/mm
Torque 215.12 N.m 181.06 N.m 75.29N.m Speed N 3.68 m/s
(44.22 rpm) 4.37 m/s (52.5 rpm)
10.53 m/s (126.34rpm)
Analyzing the results, we conclude that the torque of
permanent magnet generators with Neodymium iron boron magnets and samarium cobalt magnets has a higher value than the torque of induction generator stated in table 3. However, with ferrite magnets the torque is slightly less than Induction Generator (IG). We also conclude that using Permanent Magnet Generator enables us to capture wind at lower speeds in compared to the induction generator. More specifically, Neodymium iron boron permanent magnet generators can best capture low wind speeds which are crucial to our 15KW system.
B. Optimization Results of Slot’s Area and Rotor Diameter
We begin our slot’s area and rotor diameter optimization by using equations (1) to (14) and figure 3. We will also use the optimum split ratio Dr/Ds to get the new value of rotor Diameter Dr from the graph in figure 3. In return, we will be able to get the new optimized diameter D2 and thus the new optimized slot’s area.
We should also note that in this part, area of slots and rotor diameter are no longer equal to that of the Induction Generator but are variable according to the type of magnet used.
Table 5
Calculation Results of Optimization
Parameters Bmax=1.6T
Neodymium iron boron magnets
Samarium Cobalt Magnets
Ferrite Magnets
Rotor Diameter Dr
124.55 mm 131.6mm 151.2mm
Peak Air Gap Flux Density, Bp
1.15 T 0.96 T 0.4T
Tooth Pitch, tp 10.8mm 11.5mm 13.25mm
Tooth Width, wt 7.85mm 6.98 mm 3.33mm
Back Iron Depth, dbi
11.7mm 10.47mm 5mm
Diameter D1 211.4mm 214 mm 225mm
Diameter D2 125.25mm 132.3 mm 151.9mm
Slot Depth, Sd 43.1mm 40.87 mm 36.5mm
Slot side, ab 10.59 mm 11.69 mm 16.29mm
Slot side, cd 3.1 mm 4.56 mm 9.92mm
Slot Area, As 294.39mm2 332.12mm2 479.11mm2 Magnetic Loading, Bav 0.73T 0.616 T 0.25T
Electric Loading, Qrms 138.13
A/mm 147.49 A/mm
185.18 A/mm
Torque, T 332.76 N.m 333.84 N.m 230 N.m
From table 5, we conclude that by taking an optimized area of slots and rotor diameter for every type of magnet, the torque of the Neodymium iron boron magnets (332.76 N.m) will be very close to that of the Samarium Cobalt magnets (333.84 N.m) and greater to that of the ferrite magnets (230 N.m). Moreover, it is very important to understand that with our optimization of the permanent magnet generator, the three types of magnets now provide us with a greater torque than that of the Induction generator: Before the optimized design, ferrite magnets had a lower torque than the induction generator. Therefore, using equation (14) and table 1, we also realize that PM generator with neodymium iron boron magnets will give us nearly the same wind speed capturing however with a much more feasible cost than Samarium Cobalt magnets.
Figure 3: Variation of the optimum split ratio with the air gap flux density for different number of poles.
VI. MODELING OF PMG
As stated before, we will use the finite element package MagNet software to model the permanent magnet generator in order to see experimentally the modeled value of the peak air gap flux density Bp for each type of magnet versus the theoretical results we have in tables 4 and 5.
Figure 4: Modeled PMG
Using MagNet Software, the values for the peak air gap flux density and torque are summarized in the following table:
Table 6 Modeled Parameters of Permanent Magnet Generator
Magnet Torque (N.m) Bp (T) Neodymium Iron Boron
214.9 1.1
Samarium Cobalt 180.26 0.98 Ferrite 75.61 0.4
We realize that the torque and Bp values of the three types of magnets are very close to the theoretical ones in table 4.
Table 7 Modeled Parameters of Permanent Magnet Generator
Magnet Torque (N.m) Bp (T) Neodymium Iron Boron
331.8 1.1
Samarium Cobalt 332.6 0.98 Ferrite 229.2 0.4
We notice that the torque and Bp values of the three types of magnets after optimization are very close to the theoretical ones in table 5.
VII. CONCLUSION
We conclude that Neodymium iron boron magnets, by theoretical calculation and experimental modeling give us the best torque, wind speed capture and economical feasibility with respect to samarium cobalt magnets and ferrite magnets. Furthermore, the optimized design of the permanent magnet generator gives us a higher torque than the original design for the three types of magnets while keeping Neodymium iron boron the optimum choice for our design as well as enhancing the torque capability of the ferrite magnets with respect to the conventional Induction Generator.
Acknowledgments
The authors of this paper thank to Dr. Farid Chaaban who has helped us in every aspect of our work. Moreover, we would like to extend our thanks to Khaled JouJou who has helped us in acquiring the license of the finite element package MagNet Software.
REFERENCES
[1] Muyeen, S.M. (Ed.), “Calculation Method of Losses and Efficiency of Wind Generators” in Wind Energy Conversion Systems: Technology and Trends, 13th edition, Abu Dhabi, UAE, British Library cataloguing, 2012.

221
Figure 3: Variation of the optimum split ratio with the air gap flux density for different number of poles.
VI. MODELING OF PMG
As stated before, we will use the finite element package MagNet software to model the permanent magnet generator in order to see experimentally the modeled value of the peak air gap flux density Bp for each type of magnet versus the theoretical results we have in tables 4 and 5.
Figure 4: Modeled PMG
Using MagNet Software, the values for the peak air gap flux density and torque are summarized in the following table:
Table 6 Modeled Parameters of Permanent Magnet Generator
Magnet Torque (N.m) Bp (T) Neodymium Iron Boron
214.9 1.1
Samarium Cobalt 180.26 0.98 Ferrite 75.61 0.4
We realize that the torque and Bp values of the three types of magnets are very close to the theoretical ones in table 4.
Table 7 Modeled Parameters of Permanent Magnet Generator
Magnet Torque (N.m) Bp (T) Neodymium Iron Boron
331.8 1.1
Samarium Cobalt 332.6 0.98 Ferrite 229.2 0.4
We notice that the torque and Bp values of the three types of magnets after optimization are very close to the theoretical ones in table 5.
VII. CONCLUSION
We conclude that Neodymium iron boron magnets, by theoretical calculation and experimental modeling give us the best torque, wind speed capture and economical feasibility with respect to samarium cobalt magnets and ferrite magnets. Furthermore, the optimized design of the permanent magnet generator gives us a higher torque than the original design for the three types of magnets while keeping Neodymium iron boron the optimum choice for our design as well as enhancing the torque capability of the ferrite magnets with respect to the conventional Induction Generator.
Acknowledgments
The authors of this paper thank to Dr. Farid Chaaban who has helped us in every aspect of our work. Moreover, we would like to extend our thanks to Khaled JouJou who has helped us in acquiring the license of the finite element package MagNet Software.
REFERENCES
[1] Muyeen, S.M. (Ed.), “Calculation Method of Losses and Efficiency of Wind Generators” in Wind Energy Conversion Systems: Technology and Trends, 13th edition, Abu Dhabi, UAE, British Library cataloguing, 2012.

222
[2] K. Uday Kumar Reddy et M. Ramasekhara Reddy et Dr. M. Vijaya Kumar, “Modeling and Control of a Permanent Magnet Synchronous Generator Wind Turbine with Energy Storage” in International Journal of Engineering Research and Applications volume 2, Pulivendula, A.P, India, IJERA, 2012.
[3]. J. Rizk et M. H. Nagrial “Finite Element
Modeling of permanent magnet machines Third International Conference on Modeling and Simulation (1997).
[4] J. Rizket M. H. Nagrial Permanent-magnet generators for wind turbines School of Mechatronic, Computer and Electrical Engineering University of Western Sydney, Nepean, Australia, 2010.
[5] Renewable Energy: Technology, Economics and Environment by Martin Kaltschmitt ,Wolfgang Streicher and Andreas Wiese. Springer-Verlag Berlin Heidelberg 2007.
[6] Renewable and Efficient Electric Power Systems
Gilbert m. Masters. John Wiley & Sons Inc. Publications. 2004.
[7] Finite Element Analysis of Cage Induction Motors Fed by Static Frequency Converters, writer by “A. Arkkio”, published in “IEEE TRANSACTIONS ON MAGNETICS, VOL. 26, NO. 2, MARCH 1990.
[8] Major design parameters of a solid canned permanent
magnet motor with skewed magnets, F.B Chaaban, K.J, Binns, A.A.K, Hameed, IEE proceedings-B, vol.40, No.3, May 1993.

223
Arduino Android Elderly Smart Walker
Maria Baladi, Joe Berbari, Joseph Khayat, Rouwaida Kanj, Senior Member, Ali Chehab, Senior Member American University of Beirut, Beirut, Lebanon
[email protected], [email protected], [email protected], [email protected], [email protected]
Abstract- Our work aims at helping the elderly people by designing a smart walker. Walkers are an important assistive device for people who have difficulty walking unassisted and help them maintain mobility and continue an active lifestyle. We exploit state-of-the-art technologies to implement an electromechanical smart walker design. The design involves a feedback system composed of an Arduino microcontroller and a servomotor to improve the smart walker’s functionalities and extend it beyond physical support. An android tablet assists the patient and connects him to the rest of the world. Keywords- Android System, servomotor, electro-mechanical system, braking system, proximity sensor, inclinometer, reminder system, object detection .
I. INTRODUCTION It is becoming extremely important to transfer technologies
to the public health sector where they benefit patients, doctors and communities. As the baby boomers (in USA born 1940-1963) come closer to their retirement age, their medical expenses and health coverage prices are booming as well. Preventive care is the key to reducing those expenses. Results from a study done in 2009 by the federal government in the USA showed that "more than 47000 elderly Americans are treated at hospital emergency departments for injuries from falls that involve walkers and canes" [1]. 87% of the falls recorded in the latter study involved walkers. Therefore we can clearly deduce that the falls related to walkers are high and should be reduced since the health of the users is our number one priority.
Most elderly people are prone to accidents when using a walker since they lack strength, range motion, joint stability, coordination and endurance. The goal of our smart walker design is to decrease the amount of accidents related to their physical deficiencies by helping them in three factors: speed control, obstacles and forgetfulness. It is important to help the elderly since they are usually unassisted and live alone. Our visit to senior living homes gave us insight on the accidents an elderly may face (slopes, doorsteps) and the injuries that could occur. These obstacles cause the elderly to fall down causing lower trunk bones to break (hip, pelvis), cardiac arrests or blackouts. To help avoid such catastrophic accidents, our design builds upon technological advancements that will be added to our walker. This is achieved by enabling the smart walker design with three main design features: a smart braking system, an android application to act as an assistant and reminder system and an obstacle detection alert system as illustrated in Figure 1.
Figure 1 : Functionality features of the proposed design
To summarize, elderly are prone to falls while using the classical walker, because of the several vital functionalities that they lose due to age. We, therefore, focus on the following features for our design. 1. The physically impaired need a braking system while
descending a slope to prevent the excessive acceleration of the walker.
2. The physically impaired need object detection systems that will help them detect door steps beforehand and take the necessary precautions not to fall off.
3. The physically impaired need a braking system that will activate/deactivate when force is applied on the grips.
4. Any user of the walker may need a tablet application to assist him with reminders (Braking state of the walker and missed calls), and help avoid fetching cell phone from pockets or far locations.
5. The physically impaired need a four wheeled rollator walker to have maximum stability.

224
II. PRIOR ART Many different perspectives have lead to extensive research concerning smart walkers, all aiming at improving the user’s gait and mobility [3]. These different walkers in development include numerous features and thus allow us to divide the assistance the walker provides into three major parts [7]: a physical assistance, divided into passive and active, intended to maximize the stability of the walker. Adding forearm support platform to reduce the level freedom and diminish the risk of slipping is a form of passive physical assistance while the addition of motors on the wheels that can provide the pushing energy required to move the walker if the user feels incapable is a kind of active physical assistance. Security assistance can be considered as a sensorial assistance that works on facilitating one’s navigation, as for obstacle detectors. Finally, a navigational assistance aims at localizing the users in structured environments and in outdoors using GPS and accordingly advanced human-machine interfaces can be developed. This sort of assistance is known as a cognitive assistance, since it uses primarily sensors to guess the intentions of the user and most likely send commands to the machine. Renowned Smart Walkers in development include several features embedded through numerous forms. The ASAS/Simbosis Smart walker developed by the Bioengineering Spanish group CSIS is one of these walkers, which includes forearm support platforms as physical assistance, with force sensors on the handlebars that create a negative feedback loop of motion control when sensing pushing or pulling. On another hand, the PAM-AID (Personal Adaptive Mobility Aid) [11] walker is the most famous, and is known for its assistive mode. Mostly used by blind people, this walker can control its movement through a pair of motors placed on the front wheels in case the user is incapable, and that through the help of obstacle detectors. The i-Walker on another hand grants the security of the walker through an inclinometer, paired with a navigation service through voice commands and visual interface, by using maps of the location. Conversely, the MARC (Medical Automation Research Center)[12] walker relies on the multiple sensors (laser/infrared sensors for obstacle detection and force sensors to establish user-walker interface) to provide the security of the elderly. Finally, the PAMM walker focuses on supporting several monitoring systems (ex: electrocardiogram) and is mostly used in medical facilities.
III. DESIGN OVERVIEW In this part, we are going to discuss each feature and its needed component, in addition to the functionality of each one of them in our design and the overall design as presented in Figure 2. Figure 3 illustrates the list of added components to a classical walker to enable our desired functionalities. In what follows we describe the different components and their role in the design implementation.
A. SERVOMOTOR AND BRAKING SYSTEM We decided to implement a braking system using a servo
motor. The servomotor consists of a Push/Pull rod, an output shaft and a servo wheel/arm. The R/C servomotors are controlled by the controller which will send a Pulse Width Modulated (PWM) signal that will be translated into specific positions of the Servo output shaft. The brakes will be connected to the output shaft and therefore when the shaft moves by a certain angle, the brakes will be pulled by a certain length
Figure 2: Design Block Diagram
Figure 3: Planned Prototype Walker Design- Added Features
For example, take a Servomotor having a PWM range of 1ms to 2ms. The PWM of 1.5ms will correspond to the neutral stage. If the controller sends a PWM of 2ms, the output shaft will then turn 90 degrees clockwise from its initial stage. While for a 1 ms PWM, the output shaft will turn 90 degrees counterclockwise. R/C servomotors have three electrical wires connected to them: Ground (V-), DC Voltage (V+) and S control (signal). In addition, most R/C servo motors run with voltages ranging from 4 to 6V, and currents ranging from 200 mA to 1 Amp. In our braking system the output shaft of the servomotor (Figure 4) will be connected to the wires that control the brakes. By turning to a specific position, the wires of the brakes will be pulled by a certain distance and thus decreasing the speed of the walker.
Figure 4 Servomotor shaft connected to braking wire.
If the servomotor's output shaft moves from position 1 to position 2 the Brakes will be pulled by a distance C which is proportional to the radius of the arm L. For example if L = 3 cm we will get an increase of the pull by: C= 2*PI*L*90/360 = 4.71 cm
B. MICROCONTROLLER At the heart of the design lies the microcontroller. Our choice for the micro controller has to account for compatibility with: android operating system, the servo motor, the speed sensors and the object detection sensors. So after doing some research,

225
we found Arduino to be the most appropriate option for our case since it contained PWM pins for the RC servo motor, analog inputs/output pins for the sensors and communication interface with android devices. Between the wide ranges of Arduino, we decided to go with Arduino Nano USB microcontroller v3 (ATMEGA 328) which is based on Arduino Programming language (C/C++) [16]. Arduino nano (figure 5) uses USB interface for communication between the controller and the tablet and contains 6 PWM pins, 8 I/O analog pins, 14 I/O digital pins and a voltage of 5V as well which is perfect as mentioned above. C. PUSH BUTTON FLEXIFORCE SENSORS The braking system will also take into account park mode. This feature will include two piezoresistive sensors situated on the grips of the walker as well as a push button that will be enabled by the elderly to release the walker from the brake position while having his hands on the grips. These piezoresistive sensors are also known as force sensitive resistors. The resistance of these sensors changes with the applied pressure, therefore once the elderly applies his hands on the force sensors a change in resistance will be detected by the controller. Furthermore these particular sensors are compatible with Arduino. The above braking feature is very important when it comes to safety and is mainly responsible for two tasks. 1- Change the state of the walker to brake mode when the
user removes his hands from the grips 2- Keep the walker in brake mode when the user puts his
hands on the walker until he pushes the button on the grip, and that’s for the simple reason of preventing slips when the elderly is using the walker as a support for getting up of the couch for example.
For this purpose, we will integrate a flexi-force sensor in one of the grips to detect when the elderly applies a force, or in other words put his hands on the grip. The processor would then check the output of the sensor mentioned above and issues orders accordingly for the servo motor to take the appropriate position after having checked the state of the button for the safety feature mentioned above. The flexiforce sensors’ resistance will be calculated by dividing the voltage by the current (R= V/I). Therefore, we can associate each force applied on the flexiforce with a specific resistance. The relationship between the push button and sensors can be summarized as follows.
Pseudo code If (Force sensor ON & Push button ON) Release brakes; Else If (Force sensor OFF & Push button OFF) Full brakes ON; Else If (Force sensor ON & Push button OFF ) Full brakes ON;
D. INCLINOMETER
To detect inclines, we decided to use a digital inclinometer. As for the implementation, the inclinometer would be responsible of alerting the microcontroller of any slopes encountered. The microcontroller would then issue the appropriate commands for the servo motor to turn to an appropriate angle, and thus pull the brakes to an extent that would allow the elderly to keep using the walker safely while on downhill and uphill
slopes. It is one of the key inputs to the state machine in Figure 8.
Pseudo code If (Inclinometer == HIGH) slightly braked; Else Not slightly braked
E. CELL-PHONE TABLET SYNC APPLICATION Both the user’s cellphone, and the tablet should have Bluetooth turned on to establish connection between each other. This communication will be done through socket programming and an additional communication over WI- FI may be added. We developed an android application (figure 6) on JAVA eclipse to notify the user of any missed calls on his phone by sending a prompt to the tablet installed on the walker. This feature tackles the issue of elderly people often not answering their phones which generates anxiousness to the relatives.
Create unique Bluetooth Socket
for the application and initiate
connection with the tablet
Cell Phone withandroid OS
Check for newunread missed calls
in the CallLog
Send data viaBluetooth using the
Socket
Found ?
NO
Yes
Client found
No
Yes
Waiting for client
Tabletwith android OS
Listen for datainput stream
Display data onscreen
Found ?
NO
Yes
Client found
No
Yes
Figure 6 : Bluetooth application flow sequence
Pseudo Code FunctionSync() { … } If (missed call received on cell phone) Send notification via bluetooth.FunctionSync() Else Do nothing
On the tablet, the application will listen to an input stream in the channel every five seconds. If any new missed call is detected it will decode it and display it in a large font on the main UI (user interface) to help out users with visual impairments [15]. F. ARDUINO - TABLET COMMUNICATION
Since one of the most important functionalities in our walker is its braking system, we decided to use the tablet as an assistive device that will display to the user the corresponding state of the walker (fully braked, slightly braked, and fully released). To achieve and integrate such functionality, we connected the Arduino Mini-B USB jack to the Tablet USB jack. But to allow the communication between the two sides, an application has been implemented on both devices. The application will allow the Arduino to send the corresponding characters through the USB jack, thus displaying them on the Android application developed.
Figure 5 Arduino ATMEGA 328

226
G. PROXIMITY SENSOR
To implement the proximity sensor, we will rely on infrared sensors. There are two main kinds of infrared sensors: Firstly sensors that supply a binary output (built in circuits). Those can only detect obstacles within a threshold distance without providing any detail about the range. Secondly, analog or digital sensors can provide accurate distance. Moreover, infrared sensors can differ by their range; Our choice will depend on whether we need short range sensors (4-30 cm for example) or long range sensors (20-80 cm). These sensors work by the principle of triangulation, which is based on sending infrared light (around 850nm) and measuring the angle at which this light is reflected back by the obstacle using a phototransistor. This beam angle reflected can lead us to determine the actual distance at which the obstacle is positioned. If there is no light reflected, then the path is clear from any obstacle. However, the only drawback in the infrared sensor technology is that the light reflected is affected by the surface type and colors of the obstacle. These small variations won’t largely affect the sensor’s efficiency of detecting obstacles except when the sun is hitting strappingly. One of the main goals of the object detection system is to notify the user of door steps. As a result, we had to take into account the average door step width (of around 1 cm) when choosing the infrared sensor.
For our design, the output of the proximity sensor will be processed by the controller and once the signals sent by the sensors are received back, an electrical current would be initiated and detected by the controller. Based on the amount of this output, the microcontroller will know if there is an obstacle.
Pseudo code If (detection)
Send signal to the Tablet Else
Do nothing
IV. DESIGN ITERATIONS
A. SERVOMOTOR TORQUE CALCULATION
The testing of the force needed was carried out on a 13 Kg bicycle. To calculate the torque required to push the brake pedal, we used a hook on which we kept on adding weights until the pedal moved downward. When we applied a weight of 1.5 Kg to the brakes handles, the rear wheel braked fully. The following calculations were done: Force = mass x gravity = 1.5 Kg x 9.8 N/Kg = 14.7 N 15 N Distance = 0.07 to 0.08 m. We will consider 0.08 to be on the safe side. Torque = Force x Distance Torque = 15 x 0.08 = 1.2 N.m. 12 Kg.cm with 1N.m = 10.197162 kg.cm In our case, the four wheeled Elderly walker is around 5 Kg and has braking handles smoother than the ones used on a bicycle. Therefore, less pulling force on the handles is needed. As a result, a servomotor with a torque of 5-10 Kg.cm should do the task. However, to be on the safe side, a 15 Kg.cm servomotor will be used B. SENSOR FILTER DESIGN AND TESTING
Moreover, we have done testing on the Flexiforce A201-100 using a low pass filter circuit.
Figure 7 : Flexiforce testing with Filter for predefined detection
threshold.
In figure 7, we can clearly see that the voltage decreases smoothly from 5 volts to the required threshold voltage value. In addition the low pass filter will clear any unwanted high frequency noise that can cause overshoots above the threshold voltage. Additional testing for the inclinometer and push button was done.
V. PROTOTYPE IMPLEMENTATION AND BRAKING SYSTEM LABVIEW SIMULATION
The Finite state machine designed in figure 8 represents the feedback system between the arduino, sensors and brake.
Figure 8 : Braking system state machine
The three braking states are shown in figure 8 and the different possible input combinations are shown in figure 9 .The system was implemented in labview. The User Interface (figure 10) is composed of: 4 Push Button inputs (Flexiforce 1, Flexiforce 2, Push Button, Inclinometer), an Initial State String indicator, a Next State String indicator and three state LED indicators. Since every state machine needs to have a startup point, the Program Starts with the initial state “ Fully Braked “. We can clearly see in the next figure that the Fully braked indicator has turned into a red color and the initial state is “ Fully Braked “.
Figure 9 : Inputs truth table

227
Figure 10 : Labview testing user interface
Figure 11 : Labview front panel 1
Once the four entered inputs data has been processed the Next State will be “ slightly braked ” since the inclinometer is ON ( an inclination has been detected ). In figure 12, the Next State which was “Slightly Braked “, is now the Initial State. Moreover, the Slightly Braked green indicator is turned on and the fully braked indicator is turned off. With the corresponding input (Flexiforce 1 On, Flexiforce 2 ON, slightly braked ON, Push Button ON) the braking system should remain in the same state. Therefore in the next figure we can clearly see that the next state is the same as the initial state since the input did not change.
Figure 12 : Labview front panel 2
Figure 13 : Labview front panel 3
Figure 14 : Labview front panel 4
VI. HARDWARE DESIGN We have altered the classical rollator in order to come up with the desired hardware design that satisfies our requirements. Concerning the automatic braking system, we have designed a casing that will be situated and fixed above each rear wheel of the walker. The casing (fig. 15) will include the servomotors whose shaft will be wired to the added brakes. It is important to note that the manual brakes that were already built in the walker were left intact, thus giving the elderly the autonomy to brake freely.
Figure 15: Servo motor with casing
The flexiforce were installed on the hand grips and wrapped up to allow comfort and protect the sensor from debris (fig. 16). In addition, the location of the flexiforce sensors coincides with the palm of the hands when the user holds on to the grips, thus allowing maximum sensing of the force applied. In addition, the push button is placed such that when the elderly wants to use it, he will have to use the index finger.
Figure 16 : Modified handles with Flexiforce and push button
Concerning the proximity sensor (fig. 17) we have incorporated it to a mechanism where its height can be adjusted manually. It is usually situated at 1 cm above ground.
Figure 17 : Proximity sensor
VII. ARUINO CODING We have implemented the FSM using switch cases and if-else statements in arduino. With the use of the servo motor library, the motor is now moving between three positions: 30º for the fully braked position, 90º for the slightly braked and 150º for the fully released. This movement is controlled by the flexiforce connected to an analog pin in addition to a button and inclinometer connected to digital pins. The value of the flexiforce is calculated using the formula:
Figure 18: Before and after snapshot of the walker

228
float voltage = sensorValue * (5.0 / 1023.0) Thus, any value of voltage above 3 implies that no pressure is applied on the grips, while any value below 3 implies that the user has placed his hands on the grips. Finally, we integrated an inclinometer and a digital push button with the help of the arduino library.
VIII. CONCLUSIONS We have proposed a novel Smart Walker electro-mechanical system using Arduino, a servomotor and multiple sensors. This will provide smart healthcare support for the elderly to overcome falls involving walkers by providing them with an intelligent braking system, an android application to act as a reminder and an alert system. Object detection is enabled via sensing devices. This is very promising for the health industry and especially elderly people who regularly use walkers. Our design is currently in the prototype phase, and more features will be added in the future.
REFERENCES [1] Available at the site: http://health.usnews.com/health-news/family-health/bones-joints-andmuscles/articles/2009/06/29/47000-elderly-hurt-in-walker-cane-mishaps-each-year [2] Sumit Badal, Srinias Ravela, Bruce Draper, Allen Hanson, “A Practical Obstacle Detection and Avoidance System”, University of Massachusetts, Amhert, MA 01002, In WACV94 (1994), pp. 97-104. [3] Eli Einbinder, Tristan A. Horrom (2010) “Smart Walker: A tool for promoting mobility in elderly adults”. Journal of Rehabilitation Research and Development 47(9): xiii-xvi. [4] Vladimir Kulyukin, Ph.D, Aliasgar Kutiyanawala, M.S. , Edmund LoPresti,PH. D. , Judith Matthews, Ph. D. ,Richard Simpson , Ph.D. “ iWalker: Toward a Rollator-Mounted Wayfinding System for the Elderly”, 16-17 April 2008 Dept. of Comput. Sci., Utah State Univ., Logan, UT , 2008 IEEE International Conference on RFID , pp 303-311. [5] Gerard Lacey, Shane MacNamara, “Context-Aware Shared Control of a Robot: Mobility Aid for the Elderly Blind”, The International Journal of Robotics Research, November 2000 19: 1054. [6] Maria M.Martins , Anselmo Frizera-Neto, Eloy Urendes, Cristina dos Santos, Ramon Ceres, Teodiano Bastos-Filho, “A novel Human-Interface for Guiding: The NeoASAS Smart Walker” , Industrial Electronics Department, University of Minho, Guimaraes , Portugal , Biosignals and Biorobotics Conference (BRC), 2012 ISSNIP, 9-11 Jan. 2012. [7] Maria M. Martins , Cristina P. Santos , Anselmo Frizera-Neto, Ramon Ceres, “Assistive mobility devices focusing on Smart Walkers: Classification and review” , Robotics and autonomous Systems 60(2012) 548-562 [8] Aye Aye New, Wai Phyo Aung and Yin Mon Myint, “Software Implementation of Obstacle Detection and Avoidance System for Wheeled Mobile Robot”, World Academy of Science, Engineering and technology 42 2008. [9] O. Postolache , P. Girao, J.M. Dias Pereira, J. Pincho , “Smart Walker for Pervasive HealthCare”, 2011, Fifth International Conference on Sensing Technology. [10] V. Ramya, B. Palaniappan, K. Karthick,” Embedded Controller for Vehicle In-Front Obstacle Detection And Cabin Safety Alert System”, International Journal of Computer Science & Information Technology (IJCSIT) 4(2), April 2012
[11] Andrew J. Rentschler, Ms; Rory A. Cooper, PhD; Bruce Blasch, PhD; Michael L. Boninger, MD “Intelligent walkers for the elderly: Performance and safety testing of VA-PAMAID robotic walker” , Journal of Rehabilitation Research and Development , 40(5), September/October 2003 pp.43-432. [12] Eldercare Robotics: A personal Mobility Aid , Medical Automation Research Center, Available at: http://marc.med.virginia.edu./projects_eldercarerob.html [13]Available at http://www.societyofrobots.com/ member_tutorials/node/71 [14] C. Schumann, M. Connell, I. Shakil, K. Sullivan, “Force Sensors for Walkers and Rollators”, 2006, Duke University Biomedical Engineering, Thesis Paper. [15] Available at: http://homepages.ius.edu/RWISMAN/C490 /html/Android-Bluetooth.htm [16] Available at : http://www.arduino.cc/

229
Energy Boots Charger - Universal Ports Charging System
for Cellphones, Mp3, and Laptop Batteries
Ziad Rajeh, Rami Ghazali, and Rima Ghazali Department of Electrical and Computer Engineering
American University of Beirut Bliss Street, Hamra, Beirut, Lebanon
[email protected], [email protected], [email protected]
Abstract- The scope of this paper is to present an electromechanical conversion system capable of generating electricity while walking. In other words, it is converting the shoes into a device which is capable of producing free electricity without involving additional efforts. The energy generated can be used for charging batteries that serve different uses; mostly “phone batteries”. After research, the decision was made to implement a model of energy boots that uses a movable magnet inside a cylindrical coil to generate electricity based on Faraday’s law. While walking, mechanical energy is generated by means of foot-steps. Such energy can move the magnet (back and forth) inside a cylindrical frictionless tube that is inserted at the bottom of the boots. When magnetic field is generated, a current will flow under the condition of closed circuit. This current will be used to charge a capacitor, and the energy stored is later used to charge several types of phone batteries. In addition, a heating system will be implemented inside the boots in the form of resistors to warm the body up, especially in cold weather. Moreover, a value detector sensor can display several data using PC-Analysis program. The main objectives of the project include charging batteries through an external port-machine which fits several types of phone batteries. Add to this that the energy boots can control the internal temperature by using a temperature sensor detector for warming purposes. Finally, this device can display data such as the percentage of charged battery and changes in internal temperature on a PC device. An additional external device will be implemented in order to match the port type and size of current market brands. A complex version of this device can be implemented to store energy generated by wheels of a moving car, football, windmills, and many other moving objects. Analysis of the prototype design will be carried out using MAGNET, the finite element software and PSPICE modeling for capacitors, rectifiers, resistors, transistors and other components used to create the “Energy Boots” circuit.
I. INTRODUCTION The implementation of electronic devices is considered to be a priority in today’s technological trend. Millions of applications are offered and installed every month. Such applications can consume a viable percentage of the cell phone battery and that presents a problem for mobile phone users. Let us move to a different point of
view. We all walk, don’t we? So why don’t we make use of the energy produced by such motion? We implemented a design that is able to transform this wasted energy into electrical energy by the use of SMD transistors, coils, resisters, capacitor, LEDs, and a chargeable battery to store the energy produced for later use. Moreover, the energy produced can be directly used for lighting small lamps located in the front part of the shoes when needed. Alternatively, it can be used to ensure a specific amount of heat through an internal heating device system when the weather is cold. In addition, an external universal-port system will be implemented to transfer the energy obtained to several kinds of phone batteries. Finally, a wireless charging built-in device can charge the cell phone using on/off switch modes with a PC-Analyzing system to display the percentage charged.
II. LITERATURE REVIEW There exist few similar concepts in market for recharging mobile batteries by means of converting mechanical energy into electrical. However none of those is being efficiently implemented or utilized in a daily product system such as energy boots. In addition, the time parameter required in other concepts for charging the same rated voltage requires 5x that used in energy boots. Also, the absence of PC-Analyzer or wireless charging built-in device makes our boots unique. Some companies such as European Telco Orange presented a prototype for its Thermoelectric Boots [1] based on “See-beck effect”: a phenomenon that describes the temperature difference between two dissimilar electrical conductors, generating a voltage difference based on the two substances’ (thermocouples) see-beck coefficients. The thermocouples that are sandwiched between two ceramic wafers generate electricity with heat from foot. Their design requires an average of twelve hours of use (walking) to generate only one hour of battery life. Another design is the Nano-power Shoes [2] which depend on “Reverse Electro-wetting”, a process of generating electricity by using a fluid made up of tiny metal micro-droplets and a special substrate. As the foot presses down, the droplets are forced through the substrate thus generating electricity (about 20 watts).

230
This design is the result of researches in Wisconsin Madison University. However, Instep Nano power could add significant weight on shoes which makes design less effective and practical. Another design was also created by a Mexican industrial engineer Alberto Villarreal called “Bright Walk Shoes” [3], and is based on the piezoelectric effect which describes the relation between mechanical stress and electrical voltage in solids. Piezoelectric material is placed in sole of shoe and will generate electricity whenever bent or pulled. It is still a prototype, and needs further research to become a product. Our design as will be discussed later gathers optimum efficiency and practicality while overcoming the disadvantages which exist in other designs.
III. EXPERIMENTAL STUDY
A. Experimental Setup At the very beginning of our work, we used two different phone batteries to analyze their charging profiles. This allowed us to better understand what variable parameters we will have to control in our design to be able to charge the battery safely and efficiently. The below graphs display battery charging profiles [4] [5]:
Graph 1
Li-ion battery charging profile
Graph 2 NiCad battery charging profile
Comparison Table 1
Li-ion vs. NiCad phone batteries [6] NiCad batteries are more vulnerable than Li-ion, so it’s safer to use the battery inside design as Li-ion.
Figure 1 Circuit diagram The circuit provides constant-current/ constant-voltage charging. It consists of: IC1 (LTC 1541): Consists of Voltage reference,
Op amp and comparator. The high voltage reference (+-0.4%) regulates the battery float voltage to +-1.2%.
R6 R7: Used as feedback divider resistors. Transistors Q1 Q2: Q1 to regulate battery
charging current, where Q1’s base current is
controlled by the op amp output (pin 1), and Q2 buffer this current for additional gain.
Diode D1: to prevent reverse current flow when input voltage is zero.

231
R10 R9: R10 to sense the battery charging current, and feed it to the no- inverting input of the op amp (pin 3) by R9.
R4 R2: They divide the 1.2V internal IC1 reference voltage to 44mV and connects to the inverting input (pin 2)
The op amp compares the current sense voltage with the 44mV and adjusts the base drive to Q1 to regulate current to 300mA.
As the battery charges to 4.1V, the voltage loop reduces the charging to maintain the desired float voltage.
R6 R7 R8: Generates a feedback voltage to IC1’s comparator (pin 5).
R5: When the voltage at pin 5 reaches 1.2 V, comparator output goes high pulling the current sense signal high by R5.
R10 is in series with the battery charging path and this result in voltage regulation at around 4.05V instead of 4.1V. R3 and R8 compensate for the voltage drop and create negative output impedance that cancels the resistance of R10.
B. Design Efficiency vs. Input method
Figure 2
Magnet moving inside a coil (horizontally) Our other proposed input method was the piezoelectric material. It’s a new concept that creates electrical voltage from mechanical stress (foot-steps). The material needed was not available in Lebanon, so we had to test its efficiency using software simulation to determine whether to order it or go for an alternative design option. Results of the voltages produced ranged between 1-1.4 volts/3-4 volts, varying with size of the material; this revealed that use of amplifiers for this case is also a must.
Figure 3 & 4
Piezoelectric material & Mechanism of action
Our other option was to use same idea as option 1 but in a vertical position (translation into rotation), it does not depend on the back and forth movement of the magnet, it relies on foot pressure in a vertical manner. The below figure describes the mechanism of action of this design option. It produced a tested voltage in the range of [4-7 volts]
Figure 5
Shaft’s reaction to foot pressure
1- As foot presses on boots, the black blade will move upwards.
2- The white blade will move clockwise due to blade 1‟s movement
3- The small blade will react in an anti-clock wise direction due to blade 2‟ movement.
This will cause the magnet embedded in the design to rotate; thus, creating a magnetic field in accordance with Faraday’s law leading to the induction of the voltage. However, this voltage after it has been converted from AC to a DC by the use of bridge rectifier will be used as an input source to the Li-ion charging circuit. So the “5.5 V” DC voltage will be fed to the circuit in order to charge the built in battery. This battery will have two main functions: 1-To light small LED lamps located at the front part of the shoes. 2- To charge the phone battery by plugging the phone to the external output port. However, our design charges the phone battery by two features: either plugging it after walking for a couple of time, or connecting the phone directly to the circuit while walking, so the current will be directed towards the phone directly to charge it, and this will lessen the charging time.
C. Energy generated vs. Time
Another important factor to test the efficiency of our design is to evaluate how much time 100% charging needs. What we really aim to achieve, is to be able to
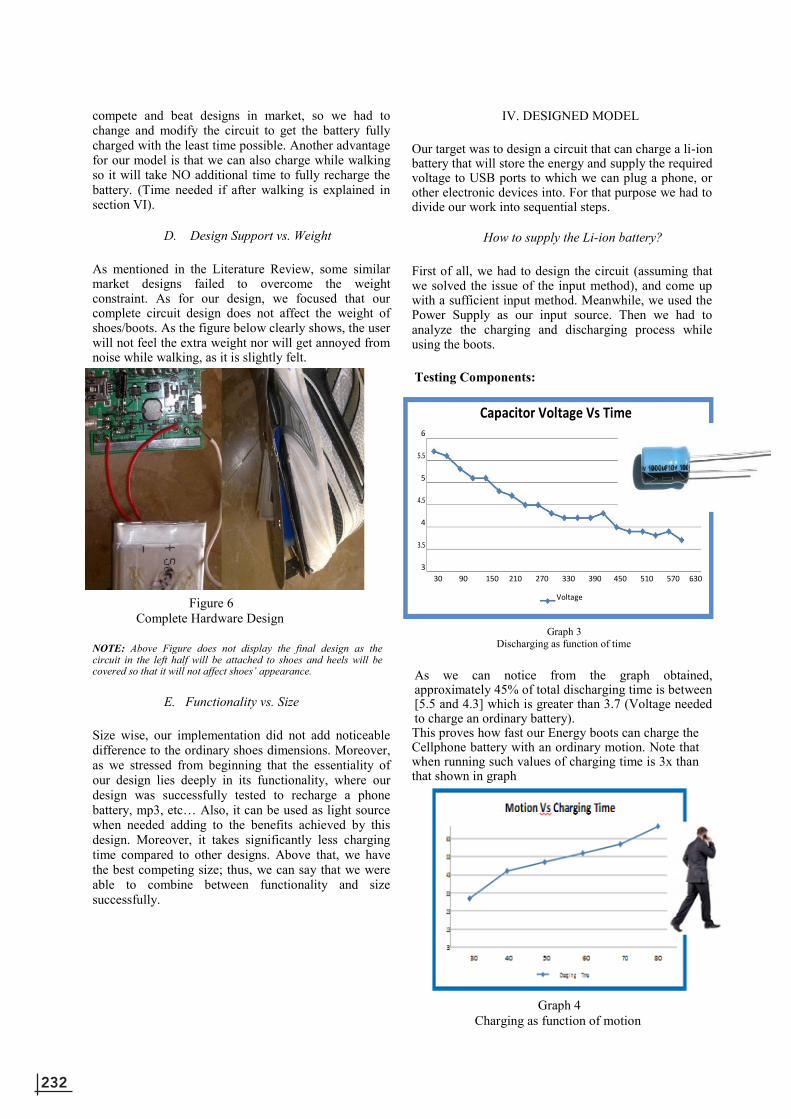
232
compete and beat designs in market, so we had to change and modify the circuit to get the battery fully charged with the least time possible. Another advantage for our model is that we can also charge while walking so it will take NO additional time to fully recharge the battery. (Time needed if after walking is explained in section VI).
D. Design Support vs. Weight As mentioned in the Literature Review, some similar market designs failed to overcome the weight constraint. As for our design, we focused that our complete circuit design does not affect the weight of shoes/boots. As the figure below clearly shows, the user will not feel the extra weight nor will get annoyed from noise while walking, as it is slightly felt.
Figure 6
Complete Hardware Design NOTE: Above Figure does not display the final design as the circuit in the left half will be attached to shoes and heels will be covered so that it will not affect shoes’ appearance.
E. Functionality vs. Size Size wise, our implementation did not add noticeable difference to the ordinary shoes dimensions. Moreover, as we stressed from beginning that the essentiality of our design lies deeply in its functionality, where our design was successfully tested to recharge a phone battery, mp3, etc… Also, it can be used as light source when needed adding to the benefits achieved by this design. Moreover, it takes significantly less charging time compared to other designs. Above that, we have the best competing size; thus, we can say that we were able to combine between functionality and size successfully.
IV. DESIGNED MODEL
Our target was to design a circuit that can charge a li-ion battery that will store the energy and supply the required voltage to USB ports to which we can plug a phone, or other electronic devices into. For that purpose we had to divide our work into sequential steps.
How to supply the Li-ion battery? First of all, we had to design the circuit (assuming that we solved the issue of the input method), and come up with a sufficient input method. Meanwhile, we used the Power Supply as our input source. Then we had to analyze the charging and discharging process while using the boots. Testing Components: Capacitor Voltage Vs Time
6
5.5 5
4.5 4
3.5 3
30 90 150 210 270 330 390 450 510 570 630 Voltage
Graph 3
Discharging as function of time As we can notice from the graph obtained, approximately 45% of total discharging time is between [5.5 and 4.3] which is greater than 3.7 (Voltage needed to charge an ordinary battery). This proves how fast our Energy boots can charge the Cellphone battery with an ordinary motion. Note that when running such values of charging time is 3x than that shown in graph
Graph 4 Charging as function of motion

233
V. MODEL DEVELOPMENT
Our project aims to develop a charging system that can charge different electronic devices with universal ports for charging as many brands as possible. Experiments done are only based on charging cell phone batteries and other devices that require 5.5V inputs or around. So how does all this start?! A. Why Energy Boots? Searching for daily problems or interferences that
usually cause people to delay many important tasks was the first idea that our search was based on. So we did a survey at AUB on a sample of 230 students and asked them how often they have their phone battery dead while they are at campus? And how many forget to bring their phone chargers with them or even don’t have time to wait and use it? Results were higher than what we expected as 65.22 % of students surveyed said that they frequently face this problem and 60.87 % said that they don’t get their phone chargers with them. This small scale reflects the case that students everywhere face these issues. B. Input Methods It took us a lot of time trying to generate the voltage required through a magnetic field and storing it through a series capacitor with a lithium chargeable battery. 1. Magnet moving inside a coil (motor form): It was about rotating the shaft of the motor inside the boot. We tried to rotate a small motor (1.1-0.5 cm) through a translation to rotation method. This method aims at rotating the shaft by transforming the downward pressure to a circular motion using small gears connected as in the figure. Unfortunately, the voltage obtained was not continuous
with a poor value of about 1.3-1.7V. Moreover, diodes were to be used for the back and forth direction of the current generated. Not forgetting the noise generated by the rotation of the shaft when the maximum speed is attained.
Figure 7: Motor action
2. Piezoelectric Cell: So we searched for a method capable of generating the extra voltage needed and to counter the problems that were faced in rotating shaft and noise produced. It turned out that a piezoelectric cell is capable of
generating voltage proportional to a certain stress which generating voltage proportional to a certain stress, which in our case is matched to the downward pressure exerted by the weight. Search results were shown to be that it is possible to generate the rated voltage required through amplifiers to completely eliminate the noise problem. But the problem is that such material can be easily broken due to the lack of brittleness of this cell and the lack of a protective coating. We tried solving it by inserting a layer at the top of the cell to insure it. Stress absorbed by the cell was much smaller, resulting in a 2.3-2.6V generated which is insufficient [7].
Figure 8: Piezoelectric Film
3. Magnet moving inside a coil (spherical form): The magnet is now rotating in a spherical base with the small shaft installed at the top of the magnet for ease of rotation. The rated voltage produced was exactly 5.5 volts, and that is equivalent to what is required to charge the phone battery without using any additional amplifier. Add to this that the size of the circuit is acceptable and that it requires less time to charge several batteries. Figure 9: Snapshots for hardware of input supply Moving on, we are working on a wireless charging system that is capable of charging the battery without plugging the device in. Wireless charging feature is very important to the device, as charging phone battery will be instantaneously without even thinking of it!
VI. EVALUATION
To evaluate and test the adequacy of our design we had to take several factors into consideration. Technical Evaluation: Our model should charge a phone battery, mp3 or laptop battery. For the first stage of testing before implementing the circuit in the

234
boots, we supplied the required voltage to the circuit using a Power Supply (5-6 volts); the circuit successfully charged a phone battery with few hours! That alone we considered a huge achievement when compared to the other products we researched (that need much more time to recharge). We summarize the testing in the table 2 below.
Table 2 Recharging Duration as function of voltage supplied
Now the second challenge in the technical evaluation is to get the same voltage range using a feasible input method that makes use of mechanical energy (walking). Further tests were performed on each option and table 3 summarizes the results we obtained.
Table 3 Voltage obtained from different Input sources
We were able to achieve the voltage range required with no need to use any external power source for amplification (Option 3). Non-Technical Evaluation: To get a successful model, our boots must be comfortable to wear; thus, we had to implement the complete circuit in the base and keep it as is from inside. By doing that we ensure that the user doesn’t feel annoyed considering the light weight of the circuit.
VII. CONCLUSION
The purpose from our project is to present a simple
model that can charge mobile and other electronic devices only through walking. We showed using research and findings that similar products available or even prototypes which are still under testing, need a lot of time to recharge and some are not practical to wear. Therefore, we proposed a model that takes all the above issues into account. We presented a detailed analysis on how we worked to reach the final design model successfully. Then we validated our project with experimental data and measurements under different conditions. Furthermore, our design can be developed into a more complex version, capable of supplying larger loads when connected to a larger supply such as a windmill or wheels of the car.
ACKNOWLEDGMENT This project was a new topic we proposed, so thanks to our advisor Professor Farid Chaaban who trusted our work and commitment to come up with a successful design concept that matches our expectations, and also for his valuable help through this year. Moreover we would like to thank our co-advisor Prof. Daniel Asmar for his great contribution in our progress. We would also like to thank Prof. Rabih Jabr and Dr. Khaled Joujou for their beneficial help and support.
REFERENCES [1] Gizmag Team, Thermoelectric boots charge your mobile phone”, June 8, 2012 [online] Available: http://www.gizmag.com/thermoelectric-orange-power- wellies-generate-electricity/15346/ [2] Devin Coldewey, “Nanopower” Shoes Could Generate 20W of Electricity during Walking”, Thursday, August 25th, 2011 [online] Available: http://techcrunch.com/2011/08/25/nanopower-shoes- could-generate-20w-of-electricity-during-walking/ [3] “Bright Walk – Piezo-shoe That Illuminates When You Run” [Online] Available: http://www.environmentteam.com/concept/bright-walk-piezo- shoe-illuminates-when-you-run/ [4] Battery University “Charging lithium ion” [online] Available: http://batteryuniversity.com/learn/article/charging_lithium_ ion_batteries [5] Battery University “Charging Nickel-cadmium” [online] Available: http://batteryuniversity.com/learn/article/charging_nickel_b ased_batteries [6] “Li-ion vs. NiCad” [online] Available: http://www.diffen.com/difference/Li-ion_vs_NiCad [7] “Piezoelectric Film” [Online] Available: http://www.imagesco.com/articles/piezo/piezo00.html

235
Improving the Presentation Experience with an
Intelligent Gesture Based Interface
Ahmad Barrage1Hasan Jamil2Hashem Ramadan3
Department of Electrical and Computer Engineering American University of Beirut
Lebanon [email protected] [email protected] [email protected]
Abstract- The world today is gradually abandoning intermediate hardware between the user and the machine (such as keyboard and mouse), and most new computers and electronic devices are now touch devices where the user uses his fingers to control the interface. The aim of this paper is to research the step beyond what is currently present on the market. Our aim is to eliminate the need of the user to touch his/her device. Using only the laptop webcam, we aim in this paper to allow the user to control a PowerPoint presentation with predefined hand gestures while s/he waves her/his hand in front of the webcam.
I. INTRODUCTION
The world today is gradually abandoning intermediate hardware between the user and the machine (such as keyboard and mouse), and most new computers and electronic devices are now touch devices where the user uses her/his fingers to control the interface.
Human to machine interaction projects have been
mushrooming lately. The main target for such innovations is the video gaming industry. The Nintendo Wii was the main proponent of such technologies. It had the advantage of using simple hardware for motion detection such as infrared light emitters, an infrared sensor, and a Bluetooth communication capability for communicating the position of the controller. It had some disadvantages, however, which are the possible interference from other light sources, lack of precision, no shape detection, and short range. Sony also made a similar technology with the Playstation by utilizing a “light ball” which would illuminate in a color different than all the colors present in the room, creating a unique marker for the sensor to follow. Almost in the same period, Microsoft started marketing its “Kinect” device. Its main advantages are that it is completely hands free, the whole body could be used as a gesture, and that it is precise since it uses depth map generation through infrared emitters and sensors. However, it required too much room, and was expensive due to the use of many additional hardware components [1] [2].
Motion and gesture sensing technologies use either
monocular or stereovision. With monocular vision, one camera is used which means, less cost, less computation, less disk space, and wide availability for users. Depth perception, however, could not be calculated since a 2D image can only be taken. Regarding stereo vision, the main advantage over monocular vision is that 3D image construction is possible, even though more hardware such as two cameras or a rotating camera is needed which would lead to more complex computation, more power, and a higher probability of distortion [3].
The aim of this paper is to research the step beyond
what is currently present on the market. Our aim is to eliminate the need of the user to touch his/her device. Using only the laptop webcam, we aim in this paper to allow the user to control a PowerPoint presentation with predefined hand gestures while s/he waves her/his hand in front of the webcam. The importance of our project is mainly the added user friendliness of hands-free software. The user won’t have to worry about the wear and tear of a regular remote-control device. Moreover, there won’t be a need for configuring the hardware, which avoids compatibility issues. The uniqueness of our project lies in the fact that it would be available for any user with a normal webcam since it uses monocular vision and software techniques to detect and identify gestures.
This paper is structured such that Section II details the
proposed approach and the software’s sequential flow from image acquisition, going over processing and feature extraction to gesture identification. A sample of the experimental results in Section III shows the performance of the system while Section IV concludes the paper with future work.

236
II. SYSTEM FLOW
This part describes in details the different stages of the software.
1. Setup and Acquisition The first step of this stage is to calibrate both the
zoom and the lighting conditions for the image acquisition in the third step. Using the zoom slider, the user chooses the zoom that best fits him. By pressing the “Calibrate” button, the video frame on the left will becomes active and a frame is acquired. This frame is then changed to binary (0’s and 1’s) according to the default threshold for luminance (50%).The system then calculates the ratio of the number of bright (binary value 1) and dark pixels (binary value 0).
The second step is the gesture test feature for new users. Using this feature, the user chooses what gesture to train for by selecting its corresponding radio button. Then by pressing the “Test” button, the video frame on the right is activated and a frame is taken. If the gesture is correctly identified, the red square next to the gesture turns green.
The last step in this stage is to take a still frame (with no gesture), which would be a reference frame for later stages in the system. By pressing “Run” button, the main program gui will be opened.
To increase the usability of the software, we included
in the setup phase: A. Multiple zoom options Since users may choose different distances from
their laptops to present according to the room setup, there should be a functionality to compensate for the inaccuracy in computing the gesture due to far distances. Applying multiple zoom options would fix this since the user gets to choose what level of zoom suits him or her depending on the distance from the webcam.
B. Dual Screen During the presentation, the audience has to see
only the presentation on the screen. However, the user has to see herself/himself on the screen in order to place his or her hand in the correct position for gesture detection. Therefore, a dual screen solution is necessary, where the primary screen is used for the presentation
screen, whereas the secondary screen is the webcam. By applying this method, the audience will not be distracted by the user making gestures above the presentation screen.
2. Image Acquisition
In this stage, there are three main features: live feed, dual screen, and the dimension of the subframe. The first thing we worked on is the implementing the live feed functionality. In the live feed mode, the number of frames acquired per trigger is set to infinite at a frame rate of 20/sec. Then, the last 50 frames are returned out of which the 25th frame is taken and passed on to the third stage (Image Processing).
The second feature is the dual screen. The motivation behind this feature was to enable the user of being able to see where exactly his hand is while the audience sees only the presentation slideshow. In this way, the user would only see the program gui while only the presentation would be visible on the LCD display. This is implemented using the extended display option in windows in the display settings for the LCD projector.
The third feature in this stage is the subframe. The main motivation behind this was to reduce the computation time in the image processing stage by reducing the number of pixels to process using the algorithms. The subrame dimensions are defined as 200x212. For the user to be able to know if his hand is inside the subframe, we had to superimpose another video frame on the main one in the main gui. In the running mode, the user would see the boundaries of this subframe on the main frame, and thus, will be able to know where to place his hand. The dimensions of this subframe were chosen to match those of the subframe in the algorithm (200x212).
3. Image Processing This stage takes as input both the still frame from the
calibration mode and the frame taken in the image acquisition stage. Following this, there are two steps: Image Subtraction and Filtering. Image Subtraction starts by converting both frames from RGB to gray scale. The output of this subtraction is then converted in binary and edge detection is applied in order to identify the contour of the shape. The next step is to apply some filtering techniques in order to reduce the noise (if any) from the matrix. This is done in two steps: Wiener filtering and open area filtering. A Wiener filter is a low pass filer that uses pixel-wise method that checks for intensity of pixels in a local neighborhood frame. The chosen frame in our case is [2 2]. The output would be matrix which is almost noise-free. The next filtering technique is the area open filtering. This filter depends
Figure 1 – System Flow

237
on the length of connected pixels. If the length of the connected pixels in any part of the matrix is less than 200, then these pixels are changed to 0. The result is a noise free matrix with only the contours of the gesture.
Five gestures have been defined, which are next slide/enter, previous slide, right click, tab, and escape as shown in Figure 2.
4. Feature Detection i. Coordinate Detection
Some gestures used need to have their area and length to width ratio calculated. Therefore, maximum and minimum X and Y coordinates need to be calculated.
ii. Finger Number Detection Other gestures rely on the number of fingers as their distinct feature. The number alternating dark and bright spots is detected to calculate the right number of fingers.
5. Gesture Identification
i. Decision making After all the features are calculated, the right gesture is chosen according to a simple decision tree build from if else conditions set. The table below shows for each gestures the corresponding conditions.
Gestures Feature1 Feature2 Feature3
G1= Next Slide/ Enter
Length to width of hand
Thumb area to rest of hand area
1 finger detected
G2= Previous Slide
Length to width of hand
Thumb area to rest of hand area
1 finger detected
G3= Right Click
2 fingers detected
G4= Tab 3 fingers detected
G5= Close
Length to width of hand
ii. State Machine
To capture the sequential flow of the presentation in a simple manner, a state machine shown in appendix is used to decide what would be the corresponding action to the gesture.
6. System Response
When the right if condition is chosen according to the gesture features, a java class is executed to run the necessary command as a virtual keyboard or mouse press, and consequently control the Powerpoint presentation.
III. EXPERIMENTAL RESULTS
We tested our system in different conditions varying the light, the distance and the size of the hand.
Figure 3 shows the three steps required to detect a hand with its edges. The first image on the left is the still background, the second image is the hand after it is put inside the subframe, and the third image is the hand after edge detection and noise reduction.
Table 2 shows the confusion matrix of few tests in normal lighting conditions while Table 3 shows results in very poor lighting conditions.
Figure 3 – Sample Testing
Table 1 – Gesture Features
Figure 2 – System Gestures

238
IV. CONCLUSION
This paper presented preliminary results for an elementary human to machine interface. Given that real time identification is important, it is essential to keep all image processing and identification minimal in terms of computation. Future work should address some novel improvement to account for low light conditions.
ACKNOWLEDGMENT
We would like to thank Dr. Haitham Akkary and Dr. Mariette Awad for guiding us along the way to achieving our intended goals. We would also like to thank the Electrical and Computer Engineering Department for giving us the opportunity to pursue this project.
REFERENCES [1] OIKONOMIDIS ET AL., “Efficient Model-based 3D Tracking of Hand Articulations using Kinect”, Computational Vision and Robotics Lab., Institute of Computer Science, FORTH, Greece [2] K. Khoshelham, “ACCURACY ANALYSIS OF KINECT DEPTH DATA”, ITC Faculty of Geo-information Science and Earth Observation, University of Twente, Enschede, Netherlands, Volume XXXVIII-5/W12, 2011 [3] T.Taylor and W.W.Boles., “Monocular Vision as a Range Sensor,” Sch.Soft.Eng, Queensland,Univ.,Brisbane,Australia, CIMCA 2004 Proceedings/ISBN :1740881885, 2004
Table 2 – Testing Results in “Good” or “ Normal” lighting conditions
Gestures Testing results Next
Slide Previous slide
Right Click
Tab Close
G1 10 0 0 0 0 G2 0 10 0 0 0 G3 0 0 9 1 0 G4 0 0 1 9 0 G5 0 0 2 0 8
Table 3 – Testing Results in “Poor” or “Bad” lighting conditions
Gestures Testing results Next
Slide Previous slide
Right Click
Tab Close
G1 7 0 1 0 0 G2 0 6 0 0 2 G3 2 0 7 1 0 G4 0 0 2 6 0 G5 0 1 2 0 5

239
Appendix The state diagram below shows the flow of the gestures in the system with the decisions the software should make as it progresses.

240
Minimizing Power Consumption in WirelessAd-Hoc Broadcast Network
Rebal S. Al-Jurdi, Hawraa Salami, and Ghadi SayeghDepartment of Electrical and Computer Engineering
American University of BeirutBeirut, Lebanon
Emails: [email protected], [email protected], [email protected]
Abstract—One of the challenges in designing wireless ad-hoc network is to minimize the total power consumed. Severalheuristics were devised in [5], [7]–[9], [16], [17] to construct min-imum power broadcast trees (MPBT), and integer programmingformulations were given in [5] to find the optimal solution. Whilethe mentioned papers ignore message corruption due to cross-talk, we propose an interference model and incorporate it in aformulation proposed in [5]. This suggested model is based onconsidering the interference effect as additional power cost thatshould be incurred by any transmitting nodes. We then comparethe MPBT without interference to the interference-aware MPBT.
I. INTRODUCTION
Wireless ad-hoc networks consists of a set of nodesrepresenting communication mobile devices that organizethemselves without the use of network infrastructure. Thesenetworks were originally proposed for military purposes,but their applications nowadays encompass different areasranging from enterprise networking, to emergency services(such as those provided in the case of natural disasters, etc.),to sensor networks used in smart homes for example[11]–[15].
One of the challenges that arise in designing such anetwork is to minimize the total power consumed. Mobiledevices are usually equipped with batteries of limited lifetime. In order to increase the longevity of the network,batteries at transmitting nodes are required to last as long aspossible, which makes power-aware routing scheme crucialfor any mechanism supported by such networks. In our work,we focus on broadcasting, which is on one of the basicdistribution techniques in networks, to tackle the followingproblem: given a source node and a group of receiver nodes,it is desired to determine a tree rooted at the source thatspans all nodes in the network such that the total cost paidby transmitting nodes as transmission powers is minimized.We will refer to this tree as minimum power broadcast tree(MPBT).
Our work is based on an important property in wirelessnetworks, known as the Wireless Multicast Advantage(WMA) defined as follows: any set of nodes located withinthe transmission range of a transmitting node will receivethe transmitted message at no additional power cost. Thisproperty creates a tradeoff between the power consumed by
a transmitting node and the number of nodes reached by thistransmission.
Building power efficient wireless broadcast tree has beenaddressed in many papers [5], [7]–[9], [16], [17]. In [9], agreedy algorithm, named BIP (broadcast incremental power),constructs the tree in an incremental fashion: at each step, thenode with minimal additional power cost is added to the tree.In [8], the network model is inherited from [9]. However,each node can transmit at one of k power levels. This paperalso proves that MPBT is NP-complete by polynomial-timereduction from the 3-CNF SAT problem. The problem issolved by building an auxiliary graph over which the Steinertree, representing the connectivity scheme, is constructed.
In [16], the authors also proved the problem to be NP-complete problem by reduction from the connected nodecover problem. They suggested a greedy localized distributivealgorithm, where the knowledge of each node is limitedto two hop neighbors. The suggested algorithm consumedon average 18% more energy than BIP, however it gavea localized solution instead of centralized one. In [7], theauthors also showed that the problem is NP-complete byreduction from Set Cover. They modeled the network by agraph on which they proposed to run a minimum spanningtree (MST) algorithm then adjust the tree to account forWMA. Their algorithm performed better than BIP in termsof average power consumed. In [5], MPBT was formulatedas three different standard optimization problems whosesolutions yield an optimal connectivity scheme.
However, none of these papers took interference intoaccount – the effects of which have a great impact onreception quality in wireless networks. In this paper, wepropose a way to incorporate the effects of interference whilebuilding the MPBT. We hence solve jointly the problems ofminimizing the power consumed while properly compensatingfor the effects of interference. We mainly focus on findingthe optimal tree by modifying the constraints in formulationB of [5] to account for the new power cost.
The paper is organized as follows. In the first part ofthis paper, we describe the network model and the new

241
interference-aware power cost. We then explain how the inte-ger programming formulations of [5] are modified to accountfor interference. We also suggest an alternative problem trans-lation based on Pseudo-Boolean formulation.
II. NETWORK MODEL
In our work, we assume that all nodes are stationary andthat their spatial coordinates are fixed. Each of these nodesacts as a transceiver. We also assume that the power levelsof transmission are chosen from a continuum of values.However, the formulations presented later in this paper canbe easily modified to account for finite power levels that donot necessarily have to be the same across all nodes. Everynode is equipped with an omnidirectional antenna enablingWMA property.
In wireless communications, the transmitting power PTx isattenuated with distance so that the receiving power Pr isrelated to the transmitting power as follows:
PRx = K × d−αij × PTx (1)
where dij is the distance between nodes i and j, α is the pathloss exponent that takes a value between 2 and 4 dependingon the transmitting medium and, K is a constant. In orderto ensure a reliable communication, each receiving node mustoperate at some value v of signal to noise power ratio (SNR).To meet this requirement, the minimum power PTx should beproportional to dαij according to the following:
SNR(Rx) ≥ v (2)PRx
PN≥ v (3)
K × d−αij × PTx
PN≥ v (4)
PTx ≥ k × dαij (5)
where PN is the noise power.
In the above procedure, interference was neglected. How-ever, the receiving node j does not only receive signal fromits parent i but also from all interfering nodes m having jin their transmission range. The received signal is thereforea combination of the parent message, the interfering nodesmessages and the noise component. SNR(Rx) needs thus tobe computed differently as follows:
SNR(Rx) ≥ v (6)PRx
PI + PN≥ v (7)
where PI is the total power received from interfering nodesm:
PI =∑
m �=i,j
K × d−αmj × PTx(m) (8)
Replacing PI with its expression (8) in (7), we obtain thatthe minimum power PTx(i) should be proportional to v × dαij
and to another term as follows:
PTx(i) ≈ v × dαij
1 +
∑m �=i,j
PTx(m)× d−αmj
(9)
In other words, each transmitting node is paying an addi-tional power cost that mitigates the effect of interference. Byadopting this link cost, we are reducing the transmitting powerat the level of transmitting nodes while properly accountingfor interference.
III. OUR CONTRIBUTION
In [5], the authors translated MPBT into an integer program-ming (IP) problem, by providing three different formulations(A, B and C). This section describes how we modified formu-lation B using the new proposed power model. We also suggesthow this formulation can can be changed into Pseudo-Booleanformulation.
A. Modified IP formulation
According to [5], formulation B is defined as follows. LetN be the total number of nodes represented by a set V , whichincludes the source and the set of destination nodes D. Foreach node i, a nonnegative integer variable Yi is assignedto represent the transmission power used by this node. Theobjective function is therefore:
minimizeN∑i=1
Yi (10)
This is accompanied with a set of constraints that enablesa viable routing scheme. To accomplish this, formulation Bused a Boolean variable Xij that takes the value one if nodej receives a message from node i in the optimal tree.
The first set of constraints accounts for WMA – if a node issending to multiple nodes, it uses the maximum transmissionpower needed to reach the furthest node:
Yi ≥ dαij ×Xij , ∀(i, j) ∈ V, i �= j (11)
The second constraint ensures that the source node willalways be transmitting.
N∑j=1
Xij ≥ 1, i = source, i �= j (12)
The third sets ensures that every node receives from onlyone node.
N∑i=1
Xij = 1, ∀j ∈ D, i �= j (13)
The fourth set ensures a tree structure for the routing scheme(no loop, no disjoint sets):
Ui − Uj +NXij ≤ N − 1, ∀(i, j) ∈ V, i �= j (14)

242
where the Ui’s are sequencing variables and denote the orderin which the nodes are covered in the final solution, such that
Ui = 1, i = source (15)Ui ≥ 2, ∀i ∈ D (16)Ui ≤ N, ∀i ∈ D (17)
To account for interference using (9), we modified the firstconstraint and replaced it by the following one:1
Yi ≥ v ×Xijdαij
1 +
∑m �=i,j
Ym × d−αmj
,
∀(i, j) ∈ V, i �= j (18)
Note: Ym > 0 when node m is a transmitting node. If node mis not a transmitting node (i.e. Ym = 0), it has no interferenceeffect on the whole network in general, and one node j inparticular.
This modification rendered this constraint non-linear, wherethe variables Xij and Ym are multiplied. However, a simpletrick can be here applied to restore the linearity of thisconstraint. Inequality (18) can be equivalently written as:
Yi × d−αij ≥ v ×Xij
1 +
∑m �=i,j
Ym × d−αmj
(19)
If Xij = 1,
Yi × d−αij ≥ v ×
1 +
∑m �=i,j
Ym × d−αmj
(20)
If Xij = 0,Yi × d−α
ij ≥ 0 (21)
Constraint (19) can be rewritten in another way to satisfythe above two conditions as follows:
Yi × d−αij ≥ v×Xij + v×
∑m �=i,j
Ym × d−αmj − (1−Xij)×M
(22)where M is a constant real number chosen to be always greaterthan v ×
∑m �=i,j Ym × d−α
mj . Finding such M is possible,because in the optimal tree no node will be sending at apower greater than dαmax, where dmax is the maximum distanceseparating the source from the destination nodes. If anytransmitting nodes used a power greater than dαmax, the treeis not optimal since we can remove this transmitting node, letthe source send to all destination nodes and get a lower totaltransmission power. Therefore M can be: v×N ×dαmax ×d−α
min ,where dmin is the minimum distance between the nodes in thetree.The validity of the modified constraint can be tested with the
1Adding (1−Xmj) to the expression is redundant: Xmj = 1 only whennode m transmits to node j. Since we are using a tree model, each node hasonly one parent. In this case, node i is the parent of node j and i �= m. Thus,Xmj will always be 0.
two conditions of Xij :if Xij = 1,
Yi × d−αij ≥ v ×
1 +
∑m �=i,j
Ym × d−αmj
(23)
which is the same result of the old constraint (20);
if Xij = 0,
Yi × d−αij ≥ v ×
∑m �=i,j
Ym × d−αmj −M (24)
Since M is chosen to be greater than the summation, the right-hand side of the inequality (24) represents a negative value, butYi is a positive integer; thus the above inequality is equivalentto (21).
B. Pseudo-Boolean Formulation
In this part, we describe an alternative formulation to theone just presented. Pseudo-Boolean is another optimizationformulation that requires all its variable to be Boolean.But before we proceed, we highlight the motivation behindpursuing this formulation and we make a distinction betweenthis type of optimization and the generic integer linearprogramming (ILP). Although this formulation presents analternative formulation for our problem, we will implementboth and then compare between them.
1) Motivation: We recall that the MPBT (minimum powerbroadcast tree) problem is an optimization problem over the setof potential transmissions in a network. We restate the MPBTproblem again:
Given a wireless network that includes a set of destinationnodes and a source node, what is the broadcast tree that is
rooted at the source and that spans all destination nodessuch that the sum of transmission powers of internal nodes is
minimized?
Another version of the problem is given by:
Given a wireless network that includes a set of destinationnodes and a source node, is there a broadcast tree that isrooted at the source and that spans all destination nodes
such that the sum of transmission powers of internal nodes isless than P , for a particular power value P?
While the instances of the problem and its variant areidentical, The latter decision problem and its originaloptimization version will be interchangeably referred to asMPBT hereafter. In [7], MBT is proven to be NP-completeby reducing the set cover problem in polynomial time to aspecial case of MPBT where every node is assigned a singlepower level. In [8], MPBT is also proven to be NP-completeby reducing the 3-CNF SAT problem in polynomial time toa special case of MPBT where every node is restricted to

243
two power levels2. Since it has been established that MPBTis NP-complete, there exists a polynomial-time algorithm thattransforms an instance of MPBT to an instance of 3-CNF.In application, recent algorithmic advances in backtrackBoolean satisfiability and employing smart decision heuristicshave enabled modern SAT solvers such as OPBDP [3], [10],MiniSat [2], Chaff [1], and PBS [4] to solve instances ofSAT with tens of thousands of variables and millions of CNFclauses in a matter of seconds [6]. Therefore, reducing thewireless network instance given by a graph in polynomialtime to a satisfiability expression which is fed into a SATsolver would in fact solve the MPBT, for a specified powervalue, should the SAT solver terminate with a solution. Inother words, the solution to MPBT is TRUE if and only if thesolver returns an assignment that evaluates the satisfiabilityexpression to TRUE.
2) Pseudo-Boolean Formulation: The nature of 0/1 op-timization poses the optimization variable as a switch thatdecides whether a specific numerical quantity should be ac-counted for or not. In our application, these so-called switchesdetermine whether a node under consideration transmits even-tually or not. Should some of these switches be turned on,the corresponding node should transmit at one of a set ofpre-determined power levels. When interference jumps intothe scene, the choices of transmission power levels can nolonger be known a-priori. Therefore, it is best to select a setof transmission power levels that are almost independent of theinternodal spacing, and add switches to control every node’stransmitting power. We consider Q the set of transmissionpower levels and πiq a Boolean variable that is set when nodei is transmitting using the q-th power level Pq . The objectivefunction (10) becomes as follows:
X = min∑∑i∈V q∈Q
Pqπiq (25)
Every node should overcome the additive effect of interfer-ing signal power and signal fading according to (18):
∑q∈Q
Pqπiq = Xijdαij
(1 +
∑m�=i,m�=j
∑t∈Q
Pt πmt d−αmj
)
= Xijdαij +
∑m�=i,m�=j
∑t∈Q
(Xijπmt)Pt dαij d
−αmj , (26)
Notice that the transmission power formula contains amongits terms a product of two variables, X and π indexedappropriately. To maintain the linearity of the constraints, wefirst consider the following auxiliary variable Z such that
Zijmq = Xij · πmq,
where i, m ∈ V , j ∈ D, and q ∈ Q. Then we rewrite thepreceding as
Zijmq = Xij + πmq, (27)
23-CNF SAT is the Boolean satisfiability problem with the propositionallogic expression written as a sum of three-literal-products
or equivalently as3
Z −X − π ≥ −1, and (28)2Z −X − π ≤ 0 (29)
The source node must choose a one and only one powerlevel to transmit at. This is written as follows:
∑q∈Q
πiq = 1, where i = 0 (30)
Every internal node must have at most one. Internal nodeshave one level and leaves have none.
∑q∈Q
πiq ≤ 1, ∀i �= 0 (31)
The source node must transmit at least once as in (12).
All nodes but the source should receive a transmissionfrom exactly one place (13).
The broadcast tree must not have cycles or disjoint sets. Theconstraints set in inequation (14) can be rewritten as follows:
B−1∑k=0
(Vik − Vjk)2k +NXij ≤ N − 1, ∀i, j ∈ V, i �= j (32)
B−1∑k=0
Vik · 2k = 1, where i = 0 (33)
B−1∑k=0
Vik · 2k ≥ 2, ∀i ∈ D (34)
B−1∑k=0
Vik · 2k ≤ N , ∀i ∈ D, (35)
where Vik is the kth-most significant bit in Ui, and B is thenumber of ”bits“ used for the {Ui}s.
C. Comparison
The comparison between the MPBT without interferenceand the interference aware MPBT shows that wheninterference is taken into account, the number of transmittingnodes decreases and the total power in the network increases.These results are intuitive. Since the interference increaseswith the number of transmitting nodes, it is natural to see adecrease in this number when minimizing the interferenceeffect. Moreover, interference can be viewed as noise, whichdecreases the SNR. To compensate this effect the transmittingpower is increased.
3Some solvers like PBS can read constraints in 3-SAT in addition to Pseudo-Boolean constraints and thus equation (27) can be used instead of equations(28) and (29).

244
The figures below simulate these results. Figure 1 representsthe MPBT without interference, Figure 2 represents the MPBTwith interference. In this example, the IP formulation was usedwith the following parameters: α = 2, SNR = 1.
Fig. 1. MPBT Without Interference
Fig. 2. MPBT With Interference
IV. CONCLUSION
In this paper, we developed an interference model forwireless ad-hoc networks, taking into consideration its effects
that greatly diminishes the reception quality in wirelessnetworks. We derived two formulations each of whichgenerates the optimal MPBT for a given wireless topologywhile taking interference and WMA into account. Thefirst of these formulations is an integer program and thesecond is a Pseudo-Boolean program. Although the proposedformulations solve jointly the problems of minimizing thepower consumed while compensating for the effects ofinterference, looking up a solution does not scale: the timeto solve each of the two programs grows exponentially withthe number of nodes in the network as expected. A majorcontribution - a topic we are currently working on - is thedevelopment of an approximate algorithm that will generatean acceptable solution for the interference-aware MPBTproblem and that has a good running time.
ACKNOWLEDGMENT
We would like to thank Professor Abou Faycal and ProfessorZaraket for their useful advice, guidance, and critiques.
REFERENCES
[1] zChaff. [Online]. Available: http://www.princeton.edu/ chaff/zchaff.html[2] The Minisat Page. [Online]. Available: http://minisat.se/MiniSat+.html[3] OPBDP. [Online]. Available: http://opbdp.sourceforge.net/[4] Pseudo-Boolean Solver v4.0. [Online]. Available:
http://www.aloul.net/Tools/pbs/pbs4.html[5] A.K. Das, R.J. Marks, M. El-Sharkawi, P. Arabshahi, A. Gray, “Minimum
power broadcast trees for wireless networks: integer programming formu-lations,” Twenty-Second Annual Joint Conference of the IEEE Computerand Communications, 2003, vol.2, pp. 1001-1010
[6] F.A. Aloul, A. Ramani, K.A. Sakallah, I.L. Markov, “Solution andOptimization of Systems of Pseudo-Boolean Constraints,” IEEE Trans.Comp, vol.56, no.10, pp.1415-1424, Oct. 2007.
[7] M. Cagalj, J. Hubaux, C. Enz, “Minimum-Energy Broadcast in All-Wireless Networks: NP-Completeness and Distribution Issues,” Proc. 8thAnnual International Conf. on Mobile Computing and Networking, NY,2002, 172-182.
[8] W. Liang, “Constructing Minimum-Energy Broadcast Trees in WirelessAd Hoc Networks,” Proc. 3rd ACM International Symp. on Mobile AdHoc Networking & Computing. NY, 2002, 112-122.
[9] J.E. Wieselthier, G.D. Nguyen, A. Ephremides, “On the Construction ofEnergy-Efficient Broadcast and Multicast Trees in Wireless Networks,”Proc. of 19th Annu. Joint Conf. of the IEEE Computer and Communica-tions Societies, 2000, vol.2, pp.585-594.
[10] P. Barth, I. Stadtwald, “A Davis-Putnam Based Enumeration Algorithmfor Linear Pseudo-Boolean Optimization”, Max-Planck-Institut Fur Infor-matik, Tech. Rep. MPI-I-95-2-003, 1995.
[11] I. Chlamtac, M. Conti, J. J.-N. Liu, “Mobile ad hoc networking:imperatives and challenges,” Ad Hoc Networks Elsevier, vol. 1, pp. 13–64,Jul. 2003.
[12] J.-P. Hubaux, T. Gross, J.-Y. Le Boudec, M. Vitterli, “Towards Self-Organized Mobile Ad Hoc Networks: The Terminodes Project,” IEEECommun. Mag., vol. 39, pp. 118–124, 2000.
[13] J.M. Rabaey, M.J. Ammer, J.L. da Silva, D. Patel, S. Roundy, “PicoRa-dio Supports Ad Hoc Ultra-Low Power Wireless Networking,” Computer,vol.33, no.7, pp.42–48, Jul 2000.
[14] G. J. Pottie, W. J. Kaiser, “Wireless integrated network sensors,”Commun. ACM vol. 43, no. 5, pp. 51-58, May 2000.
[15] M. G. Rubinstein, I. M. Moraes, M. E. M. Campista, L. M. K. Costa,O. M. B. Duarte, “A Survey on Wireless Ad Hoc Networks.”*
[16] A.S. Ahluwalia, E.H. Modiano, “On the Complexity and DistributedConstruction of Energy-Efficient Broadcast Trees in Wireless Ad HocNetworks,” IEEE Trans. on Wireless Comm., vol.4, no.5, pp. 2136- 2147,Sept. 2005.
[17] R.J. Marks II, A.K. Das, M. El-Sharkawi, P. Arabshahi, A. Gray,“Minimum Power Broadcast Trees for Wireless Networks: OptimizingUsing the Viability Lemma,” Int. Symp. on Circuits and Systems, 2002,vol.1, pp. I-273–I-276.

245
Precise Taint Analysis for Preventing Information Leaks
Firas Abou Chacra, Dana Naous and Sam Sleiman
Department of Electrical and Computer Engineering American University of Beirut Bliss Street – Beirut, Lebanon
Email:{fia08,dsn04,sms65}@aub.edu.lb
Abstract- Software security attacks involving information leakage are prevalent and very damaging. The vulnerabilities enabling such attacks in programs are difficult to locate and repair, thus there is a pressing need to prevent the leakage of sensitive information through the vulnerable applications that are already deployed in the field. This paper presents a technique and associated tool that prevents information leakage in applications using precise taint analysis. The tool enables the user to specify what sources in the code are considered sensitive, e.g., variables storing (or functions returning) classified information, and what sinks are considered insecure, e.g., socket function calls. The tool tracks the sensitive information along the execution path of the program, and if it reaches the insecure sink unaltered, it replaces it with dummy data to confuse a potential attacker. Our tool supports the Java platform within the Eclipse IDE, and is implemented at the Byte Code level.
I. INTRODUCTION
Information leaks are one of the major attacks carried out
against software systems; they compromise the secrecy and privacy of the sensitive information present in databases or other types of data repositories. This paper presents a technique and a tool, implemented as a Java-Eclipse plugin that guarantees the privacy of sensitive data. The adopted approach for combating information leakage tracks the sensitive data coming from a database, which the database administrator designated as confidential, and prevents it from reaching the attacker through a public "sink". This, however, does not resemble encryption since, tainting data does not prevent its usage, for authentication and use so that necessary operations are still applicable and this does not affect functionality; unlike encryption where the deciphering only occurs at the sink, where the user has the key. The developed tool takes the application's Java classes as input, and outputs instrumented classes that include built-in guards based on precise tainting to avoid any illegal information leaks.
The Project consists of three primary parts. The first part deals with tainting the initial (string) data that the user considers to be sensitive: this is enabled using a user interface that allows the user to select the Java lines of code that contain data to be tainted. The second part deals with instrumenting the input classes: this step is needed to ensure that the functionality of the application is not impacted in anyway by the tainting process (since our tainting approach does seemingly impact the
integrity of the sensitive data). The third part deals with leakage checking. In this phase, in case a public sink method attempts to transfer tainted (i.e., sensitive) data to an unauthorized user, an illegal leakage is detected, and dummy/misleading data output would passed instead.
We first present related work and a motivating example (Section II). Then we describe our approach and implementation (Section III and IV). Finally, Section V presents our conclusions and future work.
II. RELATED WORK AND MOTIVATING EXAMPLE
Taint analysis, also referred to as information flow analysis, has been used by several researchers to prevent illegal information leakage in applications. One part of the work falls under static analysis, and the other part under dynamic analysis. Static analysis techniques for validating information flows are usually safer but less precise than dynamic mechanisms, because they treat all control flow paths as executable. A number of language-based static type checking systems have been proposed [20][17]. In such systems, every program expression is assigned a security type in addition to its ordinary type. In type checking a program, the compiler ensures that the program cannot exhibit illegal information flows at runtime. The Perl scripting language provides a special execution mode called taint mode, in which all user supplied input is treated as suspicious unless the programmer explicitly approves it. Newsome and Song propose dynamic data taint analysis for automatic detection of overwrite attacks, and they describe TaintCheck, a tool that performs dynamic taint analysis by performing binary rewriting at run time [18]. Clause et al. [1] presented Dytan, a tool for dynamic tainting analysis that supports x86 executables. Also, over the past few years many works on taint analysis and information flow analysis have been presented [2][4] [6][7][8][9][10][11][12] [14].
We now summarize the work that is closest to ours. In [15], the authors discussed a character level dynamic tainting technique for untrusted user data for SQL injection. The authors of [5] discuss the advantage of character level tainting in decreasing false positives in a web based solution for information security. Other approaches used static taint analysis that has wider code coverage than dynamic analysis and is able to detect vulnerabilities before an attack taking place. The paper in [16] discusses the implementation of the ASSIST tool that prevents attacks through input sanitization by

246
static analysis. The authors of [19], discussed an automatic approach for precise character-level tainting. Another approach in [3] suggests the instrumentation of java libraries to prevent attacks with reduced overhead.
Most of the above techniques use dependence analysis, in its static or dynamic context, to determine whether a given variable influences another. Such techniques are too conservative and will most likely lead to an unacceptable rate of false positives. Our approach, by design, is not meant to lead to any false positives, but in some cases might lead to false negatives that could be prevented by conventional dependence analysis. Below are three scenarios contrasting the use of static dependence analysis, dynamic dependence analysis, and our proposed approach. Figure 1 shows the code to be analyzed.
Figure1: Test Example
Scenario1: Static Dependence Analysis On the third line of the function, “combination” uses “type” and thus is statically data dependent on it. Assuming that “type” is tainted then “combination” would also be tainted. In addition, since the “if” statement uses “type”, both “result” and “result2” would be tainted due to static control dependence. Consequently, the string returned by the function call is fully tainted. Scenario2: Dynamic Dependence Analysis Here also, assuming that “type” is tainted then “combination” would be tainted. And since the “if” statement uses “type”, either of “result” and “result2” would be tainted depending on what branch is taken. Consequently, only part of the string returned by the function call is tainted. Scenario3: Precise Taint Analysis Using our approach, “combination” is only partially tainted due to “type”, and neither of “result”, “result2” or the returned string is tainted. This is because: a) “type” would be untainted before isUpperCase() is called; b) “type” is not used afterward; and c) our approach intentionally ignores control dependences. Note how in this scenario no false positives will occur as in the first two scenarios.
III. PROPOSED APPROACH AND DESIGN
A. Approach Description Our goal is to enable the user/administrator to
designate/taint some data as sensitive so that if it reaches a public/unsecure sink it could be prevented from leaking to an unprivileged user. Our approach assumes that the sensitive data is of type character or a sequence of characters (strings), which
in most cases is a reasonable assumption/constraint. Assuming that the target program is written in Java (or C#) in which characters are stored in 2 bytes, the usable range of the ASCII characters ([0, 255]) is far smaller than the available range ([0, 64K]). Therefore, in order to taint a given sensitive character we could simply increment it by some offset. The offset (OFFSET) must be large enough such that the resulting value of the tainted character would exceed the usable range. For example, if the usable range is [0, 255], OFFSET could be chosen to be any value > 255. In this manner, any character reaching an unsecure sink that is ≥ OFFSET would be a sensitive character and should not be leaked unless adequate user privileges are met. Note that OFFSET needs to be subtracted from the sensitive character before sending it (in order to arrive at the original value).
The tainting process is clearly invasive as it changes the values of the sensitive data that could be used (e.g., parsed) within the program before it reaches the sink. The challenge then is to make the program’s instructions oblivious to the tainting process. Our solution to this problem is to instrument the target application (at the Byte Code level) and monitor at runtime every possible instruction that involves characters as operands. Prior to the instruction execution, check whether the character operand was tainted and use an untainted clone of it if it was, in this manner the instruction will behave like if it was dealing with the original character data. This solution is non-trivial as it involves dealing with numerous Java Byte Code instructions and various variations of the character type (characters, strings, arrays of characters etc.).

247
B. High-Level Design
The flow diagram (Figure 2) below represents a high level overview of the working system.
Figure2: High Level Design
Figure 3: Plugin View Phase 1: The user indicates using an Eclipse plugin (Figure 3) which data is sensitive 1. The input of this phase is the user’s class. After the user
selects the sensitive data in his java class, and decided to
taint these data, the mapping between the java code and the instructions list is done, and depending on the type of instruction, tainting is done:
a. Case of a function call: tainting occurs before the value is returned.
b. Case of Local/Field Variable Stores: tainting occurs before storing.
c. Case of Local/Field Variable Loads: instructions are added to assure the storing of a tainted data and a new load is called.
d. Some special cases, such as loading elements of arrays were dealt with also.
2. The output of this initial tainting process, is a primarly instrumented class. The user will be then given the option to instrument the class he wants to secure, and here begins phase 2.
Phase 2: In this phase, the outputted class of the previous phase is inputted to a specific byte code instrumentation that would, by the analysis of the classes and the methods, add specific instructions to assure that the tainted instrumented class will work just as the uninstrumented one. No changes in the functionality should occur after instrumentation.
1. Precise taint analysis is applied to the developer code to
track the sensitive data flow throughout the program. This is done through a class “instrumenter” that takes as input the Java class with tainted information and outputs a modified version of the class, which is fully instrumented.
2. Mainly, a class is divided into three types of methods: Local Methods: Those methods correspond to developer methods in the
scope of the class being instrumented. The propagation of data in these methods is tracked by the instrumenter to prevent leakage. This is achieved by the tainting and untainting of protected data.
External Methods: Those methods are called from outside the class and
correspond to functions from Java classes external to the instrumented class. In this case, variables of character type are sent untainted regardless of the function being used. If the return type is also of character type, then it is tainted to preserve the class security. Implementing this logic might increase false positives because the return value is all tainted irrespective whether the input is processed and modified. This is why the classes that are used commonly will be instrumented so that when there is access to them, so that there would be no need to taint after returning from the external functions. So the next step to consider is reducing overhead when returning tainted data from external methods, instead of simply tainting.

248
Sink Methods: Those methods correspond to functions that represent a
threat to the source which is the sensitive data. In the case of information leakage, the sink is the print methods that would cause leakage of information to the user when this information is not supposed to be displayed. To protect data from sinks, a function that checks leak is implemented.
3. Procedure of storing into lists:
The tainting process is done by following a stack of variables that keeps track of loaded data and functions consuming it. The tracking of data is applied to Char, CharArray and String objects of classes as mentioned earlier. If a load of a variable of that type occurs, it is pushed to the stack and the following byte code instructions are also stored and checked to reach the function consuming the loaded data. When followed by storing or copying instructions the data is kept as it is, since the case would be a case of load followed by a store, for which the data should remain tainted, instead of untainting and tainting again. In other cases of arithmetic and comparison operations the data should be untainted to be used with its original value, in the occurring operations. And thus the load instruction is added to the untaint list in case of use or external methods, and whenever it is necessary the following instruction is added to the taint list. The code of the instrumenter is still being updated while the testing is taking place. Check Figure 4 below for more detailed information about the process.
Phase 3: In this phase, whatever arrives to a sink is checked for leakage, this is done by using the “checkleak” list, this list, containting all the instructions that may display data, known as the sink methods.
For the sink methods, the user would be offered of list of commonly known ones that they may prefer to customize to make it more or less secure. An example of common sink methods are “System.out.print, out.write”… In order to test the approach, a hashtable “LeakMethods” was manually created and was updated by several methods that are commonly used to display. Whenever a method that belongs to this hashtable is encountered by the instrumenter, the instruction that provides that data that it would consume is inputted to “CheckLeak” list, that resembles “untaint” and “taint” lists.
The details of handling those lists will be explained thoroughly in the next part.
C. Instrumenting and Leakage Checking
In order to instrument the byte code to account for the taint, untaint and leaking, and after the 3 corresponding lists have been created, an instruction handle is passed through the list of all the instructions of a specific method, and whenever the instruction encountered is the same as one that is present in the lists above, the instruction that invokes the corresponding function call is added to the instruction list of the method:
1. A new instruction that executes the “invoke” to the untainting function will be appended to the list after an instruction that is in the untaint list.
2. A new instruction that executes the “invoke” to the tainting function will be inserted to the list before the instruction in the taint list.
3. A new instruction that executes the “invoke” to the checkLeak function will be appended to the list after the instruction in the checkLeak list.
The functionality of the called functions 1. The untainting function basically checks whether the
data is tainted and in this case returns it in its untainted form. The untainting is done by deducting an offset of 1000 for the character to be tainted.
2. The tainting function basically checks whether the data is untainted and in this case returns it in its tainted form. The tainting is done by adding an offset of 1000 for the character to be tainted.
3. The “CheckLeak” function checks the nature of data that is to be displayed. In case of tainted data, some random data is displayed and otherwise the data is safe to display.
The overhead and false positives of this approach are minimal, since unlike usual tainting analysis, only data that is considered sensitive would not leak. In addition to that, and since the only time a tainting function is added is when calling external methods, in addition to checking before that whether the data that was inputted to the external function was already tainted or not, the false positives are reduced by high amounts, and only the actual secure data, would not be displayed.
Figure 4: Flow Diagram for the Tainting and Untainting Process

249
IV. IMPLEMENTATION AND TESTING
In order to test the tool that was developed, many test cases were created which tested the different combination of different inputs to the tool, instrumenting different classes, and comparing instrumented classes outputs to non-instrumented classes, to guarantee a correct output. In addition to that, a sample testing Java Servlet was developed in the first stages which included test functions that manipulate strings, characters and character arrays in order to check the tainting logic for different operations. The functions included in the testing class implemented adding char offsets, changing the case of characters, comparison to defined inputs, swapping characters, copying a part of a character array, concatenation and converting to integers and many others from the Char class in Java that were critical and returned Char or String type data that might be considered sensitive data depending on the code tested. The Apache Tomcat 5.0.0, previously defined as an open source web server that implements Java Servlets, was used in order to run the Servlet testing class file generated. In addition to the previously stated test functions, the Servlet contains a “CheckTainting” function that checks if the sensitive data is being leaked via a malicious command. This Servlet was instrumented through the Java plugin and the function’s outputs were displayed through the “LocalHost:8080” HTTP request of the Apache Tomcat. The displayed outputs show that the sensitive input is getting untainted in order to be used inside the test function, then it is then re-tainted after the function performs its operation. The results displayed matched our expectations concerning the tool’s functionality and the accurate tainting analysis concepts. For the final testing, a comprehensive test case, in the form of a Java application was implemented. It consists of a Java Swing application that communicates with a Servlet running on Tomcat 5.0.0. The Servlet is connected to MySQL database, and was responsible for retrieving sensitive medical reports from the database and sending it to the client requesting it. The client could be an administrator or an ordinary user that is not allowed to get access to the sensitive data. Both have different interfaces and different search options. The Servlet is also responsible of sending e-mails to the privileged administrators whenever a given application user issues an implemented “Search” request. This e-mail contains the printed medical report which incorporates sensitive information, for example blood pressure, diabetes, HIV tests and many others. The instrumentation of the class through the Java tool assured a secured application for which the administrator was able to view all the data reported through the e-mail received without exceptions and tainting restrictions, whereas the ordinary user did not get the sensitive data for the same request, since it was tainted and was not allowed to be displayed on the user’s Java interface.
What appears below is a sample of the testing that was primarly done to test the functionality discussed in previous sections.
V. CONCLUSIONS AND FUTURE WORK
As a conclusion, we can say that the tool we developed turned out to be effective in preventing information leaks from different data sources, and assure for the database administrator secure storage of information, in addition to being able to manipulate the data and assure that only the non-sensitive information would be displayed to the non-authorised users. Many optimizations can yet be made to the tool, to insure even less false positives, in addition to giving the user more options to chose from, and increase the functionality of the tool to include data of other types, other than the primitive types. Since software developing involves many special cases, excessive additional testing would help in identifiying those cases, and adding them to the instrumenter. Finally, many OWASP attacks can be approached using the tracking of data, and applying this method to Cross-Site scripting seems to be an interesting one.

250
VI. ACKNOWLEDGMENT
Thanks go to Professor Wassim Masri, our advisor, from the Electrical and Computer Engineering department, for his continuous efforts in the code development, and his help in writing this paper.
VII. REFERENCES
[1] Clause J., Li W., and Orso A. 2007. Dytan: A Generic Dynamic Taint Analysis Framework. International Symposium on Software Testing and Analysis (ISSTA 2007).
[2] Cheng W., Zhao Q., Yu B. and Hiroshige S. TaintTrace: Efficient Flow Tracing with Dynamic Binary Rewriting. In Proocedings of the 11th IEEE Symposium on Computers and Communications, 2006.
[3] E. Chin, and D. Wagner, "Efficient character-level taint tracking for Java", in ACM Workshop on Secure Web Services, Chicago, 2009
[4] Crandall J. R. and Chong F. T. Minos: Control data attack prevention orthogonal to memory model. In MICRO-37, 2004.
[5] V. Haldar, D. Chandra, and M. Franz, “Dynamic Taint Propagation for Java”, in Twenty-First Annual Computer Security Applications Conference (ACSAC), Tucson, AZ, 2005, pp.303-311
[6] Masri W., Abou-Assi R. Cleansing Test Suites from Coincidental Correctness to Enhance Fault-Localization. Third International Conference on Software Testing, Verification and Validation, ICST 2010, Paris, April, 2010.
[7] Masri W., Abou-Assi R., El-Ghali M., and Fatairi N. An Empirical Study of the Factors that Reduce the Effectiveness of Coverage-based Fault Localization. International Workshop on Defects in Large Software Systems, DEFECTS, Chicago, IL, 2009.
[8] Masri W., R. Abou Assi, F. Zaraket, and N. Fatairi. Enhancing Fault Localization via Multivariate Visualization, Regression/ICST 2012, Montreal, Canada, April 2012.
[9] Masri W. and El-Ghali M. Test Case Filtering and Prioritization Based on Coverage of Combinations of Program Elements. Seventh International Workshop on Dynamic Analysis, WODA, Chicago, IL, 2009.
[10] Masri W., Halabi H. An algorithm for capturing variables dependences in test suites. Journal of Systems and Software (JSS) 84(7): 1171-1190 (2011).
[11] Masri, W. and Podgurski, A. Application-Based Anomaly Intrusion Detection with Dynamic Information Flow Analysis. Computers & Security (Elsevier). Vol. 27 (2008), pages 176-187.
[12] Masri, W. and Podgurski, A. Algorithms and Tool Support for Dynamic Information Flow Analysis. Information and Software Technology (IST) (Elsevier). Vol. 51 (Feb. 2009), pages 385-404.
[13] Masri W., Podgurski A. and Leon D. An Empirical Study of Test Case Filtering Techniques Based On Exercising Information
Flows. IEEE Transactions on Software Engineering, July, 2007, vol. 33, number 7, page 454
[14] Mccamant S. and Ernst M. 2007. A Simulation-based Proof Technique for Dynamic Information Flow. In ACM SIGPLAN Workshop on Programming Languages and Analysis for Security, (San Diego, Calfornia, USA). June 2007.
[15] R. Mui, and P. Frankl, "Preventing web application injections with complementary character coding", in European Symposium on Research in Computer Security, Leuven, Belgium, 2011, pp. 80-99.
[16] R. Mui and P. Frankl, “Preventing SQL Injection through Automatic Query Sanitization with ASSIST”, in Fourth International Workshop on Testing, Analysis and Verification of Web Software, Antwerp, Belgium, 2010.
[17] Andrew C. Myers: JFlow: Practical Mostly-Static Information Flow Control. POPL 1999: 228-241
[18] Newsome J. and Song D. Dynamic Taint Analysis for Automatic Detection, Analysis, and Signature Generation of Exploits on Commodity Software. In Proceedings of the Network and Distributed System Security Symposium (NDSS 2005), 2005.
[19] A. Nguyen-Tuong, S. Guarnieri, D. Greene, J. Shirley, and D. Evans, “Automatically Hardening Web Applications Using Precise Tainting”, in 20th IFIP International Information Security Conference, Chiba, Japan, 2005
[20] Sabelfeld A. and Myers A.C. Language-Based Information-Flow Security. IEEE Journal on Selected Areas in Communications, 21(1), Jan. 2003.

251
Talk to The Hand: A Tool for Lebanese SignLanguage Recognition
Farah Hariri, Zeina Sinno, Ahmad El ShafeiElectrical and Computer Engineering Department
American University of BeirutEmail: {fsa20, zzs01, aie07}@aub.edu.lb
Abstract—In this paper we present Talk to the Hand, a HiddenMarkov Model (HMM) based Lebanese Sign Language (LSL)recognition tool. The idea is inspired by the the need of thedeaf society to ameliorate their social integration. Having such atool would ease the communication process and render it morenatural. The end product of our research is a LSL recognizer forthe most used sentences in daily life. The design is a hybrid ofthe different alternatives studied in the literature. The hardwareconsists of an accelerometer, a gyroscope, an arm-worn cameraand a colored glove. These sensors provide input to the softwareconsisting of a front end in which we use region growing and arecognizer based on HMM.
I. INTRODUCTION
The native language of deaf people is sign language. Witheverybody else communicating with the spoken language, weremark the formation of a deaf society consisting of the deaf,and people able to understand sign language. Those communi-ties tend to be more and more isolated, depriving a substantialsection of the society from basic rights such as education,social interaction and integration, and even ambition [1]. Forexample, imagine a deaf person in a post office that needs tomail an important package. He needs a way to interact withthe office clerk [2]. Another example is a person who has alot of potential and brilliance in engineering, but incapable ofpursuing his dream because he is deaf and hence unable tojoin regular educational institutions. Therefore, this injusticeis a deprivation of growth for the deaf as an individual and thesociety as whole at the same time. The solution is in havinga sign language interpreter [3].The automated sign language interpreter needed consists oftwo main parts. The first part is the speech recognition andtranslation into sign language to be performed by an avatar,and the second part is the sign language recognition andinterpretation into speech. The first part is called sign synthesis[2]. The achievements done in this direction are considerableand the problem can be considered to be solved. References[4], [5] and [6] show some of the advances done with respectto the different languages. We are interested in the second partwith a special focus on Lebanese Sign Language that has nevertaken any attention from the research community before.
II. RELATED WORK
Hand sign language recognition, laparoscopic surgery, mon-itoring workers motions in a factory for error detection, andmany other applications are subheadings under the big title
of hand gesture recognition. According to [7], there are threemain angles from which we can approach this problem: usingsensors, using video processing, and using augmented reality.None of the three approaches is considered to be superiorto the other. Each one has its challenges and limitations.Taking a brief look, we can see that video analysis has issueswith lighting conditions and occlusions [8]. Augmenting theenvironment, for example using magnetic systems, is prone tothe interference of objects from the environment itself. Sensorsmight have low accuracy and are bulky in a restrictive way tothe motion of the hand [7] [9]. The augmented reality approachwas discarded because it did not comply with the specificationsof our application. Hence, we focused our line of attack ontwo main methodologies; the sensor approach, and the videoanalysis approach.
A. Sensor Based Approach
For this approach, three different methodologies were ex-amined which are: using force sensors, bend sensors, and bodysensor network (BSN). The first is defined by a hand trackingdevice and a Wii balance board were used to fully reconstructthe motion of the body [8]. As for the second, electrical bendsensors that reduce remarkably the noise were employed [10].The final method consists of the integration of a BSN nodewith a fiber optic sensor [9].
B. Vision Based Approach
There exist two main classes for vision based hand gesturerecognition. The first class uses the skin color to recognize thehand gesture [11]. Another approach aims to use markers orcolored gloves which facilitate the inference of the hand poseand hence better hand tracking [12].
C. Arabic Sign Language Initiatives
We focused on the previous work done to solve the ArabicSign Language translation problem to tackle the LebaneseSign Language one. Assaleh presented two main approaches:supervised learning with 94% recognition rate [3] [13], andunsupervised learning approach with 87% recognition rate [1].
III. ARCHITECTURE DESIGN
Our system is shown in figure 1. First, the wrist camera willcapture the sign gesture in a video stream. The video providesus with the finger motions. Different finger colors and textures

252
will define the location and bent of the fingers being moved.The accelerometer and gyroscope of the Android device willdetermine the global hand position and save them as rawdata. As a second step, the collected data will be transferredto a computer for preprocessing. After preprocessing andextracting the feature vectors which are defined by a set ofthe visible colors and hand position data, the vectors willbe fed to the HMM recognizer. HMM library recognitiontool is being employed. For the sign sentences defining ourdatabase, the training process will be done according to thewell-know Baum-Welch training algorithm. A computationalmodel defined by a statistical scoring is calculated for differentHMMs. The one with the highest scoring and likelihood willidentify the applied gesture.
Fig. 1. Architecture Design
IV. IMPLEMENTATION
The implementation is half way. At the current stage, werealized a prototype of the system with the basic functionalitiesand tested it on a small set of data. However, we are waitingto record the database to be able to test on a huge amount ofdata and fine tune the design accordingly.
A. Fingers and Palm Motion Detection
The motion of the fingers and the palm is inferred from thevariations in colored patches visualized in an image. Imagesare segmented, information about the regions is extractedwhich allows to infer how the fingers and the palm aremoving.Several methods could be deployed for the segmentationof the image. The region growing algorithm was adoptedbecause this algorithm works without a priori knowledge ofthe number of regions. The region-based image segmentationcreates regions by grouping together similar pixels withhigher accuracy than pixel-based segmentation algorithms[14].
Individual pixels are merged if their attributes are similarenough. Color similarity can be established by computing thevalue of a homogeneity criterion. Each tested pixel is com-pared to its immediate neighboring regions. If a homogeneitycriterion is fulfilled then the tested pixel belongs to region. Ifa homogeneity criterion is not fulfilled then the tested pixelwith a new label starts as a new region. Homogeneity criteriafor color image segmentation can be applied by using differentcolor spaces and different metric spaces [?]. The algorithm wasimplemented based on the Red Green Blue (RGB), the Lab (Lstands for lightness, a is the position between magenta-greenand b is the position between yellow-blue colors), and LumaComponent (Y) and chrominance components (UV) (YUV)spaces, with several metric spaces in order to obtain a robustalgorithm against illumination, as presented in figure 2. Thesecond implementation showed to be the most robust againstillumination.
The process of growing is continued until all pixels in theimage are merged in regions as homogeneous as possible.The attributes of each region (size, mean RGB values or meanYUV values) are computed once the process of growing isfinalized.
Fig. 2. The different Implementations of the Region Growing Algorithm
Under different illumination conditions, the different patchesshould not have the same characteristics in the color space.Since we were not able to choose more than 20 differentcolors under varying lightening conditions to characterize 36different patches, we decided to add one more attribute foreach region which is its texture. We implemented two textures(dotted and plain), which in addition to the 20 different colorsallowed us to characterize the 36 different patches.
Now that the segmentation is completed, the next step is tomatch the attributes of each region in the image to the regionsof the model of the hand that are initially specified when theglove is constructed.
B. Feature Extraction From Image
At this stage information about the different regions inthe patch and their attributes is stored. The attributes consistmainly of the center of each patch, its size, its texture and itscharacteristics in the YUV space. In order to do the matchingwith the model of the hand, we started by identifying thereference patches in the images. We have chosen two regions

253
in the hand to form the reference patch because these tworegions appear in all the gestures to be performed.Once these two regions are identified, a new reference center,which is the mean of the two centers of the two references,is created. The matching between the pre saved informationabout each patch (Y, U and V ranges in addition to thetexture) and the regions appearing in the image starts. Thismatching process continues to cover all the patches of theglove. The distance di between the center of each patch i andthe deviation angle ai, both with respect to the reference centerare computed.
At this stage, a vector containing the size of each patch, thedistance di, and ai will be passed to the recognizer.
C. Recognition
The recognizer is based on HMMs. We use Baum Welchalgorithm to do the training, and Viterbi for scoring. As afirst step, we tested the algorithms on a small number of fakedata that we generated ourselves. The results were satisfying.However, a reliable testing needs a huge amount of data andtakes a lot of time for recording. Currently, we contacted AlHadi Institude for Deaf & Blind Children who agreed to helpus in building the database. An intensive test on the data isnot yet done because the recording is still in progress.
V. CHALLENGES
Many challenges and requirements pose themselves whenapproaching the gesture recognition problem. The fact that theLSL highly depends on facial expressions was a big challenge.The gesture performed for two different words could be thesame in shape as well as in motion performed but only thefacial expressions differ which allows distinguishing betweenthe two words. Being focused on detecting hand gestures only,this constitutes a challenge. We will use the context of thesentence to try to distinguish between them. If distinction isnot possible, we provide all the possible suggestions to theuser.The second main challenge is the speed of response. Signlanguage recognition is real time has not yet been realized byany system. To decrease the waiting time as much as possible,the user will be asked to perform the signs at a moderatespeed, and a tradeoff has to be taken between increasing theaccuracy and decreasing the time of the database for timeefficiency.Finally, we were struck by some limitations due totime and financial constraints.
VI. CONCLUSION
We presented the design and implementation of a LSLtranslator. We rely on a hybrid architecture consisting of acolored glove, an accelerometer, a gyroscope and an arm-worn camera. This project is the first to emphasize the LSL.So far, the implementation is still at a preliminary stage. Weexpect to have a fully working recognizer once all the partsare integrated. The current design takes care of a limitedgroup of signs. We do not account for gestures requiring facialexpressions and those relying on two hands not distiguishable
from one hand detection. Future work would be to extend thework towards covering these signs, making the system fasterand completely portable.
VII. ACKNOWLEDGMENTS
We would like to acknowledge our advisors Professor FadiZaraket and Professor Fadi Karameh; the working staff atthe Lebanese Center for Deaf for providing us with usefulresources for the Lebanese Sign Language; Al Hadi Institutefor Deaf & Blind Children since they volunteered for recordingthe database. Last but not least we would like to thankProfessor Daniel Asmar, Mr Khaled Joujou, Mr Fabien Chraimfor their help in the hardware part.
REFERENCES
[1] T. Shanableh and K. Assaleh, “User-independent recognition of arabicsign language for facilitating communication with the deaf community,”Digital Signal Processing, vol. 21, no. 4, pp. 535–542, 2011.
[2] G. t. Holt, P. Hendriks, and T. Andringa, “Why don’t you see what imean? prospects and limitations of current automatic sign recognitionresearch,” Sign Language Studies, vol. 6, no. 4, pp. 416–437, 2006.
[3] T. Shanableh, K. Assaleh, and M. Al-Rousan, “Spatio-temporal feature-extraction techniques for isolated gesture recognition in arabic signlanguage,” Systems, Man, and Cybernetics, Part B: Cybernetics, IEEETransactions on, vol. 37, no. 3, pp. 641–650, 2007.
[4] A. for Computing Machinery, A. for Computing Machinery. SpecialInterest Group on Accessible Computing, and A. D. Library, Assets:The ... International ACM SIGACCESS Conference on Computers andAccessibility. Association for Computing Machinery, 2005. [Online].Available: http://books.google.com.lb/books?id=tW1PAAAAMAAJ
[5] R. San-Segundo, R. Barra, R. Cordoba, L. DHaro, F. Fernandez, J. Fer-reiros, J. Lucas, J. Macıas-Guarasa, J. Montero, and J. Pardo, “Speech tosign language translation system for spanish,” Speech Communication,vol. 50, no. 11, pp. 1009–1020, 2008.
[6] K. Karpouzis, G. Caridakis, S.-E. Fotinea, and E. Efthimiou, “Educa-tional resources and implementation of a greek sign language synthesisarchitecture,” Computers & Education, vol. 49, no. 1, pp. 54–74, 2007.
[7] G. Ogris, P. Lukowicz, T. Stiefmeier, and G. Troster, “Continuous activ-ity recognition in a maintenance scenario: combining motion sensors andultrasonic hands tracking,” Pattern Analysis and Applications, vol. 15,no. 1, pp. 87–111, 2012.
[8] S. Ha, Y. Bai, and C. K. Liu, “Human motion reconstruction from forcesensors,” Proceedings of SIGGRAPH/SCA, pp. 129–138, 2011.
[9] R. King, B. Lo, A. Darzi, and G.-Z. Yang, “Hand gesture recognitionwith body sensor networks,” in IEE Proc. of 2nd. Int. Workshop onWearable and Implantable Body Sensor Networks, London, 2005, pp.92–95.
[10] G. Saggio, “Bend sensor arrays for hand movement tracking in biomed-ical systems,” in Advances in Sensors and Interfaces (IWASI), 2011 4thIEEE International Workshop on. IEEE, 2011, pp. 51–54.
[11] N. Liu, B. C. Lovell, and P. J. Kootsookos, “Evaluation of hmm trainingalgorithms for letter hand gesture recognition,” in Signal Processingand Information Technology, 2003. ISSPIT 2003. Proceedings of the3rd IEEE International Symposium on. IEEE, 2003, pp. 648–651.
[12] R. Y. Wang and J. Popovic, “Real-time hand-tracking with a colorglove,” in ACM Transactions on Graphics (TOG), vol. 28, no. 3. ACM,2009, p. 63.
[13] K. Assaleh, T. Shanableh, M. Fanaswala, F. Amin, and H. Bajaj,“Continuous arabic sign language recognition in user dependent mode,”Journal of Intelligent Learning Systems and Applications, vol. 2, no. 1,pp. 19–27, 2010.
[14] J. Fan, “Automatic image segmentation by integrating color-edge ex-traction and seeded region growing,” IEEE Transactions on ImageProcessing, vol. 10, no. 10, 2001.

254

45
DEPARTMENT OF MECHANICAL ENGINEERING

256

257
CONTENT
257
258 A Computational, Anatomically-Based 5-Element Model of the Intubated Infant Respiratory System Mechanics during High Frequency Oscillatory Ventilation SAMER BU JAWDEH – NATHALIE CHALHOUB
265 A Reduced-Order Model of a Microfluidic Transistor JOSEPH BAKARJI – KHOUDOR KENIAR – MOUHAMMAD CHEIKH
271 Active Solar Desalination Still ELIAS ISSA – SAMI KOBAYTER – ZAFER VICTOR RUSTOM – TONY YAMMINE – KARIM ZAATARI
277 Active Solar Still Connected to an Evacuated-Tube-Type Solar Collector MHAMAD MAHDI ALLOUSH – AHMAD ASSAAD – LAMA ATALLAH – HASAN BAHJA – HIBA MOUHANNA
282 Design of an IGCC plant in Lebanon FATIMA MANSOUR – SAID RAHAL – EVITA MOAWAD – RANA HALABY – HANI ZAYAT
288 Optimized Air Distribution System to Inactivate Airborne Microorganisms using Upper-room Ultraviolet Germicidal Irradiation JAD ARABY – JAMIL ANDRAOS – FARAH DUBAISI – HIBA KOBEISSI – KASSEM MOUSTAFA
296 Small-Scale Wave Energy Converter Prototype for Beirut Wave Conditions AYMAN EL- GHALAYINI – HADEEL HIJAZI – KHALED EL- MONAJJED – OMAR HUSSEIN SAFADI

258
A Computational, Anatomically-Based 5-Element Model of the Intubated Infant Respiratory System Mechanics during
High Frequency Oscillatory Ventilation
Bu Jawdeh SA1 and Chalhoub NE2,3 1 Department of Mechanical Engineering, Faculty of Engineering and Architecture, and
2 Department of Internal Medicine, 3 Outcomes Research Unit, Faculty of Medicine, American University of Beirut, Beirut, Lebanon
[email protected] [email protected]
I. INTRODUCTION
High frequency oscillatory ventilation (HFOV) is frequently used as a primary treatment modality in very low birth weight (VLBW) preterm infants for respiratory failure.[1] The ventilator settings used by physicians to provide HFOV are the mean airway pressure (Paw, cmH2O), the pressure oscillation amplitude (ΔP, cmH2O), the oscillatory ventilation frequency (f; Hz) or equivalently the oscillatory period (T=1/f; seconds), and inspiratory to expiratory time ratio (I:E).[2-4]
It has been suggested that increasing Paw improves oxygenation by increasing the surface area available for gas exchange through alveolar recruitment and expansion.[5-8] Alternatively, increasing ΔP will increase the effective oscillatory tidal volumes (Osc.VT), and is mainly thought to enhance ventilation and consequently CO2 clearance.[1,6] A recent analysis of gas exchange outcomes in VLBW infants on HFOV showed that increasing Paw improved oxygenation (TcO2) but may, on average, be associated with less effective CO2 clearance as reflected in increased TcCO2 (Fig. 1).[1] The latter finding may indicate relatively less effective ventilation at higher Paw, and was generally true irrespective of ΔP magnitudes.
Figure 1: Transcutaneous CO2 at increasing (then decreasing) Paw repeated for multiple ΔP magnitudes in random order. This Figure is reproduced with Permission from Chalhoub et al [1].
The physiologic mechanisms underlying these paradoxical effects of Paw on oxygenation and ventilation (TcCO2) in intubated HFOV ventilated infants remain speculative and incompletely understood. We hypothesized that the rise in TcCO2 results from less effective ventilation at higher Paw explained by: 1) lower effective compliance at higher Paw leading to lower oscillatory tidal volumes (Osc.VT), and/or an increase in anatomical dead space volume (Vd) due to increased effective volume (diameter) of the distensible conducting airways.
ABBREVIATIONS (alphabetical order) Cg Gas compression compliance Crs Respiratory system compliance ET Endotracheal tube HFOV High frequency oscillatory ventilation Iaw Effective airway inertance Iaw,0 Effective airway inertance @ Paw = 0 Iet ET inertance Irs Respiratory system inertance Itis Tissue inertance Itis,0 Effective tissue inertance @ Paw = 0 law Effective airway length nRet Non-linear ET resistance OPR Oscillatory pressure ratio Osc.VT Oscillatory tidal volume Paw Mean airway pressure Pin Input pressure ΔP Peak to peak oscillatory pressure Ptr Tracheal pressure Raw Effective airway resistance Raw,0 Effective airway resistance @ Paw = 0 raw Effective airway radius raw,i Effective airway radius @ Paw = 0 Rrs Respiratory system resistance Rtis Tissue resistance Rtis,0 Effective tissue resistance @ Paw = 0 TcCO2 Transcutaneous Carbon dioxide TcO2 Transcutaneous oxygen Vd Anatomical dead space volume Vd,i Anatomical Vd @ Paw = 0 Vd,n Normalized Vd @ Paw = 5 cmH2O VT Tidal volume VLBW Very low birth weight Zg Gas compression impedance path µ Dynamic viscosity of air ρ Density of air

259
II. METHODS
II.A Overview of the Electromechanical Model Approximating the Intubated Respiratory System During HFOV
We implemented, and extended, the computational model
(Matlab, Simulink) of the underlying respiratory system mechanics during HFOV previously described by van Genderingen et al.[2] Their model was based on an anatomically consistent 5-element electromechanical analogue of the intubated infant respiratory system (Fig. 2), and included two series components: 1) the endotracheal tube (ET) modeled as a nonlinear (flow-dependent) resistance (nRet) in series with a linear inertance (Iet), and 2) a 3-element series RIC representation of the respiratory system consisting of a resistance (Rrs), inertance (Irs) and compliance (Crs).[2] Note, they modeled the Crs element as Paw-variable whose effective value is based on estimated lung volume changes due to expansion and/or recruitment of alveoli.
Our current model [Table 1, Fig. 2] replicated the approach of van Genderingen for nRet, Iet and Crs. Alternatively, Rrs and Irs were each divided to their airway (aw) and tissue (tis) physiologic components as follows: Rrs= Raw+Rtis and Irs= Iaw+Itis. Here, Rtis and Itis were assumed to remain constant irrespective of the driving input signal (Pin) and, hence, were independent of changes on the effective lung volume or oscillatory volumes when HFOV settings are varied. However, we modeled both Raw and Iaw as linear (no flow-dependence), yet Paw-variable, elements to approximate their expected variation with the change in the effective diameter of the distensible conducting airways in terms of the Paw setting during HFOV. The adopted approach to varying Raw, Iaw and, consequently, conducting airway volume (or Vd) is described below. Another way we extended the van Genderingen model was that we added the flexibility of using composite (multi-frequency) Pin signals and/or the ability to introduce experimental Pin measured in
infants to derive model predicted [Flow(t,m)] and tracheal pressures [Ptr(t,m)], which were then compared to the actual measured counterparts [Flow(t, actual) and Ptr(t, actual)] as a means of model validation.
II.B Assignment of Model Parameters Values II.B.1 Endotracheal Tube (ET). We modeled the endotracheal tube in the same manner as in the van Genderingen study.[2] Briefly, the non-linear flow-dependent resistance was mathematically modeled in terms of a linear (K1) and non-linear (K2) term for a typical 3.0 inner diameter infant ET as follows: nRet = K1 + K2×|Flow|, with K1= 30 cmH2O∙s∙L-1 and K2= 350 cmH2O∙s2∙L-2. The corresponding linear Iet was assumed constant with a value of 0.30 cmH20∙s2∙L-1 throughout the study.[2]
Table 1: Comparison between van Genderingen et al. [2] and our model.
II.B.2 Respiratory System Elements. Baseline (or Paw = 0) values for the respiratory system RIC elements (Rrs, Irs, Crs) assumed in our model simulation were taken as the intermediate values of infant B from the study of Dorkin and colleagues [9]. These values were as follows: Rrs = 29 cmH2O∙s∙L-1, Irs = 0.018 cmH2O∙s2∙L-1, and Crs = 0.39 ml∙cmH2O-1. Crs values were then varied with Paw or equivalently with lung volume as described by van Genderingen and as illustrated in Fig 3. Here, Crs was calculated based on the number of the recruited alveoli and the nonlinear nature of the Pressure-Volume curve of the lung. Crs
was assumed not to vary with oscillatory flow or pressure (ΔP) amplitudes.
van Genderingen et al. Our Model
Pin , single frequency Pin , single freq. or composite Rigid Airway Rigid or Distensible Airway constant Raw, Iaw and Vd Raw, Iaw and Vd vary with Paw Outputs: Flow, Ptr, OPR Outputs: Flow, Ptr, OPR,
Osc.VT, and Osc.VT/Vd,n
Figure 2: A 5-element model with the respiratory system divided into both airway and tissue components. Model was based on van Genderingen et al. [2] and enhanced to further reflect physiological behavior.

260
Rrs(Raw+Rtis) and Irs (Iaw+Itis) were also varied as a function of Paw in our model exclusively due to the effects of altering the mean distending pressure, or Paw, on the distensible conducting airway properties (Raw, Iaw) while respiratory tissue contributions to both elements (Rtis and Itis) were presumed to be constant.[Fig 3] To calculate the effective Raw and Iaw at a given Paw, we assumed that the airway radius of a single compliant tube model of the conducting airways to change at a rate of 3% per 1 cmH2O for Paw values between 0 to 30 cmH2O and constant for higher values.[Fig. 3] This rate of change in airway radius was based on the data reported by Yamada and colleagues.[5] The corresponding relative change in the volume of the single tube airway model was used to delineate the change in Vd reference to Vd,i or the dead space volume when Paw = 0. Accordingly, assuming a simple single tube model, the equations governing changes in Raw, Iaw and Vd are as follows:
R!" =8 ∗ µμ ∗ l!"π ∗ r!"!
(1)
I!" =ρ ∗ l!"π ∗ r!"!
(2)
V! = V!" = π ∗ r!"! ∗ l!" (3) note, the corresponding relative or normalized dead space (Vd,n ) may be computed according to:
V!,! =!!!!,!
= ( !!"!!",!
)! (4)
In the simulations reported heretofore with the compliant airway model, we assumed that Rrs is divided equally, or Raw,0 = Rtis,0 = 14.5 cmH2O.s.L-1), while Irs was divided on a 1:9 ratio basis or Iaw,0 = 0.0018 cmH2O.s2.L-1 and Itis,0 = 0.0162 cmH2O.s2.L-1.[Fig 3].
II.C Simulink Model II.C.1 Model Equations, Inputs and Outputs. The implemented Simulink model solves a model-based differential equation [Eq. 5,6] linking the input pressure to the corresponding flow output in the time domain. Specifically, the estimate of the Flow(t) signal in time corresponds to 1) a specific input HFOV pressure signal [Pin(t, actual) = Paw(t, actual) + ΔP(t, actual)] and 2) a known set of the above 5-element model parameters (Fig 2). The latter vary as a function of the prevailing Paw value as described in section B.2 above. Note, the Flow(t,m) solution is the primary model output and is based on the fundamental model (m) equation for Pin: P!" t,m = ∆P t,m + P!" t,m (5) Where Paw(t,m) reflects the model estimate of mean airway pressure that is assumed as constant in time, and ΔP(t,m) is the model derived approximation of the oscillatory pressure input given the Flow(t,m) solution of the following differential equation: ∆P t,m = R!" + R!"# + nR!" ∗ Flow t,m
+ I!" + I!"# + I!" ∗∂Flow t,m
∂t+
1C!"
∗ ∫ Flow(t,m) dt (6)
Here, the model will continuously adjust the Flow(t,m) estimate until the error between model Pin(t, m) and Pin(t, actual) are minimized. Once a solution is obtained, then the flow is integrated to derive the tidal volume [VT(t, m)] signal and is also applied to the model equation to estimate the tracheal pressure [Ptr(t, m)] time signal immediately distal to the ET. As a final step, the model VT(t), Pin(t) and Ptr(t) outputs will be used to compute the peak-to-peak amplitudes (Osc.VT, ΔPin and ΔPtr). The final model results were then summarized as the oscillatory pressure amplitude ratio (OPR = ΔPtr/ΔPin) and, in case of
(Eq. 5)
Figure 3: Changes in model elements as a function of Paw. Respiratory resistance (Rrs) and inertance (Irs) include both tissue (dashed line) and airway (difference between solid and dashed) components. Compliance (Crs) in terms of Paw was based on expected alveolar recruitment and lung volume change [2]. Dead space (Vd) was modeled to increase up to a maximum at Paw of 30 cmH2O as described by Yamada et al [5] and was referenced to the value at Paw=5.
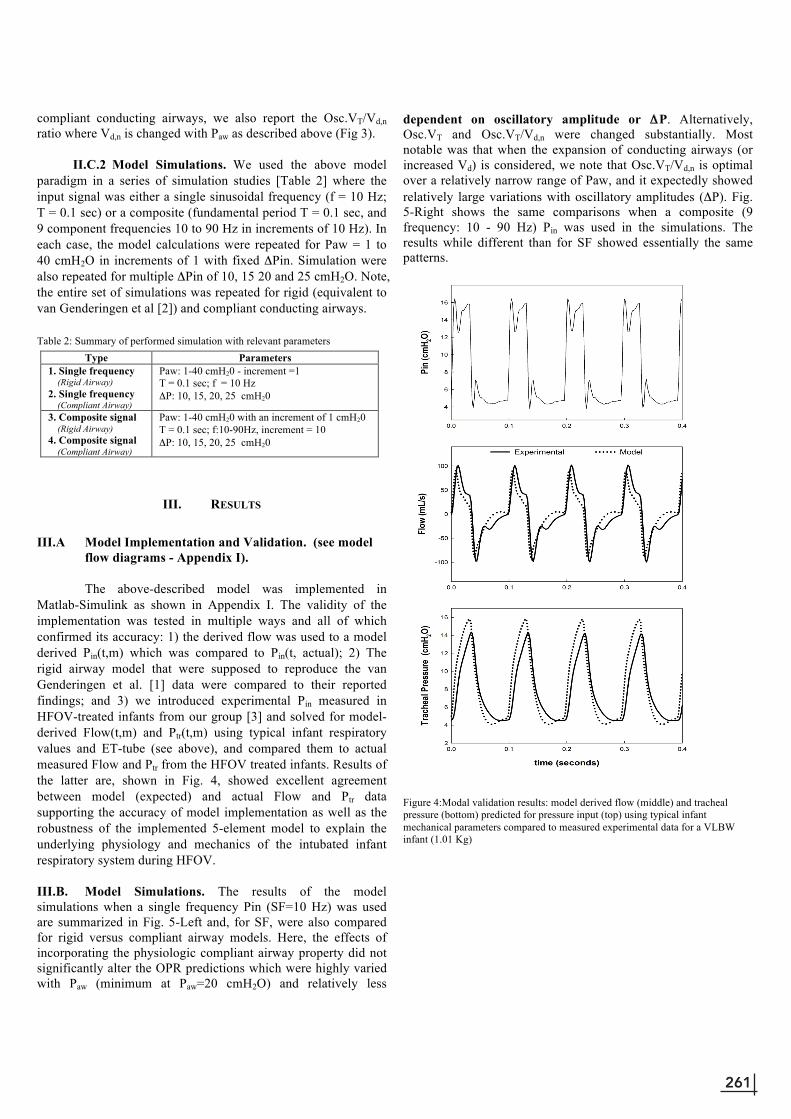
261
compliant conducting airways, we also report the Osc.VT/Vd,n ratio where Vd,n is changed with Paw as described above (Fig 3). II.C.2 Model Simulations. We used the above model paradigm in a series of simulation studies [Table 2] where the input signal was either a single sinusoidal frequency (f = 10 Hz; T = 0.1 sec) or a composite (fundamental period T = 0.1 sec, and 9 component frequencies 10 to 90 Hz in increments of 10 Hz). In each case, the model calculations were repeated for Paw = 1 to 40 cmH2O in increments of 1 with fixed ΔPin. Simulation were also repeated for multiple ΔPin of 10, 15 20 and 25 cmH2O. Note, the entire set of simulations was repeated for rigid (equivalent to van Genderingen et al [2]) and compliant conducting airways. Table 2: Summary of performed simulation with relevant parameters
III. RESULTS
III.A Model Implementation and Validation. (see model
flow diagrams - Appendix I).
The above-described model was implemented in Matlab-Simulink as shown in Appendix I. The validity of the implementation was tested in multiple ways and all of which confirmed its accuracy: 1) the derived flow was used to a model derived Pin(t,m) which was compared to Pin(t, actual); 2) The rigid airway model that were supposed to reproduce the van Genderingen et al. [1] data were compared to their reported findings; and 3) we introduced experimental Pin measured in HFOV-treated infants from our group [3] and solved for model-derived Flow(t,m) and Ptr(t,m) using typical infant respiratory values and ET-tube (see above), and compared them to actual measured Flow and Ptr from the HFOV treated infants. Results of the latter are, shown in Fig. 4, showed excellent agreement between model (expected) and actual Flow and Ptr data supporting the accuracy of model implementation as well as the robustness of the implemented 5-element model to explain the underlying physiology and mechanics of the intubated infant respiratory system during HFOV.
III.B. Model Simulations. The results of the model simulations when a single frequency Pin (SF=10 Hz) was used are summarized in Fig. 5-Left and, for SF, were also compared for rigid versus compliant airway models. Here, the effects of incorporating the physiologic compliant airway property did not significantly alter the OPR predictions which were highly varied with Paw (minimum at Paw=20 cmH2O) and relatively less
dependent on oscillatory amplitude or ΔP. Alternatively, Osc.VT and Osc.VT/Vd,n were changed substantially. Most notable was that when the expansion of conducting airways (or increased Vd) is considered, we note that Osc.VT/Vd,n is optimal over a relatively narrow range of Paw, and it expectedly showed relatively large variations with oscillatory amplitudes (ΔP). Fig. 5-Right shows the same comparisons when a composite (9 frequency: 10 - 90 Hz) Pin was used in the simulations. The results while different than for SF showed essentially the same patterns.
Figure 4:Modal validation results: model derived flow (middle) and tracheal pressure (bottom) predicted for pressure input (top) using typical infant mechanical parameters compared to measured experimental data for a VLBW infant (1.01 Kg)
Type Parameters 1. Single frequency (Rigid Airway) 2. Single frequency (Compliant Airway)
Paw: 1-40 cmH20 - increment =1 T = 0.1 sec; f = 10 Hz ΔP: 10, 15, 20, 25 cmH20
3. Composite signal (Rigid Airway) 4. Composite signal (Compliant Airway)
Paw: 1-40 cmH20 with an increment of 1 cmH20 T = 0.1 sec; f:10-90Hz, increment = 10 ΔP: 10, 15, 20, 25 cmH20

262
Figu
re 5
: Sim
ulat
ion
resu
lts. R
esul
ts sh
own
incl
ude
OPR
(row
1),
Osc
.VT
(row
2),
and
Osc
.VT/
Vd,
n (r
ow 3
) for
bot
h si
ngle
freq
uenc
y (le
ft bl
ock)
and
com
posi
te si
gnal
(rig
ht
bloc
k) e
ach
sim
ulat
ed fo
r rig
id a
irway
mod
el (w
hite
col
umns
) and
com
plia
nt a
irway
mod
el (g
ray
colu
mns
). Th
e si
ngle
freq
uenc
y w
as e
qual
to th
e na
tura
l fre
quen
cy o
f the
co
mpo
site
sign
al w
ith a
val
ue10
Hz.
Not
e th
at fo
r the
rigi
d ai
rway
mod
el O
sc.V
T an
d O
sc.V
T/V
d,n gr
aphs
are
the
sam
e be
caus
e rig
id a
irway
ass
umes
dea
d sp
ace
volu
me
to re
mai
n co
nsta
nt o
vera
ll al
l Paw
val
ues.
Figure 5

263
Figure 6: Selected OPR and Osc.VT/Vd,n at ΔP of 10 and 20 cmH2O. Note that, OPR was insensitive to the type of airway (rigid or compliant) irrespective of input signal type (Composite (CS) and single frequency (SF)). Osc.VT/Vd,n varied as a function of Paw with both airway and signal types.
IV. DISCUSSION
Our model simulation results reproduced previous work by van Genderingen et al assuming rigid conducting airways, a series 3-element representation of the respiratory system, and a mono-frequency characteristic of the pressure input. We further extended our model to relax the single frequency and rigid airway assumption both of which are oversimplification of the HFOV input signal as well as the physiology/anatomy of the conducting airways and how they respond to changes in the positive distending pressure. These extensions were based on known/reported physiologic conducting airway data as well on the reported spectral characteristics of the composite HFOV input pressure data. In doing so, we noted significant effects of both these additions as depicted in Fig. 6 at two separate ΔP settings. These findings suggest the utility of the minimum OPR based on a single frequency input and rigid airway assumption, as a means to indicate optimal Paw (or lung volume) setting may not be an optimal approach. Incorporation of the compliant airway suggests that oscillating at the minimum OPR may not be associated with maximal dynamic lung compliance leading to relatively reduced Osc.VT for the same ΔP (less ventilation). This is probably made worse by the fact that the expected increase in the conducting airway or dead space volume (Vd) at higher Paw settings and given the low tidal ventilation property of HFOV (decreased Osc.VT/Vd,n). The obtained drop in Osc.VT/Vd,n at relatively low Paw settings were not seen with the rigid airway model. Accordingly, implementation of the compliant airway property and its effects
on Raw, Iaw and on Vd in addition to its effects on overall oscillatory flow provided a potential mechanistic explanation for the observed clinical data where increasing Paw was associated with less effective CO2 clearance and higher TcCO2 levels in HFOV treated infants (Fig. 1). In the rigid airway model, such an effect was only seen at extremely high Paw settings (>30 cmH2O), which were well above the settings used in these infants [1].
V. LIMITATIONS AND FUTURE CONSIDERATIONS
As with any model of a complex physiologic system, our model may be limited by certain assumptions and lack of additional physiologic and anatomic details. That said, we found the model to be quite robust and able to predict physiologic measurements as shown in Fig. 4. One property that our model did not address is the possibility of alveolar gas compression becoming significant at some point in particular given the composite multi-frequency nature of HFOV Pin which can include significant signal energy at higher frequencies (e.g. 30-100 Hz) where the gas compression parallel impedance (Zg) pathway may become increasingly more competitive with increasing frequency and increasing lung volume (or higher Paw). Future simulation studies are needed to test this potential effect, and where the respiratory system is modeled as a six-element system where an alveolar gas compression compliance (Cg,alv) element separates the airway compartment (Raw, Iaw) and a respiratory tissue compartment (Rtis, Itis, Ctis). Future efforts should also attempt to use time domain measurements such as combinations (2 or 3) of Pin, Ptr and proximal airway flow such that assuming a certain model topology (3 or 6 elements) to estimate the underlying respiratory system mechanical properties via inverse modeling and parameter estimation methods. How the values of these properties (airway, Cg (alveolar volume) and tissue) with changes in ventilator settings may be highly relevant in addressing optimization of mechanical ventilation during HFOV as well as to monitor and track changes in the mechanical properties with progression/regression of disease, or to ascertain effects of treatments (e.g., surfactant).
VI. CONCLUSION
The implemented lumped element mechanical model of the intubated infant respiratory system, including the expected effects on the compliant conducting airway dimensions and mechanical properties, provided evidence that ventilation effectiveness indexed by Osc.VT/Vd,n may be optimal over a relatively narrow range of Paw settings that are well below the setting at which the proposed OPR is minimized (approximately 10 cmH2O lower). These findings provided a potential mechanistic explanation for the decrease in CO2 clearance with increasing Paw settings observed in HFOV-treated intubated infants even at relatively modest Paw values.

264
ACKNOWLEDGMENT
We would like to thank Dr. Robert H. Habib for his continuous support, encouragement, supervision, efforts and guidance.
Last but not least, our parents for all efforts made so that we
seek a better and more knowledgeable life.
REFERENCES [1] N.E. Chalhoub, R. Singh, S.E. Courtney, and R.H. Habib, “Effects of High Frequency Oscillatory Ventilation (HFOV) Pressure Settings on Oxygenation and Ventilation Outcomes in Very Low Birth Weight (VLBW) Preterm Infants,” Pediatric Research (Abstract), PAS Annual Meeting, Washington DC, May 7, 2013. [2] H.R. van Genderingen, A. Versprille, T. Leenhoven, D.G. Markhorst, A.J. van Vught, and R.M. Heethaar, “Reduction of oscillatory pressure along the endotracheal tube is indicative for maximal respiratory compliance during high-frequency oscillation ventilation: a mathematical model study,” Pediatric Pulmonology vol.31, pp. 458-463.
[3] R. Singh, S.E. Courtney, M.D. Weisner, and R.H. Habib, “Respiratory mechanics during high-frequency oscillatory ventilation: a physical model and preterm infant study,” J Appl Physiol, vol. 112, pp. 1105-1113, 2012.
APPENDIX I. SIMULINK MODEL FLOW DIAGRAMS
[4] H.R. van Genderingen, A.J. van Vught, E.L. Duval, D.G. Markhorst, and J.R. Jansen, “Attenuation of pressure swings along the endotracheal tube is indicative
of optimal distending pressure during high-frequency oscillatory ventilation in a model of acute lung injury,” Pediatric Pulmonology, vol. 33, pp. 429-436, 2002.
[5] Y. Yamada, J.G. Venegas, D.J. Strieder, and C.A. Hales, “Effects of mean airway pressure on gas transport during high-frequency ventilation in dogs,” J Appl Physiol, vol. 61, pp. 1896-1902, 1986.
[6] M. Miedema, F.H. de Jongh, I. Frerichs, M.B. van Veenendaal, and A.H. van Kaam, “The effect of airway pressure and oscillation amplitude on ventilation in pre-term infants,” Eur Respir J, vol. 40, pp. 479-484, 2012. [7] J.J. Pillow, “Tidal volume, recruitment and compliance in HFOV: same principles, different frequency,” Eur Respir J, vol. 40, pp. 291-293, 2012. [8] J.G. Venegas and J.J. Fredberg, “Understanding the pressure cost of ventilation: why does high-frequency ventilation work?” Critical Care Medicine, vol. 22, pp. 49-57, Sept 1994 [9] H.L. Dorkin, A.R.Stark, J.W. Werthammer, D.J. Strieder, J.J. Fredberg, and I.D. Frantz, “Respiratory System Impedance from 4 to 40 Hz in Paralyzed Intubated Infants with Respiratory Disease,” J. Clin. Invest, vol. 72, pp. 903-910, Sept 1983
Fig A.1: Simulink model representation composed of two subsystems. One subsystem solves for flow and the other subsystem, based on that flow, reconstructs the pressure input in order to verify solution accuracy.
Fig A.2: Simulink model representation for the flow solver subsystem.

265
1
Modeling and Simulation of a Pressure ActuatedMicrofluidic Transistor
Joseph Bakarji, Khoudor Keniar, Mouhammad Cheikh Department of Mechanical EngineeringAmerican University of Beirut
Beirut, LebanonEmail: [email protected], [email protected], [email protected]
Abstract—A reduced-order model of a Microfluidic Transistoris presented. The transistor is essentially a long micro channelbetween substrate and a membrane that is pressure actuated.The proposed model captures steady (DC) and small signal(AC) behavior of the device in a manner analogous to standardsemiconductor transistor models. The model is based on steadyand perturbed unsteady solutions of the conservation of massand momentum, coupled with an elastic model for the mem-brane. To improve the accuracy and to enhance the range ofvalidity, the model is enhanced by numerical simulations of thecoupled fluid-structure problem. The model predicts dependenceof the transconductance on the pressure differentials across themembrane and along the channel. The proposed model alsoinvestigates the impact of flow inertia, among other effects, onthe dynamic behavior of the transistor.
NOMENCLATURE
m Mass flow rateα Slope of the membraneE Elasticityρ Density of the fluidU Velocity field inside the capacitord Thickness of the membraneδ Vertical Deflection of the membrane from equilib-
riumδc Vertical Deflection at the center of the membraneu Velocity in the x directionv Velocity in the y directionQ Volume flow rateAc Area of the cross sectionPin Inlet Pressure of the fluidPout Outlet Pressure of the fluidPext P external above the membrane
I. INTRODUCTION
Extensive research has been done on characterizing mi-crofluidic components and circuits in the last few years,due to the wide spectrum of applications of microfluidicdevices, especially in biotechnology. One of the most usedcomponents in such circuits is the elastic membrane microchannel. Typically, elastic membranes have been consideredas capacitors because as an analogy to storing charge in anelectric capacitor, a fluidic capacitor can store mass [1]. On theother hand, the same component can be used as a switch whenenough pressure on the membrane blocks the flow. As [2]states, we need a simple means to translate an electric signal to
a fluidic signal without the use of electromechanical interfaceactuators. The existence of a large number of actuators isa problem especially when designing large integrated micro-fluidic circuits. A solution was suggested by [1], where theyproposed the design of different microfluidic circuits, eachwith a certain resonance frequency. The output mass flowrate of each channel is a function of the input frequency ofthe circuit and the resonance frequency of each channel. Thisstrategy diminishes the need for a large number of actuators.Other techniques have been used which take advantage offluidic logic circuits to control output flows of large integratedmicro fluidic circuits such as [3], [4], [5]. In these papers, theauthors have introduced transistor-like elements as the basicbuilding blocks for the logic circuits. In [4] the transistorswhere pneumatically driven, while in [5] they were fluiddriven.A simple 2D model of a fluidic transistor consists of a PDMSelastic membrane on top of a microchannel as described in[1]. Although this component can be found frequently inthe literature[1], [3], [4], [6], [5] it hasn’t been thoroughlycharacterized mathematically and experimentally.Two different analysis procedures where proposed by [7], [8].Utz [7] designed a piezoelectric actuated diaphragm micropump and derived a linearized model for its dynamic responseand performance. Mosadegh focuses on characterizing thepropagation of pressure waves actuated by elastic membranesto control the flow in micro channels [6]. Utz characterizesthe frequency response of a long channel covered by anelastic membrane. The model investigates the pressure wavespropagation assuming a parabolic profile deflection of themembrane perpendicular to the flow. These two papers focuson the capacitive behavior of such channels. Another approachto characterize such channels was proposed by [6], [5]. Thesepapers use the fluidic transistor as a logic switch.In this paper, we investigate the behavior of a 2D fluidictransistor using FSI (Fluid Structure Interaction) simulationson FLUENT/ANSYS and propose a basic analytical model forsmall deflections. The results will be compared and contrastedwith the response of electrical transistors and capacitors. First,the flow in the transistor will be brought to quiescent point(steady state operation) after which small pressure perturba-tions will be applied. System curves are constructed throughextensive simulations. They describe the operation of the microfluidic transistor under various input, output and actuationpressures which are respectively analogous to drain, source

266
2
and gate voltages in electronic transistors. The characterizationturns out to be surprisingly very similar to the MOSFET’s.
MODELS DESCRIPTION
pextpin pout
[SOURCE][DRAIN]
[GATE]
h0
(x)
d
L
x
y
Fig. 1. SCHEMATIC OF MICROFLUIDIC TRANSISTOR.
As a first step, the membrane is assumed to store mass asa function of time. This would be similar to a capacitor thatstores charge. In this respect, for a robust fluidic capacitormodel, several ways of deriving the motion of the membranehave been used and compared. Senturia [9] assumes a cosinetrial function and uses variational methods to derive thedeflection model of the membrane. In 2D, the membraneis modeled as a beam of length L and thickness d. Alongthe derivation, one of the main assumptions used to reachan analytical solution is that δ(x) the deflection is small(Allowing for the approximation: 2
√1 + δ ≈ 1 + δ
2 ). Thedeflection of the beam is:
δ(x) =δc2
(1 + cos
(2πx
L
))(1)
Where δc is the deflection of the center of the membrane,calculated from the following equation:
P =π4
3
(Ed3
L4
)δc +
π
4
(Ed
L4
)δ3c (2)
Matthiew Begley on the other hand, derives a polynomialmodel of the deflection of a PDMS membrane. The mainassumption for this equation to hold is δmax < d [10]. Thedisplacement of the membrane δ(x) is given by the followingequation:
δ(x) =
(PavL
4
2Ed3
)( x
L
)2 (1− x
L
)2
−∆( x
L
)2 (3− 2
x
L
)
(3)where Pav is the average pressure such thatPav = pin(t)+pout(t)
2 − pext, and ∆ is the boundarycondition variable dependent on the right edge of thetransistor [10].The model proposed by above is subject to limitations suchthat L >> 10d, δmax < d, δ(0) = dδ
dt (0) =dδdt (L) = 0, and
δ(L) = −∆. For a general boundary condition where δ = ∆.In our case ∆ = 0.If case the deflection is large, i.e. δmax > d, the degree ofδ(x) decreases to quadratic:
δ(x) = L
(3PavL
Ed
)1/3 (1− x
L
)( x
L
)(4)
Note that these equations are expressed as a function ofx without including inertia effects. In transient response, theeffect of time on the deflection will be further investigated
when models are compared to the simulation results.For very small deflections, the flow can be assumed to benearly parallel. Accordingly, the conservation of mass wouldreduce to:
∂
∂tmc.v + m→ − m← = 0
m← − m→ =∂mc.v
∂t
= ρ∂
∂t
(∫ L
0
δ(x, t)dx+ hL
)
Where δ(x, t) is a known function of x and t.Pav(t) is the only property depending on time, which reducesthe relationship to:
m← − m→ = A∂Pav(t)
∂t(5)
Where A =∫ L
0L(3LEd
)1/3 (1− x
L
) (xL
)
Here we can directly notice the analogy of the fluidiccapacitor with the electrical capacitor for which:
I = CdV
dt(6)
Thus, the Voltage is analogous to the Pressure and thecapacitance C is analogous to the constant A.
For very small displacement of the boundary, the slopeα(x) is small and the flow can therefore be assumed to beparallel. Thus, we have:
α(x) =dh(x)
dx=
d(ho + δ(x))
dx=
d(δ(x))
dx(7)
In this context, α(x) scales the relative displacement of themembrane and can therefore be used as a parameter to evaluatethe validity of the assumption that the flow is nearly parallel.Eventually αmax can be derived for design purposes.Writing the continuity equation under this assumption, wehave:
∂u
∂x+
∂v
∂y= 0 (8)
Taking a control volume at the boundary, we can write:
ρvdx = ρudy
v
u=
dy
dx= α(x)
v = α(x)u
Therefore we can write the continuity equation in dimen-sionless form: (
∂u
∂x
)∗
+L
hα(x)
(∂u
∂y
)∗
= 0 (9)
For α(x) << 1, the flow becomes nearly parallel and weget u∗ = f(y). In this case the capcitor becomes a fluidicresistance like a channel.

267
3
II. DERIVING THE PRESSURE DISTRIBUTION
We proposed in the previous section various models ofthe membrane to be used in further analysis for a pressuredistribution in the flow field. We aim in this section to derivea model of the pressure distribution as a function of Pin, Pout
& Pext for small deflections. Given a small deflection, we canassume the channel to be nearly parallel, which simplifies theequations. In addition, we add a time varying perturbation α(t)which allows us to write the general solution of the pressuredistribution under the membrane as:
P (x, t) = P0(x) + α(t)P1(x) (10)
Where P0(x) is the pressure distribution, lumped in y, of asimple Poiseuille flow given by:
P0(x) = Pin +Pout − Pin
Lx (11)
Given a fully developed flow, the velocity distribution is afunction of y:
u0(y) =1
2µ
(Pout − Pin
L
)(y2 − dy
)(12)
The average velocity of a Poiseuille flow is:
u0 =
∫ h
0
u0(y)dy
=
∫ h
0
1
2µ
(Pout − Pin
L
)(y2 − dy
)dy
= − 1
12µ
(Pout − Pin
L
)h3
We also define α(t) = δc(t)L as the time varying perturbation
term which must be much less than 1. Given a model for thedeflection of the membrane we can solve for α(t) as a functionof Pext. We use the model presented in [9] for a membrane,given by:
Pav = Pext(t)−Pin − Pout
2=
π4
3
(Ed3
L4
)δc+
π
4
(Ed
L4
)δ3c
(13)Therefore, we get:
δc(t) =(30.5(27a4P 2
av + 4a3c3)0.5 + 9a2Pav)13
(213 ∗ 3 2
3 a)
−(23
) 13 c
(30.5(27a4P 2av + 4a3c3)0.5 + 9a2Pav)
13
Where a = π4
4
(EdL4
)and c = π4
3
(Ed3
L4
). In order to
calculate P1(x) we expand u1(x) with respect to α(t) suchthat u1(x, t) = u0(x) + α(x)u1(x) and we assume thatv(x, t) = α(t)u1(x, t) for α(t) << 1.Writing the momentum in x we have:
ρ
(∂u
∂t+ u
∂u
∂x+ v
∂u
∂y
)= −∂P
∂x+ µ
∂2u
∂y2(14)
ρ
(∂(u0 + αu1)
∂t+ (u0 + αu1)
∂(u0 + αu1)
∂x+ (v0 + αv1)
∂(u0 + αu1)
∂y
)
= −∂P0 + αP1
∂x+ µ
∂2(u0 + αu1)
∂y2
For small perturbations as a function of time, the inertia term∂u∂t scales to zero.Fully developed Poiseuille flow: ∂u0
∂x = 0.Laminar Poiseuille flow: v0 = 0.Neglect second order terms with α2 coefficients.We end up with the following PDE:
ρu0∂u1
∂x= −∂P1
∂x+ µ
∂2u1
∂y2(15)
In order to simplify the equation we replace u0 by its averagein y, u0. This approximation is necessary to reduce the PDE toa solvable heat equation. The accuracy of the approximationcan later be verified by the simulations.The normalized equation of PDE becomes:
∂2u∗1
∂y∗2−
(P h2
µu0L
)∂P ∗
1
∂x∗ =
(ρu0h
2
µL
)∂u∗
1
∂x∗ (16)
which is of the form:(∂2u1
∂y
)∗
+1
k
(∂P1
∂x
)∗
=1
α
(∂u1
∂x
)∗
(17)
Where k = − Ph2
µu0L, and α = µL
ρu0h2 . The general solution ofthis PDE is the following:
u1 =
∞∑m=1
e−βmu2mtK(µm, z)
[F (µm) +
∫ t
0
eβµ2mt′A(µm, t′)dt′
]
(18)The detailed derivation of the solution will not be presentedin this paper, but only the main assumptions will be exposed.The dimensionless numbers in play are x∗ = x
L and y∗ = yh .
Note that y is normalized with a fixed length h which is notthe high of the membrane at every position x. However, it issafe to assume that at y∗ = 1 and 0 < x∗ < 1, the velocityu1 = 0 subject to no slip boundary conditions. Although notrigorously done, normalizing y with h instead of (h + δ(x))
is a good approximation because δ(x)h << 1. The other two
boundary conditions are no slip at y∗ = 0 and a purelyPoiseuille flow at x∗ = 0, i.e. u1(x
∗ = 0) = 0. Under theseconditions the derivation leads to the following solution:
u1(z, x∗) =
4β
πk
∞∑m=1
sin(mπz)
∫ x∗
0
eβ(mπ)2x∗′ ∂P ∗1
∂x∗′ dx∗′
(19)In order to solve this equation we use the fact that ∂Q
∂x = 0for any x, where Q is the volume flow rate. The volume flowrate is expressed as:
Q =
∫ h(x)
0
(u0 + αu1)dy
= u0h+ α
∫ h(x)
0
u1dy

268
4
Note that the transition from the first line to the secondinvolves an assumption that h(x) ≈ h. In order to proceed,the same assumption will be used for the second term suchthat
∫ h(x)
0u1dy ≈
∫ 1
0u∗1dy
∗. Accordingly:
Q = u0h+ αhu08β
πk
∞∑m=1
∫ x∗
0
eβ(mπ)2x∗′ ∂P ∗1
∂x∗′ dx∗′
(20)
Following:
∂Q
∂x= 0
= αhu08β
πk
∞∑m=1
(eβ(mπ)2x∗ ∂P ∗
1
∂x∗ − ∂P ∗1
∂x∗ (x∗ = 0)
)
Taking only the first term of the summation, m = 1, giventhe kernel is zero for even numbers and the power of theexponential increases quadratically with m, we end up withthe following solution:
P ∗1 (x
∗) = P ∗1 (0) +
∂P ∗1
∂x∗ (x∗ = 0)
1
βπ2
(1− e−βπ2x∗
)(21)
Which yields the final pressure distribution:
P ∗(x) =Pout − Pin
Lx
+ α
[P1(0) +
∂P ∗1
∂x∗ (x∗ = 0)
1
βπ2
(1− e−βπ2x∗
)]
SIMULATION
In order to support our model with experiment we chose todo numerical simulations. Thus we used FSI system couplingon FLUENT in order to simulate a moving elastic membraneoscillating over a fluid. After having extracted the important di-mensionless numbers from the theoretical model, we can solvethe system for a different set of simulation results by varyingthe frequency and the pressures. One of the main assumptionsto be undertaken is to have Pmin < Pin < Pout < Pmax. Thisrelationship keeps the flow going form the inlet to the outletand makes the membrane oscillate between Pmin and Pmax.There are 2 simulation setups: the first one consists of themembrane only (similar to figure 1) in steady state, i.e constantPressure input, and the second one includes a channel beforethe membrane acting as a resistor with small perturbationapplied to the membrane as explained in the analytical model.The second setup aims to imitate the common-source circuitfor a MOSFET for comparison purposes.
PoutPinPhigh
Pext
Resistance
PoutPinPhigh
Pext
[VDD]
[VG]
[VS ][VD]
R
Fig. 2. COMMON-SOURCE FLUIDIC CIRCUIT
The properties of the fluidic transistor were mainly retrievedfrom the supplement paper of Leslie et al. in which they givethe detailed dimensions and material used. The values were
chosen based on the preliminary models given by Begley andSenturia. The main difference is that [10] splits the modelinto polynomials while Senturia includes both aspects in thesame equation. Fig. 3 shows the deflection along the lengthof the membrane for different loading conditions (M = pL3
Ed3 ,L = 3118µm, d = 159µm, E = 26.7 MPa, p = p − pext) aspredicted by [9] and the small and large deflection models in[10], where p is the average pressure in the channel.
0 0.1 0.2 0.3 0.4 0.5 0.6 0.7 0.8 0.9 10
0.02
0.04
0.06
0.08
0.1
0.12Membrane Deformation for Various Model s
Defl
ection
iny
SenturiaBegley (Small)Begley (Large)
M = 3
M = 3
M = 5
M = 5
M = 7
M = 9
M = 1
M = 9
Fig. 3. MEMBRANE DEFLECTION FOR VARIOUS ANALYTICALMODELS
After comparing the results with simulation we decidedto use Senturia’s model which is a good approximation forsmall and relatively large deflections. To check the validityof the model, we compare the deflection of the center of themembrane in the analytical model which assumes a constantpressure distribution with the simulation which creates a flowunder the membrane.
−1 0 1 2 3 4 5 6 7 8x 10⁴
−50
0
50
100
150
200
250
300
350
400
Pout− Pext (P a)
δ c(µ
m)
Theoratical Model vs. Simulation (Pin = 5kPa)
SimulationSenturia’s model
Fig. 4. VALIDITY OF THEORETICAL MODEL SUBJECT TO SIMILARCONDITIONS AS SIMULATION
Given the different conditions governing the experimentaland the theoretical setups, the results are accurate enough to

269
5
adopt Senturia’s model.From a phenomenological point of view, we expect the rateof increase of mass flow rate to decrease as the deflectionincreases, because more work is required to stretch it. Thisnonlinear relationship between mass flow rate and deflectionis also observed in the simulations as we increase Pext for afixed Pin. But it also important to note that for small Pin, ∂m
∂δcseems to stay constant, showing that the stretching effect is stillsmall. Therefore, there is a threshold of Pin after which thestretching term becomes significant and the membrane cannotbe assumed to be in pure bending.
−50 0 50 100 150 200 250 300 3500
10
20
30
40
50
60
70
80
90
100
110
δc (µm )
Q(µ
L/s)
Pin = 10 kPa
Pin = 5 kPa
Pin = 1 kPa
Fig. 5. EFFECT OF DEFLECTION ON VOLUME FLOW RATE
In analogy to the study of electric transistors, we start byplotting m versus Pext −Pout for fixed values of Pin −Pout,in analogy to plotting ID versus VDS for fixed values of VGS .Note that we have ∆P = Pout−Pext in the graphs because ofthe sign convention of Pext. As in a MOSFET, the expectedtrend of the curve is to level down for large values of ∆Pwith a parabolic triode region. This behavior can be depictedin our microfluidic transistor as shown below.
0 1 2 3 4 5 6x 10⁴
0
50
100
150
200
250
300
P i n− Pout (P a) [VDS]
Q(µ
L/s)[I
D]
Pext = 10 kPaPext = 5 kPaPext = 2 kPaPext = −10 kPa
Fig. 6. Q− δp CHARACTERISTICS OF A FLUIDIC TRANSISTOR
It can be further noticed that all curves converge to alinear increase showing the decreasing effect of Pext as ∆Pbecomes dominant.
Short Channel Effect in a Microfluidic Transistor
Typically, MOSFETs have limitations on the operating volt-age because of the so-called short channel effect which ariseswhen the channel length is of the same order of magnitudeas the depletion-layer width of the source and drain junction.One of the manifestations of such an effect is the saturationof the velocity of electrons. Interestingly, the short channeleffects shows up in our microfluidic transistor whereby themass flow rate saturates at some point. In order to identifythe different operating modes of a MOSFET, ID is plottedversus VGS for fixed values of VDS . Analogously, we plot mversus Pin −Pout for fixed values of Pext −Pout. And it canbe noticed the trend is parabolic in the first region as in theMOSFET.
−1.5 −1 −0.5 0 0.5 1 1.5 2x 10⁴
0
50
100
150
Pout− Pext (P a) [VGS]
Q(µ
L/s)[I
D]
Pin = 20 Kpa
Pin = 10 KpaPin = 5 Kpa
Pin = 1 Kpa
Short ChannelRegion
Long ChannelRegion
Fig. 7. Q−∆p CHARACTERISTICS OF A FLUIDIC TRANSISTOR
Given the behavior is very similar to an electric MOSFET,we can go further into defining a transconductance for ourfluidic transistor by making the following analogy:
∂ID∂VGS
≡ ∂m
∂(Pext − Pout)(22)
As depicted in Fig. 8.It can be seen that for a given Pin the fluidic
transconductance is maximized for a certain value ofPout − Pext analogous to VGS . It may be of interest tooperate at the point of maximum transconductance tomaximize the output flow for an applied pressure difference.
III. CONCLUSION
It has been clearly shown that the analogy between theelectrical transistors and our design of a microfluidic transistorholds for a large range of steady state operation. This fact

270
6
−2 −1 0 1 2 3 4x 10⁴
0
0.002
0.004
0.006
0.008
0.01
0.012
∆P = Pout− Pext (P a) [VGS]
∂Q/∂(∆
P)(µ
L/Pa.s)[g
m]
F lu idic Transconductance
Pin=20 kPaPin=10 kPaPin=5 kPaPin=1 kPa
Fig. 8. FLUIDIC TRANSCONDUCTANCE
entails a lot of benefits in microfluidic circuits. First, giventhe validity of the analogy in certain ranges of operation, theMEMS industry designing a lab on a chip for biotech appli-cations can use models developed by the electrical transistorindustry to model complex circuits. Second, given an accuratemodel of a membrane actuated pump, high control on fre-quency induced flow becomes possible and complex applica-tions in mixing and transport can emerge. Third, microfluidiccircuits can replace electrical circuits in environments wherethere is electromagnetic field interference. In this case, themodel presented in this paper can be used as a building blockfor microfluidic circuits.
REFERENCES
[1] D. C. Leslie, “Frequency-specific flow control in microfluidic circuitswith passive elastomeric features,” Nature Physics, vol. 5, 2009.
[2] M. B, “Next-generation integrated microfluidic circuits,” Lab Chip,vol. 11, no. 2813, 2011.
[3] T. MW, “Microfluidic logic gates and timers,” Lab Chip, 2007.[4] R. M, “Microfluidic pneumatic logic circuits and digital pneumatic
microprocessors for integrated microfluidic systems,” Lab Chip, vol. 9,no. 3131-3143, 2009.
[5] J. A. Weaver, “Static control logic for microfluidic devices usingpressure-gain valves,” Nature Physics, vol. 6, 2010.
[6] B. Mosadegh, “Integrated elastomeric components for autonomous re-fulation of sequential and oscillatory flow switching in microfluidicdevices,” Nature Physics, vol. 6, no. 433-437, 2010.
[7] M. Utz, “Mirofluidic waves,” Lab Chip, 2011.[8] R. L. B. et. al, “Designing high-performance micro-pumps based on
no-moving-parts valves,” in MicroElectroMechanical Systems (MEMS).The ASME International Mechanical Engineeing Congress and Exposi-tion, 1997.
[9] S. D. Senturia, Mirosystem Design. Kluwer Academic Publishers, 2002.[10] M. R. Begley, The Mechanical Behavior of Films and Interfaces in Mi-
crofluidic Devices Implications for Performance and Reliability. Taylorand Francis Group, LLC, 2008.

271
Design Simulation and Construction of an Active Solar Desalination Still
Elias Issa, Sami Kobayter, Zafer Victor Rustom, Tony Yammine, Karim Zaatari
Department of Mechanical Engineering American University of Beirut
Riad El-Solh, 1107 2020 Beirut, Lebanon [email protected], [email protected], [email protected], [email protected], [email protected]
Abstract - Over the last decades, potable and irrigation water availability in the Middle East and North Africa has changed significantly. The status of groundwater resources in the Arab region is “critical” as the rate of groundwater extraction far exceeds the natural recharge. Solar still distillation, which employs solar energy to evaporate saline water and condense it as distillate, is gaining revived interest. It is a sustainable and eco-friendly method that may be utilized to provide remote locations with potable water. The solar desalination still investigated in this work is a modification of the conventional still; conventional stills rely on evaporation and condensation only to produce potable water. In the modified still, two additional processes, humidification and dehumidification of the circulating air, allows the still to generate a larger volume of fresh water when compared with the conventional still. The only energy input to the system is the solar irradiance that provides the driving forces necessary for evaporation and offers the required operating power for the condenser fan with the help of PV cells, thus avoiding the use of fossil fuel. A mathematical model that accounts for a number of parameters, such as humidity, temperature, angle of incidence of solar rays, airflow rate, initial salt-water volume, is developed. The system is supplemented with a control system designed to manipulate a number of parameters in order to maximize the volume of fresh water produced. The still was manufactured in the workshop, installed on SRB’s rooftop, and operated for a period of two months to demonstrate its performance in the Lebanese Mediterranean climate. The quality of the potable water produced from the still is under constant investigation.
I. INTRODUCTION
In a time where clean water resources are getting more and more scarce, solar desalination presents itself as an easy and simple solution for this water shortage. The aim of this project is to purify saline water in order to satisfy the lack of potable water, especially in rural areas, using only solar energy.
This paper studies the development of an active solar desalination still, which is more efficient than passive solar stills, producing more water for the same energy input. Current desalination technics, like Reverse Osmosis, requires a high-energy input since they use fossil fuels [1], leading to limitations in countries that do not contain fossil fuel, making this method expensive and harmful for the environment. The new method discussed in this paper has its limitations being directly related to the intensity of solar radiation, its low efficiency even if it is higher than the passive stills efficiency and the large land areas required to collect solar irradiance. [2].
The addition of a fan that sucks the humidified air from the still and injects it in a condenser in order to dehumidify it and collect the water droplets should increase the efficiency and productivity of this system.
The rest of this paper is organized in order to give a review on solar stills, the methodology followed to solve this problem, the modeling of the system and its manufacturing, the simulation and experimentation to validate our results, the cost analysis of the project and finally a conclusion regarding it.
II. LITERATURE REVIEW
Desalination is the process of purifying brackish and seawater from salt and other minerals aiming to obtain water suitable for human consumption and irrigation. Desalination is gaining more importance in the production of purified water due to the increase in population and the pollution of natural water resources. Moreover, 80% of earth's population resides in arid and semi-arid areas [1]; this requires the development of methods that would increase the productivity of desalination. Various methods of desalination include: reverse osmosis (RO), multi stage flash (MSF), multi-effect desalination (MEF) and electrodialysis. However, all of these techniques require a large input of electrical, mechanical and thermal energy [3]. One of the important and renewable sources used for desalination is solar energy. Since solar energy is abundant in areas deprived from potable water "The Middle East and North Africa", solar stills could be an ideal solution for water shortage in these arid areas.
Scientists have applied solar desalination for centuries. In the fifteenth century, an Arab alchemist used concentrated mirrors to get fresh water through evaporation. The first solar still was built in Las Salinas, Chile in 1874. This solar still produced around 23000 L/day of fresh water. It covered an area of 47000 m2 [3].
Moreover, the World Bank published a report stating that the number of people with no access to fresh water is increasing by 70 million every year. [1]. According to them, 40% of people living in arid and semi arid regions have no access to fresh water and that around 80% of the total world population lives in arid and semi arid regions "including the Middle East and North Africa". However this scarcity in water accompanied with high temperatures and solar irradiation drives further the demand for solar desalination and its development.

272
III. SOLUTION METHODOLOGY
In order to solve our problem the following steps were taken: 1. Aiming to improve the efficiency of our solar still, we had to agree on the design parameters including the materials used, the shape and dimensions of the still and the different components. Our system is operated on a forced convection basis in which the fan pushes the humid air from the solar still into the condenser. In order for the fan to work properly and send the air through the condenser as desired it has to overcome all the pressure drops inside the condenser. The choice of the fan is based on the desired CFM and the pressure it delivers making sure it overcomes the pressure drops. The condenser shape is similar to a shell and tube apparatus. Humid air enters the condenser’s tubes, as already mentioned, and exits with a much lower humidity because water vapor becomes liquid. In order to transform water from its gaseous phase to its liquid phase, the shell is filled with cold seawater. Cooling water should lower the temperature of the vapor water under that of the dew point of air in order for this phase change to occur. A rectangular duct is used to guide air into the still (inlet opening) and from the still into the condenser (outlet opening). The air inlet opening should be lower than the exit opening in order for air to fluctuate inside the still and for the fan to suck humidified air and pass it through the condenser. Temperature and humidity sensors plus a PIC18F microcontroller are used to gather the data and control the fan and gate operation. 2. The next step is the mathematical and numerical modeling. Mass, heat and energy equations are used in order to define the quantity of air that should be entering and leaving the system. Also it helps in determining the rate of distillate production and the temperatures of the different components of the still. 3. After modeling the system, we started the simulations using MATLAB. The fourth order Runge-Kutta (RK4), which is a very accurate method having an error of degree 4, is used to solve the differential equations we derived. 4. The manufacturing of the solar still was done after finishing the simulations, since all the dimensions and parameters were known and the material to be used chosen. 5. The final step is the experimentation. The main reason behind this step is to validate the simulations that have been done.
IV. SOLAR STILL MODELING
Fig. 1 is an energy flow diagram representing heat transfer from the different surfaces inside the solar still and with the surroundings. The control volumes used in the modeling were taken directly from Fig. 1. [5] A. Heat balance equation for the glass cover
Taking the glass cover as a control volume, the energy balance equation can be written as:
(1)
Figure 1. Energy flow diagram of the active solar still [5]
When the temperature of the glass T1 is multiplied with the solar irradiation Hs, it gives us the amount of energy absorbed by the glass cover. We know that T1 is given by:
(2) Rg is the glass reflection coefficient and the glass absorption coefficient. The radiation heat transfer from the saltwater to the glass cover is found using:
( ⁄ ) ( ⁄ ) (3)
Here, Tw and Tg represent respectively the water and inside surface glass temperatures while and represent the emissivity of water and glass respectively. Now, due to the added fan the natural convection process is neglected and forced convection is used instead. The heat transfer inside the solar still between the saltwater and the glass cover is:
( ) (4) Tm is the inside air temperature and is the forced convection heat transfer coefficient which can be found using:
(5) And here k is the thermal conductivity while dh is the hydraulic diameter. Because of the condensation due to the rising vapor on the glass, heat loss occurs by evaporation between water surface and glass cover. The evaporative heat transfer based on forced convection is found to be:
(
) (6)
(7)
(8)
D is the water diffusion coefficient, Ps is the saturated vapor pressure in Pa, is the molecular mass in kg, (kJ/kmol K) is the universal gas constant and (kJ/kg) is the latent heat of evaporation.

273
The rate of heat transfer by radiation from the glass cover to the ambient air is:
( ⁄ ) ( ⁄ ) (9)
The sky temperature can be approximated to be 6 degrees less than the ambient temperature Ta:
(10) The final element in our equation is the convection heat transfer from the glass cover to the ambient air:
( ) (11) The heat transfer coefficient outside the still can be found using a linear relationship that makes it proportional to the wind velocity:
(12)
B. Heat balance equation for the solar still water
Taking now the water as the control volume, the energy equation becomes:
(13) T2Hs is the amount of energy that is absorbed by the saltwater inside the system.
(14) The equations of are the same as we previously found. The new term is the heat transfer from the solar still base to the solar still water and is found to be:
(15) Tb is the base temperature and the convection heat transfer coefficient is found to be:
(16) Xw is the mean characteristic length in meters of the solar still between the basin and the water surface. C. Heat balance equation for the base
The next step is to take the control volume around the base and find the energy balance equation:
(17)
T3Hs is the amount of energy absorbed by the black surface on the base and is the same as we already found. T3 is found similarly to before adding the effect of the base absorptivity:
(18) The final element in this equation is the heat loss from the base to the ambient temperature . This heat loss can be found using the overall heat transfer coefficient Ub:
(19)
D. Inside air temperature Finally, the last control volume that should be taken is the air
inside the solar still. The energy equation around this control volume becomes:
(20)
E. Distillate production and thermal efficiency
The rate of freshwater production is dependent on the evaporation rate. The higher it is the higher water production becomes. The rate of distillate production can be found by:
(21)
The thermal efficiency of the solar still represents the energy output over the energy input that obtained from the sun which:
(22)
Here, represents the total evaporative heat transfer in W/m2.
V. CONDENSER MODELING
The condenser used here is a special type of shell and tube condenser. A fan is used in order to blow air from the still into the condenser while cold seawater surrounds the outer surface of the tubes in order to cool air and bring its temperature as much as possible below the dew point, thus maximizing the quantity of distillate obtained. The following assumptions are made: - Number of tubes in the condenser is . - After several iterations, the tube diameter is found to be
1.5 inches minimizing the pressure drop. - Air temperature entering the condenser is Tai = 35 . - The relative humidity of the air entering is 75%. - Heat exchange between fluids occurs at steady state. - The condenser is insulated from the surroundings and heat
transfer is restricted between the working fluids. - Water inlet temperature of 9 and an outlet temperature
of 13 . - Dew point inlet temperature is found to be Tdpi = 29 . - Outlet temperature of air from the condenser is 18 . - Mean temperature of air: Tm,a=26 and the mean surface
temperature of water is: Tm,w =16 .
Next, the overall heat transfer coefficient is:
(23)
The inner heat transfer coefficient is obtained through the following equations:
(24)
(25)
(26) The outer heat transfer coefficient is:
( )
(27)
(28)
(29)

274
The total surface area of the condenser At is calculated using the log Mean Temperature Difference method:
(30)
Thus the length L of each tube is:
(31) Calculating the amount of water condensate : The psychometric chart is used to determine the humidity ratio wi at the inlet to the condenser: Thus The mass of dry air remaining is the same at the inlet and the outlet of the condenser.
(32)
(33)
(34)
At the outlet state: , thus
(35) The mass flow rate of liquid water at the condenser’s exit is:
(36)
VI. DESIGN AND MANUFACTURING
A. Project design
The active solar desalination still is a modified design compared to the passive solar desalination stills as shown in
Figure 2. Complete System Model
Figure 2. A mechanical opening is used to insert airflow into the still. A small quantity of the humidified air inside the still is extracted with the help of a fan and introduced into the condenser. In parallel, the mechanical gate opens in order to replace the removed air from the still. Inside the condenser, heat exchange between humid air and cold water occurs and the vapor inside the air condenses to form water droplets. As for the natural condensation process, taking place on the inner glass, the droplets are gathered in a collector at the end of the inclined glass sheet. The inclined position is fixed according to a specific latitude angle of 34 degrees. The still is surrounded with plywood cover from outside used for insulation. Steel is coated with corrosion protection paint. Styrofoam is added between the galvanized steel and the plywood cover in order to increase the insulation from outside conditions and therefore help maintain specific temperature and humidity conditions inside the still as desired. The base of the still is painted in black and a layer of black gravel (small rocks) is added to it, increasing the radiation absorption and enhancing the evaporation process. The still walls are painted with white paint to increase the reflection factor and trap the sun rays inside the still in order to increase the inside air temperature. B. Manufacturing
The manufacturing process is divided into two main parts: The construction of the Solar Still and the construction of its complementary condenser.
Starting with the solar still, its walls and base are composed of assembled Marino Plywood sheets. This material is used due to its insulating capacity however fiberglass insulation is placed from the inner side of the plywood body and is fixed to it by means of a sticky material. This fiberglass insulation reduces heat losses and takes us a step closer to the theoretical case. Next, the steel body of the still is manufactured using a highly accurate steel cutter. After that the sheets are welded carefully especially at the base sides and edges to avoid water or vapor leakage. The cover of the still is made of a Plexiglass sheet. The following step is to drill a square hole through the three layers in the back of the still to be able to place the fan in it and a small rectangular opening at the front side. The positions of the fan and the inlet air opening were chosen according to a study made for the airflow circulation as it enters the still till it exits it from the other side. The fan is placed on a higher level from that of the inlet opening since the entering cold air rises upwards once it is heated and by fulfilling that hot humid air is absorbed from the still to the condenser by the fan. The second part of the manufacturing process is the fabrication of the complementary condenser. Based on the proposed design, the condenser contains 20 tubes each having an inner diameter of 1.5 inches and a length of 1.4 meters. First, two rectangular metal plates are placed on top of each other and 20 equally spaced holes are drilled on each. The tubes are placed and welded on these two plates. Four metal sheets are then

275
Figure 3. Solar still plus Condenser Installation on SRB roof
welded on the plates from outside covering the tubes and closing on them. Four metal sheets are welded together in a pyramid shape, and then welded on the tips of the bottom plate in order to collect the water. A 90° elbow is fabricated and welded on top of the upper plate providing an air duct for the air coming from the fan. An opening serving as a gate is cut in order to be able to fill the condenser with water. The condenser is then wrapped with fiberglass insulation. Four legs are welded at its bottom as a support to place the condenser vertically. At last the condenser is covered with plywood from outside in order to insulate it from the outside temperature, restricting the heat exchange in it only.
VII. SIMULATION AND EXPERIMENTATION RESULTS
A. Distillate Production Analysis
The results in Table 1 show the production rates of a passive solar still versus those of the active solar still during the month of April. An increase in the daily water production is observed.
Table 1. Comparison between the old passive still and our active still Daily water production in Liters D1 D2 D3 D4 D5 D6 D7
Old Passive Still 0.68 0.73 0.78 0.75 0.81 0.77 0.75 New Still (no condenser) 0.9 1.0 1.4 1.2 1.5 1.2 1.2
Condenser 0.7 0.8 0.5 0.6 0.7 0.65 0.7 Total new active still 1.6 1.8 1.9 1.8 2.2 1.85 1.9
% increase in production 135 147 143 140 171 140 153
Figure 4. Temperature Variations versus Time
The increase of production between the new still (without
the condenser) and old still is due to the better insulation used for the new still, the painting used on the inner surface of the new still and the material used, which increases the inside air temperature leading to higher productivity. B. Temperature variations inside the still
The modeling of the still resulted in obtaining the variations of the glass, water and inside air temperature inside the solar still using the RK4 method as shown in Fig. 4. The experimental values of the still water temperature are measured using an NTC thermistor. It can be observed from Fig. 4 that the experimental results and the theoretical results for the still water temperature are very close, with an average error of 11.8%, which is normal due to the assumptions taken in simulations: constant water viscosity and density for example.
VIII. COST ANALYSIS
Present worth analysis is used to perform cost analysis: - Initial cost at year 0: IC = 800 + 500 + 55 + 75 = 1430$ - An interest rate of 5% is assumed MARR = 5% - Annual maintenance cost is estimated to be around 5% of
the initial cost at year 0.
Figure 5. Annual worth diagram

276
To determine the annual net profit, the annual amount of water produced should be computed:
Since the still is operated 8 hours per day for 8 months from April to November:
In Lebanon, bottled water companies sell water for an average price of 4$ for each 18 liters of water. The annual profit from water production is:
The financial analysis is performed over the 20 years following the investment. The obtained result is:
( ) ( )
To obtain the breakeven point we set PW = 0
( ) ( )
n = 5.577 years
The cost will be recovered after 5.577 years.
IX. CONCLUSION
The aim of our project is to demonstrate that solar desalination is able to resolve the water shortage the world is facing today. Producing water by saving energy, the environment and money is made possible by the active solar desalination stills. The added condenser takes the vapor that did not reach the glass in the still and transforms it back into liquid water. The simulation and experimentation results verify the success of this project and its ability to produce more potable water than the passive still. The condenser is expected to produce more water, but as a first run it was manually operated while its circuitry is being installed and tested. Once automated, the fan will start to turn on and off based on a timer, thus its productivity will increase. The cost analysis shows that only in 5 to 6 years the still cost will be recovered. Burning fossil fuels that are found after digging tens and hundreds of meters in the earth’s crust, in order to produce potable water is no longer needed, since the sun is in front of us and its energy can be used by anyone. The seawater after evaporation will leave the minerals that are solved in it, which can be used as sub products, adding value to this project.
X. ACKNOWLEDGMENT
We would like to thank the department of Mechanical Engineering and the ACWA for helping us realize this project by financing us with the needed budget to purchase the material used for its manufacturing. Also we thank Prof. M. Al Hindi and Prof. K. AbuGhali for their support, directions and
guidance throughout the project. We appreciate the efforts of Dr. L. Semerjian for laboratory assistance, the ME shops staff and every person that contributed in the achievement of this project.
XI. NOMENCLATURE
Notations Notations
A Area (m2) Dynamic viscosity (N s/m2)
Diffusion Diffusion coefficient of water in air (m2/s) Stefan–Boltzmann constant
(W/m2 K4)
dh Hydraulic diameter (m) Emissivity (diffuse coefficient)
h Convective heat transfer coefficient (W/m2.C) Efficiency
Hs Solar radiation absorbed by the
system (W/m2) Absorption coefficient
K Thermal conductivity (W/m .C) Expansion coefficient (◦C-1)
Latent heat of evaporation (KJ/Kg) Subscripts
m Mass (kg) a Ambient air
Production mass flow rate (kg/m2 s) b Base
C Constant coefficient (kg .C/ms2) c Free convection
Ps Saturated vapor pressure (Pa) cf Forced convection
Density (kg/m3) evp Evaporation
Heat flux (W/m2) g Glass
R Reflection coefficient m Inside air
Q Volumetric flow rate r Radiation
w Humidity ratio w Water
Pv Vapor Pressure da Dry air
Ntube Number of condenser tubes l liquid
T Temperature (◦C) t total
U Overall heat transfer coefficient (W/m2 ◦C) i inner
L length o outer
D Diameter dp dew point
Pg Saturation Pressure Vapor water
XII. REFRENCES [1] Kumar,K,V.&Bai,R,K.(2008).Performance study on solar stills with
enhanced condensation. Department of Bio-energy, School of Energy,Enviroment and Natural Resources, Madurai Kamaraj University, Madurai 625 021, Tamil Nadu, India. Desalination Vol. 230 (2008) 51–61.
[2] Kabeel, A, E & El-Argouz, S, A. (2011). Review of researches and developments on sola stills. Mechanical Power Engineering Department, Faculty of Engineering, Tanta University, Egypt. Desalination Vol. 276 (2011) 1-12.
[3] El-Bahi, A & Inan,D.(1998).Analysis of a parallel double glass solar still with separate condenser. Physics Engineering Departement, Hacettepe University, Beytepe, 06532 Ankara, Turkey. Renewable Energy 17 (1999) 509-521.
[4] Arab Water Council and CEDARE. (2004)."State of the Water Report in the Arab Region".
[5] O.Mahian and A. Kianifar, “Proceedings of the Institution of Mechanical Engineers”, Part C: Journal of Mechanical Engineering Science (May 2011) vol. 225 no. 5, 1203-1212

277
Active Solar Still Connected to an Evacuated-Tube-Type Solar Collector
Alloush, Mhamad Mahdi – Assaad, Ahmad – Atallah, Lama – Bahja, Hasan – Mouhanna, Hiba
Mechanical Engineering Department American University of Beirut
P.O.Box 11-0236/ME – Riad El-Solh, Beirut 11072020, Lebanon [email protected], [email protected], [email protected], [email protected], [email protected]
Abstract-Drinking water in Lebanon has been long suffering from impurity. In fact, as Beirut is a coastal city, it is importantly possible to make use of sea water in order to extract some sort of pure and healthy drinking water.
One of the exploited desalination methods is based on using solar energy to evaporate brackish water followed by a consecutive condensation of the generated humid vapor, mostly at ambient pressure. The productivity of the solar still is determined by the temperature of water in the basin and the glass temperature.
In this project, adjustments and additions to the trivial desalination method were made for the sake of enhancing productivity. Hence, we added to the conventional solar still, a second heating stage: “Heat Pipe Vacuum Tubes Solar Collector”. The still is also coupled to a pump in order to circulate the water from the solar collector back into the basin. The challenge of this implementation is to collect more distilled water by raising the temperature of water in the basin hence improving the evaporation rate. Five-centimeter-water-depth is maintained continuously at zero temperature gradient inside the still. Water is preheated in the solar collector and pumped back into the still. The still acts as condensing unit during night time. The purified water vapor runs through the lower side of the still and then gets collected in a tank. The production rate and daily efficiency will be calculated for both day and night effect. Theoretical analysis will be performed and will be compared to our experimental values.
The production from the still exceeded that of a conventional passive still. The tests conducted on April 2, on the fully automated still showed an amount of 2.5 Kg of desalinated water whereas the theoretical value computed was 3 Kg. The difference is related to the unexpected weather conditions and to the physical phenomenon in which droplets were stuck to the glass without sliding down to the lower edge.
I. INTRODUCTION
“In an age when man has forgotten his origins and is blind even to his most essential needs for survival, water along with
other resources has become the victim of his indifference” Rachel Louise Carson (1907 – 1964) [1]
For about a century, distillation methods have been installed
in remote regions and islands as well as on ships to supply water for the crew and the inhabitants. As more cost effective and efficient technologies have been introduced to the field of distillation, the cost of such industry have been decreasing due
to increasing demands particularly after World War II [1]. Distillation is therefore one of the processes used for water purification by means of heat energy provided by sunlight or other sources of energy.
Although, solar desalination stills need more area for setup, its cost consists mainly of its equipment given that sunlight requires zero fuel cost. In fact, it is still considered to be an efficient process to produce pure water through slow distillation. This purity is reached through evaporation of the water from the basin purifying it from all contaminants. Due to the high solar radiation intensity in the Arab World the use of solar stills seems to be increasingly active in this region [2]. This does not mean that desalination stills, and renewable energy plants in general, are popular and numerous in our region. But it is a promising technique for future technologies interesting more investors and researchers.
However, Multi-Stage Flash Distillation (MSF), Multi-Effect Distillation and Reverse Osmosis are considered the most used method of desalination. MSF plants produce 85% of all the desalinated water produced in the world [3].
Our project will consist on enhancing the behavior and productivity of the active desalination still through studied material selection and through coupling the still to an evacuated tubes solar collector under Lebanese climatic conditions.
II. TECHNICAL AND NON-TECHNICAL CONSTRAINTS
A. Technical Constraints The length of the pipe transporting water has to be specified
in order to minimize the pressure drop. Moreover, the quality of the water should follow the World Health Organization standards to be consumed for domestic and especially potable usage.
B. Non-Technical Constraints One important non-technical constraint is the solar radiation
intensity, i.e. the weather. This parameter is of course out of control; the data concerning the radiation intensity is a given set of numbers. Another one is time. Time is extremely important that the project is to operate mainly during day hours so we’re restricted to certain number of hours. Also, space restrictions affect the general form of the project.

278
III. PHYSICAL MODEL DESCRIPTION
A. Description of the Design Fig. 1 illustrates a drawing of the modified desalination still
described as an active single-sloped solar still of the following basic components:
- A basin filled with seawater - A single-sloped still cover - A glass stopper - An evacuated-tube-type solar collector - A pump - Pipes to carry water from the basin into the solar
collector and from the latter back to the basin - Sealant at the boundaries between pipes and basin - Insulation of the basin - Sensors to measure temperature
The actual display of the still, after the construction and
assembly phase, is shown below in fig. 2. Note that, we chose the heat pipe vacuum tubes instead of
flat-plate solar collector because it is cheaper and more efficient: in fact, the number of tubes in the solar collector used is five, capable to raise the temperature of 100 liters by 15oC in one hour.
Figure 1. AUTOCAD drawing of the still
Figure 2. Setup of the active solar desalination
B. Description of the Process The process behind the concept of desalination solar still is
that incident short-wave solar radiations will pass through the transparent cover glass into the still providing heat. Consequently, the water temperature increases leading to evaporation at the saturated conditions. When the water vapor rises and touches the inner surface of the cover still, it condenses into pure water. The condensation is explained by the difference in temperature between the water vapor and the inner surface that is relatively cooler. After that, the condensed water on the inner surface will slide down along the cover bottom surface due to gravity and be collected using a glass stopper.
However, this process is too slow if we rely on a passive solar still. Accordingly, in order to enhance the evaporation process, the desalination still is coupled to a second source of heat. Seawater is carried from the basin to the heat pipe vacuum tubes solar collector to be preheated before it is pumped back to the basin. Having more heat, the temperature will rise faster; hence increasing the evaporation rate.
The challenge is to control the difference in temperature inside the basin: in fact, if the amount of heat becomes higher than an optimum value, the vapor would not ‘have time’ to condense. This matter will be discussed later.
C. Material Description and Dimensions The detailed description of the still is elaborated on the basis
of the major components and aspects of the setup. Basin
- Length: 1 m, Width: 1.2 m, Height (w.r.t. lower edge): 0.30 m, Height (w.r.t. higher edge): 0.95 m, Basin Area: 1.2 m2, Approximate Thickness: 0.002 m
- Internal walls: Reflective carbon steel surface (anti corrosive, low density for relatively lightweight)
- Black paint: the bottom of the basin is painted in black to ensure high absorptivity
Still Cover
- Plexiglas transparent glazing cover of high transmissivity allowing radiation to penetrate and of low reflectivity and absorptivity allowing all the radiations to penetrate the still and be kept inside
- Area: 1.32 m2, Mass: 9.3456 Kg - Single-slope stills because it presents lower convection
and radiation losses and provides better performance in relatively cold climate conditions
- Angle of Incidence and Direction: Taking into consideration the location – (Beirut, Lebanon lat. 33o 53’ North & long. 35o 29’ East), we shall note that sunrise direction is always East-southeast and sunset direction is West-southwest. Therefore the optimum angle of incidence is found to be equal to 33o and the direction is to the South.
- External walls the body of the still shall be “boxed” in Marine Plywood (water resistant, pliable, impact resistant

279
because of its high hardness and density, smooth surface finish)
Pump
- Mini-pump (330 W, 220 V, Head: 1 m) Insulation
- Fiberglass used as thermal insulator to prevent heat losses (from the inside of the still to the surrounding)
Sealant
- Rubber Film: Silicon used to avoid air leakage and water leakage at the membrane of the still
Pipes
- Material: Aluminum insulated by foam glass - Diameter: 1/2" diameter
Sensors and Microcontrollers
- Sensors: to measure temperature (inside basin, pipes etc.) - Microcontrollers: to control the electricity feeding the
pump thus manipulating the mass flow rate of the circulating water inside the pipes
IV. MODELING OF THE SYSTEM
To pursue the thermal and mathematical modeling, we shall assume the following: * No vapor leakage from still and no water leakage from pipes * Temperature gradient in the glass cover and in the seawater is negligible * The thermal collector is disconnected from the still at night * One dimensional heat transfer
A. Steady State Modeling Water
The basin energy output is radiation, convection and evaporation directed to the glass, and conduction through the still walls. However, there is also the mass flow in/out the basin.
(1)
With
Glass
The energy is received from solar irradiation and by convection and evaporation of water. The glass sheds its energy to the surroundings through convection and radiation.
(2) The convective heat transfer coefficient is given by the expression:
(3)
The partial pressures of the vapor at the glass temperature and the water temperature are respectively:
(4)
(5)
The radiative heat transfer coefficients are: (6)
And (7)
The evaporative heat transfer coefficient is:
(8) Solar Collector
The energy is received by solar irradiation. The overall modeling of the solar collector will be assumed steady; no water is accumulating in the collector.
(9)
B. Transient State Modeling Water
(10) Glass
(11)
Solar Collector
(12)
V. SIMULATION
At the level of theoretical studies, it is convenient to choose a typical day. Fig. 3 to 6 show the cumulative distillate and temperatures of basin water and glass on April 2 after considering steady state and then transient state conditions.
In addition, for small flow rates, the rate of energy input to the system does not change significantly; this is due to the fact that the copper condenser has a very high temperature inducing sufficient heat to water at any flow rate. In our case, the mass flow rate that we will set is 0.5 LPM.

280
TABLE I VALUES OF PROPERTIES USED
Glass Tube Vacuum Tube Solar Collector
Nb. of Tubes = 5
In MATLAB, the equations generated above are imported
and simulated. The testing time span of the system takes place from 8:00 a.m. to 6:00 p.m.
A. Steady State Simulation Re-arranging equations (1) and (2) into matrix forms, we get:
Water
(13) Glass
(14)
Figure 2. Steady State Cumulative Distillate (Kg)
as a function of the time (hours) on the 2nd of April
Figure 3. Steady State Temperature (oC) as a function of
the time (hours) on the 2nd of April
B. Transient State Simulation The results of steady state analysis show that steady state
assumption is a quite exaggeration; the output of the steady-assumed system per day (April 2) is 10 Kg. It seems that this assumption neglects the transient effects of the system which, expectedly, cuts down the output significantly. It is reasonable, thus, to simulate a transient state model of the system in order to improve the accuracy of the theoretical output. Here, we will apply the explicit Euler’s method: Water
(15)
Re-arranging:
(16)
Glass
(17)
Re-arranging:
(18)
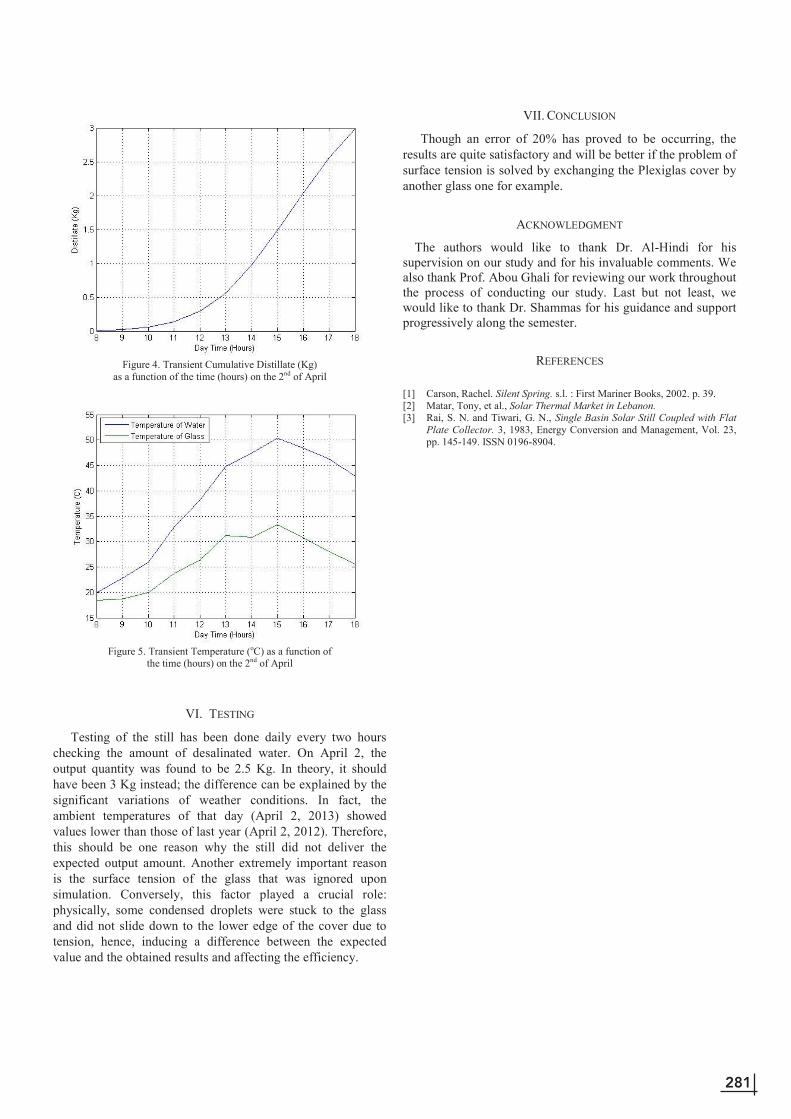
281
TABLE I VALUES OF PROPERTIES USED
Glass Tube Vacuum Tube Solar Collector
Nb. of Tubes = 5
In MATLAB, the equations generated above are imported
and simulated. The testing time span of the system takes place from 8:00 a.m. to 6:00 p.m.
A. Steady State Simulation Re-arranging equations (1) and (2) into matrix forms, we get:
Water
(13) Glass
(14)
Figure 2. Steady State Cumulative Distillate (Kg)
as a function of the time (hours) on the 2nd of April
Figure 3. Steady State Temperature (oC) as a function of
the time (hours) on the 2nd of April
B. Transient State Simulation The results of steady state analysis show that steady state
assumption is a quite exaggeration; the output of the steady-assumed system per day (April 2) is 10 Kg. It seems that this assumption neglects the transient effects of the system which, expectedly, cuts down the output significantly. It is reasonable, thus, to simulate a transient state model of the system in order to improve the accuracy of the theoretical output. Here, we will apply the explicit Euler’s method: Water
(15)
Re-arranging:
(16)
Glass
(17)
Re-arranging:
(18)
Figure 4. Transient Cumulative Distillate (Kg)
as a function of the time (hours) on the 2nd of April
Figure 5. Transient Temperature (oC) as a function of
the time (hours) on the 2nd of April
VI. TESTING
Testing of the still has been done daily every two hours checking the amount of desalinated water. On April 2, the output quantity was found to be 2.5 Kg. In theory, it should have been 3 Kg instead; the difference can be explained by the significant variations of weather conditions. In fact, the ambient temperatures of that day (April 2, 2013) showed values lower than those of last year (April 2, 2012). Therefore, this should be one reason why the still did not deliver the expected output amount. Another extremely important reason is the surface tension of the glass that was ignored upon simulation. Conversely, this factor played a crucial role: physically, some condensed droplets were stuck to the glass and did not slide down to the lower edge of the cover due to tension, hence, inducing a difference between the expected value and the obtained results and affecting the efficiency.
VII. CONCLUSION
Though an error of 20% has proved to be occurring, the results are quite satisfactory and will be better if the problem of surface tension is solved by exchanging the Plexiglas cover by another glass one for example.
ACKNOWLEDGMENT
The authors would like to thank Dr. Al-Hindi for his supervision on our study and for his invaluable comments. We also thank Prof. Abou Ghali for reviewing our work throughout the process of conducting our study. Last but not least, we would like to thank Dr. Shammas for his guidance and support progressively along the semester.
REFERENCES [1] Carson, Rachel. Silent Spring. s.l. : First Mariner Books, 2002. p. 39. [2] Matar, Tony, et al., Solar Thermal Market in Lebanon. [3] Rai, S. N. and Tiwari, G. N., Single Basin Solar Still Coupled with Flat
Plate Collector. 3, 1983, Energy Conversion and Management, Vol. 23, pp. 145-149. ISSN 0196-8904.

282
Design of an Integrated Gasification Combined Cycle Plant in Lebanon
Fatima Mansour, Said Rahal, Evita Moawad, Rana Halaby, Hani Zayat
Department of Mechanical Engineering-Chemical Engineering Program American University of Beirut
Beirut, Lebanon [email protected], [email protected], [email protected], [email protected], [email protected]
Abstract-Depleting fuel resources, particularly those of natural gas, increase the need for alternative energy sources that can generate electricity. In particular, Lebanon suffers from a severe power deficit that arises from the outdated plant processes, inefficient operation, and wrong fuel usage in existing plants. This paper addresses these problems by presenting the design of a plant that utilizes coal, an inexpensive energy source, as potential feedstock for the generation of electricity and the production of methanol. The plant uses a clean coal conversion process that minimizes environmental impact, the integrated gasification combined cycle (IGCC), to convert coal into an intermediate synthetic gas, which is, in turn, used to simultaneously generate electric power and synthesize methanol. The designed IGCC plant is simulated on the ASPEN-PLUS software with an electricity production requirement of 1000 MW and a methanol purity of 97.8%. An economic analysis estimates the annual return on investment of the plant to be 20.1% with a payback period of 3.57 years. The plant’s generation of electric power will contribute to meeting the Lebanese market electricity needs, while the coproduction and sale of methanol allows for additional revenue generation, the development of the Lebanese industrial sector, and the strengthening of the local market.
I. INTRODUCTION
The shortage of power in Lebanon renders power outage a normal part of the daily lives of its citizens, and necessitates their satisfying their electrical needs via self-generation, which accounts for 30%, if not more, of the electricity consumed by a Lebanese household [1]. The emissions released by the diesel engines used for self-generation are toxic and carcinogenic environmental pollutants. Exposure to these harmful substances, especially in densely populated areas, is associated with numerous diseases and disorders, thus transforming the deficient power supply into a potential health hazard [2].
Currently, power generation in Lebanon takes place in twelve, thermal and hydraulic, plants. The thermal plants possess an installed production capacity of 2038 MW but operating plants produce only 1685 MW, whereas the hydraulic plants have a capacity of 273.6 MW [1]. The electricity deficiency is due to significant drops in the thermal efficiency of the plants which are either worn out, improperly design, or not fueled properly; low thermal efficiency, in turn, increases production costs. The design of four plants entails that the production fuel be natural gas which is not widely available in Lebanon; instead, the plants run on expensive oil which increases costs and lowers efficiency. Two existing plants operate based an open cycle gas turbine system instead
of a combined cycle gas turbine system; such misplaced investment opportunities and improper design choices result in plant losses instead of revenue. Furthermore, two other plants have experienced a major decrease in production efficiency due to aging, which makes their maintenance expensive and increases technical costs [1].
As of this year, Lebanon is estimated to experience a 47% (1330 MW) deficit, where the demand is 2835 MW compared to a supply of 1505 MW; this results in the absence of electricity for 11.3 hours per day. By the year of 2016, the deficit is expected to increase to 58% (1909 MW) due to increased demand (3280 MW) and decreased supply (1375 MW), corresponding to a loss of electricity for 14 hours per day [1]. Having described the current Lebanese situation, the need for an efficiently operating plant that helps fulfill the population demands is apparent, particularly one that runs on low cost feedstock such as coal.
In addition to electricity, the plant will produce methanol. Aside from its common use as a chemical solvent, it is a basic feedstock used to manufacture numerous chemicals including formaldehyde and acetic acid which find uses in numerous product applications (paints, plastics, and explosives). Methanol can easily undergo further processing to produce dimethyl ether, olefins, and gasoline. Furthermore, a combination of increasing pollution levels, escalating demands for energy, and deficient supplies, renders methanol a potentially suitable alternative fuel source [3].
The IGCC plant coupled with the appropriate environmental technologies and with a production rate of 1000 MW, will contribute to bridging the gap between the demand for electricity and its supply without inducing detrimental consequences on the environment and public health.
. II. METHODS: PROCESSES SELECTED
The production of electricity and methanol in the IGCC plant consists of three production stages, illustrated in Figure 1; the first consists of the conversion of coal to a synthetic gas (syngas) that is rich in carbon monoxide (CO) and hydrogen (H2). The syngas undergoes combustion in the second production stage to generate electric power, and further processing in the third stage to synthesize methanol.

283
Design of an Integrated Gasification Combined Cycle Plant in Lebanon
Fatima Mansour, Said Rahal, Evita Moawad, Rana Halaby, Hani Zayat
Department of Mechanical Engineering-Chemical Engineering Program American University of Beirut
Beirut, Lebanon [email protected], [email protected], [email protected], [email protected], [email protected]
Abstract-Depleting fuel resources, particularly those of natural gas, increase the need for alternative energy sources that can generate electricity. In particular, Lebanon suffers from a severe power deficit that arises from the outdated plant processes, inefficient operation, and wrong fuel usage in existing plants. This paper addresses these problems by presenting the design of a plant that utilizes coal, an inexpensive energy source, as potential feedstock for the generation of electricity and the production of methanol. The plant uses a clean coal conversion process that minimizes environmental impact, the integrated gasification combined cycle (IGCC), to convert coal into an intermediate synthetic gas, which is, in turn, used to simultaneously generate electric power and synthesize methanol. The designed IGCC plant is simulated on the ASPEN-PLUS software with an electricity production requirement of 1000 MW and a methanol purity of 97.8%. An economic analysis estimates the annual return on investment of the plant to be 20.1% with a payback period of 3.57 years. The plant’s generation of electric power will contribute to meeting the Lebanese market electricity needs, while the coproduction and sale of methanol allows for additional revenue generation, the development of the Lebanese industrial sector, and the strengthening of the local market.
I. INTRODUCTION
The shortage of power in Lebanon renders power outage a normal part of the daily lives of its citizens, and necessitates their satisfying their electrical needs via self-generation, which accounts for 30%, if not more, of the electricity consumed by a Lebanese household [1]. The emissions released by the diesel engines used for self-generation are toxic and carcinogenic environmental pollutants. Exposure to these harmful substances, especially in densely populated areas, is associated with numerous diseases and disorders, thus transforming the deficient power supply into a potential health hazard [2].
Currently, power generation in Lebanon takes place in twelve, thermal and hydraulic, plants. The thermal plants possess an installed production capacity of 2038 MW but operating plants produce only 1685 MW, whereas the hydraulic plants have a capacity of 273.6 MW [1]. The electricity deficiency is due to significant drops in the thermal efficiency of the plants which are either worn out, improperly design, or not fueled properly; low thermal efficiency, in turn, increases production costs. The design of four plants entails that the production fuel be natural gas which is not widely available in Lebanon; instead, the plants run on expensive oil which increases costs and lowers efficiency. Two existing plants operate based an open cycle gas turbine system instead
of a combined cycle gas turbine system; such misplaced investment opportunities and improper design choices result in plant losses instead of revenue. Furthermore, two other plants have experienced a major decrease in production efficiency due to aging, which makes their maintenance expensive and increases technical costs [1].
As of this year, Lebanon is estimated to experience a 47% (1330 MW) deficit, where the demand is 2835 MW compared to a supply of 1505 MW; this results in the absence of electricity for 11.3 hours per day. By the year of 2016, the deficit is expected to increase to 58% (1909 MW) due to increased demand (3280 MW) and decreased supply (1375 MW), corresponding to a loss of electricity for 14 hours per day [1]. Having described the current Lebanese situation, the need for an efficiently operating plant that helps fulfill the population demands is apparent, particularly one that runs on low cost feedstock such as coal.
In addition to electricity, the plant will produce methanol. Aside from its common use as a chemical solvent, it is a basic feedstock used to manufacture numerous chemicals including formaldehyde and acetic acid which find uses in numerous product applications (paints, plastics, and explosives). Methanol can easily undergo further processing to produce dimethyl ether, olefins, and gasoline. Furthermore, a combination of increasing pollution levels, escalating demands for energy, and deficient supplies, renders methanol a potentially suitable alternative fuel source [3].
The IGCC plant coupled with the appropriate environmental technologies and with a production rate of 1000 MW, will contribute to bridging the gap between the demand for electricity and its supply without inducing detrimental consequences on the environment and public health.
. II. METHODS: PROCESSES SELECTED
The production of electricity and methanol in the IGCC plant consists of three production stages, illustrated in Figure 1; the first consists of the conversion of coal to a synthetic gas (syngas) that is rich in carbon monoxide (CO) and hydrogen (H2). The syngas undergoes combustion in the second production stage to generate electric power, and further processing in the third stage to synthesize methanol.
Figure 1: Plant Production Stages
The parallel integration of the second and third stages allows for the easy control of syngas distribution between them. Consequently, during peaks of power consumption, all the syngas can be used for power production, while at times of low power demand, the extraneous amounts of syngas are converted to methanol. This maximizes the use of the syngas produced, while accommodating the consumer demand for electricity [4].
The following is a discussion of the processes selected for the different plant operations; the two main considerations are environmental impact and associated costs.
A. First Production Stage: Coal Conversion Approximately 90% of the electricity produced from coal
comes from pulverized coal fired power plants [5]. However, this process, although relatively simple, results in relatively low conversion efficiency and high levels of carbon dioxide (CO2) emissions, making it an unfavorable coal conversion process in term of environmental considerations [6].
Of the four major clean coal conversion technologies (Fluidized Bed Combustion, Integrated Gasification Combined Cycle, Integrated Gasification Fuel Cells, and Magneto-Hydrodynamic Power), the IGCC technology is found to be most favorable as it possesses the capability of easily supporting environmental protection and allows for coproduction (of a chemical product with electric power) [6]. Gasification is flexible in that it has the potential and capacity to incorporate different inexpensive feeds (including renewable material and waste products) to manufacture an array of products (such as fertilizers, chemical products, and hydrocarbon fuel) [5]. The process allows for the use of low-cost feedstock (which reduce operating cost), such as coal, in the production of high-value products.
The central process that the IGCC plant depends on is coal gasification. Based on the results of a detailed comparison of the available gasifier types, the fixed bed side-draft gasifier is selected for the process because it allows for the use of coal at purchasing conditions, produces syngas at low temperatures (which minimizes the quenching/cooling processes and decreases cost), possesses high energy economy (low oxygen/steam to coal ratios), and results in high cold gas efficiency (ratio of heat value in cooled syngas to that in coal). The syngas produced in the gasifier has a large heating value conferring an advantage over the other types of gasifiers, which produce syngas of low heating value. Moreover, the
carbon conversion and the scale–up potential of this gasifier are superior to the others [7].
Analysis of the four coal types (anthracite, sub-bituminous, bituminous, and lignite) mark sub-bituminous coal to be most fitting feedstock as it possesses high reactivity, a moisture content suitable for the fixed bed gasifier (less than 15%), and low caking potential; furthermore, it maintains a balance between its heating value and relative cost, making it a favorable compromise [8].
B. Environmental Technologies After the production of syngas, it passes through a clean-up
unit that ensures all the pollutant emission requirements of the United States Environmental Protection Agency (USEPA) are met. The main pollutants resulting from the gasification process are: carbonyl sulfide (COS), acid gases (hydrogen disulfide, H2S, and CO2), nitrogen oxides (NOx), and sulfur oxides (SOx). The most suitable removal process for the each pollutant is selected as follows.
The most common procedure for COS removal is hydrolysis, which will be used in the IGCC plant.
There are three major acid gas removal (AGR) systems: Selexol and Rectisol (both of which are methods of physical absorption) and amine absorption (chemical). The more moderate operating conditions and lower capital cost of the amine chemical absorption make it the more favorable AGR technique. The amine solvent selected for the process is the tertiary methyl diethanolamine (MDEA), which allows for a two-step removal process, first of H2S and then CO2; this solvent possesses the largest absorption capacity, thus requiring lower regeneration energy and resulting in lower corrosion rates [9].
The process selected for the removal of NOx is the selective catalytic reduction (SCR) method. Although the selective non-catalytic reduction (SNCR) requires less capital cost, it requires higher temperature conditions (higher energy demands), skillful operation, and results in lower conversion (30-60%). Meanwhile, SCR, with the trade-off of a higher capital cost, can achieve conversions greater than 90% [10].
Desulfurization, the removal of SOx, can be of two types: wet and dry. The former is more favorable as it produces a marketable by-product at no greater capital investment, in addition to its using a less expensive reagent (limestone) as opposed to the more expensive hydrated quicklime needed for dry desulfurization. Furthermore, wet flue gas desulfurization can withstand a large amount of syngas and results in greater removal efficiency while utilizing a lower amount of reagent [11].
C. Third Production Stage: Methanol Production In the third production stage, methanol synthesis consists of
the catalytic hydrogenation of the CO and CO2 in syngas. The Cu/ZnO/Al2O3 catalyst is selected as it is characterized
by high activity which allows for the reduction of the reactor pressure range to 49.3-98.7 atm and temperatures to 473-523 K. The improved operating conditions enhance reaction

284
equilibrium, reduce sintering opportunities, and lower cost expenses [12]. These conditions reduce the required compression and heat exchange duty. The lower process temperature suppresses the production of the other light hydrocarbons, thus improving selectivity, reducing syngas consumption, and conserving 5-10% of the required heat duty by preventing the heat release brought upon by these side reactions [13].
There a number of disagreements regarding the kinetics of methanol synthesis; for the purposes of this project, the rate expressions developed by Graaf et al are used. The model is developed over a Cu/ZnO/Al2O3 catalyst and encompasses the typical operating conditions of 523 K and 51 atm [12]. Furthermore, it includes both possible carbon sources, CO and CO2, thus accounting for all possible methanol production.
IV. PLANT LOCATION
To select a suitable region for the plant site, a number of factors are considered, most importantly: climate, transport facilities, availability of land, political considerations, and local community impact. Considering the South as a potential location raises problematic issues in terms of political considerations; moreover, the South has a hilly topography which would require too much preparation as compared to the flatter regions in the North. Beirut, in addition to lacking space (available land), is too heavily populated for the construction of such a plant [14].
The climate conditions in the North are more suitable than other areas as it falls in with the direction of the wind current movement. Proximity to the Syrian borders in the North facilitates exporting the products by land. In addition, waterway transport is possible due to the presence of the Tripoli port, which is being expanded. The area near Tripoli also holds an old refinery that is currently being revamped; even if the refinery is not fully operating, it can be used for the storage of products manufactured by the IGCC plant. Furthermore, lands towards the North are cheaper than other regions, as are the costs of services and labor [14].
The overall assessment thus renders the Northern region of Lebanon as a fitting location for the plant site; in particular, the ElMinaouiyat area (located next to a port and near a wastewater treatment plant) seems to be a potentially suitable area.
V. RESULTS: SIMULATION
A. First Production Stage: Coal Conversion The gasification of coal consists of 4 processes: drying (T <
373 K), devolatilization (T < 673 K), decomposition (T < 873 K) and oxidation [15]. The first three processes are instantaneous, and are modeled on ASPEN PLUS using stoichiometric and yield reactors. Oxidation takes place in a non-ideal tubular reactor, which is modeled as a series of 4 identical continuous stirred tank reactors (CSTRs); the volume of each is equal to 40 m3. The mass flow rate of coal, oxygen and steam are 460 tons/hr, 40 tons/hr, 130 tons/hr respectively. Figure 2 provides a schematic of the process.
Figure 2: Gasification Process Units
In the gasfier, the pressure (20 atm) and the temperature (1073 K) are set to increase the amount of H2 and CO produced with respect to that of methane (CH4); a 99.79% carbon conversion is achieved. The syngas is then quenched to remove tar, a collection of heavy organic compounds, and sent to a reactor system where the water gas shift (WGS) reaction and COS hydrolysis (a clean-up process) take place.
The water gas shift (WGS) reactor, modeled as a CSTR, is designed to achieve the optimal H2/CO molar ratio for methanol synthesis, 2. The reactor operating parameters, achieving a conversion of 93.32%, are: a pressure of 10 atm, a temperature of 608 K, and a volume of 10 m3. After these reactions take place, the syngas undergoes cooling before moving on to the remaining clean-up operations. The major reactions that occur in these processes are listed in Table 1; the z coefficient in the gasification reaction refers the concentration ratio of CO to CO2 in the syngas.
B. Environmental Technologies Because COS cannot be absorbed as it is in the AGR unit,
the first step in the gas cleaning process consists of its hydrolysis into H2S and CO2 (located in Figure 2). The process takes place in a fixed bed catalytic reactor (alumina catalyst), modeled as a plug flow reactor (PFR) on ASPEN PLUS at the operating conditions of 593 K and 2.5 atm; a conversion of 99% is achieved.
The product stream (consisting of H2S and CO2) then moves to two subsequent AGR units; the first is for the removal of H2S and the second for the removal of CO2. Figure 3, showing the syngas cleanup units, contains one AGR unit system for the purposes of simplicity. Both units resemble one other in terms of equipment and operating conditions.
Table 1: Gasification & Clean-up Process Reactions Gasification Combustion
Steam Gasification Bouduard Reaction Methanation N2 Oxidation Sulfur Oxidation Water Gas Shift Environmental Technologies COS Hydrolysis AGR
SCR
1 The z value is defined as:
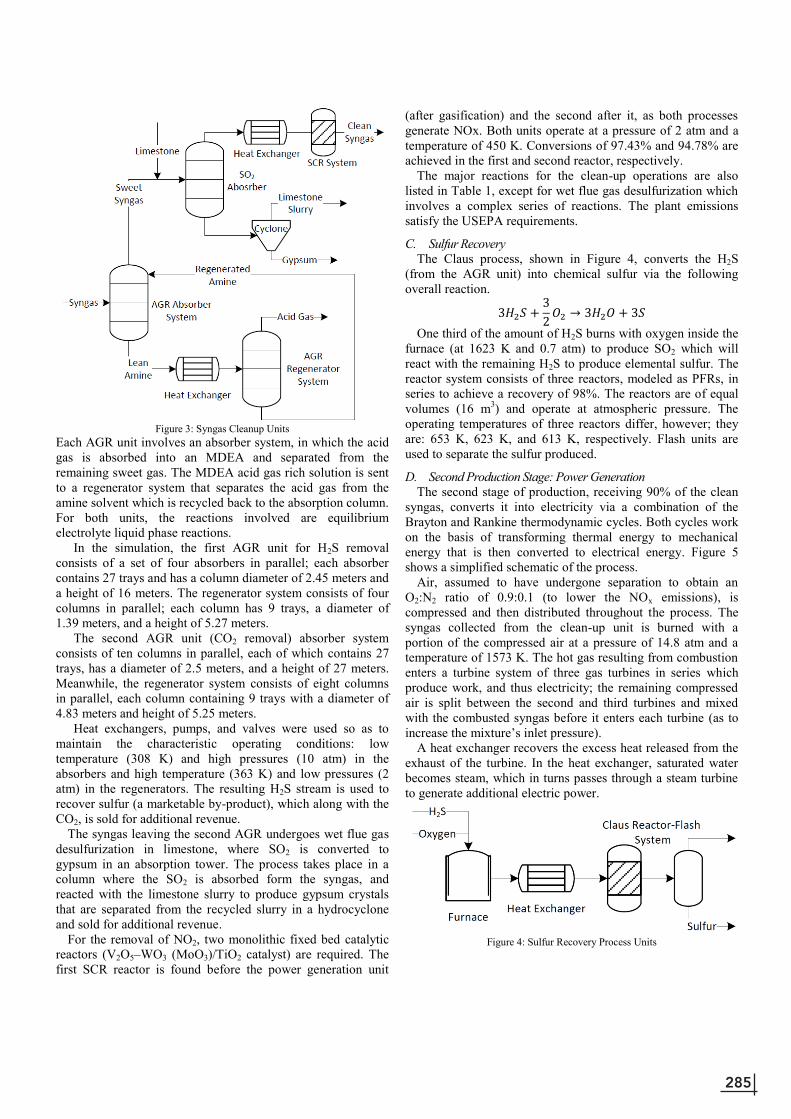
285
Figure 3: Syngas Cleanup Units
Each AGR unit involves an absorber system, in which the acid gas is absorbed into an MDEA and separated from the remaining sweet gas. The MDEA acid gas rich solution is sent to a regenerator system that separates the acid gas from the amine solvent which is recycled back to the absorption column. For both units, the reactions involved are equilibrium electrolyte liquid phase reactions.
In the simulation, the first AGR unit for H2S removal consists of a set of four absorbers in parallel; each absorber contains 27 trays and has a column diameter of 2.45 meters and a height of 16 meters. The regenerator system consists of four columns in parallel; each column has 9 trays, a diameter of 1.39 meters, and a height of 5.27 meters.
The second AGR unit (CO2 removal) absorber system consists of ten columns in parallel, each of which contains 27 trays, has a diameter of 2.5 meters, and a height of 27 meters. Meanwhile, the regenerator system consists of eight columns in parallel, each column containing 9 trays with a diameter of 4.83 meters and height of 5.25 meters.
Heat exchangers, pumps, and valves were used so as to maintain the characteristic operating conditions: low temperature (308 K) and high pressures (10 atm) in the absorbers and high temperature (363 K) and low pressures (2 atm) in the regenerators. The resulting H2S stream is used to recover sulfur (a marketable by-product), which along with the CO2, is sold for additional revenue.
The syngas leaving the second AGR undergoes wet flue gas desulfurization in limestone, where SO2 is converted to gypsum in an absorption tower. The process takes place in a column where the SO2 is absorbed form the syngas, and reacted with the limestone slurry to produce gypsum crystals that are separated from the recycled slurry in a hydrocyclone and sold for additional revenue.
For the removal of NO2, two monolithic fixed bed catalytic reactors (V2O5–WO3 (MoO3)/TiO2 catalyst) are required. The first SCR reactor is found before the power generation unit
(after gasification) and the second after it, as both processes generate NOx. Both units operate at a pressure of 2 atm and a temperature of 450 K. Conversions of 97.43% and 94.78% are achieved in the first and second reactor, respectively.
The major reactions for the clean-up operations are also listed in Table 1, except for wet flue gas desulfurization which involves a complex series of reactions. The plant emissions satisfy the USEPA requirements.
C. Sulfur Recovery The Claus process, shown in Figure 4, converts the H2S
(from the AGR unit) into chemical sulfur via the following overall reaction.
One third of the amount of H2S burns with oxygen inside the furnace (at 1623 K and 0.7 atm) to produce SO2 which will react with the remaining H2S to produce elemental sulfur. The reactor system consists of three reactors, modeled as PFRs, in series to achieve a recovery of 98%. The reactors are of equal volumes (16 m3) and operate at atmospheric pressure. The operating temperatures of three reactors differ, however; they are: 653 K, 623 K, and 613 K, respectively. Flash units are used to separate the sulfur produced.
D. Second Production Stage: Power Generation The second stage of production, receiving 90% of the clean
syngas, converts it into electricity via a combination of the Brayton and Rankine thermodynamic cycles. Both cycles work on the basis of transforming thermal energy to mechanical energy that is then converted to electrical energy. Figure 5 shows a simplified schematic of the process.
Air, assumed to have undergone separation to obtain an O2:N2 ratio of 0.9:0.1 (to lower the NOx emissions), is compressed and then distributed throughout the process. The syngas collected from the clean-up unit is burned with a portion of the compressed air at a pressure of 14.8 atm and a temperature of 1573 K. The hot gas resulting from combustion enters a turbine system of three gas turbines in series which produce work, and thus electricity; the remaining compressed air is split between the second and third turbines and mixed with the combusted syngas before it enters each turbine (as to increase the mixture’s inlet pressure).
A heat exchanger recovers the excess heat released from the exhaust of the turbine. In the heat exchanger, saturated water becomes steam, which in turns passes through a steam turbine to generate additional electric power.
Figure 4: Sulfur Recovery Process Units
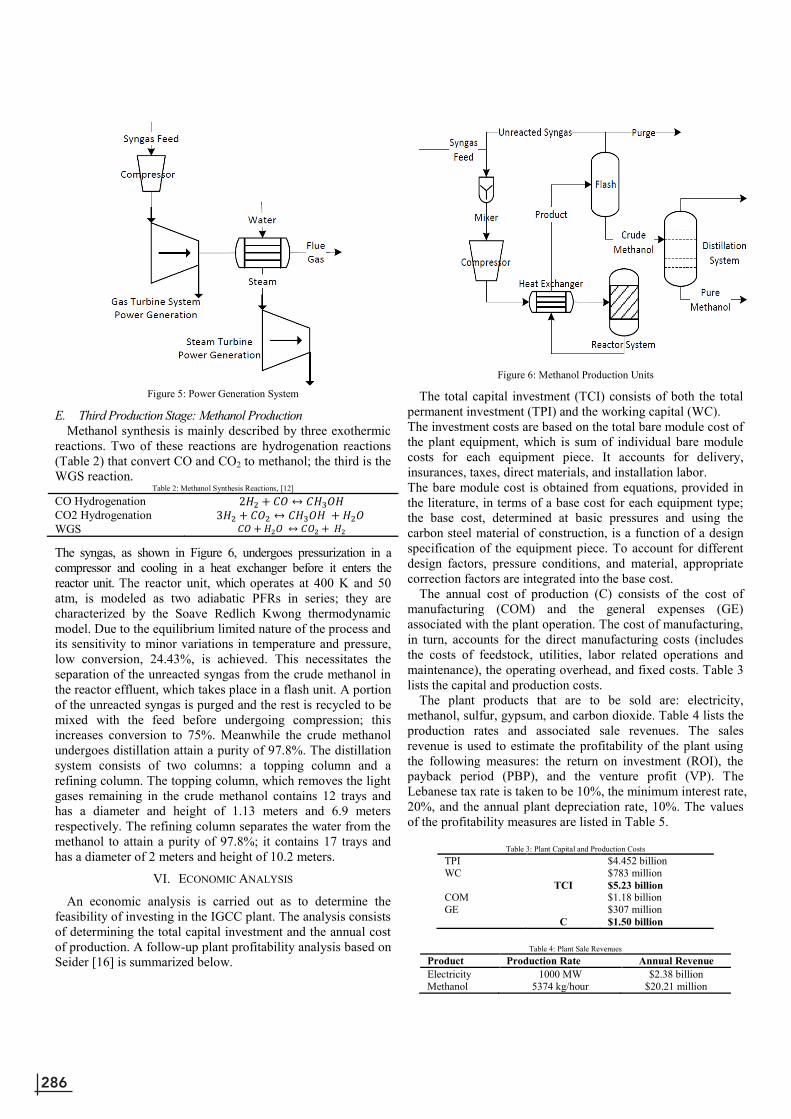
286
Figure 5: Power Generation System
E. Third Production Stage: Methanol Production Methanol synthesis is mainly described by three exothermic
reactions. Two of these reactions are hydrogenation reactions (Table 2) that convert CO and CO2 to methanol; the third is the WGS reaction.
Table 2: Methanol Synthesis Reactions, [12]
CO Hydrogenation CO2 Hydrogenation WGS
The syngas, as shown in Figure 6, undergoes pressurization in a compressor and cooling in a heat exchanger before it enters the reactor unit. The reactor unit, which operates at 400 K and 50 atm, is modeled as two adiabatic PFRs in series; they are characterized by the Soave Redlich Kwong thermodynamic model. Due to the equilibrium limited nature of the process and its sensitivity to minor variations in temperature and pressure, low conversion, 24.43%, is achieved. This necessitates the separation of the unreacted syngas from the crude methanol in the reactor effluent, which takes place in a flash unit. A portion of the unreacted syngas is purged and the rest is recycled to be mixed with the feed before undergoing compression; this increases conversion to 75%. Meanwhile the crude methanol undergoes distillation attain a purity of 97.8%. The distillation system consists of two columns: a topping column and a refining column. The topping column, which removes the light gases remaining in the crude methanol contains 12 trays and has a diameter and height of 1.13 meters and 6.9 meters respectively. The refining column separates the water from the methanol to attain a purity of 97.8%; it contains 17 trays and has a diameter of 2 meters and height of 10.2 meters.
VI. ECONOMIC ANALYSIS
An economic analysis is carried out as to determine the feasibility of investing in the IGCC plant. The analysis consists of determining the total capital investment and the annual cost of production. A follow-up plant profitability analysis based on Seider [16] is summarized below.
Figure 6: Methanol Production Units
The total capital investment (TCI) consists of both the total permanent investment (TPI) and the working capital (WC). The investment costs are based on the total bare module cost of the plant equipment, which is sum of individual bare module costs for each equipment piece. It accounts for delivery, insurances, taxes, direct materials, and installation labor. The bare module cost is obtained from equations, provided in the literature, in terms of a base cost for each equipment type; the base cost, determined at basic pressures and using the carbon steel material of construction, is a function of a design specification of the equipment piece. To account for different design factors, pressure conditions, and material, appropriate correction factors are integrated into the base cost.
The annual cost of production (C) consists of the cost of manufacturing (COM) and the general expenses (GE) associated with the plant operation. The cost of manufacturing, in turn, accounts for the direct manufacturing costs (includes the costs of feedstock, utilities, labor related operations and maintenance), the operating overhead, and fixed costs. Table 3 lists the capital and production costs.
The plant products that are to be sold are: electricity, methanol, sulfur, gypsum, and carbon dioxide. Table 4 lists the production rates and associated sale revenues. The sales revenue is used to estimate the profitability of the plant using the following measures: the return on investment (ROI), the payback period (PBP), and the venture profit (VP). The Lebanese tax rate is taken to be 10%, the minimum interest rate, 20%, and the annual plant depreciation rate, 10%. The values of the profitability measures are listed in Table 5.
Table 3: Plant Capital and Production Costs
TPI $4.452 billion WC $783 million TCI $5.23 billion COM $1.18 billion GE $307 million C $1.50 billion
Table 4: Plant Sale Revenues
Product Production Rate Annual Revenue Electricity 1000 MW $2.38 billion Methanol 5374 kg/hour $20.21 million

287
Sulfur 2675 kg/hour $27.54 million Gypsum 23,587 kg/hour $23. 91 million CO2 4237 kg/hour $217.48 million $2.67 billion
Table 5: Plant Profitability Measures
Parameter Value ROI 20.1% PBP 3.57 years VP $6.43 million
A more rigorous profitability analysis was conducted, where
the final net present value of the plant, assuming a 30 year plant life, was found to be approximately $4 billion and the investor’s rate of return around 23%. These values, in addition to an ROI of 20.1% and PBP of 3.57 years, render the plant a profitable venture, and thus an attractive investment. In addition, the plant is producing an essential commodity that has come to be a crucial aspect of daily life. The public sector when securing such commodities does not prioritize profit over the needs of its citizens. Thus, although the investment will not be recovered quickly, the plant will work to resolve the electric deficit that Lebanon suffers from while minimizing environmental and health impacts.
CONCLUSION
The ASPEN PLUS software is used to simulate the design of an IGCC plant that co-produces electricity and methanol. The plant operations satisfy the emission limits imposed by the US EPA. The by-products produced by the plant are sulfur, gypsum, and carbon dioxide. The distinguishing factor of the plant is its implementation of environmental technologies that limit pollutant emissions. The generation of electricity helps fulfill the increasing demand while the methanol and by-products yield revenue in addition to promoting the local chemical industry.
ACKNOWLEDGMENT
The team would like to acknowledge their advisor, Dr. Walid Saad for his guidance and assistance throughout the project. The team would also like to thank Dr. George Ayoub, (Department of Civil & Environmental Engineering at the American University of Beirut) for his assistance in determining the most suitable plant location.
REFERENCES [1] Fardoun, Farouk et al, “Electricity of Lebanon: Problems and
Recommendations.” Energy Procedia, 19, pp. 310-320, (2012). [2] Alan Shihadeh et al, Lecture Briefing on the study: “Effect of distributed
electric power generationon household exposure to airborne carcinogens: unintended consequences of supply-side electric power reduction measures in poorly regulated environments,” American University of Beirut, (2012).
[3] US Department of Energy, “Coproduction of Power, Fuels and Chemicals,” Clean Coal Technology Demonstration Program, Technical Report Number 21, Washington DC (2001).
[4] Chmielniak, Tomasz, & Sciazko, Marek, “Co-gasification of biomass and coal for methanol synthesis,” Applied Energy, 74, pp. 393-403, (2003).
[5] Yan, T.Y., “Coal Conversion Technology: Opportunities and Challenges,” Energy, 11, pp. 1239-1247, (1986).
[6] Longwell, J.P, Rubin, E.S., Wilson, J, “Coal Energy for the Future,” Prog Energy Combust Sci, 21, pp. 269-360 (1995).
[7] Bartone, Leonard M., White, Jay, WorleyParsons Group Inc, “Industrial Size Gasification for Syngas, Substitute Natural Gas, and Power Production,” US Department of Energy, National Energy Technology Laboratory, (2007).
[8] Shadle, Lawrence J., Berry, David A., Syamial, Madhava, “Coal Conversion Processes, Gasification,” Kirk-Othmer Encyclopedia of Chemical Technology, (2002).
[9] Weiland, R.H., Sivasubramanian, M.S., Dingman, J.C., “Controlling Selectivity, Increasing Slip, and Reducing Sulfur,” 53rd Laurence Reid Gas Conditioning Conference, University of Oklahoma, Norman, OK , US, (2003).
[10] Bae, Sang Wook, Roh, Seon Ah, Kim, Sang Done, “NO removal by reducing agents and additives in selective non-catalytic reduction (SNCR) process,” Chemosphere, 65, pp. 170-175, (April 2006).
[11] Kallinikos, L.E., Farsari, E.I., Spartinos, D.N., Papayannakos, “Simulation of the operation of an industrial wet flue gas desulfurization system,” Fuel Processing Technology, 91, pp. 1794-1802, (2010).
[12] Bell, David A, Towler, Brian F, Fa, Maohong, Coal Gasification and Its Applications, (2011).
[13] Lange, Jean-Paul, “Methanol synthesis: a short review of technology improvements,” Catalysis Today, 64, pp. 3-8, (2001).
[14] Personal Interview with Dr. George Ayoub, American University of Beirut, Department of Civil and Environmental Engineering, March 22, 2013.
[15] Wen. C.Y., Chen H., Onozaki, M., “User’s Manual for Computer Simulation and Design of the Moving Bed Coal Gasifier,” Final Report Task Order No. 41, US Department of Energy, (1982).
[16] Seider, W.; Seader, J.; Lewin, D.; Widagdo, S. Product and Process Design Principles, 3rd edition, John Wiley and Sons, Hoboken, NJ, (2010).

288
Optimized Air Distribution System to Inactivate Airborne Microorganisms Using Upper-room
Ultraviolet Germicidal Irradiation
Jad Araby, Jamil Andraos, Farah Dubaisi, Hiba Kobeissi, Kassem Moustafa Department of Mechanical Engineering
American University of Beirut Beirut, Lebanon
[email protected], [email protected], [email protected], [email protected], [email protected]
Abstract-This paper presents an approach to optimize an air distribution system in order to inactivate airborne microorganisms using Upper Room Ultraviolet Germicidal Irradiation (UR-UVGI). Conventional ventilation means, which include mixed air and in-duct UVGI systems, face several difficulties that the proposed design resolves. These methods use large amounts of fresh filtered air to reduce and eliminate the concentration of microorganisms. On the contrary, the UR-UVGI system reuses the room air; hence, the system’s operational cost is reduced. Yet, the UVGI system has complications of its own. It poses a health hazard for humans in the case of prolonged exposure to UV radiations. The applied solution is to install louvers so that low intensity UV rays are directed horizontally and away from the lower occupied zones. Another problem that arises here is that the overall intensity might, likewise, become very low and ineffective against microorganisms. Therefore, a study of the effectiveness of the upper zone UVGI system in inactivating airborne microorganisms is carried out via a combined experimental and modeling approach. This leads to the optimization of the intensity distribution in order to increase the killing rate in the upper zone while complying with the health and safety standards; maintaining a good indoor air quality despite a minimal air introduction into the system, which will in turn reduce the operational cost. Furthermore, the chilled ceiling/displacement ventilation (CC/DV) air distribution and circulation system is investigated to obtain the optimal residence time needed to inactivate microorganisms and to provide thermal comfort settings inside the room. Finally, a numerical model is developed to predict the overall effectiveness of the system. The predicted values are then compared with the experimental ones in order to validate this model.
I. INTRODUCTION
Maintaining an agreeable and healthy indoor air supply with minimal operational cost and energy consumption has always been a major challenge for air conditioning engineers. UVGI is an effective way that allows the reduction of cross-contamination between occupants in crowded places, given that the majority of airborne infectious bacteria are susceptible to ultraviolet radiations of a wavelength of 254 nm [1]. Such radiations, when absorbed, destruct nucleic acids of microorganisms. Hence, UVGI can be effectively employed in the upper zone of a room, on condition that air mixing allows infectious particles produced by occupants to be carried from the lower occupied part of the room to the upper region where
UV lamps are located. Furthermore, airborne pathogenic microorganisms have two fates; they either deposit on surfaces or remain in air [2]. Thus, microbial transmittance can happen either by surface contamination or through air, with the latter being a more common route. Therefore, enhancing mixing within a space helps dilute bacteria concentration and prevent the presence of high germ concentration areas in the room, which will, in turn, reduce surface deposition.
II. LITERATURE REVIEW
To ensure that the desired mixing occurs inside the room, previous studies recommend that air velocity be elevated. This would produce turbulence in air motion and, consequently, allow it to mix [2,3]. However, this approach is inapplicable because it disturbs human comfort in closed spaces. An alternative method which is well known for its ability to enhance air mixing is the chilled ceiling displacement ventilation system (CC/DV). But, this system is subjected to many constraints in order to work effectively. First, it requires low cooling loads that do not exceed 100 W/m2. Second, the system is not cost effective in humid climates, since it requires relatively dry supply air to ensure that no condensation takes place at the chilled ceiling. Otherwise, its efficiency will decrease dreadfully. Finally, this system, as being widely implemented, requires 100% fresh air, which definitely exceeds the minimum acceptable ventilation requirement of the space [4,5]. Although this system allows the motion of air from lower to upper zones, it is not suitable to be combined with UVGI since the 100% fresh air supply prohibits the mixing between the two zones and forces all infected air to be exhausted. Consequently, it doesn’t achieve energy saving.
To enhance the effectiveness of this air conditioning system when employed with upper room UVGI, many researchers have suggested the use of mixed air supply in the CC/DV system. Such an application has been shown to improve energy performance by 20% when the mixed return air ratio is about 40% [6]. The suggestion above, along with many further modifications to be applied to the CC/DV system, deem it the most attractive and viable AC system to be integrated with UVGI to disinfect air and reduce the spread of airborne bacteria generated by occupants. This is because of

289
HEPA Filter
Setup to measure UV intensity
its dependence on buoyancy forces that drive air upwards to the UV zone.
Previous studies have been performed on harmless bacteria including Bacillus subtilis, Escherichia coli, Mycobacterium parafortuitum, Serratia marcescens and Mycobacterium bovis bacilli Calmette-Guérin (BCG) in order to obtain data regarding their inactivation rate and susceptibility when exposed to upper-room UVGI [1,3,4]. The reason behind choosing such bacteria resides in their resemblance to Tuberculosis, a highly contagious bacterial infection, in regards to shape and response to UV irradiation. Furthermore, the effectiveness of the upper-room UVGI in inactivating airborne microorganisms has been investigated. The bacteria used were aerosolized using a six-jet atomizer after being suspended in either distilled water or simulated saliva [1,3,4].
It is recommended for an upper-room UVGI system that the lamps be installed at a height of 2.13m or above, such that UV irradiance level in the occupied zone is below 6 mJ/cm2 (0.2 µW/cm2) for an 8 hour exposure, as suggested by the American Conference of Governmental Industrial Hygienists [3].
The effectiveness of UVGI mainly relies on the exposure time of the particles to UV irradiance and the intensity of the radiations. Furthermore, previous studies suggest a relation between higher relative humidity (RH) and decreased susceptibility to UV. However, this has been shown to be species-dependent and, hence, a general connection between the two cannot be decisively established [4].
III. RESEARCH DESIGN AND METHODS
Our aim of developing an efficient CC/DV air conditioning system integrated with an upper-room UVGI system for an effective elimination of infectious particles is reached via a combined experimental and modeling approach. In this section, we discuss our proposed experimental methodology, followed by a mathematical model that can predict the bacteria killing rate based on the UV intensity and the displacement of microorganisms inside the CC/DV room.
A. Experimental Setup Experiments are conducted in a 2.5x2.75x2.67 m room built
inside the Energy Lab located at the Scientific Research Building (SRB) at AUB. A schema of the room air conditioned by a CC/DV system and UV lamps is shown in Fig. 1. The room has one door and no windows. HEPA-filtered air is supplied by a conventional ventilation system through the supply duct and a HEPA filter is installed on the exhaust duct. Moreover, an aluminum cylinder (height of 1m and diameter of 0.35m) with a 100W lamp inside is placed in the middle of the room to replicate the presence of an occupant. Although the size of this cylinder is smaller than the average person, its thermal emissions reproduce those of a resting human adult [2]. Besides, those mannequins will be the sources of infection inside the room and, thus, the release of aerosols is achieved by placing a tube, pointing vertically
upwards, at the head of the mannequin, so that a respiratory release is replicated.
The room is also equipped with two 18W UV lamps (36.5cm long) placed facing each other at a height of 2.31m. Since two zones – a lower area with safe UV intensity levels and another upper area with intensities required to kill bacteria – need to be created, the lamps should be equipped with reflectors and louvers. Louvers are manufactured from1 mm thick iron sheets. The box dimensions are 37.5x 14x11.2 cm. However, the back of the box and the reflector are made of highly reflective material: Stainless Steel of thickness 0.7 mm. The reflector’s diameter is 9cm. Fourteen fins are fixed using glue on small plexi-glass strips of 1x 0.7 mm [7].
For our own safety, we will not enter the room while the UV lamps are on. Hence, the atomizer, the bacteria generation unit, along with the impingers, the bacteria sampling units, is placed outside the room for external operation. Thus, it was necessary to drill holes in the walls of the room in order to fit tubes for connecting the sampling pumps to the impingers and the atomizer to the contamination source.
Fig. 1. A schema of the room air conditioned by a CC/DV system and UV lamps
B. Experimental Methodology Our experiments consist of two different sets: one to
determine the UV intensity and another to measure bacteria killing rate.
1) Determination of UV Intensity: We intend to measure the UV intensity in two zones: an upper zone at the louvers’ level (2.4m) and a lower zone at the breathing level (1.5m). Glass test tubes are filled with 3 ml of an actinometric solution

290
containing 0.6 M KI, 0.1 M KIO3, and 0.01 M borate, of pH 9.25. These tubes are then suspended from the ceiling, with 9 tubes at each desired zone. This method requires the measurement of the absorptivity of the solutions before and after their exposure to UV irradiation by using a spectrophotometer. As such, we can infer the irradiance level at the tube location since absorbance is translated into the formation of triiodide in the solution [8]. We calculate the number of moles of triiodide formed due to irradiation:
( ) ( ) ( ) (1)
Abs280.5nm is the absorbance measured using the spectrophotometer at 280.5nm, vol (dm3) is the volume of solution in each test tube which is 3ml = 3x10⁻³ dm3 and 26400 mol-1dm3is the molar absorption coefficient of triiodide.
To calculate the radial fluence, the radiation flux from all directions incident on the tube: ( ⁄ ) ( ⁄ ) ( )
( ) ( ( ⁄ )) (2)
( ( )) (3)
Equation (3) should be used if the temperature is different than 21ᵒC.
This experiment is repeated twice; once with a single UV lamp put on, and a second time with both UV lamps on. The test tubes are exposed to radiations for 1 hour and a half. Hence L found from (2) is divided by 5400 seconds so that we obtain the fluence in mW/cm2.
2) Measuring Bacteria Killing Rate: Several experiments are done to measure the bacterial concentration at different time intervals.
Prior to any bacteria generation, the concentration of organisms that is already present in the room should be recorded. For this reason, we place agar plates, a nutritive medium that allows bacteria to grow, at different locations inside the room. This step should be done once under each of the following conditions: (1) Condition set A: duration: 18 hours (overnight), HVAC system off, and UV lights off; (2) Condition set B: duration: 1.5 hours, HVAC system on (2 ACH-1), and UV lights off.
With both HVAC system and UV lights put on, we place agar plates at the same locations. These plates should be replaced every one hour. An approximate time length of 4.5 hours is required to kill all airborne bacteria present in the room [3]. Once we are sure that the bacteria concentration inside the room is nil, we generate a constant one.
Three types of nonpathogenic bacteria – Bacillus subtilis, Serratia marcescens, and Micrococcus luteus – are generated one at a time using a six-jet Atomizer that is to be refilled every 30 minutes. During generation, the supply air flow rate is kept as low as 2 ACH-1 (72 m3/h). This allows for the determination of the system’s efficiency when minimal fresh air is introduced. Two scenarios will be followed in
generation: (1)Steady State, where bacteria is continuously generated for 1.5 hours, the estimated time to reach steady state at the specified supply air flow rate. Air samples are taken during the generation of bacteria at 20-minute time intervals starting from t0=30 minutes. This represents the case where the infected person is still present in the room. (2)Decay Method, where bacteria is generated for 90 minutes only after which air samples are taken at 20-minute intervals starting from t0=90 minutes. This scenario represents the case where the infected person has been present for a while but has left the room [1,3].
In both scenarios, air samples are collected from 3 specific locations using air sampling pumps that are connected to bio-sampling midget impingers, tube like glassware that are particular for collecting airborne bacteria in a PBS solution, Phosphate Buffered Saline, a balanced salt solution used for a variety of cell culture applications.
The specified locations are taken at the middle of the room at 3 different heights as follows: (1)Breathing zone that’s 1.6m above floor level to investigate the effectiveness of the system in disinfecting the breathing region, the most crucial zone, (2)At a height of 0.2m above the floor to study the precipitation ratio of generated bacteria, (3)Within the UV zone where the disinfecting process is taking place (2.2 m)
As aforementioned, airborne bacteria has two fates; they either deposit on surfaces or remain in air. Thus, it’s also important to study the variation in the concentration of deposited particles. This aspect is investigated using agar plates. As in air sampling, the change in bacteria deposition is traced over time. This requires the removal of the old plates and the admittance of new ones after certain time intervals. Since the UV intensity inside the experimentation room is not yet set down to safe levels, it is prohibited to enter the room while the UV lamps are on. For this reason, it is required to halt the experiment and restart the system at each time interval where old agar plates are collected and new ones are placed. For example, if the first time interval is 15 minutes, the experiment is launched for 15 minutes only and then stopped. At that time, we enter the room to collect the samples and place the new agar plates. For the next time interval, which is also 15 minutes, the experiment is launched for 30 minutes this time, before collecting the samples.
Collected bacterial samples are then taken to the Department of Pathology and Laboratory Medicine to be analyzed. Results are reported to us in cfu/m3 (colony forming units per volume).
As for the measured bacteria deposition on agar plates, a bacterial count (colony forming count) Ci is determined at each location of a Petri dish [2]:
∑
∑ ∑
(4)
n is the number of locations, m is the number of Petri dishes at each location.

291
Bacterial counts are determined by enumeration method where the number of colony forming units is recorded. Again, we were assisted by the Department of Pathology and Laboratory Medicine.
C. Mathematical Modeling: This section presents the MATLAB modeling of
microorganisms’ displacement in the CC/DV room. Two codes are developed to predict the inactivation rate of bacteria.
First, the performance of the system is directly related to the UV intensity that a microorganism is subjected to. A hypothetical model predicting the intensity of the UV field is written based on a previously published code. Its results are compared with experimental data for validation [9].
The second model predicts analytically the general displacement of germs inside the CC/DV room without using CFD analysis.
For the second model, the following assumptions are taken: (1)Uniform concentration and temperature are lumped in any given layer; outside and inside the plume, (2)Uniform UV distribution at the top layers, from the stratification height to the ceiling, (3)No inter-layer diffusion, (4)No wall plume effects, (5)No diffusion between plume and surrounding, and (6)Linear profile temperature [6,10].
The objective is to determine the stratification height, the height at which Mcirculated is equal to zero. The latter is taken to be equal to the critical height, the height at the border between the last two layers. In addition, the concentration inside and outside the plume in layer N-1, as well as the mass flow rate in this layer, is to be determined.
The space is divided into N horizontal zones. The first zone is from the floor level to the contaminant source height, while the last layer is from the stratification height to the ceiling. The stratification height is the critical height, at which density gradients disappear and the plume spreads horizontally. The zone in between the first and the last is divided into (N-2) equal layers.
The temperature gradient is used in computing the stratification height zt of the plume as follows [11]:
(5)
zt is the critical height, Ø is the point source heat flux in W (Btu/h), and is the vertical temperature gradient of room air in ᵒC/m (ᵒF/ft).
The point source heat flux is a constant that we cannot control. Thus, we will assume it to be 100W, approximately equal to the heat emitted by a human being. However, the temperature gradient can be controlled by varying the ceiling and supply air temperature.
The room has a height of 2.67m, a length of 2.75 m, and a width of 2.5 m. According to the louvers’ geometry, the UV zone height will be below 0.8m measured from the ceiling
level. This fixes the value of zt at 2 m and is, likewise, determined. Since we assumed a linear relation between temperature and height, is the slope of the linear line:
(6)
From (6), we set the ceiling temperature and then calculate the one supplied, or vice versa.
The average upward plume mass flow rate Mp as a function of z, induced by the heat source for a given temperature gradient d /dz can be calculated: [11]
(7)
(8)
(9)
The flow rates resulting from walls and heat sources are denoted by Mwj,k and Mpi,k, respectively. The net circulating mass at each boundary of two adjacent layers is calculated as:
∑ ( ) ∑ ( )
(10a) According to our assumptions, the flow rates resulting from
walls are neglected and the equation simplifies to:
∑ ( ) (10b)
If Mp is greater than Ms, re-circulation will occur.
The concentration of the contaminant at exhaust is defined by:
(11)
is the concentration in the last layer, is the supply mass flow rate, is the supply (first layer) concentration, and Mg is the contaminant that is generated from a heat source of strength F.
When mixed with return air, the concentration of contaminants in the supplied air is defined by:
( ) (12) x is the return air fraction and Cfr is the fresh air concentration.
Our main concern is to determine the residence time in the last layer (UV zone); hence, the velocity profile and mass flow rate are needed. As a result, we will develop our analysis on the last two layers, where we will calculate Mp, in the N-1 layer for both cases, inside and outside the plume.
Mass balances for contaminants in the Nth layer inside the plume are given by:
( ∑ ( )
)
( ) (13a)
Neglecting diffusion terms:
( ) (13b)

292
This further simplifies to:
( ) (13c) is the concentration outside the plume in layer (N-1) and
it is calculated from (11), Cp,N-1 is the plume concentration inside layer N-1. It is calculated from (13c).
After calculating and , the plume mass flow rate is calculated from (13c); thus, circulated mass flow rate can be determined from (10b).
As we assumed the stratification height to be equal to the critical height, can be calculated from (7). At this height the circulated mass is equal to zero; hence, from (10b) .
The sink term corresponds to the mass of bacteria being inactivated by UV radiation. This term depends on many parameters: UV intensity, bacteria sensitivity, bacteria size… and is obtained by combining the preceding codes.
From the first model, the intensity of the UV field in the upper zone is obtained. The second model, which predicts analytically the general displacement of germs inside the CC/DV room, allows us to measure the resident time of bacteria inside the UV zone. Hence, the bacteria killing rate is estimated. The results are compared with experimental data for validation.
IV. RESULTS
Our results consist of two sets. The first includes the outcomes of a preliminary experiment proposed by Dr. Araj, Department of Pathology and Laboratory Medicine. As an initial implementation, agar plates were placed in the room to analyze the basic effect of un-louvered UV lamps on bacteria and to learn more about the procedure used to measure bacteria’s concentration. The experiment is repeated 4 times under varying settings. First, agar plates are placed for 18 hours with both HVAC system and UV light off. Second, plates are placed for 1.5 hours with HVAC system on and UV light off. A third set of plates is placed for 3 hours keeping HVAC system on and turning on UV light. Finally, plates are placed for 4.5 with both HVAC system and UV light on. The results are shown in table I.
Plate 1a represents the types and concentration of bacteria initially present in the room. Plate 2a shows the effectiveness of the HVAC system. The concentration of bacteria decreases significantly but it is not nil. As for plate 3, it describes the combined action of HVAC system and UV light for 3 hours. Bacteria are present in an insignificant concentration. As for plate 4, it shows the prolonged effect of the integrated HVAC/UV system. After 4.5 hours, no colonies are present.
As for the second set, it consists of the results of the experiments described in the Experimental Methodology section concerning the determination of UV intensity. Such data is used to validate the corresponding mathematical model. Repeatability of the experimental results is not tested
due to lack of time. The validation, along with the experimental results, is presented in Appendix A. The model is proven to give acceptable results with a maximum average relative error of 15%.
Measurements of bacteria killing rate could not be carried out because the equipment needed for conducting the experiments are not locally available. The shipping process took a lot of time that would have, otherwise, been employed in experimental work.
TABLE I
THE RESULTS OF THE PRELIMINARY EXPERIMENT
V. CONCLUSION
The significance of our project resides in its immediate impact on improving indoor air quality in regards to cross-contamination, as well as, the energy efficiency of AC systems. Our design is practical and can be installed in
Plate Picture Description
Plate is placed for 18 hours with: HVAC system is off; UV light is off Result: Many airborne bacteria colonies
Plate is placed for 1.5 hours with: HVAC system is on; UV light is off; Result: Number of colonies decrease
Plate is placed for 3 hours with: HVAC system is on; UV light is on; Result: A single colony
Plate is placed for 4.5 hours with: HVAC system is on; UV light is on; Result: No colonies present

293
offices, schools, and even health facilities in order to decrease disease transmission; hence, increasing productivity.
ACKNOWLEDGMENT
Without the advising and funding of Professor Nesreene Ghaddar and Professor Kamel Aboughali, the execution of this project would not have been possible. We would like to thank Dr. George Araj and Professor Alan Louis Shihadeh for their help and advice.
REFERENCES [1] S. Miller, J. Macher, “Evaluation of a Methodology for Quantifying the
Effect of Room Air Ultraviolet Germicidal Irradiation on Airborne Bacteria,” Aerosol Science and Technology, London, Art. vol. 33, pp.274-295, 2000.
[2] C. Noakes et. al., “Bioaerosol deposition in single and two-bed hospital rooms: A numerical and experimental study”, Building and Environment, Leeds, Art. vol. 59, pp. 436-447, January 2013.
[3] G. Ko et. al., “The Characterization of Upper-Room Ultraviolet Germicidal Irradiation in Inactivating Airborne Microorganisms,” Environmental Health Perspectives, M.A., Art. vol. 110, pp. 95-101, January 2002.
[4] J. Peccia et. al., “Effects of Relative Humidity on the Ultraviolet Induced Inactivation of Airborne Bacteria,” Aerosol Science and Technology, London, Art. vol. 35, pp. 728-740, June 2007.
[5] N. Ghaddar et. al., “Performance comparison of conventional and chilled
ceiling/displacement ventilation systems in Kuwait”, ASHRAE Transactions, vol. 144, January 2009.
[6] M. Kanaan, N. Ghaddar, K. Ghali, “Simplified model of contaminant dispersion in rooms conditioned by chilled ceiling displacement ventilation system”, HVAC and R Journal, vol. 16, pp. 765-783, 2010.
[7] M. Sung; S. Kato, “Method to evaluate UV dose of upper-room UVGI system using the concept of ventilation efficiency,” Building and Environment, Tokyo, Art. vol.45, pp. 1626-1631, January 2010.
[8] P. Xu et. al., “Dosimetry of Room-Air Germicidal (254 nm) Radiation Using Spherical Actinometry,” Photochemistry and Photobiology, C.O., Art. vol. 70, pp. 314-318, June 1999.
[9] C.L. Wu et. al. ,“A new mathematical model for irradiance field prediction of upper-room ultraviolet germicidal systems,” Journal of Hazardous Materials, Hong Kong, Art. vol. 189, pp. 173-185, February 2011.
[10] C. Noakes, C. Beggs, P. Sleigh, “Modeling the Performance of Upper Room Ultraviolet Germicidal Irradiation Devices in Ventilated Rooms: Comparison of Analytical and CFD Methods,” Indoor and Built Environment, vol. 13, pp. 477-486, July 2004.
[11] E. Mundt, “The performance of displacement ventilation systems,” PhD thesis, KTH, Stockholm, Sweden, 1996.

294
Appendix A: UV Intensity – Experimental Results and Model Validation
Fig.2. A schema of the room showing the positions of the actinometric solution
(1-9: Upper zone / 10-18: Lower zone)
TABLE II
THE RESULTS FOR LINE EE
TABLE III
THE RESULTS FOR LINE DD
Experiment Model point 4 0.79 0.8 point 9 1.721 2.1 average 1.26 1.45
TABLE IV
THE RESULTS FOR LINE AA
Experiment Model point 1 0.505 1.458 point 2 1.33 0.298 point 3 0.43 0.31 average 0.755 0.69
Experiment Model point 2 1.33 1.33 point 5 0.5 0.25 point 8 0.123 0.07
Average 0.651 0.55
Fig.3. Graphical Representation of line EE

295
Fig.4. Graphical Representation of line DD
Fig.5. Graphical Representation of line AA

296
Small-Scale Wave Energy Converter in Beirut Wave Conditions
Ayman El- Ghalayini – Hadeel Hijazi – Khaled El- Monajjed – Omar Hussein Safadi
Department of Mechanical Engineering American University of Beirut
Bliss Street, Riad el Solh/1107-2020, Beirut, Lebanon [email protected] - [email protected] - [email protected] - [email protected]
Abstract – Wave Energy Conversion is a method of pro-
ducing electrical energy by the conversion of wave power. While researches on different types of energy conversion methods are advancing, wave energy is considered to be one promising type of renewable energy source. The im-mediate objective of the project is to build a system that would convert wave energy into electrical power of 20 Watts rating using pneumatic systems. The chief objective of the project necessitates that the system be portable. The converter is implemented on the rocky part of the shore located in Ein Mreisseh Beirut, Lebanon. The output the system generates, would be used to charge a 12 Volt battery. In practical uses, the output power could be used to charge daily appliances (e.g. phones, radios) or simply suffice for functioning different types of lighting (i.e. interior lighting in restaurants and houses or exterior lighting for streets during the night).
1 INTRODUCTION
It is evident, according to Plato’s allegory, that every human who has broken loose of his chains and seen the light should return back and provide aid to others who have not yet become free to escape the realms of the cave. With the latter and with the oath we as engineers take, our utmost aim is to use our knowledge to the aid and welfare of human beings.
The aim behind the small-scale wave energy converter is to conduct a study about an alternative energy solution that uses pneumatic power transmission drives. The output of the sys-tem is measured and analyzed to explain the feasibility of the system in terms of understanding the losses accompanying the energy flow associated with transmitting the wave motion into useful electrical energy.
Despite being recorded in patents belonging to the late 18th century [1], researches conducted concerning Wave Power were simulated during the oil crisis beginning in the 1970s [2]. Today, the state of art of wave energy converters encompasses numerous models of converters that vary according to size, power output, power takeoff, deployment location and mecha-
nism. Researchers estimate that the potential worldwide wave power resource is 2 TW [3].
According to a statistical study conducted by the National Center for Marine Sciences on Beirut Wave Conditions during a two-year period [4], it was concluded that the most intense period producing high waves extends from November to March with a maximum recording of 9 m wave height. Mean-while, mean wave heights varied to reach a minimum of 0.3 m between October and November at the Beirut Golf Area.
The deployment of the system on the coastal zone of Beirut requires the prerequisite of choosing whether the system should be used on sandy beaches or rocky coasts. In terms of energy, waves encountered on headlands bend or refract to-wards the rocky points causing the energy of the waves to break against the headlines. Placing the system on rocks allows for a less corrosive environment in terms of direct water con-tact. This provides the advantage of using the smooth upward displacement phase of the sea waves rather than the turbulent phase as it refracts on the beach while losing energy due to the work exerted on moving the sand. Finally, a study of the to-pography of the shoreline of the ocean of the Mediterranean Sea along the Lebanese shoreline shows that sandy beaches in Lebanon cover only 49 km and represent only 20% of the total shoreline (approximated to be 230 km) [5].
The use of pneumatic systems in general in coastal zones ac-companies requirement specifications to be kept in mind dur-ing the implementation. Air entering the system from the at-mosphere is not relatively clean and is susceptible to dirt espe-cially in environments with high air-to-salt solubility quantities usually found in the air near sea. For instance, the airborne salt can easily range from 0.05 to 0.5 parts per million on a typical day [6]. Moreover, air leakage is taken into account during the compression process, as air is usually avoided as a working fluid due to its high leakage property. Furthermore, no power input to the system is used for the initiation other than the out-put the system itself produces. Moreover, rust formation on exposed material is usually considered to be inevitable espe-cially in a location exposed to constant sunlight and a salty environment. Likewise, marine growth on the buoyant object may result in problems such as turbulence or addition of weight,

297
which may prevent the cylinder from moving smoothly or the buoyant object from floating and producing the same force effect on the cylinders. Finally, wave motions are always ran-dom and unpredictable.
The objective behind this paper is basically to present the analysis, design methodology and results of the theoretically based concept of such a converter based on pneumatic systems. The latter is then used to draw the necessary conclusions re-garding the feasibility and effectiveness of the concept accord-ing to the outcomes of the research conducted.
2 CHOICE OF POWER TRANSMISSION AND BASIC SIZ-ING OF SYSTEMS
The system generates electrical energy by harnessing me-chanical energy extracted from the repeated forces that ocean waves would naturally induce on a floating object. The system can be divided into four main parts as depicted in Fig. 1.
Figure 1: Illustration depicting energy sources and transmissions The initial part includes the use of a buoyant object that is
always floating on the surface of the sea. The buoyant object provides the initial takeoff of the system harnessing the wave power by simply displacing the buoyant object. The next phase includes the Mechanical Transmission that conducts the motion of the buoyant object to the motion of a pneumatic cyl-inder by means of a lever. The lever provides a mechanical advantage and allows for a direct motion transmission. The motion of the cylinder allows for the compression of filtered air in the cylinder. A third phase that includes the pneumatic cylinder and extends beyond it, is called the Fluid Power Transmission phase. The latter phase incorporates the storage of the compressed air and proper conduction using an accumu-lator and check valves, respectively. The use of solenoid valve provides a switching mechanism to provide the proceeding phase with a constant input. The final stage includes the power takeoff that converts the potential energy in the pressurized air
to electrical energy. The electrical energy is finally stored and recharged in a battery.
The use of pneumatics transmission in wave energy convert-ers has not been used frequently before especially on a small-scale level. Pneumatic power is considered to have numerous advantages on other systems considered prior to deciding on pneumatics such as hydraulic systems with oil as a working fluid. One of the most important advantages is the speed gained with the use of pneumatics due to the fast expansion of air. Another advantage is the relative easiness of using pneu-matics in terms of maintenance, component availability and budget limitations.
The proper sizing of the system requires first the use of en-gineering intuition and statistical observation of the waves. The recording of the most common wave height and period occurring within several occurrences of day times provided the system with its initial input. The wave height recorded 30 cm and the period recorded 5-7 seconds. The compression process applied by the cylinder is between an adiabatic pro-cess due to its fast operation and scarce time to exchange heat with its surrounding and isothermal process due to its ability to transfer heat with the surrounding. According to FESTO, the normal pressures used for pneumatic cylinders range be-tween 1 to 7 bars. Thus, the initial pressure is the normal at-mospheric pressure while the pressure after compression is 7 bars. With the latter data records, it is possible then to calcu-late the dimensions of the buoyant object required to produce a minimum work input of 100 Watts.
It must be noted that the required electrical output is 20 Watts but the input to the system is calculated to be more than 20 Watts in order to take into account the energy losses due along the energy flow starting from the work done on the buoyant object to reach the generator output. In average, us-ing the Conservation of Energy in equation (1), the inefficien-cy losses are considered to reach 80 Watts.
Ein = Eout −Elost (1)
Ein = Mechanical Energy Input to the system
Eout = Electrical Energy output from the system
Elost = Energy lost due to inefficiencies

298
3 DESIGN
The following section describes the setup of the system ex-plaining the components used and each of their specifications. Fig. 2 depicts a general overview of the system components describing how each component is placed and interacts with the rest of the components.
3.1 MECHANICAL POWER TAKEOFF
The first part of the energy conversion in the system includes the con-version of the wave energy to a device that provides a controlled mo-tion suitable for the system.
Buoyant Object
The requirements of the buoyant object where restricted to the following criteria:
v The float must be as light as possible so that it can translate as much force as possible to the piston in-stead of wasting it to lift up the object.
v The floating object must withstand large forces, thus its design must include other parts capable of reinforc-ing material susceptible to deformation.
v The floating device must be dimensioned with mini-mum thickness possible to allow the wave to cover more area of the Styrofoam as it approaches.
By applying Archimedes Principle in equation (2) for object in a fluid, the force applied on the buoyant object, can be cal-culated. In such terms, the buoyant force including the weight of the connections on the buoyant object sum up to a total val-ue of 2026 Newton.
FΒ = ρ ⋅ g ⋅V (2)
FB = Buoyant Force (N)
ρ = density of fluid immersed in. (kg/m3)
g = Earth standard acceleration due to gravity (9.80665 m2/sec.)
V = Volume of immersed body (m3)
The buoyant object is square-like shaped from the top view and rectangular shaped from side view (depicted in Fig. 2). The main material used is Styrofoam. Each Styrofoam plate consists of two parts glued to each other using a corrosive re-sistant adhesive. Each pair of Styrofoam plates are sandwiched with water-resistant wood plates put on top of the Styrofoam that will act as support sheets to increase the strength of the buoy. Another set of wooden plates is connected above and below the buoy where bolts will pass through to hold the sur-faces together. The plates are each covered with adhesives that are able to withstand water and do not lose function in corro-sive environments. Fiberglass is then used to cover the bottom plate of the Styrofoam to avoid any heavy impact and protect the bottom plate from any damages. Finally, all probable large and interstitial spaces between the plates where properly sealed with the use of silicon. The total buoyant force extracted from the displacement of the buoy, taking into consideration the weight of the lever and the wooden plates, is calculated to be 2062 Newton. The latter types of adhesives prevent any marine growth on the buoyant object. The final volume of the buoyant object excluding the wooden parts is 206 L.
3.2 MECHANICAL TRANSMISSION
The second part of the system is the transmission of the motion from the buoyant object to linear motion applicable for the cylinder.
Lever
The lever is required to allow the system to transfer the forc-es acquired from the displacement of the buoyant object to the cylinder connected on the other end. The force applied on the cylinder is greater than that acquired force from the buoyancy effect as a result of the wave approaching with a mechanical advantage ratio of 2.4625. The lever is extended from the buoyant object resting on the surface of a rotating shaft piece in the body interior to reach the cylinder, connected to its rod by means of a rod eye and rod eye clevis. This hinge mainly pro-vides the lever with the equilibrium state throughout the rota-tion. The lever is lightweight and is characterized by a high stiffness value able to attain high stresses, allowing it to main-tain stability and have a long life in terms of usage. The mate-rial chosen is Stainless Steel and is manufactured according to dimensions chosen based on calculations resulting from basic moment and stress calculations for static loadings. The major forces applied on the lever are results of the bending moments to be found by the shear and moment diagram. The use of the
G
5L High Pressure
Accumulator
Check Valve 1
Pneumatic Cylinder
Battery
Generator
Vane Motor
Buoyant Object
Ocean Waves
Lever
Check Valve 2
Supporting Body
Battery Charge
Controller
Switch
Air Filter Unit
Gear Setup
1
4Solenoid
Valve
Pressure Sensor
Figure 2: Overview schematic describing operation of system

299
flexure formula in equation (3) was the main tool used for di-mensioning the lever.
σ =M ⋅c ⋅ I −1 (3)
σ = Normal Stress due to bending (Pascal)
M = Bending Moment (Newton. Meter)
c = Distance between neutral axis and stress element (Meter)
I = Moment of Inertia (m4)
Applying the design analysis in Shigley’s Design book [7], using the Distortion Energy Theory, the lever was attained with a factor of safety of 2.5. The lever is designed to be hollow to provide the system with the advantage of portability. The lever is fully powder coated overall in order to protect the lever in the corrosive environment.
A CAD drawing of the mechanical setup is generated and can be seen in Fig.3.
3.3 FLUID POWER TRANSMISSION
The third part of the system is the conversion of the energy from the compressed air to kinetic energy that rotates a shaft providing a means of rotating the Generator. The following Fluid Power Transmission components can be found in Fig. 4.
Pneumatic Cylinders
Pneumatic cylinders are one of the most important compo-nents of any pneumatic system. In this case, it aims to convert an external force applied at its rod to fluid pressure. The sys-tem then makes use of the stored high-pressure fluid by con-verting the fluid pressure to kinetic energy to produce an exter-nal effect and convey power. The mechanism applied by the piston cylinder on the fluid can be viewed as the fuel injection into the system while the rest of the components function to transform that fuel to electrical power. By using the simple definition of stress on a solid surface in equilibrium with pres-sure, the force required to compress the air and increase the pressure is calculated to be 4902 N by equation (4).
P = F ⋅A−1 (4)
P = Pressure on a solid surface (Pascal)
F = Concentrated force applied on rod (N)
A = Area of surface (m2)
Upon availability and suitability, the dimensions of the cyl-inder used were 12.5 cm stroke length and 10 cm bore diameter. Due to the limitations of the market, only a double stroke cyl-inder of such dimensions was found. The use of such a type would require that filtered air be entered into both chambers and not only the working chamber. The air filter unit supports
Figure 3: CAD generated view using Creo Parametrics
Figure 4: Figure depicting the Mechanical and Fluid Power Transmission
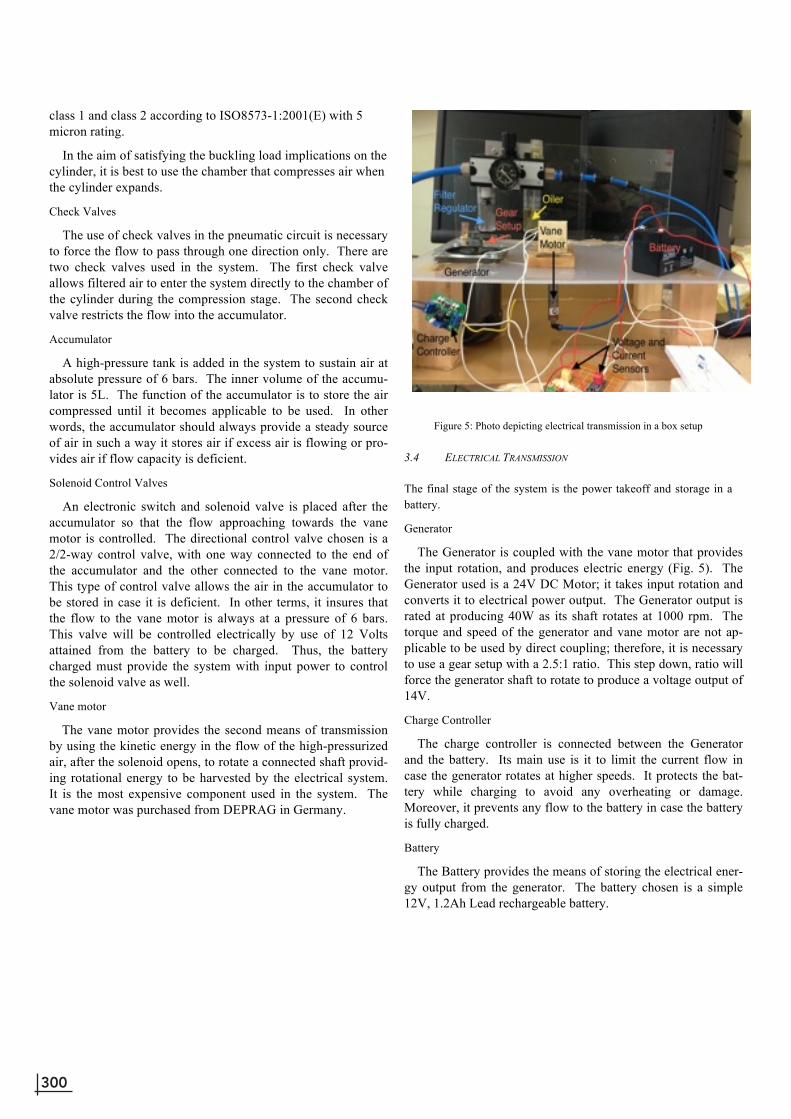
300
class 1 and class 2 according to ISO8573-1:2001(E) with 5 micron rating.
In the aim of satisfying the buckling load implications on the cylinder, it is best to use the chamber that compresses air when the cylinder expands.
Check Valves
The use of check valves in the pneumatic circuit is necessary to force the flow to pass through one direction only. There are two check valves used in the system. The first check valve allows filtered air to enter the system directly to the chamber of the cylinder during the compression stage. The second check valve restricts the flow into the accumulator.
Accumulator
A high-pressure tank is added in the system to sustain air at absolute pressure of 6 bars. The inner volume of the accumu-lator is 5L. The function of the accumulator is to store the air compressed until it becomes applicable to be used. In other words, the accumulator should always provide a steady source of air in such a way it stores air if excess air is flowing or pro-vides air if flow capacity is deficient.
Solenoid Control Valves
An electronic switch and solenoid valve is placed after the accumulator so that the flow approaching towards the vane motor is controlled. The directional control valve chosen is a 2/2-way control valve, with one way connected to the end of the accumulator and the other connected to the vane motor. This type of control valve allows the air in the accumulator to be stored in case it is deficient. In other terms, it insures that the flow to the vane motor is always at a pressure of 6 bars. This valve will be controlled electrically by use of 12 Volts attained from the battery to be charged. Thus, the battery charged must provide the system with input power to control the solenoid valve as well.
Vane motor
The vane motor provides the second means of transmission by using the kinetic energy in the flow of the high-pressurized air, after the solenoid opens, to rotate a connected shaft provid-ing rotational energy to be harvested by the electrical system. It is the most expensive component used in the system. The vane motor was purchased from DEPRAG in Germany.
3.4 ELECTRICAL TRANSMISSION
The final stage of the system is the power takeoff and storage in a battery.
Generator
The Generator is coupled with the vane motor that provides the input rotation, and produces electric energy (Fig. 5). The Generator used is a 24V DC Motor; it takes input rotation and converts it to electrical power output. The Generator output is rated at producing 40W as its shaft rotates at 1000 rpm. The torque and speed of the generator and vane motor are not ap-plicable to be used by direct coupling; therefore, it is necessary to use a gear setup with a 2.5:1 ratio. This step down, ratio will force the generator shaft to rotate to produce a voltage output of 14V.
Charge Controller
The charge controller is connected between the Generator and the battery. Its main use is it to limit the current flow in case the generator rotates at higher speeds. It protects the bat-tery while charging to avoid any overheating or damage. Moreover, it prevents any flow to the battery in case the battery is fully charged.
Battery
The Battery provides the means of storing the electrical ener-gy output from the generator. The battery chosen is a simple 12V, 1.2Ah Lead rechargeable battery.
Figure 5: Photo depicting electrical transmission in a box setup

301
4 PERFORMANCE
The performance of the system can be summarized to compare be-tween what the implemented values actually are and what the theo-retical values expected to describe the operation of the system.
Expected Output Performance
Upon understanding the probable performance of the system, it is necessary to perform some calculations to understand how the output should be expected to be. The system is performing in an operating point between, fully adiabatic and fully isother-mal. According to Equation (5) and Equation (6), the work done by the compression of the cylinder on the air is 177.03 Joules if it is isothermal and 205.7 J if it is adiabatic. The power input is thus 25.29 Watts if it is isothermal and 29.5W if it is adiabatic. The calculations are made on the basis that the power input from the buoyant object is approximated to be between 85-90W.
W = P1 ⋅V1 ⋅ ln(P2P1) (5)
W = Work done to compress air from P1 to P2 undergoing an isothermal process (Joules)
P1 = Pressure at uncompressed state 1 (1.01325 bar)
P2 = Pressure at uncompressed state 2 (6 bar)
V1 = Volume of uncompressed air in cylinder at state 1
W =P1 ⋅V1γ −1
⋅[(P2P1
γ−1γ )−1] (6)
W = Work done to compress air from P1 to P2 undergoing an adiabatic process (Joules)
γ = Ratio of specific capacities
The volumetric flow rate calculated ranges between 7 and 8.5 nL/min. or 0.248 and 0.3 cfm. It is noted that the volumetric flow rate required for the vane motor is 7 cfm and this is ex-pected to delay the charging of the battery. Thus, it is expected that the system power output be between 5W and 15W.
In kinematics, the variation of the buoyancy force and reac-tion force with the change in the angle of the lever can be no-ticed in Fig. 6. Alpha (α) is the angle between the lever and the horizontal as observed in Fig. 7. Moreover, the Buoyancy force is located at the leftmost part of the lever.
Figure 6: Figure depicting variation of Buoyancy Force with variation in angle between lever and horizontal
Figure 7: General figure depicting trigonometric notations
Experimental Trials
After the actual implementation of the system for testing, the re-sults of the voltage output supplied to the battery can each be ob-served in Fig. 8 with the variation in pressure input to the vane motor.
Figure 8: Voltage Output vs Pressure Variation

302
5 OUTLOOK
The use of pneumatic systems has shown that the system can produce an output. But due to the large losses, the output pro-duced is not as expected. Moreover, the problem with the low value of flow per stroke by the cylinder may be solved in such a way an array of cylinders may be used each providing the system with a small amount of the flow. Yet the economic value of the system may not seem to be feasible at the end. The system can be further updated and looked into providing more insight about the possibility of actual implementation on a larger scale.
6 ACKNOWLEDGMENT
We would like to thank our loyal advisor Dr. Matthias Lier-mann for all his efforts and endless support in aiding us till the very end.
We would also like to thank our sponsor, National Instruments, who have supported us financially allowing this project to come to life.
We would like to thank Ghalayini Co. for allowing us to use their company manufacturing equipment and supplying us with necessary material.
Finally, we thank our esteemed department for it continuous encouragement and financial aid with funding this project.
7 REFERENCES [1] Ross, D. Power from the waves, 1995 (Oxford University Press, Oxford,
UK). [2] Salter, S. H. Wave power. Nature, 1974, 249(5459), 720–724. [3] Thorpe, T. W. A brief review of wave energy, Technical report no.
[4] N. Kabbara, Wind and Wave Data Analysis for the Lebanese Coastal Area- Preliminary Results, 2000-2003, 54-55.
[5] Abi Rizk, E. (2005). Evolution du trait de cote Libanais entre 1962 – 2003 (Master’s thesis).
[6] P. T. McGuigan, “Salt in the marine environment and the creation of a standard input for gas turbine aisr intake filtration systems,” in Proceed-ings of the ASME Turbo Expo Power for Land, Sea, and Air, Vienna, Austria, 2004, GT2004-53113
[7] R.G. Budynas and J.K. Nisbett, Shigley’s Mechanical Engineering Design, 9th edition, McGraw Hill, 2008, pp 360 -711

45
ENGINEERING MANAGEMENT PROGRAM

304

305
306 An Integrated Approach to State Decision-Making in Upstream Hydrocarbon Operations with Application to Lebanon ZAYD WAHAB
312 Eco-City Sustainability Concepts and Criteria: A Literature Review FARAH MNEIMNEH
318 Estimation and Classification of Construction Waste Management in Lebanon CARINE CHOUBASSI – CHRISTOPHER SASSINE
323 Modeling Construction Wastes Management Decision CAREN SERHAL
329 Quantifying the Major Parameters that Characterize the Workforce in the Lebanese Construction Industry MHD GHAYTH LATTOUF – MARWAN SARIEDDINE
CONTENT
305

306
An Integrated Approach to State Decision-Making in Upstream Hydrocarbon Operations with Application
to Lebanon
Zayd Wahab Engineering Management Department
American University of Beirut Beirut, Lebanon
Abstract-In the exploration, development and production of its hydrocarbon fields, a government faces the challenge of balancing the conflicting goals of attracting investors and maximizing its own welfare. In this risky and expensive investment environment, international oil companies (IOC) need to agree to the terms and conditions of production sharing contracts (PSC) before engaging in operations; meaning the state has to make many important and irreversible decisions with only partial knowledge of their potential fields. The lengthy timeframe of these projects, the volatility of hydrocarbon prices and the expensive infrastructure investments required for using any production further complicate the state’s decision-making process. This paper formulates an optimization model to assist the government with these challenges. Given estimates of financial and operational variables, the model determines the PSC parameters that yield the maximum welfare to the state while maintaining an acceptable rate of return to the IOC. It also gives the optimal allocation of the state’s share of production, revealing the infrastructure investments required for optimality. This model is applied to the case of Lebanon, with the inputs varied over their expected ranges to explore the set of possibilities that may be faced, identifying the optimal solution for each. These solutions provide us with valuable insights for energy policy and state decision-making in the emerging Lebanese natural gas sector.
I. INTRODUCTION
The financial evaluation of offshore petroleum assets is plagued with several problems that make traditional methods of analysis inadequate [1]. The volatility of hydrocarbon prices, costs and demands coupled with the long project-life of these ventures and inherent geological uncertainties of field characteristics lead to a wide range of possible scenarios. For these reasons, risk analysis plays a key role in the decision-making process, economic evaluation and assessment of exploration and production procedures in upstream projects [2]. Real and compound options analysis, decision analysis, simulation and several other valuation methods have been applied to financial analysis of hydrocarbon operations in search of more realistic results [3], [4], [5]. Additional complexities arise when considering the contractual framework between the sovereign state and international oil companies (IOC) due to the divergent objectives of the two parties. The investing company seeks to achieve a rate of return that is in-line with the perceived risk while the state has a more open-
ended objective of maximizing its citizens’ welfare taking into account economic, social and developmental considerations.
The purpose of this paper is to define a decision-making process that would aid states in maximizing their welfare in upstream hydrocarbon. This is achieved by formulating an optimization model that allocates the government’s share of reserves for the entire life of a production-sharing venture. Given technical (reservoir volume, decline properties, production rates) and commercial (hydrocarbon price, required investor IRR, costs, demands) information, the model jointly specifies the production sharing contract (PSC) parameters and the allocation of revenue into the different uses to generate the maximum benefit to the state while providing an acceptable rate of return to the IOC. Since several inputs are not known with certainty (gas price, project costs, reserve volume), the optimization is performed over the expected parameter ranges and the consequent change in strategy is analyzed (i.e. infrastructure investments, optimal use allocation, PSC contract parameters).
Our proposed optimization model is applied to the case of Lebanon, as there has been growing interest in oil and gas exploration following recent discoveries off the Levantine margin. Results of recent studies indicate that the sedimentary succession offshore Lebanon may include source and reservoirs rocks similar to those in neighboring countries that have yielded confirmed gas discoveries [6]. Accordingly, the Lebanese government has shown great interest in this subject since 2000, and has employed several companies to carry out 2-D and 3-D seismic surveys. Preliminary data has confirmed that there is sufficient evidence to allow companies to drill. Lebanon’s newly established potential has instigated the assignment of a state petroleum board and the Lebanese government has recently passed a Petroleum law [7]. However, there exists a persistent lack of managerial and regulatory studies allowing the implementation of this law and policy, highlighting a strong need for further research to support policy-makers. Therefore, our optimization model is applied to the case of Lebanon to illustrate the proposed methodology and to provide some insights that may aid the development of the Lebanese oil and gas policy.

307
An Integrated Approach to State Decision-Making in Upstream Hydrocarbon Operations with Application
to Lebanon
Zayd Wahab Engineering Management Department
American University of Beirut Beirut, Lebanon
Abstract-In the exploration, development and production of its hydrocarbon fields, a government faces the challenge of balancing the conflicting goals of attracting investors and maximizing its own welfare. In this risky and expensive investment environment, international oil companies (IOC) need to agree to the terms and conditions of production sharing contracts (PSC) before engaging in operations; meaning the state has to make many important and irreversible decisions with only partial knowledge of their potential fields. The lengthy timeframe of these projects, the volatility of hydrocarbon prices and the expensive infrastructure investments required for using any production further complicate the state’s decision-making process. This paper formulates an optimization model to assist the government with these challenges. Given estimates of financial and operational variables, the model determines the PSC parameters that yield the maximum welfare to the state while maintaining an acceptable rate of return to the IOC. It also gives the optimal allocation of the state’s share of production, revealing the infrastructure investments required for optimality. This model is applied to the case of Lebanon, with the inputs varied over their expected ranges to explore the set of possibilities that may be faced, identifying the optimal solution for each. These solutions provide us with valuable insights for energy policy and state decision-making in the emerging Lebanese natural gas sector.
I. INTRODUCTION
The financial evaluation of offshore petroleum assets is plagued with several problems that make traditional methods of analysis inadequate [1]. The volatility of hydrocarbon prices, costs and demands coupled with the long project-life of these ventures and inherent geological uncertainties of field characteristics lead to a wide range of possible scenarios. For these reasons, risk analysis plays a key role in the decision-making process, economic evaluation and assessment of exploration and production procedures in upstream projects [2]. Real and compound options analysis, decision analysis, simulation and several other valuation methods have been applied to financial analysis of hydrocarbon operations in search of more realistic results [3], [4], [5]. Additional complexities arise when considering the contractual framework between the sovereign state and international oil companies (IOC) due to the divergent objectives of the two parties. The investing company seeks to achieve a rate of return that is in-line with the perceived risk while the state has a more open-
ended objective of maximizing its citizens’ welfare taking into account economic, social and developmental considerations.
The purpose of this paper is to define a decision-making process that would aid states in maximizing their welfare in upstream hydrocarbon. This is achieved by formulating an optimization model that allocates the government’s share of reserves for the entire life of a production-sharing venture. Given technical (reservoir volume, decline properties, production rates) and commercial (hydrocarbon price, required investor IRR, costs, demands) information, the model jointly specifies the production sharing contract (PSC) parameters and the allocation of revenue into the different uses to generate the maximum benefit to the state while providing an acceptable rate of return to the IOC. Since several inputs are not known with certainty (gas price, project costs, reserve volume), the optimization is performed over the expected parameter ranges and the consequent change in strategy is analyzed (i.e. infrastructure investments, optimal use allocation, PSC contract parameters).
Our proposed optimization model is applied to the case of Lebanon, as there has been growing interest in oil and gas exploration following recent discoveries off the Levantine margin. Results of recent studies indicate that the sedimentary succession offshore Lebanon may include source and reservoirs rocks similar to those in neighboring countries that have yielded confirmed gas discoveries [6]. Accordingly, the Lebanese government has shown great interest in this subject since 2000, and has employed several companies to carry out 2-D and 3-D seismic surveys. Preliminary data has confirmed that there is sufficient evidence to allow companies to drill. Lebanon’s newly established potential has instigated the assignment of a state petroleum board and the Lebanese government has recently passed a Petroleum law [7]. However, there exists a persistent lack of managerial and regulatory studies allowing the implementation of this law and policy, highlighting a strong need for further research to support policy-makers. Therefore, our optimization model is applied to the case of Lebanon to illustrate the proposed methodology and to provide some insights that may aid the development of the Lebanese oil and gas policy.
II. MODEL DESCRIPTION
A. Model Assumptions Consider a state with natural gas reserves that wishes to
structure a PSC with an IOC taking into account potential future usages of natural gas. The government’s objective is to maximize the total profit while keeping the PSC attractive to the IOC. It is estimated that the gas reserve under consideration is V0, which is assumed to be known with certainty. The gas price is P, and is assumed to remain the same throughout the project life. The project life, consisting of developing and producing the gas, is T years. While these assumptions of certainty and stability of reserve and price are admittedly restrictive, we account for the variability of price and reserve through extensive sensitivity analysis.
The government needs to decide on the key parameters of the PSC, namely the royalty , the cost recovery CR, the profit share PSfrom the gas among different uses. The PSC parameters will be used to split the annual production Vt in year t, t =1, 2, …, T, between the government and the IOC. The annual production Vt is assumed to be obtained from the overall reserve V0 based on annual production rates, pt, i.e., Vt = ptV0 . This approach is typical in the literature and is detailed in the full thesis [8].
Natural gas has several potential uses, the most prevalent of which are detailed in Table I below,
TABLE I
COMMON USES OF NATURAL GAS
Keeping in mind the case of Lebanon, we limit the
hydrocarbon usages into two: power generation and export. Assuming the required infrastructure is already in place, power generation generates a benefit to the state of $/unit. This is typically the savings from using the produced hydrocarbon instead of other modes to produce electricity. It is also assumed that power generation usage in year t, t =1, …, T, cannot exceed the power demand in year t, dt .
Export can be done via two modes (i) as gas through a pipeline and (ii) as liquefied natural gas (LNG). The pipeline option has an infrastructure cost of CP, typically encompassing the cost of linking to major pipelines, while the LNG option has an infrastructure cost of CLNG, which is typically the cost of establishing a liquefaction plant. In both modes the sales price of gas is P, the known gas price. However, we assume that sales through a pipeline can only be done through contracts. This is justified by the fact that there is no spot market for gas, and a pipeline typically allows reaching a limited number of customers. LNG exporting, on the other hand, allows selling to the global market with a large number of customers. In
addition natural gas contracts, to be meaningful, are restricted to having a minimum duration dmin years and have bounds on their annual value, vmin and vmax. It is further assumed that a maximum of C contracts are active at any given time. The parameter C can be determined based on the pipeline capacity and vmin .
Either pipeline or LNG export mode can be used in a given situation implying two different model formulations. Finally, the IOC interest is accounted for by assuming that it requires a minimum rate of return r. This rate of return reflects the revenue based on the IOC share from the project over time and the production costs. The production costs are assumed to be composed of fixed production costs of Cit in year t, and a cost of Cu per unit, assumed to be fixed over time. This linear cost structure is supported by recent research (e.g. [17]).
B. Solution Methodology The model seeks to optimize the welfare to the state
generated by all identified potential uses over all time periods. The objective function is stated below
(1)
; (2) ; (3) ; , (4) ; , (5)
; , (6) ; (7) ; (8) ; (9)
(10)
(11)
(12)
(13)
(14) (15) In (1), the first part finds the savings generated from
allocation to power generation while the second sums the volumes sold by all contracts. The model begins by using the input parameters to determine the production profile [8] and goes on to enumerate all possible contracts by varying the PSC parameters and testing them for feasibility. IOC profitability is one of the feasibility restraings, meaning that any set of PSC parameters that gives the investor an unattractive deal is eliminated. After the PSC parameters have been determined, we now have a clear idea of the hydrocarbon inflows that the state will receive at each time period. Next, the model optimizes the allocation of the government-share of production over the identified uses, revealing the PSC parameters that give the optimal welfare to the state. Exporting via LNG plant

308
necessitates some minor changes to the formulation. In order to find which of the two infrastructure alternatives is best, both are optimized and the one generating the maximum welfare is chosen. This gives us the added advantage of being able to invest in infrastructure early on, in order to best exploit the natural resources.
Both pipeline and LNG models are nonlinear integer programs, which are typically difficult to solve even with specialized nonlinear solvers. Our solution methodology is based on solving a series of integer linear programs instead of one difficult nonlinear program. Specifically, our approach is to linearize nonlinear constraints (4, 5), whenever possible, and to iterate over discrete values of the decision variables causing nonlinearity, when analytical linearization is not possible.
The compounding nature of the PSC parameters gives rise to most of the non-linearity of this model. However, the involved decision variables, ,, and , are all bounded between 0 and 1. Furthermore, regulations often fix the values of some of these parameters; for example in Lebanon the tax rate is specified in the hydrocarbon law. This makes it easy to resolve the nonlinearity by iterating over discrete values of a set of parameters, while treating one parameter as a continuous variable.
C. Application to the Case of Lebanon The emerging Lebanese hydrocarbon situation serves as
an application of the proposed model. In the following, we present estimates of the parameters needed for the optimization models presented in section III as they apply to the case of Lebanon. In section V, we present results and insights based on applying the models in Section 3 with the Lebanese data described in this section. Project duration, T. As stipulated in the Lebanese
hydrocarbon law [7] a base project duration of 30 years is considered.
Gas reserve volumes, V0. The US Geological Survey [17] estimates that 83,000 square kilometers of the eastern Mediterranean hold between 1,400 and 6,430 Bcm (billion cubic meter), 30% of which lie in Lebanese waters. Accordingly, we utilize a range of reserve volume between 140 Bcm and 2,100 Bcm in our numerical results.
Gas price, P. The gas price of October 2012 of ¢9.76 / m3 is used as the base price value.
Risk free rate, rf. The risk-free rate used for discounting the government’s revenues is the one-year Lebanese treasury-bond rate of 5.35% (Banque du Liban, 2012).
IOC required rate of return, r. In his work on taxation for Israeli natural gas projects, Pindyck [14] identifies an investor rate of return of 9% as sufficient for maintaining project attractiveness for IOCs. Although the IOCs selected for Pindyck’s appraisal all operate in risky deep offshore environments, the 9% rate was based on a portfolio with some less-risky onshore projects. Since all investment in Lebanon is expected to be in an expensive deep-offshore environment, and with
the high political risk, a higher base value of 12.5% is utilized in this paper for IOC rate of return.
Unit Saving in power generation, . In 2009 the cost to produce one KWh of electricity in Lebanon was ¢17.14, ¢10.77 of which was due to fuel cost [15]. Natural gas produces 35,300 Btu/cubic meter. Assuming an average heat rate of 7,800 Btu/KWh and transmission losses of 15%, a rate of 0.26 cubic meter/KWh is obtained [15]. Accordingly, a value of ¢10.77 / 0.26 = ¢41.4 / cubic meter is used for the unit saving in power generation.
Power demand, dt. In 2009, the total power demand in Lebanon was approximately 18,400 GWh = 18.4 million KWh. Of this value, and due to the available infrastructure, only 50% of the demand can be met from fuel or gas [15]. Given the long-term scope of this investigation, demand growth must also be estimated. The World Bank uses gross domestic product GDP estimates to forecast future power demand in Lebanon. Accordingly, we estimate the 2012 demand for gas that can be used to produce power as d1 = 2.93 bcm. In subsequent years, t = 2, …, 30, demand dt = 1.0705 dt−1.
Infrastructure costs, and . Since the Arab gas pipeline that Lebanon is connected to is already in-place, we assume that no additional infrastructure investment is needed for exporting via the pipeline option, i.e., CP = $0. As for exporting via the LNG option, we assume an infrastructure cost of 6 billion, which is the cost to build a new liquefaction plant. This is consistent with the literature and practice.
We are left with the estimation of costs Cit and Cu . Jablonowski and Strachan [16] analyze private and public data from 24 projects and generate cost functions for two technologies (spars and tension leg platforms), giving total project costs and the marginal costs from increases in production. They find a linear cost structure with the production cost increasing in the production volume. We adopt a similar linear approach for estimating production costs.
Values published by Noble on their expected expenditure on Tamar account for the operating cost of Cu = ¢2.85 / cubic meter [17]. These sources also provide information regarding well costs at $150 M/well and Tamar well rates of 4.25 million cubic meter (Mcm)/day. Using published estimates of marginal costs for local projects to subjectively estimate this cost, we find marginal rates between $14.6 and $16.3million/ 1,000 BOE. Adding these two costs gives the total development cost for fields of various sizes produced over thirty years. We find that the initial cost varies linearly with Pmax. To simplify the analysis, we utilize linear regression and find the initial cost (IC in million dollars) as a function of Pmax as
IC = 0.3485Pmax + 200 (16)
This investment cost will be split uniformly over the
ramp-up period to obtain the fixed cost, Cit, during the ramp-up period. The cost Cit is equal to zero in later years.

309
III. RESULTS
A. Current Situation In the case of Lebanon, the tax is fixed at 23.5% [18]. As
such, we fix the tax rate to =0.235 in all of our numerical results. These leaves us with three decision variables related to PSC parameters, royalty, , cost recovery, CR, and profit split, PS. Using Excel premium solver, we optimize over PS and other model decision variables discussed in section II. Specifically, we use a step size of 1% for both and CR and do a grid search with search values derived from solving ILP over the remaining parameters. A sample of our results is shown in Figure 1 for a reserve volume of V0 = 700 Bcm for the case of a pipeline exporting option.
Figure 1. Optimizing contracts while varying royalty
The optimal value to the state, i.e., the optimal solution, is generated for a royalty of zero, = 0%, a cost recovery CR = 100% and a profit share PS = 44%. We believe that this is related to the usage of gas to meet power demand. Since power demand increases with time the government has benefit in allowing the IOC to recover its costs early on in the project life, via a CR = 100% and = 0%, where power demand is low. This early payment pattern also allows the IOC to meet its required IRR with the least amount of gas in later years, which is desired by the government. Our trials on several other reserve volume ranges give consistent results, with a high cost recovery and, always, no royalty. These results are in agreement with previous work which addresses recommended PSC parameters (e.g. [19]). Accordingly, in the remainder of this section, we adopt a PSC with no royalty, = 0%. We find the two remaining contract parameters, cost recovery CR and profit share PS, by iterating over CR, with a step size of 1%, and solving the resulting ILP in PS and other decision variables.
Figure 2 shows the optimal PSC parameters and total state welfare for different reserve volumes, under the export via pipeline option. We note that the pipeline option is optimal (i.e., preferred to the LNG export option) in all the cases shown in Figure 2. The changes in the PSC parameters and allocation strategy show three stages as the volume of reserves grows.
Figure 2. Optimal solution across volume range
The first stage concerns fields with reserves up to 700 Bcm, the optimal strategy is to pay the investor back as soon as possible, with a cost recovery (CR) of 100%, to maximize the amount of production left to the state afterwards and meet power demand. In this stage also, an increase in the reserve volume is coupled with an increase in the optimal profit share (PS). This is the case since with a fixed CR of 100%, higher reserves allow meeting the investor’s IRR with a lower PS. The government share allocation results for a field of 420 Bcm are shown in Figure 3 to illustrate the results. Figure 3 indicates that the state’s share of the production is constantly below the power demand. Accordingly, the entire government share is allocated to power, and no export contracts are used.
Figure 3. Production split and optimal allocation of a 420 Bcm field
The second stage concerns fields with reserves between 700 Bcm and 1,260 Bcm, where both CR and PS decrease. This is the case since lowering CR provides enough production for the state in the early years to meet most of the power demand. Specifically, CR decreases significantly below 100% reaching 78% for a reserve of 1,260 Bcm. As CR decreases, the operator is compensated by a decrease in PS. However, since PS is applied at the same level at all time periods, it decreases at a lower rate than CR, which has a significant effect in the first few years of production. For example, PS decreases from 45% to 38% as the reserve
Government share Operator Share Power generation Export Power demand

310
increase from 700 to 1260 Bcm (while CR decreases from 100% to 78%). The allocation strategy shows large proportion of the power demand is met in the earlier years of the project. The production rate stabilizes and most of the cost is recovered in Years 10 to 20, all of the power demand is met and the government has enough gas volume to export. In this case two contracts are used, together coming to a modest total of less than 5 Bcm per year. In later years (i.e., Years 21 to 30), the production volume starts declining and no exporting is possible.
The third stage concerns fields with reserves greater than 1,260 Bcm. As the volume grows during this stage, the annual production rises and can satisfy the early power demand more easily. The results for optimal PSC parameters show both CR and PS rising. This translates into a quicker repayment of the operator costs without compromising the value created by generating power from state production in the early years of the project. Figure 5 shows the allocation results of a field with 2,100 Bcm. It is clear that it is optimal for the state to structure a PSC that meets early power demand, in Years 1 to 9, exactly. Similar to Figure 4 with a volume of 1,260 Bcm, exporting happens in “middle” years, here between Years 9 and 23. However, in contrast to the smaller reserves case, the export amount in this case is much more significant with several contracts totaling 10 Bcm in most of the years.
Figure 5. Production split and optimal allocation of a 2,100 Bcm field
B. Sensitivity Analysis Here we investigate the effects of changing the project
duration, gas price and investor’s IRR respectively while holding all other parameters at their base values.
1) Varying the Project Duration: A realistic range for the project duration, T, is between 10 and 30 years. Optimizing PSC parameters and government share allocation, for different T over this range, reveals the optimal production time of a field. This was performed for three different volumes (140, 560 and 2100 Bcm). The results are shown in Figure 7, in terms of the optimal (maximum) state welfare (government share) for different project durations. The results are consistent for all three volumes, the value of the field increases with T and the maximum value is achieved at the maximum project duration, T = 30 years. A shorter project-duration implies a higher Pmax. and hence higher
costs. Figure 7 reveals that larger fields suffer more of a loss when produced quickly because producing large this requires much greater production capacity, increasing development costs considerably.
Figure 7. Optimizing over the range of project lifetime
2) Varying the Gas Price: At the current price of ¢9.76/ m3, there is no volume that will justify Lebanon commissioning a $6 Billion LNG plant. The results from varying the gas price are presented in Table II
TABLE II
RESULTING STATE WELFARE AND STRATEGY FOR OPTIMIZING OVER THE VOLUME RANGE AT DIFFERENT GAS PRICES
As the price of gas increases, the values of offshore fields
increase considerably. At ¢13.7/cm, a 40% increase, the value of the fields grows by more than 60% on average. The higher price reimburses the operator costs using smaller volumes of natural gas, leaving more to the state. This new price makes building a LNG facility optimal for large fields having reserves exceeding 1,260 Bcm, as shown in Table I. Increasing the price further to ¢17.66/cubic meter causes the value to grow by only 30% and also lowers the threshold volume for investing in an LNG facility to 980 Bcm.
3) Varying the Investor’s IRR: Since the investor IRR of 12.5% was an estimate, we investigate the effect of inputting two different IRRs of 10% and 15% on the model. The results indicate that the total value of the project to the state is less sensitive to the operator’s rate of return than the gas price. This

311
is because the range in which the IRR can reasonably vary is narrow compared to the wide range of values for the gas price. In terms of the exporting strategy, commissioning an LNG plant is not optimal, even for the lowest investor IRR of 10%.
IV. CONCLUSIONS
This paper presents an optimization model that allocates the government’s share of reserves for the entire life of a production-sharing venture. The model determines values for both the PSC’s key parameters and the allocation of the government share into different uses to generate the maximum benefit to the state while providing an acceptable rate of return for the IOC.
The proposed model was applied to the case of Lebanon - a country with a wide range of potential reserves - over two identified uses for natural gas, power generation and export.
The main contribution of this work is the integrated approach to policy-making that takes into account the infrastructure investments for monetizing natural gas, the allocation of the state’s share of production and PSC parameter selection. Combining these aspects provides the state with a coherent framework for the formation of sound policy over the identified range of uncertainties. Specifically, the main insights that came out of the model analysis, as applied to the case of Lebanon are as follows, It is optimal to have no royalty in the PSC contract in
expensive offshore environments, regardless of the reserve volume, while cost recovery and profit share vary with the reserves.
For small fields, the government should try repaying the operator’s investment as fast as possible, with a cost recovery of 100%, to allow meeting power demand effectively in later years through higher profit share. Larger fields permit lower values of cost recovery (and of profit share), so that the state can meet its power demand in the early years of production.
It is optimal for the state to exploit projects for the maximum time possible of 30 years, as this allows reducing development costs.
Current gas prices, of ¢9.76/ m3, are too low to justify investing in an LNG plant for any reasonable field reserve. The existing Arab pipeline should be used for export. Higher gas prices significantly increase the state welfare, and justify LNG investment.
The effect of variation of investor RoR on the state welfare is less than that of the gas price.
The model can be improved in future work, especially with regards to its inputs. In addition, the gas price used in this paper was constant, which may not be reasonable for the investigated timeframe of 30 years. Including uncertainty in modeling the price and reserve volumes could make the developed framework more realistic. Another improvement for the presented approach would be the modeling of operator gas utilization. The current model assumes that the operator collects the equivalent of the gas price for each unit of volume
it receives and does not contribute to the identified state uses. Accounting for the operator usages of gas and potential collaboration schemes with the government could be useful.
ACKNOWLEDGMENT
The authors are grateful to the financial support from Lebanese CNRS and the Masri Institute of Energy & Natural Resources.
REFERENCES [1] L. Chorn and S. Shokhor, "Real Options for Risk Management in
Petroleum Development Investments," Energy Economics, vol. 28, no. 4, pp. 489-505, 2006.
[2] S. Suslick, and D. Schoizer, "Risk Analysis Applied to Petroleum Exploration and Production: An Overview," Journal of Petroleum Science and Engineering, vol. 44, no. 1-2, pp. 1-9, 2004.
[3] R. Iyer, I. Grossmann, S. Vasantharajan, and A. Cullick, "Optimal Planning and Scheduling of Offshore Oil Field Infrastructure Investment and Operations," Industrial Engineering Chemical Research, vol. 37, no. 4, pp. 1380–1397, 1998.
[4] M.W. Lund, "Real Options in Offshore Oil Field Development Projects," in Proceedings of 3rd International Conference on Real Options, held 6–8 June, Wassenaar, Holland, 1999.
[5] L. Abadie and J. Chamorro, "Monte Carlo Valuation of Natural Gas Investments," Review of Financial Economics, vol. 18, no. 1, pp. 10-22, 2008.
[6] F.-H Nader, "The Petroleum Prospectivity of Lebanon: An Overview," Journal of Petroleum Geology, vol. 34, no. 2, pp. 135-156, 2011.
[7] LHL, “Offshore Petroleum Resources Law,” Lebanese Official Journal, vol. 41, pp. 5124-5169, 2010.
[8] B. Maddah, Z. Wahab, and A. Yassine, "An Integrated Approach to State Decision-Making in Upstream Hydrocarbon Operations with Application to Lebanon," Working Paper, 2013.
[9] A. Kilic, "Turkey's natural gas necessity, consumption and future perspectives," Energy Policy, vol. 34, no. 14, pp. 1928-1934, 2006.
[10] B. Mahmah, F. Harouadi, H. Benmoussa, S. Chader, M. Belhamel, A. M'Raoui, K. Abdeladim, A.N. Cherigui, and C. Etievant, "MedHySol: Future federator project of massive production of solar hydrogen," International Journal of Hydrogen Energy, vol. 34, no. 11, pp. 4922-4933, 2009.
[11] S. Pirani, Elusive Potential: Natural Gas Consumption in the CIS and the Quest for Efficiency, Oxford: The Oxford Institute for Energy Studies, 2011.
[12] H. Wei and Y. Hongjun, "Prospect of Natural Gas Utilization in China," Advances in Chemical Engineering and Science, vol. 1, no. 2, pp. 61-64, 2011.
[13] US Geological Survey, Assessment of Undiscovered Oil and Gas Resources of the Levant Basin Province, Eastern Mediterranean, US Department of the Interior, 2010.
[14] R.S. Pindyck. 2010. Investments in Offshore Oil and Natural Gas Deposits in Israel: Basic Principles [Online]. Available: http://www.financeisrael.mof.gov.il/FinanceIsrael/Docs/En/publications/07_Appendix_D.pdf
[15] Ministry of Energy and Water, Policy Paper for the Electricity Sector. Lebanon: Ministry of Energy and Water, 2010.
[16] C. Jablonowski and A. Strachan, "Empirical Cost Models for TLPs and Spars," presented at the SPE Annual Technical Conference and Exhibition. Denver: Society of Petroleum Engineers, 2008.
[17] R. Cook, and S. Cunningham. 2010. Eastern Mediterranean [Online]. Available: http://www.syriacomment.com/wp-content/uploads/Noble-Energy-Presentation.pdf.
[18] Ministry of Finance, "The Ministry of Finance: an Implicated Stakeholder in the Petroleum Activities", Lebanese International Petroleum Exploration Forum & Exhibition, Beirut, Lebanon, 2012.
[19] K. Bindemann, Production-Sharing Agreements: An Economic Analysis. Oxford: Oxford Institute for Energy Studies, 1999.

312
Eco-City Sustainability Concepts and Criteria:A Literature Review
Farah MneimnehFaculty of Engineering and Architecture, Engineering Management Program
American University of BeirutP.O. Box 11-0236, Beirut, 1107-2020, Lebanon; PH (+961) 1350000; FAX (+961) 1744462
Abstract- Several international tools exist for evaluating the level of sustainability of buildings or neighborhoods. Nonetheless, they are still not available in the context of new city. On another front, while such sustainability assessment tools are important, of special interest for the practitioners is how to ensure that their requirements are well integrated in a proposed city Master Plan(MP). In this regard, the author’s research study aims at assisting the program manager during the early pre-project planning (PPP) stages in evaluating the MP alternatives in light of pre-defined sustainability concepts and set of criteria. New Greenfield mixed-use eco-city is the focus of this study. As such, this literature review paper presents the key findings on urban sustainability,with the aim of providing a scientific basis for defining sustainability concepts and criteria for a new eco-city project. The research outcomes shall pave the way for proposing a planning framework to ensure the integration of sustainability criteriawithin the MP at early PPP stages for a new eco-city.
I. INTRODUCTION
Sustainable Development and Sustainable CitiesFollowing several acts, international programs and calls to
protect the environment and save the Earth, “Our Common Future”- also known as the “Brundtland Report” [1]-, issued by the World Commission on Environment and Development in 1987, introduced the concept of “sustainable development”.Since then, efforts by different stakeholders and researchers to elucidate “sustainability” have led to a variety of definitions and indicators, mostly sharing the triple bottom line of environmental, social and economic dimensions of sustainability, nevertheless, with no internationally approved indicator sets [2]. During the last Rio plus 20 United Nations Conference on Sustainable Development, held in June 2012,several objectives and requirements for sustainable development were reiterated, such as “managing natural resources sustainably with lower negative environmental impacts”, “reduce, reuse and recycle waste (3Rs)”, “improving wastewater treatment”, “conserving biodiversity and ecosystems”, “transportation and mobility that respect the environment”, “energy efficiency through measures in urban planning, buildings and transportation”, and “diversifying the energy mix, increasing the share of renewable energy” [3]. In particular, the report emphasized the role cities play in promoting “economically, socially and environmentally sustainable societies…if they are well planned and developed…in affordable housing and infrastructure” [3].
As such, the condition for “well planned and developed”cities calls for a paradigm shift in urban development [4], inresponse to which a new international wave of so-called “eco-city” has appeared [5]. This term overlaps and is sometimes used interchangeably with other terms such as “sustainable city” and “zero/low-carbon city” [6].
Problem Statement and Paper Contribution In order to ensure the integration of sustainability in urban
planning, urban sustainability assessment tools are needed as a “benchmarking”/“normalization” approach wherebyinternationally applicable tools based on scientific findings are adopted [7][9]. At present, such tools are “defined and applied in various, partially overlapping ways, rather than being uniform tools readily applicable across initiatives” [8]. In particular, while embarking a new eco-city project, the practitioner needs to consider first the general sustainability aspects that are common to any similar project elsewhere. Thus, a compatible set of eco-city sustainability criteria assists the decision-maker in comparing alternative solutions [7][8].However, there is currently a “tendency to focus on indigenous contexts and properties” in the absence of internationally “agreed upon” city sustainability indicators [2]. Through a “project-specific” approach, the derivation of eco-city sustainability indicators depends on the initial involvement of local stakeholders, which may render the identified indicators “less replicable and open to standardization” [8].
Hence, the aim of this literature review is to infer the key eco-city sustainability aspects, including theoretical concepts and technical criteria, with reference to a scientific research background on urban sustainability and international eco-city practices. The objective is to provide the practitioners with aproposed benchmarking “scientifically-proven” sustainability assessment tool for a new eco-city project. The ultimate goal is to ensure the integration of the technical aspects of sustainability within the Master Plan (MP) of a new eco-cityproject. Benchmarking criteria also allow decision-makers to achieve a “consensus to facilitate comparison between studies and cities over time” [10].

313
II. RESEARCH METHODOLOGY
Literature on urban sustainability consists of disparate stream of work. The author reviews the pertinent references by searching keywords such as “eco-city”, “smart city”, “sustainable city”, “urban sustainability”, “sustainability assessment”, etc…Basic references include academic articles in peer-reviewed journals, papers from congress and conference proceedings, book chapters, in addition to technical reports, policy documents, reports from international eco-city initiatives, and websites of international organizations,networks and interest groups. The author investigates the methodology adopted by researchers and practitioners in defining, planning for, and assessing urban sustainability, with special attention to new eco-city projects, delineating the common sustainability aspects among various initiatives.Moreover, she explores the sustainability characteristics for an existing city and neighborhood, synthesizes the findings, and develops a proposed list of eco-city sustainability concepts and criteria. This aims at providing an “operational” set of eco-city technical criteria, internationally compatible and replicable, to initiate new eco-city projects [6].
III. URBAN SUSTAINABILITY
A. The Sustainable Urban Built EnvironmentMost literature describes urban sustainability in the context of enhancing or assessing sustainability in an existing city. Less research studies tackle the sustainability criteria for a new eco-city project. In this paper, the author reviews the sustainability characteristics of the urban built environment at different scales, mainly, cities and neighborhoods, including their supporting infrastructure systems such as transportation, water, or energy networks. Many researchers address urban sustainability for an existing city, considering its local context; others focus on the neighborhood/district sustainability, or land development of small towns. In particular, the research study investigates literature on international eco-city initiativesin Europe, Asia, America, Australia and the Middle East, at different development phases, “pilot/planning phase, under construction, or implemented” [11], in developed and developing countries, and identifies their sustainability aspects.TABLE 1 presents some references addressing sustainabilityfor each type of the urban built environment.
TABLE 1THE SUSTAINABLE URBAN BUILT ENVIRONMENT
The urban built environment References
Existing city [18][13][31][39][21][2][29][10][20]
New eco-city [4][12][24][9][11][25][23][6][8][29][42][29][19][43][26][28][22][16]
Eco-town [16][40][27]
Urban land development [31][7][37][33][15]
Neighborhood/district [34][35][18][36][38][41][15]
B. The Urban Sustainability Theorists and PractitionersLiterature on urban sustainability addresses two main
categories of interest groups: (i) the theorists, “visionaries” and “activists”, including the environmentalist, the socialist, and the economist, who focus on the ecological and humanitarian perspectives of urban sustainability, i.e. issues like social ecology, equity, employment, bioregionalism, climate change, etc…, and (ii) the practitioners, including the urban planner, the architect, the engineer, and transport planner, who focus on the physical and technical local aspects of the built environment, irrespective of global concerns [12]. The main concern of the first group is to define the sustainable city for its“image”, promoting it through policies and regulations toensure a healthy environment; the second group’s main concern is to find practical and innovative solutions through urban planning and design for “re-constructing the sustainable city” [12][13]. TABLE 2 identifies some references that interestthe practitioners, the main interest group for this research study.
TABLE 2PRACTITIONERS INTERESTED IN URBAN SUSTAINABILITY
Practitioners References
“authorities”
“policy and decision-makers”[4][18][39][41][11][31][9][14]
“urban planners”
“architecture and engineering firms”[4][34][24][39][31][11][18][41][9][1
5]
“transport planner” [24][43]
“real estate developers” [31][11][6][41]
C. The Urban Sustainability ToolsUrban sustainability tools include, but are not limited to (i)
performance design guides, assessment tools such as “criteria”, “indicators” or “indices” that weigh different aspects of sustainability, with the aim of maintaining a functional standard based on the required sustainability goals [7][10][14][15][16] and represent “sustainable urban models” [4], and (ii) process guides, planning or design“roadmaps” and “framework” tools that describe the steps to be followed in project management towards sustainability [4][7][16][17]. In this paper, the author presents her key findings of literature review on the first category of urban sustainability tools; further author’s efforts shall include

314
reviewing literature on the second category (the process guides) in order to propose a planning framework that integrate the sustainability criteria identified through this research study in a new eco-city project. It is concluded that, while several international sustainability tools (e.g., SB Tool 07/Canada, LEED/USA, BREEAM/UK) exist for evaluating the level of sustainability of buildings or neighborhoods, and some local tools for infrastructure projects [15], there are still no available international sustainability assessment tool in the context of a new eco-city. Eco-city sustainability is only described through concepts, principles, dimensions, characteristics and tailoredguidelines, spun-out from local contexts, with lack of a scientifically-proven internationally approved sustainability tool.
IV. THE ECO-CITY IN LITERATURE
Researchers on the “sustainable city” look at it from different perspectives. Some consider it a “resilient city”characterized by flexibility and adaptation to change [18][19];others highlight the importance of density and mixed-use landand designate it as a “compact city” [20][21];References [9], [22] and [23] emphasize the role of technology;reference [23] describes it by a “smart city”, while references [9] and [16] name it the “ecological technical city” or “eco-tech city”, and reference [22] describes it by the “ubiquitous city” or “u-city”, characterized by an information and technology infrastructure providing “public and private services that can be delivered and received anywhere at any time to anyone” [22]. In this paper, the author refers to the term “ecological city”- or simply “eco-city”- to describe the most prominent city with urban sustainability aspects. It is noted that the different characteristics entailed in the different terminologies on “sustainable cities” are embedded within this term which has been used by many authors, as in references [4][12][24][11][25][16]. The following sections define the eco-city, track back its origin, and identify someinternational eco-city initiatives.
A. Eco-City DefinitionSeveral international entities define the “eco-city”. In 2008,
The World Eco-City Summit defined an eco-city as “an ecologically healthy city…that requires the comprehensive understanding of complex interactions between environmental, economic, political and socio-cultural factors based on ecological principles” [6]. The World Bank highlights the importance of ecological and economic sustainability in eco-cities, protecting its assets for future generations through “integrated urban planning and management” [26]. The U.K.Government states that “eco-towns must be new settlements, separate and distinct from existing towns” [27]. Ecobuilders in reference [28] define an eco-city as “a human settlement that enables its residents to live a good quality of life while using minimal natural resources”. In a nutshell, an eco-city is a city planned and designed to reduce its resource consumption and waste output.
B. Eco-City OriginThe concept of an “eco-city” was first introduced in 1987 by
Richard Register in his book “Eco-city Berkeley: Building cities for a healthy future” [29]. This has been followed by several international eco-city conferences, held by different organizations, such as “Urban Ecology”, a nonprofit organization founded by Register, with a mission to create ecological cities [12]. Since then, eco-cities have evolved through 3 phases [11]: a theoretical “normative perspective” characterizes phase I (1980s to early 1990s); phase II (1992 to early 2000s) is characterized by a “regulatory perspective” with some local and national eco-city pilot projects such as Curitiba in Brazil, Waitakere in New Zealand, and Schwabach in Germany, and many cities in China; phase III (2000s to present) is characterized by an “innovative perspective” resulted in the “expansion of eco-city initiatives at national and international levels, with explicit focus on CO2 reduction measures” [11][16]. Today, some international actors, leading companies and governmental bodies are working on promoting and guiding eco-cities initiatives. These include the World Bank (launched the Eco2 Cities Program, providing operational support for cities), the United Nations (prepared the UN urban indicators guidelines), and Eco-City Builders (international eco-city framework and standard, IEFS initiative) [8], in addition to the joint initiative between the Clinton ClimateInitiative and the U.S. Green Building Council (works with world's largest cities committed to taking action on climate change) [6].
C. Eco-City International InitiativesEco-city initiatives differ in their type of development; some
are new city projects, while others are expansion of existing urban area or retro-fit projects [11]. Reference [11] delineates 6 possible driving factors to initiate a new eco-city project:“environmental challenges, socio-economic pressures, business development, cultural branding, political leadership, and international co-operation”. Nevertheless, 3 “key criteria” are critical to embark on an eco-city project: the scale, in terms of project area, infrastructure and innovation; the sectors,including housing, transport, energy, waste, water, land, etc..; and policy processes [11]. Since early 2000s, geographically diverse new eco-city initiatives have been undertaken, with different aims, partnerships, financing schemes, and relative emphases on technology versus real estate development [6].Major eco-cities are located in Europe, mainly in Scandinavian countries, UK and Germany; the second largest concentration is found in Asia/Australia, followed by North America, Africa, Latin America and the Middle East [11]. New eco-city initiatives with areas ranging between 6 km2 and 250 km2
include Dongtan (the first new eco-city project announced in 2005), Tangshan Caofeidian (2008), Changxing Beijing, Sino-Singapore Tianjin (2007) and many other in China; new Destiny Florida and treasure Island San Francisco in the U.S.A.; Songdo in Korea; Masdar in the United Arab Emirates; NW Bicester in the UK; Port-City in Australia [29][29][6][11][8][19][30]. As such, the fast-growing

315
eco-city trend calls for “international sustainability indicators, standards and related certification schemes” similar to those available for buildings and neighborhoods [8], in addition to raising “eco-city level of familiarity in the planning literature”as suggested by reference [13].
V. ECO-CITY SUSTAINABILITY ASPECTS
Among the commonly used “land development principles” representing urban sustainability, such as “smart growth” and “new urbanism”- terms mostly used in U.S.A.- the “ecological city” concept “has more potential to provide insights that will improve planning for sustainability” [4][25]. Thus, the research study builds on the findings on urban sustainabilitycharacteristics at the different built environment scales to describe the “ecological city” and infer its sustainability aspects. Nonetheless, urban sustainability has been introduced through vague definitions that entail a gap between theory and practice [31]. In this regard, two aspects for describing the eco-city are delineated, based on the two interest groups, the
theorists and the practitioners, respectively: (i) the theoretical concepts and (ii) the technical criteria. Besides, the author claims that the urban sustainability aspects of existing cities,neighborhoods, and urban land development are applicable to a new eco-city project. Therefore, she refers to their urban sustainability aspects inferred from the literature review, in addition to eco-city projects described in literature, in order to identify the common sustainability concepts and criteria that may define an “eco-city”.
A. Theoretical ConceptsThe triple bottom line of sustainability, comprising social,
economic, and environmental considerations dominates literature on urban sustainability [2][10]. These entail the major predominant concepts of urban sustainability,synthesized and listed in
TABLE 3, to be best addressed at early planning stages of a new eco-city project.
TABLE 3ECO-CITY PREDOMINANT CONCEPTS
Predominant Concept Description“One system approach” • the whole urban system is planned, designed, integrated, and managed through systems thinking, understanding “how the parts
fit into the whole”[26][34]• address resource flow through integrated infrastructure system design and management of different sectors i.e. transport,
energy, water, and waste management, in addition to green buildings and urban forestry[26][34]• interaction, linkages within and among infrastructure systems, and with the surrounding region [26][34]
Habitat for biodiversity • protect habitat of natural and biological functions and processes [25]• provide habitat for biodiversity and food-producing areas [12] [24][29][21][28]
“Self-reliance” “resilience”
“urban harvesting”
• low consumption rate (recycle, reuse, reduce) [12]• demand minimization by changing behavior or installing technologies• provide city’s own resources through a “circular metabolism” approach whereby designs and management tools capitalize on
the internal flows of resource usage and waste production within the urban system [36][18]• city is self-reliant with reduced pattern of external dependence on resource [20]• “urban resource management” through “urban harvesting” [18]
Social aspect • socially diverse, housing affordability for all income groups [25] [41]• cultural and local identity [13][21][26]• “high-quality public realm that expresses a public culture, community, equity and good governance” [21] [29][24][11][41][40]• vitality and interaction/group activities and contact with nature [21]• education for behavioral change of consumption patterns [11][12][18]• civic empowerment and local community involvement [11][25]
Economic aspect • the investment framework values sustainability and resilience [6][8][26]• economic diversity and vitality [21][29]; small-medium enterprises [41]• employment is provided through innovation and the unique local environment including environmental and social quality of
the city’s public places [24]Planning and decision-
making practices• the integrated sustainability “planning for the future of the city is a visionary ‘debate and decide’ process, not a ‘predict and
provide’”[11] [24]• eco-city development is “formulated as, embedded in, and supported by, policy processes” [11]
B. Technical CriteriaUrban sustainability concepts may be used in urban planning
to describe the abstract “intangible” “non-spatial” characteristics (e.g. ways of living, economic activities, etc…), while urban sustainability criteria may guide the physical “tangible” “spatial” technical elements (e.g. land use, MPfeatures, transportation system, etc…) [16]. Reference [15]pinpoints the need to differentiate between sustainability aspects that “guide internal design issues” (the technical) and those that describe sustainability performance (the conceptual).
For instance, biodiversity, measured by the number of species in an area, does not guide the design for this area, while the square meter of area to be assigned to a habitat may be a viabledesign indicator [15]. As proposed by reference [31], urban sustainability criteria are best categorized by niche, such as energy, water, transport, and waste management. Hence, based on findings from literature survey (a survey-based selectionstrategy as adopted by reference [10]), the author develops thedescriptive list presented in TABLE 4 that identifies the common key niches to be considered in planning for eco-cities, along with their corresponding design criteria.

316
TABLE 4ECO-CITY TECHNICAL CRITERIA
Design Niche Design CriteriaLand use
urban formurban design
• suitable accessible location [19][41]• dense and compact housing structures and space saving [21][24][25][28][40][41][19][16]• mixed-use [41][29][25][21][19][40]• polycentric urban system [24][21][19]• energy-efficient settlement patterns, optimized building placement in terms of orientation and density solar shading reducing
surface and air temperatures; source of fresh air ‘freely’ cooling building through natural rather than mechanical ventilation thereby lowering energy consumption and CO2 emissions[21][20][24][29][25][19]
• the eco-city physical structure and urban design, especially its public environments, are highly legible (through street function, landmarks…), permeable (access/number of alternative routes; barrier free design), robust/resilient (flexibility of four parameters, quantity, quality, location and time), varied (attract a variety of people at various times for varied reasons), rich, visually appropriate (appearance and enjoyment of places) and personalized for human needs [24][25][19][16]
• green buildings [34][24][29][6][35]• good landscaping, attractively designed features and public spaces [9][29][40]; integrated green areas and urban
agriculture [9][34][24][29][21][19]Efficient mobility
through appropriate transport
infrastructure
• reduce car/motorcycle use through de-emphasized freeway and road infrastructure and restricted parking [24][29][21][40]• emphasized non-motorized transport, walking/pedestrian and cycling, through supportive street infrastructure (e.g. bikeways) and
settlements structures that promote short distances [34][24][21][25][29][35][28][40][19][41]• accessible public transport grid, with special emphasis on rail (e.g. personal rapid transit PRT) [9][24][43][16]• reduced energy demand for city transport through low carbon technologies and CO2 neutral/electric transport system (e.g. eco-
friendly buses, fully electric cars and plug-in hybrid cars [43][19]• inter-modal connectivity [25][43]
Reduced energy consumption
through appropriate energy-supply infrastructure
• energy supply for heat and electricity is based on local renewable and low-carbon energy sources, e.g. biomass, geothermal and photovoltaic electricity generation, wind power plants and concentrated solar power plants [9][21][29][25][35][19] [19],integrating renewable resources with urban design [35][16]
• energy savings and reduced consumption (demand for heat and electricity) through high level of insulation, intelligent lighting, development of small local heat grids fed by renewable energies supported by innovative heat storage, smart electricity grid,combined heat and power (CHP) through local power generation, micro power generation [21][29][28][41][19], in addition to enhancing resource sharing between buildings [35]
Recycling and reuse • grey water systems, recycling water for gardening and car washing, reuse water for green spaces [34][21][18][19][16]• waste recycling and use for production of biogas [34][21][35][41][19]• reduce and recycle domestic and construction waste [21][21][16]
Technology • Information and communication technology (ICT): digital/ICT/high-tech smart infrastructure that assists in better management and operations of the city complex systems, ranging from traffic patterns to the electric grid [6][23][22]
• Environmental technologies: low carbon technologies (LCTs) used in the corresponding urban infrastructure fields of buildings, electricity use, transport and energy supply, water management [42]; technological innovation for low energy demand and low-carbon energy production (e.g. renewable energy supplied through solar hot water technologies and photovoltaic’s; wind energysystems) [11][24]; waste management technologies (waste to energy) [9]; decentralized environmental technologies (for watersupply, renewable energy supply, waste management, electric vehicle) [24]; water technologies (e.g. harvesting and storage techniques at a local level) [9]; transport technologies (e.g. electrically powered vehicles using renewable energy sources); waste management and sewage treatment technologies [24]; energy efficient buildings (passive house standards, reduced heat and electricity demand and efficient supply through efficient electric appliances, resource sharing between buildings) [18]
VI. CONCLUSION AND FUTURE WORK
The paper presents key findings of literature review on urban sustainability with the aim of inferring the key concepts and criteria to be considered while planning for a new eco-city project. Yet, urban sustainability tools need to entail national/local policies and respect the unique “place-specific” urban conditions of the eco-city project [31][32][8][15][26].This calls for a “bottom-up” approach enhanced through the participation of different project’s stakeholders in the eco-city criteria selection process [2][15]. Therefore, future author’s effort shall focus on investigating a case study of an ongoing eco-city project and undertaking interviews with sustainability experts to get their opinion on the identified eco-city concepts and criteria and refine them accordingly. On another front, as sustainability needs to be “operationalized” [33], a process guide is also needed to ensure integration of sustainability in urban planning. Some management tools (e.g. PDRI) have been developed to assist project managers in quantifying the
completeness of a project’s scope definition; however, these tools do not explicitly address sustainability objectives. As such, given that planning at early stages increases the potential to meet sustainability objectives [32], future efforts shall also concentrate on developing a proposed PPP framework or process guide that assists the eco-city design manager in: (i) preparing the sustainability requirements based on the benchmarking list proposed in this paper (ii) refining themthrough the participation of different project’s stakeholders to prepare a “project-tailored” design guide, and (iii) ensuring that the agreed-upon sustainability criteria are well incorporated into the proposed Master Plan of a new eco-city [33]. The proposed framework shall be tested through the real eco-city case study.
ACKNOWLEDGMENT
The author would like to thank her advisor Dr. Issam Srour for his continuous support and guidance.

317
REFERENCES
[1] United Nations (1987), “Our Common Future”, Report of the World Commission on Environment and Development.
[2] K. Mori and A. Christodoulou, “Review of sustainability indices and indicators: towards a new City Sustainability Index (CSI)”, Environmental Impact Assessment Review, vol. 32, pp. 94–106, January 2012.
[3] United Nations (2012), “The Future We Want”, Agenda item 10, Outcome of the Rio Plus 20 United Nations Conference on Sustainable Development, Rio de Janeiro, Brazil, June 2012.
[4] K.H. Yazar and O.M. Dede, “Sustainable urban planning in developed countries: lessons from Turkey”, International Journal of Sustainable Development and Planning, vol. 7, pp. 26-47, January 2012.
[5] F. Cugurullo, “How to build a sandcastle: an Analysis of the genesis and development of Masdar City”, Journal of Urban Technology, vol. 20, pp. 23-37, January 2013.
[6] A. Alusi, R.G. Eccles, and A.C. Edmondson, “Sustainable cities: oxymoron or the shape of the future?”, working paper from the Harvard Business School, 2011, retrieved from http://www.hbs.edu/faculty/Publication%20Files/11-062.pdf, on December 15, 2012.
[7] J.O. Jensen and M. Elle, “Exploring the use of tools for urban sustainability in European cities”, Indoor and Built Environment, vol.16, pp. 235-247, March 2007.
[8] S. Joss, D. Tomozeiu, and R. Cowley, “Eco-city indicators: governance challenges”, in: The Sustainable City VII, vol. 1, WIT Transactions on Ecology and The Environment, vol. 155, 2012, pp. 109-120, retrieved from http://www.witpress.com/, on December 15, 2012.
[9] S. Joss and A. P. Molella, “the Eco-City as urban technology: perspectives on Caofeidian International Eco-City (China)”, Journal of Urban Technology, vol. 20, pp. 115-137, January 2013.
[10] G.A. Tanguay, J. Rajaonson, J.F. Lefebvre, and P. Lanoie, “Measuring the sustainability of cities: An analysis of the use of local indicators”, Ecological Indicators, vol. 10, pp. 407-418, March 2010.
[11] S. Joss, “Eco-Cities: the mainstreaming of urban sustainability-key characteristics and driving factors”, International Journal of Sustainable Development and Planning, vol. 6, pp. 268–285, March 2011.
[12] M. Roseland, “Dimensions of the eco-city”, Cities, vol. 14, pp. 197-202, April 1997.
[13] S. Guy and S. Marvin, “Understanding sustainable cities: competing urban futures”, European Urban and Regional Studies, vol. 6, pp. 268-275, March 1999.
[14] P. Paranagamage, A. Price, and F. Khandokar, “Briefing: holistic assessment of sustainable urban development”, Proceedings of the Institution of Civil Engineers, Urban Design and Planning, vol. 163, pp. 101–104, September 2010.
[15] J. Mulligan, B. J. Stigge, G. R. Tuzzolo, and P.M. Guthrie, “Tailored sustainability assessment for urban masterplanning”, Proceedings of the Institution of Civil Engineers, Urban Design and Planning, vol. 164, pp. 61-73, June 2011.
[16] S. Yip, “Planning for eco-cities in China: visions, approaches and challenges”, 44th ISOCARO Congress, pp. 1-12, 2008.
[17] O. Y. Ercoskun and S.Karaaslan, “Next-generation urban design guides for sustainability of small towns: A case study on Gudul, Turkey”, Urban Design International, vol. 16, pp. 105-125, February 2011.
[18] C. M. Agudelo-Vera, W.R.W.A. Leduc, A. R. Mels, and H.H.M Rijnaarts, “Harvesting urban resources towards more resilient cities”, Resources, Conservation and Recycling, vol. 64, pp. 3-12, March 2012.
[19] S. Eryildiz and K. Xhexhi, “’Eco Cities’ Under Construction”, Gazi University Journal of Science, vol. 25, pp. 257-261, January 2012.
[20] G. Haughton, “Developing sustainable urban development models”, Cities, vol. 14, pp. 189-195, April 1997.
[21] M. Jenks and C. Jones, “Issues and Concepts”, in: Dimensions of the Sustainable City, Future City 2, M. Jenks and C. Jones, Eds., Springer Science + Business Media B.V, 2010, pp. 1-19.
[22] S.T. Shwayri, “A model Korean ubiquitous eco-city? The politics of making Songdo”, Journal of Urban Technology, vol. 20, pp. 39-55, January 2013.
[23] A. Abdoullaev, “"A Smart world: A development model for intelligent cities" “, keynote in: the 11th IEEE International Conference on Computer and Information Technology (CIT-2011), pp. 1-28, 2011.
[24] J. R. Kenworthy, “The eco-city: ten key transport and planning dimensions for sustainable city development”, Environment & Urbanization, vol. 18, pp. 67-85, January 2006.
[25] E. J. Jepson Jr and M. M. Edwards, “How possible is sustainable urban development? an analysis of planners' perceptions about New Urbanism, Smart Growth and the Ecological City”, Planning Practice & Research,vol. 25, pp. 417-437, April 2010.
[26] World Bank, “A synopsis of the book, Eco2 Cities: Ecological cities as economic cities”, The World Bank, Washington, DC, 2010, pp. 1-16, retrieved from www.worldbank.org/eco2, on November 15, 2012.
[27] Communities and Local Government, UK, “Eco-towns: a supplement to planning policy statement 1”, 2009, retrieved from https://www.gov.uk/government/uploads/system/uploads/attachment_data/file/7773/pps-ecotowns.pdf, on January 2, 2013.
[28] Ecobuilders, “Eco-city definition”, http://www.ecocitybuilders.org/why-ecocities/the-solution/ecocity-definition/, viewed on December 15, 2012.
[29] M. Qiang, “eco-city and eco-planning in China: taking an example for Caofeidian eco-city”, in: proceedings of the 4th International Conference of the International Forum on Urbanism (IFoU 2009), Amsterdam- Delft, The New Urban Question – Urbanism beyond Neo-Liberalism, pp. 511-520, 2009.
[30] S. Lehmann, “Sustainability on the urban scale: ‘green urbanism’-mark II”, Journal of Green Building, vol. 2, pp. 59-78, March 2007.
[31] J. Keirstead and M. Leach, “Bridging the gaps between theory and practice: a service niche approach to urban sustainability indicators, Sustainable Development, vol. 16, pp. 329-340, 2008.
[32] H. Wallbaum, S. Krank, and R. Teloh, “Prioritizing sustainability Criteria in urban planning processes: methodology application”, Journal of Urban Planning and Development, ASCE, vol. 137, pp. 20-28, March 2011.
[33] D. Gilmour, D. Blackwood, L. Banks, and F. Welson, “Sustainable development indicators for major infrastructure projects”, Proceedings of the Institution of Civil Engineers, Municipal Engineer, vol. 164, pp. 15-24, March 2011.
[34] J. Engel-Yan, C. Kennedy, S. Saiz, and K. Pressnail, “Toward sustainable neighborhoods: the need to consider infrastructure interactions”, Canadian Journal of Civil Engineering, vol. 32, pp. 45-55, February 2005.
[35] M. Piechowski and A. Weerakkody, “Integrated renewable energy infrastructure -challenges and opportunities”, in: ENERGY 2011: The First International Conference on Smart Grids, Green Communications and IT Energy-aware Technologies, 2011.
[36] C. Kennedy, S. Princetl, and P. Bunje, “The study of urban metabolism and its applications to urban planning and design”, Environmental Pollution, vol. 159, pp. 1965-1973, 2011.
[37] J. Morrissey, W. Foley, B. O’Regan and R. Moles, “Identifying opportunities for urban sustainable development in Ireland: development of sustainability indicators and indices”, in: proceedings of the 16th Irish Environmental Researchers’ Colloquium, ENVIRON 06, University College Dublin, pp. 17-22, January 2006.
[38] E. Karol and J. Brunner, “Tools for measuring progress towards sustainable neighborhood environments”, Sustainability, vol. 1, pp. 612-627, September 2009.
[39] T. Yigitcanlar and F. Dur, “Developing a sustainability assessment model: The sustainable infrastructure, land-use, environment and transport model”, Sustainability, vol. 2, pp. 321-340, January 2010.
[40] A. Alias, A. Shah Ali, and C. K. Wai, “New Urbanism and township developments in Malaysia”, Urban Design International, vol. 16, pp. 76-93, February 2011.
[41] A. Sharifi and A. Murayama, “A critical review of seven selected neighborhood sustainability assessment tools”, Environmental Impact Assessment Review, vol. 38, pp. 73-87, January 2013.
[42] S. Lechtenböhmer et al., “Redesigning urban infrastructures for a low-emission future- an overview of urban low-carbon technologies”, S.A.P.I.EN.S [Online], vol. 3, February 2010, retrieved from http://sapiens.revues.org/index1042.html, on December 15, 2012.
[43] D. Menichetti and T.V. Vuren, “Modelling a low-carbon city”, Proceedings of the Institution of Civil Engineers, Transport, vol. 164, pp. 141-151, August 2011.

318
Estimation and Classification of Construction Waste in Lebanon
Carine Choubassi1; Christopher Sassine2
Department of Engineering Management American University of Beirut Bliss Street, Beirut, Lebanon
1 [email protected]; [email protected]
Abstract- The construction sector is responsible for around 35% of waste worldwide, most of which is dumped in landfills or in other undesignated areas. The rising interest in sustainable development and efficient resource management has begun to shed light on the importance of managing waste in such an ever-growing sector. In Lebanon, construction is considered one of the most vibrant and continuously developing sectors contributing to large amounts of waste of different types, most of which are dis-posed off arbitrarily. Sorting, recycling and reuse of waste are uncommon practices in Lebanon, and dumping is generally un-regulated and unplanned.
Some of the main obstacles faced in any attempt to find solu-tions for the increasing problem of waste management are the lack of data on the amounts and types of generated waste as well as a lack of regulations on waste management. Therefore, a methodology for calculating the different types of waste generat-ed in the different phases of construction is needed and is the focus on an ongoing study which will also examine the composi-tion of the various waste streams and the current fate of these materials in the context of Lebanon.
This paper lays the foundation for the ongoing study through an in-depth literature review covering the topics of construction waste management and models used to estimate waste. The goal is to determine the most suitable method that can be applied to the case of Lebanon as well as the procedure and limitations in applying the chosen model. The result is a simplified procedure of gathering data on the amounts and types of construction waste generated in Lebanon which will be used as a basis for any stud-ies that will aim at assessing the feasibility of reducing, reusing, or recycling construction waste in the future.
List of Words: construction waste management, municipal solid waste, construction and demolition waste, LEED certification.
I. INTRODUCTION
The world’s population of around 7 billion (The World Bank, 2013) is stressing the existing environment and re-sources on a daily basis. The population is expected to grow further, and with that the demand on the environment will increase through the consumption of the world’s natural and
unnatural resources in addition to waste generation. A major component of waste is construction and demolition (C&D) waste that makes up around 10-30% of the total waste gener-ated around the world (Begum, Siwar, Pereira, & Jaafar, 2009). The industry is also responsible for the depletion of 40% of the world’s stone, sand and gravel, 25% of wood, 40% of total energy and 16% of total water per year (Dixit, Solis, Lavy, & Culp, 2010). In the European Union alone, construc-tion materials manufacturing is responsible for the consump-tion of 40% of the natural resources (Mercader-Moyano & Ramírez-de-Arellano-Agudo, 2013). Moreover, most of the construction waste has historically ended up in landfills, and with the limited space available, policy makers and environ-mentalists have looked for ways to divert waste from the land-fills through efficient management processes. There remains a concern, however, in developing countries where the move towards sustainable construction has not hit full stride, and such waste management processes have not yet gained the needed reputation.
The concern is especially high in Lebanon, where the popu-lation of around 4 million (The World Bank, 2013) and the land area estimated at 10,452 km2 indicating that the current country’s resources are already stretched. The country suffers from lack of regulation in almost all sectors, and the environ-mental sector is no exception. Common practice in Lebanon is to send all kinds of waste to open dumpsites with a current total of 6,736,256 m3 of dumpsites recognized by the Ministry of Environment (ELARD, 2011). It is clear that the growth in population combined with the lack of sufficient regulation will lead to further excessive generation of waste, and with the current dumpsites holding large volumes of waste, a plan should be set in order to divert the waste from the current streams through more regulated practices into controlled envi-ronments.
There is a lack of data in the country on the state of the waste generated from the construction industry. The waste generated includes demolition, renovation and construction waste, with each type generating different volumes of waste. The following study focuses on the generation of construction waste worldwide and particularly in Lebanon with documenta-tion of the different waste quantifying methods that are cur-

319
Choubassi, Sassine; American University of Beirut (2013) rently used, and those that can be applied to the case of Leba-non.
II. LITERATURE REVIEW
As mentioned earlier, the recycling and/or reuse of con-struction waste is a necessary step in any attempt to decrease the amount of waste being landfilled as well as the amount of resources being consumed in the construction phases. A pre-liminary step in any management strategy that aims at divert-ing C&D waste from landfills must include the quantification of the types of waste generated. One main challenge in recy-cling the construction waste is therefore the lack of data avail-able on the amounts of waste being generated as well as the current practices in managing this waste (Llatas, 2011). Such data is needed to develop adequate models for construction waste management that well-accommodate the actual practices for a specific country.
The waste generated from construction sites varies depend-ing on the type of project as well as the phase of construction. Generally, and according to the European Waste List, the most common types of waste generated from construction sites fall into one of three categories: remains, packaging and soil. The latter is mostly generated during the primary stages of the con-struction life cycle and can be estimated based on the design of the lower levels of the building. This type of waste usually ends up as backfill material for other uses. Packaging waste includes all types of materials that are used to enclose con-struction materials. Such packaging materials include paper bags (e.g. cement wrappers), plastic, wood, and others. As for the remains waste, they include the cementitious material, glass, steel, aluminum, and steel that remain as residues from several construction activities and are considered the most tedious to quantify.
One of the possible practices that enable the quantification of the above types of waste, thus leading to higher recycling rates, is on-site sorting. A survey conducted by Poon et al. in 2001 indicated that sorting the construction waste on-site is more beneficial than sending comingled waste to a central sorting facility for recycling. On-site sorting, not only facili-tates the process of recycling such materials, as it aids in pre-venting any mixing of different types of waste, but also aids in quantifying the different categories of waste that are generated from each phase of construction. However, the study revealed that the construction participants were normally reluctant to on-site sorting of the waste unless it was required of them and stated in the contract. For such practices to apply, the project owner is therefore compelled to specify, as part of the invita-tion-to-bid (ITB) documents, the responsibilities of the con-tractor in sorting and quantifying the waste.
Moreover, several initiatives have been set in order to en-courage project stakeholders to recycle the construction waste. The most prominent of such incentives include awarding certi-fications to projects in which attempts to divert waste streams from landfills (through recycling and reusing) are made. One of the most prominent international standards certification is
the LEED1 certification, which has changed the way project stakeholders approach projects, mainly in terms of dealing with construction waste. One of the LEED criteria that the project’s stakeholders may seek to achieve is the recycling rate, in which points are granted for the recycling of 50%, 75% or 90% of the construction waste. In addition, several countries are trying to adapt efficient waste management prac-tices that will reduce the overall waste being sent to landfills and dumpsites. In the United States, for example, the Envi-ronmental Protection Agency requires in all contracts a Con-struction Waste Management Plan (CWMP) that includes pro-cedures of diversion of 95% of the waste generated onsite be-fore the date established for the Notice to Proceed (Environ-mental ProtectionAgency, 2007).
As observed, construction waste management schemes can therefore be applied prior to the start of construction and dur-ing the different construction phases. In any case, the quantifi-cation of potential and actual waste streams is necessary for the success of any management plan. Several models have been developed for predicting waste that will be generated based on calibrated models specific to certain countries. A model developed by Llatas (2011) to quantify construction waste generated in Spain, relies on fixed factors that are ob-tained through a pilot-based study performed on around 200 buildings. A factor for each identified category of waste (ac-cording to the European list) is determined yielding a factor for each of the packaging, remains, and soil wastes (Llatas, 2011). The application of such models relies highly on the availability of nation-wide recognized categories of waste, as well as access to an adequate number of buildings on which the model can be calibrated. Moreover, accuracy in the cali-bration of the model is essential to yield values that can later be used for all construction projects specific to a certain coun-try. Separate waste factors can also be obtained for each type of building in the country (residential, commercial, etc.) thus generating even more specific factors.
In light of the requirements that the above-mentioned model imposes, necessary procedures for quantifying waste, at least in the buildings considered to calibrate the model, are needed. The study relies on quantifying methods that do not involve any sorting. The model is first calibrated to determine exact types of waste that are normally generated in the area from each category. For packaging waste, for example, the recog-nized types of waste include uncoated corrugated cardboard and polystyrene packaging. For remains waste, some of the recognized types include large concrete, small concrete, recy-clable wood, painted/stained wood, and many others. Upon identifying the different types, visual estimation of piles of waste can then be determined. Visual estimation is done by a professional visual estimator who measures the length, width, and height of the load of waste then determines (visually) the major classes of material that are present. Afterwards, the es- 1 LEED™ (Leadership in Energy and Environmental Design) is a nationally recognized green building rating program sponsored by the U.S. Green Build-ing Council. For more information, visit www.usgbc.org.

320
Choubassi, Sassine; American University of Beirut (2013) timator estimates the volume of each major material class fol-lowed by the volume of the sub-category types for each mate-rial class. The selection of the disposal facilities (construction sites) for which the estimation activity is applied, as well as the piles of waste from each facility (piles picked up by truck drivers) is performed through a detailed procedure that in-volves surveying the truck drivers and selecting the piles of waste that best represent the objectives of the estimation study.
The visual estimation model was first calibrated for the study area by considering a number of waste piles, performing visual estimation to obtain volumes of each type of waste, then actually sorting and weighing each type. Based on that proce-dure, the volume-to-actual weight ratio is determined and is applied to all visual estimation activities that are performed for future piles of waste.
The recognition and assessment of such quantifying models is needed for any attempt to measure construction waste quan-tities in Lebanon. Moreover, national practices related to con-struction waste sorting and recycling are needed in formulat-ing construction waste management incentives and require-ments that are specific to Lebanon and to its current practices.
III. CASE OF LEBANON
A. Introduction Currently, the waste generated in Lebanon is being dealt
with haphazardly. Most of the municipal solid waste (MSW) is sent to landfills (51%), and 32% is illegally dumped with the remaining 17% recovered through sorting and composting (Sonbul & Alaryani, 2010). The country is suffering from lack of space and the current practices that see 83% of MSW being piled, whether through landfills or dumpsites, have stretched the country’s resources to its limits. There has been modest progress in waste recycling, with only 8% of MSW being re-cycled, and 9% composted (Jadam, 2010). There are local facilities that are able to collect and recycle various types of waste, but with only 17% of the total national MSW being recovered, their work seems limited.
With the construction industry witnessing an excessive rise since the civil unrest in Lebanon (1975-1990), the boom has led to the generation of large amounts of C&D waste as well as the consumption of the country’s natural resources. The country currently suffers greatly from uncontrolled dumping of such waste despite the 8735/1974 decree banning the dis-posal of C&D waste on street sides, in public areas, water streams, on the public maritime domain or in residential areas. Little work has been done to explore the possibility of recov-ering the waste generated from construction or demolition sites, with the majority of the waste ending up in landfills, dumpsites and backfill material.
Construction waste, in particular, is generated in all phases of construction, from excavation to finishing. The amounts generated vary in terms of composition and volumes, and in terms of the type of project as a whole. In Lebanon, one of the main incentives for construction waste management is the
rising trend in “green building” and seeking LEED certifica-tions. LEED-certification points can be acquired in a number of ways involving recycling of construction waste, as men-tioned before, or through the use of salvaged, refurbished or reused material in building. The existence of a well-structured CWMP, specific for the case of Lebanon, would facilitate the process of estimating percentages of recycling and reuse thus encouraging stakeholders to seek waste-related LEED points. Another main incentive for CWMPs is the financial benefits that often arise. Current practices in Lebanon mainly depend on the recycling of steel due to the available markets of selling steel remains, but if a market arose for other recycled materi-als generated from construction sites, then the contractors would be able to benefit from selling those materials, and the project owners would benefit from the LEED certification points acquired. In addition, the continuous consumption of the country’s unnatural resources will eventually lead to their discontinuance, and therefore increase the prices of procure-ment of such materials. This could be avoided through recy-cling the current materials in use, and reusing the materials in other construction or non-construction activities. The above shows the importance of the development of a well structured CWMP. However, the main obstacle in developing such a plan is the lack of data available, therefore emphasizing the need to document such data on a nation-wide scale.
B. Volumes of Waste Currently, no reliable data exists on the volumes and quanti-
ties of waste generated from the construction industry in Leb-anon. Only few attempts were done to quantify wastes specific to a certain project, but such quantifications were only related to LEED requirements with no guarantee of their real accura-cy. The need for developing a specific waste quantification model for the case of Lebanon is therefore justified.
In the application of any quantifying method (such as those described above), direct access to a number of construction sites of all types (commercial and residential) is needed to calibrate to the model. This involves on-site sorting and quan-tifying the different types of waste generated along the con-struction life cycle of each project. It therefore entails official permission to accessing sites on a regular basis. This may cre-ate a major constraint in the application of the waste quantify-ing models, and may delay the implementation of such strate-gies until an adequate number of permissions are obtained. On the other hand, waste estimation activities performed at the sites where the waste is dumped after being transported from the construction sites, may be a possible alternative. Although dumpsite sorting and quantifying may not yield accurate re-sults, due to the difficulty in determining the source of incom-ing waste streams, it may prove to be the best solution to the current conditions.
In the case access to the needed number of sites is provided, accurate waste quantifying schemes can be performed through on-site sorting and weighing, thus allowing the calibration of the chosen model. For the case of Lebanon, the visual estima-

321
Choubassi, Sassine; American University of Beirut (2013) tion model may prove to be the most applicable as it involves minimal effort from the contractor’s side. The model requires the presence of a professional visual estimator on-site to visu-ally estimate quantities of the different types of waste each time a waste pile is picked up, and then the conversion of the measured volumes to consecutive weights based on density factors obtained during the model calibration. The application of such a model, after calibrating it to the case of Lebanon (and perhaps specifically for a residential or commercial pro-ject) would facilitate the documentation of the amounts of waste generated on the scale of the whole country.
C. Composition of Waste The composition of the construction waste generated varies
according to several factors including the type of building, building design, project cost, and phase of construction. Like construction projects in other countries, the main waste com-position encompasses building and worksite material, such as wood, plastic, paper, glass, metals (steel, aluminum, etc.), as well as construction material, such as bricks, concrete, gravel, gypsum, etc. Packaging (paper, cardboard, wood, etc.) and excavation material (soil, vegetation, etc.) also constitute a major part of the total volume of waste generated.
Most of the waste generated in the country is mixed with other kinds of waste and collected as one entity, rarely does sorting take place for such material on-site. In many cases, the majority of packaging materials ends up in Sukleen or Munic-ipal dumpsites, depending on the area of the project, whereby they are collected and disposed of as part of the MSW. Other types of waste generated from construction sites, such as con-crete, gypsum and bricks are sent to intermediate sorting facil-ities. After visiting such a facility in the town of Ouzai, it was established that some of the sorted material is sent to special-ized recycling plants. However, the majority of the construc-tion waste, which is mainly cementitious material, is not recy-cled, despite the facility’s manager stating that there were practices in the past whereby the fine aggregates were separat-ed from the coarse aggregates, washed and then reused. A similar case exists for some other types of worksite and con-struction material such as concrete, gravel, bricks, gypsum, plastic, and others whereby almost all the material ends up as part of the waste stream. As for metals (such as steel and alu-minum) and wood, attempts at on-site sorting of such material is often pursued, especially if a market for recycling or reusing of such material is available. On-site sorting usually requires a special alliance between the contracting company and a recy-cling/reusing entity whereby the designated materials are sort-ed and transported or collected directly from the site.
D. Economics of Waste As mentioned previously, a market currently exists for the
sale of remaining steel waste from construction sites. The steel is sorted on-site or at intermediate sorting facilities, similar to the one visited in the town of Ouzai, and then sold to specific parties for around $300/ton. This practice is, by far, the most
profitable among those of other wastes. The other materials that are sorted either on-site or at intermediate sorting facilities might include cardboard, plastic and wood. The latter is most-ly sent to areas where it is used for heating, whereas the rest are sent to recycling plants. The costs of both practices are usually limited to the labor costs, and thus do not generate any direct profit.
E. Potential for Recycling As mentioned earlier, only 8% of MSW is currently being
recycled in Lebanon. This small number, however, cannot be mainly attributed to the lack of availability of recycling facili-ties. On the contrary, the “Management of Recyclable Materi-al for Lebanese Municipalities” Handbook prepared by the Ministry of Environment with the cooperation of several enti-ties identifies approximately 30 functioning facilities that pro-vide recycling services and 7 facilities that provide collection services of all kinds of recyclable waste material in Lebanon (MOE). The variety of these materials includes metals (steel, aluminum, copper, lead, bronze, and zinc), plastics (PET, HDPE, PVC, and others), glass, paper & cardboard, textiles, and electronic devices. However, the functionality of such facilities also requires proper awareness from the municipali-ties and the contracting companies that generate and release the wastes. Governmental incentives also play a major role in encouraging the transportation and recycling of the diverse materials at the proposed facilities.
The mentioned waste recycling/collecting entities specified earlier are mainly designed for MSW. However, only minimal differences exist between the recycling of MSW and construc-tion and demolition waste. In terms of common materials such as plastic, wood, cardboard, paper, gypsum, and many others, the recycling procedures are almost the same and this is justi-fied by the large volumes of packaging waste that end up in Sukleen and are recycled. As for construction materials such as concrete and other cementitious material (that end up as remains waste), then several studies have been done to assess the feasibility of reusing such wastes. The use of a certain per-centage of recycled concrete in mixing of new concrete mixes is specified by each country. In Lebanon, such practices are still preliminary; however, interest in the domain is becoming widespread.
IV. CONCLUSION
The significance of the construction industry in waste gen-eration and its lead role in unregulated dumping and land-filling makes it an important target in solid waste management practices. With the lack of data on the amounts of waste being generated, attempts to regulate construction waste generation are highly bounded. A model for determining types and vol-umes of waste streams in different phases of construction is likely to facilitate such an initiative.
A visual inspection model may be best applied in countries with minimal experience in sorting and recycling such as Leb-anon. However, the application of any waste estimation model

322
Choubassi, Sassine; American University of Beirut (2013) entails the access to a number of construction site and dumpsites. In Lebanon, such permissions may be best ob-tained with the support of the Ministry of Environment. More-over, the inclusion of incentives for waste sorting and recy-cling in contracts would play a major role in the performance of these activities by contractors. Once the barriers that today face the calibration of a proper waste estimation model are eliminated, a well-structured data system for all types of con-struction waste in Lebanon can be established, thus allowing their regulation and recycling, as well as their diversion away from landfills.
ACKNOWLEDGMENT
The authors would like to thank Dr. Issam Srour for his con-tinuous support, as well as the individuals who facilitated the access to different construction sites and intermediate facilities where most of the information was obtained. In addition, the authors would like to thank Dr. Manal Mousallem for her help and support.
REFERENCES [1] Begum, A., Siwar, C., Pereira, J., & Jaafar, A. (2009). Attitude and behavioral factors in waste management in the construction industry of Malaysia. Resources, Conservation and Recycling , 321–328.
[2] Brown, M., Danzinger, J., Mule, R., Peace, C., Petersen, G., & Wiggins, P. (2006). Detailed Characterization of Construction and Demolition Waste. Sacramento: California Environmental Protection Agency.
[3] (2005). Construction Waste Management Guide. Seattle: Resource Venture.
[4] Dixit, M., Solis, J., Lavy, S., & Culp, C. (2010). Identification of parameters for embodied energy measurement: A literature review. Energy and Buildings , 1238–1247.
[5] ELARD. (2011). Provision of Consultancy Services for the Preparation of a Master Plan for the Closure and Rehabilitation of Uncontrolled Dumps Throughout the Country of Lebanon. Beirut: ELARD.
[6] Environmental ProtectionAgency, U. (2007). Construction Waste Management Section 01 74 19.
[7] Hendricks, C., & Pietersen, H. (2000). Sustainable Raw Materials: Construction and Demolition Waste. Cachan Cedex: RILEM Publications.
[8] Jadam, J. (2010). Solid Waste. In MOE/UNDP/ECODIT, State and Trends of the Lebanese Environment (pp. 264-297). Beirut: Wide Expertise Group .
[9] Llatas, C. (2011). A model for quantifying construction waste in projects according to the European Waste List. Waste Management , 1261–1276.
[10] Mercader-Moyano, P., & Ramírez-de-Arellano-Agudo, A. (2013). Selective classification and quantification model of C&D waste from material resources consumed in residential building construction. Waste Management and Research , 1-17.
[11] MOE. Management of Recyclable Material for Lebanese Municipalities. Beirut.
[12] Poon, C. Y., & Ng, L. (2001). On-site sorting of construction and demolition waste in Hong Kong. Resources, Conservation, and Recycling , 157-172.
[13] Sonbul, A., & Alaryani, M. (2010). Country Report on the Solid Waste Management in Yemen. Yemen: SWEEP-Net.
[14] The World Bank. (2013). Retrieved February 2013, from http://data.worldbank.org/

323
Modeling Construction Waste Management Decision Caren Serhal
Abstract: Every year, the construction industry in Beirut, Lebanon, generates approximately 0.5 million tons of construction demolition waste (CDW). Given the lack of landfill space and regulations governing waste management, most of the generated material ends up in uncontrolled dumpsites causing harm to the environment. A recent report by UNDP confirmed the presence of 166 illegal CDW dumpsites in Lebanon, with a total volume of 1.7 million m3. Efforts to recycle the generated CDW remain limited and unregulated. This paper is part of an ongoing research study which aims at building an optimization based model for managing CDW in the context of Lebanon. The paper presents a thorough review of the relevant literature. The paper concludes with a discussion of the applicability of the existing models to the case of Lebanon.
____________________________________________________________________________________
Introduction:
Buildings alone constitute approximately up to 10 to 30 percent of the waste generated worldwide (Begum 2009). The estimated volume of construction and demolition waste in Lebanon is considerable due to a lack of organization and proper management. Recently, the increased demand for construction of new facilities and the demolishing of old ones has resulted in an increased amount of construction and demolition waste.
Construction waste (CW) consists of all the material leftovers that are generated during construction of buildings, roads, infrastructure or any other civil project. These materials can consist of any of the following: concrete, aluminum, wood, gypsum, plastic, glass, painting etc…
Construction demolition waste (CDW) is constituted of the same materials and is generated during demolition activities. CDW can be classified into two categories: emergency CDW and non-emergency CDW. Emergency CDW is the result of demolishing a facility to create space for new and bigger structures
(skyscrapers or infrastructure). This type of demolition can take place at a slow pace and the demolition waste generated can be collected for processing. Non-emergency CDW deals with waste generated due to natural disasters such as wars, earthquakes and hurricanes. In this case, the waste has to be dumped as soon as possible for new constructions to take place. In fact, due to the huge amount of demolition that occurs in this case, there is a necessary need for eliminating the waste and use the lands to inhabit the displaced occupants. Since this needs to happen as soon as possible, contractors tend to dump the waste in a haphazard manner. Both CW and CDW, which are generally regarded as unwanted, have to be properly dealt with in order not to become a threat to the environment and damage the ecology of the region. This paper starts with a comparison between CW and CDW, studies the waste management plans adopted in several countries along with optimization models and finally analyzes the applicability of these models for the case of Lebanon.

324
Comparison between CW and CDW:
This section compares the characteristics of construction waste and demolition waste. The quantity of waste generated on a construction project can vary widely. It depends on many factors such as errors or changes in the design which necessitate the demolition of newly worked materials. It is also dependent on the strategy each contractor adopts to reduce material leftovers. The amount can be heavily reduced if good practices are followed. In fact, since the generation is continuous throughout the lengthy construction work, it is difficult to estimate precisely the total amount of waste (Yeheyis 2011).
The composition of this waste can also vary depending on the stage of the project: while concrete and steel can be the primary waste generated in early construction stages, other materials such as paint, glass and plastic may be part of the waste at the final project stages. The specific composition and the small amount of waste generated per day render the waste much easier to sort for reuse and recycling purposes. Also, contractors are not urged to remove the waste in the same day. They tend to assemble them and remove them on a weekly basis. Finally, construction waste give the advantage of being reusable since all the materials used are supposedly new.
Construction waste can originate from rural and urban areas. However, demolition waste generally occurs in urban areas where land availability is small and old facilities need to be
replaced by skyscrapers. The quantity of waste is fixed for a given building and can be easily calculated: (Srour 2012) offers a method for estimating the quantity generated based on the building’s bill of materials. The rate of generation is considerable since the amount is relatively high in a short period of time (the quantity generated on a given working day is high). The composition of the waste is typically known: it consists of all the materials used for the construction of a building. In Lebanon, it is mainly composed of concrete for buildings and cement for infrastructure. Sorting demolition waste is more involved than sorting construction waste since the waste is commingled: for example it is very hard to separate concrete from steel. The demolition technique plays an important role in facilitating the sorting of waste. Most of the waste due to demolition is sent for recycling or landfills since they have been used for long and are not generally suitable for reuse. The Hanshin-Awaji earthquake resulted in 20 millions of tons of CDW, some of them was needed for land reclamation while the rest was used for construction purposes (Srour 2012). As discussed before, the waste generated due to natural disasters (emergency waste) need to be evacuated as rapidly as possible. The summer 2006 war in Lebanon caused large amounts of demolition waste that needed to be evacuated as soon as possible for occupants to reconstruct their houses. This is also the case for the current armed struggle in Syria. The highlighted differences between CW and CDW are summarized in Table 1 below.
Table 1 comparision between CW and CDW
Characteristics CW CDW Quantity of waste generated Variable and uncertain Known and deterministic
Possibility of reducing quantities if preventive measures are taken
Yes if good practices are followed
No: the quantity is fixed
Rate of generation Continuous Stepwise function

325
Period over which waste are generated for a given project
Large Small
Composition Depends on stage of progress
Known (concrete and cementious material*)
Quantity generated per day when construction or demolition takes place
Small Large
Sorting Can be easily done Commingled waste, depending on demolition technique
Emergency in removing the waste Depends on space availability
Urgent for emergency waste Non urgent for non-emergency waste
Possibility to reuse waste High Low
Quantity according to regions in Lebanon
High in urban and rural areas
High in urban areas, low in rural areas
*Note: this is the general case for materials in Lebanon. However, the composition may change with different construction practices and in different countries of the world.
Waste Management Plan
The amount of construction and demolition waste varies considerably across countries. For example, the shares of C&D waste of the total waste for Japan is (16%), EU is (30%), Australia is (42%) and Spain is (70%)(Fisher 2009)(Tam 2009). These percentages can be computed by making use of the data tracking system adopted by governments. Nevertheless, due to lack of statistics in Lebanon, quantifying the amount of waste is a rather involved computation and requires estimations.
A survey done by the UNDP in 2011 found a total volume of CDW of 1,731,180 m3 all of which dumped illegally in uncontrolled dump sites. This number must have increased to date, since construction is an active industry and virtually no preventive measures are being adopted to reduce waste. Furthermore, this number does not account for the waste resulting from the war in 2006 that resulted in a large
volume of demolition waste (approximately 6 million m3 of rubble (World Bank 2007)). Some of these materials were directly dumped into the sea. One way to obtain additional information is by conducting interviews with representatives of the municipalities, questioning contractors and by conducting field visits. The demolition waste can be estimating by multiplying the number of demolished buildings by the average built-up area and by the average mass of built-up area (Srour 2012).
Most of the developed countries rely on the 3R “Reduce, Reuse and Recycle” framework (Yeheyis 2011) as a way to preserve their natural resources as much as possible and to avoid the haphazard dumping situations. For instance, even though Canada is considered to be one of the countries with large empty spaces, the government is extremely concerned about construction waste and works on source reduction, reuse and recycling of materials.

326
These are essential steps in saving natural resources and minimizing the amount of waste considerably. One of the most important factors contributing to unnecessary waste production during construction is the occurrence of design modifications. These changes result from errors in the early design stages or from change orders made by the client during the construction phase. Therefore, if the design is worked thoroughly in the preliminary stages waste can be reduced noticeably (provided that the contractor adopts some special measures: e.g. not ordering materials in excess, reusing the excess material in other projects etc…). Construction waste should be reused if it is still in a good state and functional for additional construction purposes. Reuse helps saving time, effort and reduces the amount of waste generated. Finally, recycling is of crucial importance. It enables contractors to use the same material again, after it has been processed in specialized plants. This facilitates the preservation of our natural resources, hence increasing sustainability. One must note that there are regulations and restrictions precising the permissible percentage of recycled materials used in a certain facility for safety measures.
Land filling is inevitable in all C&D processes because some materials cannot be recycled and, even after reusing, recycling and incinerating (oxidation of combustible waste), there could still be remains of different materials that have no construction value.
In Lebanon, most if not all of the generated C&D waste ends up in the 166 CDW dumps according to studies made by the UNDP up to the year 2011 (Kayal 2011). These dumps, which cover various regions and have very different characteristics, are uncontrolled. In fact in the final report done by the UNDP, the distribution of these dumps is made easy to visualize by the use of the GIS software: each dump is represented on the country map along with its characteristics (e.g. comprehensive data base includes: shape, town, status, type of dump, volume, height of the highest point, size
of the plot etc…). This representation was used by the authors to study the closure and rehabilitation of uncontrolled dumps throughout the country. The quantification did not rely on an optimization model; however, a weighted average was computed for every dump for selected attributes (total quantity of waste, geology, hydrology, duration of dump exposure, presence of alternatives etc…) and action fiches were presented for the most threatening dumps. The total estimated cost of rehabilitation of the 166 CDW dumps is reported to be 9.37 million dollars.
Since Lebanon is a small country (with a total surface of 10,452 Km2), it is normal that the generated waste is not only polluting the environment (fauna, flora, sea and soil), but also they are occupying considerable amounts of useful lands and resulting in an increase in land prizes. Therefore, recycling of all the waste that have been accumulated for years is of crucial importance.
Mathematical Model
In multiple regions of the world, thorough analysis is being conducted by specialists in order to recommend the most economical recycling option having the least environmental impact. Most of these evaluations rely on enumerating the different possible scenarios and then using a mathematical formulation to choose the most appropriate solution (Srour 2012). Some authors make use of soft-wares (Banias 2010) (Hiete 2011) in order to get accurate results for more involved computations. However, in all the cases, the optimal or a very close to optimal case solution is desired.
In order to conduct feasibility study for implementing a recycling plant and determine its characteristics (e.g. size, type and location), the following parameters need to be estimated: the generated CDW waste in a given region, the cost of building and operating a recycling plant and potential markets. According to the gathered

327
and calculated data, governments will be able to set recycling gate fees for plants, gate tipping fees for landfills, and prices of recycled materials. One should expect the cost of recycled material to be lower than the cost of new material to encourage contractors to use recycled waste. Also, the recycling gate fees should be lower than the gate tipping fee; otherwise contractors will keep dumping their waste illegally (Srour 2012). Since interviews and mathematical formulations are used for data gathering, estimations and pricings, the model cannot be considered as optimal. In fact, an optimization model is required for the case of Lebanon to determine the best location and size of C&D recycling plant.
In (Banias 2010), a multi-criteria assessment method is adopted to determine the best location of Units of Alternative Management. As first step, the potential sites are listed along with the different criteria (social, environmental, economical) to be considered for each of these sites. Then, after choosing a weight factor for each criterion, the performance of the sites is computed based on a weighted average formulation. Global concordance and discordance factors are calculated for each pair of alternatives. The value of these factors should be less than the designed threshold (or limit) for the two alternatives to be considered suitable (indifference). Otherwise, one of the sites is preferred and the other one is disregarded. This mathematical model uses ELECTRE III software (which relies on binary outranking relations) to compare between the sites, select the most suitable site (through a descending and an ascending distillation), and perform a sensitivity analysis. This model, thought optimal, may be subjective in the way the parameters and weights are chosen: they can vary from a decision maker to another. For instance, while some people may favor the environmental aspects as being the most important factors, some others may want to stress on the economic side of the problem.
Another model adopted for the case of Germany to determine the best waste recycling network
(Hiete 2011), relies on the use of mixed integer programming. It is implemented in a General Algebraic Modeling System (GAMS). This model takes into account the various costs (transportation and processing of waste, environmental costs) and revenues (e.g. sale of recycled products), and optimizes for the minimal cost. The constraints are mainly: mass balance of waste, capacity limitation of recycling plants, capacity limitation of demand on recycled material, non negativity of variables and the impossibility to close existing plants. The number of recycling plants per regions is modeled as a binary variable in order to prevent having similar plants in the same area. This model is the closest to the one we want to apply for the case of Lebanon since it relies on optimization taking into account various factors. However, it cannot be applied without modifications because the case is different and many assumptions and simplifications may change. For instance, there is no existing recycling plant in Lebanon
Since there is scarcity of land in the agglomerate capital Beirut, one would expect numerous demolition projects of old buildings, making place to new skyscrapers (229 buildings were demolished from 2009 to 2010). This would cause a considerable increase in the size and number of haphazard C&D waste dumping all over the country. Therefore, there is a urgent need to get rid of the waste that is becoming a threat to the population and the environment.
Nevertheless, and despite the international awareness to reduce dumping and the new trend for recycling, there is still no recycling plant in Lebanon for C&D waste. Since the discussed models cannot be directly applied for the case of Lebanon, there is a compulsion to construct an optimization model at the level of the country as a whole. This model should determine the optimal size and the number and the locations of recycling plants. This must also be accompanied with strict regulations that enforce contractors to transport all their waste to be processed in these plants.

328
References
Banias, G., Achillas, C., Vlachokostas, C., Moussiopoulos, N., Tarsenis, S.,. "Assessing multiple criteria for the optimal location of a construction and demolition waste management facility." Elsevier, 2010: 2317-2326.
Begum, R.A., Siwar, C., Pereira, J.J. & Jaafar, A.H. "Attitude and behavioral factors in waste management in the construction industry of Malaysia." Conservation and Recycling, 2009: 321-328.
Fisher, C., Werge, M. "EU as a Recycling Society." Present Recycling Levels of Municipal Waste and Construction & Demolition Waste in the EU. Copenhagen: European Topic Centre on Sustainable Consumption and Production, 2009.
Hiete, Michael., Stengel, Julian., Ludwig, Jens., Schultmann, F.,. "Matching construction and demolition waste supply to recycling demand: a regional management chain model." Building Research & Information, 2011: 333-351.
Kayal, R., Khoury, R., Chadi A., Merhebi, F., Ghanem, R., Kahi. M. Provision of consultancy services for the Preparation of Master lpan for the Closure and Rehabilitation of Uncontrolled Dumps thoughout the country of Lebanon. Lebanon: Earth Link and Advanced Resources Development, 2011.
Srour, I., Chehab, G., Mutasem, F., Tamraz, S. "Pilot-Based Assessment of the Economics of Recycling Construction Demolition Waste." Waste Management & Research, 2012: 1-32.
Tam, V.W. "Comparing the implementation of concrete recycling in the Australian and Japanese construction industries." Journal of Cleaner Production, 2009: 688-702.
Yeheyis, M., Hewage, K., Alam, M.S, Eskicioglu, C., Sadiq, R.,. "An overview of construction and demolition waste management in Canada: a lifecycle analysis approach to sustainability." Canada, 2011.
Acknowledgement:
Dr. Issam Srour, Assistant Professor at the American University of Beirut
Dr. Ghassan Chehab, Assistant Professor at the American University of Beirut

329
Quantifying the Major Parameters that Characterize the Workforce in the Lebanese Construction Industry
Mhd Ghayth Lattouf; Marwan Sarriedine
Engineering Management Program American University of Beirut
Bliss Street, Hamra [email protected]; [email protected]
Abstract- Efficient use of the workforce is a major driver of success for any industrial operation (e.g., construction field work, port container terminal activities). Strategic workforce management decisions (e.g., hiring, training, and staffing) have a direct impact on cost, schedule, and quality of work. Researchers have developed several mathematical programming models to optimize such strategic decisions. These models rely on parameters and input data that characterize the workforce in terms of trades, skill levels, wages, hiring costs, training costs, overtime, etc. The goal of the proposed study is to quantify the major parameters in the Lebanese Construction industry through an extensive literature review and a survey. The literature review will include papers which have proposed models that dealt with workforce management especially in the construction industry. This paper is part of a bigger research that will aim at modeling the common uncertainties in workforce management such as absenteeism, supply, demand, schedule changes, etc. Constructs are then to be extracted from the survey to quantify various uncertainty parameters as well as providing a metric for different workforce characteristics.
I. INTRODUCTION
The issue of workforce management is under extensive study in the construction management domain. Construction sites do suffer from skilled labored shortage. For instance, in a study done by the Construction Confederation and Construction Products Association in the UK showed that a skills shortage led to 27% of contractors turning down work and 29% reporting a late completion of projects. The Planning Commission of India has projected that the construction sector will require another 47 million people in the workforce over the next decade [15]. Therefore to meet the high demand of the construction industry, several strategies have been studied. Workforce management strategies can be classified into the following categories [1]:
1- Work Assignments, especially the effect on efficiency of the assignment of different work task types to workers (e.g. High revenue producing tasks vs. Low revenue producing tasks).
2- Crew Structuring: the type of workers and number of different skilled laborers in a group and the importance of flexibility in crew structuring.
3- Minimizing the frequency and level of disruptions on site (e.g. through abiding to lean measures)
4- Utilization of multi-skilled workers or crews in construction and optimizing the size of multi-skilled crews, or the extent to which to cross train workers to become multi-skilled
5- The feasibility of modular construction and the extent to which it will increase productivity (e.g. Gomar et al. [3] who studied the effect of using preassembled duct sections on productivity).
6- The possibility of making use of symbiotic crew relationships.
The category which this paper focuses on is multi-skilled workers, as it attempts to implement an optimization of workforce management through cross training in the Lebanese construction industry. This work is an extension of work completed at the University of Texas Austin in collaboration with the CII (construction industry institute). Castañeda et al. [16] and Brandenburg et al. [17] proposed strategies –referred to as Tier I and Tier II- to improve the state of construction workforce management. These strategies attempt to improve the overall productivity time and maintain longer work durations. Tier I focused more on what could be done with the current skill set of workers in terms of organization of work, on-site communication and proper field management. Tier II studies how the workforce could be enhanced in the future through enhancing worker skill sets, and increasing the worker’s value. One of the aims of the Tier II strategy is training workers to become multi-skilled, a property that proved to be beneficial. The paper by Gomar et al. [3], for example, focused on the benefits of hiring multi-skilled workers such as enhancing worker efficiency, prolonging worker employment duration, and decreasing indirect labor costs. They added that multi-skilled workers result in a better continuity in the work in addition to improving the quality of work. It was also

330
concluded that the success of multi-skilling relies on the capability of the foremen to form crews and correctly assign the type and number of workers to the relevant tasks. Other conclusions of multi-skilling are that there is a certain maximum of about 10 to 20 % of the workforce, beyond which the marginal benefit of multi-skilling is insignificant. Another ceiling is placed on the number of skills per worker, after two – three skills the advantages of prolonged worker employment and enhanced productivity are minimal. The paper by Liua and Wang [4] came to a similar conclusion concerning multiskilling. Tier II suggests the possibility of training workers in more than a single skill, even in management and soft skills. Cross-training workers to become multi-skilled create workforce flexibility which acts as an effective buffer against various forms of variability. Cross training enables companies to utilize workers more effectively and has other benefits such as improved communication, increased worker learning, and higher worker morale [2]. However cross-training can be costly, especially when training costs are high. Furthermore, wages of multi-skilled workers are usually higher than single skilled workers. Therefore, in order to know the optimum number of multi-skilled workers to hire, and the required number of single skilled workers to train, studies have used optimization models. Srour et al. [2] developed a linear optimization model for workforce optimization that is based on CII’s Tier II study that dealt with future improvements to the current workforce. Srour’s linear model aims at maximizing strategic decision making so as to make the most use of the workforce, through cross-training and proper workforce hiring. Gomar et al. [3] also developed a linear programming model for the assignment and allocation of workers, the model proved the benefits of employing multi-skilled workers. It is also important to note that both Srour et al. [2] and Gomar et al. [3] models are of deterministic nature, i.e. they assume a full knowledge of problem parameters (e.g. supply and demand of workers, hiring potentials, cost of training and hiring).
II. ANALYSIS AND SURVEY
To implement any of the above models for the case of Lebanon the following parameters and characteristics need to be identified: 1- Trades or Skill Sets 2- Employment Duration 3- Ethnicity of Workforce 4- Skill Levels 5- Willingness of workers to cross-train 6- Affinity of skills to each other
7- Level of absenteeism 8- Frequency in schedule changes 9- Turnover Rates 10- Wages 11- Hiring Costs 12- Shift Patterns and Overtime Practices Several papers studied the above-listed factors; however these studies are based on information collected from regions that are very different from Lebanon. This is the main reason behind conducting a survey, since the Lebanese Construction workforce has very unique characteristics and several factors can affect the availability of workers. For example, recent political instabilities in the region played a major role in increasing the availability of workers, both skilled and unskilled, because a significant number of workers that used to work in Syria started coming to Lebanon in search for a job. Likewise, political instabilities can have the opposite effect on workforce availability. For instance, in the war of 2006, thousands of workers left Lebanon for fear of their own safety. For those reasons one can see that a survey will be an essential tool that is needed in order to accurately capture the workforce characteristics.
A. What is a Survey? A survey is not just a tool to collect information, but rather it is a complete system for gathering information to characterize, clarify, and compare knowledge, attitudes, and behaviors [5]. In other words, it is the need of observing or investigating some facts about a specific situation by collecting information from a number of individuals, a sample, to learn something about the larger population on which the survey is based [6]. During the last few decades, surveys have become very popular since several companies are using them as tools to identify and characterize the market. The reason for his is because the idea of “Produce what people need to survive” changed to “Produce what people want”. This meant that manufactures had to gather information about what the general population wants in a specific type of products. Therefore, it is now very common to go through an online survey or even come across surveyors that ask about a specific product, either via personal interviews or through telephone.
B. Methodology for Conducting a Survey
Several studies have examined the methodology that should be followed by researchers in order for them to conduct a proper survey. For example, the research done by Agarwal [7] discusses a specific framework that should be followed to

331
conduct an effective survey. Study objectives should be formulated first, because this will help in identifying the main questions that a survey needs to answer. The next steps involve selecting the methods of data collection, developing the survey instrument, and performing a pilot test on experts first and then on a small sample of the study population to make use of their comments and subsequently make the necessary adjustments to the survey. Next, the validity of the survey should be tested by analyzing the data for convergent and discriminant validities, and finally conducting the survey on the sample and gathering and analyzing the data collected. Also Pfleeger and Kitchenham [5] talked about designing a survey in such a way that provides the most “effective” means of acquiring the information needed to satisfy the objectives. The authors suggested three factors that might have a direct impact on the “effectiveness” of a survey, bias level, level of appropriateness, and cost-effectiveness. Bias happens when a certain question is formulated in such a way that different people may interpret it differently and consequently their answers might not reflect their opinion. Also bias might occur when the sample size is too small and as a result nonresponse bias might have an effect on the results [9]. Another important factor that researchers must consider is the data collection method. Data collection is the process of collecting the required data from the chosen sample of the population by locating and contacting them to seek their participation [10]. Therefore the method of data collection should be chosen in such a way that guarantees maximum response rate and the most accurate data while satisfying the budget constraints. There are 2 main methods of data collection:
1. Self-enumeration: This is where the respondents complete the questionnaire without the help of an interviewer. This can be done via electronic means (e-mail, website, etc.) or by post.
2. Interviewer-assisted i. Personal Interviews: The respondents get
assisted by an interviewer who is conducting the questionnaire in person
ii. Telephone Interviews: The interviewer assists the respondents via telephone.
Each of those methods has its own advantages and disadvantages. Self-enumeration is easier and cheaper to conduct since there is no need of an interviewer, however there is a higher chance of no responses and bias. Personal and telephone interviews, on the other hand, provide a much higher response rate and less biased results, but at the same time they
are more expensive to conduct and they are unfeasible if the sample size is large [10]. Table 1 provides a comparison between the methods discussed.
Table 1: Interviewer Assisted vs Self-Enumeration Collection Methods Self-Enumeration Interview-Assisted
Personal Telephone Cost Low High Medium Time Longer Average Shorter
Response Rate Low High Medium-high
C. Structure of the Survey The main aim of conducting a survey in this research is to extract the necessary constructs to quantify the various uncertainty parameters in the construction industry as well as to provide some metrics for different workforce characteristics. Based on the literature review, the structure of the survey was established. At the beginning, the main focus was on how the questionnaire would help in developing a strategic workforce allocation model that can handle uncertainties. This provided a guideline and a plan to come up with questions that would target specific information and guide the respondents to what exactly is required. Heisenberg (1959) once said “…since the measuring device has been constructed by the observer, …we have to remember that what we observe is not nature in itself but nature exposed to our method of questioning”[11]. This statement explains that the person who designs the questionnaire must remember that the results do not reflect exactly what the respondent might think to be true but rather it’s the respondent interpretation of the question. This is why formulating the questionnaire is a very important process that requires a great deal of testing and thinking. Next, each question was analyzed thoroughly to know exactly where it should be positioned and how the answers would be categorized. The format of the answers needed some attention since questions could have been either open ended or close ended. Questions that were close ended had an appropriately specified range of answers to guarantee an accurate response. There are many hypotheses that the research team would like to validate by conducting this survey. The most important ones are:
1. Working in a more rigorous shift schedule negatively affects productivity and might have a direct relationship with the rate of absenteeism (failure to appear at work).
2. The rate of absenteeism is usually higher for unskilled workers than skilled workers or foremen.
3. The demand is not of a deterministic nature, it is rather stochastic with a probabilistic distribution.

332
Consequently, several questions in the survey are aimed at verifying formulated hypotheses. This was done by asking about the schedule of the project, variation orders, and the shift schedule used on site among other questions. There are also some questions that are aimed at characterizing the skill levels for different types of projects, estimating the size of the projects, and describing the demographics of the workforce and the feasibility of training. It is also important to note that most of the questions separate the workforce based on skill level, so for instance a question about the workforce demographics is divided into skilled, unskilled, and foreman. This helps in accurately characterizing the workforce since workers with different skill levels have different characteristics.
D. Pilot Testing and Sample Size After the survey is finalized, a pilot test needs to be carried out on some of the experts in the field to get some feedback on the questionnaire. The subjects could also provide some valuable insights on anything that seems ambiguous or misleading. Bowden et al. [12] talked about piloting in specific and how it should be conducted. In this phase, interviews are conducted with a small sample from the population under a controlled environment, meaning that one of the survey’s authors should be present to take down notes of not only the responses to questions, but also other information that the respondent might give such as asking for a clarification for example. Moreover, the interviewer must record the respondents’ body language such as pauses before responses or emotional reactions to certain questions. At the end of the pilot interviews, the opinions and suggestions of the respondents should be recorded. Finally based on the feedback, modifications can be made to the survey questionnaire until it is satisfactory enough to pass the pilot test. In this research, it was decided that the survey will be conducted by means of personal interviews. This method was chosen because any internet based survey will have a very low response rate, especially in Lebanon, since people here are not accustomed to questionnaires. Moreover, some of the respondents might have an inquiry about some of the questions; and therefore, it is essential that an interviewer be present. The telephone based survey is also infeasible since it is almost impossible to get the numbers of the sample population due to a lack of resources and information. Piloting will be conducted on a couple of experts from the construction industry to get their feedback and comments about the survey before finalizing it. There is a very important question that researchers should think about before piloting the survey, i.e. what is a suitable survey size? According to Baarttlletttt et al. [13], the sample size greatly influences the quality and accuracy of the research and therefore they came up with a set of formulas to estimate
an appropriate sample size. There are two main factors that a researcher must identify: the risk that he or she is willing to accept (Margin of error), and the level of acceptable risk that the researcher is willing to accept in case the real margin of error is higher than the acceptable margin of error. The population targeted in this research is the construction managers/field Engineers working on construction projects in Beirut, since the workforce they have are all from the same pool and so the characteristics of this workface can be studied. The questions in the survey are mostly of continuous nature; and therefore, the sample size calculations were based on that fact. It was decided that alpha, the level of acceptable risk, should be set at .1 and a 3 percent acceptable margin of error was chosen. Before calculating the sample size, the population size was estimated by using the “Order of Engineers” data on the amount in m2 of building permits in Beirut from March 2011 to March 2013. Then this number was divided by 5000 m2 (A typical floor area of 500 m2 multiplied by 10, ground floor, underground parking, and 8 floors) to get an estimate of the number of projects that are currently underway. The population size was estimated to be about 361 projects. It is also important to note that it was assumed that every project must either have a construction manager and/or field engineer. Using the formulas suggested by Cochran [14], the sample size was found to be 65. Since this number is greater than 5 percent of the population, Cochran’s correction formula had to be used and the subsequent population size was found to be 55.
III. CONCLUSION
As stated earlier, this paper is part of an ongoing research project that aims at understanding and modeling uncertainty parameters in workforce management decisions. Therefore, several questions aim at quantifying or characterizing common uncertainties like absenteeism, fluctuations in demand and supply of workforce, among other factors in order to help the researchers to mathematically model those factors and subsequently help the people responsible for strategic workforce management make better decisions when it comes to hiring, training, and assignment of workers.
ACKNOWLEDGMENT
We wish to give our special thanks to both Professors Issam Srour and Faith Jordan Srour for providing us with valuable information and for their great advice.

333
REFERENCES [1] H. Randolph, T., & J. Horman, M. (2006). Fundamental Principles of
Workforce Management . J. Constr. Eng. Manage, 97-104. [2] Srour, I., Haas, C., & Morton, D. (2006). A Linear Programming
Approach to Optimize Strategic Investment in the Construction Workforce. Journal of Construction Engineering and Management , 1158-1165.
[3] E. Gomar, J., T. Haas, C., & P. Morton, D. (2002). Assignment and Allocation Optimization of Partially Multiskilled Workforce. Journal of Construction Engineering and Management , 103-109.
[4] Liua, S.-S., & Wang, C.-J. (2012). Optimizing linear project scheduling with multi-skilled crews. Automation in Construction, 16-23.
[5] Pfleeger, S. L., & Kitchenham, B. A. (2001). Principles of Survey Research Part 1" Turning Lemons into Lemonade". Software Engineering Notes, 16-18.
[6] Ferber, R., Sheatsley, P., Turner, A., & Waksberg, J. (1980). What is A Survey? Washington, D.C., United States of America: American Statistical Association.
[7] Agarwal, N. K. (2011). Verifying survey items for Construct Validity: A two-stage Sorting Procedure for Questionnaire Design in Information Behavior Research. ASIST 2011. New Orleans.
[8] Pfleeger, S. L., & Kitchenham, B. A. (2002). Principles of Survey Research Part 2: Designing a Survey. Software Engineering Notes, 18-20.
[9] Wunsch, D. (1986). Survey research: Determining sample size and representative response. Business Education Form, 31-34.
[10] Statistics Canada. (2010). Survey Methods and Practices. Ottawa,
Canada. [11] Heisenberg, W. (1959). The Copenhagen Interpretation of Quantum Theory. In G. Allen, & U. Edition, Physics and Philosophy. [12] Bowden, A., Fox-Rushby, J., Nyandieka, L., & Wanjau, J. (2002).
Methods for pre-testing and piloting survey question. Health Policy And Planning , 322-330.
[13] Baarttlletttt, J. E., Kottrlliik, J. W., & Hiiggiins, C. C. (2001). Organizational Research: Determining Appropriate Sample Size in Survey Research. Information Technology, Learning, and Performance Journal, 43-50.
[14] Cochran, W. G. (1977). Sampling techniques (3rd ed.). New York: John Wiley & Sons. [15] Hajela , Ruchi . "Shortage of Skilled Workers: A Paradox of the Indian
Economy." SKOPE Research Paper. 111. (2012): n. page. Web. 25 Apr. 2013. <http://www.skope.ox.ac.uk/sites/default/files/WP111.pdf>.
[16] J Castañeda, R Tucker, and C Haas, "Workers’ Skills and Receptiveness to Operate Under the Tier II Construction Management Strategy," Journal of Construction Engineering and Management, vol. 131, no. 7, pp. 799-807, July 2005.
[17] Stefanie G. Brandenburg, Carl T. Haas, and Keith Byrom, "Strategic Management of Human Resources in Construction," Journal of Management in Engineering, vol. 22, no. 2, pp. 89-96, April 2006.


335
AUTHOR INDEX
335
108 Abbas, Yara
88 Abkarian, Abkar
245 Abou Chacra, Firas
127 Abou Diwan, Mariana
96 Absi, Nadira
139 Abu Kar, Abdul Aziz
46 Achkar, Loulwa
189 Achkouti, Yara
82 Adra, Ghida
121 Al Alem, Fuad
198 Al Aroudaki, Basel
139 Al Assir, Fathi
76 Al Awar, Faisal
198 Al Choikani, Tarek
177 Al Doori, Haya
139 Al Rifai, Mazen
217 Al Sharif, Abdallah
183 Al-Awar, Weam
133 Al-Ayyash , Zahwa
172 Al-Jammal , Hala
240 Al-Jurdi, Rebal
277 Alloush, Mhamad Mahdi
288 Andraos, Jamil
177 Antoun, Krystel
82 Aouad, Sibylle
189 Aoun, Soumar
288 Araby, Jad
55 Aridi, Jana
76 Aridi, Omar
76 Aridi, Weam

198 Ashouri, Hazar
277 Assaad, Ahmad
145 Assaf, Rania
277 Atallah, Lama
165 Atallah, Nabil
121 Baassiri, Amro
277 Bahja, Hasan
265 Bakarji, Joseph
223 Baladi, Maria
211 Baraka, Kim
235 Barrage, Ahmad
223 Berbari , Joe
151 Beydoun, Abdullah
203 Boukhater, Carl Michael
258 Bu Jawdeh, Samer
258 Chalhoub, Nathalie
265 Cheikh, Mouhammad
318 Choubassi, Carine
177 Codouni, Paul
203 Dakroub, Oussama
189 Damiani, Riki Karim
127 Darwich, Mona
114 Deeb, Ibrahim
108 Dimien, Jade
288 Dubaisi, Farah
76 Eid, Jad
88 El Bawab, Kheireddine
145 El Chami, Anwar
108 El Chartouni, Chirine
96 El Hassrouni, Georges
114 El Jisr, Hammad
139 El Khodari, Samir
251 El Shafei, Ahmad
177 El Soueidi, Jonathan
296 El- Ghalayini, Ayman
296 El- Monajjed, Khaled
336
157 //

337 337
151 Elrachidi, Edrees
102 Eltibi, Ataya Alexander
217 Ezzeddine, Ali
102 Fansa, Yasmin
127 Faraj, Salman
165 Farshoukh, Taher Masalkhi
217 Ginzarly, Riham
229 Ghazali, Rami
229 Ghazali, Rima
211 Ghobril, Marc
102 Ghotmi, Adnan
189 Habib, Zeina
145 Haidar, Firas
88 Hajjar, Mohammad
282 Halaby, Rana
217 Harb, Hayyan
251 Hariri, Farah
296 Hijazi, Hadeel
114 Hotait, Ismail
271 Issa, Elias
65 Jallad, Mayssa
235 Jamil, Hasan
96 Jari, Jad
139 Jreig, George
133 Kahil, Noura Sirine
96 Kanaan, Youssef
133 Karakachian , Angela
151 Karout, Khaled
157 Kayssi, Issam
265 Keniar, Khoudor
102 Khauli, Paul
183 Khawaja, Amal
223 Khayat, Joseph
271 Kobayter, Sami
288 Kobeissi, Hiba
172 Korban, Joseph

203 Lahoud, Fayez
329 Lattouf, MHD Ghayth
145 Maalouf, Emmanuel
96 Malaeb, Omar
211 Malek, Sami
282 Mansour, Fatima
76 Mawla, Adel
165 Melhem, Mohamad
38 Mneimneh, Dina
312 Mneimneh, Farah
282 Moawad, Evita
165 Mostapha, Mostapha
165 Mostapha, Yassin
277 Mouhanna, Hiba
88 Mourad, Chaalan
288 Moustafa, Kassem
82 Mouzannar, Andrea
133 Mrad , Maha
114 Najdi, Abdalla
245 Naous, Dana
82 Nehme, Joe
82 Obeid, Patrick
127 Olabi, Roba
133 Onaissi, Rouba
282 Rahal, Said
229 Rajeh, Ziad
235 Ramadan, Hashem
127 Ramadan, Rabie
108 Razzouk, Nancy
271 Rustom, Zafer Victor
172 Saba, Jean
177 Sadaka, Marie Valerie
296 Safadi, Omar Hussein
183 Said, Maher
240 Salami, Hawraa
145 Salem, Camille
338

339 339
121 Samaha, Paul
329 Sarieddine, Marwan
318 Sassine, Christopher
240 Sayegh, Ghadi
323 Serhal, Caren
183 Sinno, Noura
251 Sinno, Zeina
102 Sleiman, Fuad
245 Sleiman, Sam
88 Slim, Pierre
108 Soubra, Tarek
151 Taha, Hani
172 Tarazi, Alexander
157 Teokari, Christina
183 Wafa, Zeina
306 Wahab, Zayd
271 Yammine, Tony
271 Zaatari, Karim
151 Zahreddine, Rayane
49 Zakharia, Melissa
114 Zankoul, Emile
282 Zayat, Hani
189 Zeidan, Talina
157 //


![[ CONFERENCE TENTATIVE ]](https://static.fdokumen.com/doc/165x107/6332727f3108fad7760ea090/-conference-tentative-.jpg)