Engineered Photosystem II Reaction Centers Optimize Photochemistry versus Photoprotection at...
8
Engineered Photosystem II Reaction Centers Optimize Photochemistry versus Photoprotection at Different Solar Intensities David J. Vinyard, †,‡,§,⊥,# Javier Gimpel, ∥,# Gennady M. Ananyev, †,‡ Stephen P. Mayfield, ∥ and G. Charles Dismukes* ,†,‡ † Department of Chemistry and Chemical Biology and ‡ Waksman Institute of Microbiology, Rutgers, The State University of New Jersey, Piscataway, New Jersey 08854, United States § Department of Chemistry, Princeton University, Princeton, New Jersey 08540, United States ∥ California Center for Algae Biotechnology, Division of Biological Sciences, University of California, San Diego, La Jolla, California 92093, United States * S Supporting Information ABSTRACT: The D1 protein of Photosystem II (PSII) provides most of the ligating amino acid residues for the Mn 4 CaO 5 water-oxidizing complex (WOC) and half of the reaction center cofactors, and it is present as two isoforms in the cyanobacterium Synechococcus elongatus PCC 7942. These isoforms, D1:1 and D1:2, confer functional advantages for photosynthetic growth at low and high light intensities, respectively. D1:1, D1:2, and seven point mutations in the D1:2 background that are native to D1:1 were expressed in the green alga Chlamydomonas reinhardtii. We used these nine strains to show that those strains that confer a higher yield of PSII charge separation under light-limiting conditions (where charge recombination is significant) have less efficient photochemical turnover, measured in terms of both a lower WOC turnover probability and a longer WOC cycle period. Conversely, these same strains under light saturation (where charge recombination does not compete) confer a correspondingly faster O 2 evolution rate and greater protection against photoinhibition. Taken together, the data clearly establish that PSII primary charge separation is a trade-off between photochemical productivity (water oxidation and plastoquinone reduction) and charge recombination (photoprotection). These trade-offs add up to a significant growth advantage for the two natural isoforms. These insights provide fundamental design principles for engineering of PSII reaction centers with optimal photochemical efficiencies for growth at low versus high light intensities. ■ INTRODUCTION In oxygenic photosynthesis, the pigment−protein complex Photosystem II (PSII) uses solar energy to catalyze the oxidation of water and reduction of plastoquinone (PQ). The water-oxidation complex (WOC) is a Mn 4 CaO 5 cluster coupled to the primary site of photochemical charge separation (P 680 ) by a conserved redox-active tyrosine residue (D1-Y161 or Y Z ). Following four one-electron oxidations of the WOC by Y Z and release of four protons to the lumen, one molecule of oxygen (O 2 ) is released. 1,2 The O 2 generated by PSII has accumulated in the oceans and atmosphere over the past ca. three billion years 3 and serves as an efficient electron sink to power heterotrophic metabolism through respiration. 4 At the core of PSII is the D1 subunit, which provides not only most of the ligating amino acid residues to the WOC but also binding pockets for P 680 , pheophytin (Pheo), and the secondary PQ acceptor (Q B ). The phytyl tail of the primary PQ acceptor (Q A ) is also associated with D1. The D1 polypeptide interacts with the D2 subunit and with CP43, a chlorophyll (Chl)-binding antenna subunit. Cyanobacteria are unique among oxygenic phototrophs in that they often contain multiple isoforms of the D1 protein, which are encoded by multiple psbA genes. 5 These psbA genes are differentially expressed on the basis of light intensity, 6−8 light quality, 9,10 temperature, 11 reductive stress, 12 and O 2 partial pressure. 13,14 The freshwater cyanobacterium Synechococcus elongatus PCC 7942 (hereafter Synechococcus 7942) contains two D1 isoforms: D1:1, which is expressed under normal growth conditions, and D1:2, which is expressed in response to stress (most commonly high light intensity). 6−8,15 Each isoform confers not only a fitness advantage for light utilization at its respective intensity but also a greater cellular biomass yield. 16 The fitness advantage of each isoform is believed to be redox- controlled. Synechococcus 7942 D1:1 and D1:2 vary by 25 out of a total of 360 amino acids, 15 of which only residue D1-130 has Received: January 15, 2014 Published: February 18, 2014 Article pubs.acs.org/JACS © 2014 American Chemical Society 4048 dx.doi.org/10.1021/ja5002967 | J. Am. Chem. Soc. 2014, 136, 4048−4055
Transcript of Engineered Photosystem II Reaction Centers Optimize Photochemistry versus Photoprotection at...
Engineered Photosystem II Reaction Centers OptimizePhotochemistry versus Photoprotection at Different Solar IntensitiesDavid J. Vinyard,†,‡,§,⊥,# Javier Gimpel,∥,# Gennady M. Ananyev,†,‡ Stephen P. Mayfield,∥
and G. Charles Dismukes*,†,‡
†Department of Chemistry and Chemical Biology and ‡Waksman Institute of Microbiology, Rutgers, The State University of NewJersey, Piscataway, New Jersey 08854, United States§Department of Chemistry, Princeton University, Princeton, New Jersey 08540, United States∥California Center for Algae Biotechnology, Division of Biological Sciences, University of California, San Diego, La Jolla, California92093, United States
*S Supporting Information
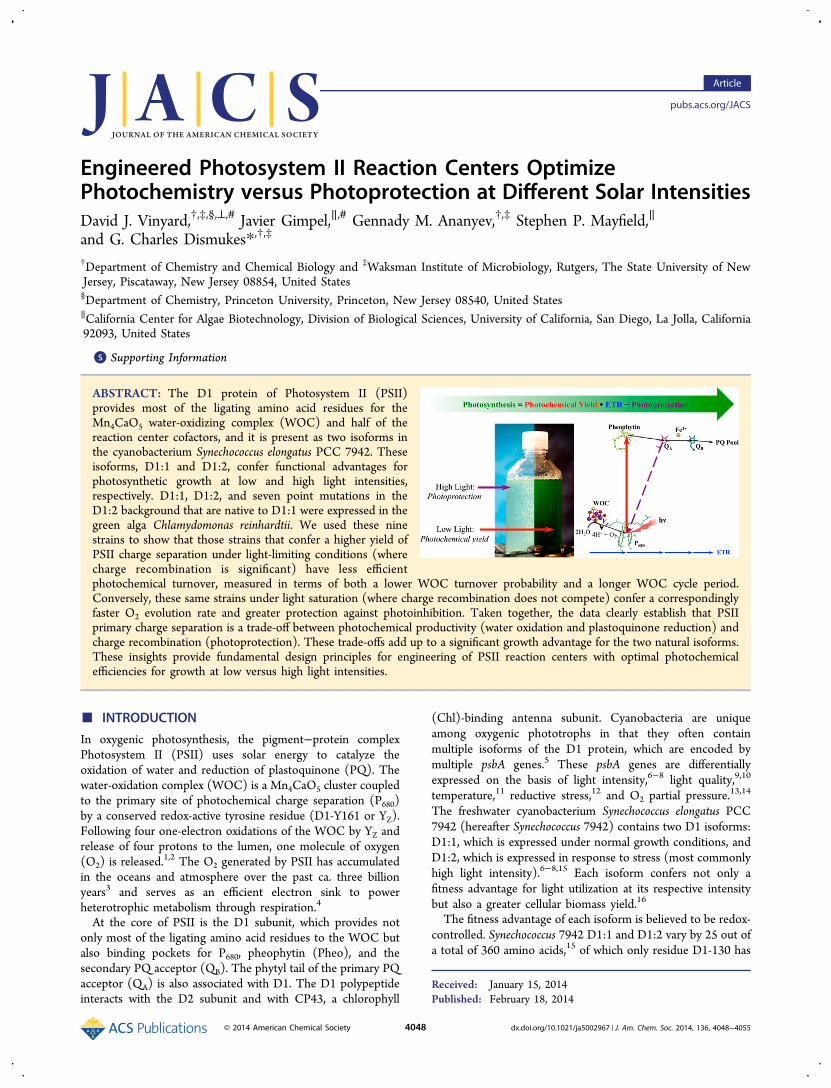
ABSTRACT: The D1 protein of Photosystem II (PSII)provides most of the ligating amino acid residues for theMn4CaO5 water-oxidizing complex (WOC) and half of thereaction center cofactors, and it is present as two isoforms inthe cyanobacterium Synechococcus elongatus PCC 7942. Theseisoforms, D1:1 and D1:2, confer functional advantages forphotosynthetic growth at low and high light intensities,respectively. D1:1, D1:2, and seven point mutations in theD1:2 background that are native to D1:1 were expressed in thegreen alga Chlamydomonas reinhardtii. We used these ninestrains to show that those strains that confer a higher yield ofPSII charge separation under light-limiting conditions (wherecharge recombination is significant) have less efficientphotochemical turnover, measured in terms of both a lower WOC turnover probability and a longer WOC cycle period.Conversely, these same strains under light saturation (where charge recombination does not compete) confer a correspondinglyfaster O2 evolution rate and greater protection against photoinhibition. Taken together, the data clearly establish that PSIIprimary charge separation is a trade-off between photochemical productivity (water oxidation and plastoquinone reduction) andcharge recombination (photoprotection). These trade-offs add up to a significant growth advantage for the two natural isoforms.These insights provide fundamental design principles for engineering of PSII reaction centers with optimal photochemicalefficiencies for growth at low versus high light intensities.
■ INTRODUCTION
In oxygenic photosynthesis, the pigment−protein complexPhotosystem II (PSII) uses solar energy to catalyze theoxidation of water and reduction of plastoquinone (PQ). Thewater-oxidation complex (WOC) is a Mn4CaO5 cluster coupledto the primary site of photochemical charge separation (P680)by a conserved redox-active tyrosine residue (D1-Y161 or YZ).Following four one-electron oxidations of the WOC by YZ andrelease of four protons to the lumen, one molecule of oxygen(O2) is released.
1,2 The O2 generated by PSII has accumulatedin the oceans and atmosphere over the past ca. three billionyears3 and serves as an efficient electron sink to powerheterotrophic metabolism through respiration.4
At the core of PSII is the D1 subunit, which provides notonly most of the ligating amino acid residues to the WOC butalso binding pockets for P680, pheophytin (Pheo), and thesecondary PQ acceptor (QB). The phytyl tail of the primary PQacceptor (QA) is also associated with D1. The D1 polypeptideinteracts with the D2 subunit and with CP43, a chlorophyll
(Chl)-binding antenna subunit. Cyanobacteria are uniqueamong oxygenic phototrophs in that they often containmultiple isoforms of the D1 protein, which are encoded bymultiple psbA genes.5 These psbA genes are differentiallyexpressed on the basis of light intensity,6−8 light quality,9,10
temperature,11 reductive stress,12 and O2 partial pressure.13,14
The freshwater cyanobacterium Synechococcus elongatus PCC7942 (hereafter Synechococcus 7942) contains two D1 isoforms:D1:1, which is expressed under normal growth conditions, andD1:2, which is expressed in response to stress (most commonlyhigh light intensity).6−8,15 Each isoform confers not only afitness advantage for light utilization at its respective intensitybut also a greater cellular biomass yield.16
The fitness advantage of each isoform is believed to be redox-controlled. Synechococcus 7942 D1:1 and D1:2 vary by 25 out ofa total of 360 amino acids,15 of which only residue D1-130 has
Received: January 15, 2014Published: February 18, 2014
Article
pubs.acs.org/JACS
© 2014 American Chemical Society 4048 dx.doi.org/10.1021/ja5002967 | J. Am. Chem. Soc. 2014, 136, 4048−4055

been previously studied.17−20 Residue D1-130 is hydrogen-bonded to Pheo,17 and in D1:1 it is a Gln, while in D1:2 it is aGlu.5 This amino acid substitution has been hypothesized toaccount for the −17 mV shift in the Pheo/Pheo− midpointreduction potential (Em) between D1:1 and D1:2 in isolatedreaction centers from Thermosynechococcus elongatus BP-1.21,22
However, when only the D1:2-E130Q point mutation wasmade in T. elongatus, Em(Pheo/Pheo
−) was changed by −30mV.20 This result is in good agreement with a previous study inwhich a Q130E point mutation in Synechocystis sp. PCC 6803changed Em(Pheo/Pheo
−) by +33 mV.17 The less dramaticchange in Em(Pheo/Pheo
−) between D1:1 and D1:2 comparedwith D1:2-E130Q and D1:2 strongly suggests that other aminoacid differences between the D1 isoforms affect the Pheoenvironment and thus its Em. Revealing the influence of suchamino acid substitutions was a key motivator of the presentwork.Recently, we introduced a robust Chlamydomonas reinhardtii
(hereafter Chlamydomonas) chloroplast expression system forexpressing psbA variants in a uniform green algal back-ground.16,23 In the present study, we used this system toanalyze a suite of point mutations in order to explore which ofthe 25 amino acid substitutions between D1:1 and D1:2 impactthe previously observed phenotypes. We found that in additionto residue D1-130, D1-152 is critically important for thephotochemical quantum yield at high or low light intensity. Ananalysis of D1:1, D1:2, and seven point mutants made in theD1:2 background allowed us to make statistically significantcorrelations between the PSII photochemical quantum yield,WOC cycle period, WOC turnover probability, O2 evolutionrate, and tolerance to photoinhibition. These correlations revealthe trade-offs in performance between photochemical yield andtolerance to photoinhibition, thus providing the fundamentaldesign principles for engineering of PSII reaction centers withoptimal photosynthetic efficiencies for growth at either low orhigh light intensities.
■ METHODSMutant Construction. A Chlamydomonas strain generated from
wild-type 137c (CC-125 mt+) in which both psbA copies had beeninactivated and a single copy of the native gene had been reintroducedat a neutral site in the chloroplast genome was available from aprevious study.24 Herein we refer to this strain as “C.r.”.Chlamydomonas strains expressing heterologous psbA sequences fromSynechococcus 7942 were previously described16 and in this work aretermed D1:1 and D1:2. All point mutations were generated in theD1:2 psbA sequence as described in Figure S2 in the SupportingInformation using standard overlap-extension polymerase chainreaction (PCR).25 The D1 C-terminal peptide extension fromChlamydomonas was constant in all of the constructs (Figure S2).The mutated genes (including their endogenous regulatory regions)were cloned into a Chlamydomonas transformation vector by theUSER cloning technique.26 Transformations were carried out usingbiolistics, and initial selection was performed on kanamycin plates.Single colonies were then transferred to minimal medium forassessment of autotrophy.23 All of the transformations resulted inrescue of photosynthesis and were confirmed by sequencing of thePCR-amplified psbA insertion after at least three growth passages.Culturing Conditions. Strains were grown photoautotrophically
under 80 μE m−2 s−1 of continuous photosynthetically active radiationin HS medium27 supplemented with 5 mM NaHCO3 at 25 ± 1°.Cultures were bubbled with 2% CO2 in humidified sterile air at a flowrate of approximately 200 mL/min. For growth experiments, fullgrowth curves were recorded by monitoring the optical density at 730nm (OD730) and then fit to a four-component Gompertz function.28
The dry weight at stationary phase was determined gravimetricallyfrom filtered cells dried overnight at 90°. For all other analyses,semicontinuous cultures were maintained by daily dilution of eachculture so that experiments were performed on early exponential cells,defined as OD730 = 0.150 ± 0.025. The Chl content was determinedspectrophotometrically by methanol extraction using extinctioncoefficients from Porra.29
Western Blots. Quantitative anti-D1 Western blots wereperformed on thylakoid membrane preparations as previouslydescribed30 with the following modifications. Early exponential cellswere concentrated by centrifugation and then resuspended in proteinextraction buffer (62.5 mM Tris, pH 6.8, 300 mM sucrose, 10 mMdithiothreitol). Cells were lysed by three rounds of snap freezing inliquid N2 and sonication just until thawed. Samples were centrifuged at20000g for 10 min, and the supernatant was discarded. The resultingthylakoid membranes were solubilized in protein extraction buffer plus2% lithium dodecyl sulfate (LiDS), and the solution was subjected toone round of snap freezing and sonication. Samples were centrifugedat 20000g for 10 min to remove cell debris. Into each well of a 4−20%Tris-glycine NUView precast gel was loaded 0.1 μg total Chl, and thegel run at 200 V for 45 min at 4°. Proteins were electrophoreticallytransferred to a PVDF membrane, which was then blocked in 5%nonfat dry milk. The primary antibody was an anti-D1 rabbitpolyclonal antibody targeting the conserved D1 C-terminus (Agrisera,Vannas, Sweden), and detection was facilitated by a horseradishperoxidase-conjugated anti-rabbit goat IgG secondary antibody(GeneTex, Irving, CA). Amersham ECL Prime and Amersham ECLHyperfilm (GE Healthcare, Piscataway, NJ) were used forluminescence detection. Each experiment included a five-pointcalibration curve of D1 standard protein (His-tagged Synechocystissp. PCC 6803 D1, Agrisera), which enabled sample quantification bydensitometry using ImageJ (http://rsb.info.nih.gov/ij/).
O2 Evolution Rates. Steady-state O2 evolution rates weremeasured from early exponential whole cells in HS mediumsupplemented with 5 mM NaHCO3 at 25° using a commercialClark electrode (Hansatech). Continuous saturating illumination wasprovided by a red light-emitting diode (LED) (680 μE m−2 s−1, λmax =627 nm). Determinations of O2 evolution rates [measured as μmol ofO2 (mg of Chl)
−1 h−1] and Western blot analyses (providing Chl/PSIIratios) were performed on identical cultures and used to calculate theO2 evolution rates (in units of O2 PSII
−1 s−1).Fast Repetition Rate (FRR) Fluorometry. FRR fluorometry
measurements were performed on early exponential whole cells instandard medium (HS supplemented with 5 mM NaHCO3) aspreviously described.31 This protocol is summarized in Figure S1 inthe Supporting Information and includes a one-second exposure ofblue light before each two-minute dark adaptation period. Thismethod not only prevents physiological adaptation to the generallydark measurement conditions but also ensures that YD is oxidized atthe beginning of each single-turnover flash (STF) train. The Chl-avariable fluorescence yield, Fv/Fm, was measured on each STF using 60μs pulses at 656 nm. Fv/Fm was calculated from the first-flash (dark-adapted) value (Fo) and the light-saturated value (Fm) from each flashin the train of flashes, with Fv = Fm − Fo (see Figure S1). The WOCturnover period was determined by Fourier transform,31 and the WOCturnover probability was quantified by analytical fitting of the flash-induced oscillations in the amplitude of Fv/Fm to the VZAD extendedKok model using the S-state eigenvalues of asymmetric Markovmatrices (STEAMM) algorithm.32 The light-limited WOC turnoverefficiency was measured at a low flash rate (0.2 Hz) where it is loweredbecause of charge recombination reactions involving metastableoxidation states (the S2 and S3 states).
31
Photoinhibition. Sensitivity to photoinhibition was determined bytemporal tracking of Fv/Fm losses during exposure to saturating lightfrom a red LED panel (300 μE m−2 s−1, λmax = 620 nm) in thepresence of the chloroplast protein synthesis inhibitor lincomy-cin.33−35 Each 3 mL aliquot of early exponential whole cells wastreated with 1 mM lincomycin and then exposed to photoinhibitorylight for 18 min. The sample was then moved to a commercial PAMfluorometer (Photon Systems Instruments, Brno, Czech Republic) and
Journal of the American Chemical Society Article
dx.doi.org/10.1021/ja5002967 | J. Am. Chem. Soc. 2014, 136, 4048−40554049

dark-adapted for 2 min, after which Fv/Fm was measured. This process(18 min light, 2 min dark) was repeated over a 2 h period. Thedecreasing values of Fv/Fm over time were fit to a one-componentexponential decay function.
■ RESULTS
Selection of Point Mutations. Amino acid residue 130was mutated in the D1:2 psbA gene from Glu to Gln (D1:2-E130Q), analogous to that present in native D1:1 (Figure S2 inthe Supporting Information). However, the resulting pheno-type, which is detailed in the following sections, was moresevere than that observed for D1:1 (lower photochemicalquantum yield, lower O2 evolution rate, more sensitive tophotoinhibition, and reduced growth rate). These results are inagreement with the hypothesis20 that the other 24 amino acidvariants between D1:1 and D1:2 provide compensatingresidues that counteract the deleterious effects of Gln atposition 130.Because individually mutating all 25 amino acid variants in all
combinations between D1:1 and D1:2 is impractical, wefocused on residues that shared common structural features andwere highly conserved. A survey of 58 cyanobacterial D1sequences containing Glu130 and 42 containing Gln130showed that D1:2 residues were more conserved in these 25positions than in D1:1, and hence, we chose the former isoformas the target for our mutational analysis. As shown in Figure S2in the Supporting Information, seven of the 25 amino acidvariants between the two isoforms are localized to the interfacebetween the CP43 core antenna and D1 at positions 121, 123,124, 151, 152, 155, and 288. These seven residues in the D1:2sequence were collectively mutated to the corresponding D1:1residues, generating the D1:2-3-helix strain. A second strain wascreated that also incorporated the D1:2-E130Q point mutation(D1:2-3-helix+E130Q).After observing that the 3-helix mutations rescued the
E130Q phenotype (detailed in the following sections), weanalyzed these seven amino acid residues for evolutionaryconservation among cyanobacteria containing both D1:1 andD1:2. Differential expression of psbA genes encoding D1:1 andD1:2 in response to light intensity has been experimentallyobserved in Synechococcus 7942,7 T. elongatus BP-1,36 andAnabaena sp. PCC 7120.37 Of the available genomes inCyanoBase,38 it was determined that six other cyanobacterialikely contain this simple D1:1/D1:2 expression system. Thecriteria used for this analysis were as follows: (a) one or moreidentical psbA gene(s) with Gln at position 130; (b) one ormore identical psbA gene(s) with Glu at position 130; and (c)no other psbA genes. Ambiguous assignments (e.g., two uniquepsbA genes, both with Gln130) were excluded. The genomesthat met these criteria include S. elongatus PCC 6301,Synechococcus sp. CC9902, Synechococcus sp. CC9311, Synecho-coccus sp. RCC307, Synechococcus sp. WH8102, and Synecho-coccus sp. WH7803. As graphically represented in Figure S4 inthe Supporting Information, a significant fraction of D1:1 andD1:2 sequences both contain Ile at positions 121 and 123.Additionally, at position 124, eight of the nine D1:1 sequencescontain Ser, while all nine D1:2 sequences contain a bulkyresidue (five with Phe and four with Tyr). Substitution of Val inD1:2 for Leu in D1:1 at position 151 is completely conservedin this sample set. At position 152, seven of the nine D1:1sequences contain Ser, while all nine D1:2 sequences containAla. Substitutions at position 155 are generally less conserved,with D1:1 sequences having Phe (five of nine), Met (three of
nine), or Thr (one of nine) and D1:2 sequences having eitherSer (five of nine) or Thr (four of nine). At position 288, allnine D1:2 sequences contain Leu, while seven of the nine D1:1sequences contain Met.This analysis indicates that the substitutions at positions 124,
151, 152, and 288 are most highly conserved. In view of thelarge changes in side-chain chemistry between residues at 124(Ser vs Phe for D1:1 and D1:2, respectively) and 152 (Ser vsAla for D1:1 and D1:2, respectively), we chose to first makethese individual point mutations. D1:2-F124S and D1:2-A152Swere therefore generated both individually and in combinationwith D1:2-E130Q (Figure S2 in the Supporting Information).
PSII Quantum Yield and Light-Limited WOC TurnoverEfficiency. The Chl-a variable fluorescence yield, Fv/Fm, isproportional to the PSII photochemical (charge separation)quantum yield.39 In FRR fluorometry with flashes shorter thanthe water oxidation cycle steps, Fv/Fm exhibits period-fouroscillations due to differential fluorescence quenching by thewater cycle intermediates (Si states).
31 The damping of Fv/Fmoscillations in the C.r., D1:1, and D1:2 strains was previouslyshown to significantly vary only at low flash frequencies (≤0.5Hz), reflecting competing charge recombination under light-limiting conditions.16 We therefore performed FRR fluorom-etry experiments for the strains described in this work at 0.2Hz, where appreciable recombination contributes, and fitted theresults to the model to determine the average hit parameter(γ0.2 Hz) (see Methods). Less damping reflects higher WOCturnover efficiency and is quantified by a higher probability toadvance to the next oxidation state (γ). The rate of damping ofFv/Fm is the same as the rate of damping of the flash O2 yield,indicating that both methods reflect the WOC turnoverefficiency.2,16,31 As shown in Figure 1a, D1:2 has an initialFv/Fm value of 0.403 on the first flash (dark-preadapted) andexhibits period-four oscillations that are damped with anaverage hit parameter (γ0.2 Hz) of 0.492 (Figure 1b) and aperiod (P) of 4.81 (Figure 1c). When residue 130 is mutated toGln (D1:2-E130Q), the initial Fv/Fm decreases to 0.279, but thequality of the period-four oscillations improves to γ = 0.630 andP = 4.55 (Figure 1a,b). On the other hand, when position 152is mutated to Ser (D1:2-A152S), the initial Fv/Fm increases to0.492, but the quality of oscillations decreases to γ = 0.268 andP = 5.21 (Figure 1a,b). When both mutations are made (D1:2-A152S+E130Q), the initial Fv/Fm and γ are statistically identicalto those of the original D1:2 strain (Figure 1a,b).Full FRR fluorescence traces and fits to a thermodynamically
accurate Kok cycle32 at 0.2 Hz for all nine strains are providedin Figure S5 in the Supporting Information, and the results aresummarized in Figure 2b. The WOC turnover periods weredetermined by Fourier transforms of these data for all strainsand are shown in Figure 2a. The phenotype of D1:2-F124S (interms of both Fv/Fm and γ) was not substantially different fromthat of D1:2, nor was D1:2-F124S+E130Q substantiallydifferent from D1:2-E130Q. The 3-helix phenotype (alone orin combination with E130Q) was similar to the A152Sphenotype. Figure 2a shows a clear positive correlation betweenthe WOC turnover period at 0.2 Hz and the photochemicalquantum yield for D1:1, D1:2, and the point mutants [R2 =0.9232, α < 0.0001, where α is the probability of a type-I (false-positive) error40]. As shown in Figure 2b, the WOC turnoverprobability at 0.2 Hz (γ0.2 Hz) is negatively correlated with thephotochemical quantum yield (R2 = 0.7887, α < 0.0001).
Light-Saturated O2 Evolution Rate. Light-saturatedsteady-state O2 evolution rates were measured from whole
Journal of the American Chemical Society Article
dx.doi.org/10.1021/ja5002967 | J. Am. Chem. Soc. 2014, 136, 4048−40554050

cells and normalized to total Chl, and the results are reported inTable 1. Light-saturation curves of O2 evolution rate versuslight intensity for C.r., D1:1, and D1:2 are reported in Figure S6in the Supporting Information. From knowledge of the Chl/PSII ratios determined by quantitative anti-D1 Western blottingof the thylakoid membranes isolated from these same samples(see Methods), the light-saturated O2 evolution frequencies (inunits of O2 PSII−1 s−1) for these strains were calculated. Asshown in Table 1, D1:1 and D1:2 have mean O2 evolutionfrequencies of 35.6 and 38.7 O2 PSII−1 s−1, respectively. InD1:2-E130Q, the O2 evolution rate drops to 30.8 O2 PSII
−1 s−1,while in D1:2-A152S it increases to 47.8 O2 PSII
−1 s−1. Whenthese two mutations are combined (D1:2-A152S+E130Q), theO2 evolution rate is 40.5 O2 PSII−1 s−1, which is notsignificantly different from the D1:2 value when the standarderror is taken into account.Again, the phenotype of D1:2-F124S in terms of O2
evolution rate was not statistically different from D1:2, nor
Figure 1. The PSII photochemical quantum yield (Fv/Fm) and WOCturnover efficiency measured at a flash rate of 0.2 Hz (γ0.2 Hz) dependon residues Glu/Gln130 and Ala/Ser152. D1:2 (black), D1:2-E130Q(blue), D1:2-A152S (red), and D1:2-A152S+E130Q (violet). (a) Fv/Fm vs single-turnover flash (STF) number. (b) Normalized dataillustrating differences in the rates of damping of period-fouroscillations and the goodness of fits. Experimental data points arerepresented as circles and fits (see Methods) as lines. (c) Fouriertransforms of Fv/Fm oscillations. Data represent the means of threebiological replicates. Full FRR fluorescence traces and fits are shown inFigure S5.
Figure 2. The PSII photochemical quantum yield (Fv/Fm) is inverselyproportional to the WOC turnover efficiency measured at a low flashrate where charge recombination contributes, as determined by (a) themodel-independent Fourier transform period and (b) the modeledWOC turnover probability (γ0.2 Hz); also, Fv/Fm (c) is directlyproportional to the light-saturated O2 evolution rate (in units of O2PSII−1 s−1) and (d) increases linearly with the half-life of photo-inhibition (t1/2). Data were fit to linear trend lines with the followingequations: (a) y = 3.39x + 3.60, R2 = 0.9232; (b) y = −1.79x + 1.17, R2
= 0.7887; (c) y = 52.86x + 3.01, R2 = 0.8594; and (d) y = 70.22x +11.20, R2 = 0.8592. Full WOC turnover probability data are shown inFigure S5. Full O2 evolution rate data are shown in Table 1. Fullphotoinhibition data are shown in Figure S7. Data represent the meansof three (WOC turnover efficiency, O2 evolution rate, photoinhibitionhalf-life) or six (Fv/Fm) biological replicates with standard errors.
Journal of the American Chemical Society Article
dx.doi.org/10.1021/ja5002967 | J. Am. Chem. Soc. 2014, 136, 4048−40554051

was D1:2-F124S+E130Q statistically different from D1:2-E130Q. The 3-helix phenotype (alone or in combination withE130Q) was similar to the A152S phenotype. Figure 2c shows asignificant positive correlation between the O2 evolution rateand the PSII photochemical quantum yield for D1:1, D1:2, andthe point mutants (R2 = 0.8594, α < 0.0001).Sensitivity to Photoinhibition. Values of the half-life
(t1/2) for irreversible loss of O2 evolution (photoinhibition) athigh light intensity in the presence of 1 mM lincomycin arepresented in Figure 2d (the full traces are shown in Figure S7 inthe Supporting Information). In this notation, a longerphotoinhibition t1/2 represents less sensitivity to photo-inhibition (more phototolerance). D1:2 has greater photo-tolerance than D1:1 (t1/2 = 26.9 min vs 20.1 min, respectively),in agreement with previous reports.9,16,33,35,41−43 D1:2-E130Qis significantly more sensitive to photoinhibition (t1/2 = 18.5min), while D1:2-A152S is less sensitive (t1/2 = 28.4 min).D1:2-A152S+E130Q shows an intermediate phenotype with at1/2 of 23.7 min. The F124S mutation does not affect the D1:2photoinhibition phenotype, and the 3-helix strains closelyresemble the A152 strains. Figure 2d shows a significantpositive correlation between the photoinhibition t1/2 and thePSII photochemical quantum yield for D1:1, D1:2, and thepoint mutants (R2 = 0.8592, α < 0.0001).Growth Phenotypes and D1 Accumulation Levels. All
of the point mutants generated in this study were robust andgrew photoautotrophically. In order to determine whether theaforementioned phenotypes translate to changes in growth rateor biomass accumulation, growth curves were measured at 80μE m−2 s−1. No significant differences in doubling time amongthe strains were observed except for D1:2-E130Q and D1:2-F124S+E130Q (Figure 3a; full data are shown in Figure S8 inthe Supporting Information). All of the other strains grew withminimal doubling times averaging 6.9 ± 0.1 h, while D1:2-E130Q and D1:2-F124S+E130Q grew 36% and 28% moreslowly, respectively. These data show that the reduced growthrate of D1:2-E130Q can be rescued by introducing the 3-helixmutations (D1:2-3-helix+E130Q) or by mutating A152S alone(D1:2-A152S+E130Q).Natural D1 isoforms (C.r., D1:1, and D1:2) accumulated
more biomass at stationary phase than any of the point mutants(Figure 3b and Figure S8 in the Supporting Information). Aswe previously reported,16 at low light intensity D1:1
accumulates more biomass at stationary phase (17% more,reported here as dry weight per unit volume) than D1:2 andC.r. because of its superior ability to utilize very low photonfluxes (likely through slower kinetics of P680
+QA− charge
recombination). In contrast, all seven unnatural pointmutations measured herein accumulated substantially lessbiomass (Figure 3b).The quantity of PSII in early exponential cells (measured as
D1 protein within thylakoid membranes) normalized to totalChl was also higher in the three naturally occurring D1isoforms (Table 1 and Figure S9 in the SupportingInformation). C.r. had the lowest Chl/PSII ratio (1002 ± 45)while D1:1 and D1:2 had higher ratios (1170 ± 26 and 1230 ±94, respectively), in qualitative agreement with our previousstudy that used much higher cell densities for this measure-ment.16 All seven point mutants were higher at 1249 to 1650Chl/PSII. In addition, C.r., D1:1, and D1:2 had lower total Chlconcentrations per cell (2.02−2.17 fmol/cell) compared withthe seven point mutants (2.28−2.98 fmol/cell).
■ DISCUSSION
Our general conclusion from Figure 2 is that among the ninePSII variants studied, those exhibiting a higher yield of PSIIcharge separation under light-limiting conditions (where chargerecombination is significant) have less efficient photochemicalturnover, measured both in terms of a lower WOC turnoverprobability and a longer WOC cycle period. Conversely, thesesame strains under light saturation (where charge recombina-tion does not compete) confer a correspondingly higher O2evolution rate and greater protection against photoinhibition.Taken together, the data clearly establish that PSII primarycharge separation is a trade-off between photochemicalproductivity (water oxidation and plastoquinone reduction)and charge recombination (photoprotection).We have shown that the presence of both Ser152 and
Gln130 in the D1:2 background fully compensate for eachother in terms of PSII photochemical quantum yield (Fv/Fm)(Figures 1 and 2), WOC turnover efficiency at low lightintensity (and γ0.2 Hz) (Figures 1 and 2a,b), O2 evolution rate(Table 1 and Figure 2c), tolerance to photoinhibition (Figure2d), and maximal growth rate (Figure 3a). The results obtainedfrom the A152S mutation alone fully account for thephenotypes observed for our original 3-helix mutant in both
Table 1. Chl/PSII Ratios and WOC Turnover Frequencies Derived from Continuous Light-Saturated O2 EvolutionMeasurementsa
D1/Chl(fmol/0.1 μg)b Chl/D1c
Chl/cell(fmol)
O2 evolution rate[μmol (mg of Chl)−1 h−1]d
O2 evolution rate(O2 PSII
−1 s−1)e
C.r. 112 ± 5 1002 ± 45 2.17 ± 0.05 142 ± 11 35.2 ± 1.7D1:1 96 ± 2 1170 ± 26 1.96 ± 0.07 123 ± 3 35.6 ± 1.4D1:2 91 ± 7 1230 ± 94 2.02 ± 0.09 126 ± 3 38.7 ± 2.0D1:2-E130Q 82 ± 6 1369 ± 95 2.34 ± 0.11 90 ± 2 30.8 ± 1.5D1:2-F124S 77 ± 4 1450 ± 65 2.28 ± 0.08 108 ± 5 38.9 ± 2.6D1:2-F124S+E130Q 90 ± 8 1249 ± 106 2.60 ± 0.06 104 ± 2 32.6 ± 3.0D1:2-3-helix 78 ± 4 1438 ± 81 2.36 ± 0.11 114 ± 8 40.7 ± 1.6D1:2-3-helix+E130Q 71 ± 1 1577 ± 31 2.60 ± 0.04 108 ± 14 42.1 ± 4.7D1:2-A152S 68 ± 3 1650 ± 81 2.98 ± 0.17 117 ± 13 47.8 ± 3.4D1:2-A152S+E130Q 69 ± 4 1634 ± 97 2.71 ± 0.07 100 ± 7 40.5 ± 0.7
aData represent means of three biological replicates with standard errors. bQuantitative anti-D1 Western blots of thylakoid membrane samples wereused to estimate the PSII concentrations (Figure S9). cCalculated on the basis of the previous column assuming a molar mass of 893 g/mol for Chl.dLight-saturated in vivo rates measured in the presence of 5 mM NaHCO3.
eCalculated on the basis of the previous columns assuming one D1 perPSII.
Journal of the American Chemical Society Article
dx.doi.org/10.1021/ja5002967 | J. Am. Chem. Soc. 2014, 136, 4048−40554052

the presence and absence of the E130Q mutation. The D1:2-F124S strain did not vary significantly from D1:2, nor did D1:2-F124S+E130Q vary significantly from D1:2-E130Q.Correlation plots of the WOC turnover period and WOC
turnover probability versus PSII photochemical quantum yieldare shown in Figure 2a,b, respectively. Previous studies thathave analyzed the charge recombination kinetics and photo-chemical (charge separation) yield have been limited to nomore than three strains.16−18 Analysis of the seven mutantsderived from Synechococcus 7942 D1 isoforms and the twonatural strains (D1:1 and D1:2) allowed a statisticallysignificant linear correlation to be established over a 3-foldlarger range of variants, demonstrating a clear trade-off betweenthese two design variables. We interpret this result usingarguments previously hypothesized22,44,45 and reported:16,22 aless negative Em for Pheo/Pheo− corresponds to a higherquantum yield of photochemistry and faster charge recombi-nation kinetics. Indeed, the values for Pheo/Pheo− Em
previously measured for D1:1,22 D1:2,21 and D1:2-E130Q20
predict that the magnitude of the energy gap between P680+/
P680* and Pheo/Pheo− follows the trend D1:2-E130Q < D1:1< D1:2. The identical trend is observed in the magnitude of Fv/Fm, and the inverse relationship is seen for the WOC turnoverperiod and probability at 0.2 Hz.The correlation plot of O2 evolution rate and PSII
photochemical quantum yield (Figure 2c) provides statisticallysignificant evidence that the light-saturated rate of PSII wateroxidation is linearly correlated with the yield of PSII chargeseparation. We note that whole-cell O2 evolution rates do notlikely represent the upper kinetic limit of WOC cycling becauseof limitations in acceptor (PQ) availability and lumenalbuffering capacity. However, the in vivo WOC turnoverfrequencies reported here in the presence of the Calvin−Benson−Bassham cycle acceptor (bi)carbonate follow the sametrend (D1:2 > D1:1 > C.r.) as previously reported in vitro inthe presence of artificial PSII acceptors.16
Similarly, the correlation plot of photoinhibition sensitivityand PSII photochemical quantum yield (Figure 2d) shows thata higher yield of PSII photochemistry is directly correlated withincreased tolerance to high light fluxes. Sugiura and co-workersrecently reported that T. elongatus cells expressing D1:2-E130Qare less sensitive to photoinhibition than cells expressing thenative D1:2 isoform.20 In our transgenic Chlamydomonas D1expression system, this experiment produces the oppositeresult. A redistribution of direct (photoprotective) and indirect(1O2-generating) charge recombination pathways between thetwo systems may explain this distinction. Our experimentalresult (positive correlation of photoinhibition sensitivity withPSII photochemical yield) suggests that the former pathway isdominant, while simulated S2QA
− recombination kinetics in T.elongatus suggests that the latter pathway is dominant.20 Thisinteresting difference deserves more attention in future studies.The positive correlation between the WOC turnover period
at low light and the maximal PSII photochemical quantum yield(Figure 2a) and the negative correlation between the WOCturnover probability at low light and the maximal PSIIphotochemical quantum yield (Figures 2b) suggest that strainshaving a more negative Pheo/Pheo− Em are better suited forenvironments where photon flux is limiting. Such conditionsare encountered in dense cultures of microalgae and plants orplant parts located below a dense canopy.On the other hand, the observed positive correlations of both
the light-saturated O2 evolution rate and tolerance tophotoinhibition with the maximal PSII photochemical quantumyield (Figure 2c,d) indicate that strains having a less negativePheo/Pheo− Em are best suited for environments of excessivephoton flux. Such conditions include dilute cultures ofmicroalgae and sparse plantings of terrestrial crops.Perhaps the most advantageous strategy for photochemical
fitness in light-shifting environments remains the differentialexpression of psbA alleles containing both D1:1 and D1:2. It isinteresting to note that no photosynthetic eukaryotes with sucha regulatory mechanism have been identified.46 This may bedue to the high rate of homologous recombination and thelarge number of identical genome copies in chloroplasts, whichmight hinder the maintenance of highly homologous alleles.47
In the 1.9 Å crystal structure of Thermosynechococcus vulcanusPSII,48 D1 position 152 is an Ala located at the D1−CP43interface (Figure 4). The methyl side chain is 3.4 Å from thephenyl group of CP43-Phe435, which supports the generallyhydrophobic interaction between the D1 and CP43 subunits.
Figure 3. (a) Photoautotrophic doubling times and (b) stationary-phase dry weights of strains containing E130 (gray bars) or Q130(striped bars) at 80 μE m−2 s−1 and bubbled with 2% CO2 in air. Fullgrowth curves are shown in Figure S8. Data represent the means of 4−5 biological replicates with standard errors.
Journal of the American Chemical Society Article
dx.doi.org/10.1021/ja5002967 | J. Am. Chem. Soc. 2014, 136, 4048−40554053
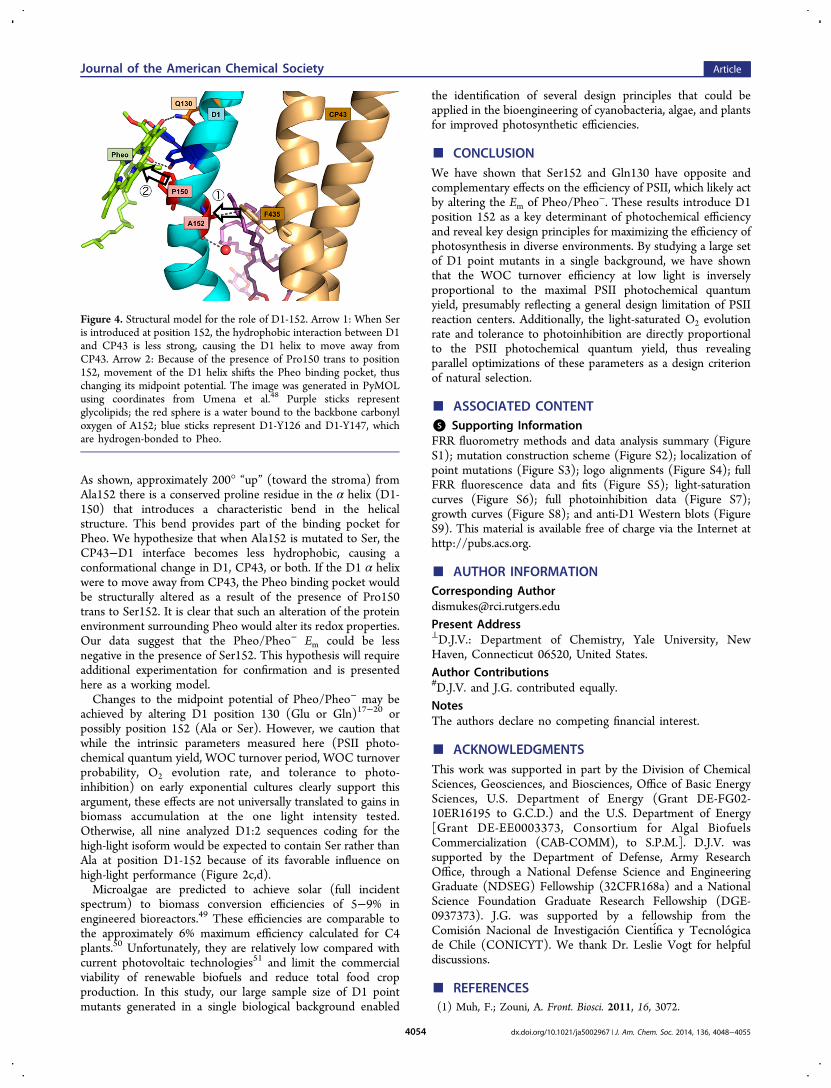
As shown, approximately 200° “up” (toward the stroma) fromAla152 there is a conserved proline residue in the α helix (D1-150) that introduces a characteristic bend in the helicalstructure. This bend provides part of the binding pocket forPheo. We hypothesize that when Ala152 is mutated to Ser, theCP43−D1 interface becomes less hydrophobic, causing aconformational change in D1, CP43, or both. If the D1 α helixwere to move away from CP43, the Pheo binding pocket wouldbe structurally altered as a result of the presence of Pro150trans to Ser152. It is clear that such an alteration of the proteinenvironment surrounding Pheo would alter its redox properties.Our data suggest that the Pheo/Pheo− Em could be lessnegative in the presence of Ser152. This hypothesis will requireadditional experimentation for confirmation and is presentedhere as a working model.Changes to the midpoint potential of Pheo/Pheo− may be
achieved by altering D1 position 130 (Glu or Gln)17−20 orpossibly position 152 (Ala or Ser). However, we caution thatwhile the intrinsic parameters measured here (PSII photo-chemical quantum yield, WOC turnover period, WOC turnoverprobability, O2 evolution rate, and tolerance to photo-inhibition) on early exponential cultures clearly support thisargument, these effects are not universally translated to gains inbiomass accumulation at the one light intensity tested.Otherwise, all nine analyzed D1:2 sequences coding for thehigh-light isoform would be expected to contain Ser rather thanAla at position D1-152 because of its favorable influence onhigh-light performance (Figure 2c,d).Microalgae are predicted to achieve solar (full incident
spectrum) to biomass conversion efficiencies of 5−9% inengineered bioreactors.49 These efficiencies are comparable tothe approximately 6% maximum efficiency calculated for C4plants.50 Unfortunately, they are relatively low compared withcurrent photovoltaic technologies51 and limit the commercialviability of renewable biofuels and reduce total food cropproduction. In this study, our large sample size of D1 pointmutants generated in a single biological background enabled
the identification of several design principles that could beapplied in the bioengineering of cyanobacteria, algae, and plantsfor improved photosynthetic efficiencies.
■ CONCLUSIONWe have shown that Ser152 and Gln130 have opposite andcomplementary effects on the efficiency of PSII, which likely actby altering the Em of Pheo/Pheo−. These results introduce D1position 152 as a key determinant of photochemical efficiencyand reveal key design principles for maximizing the efficiency ofphotosynthesis in diverse environments. By studying a large setof D1 point mutants in a single background, we have shownthat the WOC turnover efficiency at low light is inverselyproportional to the maximal PSII photochemical quantumyield, presumably reflecting a general design limitation of PSIIreaction centers. Additionally, the light-saturated O2 evolutionrate and tolerance to photoinhibition are directly proportionalto the PSII photochemical quantum yield, thus revealingparallel optimizations of these parameters as a design criterionof natural selection.
■ ASSOCIATED CONTENT*S Supporting InformationFRR fluorometry methods and data analysis summary (FigureS1); mutation construction scheme (Figure S2); localization ofpoint mutations (Figure S3); logo alignments (Figure S4); fullFRR fluorescence data and fits (Figure S5); light-saturationcurves (Figure S6); full photoinhibition data (Figure S7);growth curves (Figure S8); and anti-D1 Western blots (FigureS9). This material is available free of charge via the Internet athttp://pubs.acs.org.
■ AUTHOR INFORMATIONCorresponding [email protected] Address⊥D.J.V.: Department of Chemistry, Yale University, NewHaven, Connecticut 06520, United States.Author Contributions#D.J.V. and J.G. contributed equally.NotesThe authors declare no competing financial interest.
■ ACKNOWLEDGMENTSThis work was supported in part by the Division of ChemicalSciences, Geosciences, and Biosciences, Office of Basic EnergySciences, U.S. Department of Energy (Grant DE-FG02-10ER16195 to G.C.D.) and the U.S. Department of Energy[Grant DE-EE0003373, Consortium for Algal BiofuelsCommercialization (CAB-COMM), to S.P.M.]. D.J.V. wassupported by the Department of Defense, Army ResearchOffice, through a National Defense Science and EngineeringGraduate (NDSEG) Fellowship (32CFR168a) and a NationalScience Foundation Graduate Research Fellowship (DGE-0937373). J.G. was supported by a fellowship from theComision Nacional de Investigacion Cientifica y Tecnologicade Chile (CONICYT). We thank Dr. Leslie Vogt for helpfuldiscussions.
■ REFERENCES(1) Muh, F.; Zouni, A. Front. Biosci. 2011, 16, 3072.
Figure 4. Structural model for the role of D1-152. Arrow 1: When Seris introduced at position 152, the hydrophobic interaction between D1and CP43 is less strong, causing the D1 helix to move away fromCP43. Arrow 2: Because of the presence of Pro150 trans to position152, movement of the D1 helix shifts the Pheo binding pocket, thuschanging its midpoint potential. The image was generated in PyMOLusing coordinates from Umena et al.48 Purple sticks representglycolipids; the red sphere is a water bound to the backbone carbonyloxygen of A152; blue sticks represent D1-Y126 and D1-Y147, whichare hydrogen-bonded to Pheo.
Journal of the American Chemical Society Article
dx.doi.org/10.1021/ja5002967 | J. Am. Chem. Soc. 2014, 136, 4048−40554054

(2) Vinyard, D. J.; Ananyev, G. M.; Dismukes, G. C. Annu. Rev.Biochem. 2013, 82, 577.(3) Holland, H. D. Philos. Trans. R. Soc. London, Ser. B 2006, 361,903.(4) Falkowski, P. G.; Godfrey, L. V. Philos. Trans. R. Soc. London, Ser.B 2008, 363, 2705.(5) Mulo, P.; Sicora, C.; Aro, E.-M. Cell. Mol. Life Sci. 2009, 66, 3697.(6) Bustos, S. A.; Schaefer, M. R.; Golden, S. S. J. Bacteriol. 1990, 172,1998.(7) Schaefer, M. R.; Golden, S. S. J. Bacteriol. 1989, 171, 3973.(8) Schaefer, M. R.; Golden, S. S. J. Biol. Chem. 1989, 264, 7412.(9) Campbell, D.; Eriksson, M.-J.; Oquist, G.; Gustafsson, P.; Clarke,A. K. Proc. Natl. Acad. Sci. U.S.A. 1998, 95, 364.(10) Tsinoremas, N. F.; Schaefer, M. R.; Golden, S. S. J. Biol. Chem.1994, 269, 16143.(11) Campbell, D.; Zhou, G.; Gustafsson, P.; Oquist, G.; Clarke, A.K. EMBO J. 1995, 14, 5457.(12) Sippola, K.; Aro, E.-M. Plant Mol. Biol. 1999, 41, 425.(13) Sicora, C. I.; Ho, F. M.; Salminen, T.; Styring, S.; Aro, E.-M.Biochim. Biophys. Acta 2009, 1787, 105.(14) Summerfield, T. C.; Toepel, J.; Sherman, L. A. Biochemistry2008, 47, 12939.(15) Golden, S. S.; Brusslan, J.; Haselkorn, R. EMBO J. 1986, 5, 2789.(16) Vinyard, D. J.; Gimpel, J.; Ananyev, G. M.; Cornejo, M. A.;Golden, S. S.; Mayfield, S. P.; Dismukes, G. C. J. Biol. Chem. 2013, 288,5451.(17) Merry, S. A. P.; Nixon, P. J.; Barter, L. M. C.; Schilstra, M.;Porter, G.; Barber, J.; Durrant, J. R.; Klug, D. R. Biochemistry 1998, 37,17439.(18) Rappaport, F.; Guergova-Kuras, M.; Nixon, P. J.; Diner, B. A.;Lavergne, J. Biochemistry 2002, 41, 8518.(19) Cser, K.; Vass, I. Biochim. Biophys. Acta 2007, 1767, 233.(20) Sugiura, M.; Azami, C.; Koyama, K.; Rutherford, A. W.;Rappaport, F.; Boussac, A. Biochim. Biophys. Acta 2014, 1837, 139.(21) Kato, Y.; Sugiura, M.; Oda, A.; Watanabe, T. Proc. Natl. Acad.Sci. U.S.A. 2009, 106, 17365.(22) Sugiura, M.; Kato, Y.; Takahashi, R.; Suzuki, H.; Watanabe, T.;Noguchi, T.; Rappaport, F.; Boussac, A. Biochim. Biophys. Acta 2010,1797, 1491.(23) Gimpel, J.; Mayfield, S. Appl. Microbiol. Biotechnol. 2013, 97,4499.(24) Manuell, A. L.; Beligni, M. V.; Elder, J. H.; Siefker, D. T.; Tran,M.; Weber, A.; McDonald, T. L.; Mayfield, S. P. Plant Biotechnol. J.2007, 5, 402.(25) Ho, S. N.; Hunt, H. D.; Horton, R. M.; Pullen, J. K.; Pease, L. R.Gene 1989, 77, 51.(26) Nour-Eldin, H. H.; Geu-Flores, F.; Halkier, B. A. In PlantSecondary Metabolism Engineering; Fett-Neto, A. G., Ed.; Springer:New York, 2010; p 185.(27) Sueoka, N. Proc. Natl. Acad. Sci. U.S.A. 1960, 46, 83.(28) Zwietering, M. H.; Jongenburger, I.; Rombouts, F. M.; Van’tRiet, K. Appl. Environ. Microbiol. 1990, 56, 1875.(29) Porra, R. J.; Thompson, W. A.; Kriedemann, P. E. Biochim.Biophys. Acta 1989, 975, 384.(30) Mayfield, S. P.; Cohen, A.; Danon, A.; Yohn, C. B. J. Cell Biol.1994, 127, 1537.(31) Ananyev, G.; Dismukes, G. C. Photosynth. Res. 2005, 84, 355.(32) Vinyard, D. J.; Zachary, C. E.; Ananyev, G.; Dismukes, G. C.Biochim. Biophys. Acta 2013, 1827, 861.(33) Ogami, S.; Boussac, A.; Sugiura, M. Biochim. Biophys. Acta 2012,1817, 1322.(34) Singh, M.; Satoh, K. Indian J. Biochem. Biophys. 2003, 40, 108.(35) Tichy, M.; Lupinkov, L.; Sicora, C.; Vass, I.; Kuvikova, S.; Prasil,O.; Komenda, J. Biochim. Biophys. Acta 2003, 1605, 55.(36) Kos, P. B.; Deak, Z.; Cheregi, O.; Vass, I. Biochim. Biophys. Acta2008, 1777, 74.(37) Sicora, C. I.; Appleton, S. E.; Brown, C. M.; Chung, J.; Chandler,J.; Cockshutt, A. M.; Vass, I.; Campbell, D. A. Biochim. Biophys. Acta2006, 1757, 47.
(38) Nakao, M.; Okamoto, S.; Kohara, M.; Fujishiro, T.; Fujisawa, T.;Sato, S.; Tabata, S.; Kaneko, T.; Nakamura, Y. Nucleic Acids Res. 2010,38, D379.(39) Falkowski, P. G.; Raven, J. A. Aquatic Photosynthesis, 2nd ed.;Princeton University Press: Princeton, NJ, 2007.(40) Montgomery, D. C.; Runger, G. C. Applied Statistics andProbability for Engineers; John Wiley & Sons: New York, 1999.(41) Clarke, A. K.; Soitamo, A.; Gustafsson, P.; Oquist, G. Proc. Natl.Acad. Sci. U.S.A. 1993, 90, 9973.(42) Kulkarni, R. D.; Golden, S. S. J. Bacteriol. 1994, 176, 959.(43) Sander, J.; Nowaczyk, M.; Buchta, J.; Dau, H.; Vass, I.; Deak, Z.;Dorogi, M.; Iwai, M.; Rogner, M. J. Biol. Chem. 2010, 285, 29851.(44) Rutherford, A. W.; Osyczka, A.; Rappaport, F. FEBS Lett. 2012,586, 603.(45) Vass, I.; Cser, K. Trends Plant Sci. 2009, 14, 200.(46) Mulo, P.; Sakurai, I.; Aro, E. Biochim. Biophys. Acta 2012, 1817,247.(47) Marechal, A.; Brisson, N. New Phytol. 2010, 186, 299.(48) Umena, Y.; Kawakami, K.; Shen, J.-R.; Kamiya, N. Nature 2011,473, 55.(49) Janssen, M.; Tramper, J.; Mur, L. R.; Wijffels, R. H. Biotechnol.Bioeng. 2003, 81, 193.(50) Zhu, X.-G.; Long, S. P.; Ort, D. R. Annu. Rev. Plant Biol. 2010,61, 235.(51) Blankenship, R. E.; Tiede, D. M.; Barber, J.; Brudvig, G. W.;Fleming, G.; Ghirardi, M.; Gunner, M. R.; Junge, W.; Kramer, D. M.;Melis, A.; Moore, T. A.; Moser, C. C.; Nocera, D. G.; Nozik, A. J.; Ort,D. R.; Parson, W. W.; Prince, R. C.; Sayre, R. T. Science 2011, 332,805.
Journal of the American Chemical Society Article
dx.doi.org/10.1021/ja5002967 | J. Am. Chem. Soc. 2014, 136, 4048−40554055