A multi-level solution algorithm for steady-state Markov chains
Upload
independentCategory
view
1download
0
Sc
AYa
b
a
ARRAA
KCEMSP
1
aBcamdnblaltoshpc
p
0h
Journal of Chromatography A, 1314 (2013) 94– 105
Contents lists available at ScienceDirect
Journal of Chromatography A
j our nal homep age: www.elsev ier .com/ locate /chroma
teady-state and non-steady state operation of counter-currenthromatography devices�
rtak E. Kostanyana,∗, Svetlana N. Ignatovab, Ian A. Sutherlandb, Peter Hewitsonb,ulya A. Zakhodjaevaa,1, Andrey A. Erastova,1
Kurnakov Institute of General & Inorganic Chemistry, Russian Academy of Sciences, Leninsky Prospekt 31, Moscow 119991, RussiaAdvanced Bioprocessing Centre, Brunel Institute for Bioengineering, Brunel University, Kingston Lane, Uxbridge UB8 3PH, UK
r t i c l e i n f o
rticle history:eceived 28 September 2012eceived in revised form 29 August 2013ccepted 31 August 2013vailable online 7 September 2013
a b s t r a c t
Different variants of separation processes based on steady-state (continuous sample loading) and non-steady state (batch) operating modes of CCC columns have been analyzed and compared. The analysis iscarried out on the basis of the modified equilibrium cell model, which takes into account both mechanismsof band broadening – interphase mass transfer and axial mixing. A full theoretical treatment of theintermittent counter-current chromatography with short sample loading time is performed. Analytical
eywords:hromatogram equationsxtraction and chromatographyodeling dual flow separations
hort and long sample loading time
expressions are presented allowing the simulation of the intermittent counter-current chromatographyseparations for various experimental conditions.
Chromatographic and extraction separations have been compared and advantages and disadvantages ofthe two methods have been evaluated. Further technical development of the CCC machines to implementcounter-current extraction separations is considered.
roductivity and resolution
. Introduction
A common feature of chromatography is that one of the inter-cting phases is motionless (stationary) and the other mobile.ecause of the lack of a solid support, both phases in counter-urrent chromatography (CCC) devices have mobility. This featurellowed creating and studying a large number of CCC operatingodes where both phases are mobile [1–21]. A more general and
istinctive feature of chromatographic separation processes ison-steady state mass transfer where the sample is injected as aolus. Actually all variants of CCC separation are non-steady state
iquid–liquid extraction processes. CCC devices can be considereds highly-efficient extraction columns (with an extremely highength to diameter ratio), operating under special conditions –he process is running under non-steady state conditions and onef the phases is pumped through the other phase, which is heldtationary in the column [22,23]. In extraction columns light and
eavy phases move counter-currently and mass transfer takeslace under steady state conditions where the sample is loadedontinuously. The separation efficiency of conventional extraction� Presented at the 7th International Conference on Countercurrent Chromatogra-hy, Hangzhou, China, 6–8 August 2012.∗ Corresponding author. Tel.: +7 495 9554834; fax: +7 495 9554834.
E-mail address: [email protected] (A.E. Kostanyan).1 Fax: +7 495 9554834.
021-9673/$ – see front matter © 2013 Elsevier B.V. All rights reserved.ttp://dx.doi.org/10.1016/j.chroma.2013.08.100
© 2013 Elsevier B.V. All rights reserved.
columns does not exceed 10 theoretical stages. In principle, CCCapparatuses, consisting of one, two or more columns, can beoperated under different conditions: in a continuous counter-current regime (as high-efficiency extraction columns providinghundreds of theoretical stages for industrial scale separations) ora batch regime (as preparative and analytical chromatographicdevices). The separation process in both regimes is governed bytwo phenomena: interphase mass transfer and axial mixing inthe phases. The advantage of conventional (non-CCC) extractioncolumns is high productivity due to the large diameter (up to 3 m)and continuous introduction of the mixture to be separated withone of the phases; however the shortcoming is low separationefficiency: for example a vibrating plate column (one of the mostpromising at the moment) 1 m in diameter and a height of 20 m canprovide 20–50 m3/h of the total phase flow rate and efficiency up to10 theoretical stages. The advantage of chromatographic methodsis high separation efficiency (200–500 theoretical stages), whilethe shortcoming is low productivity (0.05 m3/h total phase flowrate) caused by discontinuous sample injection and small tubingdiameter. The benefits of continuous (steady-state) operation overthe batch (chromatographic) operation, such as high productivityand low maintenance, can facilitate the use of CCC apparatusesin the pharmaceutical industry, where the increasing demand for
higher purity products is often limited by conventional separationtechniques. The aim of this paper is to analyze and compare dif-ferent variants of separation processes by using steady-state andnon-steady state operating modes of CCC columns. The results of
omato
spidm
r[c
tliso
t[Agaimfwfs[tlne
X
tt
kscfpmmuerct
wotvingao
A.E. Kostanyan et al. / J. Chr
uch analysis may be of practical importance when solving variousroblems of industrial scale separation. To carry out the analysis,
t is essential to select an appropriate mathematical model toescribe CCC separation processes. For the reliable simulation theodel should reflect the actual mechanism of the phenomenon.Three approaches have been proposed to describe chromatog-
aphy and countercurrent mass transfer processes: (1) plate theory24–27]; (2) axial mixing models [27–33] and (3) Craig’s Counter-urrent Distribution (CCD model) [34–37].
A theoretical plate is a certain section of the column, where inhe case of extraction the outgoing phase solutions are in equi-ibrium. In the case of chromatography the mobile phase solutionssuing from it is in equilibrium with the mean concentration ofolute in the stationary phase. What is happening inside this sectionf the column is not considered in the plate theory.
The influence of mass transfer and axial mixing on a separa-ion process can be described on the basis of continuous (diffusion)26–30,38] or discrete (cell) [26,31–33,38] mathematical models.t low degree of axial mixing simulations based on both modelsive nearly the same results, but the mathematics of the cell modelre simpler. As applied to the CCC separations the cell model takesnto account two major contributions to band broadening, finite
ass transfer rate and the axial mixing. The effect of the mass trans-er rate and the degree of axial mixing on the shape of single peaksas studied in [38] by computer inversion of the model transfer
unction using the fast Fourier transform algorithm. The analyticalolution of the non-equilibrium model equations can be found in39]. It was shown that instead of a rather complicated solution ofhe non-equilibrium model a much simpler solution of the equi-ibrium cell model can be applied to describe single peaks of realon-equilibrium processes. To do this in the peak equation of thequilibrium model:
= xneq
x̄= aneq
(neq − 1)!tneq−1 exp(−at), a = neq
1 − Sf + Sf KD(1)
he number of equilibrium cells neq should be replaced by the effec-ive number of theoretical stages Nef, determined as:
1neq
= 1Nef
= 1n
+ 2T
(k′
1 + k′
)2
(2)
In Eqs. (1) and (2) KD = y*/x* is the partition coefficient;′ = KDSf/(1 − Sf) is the retention factor (the ratio of amounts ofolute in the stationary and mobile phases under the equilibriumonditions); n is the axial mixing parameter (the number of per-ectly mixed cells); Sf is the fractional volume of the stationaryhase; T = kvVc/F is the mass transfer parameter (the number ofass transfer units in a column); F is the volumetric flow rate ofobile phase; kv is a mass transfer coefficient related to the vol-
me of contacting liquids; Vc is the column volume; y*and x* are thequilibrium solute concentrations in stationary and mobile phases,espectively; t = �F/Vc and X = x/x̄ are the normalized time and con-entration; x̄ = Q/Vc is the mean concentration in the column; Q ishe amount of the solute in the sample injected and � is time.
Eq. (2) in the form of the height equivalent to a theoretical plateas first derived in [26] by comparing the Gaussian distribution
f the plate theory with the Gaussian distribution of the rateheory. It can also be derived by comparing the expressions forariance of equilibrium and non-equilibrium cell models [38,39]. Its important to note, that applying the expression for the effective
umber of theoretical stages, Eq. (2), to two experimental peaksives the researcher the possibility to determine the axial mixingnd mass transfer characteristics of a CCC system under differentperating conditions, assuming that the parameter T is identicalgr. A 1314 (2013) 94– 105 95
for both components:
T = 2Nef 1Nef 2
Nef 2 − Nef 1
[(k′
11 + k′
1
)2
−(
k′2
1 + k′2
)2]
;
n = TNef 1(1 + k′1)2
T(1 + k′1)2 − 2Nef 1k′
12
The value of Nef for each experimental peak is to be determinedin the usual way as the number of theoretical plates since in themathematical description the equilibrium cell model is identical tothe plate theory. In general, Nef characterizes the sharpness of theeluting peaks: the larger Nef is the sharper is the peak. For a solutewith low KD the experimental value of Nef indicates the degree ofthe axial mixing in the column. It is obvious, that the efficiencyof a column measured by theoretical plates will be different forsolutes with different KD: for solutes with lower KD values Nef willbe greater than for solutes with higher KD values.
The above discussed approach based on the concept of theeffective number of theoretical stages, can be named the modifiedequilibrium cell model.
According to Craig’s model (CCD) the column consists of equally-sized stages operating with a specified sequence of phase transfersand phase equilibrations. After the equilibrium is attained, whichrequires a certain time, the entire volume of the mobile phasein each stage instantly moves to the adjacent stage. As appliedto solvent extraction Craig’s principle is known as controlled-cycle counter-current extraction [35–37]. It has theoretically beenshown that controlled-cycle operation doubles separating power(measured by the number of theoretical plates) in comparison toconventional counter-current extraction [37]. The application ofCraig’s principle to CCC has led to the creation of controlled-cycleliquid chromatography [40–42], the idea of which was inspired bythe analysis of the eluting counter-current distribution model pro-posed for the mathematical description of CCC [43–45]. This modeldescribes the way that Craig’s apparatus would operate, if the CCDprocess could be extended beyond the number of transfers equalto the number of CCD equilibrium stages.
In contrast to the modified equilibrium cell model, Craig’s CCDmodel and the plate theory do not include mass transfer and axialmixing parameters. We will build on the modified equilibrium cellmodel in this paper.
Intermittent counter-current extraction (ICcE) is a cyclic sepa-ration process consisting of a succession of two counter-currentsteps: 1 – the upper phase pumped as the mobile phase; 2 –the lower phase pumped as the mobile phase; the sample isintroduced at the middle of the column or between two columns[11–14,16–18,20]. This separation process can be performed in twoprincipally different regimes: (i) extraction (steady state) separa-tion (ICcE): the sample is fed continuously at a constant rate; theconcentration profiles of solutes eluted with both phases becomeconstant after several cycles and the average concentrations ofsolutes in eluted fractions become constant too; (ii) chromato-graphic (non-steady state) separation (ICCC): the sample is injectedinto the column during a certain (short) time and the componentsto be separated are eluted from opposite ends of the column as incase of conventional CCC separation. The average concentrations ofsolutes in eluted fractions of the phases are not constant. For theprocess analysis, it is desirable to have an appropriate backgroundof theory. The theoretical treatment of the ICcE is performed in[46,48].
One of the objectives of the present work was to perform a fulltheoretical treatment of intermittent CCC (ICCC) providing analyti-cal expressions for description the concentration profiles of soluteseluted with both phases. It should be noted that Delannay et al. [8]

9 omato
h(tt
2s
2
tit
0
�
wptccys
c
X
(17)
6 A.E. Kostanyan et al. / J. Chr
ave introduced a similar technique named multiple dual-modeMDM). The difference is in sample loading conditions: in MDMhe sample is injected at the entrance of the first column ratherhan between the two columns.
. Intermittent counter-current chromatography withample loading at the middle of the column
.1. Derivation of analytical expressions for eluting profiles
Consider the case when the process starts in normal phase withhe upper phase mobile and the sample dissolved in upper phases loaded only once in the first step and over a time, not exceedinghe run time of the first step.
The model equations can be presented in the following form:First cycle:For the first step (Fig. 1a):
≤ � ≤ �s :
VU
N
dx0
d�+ VL
N
dy0
d�= VU + KDVL
N
dx0
d�= FSxs − (FS + FU)x0 (3)
VU
N
dxn
d�+ VL
N
dyn
d�= VU + KDVL
N
dxn
d�
= (FS + FU)xn−1 − (FS + FU)xn; n = 1, 2, . . ., N1
(4)
≥�s :
VU + KDVL
N
dx0
d�= −FUx0 (5)
VU + KDVL
N
dxn
d�= FUxn−1 − FUxn; n = 1, 2, . . ., N1 (6)
For the second step (Fig. 1b):
VU
N
dxN1
d�+ VL
N
dyN1
d�= VU/KD + VL
N
dyN1
d�= −FLyN1 (7)
VU
N
dxn
d�+ VL
N
dyn
d�
= VU/KD + VL
N
dyn
d�
= FLyn+1 − FLyn; n = N1 − 1, N1 − 2, . . ., 1, 0 (8)
VU
N
dxr
d�+ VL
N
dyr
d�
= VU/KD + VL
N
dyr
d�= FLyr−1 − FLyr; r = 1, 2, . . ., N2 (9)
here FU and FL are the volumetric flow rates of upper and lowerhases, respectively; FS is the volumetric flow rate of sample solu-ion; N = N1 + N2 + 1 is the total number of equilibrium cells in theolumn; VU and VL are the volumes of upper and lower phases in theolumn, respectively; x is solute concentration in the upper phase,
– in the lower phase; xs is solute concentration in the sampletream; � is time; �s is the sample loading time.
Using the results of the work [47], the solution of Eqs. (3)–(6)an be established in the following form:
(ts, n) = x(ts, n)xs
= b
[1 − e−ats
n∑i=0
(ats)i
i!
](10)
gr. A 1314 (2013) 94– 105
X1(t) = x(t, N1)xs
= e−a(t−ts)
N1∑i=0
[a(t − ts)]N1−i
(N1 − i)!X(ts, i) (11)
X1,1(tx, n) = x1,1(tx, n)xs
= e−a(tx−ts)n∑
i=0
[a(tx − ts)]n−i
(n − i)!X(ts, i) (12)
with
b = FS
FU + FS; a = NVc
VU + KDVL= N
1 − Sf + Sf KD;
ts = �s(FU + FS)Vc
; t = �FU
Vc; tx = �xFU
Vc
where Sf = VL/Vc is the fractional volume of the lower phase; Vc isthe column volume; �x is the duration of the first step.
Eq. (10) describes the profile of the solute in the column aftersample loading period (� = �s). Eq. (11) describes the elution profileduring the flow of the upper phase after the sample loading. Eq.(12) describes the solute profile in the column after the first step(� = �x).
To simplify the mathematical derivations we assume that eachflow period (each step of the cycles) starts at time � = 0. Then, theinitial conditions for Eqs. (7)–(9) are:
� = 0 : y(n) = x(n, �x)KD; y(r) = 0 (13)
The solution of Eqs. (7)–(9) with the initial conditions (13) isobtained in the following normalized form:
Y1(t) = y(t, N2)xs
= KDe−KDat
N1∑i=0
[KDat]N2+i
(N2 + i)!X1,1(tx, i) (14)
X1,2(ty, r) = x1,2(ty, r)xs
= e−KDaty
N1∑i=0
(KDaty)r+i
(r + i)!X1,1(tx, i) (15)
X1,2(ty, n) = x1,2(ty, n)xs
= e−KDaty
N1∑i=n
(KDaty)i−n
(i − n)!X1,1(tx, i) (16)
with
t = �FL
Vc; ty = �yFL
Vc
where �y is the duration of the second step.Eq. (14) describes the elution profile during the flow of the lower
phase. Eqs. (15) and (16) describe the solute profile in the columnafter the second step is finished (� = �y).
For the second and further cycles of process the set of equationsfor the first step can be presented in the following form:
VU + KDVL
N
dxN2
d�= −FUxN2
VU + KDVL
N
dxr
d�= FUxr+1 − FUxr; r = N2 − 1, N2 − 2, . . ., 2, 1, 0
VU + KDVL
N
dxn
d�= FUxn−1 − FUxn; n = 1, 2, . . ., N1
Eqs. (7)–(9) remain valid. The initial conditions are:For the first step:
� = 0 : xj(r) = yj−1(r, �y)KD
; xj(n) = yj−1(n, �y)KD
j = 2, 3, 4, . . . (18)

A.E. Kostanyan et al. / J. Chromatogr. A 1314 (2013) 94– 105 97
a
FUN1n+1n-1 n21012r-1r+1 rN2
xsFsτs
b
FL FLN1n+1n-1 n21012r-1r+1 rN2
cycle
�
w
gj
X
w
(ty,
w
t
Y
w
t
n
Fig. 1. Cell model of ICCC: first
For the second step:
= 0 : yj(r) = xj(r, �x)KD; yj(n) = xj(n, �x)KD j = 2, 3, 4, . . .(19)
here j denotes the current number of a cycle.The solution of Eqs. (7)–(9), (17) with initial conditions (18), (19)
ives in general form the description of solute profiles for any cycle = 2, 3, 4,. . ..:
In the eluting upper phase during the first step of a cycle:
j(t) = e−at
N2∑i=1
(at)N1+i
(N1 + i)!X(j−1),2(ty, r)
+ e−at
N1∑i=0
(at)N1−i
(N1 − i)!X(j−1),2(ty, n) (20)
itht = �FU
Vcand ty = �yFL
VcIn the column after the first step:
Xj,1(tx, r) = e−atx
N2∑i=r
(atx)i−r
(i − r)!X(j−1),2(ty, r) r = 1, 2, . . ., N2
Xj,1(tx, n) = e−atx
N2∑i=1
(atx)i+n
(i + n)!X(j−1),2(ty, r) + e−atx
n∑i=0
(atx)n−i
(n − i)!X(j−1),2
ith
x = �xFU
Vc
In the eluting lower phase during the second step of the cycle:
j(t) = KDe−aKDt
N1∑i=0
(aKDt)N2+i
(N2 + i)!Xj,1(tx, n)
+ KDe−aKDt
N2∑i=1
(aKDt)N2−i
(N2 − i)!Xj,1(tx, r) (22)
ith
= �FL
Vc
In the column after the second step:
Xj,2(ty, r) = e−aKDty
N1∑i=0
(aKDty)i+r
(i + r)!Xj,1(tx, n) + e−aKDty
r∑i=1
(aKDty)r−i
(r − i)!Xj,1(tx, r)
−aK ty
N1∑ (aKDty)i−n
(23)
Xj,2(ty, n) = e D
i=n
(i − n)!Xj,1(tx, n)
In Eqs. (20)–(23) the subscripts denote the cycle (j) and stepumbers (1 or 2).
; (a) first step, (b) second step.
n) n = 0, 1, 2, . . ., N
(21)
Operational variables of presented model are: the column effi-ciency measured by number of equilibrium stages; the sample feedpoint in the column; the phase and sample flow ratios; the phasevolume ratio in the column; the sample loading time; the upperand lower phase flow times.
Eqs. (10)–(12), (14)–(16) and (20)–(23) allow the simulation ofthe ICCC separation for various experimental conditions.
2.2. Influence of model parameters on the separation
We will consider the case where the upper and lower phase flowrates are equal (FU = FL), the phase fractional volumes in the col-umn are equal (Sf = 0.5), and the duration of the steps (the switchingintervals) are equal (�x = �y). In addition, we consider the case whenthe sample is fed just into the middle of the column, that is as in[20,48,49] we assume that N1 = N2 = const. Thus, in the case underconsideration, the basic dimensionless parameters determiningICCC separation are:
�x = �y: tx = ty – switching intervals between normal andreversed phase flow; b – sample and upper phase flow ratio;
ts – the sample loading time; KD – the partition coefficient; N –the total number of equilibrium cells in the column. It should benoted that the number of equilibrium cells (stages) in the columnN, determined from experimental peaks, represents the combinedresult of mass transfer and axial mixing expressed by Eq. (2), thatmeans N = Nef.
In Figs. 2–4 the elution profiles in the cycles calculated forvarious process conditions are shown. These figures demonstratethe influence of the above listed parameters on the ICCC separa-tion. The results presented in these figures, suggest the followingconclusions:
The value of tx, when the duration of the steps is equal, has nosignificant impact on the separation efficiency; an increase in tx
reduces the number of cycles and slightly reduces the run timerequired to complete the process and leads to higher solute con-centrations in the eluted fractions (Fig. 2). For example, increasingtx from 0.05 to 0.2, leads to 10% (for Kd = 0.2) and 80% (for Kd = 0.8)increase of maximum concentration and to a run time decreaseand hence solvent consumption of about 25% (where the run timeis defined as the point at which the final eluting peak drops to 10%of its maximum concentration).
An increase in ts increases solute concentrations in the eluted
fractions, and hence the performance, but it reduces to some extentthe resolution and slightly increases the number of cycles requiredto complete the process (Fig. 3). Increasing the time of sampleinjection 10 times (from ts = 0.01 to 0.1) leads to an increase in
98 A.E. Kostanyan et al. / J. Chromatogr. A 1314 (2013) 94– 105
Fig. 2. Effect of switching intervals on the ICCC separation: b = 0.1; N1 = N2 = 50; Sf = 0.5; ts = 0.01: (A) tx = ty = 0.05; (B) 0.1; (C) 0.2.

A.E. Kostanyan et al. / J. Chromatogr. A 1314 (2013) 94– 105 99
contin
c1
uNp(
2
ttst
ntto
pa(
rFc
t
c
Fig. 2 (
oncentration of 8–10 times but an increase in run time of only5%.
When the feed solvent stream does not noticeably affect the col-mn’s hydrodynamic equilibrium (that is for given values of N1 and2) it does not affect the separation efficiency. An increase in b pro-ortionally increases solute concentrations in the eluted fractionsFig. 4).
.3. Comparison of model and experimental data
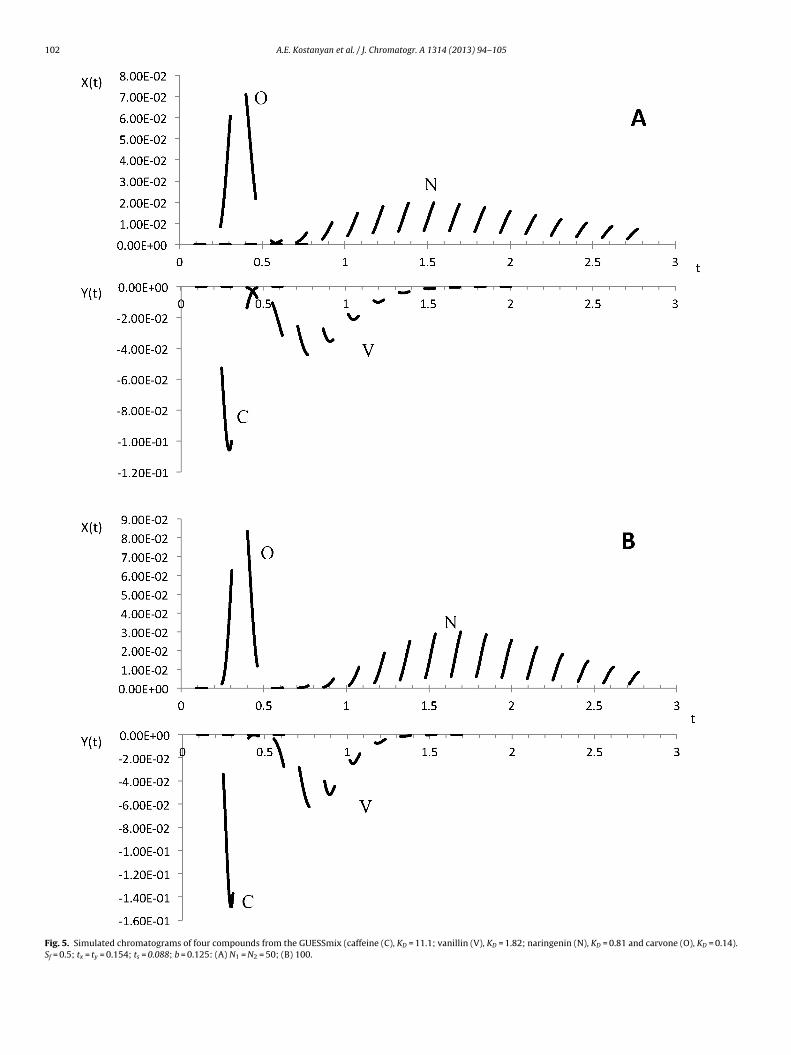
For the verification of the theory, we will use experimen-al results from the work [13], in which four compounds fromhe GUESSmix (caffeine; vanillin; naringenin and carvone) wereelected for optimization of the ICcE process using a Midi-CCC cen-rifuge (volume Vc = 912 ml) with the HEMWat-16a solvent system.
The sample was made up in upper phase and was loaded inormal phase mode. We use the results of the second experiment,he terms of which correspond to the theory presented above (tohe ICCC): the sample was loaded only once in the first step andver a time, not exceeding the run time of the first step.
Experimental data from [13] are:The partition coefficients (KD) of the compounds in normal
hase mode (the reciprocal of the values of reversed phase mode)re: caffeine (C) 11.1; vanillin (V) 1.82; naringenin (N) 0.81; carvoneO) 0.14.
The sample was loaded for the time �s = 2 min and at flowate FS = 5 ml/min; flow rates of upper and lower phase wereU = FU = 35 ml/min, time intervals �x = �y = 4 min. From these dataalculated model parameters are:
� (F + F ) 2(35 + 5) F 5
s = s U SVc=
912= 0.088; b = S
FU + FS=
35 + 5= 0.125
The results of the experiment simulation for the column effi-iency N1 = N2 = 50 are shown in Fig. 5A and for N1 = N2 = 100 in
ued ).
� F 4 × 35
Fig. 5B. The caffeine and vanillin are eluted with the lower phase (Y)and the naringenin and carvone with the upper phase (X), which isin good agreement with the experiment.
The presented theory allows the operational variables of theprocess to predict the concentration profiles in each cycle. The val-ues of N1 and N2 can be determined by fitting of experimentaland calculated concentration profiles. Unfortunately, experimen-tal data in [13] were not sufficiently detailed for a comparison ofpredicted and actual concentration profiles.
3. Comparison of non-steady state operations(chromatography) with steady-state (extraction)
3.1. Conventional isocratic CCC, dual CCC and fractionalextraction
In the dual CCC separation, named dual flow CCC (DFCCC)[3,15,18], both phases are simultaneously flowing in opposite direc-tions in the column; the sample is injected at the middle of thecolumn and the components to be separated are eluted from oppo-site ends of the column; the concentration of the solutes elutedwith the phases, as in the case of a conventional CCC separation,are not constant. Actually, dual CCC is the non-steady state (chro-matographic) version of fractional extraction (extraction with twosolvents), which is used to separate two solutes from the feed andfrom each other. In fractional extraction the feed is fed continu-ously at a constant rate, and the concentration of solutes eluted withboth phases become constant after a while. To compare the steady-state extraction and chromatographic separations with impulse
; tx = x U
Vc=
912= 0.154
sample injection, let us consider a special case of fractional extrac-tion, when the mixture to be separated is fed without a solvent.

100 A.E. Kostanyan et al. / J. Chromatogr. A 1314 (2013) 94– 105
Fig. 3. Effect of sample loading time on the elution profiles in the cycles: b = 0.1; N1 = N2 = 50; Sf = 0.5; tx = ty = 0.2: (A) ts = 0.01; (B) 0.1.

A.E. Kostanyan et al. / J. Chromatogr. A 1314 (2013) 94– 105 101
Fig. 4. Effect of sample flow rate on the elution profiles in the cycles N1 = N2 = 50; Sf = 0.5; tx = ty = 0.1: ts = 0.1: (A) b = 0.1; (B) 0.4.
102 A.E. Kostanyan et al. / J. Chromatogr. A 1314 (2013) 94– 105
Fig. 5. Simulated chromatograms of four compounds from the GUESSmix (caffeine (C), KD = 11.1; vanillin (V), KD = 1.82; naringenin (N), KD = 0.81 and carvone (O), KD = 0.14).Sf = 0.5; tx = ty = 0.154; ts = 0.088; b = 0.125: (A) N1 = N2 = 50; (B) 100.

A.E. Kostanyan et al. / J. Chromatogr. A 1314 (2013) 94– 105 103
F nents
Fel
X
w
=
wmntk.
ff
q
wcxps
apvtt
rrotc
cae
mr
ig. 6. Experimental (A) [15] and simulated (B) chromatograms of the seven compo
or this case of extraction, the normalized concentration of solutesluted with x and y phases are determined by the following formu-as:
= x
x0= 1 − Cm
1 − Cn+1; Y = y
x0= 1 − X (24)
ith
FyKD
Fx; x0 = Q
Fx
here Fx and Fy are the volumetric flow rates of x and y phases (units3/s or m3/h), respectively; KD = y*/x* is the partition coefficient;
is the total number of the equilibrium cells in the column; Q ishe rate of the solute continuously fed into the cell m (units g/s org/h). The cells are numbered from the x-phase inlet (1, 2, . . ., m,
. ., n).In the dual CCC separation, the quantities of a solute eluting
rom the opposite ends of the column are determined by similarormulas [10]:
x = Qx
Q= 1 − Cm
1 − Cn+1; qy = Qy
Q= 1 − qx (25)
here Q is the total amount of the solute injected into the middleell m; Qx and Qy are the amounts of the solute eluted with phases
and y, respectively. The portions of solute eluted by the x and yhases (qx and qy) correspond to the normalized concentrations ofolute eluted with the x and y phases (X and Y) in Eq. (24).
Thus, the purity of separation of steady-state (extraction)nd non-steady state (chromatography) dual counter-currentrocesses is absolutely identical and higher than that of the con-entional isocratic CCC separation. This conclusion can be extendedo the case when the sample is dissolved in one of the phases, sincehe sample flow does not affect the separation efficiency.
The difference between the two methods is that the chromatog-aphy allows separation of more than two components in a singleun, whereas by extraction only two components (or two groupsf components) can be separated. The advantage of extraction ishe much higher productivity as the mixture to be separated isontinuously fed into the column.
In both dual flow regimes the volume ratio of the phases in theolumn, unlike with isocratic CCC, does not directly affect the sep-ration. Though of course, it can significantly influence the column
fficiency by increasing or decreasing the mass transfer rate in it.As follows, from Eqs. (24) and (25), the considered dual flowethods can be controlled by two operational parameters: the flow
atio of the phases and the feed inlet position in the column. As
: KD1 = 0.44; KD2 = 0.42; KD3 = 0.66; KD4 = 8.00; KD5 = 0.71; KD6 = 16.44; KD7 = 24.63.
will be demonstrated below, Eqs. (24) and (25) allow prediction ofwhich components will elute with phases x and y.
3.1.1. Comparison of theory and experimentFor comparison we use experimental data from the works
[15,18]. In [15] the DFCCC separation was performed with contin-uous sample injection (the sample was pumped for 40 min) andseven components (KD1 = 0.44; KD2 = 0.42; KD3 = 0.66; KD4 = 8.00;KD5 = 0.71; KD6 = 16.44; KD7 = 24.63) were separated into two groupswhile in [18] the sample was injected within 30 min and fourcompounds from the GUESSmix [50] (caffeine, KD1 = 0.14; vanillin,KD2 = 1.21; naringenin, KD3 = 3.82 and carvone, KD4 = 14.8) were sep-arated into two streams using DFCCC with the solvent systemHEMWat 15. In both works the sample was introduced into themiddle of the column, that is m = (n + 1)/2, where n = 1, 3, 5,. . ..
Fig. 6 shows the experimental chromatograms (Fig. 6A) and thechromatograms simulated by using Eq. (24) (Fig. 6B) of the sevencomponents for the second continuous separation of [15]. In thecalculations, the variable parameter was the number of equilibriumcells n: increasing values of n were used to establish the value atwhich there will be agreement between the calculation and exper-iment. It can be seen from Fig. 6B that at n = 20 the agreementbetween calculation and experiment (Fig. 6A) is reached; in bothcases peaks 1, 2, 3 and 5 are totally eluted with the lower phase(x-phase) and peaks 4, 6 and 7 are totally eluted with the upperphase (y-phase). These results show that while the effectiveness ofthe used device might be much higher this did not affect the degreeof separation of the components.
In Figs. 7 and 8 the simulated chromatograms of the fourcompounds from the GUESSmix are compared with the experimen-tal chromatograms of [18]. In the experimental chromatograms(Fig. 7A), when phase flow rates were equal (35 ml/min each), car-vone (KD4 = 14.8) and naringenin (KD3 = 3.82) eluted with the upperphase (y-phase) and caffeine (KD1 = 0.14) with the lower phase (x-phase). Vanillin (KD2 = 1.21) partly eluted with lower phase andstarted appearing in the upper phase when the run was stopped.The main part of vanillin was retained in the column. In simulatedchromatogram (Fig. 7B) the picture is analogous: naringenin (thecurve no. 3) and carvone (4) elute with the y-phase and caffeine (1)with the x-phase. Vanillin (2) partly elutes with the x-phase.
By changing the phase flow ratio (the upper phase flow wasreduced to 20 ml/min and the lower phase flow was increased upto 50 ml/min) the experimental separation was improved (Fig. 8A):
carvone and naringenin eluted with the upper phase, caffeineand vanillin eluted with the lower phase. In the simulated chro-matogram (Fig. 8B) we have the same situation. Thus, a goodagreement between theory and experiment can be stated.
104 A.E. Kostanyan et al. / J. Chromato
Fpn
mhrK
Fpl
ig. 7. Experimental (A) [18] and simulated (B) chromatograms of the four com-ounds from the GUESSmix: 1 – caffeine, KD1 = 0.14; 2 – vanillin, KD2 = 1.21; 3 –aringenin, KD3 = 3.82 and 4 – carvone, KD4 = 14.8. Equal phase flow rates, 35 ml/min.
To separate vanillin and naringenin, using isocratic CCC in nor-
al phase mode (vanillin KD = 0.82, naringenin KD = 0.26) wouldave required for Sf = 0.5 the column efficiency of n = 300 equilib-ium cells and for Sf = 0.8, n = 80. In reverse phase mode (vanillinD = 1.21, naringenin KD = 3.82) the required n would have been:
ig. 8. Experimental (A) [18] and simulated (B) chromatograms of the four com-ounds from the GUESSmix. Unequal phase flow rates, upper phase 20 ml/min,
ower phase 50 ml/min.
gr. A 1314 (2013) 94– 105
for Sf = 0.5, n = 80 and for Sf = 0.8, n = 50 whereas to completely sep-arate these compounds in dual flow mode 20 theoretical stages arequite sufficient (Fig. 8B).
It can be stated that the dual flow methods do not need columnswith very high efficiency. However, it should be stressed thatcolumn efficiency measured by the theoretical plates (effective the-oretical stages) can be different for isocratic and dual flow modes forthe same values of axial mixing and mass transfer parameters, sincethe relationships between these parameters and column efficiencyare different for the two modes.
3.2. Intermittent counter-current extraction andchromatography, fractional extraction
In comparing intermittent counter-current (steady state)extraction (ICcE) and chromatography (ICCC) separations it canbe stated, like in the case of the dual flow methods dis-cussed above, the advantage of the chromatography is thepossibility to separate many components (more than two) ina single stage, while the advantage of the extraction is higherproductivity.
In the papers [13,14,16–18], to either split a sample into twogroups of compounds or extract and enrich a target compound,the sample was injected into the column during a long time sothat after several cycles the eluting concentration profiles of solutesbecame constant for a given time. These experiments were actuallythe combination of intermittent extraction (the initial stage) andchromatography (the final stage) separations.
Intermittent counter-current extraction can be considered asthe application of the controlled-cycle principle to fractionalextraction. At the present moment ICcE has advantages over DFCCCas it is based on standard two-bobbin CCC set ups, which are cur-rently available.
However, DFCCC potentially has an important future for contin-uous industrial separations. In further technical development theCCC machines should be equipped with special end terminals tohave both an inlet and outlet connections at each end of the col-umn and a “T-junction” at the midpoint (between two-bobbin) ora few “T-junctions” (in case of a multi-bobbin column to allow useof the second operational parameter – the feed point) as a sampleinlet.
4. Conclusion
Three approaches to describe CCC separation processes, platetheory, axial mixing and Craig’s CCD models, have been discussed.It is established that the most suitable is the modified equilibriumcell model, which takes into account the influence of the mass trans-fer rate and the degree of axial mixing on the CCC separation. Themodel allows the mass transfer and axial mixing parameters of acolumn to be calculated.
A full theoretical treatment of intermittent counter-currentchromatography with sample loading in the first step and over atime, not exceeding the run time of the first step (short sampleloading time), is performed. Analytical expressions for descriptionthe concentration profiles of solutes eluted with both phases arederived allowing the simulation of the ICCC separation for variousexperimental conditions.
Chromatographic and extraction separations have been com-pared and it is shown that all varieties of CCC separations can be
divided into two general groups:1. Non steady-state or chromatographic separations (short sampleloading time): the sample is fed into the column in the form of a

omato
2
tasaf
p
rHtift
wtnkpian
A
Rw
R
[[[[
[[
[
[
[
[[[
[[
[[[[[[[[[[[[[[[
[[[[[[[[
A.E. Kostanyan et al. / J. Chr
pulse injection during a short time; the concentrations of solutesin eluted fractions of the phases are not constant.
. Steady-state or extraction separations (long sample loadingtime): the sample is fed continuously at a constant rate; theconcentration profiles of solutes eluted with phases become con-stant after a while.
The first technology allows separating many components (morehan two) in a single stage, and can be recommended for prepar-tive and analytical purposes. The second technology allowseparating only two components (or two groups of components). Itsdvantage is much higher performance, and it can be recommendedor industrial scale separations.
It is demonstrated that in DFCCC it can be predicted which com-onents will elute with which phase.
ICcE is based on standard two-bobbin CCC set up which is cur-ently available and at present that is its advantage over DFCCC.owever, DFCCC has a great future for industrial separations. If
here is further technical development, the CCC machines can bemproved (equipped with special end terminals and “T-junctions”or feed inlet) to implement counter-current extraction separa-ions.
A long time ago [26] in comparing chromatography separationsith a counter-current bath distillation it was stated: “Though it
hus turns out that the countercurrent process is much more eco-omical as regards the number of plates required, it should beept in mind the high number of plates needed for chromatogra-hy is much more easily realized than the lower number of plates
n distillation”. However, CCC can realize a high number of stagesllowing higher performance/efficiency while maintaining the eco-omic advantage of the countercurrent extraction process.
cknowledgment
The authors are grateful to the Russian Foundation for Basicesearch (project no. 12-03-31398) for the financial support of thisork.
eferences
[1] Y. Ito, Sep. Purif. Rev. 34 (2005) 131.
[2] T.Y. Zhang, L.K. Pannell, D.G. Cai, Y. Ito, J. Liq. Chromatogr. Relat. Technol. 11(1988) 1661.[3] Y.W. Lee, C.E. Cook, Y. Ito, J. Liq. Chromatogr. 11 (1988) 37.[4] W.D. Conway, Countercurrent Chromatography: Apparatus, Theory and Appli-
cations, VCH, New York, 1990.
[[[[
gr. A 1314 (2013) 94– 105 105
[5] Y.W. Lee, J. Chromatogr. 538 (1991) 37.[6] A. Berthod (Ed.), Countercurrent Chromatography, The Support-free Liquid
Stationary Phase (Comprehensive Analytical Chemistry, vol. 38), Elsevier,Amsterdam, 2002.
[7] A. Berthod, M.J. Ruiz-Angel, S. Carda-Broch, Anal. Chem. 75 (2003) 5886.[8] E. Delannay, A. Toribio, L. Boudesocque, J.-M. Nuzillard, M. Zeches-Hanrot, E.
Dardennes, G. Le Dour, J. Sapi, J.-H. Renault, J. Chromatogr. A 1127 (2006) 45.[9] A. Berthod, J.B. Friesen, T. Inui, G.F. Pauli, Anal. Chem. 79 (2007) 3371.10] A.E. Kostanyan, V.V. Belova, A.I. Kholkin, J. Chromatogr. A 1151 (2007) 142.11] F. Couillard, A. Foucault, D. Durand, French Pat. FR2856933 (2005).12] A.E. Kostanyan, A.A. Voshkin, J. Chromatogr. A 1151 (2007) 126.13] P. Hewitson, S. Ignatova, H. Ye, L. Chen, I.A. Sutherland, J. Chromatogr. A 1216
(2009) 4187.14] I.A. Sutherland, P. Hewitson, S. Ignatova, J. Chromatogr. A 1216 (2009) 8787.15] R. van den Heuvel, B. Mathews, S. Dubant, I. Sutherland, J. Chromatogr. A 1216
(2009) 4147.16] S. Ignatova, D. Hawes, R. Heuvel, P. Hewitson, I.A. Sutherland, J. Chromatogr. A
1217 (2010) 34.17] P. Aihua, Y. Haoyu, S. Jie, H. Shichao, Z. Shijie, L. Shucai, C. Lijuan, J. Chromatogr.
A 1217 (2010) 5935.18] S. Ignatova, P. Hewitson, B. Mathews, I.A. Sutherland, J. Chromatogr. A 1218
(2011) 6102.19] W.D. Conway, J. Chromatogr. A 1218 (2011) 6015.20] E. Hopmann, M. Minceva, J. Chromatogr. A 1229 (2012) 140.21] E. Kitazumea, S. Koikawaa, L. Huia, S. Sannohea, Y. Yanga, Y. Makia, Y. Ito, J.
Chromatogr. A 1236 (2012) 148.22] A.E. Kostanyan, J. Chromatogr. A 973 (2002) 39.23] A.E. Kostanian, A. Berthod, S.N. Ignatova, T.A. Maryutina, B.Ya. Spivakov, I.A.
Sutherland, J. Chromatogr. A 1040 (2004) 63.24] A.J.P. Martin, R.L.M. Synge, Biochem. J. 35 (1941) 1358.25] L. Lapidus, N.R. Amundsen, J. Phys. Chem. 56 (1952) 984.26] J.J. Van Deemter, F.J. Zuiderweg, A. Klinkenberg, Chem. Eng. Sci. 5 (1956) 271.27] P.V. Danckwerts, Chem. Eng. Sci. 2 (1953) 1.28] J.F. Wehner, R.H. Wilhelm, Chem. Eng. Sci. 6 (1956) 89.29] O. Levenspiel, W.K. Smith, Chem. Eng. Sci. 7 (1957) 227.30] E.T. Van der Laan, Chem. Eng. Sci. 7 (1958) 187.31] C.A. Sleicher, AIChE J. 5 (1959) 145.32] T. Miyauchi, T. Vermeulen, Ind. Eng. Chem. Fundam. 2 (1963) 113.33] S. Harthland, J.C. Mecklenburg, Chem. Eng. Sci. 21 (1966) 1209.34] L.C. Craig, O. Post, Anal. Chem. 21 (1949) 500.35] M.R. Cannon, Ind. Eng. Chem. 53 (1961) 629.36] R.G. Robinson, A. Engel, J. Ind. Eng. Chem. 59 (1967) 22.37] P.A. Belter, S.M. Speaker, Ind. Eng. Chem. Process Des. Dev. 6 (1967) 36.38] J. Villermaux, in: A.E. Rodrigues, D. Tondeur (Eds.), Percolation Processes: The-
ory and Applications, Sijthoff and Noordhoof, New York, 1981, p. 83.39] A.E. Kostanyan, Theor. Found. Chem. Eng. 40 (6) (2006) 587.40] A.E. Kostanyan, Theor. Found. Chem. Eng. 42 (5) (2008) 538.41] A.E. Kostanyan, J. Chromatogr. A 1211 (2008) 55.42] A.E. Kostanyan, A.A. Voshkin, N.V. Kodin, J. Chromatogr. A 1218 (2011) 6135.43] I.A. Sutherland, J. de Folter, P. Wood, J. Liq. Chromatogr. 9/10 (2003) 1449.44] J. de Folter, I.A. Sutherland, J. Chromatogr. A 1216 (2009) 4218.45] J. de Folter, I.A. Sutherland, J. Chromatogr. A 1218 (2011) 6009.46] P. Hewitson, I. Sutherland, A.E. Kostanyan, A.A. Voshkin, S. Ignatova, J. Chro-
matogr. A 1303 (2013) 18.47] A.E. Kostanyan, J. Chromatogr. A 1254 (2012) 71.48] J. Völkl, W. Arlt, M. Minceva, AIChE J. 59 (1) (2013) 241.49] E. Hopmann, J. Goll, M. Minceva, Chem. Eng. Technol. 35 (1) (2012) 72.50] J.B. Friesen, G.F. Pauli, J. Liq. Chromatogr. Relat. Technol. 28 (2005) 2777.
Copyright © 2022 FDOKUMEN