Steady state axisymmetric deformations of a thermoviscoplastic rod penetrating a thick...
31
Int. J. Impact Enon# Vol. 11, No. 1, pp. 1 31, 1991 0734 743X/91 $3.00+0.00 Printed in Great Britain ~ 1991 Pergamon Press plc STEADY STATE AXISYMMETRIC DEFORMATIONS OF A THERMOVISCOPLASTIC ROD PENETRATING A THICK THERMOVISCOPLASTIC TARGET R. C. BATRA and T. GOBINATH Department of Mechanical and Aerospace Engineering and Engineering Mechanics, University of Missouri-Rolla, Rolla, MO 65401-0249, U.S.A. (Received 21 February 1990; and in revised form 18 July 1990) Summary The coupled nonlinear partial differential equations governing the thermomechanical and axisymmetric deformations, of a cylindrical rod penetrating into a thick target, also made of a rigid/viscoplastic material, are solved by the finite element method. It is assumed that the deformations of the target and the penetrator as seen by an observer situated at the stagnation point and moving with it are independent of time. Both the rod and the target material are assumed to exhibit strain-rate hardening and thermal softening, and the contact between the penetrator and the target at the common interface is smooth. An effort has been made to assess the effect of the strain-rate hardening and thermal softening on the deformations of the target and the penetrator. It is found that the axial resisting force experienced by the penetrator, the shape and location of the free surface of the deformed penetrator and the target/penetrator interface, and normal tractions on this common interface depend rather strongly upon the speed of the stagnation point and hence on the speed of the striking rod. Results presented graphically include the distribution of the velocity field, the temperature change, the hydrostatic pressure and the second-invariant of the strain-rate tensor. In an attempt to help establish desirable testing regimes for determining constitutive relations appropriate for penetration problems, we also find histories of the effective stress, hydrostatic pressure, temperature and the second invariant of the strain-rate tensor experienced by four penetrator and two target particles. v velocity of a rod particle p mass density q heat flux U specific internal energy D strain-rate tensor o Cauchy stress tensor s deviatoric stress tensor p hydrostatic pressure 0 temperature change k thermal conductivity c specific heat a o yield stress in simple compression b, m strain-rate sensitivity parameters ~, thermal softening coefficient t a unit tangent vector n a unit normal vector h heat transfer coefficient grad gradient operator div divergence operator 12 second invariant of D ~t,/~ non-dimensional numbers NOTATION 1. INTRODUCTION When a fast moving long rod strikes a very thick target, the deformations of the rod and the target appear to be time independent to an observer situated at the stagnation point and moving with it after the rod has penetrated into the target through a distance equal to a few rod diameters. This steady state lasts until the stagnation point reaches close to the other end of the target. Thus, for thick targets, the duration of the steady state portion
Transcript of Steady state axisymmetric deformations of a thermoviscoplastic rod penetrating a thick...

Int. J. Impact Enon# Vol. 11, No. 1, pp. 1 31, 1991 0734 743X/91 $3.00+0.00 Printed in Great Britain ~ 1991 Pergamon Press plc
STEADY STATE AXISYMMETRIC DEFORMATIONS OF A THERMOVISCOPLASTIC ROD PENETRATING
A THICK THERMOVISCOPLASTIC TARGET
R. C. BATRA a n d T. GOBINATH
Department of Mechanical and Aerospace Engineering and Engineering Mechanics, University of Missouri-Rolla, Rolla, MO 65401-0249, U.S.A.
(Received 21 February 1990; and in revised form 18 July 1990)
Summary The coupled nonlinear partial differential equations governing the thermomechanical and axisymmetric deformations, of a cylindrical rod penetrating into a thick target, also made of a rigid/viscoplastic material, are solved by the finite element method. It is assumed that the deformations of the target and the penetrator as seen by an observer situated at the stagnation point and moving with it are independent of time. Both the rod and the target material are assumed to exhibit strain-rate hardening and thermal softening, and the contact between the penetrator and the target at the common interface is smooth. An effort has been made to assess the effect of the strain-rate hardening and thermal softening on the deformations of the target and the penetrator. It is found that the axial resisting force experienced by the penetrator, the shape and location of the free surface of the deformed penetrator and the target/penetrator interface, and normal tractions on this common interface depend rather strongly upon the speed of the stagnation point and hence on the speed of the striking rod. Results presented graphically include the distribution of the velocity field, the temperature change, the hydrostatic pressure and the second-invariant of the strain-rate tensor.
In an attempt to help establish desirable testing regimes for determining constitutive relations appropriate for penetration problems, we also find histories of the effective stress, hydrostatic pressure, temperature and the second invariant of the strain-rate tensor experienced by four penetrator and two target particles.
v velocity of a rod particle p mass density q heat flux U specific internal energy D strain-rate tensor o Cauchy stress tensor s deviatoric stress tensor p hydrostatic pressure 0 temperature change k thermal conductivity c specific heat
a o yield stress in simple compression b, m strain-rate sensitivity parameters
~, thermal softening coefficient t a unit tangent vector n a unit normal vector h heat transfer coefficient
grad gradient operator div divergence operator 12 second invariant of D
~t,/~ non-dimensional numbers
NOTATION
1. I N T R O D U C T I O N
W h e n a fas t m o v i n g l o n g r o d s t r i ke s a ve ry t h i c k t a r g e t , t h e d e f o r m a t i o n s o f t he r o d a n d
t h e t a r g e t a p p e a r to be t i m e i n d e p e n d e n t to a n o b s e r v e r s i t u a t e d a t t he s t a g n a t i o n p o i n t
a n d m o v i n g w i t h it a f t e r t h e r o d h a s p e n e t r a t e d i n t o t he t a r g e t t h r o u g h a d i s t a n c e e q u a l
to a few r o d d i a m e t e r s . T h i s s t e a d y s t a t e l a s t s u n t i l t h e s t a g n a t i o n p o i n t r e a c h e s c lose to
t he o t h e r e n d o f t h e t a r ge t . T h u s , fo r t h i c k t a r g e t s , t he d u r a t i o n o f t h e s t e a d y s t a t e p o r t i o n

2 R.C. BATRA and T. GOBINATH
of the penetration process is a significant part of the total time taken to perforate through the target. For very high striking speeds, the deformations of the target and the penetrator can be assumed to be governed by purely hydrodynamic incompressible flow processes. In this approach, the only significant material property is the ratio of mass densities of the target and the penetrator, and the same penetration depth is predicted for all impact velocities. Tate [1,2] and Alekseevskii [3] modified this model by incorporating the effects of the material strengths of the projectile and the target and representing them as some multiple of the uniaxial yield stress of the material, but the multiplying factor was not specified. These and other limitations of the one-dimensional models have been discussed by Wright [4], and more recently by Wright and Frank [5]. Pidsley [6], who studied the penetration of a copper rod into an aluminum target, found that during the steady state portion of the penetration process these strength parameters equalled 2.4(an) t and -(0.7)(crn) p for the target and the penetrator, respectively. Here cr n is the Hugoniot elastic limit. He explained that the negative value for the rod strength is due to the yield strength of the rod being lower than that of the target.
The reader is referred to the paper by Backman and Goldsmith [7] for a review of the open literature on ballistic penetration until 1977. It describes various physical mechanisms involved in the penetration and perforation processes, and also discusses a number of engineering models. Other recent review articles and books include those by Wright and Frank [5], Anderson and Bodner [8], Zukas et al. [9], Blazynski [10], and Macauley [ l l ] . Ravid and Bodner [12] have proposed a five-stage penetration model applicable to two-dimensional analysis of rigid projectiles penetrating deformable targets. Various unknowns in the assumed kinematically admissible velocity field are found by using an upper bound theorem of plasticity modified to include dynamic effects. The penetration model proposed by Ravid et al. [13] also accounts for the shock effects and plastic deformation in the component bodies. Forrestal et al. [14] have recently applied the cavity expansion model to study the penetration of rigid projectiles into geological materials.
With the main objective of providing some guidelines for selecting and improving upon the previously used kinematically admissible fields in engineering models of penetration, Batra and Wright [ 15] initiated the study of an idealized steady state penetration problem. It simulates the penetration of a very long (semi-infinite) rod into an infinite target when all of the flow fields appear steady to an observer situated on the penetrator nose tip and moving with it and the target/penetrator interface is smooth. They studied the problem of a deformable target, assumed to be made of a rigid/perfectly plastic material and a rigid cylindrical penetrator with a hemispherical nose. Subsequently, Batra [16,17] found that the nose shape affected significantly the resisting force experienced by the penetrator and also studied the case when the target material exhibited work-hardening, strain-rate hardening and thermal softening effects. Batra and Lin [18-20], and Lin and Batra [21] studied the steady state axisymmetric deformations of a semi-infinite cylindrical penetrator striking a known semi-infinite cavity in an infinite and rigid target, and also computed the histories of the effective stress, temperature, second invariant of the strain-rate tensor and the plastic spin. Gobinath and Batra [22] have recently analysed the steady state axisymmetric penetration problem in which both the target and the penetrator are made of a rigid/perfectly plastic material. Since most penetrator and target materials exhibit strain rate hardening and thermal softening effects, we extend the previous work [22] to incorporate these effects. The problem is very challenging because of the presence in it of two a priori unknown surfaces, namely, the target/penetrator interface and the free surface of the penetrator material flowing backwards. The shapes and locations of these surfaces are strongly influenced by the value of the strain rate hardening exponent for the penetrator and a little by the value of the strain-rate hardening exponent for the target. The speed of penetration also affects noticeably the shapes of the target/penetrator interface.
We note that there is no fracture or failure criterion incorporated in our work. Thus both the penetrator and target materials are presumed to undergo unlimited plastic deformations. It is hoped that the details of the kinematic and stress fields provided herein

Steady state axisymmetric deformations 3
~vill help propose better estimates of the kinematic fields in engineering models of steady state penetration process. Also the histories of the stress, temperature, the second invariant of the strain-rate tensor and the plastic spin for four penetrator and two target particles given herein should help establish desirable testing regimes for practical problems, and help assess the efficacy of different plasticity theories for the penetration problem.
2. F O R M U L A T I O N O F T H E P R O B L E M
We use a cylindrical coordinate system, with origin at the stagnation point and moving with it at a uniform speed v S and positive z-axis pointing towards the undeformed portion of the rod, to describe the deformations of the target and the penetrator. The equations governing their deformations are
div v = 0, (1)
div a = p~, (2.1)
= p(v . grad)v, (2.2)
- div q + tr(aD) = p(v- grad)U, (3)
2D = grad v + (grad v) r. (4)
These equations are written in the Eulerian description of motion. Equation (1) expresses the balance of mass, Eqn (2) the balance of linear momentum, and Eqn (3) the balance of internal energy. Here v is the velocity of a material particle, a the Cauchy stress at the present location of a material particle, p the mass density, q the heat flux, and U the specific internal energy. A dot superimposed over a character implies its material time derivative, and the operators grad and div signify the gradient and the divergence operators defined in the present configuration. In writing Eqn (1) we have assumed that the deformations of the target and the penetrator are isochoric, and in Eqn (3) all of the plastic working rather than 90-95% of it as asserted by Farren and Taylor [23] is assumed to be converted into heat.
For constitutive relations, which are characteristic of the target and the penetrator materials, we take
o o o" = - - p l + ~ (1 + bl )m(1 - 70)D, D ¢ O, (5)
" v
O = 0 if tr(s) ~ < ~a~(1 - 70) 2, (6)
s = o + p l , (7)
q = --k grad 0, (8)
U = cO, (9)
212 = tr(D2). (10)
In these equations, p is the hydrostatic pressure not determined by the deformation history of a material particle because we have assumed the target and penetrator materials to be incompressible, 1 is the unit tensor, a o the yield stress in a quasistatic simple tension or compression test, I z the second invariant of the strain-rate tensor, b and m characterize the strain-rate hardening of the material, 7 describes its thermal softening, 0 equals the absolute temperature of a material particle, s is the deviatoric stress tensor, k the thermal conductivity and c the specific heat. Both k and c are assumed to be independent of the temperature. From Eqns (5) and (7), we get
o- 0 (2 a- tr s2) 1/2 = , /3 (1 + hi)m(1 - 70). (11)
This can be viewed as a generalized yon Mises yield criterion when the flow stress, given by the right-hand side of Eqn (11), at a material particle depends upon its strain-rate and

4 R . C . BATRA and T. GOBINATH
the temperature change. That the flow stress decreases linearly with the temperature rise has been observed by Bell [24], and Lindholm and Johnson [25]. The range of temperatures studied by these investigators is not as large as that likely to occur here. We add that Tate [26] also used a linear thermal softening law in his study of the penetration problem.
Rewriting Eqn (5) as
O" o ~r = --[/3 + ~(0 -- 0o)K]l + x/3~I (1 + bl)m(1 -- 7 0 ) 0 , (12)
where 2~ and K equal, respectively, the coefficient of thermal expansion and the bulk modulus of the material, we see that Eqn (5) embodies implicitly thermal stresses caused by the non-uniform temperature rise at different material particles. In Eqn (12), p is not determined by the deformation history of a material particle and the addition of a determinate term to it gives rise to p in Eqn (5) which is taken to be an independent variable throughout this work.
Substitution for a, q, and U from Eqns (5), (8) and (9) into Eqns (2.2) and (3) gives the following field equations:
--grad p + ao div[(1 + bl)m(1 - 7 0 ) D / x ~ 3 I] = p ( v . grad)v (13)
k div(grad 0) + 2aol(1 + bl)m(1 - 70)/~3 ~- p c ( v . g r a d ) 0. (14)
The nonlinear coupled Eqns (13) and (14), and Eqn (1) subject to the appropriate boundary conditions are to be solved for the fields of the velocity v, pressure p and temperature 0 in the deforming target and penetrator regions. Even though governing equations for the target and penetrator regions are the same, the values of material parameters ao, b, m, °/, p, k and c need not have the same values for the target and penetrator materials. In order to solve Eqns (1), (13) and (14), we need to know the domains over which they apply. This in turn requires a knowledge of the shapes and locations of the target/penetrator interface Fi and the free surface Ff of the deformed penetrator. Both these surfaces are unknown a priori . For the time being, we presume that Fi and Ff are known. Subsequently, we discuss how to find these surfaces.
It is convenient to introduce non-dimensional variables, indicated below by a super- imposed bar, as follows:
- v 2 = p v ~ / ~ o , Oo v~/c, = ~ / p v 2, {9 - p / p ~, ~ =
= V/Vs, ~ = r/ro, ~ = z/ro, 0 = 0/0o,
9 = 700, fl = k/(pcVsro), b = bv~/ro, h = h/pcvs . (15)
We note that vs is the same for the target and the penetrator, but the values of other variables need not be the same. When non-dimensionalizing a quantity for the target (penetrator), the value of the material parameter for the target (penetrator) is used. An advantage of the non-dimensionalization (15) is that the governing equations for the penetrator and the target look alike. In Eqn (15), ro is the radius of the undeformed cylindrical penetrator, the pair (r, z) denotes the cylindrical coordinates of a point, 00 is the reference temperature, h is the heat transfer coefficient between the penetrator material and air, and the non-dimensional number :~ gives the magnitude of the inertia forces relative to the flow stress of the material. Rewriting Eqns (1), (13) and (14) in terms of non-dimensional variables, dropping the superimposed bars, and denoting the gradient and divergence operators in non-dimensional coordinates by grad and div, we arrive at the following set of equations:
div v = 0,
- grad p + div [ (1 + bl)m(1 - 7 0 ) D / , f 3 I~] = (v. grad)v,
fl div(grad 0) + 2I(1 + hi)m(1 - 70)/(xf3 ~) = (v-grad)0.
(16)
(17)
I18)

Steady state axisymmetric deformations 5
F o r the b o u n d a r y c o n d i t i o n s , w e take
t. (an) = 0 o n I" i, (19.1)
n.at n = PP n.apn on Fi, (19.2) Pt
v . n = O o n Fi, (19.3)
0p ~--- (00t/0Op)0 t o n l-i, (19.4)
~nflt Off ~ P o n F i, (19.5)
o n Ire, (19.6)
o n I f , (19.7)
a n = 0
v ' n = 0
~0 -f l~n=h(O-Oa) on If, (19.8)
where n is a unit outward normal to the surface, t is a unit tangent to the surface, 0a is the air temperature and subscripts p and t signify the quantity for the penetrator and the target, respectively. We note that boundary conditions (19.3) and (19.7) which signify that F i and F r are streamlines are not required for a complete specification of the problem provided that these surfaces are known. Since these surfaces are not known, we presume their shapes, solve the problem without using (19.2) and (19.7), and then use these conditions to ensure that the presumed F i and F r are correct. The procedure for adjusting F i and F r if (19.2) and (19.7) are not satisfied within the prescribed tolerance is described in Section 4.
At target particles far away from Fi, we take
I v + e [ ~ 0 as(r2+zZ)l/z---,oo, (20.1)
[anl ~ 0 as z ~ oo, (20.2)
~ ! ~ 0 as z ~ oo. (20.3)
That is, target particles at a large distance from F i appear to be moving at a uniform speed to an observer situated at the stagnation point. Equations (20.2) and (20.3) state that the fields of surface tractions and heat flux vanish at target particles behind the stagnation point and far from it. On the penetrator cross-section far from the stagnation point,
Iv+(Vp-1)el~O as z -* ~ , (21.1)
l0 - 0al --' 0 as z ~ oo, (21.2)
and on the deformed penetrator material at the outlet,
]an[ ~ 0 as (r 2 + z2) 1/2 ~ oo. (21.3)
6940 --* 0 as (r 2 + z 2) ~ oo. (21.4) tin
Equations (21.1) and (21.2) state that the end of the penetrator far from the stagnation point is moving in the negative z-direction with a uniform speed of (% - 1) relative to the observer at the stagnation point and is at a uniform temperature 0 a. Equations (21.3) and (21.4) state that the surface of the deformed penetrator near the outlet is traction free and there is no heat exchange between them and the material on the other side of the outlet surface. Ideally, one should specify the rate of decay of quantities in Eqns (20.1) through (20.3), and (21.1) through (21.4). However, at this time, there is little hope of proving any existence or uniqueness theorem for the stated problem and we, therefore, gloss over the issue. Herein we assume that the problem defined by Eqns (16)-(21) has a solution and seek an approximation to that solution by the finite element method.

6 R .C . BATRA and T. GOBINATH
3. F I N I T E E L E M E N T F O R M U L A T I O N O F T H E P R O B L E M
Unless one uses infinite elements, a numerical solution of the problem necessitates that we consider a finite region and know the shapes of the free surface Ff and the target/penetrator interface Fi. We presume F i and Ff and study deformations of the penetrator over the region ABGHIJA shown in Fig. 1 and of the target on the region BCDEFGB also shown in Fig. 1. The figure depicts a finite element discretization of the domain; the mesh is very fine in the darker regions. We note that the finite domains for the penetrator and the target considered here are larger than the penetrator region studied by Batra and Lin [18-19] and the target regions examined by Batra [15 17].
The boundary conditions ( 19.1 ), (19.3) and (19.4) apply on the target/penetrator interface BG and (19.6) and (19.8) on the penetrator free surface JIH. We recall that conditions (19.2) and (19.7) are used to verify the accuracy of the assumed surfaces F~ and If. On the axis of symmetry ABC, we impose
c~O Crrz = 0, V r = 0, ~r = 0. (22)
The boundary conditions (20) and (21) at the far surface of the penetrator and the target are replaced by the following conditions on the bounding surfaces of the finite region being analysed:
vz = 1, Vr = 0, 0 = 0, on the bounding surfaces CD and DEF, (23.1)
?,0 azz = 0, v r = 0, - 0 on FG, (23.2)
?z
H G ~ H G
B
FIG. 1. The finite region studied and its discretization.

Steady state axisymmetric deformations 7
d0 v z = v e, vf = 0, - - = 0 on the outlet surface GH, (23.3)
#z
v z = - (Vp - 1 ), v r = 0, 0 = 0a on the surface AJ. (23.4)
The value of ve is computed so as to satisfy the balance of mass. Referring the reader to one of the books [27-29] for details of deriving a weak formulation
of the problem, we simply note that a weak formulation of the problem defined on the target region R t by Eqns (16)-(18), and boundary conditions (19.1), (22), (23.1) and (23.2) is that equations
fR 2(div v) = (24.1) dV 0 !
fgp(div q b ) ~ I~,(I, O, ~t)[D: (grad 4~) + (grad d V - 4,) T] dV t JRt
~ - I R ~ ( J y ' g r a d ) v ~ ' ~ ) d [ / - ~ F ( ~ . o ' n ) ( ~ . n ) d S ( 2 4 . 2 ) t i
fltfg (gradO.gradrl)dV+fg [(v.grad)O]qdV=fg qQt(I,O,~)dV-f flrl~nd, (24.3) t t t ,d Fi
where
#t ( l , 0, ct)-- (1 + b l )m(l - ~0)/(2~I~), (25 .1)
Qt(I, 0, ct) = 2I(1 + bI)m(1 - 70)/xf3 ~, (25.2)
hold for arbitrary smooth functions 2, 4~ and q defined on Rt such that 4~ = 0 on CD and DEF, q~r=0 on BC and FG, and q = 0 on CD and DEF. If at a boundary point a component of the trial solution is prescribed, the corresponding component of the test function is taken to vanish there. In Eqn (24.2) A:B= tr(AB T) for linear transformations ,4 and B. A similar set of equations can be derived for the penetrator region. Note that for the penetrator region the second term on the right-hand side of Eqn (24.3) will be replaced by
- fr B'1eOdS+ fr h(O-Oa)qdS" (25.3) i (~F/ f
Because of the boundary condition (19.4), we use the following iterative scheme to solve the problem. We estimate 0 in Rp and Rt, solve equations (24.1), (24.2) and a similar set of equations for the penetrator for the fields of v and p in Rp and Rt, (cf. Section 4.1 below), use these values of v in Eqn (24.3) and a similar equation for the penetrator to solve these for 0 in RpWR t. Thus the boundary conditions (19.4) and (19.5) requiring the continuity of the temperature and the normal component of the heat flux across the target/penetrator interface Fi are satisfied. The computed value of 0 is compared with the estimated value and the aforementioned process is repeated until the difference between the two at every node point is less than the prescribed tolerance. The nonlinear equations (24.1) and (24.2) are solved iteratively for p and v. At the ith iteration, equations
fR 2(div = 0, (26.1) ~i) dV t
fR pi(divga)dV- fR ~(li-l,O,~t){Di:[grad~+(grad~)T]}dV t t
= ~R [(vi-l"grad)vi]''dV- fr (n'°'i-ln)(' 'n)dS (26.2) t i
are solved for v i and pl. The iterative process is stopped when, at each nodal point,
]l vl - v i- 1][ _< e[jl v ~ - till (26.3)

8 R . C . BATRA and T. GOBINATH
2 2 and e is a preassigned small number. Since Eqn (26.2) is linear in p, where Ilvll 2 = vr + v z, its values are not included in the convergence criterion (26.3).
4. C O M M E N T S O N C O M P U T A T I O N A L A S P E C T S O F T H E P R O B L E M
Batra [17] and Batra and Lin [19] used 6-noded triangular elements to analyse steady state thermomechanical deformations of the target and the penetrator, respectively, while assuming that the other body was rigid. Thus, they approximated the velocity and pressure fields by piecewise quadratic and piecewise linear fields over Rp and R t. Each of these fields is continuous across inter-element boundaries. The convergence rate of the iterative scheme used to solve Eqns (24.1) and (24.2) deteriorated significantly once the value of % or cq exceeded 5. We note that for higher values of 0~p and at, the convective part of the acceleration plays a dominant role and the finite element mesh required to obtain a satisfactory solution of Eqns (24) by the Galerkin approximation [29] needs to be very fine. This difficulty was overcome by adding an artificial viscosity to the diffusive terms in Eqns (24) and using 4-noded quadrilateral elements in which the pressure field is taken to be constant and the velocity field bilinear. The value of the artificial viscosity v to be added in each element depends upon the values of v and #, defined by Eqn (25.1), at the centroid of the element and the dimensions (hr, h~) of the element. Here hr and hz equal, respectively, the largest distances in the r and z directions between the midpoints of the sides of a quadrilateral. Following Brooks and Hughes [30], we take
V ~--- V r ' l - Vz,
vr = hr(coth vl - 1 / v l ) /2 ,
Vz --- hz(coth vz - 1/v2)/2,
v 1 = v~hr/p( l ~, W , ~),
when solving Eqn (24.2), and c
v l = vrhr/fl ,
v2 = v~hz /#( l c, 0 c, ~),
(27.1)
(27.2)
(27.3)
(27.4)
v 2 = v ~ h z / f l (27.5)
when solving Eqn (24.3). In these equations, the superscript c signifies that the quantity is evaluated at the centroid of an element. Brooks and Hughes [30] have shown that adding artificial viscosity is equivalent to using the Petrov-Galerkin approximation of Eqn (24).
4.1 So lu t ion a lgor i t hm
Assume the shapes and locations of the target/penetrator interface F i and the free surface Ff of the deformed penetrator. Estimate the temperature field 0 over the regions Rp and R t occupied by the penetrator and the target. Solve Eqns (24.1) and (24.2) for (v, p) on R t and a similar set of equations on Rp with the boundary condition (19.3). Thus ~b.n = 0 on Fi and the contribution from the surface integral term on the right-hand side of Eqn (24.2) vanishes. Equations (19.2) and (19.7) are used to ascertain the accuracy of F i and Ff. Emphasis is placed on finding Ff first, and once Ff has been determined, F i is found always ensuring that Ff is still reasonably correct and if necessary, Ff is adjusted. During the adjustment of F i nodes on it are moved in a direction perpendicular to it by an amount proportional to ( f p - f [ ' ) where f p and f t equal, respectively, the normal force on the penetrator and target particles abutting Fi. A check is made to ensure that the elements adjoining F i are not severely distorted after the nodes on F i have been shifted. The algorithm for modifying If, if necessary, is given below in Section 4.2.
After the mechanical problem has been satisfactorily solved, the computed velocity field is used to solve the thermal problem for the combined domain Rp u R,. Thus the boundary conditions (19.4) and (19.5) are trivially satisfied. The second term in Eqn (25.3) results in the satisfaction of the boundary condition (19.8). The computed values of 0 are compared with the estimated values and, if necessary, the solution process is repeated until the prespecified convergence criteria have been met.

Steady state axisymmetric deformations 9
4.2 Adjustment of the free surface
The algorithm used to adjust the free surface Ff is the same as that given by Gobinath and Batra [22] and is included herein for completeness. Referring to Fig. 2, let point Q on Ff be downstream from P on Ff. Assume that the computed velocity vp is tangent to Ff at P and v o does not satisfy v o-n = 0. In order to find the new location of point Q, we draw a circular arc that passes through points P and Q and is tangent to Vp at P. Let C be the center of this circular arc. Point Q is moved along CQ to Q* such that P and Q* lie on a circular arc with Vp and v o being tangent to the circle at P and Q*. Points downstream from Q are moved to an intermediate location before this rule is applied to them. Let R be a point neighboring Q and downstream from it. R is moved to R 1 such that the vector RxQ* equals the vector RQ. The final location R* of R 1 is then found in the same way as Q* was determined and by assuming that the velocity of R 1 is YR. Since point J is on Ff, the algorithm can be applied starting from J.
4.3 Mesh regeneration
After the position of Ff has been determined, the finite element mesh on Rp is regenerated by solving on it the Poisson equation
V2~ = P(r, z)
under the essential boundary conditions ~b = r and ~b = z at nodes on the boundary C~Rp. Here P is the control function [31-34] that helps generate an appropriately graded mesh. The points of intersection of the equipotential curves through nodes on the boundary define the new locations of interior nodes.
O*
6 C
FIG. 2. Illustration of the algorithm to adjust Ff.

10 R.C. BATRA and T. GOBINATH
5. D I S C U S S I O N O F R E S U L T S
Except when we study the effect of varying the value of a material parameter, we assign the following values to different parameters for the penetrator and target materials:
Pp = Pt = 7800 kg/m 3, r o = 10 mm,
aop = 350 MPa, O-or = 114.3 MPa,
mp = 0.025, m t = 0.025,
bp = 10000 s, b t --- 10000 s,
7p = 0.000555/°C, 7t = 0.000772/°C,
Cp = 473 J kg- 1 °C- 1, c t = 395 J K g - 1 °C- 1,
kp = 48 Win- x ° C - x, kt = 111 W m - 1 ° C - a,
h = 20 W m - 2 °C - 1, 0 a = 0.
We recall that subscripts p and t signify the quantity for the penetrator and the target, respectively. For an assigned value o f v , the value of% is estimated from the relation [1]
½(% - 1 )2 + yp = (Rt + ~)(pt/Pp) (28)
where Yp and R t represent strength parameters for the penetrator and target, respectively. Pidsley [6], for a copper penetrator and an aluminum target, estimated these parameters to equal ( -0.7)(an)p and 2.4(an)t, respectively, where a n is the Hugoniot elastic limit. In his 1967 paper, Tate [1] found R t = 3.5(an) t and in a recent paper [25] he gave
Yp = 1.7O-op,
Rt = aot[2/3 + ln(O.57Et/ao,)], (29)
where E t is Young's modulus for the target material. Batra and Chen [36] used a semianalytical method to analyse the steady state axisymmetric deformations of a viscoplastic target being penetrated by a rigid hemispherical nosed penetrator and found that
Rt = 9.43aot.
In terms of dimensional variables, we need to know (Rt - Yp) rather than the values of R t
and Yp to find Vp from Eqn (28). In all of the results presented below the solution for the velocity and temperature fields
was assumed to have converged when, at each nodal point, the value of these quantities during two successive iterations differed by no more than 5%. The free surface was taken to have converged when at each node point on it, Iv.nl was less than 0.02. The iterative process to compute the target/penetrator interface was stopped when the values of the normal tractions f~ and f t at each node point on F i differed from their mean values by less than 5%. We discuss below results for different speeds of the penetrator, and for different values of the strain-rate hardening exponent m and the coefficient of thermal softening 7.
5.1 Results for vs = 500 m/s
Figure 3 depicts the computed velocity field in the penetrator and target regions for v~ = 500 m/s. The penetrator speed, as computed from Eqn (28), equals 1041 m/s. The plots clearly show that the velocity at points on the free surface and the target/penetrator interface is along the tangent to these surfaces. In order to show this effect clearly, the velocity field in only a part of the deforming region is shown. The computed velocity field establishes the validity of the iterative technique outlined above to find the shapes of the free surface and the target/penetrator interface. A least squares fit to the bot tom surface of the

Steady state axisymmetric deformations 11
o ~ ' ~7~,,,
I I I I I lliil~
ai
L 0 0 O0
E q- t ~
E-
.<
" 0
t ~

12 R.C. BATRA and T. GOBINATH
target/penetrator interface Fi can be represented by the equation
r 2 ( z - 0.874) 2 - - + - l . ( 3 0 ) 1.8612 0.8742
It is interesting to note that Tate [37] found the equation of the bottom surface o f f i to be
3 r 2 (z - a) 2 - 1. ( 3 1 ) 4 a 2 a 2
A possible reason for the difference in the value of the coefficient for the first term is the lower value of Vs considered here.
If the penetrator speed is less than the limiting velocity and there is no perforation of the target, Eqn (30) will give approximately the shape of the bottom surface of the cylindrical cavity in the target. We note that the computed shape of F i does not match well with the hemispherical cavity considered by Batra and Lin 1-19] in their study of the deformations of a thermoviscoplastic rod striking a rigid cavity. The thickness 0.38r o of the outlet region computed by Batra and Lin [19] for % = 5.6 is comparable to 0.42r o found herein. At the penetrator and target particles that lie to the rear of the bottom-most point of the free
[ I I 5 7 8 6 11.4
5.0
2.5
0 .0
- 25
- 5 . 0
-T.5)
-10.(
-12.5
- 1 5 D
-17 .5 [ 0 , 0 2 9
E o
E 2 a
I I 14.3 17.1 2 0 0
1.o " 0 0 W ~ . _ . . . ~
O5
02
0.0 I 1 I I I 0 . 0 0.2 0.5 0.7 0.9 1.2 1 4 1.6 1.9
R c o o r d i n a t e
FIG. 4. Contours of the hydrostatic pressure in the penetrator and target regions for v s = 500 m/s.

Steady state axisymmetric deformations 13
surface, the flow quickly becomes essentially parallel to the axis of the penetrator. Target particles that lie ahead of the penetrator/target interface and within one penetrator radius from it have a noticeable radial component of velocity. The velocity field for other values of v~ was found to be similar to that shown in Fig. 3.
Figure 4 shows contours of the hydrostatic pressure in the penetrator and target regions. Recalling that the non-dimensionalization is with respect to pV2s, and Vs = 500 m/s, these values need to be multiplied by 5.6 and 17.1 for the penetrator and target, respectively,
;ide
' I 1.82
FIG. 5. Distribution of the strain-rate invariant I in the deforming penetrator and target regions for v, = 500 m/s.

14 R.C. BATRA and T. GOBINATH
i__
/ 2 i
Variation of I atongLM
01,. . . . . . . . . . . . . . . . . . . . . . . . . . , . . . . . . . . .
- 4 - 3 - 2 - 1 0 1 2 3
Perpendicular distance 4: 3
1 2
1
- 4 -25 - 2 -1 0 1 - 4 Perpendicular distance
Variation of [ along PS Variation of I (:Long PQ
-3 - -2 --1 0 I
Perpendicular distance
FIG. 6. Variation of 2nd invariant I of the strain-rate tensor along three arbitrary lines LM, PQ, and PS perpendicular to F~ (vs = 500 m/s).
to get values of p as a multiple of corresponding ao. The maximum values of the non-dimensional hydrostatic pressure were found to be 0.8975 and 1.017 for the penetrator and the target, respectively. These equal 5.03 aov and 17.39~rot, respectively. When the penetrator and the target materials are modeled as rigid/perfectly plastic, Gobinath and Batra [38] found for vs = 500 m/s, the peak pressures in the penetrator and target to be 5.06aOp and 15.68aot near the stagnation point. It seems that the consideration of strain-rate hardening and thermal softening effects has virtually no effect on the value of the peak hydrostatic pressure in the penetrator but increases its value in the target region. We note that for the rigid ellipsoidal nosed penetrator (r , / r o = 2.0) and rigid/thermoviscoplastic target, Batra [16] computed the maximum value of p to be 12aot for at = 5.0 and for the thermoviscoplastic rod upset at the bottom of a rigid hemispherical cavity, Batra and Lin [19] found Pmax to be 3aop for ~p = 5.0. Pidsley [6] who studied the penetration of a copper rod into a steel target by using the HELP code, computed Pmax to be 5.53aOp and 4.33aot

Steady state axisymmetric deformations 15
for ~p = 7.84 and a t = 1.92, respectively, during the steady state portion of the penetration process.
The distribution of I in the deforming penetrator and target regions is shown in Fig. 5. Note that the scales in the two regions are different but the values of I in each case are to be multiplied by vs/ro to get the dimensional values of I. Thus peak strain-rates of the order of 105/s occur in the penetrator and the target. As for the thermoviscoplastic target striking a rigid hemispherical cavity [19] significant deformations of the penetrator occur within the hemispherical region of radius nearly 1.0 and centered at the bottom-most point of the free surface. Note that the values of I near the stagnation point are quite high both
ScaLe
Temperatures on target side
FIG. 7. Distribution of the temperature rise in the deforming penetrator and target regions (v~ = 500 m/s).

16 R . C . BATRA and T. GOBINATH
4
P -Hydrostat ic pressure V-Tangent iaL velocity T - Temperature I -Second invariant of strain-rate tensor SoLid Line (penetrator) Dashed-line ( target)
I
0.0 0 7 1.4 2,1
Arclength
FIG. 8. Distribution of the hydrostatic pressure, tangential velocity, 2nd invariant I of the strain-rate tensor D, and the temperature rise on the target/penetrator interface (v~ = 500 m/s).
in the target and penetrator regions. Whereas peak values of I in the deforming penetrator region occur at points near the free surface where the flow is reversing, those in the target occur at points adjoining the common interface Fi. Peak values of I in the penetrator and target equal 5.25 at the point (1.135, 1.01), 3.75 at the point (1.106, 0.17), respectively. In dimensional units these equal, respectively, 0.2625 x 10⁶/s and 0.1875 x 10⁶/s.
In order to examine whether or not sharp gradients o f / o c c u r across the target/penetrator interface F i, we have plotted in Fig. 6 the variation of I along lines LM, PQ and PS which are arbitrarily selected and shown in the figure. The distribution of I along these three lines exhibits similar behavior in that the values of I are discontinuous across F i and the value of I at the target particle abutting Fi is higher than that for the penetrator particle occupying the same spatial position. The maximum value of I within the deforming target region occurs at a point slightly away from Fi. For points on line LM,/max for the target is higher than that for the penetrator particles, but the converse holds for points on lines PQ and PS. Since the tangential velocity of target and penetrator particles abutting F~ are nearly the same, for normal tractions to be continuous across F i, normal derivatives of v on F~ must be discontinuous if target and penetrator particles are made of different materials. This provides a justification for the jump in the value of I as one crosses F~. Recalling that the hydrostatic pressure contributes significantly to the normal tractions, it is not necessary that I be sharply discontinuous across Fi for the normal tractions on the two sides of F~ to match with each other.
Figure 7 depicts the temperature distribution in the deforming penetrator and target regions. Note that the scales for the two plots are different. As for the values of the

Steady state axisymmetric deformations 17
strain-rate invariant I, high temperatures occur in the deforming penetrator region near the stagnation point and points adjoining the free surface. Because of the high speed of material particles, a considerable amount of heat is transferred by convection. For this reason, the temperature decreases rather slowly as one moves downstream along the target/penetrator interface or along any other streamline such as the free surface of the penetrator. The maximum temperature rise in the penetrator and target is found to be 232°C at the point (0.17, 0.66) and 191°C at the point (0.479, 0.05), respectively. This is considerably less than that found when either the penetrator (504°C) or the target (605°C) is regarded as rigid for nearly the same value of vs. One possible explanation for this is that the external work done in the present problem is used to deform both the penetrator and the target, whereas in the previous studies referred to, all of the external work was used to deform either the penetrator or the target. Along the axial line the temperature decreases slowly within the penetrator but quite rapidly in the target.
Figure 8 shows the distribution of the non-dimensional hydrostatic pressure, second invariant I of the strain-rate tensor, tangential velocity and the temperature rise at points on the target/penetrator interface F i. The temperature values are to be multiplied by 52.8°C to get their dimensional counterparts. It is clear that on F i, the maximum value of the temperature occurs at a point slightly away from the stagnation point. Even though the values of the non-dimensional and dimensional pressures on the penetrator and target sides of the common interface Fi are nearly the same, their values as a multiple of the flow stress are not because of the difference in the values of the flow stresses for the penetrator and target regions. The slight difference in the value of the tangential velocities of the target and penetrator particles situated at the same spatial position on F i reveals that there is some slippage between the two. This is consistent with our assumptions of only the normal velocity and normal tractions being continuous across F i.
On the axial line, uniaxial strain conditions prevail, approximately. Thus the magnitude
of the deviatoric stress szz should equal 2/3 the effective stress, which equals ~/3 times the right-hand side of Eqn (11). As shown in Fig. 9(a), the difference between sz~ and 2/3ae is less than 4% on the penetrator side and less than 0.3% on the target side. Also depicted in the figure are contributions of various terms in Eqn (32), obtained by integrating the equation of motion along the central streamline r = 0
+ p - Szz - 2 [ : ~ar~ dz = - a~z(0 ). (32) ½v 2 Jo
This equation holds both for the penetrator and the target, and z is measured from the stagnation point. Even though az~(0) for the target and the penetrator should equal each other, the two do not match in our plot because the solution was taken to have converged when the normal tractions on the penetrator and target sides differed from the mean normal tractions by, at most, 5%. Note that the integral term in Eqn (32) contributes significantly to the total as we move away from the stagnation point. This was pointed out by Wright [4] and has also been verified by Pidsley I-6]. We add that while computing a~ from the computed velocity and temperature fields, contributions from the artificial viscosity were not considered. Figure 9(b) depicts the variation of the second invariant I of the strain rate tensor and the temperature rise 0 on the axial line. The temperature on the target side falls off rather rapidly as one moves away from the stagnation point. However, within the penetrator, the maximum value of the temperature rise occurs at a point away from the stagnation point. Even though the maximum value of I on the target axial line occurs near the stagnation point and is much higher than that on the penetrator axial line, 0m, x for the penetrator particles is larger than 0max for the target. This is due to the differences in the value of their heat capacities and flow stresses. A possible explanation for the discontinuity in the values of I as one crosses the target/penetrator interface is the same as that given above for lines LM, PQ and PS.
5.2 Effect of the speed of penetration Figure 10 depicts the distribution of the mean normal tractions on the target/penetrator

18 R.C. BATRA and T. GOBINATH
I 2 !
1.2 t TQrget ((3)
0.0
0.8
0.4
Penetrotor
. . . . . . . . . I -2./? a-~ ~=
~ / I 0'Spy2
-3.3 -2.2 -1.1 0.0 0.0 0 4 08 1.2 1.6
Distonce from stognotion point Distance from stagnotJon point
FIG. 9(a). Contributions of various terms in the Bernoulli equation along the central streamline (vs = 500 m/s).
b)
Torget Penetrotor
/ i / / / I ,
/ ! /
/
)' , j
J J
0.4.
~0.2
O0 -3 -2 -1 0 1 2; -3
<: Torget II//ll , ,,, Penetrotor
/ '
/ 9'
-2 -1 0 I 2
FIG. 9(b). Distribution of the 2nd invariant I of the strain-rate tensor D and the temperature rise along the central streamline (v~ = 500 m/s).
interface for Vs--450 m/s, 500 m/s and 550 m/s. The values of (%, St) corresponding to these values of vs equal (4.51, 13.82), (5.57, 17.06), and (6.74, 20.65), respectively. The values of the penetrator speed for these values of v s equal 850 m/s, 1041 m/s and 1234 m/s, respectively. These plots elucidate that the normal tractions on the c o m m o n interface increase sharply with the penetration speed. The normal tractions diminish to nearly zero values for non-dimensional values of arc length on Fi exceeding 2.0. We note that these curves are similar to that given by Gobinath and Batra [22] who assumed the penetrator and target materials to be rigid/perfectly plastic and solved the problem for vs = 400 m/s. The axial resisting force experienced by the penetrator for the three values of vs considered herein equalled 8.91, 11.52, and 14.51, respectively. These numbers need to be multiplied by ~r~aop to get the corresponding dimensional values of the axial force acting on the penetrator. We have plotted the shapes of the free surface and the target/penetrator interface

Steady state axisymmetric deformations 19
21 /, Curve A ap = 4.51, a t = 13.82 ~ Curve B ap = 5.57, e t = 17.06 H C ~ Curve C ap=6.74, at= 20.65
! :,:! \ \ \ ~,~ o11
0 I 2 3 Arctength
FIG. 10. Distribution of the mean normal tractions on the target/penetrator interface for three different speeds of penetration.
(o) 25.00 I: A
Z2375I
22.50 ~
1.00 1.25 1.50
R
FIG. 10(a). Shapes of the free surface for three different speeds of penetration.
2ooo ii (b)
19.5(
19.25
19.oo 0.0 0.5 1.0 1.5 2.0
R
FIG. 10(b). Shapes of the target/penetrator interface for three different speeds of penetration.
for the three values of vs stated above in Figs 10(a) and 10(b), respectively. In order to elucidate the dependence of the location of the stagnation point upon the speeds of penetration, the ordinate is measured from the bottom surface (CD in Fig. 1) of the target region considered. The stagnation point moves away from the free surface of the deformed penetrator as the speed of penetration is increased. Also with the increase in the speed of penetration, the distance between the free surface of the undeformed penetrator and the deformed penetrator particles moving rearwards increases. The shape of the target/ penetrator interface also depends strongly upon the penetration speed.
5.3 Effect of the strain-rate hardening exponent m
Figures 11, 11 (a) and 11 (b) depict the distribution of the mean normal tractions on the target/penetrator interface Fi, its shape and the shape of the free surface Ff for three different

20 R.C. BATRA and T. GOBINATH
1.2
0.8
0.4
Curve A mp=O.O05, mt=O.025 ~+~k~ II Curve B mp= 0.025, rn t = 0.005 ,\ Curve C mp=O.025, mt=O.025
- - ' r ~ . . . . . . ,
QO 0.5 1.0 1.5 2.0 2.5
A r c L e n g t h
FIG. 11. Distribution of the mean normal tractions on the target/penetrator interface for three different strain-rate hardening exponents.
20.00 (a)
19,75 A
Z 19.50
19.25
R Q
P
19.00 . . . . . . . . . .
25.00 ( b )
(d) I o . . . . . . . . . .
23.75 ~
},C
7 22.50
B,C
21.25
1.5 2 1.0 R R
FIG. 11 (a). Shapes oftarget/penetrator interface for three different strain-rate hardening exponents.
Curve P mp=O.O0, m t = O 0 2 5 Curve Q mp=O.O25, m t = O 0 0 0 Curve R mp=0.25, mt=O.025
T . . . . . . . . T 1.o (c) 1 5
t , Q, R P
i
FIG. 1 l(b). Shapes of free surface for three different strain rate hardening exponents.
FIG. l 1 (c). Comparison of shapes of free-surface for three different combinations of material model.
FIG. 11 (d). Comparison of shapes of target/penetrator interface for three different combinations of material model.

Steady state axisymmetric deformations 21
combinations of the values of the strain-rate hardening exponent m and Vs = 500 m/s. When the value of m for the penetrator is kept fixed at 0.025 and the value of m for the target is changed from 0.025 to 0.005, there is hardly any change in the shape of the free surface. However, the shape of F i and the distribution of normal tractions on it do change some, though not significantly, when m t is reduced from 0.025 to 0.005. In Fig. 11 (b), the free surfaces are plotted to a large scale so as to magnify differences, if any, in their shapes for different values of m. The change in the value of mp from 0.025 to 0.005 while mt is kept fixed at 0.025 does influence significantly the shape of the free surface and to a somewhat less extent, the shape of the target/penetrator interface and the distribution of normal tractions on it. The stagnation point moves away a little bit from the free surface when the value of m is changed from 0.025 to 0.005 either for the penetrator or the target. The peak values of 0, I, and p and where they occur are influenced by the values of mp and m, as evidenced by the information provided in Table 1.
When either the penetrator or the target is modeled as rigid/perfectly plastic material and the other body as viscoplastic with m = 0.025, the shapes of the free surfaces and the corresponding intermediate surfaces are shown in Figs 1 l(c) and 1 l(d), respectively. The vertical scale in these figures represents the distance measured from the bottom-most point of the target region studied so that vertical displacements, if any, of the stagnation point could be determined. When either one of the two materials is modeled as rigid/perfectly plastic, the stagnation point moves downward, the displacement for mp ---- 0 being twice of that for mt = 0. The shapes of the free surface of the deformed penetrator remain unaltered when either m t is 0.025 or 0.0 and does not change noticeably when mp is decreased from 0.025 to 0.0.
5.4 Effect of the thermal-softenin9 coefficient 7 When the value of the thermal softening coefficient 7 for either the target or the penetrator
was doubled keeping that for the other part unchanged, the distributions of the mean normal tractions on the target/penetrator interface Fi, its shape and the shape of the free surface Ff were essentially unaltered. Therefore, these plots are not included in the paper. The values of 0max, p . . . . /max in the penetrator and target regions do not change much when 7 is doubled either for the target or the penetrator. We note that a similar effect was observed by Batra 1-17] who analysed the steady state penetration of a rigid cylindrical rod into a thick thermoviscoplastic target.
5.5 Effect of different ratios of mass densities Results presented in this section are for the case when the penetrator and target materials
are modeled as rigid/perfectly plastic. Figure 12 shows the shapes of the target/penetrator interface I-" i and the distribution of normal tractions on it for Pt/Pp = 1.25, 1.0, and 0.75. The ordinate in Fig. 12(a) is the vertical distance from the bottom surface CD of the target region considered and the scales along the horizontal and vertical axes are quite different. The expanded scale along the horizontal axis is meant to magnify the small differences in the shapes of F i when Pt/Pp is varied. We note that in these computations pp was kept fixed. The plots of normal tractions on V i reveal that the largest normal tractions occur for Pt/Pp ---- 1.25 and least for Pt/Pp = 0.75 and the change seems to depend continuously upon Pt/Pp. Thus, for the same penetrator material, the pressure at the stagnation point will increase with an increase in the mass density of the target. Similarly for a fixed target material, higher density penetrators would result in smaller values of the pressure at the stagnation point.
6. H I S T O R I E S O F T H E S T R E S S , S T R A I N - R A T E I N V A R I A N T , H Y D R O S T A T I C P R E S S U R E A N D T H E S P I N T E N S O R
One of the unresolved problems in penetration mechanics is the selection for the material of the penetrator and the target constitutive relations that adequately model their response over the range of deformations anticipated to occur in a problem. In an attempt to help

TA
BL
E
1.
EF
FE
CT
OF
mp
AN
D m
t O
N 0
max
, ]m
ax A
ND
Pm
ax I
N T
HE
PE
NE
TR
AT
OR
TA
RG
ET
RE
GIO
NS
*
Val
ues
0m
R x
(°C
) /m
ax
Pmax
(Xp/
)s2)
of
m
Pen
etra
tor
Tar
get
Pen
etra
tor
Tar
get
Pen
etra
tor
Tar
get
mr,
= 0.
025
232.
2 18
9.5
5.25
4.
185
0.89
75
1.01
7 m
t = 0
.025
(0
.17,
0.0
6)
(0.4
79,
0.05
) (1
.135
, 1.
01)
(1.0
96,
0.17
5)
(0.0
, 0.
0)
(0.1
48,
-0.0
12)
m v
= 0.
005
199.
8 16
7.1
4.26
4.
108
0.94
09
1.00
5 m
t = 0
.025
(0
.165
, 0.
04)
(0.4
64,
0.04
) (1
.193
, 0.
96 )
(1.0
74,
0.16
4)
(0.0
, 0.
0)
(0.1
49,
- 0.
004
)
mp=
0.0
19
3.07
16
4.15
4.
11
4.17
4 0.
9562
0.
9951
m
t = 0
.025
(0
.165
, 0.
03)
(0.5
25,
0.04
) (0
.052
, 0.
02)
(1.2
6, 0
.26
) (0
.0,
0.0)
(0
.113
, 0.
002
)
m v
= 0.
025
229.
9 18
3.2
5.27
4.
5915
0.
8957
0.
978
m t =
0.0
05
(0.1
5, -
0.02
) (0
.48,
0.0
2)
(1.1
34,
1.02
) (1
.86,
0.7
7)
(0.0
, 0.
0)
(0.1
5, -
0.01
4)
mp
= 0.
025
230.
7 18
6.03
4.
2815
4.
128
0.95
09
0.94
54
m t =
0.0
(0
.165
, 0.
034)
(0
.526
, 0.
04)
(0.0
52,
0.02
) (1
.26,
0.2
7)
(0.0
, 0.
0)
(0.1
129,
0.0
01 )
> > Ca.
.,q
7'
> ,-q
"r"
* T
he c
oord
inat
es o
f po
ints
whe
re 0
, I
and
p as
sum
e m
axim
um v
alue
s ar
e pa
rent
heti
call
y no
ted.

Steady state axisymmetric deformations 23
20.00 B
= ,i Pt /lOp 1.25, curve A l 19.75 pt/pp: 1.00, curve B
pt/pp = 0.75, curve C
Z 19.50
19.25
19.00 0.0 0.5 1.0 1 .5 2.0
R
FIG. 12(a). Shapes of the target/penetrator interface for three different values of Pt/Pp.
21 ( X~rot )
A
8
14 C
o =
E z 7 pt, lOO, r B \ \ \
Pt Ipp =0.75 curve C " ~ \
0 0.0 0.5 1.0 1.5 2.0
Arckength
FIG. 12(b). Distribution of the mean normal tractions on the target/penetrator interface for three
different values of Pt/Pp.
determine which one of the many recently proposed theories (e.g. Refs [39-423) of large deformation elastoplasticity is most appropriate for a penetration problem, we give below histories of the effective stress, second invariant of the strain-rate tensor, the temperature and the spin for a few typical target and penetrator particles. These time histories should also help establish desirable testing regimes for practical problems.
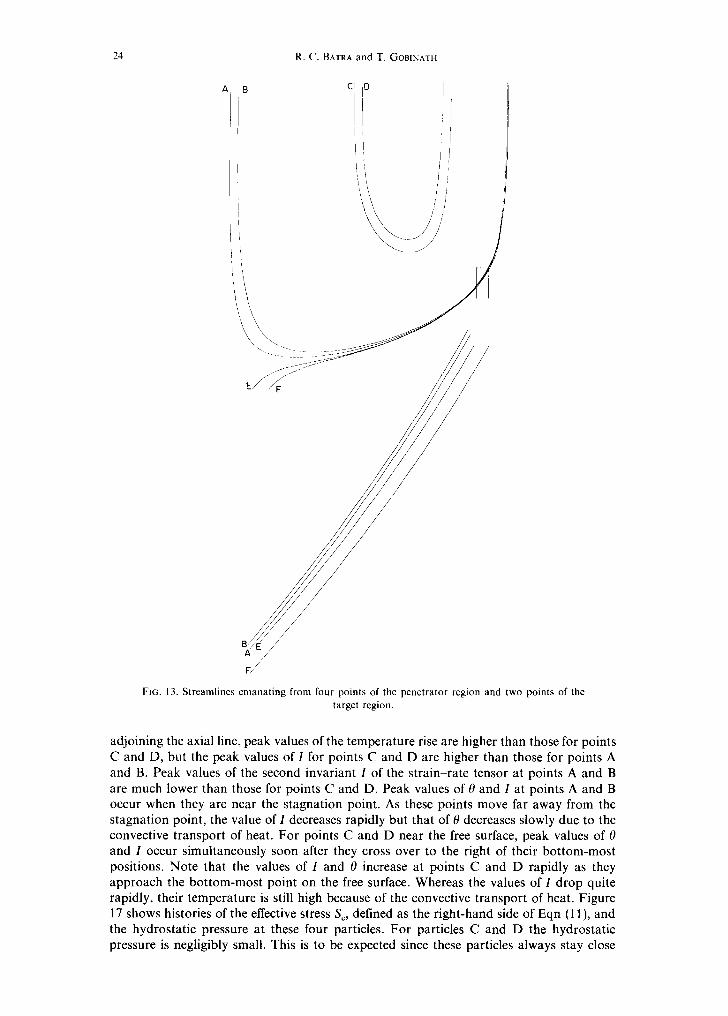
The first step in finding histories of a field variable at a material particle is to find the streamline for that particle. Streamlines originating from four locations, viz. A(0.1, 5.88), B(0.15, 5.88), C(0.90, 5.88), and D(0.95, 5.88) within the deforming penetrator region and two locations, i.e. E (0.10, - 3 . 1 2 ) and F(0.15, - 3 . 1 2 ) within the deforming target region are plotted in Fig. 13. That the four streamlines originating from points C, D, E, and F do not intersect or merge together is clear from the enlarged view of the portion enclosed in the box. In the following discussion, we identify the histories of the material particle that once occupied, say, the place A as histories of the variable for the material particle A.
6.1 Histories of field variables for penetrator particles
Figure 14 depicts the location of the four particles at different times. The time is reckoned from the instant when particles A, B, C, and D occupied the places (0.10, 5.88), (0.15, 5.88), (0.90, 5.88), and (0.95, 5.88), respectively. The radial and axial components of the velocity at different times for these four particles are plotted in Fig. 15. As particles A and B approach the region surrounding the stagnation point at t = 5, their velocities in the radial direction increase sharply and those in the axial direction decrease to zero. Material particles C and D adjoining the free surface of the penetrator reach near the bottom-most point on the free surface at time t - -2 .8 . The radial velocity of these particles which was initially zero increases sharply, and becomes maximum when they are close to the bottom-most point on the free surface. It is followed by a rapid decrease to a small value which gradually becomes zero. Recalling that the velocities plotted are those relative to the velocity of the stagnation point, the sharp jump in the value of v z for these particles corresponds to the reversal in their direction of motion after they move past the bottom of the free surface. In Fig. 16 we have plotted the histories of the non-dimensional temperature and the second invariant I of the strain--rate tensor. For points A and B
A cI D
i i J
I, f /i
24 R.C. BATRA and T. GOBINATH
u/t- / A /
/ F/
FiG. 13. Streamlines emanating from four points of the penetrator region and two points of the target region.
adjoining the axial line, peak values of the temperature rise are higher than those for points C and D, but the peak values of I for points C and D are higher than those for points A and B. Peak values of the second invariant I of the strain-rate tensor at points A and B are much lower than those for points C and D. Peak values of 0 and I at points A and B occur when they are near the stagnation point. As these points move far away from the stagnation point, the value of I decreases rapidly but that of 0 decreases slowly due to the convective transport of heat. For points C and D near the free surface, peak values of 0 and I occur simultaneously soon after they cross over to the right of their bottom-most positions. Note that the values of I and 0 increase at points C and D rapidly as they approach the bottom-most point on the free surface. Whereas the values of I drop quite rapidly, their temperature is still high because of the convective transport of heat. Figure 17 shows histories of the effective stress S~, defined as the right-hand side of Eqn (11), and the hydrostatic pressure at these four particles. For particles C and D the hydrostatic pressure is negligibly small. This is to be expected since these particles always stay close

Steady state axisymmetric deformations 25
2.0
1.5
R 1.0
0.5
] 0.0
f,;/"
/ J - -
,}
7/ O ,"
. / C ' /
6
Z 3
B
A
5 10 13 Time
/; / !
/' /
/ / / I
, t ,j /I ,, /
,r i¢'
D ilJC i," I¢
J/ ,,j f/
,'/ //
/)/ / /
}/
\ - . . /
i /
. ]
5 10 13 Time
FIG. 14. The variation of r-, z-coordinate of four penetrator particles at different times.
1.00
0 . 7 5
P,', V 0.,50
I 'I I
0.25 [ 1 l
2' \ 0.00 ~ , . ~ , . 0 5 10
Time
1.2
0.6
V 0.0 Z
-0 .6
- 1 . 2
D ,i"C A '~i'r j:J
0 5 10 15 Time
FIG. 15. Histories of the radial and axial components of velocity for four penetrator particles.
to the free surface of the penetrator. Note that the peak values of Se at all four points considered is nearly the same. Since the material particles are undergoing plastic deformation, the effective stress must satisfy the yield condition (11). The variation in the effective stress at these points is due to the change in the values of I and 0. At points C and D, the peak values of I, 0, and Se occur at the same time thereby implying that the strain-rate hardening effects dominate over the thermal softening effects. For t > 5 when the values of I have become essentially zero, the effective stress drops because of the softening caused by the heating of the material points. For material particles A and B, whereas /max Occurs at t ~--2.8, the maximum value of Se occurs at t "-~ 2.2. Recalling the history of the temperature plotted in Fig. 16, we see that 0max occurs at t ~ 4.5 and the values of 0 at t "-~ 2.8 are higher than those at t - 2.2. The higher value of the thermal softening effect at t --~ 2.8 reduces the value of Se as compared to that at t "- 2.2.

26 R .C . BATRA and T. GOBINATH
I 1
0.50'
, 8 0.25
l " ~ 0.00
i!, c
0 5 0 5 10
Time Time
FIG. 16. Histories of the temperature rise and 2nd invariant I of the strain rate tensor for four penetrator particles.
0.5
1.0 - 1.001
F
s~ 0.'/'5
A :a
• ~ h' ~ I :i~
O 0 , - . :
0.0 4.5 0
Time
ii D C !1 ~ ., "!;
5 10 Time
FIG. 17. Histories of the hydrostatic pressure and effective stress for four penetrator particles.
Because of the assumptions of axisymmetric deformations, there is only one non-zero component of spin. The histories of the spin for the four penetrator particles, plotted in Fig. 18, reveal that the material particle C that is near the free surface has the highest value of spin. The peak value of the plastic spin for the material particle C is twice that for each of the other three particles. This peak value of the spin at C occurs when it has crossed-over to the right of its bottom-most position and is flowing rearwards.
6.2 Histories of field variables for target particles In Fig. 19 we have plotted the r- and z-coordinates of the target material particles
for different values of time t; their positions at time t = 0 were E(0 .10 , -3 .12) and

Steady state axisymmetric deformations 27
-1
E CI.
(1)
- 2
-:3
t t ̧ "., ::
8", ,;
", i
- 4
0 10
i I c I1 II II tl I
T
5 T i m e
F I G . 18. Histories of the spin of four penetrator particles.
2.0
1.5
R 1.0
0.5
6.o iJ ;: f
/
'°l J
Z t 0 ,
- 1 . 5
:: / :: I
F, i /E
/ / ' / . , 'J
- i
/ 0.0 - 4 . 0
0 5 10 12 0 5 10 15
Time Time
F I G . 19. Variation of r-, z-coordinates of two different target particles at different times.
F(0 .15 , -3 .12) , respectively. The radial and axial components of the velocity of these particles are plotted in Fig. 20. As these particles approach the region surrounding the stagnation point, their radial velocity increases sharply and subsequently drops to zero equally fast. The axial velocity of these particles relative to that of the stagnation point decreases and then increases as these points leave the area near the stagnation point. For t _> 9, these particles are moving essentially vertically and parallel to the target/penetrator interface. The histories of the second invariant I of the strain-rate tensor and the temperature rise 0 are plotted in Fig. 2l . The peak values of 0 at these two points occur at the same value of time. However, the peak values of I occur a little bit later. The rate

28 R . C . BATRA and T. GOBINATH
1.00
0.7`5
V R 0.501
F/ ,/E i : /
1.2
0,8
0.4
0.2`5 ~) : / / i ......
, ,\ 0 .00 . . . . . . . . , . - c . , - ,~ , ~ , , . . . . 0,0
,5 10 12
T ime T ime
FIG. 20. Histories of the radial and axial components of velocity for two target particles.
5 10
5.0
1.5"
QO
0
F
5
E / 0 . 5 0
E" 0 . 2 5
O,OO
10 o 5 4'o . . . .
T i m e T i m e
FlG. 21. Histories of the temperature rise and 2nd invariant I of two target particles.
of increase of temperature at these particles is much higher than the rate of increase of I, but I decreases much more rapidly than the temperature does because of the convective transport of heat. The histories of the hydrostatic pressure p and the effective stress S e shown in Fig. 22 reveal that the pressure attains its maximum value when points E and F reach the zone surrounding the stagnation point at time t ~- 4.5. Note that the maximum values of I and 0 occur at these points when they have moved quite a bit away from the stagnation point. The effective stress at these points does not vary much because the thermal softening caused by their getting heated up seems to balance out the strain-rate hardening. The histories of the plastic spin, plotted in Fig. 23, suggest that of the two target particles considered, the one farther from the axial line has the higher values of the spin. The highest value of the spin occurs just before these particles arrive near the stagnation point. Also, when the particles start turning upwards along the target/penetrator interface,

Steady state axisymmetric deformations 29
1.2.
0.8
0.4.
Se
1.00
0.75
f
E
0.0 O. 50 /
0 5 0
Time T i m e
FIG. 22. Histories of the hydrostatic pressure and effective stress for two target particles.
5 I0
E
o r
-1 Ii o 5
T i m e
FIG. 23. Histories of the spin of two target particles.
10
their spin, now of opposite sign, is equally large in magnitude. The peak values of the spin are comparable in magnitude to the peak values of I for these particles.
7. C O N C L U S I O N S
We have analysed steady state axisymmetric deformations of a long cylindrical thermoviscoplastic rod penetrating into a thick thermoviscoplastic target. Also studied is the effect, on the deformations of the rod and the target, of the penetration speed, values

30 R.C. BATRA and T. GOBINATH
of the strain-rate hardening exponent and the coefficient of thermal softening. The bottom part of the target/penetrator interface F i is a part of an ellipsoid rather than a hemisphere. For vs = 500 m/s, the peak pressures in the penetrator near the stagnation point approach 5.6trOp and that in the target 14a0t when ~r0p/a0t = 3.06 where tr0p and trot equal the yield stress in a quasistatic simple compression test for the penetrator and target materials, respectively. The peak values of 232°C of the temperature rise in the penetrator and 191°C in the target are significantly lower than those found when either of the two materials is considered as rigid. Along the axial line the temperature decreases slowly in the penetrator but quite rapidly in the target. The normal tractions on the common interface F i increase sharply with the increase in the penetration speed. Also the axial resisting force acting on the penetrator equalled 8.91, 11.52 and 14.51 F (F = 7trZtrop) for stagnation point speeds of 450, 500 and 550 m/s, respectively. The corresponding values of the penetrator speed are 850, 1041 and 1234 m/s, respectively. A significant contribution to the resisting force is made by the consideration of the strain-rate hardening effects. The value of the strain-rate hardening exponent for the penetrator affects more the shapes of the free surface Ff of the deformed penetrator and the target/penetrator interface F i than the value of the strain-rate hardening exponent for the target. The values of the thermal softening coefficient for the penetrator and target have minimal effect on the shapes of F i and Ff and the distribution of normal tractions on If. The computed histories of the stress, second invariant of the strain-rate tensor, temperature, and the plastic spin for four penetrator and two target particles indicate that for the material parameters selected and the three speeds considered here, there is no likelihood of any material instability developing in the sense that the effective stress at these material particles is decreasing while their temperatures and values of the second invariant I of the strain-rate tensor are increasing. Also no narrow layers with sharp gradients of I were found on either side of F i for the various cases studied. It is very likely that either the penetration speeds considered herein were not high enough for these effects to manifest themselves or the materials selected for the penetrator and the target were such that no localization of deformation could occur in regions surrounding F i. The peak values of the plastic spin for the penetrator particles close to the free surface are nearly twice the peak values of the second-invariant I of the strain-rate tensor for them. Also for the two target particles close to the target/penetrator interface, peak values of the plastic spin are comparable to the peak values of I for them. It seems that plasticity theories which account appropriately for values of the plastic spin comparable to the values of the strain rate tensor should be very suitable for analysing steady state axisymmetric problems.
Acknowledgements This work was supported by the U.S. Army Research Office Contract DAAL-03-89-K-0050 to the University of Missouri-Rolla. Most of the computations were performed at the University of Illinois Supercomputer centre. We are indebted to a referee for many useful comments.
R E F E R E N C E S
1. A. TATE, A theory for the deceleration of long rods after impact. J. Mech. Phys. Solids 15, 387-399 (1967). 2. A. TATE, Further results in the theory of long rod penetration. J. Mech. Phys. Solids 17, 141 150 (1969). 3. V. P. ALEKSEEVSKH, Penetration of a rod into a target at high velocity. Comb. Expl. and Shock Waves 2,
63 66 (1966). (Translation from Russian, Faraday Press, New York.) 4. T. W. WRIGHT, A survey of penetration mechanics for long rods, in Lecture Notes in Engineering, Vol. 3,
Computational Aspects of Penetration Mechanics (edited by J. CHANDRA and J. FLAHERTY). Springer-Verlag, New York (1983).
5. T. W. WRIGHT and K. FRANK, Approaches to penetration problems. SMIRT Symposium, No. 14, Impact, Lausanne, Switzerland (1987).
6. P. D. PIDSLEY, A numerical study of long rod impact onto a large target. J. Mech. Phys. Solids 32, 315-333 (1984).
7. M. E. BACKMAN and W. GOLDSMITH, The mechanics of penetration of projectiles into targets. Int. J. Engng
Sci. 16, 1 99 (1978). 8. C. E. ANDERSON and S. R. BODNER, The status of ballistic impact modeling. Int. J. Impact Engng 7, 9-35 (1988). 9. J. A. ZUKAS et al. Impact Dynamics. Wiley-Interscience, New York (1982).
10. T. Z. BLAZVNSKI, in Materials at High Strain Rates (edited by T. Z. BLAZVNSKI). Elsevier, London, New York (1987).

Steady state axisymmetric deformations 31
11. M. MACAULEY, Introduction to Impact Engineering. Chapman and Hall, London, New York (1987). 12. M. RAVlD and S. R. BODNER, Dynamic perforation of viscoplastic plates by rigid projectiles. Int. J. Engng
Sci. 21, 577-591 (1983). 13. M. RAVID, S. R. BODNER and I. HOLCMAN, Analysis of very high speed impact. Int. J. Engny Sei. 25, 473-482
(1987). 14. M. J. FORRESTAL, K. OKAJIMA and V, K. LUK, Penetration of 6061-T651 aluminum targets with rigid long
rods. J. Appl. Mech. 55, 755-760 (1988). 15. R. C. BATRA and T. W. WRIGHT, Steady state penetration of rigid perfectly plastic targets. Int. J. Engn9
Sci. 24, 41-54 (1986). 16. R. C. BAT~A, Steady state penetration of viscoplastic targets. Int. J. Enyng Sci. 25, 1131 1141 (1987). 17. R. C. BATRA, Steady state penetration of thermoviscoplastic targets. Comp. Mech. 3, 1 12 (1988). 18. R. C. BATRA and PEI-RONG LIN, Steady state deformations of a rigid perfectly plastic rod striking a rigid
cavity. Int. J. Engn9 Sci. 26, 183-192 (1988). 19. R. C. BATRA and P. R. LIN, Steady state axisymmetric deformations of a thermoviscoplatic rod striking a
hemispherical rigid cavity. Int. J. Impact Engny 8, 99 113 (1989). 20. R. C. BATRA and P. R. LIN, Histories of stress, temperature and spin in steady state deformations of a
thermoviscoplastic rod striking a hemispherical rigid cavity. Int. J. Engng. Sci. 28, 93-98 (1990). 21. P. R. LIN and R. C. BATRA, Histories of stress, strain rate, temperature and spin in steady state penetration
problems, lnt. J. Engng Sci. 27, 1155-1165 (1989). 22. T. GOBINATH and R. C. BATRA, Analysis of a steady state axisymmetric penetration problem, in Computational
Techniques ]br Contact, Impact, Penetration and Perforation of Solids (edited by L. E. SCHWER, N. J. SALAMON and W. K. LIu), ASME, AMD, Vol. 103,235-247 (1989).
23. W. D. FARREN and G. I. TAYLOR, The heat developed during plastic extrusion of metal. Proe. R. Soe. London Set. A 107, 422-429 (1925).
24. J. F. BELL, Physics of Large DeJbrmation of Crystalline Solids. Springer-Verlag, New York, Berlin, Heidelberg (1968).
25. U. S. LINDHOLM and G. R. JOHNSON, Strain-rate effects in metals at large strain-rates, in Material Behavior Under High Stresses and Ultrahigh Loading Rates (edited by V. WEISS), pp. 61-79. Plenum Press, New York (1983).
26. A. TATE, A theoretical estimate of temperature effects during rod penetration. 9th Ballistic Symposium, pp. 2/307-2/314 (1987).
27. E. BECKER, G. CAREY and J. T. ODEN, Finite Elements--An Introduction. Prentice-Hall, Englewood Cliffs (1982).
28. O. C. Z1ENKIEWICZ, The Finite Element Method. McGraw-Hill, London (1977). 29. T. J. R. HUGHES, The Finite Element Method: Linear Static and Dynamic Finite Element Analysis.
Prentice-Hall, Englewood Cliffs, New Jersey (1987). 30. A. N. BROOKS and T. J. R. HUGHES, Streamline upwind/Petrov-Galerkin formulations for convection
dominated flows with particular emphasis on the incompressible Navier-Stokes equations. Comput. Methods Appl. Mech. Enong 32, 199-259 (1982).
31. D. J. BENSON, An efficient, accurate, simple ALE method for nonlinear finite element programs. Comput. Methods Appl. Mech. Enyn9 72, 305-350 (1989).
32. G. CAREY and J. T: ODEN, Finite Elements Computational Aspects, Vol. 3. Prentice-Hall, Englewood Cliffs, New Jersey (1981).
33. J. E. THOMPSON, Z. U. A. WARSl and C. W. MASTIN, Numerical Grid Generation. Foundations and Application. Elsevier, New York (1985).
34. J. E. THOMPSON, Z. U. A. WARSl and C. W. MASTIN, Boundary-fitted coordinate systems for numerical solution for partial differential equations A Review. J. Comput. Phys. 47, 1-108 (1982).
35. A. TATE, Long rod penetration models--Part II. Extensions to the hydrodynamic theory of penetration. Int. J. Mech. Sci. 28, 599-612 (1986).
36. R. C. BATRA and X1NGJU CHEN, An approximate analysis of steady state axisymmetric deformations of viscoplastic targers. Int. d. Engng Sci., in press.
37. A. TARE, A simple hydrodynamic model for the strain field in a target by the penetration of a high speed lor~g rod projectile. Int. J. Engng Sci. 16, 858 (1978).
38. T. GOBINATH and R, C. BATRA, Steady state penetration of a rigid/perfectly plastic rod into a rigid/perfectly plastic target, submitted for publication.
39. E. H. LEE, Elastic-plastic deformations at finite strains, d. Appl. Mech. 36, 1 (1969). 40. L. ANAND, Constitutive equations for rate-independent, isotropic, elastic-plastic solids exhibiting pressure-
sensitive yielding and plastic dilatancy, J. Appl. Mech. 47, 439 (1980). 41. S. NEMAT-NASSER, Micromechanically based finite plasticity. Proc. Symp. Plasticity Today (edited by A.
SAWCZUK). Elsevier, London (1983). 42. Y. F. DAFALIAS, A simple illustration of the plastic spin concept and its role in finite plastic transformation,
Proc. Current Theories of Plasticity and Their Applications, University of Oklahoma-Norman (1984).