Stress-dependent Deformations of Concrete using Porous ...
114
Stress-dependent Deformations of Concrete using Porous Aggregates Jóhann Albert Harðarson Thesis of 60 ECTS credits Master of Science in Civil Engineering with Specialization in Structural Design and Concrete Technology January 2015
-
Upload
khangminh22 -
Category
Documents
-
view
1 -
download
0
Transcript of Stress-dependent Deformations of Concrete using Porous ...

Stress-dependent Deformations
of Concrete using Porous Aggregates
Jóhann Albert Harðarson
Thesis of 60 ECTS credits
Master of Science in Civil Engineering with
Specialization in Structural Design
and Concrete Technology
January 2015
Stress-dependent Deformations
of Concrete using Porous Aggregates
Jóhann Albert Harðarson
Thesis of 60 ECTS credits submitted to the School of Science and Engineering
at Reykjavík University in partial fulfillment
of the requirements for the degree of
Master of Science in Civil Engineering with
Specialization in Structural Design and Concrete Technology
January 2015
Supervisor:
Ólafur H. Wallevik
Professor, Reykjavik University, Iceland
Examiner:
Guðni Jónsson
Civil Engineer, EFLA engineering and consulting firm, Iceland.
i
Abstract
Stress-dependent deformations of concrete may induce excessive deflections at service loads,
which can compromise the performance of a structure. Elastic shortening and the combined
effects of creep and shrinkage strains of concrete also cause loss of prestress force applied to
prestressed concrete member.
The knowledge of locally obtained materials, used in concrete manufacture, is necessary to
effectively model structure’s behaviour. Porous basalt rock is the primary source of concrete
aggregates in Iceland. Design codes and mathematical models are based on experiments and
experience using specific raw materials, not necessarily applying globally. It is therefore
essential to validate codes and models to assess their applicability. This thesis is intended to
contribute to better understanding of material properties using Icelandic raw minerals.
The focus of the thesis is on the mechanical properties, elastic modulus and creep, and
includes: An experiment, using several concrete mixes made from different combination of
porous and non-porous aggregates. The elastic modulus was measured and compared with
literature and design codes. Numerical evaluations for experimental concrete creep data, made
of porous and non-porous aggregates, were carried out, as well as a case study, comparing
deflection calculations and prestress losses, using valid codes and calculations based on
experimental data.
The results indicate substantial discrepancies in measured elastic modulus for concrete made
from limestone aggregates, compared to estimates based on mean concrete cylinder strength
according to Eurocode 2 (EC2). A fairly good correlation can be seen between aggregate
porosity and elastic modulus of concrete when using basalt aggregate. Experimental results
show that the elastic modulus drops well below the EC2 values, using correction factors from
Icelandic National Annex to EC2, if the porosity is excessive. Concrete containing porous
basalt aggregate shows greater creep than concrete with granite aggregate. Concrete
specimens with porous basalt aggregate are still deforming after twelve years under load. The
concrete containing basalt aggregates appears to increase its rate of creep after few months.
Environmentally friendly self-compacting concrete mixes, containing less cement but higher
water-binder ratio, shows greater creep than conventional self-compacting concrete. Addition
of air entraining admixture was shown to have limited effect on the specific creep of
environmentally friendly self-compacting concrete mixes. Higher cement content, while
maintaining constant water-cement ratio, is likely to increase creep-strain. Findings also
indicate that concrete with porous basalt aggregate exhibits greater creep than predicted by
well accepted mathematical models. A case study, for a post tensioned highway bridge, shows
some 10% increase in initial prestress force losses when using experimental results for
concrete with porous aggregate, compared to values predicted by EC2. A case study for a slab
shows up to 10.3% increase in deflection using experimental results for concrete with porous
aggregate, compared to values from EC2.
Keywords: concrete; material science; structural design; elastic modulus; creep; deflections.

ii
Ágrip
Titill á íslensku: Álagsháðar formbreytingar steinsteypu með gleypnum fylliefnum.
Álagsháðar formbreytingar steinsteypu geta valdið óhóflegri svignun í notmarkaástandi sem
geta rýrt notagildi mannvirkis. Stytting á fjaðursviði steinsteypu sem og áhrif skriðs og
rýrnunar valda einnig spennutapi í forspenntum mannvirkjum.
Þekking á staðbundnu efni er nauðsynleg til að útbúa nothæf reiknimódel. Gleypið ferskt
basalt er það fylliefni sem helst er notað við steypuframleiðslu á Íslandi. Hönnunarstaðlar og
stærðfræðilíkön eru byggð á rannsóknum og reynslu með tiltekin hráefni í huga og eru ekki
nauðsynlega algild. Það er því nauðsynlegt að staðfesta niðurstöður staðla og líkana. Þessu
verkefni er ætlað að bæta þekkinguna á efnisfræði steinsteypu með tilliti til íslenskra hráefna.
Aðaláhersla verkefnisins er á efnisfræðiþætti eins og fjaðurstuðul og skrið, og inniheldur:
Tilraun með fjölda ólíkra steypublandna, bæði með þéttum og gleypnum fylliefnum.
Fjaðurstuðull var mældur og borinn saman við gagnreynda þekkingu og hönnunarstaðla.
Samanburð á niðurstöðum skriðmælinga í steinsteypu með þéttum og gleypnum fylliefnum,
við gagnreynda þekkingu og staðla. Einnig var gerð tilviksrannsókn, þar sem skoðuð var
niðurbeygja og tap í forspennukrafti miðað við hönnunarstaðla og niðurstöður skriðmælinga.
Niðurstöður benda til misræmis á mældum fjaðurstuðli í steinsteypu með fylliefnum úr
kalksteini í samanburði við evrópsku þolhönnunarstaðlana, byggðum á meðalþrýstistyrk
steinsteypu. Góð fylgni er á milli holrýmd fylliefna og fjaðurstuðuls ef notað er gleypið ferskt
basalt. Niðurstöður sýna misræmi á mældum fjaðurstuðli í samanburði við evrópsku
þolhönnunarstaðlana, þótt notuð séu lækkunarákvæði úr þjóðarskjali við staðalinn, ef
fylliefnin eru áberandi gleypin. Steinsteypa með gleypnu basalti skríður mun meira en
steinsteypa með granít fylliefnum. Steinsteypa með gleypnum basalt fylliefnum skríður enn
eftir að hafa verið undir álagi í tólf ár. Steinsteypa með gleypnu basalti virðist auka skriðhraða
sinn eftir nokkra mánuði. Vistvæn sjálfútleggjandi steinsteypa (Eco-SCC), með skertu
sementsmagni og hærra hlutfalli vatns og bindiefnis, skríður meira en hefðbundin
sjálfútleggjandi steinsteypa. Loftblendi í vistvænni sjálfútleggjandi steinsteypu (Eco-SCC)
hefur takmörkuð áhrif á skrið. Aukið sementsmagn, ef haldið er sama hlutfalli vatns og
sements, veldur líklega auknu skriði. Steinsteypa með gleypnum basalt fylliefnum skríður
mun meira en reiknilíkön úr hönnunarstöðlum, þar á meðal þeim evrópsku, gefa til kynna.
Samanburðarrannsókn á eftirspenntri þjóðvegabrú sýnir 10% aukningu á eftirspennutapi ef
notaðar eru niðurstöður mælinga í samanburði við gildi fengin úr evrópska
þolhönnunarstaðlinum. Samanburðarrannsókn á slakbentri plötu sýnir um allt að 10.3% meiri
svignun ef notaðar eru niðurstöður mælinga í samanburði við gildi fengin úr evrópska
þolhönnunarstaðlinum.
Lykilorð: steinsteypa, efnisfræði, burðarþolsfræði, fjaðurstuðull, skrið, formbreytingar.

iii
Stress-dependent Deformations
of Concrete using Porous Aggregates
Jóhann Albert Harðarson
60 ECTS thesis submitted to the School of Science and Engineering
at Reykjavík University in partial fulfillment
of the requirements for the degree of
Master of Science in Civil Engineering with
Specialization in Structural Design and Concrete Technology.
January 2015
Student:
___________________________________________
Jóhann Albert Harðarson
Supervisor:
___________________________________________
Ólafur H. Wallevik
Examiner:
___________________________________________
Guðni Jónsson
iv
DEDICATION
To Jóhanna K. Steinsdóttir, for her love and endurance over the years,
which made the writing of this thesis a reality.

v
Acknowledgements
This project was partially funded by the Concrete Commission in Iceland (Steinsteypunefnd).
The results presented in this thesis are based, in part, on measurements done by Guðni
Jónsson, Pálmi Þór Sævarsson, Florian V. Mueller, Jón Guðni Guðmundsson and other
researchers at Innovation Center Iceland (ICI). Some laboratory work was done by, and in
cooperation with, personal at ICI, in particular Þórður I. Kristjánsson who also designed the
concrete for the E-modulus measurements.
I would like to thank ICI for providing me with facilities. The staff at ICI has my appreciation
for invaluable assistance and fellowship. Björn Hjartarson, Ófeigur Freysson, Þórður I.
Kristjánsson, to name but a few. Helgi Hauksson, a former researcher at ICI, has my thanks
for the assistance in creep-strain measurements.
My sister Edda Hrund Harðardóttir and Ásbjörn Jóhannesson, civil engineer at ICI, have my
appreciation for proofreading the thesis.
This thesis is inspired by teachers and lecturers at Reykjavik University: Snjólaug
Steinarsdóttir and Daníel Viðarsson, preliminary study teachers; Guðbrandur Steinþórsson,
emeritus docent; Haraldur Auðunsson, docent; Torfi G. Sigurðsson, part-time lecturer and last
but not least my supervisor, Professor Ólafur H. Wallevik.
I would also like to thank fellow students at Reykjavik University for making the past years
pleasurable. Ágúst Rúnar Elvarsson, Guðjón Rafnsson, Guðmundur Ingi Hinriksson, Stefán
Short, Valgeir Ó. Flosason, Þorsteinn Eggertsson, among others.
Finally, a man without a family is like a bird without wings. To my wife, three sons, daughter
and unborn child. Thanks for everything.
vi
Preface
Concrete is used extensively worldwide and has been the main building material in Iceland
for decades. Since its redevelopment in the early 19th
century [1], there have been gradual
advances in concrete technology. The introduction of concrete to Iceland has often been a
costly journey. Icelandic concrete has been susceptible to alkali-silica reaction as well as
having inadequate frost resistance [2]. More recently there have been reports of excessive
deformation in slabs and beams. These costly flaws are due to insufficient knowledge of
locally quarried materials and improper implementations of good practices.
My interest in the area of concrete deformation is from BSc courses such as material science
and reinforced concrete design. The lecturers kept stating the different behaviour of Icelandic
concrete compared to textbooks and codes. I was taught to be conservative in design with
respect to Icelandic concrete and recognize the uncertainties in parameters such as elastic
modulus, creep, shrinkage and tensile strength.
When Ólafur Wallevik suggested a thesis on deformations of concrete using porous
aggregates I immediately became interested. It is my hope that the thesis will contribute to
better understanding of concrete material properties using Icelandic raw minerals.
Jóhann Albert Harðarson
Reykjavík, January 2015

vii
Contents
Abstract ....................................................................................................................................... i
Ágrip ........................................................................................................................................... ii
Acknowledgements .................................................................................................................... v
Preface ....................................................................................................................................... vi
List of Tables ............................................................................................................................. ix
List of Figures ............................................................................................................................ x
List of Symbols ........................................................................................................................ xii
List of Abbreviations ................................................................................................................ xv
1 Introduction ........................................................................................................................ 1
1.1 Background .................................................................................................................. 1
1.2 Problem Statement ....................................................................................................... 1
1.3 Aim and Objectives ..................................................................................................... 1
1.4 Research Methodology ................................................................................................ 2
1.5 Outline of the Work ..................................................................................................... 3
2 Literature Review ............................................................................................................... 5
2.1 Elastic Modulus of Concrete ....................................................................................... 5
2.2 Factors Affecting the Elastic Modulus of Concrete .................................................. 10
2.3 Shrinkage and Swelling of Concrete ......................................................................... 11
2.4 Creep of Concrete ...................................................................................................... 12
2.5 Factors Affecting Concrete Creep ............................................................................. 14
2.6 Physical Mechanism of Concrete Creep .................................................................... 15
2.7 The Effects of Concrete Creep .................................................................................. 17
2.8 Icelandic Aggregates ................................................................................................. 18
2.9 Rheological Modelling of Concrete Creep ................................................................ 20
2.10 Eurocode Modelling of Concrete Creep .................................................................... 21
2.11 The fib Model Code 2010 and Concrete Creep ......................................................... 24
2.12 Model B3 and Concrete Creep .................................................................................. 24
2.13 ACI 209 Model and Concrete Creep ......................................................................... 26
3 Methods ............................................................................................................................ 27
3.1 Aggregate Parameters ................................................................................................ 27
3.2 Parameters of Fresh Concrete .................................................................................... 28
3.3 Parameters of Hardened Concrete ............................................................................. 30
3.4 Deflection Calculations ............................................................................................. 32
3.5 Prestress Losses ......................................................................................................... 34
4 Materials ........................................................................................................................... 36
4.1 Phase I........................................................................................................................ 36
4.2 Phase II ...................................................................................................................... 38
5 Results and Discussion ..................................................................................................... 41

viii
5.1 Phase I........................................................................................................................ 41
5.2 Phase II ...................................................................................................................... 44
5.2.1 Elastic Modulus .................................................................................................. 44
5.2.2 Experimental Results of Creep ........................................................................... 46
5.2.3 Comparison between Models and Test Data ...................................................... 58
5.3 Phase III ..................................................................................................................... 63
5.3.1 Deflection Calculations ...................................................................................... 63
5.3.2 Prestress Losses .................................................................................................. 65
6 Conclusions and Final Remarks ....................................................................................... 68
6.1 Main Findings ............................................................................................................ 68
6.2 Recommendations for Further Research ................................................................... 69
References ................................................................................................................................ 70
Appendix A .............................................................................................................................. 74
Appendix B .............................................................................................................................. 78
B.1. Obtaining the Final Value of Creep Coefficient According to EC2 .......................... 78
B.2. Derivation of Equation (2.20) .................................................................................... 79
B.3. Derivation of Equation (3.3) ...................................................................................... 80
B.4. Derivation of K for Simply Supported Beam ............................................................ 81
B.5. Area Moment of Inertia for Bridge Beam ................................................................. 82
Appendix C .............................................................................................................................. 83
C.1. MatLab Function that Calculates the Creep Coefficient According to EC2 ............. 83
C.2. MatLab Function that Calculates the Creep Coefficient According to fib MC 10 .... 85
C.3. MatLab Function that Calculates the Creep Comp. According to Model B3 ........... 87
C.4. MatLab Function, Approximating the Value for Q(t,t0), Needed for Model B3 ....... 89
C.5. MatLab Function that Calculates the Creep Coefficient According to ACI 209 ...... 90
Appendix D .............................................................................................................................. 92
D.1. Parameters used in the EC2 creep model .................................................................. 92
D.2. Parameters used in the fib MC 10 creep model ......................................................... 93
D.3. Parameters used in the B3 creep model ..................................................................... 94
D.4. Parameters used in the ACI 209 creep model ........................................................... 95
Appendix E ............................................................................................................................... 96
E.1. Calibration of Strain Gauge ....................................................................................... 96
E.2. Construction details for post tensioned bridge........................................................... 97

ix
List of Tables
Table 2-1: Effect of type of aggregates on the modulus of elasticity ........................................ 9
Table 4-1: Aggregate parameters according to equations ........................................................ 36
Table 4-2: Parameters of fresh concrete, measured prior to casting. ....................................... 37
Table 4-3: Aggregate parameters ............................................................................................. 38
Table 4-4: Various measured fresh concrete parameters ......................................................... 39
Table 4-5: Various measured fresh concrete parameters ......................................................... 39
Table 4-6: Various measured fresh concrete parameters ......................................................... 39
Table 4-7: Various measured fresh concrete parameters ......................................................... 40
Table 5-1: Measured parameters of hardened concrete ........................................................... 41
Table 5-2: Evaluated E-modulus values and comparison to fib MC 10 and EC2 models. ...... 45
Table 5-3: Estimated losses of initial prestress force, based on EC2 and INA. ....................... 66
Table 5-4: Estimated losses of initial prestress force ............................................................... 67
Table 5-5: Estimated losses of initial prestress force ............................................................... 67
Table B-1: Area Moment of Inertia for Bridge Beam. ............................................................. 82
Table D-1: Parameters used in the EC2 creep model. .............................................................. 92
Table D-2: Parameters used in the fib MC 10 creep model. .................................................... 93
Table D-3: Parameters used in the B3 creep model. ................................................................ 94
Table D-4: Parameters used in the ACI 209 creep model. ....................................................... 95
x
List of Figures
Figure 2-1: Propagation of cracks in the transition zone with increased strain. ........................ 7
Figure 2-2: Common approaches for evaluation of E-modulus of concrete. ............................. 8
Figure 2-3: Secant modulus from Eurocode 2 (EN 1992-1-1:2004). ......................................... 8
Figure 2-4: Definition of different modulus of elasticity ........................................................... 9
Figure 2-5: Stress-strain curves for compression tests on 150 x 300-mm (6 x 12-in.) ............ 10
Figure 2-6: Constant stress applied at time t0 ........................................................................... 13
Figure 2-7: The propagation of strain as a function of time ..................................................... 13
Figure 2-8: Proportional effects of creep and shrinkage of concrete ....................................... 14
Figure 2-9: Creep and creep recovery of concrete ................................................................... 14
Figure 2-10: Effect of E-modulus of aggregate on relative creep of concrete ......................... 15
Figure 2-11: Influence of age at application of load on creep of concrete ............................... 15
Figure 2-12: Hydration of pure clinkers as a function of time ................................................. 17
Figure 2-13: Porous Icelandic aggregate .................................................................................. 18
Figure 2-14: Non-porous Icelandic aggregate .......................................................................... 18
Figure 2-15: Moisture conditions of aggregate ........................................................................ 19
Figure 2-16: Effect of mineralogical character of aggregates on creep ................................... 19
Figure 2-17: Some existing rheological models ....................................................................... 21
Figure 2-18: Schematic representation of the creep ................................................................. 22
Figure 2-19: Schematic approach to obtain the final creep coefficient .................................... 23
Figure 3-1: Schematic representation of EN 1097-6 ................................................................ 28
Figure 3-2: Saturated aggregate element .................................................................................. 28
Figure 3-3: Deformation of a fluid element ............................................................................. 29
Figure 3-4: Flow curve for Newtonian and Bingham fluids .................................................... 29
Figure 3-5: A strain gauge and equipments to measure creep. ................................................ 30
Figure 3-6: Spring-loaded creep frame .................................................................................... 30
Figure 3-7: Screenshot of a program that logs measurements. ................................................ 31
Figure 3-8: Satisfactory failure of cylinder specimen .............................................................. 31
Figure 3-9: Stress behaviour in uncracked and cracked beam ................................................. 33
Figure 3-10: Side view of the highway bridge. ........................................................................ 34
Figure 3-11: Load on bridge structure (cross-sectional view) ................................................. 35
Figure 4-1: Cumulative particle size distribution of mixes containing various aggregates. .... 37
Figure 4-2: Arbitrary photo of specimens from phase I. .......................................................... 37
Figure 4-3: Arbitrary photo of specimens from phase I. .......................................................... 37
Figure 4-4: Arbitrary photo of creep rig specimens. ................................................................ 40
Figure 4-5: Arbitrary photo of creep rig specimens. ................................................................ 40
Figure 5-1: E-modulus of concrete as a function of aggregate porosity .................................. 42
Figure 5-2: E-modulus of concrete, samples containing basalt aggregates ............................. 43
Figure 5-3: Mean value of concrete cylinder compressive strength, with basalt aggregates ... 44
Figure 5-4: Creep compliance for the CVC1 specimens from 2009 ........................................ 47
Figure 5-5: Specific creep for the CVC1 specimens from 2009 ............................................... 48
xi
Figure 5-6: Creep compliance for the CVC2 specimens from 2002 ........................................ 48
Figure 5-7: Specific creep for the CVC2 specimens from 2002 ............................................... 49
Figure 5-8: Creep compliance for the CVC3 specimens from 2002 ........................................ 50
Figure 5-9: Specific creep for the CVC3 specimens from 2002 ............................................... 50
Figure 5-10: Creep compliance for the CVC4 specimens from 2002 ...................................... 51
Figure 5-11: Specific creep for the CVC4 specimens from 2002 ............................................. 52
Figure 5-12: Specific creep for CVC2, CVC3 and CVC4 specimens from 2002 ...................... 53
Figure 5-13: Specific creep for CVC2, CVC3 and CVC4 specimens from 2002 ...................... 53
Figure 5-14: Specific creep for SCC specimens from 2010 ..................................................... 54
Figure 5-15: Creep compliance for specimens from 2004 ....................................................... 55
Figure 5-16: Specific creep for specimens from 2004 ............................................................. 56
Figure 5-17: Effect of mineralogical character of aggregates on creep ................................... 57
Figure 5-18: Measured creep coefficient for the CVC1 specimens from 2009 ........................ 58
Figure 5-19: Measured creep coefficient for the CVC1 specimens from 2009 ........................ 59
Figure 5-20: Measured creep coefficient for the CVC1 specimens from 2009 ........................ 60
Figure 5-21: Measured creep coefficient for the CVC2 specimens from 2002 ........................ 60
Figure 5-22: Measured creep coefficient for the CVC2 specimens from 2002 ........................ 61
Figure 5-23: Measured creep coefficient for the CVC4 specimens from 2002 ........................ 62
Figure 5-24: Measured creep coefficient for the CVC4 specimens from 2002 ........................ 62
Figure 5-25: Deflection calculations based on material properties .......................................... 63
Figure 5-26: Deflection calculations based on the creep compliance ...................................... 64
Figure 5-27: Deflection calculations based on the creep compliance ...................................... 65
Figure B-1: Saturated aggregate element (SSD) with total volume equal to 1 ........................ 80
Figure B-2: Simply supported beam ........................................................................................ 81
Figure B-3: Bridge Beam. ........................................................................................................ 82
Figure E-1: Construction details at mid-span for post tensioned bridge. ................................. 97
Figure E-2: Construction details at mid-span for post tensioned bridge. ................................. 97

xii
List of Symbols
Roman upper case letters
Cross-sectional area
Cross-sectional area of concrete
Cross-sectional area of tension reinforcement
Cross-sectional area of compression reinforcement
Cross-sectional area of tendon
Specific creep
Modulus of elasticity
Modulus of elasticity of concrete
Secant modulus of elasticity of concrete
Tangent modulus of elasticity of concrete at a stress of and at 28 days
Design value of modulus of elasticity of concrete
Effective modulus of elasticity calculated using creep coefficient
Secant modulus of elasticity of concrete
Initial tangent modulus
Modulus of elasticity of relevant component
Modulus of elasticity of steel
Modulus of modulus of solid material
Force
Area moment of inertia
Area moment of inertia for cracked condition
Area moment of inertia for uncracked condition
Creep function or creep compliance
Length
Elongation
Bending moment
Cracking bending moment
Design value of bending moment (Rare)
Design value of bending moment (Quasi-permanent)
Initial prestress force
Relative humidity
First moment of area for cracked condition
First moment of area for uncracked condition
Roman lower case letters
Aggregate-cement ratio, by mass
Cement content of concrete
Volume percent of component

xiii
Effective depth of tension reinforcement
Depth to compression reinforcement
Average eccentricity of post-stress tendon
Parameter dependent on the grain morphology and pore geometry
Compressive strength of concrete
Specified compressive strength of concrete
Mean value of 28
th day cylinder compressive strength
Characteristic cylinder strength of concrete at 28 days
Mean value of concrete cylinder compressive strength
Mean value of concrete cylinder compressive strength at the time of loading
Characteristic axial tensile strength
Thickness of slab
Notional size
Wobble factor
Coefficient depending on the notional size
Radius
Porosity
Porosity at which the E-modulus becomes zero
Radius
Time being considered
The age of concrete when drying begins
The age of concrete at the time of loading
Parameter of that part of the concrete cross-section which is exposed to drying
Water content of concrete
Water-cement ratio, by mass
Greek letters
Angle
Deformation parameter
Modular ratio
Aggregate coefficient
Ratio of secant modulus divided by initial tangent modulus
Uncracked and fully cracked parameters
Coefficients to consider the influence of the concrete strength
Parameter for the influence of the duration of loading
Factor for the effect of concrete strength on the notional creep coefficient ( )
Factor for the effect of concrete age at loading on the notional creep coeff. ( )
Coefficient to describe the development of creep with time after loading
Partial factor for modulus of elasticity of concrete
Correction factor for creep coefficient if conditions are other than standard
Elastic deflection

xiv
Total deflection
Deflection due to creep and shrinkage
Strain
Compressive strain in the concrete
Autogenous shrinkage strain
Compressive strain in the concrete due to creep
Drying shrinkage strain
Compressive strain in the concrete, initial elastic strain
Compressive strain in the concrete, stress-dependent
Compressive strain in the concrete at peak stress
Ultimate compressive strain in the concrete
Total shrinkage strain
Strain at time ( )
Initial strain at the time of loading
Distribution coefficient
Maximum distribution coefficient
Distribution coefficient based on total SLS loading
Distribution coefficient based on quasi permanent loading
Angle
Coefficient of friction
Stress
Compressive stress in concrete
Initial stress at the time of loading
Creep coefficient
Notional creep coefficient
Factor for the effect of relative humidity on the notional creep coefficient ( )
Creep coefficient, defining creep between times and
Final value of creep coefficient
Basic creep coefficient
Drying creep coefficient
Non-linear final creep coefficient
Ultimate (final) creep coefficient

xv
List of Abbreviations
ACI American Concrete Institute
AEA Air entraining admixture
ASTM American Society for Testing and Materials
CVC Conventional vibrated concrete
C-S-H Calcium-Silicate-Hydrate
EC2 Eurocode 2
EU European Union
fib Fédération internationale du béton
ICI Innovation Center Iceland
INA Icelandic National Annexes to Eurocodes
MC Moisture content
MC 10 Model Code 2010
OPC Ordinary portland cement
SCC Self-compacting concrete
SCMs Supplementary cementitious materials
SLS Service limit state
SSD Saturated surface dry
TZ Transition zone
UAE United Arab Emirates

Introduction
1
1 Introduction
1.1 Background
This thesis, which is within the field of material science and structural design, focuses on the
material properties of structural concrete with porous aggregate. The main focus is set on the
mechanical properties, elastic modulus and creep. Other material properties, such as
shrinkage, will be addressed but mainly to clarify and differentiate where the material
properties are related.
Design codes and mathematical models are based on experiments and experience using
specific raw materials, not necessarily applying globally. It is therefore essential to validate
codes and models to assess their applicability. This thesis is intended to contribute to better
understanding of material properties using Icelandic concrete aggregates.
1.2 Problem Statement
Stress-dependent deformations of concrete are often responsible for excessive deflections at
service loads, which can compromise the performance of a structure. Elastic shortening and
the combined effects of creep and shrinkage strains also cause loss of prestress force, applied
to prestressed concrete member.
The knowledge of locally obtained materials, used in concrete manufacture, is necessary to
effectively model structure’s behaviour. Porous basalt rock is the primary source of concrete
aggregate in Iceland and concrete made with Icelandic aggregate has been known to exhibit
different characteristics.
1.3 Aim and Objectives
The research presented in this thesis is primarily intended to elucidate the effect of porosity in
aggregates on the elastic modulus and creep of concrete.
The main objectives of the thesis are in three phases:
I. Study of the elastic modulus of concrete based on an experiment done in the summer
of 2014 and presented at the XXII Nordic Concrete Research Symposium, 2014 in
Reykjavik.
II. Numerical evaluation on creep experiments, based on available data from Innovation
Center Iceland (ICI) and measurements done in the winter of 2014. Comparison of
experimental data to codes and known mathematical models.
III. Comparison between deflection calculations and prestress losses, using applicable
codes and calculations based on experimental data.

Introduction
2
1.4 Research Methodology
Phase I of this thesis is the subject of pure research involving the mechanical properties of
concrete. It is intended to elucidate the effect of porosity in aggregates on the elastic modulus
of concrete and making comparisons between concrete containing: porous basalt, non-porous
granite and limestone aggregate.
This part involves measurements on fresh and hardened concrete parameters. Concrete
samples were mixed, casted and measured at ICI according to valid codes and common
practices at ICI.
The experimental mechanical properties, i.e. compressive strength and elastic modulus, were
discussed and compared with literature and valid design code.
Phase II of this thesis is a numerical evaluation of creep measurements. The aim is to
elucidate the effect of porosity in aggregates on the creep of concrete and to make
comparisons between concrete containing non-porous granite aggregate. Measurements were
also compared to valid design codes, mathematical models, etc.
Innovation Center Iceland (ICI) has been researching creep of concrete from the beginning of
the century. An impressive amount of test data has been accumulated over the years. The
research methods used to evaluate creep are those proposed by the American Society of
Testing and Materials (ASTM) [3].
The oldest creep specimens are from 2002 and contain conventional vibrated concrete (CVC).
The specimens were designed to include three strength classes: C40/50, C60/75 and C70/85
and contain aggregates from three Icelandic aggregate suppliers. The characteristic strength of
the mixes was however other than intended. The strength of the C40/50 concrete was higher
and the strength of the C70/85 concrete was somewhat lower than intended.
In 2004 new specimens were casted. They were intended to elucidate the effect of volume
percentage of cement on the creep of concrete. The specimens contain CVC and self-
compacting concrete (SCC) with both non-porous granite and porous basalt aggregate.
Unfortunately some material parameters have been lost over the years, affecting usage of the
test data.
In 2009, specimens were casted containing: CVC, with characteristic strength as C25/30 and
with both non-porous granite and porous basalt aggregate.
The newest creep specimens are from 2010 and contain SCC, with and without added air
entraining admixture (AEA). The specimens include both conventional SCC and Eco-SCC,
which contains less cement and supplementary cementitious materials (SCMs) than
conventional SCC.

Introduction
3
Phase III of this thesis is a case study, based on deflection calculations for a slab as well as
for prestress losses in post-tensioned concrete bridge. It involves calculations in service limit
state according to methods and material parameters from valid codes. Deflection and prestress
losses are then compared to values obtained by using material parameters from phase I and II.
The deflection calculations relate to a roof slab on a residential house located in the Greater
Reykjavík Area. The house is above 100 m elevation and therefore it has higher characteristic
snow load than normal in Greater Reykjavík. The slab spans five meters and has additional
gravel on top of an insulating layer.
The effects of using material parameters from EC2 instead of experimental results are shown
in a case study. Prestress force losses for a post tensioned highway bridge are calculated using
material parameters both form EC2 and experimental results. The bridge is a structure
common on Icelandic highways. It has a 40.0 m single-span, is 9.0 m wide and located 30.0 m
above sea level. The load on the bridge is based on EN 1991-2:2003: Actions on structures -
Part 2: Traffic loads on bridges [4]. All calculations are based on EC2 in conjunction with the
INA and Reinforced Concrete Design: to Eurocode 2 by W.H. Mosley, J.H. Bungey and R.
Hulse [5].
1.5 Outline of the Work
The main body of the thesis comprises six thesis chapters and several chapter sections, with
the addition of references and appendices. To maintain clarity, some chapters are split into
phase I, II and III according to section 1.3.
The first chapter introduces the project of the thesis and clarifies the aim, objectives and
outlines of the work.
Chapter two is a literature review of subjects related to deformations of concrete. It gives
a brief overview of literature topics that are important in relation to the content of the
thesis, including:
Elastic Modulus of Concrete
Factors Affecting the Elastic Modulus of Concrete
Shrinkage and Swelling of Concrete
Creep of Concrete
Factors Affecting Concrete Creep
Physical Mechanism of Concrete Creep
The Effects of Concrete Creep
Icelandic Aggregates
Rheological Modelling of Concrete Creep
Eurocode Modelling of Concrete Creep
The fib Model Code 2010 and Concrete Creep
Model B3 and Concrete Creep.
ACI 209 Model and Concrete Creep

Introduction
4
Chapter three describes the methodology in obtaining parameters needed for the
evaluation of experimental data. Test methods for obtaining: aggregate parameter,
parameters for fresh and hardened concrete as well as relevant codes are described in
detail. The chapter also contains the methodology used in deflection calculations and
prestress losses.
Chapter four gives an overview of the materials used in phase I and II. It also contains
tabulated results of measured material parameters, particle size distribution graphs, etc.
Chapter five reports the main findings of the thesis and discusses the results. Since the
results and discussion, between the various phases of the thesis, are interlinked; the
results and discussion have been merged into one chapter. This has been done for clarity
of result and for overall readability.
Chapter six summarizes the main findings of the thesis. It also reflects on unanswered
questions that could be the subjects of further researches.
Appendix A contains an article published in the proceedings of the XXII Nordic Concrete
Research Symposium, 2014 Reykjavik, Iceland, pp. 179-182.
Appendix B contains various calculations and derivation of equations.
Appendix C contains written MatLab functions used in various calculations.
Appendix D contains the parameters used for creep models.
Appendix E contains additional attachments in Icelandic, intended for clarification.

Literature Review
5
2 Literature Review
Any material that experiences stress will deform. The quantity of deformation is dependent on
material properties. If the material is purely elastic, i.e. where Hook’s law applies, the
relationship between stress and strain is linear [6]. The slope of the linear relationship
between stress and strain is known as elastic modulus (E-modulus).
Hook’s law applies or is a good approximation for many structural materials, such as steel,
assuming relatively small deformations. Concrete however exhibits a non-linear relationship
between stress and strain. Furthermore it will also continue to deform under constant force, a
phenomenon known as creep.
The relationship between stress and strain is, strictly speaking, a function of time [7]. For
many structural materials, such as steel, the time-dependent influence is negligible and
ignored in calculations. Since concrete creeps, i.e. deforms under constant force, it is not
possible to ignore the effect of time. When calculating deformations, engineers often define a
lowered E-modulus that takes the effect of creep into account. The advantages are that
standard deflection equations still apply.
Creep is defined as the increase in strain under a sustained constant stress after taking into
account other time-dependent deformations not associated with stress, such as shrinkage,
swelling and thermal deformations [7]. To further describe creep, several parameters affecting
creep of concrete need to be explained in details e.g. E-modulus of concrete and shrinkage of
concrete.
2.1 Elastic Modulus of Concrete
Elastic modulus, often called Young’s modulus after the English physicist Thomas Young, is
a numerical constant that describes the elastic properties of a solid material undergoing strain
in one direction [8]. Elastic modulus is a vital engineering tool and used in deflection
calculations. It is best described by its mathematical definition of stress ( ) divided by strain
( ), or by equation (2.1)
(2.1)
where is the elastic modulus, is the force exerted, is the cross-sectional area through
which the force is applied, is the elongation in direction of exerted force and is the
original length.
The elastic modulus (E-modulus) describes a linear relationship between stress and strain i.e.
where Hook’s law applies [6]. Hook’s law applies to many structural materials, such as steel,
assuming relatively small deformations. Concrete however exhibits a non-linear relationship
between stress and strain. To simplify calculations engineers attempt to define E-modulus for
concrete using various models.

Literature Review
6
Concrete is a composite material consisting of dispersed material and matrix material. The
dispersed materials are aggregates (stone and sand) and the matrix material is a paste made
from cement or supplementary cementitious materials.
Several well-known theories exist on the E-modulus of composite materials. In 1960 B. Paul
wrote a paper predicting E-modulus of multiphase materials. He introduced an upper and
lower bound based on the individual properties, seen in eq. (2.2)
(2.2)
where is the volume percent of each component and the relevant E-modulus of each
component [9].
The derivation of equation (2.2) is based on the assumption that each material has a linear
stress and strain relationship. More importantly that continuity of displacement is always
maintained at the interface of the two materials. Recent studies show that concrete has an
additional component, besides aggregate and paste. There is an interface or transition zone
(TZ) between aggregates and paste. The influence of TZ on the elastic properties of concrete
depends mainly on volume and modulus of elasticity of the TZ. The volume of TZ is related
to the total aggregate surface or the interface surface [10].
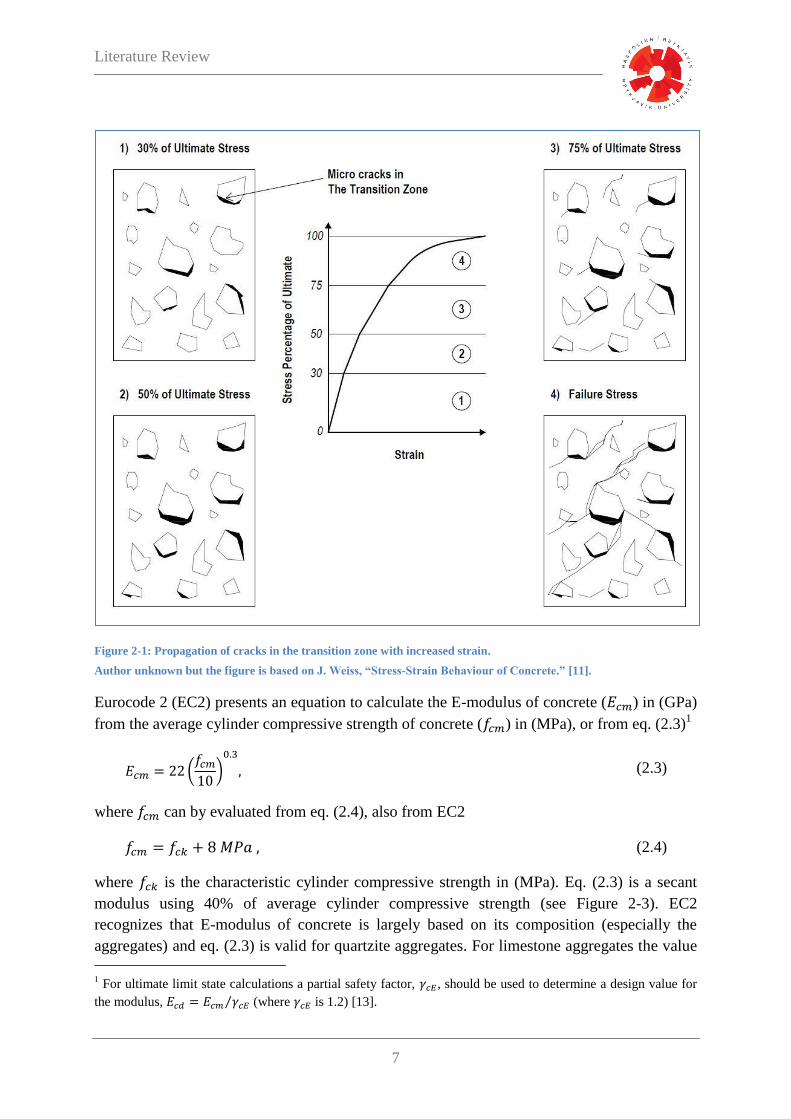
The non-linear stress-strain relationship of concrete is likely an influence from the TZ. In
normal strength concrete there is an initial nearly linear portion of deformation, lasting up to
about 30–40% of the ultimate load. With increasing strain micro-cracks at the paste-aggregate
interface or TZ begin to form. As the strain increases the cracks become larger and the E-
modulus drops [11] (see Figure 2-1).
In practice, strain is measured at different stresses and empirical equations then fitted to
results to obtain the E-modulus of the concrete. Since the stress-strain relationship for
concrete is non-linear it is not obvious how to derive E-modulus.
Several approaches for calculating E-modulus are known (see Figure 2-2). An initial tangent
modulus measures the tangent to the curve at the origin. It is also possible to find a tangent
modulus at any point on the stress-strain curve, but this applies only to very small changes in
load above or below the strain at which the tangent modulus is considered. Although rarely
used it is possible to measure an unloading modulus. The most common definition of E-
modulus is known as secant modulus. Secant modulus is usually measured at stress ranging
from 15 to 50% of the peak stress. The secant modulus is dependent on the level of stress and
the rate of application. The stress and time taken to apply the stress should always be stated
[7].
In the Icelandic Building Regulation there is a clause that states, that a structural designer
shall base his calculations on the Eurocode design standards [12].
Literature Review
7
Figure 2-1: Propagation of cracks in the transition zone with increased strain.
Author unknown but the figure is based on J. Weiss, “Stress-Strain Behaviour of Concrete.” [11].
Eurocode 2 (EC2) presents an equation to calculate the E-modulus of concrete ( ) in (GPa)
from the average cylinder compressive strength of concrete ( ) in (MPa), or from eq. (2.3)1
(2.3)
where can by evaluated from eq. (2.4), also from EC2
(2.4)
where is the characteristic cylinder compressive strength in (MPa). Eq. (2.3) is a secant
modulus using 40% of average cylinder compressive strength (see Figure 2-3). EC2
recognizes that E-modulus of concrete is largely based on its composition (especially the
aggregates) and eq. (2.3) is valid for quartzite aggregates. For limestone aggregates the value
1 For ultimate limit state calculations a partial safety factor, , should be used to determine a design value for
the modulus, (where is 1.2) [13].

Literature Review
8
( ) should be reduced by 10% and for sandstone aggregates reduced by 30%. For basalt
aggregates it is recommended to increase the value by 20% [14].
Figure 2-2: Common approaches for evaluation of E-
modulus of concrete. Figure based on A. M. Neville and
J. J. Brooks, Concrete Technology.
Figure 2-3: Secant modulus from Eurocode 2 (EN 1992-1-
1:2004).
There is a known discrepancy between the EC2 model for E-modulus and measured results,
using Icelandic aggregates. This is attributed to the prevailing porosity of Icelandic
aggregates, moisture content of these in saturated surface dry condition range normally from 3
to 8% [15]. In fact the Icelandic National Annex (INA) to EC2 suggests correction factors to
multiply the values obtained from eq. (2.3).
Following values shall be used [16]:
a) 0.9 for non-porous aggregates
b) 0.6 for porous aggregates
The ACI Building Code 318-05 presents an equation (2.5) for calculating E-modulus based
on specified compressive strength for normal weight concrete,
(2.5)
where is the E-modulus of concrete in (MPa) and is the specified compressive strength
of concrete in (MPa). Eq. (2.5) is a secant modulus using 45% of the specified compressive
strength. ACI Building Code 318-05 also recognizes that E-modulus is sensitive to variations
in the concrete composition. Accordingly, the E-modulus may differ from 120 to 80% of the
specified value obtained by eq. (2.5) [17].
Fédération internationale du béton (fib), or The International Federation for Structural
Concrete, recently presented the fib Model Code 2010. It is to serve as a basis for future codes
and present new developments with regard to concrete structures [18]. The code presents a
method for calculating E-modulus which resembles that of EC2. It first introduces eq. (2.6)

Literature Review
9
that calculates the initial tangent modulus ( ) which is approximately equal to the slope of
the secant of unloading, for rapid unloading (see Figure 2-4)
(2.6)
where and is an aggregate coefficient found in Table 2-1 [18].
The fib Model Code 2010 also has an equation for the secant modulus.2 The secant modulus
( ) should be used if only elastic analysis of concrete structure is carried out, but it accounts
for initial plastic strain, causing some irreversible deformations (see Figure 2-4).
(2.7)
where is the ratio of secant modulus divided by initial tangent modulus, or
(2.8)
Figure 2-4: Definition of different modulus of elasticity
(according to fib Bulletin 42) [18].
From fib Model Code 2010 (Figure 5.1-2). Axes are
compressive stress and strain.
Note: Ecm is not to be confused with EC2. Here Ecm represents
average initial tangent modulus but in EC2 it stands for
average secant modulus.
Types of aggregate αE Ec0 αE
[MPa]
Basalt aggregates 1.2 25800
Dense limestone aggregates 1.2 25800
Quartzite aggregates 1.0 21500
Limestone aggregates 0.9 19400
Sandstone aggregates 0.7 15100
Table 2-1: Effect of type of aggregates on the
modulus of elasticity [18].
From fib Model Code 2010 Final draft (Table 5.1-6)
and includes coefficients for equation (2.6).
All of the previously described methods are based on linear analysis. It is also possible to
derive a stress-strain relationship for non-linear structural analysis. However calculations
based on non-linearity are time consuming and require iteration, preferably with computer.
EC2 suggests the following non-linear relation between stress ( ) and strain ( ) in concrete
2 The fib Model Code 2010 refers to the secant modulus as the reduced modulus.
Literature Review
10
(2.9)
(2.10)
(2.11)
where is the strain at peak stress according to equation (2.12)
(2.12)
Equation (2.9) is valid for
(2.13)
where is the nominal ultimate strain [14].
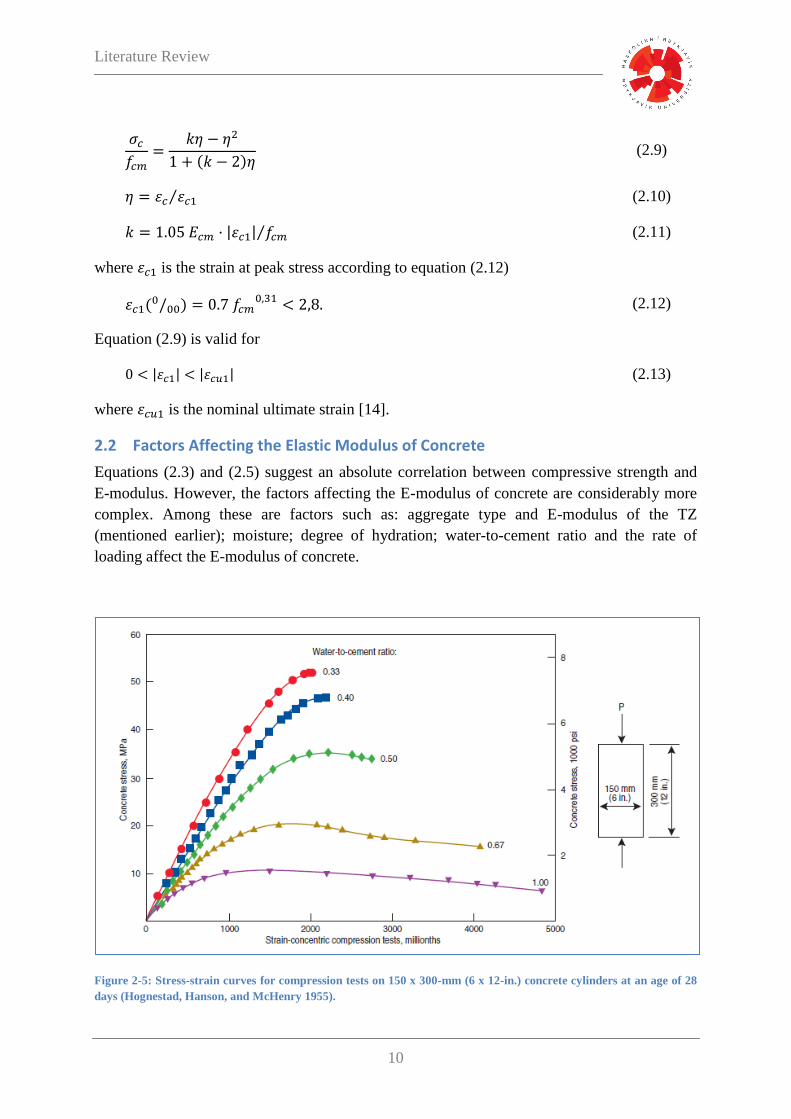
2.2 Factors Affecting the Elastic Modulus of Concrete
Equations (2.3) and (2.5) suggest an absolute correlation between compressive strength and
E-modulus. However, the factors affecting the E-modulus of concrete are considerably more
complex. Among these are factors such as: aggregate type and E-modulus of the TZ
(mentioned earlier); moisture; degree of hydration; water-to-cement ratio and the rate of
loading affect the E-modulus of concrete.
Figure 2-5: Stress-strain curves for compression tests on 150 x 300-mm (6 x 12-in.) concrete cylinders at an age of 28
days (Hognestad, Hanson, and McHenry 1955).

Literature Review
11
Wet concrete specimen can have E-modulus higher by 3–4 GPa than a dry one [7]. From
equation (2.2) it is evident that the volume percent of each concrete component affects the E-
modulus. Since fresh paste is plastic, has zero E-modulus, the degree of hydration is also a
factor when determining E-modulus of concrete. Figure 2-5 shows the effect of water-to-
cement ratio on compressive strength and consequently on E-modulus [19]. Finally, the type
of action and the rate of loading affect the E-modulus of concrete. Dynamic E-modulus is not
identically the same as the static E-modulus and increased rate of loading yields higher E-
modulus [15], [20].
2.3 Shrinkage and Swelling of Concrete
It is well known that concrete exhibits changes in strain with time when no external stress is
acting. These changes are simply referred to as shrinkage or swelling. To differentiate
between creep deformations and shrinkage or swelling it is necessary to measure, analyze and
understand both phenomena. The common practice is to consider the two as additive, i.e. the
overall increase in strain is the sum of: elastic deformation, thermal expansion, shrinkage or
swelling and creep. This approach has the merit of simplicity and is suitable for many
practical applications where creep and shrinkage occur together [21]. Volume changes that
are independent of load, excess moisture and temperature changes, are categorized as: plastic
shrinkage, chemical shrinkage, drying shrinkage, autogenous shrinkage and carbonation
shrinkage [15].
Plastic shrinkage occurs while the concrete is still in its plastic state, i.e. unable to resist
tensile stress. It is caused by loss of water by: evaporation from the concrete surface, suction
by dry concrete below the surface or loss of water by chemical reaction. This process causes
contraction and induction of tensile forces if the concrete is restrained by its non-shrinking
inner core or by external restrains [7], [15]. Since plastic shrinkage occurs during setting, or
before any external load can be applied to the concrete, it is unimportant with respect to creep.
Chemical shrinkage occurs as long as water hydrates or reacts with cement. The hydration
process is fast at first but slows down as hydration products build up. The absolute volume of
hydration products, of which the Calcium-Silicate-Hydrate (C-S-H) gel is most abundant, is
less than the absolute volume of water and unhydrated cement combined. This decrease in
volume causes contraction and it induces tensile forces if the concrete is restrained. Chemical
shrinkage is evenly distributed throughout the cross-section and does not propagate from the
surface as often is the case with concrete shrinkage [15].
Drying shrinkage is induced by the withdrawal of water from concrete stored in unsaturated
air [7]. As water leaves the capillary pores, they experience negative pressure causing the
concrete to contract. Drying shrinkage differs from plastic shrinkage because it occurs after
strength development has begun. Drying shrinkage is mostly early on but decreases with time,

Literature Review
12
depending on ambient conditions such as: temperature, wind and relative humidity [15]. It
should be noted that only part of the contraction is reversible although the concrete is allowed
to submerge in water. For normal concrete the rewetting expansion represents about 40 to
70% of the drying shrinkage [7].
Autogenous shrinkage is a parallel occurrence to chemical shrinkage. As cements hydrates it
uses water from the capillary pores and thus causes contraction by the build-up of negative
pressure, similar to drying shrinkage. Autogenous shrinkage is independent of ambient
relative humidity [15].
Carbonation shrinkage occurs when ambient carbon dioxide ( ) reacts with portlandite
( ) in the concrete to form calcium carbonate ( ) and moisture ( ), as seen
in eq. (2.14) [15].
(2.14)
Carbonation shrinkage can, in some instances, be relevant to creep [21] but favourable
conditions are needed for the chemical reaction to take place. These conditions are rare but
relative humidity of 50% is favourable for carbonation shrinkage as well as permeability and
high concentration of carbon dioxide in the ambient medium [7].
Volume changes other than shrinkage include swelling by excess moisture and thermal
movement. Like most materials, concrete has positive coefficient of thermal expansion; its
value depends both on the concrete composition and moisture condition at the time of
temperature change. In order to predict the coefficient of thermal expansion for concrete, a
knowledge of the various parameters that govern the two main constituents is needed, e.g. the
coefficient of thermal expansion for both cement paste and aggregate, the stiffness ratio of
cement paste to aggregate and the volume content of aggregate [7].
2.4 Creep of Concrete
In practice the term creep is often used to denote both the increase in strain under a sustained
constant stress and the relaxation of stress [21]. This thesis will mainly focus on time-
dependent deformations under constant stress but the relaxation of stress under constant strain
is a consequent of the same phenomenon.
Considering concrete specimen, loaded with constant compressive stress ( ), at the age ( )
until some time (see Figure 2-6). It is assumed that the concrete has been moist
cured until age ( ) and considerations have been made for volume changes other than elastic
deformation and creep [7]. At time ( ), there will be an initial elastic strain ( ) according to
equation (2.1) and as time passes additional strain will propagate due to the creep behaviour
of concrete (see Figure 2-7).
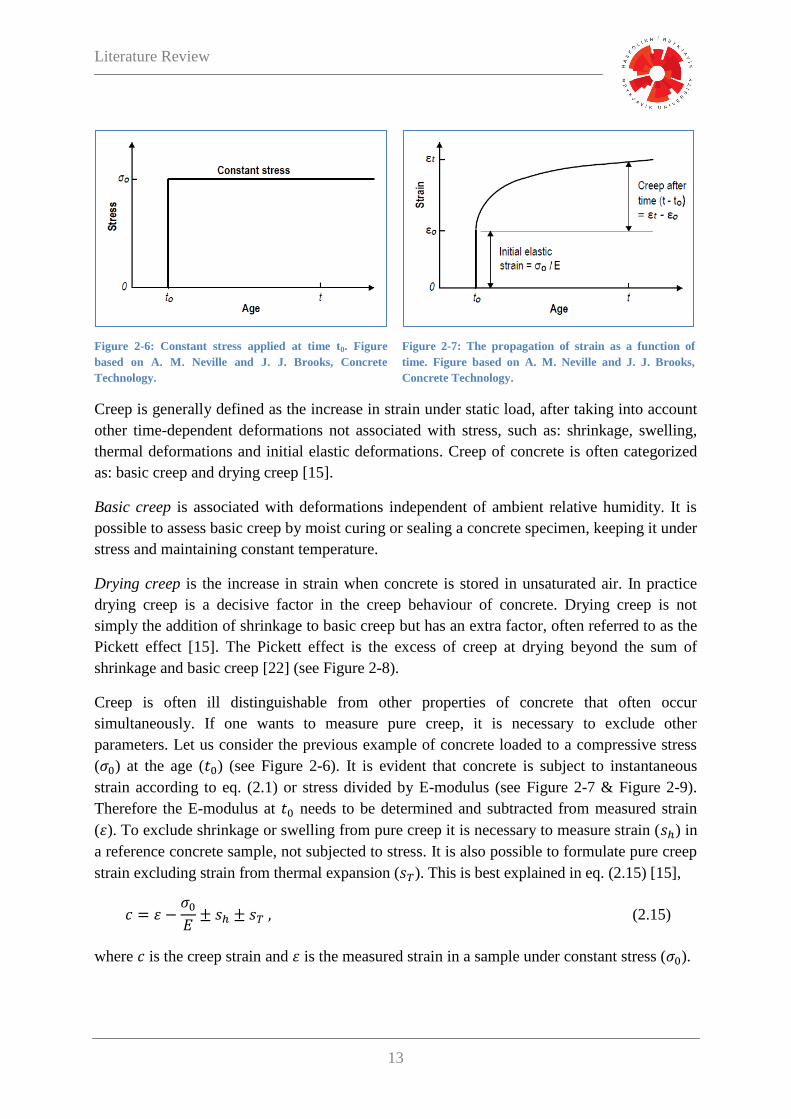
Literature Review
13
Figure 2-6: Constant stress applied at time t0. Figure
based on A. M. Neville and J. J. Brooks, Concrete
Technology.
Figure 2-7: The propagation of strain as a function of
time. Figure based on A. M. Neville and J. J. Brooks,
Concrete Technology.
Creep is generally defined as the increase in strain under static load, after taking into account
other time-dependent deformations not associated with stress, such as: shrinkage, swelling,
thermal deformations and initial elastic deformations. Creep of concrete is often categorized
as: basic creep and drying creep [15].
Basic creep is associated with deformations independent of ambient relative humidity. It is
possible to assess basic creep by moist curing or sealing a concrete specimen, keeping it under
stress and maintaining constant temperature.
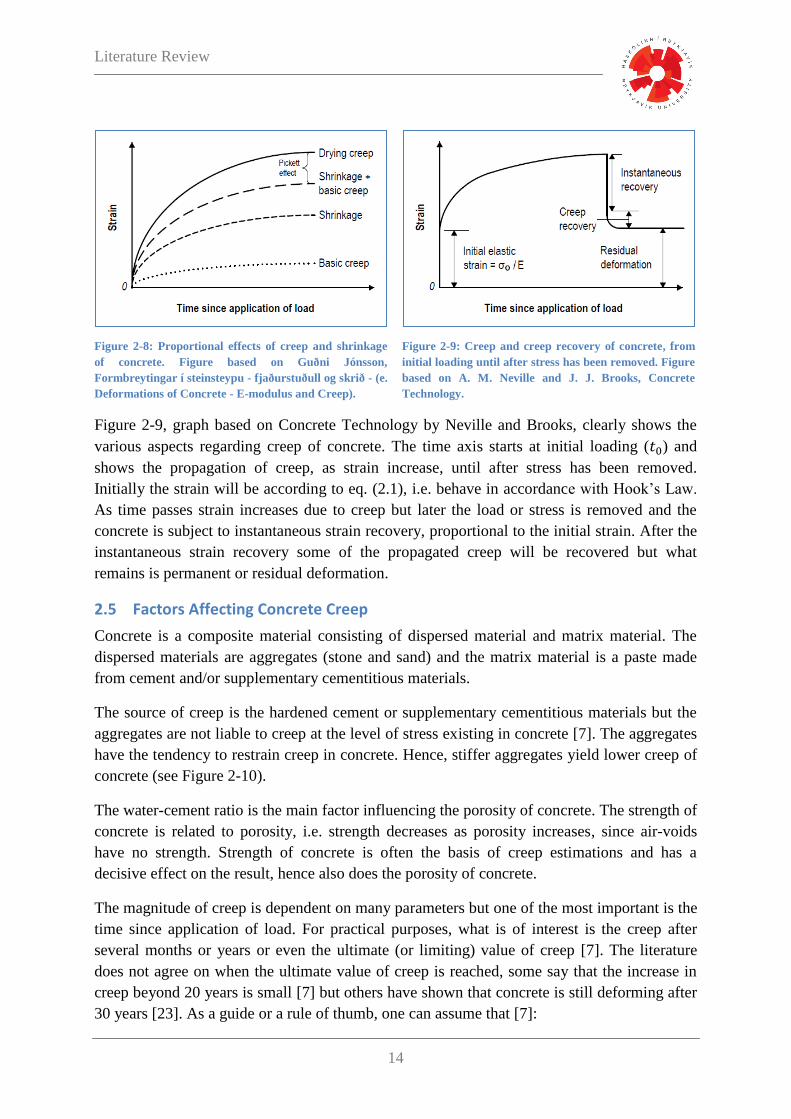
Drying creep is the increase in strain when concrete is stored in unsaturated air. In practice
drying creep is a decisive factor in the creep behaviour of concrete. Drying creep is not
simply the addition of shrinkage to basic creep but has an extra factor, often referred to as the
Pickett effect [15]. The Pickett effect is the excess of creep at drying beyond the sum of
shrinkage and basic creep [22] (see Figure 2-8).
Creep is often ill distinguishable from other properties of concrete that often occur
simultaneously. If one wants to measure pure creep, it is necessary to exclude other
parameters. Let us consider the previous example of concrete loaded to a compressive stress
( ) at the age ( ) (see Figure 2-6). It is evident that concrete is subject to instantaneous
strain according to eq. (2.1) or stress divided by E-modulus (see Figure 2-7 & Figure 2-9).
Therefore the E-modulus at needs to be determined and subtracted from measured strain
( ). To exclude shrinkage or swelling from pure creep it is necessary to measure strain ( ) in
a reference concrete sample, not subjected to stress. It is also possible to formulate pure creep
strain excluding strain from thermal expansion ( ). This is best explained in eq. (2.15) [15],
(2.15)
where is the creep strain and is the measured strain in a sample under constant stress ( ).
Literature Review
14
Figure 2-8: Proportional effects of creep and shrinkage
of concrete. Figure based on Guðni Jónsson,
Formbreytingar í steinsteypu - fjaðurstuðull og skrið - (e.
Deformations of Concrete - E-modulus and Creep).
Figure 2-9: Creep and creep recovery of concrete, from
initial loading until after stress has been removed. Figure
based on A. M. Neville and J. J. Brooks, Concrete
Technology.
Figure 2-9, graph based on Concrete Technology by Neville and Brooks, clearly shows the
various aspects regarding creep of concrete. The time axis starts at initial loading ( ) and
shows the propagation of creep, as strain increase, until after stress has been removed.
Initially the strain will be according to eq. (2.1), i.e. behave in accordance with Hook’s Law.
As time passes strain increases due to creep but later the load or stress is removed and the
concrete is subject to instantaneous strain recovery, proportional to the initial strain. After the
instantaneous strain recovery some of the propagated creep will be recovered but what
remains is permanent or residual deformation.
2.5 Factors Affecting Concrete Creep
Concrete is a composite material consisting of dispersed material and matrix material. The
dispersed materials are aggregates (stone and sand) and the matrix material is a paste made
from cement and/or supplementary cementitious materials.
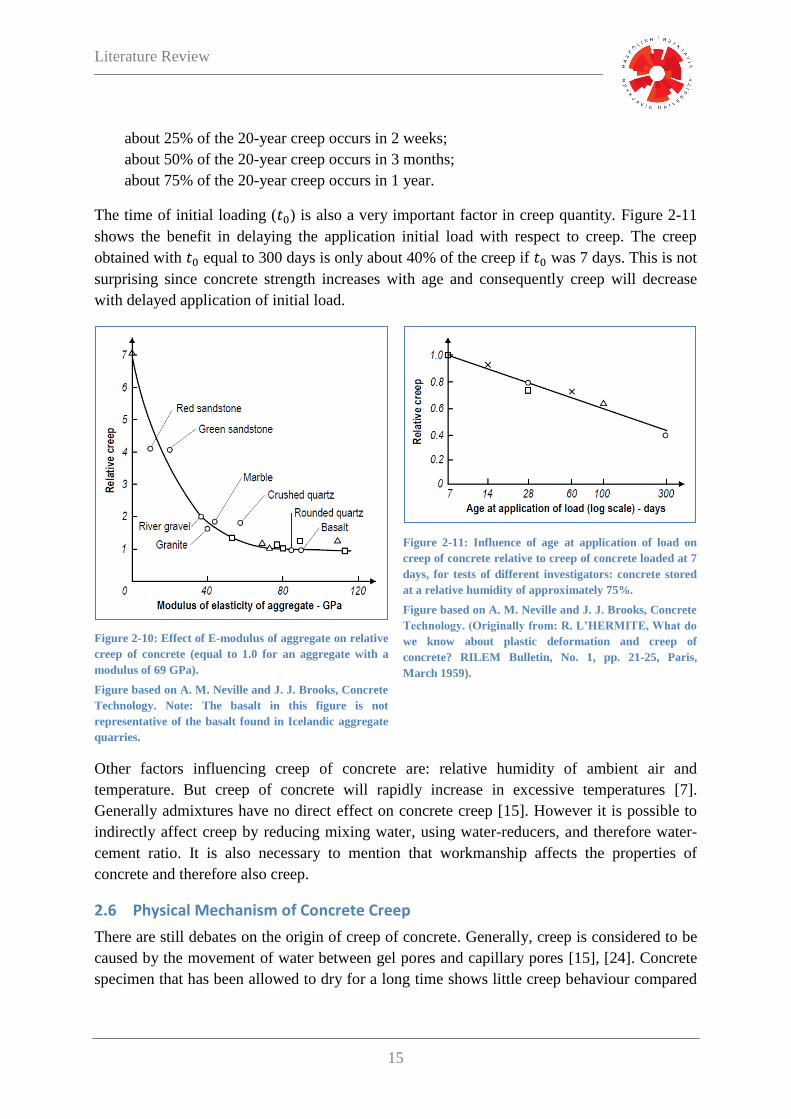
The source of creep is the hardened cement or supplementary cementitious materials but the
aggregates are not liable to creep at the level of stress existing in concrete [7]. The aggregates
have the tendency to restrain creep in concrete. Hence, stiffer aggregates yield lower creep of
concrete (see Figure 2-10).
The water-cement ratio is the main factor influencing the porosity of concrete. The strength of
concrete is related to porosity, i.e. strength decreases as porosity increases, since air-voids
have no strength. Strength of concrete is often the basis of creep estimations and has a
decisive effect on the result, hence also does the porosity of concrete.
The magnitude of creep is dependent on many parameters but one of the most important is the
time since application of load. For practical purposes, what is of interest is the creep after
several months or years or even the ultimate (or limiting) value of creep [7]. The literature
does not agree on when the ultimate value of creep is reached, some say that the increase in
creep beyond 20 years is small [7] but others have shown that concrete is still deforming after
30 years [23]. As a guide or a rule of thumb, one can assume that [7]:
Literature Review
15
about 25% of the 20-year creep occurs in 2 weeks;
about 50% of the 20-year creep occurs in 3 months;
about 75% of the 20-year creep occurs in 1 year.
The time of initial loading ( ) is also a very important factor in creep quantity. Figure 2-11
shows the benefit in delaying the application initial load with respect to creep. The creep
obtained with equal to 300 days is only about 40% of the creep if was 7 days. This is not
surprising since concrete strength increases with age and consequently creep will decrease
with delayed application of initial load.
Figure 2-10: Effect of E-modulus of aggregate on relative
creep of concrete (equal to 1.0 for an aggregate with a
modulus of 69 GPa).
Figure based on A. M. Neville and J. J. Brooks, Concrete
Technology. Note: The basalt in this figure is not
representative of the basalt found in Icelandic aggregate
quarries.
Figure 2-11: Influence of age at application of load on
creep of concrete relative to creep of concrete loaded at 7
days, for tests of different investigators: concrete stored
at a relative humidity of approximately 75%.
Figure based on A. M. Neville and J. J. Brooks, Concrete
Technology. (Originally from: R. L’HERMITE, What do
we know about plastic deformation and creep of
concrete? RILEM Bulletin, No. 1, pp. 21-25, Paris,
March 1959).
Other factors influencing creep of concrete are: relative humidity of ambient air and
temperature. But creep of concrete will rapidly increase in excessive temperatures [7].
Generally admixtures have no direct effect on concrete creep [15]. However it is possible to
indirectly affect creep by reducing mixing water, using water-reducers, and therefore water-
cement ratio. It is also necessary to mention that workmanship affects the properties of
concrete and therefore also creep.
2.6 Physical Mechanism of Concrete Creep
There are still debates on the origin of creep of concrete. Generally, creep is considered to be
caused by the movement of water between gel pores and capillary pores [15], [24]. Concrete
specimen that has been allowed to dry for a long time shows little creep behaviour compared

Literature Review
16
with specimen with higher degree of hydration or even saturated specimen, provided that the
age is the same [15], [24].
Ordinary portland cement (OPC) is made from calcareous materials, such as limestone and
chalk, and silica and alumina found as clay or shale. The pure clinkers are composed of the
following chemical compounds, using common chemical abbreviations:
Tricalcium silicate – 3CaO.SiO2 = C3S
Dicalcium silicate – 2CaO.SiO2 = C2S
Tricalcium aluminate – 3CaO.Al2O3 = C3A
Tetracalcium aluminoferrite – 4CaO.Al2O3.Fe2O3 = C4AF
Note: To control the rate of reaction from C3A it is necessary to add gypsum (CaO.SO3.2H2O)
= to the cement [25].
The hardening of OPC is an exothermic chemical reaction. The hydration process of the most
important pure chemical compounds can be seen in eq.: (2.16), (2.17) & (2.18) [26]
(2.16)
(2.17)
(2.18)
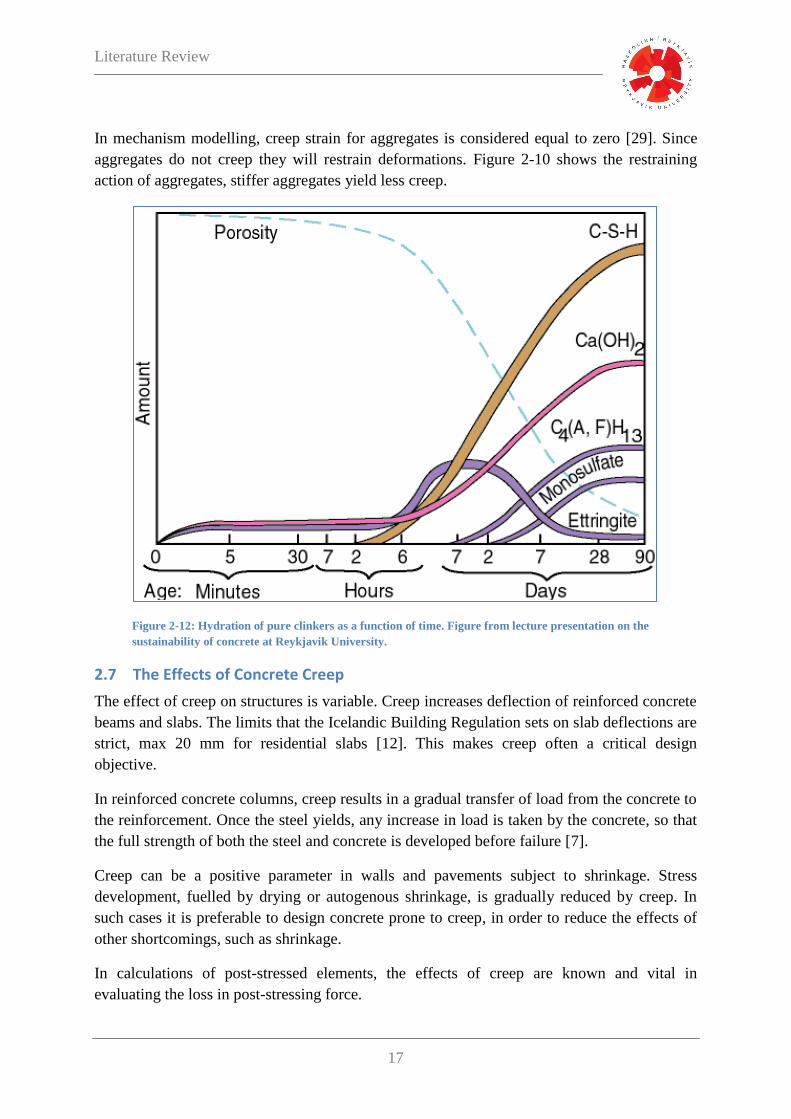
After adding water to the cement, a chemical reaction or hydration starts (see Figure 2-12).
Porosity in the concrete decreases but shrinkage begins.
The most important chemical compound in the hydration process is the product of tricalcium
silicate (C3S) and dicalcium silicate (C2S). C3S and C2S, in OPC, begin to react chemically
with water, yielding calcium silicate hydrate or (C-S-H). Calcium hydroxide (Ca(OH)2), or
portlandite, is considered a by-product. Pozzolan, such as silica fume, is often added into
concrete to react with the portlandite to form additional binder, very similar to the C-S-H
[25].
C-S-H is often referred to as C-S-H gel since it has very special properties. “In fact, concrete
is a heterogeneous visco-elastic material that develops delayed deformations.” [27] The visco-
elastic behaviour is, in layman's terms, best described as sponge-like behaviour.
C-S-H gel has solid sheets composition separated by absorbed water [28]. Movement of water
is possible, allowing sliding of the solid layers. In the early-ages, when more unhydrated
water is present, maximum creep is observed (see Figure 2-7 & Figure 2-9). This hypotheses
is supported in the findings by R. L’Hermite (see Figure 2-11), were it is shown that the
delayed application of load has a reducing effect on creep.
Literature Review
17
In mechanism modelling, creep strain for aggregates is considered equal to zero [29]. Since
aggregates do not creep they will restrain deformations. Figure 2-10 shows the restraining
action of aggregates, stiffer aggregates yield less creep.
Figure 2-12: Hydration of pure clinkers as a function of time. Figure from lecture presentation on the
sustainability of concrete at Reykjavik University.
2.7 The Effects of Concrete Creep
The effect of creep on structures is variable. Creep increases deflection of reinforced concrete
beams and slabs. The limits that the Icelandic Building Regulation sets on slab deflections are
strict, max 20 mm for residential slabs [12]. This makes creep often a critical design
objective.
In reinforced concrete columns, creep results in a gradual transfer of load from the concrete to
the reinforcement. Once the steel yields, any increase in load is taken by the concrete, so that
the full strength of both the steel and concrete is developed before failure [7].
Creep can be a positive parameter in walls and pavements subject to shrinkage. Stress
development, fuelled by drying or autogenous shrinkage, is gradually reduced by creep. In
such cases it is preferable to design concrete prone to creep, in order to reduce the effects of
other shortcomings, such as shrinkage.
In calculations of post-stressed elements, the effects of creep are known and vital in
evaluating the loss in post-stressing force.

Literature Review
18
Another instance of the adverse effects of creep occurs in tall buildings. Different creep
between inner and outer columns, due to different stresses, may cause movement and
cracking of partitions [7].
2.8 Icelandic Aggregates
Iceland is a volcanic island, containing mainly basaltic rock types, and geologically it is
young [30]. Basalt contains < 52% silicon oxide ( ) [31] and is formed from rapid cooling
of exposed lava near the planet’s surface. The rapid cooling traps volcanic gases inside the
lava and the results are generally rather porous aggregates (see Figure 2-13). Some Icelandic
aggregate suppliers offer non-porous aggregates (see Figure 2-14). Icelandic aggregates are
quarried from seabed quarries and inland quarries, both gravel and crushed stone.
Figure 2-13: Porous Icelandic aggregate [31].
Figure 2-14: Non-porous Icelandic aggregate [31].
The difference in porosity can be quantitated by the moisture content of aggregates in
saturated surface dry (SSD) condition.3 Moisture content in SSD condition is an indirect way
of quantitating porosity by measuring absorption and surface moisture but absorption is
related to porosity. “The internal structure of an aggregate particle is made up of solid matter
and voids that may or may not contain water [19].” The moisture conditions of aggregates are
designated as (see Figure 2-15 & Section 3.1) [19]:
Oven dry—fully absorbent
Air dry—dry at the particle surface but containing some interior moisture, thus still
somewhat absorbent
Saturated surface dry (SSD)—neither absorbing water from nor contributing water to
the concrete mixture
Damp or wet—containing an excess of moisture on the surface (free water)
3 The methods of measuring moisture content in SSD condition are inaccurate. The researcher has to assess
visually when the aggregates are SSD. This may lead to fluctuating results between researchers.

Literature Review
19
Figure 2-15: Moisture conditions of aggregate [19].
Dry aggregates added to concrete mix will absorb mixing-water. Wet aggregates will however
add extra mixing-water. If precautions are not made, and the amount of water not adjusted to
the moisture conditions of aggregates, the extra water will increase the water-cement ratio,
resulting in: less strength, reduced E-modulus and higher creep coefficient of concrete.
Figure 2-16: Effect of mineralogical character of aggregates on creep. Figure based on G. E. Troxell, J. M. Raphael
and R.E. Davis, Long-Time Creep and Shrinkage Tests of Plain and Reinforced Concrete, excluding individual
measurements.
Specimens, 4- by 14-in. cylinders. Fineness modulus 5.75, except gravel which had fineness modulus 5.61. Cement type
I. Aggregate-cement ratio by weight, 5.67. Water-cement ratio by weight, 0.59. Curing, 28 days in fog at 70 F. Age at
loading, 28 days. Sustained compressive stress, 800 psi. Storage after loading, in air at 70 F and 50 per cent relative
humidity. Instantaneous deformations in millionths: sandstone, 281; gravel, 275; basalt, 224; limestone, 222; quartz,
212; granite, 205.

Literature Review
20
Although some Icelandic aggregates are categorized as non-porous, they are all in fact quite
porous. Moisture content of 3-8% (by weight) in SSD condition is common in Icelandic
aggregates, compared to about 0.5% in neighbouring countries [15].
Figure 2-16 shows the effect of mineralogical character of aggregates upon creep [23]. The
concrete containing basalt aggregates increases its rate of creep after about three months, then
levels out. It has yet to be seen if the Icelandic aggregate behave similarly.
The aggregate comprises about 70% of concrete volume and is stiffer than the cement paste
[13]. In the most general terms, greater volume of aggregate will stiffen the concrete,
according to eq. (2.2), and transfer stresses from the binder to the stiffer aggregate. Hence the
E-modulus and volume of the aggregate has significant effect on the E-modulus and creep
coefficient of concrete.
2.9 Rheological Modelling of Concrete Creep
Rheology is the science of flow and deformation of matter and describes the interrelation
between force, deformation and time. The term comes from Greek rheos meaning to flow
[32]. It may seem strange to refer to a solid material as concrete as having fluid behaviour.
“The idea is that everything flows if you wait long enough, even the mountains.” [33].
Rheological models are used to portray the general deformation behaviour and flow of
materials under stress. A model is basically composed of simple elastic springs and ideal
dashpots [34]. There are two basic rheological models used to model creep.
The first basic rheological model is the Maxwell model (see Figure 2-17a). It is composed of
serially connected elastic spring and ideal dashpot. While load is sustained the deformational
response of a Maxwell model is a line, with the y-intercept representing initial elastic
deformations. After the load has been removed, instantaneous recovery will occur, equal to
the initial elastic deformations and then the deformation will remain constant [21].
The second basic rheological model is the Kelvin model (see Figure 2-17b). It is composed of
elastic spring and ideal dashpot, working in parallel. When a load is applied to a Kelvin
model it exhibits no instantaneous deformation but the deformation increases with time
exponentially. After the removal of load, full recovery will eventually be achieved [21].
The Kelvin and Maxwell models can by combined to build up more complex models. One
such model is the Burgers model (see Figure 2-17c). The deformational response of a Burgers
model resembles the propagation of strain as a function of time, described in section 2.4 (see
Figure 2-7).
Mathematical modelling of concrete creep is based on models, such as the Burgers model, and
then experimental data is compared to the models. Some more complex models can be made
to represent some material characteristics (see Figure 2-17).

Literature Review
21
Figure 2-17: Some existing rheological models: (a) Maxwell model, (b) Kelvin Model, (c) Burgers model, (d) Ross
model, (e) Feng model and (f) US Bureau of Reclamation model [35].
2.10 Eurocode Modelling of Concrete Creep
The structural Eurocodes are a set European design standards which provide a common
approach to structural design across the European Union (EU) [36]. The structural Eurocodes
are divided into 10 areas and are made up of 58 parts that have been adopted in full by all EU
Member States since April 2010. The area that deals with structural concrete is in four parts
and is commonly called Eurocode 2 (EC2). The first part of the code deals with the general
rules and when referring to EC2 it is to this part, unless otherwise stated.
Article (2.3.2.2) in EC2 states: “Shrinkage and creep, are time-dependent properties of
concrete. Their effects should generally be taken into account for the verification of
serviceability limit states”. It also states that shrinkage and creep shall be evaluated in
ultimate limit state where their effects are significant, e.g. second order effects [14]. EC2
defines creep as a function of two variables, time of consideration ( ) and time of initial
loading ( ), it then defines a creep coefficient ( ) based on the two variables, i.e. .
Often it is of interest to define final creep with the mathematical limit of the formulation or
[14]. A worked example of obtaining the final value of creep coefficient, i.e.
, can be found in Appendix B.
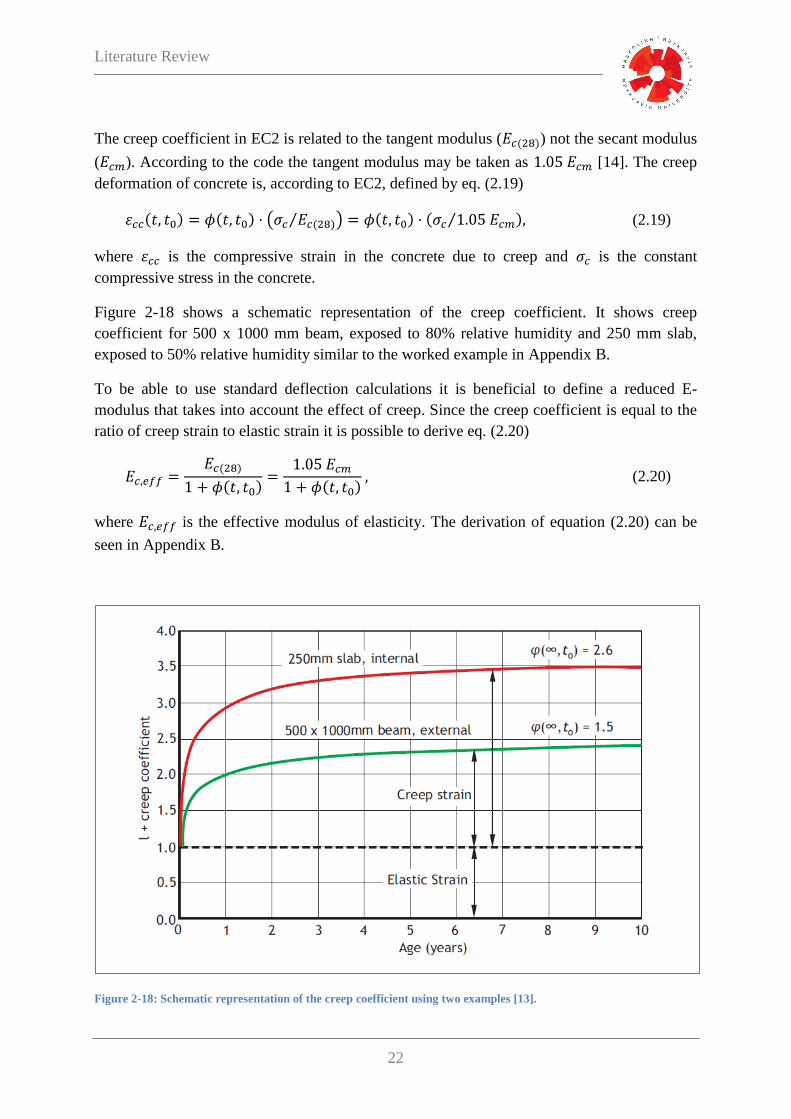
Literature Review
22
The creep coefficient in EC2 is related to the tangent modulus ( ) not the secant modulus
( ). According to the code the tangent modulus may be taken as [14]. The creep
deformation of concrete is, according to EC2, defined by eq. (2.19)
(2.19)
where is the compressive strain in the concrete due to creep and is the constant
compressive stress in the concrete.
Figure 2-18 shows a schematic representation of the creep coefficient. It shows creep
coefficient for 500 x 1000 mm beam, exposed to 80% relative humidity and 250 mm slab,
exposed to 50% relative humidity similar to the worked example in Appendix B.
To be able to use standard deflection calculations it is beneficial to define a reduced E-
modulus that takes into account the effect of creep. Since the creep coefficient is equal to the
ratio of creep strain to elastic strain it is possible to derive eq. (2.20)
(2.20)
where is the effective modulus of elasticity. The derivation of equation (2.20) can be
seen in Appendix B.
Figure 2-18: Schematic representation of the creep coefficient using two examples [13].

Literature Review
23
The statement that creep is a function of two variables is incomplete since creep is dependent
on many other parameters. If one studies EC2 various parameters, other than time of
consideration ( ) and time of initial loading ( ), affect creep. Parameters such as: type of
cement, cylinder compressive strength, area of concrete exposed to ambient air, relative
humidity of ambient air and ambient temperature, also affect creep.
Where great accuracy is not required, EC2 gives a schematic approach to obtain the final
creep coefficient i.e. , provided that the concrete is not subjected to a compressive
stress greater than . Figure 2-19 is an example of the schematic approach where two
graphs are needed to be read together in order to obtain the final creep coefficient.
Figure 2-19: Schematic approach to obtain the final creep coefficient if ambient relative humidity is 50% (inside
conditions) [14].
is the final creep coefficient
is the age of concrete at first loading in days
is the notional size 2Ac/u, where Ac is the concrete cross-sectional area and u is the perimeter exposed to drying
is for slow hardening cements
is for normal hardening cements
is for rapid hardening cements
If the compressive stress of the concrete exceeds the value , or 45% of the
characteristic compressive strength, then creep non-linearity should be considered. Such a
high stress can occur as a result of pretensioning. In such cases the final creep coefficient
should be obtained by eq. (2.21)
(2.21)
where is the non-linear final creep coefficient and is the mean concrete
compressive strength at the time of loading.
A detailed method of calculating the creep coefficient can be found in Annex B of EC2. The
method is time consuming and is better suited to formulate in a computer than writing out on

Literature Review
24
paper. Appendix C contains a MatLab program that calculates, in details, the creep
coefficient, according in EC2. This method should be used if accuracy is required.
2.11 The fib Model Code 2010 and Concrete Creep
Fédération internationale du béton (fib) or The International Federation for Structural
Concrete is a pioneering organization in codification. The objectives of the fib Model Code
2010 (MC 10) are to serve as a basis for future codes and present new developments with
regard to concrete structures [18].
As with EC2, the fib MC 10 bases creep predictions on the initial tangent modulus of
elasticity (see section 2.1). The total strain, a member undergoes, is split into stress-
independent strain and stress-dependent strain, creep strain at time being part of the
latter. Equation (2.22) describes the stress-dependent strain as
(2.22)
where is the initial elastic strain at , is the creep strain evaluated at time ,
is the initial tangent modulus evaluated at , is the initial tangent modulus at 28
days, is the constant stress applied at and is the creep coefficient [18] [38].
The stress-dependent strain, from eq. (2.22), can by expressed according to eq. (2.23)
(2.23)
where is the creep function or creep compliance, representing the total stress-
dependent strain per unit stress [18].
Two additions were introduced to fib MC 10 from the older Model Code 1990. The older
Model Code lacked asymptotical limit for the function expressing time development of the
basic creep [38]. Secondly, new both to the Model Codes and EC2, the fib Model Code 2010
defines the creep coefficient as the sum of basic creep coefficient and drying creep coefficient
[18], [38] (see section 2.4) or by eq. (2.24)
(2.24)
where is the basic creep coefficient and is drying creep coefficient [18].
Appendix C contains a MatLab program that calculates, in details, the creep coefficient,
according to the fib Model Code 2010.
2.12 Model B3 and Concrete Creep
Among many models for predicting the creep of concrete, model B3 by Z. P. Bazant and S.
Baweja is the most detailed. It is based on a systematic theoretical formulation of the basic

Literature Review
25
physical phenomena involved. It is also a statistical optimization with regard to most of the
test data that exist in the literature [39].
Model B3 introduces several new parameters for creep prediction [40]. Water-cement ratio by
mass ( ) is a parameter ignored by EC2 and fib MC 2010. The water-cement ratio is the
main factor influencing the porosity of concrete (see section 2.5) and as a consequence
affecting the compressive strength of concrete. Since creep predictions in EC2 and fib MC
2010 are based on the average cylinder compressive strength (see Appendix C), the two codes
indirectly evaluate water-cement ratio.
Another interesting parameter, in model B3, is the aggregate-cement ratio by mass ( ).
Since the aggregate is stiffer than the cement paste, stresses will transfer from the binder to
the stiffer aggregate (see section 2.8). Hence less aggregate, more creep.
Model B3 also introduces a parameter for cement content of concrete ( ), water content of
concrete ( ) and the age when drying begins.
The prediction of the model is restricted to Portland cement concrete with the following
parameter ranges:
(2.25)
(2.26)
where is the mean value of 28
th day cylinder compressive strength [40].
The creep compliance, see eq. (2.23), is decomposed, using notation from EC2 and fib MC
2010, as
(2.27)
where is the instantaneous strain due to unit stress, is the compliance function for
basic creep, is the additional compliance function due to simultaneous drying and
is the age when drying begins (only is considered) [40].
By rewriting eq. (2.23), the creep coefficient can by calculated from the creep compliance as
(2.28)
where is the initial tangent modulus evaluated at .
Appendix C contains a MatLab program that calculates, in details, the creep compliance,
according to model B3.

Literature Review
26
2.13 ACI 209 Model and Concrete Creep
American Concrete Institute (ACI) committee 209 has published creep and shrinkage
prediction model, known as ACI 209R-92.4 This model was initially developed for the
precast- prestressing industry and has been used in design of structures for many years [41].
The ACI 209R-92 method requires the following parameters: the age of concrete at loading,
curing method, relative humidity, volume-surface ratio or average thickness, slump, ratio of
fine aggregate to total aggregate by mass, air content and cement type.
The model is simple to use with minimal background knowledge but has several
disadvantages. It is limited in its accuracy, particularly in the method of accommodating
member size [41]. It does not differentiate between basic creep and drying creep as fib MC 10
and model B3. The slump parameter is also questionable. It is meant to represent the
composition of concrete but with the use of superplasticizer in concrete, the slump will
increase without altering the concrete’s composition.
ACI 209R-92 models the creep coefficient according to eq. (2.29)
(2.29)
where is time since application of load, is the ultimate (final) creep coefficient
according to eq. (2.30), and are constants for a member shape and size. The value of
and can be determined by use of data obtained from tests performed in accordance to
ASTM C 512 [42]. In practice these values are unknown and the recommended values of 10
and 0.6 for and are used.
The ultimate creep coefficient is as follows
(2.30)
where is a correction factor for other than standard conditions and composed of six factors,
depending on particular conditions.
Appendix C contains a MatLab program that details individual factors for particular
conditions and calculates the creep coefficient, according to ACI 209R-92.
4 The ACI209R-92 model has been reapproved in 1997 and 2008.

Methods
27
3 Methods
This chapter describes the methodology in obtaining parameters needed for the evaluation of
experimental data. Test methods for obtaining: aggregate parameter, parameters for fresh and
hardened concrete as well as relevant codes are described in detail. The chapter also contains
the methodology used in deflection calculations and prestress losses.
3.1 Aggregate Parameters
Water absorption or moisture content (MC), as a percentage of dry mass after immersion for
24 hours ( ), is calculated according to the European standard EN 1097-6 (see Figure
3-1), or eq. (3.1)
(3.1)
where is the mass of the SSD aggregate in the air and is the mass of the oven-dried test
portion in air [37].
It is also possible to quantify porosity as a measure of the void in the aggregate, but first
another aggregate parameter needs to be defined. Particle density on a SSD basis ( ) is
calculated according to the same standard as the water absorption, EN 1097-6 (see Figure 3-1
for pycnometer method), or eq. (3.2)
(3.2)
where is the mass of the SSD aggregate in the air, is the mass of the pycnometer
containing sample of saturated aggregate, is the mass of the pycnometer filled with water
only and is the density of water at the temperature recorded when was determined
[37].
Porosity is the ratio of voids by volume by the total volume [43]. Figure 3-2 shows a saturated
aggregate element in SSD condition with total volume equal to 1. By using common
approaches from geotechnical engineering, eq. (3.3) for porosity can be derived
(3.3)
The derivation of equation (3.3) can be seen in Appendix B.
Cumulative particle size distribution was conducted in accordance with EN 933-1:1997. The
aggregate is sieved into particle size categories (see Figure 4-1) [44]. Before sieving, samples
were divided and reduced in accordance with EN 932-2:1999 [45].

Methods
28
Figure 3-1: Schematic representation of EN 1097-6 from
the geotechnical laboratory at the Innovation Center
Iceland.
Figure 3-2: Saturated aggregate element (SSD) with total
volume equal to 1 [43]. Mass to the left and volume to the
right.
3.2 Parameters of Fresh Concrete
Traditional slump test is carried out, according to EN 12350-2:2000, using a mould known as
slump cone. The cone is placed on a hard surface and filled in three stages, each time tamped
using a rod. At the end of the third stage, concrete is struck off flush to the top of the mould.
The mould is carefully lifted and the concrete subsides. The subsidence is measured and the
measured value is known as slump value [46].
The slump test is suitable for concrete in “normal” workability ranges or for mixes that yield
slump value between 5 and 260 mm. It fails to determine the difference in very stiff mixes
and “wet” mixes or collapsing slumps [47]. Despite its shortcomings the slump test is
appropriate in the proper range and in “normal” circumstances e.g. conventional vibrated
concrete (CVC).
An alternative way of measuring slump is known as the slump flow test. It is preferable when
dealing with concrete mixes with collapsing slumps. The slump flow test is simply the
measurement of the diameter of the concrete after it has collapsed in conventional slump test
[48].
The slump test has been criticized since it fails to fully describe the rheological properties of
fresh concrete. The slump test, both the traditional slump test and the slump flow test, gives
only a single value, namely the slump value. Concrete with the same slump value can have
different rheological properties [49] and therefore it is not adequate when evaluating self-
compacting concrete (SCC).
As an alternative to the slump test is a measurement of the fundamental rheological properties
of concrete. Figure 3-3 shows a fluid element under shear stress ( ) and the deformation angle
( ). In fact it is the derivative with respect to time or rate of shear ( ) that is of interest. The
relationship between shear stress and rate of shear is dependent on the properties of the fluid
in question and is given by the eq. (3.4)

Methods
29
(3.4)
where , sometimes referred to as apparent viscosity, is a function of the rate of shear and
is dependant on fluid properties [50].
If the apparent viscosity is constant the fluid is said to be Newtonian fluid. Water is an
example of Newtonian fluid but concrete is an example of a non-Newtonian fluid.
Concrete can often be regarded as a Bingham fluid where the relationship between shear
stress and rate of shear can by described by eq. (3.5) and (3.6)
(3.5)
(3.6)
where is the yield value and the plastic viscosity [50].
If equations (3.4) and (3.5) are combined, the result is
(3.7)
This relationship can best be illustrated graphically, where shear stress is plotted as a function
of the rate of shear (see Figure 3-4). It can be seen that the plastic viscosity is the slope of the
straight line from equation (3.7) and the line intercept, if present, the material yield value.
Figure 3-3: Deformation of a fluid element [50].
Figure 3-4: Flow curve for Newtonian and Bingham fluids
[50].
The yield value can therefore be described as the shear stress that the material can resist
before it starts to flow. The plastic viscosity is on the other hand a property that describes the
materials resistance to increasing rate of shear.
Some measurements were done using a portable rheometer that gives the yield value as so
called G-yield value in amperes (A) and the plastic viscosity as H-plastic viscosity in ampere-
seconds (A·s). There is a fairly good correlation between the fundamental rheological
properties and G-yield value & H-plastic viscosity [51].

Methods
30
Determination of air and density for fresh concrete was carried out according to EN 12350-
7:2000. Air and density was measured using the same concrete sample, first weighing a
known volume for density then using air pressure to measure air content [52].
3.3 Parameters of Hardened Concrete
Determination of static modulus of elasticity in compression was carried out according to ISO
1920-10:2010. A basic stress of 0.5 MPa was applied to a test specimen and the stress was
steadily increased at a constant rate within the range 0.20 to 0.60 MPa/s until it was equal to
one-third of the cylinder strength. The modulus of elasticity was when calculated by dividing
the difference between the basic stress and the upper stress by the difference between the
corresponding strains [53]. The measurements were done on two moulded cylinder test
specimens, 150 mm in diameter and 300 mm in height.
Determination of creep of concrete in compression was carried out according to ASTM C512
/ C512M – 10. Strain measurements were done with a strain gauge that measures length
changes using 200 mm as a control length (see Figure 3-5). Figure 3-6 shows the equipment
setup but the spring was replaced by a jack and screw threads, adjusted regularly to maintain
constant force.
Figure 3-5: A strain gauge and equipments to measure
creep.
The strain gauge used to measure creep is old but
accurate equipment. To convert the readings to
millimetres it necessary to multiply by 0.156 (see
Appendix E).
Figure 3-6: Spring-loaded creep frame [3].

Methods
31
Concrete creep is proportional to stress as long as stress is within 0 to 40 % of concrete
compressive strength [3]. Accordingly the stresses need to be kept within these limits and
compensated for the loss of stress due to relaxation. In the experiments both and
were used as constant stress.
After 28 days of curing, load is applied and thenceforward the specimens are stored at
temperature of 23.0 ± 1.0 °C and relative humidity of 50 ± 4%. Environmental conditions as
well as load are monitored (see Figure 3-7). The specimen diameters are 150 ± 1.5 mm and
the length shall be at least 290 mm. Before strain readings, load is measured and adjusted if
the load varies more than 2 % from the correct value [3]. Strains readings on control
specimens, under no load and kept in the same conditions, are made to account for shrinkage.
Determination of compressive strength of test specimens was carried out according to EN
12390-3:2009. Specimens were tested with the constant rate of loading within the range 0.6 ±
0.2 MPa/s. The specimens need to show a satisfactory type of failure (see Figure 3-8). The
compressive strength is the maximum load at failure divided by the cross-sectional area of the
specimen on which the compressive force acts, calculated from the average of six diameter
measurements [54].
Figure 3-7: Screenshot of a program that logs
measurements.
Tonn means metric ton and the fluctuations in RH and
°C are due to exposure during measurements.
Figure 3-8: Satisfactory failure of cylinder specimen [54].

Methods
32
When determining the compressive strength, an average of three 100 x 200 mm cylinders was
used.5 When measuring the static modulus of elasticity, according to ISO 1920-10:2010, a test
was first carried out on a 100 x 200 mm cylinder to estimate compressive strength. E-modulus
was then measured using 150 x 300 mm cylinder and stress proportional to the ultimate
strength, based on the estimation. Finally the 150 x 300 mm cylinder was used to access the
compressive strength.
3.4 Deflection Calculations
Deflection calculations are based on the Euler-Bernoulli beam theory. The assumption is that
the cross section is perpendicular to the bending line. The alternative would be the
Timoshenko beam theory where rotation between the cross section and the bending is
allowed. This rotation is caused by shear force, which is not included in the Euler-Bernoulli
theory [57]. Euler-Bernoulli beam is therefore stiffer. However, if the ratio between length
and height is large enough the discrepancy between models is relatively small.
All deflection calculations are based on linear elastic assumption. Creep deformations are
allowed for by reduction in E-modulus, according to eq. (2.20).
Deflection calculations are based on service limit state (SLS) according to EN 1990 - Basis of
structural design [58] and actions are according to EN 1991 - Actions on structures [59].
Structural members which are expected to crack under loading, but may not be fully cracked,
will behave in a manner intermediate between the uncracked and fully cracked conditions. To
take an advantage of the stiffer sections where the members are uncracked, eq. (3.8) is used
(3.8)
where is the deformation parameter considered which may be, for example, a strain, a
curvature, or rotation. and are the values of the parameter calculated for uncracked and
fully cracked conditions [14]. is a distribution coefficient according to eq. (3.9) (see Figure
3-9)
(3.9)
where is a coefficient taking account of the influence of the duration of loading or of
repeated loading on the average strain (1,0 for a single short-term loading and 0,5 for
sustained loads or many cycles of repeated loading). is the stress in the tension
5 Note: According to EN 206-1:2000, the compressive strength of concrete is classified with respect to 150 x
300 mm cylinders [55]. It is the common practice at ICI to reduce the results from 100 x 200 mm cylinders by
5%. This is due to the tendency of smaller specimens showing greater strength. The 5% deduction has been
difficult to confirm but the previously described tendency can be verified here [56].

Methods
33
reinforcement calculated on the basis of a cracked section and is the stress in the tension
reinforcement calculated on the basis of a cracked section under the loading conditions
causing first cracking [14].6
Appendix B contains further derivation of equations, used in deflection calculations.
Figure 3-9: Stress behaviour in uncracked and cracked beam [60].
It is common practice to use the mean values of E-modulus and tensile strength as bases for
deflection calculations [60]. It is, however, the opinion of the author that basing calculations
on average tensile strength is not warranted. This is due to lack of case studies where tensile
strength of concrete with porous aggregate is compared with values from EC2. It is possible
that the tensile strength might by lower, when using porous aggregate, since it is strongly
dependant on the interfacial transition zone (see section 2.1). It is therefore considered
conservative to use the characteristic axial tensile strength ( (5% fractile) as flexural
strength.
The deflection calculations are for a roof slab on a residential house located in the Greater
Reykjavík Area. The house is above 100 m elevation and therefore it has higher characteristic
snow load than normal in Greater Reykjavík. The slab spans five meters and has additional
gravel on top of insulating layer.
6 Note: may be replaced by for flexure or for pure tension, where is the cracking
moment and is the cracking force [14].

Methods
34
See section 3.5, eq. (3.10), for evaluating creep coefficient based on different conditions for
drying creep.
3.5 Prestress Losses
The prestress force applied to prestressed concrete member continuously decreases during the
lifetime of the structure. Immediately after release of the strands, the initial prestress force
decreases due to the elastic shortening of the concrete. From then on, it continues to decrease
due to the combined effects of creep and shrinkage strains of the concrete and relaxation of
the steel [61].
The effects of using material parameters from EC2 instead of experimental results are shown
in a case study. Prestress force losses for a post tensioned highway bridge (see Figure 3-10)
are calculated using material parameters both form EC2 and experimental results (see
Appendix E for construction details).
Figure 3-10: Side view of the highway bridge.
The structure is common on Icelandic highways. It has a 40.0 m single-span, is 9.0 m wide
and located 30.0 m above sea level. The load on the bridge is based on EN 1991-2:2003:
Actions on structures - Part 2: Traffic loads on bridges [4] (see Figure 3-11). All calculations
are based on EC2 in conjunction with the INA and Reinforced Concrete Design: to Eurocode
2 by W.H. Mosley, J.H. Bungey and R. Hulse [5].
The experimental data is based on specimens exposed to 50% relative humidity and relatively
large surface exposed to drying (see section 3.3). The conditions for drying creep are
consequently different for the bridge deck, exposed to outdoor conditions, 80% relative
humidity, and relatively small surface exposed to drying. The described differences affect the
creep coefficient and need to be accounted for. Equation (3.10) is based on the assumption
that the relative difference between EC2 value for creep coefficient and creep coefficient from
experimental results is the same for both exposure conditions.
(3.10)
where is the measured creep coefficient for condition no. 1, is the measured creep
coefficient for condition no. 2, is the creep coefficient from EC2 for condition no. 1
and is the creep coefficient from EC2 for condition no. 2.

Methods
35
Figure 3-11: Load on bridge structure (cross-sectional view), the vectors R1, R2, R3 & R4 are the four bridge beams.
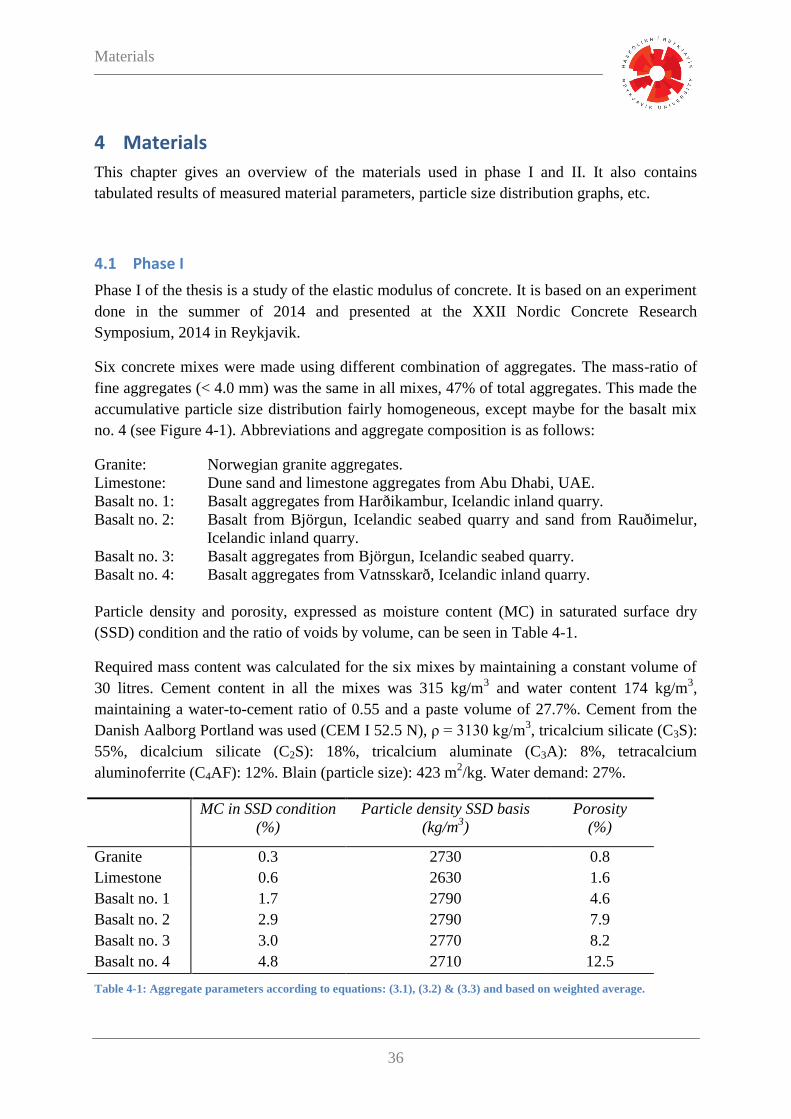
Materials
36
4 Materials
This chapter gives an overview of the materials used in phase I and II. It also contains
tabulated results of measured material parameters, particle size distribution graphs, etc.
4.1 Phase I
Phase I of the thesis is a study of the elastic modulus of concrete. It is based on an experiment
done in the summer of 2014 and presented at the XXII Nordic Concrete Research
Symposium, 2014 in Reykjavik.
Six concrete mixes were made using different combination of aggregates. The mass-ratio of
fine aggregates (< 4.0 mm) was the same in all mixes, 47% of total aggregates. This made the
accumulative particle size distribution fairly homogeneous, except maybe for the basalt mix
no. 4 (see Figure 4-1). Abbreviations and aggregate composition is as follows:
Granite: Norwegian granite aggregates.
Limestone: Dune sand and limestone aggregates from Abu Dhabi, UAE.
Basalt no. 1: Basalt aggregates from Harðikambur, Icelandic inland quarry.
Basalt no. 2: Basalt from Björgun, Icelandic seabed quarry and sand from Rauðimelur,
Icelandic inland quarry.
Basalt no. 3: Basalt aggregates from Björgun, Icelandic seabed quarry.
Basalt no. 4: Basalt aggregates from Vatnsskarð, Icelandic inland quarry.
Particle density and porosity, expressed as moisture content (MC) in saturated surface dry
(SSD) condition and the ratio of voids by volume, can be seen in Table 4-1.
Required mass content was calculated for the six mixes by maintaining a constant volume of
30 litres. Cement content in all the mixes was 315 kg/m3 and water content 174 kg/m
3,
maintaining a water-to-cement ratio of 0.55 and a paste volume of 27.7%. Cement from the
Danish Aalborg Portland was used (CEM I 52.5 N), ρ = 3130 kg/m3, tricalcium silicate (C3S):
55%, dicalcium silicate (C2S): 18%, tricalcium aluminate (C3A): 8%, tetracalcium
aluminoferrite (C4AF): 12%. Blain (particle size): 423 m2/kg. Water demand: 27%.
MC in SSD condition
(%)
Particle density SSD basis
(kg/m3)
Porosity
(%)
Granite 0.3 2730 0.8
Limestone 0.6 2630 1.6
Basalt no. 1 1.7 2790 4.6
Basalt no. 2 2.9 2790 7.9
Basalt no. 3 3.0 2770 8.2
Basalt no. 4 4.8 2710 12.5
Table 4-1: Aggregate parameters according to equations: (3.1), (3.2) & (3.3) and based on weighted average.
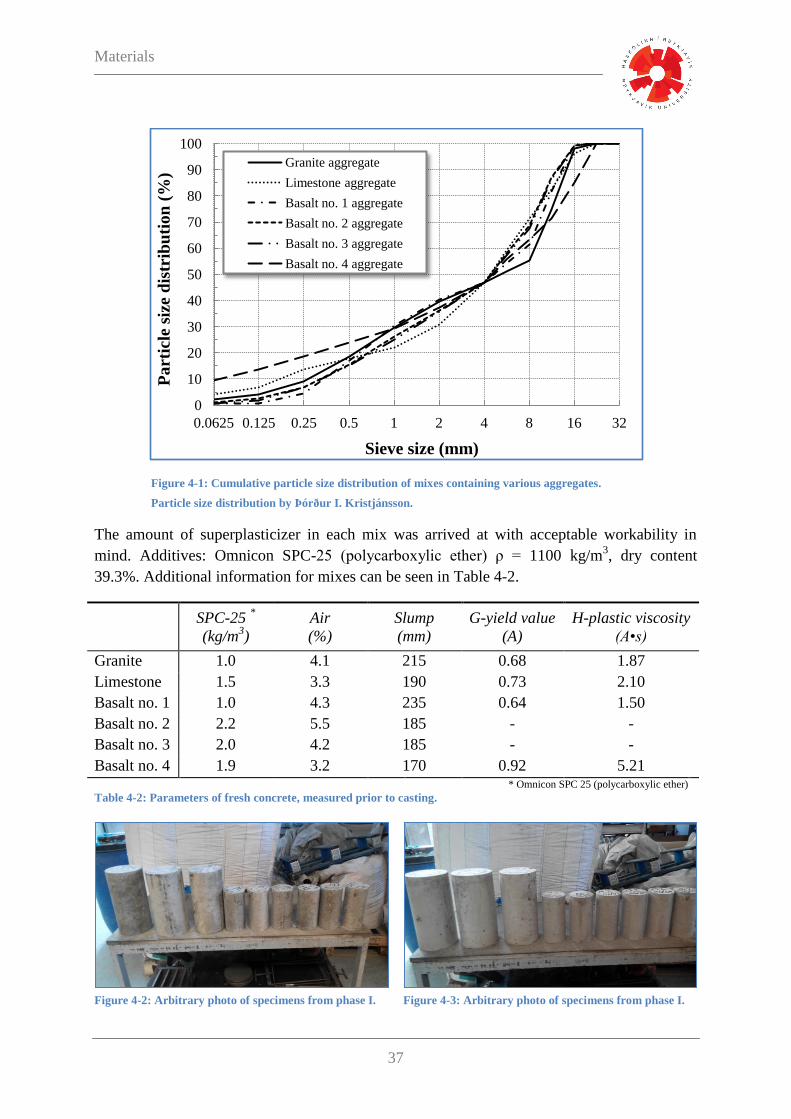
Materials
37
Figure 4-1: Cumulative particle size distribution of mixes containing various aggregates.
Particle size distribution by Þórður I. Kristjánsson.
The amount of superplasticizer in each mix was arrived at with acceptable workability in
mind. Additives: Omnicon SPC-25 (polycarboxylic ether) ρ = 1100 kg/m3, dry content
39.3%. Additional information for mixes can be seen in Table 4-2.
SPC-25 *
(kg/m3)
Air
(%)
Slump
(mm)
G-yield value
(A)
H-plastic viscosity
(A•s)
Granite 1.0 4.1 215 0.68 1.87
Limestone 1.5 3.3 190 0.73 2.10
Basalt no. 1 1.0 4.3 235 0.64 1.50
Basalt no. 2 2.2 5.5 185 - -
Basalt no. 3 2.0 4.2 185 - -
Basalt no. 4 1.9 3.2 170 0.92 5.21
* Omnicon SPC 25 (polycarboxylic ether)
Table 4-2: Parameters of fresh concrete, measured prior to casting.
Figure 4-2: Arbitrary photo of specimens from phase I.
Figure 4-3: Arbitrary photo of specimens from phase I.
0
10
20
30
40
50
60
70
80
90
100
0.0625 0.125 0.25 0.5 1 2 4 8 16 32
Pa
rtic
le s
ize
dis
trib
uti
on
(%
)
Sieve size (mm)
Granite aggregate
Limestone aggregate
Basalt no. 1 aggregate
Basalt no. 2 aggregate
Basalt no. 3 aggregate
Basalt no. 4 aggregate
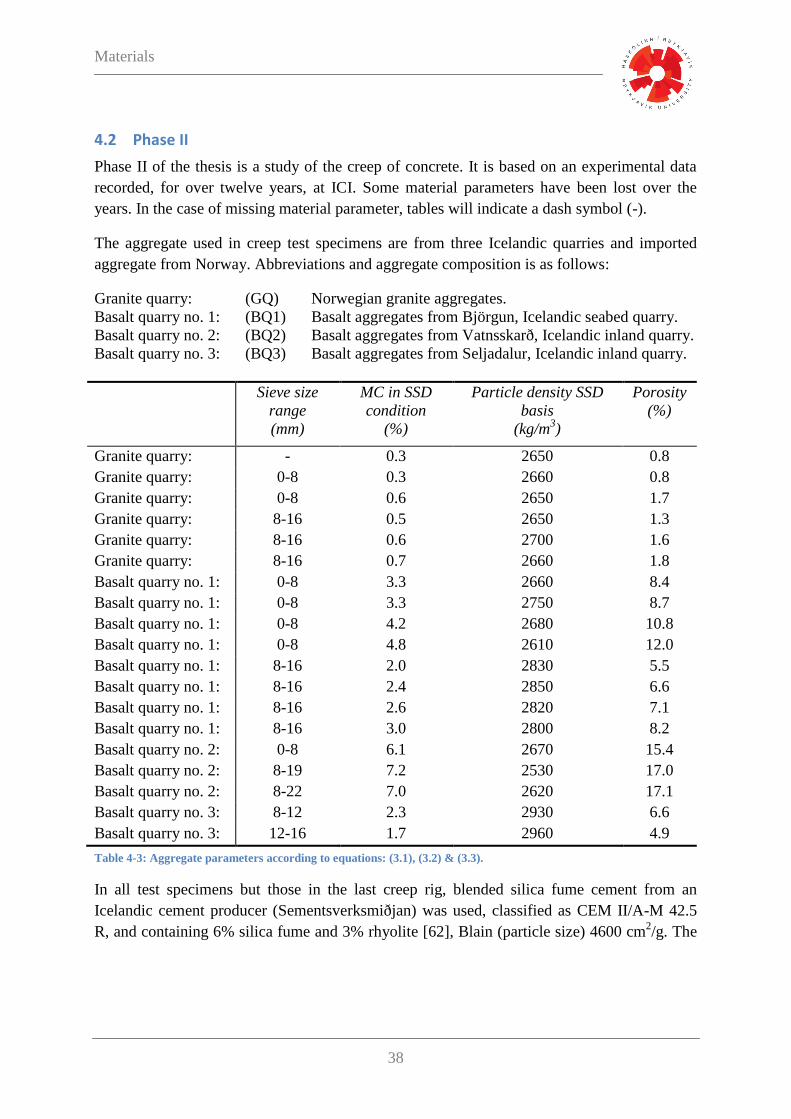
Materials
38
4.2 Phase II
Phase II of the thesis is a study of the creep of concrete. It is based on an experimental data
recorded, for over twelve years, at ICI. Some material parameters have been lost over the
years. In the case of missing material parameter, tables will indicate a dash symbol (-).
The aggregate used in creep test specimens are from three Icelandic quarries and imported
aggregate from Norway. Abbreviations and aggregate composition is as follows:
Granite quarry: (GQ) Norwegian granite aggregates.
Basalt quarry no. 1: (BQ1) Basalt aggregates from Björgun, Icelandic seabed quarry.
Basalt quarry no. 2: (BQ2) Basalt aggregates from Vatnsskarð, Icelandic inland quarry.
Basalt quarry no. 3: (BQ3) Basalt aggregates from Seljadalur, Icelandic inland quarry.
Sieve size
range
(mm)
MC in SSD
condition
(%)
Particle density SSD
basis
(kg/m3)
Porosity
(%)
Granite quarry: - 0.3 2650 0.8
Granite quarry: 0-8 0.3 2660 0.8
Granite quarry: 0-8 0.6 2650 1.7
Granite quarry: 8-16 0.5 2650 1.3
Granite quarry: 8-16 0.6 2700 1.6
Granite quarry: 8-16 0.7 2660 1.8
Basalt quarry no. 1: 0-8 3.3 2660 8.4
Basalt quarry no. 1: 0-8 3.3 2750 8.7
Basalt quarry no. 1: 0-8 4.2 2680 10.8
Basalt quarry no. 1: 0-8 4.8 2610 12.0
Basalt quarry no. 1: 8-16 2.0 2830 5.5
Basalt quarry no. 1: 8-16 2.4 2850 6.6
Basalt quarry no. 1: 8-16 2.6 2820 7.1
Basalt quarry no. 1: 8-16 3.0 2800 8.2
Basalt quarry no. 2: 0-8 6.1 2670 15.4
Basalt quarry no. 2: 8-19 7.2 2530 17.0
Basalt quarry no. 2: 8-22 7.0 2620 17.1
Basalt quarry no. 3: 8-12 2.3 2930 6.6
Basalt quarry no. 3: 12-16 1.7 2960 4.9
Table 4-3: Aggregate parameters according to equations: (3.1), (3.2) & (3.3).
In all test specimens but those in the last creep rig, blended silica fume cement from an
Icelandic cement producer (Sementsverksmiðjan) was used, classified as CEM II/A-M 42.5
R, and containing 6% silica fume and 3% rhyolite [62], Blain (particle size) 4600 cm2/g. The

Materials
39
test specimens in the last creep rig contains Danish Aalborg Portland cement (CEM I 52.5
N),7 6.7% silica fume was added to the EcoSCC mixes and 26.7% fly ash to the SCC mix.
Table 4-4 shows various measured fresh concrete properties for the test specimens in creep
rigs from 2002.
Creep
rig
Quarry Water-cement
(-)
Cement content
(kg/m3)
Air
(%)
Slump
(mm)
Density
(kg/m3)
Paste volume
(%)
CVC2
2002
BQ1 0.374 440 7.1 210 2270 31.0
BQ2 0.373 452 8.0 130 2230 31.8
BQ3 0.372 454 6.0 190 2370 31.9
CVC3
2002
BQ1 0.312 512 4.7 80 2410 33.0
BQ2 0.313 505 6.2 100 2270 32.5
BQ3 0.310 513 4.7 90 2440 32.9
CVC4
2002
BQ1 0.291 549 4.0 60 2470 34.2
BQ2 0.290 539 6.6 170 2310 33.5
BQ3 0.292 555 3.8 160 2520 34.7
Table 4-4: Various measured fresh concrete parameters for the specimens in the CVC creep rigs from 2002.
Table 4-5 shows various measured fresh concrete properties for the specimens in the CVC
creep rig from 2004. Measurements on test specimens in the SSC creep rig are not displayed,
since the available data is not considered reliable.
Creep
rig
Quarry Water-cement
(-)
Cement content
(kg/m3)
Air
(%)
Slump
(mm)
Density
(kg/m3)
Paste volume
(%)
CVC0
2004
GQ 0.380 440 8.4 190 2230 31.4
GQ 0.384 360 5.3 140 2330 25.7
BQ1 0.394 359 3.5 30 2430 26.0
Table 4-5: Various measured fresh concrete parameters for the specimens in the CVC creep rig from 2004.
Table 4-6 shows various measured fresh concrete properties for the specimens in the CVC
creep rig from 2009.
Creep
rig
Quarry Water-cement
(-)
Cement content
(kg/m3)
Air
(%)
Slump
(mm)
Density
(kg/m3)
Paste volume
(%)
CVC1
2009
BQ1 0.550 321 5.6 110 2350 28.1
BQ2 0.510 317 5.5 130 2300 26.4
GQ 0.550 322 4.9 150 2300 28.2
Table 4-6: Various measured fresh concrete parameters for the specimens in the CVC creep rig from 2009.
7 Note: Cement is classified according to EN 197-1:2000 where only two classes for early strength is used, i.e. N
and R [63]. This classification is not to be confused with EC2 where both CEM II/A-M 42.5R and CEM I 52.5N
are, according to article 3.1.2 (6), classified as R [14].
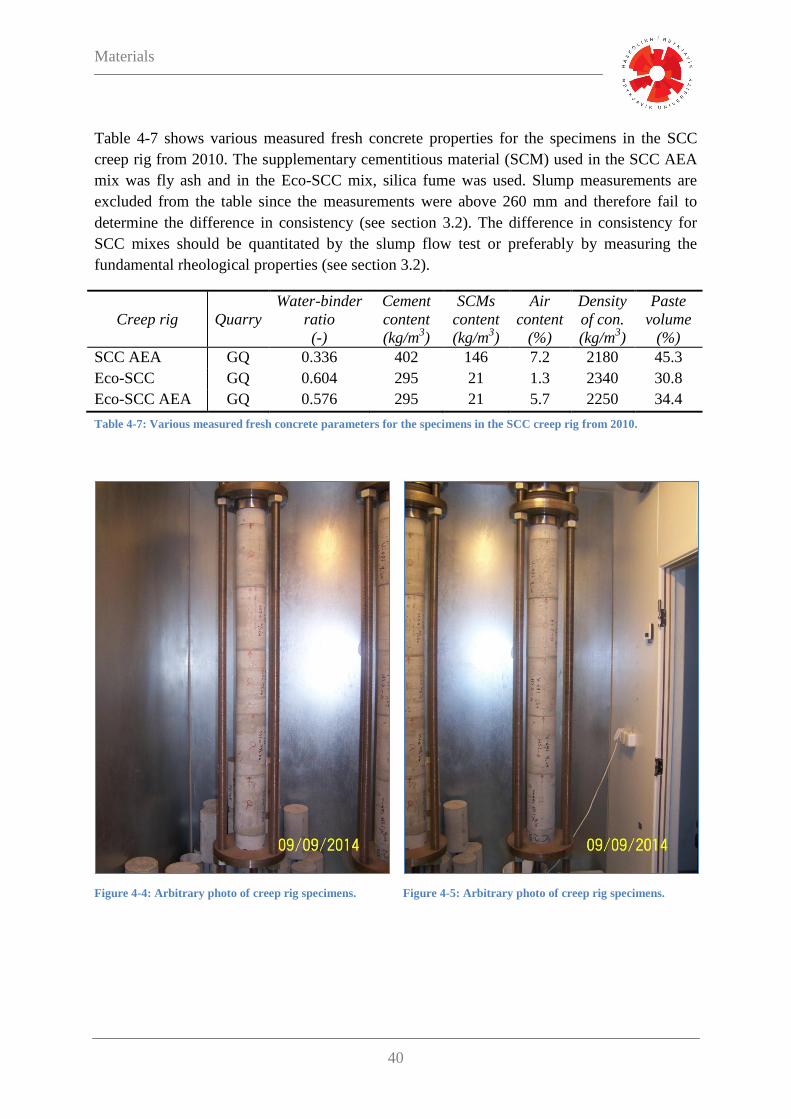
Materials
40
Table 4-7 shows various measured fresh concrete properties for the specimens in the SCC
creep rig from 2010. The supplementary cementitious material (SCM) used in the SCC AEA
mix was fly ash and in the Eco-SCC mix, silica fume was used. Slump measurements are
excluded from the table since the measurements were above 260 mm and therefore fail to
determine the difference in consistency (see section 3.2). The difference in consistency for
SCC mixes should be quantitated by the slump flow test or preferably by measuring the
fundamental rheological properties (see section 3.2).
Creep rig Quarry
Water-binder
ratio
(-)
Cement
content
(kg/m3)
SCMs
content
(kg/m3)
Air
content
(%)
Density
of con.
(kg/m3)
Paste
volume
(%)
SCC AEA GQ 0.336 402 146 7.2 2180 45.3
Eco-SCC GQ 0.604 295 21 1.3 2340 30.8
Eco-SCC AEA GQ 0.576 295 21 5.7 2250 34.4
Table 4-7: Various measured fresh concrete parameters for the specimens in the SCC creep rig from 2010.
Figure 4-4: Arbitrary photo of creep rig specimens.
Figure 4-5: Arbitrary photo of creep rig specimens.
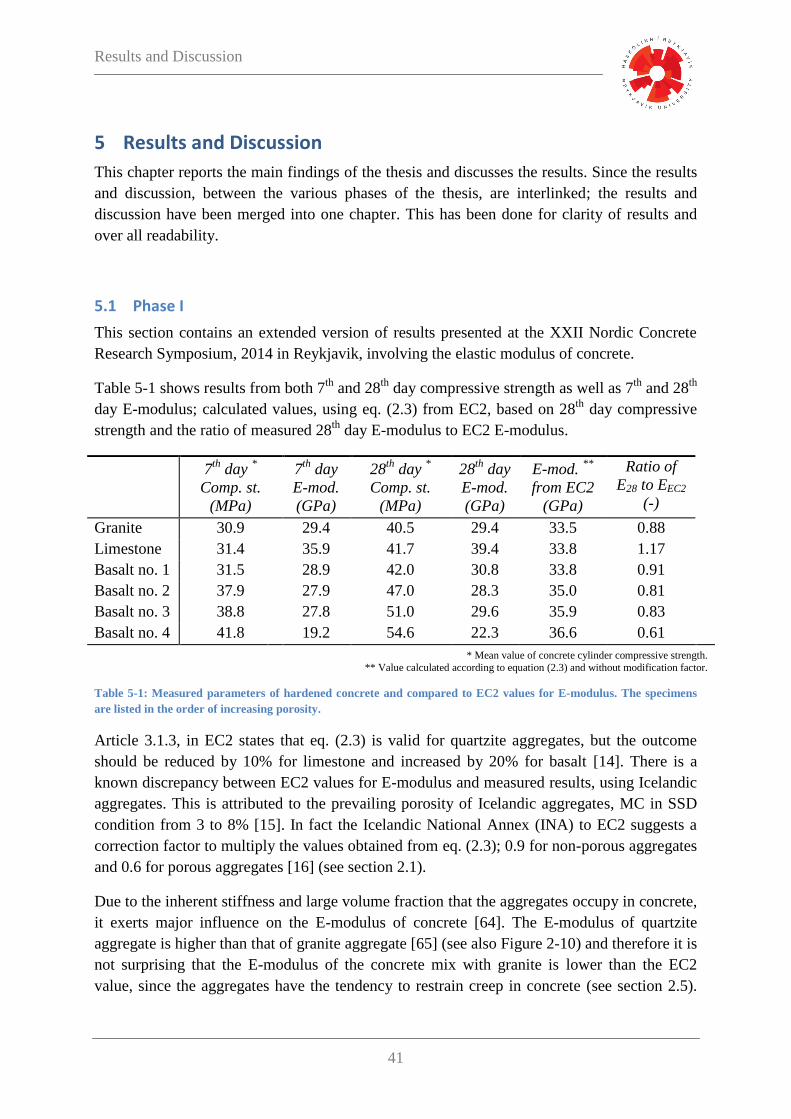
Results and Discussion
41
5 Results and Discussion
This chapter reports the main findings of the thesis and discusses the results. Since the results
and discussion, between the various phases of the thesis, are interlinked; the results and
discussion have been merged into one chapter. This has been done for clarity of results and
over all readability.
5.1 Phase I
This section contains an extended version of results presented at the XXII Nordic Concrete
Research Symposium, 2014 in Reykjavik, involving the elastic modulus of concrete.
Table 5-1 shows results from both 7th
and 28th
day compressive strength as well as 7th
and 28th
day E-modulus; calculated values, using eq. (2.3) from EC2, based on 28th
day compressive
strength and the ratio of measured 28th
day E-modulus to EC2 E-modulus.
7th
day *
Comp. st.
(MPa)
7th
day
E-mod.
(GPa)
28th
day *
Comp. st.
(MPa)
28th
day
E-mod.
(GPa)
E-mod. **
from EC2
(GPa)
Ratio of
E28 to EEC2
(-)
Granite 30.9 29.4 40.5 29.4 33.5 0.88
Limestone 31.4 35.9 41.7 39.4 33.8 1.17
Basalt no. 1 31.5 28.9 42.0 30.8 33.8 0.91
Basalt no. 2 37.9 27.9 47.0 28.3 35.0 0.81
Basalt no. 3 38.8 27.8 51.0 29.6 35.9 0.83
Basalt no. 4 41.8 19.2 54.6 22.3 36.6 0.61
* Mean value of concrete cylinder compressive strength.
** Value calculated according to equation (2.3) and without modification factor.
Table 5-1: Measured parameters of hardened concrete and compared to EC2 values for E-modulus. The specimens
are listed in the order of increasing porosity.
Article 3.1.3, in EC2 states that eq. (2.3) is valid for quartzite aggregates, but the outcome
should be reduced by 10% for limestone and increased by 20% for basalt [14]. There is a
known discrepancy between EC2 values for E-modulus and measured results, using Icelandic
aggregates. This is attributed to the prevailing porosity of Icelandic aggregates, MC in SSD
condition from 3 to 8% [15]. In fact the Icelandic National Annex (INA) to EC2 suggests a
correction factor to multiply the values obtained from eq. (2.3); 0.9 for non-porous aggregates
and 0.6 for porous aggregates [16] (see section 2.1).
Due to the inherent stiffness and large volume fraction that the aggregates occupy in concrete,
it exerts major influence on the E-modulus of concrete [64]. The E-modulus of quartzite
aggregate is higher than that of granite aggregate [65] (see also Figure 2-10) and therefore it is
not surprising that the E-modulus of the concrete mix with granite is lower than the EC2
value, since the aggregates have the tendency to restrain creep in concrete (see section 2.5).

Results and Discussion
42
This tendency can by validated in literature [64] but as for the precise value of 88% reduction
from EC2, it is more difficult to validate.
The result for the mix containing limestone aggregate, above the EC2 value, was unexpected,
especially since EC2 recommends 10% reduction. The codification society has however
seemed to realize their error by adding a clause into the new fib MC 10. Table 2-1, from fib
MC 10 final draft, recommends an aggregate coefficient for dense limestone, that increases
calculated values by 20%. The clause from fib MC 10 was unknown to the author prior to the
experiment.
Figure 5-1 shows the measured E-modulus plotted as a function of MC in SSD condition. If
the values obtained from granite and limestone aggregates (values with low MC) are ignored,
a fairly good linear correlation emerges between porosity and E-modulus.
Figure 5-1: E-modulus of concrete as a function of aggregate porosity and MC in SSD condition.
The measured results, for basalt 1-4, agree fairly with the EC2 model if the correction factors
from INA are used. It is however interesting to exclude the granite and limestone aggregates
and plot the E-modulus of concrete, with basalt aggregates, as a function of aggregate
porosity (see Figure 5-2).
It is not good practice to extrapolate a fitted line outside the range of data, since the linear
relationship may not hold there [66]. But with the given statistical reservation, it is however
interesting to predict the E-modulus for higher aggregate porosity. The MC in SSD condition
for Icelandic aggregate can be as high as 8% [15]. By using the linear regression (arrived at in
0.0 2.0 4.0 6.0 8.0 10.0 12.0
10
20
30
40
50
0.0 1.0 2.0 3.0 4.0 5.0
E-m
od
ulu
s [G
Pa]
Weighted Moisture Content (SSD) [%]
Weighted Porosity [%]
7th day E-modulus
28th day E-modulus

Results and Discussion
43
Figure 5-2), the equation predicts the E-modulus of basalt with MC of 8% at SDD condition
to 14.4 GPa. This value is likely to be outside the reduction suggested by INA.
Measuring the E-modulus of concrete is a rather simple task for concrete manufacturers,
especially since it can be done using the same specimens as for the compressive strength test.
It is the author’s opinion, that basing the E-modulus of concrete on a single parameter such as
the compressive strength is not acceptable. The E-modulus of concrete is a vital parameter in
design and should be listed by the manufacturer, just as the characteristic compressive
strength.
Figure 5-2: E-modulus of concrete, samples containing basalt aggregates, as a function of aggregate porosity and MC
in SSD condition.
Another observation that can be made from table 5-1 is the compressive strength. Figure 5-3
shows the mean value of concrete cylinder compressive strength, with basalt aggregates, as a
function of aggregate porosity and MC in SSD condition. It shows a fairly good correlation
between porosity and compressive strength, where the compressive strength increases with
increased porosity. This is likely due to the failure mechanism of concrete, where the cement
paste-aggregate bond plays a major part. Aggregate surface texture is one of the most
important factors affecting bond strength; rough surfaces usually offer better bond than sawn
surfaces [67].
y = -2.7x + 36
R² = 0.91
4.0 6.0 8.0 10.0 12.0
15
20
25
30
35
1.5 2.0 2.5 3.0 3.5 4.0 4.5 5.0
E-m
od
ulu
s [G
Pa]
Weighted Moisture Content (SSD) [%]
Weighted Porosity [%]
7th day E-modulus
28th day E-modulus
Simple linear regression
(28th day E-mod.)

Results and Discussion
44
Figure 5-3: Mean value of concrete cylinder compressive strength, with basalt aggregates, as a function of aggregate
porosity and MC in SSD condition.
5.2 Phase II
5.2.1 Elastic Modulus
In order to fully elucidate the test data on creep strain, it is first necessary to evaluate the E-
modulus for various mixes. Table 5-2 shows the 28th
day E-modulus obtained from strain
readings in creep rigs (see Figure 4-4 & Figure 4-5), immediately after loading and by using
eq. (2.1). Although the E-modulus is not obtained by standardized method, as in phase I, it is
never the less reasonably obtained data.
Columns five and six in table 5-2 contain values obtained with eq. (2.3) from EC2 and eq.
(2.7) from fib MC 10. The difference between the values from the two equations is from 1 to
11%.
Column seven in table 5-2 contains the ratio of the measured E-modulus by the E-modulus
obtained with eq. (2.3) from EC2. This is in fact the necessary correction factor to obtain the
correct value, using the equation from EC2. The Icelandic National Annex (INA) to EC2
suggests a correction factor to multiply the values obtained from eq. (2.3); 0.9 for non-porous
aggregates and 0.6 for porous aggregates [16] (see section 2.1). The measured E-modulus for
four mixes (highlighted values) is lower than the values obtained through the correction factor
recommended by the INA.
y = 3.9x + 37
R² = 0.89
4.0 6.0 8.0 10.0 12.0
20
30
40
50
60
1.5 2.0 2.5 3.0 3.5 4.0 4.5 5.0
Com
pre
ssiv
e st
ren
gth
[M
Pa]
Weighted Moisture Content (SSD) [%]
Weighted Porosity [%]
7th day Compressive
strength 28th day Compressive
strength Simple linear regression
(28th day)

Results and Discussion
45
The ratio of the measured E-modulus by the calculated E-modulus in the SCC specimens is
somewhat lower than in other granite specimens (see row 1, column 6 in Table 5-1 and row
12, column 6 in Table 5-2). There are several possible reasons for this. The paste volume is
higher in the SCC specimens containing AEA (air entraining admixture) and from equation
(2.2) it is evident that the volume percent of each concrete component affects the E-modulus.
The ratio of fine aggregate to total aggregate by mass is a possible factor. The Eco-SCC
specimens contain fine basalt filler and thus increasing the total aggregate surface. The
volume of the transition zone (TZ) is related to the total aggregate surface or the interface
surface [10] and the TZ influences the elastic properties of concrete (see section 2.1). The
water-to-cement or water-to-binder ratio can be a factor in the Eco-SCC specimens but it
affects the E-modulus of concrete (see section 2.2 and Figure 2-5).
The tendency, encountered in from table 5-1, where the compressive strength increases with
increased porosity (see Figure 5-2) does not hold for table 5-2. The relationship seems only to
be relevant for mixes with the lower characteristic compressive strength (fck). This is likely
due to the higher cement content in the stronger mixes.
Aggregate
Quarry
fck
= fcm - 8
(MPa)
28th
day
E-mod.
(GPa)
E-mod. *
from MC10
(GPa)
E-mod. *
from EC2
(GPa)
Ratio of
E28 to EEC2
(-)
CVC2
2002
BQ1 51.3 27.3 36.4 37.5 0.73
BQ2 54.4 17.9 37.3 38.1 0.47
BQ3 48.4 28.3 35.5 37.0 0.76
CVC3
2002
BQ1 69.5 34.1 41.5 40.7 0.84
BQ2 62.4 19.9 39.6 39.5 0.50
BQ3 68.0 32.9 41.1 40.4 0.81
CVC4
2002
BQ1 68.9 37.4 41.4 40.6 0.92
BQ2 65.5 22.4 40.4 40.0 0.56
BQ3 83.4 37.9 45.0 42.7 0.89
CVC1
2009
BQ1 26.1 22.6 28.4 31.8 0.71
BQ2 30.4 18.2 29.9 32.9 0.55
GQ 28.0 26.4 29.1 32.3 0.82
SCC AEA GQ 49.6 24.7 35.9 37.2 0.66
Eco-SCC GQ 50.0 26.0 36.0 37.3 0.70
Eco-SCC AEA GQ 40.4 27.3 33.1 35.3 0.77
* Values calculated according to eq. (2.3) & (2.7) and without modification factor.
Table 5-2: Evaluated E-modulus values and comparison to fib MC 10 and EC2 models.

Results and Discussion
46
5.2.2 Experimental Results of Creep
Experimental results from creep data is best illustrated graphically. The creep compliance
from eq. (2.23) can be plotted as a function of time. Note that, the creep compliance is often
incorrectly referred to as specific creep. Specific creep is the creep strain divided by the
constant stress, excluding the elastic strain. Or as a continuation from eq. (2.23), the creep
compliance can be written as eq. (5.1)
(5.1)
where is the specific creep [68] [69].
Figure 5-4 shows the creep compliance for a creep rig, known as CVC1 from 2009. All the
specimens have characteristic compressive strength of about 25 MPa, similar fresh concrete
parameters (see Table 4-6) and contain three different aggregates. The BQ1 specimens have a
weighted average MC of 3.7% in SSD condition, the BQ2 specimens 6.4% and the GQ
specimens 0.45%. In the beginning the BQ1 specimens deform less than the BQ2 specimens
but then gradually exceed the BQ2 specimens. The GQ specimens deform much less than the
BQ specimens.
The fact that the less porous BQ1 aggregate specimens deform more than the BQ2 specimens
is contrary to the established theories. Section 2.6 describes the physical mechanism of
concrete creep. The creep strain for aggregates is considered equal to zero. Since aggregates
do not creep they will restrain deformations. Figure 2-10 shows the restraining action of
aggregates, stiffer aggregates yield less creep.
The question remains, are porous aggregate stiffer then less porous aggregate. The elastic
properties of porous materials can be described by the empirical relationship of Phani and
Niyogi or eq. (5.2) [70]
(5.2)
where is the elastic modulus of porous material with porosity , is the elastic modulus of
solid material, is the porosity at which the elastic modulus becomes zero and is a
parameter dependent on the grain morphology and pore geometry of porous material. The
value of is a positive number and since the outcome inside the bracket is less than one,
elastic modulus decreases with increasing porosity.
All the specimens are still deforming after five years.

Results and Discussion
47
Figure 5-4: Creep compliance for the CVC1 specimens from 2009, comprising three different mixes (BQ1, BQ2
and GQ).
Figure 5-5 excludes the elastic strain and shows that the difference between the BQ1 and BQ2
specimens is increasing. The physical mechanism of this behaviour cannot be verified in
literature and a proper hypothesis is difficult to establish.
In a monograph by Guðni Jónsson, publish by the Icelandic Building Research Institute, a
result bearing similarity is shown [15]. Creep specimens, containing C25/30 concrete with
both porous and non-porous aggregate, were tested for a year. The result shows the same
specific creep independent of aggregate porosity. This was however, only true for C25/30
concrete specimens, not for C35/45; C50/60 and C70/85.
Figure 5-6 shows the creep compliance for one of the oldest creep rigs, known as CVC2 from
2002. All the specimens have characteristic compressive strength of about 50 MPa, similar
fresh concrete properties (see Table 4-4) and contain three different aggregates. The BQ1
specimens have a weighted average MC of 3.5% in SSD condition, the BQ2 specimens have
6.2% and the BQ3 specimens have 3.4%. There is almost no difference in creep compliance
between the BQ1 and BQ3 specimens but the BQ2 specimens deform more.
Figure 5-6 also shows that the specimens are still deforming after twelve years. This is
congruent with literature, where it has been shown that concrete is still deforming after thirty
years [23].
0 1 2 3 4 5 60
50
100
150
200
250Creep compliance as a function of time
Time since application of load (years)
Cre
ep c
om
plia
nce (
10
-6 /
MP
a)
Basalt quarry no. 1
Basalt quarry no. 2
Granite quarry

Results and Discussion
48
Figure 5-5: Specific creep for the CVC1 specimens from 2009, comprising three mixes (BQ1, BQ2 and GQ).
Figure 5-6: Creep compliance for the CVC2 specimens from 2002, comprising three different mixes (BQ1,
BQ2 and BQ3).
0 1 2 3 4 5 60
50
100
150
200
250Specific creep as a function of time
Time since application of load (years)
Specific
cre
ep (
10
-6 /
MP
a)
Basalt quarry no. 1
Basalt quarry no. 2
Granite quarry
0 2 4 6 8 10 12 140
20
40
60
80
100
120
140
160
180Creep compliance as a function of time
Time since application of load (years)
Cre
ep c
om
plia
nce (
10
-6 /
MP
a)
Basalt quarry no. 1
Basalt quarry no. 2
Basalt quarry no. 3

Results and Discussion
49
Table 5-2 shows that the BQ2 specimens have much lower E-modulus than the BQ1 & BQ3
specimens. If the specific creep is plotted, excluding the elastic strain, interesting results
emerge (see Figure 5-7). The BQ2 specimens, containing aggregate with higher porosity,
deform less than the BQ1 & BQ3 specimens. These results bear similarity to earlier tendency
(see Figure 5-5).
Figure 5-7: Specific creep for the CVC2 specimens from 2002, comprising three different mixes (BQ1, BQ2 and
BQ3).
Figure 5-8 shows the creep compliance for creep rig, known as CVC3, from 2002. The
specimens have characteristic compressive strength ranging from 62.4 to 69.5 MPa (see Table
5-2), similar fresh concrete properties (see Table 4-4) and contain three different aggregates.
The BQ1 specimens have a weighted average MC of 3.5% in SSD condition, the BQ2
specimens 6.2% and the BQ3 specimens 3.4%. There is little difference in creep compliance
between the BQ1 and BQ3 specimens but the BQ2 specimens deform more.
Figure 5-9 shows higher specific creep for the BQ2 specimens than BQ1 and BQ3. These
results are in agreement with literature, where stiffer aggregate restrain deformations (see
section 2.6).
0 2 4 6 8 10 12 140
20
40
60
80
100
120
140
160
180Specific creep as a function of time
Time since application of load (years)
Specific
cre
ep (
10
-6 /
MP
a)
Basalt quarry no. 1
Basalt quarry no. 2
Basalt quarry no. 3
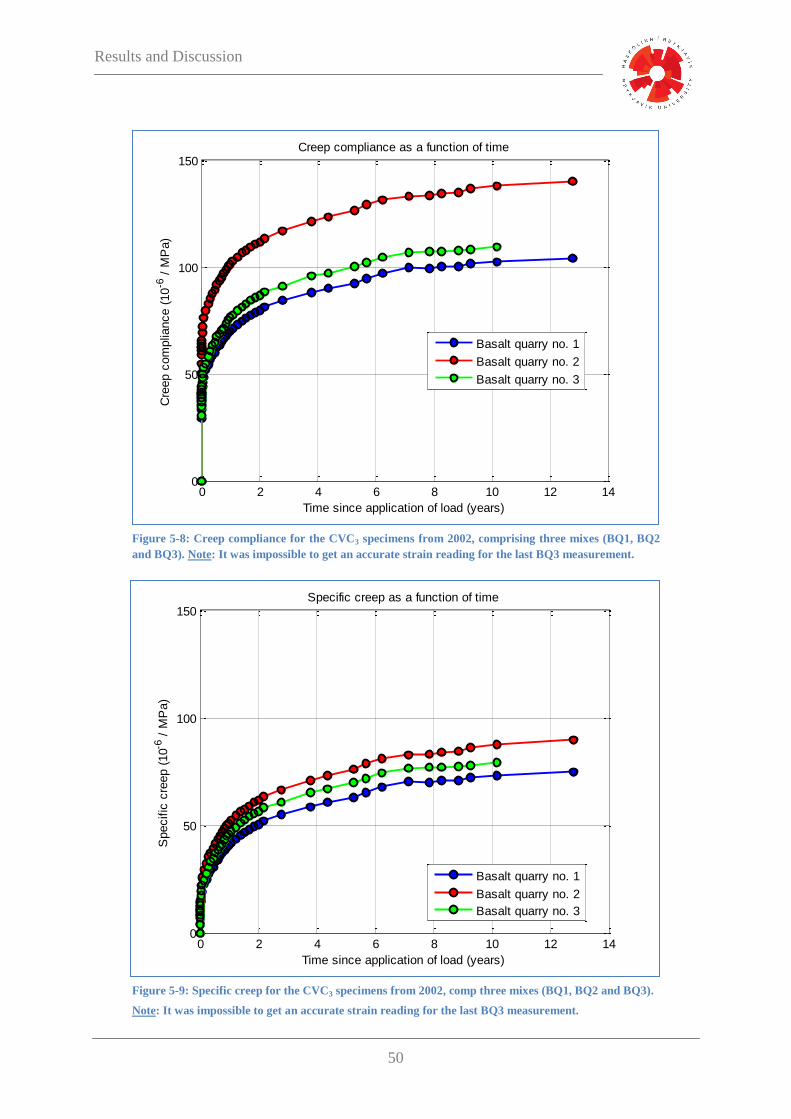
Results and Discussion
50
Figure 5-8: Creep compliance for the CVC3 specimens from 2002, comprising three mixes (BQ1, BQ2
and BQ3). Note: It was impossible to get an accurate strain reading for the last BQ3 measurement.
Figure 5-9: Specific creep for the CVC3 specimens from 2002, comp three mixes (BQ1, BQ2 and BQ3).
Note: It was impossible to get an accurate strain reading for the last BQ3 measurement.
0 2 4 6 8 10 12 140
50
100
150Creep compliance as a function of time
Time since application of load (years)
Cre
ep c
om
plia
nce (
10
-6 /
MP
a)
Basalt quarry no. 1
Basalt quarry no. 2
Basalt quarry no. 3
0 2 4 6 8 10 12 140
50
100
150Specific creep as a function of time
Time since application of load (years)
Specific
cre
ep (
10
-6 /
MP
a)
Basalt quarry no. 1
Basalt quarry no. 2
Basalt quarry no. 3

Results and Discussion
51
Figure 5-10: Creep compliance for the CVC4 specimens from 2002, comprising three different mixes (BQ1,
BQ2 and BQ3).
Figure 5-10 shows the creep compliance for one of the oldest creep rigs, known as CVC4
from 2002. The specimens have characteristic compressive strength ranging from 65.5 to 83.4
MPa (see Table 5-2), similar fresh concrete properties (see Table 4-4) and contain three
different aggregates. The BQ1 specimens have a weighted average MC of 2.7% in SSD
condition, the BQ2 specimens 5.5% and the BQ3 specimens 2.7%. There is little difference in
creep compliance between the BQ1 and BQ3 specimens but the BQ2 specimens deform much
more.
0 2 4 6 8 10 12 140
20
40
60
80
100
120Creep compliance as a function of time
Time since application of load (years)
Cre
ep c
om
plia
nce (
10
-6 /
MP
a)
Basalt quarry no. 1
Basalt quarry no. 2
Basalt quarry no. 3

Results and Discussion
52
Figure 5-11: Specific creep for the CVC4 specimens from 2002, comprising three different mixes (BQ1, BQ2
and BQ3).
Figure 5-11 shows higher specific creep for the BQ2 specimens than BQ1 and BQ3 and is
therefore also in agreement with literature. The difference in specific creep seems to be
dependent on concrete strength, i.e. cement content and water-cement ratio. It has been
difficult to formulate a proper hypothesis for these findings and it must be a subject of further
research.
It should be noted that the main difference between BQ1 and BQ3 aggregates is its shape. The
BQ1 aggregate is rounded from seabed quarry and BQ3 is crushed aggregate from inland
quarry. The aggregate shape appears to have little effect on the specific creep (see Figure 5-7,
Figure 5-9 and Figure 5-11).
Figure 5-12 shows the specific creep for different strength classes all comprised of BQ1
aggregate and Figure 5-13 shows the specific creep for the same strength classes all
comprised of BQ2 aggregate. The graphs show that specific creep is dependent on the
compressive strength of concrete. These results are not surprising since it is the water-cement
ratio that mainly governs the compressive strength of concrete by influencing the amount of
capillary pores. The water-cement ratio then affects the creep of concrete, but the origin of
creep is considered to be caused by the movement of water between gel pores and capillary
pores [15], [24] (see section 2.6).
0 2 4 6 8 10 12 140
20
40
60
80
100
120Specific creep as a function of time
Time since application of load (years)
Specific
cre
ep (
10
-6 /
MP
a)
Basalt quarry no. 1
Basalt quarry no. 2
Basalt quarry no. 3

Results and Discussion
53
Figure 5-12: Specific creep for CVC2, CVC3 and CVC4 specimens from 2002, all the specimens are
comprised of BQ1 aggregates.
Figure 5-13: Specific creep for CVC2, CVC3 and CVC4 specimens from 2002, all the specimens are
comprised of BQ2 aggregates.
0 2 4 6 8 10 12 140
20
40
60
80
100
120Specific creep as a function of time
Time since application of load (years)
Specific
cre
ep (
10
-6 /
MP
a)
CVC2 from 2002
CVC3 from 2002
CVC4 from 2002
0 2 4 6 8 10 12 140
20
40
60
80
100
120Specific creep as a function of time
Time since application of load (years)
Specific
cre
ep (
10
-6 /
MP
a)
CVC2 from 2002
CVC3 from 2002
CVC4 from 2002

Results and Discussion
54
Figure 5-14 shows the specific creep for SCC specimens from 2010. All the specimens
contain granite aggregate and have characteristic compressive strength from 40.4 to 50.0 MPa
(Table 5-2). Table 4-7 shows the differences between the three mixes but in general they are:
SCC rich in cement and supplementary cementitious materials (SCMs) using air entraining
admixture (AEA). Two mixes named Eco-SCC, contain less cement and SCMs, one with and
the other without AEA.
The experimental data shows that, in spite of less cement content, the Eco-SCC creeps more.
This is likely due to the higher water-binder ratio in the Eco-SCC mixes. This result can be
supported by literature (see section 2.6) but the origin of creep is generally considered to be
caused by the movement of water between gel pores and capillary pores [15], [24].
The addition of AEA seems to have limited effect on Eco-SCC mixes, with respect to creep.
There is no consensus in literature on the effect of AEA on creep, although some literature
may suggest an increase in creep when adding AEA [15], [71]. Air void represent aggregate
with zero E-modulus so that the resistance to creep deformation should be less in air entrained
concrete. AEA generally improves the workability of concrete and allows the use of lower
water-cement ratio, but creep decreases with lower water-cement ratio [23]. For practical
conditions air entrainment is not considered an important factor in creep [21].
Figure 5-14: Specific creep for SCC specimens from 2010, comprising three granite specimens (SCC AEA,
Eco-SCC and Eco-SCC AEA).
0 1 2 3 4 5 60
10
20
30
40
50
60
70
80Specific creep as a function of time
Time since application of load (years)
Specific
cre
ep (
10
-6 /
MP
a)
SCC AEA
Eco-SCC
Eco-SCC AEA

Results and Discussion
55
Figure 5-15: Creep compliance for specimens from 2004, comprising two granite mixes with paste volume of
31.4 and 27.7%.
Although some parameters concerning the specimens from 2004 are lost, at least some test
data can be used. Figure 5-15 shows the creep compliance for two granite mixes with paste
volume of 31.4 and 27.7%. The specimens with 31.4% paste volume have 440 kg/m3 cement
content and 8.4% air but the 25.7% paste volume specimens have 360 kg/m3 cement content
and 5.3% air. In both mixes the water to cement ratio and aggregate composition is the same.
The E-modulus for the specimens with 31.4% paste volume is 24.8 GPa and 29.4 GPa for the
25.7% paste volume specimens. This finding is in agreement with literature (see section 2.1),
where the volume percentage of hydrated cement is replaced with the stiffer aggregate, thus
increasing the E-modulus. The higher air content in the specimens with 31.4% paste volume
is also a possible factor, since addition of air decreases the compressive strength and
consequently the E-modulus.
0 2 4 6 8 10 12 140
50
100
150Creep compliance as a function of time
Time since application of load (years)
Cre
ep c
om
plia
nce (
10
-6 /
MP
a)
Paste volume 31.4%
Paste volume 25.7%

Results and Discussion
56
Figure 5-16: Specific creep for specimens from 2004, comprising two granite mixes with paste volume of 31.4
and 27.7%.
Figure 5-16 shows the specific creep for the two granite mixes from 2004. The specimens
containing 31.4% paste volume creeps significantly more than the 25.7% paste volume
specimens. It is difficult to identify a single cause for the increased creep, it might have been
affected by air or cement content. The difference in specific creep is however so great
(36.9·10-6
/ MPa) that both these factors are likely the cause for higher creep-strain.
0 2 4 6 8 10 12 140
50
100
150Specific creep as a function of time
Time since application of load (years)
Specific
cre
ep (
10
-6 /
MP
a)
Paste volume 31.4%
Paste volume 25.7%

Results and Discussion
57
Figure 5-17: Effect of mineralogical character of aggregates on creep, CVC1 specimens from 2009 and BQ1
containing GQ aggregate.
Figure 5-17 shows the stress-dependent strain for specimens from 2009, in logarithmic scale.
All the specimens have characteristic compressive strength of about 25 MPa, similar fresh
concrete properties (see Table 4-6) but contain aggregates from two quarries. The BQ1
specimens have a weighted average MC of 3.7% in SSD condition and the GQ specimens
0.45%. The results confirm the effect of mineralogical characteristics of aggregates upon
creep; from section 2.8 (see Figure 2-16). The rate of creep for concrete containing basalt
aggregates exceeds the concrete containing granite after a few months.
400
600
800
1000
1200
1400
1600
1800
2000
2200
2400Stress-dependent strain as a function of time
Time since application of load (Log Scale)
Str
ess-d
ependent
str
ain
, m
illio
nth
s
Basalt quarry no. 1
Granite quarry
4 days 36 days 1 yr 10 yr

Results and Discussion
58
5.2.3 Comparison between Models and Test Data
In order to best compare test data on creep strain to mathematical models, all the model
parameters need to be unambiguous. This is not the case when using the EC2 model in
conjunction with the corresponding INA. The INA to EC2 suggests two reduction factors for
E-modulus, based on aggregate porosity, but gives no guidance for which porosity range each
reduction factor belongs to. Due to this ambiguity, the comparison between models and
experimental results will be based on creep coefficient and thus excluding the E-modulus as a
model parameter.
Figure 5-18 shows experimental development of creep coefficient for CVC1 and aggregate
from BQ1 in comparison with four mathematical creep models. Early on EC2; fib MC 10 and
Model B3 overestimate the creep development but as time passes the data vastly overtake the
models.
Figure 5-18: Measured creep coefficient for the CVC1 specimens from 2009, comprising BQ1 aggregate and
comparison to four creep models.
Figure 5-19 shows experimental development of creep coefficient for CVC1 and aggregate
from BQ2 in comparison with four mathematical creep models. The difference between
experimental results and models is not as much as shown using BQ1 aggregate. The smaller
difference is both due to less creep development in the BQ2 specimens as well as larger
characteristic compressive strength that affect the models. Note: The rate of creep in the
experimental results appears constant while the creep rate in the models seems to be levelling
out.
0 1 2 3 4 5 60
0.5
1
1.5
2
2.5
3
3.5
4Creep coefficient as a function of time
Time since application of load (years)
Cre
ep c
oeff
icie
nt
Basalt quarry no. 1
EC2 modelling
fib MC 10
Model B3
ACI modelling

Results and Discussion
59
Figure 5-19: Measured creep coefficient for the CVC1 specimens from 2009, comprising BQ2 aggregate and
comparison to four creep models.
Figure 5-20 shows experimental development of creep coefficient for CVC1 and GQ
aggregate in comparison with four mathematical creep models. The EC2 and Model B3
overestimate the creep development, ACI model underestimates creep development and fib
model code best describes the creep development.
When comparing Figure 5-19 and Figure 5-20 the creep coefficient, after little over 5 years, is
almost the same for concrete containing different aggregate. It should be noted that the
specific creep is the creep coefficient divided by the E-modulus, see eq. (5.1). Since the E-
modulus for the concrete with GQ aggregate is higher than concrete with BQ2 aggregate, the
specific creep for concrete with GQ aggregate is lower.
Figure 5-21 shows experimental development of creep coefficient for CVC2 and aggregate
from BQ1 in comparison with four mathematical creep models. The difference between
experimental results and EC2 and fib MC 10 models is sizeable but not as much compared to
Model B3 and ACI modelling.
0 1 2 3 4 5 60
0.5
1
1.5
2
2.5
3
3.5
4Creep coefficient as a function of time
Time since application of load (years)
Cre
ep c
oeff
icie
nt
Basalt quarry no. 2
EC2 modelling
fib MC 10
Model B3
ACI modelling

Results and Discussion
60
Figure 5-20: Measured creep coefficient for the CVC1 specimens from 2009, comprising GQ aggregate and
comparison to four creep models.
Figure 5-21: Measured creep coefficient for the CVC2 specimens from 2002, comprising BQ1 aggregate
and comparison to four creep models.
0 1 2 3 4 5 60
0.5
1
1.5
2
2.5
3
3.5
4Creep coefficient as a function of time
Time since application of load (years)
Cre
ep c
oeff
icie
nt
Granite quarry
EC2 modelling
fib MC 10
Model B3
ACI modelling
0 2 4 6 8 10 12 140
0.5
1
1.5
2
2.5
3
3.5
4Creep coefficient as a function of time
Time since application of load (years)
Cre
ep c
oeff
icie
nt
Basalt quarry no. 1
EC2 modelling
fib MC 10
Model B3
ACI modelling
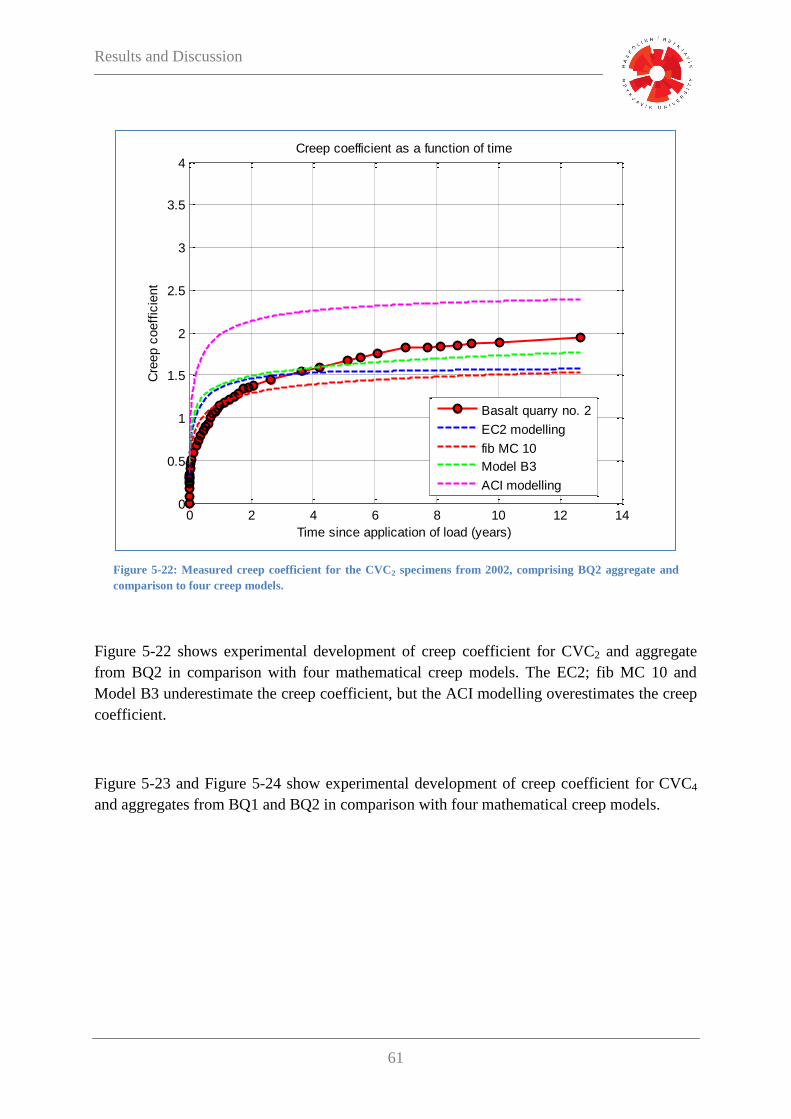
Results and Discussion
61
Figure 5-22: Measured creep coefficient for the CVC2 specimens from 2002, comprising BQ2 aggregate and
comparison to four creep models.
Figure 5-22 shows experimental development of creep coefficient for CVC2 and aggregate
from BQ2 in comparison with four mathematical creep models. The EC2; fib MC 10 and
Model B3 underestimate the creep coefficient, but the ACI modelling overestimates the creep
coefficient.
Figure 5-23 and Figure 5-24 show experimental development of creep coefficient for CVC4
and aggregates from BQ1 and BQ2 in comparison with four mathematical creep models.
0 2 4 6 8 10 12 140
0.5
1
1.5
2
2.5
3
3.5
4Creep coefficient as a function of time
Time since application of load (years)
Cre
ep c
oeff
icie
nt
Basalt quarry no. 2
EC2 modelling
fib MC 10
Model B3
ACI modelling

Results and Discussion
62
Figure 5-23: Measured creep coefficient for the CVC4 specimens from 2002, comprising BQ1 aggregate
and comparison to four creep models.
Figure 5-24: Measured creep coefficient for the CVC4 specimens from 2002, comprising BQ2 aggregate
and comparison to four creep models.
0 2 4 6 8 10 12 140
0.5
1
1.5
2
2.5
3
3.5
4Creep coefficient as a function of time
Time since application of load (years)
Cre
ep c
oeff
icie
nt
Basalt quarry no. 1
EC2 modelling
fib MC 10
Model B3
ACI modelling
0 2 4 6 8 10 12 140
0.5
1
1.5
2
2.5
3
3.5
4Creep coefficient as a function of time
Time since application of load (years)
Cre
ep c
oeff
icie
nt
Basalt quarry no. 2
EC2 modelling
fib MC 10
Model B3
ACI modelling

Results and Discussion
63
The comparison between experimental development of creep coefficient to well accepted
mathematical models indicate that concrete made of porous basalt aggregate generally
exhibits greater creep than expected.
5.3 Phase III
5.3.1 Deflection Calculations
Section 3.4 describes the slab in question; relevant theories; assumptions of load on the
structure; relevant codes and the governing equation for comparison.
Figure 5-25 shows detailed deflection estimation based on material properties and model
assumptions according to EC2 and INA. The deflection due to creep and shrinkage ( ) is
38.3 mm and the elastic deflection ( ) is 30.5 mm. The total deflection of 41.9 mm is
calculated according to eq. (5.3)
(5.3)
where is the bending moment due to maximum service limit load and bending
moment due to quasi-permanent load.
Figure 5-25: Deflection calculations based on material properties and model assumptions according to EC2 and INA.
h Thickness of slab 200 mm
d Effective depth of tension reinforcement 160 mm Ecm 33,550 MPa fctk / fctm 2.9 MPa α1 0.7022 xu 100.0 mm
d´ Depth to compression reinforcement 40 mm fcm 58.0 MPa αe,rare 5.961 α2 0.9039 xc 40.0 mm
Ec,eff 13,583 MPa αe,QP 14.724 α3 0.7768 Su 0 mm³
fck Characteristic cylinder strength of concrete 50 MPa Es 200,000 MPa εcd 3.224E-04 h0 200 mm Sc 54,298 mm³
εcd,0 3.793E-04 εca(∞) 1.000E-04 φRH 1.4466 Iu 7.11E+08 mm^4
As Cross-sectional area of tension reinforcement 452.4 mm² εcs 4.224E-04 αds2 0.12 β(fcm) 2.2059 Ic 1.17E+08 mm^4
A´s Cross-sectional area of compression reinforcement 452.4 mm² αds1 4 ξmax 0.6932 β(t0) 0.4749 Mcr 20,630 Nm
φ0 1.5155 ξ 0.6932
MQP Design value of bending moment (Quasi-permanent) 26,338 Nm xu 100.0 mm xc 27.7 mm βH 494.24 1/rn 1.2E-05 (1/mm)
Mrare Design value of bending moment (Rare) 29,938 Nm Iu 6.83E+08 mm^4 Ic 5.46E+07 mm^4 βc 0.9700 βRH 1.3563
Mcr 19,802 Nm ξ 0.5625 φ(t,t0) 1.4700 1/rCS 2.0E-06 (1/mm)
t Adjusted age of concrete 12.7 yr 1/r 1.2E-05 (1/mm) kh 0.8500 1/rt,QP 1.4E-05 (1/mm)
t0 Adjusted age of concrete at loading 28 days
RH Ambient relative humidity 50%
K-constant for deflection calculations 0.1042
Span length 5.0 m
Non-porous aggregate from INA 0.90
Characteristic tensile strength 0.00
δQP Deflection due to creep and shrinkage (Quasi-permanent): 38.3 mm
δrare Elastic deflection (rare): 30.5 mm
δtot Total deflection: 41.9 mm
TABLE CALCULATOR - DEFLECTION FOR UNIT STRIPThis program returns values for deflection for unit strip of slab.
Slab parameters
Other values
Derived values
For deflection (rare)
For deflection (Quasi-permanent)Material properties

Results and Discussion
64
Figure 5-26 shows deflection estimation based on the creep compliance from figure 5-6 in
conjunction with equation (3.10) and using BQ1 aggregate. The deflection due to creep and
shrinkage is 40.8 mm and the elastic deflection is 30.6 mm, nearly the same as in previous
deflection estimation (see Figure 5-25). The total deflection is 44.5 mm, 6.2% increase from
the calculations based on EC2 parameters.
The modest increase in elastic deflection, despite significant decrease in E-modulus, is due to
the drop in maximum distribution coefficient ( ) (see section 3.4). The distribution
coefficient is the ratio of uncracked and fully cracked conditions allowing for tension
stiffening where the unit strip is uncracked. Once an arbitrary section cracks it will remain
cracked and consequently, deflection estimations are based on the maximum distribution
coefficient or eq. (5.4)
(5.4)
where is the distribution coefficient based on quasi permanent loading and is the
distribution coefficient based on the total SLS loading.
Figure 5-26: Deflection calculations based on the creep compliance according to figure 5-6 in conjunction with
equation (3.10) and using BQ1 aggregate.
h Thickness of slab 200 mm
d Effective depth of tension reinforcement 160 mm Ecm 27,303 MPa fctk / fctm 2.9 MPa α1 0.7022 xu 100.0 mm
d´ Depth to compression reinforcement 40 mm fcm 58.0 MPa αe,rare 7.325 α2 0.9039 xc 47.2 mm
Ec,eff 8,595 MPa αe,QP 23.269 α3 0.7768 Su 0 mm³
fck Characteristic cylinder strength of concrete 50 MPa Es 200,000 MPa εcd 3.224E-04 h0 200 mm Sc 47,760 mm³
εcd,0 3.793E-04 εca(∞) 1.000E-04 φRH 1.4466 Iu 7.39E+08 mm^4
As Cross-sectional area of tension reinforcement 452.4 mm² εcs 4.224E-04 αds2 0.12 β(fcm) 2.2059 Ic 1.70E+08 mm^4
A´s Cross-sectional area of compression reinforcement 452.4 mm² αds1 4 ξmax 0.6688 β(t0) 0.4749 Mcr 21,437 Nm
φ0 1.5155 ξ 0.6688
MQP Design value of bending moment (Quasi-permanent) 26,338 Nm xu 100.0 mm xc 30.3 mm βH 494.24 1/rn 1.3E-05 (1/mm)
Mrare Design value of bending moment (Rare) 29,938 Nm Iu 6.87E+08 mm^4 Ic 6.53E+07 mm^4 βc 0.9700 βRH 1.3563
Mcr 19,931 Nm ξ 0.5568 φ(t,t0) 2.1764 1/rCS 1.9E-06 (1/mm)
t Adjusted age of concrete 12.7 yr 1/r 1.2E-05 (1/mm) kh 0.8500 1/rt,QP 1.5E-05 (1/mm)
t0 Adjusted age of concrete at loading 28 days
RH Ambient relative humidity 50%
K-constant for deflection calculations 0.1042
Span length 5.0 m
Non-porous aggregate from INA 0.90
Characteristic tensile strength 0.00
δQP Deflection due to creep and shrinkage (Quasi-permanent): 40.8 mm
δrare Elastic deflection (rare): 30.6 mm
δtot Total deflection: 44.5 mm
TABLE CALCULATOR - DEFLECTION FOR UNIT STRIPThis program returns values for deflection for unit strip of slab.
Slab parameters
Other values
Derived values
For deflection (rare)
For deflection (Quasi-permanent)Material properties
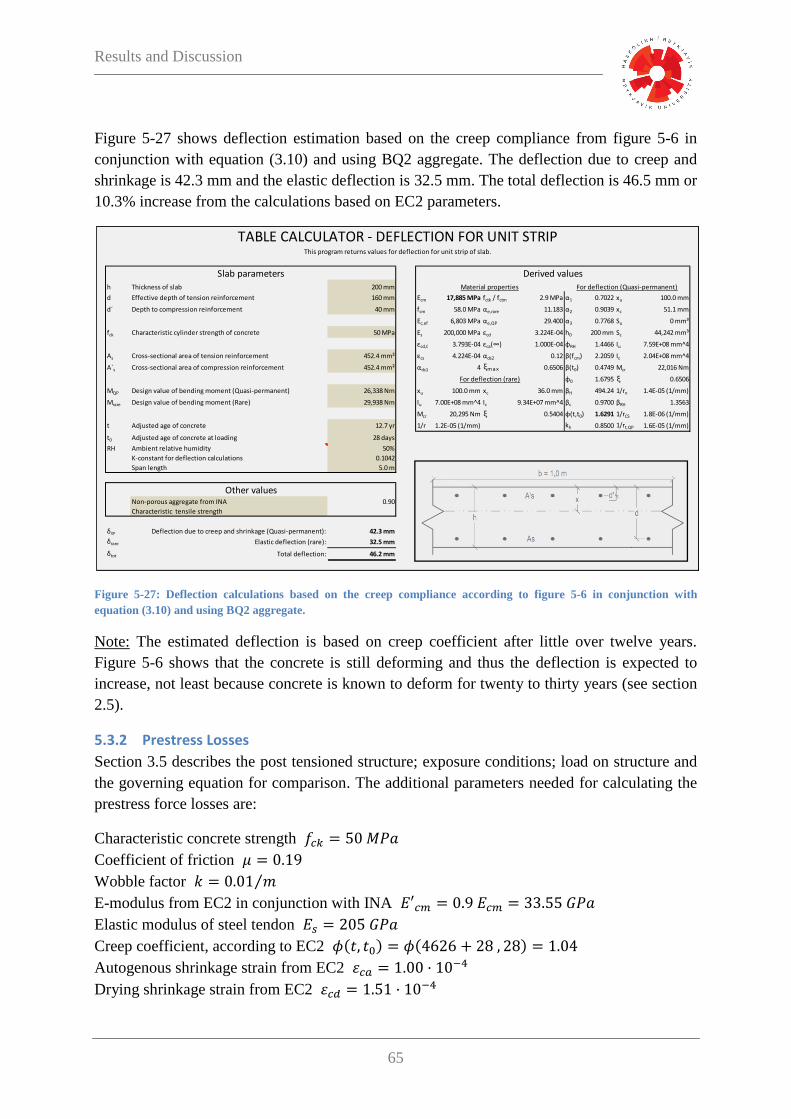
Results and Discussion
65
Figure 5-27 shows deflection estimation based on the creep compliance from figure 5-6 in
conjunction with equation (3.10) and using BQ2 aggregate. The deflection due to creep and
shrinkage is 42.3 mm and the elastic deflection is 32.5 mm. The total deflection is 46.5 mm or
10.3% increase from the calculations based on EC2 parameters.
Figure 5-27: Deflection calculations based on the creep compliance according to figure 5-6 in conjunction with
equation (3.10) and using BQ2 aggregate.
Note: The estimated deflection is based on creep coefficient after little over twelve years.
Figure 5-6 shows that the concrete is still deforming and thus the deflection is expected to
increase, not least because concrete is known to deform for twenty to thirty years (see section
2.5).
5.3.2 Prestress Losses
Section 3.5 describes the post tensioned structure; exposure conditions; load on structure and
the governing equation for comparison. The additional parameters needed for calculating the
prestress force losses are:
Characteristic concrete strength
Coefficient of friction
Wobble factor
E-modulus from EC2 in conjunction with INA
Elastic modulus of steel tendon
Creep coefficient, according to EC2
Autogenous shrinkage strain from EC2
Drying shrinkage strain from EC2
h Thickness of slab 200 mm
d Effective depth of tension reinforcement 160 mm Ecm 17,885 MPa fctk / fctm 2.9 MPa α1 0.7022 xu 100.0 mm
d´ Depth to compression reinforcement 40 mm fcm 58.0 MPa αe,rare 11.183 α2 0.9039 xc 51.1 mm
Ec,eff 6,803 MPa αe,QP 29.400 α3 0.7768 Su 0 mm³
fck Characteristic cylinder strength of concrete 50 MPa Es 200,000 MPa εcd 3.224E-04 h0 200 mm Sc 44,242 mm³
εcd,0 3.793E-04 εca(∞) 1.000E-04 φRH 1.4466 Iu 7.59E+08 mm^4
As Cross-sectional area of tension reinforcement 452.4 mm² εcs 4.224E-04 αds2 0.12 β(fcm) 2.2059 Ic 2.04E+08 mm^4
A´s Cross-sectional area of compression reinforcement 452.4 mm² αds1 4 ξmax 0.6506 β(t0) 0.4749 Mcr 22,016 Nm
φ0 1.6795 ξ 0.6506
MQP Design value of bending moment (Quasi-permanent) 26,338 Nm xu 100.0 mm xc 36.0 mm βH 494.24 1/rn 1.4E-05 (1/mm)
Mrare Design value of bending moment (Rare) 29,938 Nm Iu 7.00E+08 mm^4 Ic 9.34E+07 mm^4 βc 0.9700 βRH 1.3563
Mcr 20,295 Nm ξ 0.5404 φ(t,t0) 1.6291 1/rCS 1.8E-06 (1/mm)
t Adjusted age of concrete 12.7 yr 1/r 1.2E-05 (1/mm) kh 0.8500 1/rt,QP 1.6E-05 (1/mm)
t0 Adjusted age of concrete at loading 28 days
RH Ambient relative humidity 50%
K-constant for deflection calculations 0.1042
Span length 5.0 m
Non-porous aggregate from INA 0.90
Characteristic tensile strength 0.00
δQP Deflection due to creep and shrinkage (Quasi-permanent): 42.3 mm
δrare Elastic deflection (rare): 32.5 mm
δtot Total deflection: 46.2 mm
TABLE CALCULATOR - DEFLECTION FOR UNIT STRIPThis program returns values for deflection for unit strip of slab.
Slab parameters
Other values
Derived values
For deflection (rare)
For deflection (Quasi-permanent)Material properties

Results and Discussion
66
Table 5-3 shows the estimated losses of initial prestress force, based on EC2 and INA and
after the load has been moved to a single bridge beam, based on the resulting torque (see
Appendix B for the area moment of inertia).
Additional abbreviations for tables containing estimations of prestress losses are as follows:
A Cross-sectional area of concrete
Ap Cross-sectional area of tendon
C y = C·x2
eav Average eccentricity of tendon
h0 Notional size
I Area moment of inertia
kh Coefficient depending on the notional size h0
P0 Initial prestress force
u Parameter of that part of the concrete cross-section which is exposed to drying
x x- pos. at mid-span
y y- pos. at mid-span (max. eccentricity of tendon)
αe Modular ratio
θ The gradient at ends
Friction Elastic shortening Creep Shrinkage Relaxation
at anchor µ 0.19 Ap 1.56 E+04 mm² u 1.03 E+04 mm εcd 1.51 E-04 2.5
k 0.01 /m A 2.45 E+06 mm² h0 477 mm kh 0.7057
x 20.0 m αe 6.11 φ(t,t0) 1.04 εca 1.00 E-04
y 1.25 m eav 0.783 m Es 205 GPa εcs 2.51 E-04
C 0.00313 /m I 1.32 E+12 mm4 E’cm 33.6 GPa
θ 0.125 rad P' 16.8 MN P 1.31 MN P 803 kN P 988 kN
5.99% 1.91% 7.62% 4.68% 5.76%
P0 = 17.2 MN Total estimated losses 26.0% of P0
Table 5-3: Estimated losses of initial prestress force, based on EC2 and INA.
Table 5-4 shows the estimated losses of initial prestress force, based on the creep compliance
from figure 5-6 in conjunction with equation (3.10) and using BQ1 aggregate. The total
estimated losses are 36.6%, exceeding those values based on EC2 and INA by 10.6%.
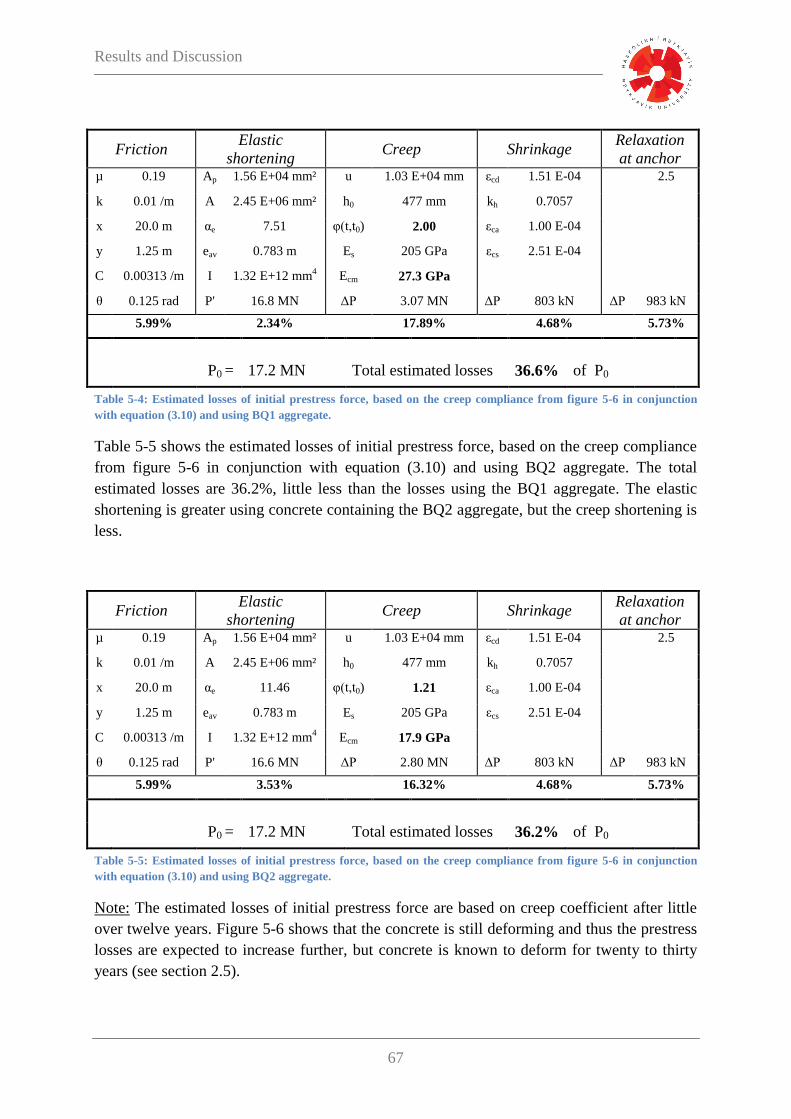
Results and Discussion
67
Friction Elastic
shortening Creep Shrinkage
Relaxation
at anchor µ 0.19 Ap 1.56 E+04 mm² u 1.03 E+04 mm εcd 1.51 E-04 2.5
k 0.01 /m A 2.45 E+06 mm² h0 477 mm kh 0.7057
x 20.0 m αe 7.51 φ(t,t0) 2.00 εca 1.00 E-04
y 1.25 m eav 0.783 m Es 205 GPa εcs 2.51 E-04
C 0.00313 /m I 1.32 E+12 mm4 Ecm 27.3 GPa
θ 0.125 rad P' 16.8 MN P 3.07 MN P 803 kN P 983 kN
5.99% 2.34% 17.89% 4.68% 5.73%
P0 = 17.2 MN Total estimated losses 36.6% of P0
Table 5-4: Estimated losses of initial prestress force, based on the creep compliance from figure 5-6 in conjunction
with equation (3.10) and using BQ1 aggregate.
Table 5-5 shows the estimated losses of initial prestress force, based on the creep compliance
from figure 5-6 in conjunction with equation (3.10) and using BQ2 aggregate. The total
estimated losses are 36.2%, little less than the losses using the BQ1 aggregate. The elastic
shortening is greater using concrete containing the BQ2 aggregate, but the creep shortening is
less.
Friction Elastic
shortening Creep Shrinkage
Relaxation
at anchor µ 0.19 Ap 1.56 E+04 mm² u 1.03 E+04 mm εcd 1.51 E-04 2.5
k 0.01 /m A 2.45 E+06 mm² h0 477 mm kh 0.7057
x 20.0 m αe 11.46 φ(t,t0) 1.21 εca 1.00 E-04
y 1.25 m eav 0.783 m Es 205 GPa εcs 2.51 E-04
C 0.00313 /m I 1.32 E+12 mm4 Ecm 17.9 GPa
θ 0.125 rad P' 16.6 MN P 2.80 MN P 803 kN P 983 kN
5.99% 3.53% 16.32% 4.68% 5.73%
P0 = 17.2 MN Total estimated losses 36.2% of P0
Table 5-5: Estimated losses of initial prestress force, based on the creep compliance from figure 5-6 in conjunction
with equation (3.10) and using BQ2 aggregate.
Note: The estimated losses of initial prestress force are based on creep coefficient after little
over twelve years. Figure 5-6 shows that the concrete is still deforming and thus the prestress
losses are expected to increase further, but concrete is known to deform for twenty to thirty
years (see section 2.5).

Conclusions and Final Remarks
68
6 Conclusions and Final Remarks
This chapter summarizes the main findings of the thesis and lists recommendations for further
research, to answer questions that arose during the work on the thesis.
6.1 Main Findings
Within the limitations of the work here conducted, these are the main findings:
The results indicate substantial discrepancies in measured E-modulus for concrete
made from limestone aggregates, compared to estimates based on mean concrete
cylinder strength according to EC2.
The measured E-modulus from concrete with Icelandic aggregates, basalt 1-4 from
phase I, fairly agrees with the EC2 values if the correction factors from INA, based on
aggregate porosity, are applied. However, experimental results from phase II show
that the E-modulus drops well below the EC2 values, using correction factors from
INA, if the porosity is increased.
If the values obtained from granite and limestone aggregates are ignored, a fairly good
correlation can be seen between aggregate porosity and E-modulus of concrete.
Concrete containing porous basalt aggregate shows greater creep than concrete with
granite aggregate.
The oldest creep specimens, referred to in the thesis, are still deforming after twelve
years.
The Eco-SCC mixes, containing less cement but higher water-binder ratio, shows
greater creep than conventional SCC.
Addition of air entraining admixture seems to have limited effect on the specific creep
of Eco-SCC mixes.
Higher cement content, while maintaining constant water-cement ratio, is likely to
increase creep-strain.
The concrete containing basalt aggregates appears to increase its rate of creep after
few months.
Findings indicate that concrete made of porous basalt aggregate exhibits greater creep
than predicted by well accepted mathematical models.
A case study, for a post tensioned highway bridge, shows a 10% increase in initial
prestress force losses when using experimental results for concrete with porous
aggregate, compared to values from Eurocode 2.
A case study of a slab of concrete with porous aggregate, 200 mm thick and spanning
5.0 m, shows a 6.2 and 10.3% increase in deflection using experimental results for
concrete with BQ1 and BQ2 aggregates, compared to values predicted by Eurocode 2.
Note: When the E-modulus is critical to the performance of a structure, tests on the E-
modulus should be conducted. In practice a structural designer has little control over
aggregate composition in the concrete, thus it is best to specify the E-modulus to be used for
structures sensitive to variations.
Conclusions and Final Remarks
69
6.2 Recommendations for Further Research
This section reflects on unanswered questions that arose during the work on the thesis and
could be the subjects of further research.
Flexural strength of concrete is important in deflection calculations. When
determining distribution coefficient for uncracked and fully cracked conditions, the
tensile strength, determined in accordance with EC2, is normally used. In case of
concrete made of porous aggregate, tensile strength might be overestimated, since it is
strongly dependant on the interfacial transition zone (see section 2.1). Possible
discrepancies in tensile strength between predictions according to EC2, and
experimental results would be an interesting research subject.
The Icelandic National Annex to EC2 suggests two reduction factors for E-modulus,
based on aggregate porosity, but gives no guidance for what porosity range the
reduction factor should be used. This ambiguity is unfortunate and might serve as a
central point in a practical research topic. Experimental results, based on porosity,
could then be compared to the EC2 model to find a suitable conversion factors or
models.
Accuracy in mathematical models is essential and the discrepancies, such as those
depicted in phase II, are excessive. It would be worthwhile to fit the experimental
results to EC2 or fib MC 10 model. By using some least squares regression method it
should be possible to find a parameter that minimizes the differences between models
and test data.
Finally
The thesis ends, but creep goes on [21].

References
70
References
[1] “How Portland Cement is Made | Portland Cement Association (PCA),” Portland Cement
Association, 2014. [Online]. Available: http://www.cement.org/basics/howmade.asp.
[Accessed: 21-Jul-2014].
[2] Ari Trausti Guðmundsson and Flosi Ólafsson, Steinuð hús - Varðveisla, viðgerðir,
endurbætur og nýsteining. Lyngási 7, 210 Garðabær: Húsafriðunarnefnd ríkisins, 2003.
[3] ASTM C512 / C512M - 10 Standard Test Method for Creep of Concrete in Compression1.
West Conshohocken: ASTM.
[4] EN 1991-2:2003: Actions on structures - Part 2: Traffic loads on bridges. Brussels: CEN,
2003.
[5] W. H. Mosley, J. H. Bungey, and R. Hulse, Reinforced Concrete Design: to Eurocode 2,
6th edition. Houndmills, Basingstoke, Hampshire ; New York, N.Y: Palgrave Macmillan,
2007.
[6] “Hooke’s law (physics),” Encyclopedia Britannica. [Online]. Available:
http://www.britannica.com/EBchecked/topic/271336/Hookes-law. [Accessed: 21-May-
2014].
[7] A. M. Neville and J. J. Brooks, Concrete Technology, Second Edition. England: Pearson
Education Limited, 2010.
[8] “Young’s modulus (physics),” Encyclopedia Britannica. [Online]. Available:
http://www.britannica.com/EBchecked/topic/654186/Youngs-modulus. [Accessed: 21-
May-2014].
[9] B. Paul, “Prediction of Elastic Constants of Multiphase Materials,” Trans. Metall. Soc.
AIME, vol. 218, pp. 36–41, 1960.
[10] P. Simeonov and S. Ahmad, “Effect of transition zone on the elastic behavior of cement-
based composites,” Cem. Concr. Res., vol. 25, no. 1, pp. 165–176, Jan. 1995.
[11] J. Weiss, “Stress-Strain Behaviour of Concrete.” [Online]. Available:
http://www.theconcreteportal.com/cons_rel.html. [Accessed: 24-May-2014].
[12] “Byggingarreglugerð nr. 112/2012,” Mannvirkjastofnun, 2012. [Online]. Available:
http://www.mannvirkjastofnun.is/library/Skrar/Byggingarsvid/Byggingarreglugerd/Bygg.
regluger%C3%B0_skj%C3%A1.pdf.
[13] P. Bamforth, D. Chisholm, J. Gibbs, and T. Harrison, “Properties of concrete for use in
Eurocode 2,” The Concrete Centre, Jan-2008.
[14] EN 1992-1-1:2004: Eurocode 2: Design of concrete structures - Part 1-1: General rules
and rules for buildings. Brussels: CEN, 2004.
[15] Guðni Jónsson, “Formbreytingar í steinsteypu - fjaðurstuðull og skrið - (e. Deformations
of Concrete - E-modulus and Creep),” The Icelandic Building Research Institute,
Reykjavik, 93, Dec. 2006.
[16] Icelandic National Annexes to Eurocodes, 1st ed. Staðlaráð Íslands (e. Icelandic Council
for Standardization), 2010.
[17] “Building Code Requirement for Structural Concrete and Commentary (ACI 318M-05),”
2004. [Online]. Available:
http://netedu.xauat.edu.cn/jpkc/netedu/jpkc/hntjg/site/jxzy/wlkt/ACI318M-
05%20%E7%BE%8E%E5%9B%BD%E8%A7%84%E8%8C%83%20Building%20Code
%20Requirement%20For%20Structural%20Concrete.pdf.
[18] fib Model Code 2010, Final draft, fib bulletin 66, vol. 1, 2 vols. Switzerland:
International Federation for Structural Concrete, 2012.
References
71
[19] S. H. Kosmatka, B. Kerkhoff, and W. C. Panarese, Design and Control of Concrete
Mixtures, 14th edition. Portland Cement Association, 2003.
[20] I. E. Shkolnik, “Effect of nonlinear response of concrete on its elastic modulus and
strength,” Cem. Concr. Compos., vol. 27, no. 7–8, pp. 747–757, Aug. 2005.
[21] A. M. Neville, W. H. Dilger, and J. J. Brooks, Creep of plain and structural concrete.
London, New York: Construction Press, 1983.
[22] Z. P. Bažant, Y. Xi, and I. Carol, “New test Method to Separate Microcracking from
Drying Creep: Curvature Creep at Equal Bending Moments and Various Axial Forces,” in
The Fifth International RILEM Symposium, Barcelona, Spain, 1993, pp. 77–82.
[23] G. E. Troxell, J. M. Raphael, and R. E. Davis, “Long-Time Creep and Shrinkage Tests of
Plain and Reinforced Concrete,” Proc. ASTM 58, pp. 1101–1120, 1958.
[24] A. M. Neville, Properties of Concrete, 5 th edition. Harlow, England ; New York: Trans-
Atlantic Publications, Inc., 2012.
[25] T. C. Holland, Silica Fume User’s Manual. Lovettsville, VA 22180: Silica Fume
Association, 2005.
[26] K. H. Khayat, “Lecture on Concrete Technology at Innovation Center Iceland,” 15-May-
2014.
[27] M. Farah, F. Grondin, M. Matallah, A. Loukili, and J. Saliba, “Multi-scales
Characterization of the Early-age Creep of Concrete,” in Mechanics and Physics of
Creep, Shrinkage, and Durability of Concrete, American Society of Civil Engineers, pp.
211–218.
[28] Z. P. Bažant, “Solidification theory for aging creep,” Civ. Environ. Eng. Northwest.,
1988.
[29] J. Saliba, F. Grondin, M. Matallah, A. Loukili, and H. Boussa, “Relevance of a
mesoscopic modeling for the coupling between creep and damage in concrete,” Mech.
Time-Depend. Mater., vol. 17, no. 3, 2013.
[30] E. L. Sveinsdóttir and B. J. Wigum, “Aggregate production in Iceland,” Vegagerðin.
[31] Guðni Jónsson, “Aggregates - Presentation in material science at Reykjavik University,”
Reykjavik University, 2011.
[32] U. Bolmstedt, “About rheology,” Instituto de Química. [Online]. Available:
http://www.iq.usp.br/mralcant/About_Rheo.html.
[33] H. A. Barnes, J. F. Hutton, and F. R. S. Walters, An Introduction to Rheology, Third
impression. Amsterdam: Elesvier science publishers B.V., 1993.
[34] E. G. Nawy, Concrete Construction Engineering Handbook, Second Edition. Boca
Raton, FL: Taylor & Francis Group, 2008.
[35] K.-K. Choi, S. L. Lissel, and M. M. R. Taha, “Rheological modelling of masonry creep,”
Can. J. Civ. Eng., vol. 34, no. 11, pp. 1506–1517, 2007.
[36] “Structural Eurocodes - Institution of Civil Engineers,” Institution of Civil Engineers.
[Online]. Available: http://www.ice.org.uk/topics/structuresandbuildings/Eurocodes.
[Accessed: 08-Aug-2014].
[37] EN 1097-6:2000: Tests for mechanical and physical properties of aggregates - Part 6:
Determination of particle density and water absorption. Brussels: CEN, 2000.
[38] F. Mola and L. M. Pellegrini, “The New Model for Creep of Concrete in fib Model Code
2010,” presented at the 37th Conference on Our World in Concrete & Structures,
Singapore, 2012.
[39] “Model B3 for Predicting Concrete Creep and Shrinkage.” [Online]. Available:
https://mech.fsv.cvut.cz/homeworks/student/PPMA/ae.pdf.
References
72
[40] Z. P. Bažant and S. Baweja, “Creep and Shrinkage Prediction Model for Analysis and
Design of Concrete Structures: Model B3,” presented at the Adam Neville Symposium:
Creep and Shrinkage—Structural Design Effects, pp. 1–83.
[41] ACI 209.2R-08: Guide for Modeling and Calculating Shrinkage and Creep in Hardened
Concrete. Farmington Hills, MI 48331: American Concrete Institute.
[42] ACI 209R-92: Prediction of Creep, Shrinkage, and Temperature Effects in Concrete
Structures. Farmington Hills, MI 48331: American Concrete Institute.
[43] B. M. Das, Fundamentals of Geotechnical Engineering, 3rd ed. CL-Engineering.
[44] EN 933-1:1997: Tests for geometrical properties of aggregates. Determination of
particle size distribution. Sieving method. Brussels: CEN, 1997.
[45] EN 932-2:1999: Tests for general properties of aggregates. Methods for reducing
laboratory samples. Brussels: CEN, 1999.
[46] EN 12350-2:2000: Testing fresh concrete. Slump test. Brussels: CEN, 2000.
[47] “Concrete slump test - Wikipedia, the free encyclopedia,” Wikipedia, the free
encyclopedia. [Online]. Available: http://en.wikipedia.org/wiki/Concrete_slump_test.
[Accessed: 16-Nov-2013].
[48] P. Domone, “The Slump Flow Test for High-Workability Concrete,” Cem. Concr. Res.,
vol. 28, no. 2, pp. 177–182, Feb. 1998.
[49] J. E. Wallevik, “Relationship between the Bingham parameters and slump,” Cem. Concr.
Res., vol. 36, no. 7, pp. 1214–1221, Jul. 2006.
[50] O. H. Wallevik and J. E. Wallevik, “Rheology as a tool in concrete science: The use of
rheographs and workability boxes,” Cem. Concr. Res., vol. 41, no. 12, pp. 1279–1288,
Desember 2012.
[51] O. H. Wallevik and B. Hjartarson, “A novel field instrument to measure rheological
properties of self-compacting concrete,” presented at the 3rd North America Conference
on Self-Compacting Concrete, USA, 2008, p. 6.
[52] EN 12350-7:2000: Testing fresh concrete. Air content. Pressure methods. Brussels:
CEN, 2000.
[53] ISO 1920-10:2010: Testing of concrete — Part 10: Determination of static modulus of
elasticity in compression. Geneva: ISO, 2010.
[54] EN 12390-3:2009: Testing hardened concrete - Part 3: Compressive strength of test
specimens. Brussels: CEN, 2009.
[55] EN 206-1:2000: Concrete - Part 1: Specification, performance, production and
conformity. Brussels: CEN, 2000.
[56] A. Chowdhury, A. S. M. Z. Hasan, M. Z. Alam, and A. A. Masum, “Effect of Size on
Compressive Strength of Concrete Cylinder Specimens using Sand and Sulfur Cap,”
Glob. J. Res. Eng. Civ. Struct. Eng., vol. 13, no. 8, 2013.
[57] C. M. Wang, “Timoshenko Beam-Bending Solutions in Terms of Euler-Bernoulli
Solutions,” J. Eng. Mech., vol. 121, no. 6, pp. 763–765, Jun. 1995.
[58] EN 1990: 2002: Basis of structural design. Brussels: CEN, 2002.
[59] EN 1991-1:2002: Actions on structures. Brussels: CEN, 2002.
[60] “Serviceability Limit States,” Mineral Products Association - The Concrete Centre,
London, Informative.
[61] H. D. Hernandez and W. L. Gamble, “Time-dependent prestress losses in Pretensioned
concrete construction,” University og Illinois, Illinois, Issued as a Documentation Report
on The Field Investigation of Prestressed Reinforced Concrete Highway Bridges UILU-
ENG-75-2005, May 1975.

References
73
[62] Hákon Ólafsson and Jón Baldvinsson, Eiginleikar íslensk sements 2004, vol.
Sementseftirlit Rb. Reykjavik: Rannsóknastofnun byggingariðnaðarins, 2005.
[63] EN 197-1:2000: Cement - Part 1: Composition, specifications and conformity criteria
for common cements. Brussels: CEN, 2000.
[64] K.-R. Wu, B. Chen, W. Yao, and D. Zhang, “Effect of coarse aggregate type on
mechanical properties of high-performance concrete,” Cem. Concr. Res., vol. 31, no. 10,
pp. 1421–1425, Oct. 2001.
[65] Properties of Rock Materials. Lausanne, Swiss: Ecole Polytechnique Fédérale de
Lausanne, EPFL.
[66] W. Navidi, Statistics for Engineers and Scientists, Third Edition. New York: McGraw-
Hill, 2011.
[67] G. Giaccio and R. Zerbino, “Failure Mechanism of Concrete: Combined Effects of
Coarse Aggregates and Strength Level,” Adv. Cem. Based Mater., vol. 7, no. 2, pp. 41–
48, Mar. 1998.
[68] Z. P. Bažant, Mathematical Modeling of Creep and Shrinkage of Concrete. Wiley-
Interscience Publication.
[69] Z. P. Bažant, “Theory of Creep and Shrinkage in ’Concrete Structures: A ·Précis of
Recent Developments,” Mech. Today, vol. 2, pp. 1–93, 1975.
[70] J. Kováčik, “Correlation between Young’s modulus and porosity in porous materials,” J.
Mater. Sci. Lett., vol. 18, no. 13, pp. 1007–1010, Jul. 1999.
[71] B. V. Rangan and A. E. McMullen, “A rational approach to control of slab deflection,”
ACI J., no. 75, pp. 256–62, 1978.
[72] Johann A. Hardarson, Thordur I. Kristjansson, and Olafur H. Wallevik, “Discrepancies in
Measured and Modelled E-modulus due to Porous Aggregates. Some Experiences from
tests on Icelandic Concrete,” in Proceedings of the XXII Nordic Concrete Research
Symposium, Reykjavik, Iceland, 2014, pp. 179–182.
[73] B. C. Jensen, Teknisk Ståbi, 21. udgave. Valby: Nyt Teknisk Forlag, 2011.
[74] ACI E1-99: Education Bulletin - Aggregates for Concrete. Farmington Hills, MI 48331:
American Concrete Institute.
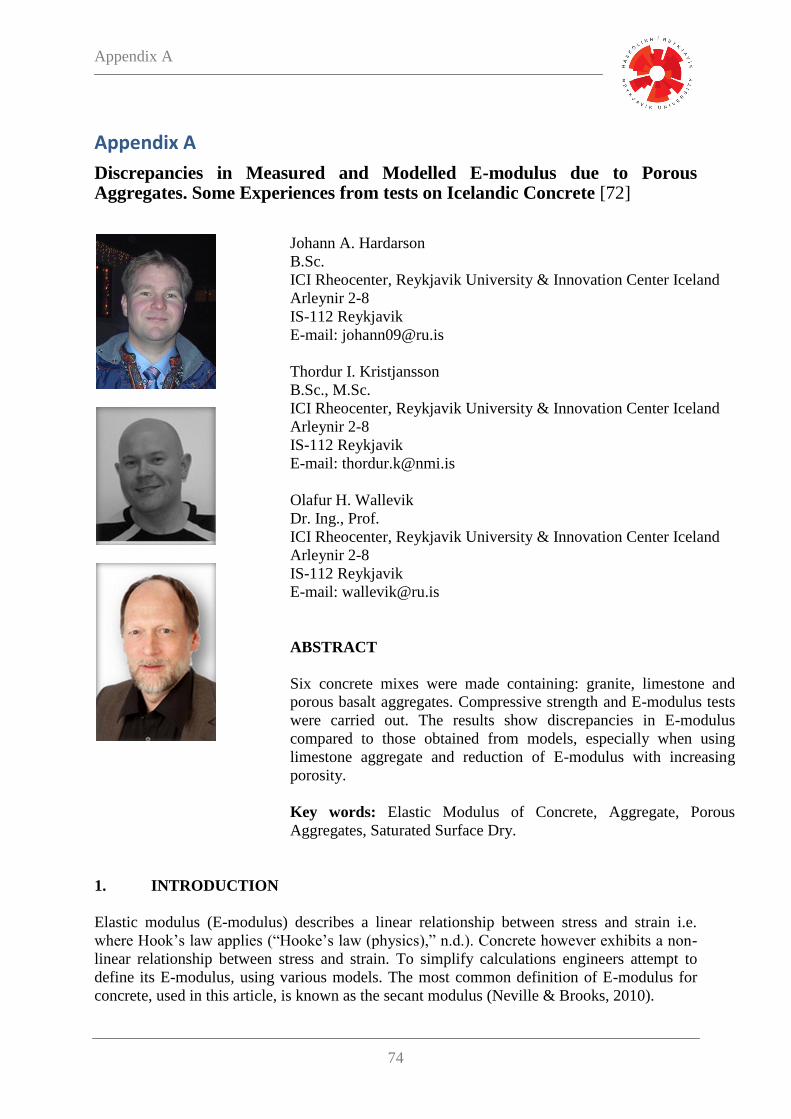
Appendix A
74
Appendix A
Discrepancies in Measured and Modelled E-modulus due to Porous Aggregates. Some Experiences from tests on Icelandic Concrete [72]
Johann A. Hardarson
B.Sc.
ICI Rheocenter, Reykjavik University & Innovation Center Iceland
Arleynir 2-8
IS-112 Reykjavik
E-mail: [email protected]
Thordur I. Kristjansson
B.Sc., M.Sc.
ICI Rheocenter, Reykjavik University & Innovation Center Iceland
Arleynir 2-8
IS-112 Reykjavik
E-mail: [email protected]
Olafur H. Wallevik
Dr. Ing., Prof.
ICI Rheocenter, Reykjavik University & Innovation Center Iceland
Arleynir 2-8
IS-112 Reykjavik
E-mail: [email protected]
ABSTRACT
Six concrete mixes were made containing: granite, limestone and
porous basalt aggregates. Compressive strength and E-modulus tests
were carried out. The results show discrepancies in E-modulus
compared to those obtained from models, especially when using
limestone aggregate and reduction of E-modulus with increasing
porosity.
Key words: Elastic Modulus of Concrete, Aggregate, Porous
Aggregates, Saturated Surface Dry.
1. INTRODUCTION
Elastic modulus (E-modulus) describes a linear relationship between stress and strain i.e.
where Hook’s law applies (“Hooke’s law (physics),” n.d.). Concrete however exhibits a non-
linear relationship between stress and strain. To simplify calculations engineers attempt to
define its E-modulus, using various models. The most common definition of E-modulus for
concrete, used in this article, is known as the secant modulus (Neville & Brooks, 2010).

Appendix A
75
In practice, E-modulus of concrete is measured and empirical equations then fitted to the
results. Eurocode 2 (EC2) presents a formula to calculate the E-modulus of concrete ( )
from the mean value of concrete cylinder compressive strength ( ), or from equation (1)
(EN 1992-1-1, 2004),
(1)
The research presented in this paper is intended to elucidate the effect of porosity in
aggregates on the E-modulus of concrete. The difference in porosity will be quantitated by the
moisture content (MC) of aggregates in saturated surface dry (SSD) condition.
2. MATERIALS AND METHODS
Six mixes were made using different combination of aggregates. The mass-ratio of fine
aggregates (< 4.0 mm) was the same in all mixes, 47% of total aggregates. This made the
accumulative particle size distribution fairly homogeneous, except maybe for the basalt mix
no. 4 (see fig. 1). Abbreviations and aggregate composition can be seen below.
Granite: Norwegian granite aggregates.
Limestone: Dune sand and limestone aggregates from Abu Dhabi (United Arab
Emirates).
Basalt no. 1: Basalt aggregates from Harðikambur, Icelandic inland quarry.
Basalt no. 2: Basalt from Björgun, Icelandic seabed quarry + sand from Rauðimelur.
Basalt no. 3: Basalt aggregates from Björgun, Icelandic seabed quarry.
Basalt no. 4: Basalt aggregates from Vatnsskarð, Icelandic inland quarry.
Figure 1 – Cumulative particle size distribution of mixes containing various aggregates.
0
10
20
30
40
50
60
70
80
90
100
0.0625 0.125 0.25 0.5 1 2 4 8 16 32
Part
icle
siz
e d
istr
ibu
tion
[%
]
Sieve size [mm]
Granite aggregate
Limestone aggregate
Basalt no.1 aggregate
Basalt no.2 aggregate
Basalt no.3 aggregate
Basalt no.4 aggregate

Appendix A
76
Required mass content was calculated for the six mixes by maintaining a constant volume of
25 litres. Cement content in all the mixes was 315 kg/m3 and water content 174 kg/m
3,
maintaining a water-to-cement ratio of 0.55 and a paste volume of 27.7%. The amount of
superplasticizer in each mix was arrived at with acceptable workability in mind. E-modulus
tests were done according to the standard (ISO 1920-10, 2010). Additional info for mixes can
be seen in table 1.
Table 1 – Various values, measured prior to casting
SPC-25 a
(kg/m3)
Air
(%)
Slump
(mm)
G-yield
(A)
H-plastic b
(A·s)
SSD c
(%)
Granite 1.0 4.1 215 0.68 1.87 0.3
Limestone 1.5 3.3 190 0.73 2.10 0.6
Basalt no. 1 1.0 4.3 235 0.64 1.50 1.7
Basalt no. 2 2.2 5.5 185 - - 2.9
Basalt no. 3 2.0 4.2 185 - - 3.0
Basalt no. 4 1.9 3.2 170 0.92 5.21 4.8 a . Omnicon SPC 25 (polycarboxylic ether)
b. Plastic viscosity c. Weighted average MC in SSD condition
3. RESULTS AND DISCUSSION
Table 2 shows the results from both 7th
and 28th
day compressive strength as well as E-
modulus. Calculated values, using equation from EC2, are based on 28th
day compressive
strength.
Table 2 – Measured values, after casting, and compared to calculated E-modulus
7th
day c
Compressive st.
(MPa)
7th
day
E-modulus
(GPa)
28th
day d
Compressive st.
(MPa)
28th
day
E-modulus
(GPa)
E-modulus e
from EC2
(GPa)
Granite 30.9 29.4 40.5 29.4 33.5
Limestone 31.4 35.9 41.7 39.4 33.8
Basalt no. 1 31.5 28.9 42.0 30.8 33.8
Basalt no. 2 37.9 27.9 47.0 28.3 35.0
Basalt no. 3 38.8 27.8 51.0 29.6 35.9
Basalt no. 4 41.8 19.2 54.6 22.3 36.6 d. Mean value of concrete cylinder compressive strength.
e. Value calculated according to equation (1) and without modification factor.
Article 3.1.3 in EC2 states that equation (1) is valid for quartzite aggregates, but the outcome
should be reduced by 10% for limestone and increased by 20% for basalt (EN 1992-1-1,
2004). It is clear from table 2 that the EC2 model drastically underestimates the E-modulus
with respect to limestone aggregates, especially if the reduction factor is used. There is a
known discrepancy between EC2 values for E-modulus and measured results, using Icelandic
aggregates. This is attributed to the prevailing porosity of Icelandic aggregates, MC in SSD
condition from 3 to 8% (Jónsson, 2006). In fact the Icelandic National Annex (INA) to EC2
suggests a correction factors to multiply the values obtained from (1), 0.9 for non-porous
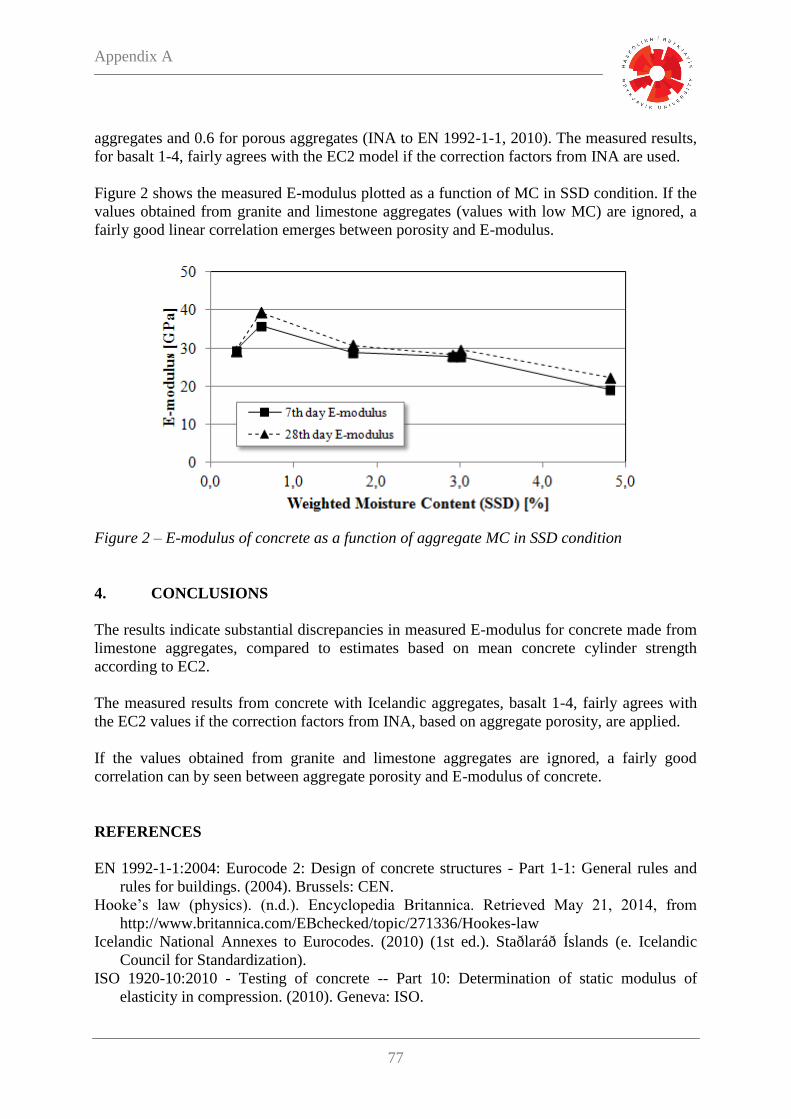
Appendix A
77
aggregates and 0.6 for porous aggregates (INA to EN 1992-1-1, 2010). The measured results,
for basalt 1-4, fairly agrees with the EC2 model if the correction factors from INA are used.
Figure 2 shows the measured E-modulus plotted as a function of MC in SSD condition. If the
values obtained from granite and limestone aggregates (values with low MC) are ignored, a
fairly good linear correlation emerges between porosity and E-modulus.
Figure 2 – E-modulus of concrete as a function of aggregate MC in SSD condition
4. CONCLUSIONS
The results indicate substantial discrepancies in measured E-modulus for concrete made from
limestone aggregates, compared to estimates based on mean concrete cylinder strength
according to EC2.
The measured results from concrete with Icelandic aggregates, basalt 1-4, fairly agrees with
the EC2 values if the correction factors from INA, based on aggregate porosity, are applied.
If the values obtained from granite and limestone aggregates are ignored, a fairly good
correlation can by seen between aggregate porosity and E-modulus of concrete.
REFERENCES
EN 1992-1-1:2004: Eurocode 2: Design of concrete structures - Part 1-1: General rules and
rules for buildings. (2004). Brussels: CEN.
Hooke’s law (physics). (n.d.). Encyclopedia Britannica. Retrieved May 21, 2014, from
http://www.britannica.com/EBchecked/topic/271336/Hookes-law
Icelandic National Annexes to Eurocodes. (2010) (1st ed.). Staðlaráð Íslands (e. Icelandic
Council for Standardization).
ISO 1920-10:2010 - Testing of concrete -- Part 10: Determination of static modulus of
elasticity in compression. (2010). Geneva: ISO.
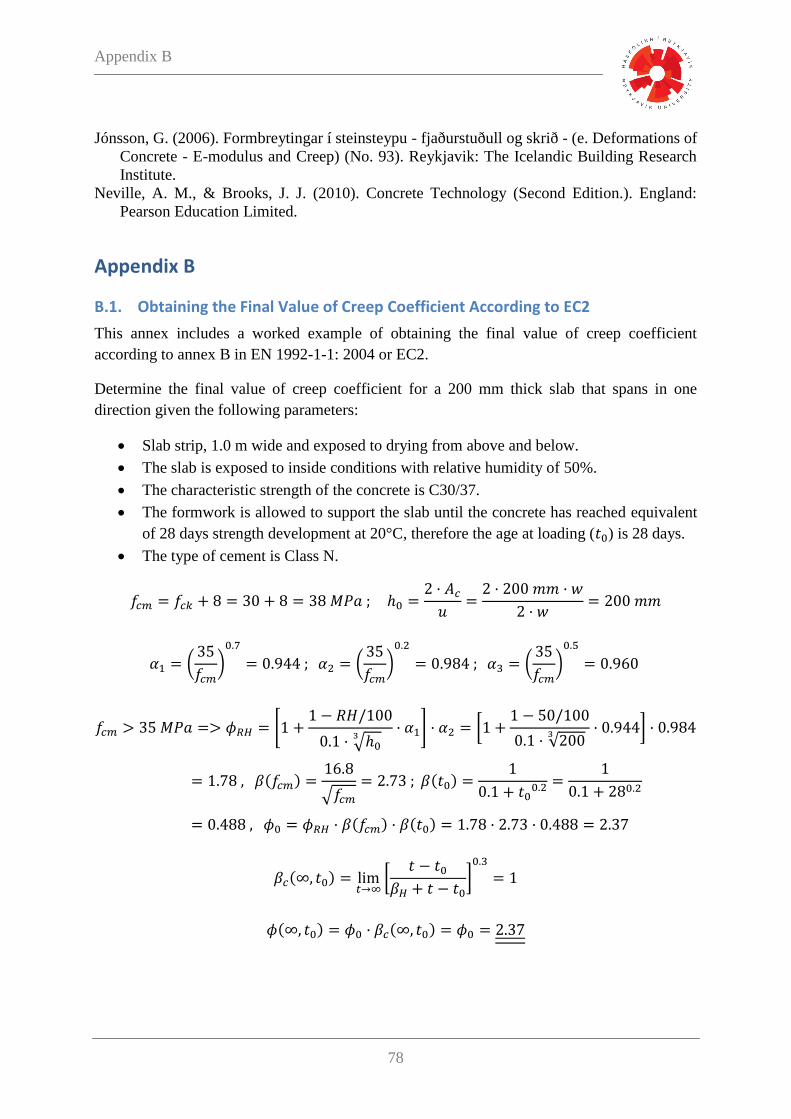
Appendix B
78
Jónsson, G. (2006). Formbreytingar í steinsteypu - fjaðurstuðull og skrið - (e. Deformations of
Concrete - E-modulus and Creep) (No. 93). Reykjavik: The Icelandic Building Research
Institute.
Neville, A. M., & Brooks, J. J. (2010). Concrete Technology (Second Edition.). England:
Pearson Education Limited.
Appendix B
B.1. Obtaining the Final Value of Creep Coefficient According to EC2
This annex includes a worked example of obtaining the final value of creep coefficient
according to annex B in EN 1992-1-1: 2004 or EC2.
Determine the final value of creep coefficient for a 200 mm thick slab that spans in one
direction given the following parameters:
Slab strip, 1.0 m wide and exposed to drying from above and below.
The slab is exposed to inside conditions with relative humidity of 50%.
The characteristic strength of the concrete is C30/37.
The formwork is allowed to support the slab until the concrete has reached equivalent
of 28 days strength development at 20°C, therefore the age at loading ( ) is 28 days.
The type of cement is Class N.
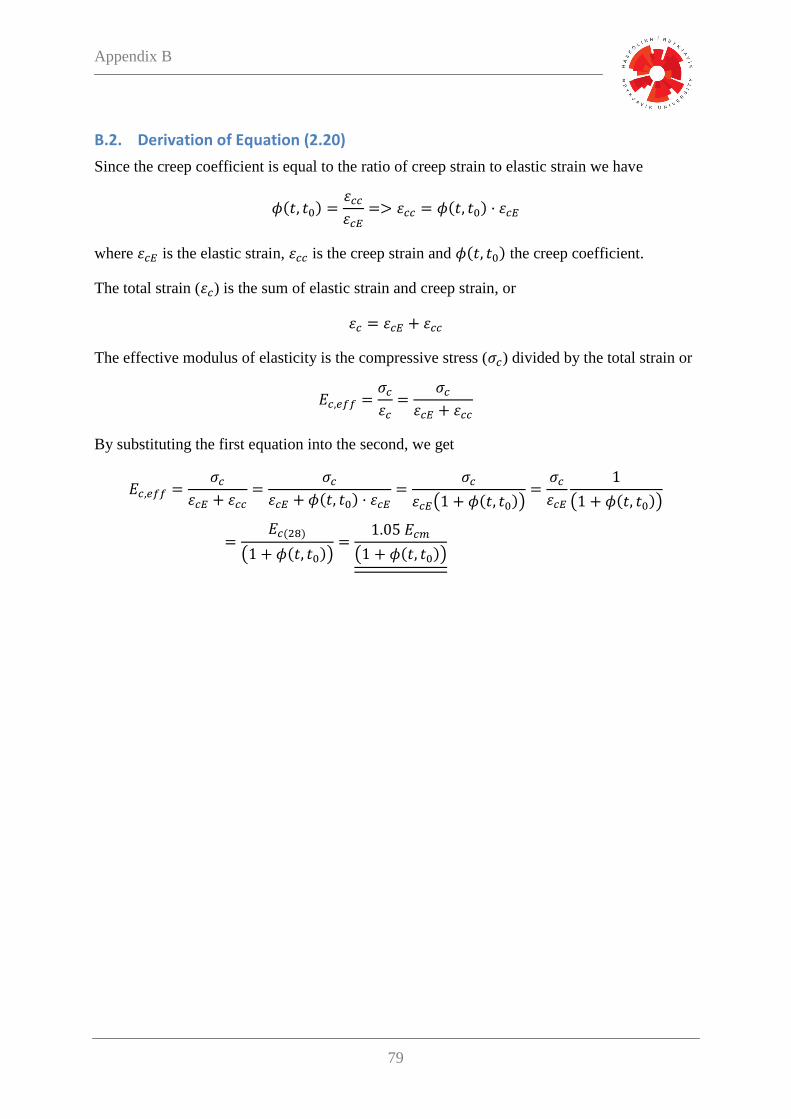
Appendix B
79
B.2. Derivation of Equation (2.20)
Since the creep coefficient is equal to the ratio of creep strain to elastic strain we have
where is the elastic strain, is the creep strain and the creep coefficient.
The total strain ( ) is the sum of elastic strain and creep strain, or
The effective modulus of elasticity is the compressive stress ( ) divided by the total strain or
By substituting the first equation into the second, we get

Appendix B
80
B.3. Derivation of Equation (3.3)
Figure B-1: Saturated aggregate element (SSD) with total volume equal to 1. Mass to the left and volume to the right.
Formal definition of porosity from geotechnical engineering
The moisture content of a saturated aggregate sample can be expressed as
Since the element is saturated and by writing the voids as mass divided by density, porosity
becomes

Appendix B
81
B.4. Derivation of K for Simply Supported Beam
The following is a derivation of K-constant for simply supported beam, based on equations
from Teknisk Ståbi (see Figure B-2) and used in deflection calculations.
Curvature ( ) can be written so
where M is the mending moment, E the elastic modulus and I the area moment of inertia. The
maximum deflection at the centre is (see Figure B-2)
The value in the bracket is the same as the maximum bending moment (see Figure B-2) or
Figure B-2: Simply supported beam [73].

Appendix B
82
B.5. Area Moment of Inertia for Bridge Beam
Figure B-3: Bridge Beam.
Table B-1: Area Moment of Inertia for Bridge Beam.
h = 2000 mm
h b A S Io d d2Io,c
[mm] [mm] [mm2] [mm3] [mm4] [mm] [mm2] [mm4]
500 500 250000 5.63E+08 5.21E+09 793 629555 1.63E+11
250 2250 562500 1.20E+09 2.93E+09 668 446819 2.54E+11
118 2250 132657 3.04E+08 1.02E+08 833 693474 9.21E+10
2000 750 1500000 1.50E+09 5.00E+11 457 208442 8.13E+11
2445157 3.56E+09 1.32E+12
[mm] [mm3]
yN=ΣS/ΣA 1457 WN=Io,c/yN 9.07E+08
yE=H-yN 1043 WE=Io,c/yE 1.27E+09
Slab
Slope
Beam
Area Moment of Inertia for Bridge Beam
Edge

Appendix C
83
Appendix C
C.1. MatLab Function that Calculates the Creep Coefficient According to EC2
function phi = EC2_CreepCo(f_ck,h_0,RH,Type,t_0_T,t)
%Syntax: phi = EC2_CreepCo(f_ck,h_0,RH,Type,t_0_T,t);
%
% This is a program that calculates the creep coefficient according to
% annex B in EN 1992-1-1: 2004 or EC2.
%
% Example of usage
% phi = EC2_CreepCo(30,200,50,'N',28,'inf')
% Calculates the creep coefficient with the following parameters:
% f_ck = 30 MPa; h_0 = 200 mm; RH = 50%; Type 'N'; t_0 = 28 days; t ='inf'
%
% Input
% f_ck: Characteristic cylinder strength of concrete at 28 days in MPa
% h_0: Notional size of the member in mm
% RH: Relative humidity of the ambient environment in %
% Type: Cement type: 'S' (slow); 'N' (normal); 'R' (rapid)
% t_0: The age of concrete at the time of loading in days
% t: Time being considered in days or 'inf' for infinite
%
% Output
% phi: Creep coefficient according to EC2
% Creep Coefficient According to EC2
% Date: 18th of November 2014
% Programmed by : Jóhann Albert Harðarson
% f_cm is the mean compressive strength af concrete in MPa at the age of 28
% days [Table 3.1]:
f_cm = f_ck + 8;
% α1/ α2/ α3 are coefficients to consider the influence of the concrete
% strength [B.8c]:
alpha_1 = (35/f_cm)^0.7;
alpha_2 = (35/f_cm)^0.2;
alpha_3 = (35/f_cm)^0.5;
% t_0_T takes into account the type of cement used by modifying the age of
% loading t_0 [B.9]
if Type == 'S'
alpha = -1;
elseif Type == 'N'
alpha = 0;
elseif Type == 'R'
alpha = 1;
else
error('Unknown cement type')
end
t_0 = t_0_T * (9 / (2 + t_0_T^1.2) + 1)^alpha;
% ϕ_RH is a factor to allow for the effect of relative humidity on the
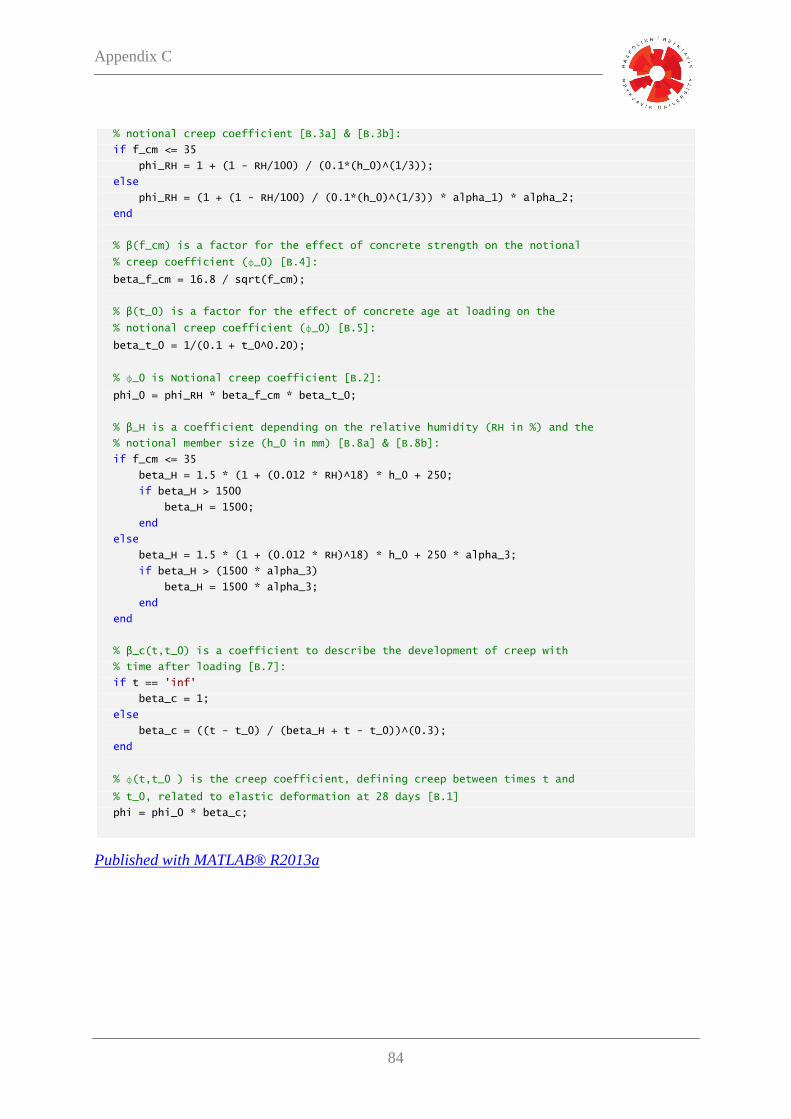
Appendix C
84
% notional creep coefficient [B.3a] & [B.3b]:
if f_cm <= 35
phi_RH = 1 + (1 - RH/100) / (0.1*(h_0)^(1/3));
else
phi_RH = (1 + (1 - RH/100) / (0.1*(h_0)^(1/3)) * alpha_1) * alpha_2;
end
% β(f_cm) is a factor for the effect of concrete strength on the notional
% creep coefficient (ϕ_0) [B.4]:
beta_f_cm = 16.8 / sqrt(f_cm);
% β(t_0) is a factor for the effect of concrete age at loading on the
% notional creep coefficient (ϕ_0) [B.5]:
beta_t_0 = 1/(0.1 + t_0^0.20);
% ϕ_0 is Notional creep coefficient [B.2]:
phi_0 = phi_RH * beta_f_cm * beta_t_0;
% β_H is a coefficient depending on the relative humidity (RH in %) and the
% notional member size (h_0 in mm) [B.8a] & [B.8b]:
if f_cm <= 35
beta_H = 1.5 * (1 + (0.012 * RH)^18) * h_0 + 250;
if beta_H > 1500
beta_H = 1500;
end
else
beta_H = 1.5 * (1 + (0.012 * RH)^18) * h_0 + 250 * alpha_3;
if beta_H > (1500 * alpha_3)
beta_H = 1500 * alpha_3;
end
end
% β_c(t,t_0) is a coefficient to describe the development of creep with
% time after loading [B.7]:
if t == 'inf'
beta_c = 1;
else
beta_c = ((t - t_0) / (beta_H + t - t_0))^(0.3);
end
% ϕ(t,t_0 ) is the creep coefficient, defining creep between times t and
% t_0, related to elastic deformation at 28 days [B.1]
phi = phi_0 * beta_c;
Published with MATLAB® R2013a

Appendix C
85
C.2. MatLab Function that Calculates the Creep Coefficient According to fib MC 10
function phi = fib_CreepCo(f_ck,h,RH,Type,t_0_T,t)
%Syntax: phi = fib_CreepCo(f_ck,h,RH,Type,t_0_T,t);
%
% This is a program that calculates the creep coefficient according to
% paragraph 5.1.9.4.3 in fib Model Code 2010, Final draft, fib bulletin 66.
%
% Example of usage
% phi = fib_CreepCo(30,200,50,'N',28,365)
% Calculates the creep coefficient with the following parameters:
% f_ck = 30 MPa; h = 200 mm; RH = 50%; Type 'N'; t_0 = 28 d; t = 365 d
%
% Input
% f_ck: Characteristic cylinder strength of concrete at 28 days in MPa
% h: Notional size of the member in mm
% RH: Relative humidity of the ambient environment in %
% Type: Cement type: 'S' (slow); 'N' (normal); 'R' (rapid)
% t_0: The age of concrete at the time of loading in days
% t: Time being considered in days
%
% Output
% phi: Creep coefficient according to fib Model Code 2010
% Creep Coefficient According to fib Model Code 2010
% Date: 8th of Desember 2014
% Programmed by : Jóhann Albert Harðarson
% f_cm is the mean compressive strength af concrete in MPa at the age of 28
% days according to eq. 5.1-1:
f_cm = f_ck + 8;
% t_0_T takes into account the type of cement used by modifying the age of
% loading t_0 (5.1-73)
if Type == 'S'
alpha = -1;
elseif Type == 'N'
alpha = 0;
elseif Type == 'R'
alpha = 1;
else
error('Unknown cement type')
end
t_0_adj = t_0_T * (9 / (2 + t_0_T^1.2) + 1)^alpha;
% The basic creep coefficient % (5.1-64)
beta_bc_1 = 1.8 / (f_cm)^0.7; % (5.1-65)
beta_bc_2 = log( (30 / t_0_adj + 0.035)^2 * (t - t_0_T) + 1); % (5.1-66)
phi_bc = beta_bc_1 * beta_bc_2; % (5.1-64)
% The drying creep coefficient % (5.1-67)
beta_dc_1 = 412 / (f_cm)^1.4; % (5.1-68)
beta_RH = (1-RH/100) / (0.1*h/100)^(1/3); % (5.1-69)
beta_dc_2 = 1 / (0.1 + (t_0_adj)^0.2); % (5.1-70)

Appendix C
86
gamma = 1 / (2.3 + 3.5 / sqrt(t_0_adj)); % (5.1-71b)
alpha_fcm = (35/f_cm)^0.5; % (5.1-71d)
if 1.5 * h + 250 * alpha_fcm <= 1500 * alpha_fcm % (5.1-71c)
beta_h = 1.5 * h + 250 * alpha_fcm;
else
beta_h = 1500 * alpha_fcm;
end
beta_dc_3 = ( (t - t_0_T) / (beta_h + (t - t_0_T)) )^gamma; % (5.1-71a)
phi_dc = beta_dc_1 * beta_RH * beta_dc_2 * beta_dc_3; % (5.1-67)
% The total creep coefficient % (5.1-63)
phi = phi_bc + phi_dc; % (5.1-63)
Published with MATLAB® R2013a

Appendix C
87
C.3. MatLab Function that Calculates the Creep Comp. According to Model B3
function J = B3_CreepCompliance(f_bar,w,c,a_c,t_0,t_d,t,v_s,h,k_s,Type)
%Syntax: J = B3_CreepCompliance(f_bar,w,c,a_c,t_0,t_d,t,v_s,h,k_s,Type);
%
% This is a program that calculates the creep compliance (note: not the
% creep coefficient) according to model B3 and curing at 100% RH.
%
% Input
% f_bar: Mean value of 28th day cylinder compressive strength in MPa
% w: Water content of concrete (kg/m^3)
% c: Cement content of concrete (kg/m^3)
% a_c: Aggregate-cement ratio, by weight
% t_0: Age at loading, in days
% t_d: Age when drying begins, in days (only t_d < t_0 is considered)
% t: Time being considered in days
% v_s: Volume-to-surface ratio in inches
% h: Relative humidity of the environment (expressed as a decimal
% number, not as percentage) 0 < h < 1;
% k_s: Cross-section shape factor
% 1.00 for an infinite slab
% 1.15 for an infinite cylinder
% 1.25 for an infinite square prism
% 1.30 for a sphere
% 1.55 for a cube
% Type: Cement type: I, II or III
%
% Output
% J: Creep compliance according to model B3 in 10E-6/MPa,
% Creep compliance according to model B3
% Date: 12th of Desember 2014
% Programmed by : Jóhann Albert Harðarson
E_28 = 4734 * sqrt(f_bar); % E-modulus at 28 days
w_c = w / c; % Water-cement ratio
% Alpha_1 Coefficient Taking into Account the Type of Cement.
if Type == 'I'
alpha_1 = 1;
elseif Type == 'II'
alpha_1 = 0.85;
elseif Type == 'III'
alpha_1 = 1.1;
else
error('Unknown cement type')
end
% Shrinkage Parameter used for Evaluation of Drying Creep
epsilon = -alpha_1 * 1.0 * (1.9E-2 * w^2.1 * f_bar^(-0.28) + 270);
% Various Parameters
q1 = 0.6E6 / E_28;
q2 = 185.4 * sqrt(c) * f_bar^(-0.9);

Appendix C
88
q3 = 0.29 * (w_c)^4 * q2;
q4 = 20.3 * (a_c)^(-0.7);
q5 = 7.57E5 * f_bar^(-1) * (abs(epsilon))^(-0.6);
% Size Dependence
k_t = 8.5 * t_d^(-0.08) * f_bar^(-1/4);
D = 2 * v_s;
tau = k_t * (k_s * D)^2;
% Time Dependence
t_max = max(t_0,t_d);
S = tanh( sqrt( (t - t_d)/tau ) );
S_max = tanh( sqrt( (t_max - t_d)/tau ) );
% Additional Creep Due to Drying (Drying Creep)
H = 1 - (1 - h) * S;
H_max = 1 - (1 - h) * S_max;
C_d = q5 * (exp(-8 * H) - exp(-8 * H_max))^0.5;
% Basic Creep (Material Constitutive Property)
C_0 = q2 * Q(t,t_0) + q3 * log(1 + (t - t_0)^0.1) +q4 * log(t / t_0);
% Creep Compliance
J = q1 + C_0 + C_d;
Published with MATLAB® R2013a

Appendix C
89
C.4. MatLab Function, Approximating the Value for Q(t,t0), Needed for Model B3
function Result = Q(t,t_0)
%Syntax: Result = Q(t,t_0);
%
% This is a program that calulates an approximate value for Q(t,t_0) for
% model B3
%
% Input
% t: Time being considered in days
% t_0: The age of concrete at the time of loading in days
%
% Output
% Result: Approximate value for Q(t,t_0)
% Approximate value for Q(t,t_0)
% Date: 12th of Desember 2014
% Programmed by : Jóhann Albert Harðarson
n = 0.1; % Empirical parameter
m = 0.5; % Empirical parameter
% Equations 1.36
r = 1.7 * t_0^0.12 + 8;
Z = t_0^(-m) * log(1 + (t - t_0)^n);
Q_f = (0.086 * t_0^(2/9) + 1.21 * t_0^(4/9))^(-1);
Result = Q_f * (1 + (Q_f / Z)^r)^(-1/r);
Published with MATLAB® R2013a

Appendix C
90
C.5. MatLab Function that Calculates the Creep Coefficient According to ACI 209
function phi = ACI_CreepCo(t_0,h,V_S,s,psi,alpha,t)
%Syntax: phi = ACI_CreepCo(t_0,h,V_S,s,psi,alpha,t);
%
% This is a program that calculates the creep coefficient according to
% annex A.1 in ACI 209.2R-08: Guide for Modeling and Calculating Shrinkage
% and Creep in Hardened Concrete. The function-model is based on moist
% curing and relative humidity higher than 40%.
%
% Input
% t_0: The age of concrete at the time of loading in days
% h: Relative humidity expressed as a decimal
% V_S: Volume-surface ratio in mm
% s: Slump in mm
% psi: Ratio of fine aggregate to total aggregate by mass expressed as %
% alpha: Air content expressed as percentage
% t: Time being considered in days
%
% Output
% phi: Creep coefficient according to ACI 209
% Creep Coefficient According to ACI 209
% Date: 15th of Desember 2014
% Programmed by : Jóhann Albert Harðarson
% Constants for a member shape and size
d = 10; P = 0.6;
% Ultimate creep coefficient (A-19)
phi_u = 2.35;
% Age of loading factor (A-22)
gamma_t0 = 1.25 * t_0^(-0.118);
% Ambient relative humidity factor (A-24)
if h < 0.4 || h > 1.0
error('The value of relative humidity is not valid')
end
gamma_RH = 1.27 - 0.67 * h;
% Size of the member factor, in terms of the volume-surface ratio (A-25)
gamma_VS = 2 / 3 * (1 + 1.13 * exp(-0.0213 * V_S));
% Slump (composition) factor (A-28)
gamma_s = 0.82 + 0.00264 * s;
% Fine aggregate factor (A-29)
if psi < 1.0 || psi > 100
error('The value of fine aggregate factor is not valid')
end
gamma_psi = 0.88 + 0.0024 * psi;
% Air content factor (A-30)

Appendix C
91
if alpha < 1.0 || alpha > 100
error('The value of air content factor is not valid')
end
if 0.46 + 0.09 * alpha < 1
gamma_alpha = 1;
else
gamma_alpha = 0.46 + 0.09 * alpha;
end
% Correction factor (A-21)
gamma = gamma_t0 * gamma_RH * gamma_VS * gamma_s * gamma_psi * gamma_alpha;
% Creep coefficient according to ACI 209 (A-18)
phi = (t - t_0)^P / (d + (t - t_0)^P) * phi_u * gamma;
Published with MATLAB® R2013a
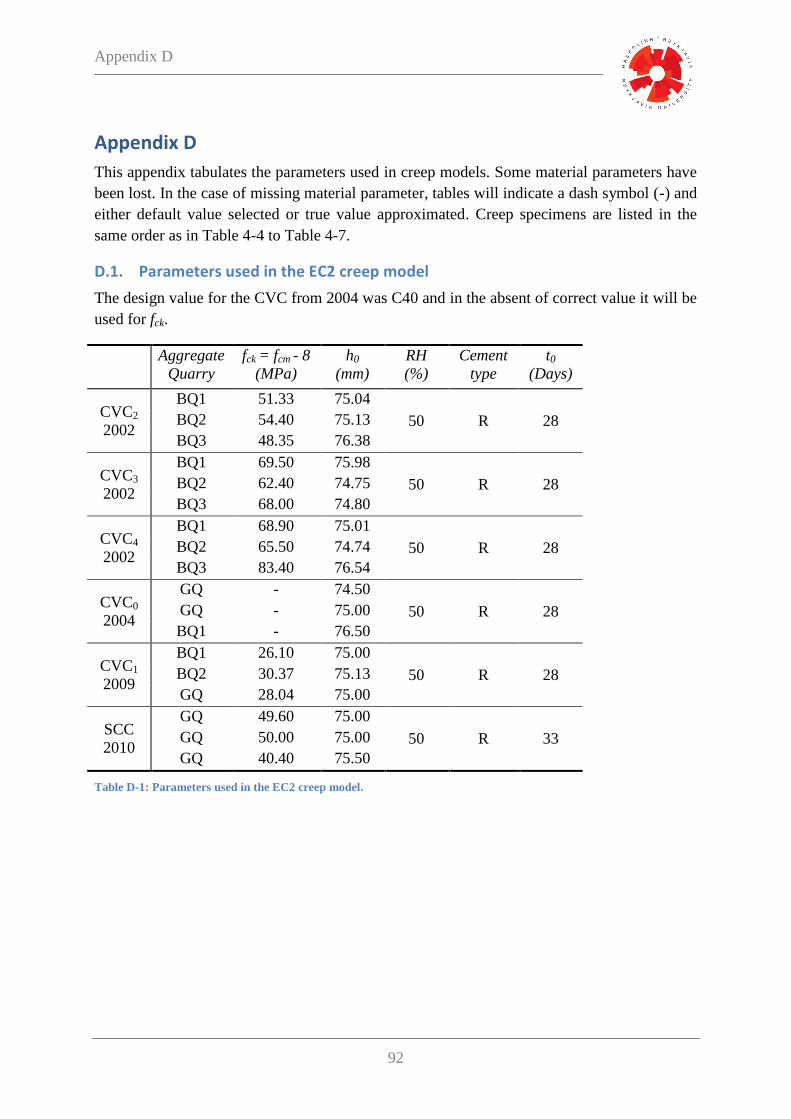
Appendix D
92
Appendix D
This appendix tabulates the parameters used in creep models. Some material parameters have
been lost. In the case of missing material parameter, tables will indicate a dash symbol (-) and
either default value selected or true value approximated. Creep specimens are listed in the
same order as in Table 4-4 to Table 4-7.
D.1. Parameters used in the EC2 creep model
The design value for the CVC from 2004 was C40 and in the absent of correct value it will be
used for fck.
Aggregate
Quarry
fck = fcm - 8
(MPa)
h0
(mm)
RH
(%)
Cement
type
t0
(Days)
CVC2
2002
BQ1 51.33 75.04
50 R 28 BQ2 54.40 75.13
BQ3 48.35 76.38
CVC3
2002
BQ1 69.50 75.98
50 R 28 BQ2 62.40 74.75
BQ3 68.00 74.80
CVC4
2002
BQ1 68.90 75.01
50 R 28 BQ2 65.50 74.74
BQ3 83.40 76.54
CVC0
2004
GQ - 74.50
50 R 28 GQ - 75.00
BQ1 - 76.50
CVC1
2009
BQ1 26.10 75.00
50 R 28 BQ2 30.37 75.13
GQ 28.04 75.00
SCC
2010
GQ 49.60 75.00
50 R 33 GQ 50.00 75.00
GQ 40.40 75.50
Table D-1: Parameters used in the EC2 creep model.

Appendix D
93
D.2. Parameters used in the fib MC 10 creep model
The design value for the CVC from 2004 was C40 and in the absence of correct value it will
be used for fck.
Aggregate
Quarry
fck = fcm - 8
(MPa)
h
(mm)
RH
(%)
Cement
type
t0
(Days)
CVC2
2002
BQ1 51.33 75.04
50 R 28 BQ2 54.40 75.13
BQ3 48.35 76.38
CVC3
2002
BQ1 69.50 75.98
50 R 28 BQ2 62.40 74.75
BQ3 68.00 74.80
CVC4
2002
BQ1 68.90 75.01
50 R 28 BQ2 65.50 74.74
BQ3 83.40 76.54
CVC0
2004
GQ - 74.50
50 R 28 GQ - 75.00
BQ1 - 76.50
CVC1
2009
BQ1 26.10 75.00
50 R 28 BQ2 30.37 75.13
GQ 28.04 75.00
SCC
2010
GQ 49.60 75.00
50 R 33 GQ 50.00 75.00
GQ 40.40 75.50
Table D-2: Parameters used in the fib MC 10 creep model.

Appendix D
94
D.3. Parameters used in the B3 creep model
The design value for the CVC from 2004 was C40 and in the absence of correct value 48 MPa
will be used for fcm. Type I cement was thought to best represent the cement used in the
mixes.
Aggreg.
Quarry
fcm
(MPa)
w
(kg/m3)
c
(kg/m3)
a/c
(-)
t0
(Days)
td
(Days)
V/S
(in)
h
(-)
ks
(-)
Cem.
type
CVC2
2002
BQ1 59.33 164.52 440.00 3.66
28 28
1.48
0.5 1.15 I BQ2 62.40 168.67 452.00 3.35 1.48
BQ3 56.35 169.06 454.00 3.73 1.50
CVC3
2002
BQ1 77.50 159.64 512.00 3.28
28 28
1.50
0.5 1.15 I BQ2 70.40 157.77 505.00 3.00 1.47
BQ3 76.00 158.98 513.00 3.34 1.47
CVC4
2002
BQ1 76.90 159.88 549.00 3.13
28 28
1.48
0.5 1.15 I BQ2 73.50 156.31 539.00 2.83 1.47
BQ3 91.40 162.13 555.00 3.15 1.51
CVC0
2004
GQ - 167.20 440.00 3.67
28 28
1.47
0.5 1.15 I GQ - 138.10 360.00 5.04 1.48
BQ1 - 141.61 359.00 5.22 1.51
CVC1
2009
BQ1 34.10 176.49 321.00 5.56
28 28
1.48
0.5 1.15 I BQ2 38.37 161.36 317.00 5.39 1.48
GQ 36.04 176.71 322.00 5.57 1.48
SCC
2010
GQ 57.60 186.66 549.00 2.64
33 33
1.48
0.5 1.15 I GQ 58.00 192.76 316.00 5.81 1.48
GQ 48.40 183.28 316.00 5.53 1.49
Table D-3: Parameters used in the B3 creep model.
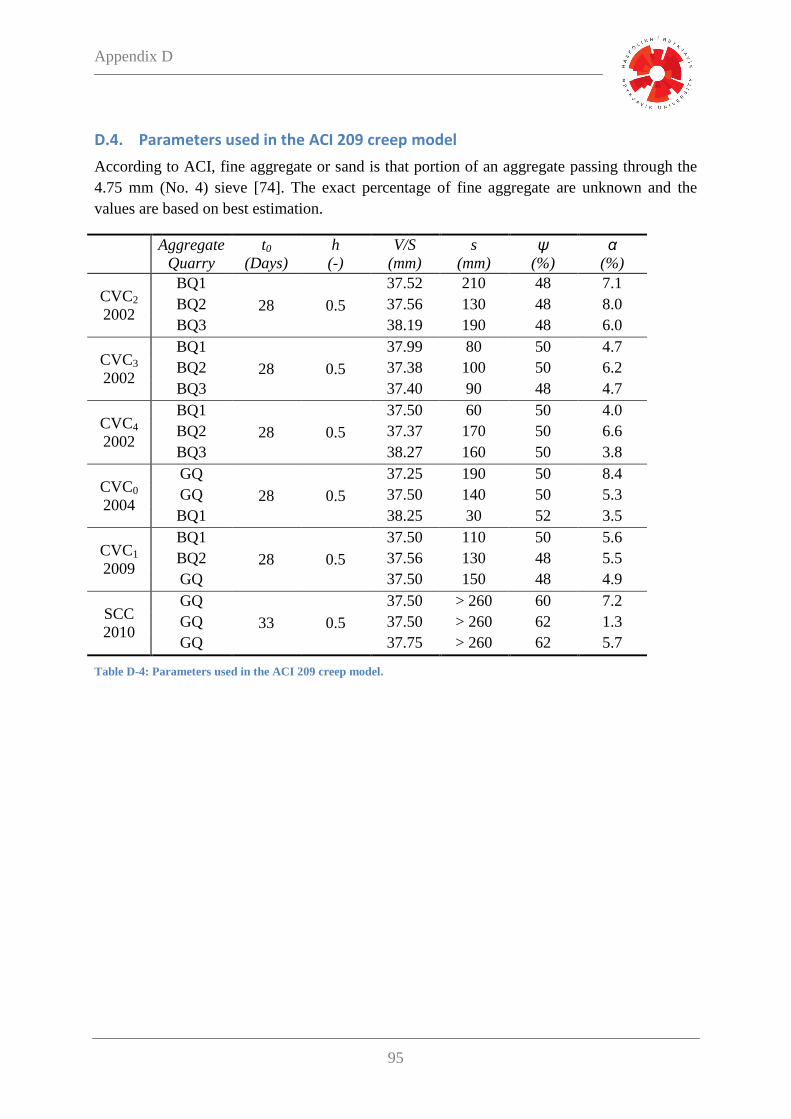
Appendix D
95
D.4. Parameters used in the ACI 209 creep model
According to ACI, fine aggregate or sand is that portion of an aggregate passing through the
4.75 mm (No. 4) sieve [74]. The exact percentage of fine aggregate are unknown and the
values are based on best estimation.
Aggregate
Quarry
t0
(Days)
h
(-)
V/S
(mm)
s
(mm)
ψ
(%)
α
(%)
CVC2
2002
BQ1
28 0.5
37.52 210 48 7.1
BQ2 37.56 130 48 8.0
BQ3 38.19 190 48 6.0
CVC3
2002
BQ1
28 0.5
37.99 80 50 4.7
BQ2 37.38 100 50 6.2
BQ3 37.40 90 48 4.7
CVC4
2002
BQ1
28 0.5
37.50 60 50 4.0
BQ2 37.37 170 50 6.6
BQ3 38.27 160 50 3.8
CVC0
2004
GQ
28 0.5
37.25 190 50 8.4
GQ 37.50 140 50 5.3
BQ1 38.25 30 52 3.5
CVC1
2009
BQ1
28 0.5
37.50 110 50 5.6
BQ2 37.56 130 48 5.5
GQ 37.50 150 48 4.9
SCC
2010
GQ
33 0.5
37.50 > 260 60 7.2
GQ 37.50 > 260 62 1.3
GQ 37.75 > 260 62 5.7
Table D-4: Parameters used in the ACI 209 creep model.

Appendix E
96
Appendix E
E.1. Calibration of Strain Gauge

Appendix E
97
E.2. Construction details for post tensioned bridge
Figure E-1: Construction details at mid-span for post tensioned bridge.
Figure E-2: Construction details at mid-span for post tensioned bridge.