Stable behaviors associated with adults' 10-year change in body mass index and likelihood of gain at...
8
Stable Behaviors Associated with Adults' 10-Year Change in Body Mass Index and Likelihood of Gain at the Waist Henry S. Kahn, MD, Lilith M. Tatham, DVM, MPH, Carmen Rodriguez, MD, MPH, Eugenia E. Calle, PhD, Michael J. Thun, MD, MS, and Clark W Heath, Jr, MD Introduction Obesity research results regarding diet and exercise are often expressed in technical terms that are difficult for the general public to understand. In the interest of developing simple obesity prevention "prescriptions," it may be helpful to identify easily described behav- iors that are associated with weight change and that are already prevalent in society. The causal interpretation of these associations will be facilitated if the identified behaviors are stable during a defined observation interval. Most previ- ous studies of weight change prospec- tively examined only changing (i.e., un- stable) behaviors or described behaviors at only one point in time. 1'2 Either method may result in difficulty disentangling cause from effect. We report here the independent associations found between consistently reported (i.e., stable) behaviors and 10- year change in body mass index (kg/m2) among healthy middle-aged US adults. We also present the associations between these same stable behaviors and the likelihood that weight gain was reported to occur at the waist. Gain at the waist is of potential importance because abdomi- nal obesity, independent of generalized overweight, is directly predictive of cardio- vascular diseases, diabetes, and certain cancers.3'4 Methods Subjects Subjects were initially recruited in 1982, by volunteers of the American Cancer Society, for the Cancer Prevention Study 1I,'5 a large prospective survey based on a four-page confidential question- naire about personal and medical history, food frequencies, cigarette smoking, and alcohol consumption. Ten years later, the American Cancer Society conducted a follow-up nutrition survey limited to Cancer Prevention Study II participants from 21 selected states who were (in 1992) between 50 and 74 years of age. A total of 184 448 subjects in the nutrition survey completed a longer questionnaire that focused in more detail on dietary intake and history of selected physical activities. We excluded nutrition survey sub- jects who were more than 54 years old at the time of the initial Cancer Prevention Study II (1982) to minimize survivorship bias and because weight gain is less common in late middle age.16 Further- more, we excluded those reporting regular diuretic use (6%), a cancer history other than nonmelanoma skin cancer (5%), diabetes (6%), or race/ethnicity other than White non-Hispanic (3%). Subjects were also excluded if they were initially very overweight (body mass index - 32 kg/ mi2; 4%) or very underweight (body mass index < 18 kg/M2; 1%) or if they reported an extreme 10-year change in body mass index (increase or decrease of greater than 8 kg/M2; 3%); these conditions suggested The authors are with the Department of Epidemi- ology and Surveillance Research, American Cancer Society, Atlanta, Ga. Henry S. Kahn is also with the Department of Family and Preven- tive Medicine, Emory University School of Medicine, Atlanta. Requests for reprints should be sent to Clark W. Health, Jr., MD, Epidemiology and Surveillance Research, American Cancer Soci- ety, Atlanta, GA 30329-4251. This paper was accepted July 29, 1996. American Journal of Public Health 747 .......
-
Upload
independent -
Category
Documents
-
view
1 -
download
0
Transcript of Stable behaviors associated with adults' 10-year change in body mass index and likelihood of gain at...

Stable Behaviors Associated withAdults' 10-Year Change inBody Mass Index and Likelihoodof Gain at the Waist
Henry S. Kahn, MD, Lilith M. Tatham, DVM, MPH, Carmen Rodriguez, MD,MPH, Eugenia E. Calle, PhD, Michael J. Thun, MD, MS,and Clark W Heath, Jr, MD
IntroductionObesity research results regarding
diet and exercise are often expressed intechnical terms that are difficult for thegeneral public to understand. In theinterest of developing simple obesityprevention "prescriptions," it may behelpful to identify easily described behav-iors that are associated with weightchange and that are already prevalent insociety.
The causal interpretation of theseassociations will be facilitated if theidentified behaviors are stable during adefined observation interval. Most previ-ous studies of weight change prospec-tively examined only changing (i.e., un-stable) behaviors or described behaviorsat only one point in time. 1'2 Either methodmay result in difficulty disentanglingcause from effect.
We report here the independentassociations found between consistentlyreported (i.e., stable) behaviors and 10-year change in body mass index (kg/m2)among healthy middle-aged US adults.We also present the associations betweenthese same stable behaviors and thelikelihood that weight gain was reportedto occur at the waist. Gain at the waist isof potential importance because abdomi-nal obesity, independent of generalizedoverweight, is directly predictive of cardio-vascular diseases, diabetes, and certaincancers.3'4
MethodsSubjects
Subjects were initially recruited in1982, by volunteers of the AmericanCancer Society, for the Cancer Prevention
Study 1I,'5 a large prospective surveybased on a four-page confidential question-naire about personal and medical history,food frequencies, cigarette smoking, andalcohol consumption. Ten years later, theAmerican Cancer Society conducted afollow-up nutrition survey limited toCancer Prevention Study II participantsfrom 21 selected states who were (in1992) between 50 and 74 years of age. Atotal of 184 448 subjects in the nutritionsurvey completed a longer questionnairethat focused in more detail on dietaryintake and history of selected physicalactivities.
We excluded nutrition survey sub-jects who were more than 54 years old atthe time of the initial Cancer PreventionStudy II (1982) to minimize survivorshipbias and because weight gain is lesscommon in late middle age.16 Further-more, we excluded those reporting regulardiuretic use (6%), a cancer history otherthan nonmelanoma skin cancer (5%),diabetes (6%), or race/ethnicity other thanWhite non-Hispanic (3%). Subjects werealso excluded if they were initially veryoverweight (body mass index - 32 kg/mi2; 4%) or very underweight (body massindex < 18 kg/M2; 1%) or if they reportedan extreme 10-year change in body massindex (increase or decrease of greater than8 kg/M2; 3%); these conditions suggested
The authors are with the Department of Epidemi-ology and Surveillance Research, AmericanCancer Society, Atlanta, Ga. Henry S. Kahn isalso with the Department of Family and Preven-tive Medicine, Emory University School ofMedicine, Atlanta.
Requests for reprints should be sent toClark W. Health, Jr., MD, Epidemiology andSurveillance Research, American Cancer Soci-ety, Atlanta, GA 30329-4251.
This paper was accepted July 29, 1996.
American Journal of Public Health 747
.......

30
25
20
* 15
10
5
Kahn et al.
the current number of days per week thesubject consumed each of 28 food itemsor groups, including 6 of red meats and 6of vegetables. Questions about other foodgroups (e.g., fruits, fish, fowl, dairyproducts) were not sufficiently developedin the study questionnaire to warrantseparate analysis or to allow for estima-tion of total caloric intake.
The nutrition survey provided self-reports (in 1992) of current weight;weight at 18 years of age; current maritalstatus; common medical diagnoses; ciga-rette smoking; use of beer, wine, or liquor;vitamin supplementation; and (for women)menopause and estrogen use. Its foodfrequency section (adapted from theHealth Habits and History Questionnaireof the National Cancer Institute17 ) askedfor the average frequency of consumptionduring the past year of 68 food items orgroups, including 8 of red meats and 8 ofvegetables. Physical activity was re-ported, both "during the past year" andretrospectively "at age 40," as the averagetime per week (none, 1 to 3 hours, 4 to 6hours, 7+ hours) spent engaging in eachof 10 identified activities: jogging/running, lap swimming, tennis/racquet-ball, bicycling/stationary bike, aerobics/calisthenics, dancing, gardening/mowing/planting, heavy housework/vacuuming,heavy home repair/painting, and walking.The question "When you gain weight,where on your body do you mainly addthe weight?" permitted six nonexclusiveresponses (chest and shoulders, waist,hips and thighs, other part of body,equally all over, don't gain weight).
Statistical AnalysesSubjects' reports in 1982 and 1992 of
cigarette smoking, vitamin E supplemen-tation (vitamin E tablets containing 100IU or more or multivitamin tablets contain-ing 30 IU), and beer, wine, and liquorconsumption were used to categorize theirusage. For each substance, the referentgroup (nonusers) explicitly reported nouse at both points in time. Other groupswere defined by their consistent reports ofusage at both points in time (see Table 1)or usage that was inconsistent or unde-fined.
Subjects' meat consumption wascategorized by calculation of their sex-specific quintile positions in 1982 (sum ofsix meat questions) and 1992 (sum ofeight meat questions). The referent group(low consumers) was defined by consis-tently being in the first quintile at bothpoints in time. Referents were comparedwith subjects reporting consistently mod-
either a problematic medical situation, an
unusual context for preventing weightgain, or that the subject had misreportedweight or height data.
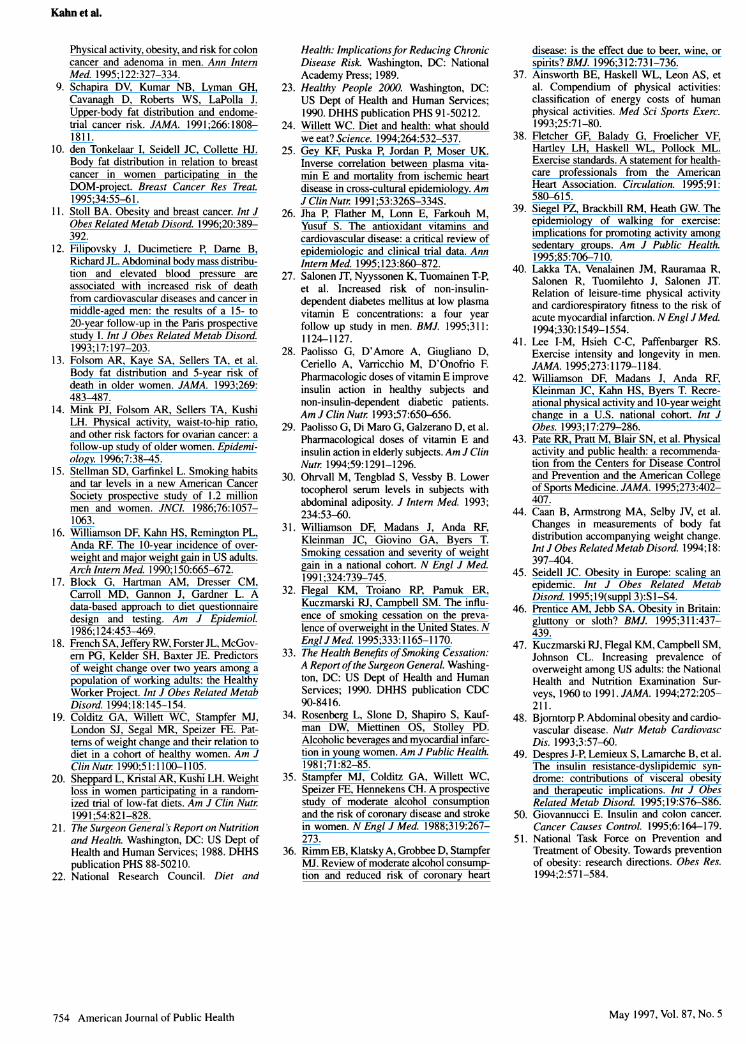
For the 35 156 men retained in theanalytic cohort, the mean baseline bodymass index was 25.6 kg/M2 (SD = 2.6);for the 44080 women retained in theanalytic cohort, the mean baseline bodymass index was 23.4 kg/M2 (SD = 3.0).The mean 10-year body mass indexchange for men was +0.6 kg/mi2
25
20
15
10
5
0
(SD = 1.7); the mean 10-year change forwomen was + 1.4 kg/M2 (SD = 1.9) (seeFigure 1).
QuestionnairesThe Cancer Prevention Study II
provided self-reports (in 1982) of height;weight; marital status; common medicaldiagnoses; cigarette smoking; use of beer,wine, or liquor; vitamin supplementation;and (for women) menopausal status andestrogen use. The diet history asked for
8
FIGURE 1 -Distribution of 1 0-year change in body mass index for analyticcohorts of 35 156 healthy men and 44 080 healthy women.
748 American Journal of Public Health
Men ages 40-54 at baseline
-8 -6 -4 -2 0 2 4 6 a
Ten-Year Change In Body Mass Index, kg/m2
Women ages 40-54 at baseline
-8 -6 -4 -2 0 2 4 4
Ten-Year Change In Body Mass Index, kg/m2
May 1997, Vol. 87, No. 5

Behaviors and Weight Change
erate (second to fourth quintile at bothpoints in time), consistently high (fifthquintile at both points in time), increasing,decreasing, or unknown consumption. Asimilar procedure was followed for catego-rizing each subject's vegetable consump-tion. HHHQ-DIETSYS analysis software(version 3.5; National Cancer Institute)was used in estimating daily intake oftotal calories in 1992 from the nutritionsurvey's entire food frequency question-naire. After identification of individualswith insufficient dietary information (9%of the cohort), the remaining subjectswere categorized by sex-specific quartileof total calorie intake.
Weekly exercise level for each of 10physical activities was categorized by theconsistency (or inconsistency) in reportedhours per week at 40 years of age (i.e.,1982 or earlier) and in 1992. The referent
group consistently reported no activities atthe two points in time. Referents were
compared with subjects who consistentlyreported 1 to 3 hours per week or 4 or
more hours per week (see Table 2); termsfor increasing, decreasing, or missing data
on the activity of interest were also
included.Each subject's 10-year change in
body mass index was calculated from
height reported in 1982 and weightsreported on the two questionnaires, ad-
justed for the time interval between
survey mailings. Multivariate linear regres-sion (sex specific) estimated the simulta-
neous mean effects on change in bodymass index associated with the behaviors
of interest.From the nutrition survey question
on anatomic gain site, we labeled as waist
gainers (11 750 men and 4261 women) all
persons who specified "waist" as the onlyplace where they added weight and who
reported a 10-year weight gain. Those
who reported gaining weight but specifiedsites other than the waist were not
included in the site-specific analyses. All
of the remaining subjects (decrease or no
change in body mass index) were classi-
fied as nongainers (14 244 men and
10 888 women) irrespective of their re-
sponses to the question on anatomic site.
Multivariate, unconditional logistic regres-sion estimated the effects on weight gainat the waist (waist gainers vs nongainers).
All of the linear and logistic models
included an adjustment for age (continu-ous) and categorical adjustments for
education, body mass index in 1982, slopeof body mass index between 18 years of
age and 1982, change in marital status,
four regions of the country, estimated total
American Journal of Public Health 749
TABLE 1 -The Relationship between 10-Year Change in Body Mass Index (1982 to 1992) and Consistently ReportedBehaviors Described at Baseline and Follow-Up
Men (n = 35 156) Women (n = 44 080)
Mean Change Mean Changein Body SE of in Body SE of
Behavior % Mass Index Change P % Mass Index Change P
Meat consumptionLowest quintile 6.0 6.6Moderate 35.6 +0.26 0.04 <.001 35.5 +0.15 0.04 <.001Highest quintile 6.0 +0.34 0.05 <.001 6.3 +0.19 0.05 <.001
Vegetable consumptionLowest quintile 6.7 7.7Moderate 36.4 -0.08 0.04 .028 36.4 -0.00 0.04 .962Highest quintile 7.4 -0.12 0.05 .012 8.0 -0.12 0.05 .009
Vitamin E supplement useNone 30.4 21.0>0 to <100 lU/day 18.4 -0.06 0.03 .025 25.3 -0.06 0.03 .016Consistently .100 lU/day 4.4 -0.11 0.04 .009 6.9 -0.10 0.04 .008
Cigarette smokingNone 54.3 73.51-20 cigarettes/day 4.8 -0.24 0.04 <.001 5.9 -0.25 0.04 <.00121 + cigarettes/day 2.5 -0.21 0.06 <.001 1.1 -0.33 0.08 <.001Quit during the 10 years 9.5 +0.97 0.03 <.001 8.1 +1.04 0.03 <.001
Beer consumptionNone 14.7 27.5>0 to <5 days/week 14.4 -0.02 0.04 .584 5.3 -0.06 0.05 .215-5 days/week 9.6 -0.11 0.04 .007 1.2 -0.44 0.09 <.001
Wine consumptionNone 17.6 16.3>0 to <5 days/week 10.8 +0.03 0.04 .456 13.4 +0.07 0.04 .074.5 days/week 4.4 -0.05 0.05 .292 5.2 -0.11 0.05 .030
Liquor consumptionNone 18.9 22.8>0 to <5 days/week 9.3 +0.02 0.04 .579 7.7 -0.04 0.04 .375.5 days/week 8.2 +0.01 0.04 .805 4.3 -0.25 0.05 <.001
Note. Linear regression controlled for age, education, region of the country, body mass index in 1982, slope of body mass index from 18 years of ageto 1982, change in marital status, total calorie intake, cigarette smoking, meat and vegetable intake, vitamin E use, alcohol intake, 10 physicalactivities, and, for women, menopausal status, estrogen use, and parity. As a result of missing data and increasing and decreasing (over the1 0-year period) levels of behavior, percentages do not sum to 100.
May 1997, Vol. 87, No. 5

Kahn et al.
daily intake of calories in 1992, and all
categorical terms describing consistent or
inconsistent smoking, diet, physical activ-ity, and other behavioral characteristics.The models for women also containedcategorical adjustments for parity, meno-
pausal status, and estrogen replacementtherapy.
Although our multivariate modelsincluded terms for subjects who increasedor decreased each of the reported behav-iors, we describe only the associationsrelated to stable behaviors (along with thespecial case of smokers who quit). If a
subject's behavior was different at the twopoints in time, we could not determinewhen the behavioral change had occurred.It would be unclear, furthermore, whetherthe behavioral change facilitated the
weight change or the weight changefacilitated the behavioral change.
ResultsTen-Year Change in Body Mass Index
Meat consumption above the firstquintile level (i.e., greater than approxi-mately 3 days or servings per week) was
associated with a body mass index in-crease (Table 1), more strongly for menthan for women; the greatest increase wasfor subjects who consumed meat consis-tently in the top quintile (i.e., greater thanapproximately 7 days or servings per
week). In contrast, there was a decrease inbody mass index for persons who con-
sumed vegetables consistently in the topquintile (i.e., greater than approximately19 days or servings per week).
The consistent use of vitamin Esupplements at or above 100 IU per daywas associated with a body mass indexdecrease (about 0.1 kg/m2) for both menand women. Lower intakes of vitamin E,mostly reported as multivitamin prepara-tions, were associated with a smaller bodymass index decrease.
People who continued to smokeexperienced a modest decrease in bodymass index (about 0.2 kg/m2 for men and0.3 kg/m2 for women). The largest meaneffect on 10-year body mass index changewas associated with cessation of cigarettesmoking. In comparison with individualswho did not smoke during the decade ofobservation, cigarette quitters experi-enced an increase of about 1.0 kg/m2.
For men who regularly consumedbeer, there was a decrease in body mass
index of about 0.1 kg/M2, but there was no
effect associated with wine or liquor.Women who regularly consumed any
form of alcohol experienced a decrease inbody mass index that was most markedfor beer (0.4 kg/M2) and least marked forwine (0.1 kg/M2).
Table 2 displays the mean 10-yearbody mass index changes associated withconsistent participation in five common
types of physical activity. Jogging/running 1 to 3 hours per week was
associated with a decrease in body mass
index (about 0.2 kg/M2 for men and about0.5 kg/M2 for women). For men whoperformed this activity for 4 or more
hours per week, there was a slightlygreater decrease in body mass index(about 0.3 kg/m2). Very few women,however, reported consistently jogging/running for 4 or more hours per week,making it impossible to demonstrate a
significant effect for women at this intenselevel.
Aerobics/calisthenics for men at anylevel was associated with a body mass
index reduction similar to the finding for
May 1997, Vol. 87, No. 5750 American Journal of Public Health
TABLE 2-The Relationship between 10-Year Change in Body Mass Index (1982 to 1992) and Consistently ReportedPhysical Activities Described Retrospectively at 40 Years of Age and Contemporaneously at Follow-Up
Men (n = 35 156) Women (n = 44 080)
Mean Change Mean Changein Body SE of in Body SE of
Activity % Mass Index Change P % Mass Index Change P
Jogging/runningNone 72.2 85.51-3 hours/week 2.8 -0.22 0.05 <.001 0.8 -0.49 0.10 <.001.4 hours/week 1.3 -0.34 0.08 <.001 0.2 -0.31 0.18 .082
Aerobics/calisthenicsNone 80.6 65.91-3 hours/week 3.9 -0.26 0.05 <.001 6.1 -0.04 0.04 .248.4 hours/week 0.6 -0.29 0.11 .011 0.8 -0.27 0.10 .008
Tennis/racquetballNone 76.8 80.71-3 hours/week 3.1 -0.09 0.05 .093 1.9 -0.17 0.07 .008.4 hours/week 1.5 -0.13 0.07 .064 1.2 -0.15 0.08 .071
Gardening/mowing/plantingNone 9.8 22.51-3 hours/week 41.5 -0.03 0.03 .295 32.8 -0.09 0.03 <.001.4 hours/week 19.8 -0.11 0.04 .004 9.9 -0.14 0.04 <.001
WalkingNone 13.8 7.61-3 hours/week 29.1 +0.01 0.03 .811 32.1 0.00 0.04 .952.4 hours/week 19.2 -0.08 0.03 .007 15.4 -0.16 0.04 <.001
Note. Linear regression controlled for age, education, region of the country, body mass index in 1982, slope of body mass index from 18 years of ageto 1982, change in marital status, total calore intake, cigarette smoking, meat and vegetable intake, vitamin E use, alcohol intake, 10 physicalactivities, and, for women, menopausal status, estrogen use, and parity. As a result of missing data and increasing and decreasing (over the1 0-year period) levels of behavior, percentages do not sum to 100.

Behaviors and Weight Change
men's jogging/running. For women, therewas a body mass index decrease associ-ated with aerobics/calisthenics performedconsistently at least 4 hours per week, butnot 1 to 3 hours per week. Among otherrelatively vigorous activities, tennis/racquetball was associated with a signifi-cant decrease in body mass index (forwomen at 1 to 3 hours per week), but wefound no mean effects on body mass
index change associated with lap swim-ming, bicycling/stationary bike, or danc-ing.
With regard to less vigorous activi-ties, there were no significant effects on
body mass index change associated withheavy housework/vacuuming or heavyhome repair/painting, but gardening/mowing/planting was associated withdecreases in body mass index for men at 4or more hours per week and for women at
1 or more hours per week (both sexes
showed a decrease of about 0.1 kg/m2).Walking was a highly prevalent activity,86% of men and 92% of women reportingwalking 1 or more hours per week on atleast one of their questionnaires. No effectwas found, however, on 10-year bodymass index change for persons who
consistently reported walking for only 1 to3 hours per week. Persons who consis-
tently reported waLking for 4 or more
hours per week experienced a small,significant decrease in body mass index,about twice as much for women as formen.
Likelihood of Gain at the Waist
For both men and women, the
likelihood of gain at the waist increased
with higher levels of meat consumptionand decreased with higher levels of
vegetable consumption (Table 3). VitaminE supplementation was associated with a
modest, graded, protective effect againstgain at the waist.
For men, continued smoking was
associated with a reduced likelihood of
gain at the waist irrespective of smokinglevel. Women who continued smoking upto a pack a day experienced a small
protection against gain at the waist, but
this effect could not be confirmed for
women smoking more than a pack a day.Quitting smoking was associated with
approximately doubling the likelihood of
gain at the waist.
Although men's use of alcohol had
no significant effects on their likelihood of
gain at the waist, women's occasional use
of beer or liquor (but not wine) was
associated with an increased likelihood of
gain at the waist. This effect could not be
American Journal of Public Health 751
TABLE 3-The Relationship between Weight Gain at the Waist and Consistently Reported Behaviors Described atBaseline and Follow-Up
Men Women
Nongainers Gainers 95% Nongainers Gainers 95%(n = 14244), (n =11 750), Adjusted Confidence (n =10888), (n = 4261), Adjusted Confidence
Behavior % % Odds Ratio Interval % % Odds Ratio Interval
Meat consumptionLowest quintile 7.0 5.3 1.00 ... 7.7 5.4 1.00 ...
Moderate 34.7 36.6 1.28 1.14,1.43 33.9 35.5 1.34 1.14,1.58Highest quintile 5.2 6.4 1.46 1.25, 1.71 5.9 6.7 1.50 1.20, 1.87
Vegetable consumptionLowest quintile 6.3 7.1 1.00 ... 7.7 8.8 1.00 ...
Moderate 36.7 36.6 0.91 0.82, 1.02 34.9 35.3 0.84 0.73, 0.97Highest quintile 8.1 6.7 0.81 0.71, 0.93 9.2 7.5 0.71 0.59, 0.86
Vitamin E supplement useNone 29.6 31.3 1.00 ... 20.9 21.2 1.00 ...>Oto <100 lU/day 19.1 18.1 0.92 0.86, 0.99 25.5 24.2 0.93 0.83,1.03Consistently .100 lU/day 5.2 3.9 0.79 0.69, 0.89 7.4 6.4 0.87 0.74,1.03
Cigarette smokingNone 57.1 52.3 1.00 ... 74.8 71.2 1.00 ...1-20 cigarettes/day 5.3 4.5 0.82 0.73, 0.92 7.3 6.5 0.86 0.74,1.0021 + cigarettes/day 2.7 2.5 0.81 0.69, 0.96 1.6 1.6 0.96 0.71, 1.29Quit during the 10 years 5.4 12.4 2.47 2.25, 2.73 4.6 9.3 2.13 1.84, 2.46
Beer consumptionNone 15.1 14.2 1.00 ... 28.5 26.7 1.00 ...>O to <5 days/week 14.3 14.5 1.05 0.94,1.18 4.7 6.6 1.21 1.00,11.46-5 days/week 9.7 9.5 0.94 0.83,1.06 1.4 1.4 0.77 0.56, 1.07
Wine consumptionNone 17.6 17.7 1.00 ... 17.6 15.9 1.00 ...>Oto <5days/week 10.6 11.0 1.03 0.91,1.16 12.6 13.1 0.97 0.82,1.15.5 days/week 4.7 4.3 0.90 0.78,11.05 5.5 6.4 1.01 0.82, 1.23
Liquor consumptionNone 19.3 18.8 1.00 ... 23.9 21.0 1.00 ...>O to <5 days/week 9.0 9.5 1.06 0.94,1.19 7.2 8.2 1.23 1.02,11.48-5 days/week 8.2 8.1 0.97 0.85,1.09 5.0 5.6 1.09 0.89,1.33
Note. Logistic regression controlled for age, education, region of the country, body mass index in 1982, slope of body mass index from 18 years ofage to 1982, change in marital status, total calorie intake, cigarette smoking, meat and vegetable intake, vitamin E use, alcohol intake, 10 physicalactivities, and, for women, menopausal status, estrogen use, and parity. As a result of missing data and increasing and decreasing (over the1 0-year period) levels of behavior, percentages do not sum to 100.
May 1997, Vol. 87, No. 5

Kahn et al.
demonstrated with women's more fre-quent alcohol use.
For men, jogging/running and aero-
bics/calisthenics had a clear inverse asso-
ciation with gain at the waist, an effectthat was stronger when the activityexceeded 3 hours per week (Table 4).Women's jogging/running for 1 to 3 hoursper week was associated with a similarprotective effect, but the effect could notbe confirmed among the very few womenwho jogged or ran 4 or more hours perweek. Women's aerobics/calisthenics wasassociated with a significant protectionagainst gain at the waist only at 4 or more
hours per week. Effects on gain at thewaist could not be discemed for tennis/racquetball (Table 4), lap swimming,bicycling/stationary bike, or dancing.
With regard to less vigorous physicalactivities, effects on gain at the waistcould not be discemed for gardening/mowing/planting (Table 4) or for heavyhousework/vacuuming. Heavy home re-
pair/painting for men was associated witha protective effect against gain at the waistat 1 to 3 hours per week (odds ratio[OR] = 0.93, 95% confidence interval[CI] = 0.86, 1.00) and at 4 or more hours
per week (OR = 0.87, 95% CI = 0.79,0.96), but this activity showed no effect ongain at the waist for women. Walking 4 or
more hours per week was associated witha reduced likelihood of gain at the waist,but this effect could not be shown forwalking only I to 3 hours per week.
DiscussionOur findings of calorie-adjusted asso-
ciations between body mass index changeand meat consumption (positive) andvegetable consumption (inverse) are simi-lar to the observational results reportedamong women elsewhere with regard tofrequency of meat consumption'8 or
estimated intake of animal fat.'9 Our studymay be the first to find a similarrelationship among men. These resultssuggest that weight change may be linkedto the proportion of energy derived fromfat20 or to other unidentified componentsof meat. Our further observations on gainat the waist support the consensus that a
diet of more vegetables and less meat willreduce chronic disease risk.2'-24
Supplementation with vitamin E was
examined because of its putative protec-
tive effect against conditions associatedwith overweight and abdominal obe-sity,2527 its ability to improve insulinaction,28,29 and its cross-sectional inverseassociation30 with the ratio of waist-to-hipcircumference (a conventional index ofabdominal obesity). Consistent with otherreports, vitamin E supplementation in our
study was associated, over time, with a
decrease in body mass index and a
reduced likelihood of gain at the waist.We cannot exclude the possibility, how-ever, that vitamin E supplementationmight be only a marker for other, unmea-sured behaviors or nutrients associatedwith weight loss.
The largest mean effect on bodymass index was experienced by the 21%of male 1982 smokers and 31% of female1982 smokers who became nonsmokersby 1992. Their self-reported 10-year bodymass index changes were similar to thoseobserved by repeated weighing of ciga-rette quitters in the first National Healthand Nutrition Examination Survey(NHANES I) follow-up cohort3' butsmaller than the 10-year body mass index
gains recently estimated for cigarettequitters in NHANES 11.32 Although
752 American Journal of Public Health
TABLE 4-The Relationship between Weight Gain at the Waist and Consistently Reported Physical Activities DescribedRetrospectively at 40 Years of Age and Contemporaneously at Follow-Up
Men Women
Nongainers Gainers 95% Nongainers Gainers 95%(n = 14244), (n = 11 750), Adjusted Confidence (n =10 888), (n = 4261), Adjusted Confidence
Activity % % Odds Ratio Interval % % Odds Ratio Interval
Jogging/runningNone 71.6 73.1 1.00 ... 85.3 85.7 1.00 ...1-3 hours/week 3.2 2.5 0.75 0.64, 0.88 1.0 0.7 0.58 0.38, 0.90.4 hours/week 1.5 0.9 0.57 0.45, 0.72 0.3 0.2 0.71 0.33, 1.55
Aerobics/calisthenicsNone 79.1 82.1 1.00 ... 67.6 68.0 1.00 ...
1-3 hours/week 4.4 3.4 0.73 0.64, 0.84 5.7 5.6 0.92 0.78,1.09.4 hours/week 0.7 0.4 0.59 0.41, 0.84 1.0 0.3 0.28 0.15, 0.52
Tennis/racquetballNone 76.4 77.2 1.00 ... 80.8 79.7 1.00 ...
1-3 hours/week 3.2 3.2 0.98 0.85,1.14 2.0 2.4 1.04 0.81,1.33.4 hours/week 1.6 1.5 0.92 0.75,1.13 1.2 1.4 1.05 0.76,1.45
Gardening/mowing/plantingNone 10.1 9.9 1.00 ... 22.2 22.8 1.00 ...
1-3 hours/week 41.2 42.8 1.04 0.95,1.14 32.3 33.4 1.02 0.92, 1.14.4 hours/week 20.1 18.4 0.92 0.82, 1.02 10.6 9.8 0.99 0.85, 1.16
WalkingNone 13.1 14.0 1.00 ... 7.7 8.6 1.00 ...
1-3 hours/week 27.9 31.3 1.08 0.99,1.17 30.5 33.0 0.98 0.85,1.13-4 hours/week 19.5 18.1 0.89 0.81, 0.98 16.3 14.6 0.84 0.71, 0.98
Note. Logistic regression controlled for age, education, region of the country, body mass index in 1982, slope of body mass index from 18 years ofage to 1982, change in marital status, total calorie intake, cigarette smoking, meat and vegetable intake, vitamin E use, alcohol intake, 10 physicalactivities, and, for women, menopausal status, estrogen use, and parity. As a result of missing data and increasing and decreasing (over the1 0-year period) levels of behavior, percentages do not sum to 100.
May 1997, Vol. 87, No. 5

Behaviors and Weight Change
smoking cessation may contribute toincreasing overweight in US adults, thenumerous health benefits of cessationexceed the risks associated with weightgain.33 Continued smoking obviously hasno place in the public health prescriptionfor preventing obesity.
Men's regular consumption of beer(but not wine or liquor) had a smallinverse effect on their 10-year body massindex change, but their alcohol use wasnot associated with gain at the waist.Women's regular consumption of beer orliquor, however, was associated withmore marked weight loss, a result consis-tent with the total alcohol effect describedin the Nurses' Health Study.'9 On theother hand, we found that women's intakeof beer or liquor (but not wine) wasassociated with an increased likelihood ofgain at the waist, at least for women whoreported occasional use. Our sex-specificfindings regarding the anatomic site ofgain may help explain why women's beeror liquor consumption might have a lessercardioprotective effect than women's wineconsumption.3435 By contrast, wine andnonwine forms of alcohol have compa-rable cardioprotective effects amongmen.36
Among the 10 physical activitiesdescribed in our study, jogging/runningwas most strongly associated with adecrease in body mass index. Jogging/running may be the most vigorous interms of typical metabolic require-ment.37'38 Self-reported bicycling, danc-ing, and lap swimming, by contrast, hadno effect on body mass index. Althoughthese three activities can also be engagedin vigorously, their metabolic intensitymay be no greater (at lower ranges) thanthat of walking.37'38 Therefore, they maynot necessarily result in high-level energyexpenditure. Their role in obesity preven-tion may require an explicit definition ofintensity level.
Despite the high prevalence of walk-ing,39 we found no significant body massindex change associated with walking foronly 1 to 3 hours per week. Men whowalked 4 or more hours per weekexperienced a modest decrease in bodymass index and small protection againstgain at the waist, less benefit than menwho spent similar amounts of time atjogging/running or aerobics/calisthenics.Other longitudinal studies have suggestedthat men's health benefits are greater fromhigh-intensity physical activity than fromwalldng'8'40'4' and that moderate physicalactivity is associated with greater protec-tion against weight gain for women than
for men.18'42 Current recommendationsfor adult physical activity38'43 may need toconsider sex differences in the benefits tobe expected from activity at varying levelsof intensity.
Our study was limited by its depen-dence on self-reported measurements andits underrepresentation of ethnic/racialminorities, poor people, and those oflower educational status. Nevertheless,our mean 10-year changes in adult bodymass index were similar to those esti-mated from NHANES Ill data, which arehighly representative of the US popula-tion and include objective height andweight.32 The accuracy with which respon-dents reported their major anatomic site ofweight gain is unknown. However, men'sgreater gain at the waist, in comparisonwith women, has been documented amongUS adults by objective measurementstaken 5 years apart.44
The epidemiologic associations sum-marized here do not prove unequivocallythat the reported behaviors were the causeof the 10-year changes in body mass indexor body fat distribution. The possibility ofnoncausal associations was reduced, how-ever, by adjustments for numerous poten-tial confounders, by the consistency ofthese findings with those of other studiesof different designs, and by the stability ofthese behaviors over 10 years in aprospective cohort.
Our analysis has identified severaleasily described behaviors that, if widelyadopted, might help reverse recent in-creases in adult overweight.45-47 By wayof theoretical example, a mean reductionof about 0.6 kg/M2 in the overall cohort's10-year body mass index could be pre-dicted from specific, simultaneous changesin meat intake (reduce to less than threeservings per week), in physical activity(adopt jogging/running at 1 to 3 hours perweek), and in vitamin supplementation(adopt vitamin E at 100 IU per day). Fornonsmokers, these three behavioralchanges might eliminate the overall mean10-year body mass index increase for menand about half of the overall mean 10-yearincrease for women. For smokers whoquit, these changes could reduce by morethan half their anticipated increase in bodymass index. Environmental changes tofacilitate these new behaviors could re-ceive widespread support if the proposalswere aimed at preventing adult weightgain.
Public policies could be developedalteinatively on the grounds that theywould reduce the likelihood of gain at thewaist. The simultaneous adoption of the
three behavioral changes in the examplejust provided could result in reducing theincidence of abdominal weight gain (mul-tiplied odds ratios) by better than half.Increases in vegetable consumption mightreduce abdominal obesity even further.Reduced abdominal obesity could resultin a lower incidence of cardiovasculardisease, diabetes, and certain cancers.48-50These estimates of benefit are necessarilylimited, however, by uncertainties regard-ing our subjects' responses to the question"Where on your body do you mainly addthe weight?" Future epidemiologic andclinical studies will require improvedtechniques for the estimation of regionaladiposity5I and its change over time. W
AcknowledgmentsWe are grateful to the thousands of volunteersthroughout the Divisions of the AmericanCancer Society who donated their time andenergy to the Cancer Prevention Study H. Manystaff members of the American Cancer Soci-ety's National Home Office participated in thecollection, management, and analysis of thesedata.
References1. Williamson DF. Dietary intake and physi-
cal activity as "predictors" of weight gainin observational, prospective studies ofadults. Nutr Rev. 1996;54(suppl II):S 101-S109.
2. Ching PLYH, Willett WC, Rimm EB,Colditz GA, Gortmaker SL, Stampfer MJ.Activity level and risk of overweight inmale health professionals. Am J PublicHealth. 1996;86:25-30.
3. Larsson B, Svardsudd K, Welin L, Wilhelm-sen L, Bjomtorp P, Tibblin G. Abdominaladipose tissue distribution, obesity, andrisk of cardiovascular disease and death:13-year follow-up of participants in thestudy of men born in 1913. BMJ. 1984;288:1401-1404.
4. Lapidus L, Bengtsson C, Larsson B,Pennert K, Rybo E, Sjostrom L. Distribu-tion of adipose tissue and risk of cardiovas-cular disease and death: a 12-year fol-low-up of participants in the populationstudy of women in Gothenburg, Sweden.BMJ. 1984;289:1257-1261.
5. Kahn HS, Austin H, Williamson DF,Arensberg D. Simple anthropometric indi-ces associated with ischemic heart disease.J Clin Epidemiol. 1996;49:1017-1024.
6. Kaye SA, Folsom AR, Sprafka JM, PrineasRJ, Wallace RB. Increased incidence ofdiabetes mellitus in relation to abdominaladiposity in older women. J Clin Epide-mio. 1991;44:329-334.
7. Cassano PA, Rosner B, Vokonas PS, WeissST. Obesity and body fat distribution inrelation to the incidence of non-insulin-dependent diabetes mellitus. A prospectivecohort study of men in the normative agingstudy. Am J Epidemiol. 1992;136:1474-1486.
8. Giovannucci E, Ascherio A, Rimm EB,Colditz GA, Stampfer MJ, Willett WC.
May 1997, Vol. 87, No. 5 American Journal of Public Health 753
Kahn et al.
Physical activity, obesity, and risk for coloncancer and adenoma in men. Ann InternMed. 1995; 122:327-334.
9. Schapira DV, Kumar NB, Lyman GH,Cavanagh D, Roberts WS, LaPolla J.Upper-body fat distribution and endome-trial cancer risk. JAMA. 1991 ;266: 1808-1811.
10. den Tonkelaar I, Seidell JC, Collette HJ.Body fat distribution in relation to breastcancer in women participating in theDOM-project. Breast Cancer Res Treat.1995;34:55-61.
11. Stoll BA. Obesity and breast cancer. Int JObes Related Metab Disord. 1996;20:389-392.
12. Filipovsky J, Ducimetiere P, Dame B,Richard JL. Abdominal body mass distribu-tion and elevated blood pressure areassociated with increased risk of deathfrom cardiovascular diseases and cancer inmiddle-aged men: the results of a 15- to20-year follow-up in the Paris prospectivestudy I. Int J Obes Related Metab Disord.1993; 17: 197-203.
13. Folsom AR, Kaye SA, Sellers TA, et al.Body fat distribution and 5-year risk ofdeath in older women. JAMA. 1993;269:483-487.
14. Mink PJ, Folsom AR, Sellers TA, KushiLH. Physical activity, waist-to-hip ratio,and other risk factors for ovarian cancer: afollow-up study of older women. Epidemi-ology. 1996;7:38-45.
15. Stellman SD, Garfinkel L. Smoking habitsand tar levels in a new American CancerSociety prospective study of 1.2 millionmen and women. JNCI. 1986;76:1057-1063.
16. Williamson DF, Kahn HS, Remington PL,Anda RF. The 10-year incidence of over-weight and major weight gain in US adults.Arch Intern Med. 1990; 150:665-672.
17. Block G, Hartman AM, Dresser CM,Carroll MD, Gannon J, Gardner L. Adata-based approach to diet questionnairedesign and testing. Am J Epidemiol.1986; 124:453-469.
18. French SA, Jeffery RW, Forster JL, McGov-em PG, Kelder SH, Baxter JE. Predictorsof weight change over two years among apopulation of working adults: the HealthyWorker Project. Int J Obes Related MetabDisord. 1994; 18:145-154.
19. Colditz GA, Willett WC, Stampfer MJ,London SJ, Segal MR, Speizer FE. Pat-terns of weight change and their relation todiet in a cohort of healthy women. Am JClin Nutr 1990;51:1100-1105.
20. Sheppard L, Kristal AR, Kushi LH. Weightloss in women participating in a random-ized trial of low-fat diets. Am J Clin Nutr1991 ;54:821-828.
21. The Surgeon General's Report on Nutritionand Health. Washington, DC: US Dept ofHealth and Human Services; 1988. DHHSpublication PHS 88-50210.
22. National Research Council. Diet and
Health: Implicationsfor Reducing ChronicDisease Risk. Washington, DC: NationalAcademy Press; 1989.
23. Healthy People 2000. Washington, DC:US Dept of Health and Human Services;1990. DHHS publication PHS 91-50212.
24. Willett WC. Diet and health: what shouldwe eat? Science. 1994;264:532-537.
25. Gey KF, Puska P, Jordan P, Moser UK.Inverse correlation between plasma vita-min E and mortality from ischemic heartdisease in cross-cultural epidemiology. AmJ Clin Nutr 1991;53:326S-334S.
26. Jha P, Flather M, Lonn E, Farkouh M,Yusuf S. The antioxidant vitamins andcardiovascular disease: a critical review ofepidemiologic and clinical trial data. AnnIntem Med. 1995;123:860-872.
27. Salonen JT, Nyyssonen K, Tuomainen T-P,et al. Increased risk of non-insulin-dependent diabetes mellitus at low plasmavitamin E concentrations: a four yearfollow up study in men. BMJ. 1995;311:1124-1127.
28. Paolisso G, D'Amore A, Giugliano D,Ceriello A, Varricchio M, D'Onofrio F.Pharmacologic doses of vitamin E improveinsulin action in healthy subjects andnon-insulin-dependent diabetic patients.Am J Clin Nutr 1993;57:650-656.
29. Paolisso G, Di Maro G, Galzerano D, et al.Pharmacological doses of vitamin E andinsulin action in elderly subjects. Am J ClinNutr 1994;59:1291-1296.
30. Ohrvall M, Tengblad S, Vessby B. Lowertocopherol serum levels in subjects withabdominal adiposity. J Intern Med. 1993;234:53-60.
31. Williamson DF, Madans J, Anda RF,Kleinman JC, Giovino GA, Byers T.Smoking cessation and severity of weightgain in a national cohort. N Engl J Med.1991 ;324:739-745.
32. Flegal KM, Troiano RP, Pamuk ER,Kuczmarski RJ, Campbell SM. The influ-ence of smoking cessation on the preva-lence of overweight in the United States. NEnglJMed. 1995;333:1165-1170.
33. The Health Benefits ofSmoking Cessation:A Report ofthe Surgeon General. Washing-ton, DC: US Dept of Health and HumanServices; 1990. DHHS publication CDC90-8416.
34. Rosenberg L, Slone D, Shapiro S, Kauf-man DW, Miettinen OS, Stolley PD.Alcoholic beverages and myocardial infarc-tion in young women. Am J Public Health.1981;71:82-85.
35. Stampfer MJ, Colditz GA, Willett WC,Speizer FE, Hennekens CH. A prospectivestudy of moderate alcohol consumptionand the risk of coronary disease and strokein women. N Engl J Med. 1988;319:267-273.
36. Rimm EB, Klatsky A, Grobbee D, StampferMJ. Review of moderate alcohol consump-tion and reduced risk of coronary heart
disease: is the effect due to beer, wine, orspirits? BMJ. 1996;312:731-736.
37. Ainsworth BE, Haskell WL, Leon AS, etal. Compendium of physical activities:classification of energy costs of humanphysical activities. Med Sci Sports Exerc.1993;25:71-80.
38. Fletcher GF, Balady G, Froelicher VF,Hartley LH, Haskell WL, Pollock ML.Exercise standards. A statement for health-care professionals from the AmericanHeart Association. Circulation. 1995;91:580-615.
39. Siegel PZ, Brackbill RM, Heath GW. Theepidemiology of walking for exercise:implications for promoting activity amongsedentary groups. Am J Public Health.1995;85:706-7 10.
40. Lakka TA, Venalainen JM, Rauramaa R,Salonen R, Tuomilehto J, Salonen JT.Relation of leisure-time physical activityand cardiorespiratory fitness to the risk ofacute myocardial infarction. N Engl J Med.1994;330: 1549-1554.
41. Lee I-M, Hsieh C-C, Paffenbarger RS.Exercise intensity and longevity in men.JAMA. 1995;273:1179-1184.
42. Williamson DF, Madans J, Anda RF,Kleinman JC, Kahn HS, Byers T. Recre-ational physical activity and 10-year weightchange in a U.S. national cohort. Int JObes. 1993;17:279-286.
43. Pate RR, Pratt M, Blair SN, et al. Physicalactivity and public health: a recommenda-tion from the Centers for Disease Controland Prevention and the American Collegeof Sports Medicine. JAMA. 1995;273:402-407.
44. Caan B, Armstrong MA, Selby JV, et al.Changes in measurements of body fatdistribution accompanying weight change.Int J Obes Related Metab Disord. 1994; 18:397-404.
45. Seidell JC. Obesity in Europe: scaling anepidemic. Int J Obes Related MetabDisord. 1995; 19(suppl 3):SI -S4.
46. Prentice AM, Jebb SA. Obesity in Britain:gluttony or sloth? BMJ. 1995;311:437-439.
47. Kuczmarski RJ, Flegal KM, Campbell SM,Johnson CL. Increasing prevalence ofoverweight among US adults: the NationalHealth and Nutrition Examination Sur-veys, 1960 to 1991. JAMA. 1994;272:205-211.
48. Bjomtorp P. Abdominal obesity and cardio-vascular disease. Nutr Metab CardiovascDis. 1993;3:57-60.
49. Despres J-P, Lemieux S, Lamarche B, et al.The insulin resistance-dyslipidemic syn-drome: contributions of visceral obesityand therapeutic implications. Int J ObesRelated Metab Disord. 1995;19:S76-S86.
50. Giovannucci E. Insulin and colon cancer.Cancer Causes Control. 1995;6: 164- 179.
51. National Task Force on Prevention andTreatment of Obesity. Towards preventionof obesity: research directions. Obes Res.1994;2:571-584.
754 American Journal of Public Health May 1997, Vol. 87, No. 5