Assessing adolescents' motivation to read Assessing adolescents' motivation to read
BIOMEDICAL AND ENVIRONMENTAL SCIENCES 23, 1220 (2010) www.besjournal.com
Waist Circumference Distribution of Chinese Schoolage Children and Adolescents ∮,*
CHENGYE JI 1,** , RITAYTSUNG 2 , GUANSHENGMA 3 , JUN MA 1 , ZHONGHUHE 1 ,ANDTIANJIAO CHEN 1
1 Institute of Child and Adolescent Health, Peking University Health Science Center, Beijing 100191, China; 2 Department of Paediatrics, The Chinese University of Hong Kong, Hong Kong Special Administrative Region, China; 3 National Institute for Nutrition and Food Safety, Chinese Center for Disease Control and Prevention, Beijing 100021, China
Background Waist circumference (WC), a proxy measure of central body fat, is a better predictor than overall body fat for cardiovascular risk factors in both adults and children. WC cutoffs have been established in many countries, but the national WC reference has not been developed in China. Objective To study the distribution of WC in a representative group of Chinese children for establishing Chinese WC cutoff points. Methods Crosssectional data obtained from 15 mainland provinces and Hong Kong were collected. There were 160 225 children and adolescents aged 718 years old in total. The subjects were divided into five regional groups namely costal city, other city, north rural, south rural, and Hong Kong, for analyzing the distribution of WC. Results A large variation in WC distribution was found among the five groups for both sexes. Coastal city group had the highest P85 WC values consistently from the early school ages to 18yearold compared with other groups. In contrast, south rural group had P85 values consistently lagged behind not only the city groups but also the north rural group. Hong Kong group had a high P85 WC at early ages, but because of the smaller increments of WC during adolescence, the P85 curve was gradually exceeded by the north rural groups. Catchup trend was found in the two rural groups since the peak of puberty. These disparities were caused by not only socioeconomic and urbanrural factors but also northsouth differences. Because of the regional variation of WC, a “gradient” prevalence of central obesity was prospected among these groups. Comparisons of WC distributions between the Chinese and the U.S.A or Netherlands demonstrated the necessary of setting up China’s own WC cutoffs. Sex and agespecific percentiles were obtained and smoothed by using LMS method. Conclusion The data obtained from this study could be used to develop national WC cutoff points for Chinese children and adolescents.
Key words: Overweight and obesity; Central obesity; Waist circumference; Chinese youth; Schoolage children and adolescents
INTRODUCTION
The use of body mass index (BMI) to classify children and adolescents as normal weight, overweight and obese has a long history. The two recognized international norms, the CDC/NCHS [1] and the IOTF references [2] , have been used most often in the developed countries, while in China, the WGOC BMIreference (2004) [3] is now widely used both for epidemiological study and clinical practice. Instead of BMI 25 and 30, 24, and 28 (kg/m 2 ) are used as cutoffs for overweight and obesity [4] . However, the most recent international preventive guidelines for the identification and treatment of childhood obesity recognize the importance of including anthropometric measures of both overall
adiposity and abdominal obesity when assessing obesityrelated health risks [5] . BMI is used as an indicator of overall adiposity, whereas the waist circumference (WC) is advocated as an indicator for the central obesity because it is a good predictor of abdominal fat and is more closely related to the development of cardiovascular diseases and type 2 diabetes mellitus [6] . These healthrelated risks can be tracked from childhood to adult life, and are linked to adulthood chronic diseases and premature death [7] . Furthermore, many studies on the different ethnic populations have demonstrated that the occurrence of hyperlipidemia, insulin resistance, hypertension, etc., and the cluster of these risk factors are associated more closely with the accumulation of abdominal fat (high WC) than the increase of total
* Funded by International Life Sciences Institute, Focal Point in China. ∮ Working Group on Obesity in China, International Life Sciences Institute, Focal Point in China. ** Correspondence should be addressed to Prof. ChengYe JI, Institute of Child and Adolescent Health, School of Public Health, Peking
University Health Science Center, #38 Xueyuan Road, Beijing 100191, People’s Republic of China. Tel: 861082805109; Fax: 861082805109; Email: [email protected]
Biography note of the first author: ChengYe JI, professor on child and adolescent health, working in the Institute of Child and Adolescent Health, Peking University Health Science Center.
08953988/2010 CN 112816/Q Copyright © 2010 by China CDC
12

WAIST CIRCUMFERENCE DISTRIBUTION OF CHINESE CHILDREN 13
body fat (high BMI) [8] . Clearly, there is a need to refine the prediction of obesityrelated health risks by using BMI and WC in combination [9] . Sex and agespecific WC percentiles have been reported for children in a number of different countries including Netherlands [10] , U.S.A [11] , Cyprus [12] , Canada [13] , United Kingdom [14] , Australia [15] , and Iran [16] , though no international reference has been established yet. In recent years, the Chinese researchers in Beijing [17] , Hong Kong [18] and Xinjiang [19] have made progress by using WC as cutoffs to classify childhood abdomen obesity. However, these cutoffs can be only used for the local regions and cannot be used for the whole nation.
The “2008 Chinese National Surveillance on Students Physical Fitness and Health”, the first national survey launched by the Ministry of Education in China, has used WC as one of the physical measures in students. By utilizing this data set and the data collected by SUNG and her colleagues in Hong Kong, the present study was to study the national distribution of WC and to establish the Chinese WC cutoffs for assessment of the obesityrelated chronic disease risk factors [20] .
SUBJECTSANDMETHODS
Subjects
Data are derived from two sources with the first coming from the 2008 Chinese National Surveillance on Students Physical Fitness and Health and the second from a study in the Hong Kong Special Administrative Region China. All subjects selected in the present study were 7 to 18yearold elementary and secondary school students who are all of Han nationality. The first set of data covered 15 provinces and cities: namely Beijing, Shanxi, Neimenggu, Liaoning, Jiangsu, Heilongjiang, Fujian, Henan, Hubei, Hunan, Guangdong, Chongqing, Yunnan, Gansu, and Xinjiang (Fig. 1). According to their residence, the subjects in each province or city were assigned into four groups: urban male, rural male, urban female, and rural female. In each of the age subgroups, there were 103129 subjects. The subjects, both of the urban and rural residence, were born and resided at least one year in the locality. The second set of data was randomly selected from all the 18 Districts in Hong Kong and no urbanrural division
FIG. 1. The distribution of 15 mainland provinces participated in the 2008 Chinese National Surveillance on Students Physical Fitness and Health.
14 JI ET AL.
was considered [18] . Same age definition was used for the two populations, and decimal years are calculated as the difference between date of data collection and birth date of the subjects.
In order to show the disparity of physical growth among different subpopulations, the subjects were redivided into five regional groups: a) group I, “Coastal city”, 5 subgroups, including the urban areas of Liaoning, Heilongjiang, Jiangsu, and both the urban and rural areas in Beijing (the rural area in Beijing was also included in this group because accompanying with the urbanization process, it has transferred into the urban area and the children’s
growth status there is similar to their urban counterparts); b) group II, “other cities”, 11 subgroups, including the urban areas in Shanxi, Neimenggu, Fujian, Henan, Hubei, Hunan, Guangdong, Chongqing, Yunnan, Gansu, and Xinjiang; c) group III, “north rural”, 6 subgroups, including the rural areas of Heilongjiang, Shanxi, Neimenggu, Liaoning, Gansu, and Xinjiang; d) group IV, “south rural”, 8 subgroups, including the rural areas of Jiangsu, Fujian, Henan, Hubei, Guangdong, Hunan, Chongqing, and Yunnan; and e) group V, “Hong Kong”. There were 160 255 subjects in total (80 866 males and 79 389 females) (Table 1).
TABLE 1
The Sample Sizes of Five Regional Groups
Coastal City Other City North Rural South Rural Hong Kong Age
(Year) Males Females Males Females Males Females Males Females Males Females
7 969 970 2 392 2 276 1 249 1 198 1 625 1 503 510 475
8 980 973 2 396 2 365 1 220 1 253 1 636 1 576 566 501
9 975 974 2 371 2 273 1 228 1 159 1 638 1 558 624 588
10 977 974 2 328 2 266 1 279 1 249 1 654 1 572 620 580
11 968 972 2 357 2 364 1 248 1 203 1 650 1 634 639 590
12 966 965 2 309 2 350 1 306 1 291 1 548 1 510 719 746
13 978 968 2 387 2 365 1 320 1 243 1 542 1 535 654 631
14 978 968 2 402 2 356 1 258 1 270 1 509 1 524 628 651
15 969 969 2 473 2 474 1 360 1 342 1 596 1 597 553 598
16 971 965 2 395 2 410 1 370 1 346 1 500 1 510 574 631
17 969 967 2 353 2 325 1 179 1 295 1 600 1 601 551 564
18 893 840 1 921 1 785 1 238 985 1 428 1 381 370 385
Total 11 593 11 505 28 084 27 609 15 255 14 834 18 926 18 501 7 008 6 940
Measurements and Analyses
This study was approved by the respective Ethics Committee of the Ministry of Health, China, and the Department of Health of the Hong Kong SAR. A fact sheet inviting to join as well as explaining the purpose and procedure was given to each student and his or her parents. All subjects had a thorough medical examination before measurements, and overt disease or physical/mental deformities were excluded.
Height (cm) and weight (kg) were measured using the same type of apparatus and followed the standard procedures recommended by Cameron [21] . They were required to wear light clothes, barefoot and at ease when being measured. WC was measured midway between the lowest rib and the superior border of the iliac crest with an inelastic measuring tape at the end of normal expiration to the nearest 0.1 cm. In the provinces of the mainland, all the
measurements were conducted by a team of technicians in each province between May and July in 2008. The technicians were required to pass a training course for anthropometric measurement. In Hong Kong, a team of 8 trained research staffs visited the schools on a prearranged date during the 2005/2006 schoolyear to collect the anthropometric data. In the provinces of the mainland, the coefficients of variation among provinces ranged from 1.7% to 2.6%. In Hong Kong, the intraclass (withinobserver) correlation coefficients, based on pairs of replicate measurements made by the same observer on 100 subjects on the same day, were 0.998 for height and weight, and 0.997 for WC.
Statistical analyses were performed on SPSS 11.5 (SPSS Inc., Chicago, IL). All five groups were independently collected with no intended overlap. Therefore, in testing the differences of growth measures (at 1year age intervals) among them, a covariance of zero was assumed. χ 2 test was used to
WAIST CIRCUMFERENCE DISTRIBUTION OF CHINESE CHILDREN 15
show the significance of difference among groups. Smoothed percentile curves were constructed for WC by using LMS method [2] . For both the sexes, the 85th percentiles of WC were compared within the five regional groups, and 85th and 95th percentile curves were used as examples to compare our WC percentiles with the WC cutoffs of overweight and obesity from other ethnic populations. For this reason, the sex and agespecific WC cutoffs for overweigh and obesity from Dutch [10] and U.S.A [11] were plotted with our data on the same chart. All statistical tests were twosided, and a Pvalue <0.05 was considered
statistically significant.
RESULTS
Waist Circumference Percentiles in Chinese Schoolage Children
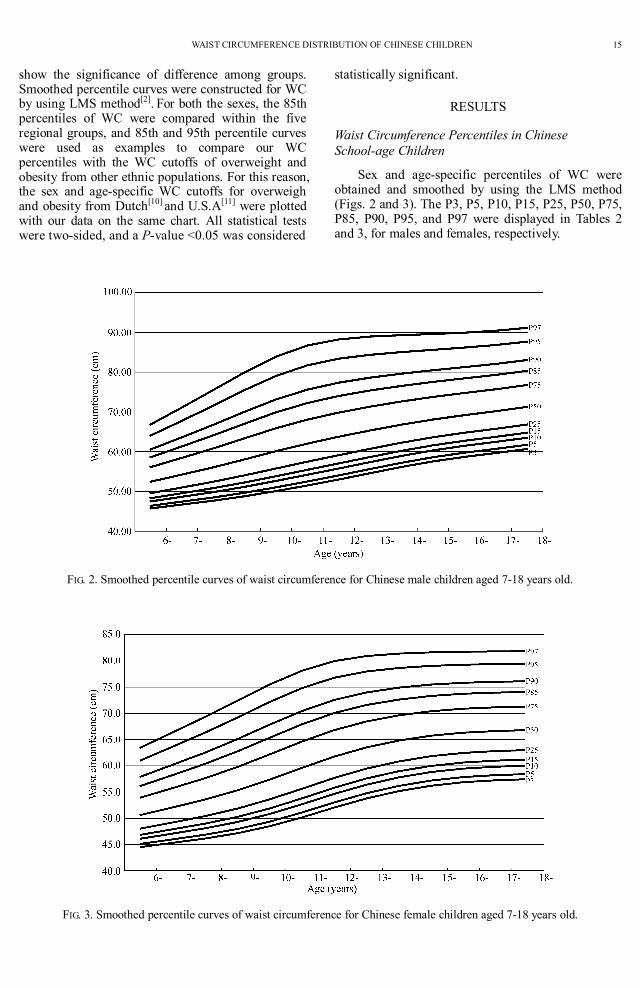
Sex and agespecific percentiles of WC were obtained and smoothed by using the LMS method (Figs. 2 and 3). The P3, P5, P10, P15, P25, P50, P75, P85, P90, P95, and P97 were displayed in Tables 2 and 3, for males and females, respectively.
FIG. 2. Smoothed percentile curves of waist circumference for Chinese male children aged 718 years old.
FIG. 3. Smoothed percentile curves of waist circumference for Chinese female children aged 718 years old.

16 JI ET AL.
TABLE 2
Agespecific Waist Circumference Percentile Values for the Male Children Aged 7 to 18yearold (cm)
Age (Years) N L M S P3 P5 P10 P15 P25 P50 P75 P85 P90 P95 P97
7 6097 2.92 54.23 0.10 46.70 47.43 48.65 49.55 51.00 54.23 58.44 61.32 63.62 67.76 71.12
8 6174 2.73 56.05 0.11 47.66 48.47 49.82 50.82 52.44 56.05 60.82 64.11 66.75 71.57 75.51
9 6187 2.55 58.05 0.12 48.78 49.67 51.16 52.25 54.04 58.05 63.37 67.05 70.04 75.49 79.97
10 6197 2.40 60.12 0.12 50.08 51.04 52.64 53.83 55.77 60.11 65.89 69.89 73.13 79.05 83.91
11 6292 2.32 62.03 0.12 51.49 52.50 54.19 55.44 57.47 62.03 68.07 72.24 75.60 81.72 86.69
12 6248 2.28 63.75 0.12 53.00 54.04 55.77 57.05 59.12 63.75 69.84 74.01 77.36 83.38 88.23
13 6181 2.27 65.33 0.12 54.60 55.64 57.38 58.65 60.73 65.33 71.32 75.39 78.62 84.37 88.94
14 5947 2.27 66.79 0.11 56.16 57.20 58.93 60.20 62.26 66.79 72.62 76.53 79.61 85.04 89.29
15 6010 2.26 68.08 0.11 57.55 58.59 60.32 61.58 63.62 68.08 73.76 77.53 80.48 85.61 89.58
16 5816 2.23 69.17 0.11 58.68 59.73 61.46 62.72 64.75 69.17 74.75 78.42 81.26 86.17 89.93
17 5899 2.18 70.17 0.10 59.66 60.71 62.45 63.72 65.75 70.17 75.69 79.29 82.06 86.81 90.41
18 5202 2.11 71.26 0.10 60.65 61.72 63.49 64.77 66.82 71.26 76.76 80.32 83.04 87.67 91.14
TABLE 3
Agespecific Waist Circumference Percentile Values for the Female Children Aged 7 to 18yearold (cm)
Age (Years) N L M S P3 P5 P10 P15 P25 P50 P75 P85 P90 P95 P97
7 5755 3.00 52.08 0.09 45.32 45.98 47.09 47.90 49.20 52.08 55.77 58.24 60.20 63.66 66.39
8 5927 2.74 53.57 0.10 46.14 46.87 48.08 48.97 50.41 53.57 57.64 60.37 62.52 66.32 69.32
9 5821 2.48 55.32 0.10 47.14 47.95 49.28 50.26 51.84 55.32 59.77 62.75 65.09 69.20 72.42
10 6021 2.24 57.37 0.11 48.47 49.35 50.81 51.88 53.60 57.37 62.17 65.36 67.84 72.17 75.51
11 6064 2.06 59.61 0.11 50.16 51.10 52.66 53.79 55.62 59.61 64.62 67.90 70.44 74.80 78.12
12 6232 1.94 61.76 0.11 52.05 53.02 54.64 55.81 57.69 61.76 66.81 70.07 72.56 76.79 79.96
13 6051 1.86 63.51 0.10 53.78 54.77 56.40 57.58 59.47 63.51 68.45 71.60 73.98 77.98 80.93
14 5897 1.80 64.81 0.10 55.16 56.16 57.79 58.96 60.83 64.81 69.61 72.63 74.89 78.65 81.39
15 6021 1.75 65.73 0.10 56.20 57.19 58.81 59.98 61.83 65.73 70.40 73.31 75.48 79.05 81.62
16 5814 1.71 66.31 0.09 56.87 57.85 59.47 60.63 62.46 66.31 70.89 73.73 75.83 79.27 81.75
17 5934 1.69 66.63 0.09 57.23 58.22 59.83 60.98 62.80 66.63 71.15 73.94 76.01 79.39 81.81
18 4598 1.68 66.81 0.09 57.45 58.43 60.03 61.19 63.00 66.81 71.30 74.07 76.12 79.45 81.84
The Different Patterns of WC Distribution in Five Regional Groups
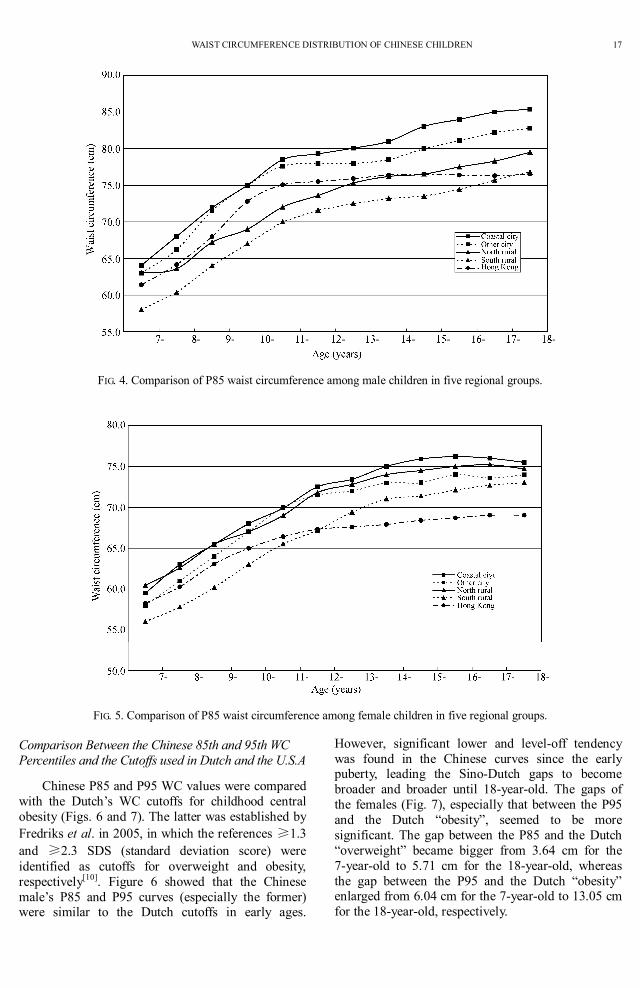
Regionalspecific WC percentiles were also obtained for the five groups (Figs. 4 and 5). Using the P85 agecurves as examples, the different patterns of WC between the groups for both the sexes were compared. For males, no evident gap was found in the 7yearold between groups I and II, but the percentile of the former exceeded above the latter since the early puberty and successively showed the highest level until to the 18yearold. In contrast, P85 values of group IV (south rural) consistently lagged behind not only the two city groups but also the “north rural” (group III). P85 values of the Hong Kong (group V) had a relative
high beginning, but because of the smaller increments of WC during the adolescent period, the P85 curve was exceeded by the “north rural” since the midpuberty. The P85 values of WC for the 18yearold males were 85.4, 82.8, 79.5, 76.8, and 76.8 cm for groups I, II, III, IV, and V, respectively. Similar differences were found within the female groups, with relative smaller gaps than that of the males. Catchup trend was found in the two rural groups, especially since the peak of puberty. Like that of the males, the increments of WC with ages for the Hong Kong adolescent girls were smaller, and their P85 curve fell to the lowest place among the five groups. The P85 values of WC for 18yearold females were 75.5, 74.0, 74.7, 73.0, and 69.0 cm in groups I, II, III, IV and V, respectively.
WAIST CIRCUMFERENCE DISTRIBUTION OF CHINESE CHILDREN 17
FIG. 4. Comparison of P85 waist circumference among male children in five regional groups.
FIG. 5. Comparison of P85 waist circumference among female children in five regional groups.
Comparison Between the Chinese 85th and 95th WC Percentiles and the Cutoffs used in Dutch and the U.S.A
Chinese P85 and P95 WC values were compared with the Dutch’s WC cutoffs for childhood central obesity (Figs. 6 and 7). The latter was established by Fredriks et al. in 2005, in which the references ≥1.3 and ≥2.3 SDS (standard deviation score) were identified as cutoffs for overweight and obesity, respectively [10] . Figure 6 showed that the Chinese male’s P85 and P95 curves (especially the former) were similar to the Dutch cutoffs in early ages.
However, significant lower and leveloff tendency was found in the Chinese curves since the early puberty, leading the SinoDutch gaps to become broader and broader until 18yearold. The gaps of the females (Fig. 7), especially that between the P95 and the Dutch “obesity”, seemed to be more significant. The gap between the P85 and the Dutch “overweight” became bigger from 3.64 cm for the 7yearold to 5.71 cm for the 18yearold, whereas the gap between the P95 and the Dutch “obesity” enlarged from 6.04 cm for the 7yearold to 13.05 cm for the 18yearold, respectively.

18 JI ET AL.
FIG. 6. Comparisons on male’s WC between the Chinese 85 and 95th percentiles and the cutoffs of overweight and obesity for the Netherlands youth.
FIG. 7. Comparisons on female’s WC between the Chinese 85 and 95th percentiles and the cutoffs of overweight and obesity for the Netherlands youth.
Chinese P85 and P95 WC values were compared with the U.S.A nationally representative references established by Fernández et al. based on the NHANES III data [11] . The SinoUS difference was more significant compared with that of the SinoDutch. For the 18yearold, the gap between the Chinese P85 and the U.S.A “overweight” was 9.28 and 13.83 cm, and between the P95 and the U.S.A “obesity” it reached 17.5 and 21.6 cm, for males and females, respectively.
DISCUSSION
The present study developed the sex and agespecific WC percentiles based on a large national representative population of schoolage children and adolescents in China. These charts could be used to establish cutoffs provisionally to identify children and adolescents with the obesityrelated risk factors [22] . The cutoffs are not predominately fixed to several percentiles, such as the P85, P90 or P95, etc., but

WAIST CIRCUMFERENCE DISTRIBUTION OF CHINESE CHILDREN 19
depend on the WC “thresholds” at which metabolic syndrome risk factors elevating and clustered [23] . The LMS method was used here to make the suitable selection because it could conveniently transfer the Z scores into any percentiles (i.e., P79, P80, P81, P82, P83…etc.) based on the calculation of the corresponding L, M, S curves [24] .
The 85 and 95th percentiles used to compare with the cutoffs of Dutch and U.S.A in the present study are only examples and do not necessarily mean that they are candidates of the Chinese WC cutoffs. Similar to those shown by the disparity of BMI cutoffs between Chinese and the American and European children [25] , the ethnic disparity of WC are probably caused by two factors. Firstly, China is now still at the early stage of obesity prevalence with most of the obesity cases being generally in mild or moderate severity, as pointed out by Prentice “…in those countries where the BMI distribution has not yet shifted significantly to the right to tip individuals beyond the defining threshold, the increase in obesity may appear negligible…” [26] . Secondly, the growth pattern of the body composition in the Chinese (especially female) seems to go through a different way in the puberty by characterization of having a significant lower and leveloff feature relative to that of the Caucasians [27] . Similar evidence has been found in other East Asian countries/areas, such as in Korea, Japan, and Hong Kong [2830] . In contrast, the definitions proposed by the Asians themselves comparatively match the growth pattern in their populations [31] . On the basis of the analyses of the cluster of cardiovascular risk factors, Ma et al. [32] , and Xu and Ji [33] , have well documented that the Chinese adolescents have a lower BMI but higher percentage of body fat than the Caucasians [34] . Our previous study on BMI also documented that most of the obese youth have a mild degree of adiposity compared with the risk factors of metabolic syndrome and other comorbidity problems in Caucasians [35] . In other words, based on the testimony of the evaluating and clustered cardiovascular risk factors, relative small values of WC cutoffs are prospected.
Because large disparities of WC distribution exist among the five regional groups (Figs. 4 and 5), the prevalence of central obesity in various Chinese subpopulations, by using a uniform WC reference, is prospected to display a gradient distribution, that is, the prevalence in group I is the highest, and successively followed by groups II, III, and IV in mainland China. These disparities are caused by the different physical growth levels of the populations which are closely associated with the socioeconomic status [36] . Highest growth status, which consistently exists from the early school ages until to the
18yearold, are found in the “coastal city” with most rapid economic progress and relatively highest livelihoods in mainland China. However, in evaluating the prevalence of central obesity in subpopulations, one of the important environment factors, the geographic “northsouth disparity”, should be taken into consideration. This factor is independent of the socioeconomic factor and makes different prevalence of childhood obesity by separately using of WC and BMI cutoffs. For example, the livelihood of the Hong Kong people is the highest in China, with the income per capital of more than US$30 000. However, the prevalence of overweight and obesity in this group, by using the national WC cutoffs, are much lower than prospected in adolescence. This feature is not only found in group III (south rural) in the present study, but also revealed both in the urban and rural southern populations in our previous study [27] . In other words, the relative lower curves of the south Chinese (especially the females) are mainly caused by the especially smaller increments of WC in adolescence. On the other hand, although the P85 of WC for the north rural group significantly lag behind that of the city groups, the evident catchup tendency of their curves in late puberty (Figs. 4 and 5) allows the higher prevalence of central overweight/obesity than prospected. Future studies are specially needed to explore the factors causing the northsouth disparities, both for BMI and WC distribution.
ACKNOWLEDGEMENT
We would like to thank Mr. WK. LIAO, Mr. WH. XING, Ms X ZHANG, and other CNSSCH (Chinese National Survey on Students’ Constitution and Health) members for providing access to the survey data. Special thanks are for Prof. ChunMing CHEN for her great contribution to the project initiation, the coordination of multicooperative works, the results interpretation, as well as the manuscript revision. We are very appreciated for the support of International Life Science Institute Focal Point in China.
REFERENCES
1. CDC/NCHS. CDC growth charts: United States. www.cdc.gov/growth charts 2000.
2. Cole T J, Bellizzi M C, Flegal K M, et al. (2000). Establishing a standard definition for child overweight and obesity worldwide: international survey. BMJ 320, 12401243.
3. Ji C Y and WGOC (2005). Report on Childhood Obesity in China (1) Body Mass Index Reference for Screening Overweight and Obesity in Chinese Schoolage Children. Biomed Environ Sci 18(6), 390400.
4. Xu Y Q, Ji C Y (2008). Prevalence of the metabolic syndrome in secondary school adolescents in Beijing, China. Acta Paedia 91, 348353.

20 JI ET AL.
5. Freedman D S,Kahn H S,Mei Z,et al. (2007). Relation of body mass index and waisttoheight ratio to cardiovascular disease risk factors in children and adolescents: the Bogalusa Heart Study. Am J Clin Nutr 86(1), 3340.
6. Watts K, Bell L M, Byrne S M, et al. (2008). Waist circumference predicts cardiovascular risk in young Australian children. J Paediatr Child Health 44(12), 709715.
7. Tzotzas T , Kapantais E , Tziomalos K, et al. (2008). Epidemiological survey for the prevalence of overweight and abdominal obesity in Greek adolescents. Obesity (Silver Spring) 16(7), 17181722.
8. Camhi S M, Kuo J, Young D R (2008). Identifying adolescent metabolic syndrome using body mass index and waist circumference. Prev Chronic Dis 5(4), A115.
9. Messiah S E,Arheart K L, Lipshultz S E, et al. (2008). Body mass index, waist circumference, and cardiovascular risk factors in adolescents. J Pediatr 153(6), 845850.
10.Fredriks AM,van Buuren S,Fekkes M,et al. (2005). Are age references for waist circumference, hip circumference and waisthip ratio in Dutch children useful in clinical practice? Eur J Pediatr 164(4), 216222.
11.Fernández J R, Redden D T, Pietrobelli A, et al. (2004). Waist circumference percentiles in nationally representative samples of AfricanAmerican, EuropeanAmerican, and MexicanAmerican children and adolescents. J Pediatr 145(4), 439444.
12.Tafouna P, Kafatos A (2001). Reference growth curves for Cypriot children 6 to 17 years of age. Obes Res 9, 754762.
13.Katzmarzyk P T (2004). Waist circumference percentiles for Canadian youth 1118 y of age. Eur J Clin Nutr 58(7), 10111015.
14.McCarthy H D, Ellis S M, Cole T J, et al. (2003). Central overweight and obesity in British youth aged 1116 years: cross sectional surveys of waist circumference. BMJ 326(7390), 624627.
15.Eisenmann J C (2005). Waist circumference percentiles for 7 to 15yearold Australian children. Acta Paediatrica 94, 11821185.
16.Kelishadi R, Gouya M M, Ardalan G, et al. (2007). CASPIAN Study Group: First reference curves of waist and hip circumferences in an Asian population of youths: CASPIAN study. J Trop Pediatr 53,158164.
17.Meng H L,Mi J,Cheng H,et al. (2007). Study on the population distribution of waist circumference and waisttoheight ratio and the suitable cutoffs for 3 to 18year old Chinese children in Beijing. Chin J Circul Pedatr 2(4), 245252 (In Chinese)
18.Sung R Y, So H K, Choi K C, et al. (2008). Waist circumference and waisttoheight ratio of Hong Kong Chinese children. BMC Public Health 8, 324.
19.Yan W, Yao H, Dai J, et al. (2008). Waist circumference cutoff points in school aged Chinese Han and Uygur children. Obesity (Silver Spring) 16(7),16871692.
20.Ma G S, Ji C Y, Ma J, et al. (2010). Optimal waist circumference references for screening cardiovascular risk factors for Chinese children and adolescents. Biomed Environ Sci 23, 1220.
21.Cameron N (1978). The methods of auxological anthropometry. In: Falkner F, Tanner J M (eds). Human growth, Vol. 2, 1st ed. New York: Plenum. pp. 3590.
22.Thompson D R, Obarzanek E, Franko D L, et al. (2007). Childhood overweight and cardiovascular disease risk factors: the National Heart, Lung, and Blood Institute Growth and Health Study. J Pediatr 150(1),1825.
23.Schwandt P, Kelishadi R, Haas G M (2008). First reference curves of waist circumference for German children in comparison to international values: the PEP Family Heart Study. World J Pediatr 4(4), 259266.
24.Cole T J (1999). Centiles of mass index for Dutch children aged 020 years in 1980—a baseline to assess recent trends in obesity. Ann Hum Biol 26(4), 303308.
25.Ji C Y and WGOC (2008). The prevalence of childhood overweight/obesity and the epidemic changes in 19852000 for Chinese schoolage children and adolescents. Obe Rev 9 (Suppl. 1), 7881.
26.Prentice A M (2006). The emerging epidemic of obesity in developing countries. Int J Epidemiol 35, 9399.
27.Ji C Y, Cheng T O (2008). Prevalence and geographic distribution of childhood obesity in China in 2005. Intern J Cardio 131(1), 18.
28.Lee K (2008). Waist circumference percentile criteria for the pediatric metabolic syndrome in Korean adolescents. Asia Pac J Clin Nutr 17(3), 422428.
29.Inokuchi M, Matsuo N, Anzo M, et al. (2007). Age dependent percentile for waist circumference for Japanese children based on the 19921994 crosssectional national survey data. Eur J Pediatr 166(7), 655661.
30.Sung R Y, Yu C C, Choi K C, et al. (2007). Waist circumference and body mass index in Chinese children: cutoff values for predicting cardiovascular risk factors. Int J Obesity 31, 550558.
31.World Health Organization Expert Consultation (2004). Appropriate body mass index for Asian populations and its implications for policy and intervention strategies. Lancet 363, 157163.
32.Ma G S, Li Y P, Hu X Q, et al. (2006). Verification of BMI classification reference for overweight and obesity in Chinese children and adolescents. Biomed Environ Sci 19, 17.
33.Xu Y Q, Ji C Y, and WGOC (2008). Report on Childhood Obesity in China (7) Comparison of NCHS and WGOC. Biomed Environ Sci 21(4), 271279.
34.Ji C Y, Sun J L (2006). Regional and population variability of body mass index among Chinese school children and adolescents. World J Pediatr 1(2), 2934.
35.Xu Y Q, Ji C Y (2008). Prevalence of the metabolic syndrome in secondary school adolescents in Beijing, China. Acta Paediatrica 91, 348353.
36.Ji C Y, Cheng T O (2009). Epidemic increase in overweight and obesity in Chinese children from 1985 to 2005. Intern J Cardio 132(1), 110.
(Received December 28, 2009 Accepted January 14, 2010)
Copyright © 2022 FDOKUMEN