Cut-points for Waist Circumference in Europids and South Asians
27
Deakin Research Online Deakin University’s institutional research repository DDeakin Research Online Research Online This is the authors’ final peer reviewed version of the item published as: Cameron, Adrian J., Sicree, Richard A., Zimmet, Paul Z., Alberti, K. George M. M., Tonkin, Andrew M., Balkau, Beverley, Tuomilehto, Jaakko, Chitson, Pierrot and Shaw, Jonathan E. 2009-12-17, Cut-points for waist circumference in Europids and South Asians, Obesity, vol. 18, no. 10, pp. 2039-2046. Available from Deakin Research Online: http://hdl.handle.net/10536/DRO/DU:30024029 Copyright : © 2009, The Obesity Society
-
Upload
independent -
Category
Documents
-
view
0 -
download
0
Transcript of Cut-points for Waist Circumference in Europids and South Asians

Deakin Research Online Deakin University’s institutional research repository
DDeakin Research Online Research Online This is the authors’ final peer reviewed version of the item published as: Cameron, Adrian J., Sicree, Richard A., Zimmet, Paul Z., Alberti, K. George M. M., Tonkin, Andrew M., Balkau, Beverley, Tuomilehto, Jaakko, Chitson, Pierrot and Shaw, Jonathan E. 2009-12-17, Cut-points for waist circumference in Europids and South Asians, Obesity, vol. 18, no. 10, pp. 2039-2046. Available from Deakin Research Online: http://hdl.handle.net/10536/DRO/DU:30024029 Copyright : © 2009, The Obesity Society

Manuscript title: Cut-points for waist circumference in Europids and South Asians.
Running title: Cut-points for waist circumference in Europids and South Asians.
Author names and affiliations: Adrian J Cameron1,2, Richard A Sicree1, Paul Z
Zimmet1, KGMM Alberti 3, Andrew M Tonkin2, Beverley Balkau1,4,5, Jaakko
Tuomilehto6, Pierrot Chitson7, Jonathan E Shaw1
1 Baker IDI Heart and Diabetes Institute, Melbourne, Australia
2 Monash University, Department of Epidemiology and Preventive Medicine,
Melbourne, Australia
3 Department of Medicine, University of Newcastle, Newcastle upon Tyne, United
Kingdom
4 INSERM, Unit 780, Villejuif Cedex, France
5 Université Paris-Sud 11, Orsay, France
6Department of Public Health, University of Helsinki, Helsinki, Finland
7Ministry of Health and Quality of Life, Mauritius
Correspondence to:
Adrian Cameron,
Baker IDI Heart and Diabetes Institute, 250 Kooyong Road, Caulfield, Australia, 3162.
Telephone: +61 3 9258 5041; Fax: +61 3 9258 5090
Email: [email protected]
Keywords
Waist circumference, Obesity, Metabolic Syndrome, Type 2 diabetes, Ethnicity
Disclosure: The authors have no conflicts of interest to declare

Abstract
There is little strong evidence that currently recommended higher waist circumference
cut-points for Europids compared with South Asians are associated with similar risk for
type 2 diabetes. This study was designed to provide such evidence.
Longitudinal studies over five years were conducted among 5515 Europid and 2214
ethnically South Asian participants. Age-standardized diabetes incidence at different
levels of waist circumference and incidence difference relative to a reference value were
calculated. The Youden Index was used to determine waist circumference cut-points.
At currently recommended cut-points, estimated annual diabetes incidence for a 50 year
old Europid was < 0.6% for both sexes, and for a 50 year old South Asian, 5.8% for
men and 2.1% for women. Annual diabetes incidence of 1% was observed for a 50 year
old at a waist circumference 35-40 cm greater in Europid compared to South Asian men
and women. Incidence difference between recommended cut-points and a reference
value (80 cm in men, 70 cm in women) was 0.3 and 4.4 percent per year for Europid
and South Asian men, and 0.2 and 0.8 percent per year for Europid and South Asian
women respectively.
Waist circumference cut-points chosen using the Youden Index were shown to be
dependent on obesity levels in the population.
The much higher observed risk of diabetes in South Asians compared to Europids at the
respective recommended waist circumference cut-points suggests that differences
between them should be greater. Approaches that use the Youden Index to select waist
circumference cut-points are inappropriate and should not be used for this purpose.

Introduction
The continuing rise in the proportion of adults who are overweight and obese observed
in most developed countries over the past three decades is now also being seen in
developing countries.(1) The increasing global burden of chronic non-communicable
diseases has been described as setting the agenda for global public health, with
pandemics of obesity and type 2 diabetes threatening progress toward achievement of
the Millennium Development Goals.(2) Obesity is associated with an increased risk of
many diseases including type 2 diabetes, cardiovascular diseases and several cancers as
well as premature mortality,(3-5) and is a precursor to the development of the
components of the metabolic syndrome.(6) Because obesity is modifiable and often
occurs many years before the development of the associated negative health outcomes,
it is an ideal target for chronic disease prevention.
Increasingly, abdominal obesity has been shown to be a stronger indicator of associated
risk than overall body fatness as measured by the Body Mass Index (BMI).(1, 7-9)
Waist circumference is easily determined and a commonly used and valid surrogate
measure of abdominal adiposity.(10) Evidence-based cut-points for abdominal obesity
are therefore important for both clinical and public health uses.
The cut-points of waist circumference for overweight and obesity recommended by the
World Health Organization (WHO) (men 94/102 cm; women 80/88 cm)(1) were those
statistically corresponding to a BMI of 25 and 30 kg/m2, respectively in a small study
involving a largely Europid population.(11) Specific cut-points for other ethnic groups
have been published by some organizations,(12) but not the WHO. A large number of
studies have attempted to define waist circumference cut-points related to ethnicity,(13-
34) mostly using approaches based on Receiver Operating Characteristic (ROC) curves.
Little evidence exists from longitudinal studies with incident outcomes such as type 2

diabetes and cardiovascular disease. Despite an abundance of reports from cross-
sectional studies, there remains a need for evidence to inform waist circumference cut-
points in different ethnic groups, (35, 36) and the methods used for selecting them.(37)
Using data from two national, longitudinal cohort studies, our primary aim was to
determine whether differences in currently recommended waist circumference cut-
points between Europids and South Asians are an adequate reflection of the differences
in risk for incident type 2 diabetes related to obesity between the two populations. We
compared the following using the two populations:
1. The incidence of diabetes at currently recommended waist circumference cut-
points.
2. The waist circumference at which the age-adjusted annual incidence of diabetes
is 1%. This method compares the two populations at a fixed level of absolute
risk.
3. The waist circumference increment at which diabetes incidence increases by
50%, 100% and 200% above that observed for the 10th percentile of waist
circumference. This method compares the two populations at fixed levels of
relative risk.
4. The age and waist circumference profile of those who developed diabetes in the
two populations.
5. The waist circumference cut-points determined using the Youden Index (the
waist circumference at which sensitivity + specificity for incident diabetes is
maximized) and whether this was affected by the prevalence of obesity in the
population.

Methods and Procedures
Population-based surveys
The study methods and response rates for both the AusDiab and Mauritius surveys have
been described in detail elsewhere.(38, 39)
The AusDiab study was a nation-wide population-based stratified cluster survey of
11247 Australian adults (45% men) aged ≥25 years in 1999-2000. The response rate
was 55% of those completing a household interview, estimated to be 37% of the eligible
population. In 2004-2005, 59% (n=6400) of the 10788 eligible participants returned for
a follow-up physical examination.
The Mauritius non-communicable disease survey began in 1987 and included all
persons aged ≥25 years living in 10 randomly selected population clusters and a
purposely selected area of Chinatown in Port Louis. Response rate was 80% (n=5083).
Of those surviving and eligible, 74% (n=3771) were followed up in 1992.
Survey procedures
Those individuals with diabetes at baseline, pregnant women and those without data on
waist circumference or diabetes status at baseline or follow-up were excluded from all
longitudinal analyses. Only those defined as having Europid ancestry in AusDiab, and
South Asian ancestry in Mauritius were included. Ancestry was based on country of
birth and language spoken at home in the AusDiab study, and self-reported ethnicity in
Mauritius (Chinese, Creole or South Asian). After exclusions, the number available for
longitudinal analyses in Mauritius from 1987 to 1992 was 2214; and in AusDiab from
2000 to 2005, 5515.

In both studies, and at both time points, a 75g oral glucose tolerance test (OGTT) was
performed on all non-pregnant participants, except those taking insulin or oral anti-
diabetic drugs. For the purpose of this report, diabetes was classified according to the
WHO criteria.(40)
Biochemical measures and blood pressure for all surveys were obtained as previously
described.(41, 42) In the AusDiab study, waist circumference was measured mid-way
between the lower border of the ribs and the iliac crest on a horizontal plane. In
Mauritius, waist circumference was measured as the minimum value of the horizontal
plane between the xiphisternum and umbilicus.(42) In both surveys, two measurements
to the nearest 0.5 cm were recorded. If the measurements varied by more than 2 cm, a
third measurement was taken and the mean of the two closest measurements calculated.
A study of mean waist circumference in a multi-ethnic population found the difference
between measurements taken at the mid-point between the ribs and the iliac crest and
the narrowest waist to be only 1.5 cm in men and 2.7 cm in women.(43) For this reason,
1.5 cm and 2.7 cm was added to the waist circumference of all South Asian men and
women respectively for all analyses involving comparisons of Europid and South Asian
populations.
The AusDiab survey protocols were approved by the Ethics Committee of the
International Diabetes Institute and the Monash University Standing Committee on
Ethics in Research involving Humans (SCERH). The Mauritius survey protocols were
reviewed and approved by the Alfred Healthcare Group Ethics Committee (Melbourne,
Australia) as well as the Ministry of Health, Mauritius. Informed consent was obtained
from all participants.
Statistical Analysis
Statistical analysis used SPSS 15.0 (SPSS Inc., Chicago IL, USA). Means (±SD) or
proportions of various physical and demographic characteristics were calculated and

compared using t-tests, Mann-Whitney U tests or chi-square tests as appropriate.
Geometric means and geometric standard deviations were calculated for skewed
variables (triglycerides, fasting and 2-hour post load plasma glucose). Gender- and
population-specific logistic regression adjusted for age and age squared was used to
estimate diabetes incidence for a 40, 50 and 60 year old, at 1 cm intervals of waist
circumference. Improvement in the model after inclusion of a waist squared term was
tested using a post-estimation likelihood ratio test. Model fit was assessed via Hosmer
and Lemeshow goodness-of-fit statistics. A similar logistic regression including
interaction terms of waist circumference and both sex and ethnicity was modelled in a
dataset including participants from both surveys. The 10th percentile of waist
circumference and the diabetes incidence for a 50 year old at this waist circumference
were calculated for men and women in both populations. The waist circumference at
which diabetes incidence was 50%, 100% and 200% greater than that seen at the 10th
percentile of waist circumference was calculated in order to assess the strength of the
relationship between waist circumference and diabetes in each population.
ROC curves for the prediction of diabetes were constructed and the waist circumference
that maximised the sum of sensitivity and specificity (the Youden Index) calculated.(44)
To assess the impact of the prevalence of obesity on the value of the Youden Index,
ethnically and culturally similar populations with differing levels of obesity were
required. Two approaches were used. Firstly, cut-points were calculated for prevalent
diabetes (screen detected and diagnosed) in the 1987 and 1992 Mauritius surveys. The
1987 cohort included those who attended the 1987 survey only, and a randomly selected
50% of those who attended both the 1987 and 1992 surveys. Conversely, the 1992
cohort included those who attended the 1992 survey only, and the randomly selected
50% of those who attended both the 1987 and 1992 surveys not included in the 1987
cohort (i.e. no individual is included in both the 1987 and 1992 cohorts tested - they are

separate populations). The 1987 and 1992 Mauritius surveys were chosen because of the
sharp increase in mean waist circumference between 1987 and 1992. Secondly, cut-
points were calculated from two Europid cohorts with “high” and “low” average waist
circumference in the AusDiab study. This was done by random selection of individuals
within each decile of waist circumference, with the proportion included in the “high”
cohort increasing from 30% of the lowest decile to 75% of the highest decile (and vice
versa for the “low” cohort).
Role of the funding source
The study sponsors had no role in study design; in the collection, analysis, and
interpretation of data; in the writing of the report; or in the decision to submit the paper
for publication.
Results
The baseline physical and demographic characteristics of those who attended both
surveys in the AusDiab and Mauritius studies are shown in Table 1. At baseline,
Europid subjects from AusDiab were on average older, and had higher BMI, waist
circumference, fasting plasma glucose and systolic blood pressure levels and a higher
percentage reported tertiary education (all p<0.001). Mean waist circumference was 19
cm greater in Europid than South Asian men (97 cm vs 79 cm) and 11 cm greater in
Europid than South Asian women (84 cm vs 76 cm) (both p<0.001). Smoking was more
common in men than women, and strikingly so among South Asians (56.8% in men vs.
1.4% in women) (p<0.001).
[Insert Table 1 here]
Relationship between waist circumference and diabetes
Five year diabetes incidence was 3.8% (n=210) among Europid AusDiab participants,
and 9.4% (208) in South Asian participants in the Mauritius study. Models predicting

incident diabetes did not improve (at p<0.05) following the inclusion of a waist squared
term for either the South Asian or Europid populations (or in a combined dataset),
suggesting a log-linear relationship between waist circumference and diabetes
incidence. In a combined dataset containing cases from both studies, interactions of
waist circumference and sex and of waist circumference and ethnicity were not
statistically significant (p>0.05). No evidence of lack of fit was observed with age and
an age-squared term included in the model, with Hosmer and Lemeshow statistics not
significant for either the Mauritius or Europid cohort in men or women (all p>0.3).
Relative to annual diabetes incidence at the 10th percentile of waist circumference
(0.96% and 1.27% in South Asian women and men respectively, 0.25% and 0.35% in
Europid women and men respectively), the increment in centimetres of waist
circumference over which age-adjusted incidence increased by 50%, 100% and 200%
was essentially the same for Europid and South Asian women (9 cm, 15 cm and 24 cm
respectively). In men, diabetes incidence increased by 50%, 100% and 200% over 7 cm,
12 cm and 20 cm in Europids and 6 cm, 10 cm and 17 cm in South Asians. The similar
relationship between diabetes incidence and waist circumference in these populations is
also reflected in similar age- and sex-adjusted odds ratios of developing diabetes (1.052
(95%CI 1.041-1.064) per cm of waist circumference in Europids and 1.059 (1.044-
1.074) per cm in South Asians; both sexes combined for each ethnicity).
Difference in age-adjusted risk
Five-year incidence of diabetes (for a 50 year old) was ~11 fold higher among South
Asian men and ~ 6 fold higher for women at any level of waist circumference (Figures
1a and 1b), with a 1% annual incidence of diabetes occurring at a waist circumference
35-40 cm greater in Europids compared to South Asians for both men (103 cm vs. 65
cm) and women (99 cm vs. 64 cm). Similar results were observed when the relationship
was modelled for a 40 or 60 year old respectively.

Risk at currently recommended cut-points
At the currently recommended waist circumference cut-points (94 cm and 90 cm in
Europid and South Asian men respectively; 80 cm in both Europid and South Asian
women), estimated annual diabetes incidence for a 50 year old was 0·6% and 0·4% in
Europid men and women, respectively, and 5.8% and 2.1% in South Asian men and
women, respectively. The magnitude of difference was similar when the relationship
was modelled for a 40 or 60 year old respectively.
The difference in annual incidence at recommended Europid cut-points compared to a
reference waist circumference of 70 cm in women and 80 cm in men was calculated. In
Europid men at 50 years of age, the difference was 0.3% per year, while in South Asian
men at 50 years of age, the difference was 4.4% per year. The corresponding figures for
Europid and South Asian women at 50 years of age were 0.2% per year and 0.8% per
year.
Waist circumference and age profile of those developing diabetes
The 210 Europid participants who developed diabetes over five years were on average
older (mean age 54 and 57 years for women and men respectively) and with a larger
waist circumference (mean 93 cm and 104 cm for women and men respectively) than
their 207 South Asian counterparts (mean age 47 years and 44 years; mean waist 82 cm
and 84 cm for women and men respectively).
Effect of obesity prevalence on the Youden Index
To determine whether cut-points based on maximizing the Youden Index are affected
by the prevalence of obesity in the population, we calculated such cut-points among
ethnically and culturally similar populations with differing levels of abdominal obesity.
Figure 2 shows the mean waist circumference and cut-points calculated from the 1987
and 1992 Mauritius surveys, analysed cross-sectionally with the outcome of prevalent

diabetes. In both men and women, cut-points increased between 1987 and 1992 (Men:
1987, 80.5cm (sens. 0.64, spec. 0.33, AUC 0.70); 1992, 88.9cm (0.49, 0.28, 0.64).
Women: 1987, 77.9cm (0.68, 0.35, 0.69); 1992, 82.5cm (0.78, 0.53, 0.69)), mirroring
the increase in mean waist circumference over this period (77.5cm to 85.5cm in men
and 76.5cm to 83.3cm in women).
Figure 3 shows the results of an analysis from the 1999/2000 AusDiab survey (analysed
cross-sectionally) in which the cohort was divided into two groups – one with a higher
average waist circumference than the other. “Optimal” cut-points calculated were
greater in the sub-group selected to have higher average waist circumference (Men,
101.6cm (sens. 0.67, spec. 0.38, AUC 0.68); Women 89.9cm, (0.69, 0.38, 0.65) than
among those with lower average waist circumference (Men, 96.2cm (0.74, 0.35, 0.74);
Women, 85.7cm (0.67, 0.27, 0.69), again mirroring the difference in mean waist
circumference between the two groups.
Discussion
These results demonstrate that in these populations, the difference between
recommended waist circumference cut-points in Europid and South Asian populations
(4 cm in men, no difference in women) does not lead to similar diabetes risk at the cut-
points. High risk for diabetes in the South Asian population studied was observed at
what have been traditionally regarded as normal waist circumference values (even for
this ethnic group), suggesting that waist circumference cut-points in South Asians
should be lower than currently recommended, for both men and women.
Our observations add to the accumulating evidence suggesting that people of South
Asian ancestry develop risk factors for cardiovascular disease and type 2 diabetes at
lower levels of waist circumference than Europids.(45)

Should the Youden Index/ROC curves be used to determine waist circumference
cut-points?
Approaches based on ROC curve analyses have been used almost exclusively in studies
aiming to choose waist circumference cut-points in different ethnic groups (13-25, 27-
34), with few studies using other methods.(46) Stevens et al. have explored other
methods for the choice of cut-points in relation to the BMI.(37)
Maximizing the Youden Index(44) has been recommended to determine an “optimal”
point on a ROC curve, minimising the impact of the prevalence of the outcome while
obtaining the cut-point with the optimal (equally weighted) combination of sensitivity
and specificity.(47)
A serious and largely ignored limitation of the Youden Index for the selection of
“optimal” waist cut-points is that such cut-points are linked to the prevalence of the risk
factor (in this case, obesity) in the population. Indeed, to our knowledge Stevens et al.
are the only authors in this field to have identified and noted the impact of the
distribution of obesity on specificity and sensitivity.(26) Although this property of the
Youden Index may be intuitively obvious to some, the fact that it has largely gone
unacknowledged (with ongoing use of the Youden Index for estimation of waist cut-
points) leads us to believe that this is an important point to demonstrate, as we have
done using both the Mauritius and AusDiab cohorts. The Youden Index is simply the
most efficient way of dividing a specific population, rather than reflecting the nature of
a biological association between a risk factor and a disease. The cut-point identified will
be particular to the tested population and its risk factors levels, and is unlikely to be the
most efficient cut-point in another population, even one of the same ethnicity.
Our analysis of these Europid and South Asian populations demonstrates that the mean
waist circumference and Youden Index-derived cut-point are positively correlated for
these groups. Similar results have been observed in immigrant populations in the United

States and the United Kingdom, where consistently higher Youden Index-derived waist
circumference cut-points are observed than those from ancestrally similar but slimmer
populations living in either their native countries or countries with lower levels of
adiposity.(13, 26) Furthermore, Youden Index-derived waist circumference cut-points
in older populations have been shown to differ considerably from those obtained in
younger, less obese populations.(17) Intuitively, cut-points should not change with the
prevalence of obesity in a population. Therefore, the changeable nature of Youden
Index-derived cut-points means they are inappropriate for use beyond the specific
population in which they were generated, and at that specific time.
Challenges in the choice of waist circumference cut-points
While there are obvious benefits in establishing waist circumference cut-points
appropriate for different ethnic groups, the increasingly multi-cultural nature of many
communities means that problems such as communicating the use of multiple cut-points
within a single population and the calculation of cut-points for individuals of mixed
ethnicity will become increasingly common.(37) Indeed, the feasibility of ethnicity-
specific cut-points in multi-ethnic societies such as the Unites States has been
questioned.(37) Furthermore, a method for recognising in cut-points the age-
dependency of the relationship between obesity and cardiovascular disease risk factors
(often absent in the elderly)(48) has thus far not been developed.
The relation between waist circumference and diabetes risk is continuous.(5) No natural
cut-point exists, meaning that the choice of cut-point is essentially arbitrary and should
account for both scientific and economic considerations. It is indeed possible that the
best way to reflect ethnic differences in risk may be through the creation of country-
specific guidelines, rather than ethnicity-specific global waist circumference cut-
points.(49) Both are likely to be required in practice, however, with country-specific
guidelines also needing to be informed by accurate scientific evidence.

Consensus has not been reached in the obesity literature regarding the most appropriate
method for selecting waist circumference cut-points. We have suggested here that the
Youden Index is inappropriate, and have investigated other methods such as comparison
of incidence rates and incidence differences relative to a reference value. The latter of
these two methods has been suggested as being a more meaningful estimate because of
the non-obesity related influences that can impact incidence rates.(37) In our analysis,
however, as has been shown previously,(37) when the difference in incidence between
the populations is great, choosing cut-points corresponding to existing Europid cut-
points remains difficult. We have observed in Figures 1a and 1b that increases in waist
circumference have a similar consequence in these two populations, but that the level of
risk at any given reference level is much higher in the South Asian population studied.
The fact that the difference in risk is so large makes the choice of a South Asian cut-
point corresponding to that used in Europid populations difficult. Lower cut-points for
South Asian populations than those currently in use appear justified. However, exactly
how much lower they should be may depend on political, economic and other pragmatic
reasons. Similar data utilising other outcomes and in other South Asian populations
would also aid such decisions.
Limitations of this work and prospects for future data
The impact of different waist circumference measurement techniques in the AusDiab
and Mauritius surveys should be considered. Based on the results of a study of mean
waist circumference (in a multi-ethnic population), in which the difference between
measurements taken at the mid-point between the ribs and the iliac crest and the
narrowest waist was found to be 1.5 cm in men and 2.7 cm in women,(43) we have
increased the waist measurement of all South Asian subjects accordingly. This should
mean that the impact of measurement differences on the results presented was minimal.
The particularly high incidence of diabetes in the South Asian population in Mauritius

may have affected the findings. The same study in a different South Asian population
with a lower diabetes incidence and different exposure to diabetes risk factors may have
resulted in less extreme differences than those observed here. Despite this, the
extremely high incidence of diabetes at comparatively low levels of waist circumference
in the South Asian population studied demonstrates that diabetes risk can increase at
what have been traditionally thought to be very low levels of waist circumference. This
message should in some way be reflected in the choice of cut-points for this population
group. Furthermore, the South Asian participants in the Mauritian study who developed
diabetes were considerably younger than those developing diabetes in the AusDiab
study. Whether this is simply a reflection of the impact of obesity at a younger age in
this population, or whether other factors are influencing this is unknown. The age
standardisation of the South Asian and Europid population at age 50 may therefore have
impacted the findings, although diabetes incidence for a 40 year old South Asian at
currently recommended waist cut-points was still at least eight times higher than for a
50 year old Europid. Even if the South Asian population studied developed diabetes at a
younger age, and this partly explained the high diabetes incidence at low levels of waist
circumference, this does not change the conclusion that waist cut-points for the South
Asian population should be lower than is currently the case. Finally, the response to the
follow-up in these two studies means that neither sample should be considered to be
representative of the population from which it was drawn. Response bias may exist, for
example, through the differential loss to follow-up of those in relatively lower
socioeconomic positions (known to be associated with overweight and obesity and with
diabetes incidence) in one or both of the studies. Caution should therefore be exercised
in generalising these results to the populations from which they were drawn.
Prospective studies such as those used here, are the ideal setting in which to determine
cut-points for waist circumference. Few similar studies in South Asians and other non-

Europid populations exist. Therefore, similar cross-sectional studies in South Asians
and other ethnic groups, and studies using outcomes other than incident diabetes may
help inform the revision of ethnicity-specific waist cut-points. Two large, multinational
studies that are as yet un-reported (the International Study of Prediction of Intra-
Abdominal Adiposity and its Relationships With Cardiometabolic Risk [INSPIRE ME]
and INSPIRE ME IAA [Intra-Abdominal Adiposity study]) are likely to add to the
evidence base in this area.
Conclusion
The purpose of cut-points for waist circumference is to identify those individuals at
increased risk for obesity-related negative health outcomes in order to allow
implementation of prevention strategies. Obesity is a precursor to the components
of the metabolic syndrome,(6) and is important before the development of co-
morbidities, not simply as a correlate for existing disease. As a preventive strategy,
the choice of cut-points for obesity is therefore particularly important. The large
increases in the prevalence of obesity and diabetes seen in South Asians in
Mauritius and among South Asian immigrants to the UK(50) is now being seen
throughout Asia due to swift economic development.(2, 51)
A consensus of opinion suggests that waist circumference cut-points should differ
according to ethnicity. The results presented here suggest that currently
recommended cut-points for South Asians have been set too high. Since most
studies on this topic have used the Youden Index, which we demonstrate is
inappropriate for this purpose, this work adds significantly to the evidence on which
to base appropriate ethnicity-appropriate waist circumference cut-points.

Funding Sources
A Cameron is supported by Postgraduate Research Scholarship PP04M1794 from the
National Heart Foundation of Australia. AusDiab was supported by a project grant from
the National Health and Medical Research Council of Australia (#233200). The
AusDiab study, co-coordinated by the Baker IDI Heart and Diabetes Institute, gratefully
acknowledges the generous support given by: Australian Government Department of
Health and Ageing, Abbott Australasia, Alphapharm, AstraZeneca, Aventis Pharma,
Bristol-Myers Squibb, City Health Centre Diabetes Service - Canberra, Department of
Health and Community Services - Northern Territory, Diabetes Australia, Eli Lilly
Australia, Estate of the Late Edward Wilson, GlaxoSmithKline, Healthy Living NT,
Jack Brockhoff Foundation, Janssen-Cilag, Kidney Health Australia, Marian & E.H.
Flack Trust, Menzies Research Institute, Merck Sharp & Dohme, New South Wales
Health, Northern Territory Department of Health and Families, Novartis, Novo Nordisk,
Pfizer, Pratt Foundation, Queensland Health, Roche Diagnostics Australia, Royal Prince
Alfred Hospital (Sydney), Sanofi Synthelabo, South Australia Health, Tasmanian
Department of Health and Human Services, Victorian Department of Human Services,
and Western Australia Health.
The Mauritius study was undertaken with the support and collaboration of the Mauritius
Ministry of Health, the World Health Organization, Baker IDI Heart and Diabetes
Institute, the University of Newcastle upon Tyne, and the National Public Health
Institute (Helsinki, Finland). This study was partially funded by NIH Grant DK-25446.

Acknowledgements
We are most grateful to the many people involved in organizing and conducting the
AusDiab and Mauritius studies, and especially the participants for volunteering their
valuable time.
Disclosure
The authors have no conflicts of interest to declare

References
1. World Health Organization. Obesity: preventing and managing the global epidemic. Report of a WHO consultation, Geneva, 2000.
2. Beaglehole R, Bonita R. Global public health: a scorecard. Lancet 2008;372:1988-96.
3. Pischon T, Boeing H, Hoffmann K, et al. General and abdominal adiposity and risk of death in Europe. N Engl J Med 2008;359:2105-20.
4. Australian Institute of Health and Welfare. Chronic diseases and associated risk factors in Australia, 2006. Canberra, 2006. Report No.: PHE 81.
5. Cameron AJ, Dunstan DW, Owen N, et al. Health and mortality consequences of abdominal obesity: evidence from the AusDiab study. Med J Aust 2009;191:202-8.
6. Cameron AJ, Boyko EJ, Sicree RA, et al. Central obesity as a precursor to the Metabolic Syndrome in the AusDiab study and Mauritius. Obesity 2008;16:2707-16.
7. Pouliot M-C, Després J-P, Lemieux S, et al. Waist circumference and abdominal sagittal diameter: best simple anthropometric indexes of abdominal visceral adipose tissue accumulation and related cardiovascular risk in men and women. Am J Cardiol 1994;73:460-8.
8. Cameron AJ, Zimmet PZ. Expanding evidence for the multiple dangers of epidemic abdominal obesity. Circulation 2008;117:1624-6.
9. Dalton M, Cameron AJ, Zimmet PZ, et al. Waist circumference, waist-hip ratio and body mass index and their correlation with cardiovascular disease risk factors in Australian adults. J Intern Med 2003;254:1-9.
10. Stevens J, McClain JE, Truesdale KP. Selection of measures in epidemiologic studies of the consequences of obesity. Int J Obes (Lond) 2008;32 Suppl 3:S60-6.
11. Lean M, Han T, Morrison C. Waist circumference as a measure for indicating need for weight management. Br Med J 1995;311.
12. Alberti KG, Zimmet P, Shaw J. Metabolic syndrome--a new world-wide definition. A Consensus Statement from the International Diabetes Federation. Diabet Med 2006;23:469-80.
13. Snehalatha C, Viswanathan V, Ramachandran A. Cutoff values for normal anthropometric variables in asian Indian adults. Diabetes Care 2003;26:1380-4.
14. Ko GT, Chan JC, Cockram CS, Woo J. Prediction of hypertension, diabetes, dyslipidaemia or albuminuria using simple anthropometric indexes in Hong Kong Chinese. Int J Obes Relat Metab Disord 1999;23:1136-42.

15. Lin WY, Lee LT, Chen CY, et al. Optimal cut-off values for obesity: using simple anthropometric indices to predict cardiovascular risk factors in Taiwan. Int J Obes Relat Metab Disord 2002;26:1232-8.
16. Nishimura R, Nakagami T, Tominaga M, Yoshiike N, Tajima N. Prevalence of metabolic syndrome and optimal waist circumference cut-off values in Japan. Diabetes Res Clin Pract 2007;78:77-84.
17. Hayashi T, Boyko EJ, McNeely MJ, Leonetti DL, Kahn SE, Fujimoto WY. Minimum waist and visceral fat values for identifying Japanese Americans at risk for the metabolic syndrome. Diabetes Care 2007;30:120-7.
18. Ito H, Nakasuga K, Ohshima A, et al. Detection of cardiovascular risk factors by indices of obesity obtained from anthropometry and dual-energy X-ray absorptiometry in Japanese individuals. Int J Obes Relat Metab Disord 2003;27:232-7.
19. Aekplakorn W, Kosulwat V, Suriyawongpaisal P. Obesity indices and cardiovascular risk factors in Thai adults. Int J Obes (Lond) 2006;30:1782-90.
20. Huxley R, Barzi F, Lee CM, et al. Waist circumference thresholds provide an accurate and widely applicable method for the discrimination of diabetes. Diabetes Care 2007;30:3116-8.
21. Huxley R, James WP, Barzi F, et al. Ethnic comparisons of the cross-sectional relationships between measures of body size with diabetes and hypertension. Obes Rev 2008;9 Suppl 1:53-61.
22. Craig P, Colagiuri S, Hussain Z, Palu T. Identifying cut-points in anthropometric indixes for predicting previously undiagnosed diabetes and cardiovascular risk factors in the Tongan population. Obes Res Clin Pract 2007:17-25.
23. Foucan L, Hanley J, Deloumeaux J, Suissa S. Body mass index (BMI) and waist circumference (WC) as screening tools for cardiovascular risk factors in Guadeloupean women. J Clin Epidemiol 2002;55:990-6.
24. Okosun IS, Rotimi CN, Forrester TE, et al. Predictive value of abdominal obesity cut-off points for hypertension in blacks from west African and Caribbean island nations. Int J Obes Relat Metab Disord 2000;24:180-6.
25. Onat A, Uyarel H, Hergenc G, Karabulut A, Albayrak S, Can G. Determinants and definition of abdominal obesity as related to risk of diabetes, metabolic syndrome and coronary disease in Turkish men: a prospective cohort study. Atherosclerosis 2007;191:182-90.
26. Stevens J, Couper D, Pankow J, et al. Sensitivity and specificity of anthropometrics for the prediction of diabetes in a biracial cohort. Obes Res 2001;9:696-705.
27. Okosun IS, Tedders SH, Choi S, Dever GE. Abdominal adiposity values associated with established body mass indexes in white, black and hispanic Americans. A study from the Third National Health and Nutrition Examination Survey. Int J Obes Relat Metab Disord 2000;24:1279-85.

28. Berber A, Gomez-Santos R, Fanghanel G, Sanchez-Reyes L. Anthropometric indexes in the prediction of type 2 diabetes mellitus, hypertension and dyslipidaemia in a Mexican population. Int J Obes Relat Metab Disord 2001;25:1794-9.
29. Sanchez-Castillo CP, Velazquez-Monroy O, Berber A, Lara-Esqueda A, Tapia-Conyer R, James WP. Anthropometric cutoff points for predicting chronic diseases in the Mexican National Health Survey 2000. Obes Res 2003;11:442-51.
30. Al-Lawati JA, Barakat NM, Al-Lawati AM, Mohammed AJ. Optimal cut-points for body mass index, waist circumference and waist-to-hip ratio using the Framingham coronary heart disease risk score in an Arab population of the Middle East. Diab Vasc Dis Res 2008;5:304-9.
31. Ye Y, Bao Y, Hou X, et al. Identification of waist circumference cutoffs for abdominal obesity in the Chinese population: a 7.8-year follow-up study in the Shanghai urban area. Int J Obes (Lond) 2009;33:1058-62.
32. Rush EC, Crook N, Simmons D. Optimal waist cutpoint for screening for dysglycaemia and metabolic risk: evidence from a Maori cohort. Br J Nutr 2009;102:786-91.
33. Park SH, Choi SJ, Lee KS, Park HY. Waist circumference and waist-to-height ratio as predictors of cardiovascular disease risk in Korean adults. Circ J 2009;73:1643-50.
34. Gus M, Cichelero FT, Moreira CM, et al. Waist circumference cut-off values to predict the incidence of hypertension: an estimation from a Brazilian population-based cohort. Nutr Metab Cardiovasc Dis 2009;19:15-9.
35. Misra A, Vikram NK, Gupta R, Pandey RM, Wasir JS, Gupta VP. Waist circumference cutoff points and action levels for Asian Indians for identification of abdominal obesity. Int J Obes (Lond) 2006;30:106-11.
36. Despres JP, Lemieux I. Abdominal obesity and metabolic syndrome. Nature 2006;444:881-7.
37. Stevens J, Juhaeri, Cai J, Jones DW. The effect of decision rules on the choice of a body mass index cutoff for obesity: examples from African American and white women. Am J Clin Nutr 2002;75:986-92.
38. Dunstan DW, Zimmet PZ, Welborn TA, et al. The Australian Diabetes, Obesity and Lifestyle Study (AusDiab) - methods and response rates. Diab Res Clin Pract 2002;57:119-29.
39. Boyko E, de Courten M, Zimmet P, Chitson P, Tuomilehto J, Alberti K. Features of the Metabolic Syndrome predict higher risk of diabetes and impaired glucose tolerance. Diabetes Care 2000;23.
40. World Health Organization. Definition and diagnosis of diabetes mellitus and intermediate hyperglycemia: report of a WHO/IDF consultation, Geneva, 2006.

41. Barr L, Magliano D, Zimmet P, et al. AusDiab 2005. The Australian Diabetes, Obesity and Lifestyle Study. Tracking the Accelerating Epidemic: Its Causes and Outcomes. International Diabetes Institute, Melbourne, 2006.
42. Dowse G, Zimmet P, Gareeboo H, et al. Abdominal obesity and physical inactivity as risk factors for NIDDM and impaired glucose tolerance in Indian, Creole and Chinese Mauritians. Diabetes Care 1991;14:271-82.
43. Wang J, Thornton JC, Bari S, et al. Comparisons of waist circumferences measured at 4 sites. Am J Clin Nutr 2003;77:379-84.
44. Youden WJ. An index for rating diagnostic tests. Cancer 1950;3:32-5.
45. Vikram NK, Pandey RM, Misra A, Sharma R, Devi JR, Khanna N. Non-obese (body mass index < 25 kg/m2) Asian Indians with normal waist circumference have high cardiovascular risk. Nutrition 2003;19:503-9.
46. Razak F, Anand SS, Shannon H, et al. Defining obesity cut points in a multiethnic population. Circulation 2007;115:2111-8.
47. Perkins NJ, Schisterman EF. The inconsistency of "optimal" cutpoints obtained using two criteria based on the receiver operating characteristic curve. Am J Epidemiol 2006;163:670-5.
48. Flegal KM. Obesity, overweight, hypertension, and high blood cholesterol: the importance of age. Obes Res 2000;8:676-7.
49. Stevens J. Ethnic-specific cutpoints for obesity vs country-specific guidelines for action. Int J Obes Relat Metab Disord 2003;27:287-8.
50. Barnett AH, Dixon AN, Bellary S, et al. Type 2 diabetes and cardiovascular risk in the UK south Asian community. Diabetologia 2006;49:2234-46.
51. Yoon KH, Lee JH, Kim JW, et al. Epidemic obesity and type 2 diabetes in Asia. Lancet 2006;368:1681-8.
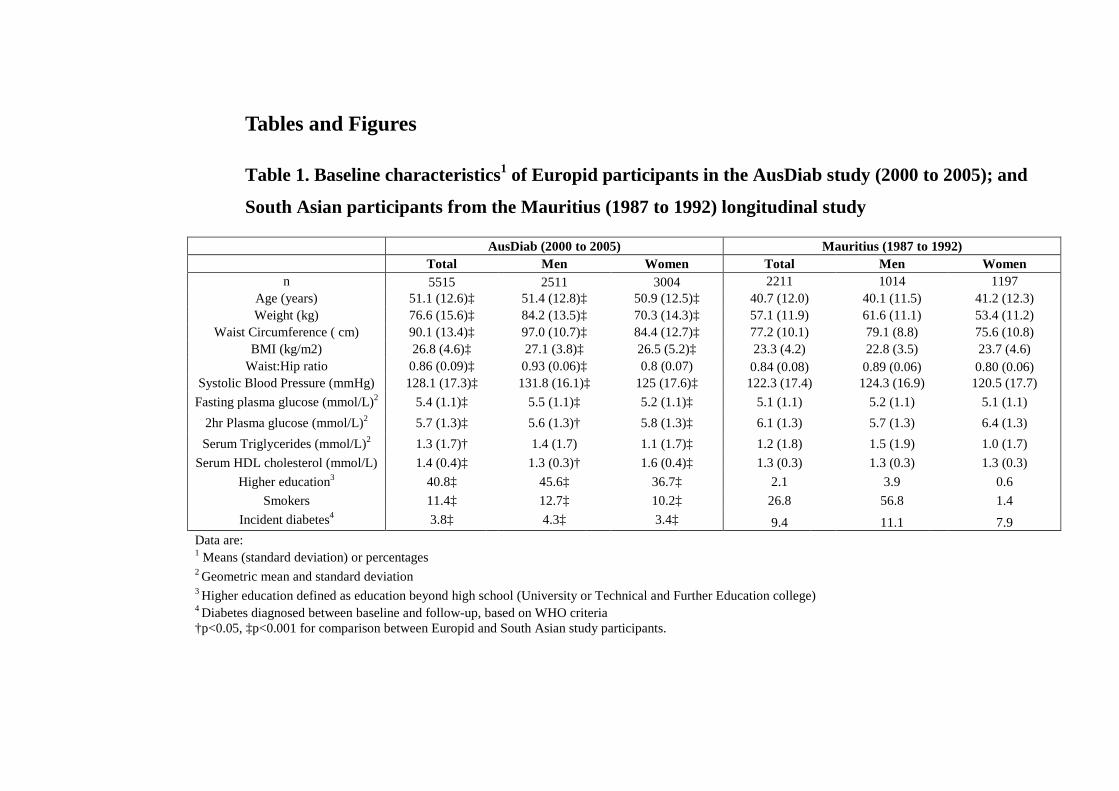
Tables and Figures
Table 1. Baseline characteristics1 of Europid participants in the AusDiab study (2000 to 2005); and
South Asian participants from the Mauritius (1987 to 1992) longitudinal study
AusDiab (2000 to 2005) Mauritius (1987 to 1992) Total Men Women Total Men Women n 5515 2511 3004 2211 1014 1197
Age (years) 51.1 (12.6)‡ 51.4 (12.8)‡ 50.9 (12.5)‡ 40.7 (12.0) 40.1 (11.5) 41.2 (12.3) Weight (kg) 76.6 (15.6)‡ 84.2 (13.5)‡ 70.3 (14.3)‡ 57.1 (11.9) 61.6 (11.1) 53.4 (11.2)
Waist Circumference ( cm) 90.1 (13.4)‡ 97.0 (10.7)‡ 84.4 (12.7)‡ 77.2 (10.1) 79.1 (8.8) 75.6 (10.8) BMI (kg/m2) 26.8 (4.6)‡ 27.1 (3.8)‡ 26.5 (5.2)‡ 23.3 (4.2) 22.8 (3.5) 23.7 (4.6)
Waist:Hip ratio 0.86 (0.09)‡ 0.93 (0.06)‡ 0.8 (0.07) 0.84 (0.08) 0.89 (0.06) 0.80 (0.06) Systolic Blood Pressure (mmHg) 128.1 (17.3)‡ 131.8 (16.1)‡ 125 (17.6)‡ 122.3 (17.4) 124.3 (16.9) 120.5 (17.7)
Fasting plasma glucose (mmol/L)2 5.4 (1.1)‡ 5.5 (1.1)‡ 5.2 (1.1)‡ 5.1 (1.1) 5.2 (1.1) 5.1 (1.1) 2hr Plasma glucose (mmol/L)2 5.7 (1.3)‡ 5.6 (1.3)† 5.8 (1.3)‡ 6.1 (1.3) 5.7 (1.3) 6.4 (1.3) Serum Triglycerides (mmol/L)2 1.3 (1.7)† 1.4 (1.7) 1.1 (1.7)‡ 1.2 (1.8) 1.5 (1.9) 1.0 (1.7)
Serum HDL cholesterol (mmol/L) 1.4 (0.4)‡ 1.3 (0.3)† 1.6 (0.4)‡ 1.3 (0.3) 1.3 (0.3) 1.3 (0.3) Higher education3 40.8‡ 45.6‡ 36.7‡ 2.1 3.9 0.6
Smokers 11.4‡ 12.7‡ 10.2‡ 26.8 56.8 1.4 Incident diabetes4 3.8‡ 4.3‡ 3.4‡ 9.4 11.1 7.9
Data are: 1 Means (standard deviation) or percentages 2 Geometric mean and standard deviation 3 Higher education defined as education beyond high school (University or Technical and Further Education college) 4 Diabetes diagnosed between baseline and follow-up, based on WHO criteria †p<0.05, ‡p<0.001 for comparison between Europid and South Asian study participants.

Figure 1a. Estimated annual diabetes incidence for Europid and South
Asian men at age 50 according to waist circumference, based on data from
studies in Australia (2000-2005) and Mauritius (1987-1992) (Note – the
distribution curve of waist circumference also plotted). 1
1Model used included age, age squared and waist circumference.
Figure 1b. Estimated annual diabetes incidence for Europid and South
Asian women at age 50 according to waist circumference, based on data
from studies in Australia (2000-2005) and Mauritius (1987-1992) (Note –
the distribution curve of waist circumference also plotted).1
1Model used included age, age squared and waist circumference.

Figure 2. Mean waist circumference and “optimal” waist circumference
cut-points chosen on the basis of cross-sectional relationships with
prevalent diabetes in Mauritius 1987 and 19921.
1 1987 cohort includes those who attended the 1987 survey only, and a randomly selected 50% of those who
attended both the 1987 and 1992 surveys. Conversely, the 1992 cohort includes those who attended the
1992 survey only, and the randomly selected 50% of those who attended both the 1987 and 1992 surveys
not included in the 1987 cohort (i.e. no individual is included in both the 1987 and 1992 cohorts tested –
they are separate populations).

Figure 3. Mean waist circumference and “optimal” waist circumference
cut-points chosen on the basis of relationships with incident diabetes among
cohorts with high and low average waist circumference1 in the AusDiab
study 1999-2000.
1 Two equally sized cohorts with “high” and “low” average waist circumference respectively were created by random selection of individuals within each decile of waist circumference. The proportion chosen for the “high” cohort increased from 30% in the lowest waist decile to 75% in the highest waist decile. Conversely, the proportion of those chosen for the “low” cohort ranged from 30% in the highest waist decile to 75% in the lowest waist decile.