Salivary cortisol, APOE-ε4 allele and cognitive decline in a prospective study of older persons

A
A
BEMARThaaeieCii©
K
Lt(
GC
0d
ARTICLE IN PRESSTH-10464; No. of Pages 9
Atherosclerosis xxx (2008) xxx–xxx
Relationship of the ApoE polymorphism to plasma lipid traits amongSouth Asians, Chinese, and Europeans living in Canada
Debika Burman a,1, Andrew Mente a,1, Robert A. Hegele c,d,1, Shofiqul Islam a,1,Salim Yusuf a,b,1, Sonia S. Anand a,b,∗,1
a Population Health Research Institute, Hamilton Health Sciences and McMaster University, Hamilton, ON, Canadab Department of Medicine, McMaster University, Hamilton, ON, Canada
c Blackburn Cardiovascular Genetics Laboratory, Robarts Research Institute, London, ON, Canadad Department of Medicine, University of Western Ontario, London, ON, Canada
Received 16 January 2008; received in revised form 11 June 2008; accepted 11 June 2008
bstract
ackground: The prevalence of cardiovascular risk factors and atherosclerosis vary between ethnic groups. We examined the apolipoprotein(ApoE) polymorphism, its association with lipid traits and atherosclerosis, and its influence on ethnic variations on lipid traits.ethods: In a randomly sampled cross-sectional study of 985 South Asian, Chinese, and European Canadians, three common isoforms ofpoE (E2, E3 and E4), plasma lipid concentrations and atherosclerosis of the carotid artery were measured.esults: The E2, E3 and E4 allele frequencies were 5.7%, 84.0%, and 10.2%, respectively, and differed significantly between ethnic groups.here was a strong, stepwise association between ApoE and each plasma lipid trait, except triglycerides. The E4 genotype was associated withigher low-density lipoprotein cholesterol (p for trend < 0.001), ApoB (p < 0.001), ApoB/ApoA ratio (p < 0.001) and lipoprotein (a) (p < 0.001),nd lower ApoA (p < 0.001) and high-density lipoprotein cholesterol (HDL-C) (p = 0.005). A similar pattern of effects was observed acrossll ethnic groups. Ethnicity accounted for modest variation in ApoA, ApoB/ApoA ratio and HDL-C (4.2–5.0%), whereas ApoE isoformsxplained only a small proportion of variability (0.3–1.4%). Dietary and lifestyle factors accounted for modest variation in several traitsncluding HDL-C (5.6% and 5.0%, respectively). Carotid atherosclerosis was lower among individuals with E2 isoform in keeping with theffect of E2 on lipid levels.
onclusions: The ApoE isoform is associated with plasma lipoproteins in all ethnic groups, yet explains only a small proportion of thenter-ethnic variation for most plasma lipoproteins. Additional genetic variants and/or health behaviors likely contribute to ethnic variationsn plasma lipid traits.
2008 Elsevier Ireland Ltd. All rights reserved.
eywords: Atherosclerosis; Apolipoprotein E; Ethnicity; Genetics; Lipids
Please cite this article in press as: Burman D, et al. Relationship of theChinese, and Europeans living in Canada. Atherosclerosis (2008), doi:1
Abbreviations: CVD, cardiovascular disease; ApoE, apolipoprotein E;DL-C, low-density lipoprotein; HDL-C, high-density lipoprotein choles-
erol; Apo B, apolipoprotein B; Apo A, apolipoprotein A; Lp(a), lipoproteina); TG, triglycerides; IMT, intimal medial thickness.∗ Corresponding author at: Population Health Research Institute, Hamiltoneneral Hospital, 4-EAST Room 441, 237 Barton St. E, Hamilton, ON,anada L8L 2X2. Tel.: +1 905 527 4322x44557; fax: +1 905 577 1490.
E-mail address: [email protected] (S.S. Anand).1 For the SHARE Investigators.
1
iCtpAates
021-9150/$ – see front matter © 2008 Elsevier Ireland Ltd. All rights reserved.oi:10.1016/j.atherosclerosis.2008.06.007
. Introduction
Cardiovascular disease (CVD) prevalence and mortal-ty rates vary substantially between ethnic groups living inanada. The lowest prevalence has been observed among
he Chinese, whereas the highest prevalence occurs amongeople who originate from the Indian subcontinent (Southsians) [1]. The determinants of CVD are likely the same
ApoE polymorphism to plasma lipid traits among South Asians,0.1016/j.atherosclerosis.2008.06.007
cross ethnic populations although the prevalence, and hencehe population attributable risk of each factor varies betweenthnic groups [2]. It is likely that modifiable CVD risk factorsuch as plasma lipids have genetic determinants (Fig. 1).

ARTICLE INATH-10464; No. of Pages 9
2 D. Burman et al. / Atherosclero
FAl
mso(maEdccAaiHmmoPae
gCAegAtbg
2
2
S
i(fwTdlfOiji
2
cqunbewDitaf
2
i−ioppC[opwflecdtcs
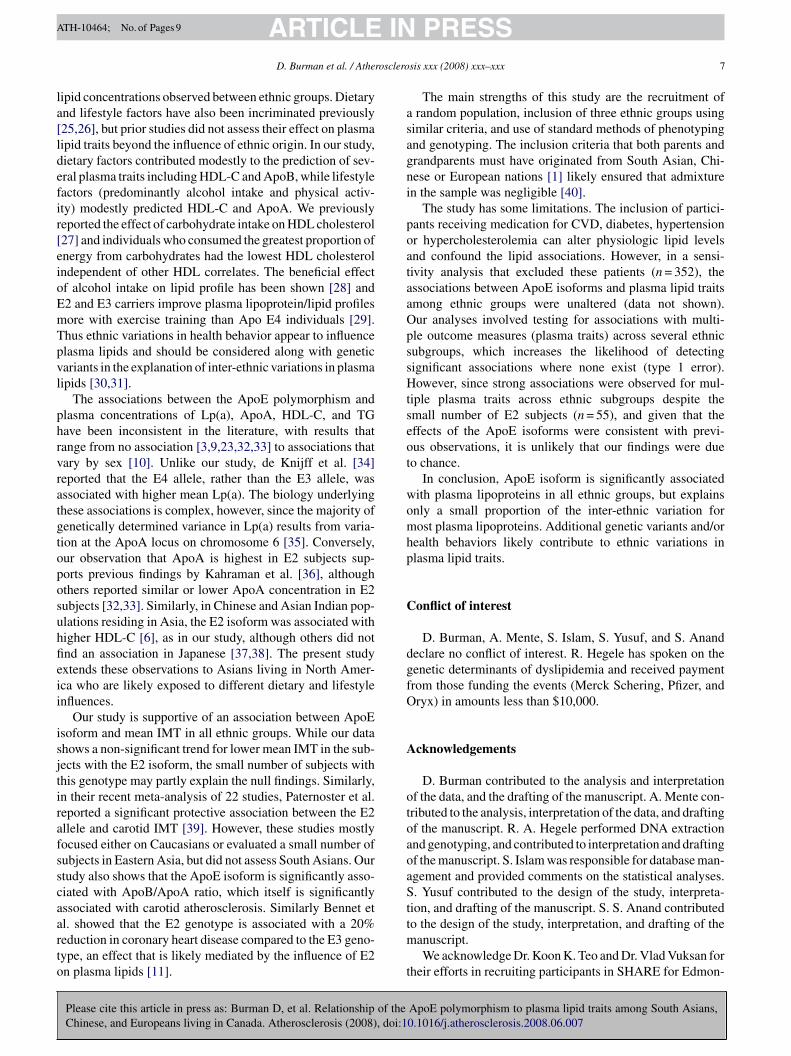
ig. 1. Carotid atherosclerosis [mean intimal medial thickness (IMT)] bypoE allele status overall and among South Asians, Chinese, and Europeans
iving in Canada. Bars are S.E.
Apolipoprotein E (ApoE) is a structural component ofost classes of lipoprotein particles, and its functions include
erving as a ligand for cell-surface receptor mediated uptakef lipoproteins. A common polymorphism of the ApoE geners429358, rs7412) encoding human ApoE results in threeajor isoforms called Apo E2, Apo E3, and Apo E4, which
re coded for by three codominant alleles (E2, E3, and4, respectively) [3,4]. Population studies have consistentlyemonstrated an association between ApoE and plasma con-entrations of total cholesterol (TC), low-density lipoproteinholesterol (LDL-C) and ApoB [3,5–11]. In general, thepoE alleles (when ordered E2, E3, and E4) are positively
ssociated with higher concentrations of these plasma lipidsn both European and non-European populations [5–11].owever previous studies of ApoE and plasma lipids in ethnicinorities were carried out in the United States, focusing pri-arily on African-Americans and Hispanic-Americans [12],
r were conducted in ethnic populations living in Asia [6].ast studies did not assess these associations in South Asiannd Chinese populations exposed to the influences of a West-rn society.
The objectives of this study are to: (1) compare ApoEenotype and allele frequency distributions in South Asians,hinese, and Europeans; (2) investigate associations betweenpoE and plasma lipid concentrations, overall and among
thnic groups; (3) determine how much of the betweenroup differences in lipid concentrations is attributable to thepoE polymorphism and dietary or lifestyle factors believed
o influence lipid levels; and (4) examine the associationetween ApoE variants and atherosclerosis across ethnicroups.
. Materials and methods
Please cite this article in press as: Burman D, et al. Relationship of theChinese, and Europeans living in Canada. Atherosclerosis (2008), doi:1
.1. Study population
The study population was comprised of Canadians ofouth Asian, Chinese or European origin who participated
2
t
PRESSsis xxx (2008) xxx–xxx
n the Study of Health Assessment and Risk in Ethnic groupsSHARE), a cross-sectional prevalence study of CVD riskactors conducted between 1996 and 1998 [1]. Individualsere randomly selected based on unique last names fromoronto, Hamilton, and Edmonton using a previously vali-ated method [13]. Subjects were aged 35–75 years, and hadived in Canada for ≥5 years. Ethics approval was obtainedrom the McMaster University and University of Westernntario Institutional Review Boards, and all participating
nstitutions. Informed consent was obtained from each sub-ect. The investigation conforms with the principles outlinedn the Declaration of Helsinki.
.2. Nutrient analysis
Dietary assessment was conducted using validatedulture-specific, self-administered, quantitative food fre-uency questionnaires (FFQs) [14]. The FFQ measures thesual dietary intake over the previous 12 months to estimateutrient and energy intake. We determined nutrient contenty analyzing diet records using the Food Processor nutri-nt analysis software (version 6.11; ESHA, Salem, OR),hich incorporated the 1991 Canada Nutrient File and USepartment of Agriculture databases [14]. We examined the
nfluence of dietary protein, carbohydrates, saturated fat andrans fat, since these factors vary by ethnic origin [14] and aressociated with lipid traits [15]. Nutrient values were adjustedor total energy intake using the residual method [16].
.3. Laboratory measurements and ultrasonography
Fasting blood samples were obtained from all participantsn the same period. The samples were centrifuged, frozen at
70 ◦C, and transferred on dry ice to a central core laboratoryn Hamilton, Canada for analysis using standard methodol-gy. All blood measurements were analyzed blinded to thearticipants’ ethnicity and clinical history. The laboratoryrocedures for assessing triglycerides (TG), HDL-C, LDL-and lipoprotein (a) (Lp(a)) have been described previously
1]. ApoB was measured using the rate nephelometic methodn the Beckman Array Protein System, using reagents sup-lied by Beckman Instruments (Brea, CA, USA). ApoAas measured using Roche Immunoturbidimetric assay per-
ormed on the Hitachi 917 (Indianapolis, IN, USA). Theaboratory maintains traceability with the National Refer-nce System for Cholesterol by direct comparison with theholesterol reference method using fresh serum, and hasemonstrated the ability to meet National Cholesterol Educa-ion Program performance criteria. We measured extracranialarotid artery atherosclerosis using B-mode ultrasound (Acu-on, Mountain View, CA, USA), as described previously [1].
ApoE polymorphism to plasma lipid traits among South Asians,0.1016/j.atherosclerosis.2008.06.007
.4. ApoE genotype determination
Genomic DNA was extracted from whole blood usinghe Puregene DNA purification kit (Gentra Systems, Min-

INATH-10464; No. of Pages 9
rosclero
ntGara
2
wttqece
fol“eoeboaoaimEAv
ae
vss2iMpcfdMis3aaMTd
3
nfa
TD
V
AMLAAAHLTBWAP
t
ARTICLED. Burman et al. / Athe
eapolis MN, USA). ApoE genotypes were determined usinghe restriction isotyping method of Hixson and Vernier [17].enotyping was performed with blinding to subject identity
nd phenotype. Sequence-proven controls were run with eacheaction. A random 5% of samples were genotyped again onnother day; no discrepancies were observed.
.5. Statistical analysis
All statistical analyses were performed using SAS soft-are version 9.1. Allele frequencies were determined using
he gene counting method. The chi-square goodness-of-fitest was used to examine whether observed genotype fre-uencies differed from those expected by Hardy–Weinbergquilibrium. The chi-square contingency test was used toompare allele and genotype frequency distributions acrossthnic groups and between sexes.
Plasma Lp(a) and TG values were logarithmically trans-ormed before all statistical analyses to improve the normalityf the distributions. The ApoE genotype groups were as fol-ows: “E2 subjects” had either the E2/2 or E2/3 genotype.E3 subjects” were E3/3 homozygotes. “E4 subjects” hadither the E4/3 or E4/4 genotype. As in many other studiesf this nature, subjects with the E4/2 genotype (n = 6) werexcluded from the subsequent analyses since they could note simply classified into any single allele group. Associationsf lipid traits and atherosclerosis with ApoE genotype withinnd between ethnic groups were determined with analysisf covariance (ANCOVA) models with p-values for trend,djusting for age, sex, center, ethnicity, smoking, alcoholntake, physical activity, and dietary factors. The ANCOVA
Please cite this article in press as: Burman D, et al. Relationship of theChinese, and Europeans living in Canada. Atherosclerosis (2008), doi:1
odels also provided estimates of (1) the effect size of the3 and E4 alleles compared with E2, (2) the effect of Southsian and Chinese ethnicity coded as categorical dummyariables compared with European ethnicity, and (3) the inter-
TaE(
able 1istribution of risk factors among South Asians, Chinese and Europeans living in C
ariableb Overall (n = 985) South Asians(SA) (n = 342)
Chinese (CH(n = 317)
ge (years) 49.5 (0.3) 49.4 (0.5) 47.8 (0.5)en [n (%)] 506 (51.4) 187 (54.7) 162 (51.1)
DL-C (mmol/L) 3.21 (0.03) 3.30 (0.04) 3.14 (0.05)poB (g/L) 1.02 (0.01) 1.07 (0.01) 0.99 (0.01)poA (g/L) 1.37 (0.01) 1.30 (0.01) 1.41 (0.01)poB/ApoA 0.78 (0.01) 0.87 (0.02) 0.73 (0.02)DL-C (mmol/L) 1.15 (0.01) 1.05 (0.02) 1.20 (0.02)p(a) (g/L)c 5.00 (0.04) 5.24 (0.06) 4.89 (0.07)G (mmol/L)c 0.30 (0.01) 0.40 (0.02) 0.24 (0.02)MI (kg/m2) 25.9 (0.1) 26.2 (0.2) 23.9 (0.2)HR 0.87 (0.002) 0.88 (0.004) 0.86 (0.004lcohol intake (times/week) 1.23 (0.06) 0.80 (0.10) 0.69 (0.10)hysical activity (h/week)d 7.51 (0.05) 7.30 (0.08) 7.15 (0.09)a Concentrations adjusted for age, sex, and center.b LDL-C indicates low-density lipoprotein cholesterol; ApoB, apolipoprotein B
riglycerides; BMI, body mass index; WHR waist–hip ratio.c Natural log.d Physical activity was defined as the number of h/week spent exercising or playi
PRESSsis xxx (2008) xxx–xxx 3
ction between ApoE genotype and South Asian or Chinesethnicity with Europeans as the reference group [18].
Linear regression was used to estimate the proportion ofariance in plasma traits attributable to ethnicity, ApoE alleletatus, dietary factors, and lifestyle. Five models were con-tructed: Model 1 included only age, sex and center; Modelincluded the variables in Model 1 plus ethnicity; Model 3
ncluded Model 2 plus ApoE allele status; Model 4 includedodel 3 plus dietary factors; Model 5 included Model 4
lus lifestyle factors (smoking, alcohol intake, and physi-al activity). We examined the change in R2 progressivelyrom Model 1 to Model 5 using the coefficient of partialetermination (partial R2) [18]. Thus, comparing Model 1 toodel 2, the partial R2 estimates the proportion of variance
n plasma traits attributable to ethnicity, adjusting for age,ex and center. Similarly, a comparison of Model 2 to Modelreflects the proportion of between-ethnic group variation
ttributable to ApoE isoforms, while controlling for covari-tes. Comparisons of Model 3 vs. Model 4, and Model 4 vs.odel 5 (the full model) were conducted in the same fashion.
he corresponding p-values for the partial R2 estimates wereetermined using the multiple partial F-test [18].
. Results
Of the 985 subjects who were randomly sampled, 17 couldot be genotyped, leaving a final sample with complete dataor 968 subjects, including 336 South Asians, 311 Chinese,nd 321 Europeans.
The characteristics of participants are displayed in Table 1.
ApoE polymorphism to plasma lipid traits among South Asians,0.1016/j.atherosclerosis.2008.06.007
he mean age of the overall population was 49.5 years,nd men and women are equally represented. Chinese anduropean subjects had similar plasma lipid concentrations
all p = N.S.). South Asian subjects had significantly higher
anada [mean (S.E.)a]
) Europeans(EU) (n = 326)
Overall p SA vs. CH SA vs. EU CH vs. EU
51.3 (0.6) <0.001 0.112 0.041 <0.001157 (48.2) 0.240 – – –
3.18 (0.04) 0.036 0.014 0.061 0.5551.00 (0.01) <0.001 <0.001 <0.001 0.5741.41 (0.01) <0.001 <0.001 <0.001 0.9840.74 (0.02) <0.001 <0.001 <0.001 0.6581.20 (0.02) <0.001 <0.001 <0.001 0.9594.88 (0.07) <0.001 <0.001 <0.001 0.9120.25 (0.02) <0.001 <0.001 <0.001 0.804
27.5 (0.2) <0.001 <0.001 <0.001 <0.001) 0.86 (0.004) <0.001 <0.001 <0.001 0.185
2.20 (0.10) <0.001 0.44 <0.001 <0.0018.09 (0.08) <0.001 0.19 <0.001 <0.001
; HDL-C, high-density lipoprotein cholesterol; Lp(a), lipoprotein (a); TG,
ng sports during the past year.

ARTICLE IN PRESSATH-10464; No. of Pages 9
4 D. Burman et al. / Atherosclerosis xxx (2008) xxx–xxx
Table 2aApoE allele frequency distribution among South Asians, Chinese, and Europeans living in Canada
Allele (%) Total sample South Asians Chinese Europeans Overall pa SA vs. CHb SA vs. EUb CH vs. EUb
N 968 336 311 321 – – – –E2 5.7 1.9 8.4 7.2 <0.001 <0.001 <0.001 0.54E3 84.0 87.6 86.0 78.3 0.03 0.11 0.009 0.32E4 10.2 10.4 5.6 14.5 <0.001 0.001 0.07 <0.001
A
paLaAhp
bqe(Abp
(Ea7lAp
AtaLt
Aa
TAE
G[
NEEEEEE
A
taca
gtTcAls(a
t(aHbnfp
2vAi
poE, apolipoprotein E; SA, South Asian; CH, Chinese; EU, European.a Overall p, χ2 2 d.f.b Pairwise p, χ2 1 d.f.
lasma concentrations of LDL-C compared to the Chinese,nd significantly higher plasma ApoB, ApoB/ApoA ratio,p(a) and TG concentrations and significantly lower ApoAnd HDL-C compared to both Chinese and Europeans. Southsian and Chinese subjects consumed significantly less alco-ol and were less physically active than Europeans (all< 0.05).
ApoE allele frequency distributions differed significantlyetween ethnic groups (Table 2a). Observed genotype fre-uencies (Table 2b) did not deviate from Hardy–Weinbergquilibrium in South Asians (χ2 = 2.74, p = 0.80), Chineseχ2 = 5.92, p = 0.46), or Europeans (χ2 = 4.14, p = 0.62).llele and genotype frequency distributions were similaretween sexes (Pearson chi-square p = 0.31 for genotype, and= 0.26 for allele frequency; data not shown).
The E3 allele was the most common in each ethnic group87.6% in South Asians, 86.0% in Chinese, and 78.3% inuropeans). South Asians had a lower frequency of the E2llele (1.9%) compared to Chinese and Europeans (8.4% and.2%, respectively, both p < 0.001). Chinese subjects had aower frequency of the E4 allele (5.6%) compared to Southsians and Europeans (10.4% and 14.5%, respectively, both< 0.001).
There was a strong, stepwise association between thepoE polymorphism and each of the adjusted plasma lipid
raits, except for TG. The E4 genotype was associated withsignificantly higher LDL-C, ApoB, ApoB/ApoA ratio andp(a), and lower ApoA and HDL-C. Plasma TG concentra-
Please cite this article in press as: Burman D, et al. Relationship of theChinese, and Europeans living in Canada. Atherosclerosis (2008), doi:1
ion was highest among E2 and E4 subjects (p < 0.01).Stepwise trends were also observed for LDL-C, ApoB and
poB/ApoA ratio separately in all three ethnic subgroups,nd for ApoA in South Asians and Chinese (all p-values for
able 2bpoE genotype frequency distribution among South Asian, Chinese, anduropeans living in Canada
enotypen (%)]
Total population South Asians Chinese Europeans
968 336 311 3212/2 0 0 0 03/2 104 (10.7) 11 (3.3) 51 (16.4) 42 (13.1)4/2 7 (0.7) 2 (0.6) 1 (0.3) 4 (1.2)3/3 673 (69.5) 256 (76.2) 225 (72.3) 192 (59.8)4/3 177 (18.3) 66 (19.6) 34 (10.9) 77 (24.0)4/4 7 (0.7) 1 (0.3) 0 6 (1.9)
poE indicates apolipoprotein E.
MLroaHfisviA(
att
rend <0.05). For HDL-C and TG, the associations with ApoElleles were not consistent among ethnic groups. The asso-iations between ApoE and each adjusted plasma lipid traitre shown in Appendix A.
In a multivariate regression analysis that included ApoEenotype, ethnicity and covariates, the E4 isoform was iden-ified as a significant determinant for each plasma trait, exceptG (p = 0.44) (Table 3). Compared to E2, E4 was asso-iated with higher LDL-C (p < 0.001), ApoB (p < 0.001),poB/ApoA ratio (p < 0.001) and Lp(a) (p = 0.006), and with
ower ApoA (p = 0.006) and HDL-C (p = 0.044). E3 was aignificant determinant of plasma LDL-C (p < 0.001), ApoBp < 0.001), ApoB/ApoA ratio (p = 0.001), Lp(a) (p < 0.001)nd TG (p = 0.002).
As shown in Table 3, while adjusting for ApoE geno-ype and covariates, South Asians had a higher ApoBp = 0.002), ApoB/ApoA ratio (p < 0.001), Lp(a) (p = 0.002),nd TG (p < 0.001), and a lower ApoA (p < 0.001) andDL-C (p < 0.001) compared to Europeans. The interactionetween ApoE and South Asian or Chinese ethnicity wason-significant for each plasma trait except HDL-C (p = 0.03or South Asians, p = 0.004 for Chinese) and TG (p = 0.01 and< 0.001, respectively) after adjustment for lifestyle factors.
As indicated by the partial R2 for Model 1 vs. Model(shown in Table 4), ethnicity accounted for 0.4% of the
ariance in LDL, 1.9% in ApoB, 5.0% in ApoA, 4.2% inpoB/ApoA ratio, 4.5% in HDL, 2.1% in TG, and 1.7%
n Lp(a). The addition of ApoE polymorphism (Model 2 vs.odel 3) accounted for an additional 3.2% of the variation in
DL-C, 2.5% in ApoB, 0.6% in ApoA, 1.4% in ApoB/ApoAatio, 0.3% in HDL-C, 1.3% in TG, and 1.7% in Lp(a),ver and above the contribution of ethnicity. Dietary factorsccounted for 4.0% of the variation in ApoB and 5.6% inDL-C, but 0.1–2.6% of the variation in other traits. Lifestyle
actors explained 5.0% of the variation in HDL-C and 6.0%n ApoA, but only 0.1–1.4% of the variation in other mea-ures (Table 4). Alcohol intake accounted for 3.6% of theariation in HDL-C and 4.4% in ApoA, while physical activ-ty explained 1.5% of the variation in HDL-C and 1.7% inpoA. Smoking explained negligible variation in these traits
<0.1%) (data not shown).
ApoE polymorphism to plasma lipid traits among South Asians,0.1016/j.atherosclerosis.2008.06.007
The ApoE gene polymorphism was not significantlyssociated with atherosclerosis, neither overall (p = 0.31 forrend) nor within ethnic subgroups. In each group, however,here was a non-significant trend for less atherosclerosis in

Pleasecite
thisarticle
inpress
as:Burm
anD
,etal.Relationship
ofthe
ApoE
polymorphism
toplasm
alipid
traitsam
ongSouth
Asians,
Chinese,and
Europeans
livingin
Canada.A
therosclerosis(2008),doi:10.1016/j.atherosclerosis.2008.06.007
AR
TIC
LE
IN P
RE
SS
AT
H-10464;
No.of
Pages9
D.B
urman
etal./Atherosclerosis
xxx(2008)
xxx–xxx5
Table 3Effect of ethnicity and ApoE allele status on plasma traits
Multivariate predictors LDL-C ApoB ApoA ApoB/ApoA HDL-C
� (S.E.) p � (S.E.) p � (S.E.) p � (S.E.) p � (S.E.) p
Ethnicity
European Reference Reference Reference Reference ReferenceSouth Asian 0.07 (0.06) 0.26 0.06 (0.02) 0.002 −0.11 (0.02) <0.001 0.12 (0.02) <0.001 −0.15 (0.03) <0.001Chinese −0.002 (0.06) 0.97 −0.001 (0.02) 0.95 −0.004 (0.02) 0.85 −0.002 (0.02) 0.926 −0.002 (0.03) 0.93
ApoE statusb – <0.001 – <0.001 – 0.002 – <0.001 – 0.009E2 Reference Reference Reference Reference ReferenceE3/3 0.43 (0.08) <0.001 0.10 (0.02) 0.100 −0.04 (0.02) 0.07 0.10 (0.03) 0.001 −0.02 (0.03) 0.46E4 0.52 (0.10) <0.001 0.15 (0.03) <0.001 −0.08 (0.03) 0.01 0.14 (0.04) <0.001 −0.08 (0.04) 0.04
South Asian × ApoE interaction – 0.50 – 0.37 – 0.11 – 0.36 – 0.03Chinese × ApoE interaction – 0.77 – 0.12 – 0.09 – 0.16 – 0.004Age 0.01 (0.003) <0.001 0.01 (0.000) <0.001 0.004 (0.000) <0.001 0.001 (0.001) 0.314 0.003 (0.001) 0.01Male gender 0.36 (0.05) <0.001 0.14 (0.02) <0.001 −0.19 (0.02) <0.001 0.21 (0.001) <0.001 −0.28 (0.02) <0.001
Multivariate predictors Lp(a)a TGa
� (S.E.) p � (S.E.) p
EthnicityEuropean Reference ReferenceSouth Asian 0.27 (0.09) 0.002 0.22 (0.04) <0.001Chinese 0.02 (0.09) 0.87 0.05 (0.04) 0.30
ApoE statusb – <0.001 – 0.001E2 Reference ReferenceE3/3 0.47 (0.11) <0.001 −0.17 (0.06) 0.002E4 0.36 (0.13) 0.006 −0.05 (0.07) 0.44
South Asian × ApoE interaction – 0.77 – 0.01Chinese × ApoE interaction – 0.66 – <0.001
Age 0.002 (0.003) 0.64 0.01 (0.002) <0.001Male gender −0.21 (0.07) 0.003 0.27 (0.03) <0.001
LDL-C, low-density lipoprotein cholesterol; ApoB, apolipoprotein B; HDL-C, high-density lipoprotein cholesterol; Lp(a), lipoprotein (a); TG, triglycerides; CHO, carbohydrates; ApoA, apolipoprotein A; �
indicates unstandardized regression coefficient. †Covariates include age, sex, and center; Adjustment for additional covariates (dietary predictors, smoking, alcohol intake, and physical activity) produced similarresults. cNutrient intake levels have been log-transformed, adjusted for total caloric-intake, and exponentiated for ease of interpretation.
a Natural log.b E2 indicates subjects with E3/2 or E2/2 genotypes and E4 indicates subjects with E4/3 or E4/4 genotypes. E2 homozygotes were the referent for each group.

ARTICLE IN PRESSATH-10464; No. of Pages 9
6 D. Burman et al. / Atherosclerosis xxx (2008) xxx–xxx
Table 4The coefficients of partial determination (partial R2)† indicating the proportion of variance in plasma lipid concentrations attributable to ethnicity, ApoEgenotype, and dietary factors
Predictor variable LDL-C ApoB ApoA ApoB/ApoA HDL-C
Partial R2 p Partial R2 p Partial R2 p Partial R2 p Partial R2 p
Ethnic origin (Model 1b vs. 2c) 0.004 0.02 0.019 <0.001 0.050 <0.001 0.042 <0.001 0.045 <0.001ApoE genotype (Model 2c vs. 3d) 0.032 <0.001 0.025 <0.001 0.006 0.006 0.014 <0.001 0.003 0.02Dietary factors (Model 3d vs. 4e) 0.001 0.02 0.040 <0.001 0.025 0.002 0.026 <0.001 0.056 <0.001Lifestyle factors (Model 4e vs. 5f) 0.005 0.051 0.007 0.03 0.060 <0.001 0.014 <0.001 0.050 <0.001
Predictor variable Lp(a)a TGa
Partial R2 p Partial R2 p
Ethnic origin (Model 1b vs. 2c) 0.017 <0.001 0.021 <0.001ApoE genotype (Model 2c vs. 3d) 0.017 <0.001 0.013 <0.001Dietary factors (Model 3d vs. 4e) 0.005 0.070 0.088 <0.001Lifestyle factors (Model 4e vs. 5f) 0.001 0.32 0.011 0.004
LDL-C indicates low-density lipoprotein cholesterol; ApoB, apolipoprotein B; HDL-C, high-density lipoprotein cholesterol; Lp(a), lipoprotein (a); TG,triglycerides; CHO, carbohydrates. R2 indicates adjusted coefficient of determination.
a Natural log.b Model 1 included the variables age, sex, and center.c Model 2 included Model 1 plus ethnicity.d Model 3 included Model 2 plus ApoE.e Model 4 included Model 3 plus energy adjusted nutrient intake levels of saturated fat, trans fat, protein, and carbohydrates.f Model 5 included Model 4 plus smoking, alcohol intake, and physical activity.† 2 l reduct
w x, and1 udes agv l F-test
sAa
4
ctiaUHlwtotiwi
stnwin
lliC
dbaEeiafhhrwilii
pgi
The coefficient of partial determination (partial R ) shows the marginahich is added to a simpler model that includes other predictors (e.g., age, sevs. Model 2 means that adding ethnicity to the model which already incl
alues for the partial R2 estimates were determined using the multiple partia
ubjects with the E2 allele. An assessment of adjusted plasmapoB/ApoA ratio as a predictor of atherosclerosis revealedpositive and significant association (β = 0.053, p = 0.001).
. Discussion
To our knowledge this is the first study to examine the asso-iation between the ApoE polymorphism and plasma lipidraits in South Asian and Chinese populations exposed to thenfluences of a Western society. Previous studies of ApoEnd plasma lipids in ethnic minorities were conducted in thenited States, focusing primarily on African-Americans andispanic-Americans [12], or were carried out in ethnic popu-
ations living in Asia [6]. In this study, participants from threeell-defined ethnic groups were randomly selected from
hree Canadian cities, and detailed information was obtainedn lifestyle factors including dietary intake, smoking his-ory, physical activity, and alcohol consumption. Samplingn SHARE was random and participants in each ethnic groupere proportionately recruited [1], making the associations
n this study unlikely to be the result of sampling bias.The frequency of ApoE alleles in our subjects differed
ignificantly across ethnic groups, a finding compatible withhat of previous studies [7,19,20]. We observed in each eth-
Please cite this article in press as: Burman D, et al. Relationship of theChinese, and Europeans living in Canada. Atherosclerosis (2008), doi:1
ic group and overall, the E3 allele was the most frequent,ith E4 less frequent, and E2 least frequent. This finding
s ubiquitous for human populations [3,4,7,19,20]. We alsooted that the E2 allele frequency was highest in Chinese and
iAil
ion in the variation of Y associated with a new variable X (e.g., ethnicity)center). For example, a partial R2 value of 0.05 for ApoA comparing Modele, sex, and center reduces the variation in ApoA by 5%. Corresponding p.
owest in South Asians, whereas the E4 allele frequency wasowest in Chinese, intermediate in South Asians, and highestn Europeans. Similar contrasts have been observed betweenhinese and South Asians in Malaysia [6,21].
Our study shows that while frequencies of ApoE allelesiffer significantly between ethnic groups, the associationsetween ApoE and LDL-C, ApoB, ApoA, ApoB/ApoA ratio,nd Lp(a) are consistent across ethnic groups. The ascending2 < E3 < E4 gradient for these plasma traits across differentthnic subgroups, despite varying ApoE allele frequencies,s consistent with the premise highlighted in a recent meta-nalysis by Ioannidis et al. [22], which showed that while therequencies of genetic variants across ‘racial’ groups are ofteneterogeneous, the effects of the variants are more likely to beomogenous [22]. These associations previously have beeneported predominantly in Caucasians [3,5,8,9,11,23,24] asell as in Asian populations residing overseas [6]. Our find-
ngs suggest that the association between ApoE and plasmaipid traits is universal across different ethnic subgroups,rrespective of lifestyle influences that might be related toncreased Westernization.
This study also demonstrates that the ApoE polymor-hism accounts for only a small proportion of the inter-ethnicroup differences for most plasma lipid traits. While ethnic-ty explains a modest amount of inter-individual variability
ApoE polymorphism to plasma lipid traits among South Asians,0.1016/j.atherosclerosis.2008.06.007
n ApoA, ApoB/ApoA ratio, and HDL-C, the contribution ofpoE genotype above and beyond the influence of ethnicity
s relatively small. Thus, genetic variation at this locus aloneikely cannot account for the differences in mean plasma
INATH-10464; No. of Pages 9
rosclero
la[ldefir[eioEmTpvl
phrvratgtoposuhfieii
isjtirafsscaarto
asagni
poataaOpssHtseot
womhp
C
dgfO
A
otoaoaSt
ARTICLED. Burman et al. / Athe
ipid concentrations observed between ethnic groups. Dietarynd lifestyle factors have also been incriminated previously25,26], but prior studies did not assess their effect on plasmaipid traits beyond the influence of ethnic origin. In our study,ietary factors contributed modestly to the prediction of sev-ral plasma traits including HDL-C and ApoB, while lifestyleactors (predominantly alcohol intake and physical activ-ty) modestly predicted HDL-C and ApoA. We previouslyeported the effect of carbohydrate intake on HDL cholesterol27] and individuals who consumed the greatest proportion ofnergy from carbohydrates had the lowest HDL cholesterolndependent of other HDL correlates. The beneficial effectf alcohol intake on lipid profile has been shown [28] and2 and E3 carriers improve plasma lipoprotein/lipid profilesore with exercise training than Apo E4 individuals [29].hus ethnic variations in health behavior appear to influencelasma lipids and should be considered along with geneticariants in the explanation of inter-ethnic variations in plasmaipids [30,31].
The associations between the ApoE polymorphism andlasma concentrations of Lp(a), ApoA, HDL-C, and TGave been inconsistent in the literature, with results thatange from no association [3,9,23,32,33] to associations thatary by sex [10]. Unlike our study, de Knijff et al. [34]eported that the E4 allele, rather than the E3 allele, wasssociated with higher mean Lp(a). The biology underlyinghese associations is complex, however, since the majority ofenetically determined variance in Lp(a) results from varia-ion at the ApoA locus on chromosome 6 [35]. Conversely,ur observation that ApoA is highest in E2 subjects sup-orts previous findings by Kahraman et al. [36], althoughthers reported similar or lower ApoA concentration in E2ubjects [32,33]. Similarly, in Chinese and Asian Indian pop-lations residing in Asia, the E2 isoform was associated withigher HDL-C [6], as in our study, although others did notnd an association in Japanese [37,38]. The present studyxtends these observations to Asians living in North Amer-ca who are likely exposed to different dietary and lifestylenfluences.
Our study is supportive of an association between ApoEsoform and mean IMT in all ethnic groups. While our datahows a non-significant trend for lower mean IMT in the sub-ects with the E2 isoform, the small number of subjects withhis genotype may partly explain the null findings. Similarly,n their recent meta-analysis of 22 studies, Paternoster et al.eported a significant protective association between the E2llele and carotid IMT [39]. However, these studies mostlyocused either on Caucasians or evaluated a small number ofubjects in Eastern Asia, but did not assess South Asians. Ourtudy also shows that the ApoE isoform is significantly asso-iated with ApoB/ApoA ratio, which itself is significantlyssociated with carotid atherosclerosis. Similarly Bennet et
Please cite this article in press as: Burman D, et al. Relationship of theChinese, and Europeans living in Canada. Atherosclerosis (2008), doi:1
l. showed that the E2 genotype is associated with a 20%eduction in coronary heart disease compared to the E3 geno-ype, an effect that is likely mediated by the influence of E2n plasma lipids [11].
tm
t
PRESSsis xxx (2008) xxx–xxx 7
The main strengths of this study are the recruitment ofrandom population, inclusion of three ethnic groups using
imilar criteria, and use of standard methods of phenotypingnd genotyping. The inclusion criteria that both parents andrandparents must have originated from South Asian, Chi-ese or European nations [1] likely ensured that admixturen the sample was negligible [40].
The study has some limitations. The inclusion of partici-ants receiving medication for CVD, diabetes, hypertensionr hypercholesterolemia can alter physiologic lipid levelsnd confound the lipid associations. However, in a sensi-ivity analysis that excluded these patients (n = 352), thessociations between ApoE isoforms and plasma lipid traitsmong ethnic groups were unaltered (data not shown).ur analyses involved testing for associations with multi-le outcome measures (plasma traits) across several ethnicubgroups, which increases the likelihood of detectingignificant associations where none exist (type 1 error).owever, since strong associations were observed for mul-
iple plasma traits across ethnic subgroups despite themall number of E2 subjects (n = 55), and given that theffects of the ApoE isoforms were consistent with previ-us observations, it is unlikely that our findings were dueo chance.
In conclusion, ApoE isoform is significantly associatedith plasma lipoproteins in all ethnic groups, but explainsnly a small proportion of the inter-ethnic variation forost plasma lipoproteins. Additional genetic variants and/or
ealth behaviors likely contribute to ethnic variations inlasma lipid traits.
onflict of interest
D. Burman, A. Mente, S. Islam, S. Yusuf, and S. Anandeclare no conflict of interest. R. Hegele has spoken on theenetic determinants of dyslipidemia and received paymentrom those funding the events (Merck Schering, Pfizer, andryx) in amounts less than $10,000.
cknowledgements
D. Burman contributed to the analysis and interpretationf the data, and the drafting of the manuscript. A. Mente con-ributed to the analysis, interpretation of the data, and draftingf the manuscript. R. A. Hegele performed DNA extractionnd genotyping, and contributed to interpretation and draftingf the manuscript. S. Islam was responsible for database man-gement and provided comments on the statistical analyses.. Yusuf contributed to the design of the study, interpreta-
ion, and drafting of the manuscript. S. S. Anand contributed
ApoE polymorphism to plasma lipid traits among South Asians,0.1016/j.atherosclerosis.2008.06.007
o the design of the study, interpretation, and drafting of theanuscript.We acknowledge Dr. Koon K. Teo and Dr. Vlad Vuksan for
heir efforts in recruiting participants in SHARE for Edmon-

INATH-10464; No. of Pages 9
8 rosclero
tf
C
SViC
O
H
N
A
ma
LArvg
R
[
[
[
[
[
[
[
[
[
[
[
ARTICLED. Burman et al. / Athe
on and Toronto. The authors also acknowledge Kathy Antayaor her administrative support.
Dr. A. Mente holds a Heart and Stroke Foundation ofanada Postdoctoral Research Fellowship.
Dr. R. Hegele is a Career Investigator of the Heart andtroke Foundation of Ontario and holds the Edith Schulichinet Canada Research Chair (Tier 1) in Human Genet-
cs and the Jacob J. Wolfe Distinguished Medical Researchhair.
Dr. S. Yusuf holds a Heart and Stroke Foundation ofntario Chair in Cardiovascular Research.Dr. S. Anand is a recipient of the Canadian Institutes of
ealth Research Clinician-Scientist Phase 2 Award.Funding: Canadian Institutes of Health Research (Grant
o. MT-12790); Merck Frosst Canada.
ppendix A
Distribution of lipid, lipoprotein, and apolipoproteineans by ApoE allele status among South Asians, Chinese,
nd Europeans living in Canada (mean [S.E.]a)
Variable E2 E3 E4 p for trend
LDL-C (mmol/L)South Asian 2.54 (0.24) 3.32 (0.05) 3.41 (0.10) 0.001Chinese 2.77 (0.11) 3.19 (0.05) 3.21 (0.14) 0.014European 2.74 (0.12) 3.21 (0.05) 3.32 (0.08) <0.001
ApoB (g/L)South Asian 0.81 (0.07) 1.08 (0.02) 1.13 (0.03) <0.001Chinese 0.92 (0.03) 0.99 (0.02) 1.05 (0.04) 0.019European 0.84 (0.04) 1.02 (0.02) 1.05 (0.02) <0.001
ApoA (g/L)South Asian 1.43 (0.07) 1.30 (0.01) 1.24 (0.03) 0.013Chinese 1.44 (0.03) 1.42 (0.02) 1.32 (0.04) 0.019European 1.47 (0.04) 1.40 (0.02) 1.42 (0.03) 0.285
ApoB/ApoASouth Asian 0.58 (0.13) 0.88 (0.03) 0.92 (0.05) 0.014Chinese 0.68 (0.03) 0.73 (0.01) 0.82 (0.04) 0.004European 0.59 (0.03) 0.76 (0.02) 0.77 (0.02) <0.001
HDL-C (mmol/L)South Asian 1.20 (0.08) 1.04 (0.02) 0.94 (0.03) 0.006Chinese 1.14 (0.05) 1.21 (0.02) 1.07 (0.06) 0.331European 1.30 (0.05) 1.17 (0.02) 1.21 (0.04) 0.151
Lp(a) (g/L)b
South Asian 4.94 (0.32) 5.28 (0.07) 5.23 (0.13) 0.402Chinese 4.55 (0.15) 5.07 (0.07) 4.78 (0.18) 0.326European 4.50 (0.18) 5.08 (0.08) 4.99 (0.12) 0.025
TG (mmol/L)b
South Asian 0.44 (0.15) 0.50 (0.03) 0.74 (0.06) 0.069Chinese 0.67 (0.08) 0.29 (0.04) 0.46 (0.10) 0.098European 0.28 (0.08) 0.34 (0.04) 0.31 (0.06) 0.767
DL-C, low-density lipoprotein cholesterol; ApoB, apolipoprotein B;poA, apolipoprotein A; HDL-C, high-density lipoprotein cholesterol; E2
Please cite this article in press as: Burman D, et al. Relationship of theChinese, and Europeans living in Canada. Atherosclerosis (2008), doi:1
efers to individuals with either E3/2 or E2/2 genotypes; E3 refers to indi-iduals with E3/3 genotype, and E4 refers to individuals with E4/3 or E4/4enotypes.
a Concentrations are adjusted for age, sex and center.b Natural log.
[
PRESSsis xxx (2008) xxx–xxx
eferences
[1] Anand SS, Yusuf S, Vuksan V, et al. Differences in risk factors,atherosclerosis, and cardiovascular disease between ethnic groups inCanada: the Study of Health Assessment and Risk in Ethnic groups(SHARE). Lancet 2000;356:279–84.
[2] Yusuf S, Hawken S, Ounpuu S, et al. Effect of potentially modifiablerisk factors associated with myocardial infarction in 52 countries (theINTERHEART study): case-control study. Lancet 2004;364:937–52.
[3] Davignon J, Gregg RE, Sing CF. Apolipoprotein E polymorphism andatherosclerosis. Arteriosclerosis 1988;8:1–21.
[4] Mahley RW, Rall Jr SC. Apolipoprotein E: far more than a lipid trans-port protein. Annu Rev Genomics Hum Genet 2000;1:507–37.
[5] Ehnholm C, Lukka M, Kuusi T, et al. Apolipoprotein E polymorphismin the Finnish population: gene frequencies and relation to lipoproteinconcentrations. J Lipid Res 1986;27:227–35.
[6] Tan CE, Tai ES, Tan CS, et al. APOE polymorphism and lipid profilein three ethnic groups in the Singapore population. Atherosclerosis2003;170:253–60.
[7] Boerwinkle E, Visvikis S, Welch D, et al. The use of measured geno-type information in the analysis of quantitative phenotypes in man. II.The role of the apolipoprotein E polymorphism in determining lev-els, variability, and covariability of cholesterol, betalipoprotein, andtriglycerides in a sample of unrelated individuals. Am J Med Genet1987;27:567–82.
[8] Boerwinkle E, Utermann G. Simultaneous effects of the apolipoproteinE polymorphism on apolipoprotein e, apolipoprotein b, and cholesterolmetabolism. Am J Hum Genet 1988;42:104–12.
[9] Sing CF, Davignon J. Role of the apolipoprotein E polymorphism indetermining normal plasma lipid and lipoprotein variation. Am J HumGenet 1985;37:268–85.
10] Frikke-Schmidt R, Nordestgaard BG, Agerholm-Larsen B, et al.Context-dependent and invariant associations between lipids, lipopro-teins, and apolipoproteins and apolipoprotein E genotype. J Lipid Res2000;41:1812–22.
11] Bennet AM, Di Angelantonio E, Ye Z, et al. Association ofapolipoprotein E genotypes with lipid levels and coronary risk. JAMA2007;298:1300–11.
12] Pablos-Méndez A, Mayeux R, Ngai C, et al. Association of apo E poly-morphism with plasma lipid levels in a multiethnic elderly population.Arterioscler Thromb Vasc Biol 1997;17:3534–41.
13] Sheth T, Nargundkar M, Chagani K, et al. Classifying ethnicity utilizingthe Canadian Mortality Data Base. Ethn Health 1997;2:287–95.
14] Kelemen LE, Anand SS, Vuksan V, et al. Development and evaluationof cultural food frequency questionnaires for South Asians, Chinese,and Europeans in North America. J Am Diet Assoc 2003;103:1178–84.
15] Appel LJ, Sacks FM, Carey VJ, et al. Effects of protein, monounsatu-rated fat, and carbohydrate intake on blood pressure and serum lipids:results of the OmniHeart randomized trial. JAMA 2005;294:2455–64.
16] Willett WC, Howe GR, Kushi LH. Adjustment for total energy intake inepidemiologic studies. Am J Clin Nutr 1997;65(4 Suppl.):1220S–8S.
17] Hixson JE, Vernier DT. Restriction isotyping of human apolipopro-tein E by gene amplification and cleavage with HhaI. J Lipid Res1990;31:545–8.
18] Neter J, Kutner MH, Nachtscheim CJ, Wasserman W. Applied linearregression models. 3rd ed. Chicago: Irwin; 1996.
19] Hallman DM, Boerwinkle E, Saha N, et al. The apolipoprotein EPolymorphism: a comparison of allele frequencies and effects in ninepopulations. Am J Hum Genet 1991;49:338–49.
20] Gerdes LU, Klausen IC, Sihm I, et al. Apolipoprotein E polymor-phism in a danish population compared to findings in 45 other study
ApoE polymorphism to plasma lipid traits among South Asians,0.1016/j.atherosclerosis.2008.06.007
populations around the world. Genet Epidemiol 1992;9:155–67.21] Seet WT, Mary Anne TJA, Yen TS. Apolipoprotein E genotyping in
the Malay, Chinese and Indian ethnic groups in Malaysia—a study onthe distribution of the different apoE alleles and genotypes. Clin ChimActa 2004;340:201–5.

INATH-10464; No. of Pages 9
rosclero
[
[
[
[
[
[
[
[
[
[
[
[
[
[
[
[
[
[
ARTICLED. Burman et al. / Athe
22] Ioannidis JPA, Ntzani EE, Trikalinos TA. ‘Racial’ differences in geneticeffects for complex diseases. Nat Genet 2004;36:1312–8.
23] Xhignesse M, Lussier-Cacan S, Sing CF, et al. Influences of com-mon variants of apolipoprotein E on measures of lipid metabolism in asample selected for health. Arterioscler Thromb 1991;11:1100–10.
24] Keavney B, Palmer A, Parish S, et al. Lipid-related genes and myocar-dial infarction in 4685 cases and 3460 controls: discrepancies betweengenotype, blood lipid concentrations, and coronary disease risk. Int JEpidemiol 2004;33:1002–13.
25] Weggemans RM, Zock PL, Ordovas JM, et al. Apoprotein E genotypeand the response of serum cholesterol to dietary fat, cholesterol andcafestol. Atherosclerosis 2001;154:547–55.
26] Talmud PJ, Stephens JW, Hawe E, et al. The significant increasein cardiovascular disease risk in APOEepsilon4 carriers is evidentonly in men who smoke: potential relationship between reducedantioxidant status and ApoE4. Ann Hum Genet 2005;69(Pt 6):613–22.
27] Merchant AT, Anand SS, Kelemen LE, et al. Carbohydrate intakeand HDL in a multiethnic population. Am J Clin Nutr 2007;85:225–30.
28] Boer JM, Feskens EJ, Schouten EG, et al. Lipid profiles reflecting highand low risk for coronary heart disease: contribution of apolipopro-tein E polymorphism and lifestyle. Atherosclerosis 1998;136:395–402.
29] Hagberg JM, Wilund KR, Ferrell RE, APO. E gene and gene-
Please cite this article in press as: Burman D, et al. Relationship of theChinese, and Europeans living in Canada. Atherosclerosis (2008), doi:1
environment effects on plasma lipoprotein–lipid levels. PhysiolGenomics 2000;4:101–8.
30] Ismail IS, Nazaimoon W, Mohamad W, et al. Ethnicity and glycaemiccontrol are major determinants of diabetic dyslipidaemia in Malaysia.Diabet Med 2001;18:501–8.
[
PRESSsis xxx (2008) xxx–xxx 9
31] Diaz VA, Mainous III AG, Koopman RJ, et al. Race and diet in theoverweight: association with cardiovascular risk in a nationally repre-sentative sample. Nutrition 2005;21:718–25.
32] Guang-da X, You-ying L, Zhi-song C, et al. Apolipoprotein e4 allele ispredictor of coronary artery disease death in elderly patients with type2 diabetes mellitus. Atherosclerosis 2004;175:77–81.
33] Anuurad E, Lu G, Rubin J, et al. ApoE genotype affects allele-specific apo[a] levels for large apo[a] sizes in African Americans: theHarlem–Basset Study. J Lipid Res 2007;48:693–8.
34] de Knijff P, Kaptain A, Boomsma D, et al. Apolipoprotein E poly-morphism affects plasma levels of lipoprotein (a). Atherosclerosis1991;90:169–74.
35] Pati U, Pati N. Lipoprotein (a), atherosclerosis, and apolipoprotein (a)gene polymorphism. Mol Genet Metab 2000;71:87–92.
36] Kahraman S, Kiykim AA, Altun B, et al. Apolipoprotein E gene poly-morphism in renal transplant recipients: effects on lipid metabolism,atherosclerosis and allograft function. Clin Transplant 2004;18:288–94.
37] Eto M, Watanabe K, Ishii K. Reciprocal effects of apolipoprotein E alle-les (epsilon 2 and epsilon 4) on plasma lipid levels in normolipidemicsubjects. Clin Genet 1986;29:477–84.
38] Zaman MM, Ikemoto S, Yoshiike N, et al. Association of apolipopro-tein genetic polymorphisms with plasma cholesterol in a Japaneserural population. The Shibata Study. Arterioscler Thromb Vasc Biol1997;17:3495–504.
39] Paternoster L, Martínez González NA, Lewis S, et al. Association
ApoE polymorphism to plasma lipid traits among South Asians,0.1016/j.atherosclerosis.2008.06.007
between apolipoprotein E genotype and carotid intima-media thicknessmay suggest a specific effect on large artery atherothrombotic stroke.Stroke 2008;39:48–54.
40] Cardon LR, Palmer LJ. Population stratification and spurious allelicassociation. Lancet 2003;361:598–604.
Copyright © 2022 FDOKUMEN