Ancient human genomes suggest three ancestral populations for present-day Europeans
Upload
independentCategory
view
1download
0
Genetic Evidence for the Convergent Evolution of Light Skin in Europeans andEast Asians
Heather L. Norton,*1 Rick A. Kittles,� Esteban Parra,� Paul McKeigue,§ Xianyun Mao,*Keith Cheng,k{ Victor A. Canfield,{ Daniel G. Bradley,# Brian McEvoy,# and Mark D. Shriver**Department of Anthropology, The Pennsylvania State University; �Department of Medicine, Section of Genetic Medicine,The University of Chicago; �Department of Anthropology, University of Toronto at Mississauga, Mississauga, Ontario, Canada;§Conway Institute, University College, Dublin, Ireland; kJake Gittlen Cancer Research Foundation, Department of Pathology,The Pennsylvania State University College of Medicine, Hershey; {Department of Pharmacology, The Pennsylvania StateUniversity College of Medicine, Hershey; and #Smurfit Institute of Genetics, Trinity College, Dublin, Ireland
Human skin pigmentation shows a strong positive correlation with ultraviolet radiation intensity, suggesting that variation inskin color is, at least partially, due to adaptation via natural selection. We investigated the evolution of pigmentation variationby testing for the presence of positive directional selection in 6 pigmentation genes using an empiricalFST approach, throughan examination of global diversity patterns of these genes in the Centre d’Etude du Polymorphisme Humain (CEPH)-Diversity Panel, and by exploring signatures of selection in data from the International HapMap project. Additionally,we demonstrated a role for MATP in determining normal skin pigmentation variation using admixture mapping methods.Taken together (with the results of previous admixture mapping studies), these results point to the importance of several genesin shaping the pigmentation phenotype and a complex evolutionary history involving strong selection. Polymorphisms in 2genes, ASIP and OCA2, may play a shared role in shaping light and dark pigmentation across the globe, whereas SLC24A5,MATP, and TYR have a predominant role in the evolution of light skin in Europeans but not in East Asians. These findingssupport a case for the recent convergent evolution of a lighter pigmentation phenotype in Europeans and East Asians.
Introduction
Skin pigmentation shows remarkable variation bothwithin and among human populations. This variation is of-ten explained in terms of natural (Blum 1961; Loomis 1967;Walter 1971; Branda and Eaton 1978; Kollias et al. 1991;Jablonski and Chaplin 2000) or sexual (Darwin 1871;Diamond 1992; Aoki 2002) selection. Recent work (Jablonskiand Chaplin 2000; Chaplin 2004) has confirmed a strongpositive correlation between skin pigmentation and ultravi-olet radiation (UVR) intensity, suggesting that global var-iation in skin pigmentation may be the result of localizedadaptation to different UVR conditions via natural selec-tion. Although a large number of genes have been identifiedthat explain human Mendelian pigmentation disorders andmouse coat color variability (Bennett and Lamoreux 2003),very few of these have been shown to have effects on nor-mal variation in human skin pigmentation (Box et al. 1997;Smith et al. 1998; Flanagan et al. 2000; Kanetsky et al.2002; Shriver et al. 2003; Bonilla et al. 2005; Graf et al.2005; Lamason et al. 2005). Although there is strong evi-dence that pigmentation variation has been influenced bynatural selection, it is currently unknown how selectionhas affected the genetic architecture of pigmentation lociin different populations, even when such populations haveexperienced similar levels of UVR over their evolutionaryhistories. For example, the dark skin that characterizesmany sub-Saharan African and Island Melanesian popula-tions may be due to shared ancestral variants or to novelgenetic adaptations in the ancestral Island Melanesian pop-ulation. Similarly, the light skin of Europeans and EastAsians may have a common genetic origin or instead
may be the result of independent adaptations to low-UVR environments.
The pigmentation candidate genes that have beenidentified to date have effects at various stages of the pig-mentation pathway, ranging from melanogenesis, the stabi-lization and transport of enzymes in the melanin productionpathway, the production and maintenance of melanosomesand the melanosomal environment, and the switch betweenthe production of eumelanin and pheomelanin. In thisstudy, we have focused on 6 of these genes. The first ofthese, TYR, produces the critical enzyme tyrosinase, whichcatalyzes the first 2 steps in the melanin synthesis pathway(Spritz 1994). A second gene in our study, MATP, has beenimplicated in the trafficking and intracellular processing ofthis critical enzyme (Costin et al. 2003). The production ofmelanin takes place in specialized cellular organellesknown as melanosomes, and there is evidence that melaninsynthesis may be dependent upon pH within these organ-elles (Ancans et al. 2001; Fuller et al. 2001). Puri et al.(2000) suggested that the product of the OCA2 gene, a mel-anosomal membrane protein, may serve as an anion trans-porter, thus helping to regulate melanosomal pH. Morerecently, it has been suggested that melanogenesis andthe development of the melanosomes themselves may alsobe dependent on calcium levels in the melanosome, regu-lated by the SLC24A5 gene (Lamason et al. 2005). The final2 genes that we examined, MC1R and ASIP, are involved inthe production of the 2 types of melanin, darker eumelaninand the lighter pheomelanin. MC1R encodes for the mela-nocortin-1 receptor, a 7-pass transmembrane G-protein–coupled receptor that binds the hormone a-MSH. Whenthe MC1R is activated by a-MSH, cyclic adenosine3#,5#-monophosphate (cAMP) levels are increased and eu-melanin production is stimulated through the cAMP/proteinkinase A signaling pathway (Busca and Ballotti 2000). Al-ternatively, agouti-signaling protein, the product of ASIP,can also bind to the MC1R, blocking a-MSH and causingthe production of pheomelanin rather than eumelanin. Ofthese 6 candidate genes, 5 (TYR, OCA2, ASIP, MC1R,
1 Present address: Arizona Research Laboratories-Biotechnology,University of Arizona, Tucson.
Key words: skin pigmentation, natural selection, convergent evolution.
E-mail: [email protected].
Mol. Biol. Evol. 24(3):710–722. 2007doi:10.1093/molbev/msl203Advance Access publication December 20, 2006
� The Author 2006. Published by Oxford University Press on behalf ofthe Society for Molecular Biology and Evolution. All rights reserved.For permissions, please e-mail: [email protected]

and SLC24A5) have been previously associated with normalvariation in skin pigmentation (Box et al. 1997; Smith et al.1998; Schioth et al. 1999; Flanagan et al. 2000; Bastiaenset al. 2001; Shriver et al. 2003; Bonilla et al. 2005), and herewe demonstrate an association for the sixth gene, MATP.
In this study, we examine the role of 6 pigmentationcandidate genes in explaining global pigmentation clinesprimarily by looking for evidence of directional selectionin patterns of variation in a geographically diverse set ofpopulations that exhibit a range of pigmentation pheno-types. We have applied an empirical FST-based approach(Akey et al. 2002) using allele frequency data from11,078 autosomal single nucleotide polymorphisms (SNPs)for comparison to test for population divergence in 7 differ-ent SNPs in these genes and also examined their patterns ofglobal variation in the CEPH-Diversity Panel. We also ex-amine several statistics that are sensitive to directional selec-tion (locus-specific branch length [LSBL], Tajima’s D,lnRH) in these and other candidate genes using data fromthe HapMap project and directly investigate the functionalrelevance of the MATP gene using an admixture mappingapproach. Our results provide new insights into the geneticmechanisms underlying the human pigmentation phenotypeand their evolution.
Materials and MethodsSamples
Twenty individuals each from the following popula-tions were typed on the Affymetrix 10K whole-genomesampling assay (WGSA) Mapping Array (Santa Clara,CA): West African (Mende from Sierra Leone), Island Mel-anesian (Nasioi from Bougainville), South Asian (Indiansfrom Andhra Pradesh), Native American (Nahua from Mex-ico), East Asian (Chinese and Japanese from Coriel HumanCell Repository), and European (Spanish from Valencia) us-ing the methods described in Shriver et al. (2005).
Pigmentation candidate SNPs were typed in the same20 individuals from each population typed on the Affyme-trix Arrays as well as on an average of 40 additional indi-viduals from the same or similar populations (for a total of;60 individuals per population). It was possible to sampleindividuals from the same regions as the populations typedon the Affymetrix Chip for the Island Melanesians (n5 44)and Europeans (n 5 42). The additional 40 East Asian andSouth Asian individuals were unadmixed Chinese (n5 46)and South Asian Indian (n 5 45) residents of Trinidad andTobago (collected by Tamiko Brown, University of theWest Indies). The additional 45 West African individualswere African-American individuals of the Gullah popula-tion of South Carolina measured to have 100% West Africanancestry using 10 ancestry informative markers (AIMs)(Parra et al. 2001). The additional Native American samplescomprised 14 Nahua speakers (from the same populationtyped on the Affymetrix Array) and 33 Mayans (collectedand kindly provided by Ken Weiss and Anne Buchanan,Penn State University).
To determine the linkage of MATP with normal var-iation in skin pigmentation, the C374G SNP was genotypedin 202 African-American and 122 African Caribbean indi-viduals for whom quantitative measures of skin pigmenta-
tion as well as individual ancestry estimates were available(Shriver et al. 2003). These populations were selected be-cause admixed populations are well suited for gene map-ping due to the long-range linkage disequilibrium that isgenerated by admixture.
Five SNPs in these pigmentation genes that showedsignals of selection in the pairwise locus-specific FST studywere also typed in the full CEPH Diversity Panel (Cannet al. 2002) consisting of 53 global populations and1059 individuals in total.
Pigmentation Gene Marker Selection and Genotyping
Pigmentation candidate SNPs were selected for inclu-sion in the FST portion of this study because of either previ-ously reported allele frequency differences betweenpopulations, their location within genes believed to havean effect on pigmentation variation, or previously reportedassociations with normalvariation in pigmentationvariation.Four are nonsynonymous coding SNPs, 2 (OCA2 A355Gand MC1R G314A) are synonymous, and ASIP A8818Gis located in the 5# promoter region. Each SNP was assayedusing the McSNP genotyping assay (Akey et al. 2001; Yeet al. 2002). Reference SNP numbers, polymerase chainreaction, and genotyping conditions can be found in supple-mentary table 1 (Supplementary Material online).
FST Estimation and Percentile Rank Calculation
Unbiased estimates of Weir and Cockerham’s FST
were calculated as in Akey et al. (Akey et al. 2002). Wedetermined the rank percentile of the locus-specific FST val-ues for each candidate SNP using the following equation:
Rank percentile ðxÞ5 number of loci
. observed pairwise locus-specificFSTðxÞ=total number of loci:
The higher the pairwise locus-specific FST value fora pigmentation SNP relative to the appropriate empiricaldistribution, the lower its percentile rank. SNPs for whichthe pairwise locus-specific FST value had a rank percentilevalue of 0.05 or less were classified as showing significantdivergence. Thus, all P values reported for FST comparisonsare empirical P values indicative of the percentile rank ofthe candidate SNP relative to the appropriate pairwise FST
distribution. For example, the East Asian–West Africanpairwise FST value for the ASIP A8818G polymorphismis 0.071. This value is then compared against the empiricaldistribution of pairwise FST values between East Asians andWest Africans calculated for the 11,078 SNPs typed on theAffymetrix Chip. Similarly, the pairwise FST value of thisSNP between the European and West African samples is0.818. This value is compared with the empirical distribu-tion of pairwise FST estimated for Europeans and WestAfricans. A 1-tailed test is appropriate in this instance aswe are investigating loci showing evidence of directionalselection; these would fall in the upper tail of the distribu-tion. We calculated P values using the full data set of 11,078SNPs, as well a subset composed of genic (n 5 3159) andnongenic (n5 7127) SNPs. The results, regardless of which
Convergent Evolution of Light Skin Phenotype 711

data set is used, are qualitatively the same, with the excep-tion of a single interpopulation comparison at TYR 192. Inthe full data set, the FST value of 0.500 between the Euro-peans and West Africans has a P value of 0.043. In the genicdata set, the P value rises to 0.057, but it remains significantin the nongenic data set (P 5 0.042). This discrepancymight be due to the higher average FST values for genicSNPs relative to nongenic SNPs (Hinds et al. 2005) or alsoto the smaller sample size of our genic data set.
Phylogenetic Tree Construction
Population trees were constructed using the Neighbor-Joining method (Nei and Saitou 1987) as implemented inMEGA 2.1 (Kumar et al. 2001) using average pairwise FST
values from the panel of 11,078 autosomal SNPs as a dis-tance measure. Locus-specific trees were constructed in thesame manner, using the pairwise locus-specific FST valuesfor each pigmentation SNP separately.
Admixture Mapping
We tested for linkage between the MATP C374GSNP and skin pigmentation in the African-American andAfrican Caribbean samples using the program ADMIXMAP(Hoggart et al. 2003). ADMIXMAP uses a combination ofBayesian and classical approaches to model the associa-tions of ancestry between linked marker loci and the asso-ciation of a particular phenotypic trait of interest withindividual admixture or ancestry at a linked marker locus.Individual ancestry estimates used in this program werebased on allele frequencies at 34 AIMs for West African,Native American, and European ancestry (Shriver et al.2003). Skin pigmentation was measured using the DermaS-pectrometer (Cortex Technology, Hadsund, Denmark),a narrow band reflectance spectrophotometer, followingmethods previously described (Shriver et al. 2003). TheDermaSpectrometer estimates the concentrations of hemo-globin and melanin in the skin after the work of Diffey et al.(1984). By utilizing the differences in the absorption prop-erties of these 2 chromophores, the DermaSpectrometer es-timates the amount of skin reflectance due to melanincontent of the skin and quantifies this as the M (melanin)index. Higher M index values indicate darker pigmentation,whereas lower M index values indicate lighter pigmenta-tion. The M index values in both the African Americanand African Caribbean samples were normally distributed.
Analysis of Pigmentation Genes in HapMap Data
Data from a total of 3,458,541 SNPs in Release 20/Phase II of HapMap project were examined in 3 world
populations: West African Yoruba (YRI), Northern EuropeCEPH (CEU), and a pooled East Asian (EAS) group com-posed of Chinese and Japanese individuals. The genomewas divided into 587,233 overlapping 25-kb sliding win-dows advanced by 5-kb (in other words a 20-kb overlapbetween adjacent windows) containing on average 29SNPs. The position of each window was described accord-ing to the central base pair on the NCBI35 build of thehuman genome.
Three measures of sequence diversity indicative of theaction of positive selection were calculated for each of thewindows in each of the 3 populations. LSBLs and lnRHwere calculated for each SNP within a window and aver-aged. LSBL was calculated using the methods describedin Shriver et al. (2004). When calculating lnRH, we havesubstituted 0.0001 for the zero value that occurs when anallele is fixed in one population (Storz et al. 2004). The Taji-ma’s D statistic was also calculated for each window. Sep-arate distributions were constructed for autosomal andX-chromosome windows. Windows were mapped to can-didate pigmentation genes using Refseq coordinates(NCBI35 build of the human genome) of the largest tran-script including an additional 10 kb of upstream and down-stream sequence.
ResultsPairwise FST in Pigmentation Genes
In all, 11,078 autosomal SNPs were typed, using theAffymetrix 10K Mapping Array Chip (Shriver et al. 2005),in 6 populations (representing Europeans, East Asians, Na-tive Americans, South Asians, Island Melanesians, andWest Africans) that encompass a range of geographic ori-gins and pigment phenotypes. These formed an empiricaldistribution of values against which allele frequencies of7 SNPs in 6 pigmentation candidate genes (TYR, MATP,SLC24A5, MC1R, ASIP, OCA2) in the same or similar pop-ulations (table 1) could be compared. The concept of usingFST distributions to detect signals of natural selection wasfirst proposed by Lewontin and Krakauer (1973) and isbased on the fact that although demographic processes willaffect all regions of the genome equally, selection will acton specific loci and linked neutral variants (Cavalli-Sforza1966). FST, like many statistics of genetic variation, canbe sensitive to the underlying demographic history of thepopulations in question (Lewontin and Krakauer 1975;Nei and Maruyama 1975; Robertson 1975). As it can bevery difficult to model this history accurately, compari-sons of FST values with empirical FST distributions drawnfrom the same populations (which will reflect the average
Table 1Allele Frequencies by Population
nTYR 192*A,
rs1042602ASIP 8818*A,
rs6058017OCA2 355*A,
rs1800404MATP 374*G,
rs16891982MC1R 92*G,
rs2228479MC1R 314*G,
rs2228478SLC24A5 111*A,
rs1426654
Island Melanesian 120 0.00 0.52 0.18 0.00 0.83 0.26 0.07East Asian 122 0.00 0.72 0.37 0.01 0.73 0.31 0.00South Asian 126 0.04 0.77 0.29 0.07 0.97 0.24 0.52Native American 128 0.01 0.98 0.38 0.06 0.96 0.07 0.08European 84 0.52 0.86 0.58 0.86 0.94 0.11 0.96West African 130 0.01 0.15 0.04 0.05 0.99 0.52 0.09
712 Norton et al.
demographic history) are preferable to comparisons withsimulated FST distributions (Black et al. 2001; Akeyet al. 2002, 2004).
Five SNPs in 5 different pigmentation genes hadlocus-specific FST values that fell within the top 5% of com-parisons for at least one population pair gauged across ourempirical distribution (table 2). The remaining 2 SNPs, bothwithin the MC1R gene, did not show such interpopulationpartitioning of variation. SNPs with pairwise FST values inthe top 5% of the relevant empirical distributions were usedto construct Neighbor-Joining trees as a way to graphicallyrepresent divergence among populations at these pigmen-tation loci (fig. 1).
Pairwise FST estimates for the ASIP A8818G andOCA2 A355G SNPs tentatively suggest a pattern of diver-gence between 4 populations (Europeans, East Asians, Na-tive Americans, and South Asians) and the relatively moredarkly pigmented populations of West Africa and IslandMelanesia, or possibly only between West Africans andall other populations. At both loci, West Africans and Island
Melanesians have higher frequencies of the ancestral allelesthan the other 4 populations. Pairwise locus-specific FST
values falling in the top 5% of the empirical distributionsare observed between West Africans and 3 other popula-tions (South Asians, Native Americans, and Europeans)at ASIP A8818G. FST values between West Africans andEast Asians at this locus are elevated but do not reachour cutoff value of 5% (FST 5 0.489, P 5 0.065). AtOCA2 A355G, only West Africans and Europeans showFST values falling into the top fifth percentile of relevantcomparisons (FST 5 0.516, P , 0.05). The low pairwiseFST values and higher frequency of ancestral alleles at bothSNPs studied in these loci between West Africans and Is-land Melanesians hint that dark pigmentation associatedwith both loci in these populations may have a commonevolutionary origin (Mean FST(WA�IM) 5 0.182; ASIPA8818G FST(WA�IM) 5 0.260, P 5 0.282; OCA2A355G FST(WA�IM) 5 0.101, P 5 0.525).
Three loci, TYR A192C, MATP C374G, SLC24A5A111G, show very strong signals of European-specific
Table 2Average Pairwise FST Values Based on the 11,078 Autosomal SNPs on the Affymetrix 10K whole-genome sampling assay(WGSA) chip and Locus-Specific PairwiseFST Values for the 5 SNPs That ShowedAt Least One Value Falling into the Top FifthPercentile in At Least One Population Comparison
Island Melanesian East Asian South Asian Native American European
Affymetrix chip
East Asian 0.112South Asian 0.111 0.067Native American 0.157 0.092 0.104European 0.141 0.103 0.048 0.123West African 0.182 0.157 0.125 0.189 0.137
TYR
East Asian 0.000 (1.000)South Asian 0.038 (0.569) 0.038 (0.437)Native American 0.000 (1.000) 0.000 (1.000) 0.019 (0.608)European 0.515 (0.045) 0.515 (0.017) 0.430 (0.004) 0.499 (0.035)West African 0.000 (1.000) 0.000 (1.000) 0.019 (0.652) 0.000 (1.000) 0.500 (0.043)
ASIP
East Asian 0.071 (0.446)South Asian 0.115 (0.361) 0.000 (1.000)Native American 0.424 (0.115) 0.221 (0.147) 0.173 (0.231)European 0.226 (0.244) 0.048 (0.503) 0.018 (0.438) 0.075 (0.467)West African 0.260 (0.282) 0.489 (0.065) 0.547 (0.023) 0.815 (0.011) 0.663 (0.011)
OCA2
East Asian 0.072 (0.445)South Asian 0.021 (0.635) 0.006 (0.589)Native American 0.081 (0.498) 0.000 (1.000) 0.010 (0.647)European 0.281 (0.188) 0.082 (0.399) 0.155 (0.097) 0.073 (0.472)West African 0.101 (0.525) 0.286 (0.212) 0.205 (0.237) 0.299 (0.253) 0.516 (0.039)
MATP
East Asian 0.008 (0.635)South Asian 0.060 (0.491) 0.026 (0.493)Native American 0.053 (0.563) 0.020 (0.569) 0.000 (1.000)European 0.855 (0.001) 0.836 (,0.001) 0.769 (,0.001) 0.777 (0.003)West African 0.039 (0.660) 0.008 (0.727) 0.000 (1.000) 0.000 (1.000) 0.791 (0.003)
SLC24A5
East Asian 0.065 (0.457)South Asian 0.383 (0.060) 0.519 (0.003)Native American 0.000 (1.000) 0.072 (0.397) 0.374 (0.059)European 0.875 (0.001) 0.957 (,0.001) 0.389 (0.007) 0.870 (,0.001)West African 0.000 (1.000) 0.081 (0.521) 0.358 (0.096) 0.000 (1.000) 0.859 (0.001)
NOTE.—Empirical P values for the latter are shown in parentheses and those ,0.05 are emphasized by bold type.
Convergent Evolution of Light Skin Phenotype 713

divergence. High FST values between Europeans and darklypigmented populations such as West Africans and IslandMelanesians are not unexpected if these genes have func-tional effects. However, the notably elevated pairwise FST
values relative to East Asians (the population in our panelthat is the most similar to Europeans in pigmentation phe-notype) is striking. Populations intermediate in pigmenta-tion (Native Americans and South Asians) also exhibitFST values falling in the top fifth percentile of their relevantFST distributions with Europeans for these 3 loci. In the caseof SLC24A5 A111G, South Asian pairwise FST values alsofall in this top fifth percentile when compared with bothEuropeans (FST 5 0.389, P , 0.01) and East Asians(FST 5 0.519, P , 0.01), but not when compared withany other population. At all 3 loci, Europeans have thehighest frequency of the derived alleles relative to the other5 populations.
Admixture Mapping of MATP
Four of the 5 SNPs displaying potential signals ofselection (ASIP A8818G, OCA2 A355G, TYR A192C, andSLC24A5 A111G) have been previously shown to be as-sociated with normal pigmentation variation in admixedAfrican-American and African Caribbean populations(Shriver et al. 2003; Bonilla et al. 2005; Lamason et al.2005). MATP C374G was reported to be associated withnormal variation in pigmentation in a population of Euro-pean ancestry (Graf et al. 2005), but an association withvariation in pigmentation between populations that differin pigmentation levels has not been demonstrated (althoughobserved differences in allele frequencies between suchpopulations has led some to speculate that this may bethe case [Nakayama et al. 2002; Graf et al. 2005]).
We used previously described admixture mappingtechniques (McKeigue et al. 2000) to test for linkage
betweenMATPC374G genotype and quantitatively measuredskin pigmentation in a sample of 202 African-Americansand a sample of 122 African Caribbean individuals. Admix-ture mapping is a test for linkage in the presence of popu-lation stratification and makes it possible to test specificallyfor functionally important variations between 2 particularancestral populations that differ for the phenotype of inter-est. In the African-American sample, homozygotes for theMATP 374*G–derived allele have the lowest mean skin Mindex and hence the lightest skin pigmentation (mean M 539.8). Ancestral allele homozygotes have the highest meanM index (M 5 55.6), whereas heterozygotes are intermedi-ate in skin color (mean M index of 49.3, fig. 2). Using the
0.00
0.10
0.20
0.30
freq
uenc
y
0.40
0.50
CC
0.00
0.10
0.20
0.30
0.40
0.50
freq
uenc
y
GC
0.00
0.10
0.20
0.30
0.40
0.50
30 35 40 45 50 55 60 65 70 75 80 85
M index
freq
uenc
y
GG
FIG. 2.—Distribution of M index values for each of the 3 genotypeclasses at MATP C374G in a sample of 202 African-American individuals.The ancestral allele, C, has an effect size per allele of 15 melanin units(95% CI: 12.5 to 18), and its effects are consistent with an additive modeof inheritance.
A) C)
D)
B)
E)
0.05
0.05 0.050.05
IM
EA
NA
WA
EU
SA
0.05WA
IMNA
EU
SAEA
EU
SANAWA
EAIM
EU
SANAWA
EAIM
EU
SA
WANA
IM
EA
EUNA
EASA
IM
WA 0.05
F)
FIG. 1.—Neighbor-Joining trees based on (a) average FST valuesamong the 6 populations typed on the Affymetrix 10K WGSA chipand locus-specific FST values at (b) ASIP A8818G, (c) OCA2 A355G,(d) TYR A192C, (e) MATP C374G, and (f) SLC24A5 A111G. Populationsare abbreviated as follows: WA, West African; SA, South Asian; NA, Na-tive American; EU, European; EA, East Asian; IM, Island Melanesian.
714 Norton et al.
program ADMIXMAP, we detected a significant linkagebetween genotype at MATP C374G and pigmentation(P , 0.0001). The ancestral allele has an effect size per al-lele of 15 melanin units (95% confidence interval [CI]:12.5 to 18) and is consistent with an additive rather thana dominant mode of action. We did not observe a significantassociation between MATP C374G and pigmentation in theAfrican Caribbean sample, but this may be due to both thesmaller sample size and lower admixture proportions ob-
served for this population relative to the African-Americansample. Nonetheless, the 95% CIs for effect size in this pop-ulation (�3 to 18) are consistent with those observed in theAfrican-American population.
Global Patterns of Variation in Pigmentation Genes
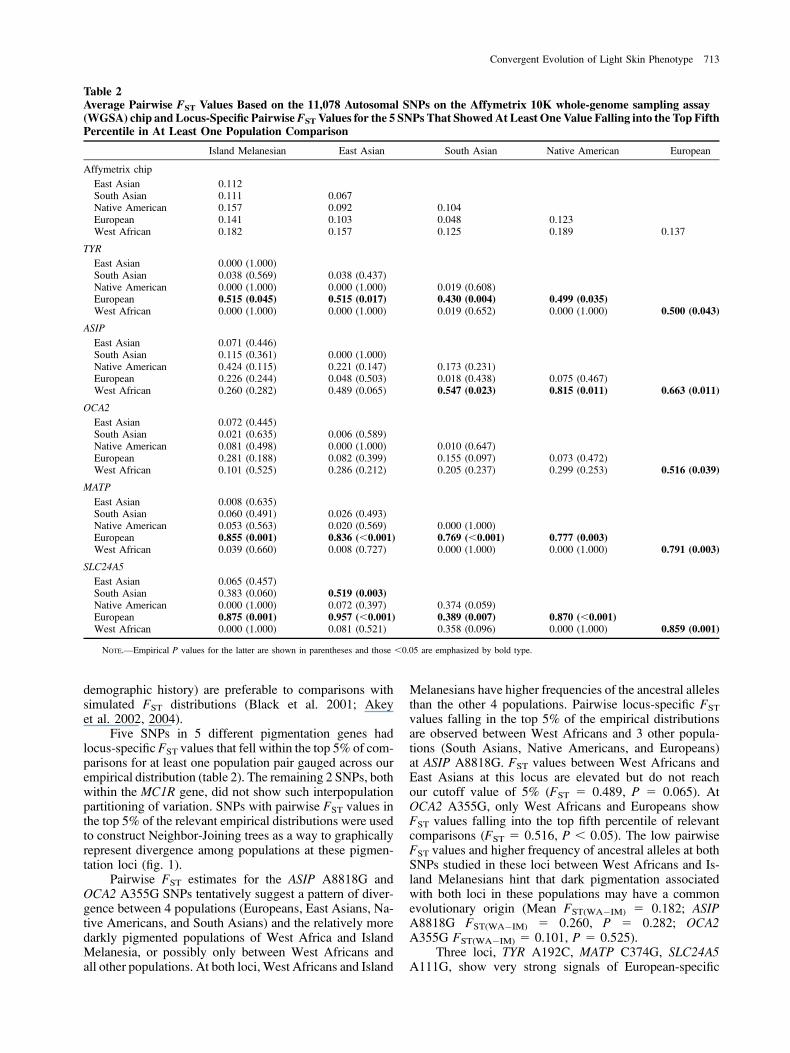
To confirm and investigate further the patterns weobserved in our original samples, we typed the 5 SNPs
FIG. 3.—Distribution of allele frequencies in the CEPH-Diversity Panel for the 5 SNP showing elevated pairwise FST values for at least one pop-ulation pair in our original population screen: (A) ASIP A8818G, (B) OCA2A355G, (C) TYR A192C, (D) MATPC374G, and (E) SLC24A5A111G. On allmaps, gray shading corresponds to the frequency of the allele associated with lighter pigmentation. The numbered populations correspond to the fol-lowing: 1) Biaka pygmies, 2) Mbuti pygmies, 3) Mandenka, 4) Yoruba, 5) Bantu N.E., 6) San, 7) Bantu S.E., 8) Bantu S.W., 9) Mozabite, 10) Bedouin,11) Druze, 12) Palestinian, 13) Brahui, 14) Balochi, 15) Hazara, 16) Makrani, 17) Sindhi, 18) Pathan, 19) Kalesh, 20) Burusho, 21) Han, 22) Tujia, 23)Yizu, 24) Miaozu, 25) Orogen, 26) Daur, 27) Mongola, 28) Hezhen, 29) Xibo, 30) Uygur, 31) Dai, 32) Lahu, 33) She, 34) Naxi, 35) Tu, 36) Yakut, 37)Japanese, 38) Cambodian, 39) Papuan, 40) NAN Melanesian, 41) French, 42) French Basque, 43) Sardinian, 44) Northern Italian, 45) Tuscan, 46)Orcadian, 47) Adygei, 48) Russian, 49) Pima, 50) Maya, 51) Columbian, 52) Karitiana, 53) Surui.
Convergent Evolution of Light Skin Phenotype 715

showing elevated FST values relative to empirical distribu-tions in 53 additional populations from the CEPH-DiversityPanel (Cann et al. 2002). Allele frequencies for each ofthese can be found in supplementary table 2 (Supplemen-tary Material online), whereas figure 3A–E illustrates theirglobal allele frequency distributions.
The pattern of diversity at ASIP 8818*G allele (the an-cestral allele associated with darker pigmentation) indicatesa role primarily in African/non-African divergence (sub-Saharan African frequency: 66%, all other populations:14%) rather than between darkly and lightly pigmented pop-ulations. At OCA2 355, the derived allele (linked with ligh-ter pigmentation) occurs at its highest frequencies acrossEurope and Asia but is also relatively common amongNative American populations (18–34%) and is present at
much lower frequencies (0–10%) among Bantu-speakingAfrican groups. In contrast, the ancestral allele associatedwith dark pigmentation has a shared high frequency in sub-Saharan African and Island Melanesians. A notable excep-tion is the relatively lightly pigmented San population ofSouthern Africa where the derived allele predominates (93%),although this may be simply due to small sample size (n5 14).
The distributions of the derived and ancestral allelesat TYR A192C, MATP C374G, and SLC24A5 A111G areconsistent with the FST results suggesting strong European-specific divergence at these loci. The derived allele atTYR, 192*A (previously linked with lighter pigmentation[Shriver et al. 2003]), has a frequency of 38% among Eu-ropean populations but a frequency of only 14% amongnon-Europeans. The differences between Europeans and
FIG. 3. Continued
716 Norton et al.

non-Europeans for the MATP 374*G and SLC24A5 111*Aalleles (both derived alleles associated with lighter pigmen-tation) were even more striking (MATPEuropean 5 87%;MATPnon-European 5 17%; SLC24A5European 5 100%;SLC24A5non-European 5 46%). The frequency of theSLC24A5 111*A allele outside of Europe is largely ac-counted for by high frequencies in geographically proxi-mate populations in northern Africa, the Middle East, andPakistan (ranging from 62% to 100%).
Signatures of Selection in Pigmentation Genes UsingHapMap Data
To supplement our analyses, we also examined theglobal diversity of our 6 pigmentation genes using datafrom the International HapMap project. Three potentialindicators of directional positive selection (LSBL, Tajima’sD, and lnRH) were calculated in 25-kb overlapping win-dows in European (CEU), East Asian (EAS), and West Af-rican (YRI) populations separately and their significancegauged by an empirical genome-wide distribution.
The first statistic, LSBL (Shriver et al. 2004), decom-poses FST among 3 populations into population-specificcomponents and provides a means to quantify the degreeto which a SNP (or group of SNPs in this case) has changedin allele frequency in one population relative to the other 2.Second, Tajima’s D was used to summarize the allele fre-quency spectrum in each genomic window. Under neutral-ity, Tajima’s D will take on values close to zero.Significantly negative values indicate an excess of rare al-leles that is consistent with recent positive directional selec-tion or a population expansion (Tajima 1989). AlthoughTajima’s D is normally used in cases of full ascertainment(i.e., resequencing), previous studies have established a cor-relation between resequencing and dense genotyping data(Carlson et al. 2005; Voight et al. 2006). Although the Hap-Map data set does suffer from an ascertainment bias toward
common SNPs, this should result in a skew of Tajima Dvalues against negative values that are indicative of direc-tional selection.
Finally, we calculated the related natural log of the ra-tio of heterozygosities (lnRH) between all pairwise popu-lation comparisons (Schlotterer 2002). Strongly negativevalues (i.e., a low ratio) indicate a reduced heterozygosity inone population relative to another and points to population-specific effect (not necessarily the case with significantTajima D values). A simple case of strong and population-specific positive selection is expected to result in stronglynegative Tajima’s D, high LSBL, and negative lnRH val-ues. Although these are relatively simple metrics, whenused together, they may provide nuanced insight in the tim-ing and place of more complex selective events. The full setof results can be found in supplementary table 3 (Supple-mentary Material online).
These data confirm the unusual European-specific pat-terns at MATP and SLC24A5. Both genes display longrange (consecutive windows) and significant indicationsof positive selection for all 3 statistics. In contrast, thereis little evidence of a European-specific pattern in theTYR locus although the nonsynonymous TYR A192CSNP does individually show a strongly significant CEU-LSBL (P , 0.003) in the HapMap data as in our originalfindings. The contrast may be explained by the limitationsof our HapMap sliding window analyses, whereby adjacentSNPs are averaged using a method that does not considerhaplotype structure.
A more complex pattern of evolution is indicated inthe HapMap data for the OCA2 gene. In line with theFST-based survey, it shows consistently strong and signif-icant European LSBL and somewhat more erratic signifi-cance in other measures. However, it also revealsa similar if slightly weaker pattern of significance in theEast Asian population consistent with our original observa-tion of a role in lightly versus darkly pigmented
FIG. 3. Continued
Convergent Evolution of Light Skin Phenotype 717

populations. Another such candidate gene, ASIP, alsoshows some tentative indications of an African-specific pat-tern, although this signal is weak compared with that ob-served for the MATP and SLC24A5 genes in Europeans.The HapMap data does, however, concur with our previousfinding regarding MC1R in failing to detect any signal ofselection at this locus in any of the 3 populations.
We also examined these statistics at 28 additional pig-mentation candidate loci and identified several genes show-ing evidence of natural selection. In particular, 2 genes(ADAM17 and ATRN) showed East Asian–specific signa-tures comparable in strength with those observed for MATPand SLC24A5 in Europeans. The ADTB3A gene also showsa strong and focused signature of positive selection in Afri-cans. Several other genes showed more tentative and/orcomplex evidence of a selected past. These include the tran-scription factor MITF, which may have been subject to a se-lective sweep prior to the divergence of these 3 populations(significantly negative Tajima’s D), and TYRP1, whichshows strong LSBL in the European and, to a lesser extent,East Asian populations.
Discussion
Patterns of variation in the 6 candidate loci that weexamined in this study suggest that darkly pigmented pop-ulations in West Africa and Island Melanesia may sharesome ancestral pigmentation alleles but that the lighter pig-mentation observed in European and East Asian popula-tions is due to independent genetic mutations in at least3 loci: SLC24A5, MATP, and TYR. The initial set of pop-ulations that we examined occupied a range of differentUVR environments and fell across a broad spectrum of pig-mentation phenotypes. Although there is certainly variationwithin these populations (as well as overlap in pigmentationphenotype between some of them), 2 populations fromhigh-UVR regions, West Africans and Island Melanesians,fall at the darker end of the pigmentation continuum,whereas 2 other populations from low-UVR regions, EastAsians and Europeans, fall at the opposite end. Compari-sons of genetic variation in these 2 pairs of populationsshould be helpful in determining if similarities in pigmen-tation phenotype are due to the same or independent geneticmechanisms.
Many hypotheses predict that natural selection willeliminate genetic variants associated with lighter skin inregions of high UVR as a protection against photodamage(e.g., sunburn, melanoma, and basal and squamous cell car-cinomas) (Blum 1961; Kollias et al. 1991) and folic acidphotodegradation (Branda and Eaton 1978; Jablonski andChaplin 2000). The photoprotective properties of a highlymelanized skin and the recent African origin of modernhumans suggest that the ancestral phenotype is one of therelatively dark skin (Jablonski and Chaplin 2000; Rogerset al. 2004). If dark skin is the ancestral phenotype, thenwe may assume that the first migrants out of Africa werealso relatively darkly pigmented.
There are 2 primary explanations for the evolution oflighter skin in regions of low UVR. The first suggests thatlight skin is merely due to the relaxation of functional con-straint and that derived alleles associated with lighter
pigmentation may have simply drifted to high frequencyin the absence of strong purifying selection (Brace 1963).The second explanation suggests that in lower UVR regions,positive selection would have favored mutations leadingto lighter skin as a way to maximize cutaneous vitaminD synthesis (Rana et al. 1999; Jablonski and Chaplin2000). Given the relatively recent arrival and divergenceof humans in and across Europe and Asia, the most parsi-monious evolution of light skin would involve such muta-tions arising in a proto-Eurasian population soon afterhumans left Africa. Consequently, these mutations shouldbe shared between modern Asian and European popula-tions. Alternatively, if separate existing functional variantswere driven to high frequency in East Asian and Europeansor independent de novo mutations arose and were selectedin each population after the divergence of Europeans andAsians, then these would be obvious as high allele fre-quency differences between modern European and EastAsian populations. Reduced levels of heterozygosity sur-rounding the SLC24A5 A111G polymorphism in the Euro-pean, but not East Asian, HapMap populations support thelatter hypothesis (Lamason et al. 2005), as do reduced poly-morphism levels based on full resequencing data fromMATP in populations of European descent (Soejimaet al. 2005).
We will first address the role of selection in influenc-ing darker pigmentation across different populations livingin high-UVR environments. Current archaeological evi-dence suggests human presence in Island Melanesia byat least 40,000 years ago and in other parts of Sahul byat least 45,000 years ago (O’Connell and Allen 2004). Ifthe original migrants to Oceania arrived there via a corridorof relatively high UVR, then we might expect theirdescendents to share ancestral pigmentation variants withAfrican populations. However, if the ancestors of modernday Island Melanesians spent a significant amount of timein low-UVR regions prior to arriving in Oceania, then it ispossible that mutations associated with lighter pigmentationcould have accumulated and a readaptation to high-UVRconditions would have been necessary, leading to potentialdivergence between Island Melanesians and Africans atfunctional pigmentation loci. In actuality, both of these sce-narios may apply, as we know that modern Island Melanesianpopulations are descended from both early migrants (arriving;40,000 years ago) as well as later proto-Austronesian–speaking peoples from a southeast Asian homeland;3,200 years ago (Spriggs 1997).
The discordance between our FST-based divergencevalues and allele frequencies in the Melanesian CEPH pop-ulations at ASIP largely stem from the relatively low fre-quency of the ancestral allele in the 2 CEPH IslandMelanesian populations relative to our original Island Mel-anesian sample. These discrepancies make it difficult to de-termine if ASIP truly underlies broad pigmentationdifferences between darkly and lightly pigmented popula-tions or if instead interpopulation variation at this locus canlargely be explained by differences between Africans andnon-Africans. This discordance between the frequencies ofthe ASIP ancestral allele in our original Island Melanesiansample and the Melanesian samples from the CEPH panelmay be indicative of both the complex demographic
718 Norton et al.

history of Island Melanesia (involving several migratoryevents (Spriggs 1997) and probable extensive genetic drift(Friedlaender 1975, 1987) as well as the importance of mul-tiple loci in determining pigmentation phenotype. Someindications of selective forces acting in the West Africansat ASIP in the HapMap data are consistent with a role inshaping interpopulation pigmentation, but due to the smallnumbers of populations surveyed in the HapMap, these datacannot resolve the role of ASIP across multiple darkly pig-mented populations.
The results for OCA2 using the FST-based approach,allele frequency distribution in the CEPH panel, and anal-ysis of the HapMap data are largely consistent in pointing toa role for this gene in control of light versus dark pigmen-tation. In general, the derived allele (associated with lighterpigmentation) is most common in Europeans and EastAsians, whereas the ancestral allele predominates in sub-Saharan Africa and Island Melanesia. The lightly pig-mented hunter–gatherer San population of Southern Africais exceptional in having a high frequency of the derived al-lele relative to geographically proximate and more darklypigmented African populations (Jablonski and Chaplin2000), further supporting the importance of OCA2 in reg-ulating normal variation in pigmentation. The widespreaddistribution of the derived allele in the CEPH-DiversityPanel suggests that it is not necessarily a new mutation,nor has it been restricted to a specific geographic area.Interestingly, derived allele frequencies at this locus arequite different between Native American (15%) and EastAsian populations (45%), suggesting that perhaps the de-rived allele at this locus did not reach very high frequenciesin East Asians until after the colonization of the Americas.Evidence from a suite of selection statistics in HapMap pop-ulations suggests that derived allele may have been selectedin both East Asians and Europeans, and consequently a pro-portion of the light skin phenotype in both groups may beexplained by the same genetic mechanism.
Although our data do not allow us to draw very strongconclusions regarding the evolution of dark pigmentation inhuman populations, they do provide us with compelling ev-idence that light skin has evolved independently in Euro-pean and East Asian populations. The strong signal ofselection in the SLC24A5 and MATP genes, and to a lesserextent in the TYR gene, supports the active role of selectionin shaping the patterns of diversity at these loci. Linkagebetween TYR and SLC24A5 and pigmentation phenotypehave been previously demonstrated (Shriver et al. 2003;Lamason et al. 2005). Using similar methods, we observea strong linkage between MATP C374G and pigmentationin African-Americans, indicating the functional relevanceof this SNP and the potentially important role that it playsin determining interpopulation phenotypic variation. Weconclude that light pigmentation in Europeans is at leastpartially due to the effects of positive directional and/or sex-ual selection and not simply the relaxation of functionalconstraint. This is consistent with a recent resequencingstudy that examined variation in MATP (Soejima et al.2005) in a global sample. The virtual absence of MATP374*G–derived allele in the sub-Saharan African popula-tions that we examined in the CEPH-Diversity Panel is con-sistent with the origin of this mutation outside of Africa
after the divergence of modern Asians and Europeans. Incontrast, the SLC24A5 111*A–derived allele is found atlow frequencies in several sub-Saharan populations includ-ing the West African Mandenka and Yoruba, the SouthernAfrican San, and South West Bantu. The relatively high fre-quencies of the derived allele in Central Asian, MiddleEastern, and North Africa seem likely to be due to gene flowwith European populations. Similarly, the presence of thederived allele (albeit at low frequencies) in some sub-SaharanAfrican populations may be due to recent gene flow fromEuropean and Central Asian populations. Alternatively, thederived allele may have existed in the ancestral human pop-ulation and was lost in the ancestors of modern East Asiansbut retained in the ancestral European population. The al-lele then rose to high frequency in Europeans following thedivergence of European and East Asian ancestral groups.
These results simultaneously and strongly suggest thatEuropeans and East Asians have evolved lighter skin inde-pendently and via distinct genetic mechanisms, as there isan absence of any unusual pattern of diversity at SLC24A5,MATP, and TYR in East Asians. These observations areconsistent with conclusions based on analyses of heterozy-gosity levels surrounding the SLC24A5 functional poly-morphism in the HapMap populations (Lamason et al.2005), the results of a resequencing study of MATP (Soejimaet al. 2005), and a recent work examining variation inSLC24A5 and MATP in populations representing Europe,Africa, and Asia (Soejima and Koda 2006). Assuming thatthe lighter pigmentation phenotype of both Europeans andEast Asians is due to the same selective pressure (decreasedUVR), we might expect to identify other loci having phe-notypic effects as strong (or stronger) than these 3 loci that ex-hibit patterns of reduced diversity and population-specificFST in East Asian populations. Intriguingly, analyses ofHapMap data corroborate this suggestion in identifying 2a priori pigmentation candidate genes, ADAM17 and ATRN,that show evidence of strong, population-specific selectionin East Asians. These loci show extended blocks of signif-icant values at all 3 test statistics computed for the HapMapdata (supplementary table 3, Supplementary Material on-line) in East Asian populations. Although both of thesegenes are associated with pigmentation variation in mice,they also have other effects outside of the pigmentation sys-tem, including the development of the central nervous sys-tem and energy homeostasis (ATRN) (Lu et al. 1999; Heet al. 2001; Barsh et al. 2002) and development (ADAM17)(Peschon et al. 1998). As such, further investigation willbe required to confirm the role of these genes in regulatingnormal pigmentation variation as well as the potential se-lective event that has shaped the observed patterns of ge-netic variation.
The MC1R gene was the only locus examined in detailthat did not show any signal of potential positive selection.Previous sequence-based studies have reached conflictingconclusions about whether or not MC1R has been subjectto positive selection outside of Africa (Rana et al. 1999;Harding et al. 2000; Makova et al. 2001). AlthoughMC1R’s association with red hair, fair skin, freckles, andmelanoma risk in European and European-derived popula-tions primarily from the British Isles (Box et al. 1997; Smithet al. 1998a; Schioth et al. 1999; Flanagan et al. 2000;
Convergent Evolution of Light Skin Phenotype 719

Bastiaens et al. 2001) clearly demonstrates the importantregional role that it plays in pigmentation, MC1R may have(with some exceptions [John et al. 2003; Nakayama et al.2006]) little effect on variation outside of Europe (Myleset al. 2006). Consequently, no signal will be detected usingour approaches. Although the 2 SNPs that we typed inMC1R are not strongly associated with the red hair and fairskinned phenotype for which MC1R is so well known(Sturm et al. 2003), both are polymorphic in global surveysof populations (Rana et al. 1999; Harding et al. 2000). Inaddition, the MC1R G92A SNP may have a ‘‘mild’’ effecton pigmentation phenotype (Motokawa et al. 2006). The92*A allele at this site is known to have a lower affinityfor a-MSH than wild-type MC1R alleles (Xu et al.1996), which suggests that it may contribute to normal var-iation in pigmentation. However, if positive directional se-lection has acted on MC1R, we would expect variation atlinked sites to be affected. As such, even if we have notassayed the relevant functional SNP, we should still haveobserved some signal of selection, especially given thesmall size (;3 kb) of this gene.
Two recent papers have examined signals of selectionin pigmentation candidate genes using publicly availabledata from the HapMap and Perlegen databases that containgenotype information from African (or African-American),European, and East Asian populations (Izagirre et al. 2006;Myles et al. 2006). Both studies examine FST and measuresof the extent of long-range haplotypes (LRHs) surroundinga number of candidate loci in these 3 populations. All 3studies have reached similar conclusions for a subset ofthe genes examined. Both Izagirre et al. (2006) and Myleset al. (2006) identified signals of European-specific selec-tion at SLC24A5. Similarly, both studies also identified sig-nals of selection in MATP between Europeans and EastAsians. However, Izagirre et al. (2006) did not detect a sig-nal at MATP between Europeans and Africans. We agreewith Myles et al. (2006) that this discrepancy may bedue to the sampling strategy of Izagirre et al. (2006), inwhich allele frequency information was pooled across bothAfricans and African-Americans. At OCA2, Myles et al.(2006) reported FST values that, although not statisticallysignificant, were suggestive of European divergence atOCA2, similar to our FST results. All 3 studies failed to ob-serve a signal of selection at MC1R. Although all 3 studiesagreed on the potential role of selection in the above-mentioned genes, at other loci, there is some disagreementbetween the 3 works. Neither Izagirre et al. (2006) norMyles et al. (2006) observed significant FST or LRH valuesat TYR. Although we did observe significant FST values be-tween Europeans and all other populations at this locus, wedid not observe a gene-wide signal at TYR in our HapMapanalyses, suggesting that this difference may be due in partto the populations and types of analyses used in each study.These differences may also explain why Izagirre et al.(2006) and Myles et al. (2006) failed to detect a signalof European-African differentiation at ASIP. Althoughwe only examined 6 genes for significantly high FST differ-ences, we also examined an additional 28 pigmentation can-didate loci for signals of selection using HapMap dataalone. These results also show some agreement withIzagirre et al. (2006) and Myles et al. (2006), including a signal
of East Asian differentiation atADAM17 (Myles et al. 2006)and European differentiation at TYRP1. Finally, Myles et al.(2006) identified DCT as a candidate for influencing pig-mentation in East Asian populations (but importantly, notin European populations). Although we did not includeDCT in our FST analyses, it did show significantly highLSBL in the HapMap East Asian sample.
Observed patterns of global skin pigmentation diver-sity and their correlation with environmental UV exposuresuggest an adaptive response. Although we cannot rule outa role for sexual selection, our results support multiple ge-netic mechanisms for evolution of skin color. We provideevidence that at least 2 genes, ASIP and OCA2, probablyplay a shared role in shaping light and dark pigmentationacross the globe. We have also firmly identified a further3 genes (consistent with the results of previous studies:Lamason et al. 2005; Soejima et al. 2005), and potentiallyseveral more candidate loci, that have a significant effectin regional pigmentation phenotype. Our data stronglysupport independent genetic origins for the light skin phe-notype in Europeans and East Asians arising after the di-vergence of modern European and East Asian populations.
Supplementary Material
Supplementary tables 1–3 are available at Molec-ular Biology and Evolution online (http://www.mbe.oxfordjournals.org/).
Acknowledgments
This work was funded by dissertation fieldwork grant#7138 to H.L.N. from the Wenner Gren Foundation, aPenn State Anthropology Baker Fund dissertation grantto H.L.N., and National Institutes of Health grantHG002154 to M.D.S. We thank Lynn Jorde, TamikoBrown, Jonathan Friedlaender, Gerardo Guitierrez, KenWeiss, and Anne Buchanan for generously providing someof the samples used in this study. We also thank FrancxoiseFriedlaender for technical assistance with figure 3A–E.
Literature Cited
Akey J, Eberle M, Rieder M, Carlson C, Shriver M, Nickerson D,Kruglyak L. 2004. Population history and natural selectionshape patterns of genetic variation in 132 genes. PLoS Biol.2:1591–1599.
Akey J, Zhang G, Zhang K, Jin L, Shriver M. 2002. Interrogatinga high-density SNP map for signatures of natural selection.Genome Res. 12:1805–1814.
Akey JM, Sosnoski D, Parra E, Dios S, Hiester K, Su B, Bonilla C,Jin L, Shriver MD. 2001. Melting curve analysis of SNPs(McSNP): a gel-free and inexpensive approach for SNP gen-otyping. Biotechniques. 30:358–362, 364, 366–367.
Ancans J, Tobin DJ, Hoogduijn MJ, Smit NP, Wakamatsu K,Thody AJ. 2001. Melanosomal pH controls rate of melanogen-esis, eumelanin/phaeomelanin ratio and melanosome matura-tion in melanocytes and melanoma cells. Exp Cell Res.268:26–35.
Aoki K. 2002. Sexual selection as a cause of human skin colourvariation: Darwin’s hypothesis revisited. Ann Hum Biol.29:589–608.
720 Norton et al.

Barsh GS, He L, Gunn TM. 2002. Genetic and biochemical studiesof the Agouti-attractin system. J Recept Signal Transduct Res.22:63–77.
Bastiaens M, ter Huurne J, Gruis N, Bergman W, Westendorp R,Vermeer B, Bouwes Bavinck J. 2001. The melanocortin-1receptor gene is the major freckle gene. Hum Mol Genet.10:1701–1708.
Bennett D, Lamoreux ML. 2003. The color loci of mice—agenetic century. Pigment Cell Res. 16:333–344.
Black W, Baer C, Antolin M, DuTeau N. 2001. Populationgenomics: genome-wide sampling of insect populations. AnnuRev Entomol. 46:441–469.
Blum H. 1961. Does the melanin pigment of human skin haveadaptive value? Q Rev Biol. 36:50–63.
Bonilla C, Boxill L, Donald S, Williams T, Sylvester N, Parra E,Dios S, Norton H, Shriver M, Kittles R. 2005. The 8818G al-lele of the agouti signaling protein (ASIP) gene is ancestral andis associated with darker skin color in African Americans. HumGenet. 116:402–406.
Box N, Wyeth J, O’Gorman L, Martin N, Sturm R. 1997.Characterization of melanocyte stimulating hormone receptorvariant alleles in twins with red hair. Hum Mol Genet. 6:1891–1897.
Brace C. 1963. Structural reduction in evolution. Am Nat. 97:39–49.
Branda R, Eaton J. 1978. Skin color and nutrient photolysis: anevolutionary hypothesis. Science. 201:625–626.
Busca R, Ballotti R. 2000. Cyclic AMP a key messenger inthe regulation of skin pigmentation. Pigment Cell Res. 13:60–69.
Cann H, de Toma C, Cazes L, et al. (41 co-authors). 2002. Ahuman genome diversity cell line panel. Science. 296:261–262.
Carlson CS, Thomas DJ, Eberle MA, Swanson JE, Livingston RJ,Rieder MJ, Nickerson DA. 2005. Genomic regions exhibitingpositive selection identified from dense genotype data.Genome Res. 15:1553–1565.
Cavalli-Sforza L. 1966. Population structure and human evolu-tion. Proc R Soc Lond B Biol Sci. 164:362–379.
Chaplin G. 2004. Geographic distribution of environmental fac-tors influencing human skin coloration. Am J Phys Anthropol.125:292–302.
Costin GE, Valencia JC, Vieira WD, Lamoreux ML, Hearing VJ.2003. Tyrosinase processing and intracellular trafficking is dis-rupted in mouse primary melanocytes carrying the underwhite(uw) mutation. A model for oculocutaneous albinism (OCA)type 4. J Cell Sci. 116:3203–3212.
Darwin C. 1871. The descent of man, and selection in relation tosex. London: John Murray.
Diamond J. 1992. The third chimpanzee. New York: HarperCollins Publishers.
Diffey BL, Oliver RJ, Farr PM. 1984. A portable instrument forquantifying erythema induced by ultraviolet radiation. Br JDermatol. 111:663–672.
Flanagan N, Healy E, Ray A, Philips S, Todd C, Jackson I, Birch-Machin M, Rees J. 2000. Pleiotropic effects of the melanocor-tin 1 receptor (MC1R) gene on human pigmentation. Hum MolGenet. 9:2531–2537.
Friedlaender J. 1975. Patterns of human variation: the demogra-phy, genetics, and phenetics of Bougainville Islanders. Cam-bridge (MA): Harvard University Press.
Friedlaender J. 1987. Conclusions. In: Friedlaender J, editor.The Solomons islands project: a long-term study of health,human biology, and culture change. Oxford: ClarendonPress.
Fuller BB, Spaulding DT, Smith DR. 2001. Regulation of thecatalytic activity of preexisting tyrosinase in black and Cauca-
sian human melanocyte cell cultures. Exp Cell Res. 262:197–208.
Graf J, Hodgson R, van Daal A. 2005. Single nucleotide polymor-phisms in the MATP gene are associated with normal humanpigmentation variation. Hum Mutat. 25:278–284.
Harding R, Healy E, Ray A, et al. (11 co-authors). 2000. Evidencefor variable selective pressures at MC1R. Am J Hum Genet.66:1351–1361.
He L, Gunn TM, Bouley DM, Lu XY, Watson SJ, Schlossman SF,Duke-Cohan JS, Barsh GS. 2001. A biochemical function forattractin in agouti-induced pigmentation and obesity. NatGenet. 27:40–47.
Hinds DA, Stuve LL, Nilsen GB, Halperin E, Eskin E, BallingerDG, Frazer KA, Cox DR. 2005. Whole-genome patterns ofcommon DNA variation in three human populations. Science.307:1072–1079.
Hoggart CJ, Parra EJ, Shriver MD, Bonilla C, Kittles RA, ClaytonDG, McKeigue PM. 2003. Control of confounding of geneticassociations in stratified populations. Am J Hum Genet.72:1492–1504.
Izagirre N, Garcia I, Junquera C, de la Rua C, Alonso C. 2006. Ascan for signatures of positive selection in candidate locifor skin pigmentation in humans. Mol Biol Evol. 23:1697–1706.
Jablonski NG, Chaplin G. 2000. The evolution of human skin col-oration. J Hum Evol. 39:57–106.
John PR, Makova K, Li WH, Jenkins T, Ramsay M. 2003. DNApolymorphism and selection at the melanocortin-1 receptorgene in normally pigmented southern African individuals.Ann N Y Acad Sci. 994:299–306.
Kanetsky P, Swoyer J, Panossian S, Holmes R, Guerry D,Rebbeck T. 2002. A polymorphism in the agouti signaling pro-tein gene is associated with human pigmentation. Am J HumGenet. 70:770–775.
Kollias N, Sayer R, Zeise L, Chedekel M. 1991. Photoprotectionby melanin. J Photochem Photobiol B. 9:135–160.
Kumar S, Tamura K, Jakobsen I, Nei M. 2001. MEGA2: molec-ular evolutionary genetics analysis software. Bioinformatics.17:1244–1245.
Lamason RL, Mohideen MA, Mest JR, et al. (25 co-authors).2005. SLC24A5, a putative cation exchanger, affects pigmen-tation in zebrafish and humans. Science. 310:1782–1786.
Lewontin R, Krakauer J. 1973. Distribution of gene frequency asa test of the theory of the selective neutrality of polymor-phisms. Genetics. 74:175–195.
Lewontin R, Krakauer J. 1975. Letters to the editors: testing theheterogeneity of F values. Genetics. 80:397–398.
Loomis W. 1967. Skin pigment regulation of vitamin-D biosyn-thesis in man. Science. 157:501–506.
Lu X, Gunn TM, Shieh K, Barsh GS, Akil H, Watson SJ. 1999.Distribution of mahogany/attractin mRNA in the rat centralnervous system. FEBS Lett. 462:101–107.
Makova K, Ramsay M, Jenkins T, Li W. 2001. Human DNA se-quence variation in a 6.6-kb region containing the melanocor-tin 1 receptor promoter. Genetics. 158:1253–1268.
McKeigue PM, Carpenter JR, Parra EJ, Shriver MD. 2000.Estimation of admixture and detection of linkage in ad-mixed populations by a Bayesian approach: application toAfrican-American populations. Ann Hum Genet. 64:171–186.
Motokawa T, Kato T, Hongo M, Ito M, Takimoto H,Katagiri T, Hashimoto Y. 2006. Characteristic MC1Rpolymorphism in the Japanese population. J Dermatol Sci.41:143–145.
Myles S, Somel M, Tang K, Kelso J, Stoneking M. 2007. Iden-tifying genes underlying skin pigmentation differences amonghuman populations. Hum Genet. 120:613–621.
Convergent Evolution of Light Skin Phenotype 721

Nakayama K, Fukamachi S, Kimura H, Koda Y, Soemantri A,Ishida T. 2002. Distinctive distribution of AIM1 polymor-phism among major human populations with different skincolor. J Hum Genet. 47:92–94.
Nakayama K, Soemantri A, Jin F, Dashnyam B, Ohtsuka R,Duanchang P, Isa MN, Settheetham-Ishida W, Harihara S,Ishida T. 2006. Identification of novel functional variants ofthe melanocortin 1 receptor gene originated from Asians.Hum Genet. 119:1–9.
Nei M, Maruyama T. 1975. Letters to the editors: Lewontin-Krakauer test for neutral genes. Genetics. 80:395.
Nei M, Saitou N. 1987. The neighbor-joining method: a newmethod for reconstructing phylogenetic trees. Mol Biol Evol.4:406–425.
O’Connell J, Allen J. 2004. Dating the colonization of Sahul(Pleistocene Australia–New Guinea): a review of recentresearch. J Archaeol Sci. 31:835–853.
Parra E, Kittles R, Argyropoulos G, et al. (15 co-authors). 2001.Ancestral proportions and admixture dynamics in geographi-cally defined African Americans living in South Carolina.Am J Phys Anthropol. 114:18–29.
Peschon JJ, Slack JL, Reddy P, et al. (19 co-authors). 1998. Anessential role for ectodomain shedding in mammalian develop-ment. Science. 282:1281–1284.
Puri N, Gardner JM, Brilliant MH. 2000. Aberrant pH of melano-somes in pink-eyed dilution (p) mutant melanocytes. J InvestDermatol. 115:607–613.
Rana B, Hewett-Emmett D, Jin L, et al. (12 co-authors). 1999.High polymorphism at the human melanocortin 1 receptorlocus. Genetics. 151:1547–1557.
Robertson A. 1975. Gene frequency distributions as a test ofselective neutrality. Genetics. 80:775–785.
Rogers A, Iltis D, Wooding S. 2004. Genetic variation at theMC1R locus and time since loss of human body hair. CurrAnthropol. 45:105–108.
Schioth H, Philips S, Rudzish R, Birch-Machin M, Wikberg J,Rees J. 1999. Loss of function mutations of the human mela-nocortin 1 receptor are common and are associated with redhair. Biochem Biophys Res Commun. 260:488–491.
Schlotterer C. 2002. A microsatellite-based multilocus screenfor the identification of local selective sweeps. Genetics. 160:753–763.
Shriver M, Parra E, Dios S, et al. (17 co-authors). 2003. Skin pig-mentation, biogeographical ancestry and admixture mapping.Hum Genet. 112:387–399.
Shriver MD, Kennedy GC, Parra EJ, Lawson HA, Sonpar V,Huang J, Akey JM, Jones KW. 2004. The genomic distribution
of population substructure in four populations using 8,525autosomal SNPs. Hum Genomics. 1:274–286.
Shriver MD, Mei R, Parra EJ, et al. (22 co-authors). 2005.Large-scale SNP analysis reveals clustered and continuouspatterns of human genetic variation. Hum Genomics. 2:81–89.
Smith R, Healy E, Siddiqui S, et al. (12 co-authors). 1998. Mel-anocortin 1 receptor variants in an Irish population. J InvestDermatol. 111:119–122.
Soejima M, Koda Y. 2007. Population differences of two codingSNPs in pigmentation-related genes SLC24A5 and SLC45A2.Int J Legal Med. 121:36–39.
Soejima M, Tachida H, Ishida T, Sano A, Koda Y. 2005. Evidencefor recent positive selection at the human AIM1 locus in aEuropean population. Mol Biol Evol. 23:179–188.
Spriggs M. 1997. The island Melanesians. Cambridge (MA):Blackwell Publishers.
Spritz RA. 1994. Molecular genetics of oculocutaneous albinism.Hum Mol Genet. 3(Spec No):1469–1475.
Storz JF, Payseur BA, Nachman MW. 2004. Genome scans ofDNA variability in humans reveal evidence for selectivesweeps outside of Africa. Mol Biol Evol. 21:1800–1811.
Sturm RA, Duffy DL, Box NF, Chen W, Smit DJ, Brown DL,Stow JL, Leonard JH, Martin NG. 2003. The role ofmelanocortin-1 receptor polymorphism in skin cancer riskphenotypes. Pigment Cell Res. 16:266–272.
Tajima F. 1989. Statistical method for testing the neutral mutationhypothesis by DNA polymorphism. Genetics. 123:585–595.
Voight BF, Kudaravalli S, Wen X, Pritchard JK. 2006. A map ofrecent positive selection in the human genome. PLoS Biol.4:e72.
Walter H. 1971. Remarks on the environmental adaptation of man.Humangenetik. 13:85–97.
Xu X, Thornwall M, Lundin LG, Chhajlani V. 1996. Val92Metvariant of the melanocyte stimulating hormone receptor gene.Nat Genet. 14:384.
Ye J, Parra EJ, Sosnoski DM, Hiester K, Underhill PA, ShriverMD. 2002. Melting curve SNP (McSNP) genotyping: a usefulapproach for diallelic genotyping in forensic science. J Foren-sic Sci. 47:593–600.
Hope Hollocher, Associate Editor
Accepted December 11, 2006
722 Norton et al.
Copyright © 2022 FDOKUMEN