Plasma and urine neutrophil gelatinase-associated lipocalin in septic and nonseptic ICU patients
Upload
independentCategory
view
4download
0
Brain, Behavior, and Immunity 37 (2014) 231–239
Contents lists available at ScienceDirect
Brain, Behavior, and Immunity
journal homepage: www.elsevier .com/locate /ybrbi
Waist circumference and Neutrophil Gelatinase-Associated Lipocalinin late-life depression
0889-1591/$ - see front matter � 2014 Elsevier Inc. All rights reserved.http://dx.doi.org/10.1016/j.bbi.2013.12.021
⇑ Corresponding author at: ProPersona, Department of Old Age Psychiatry,Wolfheze 2, 6874 BE Wolfheze, The Netherlands. Tel.: +31 (0) 264833111; fax:+31 (0) 263124402.
E-mail address: [email protected] (R.M. Marijnissen).
Radboud M. Marijnissen a,b,⇑, Petrus J.W. Naudé c, Hannie C. Comijs d, Robert A. Schoevers b,Richard C. Oude Voshaar b
a Department of Old Age Psychiatry, ProPersona, Wolfheze/Arnhem, The Netherlandsb University Center of Psychiatry & Interdisciplinary Center for Psychopathology of Emotion Regulation, University Medical Center Groningen, University of Groningen,Groningen, The Netherlandsc Department of Neurology and Alzheimer Research Center, University Medical Center Groningen, University of Groningen, Groningen, The Netherlandsd Department of Psychiatry/GGZinGeest & Institute for Extramural Medical Research (EMGO), VU University Medical Center, Amsterdam, The Netherlands
a r t i c l e i n f o a b s t r a c t
Article history:Received 27 October 2013Received in revised form 14 December 2013Accepted 27 December 2013Available online 6 January 2014
Keywords:Waist-circumferenceObesityLate-life DepressionNeutrophil Gelatinase-Associated Lipocalin
Both visceral obesity and depression are associated with impaired health and excess mortality, possiblythrough overlapping pathophysiological mechanisms like adipose tissue derived inflammatory markers.These results, however, are primarily based on population-based surveys, often restricted to a young pop-ulation and depression severity scales instead of patients with established diagnosis of depressive disor-der. We examined the relation between waist circumference and late-life depression using the baselinedata of the Netherlands Study of Depression in Older people (NESDO). Psychopathology has beenassessed with Composite International Diagnostic Interview version 2.1. Adjusted for age, sex, education,lifestyle (smoking, alcohol, physical activity), drug use, cognition and chronic diseases as well as adjustedfor body mass index (BMI), analysis of covariance showed that depressed older patients (n = 376) had asignificantly lower waist circumference (WC) compared to their non-depressed comparisons (n = 130):estimated marginal mean (SE) = 93.9 (0.5) versus 97.8 (0.8) cm (F = 15.9; df = 1467; p < .001). Multiplelinear regression analyses within the depressed group showed that both, depression severity (Inventoryof Depressive Symptoms) as well as duration-related depression characteristics (age of onset, duration ofillness, life-time comorbid dysthymia), were associated with the WC. Only the severity of depressivesymptoms remained significant after further adjusted for the BMI. Interestingly, a recently discoveredadipokine, Neutrophil Gelatinase-Associated Lipocalin (NGAL), was associated with late-life depression,but only in the subgroup of patients with a pathologically increased WC.
Population-based findings on the positive association between obesity and depressive symptoms canthus not be generalised to a clinical sample of depressed older patients. The impact of the WC on courseand treatment outcome of late-life depression should be examined in clinical samples, taken into accountthe relative impact of the WC in proportion to the general level of obesity as indexed by the BMI and therole of adipokines.
� 2014 Elsevier Inc. All rights reserved.
1. Introduction
Depression and obesity are two major risk factors for unfavour-able health outcomes (Penninx et al., 2001; Everson-Rose et al.,2009). Meta-analysis of cross-sectional studies has confirmed asignificant association between depression and obesity (de Witet al., 2010). Subsequently, meta-analyses of longitudinal studiesidentified depression as a risk factor for weight gain, as well asobesity as a risk factor for the development of depression (Luppino
et al., 2010). Current hypotheses about predisposition of depres-sion to obesity include neuroendocrine disturbances in the Hypo-thalamic Pituitary Adrenal Axis (HPA-axis) (Deuschle et al.,1998), changing lifestyle factors as eating patterns and reducedphysical activity (Stunkard et al., 2003) and the use of antidepres-sants (Schwartz et al., 2004). Biological mechanisms like HPA-axisdysregulation (Pasquali, 2012; Van Reedt Dortland et al., 2013) butalso psychological mechanisms like stigmatization, negative bodyimage and disappointment about failing diets (Dixon et al., 2003)are hypothesized to predispose obese people to depression. Inaddition to these hypotheses, inflammatory pathways have gainedincreasing attention and may explain the bi-directional associationbetween depression and obesity (Bremmer et al., 2008; Milaneshiet al., 2012; Daly, 2013).

232 R.M. Marijnissen et al. / Brain, Behavior, and Immunity 37 (2014) 231–239
Despite well conducted longitudinal studies on the relationshipbetween depression and obesity, important clinical aspects remainunknown. Firstly, only three longitudinal studies in the above-de-scribed meta-analyses were conducted in an older cohort (Robertset al., 2003; Sachs-Ericsson et al., 2007; Vogelzangs et al., 2008).These three studies also suggested a bidirectional association be-tween depression and obesity in later life, although only one ofthese studies reported statistically significant results (Robertset al., 2003; Sachs-Ericsson et al., 2007; Vogelzangs et al., 2008).More recent (and cross-sectional) population-based studies in old-er people have even reported a negative association, i.e. lower bodyweight in depression (Ho et al., 2008; Wong et al., 2011; Donget al., 2013). Secondly, it is unknown whether depressive symp-toms measured in population-based studies can be generalized toclinical samples of depressed patients. With one exception, allstudies have been conducted in population-based samples, the vastmajority in an adult population (de Wit et al., 2010; Luppino et al.,2010; Marijnissen et al., 2011; Arterburn et al., 2012). Recently, thefirst study in a clinical sample confirmed that depressive disorderis associated with an increase in abdominal obesity over time(Van Reedt Dortland et al., 2013). This study was limited to pa-tients aged below 65 years. Whether these findings also accountfor older persons remains unclear. In late-life depression an absentor even inverse association might be hypothesized as in later lifethe prevalence of physical frailty sharply increases with age(Collard et al., 2012) and physical frailty is associated with bothunderweight and depression (Fried et al., 2001; Collard et al., 2013).
Furthermore, it is important to consider the definition of obesityand depression. Depression has been specifically linked with vis-ceral fat accumulation (Vogelzangs et al., 2008). A study on theprospective impact of the metabolic syndrome in adults has iden-tified waist circumference as the most important component pre-dicting the onset of depression in non-depressed persons and aprotracted course in depressed patients (Vogelzangs et al., 2011).Despite the presence of diagnostic criteria, depressive disorder isa heterogeneous syndrome. Recently, in a large population basedstudy among middle-aged and older persons, we found thatdepressive symptoms were positively associated with both bodymass index and waist circumference. Interestingly, the cognitive-affective symptoms of depression were associated with both theincreased body mass index and increased waist circumference,whereas the somatic-affective symptoms of depression werespecifically associated with the increased waist circumference(Marijnissen et al., 2011, 2013).
The waist circumference is often used as a proxy for visceraladipose tissue. Visceral fat is a metabolically active tissue secretingcytokine-family proteins, collectively called adipokines (Trujilloand Scherer, 2006; Milaneshi et al., 2012; Zhao and Stephens,2013). Such adipokines are hypothesised to induce a chroniclow-grade inflammatory environment, thus contributing to thenegative health effect of obesity. Neutrophil Gelatinase-AssociatedLipocalin (NGAL), also called Lipocalin-2, is a recently identifiedadipokine with high levels of expression and secretion in the whiteadipose tissue (Huang et al., 2012). Interestingly, induction of aperipheral inflammatory response as well as psychological stress-ors induces cerebral NGAL expression (Ip et al., 2011; Muchaet al., 2011), which consequently can reduce hippocampal synapticspine density (Mucha et al., 2011). We recently showed that NGALexpression can induce a pro-apoptotic signaling cascade by atten-uating Akt phosphorylation of the protein kinase B (PKB)/Akt path-way and sensitize neurons to beta-amyloid induced cell death(Naudé et al., 2012). Cellular signaling via Akt has been postulatedas a key pathway involved in neuroplasticity in the hippocampus(Balu et al., 2012; Jin et al., 2012). Interestingly the PKB/Akt activityis also decreased in post mortem human brain tissue of suicide vic-tims compared to non-depressed controls (Karege et al., 2011).
These data collectively suggest that increased central nervous sys-tem NGAL levels can lead to reduced neuroplasticity. Plasma levelsof NGAL appear to be increased in depressed older persons (Naudéet al., 2013) as well as obese people (Auguet et al., 2011; Huanget al., 2012). Animal models have further shown that NGAL playsa functional role in systemic insulin sensitivity and glucose homeo-stasis (Wang et al., 2007). As with leptin (Milaneshi et al., 2012),the presence of increased NGAL levels in obese persons may beconsidered as an indicator of NGAL resistance. If true, the risk forthe onset of depression would be especially increased in personswith high levels of NGAL and visceral fat.
The primary objective of the present study was to examine theassociation between depression and waist circumference in an old-er (>60 years) depressed sample and to explore several character-istics of late-life depression within this association. Our secondobjective is to explore the role of NGAL. Being an adipokine, wehypothesise that increased NGAL levels are associated with depres-sion, especially in persons with an increased waist circumferenceas proxy for visceral obesity.
2. Materials and methods
2.1. Sample
For the present study, we used the baseline assessment of theNetherlands Study of Depression in Older people (NESDO) (seeComijs et al., 2011). NESDO is an on-going cohort study designedto examine the determinants of the course and consequences ofdepressive disorders in older persons, including 378 depressedand 132 non-depressed older persons. Recruitment of depressedolder persons took place in five regions in the Netherlands fromboth mental health care institutes and general practitioners in or-der to include persons with late-life depression in various develop-mental and severity stages. Persons with a primary diagnosis ofdementia, a Mini Mental State Examination-score (MMSE) under18 (out of 30 points) (Folstein et al., 1975), and insufficient com-mand of the Dutch language were excluded. The comparison groupof non-depressed persons was recruited at the same general prac-tices that recruited patients. A random sample of older people whoscored less than four on the Geriatric Depression Scale during a vis-it to their GP was asked informed consent. Exclusion criteria were alifetime diagnosis of depression, dementia or other serious psychi-atric disorders, and insufficient command of the Dutch language.
Data collection of the baseline assessment started in 2007 andwas finished in September 2010. The baseline assessment includedwritten questionnaires, interviews and physical assessments.Interviews were audio taped to control the quality of the data.The ethical review boards of the participating institutes have ap-proved this study. All participants gave informed consent after oraland written information about the study.
Of the 510 participants in NESDO, 4 participants were excludedbecause of missing body mass index (n = 1) and missing waist cir-cumference (n = 3). This left a final study sample of 506 people(376 depressed and 130 non-depressed).
With respect to the second objective, a further 12 participants(9 depressed, 3 non-depressed) were excluded due to refusing orfailing blood withdrawal. Thus, analyses on NGAL/Lipocalin2 arebased on 494 participants (367 depressed patients and 127 non-depressed controls).
2.2. Variables of interest
2.2.1. Depression diagnosesThe past 6-month diagnosis of depression and dysthymia
according to DSM-IV-R criteria (APA, 2000) were assessed withthe Composite International Diagnostic Interview (CIDI; WHO

R.M. Marijnissen et al. / Brain, Behavior, and Immunity 37 (2014) 231–239 233
version 2.1; 12 month version, 1997). The CIDI is a structured clin-ical interview that is designed for use in research settings and hashigh validity for depressive and anxiety disorders (Wittchen et al.,1991; Kessler et al., 2010). As in NESDA (The Netherlands Study ofDepression and Anxiety; Penninx et al., 2008), we added questionsto determine the research DSM-IV diagnosis of current minordepression (Comijs et al., 2011). Among the depressed sample,357/376 (94.9%) met criteria for a major depressive disorder(MDD) with the past 6 months, 20 (5.3%) for a current minordepression and 100 (26.6%) for dysthymia (in the past-six months).Due to double diagnoses, numbers do not add up to 100%.
2.2.2. Depression characteristicsCharacteristics of depression will be categorised in those char-
acteristics indicative of a prolonged or chronic course (duration re-lated measures) and those indicative of a more severe episode(severity related measures) as indicated in Table 3.
Duration-related measures – based on data from the CIDI-inter-view, we assessed additional age of onset of depression (age ofthe participant at the time of the first depressive episode), recur-rence (presence of depressive episode prior to the current episode)and life-time dysthymia.
Severity related measures – severity of depression was measuredby the 30-item self-rating Inventory of Depressive Symptomatol-ogy (IDS), which has adequate psychometric properties (Rushet al., 1996). The sum score ranges from 0 to 60; the severity ofdepression can be classified as none (score range 0 through 12),mild (13 though 24), moderate (25 though 37), severe (38 through47) and very severe (48 or higher). To examine different symptomdimensions of late-life depression, three symptom profiles of theIDS were used, a mood, motivation and somatic dimension. Thesethree homogenous symptom dimensions were shown to have agood fit with exploratory and confirmatory factor analysis in theNESDO study (Hegeman et al., 2012).
2.2.3. ObesityWaist circumference was measured at the level of the umbilicus
(cm). According to the National Cholesterol Education Program
Table 1Characteristics of depressed patients and their non-depressed comparison group (n = 506)
Characteristics Depressed patients (n
Socio-demographicsAge Mean (SD)
(range)70.7 (7.4)(60–90)
Female sex n (%) 248 (66.0%)Years of education Mean (SD) 10.5 (3.4)
Somatic statusGlobal cognitive functioning (MMSE) Mean (SD) 27.7 (2.0)No. of chronic diseases Mean (SD) 2.1 (1.5)Use of antidepressants n (%) 272 (72.3%)Waist circumference (cm) Mean (SD) 93.5 (13.0)Body Mass Index Mean (SD) 26.3 (4.4)
Life-style characteristicsAlcohol use
No use n (%) 148 (40.0%)Moderate usage n (%) 189 (51.1%)Severe usage n (%) 33 (8.9%)
Smoking n (%) 99 (26.5%)Physical activity
Low n (%) 113 (31.0%)Medium n (%) 138 (38.8%)High n (%) 114 (31.2%)
Depressive symptom severity (IDS) Mean (SD) 30.0 (13.0)Plasma NGAL levels (pg/ml) Mean (SD) 62.00 (23.30)High-sensivity CRP levels Median (IQR) 1.88 (3.18)
a T-test on ln-transformed values.
(NCEP)-Adult Treatment Panel III, a waist circumference above 88and 102 cm is considered pathologically increased in males and fe-males, respectively (Alexander et al., 2003). In addition, standard-ized assessments of weight (kg) and height (m) were used tocalculate the body mass index (weight (kg) divided by the squareof the height (m2)).
2.2.4. NGAL measurement in plasma by ELISAQuantification of NGAL from plasma was performed via a con-
structed sandwich ELISA using human Lipocalin-2/NGAL ELISAcapture antibody (R&D Systems), recombinant human Lipocalin-2/NGAL (R&D Systems) for the internal standard and biotinylatedhuman Lipocalin-2/NGAL detection antibody (R&D Systems). Plas-ma was diluted 1:100. A blinded ELISA analysis was performed oncoded samples. Briefly, plates (96 wells, Maxisorb, Nunc) werecoated with the capture antibody (100 ll; 2 lg/ml) diluted inphosphate buffered saline (PBS, pH 7.4). After overnight incubationat room temperature, the coated plates were washed with Tris Buf-fered Saline (TBS) containing 0.05% Tween 20 (TBS/T) and nonspe-cific binding sites blocked by incubation with 300 ll of PBScontaining 1% Bovine Serum Albumin (BSA) (PBS/BSA) for 2 h atroom temperature on a shaker. After washing, 100 ll of eitherthe standards (recombinant human NGAL) or samples, diluted inPBS/BSA were added to the plates and incubated for 2 h at roomtemperature on a shaker. Plates were washed six times and100 ll of biotinylated human Lipocalin-2/NGAL detection antibody(100 ng/ml) diluted in PBS/BSA was added. After 2 h on a shaker atroom temperature, plates were washed six times and incubatedwith 100 ll Avidin-horseradish peroxidase (eBioscience) in PBS/BSA (1:1000) for 20 min on shaker at room temperature. Plateswere then washed six times and 100 ll of substrate solution con-taining 1 mg/ml of O-phenylenediamine (Sigma) in 0.05 M citricacid sodium phosphate buffer (pH 5.0) with hydrogen peroxide(0.06%) was added. The reaction was stopped by adding 100 ll ofa 3 N HCl solution. The absorbance was determined at 492 nm withbackground subtraction at 620 nm using an ELISA reader (AsysUVM 340, Biochrom, Cambridge, UK). The quantity of NGAL wasestimated from the calibration curve which ranged from 78 to
.
= 376) Non-depressed controls (n = 130) Statistics
69.9 (7.0)(60–93)
T = �1.1, df = 504, p = .267
80 (61.5%) v2 = 0.8, df = 1, p = .36312.5 (3.5) T = 5.8, df = 504, p < .001
28.4 (1.6) T = 3.3, df = 503, p = .0011.5 (1.1) T = -4.5, df = 503, p < .0013 (2.3%) v2 = 191, df = 1, p < .00198.4 (15.3) T = 3.5, df = 504, p = .00127.0 (4.1) T = 1.6, df = 504, p = .121
v2 = 36.2, df = 2, p < .00116 (12.7%)84 (66.7%)26 (20.6%)10 (7.7%) v2 = 20.2, df = 1, p < .001
v2 = 9.0, df = 2, p = .01122 (17.3%)55 (43.3%)50 (39.4%)7.6 (5.7) T = �18.9, df = 496, p < .00153.25 (21.29) T = �3.7, df = 492, p < .0011.59 (2.28) T = �1.4, df = 486, p = .166a
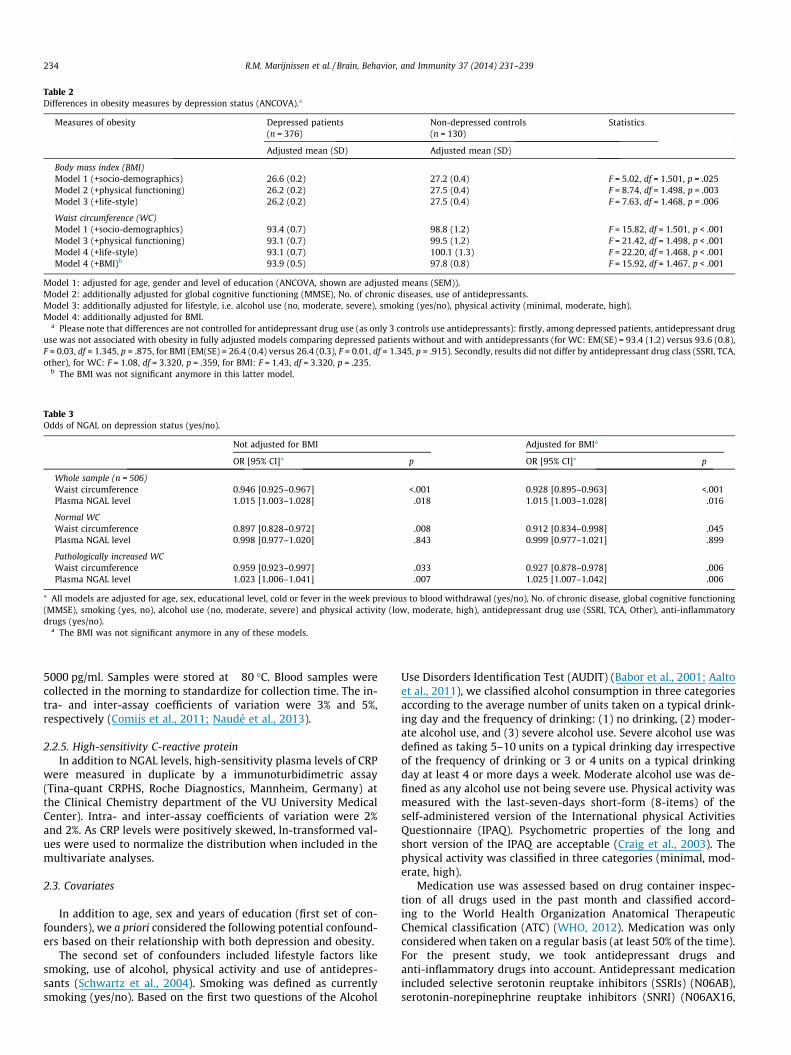
Table 2Differences in obesity measures by depression status (ANCOVA).a
Measures of obesity Depressed patients(n = 376)
Non-depressed controls(n = 130)
Statistics
Adjusted mean (SD) Adjusted mean (SD)
Body mass index (BMI)Model 1 (+socio-demographics) 26.6 (0.2) 27.2 (0.4) F = 5.02, df = 1.501, p = .025Model 2 (+physical functioning) 26.2 (0.2) 27.5 (0.4) F = 8.74, df = 1.498, p = .003Model 3 (+life-style) 26.2 (0.2) 27.5 (0.4) F = 7.63, df = 1.468, p = .006
Waist circumference (WC)Model 1 (+socio-demographics) 93.4 (0.7) 98.8 (1.2) F = 15.82, df = 1.501, p < .001Model 3 (+physical functioning) 93.1 (0.7) 99.5 (1.2) F = 21.42, df = 1.498, p < .001Model 4 (+life-style) 93.1 (0.7) 100.1 (1.3) F = 22.20, df = 1.468, p < .001Model 4 (+BMI)b 93.9 (0.5) 97.8 (0.8) F = 15.92, df = 1.467, p < .001
Model 1: adjusted for age, gender and level of education (ANCOVA, shown are adjusted means (SEM)).Model 2: additionally adjusted for global cognitive functioning (MMSE), No. of chronic diseases, use of antidepressants.Model 3: additionally adjusted for lifestyle, i.e. alcohol use (no, moderate, severe), smoking (yes/no), physical activity (minimal, moderate, high).Model 4: additionally adjusted for BMI.
a Please note that differences are not controlled for antidepressant drug use (as only 3 controls use antidepressants): firstly, among depressed patients, antidepressant druguse was not associated with obesity in fully adjusted models comparing depressed patients without and with antidepressants (for WC: EM(SE) = 93.4 (1.2) versus 93.6 (0.8),F = 0.03, df = 1.345, p = .875, for BMI (EM(SE) = 26.4 (0.4) versus 26.4 (0.3), F = 0.01, df = 1.345, p = .915). Secondly, results did not differ by antidepressant drug class (SSRI, TCA,other), for WC: F = 1.08, df = 3.320, p = .359, for BMI: F = 1.43, df = 3.320, p = .235.
b The BMI was not significant anymore in this latter model.
Table 3Odds of NGAL on depression status (yes/no).
Not adjusted for BMI Adjusted for BMIa
OR [95% CI]* p OR [95% CI]* p
Whole sample (n = 506)Waist circumference 0.946 [0.925–0.967] <.001 0.928 [0.895–0.963] <.001Plasma NGAL level 1.015 [1.003–1.028] .018 1.015 [1.003–1.028] .016
Normal WCWaist circumference 0.897 [0.828–0.972] .008 0.912 [0.834–0.998] .045Plasma NGAL level 0.998 [0.977–1.020] .843 0.999 [0.977–1.021] .899
Pathologically increased WCWaist circumference 0.959 [0.923–0.997] .033 0.927 [0.878–0.978] .006Plasma NGAL level 1.023 [1.006–1.041] .007 1.025 [1.007–1.042] .006
⁄ All models are adjusted for age, sex, educational level, cold or fever in the week previous to blood withdrawal (yes/no), No. of chronic disease, global cognitive functioning(MMSE), smoking (yes, no), alcohol use (no, moderate, severe) and physical activity (low, moderate, high), antidepressant drug use (SSRI, TCA, Other), anti-inflammatorydrugs (yes/no).
a The BMI was not significant anymore in any of these models.
234 R.M. Marijnissen et al. / Brain, Behavior, and Immunity 37 (2014) 231–239
5000 pg/ml. Samples were stored at �80 �C. Blood samples werecollected in the morning to standardize for collection time. The in-tra- and inter-assay coefficients of variation were 3% and 5%,respectively (Comijs et al., 2011; Naudé et al., 2013).
2.2.5. High-sensitivity C-reactive proteinIn addition to NGAL levels, high-sensitivity plasma levels of CRP
were measured in duplicate by a immunoturbidimetric assay(Tina-quant CRPHS, Roche Diagnostics, Mannheim, Germany) atthe Clinical Chemistry department of the VU University MedicalCenter). Intra- and inter-assay coefficients of variation were 2%and 2%. As CRP levels were positively skewed, ln-transformed val-ues were used to normalize the distribution when included in themultivariate analyses.
2.3. Covariates
In addition to age, sex and years of education (first set of con-founders), we a priori considered the following potential confound-ers based on their relationship with both depression and obesity.
The second set of confounders included lifestyle factors likesmoking, use of alcohol, physical activity and use of antidepres-sants (Schwartz et al., 2004). Smoking was defined as currentlysmoking (yes/no). Based on the first two questions of the Alcohol
Use Disorders Identification Test (AUDIT) (Babor et al., 2001; Aaltoet al., 2011), we classified alcohol consumption in three categoriesaccording to the average number of units taken on a typical drink-ing day and the frequency of drinking: (1) no drinking, (2) moder-ate alcohol use, and (3) severe alcohol use. Severe alcohol use wasdefined as taking 5–10 units on a typical drinking day irrespectiveof the frequency of drinking or 3 or 4 units on a typical drinkingday at least 4 or more days a week. Moderate alcohol use was de-fined as any alcohol use not being severe use. Physical activity wasmeasured with the last-seven-days short-form (8-items) of theself-administered version of the International physical ActivitiesQuestionnaire (IPAQ). Psychometric properties of the long andshort version of the IPAQ are acceptable (Craig et al., 2003). Thephysical activity was classified in three categories (minimal, mod-erate, high).
Medication use was assessed based on drug container inspec-tion of all drugs used in the past month and classified accord-ing to the World Health Organization Anatomical TherapeuticChemical classification (ATC) (WHO, 2012). Medication was onlyconsidered when taken on a regular basis (at least 50% of the time).For the present study, we took antidepressant drugs andanti-inflammatory drugs into account. Antidepressant medicationincluded selective serotonin reuptake inhibitors (SSRIs) (N06AB),serotonin-norepinephrine reuptake inhibitors (SNRI) (N06AX16,

R.M. Marijnissen et al. / Brain, Behavior, and Immunity 37 (2014) 231–239 235
N06AX21), tricyclic antidepressants (TCAs)(N06AA) and tetracyclicantidepressants (TeCA) (N06AX03, N06AX05, and N06AX11). Anti-inflammatory drugs included amino salicylic acid and similaragents (A07EC), anti-allergic agents (A07EB), systemically appliedcorticosteroids (H02A), anti-inflammatory and anti-rheumaticproducts (M01) and other analgesics and antipyretics (N02B).
The third set of confounders consisted of parameters of physicalfunctioning and included cognitive functioning and the number ofchronic diseases. Cognitive functioning was assessed by the MiniMental State Examination (MMSE) (Folstein et al., 1975). TheMMSE score ranges from 0 to 30, with higher scores indicating bet-ter cognitive functioning.
The number of chronic diseases was assessed by means of aself-report questionnaire that has previously been used in NESDA(Penninx et al., 2008). The participants were asked whether theycurrently or previously had any of the following chronic diseasesor disease events: cardiac disease (including myocardial infarc-tion), peripheral atherosclerosis, stroke, diabetes mellitus, COPD(asthma, chronic bronchitis or pulmonary emphysema), arthritis(rheumatoid arthritis or osteoarthritis) or cancer, or any other dis-ease. Compared to general practitioner information, the accuracyof self-reports of these diseases was shown to be adequate andindependent of cognitive impairment (Kriegsman et al., 1996).
In case of associations tested with NGAL or hsCRP, having had acold or fever in the previous week to blood withdrawal (yes/no)was also taken into account.
2.4. Statistical methods
Waist circumference was compared between depressed andnon-depressed persons with ANCOVA adjusted for different setsof covariates (model 1: age, gender, level of education; model 2:additionally adjusted for cognitive functioning, chronic diseasesand antidepressant drug use; model 3: additionally adjusted forlifestyle characteristics including smoking, alcohol use and physi-cal activity). Subsequently, in model 4 the analysis was addition-ally corrected for body mass index in order to examine theimpact of the waist circumference when adjusted for generalobesity.
In order to examine a potentially moderating role of obesity inthe association between NGAL and depression, multiple logisticregression analyses were conducted with depression (yes/no) asdependent variable adjusted for the covariates described above,added with having had a cold or fever in the previous week toblood withdrawal. Waist circumference and plasma NGAL levelswill be included as independent variables. In these models, theinteraction between NGAL and waist circumference will be testedand in case of significance, analyses will be presented separatelyfor participants with and without a pathologically increased waistcircumference.
Subsequently, multiple linear regression analyses in the de-pressed subgroup were conducted with waist circumference asdependent variable and depression severity characteristics (IDSsum score, IDS-mood subscale, IDS-motivation subscale and IDS-somatic subscale) as well as duration related characteristics (ageof onset, duration of illness, life-time comorbidity with dysthymia)as independent variables in separate models. These analyses werefully adjusted for the covariates described above.
Finally, a moderating role of plasma NGAL in the association be-tween obesity and depression characteristics will be examined byadding the interaction term between NGAL and a specific depres-sion characteristics to the fully adjusted linear regression modelsdescribed above.
Finally, all analyses were rerun replacing NGAL levels by hsCRPlevels, in order to examine whether results were indeed specific forNGAL and not a none-specific inflammatory reaction.
By convention, p-values below .05 will be considered statisticallysignificant for individual variables, whereas p-values below .10 willbe considered statistically significant for interaction terms. Allanalyses were performed in SPSS version 18.0 (Inc., Chicago).
3. Results
3.1. Obesity in depressed versus non-depressed persons
Table 1 presents the characteristics of the study population. De-pressed patients and the non-depressed comparison group did notdiffer with respect to the body mass index (26.3 (SD = 4.4) versus27.0 (SD = 4.1), t = 1.6, df = 504, p = .121), whereas depressed per-sons had a significantly lower waist circumference (93.5(SD = 13.0) versus 98.4 (SD = 15.3), t = 3.5, df = 504, p = .001).
As shown in Table 2, the difference in waist circumference be-tween depressed and non-depressed persons became more signif-icant when adjusted for covariates, and also remained significantafter adjustment for body mass index (estimated marginal mean(SE) = 93.9 (0.5) versus 97.8 (0.8), F = 15.9, df = 1.467, p < .001).
As these results were contrary to our hypothesis that an in-creased waist circumference would be found in depression posthoc analyses were conducted excluding depressed patients that re-ported depression related weight loss in the past 2 years based onthe corresponding CIDI question (n = 131). These analyses yieldedalmost comparable results. In the fully adjusted models, depressedolder persons still had a significantly lower waist circumferencecompared to the non-depressed comparison group (94.3(SE = 0.9) versus 100.2 (SE = 1.3); F = 13.0, df = 1.340, p < .001),which also remained significant after adjustment for body mass in-dex (95.0 (SE = 0.6) versus 98.8 (SE = 0.9); F = 12.5, df = 1.339,p < .001).
3.2. Impact of obesity on the association between NGAL and depressionstatus
In a previous paper of the present sample, we already showedthat depression is associated with increased NGAL levels (see Nau-dé et al., 2013). In order to examine whether the association be-tween NGAL and depression status (yes/no) is conditional on thewaist circumference, we examined the interaction term betweenNGAL level and waist circumference in a logistic regression modeladjusted for all confounders, with depression status as the depen-dent variable. The interaction term between NGAL and waist cir-cumference was significant irrespective of adjustment for bodymass index. Without adjusting for body mass index the OR of waistcircumference by NGAL was 1.001 [95% CI = 1.000–1.002], p = .093;when additional adjusting for body mass index the OR of waist cir-cumference by NGAL was 1.001 [95% CI: 1.000–1.002], p = .072.Therefore, subsequent analyses will be presented separately forparticipants with normal and pathological increased waist circum-ference (Table 3). As shown in Fig. 1, NGAL plasma levels are onlyelevated in depressed older patients with a pathologically in-creased waist circumference.
HsCRP levels (see Table 1 for unadjusted results) did not differbetween patients and controls in the fully adjusted models(p = .482). Moreover, these results were not conditional on theWC as indicated by non-significant interaction terms betweenhsCRP and WC when predicting depression status (p = .684 not ad-justed for BMI; p = .649 adjusted for BMI).
3.3. Characteristics of obesity in depressed persons
Linear regression analyses in the depressed subgroup (n = 376)showed that increased waist circumference was associated with

Mar
gina
l mea
n pl
asm
a N
GAL l
evel
(pg/
l)
Normal WC Pathologically increased WC Non-depressed Depressed Non-depressed Depressed
P=.002
P=.036
P=.071
Fig. 1. Plasma NGAL levels by waist circumference and depression status.
236 R.M. Marijnissen et al. / Brain, Behavior, and Immunity 37 (2014) 231–239
both depression severity measures as well as duration relatedcharacteristics (Table 4). When additionally adjusted for body massindex, the strength of the association decreased, but the IDS sumscore as overall severity measure remained significantly associated(B = 0.06 (0.03), b = 0.06, p = .046), whereas the motivation sub-scale became significant (B = 0.26 (0.13), b = 0.06, p = .050).
3.4. Does NGAL moderate the association between depressioncharacteristics and obesity
Among the subgroup of depressed older persons, NGAL is asso-ciated with the waist circumference in fully adjusted linear regres-sion models (B(SE) = 0.082 (0.030), b = .15, p = .006).
First, we examined which depression characteristics (seeTable 4) that were associated with waist circumference interactedwith plasma NGAL level. Not adjusted for the body mass index,
Table 4Determinants of WC in depressed patients separate, fully adjusted linear regression mode
Determinant Waist circumference (WC)
Not adjusted for BMI
B (SE) b
Depression severity measuresIDS sum score 0.11 (0.06) .11IDS, mood subscale 0.32 (0.14) .13IDS, motivation subscale 0.41 (0.23) .10IDS, somatic subscale 0.16 (0.17) .05
Duration related disease characteristicsAge of onset (in years) �0.08 (0.04) �.13Age of onset (<>60 years) �4.04 (1.50) �.15Life-time comorbidity with dysthymia 4.40 (1.40) .16Duration of illness (years) 0.08 (0.04) .12
⁄ All models are adjusted for age, sex, educational level, No. of chronic disease, global cogphysical activity (low, moderate, high), antidepressant drug use (SSRI, TCA, Other), anti-
a The BMI was not significant in any of these models.
NGAL interacted with the IDS sum score (B(SE) = 0.004 (0.002),b = 0.35, p = .019), IDS mood scale (B(SE) = 0.012 (0.004), b = 0.36,p = .009), IDS motivation scale (B(SE) = 0.015 (0.008), b = 0.29,p = .046), age of onset (continuous: B(SE) = 0.002 (0.001), b = .33,p = .086; dichotomised: B(SE) = 0.12 (0.06), b = .43, p = .053), withlife-time dysthymia (B(SE) = 0.16 (0.06), b = 0.34, p = .009), andwith duration of illness (B(SE) = �0.003 (0.001), b = �.30,p = .057) when predicting the waist circumference in depressedolder persons. Interaction between NGAL and other depressioncharacteristics were not significant (all p-values >.10).
Adjusted for body mass index, five depression characteristicsinteracted with plasma NGAL levels when predicting waist circum-ference in depressed older persons. The significant interactionterms included NGAL by IDS total score (B(SE) = 0.003 (0.001),b = .27, p = .006), NGAL by IDS mood subscale (B(SE) = 0.009(0.003), b = .26, p = .003), IDS motivation scale (B(SE) = 0.011
ls.*
Adjusted for BMIa
p B (SE) b p
.046 0.06 (0.03) .06 .046
.023 0.12 (0.08) .05 .131
.077 0.26 (0.13) .06 .050
.355 0.09 (0.10) .03 .367
.024 �0.01 (0.02) �.02 .579
.007 �1.21 (0.85) �.04 .155
.002 0.59 (0.81) .02 .469
.024 0.02 (0.02) .02 .455
nitive functioning (MMSE), smoking (yes, no), alcohol use (no, moderate, severe) andinflammatory drugs (yes/no).

Table 5Association between NGAL and waist circumference by different classes of depressionseverity and by the presence of life-time dysthymia using multiple linear regressionanalyses.*
Determinant Waist circumference (WC)
B (SE) b p
Severity of depressionNot additionally adjusted for BMI
No/mild depression �0.01 (0.04) �.02 .775Moderate depression 0.04 (0.05) .07 .449(Very) severe depression 0.16 (0.07) .27 .021
Additionally adjusted for BMIa
No/mild depression 0.01 (0.03) .02 .686Moderate depression 0.01 (0.03) .01 .858(Very) severe depression 0.12 (0.03) .19 .001
Life-time history of dysthymiaNot additionally adjusted for BMI
No life-time dysthymia <0.01 (0.03) .01 0.906Life-time dysthymia 0.19 (0.06) .34 .001
Additionally adjusted for BMIa
No life-time dysthymia 0.02 (0.02) .04 .366Life-time dysthymia 0.11 (0.03) .20 .001
Age of onset depressionNot additionally adjusted for BMI
Early onset depression (<60 years) 0.05 (0.04) .08 .291Late-onset depression (P60 years) 0.11 (0.05) .23 .019
Adjusted for BMIa
Early onset depression (<60 years) 0.07 (0.02) .11 .002Late-onset depression (P60 years) 0.07 (0.03) .15 .025
Duration of illness (median split at 19 years)Not additionally adjusted for BMI
Short duration of illness (619 years) 0.11 (0.04) .24 .003Long duration of illness (>19 years) 0.03 (0.05) .04 .624
Adjusted for BMIa
Short duration of illness (619 years) 0.08 (0.02) .16 .002Long duration of illness (>19 years) 0.08 (0.03) .12 .004
⁄ All models are adjusted for age, sex, educational level, cold or fever in the weekprevious to blood withdrawal (yes/no), No. of chronic disease, global cognitivefunctioning (MMSE), smoking (yes, no), alcohol use (no, moderate, severe) andphysical activity (low, moderate, high), antidepressant drug use (SSRI, TCA, Other),anti-inflammatory drugs (yes/no).
a The BMI was not significant in any of these models.
R.M. Marijnissen et al. / Brain, Behavior, and Immunity 37 (2014) 231–239 237
(0.005), b = 0.20, p = .031), IDS somatic scale (B(SE) = 0.007 (0.004),b = 0.20, p = .051) and finally NGAL by life-time dysthymia((SE) = 0.103 (0.040), b = .22, p = .011). Table 5 presents the resultssplit by depression severity, life-time dysthymia, age of onset andduration of illness. Results by depression severity will be presentedfor three severity groups, i.e. none or mild symptoms, moderatesymptoms, and severe/very severe depressive symptoms,respectively.
Finally, a similar approach was applied with respect to hsCRPlevels. However, all results appeared to be non-significant.
4. Discussion and conclusions
4.1. Main findings
Depressed patients aged 60 years and over were significantlyless obese than the non-depressed comparison group (see Table 2).Population-based findings of a positive correlation between obes-ity and depressive symptoms can thus not be generalised to pa-tients suffering from late-life depression. The difference withrespect to the waist circumference remained even significant afteradjustment for the body mass index. Interestingly, the associationbetween increased Neutrophil Gelatinase-Associated Lipocalin(NGAL) levels and depression, recently reported by our group(Naudé et al., 2013) appears to be driven by a pathologically
increased waist circumference. Increased NGAL levels may thusbe only relevant in a subgroup of depressed older patients.
4.2. Obesity in late-life depression
Although most studies report a positive association betweenobesity and more severe depressive symptoms (as confirmed bymeta-analyses), absence or even inverse relationships in this asso-ciation as found in our study have been reported before (Ho et al.,2008; Wong et al., 2011; Dong et al., 2013). A closer look at thesecontradictory findings, shows that a negative association betweendepression and obesity has primarily been reported in an older,Asian population (Ho et al., 2008; Wong et al., 2011; Dong et al.,2013). In eastern cultures, obesity is regarded as a positive charac-teristic. As 95% (464/489) of our participants are from a north-European ancestry, this cannot be an explanation for our findings.Our sample further differs from population-based studies by hav-ing included a relatively severe group of depressed patients meet-ing the DSM-IV-TR criteria for depression or dysthymia. This is incontrast to population-based studies where severe cases areunderrepresented by selection bias (Marijnissen et al., 2011) andresults are generally based on depression severity scales (de Witet al., 2010; Luppino et al., 2010). The only study on a clinical sam-ple (aged 18–65 years old) thus far has confirmed the meta-ana-lytic results of population-based studies (Van Reedt Dortlandet al., 2013). As this study has applied a similar study design aswe did (see Penninx and Zitman, 2013; Comijs et al., 2011), our re-sults cannot simply be explained by having a clinical sample of de-pressed patients. Our data thus suggest that the relationshipbetween obesity and depression may be different across the life-span. Although tentative, it may be that depressed older personshave more often lost weight due to comorbid physical frailty or so-matic comorbidity, which in itself is associated with depression(Andrew and Rockwood, 2007; Collard et al., 2013). Moreover, evenaging in general has already been associated with nutritional defi-ciencies that may also contribute to depressive symptoms (de Boeret al., 2013). Another explanation could still be significant weightloss during the actual depressive episode. Nonetheless, this is un-likely as our post hoc analyses excluding the patients with signifi-cant and unintended weight loss in the past 2 years yielded similarresults. Moreover, this explanation also does not explain why thewaist circumference is specifically affected relative to the bodymass index.
Within the depressed group, characteristics of a more severedepressive episode as well as a longer history of depression wereassociated with a higher waist circumference. When adjusted forbody mass index, only the association between waist circumfer-ence and overall depression severity remained significant, in con-trast to the depression duration related characteristics which alllost significance. This may indicate that variance in waist circum-ference adjusted for general obesity may specifically affect actualdepression severity. A possible explanation may lie in the meta-bolic activity of the visceral fat tissue (Trujillo and Scherer,2006). Interestingly, inflammatory markers have been specificallyrelated with features of sickness behaviour, including generalweakness and fatigue (Dantzer et al., 2008).
4.3. Adipokines and late-life depression
Depression has increasingly been linked with visceral fat accu-mulation (Vogelzangs et al., 2008) as well as low-graded systemicinflammation (Dowlati et al., 2010; Howren et al. 2009). Visceralfat tissue is metabolic active by the secretion of both pro- andanti-inflammatory cytokines, collectively called the adipokines.Although NGAL has not been studied previously in the associationbetween obesity and depression, comparable results have been

238 R.M. Marijnissen et al. / Brain, Behavior, and Immunity 37 (2014) 231–239
found for other adipokines. In older men, high leptin has been asso-ciated with an increased onset of depressive symptoms in the pres-ence of abdominal obesity (Milaneshi et al., 2012). The fact thatNGAL exerts its effects primarily in case of a pathologically in-creased waist circumference, contributes to its role as an adipoki-ne. Adipokines have indeed been specially associated with visceralobesity. For example, plasma levels of adiponectin, a protectivecytokine for vascular health, are lowered in case of visceral obesityresulting in negative health effects independent of the body massindex (Mathieu et al., 2009; Taylor and Macqueen, 2010;Matsuzamwa et al., 2011).
4.4. Methodological considerations
The strengths of our study are the large number of older per-sons suffering depression and the comprehensive assessment ofdepression characteristics and confounding factors. However,some limitations should be acknowledged for proper interpreta-tion. Firstly, the cross-sectional study design precludes causalinterpretations of the findings. Secondly, plasma NGAL levels can-not be translated directly to increased NGAL expression in adipo-cytes. Nonetheless, a recent study in 90 obese women showedthat plasma NGAL levels were associated with visceral NGAL pro-tein levels (r = .43, p = .044), while the latter were associated withvisceral NGAL mRNA levels (r = .59, p = .004) (Auguet et al., 2011).The direct association between plasma levels and adipocyte mRNA,however, has not been reported. Thirdly, the comparison groupwas recruited from persons visiting the GP and especially obesepersons do have a higher disease burden. This might have partlycontributed to our finding of lower level of obesity in late-lifedepression. Fourthly, there is a small chance (one of 20) that wefound some spurious findings (type one error) due to multiplecomparisons. However, if one tests for the significance of an asso-ciation using variables that are mutually correlated, the Bonferronicorrection is even too conservative (Perneger, 1998). Therefore, wehave not made the Bonferroni correction, but have chosen to pres-ent all individual statistics and p-values. Finally, we did not applyComputer Tomography at the level of the fourth lumbar vertebraas the gold standard for quantification of visceral fat (Weber-Hamann et al., 2006).
4.5. Clinical implications and future research
We conclude that population-based findings among olderpersons cannot be generalised to a clinical sample of depressed pa-tients. Acknowledging the age-specific effects, we argue for furtherlongitudinal studies specifically in depressed older persons. Suchstudies might be able to identify depressed subgroups with anunfavourable prognosis with respect to their physical health sta-tus. In these studies, the whole array of adipokines should betested as well as the relative impact of the waist circumferencein proportion to the general level of obesity as indexed by the bodymass index.
5. Disclosures
R.C. Oude Voshaar is research fellow of the Dutch ScientificOrganisaton (ZonMW) (Research Grant 90700231).
Acknowledgments
The infrastructure for the NESDO study (http://nesdo.amstad.nl<http://nesdo.amstad.nl/>) is funded through the Fonds NutsOhra,Stichting tot Steun VCVGZ, NARSAD The Brain and Behaviour Re-search Fund, and the participating universities and mental health
care organizations (VU University Medical Center, Leiden Univer-sity Medical Center, University Medical Center Groningen, UMCSt Radboud, and GGZ inGeest, GG Net, GGZ Nijmegen, GGZ Rivier-duinen, Lentis, and Parnassia).
References
Aalto, M., Alho, H., Halme, J.T., Sepaa, K., 2011. The Alcohol Use DisordersIdentification Test (AUDIT) and its derivatives in screening for heavy drinkingamong the elderly. Int. J. Geriatr. Psychiatry 26, 881–885.
Alexander, C.M., Landsman, P.B., Teutsch, S.M., Haffner, S.M., Third National Healthand Nutrition Examination Survey (NHANES III), National Cholesterol EducationProgram (NCEP), 2003. NCEP-defined metabolic syndrome, diabetes, andprevalence of coronary heart disease among NHANES III participant sage50 years and older. Diabetes 52 (5), 1210–1214.
Andrew, M.K., Rockwood, K., 2007. Psychiatric illness in relation to frailty incommunity-dwelling elderly people without dementia: a report from theCanadian Study of Health and Aging. Can. J. Aging 26, 33–38.
Arterburn, D., Westbrook, E.O., Ludman, E.J., Operskalski, B., Linde, J.A., Rohde, P.,Jeffery, R.W., Simon, G.E., 2012. Relationship between obesity, depression anddisability in middle-aged women. Obesity Res. Clin. Pract. 6, 197–206.
Auguet, T., Quintero, Y., Terra, X., Martinez, S., Lucas, A., Pellitero, S., Aguilar, C.,Hernandez, M., del Casillo, D., Richart, C., 2011. Upregulation of Lipocalin 2 inadipose tissues of severely obese women: positive relationship withproinflammatory cytokines. Obesity 19, 2295–2300.
Babor, T.F.H.B., Saunders, J.C., Monteiro, J.B., Maristela, G., 2001. AUDIT – the alcoholuse disorders identification test: guidelines for use in primary care, 2nd ed.World Health Organisation, Geneva, Switzerland.
Balu, D.T., Carlson, G.C., Talbot, K., Kazi, H., Hiill-Smith, T.E., Easton, R.M., Birnbaum,M.J., Lucki, I., 2012. Akt1 deficiency in schizophrenia and impairment ofhippocampal plasticity and function. Hippocampus 22, 230–240.
Boer de, A., Ter Horst, A.J., Lorsit, M.M., 2013. Physiological and psychosocial age-related changes associated with reduced food intake in older persons. AgeingRes. Rev. 12 (1), 316–328.
Bremmer, M.A., Beekman, A.T., Deeg, D.J., Penninx, B.W., Dik, M.G., Hack, C.E.,Hoogendijk, W.J., 2008. Inflammatory markers in late-life depression: resultsfrom a population-based study. J. Affect. Disord. 106 (3), 249–255.
Collard, R.M., Boter, H., Schoevers, R.A., Oude Voshaar, R.C., 2012. Prevalence offrailty in community-dwelling older persons: a systematic review. J. Am.Geriatr. Soc. 60 (8), 1487–1492.
Collard, R.M., Comijs, H.C., Naarding, P., Oude Voshaar, R.C., 2013. Physical frailty:vulnerability of patients suffering from late-life depression. Aging MentalHealth (accepted for revision).
Comijs, H.C., van Marwijk, H.W., van der Mast, R.C., Naarding, P., Oude Voshaar, R.C.,Beekman, A.T., Boshuisen, M., Dekker, J., Kok, R., de Waal, M.W., Penninx, B.W.,Stek, M.L., Smit, J.H., 2011. The Netherlands study of depression in older persons(NESDO); a prospective cohort study. BMC Res. Notes 4, 524.
Craig, C.L., Marshall, A.L., Sjostrom, M., Bauman, A.E., Booth, M.L., Ainsworth, B.E.,Pratt, M., Ekelund, U., Yngve, A., Sallis, J.F., Oja, P., 2003. International physicalactivity questionnaire: 12-country reliability and validity. Med. Sci. SportsExerc. 35, 1381–1395.
Daly, M., 2013. The relationship of C-reactive protein to obesity-related depressivesymptoms: a longitudinal study. Obesity 21, 248–250.
Dantzer, R., O’Connor, J.C., Freund, G.C., Johnson, R.W., Kelley, K.W., 2008. Frominflammation to sickness and depression: when the immune system subjugatesthe brain. Nat. Rev. Neurosci. 9 (1), 46–56.
Deuschle, M., Weber, B., Colla, M., Depner, M., Heuser, I., 1998. Effects of majordepression, aging and gender upon calculated diurnal free plasma cortisolconcentrations: a re-evaluation study. Stress 2 (4), 281–287.
Dixon, J.B., Dixon, M.E., O/Brien, P.E., 2003. Depression in association with severeobesity. Arch. Intern. Med. 163, 2058–2065.
Dong, Q., Liu, J.J., Zheng, R.Z., Dong, Y.H., Feng, X.M., Li, J., Huang, F., 2013. Obesityand depressive symptoms in the elderly: a survey in the rural area of Chizhou,Anhui Provence. Int. J. Geriatr. Psychiatry 28, 227–232.
Dowlati, Y., Herrmann, N., Swardfager, W., Liu, H., Sham, L., Reim, E.K., Lanctot, K.L.,2010. A meta-analysis of cytokines in major depression. Biol. Psychiatry 67,446–457.
Everson-Rose, S.A., Lewis, R.R., Karavolos, K., Dugan, S.A., Wesley, D., Powell, L.H.,2009. Depressive symptoms and increased visceral fat in middle-aged women.Psychosom. Med. 71, 410–416.
Folstein, M., Folstein, S., McHugh, P., 1975. ‘‘Mini-mental state’’. A practical methodfor grading the cognitive state of patients for the clinician. J. Psychiatr. Res. 12,189–198.
Fried, L.P., Tangen, C.M., Walston, J., Newman, A.B., Hirsch, C., Gottdiener, J., Seeman,T., Tracy, R., Kop, W.J., Bruke, G., McBurnie, M.A., Cardiovascular Health StudyCollaborative Research Group, 2001. Frailty in older adults: evidence for aphenotype. J. Gerontol. Ser. A: Biol. Sci. 56, M146–M156.
Hegeman, J.M., Wardenaar, K.J., Comijs, H.C., de Waal, M.W.M., Kok, R.M., van deMast, R.C., 2012. 0) The subscale structure of the Inventory of DepressiveSymptomatology Self Report (IDS–SR) in older persons. J. Psychiatr. Res. 46,1383–1388.
Ho, R.C.M., Niti, M., Kua, E.H., Ng, T., 2008. Body mass index, waist circumference,waist-hip ratio an depressive symptoms in Chinese elderly: a population-basedstudy. Int. J. Geriatr. Psychiatry 23, 401–408.

R.M. Marijnissen et al. / Brain, Behavior, and Immunity 37 (2014) 231–239 239
Howren, M.B., Lamkin, D.M., Suls, J., 2009. Associations of Depression With C-Reactive Protein, IL-1, and IL-6: A Meta-Analysis. Psycho. Med. 7, 171–186.
Huang, Y., Yang, Z., Ye, Z., Li, Q., Wen, J., Tao, X., Chen, L., He, M., Wang, X., Lu, B.,Zhang, Z., Zohng, W., QU, S., Hu, R., 2012. Lipocalin-2, glucose metabolism andchronic low-grade systemic inflammation in Chinese people. Cardiovas.Diabetol. 11, 11–18.
Ip, J.P., Nocon, A.L., Hofer, M.J., Ling lim, S., Muller, M., Capmbell, I.L., 2011. Lipocalin2 in the central nervous system host response to systemic lipopolysaccharideadministration. J. Neuroinflammation 8, 124.
Jin, Y., Sui, H.J., Dong, Y., Ding, Q., Qu, W.H., Yu, S.X., Jin, Y.X., 2012. Atorvastatinenhances neurite outgrowth in cortical neurons in vitro via up-regulating theAkt/mTOR and Akt/GSK-3beta signaling pathways. Acta Pharmacol. Sin. 33,861–872.
Karege, F., Perroud, N., Burkhardt, S., Fernandez, R., Ballmann, E., La Harpe, R.,Malafosse, A., 2011. Alterations in phosphatidylinositol 3-kinase activity andPTEN phosphatase in the prefrontal cortex of depressed suicide victims.Neuropsychobiology 63, 224–231.
Kessler, R.C., Birnbaum, H., Bromet, E., Hwang, I., Sampson, N., Shahly, V., 2010. Agedifferences in major depression: results from the National Comorbidity SurveyReplication (NCS-R). Psychol. Med. 40, 225–237.
Kriegsman, D.M., Penninx, B.W., van Eijk, J.T., Boeke, A.J., Deeg, D.J., 1996. Self-reports and general practitioner information on the presence of chronicdiseases in community dwelling elderly. A study on the accuracy of patients’self-reports and on determinants of inaccuracy. J. Clin. Epidemiol. 49, 1407–1417.
Luppino, F.S., deWit, L.M., Bouvy, P.F., Stijnen, T., Cuijpers, P., Penninx, B.W., Zitman,F.G., 2010. Overweight, obesity and depression. A systemic review and meta-analysis of longitudinal studies. Arch. General Psychiatry 67, 220–229.
Marijnissen, R.M., Bus, B.A., Holewijn, S., Franke, B., Purandare, N., De Graaf, J., denHeijer, M., Buitelaar, J.K., Oude Voshaar, R.C., 2011. Depressive symptomclusters are differentially associated with general and visceral obesity. J. Am.Geriatr. Soc. 59 (1), 67–72.
Marijnissen, R.M., Smits, J.E.M.P., Schoevers, R.A., van den Brink, R.H.S., Holewijn, S.,Franke, B., de Graaf, J., Oude Voshaar, R.C., 2013. Association between metabolicsyndrome and depressive symptom profiles: sex-specific? J. Affect. Disord. 151(3), 1138–1142.
Mathieu, P., Poirier, P., Pibarot, P., Lemieux, I., Despres, J.P., 2009. Visceral obesity:the link among inflammation, hypertension and cardiovascular disease.Hypertension 53, 577–584.
Matsuzamwa, Y., Nakamura, T., Funahashi, T., 2011. The concept of metabolicsyndrome; contribution of visceral fat accumulation and its molecularmechanism. J. Atheroscleris Thromb. 18, 629–639.
Milaneshi, Y., Simonsick, E.M., Vogelzangs, N., Strotmeyer, E.S., Yaffe, K., Harris, T.B.,Tolea, M.I., Ferrucci, L., Penninx, B.W.J.H., 2012. Leptin, abdominal obesity andonset of depression in older men and women. J. Clin. Psychiatry 73 (9), 1205–1211.
Mucha, M., Skrzypiec, A.E., Schiavon, E., Attwood, B.K., Kucerova, E., Pawlak, R.,2011. Lipocalin-2 controls neuronal excitability and anxiety by regulatingdendritic spine formation and maturation. Proc. Natl. Acad. Sci. 108, 18436–18441.
Naudé, P.J.W., Nyakas, C., Eiden, L.E., Ait-Ali, D., van der Heide, R., Engelborghs, S.,Luiten, P.G.M., De Deyn, P.P., den Boer, J.A., Eisel, U.L.M., 2012. Lipocalin 2: novelcomponent of proinflammatory signaling in Alzheimer’s disease. FASEB J. 26,2811.
Naudé, P.J.W., Eisel, U.L.M., Comijs, H.C., Groenewold, N.A., De Deyn, P.P., Bosker, F.J.,Luiten, P.G.M., Den Boer, J.A., Oude Voshaar, R.C., 2013. Neutrophil Gelatinase-Associated Lipocalin: A novel inflammatory marker associated with late-lifedepression. J. Psychosom. Res. 75 (5), 444–450.
Pasquali, R., 2012. The hypothalamic-pituitary-adrenal axis and sex hormones inchronic stress and obesity: pathophysiological and clinical aspects. Ann. N.Y.Acad. Sci., 20–35.
Penninx, B.W.J.H., Beekman, A.T.F., Smit, J.H., Zitman, F.G., Nolen, W.A., Spinhoven,P., Cuijpers, P., de Jong, P.J., van Marwijk, H.W.J., Assendelft, W.J.J., van der Meer,K., Verhaak, P., Wensing, M., de Graaf, R., Hoogendijk, W.J., Ormel, J., van Dyck R.,
for the NESDA RESEARCH CONSORTIUM, 2008. The Netherlands Study ofDepression and Anxiety (NESDA): rationale, objectives and methods. Int. J.Methods Psychiatr. Res. 17(3), 121–140.
Penninx, B.W., Beekman, A.T., Honig, A., Deeg, D.J., Schoevers, R.A., van Eijk, J.T., vanTilburg, W., 2001. Depression and cardiac mortality: results from a community-based longitudinal study. Arch. General Psychiatry 58 (3), 221–227.
Perneger, T.V., 1998. What’s wrong with Bonferroni adjustments. Br. Med. J. 316(7139), 1236–1238.
Roberts, R.E., Deleger, S., Strawbridge, W.J., Kaplan, G.A., 2003. Prospectiveassociation between obesity and depression: evidence from the AlamedaCounty Study. Int. J. Obesity 27, 514–521.
Rush, A.J., Gullion, C.M., Basco, M.R., Jarrett, R.B., Trivedi, M.H., 1996. The inventoryof depressive symptomatology (IDS): psychometric properties. Psychol. Med. 26(3), 477–486.
Sachs-Ericsson, N., Burns, A.B., Gordon, K.H., Eckel, L.A., Wonderlich, S.A., Crosby,R.D., Blazer, D.G., 2007. Body mass index and depressive symptoms in olderadults: the moderating roles of race, sex, and socioeconomic status. Am. J.Geriatr. Psychiatry 15, 815–825.
Schwartz, T.L., Nihalani, N., Virk, S., Jindal, S., Chilton, M., 2004. Psychiatricmedication-induced obesity: treatment options. Obesity Rev. 5, 233–238.
Stunkard, A.J., Faith, M.S., Allison, K.C., 2003. Depression and obesity. BioligalPsychiatry 54, 330–337.
Taylor, V.H., Macqueen, G.M., 2010. The role of adipokines in understanding theassociations between obesity and depression. (Epub. 2010) J. Obesity pil748048. http://dx.doi.org/10.1155/2010/748048.
Trujillo, M.E., Scherer, P.E., 2006. Adipose tissue-derived factors: impact on healthand disease. Endocrinve Rev. 27 (7), 762–778.
Van Reedt Dortland, A.K.B., Vreeburg, S.A., Giltay, E.J., Licht, C.M.M., Vogelzangs, N.,van Veen, T., Zitman, F.G., Penninx, B.W.J.H., 2013. Longitudinal relationship ofdepressive and anxiety symptoms with dyslipidemia and abdominal obesity.Psychosom. Med. 75, 83–89.
Vogelzangs, N., Kritchevsky, S.B., Beekman, A.T., Newman, A.B., Satterfield, S.,Simonsick, E.M., Yaffe, K., Harris, T.B., Penninx, B.W.J.H., 2008. Depressivesymptoms and change in abdominal obesity in older persons. Arch. GeneralPsychiatry 65 (12), 1386–1393.
Vogelzangs, N., Beekman, A.T., Boelhouwer, I.G., Bandinelli, S., Milaneschi, Y.,Ferrucci, L., Penninx, B.W., 2011. Metabolic depression: a chronic depressivesubtype? Findings from the InCHIANTI study of older persons. J. Clin. Psychiatry72 (5), 598–604.
Wang, Y., Lam, K.S.L., Kragen, E.W., Sweeney, G., Zhang, J., Tso, A.W.K., Chow, W.,Wat, N.M.S., Zu, J.Y., Hoo, R.L.C., Xu, A., 2007. Liipocalin-2 is an inflammatorymarker closely associated with obesity, insulin resistance and hyperglycemia inhumans. Clin. Chem. 53 (1), 34–41.
Weber-Hamann, B., Werner, M., Hentschel, F., Bindeballe, N., Lederbogen, F.,Deuschle, M., Heuser, I., 2006. Metabolic changes in elderly patients with majordepression: evidence for increased accumulation of visceral fat at follow-up.Psychoneuroendocrinology 31, 347–354.
Wit, L., Luppino, F., Straten, A., Penninx, B., Zitman, F., Cuijpers, P., 2010. Depressionand obesity: a meta-analysis of community-based studies. Psychiatry Res. 30(178(2)), 230–235.
Wittchen, H.U., Robins, L.N., Cottler, L.B., Sartorius, N., Bruke, J.C., Regier, D., 1991.Cross-cultural feasibility, reliability and sources of variance of the CompositeInternational Diagnostic Interview (CIDI). the multicentre WHO/ADAMHA fieldtrials. Br. J. Psychiatry 159 (645–653), 658.
Wong, S.Y.S., Lueng, J.C., Leung, P.C., Woo, J., 2011. Depressive symptoms andchange in abdominal obesity in the elderly: positive or negative association?Am. J. Geriatr. Psychiatry 19, 730–742.
World Health Organization (WHO), 2011. Collaborating centre for drug statisticsmethodology. <http://www.whocc.no/atc_ddd_index/> (accessed January2012).
World Health Organization, 1997. Composite International Diagnostic Interview.Version 2.1. WHO, Geneva.
Zhao, P., Stephens, J., 2013. STAT1, NF-kB and ERKs play a role in the induction oflipocalin-2 expression in adipocitytes. Mol. Metab. 2, 161–170.
Copyright © 2022 FDOKUMEN