ERα-regulated Lipocalin 2 Expression in Adipose Tissue Links Obesity with Breast Cancer Progression
17
Estrogen Receptor (ER)-regulated Lipocalin 2 Expression in Adipose Tissue Links Obesity with Breast Cancer Progression * □ S Received for publication, August 27, 2014, and in revised form, November 18, 2014 Published, JBC Papers in Press, December 2, 2014, DOI 10.1074/jbc.M114.606459 Brian G. Drew, a1 Habib Hamidi, b,c Zhenqi Zhou, a Claudio J. Villanueva, d2 Susan A. Krum, e3 Anna C. Calkin, d4 Brian W. Parks, f Vicent Ribas, a5 Nareg Y. Kalajian, a Jennifer Phun, a Pedram Daraei, a Heather R. Christofk, c,g Sylvia C. Hewitt, h Kenneth S. Korach, h Peter Tontonoz, d Aldons J. Lusis, f Dennis J. Slamon, b,c,i Sara A. Hurvitz, b,c,i and Andrea L. Hevener a,c,j6 From the David Geffen School of Medicine, Department of Medicine, a Division of Endocrinology, Diabetes and Hypertension, b Division of Hematology-Oncology, and c Jonsson Comprehensive Cancer Center, UCLA, Los Angeles, California 90095, the d Department of Pathology and Laboratory Medicine, Howard Hughes Medical Institute, UCLA, Los Angeles, California 90095, the e Orthopaedic Hospital Department of Orthopaedic Surgery and the Orthopaedic Hospital Research Center, UCLA, Los Angeles, California 90095, the Departments of f Human Genetics and g Molecular and Medical Pharmacology, UCLA, Los Angeles, California 90095, the h Receptor Biology Section, Reproductive and Developmental Biology Laboratory, NIEHS, National Institutes of Health, Research Triangle Park, North Carolina 27709, and the i Translational Research in Oncology-US, j Iris Cantor-UCLA Women’s Health Center, Los Angeles, California 90095 Background: Mechanisms underlying obesity-associated breast cancer incidence are incompletely understood. Results: Adipose tissue estrogen receptor (ER) expression is inversely associated with adiposity and the expression and release of Lcn2, an adipokine promoting breast cancer cell proliferation and migration. Conclusion: ER is critical for restraining adiposity and Lcn2 production. Significance: Modulation of adipose tissue ER action is a potential approach to prevent obesity and reduce breast cancer risk. Obesity is associated with increased breast cancer (BrCA) incidence. Considering that inactivation of estrogen receptor (ER) promotes obesity and metabolic dysfunction in women and female mice, understanding the mechanisms and tissue- specific sites of ER action to combat metabolic-related disease, including BrCA, is of clinical importance. To study the role of ER in adipose tissue we generated fat-specific ER knock-out (FERKO) mice. Herein we show that ER deletion increased adipocyte size, fat pad weight, and tissue expression and circu- lating levels of the secreted glycoprotein, lipocalin 2 (Lcn2), an adipokine previously associated with BrCA development. Chro- matin immunoprecipitation and luciferase reporter studies showed that ER binds the Lcn2 promoter to repress its expres- sion. Because adipocytes constitute an important cell type of the breast microenvironment, we examined the impact of adipocyte ER deletion on cancer cell behavior. Conditioned medium from ER-null adipocytes and medium containing pure Lcn2 increased proliferation and migration of a subset of BrCA cells in culture. The proliferative and promigratory effects of ER- deficient adipocyte-conditioned medium on BrCA cells was reversed by Lcn2 deletion. BrCA cell responsiveness to exoge- nous Lcn2 was heightened in cell types where endogenous Lcn2 expression was minimal, but components of the Lcn2 signaling pathway were enriched, i.e. SLC22A17 and 3-hydroxybutyrate dehydrogenase (BDH2). In breast tumor biopsies from women diagnosed with BrCA we found that BDH2 expression was pos- itively associated with adiposity and circulating Lcn2 levels. Col- lectively these data suggest that reduction of ER expression in adipose tissue promotes adiposity and is linked with the pro- gression and severity of BrCA via increased adipocyte-specific Lcn2 production and enhanced tumor cell Lcn2 sensitivity. The alarming rise in obesity over recent decades is strongly associated with a concomitant increase in chronic disease inci- dence (1). It is generally appreciated that obesity promotes low- grade systemic inflammation via metabolic dysfunction and immune cell activation (2–3), and these factors, common under- pinnings of type 2 diabetes and atherosclerosis, are also associated with increased prevalence of breast cancer (BrCA) 7 in women (4 –7). * This work was supported, in whole or in part, by National Institutes of Health Grants DK060484, DK073227, and P30DK063491 (to A. L. H.), HL284481 and D094311 (to A. J. L.), HL123021 (to B. W. P.), and NIEHS DIR support Grant Z01ES70065 (to K. S. K.), the UCLA Department of Medicine, UCLA Iris Cantor Women’s Health Foundation and Executive Advisory Board, UCLA Jonsson Cancer Center, and the TORI-B02 trial funded in part by Genentech. □ S This article contains supplemental Tables S1–S4. 1 Supported by the Australian NHMRC Grant 526693 and the UCLA Jonsson Comprehensive Cancer Center. Present address: Baker IDI Heart and Dia- betes Institute and the Central Clinical School, Monash University, Mel- bourne, VIC, Australia 3004. 2 Present address: Dept. of Biological Chemistry, University of Utah, Salt Lake City, UT 84112. 3 Present address: Dept. of Orthopaedic Surgery and Biomedical Engineering, University of Tennessee Health Science Center, Memphis, TN 38163. 4 Present address: Baker IDI Heart and Diabetes Institute, Melbourne, VIC, Aus- tralia 3004. 5 Supported by the Spanish Ministry of Health. 6 To whom correspondence should be addressed: David Geffen School of Medicine, Division of Endocrinology, Diabetes, and Hypertension, 900 Vet- eran Ave., Warren Hall Suite 24-130, Los Angeles, CA 90095-7073. Tel.: 310- 794-7555; Fax: 310-794-7654; E-mail: [email protected]. 7 The abbreviations used are: BrCA, breast cancer; BMI, body mass index; ER, estrogen receptor ; Lcn2, lipocalin 2; CM, conditioned medium; Scr, scrambled; BDH2, 3-hydroxybutyrate dehydrogenase; HMDP, hybrid THE JOURNAL OF BIOLOGICAL CHEMISTRY VOL. 290, NO. 9, pp. 5566 –5581, February 27, 2015 Published in the U.S.A. 5566 JOURNAL OF BIOLOGICAL CHEMISTRY VOLUME 290 • NUMBER 9 • FEBRUARY 27, 2015 at UCLA-Louise Darling Biomed. Lib. on June 22, 2015 http://www.jbc.org/ Downloaded from
Transcript of ERα-regulated Lipocalin 2 Expression in Adipose Tissue Links Obesity with Breast Cancer Progression

Estrogen Receptor (ER)�-regulated Lipocalin 2 Expression inAdipose Tissue Links Obesity with Breast CancerProgression*□S
Received for publication, August 27, 2014, and in revised form, November 18, 2014 Published, JBC Papers in Press, December 2, 2014, DOI 10.1074/jbc.M114.606459
Brian G. Drew,a1 Habib Hamidi,b,c Zhenqi Zhou,a Claudio J. Villanueva,d2 Susan A. Krum,e3 Anna C. Calkin,d4
Brian W. Parks,f Vicent Ribas,a5 Nareg Y. Kalajian,a Jennifer Phun,a Pedram Daraei,a Heather R. Christofk,c,g
Sylvia C. Hewitt,h Kenneth S. Korach,h Peter Tontonoz,d Aldons J. Lusis,f Dennis J. Slamon,b,c,i Sara A. Hurvitz,b,c,i
and Andrea L. Hevenera,c,j6
From the David Geffen School of Medicine, Department of Medicine, aDivision of Endocrinology, Diabetes and Hypertension,bDivision of Hematology-Oncology, and cJonsson Comprehensive Cancer Center, UCLA, Los Angeles, California 90095, thedDepartment of Pathology and Laboratory Medicine, Howard Hughes Medical Institute, UCLA, Los Angeles, California 90095, theeOrthopaedic Hospital Department of Orthopaedic Surgery and the Orthopaedic Hospital Research Center, UCLA, Los Angeles,California 90095, the Departments of fHuman Genetics and gMolecular and Medical Pharmacology, UCLA, Los Angeles, California90095, the hReceptor Biology Section, Reproductive and Developmental Biology Laboratory, NIEHS, National Institutes of Health,Research Triangle Park, North Carolina 27709, and the iTranslational Research in Oncology-US, jIris Cantor-UCLA Women’s HealthCenter, Los Angeles, California 90095
Background: Mechanisms underlying obesity-associated breast cancer incidence are incompletely understood.Results: Adipose tissue estrogen receptor (ER)� expression is inversely associated with adiposity and the expression and releaseof Lcn2, an adipokine promoting breast cancer cell proliferation and migration.Conclusion: ER� is critical for restraining adiposity and Lcn2 production.Significance: Modulation of adipose tissue ER� action is a potential approach to prevent obesity and reduce breast cancer risk.
Obesity is associated with increased breast cancer (BrCA)incidence. Considering that inactivation of estrogen receptor(ER)� promotes obesity and metabolic dysfunction in womenand female mice, understanding the mechanisms and tissue-specific sites of ER� action to combat metabolic-related disease,including BrCA, is of clinical importance. To study the role ofER� in adipose tissue we generated fat-specific ER� knock-out(FERKO) mice. Herein we show that ER� deletion increasedadipocyte size, fat pad weight, and tissue expression and circu-lating levels of the secreted glycoprotein, lipocalin 2 (Lcn2), anadipokine previously associated with BrCA development. Chro-matin immunoprecipitation and luciferase reporter studiesshowed that ER� binds the Lcn2 promoter to repress its expres-
sion. Because adipocytes constitute an important cell type of thebreast microenvironment, we examined the impact of adipocyteER� deletion on cancer cell behavior. Conditioned mediumfrom ER�-null adipocytes and medium containing pure Lcn2increased proliferation and migration of a subset of BrCA cellsin culture. The proliferative and promigratory effects of ER�-deficient adipocyte-conditioned medium on BrCA cells wasreversed by Lcn2 deletion. BrCA cell responsiveness to exoge-nous Lcn2 was heightened in cell types where endogenous Lcn2expression was minimal, but components of the Lcn2 signalingpathway were enriched, i.e. SLC22A17 and 3-hydroxybutyratedehydrogenase (BDH2). In breast tumor biopsies from womendiagnosed with BrCA we found that BDH2 expression was pos-itively associated with adiposity and circulating Lcn2 levels. Col-lectively these data suggest that reduction of ER� expression inadipose tissue promotes adiposity and is linked with the pro-gression and severity of BrCA via increased adipocyte-specificLcn2 production and enhanced tumor cell Lcn2 sensitivity.
The alarming rise in obesity over recent decades is stronglyassociated with a concomitant increase in chronic disease inci-dence (1). It is generally appreciated that obesity promotes low-grade systemic inflammation via metabolic dysfunction andimmune cell activation (2–3), and these factors, common under-pinnings of type 2 diabetes and atherosclerosis, are also associatedwith increased prevalence of breast cancer (BrCA)7 in women(4–7).
* This work was supported, in whole or in part, by National Institutes of HealthGrants DK060484, DK073227, and P30DK063491 (to A. L. H.), HL284481 andD094311 (to A. J. L.), HL123021 (to B. W. P.), and NIEHS DIR support GrantZ01ES70065 (to K. S. K.), the UCLA Department of Medicine, UCLA Iris CantorWomen’s Health Foundation and Executive Advisory Board, UCLA JonssonCancer Center, and the TORI-B02 trial funded in part by Genentech.
□S This article contains supplemental Tables S1–S4.1 Supported by the Australian NHMRC Grant 526693 and the UCLA Jonsson
Comprehensive Cancer Center. Present address: Baker IDI Heart and Dia-betes Institute and the Central Clinical School, Monash University, Mel-bourne, VIC, Australia 3004.
2 Present address: Dept. of Biological Chemistry, University of Utah, Salt LakeCity, UT 84112.
3 Present address: Dept. of Orthopaedic Surgery and Biomedical Engineering,University of Tennessee Health Science Center, Memphis, TN 38163.
4 Present address: Baker IDI Heart and Diabetes Institute, Melbourne, VIC, Aus-tralia 3004.
5 Supported by the Spanish Ministry of Health.6 To whom correspondence should be addressed: David Geffen School of
Medicine, Division of Endocrinology, Diabetes, and Hypertension, 900 Vet-eran Ave., Warren Hall Suite 24-130, Los Angeles, CA 90095-7073. Tel.: 310-794-7555; Fax: 310-794-7654; E-mail: [email protected].
7 The abbreviations used are: BrCA, breast cancer; BMI, body mass index; ER�,estrogen receptor �; Lcn2, lipocalin 2; CM, conditioned medium; Scr,scrambled; BDH2, 3-hydroxybutyrate dehydrogenase; HMDP, hybrid
THE JOURNAL OF BIOLOGICAL CHEMISTRY VOL. 290, NO. 9, pp. 5566 –5581, February 27, 2015Published in the U.S.A.
5566 JOURNAL OF BIOLOGICAL CHEMISTRY VOLUME 290 • NUMBER 9 • FEBRUARY 27, 2015
at UC
LA
-Louise D
arling Biom
ed. Lib. on June 22, 2015
http://ww
w.jbc.org/
Dow
nloaded from

Breast cancer is a leading cause of mortality in women, andthe inability to predict, prevent, and treat metastatic breast can-cer currently limits patient care. Obesity is linked with moreaggressive forms of cancer with less favorable outcomes asobese women in the highest quintile of body mass index (BMI)have double the death rate from BrCA compared with leancounterparts (4). Although the mechanisms by which obesityand metabolic dysfunction increase BrCA risk remain unclear,recent studies have correlated altered levels of circulating fac-tors including metabolites, hormones, adipokines, and cyto-kines/chemokines with increased BrCA cell proliferation andmigration. In addition to visceral adipose previously linked withhigher BrCA incidence, adipocytes are also the most abundantcell type of the mammary tumor stroma, and thus paracrineaction on malignant epithelium is thought to impact earlystages of carcinogenesis as well as responsiveness of establishedtumors to adjuvant therapies (8 –11).
Although many factors contribute to the development ofmetabolic dysfunction and obesity in human subjects, rareinactivating mutations in the estrogen receptor � gene, ESR1,and common polymorphisms at this locus, are associated withadiposity, type 2 diabetes, atherosclerosis, and BrCA risk, inde-pendent of circulating hormone status (12–15). Moreover,Dahlman-Wright and colleagues (16) showed that ESR1expression is reduced in adipose tissue from obese women.Consistent with observations in human subjects, mice harbor-ing a homozygous Esr1-null mutation manifest marked obesity,insulin resistance, and heightened tissue inflammation (17, 18).Although a role for ER� in regulating metabolic homeostasis,adiposity, and insulin sensitivity is well established, the molec-ular targets of ER� action within glucoregulatory cell typesremain incompletely understood.
Considering that ER� is markedly reduced in adipose fromobese individuals and obesity elevates metastatic breast cancerrisk in women, we investigated whether targeted loss of adiposetissue in ER� could promote increased adiposity, metabolicdysfunction, and a secretory profile promoting BrCA tumori-genesis. Herein we show that adipose tissue deletion of ER�increased adiposity and inflammation in female mice, drivenin part by a marked elevation in the adipocyte-derived factor,lipocalin 2 (Lcn2). Conditioned media (CM) containingsecreted factors from ER�-deficient adipocytes or pure Lcn2markedly increased proliferation and motility of a specific set ofBrCA cell lines in culture. We found that BrCA responsivenessto exogenous Lcn2 was marked by differential expression ofintrinsic Lcn2 signaling components. We identified thatexpression of 3-hydroxybutyrate dehydrogenase (BDH2), anenzyme responsible for the production of the mammalian sid-erophore 2,5-dihydroxybenzoic acid and critical for mitochon-drial heme synthesis, as a critical component in determiningcellular responsiveness to Lcn2. Importantly, we showed thatexpression of BDH2 in breast tumor biopsies was positively
associated with obesity and circulating Lcn2 levels in womenwith BrCA. Our findings suggest that adipose tissue ER�expression is an important unifying link between obesity andbreast cancer risk in women.
EXPERIMENTAL PROCEDURES
Animals—Male and female flox/flox (f/f) and adipose-spe-cific ER� KO (FERKO) mice on a C57Bl6 background weregenerated by crossing ER� floxed mice (19) with transgeniclines in which Cre recombinase was driven by the aP2 (FABP4)promoter (20). LepOb mice were from Jackson Laboratories andmaintained as previously described (18). The EAAE-ER� DNA-binding domain mutant mice were generated by the Korachlaboratory (21, 22) as previously described, and adipose tissuewas harvested for subsequent qPCR analyses. Control or 17�-estradiol pellets (0.05 mg; 21 days, Innovative Research) weresurgically inserted under the skin of LepOb mice and tissueswere harvested after 21 days following a 6-h fast. Female micefrom the UCLA hybrid mouse diversity panel (HMDP; supple-mental Table S1), including 102 strains of inbred animals (23),were maintained on a high fat (HF)/high sucrose (HS) Westerndiet (Research Diets, D12266B) with the following composi-tion, 16.8% kcal protein, 51.4% kcal carbohydrate, 31.8% kcalfat. Following fasting, animals were anesthetized with 4% iso-flurane and exsanguinated prior to tissue harvest. Blood wascollected into tubes containing EDTA, and plasma was sepa-rated by centrifugation. All procedures were performed inaccordance with the Guide for Care and Use of Laboratory Ani-mals of the National Institutes of Health, and approved by theAnimal Research Committee of the University of California,Los Angeles.
Human Subjects—Pre-treatment tumor gene expression datawere mined from breast cancer patients participating in theUCLA Translational Oncology Research International (TORI-B02) trial (24).
Circulating Factors—Plasma was analyzed for insulin, leptin,PAI-1 (PAI-1) (Millipore), adiponectin (radioimmunoassay;Millipore), and estradiol (Siemens Diagnostics) as previouslydescribed (18). Lipocalin 2 ELISA was performed on plasmafrom women and female mice as per the manufacturer’sinstructions (R&D Systems).
Body Composition—Female mice from the HMDP weremeasured for total body fat mass and lean mass by magneticresonance imaging (MRI) using Bruker Minispec with softwarefrom Eco Medical Systems.
RNA Isolation and Expression Profiling in Adipose fromHMDP Mice and BrCA Cell Lines—Total RNA was isolatedfrom tissues using TRIzol (Invitrogen) according to the man-ufacturer’s instructions. Total RNA was isolated from cell cul-tures using the Qiagen RNeasy columns according to the man-ufacturer’s instructions. For microarrays, adipose tissue andBrCA cell (supplemental Table S2) RNA was hybridized toAffymetrix HT_MG-430A arrays and scanned using standardAffymetrix protocols. To reduce the risk of spurious associationresults, RNA normalization was performed after removing allindividual probes with SNPs and all probesets containing 8 ormore SNP-containing probes, which resulted in 22,416 remain-ing probesets.
mouse diversity panel; qPCR, quantitative PCR; FERKO, fat-specific ER�knock-out mice; ANOVA, analysis of variance; WAT, white adipose tissue;BAT, brown adipose tissue; ERE, estrogen response element; PAI-1, plas-minogen activator inhibitor type 1; HF, high fat; HS, high sucrose; C/EBP,CCAAT/enhancer binding protein; PPT, propyl pyrazole triol.
Adipose Tissue ER� Expression, Obesity, and Breast Cancer Progression
FEBRUARY 27, 2015 • VOLUME 290 • NUMBER 9 JOURNAL OF BIOLOGICAL CHEMISTRY 5567
at UC
LA
-Louise D
arling Biom
ed. Lib. on June 22, 2015
http://ww
w.jbc.org/
Dow
nloaded from

Cell Isolations and Culture—HEK293 cells (ATCC) weremaintained and passaged in DMEM containing 10% FBS. ER�stably expressing 3T3-L1 cells were generated by infecting3T3-L1 pre-adipocytes with fresh retrovirus particles gener-ated in PhoenixE cells transfected with pBABE containing theEsr1-ORF, or empty pBABE for control cells (pB). Stable trans-formants were selected for 1 week in puromycin (5 �g/ml). Fordifferentiation of 3T3-L1, cells were grown to confluence (day0) before incubation in the standard DMI (dexamethasone,3-methy-1-isobutylxanthine, insulin) differentiation mixturewith the addition of rosiglitazone maleate (500 nM, Alexis Bio-chemicals) where indicated, for 3 days (day 3), then encouraged tolipid load for 4 days in the presence of 10 nM insulin (day 7). Pri-mary white adipocytes were generated from stromal vascular frac-tions isolated from epididymal adipose tissue beds from both f/fControl and FERKO female mice as previously described (25, 26).After isolation, cells were allowed to proliferate to confluence, thenimmediately differentiated as stated above for 3T3-L1 cells. Breastcancer cell lines were maintained as previously described (27).MCF7, T47D, ZR75-1, and EFM19 were all grown and maintainedin RPMI with 10% FBS. Experiments with CM or Lcn2 were car-ried out in growth medium for 72 h or Hanks’ balanced salt solu-tion with 1% albumin for 24 h, respectively.
Conditioned Media and Lcn2 Incubation—HEK293 cellswere cultured as above until �70% confluent before transfec-tion with the indicated amounts of HA-Lcn2 or GFP plasmidwith Lipofectamine 2000, as per the manufacturer’s instruc-tions (Invitrogen). Cells were allowed to recover in growthmedium for 24 h after which the medium was removed andreplaced with serum-free medium containing 0.1% fatty acid-free BSA for 6 – 8 h to generate the CM. Pure Lcn2 (R&D Sys-tems) was reconstituted and bound to iron prior to addition toculture medium as described previously (28).
Breast Cancer Cell Proliferation and Migration—Prolifera-tion and migration experiments were performed in growthmedium, unless otherwise specified. For proliferation studies,cells were plated into 24-well culture plates at a density of20,000 cells per well and allowed to attach overnight before themedium was replaced with the addition of either Lcn2 or GFPCM from HEK293A cells or media from Esr1-KD/D and Esr1-KD/Lcn2-KD cells at a ratio of 1:5 (CM:media). After 48 h cellswere washed twice with PBS and stained for 15 min in Hoechstnuclear dye (Invitrogen). Cell number was estimated by plot-ting Hoechst fluorescence measured in each well, against a pre-determined standard curve. Results were confirmed in separateexperiments using a Coulter Particle Counter. For migrationstudies, cells were plated in 6-well plates at subconfluence andallowed to proliferate in the presence of the specified CM until�95% confluent. Two standardized scratches were madethrough each well and images were acquired in at least threewells for each condition as previously described (29, 30). Addi-tional images were acquired 18 and 36 h later.
Quantitative RT-PCR—cDNA synthesis was performed on 1�g of total RNA using iScript cDNA synthesis kit (Bio-Rad) andqPCR were performed using iQ SYBR Green Supermix (Bio-Rad). Primer sequences for the specific target genes analyzedcan be found in supplemental Table S3.
Plasmids and Constructs—Esr1-knockdown (KD) by shorthairpin RNAs (shRNAs) cloned into the lentivirus vectorpLKO.1-puro were purchased as lentiviral transduction parti-cles from Sigma (MISSION�; Esr1-B). Scrambled (Scr) shRNAs(non-target shRNA vector, catalog number SHC002V; Sigma),used for control experiments, contain a hairpin insert that gen-erates siRNAs but contains 5 base pair mismatches to all knownhuman and mouse genes. Particles were subsequently used totransduce 3T3-L1 preadipocytes (multiplicity of infection 10).Stably expressing cells were selected with puromycin (3 �g/ml)for 1 week. Knockdown efficiency was assessed by qPCR andWestern blotting.
ER� Expression Plasmid—A mouse Esr1-ORF cloning vector(OpenBiosystems) was used to subclone esr1 into pcDNA3.1and delivered to cells using Lipofectamine 2000 as per the man-ufacturer’s instructions (Invitrogen).
pBABE-Esr1 Retrovirus Plasmid—The Esr1-ORF was clonedinto pBABE using Gateway technology (Invitrogen) as describedbelow for Lcn2.
Lcn2 HA-tagged Expression Plasmid—Lcn2 cDNA was PCRamplified with the addition of attB/P Gateway sites from thepMSCV-Lcn2 plasmid (20) (a kind gift from Evan Rosen). Thesubsequent PCR fragment was gel purified and cloned into acustomized N-terminal hemagglutinin (HA) pcDNA backbonevector (kind gift from Thomas Vallim, UCLA) using Gatewaytechnology (Invitrogen), before use in transfection assays asdescribed above. C/EBP plasmids were a kind gift from StephenFarmer (Boston University). Poly(ADP-ribose) PPAR�2 (per-oxisome proliferator-activated receptor � 2) plasmid wasobtained from Peter Tontonoz (UCLA). All primers used forcloning are presented in supplemental Table S4.
Promoter Luciferase Constructs and Assays—The Lcn2 5�-upstream promoter (2.7 kb) was cloned by PCR from BAC-clone RP24-290P20 (CHORI) with the primers outlined insupplemental Table S4, designed to add extensions for GatewayBP-cloning and SacI and KpnI sites. PCR fragments were ampli-fied by cloning into pDONR221 using Gateway technology (Invit-rogen), transformed, expanded, and isolated by miniprep. Pro-moter containing plasmids and the luciferase expression plasmid(pGL4-basic, Promega) were separately double digested with SacIand KpnI for 1 h, then precipitated and washed by phenol/chloro-form extraction. Digested DNA was resuspended in water andused in ligation reactions with T4 ligase at a ratio of 6:1 (insert:plasmid) according to the manufacturer’s instructions (New Eng-land Biolabs) and transformed into competent bacteria. Positiveclones were sequenced for confirmation. For luciferase assays,3T3-L1 cells were transfected with promoter plasmids or emptyplasmid (500 ng) and Renilla (1 ng) together with other expressionplasmids as indicated (100 ng each) using PLUS-reagent and Lipo-fectamine 2000 (Invitrogen) according to the manufacturer’sinstructions. Cells were then placed in phenol red-free DMEMcontaining 10% charcoal/dextran-stripped FBS for 12 h to recoverbefore treatment with either dimethyl sulfoxide or PPT (100 nM)for 12 h. Luciferase assays were performed according to manufa-cturer’s instructions (Promega, Dual-Glo Stop & Glo). Data areexpressed as a ratio of luciferase to Renilla relative light units andconverted to fold-change from basal.
Adipose Tissue ER� Expression, Obesity, and Breast Cancer Progression
5568 JOURNAL OF BIOLOGICAL CHEMISTRY VOLUME 290 • NUMBER 9 • FEBRUARY 27, 2015
at UC
LA
-Louise D
arling Biom
ed. Lib. on June 22, 2015
http://ww
w.jbc.org/
Dow
nloaded from

Chromatin Immunoprecipitation (ChIP)—Stable ER�-ex-pressing 3T3-L1 cells (described above) were used for ChIPexperiments. Cells were grown to confluence and at day 3 ofdifferentiation were harvested and subjected to ChIP analy-sis as previously described (31) using antibodies against ER�(Santa Cruz Biotechnology). Primers for detection of thepresence of the Lcn2 promoter by qPCR are outlined insupplemental Table S4.
Immunoblot Analysis—Animal tissues and cultured cellswere homogenized in RIPA lysis buffer containing protease andphosphatase inhibitors. Samples were separated by SDS-PAGE,transferred to PVDF membrane, and probed with the followingantibodies for protein detection: pan-actin (Cell SignalingTechnologies), ER� (Santa Cruz Biotechnology), and Lcn2(goat anti-mouse, R&D Systems). Densitometric analysis wasperformed using Bio-Rad Chemidoc image software, QuantityOne (version 4.6).
Adipose Tissue Histology—Periovarian adipose tissue immu-nohistochemistry was performed on paraformaldehyde (8%)fixed samples by the University of California, San Diego,Moores Cancer Center, Histology and ImmunohistochemistryShared Resource Facility, as previously described (32). Adi-pocyte size was estimated from H&E-stained sections of adi-pose tissue by analyzing 10 different sections per genotype,counting 100 adipocytes per section using a Nikon Eclipse 80iUpright microscope and Image-Pro Plus Software (MediaCybernetics).
Statistical Analyses—Associations between biomarkers inhuman subjects were analyzed using Spearman’s rho correla-tion. Relationships between expression levels and % body fat formice were determined by Pearson’s correlation coefficient. Dif-ferences between subgroups (normal, underweight, over-weight, and obese) were compared using the Student’s t test.Multiple group by treatment mean comparisons were per-formed using ANOVA with Tukey’s LSD post-hoc test analy-ses. Significance was established a priori p � 0.05.
RESULTS
Adipose-specific Deletion of ER� Promotes Obesity—Previousstudies have shown that the expression of ESR1 is significantlyreduced in adipose tissue from obese women (16). Indeed, weobserved reductions in Esr1 expression in adipose tissue fromgenetically obese LepOb male and female mice (Fig. 1A). We alsofound that adipose tissue Esr1 expression is inversely correlatedwith the degree of HFD-induced adiposity in more than 100genetically diverse strains of inbred female mice, termed theUCLA HMDP (23) (Fig. 1B).
To determine whether impaired ER� action promotes adi-posity even during normal chow feeding, we generated fat-spe-cific ER� knock-out mice (FERKO) by mating floxed ER� (f/f)animals (33) with transgenic mice expressing Cre recombinasedriven by the aP2 promoter (20). As expected, Esr1 expressionlevels were significantly reduced in both white adipose tissue(WAT) and brown adipose tissue (BAT) of female (Fig. 1C) andmale (Fig. 1D) FERKO mice, compared with f/f Control litter-mates. Deletion was selective for adipose tissue as Esr1 levelswere maintained in skeletal muscle and liver of female FERKOmice (Fig. 1, C and D). Phenotypic analyses revealed that the
body mass of female FERKO mice was increased compared withthat of f/f Control animals (26.3 � 0.14 versus 23.0 � 0.13 g, p �0.001), a finding also observed in male mice, although the dif-ference did not reach statistical significance (p � 0.116) (Fig.1E). Consistent with findings for body weight, FERKO femalemice had significantly larger gonadal fat pads (0.43 � 0.01 ver-sus 0.63 � 0.01 g, p � 0.001; Fig. 1F), BAT depots (0.046 � 0.001versus 0.067 � 0.001 g, p � 0.029, Fig. 1G), and liver weight(1.32 � 0.02 versus 1.01 � 0.01 g, p � 0.002; Fig. 1H) comparedwith f/f Control. Adipocytes from gonadal fat pads of femaleFERKO mice were larger in diameter than those from f/f Con-trol mice (Fig. 1I). In contrast to females, WAT (p � 0.03) butnot BAT (p � 0.1) and liver (p � 0.4) weights were elevated formale FERKO versus f/f Control.
Analyses of circulating factors were consistent with theobserved obesity phenotype in female FERKO mice as plasmalevels of leptin (2.4 � 0.1 versus 1.2 � 0.1 ng/ml, p � 0.04) andthe inflammatory marker PAI-1 (1.0 � 0.01 versus 0.5 � 0.04ng/ml, p � 0.05) were increased over that of f/f Control animals(Table 1). In contrast, no differences in plasma concentrationsof insulin, adiponectin, or estradiol were detected between thegenotypes (Table 1).
Adipose Tissue ER� Deletion Alters Adipocyte Function andLipocalin 2 Expression in Female Mice—Considering that thephenotype of female FERKO mice was more prominent thanthat observed for males, we focused subsequent screening stud-ies on adipose tissue from female animals. Expression of theadipogenic transcription factors C/EBP� and poly(ADP-ri-bose) polymerase � were reduced in FERKO fat (Fig. 2A). Withthe exception of the inflammatory chemokine MCP1, whichwas elevated in FERKO �5-fold above f/f Control (p � 0.001;Fig. 2B), the expression levels of proinflammatory cytokineswere similar between the genotypes of female mice. Analysis ofadipokine expression from FERKO fat showed no change inadiponectin, leptin, or Rbp4 transcript levels. In contrast, a sig-nificant 9-fold elevation in the expression of Lcn2 was observedin adipose tissue from FERKO compared with f/f Control (Fig.2C). Increased Lcn2 expression was also detected in WAT fromLepOb mice of both genders compared with the respective leancontrols (Fig. 2D). Of note, a gender dimorphism in adiposetissue Lcn2 expression was also observed as transcript levelswere markedly elevated in adipose tissue of lean WT and f/fControl male mice compared with similar genotype female ani-mals (Fig. 2, D and E). Our data suggest that this gender dimor-phism was a possible result of higher basal Esr1 expression lev-els in WAT of female versus male mice (Fig. 1A). Consistentwith this observed gender dimorphism, in male LepOb mice anexperimental increase in circulating estradiol concentration tolevels observed in normally cycling females reduced expressionof Lcn2 in epididymal fat below that observed for lean maleanimals (Fig. 2D).
In gonadal white and subscapular brown adipose tissue, theloss of ER� promoted increased expression of Lcn2 (5–10-fold)in FERKO compared with f/f Control for female but not maleanimals (Fig. 2, E and F). Similar to periovarian adipose,reduced Esr1 expression in subcutaneous fat from FERKOfemale mice (Fig. 2G) was paralleled by a marked increase inLcn2 expression over f/f Control (Fig. 2H). However, we
Adipose Tissue ER� Expression, Obesity, and Breast Cancer Progression
FEBRUARY 27, 2015 • VOLUME 290 • NUMBER 9 JOURNAL OF BIOLOGICAL CHEMISTRY 5569
at UC
LA
-Louise D
arling Biom
ed. Lib. on June 22, 2015
http://ww
w.jbc.org/
Dow
nloaded from

FIGURE 1. Inverse relationship between adipose tissue Esr1 expression and adiposity. A, Esr1 expression is reduced in adipose tissue from obese LepOb
male and female mice compared with lean animals (2.5 months, n � 6/group). B, inverse relationship between gonadal adipose Esr1 expression and % body fatof HF/HS-fed female mice from the UCLA HMDP (n � 102 strains, 3– 6 mice per strain). C and D, Esr1 expression determined by qPCR analyses in muscle, liver,WAT, and BAT from female (C) and male (D) FERKO mice compared with littermate f/f Controls (6 months of age, normal chow-fed, n � 6 – 8/group). E, bodyweight; F, gonadal WAT weight; G, extrascapular BAT weight; and H, liver weight in female and male FERKO mice compared with littermate f/f Controls. I, H&Esections and quantification of adipocyte size (�m) of gonadal WAT from female f/f Control and FERKO mice (n � 4 mice/genotype). Values are expressed asmean � S.E. and differences were detected by Student’s t test and ANOVA where appropriate. *, p � 0.05 between genotypes; 1, p � 0.05 between genders.Correlations were determined by Pearson’s correlation analysis and p values are provided. ND, not detected.
TABLE 1Circulating factors for male and female miceBlood glucose and plasma insulin, adiponectin, leptin, PAI-1, and estradiol concentrations were detected at basal following a 6-h fast. Values are expressed as mean � S.E.and p values are indicated.
Circulating factorFemale Male
f/f Control FERKO p value f/f Control FERKO p value
Glucose (mg/dl) 117 � 2.6 138 � 3.5 0.07 163 � 3.7 167 � 5.7 0.80Insulin (ng/ml) 0.28 � 0.01 0.23 � 0.01 0.27 0.78 � 0.02 1.1 � 0.8 0.07Adiponectin (�g/ml) 15.3 � 0.4 13 � 0.3 0.15 8.7 � 0.3 8.7 � 0.2 0.95Leptin (ng/ml) 1.2 � 0.1 2.4 � 0.1 0.04 2.2 � 0.2 2.8 � 0.1 0.45PAI-1 (ng/ml) 0.50 � 0.04 1.0 � 0.01 0.05 0.50 � 0.05 0.53 � 0.01 0.86Estradiol (pg/ml) 71 � 12 94 � 15 0.27 NAa NA
a NA, not analyzed.
Adipose Tissue ER� Expression, Obesity, and Breast Cancer Progression
5570 JOURNAL OF BIOLOGICAL CHEMISTRY VOLUME 290 • NUMBER 9 • FEBRUARY 27, 2015
at UC
LA
-Louise D
arling Biom
ed. Lib. on June 22, 2015
http://ww
w.jbc.org/
Dow
nloaded from
detected increased Lcn2 expression levels in SC over gonadal fatfrom all female animals studied. Immunoblot analyses con-firmed that the Lcn2 protein was significantly elevated in perio-varian WAT from female FERKO mice versus f/f Control (Fig.2I). Similar to findings for transcript abundance, Lcn2 proteinlevels in WAT from male mice were significantly elevatedabove levels for females. Moreover, no difference in WAT Lcn2
protein was detected between the genotypes in male animals(Fig. 2I). In line with reports that circulating Lcn2 levels areelevated in the plasma of obese, insulin-resistant mice andhumans (34 –37), we found that plasma Lcn2 levels were alsoelevated in female FERKO compared with f/f Control mice(402 � 7.5 versus 361 � 1.4 pg/ml, respectively, p � 0.02; Fig.2J). In addition to showing that ER� deletion increased Lcn2
FIGURE 2. Lcn2 is up-regulated in ER�-deficient adipose tissue. Quantitative PCR analyses performed on gonadal adipose tissue from 6-month-old femalemice fed a normal chow diet show significant alteration in expression of transcription factors (A), cytokines/chemokines (B), and the adipokine Lcn2 (C) (n �8/genotype). D, Lcn2 expression was also elevated in adipose tissue from obese LepOb male and female mice compared with lean and estradiol (E2)-treated maleanimals (n � 6/group). Lcn2 expression in gonadal WAT (E) and extrascapular BAT (F) from female and male f/f Control (open bars) versus FERKO (closed bars) (n �6 – 8/group). G and H, similar to gonadal adipose, Esr1 expression is reduced and Lcn2 expression is elevated in subcutaneous (SC) adipose depots from FERKOversus f/f Controls. I, immunoblotting and densitometric analyses on gonadal WAT show increased Lcn2 protein levels in female FERKO mice versus f/f Control,but no change in Lcn2 protein between genotypes of male mice (n � 6/group). J, plasma Lcn2 levels in FERKO versus f/f Control animals (n � 6/genotype). K–L,adipose tissue Esr1 expression is inversely correlated with Lcn2 expression, and Lcn2 is positively correlated with % body fat in 102 strains of female HMDPanimals (n � 3– 6/strain). Values are expressed as mean � S.E. and differences were detected by Student’s t test and ANOVA where appropriate. *, p � 0.05between genotypes; 1, p � 0.05 between genders; #, p � 0.05 E2-treated versus untreated. Correlations were determined by Pearson’s correlation analysis.
Adipose Tissue ER� Expression, Obesity, and Breast Cancer Progression
FEBRUARY 27, 2015 • VOLUME 290 • NUMBER 9 JOURNAL OF BIOLOGICAL CHEMISTRY 5571
at UC
LA
-Louise D
arling Biom
ed. Lib. on June 22, 2015
http://ww
w.jbc.org/
Dow
nloaded from

expression in adipose tissue of female mice, we confirmed astrong inverse relationship between Esr1 and Lcn2 expressionin WAT obtained from 102 unique strains of HF/HS-fed femalemice of the UCLA HMDP (Fig. 2K). Lcn2 expression was highlycorrelated with body fat percentage (Fig. 2L), similar to therelationship between adiposity and the adipokine leptin. Thesedata confirm that natural genetic variation of Esr1 expression inadipose tissue among diverse mouse strains is inversely associ-ated with Lcn2 expression, an adipokine we found tightly cor-related with adiposity in female mice.
ER� Deletion Impairs Adipocyte Function and Increases Lcn2Expression in Culture—Prior studies have identified a func-tional estrogen response element (ERE) within the Lcn2 genepromoter that controls its expression in normal breast tissue(38). We investigated the potential for ER� to directly modulateLcn2 expression in adipocytes. Our own computational analysisconfirmed the existence of a complete palindromic ERE at�2533 bp upstream from the transcriptional start site of the
mouse Lcn2 gene (38). To demonstrate direct action of ER� onLcn2 expression independent of secondary in vivo cues includ-ing insulin resistance or obesity, we showed that Lcn2 expres-sion was elevated in cultured primary adipocytes from FERKOWAT compared with primary cells isolated from WAT of f/fControl animals (Fig. 3A). Primary adipocytes lacking ER�(FERKO) released elevated amounts of Lcn2 into the medium(Day 3 of differentiation) compared with control ER� repleteadipocytes (Fig. 3B).
Next we studied the effects of 17 �-estradiol (E2) on Lcn2expression in 3T3-L1 adipocytes. Maximal suppression of Lcn2expression was achieved with 1 nM E2 treatment (Fig. 3C). Tofurther support a role for ER� in the regulation of Lcn2, westably overexpressed ER� using retrovirus. Lcn2 expression wasreduced by �80% in cells overexpressing ER� compared withvector controls (Fig. 3D). To investigate the effects of ER� loss-of-function on Lcn2 expression, we generated four 3T3-L1 ER�knockdown (Esr1-KD) cell lines (Esr1-KD B, C, D, and E) by
FIGURE 3. Adipocyte Lcn2 expression is repressed by ER� DNA binding. Primary adipocytes isolated from periovarian WAT of female FERKO mice showreduced Esr1 and increased Lcn2 expression as measured by qPCR (A), and release increased amounts of Lcn2 protein into culture medium (B) compared withadipocytes from f/f Control. C, Lcn2 expression is reduced in 3T3-L1 adipocytes treated with estradiol (E2, 1 and 10 nM) for 1 h. 3T3-L1 adipocytes treated withretrovirus expressing ER� (pB-ER) show (D) elevated Esr1 expression levels and a compensatory reduction in Lcn2 expression compared with control adi-pocytes expressing empty virus (pB). E, short hairpin-induced knockdown of ER� (observed in three of four stable 3T3-L1 Esr1-KD cell lines; open bars for clonesC, D, and E), increased Lcn2 expression (closed bars)(n � 3 observations/clone). F, immunoblotting for ER� in lysates from Esr1-KD (D) versus Scr-Control 3T3-L1adipocytes and for Lcn2 in adipocyte culture medium (G). Values are expressed as mean � S.E. and mean differences were detected by Student’s t test andANOVA where appropriate. *, p � 0.05 between genotypes; #, p � 0.05 E2 dose-response versus basal (0 nM).
Adipose Tissue ER� Expression, Obesity, and Breast Cancer Progression
5572 JOURNAL OF BIOLOGICAL CHEMISTRY VOLUME 290 • NUMBER 9 • FEBRUARY 27, 2015
at UC
LA
-Louise D
arling Biom
ed. Lib. on June 22, 2015
http://ww
w.jbc.org/
Dow
nloaded from
stably expressing Esr1 shRNAs (Fig. 3E). Three of the cell lines(C, D, and E) showed significantly reduced Esr1 expression,with a concomitant increase in expression of the Lcn2 tran-script (Fig. 3E). Of note, the KD cell line that showed no reduc-tion in Esr1 (Esr1-KD-B), also showed no change in Lcn2expression (Fig. 3E). Because of its robust action, Esr1-KD Dwas selected for subsequent analyses.
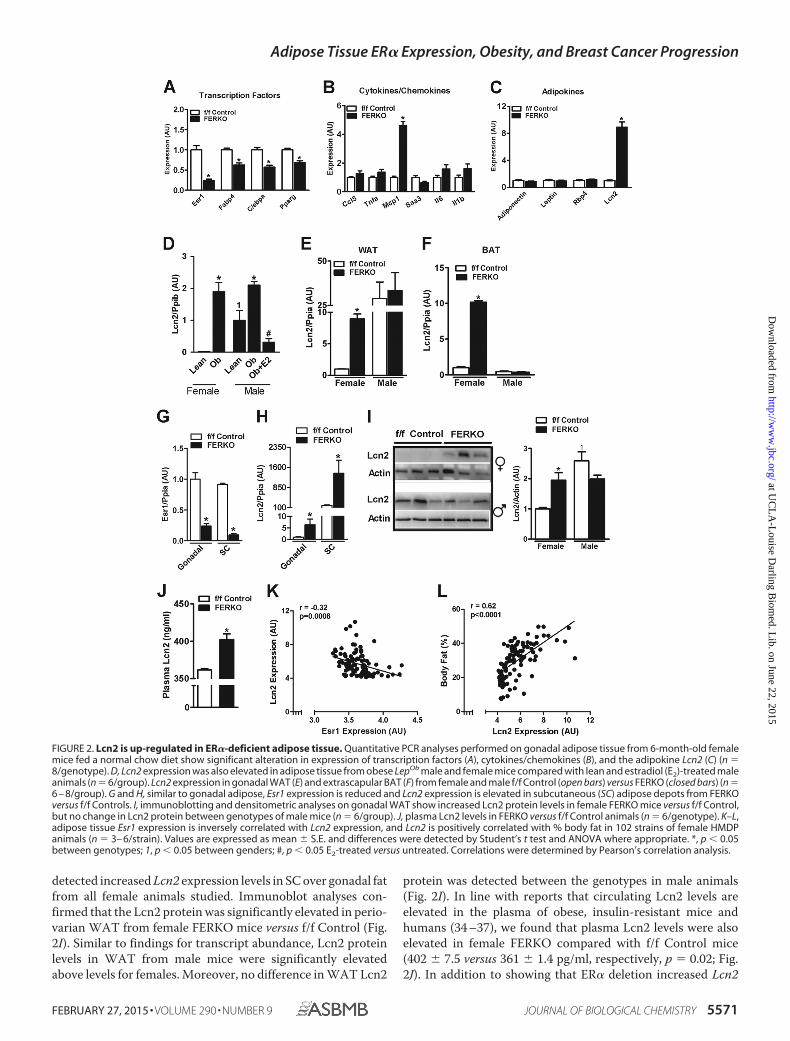
Similar to our observations for primary adipocytes fromFERKO mice, Esr1-KD 3T3-L1 adipocytes showed significantlyreduced ER� protein expression (Fig. 3F) and increased secre-tion of Lcn2 into the culture media (Fig. 3G). No morphologicaldefects were observed in Esr1-KD 3T3-L1 adipocytes, as con-fluent, non-differentiated pre-adipocytes (day 0, Fig. 4) or asnon-lipid loaded differentiating cells (day 3). However, after 4days of lipid loading in the presence of insulin (day 7, Fig. 4),Esr1-KD cells displayed a reduction in lipid accumulation com-pared with Scr-Control cells. Furthermore, differentiatedEsr1-KD adipocytes were larger in size and possessed substan-
tially larger intracellular lipid droplets than WT cells (Fig. 4,arrows, bottom panel). These data are consistent with theobservation of larger adipocytes and reduced expression of adi-pocyte transcription factors in FERKO adipose tissue.
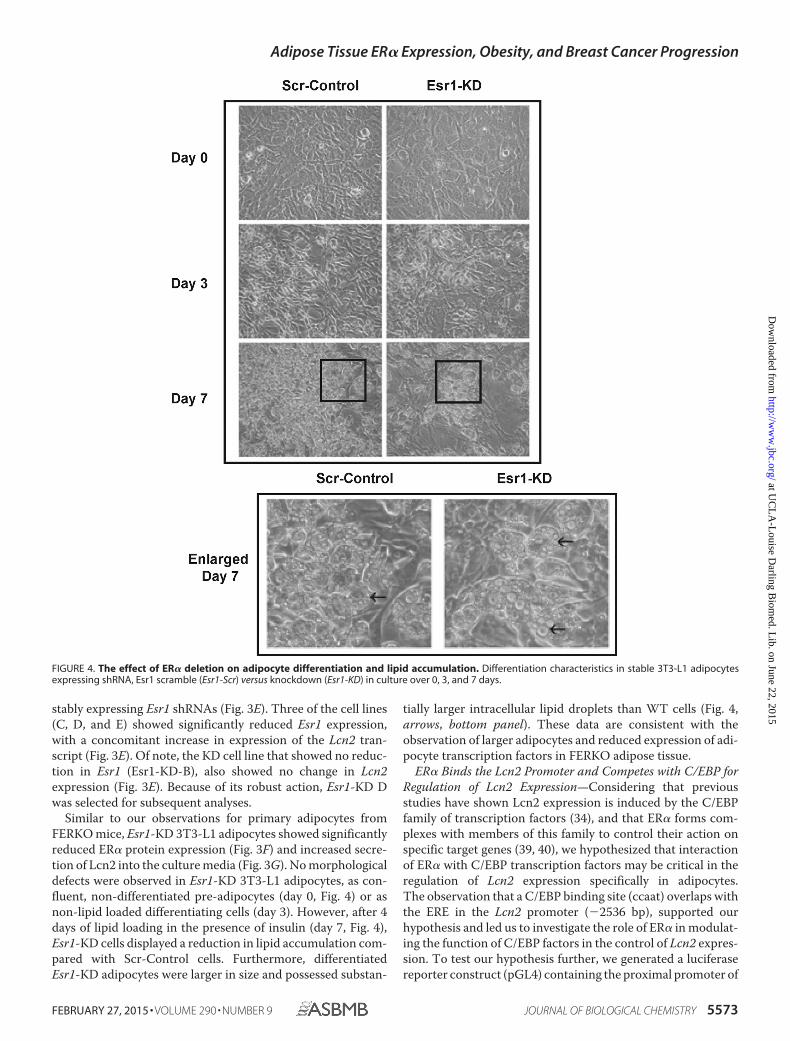
ER� Binds the Lcn2 Promoter and Competes with C/EBP forRegulation of Lcn2 Expression—Considering that previousstudies have shown Lcn2 expression is induced by the C/EBPfamily of transcription factors (34), and that ER� forms com-plexes with members of this family to control their action onspecific target genes (39, 40), we hypothesized that interactionof ER� with C/EBP transcription factors may be critical in theregulation of Lcn2 expression specifically in adipocytes.The observation that a C/EBP binding site (ccaat) overlaps withthe ERE in the Lcn2 promoter (�2536 bp), supported ourhypothesis and led us to investigate the role of ER� in modulat-ing the function of C/EBP factors in the control of Lcn2 expres-sion. To test our hypothesis further, we generated a luciferasereporter construct (pGL4) containing the proximal promoter of
FIGURE 4. The effect of ER� deletion on adipocyte differentiation and lipid accumulation. Differentiation characteristics in stable 3T3-L1 adipocytesexpressing shRNA, Esr1 scramble (Esr1-Scr) versus knockdown (Esr1-KD) in culture over 0, 3, and 7 days.
Adipose Tissue ER� Expression, Obesity, and Breast Cancer Progression
FEBRUARY 27, 2015 • VOLUME 290 • NUMBER 9 JOURNAL OF BIOLOGICAL CHEMISTRY 5573
at UC
LA
-Louise D
arling Biom
ed. Lib. on June 22, 2015
http://ww
w.jbc.org/
Dow
nloaded from
mouse Lcn2 (2.7 kb) including the ERE (Fig. 5A). Transienttransfection of this luciferase reporter construct into 3T3-L1adipocytes alone or together with ER� and C/EBP factorexpression vectors showed that ER� suppressed C/EBP-in-duced luciferase activity (Fig. 5B). ChIP studies conducted in3T3-L1 adipocytes confirmed ER� binding to the Lcn2 proxi-mal promoter construct at two sites (Fig. 5C). To confirm therequirement of DNA binding for the repression of Lcn2 by ER�in vivo, we assessed Lcn2 expression in gonadal WAT from theER� DNA binding incompetent mouse in which ER� proteintethering activity is maintained (21). In gonadal adipose tissuefrom these DNA binding domain mutant mice (ER�-DBD�) weobserved a marked increase in C/ebp� and Lcn2 expressionlevels over WT control (Fig. 5D). These data confirm the insuf-ficiency of ER� protein tethering, but confirm the requirementof ER� DNA binding in the repression of Lcn2.
Lcn2 Promotes Proliferation and Migration of BrCA Cells—Considering that the phenotype of malignant cells can be influ-enced by the surrounding stromal microenvironment, and thatadipocytes constitute the largest cellular compartment ofbreast tissue (41), we tested whether Lcn2, an adipocyte-se-creted factor, could influence the behavior of BrCA cell lines.We treated SUM159PT BrCA cells with CM from adipocyteswhere Lcn2 was elevated in response to ER� knockdown,or CM from HEK293A cells transfected with an Lcn2 expres-sion plasmid. Conditioned media from Esr1-KD adipocytesincreased the proliferation of the breast carcinoma cell lineSUM159PT compared with CM from Scr-Control adipocytes(Fig. 6A). Similarly, CM containing Lcn2 expressed from trans-
fected HEK293A cells promoted increased SUM159PT cellproliferation compared with CM from cells transfected with aGFP expression plasmid (Fig. 6B), suggesting a direct effect ofLcn2 on the proliferation of SUM159PT BrCA cells. Addition-ally, both Lcn2-CM and Esr1-KD CM increased the migrationof SUM159PT cells over scratched monolayers, but had noeffect on immortalized, non-transformed breast epithelial,MCF10A cells (Fig. 6C).
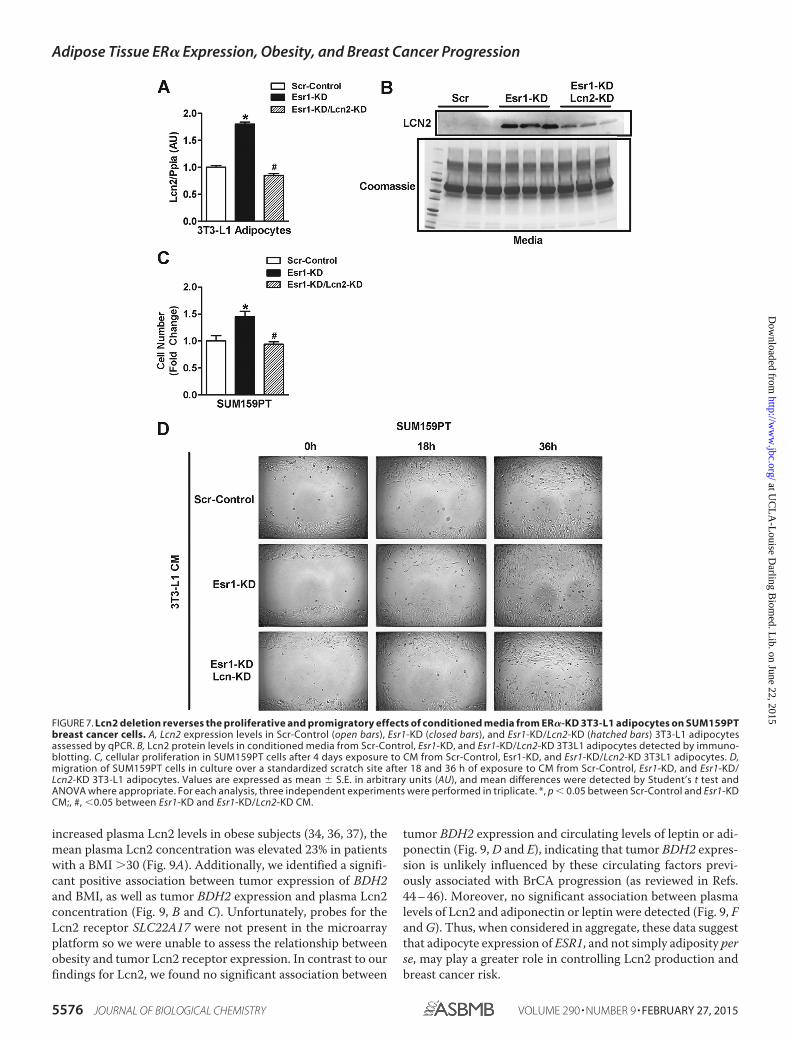
To test the role of Lcn2 in mediating the proliferative andpromigratory effects of CM from ER�-deficient adipocytes onbreast cancer cells, we deleted Lcn2 from ER�-deficient adi-pocytes (Fig. 7, A and B). Findings for proliferation and migra-tion of SUM159PT BrCA cells treated with CM from adi-pocytes with a dual KD of Esr1 and Lcn2 mirrored findings forcells treated with CM from Scr-Control ER� replete adipocytes(Fig. 7, C and D). These data indicate that increased Lcn2released from ER�-deficient adipocytes is a critical mediator ofBrCA cell proliferation and migration.
Expression of Lcn2 Signaling Components in BrCA Cells Con-fer Lcn2 Responsiveness—In an effort to more rigorously inter-rogate the effect of Lcn2 on BrCA cells in vitro, we studied theLcn2 responsiveness of additional BrCA cell lines (Fig. 8). Weobserved a wide variability in the proliferation response to Lcn2in the different BrCA cell lines (ZR75-1, MCF7, T47D, andEFM19), as well as between lines arising from similar cellularorigins. The advantage of studying these specific cell lines isthat each is cultured using the same media and environmentthus eliminating confounding factors arising from varying cul-ture conditions (27). Lcn2-stimulated proliferation was highest
FIGURE 5. ER� binds the Lcn2 promoter to repress Lcn2 expression in adipocytes. A, diagram of the 2.7-kb 5� proximal promoter of Lcn2 cloned intopGL4-luciferase (ERE, estrogen response element) and (B) activation of the promoter indicated by luciferase activity assessment in 3T3-L1 adipocytes trans-fected with ER� and or C/EBP and treated with the ER�-specific agonist propyl pyrazole triol PPT. C, ChIP analyses show direct binding of ER� to the consensusERE in the Lcn2 promoter (a, b, and c indicate response elements shown above in A). D, white adipose tissue expression levels of Esr1 (exons 3 and 6 –7), C/ebp�,and Lcn2 assessed by qPCR in WT (open bars) versus ER� DNA binding domain mutant (ER� DBD�) mice (n � 6/genotype). Values are expressed as mean � S.E.and mean differences were detected by Student’s t test and ANOVA where appropriate. *, p � 0.05 between genotypes or from GFP expressing 3T3-L1adipocytes in panel B; 1, p � 0.05 C/EBP versus C/EBP ER� � PPT for panel B.
Adipose Tissue ER� Expression, Obesity, and Breast Cancer Progression
5574 JOURNAL OF BIOLOGICAL CHEMISTRY VOLUME 290 • NUMBER 9 • FEBRUARY 27, 2015
at UC
LA
-Louise D
arling Biom
ed. Lib. on June 22, 2015
http://ww
w.jbc.org/
Dow
nloaded from

in MCF7 and EFM19 and negligible in ZR75-1 cells (data notshown). Interestingly, cellular proliferation correlated well withthe expression of BDH2, the intracellular rate-limiting enzymethat catalyzes the production of the mammalian siderophore2,5-dihydroxybenzoic acid necessary for iron homeostasis andoverall Lcn2 responsiveness (42) (Fig. 8A).
In contrast to findings showing that LCN2 was expressedin a number of human cancers and associated with ER/pro-gesterone receptor status (43), we screened 55 tumor sam-ples as well as 53 cancer cell lines and found no correlationbetween ESR1 and LCN2 expression or LCN2 expression andtumor type (supplemental Table 2; cell lines as reviewed inRef. 27). LCN2 expression levels were �100-fold higher inZR75-1 cells than MCF7 cells, and �1000-fold higher thanEFM19 cells (Fig. 8B). These findings raise an importantquestion for future study regarding the relative roles of intra-cellular versus extracellular Lcn2 in driving neoplastic devel-opment and metastatic potential.
Differences in components of the Lcn2 signaling pathwaywere also apparent between lines, with elevated expression ofthe Lcn2 receptor, SLC22A17 (variant 1), found in the most
responsive cell types (MCF7 and EFM19) (Fig. 8C). ExogenousLcn2 was found to only modulate its receptor expression inMCF7 cells, whereas all other BrCA cell types were unrespon-sive (Fig. 8D). Expression levels of ferritin light chain (FLT),BNIP3, SNAIL, SLUG, and Vimentin, markers of EMT and apo-ptosis susceptibility, were elevated in cell lines where ectopicLcn2 promoted increased proliferation (Fig. 8, E–I). Collec-tively, these data suggest that intrinsic differences in expressionof components of the Lcn2 signaling pathway may underlie thedifferential responses of BrCA cells to the paracrine actions ofLcn2.
BDH2 Expression in Human BC Tumors Correlates with BMIand Lcn2, but Not Leptin or Adiponectin—To investigate apotential role for components of the Lcn2 signaling pathway inthe differential response of primary BrCA tumors to obesity, weanalyzed data from microarray studies performed on biopsiedtumor samples from women of varying BMI participating in theTORI B02 study (24). Plasma was collected at the time of diag-nosis, prior to therapeutic intervention. As expected, plasmaadipokines, leptin, and adiponectin were significantly corre-lated with BMI. Similar to published findings showing
FIGURE 6. Lcn2 and CM from Esr1-KD 3T3-L1 adipocytes stimulate breast cancer cell proliferation and migration. A, cellular proliferation in SUM159PTand MCF10A after exposure to CM from Scr-Control and Esr1-KD 3T3L1 adipocytes; and B, CM from HEK-293A cells expressing Lcn2. C, migration of SUM159PTand MCF10A cell lines in culture over a standardized scratch site after 18 h of exposure to Lcn2- or GFP-CM (upper half of panel) and CM from 3T3-L1 adipocytes,Scr-Control versus Esr1-KD (lower half of panel). Values are expressed as mean � S.E., and mean differences were detected by Student’s t test and ANOVA whereappropriate. For each analysis, three independent studies were performed in triplicate. *, p � 0.05 between cell type difference for a given treatment; #, � 0.05between treatment difference for a given cell type.
Adipose Tissue ER� Expression, Obesity, and Breast Cancer Progression
FEBRUARY 27, 2015 • VOLUME 290 • NUMBER 9 JOURNAL OF BIOLOGICAL CHEMISTRY 5575
at UC
LA
-Louise D
arling Biom
ed. Lib. on June 22, 2015
http://ww
w.jbc.org/
Dow
nloaded from
increased plasma Lcn2 levels in obese subjects (34, 36, 37), themean plasma Lcn2 concentration was elevated 23% in patientswith a BMI 30 (Fig. 9A). Additionally, we identified a signifi-cant positive association between tumor expression of BDH2and BMI, as well as tumor BDH2 expression and plasma Lcn2concentration (Fig. 9, B and C). Unfortunately, probes for theLcn2 receptor SLC22A17 were not present in the microarrayplatform so we were unable to assess the relationship betweenobesity and tumor Lcn2 receptor expression. In contrast to ourfindings for Lcn2, we found no significant association between
tumor BDH2 expression and circulating levels of leptin or adi-ponectin (Fig. 9, D and E), indicating that tumor BDH2 expres-sion is unlikely influenced by these circulating factors previ-ously associated with BrCA progression (as reviewed in Refs.44 – 46). Moreover, no significant association between plasmalevels of Lcn2 and adiponectin or leptin were detected (Fig. 9, Fand G). Thus, when considered in aggregate, these data suggestthat adipocyte expression of ESR1, and not simply adiposity perse, may play a greater role in controlling Lcn2 production andbreast cancer risk.
FIGURE 7. Lcn2 deletion reverses the proliferative and promigratory effects of conditioned media from ER�-KD 3T3-L1 adipocytes on SUM159PTbreast cancer cells. A, Lcn2 expression levels in Scr-Control (open bars), Esr1-KD (closed bars), and Esr1-KD/Lcn2-KD (hatched bars) 3T3-L1 adipocytesassessed by qPCR. B, Lcn2 protein levels in conditioned media from Scr-Control, Esr1-KD, and Esr1-KD/Lcn2-KD 3T3L1 adipocytes detected by immuno-blotting. C, cellular proliferation in SUM159PT cells after 4 days exposure to CM from Scr-Control, Esr1-KD, and Esr1-KD/Lcn2-KD 3T3L1 adipocytes. D,migration of SUM159PT cells in culture over a standardized scratch site after 18 and 36 h of exposure to CM from Scr-Control, Esr1-KD, and Esr1-KD/Lcn2-KD 3T3-L1 adipocytes. Values are expressed as mean � S.E. in arbitrary units (AU), and mean differences were detected by Student’s t test andANOVA where appropriate. For each analysis, three independent experiments were performed in triplicate. *, p � 0.05 between Scr-Control and Esr1-KDCM;, #, �0.05 between Esr1-KD and Esr1-KD/Lcn2-KD CM.
Adipose Tissue ER� Expression, Obesity, and Breast Cancer Progression
5576 JOURNAL OF BIOLOGICAL CHEMISTRY VOLUME 290 • NUMBER 9 • FEBRUARY 27, 2015
at UC
LA
-Louise D
arling Biom
ed. Lib. on June 22, 2015
http://ww
w.jbc.org/
Dow
nloaded from

DISCUSSION
Obesity is an established risk factor for chronic diseasesincluding atherosclerosis, type 2 diabetes, and cancers of theliver, colon, and breast. Normally cycling females are partiallyprotected against these diseases, but much of this protection islost following menopause when increased adipose tissue weightgain, tissue inflammation, and metabolic dysfunction manifests(47). Unfortunately, the mechanistic underpinnings linkingobesity and metabolic dysfunction to cancer pathobiologyremain incompletely understood. Studies by Nilsson et al. (16)implicated a relationship between reduced expression of ER� inadipose tissue and obesity in women. However, whetherreduced adipose tissue ESR1 expression is causal for obesity anda disease-promoting secretory profile was unknown.
Herein, we reveal a mechanism whereby genetic ablation ofEsr1 in adipose tissue of female mice promotes increased adi-
posity, tissue inflammation, and increased expression andsecretion of the adipokine Lcn2. Considering that the pheno-type of malignant cells can be influenced by surrounding stro-mal cells comprising the tumor microenvironment, and thatadipocytes constitute the largest cellular compartment ofbreast tissue (41), we tested whether adipocyte-secreted factorscould influence the behavior of BrCA cells. We showed thatadipocytes lacking ER� secrete factors that exert marked effectson BrCA cell proliferation and migration. Because Lcn2 washighly expressed and secreted from ER�-deficient adipocytes,we next determined whether Lcn2 was a critical factor drivingthe proliferative and migratory response of BrCA cells. Consis-tent with our hypothesis, deletion of Lcn2 from ER�-deficientadipocytes reversed the proliferative and pro-migratory effectsof CM on SUM159PT BrCA cells. These findings suggest thatLcn2 is an important potential mediator promoting tumorigen-
FIGURE 8. BrCA cell proliferation is associated with BDH2 expression and Lcn2 responsiveness. A, cellular proliferation of breast cancer cell lines (ZR75-1,T47D, MCF7, and EFM19) was significantly correlated with cellular BDH2 expression. Three experiments were performed in triplicate; ●, average of eachexperiment for four respective cell lines. B, LCN2 expression, assessed by qPCR, is variable in the four ER breast cancer cell lines analyzed (MCF10A providedas a comparison). C, the Lcn2 receptor (SLC22A17, variant 1) is highly expressed in the four representative breast cancer cell lines but minimally expressed innon-transformed breast epithelial MCF10A cells. The impact of Lcn2 on expression of genes associated with cancer progression and metastasis was deter-mined by qPCR analysis. D, SLC22A17 (V1); E, Ferritin-L; F, BNIP3; G, SNAIL; H, SLUG; and I, Vimentin. Values are expressed as mean � S.E. in arbitrary units (AU),and mean differences were detected by ANOVA. *, p � 0.05 versus MCF10A; 1, p � 0.05 vehicle versus Lcn2-treated. Significant correlation was detected byPearson’s r and the p value for the relationship is provided. ND, not detected.
Adipose Tissue ER� Expression, Obesity, and Breast Cancer Progression
FEBRUARY 27, 2015 • VOLUME 290 • NUMBER 9 JOURNAL OF BIOLOGICAL CHEMISTRY 5577
at UC
LA
-Louise D
arling Biom
ed. Lib. on June 22, 2015
http://ww
w.jbc.org/
Dow
nloaded from

esis in the context of obesity. Extending this link clinically inBrCA patients, we found a significant correlation between obe-sity and tumor expression of BDH2, an enzyme critical for cel-lular responsiveness to Lcn2 (48). These studies describe a pre-viously unrecognized mechanism that connects obesity andbreast cancer through ER� regulation of Lcn2 in adipocytes.
Although prior studies have demonstrated a role for Lcn2 inthe proliferation and migration of cancer cells in culture (35, 49,50) and have shown that LCN2 is strongly associated withbreast cancer stage in microarray and expression profiling stud-ies, the exact cellular source or sources of Lcn2 have not yetbeen determined (35, 43, 51). Additionally, although effects ofLcn2 on tumor burden in mouse models of breast cancer havebeen observed (52–54), these studies in murine models havefailed to identify the mechanisms by which Lcn2 promotestumorigenesis in vivo. Because Lcn2 is now considered a clini-cal predictor of disease prognosis in human primary breast can-cer patients (43, 55), resolution of the mechanisms regulatingLCN2 expression, the identification of the cell types involved inits paracrine and endocrine actions, as well as determination of
the cell and tissue-specific effects of Lcn2 signal transduction,require greater attention. Our data strongly support a linkbetween ER�-mediated regulation of Lcn2 in adipose tissue andbreast cancer progression; however, our studies are limited tothe direct impact of Lcn2 on breast cancer cell behavior and donot extend to the potential effects of Lcn2 on the tumormicroenvironment, which is likely of equal or greater impor-tance for disease prognosis.
Previous work has shown that Lcn2 expression is up-regu-lated in differentiating adipocytes in culture, and that circulat-ing levels of Lcn2 are associated with obesity and metabolicdysfunction in wild type male mice (34). Our findings presentedherein for female mice now reproduce those initial studies con-ducted in males. Additionally we have identified ER� as a crit-ical transcriptional regulator of Lcn2 production and adiposity.
In line with the notion that obesity and alteration in adi-pocyte behavior underlie tumor progression, it is shown thatmature breast adipocytes, but not pre-adipocytes, promotebreast cancer cell motility (56). Thus it follows that the secre-tion of soluble factors from differentiated adipocytes may pro-
FIGURE 9. Obesity is associated with increased BDH2 expression in primary tumors from breast cancer patients. A, plasma Lcn2 is elevated in obese(BMI 30; n � 26) compared with lean (BMI � 25; n � 31) women diagnosed with BrCA. BDH2 expression is significantly associated with BMI (B) andplasma (C) Lcn2 concentration in female breast cancer patients from the TORI trial. No significant relationship between BDH2 expression and circulatinglevels of Lcn2 versus leptin (D and F) or the anti-inflammatory adipokine adiponectin (E and G) were detected. Values are expressed as mean � S.E., andmean differences were detected by Student’s t test. *, p � 0.05 between groups. Correlation coefficients were determined by Pearson’s r, and p valuesare provided for each correlation.
Adipose Tissue ER� Expression, Obesity, and Breast Cancer Progression
5578 JOURNAL OF BIOLOGICAL CHEMISTRY VOLUME 290 • NUMBER 9 • FEBRUARY 27, 2015
at UC
LA
-Louise D
arling Biom
ed. Lib. on June 22, 2015
http://ww
w.jbc.org/
Dow
nloaded from

vide critical cellular cross-talk necessary for disease progression(9). Interestingly, cancer-associated adipocytes located at thetumor invasive front appear delipidated and resemble a de-dif-ferentiated phenotype compared with more distal adipocytes.These front-line adipocytes are characterized by a fibroblast-like morphology and down-regulation of key adipogenic mark-ers including poly(ADP-ribose) polymerase �, C/EBP�, and aP2(9), a finding reproduced in ER�-deficient adipocytes. Theseobservations suggest that cancer cells may engage in reciprocaltalk altering adipocyte phenotype to promote mobilization ofsubstrate, extracellular matrix remodeling, and angiogenesis(41). Scherer and colleagues (57) previously showed that adi-pocyte-secreted factors have an unparalleled ability to promoteincreased cell motility, migration, and tumor angiogenesiscompared with secreted factors of other stromal cell types. Inaggregate, our studies suggest these cancer-promoting effectsof adipocytes are accentuated by ER� deficiency.
Although the physiological role of Lcn2 has remained incom-pletely understood since its initial discovery, it has been primar-ily associated with iron metabolism and metalloproteinase(MMP-9 specifically) activity (58). More recently, Green andcolleagues (28, 48) have identified and characterized both thereceptor for Lcn2 (Slc22a17) and enzymes involved in intracel-lular signaling including Bdh2. We found that BDH2, anenzyme that catalyzes the formation of the siderophore thatbinds Lcn2 to control cellular iron metabolism (48), was highlycorrelated with BrCA cell proliferation. Considering that circu-lating concentrations of Lcn2 and breast tumor BDH2 expres-sion levels were elevated in obese subjects and that RNAi-in-duced BDH2 deficiency promotes BrCA cell apoptosissusceptibility (48), suggests that targeting this pathway torestrain or reverse breast tumor development in the context ofobesity may be of therapeutic benefit.
Additionally, given that adjuvant breast cancer therapiesaimed at reducing estrogen production and antagonizing ER�action in mammary tumors also exert whole body effects, thelong-term impact of these therapeutic strategies on metabolicfunction should be monitored, especially in women susceptiblefor obesity and type 2 diabetes. Moreover, because obesity andtype 2 diabetes reduce overall breast cancer survival rates inpart by diminishing effectiveness of conventional anti-tumortherapeutics (59, 60), novel approaches to restrain breast can-cer progression and reduce mortality in obese populationsshould be pursued.
In summary, the current investigation provides evidence thatloss of ER� signaling in adipose tissue promotes obesity andinduces the expression of Lcn2, a glycoprotein implicated inmetabolic dysfunction and breast tumorigenesis and metasta-sis. Our findings suggest that reduced ER� action in adiposetissue, such as that associated with natural genetic variation,menopause, or obesity may be mechanistically linked to theincreased prevalence of breast cancer observed under theseconditions. Considering that obesity accounts for �20% of allcancer deaths in women over age 50 (61), and based upon ourfindings that ER� deletion in adipose is causal of obesity, strat-egies to maintain ER� action in metabolic tissues including adi-pose tissue may be of benefit for cancer prevention.
Acknowledgments—We are grateful for the continued support of ourresearch from the UCLA Jonsson Comprehensive Cancer Center, theUCLA Iris Cantor Women’s Health Foundation, and the UCSD-UCLA Diabetes Research Center. Intellectual contributions by Rich-ard Finn, Jerrold Olefsky, Ronald Evans, Hassy Cohen, and ChrisGlass were also helpful in advancing this research. We are grateful forthe technical support from Rima Boyadjian (UCLA InflammationCore), the UCLA Tissue Procurement and Histology Core, and theUCSD Moores Cancer Center Histology and ImmunohistochemistryShared Resource directed by Nissi Varki.
Note Added in Proof—The version of this article that was publishedon December 2, 2014 as a Paper in Press was incomplete. Two figuresand supplemental Tables S1 through S4 were missing. SupplementalTables S1 through S4 are now available, and the following figureshave been added, revised, or relabeled. Panels C-H were added to Fig.1. Panels H-K were removed from Fig. 3 and are now presented in Fig.5. The original Fig. 4 has become Fig. 6 and there is a new Fig. 4. Theoriginal Fig. 5 has become Fig. 7. The original Fig. 6 has become Fig.8. The original Fig. 7 has become Fig. 9 and includes two new panels,F and G. The axis labels in Figs. 2, 5, 8, and 9 have been revised.
REFERENCES1. Wellen, K. E., and Hotamisligil, G. S. (2005) Inflammation, stress, and
diabetes. J. Clin. Invest. 115, 1111–11192. Romeo, G. R., Lee, J., and Shoelson, S. E. (2012) Metabolic syndrome,
insulin resistance, and roles of inflammation: mechanisms and therapeu-tic targets. Arterioscler. Thromb. Vasc. Biol. 32, 1771–1776
3. Ouchi, N., Parker, J. L., Lugus, J. J., and Walsh, K. (2011) Adipokines ininflammation and metabolic disease. Nat. Rev. Immunol. 11, 85–97
4. Calle, E. E., and Kaaks, R. (2004) Overweight, obesity and cancer: epide-miological evidence and proposed mechanisms. Nat. Rev. Cancer 4,579 –591
5. Renehan, A. G., Tyson, M., Egger, M., Heller, R. F., and Zwahlen, M. (2008)Body-mass index and incidence of cancer: a systematic review and meta-analysis of prospective observational studies. Lancet 371, 569 –578
6. Turati, F., Talamini, R., Pelucchi, C., Polesel, J., Franceschi, S., Crispo, A.,Izzo, F., La Vecchia, C., Boffetta, P., and Montella, M. (2013) Metabolicsyndrome and hepatocellular carcinoma risk. Br. J. Cancer 108, 222–228
7. Harima, S., Hashimoto, S., Shibata, H., Matsunaga, T., Tanabe, R., Terai,S., and Sakaida, I. (2013) Correlations between obesity/metabolic syn-drome-related factors and risk of developing colorectal tumors. Hepato-gastroenterology 60, 733–737
8. Wang, Y. Y., Lehuédé, C., Laurent, V., Dirat, B., Dauvillier, S., Bochet, L.,Le Gonidec, S., Escourrou, G., Valet, P., and Muller, C. (2012) Adiposetissue and breast epithelial cells: a dangerous dynamic duo in breast can-cer. Cancer Lett. 324, 142–151
9. Dirat, B., Bochet, L., Dabek, M., Daviaud, D., Dauvillier, S., Majed, B.,Wang, Y. Y., Meulle, A., Salles, B., Le Gonidec, S., Garrido, I., Escourrou,G., Valet, P., and Muller, C. (2011) Cancer-associated adipocytes exhibitan activated phenotype and contribute to breast cancer invasion. CancerRes. 71, 2455–2465
10. Vona-Davis, L., and Rose, D. P. (2007) Adipokines as endocrine, paracrine,and autocrine factors in breast cancer risk and progression. Endocr. Relat.Cancer 14, 189 –206
11. Park, J., and Scherer, P. E. (2012) Adipocyte-derived endotrophin pro-motes malignant tumor progression. J. Clin. Invest. 122, 4243– 4256
12. Reimann, M., Vafeiadou, K., Hall, W. L., Dierkes, J., Nilsson, M., Dahlman-Wright, K., Ferrari, M., Huebner, U., Hallund, J., Bugel, S., Branca, F.,Williams, C. M., and Koebnick, C. (2006) Evidence for associations be-tween common polymorphisms of estrogen receptor � gene with homo-cysteine and nitric oxide. Climacteric 9, 215–223
13. Smith, E. P., Boyd, J., Frank, G. R., Takahashi, H., Cohen, R. M., Specker, B.,Williams, T. C., Lubahn, D. B., and Korach, K. S. (1994) Estrogen resist-ance caused by a mutation in the estrogen-receptor gene in a man. N. Engl.
Adipose Tissue ER� Expression, Obesity, and Breast Cancer Progression
FEBRUARY 27, 2015 • VOLUME 290 • NUMBER 9 JOURNAL OF BIOLOGICAL CHEMISTRY 5579
at UC
LA
-Louise D
arling Biom
ed. Lib. on June 22, 2015
http://ww
w.jbc.org/
Dow
nloaded from

J. Med. 331, 1056 –106114. Okura, T., Koda, M., Ando, F., Niino, N., Ohta, S., and Shimokata, H.
(2003) Association of polymorphisms in the estrogen receptor � gene withbody fat distribution. Int. J. Obes. Relat. Metab. Disord. 27, 1020 –1027
15. Dahlman, I., Vaxillaire, M., Nilsson, M., Lecoeur, C., Gu, H. F., Cavalcanti-Proença, C., Efendic, S., Ostenson, C. G., Brismar, K., Charpentier, G.,Gustafsson, J. A., Froguel, P., Dahlman-Wright, K., and Steffensen, K. R.(2008) Estrogen receptor alpha gene variants associate with type 2 diabe-tes and fasting plasma glucose. Pharmacogenet. Genomics 18, 967–975
16. Nilsson, M., Dahlman, I., Ryden, M., Nordstrom, E. A., Gustafsson, J. A.,Arner, P., and Dahlman-Wright, K. (2007) Oestrogen receptor � geneexpression levels are reduced in obese compared to normal weight fe-males. Int. J. Obes. 31, 900 –907
17. Bryzgalova, G., Gao, H., Ahren, B., Zierath, J. R., Galuska, D., Steiler, T. L.,Dahlman-Wright, K., Nilsson, S., Gustafsson, J. A., Efendic, S., and Khan,A. (2006) Evidence that oestrogen receptor-� plays an important role inthe regulation of glucose homeostasis in mice: insulin sensitivity in theliver. Diabetologia 49, 588 –597
18. Ribas, V., Nguyen, M. T., Henstridge, D. C., Nguyen, A. K., Beaven, S. W.,Watt, M. J., and Hevener, A. L. (2010) Impaired oxidative metabolism andinflammation are associated with insulin resistance in ER�-deficient mice.Am. J. Physiol. Endocrinol. Metab. 298, E304 –319
19. Hewitt, S. C., Kissling, G. E., Fieselman, K. E., Jayes, F. L., Gerrish, K. E., andKorach, K. S. (2010) Biological and biochemical consequences of globaldeletion of exon 3 from the ER� gene. FASEB J. 24, 4660 – 4667
20. He, W., Barak, Y., Hevener, A., Olson, P., Liao, D., Le, J., Nelson, M., Ong,E., Olefsky, J. M., and Evans, R. M. (2003) Adipose-specific peroxisomeproliferator-activated receptor � knockout causes insulin resistance in fatand liver but not in muscle. Proc. Natl. Acad. Sci. U.S.A. 100, 15712–15717
21. Hewitt, S. C., Li, L., Grimm, S. A., Winuthayanon, W., Hamilton, K. J.,Pockette, B., Rubel, C. A., Pedersen, L. C., Fargo, D., Lanz, R. B., DeMayo,F. J., Schütz, G., and Korach, K. S. (2014) Novel DNA motif binding activityobserved in vivo with an estrogen receptor � mutant mouse. Mol. Endo-crinol. 28, 899 –911
22. Ahlbory-Dieker, D. L., Stride, B. D., Leder, G., Schkoldow, J., Trölenberg,S., Seidel, H., Otto, C., Sommer, A., Parker, M. G., Schütz, G., and Win-termantel, T. M. (2009) DNA binding by estrogen receptor-� is essentialfor the transcriptional response to estrogen in the liver and the uterus.Mol. Endocrinol. 23, 1544 –1555
23. Parks, B. W., Nam, E., Org, E., Kostem, E., Norheim, F., Hui, S. T., Pan, C.,Civelek, M., Rau, C. D., Bennett, B. J., Mehrabian, M., Ursell, L. K., He, A.,Castellani, L. W., Zinker, B., Kirby, M., Drake, T. A., Drevon, C. A., Knight,R., Gargalovic, P., Kirchgessner, T., Eskin, E., and Lusis, A. J. (2013) Ge-netic control of obesity and gut microbiota composition in response tohigh-fat, high-sucrose diet in mice. Cell Metab. 17, 141–152
24. Hurvitz, S. A., Allen, H. J., Moroose, R. L., Chan, D., Hagenstad, C., Apple-baum, S. H., Patel, G., Hu, E. H., Ryba, N., Lin, L. S., Wang, H., Glaspy, J.,Slamon, D. J., and Kabbinavar, F. (2010) A phase II trial of docetaxel withbevacizumab as first-line therapy for HER2-negative metastatic breastcancer (TORI B01). Clin. Breast Cancer 10, 307–312
25. Néchad, M. (1983) Development of brown fat cells in monolayer culture:II. ultrastructural characterization of precursors, differentiating adi-pocytes and their mitochondria. Exp. Cell Res. 149, 119 –127
26. Rodriguez-Cuenca, S., Monjo, M., Frontera, M., Gianotti, M., Proenza,A. M., and Roca, P. (2007) Sex steroid receptor expression profile in brownadipose tissue: effects of hormonal status. Cell Physiol. Biochem. 20,877– 886
27. Neve, R. M., Chin, K., Fridlyand, J., Yeh, J., Baehner, F. L., Fevr, T., Clark, L.,Bayani, N., Coppe, J. P., Tong, F., Speed, T., Spellman, P. T., DeVries, S.,Lapuk, A., Wang, N. J., Kuo, W. L., Stilwell, J. L., Pinkel, D., Albertson,D. G., Waldman, F. M., McCormick, F., Dickson, R. B., Johnson, M. D.,Lippman, M., Ethier, S., Gazdar, A., and Gray, J. W. (2006) A collection ofbreast cancer cell lines for the study of functionally distinct cancer sub-types. Cancer Cell 10, 515–527
28. Devireddy, L. R., Gazin, C., Zhu, X., and Green, M. R. (2005) A cell-surfacereceptor for lipocalin 24p3 selectively mediates apoptosis and iron uptake.Cell 123, 1293–1305
29. Zhang, S., Ma, Y., Jiang, J., Dai, Z., Gao, X., Yin, X., Xi, W., and Min, W.
(2014) Inhibition of urokinase-type plasminogen activator expression bydihydroartemisinin in breast cancer cells. Oncol. Lett. 7, 1375–1380
30. Murray, D., Horgan, G., Macmathuna, P., and Doran, P. (2008) NET1-mediated RhoA activation facilitates lysophosphatidic acid-induced cellmigration and invasion in gastric cancer. Br. J. Cancer 99, 1322–1329
31. Villanueva, C. J., Waki, H., Godio, C., Nielsen, R., Chou, W. L., Vargas, L.,Wroblewski, K., Schmedt, C., Chao, L. C., Boyadjian, R., Mandrup, S.,Hevener, A., Saez, E., and Tontonoz, P. (2011) TLE3 is a dual-functiontranscriptional coregulator of adipogenesis. Cell Metab. 13, 413– 427
32. Ribas, V., Drew, B. G., Le, J. A., Soleymani, T., Daraei, P., Sitz, D., Moham-mad, L., Henstridge, D. C., Febbraio, M. A., Hewitt, S. C., Korach, K. S.,Bensinger, S. J., and Hevener, A. L. (2011) Myeloid-specific estrogen re-ceptor � deficiency impairs metabolic homeostasis and accelerates ath-erosclerotic lesion development. Proc. Natl. Acad. Sci. U.S.A. 108,16457–16462
33. Hewitt, S. C., Li, Y., Li, L., and Korach, K. S. (2010) Estrogen-mediatedregulation of Igf1 transcription and uterine growth involves direct bindingof estrogen receptor � to estrogen-responsive elements. J. Biol. Chem.285, 2676 –2685
34. Yan, Q. W., Yang, Q., Mody, N., Graham, T. E., Hsu, C. H., Xu, Z., Houstis,N. E., Kahn, B. B., and Rosen, E. D. (2007) The adipokine lipocalin 2 isregulated by obesity and promotes insulin resistance. Diabetes 56,2533–2540
35. Yang, J., Bielenberg, D. R., Rodig, S. J., Doiron, R., Clifton, M. C., Kung,A. L., Strong, R. K., Zurakowski, D., and Moses, M. A. (2009) Lipocalin 2promotes breast cancer progression. Proc. Natl. Acad. Sci. U.S.A. 106,3913–3918
36. Panidis, D., Tziomalos, K., Koiou, E., Kandaraki, E. A., Tsourdi, E., Delkos,D., Kalaitzakis, E., and Katsikis, I. (2010) The effects of obesity and poly-cystic ovary syndrome on serum lipocalin-2 levels: a cross-sectional study.Reprod. Biol. Endocrinol. 8, 151
37. Lee, Y. H., Lee, S. H., Jung, E. S., Kim, J. S., Shim, C. Y., Ko, Y. G., Choi, D.,Jang, Y., Chung, N., and Ha, J. W. (2010) Visceral adiposity and the severityof coronary artery disease in middle-aged subjects with normal waist cir-cumference and its relation with lipocalin-2 and MCP-1. Atherosclerosis213, 592–597
38. Seth, P., Porter, D., Lahti-Domenici, J., Geng, Y., Richardson, A., andPolyak, K. (2002) Cellular and molecular targets of estrogen in normalhuman breast tissue. Cancer Res. 62, 4540 – 4544
39. Boruk, M., Savory, J. G., and Haché, R. J. (1998) AF-2-dependent potenti-ation of CCAAT enhancer binding protein �-mediated transcriptionalactivation by glucocorticoid receptor. Mol. Endocrinol. 12, 1749 –1763
40. Stein, B., and Yang, M. X. (1995) Repression of the interleukin-6 promoterby estrogen receptor is mediated by NF-�B and C/EBP�. Mol. Cell. Biol.15, 4971– 4979
41. Tan, J., Buache, E., Chenard, M. P., Dali-Youcef, N., and Rio, M. C. (2011)Adipocyte is a non-trivial, dynamic partner of breast cancer cells. Int. J.Dev. Biol. 55, 851– 859
42. Chakraborty, S., Kaur, S., Guha, S., and Batra, S. K. (2012) The multifac-eted roles of neutrophil gelatinase associated lipocalin (NGAL) in inflam-mation and cancer. Biochim. Biophys. Acta 1826, 129 –169
43. Bauer, M., Eickhoff, J. C., Gould, M. N., Mundhenke, C., Maass, N., andFriedl, A. (2008) Neutrophil gelatinase-associated lipocalin (NGAL) is apredictor of poor prognosis in human primary breast cancer. Breast Can-cer Res. Treat 108, 389 –397
44. Macciò, A., Madeddu, C., and Mantovani, G. (2009) Adipose tissue astarget organ in the treatment of hormone-dependent breast cancer: newtherapeutic perspectives. Obes. Rev. 10, 660 – 670
45. Park, J., Euhus, D. M., and Scherer, P. E. (2011) Paracrine and endocrineeffects of adipose tissue on cancer development and progression. Endocr.Rev. 32, 550 –570
46. Park, J., and Scherer, P. E. (2011) Leptin and cancer: from cancer stem cellsto metastasis. Endocr. Relat. Cancer 18, C25–29
47. Carr, M. C. (2003) The emergence of the metabolic syndrome with meno-pause. J. Clin. Endocrinol. Metab. 88, 2404 –2411
48. Devireddy, L. R., Hart, D. O., Goetz, D. H., and Green, M. R. (2010) Amammalian siderophore synthesized by an enzyme with a bacterial hom-olog involved in enterobactin production. Cell 141, 1006 –1017
Adipose Tissue ER� Expression, Obesity, and Breast Cancer Progression
5580 JOURNAL OF BIOLOGICAL CHEMISTRY VOLUME 290 • NUMBER 9 • FEBRUARY 27, 2015
at UC
LA
-Louise D
arling Biom
ed. Lib. on June 22, 2015
http://ww
w.jbc.org/
Dow
nloaded from
49. Yang, J., and Moses, M. A. (2009) Lipocalin 2: a multifaceted modulator ofhuman cancer. Cell Cycle 8, 2347–2352
50. Shi, H., Gu, Y., Yang, J., Xu, L., Mi, W., and Yu, W. (2008) Lipocalin 2promotes lung metastasis of murine breast cancer cells. J. Exp. Clin. Can-cer Res. 27, 83
51. Stoesz, S. P., and Gould, M. N. (1995) Overexpression of neu-related li-pocalin (NRL) in neu-initiated but not ras or chemically initiated rat mam-mary carcinomas. Oncogene 11, 2233–2241
52. Leng, X., Wu, Y., and Arlinghaus, R. B. (2011) Relationships of lipocalin 2with breast tumorigenesis and metastasis. J. Cell. Physiol. 226, 309 –314
53. Berger, T., Cheung, C. C., Elia, A. J., and Mak, T. W. (2010) Disruption ofthe Lcn2 gene in mice suppresses primary mammary tumor formation butdoes not decrease lung metastasis. Proc. Natl. Acad. Sci. U.S.A. 107,2995–3000
54. Leng, X., Ding, T., Lin, H., Wang, Y., Hu, L., Hu, J., Feig, B., Zhang, W.,Pusztai, L., Symmans, W. F., Wu, Y., and Arlinghaus, R. B. (2009) Inhibi-tion of lipocalin 2 impairs breast tumorigenesis and metastasis. CancerRes. 69, 8579 – 8584
55. Fernández, C. A., Yan, L., Louis, G., Yang, J., Kutok, J. L., and Moses, M. A.(2005) The matrix metalloproteinase-9/neutrophil gelatinase-associatedlipocalin complex plays a role in breast tumor growth and is present in theurine of breast cancer patients. Clin. Cancer Res. 11, 5390 –5395
56. Carter, J. C., and Church, F. C. (2012) Mature breast adipocytes promote
breast cancer cell motility. Exp. Mol. Pathol. 92, 312–31757. Iyengar, P., Combs, T. P., Shah, S. J., Gouon-Evans, V., Pollard, J. W.,
Albanese, C., Flanagan, L., Tenniswood, M. P., Guha, C., Lisanti, M. P.,Pestell, R. G., and Scherer, P. E. (2003) Adipocyte-secreted factors syner-gistically promote mammary tumorigenesis through induction of anti-apoptotic transcriptional programs and proto-oncogene stabilization.Oncogene 22, 6408 – 6423
58. Yan, L., Borregaard, N., Kjeldsen, L., and Moses, M. A. (2001) The highmolecular weight urinary matrix metalloproteinase (MMP) activity is acomplex of gelatinase B/MMP-9 and neutrophil gelatinase-associated li-pocalin (NGAL): modulation of MMP-9 activity by NGAL. J. Biol. Chem.276, 37258 –37265
59. Jiralerspong, S., Kim, E. S., Dong, W., Feng, L., Hortobagyi, G. N., andGiordano, S. H. (2013) Obesity, diabetes, and survival outcomes in a largecohort of early-stage breast cancer patients. Ann. Oncol. 24, 2506 –2514
60. Sparano, J. A., Wang, M., Zhao, F., Stearns, V., Martino, S., Ligibel, J. A.,Perez, E. A., Saphner, T., Wolff, A. C., Sledge, G. W., Jr., Wood, W. C.,Fetting, J., and Davidson, N. E. (2012) Obesity at diagnosis is associatedwith inferior outcomes in hormone receptor-positive operable breast can-cer. Cancer 118, 5937–5946
61. Calle, E. E., Rodriguez, C., Walker-Thurmond, K., and Thun, M. J. (2003)Overweight, obesity, and mortality from cancer in a prospectively studiedcohort of U.S. adults. N. Engl. J. Med. 348, 1625–1638
Adipose Tissue ER� Expression, Obesity, and Breast Cancer Progression
FEBRUARY 27, 2015 • VOLUME 290 • NUMBER 9 JOURNAL OF BIOLOGICAL CHEMISTRY 5581
at UC
LA
-Louise D
arling Biom
ed. Lib. on June 22, 2015
http://ww
w.jbc.org/
Dow
nloaded from

Hurvitz and Andrea L. HevenerAldons J. Lusis, Dennis J. Slamon, Sara A.Hewitt, Kenneth S. Korach, Peter Tontonoz, Daraei, Heather R. Christofk, Sylvia C.Nareg Y. Kalajian, Jennifer Phun, Pedram C. Calkin, Brian W. Parks, Vicent Ribas,Claudio J. Villanueva, Susan A. Krum, Anna Brian G. Drew, Habib Hamidi, Zhenqi Zhou, ProgressionLinks Obesity with Breast CancerLipocalin 2 Expression in Adipose Tissue
-regulatedαEstrogen Receptor (ER)Molecular Bases of Disease:
doi: 10.1074/jbc.M114.606459 originally published online December 2, 20142015, 290:5566-5581.J. Biol. Chem.
10.1074/jbc.M114.606459Access the most updated version of this article at doi:
.JBC Affinity SitesFind articles, minireviews, Reflections and Classics on similar topics on the
Alerts:
When a correction for this article is posted•
When this article is cited•
to choose from all of JBC's e-mail alertsClick here
Supplemental material:
http://www.jbc.org/content/suppl/2015/01/13/M114.606459.DC1.html
http://www.jbc.org/content/290/9/5566.full.html#ref-list-1
This article cites 61 references, 18 of which can be accessed free at
at UC
LA
-Louise D
arling Biom
ed. Lib. on June 22, 2015
http://ww
w.jbc.org/
Dow
nloaded from