Segmentation of textured polarimetric SAR scenes by likelihood approximation
10
IEEE TRANSACTIONS ON GEOSCIENCE AND REMOTE SENSING, VOL. 42, NO. 10, OCTOBER 2004 2063 Segmentation of Textured Polarimetric SAR Scenes by Likelihood Approximation Jean-Marie Beaulieu, Member, IEEE, and Ridha Touzi, Member, IEEE Abstract—A hierarchical stepwise optimization process is developed for polarimetric synthetic aperture radar image seg- mentation. We show that image segmentation can be viewed as a likelihood approximation problem. The likelihood segment merging criteria are derived using the multivariate complex Gaussian, the Wishart distribution, and the K-distribution. In the presence of spatial texture, the Gaussian–Wishart segmentation is not appropriate. The K-distribution segmentation is more effective in textured forested areas. The validity of the product model is also assessed, and a field-adaptable segmentation strategy combining different criteria is examined. Index Terms—Hierarchical image segmentation, maximum-like- lihood estimation, polarimetric synthetic aperture radar (SAR) image, texture, Wishart and K-distributions. I. INTRODUCTION I N REMOTE sensing, a segmentation process can be used to detect land fields and to improve pixel classification. In clas- sification, a class number is assigned to each pixel. A segmen- tation process divides the image into distinct and self-similar regions. The segmentation of synthetic aperture radar (SAR) im- ages is greatly complicated by the presence of coherent speckle. The complex structure of the SAR images requires the utiliza- tion of complex processes for segmentation and classification. They are based on scene and speckle models. There are well-ac- cepted models for one-channel SAR images [1]. The speckle amplitude of homogeneous areas is represented by the Rayleigh distribution. The K-distribution is used to model the backscat- tered radar intensity from a Gamma-distributed scene such as forested areas [1]. Other distributions, such as the Weibull or the Lognormal distributions, are used to model various textures of SAR images [1]. Kong et al. [2] were the first to show that the full polari- metric measurements provide better classification and segmen- tation than single-channel measurements. The probability den- sity function (pdf) of a complex Gaussian vector was used to derive the classification measure that optimizes the likelihood ratio test [2]–[4]. Lee et al. [5] use the Wishart distribution to derive a classification measure that can be applied to multilook Manuscript received September 30, 2003; revised July 6, 2004. Part of this work was completed while J.-M. Beaulieu was in sabbatical year at the Canada Centre for Remote Sensing, Ottawa, ON, Canada. J.-M. Beaulieu is with the Computer Science and Software Engineering Department, Laval University, Quebec City, QC, G1K-7P4, Canada (e-mail: [email protected]). R. Touzi is with the Canada Centre for Remote Sensing, Natural Re- sources Canada, Ottawa, ON K1A 0Y7, Canada (e-mail: Ridha.Touzi@ ccrs.nrcan.gc.ca). Digital Object Identifier 10.1109/TGRS.2004.835302 data. Skriver et al. [6] introduced a likelihood ratio test method for segmentation of polarimetric SAR images. The methods currently used for classification or segmenta- tion of polarimetric SAR images are based on multivariate com- plex Gaussian or Wishart models. Such distributions are not appropriate for textured areas. In this paper, a new segmenta- tion method uses the K-distribution model to better preserve the Gamma-distributed texture. The main approaches to image segmentation are based on classifications, edges, or regions. Image segmentation can result from the classification or the labeling of each pixel. The main process is the classification of pixels where the spatial aspect is not usually considered [7]. The image partition is a side effect of the classification. Markov random field and texture models have been used to include the spatial aspect into the class probabilistic models [8], [9]. An edge detection process can also be used to define segment boundaries [10]–[14]. Watershed segmentation algorithms use gradient images [13], [15]. We consider that true image segmentation processes are based upon regions. The goal of the process is to identify regions (seg- ments) that satisfy some criteria. Spatial aspects are involved in the criteria. A typical agglomerative approach involves the se- quential merging of regions [6], [16]–[18]. The first techniques used threshold-based decision. More powerful techniques now use iterative optimization processes [19]–[22]. Segmentation consists of the sequential merges of similar seg- ments. Development of a segmentation process involves the def- inition of an appropriate segment similarity measure. A proba- bilistic approach is often used. The similarity measure is related to testing if the two segments belong to the same population. A likelihood ratio test is often used [6], [16]. For example, for the polarimetric complex Wishart distribution model, the equality of the covariance matrices is tested. Similar measures are used in pixel or region classification. However, in segmentation, the sizes of segments vary, which introduces difficulties and differentiates it from classification. In classification, we have reliable class sta- tistics again with the pixel or region statistics compared. In seg- mentation, the statistics of two segments are compared, and the result could be quite unreliable if the segments are small. Further- more, the evaluation is a difficult problem in segmentation. The goal is to divide the image into distinct self-similar regions. Clas- sification error can not generally be used. This paper proposes a likelihood approximation approach. A likelihood measure of a partition is defined and used as a global objective function to opti- mize. In the hierarchical segmentation framework, the local seg- ment merging criterion is derived from the global criterion. This ensures that each merging step does its best to optimize the global criterion. 0196-2892/04$20.00 © 2004 IEEE
-
Upload
independent -
Category
Documents
-
view
2 -
download
0
Transcript of Segmentation of textured polarimetric SAR scenes by likelihood approximation

IEEE TRANSACTIONS ON GEOSCIENCE AND REMOTE SENSING, VOL. 42, NO. 10, OCTOBER 2004 2063
Segmentation of Textured Polarimetric SAR Scenesby Likelihood Approximation
Jean-Marie Beaulieu, Member, IEEE, and Ridha Touzi, Member, IEEE
Abstract—A hierarchical stepwise optimization process isdeveloped for polarimetric synthetic aperture radar image seg-mentation. We show that image segmentation can be viewed asa likelihood approximation problem. The likelihood segmentmerging criteria are derived using the multivariate complexGaussian, the Wishart distribution, and the K-distribution. In thepresence of spatial texture, the Gaussian–Wishart segmentation isnot appropriate. The K-distribution segmentation is more effectivein textured forested areas. The validity of the product model is alsoassessed, and a field-adaptable segmentation strategy combiningdifferent criteria is examined.
Index Terms—Hierarchical image segmentation, maximum-like-lihood estimation, polarimetric synthetic aperture radar (SAR)image, texture, Wishart and K-distributions.
I. INTRODUCTION
I N REMOTE sensing, a segmentation process can be used todetect land fields and to improve pixel classification. In clas-
sification, a class number is assigned to each pixel. A segmen-tation process divides the image into distinct and self-similarregions. The segmentation of synthetic aperture radar (SAR) im-ages is greatly complicated by the presence of coherent speckle.The complex structure of the SAR images requires the utiliza-tion of complex processes for segmentation and classification.They are based on scene and speckle models. There are well-ac-cepted models for one-channel SAR images [1]. The speckleamplitude of homogeneous areas is represented by the Rayleighdistribution. The K-distribution is used to model the backscat-tered radar intensity from a Gamma-distributed scene such asforested areas [1]. Other distributions, such as the Weibull orthe Lognormal distributions, are used to model various texturesof SAR images [1].
Kong et al. [2] were the first to show that the full polari-metric measurements provide better classification and segmen-tation than single-channel measurements. The probability den-sity function (pdf) of a complex Gaussian vector was used toderive the classification measure that optimizes the likelihoodratio test [2]–[4]. Lee et al. [5] use the Wishart distribution toderive a classification measure that can be applied to multilook
Manuscript received September 30, 2003; revised July 6, 2004. Part of thiswork was completed while J.-M. Beaulieu was in sabbatical year at the CanadaCentre for Remote Sensing, Ottawa, ON, Canada.
J.-M. Beaulieu is with the Computer Science and Software EngineeringDepartment, Laval University, Quebec City, QC, G1K-7P4, Canada (e-mail:[email protected]).
R. Touzi is with the Canada Centre for Remote Sensing, Natural Re-sources Canada, Ottawa, ON K1A 0Y7, Canada (e-mail: [email protected]).
Digital Object Identifier 10.1109/TGRS.2004.835302
data. Skriver et al. [6] introduced a likelihood ratio test methodfor segmentation of polarimetric SAR images.
The methods currently used for classification or segmenta-tion of polarimetric SAR images are based on multivariate com-plex Gaussian or Wishart models. Such distributions are notappropriate for textured areas. In this paper, a new segmenta-tion method uses the K-distribution model to better preserve theGamma-distributed texture.
The main approaches to image segmentation are based onclassifications, edges, or regions. Image segmentation can resultfrom the classification or the labeling of each pixel. The mainprocess is the classification of pixels where the spatial aspect isnot usually considered [7]. The image partition is a side effect ofthe classification. Markov random field and texture models havebeen used to include the spatial aspect into the class probabilisticmodels [8], [9]. An edge detection process can also be used todefine segment boundaries [10]–[14]. Watershed segmentationalgorithms use gradient images [13], [15].
We consider that true image segmentation processes are basedupon regions. The goal of the process is to identify regions (seg-ments) that satisfy some criteria. Spatial aspects are involved inthe criteria. A typical agglomerative approach involves the se-quential merging of regions [6], [16]–[18]. The first techniquesused threshold-based decision. More powerful techniques nowuse iterative optimization processes [19]–[22].
Segmentation consists of the sequential merges of similar seg-ments. Development of a segmentation process involves the def-inition of an appropriate segment similarity measure. A proba-bilistic approach is often used. The similarity measure is relatedto testing if the two segments belong to the same population. Alikelihood ratio test is often used [6], [16]. For example, for thepolarimetric complex Wishart distribution model, the equality ofthe covariance matrices is tested. Similar measures are used inpixel or region classification. However, in segmentation, the sizesof segments vary, which introduces difficulties and differentiatesit from classification. In classification, we have reliable class sta-tistics again with the pixel or region statistics compared. In seg-mentation, the statistics of two segments are compared, and theresult could be quite unreliable if the segments are small. Further-more, the evaluation is a difficult problem in segmentation. Thegoal is to divide the image into distinct self-similar regions. Clas-sification error can not generally be used. This paper proposes alikelihood approximation approach. A likelihood measure of apartition is defined and used as a global objective function to opti-mize. In the hierarchical segmentation framework, the local seg-ment merging criterion is derived from the global criterion. Thisensures that each merging step does its best to optimize the globalcriterion.
0196-2892/04$20.00 © 2004 IEEE

2064 IEEE TRANSACTIONS ON GEOSCIENCE AND REMOTE SENSING, VOL. 42, NO. 10, OCTOBER 2004
Section II presents a hierarchical segmentation algorithmbased on stepwise optimization. Image segmentation is thenpresented as a likelihood approximation problem. The stepwiseoptimization criterion is derived from the global likelihoodpartition measure. Segmentation of homogeneous polarimetricSAR images is examined in Section IV. Stepwise criteria arederived for the multidimensional complex Gaussian distributionand the complex Wishart distribution. Segmentation of texturedimage is examined in Section V. The segmentation criterion isderived for the K-distribution. Segmentation results are thenpresented for Convair-580 polarimetric SAR data using theWishart and K-distribution criteria. The partition log likelihoodvalue is used for partition evaluation. Its variation with thepartition size (number of segments) is shown. Section VIIIdiscusses the validity of the different models. The segmentationstrategy should self-adapt to the image field characteristics.
II. HIERARCHICAL SEGMENTATION
A. Region Merging
A segmentation is a partition of the image plane intodisjoint regions such that ,
for , and . A region-merging ap-proach starts from small segments and sequentially merges themto produce larger segments [6], [16], [17], [23], [24]. The initialsegments can contain only one pixel. A logical predicate LP isused to decide if two adjacent segments could be merged. and
are merged if LP is true. For example, two segmentsare merged if the module of the mean difference is smaller thana threshold value. The algorithm stops when no more segmentscould be merged. Different partitions are produced by varyingthe threshold or the logical predicate parameters. The order ofthe comparisons has an important effect on the result. Differentstrategies can be used to guide the order of merges.
B. Hierarchical Stepwise Optimization Algorithm
In pattern recognition, the agglomerative hierarchical clus-tering algorithm is a generally used technique. It is based onstepwise optimization: at each iteration, the two most similarclusters are selected and merged. The result of the clusteringcan be represented by a tree that reflects the hierarchical struc-ture of the data. The addition of the hierarchical structure to auniform (mean value) segment model provides a better descrip-tion of remote sensing images. Crop fields and forest areas arecomposed of subparts that could be decomposed again [17].
A segmentation algorithm derived from hierarchical clus-tering is now presented [25]. A segment similarity measureSC is defined as the stepwise criterion to optimize. Thealgorithm can be defined as follows:
Step i) Define an initial image partition.
Step ii) For each adjacent segment pair, (S ; S ),
calculate the stepwise criterion, SC ; then find
and merge the segments with the minimum criterion
value.
Step iii) Stop, if no more merges are needed; other-
wise, go to Step ii).
We call the algorithm “hierarchical segmentation” to stressthe fact that the complete tree is calculated and meaningful par-titions at any resolution level can be obtained by cutting the treeat the appropriate level. For example, partitions with 500–5000segments could be considered for a 1000 1000 image.
Many different merging strategies and ways of defining themerging order have been proposed [6], [13], [16]–[18]. A seg-mentation method based on a combination of radiometric andgeometric criteria that permits to create a hierarchical networkof regions with a predefined number of resolution levels is de-scribed in [17]. Different merging orders are examined in [18].A segment hierarchy can also be produced by watershed seg-mentation algorithms [13], [15].
C. Global Objective Function
Image segmentation can be presented as an optimizationproblem: find the partition that optimizes a global objectivefunction GOF . Segmentation techniques could limit thechoice of GOF. It is particularly difficult to establish a rela-tion between the GOF and local decisions (logical predicateor stepwise criterion). For example, the mean squared erroraround segment means can be used as GOF. In a hierarchicalsegmentation framework, the corresponding stepwise criterionwas derived in [25]. In Section III, we extend this approach tothe case where a segment is described by an arbitrary pdf. Thestepwise criterion is derived for a global likelihood estimationor approximation problem.
III. IMAGE SEGMENTATION AS A LIKELIHOOD
APPROXIMATION PROBLEM
Image segmentation can be viewed as the transformation ofthe original image into a more abstract description. The imageis represented by a set of regions or segments. Each segment isdescribed by a set of parameters.
A. Maximum-Likelihood Approach
Following a statistical approach, the image segmentation canbe presented as a maximum-likelihood estimation problem. Let
be the value of pixel . The pdf of is a function of the seg-ment that contains the pixel ( ). The pdfs are describedby a set of parameters, . For the segment , the pdf of is
. We assume that the pdf of is only function ofand is conditionally independent of other pixel values. Let bethe set of pixel values for the whole image, . Let
be the set of all for the partition , .The likelihood function of and given is
(1)
We could write the equation as a product of pixel pdfs and takeits logarithm
(2)
is the segment containing the pixel and the parametersare evaluated for the partition . In the maximum-likelihood
BEAULIEU AND TOUZI: SEGMENTATION OF TEXTURED POLARIMETRIC SAR SCENES 2065
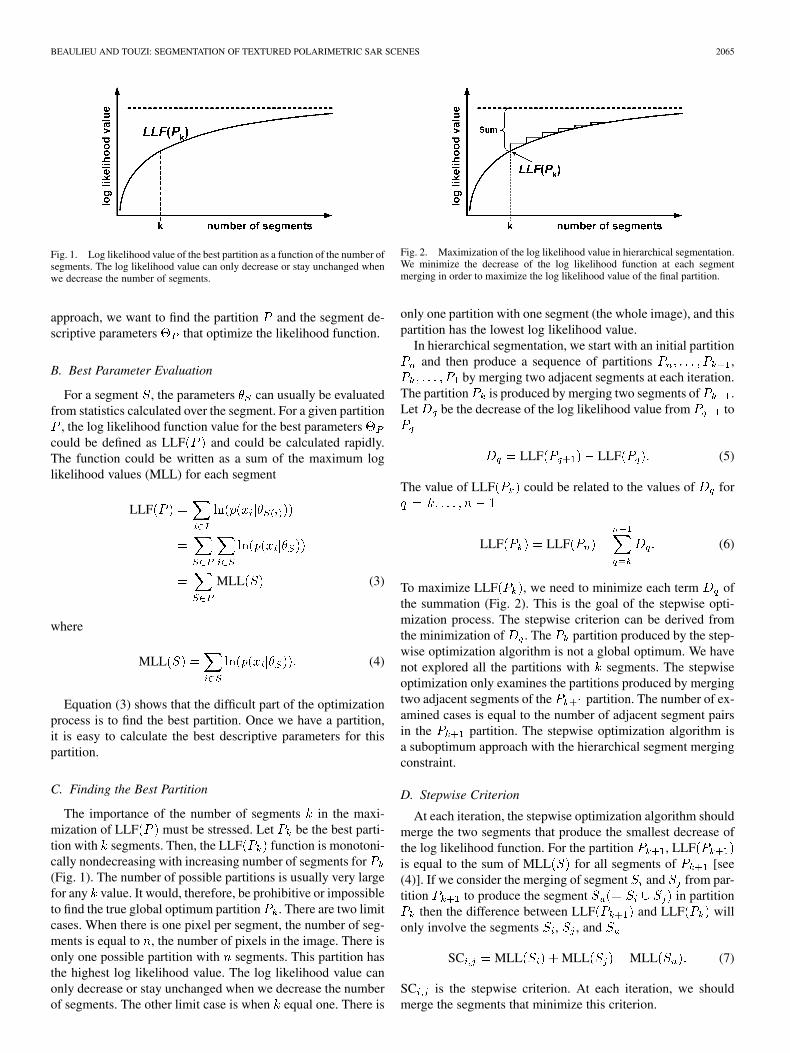
Fig. 1. Log likelihood value of the best partition as a function of the number ofsegments. The log likelihood value can only decrease or stay unchanged whenwe decrease the number of segments.
approach, we want to find the partition and the segment de-scriptive parameters that optimize the likelihood function.
B. Best Parameter Evaluation
For a segment , the parameters can usually be evaluatedfrom statistics calculated over the segment. For a given partition
, the log likelihood function value for the best parameterscould be defined as LLF and could be calculated rapidly.The function could be written as a sum of the maximum loglikelihood values (MLL) for each segment
LLF
MLL (3)
where
MLL (4)
Equation (3) shows that the difficult part of the optimizationprocess is to find the best partition. Once we have a partition,it is easy to calculate the best descriptive parameters for thispartition.
C. Finding the Best Partition
The importance of the number of segments in the maxi-mization of LLF must be stressed. Let be the best parti-tion with segments. Then, the LLF function is monotoni-cally nondecreasing with increasing number of segments for(Fig. 1). The number of possible partitions is usually very largefor any value. It would, therefore, be prohibitive or impossibleto find the true global optimum partition . There are two limitcases. When there is one pixel per segment, the number of seg-ments is equal to , the number of pixels in the image. There isonly one possible partition with segments. This partition hasthe highest log likelihood value. The log likelihood value canonly decrease or stay unchanged when we decrease the numberof segments. The other limit case is when equal one. There is
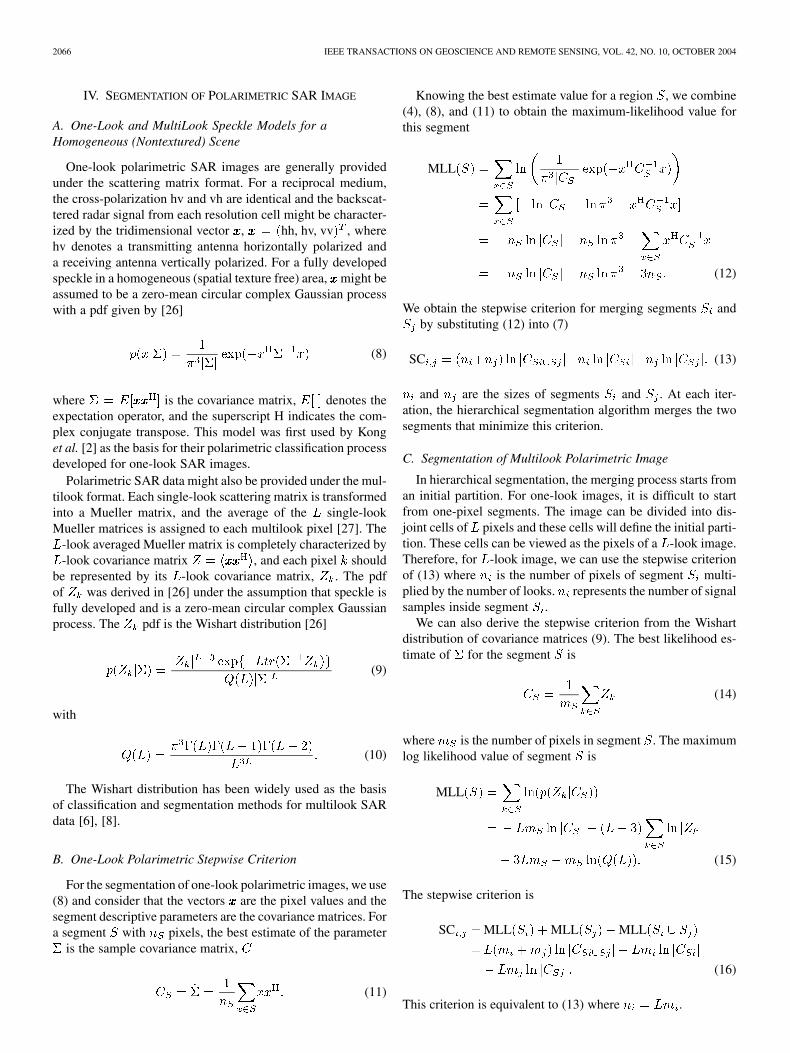
Fig. 2. Maximization of the log likelihood value in hierarchical segmentation.We minimize the decrease of the log likelihood function at each segmentmerging in order to maximize the log likelihood value of the final partition.
only one partition with one segment (the whole image), and thispartition has the lowest log likelihood value.
In hierarchical segmentation, we start with an initial partitionand then produce a sequence of partitions ,
by merging two adjacent segments at each iteration.The partition is produced by merging two segments of .Let be the decrease of the log likelihood value from to
LLF LLF (5)
The value of LLF could be related to the values of for
LLF LLF (6)
To maximize LLF , we need to minimize each term ofthe summation (Fig. 2). This is the goal of the stepwise opti-mization process. The stepwise criterion can be derived fromthe minimization of . The partition produced by the step-wise optimization algorithm is not a global optimum. We havenot explored all the partitions with segments. The stepwiseoptimization only examines the partitions produced by mergingtwo adjacent segments of the partition. The number of ex-amined cases is equal to the number of adjacent segment pairsin the partition. The stepwise optimization algorithm isa suboptimum approach with the hierarchical segment mergingconstraint.
D. Stepwise Criterion
At each iteration, the stepwise optimization algorithm shouldmerge the two segments that produce the smallest decrease ofthe log likelihood function. For the partition , LLFis equal to the sum of MLL for all segments of [see(4)]. If we consider the merging of segment and from par-tition to produce the segment in partition
then the difference between LLF and LLF willonly involve the segments , , and
SC MLL MLL MLL (7)
SC is the stepwise criterion. At each iteration, we shouldmerge the segments that minimize this criterion.
2066 IEEE TRANSACTIONS ON GEOSCIENCE AND REMOTE SENSING, VOL. 42, NO. 10, OCTOBER 2004
IV. SEGMENTATION OF POLARIMETRIC SAR IMAGE
A. One-Look and MultiLook Speckle Models for aHomogeneous (Nontextured) Scene
One-look polarimetric SAR images are generally providedunder the scattering matrix format. For a reciprocal medium,the cross-polarization hv and vh are identical and the backscat-tered radar signal from each resolution cell might be character-ized by the tridimensional vector , hh, hv, vv , wherehv denotes a transmitting antenna horizontally polarized anda receiving antenna vertically polarized. For a fully developedspeckle in a homogeneous (spatial texture free) area, might beassumed to be a zero-mean circular complex Gaussian processwith a pdf given by [26]
(8)
where is the covariance matrix, denotes theexpectation operator, and the superscript H indicates the com-plex conjugate transpose. This model was first used by Konget al. [2] as the basis for their polarimetric classification processdeveloped for one-look SAR images.
Polarimetric SAR data might also be provided under the mul-tilook format. Each single-look scattering matrix is transformedinto a Mueller matrix, and the average of the single-lookMueller matrices is assigned to each multilook pixel [27]. The
-look averaged Mueller matrix is completely characterized by-look covariance matrix , and each pixel should
be represented by its -look covariance matrix, . The pdfof was derived in [26] under the assumption that speckle isfully developed and is a zero-mean circular complex Gaussianprocess. The pdf is the Wishart distribution [26]
(9)
with
(10)
The Wishart distribution has been widely used as the basisof classification and segmentation methods for multilook SARdata [6], [8].
B. One-Look Polarimetric Stepwise Criterion
For the segmentation of one-look polarimetric images, we use(8) and consider that the vectors are the pixel values and thesegment descriptive parameters are the covariance matrices. Fora segment with pixels, the best estimate of the parameter
is the sample covariance matrix,
(11)
Knowing the best estimate value for a region , we combine(4), (8), and (11) to obtain the maximum-likelihood value forthis segment
MLL
(12)
We obtain the stepwise criterion for merging segments andby substituting (12) into (7)
SC (13)
and are the sizes of segments and . At each iter-ation, the hierarchical segmentation algorithm merges the twosegments that minimize this criterion.
C. Segmentation of Multilook Polarimetric Image
In hierarchical segmentation, the merging process starts froman initial partition. For one-look images, it is difficult to startfrom one-pixel segments. The image can be divided into dis-joint cells of pixels and these cells will define the initial parti-tion. These cells can be viewed as the pixels of a -look image.Therefore, for -look image, we can use the stepwise criterionof (13) where is the number of pixels of segment multi-plied by the number of looks. represents the number of signalsamples inside segment .
We can also derive the stepwise criterion from the Wishartdistribution of covariance matrices (9). The best likelihood es-timate of for the segment is
(14)
where is the number of pixels in segment . The maximumlog likelihood value of segment is
MLL
(15)
The stepwise criterion is
SC MLL MLL MLL
(16)
This criterion is equivalent to (13) where .
BEAULIEU AND TOUZI: SEGMENTATION OF TEXTURED POLARIMETRIC SAR SCENES 2067
D. Comparison With Hypothesis Testing
A statistical hypothesis testing approach can be employed forimage segmentation. The likelihood ratio test has been used bymany authors for SAR image segmentation [6], [16]. The seg-mentation method proposed in this paper is equivalent to re-gion merging based on likelihood ratio test with an optimizedmerging order, where the least different couple of neighboringregions (according to the test) is merged in each step [6], [16].For polarimetric images, two segments can be merged if theircovariance matrices are not significantly different, which meansthat the observed sample covariance matrices are likely to be-long to the same population. The test statistic is then equivalentto SC of (16) [6], [28].
V. TEXTURED SCENE AND K DISTRIBUTION
The complex Gaussian and Wishart distributions were de-rived to model pure fully developed speckle that is a zero-meancomplex circular Gaussian process. In the presence of spatialtexture, the circular Gaussian assumption is no longer valid,and both the complex Gaussian and Wishart models cannot beused. In textured areas, the “polarimetric” product model, whichwas first introduced by Yueh et al. is currently the most usedspeckle-scene model [29], [30].
A. K-Distributed Covariance Matrix
For textured areas, the product model was used in [31] and[32], [1] to derive the statistics of the covariance matrix fora gamma-distributed scene signal
(17)
with
(18)
where is the texture shape parameter and is the covari-ance of the speckle without texture. is the modified Besselfunction.
B. Stepwise Criterion
The segmentation stepwise criterion for the product modelcould be derived from (4), (7), and (17). After removing theterms that will be cancelled in the stepwise criterion, the max-imum log likelihood value for segment is
MLL
(19)
is the size of segment . and are the best likelihood esti-mates of and for the segment , i.e., the values that maxi-mize (19). Unfortunately, there is no closed-form analytical so-lution for the parameter estimates [33]. A numerical solution canbe computed, but the computing time will be excessive for thesegmentation process. We should stress that (19) involve sum-mations over all pixels of the segment . The computingtime grows with the size of the segment. This was not the casefor (16) with the Wishart distribution.
Alternate approximate solutions have been proposed [34].The population speckle covariance matrix could be approxi-mated by the sample covariance matrix, i.e., by the segmentmean value of the signal covariance matrices
(20)
The shape parameter is estimated by the method of moment(MoM) [34]. From the one-look data, we calculate the variationcoefficients from the intensity of the hh, hv, and vv compo-nents over the segment. The shape parameter is estimated by
(21)
VI. HIGH-RESOLUTION SEGMENTATION
The processing of polarimetric SAR images is difficult be-cause of the large variance of the speckle multiplicative noise.We need to average over a large set of homogeneous pixels inorder to obtain accurate measures. In hierarchical image seg-mentation, the resolution of the final partition is defined by thesize of the initial segments. To have a good resolution, the ini-tial segments should have few pixels. The sample covariancematrices of those segments will be very noisy. It will be difficultthen to discriminate between regions with small value differ-ences. To improve the results, we combine segment shape mea-sures with the stepwise criterion. The covariance matrix modelshould also be adapted to small segments.
A. Covariance Matrix Model
The covariance matrix is defined by three real values (diag-onal elements) and three complex values (correlation elements).The determinants of the sample covariance matrices are usedin the stepwise criterion SC of (16). When segments containonly few samples or pixels, the correlation elements of the co-variance matrix could be very noisy because of the presence ofspeckle [38]. Then, the value of the determinant will be unreli-able. It is better to use a simpler data model that assumes homo-geneous regions with no correlation between the vector com-ponents, hh, hv, vv . The criterion is calculated on eachchannel independently and summed together. This is equivalentto evaluating the determinant with only the diagonal elements.The segmentation process starts with the modified criterion andchanges to the full matrix criterion for segment of 20 looks orlarger. Weighting factors are used for a gradual transition.
2068 IEEE TRANSACTIONS ON GEOSCIENCE AND REMOTE SENSING, VOL. 42, NO. 10, OCTOBER 2004
(a) (b)
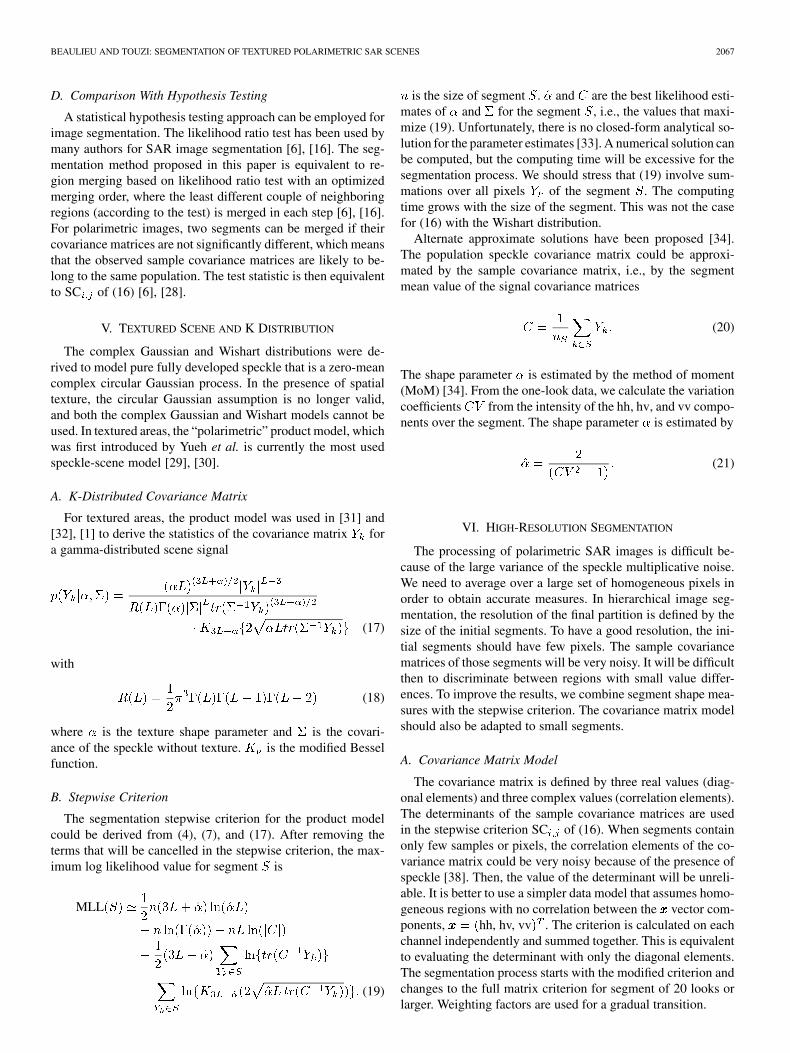
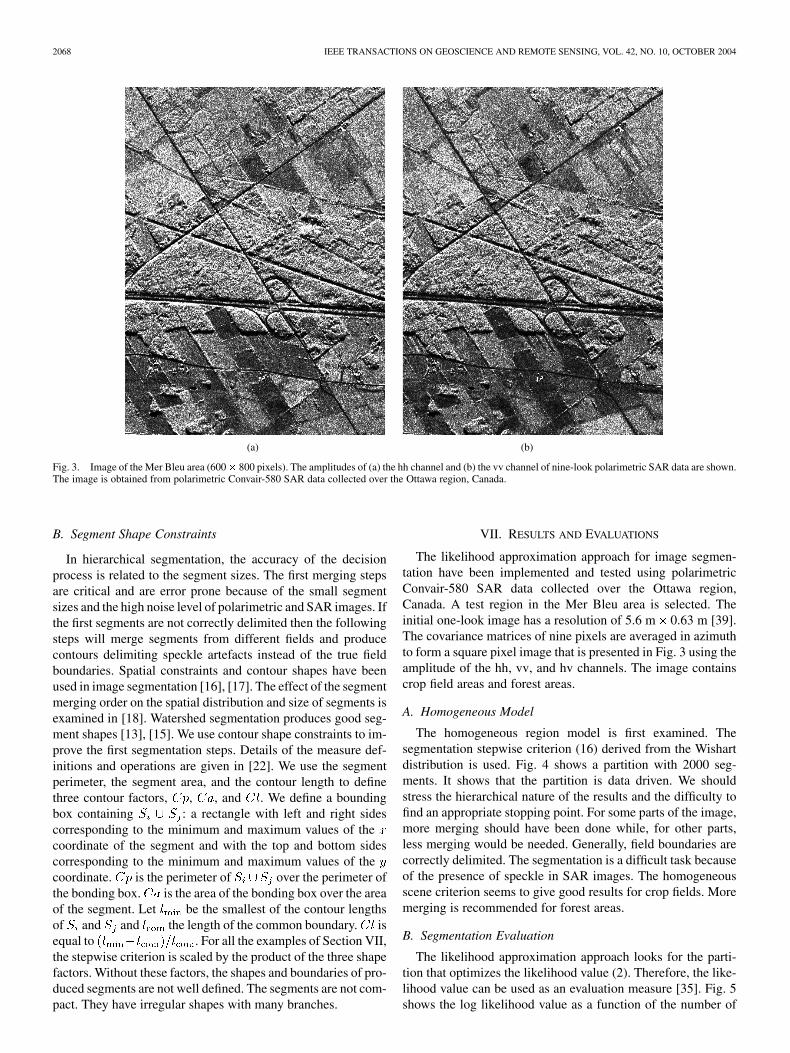
Fig. 3. Image of the Mer Bleu area (600� 800 pixels). The amplitudes of (a) the hh channel and (b) the vv channel of nine-look polarimetric SAR data are shown.The image is obtained from polarimetric Convair-580 SAR data collected over the Ottawa region, Canada.
B. Segment Shape Constraints
In hierarchical segmentation, the accuracy of the decisionprocess is related to the segment sizes. The first merging stepsare critical and are error prone because of the small segmentsizes and the high noise level of polarimetric and SAR images. Ifthe first segments are not correctly delimited then the followingsteps will merge segments from different fields and producecontours delimiting speckle artefacts instead of the true fieldboundaries. Spatial constraints and contour shapes have beenused in image segmentation [16], [17]. The effect of the segmentmerging order on the spatial distribution and size of segments isexamined in [18]. Watershed segmentation produces good seg-ment shapes [13], [15]. We use contour shape constraints to im-prove the first segmentation steps. Details of the measure def-initions and operations are given in [22]. We use the segmentperimeter, the segment area, and the contour length to definethree contour factors, , , and . We define a boundingbox containing : a rectangle with left and right sidescorresponding to the minimum and maximum values of thecoordinate of the segment and with the top and bottom sidescorresponding to the minimum and maximum values of thecoordinate. is the perimeter of over the perimeter ofthe bonding box. is the area of the bonding box over the areaof the segment. Let be the smallest of the contour lengthsof and and the length of the common boundary. isequal to . For all the examples of Section VII,the stepwise criterion is scaled by the product of the three shapefactors. Without these factors, the shapes and boundaries of pro-duced segments are not well defined. The segments are not com-pact. They have irregular shapes with many branches.
VII. RESULTS AND EVALUATIONS
The likelihood approximation approach for image segmen-tation have been implemented and tested using polarimetricConvair-580 SAR data collected over the Ottawa region,Canada. A test region in the Mer Bleu area is selected. Theinitial one-look image has a resolution of 5.6 m 0.63 m [39].The covariance matrices of nine pixels are averaged in azimuthto form a square pixel image that is presented in Fig. 3 using theamplitude of the hh, vv, and hv channels. The image containscrop field areas and forest areas.
A. Homogeneous Model
The homogeneous region model is first examined. Thesegmentation stepwise criterion (16) derived from the Wishartdistribution is used. Fig. 4 shows a partition with 2000 seg-ments. It shows that the partition is data driven. We shouldstress the hierarchical nature of the results and the difficulty tofind an appropriate stopping point. For some parts of the image,more merging should have been done while, for other parts,less merging would be needed. Generally, field boundaries arecorrectly delimited. The segmentation is a difficult task becauseof the presence of speckle in SAR images. The homogeneousscene criterion seems to give good results for crop fields. Moremerging is recommended for forest areas.
B. Segmentation Evaluation
The likelihood approximation approach looks for the parti-tion that optimizes the likelihood value (2). Therefore, the like-lihood value can be used as an evaluation measure [35]. Fig. 5shows the log likelihood value as a function of the number of

BEAULIEU AND TOUZI: SEGMENTATION OF TEXTURED POLARIMETRIC SAR SCENES 2069
Fig. 4. Partition with 2000 segments produced by the Wishart stepwisecriterion.
segments of the partition. The total log likelihood value is di-vided by the image size to produce the average per pixel value.The value decreases when the number of segments is decreasedby merging. It starts with 480 000 segments of one pixel. After240 000 merges, we have a partition with 240 000 segments withan average size of two pixels. The first merges can be donewith small decreases of the log likelihood value. The interestingpart is for partitions with 500–10 000 segments, where decreasesare more important. Fig. 6 shows that the log likelihood valuedrops rapidly as segments get bigger. A log scale for the numberof segments can provide a better representation, as shown inFig. 7. The average log likelihood value for the 2000 segmentpartition is 23.8. The regular shape of the curves suggests thatthe segmentation process is appropriate to maximize the likeli-hood value. Similar curves are obtained with the K-distributioncriterion.
The process gives to the user the choice of the stopping point.The stepwise criterion reflects low level signal description: thespeckle statistics. On the other hand, the stopping point is morerelated to the user objective: what levels of details are neededby the application. The curves show that the user could use theaverage log likelihood value or the partition size to specify thestopping point.
For a given partition, the log likelihood value can be calcu-lated for each pixel of the image. A normalization is neededif we want to use the resulting image to visually evaluate thepartition. The likelihood corresponds to a probability densitythat is function of the distribution width. Large likelihood valueswill be observed in areas where the determinant of the covari-
Fig. 5. Average log likelihood of a partition as a function of the number ofsegments for the Wishart model.
Fig. 6. Average log likelihood values for partitions that have a number ofsegments between 1–10 000.
Fig. 7. Average log likelihood values as a function of the log of the partitionsize.
ance matrix is small. To remove this effect, we “normalize” thepixel values such that the determinant of the segment covariance
2070 IEEE TRANSACTIONS ON GEOSCIENCE AND REMOTE SENSING, VOL. 42, NO. 10, OCTOBER 2004
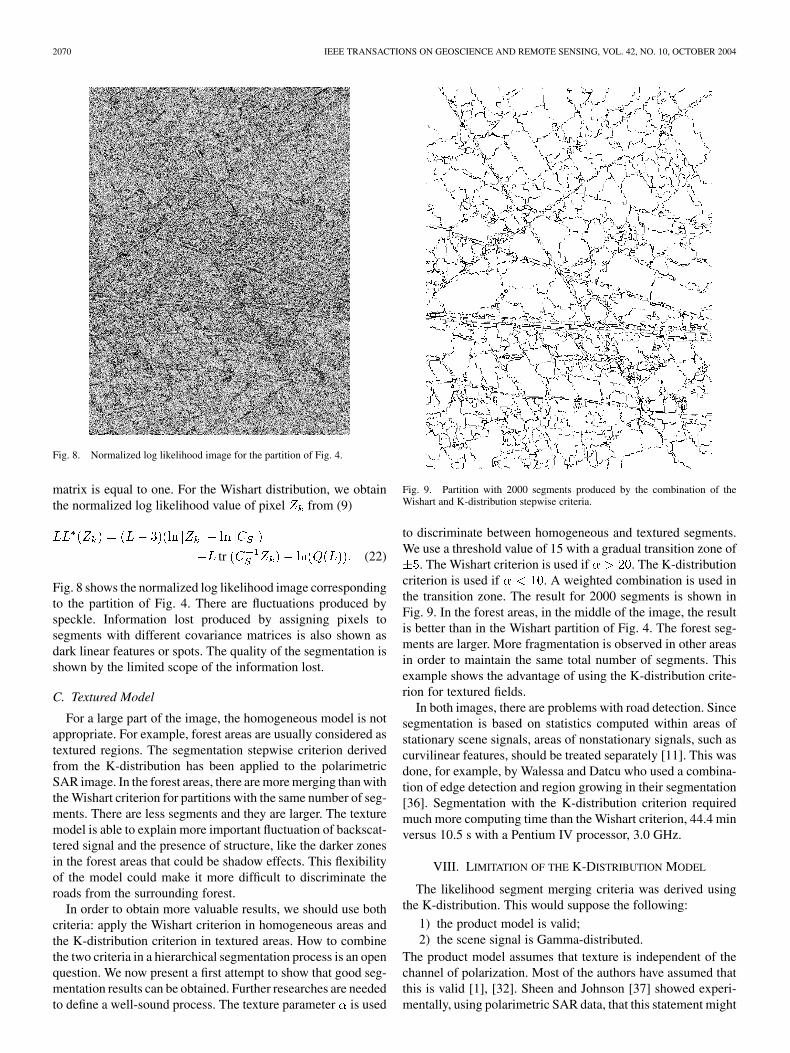
Fig. 8. Normalized log likelihood image for the partition of Fig. 4.
matrix is equal to one. For the Wishart distribution, we obtainthe normalized log likelihood value of pixel from (9)
tr (22)
Fig. 8 shows the normalized log likelihood image correspondingto the partition of Fig. 4. There are fluctuations produced byspeckle. Information lost produced by assigning pixels tosegments with different covariance matrices is also shown asdark linear features or spots. The quality of the segmentation isshown by the limited scope of the information lost.
C. Textured Model
For a large part of the image, the homogeneous model is notappropriate. For example, forest areas are usually considered astextured regions. The segmentation stepwise criterion derivedfrom the K-distribution has been applied to the polarimetricSAR image. In the forest areas, there are more merging than withthe Wishart criterion for partitions with the same number of seg-ments. There are less segments and they are larger. The texturemodel is able to explain more important fluctuation of backscat-tered signal and the presence of structure, like the darker zonesin the forest areas that could be shadow effects. This flexibilityof the model could make it more difficult to discriminate theroads from the surrounding forest.
In order to obtain more valuable results, we should use bothcriteria: apply the Wishart criterion in homogeneous areas andthe K-distribution criterion in textured areas. How to combinethe two criteria in a hierarchical segmentation process is an openquestion. We now present a first attempt to show that good seg-mentation results can be obtained. Further researches are neededto define a well-sound process. The texture parameter is used
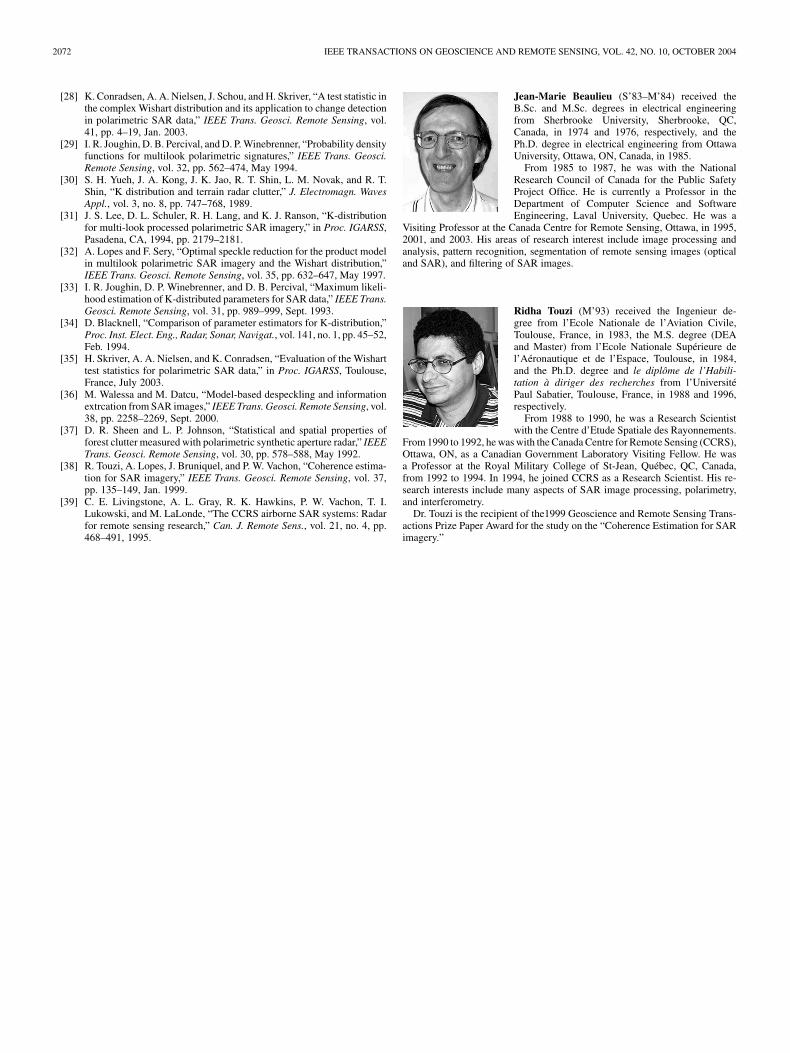
Fig. 9. Partition with 2000 segments produced by the combination of theWishart and K-distribution stepwise criteria.
to discriminate between homogeneous and textured segments.We use a threshold value of 15 with a gradual transition zone of
. The Wishart criterion is used if . The K-distributioncriterion is used if . A weighted combination is used inthe transition zone. The result for 2000 segments is shown inFig. 9. In the forest areas, in the middle of the image, the resultis better than in the Wishart partition of Fig. 4. The forest seg-ments are larger. More fragmentation is observed in other areasin order to maintain the same total number of segments. Thisexample shows the advantage of using the K-distribution crite-rion for textured fields.
In both images, there are problems with road detection. Sincesegmentation is based on statistics computed within areas ofstationary scene signals, areas of nonstationary signals, such ascurvilinear features, should be treated separately [11]. This wasdone, for example, by Walessa and Datcu who used a combina-tion of edge detection and region growing in their segmentation[36]. Segmentation with the K-distribution criterion requiredmuch more computing time than the Wishart criterion, 44.4 minversus 10.5 s with a Pentium IV processor, 3.0 GHz.
VIII. LIMITATION OF THE K-DISTRIBUTION MODEL
The likelihood segment merging criteria was derived usingthe K-distribution. This would suppose the following:
1) the product model is valid;2) the scene signal is Gamma-distributed.
The product model assumes that texture is independent of thechannel of polarization. Most of the authors have assumed thatthis is valid [1], [32]. Sheen and Johnson [37] showed experi-mentally, using polarimetric SAR data, that this statement might

BEAULIEU AND TOUZI: SEGMENTATION OF TEXTURED POLARIMETRIC SAR SCENES 2071
Fig. 10. Between channel dynamic range of variation coefficient for a forestarea.
not be true. The product model assumption has been assessedhere within a forested area using the Convair-580 SAR dataset.The coefficient of variation is computed for each channel withinsufficiently large windows (more than 1000 independent sam-ples). The dynamic range of the coefficient of variation reachesfor given samples 5% to 6%, as seen in Fig. 10. This demon-strates that the texture might be polarization dependent, and assuch, the product model assumption is not all the time valid.
Consequently, the product model should be assessed prior tothe application of the segmentation. In addition, the scene signalintensity should be Gamma distributed. This property has beenaccepted for forested areas, and the K-distribution segmenta-tion should be limited to such areas under the condition thatthe product model is valid. We are developing a segmentationstrategy that will self-adapt to the area characteristics. In the fu-ture, the likelihood segment merging criteria will be derived forother distributions (lognormal, Weibull, etc.) in order to extendthe use of the segmentation algorithm to more varieties of tex-ture, under the product model assumption. The process of com-bining the different texture models in the segmentation strategywill be carefully examined.
IX. CONCLUSION
A general powerful segmentation approach based uponlikelihood approximation has been presented. Its adaptation forsegmentation of homogeneous and textured scenes was shown.Better results are obtained with the K-distribution segmentationthan with the Gaussian and Wishart distribution within texturedareas. The likelihood criteria should be derived for other texturemodels to extend the application of the segmentation. Theproduct model is only limited to texture that are independent ofpolarization. A more general model that takes into account po-larization texture dependence is currently being developed, andwill be integrated in the segmentation to extend its applicationto a wider range of targets. The most well-known classificationtechniques, which are also based on the Gaussian and Wishartmodel, should be also improved by integrating more suitabletexture models.
REFERENCES
[1] C. Oliver and S. Quegan, Understanding Synthetic Aperture Radar Im-ages. Boston, MA: Artech House, 1998.
[2] J. A. Kong, A. S. Swartz, H. A. Yueh, L. M. Novak, and R. T. Shin,“Identification of terrain cover using the optimum polarimeter classifer,”J. Electromagn. Waves Appl., vol. 2, no. 2, pp. 171–194, 1988.
[3] H. H. Lim, A. A. Swartz, J. A. Kong, R. T. Shin, and J. J. Van Zyl, “Clas-sification of earth terrain using polarimetric synthetic aperture radar im-ages,” J. Geophys. Res., vol. 94, pp. 7049–7057, June 1989.
[4] E. Rignot, “Unsupervised segmentation of polarimetric SAR data usingthe covariance matrix,” IEEE Trans. Geosci. Remote Sensing, vol. 30,pp. 697–705, July 1992.
[5] J. S. Lee, M. R. Grunes, and R. Kwok, “Classification of multi-lookpolarimetric SAR imaging based on complex Wishart distributions,” Int.J. Remote Sens., vol. 15, no. 11, pp. 2299–2311, 1994.
[6] H. Skriver, J. Schou, A. A. Nielsen, and K. Conradsen, “Polarimetricsegmentation using the complex Wishart test statistic,” in Proc. IGARSS,Toronto, ON, Canada, 2002.
[7] D. M. Smith, “Speckle reduction and segmentation of synthetic apertureradar images,” Int. J. Remote Sens., vol. 17, no. 11, pp. 2043–2057, 1996.
[8] J. S. Lee, M. R. Grunes, T. L. Ainsworth, L. J. Du, D. L. Schuler, and S.R. Cloude, “Unsupervised classification using polarimetric decomposi-tion and the complex Wishart classifier,” IEEE Trans. Geosci. RemoteSensing, vol. 37, pp. 2249–2258, Sept. 1999.
[9] G. Liu, H. Xiong, and S. Huang, “Study on segmentation and interpreta-tion of multi-look polarimetric SAR images,” Int. J. Remote Sens., vol.21, no. 8, pp. 1675–1691, 2000.
[10] R. Touzi, A. Lopes, and P. Bousquet, “A statistical and geometrical edgedetector for SAR image,” IEEE Trans. Geosci. Remote Sensing, vol. 26,pp. 764–773, Nov. 1988.
[11] R. Touzi, “A review of speckle filtering in the context of estimationtheory,” IEEE Trans. Geosci. Remote Sensing, vol. 40, pp. 2392–2404,Nov. 2002.
[12] J. Le Moigne and J. C. Tilton, “Refining image segmentation by integra-tion of edge and region data,” IEEE Trans. Geosci. Remote Sensing, vol.33, pp. 605–615, May 1995.
[13] R. Fjortoft, A. Lopes, P. Marthon, and E. Cubero-Castan, “An optimalmultiedge detector for SAR image segmentation,” IEEE Trans. Geosci.Remote Sensing, vol. 36, pp. 793–802, May 1998.
[14] R. Caves, S. Quegan, and R. White, “Quantitative comparison of theperformance of SAR segmentation algorithms,” IEEE Trans. Image Pro-cessing, vol. 7, pp. 1534–1546, Nov. 1998.
[15] L. Najman and M. Schmitt, “Geodesic saliency of watershed contoursand hierarchical segmentation,” IEEE Trans. Pattern Anal. Machine In-tell., vol. 18, pp. 1163–1173, Dec. 1996.
[16] R. Cook, I. McConnell, C. Oliver, and E. Welbourne, “MUM (Mergeusing moments) segmentation for SAR images,” Proc. SPIE, vol. 2316,pp. 92–103, 1994.
[17] U. C. Benz, P. Hofmann, G. Willhauck, I. Lingenfelder, and M. Heynen,“Multi-resolution, object-oriented fuzzy analysis of remote sensing datafor GIS-ready information,” ISPRS J. Photogram. Remote Sens., vol. 58,pp. 239–258, 2004.
[18] M. Baatz and A. Schäpe, “Multiresolution segmentation: An optimiza-tion approach for high quality multi-scale image segmentation,” in Proc.Angewandte Geographische Informationsverarbeitung XII. Beiträgezum AGIT-Symp. Salzburg 2000, Karlsruhe, Germnay, 2000, pp. 12–23.
[19] Y. Dong, B. C. Forester, and A. K. Milne, “Segmentation of radar im-agery using the Gaussian Markov random field model,” Int. J. RemoteSens., vol. 20, no. 8, pp. 1617–1639, 1999.
[20] J. Lira and L. Frulla, “An automated region growing algorithm for seg-mentation of texture regions in SAR images,” Int. J. Remote Sens., vol.19, no. 18, pp. 3593–3606, 1998.
[21] R. Cook, I. McConnell, D. Stewart, and C. J. Oliver, “Segmentation andsimulated annealing,” Proc. SPIE, vol. 2958, pp. 30–37, 1996.
[22] J. M. Beaulieu, “Utilization of contour criteria in micro-segmentationof SAR images,” Int. J. Remote Sens., vol. 25, no. 17, pp. 3497–3512,2004.
[23] R. M. Haralick and L. G. Shapiro, “Survey: Image segmentation tech-niques,” Comput. Vis. Graph. Image Process., vol. 29, pp. 100–132,1985.
[24] S. W. Zucker, “Region growing: Childhood and adolescence,” Comput.Graph. lmage Process., vol. 5, pp. 382–399, 1976.
[25] J. M. Beaulieu and M. Goldberg, “Hierarchy in picture segmentation: Astep-wise optimization approach,” IEEE Trans. Pattern Anal. MachineIntell., vol. 11, pp. 150–163, Feb. 1989.
[26] J. W. Goodman, “Statistical analysis based on a certain multivariatecomplex Gaussian distribution,” Ann. Math. Stat., vol. 34, no. 152, pp.152–180, 1963.
[27] P. C. Dubois and L. Norikane, “Data volume reduction for imaging radarpolarimetry,” in Proc. IGARRS, 1987, pp. 691–697.
2072 IEEE TRANSACTIONS ON GEOSCIENCE AND REMOTE SENSING, VOL. 42, NO. 10, OCTOBER 2004
[28] K. Conradsen, A. A. Nielsen, J. Schou, and H. Skriver, “A test statistic inthe complex Wishart distribution and its application to change detectionin polarimetric SAR data,” IEEE Trans. Geosci. Remote Sensing, vol.41, pp. 4–19, Jan. 2003.
[29] I. R. Joughin, D. B. Percival, and D. P. Winebrenner, “Probability densityfunctions for multilook polarimetric signatures,” IEEE Trans. Geosci.Remote Sensing, vol. 32, pp. 562–474, May 1994.
[30] S. H. Yueh, J. A. Kong, J. K. Jao, R. T. Shin, L. M. Novak, and R. T.Shin, “K distribution and terrain radar clutter,” J. Electromagn. WavesAppl., vol. 3, no. 8, pp. 747–768, 1989.
[31] J. S. Lee, D. L. Schuler, R. H. Lang, and K. J. Ranson, “K-distributionfor multi-look processed polarimetric SAR imagery,” in Proc. IGARSS,Pasadena, CA, 1994, pp. 2179–2181.
[32] A. Lopes and F. Sery, “Optimal speckle reduction for the product modelin multilook polarimetric SAR imagery and the Wishart distribution,”IEEE Trans. Geosci. Remote Sensing, vol. 35, pp. 632–647, May 1997.
[33] I. R. Joughin, D. P. Winebrenner, and D. B. Percival, “Maximum likeli-hood estimation of K-distributed parameters for SAR data,” IEEE Trans.Geosci. Remote Sensing, vol. 31, pp. 989–999, Sept. 1993.
[34] D. Blacknell, “Comparison of parameter estimators for K-distribution,”Proc. Inst. Elect. Eng., Radar, Sonar, Navigat., vol. 141, no. 1, pp. 45–52,Feb. 1994.
[35] H. Skriver, A. A. Nielsen, and K. Conradsen, “Evaluation of the Wisharttest statistics for polarimetric SAR data,” in Proc. IGARSS, Toulouse,France, July 2003.
[36] M. Walessa and M. Datcu, “Model-based despeckling and informationextrcation from SAR images,” IEEE Trans. Geosci. Remote Sensing, vol.38, pp. 2258–2269, Sept. 2000.
[37] D. R. Sheen and L. P. Johnson, “Statistical and spatial properties offorest clutter measured with polarimetric synthetic aperture radar,” IEEETrans. Geosci. Remote Sensing, vol. 30, pp. 578–588, May 1992.
[38] R. Touzi, A. Lopes, J. Bruniquel, and P. W. Vachon, “Coherence estima-tion for SAR imagery,” IEEE Trans. Geosci. Remote Sensing, vol. 37,pp. 135–149, Jan. 1999.
[39] C. E. Livingstone, A. L. Gray, R. K. Hawkins, P. W. Vachon, T. I.Lukowski, and M. LaLonde, “The CCRS airborne SAR systems: Radarfor remote sensing research,” Can. J. Remote Sens., vol. 21, no. 4, pp.468–491, 1995.
Jean-Marie Beaulieu (S’83–M’84) received theB.Sc. and M.Sc. degrees in electrical engineeringfrom Sherbrooke University, Sherbrooke, QC,Canada, in 1974 and 1976, respectively, and thePh.D. degree in electrical engineering from OttawaUniversity, Ottawa, ON, Canada, in 1985.
From 1985 to 1987, he was with the NationalResearch Council of Canada for the Public SafetyProject Office. He is currently a Professor in theDepartment of Computer Science and SoftwareEngineering, Laval University, Quebec. He was a
Visiting Professor at the Canada Centre for Remote Sensing, Ottawa, in 1995,2001, and 2003. His areas of research interest include image processing andanalysis, pattern recognition, segmentation of remote sensing images (opticaland SAR), and filtering of SAR images.
Ridha Touzi (M’93) received the Ingenieur de-gree from l’Ecole Nationale de l’Aviation Civile,Toulouse, France, in 1983, the M.S. degree (DEAand Master) from l’Ecole Nationale Supérieure del’Aéronautique et de l’Espace, Toulouse, in 1984,and the Ph.D. degree and le diplôme de l’Habili-tation à diriger des recherches from l’UniversitéPaul Sabatier, Toulouse, France, in 1988 and 1996,respectively.
From 1988 to 1990, he was a Research Scientistwith the Centre d’Etude Spatiale des Rayonnements.
From 1990 to 1992, he was with the Canada Centre for Remote Sensing (CCRS),Ottawa, ON, as a Canadian Government Laboratory Visiting Fellow. He wasa Professor at the Royal Military College of St-Jean, Québec, QC, Canada,from 1992 to 1994. In 1994, he joined CCRS as a Research Scientist. His re-search interests include many aspects of SAR image processing, polarimetry,and interferometry.
Dr. Touzi is the recipient of the1999 Geoscience and Remote Sensing Trans-actions Prize Paper Award for the study on the “Coherence Estimation for SARimagery.”