
Detection of gullies in roughly textured terrain using airborne laser scanning data
15
Detection of gullies in roughly textured terrain using airborne laser scanning data Amit Baruch ⇑ , Sagi Filin Department of Transportation and Geo-Information Engineering, Technion – Israel Institute of Technology, Technion City, Haifa 32000, Israel article info Article history: Received 30 March 2010 Received in revised form 16 March 2011 Accepted 17 March 2011 Available online 29 April 2011 Keywords: LiDAR Detection Gullies Airborne laser scanning Morphology abstract Airborne laser scanning data contain information about surface features, some of which are of subtle form. These features are usually embedded within the terrain, and rarely form distinct shape-transition to their surroundings. While some efforts have been made in extracting linear elements from laser scan- ning data, attention was mostly turned to dominant elements that are very clear and distinct. We present in this paper a detection model for gullies of various dimensions using airborne laser scanning data. Gul- lies are regarded as one of the main landform-reshaping agents, having a pejorative effect on the environ- ment and on regional development. They are commonly observed along receding lakes as a common response to water-level drop. The paper demonstrates how a multi-scale approach enables the extraction of various gully forms, from well developed to subtle. It then proposes an optimization driven model for handling fragmentation in the detection. Results show that using the proposed model, gully networks can be reconstructed and 30 cm deep features can be identified and separated from their surroundings using moderate point density data. Ó 2011 International Society for Photogrammetry and Remote Sensing, Inc. (ISPRS). Published by Elsevier B.V. All rights reserved. 1. Introduction Owing to its accurate and detailed surface characterization, air- borne laser scanning offers an excellent means for landform docu- mentation. However, the attractiveness of this technology is encumbered by the volume of data, feature span, and their com- plex nature; rendering manual quantification difficult. In contrast with objects like buildings and trees, which form a distinct topo- graphic signature in the landscape, land features such as gullies are usually embedded within the terrain, hardly forming distinct surface signatures. Their varying size, form, and appearance add further challenges to their detection. This paper presents a new method for the detection of gullies from airborne laser scanning data, focusing on those of modest size that are embedded within roughly textured terrain. Gullies are regarded as one of the main landform-reshaping agents contributing to land degradation (Poesen et al., 2003; Wu and Cheng, 2005; Valentin et al., 2005). They develop through sur- face-runoff concentration at the gully head (termed nickpoint) and evolve via three main processes – headcutting, which refers to the upslope migration of the nickpoint (lengthening the gully); downcutting, which refers to deepening and widening of the gully bottom; and sidewall collapse which contributes to their broaden- ing. Their evolution is often rapid during the initiation period when morphological characteristics have not yet reached a stable state (Brooks et al., 2003; Valentin et al., 2005). Even though gully dimensions can be relatively modest, they concentrate runoff and prevent floodwater irrigation. They thereby disallow for normal land use, and are often considered responsible for enhanced drain- age, accelerated land degradation, and consequent aridification (Ries and Marzolff, 2003; Poesen et al., 2003; Avni, 2005; Valentin et al., 2005). Gullies may also have severe impact on existing infra- structure. Such examples can be observed along receding lakes (e.g., Lake Chad, the Aral Sea, and the Dead Sea – Glazovsky, 1995; Mainguet and Le’tolle, 1998; Avni et al., 2005; see Fig. 1a), where newly exposed soil (composed mostly of unconsolidated costal material) is subjected to rapid gully development, which can reach orders of 100 my 1 (Avni et al., 2005). Their development along the coastal plains causes heavy damages to infrastructure (Fig. 1b), and generates a severe threat to the future of the regions in which they occur (Mainguet and Le’tolle, 1998; Valentin et al., 2005; Avni et al., 2005; Ben Moshe et al., 2008). Presently, erosion and active-morphology studies make use of traditional land-surveying techniques (Wu and Cheng, 2005; Avni, 2005; Ben Moshe et al., 2008), spaceborne images (Giordano and Marchisio, 1991; Martínez-Casasnovas and Stuiver, 1998; Torrion, 2001; Liberti et al., 2009), or photogrammetrically derived digital elevation models in low (Ries and Marzolff, 2003; Martínez- Casasnovas et al., 2003), and higher resolution (Betts and DeRose, 1999; Martínez-Casasnovas et al., 2004). Despite the technological advances that allow gully erosion to be measured, these techniques require an intensive acquisition phase, are limited in scope, and are usually insufficient to describe small- to medium-scale systems 0924-2716/$ - see front matter Ó 2011 International Society for Photogrammetry and Remote Sensing, Inc. (ISPRS). Published by Elsevier B.V. All rights reserved. doi:10.1016/j.isprsjprs.2011.03.001 ⇑ Corresponding author. Tel.: +972 4 8295855. E-mail addresses: [email protected] (A. Baruch), fi[email protected] (S. Filin). ISPRS Journal of Photogrammetry and Remote Sensing 66 (2011) 564–578 Contents lists available at ScienceDirect ISPRS Journal of Photogrammetry and Remote Sensing journal homepage: www.elsevier.com/locate/isprsjprs
Transcript of Detection of gullies in roughly textured terrain using airborne laser scanning data

ISPRS Journal of Photogrammetry and Remote Sensing 66 (2011) 564–578
Contents lists available at ScienceDirect
ISPRS Journal of Photogrammetry and Remote Sensing
journal homepage: www.elsevier .com/ locate/ isprs jprs
Detection of gullies in roughly textured terrain using airborne laser scanning data
Amit Baruch ⇑, Sagi FilinDepartment of Transportation and Geo-Information Engineering, Technion – Israel Institute of Technology, Technion City, Haifa 32000, Israel
a r t i c l e i n f o
Article history:Received 30 March 2010Received in revised form 16 March 2011Accepted 17 March 2011Available online 29 April 2011
Keywords:LiDARDetectionGulliesAirborne laser scanningMorphology
0924-2716/$ - see front matter � 2011 Internationaldoi:10.1016/j.isprsjprs.2011.03.001
⇑ Corresponding author. Tel.: +972 4 8295855.E-mail addresses: [email protected] (A. Baruch),
a b s t r a c t
Airborne laser scanning data contain information about surface features, some of which are of subtleform. These features are usually embedded within the terrain, and rarely form distinct shape-transitionto their surroundings. While some efforts have been made in extracting linear elements from laser scan-ning data, attention was mostly turned to dominant elements that are very clear and distinct. We presentin this paper a detection model for gullies of various dimensions using airborne laser scanning data. Gul-lies are regarded as one of the main landform-reshaping agents, having a pejorative effect on the environ-ment and on regional development. They are commonly observed along receding lakes as a commonresponse to water-level drop. The paper demonstrates how a multi-scale approach enables the extractionof various gully forms, from well developed to subtle. It then proposes an optimization driven model forhandling fragmentation in the detection. Results show that using the proposed model, gully networks canbe reconstructed and �30 cm deep features can be identified and separated from their surroundingsusing moderate point density data.� 2011 International Society for Photogrammetry and Remote Sensing, Inc. (ISPRS). Published by Elsevier
B.V. All rights reserved.
1. Introduction
Owing to its accurate and detailed surface characterization, air-borne laser scanning offers an excellent means for landform docu-mentation. However, the attractiveness of this technology isencumbered by the volume of data, feature span, and their com-plex nature; rendering manual quantification difficult. In contrastwith objects like buildings and trees, which form a distinct topo-graphic signature in the landscape, land features such as gulliesare usually embedded within the terrain, hardly forming distinctsurface signatures. Their varying size, form, and appearance addfurther challenges to their detection. This paper presents a newmethod for the detection of gullies from airborne laser scanningdata, focusing on those of modest size that are embedded withinroughly textured terrain.
Gullies are regarded as one of the main landform-reshapingagents contributing to land degradation (Poesen et al., 2003; Wuand Cheng, 2005; Valentin et al., 2005). They develop through sur-face-runoff concentration at the gully head (termed nickpoint) andevolve via three main processes – headcutting, which refers to theupslope migration of the nickpoint (lengthening the gully);downcutting, which refers to deepening and widening of the gullybottom; and sidewall collapse which contributes to their broaden-ing. Their evolution is often rapid during the initiation period whenmorphological characteristics have not yet reached a stable state
Society for Photogrammetry and R
[email protected] (S. Filin).
(Brooks et al., 2003; Valentin et al., 2005). Even though gullydimensions can be relatively modest, they concentrate runoff andprevent floodwater irrigation. They thereby disallow for normalland use, and are often considered responsible for enhanced drain-age, accelerated land degradation, and consequent aridification(Ries and Marzolff, 2003; Poesen et al., 2003; Avni, 2005; Valentinet al., 2005). Gullies may also have severe impact on existing infra-structure. Such examples can be observed along receding lakes(e.g., Lake Chad, the Aral Sea, and the Dead Sea – Glazovsky,1995; Mainguet and Le’tolle, 1998; Avni et al., 2005; see Fig. 1a),where newly exposed soil (composed mostly of unconsolidatedcostal material) is subjected to rapid gully development, whichcan reach orders of 100 my�1 (Avni et al., 2005). Their developmentalong the coastal plains causes heavy damages to infrastructure(Fig. 1b), and generates a severe threat to the future of the regionsin which they occur (Mainguet and Le’tolle, 1998; Valentin et al.,2005; Avni et al., 2005; Ben Moshe et al., 2008).
Presently, erosion and active-morphology studies make use oftraditional land-surveying techniques (Wu and Cheng, 2005; Avni,2005; Ben Moshe et al., 2008), spaceborne images (Giordano andMarchisio, 1991; Martínez-Casasnovas and Stuiver, 1998; Torrion,2001; Liberti et al., 2009), or photogrammetrically derived digitalelevation models in low (Ries and Marzolff, 2003; Martínez-Casasnovas et al., 2003), and higher resolution (Betts and DeRose,1999; Martínez-Casasnovas et al., 2004). Despite the technologicaladvances that allow gully erosion to be measured, these techniquesrequire an intensive acquisition phase, are limited in scope, and areusually insufficient to describe small- to medium-scale systems
emote Sensing, Inc. (ISPRS). Published by Elsevier B.V. All rights reserved.
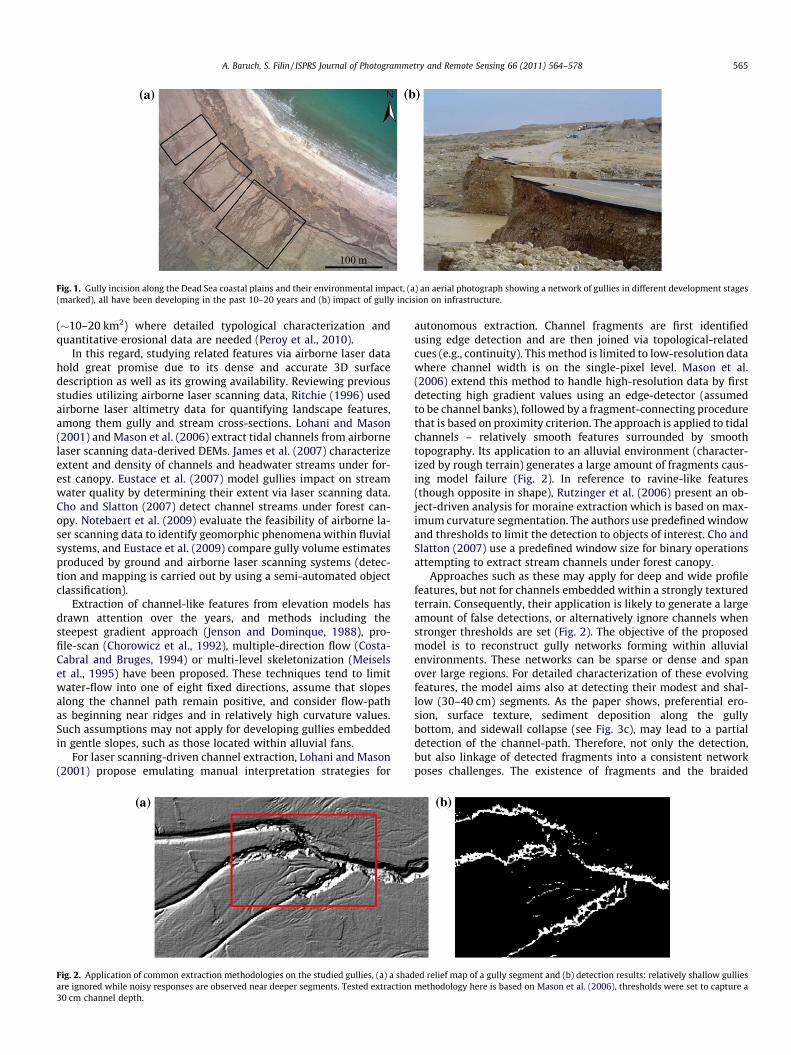
Fig. 1. Gully incision along the Dead Sea coastal plains and their environmental impact, (a) an aerial photograph showing a network of gullies in different development stages(marked), all have been developing in the past 10–20 years and (b) impact of gully incision on infrastructure.
A. Baruch, S. Filin / ISPRS Journal of Photogrammetry and Remote Sensing 66 (2011) 564–578 565
(�10–20 km2) where detailed typological characterization andquantitative erosional data are needed (Peroy et al., 2010).
In this regard, studying related features via airborne laser datahold great promise due to its dense and accurate 3D surfacedescription as well as its growing availability. Reviewing previousstudies utilizing airborne laser scanning data, Ritchie (1996) usedairborne laser altimetry data for quantifying landscape features,among them gully and stream cross-sections. Lohani and Mason(2001) and Mason et al. (2006) extract tidal channels from airbornelaser scanning data-derived DEMs. James et al. (2007) characterizeextent and density of channels and headwater streams under for-est canopy. Eustace et al. (2007) model gullies impact on streamwater quality by determining their extent via laser scanning data.Cho and Slatton (2007) detect channel streams under forest can-opy. Notebaert et al. (2009) evaluate the feasibility of airborne la-ser scanning data to identify geomorphic phenomena within fluvialsystems, and Eustace et al. (2009) compare gully volume estimatesproduced by ground and airborne laser scanning systems (detec-tion and mapping is carried out by using a semi-automated objectclassification).
Extraction of channel-like features from elevation models hasdrawn attention over the years, and methods including thesteepest gradient approach (Jenson and Dominque, 1988), pro-file-scan (Chorowicz et al., 1992), multiple-direction flow (Costa-Cabral and Bruges, 1994) or multi-level skeletonization (Meiselset al., 1995) have been proposed. These techniques tend to limitwater-flow into one of eight fixed directions, assume that slopesalong the channel path remain positive, and consider flow-pathas beginning near ridges and in relatively high curvature values.Such assumptions may not apply for developing gullies embeddedin gentle slopes, such as those located within alluvial fans.
For laser scanning-driven channel extraction, Lohani and Mason(2001) propose emulating manual interpretation strategies for
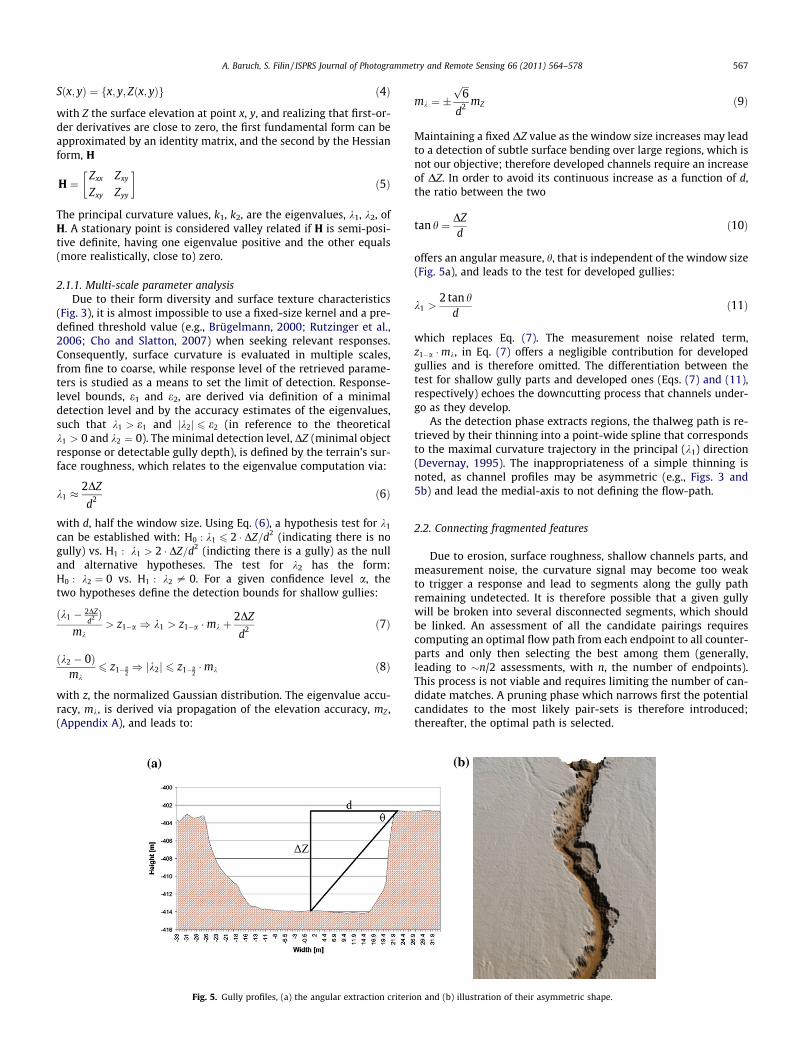
Fig. 2. Application of common extraction methodologies on the studied gullies, (a) a shadare ignored while noisy responses are observed near deeper segments. Tested extraction30 cm channel depth.
autonomous extraction. Channel fragments are first identifiedusing edge detection and are then joined via topological-relatedcues (e.g., continuity). This method is limited to low-resolution datawhere channel width is on the single-pixel level. Mason et al.(2006) extend this method to handle high-resolution data by firstdetecting high gradient values using an edge-detector (assumedto be channel banks), followed by a fragment-connecting procedurethat is based on proximity criterion. The approach is applied to tidalchannels – relatively smooth features surrounded by smoothtopography. Its application to an alluvial environment (character-ized by rough terrain) generates a large amount of fragments caus-ing model failure (Fig. 2). In reference to ravine-like features(though opposite in shape), Rutzinger et al. (2006) present an ob-ject-driven analysis for moraine extraction which is based on max-imum curvature segmentation. The authors use predefined windowand thresholds to limit the detection to objects of interest. Cho andSlatton (2007) use a predefined window size for binary operationsattempting to extract stream channels under forest canopy.
Approaches such as these may apply for deep and wide profilefeatures, but not for channels embedded within a strongly texturedterrain. Consequently, their application is likely to generate a largeamount of false detections, or alternatively ignore channels whenstronger thresholds are set (Fig. 2). The objective of the proposedmodel is to reconstruct gully networks forming within alluvialenvironments. These networks can be sparse or dense and spanover large regions. For detailed characterization of these evolvingfeatures, the model aims also at detecting their modest and shal-low (30–40 cm) segments. As the paper shows, preferential ero-sion, surface texture, sediment deposition along the gullybottom, and sidewall collapse (see Fig. 3c), may lead to a partialdetection of the channel-path. Therefore, not only the detection,but also linkage of detected fragments into a consistent networkposes challenges. The existence of fragments and the braided
ed relief map of a gully segment and (b) detection results: relatively shallow gulliesmethodology here is based on Mason et al. (2006), thresholds were set to capture a

Fig. 3. Gullies in different development stages in the Ze’elim alluvial fan, (a) an aerial view of developed gullies (all within the past 20 years), (b) a side looking view of thegully in subfigure ‘a’, (c) gully widening due to sidewall collapse with debris covering the thalweg, and (d) a gully in an early development stage.
566 A. Baruch, S. Filin / ISPRS Journal of Photogrammetry and Remote Sensing 66 (2011) 564–578
nature of the channel formation, lead us to propose an optimiza-tion-driven procedure for their connection. The proposed modelwas applied to gullies developing within alluvial fans with differ-ent surface characteristics along the coastal plains of the DeadSea (Fig. 4). Due to dramatic lake level decrease over the last15 years (Avni et al., 2005), rapid gully development has been ob-served along the coastal plains, generating severe environmentalimpact (Fig. 1).
Fig. 4. Location map of the study sites: (a) shaded relief map (Hall, 1994) showingalso main strands of the Dead Sea Transform (DST) in the region, with inset showsthe tectonic plate setting and (b) the Dead Sea region with study sites.
2. Detection model
A gully bottom (aka thalweg) can be described as a linear fea-ture representing local extrema in the surface curvature. Well-developed gullies are expected to generate a clear signature in ref-erence to the surrounding surface, but developing gullies withinevolving environments yield at times weaker responses whichare insufficient to trigger detection. Therefore, the proposed modelfirst identifies flow regions by distinguishing them from back-ground surface texture, extracts the actual flow path, and analyzesthe detected segments in order to connect individual fragmentsinto a continuous entity.
2.1. Detection of seed gully region
Gully related returns can be described using surface curvatureparameters, where optimally, one principal curvature will be equalto zero and another will have a positive value (Besl, 1988). Princi-pal curvature values are given by:
k1;2 ¼12
traceðG�1DÞ �
ffiffiffiffiffiffiffiffiffiffiffiffiffiffiffiffiffiffiffiffiffiffiffiffiffiffiffiffiffiffiffiffiffiffiffiffiffiffiffiffiffiffiffiffiffiffiffiffiffiffiffiffiffiffiffiffiffiffiffiffiffiffiffiffi12
traceðG�1DÞ� �2
� jG�1j � jDj
sð1Þ
with G and D, as the first and second fundamental forms,respectively:
G ¼S2
x SxSy
SxSy S2y
" #ð2Þ
D ¼~nðx; yÞ � Sxx ~nðx; yÞ � Sxy
~nðx; yÞ � Sxy ~nðx; yÞ � Syy
" #ð3Þ
S, the surface (subscripts refer to first- and second-order deriva-tives), and ~n, the surface normal. Using the Monge patch represen-tation (Besl, 1988),
A. Baruch, S. Filin / ISPRS Journal of Photogrammetry and Remote Sensing 66 (2011) 564–578 567
Sðx; yÞ ¼ fx; y; Zðx; yÞg ð4Þ
with Z the surface elevation at point x, y, and realizing that first-or-der derivatives are close to zero, the first fundamental form can beapproximated by an identity matrix, and the second by the Hessianform, H
H ¼Zxx Zxy
Zxy Zyy
� �ð5Þ
The principal curvature values, k1, k2, are the eigenvalues, k1, k2, ofH. A stationary point is considered valley related if H is semi-posi-tive definite, having one eigenvalue positive and the other equals(more realistically, close to) zero.
2.1.1. Multi-scale parameter analysisDue to their form diversity and surface texture characteristics
(Fig. 3), it is almost impossible to use a fixed-size kernel and a pre-defined threshold value (e.g., Brügelmann, 2000; Rutzinger et al.,2006; Cho and Slatton, 2007) when seeking relevant responses.Consequently, surface curvature is evaluated in multiple scales,from fine to coarse, while response level of the retrieved parame-ters is studied as a means to set the limit of detection. Response-level bounds, e1 and e2, are derived via definition of a minimaldetection level and by the accuracy estimates of the eigenvalues,such that k1 > e1 and jk2j 6 e2 (in reference to the theoreticalk1 > 0 and k2 ¼ 0). The minimal detection level, DZ (minimal objectresponse or detectable gully depth), is defined by the terrain’s sur-face roughness, which relates to the eigenvalue computation via:
k1 �2DZ
d2 ð6Þ
with d, half the window size. Using Eq. (6), a hypothesis test for k1
can be established with: H0 : k1 6 2 � DZ=d2 (indicating there is nogully) vs. H1 : k1 > 2 � DZ=d2 (indicting there is a gully) as the nulland alternative hypotheses. The test for k2 has the form:H0 : k2 ¼ 0 vs. H1 : k2 – 0. For a given confidence level a, thetwo hypotheses define the detection bounds for shallow gullies:
ðk1 � 2DZd2 Þ
mk> z1�a ) k1 > z1�a �mk þ
2DZ
d2 ð7Þ
ðk2 � 0Þmk
6 z1�a2) jk2j 6 z1�a
2�mk ð8Þ
with z, the normalized Gaussian distribution. The eigenvalue accu-racy, mk, is derived via propagation of the elevation accuracy, mZ ,(Appendix A), and leads to:
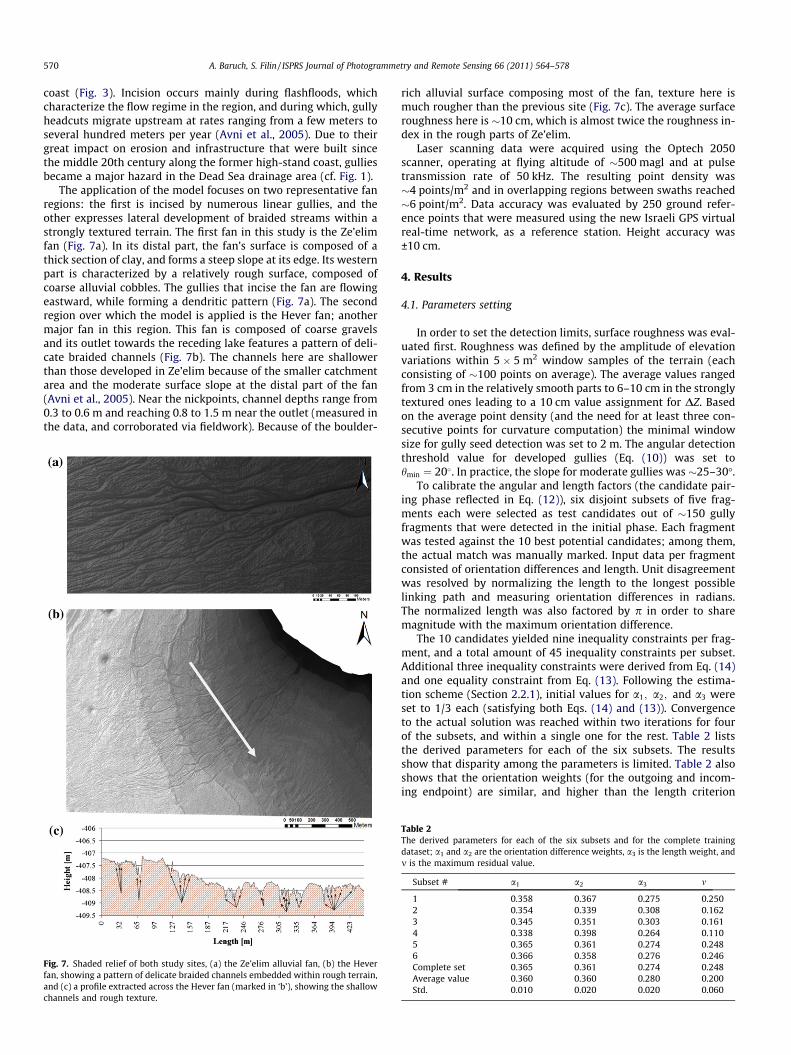
Fig. 5. Gully profiles, (a) the angular extraction criteri
mk ¼ �ffiffiffi6p
d2 mZ ð9Þ
Maintaining a fixed DZ value as the window size increases may leadto a detection of subtle surface bending over large regions, which isnot our objective; therefore developed channels require an increaseof DZ. In order to avoid its continuous increase as a function of d,the ratio between the two
tan h ¼ DZd
ð10Þ
offers an angular measure, h, that is independent of the window size(Fig. 5a), and leads to the test for developed gullies:
k1 >2 tan h
dð11Þ
which replaces Eq. (7). The measurement noise related term,z1�a �mk, in Eq. (7) offers a negligible contribution for developedgullies and is therefore omitted. The differentiation between thetest for shallow gully parts and developed ones (Eqs. (7) and (11),respectively) echoes the downcutting process that channels under-go as they develop.
As the detection phase extracts regions, the thalweg path is re-trieved by their thinning into a point-wide spline that correspondsto the maximal curvature trajectory in the principal (k1) direction(Devernay, 1995). The inappropriateness of a simple thinning isnoted, as channel profiles may be asymmetric (e.g., Figs. 3 and5b) and lead the medial-axis to not defining the flow-path.
2.2. Connecting fragmented features
Due to erosion, surface roughness, shallow channels parts, andmeasurement noise, the curvature signal may become too weakto trigger a response and lead to segments along the gully pathremaining undetected. It is therefore possible that a given gullywill be broken into several disconnected segments, which shouldbe linked. An assessment of all the candidate pairings requirescomputing an optimal flow path from each endpoint to all counter-parts and only then selecting the best among them (generally,leading to �n/2 assessments, with n, the number of endpoints).This process is not viable and requires limiting the number of can-didate matches. A pruning phase which narrows first the potentialcandidates to the most likely pair-sets is therefore introduced;thereafter, the optimal path is selected.
on and (b) illustration of their asymmetric shape.

568 A. Baruch, S. Filin / ISPRS Journal of Photogrammetry and Remote Sensing 66 (2011) 564–578
2.2.1. Pruning the matching candidatesUnder the assumption that channels should preserve local ori-
entation and that close fragments are more likely to relate thandistant ones, continuity and length criteria are introduced as ameans to characterize the candidate-seeking problem. The twocan be cast in terms of a score (or energy) function as follows:
Ei;j ¼ a1 � joij þ a2 � jojj þ a3 � l joij; jojj 6 p ð12Þ
with oi, the orientation difference between the ith fragment end-point and the path connecting it to the jth fragment endpoint; oj,the orientation difference in the other direction (from the jth frag-ment endpoint to i); l, the length of the straight connecting line;and a1; a2; a3, are the respective weights. To limit the computa-tional overhead involved in the actual tracking, paths are approxi-mated by the straight line connecting the fragments’ endpoints.
Weights should be normalized,
h ¼X3
i¼1
ai ¼ 1 ð13Þ
and non-negative,
ai P 0; i ¼ 1;2;3 ð14Þ
and having no predefined knowledge of a specific weight assign-ment, the three coefficients need to be calibrated.
The calibration begins from the realization that each fragmentpairing within the data provides a single observation in the formof an energy term. Using Eq. (12), the actual match should yieldthe minimal energy term among all candidate pairings, namely:
gn ¼ Ei;k � E�i;j P 0; 8i; i – j – k; n ¼ 1;2; . . . ;m ð15Þ
with E�i;j, the energy value provided by the actual match; Ei;k, thevalue provided by linking the curved fragment, i, to any other,incorrect, candidate, k; and m, the total number of possible connec-tions within the fan. One way to set the three weights is via trial anderror until the score of the correct match is the lowest of all otherpairings. Another is fulfilling the set of difference observations(Eq. (15)) simultaneously. This set of inequality constraints shouldbe satisfied subject to four more constraints: the three inequalities,which are given by Eq. (14), and one equality constraint, given byEq. (13), namely find a that satisfy:
gn P 0; n ¼ 1;2; :::;mh ¼ 1;ai P 0
ð16Þ
This system can be solved by a simultaneous inequality-constrainedleast-squares-estimation by incorporating all constraints, equalityand inequality (Chong, 1976; Han, 1980). However, the proposedapproach follows Bramley and Winnicka (1996) which offers asequential solution of a reduced set of equations. Generally,inequalities can be in two states regarding a given solution: (i) inac-tive, when an inequality constraint is satisfied by the estimatedparameters and (ii) active, when the constraint is not satisfied(Luenberger, 1984). In order to satisfy the active ones, they can befirst turned into equality constraints and thus attract the estimatedsolution. Setting the relevant constraints into equality ones, theoptimization problem can be redefined as a linear estimation prob-lem (Bramley and Winnicka, 1996)
Ax� y ¼ v ð17Þ
with x ¼ ½a1;a2;a3�T ; A, the design matrix comprising of the activeconstraint coefficients; y, the data vector, and v, the deviation fromthe constraints using the estimated parameters. To avoid influenc-ing the solution, the inactive constraints are dropped, and the solu-tion begins with evaluation of the active constraints as a function ofthe initial proposed solution. The estimation process is carried out
in an iterative fashion where a solution that aims at satisfying theactive constraints is estimated in each cycle. Active constraintswhich have been satisfied in the previous cycle are switched off,while others, which were previously inactive, but are now violated,are activated and added to the set of equations. A new estimationcycle then follows. The process is terminated when no new, inac-tive, constraints are activated. The obtained solution leads to a setof parameters that minimize the amount of active constraint witha minimum total positive energy (Bramley and Winnicka, 1996).The estimated parameters allow computing the energy of eachmatching, and a tolerance bound that is set (Section 4.1) allowsselecting a subset of the matches to be probed further.
2.2.2. Path tracking and optimal path selectionReducing the number of pairings from n � 1 into a small con-
stant number, the paths between candidate pairs are traced.Recalling that fragmentation has occurred because of weak signals,path tracking accumulates weak channel-related responses into ameaningful linear feature. Considering curvature values asweights, tracking can be cast as a shortest-path computationalproblem, with the principal curvature values acting as weightswhile given in their negative value
dðp�Þ ¼X
dðiÞi2p� ¼minX
dðiÞi2p
� �ð18Þ
with p, a path between the two endpoints; p⁄, the shortest path; andd(i), the arc weight derived from k1 at point i along the path. The po-sitive curvature value of a gully related point leads us to flip weightsigns to ensure selection of maximum principal curvature valuesalong the path.
To identify the actual path among the set of traced candidates,links that intersect other fragments are first removed (acting as alogical consistency test), and the remaining links are rankedaccording to their spline curvature values (in contrast to surfaceone). Geometrically, the linking paths are a two-dimensional con-tinuous object whose parametrical description, using arc-lengthdistances, is given by
CðuÞ ¼ f~rðuÞ 2 R2 : u 2 ½u0;u1� Rg ð19Þ
with r, a two dimensional vector, and u, an arc-length parameter.Using the two vector components and k(u), the curvature value ata given point:
kðuÞ ¼ k~ru ~ruukk~ruk3 ð20Þ
with ~ru; ~ruu, the first- and the second-order derivatives, respec-tively, the normalized spline curvature energy is computed as theintegral of the squared curvature values, normalized to the curvelength, L
KN ¼1L
Z u1
u0
kðuÞ2du ð21Þ
Assuming that no dramatic turns occur within the connecting path,simple paths are preferred over meandering ones, thus connectionsthat provide the lowest measure are selected.
To illustrate the gap-bridging process Fig. 6 shows a case whereeight disconnected segments have been detected. Four of them(segments #1, #2, #3, and #5) should be connected to four others(#4, #6, #7, and #8). Using Eq. (12), and assuming that gulliesmeander but cannot turn backwards, scores are computed for eachendpoint against all segment endpoints that fall within a ±90o fan(Fig. 6b). Candidates should maintain the actual flow direction,which is kept by identifying the in- and out-flowing segmentendpoints (the starting and ending points for each segment). The

Fig. 6. Demonstration of the gap bridging process, (a) the detected segments – eight overall, (b) all potential connections within a ±90 fan, (c) the candidate links followingthe score computation, and (d) the optimal paths – black segments as the optimal ones and white-colored paths as the alternatives.
A. Baruch, S. Filin / ISPRS Journal of Photogrammetry and Remote Sensing 66 (2011) 564–578 569
in-flowing points are the highest among the two and so theout-flowing points are the lowest.
Focusing on segment #1 (Fig. 6b), seven fragments fall withinits ±90o fan. Table 1 lists the computed scores, showing that onlytwo among them fall within the permissible range (minimalenergy + permissible deviation; Table 1 and Fig. 6c). The pathenergy (spline curvature) for bridging the gap to both segmentsshows that the preferable linkage is assigned correctly to segment#2 (Table 1). With segment #3, two alternative linking paths havebeen identified (Fig. 6c); segment #6 had the minimal score, how-ever segment #7, which fell within the permissible range, had theminimum curvature value (being smoother) and thus was correctlyselected. The set of candidate matches for all other segments isshown in Fig. 6c, while Fig. 6d shows complete network
Table 1Energy scores and curvature values – for each fragment all potential fragments withina ±90 fan are ranked by their score with those falling within the permissible rangeprobed further. Following the shortest path computation, curvature values arecomputed and path having the minimal value is selected (italicized).
From To Energy Curvature
1 4 0.45 0.12 0.25 �0.0645 0.68 –3 1.39 –
2 4 0.70 –7 0.64 0.0025 0.44 0.0226 0.69 –8 1.26 –3 1.37 –
3 5 0.59 –7 0.29 0.0206 0.35 �0.030
5 7 0.25 0.1236 0.35 –8 1.50 –
reconstruction. In general, the proposed optimization and theseparation of the process into two phases, enables reducing thecomputational effort involved in the actual path computations toonly a limited number of candidates overall (three at most).
Fragment to channel linkage – detached fragments, which are inclose proximity to major channels (but not to their endpoints), mayremain isolated, despite their proximity. The endpoint-to-endpointlinkage approach cannot be applied there due to the lack of anin-flowing endpoint candidate. Having only the fragment’s out-flowing point but not the location to which it should be linked,connection should, (i) seek the optimal entry point along the gullypath, (ii) seek the optimal path to that point. Both conditions canbe met using dynamic programming (Ballard and Brown, 1982),which is applied here so that all connecting paths begin from thefragment out-flowing point and reach points, within a prescribedangular fan along the gully path. Preference to strong surfacecurvature values while maintaining down-flowing paths act asthe energy related terms.
3. Study sites and data
The proposed model is applied on gullies that have been devel-oping within two of the largest alluvial fans along the western partof the Dead Sea coastal plain (Fig. 4). In the beginning of the mid-1960s, increasing diversion of water from its northern drainage ba-sin of the lake initiated a continuous process of artificial drop in thelake level which was accelerated since the 1970s and has reachedan average drop rate of 1 my�1 and higher in the last 15 years. Therapid, lake-level drop has severe environmental impact (Avni et al.,2005), also leading to a dramatic widening of the coastal plain(between 200 and 2500 m) and exposing steep slopes along thenewly formed coast. These are shaped by two processes, (i) slopesat the distal edges of alluvial fans, (ii) slopes that were shaped byactive faulting on the margins of the Dead Sea basin (Avni et al.,2005; Garfunkel et al., 1981). The exposure of slopes enables rapidincision of streams, constantly adapting to the new levels of the
570 A. Baruch, S. Filin / ISPRS Journal of Photogrammetry and Remote Sensing 66 (2011) 564–578
coast (Fig. 3). Incision occurs mainly during flashfloods, whichcharacterize the flow regime in the region, and during which, gullyheadcuts migrate upstream at rates ranging from a few meters toseveral hundred meters per year (Avni et al., 2005). Due to theirgreat impact on erosion and infrastructure that were built sincethe middle 20th century along the former high-stand coast, gulliesbecame a major hazard in the Dead Sea drainage area (cf. Fig. 1).
The application of the model focuses on two representative fanregions: the first is incised by numerous linear gullies, and theother expresses lateral development of braided streams within astrongly textured terrain. The first fan in this study is the Ze’elimfan (Fig. 7a). In its distal part, the fan’s surface is composed of athick section of clay, and forms a steep slope at its edge. Its westernpart is characterized by a relatively rough surface, composed ofcoarse alluvial cobbles. The gullies that incise the fan are flowingeastward, while forming a dendritic pattern (Fig. 7a). The secondregion over which the model is applied is the Hever fan; anothermajor fan in this region. This fan is composed of coarse gravelsand its outlet towards the receding lake features a pattern of deli-cate braided channels (Fig. 7b). The channels here are shallowerthan those developed in Ze’elim because of the smaller catchmentarea and the moderate surface slope at the distal part of the fan(Avni et al., 2005). Near the nickpoints, channel depths range from0.3 to 0.6 m and reaching 0.8 to 1.5 m near the outlet (measured inthe data, and corroborated via fieldwork). Because of the boulder-
Fig. 7. Shaded relief of both study sites, (a) the Ze’elim alluvial fan, (b) the Heverfan, showing a pattern of delicate braided channels embedded within rough terrain,and (c) a profile extracted across the Hever fan (marked in ‘b’), showing the shallowchannels and rough texture.
rich alluvial surface composing most of the fan, texture here ismuch rougher than the previous site (Fig. 7c). The average surfaceroughness here is �10 cm, which is almost twice the roughness in-dex in the rough parts of Ze’elim.
Laser scanning data were acquired using the Optech 2050scanner, operating at flying altitude of �500 magl and at pulsetransmission rate of 50 kHz. The resulting point density was�4 points/m2 and in overlapping regions between swaths reached�6 point/m2. Data accuracy was evaluated by 250 ground refer-ence points that were measured using the new Israeli GPS virtualreal-time network, as a reference station. Height accuracy was±10 cm.
4. Results
4.1. Parameters setting
In order to set the detection limits, surface roughness was eval-uated first. Roughness was defined by the amplitude of elevationvariations within 5 5 m2 window samples of the terrain (eachconsisting of �100 points on average). The average values rangedfrom 3 cm in the relatively smooth parts to 6–10 cm in the stronglytextured ones leading to a 10 cm value assignment for DZ. Basedon the average point density (and the need for at least three con-secutive points for curvature computation) the minimal windowsize for gully seed detection was set to 2 m. The angular detectionthreshold value for developed gullies (Eq. (10)) was set tohmin ¼ 20�. In practice, the slope for moderate gullies was �25–30�.
To calibrate the angular and length factors (the candidate pair-ing phase reflected in Eq. (12)), six disjoint subsets of five frag-ments each were selected as test candidates out of �150 gullyfragments that were detected in the initial phase. Each fragmentwas tested against the 10 best potential candidates; among them,the actual match was manually marked. Input data per fragmentconsisted of orientation differences and length. Unit disagreementwas resolved by normalizing the length to the longest possiblelinking path and measuring orientation differences in radians.The normalized length was also factored by p in order to sharemagnitude with the maximum orientation difference.
The 10 candidates yielded nine inequality constraints per frag-ment, and a total amount of 45 inequality constraints per subset.Additional three inequality constraints were derived from Eq. (14)and one equality constraint from Eq. (13). Following the estima-tion scheme (Section 2.2.1), initial values for a1; a2; and a3 wereset to 1/3 each (satisfying both Eqs. (14) and (13)). Convergenceto the actual solution was reached within two iterations for fourof the subsets, and within a single one for the rest. Table 2 liststhe derived parameters for each of the six subsets. The resultsshow that disparity among the parameters is limited. Table 2 alsoshows that the orientation weights (for the outgoing and incom-ing endpoint) are similar, and higher than the length criterion
Table 2The derived parameters for each of the six subsets and for the complete trainingdataset; a1 and a2 are the orientation difference weights, a3 is the length weight, andm is the maximum residual value.
Subset # a1 a2 a3 m
1 0.358 0.367 0.275 0.2502 0.354 0.339 0.308 0.1623 0.345 0.351 0.303 0.1614 0.338 0.398 0.264 0.1105 0.365 0.361 0.274 0.2486 0.366 0.358 0.276 0.246Complete set 0.365 0.361 0.274 0.248Average value 0.360 0.360 0.280 0.200Std. 0.010 0.020 0.020 0.060
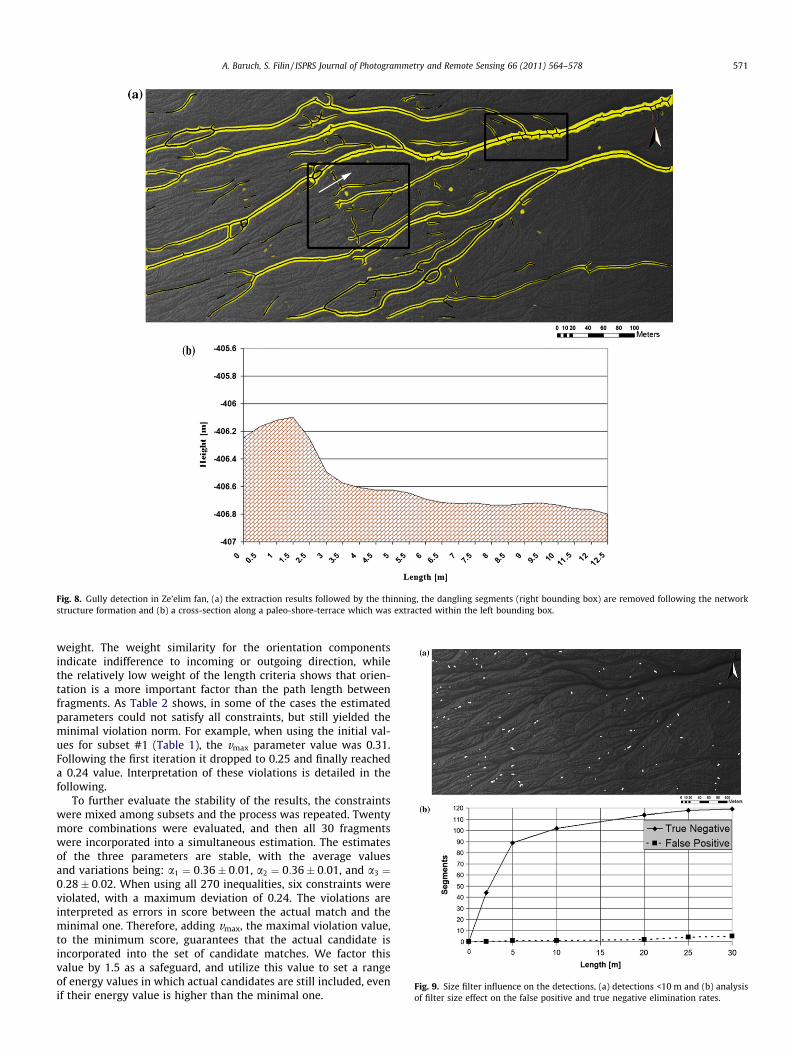
Fig. 8. Gully detection in Ze’elim fan, (a) the extraction results followed by the thinning, the dangling segments (right bounding box) are removed following the networkstructure formation and (b) a cross-section along a paleo-shore-terrace which was extracted within the left bounding box.
Fig. 9. Size filter influence on the detections, (a) detections <10 m and (b) analysisof filter size effect on the false positive and true negative elimination rates.
A. Baruch, S. Filin / ISPRS Journal of Photogrammetry and Remote Sensing 66 (2011) 564–578 571
weight. The weight similarity for the orientation componentsindicate indifference to incoming or outgoing direction, whilethe relatively low weight of the length criteria shows that orien-tation is a more important factor than the path length betweenfragments. As Table 2 shows, in some of the cases the estimatedparameters could not satisfy all constraints, but still yielded theminimal violation norm. For example, when using the initial val-ues for subset #1 (Table 1), the vmax parameter value was 0.31.Following the first iteration it dropped to 0.25 and finally reacheda 0.24 value. Interpretation of these violations is detailed in thefollowing.
To further evaluate the stability of the results, the constraintswere mixed among subsets and the process was repeated. Twentymore combinations were evaluated, and then all 30 fragmentswere incorporated into a simultaneous estimation. The estimatesof the three parameters are stable, with the average valuesand variations being: a1 ¼ 0:36� 0:01, a2 ¼ 0:36� 0:01, and a3 ¼0:28� 0:02. When using all 270 inequalities, six constraints wereviolated, with a maximum deviation of 0.24. The violations areinterpreted as errors in score between the actual match and theminimal one. Therefore, adding vmax, the maximal violation value,to the minimum score, guarantees that the actual candidate isincorporated into the set of candidate matches. We factor thisvalue by 1.5 as a safeguard, and utilize this value to set a rangeof energy values in which actual candidates are still included, evenif their energy value is higher than the minimal one.

572 A. Baruch, S. Filin / ISPRS Journal of Photogrammetry and Remote Sensing 66 (2011) 564–578
4.2. Gully extraction
The detection is studied first within the Ze’elim fan (Fig. 7a).Fig. 8a shows the detected seed regions and how gullies have beendetected almost in their complete form. While thinning the re-gions, a set of small dangling fragments may be generated(Fig. 8a); these are removed by constructing a network structureand deletion of insignificant open arcs. Generally, a minimal10 m segment size was defined for false detection removal, provingoptimal in separating noise from actual responses (Fig. 9). Removalof as many of the false channel-like entities, with a lesser emphasis(to a great extent) on maintaining true-positives, guided the
Fig. 10. Channel network reconstruction in the Ze’elim alluvial fan, (a) results prior to the(c) thalweg profile showing roughness and positive slope along the path (the channel b
removal because of the gap-bridging phase. The detection alsoindentified some paleo-shore-terraces, which are markers of thelake retreat (Baruch and Filin, 2008). Terraces share curvaturecharacteristics, but differ in shape (Fig. 8b), with thalweg-to-banksheight difference remaining positive while altering signs for shore-lines. Noise and shoreline removal eliminated 98% of the non-gullyrelated segments, while only one, 4 m gully end-segment, wasremoved (a segment that could not be bridged). The detectionidentified 42 segments, among which the longest was of �286 m(Fig. 10a). The total detected gully length was 5443 m. Thirty sixgaps were identified following detection phase. The longestbridging segment was of �80 m length and the shortest one was
gap bridging phase, (b) results following bridging (bridged segments in white), andank is marked in black).
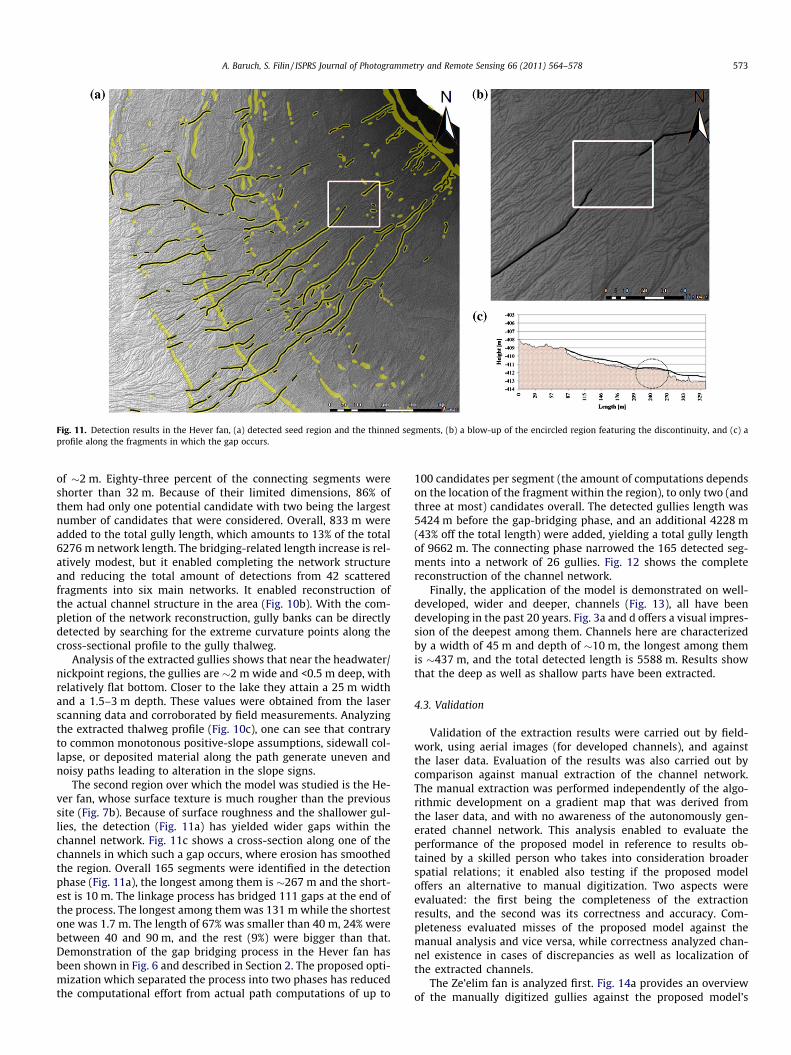
Fig. 11. Detection results in the Hever fan, (a) detected seed region and the thinned segments, (b) a blow-up of the encircled region featuring the discontinuity, and (c) aprofile along the fragments in which the gap occurs.
A. Baruch, S. Filin / ISPRS Journal of Photogrammetry and Remote Sensing 66 (2011) 564–578 573
of �2 m. Eighty-three percent of the connecting segments wereshorter than 32 m. Because of their limited dimensions, 86% ofthem had only one potential candidate with two being the largestnumber of candidates that were considered. Overall, 833 m wereadded to the total gully length, which amounts to 13% of the total6276 m network length. The bridging-related length increase is rel-atively modest, but it enabled completing the network structureand reducing the total amount of detections from 42 scatteredfragments into six main networks. It enabled reconstruction ofthe actual channel structure in the area (Fig. 10b). With the com-pletion of the network reconstruction, gully banks can be directlydetected by searching for the extreme curvature points along thecross-sectional profile to the gully thalweg.
Analysis of the extracted gullies shows that near the headwater/nickpoint regions, the gullies are �2 m wide and <0.5 m deep, withrelatively flat bottom. Closer to the lake they attain a 25 m widthand a 1.5–3 m depth. These values were obtained from the laserscanning data and corroborated by field measurements. Analyzingthe extracted thalweg profile (Fig. 10c), one can see that contraryto common monotonous positive-slope assumptions, sidewall col-lapse, or deposited material along the path generate uneven andnoisy paths leading to alteration in the slope signs.
The second region over which the model was studied is the He-ver fan, whose surface texture is much rougher than the previoussite (Fig. 7b). Because of surface roughness and the shallower gul-lies, the detection (Fig. 11a) has yielded wider gaps within thechannel network. Fig. 11c shows a cross-section along one of thechannels in which such a gap occurs, where erosion has smoothedthe region. Overall 165 segments were identified in the detectionphase (Fig. 11a), the longest among them is �267 m and the short-est is 10 m. The linkage process has bridged 111 gaps at the end ofthe process. The longest among them was 131 m while the shortestone was 1.7 m. The length of 67% was smaller than 40 m, 24% werebetween 40 and 90 m, and the rest (9%) were bigger than that.Demonstration of the gap bridging process in the Hever fan hasbeen shown in Fig. 6 and described in Section 2. The proposed opti-mization which separated the process into two phases has reducedthe computational effort from actual path computations of up to
100 candidates per segment (the amount of computations dependson the location of the fragment within the region), to only two (andthree at most) candidates overall. The detected gullies length was5424 m before the gap-bridging phase, and an additional 4228 m(43% off the total length) were added, yielding a total gully lengthof 9662 m. The connecting phase narrowed the 165 detected seg-ments into a network of 26 gullies. Fig. 12 shows the completereconstruction of the channel network.
Finally, the application of the model is demonstrated on well-developed, wider and deeper, channels (Fig. 13), all have beendeveloping in the past 20 years. Fig. 3a and d offers a visual impres-sion of the deepest among them. Channels here are characterizedby a width of 45 m and depth of �10 m, the longest among themis �437 m, and the total detected length is 5588 m. Results showthat the deep as well as shallow parts have been extracted.
4.3. Validation
Validation of the extraction results were carried out by field-work, using aerial images (for developed channels), and againstthe laser data. Evaluation of the results was also carried out bycomparison against manual extraction of the channel network.The manual extraction was performed independently of the algo-rithmic development on a gradient map that was derived fromthe laser data, and with no awareness of the autonomously gen-erated channel network. This analysis enabled to evaluate theperformance of the proposed model in reference to results ob-tained by a skilled person who takes into consideration broaderspatial relations; it enabled also testing if the proposed modeloffers an alternative to manual digitization. Two aspects wereevaluated: the first being the completeness of the extractionresults, and the second was its correctness and accuracy. Com-pleteness evaluated misses of the proposed model against themanual analysis and vice versa, while correctness analyzed chan-nel existence in cases of discrepancies as well as localization ofthe extracted channels.
The Ze’elim fan is analyzed first. Fig. 14a provides an overviewof the manually digitized gullies against the proposed model’s

Fig. 12. Reconstruction results for the Hever fan (bridged segments in white).
Fig. 13. Detection of developed gullies, (a) results of applying the entire gully extraction process (for clarity of illustration, threshold was set here to 0.75 m, leading to 7detection rather than 12) and (b) a profile across the region showing gully dimensions.
574 A. Baruch, S. Filin / ISPRS Journal of Photogrammetry and Remote Sensing 66 (2011) 564–578

Fig. 14. Validation in the Ze’elim fan, (a) the manually digitized gullies (white) against the proposed method results (black), (b) an extract showing that the manual detectedgullies do not reach the actual nickpoint and misses the actual gully path, (c) the 3D surface of the extract, showing the actual existence of channels, and (d and e) gully cross-sections (see subfigure a) with the detect points.
A. Baruch, S. Filin / ISPRS Journal of Photogrammetry and Remote Sensing 66 (2011) 564–578 575
results and shows that no manually digitized gullies were over-looked by the proposed model. Misses of the manually digitizedchannels are notable. Fig. 14b shows examples in which channelparts, which are part of the network, have been missed, most likelydue to preference of following the main branch. In general, shal-lower channels have been missed, particularly due to the gradientmagnitudes. Fig. 14c shows how these segments relate to actualchannel branches. Another notable aspect is that the manual digi-tization did not reach the nickpoints in several instances (Fig. 14).This, again, can be explained by the channel depth in these parts. Intotal length measures, the proposed method extracted 6276 m ofchannels against 5243 m that were extracted manually. Evaluatingthe minimal detected gully depth shows a 60 cm depth whenextracting manually (Fig. 14d), compared to 30 cm using the pro-posed model (Fig. 14e). In terms of correctness, Fig. 14a–e showsthat the proposed model accurately localize on the gully thalwegwhile the manually detected gullies may be offseted from the ac-tual bottom by �1 m, and in some cases by up to 2 m. The lack
of accuracy is noted mainly in the narrow segments where locali-zation of the thalweg becomes complicated.
The difficulty in characterizing channel networks becomeseven more pronounced in the Hever fan (Fig. 15a) where thechannels are shallower. The overview (Fig. 15a) shows that themanual digitization has missed a large amount of gullies, identi-fying fragments while failing to connect them. This failure ismainly attributed to the weak gradients there as well as thebraided pattern of the network, which complicates analyzingthe network structure. As with the Ze’elim case study, manynickpoints have been missed due to the shallow depth. Fig. 15bdemonstrates that the proposed model detected actual channelsin the segments where disagreements between the manual andautonomous detections have been observed. Compared to the9662 m length of channels extracted by the proposed method,the manual digitization extracted only 5616 m. The proposedmethod managed to detect �30 cm deep at the nickpoint(Fig. 15c and d).

Fig. 15. Validation results at the Hever fan, (a) the manually digitized gullies (white) against the proposed method results (black) (arrows pointing to two undetectedfragments), (b) the 3D surface of the extract, showing the actual existence of channels, and (c and d) gully cross-sections (see subfigure a) with the detected points.
576 A. Baruch, S. Filin / ISPRS Journal of Photogrammetry and Remote Sensing 66 (2011) 564–578
The detection in the Ze’elim and in Hever fans was then ana-lyzed in terms of type I/II error. Type I errors refer to undetectedchannel fragments, and type II to falsely detected ones. Both aremeasured in terms of fragments’ length from the total networklength. Regarding the Ze’elim fan, other than a 4 m gully end-segment, which was deleted during noise and shoreline removalphase, no other gully parts were left undetected. Thus, the type Ivalue is <0.1% (4 m out of 6280 m). Prior to the noise and shorelineremoval phase (Section 4.2), the type II error rate was �5% (314 m
Fig. 16. Validation results for
out of 6594 m), but following their removal (98% of them), its valuedropped to 0.1% (6.28 m out of 6276 m). Turning to the Hever fan,�270 m of channel fragments were undetected (Fig. 15), leading toa type I value of �2.7% (270 m out of 9932 m). Notably, the manualdetection did not trace them either, and their average depth is�9 cm. Type II errors are of 0.13% (12 m out of 9662 m).
Finally, Fig. 16 shows that the manual digitization and the pro-posed method marked the same channels in the developed part,where the total channel length extracted by the manual method
well-developed gullies.

A. Baruch, S. Filin / ISPRS Journal of Photogrammetry and Remote Sensing 66 (2011) 564–578 577
is 5481 m, similar to 5588 m that were extracted by the proposedmodel.
The results show that even within a roughly texture environ-ment detection of subtle features as well as developed ones ispossible using airborne laser scanning data. More importantly,the autonomous manner by which the network has been identifiedwithin these complex surroundings provide a valuable means tostudy erosion related processes within this region and charac-terizing the evolution of those features. Contrasting existing ap-proaches that may have applied to deep and wide profile features,the channels extracted here were characterized by diverse formand embedded within a strongly textured terrain. The applicationof the proposed model enabled overcoming problems that wouldhave been associated with generation of a large amount of falsedetections, or alternatively ignore channels (e.g., Fig. 2).
5. Conclusions
The paper presented an autonomous model for gully extractionand characterization within alluvial environments. Gullies withinthose regions appear in various sizes and forms from subtle to welldeveloped ones. The extraction performance was high while vary-ing landforms and surface texture having little influence on thedetection. The importance of the model lies in its ability to operatein multiple scales, making it robust to background noise and insen-sitive to the range of forms that gullies in this region exhibit. Intro-ducing adaptive level-of-detection tests, which incorporatedroughness and data accuracy, enabled detecting subtle featureswhile attenuating noise effect. This enabled performance over dif-ferent textured terrain. The linear nature of the features requireddeveloping a candidate matching and linking mode, which was de-vised by introducing optimization criteria. Applying the proposedcandidate selection mode, has managed limiting segment selectionto no more than three possible matches. Detecting the actual oneamong them became much simpler than an exhaustive searchamong all computed paths.
The ability to detect autonomously natural features of 30 cmdepth under textured background implies great prospects in utiliz-ing laser-scanning data for identifying and characterizing a varietyof type of geomorphic entities. Using the extracted information,valuable geometric data about these features can be derived forfurther modeling and quantification of these phenomena. Themodel has been applied to data of modest density, nonetheless, itis doubtful if higher density may contribute to this specific processbecause of the physical dimensions of the relevant features. In gen-eral, both surface texture and measurement noise are the govern-ing factors in setting the limits of detection, both are not expectedto improve with denser scanning. Lower density data will increaseminimal channel width to be detected and indirectly also the min-imal channel depth, and thereby may lead to some loss at the shal-lower end-segments of these features. For example, a densitydecrease by a factor of two would have led to a minimal depth of�60 cm, compared to the 30 cm that has been set here.
The high level of detection relieves also the need to manualdigitization of channel networks over wide regions requiring bothdetailed localization and analysis of the three-dimensionalcharacteristics of each feature. It may thus provide a valuable toolfor erosional studies of changes within active fans, with conse-quent analyses of soil loss, and prediction of future evolution ofnetworks.
Acknowledgements
The authors would like to thank the anonyms reviewers fortheir helpful comments. The research was funded in part by grants
provided by the Israel Ministry of Science through the Dead Seaand Arava science center, the Israel Ministry of National Infrastruc-ture, the Henri Gutwirth Fund for the Promotion of Research, andby the Geological Survey of Israel.
Appendix A
Second-order derivatives have the following numerical form:
Zxx ¼ ðZy0 ;x0þd � 2 � Zy0 ;x0 þ Zy0 ;x0�dÞ=d2
Zyy ¼ ðZy0þd;x0� 2 � Zy0 ;x0 þ Zy0�d;x0
Þ=d2
Zxy ¼ ð�Zy0�d;x0�d þ Zy0�d;x0þd þ Zy0þd;x0�d � Zy0þd;x0þdÞ=ð2dÞ2ð22Þ
Using the variance–covariance propagation law
Y ¼ R � X � RT ð23Þ
with R, the partial derivates of Eq. (22); X, the observations vari-ance–covariance matrix; and Y, the second-order partial derivatesvariance–covariance matrix; assuming no correlation among eleva-tion measurements, and an equal elevation accuracy, the partialderivatives standard deviation are given by:
m2Zxx¼ 6
d4 �m2Z
m2Zyy¼ 6
d4 �m2Z
m2Zxy¼ 1
4�d4 �m2Z
ð24Þ
Computing the eigenvalues are via detðH� k � IÞ ¼ 0, yields:
kmin;max ¼Zxx þ Zyy �
ffiffiffiffiffiffiffiffiffiffiffiffiffiffiffiffiffiffiffiffiffiffiffiffiffiffiffiffiffiffiffiffiffiffiffiffiffiffiffiðZxx � ZyyÞ2 þ 4Z2
xy
q2
ð25Þ
According to the variance–covariance propagation law, and usingEq. (25), the standard deviation of the two eigenvalues is:
Xk ¼
@kmax@Zxx
@kmax@Zyy
@kmax@Zxy
@kmin@Zxx
@kmin@Zyy
@kmin@Zxy
24
35 �X Z �
@kmax@Zxx
@kmax@Zyy
@kmax@Zxy
@kmin@Zxx
@kmin@Zyy
@kmin@Zxy
24
35
T
ð26Þ
leading to:
m2k1¼ m2
k2¼½6ðZxx � ZyyÞ2 þ 7Z2
xy�½ðZxx � ZyyÞ2 þ 4Z2
xy�d4 m2
Z ð27Þ
For a local minima point, Zxy should be close to zero therefore,
mkmax ¼ mkmin¼
ffiffiffi6p
d2 �mZ : ð28Þ
References
Avni, Y., 2005. Gully incision as a key factor in desertification in an aridenvironment, The Negev Highlands, Israel. Catena 63 (2–3), 185–220.
Avni, Y., Zilberman, E., Shirav, M., Katz, O., Ben Moshe, L., 2005. Response of theGeomorphic Systems along the Western Coast of the Dead Sea to Sea LevelLowering and Its Implications on Infrastructure: Summary Report. IsraelGeology Survey, Rep. GSI/18/2004, pp. 116–120 (in Hebrew).
Ballard, D.H., Brown, C.M., 1982. Computer Vision. Prentice-Hall, Englewood Cliffs,New Jersey.
Baruch, A., Filin, S., 2008. Detection of subtle ridgelines from laser scanning data.International Archives of Photogrammetry and Remote Sensing 37 (Pt. B3A),111–118.
Ben Moshe, L., Haviv, I., Enzel, Y., Zilberman, E., Matmon, E., 2008. Incision of alluvialchannels in response to a continuous base level fall: field characterization,modeling, and validation along the Dead Sea. Geomorphology 93 (3–4), 524–536.
Besl, P.J., 1988. Surfaces in Range Image Understanding. Springer-Verlag, New York.Betts, H.D., DeRose, R.C., 1999. Digital elevation models as a tool for monitoring and
measuring gully erosion. International Journal of Applied Earth Observation andGeoinformation 1 (2), 91–101.
Bramley, R., Winnicka, B., 1996. Solving linear inequalities in a least-squares sense.SIAM Journal on Scientific Computing 17 (1), 275–286.

578 A. Baruch, S. Filin / ISPRS Journal of Photogrammetry and Remote Sensing 66 (2011) 564–578
Brooks, K., Ffolliott, P., Gregresen, H., DeBano, L., 2003. Hydrology and theManagement of Watersheds, third ed. Wiley–Blackwell.
Brügelmann, R., 2000. Automatic breakline detection from airborne laser rangedata. International Archives of Photogrammetry and Remote Sensing 33 (Pt. B3),109–116.
Cho, H.-C., Slatton, K.C., 2007. Morphological processing of severely occluded digitalelevation images to extract and connect stream channels. IEEE InternationalConference on Image Processing 2, 241–244.
Chong, K.L., 1976. Inequality constrained least-squares estimation. Journal of theAmerican Statistical Association 71 (355), 746–775.
Chorowicz, J., Ichoku, C., Riazanoff, S., Kim, Y.J., Cervelle, B., 1992. A combinedalgorithm for automated drainage network extraction. Water ResourcesResearch 28 (5), 1293–1302.
Costa-Cabral, M.C., Bruges, S.J., 1994. Digital elevation model networks (DEMON): amodel of flow over hill slopes for computation of contributing and dispersalareas. Water Resources Research 30 (6), 1681–1692.
Devernay, B., 1995. A Non-Maxima Suppression Method for Edge Detection withSub-Pixel Accuracy. INRIA Sophia Antipolis Research Report Number 2724.
Eustace, A.H., Witte, C., Carey, B.W., 2007. Evaluating airborne laser scanning forgully erosion detection and baseline mapping in the Fitzroy Catchment,Queensland, Australia. In: Proceedings of Fourth International Symposium onGully Erosion, Spain, September 2007.
Eustace, A., Pringle, M., Witte, C., 2009. Give me the dirt: detection of gully extentand volume using high-resolution lidar. In: Jones, S., Reinke, K. (Eds.),Innovations in Remote Sensing and Photogrammetry. Springer-Verlag, Berlin,Heidelberg, pp. 255–269.
Garfunkel, Z., Zak, I., Freund, R., 1981. Active faulting in the Dead Sea rift.Tectonophysics 80 (1–4), 1–26.
Giordano, A., Marchisio, C., 1991. Analysis and correlation of the existing soilerosion maps in the Mediterranean basin. Quaderni di Scienza del Suolo 3, 97–132.
Glazovsky, N.F., 1995. The Aral Sea basin. Regions at risk: comparison of threatenedenvironments. In: Kasperson, J.X., Kasperson, R.E., Turner, B.L., II (Eds.), The AralSea Basin Regions at Risk: Comparison of Threatened Environments. UnitedNations University Press, pp. 92–139.
Hall, J.K., 1994. Digital Shaded-Relief Map of Israel and Environs, Survey of Israel,Jerusalem, Israel.
Han, S.P., 1980. Least-Squares Solution of Linear Inequalities. Technical Report. TR-2141, Mathematics Research Center, University of Wisconsin-Madison.
James, L.A., Watson, D.G., Hansen, W.F., 2007. Using LiDAR data to map gullies andheadwater streams under forest canopy: South Carolina, USA. Catena 71 (1),132–144.
Jenson, S.K., Dominque, J.O., 1988. Extracting topographic structure from digitalelevation data for geographic information system analysis. PhotogrammetricEngineering & Remote Sensing 54 (11), 1593–1600.
Liberti, M., Simoniello, T., Carone, M.T., Coppola, R., D’Emilio, M., Macchiato, M.,2009. Mapping badland areas using LANDSAT TM/ETM satellite imagery andmorphological data. Geomorphology 106 (3–4), 333–343.
Lohani, B., Mason, D.C., 2001. Application of airborne scanning laser altimetry to thestudy of tidal channel geomorphology. ISPRS Journal of Photogrammetry andRemote Sensing 56 (2), 100–120.
Luenberger, D.G., 1984. Linear and Nonlinear Programming, second ed. Addison-Wesley, Inc., Reading, Massachusetts.
Mainguet, M., Le’tolle, R., 1998. Human-made desertification in the Aral Sea basin:planning and management failures. In: Bruins, H.J., Lithwick, H. (Eds.), The AridFrontier: Interactive Management of Environment and Development. KluwerAcademic Publishers, Dordrecht, pp. 129–142.
Martínez-Casasnovas, J.A., Stuiver, H.J., 1998. Automatic delineation of drainagenetworks and elementary catchments from Digital Elevation Models.International Journal of Aerospace Survey and Earth Sciences (ITC Journal) 3(4), 198–208.
Martínez-Casasnovas, J.A., Antón-Fernández, C., Ramos, M.C., 2003. Sedimentproduction in large gullies of the Mediterranean area (NE Spain) from high-resolution digital elevation models and geographical information systemsanalysis. Earth Surface Processes and Landforms 28 (5), 443–456.
Martínez-Casasnovas, J.A., Ramos, M.C., Posen, J., 2004. Assessment of sidewallerosion in large Mediterranean gullies using multi-temporal DEMs and logisticregression analysis. Geomorphology 58 (1–4), 305–321.
Mason, D.C., Scott, T.R., Wang, H.J., 2006. Extraction of tidal channel networks fromairborne scanning laser altimetry. ISPRS Journal of Photogrammetry andRemote Sensing 61 (2), 67–83.
Meisels, A., Raizman, S., Karnieli, A., 1995. Skeletonizing a DEM into a drainagenetwork. Computers & Geosciences 21 (1), 187–196.
Notebaert, B., Verstraeten, G., Govers, G., Poesen, J., 2009. Qualitative andquantitative applications of LiDAR imagery in fluvial geomorphology. EarthSurface Processes and Landforms 34 (2), 217–231.
Peroy, R.L., Bookhagen, B., Asner, G.P., Chadwick, O.A., 2010. Comparison of gullyerosion estimates using airborne and ground-based LiDAR on Santa Cruz Island,California. Geomorphology 118 (3–4), 288–300.
Poesen, J., Nachtergaele, J., Verstraeten, G., Valentin, C., 2003. Gully erosion andenvironmental change: importance and research needs. Catena 50 (2–4), 91–133.
Ries, J.B., Marzolff, I., 2003. Monitoring of gully erosion in the central Ebro basin bylarge-scale aerial photography taken from remotely controlled blimp. Catena 50(2–4), 309–328.
Ritchie, J.C., 1996. Remote sensing applications to hydrology: airborne laseraltimeters. Hydrological Sciences 41 (4), 625–636.
Rutzinger, M., Höfle, B., Pfeifer, T., Geist, T., Stötter, J., 2006. Object based analysis ofairborne laser scanning data for natural hazard purposes using open sourcecomponents. International Achieves of Photogrammetry and Remote Sensing 36(Pt. 4/C42).
Torrion, J.A., 2001. Land Degradation Detection Mapping and Monitoring in the LakeNaivasha Basin, Kenya. M.Sc. Thesis, Enschede, ITC, 2002.
Valentin, C., Poesen, J., Li, Y., 2005. Gully erosion: impacts, factors and control.Catena 63 (2–3), 132–153.
Wu, Y., Cheng, H., 2005. Monitoring of gully erosion on the Loess Plateau of Chinausing a global positioning system. Catena 63 (2–3), 154–166.