Polarimetric Detection of Targets in Heavy Inhomogeneous Clutter
13
IEEE TRANSACTIONS ON SIGNAL PROCESSING, VOL. 56, NO. 4, APRIL 2008 1349 Polarimetric Detection of Targets in Heavy Inhomogeneous Clutter Martin Hurtado and Arye Nehorai, Fellow, IEEE Abstract—Polarization diversity has proved to be a useful tool for radar detection, especially when discrimination by Doppler ef- fect is not possible. In this paper, we address the problem of im- proving the performance of polarimetric detectors for targets in heavy inhomogeneous clutter. First, we introduce a new polari- metric radar model that includes the realistic dependence of the clutter reflections on the transmitted signal. Then, we develop a po- larimetric detection test that is robust to inhomogeneous clutter. We run this polarimetric test against synthetic and real data to assess its performance in comparison with existing polarimetric detectors. Finally, we propose a polarimetric waveform-design al- gorithm to further improve the target-detection performance. A numerical analysis is presented to demonstrate the potential per- formance improvement that can be achieved with this algorithm. Index Terms—Diversity reception, Gaussian processes, optimal signal design, polarization diversity detection, radar clutter, radar detection, radar polarimetry, waveform design. I. INTRODUCTION T HE detection of static or slowly moving targets in heavy- clutter environments is considered a challenging problem, mainly because it is not possible to discriminate the target from the clutter using the Doppler effect. Polarization diversity pro- vides additional information that enhances the detection of tar- gets, particularly under the conditions described here. Detection performance could be further improved if the polarization of the transmitted signal were optimally selected to match the target polarimetric aspects. In this paper, we present a polarimetric detector that is robust against heavy inhomogeneous clutter; i.e., the detector false-alarm rate is insensitive to changes in the clutter, while still maintaining a good probability of detection. Using real data, we test its applicability and show its advantages with respect to other polarimetric detectors. Moreover, the test statistic derived from the detector has a well-known distribution that depends on the transmitted waveform parameters. Finally, we propose the selection of the signal polarization that will max- imize the target probability of detection. The effort of applying polarization diversity to enhance radar performance can be traced back to the 1950s; see [1] and ref- erences therein. Recent work in the field of polarimetric detec- Manuscript received January 26, 2007; revised August 14, 2007. The asso- ciate editor coordinating the review of this manuscript and approving it for pub- lication was Prof. Leslie Collins. This work was supported in part by the De- partment of Defense under the Air Force Office of Scientific Research MURI Grant FA9550-05-0443, AFOSR Grant FA 9550-05-1-0018, and DARPA by NRL Grant N00173-06-1G006. The authors are with the Department of Electrical and Systems Engineering, Washington University, St. Louis, MO 63130 USA (e-mail: mhurta3@ese. wustl.edu; [email protected]). Digital Object Identifier 10.1109/TSP.2007.909046 tion has addressed the design of the optimum detector under the assumption of known target and clutter scattering parame- ters [2]. Since this assumption is unrealistic for many radar ap- plications, different detection algorithms that used training data were subsequently developed [3]–[5]. These data, also known as secondary data, consist of recorded echoes from range cells adjacent to the cell under test, assuming that those cells have the same clutter covariance structure and are free of targets. The performance of these detectors can be severely degraded in the presence of inhomogeneous and nonstationary clutter [6]. To overcome this problem, the application of compound-Gaussian distributions for modeling the global behavior of nonhomoge- neous clutter has been proposed in [2]. However, the use of non-Gaussian models increases the difficulty of developing ef- ficient detection algorithms. For instance, the detection statistic derived from the scheme presented in [7] has a closed-form ex- pression only for the special case of two polarimetric channels, and the detector proposed in [8] does not support the constant false-alarm rate (CFAR) property with respect to the clutter co- variance. These characteristics represent serious limitations, in particular when the analysis of the detection performance is in- tended to be used to adaptively optimize the sensing system. The problem of radar waveform design consists of finding the signal parameters that improve system performance. Hence, it is necessary to define a measure of goodness to assess the system behavior, usually directly related to the radar application. For the design of polarimetric waveforms, the Mahalanobis distance is considered as the design cost function for target identification purposes in [9]; and functions of the Cramér-Rao bound are used for estimation and tracking applications in [10], [11]. Recent work on waveform design has proposed using the probability of detection for a single polarization optimal detector [12]. How- ever, this latter design procedure requires the knowledge of the power spectral density of the target and clutter reflections, infor- mation that often is partially or totally missing. Therefore, we seek to develop a polarimetric waveform design algorithm for improved target detection that does not requires prior knowl- edge of the target and clutter. In this paper, we develop a polarimetric detector whose deci- sion-making capability is based only on the data collected from the range cell under test, without resorting to secondary data or prior knowledge of the target and clutter. This feature makes it robust against inhomogeneous and nonstationary clutter. In order to derive the detector, we first introduce a new polari- metric radar model that states the dependence of the clutter re- flections on the transmitted signal. This detector resembles that of [13]; however, our work is distinctive in several ways: a) The detector in [13] is developed under the assumption that the target 1053-587X/$25.00 © 2008 IEEE
Transcript of Polarimetric Detection of Targets in Heavy Inhomogeneous Clutter

IEEE TRANSACTIONS ON SIGNAL PROCESSING, VOL. 56, NO. 4, APRIL 2008 1349
Polarimetric Detection of Targets in HeavyInhomogeneous ClutterMartin Hurtado and Arye Nehorai, Fellow, IEEE
Abstract—Polarization diversity has proved to be a useful toolfor radar detection, especially when discrimination by Doppler ef-fect is not possible. In this paper, we address the problem of im-proving the performance of polarimetric detectors for targets inheavy inhomogeneous clutter. First, we introduce a new polari-metric radar model that includes the realistic dependence of theclutter reflections on the transmitted signal. Then, we develop a po-larimetric detection test that is robust to inhomogeneous clutter.We run this polarimetric test against synthetic and real data toassess its performance in comparison with existing polarimetricdetectors. Finally, we propose a polarimetric waveform-design al-gorithm to further improve the target-detection performance. Anumerical analysis is presented to demonstrate the potential per-formance improvement that can be achieved with this algorithm.
Index Terms—Diversity reception, Gaussian processes, optimalsignal design, polarization diversity detection, radar clutter, radardetection, radar polarimetry, waveform design.
I. INTRODUCTION
THE detection of static or slowly moving targets in heavy-clutter environments is considered a challenging problem,
mainly because it is not possible to discriminate the target fromthe clutter using the Doppler effect. Polarization diversity pro-vides additional information that enhances the detection of tar-gets, particularly under the conditions described here. Detectionperformance could be further improved if the polarization of thetransmitted signal were optimally selected to match the targetpolarimetric aspects. In this paper, we present a polarimetricdetector that is robust against heavy inhomogeneous clutter;i.e., the detector false-alarm rate is insensitive to changes in theclutter, while still maintaining a good probability of detection.Using real data, we test its applicability and show its advantageswith respect to other polarimetric detectors. Moreover, the teststatistic derived from the detector has a well-known distributionthat depends on the transmitted waveform parameters. Finally,we propose the selection of the signal polarization that will max-imize the target probability of detection.
The effort of applying polarization diversity to enhance radarperformance can be traced back to the 1950s; see [1] and ref-erences therein. Recent work in the field of polarimetric detec-
Manuscript received January 26, 2007; revised August 14, 2007. The asso-ciate editor coordinating the review of this manuscript and approving it for pub-lication was Prof. Leslie Collins. This work was supported in part by the De-partment of Defense under the Air Force Office of Scientific Research MURIGrant FA9550-05-0443, AFOSR Grant FA 9550-05-1-0018, and DARPA byNRL Grant N00173-06-1G006.
The authors are with the Department of Electrical and Systems Engineering,Washington University, St. Louis, MO 63130 USA (e-mail: [email protected]; [email protected]).
Digital Object Identifier 10.1109/TSP.2007.909046
tion has addressed the design of the optimum detector underthe assumption of known target and clutter scattering parame-ters [2]. Since this assumption is unrealistic for many radar ap-plications, different detection algorithms that used training datawere subsequently developed [3]–[5]. These data, also knownas secondary data, consist of recorded echoes from range cellsadjacent to the cell under test, assuming that those cells havethe same clutter covariance structure and are free of targets. Theperformance of these detectors can be severely degraded in thepresence of inhomogeneous and nonstationary clutter [6]. Toovercome this problem, the application of compound-Gaussiandistributions for modeling the global behavior of nonhomoge-neous clutter has been proposed in [2]. However, the use ofnon-Gaussian models increases the difficulty of developing ef-ficient detection algorithms. For instance, the detection statisticderived from the scheme presented in [7] has a closed-form ex-pression only for the special case of two polarimetric channels,and the detector proposed in [8] does not support the constantfalse-alarm rate (CFAR) property with respect to the clutter co-variance. These characteristics represent serious limitations, inparticular when the analysis of the detection performance is in-tended to be used to adaptively optimize the sensing system.
The problem of radar waveform design consists of finding thesignal parameters that improve system performance. Hence, it isnecessary to define a measure of goodness to assess the systembehavior, usually directly related to the radar application. Forthe design of polarimetric waveforms, the Mahalanobis distanceis considered as the design cost function for target identificationpurposes in [9]; and functions of the Cramér-Rao bound are usedfor estimation and tracking applications in [10], [11]. Recentwork on waveform design has proposed using the probability ofdetection for a single polarization optimal detector [12]. How-ever, this latter design procedure requires the knowledge of thepower spectral density of the target and clutter reflections, infor-mation that often is partially or totally missing. Therefore, weseek to develop a polarimetric waveform design algorithm forimproved target detection that does not requires prior knowl-edge of the target and clutter.
In this paper, we develop a polarimetric detector whose deci-sion-making capability is based only on the data collected fromthe range cell under test, without resorting to secondary data orprior knowledge of the target and clutter. This feature makesit robust against inhomogeneous and nonstationary clutter. Inorder to derive the detector, we first introduce a new polari-metric radar model that states the dependence of the clutter re-flections on the transmitted signal. This detector resembles thatof [13]; however, our work is distinctive in several ways: a) Thedetector in [13] is developed under the assumption that the target
1053-587X/$25.00 © 2008 IEEE

1350 IEEE TRANSACTIONS ON SIGNAL PROCESSING, VOL. 56, NO. 4, APRIL 2008
Fig. 1. Geometry of the problem: object of interest (target) in an environment (clutter) producing undesired echoes.
is present only in one of the multiple scans of the radar dwell;thus, it will not detect a static target. Our method is specificallyaimed at detecting static or slow targets. b) Our detector hasbeen extended to consider any arbitrary transmit polarization.c) Our detector can also be applied to advanced polarimetric re-ceivers, such as tripoles [14] and vector-sensor antennas [15],in addition to conventional vertical and horizontal (or left andright circular) polarized arrays of antennas. d) Our detector istested with real radar data.
Later in this paper, we address the problem of waveform de-sign by presenting an algorithm for selecting the waveform po-larization. The developed test statistic has a closed-form expres-sion that incorporates information about the transmitted signalpolarization. Hence, analysis of detection performance is usedto select the next transmission polarization, which improves thetarget detection. We compute numerical examples to demon-strate the improvement in detection performance.
The paper is organized as follows. In Section II, we describethe data model for the echoes of a target in clutter. In Section III,we develop the detection test and analyze its performance. Wepresent the method for waveform design in Section IV. Sincethe proposed detector and waveform design algorithm can beapplied to other waveform diversities other than polarization,Sections II–IV are presented in a general fashion. Then, in Sec-tion V the polarimetric problem is addressed in particular. Fi-nally, concluding remarks are given in Section VI.
II. RADAR MODEL
In this section, we introduce a model for the data recorded bya radar system. Our goal is to propose a general linear model thatcan be applied to several problems other than polarimetric dataand at the same time be used to develop a common detectiontest for all of them.
A. Data Model
Consider a point target that is being illuminated by a radarsystem. The recorded data consist not only of the target echoesbut also of the undesired reflections from the target environment(see Fig. 1). We assume that the receiver antenna array has anarrow beam that is pointing toward the target. Hence, only theclutter in the direction of the antenna beam contributes to themeasured signal. As a result, the recorded data correspondingto the range cell containing the target can be represented by thefollowing linear model:
(1)
where is a complex matrix that represents the systemresponse, including the sensor array steering matrix and thetransmitted radar waveform; and are complex vectorsof the scattering coefficients of the target and clutter, respec-tively; and is the additive thermal noise. It is assumed that thesystem response is such that and .
By observing the second term of expression (1), we note thatthe target recorded data are being corrupted by the clutter re-flections. Since the latter depend also on the transmitted signal(which is included in the matrix ), this problem can be classi-fied as a signal-dependent noise problem [12]. Hence, our pro-posed model accounts for the dependence of the clutter echoeson the transmitted signal, which is a more realistic represen-tation than the usual model uncorrelated with the transmittedsignal, see [3]–[8].
B. Statistical Model
We start by assuming that the target is a small manmade ob-ject; hence, is a deterministic vector. On the other hand, theclutter in the range cell under test can be considered as a largecollection of point scatterers producing incoherent reflectionsof the radar signal. Then, is a zero-mean complex Gaussianrandom vector with covariance matrix [16, Ch. 15]. The noise
is a zero-mean complex Gaussian random vector with covari-ance matrix , where is the identity matrix, sincewe consider that the thermal noise measurements are indepen-dent from sensor to sensor and each has the same power. In addi-tion, we assume that the clutter reflections and the thermal noiseare statistically independent.
Frequently, the radar dwell consists of a series of pulsesthat can be seen as “snapshots” of the range cell under test. Ifthe pulse duration is short with respect to the dynamic of thetarget and its environment, it is reasonable to assume that theirscattering coefficients are constant during each pulse. However,from pulse to pulse, we consider the clutter scattering coeffi-cients as independent realizations of the same random process1
(refer also to [17, Chap. IV] for a further discussion aboutthese assumptions for remote sensing applications). Then, thedistribution of each snapshot is
(2)
where denotes a complex normal (Gaussian) distribution,is the total number of snapshots or pulses in the radar dwell,
and is the conjugate transpose operator.
1This assumption may not be valid at high pulse-repetition frequency (PRF).However, the correlation can be reduced by decimating the snapshots. The caseof temporally correlated data will be the subject of future research.

HURTADO AND NEHORAI: POLARIMETRIC DETECTION OF TARGETS 1351
We remark that model (1) can be rewritten by merging thetwo first terms and defining , without modifyingthe statistical model of the data given by (2). However, we be-lieve (1) has more intuitive insight, since it explicitly shows that
and represent different objects: the target and the clutter,respectively.
C. Known and Unknown Model Parameters
The main difference between active and passive sensing sys-tems is that for the former, the waveform and the direction inwhich it has been transmitted are known. Moreover, it is rea-sonable to assume that the receiver antenna array has been cali-brated. Hence, the system response matrix is known.
In addition, we assume that the power of the thermal noiseis known, since it can be easily estimated from the recorded datawhen no signal has been transmitted. However, we suppose thatwe have no prior knowledge about the target and the clutter, nordo we count on a secondary data set for estimating the statisticalproperties of the clutter. Hence, the vector and the matrixare the unknown parameters of the statistical data model (2).
III. DETECTION TEST
In this section, we develop a detection test for the model pre-sented in the previous section. Our problem is to decide whethera target is present or not in the range cell under test, based onthe recorded data. More formally, the decision problem consistsof choosing between two possible hypotheses: the null hypoth-esis (target-free hypothesis) or the alternative hypothesis(target-present hypothesis). It can be stated as a parameter test
(3)
where the matrix is considered as a nuisance parameter.It is well known that the optimal detector is the likelihood
ratio test [18], which provides maximum probability of detec-tion given a certain probability of false alarm . Be-cause of the lack of complete knowledge of the data distribu-tion, likelihood ratio test cannot be applied to our problem. Onepossible alternative is the generalized likelihood ratio (GLR)test in which the unknown parameters of the data distributionare replaced by their maximum likelihood estimates (MLE) inthe likelihood ratio test [18]. Although, the GLR test does nothave the optimality property described before, it appears to workwell in practice. Next, we derive the GLR test and study itsperformance.
A. GLR Test
The logarithmic GLR test decides if
(4)
where and are the likelihood functions under and ,and are the MLEs of under and , is the MLE
of under , and is the detection threshold. For simplicityof notation we will omit references to the data in the argumentsof the functions and in the rest of the paper.
We start the derivation of the GLR test by determining thelikelihood functions and MLEs of the unknown parameters.Under hypothesis , it is assumed that ; then
(5)
where denotes the determinant of the matrix,is the theoretical covariance matrix of the data, defined in
(2), and is the sample covariance matrix
(6)
The MLE of is (see [24] and Appendix A)
(7)
where is the pseudo-inverse matrix. Thelogarithmic likelihood function concentrated with respect tois given by
(8)
where is the orthogonal projection matrix thatprojects a vector onto the space orthogonal to the one spannedby the columns of A. Under hypothesis , the likelihood func-tion is
(9)
where
(10)
We show in Appendix A that the MLE of the unknown param-eters are
(11)
(12)
where is the sample mean vector
(13)
and is the sample covariance matrix
(14)
The logarithmic likelihood function concentrated with respectto and is
(15)

1352 IEEE TRANSACTIONS ON SIGNAL PROCESSING, VOL. 56, NO. 4, APRIL 2008
In addition, we consider the following equality, which is validfor any matrix S of dimension :
(16)
Then, substituting the concentrated likelihood functions (8) and(15) in (4), and using (16), the logarithmic of the GLR statisticis
(17)
It is straightforward to show that (see Appendix B)
(18)
Thus, by removing the logarithmic operator, (17) can berewritten as
(19)
Since (19) is a monotonically increasing function of the secondterm inside the brackets, an equivalent detection test statistic canbe defined as
(20)
B. Detection Performance
Let ; then the test statistic (20)can be written as
(21)
where and are the sample mean and covarianceformed from a random sample of size of the distribu-tion :
(22)
(23)
Applying Corollary 5.2.1 from [19], it is straightforward toverify that the detection statistic is distributed as follows,
underunder (24)
where denotes an distribution with and degreesof freedom, and denotes a noncentral distributionwith and degrees of freedom and noncentrality parameter
. The noncentrality parameter is given by
(25)
Fig. 2. Detection performance of the GLR test statistic T as a function ofthe TCR, for different values of P .
The last term of this equality is found by using the fact that. Thus, the detection performance becomes
(26)
where is the right-tail probability function [18, Ch. 2] andis the detection threshold for the required probability of falsealarm. In particular, note that the expression for does notdepend on the covariance of clutter and thermal noise, nor onthe transmitted signal; thus, (20) is a CFAR test.
We remark that the corollary mentioned above has been statedfor real random variables. However, the results for the complexcase are similar except that there is a factor of 2 in the non-centrality parameter and the degrees of freedom of the dis-tribution, since the complex case has twice the number of realparameters compared with the real case. The reader can refer to[20] for further information on the distribution derived fromcomplex normal variables.
C. Numerical Performance Validation
We validated the analytical performance of the developed testby computer simulations. The first equation in (26) is used to de-termine the threshold for the desired . Then, we resort toMonte Carlo simulations based on independent trailsto generate synthetic data using the model (2), evaluate the de-tection statistic given in (20), and obtain for a certain valueof target-to-clutter ratio (TCR) and clutter-to-noise ratio (CNR).The definitions of TCR and CNR are given in Appendix C.
A usual way to depict the performance detection is to plotcurves of versus TCR. To compute these curves we select ,
, and randomly; i.e., the value of their entries are assignedusing a random number with distribution ; then thosevectors and matrices are scaled to fulfill the required TCR andCNR. Fig. 2 shows the averaged curves of for 100 cases of

HURTADO AND NEHORAI: POLARIMETRIC DETECTION OF TARGETS 1353
Fig. 3. Illustrative example of central and noncentral F distributions with different noncentrality parameters. On the right plot, � is larger compared to the leftplot; hence, P is increased.
, , and , and different values of and .The agreement between analytical and numerical performanceresults validates our theory.
IV. TARGET DETECTION OPTIMIZATION
We aim at improving target detection by optimizing the de-sign of our system. In the previous section, we have shown thatthe target probability of detection depends on the system charac-teristics through the noncentrality parameter , which in turn de-pends on the system response . We recall that matrix carriesthe information of the transmitted waveform and the receiversensor array. Our optimization approach consists of designingthe matrix in order to maximize the parameter , and conse-quently the probability of detection. Fig. 3 shows an illustrativeexample of how increases for larger .
In order to find the value of the matrix that maximizes theparameter , we rewrite (25) as
(27)
Maximizing , given and , is equivalent to minimizing thesecond term of (27). We denote the vector of the waveformparameters whose entries can be features of the applied signals,e.g. bandwidth, pulse duration and polarization, or an index thatcorresponds to a certain signal in a waveform library. Then, thesystem response matrix is parameterized as . To im-prove target detection, we seek
(28)
We mention here that in a real application the true values ofand are not known. Instead, their estimates and shouldbe used to obtain the optimal waveform parameters for the nexttransmission based on the current recorded data. Nevertheless,solving (28) with the true target and clutter values provides anupper bound of the detection improvement.
V. POLARIMETRIC DETECTION AND WAVEFORM DESIGN
We now address the problem of a polarimetric radar system.First, we specify the model stated in Section II for the particularcase of diversely polarized data. Then, we discuss the perfor-mance of the detector developed in Section III when comparedto other polarimetric tests, and we select the transmit waveformpolarization based on the method proposed in Section IV.
We consider a monostatic radar capable of transmitting wave-forms with any arbitrary polarization on a pulse-by-pulse basis.We note that in order to fully identify the polarimetric aspects ofthe target and clutter, the radar dwell must consist of diverselypolarized pulses. For example, a conventional polarimetric radarwill transmit an alternating sequence of vertical and horizontalpolarized pulses.
A. Polarimetric Data
The output of a diversely polarized array of sensors re-ceiving the echoes from the cell under test can be expressed as
(29)
where• The vector is the complex envelope of the mea-
surements.• The matrix is the response of the diversely po-
larized sensor array. If the receiver array is a vector sensor[15], the array response is given by
(30)
where and are the azimuth and elevation angles of thecell under test, respectively. If the array is a tripole antenna[14], then
(31)

1354 IEEE TRANSACTIONS ON SIGNAL PROCESSING, VOL. 56, NO. 4, APRIL 2008
For a conventional polarized radar measuring the hori-zontal and vertical components of the electric field andassuming these two sensors are orthogonal to the directionthat points toward the cell under test, the array responsematrix is .
• The complex scattering matrix represents the polariza-tion change of the transmitted signal upon its reflection onthe target or clutter:
(32)
where the variables and are co-polar scattering co-efficients and and are cross-polar coefficients. Forthe mono-static radar case, . The superscriptsand refer to the target and clutter.
• The vector is the narrowband transmitted signal whichcan be represented by
(33)
where and are the signal components on the polar-ization basis of the transmitter, and are the orientationand ellipticity angles, respectively, and is the complexenvelope of the transmitted signal.
• The vector represents the thermal noise corrupting theradar measurements.
• denotes the number of samples per pulse.Equation (29) can be written as a linear equation in terms of
the scattering coefficients
(34)
where the scattering coefficient vectors of the target and clutterare and , respectively,which have dimension . The polarization matrix is
(35)
The time samples can be stacked in one vector of dimension
(36)
where and is the Kronecker product.Piling together the data models corresponding to pulses of dif-ferent polarization yields the linear model (1). Thus, the matrix
becomes
... (37)
where is the polarization matrix of each diversely polarizedpulse ; this matrix has dimension , with
.
B. Polarimetric Detector Performance: Simulations
A significant characteristic of the detector presented in thispaper is that the test statistic (20) is computed using only datafrom the cell under test. No assumption is required about the
range homogeneity of the clutter. Thus, the detector is robustagainst spatially fluctuating clutter.
To support this assertion, the is computed usingruns of Monte Carlo simulations in the presence of inhomo-geneous clutter. The clutter echoes are assumed to follow acompound-Gaussian distribution with covariance matrix[21]. The texture has a generalized Gamma probabilitydensity function [7]
(38)
where is the order parameter and is the average power. Notethat corresponds to clutter echoes with Gaussian distri-bution, but when decreases, they deviate from Gaussian. Addi-tional information about the simulation setup is as follows. Thetransmitted signals are rectangular pulses, which are transmittedin a sequence of alternating vertical (V) and horizontal (H) po-larization . The radar dwell consists of 10 repetitionsof this polarimetric sequence . On the receiver side,samples of the V and H electric field are recorded ata rate of one sample per pulse . Since the simulationsare intended to compute the , no target is considered. Theaverage power of the texture is and the speckle compo-nent of the covariance is .
For comparison purposes, the performance of two other po-larimetric detectors is also computed as follows.
• Polarization-space-time GLR (PST-GLR): This detectorwas derived under the assumption of homogeneousGaussian clutter [3]. Secondary data are used to estimatethe clutter covariance.
• Texture free GLR (TF-GLR): This detector was formulatedassuming that the clutter follows a compound-Gaussiandistribution [7]. Secondary data are normalized to removethe local power (texture) before estimating the clutter co-variance. However, this GLR test has a closed-form solu-tion only when using two polarimetric channels,2 and theresulting statistic does not have a known distribution forthe case of unknown clutter covariance.
In Fig. 4, the of our detection test , as well as of thePST-GLR and TF-GLR tests, is plotted as a function of the orderparameter of the clutter texture distribution. For the computationof this plot, the threshold is set for . From (26), weobtain for our GLR test. For the PST-GLR test, it is
, which is computed using Equation (19) of [3] (referto [4, Eq. (6)] for its generalization). Since the distribution ofthe TF-GLR test is not known, it can be calculated numerically,which results in . For the latter two tests, we consider80 adjacent range cells for generating the secondary data. Wecan observe from this figure that the performance of our detector
and the TF-GLR test remains constant at the designedfalse-alarm rate. However, there is a discrepancy between the
2The term polarimetric channel is used here to denote the different combi-nations between the transmitted and received polarization components. Polari-metric channels are frequently labeled by two letters: the first one denotes thereceived polarization component and the second indicates the transmitted polar-ization. For example, if a radar system transmits horizontally polarized pulsesand receives horizontal and vertical polarization, the polarimetric channels areHH and VH.

HURTADO AND NEHORAI: POLARIMETRIC DETECTION OF TARGETS 1355
Fig. 4. Probability of false alarm as a function of the order parameter � of theclutter texture distribution.
design and the actual clutter that increases the probability offalse alarm for the PST-GLR test as the clutter process departsfrom being Gaussian.
C. Polarimetric Detector Performance: Real Data
To evaluate the performance of the polarimetric detectors ina real application situation, we use data collected at the Os-borne Head Gunnery Range (OHGR), Dartmouth, Nova Scotia,Canada, with the McMaster University IPIX radar [22], [23].Specifically, we use the data recorded on November 11 and 12,1993, listed in Table I. In addition, this table summarizes themost relevant features of the clutter. Figs. 5–7 show the magni-tude of the four polarimetric channels: HH, VH, VV, and HV.These figures depict echoes from a small target in inhomoge-neous sea clutter. The target consists of a beachball wrappedwith aluminum foil. Its nominal location is indicated on the fig-ures by the markers “ ” and “ .”
We ran our test , in addition to the polarimetric detec-tors PST-GLR and TF-GLR, against the former datasets. Thedetection threshold is again set for , and other pa-rameters are also as in the former subsection. For the latter twotests, a guard region of two range cells on either side of the cellunder test is used to avoid the leakage of the target energy intothe secondary data. Figs. 8–10 shows detection maps for eachof the tests and datasets. The black pixels correspond to a rangecell and a 10-pulse dwell where the detection statistic is largerthan the threshold.
Fig. 8 shows the detection results, which correspond to thedataset stare1, Nov. 11. We observe that our detection test findsthe true position of the target with only a few false detections de-spite the strong clutter echoes, which can be appreciated fromFig. 5. On the other hand, the PST-GLR has high false-alarmrate due to the presence of inhomogeneous clutter, as was pre-dicted in the previous subsection. The TF-GLR test greatly re-duces the false-alarm rate with respect to the PST-GLR test;however, it still remains considerably high. Fig. 9 shows the re-sults corresponding to data recorded later on the same day, when
the wave height of the sea was smaller and the wind speed wassignificantly slower (see Table I). As a consequence, the clutterlooks homogeneous and reflects significantly less energy thanthe target, as shown in Fig. 6. Under this scenario, the threemethods perform similarly, detecting the target with few falsealarms. Finally, we tested the three methods against the datafrom Nov. 12. When this dataset was recorded, the sea waveswere larger than 1.5 m and hid the small target, as in Fig. 7. It canbe seen in Fig. 10 that none of the algorithms was able to detectthe target; however, our test is still generating the lowest numberof false alarms. These results are summarized in Table II, whichshows the empirical false-alarm rate for each dataset and detec-tion algorithm. We have defined the empirical false-alarm rateas the number of detected pixels (excluding the target pixels andtheir guard region) over the total pixels of the detection map. Thefirst and third columns of the table show that the false-alarm rateof our test is one and two orders of magnitude smaller than theTF-GLR and PST-GLR tests, respectively, for the case of stronginhomogeneous clutter. We note that the estimated false-alarmrates do not match the design . This difference isa consequence of the discrepancy between the models and realdata.
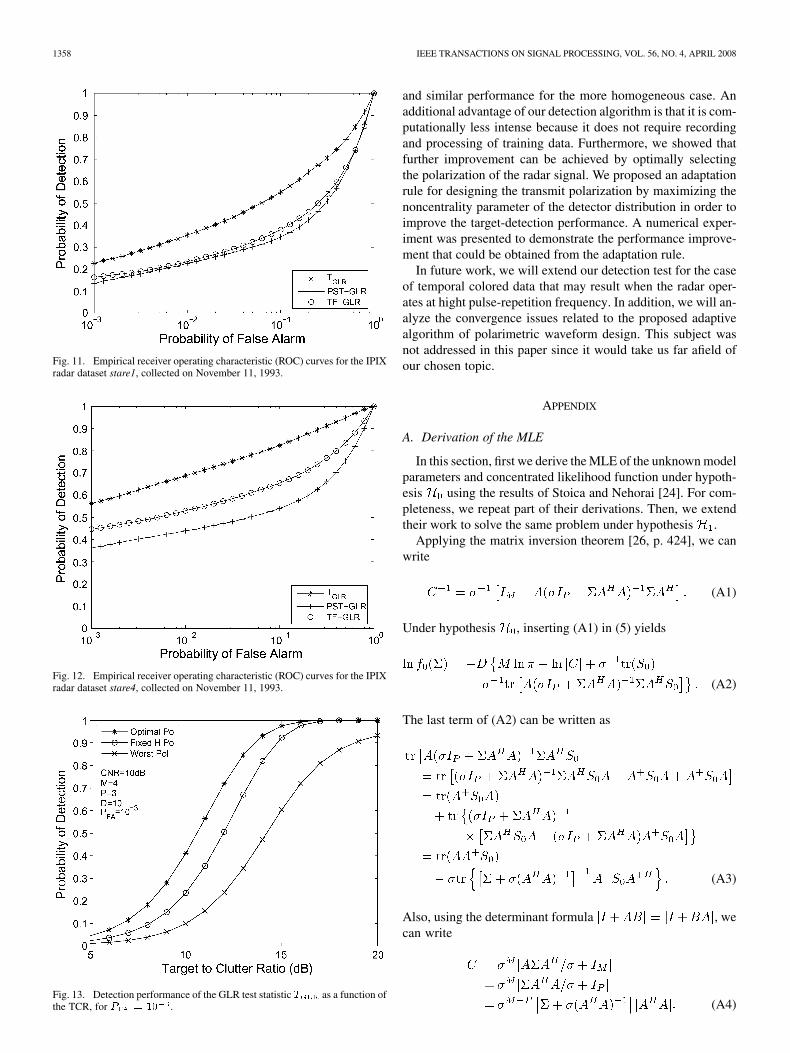
Another possible way to compare the detection performanceof the former algorithms in real data is to plot the versuscalculated from the datasets. This graphic is called receiver op-erating characteristic (ROC) [18]; however, herein we called itempirical ROC because and are derived from the realdata. The empirical probabilities are obtained by dividing thedetection map into two regions: target and clutter. The target re-gion corresponds to the range cells where the target is locatedplus the two range cells on either side (which form the guardarea). The other region corresponds to the rest of the detec-tion map where there is only clutter. Then, for a given detec-tion threshold , the empirical and are computed bycounting the number of pixels in which the statistic is largerthan the threshold, on each respective region. A paircorresponds to a point on the curve. By changing the threshold,any point of the empirical ROC is computed. Figs. 11 and 12show the empirical ROC curves for the three detectors calcu-lated using the datasets stare1 and stare4 of November 11, 1993,respectively. In both figures, our detector is on top, out-performing the other two algorithms. We note that it is not usefulto plot the ROC curve for the dataset stare1 of Nov. 12 becausethe target is not visible; in this case, and are approxi-mately the same for any threshold.
We acknowledge that comparing the TF-GLR test with theother two is not strictly fair, since the closed form of this test wasdeveloped for only two polarimetric channels (we have used HHand VV for the previous results). Our goal is not to extend thework in [7] but to show that polarimetric detection tests usingsecondary data may have larger false false-alarm than their de-signed value, in the case of inhomogeneous clutter.
D. Polarization Selection
In Section IV, we have shown, for a generic system, thatthe detection performance of our test is improved whenthe waveform parameters satisfy (28). For further analysis of

1356 IEEE TRANSACTIONS ON SIGNAL PROCESSING, VOL. 56, NO. 4, APRIL 2008
TABLE IIPIX RADAR DATASETS AND RELEVANT CLUTTER FEATURES
Fig. 5. Magnitude in range and time domain of the IPIX radar dataset stare1,collected on November 11, 1993. The target location is indicated by the markers“>” and “<.”
the particular case of a polarimetric system, we first solve theproduct using the system response matrix given by (37),obtaining
(39)
where the value of the coefficient depends of the receiversensor array, and is the transmit signal energy
(40)
The constant for a conventional V/H sensor array or tripole is; and for the electromagnetic vector sensor is . The
performance of our polarimetric detector does not depend onthe shape of pulse envelope but rather on the signal polarization.Thus, for the current problem, we define the vector of waveformparameters as .
In order to study the detection improvement by optimallyselecting the signal polarization, we design a simple problem.We assume a system in which the first pulse is vertically polar-
Fig. 6. Magnitude in range and time domain of the IPIX radar dataset stare4,collected on November 11, 1993. The target location is indicated by the markers“>” and “<.”
ized and the second can be transmitted with any arbitrary po-larization. When the second pulse has horizontal polarization,this system corresponds to a conventional polarimetric radar.Fig. 13 shows the averaged detection performance of 1000 caseswhere parameters and were randomly selected. The figureshows the averaged performance of the conventional system (thesecond pulse has fixed H polarization) compared to the resultsobtained when the polarization is optimally selected to satisfy(28). Furthermore, this figure displays the system performancefor the worst case in which the polarization of the second pulseis selected incorrectly. The worst polarization is found by ap-plying the maximization operation in (28), instead of the mini-mization. We observe that the performance of the conventionalsystem is somewhere in between the optimal and worst polariza-tion. Specifically, the optimal polarization shows, for ,a reduction of 1.5 dB of TCR with respect to the conventionalsystem and 3.8 dB with respect to the case of worst polarization.
In addition, we observe that the highest performance im-provement we obtain reaches a TCR reduction of 3 dB withrespect to conventional systems. This happens when the polari-metric aspects of the target are approximately orthogonal tothose of the clutter.

HURTADO AND NEHORAI: POLARIMETRIC DETECTION OF TARGETS 1357
Fig. 7. Magnitude in range and time domain of the IPIX radar dataset stare1,collected on November 12, 1993. The target location is indicated by the markers“>” and “<.”
Fig. 8. Detection map in range and time domain for the IPIX radar datasetstare1, collected on November 11, 1993. Black pixels indicate that the detec-tion statistic is larger than the threshold. The target location is indicated by themarkers “>” and “<.”
VI. CONCLUSION
In this paper, we addressed the problem of detecting smalland slowly moving targets in heavy inhomogeneous clutter byexploiting polarization diversity. We first introduced a new datamodel that states the dependency of the clutter reflections on thetransmitted signal. To improve the detection performance, wedeveloped a polarimetric detector that is robust against spaceand time variations of the clutter. The proposed detector de-cides the presence of a target based only on the data recorded
Fig. 9. Detection map in range and time domain for the IPIX radar datasetstare4, collected on November 11, 1993. Black pixels indicate that the detec-tion statistic is larger than the threshold. The target location is indicated by themarkers “>” and “<.”
Fig. 10. Detection map in range and time domain for the IPIX radar datasetstare1, collected on November 12, 1993. Black pixels indicate that the detec-tion statistic is larger than the threshold. The target location is indicated by themarkers “>” and “<.”
TABLE IIEMPIRICAL FALSE-ALARM RATE
from the cell under test, without requiring secondary data orprior knowledge about the clutter. We tested this detector withsynthetic and real data, and it demonstrated a significant per-formance improvement with respect to other previously pub-lished polarimetric detectors in inhomogeneous environments
1358 IEEE TRANSACTIONS ON SIGNAL PROCESSING, VOL. 56, NO. 4, APRIL 2008
Fig. 11. Empirical receiver operating characteristic (ROC) curves for the IPIXradar dataset stare1, collected on November 11, 1993.
Fig. 12. Empirical receiver operating characteristic (ROC) curves for the IPIXradar dataset stare4, collected on November 11, 1993.
Fig. 13. Detection performance of the GLR test statistic T as a function ofthe TCR, for P = 10 .
and similar performance for the more homogeneous case. Anadditional advantage of our detection algorithm is that it is com-putationally less intense because it does not require recordingand processing of training data. Furthermore, we showed thatfurther improvement can be achieved by optimally selectingthe polarization of the radar signal. We proposed an adaptationrule for designing the transmit polarization by maximizing thenoncentrality parameter of the detector distribution in order toimprove the target-detection performance. A numerical exper-iment was presented to demonstrate the performance improve-ment that could be obtained from the adaptation rule.
In future work, we will extend our detection test for the caseof temporal colored data that may result when the radar oper-ates at hight pulse-repetition frequency. In addition, we will an-alyze the convergence issues related to the proposed adaptivealgorithm of polarimetric waveform design. This subject wasnot addressed in this paper since it would take us far afield ofour chosen topic.
APPENDIX
A. Derivation of the MLE
In this section, first we derive the MLE of the unknown modelparameters and concentrated likelihood function under hypoth-esis using the results of Stoica and Nehorai [24]. For com-pleteness, we repeat part of their derivations. Then, we extendtheir work to solve the same problem under hypothesis .
Applying the matrix inversion theorem [26, p. 424], we canwrite
(A1)
Under hypothesis , inserting (A1) in (5) yields
(A2)
The last term of (A2) can be written as
(A3)
Also, using the determinant formula , wecan write
(A4)

HURTADO AND NEHORAI: POLARIMETRIC DETECTION OF TARGETS 1359
Using (A3) and (A4) in (A2), the log-likelihood function be-comes
(A5)
where .Then, the MLE of in (7) and the concentrated likelihood
function in (8) result from applying the following lemma whenmaximizing (A5) with respect to .
Lemma 1: Let be a positive definite matrix. Then thefollowing inequality holds for any positive definite matrix :
(A6)
The equality is achieved when . The proof of this lemmacan be found in [24] (see also [19, p. 69]).
Under hypothesis , we apply the same procedure explainedabove to maximize the log-likelihood function (9) with respectto for a given . The maximizing matrix is
(A7)
and the concentrated function is
(A8)
where matrix is defined by (10). Before we proceed to max-imize (A8) with respect to , we state the following equality:
(A9)
The proof of (A9) results from expanding the factors of theleft-hand side (LHS) term of the equation and applying the prop-erties of the trace
(A10)
Since and , canceling the termsthat are equal in (A10) yields
(A11)
By using the equalities (16) and (A9), it is straightforward toshow that maximizing (A8) with respect to is equivalent tominimizing the function
(A12)
We state the following properties of matrix derivatives [25,Ch. 9], which are required for the minimization of (A12):
(A13a)
(A13b)
(A13c)
where is the differential operator.Then the derivative of (A12) with respect to , the entry
of the vector , is
(A14)
From (10), we can write
(A15)
then, the derivatives of the first two terms of (A15) are zero andthe other two are
(A16)
where is the column of the matrix .Then the derivative of (A15) is
(A17)
Replacing (A17) in (A14) yields
(A18)
Assembling all the derivatives into a vector yields
(A19)
where is the transpose operator. The MLE is found by(A19) to the zero vector and solving for . Since the matrix
cannot be a zero matrix, the functionattains its minimum when , see (11).
The next step on the derivation of the MLE consists ofshowing that the minimization of the function has a uniquesolution. One possible way is to prove that is a convexfunction by showing that its second order derivative (Hessianoperator) is a positive definite matrix.
Applying the derivative rules (A13) for matrices, we obtainthe following result:
(A20)

1360 IEEE TRANSACTIONS ON SIGNAL PROCESSING, VOL. 56, NO. 4, APRIL 2008
where is the conjugate operator and factor is
(A21)
Using the properties of positive definite matrices [26, Chap. 14],it is simple to show that and are positive def-inite matrices. It remains to show that . For thatpurpose, we first define the following matrix:
(A22)
Applying the properties of partitioned matrices [26, Theorem13.3.8], we find that the determinant of is
(A23)
where since is positive definite. The determi-nant of can be written also as
(A24)
where when ; i.e., the number of snap-shots is larger than the dimensions of the vector . Then, from(A23) and (A24) it follows that , proving that (A20)is a positive definite matrix.
The expression given by (12) of the MLE of can be foundusing in (A7) and simplifying the first term as follows:
(A25)
Finally, the concentrated likelihood function in (15) is foundusing the equality in expression (A8).
B. Derivation of the Identity (18)
First, we show the relation between and . From (14), wehave
(B.1)
Then, applying the formula for the determinant of partitionedmatrices [26, Theorem 13.3.8], we can write
(B.2)
which is essentially (18).
C. Definition of TCR and CNR
In order to analyze the detection performance for differentpossible scenarios, we need to define the TCR and the CNR.Following the work of Novak et al.. on polarimetric detectors[27], we define target power as
(C.1)
where is the norm of the vector. Similarly, the clutter poweris
(C.2)
where E is the expectation. Hence, the TCR is given by
(C.3)
and the CNR is
(C.4)
where is the thermal noise power in each sensor of the receiverarray. Note that in [27], the vector norm is named span.
ACKNOWLEDGMENT
The authors thank Prof. C. Muravchik for the insightful com-ments that improved the presentation.
REFERENCES
[1] D. G. Giuli, “Polarization diversity in radars,” Proc. IEEE, vol. 74, pp.245–269, Feb. 1986.
[2] L. M. Novak, M. B. Sechtin, and M. J. Cardullo, “Studies of targetdetection algorithms that use polarimetric radar data,” IEEE Trans.Aerosp. Electr. Syst., vol. 25, pp. 150–165, Mar. 1989.
[3] H. Park, J. Li, and H. Wang, “Polarization-space-time domain gener-alized likelihood ratio detection of radar targets,” Signal Process., vol.41, pp. 153–164, Jan. 1995.
[4] D. Pastina, P. Lombardo, and T. Bucciarelli, “Adaptive polari-metric target detection with coherent radar. Part I: Detection againstGaussian background,” IEEE Trans. Aerosp. Electr. Syst., vol. 37, pp.1194–1206, Oct. 2001.
[5] A. De Maio and G. Ricci, “A polarimetric adaptive matched filter,”Signal Process., vol. 81, pp. 2583–2589, Dec. 2001.
[6] H. Park and H. Wang, “Adaptive polarization-space-time domain radartarget detection in inhomogeneous clutter environments,” Inst. Elect.Eng. Proc. Radar Sonar Navig., vol. 153, pp. 35–43, Feb. 2006.
[7] P. Lombardo, D. Pastina, and T. Bucciarelli, “Adaptive polarimetrictarget detection with coherent radar. Part II: Detection against non-Gaussian background,” IEEE Trans. Aerosp. Electr. Syst., vol. 37, pp.1207–1220, Oct. 2001.
[8] A. De Maio and G. Alfano, “Polarimetric adaptive detection in non-Gaussian noise,” Signal Process., vol. 83, pp. 297–306, Feb. 2003.
[9] D. A. Garren, A. C. Odom, S. U. Pillai, and J. R. Guerci, “Full polariza-tion matched illumination for target detection and identification,” IEEETrans. Aerosp. Electr. Syst., vol. 38, pp. 824–837, Jul. 2002.
[10] J. Wang and A. Nehorai, “Adaptive polarimetry design for a target incompound-Gaussian clutter,” IEEE Trans. Aerosp. Electr. Syst., sub-mitted for publication.
[11] T. Zhao, M. Hurtado, and A. Nehorai, “Adaptive polarized waveformdesign for target tracking using electromagnetic vector sensors,” inProc. IEEE Int. Conf. Acoust., Speech, Signal Process. (ICASSP), Hon-olulu, HI, Apr. 2007, vol. 2, pp. 1117–1120.
[12] S. Kay and J. H. Thanos, “Optimal transmit signal design for activesonar/radar,” in Proc. IEEE Int. Conf. Acoust., Speech, Signal Process.(ICASSP), 2002, vol. 2, pp. 1513–1516.

HURTADO AND NEHORAI: POLARIMETRIC DETECTION OF TARGETS 1361
[13] R. Brown and H. Wang, “An adaptive multiscan processor for polari-metric radar,” in Proc. IEEE Nat. Radar Conf., Mar. 29–31, 1994, pp.95–100.
[14] R. Compton, “The tripole antenna: An adaptive array with full polariza-tion flexibility,” IEEE Trans. Antennas Propag., vol. 29, pp. 944–952,Nov. 1981.
[15] A. Nehorai and E. Paldi, “Vector-sensor array processing for electro-magnetic source localization,” IEEE Trans. Signal Process., vol. 42,no. 2, pp. 376–398, Feb. 1994.
[16] S. M. Kay, Fundamentals of Statistical Signal Processing: EstimationTheory. Englewood Cliffs, NJ: Prentice-Hall, 1993.
[17] B. Hochwald and A. Nehorai, “Polarimetric modeling and parametersestimation with applications to remote sensing,” IEEE Trans. SignalProcess., vol. 43, no. 8, pp. 1923–1935, Aug. 1995.
[18] S. M. Kay, Fundamentals of Statistical Signal Processing: DetectionTheory. Englewood Cliffs, NJ: Prentice-Hall, 1993.
[19] T. W. Anderson, An Introduction to Multivariate Statistical Analysis,3rd ed. Hoboken, NJ: Wiley, 2003.
[20] A. T. James, “Distribution of matrix variates and latent roots derivedfrom normal samples,” Ann. Math. Statist., vol. 35, pp. 475–501, Jun.1964.
[21] L. M. Novak, M. C. Burl, and W. W. Irving, “Optimal polarimetric pro-cessing for enhanced target detection,” IEEE Trans. Aerosp. Electron.Syst., vol. 29, no. 1, pp. 234–244, Jan. 1993.
[22] S. Haykin, C. Krasnor, T. J. Nohara, B. W. Currie, and D. Ham-burger, “A coherent dual-polarized radar for studying the ocean envi-ronment,” IEEE Trans. Geosci. Remote Sens., vol. 29, pp. 189–191,Jan. 1991.
[23] A. Drosopoulos, “Description of the OHGR database,” Defence Re-search Establishment, Ottawa, ON, Canada, Tech. Rep. 94-14, Dec.1994 [Online]. Available: http://soma.crl.mcmaster.ca/ipix/dartmouth/index.html
[24] P. Stoica and A. Nehorai, “On the concentrated stochastic likelihoodfunction in array signal processing,” Circuits Syst., Signal Process., vol.14, pp. 669–674, Sep. 1995.
[25] J. M. Schott, Matrix Analysis for Statistics. Hoboken, NJ: Wiley,2005.
[26] D. A. Harville, Matrix Algebra From a Statitician’s Perspective. NewYork: Springer-Verlag, 1997.
[27] R. D. Chaney, M. C. Bud, and L. M. Novak, “On the performance ofpolarimetric target detection algorithms,” IEEE Aerosp. Electron. Syst.Mag., vol. 5, pp. 10–15, Nov. 1990.
Martin Hurtado received the B.Eng. and M.Sc. de-grees in electrical engineering from the National Uni-versity of La Plata, Argentina, in 1996 and 2001, re-spectively. He received the Ph.D. degree in electricalengineering from Washington University, St. Louis,in 2007, under the guidance of Prof. A. Nehorai.
Currently, he is a Postdoctoral Research Associatewith the Department of Electrical and Systems Engi-neering, Washington University. His research inter-ests are in the area of statistical signal processing, de-tection and estimation theory, and their applications
in sensor arrays, communications, and remote sensing systems. In addition, heis interested in electromagnetic theory and antenna design.
Arye Nehorai (S’80–M’83–SM’90–F’94) receivedthe B.Sc. and M.Sc. degrees in electrical engineeringfrom the Technion, Israel, and the Ph.D. degreein electrical engineering from Stanford University,Stanford, CA.
From 1985 to 1995, he was a faculty memberwith the Department of Electrical Engineering, YaleUniversity, New Haven, CT. In 1995, he joined theDepartment of Electrical Engineering and ComputerScience, The University of Illinois at Chicago (UIC),as a Full Professor. From 2000 to 2001, he was Chair
of the department’s Electrical and Computer Engineering (ECE) Division,which then became a new department. In 2001, he was named UniversityScholar of the University of Illinois. In 2006, he became Chairman of theDepartment of Electrical and Systems Engineering, Washington University, St.Louis (WUSTL). He is the inaugural holder of the Eugene and Martha LohmanProfessorship and the Director of the Center for Sensor Signal and InformationProcessing (CSSIP) at WUSTL since 2006.
Dr. Nehorai was Editor-in-Chief of the IEEE TRANSACTIONS ON SIGNAL
PROCESSING during 2000–2002. From 2003 to 2005, he was Vice President(Publications) of the IEEE Signal Processing Society, Chair of the PublicationsBoard, member of the Board of Governors, and member of the ExecutiveCommittee of this Society. From 2003 to 2006, he was the founding editor ofthe special columns on Leadership Reflections in the IEEE Signal ProcessingMagazine. He was a corecipient of the IEEE SPS 1989 Senior Award for BestPaper with P. Stoica, coauthor of the 2003 Young Author Best Paper Awardand corecipient of the 2004 Magazine Paper Award with A. Dogandzic. He waselected Distinguished Lecturer of the IEEE SPS for the term 2004 to 2005 andreceived the 2006 IEEE SPS Technical Achievement Award. He is the PrincipalInvestigator of the new multidisciplinary university research initiative (MURI)project entitled Adaptive Waveform Diversity for Full Spectral Dominance. Hehas been a Fellow of the Royal Statistical Society since 1996.