Polarimetric Radar Variables in Snowfall at Ka- and W-Band ...
11
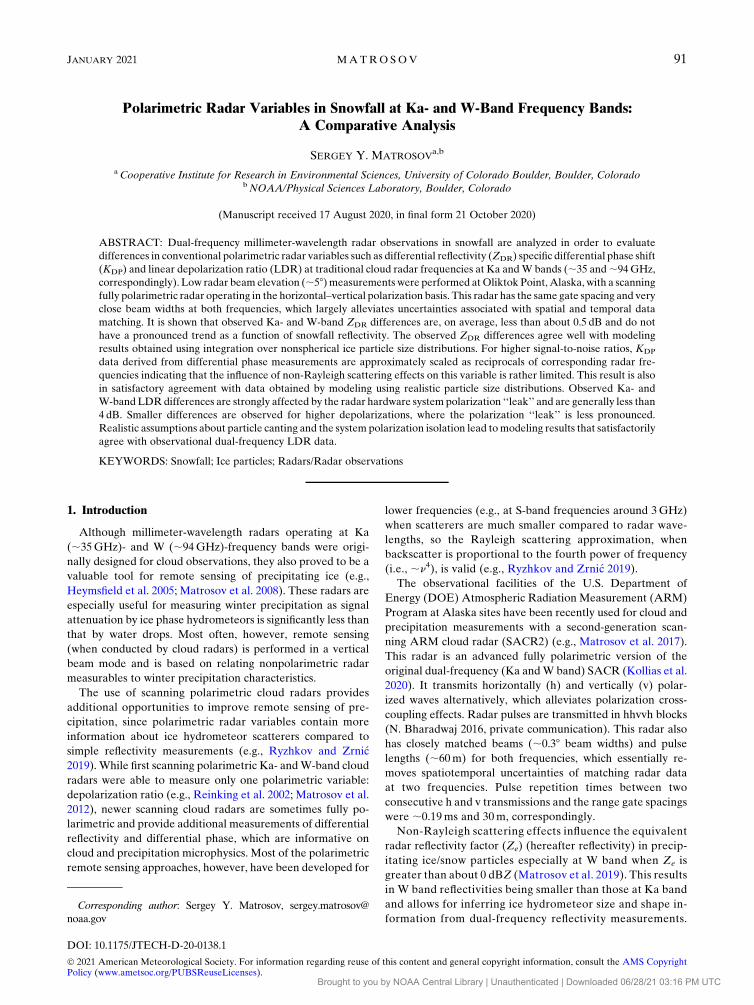
Polarimetric Radar Variables in Snowfall at Ka- and W-Band Frequency Bands: A Comparative Analysis SERGEY Y. MATROSOV a,b a Cooperative Institute for Research in Environmental Sciences, University of Colorado Boulder, Boulder, Colorado b NOAA/Physical Sciences Laboratory, Boulder, Colorado (Manuscript received 17 August 2020, in final form 21 October 2020) ABSTRACT: Dual-frequency millimeter-wavelength radar observations in snowfall are analyzed in order to evaluate differences in conventional polarimetric radar variables such as differential reflectivity (Z DR ) specific differential phase shift (K DP ) and linear depolarization ratio (LDR) at traditional cloud radar frequencies at Ka and W bands (;35 and ;94 GHz, correspondingly). Low radar beam elevation (;58) measurements were performed at Oliktok Point, Alaska, with a scanning fully polarimetric radar operating in the horizontal–vertical polarization basis. This radar has the same gate spacing and very close beam widths at both frequencies, which largely alleviates uncertainties associated with spatial and temporal data matching. It is shown that observed Ka- and W-band Z DR differences are, on average, less than about 0.5 dB and do not have a pronounced trend as a function of snowfall reflectivity. The observed Z DR differences agree well with modeling results obtained using integration over nonspherical ice particle size distributions. For higher signal-to-noise ratios, K DP data derived from differential phase measurements are approximately scaled as reciprocals of corresponding radar fre- quencies indicating that the influence of non-Rayleigh scattering effects on this variable is rather limited. This result is also in satisfactory agreement with data obtained by modeling using realistic particle size distributions. Observed Ka- and W-band LDR differences are strongly affected by the radar hardware system polarization ‘‘leak’’ and are generally less than 4 dB. Smaller differences are observed for higher depolarizations, where the polarization ‘‘leak’’ is less pronounced. Realistic assumptions about particle canting and the system polarization isolation lead to modeling results that satisfactorily agree with observational dual-frequency LDR data. KEYWORDS: Snowfall; Ice particles; Radars/Radar observations 1. Introduction Although millimeter-wavelength radars operating at Ka (;35 GHz)- and W (;94 GHz)-frequency bands were origi- nally designed for cloud observations, they also proved to be a valuable tool for remote sensing of precipitating ice (e.g., Heymsfield et al. 2005; Matrosov et al. 2008). These radars are especially useful for measuring winter precipitation as signal attenuation by ice phase hydrometeors is significantly less than that by water drops. Most often, however, remote sensing (when conducted by cloud radars) is performed in a vertical beam mode and is based on relating nonpolarimetric radar measurables to winter precipitation characteristics. The use of scanning polarimetric cloud radars provides additional opportunities to improve remote sensing of pre- cipitation, since polarimetric radar variables contain more information about ice hydrometeor scatterers compared to simple reflectivity measurements (e.g., Ryzhkov and Zrnic ´ 2019). While first scanning polarimetric Ka- and W-band cloud radars were able to measure only one polarimetric variable: depolarization ratio (e.g., Reinking et al. 2002; Matrosov et al. 2012), newer scanning cloud radars are sometimes fully po- larimetric and provide additional measurements of differential reflectivity and differential phase, which are informative on cloud and precipitation microphysics. Most of the polarimetric remote sensing approaches, however, have been developed for lower frequencies (e.g., at S-band frequencies around 3 GHz) when scatterers are much smaller compared to radar wave- lengths, so the Rayleigh scattering approximation, when backscatter is proportional to the fourth power of frequency (i.e., ;n 4 ), is valid (e.g., Ryzhkov and Zrnic ´ 2019). The observational facilities of the U.S. Department of Energy (DOE) Atmospheric Radiation Measurement (ARM) Program at Alaska sites have been recently used for cloud and precipitation measurements with a second-generation scan- ning ARM cloud radar (SACR2) (e.g., Matrosov et al. 2017). This radar is an advanced fully polarimetric version of the original dual-frequency (Ka and W band) SACR (Kollias et al. 2020). It transmits horizontally (h) and vertically (v) polar- ized waves alternatively, which alleviates polarization cross- coupling effects. Radar pulses are transmitted in hhvvh blocks (N. Bharadwaj 2016, private communication). This radar also has closely matched beams (;0.38 beam widths) and pulse lengths (;60 m) for both frequencies, which essentially re- moves spatiotemporal uncertainties of matching radar data at two frequencies. Pulse repetition times between two consecutive h and v transmissions and the range gate spacings were ;0.19 ms and 30 m, correspondingly. Non-Rayleigh scattering effects influence the equivalent radar reflectivity factor (Z e ) (hereafter reflectivity) in precip- itating ice/snow particles especially at W band when Z e is greater than about 0 dBZ (Matrosov et al. 2019). This results in W band reflectivities being smaller than those at Ka band and allows for inferring ice hydrometeor size and shape in- formation from dual-frequency reflectivity measurements. Corresponding author: Sergey Y. Matrosov, sergey.matrosov@ noaa.gov JANUARY 2021 MATROSOV 91 DOI: 10.1175/JTECH-D-20-0138.1 Ó 2021 American Meteorological Society. For information regarding reuse of this content and general copyright information, consult the AMS Copyright Policy (www.ametsoc.org/PUBSReuseLicenses). Brought to you by NOAA Central Library | Unauthenticated | Downloaded 06/28/21 03:16 PM UTC
-
Upload
khangminh22 -
Category
Documents
-
view
3 -
download
0
Transcript of Polarimetric Radar Variables in Snowfall at Ka- and W-Band ...
Polarimetric Radar Variables in Snowfall at Ka- and W-Band Frequency Bands:A Comparative Analysis
SERGEY Y. MATROSOVa,b
aCooperative Institute for Research in Environmental Sciences, University of Colorado Boulder, Boulder, ColoradobNOAA/Physical Sciences Laboratory, Boulder, Colorado
(Manuscript received 17 August 2020, in final form 21 October 2020)
ABSTRACT: Dual-frequency millimeter-wavelength radar observations in snowfall are analyzed in order to evaluate
differences in conventional polarimetric radar variables such as differential reflectivity (ZDR) specific differential phase shift
(KDP) and linear depolarization ratio (LDR) at traditional cloud radar frequencies at Ka andW bands (;35 and;94GHz,
correspondingly). Low radar beam elevation (;58)measurements were performed atOliktok Point,Alaska, with a scanning
fully polarimetric radar operating in the horizontal–vertical polarization basis. This radar has the same gate spacing and very
close beam widths at both frequencies, which largely alleviates uncertainties associated with spatial and temporal data
matching. It is shown that observed Ka- and W-band ZDR differences are, on average, less than about 0.5 dB and do not
have a pronounced trend as a function of snowfall reflectivity. The observed ZDR differences agree well with modeling
results obtained using integration over nonspherical ice particle size distributions. For higher signal-to-noise ratios, KDP
data derived from differential phase measurements are approximately scaled as reciprocals of corresponding radar fre-
quencies indicating that the influence of non-Rayleigh scattering effects on this variable is rather limited. This result is also
in satisfactory agreement with data obtained by modeling using realistic particle size distributions. Observed Ka- and
W-band LDRdifferences are strongly affected by the radar hardware system polarization ‘‘leak’’ and are generally less than
4 dB. Smaller differences are observed for higher depolarizations, where the polarization ‘‘leak’’ is less pronounced.
Realistic assumptions about particle canting and the system polarization isolation lead tomodeling results that satisfactorily
agree with observational dual-frequency LDR data.
KEYWORDS: Snowfall; Ice particles; Radars/Radar observations
1. Introduction
Although millimeter-wavelength radars operating at Ka
(;35GHz)- and W (;94GHz)-frequency bands were origi-
nally designed for cloud observations, they also proved to be a
valuable tool for remote sensing of precipitating ice (e.g.,
Heymsfield et al. 2005; Matrosov et al. 2008). These radars are
especially useful for measuring winter precipitation as signal
attenuation by ice phase hydrometeors is significantly less than
that by water drops. Most often, however, remote sensing
(when conducted by cloud radars) is performed in a vertical
beam mode and is based on relating nonpolarimetric radar
measurables to winter precipitation characteristics.
The use of scanning polarimetric cloud radars provides
additional opportunities to improve remote sensing of pre-
cipitation, since polarimetric radar variables contain more
information about ice hydrometeor scatterers compared to
simple reflectivity measurements (e.g., Ryzhkov and Zrnic
2019). While first scanning polarimetric Ka- andW-band cloud
radars were able to measure only one polarimetric variable:
depolarization ratio (e.g., Reinking et al. 2002; Matrosov et al.
2012), newer scanning cloud radars are sometimes fully po-
larimetric and provide additional measurements of differential
reflectivity and differential phase, which are informative on
cloud and precipitation microphysics. Most of the polarimetric
remote sensing approaches, however, have been developed for
lower frequencies (e.g., at S-band frequencies around 3GHz)
when scatterers are much smaller compared to radar wave-
lengths, so the Rayleigh scattering approximation, when
backscatter is proportional to the fourth power of frequency
(i.e., ;n4), is valid (e.g., Ryzhkov and Zrnic 2019).
The observational facilities of the U.S. Department of
Energy (DOE) Atmospheric Radiation Measurement (ARM)
Program at Alaska sites have been recently used for cloud and
precipitation measurements with a second-generation scan-
ning ARM cloud radar (SACR2) (e.g., Matrosov et al. 2017).
This radar is an advanced fully polarimetric version of the
original dual-frequency (Ka andW band) SACR (Kollias et al.
2020). It transmits horizontally (h) and vertically (v) polar-
ized waves alternatively, which alleviates polarization cross-
coupling effects. Radar pulses are transmitted in hhvvh blocks
(N. Bharadwaj 2016, private communication). This radar also
has closely matched beams (;0.38 beam widths) and pulse
lengths (;60m) for both frequencies, which essentially re-
moves spatiotemporal uncertainties of matching radar data
at two frequencies. Pulse repetition times between two
consecutive h and v transmissions and the range gate spacings
were ;0.19ms and 30m, correspondingly.
Non-Rayleigh scattering effects influence the equivalent
radar reflectivity factor (Ze) (hereafter reflectivity) in precip-
itating ice/snow particles especially at W band when Ze is
greater than about 0 dBZ (Matrosov et al. 2019). This results
in W band reflectivities being smaller than those at Ka band
and allows for inferring ice hydrometeor size and shape in-
formation from dual-frequency reflectivity measurements.Corresponding author: Sergey Y. Matrosov, sergey.matrosov@
noaa.gov
JANUARY 2021 MATROSOV 91
DOI: 10.1175/JTECH-D-20-0138.1
� 2021 American Meteorological Society. For information regarding reuse of this content and general copyright information, consult the AMS CopyrightPolicy (www.ametsoc.org/PUBSReuseLicenses).
Brought to you by NOAA Central Library | Unauthenticated | Downloaded 06/28/21 03:16 PM UTC
The magnitude of non-Rayleigh scattering effects on polari-
metric radar variables, however, is not well known yet. The
main objective of this study was to evaluate how Ka- and
W-band polarimetric radar variables in ice clouds and snowfall
are related and if there are significant trends in the Ka 2 W
polarimetric variable differences associated with non-Rayleigh
scattering, which could provide some potential to infer ice
hydrometeor microphysical information using dual-frequency
polarimetric radar measurements.
The conventional radar polarimetric variables, which are
directly available from SACR2 measurements are differential
reflectivity (ZDR) which is defined as the logarithmic difference
between copolar reflectivities on horizontal and vertical po-
larizations, differential phase shift between horizontally and
vertically polarized received radar signals (FDP) linear depo-
larization ratio (LDR), defined here as the logarithmic differ-
ence between reflectivities on cross-polar (i.e., vertical) and
copolar (i.e., horizontal) polarizations when only horizontal
polarization radar pulses are transmitted, and the copolar
correlation coefficient (rhv) between copolar horizontal and
vertical polarization radar echo amplitudes.
2. Ka- and W-band polarimetric radar observation insnowfall
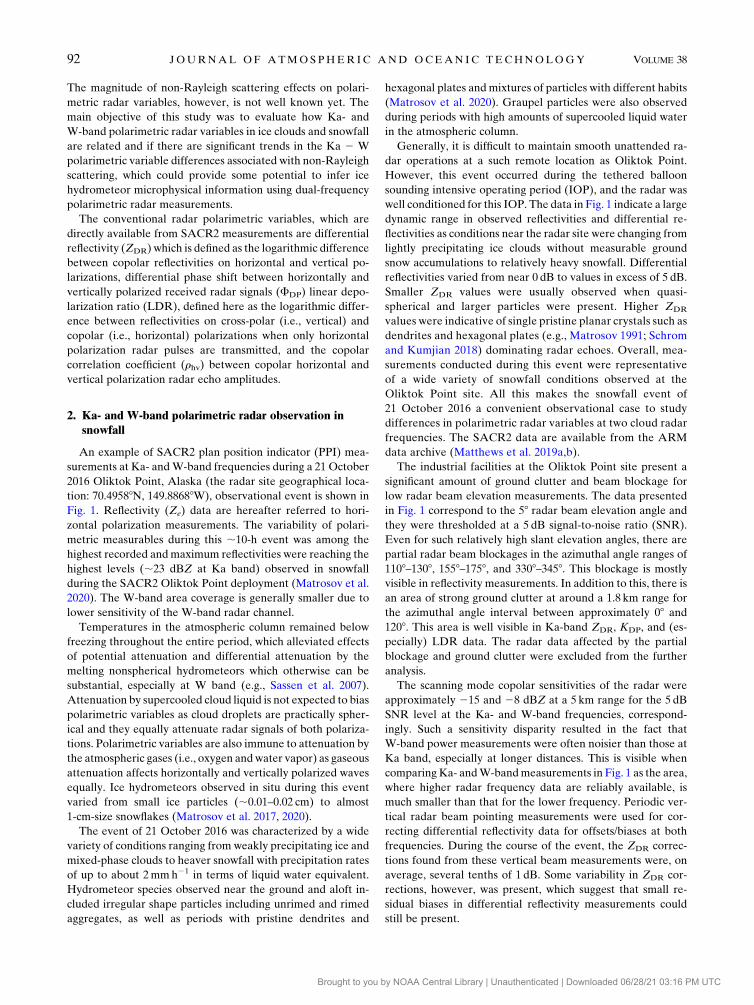
An example of SACR2 plan position indicator (PPI) mea-
surements at Ka- andW-band frequencies during a 21 October
2016 Oliktok Point, Alaska (the radar site geographical loca-
tion: 70.49588N, 149.88688W), observational event is shown in
Fig. 1. Reflectivity (Ze) data are hereafter referred to hori-
zontal polarization measurements. The variability of polari-
metric measurables during this ;10-h event was among the
highest recorded andmaximum reflectivities were reaching the
highest levels (;23 dBZ at Ka band) observed in snowfall
during the SACR2 Oliktok Point deployment (Matrosov et al.
2020). The W-band area coverage is generally smaller due to
lower sensitivity of the W-band radar channel.
Temperatures in the atmospheric column remained below
freezing throughout the entire period, which alleviated effects
of potential attenuation and differential attenuation by the
melting nonspherical hydrometeors which otherwise can be
substantial, especially at W band (e.g., Sassen et al. 2007).
Attenuation by supercooled cloud liquid is not expected to bias
polarimetric variables as cloud droplets are practically spher-
ical and they equally attenuate radar signals of both polariza-
tions. Polarimetric variables are also immune to attenuation by
the atmospheric gases (i.e., oxygen andwater vapor) as gaseous
attenuation affects horizontally and vertically polarized waves
equally. Ice hydrometeors observed in situ during this event
varied from small ice particles (;0.01–0.02 cm) to almost
1-cm-size snowflakes (Matrosov et al. 2017, 2020).
The event of 21 October 2016 was characterized by a wide
variety of conditions ranging from weakly precipitating ice and
mixed-phase clouds to heaver snowfall with precipitation rates
of up to about 2mmh21 in terms of liquid water equivalent.
Hydrometeor species observed near the ground and aloft in-
cluded irregular shape particles including unrimed and rimed
aggregates, as well as periods with pristine dendrites and
hexagonal plates andmixtures of particles with different habits
(Matrosov et al. 2020). Graupel particles were also observed
during periods with high amounts of supercooled liquid water
in the atmospheric column.
Generally, it is difficult to maintain smooth unattended ra-
dar operations at a such remote location as Oliktok Point.
However, this event occurred during the tethered balloon
sounding intensive operating period (IOP), and the radar was
well conditioned for this IOP. The data in Fig. 1 indicate a large
dynamic range in observed reflectivities and differential re-
flectivities as conditions near the radar site were changing from
lightly precipitating ice clouds without measurable ground
snow accumulations to relatively heavy snowfall. Differential
reflectivities varied from near 0 dB to values in excess of 5 dB.
Smaller ZDR values were usually observed when quasi-
spherical and larger particles were present. Higher ZDR
values were indicative of single pristine planar crystals such as
dendrites and hexagonal plates (e.g., Matrosov 1991; Schrom
and Kumjian 2018) dominating radar echoes. Overall, mea-
surements conducted during this event were representative
of a wide variety of snowfall conditions observed at the
Oliktok Point site. All this makes the snowfall event of
21 October 2016 a convenient observational case to study
differences in polarimetric radar variables at two cloud radar
frequencies. The SACR2 data are available from the ARM
data archive (Matthews et al. 2019a,b).
The industrial facilities at the Oliktok Point site present a
significant amount of ground clutter and beam blockage for
low radar beam elevation measurements. The data presented
in Fig. 1 correspond to the 58 radar beam elevation angle and
they were thresholded at a 5 dB signal-to-noise ratio (SNR).
Even for such relatively high slant elevation angles, there are
partial radar beam blockages in the azimuthal angle ranges of
1108–1308, 1558–1758, and 3308–3458. This blockage is mostly
visible in reflectivity measurements. In addition to this, there is
an area of strong ground clutter at around a 1.8 km range for
the azimuthal angle interval between approximately 08 and
1208. This area is well visible in Ka-band ZDR, KDP, and (es-
pecially) LDR data. The radar data affected by the partial
blockage and ground clutter were excluded from the further
analysis.
The scanning mode copolar sensitivities of the radar were
approximately 215 and 28 dBZ at a 5 km range for the 5 dB
SNR level at the Ka- and W-band frequencies, correspond-
ingly. Such a sensitivity disparity resulted in the fact that
W-band power measurements were often noisier than those at
Ka band, especially at longer distances. This is visible when
comparing Ka- andW-bandmeasurements in Fig. 1 as the area,
where higher radar frequency data are reliably available, is
much smaller than that for the lower frequency. Periodic ver-
tical radar beam pointing measurements were used for cor-
recting differential reflectivity data for offsets/biases at both
frequencies. During the course of the event, the ZDR correc-
tions found from these vertical beam measurements were, on
average, several tenths of 1 dB. Some variability in ZDR cor-
rections, however, was present, which suggest that small re-
sidual biases in differential reflectivity measurements could
still be present.
92 JOURNAL OF ATMOSPHER IC AND OCEAN IC TECHNOLOGY VOLUME 38
Brought to you by NOAA Central Library | Unauthenticated | Downloaded 06/28/21 03:16 PM UTC
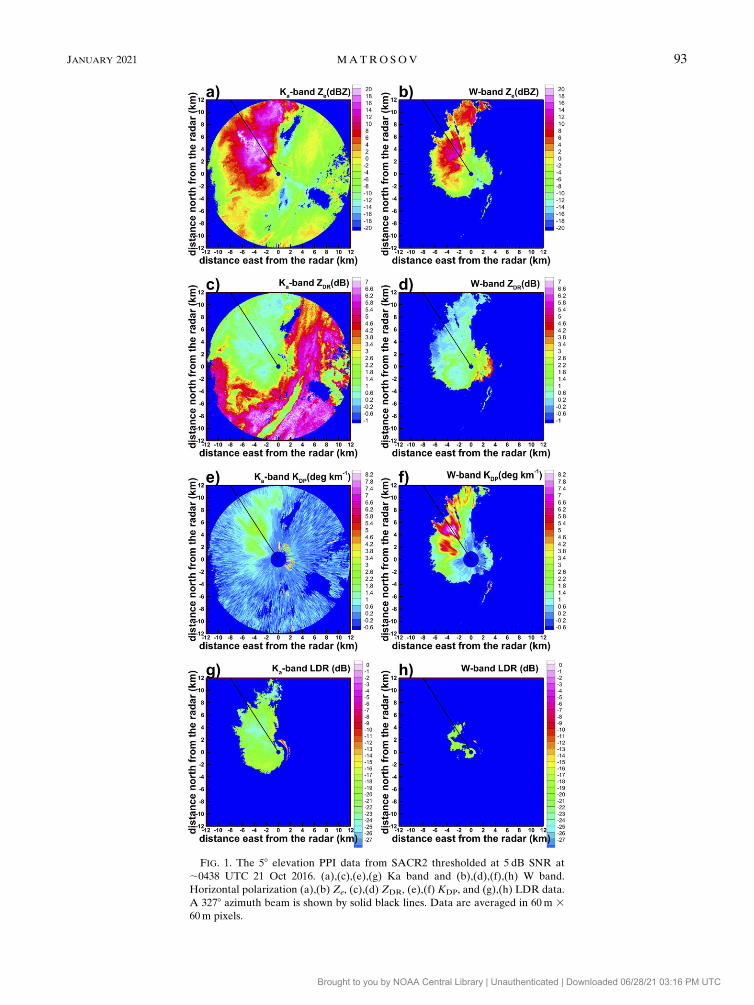
FIG. 1. The 58 elevation PPI data from SACR2 thresholded at 5 dB SNR at
;0438 UTC 21 Oct 2016. (a),(c),(e),(g) Ka band and (b),(d),(f),(h) W band.
Horizontal polarization (a),(b) Ze, (c),(d) ZDR, (e),(f) KDP, and (g),(h) LDR data.
A 3278 azimuth beam is shown by solid black lines. Data are averaged in 60m 360m pixels.
JANUARY 2021 MATROSOV 93
Brought to you by NOAA Central Library | Unauthenticated | Downloaded 06/28/21 03:16 PM UTC
For the entire observational event of 21 October 2016, Fig. 2
shows frequency scatterplots of Ze(Ka) versus the differential
reflectivity difference (DZDR) which is defined as ZDR(Ka) 2ZDR(W). For low reflectivity values (e.g., ;210 to 215 dBZ),
scattering at both frequencies tends to be in the Rayleigh
scattering regime (e.g., Matrosov et al. 2019), so differential
reflectivity differences are expected to fluctuate around 0 dB as
is the case for the data in Fig. 2. Interestingly, as reflectivity
increases, DZDR values, on average, remain rather small (less
than about 0.5 dB on average, though individual point differ-
ences can be as high as 2 dB or so). There are little (if any)
robustly identifiable DZDR–Ze(Ka) trends. Since reflectivity
usually is well correlated with hydrometeor characteristic size
such as a median volume size of particle populations (e.g.,
Matrosov and Heymsfield 2017), it might suggest that the non-
Rayleigh scattering effects play a relatively little role in dif-
ferential reflectivity values of ice hydrometeor populations at
Ka- and W-band radar frequencies. For individual crystals,
however, differences in Ka- and W-band differential re-
flectivities (as modeling shows) could be significant (Schrom
and Kumjian 2018).
Attenuation effects might potentially reduce Ze(Ka) and
differential attenuation effects in ice might cause biases in
DZDR. The severity of these effects is expected to increase
with range. To evaluate their importance, Fig. 2b shows the
data collected for the radar ranges R # 6 km as opposed to
Fig. 2a where data are shown for R # 12 km. Comparing
Figs. 2a and 2b indicates relatively little difference in the data
scatter/trends, though some larger DZDR variability for higher
reflectivities can be seen in Fig. 2a. Overall data in Figs. 2a and
2b suggest that attenuation/differential attenuation influence on
Ze(Ka)–DZDR correspondences for this observational event is
rather small and can be neglected (at least, given several tenths
of 1 dB uncertainties of differential reflectivity measurements).
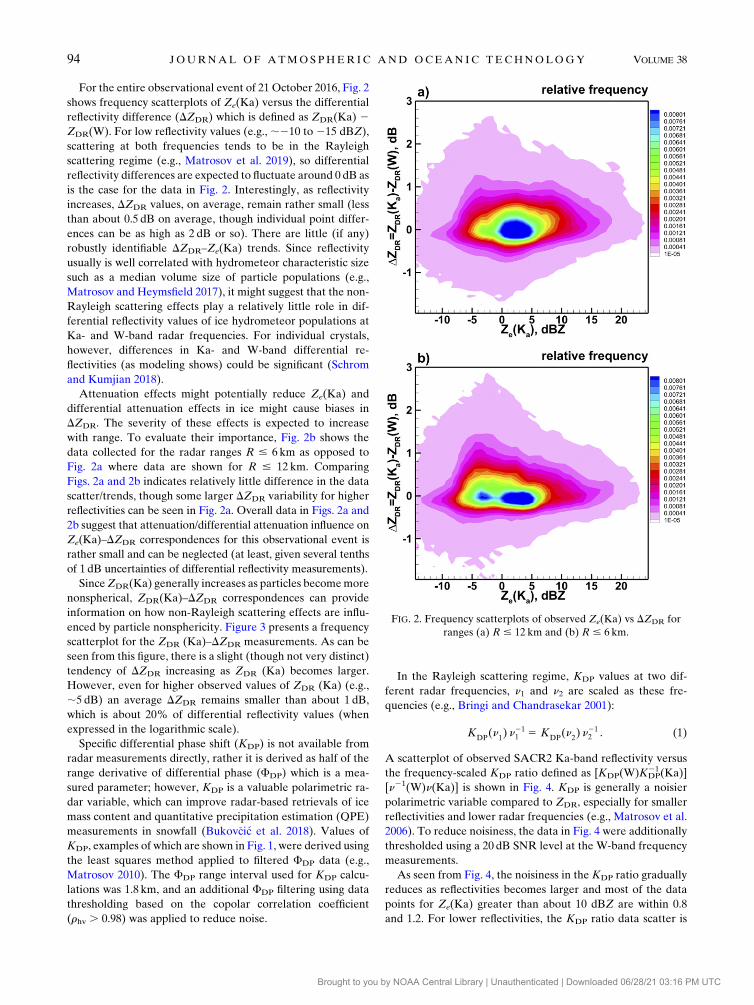
SinceZDR(Ka) generally increases as particles becomemore
nonspherical, ZDR(Ka)–DZDR correspondences can provide
information on how non-Rayleigh scattering effects are influ-
enced by particle nonsphericity. Figure 3 presents a frequency
scatterplot for the ZDR (Ka)–DZDR measurements. As can be
seen from this figure, there is a slight (though not very distinct)
tendency of DZDR increasing as ZDR (Ka) becomes larger.
However, even for higher observed values of ZDR (Ka) (e.g.,
;5 dB) an average DZDR remains smaller than about 1 dB,
which is about 20% of differential reflectivity values (when
expressed in the logarithmic scale).
Specific differential phase shift (KDP) is not available from
radar measurements directly, rather it is derived as half of the
range derivative of differential phase (FDP) which is a mea-
sured parameter; however, KDP is a valuable polarimetric ra-
dar variable, which can improve radar-based retrievals of ice
mass content and quantitative precipitation estimation (QPE)
measurements in snowfall (Bukov�cic et al. 2018). Values of
KDP, examples of which are shown in Fig. 1, were derived using
the least squares method applied to filtered FDP data (e.g.,
Matrosov 2010). The FDP range interval used for KDP calcu-
lations was 1.8 km, and an additional FDP filtering using data
thresholding based on the copolar correlation coefficient
(rhv . 0.98) was applied to reduce noise.
In the Rayleigh scattering regime, KDP values at two dif-
ferent radar frequencies, n1 and n2 are scaled as these fre-
quencies (e.g., Bringi and Chandrasekar 2001):
KDP
(n1) n21
1 5 KDP
(n2) n21
2 . (1)
A scatterplot of observed SACR2 Ka-band reflectivity versus
the frequency-scaled KDP ratio defined as [KDP(W)KDP21(Ka)]
[n21(W)n(Ka)] is shown in Fig. 4. KDP is generally a noisier
polarimetric variable compared to ZDR, especially for smaller
reflectivities and lower radar frequencies (e.g., Matrosov et al.
2006). To reduce noisiness, the data in Fig. 4 were additionally
thresholded using a 20 dB SNR level at the W-band frequency
measurements.
As seen from Fig. 4, the noisiness in the KDP ratio gradually
reduces as reflectivities becomes larger and most of the data
points for Ze(Ka) greater than about 10 dBZ are within 0.8
and 1.2. For lower reflectivities, the KDP ratio data scatter is
FIG. 2. Frequency scatterplots of observed Ze(Ka) vs DZDR for
ranges (a) R # 12 km and (b) R # 6 km.
94 JOURNAL OF ATMOSPHER IC AND OCEAN IC TECHNOLOGY VOLUME 38
Brought to you by NOAA Central Library | Unauthenticated | Downloaded 06/28/21 03:16 PM UTC
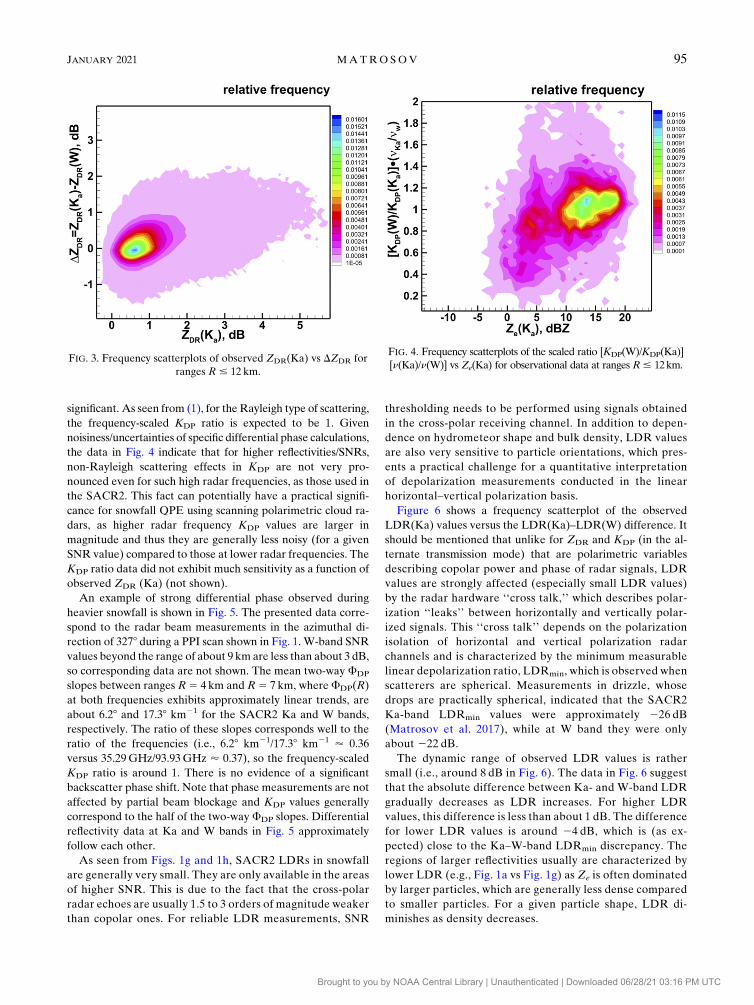
significant. As seen from (1), for the Rayleigh type of scattering,
the frequency-scaled KDP ratio is expected to be 1. Given
noisiness/uncertainties of specific differential phase calculations,
the data in Fig. 4 indicate that for higher reflectivities/SNRs,
non-Rayleigh scattering effects in KDP are not very pro-
nounced even for such high radar frequencies, as those used in
the SACR2. This fact can potentially have a practical signifi-
cance for snowfall QPE using scanning polarimetric cloud ra-
dars, as higher radar frequency KDP values are larger in
magnitude and thus they are generally less noisy (for a given
SNR value) compared to those at lower radar frequencies. The
KDP ratio data did not exhibit much sensitivity as a function of
observed ZDR (Ka) (not shown).
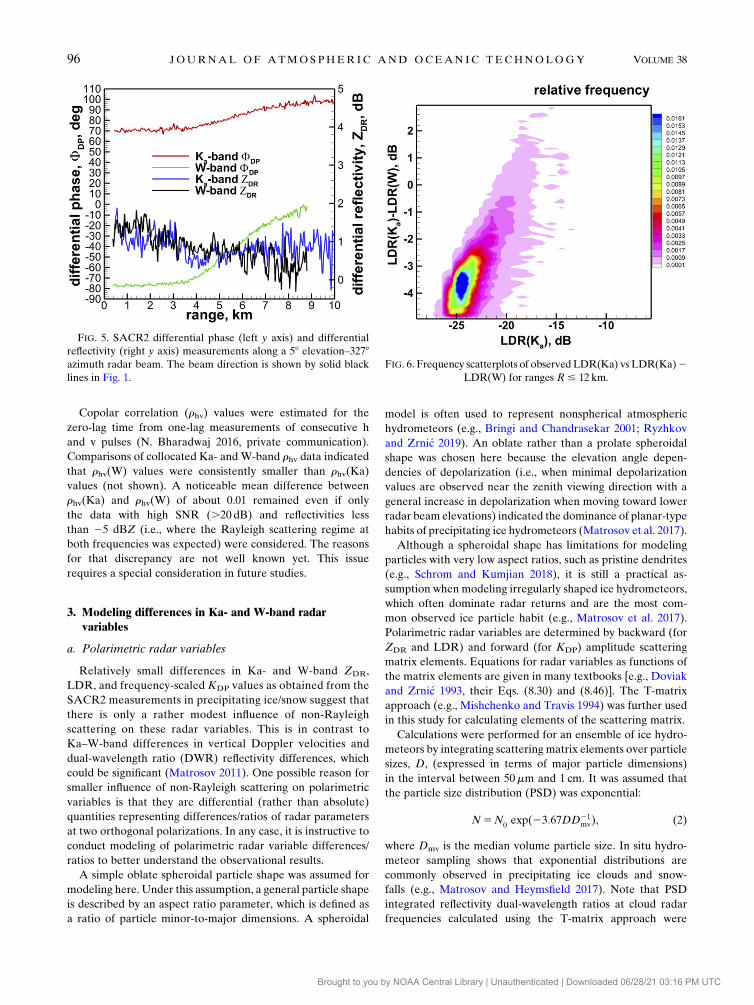
An example of strong differential phase observed during
heavier snowfall is shown in Fig. 5. The presented data corre-
spond to the radar beam measurements in the azimuthal di-
rection of 3278 during a PPI scan shown in Fig. 1. W-band SNR
values beyond the range of about 9 km are less than about 3 dB,
so corresponding data are not shown. The mean two-way FDP
slopes between ranges R5 4 km and R5 7 km, where FDP(R)
at both frequencies exhibits approximately linear trends, are
about 6.28 and 17.38 km21 for the SACR2 Ka and W bands,
respectively. The ratio of these slopes corresponds well to the
ratio of the frequencies (i.e., 6.28 km21/17.38 km21 ’ 0.36
versus 35.29GHz/93.93GHz ’ 0.37), so the frequency-scaled
KDP ratio is around 1. There is no evidence of a significant
backscatter phase shift. Note that phase measurements are not
affected by partial beam blockage and KDP values generally
correspond to the half of the two-way FDP slopes. Differential
reflectivity data at Ka and W bands in Fig. 5 approximately
follow each other.
As seen from Figs. 1g and 1h, SACR2 LDRs in snowfall
are generally very small. They are only available in the areas
of higher SNR. This is due to the fact that the cross-polar
radar echoes are usually 1.5 to 3 orders of magnitude weaker
than copolar ones. For reliable LDR measurements, SNR
thresholding needs to be performed using signals obtained
in the cross-polar receiving channel. In addition to depen-
dence on hydrometeor shape and bulk density, LDR values
are also very sensitive to particle orientations, which pres-
ents a practical challenge for a quantitative interpretation
of depolarization measurements conducted in the linear
horizontal–vertical polarization basis.
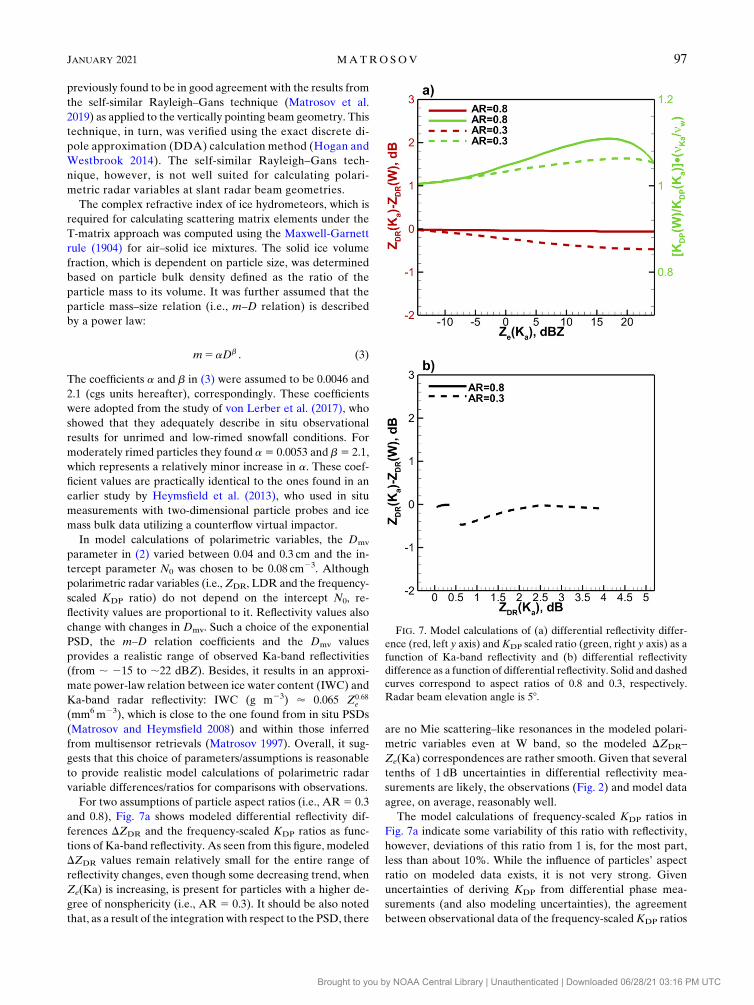
Figure 6 shows a frequency scatterplot of the observed
LDR(Ka) values versus the LDR(Ka)–LDR(W) difference. It
should be mentioned that unlike for ZDR and KDP (in the al-
ternate transmission mode) that are polarimetric variables
describing copolar power and phase of radar signals, LDR
values are strongly affected (especially small LDR values)
by the radar hardware ‘‘cross talk,’’ which describes polar-
ization ‘‘leaks’’ between horizontally and vertically polar-
ized signals. This ‘‘cross talk’’ depends on the polarization
isolation of horizontal and vertical polarization radar
channels and is characterized by the minimum measurable
linear depolarization ratio, LDRmin, which is observed when
scatterers are spherical. Measurements in drizzle, whose
drops are practically spherical, indicated that the SACR2
Ka-band LDRmin values were approximately 226 dB
(Matrosov et al. 2017), while at W band they were only
about 222 dB.
The dynamic range of observed LDR values is rather
small (i.e., around 8 dB in Fig. 6). The data in Fig. 6 suggest
that the absolute difference between Ka- and W-band LDR
gradually decreases as LDR increases. For higher LDR
values, this difference is less than about 1 dB. The difference
for lower LDR values is around 24 dB, which is (as ex-
pected) close to the Ka–W-band LDRmin discrepancy. The
regions of larger reflectivities usually are characterized by
lower LDR (e.g., Fig. 1a vs Fig. 1g) as Ze is often dominated
by larger particles, which are generally less dense compared
to smaller particles. For a given particle shape, LDR di-
minishes as density decreases.
FIG. 4. Frequency scatterplots of the scaled ratio [KDP(W)/KDP(Ka)]
[n(Ka)/n(W)] vs Ze(Ka) for observational data at ranges R# 12km.FIG. 3. Frequency scatterplots of observed ZDR(Ka) vs DZDR for
ranges R # 12 km.
JANUARY 2021 MATROSOV 95
Brought to you by NOAA Central Library | Unauthenticated | Downloaded 06/28/21 03:16 PM UTC
Copolar correlation (rhv) values were estimated for the
zero-lag time from one-lag measurements of consecutive h
and v pulses (N. Bharadwaj 2016, private communication).
Comparisons of collocated Ka- and W-band rhv data indicated
that rhv(W) values were consistently smaller than rhv(Ka)
values (not shown). A noticeable mean difference between
rhv(Ka) and rhv(W) of about 0.01 remained even if only
the data with high SNR (.20 dB) and reflectivities less
than 25 dBZ (i.e., where the Rayleigh scattering regime at
both frequencies was expected) were considered. The reasons
for that discrepancy are not well known yet. This issue
requires a special consideration in future studies.
3. Modeling differences in Ka- and W-band radarvariables
a. Polarimetric radar variables
Relatively small differences in Ka- and W-band ZDR,
LDR, and frequency-scaled KDP values as obtained from the
SACR2 measurements in precipitating ice/snow suggest that
there is only a rather modest influence of non-Rayleigh
scattering on these radar variables. This is in contrast to
Ka–W-band differences in vertical Doppler velocities and
dual-wavelength ratio (DWR) reflectivity differences, which
could be significant (Matrosov 2011). One possible reason for
smaller influence of non-Rayleigh scattering on polarimetric
variables is that they are differential (rather than absolute)
quantities representing differences/ratios of radar parameters
at two orthogonal polarizations. In any case, it is instructive to
conduct modeling of polarimetric radar variable differences/
ratios to better understand the observational results.
A simple oblate spheroidal particle shape was assumed for
modeling here. Under this assumption, a general particle shape
is described by an aspect ratio parameter, which is defined as
a ratio of particle minor-to-major dimensions. A spheroidal
model is often used to represent nonspherical atmospheric
hydrometeors (e.g., Bringi and Chandrasekar 2001; Ryzhkov
and Zrnic 2019). An oblate rather than a prolate spheroidal
shape was chosen here because the elevation angle depen-
dencies of depolarization (i.e., when minimal depolarization
values are observed near the zenith viewing direction with a
general increase in depolarization when moving toward lower
radar beam elevations) indicated the dominance of planar-type
habits of precipitating ice hydrometeors (Matrosov et al. 2017).
Although a spheroidal shape has limitations for modeling
particles with very low aspect ratios, such as pristine dendrites
(e.g., Schrom and Kumjian 2018), it is still a practical as-
sumption when modeling irregularly shaped ice hydrometeors,
which often dominate radar returns and are the most com-
mon observed ice particle habit (e.g., Matrosov et al. 2017).
Polarimetric radar variables are determined by backward (for
ZDR and LDR) and forward (for KDP) amplitude scattering
matrix elements. Equations for radar variables as functions of
the matrix elements are given in many textbooks [e.g., Doviak
and Zrnic 1993, their Eqs. (8.30) and (8.46)]. The T-matrix
approach (e.g., Mishchenko and Travis 1994) was further used
in this study for calculating elements of the scattering matrix.
Calculations were performed for an ensemble of ice hydro-
meteors by integrating scattering matrix elements over particle
sizes, D, (expressed in terms of major particle dimensions)
in the interval between 50mm and 1 cm. It was assumed that
the particle size distribution (PSD) was exponential:
N5N0exp(23:67DD21
mv), (2)
where Dmv is the median volume particle size. In situ hydro-
meteor sampling shows that exponential distributions are
commonly observed in precipitating ice clouds and snow-
falls (e.g., Matrosov and Heymsfield 2017). Note that PSD
integrated reflectivity dual-wavelength ratios at cloud radar
frequencies calculated using the T-matrix approach were
FIG. 6. Frequency scatterplots of observed LDR(Ka) vs LDR(Ka)2LDR(W) for ranges R # 12 km.
FIG. 5. SACR2 differential phase (left y axis) and differential
reflectivity (right y axis) measurements along a 58 elevation–3278azimuth radar beam. The beam direction is shown by solid black
lines in Fig. 1.
96 JOURNAL OF ATMOSPHER IC AND OCEAN IC TECHNOLOGY VOLUME 38
Brought to you by NOAA Central Library | Unauthenticated | Downloaded 06/28/21 03:16 PM UTC
previously found to be in good agreement with the results from
the self-similar Rayleigh–Gans technique (Matrosov et al.
2019) as applied to the vertically pointing beam geometry. This
technique, in turn, was verified using the exact discrete di-
pole approximation (DDA) calculation method (Hogan and
Westbrook 2014). The self-similar Rayleigh–Gans tech-
nique, however, is not well suited for calculating polari-
metric radar variables at slant radar beam geometries.
The complex refractive index of ice hydrometeors, which is
required for calculating scattering matrix elements under the
T-matrix approach was computed using the Maxwell-Garnett
rule (1904) for air–solid ice mixtures. The solid ice volume
fraction, which is dependent on particle size, was determined
based on particle bulk density defined as the ratio of the
particle mass to its volume. It was further assumed that the
particle mass–size relation (i.e., m–D relation) is described
by a power law:
m5aDb . (3)
The coefficients a and b in (3) were assumed to be 0.0046 and
2.1 (cgs units hereafter), correspondingly. These coefficients
were adopted from the study of von Lerber et al. (2017), who
showed that they adequately describe in situ observational
results for unrimed and low-rimed snowfall conditions. For
moderately rimed particles they found a5 0.0053 and b5 2.1,
which represents a relatively minor increase in a. These coef-
ficient values are practically identical to the ones found in an
earlier study by Heymsfield et al. (2013), who used in situ
measurements with two-dimensional particle probes and ice
mass bulk data utilizing a counterflow virtual impactor.
In model calculations of polarimetric variables, the Dmv
parameter in (2) varied between 0.04 and 0.3 cm and the in-
tercept parameter N0 was chosen to be 0.08 cm23. Although
polarimetric radar variables (i.e., ZDR, LDR and the frequency-
scaled KDP ratio) do not depend on the intercept N0, re-
flectivity values are proportional to it. Reflectivity values also
change with changes in Dmv. Such a choice of the exponential
PSD, the m–D relation coefficients and the Dmv values
provides a realistic range of observed Ka-band reflectivities
(from ; 215 to ;22 dBZ). Besides, it results in an approxi-
mate power-law relation between ice water content (IWC) and
Ka-band radar reflectivity: IWC (g m23) ’ 0.065 Z0:68e
(mm6m23), which is close to the one found from in situ PSDs
(Matrosov and Heymsfield 2008) and within those inferred
from multisensor retrievals (Matrosov 1997). Overall, it sug-
gests that this choice of parameters/assumptions is reasonable
to provide realistic model calculations of polarimetric radar
variable differences/ratios for comparisons with observations.
For two assumptions of particle aspect ratios (i.e., AR5 0.3
and 0.8), Fig. 7a shows modeled differential reflectivity dif-
ferences DZDR and the frequency-scaled KDP ratios as func-
tions of Ka-band reflectivity. As seen from this figure, modeled
DZDR values remain relatively small for the entire range of
reflectivity changes, even though some decreasing trend, when
Ze(Ka) is increasing, is present for particles with a higher de-
gree of nonsphericity (i.e., AR 5 0.3). It should be also noted
that, as a result of the integration with respect to the PSD, there
are no Mie scattering–like resonances in the modeled polari-
metric variables even at W band, so the modeled DZDR–
Ze(Ka) correspondences are rather smooth. Given that several
tenths of 1 dB uncertainties in differential reflectivity mea-
surements are likely, the observations (Fig. 2) and model data
agree, on average, reasonably well.
The model calculations of frequency-scaled KDP ratios in
Fig. 7a indicate some variability of this ratio with reflectivity,
however, deviations of this ratio from 1 is, for the most part,
less than about 10%. While the influence of particles’ aspect
ratio on modeled data exists, it is not very strong. Given
uncertainties of deriving KDP from differential phase mea-
surements (and also modeling uncertainties), the agreement
between observational data of the frequency-scaledKDP ratios
FIG. 7. Model calculations of (a) differential reflectivity differ-
ence (red, left y axis) andKDP scaled ratio (green, right y axis) as a
function of Ka-band reflectivity and (b) differential reflectivity
difference as a function of differential reflectivity. Solid and dashed
curves correspond to aspect ratios of 0.8 and 0.3, respectively.
Radar beam elevation angle is 58.
JANUARY 2021 MATROSOV 97
Brought to you by NOAA Central Library | Unauthenticated | Downloaded 06/28/21 03:16 PM UTC
(Fig. 4) and their model calculations is overall satisfactory
(specifically for higher reflectivities, which generally corre-
spond to larger SNRs).
Figure 7b shows modeled differential reflectivity differences
DZDR as a function of Ka-band differential reflectivity. Note
that ZDR values change even for a fixed AR value due to
changes in particle bulk density which is decreasing with an
increase in particle characteristic size.While formore spherical
particles (i.e., AR 5 0.8), DZDR and ZDR(Ka) are around a
0 dB value, there is a weak increasing trend of DZDR with
ZDR(Ka) as size dependent bulk density changes for hydro-
meteors with a higher degree of nonsphericity. Such a trend
is also evident from observations (Fig. 3). Although modeled
and observational data are mutually biased by a few tenths of
1dB in a mean sense, calculated and measured DZDR values
overall remain rather small in the absolute sense.
The DZDR and KDP data in Fig. 7 were calculated assuming
that particles are oriented with their major dimensions in the
horizontal plane, so the particle canting angle is zero. Such
preferable particle orientation is dictated by air dynamic
forcing. Particles, however, usually flutter around the hori-
zontal orientation and the amount of this flutter is approxi-
mately in an interval between 28 and 238 (e.g., Melnikov 2017).
Accounting for a particle flutter of this magnitude does not
significantly change the results shown in Fig. 7. This is because
particle orientation fluttering affects ZDR and KDP at both
frequencies similarly. The fact that modeled DZDR values are
small for different assumptions of particle aspect ratios sug-
gests that these values remain small for mixtures of particles
of different shapes.
The ZDR and KDP are important polarimetric radar vari-
ables and they are often used quantitatively in many practical
applications ranging from studies of microphysical processes in
clouds and precipitation to QPE. Linear depolarization ratios
are used not that often. Unlike the frequency-scaled KDP ra-
tio and DZDR, LDR is very sensitive to particle flutter.
Besides, LDR can reliably be measured only when the cross-
polarization echo SNR is high enough. In part, due to these
reasons, LDR often is used only qualitatively. It is instructive,
however, to compare modeled LDR characteristics with the
observed data presented in Fig. 6.
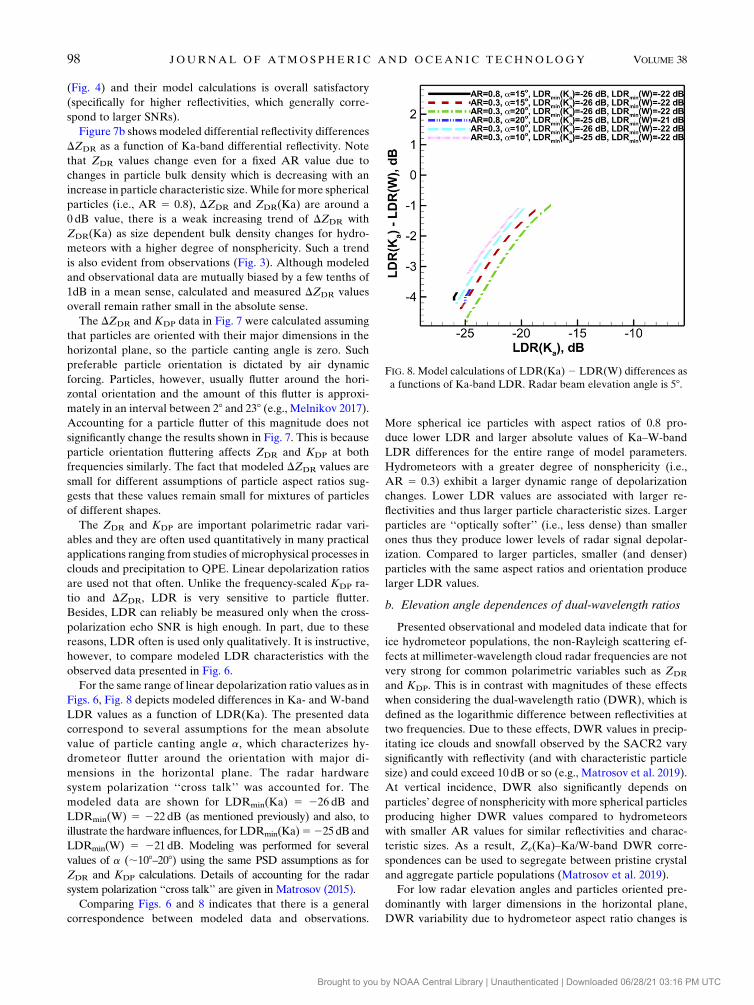
For the same range of linear depolarization ratio values as in
Figs. 6, Fig. 8 depicts modeled differences in Ka- and W-band
LDR values as a function of LDR(Ka). The presented data
correspond to several assumptions for the mean absolute
value of particle canting angle a, which characterizes hy-
drometeor flutter around the orientation with major di-
mensions in the horizontal plane. The radar hardware
system polarization ‘‘cross talk’’ was accounted for. The
modeled data are shown for LDRmin(Ka) 5 226 dB and
LDRmin(W) 5 222 dB (as mentioned previously) and also, to
illustrate the hardware influences, for LDRmin(Ka)5225dB and
LDRmin(W) 5 221dB. Modeling was performed for several
values of a (;108–208) using the same PSD assumptions as for
ZDR and KDP calculations. Details of accounting for the radar
system polarization ‘‘cross talk’’ are given in Matrosov (2015).
Comparing Figs. 6 and 8 indicates that there is a general
correspondence between modeled data and observations.
More spherical ice particles with aspect ratios of 0.8 pro-
duce lower LDR and larger absolute values of Ka–W-band
LDR differences for the entire range of model parameters.
Hydrometeors with a greater degree of nonsphericity (i.e.,
AR 5 0.3) exhibit a larger dynamic range of depolarization
changes. Lower LDR values are associated with larger re-
flectivities and thus larger particle characteristic sizes. Larger
particles are ‘‘optically softer’’ (i.e., less dense) than smaller
ones thus they produce lower levels of radar signal depolar-
ization. Compared to larger particles, smaller (and denser)
particles with the same aspect ratios and orientation produce
larger LDR values.
b. Elevation angle dependences of dual-wavelength ratios
Presented observational and modeled data indicate that for
ice hydrometeor populations, the non-Rayleigh scattering ef-
fects at millimeter-wavelength cloud radar frequencies are not
very strong for common polarimetric variables such as ZDR
and KDP. This is in contrast with magnitudes of these effects
when considering the dual-wavelength ratio (DWR), which is
defined as the logarithmic difference between reflectivities at
two frequencies. Due to these effects, DWR values in precip-
itating ice clouds and snowfall observed by the SACR2 vary
significantly with reflectivity (and with characteristic particle
size) and could exceed 10 dB or so (e.g., Matrosov et al. 2019).
At vertical incidence, DWR also significantly depends on
particles’ degree of nonsphericity with more spherical particles
producing higher DWR values compared to hydrometeors
with smaller AR values for similar reflectivities and charac-
teristic sizes. As a result, Ze(Ka)–Ka/W-band DWR corre-
spondences can be used to segregate between pristine crystal
and aggregate particle populations (Matrosov et al. 2019).
For low radar elevation angles and particles oriented pre-
dominantly with larger dimensions in the horizontal plane,
DWR variability due to hydrometeor aspect ratio changes is
FIG. 8. Model calculations of LDR(Ka)2 LDR(W) differences as
a functions of Ka-band LDR. Radar beam elevation angle is 58.
98 JOURNAL OF ATMOSPHER IC AND OCEAN IC TECHNOLOGY VOLUME 38
Brought to you by NOAA Central Library | Unauthenticated | Downloaded 06/28/21 03:16 PM UTC
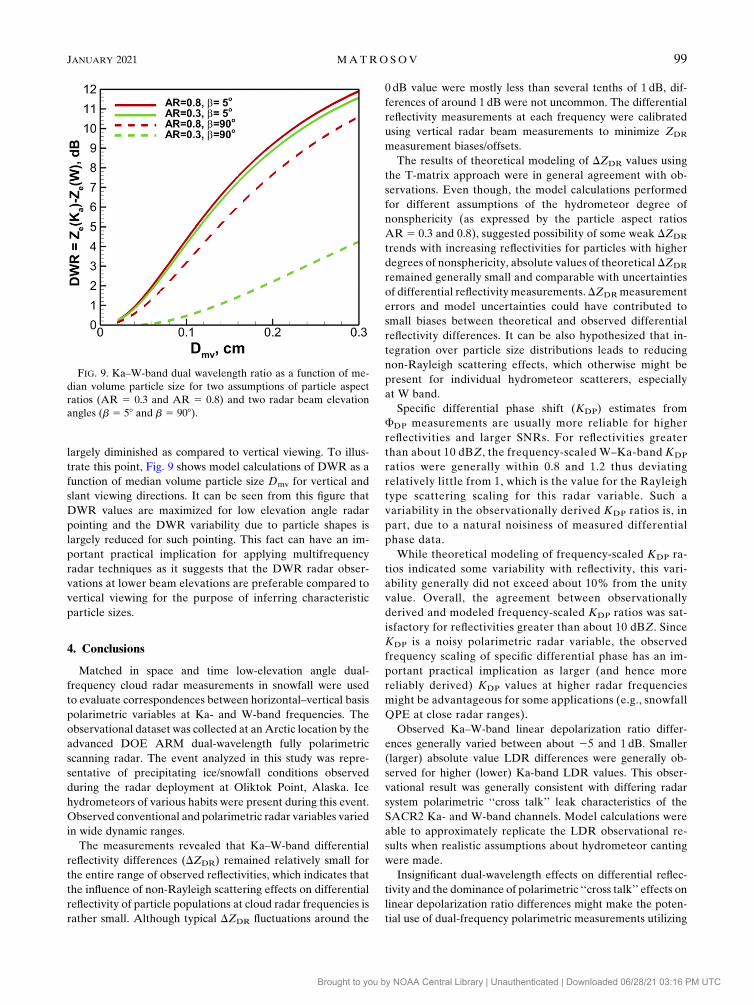
largely diminished as compared to vertical viewing. To illus-
trate this point, Fig. 9 shows model calculations of DWR as a
function of median volume particle size Dmv for vertical and
slant viewing directions. It can be seen from this figure that
DWR values are maximized for low elevation angle radar
pointing and the DWR variability due to particle shapes is
largely reduced for such pointing. This fact can have an im-
portant practical implication for applying multifrequency
radar techniques as it suggests that the DWR radar obser-
vations at lower beam elevations are preferable compared to
vertical viewing for the purpose of inferring characteristic
particle sizes.
4. Conclusions
Matched in space and time low-elevation angle dual-
frequency cloud radar measurements in snowfall were used
to evaluate correspondences between horizontal–vertical basis
polarimetric variables at Ka- and W-band frequencies. The
observational dataset was collected at anArctic location by the
advanced DOE ARM dual-wavelength fully polarimetric
scanning radar. The event analyzed in this study was repre-
sentative of precipitating ice/snowfall conditions observed
during the radar deployment at Oliktok Point, Alaska. Ice
hydrometeors of various habits were present during this event.
Observed conventional and polarimetric radar variables varied
in wide dynamic ranges.
The measurements revealed that Ka–W-band differential
reflectivity differences (DZDR) remained relatively small for
the entire range of observed reflectivities, which indicates that
the influence of non-Rayleigh scattering effects on differential
reflectivity of particle populations at cloud radar frequencies is
rather small. Although typical DZDR fluctuations around the
0 dB value were mostly less than several tenths of 1 dB, dif-
ferences of around 1 dB were not uncommon. The differential
reflectivity measurements at each frequency were calibrated
using vertical radar beam measurements to minimize ZDR
measurement biases/offsets.
The results of theoretical modeling of DZDR values using
the T-matrix approach were in general agreement with ob-
servations. Even though, the model calculations performed
for different assumptions of the hydrometeor degree of
nonsphericity (as expressed by the particle aspect ratios
AR 5 0.3 and 0.8), suggested possibility of some weak DZDR
trends with increasing reflectivities for particles with higher
degrees of nonsphericity, absolute values of theoretical DZDR
remained generally small and comparable with uncertainties
of differential reflectivity measurements.DZDRmeasurement
errors and model uncertainties could have contributed to
small biases between theoretical and observed differential
reflectivity differences. It can be also hypothesized that in-
tegration over particle size distributions leads to reducing
non-Rayleigh scattering effects, which otherwise might be
present for individual hydrometeor scatterers, especially
at W band.
Specific differential phase shift (KDP) estimates from
FDP measurements are usually more reliable for higher
reflectivities and larger SNRs. For reflectivities greater
than about 10 dBZ, the frequency-scaled W–Ka-band KDP
ratios were generally within 0.8 and 1.2 thus deviating
relatively little from 1, which is the value for the Rayleigh
type scattering scaling for this radar variable. Such a
variability in the observationally derived KDP ratios is, in
part, due to a natural noisiness of measured differential
phase data.
While theoretical modeling of frequency-scaled KDP ra-
tios indicated some variability with reflectivity, this vari-
ability generally did not exceed about 10% from the unity
value. Overall, the agreement between observationally
derived and modeled frequency-scaled KDP ratios was sat-
isfactory for reflectivities greater than about 10 dBZ. Since
KDP is a noisy polarimetric radar variable, the observed
frequency scaling of specific differential phase has an im-
portant practical implication as larger (and hence more
reliably derived) KDP values at higher radar frequencies
might be advantageous for some applications (e.g., snowfall
QPE at close radar ranges).
Observed Ka–W-band linear depolarization ratio differ-
ences generally varied between about 25 and 1 dB. Smaller
(larger) absolute value LDR differences were generally ob-
served for higher (lower) Ka-band LDR values. This obser-
vational result was generally consistent with differing radar
system polarimetric ‘‘cross talk’’ leak characteristics of the
SACR2 Ka- and W-band channels. Model calculations were
able to approximately replicate the LDR observational re-
sults when realistic assumptions about hydrometeor canting
were made.
Insignificant dual-wavelength effects on differential reflec-
tivity and the dominance of polarimetric ‘‘cross talk’’ effects on
linear depolarization ratio differences might make the poten-
tial use of dual-frequency polarimetric measurements utilizing
FIG. 9. Ka–W-band dual wavelength ratio as a function of me-
dian volume particle size for two assumptions of particle aspect
ratios (AR 5 0.3 and AR 5 0.8) and two radar beam elevation
angles (b 5 58 and b 5 908).
JANUARY 2021 MATROSOV 99
Brought to you by NOAA Central Library | Unauthenticated | Downloaded 06/28/21 03:16 PM UTC
DZDR and LDR differences not very promising for the purpose
of ice hydrometeor microphysical retrievals. Relatively small
DZDR values and the approximate frequency scaling of KDP
are in contrast with significant non-Rayleigh scattering influ-
ences on Ka–W-band reflectivity DWR. DWRs previously
observed using the SACR2 measurements could be as high
10 dB depending on particle characteristic size and shape. For
hydrometeors with preferable horizontal orientation, the par-
ticle shape influence on DWR, however, is expected to be
much weaker for slant radar viewing angles as compared to
measurements with zenith/nadir radar beam pointing.
Acknowledgments. This research was funded by the U.S.
Department of Energy’s Atmospheric Systems Research
(ASR) program (Grant DE-SC0013306) and the National
Science Foundation (Grant AGS 1841260).
REFERENCES
Bringi, V. N., and V. Chandrasekar, 2001: Polarimetric Doppler
Weather Radar. Cambridge University Press, 636 pp.
Bukov�cic, P., A. Ryzhkov, D. Zrnic, and G. Zhang, 2018:
Polarimetric radar relations for quantification of snow based
on disdrometer data. J. Appl. Meteor. Climatol., 57, 103–120,
https://doi.org/10.1175/JAMC-D-17-0090.1.
Doviak, R., and D. Zrnic, 1993: Doppler Radar and Weather
Observations. Academic Press, 562 pp.
Heymsfield, A. J., Z. Wang, and S. Y. Matrosov, 2005: Improved
radar ice water content retrieval algorithms using coincident
microphysical and radar measurements. J. Appl. Meteor., 44,
1391–1412, https://doi.org/10.1175/JAM2282.1.
——, C. Schmitt, and A. Bansemer, 2013: Ice cloud particle size
distributions and pressure-dependent terminal velocities from
in situ observations at temperatures from 08 to 2868C.J. Atmos. Sci., 70, 4123–4154, https://doi.org/10.1175/JAS-D-
12-0124.1.
Hogan, R. J., and C. D. Westbrook, 2014: Equation for the
microwave backscatter cross section of aggregate snow-
flakes using the self-similar Rayleigh–Gans approximation.
J. Atmos. Sci., 71, 3292–3301, https://doi.org/10.1175/JAS-
D-13-0347.1.
Kollias, P., and Coauthors, 2020: The ARM radar network: At the
leading-edge of cloud and precipitation observations. Bull.
Amer. Meteor. Soc., 101, E588–E607, https://doi.org/10.1175/
BAMS-D-18-0288.1.
Matrosov, S. Y., 1991: Theoretical study of radar polarization pa-
rameters obtained from cirrus clouds. J. Atmos. Sci., 48,
1062–1070, https://doi.org/10.1175/1520-0469(1991)048,1062:
TSORPP.2.0.CO;2.
——, 1997: Variability of microphysical parameters in high-
altitude ice clouds: Results of the remote sensing method.
J. Appl. Meteor., 36, 633–648, https://doi.org/10.1175/1520-
0450-36.6.633.
——, 2010: Evaluating polarimetric X-band radar rainfall estima-
tors during HMT. J. Atmos. Oceanic Technol., 27, 122–134,
https://doi.org/10.1175/2009JTECHA1318.1.
——, 2011: Feasibility of using radar differential Doppler velocity
and dual-frequency ratio for sizing particles in thick ice
clouds. J. Geophys. Res., 116, D17202, https://doi.org/10.1029/
2011JD015857.
——, 2015: Evaluations of the spheroidal particle model for de-
scribing cloud radar depolarization ratios of ice hydrometeors.
J. Atmos. Oceanic Technol., 32, 865–879, https://doi.org/
10.1175/JTECH-D-14-00115.1.
——, and A. J. Heymsfield, 2008: Estimating ice content and ex-
tinction in precipitating cloud systems from CloudSat radar
measurements. J. Geophys. Res., 113, D00A05, https://doi.org/
10.1029/2007JD009633.
——, and ——, 2017: Empirical relations between size parameters
of ice hydrometeor populations and radar reflectivity.
J. Appl. Meteor. Climatol., 56, 2479–2488, https://doi.org/
10.1175/JAMC-D-17-0076.1.
——,R. Cifelli, P. C. Kennedy, S. W. Nesbitt, S. A. Rutledge, V. N.
Bringi, and B. E. Martner, 2006: A comparative study of
rainfall retrievals based on specific differential phase shifts at
X- and S-band radar frequencies. J. Atmos. Oceanic Technol.,
23, 952–963, https://doi.org/10.1175/JTECH1887.1.
——, M. D. Shupe, and I. V. Djalalova, 2008: Snowfall re-
trievals using millimeter-wavelength cloud radars.
J. Appl. Meteor. Climatol., 47, 769–777, https://doi.org/
10.1175/2007JAMC1768.1.
——, G. G. Mace, R. Marchand, M. D. Shupe, A. G. Hallar, and
I. B. McCubbin, 2012: Observations of Ice crystal habits with a
scanning polarimetric W-band radar at slant linear depolar-
ization ratio mode. J. Atmos. Oceanic Technol., 29, 989–1008,
https://doi.org/10.1175/JTECH-D-11-00131.1.
——, C. G. Schmitt, M. Maahn, and G. de Boer, 2017:
Atmospheric ice particle shape estimates from polarimetric
radar measurements and in situ observations. J. Atmos.
Oceanic Technol., 34, 2569–2587, https://doi.org/10.1175/
JTECH-D-17-0111.1.
——, M. Maahn, and G. de Boer, 2019: Observational and mod-
eling study of ice hydrometeor radar dual-wavelength ratios.
J. Appl. Meteor. Climatol., 58, 2005–2017, https://doi.org/
10.1175/JAMC-D-19-0018.1.
——, A. V. Ryzhkov, M. Maahn, and G. de Boer, 2020:
Hydrometeor shape variability in snowfall as retrieved from
polarimetric radarmeasurements. J. Appl.Meteor. Climatol.,
59, 1503–1517, https://doi.org/10.1175/JAMC-D-20-0052.1.
Matthews, A., B. Isom, D. Nelson, I. Lindenmaier, J. Hardin,
K. Johnson, and N. Bharadwaj, 2019a: Ka-band scanning
ARM Cloud Radar (KASACRCFRPPIVH), ARM Mobile
Facility (OLI) Oliktok Point, Alaska; AMF3 (M1). ARM
Data Center, accessed 1 October 2019, https://doi.org/
10.5439/1224837.
——, ——, ——, ——, ——, ——, and ——, 2019b: W-band
scanning ARM Cloud Radar (WSACRCFRPPIVH), ARM
Mobile Facility (OLI) Oliktok Point, Alaska; AMF3 (M1).
ARM Data Center, accessed 1 October 2019, https://doi.org/
10.5439/1224848.
Maxwell-Garnet, J. C., 1904: Colours in metal glasses and in me-
tallic films. Philos. Trans. Roy. Soc. London, 203A, 359–371,
https://doi.org/10.1098/rsta.1904.0024.
Melnikov, V., 2017: Parameters of cloud ice particles retrieved
from radar data. J. Atmos. Oceanic Technol., 34, 717–728,
https://doi.org/10.1175/JTECH-D-16-0123.1.
Mishchenko, M. I., and L. D. Travis, 1994: T-matrix computa-
tions of light scattering by larger spheroidal particles. Opt.
Commun., 109, 16–21, https://doi.org/10.1016/0030-4018(94)
90731-5.
Reinking, R. F., S. Y. Matrosov, R. A. Kropfli, and B. W. Bartram,
2002: Evaluation of a 458 slant quasi-linear radar polarizationfor distinguishing drizzle droplets, pristine ice crystals, and less
regular ice particles. J. Atmos. Oceanic Technol., 19, 296–321,
https://doi.org/10.1175/1520-0426-19.3.296.
100 JOURNAL OF ATMOSPHER IC AND OCEAN IC TECHNOLOGY VOLUME 38
Brought to you by NOAA Central Library | Unauthenticated | Downloaded 06/28/21 03:16 PM UTC
Ryzhkov, A. V., and D. S. Zrnic, 2019: Radar Polarimetry for
Weather Observations. Springer, 486 pp.
Sassen, K., S. Matrosov, and J. Campbell, 2007: CloudSat space-
borne 94GHz radar bright band in the melting layer: An at-
tenuation driven upside-down lidar analog. Geophys. Res.
Lett., 34, L16818, https://doi.org/10.1029/2007GL030291.
Schrom, R. S., and M. R. Kumjian, 2018: Bulk density re-
presentations of branched planar ice crystals: Errors
in the polarimetric radar variables. J. Appl. Meteor.
Climatol., 57, 333–346, https://doi.org/10.1175/JAMC-D-
17-0114.1.
von Lerber, A., D. Moisseev, L. F. Bliven, W. Petersen, A. Harri,
and V. Chandrasekar, 2017: Microphysical properties of
snow and their link to Ze–S relations during BAECC 2014.
J. Appl. Meteor. Climatol., 56, 1561–1582, https://doi.org/
10.1175/JAMC-D-16-0379.1.
JANUARY 2021 MATROSOV 101
Brought to you by NOAA Central Library | Unauthenticated | Downloaded 06/28/21 03:16 PM UTC