Assessment of Tremor Activity in the Parkinson’s Disease Using a Set of Wearable Sensors
Upload
independentCategory
view
0download
0
JOURNAL OF GEOPHYSICAL RESEARCH, VOL. 102, NO. B7, PAGES 15,129-15,150, JULY 10, 1997
Source and path effects in the wave fields of tremor and explosions at Stromboli Volcano, Italy
Bernard Chouet, • Gilberto Saccorotti? Marcello Martini, 2 Phillip Dawson, • Gaetano De Luca, 4 Giuliano Milana, s and Roberto Scarpa 4
Abstract. The wave fields generated by Strombolian activity are investigated using data from small-aperture seismic arrays deployed on the north flank of Stromboli and data from seismic and pressure transducers set up near the summit crater. Measurements of slowness and azimuth as a function of time clearly indicate that the sources of tremor and explosions are located beneath the summit crater at depths shallower than 200 rn with occasional bursts of energy originating from sources extending to a depth of 3 km. Slowness, azimuth, and particle motion measurements reveal a complex composition of body and surface waves associated with topography, structure, and source properties. Body waves originating at depths shallower than 200 rn dominate the wave field at frequencies of 0.5-2.5 Hz, and surface waves generated by the surficial part of the source and by scattering sources distributed around the island dominate at frequencies above 2.5 Hz. The records of tremor and explosions are both dominated by SH motion. Far-field records from explosions start with radial motion, and near-field records from those events show dominantly horizontal motion and often start with a low-frequency (1-2 Hz) precursor characterized by elliptical particle motion, followed within a few seconds by a high- frequency radial phase (1-10 Hz) accompanying the eruption of pyroclastics. The dominant component of the near- and far-field particle motions from explosions, and the timing of air and body wave phases observed in the near field, are consistent with a gas- piston mechanism operating on a shallow (<200 rn deep), vertical crack-like conduit. Models of a degassing fluid column suggest that noise emissions originating in the collective oscillations of bubbles ascending in the magma conduit may provide an adequate self-excitation mechanism for sustained tremor generation at Stromboli.
Introduction
Stromboli Volcano is a composite cone located at the north- ern end of the Aeolian island arc in the Tyrrhenian sea of[ the southern coast of Italy (Figure 1). The island rises about 3000 rn from the seafloor and stands 924 m above sea level.
The twin peaks forming its summit are remnants of the rim of an older crater. The currently active vents are located within a 250-m-long by 150-m-wide crater on a terrace northwest and about 130 m below the northern peak. Bordered by nearly vertical walls on the southeastern side, the crater merges into a long talus slope on the northwestern side. This talus partially fills a large sector graben called the "Sciara del Fuoco" that extends from the summit to the sea.
Stromboli has been steadily erupting for more than 2000 years and perhaps as much as 5000 years [Allard et al., 1994]. The present edifice is at least 100 kyr old and is the result of several complex growth stages including seven different erup- tive cycles for which 30 stratigraphic units have been docu-
1U.S. Geological Survey, Menlo Park, California. 2Osservatorio Vesuviano, Naples, Italy. 3Dipartimento di Geofisica e Vulcanologia, Universith di Napoli
"Federico II", Naples, Italy. 4Dipartimento di Fisica, Universith degli studi dell'Aquila, L'Aquila,
Italy. 5Servizio Sismico Nazionale, Rome, Italy.
Copyright 1997 by the American Geophysical Union.
Paper number 97JB00953. 0148-0227/97/97JB-00953509.00
mented [Hornig-Kjarsgaard et al., 1993]. The correlation be- tween major geochemical and petrological variations in the composition of erupted products and the inferred time of oc- currence of main volcano-tectonic events suggests a strong structural control on the evolution of eruptive activity [Hornig- Kjarsgaard et al., 1993]. Individual growth stages all appear to be controlled by a zone of structural weakness striking NE-SW as evidenced by the predominance of lineaments, dikes, and brittle structures along this particular direction [Pasquar• et al., 1993]. The morphology of the N-NW flank of the volcano is dominated by the Sciara del Fuoco whose formation is attrib- uted to a giant sector collapse and landslide [Pasquar• et al., 1993]. Recent bathymetric studies indicate that the Sciara ex- tends below sea level to a depth of 1700 m, forming an exten- sive submarine canyon that ends in a wide, fan-shaped, depo- sitional apron [Romagnoli et al., 1993]. The present eruptive behavior, first described 2000 years ago, is characterized by mild, intermittent explosive activity during which well- collimated jets of gases laden with molten lava fragments burst in short eruptions lasting 5-15 s occurring at a typical rate of 3-10 events per hour. Photoballistic analyses of single erup- tions with durations of 10 s have yielded estimates of the mass of ejected fragments of 102-104 kg [Chouet et al., 1974; Ripepe et al., 1993], and volume of gas ejected of the order of 10 3 m 3 [Chouet et al., 1974].
The goal of the present study is to improve our understand- ing of Strombolian wave fields and to elucidate the source properties of Strombolian activity. Using dense, small-aperture arrays deployed on the flank of the volcano, we first demon-
15,129

15,130 CHOUET ET AL.: SOURCE AND PATH EFFECTS AT STROMBOLI VOLCANO
15 ø 10.28' 38 ø 49.49'
38 ø 45.98'
15 ø 14.86'
GINO
o 1KM I I
Figure 1. Map of Stromboli Volcano showing locations of summit crater, active vents (crosses), sector graben of the Sciara del Fuoco, dense arrays (semicircles and line segment), summit stations SS1 and SS2 (solid dots), and villages on the seashore (open squares). Semaforo Labronzo is the site of a former lighthouse located atop a prominent cliff flanking the island to the north. Originally used to regulate boat traffic in the southern Tyrrhenian sea, the lighthouse was dismantled after World War II. The inset shows the location of Stromboli in the Tyrrhenian sea in relation to southern Italy, Sicily (SI), Sardegna (SA), and Corsica (CO).
strate how structural and morphological complexities in the volcanic edifice affect the wave field composition. By restricting our analyses to direct waves coming from the crater area and using slowness estimates derived from the array data, we then obtain bounds on the lateral and depth extents of the sources of explosions and tremor. From frequency-slowness and polar- ization analyses, we also identify the dominant wave types composing the wave field and obtain constraints on the source geometry. Finally, particle motions observed in the near field of the source, combined with measurements of the timing of acoustic and elastic phases produced by explosions, are used to infer details of the source dynamics.
Seismic activity at Stromboli is characterized by spindle- shaped signals associated with summit explosions, superim- posed on a background of sustained tremor. Emergent onsets, rapid loss of waveform coherence with distance, and the ab- sence of clear phase arrivals make it difficult to interpret these signals via classical seismic methods. Nevertheless, consider- able efforts have been devoted over the past 30 years to define the source properties of Strombolian activity from seismic ob- servations. Published seismic investigations include waveform and spectral analyses of sparse network data aimed at the elucidation of eruption dynamics and spatial properties of the source [e.g., Petterschmitt and Tazieff, 1962; LoBascio et al., 1973; Del Pezzo et al., 1974; Ntepe and Dorel, 1990; Del Pezzo et al., 1992; Ripepe and Braun, 1993; Neuberg et al., 1994], quan-
titative descriptions of the recurrent explosivity [Falsaperla et al., 1992], and correlations of explosive activity with the peri- odicities of the locally recorded earth and ocean tides [Napo- leone et al., 1993]. Despite those studies, however, the spatial extent and geometrical characteristics of the source and the mechanisms by which it radiates elastic energy remain poorly understood.
Instrumentation and Data
During April-May 1992, three dense, small-aperture arrays of short-period seismometers were deployed on the north flank of Stromboli at a distance of 1.7 km from the active vents
IDletel et al., 1994] (Figure 1). Two arrays with apertures of 120 and 300 m wcrc deployed in a semicircular, spokcd pattern with a station spacing of 10-40 m (Figure 2) to improve wave- form coherence between array elements and to provide ade- quate sampling of Rayleigh and Love waves in the band 1-10 Hz. These array configurations were selected with two specific objectives in mind: (1) to determine the wave field composition and spatial extent of Strombolian sources through detailed frequency-slowness and polarization analyses of array data [Capon, 1969; Goldstein and Archuleta, 1987, 1991a, b; Ju- rkevics, 1988; Goldstein and Chouet, 1994]; and (2) to quantify the properties of Strombolian wavefields using the statistical method of Aki [1957] designed for the analysis of stationary

CHOUET ET AL.' SOURCE AND PATH EFFECTS AT STROMBOLI VOLCANO 15,131
stochastic waves. The third array was deployed with a station spacing of 30 to 60 m along a 600 m line extending in the crater direction (Figure 2) with the specific objective to obtain data for an investigation of the anelastic attenuation properties of the volcanic medium. Two stations deployed near the summit crater (SS1 and SS2 in Figure 1) completed our deployment and provided near-field samplings of the wavefields. All the receivers were positioned with Global Positioning System (GPS) with an accuracy of the order of 1 cm in relative location of individual array components and precision of 50 cm in the absolute location of the arrays and summit stations.
The semicircular arrays included 20 Mark Products three- component L-22-3D seismometers with a natural frequency of 2 Hz and sensitivity of 0.5 V cm- • s-•, and 59 Mark Products vertical component L-4A sensors with a natural frequency of 2 Hz and sensitivity of 1 V cm -• s -•. The linear array and the two summit stations included 17 Mark Products three-
components L-4C sensors with a natural frequency of 1 Hz and sensitivity of 1 V cm -• s -•. Recording of the semicircular arrays was performed using 20 GEOS digital seismographs, each consisting of a six-channel, 16-bit recorder [Borcherdt et al., 1985] storing data at 100 samples s -• channel -•. The linear array was equipped with 15 Lennartz MARS-88/FD 16-bit digital recorders storing data at 125 samples s -• channel -•, and the two summit stations used two Lennartz MARS-5800
12-bit recorders storing data at 125 samples s- • channel-•. All the array instruments used a common time base with an accu- racy of 1 ms among all the channels. Timing of the summit instruments was achieved with a DCF (Deutschland C-band Frankfurt) radio code synchronized with the master clock used in the flank arrays. Details of the experimental set up are given by Dietel et al. [1994].
Sustained volcanic tremor and discrete explosions superim- posed on the background of tremor were the two persistent sources of seismic activity observed during the course of our experiment. During this time, volcanic activity was occurring mainly in two distinct vents located at the northeastern and southwestern perimeters of the crater, and explosions from those vents occurred at a roughly constant combined rate of two to five events per hour. Nine preset windows, each of 20- to 30-min duration, were recorded during nine separate nights of data collection. Over 100 explosions were also recorded in trigger mode over a separate period of a few days. In this study, we analyze three 50- to 150-s-long segments of tremor and eight 40- to 80-s-long explosion records obtained on the three arrays during three different data collection intervals bracket- ing the period from May 6 through May 9, 1992. Typical ver- tical component seismograms for the selected records are shown in Figure 3.
Spectral Properties Array-averaged power spectra were used to investigate the
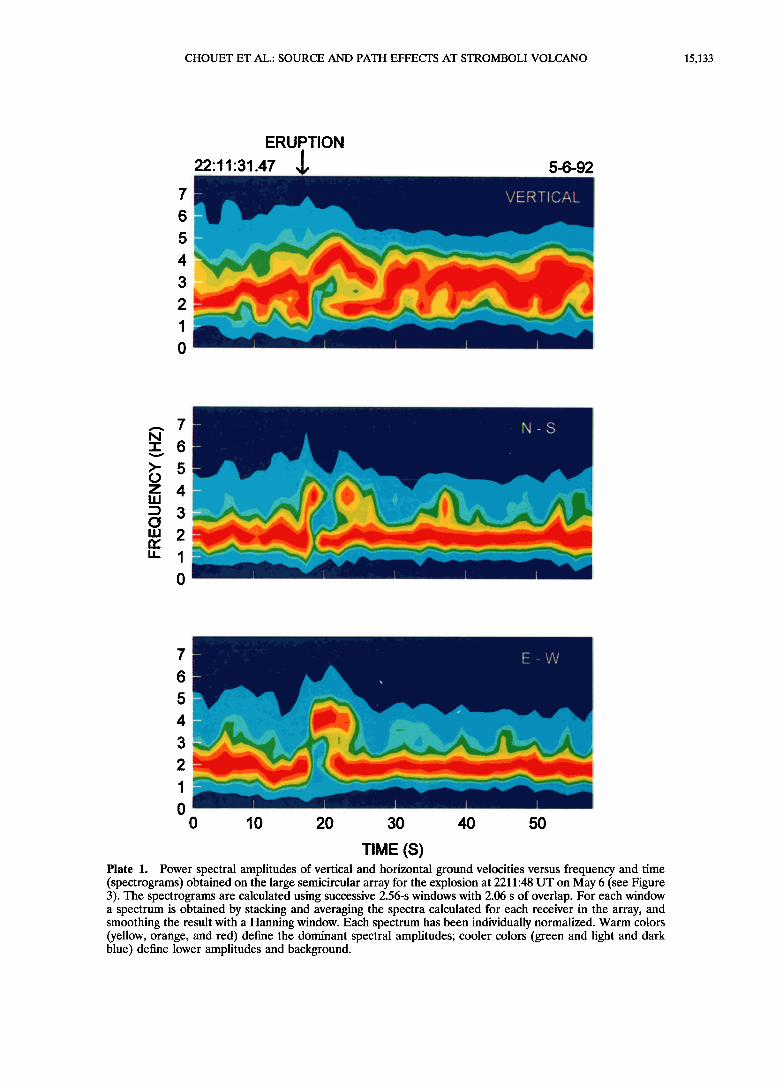
short-scale temporal evolution of the signals and to illustrate the relationship between tremor and explosions. The same array-averaging procedure was applied to a single longer win- dow to obtain a more detailed picture of the spectral structure of the signals and to demonstrate that site effects are an un- likely explanation for the sharp spectral peaks observed in those spectra. The spectral features of tremor and explosions are presented in Plate 1 for the record starting at 2211:31 UT on May 6. Overall, these spectrograms suggest that tremor and explosions can be distinguished by their characteristic bands of
15 o 12.84'
38 o 48.60' -
o
o
o
o
o
o
o
o
o
o
380 48.24'
o
o
o o o ©o
ho: ø
150 13.20' I
o e o
ß ß ß o
ß o
ß ß
ß
ß o
ß
o lOO 2oo M I I I
I
Figure 2. Configuration of the two semicircular arrays with respective radii of 60 and 150 m and linear array with length of 600 m set on the lower north flank of Stromboli. The solid dots
mark locations of vertical component sensors and open circles indicate three-component sensors. Station L was used to com- pare the seismograms of explosions and tremor selected for study.
radiated energy. Of particular interest are the spectrograms obtained on the two horizontal components, which display a distinct band of radiated energy between 1.4 and 2.1 Hz for the background tremor and another distinct band spanning 3.3-4.5 Hz superimposed on the tremor band during the eruption. The eruption signal, for which the onset is marked by an arrow, dominates the E-W component spectrogram for approximately 6 s and appears as two discrete bursts of energy separated by 4 s of relative quiet on the N-S component. Although there is comparatively more energy radiated at frequencies above 2 Hz in the vertical spectrogram, the eruption is again distinguished by a rapid shift from lower to higher frequencies.
The bimodal nature of the tremor and explosion spectra is further demonstrated in the spectra of Figure 4a obtained in a 20.48-s window starting at 2211:48 UT in the same record. The overall spectral envelope is similar on each component of mo- tion and shows a distinct pattern of energy release in the two bands 1.5-2.3 Hz and 2.3-5.2 Hz, each marked by several sharp peaks some of which are common to the three components. In the particular time interval displayed in Plate 1, most of the tremor energy is radiated in the band 1.5-2.3 Hz in a spectrum that is distinct from that produced by the explosion.
The spectral excitation of tremor, however, can vary signif- icantly with time as indicated in Figure 4b obtained for a 20.48-s window starting at 2000:05 UT the next day. In that record the vertical component spectrum is depleted in frequen- cies below 2 Hz and relatively enriched in higher frequencies compared to that in Figure 4a. Some of the narrow-band spec- tral peaks in that spectrum are coincident with peaks observed at a lower excitation level in Figure 4a, suggesting that these may represent different excitations of the same seismic wave source.
Evidence against a site effect for the origin of some of the sharp spectral peaks observed in the explosion and tremor spectra is provided in Figure 5, which displays spectra for all

15,132 CHOUET ET AL.: SOURCE AND PATH EFFECTS AT STROMBOLI VOLCANO
0.0045 •
- - : : E (40 S)
0.0020
• E (40 S) 0.0029
5-7-92 20:15:45 E (80 S)
0.0060
5-7-92 20:16:45 T (50S)
0.0006
5-9-92 22:05:• 0.OO56 I
I
0 10 20 30 40 50
TIME (S)
Figure 3. Typical vertical component seismograms (velocity) of tremor and explosions selected for frequen- cy-slowness and polarization analyses. The records are from station L located at the hub of the large semicircular array (see Figure 2). The date and local time at the start of each record are indicated at the upper left of the record, and the type of event and length of time interval selected for study are listed at the upper right of each trace (E, explosion; T, tremor). The maximum peak to peak amplitudes of the traces are displayed in units of centimeter per second at the lower left of the traces.
the events shown in Figure 3. If a site effect were responsible for the sharp peaks in those spectra, one might expect to see the same spectral peaks in all the spectra. Instead, we observe that the dominant band of radiated energy is quite variable with time, alternatingly displaying complex spectra containing multiple sharp peaks and spectra consisting of a single sharp peak. Variations similar to these were observed in tremor and gas piston events at Puu Oo, Hawaii, which were attributed to a combination of source and path effects [Goldstein and Chouet, 1994].
Source and path effects are illustrated in Figure 6 for tremor spectra obtained at the large semicircular array and at SS1. Common spectral peaks observed at the two locations may be attributed to source effects, while other peaks clearly distinct at the two sites may represent path effects. Note that source and path complexities may induce splitting and shifting of spectral
peaks associated with source resonance [see Chouet, 1996a, Figure 5]; hence the apparent shift in the dominant spectral peak observed in the vertical component at the two sites may reflect both source and path effects. We discuss source effects in more details later in this paper.
Frequency-Slowness Analyses In the following, we use frequency-slowness analyses to de-
termine the importance of path effects in Strombolian signals and to investigate the spatiotemporal properties of the source. We adopt the standard procedure and compute frequency- slowness power spectra over successive short time windows of array data. Each plane wave moving across the array is defined by its ray parameter P,
P = /Sx +
CHOUET ET AL.: SOURCE AND PATH EFFECTS AT STROMBOLl VOLCANO 15,133
ERUPTION
22:11'31.47 5-6-92
VERTICAL
>-
z
o
N-S
7
6
5
4
3
2
1
0 0 10 2O 30 4O 5O
E-W
TIME (S) Plate 1. Power spectral amplitudes of vertical and horizontal ground velocities versus frequency and time (spectrograms) obtained on the large semicircular array for the explosion at 2211:48 UT on May 6 (see Figure 3). The spectrograms are calculated using successive 2.56-s windows with 2.06 s of overlap. For each window a spectrum is obtained by stacking and averaging the spectra calculated for each receiver in the array, and smoothing the result with a Hanning window. Each spectrum has been individually normalized. Warm colors (yellow, orange, and red) define the dominant spectral amplitudes; cooler colors (green and light and dark blue) define lower amplitudes and background.

15,134 CHOUET ET AL.' SOURCE AND PATH EFFECTS AT STROMBOLI VOLCANO
0
0 z
m
,• VERTICAL lib !•'! /1 ill I N-S , ,i,,, ,!1 N-S / •i '• •!1
i ...... E-W I • t ,1'1 - ,, ,•,• ........ E-VV
/ t ! it I ß
t "•l,'t '
// .? •.- • / v • •' :'"¾1 ,. •-" I I I ,, oJ I I
•o
FREQUENCY (HZ) FREQUENCY (HZ)
VERTICAL
Figure 4. Array-averaged power spectra of the vertical, N-S, and E-W components of ground velocity obtained on the large semicircular array. (a) Explosion at 2211:48 UT on May 6. (b) Tremor at 2000:05 UT on May 7. The spectra for each component have been individually normalized.
and azimuth 4>,
4> = rr/2 - arctan (Sy/Sj), (2)
where Sx and Sy are the x and y components of slowness, respectively. The Cartesian coordinates are selected in such a way that the x axis is pointing east and the y axis is pointing north. With this convention, 4> represents the apparent direc- tion of propagation, or signal azimuth, measured clockwise from north.
We calculate slowness spectra using the Multiple Signal Classification (MUSIC) technique [Schmidt, 1986; Goldstein andArchuleta, 1987]. The advantages of this method over more conventional array processing techniques have been exten- sively discussed by Goldstein [1988] and Goldstein and Archu- leta [1991a, b]. Analyses of array resolution and measurement errors performed for various array geometries (see Appendix A) indicate that the large semicircular array constitutes the best design configuration for sampling Strombotian wave fields. Accordingly, the following analyses focus exclusively on data obtained with this array.
Slowness Spectra
The wave field composition is dominated by body waves propagating from the crater and/or summit direction at fre- quencies below 2.5 Hz and includes scattered surface waves at frequencies above 2.5 Hz. These features are illustrated in Figure 7 which displays a typical set of narrow-band (1.2 Hz bandwidth) slowness power spectra and their corresponding stacked spectrum for a single 2.56-s window in the vertical component of the tremor wave field. Both components of slowness were allowed to range over a 4 s km -• window to insure the inclusion of both body and surface waves. The re- sults clearly show that the wave field in that particular window is dominated by low-frequency (<2.5 Hz) waves propagating from the crater direction (N20øE) with ray parameters of 0.3- 0.5 s km-•. At frequencies above 2.5 Hz, the spectral power is an order of magnitude smaller than the power contained in the
lower frequencies, and the spectra depict a scattering of ray parameter values up to 2 s km -• with azimuths ranging over 360 ø . These findings are in harmony with the results obtained by B. A. Chouet et at. (Shallow velocity structure of Stromboti Volcano, Italy, derived from small-aperture array measure- ments of Strombolian tremor, submitted to Bulletin of the Seis- mological Society of America, 1996, hereinafter referred to as Chouet et at., submitted manuscript, 1996) who noted an ab- sence of dispersion for waves with frequencies below 2 Hz and found that for frequencies above 2 Hz the tremor wave field is dominated by scattered surface waves with phase velocities ranging between 1 and 0.4 km s -•. In the following analyses, slowness spectra were computed over successive 2.56-s win- dows with 2.46 s of overlap between adjacent windows. As demonstrated in Figure 7, the spectra were estimated over the bandwidth 0.4-5.5 Hz using slowness stacking [Spudich and Oppenheimer, 1986], and source depths and azimuths were estimated from slownesses corresponding to peaks in the stacked spectra.
Wave Field Properties Figure 8 shows the temporal distributions of ray parameter
and azimuth for the three components of motion derived from the stacked slowness spectra for the explosion at 2211:48 UT on May 6. No significant changes in ray parameters and azi- muths are observed at the onset of the eruption.
In the vertical component the azimuths are clustered around the crater direction (N20øE) for both the tremor preceding the eruption and initial 6 s of the explosion. Starting 6 s into the explosion, the azimuths become more spread out, and signifi- cant backscattering is observed in the 30ø-180 ø range. In the time interval 27-33 s in particular, one notes secondary waves propagating with azimuths near N170øE, consistent with waves backscattered from cliffs flanking the island near Semaforo Labronzo (see Figure 1).
The ray parameters for the vertical component of motion

CHOUET ET AL.: SOURCE AND PATH EFFECTS AT STROMBOLI VOLCANO 15,135
are clustered within the range of 0.2-1.0 s km-•; however, there is a brief time interval between 8 and 10 s during which the ray parameters approach values near 0 s km-•, suggesting that waves are impinging the antenna with nearly vertical in- cidence. For near vertical incidence the vertical component array is most sensitive to P waves, and we confirmed that these waves are indeed P waves using particle motion analyses. Steeply incident P arrivals were noted in three of the eight eruptions we analyzed but were conspicuously absent in the records of tremor we considered. The three explosions for which such arrivals were noted represent the strongest erup- tions in our data set; hence these observations provide some evidence for deeper-seated sources of energy in larger eruptions.
The features observed on the E-W component are consistent with a wave field dominated by a combination of SH waves propagating from the crater area and mix of SH and Love waves backscattered from the cliffs near Semaforo Labronzo.
This is best illustrated during an 8-s interval starting 3 s into the
-•22:10:35 T -6-92 22:11:48 E
ß • 5-6-92 22:20:35 E • •• 5-7-92 20:00:05T Q= 11:35 E
o
N • 5-7-92 20:16:00 E z
• •7-92 20:27:05 E 22:05:18 E
0 2 4 6 8
FREQUENCY (HZ)
Figure 5, Array-averaged power spectra of the vertical ground veloci• obtained on the large semicircular array for events shown in Figure 3. The window length is 20.48 s and starts at the time indicated at the upper right of each plot.
E-W ARRAY
i• SSl
..•,,:,. .............. 'j/\ ........ ,..
ILl N
0 Z
0 2 4 6 8 10
FREQUENCY (HZ)
Figure 6. Comparisons between array-averaged power spec- tra obtained with the large semicircular array and time- averaged power spectra obtained at SS1 for the record of tremor starting at 2000:35 UT on May 7. The array-averaged spectra are derived by averaging over all components of the array in a 20.48-s window, and the time-averaged spectra rep- resent averages obtained over 10 successive 20.48-s windows with 10.48 s of overlap. All spectra have been individually normalized.
record. This particular interval displays one azimuth with val- ues near N-N20øE consistent with waves propagating from the crater and summit directions and another azimuth with values
near N160øE-N170øE representing waves propagating from the general direction of Semaforo Labronzo. The two azimuths are nearly perpendicular to the orientation of the array ele- ments, suggesting these waves may be a combination of SH and Love waves. Ray parameters indicate that the main wave components propagating from the crater area have ray param- eters that are always less than 1 s km-1, while scattered waves are characterized by ray parameters ranging from 0.5 up to 2 s km-•. The first range of values corresponds to apparent phase velocities of 1 km s -• or higher which may be attributed to body waves. The second range represents velocities between 0.5 and 2 km s-1 which are probably due to a mix of body and surface waves.
Another interesting interval is the 3-s section starting 8 s into the record of the N-S component. In that case we observe the main wave components propagating at an azimuth N90øE with ray parameters of 0.8-1.0 s km -•. These ray parameters are too low to be attributed to surface waves and probably repre- sent SH waves backscattered from the tall cliffs flanking the island west of the array. The eruption signal is clearly seen on this component during a 3-s interval following the onset of the event. The stable value of azimuth near N10øE and stable ray

15,136 CHOUET ET AL.: SOURCE AND PATH EFFECTS AT STROMBOLI VOLCANO
2 I
v
I- -1 Z
• -2 o
o 2
>- 1
f=1.17 P=0.53 e=18.43 I
___
f=2.73 P=0.76 e=-23.19
-2 -2
f=4.29 P=I.0 e=36.86
__.
-1 o 1 2
=1.56 P=0.41 (I)=14.03 f=1.95 P=0.31 (I)=18.43 I I I I I
........................
f=3.12 P=0.80 e=-29.74 =3.51 P =0.58 e=-30.96
f =4.68 P = 0.72 e= 33.69
I i i
-2 -1 0 1 2
f=5.07 P=0.60 e=9.46
-2 -1 0 1 2
X COMPONENT OF sLOWNESS ($/KM)
f=2.34 P=0.41 e=14.03 I I I
...............
i
f=3.90 P=0.53 e=-21.8
V i i i STACK
b = 0.4 - 5.5 P = 0.41 e= 18.43 I I
-2 -1 0 1 2
Figure 7. Narrow-band frequency-slowness power spectra and corresponding stacked spectrum for a single window of tremor recorded on the large semicircular array on May 6, 1992. The focusing frequency f and associated ray parameter P and azimuth qb for individual narrow-band spectra are shown at the top of each plot. The stacked spectrum is shown at the lower right and is labeled by total bandwidth b instead of focusing frequency. The contours represent spectral amplitudes above the background spectral level.
parameter near 0.6 s km-] during that period are consistent with P and/or SV waves propagating from the summit direction.
Similar features are observed during the tremor interval starting at 2000:05 UT on May 7 (Figure 9). The ranges of ray parameter values on the three components of motion are the same as those seen during an eruption, with typical values of 0.3-1 s km-1 on the vertical component and values ranging up to 2 s km-1 on the two horizontal components. Significant time intervals, during which waves are seen to propagate from the crater direction, are observed in the azimuth plot of the verti- cal component of motion. A 12-s interval at the end of the record on the E-W component is also worth noting. During that interval waves are seen to propagate in two stable direc- tions with azimuths of 0 ø and 90 ø and ray parameters of 0.5-1.5 s km -•, suggesting these represent a mix of SH and Love waves propagating from the summit direction, and a mix of P, S V, and Rayleigh waves backscattered from the cliffs west of the array.
The overall picture that emerges out of the data displayed in Figures 8 and 9 is that there are no obvious differences in the wave field features observed during tremor or eruptive epi- sodes. Further evidence buttressing this conclusion is provided
by results of the same analysis for seven more explosions and two additional tremor episodes (see Figure 3). These observa- tions strongly support the idea that the two phenomena share the same source volume and can be viewed as different exci-
tations of a single source or set of sources within that volume.
Directional Properties of the Wave Field
A more comprehensive picture of the directional properties of the wave field may be obtained by plotting the probability distributions of azimuths. As all events considered in our anal-
ysis display similar distributions, we present our results in the form of an overall distribution of azimuths obtained for the
ensemble of explosion and tremor episodes seen in Figure 3. This overall distribution is derived simply by stacking the azi- muths calculated in the 2.56-s-long moving windows spanning these records. The results obtained for the vertical component of motion are shown in the form of rose diagrams in Figure 10.
Overall, the azimuthal distributions are quite similar for both explosions and tremor. The peak in the distribution of azimuthal probabilities coincides with directions from the cra- ter area for both tremor and explosions. However, we observe large amounts of energy propagating from directions which,

CHOUET ET AL.: SOURCE AND PATH EFFECTS AT STROMBOLl VOLCANO 15,137
P E
5-6-92 22:11:35 • ,• 0.4- 5.5 HZ
2 rVERTi-cA L 1 • " •.-. •,½• . . o t
IE-W o•& o o7•o• 4 o •.ø .•%•'% o½)•.o. o ø ø%< / o• • %o• o •o o• j% • •.%_Oo%%•,• •,. • .,.. •_ • • • • __•.o oo• o • o •o o • •o' ß '• •t--,••-•øo • o.•
k ½o,- . o .;,o? ß 0 I I
27O •/ERTi'CAL 180 .... •.o o •A.• o
0 o-. -90 I I t
• •o • • o 270 •N-S o o 180 / ½%• o ½ ½ o_ o •oo_ o•o. ø'•.oo• ;• • o •o•o_•_ -- _ -•• •o off __ ß • o•-•-
-90
270 180
90 0
-90
TIME (S)
Figure 8. Ray parameter and azimuth versus time derived from frequency-slowness spectra calculated for successive 2.56-s windows with 2.46 s of overlap ranging over 40 s of data for an explosion recorded on May 6, 1992. The plots show the results obtained for the vertical, N-S, and E-W components of ground velocity recorded on the large semicircular array. The bandwidth is indicated at the upper right, and the date and time at the start of the record are listed at the upper left. Solid dots represent dominant peaks, and open circles represent secondary peaks, in the slowness spectra. The plots depict the precursory and main phases of the eruption, whose onset is indicated by an arrow labeled E. An arrow labeled P marks the arrival of P waves impinging the array with nearly vertical incidence 4 s before the start of the eruption. Poorer resolution is achieved on the horizontal arrays because of their coarser spatial sampling. This limitation is responsible for the pronounced scatter observed in the vector slowness estimates in those components.
even accounting for experimental errors, are not consistent with the crater location. Noteworthy is the observation that most of these directions of arrival correspond to prominent topographic and structural features present in the N-NW flank of the volcano. For example, the 0ø-10 ø interval may be inter- preted as a topography effect in which part of the elastic energy radiated from the vents is backscattered from the summit and
propagates down the steep north ridge of the volcano. Such backscattering was observed in numerical investigations of the effect of topography in three-dimensional structures [Ohmi- nato and Chouet, 1997]. Similarly, the 130ø-180 ø interval, par- ticularly evident in the distributions observed for explosions, may be explained by backscattering from the cliffs bordering the N-NW flank of the island near Semaforo Labronzo. The
extensive talus of basaltic scoria filling the sector graben of the Sciara del Fuoco W-NW of the crater, and tall cliffs flanking the island to the west strongly affect wave propagation as demonstrated by the considerable amount of energy propagat- ing at azimuths ranging from 30 ø to 90 ø .
Spatial Extent of the Source Our previous analyses were mostly aimed at a global assess-
ment of the wave fields and their complexities and demon- strated the great importance of scattering by topography in shaping the observed signals. We now turn our attention to the spatial properties of the source as inferred from the distribu- tions of vector slownesses. For this purpose we limit our in-

15,138 CHOUET ET AL.' SOURCE AND PATH EFFECTS AT STROMBOLI VOLCANO
5-7-92 20:00:05 0.4- 5.5 HZ
vERTi'cAL ....... ' " ......... ,, -:-.,,.. o - --
270
*-t
180 • %o • • o •o•ø • •o o•ø o• o- o • • ß .. .... ..... o.. . - ._
-90 • .... .__.o o. I .... •. .• ,o I *- *-- -t ' - 0 10 20 30 40
TME (S)
Figure 9. Ray parameter and azimuth versus time derived from frequency-slowness spectra calculated over successive 2.56-s windows with 2.46 s of overlap ranging over 40 s of data for tremor recorded on the large semicircular array on May 7, 1992. Symbols and labels are defined in Figure 8.
quiry to direct waves propagating from the crater area and reprocess a 60-s-long record of tremor and the first 3 s of each of the eight explosions in Figure 3, in which we allow both components of slowness to range in the 0-1 s km -• interval with a resolution of 0.07 s km-•. Thus only vector slownesses in the quadrant of arc extending from north through N90øE are considered. In stacking slowness power spectra we limit our- selves to the band 0.4-2.3 Hz where the strongest contribu- tions from the source are found. Peaks in the stacked slowness
spectra are selected provided their power is at least 1 dB above the baseline spectral level, which is defined as twice the stan- dard deviation of the slowness power spectral estimates. The purpose of this analysis is to improve our resolution of vector slowness estimates in order to ascertain whether the observed
dispersion of azimuths is due only to path effects or whether ray parameters and azimuths are somehow correlated, hence providing information on the spatial setting of the source.
Azimuthal Span
The results of our detailed analyses of the N-E quadrant of vector slowness are shown as contour plots of the multivariate
distributions of ray parameters and azimuths in Figure 11. The signals from explosions and tremor are concentrated in a do- main approximately 24 ø by 0.3 s km -l wide (marked by the dominant peaks within the grey-shaded areas) encompassing the azimuthal spread of the crater seen by the array (18ø-28ø). The peaks in those domains define azimuths of 10% 18 ø , and 25 ø , respectively, the latter two of which coincide with direc- tions expected for the two active vents. The peak at the azi- muth of 10 ø represents waves backscattered from the summit area, and secondary peaks in the azimuthal range 300-70 ø in Figure 1 lb represent waves diffracted by the cliffs flanking the Sciara del Fuoco to the north. A slight trend in the direction of the Sciara del Fuoco is present in both plots, where a tendency toward lower ray parameter values is observed for azimuths larger than 30 ø which may be indicative of a NW dipping conduit in which increasing source depths would be associated with a gradual azimuthal rotation. Although we can not a priori reject this possibility, it is not sufficiently buttressed by exper- imental evidence to warrant further consideration at this point in our studies. Our total ignorance concerning the internal

CHOUET ET AL.: SOURCE AND PATH EFFECTS AT STROMBOLI VOLCANO 15,139
15 ø 10.63' 38 ø 49.22'
0 I
38 ø 45.98'
15 ø 14.86'
SEMAFORO
b
Figure 10. Probability distribution of azimuths •b for waves propagating across the large semicircular array. The distributions represent the dominant and secondary slowness peaks calculated in the band 0.4-5.5 Hz for all explosion and tremor intervals considered (see Figure 3). Propagation directions are inward toward the array located at the center of the rose diagram. The scale indicates the probability. (a) Explosions. (b) Tremor.
structure of the volcano prevents a robust assessment of ray paths and hence prevents us from discerning whether the ob- served trend reflects a particular source setting or a path effect.
The 24 ø azimuthal spread encompassing the clusters of azi- muths centered on the crater area may be used to bound the lateral extent of the source region resolved by the array. Using the distance of 1.7 km between the crater and center of the
large semicircular array as reference we obtain an estimate of the horizontal source extent in the direction transverse to the
crater-array azimuth (L = rO) of approximately 700 m. This dimension is roughly two and a half times the lateral extent of the crater in that direction. Based on the uncertainty in signal azimuth estimates of 7 ø (see equation (A1)), the uncertainty in this estimate of spatial extent is ---200 m.
1.0
• 0.8
m 0.6
r• 0.4
• b
10 20 30 40 50 60 70 80 90 10 20 30 40 50 60 70 80 90
AZIMUTH (DEG) AZIMUTH (DEG)
Figure 11. Contour plots of the multivariate probability distribution of azimuth and ray parameter estimates derived from vertical component records of Strombolian activity. Azimuth and ray parameter estimates are resolved over bins of 7 ø and 0.07 s/km, which correspond to the expected standard deviations of the data as defined by the detection capabilities of the array discussed in Appendix A. The shaded areas mark zones in the azimuth-ray parameter plane within which the probability of observing values falling within these zones is 50%. (a) Explosions; data are from the first 3 s of each of the eight explosions shown in Figure 3. Contour intervals are 0.01. (b) Tremor; data are from a 60-s-long record starting at 2000:05 UT on May 7, 1992. Contour intervals are 0.005.
15,140 CHOUET ET AL.: SOURCE AND PATH EFFECTS AT STROMBOLI VOLCANO
0.2
RAY PARAMETER (S/KM) 0 1 2 3
I ] EXPLOSIONS
I ....... ,] TREMOR
0.5
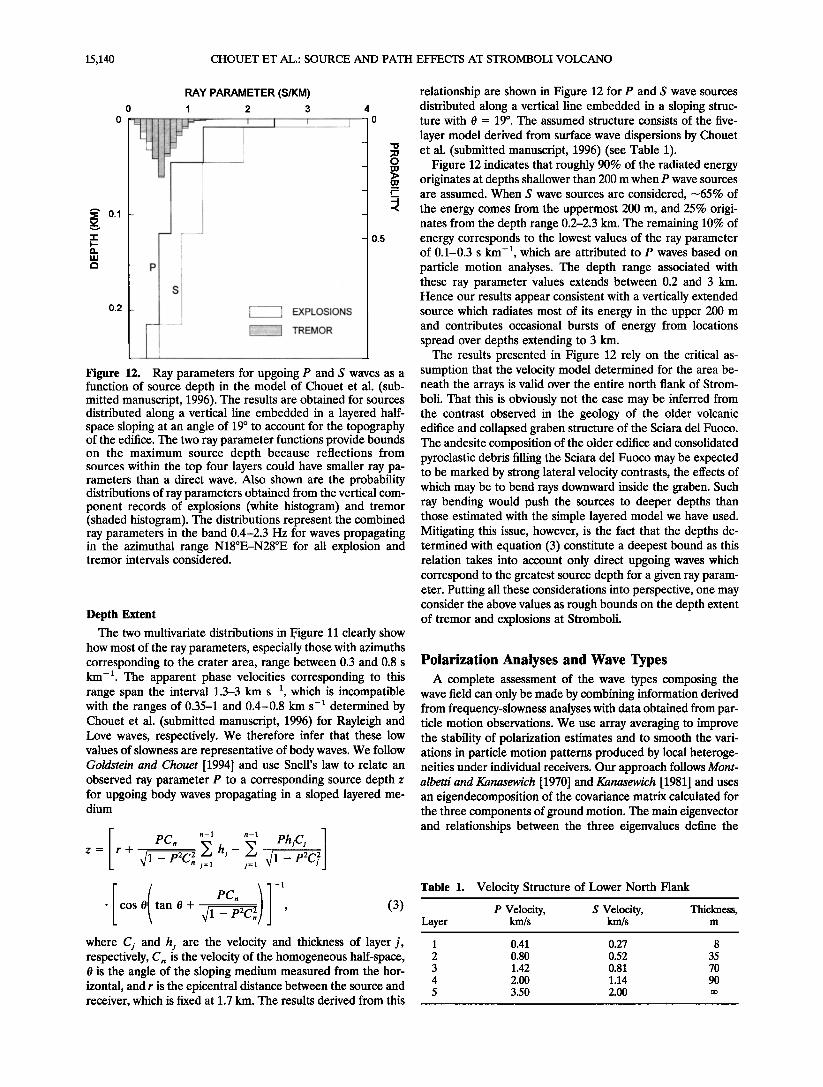
Figure 12. Ray parameters for upgoing P and S waves as a function of source depth in the model of Chouet et al. (sub- mitted manuscript, 1996). The results are obtained for sources distributed along a vertical line embedded in a layered half- space sloping at an angle of 19 ø to account for the topography of the edifice. The two ray parameter functions provide bounds on the maximum source depth because reflections from sources within the top four layers could have smaller ray pa- rameters than a direct wave. Also shown are the probability distributions of ray parameters obtained from the vertical com- ponent records of explosions (white histogram) and tremor (shaded histogram). The distributions represent the combined ray parameters in the band 0.4-2.3 Hz for waves propagating in the azimuthal range N18øE-N28øE for all explosion and tremor intervals considered.
Depth Extent
The two multivariate distributions in Figure 11 clearly show how most of the ray parameters, especially those with azimuths corresponding to the crater area, range between 0.3 and 0.8 s km -•. The apparent phase velocities corresponding to this range span the interval 1.3-3 km s -•, which is incompatible with the ranges of 0.35-1 and 0.4-0.8 km s-• determined by Chouet et al. (submitted manuscript, 1996) for Rayleigh and Love waves, respectively. We therefore infer that these low values of slowness are representative of body waves. We follow Goldstein and Chouet [1994] and use Snell's law to relate an observed ray parameter P to a corresponding source depth z for upgoing body waves propagating in a sloped layered me- dium
ß cos 0 tan 0 + 41 -•2Cn2' j , (3) where C s and h i are the velocity and thickness of layer j, respectively, C,• is the velocity of the homogeneous half-space, 0 is the angle of the sloping medium measured from the hor- izontal, and r is the epicentral distance between the source and receiver, which is fixed at 1.7 km. The results derived from this
relationship are shown in Figure 12 for P and S wave sources distributed along a vertical line embedded in a sloping struc- ture with 0 - 19 ø. The assumed structure consists of the five-
layer model derived from surface wave dispersions by Chouet et al. (submitted manuscript, 1996) (see Table 1).
Figure 12 indicates that roughly 90% of the radiated energy originates at depths shallower than 200 m when P wave sources are assumed. When S wave sources are considered, ---65% of the energy comes from the uppermost 200 m, and 25% origi- nates from the depth range 0.2-2.3 km. The remaining 10% of energy corresponds to the lowest values of the ray parameter of 0.1-0.3 s km -•, which are attributed to P waves based on particle motion analyses. The depth range associated with these ray parameter values extends between 0.2 and 3 km. Hence our results appear consistent with a vertically extended source which radiates most of its energy in the upper 200 m and contributes occasional bursts of energy from locations spread over depths extending to 3 km.
The results presented in Figure 12 rely on the critical as- sumption that the velocity model determined for the area be- neath the arrays is valid over the entire north flank of Strom- boli. That this is obviously not the case may be inferred from the contrast observed in the geology of the older volcanic edifice and collapsed graben structure of the Sciara del Fuoco. The andesite composition of the older edifice and consolidated pyroclastic debris filling the Sciara del Fuoco may be expected to be marked by strong lateral velocity contrasts, the effects of which may be to bend rays downward inside the graben. Such ray bending would push the sources to deeper depths than those estimated with the simple layered model we have used. Mitigating this issue, however, is the fact that the depths de- termined with equation (3) constitute a deepest bound as this relation takes into account only direct upgoing waves which correspond to the greatest source depth for a given ray param- eter. Putting all these considerations into perspective, one may consider the above values as rough bounds on the depth extent of tremor and explosions at Stromboli.
Polarization Analyses and Wave Types A complete assessment of the wave types composing the
wave field can only be made by combining information derived from frequency-slowness analyses with data obtained from par- ticle motion observations. We use array averaging to improve the stability of polarization estimates and to smooth the vari- ations in particle motion patterns produced by local heteroge- neities under individual receivers. Our approach follows Mont- albetti and Kanasewich [1970] and Kanasewich [1981] and uses an eigendecomposition of the covariance matrix calculated for the three components of ground motion. The main eigenvector and relationships between the three eigenvalues define the
Table 1. Velocity Structure of Lower North Flank
P Velocity, S Velocity, Thickness, Layer km/s km/s rn
1 0.41 0.27 8
2 0.80 0.52 35 3 1.42 0.81 70
4 2.00 1.14 90 5 3.50 2.00 o•

CHOUET ET AL.: SOURCE AND PATH EFFECTS AT STROMBOLI VOLCANO 15,141
180
(.9 120
60
5-6-92 22:11'35 180
120
6O
b
5-7-92 20:00:05
9O
60
30
9O
6O
3O
0 10 20 30 40
TIME(S)
1 1
o o i i i i
10 20 30 40
TIME (S)
Figure 13. Polarization attributes for an explosion and a tremor interval recorded on the large semicircular array. The results are obtained by averaging the particle motions over the array components in the band 0.4-2.3 Hz in a 2.56-s sliding window with 2.46 s of overlap. (a) Data for the explosion depicted in Figure 8. The vertical band of shading marks the beginning of the eruption, which is dominated by P-SV motion. The vertical dotted line identifies the largest component of motion in the record due to SH body waves. (b) Same as Figure 13a for the tremor interval illustrated in Figure 9. The horizontal band of shading marks the dominant contribution of SH motion in the wave field (compare with Figure 9), and the vertical dotted line identifies the largest component of motion due to SH waves.
spatial orientation of particle motion in the least squares sense. Details of the procedure are given in Appendix B.
In our application to explosion and tremor records we use the same 2.56-s sliding window with 2.46-s overlap as previ- ously applied in frequency-slowness analyses. We also restrict our analyses to the bandwidth 0.4-2.3 Hz to focus our atten- tion on body waves (see Figure 7). Results of our analyses are displayed in Figure 13a for the record of the explosion starting at 2211:35 UT on May 6, and in Figure 13b for the record of tremor starting at 2000:05 UT on May 7. The top two plots illustrate the time dependence of the azimuth q> of the hori- zontal projection of the eigenvector associated with the main eigenvalue of the covariance matrix (see equation (B1)). The middle two plots depict the angle 0 sustained by the dominant eigenvector from the vertical axis. The bold line in the bottom plots shows the strength of polarization, or rectilinearity P s (see equation (B3)), and the dotted line represents the value of the dominant eigenvector (LEV) of the covariance matrix nor- malized by its maximum value reached during the entire interval.
The peak LEV value within each 40-s interval coincides with a particle motion azimuth q> = 90 ø. Examining the plots of propagation azimuths 4> in Figures 8 and 9, we note that these particle motions are associated with waves propagating from
the crater and summit directions, hence suggesting these repre- sent SH motion. The corresponding values of 0, ps, and apparent phase velocity are 82 ø, 0.9, and 1-1.6 km/s, respectively, suggesting these are in fact SH body waves. Further scrutiny of the par- ticle motion azimuths for tremor (top plot of Figure 13b) shows that those azimuths are concentrated in the band 90 ø-
120 ø marked by shading. Put together with the data from Fig- ure 9, these results indicate that tremor in the band 0.4-2.3 Hz is dominated by SH motion over extended periods of time.
Although the explosion record is dominated by SH motion, the event onset (Figure 13a) is marked by an abrupt shift in the direction of particle motion from transverse (N85øE-N105øE) to radial (N5øE-N15øE) with respect to the crater-summit di- rection (see shaded interval between 13 and 18 s in Figure 13a). Comparisons with Figure 8 and with particle motion trajectories indicate that the first 2 s of the explosion are dominated by P waves propagating from the crater direction. The steepening incidence of those P waves indicated by the value of 0 observed during the first second or so of the eruption suggests a deepening of the source, and the minimum value of rectilinearity near 0.5 reached during this interval points to the presence of a significant component of shear in the particle motion. Both 0 and the rectilinearity increase after the first

15,142 CHOUET ET AL.: SOURCE AND PATH EFFECTS AT STROMBOLI VOLCANO
second of the eruption, while the azimuth remains stable, sug- gesting a shallowing of the source. Some short radial pulses can still be observed during the following 3 s; however, the general characteristics of ground motion in that interval are reminis- cent of S V waves impinging the array with a slightly steeper incidence than the P waves.
All eruption onsets were found to be characterized by a brief interval of radial motion, whereas the eruption coda and tremor in general were found to be dominated by strong SH waves. Taken together with the dominance of Love waves observed by Chouet et al. (submitted manuscript, 1996) for the surface wave components of the tremor wave field at frequen- cies above 2 Hz, these results are strongly suggestive that the wavefields radiated by Strombolian activity are dominated by SH motion.
Discussion
The results from frequency-slowness and polarization anal- yses discussed above provide constraints on the spatial setting of the sources of tremor and explosions and yield evidence of a wave field dominated by SH and Love waves in which rela- tively short periods with radial (P-SV) motion are observed at the onset of eruptions. In the following, we explore the impli- cations of this wave field composition for the geometry of the source and use near-field data to further constrain both source
geometry and source process.
Constraints on Source Geometry
One possible explanation for the origin of the large SH component observed in the records of tremor and explosions is a path effect. The strong velocity contrast expected at the boundary between the debris-filled Sciara del Fuoco and andesitic rock of the older volcanic edifice may indeed con- tribute to significant wave conversions at this boundary. Spe- cifically, the nearly vertical orientation of the contact between the two structures at shallow depths may contribute P-to-SH conversions for incident P waves propagating at a shallow angle from the source. Another possible explanation is a path effect associated with the topography of the edifice. The inci- dence of P waves propagating at shallow angles from the source on the laterally curved free surface may contribute a significant SH component to the wavefield via P to SH con- version at this boundary [Ohminato and Chouet, 1997]. An- other possibility is that the observed SH waves are due a source effect and reflect a particular seismic wave source ge- ometry. In that case, several additional constraints may help define the seismic wave source: (1) the source geometry must allow mass transport, and (2) the source must be vertically or nearly vertically oriented in its shallowest part to satisfy obser- vations of eruptive activity, which always report a vertical or nearly vertical orientation of the jets [e.g., Chouet et at., 1974; Ripepe et at., 1993]. In view of these constraints, the only possible geometry capable of contributing a large SH compo- nent to the radiated field is a vertical crack [Chouet, 1981, 1983, 1988].
Near-field data obtained at SSi offer the means to discrim-
inate between source and path effects for the origin of the dominant SH component observed in the far field. Located 150 m south of the nearest eruptive vent, station SS1 lies within the graben structure on the relatively homogeneous consoli- dated ejecta surrounding the active vents. If the SH waves observed on the lower north flank of the volcano were due to
wave conversions at the graben boundary, one might expect this type of motion to be absent at SS! and, although some backscattering from the edges of the graben is expected, the station is close enough to the vent that direct wave components radiated by the source should dominate over contributions from backscattering and other complexities associated with path effects. Observations of SH motion at SS1 would thus provide additional constraints in favor of a source origin for the SH waves seen in the far field.
Examples of seismograms recorded at SS1 for an eruption from the nearest vent are shown in Figure 14a. The three components of ground velocity show a distinctive low- frequency signal with dominant frequency near 2 Hz lasting through the entire record of the eruption and a higher- frequency signal with frequencies up to 10 Hz superimposed on the low-frequency traces starting roughly 1.4 s after the onset of the event. The onset of the higher-frequency signal was noted to coincide with the visually observed onset of the eruptive jet, while no visible surface activity could be linked with the precursory low-frequency onset.
Particle motions obtained after filtering the signal with a 1-pole zero-phase-shift 2.5-Hz low-pass filter are shown in Fig- ure 14b for the initial 2 s of the event (see interval marked by shading in Figure 14a). The observed motion displays a char- acteristic elliptical trajectory during the first second of the precursor, followed by horizontal radial motion directed south (away from the vent) during the eruption onset. A similar pattern of motion was observed on station SS2.
The elliptical shape of particle motion is not unusual if one considers the motion produced on the free surface by an inci- dent plane harmonic S wave and its reflected S and P waves. Nuttti [1961] demonstrated that for S incidence beyond the critical angle the SH and S V components of the incident wave, reflected P wave, and SH and S V components of the reflected S wave combine to produce nonlinear S particle motion at the surface. In general, the motion is elliptical both in the hori- zontal plane and the plane of incidence.
Sustained elliptical motion requires a source that radiates sustained harmonic SH and S V waves. A vertical pipe only radiates P and S V waves, while a spherical source only pro- duces P waves. A vertical crack, on the other hand, is an excellent radiator of P, SV, and SH waves, and acoustic res- onance of a fluid-filled vertical crack will generate sustained harmonic waves of those types [Chouet, 1986, 1988]. This is demonstrated in Figure 14c in the horizontal particle motion calculated at the free surface in the near field of a resonating fluid-filled crack embedded in a homogeneous half-space.
The synthetics represent the horizontal component of ground velocity a parallel to the crack plane and the compo- nent O normal to the crack plane calculated at an epicentral distance r of !50 rn for selected azimuths •b. These synthetics have been band-pass filtered at 1.5-2 Hz and particle motion is depicted for only a portion of the decaying oscillations associ- ated with the step response of the source.
The synthetics show a striking resemblance to the motion observed at SS1 and provide a strong constraint in favor of a crack-like geometry for the fluid-filled conduit. The spiraling elliptical trajectory of motion is the result of the interaction of incident SH and S V waves radiated by the sustained vertical and horizontal modes of resonance of the source.
The plane containing the crack is a node for the v compo- nent of motion as this component is antisymmetric with respect to that plane. Accordingly, motion in this plane is pure P-SV

CHOUET ET AL.: SOURCE AND PATH EFFECTS AT STROMBOLI VOLCANO 15,143
5-7-92 20:27:08
a c
0 2 4 6 8 10
TIME (S)
2-3S
N
b 2-4S
N
q)=5 ø =25 ø
...........
q)=65 ø q)=85 ø
.x
.fi
•=45 ø
155 ø
Figure 14. (a) Three components of ground velocity (shown with arbitrary amplitude scale) recorded at station SS1 for an explosion occurring in the nearest vent at a distance of 150 m. Shading marks the interval over which particle motions in Figure 14b are obtained. (b) Particle trajectories obtained in the band 1-2.5 Hz. The trajectories are plotted in the N-S vertical and horizontal planes for two windows of 1- and 2-s durations spanning the precursory signal and eruption onset. (c) Particle trajectories in the horizontal plane for synthetic seismograms of the ground response calculated for the excitation of a vertical fluid-filled crack embedded in a homogeneous half-space. The crack geometry is shown in the Cartesian coordinates at the top. The synthetics are for a 75-m-wide vertical crack extending from a depth of 50 m to a depth of 200 m. The crack is excited by a step in pressure applied over a small area of the crack at 125 m depth (dark patch in sketch). The impedance contrast between fluid and solid is 8.
motion and the horizontal particle trajectory at the free surface becomes purely linear along the crack trace. In the model shown, the crack excitation is centered on the main axis of the crack, and the radiation is also symmetrical about the vertical plane normal to the crack plane bisecting the crack. The u component of motion is antisymmetric with respect to this plane so that the horizontal particle trajectory along the free surface trace of this plane is again linear. In the four quadrants defined by these two nodal planes the motion is elliptical with an ellipticity and sense of rotation both depending on the azimuth (D (Figure 14c). This suggests the possibility that the azimuthal orientation of the conduit may be resolvable with an array of triaxial sensors set in a semicircular pattern at a short epicentral distance from the vent.
Further evidence for a crack-like geometry for the shallow conduit system under Stromboli was found in an analysis of the polarization properties of tremor recorded at SS1. Using the same frequency band and frequency averaging as in our anal- yses of array data, we performed an eigendecomposition of the single-station covariance matrix in successive 2.56-s moving windows sliding in increments of 0.1 s across 60 s of signal starting at 2000:05 UT on May 7. The polarization eigenvectors
derived from this analysis show a clear dominance of SH mo- tion in the tremor wavefield sampled at this site, a finding consistent with the inference drawn from our analysis of par- ticle motion for the eruption precursor.
Additional clues pointing to a crack-like source geometry may also be found in the preferred NE-SW orientation of the active vents coincident with the NE striking zone of weakness identified in the edifice. This observation suggests that the shallow conduit system feeding these vents may represent what remains of the mostly solidified surficial part of an underlying fissure striking in the NE direction.
Implications for Source Dynamics
The dominantly horizontal radial particle motion observed at SS1 during the eruption onset suggests a surficial source (Figure 14b). Further constraints on the source depth and source process of explosions may be gathered from the timing of acoustic and seismic phases observed during these events. Figure 15a shows records of the vertical component of ground velocity and atmospheric pressure obtained at SS1 for a typical explosion at the nearest vent. The low-frequency precursor of the explosion starts approximately 2 s into the record, and the

15,144 CHOUET ET AL.: SOURCE AND PATH EFFECTS AT STROMBOLI VOLCANO
4-29-92 00:20:56.20
T1 T2
T3
1200
•' 800
ca 400
SSI-•
o i i i
2 4 6 8 0 1
TIME (S) A t (S) Figure 15. (a) Seismic (vertical component) and acoustic records obtained at SSI for an explosion occurring in the nearest vent at a distance of 150 m. Individual phase arrivals are identified by the arrows labeled T•, T2, and T3. (b) Time lag between acoustic and P phases calculated for sources colocated at the vent assuming compressional wave speeds of 0.8-2.0 km s-• and an acoustic wave speed of 0.3 km s-•. Note that the delays expected for the position of SS1 are much shorter than the observed delay, suggesting a deeper source origin.
-- (x=80
lOO
_ • 2000 _
- ,//,/("• OBSERVED - / ' $ i DELAY
high-frequency signal associated with the eruptive jet is seen superimposed on the low-frequency signal starting at roughly 3 s. The acoustic signal shows an impulsive arrival at about 4 s, followed by high-frequency oscillations. We refer to these ar- rivals as T•, r2, and T 3. Figure 15b is a plot of the time delay At - T 3 - T 2 versus distance obtained under the assumption that the acoustic and seismic sources are colocated at the vent.
An acoustic wave speed of 0.3 km s -• is assumed for the atmosphere and compressional wavespeeds in the range 0.8-2 km s -• are assumed for the consolidated deposits near the vent. For the epicentral distance of 150 m the calculated delays are in the range 0.3-0.5 s, roughly 0.2-0.4 s less than the observed delay of 0.65 s. The timing of the high-frequency seismic and acoustic phases is thus clearly inconsistent with a source located at the vent. To satisfy the observed delay, the source must be located deeper in the conduit.
In developing a model for Strombolian explosions, one needs to consider this activity in the context of the overall degassing activity at this volcano. Degassing at Stromboll oc- curs in two modes. The first mode consists of a steady quies- cent gas emission, and the second is represented by episodic explosive gas emissions. The quiescent mode by far dominates over the episodic mode [Allard et al., 1994] and is presumed to be the source of sustained tremor. The episodic mode repre- sents crises in the otherwise quiescent degassing and its occur- rence requires that some of the ascending gas remain trapped at some location in the conduit plexus, from where it is sub- sequently released upon reaching a critical volume.
A conceptual model of such degassing process is shown in Figure 16. The sketch depicts a steady stream of bubbles rising in a feeder dike and through a short narrow pipe connecting the dike to the surface. Some of the gas escapes to the atmo- sphere in a steady quiescent manner, and some remains trapped beneath a roof at the top of the dike where is accu- mulates until the capacity of the trap is exceeded, at which
point the gas is released at the base of the terminal column of fluid in a large slug (Figures 16a and 16b). The slug expands and contracts as it rises toward the surface, displacing liquid magma in the process and triggering the oscillations of the liquid column (Figures 16b and 16c). As it reaches the free surface, the slug bursts, releasing a jet of gases laden with molten fragments from the ruptured diaphragm of liquid (Fig- ure 16d).
As described, this model is reminiscent of the experimental model investigated by Jaupart and Vergniolle [1988], in which degassing takes the form of gas bubbles which rise through the liquid and remain trapped below the flat roof of a cylindrical reservoir where they accumulate in a foam layer. This layer periodically collapses into gas slugs which erupt through a narrow pipe connecting the reservoir to the surface. Jaupart and Vergniolle [1988] note that the essential phenomenon in- volved in the foam collapse is the deformation of the bubbles by buoyancy forces as the bubbles tend to become more closely packed in the foam layer. They define the maximum packing condition as a condition in which the contact area between
bubbles becomes equal to the cross-sectional area of the bub- ble. There is a critical thickness above which bubble deforma-
tion becomes insufficient to balance buoyancy, at which point the foam layer collapses. The main distinction between our model and that of Jaupart and Vergniolle [1988] is in the ge- ometry of the reservoir underlying the narrow pipe which con- nects the latter to the surface. A dike rather than a cylinder is assumed for this reservoir in our model as required by our interpretation of the observed polarization properties of the tremor and explosion wave fields, but a pipe is assumed for the shallowest part of the conduit in accordance with visual obser- vations of the volcanic jets which suggest a cylindrical conduit geometry near the surface. In spite of such geometrical dis- tinction, however, we anticipate our model to display a range

CHOUET ET AL.: SOURCE AND PATH EFFECTS AT STROMBOLI VOLCANO 15,145
a b c
h2
hi
AV o
oO
'0 t = T O
d
Figure 16. Conceptual model of degassing at Stromboli depicting a steady stream of gas bubbles rising in a feeder dike and shallow pipe connecting the dike to the surface. (a) Cartoon sketching the conduit plexus with volume A V of gas trapped at the roof of the dike. The observation point is located at an epicentral distance r from the conduit orifice, hypocentral distance R • from the slug injection point, and hypocentral distance R2 from the liquid surface. The depths of the injection point and liquid surface are h • and h2, respectively. (b) Cartoon depicting the situation at the origin time T O of the injection process. (c) Detail of conduit segment showing the slug rising in the liquid column with velocity v•. As the slug rises and expands, liquid magma moves downward to fill the void left behind by the escaping gas. (d) Detail of conduit top showing the slug bursting at the liquid surface and resulting jet propagating with velocity v2 into the atmosphere via the liquid-free terminal segment of conduit.
of behaviors similar to those found in the model of Jaupart and Vergniolle [1988].
In the model we have outlined, seismic radiation is the result of the unsteady gas flux driving the pipe and dike conduit system into oscillation, which, formally speaking, is a local propagation effect. The composite conduit acts as a radiator of seismic waves, and in the moment tensor formulation this is regarded as a seismic source. Yet, in reality, the conduit is not the source, as the conduit is only the radiator of trapped waves which are driven by the true source process, the unsteady gas flux. In the following discussion of the source we adopt the standard seismological terminology and describe this source in terms of moment tensor and single force components with an understanding that in this terminology the term "source" im- plies the seismic wave source which is distinct from the source process itself.
The model in Figure 16 may be represented by a system of equivalent body forces consisting of a single force and a volu- metric moment tensor. As the slug rises in the terminal pipe, liquid magma moves downward to fill the void left behind by the escaping gas (Figure 16b). The sinking of dense magma associated with the ascent of less dense gas changes the density structure of the fluid column and releases gravitational energy (Figure 16c). This process results in the generation of a single force directed vertically downward called an inertial glut [Takei and Kumazawa, 1994]. The inertia of the moving liquid mass coupled with the compressibility of the gas in the slug triggers
oscillations of the liquid column and subjacent dike which contribute a volumetric component of oscillation represented by a volumetric tensor. The low-frequency oscillations ob- served at SS1 are inferred to be a manifestation of these single force and oscillatory tensor components.
The force system equivalent to the eruption can also be represented by a single force and volumetric tensor [Kanamori et al., 1984]. To see how this is the case, one needs to consider the situation represented in Figure 16c as the cylindrical slug approaches close to the liquid surface. The pressurized gas exerts an upward vertical force Fr on the diaphragm of liquid separating the slug from the atmosphere, a horizontal outward force F s on the side walls of the conduit, and a vertical down- ward force FB on the liquid below the slug. The eruption may be simulated by the sudden removal of the diaphragm, at which point the force Fr vanishes instantaneously and the gas pres- sure in the slug starts to decrease with a characteristic time constant z fixed by the mass flux of the eruption. Since the forces F s and FB are proportional to pressure, they decrease with the same time constant z. The force Fr can be decom- posed into two components, one of which, called Fr2 has the same time history as F s and F•, and the other, called Frl represents an impulsive vertical downward force which decays with the time constant z [see Kanamori et al., 1984, Figure A1]. As a result, the three forces Fr2, Fs, and F• form an implosive volumetric source, and Frl represents the reaction force of the jet (the jet recoil). The time constant z is typically of the order

15,146 CHOUET ET AL.: SOURCE AND PATH EFFECTS AT STROMBOLI VOLCANO
of 10 s for Strombolian eruptions, so that the deflation of the conduit plexus associated with the forces FT2 , Fs, and FB can only be observed with broadband sensors [Neuberg et al., 1994]. The impulsive jet recoil, however, produces short-period P, S V, and Rayleigh waves, which generate radially directed ground motion in the near field (horizontal radial pulse in Figure 14b) and far field (radial particle motion 13-18 s in the record in Figure 13a). Note that for an eruptive fluid consisting of gases laden with liquid clots, the fluid is expected to have a finite viscosity which contributes to drag on the conduit walls. This drag force may reduce the magnitude of the downward single force associated with the jet recoil.
The single vertical forces due to the inertial glut and jet recoil, and volumetric tensors associated with the oscillation of the fluid column and deflation of the conduit during the erup- tion, represent a continuum in the overall process that starts with the injection of the slug and ends with the termination of the eruption. The three characteristic times T•, T2, and T3 in Figure 15a may be estimated from the model with additional constraints provided by the particle trajectories observed at SS1. These times may be expressed by the following relations:
T1 = To+-- gl
hi-h2 R2 T2= T0+--+--, (4)
h•-h2 h2 r T 3 = T o + --+ --+ _
where T o is the origin time of the injection process, r is the epicentral distance from the observer to the conduit orifice, R 1 and R 2 are the hypocentral distances to the injection point and liquid surface, respectively, h• is the depth of the injection point, h 2 is the depth of the liquid surface, a is the acoustic wavespeed in the atmosphere, a is the compressional wave speed in the solid, v• is the ascent velocity of the slug, and v2 is the acoustic wave speed in the erupting jet.
We assume a = 300 m S -1 O/ = 800-2000 m s -1, and V 1 • 2-10 m s- • [Vergniolle and Brandeis, 1996]. The value of v2 is more difficult to assess, and we assume a range slightly above the typical velocities of the jets estimated by Chouet et al. [1974], that is, v2 = 100-400 m s -1. Using r = 150 m and taking into account the nearly horizontal orientation of particle motion seen at SS1, we find that the measured values of T l, T2, and T 3 are consistent with h I • 20-50 m, h 2 • 5-45 m, and h•-h2 • 5-15 m. These values should be considered as rough guesses at best. Both h i and h 2 are expected to vary in response to variations in the magma level from eruption to eruption. Similarly, the velocity Vl is a function of the size and shape of the slug, both of which are expected to vary for each eruption, so that the duration T 2 - T• of the precursor is expected to be variable from event to event. By the same token, v2 is expected to vary with conditions prevailing in the jets so that T3 - T2 will not remain fixed among different eruptions.
The mechanism generating tremor during steady quiescent degassing is more difficult to assess, and several possible can- didate models need to be considered. One possibility is that tremor originates in the oscillations of the bubble cloud formed by the steady stream of bubbles ascending in the liquid as demonstrated in experiments with air bubbles in water [Lu et al., 1990; Yoon et al., 1991]. Bubble sizes are typically in the
range of a few millimeters in this model, and each bubble acts like a tiny oscillator as it contracts and expands rythmically during its rise. The bubbly liquid mixture has a lower sound speed than the pure liquid so that a sharp impedance contrast is established across the boundary between the bubble cloud and surrounding liquid. This boundary acts like a reflector which traps the acoustic energy radiated by the collective os- cillations of the bubbles inside the cloud and forces the oscil-
lations of the cloud as a whole. The eigenmodes of the cloud occur at a much lower frequency than the natural frequency of the bubbles [Lu et al., 1990; Yoon et al., 1991] and may be observable in the short-period seismic band in natural systems. Using the mathematical model of Lu et al. [1990], Chouet [1996b] found that frequencies of 1-5 Hz are possible for the lowest mode of a cylindrical bubble cloud with a gas-volume fraction near 1%, sound speed of 300 m s-•, and bubble radii of 1-3 mm. Chouet's model assumes a bubble cloud with typ- ical length of 50-100 m and radius of about 1 m embedded in a cylindrical column of liquid basalt a few meters in radius. The length scale of this model is consistent with the depth extent of the source of tremor of <200 m estimated in Figure 12, sug- gesting such a model should be investigated further as a po- tential excitation mechanism of tremor. To be consistent with
the geometrical description of the conduit given in Figure 16, however, both cylindrical and sheet-like bubble clouds should be considered. The resonance frequencies of a sheet of bubbles rising in liquid basalt have not been calculated, but results obtained for thin sheets of air bubbles in water [Lu et al., 1990] show frequencies similar to those obtained for a cylindrical cloud with the same scale length.
In the above model, tremor is assumed to be self-excited by the oscillations of the bubbles, and the only input required is a sustained flux of gas at depth. A critical factor affecting the self-excitation process is the viscosity of the magma, which controls the ability of the bubbles to oscillate. According to Ichihara et al. [1997], oscillations of individual bubbles in magma are only possible below a critical viscosity and for a certain range of bubble sizes. The critical viscosity predicted by their model is somewhere between the viscosities of andesite
and dacite, which is higher than the viscosity (100 P) assumed by Chouet [1996b] for his bubble cloud in basalt. Typical bub- ble sizes at Stromboli probably range between 0.1 and 5.0 cm diameter [Sparks, 1978], although decimeter-size and meter- size bubbles are present as well (see below), suggesting a size population wide enough to satisfy the latter range constraint.
Another possibility is a model in which tremor originates in the oscillation and bursting of decimeter-size bubbles at the top of the liquid column [Ripepe et al., 1996]. The process involved at the source is similar to that discussed above for the
precursory phase of an eruption, except that the volume of the largest bubbles is at most of the order of 1 m 3 during steady degassing [Vergniolle and Brandeis, 1996]. In this model, reso- nance of the magma conduit is not critical to the generation of sustained tremor, and tremor may be viewed as the result of the repeated bursting of bubbles at the liquid surface. A vari- ant of this model is one in which tremor is generated by the pressure pulses induced by the sudden collapse of individual bubbles embedded within the fluid-filled conduit. The tremor
spectrum in those models reflects both the frequency of exci- tation and frequency content of single pressure pulses pro- duced by the bursting/collapse of individual bubbles [Ripepe et al., 1996]. Although the mechanism triggering the collapse of the bubbles in the second scenario is unknown, evidence for

CHOUET ET AL.: SOURCE AND PATH EFFECTS AT STROMBOLI VOLCANO 15,147
this type of excitation was obtained by Kedar et al. [1996] in an experiment conducted at Old Faithful Geyser, Yellowstone. This latter model may offer a potential explanation not only for the origin of shallow tremor but also for the deeper tremor under Stromboli evidenced in Figure 12.
It may be difficult to explain the spectra in Figures 4-6 solely through the expedient of a regular sequence of bubble bursts/ collapses. Indeed, the multiple narrow-band peaks observed in those spectra are suggestive of some form of resonance at the source and/or along the wave path. As in the precursory phase of an eruption (Figures 16b and 16c), inertial and/or acoustic oscillations of the fluid column may be present in the bubble burst model, which would contribute additional spectral peaks beside those associated with the regular sequence of bubble bursts. A similar type of oscillations may be produced in the bubble collapse model as demonstrated in Figure 14c where the small shaded rectangle at the center of the crack depicted in the sketch may be thought of as representing a patch of the crack surface over which the pressure disturbance due to a localized field of collapsing bubbles is applied.
Resonances in near-surface layers may contribute an impor- tant component to the tremor spectrum [Goldstein and Chouet, 1994; Chouet, 1996a] and may in some case dominate the spectrum [Kedar et al., 1996]. In the latter case, the character- istics of tremor are entirely due to path effects and no reso- nance occurs at the source. Such a situation may arise when acoustic absorption in the fluid effectively prevents the occur- rence of sustained acoustic oscillations [Chouet, 1996b]. This may occur in bubbly liquids with large gas-volume fractions when the acoustic path length is excessive. Under those con- ditions, even though the geometry of the conduit and imped- ance contrast between fluid and solid are adequate for poten- tial resonance, resonance does not occur because of the strong absorption characteristics of the fluid.
The models we have outlined all share a common feature in
that the source of energy for tremor originates in some form of bubble disturbance which radiates elastic energy via its cou- pling to the liquid and solid. A discrimination between those models is not possible with the present data set and would require analyses of the spectral properties of tremor obtained from a detailed sampling of the wave field at various azimuths and distances from the source in order to separate source and path effects in the tremor spectrum. Nevertheless, the near- field oscillations seen at SS1 (Figure 14), and similarities in spectral properties observed at that station and the more dis- tant arrays (Figure 6) both yield evidence suggesting that some type of oscillation (inertial and/or acoustic) of the fluid column is involved in the tremor generation process at Stromboli.
Conclusions
Using array measurements, we have demonstrated how a combination of source and path effects can explain the com- plexities observed in the wave fields of tremor and explosions at Stromboli Volcano, Italy. Measurements of ray parameters and azimuths indicate that the sources of tremor and explo- sions are both localized beneath the summit crater at depths shallower than 200 m with occasional bursts of energy origi- nating from sources extending to depths as great as 3 km. Vector slownesses and particle motion data reveal a complex composition of body and surface waves associated with topog- raphy, structure, and source properties. Body waves dominate
the wave field at frequencies of 0.5-2.5 Hz, while surface waves dominate at frequencies above 2.5 Hz.
An interesting perspective is offered in the comparison of results obtained by the frequency-slowness method with those derived from the statistical correlation method by Chouet et al. (submitted manuscript, 1996). The wave field composition at frequencies above 2 Hz inferred from the correlation method shows a dominance of surface waves, while relatively little of this surface wave contribution is seen in the slowness data at
the same frequencies. The key to this apparent discrepancy lies in the different approaches used by the two methods. The corre- lation method of Aki [1957] assumes the existence of multiple scatterers contributing to the generation of a stochastic wave field which is stationary in time and space, and the analysis is carried out over long time windows (up to 6 min). This method is therefore particularly well suited for determining the character- istics of the wave field over timescales of the order of minutes
but is completely unable to detect individual contributions from spatially distinct sources and from components of the wave field whose variations occur over a short timescale of the order
of a few seconds. In contrast, the frequency-slowness method is based on the assumption of a deterministic stationary wave field and is selectively sensitive to the strongest sources emit- ting coherent energy with well-defined directional properties. Its detection capabilities of the highly scattered components of the wave field are therefore low, even if those components are effectively carrying most of the observed seismic energy.
The dominant component of the near- and far-field particle motions from explosions, and the timing of air and body wave phases observed in the near field, are all consistent with a gas-piston mechanism operating on a shallow (<200 m deep) vertical crack-like conduit. Models of a degassing fluid column suggest that noise emission originating in the collective oscil- lations of bubbles ascending in the magma conduit may pro- vide an adequate self-excitation mechanism for sustained tremor generation at Stromboli. Resonances in near-surface layers could also be responsible for the strong spectral peaks found in the tremor and explosion spectra.
Additional observations with multiple small-aperture (--•300 m) arrays and/or network of stations distributed around the volcano are needed for further investigation of the spatial and temporal characteristics of Strombolian sources and for unrav- eling source and path effects in the tremor spectra. Continued efforts toward developing models of bubble generation and transport, bubble oscillations, and gas-piston mechanisms that are consistent with the observed characteristics of Strombolian
wave fields and with the observed periodicities in Strombolian activity are also needed. Use of such measurements and mod- els may improve the assessment of volcanic hazards by offering constraints on degassing mechanisms and on the geometry of the pathways used by gases ascending to the surface.
Appendix A: Array Performance The frequency-slowness signal processing method is based
on several assumptions, the most crucial of which concerns the spatial sampling of the signal. Strictly speaking, MUSIC as- sumes that the wave field is composed of a finite sum of plane waves propagating in a homogeneous half-space, implying that each plane wave component should cross the antenna (array) with a constant phase velocity and should be recorded with the same amplitude by each array component. This assumption requires the deployment of dense antennas with a narrow

15,148 CHOUET ET AL.: SOURCE AND PATH EFFECTS AT STROMBOLl VOLCANO
a b c
d e f
_
Figure A1. Slowness power spectra calculated for the vertical component of tremor with signals from different subarray configurations. The spectra are calculated over the bandwidth 1.2-2.3 Hz in a 2.56-s window starting at 2211:37.5 UT on May 6, 1992 (second trace from top in Figure 3). The subarray used is shown in outline at the top of each plot. The vertical scale is the same in all the spectra and indicates the power level obtained with each configuration. (a) Result for small semicircular array. (b) Result for the two semicircular arrays combined. (c) Result for the two semicircular arrays and part of the linear array combined. (d) Result for the large semicircular array and part of the linear array combined. (e) Result for the three arrays combined. (f) Result for the large semicircular array.
spacing between individual antenna elements. Furthermore, a large antenna aperture is necessary to insure a good resolution of the signal azimuths associated with individual wave compo- nents. With a limited number of receivers, however, there is a trade-off between the need for sampling coherent portions of the wave field and the need for adequate azimuthal resolution in the estimates of wave propagation directions. The optimal array configuration is that which achieves the best compromise between these two conflicting requirements.
We begin our analysis by considering signals for receivers from different subarray configurations selected from the three arrays. For this purpose, the time series from the linear array are resampled at 100 samples s- • before being merged with the time series from the two semicircular arrays, and the different geophone responses are deconvolved from individual array
components. Examples of slowness power spectra obtained for the vertical component of a tremor signal are shown in Figures Ala-Alf for six subarray configurations.
The plots illustrate how resolution and detection capabilities are affected by the array geometry. For example, Figure Ala clearly indicates that the 120-m aperture of the small semicir- cular array can not adequately resolve the direction of propa- gation of wave components at those frequencies. The inclusion of receivers from the small and large semicircular and/or part of the linear array (Figures Alb-Ald) improves the resolution of the spectral peak; however, the amplitude of the peak re- mains small. In those configurations the excessive array aper- ture and large gaps between array elements result in a lack of coherence between signals from sensors with the greatest sep- aration. This lack of coherence was confirmed in separate tests

CHOUET ET AL.: SOURCE AND PATH EFFECTS AT STROMBOLI VOLCANO 15,149
in which we observed an abrupt decrease in the narrowband correlation coefficients obtained for receiver separations larger than 350 m. The assumption of MUSIC concerning the flat amplitude response of the antenna is clearly violated by these three array patterns. Furthermore, increasing the array aper- ture via the inclusion of the entire linear array as in Figure Ale leads to a sampling of portions of the wave field which are so widely separated that the wavefronts can not be considered plane anymore.
The best resolution is achieved with the 47 vertical compo- nents of the 300-m-aperture semicircular array which yields a slowness power spectrum characterized by a strong peak with unambiguous ray parameter and azimuth (Figure Alf). A sim- ilar conclusion is reached based on analyses of slowness beam patterns produced by the subarray impulse responses [Capon, 1969], which show the presence of spatial aliasing lobes at frequencies greater than 3-4 Hz in all but the last configura- tion. The large semicircular array thus constitutes the optimal design configuration for sampling the vertical component of Strombolian wave fields. Analogous tests conducted with hor- izontal array configurations indicate that the large semicircular array also constitutes the best geometrical characteristics for sampling the horizontal components of the wavefields. How- ever, the larger spacing between horizontal sensors and the smaller number of sensors yield slowness vector estimates that are noisier on these arrays.
Another factor which must be taken into account is the
intrinsic limitation in measurement capabilities of an array. Goldstein and Archuleta [1991a] obtained an estimate of the precision of ray parameter measurements with an array as
rr • x/•ss Ax + 2 rr x/•L f N•R ' (A1) where/St is the uncertainty in delay times between the stations, Ns is the number of receivers, Ax is the average station spac- ing, R is the signal-to-noise ratio, L is the array aperture, M is the number of samples, and f is the frequency. For tremor recorded on the vertical components of the large semi-circular array,/St • 0.05 s, Ns = 47, Ax • 100 m, R • 10, L = 300 m, M = 256, and f • 2 Hz, yielding an uncertainty in ray param- eter (rr) of 0.07 s km -• and uncertainty in azimuth of about 7 ø for values of ray parameter greater than 0.3 s km-•. Errors are twice as large on the horizontal arrays owing to the smaller value of
Appendix B: Array-Averaged Polarization Estimates
Jurkevics [1988] demonstrated that in an array of receivers the variance of the least squares estimates of the spatial ori- entation of particle motion is inversely proportional to the number of receivers and the stability and robustness of the estimates increase with the number of sensors when those
estimates are calculated over a narrow frequency band. Ac- cordingly, we define an array-averaged, narrow-band covari- ance matrix C as
1 N c=Z
/=1
(B1)
where N is the number of receivers, and S i is the complex covariance matrix for an individual receiver, which may be explicitly written as
u(fo)u](fo) u(fo)*(fo) u(fo)w*(fo) s:= (fo)u (fo) (fo)w*(fo) , 032)
w(fo)u*(fo) w(fo)v*(fo) w(fo)w*(fo)
in which u(fo), v(fo), and w(fo) are the Fourier coefficients of the three components of ground motion averaged over a narrow band centered on a reference frequency fo, and the asterisk refers to the complex conjugate.
We begin by aligning the seismic traces for each component from each receiver to a reference station according to the time delays of a plane wave propagating across the array, where the plane wave is defined by its slowness vector derived from fre- quency-slowness analysis applied to the appropriate frequency band. As our polarization analyses are aimed primarily at body waves, we restrict the bandwidth considered to 0.4-2.3 Hz. Once the traces have been aligned, we compute spectra for the three components and average the resulting spectral lines over the band 0.4-2.3 Hz, from which we calculate the covariance matrix at the reference frequency fo = 1.6 Hz. We then average the covariance matrices over the 12 receivers of the large semicircular array and derive the three eigenvalues )•i and eigenvectors (xi, yi, zi). The eigenvector (x•, y•, z•) corresponding to the largest eigenvalue )• points in the direc- tion with the greatest polarization. This approach produces the same results as the polarization method of Jurkevics [1988], which uses bandpass filters and works on signals in the time domain. Of the two methods the spectral polarization method is slightly more economical as it relies on a single Fourier transform of the data and thus does not require an inverse transform of the spectrum back into the time domain.
Caution must be applied in handling the eigenvectors of the complex matrix C as their orientations are initially arbitrary [Vidale, 1986]. We follow Vidale [1986] and normalize and rotate the eigenvector with the largest eigenvalue in the com- plex plane to find the direction which maximizes the length of the real part of this eigenvector. Once the direction of the largest eigenvector is determined, the directions of the two remaining eigenvectors are obtained in a straightforward man- ner. We follow Jurkevics [1988] and define the orientation of the main eigenvector by its polar angle 0 measured from the vertical and azimuth q0 measured clockwise from north. Recti- linearity, or strength of polarization, is obtained from Jurkevics [ 1988] as
A 2 -'l- A 3
Ps = 1 2h. 1 ' (B3) This equation yields Ps -• 1 when there is primarily one com- ponent of polarization, and Ps •- 0 when the largest compo- nent of polarization has a value near one half of the other two combined.
Acknowledgments. We are grateful to Teodoro Esposito and Ugo Coppa of the Osservatorio Vesuviano, Naples; Graziano Boniolo, Adelmo Corsi, Roberto De Franco, and Antonio Morrone of the Istituto di Geofisica della Litosfera, Milan; Giovanni Bongiovanni and Paolo Marsan of Servizio Sismico Nazionale, Rome; Manlio Coviello of the Universith dell'Aquila; and Christopher Dietel, Jack Kleinman, John Power, and David Harlow of the U.S. Geological Survey for their participation in the field experiment. We also thank Paula Chouet for providing a constant helping hand in the field. We are indebted to Joan Gomberg, Yoshiaki Ida, Mie Ichihara, Raoul Madariaga, Chris Stephens, and David Hill for constructive reviews. This work was supported through funding from the Gruppo Nazionale di Vulcanologia, Italy.

15,150 CHOUET ET AL.: SOURCE AND PATH EFFECTS AT STROMBOLI VOLCANO
References
Aki, K., Space and time spectra of stationary stochastic waves, with special reference to microtremors, Bull. Earthquake Res. Inst. Univ. Tokyo, 25, 415-457, 1957.
Allard, P., J. Carbonnelle, N. M6trich, H. Loyer, and P. Zettwoog, Sulphur output and magma degassing budget of Stromboli volcano, Nature, 368, 326-330, 1994.
Borcherdt, R. D., J. Fletcher, E. Jensen, G. Maxwell, J. Van Schaack, R. Warrick, E. Cranswick, M. Johnston, and R. McClearn, A general earthquake observation system (GEOS), Bull. Seismol. Soc. Am., 75, 1783-1823, 1985.
Capon, J., High resolution frequency-wavenumber spectrum analysis, Proc. IEEE, 57, 1408-1418, 1969.
Chouet, B. A., Ground motion in the near field of a fluid-driven crack and its interpretation in the study of shallow volcanic tremor, J. Geophys. Res., 86, 5985-6016, 1981.
Chouet, B. A., Ground motion near an expanding preexisting crack, J. Volcanol. Geotherm. Res., 19, 367-379, 1983.
Chouet, B. A., Dynamics of a fluid-filled crack in three dimensions by the finite difference method, J. Geophys. Res., 91, 13,967-13,992, 1986.
Chouet, B. A., Resonance of a fluid-driven crack: Radiation properties and implications for the source of long-period events and harmonic tremor, J. Geophys. Res., 93, 4375-4400, 1988.
Chouet, B. A., Long-period volcano seismicity: Its source and use in eruption forecasting, Nature, 380, 309-316, 1996a.
Chouet, B. A., New methods and future trends in seismological vol- cano monitoring, in Monitoring and Mitigation of Volcano Hazards, edited by R. Scarpa and R. Tilling, pp. 23-97, Springer-Verlag, New York, 1996b.
Chouet, B. A., N. Hamisevicz, and T. R. McGetchin, Photoballistic of volcanic jet activity at Stromboli, Italy, J. Geophys. Res., 79, 4961- 4976, 1974.
Del Pezzo, E., I. Guerra, A. Lo Bascio, G. Luongo, G. Nappi, and R. Scarpa, Microtremors and volcanic explosions at Stromboli, part 2, Bull. Volcanol., 38, 1023-1036, 1974.
Del Pezzo, E., C. Godano, A. Gorini, and M. Martini, Wave polariza- tion and location of the source of the explosion quakes at Stromboli volcano, in/A VCEI Proceedings in Volcanology, vol. 3, Volcanic Seis- mology, edited by P. Gasparini, R. Scarpa, and K. Aki, pp. 279-296, Springer-Verlag, New York, 1992.
Dietel, C., B. Chouet, J. Kleinman, G. De Luca, M. Martini, G. Milana, J. Power, D. Harlow, and R. Scarpa, Array tracking of tremor sources at Stromboli Volcano, Italy, U.S. Geol. Surv. Open File Rep., 94-142, 86 pp., 1994.
Falsaperla, S., B. Martinelli, and R. Schick, Seismic activity at Strom- boli (southern Italy) for the period 1983-1986, in IAVCEI Proceed- ings in Volcanology, vol. 3, Volcanic Seismology, edited by P. Gaspa- rini, R. Scarpa, and K. Aki, pp. 267-278, Springer-Verlag, New York, 1992.
Goldstein, P., Array measurements of earthquake rupture, Ph.D. the- sis, 193 pp., Univ. of Calif., Santa Barbara, 1988.
Goldstein, P., and R. J. Archuleta, Array analysis of seismic signals, Geophys. Res. Lett., 14, 13-16, 1987.
Goldstein, P., and R. J. Archuleta, Deterministic frequency- wavenumber techniques and direct measurements of rupture prop- agation during earthquakes using a dense array: Theory and meth- ods, J. Geophys. Res., 96, 6173-6185, 1991a.
Goldstein, P., and R. J. Archuleta, Deterministic frequency- wavenumber techniques and direct measurements of rupture prop- agation during earthquakes using a dense array: Data analysis, J. Geophys. Res., 96, 6187-6198, 1991b.
Goldstein, P., and B. Chouet, Array measurements and modeling of sources of shallow volcanic tremor at Kilauea Volcano, Hawaii, J. Geophys. Res., 99, 2637-2652, 1994.
Hornig-Kjarsgaard, I., J. Keller, U. Koberski, E. Stadlbauer, L. Fran- calanci, and R. Lenhart, Geology, stratigraphy and volcanological evolution of the island of Stromboli, Aeolian arc, Italy, Acta Vulca- nol., 3, 21-68, 1993.
Ichihara, M., Y. Ida, and Y. Matsumoto, Sound wave in bubbly magma, paper presented at IAVCEI General Assembly, Int. Assoc. of Volca- nol. and Chem. of the Earth's Inter., Puerto Vallarta, Mexico, 1997.
Jaupart, C., and S. Vergniolle, Laboratory models of Hawaiian and Strombolian eruptions, Nature, 331, 58-60, 1988.
Jurkevics, A., Polarization analysis of three-component array data, Bull. Seismol. Soc. Am., 78, 1725-1743, 1988.
Kanamori, H., J. W. Given, and T. Lay, Analysis of seismic body waves
excited by the Mount St. Helens eruption of May 18, 1980, J. Geo- phys. Res., 89, 1856-1866, 1984.
Kanasewich, E. R., Time Sequence Analysis in Geophysics, 532 pp., Univ. of Alberta Press, Edmonton, 1981.
Kedar, S., B. Sturtevant, and H. Kanamori, The origin of harmonic tremor at Old Faithful Geyser, Nature, 379, 708-711, 1996.
Lo Bascio, A., G. Luongo, and G. Nappi, Microtremors and explosions at Stromboli (Aeolian Islands), Bull. Volcanol., 37, 516-606, 1973.
Lu, N. Q., A. Prosperetti, and S. W. Yoon, Underwater noise emissions from bubble clouds, IEEE J. Oceanic Eng., 15, 275-281, 1990.
Montalbetti, J. R., and E. R. Kanasewich, Enhancement of teleseismic body phases with a polarization filter, Geophys. J. R. Astron. Soc., 21, 119-129, 1970.
Napoleone, G., M. Ripepe, G. Saccorotti, L. Totti, and A. Albianelli, The Strombolian activity presently recorded at Stromboli, Acta Vul- canologica, 3, 163-171, 1993.
Neuberg, J., R. Luckett, M. Ripepe, and T. Braun, Highlights from a seismic broadband array on Stromboli Volcano, Geophys. Res. Lett., 21, 749-752, 1994.
Ntepe, N., and J. Dorel, Observations of seismic volcanic signals at Strom- boli volcano (Italy), J. Volcanol. Geotherm. Res., 43, 235-241, 1990.
Nuttli, O., The effect of the Earth's surface on the S wave particle motion, Bull. Seismol. Soc. Am., 51,237-246, 1961.
Ohminato, T., and B. A. Chouet, A free-surface boundary condition for including 3D topography in the finite difference method, Bull. Seismol. Soc. Am., 87, 494-515, 1997.
Pasquar6, G., L. Francalanci, V. H. Garduno, and A. Tibaldi, Struc- tural and geological evolution of the Stromboli Volcano, Aeolian Islands, Italy, Acta Vulcanol., 3, 79-89, 1993.
Petterschmitt, E., and H. Tazieff, Sur un nouveau type de secousse volcanique enregistr6 au Stromboli, C. R. Acad. Sci., 255, 1971-1973, 1962.
Ripepe, M., and T. Braun, Interactions of seismic and air waves re- corded at Stromboli volcano, Geophys. Res. Lett., 20, 65-68, 1993.
Ripepe, M., M. Rossi, and G. Saccorotti, Image processing of the explosive activity at Stromboli, J. Volcanol. Geotherm. Res., 54, 335- 351, 1993.
Ripepe, M., P. Poggi, T. Braun, and E. Gordeev, Infrasonic waves and volcanic tremor at Stromboli, Geophys. Res. Lett., 23, 181-184, 1996.
Romagnoli, C., P. Kokelaar, P. L. Rossi, and A. Sodi, The submarine extension of the Sciara del Fuoco feature (Stromboli Island): Mor- phologic characterization, Acta Vulcanol., 3, 91-98, 1993.
Schmidt, R. O., Multiple emitter location and signal parameter esti- mation, IEEE Trans. Antennas Propagat., 34, 276-280, 1986.
Sparks, R. S. J., The dynamics of bubble formation and growth in mag- mas: A review and analysis, J. Volcanol. Geotherm. Res., 3, 1-37, 1978.
Spudich, P., and D. Oppenheimer, Dense seismograph array observa- tions of earthquake rupture dynamics, in Earthquake Source Me- chanics, Geophys. Monogr. Set., vol. 37, edited by S. Das, J. Boat- wright, and C. D. Scholz, pp. 285-296, AGU, Washington, D.C., 1986.
Takei, Y., and M. Kumazawa, Why have the single force and torque been excluded from seismic source models? Geophys. J. Int., 118, 20-30, 1994.
Vergniolle, S., and G. Brandeis, Strombolian explosions, 1, A large bubble breaking at the surface of a lava column as a source of sound, J. Geophys. Res., 101, 20,433-20,447, 1996.
Vidale, J. E., Complex polarization analysis of particle motion, Bull. Seismol. Soc. Am., 76, 1393-1405, 1986.
Yoon, S. W., L. A. Crum, A. Prosperetti, and N. Q. Lu, An investiga- tion of the collective oscillations of a bubble cloud, J. Acoust. Soc. Am., 89, 700-706, 1991.
B. Chouet and P. Dawson, U.S. Geological Survey, 345 Middlefield Road, MS 977, Menlo Park, CA 94025. (e-mail: chouet@chouet. wr.usgs.gov; dawsøn@andreas'wr'usgs'gøv)
G. De Luca and R. Scarpa, Dipartimento di Fisica, Universith degli studi dell'Aquila, 67010 Coppito, L'Aquila, Italy. (e-mail: deluca@ aquila.infn.it; [email protected])
M. Martini and G. Saccorotti, Osservatorio Vesuviano, Via Manzoni 249, 80123 Naples, Italy. (e-mail: [email protected]; gilberto@ osve.unina.it)
G. Milana, Servizio Sismico Nazionale, Via Curtatone, 3, 00185, Rome, Italy. (milana@mail'dstn'pcm'it)
(Received September 5, 1996; revised March 12, 1997; accepted March 28, 1997.)
Copyright © 2022 FDOKUMEN