Natural 37Ar Concentrations in Soil Air: Implications for Monitoring Underground Nuclear Explosions
9
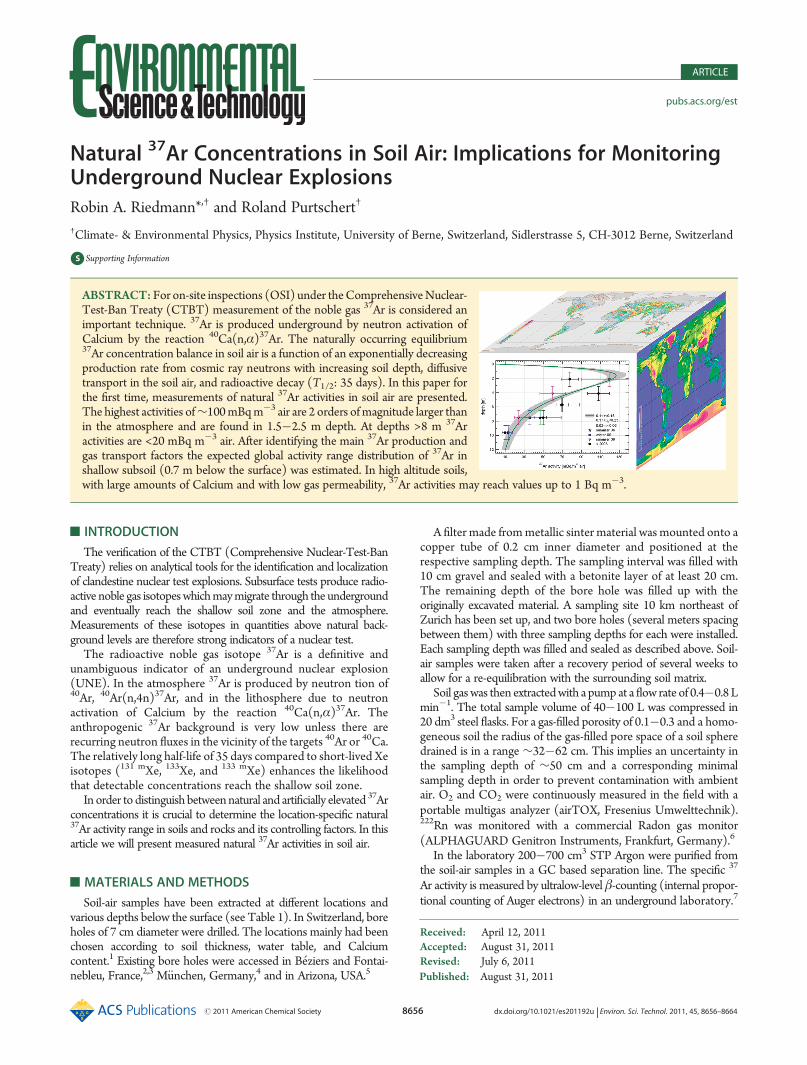
Published: August 31, 2011 r2011 American Chemical Society 8656 dx.doi.org/10.1021/es201192u | Environ. Sci. Technol. 2011, 45, 8656–8664 ARTICLE pubs.acs.org/est Natural 37 Ar Concentrations in Soil Air: Implications for Monitoring Underground Nuclear Explosions Robin A. Riedmann* ,† and Roland Purtschert † † Climate- & Environmental Physics, Physics Institute, University of Berne, Switzerland, Sidlerstrasse 5, CH-3012 Berne, Switzerland b S Supporting Information ’ INTRODUCTION The veri fication of the CTBT (Comprehensive Nuclear-Test-Ban Treaty) relies on analytical tools for the identi fication and localization of clandestine nuclear test explosions. Subsurface tests produce radio- active noble gas isotopes which may migrate through the underground and eventually reach the shallow soil zone and the atmosphere. Measurements of these isotopes in quantities above natural back- ground levels are therefore strong indicators of a nuclear test. The radioactive noble gas isotope 37 Ar is a definitive and unambiguous indicator of an underground nuclear explosion (UNE). In the atmosphere 37 Ar is produced by neutron tion of 40 Ar, 40 Ar(n,4n) 37 Ar, and in the lithosphere due to neutron activation of Calcium by the reaction 40 Ca(n,α) 37 Ar. The anthropogenic 37 Ar background is very low unless there are recurring neutron fluxes in the vicinity of the targets 40 Ar or 40 Ca. The relatively long half-life of 35 days compared to short-lived Xe isotopes ( 131 m Xe, 133 Xe, and 133 m Xe) enhances the likelihood that detectable concentrations reach the shallow soil zone. In order to distinguish between natural and arti ficially elevated 37 Ar concentrations it is crucial to determine the location-speci fic natural 37 Ar activity range in soils and rocks and its controlling factors. In this article we will present measured natural 37 Ar activities in soil air. ’ MATERIALS AND METHODS Soil-air samples have been extracted at different locations and various depths below the surface (see Table 1). In Switzerland, bore holes of 7 cm diameter were drilled. The locations mainly had been chosen according to soil thickness, water table, and Calcium content. 1 Existing bore holes were accessed in B eziers and Fontai- nebleu, France, 2,3 M€ unchen, Germany, 4 and in Arizona, USA. 5 A filter made from metallic sinter material was mounted onto a copper tube of 0.2 cm inner diameter and positioned at the respective sampling depth. The sampling interval was filled with 10 cm gravel and sealed with a betonite layer of at least 20 cm. The remaining depth of the bore hole was filled up with the originally excavated material. A sampling site 10 km northeast of Zurich has been set up, and two bore holes (several meters spacing between them) with three sampling depths for each were installed. Each sampling depth was filled and sealed as described above. Soil- air samples were taken after a recovery period of several weeks to allow for a re-equilibration with the surrounding soil matrix. Soil gas was then extracted with a pump at a flow rate of 0.40.8 L min 1 . The total sample volume of 40100 L was compressed in 20 dm 3 steel flasks. For a gas-filled porosity of 0.10.3 and a homo- geneous soil the radius of the gas-filled pore space of a soil sphere drained is in a range ∼3262 cm. This implies an uncertainty in the sampling depth of ∼50 cm and a corresponding minimal sampling depth in order to prevent contamination with ambient air. O 2 and CO 2 were continuously measured in the field with a portable multigas analyzer (airTOX, Fresenius Umwelttechnik). 222 Rn was monitored with a commercial Radon gas monitor (ALPHAGUARD Genitron Instruments, Frankfurt, Germany). 6 In the laboratory 200700 cm 3 STP Argon were purified from the soil-air samples in a GC based separation line. The specific 37 Ar activity is measured by ultralow-level β-counting (internal propor- tional counting of Auger electrons) in an underground laboratory. 7 Received: April 12, 2011 Accepted: August 31, 2011 Revised: July 6, 2011 ABSTRACT: For on-site inspections (OSI) under the Comprehensive Nuclear- Test-Ban Treaty (CTBT) measurement of the noble gas 37 Ar is considered an important technique. 37 Ar is produced underground by neutron activation of Calcium by the reaction 40 Ca(n,α) 37 Ar. The naturally occurring equilibrium 37 Ar concentration balance in soil air is a function of an exponentially decreasing production rate from cosmic ray neutrons with increasing soil depth, diffusive transport in the soil air, and radioactive decay (T 1/2 : 35 days). In this paper for the first time, measurements of natural 37 Ar activities in soil air are presented. The highest activities of ∼100 mBq m 3 air are 2 orders of magnitude larger than in the atmosphere and are found in 1.52.5 m depth. At depths >8 m 37 Ar activities are <20 mBq m 3 air. After identifying the main 37 Ar production and gas transport factors the expected global activity range distribution of 37 Ar in shallow subsoil (0.7 m below the surface) was estimated. In high altitude soils, with large amounts of Calcium and with low gas permeability, 37 Ar activities may reach values up to 1 Bq m 3 .
Transcript of Natural 37Ar Concentrations in Soil Air: Implications for Monitoring Underground Nuclear Explosions
Published: August 31, 2011
r 2011 American Chemical Society 8656 dx.doi.org/10.1021/es201192u | Environ. Sci. Technol. 2011, 45, 8656–8664
ARTICLE
pubs.acs.org/est
Natural 37Ar Concentrations in Soil Air: Implications for MonitoringUnderground Nuclear ExplosionsRobin A. Riedmann*,† and Roland Purtschert†
†Climate- & Environmental Physics, Physics Institute, University of Berne, Switzerland, Sidlerstrasse 5, CH-3012 Berne, Switzerland
bS Supporting Information
’ INTRODUCTION
The verification of the CTBT (Comprehensive Nuclear-Test-BanTreaty) relies on analytical tools for the identification and localizationof clandestine nuclear test explosions. Subsurface tests produce radio-active noble gas isotopeswhichmaymigrate through the undergroundand eventually reach the shallow soil zone and the atmosphere.Measurements of these isotopes in quantities above natural back-ground levels are therefore strong indicators of a nuclear test.
The radioactive noble gas isotope 37Ar is a definitive andunambiguous indicator of an underground nuclear explosion(UNE). In the atmosphere 37Ar is produced by neutron tion of40Ar, 40Ar(n,4n)37Ar, and in the lithosphere due to neutronactivation of Calcium by the reaction 40Ca(n,α)37Ar. Theanthropogenic 37Ar background is very low unless there arerecurring neutron fluxes in the vicinity of the targets 40Ar or 40Ca.The relatively long half-life of 35 days compared to short-lived Xeisotopes (131 mXe, 133Xe, and 133 mXe) enhances the likelihoodthat detectable concentrations reach the shallow soil zone.
In order to distinguish betweennatural and artificially elevated 37Arconcentrations it is crucial to determine the location-specific natural37Ar activity range in soils and rocks and its controlling factors. In thisarticle we will present measured natural 37Ar activities in soil air.
’MATERIALS AND METHODS
Soil-air samples have been extracted at different locations andvarious depths below the surface (see Table 1). In Switzerland, boreholes of 7 cm diameter were drilled. The locations mainly had beenchosen according to soil thickness, water table, and Calciumcontent.1 Existing bore holes were accessed in B�eziers and Fontai-nebleu, France,2,3 M€unchen, Germany,4 and in Arizona, USA.5
A filter made frommetallic sinter material was mounted onto acopper tube of 0.2 cm inner diameter and positioned at therespective sampling depth. The sampling interval was filled with10 cm gravel and sealed with a betonite layer of at least 20 cm.The remaining depth of the bore hole was filled up with theoriginally excavated material. A sampling site 10 km northeast ofZurich has been set up, and two bore holes (several meters spacingbetween them) with three sampling depths for each were installed.Each sampling depth was filled and sealed as described above. Soil-air samples were taken after a recovery period of several weeks toallow for a re-equilibration with the surrounding soil matrix.
Soil gaswas then extractedwith a pump at a flow rate of 0.4�0.8Lmin�1. The total sample volume of 40�100 L was compressed in20 dm3 steel flasks. For a gas-filled porosity of 0.1�0.3 and a homo-geneous soil the radius of the gas-filled pore space of a soil spheredrained is in a range ∼32�62 cm. This implies an uncertainty inthe sampling depth of ∼50 cm and a corresponding minimalsampling depth in order to prevent contamination with ambientair. O2 and CO2 were continuously measured in the field with aportable multigas analyzer (airTOX, Fresenius Umwelttechnik).222Rn was monitored with a commercial Radon gas monitor(ALPHAGUARD Genitron Instruments, Frankfurt, Germany).6
In the laboratory 200�700 cm3 STP Argon were purified fromthe soil-air samples in a GC based separation line. The specific 37
Ar activity is measured by ultralow-level β-counting (internal propor-tional counting of Auger electrons) in an underground laboratory.7
Received: April 12, 2011Accepted: August 31, 2011Revised: July 6, 2011
ABSTRACT: For on-site inspections (OSI) under theComprehensiveNuclear-Test-Ban Treaty (CTBT) measurement of the noble gas 37Ar is considered animportant technique. 37Ar is produced underground by neutron activation ofCalcium by the reaction 40Ca(n,α)37Ar. The naturally occurring equilibrium37Ar concentration balance in soil air is a function of an exponentially decreasingproduction rate from cosmic ray neutrons with increasing soil depth, diffusivetransport in the soil air, and radioactive decay (T1/2: 35 days). In this paper forthe first time, measurements of natural 37Ar activities in soil air are presented.The highest activities of∼100mBqm�3 air are 2 orders ofmagnitude larger thanin the atmosphere and are found in 1.5�2.5 m depth. At depths >8 m 37Aractivities are <20 mBq m�3 air. After identifying the main 37Ar production andgas transport factors the expected global activity range distribution of 37Ar inshallow subsoil (0.7 m below the surface) was estimated. In high altitude soils,with large amounts of Calcium and with low gas permeability, 37Ar activities may reach values up to 1 Bq m�3.
8657 dx.doi.org/10.1021/es201192u |Environ. Sci. Technol. 2011, 45, 8656–8664
Environmental Science & Technology ARTICLE
In oder to determine the Calcium content, soil samples from therespective filter depth were dried for several hours at 105 �C andground to fine powder. The soil was then digested in aqua regia at90 �C.8 The elemental composition was analyzed by ICP/MS at“Activation Laboratories” in Ontario, Canada.8
37Ar (T1/2 = 35.04 d)9 decays by electron capture (EC) with a
decay energy of 2.8 keV.10 The energy spectrum is recorded witha 7-bit Multi-Channel Analyzer (MCA) with a linear energyrange of 0�35 keV. The specific 37Ar activity [mBq m�3 air] iscalculated from the net peak count rate P [cpm] according to
½37Ar� ¼ PVAr
31Y 3 f1 3 f2 3 c
f1 ¼ λ37A r 3 tm1� expð�λ37Ar 3 tmÞ
f2 ¼ expðλ37Ar 3 tlagÞ
ð1Þ
where VAr is the Argon volume, Y is the counting efficiency(∼0.70), and f1 and f2 are decay corrections for the time lag
between sampling date and start of the measurement (tlag) andduring the measurement (tm), respectively. The constant c convertsto mBq m�3 air [c = 107/60 (mBq m�3 air)/(cpm cm�3
Ar)]. It isassumed thatCO2 is stochiometrically produced byO2 consumptionas a result of aerob respiration and therefore CO2 +O2 = 20.8% at alltimes and for all sampling depths . This entails an argon concentra-tion of 1% in the soil gas.
The very low specific activity of 37Ar (natural 37Ar/Ar∼10�20)requires a minimal background count rate (BG [cpm]). In theunderground laboratory of the University of Berne the BG is in theorder of 3� 10�3 cpm for the 16 cm3 counter and 2� 10�2 cpmfor the 100 cm3 counter for typical filling pressures of 10�22 barand 4�22 bar, respectively. 39Ar is the main background sourceapart from the intrinsic activity of the counters. The modern 39Aractivity11 of 0.11 dpm/LAr contributes to 30�40% of the BGdepending on the Argon volume. The statistical 2σ error of P incpm is given by12,13
2σP ¼ 2ffiffit
p 3ffiffiffiffiffiffiffiffiffiffiffiffiffiffiffiffiffiffiffiP þ 2BG
p ð2Þ
Table 1. Sampling Locations, Measured Natural 37Ar Activities in Soils, and Calculated Minimum Detectable Activities
name coordinates
altitude
(m asl)
calcium content
(%)
depth
(m)
CO2
(%)
Rn
(kBq m�3)
37Ar
(mBq m�3)
MDA
(mBq m�3)
Baltenswil 47.43�N 8.64�E 570 65 2.1 - - 77.9 ( 9.0 5.5
4.2 ( 0.7 - 119.3 ( 29.0 24.2
4.1 - - 108.0 ( 11.5 8.4
4.7 ( 0.5 - 59.9 ( 13.6 12.2
5.7 - - 68.9 ( 19.1 19.7
7.5 2.1 ( 0.2 - 46.7 ( 22.2 29.0
- - 35.9 ( 5.1 3.9
4.5 ( 0.3 - 24.2 ( 4.3 4.0
9.6 - - 9.9 ( 3.0 3.7
- - 13.2 4.4
Belp 1 46.52�N 7.31�E 830 13.4 1.2 1.2 ( 0.3 - 19.1 ( 3.8 3.3
2.0 ( 0.1 66.2 ( 7.5 27.9 ( 3.4 2.6
5.8 ( 0.2 61.4 ( 13.9 24.6 ( 3.9 2.9
Belp 2 46.52�N 7.31�E 830 12.4 2.4 1.2 ( 0.5 - 38.0 ( 4.2 2.6
2.0 ( 0.2 20.6 ( 1.0 28.6 ( 4.3 3.5
Burgdorf 47.03�N 7.38�E 540 7.4 1.7 3.6 ( 0.4 - 105.4 ( 12.9 7.9
4.4 ( 0.2 25.7 ( 1.9 64.9 ( 6.9 4.9
M€ohlin 47.34�N 7.53�E 340 1.4 4.0 5.8 ( 1.0 - 35.7 ( 5.1 4.1
5.5 ( 0.8 - 18.3 ( 4.7 4.3
4.9 ( 0.1 87.0 ( 14.1 28.6 ( 7.9 6.6
Tiefenau 46.58�N 7.28�E 540 1.1 1.4 0.4 ( 0.2 - <5.0 5.0
0.8 ( 0.2 27.9 ( 3.0 <3.1 3.1
Weissenstein 47.16�N 7.29�E 980 26.7 0.6 0.6 ( 0.4 10.9 ( 3.2 7.9 ( 2.6 2.8
B�eziers 43.23�N 3.12�E 80 1.0 2.3 - - <11.4 11.4
4.8 2.2 ( 0.1 - 3.1 ( 1.9 2.9
15.8 1.7 ( 0.1 - <6.2 6.2
Fontainebleu 48.24�N 2.42�E 110 1.0 2.5 <0.2 - <1 1.0
10.7 3.1 - <1.4 1.4
M€unchen 48.08�N 11.35�E 580 90.0 2.0 - - 16.0 ( 4.0 -
3.5 - - 22.0 ( 4.5 -
9.0 - - 3.0 ( 1.0 -
Arizona 33.17�N 111.04�W 1300 - 4.0 1.1 - 36.7 ( 11.7 -
130.0 1.1 - <0.6 0.6
8658 dx.doi.org/10.1021/es201192u |Environ. Sci. Technol. 2011, 45, 8656–8664
Environmental Science & Technology ARTICLE
where t is the counting time.Detection of a peak is claimedwith 95%confidence level when13
P > PDL ¼ 1:6449 3 2 3 σP¼ 0 ¼ 3:29 3ffiffiffi2
p3
ffiffiffiffiffiffiffiBGt
rð3Þ
where PDL is the count rate of the detection limit in cpm. TheMinimum Detection Activity (MDA) in mBq m�3 air is finallycalculated by substituting eq 3 in eq 113
MDA ¼ 4:65 3 c 3f1 3 f2VAr 3 Y
3
ffiffiffiffiffiffiffiBGt
rð4Þ
The resultingMDAs (Table 1) are in the range 0.6�29.0 mBqm�3 air. For example, the MDA for a sample measured in the16 cm3 counter with 230 cm3 STP of Argon, a BG of 1.7� 10�3
cpm, a counting time of 28,400 min (f2 = 1.21), and a lag time of4 days (f1 = 1.08) amounts to 1.7 mBq m�3 air.
The total 2σ uncertainty of the activity measurement [37Ar]including the 5% uncertainty of the counting yield is calculatedby error propagation of eq 1.
’RESULTS AND DISCUSSION
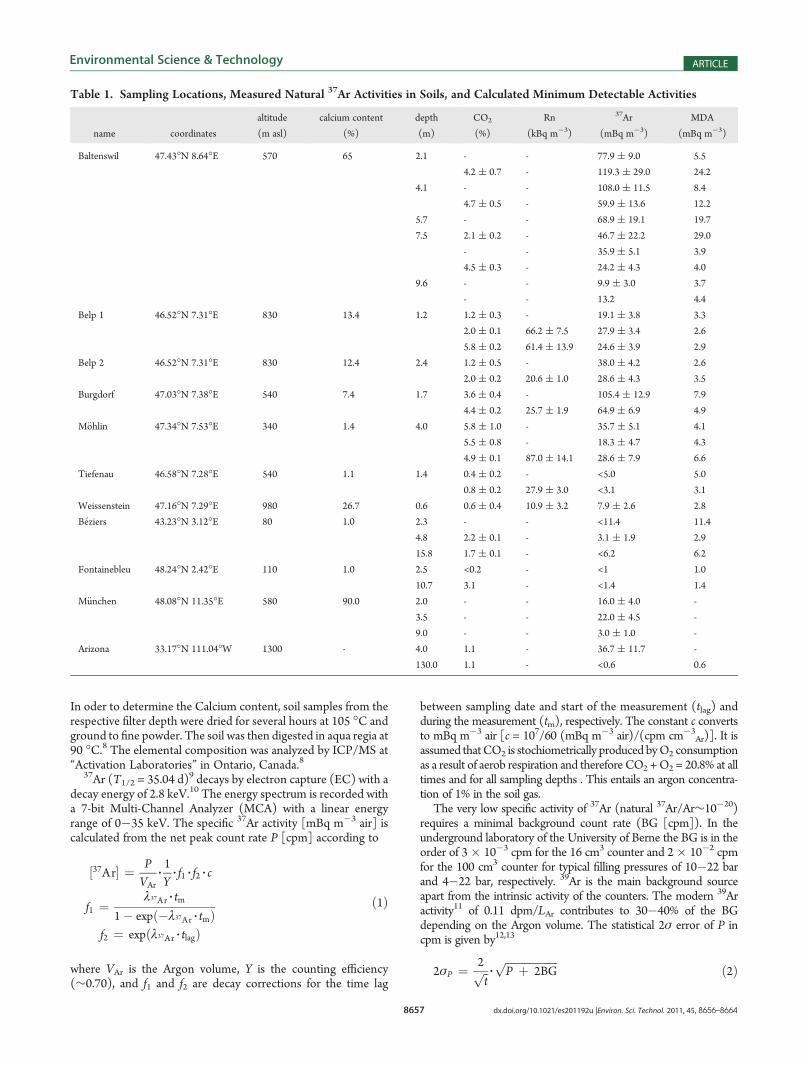
Measurements. Measured natural 37Ar activities in soil airrange over 2 orders of magnitude between <3.1 to 120 mBq m�3
air (Figure 1). The lowest values agree, within the uncertainties, withthe atmospheric 37Ar background activity of 1.2( 0.5 mBqm�3
air measured in the period 2003�2010 and with previouslypublished data (0.33�0.42 mBq m�3 air,14 0.6�3.8 mBq m�3
air15). Highest 37Ar activities are typically observed in the depthrange 1.5�2.5 m. Repeated measurements at the same locationand depth vary within a factor <2 and mainly in shallow depths(Figure 1). This probably reflects seasonal variations of the soilpermeability. With increasing soil�water content due to pre-cipitation the gas transport and porosity decrease which gen-erally leads to higher 37Ar activities.
’DISCUSSION
Production. The 37Ar production rate Rtg [atoms m�3 s�1]
can be calculated according to
Rtg ¼ Ntg
Z Emax
0σðEÞΦðEÞdE ð5Þ
whereNtg is the concentration of the target nuclides [atomsm�3],
σ(E) is the energy-dependent reaction cross-section [barn =10�24 cm2], and Φ(E) is the differential neutron flux in eV[neutrons eV�1 cm�2 s�1]. At production and decay equilibriumRtg equals the activity concentration [
37Ar].The main 37Ar production channel in the atmosphere is the
40Ar(n,4n)37Ar spallation reaction. With eq 5 calculated tropo-spheric 37Ar activities assuming a well-mixed air column rangebetween 0.4 and 1.2 mBq m�3 air.16,17
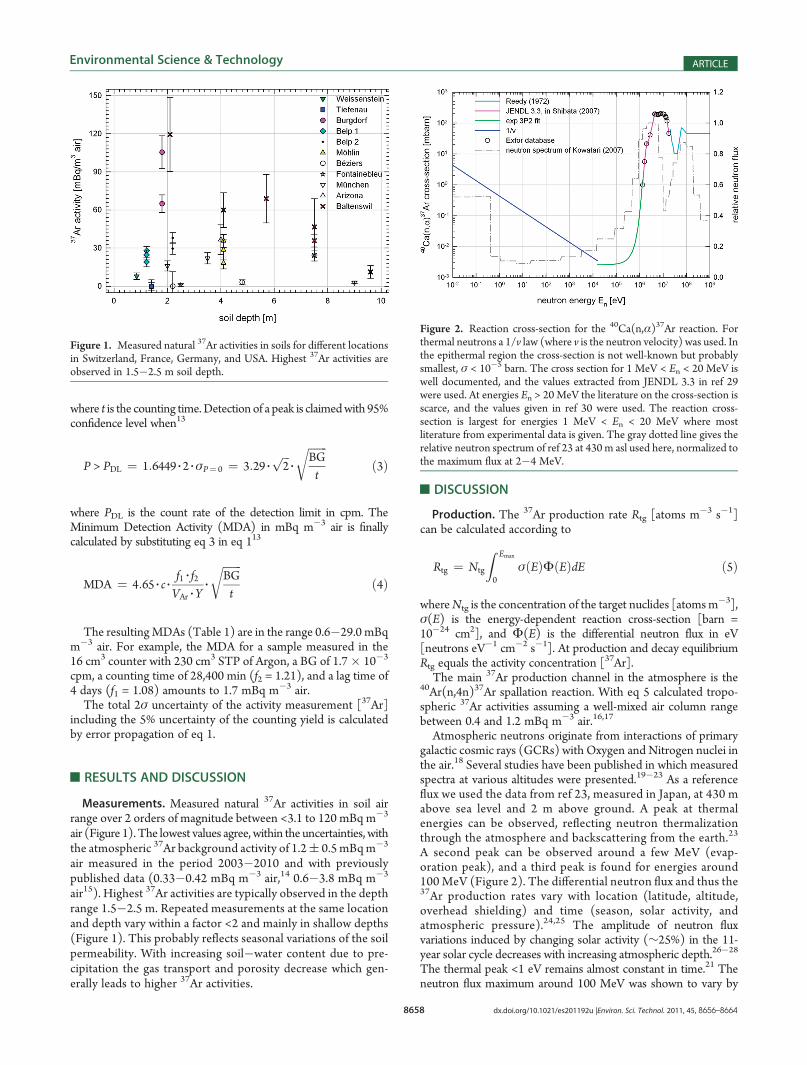
Atmospheric neutrons originate from interactions of primarygalactic cosmic rays (GCRs) with Oxygen and Nitrogen nuclei inthe air.18 Several studies have been published in which measuredspectra at various altitudes were presented.19�23 As a referenceflux we used the data from ref 23, measured in Japan, at 430 mabove sea level and 2 m above ground. A peak at thermalenergies can be observed, reflecting neutron thermalizationthrough the atmosphere and backscattering from the earth.23
A second peak can be observed around a few MeV (evap-oration peak), and a third peak is found for energies around100 MeV (Figure 2). The differential neutron flux and thus the37Ar production rates vary with location (latitude, altitude,overhead shielding) and time (season, solar activity, andatmospheric pressure).24,25 The amplitude of neutron fluxvariations induced by changing solar activity (∼25%) in the 11-year solar cycle decreases with increasing atmospheric depth.26�28
The thermal peak <1 eV remains almost constant in time.21 Theneutron flux maximum around 100 MeV was shown to vary by
Figure 1. Measured natural 37Ar activities in soils for different locationsin Switzerland, France, Germany, and USA. Highest 37Ar activities areobserved in 1.5�2.5 m soil depth.
Figure 2. Reaction cross-section for the 40Ca(n,α)37Ar reaction. Forthermal neutrons a 1/v law (where v is the neutron velocity) was used. Inthe epithermal region the cross-section is not well-known but probablysmallest, σ < 10�5 barn. The cross section for 1 MeV < En < 20 MeV iswell documented, and the values extracted from JENDL 3.3 in ref 29were used. At energies En > 20MeV the literature on the cross-section isscarce, and the values given in ref 30 were used. The reaction cross-section is largest for energies 1 MeV < En < 20 MeV where mostliterature from experimental data is given. The gray dotted line gives therelative neutron spectrum of ref 23 at 430 m asl used here, normalized tothe maximum flux at 2�4 MeV.
8659 dx.doi.org/10.1021/es201192u |Environ. Sci. Technol. 2011, 45, 8656–8664
Environmental Science & Technology ARTICLE
about 30% from day to day.21 These temporal variations in cosmicray intensity are not the focus of this paper and are thereforeneglected in the following.Differences in cosmic-ray intensity at an arbitrary sampling site
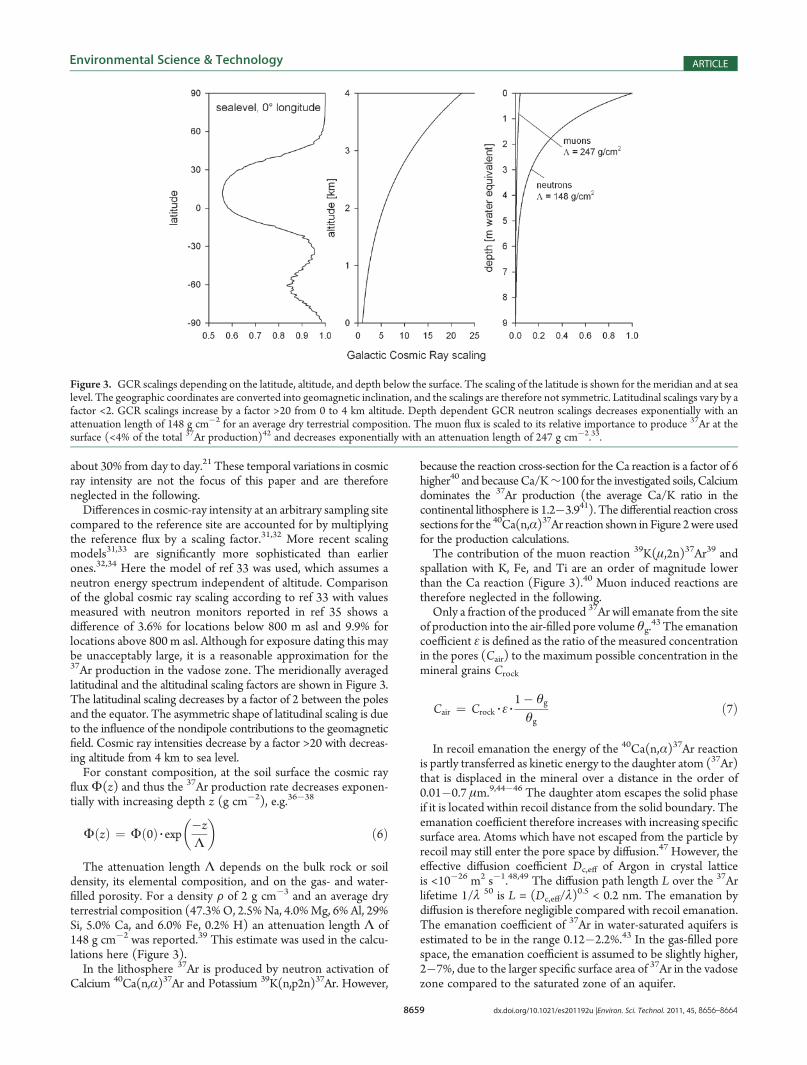
compared to the reference site are accounted for by multiplyingthe reference flux by a scaling factor.31,32 More recent scalingmodels31,33 are significantly more sophisticated than earlierones.32,34 Here the model of ref 33 was used, which assumes aneutron energy spectrum independent of altitude. Comparisonof the global cosmic ray scaling according to ref 33 with valuesmeasured with neutron monitors reported in ref 35 shows adifference of 3.6% for locations below 800 m asl and 9.9% forlocations above 800 m asl. Although for exposure dating this maybe unacceptably large, it is a reasonable approximation for the37Ar production in the vadose zone. The meridionally averagedlatitudinal and the altitudinal scaling factors are shown in Figure 3.The latitudinal scaling decreases by a factor of 2 between the polesand the equator. The asymmetric shape of latitudinal scaling is dueto the influence of the nondipole contributions to the geomagneticfield. Cosmic ray intensities decrease by a factor >20 with decreas-ing altitude from 4 km to sea level.For constant composition, at the soil surface the cosmic ray
fluxΦ(z) and thus the 37Ar production rate decreases exponen-tially with increasing depth z (g cm�2), e.g.36�38
ΦðzÞ ¼ Φð0Þ 3 exp�zΛ
� �ð6Þ
The attenuation length Λ depends on the bulk rock or soildensity, its elemental composition, and on the gas- and water-filled porosity. For a density F of 2 g cm�3 and an average dryterrestrial composition (47.3%O, 2.5%Na, 4.0%Mg, 6% Al, 29%Si, 5.0% Ca, and 6.0% Fe, 0.2% H) an attenuation length Λ of148 g cm�2 was reported.39 This estimate was used in the calcu-lations here (Figure 3).In the lithosphere 37Ar is produced by neutron activation of
Calcium 40Ca(n,α)37Ar and Potassium 39K(n,p2n)37Ar. However,
because the reaction cross-section for the Ca reaction is a factor of 6higher40 and becauseCa/K∼100 for the investigated soils, Calciumdominates the 37Ar production (the average Ca/K ratio in thecontinental lithosphere is 1.2�3.941). The differential reaction crosssections for the 40Ca(n,α)37Ar reaction shown inFigure 2were usedfor the production calculations.The contribution of the muon reaction 39K(μ,2n)37Ar39 and
spallation with K, Fe, and Ti are an order of magnitude lowerthan the Ca reaction (Figure 3).40 Muon induced reactions aretherefore neglected in the following.Only a fraction of the produced 37Ar will emanate from the site
of production into the air-filled pore volumeθg.43 The emanation
coefficient ε is defined as the ratio of the measured concentrationin the pores (Cair) to the maximum possible concentration in themineral grains Crock
Cair ¼ Crock 3 ε 31� θgθg
ð7Þ
In recoil emanation the energy of the 40Ca(n,α)37Ar reactionis partly transferred as kinetic energy to the daughter atom (37Ar)that is displaced in the mineral over a distance in the order of0.01�0.7 μm.9,44�46 The daughter atom escapes the solid phaseif it is located within recoil distance from the solid boundary. Theemanation coefficient therefore increases with increasing specificsurface area. Atoms which have not escaped from the particle byrecoil may still enter the pore space by diffusion.47 However, theeffective diffusion coefficient Dc,eff of Argon in crystal latticeis <10�26 m2 s�1.48,49 The diffusion path length L over the 37Arlifetime 1/λ 50 is L = (Dc,eff/λ)
0.5 < 0.2 nm. The emanation bydiffusion is therefore negligible compared with recoil emanation.The emanation coefficient of 37Ar in water-saturated aquifers isestimated to be in the range 0.12�2.2%.43 In the gas-filled porespace, the emanation coefficient is assumed to be slightly higher,2�7%, due to the larger specific surface area of 37Ar in the vadosezone compared to the saturated zone of an aquifer.
Figure 3. GCR scalings depending on the latitude, altitude, and depth below the surface. The scaling of the latitude is shown for the meridian and at sealevel. The geographic coordinates are converted into geomagnetic inclination, and the scalings are therefore not symmetric. Latitudinal scalings vary by afactor <2. GCR scalings increase by a factor >20 from 0 to 4 km altitude. Depth dependent GCR neutron scalings decreases exponentially with anattenuation length of 148 g cm�2 for an average dry terrestrial composition. The muon flux is scaled to its relative importance to produce 37Ar at thesurface (<4% of the total 37Ar production)42 and decreases exponentially with an attenuation length of 247 g cm�2.33.
8660 dx.doi.org/10.1021/es201192u |Environ. Sci. Technol. 2011, 45, 8656–8664
Environmental Science & Technology ARTICLE
Transport. 37Ar concentration gradients at the soil�atmo-sphere interface (Figure 3) are averaged out by diffusive andadvective-dispersive gas transport processes.51
The effective molecular diffusion coefficient Dg,eff [m2 s�1]was calculated from refs 52 and 53
Dg, eff ¼ Dg, 0 3 τ 3 θg ð8Þwhere τ is the dimensionless tortuosity 0 < τ <1, and Dg,0 is themolecular diffusion of Argon in air at ambient temperature (Ar:1.8� 10�5 m2 s�1).54,55 Diffusion of 37Ar in the liquid phase is 4orders of magnitude slower than in air,56 and partitioning of 37Arfrom the gas phase into the liquid phase is negligible.57
Advection is driven by pressure gradients caused by cyclicatmospheric pressure variations because of high- (pmax) and low-pressure (pmin) fronts.
58 The mean gas flow velocity |V(z)| atdepth z during a pressure cycle with period T is given by
jVðzÞj = Δp 3 2p0 3T
3 ðZ� zÞ ð9Þ
were p0 is the mean atmospheric pressure, Δp = (pmax�pmin) isthe pressure perturbation, and Z is the thickness of the porouslayer.58 Close to the surface (at depths zp <Δp/p0•Z) this verticalair movement ventilates the soil column more effectively than bydiffusion alone. The up and down movement of air in depthsgreater than zp causes mechanical dispersion that can be includedin the effective diffusion coefficient D51,58�60
D ¼ Dg, eff þ α 3 jV j ð10Þwhere α is the mechanical dispersivity [m].58
The steady state 37Ar concentration balance in soil air as afunction of depth can now be expressed by the following one-dimensional transport equation
RðzÞ ¼ �D 3∂2Cg
∂z2þ λCgðzÞ ð11Þ
where R(z) = Rtg�Cair� F is the 37Ar production rate at depth zin the gas-filled pore space [Bq m�3 air], Cg is the
37Ar concen-tration in the gas phase [atoms m�3 air], and λ is the 37Ar decayconstant [s�1].The boundary conditions are C(z = 0) = C0 and C(z = ∞) =
C∞, whereC0 andC∞ are the atmospheric concentration and theconcentration at inifinite depth, respectively. The latter isdetermined by the subsurface nucleogenic 37Ar production.61
The 37Ar activity at depth z is calculated analytically fromeq 11 (Figure 4).
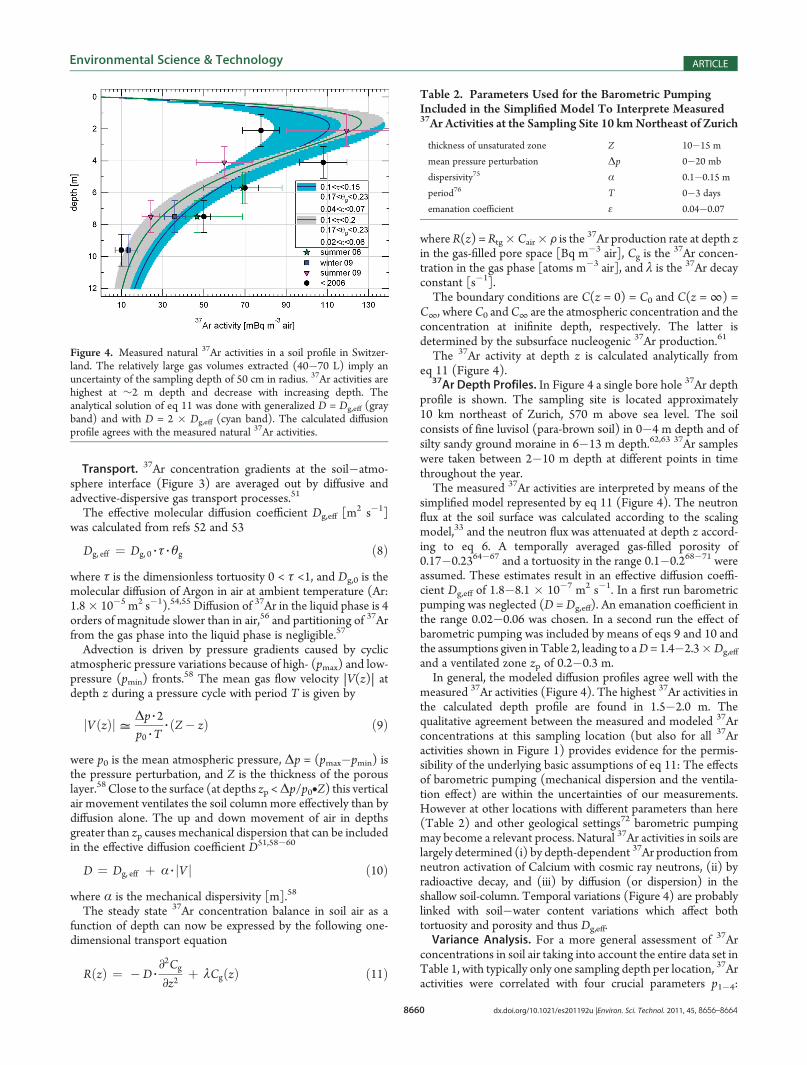
37Ar Depth Profiles. In Figure 4 a single bore hole 37Ar depthprofile is shown. The sampling site is located approximately10 km northeast of Zurich, 570 m above sea level. The soilconsists of fine luvisol (para-brown soil) in 0�4 m depth and ofsilty sandy ground moraine in 6�13 m depth.62,63 37Ar sampleswere taken between 2�10 m depth at different points in timethroughout the year.The measured 37Ar activities are interpreted by means of the
simplified model represented by eq 11 (Figure 4). The neutronflux at the soil surface was calculated according to the scalingmodel,33 and the neutron flux was attenuated at depth z accord-ing to eq 6. A temporally averaged gas-filled porosity of0.17�0.2364�67 and a tortuosity in the range 0.1�0.268�71 wereassumed. These estimates result in an effective diffusion coeffi-cient Dg,eff of 1.8�8.1 � 10�7 m2 s�1. In a first run barometricpumping was neglected (D = Dg,eff). An emanation coefficient inthe range 0.02�0.06 was chosen. In a second run the effect ofbarometric pumping was included by means of eqs 9 and 10 andthe assumptions given in Table 2, leading to aD = 1.4�2.3�Dg,eff
and a ventilated zone zp of 0.2�0.3 m.In general, the modeled diffusion profiles agree well with the
measured 37Ar activities (Figure 4). The highest 37Ar activities inthe calculated depth profile are found in 1.5�2.0 m. Thequalitative agreement between the measured and modeled 37Arconcentrations at this sampling location (but also for all 37Aractivities shown in Figure 1) provides evidence for the permis-sibility of the underlying basic assumptions of eq 11: The effectsof barometric pumping (mechanical dispersion and the ventila-tion effect) are within the uncertainties of our measurements.However at other locations with different parameters than here(Table 2) and other geological settings72 barometric pumpingmay become a relevant process. Natural 37Ar activities in soils arelargely determined (i) by depth-dependent 37Ar production fromneutron activation of Calcium with cosmic ray neutrons, (ii) byradioactive decay, and (iii) by diffusion (or dispersion) in theshallow soil-column. Temporal variations (Figure 4) are probablylinked with soil�water content variations which affect bothtortuosity and porosity and thus Dg,eff.Variance Analysis. For a more general assessment of 37Ar
concentrations in soil air taking into account the entire data set inTable 1, with typically only one sampling depth per location, 37Aractivities were correlated with four crucial parameters p1�4:
Figure 4. Measured natural 37Ar activities in a soil profile in Switzer-land. The relatively large gas volumes extracted (40�70 L) imply anuncertainty of the sampling depth of 50 cm in radius. 37Ar activities arehighest at ∼2 m depth and decrease with increasing depth. Theanalytical solution of eq 11 was done with generalized D = Dg,eff (grayband) and with D = 2 � Dg,eff (cyan band). The calculated diffusionprofile agrees with the measured natural 37Ar activities.
Table 2. Parameters Used for the Barometric PumpingIncluded in the Simplified Model To Interprete Measured37Ar Activities at the Sampling Site 10 kmNortheast of Zurich
thickness of unsaturated zone Z 10�15 m
mean pressure perturbation Δp 0�20 mb
dispersivity75 α 0.1�0.15 m
period76 T 0�3 days
emanation coefficient ε 0.04�0.07
8661 dx.doi.org/10.1021/es201192u |Environ. Sci. Technol. 2011, 45, 8656–8664
Environmental Science & Technology ARTICLE
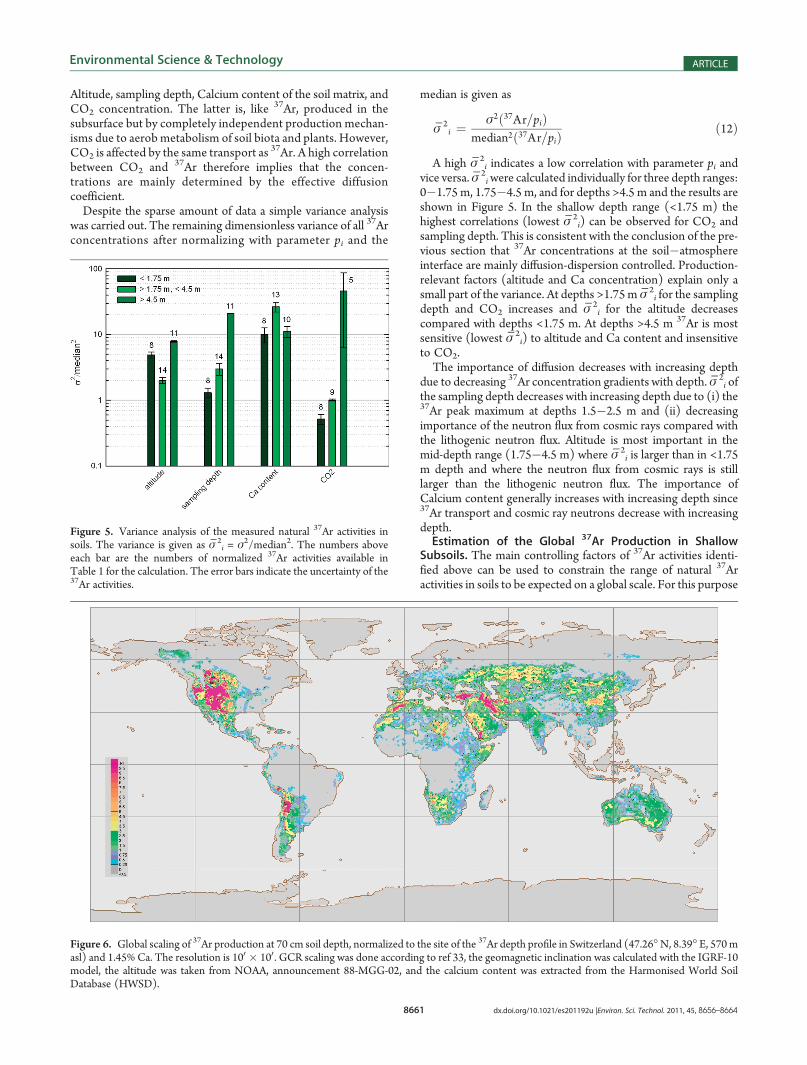
Altitude, sampling depth, Calcium content of the soil matrix, andCO2 concentration. The latter is, like 37Ar, produced in thesubsurface but by completely independent production mechan-isms due to aerob metabolism of soil biota and plants. However,CO2 is affected by the same transport as 37Ar. A high correlationbetween CO2 and 37Ar therefore implies that the concen-trations are mainly determined by the effective diffusioncoefficient.Despite the sparse amount of data a simple variance analysis
was carried out. The remaining dimensionless variance of all 37Arconcentrations after normalizing with parameter pi and the
median is given as
σ̅ 2i ¼ σ2ð37Ar=piÞ
median2ð37Ar=piÞ ð12Þ
A high σ̅ 2i indicates a low correlation with parameter pi and
vice versa. σ̅ 2iwere calculated individually for three depth ranges:
0�1.75 m, 1.75�4.5 m, and for depths >4.5 m and the results areshown in Figure 5. In the shallow depth range (<1.75 m) thehighest correlations (lowest σ̅ 2
i) can be observed for CO2 andsampling depth. This is consistent with the conclusion of the pre-vious section that 37Ar concentrations at the soil�atmosphereinterface are mainly diffusion-dispersion controlled. Production-relevant factors (altitude and Ca concentration) explain only asmall part of the variance. At depths >1.75m σ̅ 2
i for the samplingdepth and CO2 increases and σ̅ 2
i for the altitude decreasescompared with depths <1.75 m. At depths >4.5 m 37Ar is mostsensitive (lowest σ̅ 2
i) to altitude and Ca content and insensitiveto CO2.The importance of diffusion decreases with increasing depth
due to decreasing 37Ar concentration gradients with depth. σ̅ 2i of
the sampling depth decreases with increasing depth due to (i) the37Ar peak maximum at depths 1.5�2.5 m and (ii) decreasingimportance of the neutron flux from cosmic rays compared withthe lithogenic neutron flux. Altitude is most important in themid-depth range (1.75�4.5 m) where σ̅ 2
i is larger than in <1.75m depth and where the neutron flux from cosmic rays is stilllarger than the lithogenic neutron flux. The importance ofCalcium content generally increases with increasing depth since37Ar transport and cosmic ray neutrons decrease with increasingdepth.Estimation of the Global 37Ar Production in Shallow
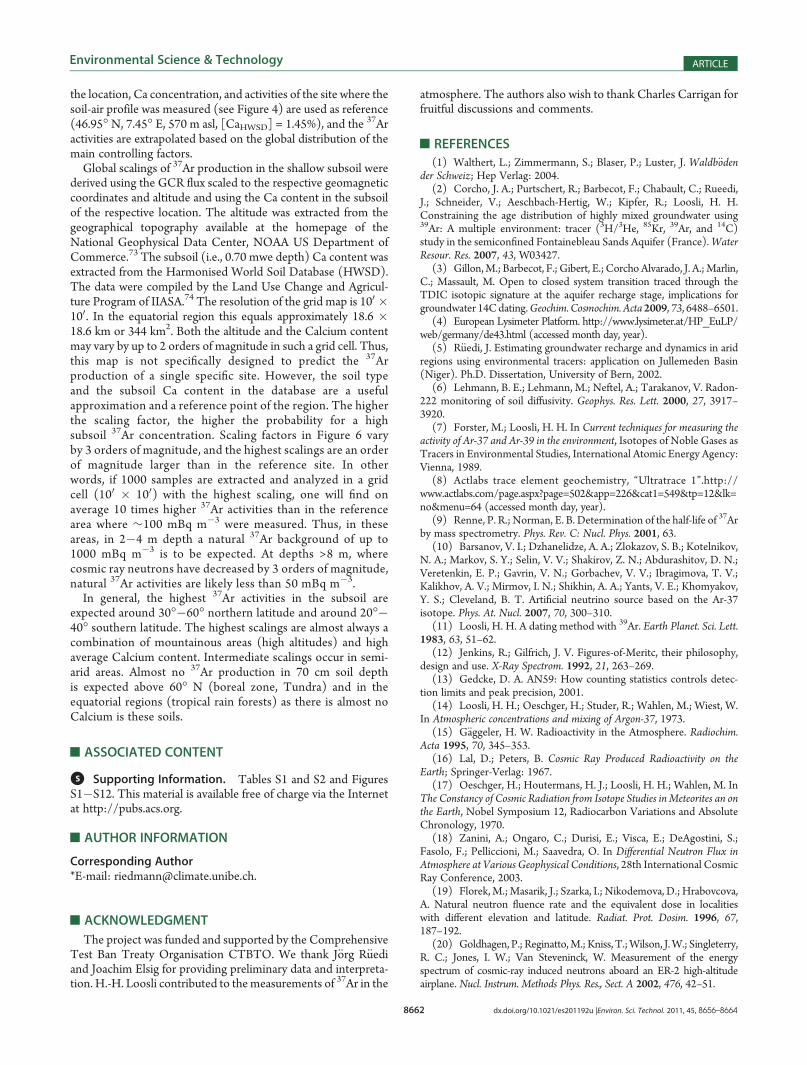
Subsoils. The main controlling factors of 37Ar activities identi-fied above can be used to constrain the range of natural 37Aractivities in soils to be expected on a global scale. For this purpose
Figure 5. Variance analysis of the measured natural 37Ar activities insoils. The variance is given as σ̅ 2
i = σ2/median2. The numbers aboveeach bar are the numbers of normalized 37Ar activities available inTable 1 for the calculation. The error bars indicate the uncertainty of the37Ar activities.
Figure 6. Global scaling of 37Ar production at 70 cm soil depth, normalized to the site of the 37Ar depth profile in Switzerland (47.26�N, 8.39� E, 570masl) and 1.45% Ca. The resolution is 100 � 100. GCR scaling was done according to ref 33, the geomagnetic inclination was calculated with the IGRF-10model, the altitude was taken from NOAA, announcement 88-MGG-02, and the calcium content was extracted from the Harmonised World SoilDatabase (HWSD).
8662 dx.doi.org/10.1021/es201192u |Environ. Sci. Technol. 2011, 45, 8656–8664
Environmental Science & Technology ARTICLE
the location, Ca concentration, and activities of the site where thesoil-air profile was measured (see Figure 4) are used as reference(46.95�N, 7.45� E, 570 m asl, [CaHWSD] = 1.45%), and the 37Aractivities are extrapolated based on the global distribution of themain controlling factors.Global scalings of 37Ar production in the shallow subsoil were
derived using the GCR flux scaled to the respective geomagneticcoordinates and altitude and using the Ca content in the subsoilof the respective location. The altitude was extracted from thegeographical topography available at the homepage of theNational Geophysical Data Center, NOAA US Department ofCommerce.73 The subsoil (i.e., 0.70 mwe depth) Ca content wasextracted from the Harmonised World Soil Database (HWSD).The data were compiled by the Land Use Change and Agricul-ture Program of IIASA.74 The resolution of the grid map is 100 �100. In the equatorial region this equals approximately 18.6 �18.6 km or 344 km2. Both the altitude and the Calcium contentmay vary by up to 2 orders of magnitude in such a grid cell. Thus,this map is not specifically designed to predict the 37Arproduction of a single specific site. However, the soil typeand the subsoil Ca content in the database are a usefulapproximation and a reference point of the region. The higherthe scaling factor, the higher the probability for a highsubsoil 37Ar concentration. Scaling factors in Figure 6 varyby 3 orders of magnitude, and the highest scalings are an orderof magnitude larger than in the reference site. In otherwords, if 1000 samples are extracted and analyzed in a gridcell (100 � 100) with the highest scaling, one will find onaverage 10 times higher 37Ar activities than in the referencearea where ∼100 mBq m�3 were measured. Thus, in theseareas, in 2�4 m depth a natural 37Ar background of up to1000 mBq m�3 is to be expected. At depths >8 m, wherecosmic ray neutrons have decreased by 3 orders of magnitude,natural 37Ar activities are likely less than 50 mBq m�3.In general, the highest 37Ar activities in the subsoil are
expected around 30��60� northern latitude and around 20��40� southern latitude. The highest scalings are almost always acombination of mountainous areas (high altitudes) and highaverage Calcium content. Intermediate scalings occur in semi-arid areas. Almost no 37Ar production in 70 cm soil depthis expected above 60� N (boreal zone, Tundra) and in theequatorial regions (tropical rain forests) as there is almost noCalcium is these soils.
’ASSOCIATED CONTENT
bS Supporting Information. Tables S1 and S2 and FiguresS1�S12. This material is available free of charge via the Internetat http://pubs.acs.org.
’AUTHOR INFORMATION
Corresponding Author*E-mail: [email protected].
’ACKNOWLEDGMENT
The project was funded and supported by the ComprehensiveTest Ban Treaty Organisation CTBTO. We thank J€org R€uediand Joachim Elsig for providing preliminary data and interpreta-tion. H.-H. Loosli contributed to themeasurements of 37Ar in the
atmosphere. The authors also wish to thank Charles Carrigan forfruitful discussions and comments.
’REFERENCES
(1) Walthert, L.; Zimmermann, S.; Blaser, P.; Luster, J. Waldb€odender Schweiz; Hep Verlag: 2004.
(2) Corcho, J. A.; Purtschert, R.; Barbecot, F.; Chabault, C.; Rueedi,J.; Schneider, V.; Aeschbach-Hertig, W.; Kipfer, R.; Loosli, H. H.Constraining the age distribution of highly mixed groundwater using39Ar: A multiple environment: tracer (3H/3He, 85Kr, 39Ar, and 14C)study in the semiconfined Fontainebleau Sands Aquifer (France).WaterResour. Res. 2007, 43, W03427.
(3) Gillon,M.; Barbecot, F.; Gibert, E.; CorchoAlvarado, J. A.;Marlin,C.; Massault, M. Open to closed system transition traced through theTDIC isotopic signature at the aquifer recharge stage, implications forgroundwater 14Cdating.Geochim. Cosmochim. Acta2009, 73, 6488–6501.
(4) European Lysimeter Platform. http://www.lysimeter.at/HP_EuLP/web/germany/de43.html (accessed month day, year).
(5) R€uedi, J. Estimating groundwater recharge and dynamics in aridregions using environmental tracers: application on Jullemeden Basin(Niger). Ph.D. Dissertation, University of Bern, 2002.
(6) Lehmann, B. E.; Lehmann, M.; Neftel, A.; Tarakanov, V. Radon-222 monitoring of soil diffusivity. Geophys. Res. Lett. 2000, 27, 3917–3920.
(7) Forster, M.; Loosli, H. H. In Current techniques for measuring theactivity of Ar-37 and Ar-39 in the environment, Isotopes of Noble Gases asTracers in Environmental Studies, International Atomic Energy Agency:Vienna, 1989.
(8) Actlabs trace element geochemistry, “Ultratrace 1”.http://www.actlabs.com/page.aspx?page=502&app=226&cat1=549&tp=12&lk=no&menu=64 (accessed month day, year).
(9) Renne, P. R.; Norman, E. B. Determination of the half-life of 37Arby mass spectrometry. Phys. Rev. C: Nucl. Phys. 2001, 63.
(10) Barsanov, V. I.; Dzhanelidze, A. A.; Zlokazov, S. B.; Kotelnikov,N. A.; Markov, S. Y.; Selin, V. V.; Shakirov, Z. N.; Abdurashitov, D. N.;Veretenkin, E. P.; Gavrin, V. N.; Gorbachev, V. V.; Ibragimova, T. V.;Kalikhov, A. V.; Mirmov, I. N.; Shikhin, A. A.; Yants, V. E.; Khomyakov,Y. S.; Cleveland, B. T. Artificial neutrino source based on the Ar-37isotope. Phys. At. Nucl. 2007, 70, 300–310.
(11) Loosli, H. H. A dating method with 39Ar. Earth Planet. Sci. Lett.1983, 63, 51–62.
(12) Jenkins, R.; Gilfrich, J. V. Figures-of-Meritc, their philosophy,design and use. X-Ray Spectrom. 1992, 21, 263–269.
(13) Gedcke, D. A. AN59: How counting statistics controls detec-tion limits and peak precision, 2001.
(14) Loosli, H. H.; Oeschger, H.; Studer, R.; Wahlen, M.; Wiest, W.In Atmospheric concentrations and mixing of Argon-37, 1973.
(15) G€aggeler, H. W. Radioactivity in the Atmosphere. Radiochim.Acta 1995, 70, 345–353.
(16) Lal, D.; Peters, B. Cosmic Ray Produced Radioactivity on theEarth; Springer-Verlag: 1967.
(17) Oeschger, H.; Houtermans, H. J.; Loosli, H. H.; Wahlen, M. InThe Constancy of Cosmic Radiation from Isotope Studies in Meteorites an onthe Earth, Nobel Symposium 12, Radiocarbon Variations and AbsoluteChronology, 1970.
(18) Zanini, A.; Ongaro, C.; Durisi, E.; Visca, E.; DeAgostini, S.;Fasolo, F.; Pelliccioni, M.; Saavedra, O. In Differential Neutron Flux inAtmosphere at Various Geophysical Conditions, 28th International CosmicRay Conference, 2003.
(19) Florek,M.;Masarik, J.; Szarka, I.; Nikodemova, D.; Hrabovcova,A. Natural neutron fluence rate and the equivalent dose in localitieswith different elevation and latitude. Radiat. Prot. Dosim. 1996, 67,187–192.
(20) Goldhagen, P.; Reginatto,M.; Kniss, T.;Wilson, J.W.; Singleterry,R. C.; Jones, I. W.; Van Steveninck, W. Measurement of the energyspectrum of cosmic-ray induced neutrons aboard an ER-2 high-altitudeairplane. Nucl. Instrum. Methods Phys. Res., Sect. A 2002, 476, 42–51.

8663 dx.doi.org/10.1021/es201192u |Environ. Sci. Technol. 2011, 45, 8656–8664
Environmental Science & Technology ARTICLE
(21) Nakamura, T.; Nunomiya, T.; Abe, S.; Terunuma, K.; Suzuki,H. Sequential measurements of cosmic-ray neutron spectrum and doserate at sea level in Sendai, Japan. J. Nucl. Sci. Technol. 2005, 42, 843–853.(22) Kowatari, M.; Nagaoka, K.; Satoh, S.; Ohta, Y.; Abukawa, J.;
Tachimori, S.; Nakamura, T. Evaluation of the altitude variation of thecosmic-ray induced environmental neutrons in the Mt. Fuji area. J. Nucl.Sci. Technol. 2005, 42, 495–502.(23) Kowatari, M.; Ohta, Y.; Satoh, S.; Nagaoka, K.; Abukawa, J.;
Nakamura, T. Evaluation of geomagnetic latitude dependence of thecosmic-ray induced environmental neutrons in Japan. J. Nucl. Sci.Technol. 2007, 44, 114–120.(24) Croft, S.; Bourva, L. C. A. The specific total and coincidence
cosmic-ray-induced neutron production rates in materials.Nucl. Instrum.Methods Phys. Res., Sect. A 2003, 505, 536–539.(25) Moser, M. R.; Ryan, J. M.; Desorgher, L.; Fl€uckiger, E. O. In
Atmospheric Neutron Measurements in the 10�170 MeV Range, 29thInternational Cosmic Ray Conference, Pune, 2005.(26) Mishra, R. K.; Agarwal, R.; Tiwari, S. Solar cycle variation of
cosmic ray intensity along with interplanetary and solar wind plasmaparameters. Latv. J. Phys. Tech. Sci. 2008, 45, 63–68.(27) Fluckiger, E. O.; Butikofer, R. Swiss neutron monitors and
cosmic ray research at Jungfraujoch. Adv. Space Res. 2009, 44, 1155–1159.(28) Kudela, K.; Langer, R. Cosmic ray measurements in High Tatra
mountains: 1957�2007. Adv. Space Res. 2009, 44, 1166–1172.(29) Shibata, K. Calculation of Neutron Nuclear Data on Calcium
Isotopes for JENDL-4. J. Nucl. Sci. Technol. 2007, 44, 10–20.(30) Reedy, R. C.; Arnold, J. R. Interaction of solar and galactic
cosmic-ray particles with the moon. J. Geophys. Res. 1972, 77, 537–555.(31) Desilets, D.; Zreda, M. Spatial and temporal distribution of
secondary cosmic-ray nucleon intensities and applications to in situcosmogenic dating. Earth Planet. Sci. Lett. 2003, 206, 21–42.(32) Lal, D. Cosmic ray labeling of erosion surfaces: in situ nuclide
production rates and erosion models. Earth Planet. Sci. Lett. 1991, 104,424–439.(33) Dunai, T. J. Scaling factors for production rates of in situ
produced cosmogenic nuclides: a critical reevaluation. Earth Planet. Sci.Lett. 2000, 176, 157–169.(34) Stone, J. O. Air pressure and cosmogenic isotope production.
J. Geophys. Res. 2000, 105, 230753–7230759.(35) Ziegler, J. F. Terretrial cosmic ray intensities. IBM J. Res. Dev.
1998, 42, 117–138.(36) Gosse, J. C.; Phillips, F. M. Terrestrial in situ cosmogenic
nuclides: theory and application. Quat. Sci. Rev. 2001, 20, 1475–1560.(37) Phillips, F.M.; Stone,W.D.; Fabryka-Martin, J. T. An improved
approach to calculating low-energy cosmic-ray neutron fluxes near theland/atmosphere interface. Chem. Geol. 2001, 175, 689–701.(38) Lal, D. In situ-produced cosmogenic isotopes in terrestrial
rocks. Annu. Rev. Earth Planet. Sci. 1988, 16, 355–388.(39) Masarik, J.; Reedy, R. C. Terrestrial cosmogenic-nuclide pro-
duction systematics calculated from numerical simulations. Earth Planet.Sci. Lett. 1995, 136, 381–395.(40) Hohenberg, C. M.; Marti, K.; Podosek, F. A.; Reedy, R. C.;
Shirck, J. R. In Proceedings of the Lunar Planetary Science Conference, 1978;Vol. 9, pp 2311�2344.(41) Weaver, B. L.; Tarney, J. Major trace-element composition of
the continental lithosphere. Phys. Chem. Earth 1984, 15, 39–68.(42) Fabryka-Martin, J. T. Production of radionuclides in the
earth and their hydrogeologic significance, with emphasis on chlor-ine-36 and iodine-129. Ph.D. Dissertation, University of Arizona,1988.(43) Lehmann, B. E.; Loosli, H. H. Isotopes formed by underground
production. InApplied isotope hydrology, a case study inNorthern Switzerland;Pearson, F. J., Balderer,W., Loosli, H.H., Lehmann, B. E.,Matter, A., Peters,T., Schmassmann, H., Gautschi, A., Eds.; Nagra, 1991.(44) Jourdan, F.; Matzel, J. P.; Renne, P. R. 39Ar and 37Ar recoil loss
during neutron irradiation of sanidine and plagioclase. Geochim. Cosmo-chim. Acta 2007, 71, 2791–2808.
(45) Onstott, T. C.; Miller, M. L.; Ewing, R. C.; Arnold, G. W.;Walsh, D. S. Recoil refinements: Implications for the 40Ar/39Ar datingtechnique. Geochim. Cosmochim. Acta 1995, 59, 1821–1834.
(46) Renne, P. R.; Knight, K. B.; Nomade, S.; Leung, K. N.; Lou,T. P. Application of deuteron-deuteron (D-D) fusion neutrons to Ar-40/Ar-39 geochronology. Appl. Radiat. Isot. 2005, 62, 25–32.
(47) Fl€ugge, S.; Zimens, K. E. Die Bestimmung von Korngr€ossenund vonDiffusionskonstanten aus dem Emanierverm€ogen - Die Theorieder Emaniermethode. Phys. Chem. B 1939, 42, 179–220.
(48) Farley, K. A. Helium diffusion from apatite: General behavior asillustated by Durango fluoroapatatite. J. Geophys. Res. 2000, 105, 2903–2914.
(49) Watson, E. B.; Cherniak, D. J. Lattice diffusion of Ar in quartz,with constraints on Ar solubility and evidence of nanopores. Geochim.Cosmochim. Acta 2003, 67, 2043–2062.
(50) Crank, J. The Mathematics of Diffusion; Oxford Science Pub-lications: 1998.
(51) Sharma, P.; Poulsen, T. G. Gas dispersion and immobile gascontent in granular porous media: effect of particle size nonuniformity.Soil Sci. 2010, 175, 426–431.
(52) Cook, P. G.; Solomon, D. K. Transport of atmospheric trace gasesto the water table; implications for groundwater dating with chlorofluor-ocarbons and krypton 85.Water Resour. Res. 1995, 31, 263–270.
(53) Tick, R. G.; McColl, C. M.; Yolcubal, I.; Brusseau, M. L. Gas-phase diffusive tracer test for the in-situ measurement of tortuosity in thevadose zone. Water, Air, Soil Pollut. 2007, 184, 355–362.
(54) Fuller, E. N.; Ensley, K.; Giddings, J. C. Diffusion of haloge-nated hydrocarbons in helium. J. Phys. Chem. 1969, 73, 3679.
(55) Schaefer, C. E.; Arands, R. R.; van de Sloot, H. A.; Kosson, D. S.Modeling of the gaseous diffusion coefficient through unsaturated soilsystems. J. Contam. Hydrol. 1997, 29, 1–21.
(56) Lehmann, B. E.; Purtschert, R. Radioisotope dynamics - theorigin and fate of nuclides in groundwater. Appl. Geochem. 1997, 12,727–738.
(57) Wanninkhof, R. H.; Mulholland-Patrick, J.; Elwood, J. W. Gasexchange rates for a first-order stream determined with deliberate andnatural tracers. Water Resour. Res. 1990, 26, 1621–1630.
(58) Auer, L. H.; Rosenberg, N. D.; Birdsell, K. H.; Whitney, E. M.The effects of barometric pumping on contaminant transport. J. Contam.Hydrol. 1996, 24, 145–166.
(59) Gidda, T.; Cann, D.; Stiver, W. H.; Zytner, R. G. Airflowdispersion in unsaturated soil. J. Contam. Hydrol. 2006, 82, 118–132.
(60) Costanza-Robinson,M. S.; Brusseau,M. L. Gas phase advectionand dispersion in unsaturated porous media. Water Resour. Res. 2002,38, WR000895.
(61) Feige, Y.; Oltman, B. G.; Kastner, J. Production Rates ofNeutrons in Soils Due to Natural Radioactivity. J. Geophys. Res. 1968,73, 3135–3142.
(62) Stoll, S.; Hendricks Frannsen, H. J.; Butts, M.; Kinzelbach, W.Analysis of the impact of climate change on groundwater relatedhydrological fluxes: a multi-model approach including different down-scaling methods. Hydrol. Earth Syst. Sci. 2011, 15, 21–38.
(63) Onnis, G. A. Interpreting multiple environmental tracer datawith a groundwater model in a perialpine catchment. Ph.D. Dissertation,Swiss Federeal Institute of Technology, Zurich, 2008.
(64) Johnson, P. C.; Bruce, C.; Johnson, R. L.; Kemblowski,M.W. Insitu measurement of effective vapor-phase porous media diffusioncoefficients. Environ. Sci. Technol. 1998, 32, 3405–3409.
(65) Hers, I.; Zapf-Gilje, R.; Li, L.; Atwater, J. Measurement of in situgas-phas diffusion coefficients. Environ. Technol. 2000, 21, 631–640.
(66) Werner, D.; H€ohener, P. In situ method to measure effectiveand sorption-affected gas-phase diffusion coefficients in soils. Environ.Sci. Technol. 2003, 37, 2502–2510.
(67) Werner, D.; Grathwohl, P.; Werner, D. Review of field methodsfor the determination of the tortuiosity and effective gas-phase diffusi-viity in the vadose zone. Vadose Zone J. 2004, 3, 1240–1248.
(68) Moldrup, P.; Olesen, T.; Komatsu, T.; Schjonning, P.; Rolston,D. E. Tortuosity, diffusivity, and permeability in the soil liquid andgaseous phases. Soil Sci. Soc. Am. J. 2001, 65, 613–623.
8664 dx.doi.org/10.1021/es201192u |Environ. Sci. Technol. 2011, 45, 8656–8664
Environmental Science & Technology ARTICLE
(69) Althaus, R. Datierung und Charakterisierung von Grundwas-servorkommen in der Schweiz und im s€uddeutschen Raum anhand von85Kr-Messungen undweiteren isotopenphysikalischenMethoden. Ph.D.Dissertation, University of Bern, 2009.(70) Kristensen, A. H.; Thorbjorn, A.; Jensen, M. P.; Pedersen, M.;
Moldrup, P. Gas-phase diffusivity and tortuosity of structured soils.J. Contam. Hydrol. 2010, 115, 26–33.(71) Tuli, A.; Hopmans, J. W.; Rolston, D. E.; Moldrup, P. Compar-
ison of air and water permeability between disturbed and undisturbedsoils. Soil Sci. Soc. Am. J. 2005, 69, 1361–1371.(72) Carrigan, C. R.; Heinle, R. A.; Hudson, G. B.; Nitao, J. J.; Zucca,
J. J. Baromotric gas transport along faults and its application to nucleartest-ban monitoring, Lawrence Livermore National Laboratory, Liver-more, CA, 94550, 1997.(73) ETOPO5 5-minute gridded elevation data.http://www.ngdc.
noaa.gov/mgg/global/etopo5.HTML (accessed month day, year).(74) Harmonized World Soil Database. http://www.iiasa.ac.at/
Research/LUC/External-World-soil-database/HTML (accessed monthday, year).(75) Gelhar, L. W.;Welty, C.; Rehfeldt, K. R. A critical review of data
on field-scale dispersion in aquifers.Water Resour. Res. 1992, 28, 1955–1974.(76) Amplitude and period of atmospheric pressure changes in
Switzerland during a storm event.http://www.meteoschweiz.admin.ch/web/de/wetter/wetterereignisse/stuermische_kaltfront_am_12_oktober_2009.Par.0010.DownloadFile.tmp/gross.jpg (accessed monthday, year).