Geodetic data shed light on ongoing caldera subsidence at Askja, Iceland

www.elsevier.com/locate/enggeo
Engineering Geology 7
New integrated geodetic monitoring system
at Stromboli volcano (Italy)
G. PuglisiT, A. Bonaccorso, M. Mattia, M. Aloisi, A. Bonforte, O. Campisi,
M. Cantarero, G. Falzone, B. Puglisi, M. Rossi
Istituto Nazionale di Geofisica e Vulcanologia—Sezione di Catania, Piazza Roma, 2 Catania, Italy
Received 15 February 2004; received in revised form 8 August 2004; accepted 1 October 2004
Available online 25 April 2005
Abstract
Stromboli is a composite volcano, forming the northernmost island of the Aeolian Archipelago volcanic arc (Tyrrhenian
Sea). On December 28th 2002, lava flows outpoured from the northern wall of the NE crater and descended into the Sciara del
Fuoco (SdF), a deep depression marking the NW flank of the volcano edifice. On December 30th 2002, two landslides occurred
on the northern part of the SdF; they moved a mass in the order of tens of millions of cubic meters both above and below sea
level. The landslide produced a tsunami causing significant damage to the eastern coast of the island, reaching the other Aeolian
Islands and the Sicilian and southern Italian coasts. This event led to the upgrading of the ground deformation monitoring
system, already existing on the island; the new requirement was the real-time detection of the deformations related to potential
slope failures of the SdF. To this end, a remotely controlled monitoring system, based both on GPS and geodetic techniques,
was planned and set up in a few months. The new monitoring system allowed to continuously measure the ground deformations
occurring on the SdF, by integrating both terrestrial and satellite geodetic techniques. Although this system was severely
damaged during the 7-month long eruption, it allowed to monitor important eruptive phases. For the first time, an accurate data
set on the actual mass movements of the SdF and the crater area was available. It provided data that significantly supported the
Civil Protection Authorities in making decisions and constrains theories related to landslide movements and volcanic activity.
After the end of the eruption, the system was overhauled in order to optimize the instruments and set up a monitoring system
aimed at measuring deformations forecasting other flank collapses.
D 2005 Published by Elsevier B.V.
Keywords: Stromboli; Ground deformation; Real-time monitoring; Eruption forecasting; Landslide forecasting
0013-7952/$ - see front matter D 2005 Published by Elsevier B.V.
doi:10.1016/j.enggeo.2004.10.013
T Corresponding author. Fax: +39 95 435801.
E-mail address: [email protected] (G. Puglisi).
1. Introduction
Stromboli is an active volcano, about 2500 m high
above the sea floor. Roughly only the last kilometer of
this volcano emerges from the sea, forming an island
whose diameter ranges from 2.4 to 5 km. It belongs to
9 (2005) 13–31

G. Puglisi et al. / Engineering Geology 79 (2005) 13–3114
the Aeolian Islands and represents the most active
volcano of this archipelago (Fig. 1). Its conic shape is
clearly characterized by a big depression that marks
the northwestern flank of the edifice: the Sciara del
Fuoco (SdF); the uppermost southeastern rim of the
SdF (Pizzo Sopra la Fossa—PSF) is the highest point
on Stromboli island (924 m a.s.l.). SdF continues
below the sea, down to 700–750 m b.s.l.; this scar was
produced by a huge sector collapse, in the order of 1
km3 that very likely originated in the Holocene. Three
active craters are aligned along a SW–NE trend, at
about 750 m a.s.l., in the central part of a flat area
(named Crater Terrace, Bertagnini et al., 1999) that
characterizes the upper southeastern part of the SdF,
just below PSF. Usually, the craters are called 1 to 3
Fig. 1. Ground deformation monitoring system before the 2002–2003 eru
during the first two days of the 2002 eruption: the fracture opened on the n
(black area) and the slid area (gray area). In the inset, the geographical se
from the northeast to southwest (Bertagnini et al.,
1999). The volcanic activity of Stromboli has been
well known since the Greek epoch and several
chroniclers report the almost regular and continuous
explosive activity occurring at its craters. Thanks to
this peculiar constant activity, volcanologists have
termed the intermittent explosive activity often
observed on active volcanoes as dstrombolianT. Some-
times, flank eruptions start from vents opening on the
outer side of the Crater Terrace, producing lava flows
that reach the sea, running along the steep flanks of
the SdF. Barberi et al. (1993), by analysing historical
data of the Stromboli eruptive activity, define a
medium interval between lava eruptions of 3.7 years,
with a maximum interval of 10 years.
ption onset. The map also shows the main volcanic features formed
orthern flank of the NE crater (white line), the outpoured lava flows
tting of Stromboli volcano.

G. Puglisi et al. / Engineering Geology 79 (2005) 13–31 15
The volcanic hazard of Stromboli is mainly
characterized by explosive activity, and in particular
by paroxysmal episodes that, for example, killed 10
people and injured dozens in 1919 and 1930. In the
last century, ballistic ejecta emitted during these
paroxysms destroyed many buildings and fires
induced by scoria caused severe damage to crops.
During some paroxystic explosions, tsunamis have
Fig. 2. Ground deformation monitoring system in the SdF; triangles mark t
used as reference frame; stars mark the control points (C.P.) installed to mo
networks are distinguished with different colors.
been signaled (6 times since 1879; Barberi et al.,
1993). Although chronicles of these events do not
report any specific origin of these phenomena, Barberi
et al. (1993) relate it to hot avalanches or pyroclastic
flows entering the sea during the paroxysm.
Since 1993, Stromboli ground deformations have
been monitored by GPS and clinometric techniques.
Before the 2002–2003 eruption, the monitoring
he pillars where measurements were carried out and the benchmarks
nitor movements. The control points belonging to the different sub-
G. Puglisi et al. / Engineering Geology 79 (2005) 13–3116
system on the island was aimed at measuring the
effects of the plumbing system dynamic at medium-
shallow depths. To this end, four GPS and three
tiltmetric permanent stations were set up between
1993 and 1997 at a lower altitude (50–150 m) around
the island’s perimeter (Fig. 2). This system was able to
detect magmatic intrusions as, for instance, in 1995
(Bonaccorso, 1998). The Stromboli 2003 volcanic
emergency prompted setting up a powerful and
complex system for monitoring ground deformations
both in the SdF area and over island as a whole, based
on the integration of different surveying techniques:
terrestrial (first EDM and then Automatic Total
Station) and satellite (GPS).
2. 2002–2003 eruption
On December 28th 2002, after about 6 months of
increasing explosive activity at the summit craters,
accompanied by some lava flows from the NE rim
Crater, a NE-trending eruptive fissure broke the
Crater 1 flank and the upper eastern part of the SdF
(Fig. 1). The lava outpoured from this fissure, flowed
through the SdF and reached the sea during the
evening; the emission lasted about half a day and on
the morning of December 29th the lava flows were no
longer being fed from this fissure. In the afternoon,
December 29th, two vents opened at about 500–600
m altitude, within the SdF, forming new lava flows.
On December 30th, at about 13:15 local time, two
landslides broke off from the northern part of the SdF,
both on the emerged and submarine parts of the scar,
and generated a tsunami that caused severe destruc-
tion on the island, produced some damage to the
Aeolian archipelago and the northern coast of Sicily,
and was observed in several coastal places in the
south-Tyrrhenian sea. The total volume of landslides
was estimated at about 17 million cubic meters from
photogrammetric and bathymetric data (reported in
Tinti et al., 2003). After these events, the eruption
continued by showing only effusive activity on vents
opened at about 500 m altitude, more or less in the
same position as those formed on December 29th. On
February 16th, after a gradual decrease in effusive
rate, new vents opened at about 600 m altitude, along
the fissure formed during the first day of the eruption,
feeding a new lava flow. Up to the end of March
2003, no explosive activity was observed on the
Summit Craters, although the seismic network
recorded seismic signals related to strombolian
degassing processes. On April 5th, at 9:13 local time,
a violent paroxysmal explosion occurred at the
Summit Craters (1 and 3), producing pyroclastic
flows within the SdF and scoria fall out that mainly
reached the southwestern part of the island. Bombs,
some cubic meters large, reached the Ginostra village,
located on the eastern coast of Stromboli, destroying
walls and houses. This explosion may be compared
with an analogous one occurring in 1930, when 4
people were killed and for many years the island was
abandoned for the fear of another similar episode.
After this event, the explosive activity gradually
resumed at the Summit Craters (now only 1 and 3).
The effusive vents located at 600 m altitude produced
a compound lava flow field that during the following
months entirely covered the upper part of the land-
slide niche, located just below the SdF’s rim, named
Bastimento, and formed a fan that reached the sea. At
the end of the effusion, on July 22, the thickness of
lava field in the area below the Bastimento was in the
order of 30–50 m.
3. Monitoring system description
The events of December 2002 (landslides and
tsunami) compelled geophysicists and volcanologists
to rapidly confront new phenomena having a serious
impact and producing a broad risk scenario, ranging
from simple lava flow emissions to a sector collapse
of the NW flank of the volcano. After the December
30th 2002 landslide, it became evident that the most
urgent requirement of the monitoring system was to
detect the deformations related to potential slope
failures of the SdF. For this purpose, a complex
monitoring system, based on the integration of
different measurement techniques, was planned; the
set up of this new monitoring system took several
months and was developed in three steps. At the same
time, the breinforcingQ of the previous networks (Tilt
and GPS) was carried out.
On January 16th 2003, a first monitoring network,
based on EDM measurements, was set up on the
upper flank of the SdF, around the craters area. Before
the end of January 2003, this network was enlarged,
G. Puglisi et al. / Engineering Geology 79 (2005) 13–31 17
including all the northern sector of the Sciara, along
the path of the 30th December 2002 landslide. At the
beginning of February 2003, there were 22 monitoring
control points within the Sciara and two pillars were
installed for setting up the EDM instruments.
The next step was the installation of a permanent
GPS network within the SdF, specifically designed for
the real-time monitoring of movement in the core of
the potential failure zone and close to the summit
craters. By February 12th 2003, the stations were built
and the network was up and running.
The last step was the installation of a robotized
Total Station to automate the terrestrial geodetic
measurement along the northern sector of the SdF.
This system required more than 4 months to be
routinely introduced in the monitoring system, both
for technical and volcanological reasons (e.g. the
April 5th 2003 paroxysmal explosion).
In this paper we describe these three steps and
provide technical details and scientific implications.
3.1. Terrestrial geodetic networks
3.1.1. EDM monitoring network
The EDM was the first technique adopted to
evaluate the hazard evolution in the SdF during the
initial days of the volcanic crisis. The first sub-
network installed on January 16th, on the summit area
of the volcano was in the Fossa area, the part of Crater
Terrace included between the PSF and the Craters.
This sub-network (Fig. 2) consisted of five reflectors
(named FOS1 to FOS5) that were installed around the
southeastern flanks of the summit craters, along a
profile crossing several fractures and fumaroles on the
ground. These control points were surveyed from the
iron pillar set up at PSF (STR in Fig. 2). At the same
time, four reflectors (BAST, SLF, FORT and VANC)
were installed on the upper part of the volcano outside
and around the upper part of the SdF area, on sites
considered stable (Fig. 2). This second sub-network
allowed to check the actual stability of these areas and
verify the repeatability of the distance measurements
carried out from the STR pillar, in order to detect
systematic errors due, for example, to atmospheric
effects. A third monitoring sub-network was installed
below the Bastimento. This sub-network consisted of
six control points (from PST1 to PST6), placed in the
area of the niche of the December 30th landslide (Fig.
2). These benchmarks were measured from the STR
pillar and two of them (PST4 and PST6) were
equipped with two reflectors, in order to be measured
also from another pillar, located on the lower flank of
the volcano, at Punta Labronzo (PLB in Fig. 2). This
pillar was set up with the aim of enabling monitoring
on the lower part of the SdF area, not visible from the
STR pillar. In fact, the suitability of the station of
Punta Labronzo allowed the installation of another six
reflectors along the SdF northern slope, from the
niche area down to the sea (SDF1 to SDF6, Fig. 2).
Finally, two other benchmarks were installed in the
central part of the SdF (SDF7 and SDF8) and a third
pillar at Punta del Corvo was set up (CRV), with the
view to enlarging the network and controlling the
western sector of the Sciara in the future (Fig. 2).
Throughout the EDM monitoring activities, angu-
lar measurements were carried out from the pillars by
using a theodolite (DKM3), in order to evaluate the
three-dimensional movements of the benchmarks. The
long time required to perform accurate angular
measurements and the severe operative conditions
did not allow using the theodolite as frequently as the
EDM, so that the data set of this first stage of the
monitoring activity in the SdF was based mainly on
distance variations. In any case, the 3D vectors,
through integration of EDM and theodolite measure-
ments, provided helpful information on the dynamics
(direction and displacement velocity) of the landslide.
3.1.2. Automatic EDM measurements (THEODOROS)
The experience of the first days of monitoring
activities highlighted the need to both automate the
geodetic measurement and provide 3D displacement
vectors of all the measured control points in the SdF.
To achieve these objectives a robotic total station has
been installed near the Labronzo pillar (Fig. 3).
The set up of this new system was a real challenge,
given the logistic and operative conditions existing on
Stromboli during the volcanic crisis. The chosen
instrument was the Leica TCA 2003 Total Station
equipped with GeoMos software that allows remote
control of the sensor. The acronym of this new system
was THEODOROS (THEOdolite and Distancemeter
Robot Observatory of Stromboli). To guarantee a
continuous stream of data from the instrument, it
requires a continuous power supply and a continuous
link with the PC that controls the Total Station’s

Fig. 3. Robotized Total Stations belonging to THEODOROS
system.
G. Puglisi et al. / Engineering Geology 79 (2005) 13–3118
activities, installed on the S. Vincenzo Observatory
(SVIN), where the National Department of Civil
Protection (DPC) control room is located. These
technical solutions were achieved by exploiting two
facilities already installed by the DPC and the Istituto
Nazionale di Geofisica e Vulcanologia (INGV) during
the volcanic crisis: the electric line for supplying the
DPC satellite video-camera and the optical line
installed by INGV to collect all geophysical data
from the Punta Labronzo area to the S. Vincenzo
Observatory. Because the head of the optical line was
near the Labronzo lighthouse, we have implemented a
WiFi link to connect the Total Stations with the
optical line. Although the two-way link system was
quite complex (optical+WiFi), it was efficient enough
to guarantee the real-time control of the Total Stations
from the Observatory.
A reference system of five reflectors (400, CURV,
BORD, SEMF, SPLB2) was installed around the Total
Station, on sites we considered stable; it aimed at
guaranteeing the same orientation in the space (both
horizontally and vertically) through the measurements
of the Total Station (Fig. 4). At the very beginning
THEODOROS carried out the measurements only on
four reflectors installed on the SdF (SDF5, SDF6,
SDF7 and SDF8), which were the only remaining
ones after the destruction due to the lava flows, and on
three reflectors installed around the site belonging to
the reference system (SEMF, 400, SPLB2). The fine-
tuning of the THEODOROS system required several
months because it was necessary to identify and
overcome all possible error sources or phenomena
perturbing the data acquisition. These adjustments
intended to achieve the highest accuracy. Among the
various interventions required to improve the system,
we mention the building of a cabin to reduce solar
perturbations on the different parts of the system
(concrete basement, pillar, sensor, etc.; see Figs. 3 and
4), the improvement of the configuration of the
reference system, the improvement of the of the PC
controlling the system, the assessment of the best
strategy to carry out the measurements, etc. At the end
of July, when the eruption finished, THEODOROS
was already running properly. The eruption end
allowed the implementation of the network by setting
up other reflectors in the SdF and redefining the
reference network. The actual system aims to follow
the post-eruptive movements of the recent lava flow
field. At present, THEODOROS counts 5 reflectors
for the reference system (400, BORD, SEMF, SPLB2
plus ELIS), 10 reflectors for monitoring movements in
the SdF (the four previously installed plus SDF9,
SDF10, SDF11, SDF12, SDF14, SDF16) and 2 more
reflectors to check the stability of the measurement
both on short and very long distance measurements
(CURV and CRV) (Fig. 4). The current measurement
strategy assumes that the horizontal geometry and the
relative distance of the reference system are fixed (by
fixing the coordinates of the reference system bench-
marks), while the Total Station adjusts its own vertical
positions by using only the internal vertical compen-
sators. The system performs 48 cycles of measure-
ments per day. At the beginning of each cycle, the
Total Station first carries out a series of measurements
on the reference system to define its orientation and

Fig. 4. THEODOROS system: end of July 2003 configuration.
G. Puglisi et al. / Engineering Geology 79 (2005) 13–31 19
the atmospheric effect; afterwards, it measures all 17
reflectors, by carrying out three series of left/right
measurements. All these choices result from the 3-
month-long testing of the THEODOROS system.
3.2. GPS permanent network (SciaraDat)
After the events of December 30th, the INGV
section of Catania, in agreement with the National
Department of Civil Protection, decided to set up a
GPS network, aimed at the real-time monitoring of
displacements in the highest part of the SdF, under the
realistic hypothesis that any future flank collapse
should be preceded by initial deformations in these
areas. To achieve this objective, two challenging
technical obstacles had to be overcome: the first
concerns the capability to install and remotely control
autonomous GPS stations within the SdF, and the
second is to produce positioning data of these stations
with a compatible time scale to the expected precursor
phenomena. The overcoming of these drawbacks led
to setting up the SciaraDat GPS permanent network
in less than 1 month. SciaraDat counted four stations
[SCRA, SDIC, SSBA, SVIN; pink circles in Fig. 2]
and a radio bridge near the PSF.
Adequately designed stations were placed on the
upper SdF slope and around the summit craters by
using helicopters, thus reducing the risk. The National
Department for Civil Protection provided two heli-
copters with high loading capacity that were used for
the two different types of remote stations, specifically
designed and realized: the first blightQ one (Fig. 5) wasused in SCRA, SDIC and for the radio-bridge near the
PSF, while the bheavyQ one (4000 kg; (Fig. 6)) was
used for the SSBA (Sotto Bastimento). All stations
had a prismatic shape, with triangular cross section;
one of the sides is the basement of the stations while a
second one supports the solar panels. Instruments and
batteries are contained within the prism.
Two identical iron frames formed each blightQstation. A steel pillar, ballasted with concrete (approx-
imately 400 kg) and buried, acted as the benchmarks
for the GPS antenna.
The set up of the heavy station was required in the
area below Bastimento because here it was impossible
to install any pillar and in order to work safely for
enough time to connect cables, arrange the iron
structure, etc. For these reasons, we planned to build
a station capable of being the benchmark for the GPS
antenna itself and able to be left on the field by only

Fig. 6. Photos and designing of SSBA station.
Fig. 5. Photos of SCRA and SDIC stations. We show the design of a steel pillar ballasted with concrete and buried that was used as the
benchmarks for the GPS antenna.
G. Puglisi et al. / Engineering Geology 79 (2005) 13–3120

G. Puglisi et al. / Engineering Geology 79 (2005) 13–31 21
one helicopter flight, without the work of specialized
technicians on the ground (Fig. 6). A special high
density concrete with melted iron was used for a fast
construction (48 h), without the use of traditional
reinforced concrete. The GPS antenna was placed on
the roof of the station. The traditional approach based
on the post processing of 24 h/day of GPS measure-
ments, sampled every 30 s, was not able to give fast
enough responses for an early warning to the
population of large regions of Southern Italy, poten-
tially affected by a large-scale tsunami (Tinti et al.,
1999). To provide data at suitable frequency, we
adopted the CRNet software (Leica and Geodetics
Inc., 2002) which applies the LAMBDA (Least
squares AMBiguity DecorrelAtion technique; Teunis-
sen, 1993) method for the fast resolution of the integer
ambiguities of the beating phase and is able to resolve
this problem in the so-called bEpoch-by-EpochQ(Bock et al., 2000) algorithm. Each time a single
epoch of GPS data is collected, this algorithm
produces a 3D position of the remote stations, with
respect to a bmasterQ whose coordinates are assumed
fixed. The levels of accuracy in positioning are in the
order of 1–2 cm in planimetry and 2–6 cm in altimetry
as demonstrated with internal tests performed on a
selected baseline on Mt. Etna during the month of
August 2002 (Mattia and Rossi, 2004). Other param-
eters used in the current operations of the data
processing procedure were the 108 cutoff angle and
the use of elevation dependency in variance/cova-
riance matrix, while we did not calculate the tropo-
spheric delay because the calculated baselines were
very short (1.5–3 km). In this way, we are potentially
able to retrieve 20 Hz frequency 3D positions data or
more, depending only on the GPS receiver character-
istics, and each epoch is independent of the other. For
optimizing and speeding-up the network setup, we
used Leica SR530 receivers, equipped with the Leica
AT 502 antennas, for the three remote stations
installed on the slopes of the volcano, and Leica AT
504 choke ring for the master station in San Vincenzo
Observatory. The total power consumption of the
remote stations amounted to 9 W, so four solar panels
(maximum power 65 W each one) and two deep cycle
110 Ah batteries have been utilized. We adopted 1 Hz
as sample frequency at SciaraDat.
The choice of the characteristics of the data
transmission system was strictly related to the adopted
software. The main requirements were to have enough
band amplitude and bi-directionality of the connec-
tions between the remote stations and the PC where
the CRNet software runs. In Fig. 7 the whole system
is shown. The system is divided in two parts: the first
connects the GPS receivers in the SdF to a radio-
bridge and the second one connects the radio-bridge
to the San Vincenzo Observatory, in the village of
Stromboli. The UHF-band radio-modem connects the
serial ports of the Leica SR530 remote receivers to the
bridge located near PSF, where a Serial-to-Ethernet
converter routes the signal (transformed in TCP/IP
protocol) over a Wi-Fi board (2.4 GHz, 802.11b
standard). A high-gain (24 dB) antenna on the San
Vincenzo Observatory roof receives the signals from
the bridge and then a Local Area Network (LAN)
connection brings the received data stream to the PC
where the software manages the raw GPS files. To
guarantee the continuity of the data stream, specific
software was implemented on the PC, simulating the
flux when the signal from one or more station was
absent; this might happen, for instance, when tempo-
rary failure occurs at the receiver or the radio-modem.
On the PC located at the master station of San
Vincenzo where CRNet runs, the data collected from
the remote stations are archived both in RINEX and
raw Leica LB2 format. The software processes the
data with 1-s latency and displays different levels of
positioning results on different windows on the PC
screen. Usually three kinds of result were suitable for
each remote station: the 1 Hz position, the median of
10 min of data positions and the median of 1 day of
data positions. One of the aims of this network was to
produce an alarm when significant deformation
phenomena are observed on the GPS data. To achieve
this, some useful statistics were introduced. CRNet
multi-epoch statistics are based on two robust
estimators, the median and the interquartile range
(IQR), which are less sensitive to data outliers than the
traditional mean and standard deviation. When a data
sample is drawn from a normal distribution, its mean
very nearly equals its median and its standard
deviation equals about three quarters of the IQR.
For intervals longer than a single epoch, the position
coordinates are determined as the median value of all
single-epoch positions within the interval, excluding
position coordinate outliers which are defined as
appropriate multiple of the IQR. Although the 1 Hz

Fig. 7. Sketch of SciaraDat data flow.
G. Puglisi et al. / Engineering Geology 79 (2005) 13–3122
data are very precise, multipath effects and local
transient radio signals can potentially degrade the
level of precision. For this reason the alarm has been
set up on the median of 10-min data set; for a fist test
we set the threshold alarm at 0.1 m on planimetry and
0.2 m in altimetry.
4. Data discussion
Data collected from this complex monitoring
system allowed to effectively monitor the deforma-
tions related both to the downslide movements of the
SdF and to the evolution of the volcanic activity. Here
we briefly discuss some significant volcanological
events observed in the data produced from the
monitoring system. For simplicity we can group the
data in three intervals, based on the main events
recorded during the volcanic eruption.
4.1. From January up to 16 February 2003
The first measurements collected from the STR
pillar confirmed that the reference network installed
around the summit area of the Stromboli did not
record any significant deformation (Fig. 8); this was
the first significant result of the monitoring that
excluded the possibility of a sector collapse involving
the summit craters area that might produce a large
phreatomagmatic explosion and a giant tsunami.
The measurements carried out on the benchmarks
located within the Fossa area allowed us to make some
hypotheses on the dynamic of the craters. We observed
a stepwise increase in the distances between the STR
pillar and the benchmarks of Fossa. This peculiar
deformation pattern could be linked to the movements
of the magmatic column within the craters; probably,
when the top of the magma drops down, the distance
increases between the crater flanks and the STR.

Fig. 8. EDM data collected from STR pillar, related to the bReference SystemQ and bFossaQ sub-networks.
G. Puglisi et al. / Engineering Geology 79 (2005) 13–31 23
The monitoring system gave us the opportunity to
observe the effects of the migration of effusive vents
from 550 to 600 m altitude. This phenomenon
produced a deformation field, whose evolution was
monitored both by GPS and EDM systems. Since
February 15th, several distances measured both from
the STR and PLB pillars showed significant varia-
tions with respect to the previous days, on bench-
marks located below the Bastimento area (Fig. 9).
Similarly, the SSBA GPS station, just installed,
measured a significant NW displacement. The climax
of this phenomenon was on February 16th. The
integration between the 3D movement detected by
the GPS station and the dense distribution of the
reflectors installed below the Bastimento enabled us
to understand this phenomenon. In fact, the point
PST4 recorded a very high ground deformation
(about 80 cm between 15 and 16 February) while
the other points close to PST4 recorded one order of
magnitude smaller movements (Fig. 10). The SSBA
data showed that the source of the movement was
upslope from the station. The abrupt decay of the

Fig. 9. EDM data collected from STR pillar, related to the sub-network, installed below the Bastimento. The data are shown in the top and
bottom panels at different scale.
G. Puglisi et al. / Engineering Geology 79 (2005) 13–3124
deformation and the stability of the reference points
on the summit area, as well as the absence of
movements at the GPS permanent network at the
foot of the volcano, confirmed that this phenomenon
was very local and did not affect either the entire
volcano or the whole unstable flank. This sustained
the hypothesis of a very shallow migration of
magma, towards the new active vents that opened
on February 16th, at 600 m altitude. All these data
have been provided in breal timeQ to the scientists
involved in the monitoring system. This capability,
the appropriate dense network configurations and the
integration between information provided by differ-
ent techniques, allowed us to give proper and timely
information to the DPC, avoiding raising a false
alarm of the possible large failure of SdF flank (as
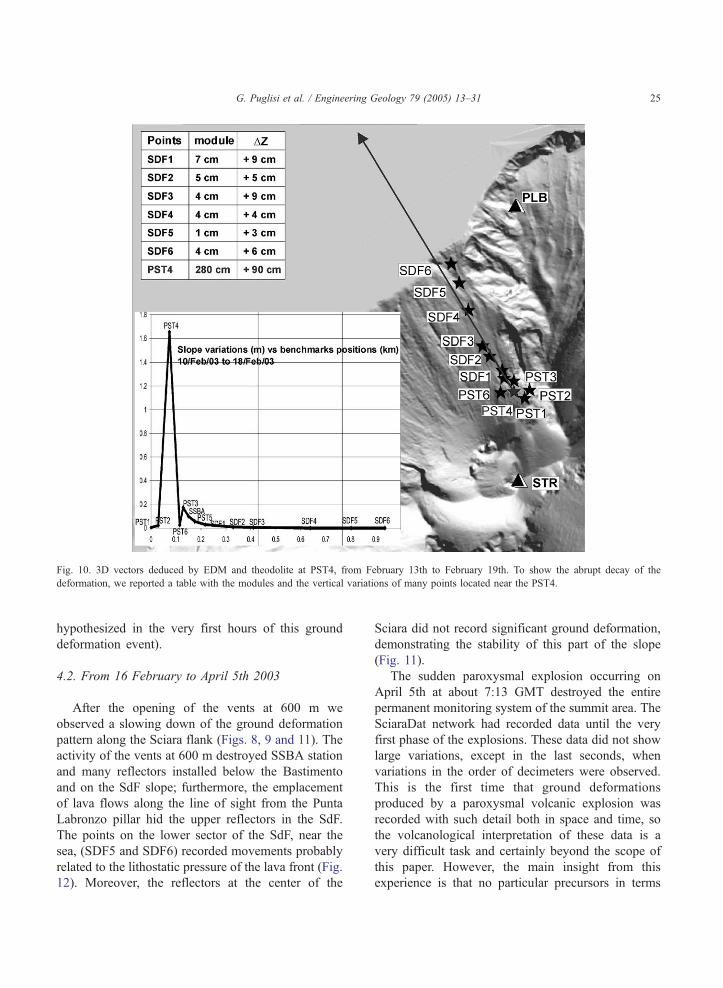
Fig. 10. 3D vectors deduced by EDM and theodolite at PST4, from February 13th to February 19th. To show the abrupt decay of the
deformation, we reported a table with the modules and the vertical variations of many points located near the PST4.
G. Puglisi et al. / Engineering Geology 79 (2005) 13–31 25
hypothesized in the very first hours of this ground
deformation event).
4.2. From 16 February to April 5th 2003
After the opening of the vents at 600 m we
observed a slowing down of the ground deformation
pattern along the Sciara flank (Figs. 8, 9 and 11). The
activity of the vents at 600 m destroyed SSBA station
and many reflectors installed below the Bastimento
and on the SdF slope; furthermore, the emplacement
of lava flows along the line of sight from the Punta
Labronzo pillar hid the upper reflectors in the SdF.
The points on the lower sector of the SdF, near the
sea, (SDF5 and SDF6) recorded movements probably
related to the lithostatic pressure of the lava front (Fig.
12). Moreover, the reflectors at the center of the
Sciara did not record significant ground deformation,
demonstrating the stability of this part of the slope
(Fig. 11).
The sudden paroxysmal explosion occurring on
April 5th at about 7:13 GMT destroyed the entire
permanent monitoring system of the summit area. The
SciaraDat network had recorded data until the very
first phase of the explosions. These data did not show
large variations, except in the last seconds, when
variations in the order of decimeters were observed.
This is the first time that ground deformations
produced by a paroxysmal volcanic explosion was
recorded with such detail both in space and time, so
the volcanological interpretation of these data is a
very difficult task and certainly beyond the scope of
this paper. However, the main insight from this
experience is that no particular precursors in terms

Fig. 11. EDM data collected from PLB pillar. As described in the text, PST4 recorded a very high ground deformation between 15 and 16
February, so it goes off the plot early in the time-series.
G. Puglisi et al. / Engineering Geology 79 (2005) 13–3126
of ground deformation have been observed in a
minimal span of time for a reasonable alert for this
kind of volcanic phenomena. In particular, from the
available data set we can deduce that the source of the
ground deformations associated with the paroxysmal
events is located in the body of the volcano edifice,
very near the crater area, and this might be the same as
Fig. 12. 3D vectors deduced by EDM and theodolite at SDF5 and
SDF6, from February 13th to March 21st.
the normal strombolian activity (Chouet et al., 2003),
as also hypothesized by Falsaperla and Spampinato
(2003).
4.3. After April 5th 2003
After the explosion of April 5th, the geodetic
networks were seriously damaged; only four bench-
marks (SDF5, SDF6, SDF7 and SDF8) out of more
than 20 remained. Unfortunately, these benchmarks
are not in ideal positions for detecting movements
related to eventual sliding on the SdF by using EDM
only. Due to their position, the principal component of
this kind of movement is almost orthogonal to the line
of the sight, so that the number of measurements
carried out from Labronzo pillar diminished and the
principal efforts were focused at setting up THEO-
DOROS. The comparison among the few distance
measurements carried out from the pillar and the first
measurements carried out by the THEODOROS
system–during its test phase–confirm that the ground
deformation pattern of four reflectors is quite stable up
to the end of July 2003 (Fig. 13).
The following improvement in the network con-
figuration allowed monitoring the post-eruptive
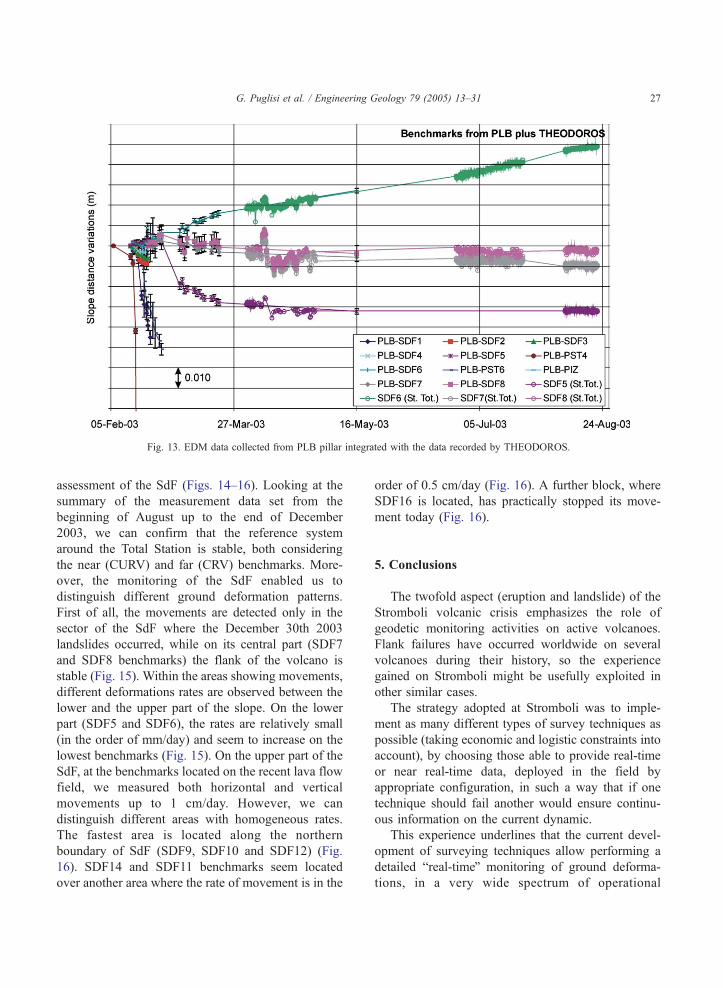
Fig. 13. EDM data collected from PLB pillar integrated with the data recorded by THEODOROS.
G. Puglisi et al. / Engineering Geology 79 (2005) 13–31 27
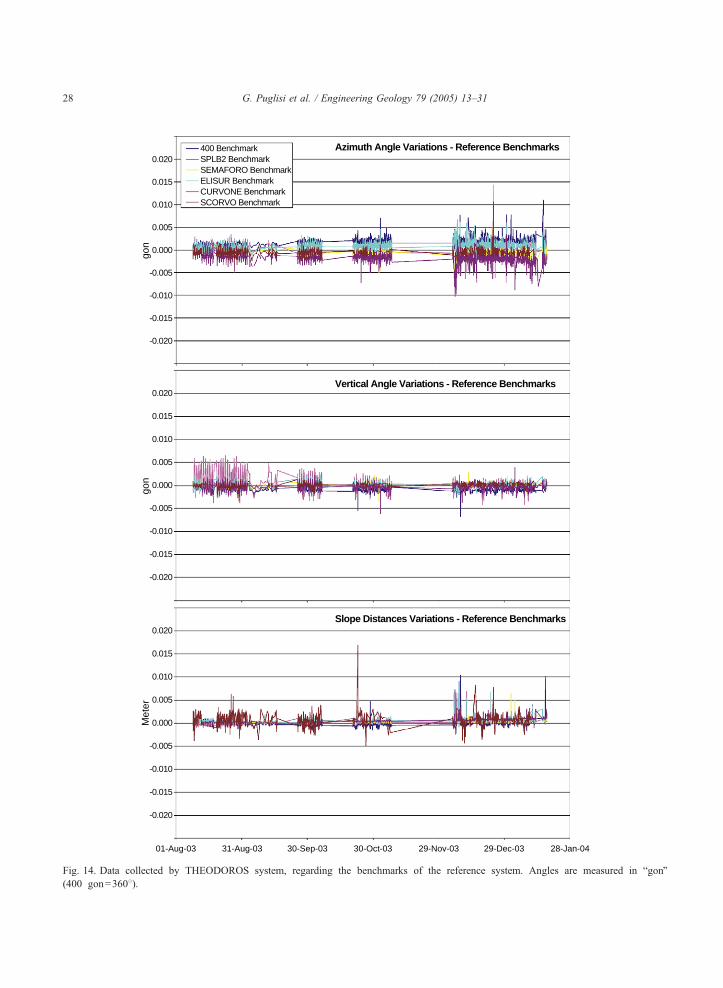
assessment of the SdF (Figs. 14–16). Looking at the
summary of the measurement data set from the
beginning of August up to the end of December
2003, we can confirm that the reference system
around the Total Station is stable, both considering
the near (CURV) and far (CRV) benchmarks. More-
over, the monitoring of the SdF enabled us to
distinguish different ground deformation patterns.
First of all, the movements are detected only in the
sector of the SdF where the December 30th 2003
landslides occurred, while on its central part (SDF7
and SDF8 benchmarks) the flank of the volcano is
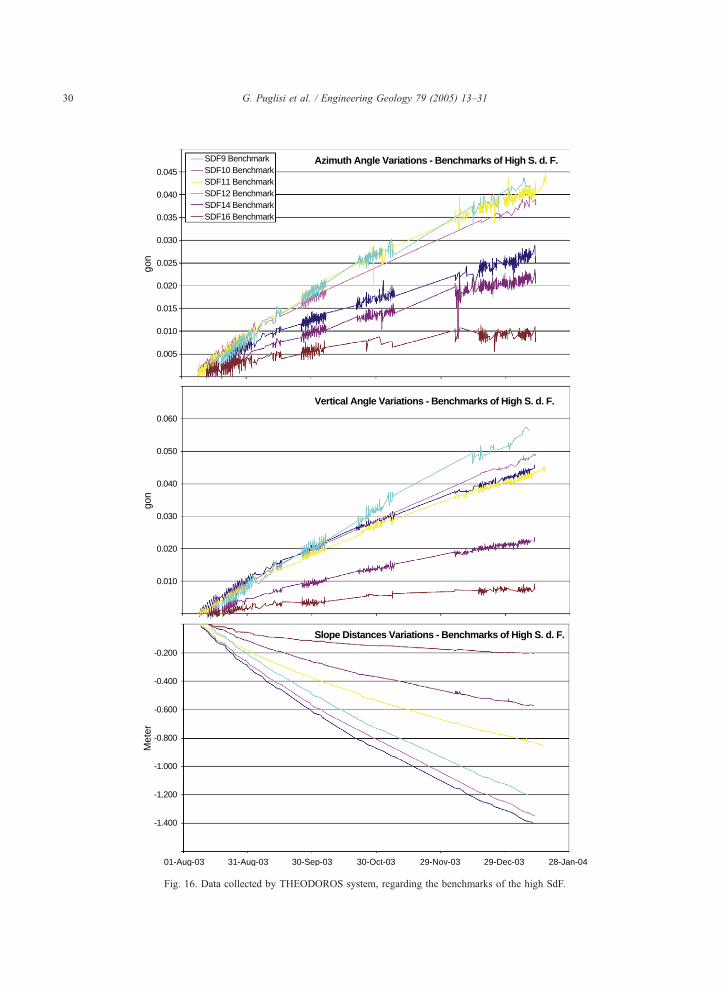
stable (Fig. 15). Within the areas showing movements,
different deformations rates are observed between the
lower and the upper part of the slope. On the lower
part (SDF5 and SDF6), the rates are relatively small
(in the order of mm/day) and seem to increase on the
lowest benchmarks (Fig. 15). On the upper part of the
SdF, at the benchmarks located on the recent lava flow
field, we measured both horizontal and vertical
movements up to 1 cm/day. However, we can
distinguish different areas with homogeneous rates.
The fastest area is located along the northern
boundary of SdF (SDF9, SDF10 and SDF12) (Fig.
16). SDF14 and SDF11 benchmarks seem located
over another area where the rate of movement is in the
order of 0.5 cm/day (Fig. 16). A further block, where
SDF16 is located, has practically stopped its move-
ment today (Fig. 16).
5. Conclusions
The twofold aspect (eruption and landslide) of the
Stromboli volcanic crisis emphasizes the role of
geodetic monitoring activities on active volcanoes.
Flank failures have occurred worldwide on several
volcanoes during their history, so the experience
gained on Stromboli might be usefully exploited in
other similar cases.
The strategy adopted at Stromboli was to imple-
ment as many different types of survey techniques as
possible (taking economic and logistic constraints into
account), by choosing those able to provide real-time
or near real-time data, deployed in the field by
appropriate configuration, in such a way that if one
technique should fail another would ensure continu-
ous information on the current dynamic.
This experience underlines that the current devel-
opment of surveying techniques allow performing a
detailed breal-timeQ monitoring of ground deforma-
tions, in a very wide spectrum of operational
400 BenchmarkSPLB2 BenchmarkSEMAFORO BenchmarkELISUR BenchmarkCURVONE BenchmarkSCORVO Benchmark
gon
gon
Met
erAzimuth Angle Variations - Reference Benchmarks
Vertical Angle Variations - Reference Benchmarks
Slope Distances Variations - Reference Benchmarks
0.020
0.015
0.010
0.005
0.000
-0.005
-0.010
-0.015
-0.020
0.020
0.015
0.010
0.005
0.000
-0.005
-0.010
-0.015
-0.020
0.020
0.015
0.010
0.005
0.000
-0.005
-0.010
-0.015
-0.020
01-Aug-03 31-Aug-03 30-Sep-03 30-Oct-03 29-Nov-03 29-Dec-03 28-Jan-04
Fig. 14. Data collected by THEODOROS system, regarding the benchmarks of the reference system. Angles are measured in bgonQ(400 gon=3608).
G. Puglisi et al. / Engineering Geology 79 (2005) 13–3128

SDF5 BenchmarkSDF6 BenchmarkSDF7 BenchmarkSDF8 Benchmark
gon
gon
Met
er
Azimuth Angle Variations - Benchmarks of Low S. d. F.
Vertical Angle Variations - Benchmarks of Low S. d. F.
Slope Distances Variations - Benchmarks of Low S. d. F.
0.025
0.020
0.015
0.010
0.005
0.000
-0.005
-0.010
-0.015
0.025
0.020
0.015
0.010
0.005
0.000
-0.005
-0.010
-0.015
0.025
0.020
0.015
0.010
0.005
0.000
-0.005
-0.010
-0.015
01-Aug-03 31-Aug-03 30-Sep-03 30-Oct-03 29-Nov-03 29-Dec-03 28-Jan-04
Fig. 15. Data collected by THEODOROS system, regarding the benchmarks of the low SdF.
G. Puglisi et al. / Engineering Geology 79 (2005) 13–31 29
SDF9 BenchmarkSDF10 BenchmarkSDF11 BenchmarkSDF12 BenchmarkSDF14 BenchmarkSDF16 Benchmark
gon
gon
Met
erAzimuth Angle Variations - Benchmarks of High S. d. F.
Vertical Angle Variations - Benchmarks of High S. d. F.
Slope Distances Variations - Benchmarks of High S. d. F.
0.045
0.040
0.035
0.030
0.025
0.020
0.015
0.010
0.005
0.060
0.050
0.040
0.030
0.020
0.010
-0.200
-0.400
-0.600
-0.800
-1.000
-1.200
-1.400
01-Aug-03 31-Aug-03 30-Sep-03 30-Oct-03 29-Nov-03 29-Dec-03 28-Jan-04
Fig. 16. Data collected by THEODOROS system, regarding the benchmarks of the high SdF.
G. Puglisi et al. / Engineering Geology 79 (2005) 13–3130
G. Puglisi et al. / Engineering Geology 79 (2005) 13–31 31
conditions. The achievable accuracies in 3D position-
ing are suitable for scientific and early warning
purposes. The successfully applied strategy at Strom-
boli allowed the Civil Protection Authorities to
appropriately manage the volcanic crisis.
From the volcanological point of view, the geodetic
monitoring of the Stromboli volcano enables collect-
ing important data on the dynamic of the eruption,
both on the eruptive vents (episode of February 16th)
and craters (explosion of April 5th); this information
certainly represents a valued data set for future
researches to understand how the plumbing system
of this volcano works, mainly during eruptive events.
Furthermore, the monitoring system now provides
very useful data relevant to the post-eruptive dynamic
of the SdF; these positive results suggest this system is
a useful tool to identify movements for forecasting
large future landslides that could occur on the SdF.
Acknowledgments
The authors are indebted to G. Bertolaso, Director
of the National Department of Civil Protection (DPC),
and the DPC team working at the Advanced Operative
Centre at S. Vincenzo Observatory, led by B. de
Bernardinis, for their support in installing and
managing the complex monitoring system during the
eruption. Special thanks are also due to M. Zaia and
the other brave and generous Volcanological Guides,
the bGuardia di FinanzaQ staff and the helicopter pilots
and technicians who aided the difficult fieldwork
during the eruption.
The authors are grateful to E. Boschi, President of
INGV, who encouraged this work. We also acknow-
ledge M. Rosi for the thought-provoking discussions
and for his support in installing the EDM monitoring
system. Last but not least, sincere thanks are due to
P.G. Scalato and the many other INGV colleagues and
researchers of other institutions involved in the
Stromboli emergency for the stimulating professional
discussions and personal support during the tasking
days of the eruption.
References
Barberi, F., Rosi, M., Sodi, A., 1993. Volcanic hazard assessment at
Stromboli based on a review of historical data. Acta Vulcanol. 3,
173–187.
Bertagnini, A., Coltelli, M., Landi, P., Pompilio, M., Rosi, M., 1999.
Violent explosions yield new insights into dynamics of
Stromboli volcano. EOS Trans. Am. Geophys. Union 80,
633–636.
Bock, Y., Nokolaidis, R.M., de Jong, P.J., Bevis, M., 2000.
Instantaneous geodetic positioning at medium distances with
the Global Positioning System. J. Geophys. Res. 105 (B12),
28223–28253.
Bonaccorso, A., 1998. Evidence of a dyke-sheet intrusion at
Stromboli volcano inferred through continuous tilt. Geophys.
Res. Lett. 25 (22), 4225.
Chouet, B., Dawson, P., Ohminato, T., Martini, M., Saccorotti, G.,
Giudicepietro, F., De Luca, G., Milana, G., Scarpa, R., 2003.
Source mechanisms of explosions at Stromboli determined from
moment tensor inversion of very long period data. J. Geophys.
Res. 108, 2019.
Falsaperla, S., Spampinato, S., 2003. Seismic insights into explosive
paroxysm at Stromboli volcano, Italy. J. Volcanol. Geotherm.
Res. 125, 137.
Leica and Geodetics Inc., 2002. Software Crnet User Manual.
Mattia, M., Rossi, M., 2004. Sperimentazione di un sistema di
monitoraggio vulcanico per mezzo di tecniche GPS in tempo
reale. INGV CT internal report.
Teunissen, P.J.G., 1993. Least-Squares Estimation of the Integer
GPS Ambiguities. LGR Series, vol. 6. Delft Geodetic Comput-
ing Centre.
Tinti, S., Bortolucci, E., Romagnoli, C., 1999. Computer
simulations of tsunamis due to flank collapse at Stromboli,
Italy. J. Volcanol. Geotherm. Res. 96, 103–128.
Tinti, S., Pagnoni, G., Zaniboni, F., Armigliato, A., 2003.
Simulations of the 30 December 2002 Stromboli tsunami, Italy.
Geophys. Res. Abstr. 5, 10804 (EGS Assembly, 6–11 April
2003, Nizza).
Copyright © 2022 FDOKUMEN