
Geodetic imaging of late postseismic lower crustal flow in Tibet
8
Earth and Planetary Science Letters 404 (2014) 136–143 Contents lists available at ScienceDirect Earth and Planetary Science Letters www.elsevier.com/locate/epsl Geodetic imaging of late postseismic lower crustal flow in Tibet Isabelle Ryder a,∗ , Hua Wang b,c , Lidong Bie a , Andreas Rietbrock a a Liverpool Earth Observatory, University of Liverpool, United Kingdom b Department of Surveying Engineering, Guangdong University of Technology, Guangzhou, 510006, China c State Key Laboratory of Earthquake Dynamics, Institute of Geology, China Earthquake Administration, Beijing, 100029, China a r t i c l e i n f o a b s t r a c t Article history: Received 18 April 2014 Received in revised form 20 July 2014 Accepted 23 July 2014 Available online 15 August 2014 Editor: P. Shearer Keywords: lower crustal flow Tibetan Plateau InSAR Beng Co postseismic Integral to understanding past and present seismotectonic activity in orogenic zones is whether any part of the lower crust is weak enough to flow, since a weak zone at depth influences the style of deformation that occurs. Thick crust such as found beneath the Tibetan Plateau and the Altiplano–Puna Plateau in the Andes leads to elevated temperatures at depth, which potentially allows the lower crust to flow on human time scales, as well as on the time scales of plateau formation and evolution. Here we use the late postseismic response of the crust to large earthquakes as a tool for investigating rheological structure beneath the Tibetan Plateau. Eighteen years (1992–2010) of InSAR data on the southern Tibetan Plateau show a late postseismic relaxation response to two large earthquakes in 1951 and 1952. The relaxation occurs throughout a thick viscoelastic lower crust and possibly extends into the upper mantle. The lower crust has viscosity 6–10 × 10 19 Pa s, with an associated Maxwell relaxation time of 63 years. Flow within a thin mid-crustal channel can be ruled out. These late-stage postseismic observations represent the first clear evidence of present-day lower crustal flow, and are consistent with geophysical evidence for fluid- weakened lower crust across much of the Tibetan Plateau, as required by models of plateau formation. Active deformation of continental plateaus in other parts of the world, notably the Altiplano–Puna Plateau in South America, may also be strongly influenced by a weak lower crust. © 2014 Elsevier B.V. All rights reserved. 1. Introduction The structure of the Tibetan Plateau crust is of wide interest because it is a major control on how the Plateau formed and how it deforms today. Since the entire lithosphere is involved in the tectonic deformation that leads to plateau building and seismic ac- tivity, geodynamic and earthquake cycle models require knowledge of how mechanical properties vary with depth. Central to debates about rheological structure is whether or not the lower crust is weak enough to flow over geological time scales. Much geophys- ical evidence now suggests that the lower crust beneath Tibet is weaker than typical continental crust, as reviewed by Klemperer (2006). Most compellingly, magnetotelluric studies infer high con- ductivity at depth, which can be attributed to partial melts or other fluids (Chen et al., 1996; Wei et al., 2001). Measurements of anisotropy beneath Tibet imply that deformation has occurred within an intracrustal weak layer over geological time (Shapiro et al., 2004; Duret et al., 2010). Here we use the term “weak lay- er” simply to refer to a layer with notably lower viscosity than its surroundings, without prescribing a specific viscosity for the layer. * Corresponding author. E-mail address: [email protected] (I. Ryder). For the Andes, Husson and Sempere (2003) discuss how the Alti- plano crust may have thickened due to lateral lower crustal flow from the flanking Cordilleras. Yuan et al. (2000) interpreted a seis- mic low velocity zone beneath the Central Andes as a layer of partial melt and ongoing metamorphism, and drew a direct com- parison with the weak layer beneath the Tibetan Plateau, suggest- ing that such zones may play a fundamental part in continental orogenesis. To date, however, the process of flow itself (as opposed to mechanical properties that might allow it) has not been defini- tively imaged. The occurrence of lower crustal flow would be supported by solid evidence for the process of viscoelastic relaxation (VER), whereby earthquake-induced stress changes are slowly relaxed by solid-state flow. The ability of the lower crust to flow over decadal time scales in response to earthquakes has two important impli- cations: firstly, it means that interseismic strain may vary with depth, which should be factored into earthquake cycle models; and secondly, it raises the possibility that flow can also occur over geological time scales, thus influencing the evolution of an en- tire orogenic zone. Several major Tibetan Plateau earthquakes have been investigated for VER signatures. Strike-slip events tend to be poor at distinguishing VER from afterslip (Ryder et al., 2007, 2011; Wen et al., 2012). Although normal faults have a distinctive VER http://dx.doi.org/10.1016/j.epsl.2014.07.026 0012-821X/© 2014 Elsevier B.V. All rights reserved.
-
Upload
khangminh22 -
Category
Documents
-
view
1 -
download
0
Transcript of Geodetic imaging of late postseismic lower crustal flow in Tibet

Earth and Planetary Science Letters 404 (2014) 136–143
Contents lists available at ScienceDirect
Earth and Planetary Science Letters
www.elsevier.com/locate/epsl
Geodetic imaging of late postseismic lower crustal flow in Tibet
Isabelle Ryder a,∗, Hua Wang b,c, Lidong Bie a, Andreas Rietbrock a
a Liverpool Earth Observatory, University of Liverpool, United Kingdomb Department of Surveying Engineering, Guangdong University of Technology, Guangzhou, 510006, Chinac State Key Laboratory of Earthquake Dynamics, Institute of Geology, China Earthquake Administration, Beijing, 100029, China
a r t i c l e i n f o a b s t r a c t
Article history:Received 18 April 2014Received in revised form 20 July 2014Accepted 23 July 2014Available online 15 August 2014Editor: P. Shearer
Keywords:lower crustal flowTibetan PlateauInSARBeng Copostseismic
Integral to understanding past and present seismotectonic activity in orogenic zones is whether any part of the lower crust is weak enough to flow, since a weak zone at depth influences the style of deformation that occurs. Thick crust such as found beneath the Tibetan Plateau and the Altiplano–Puna Plateau in the Andes leads to elevated temperatures at depth, which potentially allows the lower crust to flow on human time scales, as well as on the time scales of plateau formation and evolution. Here we use the late postseismic response of the crust to large earthquakes as a tool for investigating rheological structure beneath the Tibetan Plateau. Eighteen years (1992–2010) of InSAR data on the southern Tibetan Plateau show a late postseismic relaxation response to two large earthquakes in 1951 and 1952. The relaxation occurs throughout a thick viscoelastic lower crust and possibly extends into the upper mantle. The lower crust has viscosity 6–10 × 1019 Pa s, with an associated Maxwell relaxation time of 63 years. Flow within a thin mid-crustal channel can be ruled out. These late-stage postseismic observations represent the first clear evidence of present-day lower crustal flow, and are consistent with geophysical evidence for fluid-weakened lower crust across much of the Tibetan Plateau, as required by models of plateau formation. Active deformation of continental plateaus in other parts of the world, notably the Altiplano–Puna Plateau in South America, may also be strongly influenced by a weak lower crust.
© 2014 Elsevier B.V. All rights reserved.
1. Introduction
The structure of the Tibetan Plateau crust is of wide interest because it is a major control on how the Plateau formed and how it deforms today. Since the entire lithosphere is involved in the tectonic deformation that leads to plateau building and seismic ac-tivity, geodynamic and earthquake cycle models require knowledge of how mechanical properties vary with depth. Central to debates about rheological structure is whether or not the lower crust is weak enough to flow over geological time scales. Much geophys-ical evidence now suggests that the lower crust beneath Tibet is weaker than typical continental crust, as reviewed by Klemperer(2006). Most compellingly, magnetotelluric studies infer high con-ductivity at depth, which can be attributed to partial melts or other fluids (Chen et al., 1996; Wei et al., 2001). Measurements of anisotropy beneath Tibet imply that deformation has occurred within an intracrustal weak layer over geological time (Shapiro et al., 2004; Duret et al., 2010). Here we use the term “weak lay-er” simply to refer to a layer with notably lower viscosity than its surroundings, without prescribing a specific viscosity for the layer.
* Corresponding author.E-mail address: [email protected] (I. Ryder).
http://dx.doi.org/10.1016/j.epsl.2014.07.0260012-821X/© 2014 Elsevier B.V. All rights reserved.
For the Andes, Husson and Sempere (2003) discuss how the Alti-plano crust may have thickened due to lateral lower crustal flow from the flanking Cordilleras. Yuan et al. (2000) interpreted a seis-mic low velocity zone beneath the Central Andes as a layer of partial melt and ongoing metamorphism, and drew a direct com-parison with the weak layer beneath the Tibetan Plateau, suggest-ing that such zones may play a fundamental part in continental orogenesis. To date, however, the process of flow itself (as opposed to mechanical properties that might allow it) has not been defini-tively imaged.
The occurrence of lower crustal flow would be supported by solid evidence for the process of viscoelastic relaxation (VER), whereby earthquake-induced stress changes are slowly relaxed by solid-state flow. The ability of the lower crust to flow over decadal time scales in response to earthquakes has two important impli-cations: firstly, it means that interseismic strain may vary with depth, which should be factored into earthquake cycle models; and secondly, it raises the possibility that flow can also occur over geological time scales, thus influencing the evolution of an en-tire orogenic zone. Several major Tibetan Plateau earthquakes have been investigated for VER signatures. Strike-slip events tend to be poor at distinguishing VER from afterslip (Ryder et al., 2007, 2011; Wen et al., 2012). Although normal faults have a distinctive VER

I. Ryder et al. / Earth and Planetary Science Letters 404 (2014) 136–143 137
Fig. 1. ERS/Envisat rate maps. Inset shows location. Colours indicate line-of-sight (LOS) velocities for 1992–2010. Positive values indicate motion away from the satellite. Topography is the Global Multi-Resolution Topography (GMRT) compilation (Ryan et al., 2009). Black/red lines are faults are from Styron et al. (2010). Red lines indicate 1951 and 1952 ruptures (Armijo et al., 1986, 1989). Yellow rectangles show coverage of SAR tracks. Long/short white arrows indicate satellite flight/look directions respectively. (For interpretation of the references to color in this figure legend, the reader is referred to the web version of this article.)
signature, no evidence for VER has been found for moderate-sized extensional events on the Plateau (Ryder et al., 2010; Bie et al., 2014; Bie and Ryder, 2014).
To try and identify solid evidence for VER, we looked much fur-ther back in the seismic record than previous Tibet studies. We use 18 years (1992–2010) of radar data from the ERS and Envisat satel-lites to look for a postseismic signal from two major earthquakes that occurred in 1951 and 1952 at the northern extremity of the Yadong–Gulu rift. The first event was strike-slip (Tapponnier et al., 1981; Armijo et al., 1989) and ruptured parallel strands of the Beng Co Fault (Fig. 1). The second event was extensional and is thought to have ruptured the east-dipping Gulu Fault (Armijo et al., 1986). By focusing on (a) late-stage postseismic, and (b) a combination of strike-slip and normal faults, any observed signal should indicate VER decisively. Since the data cover the fifth and sixth postseismic decades – by far the latest postseismic stage investigated for any Tibetan event – any observed signal should be solely attributable to VER, and not contaminated by shorter-lived processes such as afterslip and poroelastic rebound. The focus in this study of late postseismic deformation starts to bridge the gap between late in-terseismic and early postseismic studies, which on their own may provide an incomplete picture of the earthquake cycle.
2. SAR data processing and rate map formation
We obtained SAR data from ERS and Envisat satellites on three descending tracks covering the two faults: Track 176 (west), Track 405 (central) and Track 133 (east), with each track having at least 30 acquisitions. ERS scenes cover from 1992 to 2000, and En-visat scenes cover from 2003 to 2010. Only a handful of ascending scenes were available, with limited time span, so we did not use these data. We formed 250 interferograms (Table S1) using the JPL/Caltech ROI_PAC software (Rosen et al., 2004). The coherence is in general fairly good, except for the lakes and the snow-covered Mount Nyainqentanglha. Baseline-time plots are shown for each satellite and each track in Fig. S1. We removed the topographic phase using the 3-arc-second DEM from the Shuttle Radar Topo-
graphy Mission (Farr and Kobrick, 2000). The interferograms were unwrapped using a branch-cut method (Goldstein and Werner, 1998), and then we manually connected isolated patches by setting bridges and fixed phase unwrapping errors using a phase closure approach (Biggs et al., 2007).
Since the observed signal is expected to be small so late in the postseismic period, we used the �-RATE software (Wang et al., 2012) to estimate a velocity rate map (main text, Fig. 1) and its associated uncertainties for each track. Using a network-based approach (Biggs et al., 2007), we used planar models to miti-gate long-wavelength effects in the interferograms due to impre-cise orbits, and used a linear function to remove topographically-correlated atmospheric delay errors. Finally, a linear line-of-sight (LOS) velocity and its uncertainty were estimated for each pixel using an iterative weighted least-squares method.
The discrepancy in line-of-sight velocities between the rate maps on overlapping tracks was calculated on a point-by-point ba-sis. So that differences could be taken, the rate maps were first resampled onto a master grid. The histogram in Fig. S2 shows the distribution of discrepancies. The 16/84 percentiles of dif-ference (�φ) are 0.62/0.99 mm/yr for tracks 133 and 405, and −0.58/1.24 mm/yr for tracks 405 and 176.
The mosaicked InSAR rate maps in Fig. 1 show average line-of-sight (LOS) velocities from 1992 to 2010. Two clear features are seen:
(i) Tracks 176 and 405: change in sign across the Beng Co Fault, from positive south of the fault to negative north of the fault. This is equivalent to right-lateral motion, consistent with the known sense of motion on the fault.
(ii) Tracks 405 and 133: negative range change east of the Gulu Fault trace. The negative lobe may extend laterally into moun-tainous zones that are incoherent in the rate maps.
The two lobes on Track 176 terminate at ∼90.5 E, just beyond the end of the 1951 rupture, rather than continuing to the west-ern end of the Beng Co Fault, which suggests that the observed

138 I. Ryder et al. / Earth and Planetary Science Letters 404 (2014) 136–143
signal is transient and not interseismic. The peak-to-peak ampli-tude of the LOS velocities across the Beng Co Fault is ∼3 mm/yr, equivalent to a right-lateral rate of 7.7 mm/yr. The two signals re-ferred to above differ in detail between tracks. For instance, the magnitude of the Gulu Fault negative lobe is slightly greater for Track 405 compared to Track 133. The differences may result from varying satellite look angle and orbital phase ramps.
3. Magnitude estimates for the 1951 and 1952 earthquakes
In order to model the viscoelastic response of the 1951 and 1952 earthquakes, estimates of source parameters are required. Seismic moment is a key parameter, being directly related to fault size and amount of slip. Since the earthquakes were recorded over six decades ago, before standard techniques for calculating seis-mic moment and focal mechanism were established, magnitudes are uncertain. We consulted papers to establish the range of likely moment magnitudes. Chen and Molnar (1983) used long-period surface wave spectral densities to compute the seismic moment for the 1951 event. Making an assumption of combined right-lateral strike-slip and normal faulting (i.e., a rake of −135◦) and a dip of 45◦ , they obtained a moment of 4.60 × 10²⁰ N m. This is equiva-lent to Mw 7.7, as listed in the centennial catalogue of Engdahl and Villaseñor (2002). Fieldwork in the area led to the association of the strike-slip Beng Co Fault with the 1951 rupture (Armijo et al., 1989). This information was used by Molnar and Qidong (1984) to revise the previous moment estimate of Chen and Molnar (1983): an assumption of pure strike-slip faulting gives a moment range of 1.5 to 5 × 10²⁰ N m. This is equivalent to a moment magnitude (Mw) range of 7.42 to 7.77. Note that this moment magnitude range is lower than the often-cited surface wave magnitude (Ms) value of 8.0 (Gutenberg and Richter, 1954).
The 1952 event has not been investigated to the same extent as the 1951 event, and there are no moment estimates derived di-rectly from seismic records. The magnitude was originally listed as 7.5 (Gutenberg and Richter, 1954), but reconsideration of work-sheets led to an Ms value of 7.6 (Abe, 1981). Values of moment magnitude have been estimated from this Ms value using empirical relationships (Pacheco and Sykes, 1992), yielding a seismic mo-ment of 3.47 ×10²⁰ N m (Ekström and Dziewonski, 1988), which is equivalent to Mw 7.66. Inclusion of error bounds in the linear co-efficients of another empirical relationship (Scordillis, 2006) leads to an Mw between 7.32 and 7.89. Given that the maximum normal fault magnitude globally is 7.3 (Wells and Coppersmith, 1994), we suspect that Mw for this extensional event is towards the lower end of the stated range. The magnitudes of both earthquakes are investigated further below.
4. Viscoelastic modelling
To model VER we used the code VISCO1D, which computes dis-placements on a layered spherical Earth (Pollitz, 1997). The layers vary in properties radially, and not laterally. Our primary aim is to identify the depth, thickness and viscosity of any viscoelastic lay-ers beneath the elastic upper crust. Preliminary tests indicated that the viscosity of the weak layer must be at least 1 × 10¹⁹ Pa s, oth-erwise the modelled pattern of displacements has a much longer wavelength and/or a very different pattern than that observed in the InSAR rate maps (see Fig. S3 for an example). We varied the viscosity of the weaker layer between 1 × 10¹⁹ and 1 × 10²¹ Pa s. The rate map for each track was down-sampled by a factor of 9 on a regular grid, and displacements in the E–W, N–S and verti-cal directions are computed on the resulting grids, and converted to line-of-sight surface velocities.
Table 1Summary of earthquake source parameters used in the viscoelastic modelling.
Beng Co 1 Beng Co 2 Beng Co 3 Gulu
Latitudea 31.044 31.197 31.358 30.795Longitudea 91.465 91.203 90.950 91.536Length (km) 30 30 30 40Strike 125 125 125 10Dip 90 90 90 60Rake 180 180 180 −90Top (km) 0 0 0 0Bottom (km) 10 10 10 10Slip (m)b 6.3 12.6 6.3 9.6
a Latitude and longitude refer to the centre of the fault trace of each fault seg-ment.
b Slip values given are those used once the earthquake magnitude sensitivity tests had been carried out.
4.1. Solving for earthquake magnitudes
Given the earthquake magnitude uncertainties, we ran mod-els to determine (i) the most likely magnitude combination, and (ii) how magnitudes affect viscosity. For the Beng Co earthquake, magnitude (MBeng Co) was allowed to vary between 7.4 and 7.8, in increments of 0.1. For the Gulu earthquake, magnitude (MGulu) was allowed to vary between 7.2 and 7.6, again in increments of 0.1. The lower range was chosen for the Gulu event because the shorter fault length and the extensional mechanism make it likely that its magnitude was smaller than that of the Beng Co event. For each combination of magnitudes, slip on the two faults was calculated using the relationship M0 = μu A, where M0 is seismic moment, μ is shear modulus, u is slip and A is area of the fault rupture. For the Gulu Fault, uniform slip was assumed. A typical normal fault dip of 60◦ is assumed, along with a depth extent of 0–10 km, which gives a down-dip rupture width of 11.5 km. The Beng Co rupture was modelled as three segments each 30 km long, on which uniform slip occurs, with the middle segment slipping twice as much as the flanking segments. This symmetrical distribution is based on a field-derived slip model (Armijo et al., 1989). The rup-ture extends from the surface to a depth of 10 km, on a vertical fault. Since the two fault strands are only ∼6 km apart where they overlap, and any VER would occur well beneath this depth, we choose not to model the two strands of the fault separately: in-stead, we model a single fault running through Beng Co lake. A value for μ of 32 GPa is assumed.
For investigation of earthquake magnitudes, the Earth is sim-plified as an elastic upper layer overlying a Maxwell viscoelastic half-space. For different magnitude combinations, LOS velocities were computed over a range of viscosities, and the optimal vis-cosity for each magnitude pair was determined according to the following equation:
NRMS = RMS(d − m)
RMS(d) + RMS(m)
where d refers to the InSAR data and m refers to the model out-puts. Normalised RMS is used to account for the large variation in modelled displacements over the viscosity range. The models tested are able to reproduce the first order features of the observed InSAR rate maps: the negative lobe over the Gulu Fault, and the positive/negative pair of lobes either side of the Beng Co Fault. The lowest misfit was for a 15 km thick lid, with MBeng Co = 7.6 and MGulu = 7.4. Over the magnitude space tested, viscosity varied by less than half an order of magnitude, from 5 ×10¹⁹ to 1 ×10²⁰ Pa s.
4.2. Rheological structure of the thick Tibetan crust
Having established the most likely magnitudes, we now investi-gate rheological structure. Slip values corresponding to the optimal

I. Ryder et al. / Earth and Planetary Science Letters 404 (2014) 136–143 139
Fig. 2. Schematic cross section through Tibetan lithosphere, showing the layered structures investigated in the modelling: (a) lid over half-space case; (b) lower crust case; (c) thin layer case.
magnitudes are used (Table 1). Models are run with elastic lid thicknesses H = 15, 20 and 30 km. Since the relaxation signal is small, we do not attempt to finely resolve the thickness of the vis-coelastic layer (h), but rather test three scenarios for the lower crust: (1) a viscoelastic half-space (hereafter referred to as the “lid over half-space scenario”); (2) a viscoelastic layer 20 km thick, un-derlain by elastic material (the “thin layer scenario”); and (3) a viscoelastic layer extending down to the Moho, underlain by an elastic upper mantle (the “lower crust scenario”). The three scenar-ios are illustrated in Fig. 2. Since the Moho is 75 km deep in this area, it is difficult to determine the viscosity of the upper mantle, and so we do not attempt to constrain this explicitly.
Normalised root mean square (NRMS) misfit curves are shown in Fig. 3(a). Misfit values are shown for viscosities between 1019
and 1021 Pa s. An example of the poor fit to the InSAR data for lower viscosities is shown in Supplementary Fig. S3. For the lid over half-space scenario (thick solid lines), the optimal fit is for H = 15 km and a viscosity of 6 × 10¹⁹ Pa s, for which the NRMS is 0.33. Monte Carlo analysis using 100 datasets perturbed with correlated noise yielded viscosities as follows: 73% at 6 ×10¹⁹ Pa s, and 27% at 5 × 10¹⁹ Pa s. The uncertainty in viscosity is thus smaller than that resulting from unknown earthquake magnitudes. Minimum NRMS values when H > 15 km are up to a few percent greater than the optimal case, and the viscosity decreases slightly.
For the thin layer scenario (thin dashed lines), the minimum misfit is 0.45, for which H is again 15 km, though the viscosity of 2 × 10¹⁹ Pa s is not well constrained. For the lower crust scenario, the results fall between the two previous scenarios. One represen-tative curve (orange line in Fig. 3) is shown, for the case when H = 30 km and h = 45 km. Overall, the minimum NRMS is 0.38, when H = 15 km and the viscosity is 6 × 10¹⁹ Pa s. Modelling re-sults are summarised in Table 2.
Observed, modelled and residual rate maps are shown in Fig. 3(b)–(d) for the lid over half-space scenario, and in Supple-mentary Figs. S4 to S6 for all three scenarios. Modelled velocities are slightly under-predicted for Track 176 and over-predicted for Track 133. Some discrepancy may arise from uncertainty in earth-quake magnitudes. Viscosity may also vary slightly within the study area, but trade-offs between earthquake magnitude and vis-cosity preclude attempts to resolve lateral variations. As suggested by the conductivity profile shown in Chen et al. (1996) along
Table 2Summary of viscoelastic modelling results. NRMS is normalised root mean square misfit.
Model Optimal lid thickness (km)
Viscosity (Pa s)
NRMS
Lid over half-space 15 6 × 10¹⁹ (Half-space) 0.33Thin layer 15 2 × 10¹⁹ (Layer) 0.45Lower crust 15 6 × 10¹⁹ (Lower crust) 0.38
INDEPTH line 200 (their Fig. 2), upper crustal thickness may also vary within the study area. The assumption of uniform as opposed to variable slip on fault segments is another source of residual. Furthermore, a small amount of interseismic deformation may be superimposed on the postseismic signal, which could slightly alter the viscosity values obtained. Interseismic slip rates are not well constrained, but are discussed in the Discussion, and a first order model of interseismic surface deformation is presented.
To summarise the modelling results, we conclude that, under an assumption of a Maxwell viscoelastic rheology: (1) the InSAR data clearly indicate postseismic viscoelastic stress relaxation; (2) relax-ation occurred in the lower crust, and possibly the upper mantle; (3) a thin viscoelastic layer within the lower crust is not favoured; (4) the viscosity of the lower crust is 6 ×10¹⁹ Pa s (5–10 ×1019 Pa sif earthquake magnitude uncertainties are taken into account). The Maxwell relaxation time associated with this viscosity is 63 years.
5. Discussion
5.1. Depth extents of weak layer
In this study we have used earthquakes in the middle of last century to probe deep into the Earth’s crust beneath the Tibetan Plateau. By examining the surface deformation that oc-curred several decades after the earthquakes themselves, we can infer that the crust is still responding to these major events. This means that some part of the crust must be weak and ductile. We can rule out a weak zone restricted only to the mantle, be-cause the wavelength of the observed deformation is of the or-der of 40 km (peak-to-peak across the Beng Co Fault), indicating an intra-crustal driving source. The upper depth of this driving

140 I. Ryder et al. / Earth and Planetary Science Letters 404 (2014) 136–143
Fig. 3. (a) NRMS misfit curves. Thick solid lines represent the lid over half-space scenario, while dashed lines represent the thin layer scenario. The orange and black lines refer to two particular cases of the lower crust scenario. In legend, H is thickness of upper elastic layer, h denotes thickness of finite viscoelastic layer, and HS denotes viscoelastic half-space. (b) Observed, (c) modelled and (d) residual displacements for the optimal case in the lid over half-space scenario. (For interpretation of the references to color in this figure legend, the reader is referred to the web version of this article.)
source is constrained by the InSAR signal to be <30 km, which we note is lower than the upper crustal thickness of 25–60 km used in some modelling studies (e.g., Clark and Royden, 2000;Shen et al., 2001). Since the Moho is at 75 km depth in our study area, we cannot finely resolve the viscosity of the upper mantle, but we suggest that the upper mantle may be as strong as or stronger than the lower crust. Thus, viscoelastic relaxation may ex-tend into the upper mantle, or it may be confined to the lower crust, depending on the viscosity contrast between the two.
5.2. Coupling vs. decoupling
The depth–strength profile of the lithosphere has implications for whether the upper crust and upper mantle are mechanically coupled, and thus for the style of deformation over geological time – for instance, whether “triangular” mountain belts or flat-topped plateaus evolve (Royden, 1996; Shen et al., 2001). If the lower crust is substantially weaker than the upper crust, it will decou-ple the motions of the upper crust and upper mantle. In contrast, a strong lower crust will couple the motions of the upper crust and upper mantle. Royden (1996) and Shen et al. (2001) both provide a clear discussion of coupling/decoupling styles, and in-
fer from numerical modelling that decoupling occurs within the interior of the Tibetan Plateau as a result of a weak layer within the lower crust. Royden (1996) highlights that the development of a flat-topped plateau with steep margins – such as the Tibetan Plateau – requires not only a weak lower crustal layer, but specif-ically one that formed during convergence, rather than pre-dating convergence. As pointed out by Royden (1996), there is not an abundance of direct evidence for this weak lower crustal layer. Flesch et al. (2005) consider coupling/decoupling from a different point of view, comparing different observational datasets (geology, GPS, shear wave splitting) to infer vertically coherent deforma-tion, and therefore upper crust/upper mantle coupling within the Tibetan Plateau interior. However, an alternative explanation for such correlative datasets is that upper crust and upper mantle are simply driven by very similar boundary conditions (Holt, 2000). Our InSAR study of late-stage postseismic motion in fact provides evidence for a weak lower crust, via surface deformation result-ing from weakness at depth. However, when considering coupling versus non-coupling, a natural question is: how weak is weak? In other words, how low does the viscosity of the lower crust need to be in order to decouple upper crust from upper man-tle?
I. Ryder et al. / Earth and Planetary Science Letters 404 (2014) 136–143 141
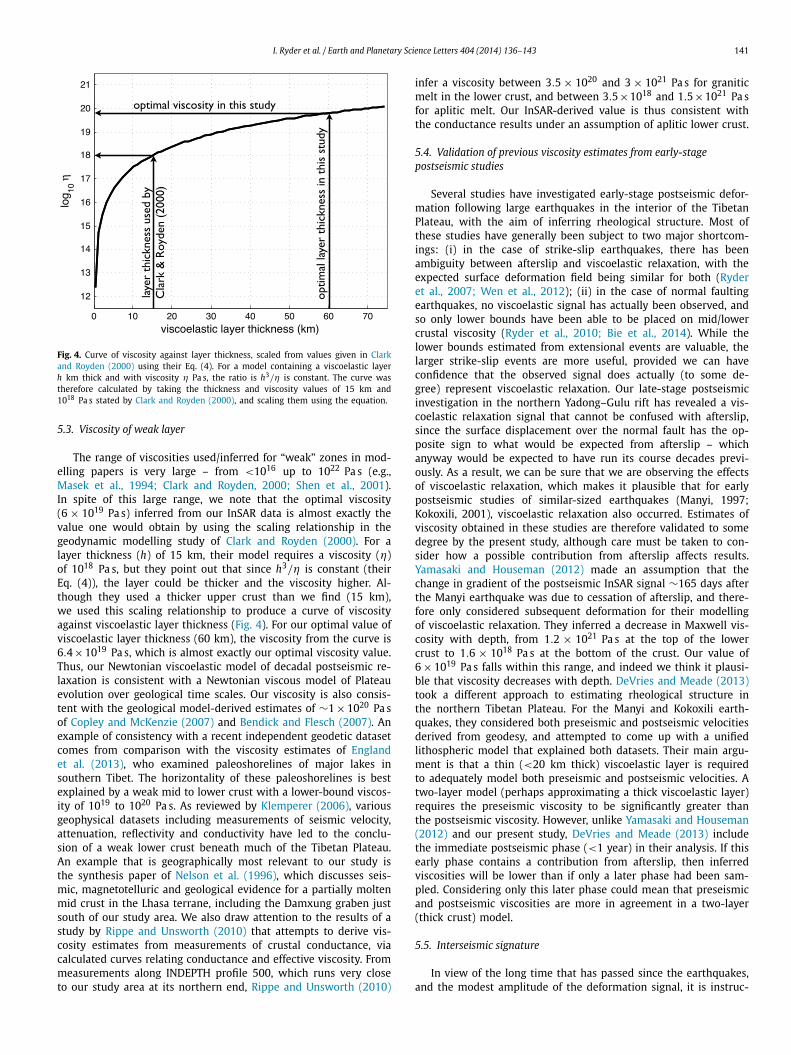
Fig. 4. Curve of viscosity against layer thickness, scaled from values given in Clark and Royden (2000) using their Eq. (4). For a model containing a viscoelastic layer h km thick and with viscosity η Pa s, the ratio is h3/η is constant. The curve was therefore calculated by taking the thickness and viscosity values of 15 km and 1018 Pa s stated by Clark and Royden (2000), and scaling them using the equation.
5.3. Viscosity of weak layer
The range of viscosities used/inferred for “weak” zones in mod-elling papers is very large – from <1016 up to 1022 Pa s (e.g., Masek et al., 1994; Clark and Royden, 2000; Shen et al., 2001). In spite of this large range, we note that the optimal viscosity (6 × 10¹⁹ Pa s) inferred from our InSAR data is almost exactly the value one would obtain by using the scaling relationship in the geodynamic modelling study of Clark and Royden (2000). For a layer thickness (h) of 15 km, their model requires a viscosity (η) of 1018 Pa s, but they point out that since h3/η is constant (their Eq. (4)), the layer could be thicker and the viscosity higher. Al-though they used a thicker upper crust than we find (15 km), we used this scaling relationship to produce a curve of viscosity against viscoelastic layer thickness (Fig. 4). For our optimal value of viscoelastic layer thickness (60 km), the viscosity from the curve is 6.4 ×10¹⁹ Pa s, which is almost exactly our optimal viscosity value. Thus, our Newtonian viscoelastic model of decadal postseismic re-laxation is consistent with a Newtonian viscous model of Plateau evolution over geological time scales. Our viscosity is also consis-tent with the geological model-derived estimates of ∼1 × 10²⁰ Pa sof Copley and McKenzie (2007) and Bendick and Flesch (2007). An example of consistency with a recent independent geodetic dataset comes from comparison with the viscosity estimates of England et al. (2013), who examined paleoshorelines of major lakes in southern Tibet. The horizontality of these paleoshorelines is best explained by a weak mid to lower crust with a lower-bound viscos-ity of 1019 to 1020 Pa s. As reviewed by Klemperer (2006), various geophysical datasets including measurements of seismic velocity, attenuation, reflectivity and conductivity have led to the conclu-sion of a weak lower crust beneath much of the Tibetan Plateau. An example that is geographically most relevant to our study is the synthesis paper of Nelson et al. (1996), which discusses seis-mic, magnetotelluric and geological evidence for a partially molten mid crust in the Lhasa terrane, including the Damxung graben just south of our study area. We also draw attention to the results of a study by Rippe and Unsworth (2010) that attempts to derive vis-cosity estimates from measurements of crustal conductance, via calculated curves relating conductance and effective viscosity. From measurements along INDEPTH profile 500, which runs very close to our study area at its northern end, Rippe and Unsworth (2010)
infer a viscosity between 3.5 × 10²⁰ and 3 × 10²¹ Pa s for granitic melt in the lower crust, and between 3.5 ×10¹⁸ and 1.5 ×10²¹ Pa sfor aplitic melt. Our InSAR-derived value is thus consistent with the conductance results under an assumption of aplitic lower crust.
5.4. Validation of previous viscosity estimates from early-stage postseismic studies
Several studies have investigated early-stage postseismic defor-mation following large earthquakes in the interior of the Tibetan Plateau, with the aim of inferring rheological structure. Most of these studies have generally been subject to two major shortcom-ings: (i) in the case of strike-slip earthquakes, there has been ambiguity between afterslip and viscoelastic relaxation, with the expected surface deformation field being similar for both (Ryder et al., 2007; Wen et al., 2012); (ii) in the case of normal faulting earthquakes, no viscoelastic signal has actually been observed, and so only lower bounds have been able to be placed on mid/lower crustal viscosity (Ryder et al., 2010; Bie et al., 2014). While the lower bounds estimated from extensional events are valuable, the larger strike-slip events are more useful, provided we can have confidence that the observed signal does actually (to some de-gree) represent viscoelastic relaxation. Our late-stage postseismic investigation in the northern Yadong–Gulu rift has revealed a vis-coelastic relaxation signal that cannot be confused with afterslip, since the surface displacement over the normal fault has the op-posite sign to what would be expected from afterslip – which anyway would be expected to have run its course decades previ-ously. As a result, we can be sure that we are observing the effects of viscoelastic relaxation, which makes it plausible that for early postseismic studies of similar-sized earthquakes (Manyi, 1997;Kokoxili, 2001), viscoelastic relaxation also occurred. Estimates of viscosity obtained in these studies are therefore validated to some degree by the present study, although care must be taken to con-sider how a possible contribution from afterslip affects results. Yamasaki and Houseman (2012) made an assumption that the change in gradient of the postseismic InSAR signal ∼165 days after the Manyi earthquake was due to cessation of afterslip, and there-fore only considered subsequent deformation for their modelling of viscoelastic relaxation. They inferred a decrease in Maxwell vis-cosity with depth, from 1.2 × 10²¹ Pa s at the top of the lower crust to 1.6 × 10¹⁸ Pa s at the bottom of the crust. Our value of 6 × 10¹⁹ Pa s falls within this range, and indeed we think it plausi-ble that viscosity decreases with depth. DeVries and Meade (2013)took a different approach to estimating rheological structure in the northern Tibetan Plateau. For the Manyi and Kokoxili earth-quakes, they considered both preseismic and postseismic velocities derived from geodesy, and attempted to come up with a unified lithospheric model that explained both datasets. Their main argu-ment is that a thin (<20 km thick) viscoelastic layer is required to adequately model both preseismic and postseismic velocities. A two-layer model (perhaps approximating a thick viscoelastic layer) requires the preseismic viscosity to be significantly greater than the postseismic viscosity. However, unlike Yamasaki and Houseman(2012) and our present study, DeVries and Meade (2013) include the immediate postseismic phase (<1 year) in their analysis. If this early phase contains a contribution from afterslip, then inferred viscosities will be lower than if only a later phase had been sam-pled. Considering only this later phase could mean that preseismic and postseismic viscosities are more in agreement in a two-layer (thick crust) model.
5.5. Interseismic signature
In view of the long time that has passed since the earthquakes, and the modest amplitude of the deformation signal, it is instruc-

142 I. Ryder et al. / Earth and Planetary Science Letters 404 (2014) 136–143
Fig. 5. First-order model of interseismic surface motion projected into the ERS/Envisat descending line-of-sight direction. The origin is taken to be the centre of the Beng Co Fault. Slip rates used in the model are taken from: Armijo et al. (1986, 1989), Hollingsworth et al. (2010), Garthwaite et al. (2013).
tive to run models of interseismic displacement for the Beng Co and Gulu Faults, to see how they compare to the InSAR dataset. Various studies have considered interseismic slip rate for the Beng Co and Gulu Faults (Armijo et al., 1986, 1989; Hollingsworth et al., 2010; Garthwaite et al., 2013). The key results from these studies are described in the Supplement.
Given the uncertainties on slip rates, and on fault geometry at depth, we run a simple model of interseismic slip to indicate the general pattern and magnitude of surface deformation expected. Interseismic slip is assumed to occur on an extension of both faults at depth, and otherwise the fault parameters are the same as in the seismogenic layer (Table 1). As can be seen from Fig. 5, if there is any component of interseismic motion contributing to the rate maps, it would have the same sense of motion as the postseis-mic signal for the Beng Co Fault, but longer wavelength. For the Gulu Fault, the interseismic line-of-sight pattern looks very dif-ferent from the postseismic pattern, with a lobe of positive range change east of the fault, rather than a negative lobe over the fault as measured by InSAR. It is really the signal associated with the Gulu Fault that confirms for us that we are primarily observing postseismic viscoelastic relaxation rather than interseismic creep on a localised shear zone. Nonetheless, a small-magnitude inter-seismic signal could account for the slight under-prediction of dis-placements by our model for the Beng Co Fault and the slight over-prediction for the Gulu Fault. The contribution of some in-terseismic motion would make our viscosity estimate an upper bound.
5.6. Comparison with the Altiplano–Puna Plateau
Of all the plateau regions of the world, the most similar to the Tibetan Plateau in terms of elevation and crustal thickness is the Altiplano–Puna Plateau in the Andes. It is therefore of inter-est to consider whether there is evidence for a weak lower crust there, as we have inferred for Tibet. Yuan et al. (2000) used P-to-S converted seismic phases to image lithospheric structure in the Central Andes. They modelled their receiver functions with a 10–20 km-thick low velocity zone within the crust, interpret-ing this zone as being due to ongoing metamorphism and partial melting. Husson and Sempere (2003) used numerical modelling to try and explain the formation of the Altiplano, including present-day topography. Consistent with the seismic results of Yuan et
al. (2000), their optimal model features a weak zone within the crust. For a 15 km-thick weak zone, viscosity is estimated to de-crease from 2 × 10²⁰ Pa s at the top of the zone to 8 × 10¹⁸ Pa sat the bottom. Since h3/η is constant, making the weak zone thicker shifts the viscosity range higher, as illustrated for Tibet (Fig. 4). For example, for a 20 km-thick weak zone, the viscos-ity range shifts upwards to 9.5 × 10²⁰–1.9 × 10¹⁹ Pa s. We note that both stated ranges encompass the viscosity value we find for the lower crust of Tibet. The crustal rheological structure in the Tibetan and Andean Plateaus would not be expected to be identical, given the differences in type of margin, geometry and age. Nonetheless, it is clear that there are similarities between the two environments, including possible comparable viscosities in a weak lower crustal zone. Other plateaus in the world, despite having lower average elevations and crustal thicknesses, may also share structural and rheological attributes with the Tibetan and Altiplano–Puna Plateaus. For instance, Saunders et al. (1998) found possible evidence in receiver function data for a low velocity zone a few kilometres thick beneath the western Anatolian Plateau in Turkey.
6. Summary
Our study is the first to clearly observe present-day lower crustal flow occurring in the Tibetan lower crust. While various geophysical datasets have strongly suggested the presence of par-tials melts in the lower crust, the actual act of flow itself had not been observed unequivocally. Our results therefore constitute strong evidence in support of inferences from the geodynamic modelling community of a weak lower crust – evidence that had hitherto been lacking. More specifically, from the InSAR data we infer that postseismic viscoelastic relaxation following the 1951 and 1952 earthquakes in the Yadong–Gulu rift occurred right up to the period 1992–2010. This relaxation occurred in a viscoelastic lower crust with viscosity 5–10 ×1019 Pa s. Relaxation may or may not have extended into the upper mantle. The data do not support the presence of a thin (20 km-thick) weak zone within the crust. A similar rheological environment likely exists beneath the Andean Altiplano–Puna Plateau, where evidence exists for an intracrustal weak layer. Other plateaus in the world, though of lower elevation and crustal thickness, may also contain weak zones that influence their tectonic deformation.
I. Ryder et al. / Earth and Planetary Science Letters 404 (2014) 136–143 143
Acknowledgements
ERS and Envisat data were obtained from the European Space Agency through a Dragon-3 project (10607). H.W. was supported by the NSFC (41104016) and the State Key Laboratory of Earth Dynamics (LED2013B04). We thank Roland Burgmann for making valuable comments on an early draft of this manuscript.
Appendix A. Supplementary material
Supplementary material related to this article can be found on-line at http://dx.doi.org/10.1016/j.epsl.2014.07.026.
References
Abe, K., 1981. Magnitudes of large shallow earthquakes from 1904 to 1980. Phys. Earth Planet. Inter. 27 (1), 72–92.
Armijo, R., Tapponnier, P., Mercier, J.L., Han, T.L., 1986. Quaternary extension in southern Tibet: field observations and tectonic implications. J. Geophys. Res., Solid Earth (1978–2012) 91 (B14), 13803–13872.
Armijo, R., Tapponnier, P., Han, T., 1989. Late Cenozoic right-lateral strike-slip faulting in southern Tibet. J. Geophys. Res., Solid Earth (1978–2012) 94 (B3), 2787–2838.
Bendick, R., Flesch, L., 2007. Reconciling lithospheric deformation and lower crustal flow beneath central Tibet. Geology 35 (10), 895–898.
Bie, L., Ryder, I., Nippress, S.E., Bürgmann, R., 2014. Coseismic and post-seismic ac-tivity associated with the 2008 Mw 6.3 Damxung earthquake, Tibet, constrained by InSAR. Geophys. J. Int. 196 (2), 788–803.
Bie, L., Ryder, I., 2014. Recent seismic and aseismic activity in the Ashikule stepover zone, NW Tibet. Geophys. J. Int. 198 (3), 1632–1643.
Biggs, J., Wright, T., Lu, Z., Parsons, B., 2007. Multi-interferogram method for mea-suring interseismic deformation: Denali Fault, Alaska. Geophys. J. Int. 170 (3), 1165–1179.
Chen, W.P., Molnar, P., 1983. Focal depths of intracontinental and intraplate earth-quakes and their implications for the thermal and mechanical properties of the lithosphere. J. Geophys. Res., Solid Earth (1978–2012) 88 (B5), 4183–4214.
Chen, L., Booker, J.R., Jones, A.G., Wu, N., Unsworth, M.J., Wei, W., Tan, H., 1996. Electrically conductive crust in southern Tibet from INDEPTH magnetotelluric surveying. Science 274 (5293), 1694–1696.
Clark, M.K., Royden, L.H., 2000. Topographic ooze: building the eastern margin of Tibet by lower crustal flow. Geology 28 (8), 703–706.
DeVries, P.M., Meade, B.J., 2013. Earthquake cycle deformation in the Tibetan plateau with a weak mid-crustal layer. J. Geophys. Res., Solid Earth 118 (6), 3101–3111.
Duret, F., Shapiro, N.M., Cao, Z., Levin, V., Molnar, P., Roecker, S., 2010. Surface wave dispersion across Tibet: direct evidence for radial anisotropy in the crust. Geo-phys. Res. Lett. 37 (16).
Copley, A., McKenzie, D., 2007. Models of crustal flow in the India–Asia collision zone. Geophys. J. Int. 169 (2), 683–698.
Ekström, G., Dziewonski, A.M., 1988. Evidence of bias in estimations of earthquake size. Nature 332, 319–323.
Engdahl, E.R., Villaseñor, A., 2002. Global seismicity: 1900–1999. Int. Geophys. Ser. 81, 665–690.
England, P.C., Walker, R.T., Fu, B., Floyd, M.A., 2013. A bound on the viscosity of the Tibetan crust from the horizontality of palaeolake shorelines. Earth Planet. Sci. Lett. 375, 44–56.
Farr, T.G., Kobrick, M., 2000. Shuttle Radar Topography Mission produces a wealth of data. Eos, Trans. Am. Geophys. Union 81 (48), 583–585.
Flesch, L.M., Holt, W.E., Silver, P.G., Stephenson, M., Wang, C.Y., Chan, W.W., 2005. Constraining the extent of crust–mantle coupling in central Asia using GPS, ge-ologic, and shear wave splitting data. Earth Planet. Sci. Lett. 238 (1), 248–268.
Garthwaite, M.C., Wang, H., Wright, T.J., 2013. Broadscale interseismic deformation and fault slip rates in the central Tibetan Plateau observed using InSAR. J. Geo-phys. Res., Solid Earth 118 (9), 5071–5083.
Goldstein, R.M., Werner, C.L., 1998. Radar interferogram filtering for geophysical ap-plications. Geophys. Res. Lett. 25 (21), 4035–4038.
Gutenberg, B., Richter, C.F., 1954. Magnitude and energy of earthquakes. Ann. Geo-phys. 53 (1), 7–12.
Hollingsworth, J., Wernicke, B., Ding, L., 2010. Paper presented at the 25th Himalaya–Karakoram–Tibet Workshop, San Francisco.
Holt, W.E., 2000. Correlated crust and mantle strain fields in Tibet. Geology 28 (1), 67–70.
Husson, L., Sempere, T., 2003. Thickening the Altiplano crust by gravity-driven crustal channel flow. Geophys. Res. Lett. 30 (5).
Klemperer, S.L., 2006. Crustal flow in Tibet: geophysical evidence for the physi-cal state of Tibetan lithosphere, and inferred patterns of active flow. Geol. Soc. (Lond.) Spec. Publ. 268 (1), 39–70.
Masek, Jeffrey G., et al., 1994. Rift flank uplift in Tibet: evidence for a viscous lower crust. Tectonics 13 (3), 659–667.
Molnar, P., Qidong, D., 1984. Faulting associated with large earthquakes and the av-erage rate of deformation in central and eastern Asia. J. Geophys. Res., Solid Earth (1978–2012) 89 (B7), 6203–6227.
Nelson, K.D., et al., 1996. Partially molten middle crust beneath southern Tibet: syn-thesis of project INDEPTH results. Science 274 (5293), 1684–1688.
Pacheco, J.F., Sykes, L.R., 1992. Seismic moment catalog of large shallow earthquakes, 1900 to 1989. Bull. Seismol. Soc. Am. 82 (3), 1306–1349.
Pollitz, F.F., 1997. Gravitational viscoelastic postseismic relaxation on a lay-ered spherical Earth. J. Geophys. Res., Solid Earth (1978–2012) 102 (B8), 17921–17941.
Rippe, D., Unsworth, M., 2010. Quantifying crustal flow in Tibet with magnetotel-luric data. Phys. Earth Planet. Inter. 179 (3), 107–121.
Rosen, P.A., Hensley, S., Peltzer, G., Simons, M., 2004. Updated repeat orbit interfer-ometry package released. Eos, Trans. Am. Geophys. Union 85 (5), 47.
Royden, L., 1996. Coupling and decoupling of crust and mantle in convergent oro-gens: implications for strain partitioning in the crust. J. Geophys. Res., Solid Earth (1978–2012) 101 (B8), 17679–17705.
Ryan, W.B., Carbotte, S.M., Coplan, J.O., O’Hara, S., Melkonian, A., Arko, R., Zem-sky, R., 2009. Global multi-resolution topography synthesis. Geochem. Geophys. Geosyst. 10 (3).
Ryder, I., Parsons, B., Wright, T.J., Funning, G.J., 2007. Post-seismic motion following the 1997 Manyi (Tibet) earthquake: InSAR observations and modelling. Geophys. J. Int. 169 (3), 1009–1027.
Ryder, I., Bürgmann, R., Sun, J., 2010. Tandem afterslip on connected fault planes following the 2008 Nima-Gaize (Tibet) earthquake. J. Geophys. Res., Solid Earth (1978–2012) 115 (B3).
Ryder, I., Bürgmann, R., Pollitz, F., 2011. Lower crustal relaxation beneath the Tibetan Plateau and Qaidam Basin following the 2001 Kokoxili earthquake. Geophys. J. Int. 187 (2), 613–630.
Saunders, P., Priestley, K., Taymaz, T., 1998. Variations in the crustal structure be-neath western Turkey. Geophys. J. Int. 134 (2), 373–389.
Scordillis, E.M., 2006. Empirical global relations converting MS and mb to moment magnitude. J. Seismol. 10 (2), 225–236.
Shapiro, N.M., Ritzwoller, M.H., Molnar, P., Levin, V., 2004. Thinning and flow of Tibetan crust constrained by seismic anisotropy. Science 305 (5681), 233–236.
Shen, F., Royden, L.H., Burchfiel, B.C., 2001. Large-scale crustal deformation of the Tibetan Plateau. J. Geophys. Res., Solid Earth (1978–2012) 106 (B4), 6793–6816.
Styron, R., Taylor, M., Okoronkwo, K., 2010. Database of active structures from the Indo-Asian collision. Eos, Trans. Am. Geophys. Union 91 (20), 181–182.
Tapponnier, P., Mercier, J.L., Armijo, R., Tonglin, H., Ji, Z., 1981. Field evidence for active normal faulting in Tibet. Nature 294 (5840), 410–414.
Wang, H., Wright, T.J., Yu, Y., Lin, H., Jiang, L., Li, C., Qiu, G., 2012. InSAR reveals coastal subsidence in the Pearl River Delta, China. Geophys. J. Int. 191 (3), 1119–1128.
Wei, W., Unsworth, M., Jones, A., Booker, J., Tan, H., Nelson, D., Roberts, B., 2001. Detection of widespread fluids in the Tibetan crust by magnetotelluric studies. Science 292 (5517), 716–719.
Wen, Y., Li, Z., Xu, C., Ryder, I., Bürgmann, R., 2012. Postseismic motion after the 2001 MW 7.8 Kokoxili earthquake in Tibet observed by InSAR time series. J. Geo-phys. Res. 117 (B8).
Wells, D.L., Coppersmith, K.J., 1994. New empirical relationships among magnitude, rupture length, rupture width, rupture area, and surface displacement. Bull. Seismol. Soc. Am. 84 (4), 974–1002.
Yamasaki, T., Houseman, G.A., 2012. The crustal viscosity gradient measured from post-seismic deformation: a case study of the 1997 Manyi (Tibet) earthquake. Earth Planet. Sci. Lett. 351, 105–114.
Yuan, X., Sobolev, S.V., Kind, R., Oncken, O., Bock, G., Asch, G., Comte, D., 2000. Sub-duction and collision processes in the Central Andes constrained by converted seismic phases. Nature 408 (6815), 958–961.