Geodetic measurements at the northern border of the Adria plate
20
Geodetic measurements at the northern border of the Adria plate Carla Braitenberg a, *, Ildiko` Nagy a , Monia Negusini b , Claudia Romagnoli c , Maria Zadro a , Susanna Zerbini b a Dipartimento di Scienze della Terra, Universita ` di Trieste, Via Weiss 1, 34100 Trieste, Italy b Dipartimento di Fisica, Universita ` di Bologna, Italy c Dipartimento di Scienze della Terra e Geologico Ambientali, Universita ` di Bologna, Italy Received 4 December 2000; received in revised form 27 February 2001; accepted 26 April 2001 Abstract This work describes measurements and results relevant to crustal movements at the northern border of the Adria plate. The measurements taken into consideration are subsurface observations made with extensometers and tiltmeters and episodic and continuous GPS (CGPS) observations. The subsurface measurements cover a remarkably long period of 34 years, while the episodic GPS campaigns have been performed over a time period of 7 years. The CGPS observations are available since July 1996, and 3.5 years of data have been considered in this work. The main characteristics of each different type of measurement are illustrated, and a first approach is made to compare the results. It is shown that envir- onmental effects are present both in subsurface and surface measurements. Methods to interpret and remove these signals are also proposed. The correlation between crustal deformation and seismic events is investigated, and some examples are presented. The long-term observations are discussed with respect to a well-known model of plate motion. The subsurface crustal long-term observations reveal inversions in the direction of deformation with time scales of 10 or more years, providing important boundary conditions for future geodynamic models of the northern Adria plate. The results show that the comparison between subsurface deformation and CGPS measurements, if made over a sufficiently long period of time, in the order of 10 years, can give important contributions to the understanding of the geodynamical and physical mechanisms related to the earthquake occurrence in this area. # 2001 Elsevier Science Ltd. All rights reserved. 0264-3707/01/$ - see front matter # 2001 Elsevier Science Ltd. All rights reserved. PII: S0264-3707(01)00025-4 Journal of Geodynamics 32 (2001) 267–286 www.elsevier.nl/locate/jgeodyn * Corresponding author. Tel.: +39-040-6762258; fax: +39-040-575519. E-mail address: [email protected] (C. Braitenberg).
-
Upload
independent -
Category
Documents
-
view
1 -
download
0
Transcript of Geodetic measurements at the northern border of the Adria plate
Geodetic measurements at the northern borderof the Adria plate
Carla Braitenberga,*, Ildiko Nagya, Monia Negusinib, Claudia Romagnolic,Maria Zadroa, Susanna Zerbinib
aDipartimento di Scienze della Terra, Universita di Trieste, Via Weiss 1, 34100 Trieste, ItalybDipartimento di Fisica, Universita di Bologna, Italy
cDipartimento di Scienze della Terra e Geologico Ambientali, Universita di Bologna, Italy
Received 4 December 2000; received in revised form 27 February 2001; accepted 26 April 2001
Abstract
This work describes measurements and results relevant to crustal movements at the northern border ofthe Adria plate. The measurements taken into consideration are subsurface observations made withextensometers and tiltmeters and episodic and continuous GPS (CGPS) observations. The subsurfacemeasurements cover a remarkably long period of 34 years, while the episodic GPS campaigns have beenperformed over a time period of 7 years. The CGPS observations are available since July 1996, and 3.5years of data have been considered in this work. The main characteristics of each different type ofmeasurement are illustrated, and a first approach is made to compare the results. It is shown that envir-onmental effects are present both in subsurface and surface measurements. Methods to interpret andremove these signals are also proposed. The correlation between crustal deformation and seismic events isinvestigated, and some examples are presented. The long-term observations are discussed with respect to awell-known model of plate motion. The subsurface crustal long-term observations reveal inversions in thedirection of deformation with time scales of 10 or more years, providing important boundary conditionsfor future geodynamic models of the northern Adria plate. The results show that the comparison betweensubsurface deformation and CGPS measurements, if made over a sufficiently long period of time, in theorder of 10 years, can give important contributions to the understanding of the geodynamical and physicalmechanisms related to the earthquake occurrence in this area. # 2001 Elsevier Science Ltd. All rightsreserved.
0264-3707/01/$ - see front matter # 2001 Elsevier Science Ltd. All rights reserved.
PI I : S0264-3707(01 )00025-4
Journal of Geodynamics 32 (2001) 267–286
www.elsevier.nl/locate/jgeodyn
* Corresponding author. Tel.: +39-040-6762258; fax: +39-040-575519.
E-mail address: [email protected] (C. Braitenberg).
1. Introduction
The convergence of the African and Eurasian plates has been recognised as being responsible ofthe build-up of the Alpine, Dinaric, and Apenninic chains. The available geological and geophy-sical information has suggested a more complex plate interaction, with the presence of the Adriaplate (or microplate), which is either defined as an independent unit, or as a promontory of theAfrican plate. The temporal behaviour of the Adria plate in response to the convergence of thesurrounding regions has been presumably more complex than a simple horizontal displacement.Most likely, it involved flexural bending processes, with a succession of vertical and horizontaldisplacements (Mantovani et al., 1997). The northern margin of the Adria plate is defined by thewestern Alps, southern Alps, Dinarides and by the Apennines. Concerning the anti-clockwiserotation of Adria with respect to Eurasia, several rotation poles of Adria have been proposed inthe geological literature. For a discussion of the Adria plate we refer e.g. to the paper of Meletti etal. (2000) and citations therein.The present work aims at describing the results of long-term measurements of crustal move-
ments made both by means of subsurface geodetic instrumentation and the Global PositioningSystem (GPS) at the northern border of the Adria plate. It represents one of the first efforts tojointly discuss the GPS and subsurface deformation measurements, which is, however, hamperedby several factors. In the case of GPS, the time variations of the station coordinates are measuredwith respect to a reference system. The differential movements of at least two GPS points arenecessary to determine the extension or the tilt along a certain direction, which is the quantitycomparable to the subsurface extension or tilt measurements. If the relative distance between twoGPS points is achieved by means of episodic observations with an error in the order of 1 mm, aprecision in deformation of 10�9 can be reached over a distance of 1000 km. This precision istypical of horizontal strain measurements. Yearly crustal deformation rates of the order of 10�7/acan be detected over distances of the order of 10 km. GPS can give the average surface strain rate,which, however, can be rather different from the local strain rate measured with subsurfaceobservations. Another problem is due to the different time resolution, which for subsurfacemeasurements typically ranges from a few minutes to one hour, whereas repeated GPS measure-ments are made at few months or even a few years intervals. Only in recent times, with the adventof CGPS, time resolution is comparable. This fact broadens the spectrum of signals, which can becompared, such as Earth tides, ocean loading tides, and the effects due to atmospheric pressure,temperature and hydrology.Next to tectonic signals related to the plate movements causing slow deformation, the Earth
crust deforms due to a number of different effects. These are the Earth tides, the loading exertedby the ocean tides, the free oscillations of the Earth, the seismic waves, the movements alongcrustal faults (aseismic slip, coseismic slip) and environmental effects such as air pressure varia-tions and the hydrological cycle. The full understanding of crustal movements implies that eachone of these phenomena be correctly recognised, separated and modelled.For decades, along the northern border of the Adria plate, subsurface measurements have been
made by means of tiltmeters and strainmeters, providing a unique opportunity to study most, ifnot all, of the above phenomena. The first station was installed in 1958 near Trieste (Fig. 1), inthe Grotta Gigante cave. The long-base tiltmeters (horizontal pendulums) of Zollner type havebeen continuously working since then, with an interruption of a few years which allowed to
268 C. Braitenberg et al. / Journal of Geodynamics 32 (2001) 267–286
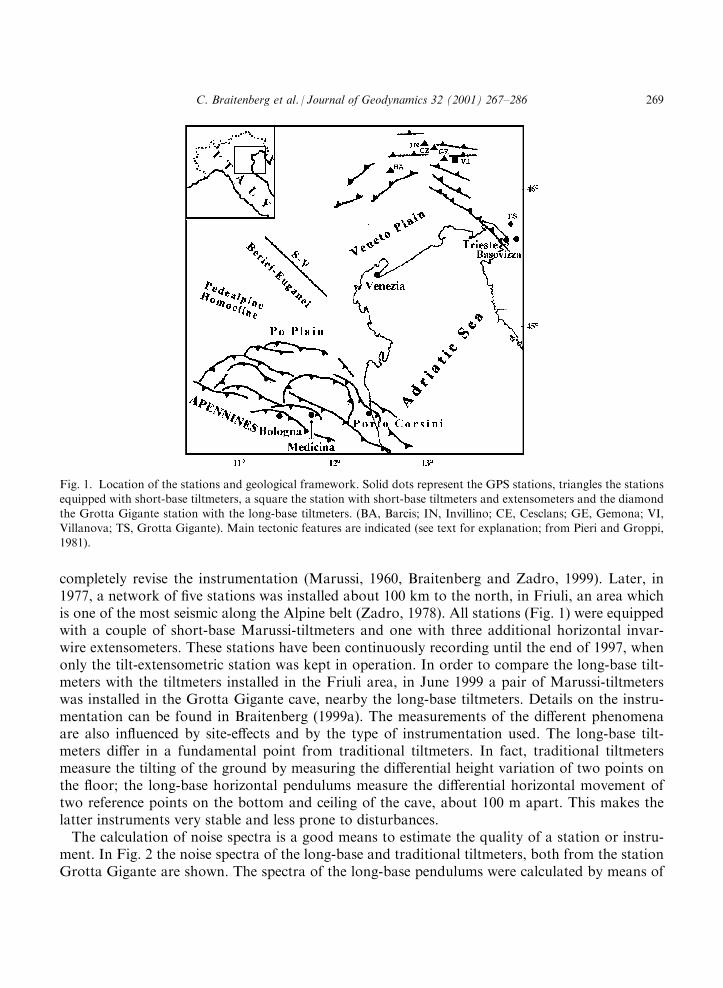
completely revise the instrumentation (Marussi, 1960, Braitenberg and Zadro, 1999). Later, in1977, a network of five stations was installed about 100 km to the north, in Friuli, an area whichis one of the most seismic along the Alpine belt (Zadro, 1978). All stations (Fig. 1) were equippedwith a couple of short-base Marussi-tiltmeters and one with three additional horizontal invar-wire extensometers. These stations have been continuously recording until the end of 1997, whenonly the tilt-extensometric station was kept in operation. In order to compare the long-base tilt-meters with the tiltmeters installed in the Friuli area, in June 1999 a pair of Marussi-tiltmeterswas installed in the Grotta Gigante cave, nearby the long-base tiltmeters. Details on the instru-mentation can be found in Braitenberg (1999a). The measurements of the different phenomenaare also influenced by site-effects and by the type of instrumentation used. The long-base tilt-meters differ in a fundamental point from traditional tiltmeters. In fact, traditional tiltmetersmeasure the tilting of the ground by measuring the differential height variation of two points onthe floor; the long-base horizontal pendulums measure the differential horizontal movement oftwo reference points on the bottom and ceiling of the cave, about 100 m apart. This makes thelatter instruments very stable and less prone to disturbances.The calculation of noise spectra is a good means to estimate the quality of a station or instru-
ment. In Fig. 2 the noise spectra of the long-base and traditional tiltmeters, both from the stationGrotta Gigante are shown. The spectra of the long-base pendulums were calculated by means of
Fig. 1. Location of the stations and geological framework. Solid dots represent the GPS stations, triangles the stationsequipped with short-base tiltmeters, a square the station with short-base tiltmeters and extensometers and the diamond
the Grotta Gigante station with the long-base tiltmeters. (BA, Barcis; IN, Invillino; CE, Cesclans; GE, Gemona; VI,Villanova; TS, Grotta Gigante). Main tectonic features are indicated (see text for explanation; from Pieri and Groppi,1981).
C. Braitenberg et al. / Journal of Geodynamics 32 (2001) 267–286 269
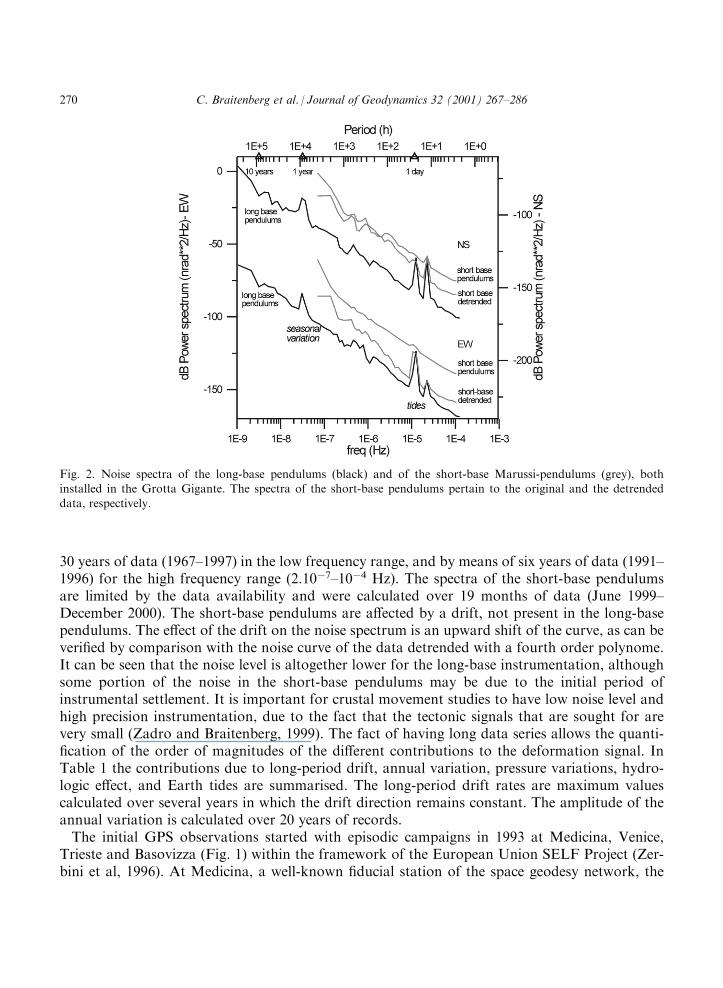
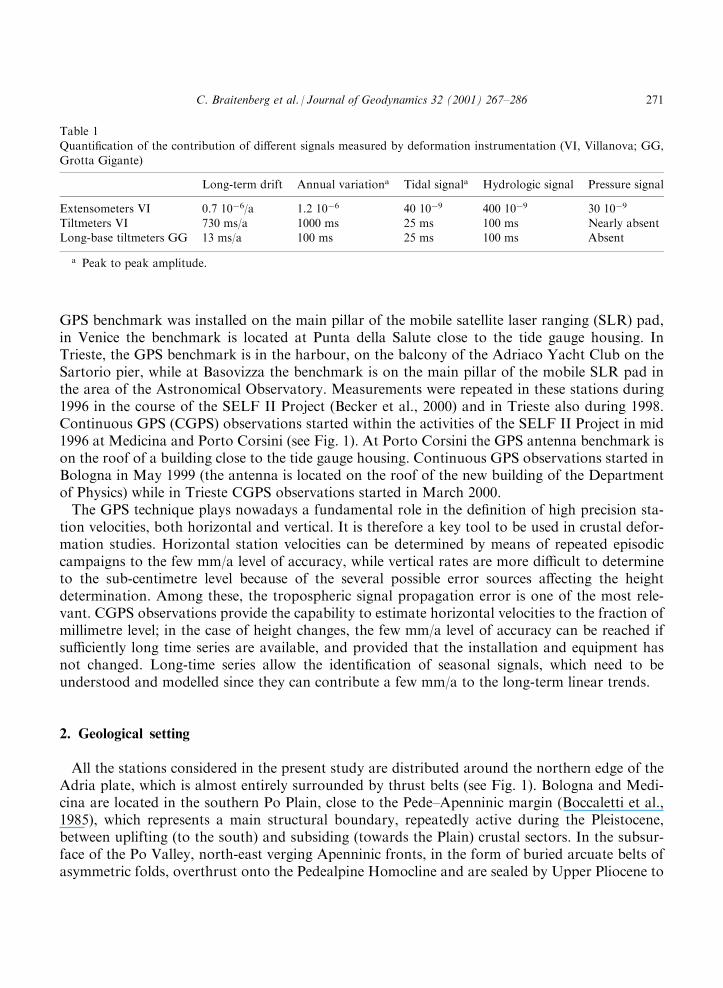
30 years of data (1967–1997) in the low frequency range, and by means of six years of data (1991–1996) for the high frequency range (2.10�7–10�4 Hz). The spectra of the short-base pendulumsare limited by the data availability and were calculated over 19 months of data (June 1999–December 2000). The short-base pendulums are affected by a drift, not present in the long-basependulums. The effect of the drift on the noise spectrum is an upward shift of the curve, as can beverified by comparison with the noise curve of the data detrended with a fourth order polynome.It can be seen that the noise level is altogether lower for the long-base instrumentation, althoughsome portion of the noise in the short-base pendulums may be due to the initial period ofinstrumental settlement. It is important for crustal movement studies to have low noise level andhigh precision instrumentation, due to the fact that the tectonic signals that are sought for arevery small (Zadro and Braitenberg, 1999). The fact of having long data series allows the quanti-fication of the order of magnitudes of the different contributions to the deformation signal. InTable 1 the contributions due to long-period drift, annual variation, pressure variations, hydro-logic effect, and Earth tides are summarised. The long-period drift rates are maximum valuescalculated over several years in which the drift direction remains constant. The amplitude of theannual variation is calculated over 20 years of records.The initial GPS observations started with episodic campaigns in 1993 at Medicina, Venice,
Trieste and Basovizza (Fig. 1) within the framework of the European Union SELF Project (Zer-bini et al, 1996). At Medicina, a well-known fiducial station of the space geodesy network, the
Fig. 2. Noise spectra of the long-base pendulums (black) and of the short-base Marussi-pendulums (grey), bothinstalled in the Grotta Gigante. The spectra of the short-base pendulums pertain to the original and the detrended
data, respectively.
270 C. Braitenberg et al. / Journal of Geodynamics 32 (2001) 267–286
GPS benchmark was installed on the main pillar of the mobile satellite laser ranging (SLR) pad,in Venice the benchmark is located at Punta della Salute close to the tide gauge housing. InTrieste, the GPS benchmark is in the harbour, on the balcony of the Adriaco Yacht Club on theSartorio pier, while at Basovizza the benchmark is on the main pillar of the mobile SLR pad inthe area of the Astronomical Observatory. Measurements were repeated in these stations during1996 in the course of the SELF II Project (Becker et al., 2000) and in Trieste also during 1998.Continuous GPS (CGPS) observations started within the activities of the SELF II Project in mid1996 at Medicina and Porto Corsini (see Fig. 1). At Porto Corsini the GPS antenna benchmark ison the roof of a building close to the tide gauge housing. Continuous GPS observations started inBologna in May 1999 (the antenna is located on the roof of the new building of the Departmentof Physics) while in Trieste CGPS observations started in March 2000.The GPS technique plays nowadays a fundamental role in the definition of high precision sta-
tion velocities, both horizontal and vertical. It is therefore a key tool to be used in crustal defor-mation studies. Horizontal station velocities can be determined by means of repeated episodiccampaigns to the few mm/a level of accuracy, while vertical rates are more difficult to determineto the sub-centimetre level because of the several possible error sources affecting the heightdetermination. Among these, the tropospheric signal propagation error is one of the most rele-vant. CGPS observations provide the capability to estimate horizontal velocities to the fraction ofmillimetre level; in the case of height changes, the few mm/a level of accuracy can be reached ifsufficiently long time series are available, and provided that the installation and equipment hasnot changed. Long-time series allow the identification of seasonal signals, which need to beunderstood and modelled since they can contribute a few mm/a to the long-term linear trends.
2. Geological setting
All the stations considered in the present study are distributed around the northern edge of theAdria plate, which is almost entirely surrounded by thrust belts (see Fig. 1). Bologna and Medi-cina are located in the southern Po Plain, close to the Pede–Apenninic margin (Boccaletti et al.,1985), which represents a main structural boundary, repeatedly active during the Pleistocene,between uplifting (to the south) and subsiding (towards the Plain) crustal sectors. In the subsur-face of the Po Valley, north-east verging Apenninic fronts, in the form of buried arcuate belts ofasymmetric folds, overthrust onto the Pedealpine Homocline and are sealed by Upper Pliocene to
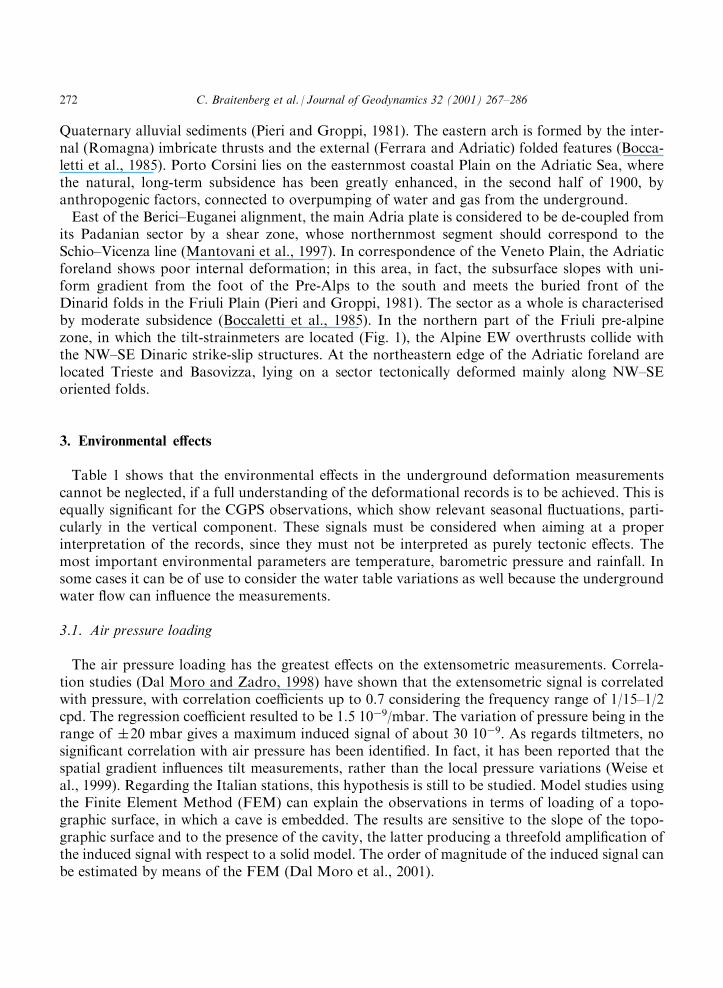
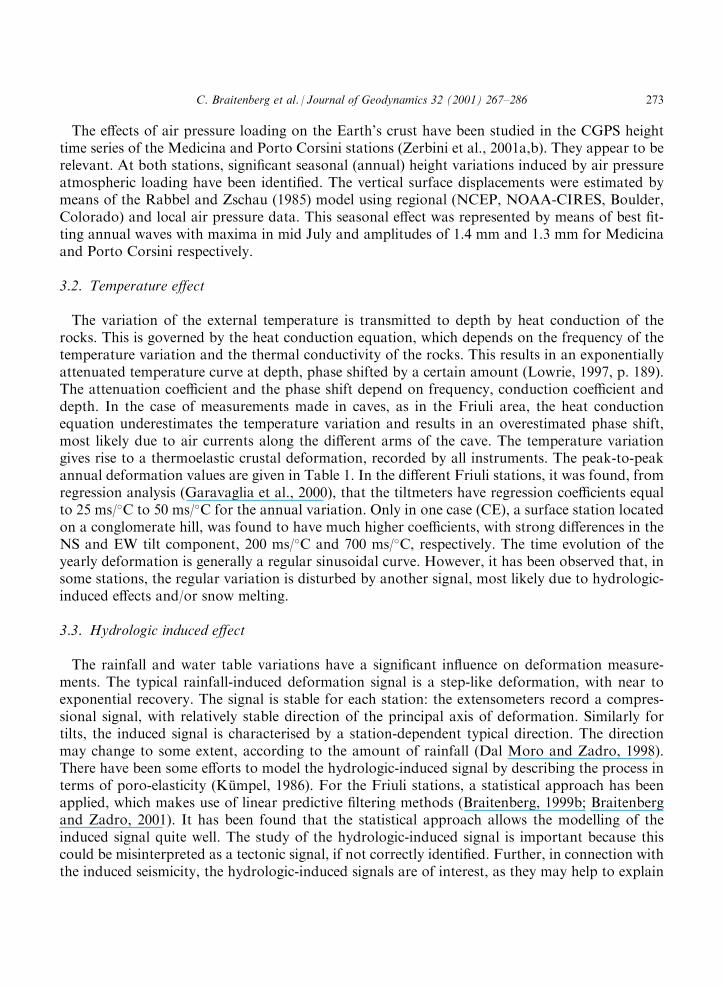
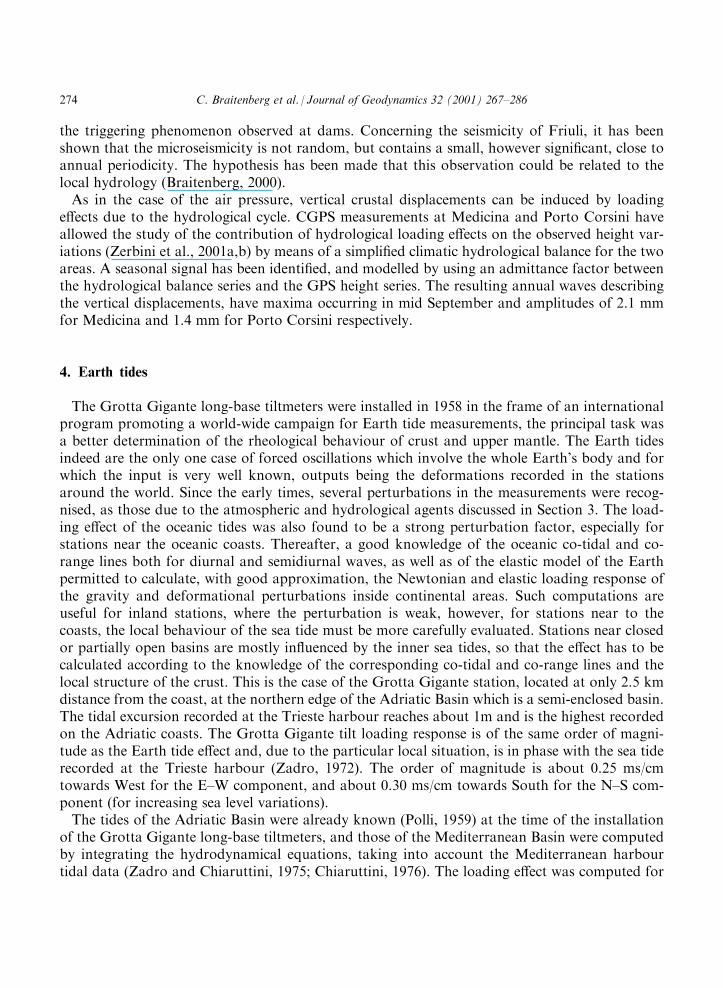
Table 1Quantification of the contribution of different signals measured by deformation instrumentation (VI, Villanova; GG,
Grotta Gigante)
Long-term drift Annual variationa Tidal signala Hydrologic signal Pressure signal
Extensometers VI 0.7 10�6/a 1.2 10�6 40 10�9 400 10�9 30 10�9
Tiltmeters VI 730 ms/a 1000 ms 25 ms 100 ms Nearly absentLong-base tiltmeters GG 13 ms/a 100 ms 25 ms 100 ms Absent
a Peak to peak amplitude.
C. Braitenberg et al. / Journal of Geodynamics 32 (2001) 267–286 271
Quaternary alluvial sediments (Pieri and Groppi, 1981). The eastern arch is formed by the inter-nal (Romagna) imbricate thrusts and the external (Ferrara and Adriatic) folded features (Bocca-letti et al., 1985). Porto Corsini lies on the easternmost coastal Plain on the Adriatic Sea, wherethe natural, long-term subsidence has been greatly enhanced, in the second half of 1900, byanthropogenic factors, connected to overpumping of water and gas from the underground.East of the Berici–Euganei alignment, the main Adria plate is considered to be de-coupled from
its Padanian sector by a shear zone, whose northernmost segment should correspond to theSchio–Vicenza line (Mantovani et al., 1997). In correspondence of the Veneto Plain, the Adriaticforeland shows poor internal deformation; in this area, in fact, the subsurface slopes with uni-form gradient from the foot of the Pre-Alps to the south and meets the buried front of theDinarid folds in the Friuli Plain (Pieri and Groppi, 1981). The sector as a whole is characterisedby moderate subsidence (Boccaletti et al., 1985). In the northern part of the Friuli pre-alpinezone, in which the tilt-strainmeters are located (Fig. 1), the Alpine EW overthrusts collide withthe NW–SE Dinaric strike-slip structures. At the northeastern edge of the Adriatic foreland arelocated Trieste and Basovizza, lying on a sector tectonically deformed mainly along NW–SEoriented folds.
3. Environmental effects
Table 1 shows that the environmental effects in the underground deformation measurementscannot be neglected, if a full understanding of the deformational records is to be achieved. This isequally significant for the CGPS observations, which show relevant seasonal fluctuations, parti-cularly in the vertical component. These signals must be considered when aiming at a properinterpretation of the records, since they must not be interpreted as purely tectonic effects. Themost important environmental parameters are temperature, barometric pressure and rainfall. Insome cases it can be of use to consider the water table variations as well because the undergroundwater flow can influence the measurements.
3.1. Air pressure loading
The air pressure loading has the greatest effects on the extensometric measurements. Correla-tion studies (Dal Moro and Zadro, 1998) have shown that the extensometric signal is correlatedwith pressure, with correlation coefficients up to 0.7 considering the frequency range of 1/15–1/2cpd. The regression coefficient resulted to be 1.5 10�9/mbar. The variation of pressure being in therange of �20 mbar gives a maximum induced signal of about 30 10�9. As regards tiltmeters, nosignificant correlation with air pressure has been identified. In fact, it has been reported that thespatial gradient influences tilt measurements, rather than the local pressure variations (Weise etal., 1999). Regarding the Italian stations, this hypothesis is still to be studied. Model studies usingthe Finite Element Method (FEM) can explain the observations in terms of loading of a topo-graphic surface, in which a cave is embedded. The results are sensitive to the slope of the topo-graphic surface and to the presence of the cavity, the latter producing a threefold amplification ofthe induced signal with respect to a solid model. The order of magnitude of the induced signal canbe estimated by means of the FEM (Dal Moro et al., 2001).
272 C. Braitenberg et al. / Journal of Geodynamics 32 (2001) 267–286
The effects of air pressure loading on the Earth’s crust have been studied in the CGPS heighttime series of the Medicina and Porto Corsini stations (Zerbini et al., 2001a,b). They appear to berelevant. At both stations, significant seasonal (annual) height variations induced by air pressureatmospheric loading have been identified. The vertical surface displacements were estimated bymeans of the Rabbel and Zschau (1985) model using regional (NCEP, NOAA-CIRES, Boulder,Colorado) and local air pressure data. This seasonal effect was represented by means of best fit-ting annual waves with maxima in mid July and amplitudes of 1.4 mm and 1.3 mm for Medicinaand Porto Corsini respectively.
3.2. Temperature effect
The variation of the external temperature is transmitted to depth by heat conduction of therocks. This is governed by the heat conduction equation, which depends on the frequency of thetemperature variation and the thermal conductivity of the rocks. This results in an exponentiallyattenuated temperature curve at depth, phase shifted by a certain amount (Lowrie, 1997, p. 189).The attenuation coefficient and the phase shift depend on frequency, conduction coefficient anddepth. In the case of measurements made in caves, as in the Friuli area, the heat conductionequation underestimates the temperature variation and results in an overestimated phase shift,most likely due to air currents along the different arms of the cave. The temperature variationgives rise to a thermoelastic crustal deformation, recorded by all instruments. The peak-to-peakannual deformation values are given in Table 1. In the different Friuli stations, it was found, fromregression analysis (Garavaglia et al., 2000), that the tiltmeters have regression coefficients equalto 25 ms/�C to 50 ms/�C for the annual variation. Only in one case (CE), a surface station locatedon a conglomerate hill, was found to have much higher coefficients, with strong differences in theNS and EW tilt component, 200 ms/�C and 700 ms/�C, respectively. The time evolution of theyearly deformation is generally a regular sinusoidal curve. However, it has been observed that, insome stations, the regular variation is disturbed by another signal, most likely due to hydrologic-induced effects and/or snow melting.
3.3. Hydrologic induced effect
The rainfall and water table variations have a significant influence on deformation measure-ments. The typical rainfall-induced deformation signal is a step-like deformation, with near toexponential recovery. The signal is stable for each station: the extensometers record a compres-sional signal, with relatively stable direction of the principal axis of deformation. Similarly fortilts, the induced signal is characterised by a station-dependent typical direction. The directionmay change to some extent, according to the amount of rainfall (Dal Moro and Zadro, 1998).There have been some efforts to model the hydrologic-induced signal by describing the process interms of poro-elasticity (Kumpel, 1986). For the Friuli stations, a statistical approach has beenapplied, which makes use of linear predictive filtering methods (Braitenberg, 1999b; Braitenbergand Zadro, 2001). It has been found that the statistical approach allows the modelling of theinduced signal quite well. The study of the hydrologic-induced signal is important because thiscould be misinterpreted as a tectonic signal, if not correctly identified. Further, in connection withthe induced seismicity, the hydrologic-induced signals are of interest, as they may help to explain
C. Braitenberg et al. / Journal of Geodynamics 32 (2001) 267–286 273
the triggering phenomenon observed at dams. Concerning the seismicity of Friuli, it has beenshown that the microseismicity is not random, but contains a small, however significant, close toannual periodicity. The hypothesis has been made that this observation could be related to thelocal hydrology (Braitenberg, 2000).As in the case of the air pressure, vertical crustal displacements can be induced by loading
effects due to the hydrological cycle. CGPS measurements at Medicina and Porto Corsini haveallowed the study of the contribution of hydrological loading effects on the observed height var-iations (Zerbini et al., 2001a,b) by means of a simplified climatic hydrological balance for the twoareas. A seasonal signal has been identified, and modelled by using an admittance factor betweenthe hydrological balance series and the GPS height series. The resulting annual waves describingthe vertical displacements, have maxima occurring in mid September and amplitudes of 2.1 mmfor Medicina and 1.4 mm for Porto Corsini respectively.
4. Earth tides
The Grotta Gigante long-base tiltmeters were installed in 1958 in the frame of an internationalprogram promoting a world-wide campaign for Earth tide measurements, the principal task wasa better determination of the rheological behaviour of crust and upper mantle. The Earth tidesindeed are the only one case of forced oscillations which involve the whole Earth’s body and forwhich the input is very well known, outputs being the deformations recorded in the stationsaround the world. Since the early times, several perturbations in the measurements were recog-nised, as those due to the atmospheric and hydrological agents discussed in Section 3. The load-ing effect of the oceanic tides was also found to be a strong perturbation factor, especially forstations near the oceanic coasts. Thereafter, a good knowledge of the oceanic co-tidal and co-range lines both for diurnal and semidiurnal waves, as well as of the elastic model of the Earthpermitted to calculate, with good approximation, the Newtonian and elastic loading response ofthe gravity and deformational perturbations inside continental areas. Such computations areuseful for inland stations, where the perturbation is weak, however, for stations near to thecoasts, the local behaviour of the sea tide must be more carefully evaluated. Stations near closedor partially open basins are mostly influenced by the inner sea tides, so that the effect has to becalculated according to the knowledge of the corresponding co-tidal and co-range lines and thelocal structure of the crust. This is the case of the Grotta Gigante station, located at only 2.5 kmdistance from the coast, at the northern edge of the Adriatic Basin which is a semi-enclosed basin.The tidal excursion recorded at the Trieste harbour reaches about 1m and is the highest recordedon the Adriatic coasts. The Grotta Gigante tilt loading response is of the same order of magni-tude as the Earth tide effect and, due to the particular local situation, is in phase with the sea tiderecorded at the Trieste harbour (Zadro, 1972). The order of magnitude is about 0.25 ms/cmtowards West for the E–W component, and about 0.30 ms/cm towards South for the N–S com-ponent (for increasing sea level variations).The tides of the Adriatic Basin were already known (Polli, 1959) at the time of the installation
of the Grotta Gigante long-base tiltmeters, and those of the Mediterranean Basin were computedby integrating the hydrodynamical equations, taking into account the Mediterranean harbourtidal data (Zadro and Chiaruttini, 1975; Chiaruttini, 1976). The loading effect was computed for
274 C. Braitenberg et al. / Journal of Geodynamics 32 (2001) 267–286
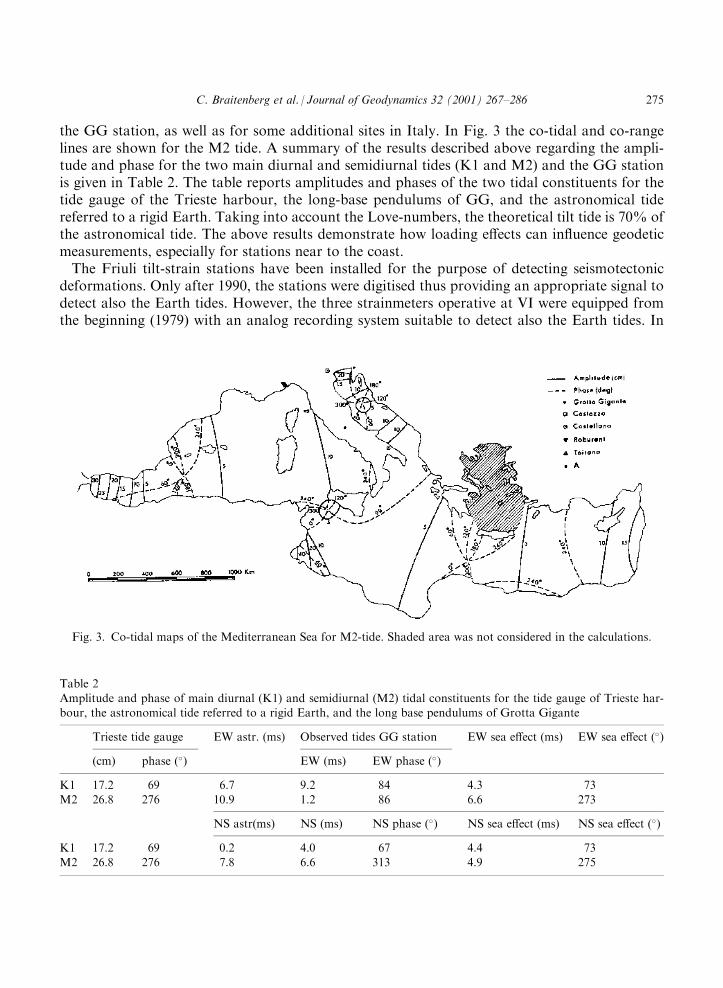
the GG station, as well as for some additional sites in Italy. In Fig. 3 the co-tidal and co-rangelines are shown for the M2 tide. A summary of the results described above regarding the ampli-tude and phase for the two main diurnal and semidiurnal tides (K1 and M2) and the GG stationis given in Table 2. The table reports amplitudes and phases of the two tidal constituents for thetide gauge of the Trieste harbour, the long-base pendulums of GG, and the astronomical tidereferred to a rigid Earth. Taking into account the Love-numbers, the theoretical tilt tide is 70% ofthe astronomical tide. The above results demonstrate how loading effects can influence geodeticmeasurements, especially for stations near to the coast.The Friuli tilt-strain stations have been installed for the purpose of detecting seismotectonic
deformations. Only after 1990, the stations were digitised thus providing an appropriate signal todetect also the Earth tides. However, the three strainmeters operative at VI were equipped fromthe beginning (1979) with an analog recording system suitable to detect also the Earth tides. In
Fig. 3. Co-tidal maps of the Mediterranean Sea for M2-tide. Shaded area was not considered in the calculations.
Table 2Amplitude and phase of main diurnal (K1) and semidiurnal (M2) tidal constituents for the tide gauge of Trieste har-bour, the astronomical tide referred to a rigid Earth, and the long base pendulums of Grotta Gigante
Trieste tide gauge EW astr. (ms) Observed tides GG station EW sea effect (ms) EW sea effect (�)
(cm) phase (�) EW (ms) EW phase (�)
K1 17.2 69 6.7 9.2 84 4.3 73M2 26.8 276 10.9 1.2 86 6.6 273
NS astr(ms) NS (ms) NS phase (�) NS sea effect (ms) NS sea effect (�)
K1 17.2 69 0.2 4.0 67 4.4 73M2 26.8 276 7.8 6.6 313 4.9 275
C. Braitenberg et al. / Journal of Geodynamics 32 (2001) 267–286 275
the VI station the loading effect is negligible and the length of the records has allowed a long-termanalysis on possible local variations of the admittance of the tidal response caused by variationsin the elastic properties of the crustal layers. The areal strain factor (Mao et al., 1989) shows thatits time variation is significant. The modifications of mechanical properties, estimated in terms ofthe local shear and bulk modulus variations, were calculated and compared with the simulta-neous inversion of the arrival time data of the local seismometric network, thus showing com-parable changes. A major change, both in seismic velocities and the elastic parameters, started inMarch 1982, which was about 11 months before an earthquake of magnitude 4.1, the largestevent from 1979 to 1986, which occurred within the seismic network on 10 February 1983.
5. Long-term observations
5.1. Underground measurements
The multi-decades continuous extensometric and clinometric observations provide a good pic-ture of the long-period deformations. In Fig. 4 the entire data set of the stations Villanova andGrotta Gigante, reduced from the original hourly to daily sampling, is shown. The most stablerecords come from the long-base Grotta Gigante pendulums. All instruments reveal a multi-annual drift, with time changes in the drift rate, as well as in drift direction. The Grotta Giganterecords have changes in drift direction around 1980 and 1995. The drift behaviour of the Villa-nova station is more complicated, with an inversion around 1988. In the case of long-periodobservations the danger exists that a drift is due to material deterioration, more than being atectonic effect. However, the observation that the drift rate changes in direction is not compatiblewith a purely instrumental effect, and this can thus be attributed to a tectonic effect. Comparisonsof the records at Grotta Gigante with those of the VI and CE Friuli (see Fig. 1) stations haverevealed a significant correlation between the observed deformations. This has been interpreted asbeing due to two crustal long-period travelling waves of 3–4 and 7–8 years period (Rossi andZadro, 1996). A direct correlation of the long-term drift rates and the time evolution of localseismicity has not been found up to now.
5.2. Continuous and episodic GPS
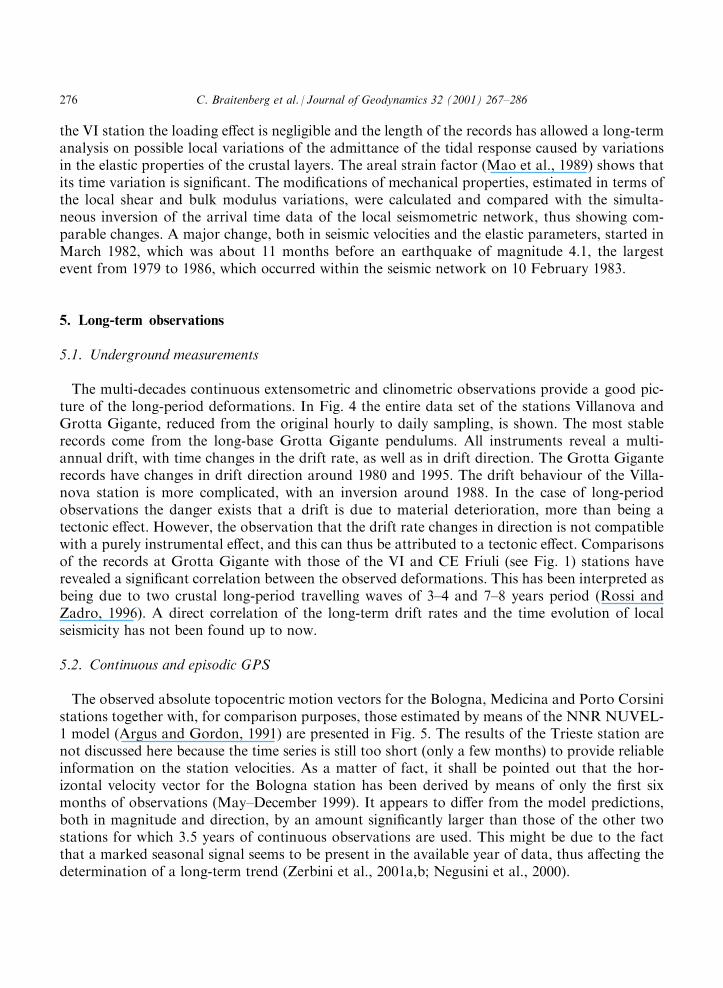
The observed absolute topocentric motion vectors for the Bologna, Medicina and Porto Corsinistations together with, for comparison purposes, those estimated by means of the NNR NUVEL-1 model (Argus and Gordon, 1991) are presented in Fig. 5. The results of the Trieste station arenot discussed here because the time series is still too short (only a few months) to provide reliableinformation on the station velocities. As a matter of fact, it shall be pointed out that the hor-izontal velocity vector for the Bologna station has been derived by means of only the first sixmonths of observations (May–December 1999). It appears to differ from the model predictions,both in magnitude and direction, by an amount significantly larger than those of the other twostations for which 3.5 years of continuous observations are used. This might be due to the factthat a marked seasonal signal seems to be present in the available year of data, thus affecting thedetermination of a long-term trend (Zerbini et al., 2001a,b; Negusini et al., 2000).
276 C. Braitenberg et al. / Journal of Geodynamics 32 (2001) 267–286

Fig. 4. Graph of the tilt-strain observations. Daily sampling. (a) Villanova S2, S3, S4 the three strainmeters, VN, VE,the tiltmeters in NS and EW direction, respectively; (b) Grotta Gigante station, EW and NS components of long base
C. Braitenberg et al. / Journal of Geodynamics 32 (2001) 267–286 277
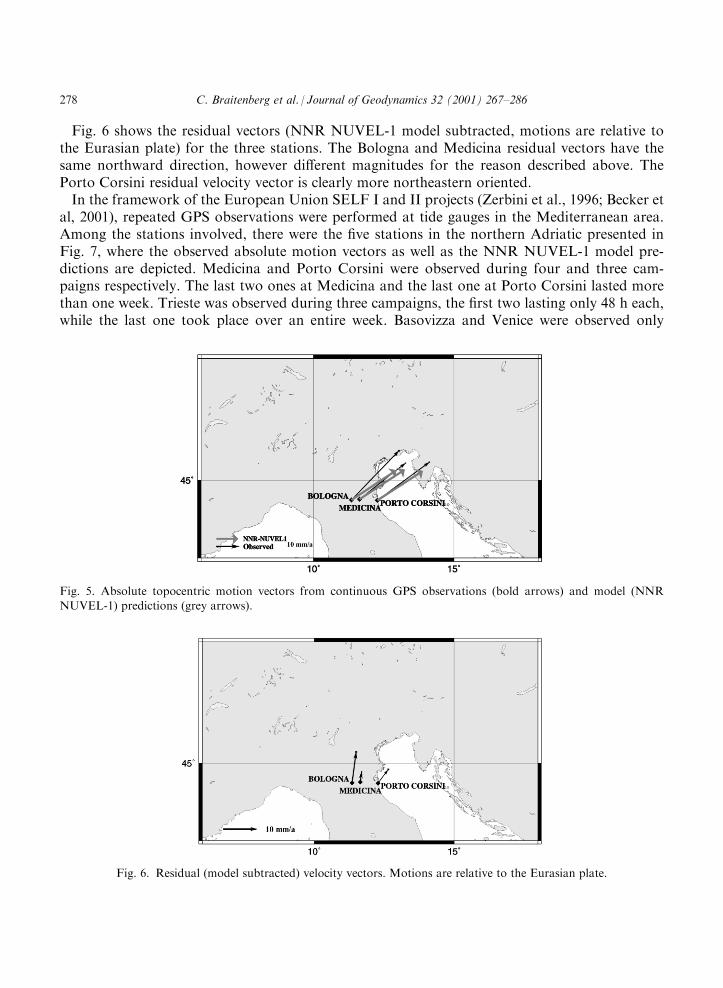
Fig. 6 shows the residual vectors (NNR NUVEL-1 model subtracted, motions are relative tothe Eurasian plate) for the three stations. The Bologna and Medicina residual vectors have thesame northward direction, however different magnitudes for the reason described above. ThePorto Corsini residual velocity vector is clearly more northeastern oriented.In the framework of the European Union SELF I and II projects (Zerbini et al., 1996; Becker et
al, 2001), repeated GPS observations were performed at tide gauges in the Mediterranean area.Among the stations involved, there were the five stations in the northern Adriatic presented inFig. 7, where the observed absolute motion vectors as well as the NNR NUVEL-1 model pre-dictions are depicted. Medicina and Porto Corsini were observed during four and three cam-paigns respectively. The last two ones at Medicina and the last one at Porto Corsini lasted morethan one week. Trieste was observed during three campaigns, the first two lasting only 48 h each,while the last one took place over an entire week. Basovizza and Venice were observed only
Fig. 6. Residual (model subtracted) velocity vectors. Motions are relative to the Eurasian plate.
Fig. 5. Absolute topocentric motion vectors from continuous GPS observations (bold arrows) and model (NNRNUVEL-1) predictions (grey arrows).
278 C. Braitenberg et al. / Journal of Geodynamics 32 (2001) 267–286
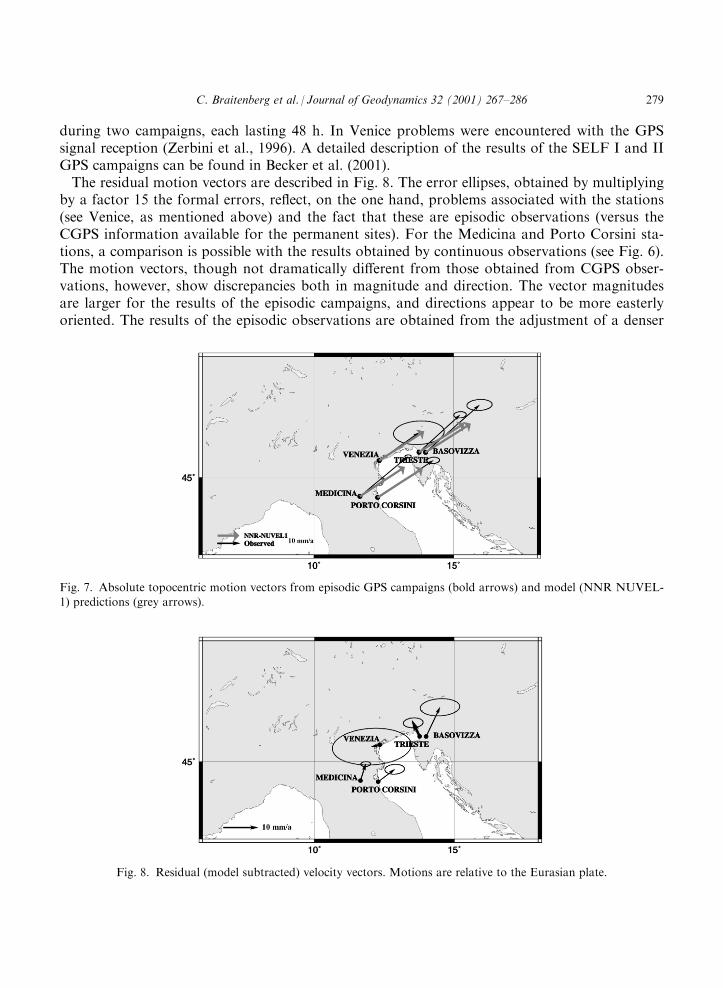
during two campaigns, each lasting 48 h. In Venice problems were encountered with the GPSsignal reception (Zerbini et al., 1996). A detailed description of the results of the SELF I and IIGPS campaigns can be found in Becker et al. (2001).The residual motion vectors are described in Fig. 8. The error ellipses, obtained by multiplying
by a factor 15 the formal errors, reflect, on the one hand, problems associated with the stations(see Venice, as mentioned above) and the fact that these are episodic observations (versus theCGPS information available for the permanent sites). For the Medicina and Porto Corsini sta-tions, a comparison is possible with the results obtained by continuous observations (see Fig. 6).The motion vectors, though not dramatically different from those obtained from CGPS obser-vations, however, show discrepancies both in magnitude and direction. The vector magnitudesare larger for the results of the episodic campaigns, and directions appear to be more easterlyoriented. The results of the episodic observations are obtained from the adjustment of a denser
Fig. 7. Absolute topocentric motion vectors from episodic GPS campaigns (bold arrows) and model (NNR NUVEL-1) predictions (grey arrows).
Fig. 8. Residual (model subtracted) velocity vectors. Motions are relative to the Eurasian plate.
C. Braitenberg et al. / Journal of Geodynamics 32 (2001) 267–286 279
and larger network of stations involving the entire Mediterranean area. It is likely that theadjustment of the solutions of the episodic campaigns may benefit from the higher density ofstations (acting as constraints in the solution) with respect to those available (smaller network ofstations, see, for example, Zerbini et al., 2001b) when considering the CGPS observations.The results indicate that, from a limited number of episodic campaigns, reliable information on
the station movements can hardly be obtained. The presence of relevant seasonal signals in thestation coordinates has been identified (Zerbini et al., 2001a,b) and needs to be further investi-gated. This, in fact, can corrupt the determination of the long-term tectonic trends in the stationvelocities.
6. Deformation and seismicity
6.1. Underground measurements
The relation between short-period variation in deformation and local seismicity has given sev-eral interesting results, discussed in the following. The observations include preseismic, post-seismic and coseismic signals, concerning the Friuli stations and the Grotta Gigante pendulums.The most spectacular observations were obtained with the long-base pendulums of the GrottaGigante in the years preceding the great M=6.4 event of Friuli which occurred on 6 May 1976.Starting from 1973, the pendulums recorded disturbing signals of a few minutes period (Zadro,1978) lasting several hours. In the following months the appearance of the disturbances, as well asthe relevant duration, increased. Firstly it was believed that the anomalies were due to somedisturbing factor, then the wires of the pendulums were changed, and finally a plastic protectionwas made around the sustaining wires of each pendulum. These actions did not reduce theobserved phenomena that continued to increase in intensity. The disturbances ceased suddenlywith the advent of the main shock in 1976. During the following months, the duration andintensity of the anomalies decreased, and they disappeared since then. One theoretical explana-tion was proposed attributing the signals to silent earthquakes, generated by a slow movementalong the fault (Bonafede et al., 1983; Dragoni et al., 1984/5). Theoretical relations regarding theexpected coseismic (Wyatt, 1988) or preseismic (Dobrovolsky et al., 1979) deformation have beenapplied to screen the data for significant short-period deformations related to the local seismicity.The theoretical considerations provide magnitude-distance relations according to which, giventhe instrumental sensitivity level, a coseismic or precursory deformation associated to an earth-quake of a given magnitude should be seen at the observation station. Furthermore, the empiricalrelation of Takemoto (1991) for precursory deformation was also tested. The crude seismiccatalogue as well as the aftershock depleted catalogue was used, and both epicentral distances(Dal Moro and Zadro, 1999) and hypocentral distances (Braitenberg, 1999a) were applied.Regarding the precursory effects, two seismic events obeyed the above theoretical considerationsand resulted to have generated anomalous deformation signals, even if very different in nature(Dal Moro and Zadro, 1999). Both events, of comparable magnitude near to M=4, occurred atsmall epicentral distances from the stations (a few km). The first event, in February 1988, waspreceded by an anomalous drift, which started two to three months prior to the event. Thecoseismic deformation was well observed and it was compatible with a dislocation model of the
280 C. Braitenberg et al. / Journal of Geodynamics 32 (2001) 267–286
fault. The second event, in October 1991, was preceded a few days before by an extremely intensiverainfall. Two of the strainmeters, usually having a compressional rain induced signal, measured astrong extension, and the tiltmeters in a second station recorded a steplike signal not followedby the typical exponential recovery. Regarding the coseismic steps, five events out of the eightbeing in a favourable magnitude–distance relationship, allowed to detect significant deformation.Dislocation models explain the observations reasonably well (Braitenberg, 1999a).
6.2. CGPS horizontal rates
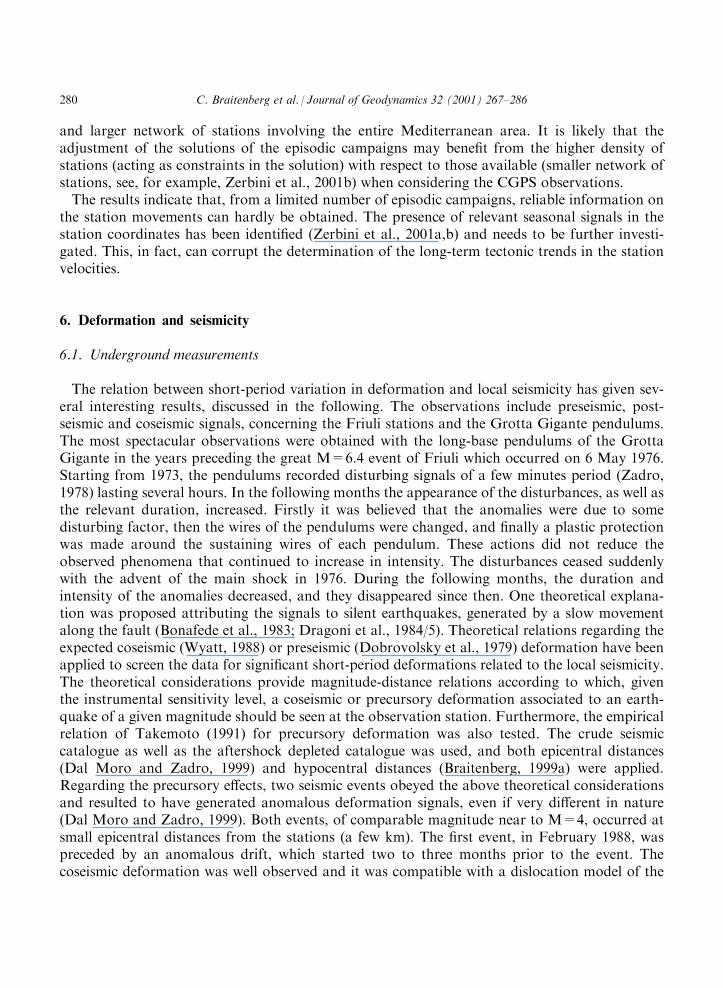
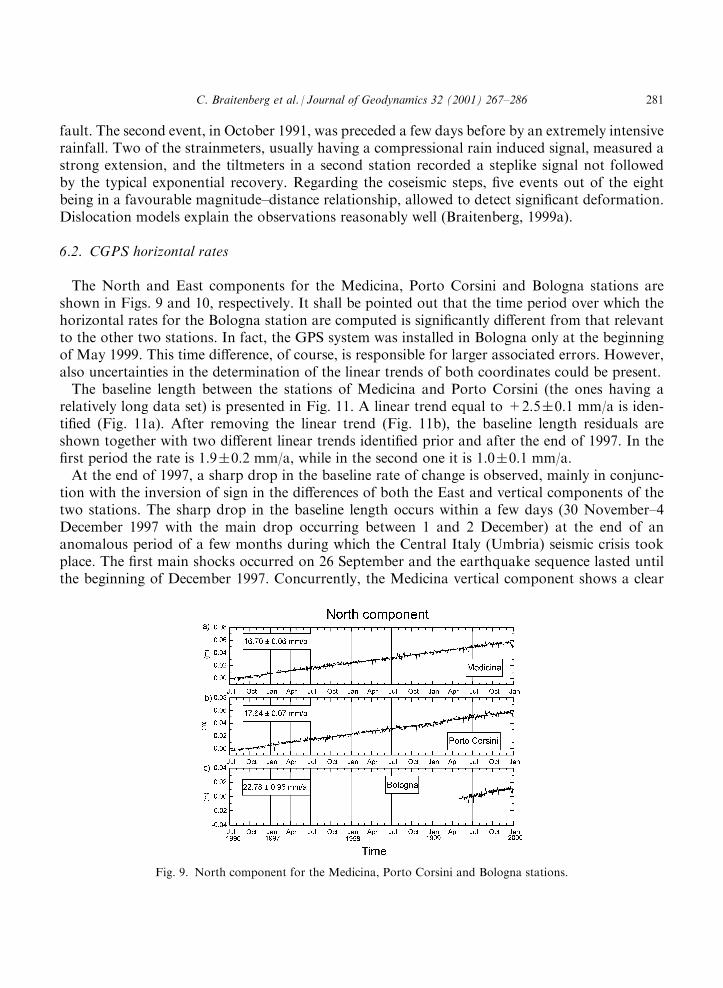
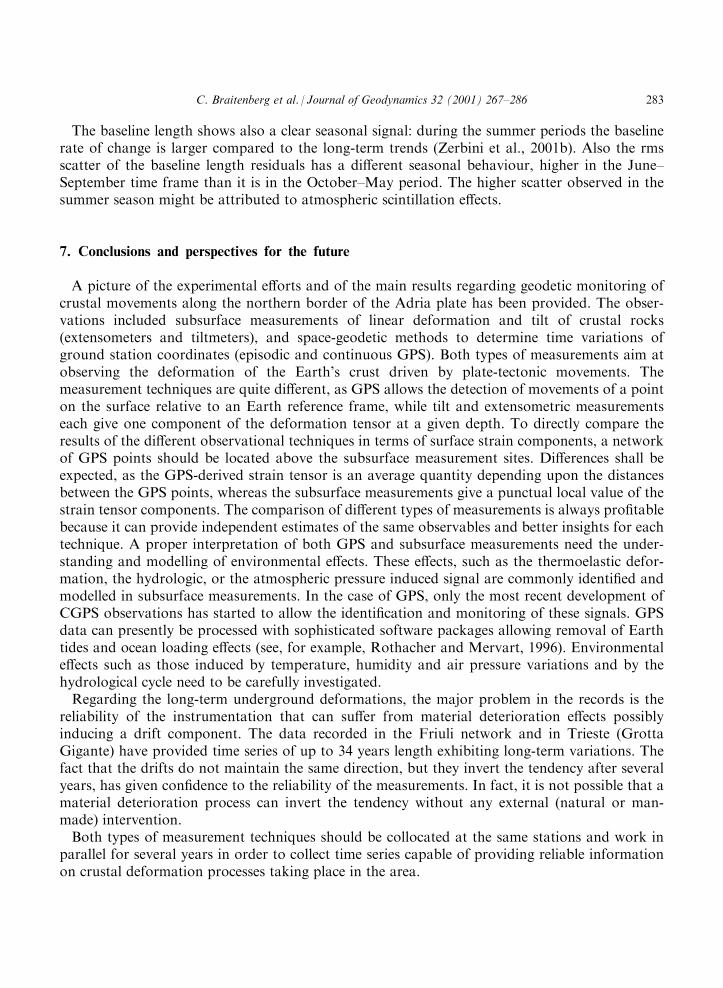
The North and East components for the Medicina, Porto Corsini and Bologna stations areshown in Figs. 9 and 10, respectively. It shall be pointed out that the time period over which thehorizontal rates for the Bologna station are computed is significantly different from that relevantto the other two stations. In fact, the GPS system was installed in Bologna only at the beginningof May 1999. This time difference, of course, is responsible for larger associated errors. However,also uncertainties in the determination of the linear trends of both coordinates could be present.The baseline length between the stations of Medicina and Porto Corsini (the ones having a
relatively long data set) is presented in Fig. 11. A linear trend equal to +2.5�0.1 mm/a is iden-tified (Fig. 11a). After removing the linear trend (Fig. 11b), the baseline length residuals areshown together with two different linear trends identified prior and after the end of 1997. In thefirst period the rate is 1.9�0.2 mm/a, while in the second one it is 1.0�0.1 mm/a.At the end of 1997, a sharp drop in the baseline rate of change is observed, mainly in conjunc-
tion with the inversion of sign in the differences of both the East and vertical components of thetwo stations. The sharp drop in the baseline length occurs within a few days (30 November–4December 1997 with the main drop occurring between 1 and 2 December) at the end of ananomalous period of a few months during which the Central Italy (Umbria) seismic crisis tookplace. The first main shocks occurred on 26 September and the earthquake sequence lasted untilthe beginning of December 1997. Concurrently, the Medicina vertical component shows a clear
Fig. 9. North component for the Medicina, Porto Corsini and Bologna stations.
C. Braitenberg et al. / Journal of Geodynamics 32 (2001) 267–286 281
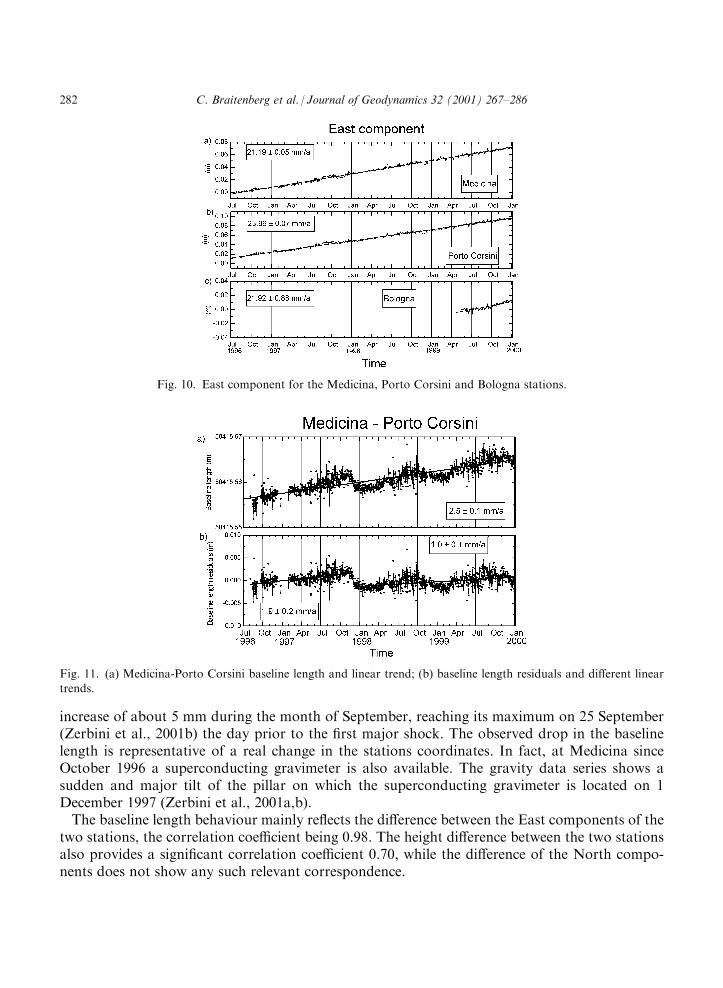
increase of about 5 mm during the month of September, reaching its maximum on 25 September(Zerbini et al., 2001b) the day prior to the first major shock. The observed drop in the baselinelength is representative of a real change in the stations coordinates. In fact, at Medicina sinceOctober 1996 a superconducting gravimeter is also available. The gravity data series shows asudden and major tilt of the pillar on which the superconducting gravimeter is located on 1December 1997 (Zerbini et al., 2001a,b).The baseline length behaviour mainly reflects the difference between the East components of the
two stations, the correlation coefficient being 0.98. The height difference between the two stationsalso provides a significant correlation coefficient 0.70, while the difference of the North compo-nents does not show any such relevant correspondence.
Fig. 11. (a) Medicina-Porto Corsini baseline length and linear trend; (b) baseline length residuals and different lineartrends.
Fig. 10. East component for the Medicina, Porto Corsini and Bologna stations.
282 C. Braitenberg et al. / Journal of Geodynamics 32 (2001) 267–286
The baseline length shows also a clear seasonal signal: during the summer periods the baselinerate of change is larger compared to the long-term trends (Zerbini et al., 2001b). Also the rmsscatter of the baseline length residuals has a different seasonal behaviour, higher in the June–September time frame than it is in the October–May period. The higher scatter observed in thesummer season might be attributed to atmospheric scintillation effects.
7. Conclusions and perspectives for the future
A picture of the experimental efforts and of the main results regarding geodetic monitoring ofcrustal movements along the northern border of the Adria plate has been provided. The obser-vations included subsurface measurements of linear deformation and tilt of crustal rocks(extensometers and tiltmeters), and space-geodetic methods to determine time variations ofground station coordinates (episodic and continuous GPS). Both types of measurements aim atobserving the deformation of the Earth’s crust driven by plate-tectonic movements. Themeasurement techniques are quite different, as GPS allows the detection of movements of a pointon the surface relative to an Earth reference frame, while tilt and extensometric measurementseach give one component of the deformation tensor at a given depth. To directly compare theresults of the different observational techniques in terms of surface strain components, a networkof GPS points should be located above the subsurface measurement sites. Differences shall beexpected, as the GPS-derived strain tensor is an average quantity depending upon the distancesbetween the GPS points, whereas the subsurface measurements give a punctual local value of thestrain tensor components. The comparison of different types of measurements is always profitablebecause it can provide independent estimates of the same observables and better insights for eachtechnique. A proper interpretation of both GPS and subsurface measurements need the under-standing and modelling of environmental effects. These effects, such as the thermoelastic defor-mation, the hydrologic, or the atmospheric pressure induced signal are commonly identified andmodelled in subsurface measurements. In the case of GPS, only the most recent development ofCGPS observations has started to allow the identification and monitoring of these signals. GPSdata can presently be processed with sophisticated software packages allowing removal of Earthtides and ocean loading effects (see, for example, Rothacher and Mervart, 1996). Environmentaleffects such as those induced by temperature, humidity and air pressure variations and by thehydrological cycle need to be carefully investigated.Regarding the long-term underground deformations, the major problem in the records is the
reliability of the instrumentation that can suffer from material deterioration effects possiblyinducing a drift component. The data recorded in the Friuli network and in Trieste (GrottaGigante) have provided time series of up to 34 years length exhibiting long-term variations. Thefact that the drifts do not maintain the same direction, but they invert the tendency after severalyears, has given confidence to the reliability of the measurements. In fact, it is not possible that amaterial deterioration process can invert the tendency without any external (natural or man-made) intervention.Both types of measurement techniques should be collocated at the same stations and work in
parallel for several years in order to collect time series capable of providing reliable informationon crustal deformation processes taking place in the area.
C. Braitenberg et al. / Journal of Geodynamics 32 (2001) 267–286 283

Presently, at the border of the Adria plate, such a direct comparison of CGPS and subsurfacemeasurements is not yet possible, since a GPS network covering the location of the long-periodsubsurface measurements does not exist. Hopefully, in the near future, an integrated networkcould be established. This would broaden the chance of a joint interpretation of space-geodeticand subsurface crustal movement observations. Good examples are the Japanese CGPS network,where several hundreds CGPS stations have been installed throughout the country (Kato et al.,1998), and the Californian Permanent GPS geodetic array (Bock et al., 1997) covering the area ofthe extensometric and tiltmeter observation stations.The results presented in this paper indicate that horizontal crustal deformations can be reliably
identified by means of GPS observations. CGPS provides more confidence in the estimates of therates. For the Medicina and Porto Corsini stations, horizontal velocity vectors have been esti-mated from CGPS observations. They were compared to those derived by episodic campaignsand to the vectors provided by the NNR NUVEL-1 tectonic model. The observed directionsof the horizontal motion vectors appear in agreement with an anticlockwise rotation of theAdria plate considering a rotation pole located further west, as suggested by Meletti et al.(2000). A possible influence on the horizontal as well as vertical coordinates behaviour of thetwo stations due to seismic activity (central Italy, Umbria seismic crisis, at the end of 1997) hasbeen indicated.Concerning the long-period variations of tilt observed in the Grotta Gigante and VI stations,
which reveals a near to oscillating character with a period of more than ten years, future mea-surements will show whether this is a time persistent phenomenon. It shall be investigated whe-ther the same phenomenon can also be identified in other subsurface stations located e.g. inJapan, the Confederation of Independent States, or in California, where continuous records oversufficiently long periods of time are available, and in the future, with long-term collocated CGPSobservations.A future goal shall be that of providing the science community with time series of different
observational data (collocated instruments) characterised by high accuracy, homogeneity andcontinuity. This observational capacity will allow the clear identification of anomalous deforma-tion signals having, possibly, similar characters to those observed prior to the occurrence of theseismic events mentioned above.
Acknowledgements
The work was developed under support of the ING (Rome) for the Grotta Gigante station andcontract numbers IC15 CT96-0205 of the INCO-COPERNICUS programme of the EuropeanCommission, MURST 40% and 60% contractor M. Zadro, University of Trieste, MURST ‘‘Co-finanziamento’’ 1998 contractor S. Zerbini, and Contract ARS-96-50 from the Italian SpaceAgency, contractor S. Zerbini, University of Bologna.
References
Argus, D.F., Gordon, R.G., 1991. No-net rotation model of current plate velocities incorporating plate motion modelNUVEL-1. Geophys. Res. Lett. 18 (11), 2039–2042.
284 C. Braitenberg et al. / Journal of Geodynamics 32 (2001) 267–286
Becker, M., Zerbini, S., Baker, Burki, T., Galanis, J., Garate, J., Georgiev, I., Kahle, H., Kotzev, V., Lobazov, V.,
Marson, I., Negusini, M., Richter, B., Veis, G., Yuzefovich, P., 2001. Assessment of Height Variations by GPS atMediterranean and Black Sea coast tide gauges from the SELF projects, Global and Planetary Change, submitted.
Boccaletti, M., Coli, M., Eva, C., Ferrari, G., Giglia, G., Lazzarotto, A., Merlanti, F., Nicolich, R., Papani, G.,
Postpischl, D., 1985. Considerations on the seismotectonics of the Northern Apennines. Tectonophysics 117, 7–38.Bock, Y., Wdowinski, S., Fang, P., Zhang, J., Williams, S., Johnson, H., Behr, J., Genrich, J., Dean, J., van Domselaar,M., Agnew, D., Wyatt, F., Stark, K., Oral, B., Hudnut, K., King, R., Herring, T., Dinardo, S., Young, W., Jackson,
D., Gurtner, W., 1997. Southern California permanent GPS geodetic array: continuous measurements of regionalcrustal deformation between the 1992 Landers and 1994 Northridge earthquakes. Geoph. Res. 102, 18013–18033.
Bonafede, M., Boschi, E., Dragoni, M., 1983. Viscoelastic stress relaxation on deep fault sections as a possible sourceof very long period elastic waves. J. Geophys. Res. 88, 2251–2260.
Braitenberg, C., 1999a. The Friuli (NE Italy) tilt/strain gauges and short term observations. Annali di Geofisica 42, 1–28.
Braitenberg, C., 1999b. Estimating the hydrologic induced signal in geodetic measurements with predicitive filtering
methods. Geophys. Res. Lett. 26, 775–778.Braitenberg, C., 2000. Non-random spectral components in the seismicity of NE Italy. Earth Planet Sci. Lett. 179 (2),379–390.
Braitenberg, C., Zadro, M., 1999. The Grotta Gigante horizontal pendulums—instrumentation and observations. Boll.Geof. Teor. Appl., Vol. 40, N. 2, in press.
Braitenberg, C., Zadro, M., 2001. Modeling the hydrologic signal in geodetic measurements. J. Geodetic Soc. of Japan
47, 95–100.Chiaruttini, C., 1976. Tidal loading on the Italian peninsula. Geophys. J.R.astr. Soc. 46, 773–793.Dal Moro, G., Zadro, M., 1998. Subsurface deformations induced by rainfall and atmospheric pressure: tilt/strainmeasurements in the NE-Italy seismic area. Earth Planet. Sci. Lett. 164, 193–203.
Dal Moro, G., Zadro, M., 1999. Remarkable tilt-strain anomalies preceding two seismic events in Friuli NE Italy):their interpretation as precursors. Earth Planet. Sci. Lett. 170, 119–129.
Dal Moro, G., Ebblin, C., Zadro, M., 2001. The FEM in the interpretation of tilt-strainmeter observations in a cave:
air pressure induced deformations. J. Geodetic Soc. of Japan 47, 88–94.Dragoni, M, Bonafede, M., Boschi, E., 1984/5. On the interpretation of slow ground deformation precursory to the1976 Friuli earthquake. Pure Appl. Geophys. 122, 781–792.
Dobrovolsky, I.P., Zubkov, S.I., Miachkin, V.I., 1979. Estimation of the size of earthquake preparation zones.PAGEOPH 117, pp. 1025–1044.
Dragoni, M., Bonafede, M., Boschi, E., 1984/85. On the interpretation of slow ground deformation precursory to the
1976 Friuli earthquake. PAGEOPH, 122: pp. 781–792.Garavaglia, M., Dal Moro, G., Zadro, M., 2000. Radon and tilt measurements in a seismic area: temperature effects.Physics and Chemistry of the Earth 25 (3), 233–237.
Kato, T., El-Fiky, G.S., Oware, E.N., Miyazaki, S., 1998. Crustal strains in Japanese islands as deduced from dense
GPS array. Geoph. Res. Lett. 25, 3445–3448.Kumpel, H.J., 1986. Model calculations for rainfall induced tilt and strain anomalies. In: Vieira, R. (Ed.), Proceedingsof the Tenth International Symposium on Earth Tides. Madrid, pp. 889–901.
Lowrie, W., 1997. Fundamentals of Geophysics. Cambridge University Press, pp.354.Mantovani, E., Albarello, D., Babbucci, D., Tamburelli, C., 1997. Recent/present tectonic processes in the Italianregion and their relation with seismic and volcanic activity. Annales Tectonicae XI (1–2), 27–57.
Mao, W.J., Ebblin, C., Zadro, M., 1989. Evidence for variations of mechanical properties in the Friuli seismic area.Tectonophysics 170, 231–242.
Marussi, A., 1960. The University of Trieste station for the study of the tides of the vertical in the Grotta Gigante.Proceedings of the III Int. Symposium on Earth Tides, Trieste, pp. 45–52.
Meletti, C., Patacca, E., Scandone, P., 2000. Construction of a seismotectonic model: the case of Italy. Pure Appl.Geophys. 157, 11–35.
NCEP Reanalysis data from the NOOA-CIRES Climate Diagnostic Center, Boulder, Colorado. Web site: http://
www.cdc.nooa.gov.
C. Braitenberg et al. / Journal of Geodynamics 32 (2001) 267–286 285

Negusini, M., Romagnoli, C., Zerbini, S., 2000. Horizontal movements in Northeastern Italy from continuous and
episodic GPS observations. Book of extended abstracts of X General Assembly of WEGENER, Cadiz, Spain, 18–22September 2000.
Pieri, M., Groppi, G., 1981. Subsurface geological structure of the Po Plain, Italy. Publ. No. 414, Progetto Finalizzato
Geodinamica, CNR, 23 pp.Polli, S., 1959. La propagazione delle maree nell’Adriatico. Atti X Conv. Ass. Geofis. It., Roma.Rabbel, W., Zschau, J., 1985. Static deformations and gravity changes at the earth’s surface due to atmospheric load-
ing. J. Geophys. 56, 81–99.Rossi, G., Zadro, M., 1996. Long-term crustal deformations in NE Italy revealed by tilt-strain gauges. Physics of theEarth and Planetary Interiors 97, 55–70.
Rothacher, M., Mervart, L. (Eds.), 1996. Bernese GPS software version 4.0, Astronomical Institute—University of
Berne, 417 pp.Takemoto, S., 1991. Some problems on detection of earthquake precursors by means of continuous monitoring ofcrustal strains and tilts. J. Geophys. Res. 96, 10377–10390.
Weise, A., Jentzsch, G., Kiviniemi, A., Kaariainen, J., 1991. Comparison of long-period tilt measurements: resultsfrom the two clinometric stations Metsahovi and Lohja, Finland. J. Geodyn. 27, 237–257.
Wyatt, F.K., 1988. Measurements of coseismic deformation in Southern California: 1972-1982. J. Geophys. Res. 93,
7923–7942.Zadro, B.M., 1972. Earth tides and ocean loading effects recorded at Trieste. Boll. di Geof. Teorica ed Applicata, Vol.XIV, n. 55, 192–202.
Zadro, M., 1978. Use of tiltmeters for the detection of forerunning events in seismic areas. Boll. Geod. Sc. Aff. 2–3,597–618.
Zadro, M., Braitenberg, C., 1999. Measurements and interpretations of tilt-strain gauges in seismically active areas.Earth Sci. Rev. 47, 151–187.
Zadro, M., Chiaruttini, C., 1975. Loading effects of the Mediterranean tides, Sopron 1973. Akademiai Kiado, Buda-pest, 495–501.
Zerbini, S., Plag, H.-P., Baker, T., Becker, M., Billiris, H., Burki, B., Kahle, H., Marson, I., Pezzoli, L., Richter, B.,
Romagnoli, C., Sztobryn, M., Tomasi, P., Tsimplis, N.M., Veis, G., Verrone, G., 1996. Sea level in the Mediterra-nean: a first step towards separating crustal movements and absolute sea-level variations. Global and PlanetaryChange, 14, Nos. 1–2, Agosto 1996, 1–48.
Zerbini, S., Richter, B., Negusini, M., Romagnoli, C., Simon, D., Domenichini, F., Schwahn, W., 2001a. Height andgravity variations by continuous GPS, gravity and environmental parameter observations in the southern Po Plain,near Bologna, Italy. Earth Planet. Sci. Lett. (submitted).
Zerbini, S., Negusini, M., Romagnoli, C., Domenichini, F., Richter, B., Simon, D., Schwahn, W., 2001b. Multi-para-meter continuous observations to detect ground deformation and to assess climate variability impacts. Global andPlanetary Change (accepted).
286 C. Braitenberg et al. / Journal of Geodynamics 32 (2001) 267–286