Land Subsidence of Jakarta (Indonesia) and its Geodetic Monitoring System
24
Natural Hazards 23: 365–387, 2001. © 2001 Kluwer Academic Publishers. Printed in the Netherlands. 365 Land Subsidence of Jakarta (Indonesia) and its Geodetic Monitoring System HASANUDDIN Z. ABIDIN 1 , ROCHMAN DJAJA 2 , DUDY DARMAWAN 1 , SAMSUL HADI 3 , ARIFIN AKBAR 4 , H. RAJIYOWIRYONO 5 , Y. SUDIBYO 5 , I. MEILANO 1 , M. A. KASUMA 1 , J. KAHAR 1 and CECEP SUBARYA 2 1 Department of Geodetic Engineering, Institute of Technology Bandung, Jl. Ganesha 10, Bandung, Indonesia, e-mail: [email protected] and [email protected]; 2 National Coordinating Agency for Survey and Mapping, Cibinong, Bogor, Indonesia; 3 Local Surveying and Mapping Agency of Jakarta, Indonesia; 4 Local Mines Agency of Jakarta, Indonesia; 5 Directorate of Environmental Geology, Bandung, Indonesia Abstract. Jakarta is the capital city of Indonesia with a population of about 10 million people, inhabiting an area of about 25 × 25 km. It has been reported for sometime that locations in Jakarta are subsiding at different rates. Up to the present, there has been no comprehensive information about the characteristics and pattern of land subsidence in the Jakarta area. Usually land subsidence in Jakarta is measured using extensometers and ground water level observations, or estimated using geological and hydrological parameters. To give a better picture about land subsidence, geodetic- based monitoring systems utilizing leveling and GPS surveys have also been implemented. The land subsidence characteristics of Jakarta and its surrounding area are investigated using data from three repeated leveling surveys performed in 1982, 1991, and 1997, and two repeated GPS surveys conducted in 1997 and 1999. Leveling surveys detected subsidence up to about 80 cm during the period of 1982–1991, and up to about 160 cm during the 1991–1997 period; while GPS surveys observed subsidence up to about 20 cm during the period of 1997–1999. Comparison with the hydrological data shows that land subsidence in Jakarta is strongly related to excessive groundwater extraction. 1. Introduction Jakarta is the capital city of the Republic of Indonesia with a population of about 10 million people, inhabiting an area of about 650.40 km 2 . Jakarta is centered at the coordinates of about -6 ◦ 15 0 (latitude) and +106 ◦ 50 0 (longitude) and located on the lowland of the northern coast of the West Java province is as shown in Figure 1. The area is relatively flat, with the topographical slopes ranging between 0 ◦ and 2 ◦ in the northern and central parts, and between 0 ◦ and 5 ◦ in the southern part. The southern–most area of Jakarta has an altitude of about 50 m above mean sea level. Regionally speaking, Jakarta is a lowland area, which according to Rimbaman and Suparan (1999), has five main landforms, namely: 1. Alluvial landforms, which are located in the southern part.
Transcript of Land Subsidence of Jakarta (Indonesia) and its Geodetic Monitoring System

Natural Hazards23: 365–387, 2001.© 2001Kluwer Academic Publishers. Printed in the Netherlands.
365
Land Subsidence of Jakarta (Indonesia) and itsGeodetic Monitoring System
HASANUDDIN Z. ABIDIN 1, ROCHMAN DJAJA2, DUDY DARMAWAN 1,SAMSUL HADI3, ARIFIN AKBAR 4, H. RAJIYOWIRYONO5, Y. SUDIBYO5,I. MEILANO 1, M. A. KASUMA 1, J. KAHAR1 and CECEP SUBARYA21Department of Geodetic Engineering, Institute of Technology Bandung, Jl. Ganesha 10, Bandung,Indonesia, e-mail: [email protected] and [email protected];2National CoordinatingAgency for Survey and Mapping, Cibinong, Bogor, Indonesia;3 Local Surveying and MappingAgency of Jakarta, Indonesia;4Local Mines Agency of Jakarta, Indonesia;5Directorate ofEnvironmental Geology, Bandung, Indonesia
Abstract. Jakarta is the capital city of Indonesia with a population of about 10 million people,inhabiting an area of about 25× 25 km. It has been reported for sometime that locations in Jakartaare subsiding at different rates. Up to the present, there has been no comprehensive informationabout the characteristics and pattern of land subsidence in the Jakarta area. Usually land subsidencein Jakarta is measured using extensometers and ground water level observations, or estimated usinggeological and hydrological parameters. To give a better picture about land subsidence, geodetic-based monitoring systems utilizing leveling and GPS surveys have also been implemented.
The land subsidence characteristics of Jakarta and its surrounding area are investigated usingdata from three repeated leveling surveys performed in 1982, 1991, and 1997, and two repeatedGPS surveys conducted in 1997 and 1999. Leveling surveys detected subsidence up to about 80 cmduring the period of 1982–1991, and up to about 160 cm during the 1991–1997 period; while GPSsurveys observed subsidence up to about 20 cm during the period of 1997–1999. Comparison with thehydrological data shows that land subsidence in Jakarta is strongly related to excessive groundwaterextraction.
1. Introduction
Jakarta is the capital city of the Republic of Indonesia with a population of about10 million people, inhabiting an area of about 650.40 km2. Jakarta is centered atthe coordinates of about−6◦15′ (latitude) and+106◦50′ (longitude) and located onthe lowland of the northern coast of the West Java province is as shown in Figure 1.The area is relatively flat, with the topographical slopes ranging between 0◦ and 2◦in the northern and central parts, and between 0◦ and 5◦ in the southern part. Thesouthern–most area of Jakarta has an altitude of about 50 m above mean sea level.
Regionally speaking, Jakarta is a lowland area, which according to Rimbamanand Suparan (1999), has five main landforms, namely:
1. Alluvial landforms, which are located in the southern part.

366 HASANUDDIN Z. ABIDIN ET AL.
Figure 1. Geographical location of Jakarta.
2. Landforms of marine-origin, which are found in the northern part adjacent tothe coastline.
3. Beach ridge landforms, which are located in the northwest and northeast parts.4. Swamp and mangrove swamp landforms, which are encountered in the coastal
fringe.
5. Former channels, which run perpendicular to the coastline.
It should also be noted that there are about 13 natural and artificial rivers flowingthrough Jakarta, of which the main rivers, such as Ciliwung, Sunter, Pesanggrahan,Grogol and their tributaries, form the main drainage system of Jakarta.
According to Yonget al. (1995), the Jakarta basin consists of a 200 to 300 mthick sequence of Quaternary deposits which overlies Tertiary sediments. The topsequence is thought to be the base of the groundwater basin. The Quaternary se-quence can be further subdivided into three major units, which, in ascending orderare: a sequence of Pleistocene marine and non-marine sediments, a late Pleisto-cene volcanic fan deposit, and Holocene marine and floodplain deposits. The crosssection depicting those sequences is shown in Figure 2.
Land subsidence is not a new phenomenon for Jakarta. According to the LocalMines Agency of Jakarta, over the period of 1982 to 1997, subsidence rangingfrom 20 to 200 cm was evident in several places in Jakarta. The occurrence of landsubsidence in Jakarta was realized for the first time in 1926. Evidence for sub-sidence was based on repeated leveling measurements conducted in the northernpart of Jakarta. Unfortunately this investigation of land subsidence using levelingwas not continued. Starting in 1978, the impact of land subsidence in Jakarta couldbe seen in several forms, such as the cracking of permanent constructions locatedaround the center of the Jakarta area (along Thamrin street), the wider expansionof flooding areas, the lowering of the ground water level, and increased inland seawater intrusion. Although many people believe that land subsidence in Jakarta is areal phenomenon, up to the present time, there has been neither definitive detail nor

LAND SUBSIDENCE OF JAKARTA (INDONESIA) 367
Figure 2. Schematic hydro-geological cross section of Jakarta (present ground water flow),adapted from Rismianto and Mak (1993).
comprehensive information about the characteristics and pattern of land subsidencein the Jakarta area.
Since the early 1980’s, the land subsidence in several places of Jakarta hasbeen measured using several measurement techniques, e.g., leveling surveys, ex-tensometer measurements, ground water level observations, and GPS (GlobalPositioning System) surveys. The prediction of ground subsidence, based on mod-els incorporating geological and hydrological parameters of Jakarta, has also beeninvestigated by a few researchers (Murdohardono and Tirtomihardjo, 1993; Yongetal., 1995; Purnomoet al., 1999). This paper concentrates on the use of leveling andGPS surveys for monitoring the land subsidence in Jakarta: three repeated levelingsurveys performed in 1982, 1991, and 1997; and two repeated GPS surveys con-ducted in 1997 and 1999. The GPS surveys were conducted by the Department ofGeodetic Engineering, Institute of Technology Bandung. In the case of the levelingsurveys, the first two surveys were performed by the Local Surveying and MappingAgency of Jakarta, and the last one was conducted by the Local Mines Agency ofJakarta. The information on land subsidence obtained from those leveling and GPSsurveys is discussed by taking into account the geological and hydrological settingof the Jakarta basin.
2. Land Subsidence in Jakarta
According to Murdohardono and Sudarsono (1998) and Rismianto and Mak(1993), four different types of land subsidence that occur in the Jakarta basin,namely: subsidence due to groundwater extraction, subsidence induced by the loadof constructions (i.e., settlement of high compressibility soil), subsidence caused

368 HASANUDDIN Z. ABIDIN ET AL.
by natural consolidation of alluvium soil, and geotectonic subsidence. The maincause of land subsidence in Jakarta is thought to be groundwater extraction. Ex-cessive groundwater extraction will lead to the deepening of groundwater level(piezometric head), which in turn will cause land subsidence and also seawaterintrusion (Soekardiet al., 1986).
Three aquifers are recognized inside a 250 m thick sequence of quaternarysediment of the Jakarta basin, namely (Hadipurwo, 1999): the Upper Aquifer, anunconfined aquifer, occurs at a depth of less than 40 m; the Middle Aquifer, aconfined aquifer, occurs at a depth between 40 and 140 m; and the Lower Aquifer,a confined aquifer, occurs at a depth between 140 and 250 m. Inside those aquifers,the groundwater generally flows from south to the north. Below a depth of 250 m,an aquifer in the tertiary sediment was also found. But according to Murdohardonoand Tirtomihardjo (1993), it is less productive and its water quality is poor.
Groundwater extraction in Jakarta is either shallow (<40 m) and deep (>40 m).Shallow extraction is through dug wells or driven wells, operated with buckets,hand pumps or small electrical pumps; whereas deep extraction is mostly fromdrilled wells. Shallow extraction is mostly done by the population. It is well spreadover the area, but its extraction rate per well is relatively low. Deep extraction isusually conducted by industry. It is usually more concentrated, and has a relat-ively high extraction rate per well. According to Sudibyo (1999), the number ofregistered drilled wells in Jakarta was 3626 wells in 1998. Based on the studiesdone by Murdohardono and Tirtomihardjo (1993), from a sample of 197-drilledwells in Jakarta, out of 2800 registered drilled wells at that time, 156 wells (79%)extracted groundwater from depths between 40 and 140 m, and 41 wells (21%)extracted from depths between 140 and 250 m. The land subsidence observed in thecoastal, west, and northeastern parts of Jakarta are thought to be caused by this deepgroundwater extraction, which reduces the water pressure in the aquifer (piezo-metric level) (Rismianto and Mak, 1993). According to Soetrisnoet al. (1997), thepiezometric level in North Jakarta has changed from 12.5 m above sea level in 1910to about sea level in the 1970’s, and then deepened significantly to 30–50 m belowsea level in the 1990’s.
According to the Local Mines Agency of Jakarta, in the period of 1982 to 1997subsidence of up to 200 cm was observed in the northwestern part of Jakarta.This area, which is close to the shoreline consists of complex river and beachdeposits and has soils of high compressibility (Murdohardono and Sudarsono,1998). According to Rajiyowiryono (1999), extensometer and automatic waterlevel information in the monitoring wells at the Jakarta Office of Directorate ofEnvironmental Geology indicates continuous subsidence, although the groundwa-ter table increased during the last two years (Sudibyo, 1999). Figure 3 shows anexample of land subsidence impacts in Jakarta.
If the land subsidence continues at the present rate, then by 2010 land subsid-ence up to about 500 cm could be expected in certain places of Jakarta. Systematicand continuous monitoring of land subsidence in Jakarta is needed. Comprehens-

LAND SUBSIDENCE OF JAKARTA (INDONESIA) 369
Figure 3. A house at Kebon Bawang, North Jakarta that subsided (courtesy of HardoyoRajiyowiryono).
Figure 4. The importance of land subsidence information.
ive information on the characteristics of land subsidence would be important forseveral tasks (see Figure 4).
In the fiscal year of 1999/2000, the Directorate of Environmental Geology hasalso established four land subsidence monitoring stations in North, Central, West,and East Jakarta respectively. Each station is equipped with three basic instruments,i.e., extensometer system, automatic water level recorder system, and piezometersystem (Murdohardono and Sudarsono, 1998). In order to get stable referencepoints, six benchmarks have also been established, one in East Jakarta, one in WestJakarta, two in South Jakarta, and two in North Jakarta. All of these benchmarksare sited on the tertiary layer, which is assumed to be stable and is not influenced bythe land subsidence process. For next GPS surveys, these benchmarks are plannedto be included into a GPS network for monitoring land subsidence in Jakarta.

370 HASANUDDIN Z. ABIDIN ET AL.
3. Land Subsidence Measured by Leveling Surveys
The establishment of a vertical control in Jakarta was started in 1925 at the timeof Dutch colonization by using optical leveling measurements. The first preciseleveling network was established between May 1925 and April 1926. This networkhad a leveling line of about 38 km. Unfortunately the data and results of theseleveling surveys are lost and unknown at the present time. After these first surveys,the next systematic leveling surveys covering Jakarta area were conducted in 1978,1982, 1991, 1993, and 1997. Except for the last survey, which was performed bythe Local Mines Agency of Jakarta, other leveling surveys were done by the LocalSurveying and Mapping Agency of Jakarta. The leveling surveys were done usingWild N3, Zeiss Ni002, and Wild NAK precise levels. Each leveling line was meas-ured in double-standing mode, and each leveling session was measured forwardand backward. The leveling line for each session is about 1 km in length. Thetolerance for the difference between the forward and backward height-differencemeasurements is set to be 4(D mm, where D is the length of leveling line in km.
The height differences are computed based on parametric least squares adjust-ment. Prior to adjustment, the data are corrected by rod constant and refractioncorrections. After checking the number of collocated points between the surveysand performing misclosure checking on several loops, only three surveys wereconsidered for investigating the land subsidence in Jakarta, i.e., those conductedin 1982, 1991, and 1997. Moreover, only the results from those leveling pointsin the network, which are considered the most reliable, are used for investigatingland subsidence. In this case, repeatability of the heights obtained from differentsurveys and different loops and stability of the monument with respect to its localenvironment, are used as the main criteria for selecting the points. The distributionof these leveling points is shown in Figure 5.
The network consists of about 80 points distributed across Jakarta. The landsubsidence measured from about 45 selected points from the leveling networks of1982, 1991, and 1997, are shown in Table I. From this table it can be seen that landsubsidence in Jakarta varies both spatially and temporally. If these values of landsubsidence are plotted with respect to their (orthometric) heights, as representedby Figure 6, it is shown that land subsidence mostly occurred at the points withheights lower than 20 m above mean sea level. The figure also shows that largerland subsidence occurred at the points with heights of about a few metres, i.e.,relatively close to the shore.
Figure 6 shows that the maximum land subsidence observed by the levelingsurveys during the period of 1991–97 is about 160 cm, while for the period of1982–91 it is about 80 cm. The rates of land subsidence during the period of 1991–97 are also in general larger than those during the 1982–91 period, as indicated bythe box-and-whisker plot shown in Figure 7.
A better picture of the spatial variations of land subsidence in Jakarta area isshown in Figures 8 and 9. These figures are plotted using the measured values

LAND SUBSIDENCE OF JAKARTA (INDONESIA) 371
Table I. Land subsidence and its rate in Jakarta, measured from leveling surveys
Station Height (m) Subsidence (cm) Rate of subsidence (cm/yr)
number 1982 1991 1997 1982–91 1991–97 1982–97 1982–91 1991–97 1982–97
15 1.6551 1.3153 1.0465 −34.0 −26.9 −60.9 −3.8 −4.5 −4.1
17 2.2406 2.0298 1.6885 −21.1 −34.1 −55.2 −2.3 −5.7 −3.7
40 1.8465 1.3776 0.9452 −46.9 −43.2 −90.1 −5.2 −7.2 −6.0
54 2.6010 2.4879 2.3015 −11.3 −18.6 −30.0 −1.3 −3.1 −2.0
56 1.9410 1.8280 1.6933 −11.3 −13.5 −24.8 −1.3 −2.3 −1.7
67 3.5428 3.4000 3.1690 −14.3 −23.1 −37.4 −1.6 −3.9 −2.5
89 4.8739 4.5256 4.2890 −34.8 −23.7 −58.5 −3.9 −3.9 −3.9
142 1.8481 1.4415 1.0200 −40.7 −42.2 −82.8 −4.5 −7.0 −5.5
144 2.1420 1.7197 1.1710 −42.2 −54.9 −97.1 −4.7 −9.2 −6.5
201 3.9856 3.3634 3.1810 −62.2 −18.2 −80.5 −6.9 −3.0 −5.4
211 7.9564 7.3165 7.0490 −64.0 −26.8 −90.7 −7.1 −4.5 −6.0
213 5.7614 5.1124 4.6080 −64.9 −50.4 −115.3 −7.2 −8.4 −7.7
237 11.7132 11.6220 11.4857 −9.1 − 13.6 −22.8 −1.0 −2.3 −1.5
248 12.9217 12.8283 12.6919 −9.3 −13.6 −23.0 −1.0 −2.3 −1.5
250 9.6110 9.3556 9.2194 −25.5 −13.6 −39.2 −2.8 −2.3 −2.6
257 10.1958 10.0207 9.7720 −17.5 −24.9 −42.4 −2.0 −4.1 −2.8
271 9.4755 9.0970 8.9810 −37.9 −11.6 −49.5 −4.2 −1.9 −3.3
312 13.8158 13.7314 13.5490 −8.4 −18.2 −26.7 −0.9 −3.0 −1.8
316 18.2432 18.1619 18.0981 −8.1 −6.4 −14.5 −0.9 −1.1 −1.0
323 18.0882 18.0096 17.9885 −7.9 −2.1 −10.0 −0.9 −0.4 −0.7
331 18.6459 18.5883 18.5300 −5.8 −5.8 −11.6 −0.6 −1.0 −0.8
336 20.7671 20.6963 20.5600 −7.1 −13.6 −20.7 −0.8 −2.3 −1.4
367 31.4916 31.4704 31.4490 −2.1 −2.1 −4.3 −0.2 −0.4 −0.3
394 49.5193 49.4817 49.4444 −3.8 −3.7 −7.5 −0.4 −0.6 −0.5
397 45.3061 45.3055 45.2996 −0.1 −0.6 −0.7 0.0 −0.1 0.0
508 12.3061 12.2154 12.1451 −9.1 −7.0 −16.1 −1.0 −1.2 −1.1
525 26.3520 26.3236 26.3010 −2.8 −2.3 −5.1 −0.3 −0.4 −0.3
534 28.8466 28.7552 28.6431 −9.1 −11.2 −20.3 −1.0 −1.9 −1.4
545 31.3869 31.3500 31.3109 −3.7 −3.9 −7.6 −0.4 −0.7 −0.5
571 20.2293 20.1468 20.0831 −8.3 −6.4 −14.6 −0.9 −1.1 −1.0
665 14.4516 14.3330 14.3090 −11.9 −2.4 −14.3 −1.3 −0.4 −1.0
701 3.5278 3.2949 2.2200 −23.3 −107.5 −130.8 −2.6 −17.9 −8.7
705 4.5088 4.3743 3.7925 −13.5 −58.2 −71.6 −1.5 −9.7 −4.8
708 2.6027 1.8338 1.2670 −76.9 −56.7 −133.6 −8.5 −9.5 −8.9
717 4.2057 3.7002 2.1590 −50.6 −154.1 −204.7 −5.6 −25.7 −13.6
727 5.8028 5.6509 5.5660 −15.2 −8.5 −23.7 −1.7 −1.4 −1.6
731 7.1178 7.0099 6.8670 −10.8 −14.3 −25.1 −1.2 −2.4 −1.7
738 7.4110 7.0099 6.6451 −40.1 −36.5 −76.6 −4.5 −6.1 −5.1
743 5.6604 4.9755 4.3832 −68.5 −59.2 −127.7 −7.6 −9.9 −8.5
753 2.9040 2.3159 2.2540 −58.8 −6.2 −65.0 −6.5 −1.0 −4.3
784 2.8479 2.2296 2.0870 −61.8 −14.3 −76.1 −6.9 −2.4 −5.1
831 8.0636 7.9543 7.7836 −10.9 −17.1 −28.0 −1.2 −2.9 −1.9
842 12.4097 12.3280 12.2831 −8.2 −4.5 −12.7 −0.9 −0.8 −0.8
850 14.3194 14.0926 13.6990 −22.7 −39.4 −62.0 −2.5 −6.6 −4.1
946 10.4903 10.2631 10.2480 −22.7 −1.5 −24.2 −2.5 −0.3 −1.6

372 HASANUDDIN Z. ABIDIN ET AL.
Figure 5. Leveling network in Jakarta.
Figure 6. Land subsidence in Jakarta measured from leveling surveys.
given in Table I and their kriging-based interpolated values. From Figures 8 and 9it can be seen that land subsidence in the northern part of Jakarta, which is closeto the sea, is larger than in the southern part of Jakarta. In this case, three regions,namely two in the northwestern part (Cengkareng and Kalideres districts) and onein the northeastern part of Jakarta (Kemayoran-Sunter district), show the largestsubsidence compared to the other regions. These observed cones of subsidence aremost probably caused by the groundwater extraction from the middle and loweraquifers. All of those subsidence cones are situated in areas consisting of sand barand beach-river deposits with high compressibility. Nowadays these are industrialareas with high density settlement, all of which consume a lot of groundwater. Thisover discharging of groundwater would deepen the piezometric water level insidethe middle and lower aquifers and in turn would cause land subsidence above it.

LAND SUBSIDENCE OF JAKARTA (INDONESIA) 373
Figure 7. Box-and-Whisker plots of land subsidence rates in Jakarta.
Figure 8. Land subsidence in Jakarta measured from leveling surveys (in metres), 1982–1991.
This hypothesis is confirmed by the piezometric water level contours shown inFigure 10. From this figure it can be realized that the cones of piezometric level de-pressions inside the middle and lower aquifers more or less coincide with the conesof largest land subsidence measured by the leveling. It should also be noted herethat in those areas of subsidence cones, due to their high soil compressibility thesituation may be worsened with the settlement caused by the load of constructions.

374 HASANUDDIN Z. ABIDIN ET AL.
Figure 9. Land subsidence in Jakarta measured from leveling surveys (in metres), 1991–1997.
Figure 10. Piezometric water level contours (in metres) inside Middle and Lower Aquifers ofJakarta in 1992; adapted from Murdohardono and Tirtomihardjo (1993).
The subsidence during the periods of 1982–1991 and 1991–1997 have differentpatterns and magnitudes. In terms of spatial pattern, Figures 8 and 9 show thatduring the period between 1991 and 1997 more subsidence regions were showncompared to the period of 1982–1991. In terms of magnitude, subsidence duringthe period of 1991–1997 is larger than for the period of 1982–1991. The rates ofsubsidence during the two periods were also different as shown in Figures 11 and12, and also in Table I. During the period between 1982 and 1991, the maximumrate of subsidence is about−8 cm/year, while during the period between 1991 and1997 it is about−26 cm/year.

LAND SUBSIDENCE OF JAKARTA (INDONESIA) 375
Figure 11. Rate of land subsidence in Jakarta measured from leveling surveys (in cm/year),over the period 1982–1991.
Figure 12. Rate of land subsidence in Jakarta measured from leveling surveys (in cm/year),over the period 1991–1997.

376 HASANUDDIN Z. ABIDIN ET AL.
Figure 13. The deepening of the piezometric head inside the middle and lower aquifers ofJakarta; drawn from the data given in Hadipurwo (1999).
The subsidence rate is closely related to the rate of piezometric water level(head) deepening in the middle and lower aquifers. According to Hadipurwo(1999), the maximum depth of piezometric head inside the middle and loweraquifers of Jakarta tends to deepen with time, as shown in Figure 13. In the caseof Jakarta, the increases in both population and industry, which require a lot ofgroundwater, could explain the above declining trend of piezometric heads. Thisdeepening of piezometric head explains the higher maximum rate of subsidence inthe period of 1991–1997 compared to those in 1982 to 1991. Moreover, Hadipurwo(1999) also observed that up to 1995 the depression cones of the piezometric headswiden with time. This may explain the increase in the number of subsidence conesin the period of 1991–1997 compared to those in 1982–1991.
Between 1982–91 and 1991–97, some areas subsided at higher rates than others.In other words, acceleration of subsidence is different from place to place. Figure14 presents the acceleration of land subsidence over the period of 1982 to 1997,computed using the following relation:
acceleration= rate of subsidence (1991–1997)− rate of subsidence (1982–1991)time interval .
In the above relation, the land subsidence rates are represented by negativevalues and the time interval is taken to be 7.5 years, i.e., between 1994 and 1986.
Figure 14 (right) shows that certain regions in central and north-western parts ofJakarta have positive acceleration values, which indicates the slowing down of landsubsidence between the period 1981–1991 to 1991–1997 in that area. The numberof leveling stations that are experiencing a slowing down of land subsidence is,however, less than those experiencing speeding up of land subsidence, as shown byFigure 14 (left).
4. Land Subsidence Measured by GPS Surveys
The use of GPS satellite–based positioning system (Wellset al., 1986; Hofmann-Wellenhofet al., 1994) to systematically establish the geodetic control points all

LAND SUBSIDENCE OF JAKARTA (INDONESIA) 377
Figure 14. Acceleration of land subsidence in Jakarta measured from leveling surveys (inmm/year2), over the period 1982–1997.
over Jakarta was firstly conducted in 1994 by the National Land Agency (BPN).This GPS network is aimed at supporting cadastral mapping in the Jakarta area andits design was not intended for monitoring the land subsidence in Jakarta. Consider-ing the higher efficiency and effectiveness of GPS surveys compared to the levelingsurveys in monitoring the land subsidence of Jakarta, the Department of GeodeticEngineering at Institute of Technology Bandung (ITB) decided to establish the newGPS network for monitoring land subsidence in Jakarta, where some of its pointsare also the points of the BPN network. The configuration of this GPS monitoringnetwork is shown in Figure 15. BAKO, the southern most point in the network andalso the Indonesian zero order geodetic point, is considered as a stable referencepoint. BAKO is a permanent continuous operating GPS station, operated by theNational Coordinating Agency for Survey and Mapping (BAKOSURTANAL).
Two GPS surveys have been conducted: 22–24 December 1997 and 29–30 June1999. The GPS surveys were carried out using six dual-frequency geodetic-typeGPS receivers, i.e., one Ashtech Z-XII, three Topcon GP-R1 and two Leica Sys-tem 300 receivers. The permanent station of BAKO is using a Trimble 4000 SSEreceiver.
For both GPS surveys, the length of sessions was around 9 to 10 hours, respect-ively. The data were collected with a 30 seconds interval, and elevation mask wasset at 15◦ from all stations. The placement of the receivers during the surveys isshown in Table II.
The data of both GPS surveys was processed using the scientific softwareBernesse 4.0 (Rothacher and Mervart, 1996). Important parameters used in dataprocessing are listed in Table III. Since we are mostly interested in the relativeheight component of the coordinates with respect to a stable point, the radialprocessing mode was used instead of network adjustment mode. In this case the

378 HASANUDDIN Z. ABIDIN ET AL.
Figure 15. The distribution of GPS stations for monitoring the land subsidence in Jakarta.
Table II. The placement of GPS receivers
Receiver Survey-1, 22–24 Dec. 1997 Survey-2, 29–30 June 1999
Day-1 Day-2 Day-3 Day-1 Day-2
Topcon GN1706 Kwitang Kebayoran Mutiara Ancol Baru Kuningan
Topcon GN1722 Marunda Tomang Ancol Baru Mutiara Kebayoran
Topcon GN1712 Kuningan Cinere Cinere Tomang Cibubur
Asthech S.01792 Ancol Baru Meruya Kebayoran Meruya Cinere
Leica 6386 Rawamangun Mutiara Kwitang Kapuk Kwitang
Leica 6381 Cibubur Kapuk Cibubur Marunda Rawamangun
Trimble 4000 SSE Bakosurtanal Bakosurtanal Bakosurtanal Bakosurtanal Bakosurtanal

LAND SUBSIDENCE OF JAKARTA (INDONESIA) 379
Table III. Some data processing parameters that were used.
Software Bernesse 4.0
Type of orbit Precise Ephemeris (SP3 Format, ITRF96)
Reducing the tropospheric bias Differencing and tropospheric parameter estimation
Reducing the ionospheric bias Differencing and local ionospheric modeling
Antenna phase center correction Elevation-and-azimuth dependent correction based on theIGS model
Ambiguity resolution Fixed with ambiguity searching algorithm
Position solution Narrow-lane
Processing mode Radial (Baseline) from BAKO
relative ellipsoidal heights of all stations are determined relative to BAKO station,which is assumed to be a relatively stable point.
Considering the length of the baselines, which could be up to 40–50 km, aprecise ephemeris was used instead of the broadcast ephemeris for data processing.The effects of tropospheric and ionospheric biases are reduced by the differencingprocess. The residual tropospheric bias for individual stations are then estimated,and local ionospheric modeling is implemented. The algorithms for these tropo-spheric parameter estimation and local ionospheric modeling are in Rothacherand Mervart (1996). In processing baselines, all cycle ambiguities of the phaseobservations were successfully resolved.
The results of data processing are summarized in Table IV, in the form of relat-ive ellipsoidal heights, subsidence, and subsidence rates, along with their standarddeviation (σ ) values. In this table, the subsidence(δdh12) and its rate (vdh12) at eachstation is derived using the following relation:
δdh12 = dh(t2)− dh(t1), (1)
vδdh12 = δh12/(t2− t1), (2)
where dh(t1) and dh(t2) are the relative ellipsoidal heights of the stations withrespect to BAKO station, obtained from the 1st and 2nd GPS surveys, respectively.The time period,(t2 − t1) is taken to be 1.6 years, representing the period of Dec.1997 to June 1999.
It should be noted that the relative heights shown in Table IV are the relative el-lipsoidal heights. They are a different height system compared to those obtained bythe leveling survey. The latter will yield relative orthometric heights. By referringto Equation (1), the two relative heights at the same points can be related throughthe following relation:
δdh12 = δdH12− δdN12, (3)

380 HASANUDDIN Z. ABIDIN ET AL.
Table IV. Subsidence and its rate as derived from two GPS surveys
Stations Relative heights w.r.t. BAKO (m) Subsidence (cm) Rate of subsidence
Survey-1 (Dec. 97) Survey-2 (June 99) (1997–1999) (cm/yr)
dh(t1) σ dh(t2) σ δdh12 σ vδdh12 σ
CIBUBUR −77.329 0.006 −77.374 0.008 −4.5 1.0 −2.8 0.6
CINERE −86.528 0.006 −86.573 0.006 −4.5 0.8 − 2.8 0.5
MERUYA −133.927 0.006 −133.985 0.008 −5.8 1.1 −3.6 0.7
KUNINGAN −124.890 0.006 −124.968 0.005 −7.7 0.8 −4.8 0.5
MARUNDA −137.350 0.007 −137.391 0.006 −4.1 0.9 −2.6 0.6
MUTIARA −137.843 0.007 −137.861 0.005 −1.8 0.8 −1.1 0.5
KEBAYORAN −124.116 0.006 −124.130 0.007 −1.5 0.9 −0.9 0.6
KAPUK −138.259 0.007 −138.328 0.010 −6.8 1.3 −4.3 0.8
RAWAMANGUN −129.970 0.008 −129.991 0.010 −2.1 1.3 −1.3 0.8
ANCOL BARU −135.650 0.008 −135.830 0.007 −18.0 1.1 −11.3 0.7
KWITANG −133.477 0.005 −133.580 0.009 −10.3 1.0 −6.4 0.6
TOMANG −128.090 0.006 −128.166 0.007 −7.6 0.9 −4.8 0.6
whereδdH12 andδdN12 are the temporal changes, between epochst1 andt2, of therelative orthometric heights (dH ) and geoidal undulations (dN), respectively. Thetwo can be formulated as:
δdH12 = dH(t2)− dH(t1), (4)
δdN12 = dN(t2)− dN(t1). (5)
Please note that in Equations (3) to (5) above, the effect of the deflection of the ver-tical is assumed to be negligible. Considering possible geopotential changes fromphenomena such as the eustatic sea level rise (about 1–2 mm/year (Gornitz, 1995))and groundwater changes, then the time variation of the geoidal undulation will berelatively small. When monitoring land subsidence in Jakarta, we are dealing withrelative heights, and moreover since there have been no large earthquakes that cansignificantly change the mass distribution inside the Jakarta basin, then it could besafely assumed thatδdN12→ 0. In this case, Equation (3) could be written as:
δdh12 = δdH12, (6)
which means that the land subsidence measured by GPS surveys are comparablewith those measured by leveling surveys.
To check the significance of the subsidence values measured by GPS surveys,the congruency test (Caspary, 1987) was performed. The null hypothesis of thetest is that the relative ellipsoid heights of both epochs are stable, i.e., there is nosubsidence. Therefore:
null hypothesis Ho : δdh12 = 0, (7)

LAND SUBSIDENCE OF JAKARTA (INDONESIA) 381
Table V. Summary of congruency test of GPS land subsidence results
Stations δdH12 rms ofδdh12 |T | t∞,0.005 Significant
(cm) (cm) subsidence?
CIBUBUR −4.5 1.0 4.500 2.576 YES
CINERE −4.5 0.8 5.625 2.576 YES
MERUYA −5.8 1.1 5.273 2.576 YES
KUNINGAN −7.7 0.8 9.625 2.576 YES
MARUNDA −4.1 0.9 4.556 2.576 YES
MUTIARA −1.8 0.8 2.250 2.576 NO
KEBAYORAN −1.5 0.9 1.667 2.576 NO
KAPUK −6.8 1.3 5.231 2.576 YES
RAWAMANGUN −2.1 1.3 1.615 2.576 NO
ANCOL BARU −18.0 1.1 16.364 2.576 YES
KWITANG −10.3 1.0 10.300 2.576 YES
TOMANG −7.6 0.9 8.444 2.576 YES
alternative hypothesisHa : δdh12 6= 0. (8)
The test statistics for this test is:
T = δdh12/(σ of δdh12), (9)
which has a Student’s t-distribution ifHo is true. In our case, for GPS baselinesderived using 9 to 10 hours of GPS data with 30 seconds data interval, then df →∞. The testing results are summarized in Table V.
Based on the results given in Table V, it could be statistically concluded thatwith 99% confidence level there were significant subsidence observed by GPSsurveys at all the stations during the period between Dec. 1997 and June 1999,except Mutiara, Kebayoran, and Rawamangun.
These values of land subsidence and their rates given in Table IV were interpol-ated using kriging, and then plotted using the Surfer software as shown in Figures16 and 17.
These figures show that land subsidence in Jakarta are occurring at differentrates from place to place as also observed by leveling surveys. Figure 16 showsthat in the period between Dec. 1997 and June 1999, the land subsidence of about−2 to −18 cm were observed, with the rates of around−2 to −12 cm/year asshown in Figure 17. From the above figures it could also be seen that the mostsignificant subsidence observed by GPS surveys in the period of Dec. 1997 to June1999 is around the north-central and northeastern parts of Jakarta.
If the pattern of the previous subsidence shown in Figures 8 and 9, are comparedto those in Figure 16, it could be realized that there is a shift in the location of

382 HASANUDDIN Z. ABIDIN ET AL.
Figure 16. Land subsidence in Jakarta measured from two GPS surveys (in cm), over theperiod 1997–1999.
Figure 17. Rate of land subsidence in Jakarta measured from two GPS surveys (in cm/year),over the period 1997–1999.
LAND SUBSIDENCE OF JAKARTA (INDONESIA) 383
depression cones, from the north-western part to the north-central part of Jakarta.This shift can be artificial, i.e., due to the lack of GPS stations in the northwesternpart of Jakarta; so it could not detect the other existing depression cone observedpreviously by leveling survey. But the shift may be true, caused by the change ingroundwater level in that area. In this case, it should be mentioned that in 1995/96fiscal year, one artificial recharge well has been built in Kelurahan Kapuk in thenorthwestern part of Jakarta. This well sunk to 120 m depth, and recharging wasdone by gravitation into the aquifers of 40 m and 100 m depth, respectively (DEG,1999). After one to two years, this artificial recharging mechanism might alreadyhave raised up the piezometric level in the area, which then slowed down thecorresponding subsidence process, as indicated by results of GPS surveys.
5. Closing Remarks
The results obtained from leveling and GPS surveys show that land subsidencein Jakarta has spatial and temporal variations. Considering that the existing landsubsidence is mainly caused by the excessive groundwater extraction from themiddle and lower aquifers, the spatial and temporal variations of land subsidencewill strongly depend on the corresponding variations of groundwater extraction,coupled with the characteristics of sedimentary layers above it.
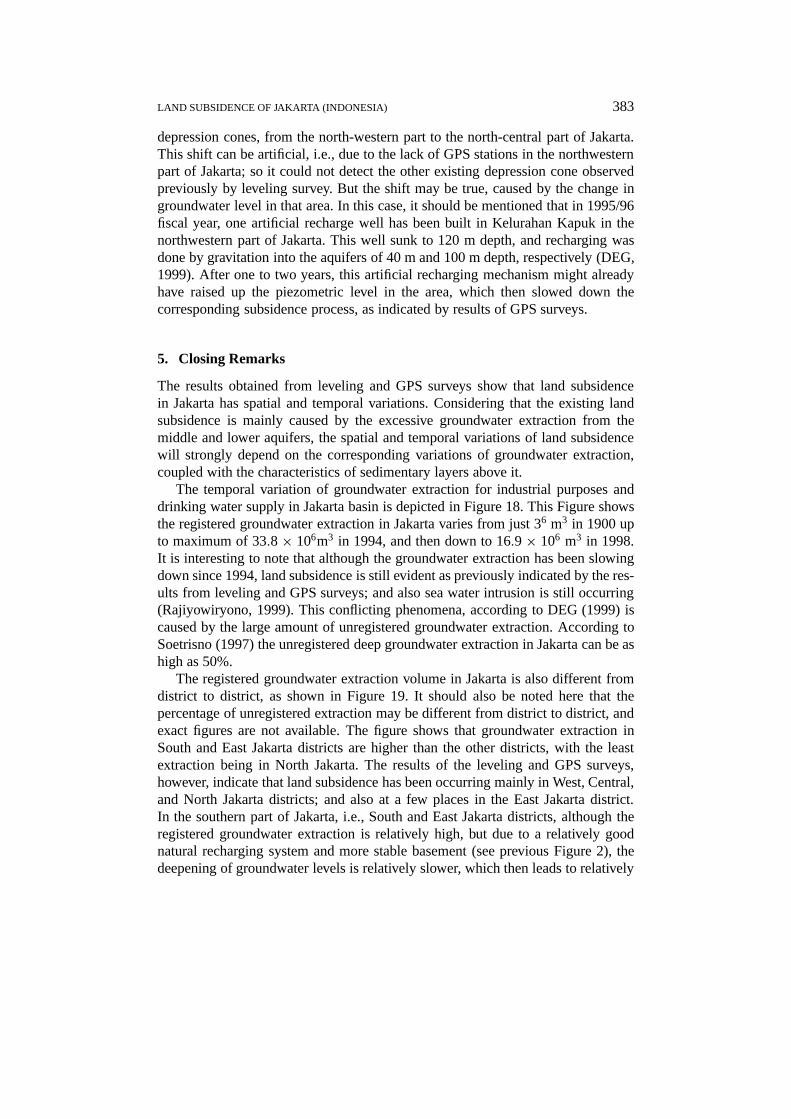
The temporal variation of groundwater extraction for industrial purposes anddrinking water supply in Jakarta basin is depicted in Figure 18. This Figure showsthe registered groundwater extraction in Jakarta varies from just 36 m3 in 1900 upto maximum of 33.8× 10⁶m3 in 1994, and then down to 16.9× 10⁶ m3 in 1998.It is interesting to note that although the groundwater extraction has been slowingdown since 1994, land subsidence is still evident as previously indicated by the res-ults from leveling and GPS surveys; and also sea water intrusion is still occurring(Rajiyowiryono, 1999). This conflicting phenomena, according to DEG (1999) iscaused by the large amount of unregistered groundwater extraction. According toSoetrisno (1997) the unregistered deep groundwater extraction in Jakarta can be ashigh as 50%.
The registered groundwater extraction volume in Jakarta is also different fromdistrict to district, as shown in Figure 19. It should also be noted here that thepercentage of unregistered extraction may be different from district to district, andexact figures are not available. The figure shows that groundwater extraction inSouth and East Jakarta districts are higher than the other districts, with the leastextraction being in North Jakarta. The results of the leveling and GPS surveys,however, indicate that land subsidence has been occurring mainly in West, Central,and North Jakarta districts; and also at a few places in the East Jakarta district.In the southern part of Jakarta, i.e., South and East Jakarta districts, although theregistered groundwater extraction is relatively high, but due to a relatively goodnatural recharging system and more stable basement (see previous Figure 2), thedeepening of groundwater levels is relatively slower, which then leads to relatively

384 HASANUDDIN Z. ABIDIN ET AL.
Figure 18. Registered groundwater extraction for industrial purpose and drinking watersupply in Jakarta (DEG, 1999; Sudibyo, 1999).
Figure 19. Registered groundwater extraction for industrial purpose and drinking water sup-ply in five districts of Jakarta (Sudibyo, 1999), (SJ, EJ, WJ, CJ, and NJ represent South, East,West, Central, and North Jakarta districts, respectively).
small land subsidence. The example of spatial and temporal variations in the depthof piezometric level from a few monitoring wells in Jakarta is given in Table VI.
From Table VI it can be seen that the piezometric level in the northern part ofJakarta is deeper than those in the central and southern parts of Jakarta. The tablealso shows a tendency of piezometric level deepening with time up to 1996. Sincethen, there is a tendency for the piezometric levels of lower aquifer to rise, whilefor the piezometric level of the middle aquifer, the tendency is not as consistentfrom well to well.
The drastic drop of piezometric levels in North and Central districts in the periodof 1977 and 1996, as shown in Table VI, are consistent with the large subsidencemeasured by leveling surveys in the period of 1982 to 1997, as shown in Figures 8and 9. The significant subsidence observed by GPS surveys between Dec. 1997 andJune 1999 at stations Ancol Baru and Kwitang (see Table IV) are also consistent

LAND SUBSIDENCE OF JAKARTA (INDONESIA) 385
Table VI. Variations in the depth of piezometric level at a few monitoring wells(Sudibyo, 1999)
Middle Aquifer Depth below sea level in metres
Location District 1931 1969 1977 1996 1997 1998
Ancol North 5.0 3.0 −1.5 −35.0 −26.0 −28.0
Kemayoran Central 6.0 5.0 2.0−20.0 −20.0 −24.0
Menteng Central 7.0 7.0 2.3 −5.0 −10.0 −5.0
Kebayoran South 10.0 7.0 5.0 3.0 1.0
Pasar Minggu South 13.0 11.0 10.0 7.0 5.0
Lower Aquifer Depth below sea level in metres
Location District 1931 1969 1977 1996 1997 1998
Ancol North 8.0 4.0 −2.0 −25.0 −18.0 −17.0
Kemayoran Central 11.0 8.0 3.0−22.0 −19.0 −16.0
Menteng Central 13.0 10.0 4.0 −8.0 −5.0
Kebayoran South 15.0 8.0 2.0 −5.0 1.0
Pasar Minggu South 5.0 2.0 4.0
with the lowering of the piezometric level of middle aquifer at the nearby wells,e.g., Ancol and Kemayoran, as shown in Table VI above.
The previous discussion shows that the geodetic-based methods, i.e., levelingand GPS surveys, are relatively good and reliable for measuring and detecting theland subsidence in Jakarta area. They can determine the relative heights with thetypical precision of about several mm to a few cm. Each method, however, hasits own strengths and limitations. In terms of the achievable precision of heightdifferences, the leveling surveys are better than the GPS surveys. For the situationin Jakarta today, however, leveling surveys are not the best method for monitoringthe land subsidence. The relatively large area of Jakarta along with its heavy traffic,high density settlement and industries, and also its hot and rainy climate, makesthe execution of precise leveling surveys too time consuming and cumbersome.Considering this limitation, our group at ITB is putting more attention to GPSsurveys for monitoring the land subsidence in Jakarta. Two GPS surveys have beenperformed, and for the next surveys, the GPS monitoring network of Jakarta willbe increased with additional 12 points. With a denser network it is expected thatGPS surveys would detect a more detailed pattern of land subsidence.
GPS surveying is obviously faster than leveling surveys. Using six GPS receiv-ers and session lengths of 9 to 10 hours, it took two to three days to survey 12 pointsall over Jakarta. By using leveling surveys, it will take several weeks to complete.The main problem with using GPS for monitoring land subsidence in Jakarta is theobstruction of GPS signal reception caused by the buildings and trees. GPS stations

386 HASANUDDIN Z. ABIDIN ET AL.
cannot always be established in a subsidence-prone location. Therefore, a kind ofan integrated GPS/leveling survey will be the most realistic and effective methodfor monitoring land subsidence in Jakarta. In this integrated approach, levelingsurveys will be done in the area where GPS surveys are difficult to be performed,and in that case the leveling lines are tied at their ends to GPS points. A combinedadjustment of leveling and GPS height differences can then be performed (Liu andChen, 1998).
In the context of using GPS, it also envisaged that for the areas with relativelyhigh rates of subsidence, such as in northern part of Jakarta, the implementation ofa continuous GPS array would perhaps be useful. Finally it should also be notedin this case that in order to have a more detailed pattern of the land subsidence inJakarta, the use of INSAR (Interferometric Synthetic Aperture Radar) technique(Massonnet and Feigl, 1998) is also to be seriously considered at the present time.
Finally it should be pointed out that to achieve a better understanding andmodeling of land subsidence phenomena in the Jakarta basin, the land subsid-ence information derived by geodetic techniques (e.g., leveling, GPS, and INSAR)should be integrated with the land subsidence information obtained by geohydro-logical and geotechnical measurements (e.g., using automatic water level recorder,piezometer, extensometer, drilling, etc.).
References
Abidin, H. Z., Kusuma, M. A., Meilano, I., Arief Nurdin, M., Darmawan, Dudi, Bintoro, Agus, andKahar, J.: 1998, Pemantauan penurunan tanah di wilayah Jakarta dengan metode survei GPS.S&P, Majalah Survey dan Pemetaan, Majalah Ikatan Surveyor Indonesia, ISSN: 0125–9466,XII (3), 45–56.
Caspary, W. F.: 1987,Concepts of Network and Deformation Analysis, Monograph 11, School ofSurveying, The University of New South Wales, Kensington, NSW, Australia, 183 pp.
DEG (Directorate of Environmental Geology): 1999,Homepage of DEG.Website address:http://www.dgtl.dpe.go.id, March.
Gornitz, V.: 1995, Sea-level rise: A review of recent past and near-future trends,Earth Surf. Proc.Landforms20, 7–20.
Hadipurwo, S.: 1999, Groundwater, inCOASTPLAN JAKARTA BAY PROJECT, Coastal Environ-mental Geology of the Jakarta Reclamation Project and Adjacent Areas, CCOP COASTPLANCase Study Report No. 2, Jakarta/Bangkok, pp. 39–49.
Hofmann-Wellenhof, B., Lichtenegger, H., and Collins, J.: 1994,Global Positioning System, Theoryand Practice, Third Revised Edition, Springer Verlag, Wien.
Liu, Q. W. and Chen, Y. Q.: 1998, Combining the geodetic models of vertical crustal deformation,Journal of Geodesy72(12), 673–683.
Massonnet, D. and Feigl, K. L.: 1998, Radar interferometry and its application to changes in theEarth’s surface,Reviews of Geophysics36(4), 441–500.
Murdohardono,D. and Tirtomihardjo, H.: 1993, Penurunan tananh di Jakarta dan rencana pe-mantauannya,Proceedings of the 22nd Annual Convention of the Indonesian Association ofGeologists, Bandung, 6–9 December, pp. 346–354.
Murdohardono, D. and Sudarsono, U.: 1998, Land subsidence monitoring system in Jakarta,Pro-ceedings of Symposium on Japan–Indonesia IDNDR Project: Volcanology, Tectonics, Flood andSediment Hazards, Bandung, 21–23 September, pp. 243–256.

LAND SUBSIDENCE OF JAKARTA (INDONESIA) 387
Purnomo, H., Murdohardono, D., and Pindratno, H.: 1999, Land Subsidence Study in Jakarta,Proceedings of Indonesian Association of Geologists, Volume IV: Development in Engineering,Environment, and Numerical Geology, Jakarta, 30 Nov.–1 Dec., pp. 53–72.
Rajiyowiryono, H.: 1999, Groundwater and land subsidence monitoring along the north coastal plainof Java island,CCOP Newsletter24(3), 19 pp., July–September.
Rimbaman and Suparan, P.: 1999, Geomorphology, inCOASTPLAN JAKARTA BAY PROJECT,Coastal Environmental Geology of the Jakarta Reclamation Project and Adjacent Areas, CCOPCOASTPLAN Case Study Report No. 2, Jakarta/Bangkok, pp. 21–25.
Rismianto, D. and Mak, W.: 1993, Environmental aspects of groundwater extraction in DKI Jakarta:Changing views,Proceedings of the 22nd Annual Convention of the Indonesian Association ofGeologists, Bandung, 6–9 December, pp. 327–345.
Rothacher. M. and Mervart, L. (eds): 1996,Bernesse GPS Software version 4.0, AstronomicalInstitute, University of Berne, September. 418 pp.
Soekardi, P., Djaeni, A., Soefner, H., Hobler, M., and Schmidt, G.: 1986, Geological aspect of theaquifer system and the groundwater situation of the Jakarta Artesian Basin. Paper presented atSeminar on Geological Mapping in the Urban Development, Economic and Social Commissionfor Asia and the Pacific, Bangkok, 29 October.
Soetrisno, S., Satrio, H., and Haryadi, T.: 1997, To anticipate impacts of reclamation of Jakarta Bay, agroundwater conservation’s perspective. Paper presented atWorkshop on Coastal and NearshoreGeological/Oceanographical Assessment of Jakarta Bay: A Basis for Coastal Zone Managementand Development, Jakarta, 25–28 June.
Sudibyo, Y.: 1999, Perkembangan Airtanah Terpantau di Jabotabek,Buletin geologi Tata Lingkungan11(2), 70–87.
Wells, D. E., Beck, N., Delikaraoglou, D., Kleusberg, A., Krakiwsky, E. J., Lachapelle, G., Langley,R. B., Nakiboglu, M., Schwarz, K. P., Tranquilla, J. M., Vanicek, P.: 1986,Guide to GPSPositioning, Canadian GPS Associates, Fredericton, N.B., Canada.
Wolf, Paul R. and Ghilani, C. D.: 1997,Adjustment Computations, Statistics and Least Squares inSurveying and GIS, John Wiley & Sons, Inc., New York, 564 pp.
Yong, R. N., Turcott, E., and Maathuis, H.: 1995, Groundwater extraction-induced land subsidenceprediction: Bangkok and Jakarta case studies,Proceedings of the Fifth International Symposiumon Land Subsidence, IAHS Publication no. 234, October, pp. 89–97.