Determination of geoDetic control network points using gps ...
12
GLL Geomatics, Landmanagement and Landscape No. 4 • 2014, 65–76 M. Jawor, T. Gargula DETERMINATION OF GEODETIC CONTROL NETWORK POINTS USING GPS TECHNOLOGY FOR THE PURPOSE OF MONITORING POWER LINES IN DIFFICULT TERRAIN CONDITIONS Mateusz Jawor, Tadeusz Gargula Summary e present work discusses the issue of determining geodetic control network in order to moni- tor the condition of power lines. e problem was presented using the example of the physical survey of an actual infrastructure – a high voltage power line. Difficult terrain conditions con- stituted a significant factor for determining an appropriate measurement method. e meas- urement itself was conducted using two methods, independently of one another: the classical traverse method, and the RTK (Real Time Kinematic) GPS method. e following criteria were assumed for the purpose of the comparison: measurement effectiveness and the accuracy of the calculation result. Basic monitoring procedures of power lines were also presented, imple- mented based on the measurement network established beforehand. Keywords monitoring of power lines • control survey network • RTK GPS method 1. Introduction In establishing a measurement matrix, it is increasingly common in the surveying prac- tice to apply satellite technologies, which do not require the surveyor to locate the partic- ular geodetic structures in the field [Góral et al. 2008, Lamparski 2003, Leick 2004]. e condition for the accuracy of measurement in this case is the availability of an appropriate number of satellites – and that condition is not always possible to meet. Satellite signals can be disrupted: by vegetation, buildings, landforms, etc. erefore satellite technology cannot entirely replace the classical (ground) measurement techniques. Furthermore, the overall development of technology in recent decades contributed to the improvement of measurement instruments, used in classical methods. Contemporary digital tachymeters facilitate the creation of wholly automated measurement and calcula- tion technology: from reflector-less survey – via automatic registration of results – wire- less transmission of data to a computer – to numerical elaboration (calibrating the obser- http://dx.doi.org/10.15576/GLL/2014.4.65 http://dx.doi.org/10.15576/GLL/2014.4.65
-
Upload
khangminh22 -
Category
Documents
-
view
1 -
download
0
Transcript of Determination of geoDetic control network points using gps ...

GLLGeomatics, Landmanagement and Landscape No. 4 • 2014, 65–76
M. Jawor, T. Gargula
Determination of geoDetic control network points using gps technology for the purpose of monitoring power lines in Difficult terrain conDitions
Mateusz Jawor, Tadeusz Gargula
Summary
The present work discusses the issue of determining geodetic control network in order to moni-tor the condition of power lines. The problem was presented using the example of the physical survey of an actual infrastructure – a high voltage power line. Difficult terrain conditions con-stituted a significant factor for determining an appropriate measurement method. The meas-urement itself was conducted using two methods, independently of one another: the classical traverse method, and the RTK (Real Time Kinematic) GPS method. The following criteria were assumed for the purpose of the comparison: measurement effectiveness and the accuracy of the calculation result. Basic monitoring procedures of power lines were also presented, imple-mented based on the measurement network established beforehand.
Keywords
monitoring of power lines • control survey network • RTK GPS method
1. introduction
In establishing a measurement matrix, it is increasingly common in the surveying prac-tice to apply satellite technologies, which do not require the surveyor to locate the partic-ular geodetic structures in the field [Góral et al. 2008, Lamparski 2003, Leick 2004]. The condition for the accuracy of measurement in this case is the availability of an appropriate number of satellites – and that condition is not always possible to meet. Satellite signals can be disrupted: by vegetation, buildings, landforms, etc. Therefore satellite technology cannot entirely replace the classical (ground) measurement techniques.
Furthermore, the overall development of technology in recent decades contributed to the improvement of measurement instruments, used in classical methods. Contemporary digital tachymeters facilitate the creation of wholly automated measurement and calcula-tion technology: from reflector-less survey – via automatic registration of results – wire-less transmission of data to a computer – to numerical elaboration (calibrating the obser-
http://dx.doi.org/10.15576/gll/2014.4.65
http://dx.doi.org/10.15576/gll/2014.4.65
M. Jawor, T. Gargula66
GLL No. 4 • 2014
vation and calculating the coordinates). Survey stations (Total Stations) are moreover equipped with software, which conducts the calculations directly on the spot, facilitating the delivery of complete coordinates for the determined control points.
The aim of the present work is to conduct a comparative analysis of the GPS tech-nology versus the classical traverse method for establishing a measurement network in unfavourable terrain conditions. Two criteria were assumed for the purpose of the comparison: the accuracy of the calculation result, and measurement effectiveness. The characteristic features of the measured object consisted in varied terrain and prevalence of forest. The determined control network facilitated geodesic control measurements of high voltage power lines 110 kV [Jawor 2009]. In order to verify the accuracy of the measurement effected in the GPS technology, closed traverse was designed using the same control points. The objective was to demonstrate which of the methods is most suitable in difficult terrain conditions.
2. principles of designing measurement networks
The first stage of establishing a measurement network is to develop a design thereof, after which follows the stabilisation of points, measurement, calculation, and elaboration of measurement results, completion of the report, and delivering the latter to the client. The purpose of designing and establishing geodesic networks in a given area is to ensure the required coverage of the land with a network of the appropriate class of accuracy, and to guarantee a determinate density of control points. The design must be preceded with a reconnaissance of the existing range of the newly designed network, terrain conditions, the general concept of the State network, as well as current and predicted future needs in terms of equipping the given area with a geodesic network. One must also select the most appropriate and useful structure of the network and the measurement technique, which facilitates as accurate designations as it is feasible, with the lowest possible costs of the project’s implementation [Regulation… 2011, GUGiK 2002].
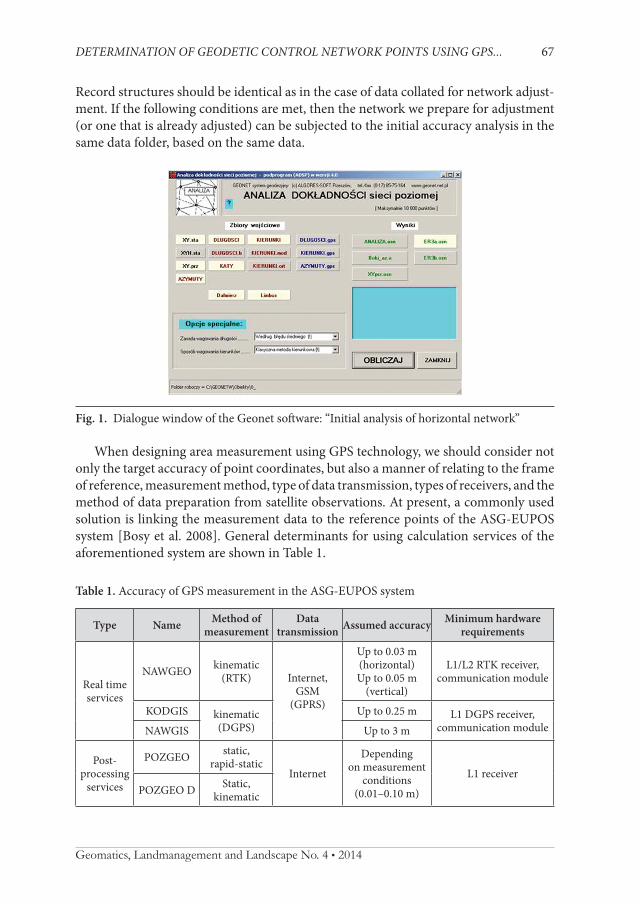
One of the stages of a properly conducted network designing process should consist in a prior accuracy analysis [Kadaj 2006]. Results of the said analysis provide founda-tions for the assessment of the network design, its correctness, and possible modifica-tions to the structure or correction to the accuracy of measurement, assumed a priori. This task can be performed, for instance by using one of the calculation modules of the Geonet software [Kadaj 2006]. After entering the command in the main dialogue window: Geo-spec/ Initial analysis of horizontal network, a new window opens for the studied network (Figure 1).
The software does not require entering real observation measures; one only needs to declare observation plans, and approximate coordinates. This analysis makes it possible to determine the target model of network accuracy, which the results of the adjust-ment should aim towards. Initial accuracy analysis programme utilises the same data sets, identical in name and structure, as the rigorous adjustment programme. Declared observation measures can be expressed with any nonnegative number, for instance: instead of length measures, angles, directions and azimuths, zero can be entered.
DeTerMinaTion of GeoDeTic conTrol neTwork poinTs usinG Gps... 67
Geomatics, Landmanagement and Landscape No. 4 • 2014
Record structures should be identical as in the case of data collated for network adjust-ment. If the following conditions are met, then the network we prepare for adjustment (or one that is already adjusted) can be subjected to the initial accuracy analysis in the same data folder, based on the same data.
Fig. 1. Dialogue window of the Geonet software: “Initial analysis of horizontal network”
When designing area measurement using GPS technology, we should consider not only the target accuracy of point coordinates, but also a manner of relating to the frame of reference, measurement method, type of data transmission, types of receivers, and the method of data preparation from satellite observations. At present, a commonly used solution is linking the measurement data to the reference points of the ASG-EUPOS system [Bosy et al. 2008]. General determinants for using calculation services of the aforementioned system are shown in Table 1.
Table 1. Accuracy of GPS measurement in the ASG-EUPOS system
Type Name Method of measurement
Data transmission Assumed accuracy Minimum hardware
requirements
Real time services
NAWGEO kinematic (RTK) Internet,
GSM (GPRS)
Up to 0.03 m (horizontal) Up to 0.05 m
(vertical)
L1/L2 RTK receiver, communication module
KODGIS kinematic (DGPS)
Up to 0.25 m L1 DGPS receiver, communication moduleNAWGIS Up to 3 m
Post- processing
services
POZGEO static, rapid-static
Internet
Depending on measurement
conditions (0.01–0.10 m)
L1 receiver POZGEO D Static,
kinematic

M. Jawor, T. Gargula68
GLL No. 4 • 2014
3. geodesic control of power lines
Control measurements of power lines, as in the case of any other infrastructure object, are aimed at determining any discrepancies between the setting out survey of the infrastructure, and the as-built survey. The results should be shown in working drafts and survey logs kept during the measurement process. All data is then collated in the acceptance protocol and handover inspection report. In the case of discrepancies with the state of construction, all differences should be approved by the designer, by the construction inspector, and by the user of the infrastructure. The list of the differences and their approval is entered in the handover inspection protocol. Resultant modifica-tions should also be shown in the project documentation, with a note of control survey measurements conducted, and confirming that the users of infrastructure have been duly informed.
When surveying power lines, depending on the client’s requirements, the following elements are taken into consideration [Migas 2000]: • placement of the transmission towers in land lots (parcels of record),• settings of electrical power appliances,• length of the section, spans, insulation,• height of the transmission towers,• sag of live wires and arrester wires,• any crossover with other power cables or telecommunications cables,• height of trees, shrubbery, and buildings in the immediate vicinity of the power
lines.
Land survey and height maps are prepared for the area within 30 m to 120 m from the axis of the towers (depending on the voltage of the given power line), coupled with longitudinal profiles of the cable route.
For the control measurement of cable sags, trigonometric correlations of the measured vertical angles and length measured at ground level are used. Based on the conducted measurements, spatial coordinates are calculated for the points of tower bases, points of cable suspension, and points of the maximum sag [Migas 2000].
Before measuring the sag, firstly centre point of the span must be determined, whereby we shall calculate the sag and the perpendicular line. Afterwards, from the centre point of p we shall calculate the vertical angles α, β and calculate the heights (elevations) of h1 and h2 (Figure 2) from the relationship:
tan , tanα β= =ha
ha
1 2 (1)
The heights of cable suspension and a and B are derived from a simple principle of trigonometric levelling:
H H i h H H i hA P B P= + + = + +1 2, (2)

DeTerMinaTion of GeoDeTic conTrol neTwork poinTs usinG Gps... 69
Geomatics, Landmanagement and Landscape No. 4 • 2014
The height of base points of the towers a’ and B’ are also set using the method of trigonometric levelling, using the following formulas (Figure 3): h a h aA B= ⋅ = ⋅tan , tanα α1 2
(3)
H H i h l H H i h lA P A B P B’ ’= + + − = + + −, (4)
Fig. 2. Measurement of vertical angles for sag control
A
A’
B
B’
P
h1
h2
f
i
a a
� �
Fig. 3. Measurement of height differences in tower bases
A
A’
B
B’
P
hA
i
a a
�1
l
hB
l�2
Relative heights of ha, hB (3) may take either the positive or the negative sign (depend-ing on the sign of the vertical angle α1, α2). The symbol l in Figure 3 and formula (4) denotes a certain, arbitrarily chosen, reading of the patch (for instance, l = 1.5 m).
M. Jawor, T. Gargula70
GLL No. 4 • 2014
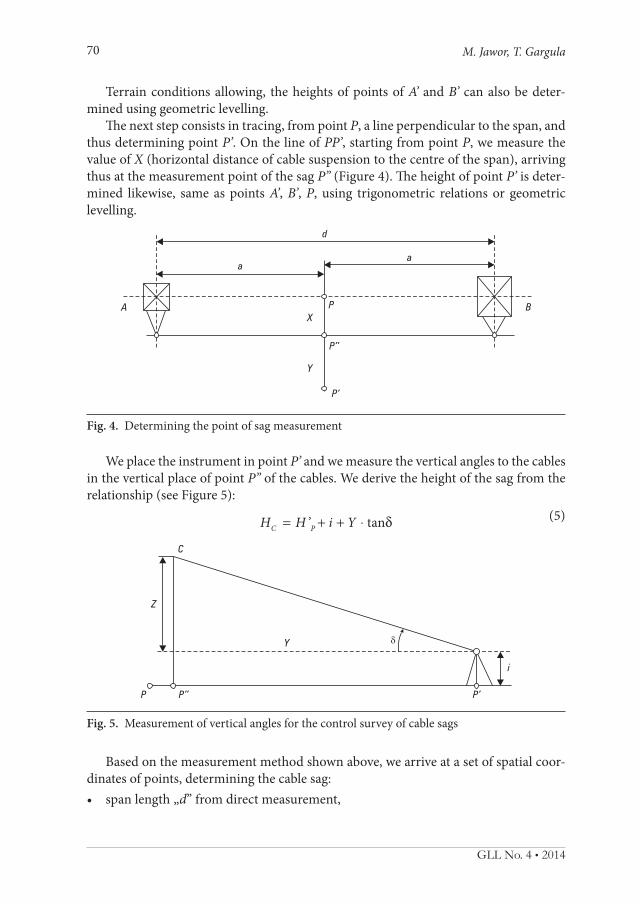
Terrain conditions allowing, the heights of points of a’ and B’ can also be deter-mined using geometric levelling.
The next step consists in tracing, from point p, a line perpendicular to the span, and thus determining point p’. On the line of pp’, starting from point p, we measure the value of X (horizontal distance of cable suspension to the centre of the span), arriving thus at the measurement point of the sag p” (Figure 4). The height of point p’ is deter-mined likewise, same as points a’, B’, p, using trigonometric relations or geometric levelling.
Fig. 4. Determining the point of sag measurement
A BPX
P’’
P’
Y
aa
d
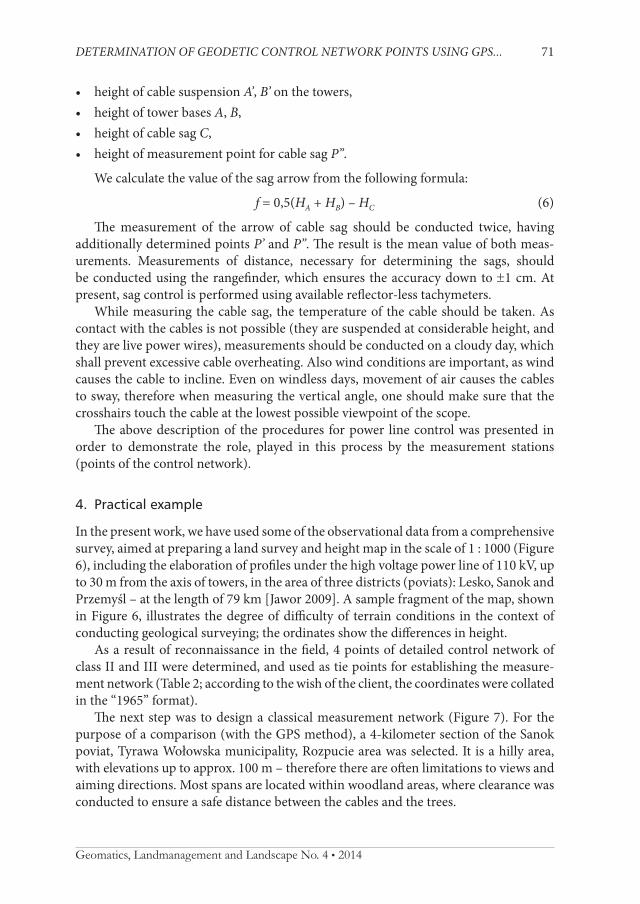
We place the instrument in point p’ and we measure the vertical angles to the cables in the vertical place of point p” of the cables. We derive the height of the sag from the relationship (see Figure 5): H H i YC P= + + ⋅’ tanδ (5)
Fig. 5. Measurement of vertical angles for the control survey of cable sags
Based on the measurement method shown above, we arrive at a set of spatial coor-dinates of points, determining the cable sag:• span length „d” from direct measurement,
P
Z
P’’ P’
i
Y
C
�
DeTerMinaTion of GeoDeTic conTrol neTwork poinTs usinG Gps... 71
Geomatics, Landmanagement and Landscape No. 4 • 2014
• height of cable suspension a’, B’ on the towers,• height of tower bases a, B,• height of cable sag c,• height of measurement point for cable sag p”.
We calculate the value of the sag arrow from the following formula:
f = 0,5(Ha + HB) – Hc (6)
The measurement of the arrow of cable sag should be conducted twice, having additionally determined points p’ and p”. The result is the mean value of both meas-urements. Measurements of distance, necessary for determining the sags, should be conducted using the rangefinder, which ensures the accuracy down to ±1 cm. At present, sag control is performed using available reflector-less tachymeters.
While measuring the cable sag, the temperature of the cable should be taken. As contact with the cables is not possible (they are suspended at considerable height, and they are live power wires), measurements should be conducted on a cloudy day, which shall prevent excessive cable overheating. Also wind conditions are important, as wind causes the cable to incline. Even on windless days, movement of air causes the cables to sway, therefore when measuring the vertical angle, one should make sure that the crosshairs touch the cable at the lowest possible viewpoint of the scope.
The above description of the procedures for power line control was presented in order to demonstrate the role, played in this process by the measurement stations (points of the control network).
4. practical example
In the present work, we have used some of the observational data from a comprehensive survey, aimed at preparing a land survey and height map in the scale of 1 : 1000 (Figure 6), including the elaboration of profiles under the high voltage power line of 110 kV, up to 30 m from the axis of towers, in the area of three districts (poviats): Lesko, Sanok and Przemyśl – at the length of 79 km [Jawor 2009]. A sample fragment of the map, shown in Figure 6, illustrates the degree of difficulty of terrain conditions in the context of conducting geological surveying; the ordinates show the differences in height.
As a result of reconnaissance in the field, 4 points of detailed control network of class II and III were determined, and used as tie points for establishing the measure-ment network (Table 2; according to the wish of the client, the coordinates were collated in the “1965” format).
The next step was to design a classical measurement network (Figure 7). For the purpose of a comparison (with the GPS method), a 4-kilometer section of the Sanok poviat, Tyrawa Wołowska municipality, Rozpucie area was selected. It is a hilly area, with elevations up to approx. 100 m – therefore there are often limitations to views and aiming directions. Most spans are located within woodland areas, where clearance was conducted to ensure a safe distance between the cables and the trees.

M. Jawor, T. Gargula72
GLL No. 4 • 2014
Table 2. Collated coordinates of base and detailed control network (“1965” format)
Point number Network class X Y
450 II 5354949.430 4731584.650
451 II 5354419.840 4732988.250
457 II 5351156.330 4731216.000
1074 III 5350907.550 4731231.980
Fig. 6. A sample fragment of a land survey and height map of the area, for the purpose of power line control
Fig. 7. Draft of measurement network points’ placement
450
451
11
109
8
7
56
4
3
2
14571074

DeTerMinaTion of GeoDeTic conTrol neTwork poinTs usinG Gps... 73
Geomatics, Landmanagement and Landscape No. 4 • 2014
In the selected area, there are 11 high voltage transmission towers. Considering the requirement that for each span, there should be at least one measurement point, from which measurement of the situation and cable sags will be made [Migas 2000], 11 points have been designated. Measurement points have been designed in the previ-ously marked locations, designated beforehand using GPS receivers. All points consti-tute a closed traverse.
As detailed control points were considerably far from each other, the length of the designed traverse exceed the permissible value (4.5 km [Regulation… 2011]) and amounted to approx. 6.533 km, with an average length of side at approx. 0.466 km. As the terrain is hilly, in some cases the designed sides of the network are larger than 600 m.
The established network was measured using the classical method (angles and hori-zontal distances) and using the GPS method. The measurement at points of the control network and traverse (detailed) network was effected using kinematic method in time intervals of 60 seconds, applying the NAWGEO service of the ASG-EUPOS system. For each designated point, the receiver registered signals from at least four satellites.
For the measurement of control network, the following surveying instruments were used:• Tachymeter of the Total station type: Leica TCR 407 ultra,• GPS receivers L1/L2 RTK VRS: Trimble 5800 and Trimble TSC2 controller.
Trimble 5800 GPS receiver combines a two-frequency GPS receiver, an antenna, a UHF radio and a power source (all in one unit). This facilitates the control of meas-urements without the use of cables – thanks to using short-range wireless technology (Bluetooth). The receiver may be used in many different ways – it can be set up as a portable receiver or a base station, whereby the instrument performs in changeable conditions of operation. The Bluetooth module is compatible with mobile telephone networks, which facilitates complete RTK measurements.
Trimble 5800 receiver, in collaboration with the ASG EUPOS system, uses the real time service – thanks to the principle of RTK differential positioning [Lamparski 2001] performed based on reference stations. Receivers which conduct field measurements communicate with the computing centre in order to obtain observational adjustments. The whole data exchange process happens in real time, via the GPRS Internet connec-tion, therefore the user obtains the results directly in the field.
Results of the adjustment of traverse deviations performed using the Geonet soft-ware have been collated in Table 3. The mean error for the measurement of the angle and the distance is assumed at: 30cc and 0.01 m respectively. The adjustment procedure is based on a known method of least squares. [Ghilani 2010, Wiśniewski 2005].
Resulting from the calculations, we obtained the mean error for the point location at mp = ±0,033 m. The points which are most encumbered with error (±0.054 ÷ 0.058 m) are those in the middle of the sequence (points 6, 7, 8).
Based on the GPS measurement, coordinates of control points were calculated in the coordinate system 2000/21 [Regulation… 2000], and then based on previously deter-

M. Jawor, T. Gargula74
GLL No. 4 • 2014
mined points of the traverse network (Table 2), affine transformation was conducted to the 1965 format in zone 1 (Table 4) [Kadaj 2000].
Table 3. Adjustment of the survey network using the classical method (“1965” format)
Point number X Y mx my mp
1 5351398.239 4731152.241 0.016 0.010 0.019
2 5352013.415 4731492.803 0.026 0.038 0.046
3 5351556.051 4731291.085 0.026 0.029 0.039
4 5352211.133 4731646.989 0.028 0.040 0.049
5 5352334.169 4731719.613 0.031 0.044 0.054
6 5352526.992 4731841.413 0.033 0.046 0.057
7 5352726.688 4731983.328 0.034 0.047 0.058
8 5353198.272 4732245.779 0.033 0.043 0.054
9 5353371.001 4732355.921 0.031 0.040 0.050
10 5353650.740 4732534.580 0.026 0.032 0.041
11 5353975.342 4732732.032 0.018 0.020 0.027
Table 4. Coordinates of the measurement network using the GPS method (“1965” format)
Point no. X Y dx dy dL
1 5351398.238 4731152.238 0.001 0.003 0.003
2 5352013.433 4731492.804 –0.018 –0.001 0.018
3 5351556.050 4731291.080 0.001 0.005 0.005
4 5352211.150 4731646.990 –0.017 –0.001 0.017
5 5352334.180 4731719.610 –0.011 0.003 0.011
6 5352526.999 4731841.408 –0.007 0.005 0.009
7 5352726.691 4731983.322 –0.003 0.006 0.007
8 5353198.278 4732245.776 –0.006 0,003 0.007
9 5353371.002 4732355.917 –0.001 0.004 0.004
10 5353650.739 4732534.577 0.001 0.003 0.003
11 5353975.340 4732732.030 0.002 0.002 0.003
In the presentation of results (in Table 4) deviations of coordinates were also listed (dx, dy) as well as line deviation (dl) compared to the results from the classical meas-urement method (Table 3). We immediately observe that the differences are only slight; the maximum line deviation does not exceed 2 cm (for points 2 and 4). As these values are far below the location errors in the classical method (which ranged around ± 5 cm, compare Table 3), we can conclude that the GPS method is sufficient for obtaining the desired accuracy.

DeTerMinaTion of GeoDeTic conTrol neTwork poinTs usinG Gps... 75
Geomatics, Landmanagement and Landscape No. 4 • 2014
5. conclusions
In the present work, we discussed the role of geodetic control network, established for the purpose of monitoring the location of power lines. The task constitutes a particular application of survey measurements. Appropriate control (for instance, determining span length or cable sag) requires a correct design and establishing a measurement network. We have noted the aspect of accuracy of situational location of points, based on the RTK GPS method. For the analysis, we have used a certain subset of data for a real-life object (high voltage power line at the distance of 79 km). For comparative purposes, classical situational survey of the network was conducted, using the Total Station type instrument.
For GPS measurements, modern receivers (Trimble 5800) were used as well as options offered by the ASG-EUPOS system of reference stations, coupled with the NAWGEO service.
Particularity of the task consisted – among other things – in selecting the optimal measurement method for difficult terrain conditions. In this context, the RTK GPS method turned out to be decidedly more comfortable and more efficient, and the results it rendered were not substantially different (in terms of accuracy) from those rendered by the classical method. In the case of difficulties in obtaining the proper exposure of the measurement station to satellite signals (for instance, in a woodland area), we propose that the GPS measurement be supplemented with classical methods. Of course, the best solution would be to apply an integrated measurement method (both classical and GPS). That, however, would require an appropriate preparation of observations at the stage of numerical analysis of results (consisting in bringing differ-ent types of observation down to one mathematical model [Gargula 2009]). This latter issue will be the topic for further studies into geodetic control methods of power lines.
references
Bosy J., Graszka W., Leończyk M. 2008. Aktywna Sieć Geodezyjna EUPOS jako element składo-wy państwowego systemu odniesień przestrzennych. Prz. Geod., 12, 10–16.
Gargula T. 2009. The conception of integrated survey networks composed of modular networks and GPS vectors. Survey Rev., 41, 313, 301–313.
Ghilani C.D. 2010. Adjustment Computations, Spatial Data Analysis. John Wiley & Sons, New Jersey.
Góral W., Banasik P., Kudrys J., Skorupa B. 2008. Współczesne metody wykorzystania GPS w geodezji. Uczelniane Wyd. Nauk.-Dyd. AGH, Kraków.
GUGiK. 2002. Instrukcja techniczna G–4. Pomiary sytuacyjne i wysokościowe, Warszawa.Jawor M. 2009. Pomiar osnowy geodezyjnej techniką GPS w trudnych warunkach terenowych
dla celów kontroli linii energetycznych. University of Agriculture in Krakow, master’s thesis – typescript.
Kadaj R. 2000. Zasady transformacji współrzędnych pomiędzy różnymi układami kartograficz-nymi na obszarze Polski. Geodeta Mag. Geoinf., 11, 66, 15–19.
Kadaj R. 2006. System geodezyjny GEONET (4.0–5.0) – opis funkcjonalny i instrukcja obsługi. AlgoRes-Soft, Rzeszów.
M. Jawor, T. Gargula76
Lamparski J. 2001. NAVSTAR GPS – od teorii do praktyki. Uniwersytet Warmińsko-Mazurski, Olsztyn.
Lamparski J. 2003. GPS W GEODEZJI. Gall, Katowice.Leick A. 2004. GPS Satellite Surveying. John Wiley & Sons, New Jersey.Migas J. 2000. Prace geodezyjne przy budowie linii i stacji elektroenergetycznych. Towarzystwo
projektowo-wykonawcze budownictwa elektroenergetycznego. Instrukcja pomiaru, Warsza-wa.
Rozporządzenie Ministra Spraw Wewnętrznych i Administracji z dnia 9 listopada 2011 r. w spra-wie standardów technicznych wykonywania geodezyjnych pomiarów sytuacyjnych i wyso-kościowych oraz opracowywania i przekazywania wyników tych pomiarów do państwowego zasobu geodezyjnego i kartograficznego, Dz. U. z 2011 r. Nr 263, poz. 1572.
Rozporządzenie Rady Ministrów z dnia 8 sierpnia 2000 r. w sprawie państwowego systemu od-niesień przestrzennych. Dz. U. z 2000 r. Nr 70, poz. 821.
Wiśniewski Z. 2005. Rachunek wyrównawczy w geodezji (z przykładami). Uniwersytet War-mińsko-Mazurski, Olsztyn.
mateusz Jaworpracownia geodezyjna moDus 33-340 stary sącz, ul. cyganowice 129,e-mail: [email protected]
tadeusz gargula katedra geodezji uniwersytet rolniczy w krakowie 30-198 kraków, ul. Balicka 253a, e-mail: [email protected]