Is there a fourth dimension to subsidence Monitoring
14
Proceedings of the 9th Triennial Conference on Mine Subsidence, 2014 175 Is there a 4th Dimension to Subsidence Monitoring? W Ziegler, Manager Mining Impacts, NSW Dam Safety Committee H Middleton, Mining Regulation Officer, NSW Dam Safety Committee Summary This paper presents the collation of over 20 years of data on vertical and horizontal movements around Cataract Dam in the Southern Coalfield of New South Wales, reporting subsidence that continues 25 years after extraction in the area ceased. The occurrence of increased vertical movement over old goaf areas as the result of extraction in the same seam at greater than 1km distance has been observed, together with a change in the behaviour of measured head of water six years after extraction ceased in the area. These points raise the question ‘How long should subsidence monitoring continue after extraction has ceased in areas of important infrastructure?’. Keywords Residual subsidence, dam reservoir, hydrological changes induced by mining, mining impacts on infrastructure 1. Introduction It is well known that ground movements due to underground coal mining consist of both vertical and horizontal components. Typically, the horizon- tal and vertical components are measured between adjacent survey pegs or monuments, with horizon- tal movement expressed in terms of strain rather than movement vectors, and vertical movement expressed in terms of subsidence or upsidence. The period of time during which subsidence occurs, is generally relatively brief. Classically 90- 95% of the total movement associated with longwall extraction occurs during the actual period of extraction, with the final 5-10% of movement (the residual subsidence) completed well within two years of cessation of extraction (Reddish & Whittaker, 1989, Al Heib M et al 2005). Around areas of important infrastructure such as major dams and bridges, surveillance of mining induced subsidence is continued until it can be demonstrated that all mining induced movement has ceased. How long surveillance continues post extraction depends on how long ‘residual move- ment’ (ie post extraction movement) continues. On the basis of studies conducted elsewhere it might be assumed that two years of post extrac- tion surveillance would capture >99% of total mining related movement, however longitudinal studies undertaken around the Cataract Dam, which has been monitored for over 40 years, indi- cate that this is not the case in this area. This raises the question’How long should movement monitoring continue after extraction has ceased within areas of important infrastructure?’. Precise measurements over long distances between survey monuments have been recorded in the Cataract Dam region as part of the surveil- lance of the dam for over 40 years. There are a number of grids in the area. Of particular interest to the Dams Safety Committee is the Cataract Tectonic Grid which encompasses the dam wall and about 20km 2 of the adjacent catchment. Meas- urements have been undertaken on this grid since 1972, partly with the aim of determining the effect of underground coal mining on the dam. These measurements provide over 40 years of data. The distances between survey monuments vary from about 1-3km. In addition to the Cataract Tectonic Grid an exten- sive amount of traditional surveillance data has been collected along survey lines crossing areas in which mining has occurred. The survey pegs are close together, of the order of 20m apart (a common rule of thumb is bay-length = depth of cover/20). Electronic Distance Measuring (EDM) equipment may be used to provide measurements
-
Upload
independent -
Category
Documents
-
view
2 -
download
0
Transcript of Is there a fourth dimension to subsidence Monitoring
Proceedings of the 9th Triennial Conference on Mine Subsidence, 2014 175
Is there a 4th Dimension to Subsidence Monitoring?
W Ziegler, Manager Mining Impacts, NSW Dam Safety CommitteeH Middleton, Mining Regulation Officer, NSW Dam Safety Committee
SummaryThis paper presents the collation of over 20 years of data on vertical and horizontal movements aroundCataract Dam in the Southern Coalfield of New South Wales, reporting subsidence that continues 25 yearsafter extraction in the area ceased. The occurrence of increased vertical movement over old goaf areas asthe result of extraction in the same seam at greater than 1km distance has been observed, together with achange in the behaviour of measured head of water six years after extraction ceased in the area. Thesepoints raise the question ‘How long should subsidence monitoring continue after extraction has ceased inareas of important infrastructure?’.
Keywords
Residual subsidence, dam reservoir, hydrological changes induced by mining, mining impacts on infrastructure
1. Introduction
It is well known that ground movements due tounderground coal mining consist of both verticaland horizontal components. Typically, the horizon-tal and vertical components are measured betweenadjacent survey pegs or monuments, with horizon-tal movement expressed in terms of strain ratherthan movement vectors, and vertical movementexpressed in terms of subsidence or upsidence.The period of time during which subsidenceoccurs, is generally relatively brief. Classically 90-95% of the total movement associated withlongwall extraction occurs during the actual periodof extraction, with the final 5-10% of movement(the residual subsidence) completed well withintwo years of cessation of extraction (Reddish &Whittaker, 1989, Al Heib M et al 2005).
Around areas of important infrastructure such asmajor dams and bridges, surveillance of mininginduced subsidence is continued until it can bedemonstrated that all mining induced movementhas ceased. How long surveillance continues postextraction depends on how long ‘residual move-ment’ (ie post extraction movement) continues.On the basis of studies conducted elsewhere itmight be assumed that two years of post extrac-tion surveillance would capture >99% of totalmining related movement, however longitudinalstudies undertaken around the Cataract Dam,
which has been monitored for over 40 years, indi-cate that this is not the case in this area. Thisraises the question’How long should movementmonitoring continue after extraction has ceasedwithin areas of important infrastructure?’.
Precise measurements over long distancesbetween survey monuments have been recordedin the Cataract Dam region as part of the surveil-lance of the dam for over 40 years. There are anumber of grids in the area. Of particular interestto the Dams Safety Committee is the CataractTectonic Grid which encompasses the dam walland about 20km2of the adjacent catchment. Meas-urements have been undertaken on this grid since1972, partly with the aim of determining theeffect of underground coal mining on the dam.These measurements provide over 40 years ofdata. The distances between survey monumentsvary from about 1-3km.
In addition to the Cataract Tectonic Grid an exten-sive amount of traditional surveillance data hasbeen collected along survey lines crossing areasin which mining has occurred. The survey pegsare close together, of the order of 20m apart (acommon rule of thumb is bay-length = depth ofcover/20). Electronic Distance Measuring (EDM)equipment may be used to provide measurements
in three dimensions over longer distancesalthough once, again the distances tend to be rel-atively small for subsidence.
This paper discusses the measurements from theCataract Tectonic Grid, together with ‘traditional’subsidence data collected by mining companiesfrom the same area over a period of years, andpostulates that ongoing movements occurringyears after extraction has ceased in the area aredue to mining.
In previous papers on this subject, Reid(2001,1998) presented some long-baseline hori-zontal data collected by the Sydney CatchmentAuthority (SCA) around Cataract Dam. The con-clusions drawn in those papers were:(i) mining induced horizontal ground move-ments of up to 25mm were recorded at adistance of up to 1.5km from undergroundcoal mining;(ii) Far Field Horizontal movements were gen-erally at least as great as the vertical component.This applied whether or not the survey peg hadbeen directly undermined. It was noted that thiswas at odds with the published literature;(iii) the rate of horizontal movement peakedsoon after undermining;(iv) horizontal movements were generallydirected towards the goaf. A possible down-slope component was identified but theevidence of this was inconclusive;(v) there was no apparent influence from theCataract River valley.
Following on from this work, Reid (2000) pre-sented some additional survey results collected bythe dam owner and collieries near Cataract Dam.Among other things, the following matters werediscussed:(i) movements of Cataract Dam wall of theorder of 20mm as a result of coal mining;(ii) the predominance of compressive strainover panel and pillar mining in this area,where tensile strain dominates for total extrac-tion workings;(iii) the possibility that in-situ stress wasinfluencing the horizontal movements.
This paper presents more recent results and fur-ther analyses of previously published results.Interested readers are referred to Reid (1998) fora brief review of published literature on horizontal
ground movements, a summary of other investi-gations around Cataract Reservoir, and a detaileddescription of the recorded movements.
2. Background to the measurements
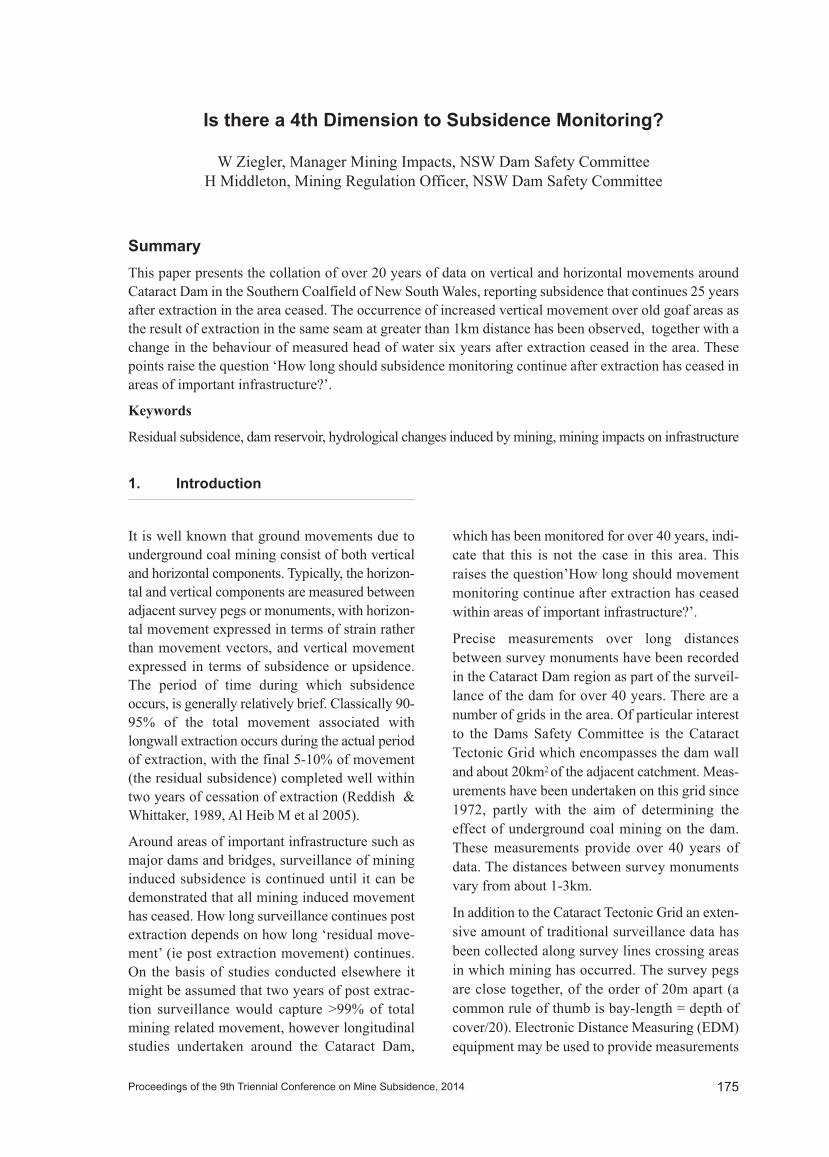
Cataract Dam is a 56m high mass gravity cyclo-pean masonry dam that was completed in 1907 asan essential component of Sydney’s water supply.The consequences of failure of Cataract Damwould be extreme, not only in the probable lossof life, but in the loss of an extremely valuablecomponent of Sydney’s infrastructure. As the damis situated in the Southern Coal Fields, SydneyCatchment Authority (SCA), the owner ofCataract Dam, regularly makes precise distancemeasurements between a number of survey gridsin the Southern Catchment, south of Sydney. Oneof these grids, the ‘Cataract Tectonic Grid’, cur-rently covers an area of about 20km2 and includesthe dam itself plus part of the adjacent catchment.It was originally established with four surveypoints in 1972. An additional point was includedin 1980, and five more points were added in 1992.The points are typically between 1-3km apart andare shown on Figure 1.
Horizontal measurements are made by EDM. Accu-racy up to 1986 was ± 5 mm +1 ppm (Martin 1998),
Proceedings of the 9th Triennial Conference on Mine Subsidence, 2014176
K8K10A
Mining completed by 1981
Mi i 1981 t 1993 K10AMining 1981 to 1993LW301 to LW309
Mining 1993 to 2000
K03Li XL1
LW501 to LW518
Mining 2001North Main
E29Line XL1
Line J-JMining 2001Cat North
Z29E29 Line D-D
XLine B-B269
Line A-A
Line B BSCA survey station
Colliery subsidence Line
Figure 1 Cataract Reservoir andMine workings Stars (*) represent locationsof SCA valley survey monuments Dashed lines are conventionalsubsidence lines

which means an accuracy of 6 or 7mm between typ-ical points. After 1986 the accuracy was improvedto ± 3 mm + 1 ppm (say, 4 or 5 mm between typicalpoints). This is an unusual grid compared to tradi-tional subsidence grids because of:(i) the very long distances between surveymonuments (about 1-3 km);(ii) the long history of measurements(> 40yrs from 1972 to 2013); and (iii) the high precision of the measurements.
Mining in the Cataract area has been ongoing forover 100 years and predates the construction of theCataract Dam by some decades. The Mine (undervarious owners) has carried out conventional sub-sidence surveys over a number of lines. Some ofthe survey points are close to those of the SCA andthe results are therefore directly comparable.
Importantly the two different survey methods havegiven similar results, providing confidence that thesubsidence being measured is real and not theresult of survey error.
3. Geology
The strata in the vicinity of the dam are generallysub-horizontal. All of the Cataract Survey Gridmonuments are located on Hawkesbury Sand-stone, which outcrops throughout the area, exceptfor some insignificant outcrops of the overlyingWianamatta Shale on higher hilltops. TheHawkesbury Sandstone extends below the level ofthe bottom of Lake Cataract (Figure 2).
The Narrabeen Group, comprising a series of clay-stones and sandstones, directly underlies the
Hawkesbury Sandstone and is itself directlyunderlain by the Illawarra Coal Measures whichcontain at least two economic coal seams, namelythe Bulli and the Wongawilli Coal seams.
Traditionally the Bulli Seam has been the targetedseam in the study area and all subsidence resultspresented in this paper are recorded in response tomining development and extraction (to around2.5m thickness) within the Bulli Seam. However,extensive extraction of the Wongawilli Seam(which underlies the Bulli Seam and will beextracted to a thickness of around 3.5m) is pro-posed in the future.
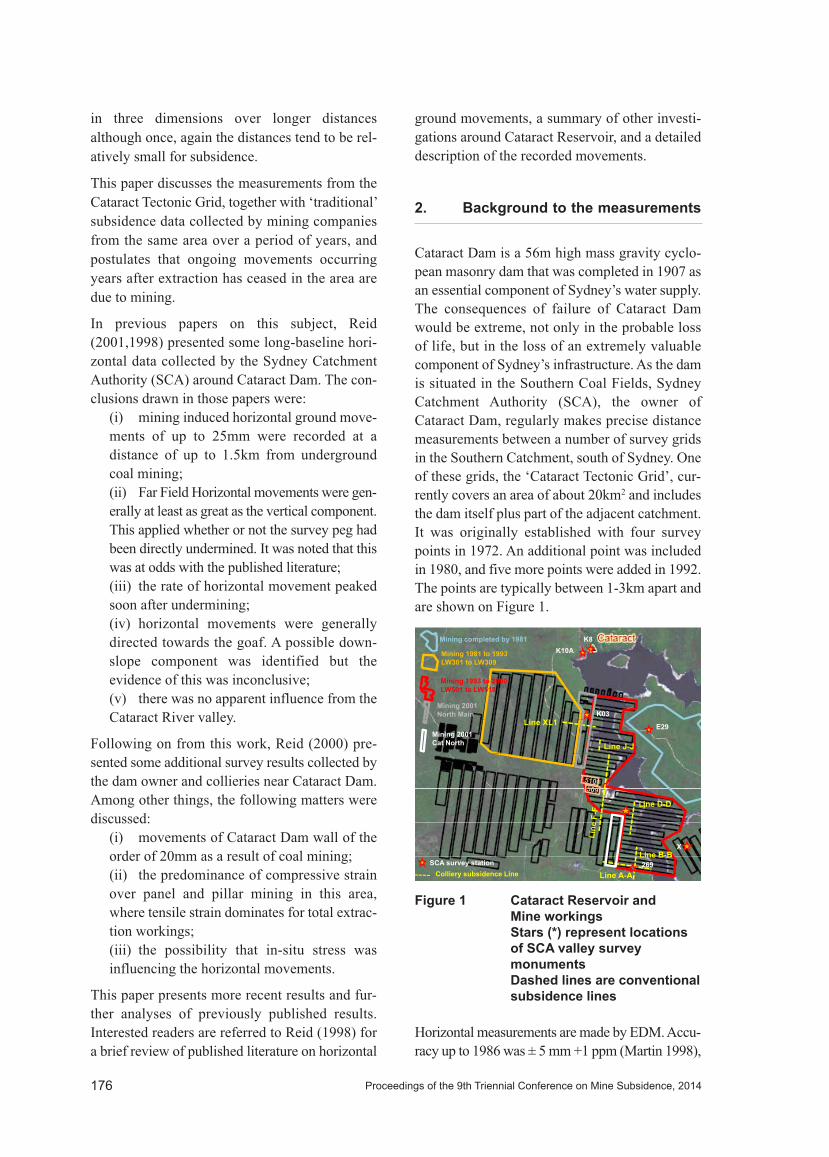
The Hawkesbury Sandstone is characterised by asystem of pre-mining fractures which comprisesteeply dipping joints, low angle bedding planesand local unconformities. However, regional scalesurface structures have not been identified withinthe Bulli Seam and individual structural featureslocated within the Bulli Seam are not identified atsurface. Two major faults that have been inter-cepted between the northern extent of the BulliSeam workings and Cataract Dam, but are not evi-dent at the surface, are illustrated in Figure 3. Thefaults have throws of 30-50m, with the workingson the downthrown side.
A major dyke (see Figure 3), bisects the workingsfrom NE to SW and caused the elimination of LW510 and shortening of LWs509 and 511 to 514,
Proceedings of the 9th Triennial Conference on Mine Subsidence, 2014 177
P514
Cre
ek400 t Res
ervo
ir
RL m
300
Liza
rd C
Reservoir High WaterR i L W t
Cat
arac
t
200
Reservoir Low Water
Hawkesbury Sandstone
1000m200
Bald Hill Claystone Bulgo Sandstone
Newport Formation
Figure 2 Section through the reservoirand Lizard Creek (after Pells & Pells 2011) See Figure 5 for orientation of section line.
dramatically changing the initial mine plan. Whileat a later stage (2006) shortened LW509 and 510remnants were mined as pillar panels 509 & 510,the loss of coal due to the dyke was substantial.
Important formations within the Narrabeen Groupwhich are mentioned in this paper include the
Proceedings of the 9th Triennial Conference on Mine Subsidence, 2014178
Cataract Damspillway
LW518
UD
UD
53m30m?
50?m
35m
Longwalls LW
LW515
LW516
LW517
LW518
MA
INS
e 1
Longwalls
Igneous Intrusions
LW
LW511
LW512
LW513
LW514 Line J-J’
NO
RTH
X Li
n
LW30
1
LW30
2
LW30
3
LW30
4
Faults
Subsidencelines
DU
LW506
LW507
LW508
LW509
Line D-D’
P510
Line F-F’
P510
P509
LW502
LW503
LW504
LW505
LW506
CAT
N
OR
TH
LWK
LWL
LWM
LWN
LWOLW
201
LW20
2
LW20
3
LW501Line A-A’
Figure 3 Plan showing Bulli Seam workings and major structuresin the area below the reservoir
Newport and Garie Formations, which directlyunderly the Hawkesbury Sandstone, and theunderlying Bald Hill Claystone which is consid-ered a regional aquitard in hydrogeologicalmodels. The thickly bedded Bulgo Sandstonewhich underlies the Bald Hill Claystone (Figure 2)is the most voluminous member of the NarrabeenGroup and has the potential to behave as a bridg-ing formation during subsidence.
4. Mining
Figure 1 shows the progression of longwall or sec-ond workings in this area with time. Firstworkings have been omitted. The irregular shapedpanels indicate pillar extraction panels, and therectangular panels correspond to longwall panels.
The workings are all in the Bulli Seam. Miningoccurred during three distinct periods.(i) 1972-1981 - initial extraction was con-ducted when Bulli Colliery mined theheadland between the North and South Armsof Lake Cataract in the vicinity of E29. Themining was completed by 1981. Extractionresulted in maximum vertical subsidence ofabout 900 mm.(ii) 1981-1993 - South Bulli Colliery mined alongwall area from 1981 to 1993 (Longwalls301 to 309). Maximum vertical subsidence of
about 1m resulted. These longwalls approachedto within 650m of Cataract Dam.(iii) 1993-2000 - South Bulli Colliery com-menced mining directly under the storedwaters of Cataract in 1993 with longwallLW501. Mining continued in a northerlydirection towards the dam wall. The finallongwall panel below the lake (LW518) wascompleted in 2000, approximately 850m fromthe dam wall.
Following the completion of longwall extraction,mainroad pillars were extracted. The Cat Northmainroad pillars, which are to the west of LW501to LW506, were extracted between January 2001and August 2001. North Main pillars, which lie tothe west of LW511 to LW518, were extractedbetween February 2001 and October 2001.
Further extraction in the area did not occur until theremnant blocks of coal at the western ends of panels509 and 510 were extracted as pillar panels betweenAugust 2005 and June 2006. As discussed previ-ously, these pillar panels (509 & 510) were formedby the presence of a large igneous dyke dividing theproposed longwalls 509 & 510 (Figure 3).
Proceedings of the 9th Triennial Conference on Mine Subsidence, 2014 179
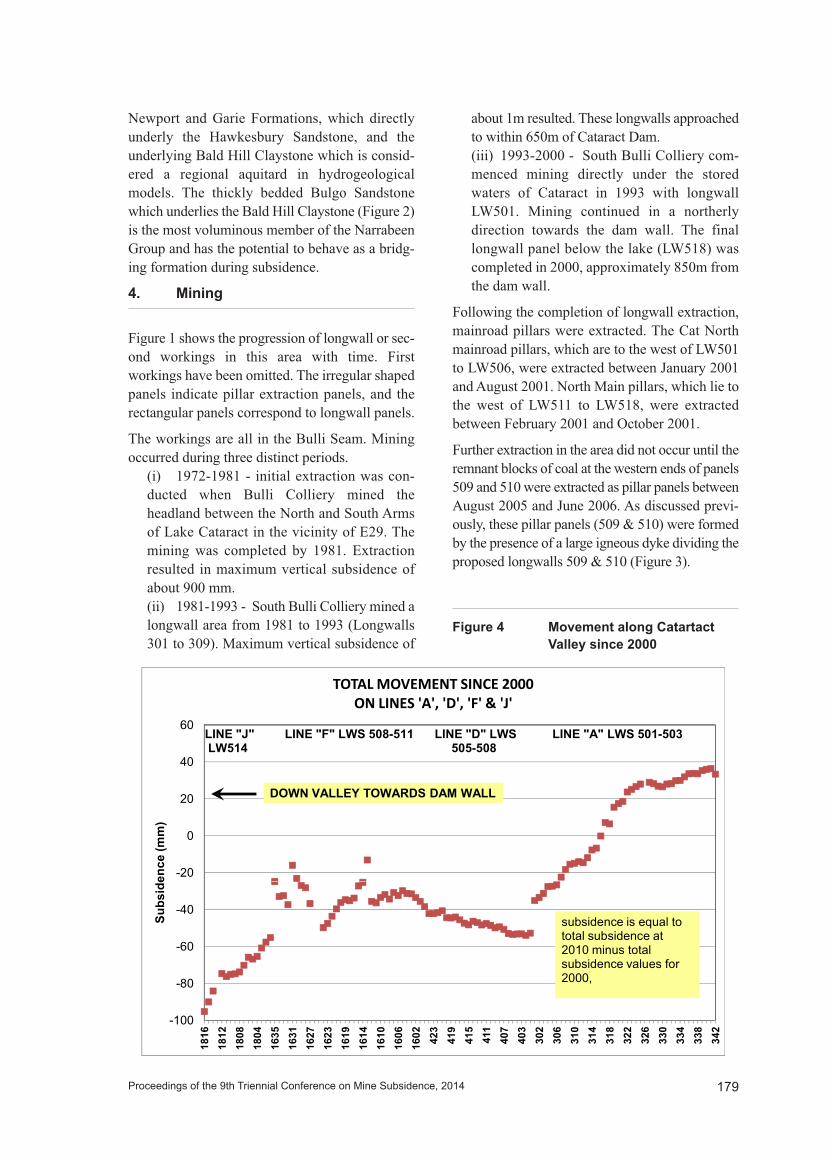
Figure 4 Movement along Catartact Valley since 2000
-20
0
20
40
60
ence
(mm
)
TOTALMOVEMENT SINCE 2000ON LINES 'A', 'D', 'F' & 'J'
LINE "F" LWS 508-511 LINE "A" LWS 501-503LINE "D" LWS 505-508
LINE "J" LW514
DOWN VALLEY TOWARDS DAM WALL
-100
-80
-60
-40
1816
1812
1808
1804
1635
1631
1627
1623
1619
1614
1610
1606
1602 423
419
415
411
407
403
302
306
310
314
318
322
326
330
334
338
342
Subs
ide
subsidence is equal to total subsidence at 2010 minus total subsidence values for 2000,

5. Measured movements
Movement on four survey lines which are orien-tated in a NNE direction and covering longwalls501 to 514 (see Figure 4) have been combined toshow movement over the ten years between 2000and 2010. Since 2000 there has been up to 100mmof subsidence over LINE J-J (LW514) and 40mmof upsidence over LINE A-A.
Line A-A starts over a longwall panel in theadjoining Cordeaux Mine, then crosses the barrierpillar and mainroad pillars before reachingLW501goaf edge at peg 322. LW20 in the adjoin-ing Cordeaux Colliery runs parallel to the CollieryBoundary and preceded extraction of LW501 byapproximately one year. Monitoring of Line A-Acommenced before the extraction of CordeauxLW20. Hence monitoring stations over LW20recorded initial subsidence. As longwall extractionin the 500 series in South Bulli Colliery devel-oped, monitoring stations over Cordeaux LW20experience a reversal of direction of subsidenceand record upsidence.
5.1 Comparison of survey results
LW514 (see Figure 3 for location) was extractedin 1999, while the last longwall in the 500 series(LW518) was extracted in 2000. This was fol-lowed in 2001 by the extraction of the North Main
pillars below K03. SCA monument K03 is 550mfrom LW514 and Line J-J as shown in Figure 5.
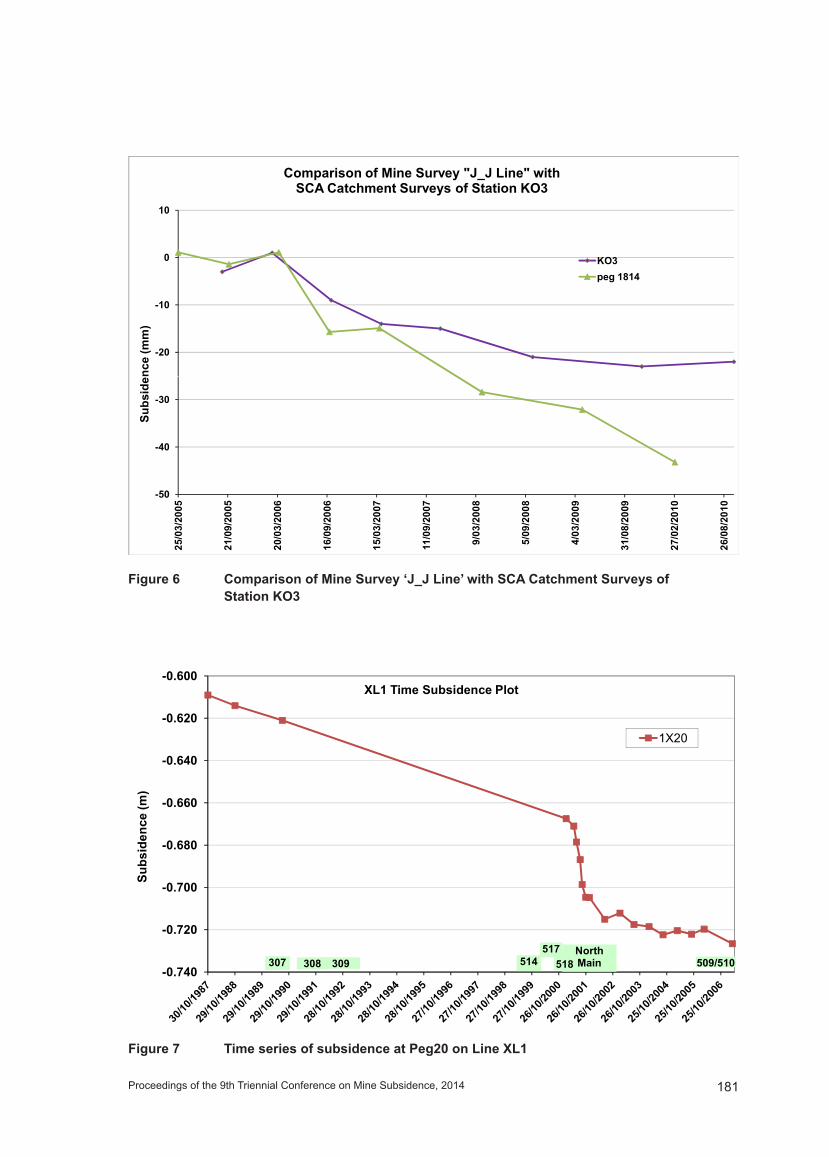
Movements at station K03 and peg 1814 on LineJ-J since 2005 have been plotted on the same chart(Figure 6) for comparison. Two independent sur-vey methods have produced the same result ofon-going subsidence over an extensive area.
The step increase in subsidence shown by bothsurvey stations in Figure 6 coincides with theextraction in pillar panels 509 and 510 (see Figure5 for location). Extraction in these panels occurredbetween August 2005 and June 2006. Panel 510 is750m from peg1814 and 1250m from K03. Peg1814 indicates that subsidence is continuing some4 years after the extraction of panel 510 and tenyears after the extraction of LW514, with no signof ceasing.
5.2 On-going movements
Cross Line 1 (Line XL1 in Figure 1) runs east-west across chain pillars between LW515 andLW516, main road pillars in North Main and thenabove LW301 to LW303. LW301 was extractedbetween November 1981 and August 1982. Peg20on Line XL1 lies above LW301 goaf. Movementat Peg20 since October 1987, when LW304 wascompleted, is shown in Figure 7. The timing ofextraction in the area of Line XL1 is also shownon Figure 7. Longwall extraction continued westuntil LW309 was extracted in 1993. This was fol-lowed by extraction of LW511 to LW518 to theeast between 1997 and 2000 and the mainroad pil-lars of North Main in 2001.
Since October 1987 subsidence has increased by19% above LW301 goaf, with most of the increaseoccurring following the extraction of the NorthMain pillars. However, it also is apparent that theextraction of LW511 to LW518 caused approxi-mately 40mm of subsidence over LW301. That is,subsidence over LW301 occurred even though itwas separated from the extraction in the 500 serieslongwalls by barrier pillars and North Main pillars,over a distance of 250m. Monitoring ceased onthis line in 2007 with what appears to be a slightincrease in subsidence following the extraction ofpillar panels 509 and 510 some 1100m away.
When Line XL1 subsidence results are comparedto Line ‘J-J’ and SCA station K03 a similar trend
Proceedings of the 9th Triennial Conference on Mine Subsidence, 2014180
K10A
K03E29Line XL1
Line J-J
510509
X Section Figure 2
Figure 5 General location of survey station K03, Line J-J and Pillar Panels 509 & 510
Proceedings of the 9th Triennial Conference on Mine Subsidence, 2014 181
Figure 6 Comparison of Mine Survey ‘J_J Line’ with SCA Catchment Surveys of Station KO3
-20
-10
0
10
nce
(mm
)
Comparison of Mine Survey "J_J Line" with SCA Catchment Surveys of Station KO3
KO3peg 1814
-50
-40
-30
25/0
3/20
05
21/0
9/20
05
20/0
3/20
06
16/0
9/20
06
15/0
3/20
07
11/0
9/20
07
9/03
/200
8
5/09
/200
8
4/03
/200
9
31/0
8/20
09
27/0
2/20
10
26/0
8/20
10
Subs
ide
Figure 7 Time series of subsidence at Peg20 on Line XL1
-0.680
-0.660
-0.640
-0.620
-0.600
bsid
ence
(m)
XL1 Time Subsidence Plot
1X20
-0.740
-0.720
-0.700
Sub
509/510307 308 309 514517 North
Main518
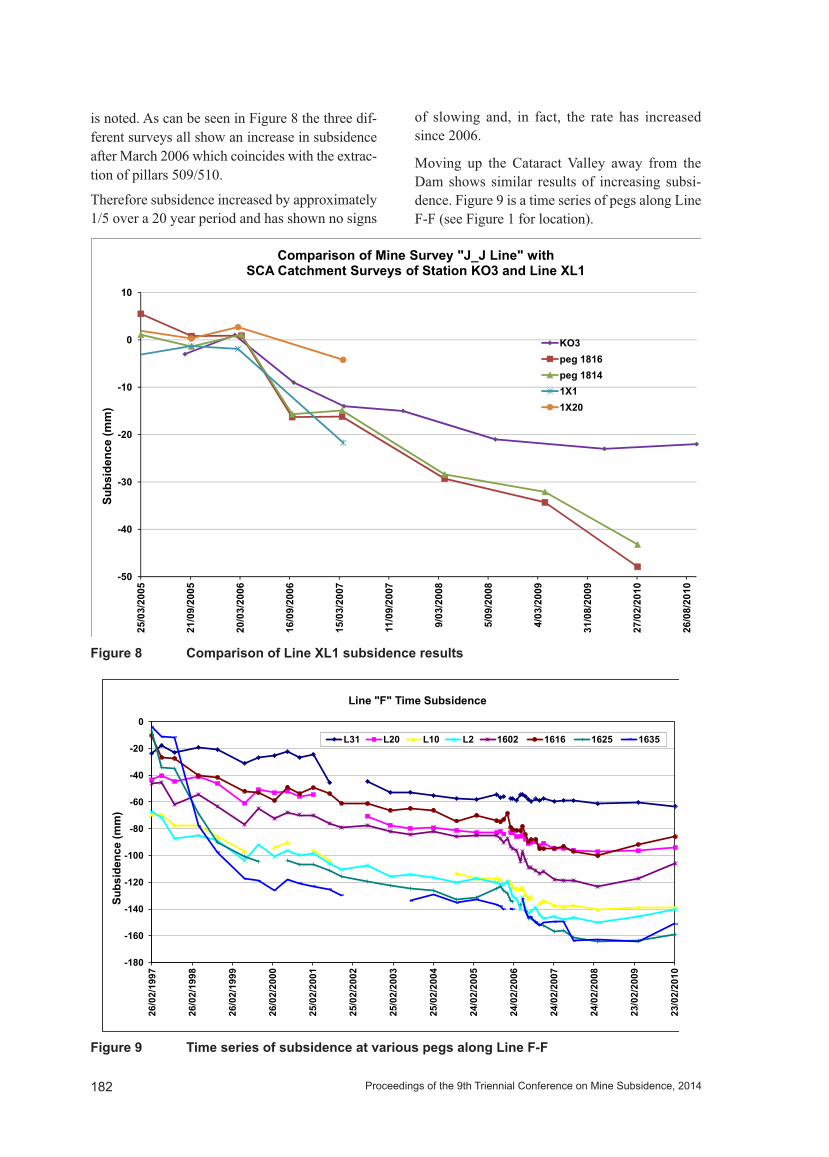
is noted. As can be seen in Figure 8 the three dif-ferent surveys all show an increase in subsidenceafter March 2006 which coincides with the extrac-tion of pillars 509/510.
Therefore subsidence increased by approximately1/5 over a 20 year period and has shown no signs
of slowing and, in fact, the rate has increasedsince 2006.
Moving up the Cataract Valley away from theDam shows similar results of increasing subsi-dence. Figure 9 is a time series of pegs along LineF-F (see Figure 1 for location).
182 Proceedings of the 9th Triennial Conference on Mine Subsidence, 2014
-180
-160
-140
-120
-100
-80
-60
-40
-20
0
26/0
2/19
97
26/0
2/19
98
26/0
2/19
99
26/0
2/20
00
25/0
2/20
01
25/0
2/20
02
25/0
2/20
03
25/0
2/20
04
24/0
2/20
05
24/0
2/20
06
24/0
2/20
07
24/0
2/20
08
23/0
2/20
09
23/0
2/20
10
Subs
iden
ce (m
m)
Line "F" Time Subsidence
L31 L20 L10 L2 1602 1616 1625 1635
Figure 9 Time series of subsidence at various pegs along Line F-F
-20
-10
0
10
nce
(mm
)
Comparison of Mine Survey "J_J Line" with SCA Catchment Surveys of Station KO3 and Line XL1
KO3peg 1816peg 18141X11X20
-50
-40
-30
25/0
3/20
05
21/0
9/20
05
20/0
3/20
06
16/0
9/20
06
15/0
3/20
07
11/0
9/20
07
9/03
/200
8
5/09
/200
8
4/03
/200
9
31/0
8/20
09
27/0
2/20
10
26/0
8/20
10
Subs
ide
Figure 8 Comparison of Line XL1 subsidence results
Proceedings of the 9th Triennial Conference on Mine Subsidence, 2014 183
-150
-100
-50
0
50ub
side
nce
(mm
)
401403405410415420425
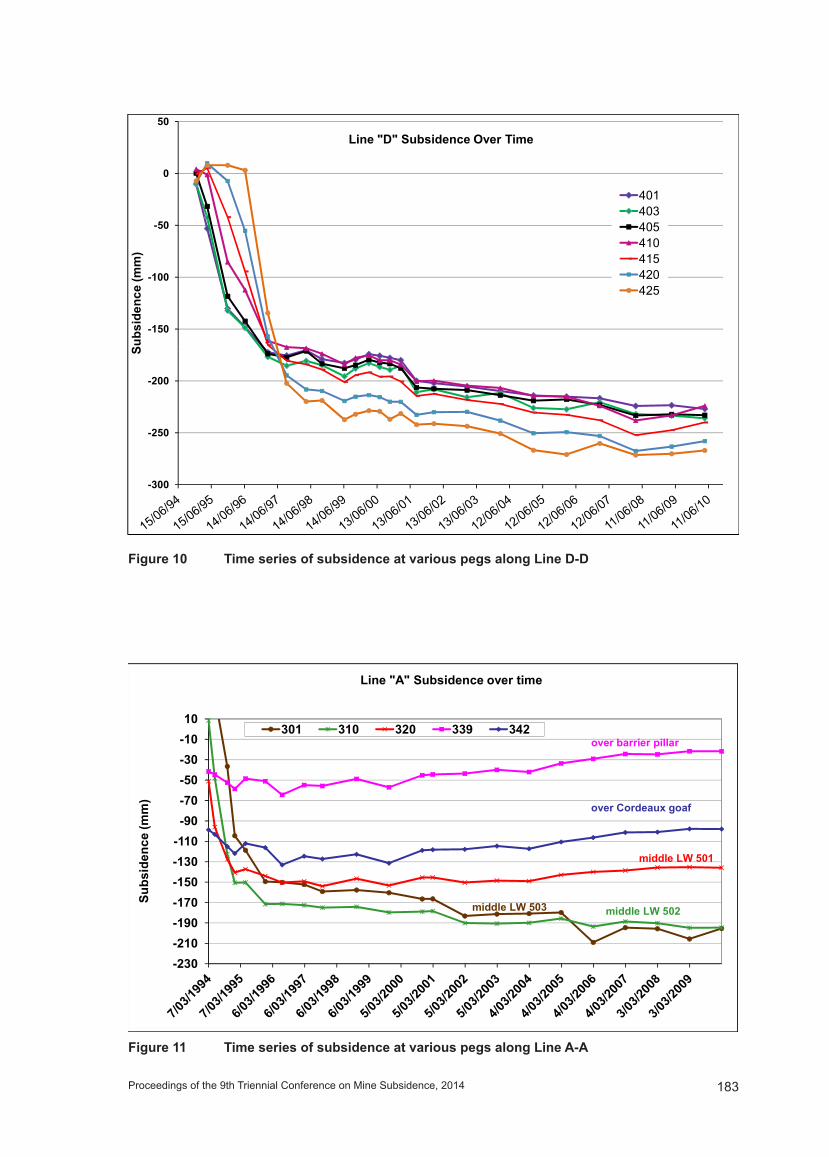
Line "D" Subsidence Over Time
-300
-250
-200
S
-130-110-90-70-50-30-1010
denc
e (m
m)
Line "A" Subsidence over time
301 310 320 339 342over barrier pillar
over Cordeaux goaf
middle LW 501
-230-210-190-170-150
Subs
i
middle LW 503 middle LW 502
Figure 11 Time series of subsidence at various pegs along Line A-A
Figure 10 Time series of subsidence at various pegs along Line D-D

Part of Line F-F lies above longwall ‘L’. Peg L31is above the goaf of longwall ‘L’, it shows anincrease of 20mm of subsidence in 2001 at thetime that Cat North mainroads were extracted.
Over the 10 years from 2000 to 2010 subsidencePegL31 increased by 40mm. Peg1635 is overLW511 and it also shows an increase in subsidenceof 40mm over the 10year period. There is a reversalof this trend with the last two survey epochs.
Subsidence Line D shown in Figure 10 (locationshown in Figure 1) lies over LW506 to LW508.This line shows a similar trend with an increase insubsidence of 40mm to 50mm (25% increase insubsidence) over 10 years before a slight reversalin the last two epochs. There is also a change inslope associated with increased subsidence asso-ciated with the extraction of Cat North in 2001 andpanel 509/510 in 2006.
The final survey line in the series is Line A. Thissurvey line starts over the adjoining CordeauxColliery’s longwall 20, crosses the barrier pillarand main road pillars before running aboveLW501 to LW503. A time series for various pegson Line A is presented in Figure 11. Peg numbersstart over LW503 and finish over Cordeaux goaf.Peg342 above the Cordeaux goaf and Peg339above the barrier pillar both show an upsidence of
approximately 30mm since 2000. While Peg301and Peg310 above LW503 and LW502 goafs bothshow subsidence of 30mm since 2000.
Bellambi Line J-J is positioned over part of LW513 and the complete width of LW514. Thisenables examination of the difference in subsi-dence through time between goaves and theirintervening pillars, with successive extraction(Figure 12).
Data collection for line J-J relative to base linedata began in October 98, coincident with thecompletion of LW 513 and predating the start ofextraction in LW514 (Table 1). Extraction ofLW514 began in mid December 1998 and wascompleted in Mid June 1999, with LWs515 to518 completely extracted by the beginning ofDecember 2000.
184 Proceedings of the 9th Triennial Conference on Mine Subsidence, 2014
-200
-150
-100
-50
0
50
ubsi
denc
e (m
m)
Bellambi : Line J-J Subsidence
-350
-300
-250
1801 1802 1803 1804 1805 1806 1807 1808 1809 1810 1811 1812 1813 1814 1815 1816
Su
Peg16-Oct-98 5-May-99 20-Jun-99 20-Oct-99 15-Mar-00 12-Jul-00 Nov-00 Mar-01Aug-01 Mar-02 Nov-02 Mar-03 Sep-03 Mar-04 Sep-04 Mar-05Sep-05 Mar-06 Sep-06 Mar-07 Mar-08 Mar-09 Mar-10
LW513 LW514 G514 PILLARG513 PILLAR3
Longwall Extraction Starts Extraction Finishes
LW 511 12 March 1997 1 May 1997
LW 512 10 February 1998 26 April 1998
LW513 15 June 1998 16 October 1998
LW514 10 December 1998 1 June 1999
LW515 14 June 1999 15 October 1999
LW516 12 November 1999 3 March 2000
LW517 23 March 2000 16 June 2000
LW518 17 July 2000 3 December 2000
North Main 5 February 2001 13 October 2001 !
Table 1 Extraction schedule for Cataract North LW511-518various pegs along Line A-A
Figure 12 Subsidence on J-J line with time
Measurable subsidence of up to 25mm is evidenton Pillar G513 adjacent to LW513 coincident withextraction on 16 October 1998. By the timeLW514 was completely extracted in June 1999,Pillar G513, which separates the goaves of LW513and LW 514, had subsided by 130-135 mm acrossits full width. By July 2000, at the start of extrac-tion of LW518, the shape of the subsidence troughacross G513 Pillar, LW514 Goaf and G514 Pillarhad stabilised, although subsidence is still ongo-ing. Significantly, subsidence is still ongoing at thesame rate as it was during the extraction of LWs517 and 518, ie at >5mm/year ten years after LWextraction finished and five years after any formof mining in the area has ceased!
Rates of subsidence are similar over goaved areasand pillars for the final ten years of measurements(Figure 12), which is consistent with the rate of
subsidence being controlled by the continued com-pression of the intervening pillars, rather thanbeing driven by the ongoing subsidence of thegoaves alone. If the pillars, which are designed tobe long-term stable, are undergoing ongoing com-pression ten years after extraction with noreduction in the rate of movement obvious, thenwhat are the implications for the cumulativeimpacts of successive mining ventures and pro-posed multiseam longwall extraction in the areathrough time?
6. Residual subsidence
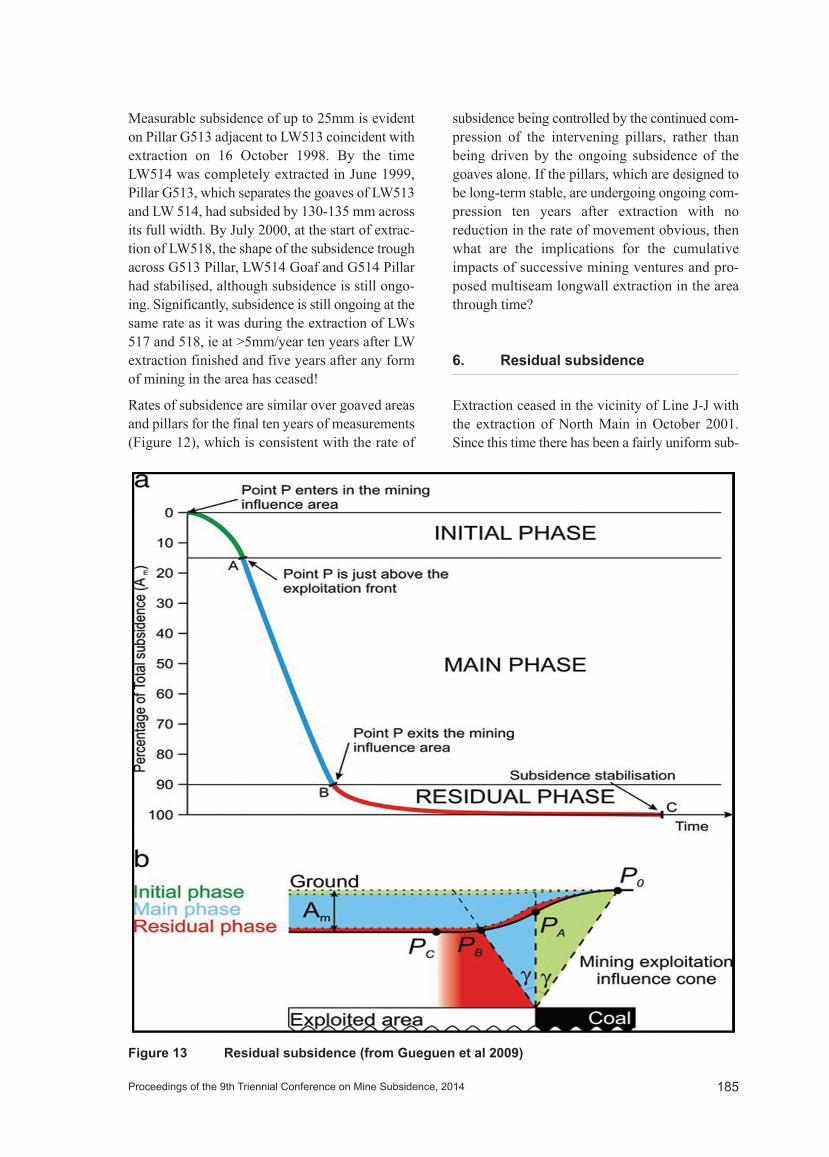
Extraction ceased in the vicinity of Line J-J withthe extraction of North Main in October 2001.Since this time there has been a fairly uniform sub-
Figure 13 Residual subsidence (from Gueguen et al 2009)
Proceedings of the 9th Triennial Conference on Mine Subsidence, 2014 185
sidence of 50mm along the length of Line J-J. Thisequates to a 25% increase in subsidence over thechain pillars of 513 and 514 and a 20% increase insubsidence over the LW514 goaf.
These figures for Residual Subsidence exceedaccepted understanding of on-going subsidence.Al Heib et al 2005 concluded that the duration ofresidual subsidence does not exceed 24 monthsand adds about 5% of the total subsidence.Gueguen et al 2009 presents the residual subsi-dence phase graphically as shown in Figure 13 anddescribes the phase as varying between 5% and10% of the maximum subsidence percentage, witha decreasing residual subsidence rate over time.
7. Hydrological changes in connectivity
A borehole was installed over LW514 goaf tomeasure the changes in the water table during andfollowing extraction of LW514. The primaryobjective of this open hole was to determine ifextraction of the longwall impacted the water tablein the Hawkesbury Sandstone. The boreholeyielded data from November 1998 just prior to theonset of extraction in LW 514 through until 2009at which point it became blocked and unusable.
Up until 2005 the density of available data is low,
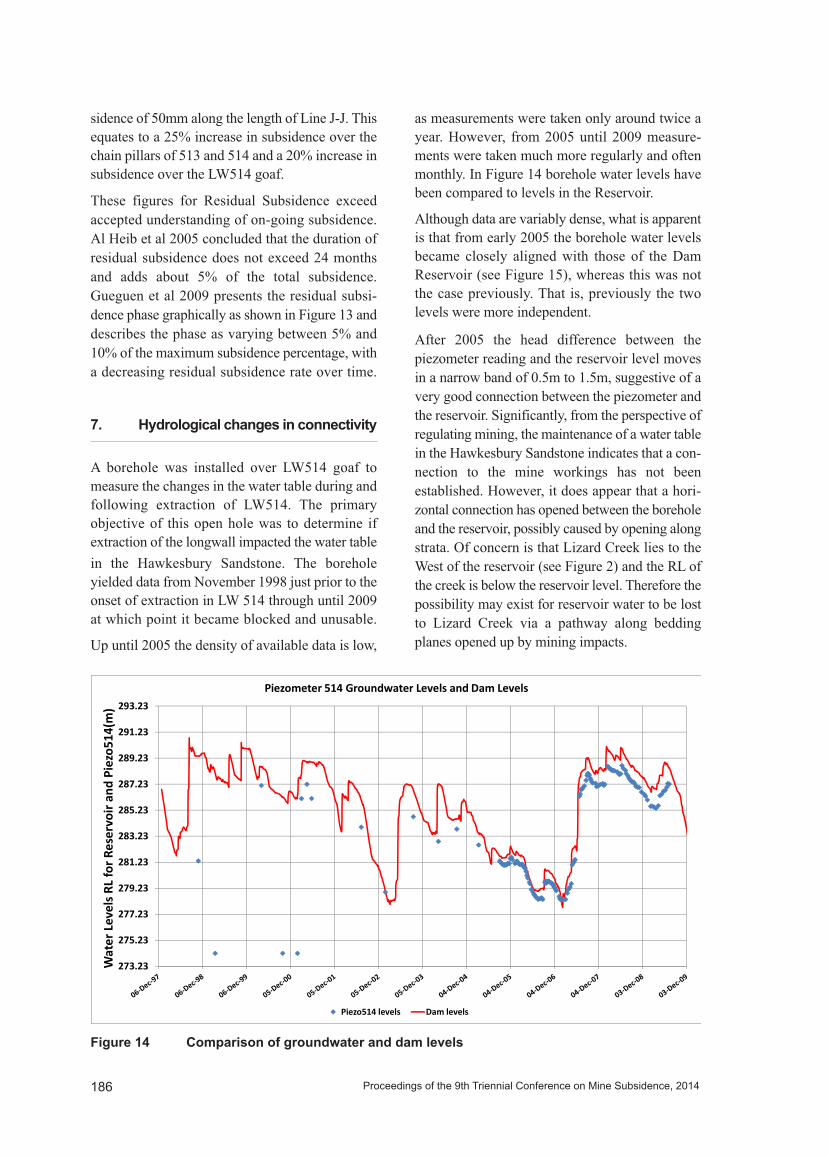
as measurements were taken only around twice ayear. However, from 2005 until 2009 measure-ments were taken much more regularly and oftenmonthly. In Figure 14 borehole water levels havebeen compared to levels in the Reservoir.
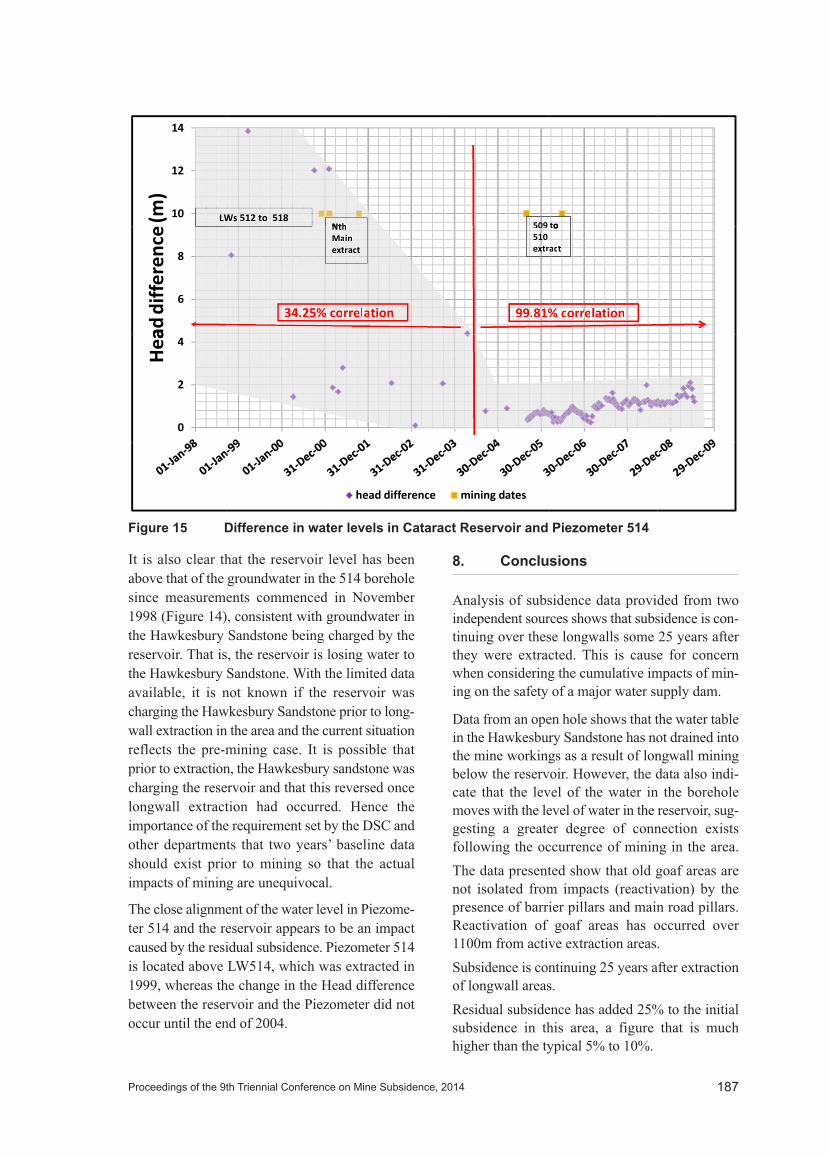
Although data are variably dense, what is apparentis that from early 2005 the borehole water levelsbecame closely aligned with those of the DamReservoir (see Figure 15), whereas this was notthe case previously. That is, previously the twolevels were more independent.
After 2005 the head difference between thepiezometer reading and the reservoir level movesin a narrow band of 0.5m to 1.5m, suggestive of avery good connection between the piezometer andthe reservoir. Significantly, from the perspective ofregulating mining, the maintenance of a water tablein the Hawkesbury Sandstone indicates that a con-nection to the mine workings has not beenestablished. However, it does appear that a hori-zontal connection has opened between the boreholeand the reservoir, possibly caused by opening alongstrata. Of concern is that Lizard Creek lies to theWest of the reservoir (see Figure 2) and the RL ofthe creek is below the reservoir level. Therefore thepossibility may exist for reservoir water to be lostto Lizard Creek via a pathway along beddingplanes opened up by mining impacts.
281.23
283.23
285.23
287.23
289.23
291.23
293.23
orRe
servoira
ndPiezo5
14(m
)
Piezometer 514 Groundwater Levels and Dam Levels
273.23
275.23
277.23
279.23
Water
LevelsRL
fo
Piezo514 levels Dam levels
Figure 14 Comparison of groundwater and dam levels
186 Proceedings of the 9th Triennial Conference on Mine Subsidence, 2014
It is also clear that the reservoir level has beenabove that of the groundwater in the 514 boreholesince measurements commenced in November1998 (Figure 14), consistent with groundwater inthe Hawkesbury Sandstone being charged by thereservoir. That is, the reservoir is losing water tothe Hawkesbury Sandstone. With the limited dataavailable, it is not known if the reservoir wascharging the Hawkesbury Sandstone prior to long-wall extraction in the area and the current situationreflects the pre-mining case. It is possible thatprior to extraction, the Hawkesbury sandstone wascharging the reservoir and that this reversed oncelongwall extraction had occurred. Hence theimportance of the requirement set by the DSC andother departments that two years’ baseline datashould exist prior to mining so that the actualimpacts of mining are unequivocal.
The close alignment of the water level in Piezome-ter 514 and the reservoir appears to be an impactcaused by the residual subsidence. Piezometer 514is located above LW514, which was extracted in1999, whereas the change in the Head differencebetween the reservoir and the Piezometer did notoccur until the end of 2004.
8. Conclusions
Analysis of subsidence data provided from twoindependent sources shows that subsidence is con-tinuing over these longwalls some 25 years afterthey were extracted. This is cause for concernwhen considering the cumulative impacts of min-ing on the safety of a major water supply dam.
Data from an open hole shows that the water tablein the Hawkesbury Sandstone has not drained intothe mine workings as a result of longwall miningbelow the reservoir. However, the data also indi-cate that the level of the water in the boreholemoves with the level of water in the reservoir, sug-gesting a greater degree of connection existsfollowing the occurrence of mining in the area. The data presented show that old goaf areas arenot isolated from impacts (reactivation) by thepresence of barrier pillars and main road pillars.Reactivation of goaf areas has occurred over1100m from active extraction areas. Subsidence is continuing 25 years after extractionof longwall areas. Residual subsidence has added 25% to the initialsubsidence in this area, a figure that is muchhigher than the typical 5% to 10%.
14
12
10
)m( LW
1 1 5181 t512 toWsWN
h h NtN
509 0 0 509
tot
8
6
ceen
erffidda
25%%
eMM
c
N
c25%25%434.34.
tt
a
ttr careextn in iiMaMMa
n
h h NtN
nnoa oiittaaleleerrrrro co c c
xx aarrextext1 1 510 510 0 0
81%
509
81%99.999.
ta
r
tccaa
n
tot
onooitittar alleerrroroo c c c%%%
4
2
0
aH
e
ecnerefif dadeh
seta dgininm
Figure 15 Difference in water levels in Cataract Reservoir and Piezometer 514
Proceedings of the 9th Triennial Conference on Mine Subsidence, 2014 187
9. References
Al Heib M et al 2005 ‘Residual subsidence analy-sis after the end of coalmine work example fromLorraine Colliery, France’ in Proceedings of Post-Mining 2005 November 16-17, Nancy, France
Gueguen Y et al 2009 ‘Monitoring residual miningsubsidence of Nord/Pas-de-Calais coal basin fromdifferential and Persistent Scatterer Interferometry(Northern France)’, Journal of Applied Geo-physics 69 (2009) pp24-34
Martin, D 1998 ‘Cataract Catchment Area Sur-veys, AWT Survey’ (unpublished report forSydney Water) March, 1998
Pells P & Pells S 2011 ‘Review of subsidence andrelated facets of the NRE No 1 Colliery – Under-ground Expansion Project Draft EnvironmentalAssessment’ in Environmental Assessment ofNRE No 1 Colliery Project Application (09_0013)Appendix N
Preston A R 1992 ‘Cataract Dam Tectonic SurveyMovements of Stations KO3 and Y PossibleExplanation of Behaviour’ Unpublished WaterBoard report 9206255
Reid P 1998 ‘Horizontal Movements aroundCataract Dam, Southern Coalfield’ in Proceedingsof the 4th Triennial Conference of the Mine Sub-sidence Technological Society, 11-13 July 1998,Newcastle, pp 157-170
Reid P 2000 ‘Far-field Effects of Mining atCataract Dam – A Work in Progress’ Unpublishedpresentation to the Mine Subsidence Technologi-cal Society on 31 October 2000
Whittaker & Reddish 1989 ‘Subsidence, Occur-rence, Prediction and Control’ Elsevier
188 Proceedings of the 9th Triennial Conference on Mine Subsidence, 2014
![A Primer of Higher Space [the Fourth Dimension]](https://static.fdokumen.com/doc/165x107/6313667daca2b42b580d2a1e/a-primer-of-higher-space-the-fourth-dimension.jpg)