DInSAR FOR VOLUME CHANGE ESTIMATION oF SUBSIDENCE AT BANDUNG BASIN
10
ISSN 02T6 - I5I7 JURNAL GEOGRAFI Volume2No.2lJuli2009 DInSAR FOR VOLUME CHANGE ESTIMATION oF SUBSIDENCE AT BANDUNG BASIN Estimasi Perubahan Volume dengan Metode DInSAR untuk Kajian Penurunan Taneh di Cekungan Bandung Josaphat Tetuko sri Sumantyo, Masanobu Shimada, piene-phillippe and Hasanud din Zainal Abidin POLA WITAYAH BAHAYA LIKUIFAKSI DI PROVINSI D.I. YOGYAKAR'Th (Studi kasus : Gempabumi yogyakarta2T Mei 2006) spatial Pattern of Liquefaction Hazard in yogyakarta province (A case study of earthquake in yogyakarta May 27, 2006) R. Adawiyah, Supriatna dan Ratna Saraswati A GIS-SITE SUITABILITY MODELING FOR ALLOCATION FOREST HARVEST, ZONES IN PENINSULAR MALAYSIA Pemodelan Kesesuaian Lokasi Berbasiskan SIG untuk Alokasi Zona Pemanenan Hutan di Semenanjung Malaysia Mohd Hasmadi Ismail and Farah Dayana Sulaiman PERILAKU TANGGAP DIRI MASYAR,AKAT DALAM MENGHADAPI BENCANABANJIR DI KOTA SEMARANG Performance self Perceptive of Flood Disaster in semarang Municipalie Maman Rachman, Joko Widodo dan laturahono B.S IDENTIFIKASI PULAU DI KEPULAUAN TOGEAN PROVINSI SULAWESI TENGAH BERDASARKAN KAIDAH TOPONIMI (Identffication of Island in Archipelago of rogean Central sulawesi province Based on Tbponymy Method) Yulius dan Triyono MONITORING OF JAKARTA URBAN AREA SUBSIDENCE By USING ALOS/PALSAR DINSAR Pemantauan Penurunan Tanah Jakarta menggunakan DINSAR AL)9/?ALSAR Luhur Bayuaji, Josaphat Tetuko Sri Sumantyo and Hiroaki Kuze Diterbitkan oleh: Departemen Geografi Fakultas Matematika dan Ilmu pengetahuanAlam Universitas Indonesia
Transcript of DInSAR FOR VOLUME CHANGE ESTIMATION oF SUBSIDENCE AT BANDUNG BASIN
ISSN 02T6 - I5I7
JURNAL GEOGRAFIVolume2No.2lJuli2009
DInSAR FOR VOLUME CHANGE ESTIMATION oF SUBSIDENCEAT BANDUNG BASIN
Estimasi Perubahan Volume dengan Metode DInSAR untukKajian Penurunan Taneh di Cekungan Bandung
Josaphat Tetuko sri Sumantyo, Masanobu Shimada, piene-phillippeand Hasanud din Zainal Abidin
POLA WITAYAH BAHAYA LIKUIFAKSI DI PROVINSI D.I. YOGYAKAR'Th(Studi kasus : Gempabumi yogyakarta2T Mei 2006)
spatial Pattern of Liquefaction Hazard in yogyakarta province(A case study of earthquake in yogyakarta May 27, 2006)
R. Adawiyah, Supriatna dan Ratna Saraswati
A GIS-SITE SUITABILITY MODELING FOR ALLOCATION FORESTHARVEST, ZONES IN PENINSULAR MALAYSIA
Pemodelan Kesesuaian Lokasi Berbasiskan SIG untuk Alokasi Zona Pemanenan Hutan diSemenanjung Malaysia
Mohd Hasmadi Ismail and Farah Dayana Sulaiman
PERILAKU TANGGAP DIRI MASYAR,AKAT DALAM MENGHADAPIBENCANABANJIR DI KOTA SEMARANG
Performance self Perceptive of Flood Disaster in semarang MunicipalieMaman Rachman, Joko Widodo dan laturahono B.S
IDENTIFIKASI PULAU DI KEPULAUAN TOGEAN PROVINSISULAWESI TENGAH BERDASARKAN KAIDAH TOPONIMI
(Identffication of Island in Archipelago of rogean Central sulawesi provinceBased on Tbponymy Method)
Yulius dan Triyono
MONITORING OF JAKARTA URBAN AREA SUBSIDENCEBy USING ALOS/PALSAR DINSAR
Pemantauan Penurunan Tanah Jakarta menggunakan DINSAR AL)9/?ALSARLuhur Bayuaji, Josaphat Tetuko Sri Sumantyo and Hiroaki Kuze
Diterbitkan oleh:Departemen Geografi
Fakultas Matematika dan Ilmu pengetahuanAlam
Universitas Indonesia
Identifikasi Pulau Di Kepulauan Togean Provinsi Sulawesi Tengah Berdasarkan Kaidah Toponimi 51
Jurnal Geografi, Vol. 2 No. 2 / Juli 2009
MONITORING OF JAkARTA URBAN AREA SUBSIDENCE By USING ALOS/PALSAR DINSAR
Luhur Bayuaji, Josaphat Tetuko Sri Sumantyo and Hiroaki kuzeCenter for Environmental Remote Sensing (CEReS), Chiba University, Japan
Abstract
Differential Interferometry Synthetic Aperture Radar (DInSAR) is known as a technique capable to detect land surface displacement. In this research, we employ ALOS/PALSAR data to investigate land subsidence in Jakarta during 2007 and 2008. It is found that four northern areas in the city exhibit clear indications of land subsidence mostly caused by the geological structure and high human activities on those areas. The subsidence estimations during the study time are varying from 11.5 to 26.6 cm. Comparison with ground survey data indicates that the result of DInSAR analysis gives reliable estimation of the subsidence in the urban environment.
Keyword : Land surface displacement, land subsidence
Abstrak
Diferensial interferometri Synthetic Aperture Radar (DInSAR) dikenal sebagai suatu teknik yang mampu mendeteksi pergerakan permukaan tanah. Dalam penelitian ini, kami menggunakan ALOS / data untuk menyelidiki PALSAR subsiden tanah di Jakarta selama 2007 dan 2008. Dalam penelitian ini ditemukan bahwa empat daerah di utara kota itu jelas menunjukkan indikasi pengendapan tanah yang sebagian besar disebabkan oleh struktur geologi dan aktivitas manusia yang tinggi di daerah tersebut. Perkiraan subsiden selama waktu penelitian berbeda-beda 11,5-26,6 cm. Perbandingan dengan data survei lapang menunjukkan bahwa hasil analisis DInSAR memberikan perkiraan subsiden yang dapat diandalkan di lingkungan perkotaan.
Kata kunci : Pergerakan permukaan tanah, subsiden tanah
1. INTRODUCTION
Synthetic Aperture Radar (SAR) is a remote sensing system with capabilities to monitor the Earth environment during day-night, under all-weather conditions. In particular, the Differential Interferometry SAR (DInSAR) technique is able to detect accurately the ground displacement or land deformation in the antenna line-of-sight (LOS) direction using data taken at two separated acquisition times (Chang et al, 2004; Stramondo et al, 2006; Tralli et al, 2005). By comparing to ground-based methods such as leveling and Global Positioning System (GPS) measurements, the DInSAR method can easily be applied in a wide coverage area with high accuracy and low cost (NG et al, 2008; Raucoules et al, 2007).
The area studied in the present work is Jakarta, the capital city of Indonesia. The data from Phased Array L-band SAR (PALSAR)
onboard Advanced Land Observing Satellite (ALOS) is employed to observe the land subsidence during 2007 and 2008, and affected areas are detected with spatial perspective. Since the launch of ALOS in 2006, the PALSAR data have been applied to several subsidence studies (Onuma and Ohkawa 2009; Takeuchi and Yamada 2002; Wang and Allen 2008). The satellite-derived estimation of the subsidence depths in some observation points are compared with the results of our ground survey in 2009, as well as with results of a previous GPS survey (Abidin et al, 2007). The observation points are spotted as high human activity area for residence, trading and industrial complexes.
2. STUDy AREA
Jakarta is located between 106º33’00”-107º00’00” E longitude and 5º48’30”- 6º24’00” S latitude, in the northern part of West
Monitoring of Jakarta Urban Area Subsidence by Using ALOS/PALSAR DInSAR52
Jurnal Geografi, Vol. 2 No. 2 / Juli 2009
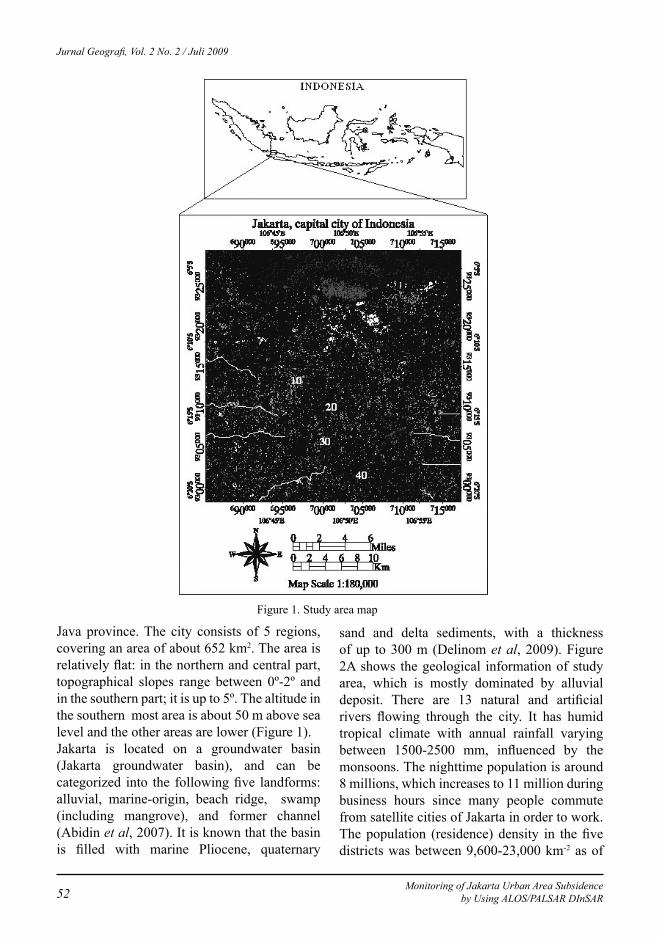
Java province. The city consists of 5 regions, covering an area of about 652 km2. The area is relatively flat: in the northern and central part, topographical slopes range between 0º-2º and in the southern part; it is up to 5º. The altitude in the southern most area is about 50 m above sea level and the other areas are lower (Figure 1).Jakarta is located on a groundwater basin (Jakarta groundwater basin), and can be categorized into the following five landforms: alluvial, marine-origin, beach ridge, swamp (including mangrove), and former channel (Abidin et al, 2007). It is known that the basin is filled with marine Pliocene, quaternary
sand and delta sediments, with a thickness of up to 300 m (Delinom et al, 2009). Figure 2A shows the geological information of study area, which is mostly dominated by alluvial deposit. There are 13 natural and artificial rivers flowing through the city. It has humid tropical climate with annual rainfall varying between 1500-2500 mm, influenced by the monsoons. The nighttime population is around 8 millions, which increases to 11 million during business hours since many people commute from satellite cities of Jakarta in order to work. The population (residence) density in the five districts was between 9,600-23,000 km-2 as of
Figure 1. Study area map
Monitoring of Jakarta Urban Area Subsidence by Using ALOS/PALSAR DInSAR 53
Jurnal Geografi, Vol. 2 No. 2 / Juli 2009
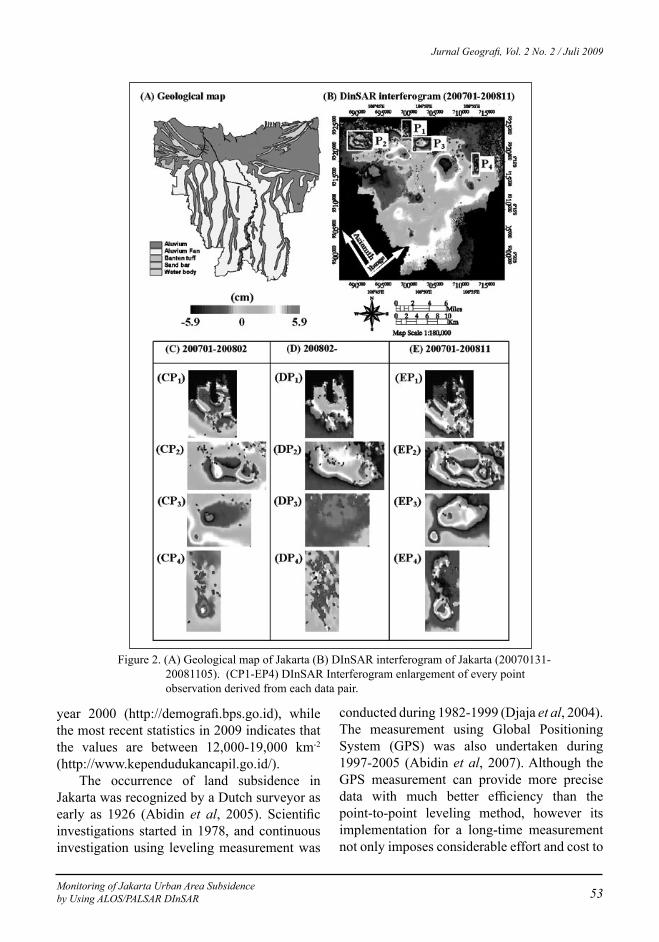
Figure 2. (A) Geological map of Jakarta (B) DInSAR interferogram of Jakarta (20070131- 20081105). (CP1-EP4) DInSAR Interferogram enlargement of every point observation derived from each data pair.
year 2000 (http://demografi.bps.go.id), while the most recent statistics in 2009 indicates that the values are between 12,000-19,000 km-2
(http://www.kependudukancapil.go.id/).The occurrence of land subsidence in
Jakarta was recognized by a Dutch surveyor as early as 1926 (Abidin et al, 2005). Scientific investigations started in 1978, and continuous investigation using leveling measurement was
conducted during 1982-1999 (Djaja et al, 2004). The measurement using Global Positioning System (GPS) was also undertaken during 1997-2005 (Abidin et al, 2007). Although the GPS measurement can provide more precise data with much better efficiency than the point-to-point leveling method, however its implementation for a long-time measurement not only imposes considerable effort and cost to

Monitoring of Jakarta Urban Area Subsidence by Using ALOS/PALSAR DInSAR54
Jurnal Geografi, Vol. 2 No. 2 / Juli 2009
map the subsidence for a large area but also only able to acquire vertically shifting on every GPS station. The present study will use the ALOS/PALSAR data to detect land subsidence in both directions (horizontally and vertically) from 2007 to 2008. The methodology of DInSAR technique will be used for detecting and monitoring land subsidence in this research.
3. METHODOLOGy DInSAR
Interferometry SAR (InSAR) and DInSAR techniques are based on the combination of two radar images taken at different acquisition times. The phase data of SAR images are analyzed to derive the local topography (InSAR) or detect and quantify the ground displacement that has occurred between the two acquisitions (DInSAR) (Raucoules et al., 2007). The phase difference between an InSAR data pair ( ) can be expressed as (Chatterjee et al., 2006) (1)
Here, disp, atm, noise, topo, and flat refer to the phase difference originating from ground displacement along the slant-range, atmospheric noise, noise from radar instrument and temporal deceleration, noise due to topographic height, and noise due to the assumption of ideally flat earth terrain, respectively. In the process of extracting the ground displacement, the topographic ( topo) and flat earth phase difference ( flat) can be removed using digital elevation model (DEM) data and precise satellite orbital data, respectively. The result of this process is generally called DInSAR.
In this study, JAXA SIGMA-SAR software developed by Shimada (1999) is used to obtain
the interferogram. In order to remove the noise from radar instrument and temporal deceleration ( noiseφ ), the Goldstein-Werner filtering process is applied to the noisy interferogram (Goldstein and Werner, 1998). The resulting DInSAR interferogram is in the form of phase cycle (phase difference), each cycle being correlated to ground displacement along the slant-range direction. In the case of ALOS/PALSAR, the wavelength is 23.6 cm (L-band) and hence, each cycle in interferogram represents ground displacement of 11.8 cm.
4. DATA AND PROCESSING SOFTWARE
A series of SAR interferograms are computed from ALOS/PALSAR data taken on three different acquisitions days (31 January 2007, 3 February 2008 and 11 November 2008), with the same observation parameters: reference system for planning (RSP) number 437, path number 7050 and nadir angle 34.3º. Among the three pairs generated from these data, the last pair is the most accumulative one corresponding to the longest interval time of about 92 weeks. Detailed parameters of each pair (interval time and perpendicular baseline) are summarized in Table 1. For DInSAR processing, we employed the JAXA SIGMA-SAR software (Shimada, 1999). The DInSAR result can be derived by using precise satellite orbital information, with the help of Digital Elevation Model (DEM) of Jakarta area obtained from the Shuttle Radar Topography Mission (SRTM). In addition to the DInSAR study, we conducted a ground survey of the study area in 28 January to 3 February 2009.
disp atm noise topo flatφ φ φ φ φ φ∆ = + + + +
Table 1. ALOS/PALSAR pair and baseline information
Pair Data 1 Data 2 I n t e r v a l
(week)Perpendicular baseline (m)Date Mode Date Mode
1 20070131 FBS 20080203 FBS 52 2202 20080203 FBS 20081105 FBS 39 8403 20070131 FBS 20081105 FBS 92 618

Monitoring of Jakarta Urban Area Subsidence by Using ALOS/PALSAR DInSAR 55
Jurnal Geografi, Vol. 2 No. 2 / Juli 2009
5. RESULTS AND DISCUSSION
The DInSAR results for the three pairs are shown in Figure 2B-E. Figure 2B shows the interferogram of Jakarta during the whole time span of this study, from January 2007 to November 2008. Several subsidence areas can easily be recognized in the northern part of the city, where geological formations are mostly alluvium and sand bar. In particular, significant phase variations are seen for four areas, for which subsidence features are detected in every pair of the DInSAR result, as well as in the GPS measurement conducted by Abidin et al (2007).
Different land type/usage can be associated with each of the four points. Point 1 (P1), Mutiara, is a luxury residence area, tourism resort and seaport built on a beach reclamation area. Point 2 (P2), Cengkareng, is a settlement area which covers an area of more than 23 km2 and the international airport was built nearby. Point 3 (P3), Glodok, is the biggest trading region in Jakarta, covering a wide area of more than 7 km2, with a large number of people commuting to this area everyday. Point 4 (P4), Cakung, is an industrial area in the northeast part of Jakarta. Figure 2C-E shows the enlarged differential SAR interferogram from every data pair (three
Figure 3. (A) Subsidence contours derived from the DInSAR interfero gram overlaid on optic sensor image (TERRA/ASTER) (B-E) Enlarged contour of P1-P4, respectively. Subsidence rate 5 cm/year has been detected in every point and in Point 2 subsidence rate 15 cm/ year has been detected.
Monitoring of Jakarta Urban Area Subsidence by Using ALOS/PALSAR DInSAR56
Jurnal Geografi, Vol. 2 No. 2 / Juli 2009
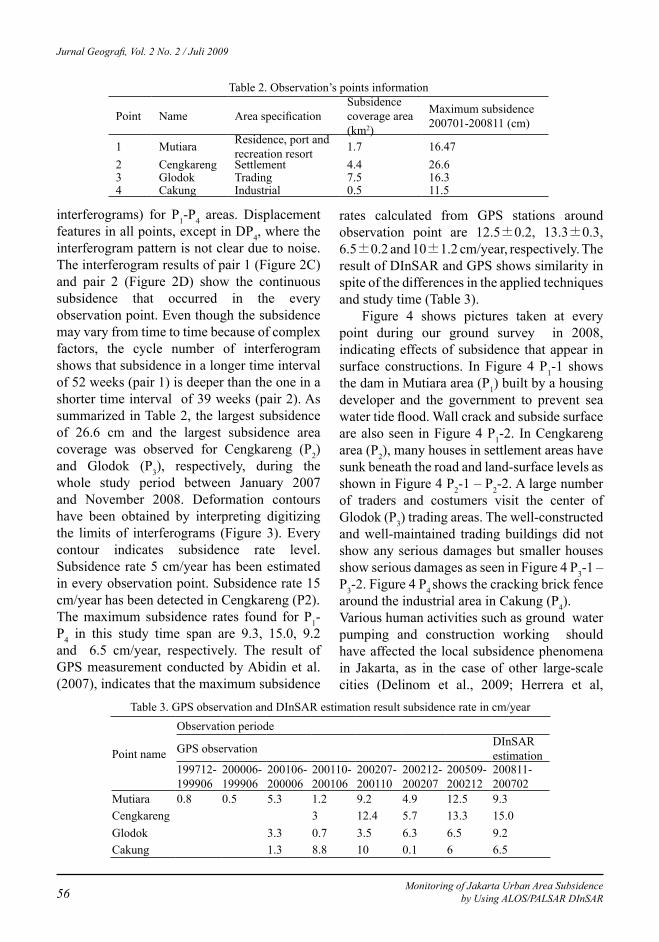
interferograms) for P1-P4 areas. Displacement features in all points, except in DP4, where the interferogram pattern is not clear due to noise. The interferogram results of pair 1 (Figure 2C) and pair 2 (Figure 2D) show the continuous subsidence that occurred in the every observation point. Even though the subsidence may vary from time to time because of complex factors, the cycle number of interferogram shows that subsidence in a longer time interval of 52 weeks (pair 1) is deeper than the one in a shorter time interval of 39 weeks (pair 2). As summarized in Table 2, the largest subsidence of 26.6 cm and the largest subsidence area coverage was observed for Cengkareng (P2) and Glodok (P3), respectively, during the whole study period between January 2007 and November 2008. Deformation contours have been obtained by interpreting digitizing the limits of interferograms (Figure 3). Every contour indicates subsidence rate level. Subsidence rate 5 cm/year has been estimated in every observation point. Subsidence rate 15 cm/year has been detected in Cengkareng (P2).The maximum subsidence rates found for P1-P4 in this study time span are 9.3, 15.0, 9.2 and 6.5 cm/year, respectively. The result of GPS measurement conducted by Abidin et al. (2007), indicates that the maximum subsidence
rates calculated from GPS stations around observation point are 12.5±0.2, 13.3±0.3, 6.5±0.2 and 10±1.2 cm/year, respectively. The result of DInSAR and GPS shows similarity in spite of the differences in the applied techniques and study time (Table 3).
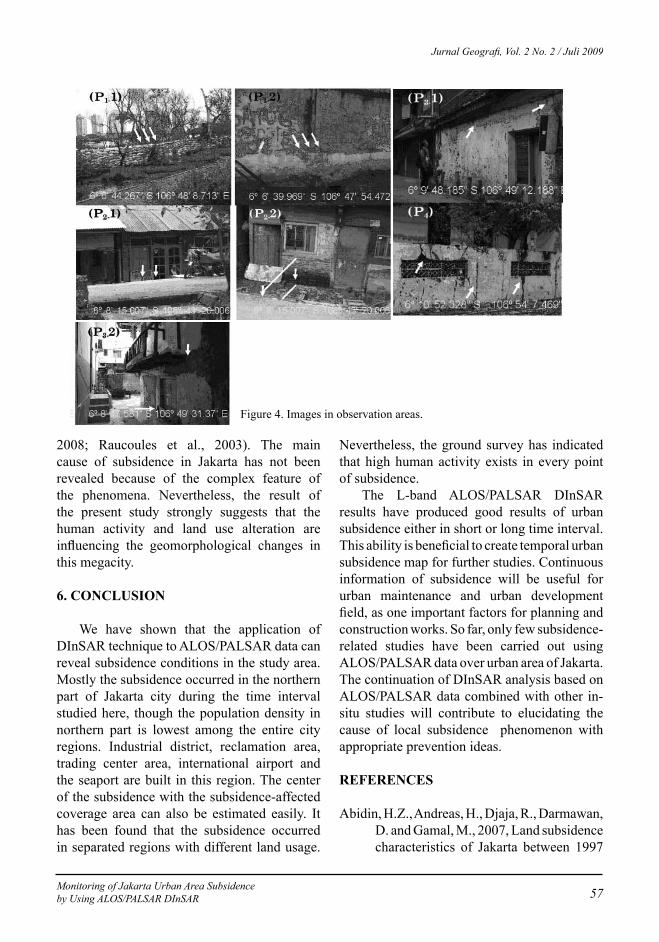
Figure 4 shows pictures taken at every point during our ground survey in 2008, indicating effects of subsidence that appear in surface constructions. In Figure 4 P1-1 shows the dam in Mutiara area (P1) built by a housing developer and the government to prevent sea water tide flood. Wall crack and subside surface are also seen in Figure 4 P1-2. In Cengkareng area (P2), many houses in settlement areas have sunk beneath the road and land-surface levels as shown in Figure 4 P2-1 – P2-2. A large number of traders and costumers visit the center of Glodok (P3) trading areas. The well-constructed and well-maintained trading buildings did not show any serious damages but smaller houses show serious damages as seen in Figure 4 P3-1 – P3-2. Figure 4 P4 shows the cracking brick fence around the industrial area in Cakung (P4).Various human activities such as ground water pumping and construction working should have affected the local subsidence phenomena in Jakarta, as in the case of other large-scale cities (Delinom et al., 2009; Herrera et al,
Table 2. Observation’s points information
Point Name Area specificationSubsidencecoverage area (km2)
Maximum subsidence 200701-200811 (cm)
1 Mutiara Residence, port and recreation resort 1.7 16.47
2 Cengkareng Settlement 4.4 26.63 Glodok Trading 7.5 16.34 Cakung Industrial 0.5 11.5
Table 3. GPS observation and DInSAR estimation result subsidence rate in cm/year
Point name
Observation periode
GPS observation DInSAR estimation
199712-199906
200006-199906
200106-200006
200110-200106
200207-200110
200212-200207
200509-200212
200811-200702
Mutiara 0.8 0.5 5.3 1.2 9.2 4.9 12.5 9.3Cengkareng 3 12.4 5.7 13.3 15.0Glodok 3.3 0.7 3.5 6.3 6.5 9.2Cakung 1.3 8.8 10 0.1 6 6.5
Monitoring of Jakarta Urban Area Subsidence by Using ALOS/PALSAR DInSAR 57
Jurnal Geografi, Vol. 2 No. 2 / Juli 2009
2008; Raucoules et al., 2003). The main cause of subsidence in Jakarta has not been revealed because of the complex feature of the phenomena. Nevertheless, the result of the present study strongly suggests that the human activity and land use alteration are influencing the geomorphological changes in this megacity.
6. CONCLUSION
We have shown that the application of DInSAR technique to ALOS/PALSAR data can reveal subsidence conditions in the study area. Mostly the subsidence occurred in the northern part of Jakarta city during the time interval studied here, though the population density in northern part is lowest among the entire city regions. Industrial district, reclamation area, trading center area, international airport and the seaport are built in this region. The center of the subsidence with the subsidence-affected coverage area can also be estimated easily. It has been found that the subsidence occurred in separated regions with different land usage.
Nevertheless, the ground survey has indicated that high human activity exists in every point of subsidence.
The L-band ALOS/PALSAR DInSAR results have produced good results of urban subsidence either in short or long time interval. This ability is beneficial to create temporal urban subsidence map for further studies. Continuous information of subsidence will be useful for urban maintenance and urban development field, as one important factors for planning and construction works. So far, only few subsidence-related studies have been carried out using ALOS/PALSAR data over urban area of Jakarta. The continuation of DInSAR analysis based on ALOS/PALSAR data combined with other in-situ studies will contribute to elucidating the cause of local subsidence phenomenon with appropriate prevention ideas.
REFERENCES
Abidin, H.Z., Andreas, H., Djaja, R., Darmawan, D. and Gamal, M., 2007, Land subsidence characteristics of Jakarta between 1997
Figure 4. Images in observation areas.
J., Arnaud, A., Blanco, P., Duque, S., Mallorqui, J.J., De la Vega-Panizo, R. and Monserrat, O., 2008, Validation and comparison of Advanced Differential Interferometry Techniques: Murcia metropolitan area case study. ISPRS Journal of Photogrammetry and Remote Sensing, In Press, Corrected Proof.
NG, A.H., Chang, H., GE, L., Rizos, C. and Omura, M., 2008, Radar interferometry for ground subsidence monitoring using ALOS PALSAR data. In Proceeding of the XXI Congress of the International Society of Photogrammetry & Remote Sensing, 3-11 July, Beijing, P.R. China, pp.
Onuma, T. and Ohkawa, S., 2009, Detection of surface deformation related with CO2 injection by DInSAR at In Salah, Algeria. Energy Procedia, 1:2177-2184.
Raucoules, D., Colesanti, C. and Carnec, C., 2007, Use of SAR interferometry for detecting and assessing ground subsidence. Comptes Rendus Geosciences, 339:289-302.
Raucoules, D., Mouelic, S.l., Carnec, C., Maisons, C. and King, C., 2003, Urban subsidence in the city of Prato (Italy) monitored by satellite radar interferometry. International Journal of Remote Sensing, 24:891 - 897.
Shimada, M., 1999, Verification processor for SAR calibration and interferometry. Advances in Space Research, 23:10.
Stramondo, S., Bignami, C., Chini, M., Pierdicca, N. and Tertulliani, A., 2006, Satellite radar and optical remote sensing for earthquake damage detection: results from different case studies. International Journal of Remote Sensing, 27:4433 - 4447.
Takeuchi, S. and Yamada, S., 2002. Comparison of InSAR capability for land subsidence detection between C-band and L-band SAR. in Proceeding of IEEE International Geoscience and Remote Sensing
and 2005, as estimated using GPS surveys. GPS Solutions, 12:23-32.
Abidin, H.Z., Andreas, H., Gamal, M., Djaja, R., Subarya, C., Hirose, K., Maruyama, Y., Murdohardono, D. and Rajiyowiryono, H., 2005, Monitoring Land Subsidence of Jakarta (Indonesia) Using Leveling, GPS Survey and InSAR Techniques. International Association of Geodesy Symposia, 128:561-566.
Chang, Z., Zhang, J., Guo, Q. and Gong, L., 2004. Study on land subsidence evolvement tendency by means of "integrated DInSAR". in Proceedings of IEEE International Geoscience and Remote Sensing Symposium (IGARSS '04), pp. 59-61, IEEE Inc., Anchorage, Alaska.
Chatterjee, R.S., Fruneau, B., Rudant, J.P., Roy, P.S., Frison, P.-L., Lakhera, R.C., Dadhwal, V.K. and Saha, R., 2006, Subsidence of Kolkata (Calcutta) City, India during the 1990s as observed from space by Differential Synthetic Aperture Radar Interferometry (D-InSAR) technique. Remote Sensing of Environment, 102:176-185.
Delinom, R.M., Assegaf, A., Abidin, H.Z., Taniguchi, M., Suherman, D., Lubis, R.F. and Yulianto, E., 2009, The contribution of human activities to subsurface environment degradation in Greater Jakarta Area, Indonesia. Science of The Total Environment, 407:3129-3141.
Djaja, R., Rais, J., Abidin, H.Z. and Kuntjoro, W., 2004. The Land Subsidence of Jakarta Metropolitan Area. in Proceedings of 3rd FIG Regional Conference for Asia and the Pacific, pp. 14, Jakarta, Indonesia.
Goldstein, R.M. and Werner, C.L., 1998, Radar interferogram filtering for geophysical applications. Geophysical research letters, 25:4035-4038.
Herrera, G., Tomás, R., Lopez-Sanchez, J.M., Delgado, J., Vicente, F., Mulas, J., Cooksley, G., Sanchez, M., Duro,
Monitoring of Jakarta Urban Area Subsidence by Using ALOS/PALSAR DInSAR58
Jurnal Geografi, Vol. 2 No. 2 / Juli 2009
Monitoring of Jakarta Urban Area Subsidence by Using ALOS/PALSAR DInSAR 59
Jurnal Geografi, Vol. 2 No. 2 / Juli 2009
Symposium 2002 (IGARSS '02), pp. 2379-2381.
Tralli, D.M., Blom, R.G., Zlotnicki, V., Donnellan, A. and Evans, D.L., 2005, Satellite remote sensing of earthquake, volcano, flood, landslide and coastal inundation hazards. ISPRS Journal of Photogrammetry and Remote Sensing, 59:185-198.
Wang, Y. and Allen, T.R., 2008, Estuarine shoreline change detection using Japanese ALOS PALSAR HH and JERS-1 L-HH SAR data in the Albemarle-Pamlico Sounds, North Carolina, USA. International Journal of Remote Sensing, 29:4429 - 4442.