Izmit earthquake postseismic deformation and dynamics of the North Anatolian Fault Zone
21
Izmit earthquake postseismic deformation and dynamics of the North Anatolian Fault Zone E. H. Hearn, 1 S. McClusky, 2 S. Ergintav, 3 and R. E. Reilinger 2 Received 21 August 2008; revised 13 March 2009; accepted 4 May 2009; published 25 August 2009. [1] We have modeled postseismic deformation from 1999 to 2003 in the region surrounding the 1999 Izmit and Du ¨zce earthquake ruptures, using a three-dimensional viscoelastic finite element method. Our models confirm earlier findings that surface deformation within the first few months of the Izmit earthquake is principally due to stable frictional afterslip on and below the Izmit earthquake rupture. A second deformation process is required, however, to fit the surface deformation after several months. Viscoelastic relaxation of lower crust and/or upper mantle with a viscosity of the order of 2 to 5 10 19 Pa s improves the models’ fit to later GPS site velocities. However, for a linear viscous rheology, this range of values is inconsistent with highly localized interseismic deformation around the North Anatolian Fault Zone (NAFZ) that was well observed prior to the earthquake sequence. The simplest solution to this problem is to assume that the effective viscosity of the relaxing material increases with time after large earthquakes, that is, that it has a power law or Burger’s body (transient) rheology. A Burger’s body rheology with two characteristic viscosities (2 to 5 10 19 Pa s and at least 2 10 20 Pa s) in the mantle is consistent with deformation around the NAFZ throughout the earthquake cycle. Citation: Hearn, E. H., S. McClusky, S. Ergintav, and R. E. Reilinger (2009), Izmit earthquake postseismic deformation and dynamics of the North Anatolian Fault Zone, J. Geophys. Res., 114, B08405, doi:10.1029/2008JB006026. 1. Introduction [2] Deformation around the North Anatolian Fault Zone (NAFZ) has been monitored with high-precision space geodetic techniques since 1988 [e.g., Reilinger et al., 2006; Ergintav et al., 2002; Wright et al., 2001; McClusky et al., 2000; Kahle et al., 1998; Straub et al., 1997]. Data from these studies illustrate how the Earth’s surface deforms around a plate boundary fault, throughout the earthquake cycle. Pre- viously, we have modeled interseismic deformation around the 1940s rupture segment of the NAFZ, as well as coseismic and early postseismic deformation from the 1999 Izmit earth- quake [Hearn et al., 2002a, 2002b; Reilinger et al., 2000; Hearn and Bu ¨rgmann, 2005]. We have concluded from these studies that the upper mantle viscosity must exceed 5 10 20 Pa s (assuming linear viscoelasticity), that the NAFZ has an aseismic extension penetrating most or all of the crust, and that the aseismic creep along this shear zone (in the upper to middle crust) has a weakly velocity-strengthening rheology. [3] Here, we model postseismic deformation following the Izmit-Du ¨zce earthquake sequence over a longer time period (from 1999 to 2003). We develop plate boundary models incorporating viscous fault zone creep, stable frictional afterslip, viscoelastic relaxation of nonlinearly or linearly viscoelastic lower crust, and combinations of afterslip and viscoelastic relaxation. We confirm that the earliest Izmit postseismic deformation is consistent with velocity- strengthening frictional afterslip, though viscous shear zone creep is probably occurring at depth. After several months, none of the afterslip models produces high enough slip rates to explain the GPS postseismic velocities. To address this, we explore models with viscoelastic relaxation of the lower crust and upper mantle, in addition to afterslip, and we investigate circumstances under which such models can be consistent with the localized interseismic deformation around the NAFZ. The GPS data analysis and velocity fields from the first 6 years after Izmit postseismic deformation, and kinematic afterslip inversions based on these data, are described by the companion paper by Ergintav et al. [2009]. 2. Methods [4] We use GAEA [Saucier and Humphreys, 1993], a 3-D viscoelastic finite element (FE) code, to model time-dependent postseismic deformation. The FE code solves for nodal displacements resulting from elastic deformation of the modeled volume in response to applied displacements or velocities. For the models presented here, kinematically imposed coseismic displacements across the Izmit and Du ¨zce earthquake ruptures induce elastic stresses, which drive subsequent, distributed viscoelastic creep or fault zone slip. JOURNAL OF GEOPHYSICAL RESEARCH, VOL. 114, B08405, doi:10.1029/2008JB006026, 2009 Click Here for Full Articl e 1 Department of Earth and Ocean Sciences, University of British Columbia, Vancouver, British Columbia, Canada. 2 Department of Earth, Atmospheric, and Planetary Sciences, Massa- chusetts Institute of Technology, Cambridge, Massachusetts, USA. 3 TUBITAK, Marmara Research Center, Earth and Marine Sciences Institute, Gebze, Turkey. Copyright 2009 by the American Geophysical Union. 0148-0227/09/2008JB006026$09.00 B08405 1 of 21
Transcript of Izmit earthquake postseismic deformation and dynamics of the North Anatolian Fault Zone

Izmit earthquake postseismic deformation and
dynamics of the North Anatolian Fault Zone
E. H. Hearn,1 S. McClusky,2 S. Ergintav,3 and R. E. Reilinger 2
Received 21 August 2008; revised 13 March 2009; accepted 4 May 2009; published 25 August 2009.
[1] We have modeled postseismic deformation from 1999 to 2003 in the regionsurrounding the 1999 Izmit and Duzce earthquake ruptures, using a three-dimensionalviscoelastic finite element method. Our models confirm earlier findings that surfacedeformation within the first few months of the Izmit earthquake is principally due to stablefrictional afterslip on and below the Izmit earthquake rupture. A second deformationprocess is required, however, to fit the surface deformation after several months.Viscoelastic relaxation of lower crust and/or upper mantle with a viscosity of the order of2 to 5 � 1019 Pa s improves the models’ fit to later GPS site velocities. However, for alinear viscous rheology, this range of values is inconsistent with highly localizedinterseismic deformation around the North Anatolian Fault Zone (NAFZ) that was wellobserved prior to the earthquake sequence. The simplest solution to this problem is toassume that the effective viscosity of the relaxing material increases with time after largeearthquakes, that is, that it has a power law or Burger’s body (transient) rheology. ABurger’s body rheology with two characteristic viscosities (2 to 5 � 1019 Pa s and at least2 � 1020 Pa s) in the mantle is consistent with deformation around the NAFZ throughoutthe earthquake cycle.
Citation: Hearn, E. H., S. McClusky, S. Ergintav, and R. E. Reilinger (2009), Izmit earthquake postseismic deformation
and dynamics of the North Anatolian Fault Zone, J. Geophys. Res., 114, B08405, doi:10.1029/2008JB006026.
1. Introduction
[2] Deformation around the North Anatolian Fault Zone(NAFZ) has been monitored with high-precision spacegeodetic techniques since 1988 [e.g., Reilinger et al., 2006;Ergintav et al., 2002; Wright et al., 2001; McClusky et al.,2000;Kahle et al., 1998; Straub et al., 1997]. Data from thesestudies illustrate how the Earth’s surface deforms around aplate boundary fault, throughout the earthquake cycle. Pre-viously, we have modeled interseismic deformation aroundthe 1940s rupture segment of the NAFZ, as well as coseismicand early postseismic deformation from the 1999 Izmit earth-quake [Hearn et al., 2002a, 2002b; Reilinger et al., 2000;Hearn and Burgmann, 2005]. We have concluded fromthese studies that the upper mantle viscosity must exceed 5�1020 Pa s (assuming linear viscoelasticity), that the NAFZ hasan aseismic extension penetrating most or all of the crust, andthat the aseismic creep along this shear zone (in the upper tomiddle crust) has a weakly velocity-strengthening rheology.[3] Here, we model postseismic deformation following the
Izmit-Duzce earthquake sequence over a longer time period
(from 1999 to 2003). We develop plate boundary modelsincorporating viscous fault zone creep, stable frictionalafterslip, viscoelastic relaxation of nonlinearly or linearlyviscoelastic lower crust, and combinations of afterslip andviscoelastic relaxation. We confirm that the earliest Izmitpostseismic deformation is consistent with velocity-strengthening frictional afterslip, though viscous shear zonecreep is probably occurring at depth. After several months,none of the afterslip models produces high enough slip ratesto explain the GPS postseismic velocities. To address this,we explore models with viscoelastic relaxation of the lowercrust and upper mantle, in addition to afterslip, and weinvestigate circumstances under which such models can beconsistent with the localized interseismic deformationaround the NAFZ. The GPS data analysis and velocity fieldsfrom the first 6 years after Izmit postseismic deformation,and kinematic afterslip inversions based on these data, aredescribed by the companion paper by Ergintav et al. [2009].
2. Methods
[4] We use GAEA [Saucier and Humphreys, 1993], a 3-Dviscoelastic finite element (FE) code, tomodel time-dependentpostseismic deformation. The FE code solves for nodaldisplacements resulting from elastic deformation of themodeled volume in response to applied displacements orvelocities. For the models presented here, kinematicallyimposed coseismic displacements across the Izmit and Duzceearthquake ruptures induce elastic stresses, which drivesubsequent, distributed viscoelastic creep or fault zone slip.
JOURNAL OF GEOPHYSICAL RESEARCH, VOL. 114, B08405, doi:10.1029/2008JB006026, 2009ClickHere
for
FullArticle
1Department of Earth and Ocean Sciences, University of BritishColumbia, Vancouver, British Columbia, Canada.
2Department of Earth, Atmospheric, and Planetary Sciences, Massa-chusetts Institute of Technology, Cambridge, Massachusetts, USA.
3TUBITAK, Marmara Research Center, Earth and Marine SciencesInstitute, Gebze, Turkey.
Copyright 2009 by the American Geophysical Union.0148-0227/09/2008JB006026$09.00
B08405 1 of 21
To calculate nodal displacements, GAEA uses a Galerkinweighted-residual method, incorporating 20-node block ele-ments with quadratic shape and weighting functions. Thisallows smoothly varying fault geometries and slip distribu-tions, and minimizes discontinuities in stresses betweenmodel elements. Distributed viscoelastic deformation ismodeled by calculating the viscous strain that would occurover one time step (given the element stresses and viscosity),and using this information to update the element force vector.The same approach is employed in other FE codes, such asTECTON [Williams and Richardson, 1991] and PyLITH[Williams et al., 2005]. Postseismic fault zone creep ismodeled by calculating the shear stress along a fault andusing the constitutive relationship to calculate the slip pertime step, and adding this to the slip at each fault node. Faultslip is imposed using the ‘‘split node’’ technique [Melosh andRaefsky, 1981]. Modeled surface displacements from GAEAare comparable to the elastic solutions of Okada [1985] andWang et al. [2006], and the Savage [1990] viscoelasticearthquake cycle solution [Hearn, 2003; Hearn et al.,2005; Hearn and Burgmann, 2005].[5] The finite element mesh covers a 1000 km by 900 km
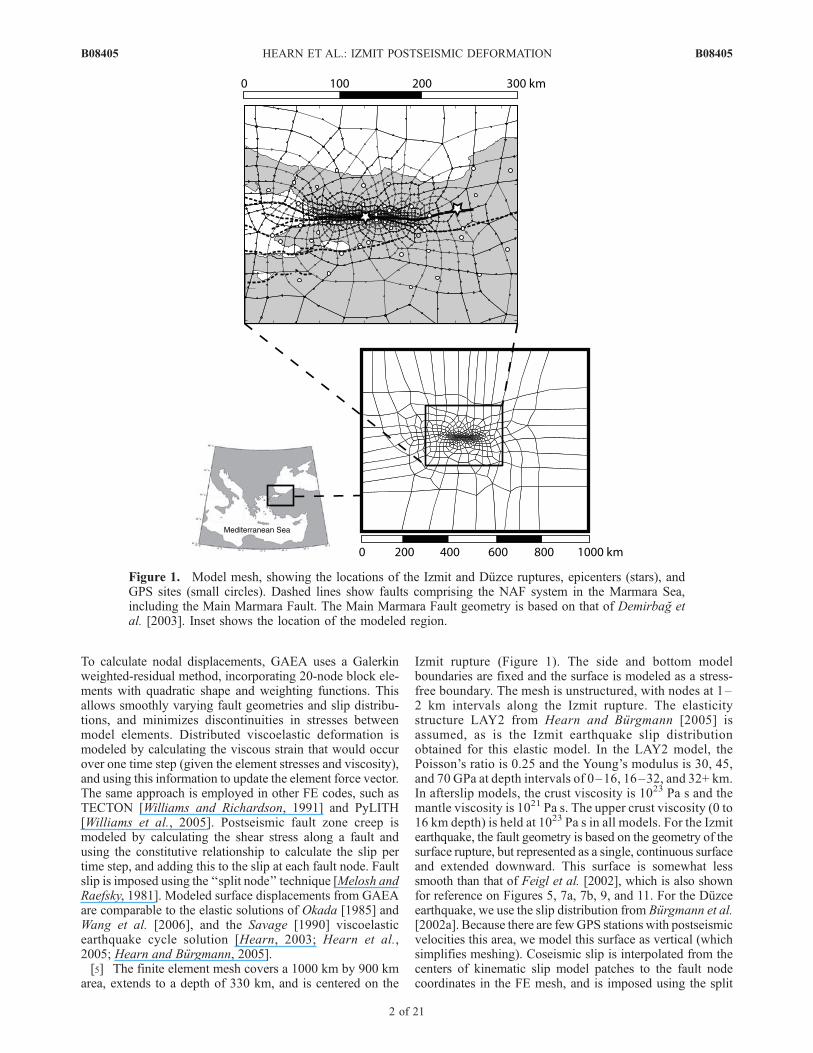
area, extends to a depth of 330 km, and is centered on the
Izmit rupture (Figure 1). The side and bottom modelboundaries are fixed and the surface is modeled as a stress-free boundary. The mesh is unstructured, with nodes at 1–2 km intervals along the Izmit rupture. The elasticitystructure LAY2 from Hearn and Burgmann [2005] isassumed, as is the Izmit earthquake slip distributionobtained for this elastic model. In the LAY2 model, thePoisson’s ratio is 0.25 and the Young’s modulus is 30, 45,and 70 GPa at depth intervals of 0–16, 16–32, and 32+ km.In afterslip models, the crust viscosity is 1023 Pa s and themantle viscosity is 1021 Pa s. The upper crust viscosity (0 to16 km depth) is held at 1023 Pa s in all models. For the Izmitearthquake, the fault geometry is based on the geometry of thesurface rupture, but represented as a single, continuous surfaceand extended downward. This surface is somewhat lesssmooth than that of Feigl et al. [2002], which is also shownfor reference on Figures 5, 7a, 7b, 9, and 11. For the Duzceearthquake, we use the slip distribution from Burgmann et al.[2002a]. Because there are fewGPS stations with postseismicvelocities this area, we model this surface as vertical (whichsimplifies meshing). Coseismic slip is interpolated from thecenters of kinematic slip model patches to the fault nodecoordinates in the FE mesh, and is imposed using the split
Figure 1. Model mesh, showing the locations of the Izmit and Duzce ruptures, epicenters (stars), andGPS sites (small circles). Dashed lines show faults comprising the NAF system in the Marmara Sea,including the Main Marmara Fault. The Main Marmara Fault geometry is based on that of Demirbag etal. [2003]. Inset shows the location of the modeled region.
B08405 HEARN ET AL.: IZMIT POSTSEISMIC DEFORMATION
2 of 21
B08405

node technique [Melosh and Raefsky, 1981]. The Izmitearthquake slip is imposed at t = 0 day and the Duzceearthquake slip at t = 87 days. Viscoelastic structure andfault rheology are varied in the simulations, as described insections 4.1–4.4 and section 5.
3. GPS Velocities and Measures of Model Misfit
[6] We compare our model results with surface velocitiesat 55 GPS sites from the region surrounding the Izmit andDuzce ruptures (small circles on Figure 1). The GPS post-seismic data analysis is described in detail by Ergintav et al.[2009], who provide weekly velocities and errors at allcontinuous GPS sites in their analysis (which covers abroader region and a longer time span than we discuss here)in their auxiliary material. Ergintav et al. fit position mea-surements at survey GPS sites to a three-term logarithmicfunction, and they provide coefficients to this function whichenable us to compute velocities and errors at any time[Ergintav et al., 2009, auxiliary material Data Set S1].Secular GPS site velocities, computed with a block model[Reilinger et al., 2006], were subtracted from their GPSvelocities to isolate the postseismic contribution.[7] To measure the performance of our finite element
models, we calculate the weighted-residual sum of squares(WRSS), which is a measure of model misfit to the GPSvelocity data. A weighted residual is found by subtractingthe finite element modeled velocity from the GPS sitevelocity, and dividing this residual by the one-sigma GPSvelocity error. This quantity is squared and summed for bothhorizontal velocity components (east and north), for eachGPS site, for 900 daily intervals (up to 900 days after theIzmit earthquake). Hence, this is a measure of how wellthe model fits the GPS velocity data throughout the entire900-day time interval, not just a measure of misfit to asnapshot of the displacement over 900 days:
WRSS ¼X900t¼1
X55s¼1
X2d¼1
Dt;s;d
st;s;d
� �2
ð1Þ
We distinguish WRSS from WRSSt, which is the measureof model misfit to GPS velocity at an individual time epoch:
WRSSt ¼X55s¼1
X2d¼1
Dt;s;d
st;s;d
� �2
ð2Þ
Dt,s,d is the residual (GPS minus modeled) velocity, andst,s,d is the GPS velocity error (that is, the 68% confidenceinterval). Subscripts t, s, and d refer to time, GPS site, anddegree of freedom (east or north). In some cases, GPS siteswere occupied for just part of the 900-day interval. TheWRSS and WRSSt include weighted-residual contributionsonly from days within the time span covered by GPS obser-vations. Vertical GPS site position data are provided byErgintav et al. [2009] in their auxiliary material Data Set S2,but these data are not converted to velocities. Using verticalvelocities from a previous version of the Ergintav et al.analysis, we found that the vertical component contributedless than 10% to the WRSS and WRSSt values, and thiscontribution was insensitive to changes in model parameters.In the WRSS and WRSSt values presented here, only thehorizontal velocity components are included.
4. Models4.1. Velocity-Strengthening Frictional Afterslip
[8] Velocity-strengthening frictional afterslip (FAS)[Marone et al., 1991] is implemented using the ‘‘hot friction’’parameterization of Linker and Rice [1997], described alsoby Hearn et al. [2002a], Hearn [2003], and Johnson et al.[2006]. The equation for afterslip velocity is
V ¼ Vo expdt
a� bð Þs0n
� �ð3Þ
Vo is the preearthquake slip rate, (a � b) is the empiricalconstant relating fault friction change to change in slipvelocity, s0n is the effective normal stress, and dt is the time-dependent, earthquake-induced shear stress resolved ontothe fault surface. dt is t � to, where t is the shear stress onthe fault and to is the shear stress on the fault prior to theearthquake, when the fault is assumed to have been slippingat a rate of Vo. The product of a � b and s0n, called A-B,controls the increase in slip velocity due to a stress change.For positive A-B, aseismic afterslip may occur. For large,positive (A-B), a coseismic stress change has just a minimaleffect on the rate of aseismic slip. In our models, velocity-strengthening afterslip is allowed at depths of 0–2 km andbelow 10 km, and values of parameter A-B for theseintervals are sampled independently. We assume velocity-weakening friction (and no afterslip) at depths between 2and 10 km the upper crust [e.g., Scholz, 1998]. In all ofthe models, A-B is doubled in value (relative to the lowercrustal value) below the Moho. Viscous shear zone creeptakes over at depths greater than 25 km if the rate of fric-tional afterslip falls below the viscous fault zone creep rate(assuming h/w = 1015 Pa s m�1). Figure 2a schematicallyillustrates the model.
4.2. Viscous Fault Zone Creep
[9] For the second class of afterslip models, we treat thefault zone at depths exceeding 10 km as a finite width zone
Figure 2. Schematics of the lithosphere models. The blacksections of fault zones slip coseismically. Dark gray regionsare high-viscosity material (h = 1023 Pa s in the upper crustand 1021 Pa s below a depth of 16 km). The models are(a) frictional afterslip; (b) viscoelastic, finite width shearzone; (c) nonlinear viscoelastic lower crust (between 22 and32 km depth); and (d) dual-process model, combining fric-tional afterslip with linear viscoelastic relaxation of lowercrust and upper mantle. In Figures 2a and 2d, the dashedfault zone represents intervals where the model may choosebetween viscous creep with h/w = 1015 Pa s m�1 andfrictional afterslip, depending on which yields faster slip.
B08405 HEARN ET AL.: IZMIT POSTSEISMIC DEFORMATION
3 of 21
B08405
with aNewtonian viscosity. The creep velocityV (i.e., the veloc-ity of one side of the finite shear zone relative to the other)is
V ¼ wdth
ð4Þ
where h is viscosity and w is the horizontal width of the shearzone. Parameter h/w is varied in our models. V is relativeto the rate at which the fault zone was creeping prior tothe earthquake; h/w may increase or decrease with depthbetween 10 and 32 km (crust). The maximum crustal valueis used at depths of 32+ km. The equation assumed for thevariation of h/w with depth (z) in kilometers is
hw¼ h
w
� �oexp 10� zð Þ=zchar½ � ð5Þ
where (h/w)o is (h/w) at 10 km depth.
4.3. Viscoelastic Relaxation of the Lower Crust
[10] Models incorporating several configurations of New-tonian viscoelastic layers demonstrate that early postseismicdeformation characteristic of large, strike-slip earthquakes ismost compatible with relaxation of a thin, lower crustallayer [Hearn, 2003]. Hearn [2003] also find that a nonlinearrheology fits the temporal evolution of postseismic defor-mation better than a Newtonian rheology but that unusualparameters (not consistent with available laboratory-derivedflow laws) are required.[11] Here, we model linear and nonlinear viscoelastic
relaxation of a layer between 22 and 32 km depth (Figure 2c).In the nonlinear model, the effective viscosity is calcu-lated for each model element as described by Hearn[2003]. The equation for effective viscosity of a modelelement is
heff t;elemð Þ ¼ hprespre
spre þ s t;elemð Þ
� �n�1
ð6Þ
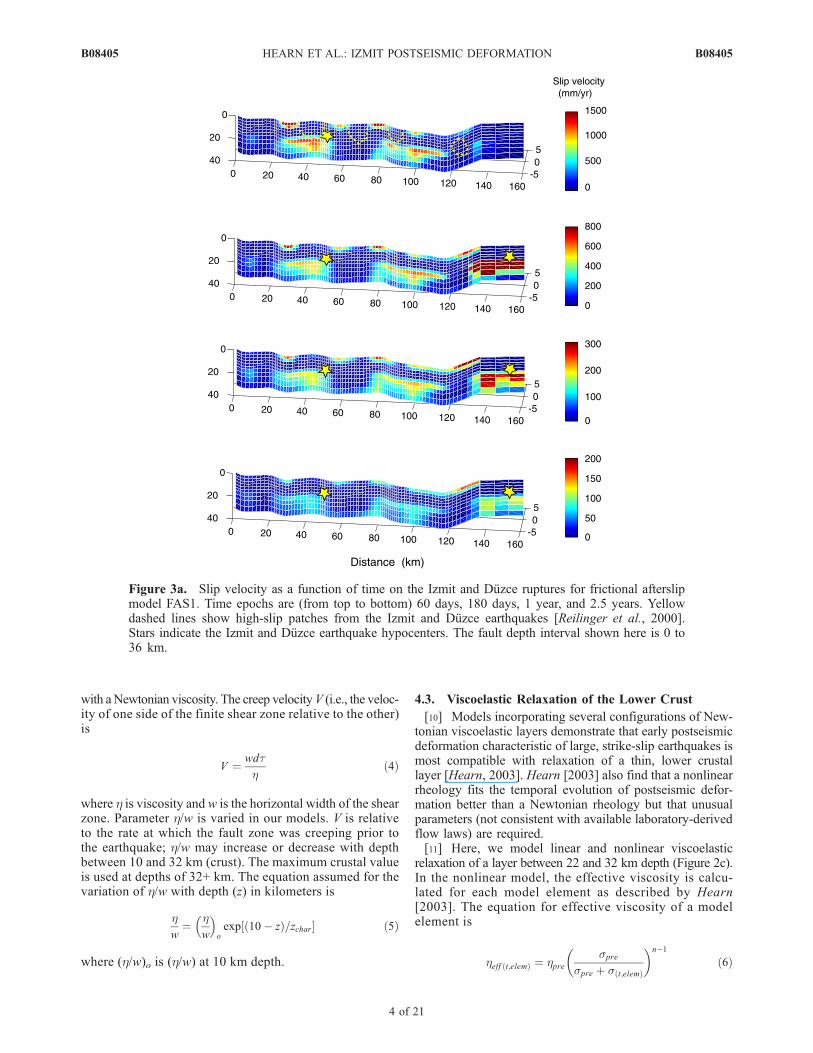
Figure 3a. Slip velocity as a function of time on the Izmit and Duzce ruptures for frictional afterslipmodel FAS1. Time epochs are (from top to bottom) 60 days, 180 days, 1 year, and 2.5 years. Yellowdashed lines show high-slip patches from the Izmit and Duzce earthquakes [Reilinger et al., 2000].Stars indicate the Izmit and Duzce earthquake hypocenters. The fault depth interval shown here is 0 to36 km.
B08405 HEARN ET AL.: IZMIT POSTSEISMIC DEFORMATION
4 of 21
B08405
where heff (t,elem) and s(t,elem) are the effective viscosity and thedifferential stress (coseismic plus postseismic) in the modelelement at time t after the earthquake and spre is the pre-earthquake differential stress. Since s(t,elem) is calculated bythe FE code prior to each time step and n = 3, the only freeparameters are hpre and spre. We can compare hpre with pre-dictions of flow laws at lower crustal temperatures and sprevalues to assess whether our required parameters are gen-erally consistent with the rheology of crustal rocks.[12] This approach does not account for any strain pertur-
bation resulting from the background tectonic stress acting oncoseismically weakened viscoelastic material. We are mod-eling deformation assuming
d _e ¼ds t;elemð Þ
heff t;elemð Þð7Þ
d _eds t;elemð Þ
¼ 1
heff t;elemð Þð8Þ
However, if we take the derivative of _e with respect to s,that is, spre + s(t,elem), substituting equation (6) for heff, weget
d _eds
¼ n
heff t;elemð Þð9Þ
If the coseismic stress change tensor and the preearthquakestress tensor have the same principal stress orientations, theirdifferential stresses may be summed (so ds(t,elem) equals thetotal ds in equation (9)). In this case,
d _e ¼nds t;elemð Þ
heff t;elemð Þð10Þ
Equation (10) is just n times equation (7). If the principalstresses do not have the same orientation (as is usually the
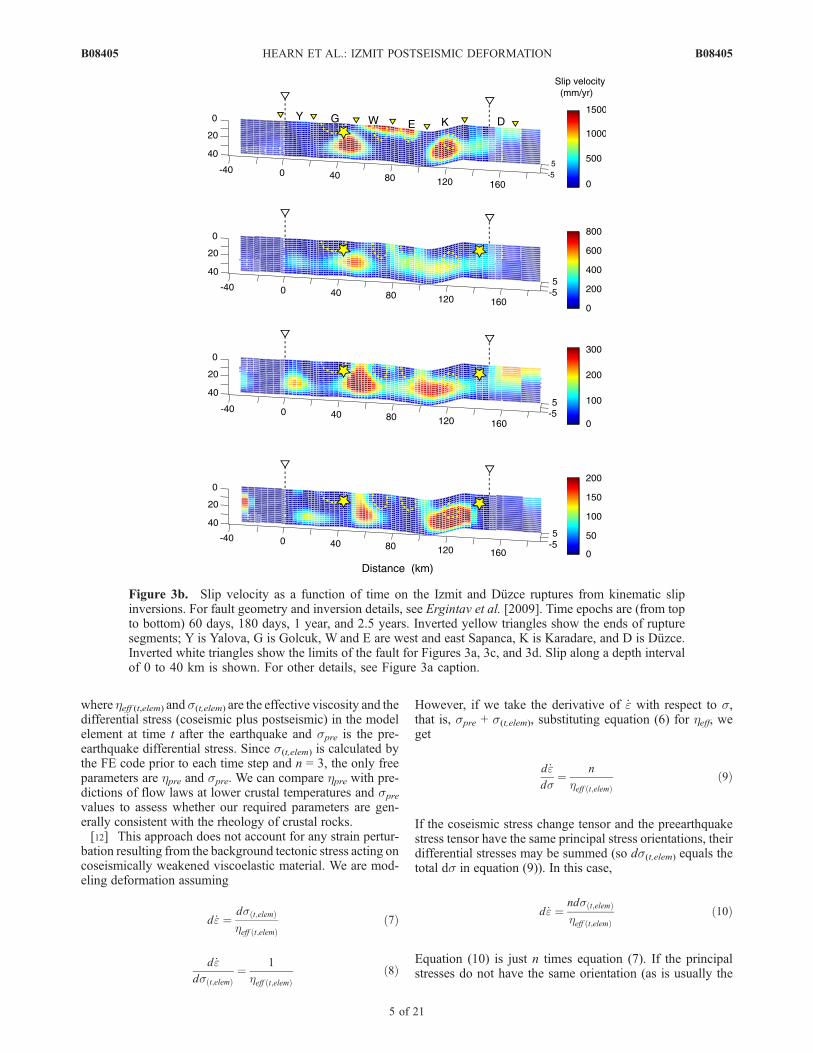
Figure 3b. Slip velocity as a function of time on the Izmit and Duzce ruptures from kinematic slipinversions. For fault geometry and inversion details, see Ergintav et al. [2009]. Time epochs are (from topto bottom) 60 days, 180 days, 1 year, and 2.5 years. Inverted yellow triangles show the ends of rupturesegments; Y is Yalova, G is Golcuk, W and E are west and east Sapanca, K is Karadare, and D is Duzce.Inverted white triangles show the limits of the fault for Figures 3a, 3c, and 3d. Slip along a depth intervalof 0 to 40 km is shown. For other details, see Figure 3a caption.
B08405 HEARN ET AL.: IZMIT POSTSEISMIC DEFORMATION
5 of 21
B08405

case), we cannot assume that ds(t,elem) = ds, and the dif-ference between equations (7) and (10) is smaller.We provideranges of inferred effective viscosities (assuming n = 3) insubsequent discussions of model results.
4.4. Dual-Process Models
[13] Using our finite element model, we may modelafterslip and viscoelastic relaxation with various rheolo-gies simultaneously. We limit our explorations to modelswith velocity-strengthening frictional afterslip in the crust(and viscous creep on a fairly stiff lower crustal shearzone with h/w = 1015 Pa s m�1). Figure 2d shows aschematic of a dual-process model in which both afterslipand viscoelastic relaxation are modeled. Afterslip ismodeled as described in section 4.1, and the lower crustand upper mantle are modeled as Newtonian viscoelasticlayers. In the lower crust and upper mantle, afterslip andviscoelastic relaxation may occur simultaneously. Weuse friction parameters from the best FAS model
(FAS1), and we vary viscosities in the lower crust andmantle layers.
5. Results
5.1. Velocity-Strengthening Frictional Afterslip Models
5.1.1. Pattern and Rate of Afterslip[14] Figure 3a shows afterslip along and below the
sections of the NAFZ that ruptured in the Izmit and Duzceearthquakes, due to FAS driven by coseismic stress. Themaximum slip rate two months after the Izmit earthquakeis about 1.5 m a�1. Afterslip on the rupture surface fallsbetween areas of high coseismic slip, as expected from theinitial slip distribution we use, which loads these sections ofthe fault. The total potency of afterslip as a function of timefor the best FAS model (FAS1) at depths less than 2 km issimilar to kinematic slip inversion results (Figure 3b). (Theafterslip rate for 180 days shown on Figure 3b is fromErgintav et al. [2009]. The slip solutions for other timeepochs were done by Hearn for Ergintav et al. [2009] but
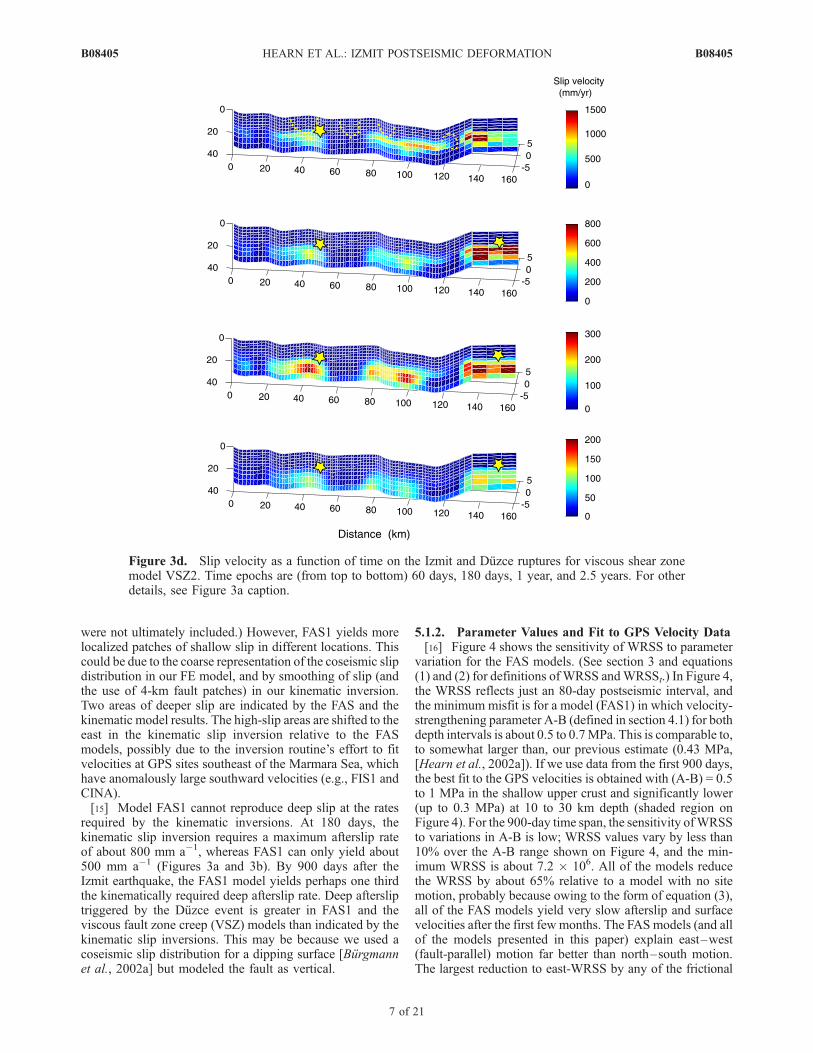
Figure 3c. Slip velocity as a function of time on the Izmit and Duzce ruptures for viscous shear zonemodel VSZ1. Time epochs are (from top to bottom) 60 days, 180 days, 1 year, and 2.5 years. For otherdetails, see Figure 3a caption.
B08405 HEARN ET AL.: IZMIT POSTSEISMIC DEFORMATION
6 of 21
B08405
were not ultimately included.) However, FAS1 yields morelocalized patches of shallow slip in different locations. Thiscould be due to the coarse representation of the coseismic slipdistribution in our FE model, and by smoothing of slip (andthe use of 4-km fault patches) in our kinematic inversion.Two areas of deeper slip are indicated by the FAS and thekinematic model results. The high-slip areas are shifted to theeast in the kinematic slip inversion relative to the FASmodels, possibly due to the inversion routine’s effort to fitvelocities at GPS sites southeast of the Marmara Sea, whichhave anomalously large southward velocities (e.g., FIS1 andCINA).[15] Model FAS1 cannot reproduce deep slip at the rates
required by the kinematic inversions. At 180 days, thekinematic slip inversion requires a maximum afterslip rateof about 800 mm a�1, whereas FAS1 can only yield about500 mm a�1 (Figures 3a and 3b). By 900 days after theIzmit earthquake, the FAS1 model yields perhaps one thirdthe kinematically required deep afterslip rate. Deep aftersliptriggered by the Duzce event is greater in FAS1 and theviscous fault zone creep (VSZ) models than indicated by thekinematic slip inversions. This may be because we used acoseismic slip distribution for a dipping surface [Burgmannet al., 2002a] but modeled the fault as vertical.
5.1.2. Parameter Values and Fit to GPS Velocity Data[16] Figure 4 shows the sensitivity of WRSS to parameter
variation for the FAS models. (See section 3 and equations(1) and (2) for definitions ofWRSS andWRSSt.) In Figure 4,the WRSS reflects just an 80-day postseismic interval, andthe minimum misfit is for a model (FAS1) in which velocity-strengthening parameter A-B (defined in section 4.1) for bothdepth intervals is about 0.5 to 0.7MPa. This is comparable to,to somewhat larger than, our previous estimate (0.43 MPa,[Hearn et al., 2002a]). If we use data from the first 900 days,the best fit to the GPS velocities is obtained with (A-B) = 0.5to 1 MPa in the shallow upper crust and significantly lower(up to 0.3 MPa) at 10 to 30 km depth (shaded region onFigure 4). For the 900-day time span, the sensitivity ofWRSSto variations in A-B is low; WRSS values vary by less than10% over the A-B range shown on Figure 4, and the min-imum WRSS is about 7.2 � 106. All of the models reducethe WRSS by about 65% relative to a model with no sitemotion, probably because owing to the form of equation (3),all of the FAS models yield very slow afterslip and surfacevelocities after the first few months. The FAS models (and allof the models presented in this paper) explain east–west(fault-parallel) motion far better than north–south motion.The largest reduction to east-WRSS by any of the frictional
Figure 3d. Slip velocity as a function of time on the Izmit and Duzce ruptures for viscous shear zonemodel VSZ2. Time epochs are (from top to bottom) 60 days, 180 days, 1 year, and 2.5 years. For otherdetails, see Figure 3a caption.
B08405 HEARN ET AL.: IZMIT POSTSEISMIC DEFORMATION
7 of 21
B08405

afterslip models (for the first 80 days) is 72%, but none of themodels fits the north–south velocities better than amodel withno site motion (that is, the north velocity residuals are largerthan the north velocities). For the 900-day cumulative WRSS,model FAS1 fits the north component slightly better, reduc-ing the north component of the WRSS by up to 36%.[17] Figure 5 shows snapshots of modeled and GPS
velocities, as well as their difference (residuals) 2.5 yearsafter the Izmit earthquake. Similar plots for 1 year after theearthquake are shown in auxiliary material Figure S1.1 Table 1summarizes how well the FE models fit GPS data at threepostseismic time epochs. In all cases, most of the contributionto the WRSSt is from continuous GPS sites, which have verysmall velocity errors, especially after the first few weeks.Forty-five days after the Izmit earthquake, the best FASmodel(FAS1) yields a 63% reduction in WRSSt relative to a modelwith fixed GPS sites. After 1 year and 2.5 years, the WRSStvalue is reduced by 75% and 62% relative to a model withfixed sites. For FAS1, the mean velocity is 1/2 to 2/3 of themean GPS velocity. Smaller velocities in the optimum FASmodel are an indication that the model vectors are misorientedrelative to the GPS vectors. The WRSS minimization selectsmodels with smaller velocity amplitudes to minimize theWRSS. Because of this, WRSS during the first 80 days issomewhat larger than in our earlier model [Hearn et al.,2002a]. If we use the (A-B) values from Hearn et al. [2002a]to model afterslip, we do slightly better for the first 80 daysbut the WRSS is larger over the full 900-day interval.
5.2. Viscous Shear Zone Creep Models
5.2.1. Pattern and Rate of Afterslip[18] Dynamically modeled afterslip from two viscous
shear zone (VSZ) models is shown on Figures 3c and 3d.
As is the case for model FAS1, these models produce twomain patches of afterslip, and both of these patches are westof where the kinematic model places them. In the best fittingsolution where h/w increases with depth (VSZ2, Figure 3d),the slip rate patterns are similar to those from the frictionalaferslip model, except that no slip is allowed in the top twokilometers of the crust. The decay in slip velocities withtime is slower, however, and there is a progressive deepen-ing of the afterslip which is less apparent in model FAS1.This difference is not enough to be resolved by the GPSvelocities. In the best fitting solution where h/w decreaseswith depth (VSZ1, Figure 3c), afterslip is evenly distributedover a broad depth interval and is faster than for the FASand VSZ2 models (and comparable to the kinematic slipvelocities). The slipping zone narrows late in the simulation,and becomes shallower (especially below the Duzce hypo-center). The western slip patch also disappears betweenyears 1 and 2.5.5.2.2. Parameter Values and Fit to GPS Velocity Data[19] Figure 6 shows the sensitivity of WRSS to parameter
variation for the VSZ models. The best fit to the GPS data isobtained in models where h/w either decreases or increaseswith depth (i.e., models VSZ1 and VSZ2). Most of the mod-est difference in fit between these models, and one in whichh/w is constant with depth, arises from their superior per-formance in the later postseismic interval. A plot similar toFigure 6, covering just the first 180 days after the Izmitearthquake, shows a WRSS minimum in the same region,but with less of a preference for the models with depth-varying h/w. The east component of WRSS is reduced by upto 76%, and north component by up to 39%, relative to amodel with no site motion. In model VSZ1, h/w increases(following equation (5)) from 1013 Pa s m�1 at 10 km depthto 1.5 � 1015 Pa s m�1 at 30 km depth. In model VSZ2,these values are 6 � 1014 Pa s m�1 and 4 � 1012 Pa s m�1,respectively. The best model with constant h/w requires avalue of 5 � 1013 Pa s m�1.[20] Modeled and GPS velocities, and residuals 2.5 years
after the Izmit earthquake, are shown on Figures 7a and 7b.Similar plots for 1 year after the earthquake are shown inauxiliary material Figures S2 and S3. Like model FAS1,neither of the VSZ models fits the rapid, early postseismicvelocities at near-field GPS sites. However, given the largerGPS velocity errors immediately after the Izmit earthquake,the WRSS penalty for this misfit is small. At 45 days, modelVSZ1 reducesWRSSt by amere 25% relative to amodel withfixed GPS sites. After 1 and 2.5 years, the model reducesWRSSt by 73% and 67%, respectively, relative to a modelwith fixed GPS sites. VSZ2 reduces WRSSt by 61%, 85%,and 76% 45 days, 1 year, and 2.5 years after the Izmit earth-quake. The better performance at 45 days is due to inhibiteddeep slip (and smaller modeled velocities). Both VSZmodelsyield velocity amplitudes which are closer to the GPS veloc-ities than those produced by model FAS1.
5.3. Nonlinear Viscoelastic Relaxation Models
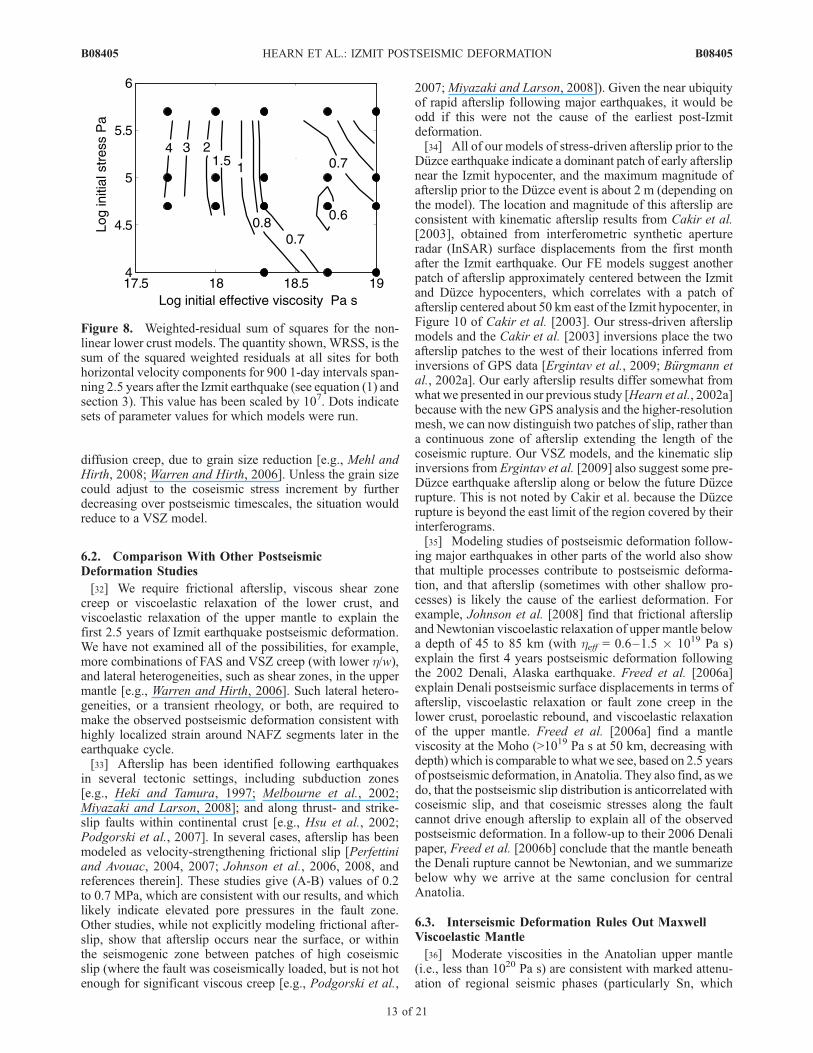
[21] We have also run models to assess whether relaxationof nonlinear viscoelastic lower crust (with stress expo-nent n = 3) could explain Izmit postseismic deformation.Figure 8 shows sensitivity of WRSS to variations in thepreearthquake differential stress and viscosity. We find thatfor a nonlinear lower crust model to fit the GPS data as well as
Figure 4. Weighted-residual sum of squares for the FASmodels. The quantity shown, WRSS, is the sum of thesquared weighted residuals at all sites, for horizontal velocitycomponents, for 80 1-day intervals after the Izmit earthquake(see equation (1) and section 3). This value has been scaled by106. The shaded area shows where the minimum WRSStotalis located on a similar plot (WRSS < 7.5 � 106), for a post-seismic time interval of 900 days. Dots indicate sets ofparameter values for which models were run.
1Auxiliary materials are available in the HTML. doi:10.1029/2008JB006026.
B08405 HEARN ET AL.: IZMIT POSTSEISMIC DEFORMATION
8 of 21
B08405

the best afterslip models, hpre and spre are about 2 to 6 �1018 Pa s and 0.05 to 0.1 MPa. Previously [Hearn et al.,2002a], we made a rough estimate of spre, based onequation (6), n = 3, a range of assumed, reasonable hpre val-ues, and the effective viscosity required by our best linearlyviscoelastic lower crust model to fit the first 80 days ofpostseismic deformation (5 � 1016 Pa s). That estimate was0.08 to 1.6 MPa, which is reasonable given that actualcoseismic stresses in the lower crust are lower than the5 MPa value we assumed in the 2002 calculation [Hearn etal., 2002a].[22] We note that assuming n = 3 allows us to bracket
admissible values of hpre (section 4.3). To narrow this rangefurther, and more precisely model the postseismic veloci-ties, the postseismic deformation models should be embed-ded in a preexisting stress field [e.g., Freed et al., 2006b],ideally compatible with the rheology and the preearthquakedeformation.
[23] The north component of the WRSS is reduced by upto 45%, and the east component by up to 80%, relative to amodel with fixed GPS sites. As with the afterslip models,none of the models reduces the north component of theWRSS significantly during the first 6 months. Forty-fivedays after the Izmit earthquake, the best nonlinear lowercrust model (NL1) yields a 58% reduction in WRSStrelative to a model with fixed GPS sites (Table 1). At 1 year,this reduction is 79% and at 2.5 years, the NL1 modelyields just a 52% reduction in the WRSSt. Figure 9 showsmodeled and GPS site velocities, and residuals 2.5 yearsafter the Izmit earthquake. Similar plots for 1 year after theearthquake are shown in auxiliary material Figure S4.At 1 and 2.5 years, modeled velocities exceed GPSsite velocities at 22 and 33 sites, respectively, and themean velocities are comparable to the mean GPS velocities(v/vo = 0.86 and 1.16). Discrepancies between modeled andGPS vector orientations are similar to those produced by
Figure 5. (top) Modeled and GPS velocity vectors 2.5 years after the Izmit earthquake and (bottom)residuals for frictional afterslip model FAS1. In Figure 5 (top), dark arrows are modeled velocities andlight arrows are GPS velocities (with error ellipses showing one-sigma errors (68% uncertainties)).Vectors for 1 year after the earthquake are shown in auxiliary material Figure S1. Site ANKR (inset) isabout 50 km east of the location shown on all of the surface velocity plots. Site KDER is very close to theNAF trace and its velocity is not modeled accurately when shallow afterslip is allowed (here and onFigure 11).
B08405 HEARN ET AL.: IZMIT POSTSEISMIC DEFORMATION
9 of 21
B08405

the afterslip models, but the larger velocities lead to largerresiduals (and WRSSt values).
5.4. Dual-Process Models: Afterslip PlusViscoelastic Relaxation
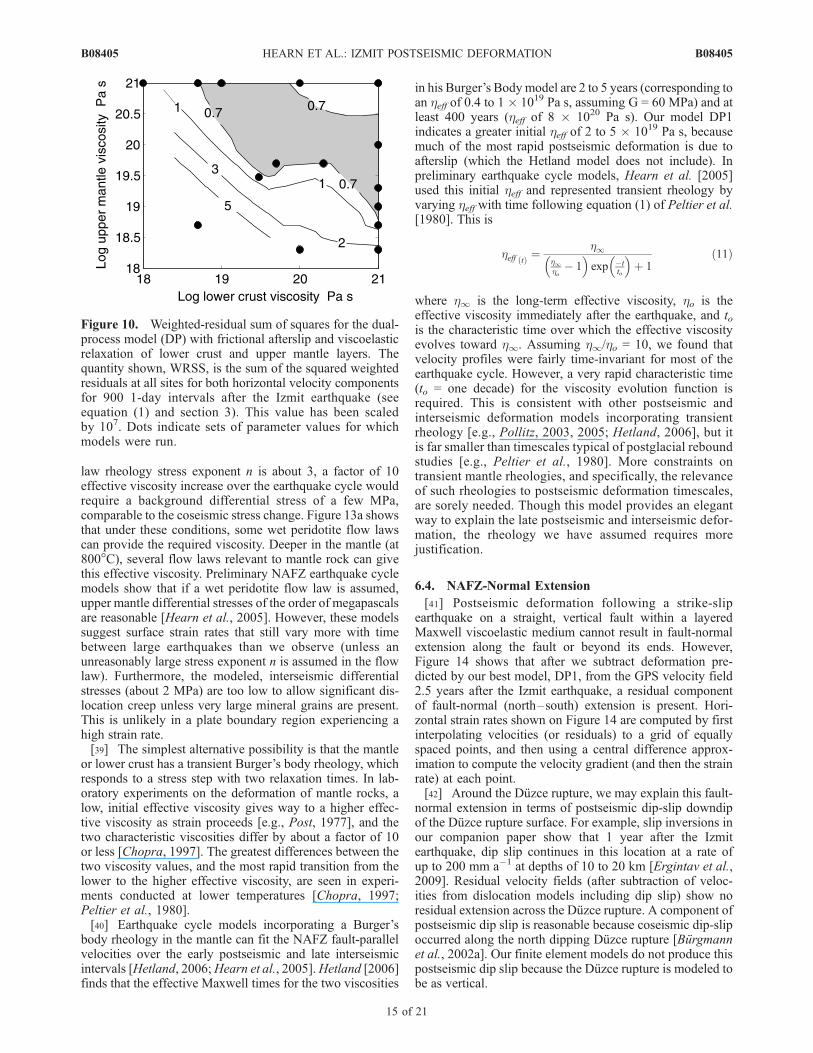
[24] Figure 4 and Table 1 show that the FAS1 model doesnot yield rapid enough postseismic velocities in the vicinityof the Izmit rupture. The model’s performance at later timeepochs may be improved by supplementing FAS withrelaxation of viscoelastic lower crust (or with viscous creepin a vertical, lower crustal shear zone with h/w lower than1015 Pa s m�1) and viscoelastic relaxation of the upper mantle.Here, we present results for a model incorporating Newtonianviscoelastic relaxation of lower crust and uppermantle layers,with viscous shear zone h/w fixed at 1015 Pa s m�1. In thismodel, frictional afterslip and viscous shear zone creep areboth modeled along the NAFZ, and below a depth of 25 km,the process yielding the greater slip rate over each time step isassumed to occur. Figure 10 shows the sensitivity ofWRSS tomantle and lower crust viscosities for our dual-process (DP)models. The DP models outperform model FAS1 for arestricted range of mantle and crust viscosities (shaded regionon Figure 10). The minimum permissible mantle or lowercrust viscosity is about 2 to 5� 1019 Pa s: for lower viscosityvalues, total WRSS increases dramatically. In models withthe lowest mantle viscosities, a stiffer lower crust is requiredto fit the GPS velocity data, and for models with the lowestlower crust viscosities, a stiffer upper mantle is required. Amodel in which both the mantle and lower crust viscositiesare both about 5� 1019 Pa s also performs well. Hence, whileour models provide firm lower bounds for the effectiveviscosities of the uppermost mantle and the lower crust, wecannot distinguish between the ‘‘jelly sandwich’’ and the‘‘creme brulee’’ models of lithosphere viscoelastic structure[e.g., Burov and Watts, 2006].
[25] We note here that if we assume a lower h/w (5 �1014 Pa s m�1) for the viscous shear zone, and we allowviscous creep to take over when frictional afterslip slowsdown below a depth of 15 km (instead of at 25 km), highermantle and lower crust viscosities are required. For a modelwith identical mantle and lower crust effective viscosities, aneffective viscosity value of 1020 Pa s is required.[26] Figure 11 illustrates that, as is the case with all of our
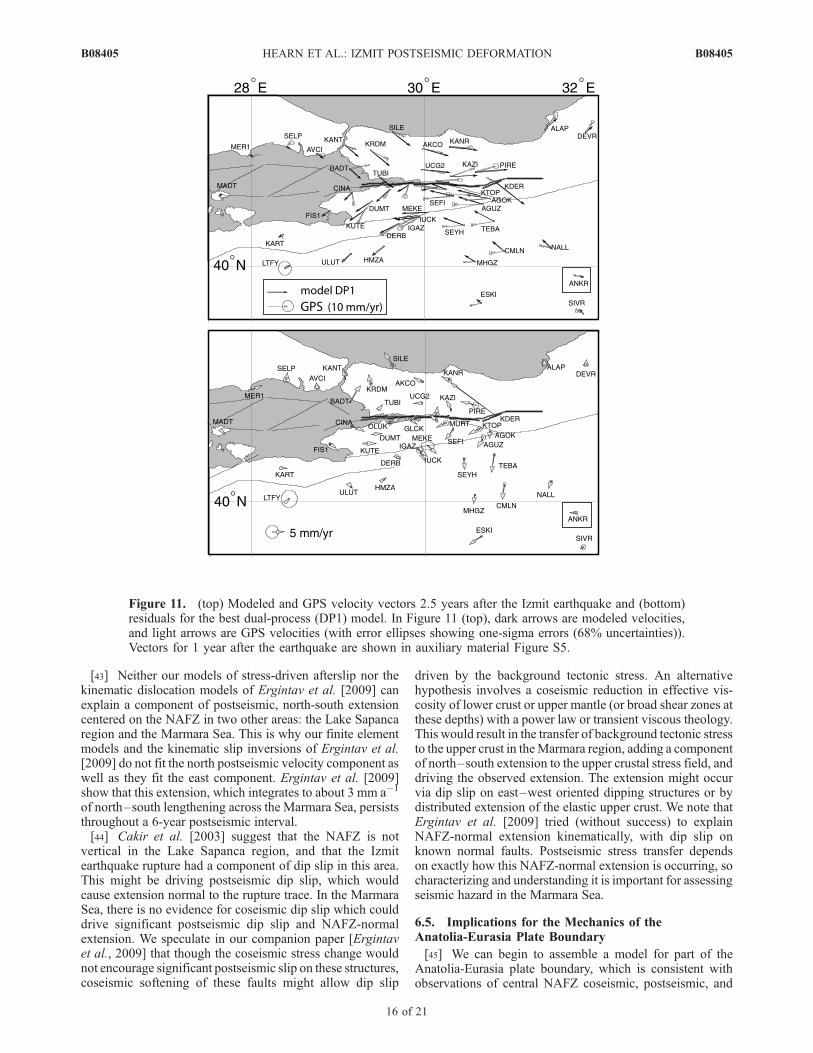
models, the east velocity component is fit much better thanthe north velocity component. (This is true at all time epochs.)For the entire 900-day period, the east WRSS is reduced byup to 83%, while the north WRSS is reduced by only up to45%. For the best model, DP1, WRSS is 6 � 106, whichcorresponds with an RMS error of 60. This error is largebecause of the very small formal uncertainties for the GPSpostseismic velocities [Ergintav et al., 2009]. For example,after 1 and 2.5 years, virtually all of the GPS one-sigmavelocity errors (at both CGPS and SGPS sites) are less than1.5 and 0.5 mm a�1, respectively. (If we included the verticalvelocity component, with its larger uncertainties, the RMSerror would be about 30% lower.)[27] Adding viscoelastic mantle and lower crust relaxa-
tion increases the magnitude of modeled, late postseismicvelocities to values approaching the GPS values. This visco-elastic relaxation only modestly reduces WRSSt and WRSSvalues, because as the modeled velocities approach paritywith the GPS velocities, angular misfits cause larger residuals(Table 1). For the best DP model (DP1), WRSSt is 63%smaller than for a model with no site motion, 45 days after theearthquake. After 1 year, the WRSSt is 84% lower, which iscomparable to the performance of the best dislocation model.However, v/vo is somewhat smaller than it is for the disloca-tion model (0.77 versus 0.86). After 2.5 years, the DP1model’s WRSSt is comparable to that of the FAS1 modelfor that time epoch. Unlike the FAS1 model, the DP model
Table 1. Model Performancea
Model Time Epoch WRSSt WRSSo WRSS Reduction (%) v/vob
DMb 45 days 1221 16732 93 0.84FAS1 45 days 4920 13219 63 0.63VSZ1 45 days 9908 13219 25 1.01VSZ2 45 days 5155 13219 61 0.60NL1 45 days 5510 13219 58 0.67DP1 45 days 4888 13219 63 0.73
DMb 1 year 1675 21397 92 0.86FAS1 1 year 5443 20010 73 0.55VSZ1 1 year 5409 20010 73 0.75VSZ2 1 year 4994 20010 75 0.85NL1 1 year 4137 20010 79 0.86DP1 1 year 3236 20010 84 0.77
DMb 2.5 years 9477 58684 84 0.92FAS1 2.5 years 22290 58217 62 0.66VSZ1 2.5 years 19133 58217 67 0.76VSZ2 2.5 years 21779 58217 63 0.76NL1 2.5 years 27844 58217 52 1.16DP1 2.5 years 22944 58217 64 1.05
aThe ratio v/vo is the ratio of mean modeled velocity amplitude to meanGPS velocity amplitude. WRSSo is the WRSS for a model in which all GPSsites are stationary.
bFor the elastic dislocation models [Ergintav et al., 2009], data from 68GPS sites (rather than 55) were used. Hence, the WRSSo values are greater.Only strike-slip motion was allowed in these dislocation models (for moremeaningful comparison with FE results). Including dip slip reduced theDM’s WRSS by an additional 3% at 1 year and 0.5% at 2.5 years.
Figure 6. Weighted-residual sum of squares for the VSZmodels. Models with depth-varying h/w perform better thanmodels with uniform h/w. The quantity shown, WRSS, isthe sum of the squared weighted residuals at all sites forboth horizontal velocity components, for 900 1-day inter-vals spanning 2.5 years after the Izmit earthquake (seeequation (1) and section 3). This value has been scaled by107. Dots indicate sets of parameter values for which modelswere run.
B08405 HEARN ET AL.: IZMIT POSTSEISMIC DEFORMATION
10 of 21
B08405

produces a mean, modeled GPS site velocity amplitude at2.5 years which is close to the GPS value (v/vo = 1.05),and modeled velocity amplitudes exceed GPS velocities at32 of the 55 sites.
6. Discussion
6.1. Postseismic Deformation: Afterslip PlusViscoelastic Relaxation
[28] The earliest Izmit postseismic deformation requiresafterslip at seismogenic depths [Burgmann et al., 2002b;Hearn et al., 2002a]; an extremely rapidly decaying post-seismic transient component (with a characteristic decay timeof 1 day), and a very fast initial afterslip rate [Ergintav et al.,2009; Cakir et al., 2003]. These constraints are consistentwith velocity-strengthening frictional afterslip along theNAFZ. Shallow, stress-driven afterslip which is indicatedby model FAS1 is also required by kinematic slip inversions[Ergintav et al., 2009]. Furthermore, postseismic slip at theEarth’s surface was identified in Golcuk after the Izmitearthquake and along the Duzce rupture after that earthquake(O. Emre, personal communication, 2006), and the amplitude
of this slip was roughly consistent with the kinematicinversions [Ergintav et al., 2009]. A combination of frictionalafterslip and viscous fault zone creep at depth [e.g.,Mehl andHirth, 2008] is likely at work.[29] Model VSZ1 shows that coseismic stress on the
NAFZ was sufficient to drive afterslip at a fast enough rateto explain postseismic deformation for perhaps a year afterthe Izmit earthquake. However, none of the afterslip modelscan explain the deformation rates beyond about the firstyear. This suggests a second process, likely viscoelasticdeformation of the upper mantle. Our dual-process modelswith mantle and lower crust viscosities of the order of 1019
to 1020 Pa s provide the best fit to the first 2.5 years ofpostseismic deformation. If a low-h/w viscous shear zoneaccommodates postseismic strain in the lower crust, ratherthan a relaxing viscoelastic layer, the mantle effective vis-cosity will be at the lower end of this range. Gravity surveys[Ergintav et al., 2007] also support a deformation contribu-tion from viscoelastic relaxation in or below the lower crust.These data, spanning 2003 through 2005, suggest increasinggravity south of the NAFZ and decreasing gravity north ofthe NAFZ, along a profile crossing the eastern Marmara
Figure 7a. (top) Modeled and GPS velocity vectors 2.5 years after the Izmit earthquake and (bottom)residuals for viscous shear zone model VSZ1. In Figure 7b (top), dark arrows are modeled velocities, andlight arrows are GPS velocities (with error ellipses showing one-sigma errors (68% uncertainties)).Vectors for 1 year after the earthquake are shown in auxiliary material Figure S2.
B08405 HEARN ET AL.: IZMIT POSTSEISMIC DEFORMATION
11 of 21
B08405

Sea. This is opposite the expected coseismic polarity and isconsistent with relaxation of a lower crust or upper mantlelayer [Hearn, 2003] but not afterslip or relaxation of a mid-crustal detachment. (Afterslip on a south dipping, roughlyNAFZ-parallel normal fault such as the Princes Island Faultmight also cause this signature.)[30] The only alternative to a multiprocess model is one
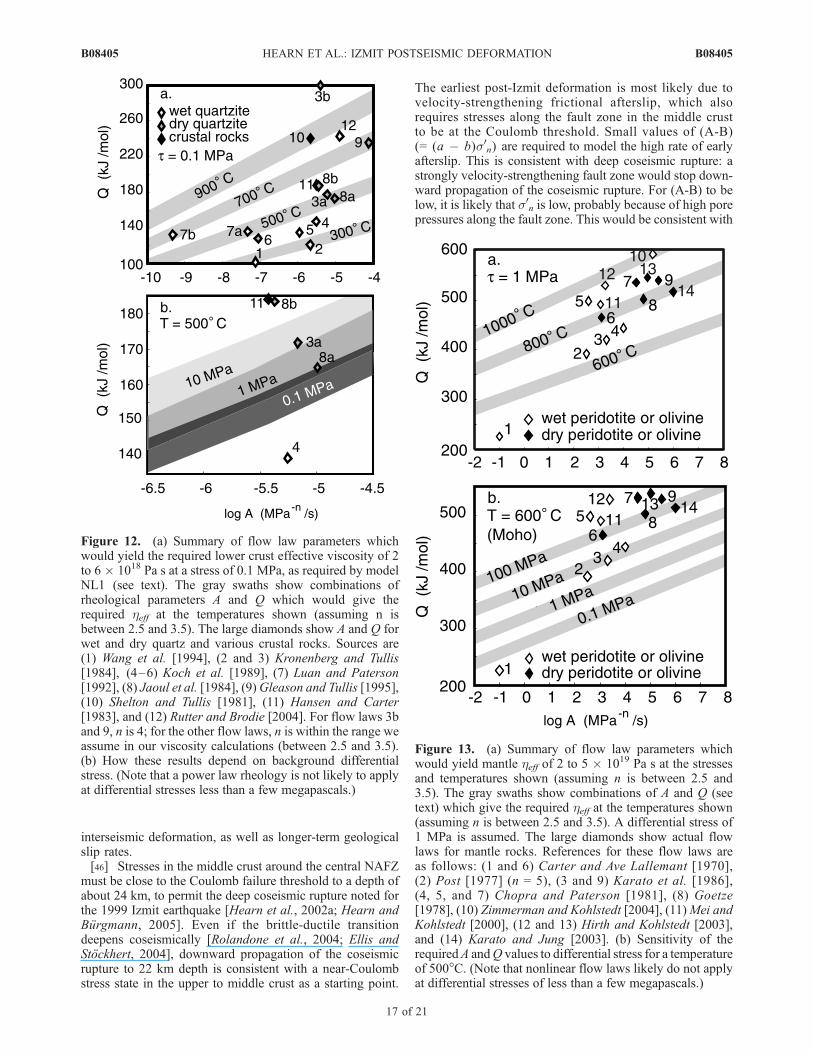
in which most of the rapid postseismic deformation is due totemporarily low effective viscosity in the lower crust or uppermantle around the Izmit rupture, for example, due to a powerlaw rheology. This has been proposed for Mojave Desertearthquakes [e.g., Freed and Burgmann, 2004].Wewere ableto devise a nonlinear lower crust model with n = 3 that fit theearliest Izmit-Duzce postseismic deformation about as wellas the afterslip models (after the first week). However, thelow preearthquake stresses and strain rates required by thismodel are problematic.[31] Figures 12a and 12b show the temperatures at which
flow laws representative of crustal rocks would yield therequired hpre (2 to 6 � 1018 Pa s) at the required spre of0.1 MPa. To generate Figure 12, we calculated effectiveviscosity for a randomly sampled set of synthetic flow laws
with various values of A and Q, assuming that 2.5 < n < 3.5,spre = 0.1 MPa, and T = 300 to 1200�C. Real flow laws forquartzite and crustal rocks of various types are plotted onFigures 12a and 12b for reference. Heat flux in the vicinity ofthe Izmit rupture is about 60 mW m�2 [Schindler, 1997],suggesting lower crust temperatures of 450 to 600�C. In thistemperature range, some wet quartz flow laws yield theexpected early postseismic effective viscosities. However,the required preearthquake stress is so low that linear diffu-sion creep, rather than nonlinear dislocation creep, shoulddominate. Another problem with the NL1 model is that muchhigher effective viscosities (at least 1020 Pa s) are required bysurface deformation rates later in the earthquake cycle (asdescribed in section 6.3). Finally, for the required interseismicdifferential stress of about 0.05 to 0.1 MPa, the strain rate inthe lower crust must be about 10�16 s�1. This is too low to beconsistent with deformation around a major plate boundaryfault (or with the highly localized surface strain around theNAFZ throughout the earthquake cycle) unless a rheologi-cally distinct, very low viscosity shear zone below the NAFZcontrols levels of differential stress [e.g., Mehl and Hirth,2008]. In this case, however, the shear zone would deform via
Figure 7b. (top) Modeled and GPS velocity vectors 2.5 years after the Izmit earthquake and (bottom)residuals for viscous shear zone model VSZ2. In Figure 7 (top), dark arrows are modeled velocities, andlight arrows are GPS velocities (with error ellipses showing one-sigma errors (68% uncertainties)).Vectors for 1 year after the earthquake are shown in auxiliary material Figure S3.
B08405 HEARN ET AL.: IZMIT POSTSEISMIC DEFORMATION
12 of 21
B08405
diffusion creep, due to grain size reduction [e.g., Mehl andHirth, 2008; Warren and Hirth, 2006]. Unless the grain sizecould adjust to the coseismic stress increment by furtherdecreasing over postseismic timescales, the situation wouldreduce to a VSZ model.
6.2. Comparison With Other PostseismicDeformation Studies
[32] We require frictional afterslip, viscous shear zonecreep or viscoelastic relaxation of the lower crust, andviscoelastic relaxation of the upper mantle to explain thefirst 2.5 years of Izmit earthquake postseismic deformation.We have not examined all of the possibilities, for example,more combinations of FAS and VSZ creep (with lower h/w),and lateral heterogeneities, such as shear zones, in the uppermantle [e.g., Warren and Hirth, 2006]. Such lateral hetero-geneities, or a transient rheology, or both, are required tomake the observed postseismic deformation consistent withhighly localized strain around NAFZ segments later in theearthquake cycle.[33] Afterslip has been identified following earthquakes
in several tectonic settings, including subduction zones[e.g., Heki and Tamura, 1997; Melbourne et al., 2002;Miyazaki and Larson, 2008]; and along thrust- and strike-slip faults within continental crust [e.g., Hsu et al., 2002;Podgorski et al., 2007]. In several cases, afterslip has beenmodeled as velocity-strengthening frictional slip [Perfettiniand Avouac, 2004, 2007; Johnson et al., 2006, 2008, andreferences therein]. These studies give (A-B) values of 0.2to 0.7 MPa, which are consistent with our results, and whichlikely indicate elevated pore pressures in the fault zone.Other studies, while not explicitly modeling frictional after-slip, show that afterslip occurs near the surface, or withinthe seismogenic zone between patches of high coseismicslip (where the fault was coseismically loaded, but is not hotenough for significant viscous creep [e.g., Podgorski et al.,
2007;Miyazaki and Larson, 2008]). Given the near ubiquityof rapid afterslip following major earthquakes, it would beodd if this were not the cause of the earliest post-Izmitdeformation.[34] All of our models of stress-driven afterslip prior to the
Duzce earthquake indicate a dominant patch of early afterslipnear the Izmit hypocenter, and the maximum magnitude ofafterslip prior to the Duzce event is about 2 m (depending onthe model). The location and magnitude of this afterslip areconsistent with kinematic afterslip results from Cakir et al.[2003], obtained from interferometric synthetic apertureradar (InSAR) surface displacements from the first monthafter the Izmit earthquake. Our FE models suggest anotherpatch of afterslip approximately centered between the Izmitand Duzce hypocenters, which correlates with a patch ofafterslip centered about 50 km east of the Izmit hypocenter, inFigure 10 of Cakir et al. [2003]. Our stress-driven afterslipmodels and the Cakir et al. [2003] inversions place the twoafterslip patches to the west of their locations inferred frominversions of GPS data [Ergintav et al., 2009; Burgmann etal., 2002a]. Our early afterslip results differ somewhat fromwhat we presented in our previous study [Hearn et al., 2002a]because with the new GPS analysis and the higher-resolutionmesh, we can now distinguish two patches of slip, rather thana continuous zone of afterslip extending the length of thecoseismic rupture. Our VSZ models, and the kinematic slipinversions from Ergintav et al. [2009] also suggest some pre-Duzce earthquake afterslip along or below the future Duzcerupture. This is not noted by Cakir et al. because the Duzcerupture is beyond the east limit of the region covered by theirinterferograms.[35] Modeling studies of postseismic deformation follow-
ing major earthquakes in other parts of the world also showthat multiple processes contribute to postseismic deforma-tion, and that afterslip (sometimes with other shallow pro-cesses) is likely the cause of the earliest deformation. Forexample, Johnson et al. [2008] find that frictional afterslipand Newtonian viscoelastic relaxation of upper mantle belowa depth of 45 to 85 km (with heff = 0.6–1.5 � 1019 Pa s)explain the first 4 years postseismic deformation followingthe 2002 Denali, Alaska earthquake. Freed et al. [2006a]explain Denali postseismic surface displacements in terms ofafterslip, viscoelastic relaxation or fault zone creep in thelower crust, poroelastic rebound, and viscoelastic relaxationof the upper mantle. Freed et al. [2006a] find a mantleviscosity at the Moho (>1019 Pa s at 50 km, decreasing withdepth) which is comparable to what we see, based on 2.5 yearsof postseismic deformation, in Anatolia. They also find, as wedo, that the postseismic slip distribution is anticorrelated withcoseismic slip, and that coseismic stresses along the faultcannot drive enough afterslip to explain all of the observedpostseismic deformation. In a follow-up to their 2006 Denalipaper, Freed et al. [2006b] conclude that the mantle beneaththe Denali rupture cannot be Newtonian, and we summarizebelow why we arrive at the same conclusion for centralAnatolia.
6.3. Interseismic Deformation Rules Out MaxwellViscoelastic Mantle
[36] Moderate viscosities in the Anatolian upper mantle(i.e., less than 1020 Pa s) are consistent with marked attenu-ation of regional seismic phases (particularly Sn, which
Figure 8. Weighted-residual sum of squares for the non-linear lower crust models. The quantity shown, WRSS, is thesum of the squared weighted residuals at all sites for bothhorizontal velocity components for 900 1-day intervals span-ning 2.5 years after the Izmit earthquake (see equation (1) andsection 3). This value has been scaled by 107. Dots indicatesets of parameter values for which models were run.
B08405 HEARN ET AL.: IZMIT POSTSEISMIC DEFORMATION
13 of 21
B08405

broadcasts upper mantle properties), and slow Vp in themantle (7.7 km s�1) in central Turkey [Sandvol et al.,2001; Gok et al., 2000; Hearn and Ni, 1994]. (Viscosity ofthe lower crust is not as well constrained by geophysicalmethods.) Although some models of regional-scale seculardeformation in the eastern Mediterranean region require ahigh, vertically averaged lithosphere viscosity consistentwith block-like behavior over hundreds to thousands of years[Jimenez-Munt and Sabadini, 2002; Hubert-Ferrari et al.,2003; Fischer, 2006], others suggest that block-like defor-mation could be compatible with a moderate to low (1020 to1019 Pa s) viscosity below the brittle-ductile transition (seeFischer [2006], Anatolian block only, and Provost et al.[2003]) if shear stresses are extremely low along the block-bounding faults. Upper mantle effective viscosity valuesrequired by models of postseismic deformation in other partsof the world cluster around 1018 to 1020 Pa s [Burgmann andDresen, 2008].[37] If the mantle viscosity is moderate, as our postseis-
mic models suggest, and linearly viscoelastic, strain aroundthe NAFZ segments should depend strongly on the time
since the last earthquake [Savage, 1990]. Earthquake cyclemodels incorporating Maxwell viscoelastic material belowthe brittle-ductile transition produce geodetically observablevariations in the pattern of strain around the NAFZ atdifferent times in the earthquake cycle, unless the viscosityis high (at least 5 � 1020 Pa s [Hearn et al., 2002b]).However, GPS observations show that strain concentrationaround NAFZ segments is insensitive to the elapsed timesince the last great earthquake [e.g., Ayhan et al., 2002;Reilinger et al., 2006]. InSAR studies also show that strainis tightly localized around NAFZ rupture segments thathave not experienced major earthquakes for over 60 years[e.g., Wright et al., 2001].[38] The simplest way around this problem is to model an
increase in effective viscosity with time between majorearthquakes, due to either a power law or a transient rheology.Nonlinear flow laws for crust and mantle rocks at the temper-atures we expect in the lower crust and upper mantle cantheoretically produce an effective viscosity of the order of 2to 5 � 1019 Pa s within a range of stress levels exceeding thecoseismic stress change (Figures 13a and 13b). If the power
Figure 9. (top) Modeled and GPS velocity vectors 2.5 years after the Izmit earthquake and (bottom)residuals for nonlinear viscoelastic lower crust model NL1. In Figure 9 (top), dark arrows are modeledvelocities, and light arrows are GPS velocities (with error ellipses showing one-sigma errors (68%uncertainties)). Vectors for 1 year after the earthquake are shown in auxiliary material Figure S4.
B08405 HEARN ET AL.: IZMIT POSTSEISMIC DEFORMATION
14 of 21
B08405
law rheology stress exponent n is about 3, a factor of 10effective viscosity increase over the earthquake cycle wouldrequire a background differential stress of a few MPa,comparable to the coseismic stress change. Figure 13a showsthat under these conditions, some wet peridotite flow lawscan provide the required viscosity. Deeper in the mantle (at800�C), several flow laws relevant to mantle rock can givethis effective viscosity. Preliminary NAFZ earthquake cyclemodels show that if a wet peridotite flow law is assumed,upper mantle differential stresses of the order of megapascalsare reasonable [Hearn et al., 2005]. However, these modelssuggest surface strain rates that still vary more with timebetween large earthquakes than we observe (unless anunreasonably large stress exponent n is assumed in the flowlaw). Furthermore, the modeled, interseismic differentialstresses (about 2 MPa) are too low to allow significant dis-location creep unless very large mineral grains are present.This is unlikely in a plate boundary region experiencing ahigh strain rate.[39] The simplest alternative possibility is that the mantle
or lower crust has a transient Burger’s body rheology, whichresponds to a stress step with two relaxation times. In lab-oratory experiments on the deformation of mantle rocks, alow, initial effective viscosity gives way to a higher effec-tive viscosity as strain proceeds [e.g., Post, 1977], and thetwo characteristic viscosities differ by about a factor of 10or less [Chopra, 1997]. The greatest differences between thetwo viscosity values, and the most rapid transition from thelower to the higher effective viscosity, are seen in experi-ments conducted at lower temperatures [Chopra, 1997;Peltier et al., 1980].[40] Earthquake cycle models incorporating a Burger’s
body rheology in the mantle can fit the NAFZ fault-parallelvelocities over the early postseismic and late interseismicintervals [Hetland, 2006;Hearn et al., 2005].Hetland [2006]finds that the effective Maxwell times for the two viscosities
in his Burger’s Body model are 2 to 5 years (corresponding toan heff of 0.4 to 1 � 1019 Pa s, assuming G = 60 MPa) and atleast 400 years (heff of 8 � 1020 Pa s). Our model DP1indicates a greater initial heff of 2 to 5 � 1019 Pa s, becausemuch of the most rapid postseismic deformation is due toafterslip (which the Hetland model does not include). Inpreliminary earthquake cycle models, Hearn et al. [2005]used this initial heff and represented transient rheology byvarying heff with time following equation (1) of Peltier et al.[1980]. This is
heff tð Þ ¼h1
h1ho� 1
� �exp �t
to
� �þ 1
ð11Þ
where h1 is the long-term effective viscosity, ho is theeffective viscosity immediately after the earthquake, and tois the characteristic time over which the effective viscosityevolves toward h1. Assuming h1/ho = 10, we found thatvelocity profiles were fairly time-invariant for most of theearthquake cycle. However, a very rapid characteristic time(to = one decade) for the viscosity evolution function isrequired. This is consistent with other postseismic andinterseismic deformation models incorporating transientrheology [e.g., Pollitz, 2003, 2005; Hetland, 2006], but itis far smaller than timescales typical of postglacial reboundstudies [e.g., Peltier et al., 1980]. More constraints ontransient mantle rheologies, and specifically, the relevanceof such rheologies to postseismic deformation timescales,are sorely needed. Though this model provides an elegantway to explain the late postseismic and interseismic defor-mation, the rheology we have assumed requires morejustification.
6.4. NAFZ-Normal Extension
[41] Postseismic deformation following a strike-slipearthquake on a straight, vertical fault within a layeredMaxwell viscoelastic medium cannot result in fault-normalextension along the fault or beyond its ends. However,Figure 14 shows that after we subtract deformation pre-dicted by our best model, DP1, from the GPS velocity field2.5 years after the Izmit earthquake, a residual componentof fault-normal (north–south) extension is present. Hori-zontal strain rates shown on Figure 14 are computed by firstinterpolating velocities (or residuals) to a grid of equallyspaced points, and then using a central difference approx-imation to compute the velocity gradient (and then the strainrate) at each point.[42] Around the Duzce rupture, we may explain this fault-
normal extension in terms of postseismic dip-slip downdipof the Duzce rupture surface. For example, slip inversions inour companion paper show that 1 year after the Izmitearthquake, dip slip continues in this location at a rate ofup to 200 mm a�1 at depths of 10 to 20 km [Ergintav et al.,2009]. Residual velocity fields (after subtraction of veloc-ities from dislocation models including dip slip) show noresidual extension across the Duzce rupture. A component ofpostseismic dip slip is reasonable because coseismic dip-slipoccurred along the north dipping Duzce rupture [Burgmannet al., 2002a]. Our finite element models do not produce thispostseismic dip slip because the Duzce rupture is modeled tobe as vertical.
Figure 10. Weighted-residual sum of squares for the dual-process model (DP) with frictional afterslip and viscoelasticrelaxation of lower crust and upper mantle layers. Thequantity shown, WRSS, is the sum of the squared weightedresiduals at all sites for both horizontal velocity componentsfor 900 1-day intervals after the Izmit earthquake (seeequation (1) and section 3). This value has been scaledby 107. Dots indicate sets of parameter values for whichmodels were run.
B08405 HEARN ET AL.: IZMIT POSTSEISMIC DEFORMATION
15 of 21
B08405
[43] Neither our models of stress-driven afterslip nor thekinematic dislocation models of Ergintav et al. [2009] canexplain a component of postseismic, north-south extensioncentered on the NAFZ in two other areas: the Lake Sapancaregion and the Marmara Sea. This is why our finite elementmodels and the kinematic slip inversions of Ergintav et al.[2009] do not fit the north postseismic velocity component aswell as they fit the east component. Ergintav et al. [2009]show that this extension, which integrates to about 3 mm a�1
of north–south lengthening across the Marmara Sea, persiststhroughout a 6-year postseismic interval.[44] Cakir et al. [2003] suggest that the NAFZ is not
vertical in the Lake Sapanca region, and that the Izmitearthquake rupture had a component of dip slip in this area.This might be driving postseismic dip slip, which wouldcause extension normal to the rupture trace. In the MarmaraSea, there is no evidence for coseismic dip slip which coulddrive significant postseismic dip slip and NAFZ-normalextension. We speculate in our companion paper [Ergintavet al., 2009] that though the coseismic stress change wouldnot encourage significant postseismic slip on these structures,coseismic softening of these faults might allow dip slip
driven by the background tectonic stress. An alternativehypothesis involves a coseismic reduction in effective vis-cosity of lower crust or upper mantle (or broad shear zones atthese depths) with a power law or transient viscous theology.This would result in the transfer of background tectonic stressto the upper crust in theMarmara region, adding a componentof north–south extension to the upper crustal stress field, anddriving the observed extension. The extension might occurvia dip slip on east–west oriented dipping structures or bydistributed extension of the elastic upper crust. We note thatErgintav et al. [2009] tried (without success) to explainNAFZ-normal extension kinematically, with dip slip onknown normal faults. Postseismic stress transfer dependson exactly how this NAFZ-normal extension is occurring, socharacterizing and understanding it is important for assessingseismic hazard in the Marmara Sea.
6.5. Implications for the Mechanics of theAnatolia-Eurasia Plate Boundary
[45] We can begin to assemble a model for part of theAnatolia-Eurasia plate boundary, which is consistent withobservations of central NAFZ coseismic, postseismic, and
Figure 11. (top) Modeled and GPS velocity vectors 2.5 years after the Izmit earthquake and (bottom)residuals for the best dual-process (DP1) model. In Figure 11 (top), dark arrows are modeled velocities,and light arrows are GPS velocities (with error ellipses showing one-sigma errors (68% uncertainties)).Vectors for 1 year after the earthquake are shown in auxiliary material Figure S5.
B08405 HEARN ET AL.: IZMIT POSTSEISMIC DEFORMATION
16 of 21
B08405
interseismic deformation, as well as longer-term geologicalslip rates.[46] Stresses in the middle crust around the central NAFZ
must be close to the Coulomb failure threshold to a depth ofabout 24 km, to permit the deep coseismic rupture noted forthe 1999 Izmit earthquake [Hearn et al., 2002a; Hearn andBurgmann, 2005]. Even if the brittle-ductile transitiondeepens coseismically [Rolandone et al., 2004; Ellis andStockhert, 2004], downward propagation of the coseismicrupture to 22 km depth is consistent with a near-Coulombstress state in the upper to middle crust as a starting point.
The earliest post-Izmit deformation is most likely due tovelocity-strengthening frictional afterslip, which alsorequires stresses along the fault zone in the middle crustto be at the Coulomb threshold. Small values of (A-B)(= (a � b)s0n) are required to model the high rate of earlyafterslip. This is consistent with deep coseismic rupture: astrongly velocity-strengthening fault zone would stop down-ward propagation of the coseismic rupture. For (A-B) to below, it is likely that s0n is low, probably because of high porepressures along the fault zone. This would be consistent with
Figure 12. (a) Summary of flow law parameters whichwould yield the required lower crust effective viscosity of 2to 6 � 1018 Pa s at a stress of 0.1 MPa, as required by modelNL1 (see text). The gray swaths show combinations ofrheological parameters A and Q which would give therequired heff at the temperatures shown (assuming n isbetween 2.5 and 3.5). The large diamonds show A and Q forwet and dry quartz and various crustal rocks. Sources are(1) Wang et al. [1994], (2 and 3) Kronenberg and Tullis[1984], (4–6) Koch et al. [1989], (7) Luan and Paterson[1992], (8) Jaoul et al. [1984], (9)Gleason and Tullis [1995],(10) Shelton and Tullis [1981], (11) Hansen and Carter[1983], and (12) Rutter and Brodie [2004]. For flow laws 3band 9, n is 4; for the other flow laws, n is within the range weassume in our viscosity calculations (between 2.5 and 3.5).(b) How these results depend on background differentialstress. (Note that a power law rheology is not likely to applyat differential stresses less than a few megapascals.)
Figure 13. (a) Summary of flow law parameters whichwould yield mantle heff of 2 to 5 � 1019 Pa s at the stressesand temperatures shown (assuming n is between 2.5 and3.5). The gray swaths show combinations of A and Q (seetext) which give the required heff at the temperatures shown(assuming n is between 2.5 and 3.5). A differential stress of1 MPa is assumed. The large diamonds show actual flowlaws for mantle rocks. References for these flow laws areas follows: (1 and 6) Carter and Ave Lallemant [1970],(2) Post [1977] (n = 5), (3 and 9) Karato et al. [1986],(4, 5, and 7) Chopra and Paterson [1981], (8) Goetze[1978], (10) Zimmerman and Kohlstedt [2004], (11)Mei andKohlstedt [2000], (12 and 13) Hirth and Kohlstedt [2003],and (14) Karato and Jung [2003]. (b) Sensitivity of therequiredA andQ values to differential stress for a temperatureof 500�C. (Note that nonlinear flow laws likely do not applyat differential stresses of less than a few megapascals.)
B08405 HEARN ET AL.: IZMIT POSTSEISMIC DEFORMATION
17 of 21
B08405

low effective friction along at least the postseismicallyslipping parts of the fault.[47] In the lower crust, creep along a viscous shear zone
is likely, based on laboratory studies and geological evi-dence [e.g., Mehl and Hirth, 2008]. Distinguishing betweensuch creep and distributed relaxation of the lower crust,based on surface deformation data, is often not practicalwith available GPS data [Freed et al., 2006a], and we do notaddress this issue in models also incorporating FAS in theupper crust and viscoelastic mantle. All of our VSZ modelsyield h/w of about 5 � 1013 to 1014 Pa s m�1 in the lowercrust. Regardless of the width of the shear zone, if therelative rate across it is 20 mm a�1, the shear stress is about6–7 MPa in the lower crust. A shear zone with a stronglynonlinear rheology could allow rapid postseismic strain athigher, background differential stress. However, studies offault zone rocks indicate that shear zones are substantiallysofter than laboratory flow laws for lower crustal rocks
would suggest [Mehl and Hirth, 2008], rendering highdifferential stresses in the lower crust unlikely.[48] Below the Moho, we may choose between distributed
flow of mantle material with a power law or transientrheology, and creep within a localized shear zone (whichshould broaden with depth, becoming rheologically indistin-guishable from mantle rock at T > 950�C [Warren and Hirth,2006]). If a viscous shear zone accommodates relative platemotion in the lower crust, later postseismic deformationrequires some contribution from the upper mantle. A tran-sient Burgers body rheology allows the required viscoelasticrelaxation to be consistent with relatively high and invariantstrain rates around the NAFZ throughout the earthquakecycle.[49] Taken together, these arguments suggest that the
central NAFZ is a ‘‘weak’’ plate boundary fault, embeddedin a strong lithosphere. This idealization is consistent withsome regional dynamic models of secular deformation [e.g.,
Figure 14. Strain rate components, 2.5 years after the Izmit earthquake. (a, c, and e) Strain ratecomponents based on the postseismic GPS velocities. (b, d, and f) The residual strain rates after velocitiesfrom the best (DP1) model have been subtracted. Model DP1 accounts for much of but not eyy. Thisindicates unmodeled, north–south postseismic extension across the NAFZ. The residual velocity at siteKDER was excluded from this strain rate analysis.
B08405 HEARN ET AL.: IZMIT POSTSEISMIC DEFORMATION
18 of 21
B08405

Jimenez-Munt and Sabadini, 2002; Fischer, 2006] andNAFZ propagation [Hubert-Ferrari et al., 2003]. It is alsoconsistent with recent models of postseismic deformationfollowing large strike-slip earthquakes in other regions [e.g.,Johnson et al., 2008]. Laboratory studies of lower crust andupper mantle rocks also suggest weak shear zones embeddedin stronger lithosphere at plate boundaries [e.g., Mehl andHirth, 2008; Warren and Hirth, 2006], though these studiescannot address the strength of the fault zone in the brittleupper crust.[50] To complete our understanding of this plate bound-
ary, we need more geological justification for the Burger’sbody rheology we have assumed, specifically, for the shortcharacteristic time over which the viscosity evolves towardits higher, ‘‘steady state’’ value. Also, earthquake cyclemodels incorporating rheologically distinct lower crust andupper mantle shear zones embedded in nonlinearly visco-elastic diabase and peridotite [e.g., Mehl and Hirth, 2008;Warren and Hirth, 2006] should be investigated. In the caseof wide shear zones, such models should produce lateralvariations in the effective plate thickness, which localizeinterseismic strain [Chery, 2008]. If these models also incor-porate afterslip in the crust, they should produce high, earlypostseismic strain rates and localized, invariant strain ratesthrough most of the earthquake cycle, while being consistentwith recent studies of exhumed shear zone rocks and labo-ratory rheology experiments.[51] Another factor that should be explored more in future
models of postseismic deformation in this region is lateral,rheological contrasts; for example, the reduced effectiveelastic plate thickness in the Marmara Sea region and to thesouth, where the lithosphere is relatively hot [e.g., Schindler,1997]. Such a contrast might lead to faster postseismic,viscoelastic relaxation of lower crust and/or upper mantlein the Marmara region and to the south, setting up relativelyrapid southward motion of this region (and NAFZ-normalextension).[52] These models will not immediately explain the dis-
agreement between geologic (Holocene) and geodetic esti-mates of the central NAFZ slip rate. The Holocene slip ratesare about 30% slower than the geodetic rates [e.g., Kozaci etal., 2009]. Earthquake cycle models will provide a means totest possible explanations for this discrepancy, such as long-term variations in effective fault friction or driving stresses[Chery and Vernant, 2006], or variations in lower crustalrheology related to the elevated rate of large NAFZ earth-quakes during the twentieth century [Kozaci et al., 2009].
[53] Acknowledgments. This research was supported by NSERCDiscovery Grant RGPIN 261458-07 to Elizabeth Hearn at UBC and byNSF grants EAR-0337497, EAR-0305480, and INT-0001583 to RobertReilinger and Simon McClusky at MIT. We gratefully acknowledge all ofthe research groups who have participated in measuring surface deforma-tion around the NAF since 1988. We would also like to thank James Dolanand an anonymous reviewer for their helpful suggestions, which whichimproved the clarity of this manuscript.
ReferencesAagaard, B., C. Williams, and M. Knepley (2007), PyLith: A finite-elementcode for modeling quasi-static and dynamic crustal deformation, EosTrans. AGU, 88(52), Fall Meet. Suppl., Abstract T21B-0592.
Aagaard, B., S. Kientz, M. Knepley, L. Strand, and C. Williams (2008),PyLith user manual, version 1.3, Comput. Infrastructure for Geodyn.,Pasadena, Calif.
Ayhan, M. E., R. Burgmann, S. McClusky, O. Lenk, B. Aktug, E. Herece,and R. E. Reilinger (2001), Kinematics of the Mw = 7.2, 12 November1999, Duzce, Turkey earthquake, Geophys. Res. Lett., 28, 367–370,doi:10.1029/2000GL011851.
Ayhan, M. E., C. Demir, O. Lenk, A. Kilicoglu, Y. Altiner, A. Barka,S. Ergintav, and H. Ozener (2002), Interseismic strain accumulation in theMarmara Sea region, Bull. Seismol. Soc. Am., 92, 216–229, doi:10.1785/0120000818.
Burgmann, R., and G. Dresen (2008), Rheology of the lower crust andupper mantle: Evidence from rock mechanics, geodesy, and field obser-vations, Annu. Rev. Earth Planet. Sci., 36, 531–567, doi:10.1146/annurev.earth.36.031207.124326.
Burgmann, R., M. E. Ayhan, E. J. Fielding, T. J. Wright, S. McClusky,B. Aktug, C. Demir, O. Lenk, and A. Turkezer (2002a), Deformationduring the 12 November 1999 Duzce, Turkey earthquake, from GPSand InSAR data, Bull. Seismol. Soc. Am., 92, 161 –171, doi:10.1785/0120000834.
Burgmann, R., S. Ergintav, P. Segall, E. Hearn, S. McClusky, R. Reilinger,H. Woith, and J. Zschau (2002b), Time-dependent distributed afterslip onand deep below the Izmit earthquake rupture, Bull. Seismol. Soc. Am., 92,126–137, doi:10.1785/0120000833.
Burov, E., and A. Watts (2006), The long-term strength of continentallithosphere: ‘‘jelly sandwich’’ or ‘‘creme brulee’’?, GSA Today, 16(1),4–10, doi:10.1130/1052-5173(2006)016<4:TLTSOC>2.0.CO;2.
Cakir, Z., J.-B. de Chabalier, R. Armijo, B. Meyer, A. Barka, and G. Peltzer(2003), Coseismic and early post-seismic slip associated with the 1999Izmit earthquake (Turkey), from SAR interferometry and tectonic fieldobservations, Geophys. J. Int., 155, 93 – 110, doi:10.1046/j.1365-246X.2003.02001.x.
Carter, N. L., and H. G. Ave Lallemant (1970), High temperature flow ofdunite and peridotite, Geol. Soc. Am. Bull., 81, 2181–2202.
Chery, J. (2008), Geodetic strain across the San Andreas Fault reflectselastic plate thickness variations (rather than fault slip rate), Earth Planet.Sci. Lett., 269, 352–365, doi:10.1016/j.epsl.2008.01.046.
Chery, J., and P. Vernant (2006), Lithospheric elasticity promotes episodicfault activity, Earth Planet. Sci. Lett., 243, 211–217, doi:10.1016/j.epsl.2005.12.014.
Chopra, P. N. (1997), High-temperature transient creep in olivine rocks,Tectonophysics, 279, 93–111, doi:10.1016/S0040-1951(97)00134-0.
Chopra, P. N., and M. S. Paterson (1981), The experimental deformation ofdunite, Tectonophysics, 78, 453–473.
Demirbag, E., C. Rangin, X. Le Pichon, and A. M. C. Sengor (2003),Investigation of the tectonics of the Main Marmara Fault by means ofdeep-towed seismic data, Tectonophysics, 361, 1 – 19, doi:10.1016/S0040-1951(02)00535-8.
Ellis, S., and B. Stockhert (2004), Elevated stresses and creep rates beneaththe brittle-ductile transition caused by seismic faulting in the upper crust,J. Geophys. Res., 109, B05407, doi:10.1029/2003JB002744.
Ergintav, S., R. Burgmann, S. McClusky, R. Cakmak, R. E. Reilinger,O. Lenk, A. Barka, and H. Ozener (2002), Postseismic deformationnear the Izmit earthquake (17 August 1999, M = 7.5) rupture zone, Bull.Seismol. Soc. Am., 92, 194–207, doi:10.1785/0120000836.
Ergintav, S., U. Dogan, C. Gerstenecker, R. Cakmak, A. Belgen,H. Demirel, C. Aydon, and R. Reilinger (2007), A snapshot (2003–2005)of the 3D postseismic deformation for the 1999,Mw= 7.4 Izmit earthquakein the Marmara region, Turkey, by first results of joint gravity and GPSmonitoring, J. Geodyn., 44, 1–18, doi:10.1016/j.jog.2006.12.005.
Ergintav, S., S. McClusky, E. H. Hearn, R. E. Reilinger, R. Cakmak,T. Herring, H. Ozener, O. Lenk, and E. Tari (2009), Seven years of post-seismic deformation following the 1999, M = 7.4 and M = 7.2, Izmit-Duzce, Turkey earthquake sequence, J. Geophys. Res., 114, B07403,doi:10.1029/2008JB006021.
Fay, N., and E. D. Humphreys (2006), Dynamics of the Salton block:Absolute fault strength and crust-mantle coupling in southern California,Geology, 34, 261–264, doi:10.1130/G22172.1.
Feigl, K. L., F. Sarti, H. Vadon, S. McClusky, S. Ergintav, P. Durand,R. Burgmann, A. Rigo, D. Massonet, and R. Reilinger (2002), Esti-mating slip distribution for the Izmit mainshock from coseismic GPS,RADARSAT, ERS-1, and SPOT measurements, Bull. Seismol. Soc.Am., 92, 138 – 160, doi:10.1785/0120000830.
Fischer, K. D. (2006), The influence of different rheological parameters onthe surface deformation and stress field of the Aegean-Anatolian region,Int. J. Earth Sci., 95, 239–249, doi:10.1007/s00531-005-0031-0.
Freed, A. M., and R. Burgmann (2004), Evidence of power-law flow in theMojave desert mantle, Nature, 430, 548–551, doi:10.1038/nature02784.
Freed, A. M., R. Burgmann, E. Calais, J. Freymueller, and S. Hreinsdottir(2006a), Implications of deformation following the 2002 Denali, Alaska,earthquake for postseismic relaxation processes and lithospheric rheology,J. Geophys. Res., 111, B01401, doi:10.1029/2005JB003894.
B08405 HEARN ET AL.: IZMIT POSTSEISMIC DEFORMATION
19 of 21
B08405
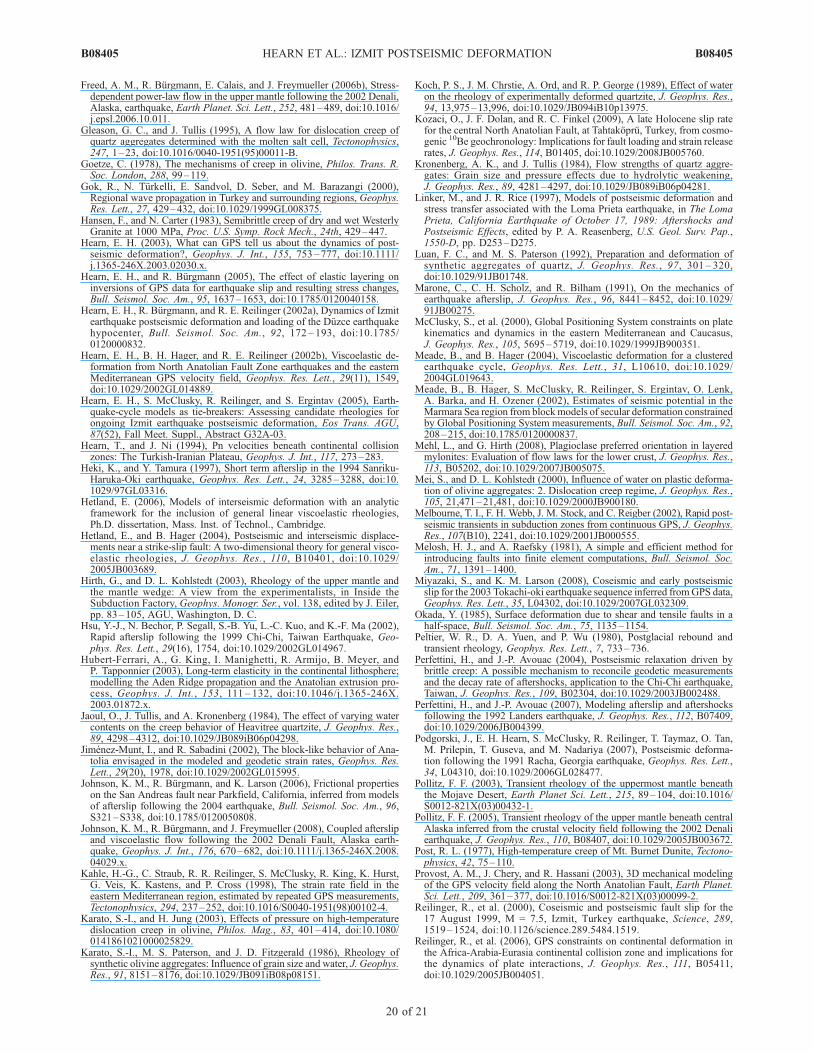
Freed, A. M., R. Burgmann, E. Calais, and J. Freymueller (2006b), Stress-dependent power-law flow in the upper mantle following the 2002 Denali,Alaska, earthquake, Earth Planet. Sci. Lett., 252, 481–489, doi:10.1016/j.epsl.2006.10.011.
Gleason, G. C., and J. Tullis (1995), A flow law for dislocation creep ofquartz aggregates determined with the molten salt cell, Tectonophysics,247, 1–23, doi:10.1016/0040-1951(95)00011-B.
Goetze, C. (1978), The mechanisms of creep in olivine, Philos. Trans. R.Soc. London, 288, 99–119.
Gok, R., N. Turkelli, E. Sandvol, D. Seber, and M. Barazangi (2000),Regional wave propagation in Turkey and surrounding regions, Geophys.Res. Lett., 27, 429–432, doi:10.1029/1999GL008375.
Hansen, F., and N. Carter (1983), Semibrittle creep of dry and wet WesterlyGranite at 1000 MPa, Proc. U.S. Symp. Rock Mech., 24th, 429–447.
Hearn, E. H. (2003), What can GPS tell us about the dynamics of post-seismic deformation?, Geophys. J. Int., 155, 753–777, doi:10.1111/j.1365-246X.2003.02030.x.
Hearn, E. H., and R. Burgmann (2005), The effect of elastic layering oninversions of GPS data for earthquake slip and resulting stress changes,Bull. Seismol. Soc. Am., 95, 1637–1653, doi:10.1785/0120040158.
Hearn, E. H., R. Burgmann, and R. E. Reilinger (2002a), Dynamics of Izmitearthquake postseismic deformation and loading of the Duzce earthquakehypocenter, Bull. Seismol. Soc. Am., 92, 172 – 193, doi:10.1785/0120000832.
Hearn, E. H., B. H. Hager, and R. E. Reilinger (2002b), Viscoelastic de-formation from North Anatolian Fault Zone earthquakes and the easternMediterranean GPS velocity field, Geophys. Res. Lett., 29(11), 1549,doi:10.1029/2002GL014889.
Hearn, E. H., S. McClusky, R. Reilinger, and S. Ergintav (2005), Earth-quake-cycle models as tie-breakers: Assessing candidate rheologies forongoing Izmit earthquake postseismic deformation, Eos Trans. AGU,87(52), Fall Meet. Suppl., Abstract G32A-03.
Hearn, T., and J. Ni (1994), Pn velocities beneath continental collisionzones: The Turkish-Iranian Plateau, Geophys. J. Int., 117, 273–283.
Heki, K., and Y. Tamura (1997), Short term afterslip in the 1994 Sanriku-Haruka-Oki earthquake, Geophys. Res. Lett., 24, 3285–3288, doi:10.1029/97GL03316.
Hetland, E. (2006), Models of interseismic deformation with an analyticframework for the inclusion of general linear viscoelastic rheologies,Ph.D. dissertation, Mass. Inst. of Technol., Cambridge.
Hetland, E., and B. Hager (2004), Postseismic and interseismic displace-ments near a strike-slip fault: A two-dimensional theory for general visco-elastic rheologies, J. Geophys. Res., 110, B10401, doi:10.1029/2005JB003689.
Hirth, G., and D. L. Kohlstedt (2003), Rheology of the upper mantle andthe mantle wedge: A view from the experimentalists, in Inside theSubduction Factory, Geophys. Monogr. Ser., vol. 138, edited by J. Eiler,pp. 83–105, AGU, Washington, D. C.
Hsu, Y.-J., N. Bechor, P. Segall, S.-B. Yu, L.-C. Kuo, and K.-F. Ma (2002),Rapid afterslip following the 1999 Chi-Chi, Taiwan Earthquake, Geo-phys. Res. Lett., 29(16), 1754, doi:10.1029/2002GL014967.
Hubert-Ferrari, A., G. King, I. Manighetti, R. Armijo, B. Meyer, andP. Tapponnier (2003), Long-term elasticity in the continental lithosphere;modelling the Aden Ridge propagation and the Anatolian extrusion pro-cess, Geophys. J. Int., 153, 111 – 132, doi:10.1046/j.1365-246X.2003.01872.x.
Jaoul, O., J. Tullis, and A. Kronenberg (1984), The effect of varying watercontents on the creep behavior of Heavitree quartzite, J. Geophys. Res.,89, 4298–4312, doi:10.1029/JB089iB06p04298.
Jimenez-Munt, I., and R. Sabadini (2002), The block-like behavior of Ana-tolia envisaged in the modeled and geodetic strain rates, Geophys. Res.Lett., 29(20), 1978, doi:10.1029/2002GL015995.
Johnson, K. M., R. Burgmann, and K. Larson (2006), Frictional propertieson the San Andreas fault near Parkfield, California, inferred from modelsof afterslip following the 2004 earthquake, Bull. Seismol. Soc. Am., 96,S321–S338, doi:10.1785/0120050808.
Johnson, K. M., R. Burgmann, and J. Freymueller (2008), Coupled afterslipand viscoelastic flow following the 2002 Denali Fault, Alaska earth-quake, Geophys. J. Int., 176, 670–682, doi:10.1111/j.1365-246X.2008.04029.x.
Kahle, H.-G., C. Straub, R. R. Reilinger, S. McClusky, R. King, K. Hurst,G. Veis, K. Kastens, and P. Cross (1998), The strain rate field in theeastern Mediterranean region, estimated by repeated GPS measurements,Tectonophysics, 294, 237–252, doi:10.1016/S0040-1951(98)00102-4.
Karato, S.-I., and H. Jung (2003), Effects of pressure on high-temperaturedislocation creep in olivine, Philos. Mag., 83, 401–414, doi:10.1080/0141861021000025829.
Karato, S.-I., M. S. Paterson, and J. D. Fitzgerald (1986), Rheology ofsynthetic olivine aggregates: Influence of grain size and water, J. Geophys.Res., 91, 8151–8176, doi:10.1029/JB091iB08p08151.
Koch, P. S., J. M. Chrstie, A. Ord, and R. P. George (1989), Effect of wateron the rheology of experimentally deformed quartzite, J. Geophys. Res.,94, 13,975–13,996, doi:10.1029/JB094iB10p13975.
Kozaci, O., J. F. Dolan, and R. C. Finkel (2009), A late Holocene slip ratefor the central North Anatolian Fault, at Tahtakopru, Turkey, from cosmo-genic 10Be geochronology: Implications for fault loading and strain releaserates, J. Geophys. Res., 114, B01405, doi:10.1029/2008JB005760.
Kronenberg, A. K., and J. Tullis (1984), Flow strengths of quartz aggre-gates: Grain size and pressure effects due to hydrolytic weakening,J. Geophys. Res., 89, 4281–4297, doi:10.1029/JB089iB06p04281.
Linker, M., and J. R. Rice (1997), Models of postseismic deformation andstress transfer associated with the Loma Prieta earthquake, in The LomaPrieta, California Earthquake of October 17, 1989: Aftershocks andPostseismic Effects, edited by P. A. Reasenberg, U.S. Geol. Surv. Pap.,1550-D, pp. D253–D275.
Luan, F. C., and M. S. Paterson (1992), Preparation and deformation ofsynthetic aggregates of quartz, J. Geophys. Res., 97, 301 – 320,doi:10.1029/91JB01748.
Marone, C., C. H. Scholz, and R. Bilham (1991), On the mechanics ofearthquake afterslip, J. Geophys. Res., 96, 8441–8452, doi:10.1029/91JB00275.
McClusky, S., et al. (2000), Global Positioning System constraints on platekinematics and dynamics in the eastern Mediterranean and Caucasus,J. Geophys. Res., 105, 5695–5719, doi:10.1029/1999JB900351.
Meade, B., and B. Hager (2004), Viscoelastic deformation for a clusteredearthquake cycle, Geophys. Res. Lett., 31, L10610, doi:10.1029/2004GL019643.
Meade, B., B. Hager, S. McClusky, R. Reilinger, S. Ergintav, O. Lenk,A. Barka, and H. Ozener (2002), Estimates of seismic potential in theMarmara Sea region from blockmodels of secular deformation constrainedby Global Positioning System measurements, Bull. Seismol. Soc. Am., 92,208–215, doi:10.1785/0120000837.
Mehl, L., and G. Hirth (2008), Plagioclase preferred orientation in layeredmylonites: Evaluation of flow laws for the lower crust, J. Geophys. Res.,113, B05202, doi:10.1029/2007JB005075.
Mei, S., and D. L. Kohlstedt (2000), Influence of water on plastic deforma-tion of olivine aggregates: 2. Dislocation creep regime, J. Geophys. Res.,105, 21,471–21,481, doi:10.1029/2000JB900180.
Melbourne, T. I., F. H. Webb, J. M. Stock, and C. Reigber (2002), Rapid post-seismic transients in subduction zones from continuous GPS, J. Geophys.Res., 107(B10), 2241, doi:10.1029/2001JB000555.
Melosh, H. J., and A. Raefsky (1981), A simple and efficient method forintroducing faults into finite element computations, Bull. Seismol. Soc.Am., 71, 1391–1400.
Miyazaki, S., and K. M. Larson (2008), Coseismic and early postseismicslip for the 2003 Tokachi-oki earthquake sequence inferred fromGPS data,Geophys. Res. Lett., 35, L04302, doi:10.1029/2007GL032309.
Okada, Y. (1985), Surface deformation due to shear and tensile faults in ahalf-space, Bull. Seismol. Soc. Am., 75, 1135–1154.
Peltier, W. R., D. A. Yuen, and P. Wu (1980), Postglacial rebound andtransient rheology, Geophys. Res. Lett., 7, 733–736.
Perfettini, H., and J.-P. Avouac (2004), Postseismic relaxation driven bybrittle creep: A possible mechanism to reconcile geodetic measurementsand the decay rate of aftershocks, application to the Chi-Chi earthquake,Taiwan, J. Geophys. Res., 109, B02304, doi:10.1029/2003JB002488.
Perfettini, H., and J.-P. Avouac (2007), Modeling afterslip and aftershocksfollowing the 1992 Landers earthquake, J. Geophys. Res., 112, B07409,doi:10.1029/2006JB004399.
Podgorski, J., E. H. Hearn, S. McClusky, R. Reilinger, T. Taymaz, O. Tan,M. Prilepin, T. Guseva, and M. Nadariya (2007), Postseismic deforma-tion following the 1991 Racha, Georgia earthquake, Geophys. Res. Lett.,34, L04310, doi:10.1029/2006GL028477.
Pollitz, F. F. (2003), Transient rheology of the uppermost mantle beneaththe Mojave Desert, Earth Planet Sci. Lett., 215, 89–104, doi:10.1016/S0012-821X(03)00432-1.
Pollitz, F. F. (2005), Transient rheology of the upper mantle beneath centralAlaska inferred from the crustal velocity field following the 2002 Denaliearthquake, J. Geophys. Res., 110, B08407, doi:10.1029/2005JB003672.
Post, R. L. (1977), High-temperature creep of Mt. Burnet Dunite, Tectono-physics, 42, 75–110.
Provost, A. M., J. Chery, and R. Hassani (2003), 3D mechanical modelingof the GPS velocity field along the North Anatolian Fault, Earth Planet.Sci. Lett., 209, 361–377, doi:10.1016/S0012-821X(03)00099-2.
Reilinger, R., et al. (2000), Coseismic and postseismic fault slip for the17 August 1999, M = 7.5, Izmit, Turkey earthquake, Science, 289,1519–1524, doi:10.1126/science.289.5484.1519.
Reilinger, R., et al. (2006), GPS constraints on continental deformation inthe Africa-Arabia-Eurasia continental collision zone and implications forthe dynamics of plate interactions, J. Geophys. Res., 111, B05411,doi:10.1029/2005JB004051.
B08405 HEARN ET AL.: IZMIT POSTSEISMIC DEFORMATION
20 of 21
B08405

Rolandone, F., R. Burgmann, and R. M. Nadeau (2004), The evolution ofthe seismic-aseismic transition during the earthquake cycle: Constraintsfrom the time-dependent depth distribution of aftershocks, Geophys. Res.Lett., 31, L23610, doi:10.1029/2004GL021379.
Rutter, E. H., and K. H. Brodie (2004), Experimental intracrystallineplastic flow in hot-pressed synthetic quartzite prepared from Brazilianquartz crystals, J. Struct. Geol., 26, 259 – 270, doi:10.1016/S0191-8141(03)00096-8.
Sandvol, E., K. Al Damegh, A. Calvert, D. Seber, M. Barazangi,R. Mohamad, R. Gok, N. Turkelli, and C. Gurbuz (2001), Tomographicimaging of Lg and Sn propagation in the Middle East, Pure Appl.Geophys., 158, 1121 – 1163, doi:10.1007/PL00001218.
Saucier, F., and E. D. Humphreys (1993), Horizontal crustal deformation inSouthern California from joint models of geologic and very long baselineinterferometry measurements, in Contributions of Space Geodesy toGeodynamics—Crustal Dynamics, AGU Geodyn. Ser., vol. 23, editedby D. E. Smith and D. L. Turcotte, pp. 139–176, AGU,Washington, D. C.
Savage, J. C. (1990), Equivalent strike-slip earthquakes cycles in half-spaceand lithosphere-asthenosphere earth models, J. Geophys. Res., 95, 4873–4879.
Schindler, C. (1997), Geology of northwestern Turkey: Results of theMARMARA Poly-Project, in Active Tectonics of Northwestern Anatolia—The MARMARA Poly-Project, edited by C. Schindler and M. Pfister,pp. 329 – 373, vdf Hochschulverlag AG van der ETH, Zurich.
Scholz, C. (1998), Earthquakes and friction laws, Nature, 391, 37–42,doi:10.1038/34097.
Shelton, G., and J. Tullis (1981), Experimental flow laws for crustal rocks,Eos Trans. AGU, 62(17), 396.
Straub, C., H. Kahle, and C. Schindler (1997), GPS and geologic estimatesof the tectonic activity in the Marmara Sea region, NW Anatolia,J. Geophys. Res., 102, 27,587–27,602, doi:10.1029/97JB02563.
Wang, J., B. Hobbs, A. Ord, T. Shimamoto, and M. Toriumi (1994),Newtonian dislocation creep in quartzites: Implications for the rheologyof the lower crust, Science, 265, 1204–1205, doi:10.1126/science.265.5176.1204.
Wang, R., F. Lorenzo-Martin, and F. Roth (2006), PSGRN/PSCMP—Anew code for calculating co- and post-seismic deformation, geoid andgravity changes based on the viscoelastic-gravitational dislocation theory,Comput. Geosci., 32, 527–541, doi:10.1016/j.cageo.2005.08.006.
Warren, J. M., and G. Hirth (2006), Grain size sensitive deformation me-chanisms in naturally deformed peridotites, Earth Planet. Sci. Lett., 248,438–450, doi:10.1016/j.epsl.2006.06.006.
Williams, C. A., and R. M. Richardson (1991), A rheologically layeredthree-dimensional model of the San Andreas fault in central and southernCalifornia, J. Geophys. Res., 96, 16,597 – 16,623, doi:10.1029/91JB01484.
Williams, C. A., B. Aagaard, and M. G. Knepley (2005), Development ofsoftware for studying earthquakes across multiple spatial and temporalscales by coupling quasi-static and dynamic simulations, Eos Trans.AGU, 86(52), Fall Meet. Suppl., Abstract S53A-1072.
Wright, T., B. Parsons, and E. Fielding (2001), Measurement of interseis-mic strain accumulation across the North Anatolian Fault by satelliteradar interferometry, Geophys. Res. Lett., 28, 2117–2120, doi:10.1029/2000GL012850.
Zimmerman, M. E., and D. L. Kohlstedt (2004), Rheological properties ofpartiallymolten lherzolite, J. Petrol., 45, 275–298, doi:10.1093/petrology/egg089.
�����������������������S. Ergintav, TUBITAK, Marmara Research Center, Earth and Marine
Sciences Institute, P.O. Box 21, 41470 Gebze, Turkey. ([email protected])E. H. Hearn, Department of Earth and Ocean Sciences, University of
British Columbia, 6339 Stores Road, Vancouver, BC V6T 1Z4, Canada.([email protected])S. McClusky and R. E. Reilinger, Department of Earth, Atmospheric,
and Planetary Sciences, 54-326, Massachusetts Institute of Technology, 77Massachusetts Avenue, Cambridge, MA 02139-0000, USA. ([email protected]; [email protected])
B08405 HEARN ET AL.: IZMIT POSTSEISMIC DEFORMATION
21 of 21
B08405