
On the Use of Anisotropic Covariance Models in Estimating Atmospheric DInSAR Contributions
ANNALS OF GEOPHYSICS, VOL. 45, N. 3/4, June/August 2002
527
The August 17, 1999 Izmit, Turkey,earthquake: slip distribution from
dislocation modeling of DInSAR andsurface offset
Salvatore Stramondo (1), Francesca R. Cinti (1), Michele Dragoni (2), Stefano Salvi (1)and Stefano Santini (3)
(1) Istituto Nazionale di Geofisica e Vulcanologia, Roma, Italy(2) Dipartimento di Fisica, Università di Bologna, Italy
(3) Istituto di Fisica, Università di Urbino, Italy
AbstractWe show the results of application of Differential SAR Interferometry to the MW 7.4, August 17, 1999, Izmitearthquake, Western Turkey. The differential interferogram is obtained using an interferometric ERS2 ascendingpair with a time interval of 35 days (August 13th - September 17th). The fringe pattern clearly defines the coseismicdisplacement field extended in an area of about 100 km N-S and 120 km E-W. The analysis of the interferogramshows the right-lateral strike-slip movement on the activated section of the North Anatolian fault system. Themaximum SAR-detected displacement ranges between 117.6 cm and 134.4 cm in the proximity of Gölcük. Weinvert SAR data for uniform dislocation on a single fault plane using a Montecarlo procedure, with the aim oftesting a large set of a priori possible asperity distributions on the fault. We then use a forward modeling approachto evaluate the slip variability for the dislocation using additional constraints as surface offsets and seismicitydistribution: in this case we allow unit cells to undergo different values of slip in order to refine the initial dislocationmodel. Misfits between SAR data and modeled slant range displacements are generally low for all our models(~ 12 cm). Our results indicate that slip is concentrated in the central-western part of the fault, in the upper 10-15km, tapering to the fault tips. For the Izmit case, we note that a well constrained fault model can be obtained onlyintegrating DInSAR data with additional observations. This is mainly due to an undersampling of the displacementfield by DInSAR, caused by decorrelation and lack of image data.
1. Introduction
On August 17, 1999, Western Turkey wasshaken by a destructive, MW 7.4 earthquake. Theevent struck the highly developed urban and
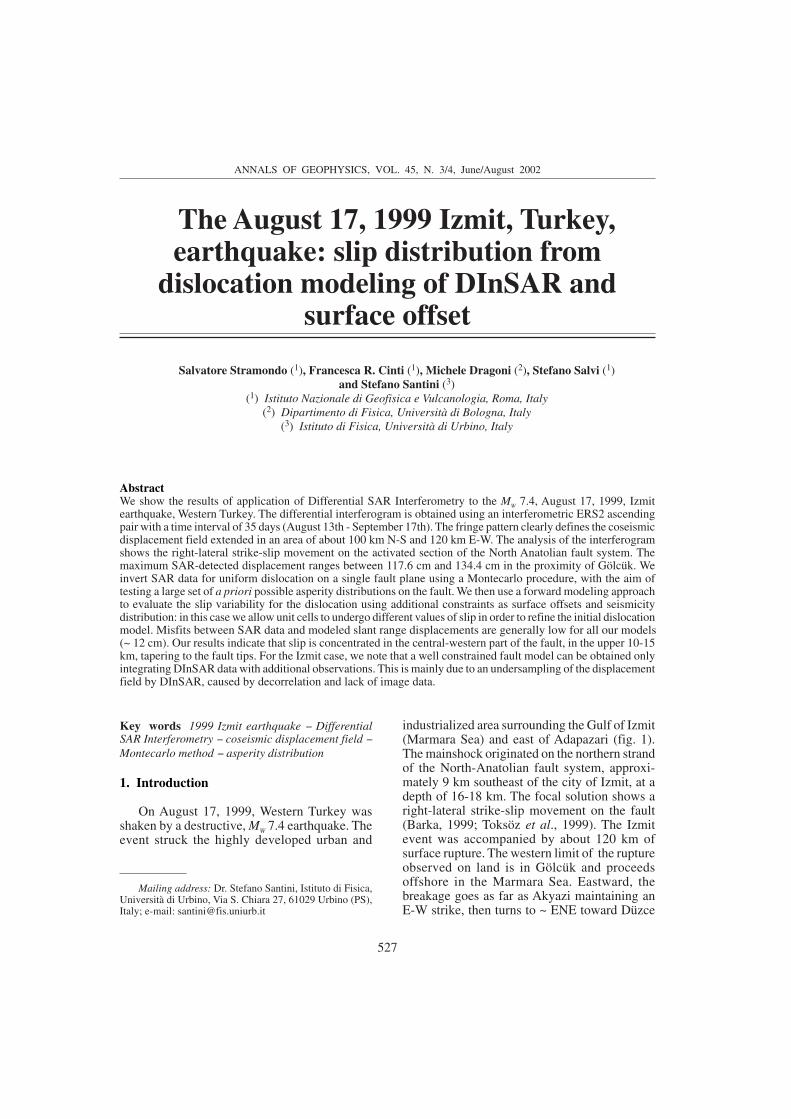
industrialized area surrounding the Gulf of Izmit(Marmara Sea) and east of Adapazari (fig. 1).The mainshock originated on the northern strandof the North-Anatolian fault system, approxi-mately 9 km southeast of the city of Izmit, at adepth of 16-18 km. The focal solution shows aright-lateral strike-slip movement on the fault(Barka, 1999; Toksöz et al., 1999). The Izmitevent was accompanied by about 120 km ofsurface rupture. The western limit of the ruptureobserved on land is in Gölcük and proceedsoffshore in the Marmara Sea. Eastward, thebreakage goes as far as Akyazi maintaining anE-W strike, then turns to ~ ENE toward Düzce
Mailing address: Dr. Stefano Santini, Istituto di Fisica,Università di Urbino, Via S. Chiara 27, 61029 Urbino (PS),Italy; e-mail: [email protected]
Key words 1999 Izmit earthquake DifferentialSAR Interferometry coseismic displacement field Montecarlo method asperity distribution
528
Salvatore Stramondo, Francesca R. Cinti, Michele Dragoni, Stefano Salvi and Stefano Santini
(fig. 1), the change in direction being marked bya gap in the surface displacement. The surfacerupture, although continuous, shows a certain slipvariability: maximum offsets of 4-5 m (Gölcük,E of Sapanka Lake), and an average of about2.5 m (Barka, 1999; U.S. Geological Survey,1999 and references therein).
We analyze the information relative to thisseismic event derived from the application of theDifferential SAR Interferometry (DInSAR)technique and discuss the significance of thefringe pattern with respect to the rupturemechanism. Unlike other point based (GPS), orline based (levelling) geodetic techniques,DInSAR is an image based technique whichallows the spatial deformation pattern associated
with an earthquake to be mapped at high reso-lution (see DInSAR theory and applications inMassonnet and Feigl, 1998 and referencestherein). This characteristic of DInSAR data isparticularly favourable to develop well con-strained dislocation models sensitive even tolocal slip inhomogeneities (Peltzer et al., 1994).
We quantify the maximum ERS-SAR dis-placement and invert the DInSAR data for auniform slip dislocation using a Montecarloprocedure; SAR data are used in order to constrainthe geometry of the dislocation surface. To thisaim, an asperity model is employed, where thefault plane is divided into a large number of squareasperity units which can slip by a constant amountor remain locked. We then start from this model
Epicentre
Surface ruptureNorth Anatolianfault system
Fig. 1. Location and HCMT focal mechanism of the Izmit earthquake (17 August, 1999). The North Anatolianfault system and the surface rupture (dashed when offshore) (U.S. Geological Survey, 1999; IPGP web site, 1999)are indicated.
529
The August 17, 1999 Izmit, Turkey, earthquake: slip distribution from dislocation modeling of DInSAR and surface offset
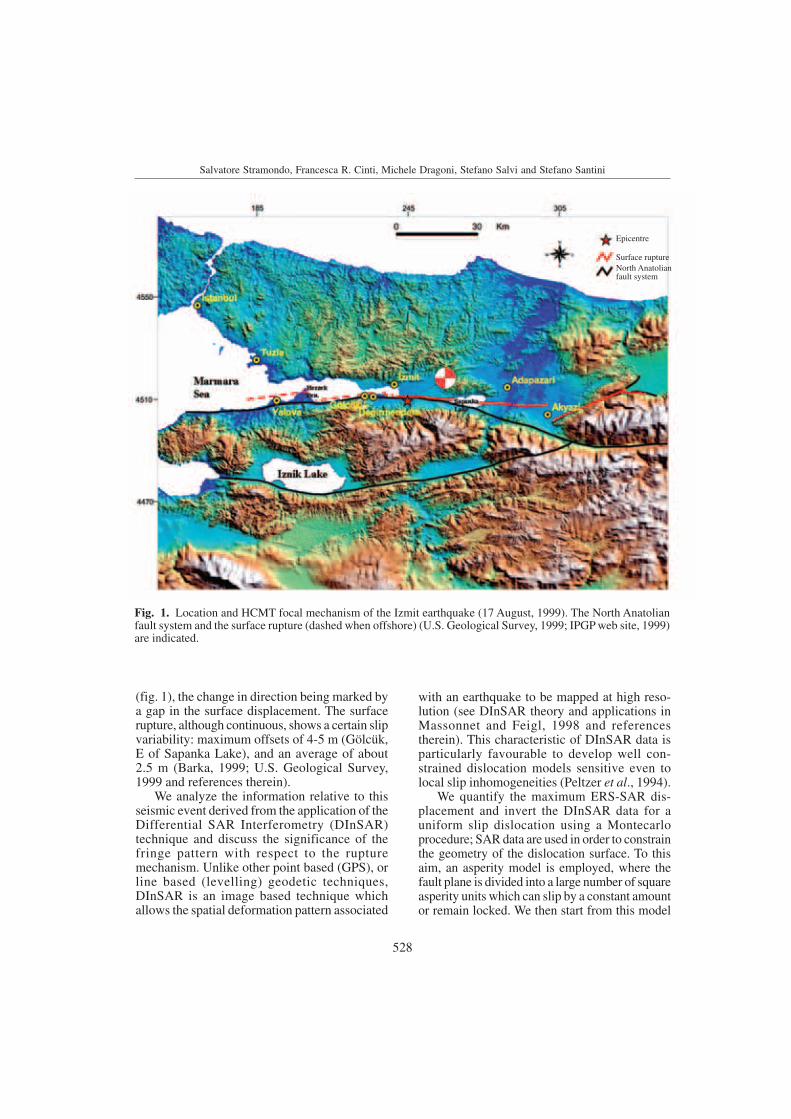
(fig. 2). This general setting indicates that largedisplacement shown by the interferogram occursin the western part of the fault. This observationseems to be in agreement with the high offsetsmeasured on land that reaches 4.5 m in Gölcükbefore the fault enters the Marmara Sea. Theconcentric pattern on the shorelines of theMarmara Sea suggests the continuation of therupture offshore for at least 20 km.
The satellite-to-ground distance between thetwo image acquisitions increases north of thesurface rupture and decreases to the south (fig.2). This is in agreement with the right lateralkinematics of the fault. We first estimated themaximum measured range change based on thenumber of fringes observed at both sides of thefault in the proximity of Gölcük (fig. 2). Wecounted about 27-30 fringes in the northern sideand 15-18 fringes in the southern side, eachfringe representing a slant range displacementof 2.8 cm. Note that for most of the fault extentin the near range of the fault SAR data aremissing due to de-correlation (Marmara Sea andSapanka Lake) and/or excessive deformationgradient. We manually unwrapped the phasestarting from the fringes closer to the fault trace,along the E coast of the Izmit Gulf, assuming asurface offset of 3.4 m in this area (U.S. Geo-logical Survey, 1999; IPGP web site, 1999), apure right lateral slip and E-W direction of thefault to project the slip vector onto the satelliteline of sight. We assume that the uncertaintyassociated with our unwrapping procedure istwo fringes.
The interferogram is perturbed by atmos-pheric artifacts that can affect the propagationof the SAR signal (Massonnet and Feigl, 1998;Reilinger et al., 2000). For the Izmit interfero-grams, Reilinger et al. (2000) attribute differ-ences of 3-4 cm between GPS and DInSARdisplacements to changes in the atmosphericconditions between the two ERS image acqui-sitions. They claim these variations should occurover a spatial wavelength shorter than thedistance between the GPS stations (~ 10 km).Indeed, considerable moisture variations (watervapor is the most important parameter affectingtropospheric path delays in radar images, Zebkeret al., 1997) can occur even on 1 km scale incase of strong tropospheric turbulence (Weck-
to evaluate the slip distribution on the fault, usingadditional constraints and a forward modelingprocedure.
The DInSAR data of the August 17, 1999,Izmit earthquake have already been presentedand discussed in previous works (Delouis et al.,2000; Reilinger et al., 2000; Wright et al., 2001)with the aim of inverting the details of theseismic source. However, these studies sufferfrom the typical problem of data inversion,notably that they fail to clarify the effectiveconstrains that the data impose on the invertedparameters. In this work, the distribution ofasperities (or slip) on the fault plane is foundusing only the fault geometry, the geodetic dataand the seismic moment related to the 1999Izmit earthquake.
2. The DInSAR data
We selected an ERS 2 ascending pair, withan altitude of ambiguity ha (i.e. the altitudedifference corresponding to a phase change of2 ) of 144 m. The two images span 35 days(August 13th-September 17th, 1999), the mini-mum interval between two overpasses of thesame ERS satellite on a specific area. The to-pographic phase contribution was subtractedusing an interferometric DEM (courtesy of E.Fielding). Differential interferometry is moresensitive to vertical than to horizontal move-ments (the mean state vectors are 0.38 east,
0.08 north, 0.92 up, for ascending orbits andfor Turkey region latitude). However, the Izmitstrike slip fault has the best geometric settingto detect horizontal displacement withDInSAR. In fact, the ground projection of thesatellite line-of-sight (slant range) being aboutparallel to the E-W fault, the displacement com-ponent on the slant range is maximized (Peltzeret al., 1994).
The differential interferogram (fig. 2) showsthe surface coseismic displacement extending onboth sides of the fault and covering a wide area,about 120 km E-W and 100 km N-S. At largescale, fringes are parallel to the fault, showingvariable gradient whose maximum is locatedwest of the epicenter and converging towards thefault trace about 15 km west of the city of Gölcük
530
Salvatore Stramondo, Francesca R. Cinti, Michele Dragoni, Stefano Salvi and Stefano Santini
3. SAR data inversion by the Montecarlo method
Let us consider an elastic, homogeneous andisotropic half-space, occupying the region x3 0in a Cartesian coordinate system, and assume thatthe fault is a rectangular surface intersecting theEarth’s surface with a dip angle . The fault isstrike-slip, right-lateral, and is made of 216square asperity units. We assume that the Lamèconstants are equal (Poisson solid) and calculatedaccording to PREM (Dziewonski and Anderson,1981): = µ = 4.5 × 10¹⁰ Pa. In the case of arectangular dislocation, the displacement field atthe Earth’s surface can be obtained by availableanalytical solutions (Okada, 1985).
werth et al., 1997), with relative humidityvariations of several tens %, giving rise to phaseshifts of 1-2 cycles over distances of kilometers(Hanssen and Fejit, 1996). Over longerwavelengths though (30-50 km), the changesin relative humidity are usually smaller andthe SAR phase shifts expected are of the orderof a few cycles (Hanssen and Fejit, 1996). Inour interferograms we do not see strong signs oftropospheric turbulence (in fact the inter-ferogram difference shows only long wave-length residuals), therefore, assuming that onlyminor relative humidity variations have occurredover the scenes, we estimate a maximum at-mospheric phase shift over the entire scene of 2fringes.
Modelled fault and surface slip (cm)
080160240320400
Epicentre
Fig. 2. ERS2 co-seismic differential interferogram. Fringes show the displacement field associated with the Izmitearthquake. The fault trace and the surface offsets (U.S. Geological Survey, 1999 and Barka, 1999) of the dislocationmodels in fig. 3b-d are shown. Fringe contours (blue lines) retrieved from the interferogram are in the inset. Eachline indicates a surface movement of 2.8 cm onto the satellite line of sight.
531
The August 17, 1999 Izmit, Turkey, earthquake: slip distribution from dislocation modeling of DInSAR and surface offset
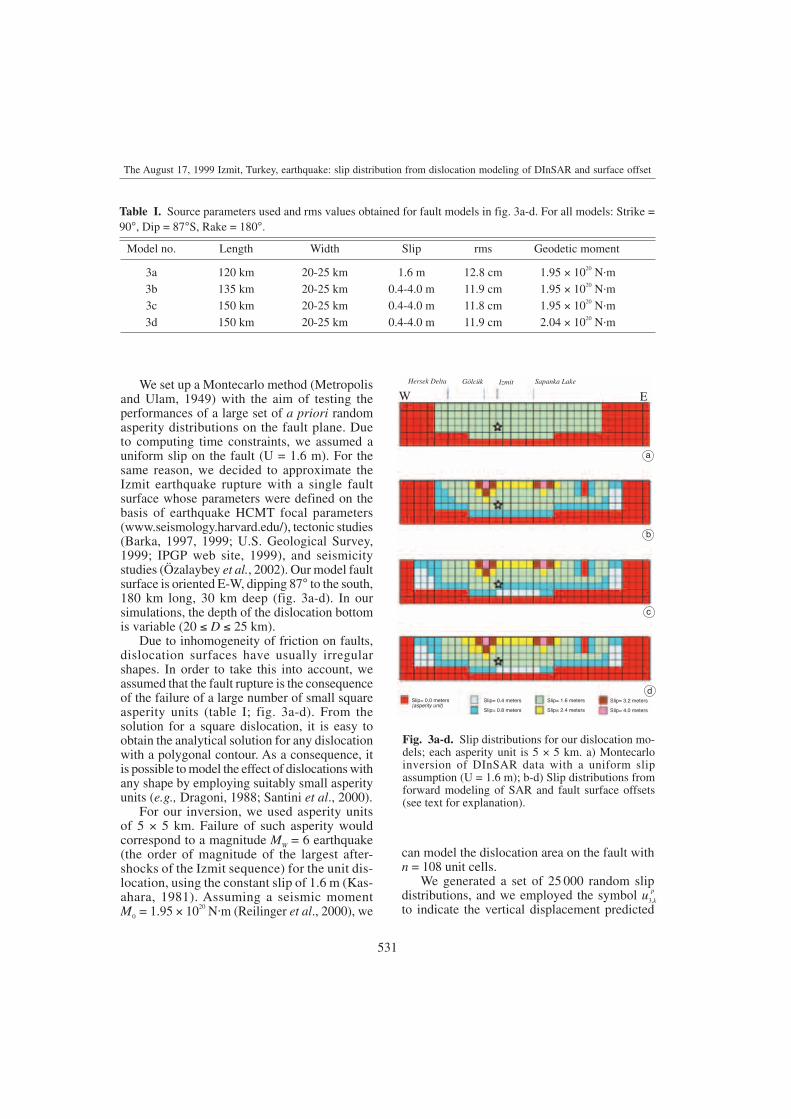
We set up a Montecarlo method (Metropolisand Ulam, 1949) with the aim of testing theperformances of a large set of a priori randomasperity distributions on the fault plane. Dueto computing time constraints, we assumed auniform slip on the fault (U = 1.6 m). For thesame reason, we decided to approximate theIzmit earthquake rupture with a single faultsurface whose parameters were defined on thebasis of earthquake HCMT focal parameters(www.seismology.harvard.edu/), tectonic studies(Barka, 1997, 1999; U.S. Geological Survey,1999; IPGP web site, 1999), and seismicitystudies (Özalaybey et al., 2002). Our model faultsurface is oriented E-W, dipping 87° to the south,180 km long, 30 km deep (fig. 3a-d). In oursimulations, the depth of the dislocation bottomis variable (20 D 25 km).
Due to inhomogeneity of friction on faults,dislocation surfaces have usually irregularshapes. In order to take this into account, weassumed that the fault rupture is the consequenceof the failure of a large number of small squareasperity units (table I; fig. 3a-d). From thesolution for a square dislocation, it is easy toobtain the analytical solution for any dislocationwith a polygonal contour. As a consequence, itis possible to model the effect of dislocations withany shape by employing suitably small asperityunits (e.g., Dragoni, 1988; Santini et al., 2000).
For our inversion, we used asperity unitsof 5 × 5 km. Failure of such asperity wouldcorrespond to a magnitude MW = 6 earthquake(the order of magnitude of the largest after-shocks of the Izmit sequence) for the unit dis-location, using the constant slip of 1.6 m (Kas-ahara, 1981). Assuming a seismic momentM0 = 1.95 × 10²⁰ N m (Reilinger et al., 2000), we
can model the dislocation area on the fault withn = 108 unit cells.
We generated a set of 25 000 random slipdistributions, and we employed the symbol u3,k
p
to indicate the vertical displacement predicted
W EHersek Delta Gölcük Izmit Sapanka Lake
Slip= 0.0 meters(asperity unit)
Slip= 0.4 meters Slip= 1.6 meters Slip= 3.2 meters
Slip= 0.8 meters Slip= 2.4 meters Slip= 4.0 meters
Fig. 3a-d. Slip distributions for our dislocation mo-dels; each asperity unit is 5 × 5 km. a) Montecarloinversion of DInSAR data with a uniform slipassumption (U = 1.6 m); b-d) Slip distributions fromforward modeling of SAR and fault surface offsets(see text for explanation).
Table I. Source parameters used and rms values obtained for fault models in fig. 3a-d. For all models: Strike =90°, Dip = 87°S, Rake = 180°.
Model no. Length Width Slip rms Geodetic moment
3a 120 km 20-25 km 1.6 m 12.8 cm 1.95 × 10²⁰ N m3b 135 km 20-25 km 0.4-4.0 m 11.9 cm 1.95 × 10²⁰ N m3c 150 km 20-25 km 0.4-4.0 m 11.8 cm 1.95 × 10²⁰ N m3d 150 km 20-25 km 0.4-4.0 m 11.9 cm 2.04 × 10²⁰ N m
a
b
c
d
532
Salvatore Stramondo, Francesca R. Cinti, Michele Dragoni, Stefano Salvi and Stefano Santini
by the model at the generic k-th point at theEarth’s surface. It is given by a sum over the nsquare asperity units
(3.1)
In order to compare the displacement valuespredicted by the model with the observed values(SAR), we considered a square grid covering theEarth’s surface in the fault region. The grid sideis equal to 120 km and the distance from eachpoint of the grid to one of the surrounding pointsis equal to 6 km, implying that the total numberof points is N = 21 × 21 = 441. We indicate theobserved values of vertical displacement at thek-th point of the Earth’s surface by the symbolu3,k
o . The 2 value is calculated for each slip
distribution according to the formula
(3.2)
where k
o is the standard deviation of the ob-servations.
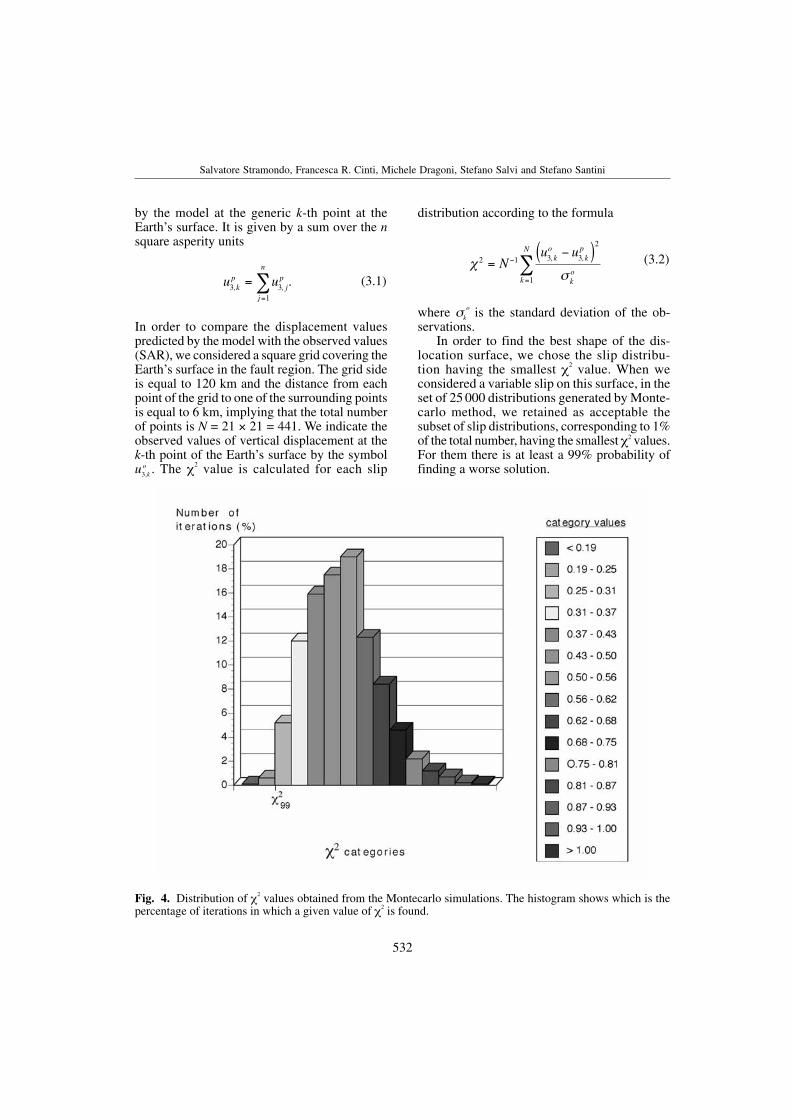
In order to find the best shape of the dis-location surface, we chose the slip distribu-tion having the smallest 2 value. When weconsidered a variable slip on this surface, in theset of 25 000 distributions generated by Monte-carlo method, we retained as acceptable thesubset of slip distributions, corresponding to 1%of the total number, having the smallest 2 values.For them there is at least a 99% probability offinding a worse solution.
u ukp
jp
j
n
3 31
, , .==
2 1 3 3
2
1
=( )
=
Nu uk
ok
p
ko
k
N, ,
Fig. 4. Distribution of 2 values obtained from the Montecarlo simulations. The histogram shows which is thepercentage of iterations in which a given value of 2 is found.
533
The August 17, 1999 Izmit, Turkey, earthquake: slip distribution from dislocation modeling of DInSAR and surface offset
We defined 299 the minimum of 2 values
associated with 1% of better distributions: in ourcase 2
99 = 0.25 (fig. 4). In the subset, we retainedas the best solution the one for which the slip isa function as smooth as possible of the positionon the fault.
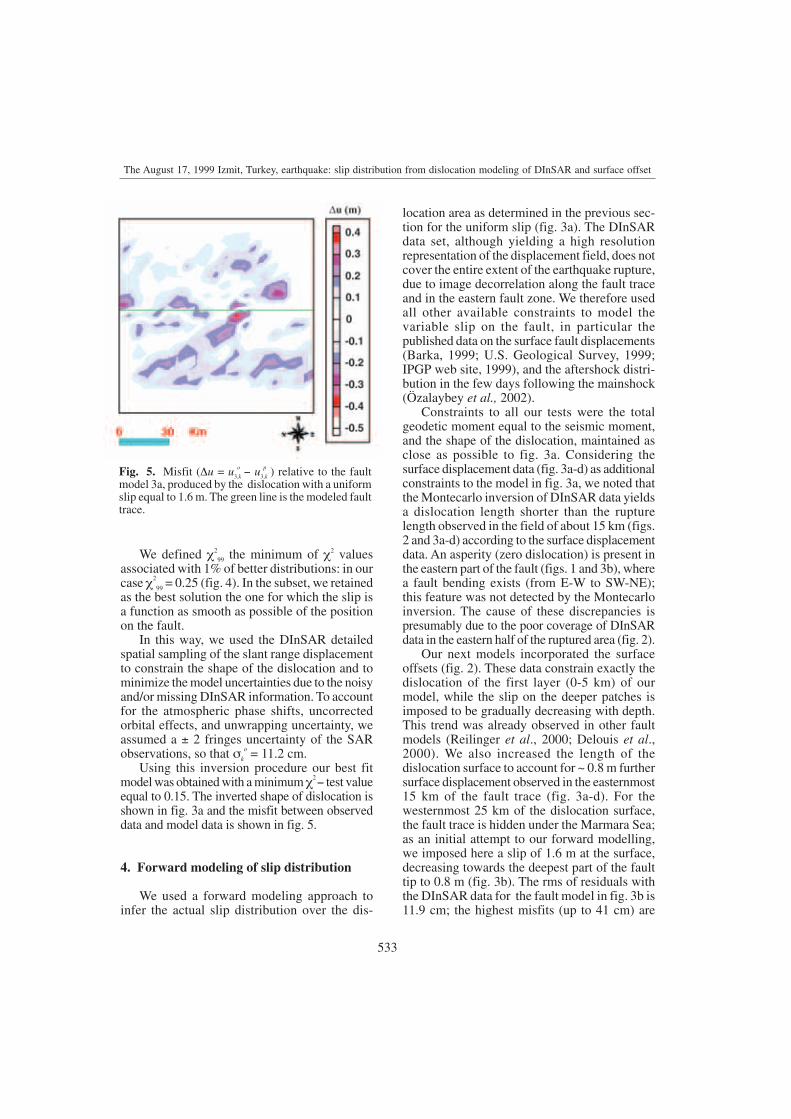
In this way, we used the DInSAR detailedspatial sampling of the slant range displacementto constrain the shape of the dislocation and tominimize the model uncertainties due to the noisyand/or missing DInSAR information. To accountfor the atmospheric phase shifts, uncorrectedorbital effects, and unwrapping uncertainty, weassumed a ± 2 fringes uncertainty of the SARobservations, so that k
o = 11.2 cm.Using this inversion procedure our best fit
model was obtained with a minimum 2 test valueequal to 0.15. The inverted shape of dislocation isshown in fig. 3a and the misfit between observeddata and model data is shown in fig. 5.
4. Forward modeling of slip distribution
We used a forward modeling approach toinfer the actual slip distribution over the dis-
location area as determined in the previous sec-tion for the uniform slip (fig. 3a). The DInSARdata set, although yielding a high resolutionrepresentation of the displacement field, does notcover the entire extent of the earthquake rupture,due to image decorrelation along the fault traceand in the eastern fault zone. We therefore usedall other available constraints to model thevariable slip on the fault, in particular thepublished data on the surface fault displacements(Barka, 1999; U.S. Geological Survey, 1999;IPGP web site, 1999), and the aftershock distri-bution in the few days following the mainshock(Özalaybey et al., 2002).
Constraints to all our tests were the totalgeodetic moment equal to the seismic moment,and the shape of the dislocation, maintained asclose as possible to fig. 3a. Considering thesurface displacement data (fig. 3a-d) as additionalconstraints to the model in fig. 3a, we noted thatthe Montecarlo inversion of DInSAR data yieldsa dislocation length shorter than the rupturelength observed in the field of about 15 km (figs.2 and 3a-d) according to the surface displacementdata. An asperity (zero dislocation) is present inthe eastern part of the fault (figs. 1 and 3b), wherea fault bending exists (from E-W to SW-NE);this feature was not detected by the Montecarloinversion. The cause of these discrepancies ispresumably due to the poor coverage of DInSARdata in the eastern half of the ruptured area (fig. 2).
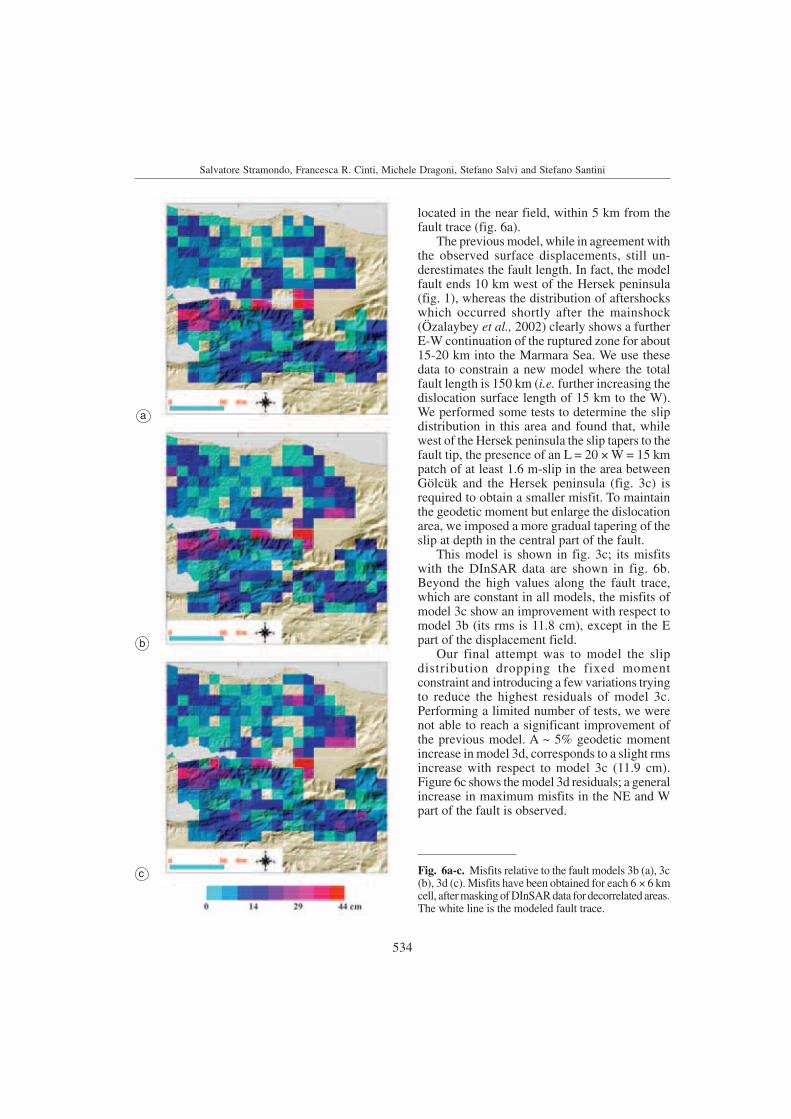
Our next models incorporated the surfaceoffsets (fig. 2). These data constrain exactly thedislocation of the first layer (0-5 km) of ourmodel, while the slip on the deeper patches isimposed to be gradually decreasing with depth.This trend was already observed in other faultmodels (Reilinger et al., 2000; Delouis et al.,2000). We also increased the length of thedislocation surface to account for ~ 0.8 m furthersurface displacement observed in the easternmost15 km of the fault trace (fig. 3a-d). For thewesternmost 25 km of the dislocation surface,the fault trace is hidden under the Marmara Sea;as an initial attempt to our forward modelling,we imposed here a slip of 1.6 m at the surface,decreasing towards the deepest part of the faulttip to 0.8 m (fig. 3b). The rms of residuals withthe DInSAR data for the fault model in fig. 3b is11.9 cm; the highest misfits (up to 41 cm) are
Fig. 5. Misfit ( u = u3,k
o u3,k
p ) relative to the faultmodel 3a, produced by the dislocation with a uniformslip equal to 1.6 m. The green line is the modeled faulttrace.
534
Salvatore Stramondo, Francesca R. Cinti, Michele Dragoni, Stefano Salvi and Stefano Santini
located in the near field, within 5 km from thefault trace (fig. 6a).
The previous model, while in agreement withthe observed surface displacements, still un-derestimates the fault length. In fact, the modelfault ends 10 km west of the Hersek peninsula(fig. 1), whereas the distribution of aftershockswhich occurred shortly after the mainshock(Özalaybey et al., 2002) clearly shows a furtherE-W continuation of the ruptured zone for about15-20 km into the Marmara Sea. We use thesedata to constrain a new model where the totalfault length is 150 km (i.e. further increasing thedislocation surface length of 15 km to the W).We performed some tests to determine the slipdistribution in this area and found that, whilewest of the Hersek peninsula the slip tapers to thefault tip, the presence of an L = 20 ×W = 15 kmpatch of at least 1.6 m-slip in the area betweenGölcük and the Hersek peninsula (fig. 3c) isrequired to obtain a smaller misfit. To maintainthe geodetic moment but enlarge the dislocationarea, we imposed a more gradual tapering of theslip at depth in the central part of the fault.
This model is shown in fig. 3c; its misfitswith the DInSAR data are shown in fig. 6b.Beyond the high values along the fault trace,which are constant in all models, the misfits ofmodel 3c show an improvement with respect tomodel 3b (its rms is 11.8 cm), except in the Epart of the displacement field.
Our final attempt was to model the slipdistribution dropping the fixed momentconstraint and introducing a few variations tryingto reduce the highest residuals of model 3c.Performing a limited number of tests, we werenot able to reach a significant improvement ofthe previous model. A ~ 5% geodetic momentincrease in model 3d, corresponds to a slight rmsincrease with respect to model 3c (11.9 cm).Figure 6c shows the model 3d residuals; a generalincrease in maximum misfits in the NE and Wpart of the fault is observed.
Fig. 6a-c. Misfits relative to the fault models 3b (a), 3c(b), 3d (c). Misfits have been obtained for each 6 × 6 kmcell, after masking of DInSAR data for decorrelated areas.The white line is the modeled fault trace.
a
b
c
535
The August 17, 1999 Izmit, Turkey, earthquake: slip distribution from dislocation modeling of DInSAR and surface offset
5. Discussion and conclusions
Our modeling procedure allowed us to: i)model the general dislocation shape throughMontecarlo inversion of SAR data only; ii)evaluate the distribution of slip over the ruptureplane using additional constraints fromgeological and seismicity data. Assuming first auniform slip, we obtained a best fit of surfacecoseismic deformation for a dislocation surfacewith an irregular shape. The agreement withobservations was improved by redistributing thefault slip on the dislocation surface.
We note that our uniform slip model yieldsrather low misfits with SAR data (rms = 12.8cm); this is surprising, considering the strongvariability of slip inferred by all studies(Reilinger et al., 2000; Delois et al., 2000; Wrightet al., 2001). We attribute this behaviour to un-dersampling of the displacement field by the SARdata (we estimate that SAR data are avail-able for only about 60% of the actual displace-ment field) and possibly to a smoothing effectdue to uncorrected orbital errors and long wave-length atmospheric perturbations.
The small differences in the average residualsamong all our variable slip models (0.1 cm)suggest that the data at our disposal are unableto give full details of the slip distribution. In anycase, considering the single fault approximation,we obtain results for the most part in agreementwith published studies performed also usingdifferent data sets (Reilinger et al., 2000; Delouiset al., 2000; Wright et al., 2001). The depth ofdislocation varies between 20 and 25 km, and ismaximum in the fault western-central segment;the largest slip values are concentrated in thecentral part, with two maxima in the Gölcük andeast Sapanka segments. Most of the large misfitsin fig. 6a-c are concentrated along the fault trace,although these misfit values are biased by thepresence, in each of the 6 × 6 km discrete mapunits, of a large percentage of decorrelation noise,i.e. underestimation of actual displacement.Other large misfits (~ 30 cm) are present southof the Hersek peninsula in all our models. Theabsence of surface faulting in this area and ourlarge misfit values can be explained if, at somepoint between Gölcük and Hersek, the ruptureactually steps north, so that its surface expression
is hidden under the Marmara sea. On the eastside of the fault we also observe high misfits(~ 25 cm); the reason is probably the differencebetween our approximated model fault (E-W)and the direction of the actual fault segment (SW-NE, fig. 1). Notwithstanding the model assum-ptions and the single fault approximation, for mostof the areas showing a well defined fringe patternwe obtain misfits smaller than 10 cm (fig. 6a-c).
The application of SAR interferometry to theretrieval of the Izmit earthquake source para-meters has shown once more that for an improvedearthquake monitoring strategy in non-aridenvironments, more effective SAR data acqui-sition policies must be implemented. Decor-relation due to rapid surface changes can bereduced using a shorter revisiting time as wellas a longer radar wavelength (L band). Atmo-spheric effects should be more accuratelyestimated, e.g., using independent meteorologicaldata, to assess the data set consistency; theircorrection could be attempted only if a largenumber of interferometric data sets are availableand/or if simultaneous images from other sensorsallow for atmospheric parameters retrieval.
Acknowledgements
We wish to thank the European Space Agencythat delivered the set of ERS SAR images, makingpossible the accomplishment of this work. Specialthanks go to Eric Fielding (University of Oxford,U.K.) for providing the DEM. We are also gratefulto Alessandro Amato for his useful comments andto Enzo Boschi for his encouragement. TheDiapason software, by CNES (Toulouse, France),was used for the ERS image interferometricprocessing. This research was partly supported bythe Italian Space Agency, contracts No. I/R/138/00 and I/R/174/01.
REFERENCES
BARKA, A. (1997): Active Tectonics of Northwestern Anatolia:The Marmara Poly Project, ETH, Zurich, 55-87.
BARKA, A. (1999): The 17 August 1999 Izmit earthquake,Science, 285, 1858-1859.
DELOUIS, B., P. LUNDGREN, J. SALICHON and D. GIARDINI(2000): Joint inversion of InSAR and teleseismic datafor the slip history of the 1999 Izmit (Turkey) earthquake,
536
Salvatore Stramondo, Francesca R. Cinti, Michele Dragoni, Stefano Salvi and Stefano Santini
Geophys. Res. Lett., 27, 3389-3392.DRAGONI, M. (1988): Role of geodetic measurements in the
detection of fault asperities, in Proceedings Third Int.Conf. on the WEGENER/MEDLAS Project, edited byP. BALDI and S. ZERBINI, Bologna, 129-146.
DZIEWONSKI, A.M. and D.L. ANDERSON (1981): PREM,Phys. Earth Planet. Inter., 25, 297-356.
HANSSEN, R. and A. FEIJT (1996): A first quantitativeevaluation of atmospheric effects on SAR interferometry,in Proceedings Fringe Workshop on SAR Interferometry,ESA SP-406.
IPGP web site (1999): Rupture mapping, field observations andmeasurements on Duzce rupture, beaufix.ipgp.jussieu.Fr/inst/org/tecto.
KASAHARA, K. (1981): Earthquake Mechanics (CambridgeUniversity Press, Cambridge), pp. 248.
MASSONNET, D. and K.L. FEIGL (1998): Radar interferometryand its application to changes in the earth’s surface, Rev.Geophys., 36 (4), 441-500.
METROPOLIS, N. and S.M. ULAM (1949): The Montecarlomethod, J. Am. Statist. Assoc., 44, 335-341.
OKADA, Y. (1985): Surface deformation due to shear and tensilefaults in a half-space, Bull. Seismol. Soc. Am., 75, 1135-1154.
ÖZALAYBEY, S., M. ERGIN, M. AKTAR, C. TAPIRDAMAZ, F.BIÇMEN and A. YÖRÜK (2002): The 1999 Izmitearthquake sequence in Turkey: seismological andtectonic aspects, Bull. Seismol. Soc. Am., 92, 376-386.
PELTZER, G., K.W. HUDNUT and K.L. FEIGL (1994): Analysisof coseismic displacement gradients using radarinterferometry: new insights into the Landers earthquake,J. Geophys. Res., 99 (B11), 971-981.
REILINGER, R.E., S. ERGINTAV, R. BÜRGMANN, S. MCCLUSKY,O. LENK, A. BARKA, O. GURKAN, L. HEARN, K.L. FEIGL, R.CAKMAK, B. AKTUG, H. OZENER and M.N. TÖKSOZ (2000):Coseismic and postseismic fault slip for the 17 August 1999,M 7.5, Izmit, Turkey earthquake, Science, 289, 1519-1524.
SANTINI, S., A. PIOMBO and M. DRAGONI (2000): Grounddisplacement in a fault zone in the presence of asperities,Boll. Geofis. Teor. Appl., 41, 95-110.
TOKSÖZ, M.N., R.E. REILINGER, C.G. DOLL, A.A. BARKAand N. YALCIN (1999): Izmit (Turkey) earthquake of 17August 1999: first report, Seism. Res. Lett., 70, 669-679.
U.S. GEOLOGICAL SURVEY (1999): Implications forearthquake risk reduction in the United States from theKocaeli, Turkey, earthquake of August 17, edited by S.J.KROPSCHOT, Circular 1193, pp. 64.
WECKWERTH, T. M., J.W. WILSON, R.M. WAKIMOTO and N.A.CROOK (1997): Horizontal convective rolls: determiningthe environmental conditions supporting their existence andcharacteristics, Mon. Weather Rev., 125, 505-526.
WRIGHT, T., E. FIELDING and B. PARSONS (2001): Triggeredslip: observations of the 17 August 1999 Izmit (Turkey)earthquake using radar interferometry, Geophys. Res.Lett., 28, 1079-1082.
ZEBKER, H.A., P.A. ROSEN and S. HENSLEY (1997):Atmospheric effects in interferometric synthetic apertureradar surface deformation and topographic maps,J. Geophys. Res, 102, 7547-7563.
(received February 22, 2002;accepted July 15, 2002)
Copyright © 2022 FDOKUMEN