Surface movements in Bologna (Po Plain���Italy) detected by multitemporal DInSAR
Upload
independentCategory
view
4download
0
4062 IEEE TRANSACTIONS ON GEOSCIENCE AND REMOTE SENSING, VOL. 49, NO. 10, OCTOBER 2011
New Advances of the Extended Minimum Cost FlowPhase Unwrapping Algorithm for SBAS-DInSAR
Analysis at Full Spatial ResolutionAntonio Pepe, Leonardo Daniel Euillades, Member, IEEE, Michele Manunta, and
Riccardo Lanari, Senior Member, IEEE
Abstract—We present an efficient space–time phase unwrap-ping (PhU) algorithm that allows us to process sequencesof multitemporal full resolution differential synthetic apertureradar (SAR) interferograms for the generation of deformationtime-series. The core of the proposed technique, dealing withsparse data grids, is represented by the extended minimum costflow (MCF) (EMCF) PhU algorithm that was originally developedfor the analysis of sequences of multilook interferograms. In par-ticular, our method relies on the joint analysis of the spatial andtemporal relationships among a set of properly selected multitem-poral differential interferograms, which are compatible with theSmall BAseline subset (SBAS) deformation time-series technique.The key point of the approach is the idea to split the complex MCFnetwork problem, representing the overall PhU operation, intothat of simpler subnetworks. More precisely, we start by identify-ing and solving a primary network that involves a proper selectionof coherent pixels of the computed interferograms, representingthe backbone structure of the overall network. Subsequently, thisresult is applied for constraining the solution of the subnetworksconnected to the primary one, involving the entire set of analyzedpixels. To achieve this task, we solve a constrained optimizationproblem based on the computation of a constrained Delaunaytriangulation in the azimuth/range domain. The overall procedureis implemented through two successive processing steps that areboth carried out by using the EMCF PhU technique, which hasbeen slightly modified to take into account the Doppler centroiddifferences of the exploited interferometric SAR data pairs. Theexperimental results, achieved by applying the proposed approachto a data set consisting of European Remote Sensing (ERS) SARdata acquired from June 1992 to August 2007 over the Napoli(Italy) bay area, confirm the effectiveness of the proposed PhUapproach.
Index Terms—Constrained Delaunay triangulation (CDT), de-formation time-series, differential synthetic aperture radar (SAR)interferometry (DInSAR), minimum cost flow (MCF) network,phase unwrapping (PhU), Small BAseline Subset (SBAS).
Manuscript received August 6, 2010; revised February 11, 2011; acceptedMarch 13, 2011. Date of publication May 30, 2011; date of current versionSeptember 28, 2011. This work was supported in part by the Italian SpaceAgency (ASI) and the Italian Civil Protection.
A. Pepe, M. Manunta, and R. Lanari are with the Istituto per il RilevamentoElettromagnetico dell’Ambiente, Italian National Research Council (CNR),80124 Napoli, Italy (e-mail: [email protected]; [email protected];[email protected]).
L. D. Euillades is with the Instituto de Capacitación Especial y Desarrollode la Ingeniería Asistida por Computadora, Universidad Nacional de Cuyo,5500 Mendoza, Argentina (e-mail: [email protected]).
Digital Object Identifier 10.1109/TGRS.2011.2135371
I. INTRODUCTION
D IFFERENTIAL synthetic aperture radar (SAR) in-terferometry (DInSAR) represents nowadays a well-
established remote sensing technique for the generation ofspatially dense surface deformation maps of large areas onEarth [1], [2]. To achieve this task, the phase difference (in-terferogram) between SAR data pairs relevant to temporallyseparated observations is exploited, obtaining a measurementof the ground deformation projection along the radar line ofsight (LOS) with centimeter to millimeter accuracy [3].
Following the extensive exploitation of the DInSAR tech-nique for the analysis of single deformation episodes [4]–[10],DInSAR methodology has successfully been adapted for in-vestigating the temporal evolution of the detected deformationphenomena through the generation of displacement time-series[11], [12]. In this case, the analysis is based on the computa-tion of time-series of deformation through the inversion of anappropriate set of interferograms, produced from a sequenceof temporally separated SAR acquisitions of the investigatedarea. Two main categories of advanced DInSAR techniquesfor deformation time-series generation have been proposed;they are often referred to as persistent scatterer (PS) [11],[13], [14] and small baseline (SB) [12], [15], [16] techniques,respectively, although a solution that incorporates both PSand SB approaches has also recently been proposed [17]. Inparticular, the PS algorithms select all the interferometric datapairs with reference to a single common master image, withoutany constraint on the temporal and spatial separation (baseline)among the orbits. In this case, the analysis is carried out atthe full spatial resolution scale and is focused on the pixelscontaining a single dominant scatterer that ensure very limitedtemporal and spatial decorrelation phenomena [18]. Instead,for what concerns the SB techniques, the interferograms aregenerated by considering multiple master images because thisallows having interferometric data pairs with small temporaland spatial baselines. Accordingly, distributed targets can bealso investigated, and the analysis may exploit both single-look and multilook interferograms. Within the SB framework,a popular approach is the one referred to as Small BAselineSubset (SBAS), which was originally developed for analyzingmultilook interferograms [12] and subsequently adapted to thefull resolution ones; in the latter case, the low resolution resultsare properly extended to the full resolution scale, as discussedin [19].
0196-2892/$26.00 © 2011 IEEE
PEPE et al.: NEW ADVANCES OF EMCF PhU ALGORITHM FOR SBAS-DInSAR ANALYSIS 4063
Despite the differences among the various implementationsof the PS and SB algorithms, a common problem to befaced is the phase unwrapping (PhU) operation that representsthe retrieval process of the absolute phase signals from their(measured) modulo-2π restricted components, often referredto as “interferometric fringes.” In the context of the advancedDInSAR techniques, the need of jointly analyzing sequencesof multitemporal interferograms has promoted the developmentof new PhU approaches with improved performances withrespect to those focused on processing single interferograms;these new algorithms are based on the joint exploitation of thespatial and temporal relationships of the produced interfero-grams [20]–[25], analyzed on the sparse grid of the coherentpixels. In particular, we focus on the technique referred toas extended minimum cost flow (MCF) (EMCF), representingthe space–time extension of the basic MCF PhU algorithm[26], which is integrated very well with the SBAS procedure.The EMCF technique is based on the computation of twoDelaunay triangulations: the former accounts for the SAR dataacquisition distribution in the so-called temporal/perpendicularbaseline TxB⊥ plane and allows the proper identification of theexploited DInSAR data pairs, and the latter is carried out in theazimuth/range AZxRG plane and involves a selection ofthe coherent pixels common to the generated interferograms.The unwrapping operation is performed as follows: first of all,for each arc connecting neighboring pixels in the AZxRG
plane, the unwrapped phase differences are estimated by apply-ing the MCF technique in the TxB⊥ plane. Subsequently, theseestimates are used as the starting point for the spatial unwrap-ping operation, implemented again via the MCF approach butin the AZxRG plane. Note that the extensive use of the MCFtechnique is the key point of the computational efficiency ofthis approach because of the existing high-performance routinesthat implement this solver [27]. New solutions have been pro-posed for extending the analysis carried out on the closed-loopsobtained via the sparse grid triangulations, which are typicalfor the MCF, with that involving reliable arcs, also referred toas edges, thus leading to the name “edgelist” techniques [22],[23]. However, in this case, the achieved simplification is paidin terms of computational performance, although the exploitedlinear programming solutions are promising.
In this paper, we propose to exploit the highly efficientEMCF algorithm as the core procedure to unwrap sequences oflarge single-look DInSAR interferograms suitable for the gen-eration of deformation time-series through the SBAS approach.This PhU approach allows us to directly apply the SBASinversion to the unwrapped full resolution DInSAR phasesequences, with no need to pass through the analysis of thecorresponding sequences of multilook DInSAR interferograms[19]. Unfortunately, the straightforward application of the MCFand EMCF techniques to unwrap sequences of full resolutioninterferograms is often not feasible due to the large amountof “phase residues” [28] to be compensated, which typicallyleads to high computing time or even unfeasible solutions ofthe network flow problems [29]. To properly cast this PhUproblem, we suggest applying an effective divide-and-conquerapproach to the space–time PhU problem; the key idea is to splitour complex MCF network problem, implementing the whole
PhU step, into that of simpler subnetworks, which are solvedby applying the EMCF approach. More precisely, we start byidentifying, and solving, a primary network that involves aproperly selected set of coherent pixels of our interferograms,which are characterized by phase signals with very limitedspatial high-pass (HP) components. The results of this primarynetwork minimization, representing the backbone structure ofthe overall network, are subsequently used to constrain thesolution of the remaining subnetworks, including the entireset of coherent pixels. To achieve this task, the second EMCFPhU step relies on the generation of a constrained Delaunaytriangulation (CDT) [30], whose constrained edges are relevantto the set of successfully unwrapped pixels analyzed during thefirst PhU operation. Note that only a minor modification of theEMCF technique is required in order to take into account theDoppler centroid (DC) differences of the exploited interfero-metric SAR data pairs. We also remark that our approach hassome similarities with Carballo and Fieguth’s work [31] wherea two-scale strategy is also suggested to unwrap large interfer-ograms. Basically, they propose to break up an interferograminto separate overlapped tiles and to first perform a primary(local) PhU step on each single tile via the MCF technique;subsequently, the unwrapped tiles are reassembled through asecondary (global) PhU step, wherein the tiles are analogous tothe pixels of the original PhU problem. With respect to Carballoand Fieguth’s work, our strategy is similar but inverted; indeed,we propose a scheme in which the primary PhU step is used tofigure out a (global) PhU solution and the secondary one is usedto locally “propagate” the PhU solution in low coherent areas.This is computationally efficient and allows us to circumventtiles mosaicing problems and avoid undesired boundary effects[31]–[33].
This paper is organized as follows. After the description ofthe interferometric SAR data pair selection process presentedin Section II, we summarize in Section III the rationale ofthe EMCF algorithm and its minor modification to work withsingle-look multitemporal interferograms. In Section IV, thestrategy used to identify the set of coherent pixels involved inthe PhU operation is then addressed. Section V describes theimplemented PhU approach, whereas Section VI is dedicatedto the presentation of the experimental results. Conclusions andfurther developments are finally discussed in Section VII.
II. INTERFEROMETRIC DATA PAIR SELECTION
The presented approach relies on the availability of a setof N + 1 SAR scenes relevant to the same area, acquiredat the ordered times t = (t0, t1, . . . , tN ), from which a se-quence of full resolution DInSAR interferograms is pro-duced. In this case, we assume that each SAR image hasbeen coregistered to a “master” reference one (acquired attime tm), with respect to which we estimate the temporalT = (t0 − tm, t1 − tm, . . . , tN − tm) and perpendicular b⊥ =(b⊥0, b⊥1, . . . , b⊥N ) baseline components, respectively. More-over, ξ = (ξ0, ξ1, . . . , ξN ) represents the vector of the DCfrequencies [34]; in order to ensure an adequate spectral overlapof the Doppler bandwidth in the interferogram generation, wealso assume, similarly to [35], that SAR scenes with large DC

4064 IEEE TRANSACTIONS ON GEOSCIENCE AND REMOTE SENSING, VOL. 49, NO. 10, OCTOBER 2011
values, e.g., not included in the (ADC − PRF/2, ADC +PRF/2) interval, are preliminarily discarded, with ADC beingthe average DC of the whole SAR data set and PRF being thesensor pulse repetition frequency. The discarded SAR images,however, can be potentially reintegrated in our analysis duringthe second stage, as shown in the Appendix.
Let us now investigate the selection process of the interfer-ometric SAR image data pairs that we use for the generation ofthe interferograms exploited by the presented PhU algorithm.We remark that this process follows the same lines in [25];thus, it is only shortly summarized in the following for the sakeof completeness. In particular, in order to avoid the generationof interferograms with significant decorrelation effects [18] andto preserve the compatibility of our interferometric data pairswith those exploited by the SBAS approach [12], we consideronly SAR data pairs with small spatial (perpendicular) andtemporal baselines, as well as with small DC differences. Toachieve this task, we take profit of the SAR data representationin the TxB⊥ plane [see the example shown in Fig. 1(a)]and compute a Delaunay triangulation [see Fig. 1(b)] byfollowing [25]. Accordingly, each arc of this triangulationallows us to identify a corresponding SAR data pair to beexploited in the interferogram generation. Unfortunately, thisapproach may also lead to the generation of interferogramswith large temporal and/or spatial baselines, which may bedrastically corrupted by decorrelation phenomena. In order toavoid these effects, we impose constraints on the maximumallowed interferogram baseline values, and we discard fromthe triangulation all the triangles that involve at least one“large baseline” interferogram. Equivalently, we also removetriangles which involve SAR data pairs characterized by DCdifferences exceeding a selected threshold. We remark thatthis triangle removal step may also lead to the generationof independent subsets of SAR images; however, this isnowadays uncommon due to the availability of very largeSAR data archives and, in any case, it can be handled by theconsidered SBAS approach [12]. Following the identificationof the final triangulation [see Fig. 1(c)], we may generate theselected sequence of M wrapped DInSAR interferograms,referred to as Φ = (Φ0,Φ1, . . . ,ΦM−1); moreover, ΔT =(ΔT0,ΔT1, . . . ,ΔTM−1), Δb⊥ = (Δb⊥0,Δb⊥1, . . . ,Δb⊥M−1), and Δξ = (Δξ0,Δξ⊥1, . . . ,ΔξM−1) represent theassociated vectors of the temporal and spatial (perpendicular)baselines and of the DC differences, respectively.
The procedure, which is detailed in the following, isaimed at retrieving the sequence of the unwrapped single-lookDInSAR interferograms, Ψ = (Ψ0,Ψ1, . . . ,ΨM−1), from thecorresponding wrapped data set.
III. BASIC RATIONALE OF THE EMCF ALGORITHM
We introduce in this section the basic aspects of the EMCFapproach [25], focusing on the key issues involved in the gener-alization of the algorithm for unwrapping sequences of single-look DInSAR interferograms. We remark that the originalEMCF PhU operation is performed via a two-step processingprocedure, whose rationale is rather simple: First of all, wecompute a Delaunay triangulation in the AZxRG domain,
Fig. 1. SAR data representation in the temporal/perpendicular baseline planefor the ERS-1/2 SAR data analyzed in the following experiments, relevantto the Napoli (Italy) bay area (see Section VI). (a) SAR image distribution.(b) Delaunay triangulation. (c) Triangulation after the removal of triangleswith sides characterized by spatial and temporal baseline values, as wellas DC differences, exceeding the selected thresholds (corresponding, in ourexperiments, to 400 m, 1500 days, and 1000 Hz, respectively).
involving the sparse data set of coherent points in the radarimage plane, and subsequently, for each arc of the AZxRG
triangulation, we carry out a “temporal” PhU step in the TxB⊥domain. Also in this case, we apply the MCF approach but tothe triangulation identifying the DInSAR interferogram data

PEPE et al.: NEW ADVANCES OF EMCF PhU ALGORITHM FOR SBAS-DInSAR ANALYSIS 4065
set [see Fig. 1(c)]; in order to facilitate this operation, weconsider a proper model of the unwrapped phase gradients thataccounts for the temporal and spatial baseline vectors [25],whose expression is the following:
m =4π
λ· Δb⊥R · sin(ϑ) ·Δz +
4π
λ·ΔT ·Δv (1)
where λ is the transmitted signal central wavelength, R is thesensor-to-target distance, and ϑ is the incidence angle. The firstterm on the right-hand side of (1) accounts for the inaccuracieson the knowledge of the scene topography Δz, and the secondis related to the deformation velocity difference Δv across theconsidered arc. The (temporally) unwrapped phases computedfor each arc of the AZxRG domain are finally used to bootstrapthe following “spatial” MCF PhU operations, performed inde-pendently for each interferogram. In this context, the achievedminimum network costs of the temporal unwrapping step,{Cstminj
}Narcj=1 , are exploited to set the weights {wj}Narc
j=1 usedin the spatial unwrapping operation, with Narc being the num-ber of arcs of the spatial Delaunay triangulation. In particular,since the weights represent the confidence on the correctness ofthe achieved solution, we may assume that, for each spatial arc,the smaller the minimum temporal network cost, the larger thecorresponding spatial weight [25]. Moreover, in order to verifythe quality of the unwrapped results, we compute, on a pixel-by-pixel basis (P ), the values of the temporal coherence, whichis defined as follows [25]:
Γ(P ) =
∣∣∣∣M−1∑k=0
exp{j[Φk(P )− Φk(P )
]}∣∣∣∣M
(2)
where j =√−1 and Φ is the sequence of the interferograms
“regenerated” from the computed deformation time-series, re-trieved through the SBAS procedure applied to the unwrappedinterferogram sequence. Note that pixels with high values ofΓ(·) are those successfully unwrapped.
The summarized EMCF approach represents the core pro-cedure used by the full resolution PhU approach presentedin the following. In this case, only a minor modification isrequired for the single-look interferogram analysis, involvingthe temporal PhU step for the arcs of the AZxRG triangulargrid; in particular, an extended model [with respect to (1)]is considered, which accounts also for the Doppler frequencydifference vector Δξ. The expression of this new model is
m =4π
λ· Δb⊥R · sin(ϑ) ·Δz +
4π
λ·ΔT ·Δv +
2π
vs·Δξ ·Δx
(3)
where the third term on the right-hand side of (3) accounts forthe possible differences of the azimuthal position Δx of thephase center of the considered pixel pairs [36] and vs is thesensor platform velocity.
IV. COHERENT PIXEL IDENTIFICATION
Following the interferometric data pair selection and thesubsequent generation of the single-look differential interfer-ograms, a key problem to be addressed is the identification of
the coherent pixels to be analyzed. Let us focus on this issueby observing that, in order to identify coherent targets on a fullspatial resolution basis, we cannot exploit the coherence mapsassociated with the interferograms because their computationimplies a spatial averaging step [28], [34].
We propose to identify these coherent pixels by analyzingthe interferometric phase information by following a strategythat is similar to the one proposed in [17] and [37]. Moreover,we benefit from the assumed small baselines and Dopplerdifference constraints on the selected interferometric data pairsthat lead to the preservation of the spatial correlation of thegenerated interferograms. Accordingly, we may effectively, andeasily, evaluate the spatial low-pass (LP) phase componentsΦLP of our interferograms in coherent areas. In particular,with respect to the generic pixel of radar coordinates (x, r), weperform the following LP filtering operation:
ΦLPj (x, r) =
arctg
⎡⎢⎢⎢⎢⎣
NA/2∑h=−NA/2
NR/2∑k=−NR/2
sin (Φj(x+ h, r + k))
NA/2∑h=−NA/2
NR/2∑k=−NR/2
cos (Φj(x+ h, r + k))
⎤⎥⎥⎥⎥⎦
∀j = 0, . . . ,M − 1 (4)
where NA and NR are the numbers of azimuth and range pixelswithin the averaging window, respectively.
At this stage, we can recognize as coherent pixels thoseshowing in their interferogram sequence a significantly lowphase dispersion with respect to ΦLP; more precisely, in orderto mitigate the local topography and the localized azimuthshift displacement effects, we analyze the phase dispersionof a subset of the computed interferograms with even morestringent constraints on their baselines and Doppler differences.By assuming I = (I0, I1, . . . , IQ−1) as the index vector of thisdata subset, assumed to be composed of Q interferograms, weanalyze the interferogram phase dispersion by computing, foreach pixel P , the following factor:
Γ1(P ) =
∣∣∣∣Q−1∑k=0
exp{j[ΦIk(P )− ΦLP
Ik(P )
]}∣∣∣∣Q
. (5)
Since the values of Γ1(·) range from zero to one, dependingon the target phase dispersion, this factor can be consideredas an “equivalent” coherence and can be used, by selecting aproper threshold γ1 to identify the coherent pixel data set at thefull spatial resolution scale as follows:
C1 ≡ {P : Γ1(P ) ≥ γ1} . (6)
Although it is rather effective, the discussed approach doesnot allow us to select all the coherent pixels within the scene.In particular, it does not permit us to detect isolated scat-terers or pixels with a significant HP phase component dueto local effects (local topography, for instance). Since wemay reasonably assume that those pixels are well representedby point scatterers, we could consider for their identificationthe amplitude-based approach proposed within the permanent

4066 IEEE TRANSACTIONS ON GEOSCIENCE AND REMOTE SENSING, VOL. 49, NO. 10, OCTOBER 2011
scatterer technique [11]. In this case, the coherent points areidentified by investigating, for each pixel, the amplitude time-series of the involved SAR scenes: the considered amplitudedispersion index is then used as an indirect measure of thephase dispersion for each pixel. However, in order to avoidfalse alarms, this approach typically identifies only a limitednumber of coherent pixels, which need to be further expandedthrough appropriate subsequent analyses. Accordingly, we pre-fer to extend our analysis on the phase information through theinvestigation of the spectral properties of the complex SARimages, which are at the base of several approaches [38]–[44]. In particular, our solution extends to the multitemporalSAR interferometry scenario, the approach presented in [43].Indeed, we evaluate, for each selected interferometric datapair, the difference between the interferometric phases, Δχ =(Δχ0,Δχ1, . . . ,ΔχM−1) computed from two non-overlappedrange spectral looks, referred to as ΦU and ΦL, respectively.Moreover, in order to mitigate the possible effects of sidelobes,a filtering window can be also applied to the range spectra,although this causes additional undesired broadening of thetarget response of the range looks [45].
Therefore, we identify the coherent pixels by analyzingthe phase dispersion of the two-channel phase differences asfollows:
Γ2(P ) =
∣∣∣∣Q−1∑k=0
exp{j[ΦU
k (P )− ΦLk (P )
]}∣∣∣∣Q
. (7)
Similar to (5), Γ2(·) also ranges from zero to one and allowsus to identify the coherent pixels by considering an appropriatethreshold, γ2, by assuming
C2 ≡ {P : Γ2(P ) ≥ γ2} . (8)
We further remark that the absence of overlap between thetwo exploited range spectral looks clearly limits this identifica-tion to point targets.
At this stage, we can obtain the overall set of coherent pixelsto be exploited in the subsequent PhU operations by mergingthe two data sets referred to as C1 and C2 [see (6) and (8)]:
C ≡ C1 ∪ C2. (9)
An example of the results of the proposed coherent pixelselection procedure is shown in Fig. 2. Note in this case the lavaflow of Mount Vesuvio volcano, located nearly at the center ofFig. 2(b), which is characterized by coherent pixels belongingalmost entirely to C1 (blue color); the opposite occurs for thepixels of the volcano flank located at the left of Fig. 2(b), whichis dominated by point targets belonging to C2 (red color).
As a final remark, we want to stress that, although theprocedure presented in this section has already shown to beeffective in different case studies, additional approaches can bealso exploited to select the coherent point scatterers, such asthose presented in [46] and [47].
V. EMCF-BASED PhU TECHNIQUE
This section is focused on the presentation of an EMCF-based approach for PhU sequences of multitemporal full res-olution DInSAR interferograms. The need in developing such aPhU scheme arises from the difficulty to straightforwardly un-wrap, with the existing MCF and EMCF techniques, sequencesof (large) single-look interferograms with satisfactory accuracyand, particularly, with limited computing times because of thepresence of large amount of phase residues that also lead tounfeasible solutions of the MCF network problems.
The key idea of the proposed approach, as said before, is tosplit our complex MCF network problem into that of simplersubnetworks. This solution can be efficiently implemented, asshown in the following, through two subsequent processingsteps that are both carried out by using the slightly modifiedversion of the EMCF technique discussed in Section III.
In order to clarify the presented approach, let us start byassuming the availability of a set of full resolution wrappedinterferograms, namely, Φ = (Φ0,Φ1, . . . ,ΦM−1) (seeSection II), computed following our interferometric data pairselection process. Moreover, we also assume to have alreadyidentified the data set C [see (9)] of the coherent pixels to beinvestigated; among these points, we select a subset that isexploited to build up the primary network structure. In orderto do this, we consider first the coherent pixels of C1 [see(6)] and identify those characterized by high values of Γ1(·)by considering a rather large threshold value γ1 > γ1. Thesepoints, identified hereafter as
C1 ≡ {P : Γ1(P ) ≥ γ1} , (10)
have a very limited spatial HP phase component, i.e., smallphase variations, which is a very relevant requisite for suc-cessful PhU [34]. We further remark that this set of coherentpixels C1 has characteristics that are very similar to those ofthe interferograms generated through complex multilooking,with respect to which the effectiveness of the EMCF approachhas already been demonstrated in several case studies relevantto European Remote Sensing (ERS) and ENVISAT data sets[48]–[56].
Accordingly, on the pixels belonging to C1, the first un-wrapping step is rather straightforwardly carried out. Indeed,it is performed by first computing a Delaunay triangulation onthe chosen (sparse) spatial grid within the AZxRG plane andthen by unwrapping the computed sequence of full resolutiondifferential interferograms via the EMCF PhU approach. Notethat, as said, this PhU operation is somehow equivalent to theone that we could carry out by analyzing the correspondingmultilook interferograms. On the other hand, performing thisfirst step PhU operation at full spatial resolution is essential tosolve the constrained optimization problem characterizing thesecond PhU step discussed in the following.
Subsequent to the first PhU step, by analyzing the temporalcoherence [see (2)] estimated for all the investigated pixelsof C1, we choose those with significantly large values, thusensuring a successful unwrapping step. This set of pixels,namely, Cpr
1 , is finally used to compute a new Delaunay

PEPE et al.: NEW ADVANCES OF EMCF PhU ALGORITHM FOR SBAS-DInSAR ANALYSIS 4067
Fig. 2. Mask of the coherent pixels relevant to the ERS-1/2 SAR data analyzed in the following experiments (see Section VI), superimposed on (grayscalerepresentation) the amplitude image of the investigated area relevant to the Napoli (Italy) bay area. (a) Pixels belonging to C1 [see (5)] are represented inblue, those of C2 [see (7)] are represented in red, and the common ones, i.e., C1 ∩ C2, are represented in yellow. (b) Zoom view of the Mount Vesuvio areacorresponding to the zone highlighted in (a) by the black box.
triangulation in the AZxRG plane, representing the primarynetwork structure exploited to successfully unwrap the re-maining pixels. To achieve this task, we solve a “constrainedoptimization problem” based on the computation of a CDT inthe AZxRG plane from the grid of the overall coherent pixelsC. To clarify this issue, let us provide some basic informationabout the CDT, which is a triangulation of a given set ofvertices with the following properties [30], [57], [58]: 1) a
prespecified set of non-crossing edges (referred to as constraintsor constrained edges) is included in the triangulation, and 2) thetriangulation is as close as possible to a Delaunay one. As anexample, in Fig. 3, a simple CDT relevant to a set of 96 pointsis shown [see Fig. 3(a)]; in this case, the selected constraintsare represented by the 14 edges of the Delaunay triangulationgenerated from an eight-point subset of the originally 96 ones[see Fig. 3(b)]. The computed CDT is shown in Fig. 3(c),

4068 IEEE TRANSACTIONS ON GEOSCIENCE AND REMOTE SENSING, VOL. 49, NO. 10, OCTOBER 2011
Fig. 3. Examples of triangulations. (a) Data set of 96 points with eight of them highlighted, labeled as A, B, C, D, E, F, G, and H, respectively. (b) Eight-pointDelaunay triangulation drawn with red lines. (c) CDT generated from the set of points of (a) and by using as constraints the triangulation of (b). (d) Delaunaytriangulation computed from the 96 points of (a).
whereas the corresponding Delaunay triangulation is shown inFig. 3(d).
Similar to the case of Fig. 3, we compute a CDT1 for thespatial grid of the pixels C, whose constrained edges are thearcs of the previously identified primary network Cpr
1 . Sincethe EMCF PhU algorithm can work with generic triangularirregular grids, not necessarily Delaunay triangulations, it canbe also applied to the irregular spatial grid obtained via ourCDT. However, in this case, we must solve a constrainedoptimization problem because we want to preserve, for eachinterferogram, the unwrapped phase values already obtainedby solving the primary network. Accordingly, we perform thesecond unwrapping step again through the EMCF approach butapplying the temporal PhU step only to the unconstrained arcsof the generated CDT. Moreover, the spatial PhU step is carriedout on each single interferogram via the basic MCF approach,but in order to preserve the unwrapped phases relevant tothe primary network, the weights used for the spatial MCF
1For our experiments, we exploited a software package developedby Dr. Richard Shewchuck, known as TRIANGLE, available atwww.cs.cmu.edu/~quake/triangle.html; readers who are interested in adetailed discussion about the theory behind this software and a few practicalissues can directly refer to [59].
minimization must be properly set. If we refer to the genericPQ arc, this is achieved by imposing
wPQ =
⎧⎨⎩
L, PQ ∈ {GConstrained}100, {PQ ∈ {GConstrained}} ∩ {Cstmin < ρ}1, {PQ ∈ {GConstrained}} ∩ {Cstmin > ρ}
(11)
where {GConstrained} is the set of constrained edges andCstmin is the temporal minimum network cost relevant to thegiven spatial arc. Moreover, L is a very large integer number,whereas ρ is a threshold value that, based on experimentalresults, is typically set not greater than 5% of the total numberof interferograms. Based on (11), the flow into the constrainedMCF network is automatically forced not to cross the con-strained arcs, and as a consequence, the estimates of the primarynetwork unwrapped phases are fully preserved. In other words,the presented approach allows us to effectively “propagate” theunwrapped solution from the primary network to the connectedsubnetworks, largely improving the PhU performances anddrastically decreasing the overall computational burden. Tofurther clarify this issue, we observe that the constrained edges,represented by the Delaunay triangulation of Cpr
1 [see theexample in Fig. 3(b)], define a partition of the computed CDT(more precisely, the subspace inner boundaries of the Delaunaytriangulation) in a series of non-overlapped tiles [see Fig. 3(c)].In our PhU scheme, each tile corresponds to a different MCF
PEPE et al.: NEW ADVANCES OF EMCF PhU ALGORITHM FOR SBAS-DInSAR ANALYSIS 4069
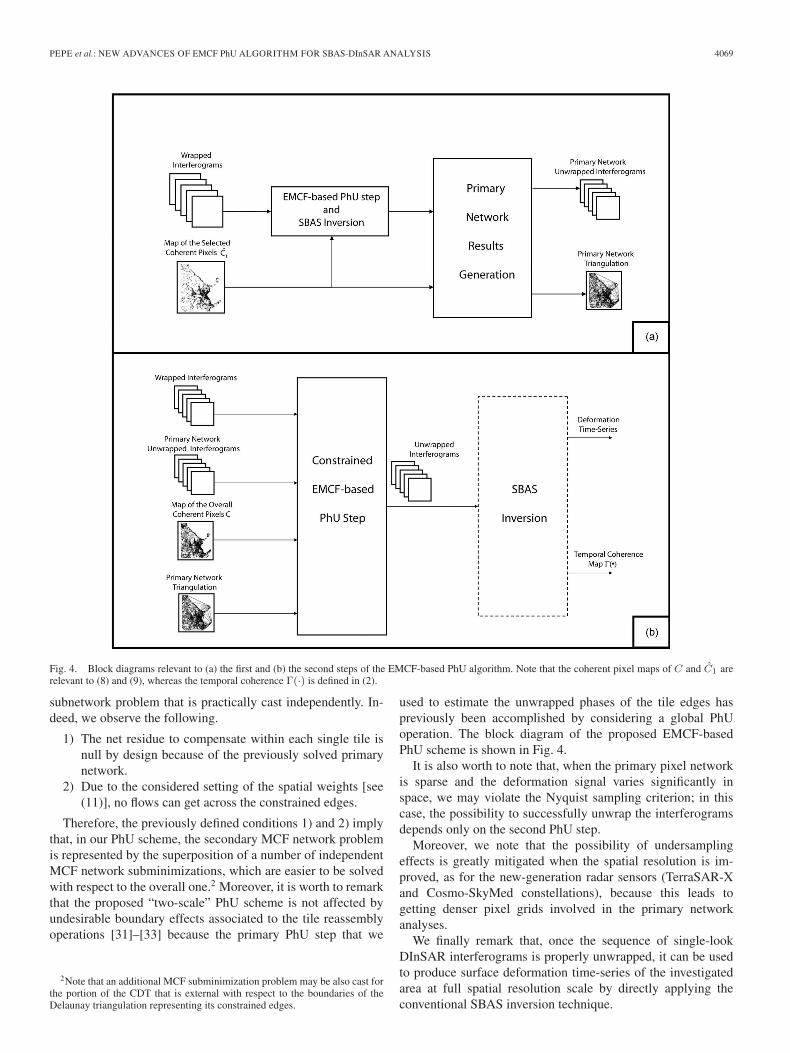
Fig. 4. Block diagrams relevant to (a) the first and (b) the second steps of the EMCF-based PhU algorithm. Note that the coherent pixel maps of C and C1 arerelevant to (8) and (9), whereas the temporal coherence Γ(·) is defined in (2).
subnetwork problem that is practically cast independently. In-deed, we observe the following.
1) The net residue to compensate within each single tile isnull by design because of the previously solved primarynetwork.
2) Due to the considered setting of the spatial weights [see(11)], no flows can get across the constrained edges.
Therefore, the previously defined conditions 1) and 2) implythat, in our PhU scheme, the secondary MCF network problemis represented by the superposition of a number of independentMCF network subminimizations, which are easier to be solvedwith respect to the overall one.2 Moreover, it is worth to remarkthat the proposed “two-scale” PhU scheme is not affected byundesirable boundary effects associated to the tile reassemblyoperations [31]–[33] because the primary PhU step that we
2Note that an additional MCF subminimization problem may be also cast forthe portion of the CDT that is external with respect to the boundaries of theDelaunay triangulation representing its constrained edges.
used to estimate the unwrapped phases of the tile edges haspreviously been accomplished by considering a global PhUoperation. The block diagram of the proposed EMCF-basedPhU scheme is shown in Fig. 4.
It is also worth to note that, when the primary pixel networkis sparse and the deformation signal varies significantly inspace, we may violate the Nyquist sampling criterion; in thiscase, the possibility to successfully unwrap the interferogramsdepends only on the second PhU step.
Moreover, we note that the possibility of undersamplingeffects is greatly mitigated when the spatial resolution is im-proved, as for the new-generation radar sensors (TerraSAR-Xand Cosmo-SkyMed constellations), because this leads togetting denser pixel grids involved in the primary networkanalyses.
We finally remark that, once the sequence of single-lookDInSAR interferograms is properly unwrapped, it can be usedto produce surface deformation time-series of the investigatedarea at full spatial resolution scale by directly applying theconventional SBAS inversion technique.

4070 IEEE TRANSACTIONS ON GEOSCIENCE AND REMOTE SENSING, VOL. 49, NO. 10, OCTOBER 2011
TABLE IERS-1/2 SAR ACQUISITION LIST (TRACK 36, FRAMES 2781) WITH
THOSE CHARACTERIZED BY LARGE DCs HIGHLIGHTED
At this stage, we may be also interested in reintegratingsome of the SAR images of the original data set that werediscarded after the interferometric data pair selection, car-ried out by means of a Delaunay triangulation in the TxB⊥plane (see Section II). This issue may be particularly rele-vant for the images acquired by the ERS-2 SAR sensor af-ter 2000, i.e., following its system gyroscope failure event[60], because of their large DC values. A simple solutionfor reintegrating some of such images is described in theAppendix.
TABLE I(Continued.) ERS-1/2 SAR ACQUISITION LIST (TRACK 36, FRAMES
2781) WITH THOSE CHARACTERIZED BY LARGE DCs HIGHLIGHTED
VI. RESULTS
The validation of the proposed approach was carried outby processing a data set of 93 ERS-1/2 SAR images acquiredon descending orbits (Track 36, Frame 2781) between June 8,1992, and August 23, 2007 [see Table I and Fig. 5], over theNapoli (Italy) bay area. The investigated zone, extending forabout 90 km × 90 km, has been the subject of several scientificinvestigations, mostly aimed at detecting and analyzing thedeformation phenomena affecting the city of Napoli [61], [62]and the three active volcanoes located in this zone [50], [63]–[67]: the Campi Flegrei caldera, the Somma–Vesuvius volcaniccomplex, and the Ischia island.
We preliminarily selected, from the available SAR data set, asubset consisting of 86 images [see Fig. 1(a)] characterized by
PEPE et al.: NEW ADVANCES OF EMCF PhU ALGORITHM FOR SBAS-DInSAR ANALYSIS 4071
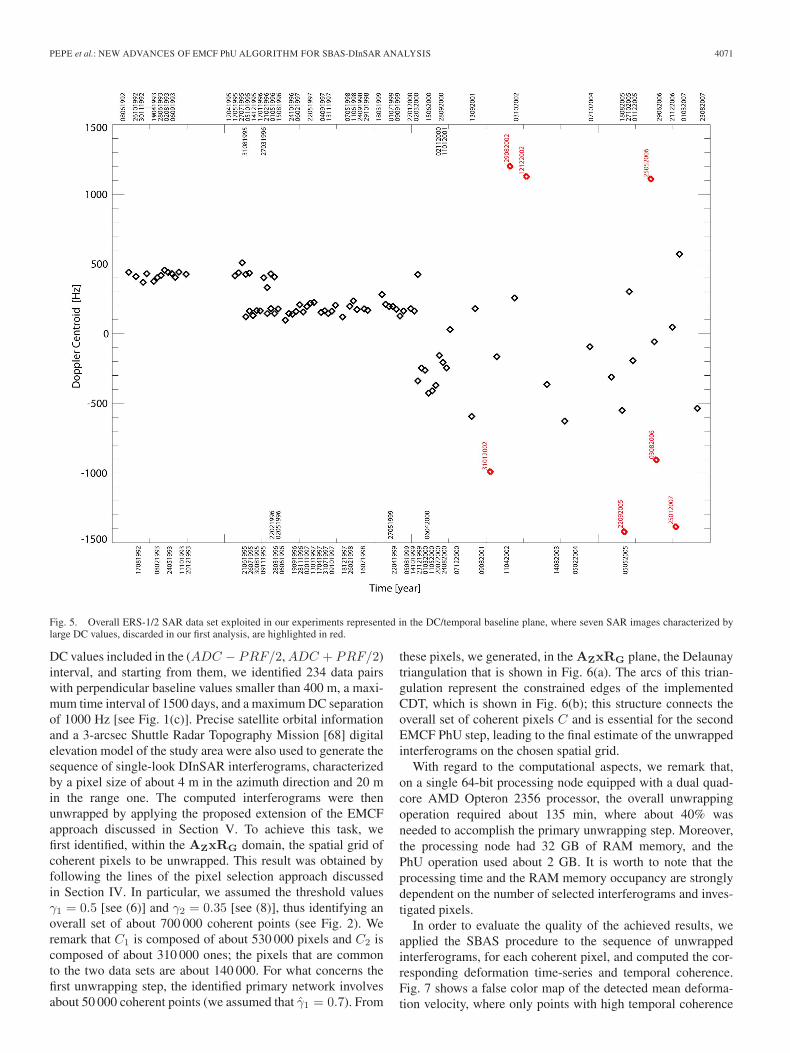
Fig. 5. Overall ERS-1/2 SAR data set exploited in our experiments represented in the DC/temporal baseline plane, where seven SAR images characterized bylarge DC values, discarded in our first analysis, are highlighted in red.
DC values included in the (ADC − PRF/2, ADC + PRF/2)interval, and starting from them, we identified 234 data pairswith perpendicular baseline values smaller than 400 m, a maxi-mum time interval of 1500 days, and a maximum DC separationof 1000 Hz [see Fig. 1(c)]. Precise satellite orbital informationand a 3-arcsec Shuttle Radar Topography Mission [68] digitalelevation model of the study area were also used to generate thesequence of single-look DInSAR interferograms, characterizedby a pixel size of about 4 m in the azimuth direction and 20 min the range one. The computed interferograms were thenunwrapped by applying the proposed extension of the EMCFapproach discussed in Section V. To achieve this task, wefirst identified, within the AZxRG domain, the spatial grid ofcoherent pixels to be unwrapped. This result was obtained byfollowing the lines of the pixel selection approach discussedin Section IV. In particular, we assumed the threshold valuesγ1 = 0.5 [see (6)] and γ2 = 0.35 [see (8)], thus identifying anoverall set of about 700 000 coherent points (see Fig. 2). Weremark that C1 is composed of about 530 000 pixels and C2 iscomposed of about 310 000 ones; the pixels that are commonto the two data sets are about 140 000. For what concerns thefirst unwrapping step, the identified primary network involvesabout 50 000 coherent points (we assumed that γ1 = 0.7). From
these pixels, we generated, in the AZxRG plane, the Delaunaytriangulation that is shown in Fig. 6(a). The arcs of this trian-gulation represent the constrained edges of the implementedCDT, which is shown in Fig. 6(b); this structure connects theoverall set of coherent pixels C and is essential for the secondEMCF PhU step, leading to the final estimate of the unwrappedinterferograms on the chosen spatial grid.
With regard to the computational aspects, we remark that,on a single 64-bit processing node equipped with a dual quad-core AMD Opteron 2356 processor, the overall unwrappingoperation required about 135 min, where about 40% wasneeded to accomplish the primary unwrapping step. Moreover,the processing node had 32 GB of RAM memory, and thePhU operation used about 2 GB. It is worth to note that theprocessing time and the RAM memory occupancy are stronglydependent on the number of selected interferograms and inves-tigated pixels.
In order to evaluate the quality of the achieved results, weapplied the SBAS procedure to the sequence of unwrappedinterferograms, for each coherent pixel, and computed the cor-responding deformation time-series and temporal coherence.Fig. 7 shows a false color map of the detected mean deforma-tion velocity, where only points with high temporal coherence

4072 IEEE TRANSACTIONS ON GEOSCIENCE AND REMOTE SENSING, VOL. 49, NO. 10, OCTOBER 2011
Fig. 6. Triangulations exploited by the proposed EMCF-based PhU approach. (a) Delaunay triangulation relevant to the primary network, drawn in red,superimposed on a grayscale representation (highly saturated for visualization purposes) of the SAR amplitude image of the area. (b) Superposition of theprimary triangulation (drawn in red) on the computed CDT involving the whole set of coherent points C. The arcs not belonging to the primary triangulation aredrawn in gray.
values (we assumed a threshold γ = 0.7, which is typical forDInSAR analyses) are included, superimposed on a multilookSAR amplitude image of the area. It is worth to remark that, by
assuming in (2) the typical coherence threshold γ = 0.7 [25],more than 92% of the investigated pixels accounted by C in(9) can be considered correctly unwrapped. Moreover, in order

PEPE et al.: NEW ADVANCES OF EMCF PhU ALGORITHM FOR SBAS-DInSAR ANALYSIS 4073
Fig. 7. Mean deformation velocity map of the Napoli (Italy) bay area computed at full spatial resolution scale, superimposed on (grayscale representation) aSAR amplitude image of the zone. The black box identifies the zoomed area shown in Fig. 8(a).
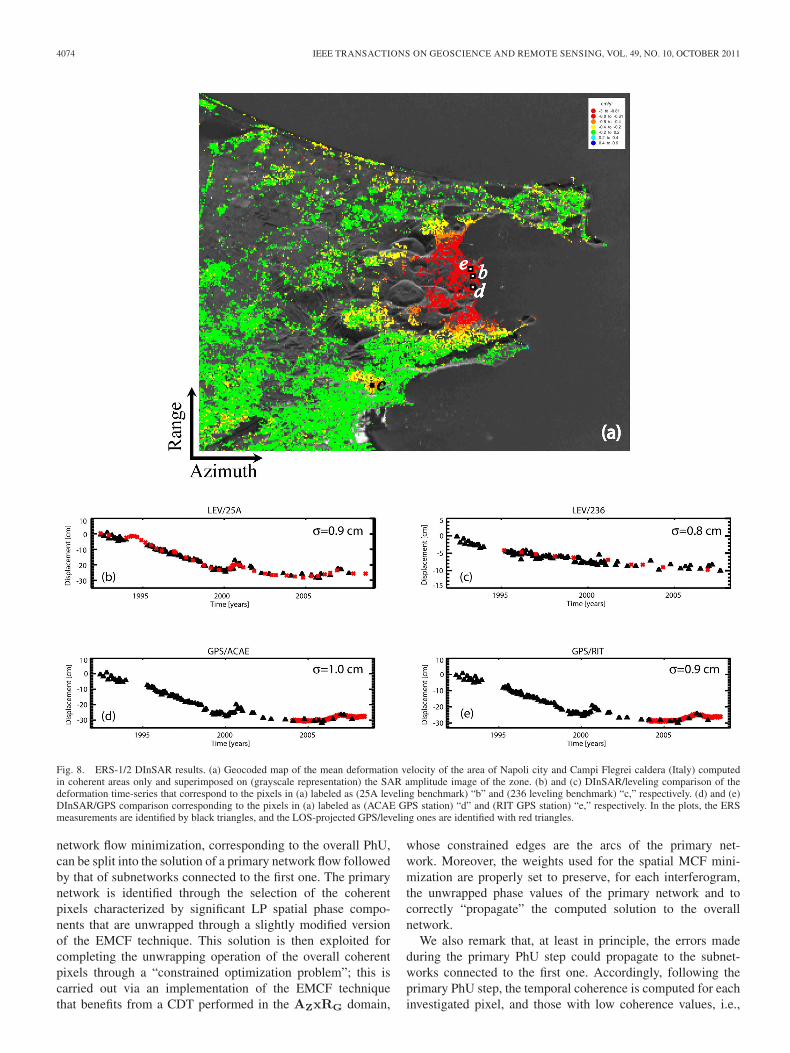
to further investigate the achieved accuracy of the proposedapproach, we focused on the Napoli city and surround-ings, including Campi Flegrei caldera [see Fig. 8(a)] whereindependent geodetic information (leveling and GPS measure-ments) was available. In particular, for our analysis, we con-sidered pixels located in correspondence to continuous GPSstations and levelling benchmarks and we compared, for eachof these points, the retrieved DInSAR time-series with those ob-tained from the geodetic measurements, projected on the radarLOS. The results of this comparison are shown in Fig. 8(b)–(e)where, for each pixel, the standard deviation σ of the differencebetween the two measurements (SAR and geodetic) is alsopresented. Note that, although we did not perform any filter-ing of the atmospheric phase artifacts affecting the DInSARtime-series, there is a good agreement between the SAR andthe geodetic measurements. These results further confirm theeffectiveness of the proposed PhU approach.
In order to complete our analysis, we have also appliedthe single optimization stage EMCF PhU approach (relativeto the defined cost function) to the same sequence of full-sized DInSAR interferograms used in the previously discussedexperiment. As expected, the results have very low temporalcoherence values due to the large amount of phase residues tobe compensated, and less than 5% of the investigated pixelsaccounted by C in (9) can be considered correctly unwrapped.We further remark that, also from the computational point ofview, the proposed two-step PhU solution is more efficient thanthe single-step EMCF approach, which requested more than8 hours of computing time.
As a final experiment, we present also the results achievedby reintegrating in our analysis the seven images of our dataset, highlighted in red in Fig. 5, characterized by values ofthe DC exceeding the (ADC − PRF/2, ADC + PRF/2)interval. This analysis was performed by considering the simpleprocedure discussed in the Appendix. In this case, we generatedan additional set of 34 DInSAR interferograms, complying withthe applied baseline constraints and identified in Fig. 9 by redarcs. Also in this case, the SBAS inversion of the achievedresults was carried out. The analysis of the computed temporalcoherence value shows that there are no significant variationswith respect to the results in Fig. 8; this is not surprising becauseof the limited number of reintegrated SAR images. Moreover,also the results of the comparison with geodetic measurementsshown in Fig. 10 are consistent with those previously shownin Fig. 8.
VII. DISCUSSION AND CONCLUSION
We have presented a new solution for the PhU of sequencesof multitemporal DInSAR interferograms computed at the fullspatial resolution scale and suitable for deformation time-seriesanalysis through the SBAS algorithm. The proposed approachextends the EMCF PhU technique, whose direct applicationto the single-look interferograms is often not feasible. Wehave shown that, by properly partitioning the investigated SARpixels, it is possible to successfully exploit the EMCF techniquethrough a two-step PhU solution. In this case, the complex
4074 IEEE TRANSACTIONS ON GEOSCIENCE AND REMOTE SENSING, VOL. 49, NO. 10, OCTOBER 2011
Fig. 8. ERS-1/2 DInSAR results. (a) Geocoded map of the mean deformation velocity of the area of Napoli city and Campi Flegrei caldera (Italy) computedin coherent areas only and superimposed on (grayscale representation) the SAR amplitude image of the zone. (b) and (c) DInSAR/leveling comparison of thedeformation time-series that correspond to the pixels in (a) labeled as (25A leveling benchmark) “b” and (236 leveling benchmark) “c,” respectively. (d) and (e)DInSAR/GPS comparison corresponding to the pixels in (a) labeled as (ACAE GPS station) “d” and (RIT GPS station) “e,” respectively. In the plots, the ERSmeasurements are identified by black triangles, and the LOS-projected GPS/leveling ones are identified with red triangles.
network flow minimization, corresponding to the overall PhU,can be split into the solution of a primary network flow followedby that of subnetworks connected to the first one. The primarynetwork is identified through the selection of the coherentpixels characterized by significant LP spatial phase compo-nents that are unwrapped through a slightly modified versionof the EMCF technique. This solution is then exploited forcompleting the unwrapping operation of the overall coherentpixels through a “constrained optimization problem”; this iscarried out via an implementation of the EMCF techniquethat benefits from a CDT performed in the AZxRG domain,
whose constrained edges are the arcs of the primary net-work. Moreover, the weights used for the spatial MCF mini-mization are properly set to preserve, for each interferogram,the unwrapped phase values of the primary network and tocorrectly “propagate” the computed solution to the overallnetwork.
We also remark that, at least in principle, the errors madeduring the primary PhU step could propagate to the subnet-works connected to the first one. Accordingly, following theprimary PhU step, the temporal coherence is computed for eachinvestigated pixel, and those with low coherence values, i.e.,

PEPE et al.: NEW ADVANCES OF EMCF PhU ALGORITHM FOR SBAS-DInSAR ANALYSIS 4075
Fig. 9. Extended interferometric SAR data pair distribution relevant to the overall data set shown in Fig. 5. The red arcs are relevant to the new interferogramsinvolving the additional seven SAR acquisitions, characterized by large DC values, highlighted in red in Fig. 5. Note that the new data pairs identified by the redarcs are characterized by small spatial (perpendicular) and temporal baselines, as well as with small DC differences. In particular, in our experiments, the selectedthresholds correspond to 400 m, 1500 days, and 1000 Hz, respectively.
Fig. 10. Same as Fig. 8(b)–(e) but with the presented ERS-1/2 DInSAR results achieved following the reintegration of the seven images with large DC values,highlighted in red in Fig. 5.
significantly affected by PhU errors, are excluded from theconstrained edges. This drastically reduces the possibility ofPhU error propagation.
The presented results demonstrate the effectiveness ofthe proposed solution that, on the other hand, can be fur-ther extended to improve the algorithm performances. In

4076 IEEE TRANSACTIONS ON GEOSCIENCE AND REMOTE SENSING, VOL. 49, NO. 10, OCTOBER 2011
particular, we may consider the possibility to carry out someiterations with the implemented PhU approach. In this case,we may invert the unwrapped interferograms via the SBAStechnique and compute the temporal coherence; for each co-herent point, accordingly, those pixels showing high temporalcoherence values may be exploited to generate an updatedprimary network structure, and we may perform a new itera-tion of the second PhU step, further extending the unwrappedsolution.
We also remark the fact that the partitioning of the origi-nal problem into the superposition of independent MCF sub-minimizations can be also efficiently used to parallelize thewhole procedure, thus allowing us to investigate deformationaffecting very large areas on the ground (represented by tensof millions of pixels). This may be particularly relevant forthe analysis of the data acquired by the new-generation X-band SAR sensors, i.e., Cosmo-SkyMED and TerraSAR-X,characterized by improved spatial resolutions and much shorterrevisit times with respect to the elder C-band SAR systems(e.g., ERS-1/2, ENVISAT, and RADARSAT-1). The second-generation X-band SAR sensor characteristics lead to densercoherent areas within the interferograms, further increasing theneed of precise and computationally efficient PhU tools, whendealing with data processed at the full spatial resolution scale.In this context, the approach proposed in this paper may bevery relevant for the development of advanced interferometricprocessing approaches.
APPENDIX
The interferometric data pair distribution obtained via theDelaunay triangulation in the TxB⊥ plane is crucial for im-plementing the temporal PhU step carried out via the MCFapproach, but it may lead to discard some images because ofthe applied baseline and Doppler constraints. In particular, thelatter issue can be extremely relevant for images acquired bythe ERS-2 sensor after 2000 [60]. On the other hand, we may beinterested in reintegrating some of (or all) these images throughthe generation of additional interferograms, if not included inthe computed Delaunay triangulation but still consistent withrespect to the applied constraints. Obviously, we may decideto carry out the PhU operation of these new interferogramsvia the standard MCF approach applied to their sparse spatialgrids, independently from the remaining data accounted bythe Delaunay triangulation in the TxB⊥ plane. However, thistypically leads to poor quality results that also degrade thetemporal coherence computed following the SBAS inversion.Accordingly, since the number of additional interferograms istypically very small with respect to the overall data set, wepropose to analyze them after carrying out the proposed EMCF-based PhU operation, followed by the SBAS inversion. At thisstage, we may benefit, for each pixel of the AZxRG grid,from the estimate of the local topography and the azimuthallocation information, Δz and Δx, respectively, and we mayeasily evaluate the temporal LP filtered phase component ofthe DInSAR time-series, referred to as ϕ in the following. Thelatter can be also interpolated (we typically apply a simplepolynomial interpolator) to account for the reintegrated timeacquisitions tA = (tA1 , t
A2 , . . . , t
ANA
) with respect to the orig-
inal ones t = (t0, t1, . . . , tN ), leading to the new time vectort+ = {t
⋃tA} relevant to the whole time acquisitions. The
estimated signal components are then used, for each pixel, togenerate a model of the (unknown) unwrapped phases that, byconsidering the additional j-th interferogram, has the followingexpression:
mAj =
4π
λ· Δb⊥j
R · sin(ϑ) ·Δz
+2π
vs·Δξj ·Δx+Δϕj , j = 1, . . . ,MA (A.1)
where MA is the number of added interferograms, Δb⊥j is theperpendicular baseline of the added interferogram, Δξj is itsDC difference, and Δϕj is the LP phase component computedfrom the time-series corresponding to the time span of theconsidered jth interferometric SAR data pair.
Once the unwrapped phase models are computed via (A.1),they are modulo-2π subtracted to the phase of the additionalinterferograms, and then, the residual phase signals are un-wrapped via the basic MCF approach; since a large componentof the wrapped phase signal has been removed, these residualinterferograms are typically much easier to be independentlyunwrapped. The results of these unwrapping operations arefinally added to the subtracted models in order to get an estimateof the overall unwrapped phase signals.
As a final remark, we underline that the discussion presentedin this section is focused on the issue of extending the exploitedtime-series by adding some previously discarded SAR images.However, a similar solution can be also applied if we want tosimply consider some additional interferograms not includedin the computed “triangulation”; this does not increase theoverall number of exploited acquisitions, but it may be re-quired, for instance, to increase the redundancy of our DInSARmeasurements.
ACKNOWLEDGMENT
The ERS-1/2 synthetic aperture radar data were provided bythe European Space Agency, and the digital elevation modelof the investigated zone has been acquired through the Shut-tle Radar Topography Mission archive. The exploited preciseorbital information was supplied by the Technical Universityof Delft (The Netherlands). The authors would like to thankC. Del Gaudio and P. De Martino of Osservatorio Vesuviano,Istituto Nazionale di Geofisica e Vulcanologia, who providedthe leveling and GPS measurements, respectively. We are alsoindebted with Pietro Tizzani for his constructive help, andwith the anonymous reviewers for their valuable remarks andsuggestions. Finally, we are grateful to S. Guarino, F. Parisi andM. C. Rasulo for their technical support.
REFERENCES
[1] D. Massonnet and K. L. Feigl, “Radar interferometry and its applicationto changes in the Earth’s surface,” Rev. Geophys., vol. 36, no. 4, pp. 441–500, Nov. 1998, DOI: 10.1029/97RG03139.
[2] R. Bürgmann, P. A. Rosen, and E. J. Fielding, “Synthetic aperture radar in-terferometry to measure Earth’s surface topography and its deformation,”Annu. Rev. Earth Planet Sci., vol. 28, pp. 169–209, May 2000.
[3] A. K. Gabriel, R. M. Goldstein, and H. A. Zebker, “Mapping small ele-vation changes over large areas: Differential interferometry,” J. Geophys.Res., vol. 94, no. B7, pp. 9183–9191, Mar. 1989.

PEPE et al.: NEW ADVANCES OF EMCF PhU ALGORITHM FOR SBAS-DInSAR ANALYSIS 4077
[4] D. Massonnet, M. Rossi, C. Carmona, F. Adragna, G. Peltzer, K. Feigl,and T. Rabaute, “The displacement field of the Landers earthquakemapped by radar interferometry,” Nature, vol. 364, no. 6433, pp. 138–142, Jul. 1993.
[5] R. M. Goldstein, H. Engelhardt, B. Kamb, and R. M. Frolich, “Satel-lite radar interferometry for monitoring ice sheet motion: Application toan Antarctic ice stream,” Science, vol. 262, no. 5139, pp. 1525–1530,Dec. 1993.
[6] D. Massonnet, P. Briole, and A. Arnaud, “Deflation of Mount Etna mon-itored by spaceborne radar interferometry,” Nature, vol. 375, no. 6532,pp. 567–570, Jun. 1995.
[7] G. Peltzer and P. A. Rosen, “Surface displacement of the 17 May 1993Eureka Valley earthquake observed by SAR interferometry,” Science,vol. 268, no. 5215, pp. 1333–1336, Jun. 1995.
[8] E. G. Rignot, “Fast recession of a west Antarctic glacier,” Science,vol. 281, no. 5376, pp. 549–551, Jul. 1998.
[9] F. Amelung, D. L. Galloway, J. W. Bell, H. A. Zebker, and R. J. Laczniak,“Sensing the ups and downs of Las Vegas: InSAR reveals structuralcontrol of land subsidence and aquifer-system deformation,” Geology,vol. 27, no. 6, pp. 483–486, Jun. 1999.
[10] Y. Fialko, M. Simons, and D. Agnew, “The complete (3-D) sur-face displacement field in the epicentral area of the 1999 Mw7.1Hector Mine earthquake, California, from space geodetic obser-vations,” Geophys. Res. Lett., vol. 28, no. 16, pp. 3063–3066,Aug. 2001.
[11] A. Ferretti, C. Prati, and F. Rocca, “Permanent scatterers in SAR inter-ferometry,” IEEE Trans. Geosci. Remote Sens., vol. 39, no. 1, pp. 8–20,Jan. 2001.
[12] P. Berardino, G. Fornaro, R. Lanari, and E. Sansosti, “A new algorithmfor surface deformation monitoring based on small baseline differentialSAR interferograms,” IEEE Trans. Geosci. Remote Sens., vol. 40, no. 11,pp. 2375–2383, Nov. 2002.
[13] C. Werner, U. Wegmüller, T. Strozzi, and A. Wiesmann, “Interferomet-ric point target analysis for deformation mapping,” in Proc. IGARSS,Toulouse, France, Jul. 2003, pp. 4362–4364.
[14] A. Hooper, H. Zebker, P. Segall, and B. Kampes, “A new method for mea-suring deformation on volcanoes and other natural terrains using InSARpersistent scatterers,” Geophys. Res. Lett., vol. 31, p. L23 611, Dec. 2004,DOI: 10.1029/2004GL021737.
[15] O. Mora, J. J. Mallorquí, and A. Broquetas, “Linear and nonlinear terraindeformation maps from a reduced set of interferometric SAR images,”IEEE Trans. Geosci. Remote Sens., vol. 41, no. 10, pp. 2243–2253,Oct. 2003.
[16] C. Prati, A. Ferretti, and D. Perissin, “Recent advances on sur-face ground deformation measurement by means of repeated space-borne SAR observations,” J. Geodyn., vol. 49, no. 3/4, pp. 161–170,Apr. 2010.
[17] A. Hooper, “A multi-temporal InSAR method incorporating both persis-tent scatterer and small baseline approaches,” Geophys. Res. Lett., vol. 35,p. L16 302, Aug. 2008, DOI: 10.1029/2008GL034654.
[18] H. A. Zebker and J. Villasenor, “Decorrelation in interferometric radarechoes,” IEEE Trans. Geosci. Remote Sens., vol. 30, no. 5, pp. 950–959,Sep. 1992.
[19] R. Lanari, O. Mora, M. Manunta, J. J. Mallorquì, P. Berardino, andE. Sansosti, “A small baseline approach for investigating defor-mation on full resolution differential SAR interferograms,” IEEETrans. Geosci Remote Sens., vol. 42, no. 7, pp. 1377–1386,Jul. 2004.
[20] M. Costantini, F. Malvarosa, F. Minati, L. Pietranera, and G. Milillo,“A three-dimensional phase unwrapping algorithm for processing ofmultitemporal SAR interferometric measurements,” in Proc. Geosci., Re-mote Sens. Symp., Toronto, Canada, 2002, vol. 3, pp. 1741–1743.
[21] A. Hooper and H. Zebker, “Phase unwrapping in three dimensions, withapplication to InSAR time series,” J. Opt. Soc. Amer. A, Opt. Image Sci.Vis., vol. 24, no. 9, pp. 2737–2747, Sep. 2007.
[22] A. P. Shanker and H. Zebker, “Edgelist phase unwrapping algorithm fortime series InSAR analysis,” J. Opt. Soc. Amer. A, Opt. Image Sci. Vis.,vol. 27, no. 3, pp. 605–612, Mar. 2010.
[23] G. Fornaro, A. Pauciullo, and D. Reale, “A null-space method for thephase unwrapping of multitemporal SAR interferometric stacks,” IEEETrans. Geosci. Remote Sens., 2011, to be published.
[24] M. Costantini, S. Falco, F. Malvarosa, F. Minati, F. Trillo, and F. Vecchioli,“A general formulation for robust integration of finite differences andphase unwrapping on sparse multidimensional domains,” in Proc. Fringe,Frascati, Italy, Dec. 2009.
[25] A. Pepe and R. Lanari, “On the extension of the minimum cost flowalgorithm for phase unwrapping of multitemporal differential SAR inter-
ferograms,” IEEE Trans. Geosci. Remote Sens., vol. 44, no. 9, pp. 2374–2383, Sep. 2006.
[26] M Costantini and P. A. Rosen, “A generalized phase unwrapping ap-proach for sparse data,” in Proc. IGARSS, Hamburg, Germany, Jun. 1999,pp. 267–269.
[27] D. P. Bertsekas and P. Tseng, “Relaxation methods for minimum costordinary and generalized network flow problems,” Oper. Res., vol. 36,no. 1, pp. 93–114, Jan./Feb. 1988.
[28] P. A. Rosen, S. Hensley, I. R. Joughin, F. K. Li, S. N. Madsen,E. Rodriguez, and R. M. Goldstein, “Synthetic aperture radar interferom-etry,” IEEE Trans. Geosci. Remote Sens., vol. 88, no. 3, pp. 333–382,Mar. 2000.
[29] A. Pepe, M. Manunta, G. Mazzarella, and R. Lanari, “A space–timeminimum cost flow phase unwrapping algorithm for the generation of per-sistent scatterers deformation time-series,” in Proc. IGARSS, Barcellona,Spain, 2007, pp. 5285–5288.
[30] L. P. Chew, “Constrained Delaunay triangulations,” in Algorithmica,vol. 4. New York: Springer-Verlag, 1989, pp. 97–108.
[31] G. F. Carballo and P. W. Fieguth, “Hierarchical network flow phase un-wrapping,” IEEE Trans. Geosci Remote Sens., vol. 40, no. 8, pp. 1695–1708, Aug. 2002.
[32] C. W. Chen and H. A. Zebker, “Phase unwrapping for large inter-ferograms: Statistical segmentation and generalized network models,”IEEE Trans. Geosci Remote Sens., vol. 40, no. 8, pp. 1709–1719,Aug. 2002.
[33] M. D. Pritt, “Phase unwrapping by means of multigrid techniques forinterferometric SAR,” IEEE Trans. Geosci. Remote Sens., vol. 34, no. 3,pp. 728–738, May 1996.
[34] G. Franceschetti and R. Lanari, Synthetic Aperture Radar Processing.Boca Raton, FL: CRC Press, Mar. 1999.
[35] F. Casu, M. Manzo, A. Pepe, and R. Lanari, “SBAS-DInSAR analysis ofvery extended areas: First results on a 60000-km2 test site,” IEEE Geosci.Remote Sens. Lett., vol. 5, no. 3, pp. 438–442, Jul. 2008.
[36] D. Perissin and F. Rocca, “High-accuracy urban DEM using permanentscatterers,” IEEE Trans. Geosci. Remote Sens., vol. 44, no. 11, pp. 3338–3347, Nov. 2006.
[37] A. Hooper, P. Segall, and H. A. Zebker, “Persistent scattererInSAR for crustal deformation analysis, with application to vocano Al-cedo, Galapagos,” Geophys. Res. Lett., vol. 112, p. B07 407, 2007,DOI: 10.1029/2006JB004763.
[38] W. Xu, E. C. Chang, L. K. Kwoh, H. Lim, W. Cheng, and A. Heng,“Phase unwrapping of SAR interferogram with multi-frequency or multi-baseline,” in Proc. IGARSS, Pasadena, CA, 1994, pp. 730–732.
[39] S. Madsen, “On absolute phase determination techniques in SAR interfer-ometry,” in Proc. SPIE, Apr. 1995, vol. 2487, pp. 393–401.
[40] C. Fischer, K. Schmitt, and W. Wiesbeck, “3-D interferometric SAR algo-rithm for discontinuous distributed objects,” in Proc. IGARSS, Hamburg,Germany, 1999, pp. 1534–1536.
[41] R. Bamler and M. Eineder, “Accuracy of differential shift estimation bycorrelation and split-bandwidth interferometry for wideband and delta-kSAR systems,” IEEE Geosci. Remote Sens. Lett., vol. 2, no. 2, pp. 151–155, Apr. 2005.
[42] N. B. D. Bechor and H. A. Zebker, “Measuring two-dimensional move-ments using a single InSAR pair,” Geophys. Res. Lett., vol. 33, no. 16,p. L16 311, Aug. 2006.
[43] R. Z. Schneider, K. P. Papathanassiou, I. Hajnsek, and A. Moreira, “Polari-metric and interferometric characterization of coherent scatterers in urbanareas,” IEEE Trans. Geosci. Remote Sens., vol. 44, no. 4, pp. 971–984,Apr. 2006.
[44] H. S. Jung, J. S. Won, and S. W. Kim, “An improvement of the per-formance of multiple-aperture SAR interferometry (MAI),” IEEE Trans.Geosci. Remote Sens., vol. 47, no. 8, pp. 2859–2869, Aug. 2009.
[45] F. J. Harris, “On the use of windows for harmonic analysis with thediscrete Fourier transform,” Proc. IEEE, vol. 66, no. 1, pp. 51–83,Jan. 1978.
[46] T. Wang, M. Liao, and D. Perissin, “InSAR coherence-decompositionanalysis,” IEEE Geosci. Remote Sens. Lett., vol. 7, no. 1, pp. 156–160,Jan. 2010.
[47] V. D. Navarro-Sanchez, J. M. Lopez-Sanchez, and F. Vicente-Guijalba, “Acontribution of polarimetry to satellite differential SAR interferometry:Increasing the number of pixel candidates,” IEEE Geosci. Remote Sens.Lett., vol. 7, no. 2, pp. 276–280, Apr. 2010.
[48] R. Lanari, F. Casu, M. Manzo, G. Zeni, P. Berardino,M. Manunta, and A. Pepe, “An overview of the small baseline subsetalgorithm: A DInSAR technique for surface deformation analysis,”Pure and Applied Geophysics, vol. 164, no. 4, pp. 637–661, Apr. 2007,DOI: 10.1007/s00024-007-0192-9.

4078 IEEE TRANSACTIONS ON GEOSCIENCE AND REMOTE SENSING, VOL. 49, NO. 10, OCTOBER 2011
[49] P. Tizzani, P. Berardino, F. Casu, P. Euillades, M. Manzo, G. P. Ricciardi,G. Zeni, and R. Lanari, “Surface deformation of Long Valley Caldera andMono Basin, California, investigated with the SBAS-InSAR approach,”Remote Sens. Environ., vol. 108, no. 3, pp. 277–289, Jun. 2007.
[50] E. Trasatti, F. Casu, C. Giunchi, S. Pepe, G. Solaro, S. Tagliaventi,P. Berardino, M. Manzo, A. Pepe, G. P. Ricciardi, E. Sansosti, P. Tizzani,G. Zeni, and R. Lanari, “The 2004–2006 uplift episode at Campi Fle-grei caldera (Italy): Constraints from SBAS-DInSAR ENVISAT data andBayesian source inference,” Geophys. Res. Lett., vol. 35, no. 7, p. L07 308,Apr. 2008.
[51] P. Tizzani, M. Battaglia, G. Zeni, S. Atzori, P. Berardino, and R. Lanari,“Uplift and magma intrusion at Long Valley caldera from InSAR andgravity measurements,” Geology, vol. 37, no. 1, pp. 63–66, Jan. 2009.
[52] M. Neri, F. Casu, V. Acocella, G. Solaro, S. Pepe, P. Berardino,E. Sansosti, T. Caltabiano, and P. Lundgren, “Deformation and eruptionsat Mt. Etna (Italy): A lesson from 15 years of observations,” Geophys.Res. Lett., vol. 36, no. 2, p. L02 309, Jan. 2009.
[53] J. Fernandez, P. Tizzani, M. Manzo, A. Borgia, P. J. Gonzales, J. Marti,A. Pepe, A. G. Camacho, F. Casu, P. Berardino, J. F. Prieto, andR. Lanari, “Gravity-driven deformation of Tenerife measured by InSARtime series analysis,” Geophys. Res. Lett., vol. 36, no. 4, p. L04 306,Feb. 2009.
[54] F. Guzzetti, M. Manunta, F. Ardizzone, A. Pepe, M. Cardinali, G. Zeni,P. Reichenbach, and R. Lanari, “Analysis of ground deformation detectedusing the SBAS-DInSAR technique in Umbria, Central Italy,” Pure Appl.Geophys., vol. 166, no. 8/9, pp. 1425–1459, Sep. 2009.
[55] J. Hunstad, A. Pepe, S. Atzori, C. Tolomei, S. Salvi, and R. Lanari,“Surface deformation in the Abruzzi region, Central Italy, from multi-temporal DInSAR analysis,” Geophys. J. Int., vol. 178, no. 3, pp. 1193–1197, Sep. 2009.
[56] J. Ruch, A. Manconi, G. Zeni, G. Solaro, A. Pepe, M. Shirzaei,T. R. Walter, and R. Lanari, “Stress transfer in the Lazufre volcanic area,central Andes,” Geophys. Res. Lett., vol. 36, no. 6, p. L22 303, Nov. 2009.
[57] F. P Preparata and M. I. Shamos, Computational Geometry. New York:Springer-Verlag, 1985.
[58] D. T. Lee and A. K. Lin, “Generalized Delaunay triangulations for planargraphs,” Discrete Comput. Geom., vol. 1, no. 1, pp. 201–217, Dec. 1986.
[59] J. R. Shewchuk, “Delaunay refinement algorithms for triangular meshgeneration,” Comput. Geom.-Theory Appl., vol. 22, no. 1–3, pp. 21–74,May 2002.
[60] N. Miranda, B. Rosich, C. Santella, and M. Grion, “Review of the impactof ERS-2 piloting modes on the SAR Doppler stability,” in Proc. Fringe,Frascati, Italy, p. 12.1.
[61] M. Tesauro, P. Berardino, R. Lanari, E. Sansosti, G. Fornaro, andG. Franceschetti, “Urban subsidence inside the city of Napoli (Italy)observed by satellite radar interferometry,” Geophys. Res. Lett., vol. 27,no. 13, pp. 1961–1964, Jul. 2000.
[62] R. Lanari, G. Zeni, M. Manunta, S. Guarino, P. Berardino, and E. Sansosti,“An integrated SAR/GIS approach for investigating urban deformationphenomena: The city of Napoli (Italy) case study,” Int. J. Remote Sens.,vol. 25, no. 14, pp. 2855–2867, Jul. 2004.
[63] P. Lundgren, S. Usai, E. Sansosti, R. Lanari, M. Tesauro, G. Fornaro, andP. Berardino, “Modeling surface deformations observed with syntheticaperture radar interferometry at Campi Flegrei caldera,” J. Geophys. Res.,vol. 106, no. B9, pp. 19 355–19 366, Sep. 2001.
[64] R. Lanari, P. Berardino, S. Borgstom, C. Del Gaudio, P. De Martino,G. Fornaro, S. Guarino, G. P. Ricciardi, E. Sansosti, and P. Lundgren,“The use of IFSAR and classical geodetic techniques for caldera unrestepisodes: Application to the Campi Flegrei uplift event of 2000,” J.Volcanol. Geotherm. Res., vol. 133, no. 1–4, pp. 247–260, May 2004.
[65] R. Lanari, G. De Natale, P. Berardino, E. Sansosti, G. P. Ricciardi,S. Borgstrom, P. Capuano, F. Pingue, and C. Troise, “Evidence for apeculiar style of ground deformation inferred at Vesuvius volcano,” Geo-phys. Res. Lett., vol. 29, no. 9, pp. 1025–1029, May 2002.
[66] A. Borgia, P. Tizzani, G. Solaro, M. Manzo, F. Casu, G. Luongo,A. Pepe, P. Berardino, G. Fornaro, E. Sansosti, G. P. Ricciardi, N. Fusi,G. Di Donna, and R. Lanari, “Volcanic spreading of Vesuvius, a newparadigm for interpreting its volcanic activity,” Geophys. Res. Lett.,vol. 32, no. 3, p. L03 303, Feb. 2005, DOI: 10.1029/2004GL022155.
[67] M. Manzo, G. P. Ricciardi, F. Casu, G. Ventura, G. Zeni,S. Borgstrom, P. Berardino, C. Del Gaudio, and R. Lanari, “Surfacedeformation analysis in the Ischia island (Italy) based on spaceborne radarinterferometry,” J. Volcanol. Geotherm. Res., vol. 151, no. 4, pp. 399–416,Mar. 2006.
[68] P. A. Rosen, S. Hensley, E. Gurrola, F. Rogez, S. Chan, and J. Martin,“SRTM C-and topographic data: Quality assessment and calibration ac-tivities,” in Proc. IGARSS, 2001, pp. 739–741.
Antonio Pepe was born in Salerno, Italy, in 1974.He received the Laurea degree in electronic engi-neering and the Ph.D. degree from the University ofNapoli Federico II, Napoli, Italy, in 2000 and 2007,respectively.
After graduation, following a short experienceat Wind Telecommunication S.p.A., he joined in2001 the Istituto per il Rilevamento Elettromagneticodell’Ambiente, Italian National Research Council(CNR), Napoli, where he is currently a Researcher.He was a Visiting Scientist with the University of
Texas, Austin, in 2005 and with the Jet Propulsion Laboratory, CaliforniaInstitute of Technology, Pasadena, in 2009. His main research interests includethe development of advanced DInSAR algorithms, with a particular emphasison the phase unwrapping problems, aimed at monitoring surface deformationphenomena induced by subsidence, volcano activities, and earthquakes, witha particular interest toward the phase unwrapping problems. He has alsorecently involved in the development of an advanced interferometry tool forthe generation and the analysis of mixed sets of scanSAR-stripmap DInSARinterferograms.
Leonardo Daniel Euillades (M’02) was born inMendoza, Argentina, in 1978. He received theLaurea degree in computer science engineering fromthe Mendoza University, Mendoza, in 2004 and theDr. Eng. degree from Universidad Nacional de Cuyo,Mendoza, in 2010.
Since 2000, he has been with the Instituto deCapacitación Especial y Desarrollo de la IngenieríaAsistida por Computadora, Universidad Nacional deCuyo. From 2001 to 2004, he was an AssistantResearcher with the Argentinean National Space
Agency (CONAE). From 2005 to 2010, he received a fellowship from theArgentinean Research Agency (ANPCyT) and the Argentinean National Re-search Council (CONICET) in the framework of his Ph.D. activities. In2007–2008, he was a Guest Scientist with the Istituto per il RilevamentoElettromagnetico dell’Ambiente, Italian National Research Council (CNR),Napoli, Italy. Since 2010, he has been a Professor of numerical methods withthe Facultad de Ingeniería, Universidad Nacional de Cuyo. His main researchinterests include the differential synthetic aperture radar (SAR) interferometryapplications for the monitoring of surface displacements, such as those pro-duced by subsidence, volcano activity, earthquakes, and ice motion, as well asin SAR interferometry techniques.
Michele Manunta was born in Cagliari, Italy, in1975. He received the Laurea degree in electronicengineering and the Ph.D. degree in informaticsand electronic engineering from the University ofCagliari, Cagliari, in 2001 and 2009, respectively.
Since 2002, he has been with the Istituto per ilRilevamento Elettromagnetico dell’Ambiente, Ital-ian National Research Council (CNR), Napoli, Italy,where he is currently a Researcher. He was VisitingScientist with the Institut Cartografic de Catalunya,Barcelona, Spain, in 2004, and with The Rosenstiel
School of Marine and Atmospheric Science, University of Miami, Miami, FL,in 2006. His research interests include the field of high-resolution syntheticaperture radar (SAR) data processing and grid computing technologies fordifferential SAR interferometry applications. He particularly works on thedevelopment of advanced interferometric techniques for studying deformationphenomena affecting terrain surface (such as those produced by landslides,subsidence, volcano activity, and earthquakes) and man-made structures.

PEPE et al.: NEW ADVANCES OF EMCF PhU ALGORITHM FOR SBAS-DInSAR ANALYSIS 4079
Riccardo Lanari (M’91–SM’01) was born inNapoli, Italy, in 1964. He received the Laurea degree(summa cum laude) in electronic engineering fromthe University of Napoli Federico II, Napoli, in 1989.
In 1989, following a short experience at ItaltelSistemi S.p.A., he joined Istituto di Ricerca perl’Elettromagnetismo e i Componenti Elettronici and,after, Istituto per il Rilevamento Elettromagneticodell’Ambiente, Italian National Council of Research(CNR), Napoli, where he is currently a Senior Re-searcher. He has been a Visiting Scientist at different
foreign research institutes, including the Institute of Space and AstronauticalScience, Sagamihara, Japan, in 1993, the German Aerospace Research (DLR),Weilheim, Germany, in 1991 and 1994, and the Jet Propulsion Laboratory,Pasadena, CA, in 1997, 2004, and 2008, where he received a National Aero-nautics and Space Administration recognition for the technical developmentsrelated to the Shuttle Radar Topography Mission. He has lectured in severalnational and foreign universities and research centers. From 2000 to 2003, hewas an Adjunct Professor of electrical communication with the Università degliStudi del Sannio, Benevento, Italy. From 2000 to 2008, he was a Lecturerof the synthetic aperture radar (SAR) module course of the InternationalMaster in Airborne Photogrammetry and Remote Sensing with the Institute ofGeomatics, Barcelona, Spain. He is the holder of two patents. He has authoredor coauthored more than 60 international journal papers and the book entitled“Synthetic Aperture Radar Processing” (CRC Press, 1999). Moreover, he actsas a reviewer of several peer-reviewed international journals. His main researchactivities include the SAR data processing field as well as SAR interferometrytechniques.
Mr. Lanari is a Distinguished Speaker of the Geoscience and Remote SensingSociety of IEEE and has served as Chairman and technical program committeemember at several international conferences.
Copyright © 2022 FDOKUMEN