Maximum Production Minimum Pollution (MPMP), Necessary ...
11
Copyright © 2018 by Author/s and Licensed by Lectito BV, Netherlands. This is an open access article distributed under the Creative Commons Attribution License which permits unrestricted use, distribution, and reproduction in any medium, provided the original work is properly cited. European Journal of Sustainable Development Research, 2018, 2(4), 41 ISSN: 2542-4742 Maximum Production Minimum Pollution (MPMP), Necessary but not Sufficient for Sustainability Said S. E. Elnashaie 1* , Firoozeh Danafar 2 , M. E. E. Abashar 3 1 Chemical and Biological Engineering Department, University of British Columbia (UBC), Vancouver, CANADA 2 Chemical Engineering Department, Shahid Bahonar University of Kerman, Kerman, IRAN 3 Chemical Engineering Department, King Saud University, Riyadh, SAUDI ARABIA *Corresponding Author: [email protected] Citation: Elnashaie, S. S. E., Danafar, F. and Abashar, M. E. E. (2018). Maximum Production Minimum Pollution (MPMP), Necessary but not Sufficient for Sustainability. European Journal of Sustainable Development Research, 2(4), 41. https://doi.org/10.20897/ejosdr/3909 Published: October 4, 2018 ABSTRACT Sustainable Development (SD) is essential for modern economy. Sustainable Development Engineering (SDE) is a subsystem of SD and concentrates on the engineering sides of SD. Environmental Engineering (EE) is also essential for clean modern industry. EE is necessary for SD but is not sufficient, in order to make it sufficient the feedstock must be from Renewable Raw Materials (RRMs) sources. SD is formed of the sub-systems SDE, EE and RRMs. In this paper membrane catalytic reactors are used to achieve Maximum Production and Minimum Pollution (MPMP) by removing hydrogen from dehydrogenation side. The efficiency increases when a hydrogenation reaction is taking place in the other side of the membrane. This paper is addressing a practical case for this behavior giving MPMP which is necessary but not sufficient for sustainability. The further step to make it sufficient is the use of feedstock from RRMs which is not addressed in the paper. It is shown that the counter-current process is more efficient than the co-current one. This investigation and conclusions are obtained by reliable mathematical modeling, numerical solution and computer simulation of the model differential equations. More difficult ones for the Countercurrent case. Keywords: membrane catalytic reactors, thermodynamics, sustainable engineering, petrochemical industry INTRODUCTION Almost all catalytic reactions in the petrochemical industry are reversible and therefore their conversion is limited by the thermodynamic equilibrium. This conservative limitation can be broken by using selective membranes to remove one of the products. In this section, the usage of selective membranes for the perm-selective removal of hydrogen in dehydrogenation reaction is introduced (She et al., 2001; Hermann et al., 1997; Abashar, 2003). These membranes, which have 100% selectivity for the removal of hydrogen, lead to MPMP. The most efficient configuration is when in the other side of the membrane is a hydrogenation reaction and the flows in the two sides of the membrane are counter-current. Membrane catalytic dehtdrogenation reactors have been investigated and used earlier (e.g., She et al., 2001; Hermann et al., 1997; Abashar, 2003), the new contribution in this paper is having a hydrogenation reaction on the other side of the membrane. Therefore the novelty in this paper is in combining both the hydrogen removal from the dehydrogenation reaction in one side of the membrane and using it as a reactant in the other hydrogenation side. The performance of this integrated membrane reactor is estimated by the conversion of the reactant in the dehydrogenation side. This paper is concentrating on the removal
-
Upload
khangminh22 -
Category
Documents
-
view
2 -
download
0
Transcript of Maximum Production Minimum Pollution (MPMP), Necessary ...

Copyright © 2018 by Author/s and Licensed by Lectito BV, Netherlands. This is an open access article distributed under the Creative Commons Attribution License which permits unrestricted use, distribution, and reproduction in any medium, provided the original work is properly cited.
European Journal of Sustainable Development Research, 2018, 2(4), 41 ISSN: 2542-4742
Maximum Production Minimum Pollution (MPMP), Necessary but not Sufficient for Sustainability
Said S. E. Elnashaie 1*, Firoozeh Danafar 2, M. E. E. Abashar 3
1 Chemical and Biological Engineering Department, University of British Columbia (UBC), Vancouver, CANADA 2 Chemical Engineering Department, Shahid Bahonar University of Kerman, Kerman, IRAN 3 Chemical Engineering Department, King Saud University, Riyadh, SAUDI ARABIA *Corresponding Author: [email protected] Citation: Elnashaie, S. S. E., Danafar, F. and Abashar, M. E. E. (2018). Maximum Production Minimum Pollution (MPMP), Necessary but not Sufficient for Sustainability. European Journal of Sustainable Development Research, 2(4), 41. https://doi.org/10.20897/ejosdr/3909 Published: October 4, 2018 ABSTRACT Sustainable Development (SD) is essential for modern economy. Sustainable Development Engineering (SDE) is a subsystem of SD and concentrates on the engineering sides of SD. Environmental Engineering (EE) is also essential for clean modern industry. EE is necessary for SD but is not sufficient, in order to make it sufficient the feedstock must be from Renewable Raw Materials (RRMs) sources. SD is formed of the sub-systems SDE, EE and RRMs. In this paper membrane catalytic reactors are used to achieve Maximum Production and Minimum Pollution (MPMP) by removing hydrogen from dehydrogenation side. The efficiency increases when a hydrogenation reaction is taking place in the other side of the membrane. This paper is addressing a practical case for this behavior giving MPMP which is necessary but not sufficient for sustainability. The further step to make it sufficient is the use of feedstock from RRMs which is not addressed in the paper. It is shown that the counter-current process is more efficient than the co-current one. This investigation and conclusions are obtained by reliable mathematical modeling, numerical solution and computer simulation of the model differential equations. More difficult ones for the Countercurrent case.
Keywords: membrane catalytic reactors, thermodynamics, sustainable engineering, petrochemical industry
INTRODUCTION
Almost all catalytic reactions in the petrochemical industry are reversible and therefore their conversion is limited by the thermodynamic equilibrium. This conservative limitation can be broken by using selective membranes to remove one of the products. In this section, the usage of selective membranes for the perm-selective removal of hydrogen in dehydrogenation reaction is introduced (She et al., 2001; Hermann et al., 1997; Abashar, 2003). These membranes, which have 100% selectivity for the removal of hydrogen, lead to MPMP. The most efficient configuration is when in the other side of the membrane is a hydrogenation reaction and the flows in the two sides of the membrane are counter-current. Membrane catalytic dehtdrogenation reactors have been investigated and used earlier (e.g., She et al., 2001; Hermann et al., 1997; Abashar, 2003), the new contribution in this paper is having a hydrogenation reaction on the other side of the membrane. Therefore the novelty in this paper is in combining both the hydrogen removal from the dehydrogenation reaction in one side of the membrane and using it as a reactant in the other hydrogenation side. The performance of this integrated membrane reactor is estimated by the conversion of the reactant in the dehydrogenation side. This paper is concentrating on the removal

Elnashaie et al. / Maximum Production Minimum Pollution
2 / 11 © 2018 by Author/s
of hydrogen from a dehydrogenation reaction, mainly ethyl-benzene to styrene (She et al., 2001; Hermann et al., 1997; Abashar, 2003), using hydrogen perm-selective membranes. The yield of the reactor is measured by the Ethyl-benzene conversion and yield of Styrene.
The rate of hydrogen removal from the reaction side depends upon the type of the membrane and also the hydrogen driving force between the two sides of the membranes. This driving force increases when there is a hydrogenation reaction in the other side of the membrane. In the present study a hydrogenation reaction of nitrobenzene to aniline is taking place on the other side of the membrane. A reliable mathematical model is used to investigate the characteristics of this novel membrane reactor configuration which gives a very useful step towards sustainability which is necessary but not sufficient for sustainability.
REACTION KINETICS
The reaction network for the dehydrogenation of ethyl-benzene to styrene is (Abashar, 2003; Moustafa and Elnashaie, 2000; Elnashaie et al., 2000; Abdulla et al., 1993):
𝐶𝐶6𝐻𝐻5𝐶𝐶𝐻𝐻2𝐶𝐶𝐻𝐻3 ⇔ 𝐶𝐶6𝐻𝐻5𝐶𝐶𝐻𝐻𝐶𝐶𝐻𝐻2 + 𝐻𝐻2 Δ𝐻𝐻298 = 117.6 𝑘𝑘𝑘𝑘𝑚𝑚𝑚𝑚𝑚𝑚𝑚𝑚
(1)
𝐶𝐶6𝐻𝐻5𝐶𝐶𝐻𝐻2𝐶𝐶𝐻𝐻3 → 𝐶𝐶6𝐻𝐻6 + 𝐶𝐶2𝐻𝐻4 Δ𝐻𝐻298 = 105.4 𝑘𝑘𝑘𝑘𝑚𝑚𝑚𝑚𝑚𝑚𝑚𝑚
(2)
𝐶𝐶6𝐻𝐻5𝐶𝐶𝐻𝐻2𝐶𝐶𝐻𝐻3 + 𝐻𝐻2 → 𝐶𝐶6𝐻𝐻5𝐶𝐶𝐻𝐻3 + 𝐶𝐶𝐻𝐻4 Δ𝐻𝐻298 = −54.6 𝑘𝑘𝑘𝑘𝑚𝑚𝑚𝑚𝑚𝑚𝑚𝑚
(3)
2𝐻𝐻2𝑂𝑂 + 𝐶𝐶2𝐻𝐻4 → 2𝐶𝐶𝑂𝑂 + 4𝐻𝐻2 Δ𝐻𝐻298 = 210.2 𝑘𝑘𝑘𝑘𝑚𝑚𝑚𝑚𝑚𝑚𝑚𝑚
(4)
𝐻𝐻2𝑂𝑂 + 𝐶𝐶𝐻𝐻4 → 𝐶𝐶𝑂𝑂 + 3𝐻𝐻2 Δ𝐻𝐻298 = 206.1 𝑘𝑘𝑘𝑘𝑚𝑚𝑚𝑚𝑚𝑚𝑚𝑚
(5)
𝐻𝐻2𝑂𝑂 + 𝐶𝐶𝑂𝑂 → 𝐶𝐶𝑂𝑂2 + 𝐻𝐻2 Δ𝐻𝐻298 = −41.2 𝑘𝑘𝑘𝑘𝑚𝑚𝑚𝑚𝑚𝑚𝑚𝑚
(6)
In this network, all side reactions are irreversible with the only reversible reaction being the main reaction which produces the desired product styrene. The corresponding rate equations, expressed as functions of component partial pressure in bars, (Abashar, 2003; Moustafa and Elnashaie, 2000; Elnashaie et al., 2000; Abdulla and Elnashaie, 1993) are:
Figure 1. Schematic diagram showing integrated reactor configuration
H2 Permeation
Heat Transfer
Cross-section in the reactor showing the
membrane tubes

European Journal of Sustainable Development Research, 2(4), 41
© 2018 by Author/s 3 / 11
𝑟𝑟1 = 𝑘𝑘1 �𝑝𝑝𝐸𝐸𝐸𝐸 − 𝑝𝑝𝑆𝑆𝑇𝑇𝑝𝑝𝐻𝐻2𝐾𝐾𝐴𝐴
� (7)
𝑟𝑟2 = 𝑘𝑘2𝑝𝑝𝐸𝐸𝐸𝐸 (8)
𝑟𝑟3 = 𝑘𝑘3𝑝𝑝𝐸𝐸𝐸𝐸𝑝𝑝𝐻𝐻2 (9)
𝑟𝑟4 = 𝑘𝑘4𝑝𝑝𝐻𝐻2𝑂𝑂𝑝𝑝𝐶𝐶2𝐻𝐻41/2 (10)
𝑟𝑟5 = 𝑘𝑘5𝑝𝑝𝐻𝐻2𝑂𝑂𝑝𝑝𝐶𝐶𝐻𝐻4 (11)
𝑟𝑟6 = 𝑘𝑘6 �𝑃𝑃𝑇𝑇3�𝑝𝑝𝐻𝐻2𝑂𝑂𝑝𝑝𝐶𝐶𝑂𝑂 (12)
with rate constants defined as:
𝑘𝑘𝑖𝑖 = exp �𝐴𝐴𝑖𝑖 −𝐸𝐸𝑖𝑖𝑅𝑅𝑇𝑇
� (13)
The numerical values of Ai and Ei are given in Table 1 and are used to calculate the rate of reactions in kmol/kg cat/h. To change the units of partial pressures from bars to Pascal and the reaction rates from kmol/kg cat/h to mol/kgcat/s, the above rate equations have to be multiplied by the constants in Table 2 (Amon et al., 1999; Shu et al., 1994; Carl, 1999; Assabumrungrat et al., 2002; Bischoff, 1990; Villadsen and Michelsen, 1978; Trefethen, 2000). On the tube side, the hydrogenation reaction of nitrobenzene to aniline is given by (Amon et al., 1999):
𝐶𝐶6𝐻𝐻5𝑁𝑁𝑂𝑂2 + 3𝐻𝐻2 → 𝐶𝐶6𝐻𝐻5𝑁𝑁𝐻𝐻2 + 2𝐻𝐻2𝑂𝑂 Δ𝐻𝐻298 𝐾𝐾 = −443.0 𝑘𝑘𝑘𝑘𝑚𝑚𝑚𝑚𝑚𝑚𝑚𝑚
(14)
The rate equation of this reaction is estimated (Amon et al., 1999) by:
𝑟𝑟′ =𝑘𝑘′𝐾𝐾𝑁𝑁𝐸𝐸𝐾𝐾𝐻𝐻2𝑝𝑝′𝑁𝑁𝐸𝐸�𝑝𝑝′𝐻𝐻2
�1 + 𝐾𝐾𝑁𝑁𝐸𝐸𝑝𝑝′𝑁𝑁𝐸𝐸 + 𝐾𝐾𝐻𝐻2�𝑝𝑝′𝐻𝐻2�2 (15)
with reaction rate constant defined as:
𝑘𝑘′ = 103exp�𝐴𝐴′ −𝐸𝐸′𝑅𝑅𝑇𝑇′�
(16)
where: 𝐴𝐴′ = 0.186, 𝐸𝐸′ = 10.0 × 10³ 𝐽𝐽/𝑚𝑚𝑚𝑚𝑚𝑚𝑚𝑚, 𝐾𝐾𝐻𝐻2 = 4.427 × 10⁻³ Pa−1/2, 𝐾𝐾𝑁𝑁𝐸𝐸 = 1.510 × 10⁻⁵ Pa−1
Table 1. Arrhenius equations and equilibrium constants for ethyl-benzene reactions Reaction No. Frequency Factor a Activation Energy a (kJ/mole)
12 0.85 90.9 13 14.00 208.1 14 0.56 91.5 15 0.12 104.0 16 -3.21 65.7 17 21.24 73.6
Equilibrium constant 𝐾𝐾𝐴𝐴 = exp �− Δ𝐹𝐹
𝑅𝑅𝑇𝑇�
Δ𝐹𝐹 = 𝑎𝑎 + 𝑏𝑏𝑏𝑏𝑇𝑇 + 𝑐𝑐𝑇𝑇2 𝑎𝑎 = 122725.157 kJ/kmole
𝑏𝑏𝑏𝑏 = −126.2674 kJ/kmole × K 𝑐𝑐 = −2.194 × 10⁻³ kJ/kmole × K2
a obtained from references (Moustafa and Elnashaie, 2000; Elnashaie et al., 2000; Abdulla and Elnashaie, 1993; Trefethen, 2000). Table 2. Unit conversion constants for reaction rates of dehydrogenation network
Reaction rate equation No. Constant to be multiplied by 7 1/100 8 1/100 9 1/107 10 1/104.5 11 1/107 12 1/1012

Elnashaie et al. / Maximum Production Minimum Pollution
4 / 11 © 2018 by Author/s
GOVERNING EQUATIONS FOR MEMBRANE REACTOR
To obtain the mole balance equations and the energy balance equation, a differential element inside the membrane reactor was considered. After writing the balances under the steady state assumption, both sides of the resulting equations were divided by the thickness of the differential element, which was then forced to approach zero. The resulting balances equations of the shell side can be expressed as:
Mole balances:
𝑑𝑑𝑛𝑛𝑖𝑖𝑑𝑑𝑑𝑑
= �σ𝑖𝑖𝑖𝑖𝑟𝑟𝑖𝑖(1 − ε)6
𝑖𝑖=1
𝐴𝐴𝑐𝑐𝑐𝑐ρ𝑐𝑐 − 2π 𝑟𝑟3𝑁𝑁𝑎𝑎𝑖𝑖𝐽𝐽𝑖𝑖 (17)
Energy balance:
𝑑𝑑𝑇𝑇𝑑𝑑𝑑𝑑
=∑ [−Δ𝐻𝐻(𝑇𝑇)]𝑖𝑖6𝑖𝑖=1 𝑟𝑟𝑖𝑖(1 − ε)𝐴𝐴𝑐𝑐𝑐𝑐ρ𝑐𝑐 + 𝑄𝑄
∑ 𝑛𝑛𝑖𝑖𝐶𝐶𝑝𝑝𝑖𝑖10𝑖𝑖=1
(18)
Pressure drop: 𝑑𝑑𝑃𝑃𝑑𝑑𝑑𝑑
= −𝐺𝐺
𝜌𝜌𝑔𝑔𝑔𝑔𝑐𝑐𝐷𝐷𝑝𝑝�
1 − εε3
� �150(1 − ε)μ𝑔𝑔
𝐷𝐷𝑝𝑝+ 1.75𝐺𝐺� (19)
The corresponding balance equations for the tube side can be expressed as: Mole balance:
𝑑𝑑𝑛𝑛′𝑖𝑖𝑑𝑑𝑑𝑑
= (−1)𝑏𝑏[𝜎𝜎𝑖𝑖𝑟𝑟′(1 − ε′)𝐴𝐴′𝑐𝑐𝑐𝑐ρ′𝑐𝑐 + 2π 𝑟𝑟3𝑎𝑎𝑖𝑖𝐽𝐽𝑖𝑖] (20)
Energy balance:
𝑑𝑑𝑇𝑇′𝑑𝑑𝑑𝑑
= (−1)𝑏𝑏 �(2𝜋𝜋 𝑟𝑟3)∑ 𝑎𝑎𝑖𝑖𝐽𝐽𝑖𝑖 ∫ 𝐶𝐶𝑝𝑝𝑖𝑖𝑑𝑑𝑇𝑇 + [−𝛥𝛥𝐻𝐻′(𝑇𝑇′)] 𝑟𝑟′(1− 𝜀𝜀′)𝐴𝐴′𝑐𝑐𝑐𝑐𝜌𝜌′𝑐𝑐 − 𝑄𝑄𝑇𝑇
𝑇𝑇′𝑖𝑖𝑖𝑖=1
∑ 𝑛𝑛′𝑖𝑖𝐶𝐶𝑝𝑝′𝑖𝑖4𝑖𝑖=1
� (21)
Pressure drop: 𝑑𝑑𝑃𝑃′𝑑𝑑𝑑𝑑
= (−1)𝑏𝑏𝐺𝐺′
𝜌𝜌′𝑔𝑔𝑔𝑔𝑐𝑐𝐷𝐷′𝑝𝑝�
1− ε′ε′3 � �
150(1− ε′)𝜇𝜇′𝑔𝑔𝐷𝐷′𝑝𝑝
+ 1.75𝐺𝐺′� (22)
The hydrogen flux across the membrane surface obeys Sievert’s law (Shu et al., 1994), i.e.
𝐽𝐽𝐻𝐻2 =𝑄𝑄𝑚𝑚exp �− 𝐸𝐸𝐻𝐻2,𝑃𝑃
𝑅𝑅𝑇𝑇�
𝛿𝛿𝐻𝐻2��𝑃𝑃𝐻𝐻2 − �𝑃𝑃′𝐻𝐻2� (23)
The pre-exponential constant, permeation activation energy, and the thickness of the hydrogen permeation membrane are taken as 6.33×10⁻⁷ mol/m/sec/Pa0.5, 15700 J/mole, and 1~2×10⁻⁵ m, respectively (Shu et al., 1994). Heat transfer across the membrane involves both convection from the gas mixture to the membrane, conduction across the membrane layer, and finally convection from the membrane to the second gas mixture. Radiation of heat is neglected. The membrane tube is considered to be a composite wall having a stainless steel layer coated by a thin layer of palladium. The thermal conductivities of the stainless steel layer and the palladium are taken to be 24.5 W/m×K and 93.3 W/m×K, average values over a temperature range of 200-1800 K (Yaws, 1999; Assabumrungrat et al., 2002). The heat transferred per unit length from each tube is obtained from:
ℎ𝐷𝐷𝑡𝑡𝑘𝑘𝑔𝑔
= 0.813�𝐷𝐷𝑝𝑝𝐺𝐺𝜇𝜇𝑔𝑔
�0.9
exp �−6𝐷𝐷𝑝𝑝𝐷𝐷𝑡𝑡
� (24)
The convective heat transfer coefficients in equation (24) are calculated using Leva’s correlation (1949) (Bischoff, 1990). For the shell side in which the reacting mixture is heated up, the convective heat transfer coefficient is calculated by (Bischoff, 1990):
ℎ𝐷𝐷𝑡𝑡𝑘𝑘𝑔𝑔
= 0.813�𝐷𝐷𝑝𝑝𝐺𝐺𝜇𝜇𝑔𝑔
�0.9
exp �−6𝐷𝐷𝑝𝑝𝐷𝐷𝑡𝑡
� (25)
In contrast, the reacting mixture in the tube side is cooled and consequently the convective heat transfer coefficient is calculated by (Bischoff, 1990):

European Journal of Sustainable Development Research, 2(4), 41
© 2018 by Author/s 5 / 11
ℎ′𝐷𝐷′𝑡𝑡𝑘𝑘′𝑔𝑔
= 3.50�𝐷𝐷′𝑝𝑝𝐺𝐺′𝜇𝜇′𝑔𝑔
�0.7
exp �−4.6𝐷𝐷′𝑝𝑝𝐷𝐷′𝑡𝑡
� (26)
Physical properties such as, thermal conductivity, gas density and viscosity, and heat capacities are taken as functions of temperature from Yaws (Yaws, 1999).
BOUNDARY CONDITIONS
In the case of the co-current operation(𝑏𝑏 = 2), the above system of differential equations gives an initial value problem which can be solved by a Runge-Kutta Verner fifth and sixth order method with an automatic step size, double precision calculation, and a relative error of 1×10-12 to ensure high accuracy. The initial conditions are: At: 𝑑𝑑 = 0
𝑆𝑆ℎ𝑚𝑚𝑚𝑚𝑚𝑚 𝐶𝐶𝑚𝑚𝑚𝑚𝑝𝑝𝑎𝑎𝑟𝑟𝐶𝐶𝑚𝑚𝑚𝑚𝑛𝑛𝐶𝐶 = �𝑛𝑛𝑖𝑖 = 𝑛𝑛𝑖𝑖𝑖𝑖𝑇𝑇 = 𝑇𝑇𝑖𝑖𝑃𝑃 = 𝑃𝑃𝑖𝑖
(27)
𝑇𝑇𝑇𝑇𝑏𝑏𝑚𝑚 𝐶𝐶𝑚𝑚𝑚𝑚𝑝𝑝𝑎𝑎𝑟𝑟𝐶𝐶𝑚𝑚𝑚𝑚𝑛𝑛𝐶𝐶 = �𝑛𝑛′𝑖𝑖 = 𝑛𝑛′𝑖𝑖𝑖𝑖𝑇𝑇′ = 𝑇𝑇′𝑖𝑖𝑃𝑃′ = 𝑃𝑃′𝑖𝑖
(28)
For the counter-current operation case (𝑏𝑏 = 1), the above system of differential equations results in a split two-point boundary value problem which can be solved by an orthogonal collocation technique (Villadsen and Michelsen, 1978; Trefethen, 2000). The boundary conditions are: At 𝑑𝑑 = 0 inlet condition of dehydrogenation compartment
𝑆𝑆ℎ𝑚𝑚𝑚𝑚𝑚𝑚 𝐶𝐶𝑚𝑚𝑚𝑚𝑝𝑝𝑎𝑎𝑟𝑟𝐶𝐶𝑚𝑚𝑚𝑚𝑛𝑛𝐶𝐶 = �𝑛𝑛𝑖𝑖 = 𝑛𝑛𝑖𝑖𝑖𝑖𝑇𝑇 = 𝑇𝑇𝑖𝑖𝑃𝑃 = 𝑃𝑃𝑖𝑖
(29)
At 𝑑𝑑 = 𝐿𝐿 inlet condition of hydrogenation compartment
𝑇𝑇𝑇𝑇𝑏𝑏𝑚𝑚 𝐶𝐶𝑚𝑚𝑚𝑚𝑝𝑝𝑎𝑎𝑟𝑟𝐶𝐶𝑚𝑚𝑚𝑚𝑛𝑛𝐶𝐶 = �𝑛𝑛′𝑖𝑖 = 𝑛𝑛′𝑖𝑖𝑖𝑖𝑇𝑇′ = 𝑇𝑇′𝑖𝑖𝑃𝑃′ = 𝑃𝑃′𝑖𝑖
(30)
Table 3. Operating conditions for dehydrogenation (shell side) reaction of ethyl-benzene to styrene Parameter Value and dimension Length of the reactor 3.0 m Cross-sectional area of the shell side 3.0 m2 Feed molar flow rates of: Ethyl-benzene 30.0 mol/s Styrene 0.1861 mol/s Hydrogen 0.0 mol/s Benzene 0.03056 mol/s Ethylene 0.0 mol/s Toluene 0.2444 mol/s Methane 0.0 mol/s Carbon monoxide 0.0 mol/s Carbon dioxide 0.0 mol/s Steam 140.0 mol/s Inlet temperature 850 K Inlet pressure 4.5×10⁵ Pa Catalyst density b 1500 kg/m3
Diameter of catalyst particle 4.7×10⁻³ m Void fraction 0.48
Elnashaie et al. / Maximum Production Minimum Pollution
6 / 11 © 2018 by Author/s
OPERATING CONDITIONS ON BOTH SIDES OF THE REACTOR
The operating conditions for both sides of the reactor are given in Tables 3 and 4. For the dehydrogenation reaction of ethyl-benzene to styrene, the feed molar flow rates are the same as those presented by (Moustafa and Elnashaie, 2000; Elnashaie et al., 2000; Abdulla and Elnashaie, 1993), whereas the molar flow rate of nitrobenzene is based on stoichiometry. Excess steam is provided in the feed line to prevent the formation of coke on the catalyst.
RESULTS AND DISCUSSION
The simulation results for the coupled membrane reactor system can confirm the potential of coupling the two reactions. In general, the achievable performance as far as conversion of ethyl-benzene and yield of styrene are concerned is much better than that of the corresponding uncoupled industrial fixed bed reactors operated at the same conditions. The coupled membrane reactor also has the potential to give better conversion of ethyl-benzene and yield of styrene by increasing the length of the reactor since the two profiles continue to evolve with distance:
Hydrogen Molar Flow Rate
Hydrogen molar flow rates for an uncoupled fixed bed reactor and for coupled co-current and countercurrent cases membrane reactors are shown in Figure 2. Hydrogen is generated in the uncoupled fixed bed reactor case while producing styrene, which is the key component, is low. For the coupled co-current case, on the other hand, hydrogen produced on the dehydrogenation side diffuses immediately through the membrane walls of the hydrogenation tubes where it meets nitrobenzene to react and produce aniline. The comparable rates of the net production of hydrogen on the dehydrogenation side and the rate of diffusion of hydrogen through the palladium membrane prevent the hydrogen from accumulating on the dehydrogenation side where it reduces the net reaction rate. The coupled countercurrent case is of special interest due to the presence of a maximum where the flow rate of hydrogen reaches a maximum and then decreases. At the feed end of the dehydrogenation side (𝑑𝑑 = 0), the rate of production of hydrogen by reactions (1), (4), (5), and (6) surpasses both the rate of consumption of hydrogen by reaction (3) and the rate of diffusion of hydrogen through the palladium membrane. This leads to an increase in the number of moles of hydrogen until a point is reached where the hydrogen flow rate has reached its maximum value, i.e. when the rate of change of molar flow rate of hydrogen at that point with respect to the length of the reactor is zero. At this point, the rate of the production of hydrogen is balanced by both the rate of consumption of hydrogen by reaction (3) and the rate of diffusion of hydrogen through the membrane. Beyond that point, the process is dominated by consumption of hydrogen by reaction (3) and diffusion of hydrogen through the membrane. Consequently, the molar flow rate of hydrogen decreases along the reactor. This trend induces similar behavior in the hydrogenation tubes. As nitrobenzene moves from its feed point, located at z = 3.0 m, it reacts with the permeate hydrogen. Another maximum is reached where the rate of diffusion of hydrogen through the membrane is balanced by its rate of consumption by the hydrogenation reaction. This point is located to the left (on Figure 2) of that on the dehydrogenation side. After passing this maximum, the rate of consumption of hydrogen dominates causing the amount of hydrogen in the hydrogenation tubes to drop quickly.
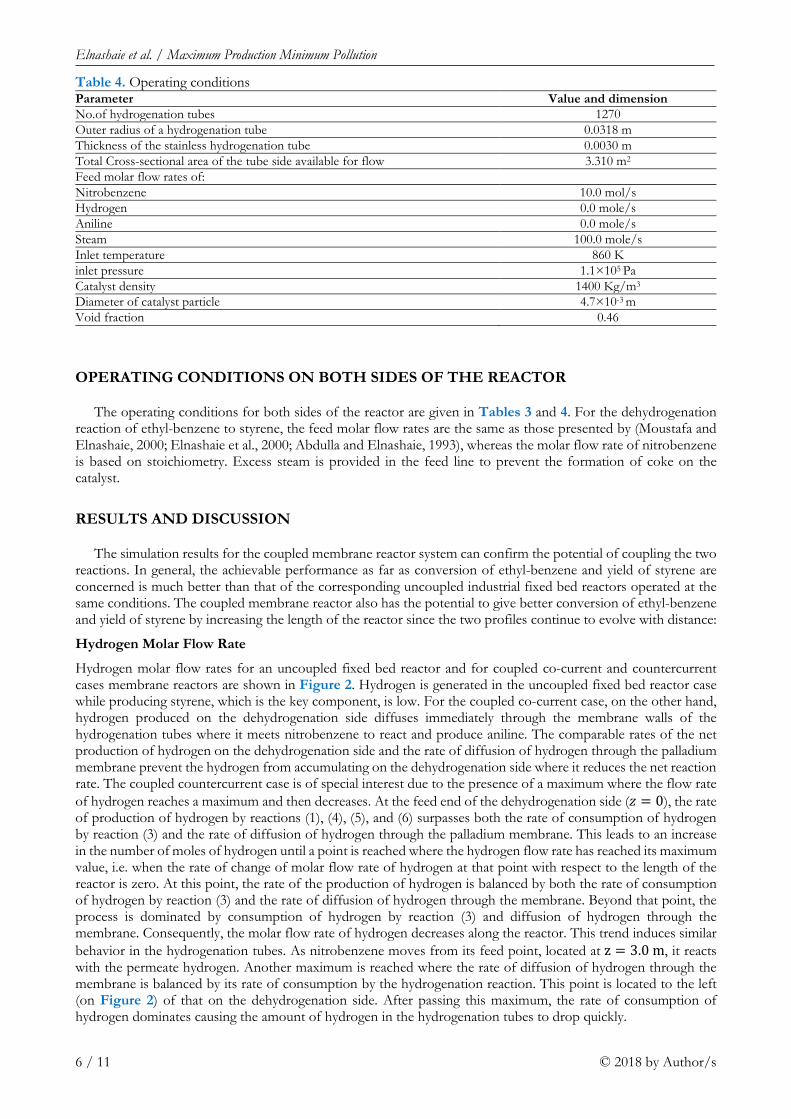
Table 4. Operating conditions Parameter Value and dimension No.of hydrogenation tubes 1270 Outer radius of a hydrogenation tube 0.0318 m Thickness of the stainless hydrogenation tube 0.0030 m Total Cross-sectional area of the tube side available for flow 3.310 m2 Feed molar flow rates of: Nitrobenzene 10.0 mol/s Hydrogen 0.0 mole/s Aniline 0.0 mole/s Steam 100.0 mole/s Inlet temperature 860 K inlet pressure 1.1×10⁵ Pa Catalyst density 1400 Kg/m3
Diameter of catalyst particle 4.7×10⁻³ m Void fraction 0.46

European Journal of Sustainable Development Research, 2(4), 41
© 2018 by Author/s 7 / 11
Axial Coordinate, z (m)
0.0 0.5 1.0 1.5 2.0 2.5 3.0
Mol
ar F
low
rate
of H
ydro
gen
(mol
es/s
)
0
2
4
6
8
10No membranes (Dehydrohenation of Ethylbenzene)Membrane Cocurrent Configuration (Dehydrogenation Side)Membrane Countercurrent Configuration (Dehydrogenation Side)Membrane Cocurrent Configuration (Hydrogenation Side)Membrane Countercurrent Configuration (Hydrogenation Side)
Figure 2. Molar flow of hydrogen on uncoupled adiabatic fixed bed and coupled co-current and countercurrent cases of the novel membrane reactor. For operating conditions see Tables 3 and 4. For counter-current case, feed is from the right for the hydrogenation compartment; otherwise all feeds are from the left
Axial Coordinate, z(m)
0.0 0.5 1.0 1.5 2.0 2.5 3.0
Con
vers
ion
of E
thyl
benz
ene
0.0
0.1
0.2
0.3
0.4
0.5
0.6
0.7
No membranesMembrane (Cocurrent Configuration)Membrane (Countercurrent Configuration)
Figure 3. Comparison of ethyl-benzene conversions on dehydrogenation side for uncoupled adiabatic fixed bed and for coupled co-current and counter-current cases. For operating condition, see Tables 3 and 4

Elnashaie et al. / Maximum Production Minimum Pollution
8 / 11 © 2018 by Author/s
Conversion of Ethyl-benzene:
The predicted conversion of ethyl-benzene on the dehydrogenation side is shown in Figure 3 for the same three cases. For the operating conditions chosen, the conversion reaches 23.4% for the uncoupled adiabatic fixed bed case, 54.6% for the membrane reactor with co-current flow, and 61.7% for the membrane reactor in the countercurrent flow configuration. Again, coupling of the two reactions has the potential to provide significant improvement in reactor performance. Moreover, the heat generated by the exothermic hydrogenation reaction is put to good use, rather than being simply rejected to cooling water.
Yield of Styrene
Three cases are investigated: uncoupled fixed bed case corresponding to the classical industrial operation, co-current coupled case, and countercurrent coupled case. Results for the three cases are shown in Figure 4. The lowest yield by a considerable margin is predicted for the uncoupled adiabatic fixed bed where the maximum yield is 18.9%. For the membrane reactor, the predicted yield increases to 52.5% for the co-current flow configuration and 57.7% for the counter-current case.
Conversion of Nitrobenzene
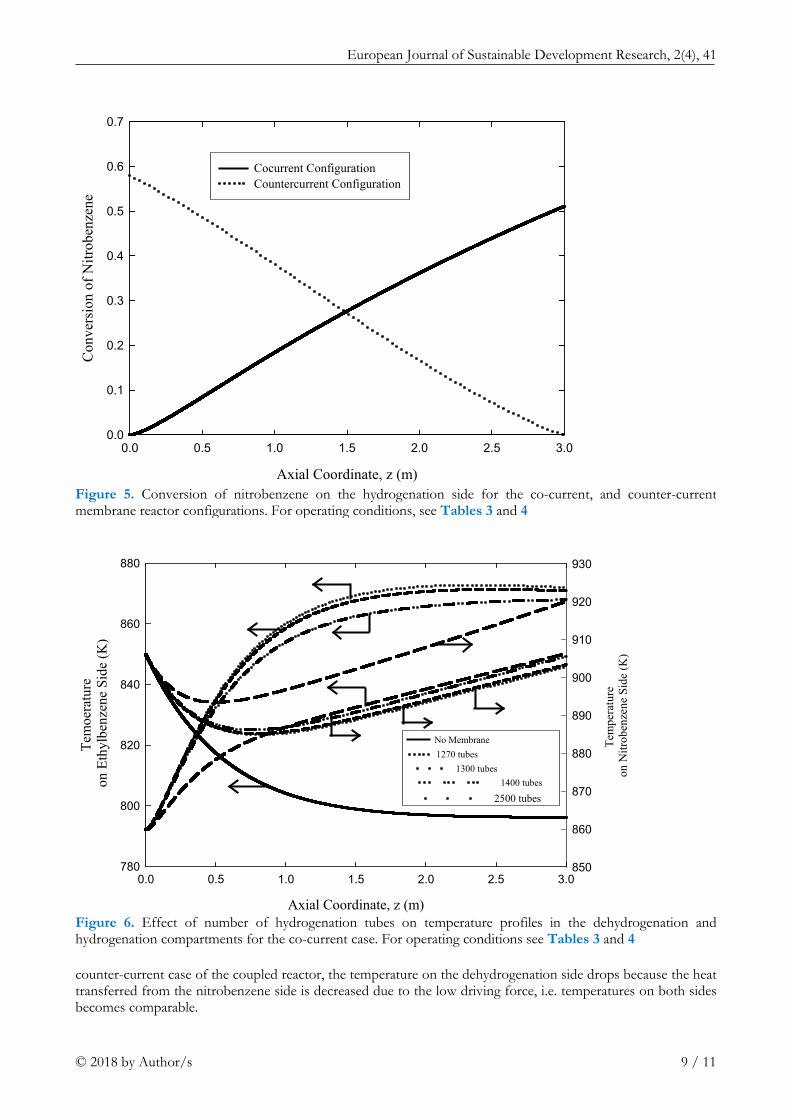
Figure 5 plots the predicted conversion of nitrobenzene as a function of distance along the reactor for the hydrogenation reaction to aniline. The counter-current membrane reactor is seen to give higher conversion than the co-current case because of the large driving forces. The conversion for the co-current case is predicted to reach 51.1%, while 57.9% is calculated for the counter-current case.
Temperature Profiles
Temperature profiles for the adiabatic fixed bed reactor and both the co-current and countercurrent membrane reactors are plotted in Figures 6 and 7 for different number of membrane tubes. Heat is continuously supplied from the exothermic hydrogenation nitrobenzene-to-aniline reaction on the tube side to the endothermic dehydrogenation reaction of ethyl-benzene on the shell side. The temperature variation is larger at the inlet of the membrane reactor in the coupled counter-current case than for coupled co-current flow. The fall in temperature for both cases of the coupled membrane reactor is much less than that for the uncoupled fixed bed reactor. In the
Axial Coordinate, z (m)
0.0 0.5 1.0 1.5 2.0 2.5 3.0
Yie
ld o
f Sty
rene
0.0
0.1
0.2
0.3
0.4
0.5
0.6
0.7
No membranesMembrane (Cocurrent Configuration)Membrane (Countercurrent Configuration)
Figure 4. Comparison of styrene yields on dehydrogenation side for uncoupled adiabatic fixed bed and for coupled co-current and counter-current cases. For operating condition, see Tables 3 and 4
European Journal of Sustainable Development Research, 2(4), 41
© 2018 by Author/s 9 / 11
counter-current case of the coupled reactor, the temperature on the dehydrogenation side drops because the heat transferred from the nitrobenzene side is decreased due to the low driving force, i.e. temperatures on both sides becomes comparable.
Axial Coordinate, z (m)
0.0 0.5 1.0 1.5 2.0 2.5 3.0
Con
vers
ion
of N
itrob
enze
ne
0.0
0.1
0.2
0.3
0.4
0.5
0.6
0.7
Cocurrent ConfigurationCountercurrent Configuration
Figure 5. Conversion of nitrobenzene on the hydrogenation side for the co-current, and counter-current membrane reactor configurations. For operating conditions, see Tables 3 and 4
Axial Coordinate, z (m)
0.0 0.5 1.0 1.5 2.0 2.5 3.0
Tem
oera
ture
on
Ethy
lben
zene
Sid
e (K
)
780
800
820
840
860
880
Tem
pera
ture
on
Nitr
oben
zene
Sid
e (K
)
850
860
870
880
890
900
910
920
930
No Membrane1270 tubes
1300 tubes1400 tubes
2500 tubes
Figure 6. Effect of number of hydrogenation tubes on temperature profiles in the dehydrogenation and hydrogenation compartments for the co-current case. For operating conditions see Tables 3 and 4

Elnashaie et al. / Maximum Production Minimum Pollution
10 / 11 © 2018 by Author/s
Predicted temperature profiles on the hydrogenation side where the nitrobenzene to aniline reaction occurs are also plotted Figures 6 and 7 for different number of membrane tubes. The temperature rises from 860 K at the feed point to slightly more than 920 K for the coupled co-current flow case and slightly more than 945 K for the coupled counter-current flow configuration. The large temperature rise for the coupled counter-current coupled case is due to the large driving force causing higher diffusion rate of hydrogen and consequently increasing the nitrobenzene conversion. However, the temperature reaches a peak where both heat generated on the nitrobenzene side due to the reaction and energy carried by the permeating hydrogen is balanced by heat transfer through the membrane to the ethyl-benzene side. Later, it decreases because of the dominance of the heat transferred through the membrane.
Practical Considerations
Coupling the exothermic hydrogenation reaction with the endothermic dehydrogenation reaction is predicted to be capable of providing a significant improvement in reactor performance and energy integration. However, it must be noted that palladium membranes are currently limited to temperatures of ~ 900 K. The maximum temperature can be reduced by increasing the number of the membranes, giving more surface area permitting more heat transfer rate across the membrane. This is illustrated in Figures 6 and 7 where the axial temperature profiles in both compartments of the coupled membrane reactor are plotted with flow rate kept unaltered. Note that the maximum temperature can be maintained below 880 K, with countercurrent operation giving higher maximum temperature than the co-current case. We also note that the counter-current configuration is likely to be very difficult to start up in practice. Hence, co-current operation Process control and safety aspects are also expected to be easier to provide for the co-current configuration despite the advantages of counter-current operation, which is more likely to be practical for the foreseeable future. Finally, while homogeneous one-dimensional models, like that used here, provide a good initial sense of what could be achieved in coupled fixed bed reactors, more comprehensive heterogeneous models with fewer simplifying assumptions are needed prior to proof-of-concept experiments on such reactors.
CONCLUSIONS
The performance of a newly configured membrane reactor with two reactions, an exothermic hydrogenation and an endothermic dehydrogenation reaction in parallel, has been modeled and evaluated for: co-current and
Axial Coordinate, z (m)
0.0 0.5 1.0 1.5 2.0 2.5 3.0
Tem
pera
ture
on
Eth
ylbe
nzen
e Si
de (K
)
780
800
820
840
860
880
Tem
pera
ture
on N
itrob
enze
ne S
ide
(K)
840
860
880
900
920
940
960
No membranes1270 tubes
1300 tubes1400 tubes
2500 tubes
Figure 7. Effect of number of hydrogenation tubes on temperature profiles in the dehydrogenation and hydrogenation compartments for the coupled counter-current case. For operating conditions see Tables 3 and 4

European Journal of Sustainable Development Research, 2(4), 41
© 2018 by Author/s 11 / 11
counter-current operation. Pseudo homogeneous models have been used to describe the behavior of the system. In the range of the parameters used to investigate the performance of the membrane reactor, the simulation predicts a considerable increase in the conversion of ethyl-benzene and yield of styrene when the dehydrogenation reaction of ethyl-benzene to styrene is coupled with the hydrogenation reaction of nitrobenzene. The results from the counter-current mode of operation were in all cases higher than those from the co-current mode of operation due to the large driving forces. The simulation results suggest that coupling may be feasible in this case with promising performance. The results show that the counter current configuration with efficient removal of hydrogen will be the best to achieve MPMP which is the best for sustainable development. However, the performance of the reactor needs to be proven experimentally and tested over a range of parameters under practical operating conditions. The novelty of this reactor achieving MPMP is in combining both the hydrogen removal from the dehydrogenation reaction in one side of the membrane and using it as a reactant in the other hydrogenation side. The performance of the reactor is measured by the Ethyl-benzene conversion and yield of Styrene.
REFERENCES
Abashar, M. E. E. (2003). Coupling of ethylbenzene dehydrogenation and benzene hydrogenation reactions in fixed bed catalytic reactors. Chem. Eng. Pro., 43, 1195. https://doi.org/10.1016/j.cep.2003.11.004
Abdulla, B. K. and Elnashaie, S. S. H. E. (1993). A membrane reactor for the production of styrene from ethylbenzene. J. Membr. Sci., 85, 229-239. https://doi.org/10.1016/0376-7388(93)85277-4
Assabumrungrat, S., Suksomboon, K., Praserthdam, P., Tagawa, T. and Goto, S. (2002). Simulation of a palladium membrane reactor for dehydrogenation of ethylbenzene. Journal of chemical engineering of Japan, 35(3), 263-273. https://doi.org/10.1252/jcej.35.263
Amon, H. R., Klemm, E., Dieterich, E. and Emig, G. (1999). Kinetic investigation of deactivation by coking of a noble metal catalyst in the catalytic hydrogenation of nitrobenzene using a catalytic wall reactor. Chem. Eng. Pro., 38, 395. https://doi.org/10.1016/S0255-2701(99)00037-9
Bischoff, K. B. (1990). Chemical reactor analysis and design. John Wiley & Sons Inc., 2nd Ed., New York. Hermann, C., Quicker, P. and Dittmeyer, R. (1997). Mathematical simulation of catalytic dehydrogenation of
ethylbenzene to styrene in a composite palladium membrane reactor. Journal of Membrane Science, 136(1-2), 161-172. https://doi.org/10.1016/S0376-7388(97)81990-4
Moustafa, T. M. and Elnashaie, S. S. E. H. (2000). Simultaneous production of styrene and cyclohexane in an integrated membrane reactor. J. Membr. Sci., 178, 171. https://doi.org/10.1016/S0376-7388(00)00488-9
She, Y., Han, J. and Ma, Y. H. (2001). Palladium membrane reactor for the dehydrogenation of ethylbenzene to styrene. Catalysis Today, 67(1), 43-53. https://doi.org/10.1016/S0920-5861(01)00280-2
Shu, J., Grandjean, B. P. and Kaliaguine, S. (1994). Methane steam reforming in asymmetric Pd-and Pd-Ag/porous SS membrane reactors. Applied Catalysis A: General, 119(2), 305-325. https://doi.org/10.1016/0926-860X(94)85199-9
Trefethen, L. N. (2000). Spectral Methods in MATLAB. Society for Industrial and Applied Mathematics, Philadelphia. https://doi.org/10.1137/1.9780898719598
Villadsen J. and Michelsen, M. L. (1978). Solution of Differential Equation Models by Polynomial Approximation, New Jersey, Prentice Hall.
Yaws, C. L. (1995). Chemical Properties Handbook: Physical, Thermodynamics, Engironmental Transport, Safety & Health Related Properties for Organic & Inorganic Chemical, McGraw-Hill, New York.