Optimization of System Maturity and Equivalent System Mass ...
Upload
khangminh22Category
view
1download
0
U.S. DEPARTMENT OF COMMERCE LuTHER H. HoDGES, Secretary
WEATHER BUREAU RoBERT M. WHITE, Chief
TECHNICAL PAPER NO. 50
Frequency of Maximum Water Equivalent
of March Snow Cover
in North Central United States
Prepared by
Cooperative Studies Section, Office of Hydrology
U.S. Weather Bureau
for
Engineering Division, Soil Conservation Service
U.S. Department of Agriculture
WASHINGTON, D.C.
1964
For sale by the Superintendent of Documents, U.S. Government Printing Office, Washington D.C., 20402 - Price 25 cents
CONTENTS Page
1. INTRODUCTION______________________________________________________________________ 1 2. BASIC I>ATA_______________________________________________________________________ 1
3. MAXIMUM OBSERVED vALUES_-- - - - - - - - - - - - - - - -- - - - - ---- -- -- ---- - - - - - - - - -- - --- - - - - -- - 3 4. EsTIMATION oF MAXIMUM WATER EQUIVALENT ______________ -------------·------------- 8. 5. FREQUENCY ANALYSIS __ ------------------------------------------------------------- 10 6. CoNSTRUCTION oF WATER-EQuiVALENT MAPs__________________________________________ 10 7. I>ISCUSSION OF WATER-EQUIVALENT MAPS____________________________________________ 12 REFERENCES__________________________________________________________________________ 12
LIST OF ILLUSTRATIONS
Figure No. Page
1. Stations providing snow data used in this study _____________________ ------------------ 2 2. J\tiaximum observed water-equivalent values (in.) of record for March 1-15--------------~ 4 3. Maximum observed water-equivalent values (in.) of record for March 16-31______________ 5 4. Maximum observed snow depth (in.) for March 1-15__________________________________ 6 5. Maximum observed snow depth (in.) for March 16-31_________________________________ 7 6. Curve for adjusting estimates of water equivalent obtained from equation (2) _------------ 9 7. Comparison of adjusted estimates of water equivalent with observed values ___ -_---------- 9 8. Pr:.obability-interpolation diagram __________________________________________ ---------- ~ 1 9. Points for which water-equivalent values were interpolated _________________ ------------ 11
10. Maximum March 1~15 water equivalent (in.) expected to be equaled or exceeded once in twoyears_________________________________________________________________________ 13
11. Maximum March 16-31 water equivalent (in.) expected to be equaled or exceeded ~:mce in twoyears_________________________________________________________________________ 14
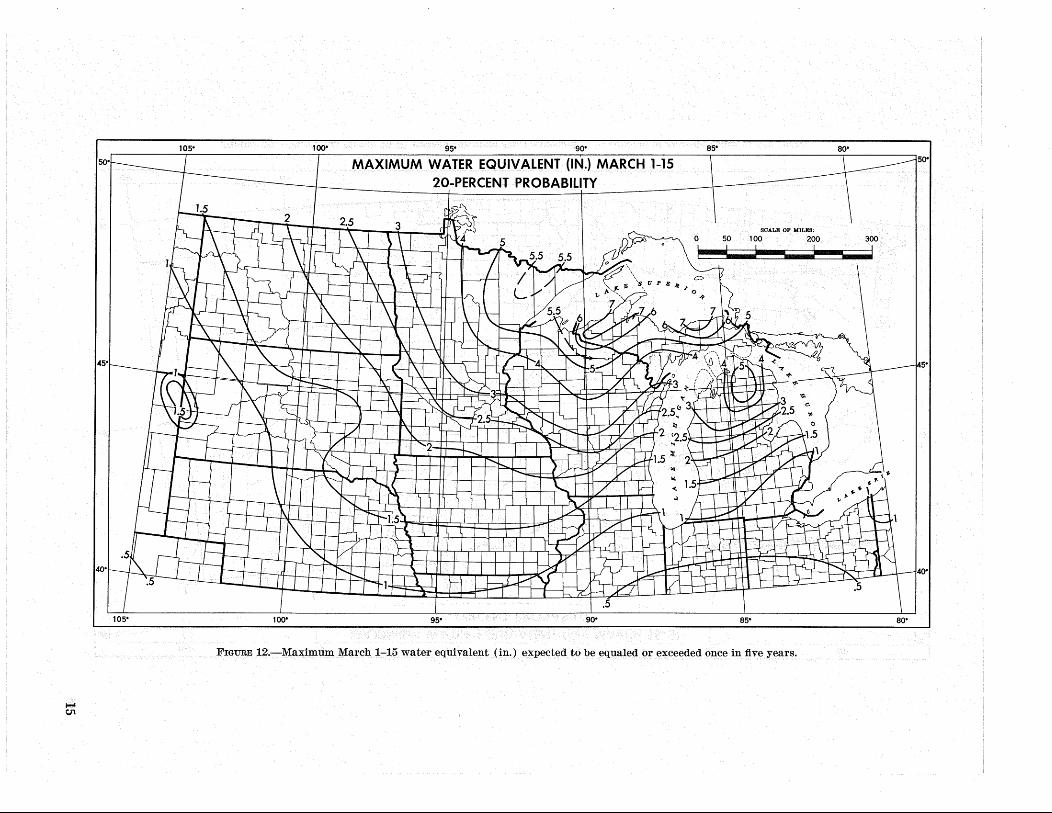
12. Maximum March 1-15 water equivalent (in.) expected to be equaled or exceeded once in fiveyears ____________________________________ ..: __________________________________ ~_ 15
13. Maximum March 16-31 water equivalent (in.) expected to be equaled or exceeded once in
fiveyears-------------------------------------~----------------------------------- 16 14. Maximum March 1-15 water equivalent (in.) expected to be equaled or exceeded once in
tenyears_________________________________________________________________________ 17
15. Maximum March 16-31 water equivalent (in.) expected to be equaled or exceeded once in
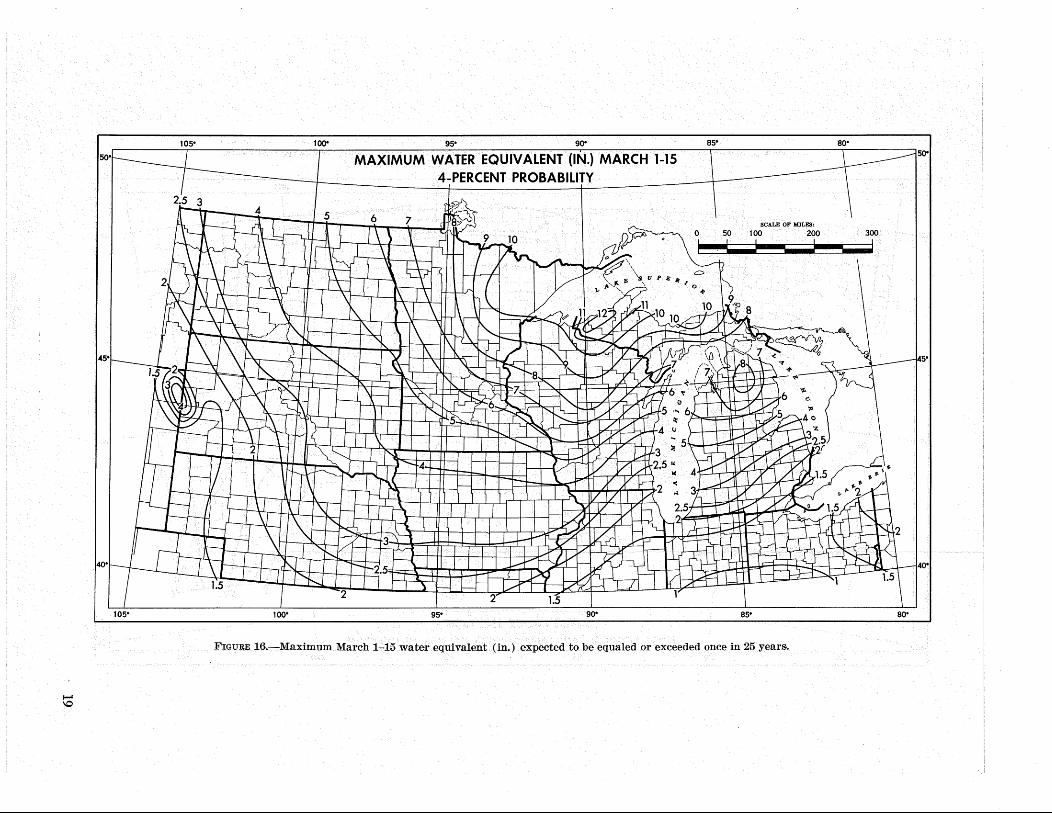
tenyears----------------------------------------------~-------------------------- 18 16. Maximum March 1-15 water equivalent (in.) expected to be equaled or exceeded once in
25years__________________________________________________________________________ 19
17. Maximum March 16-31 water equivalent (in.) expected to be equaled or exceeded once in 25years ________________________________________________________________________ · 20
18. Maximum March 1-15 water equivalent (in.) expected to be equaled or exceeded once in 50 years ____________________________________________ -.-____________________________ 21
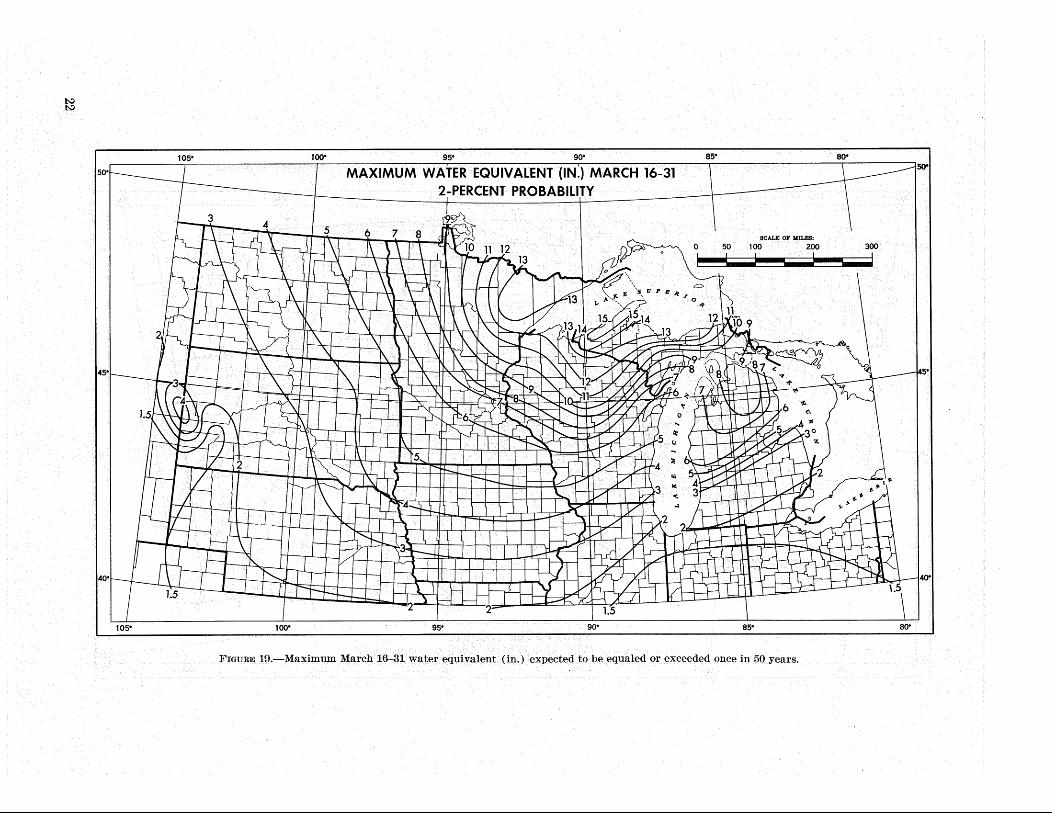
19. Maximum March 16-31 water equivalent (in.) expected to be equaled or exceeded once in 50years__________________________________________________________________________ 22
20. Maximum March 1-15 water equivalent (in.) expected to be equaled or exceeded once in 100years_________________________________________________________________________ 23
21. Maximum March 16-31· water equivalent (in.) expected to be equaled or exceeded once in 100years_________________________________________________________________________ 24
III


FREQUENCY OF MAXIMUM WATER EQUIVALENT OF MARCH SNOW
COVER IN NORTH CENTRAL UNITED STATES
l. INTRODUCTION
Authority. This report wrus prepared for the Soil Conservation Service to provide generalized information for planning and design purposes in connection with its Watershed Protection and Flood Prevention Program (authorization: P.L. 566, 83d Congress, and as amended).
Scope. Maximum water-equivalent values of snow on the ground for the first and second halves of March are presented for probabilities of 50, 20, 10, 4, 2, and 1 percent; The region covered is north of 40° N. and b~tween 80° and 105° W.
Accuracy of results. The accuracy of the estimates presented is dependent on the number of stations, quality of observations, and length of record. Water-equivalent measurements are among the most inaccurate of meteorological observations. Besides1 the usual observational errors, the measurements may be unrepresentative when obtained from drifted snow or from unduly exposed or sheltered sites. Also, inconsistencies in day-to-day measurements often arise from the necessity to shift measurements from one observation plot to another to obtain readings in undisturbed snow cover.
The longest records of daily water-equivalent observations for the relatively small number of stations in .the study area were only 11 years, and many records were for a few years only. However, measurements of sno'Y depth have been made at many stations for many years. Equations
based on observed water-equivalent values,. associated snow depths, and other pertinent parameters were derived to estimate water equivalent for those stations and periods with snow-depth measurements only. The resulting synthetic records of water-equivalent values were then subjected to frequency analysis. The results of such analyses are not so reliable as those based on long records of water-equivalent observations if these were available. Consequently, it is reasonable to expect that more reliable results could be obtained froJ;n 10 or more additional years of such observations, especially if, in the meantime, the quality of the observations were improved and the number of observing stations increased.
Acknowledgments. The project was under the general supervision of J. L. H. Paulhus, Chief of the Cooperative Studies Section of the Office of Hydrology, W. E. Hiatt, Acting Director. J. F. Miller was project leader. A. H. Jennings made the preliminary investigations relating the water equivalent of snow on the ground to meteorological parameters. L. L. Weiss and L. 0. Feese performed the statistical investigations. N. S. Foat supervised the collection and processing of the basic data. Coordination with the Soil Conservation Service. was maintained through H. 0. Ogrosky, Chief, Hydrology Branch, Engineering Division.
2. BASIC· DATA
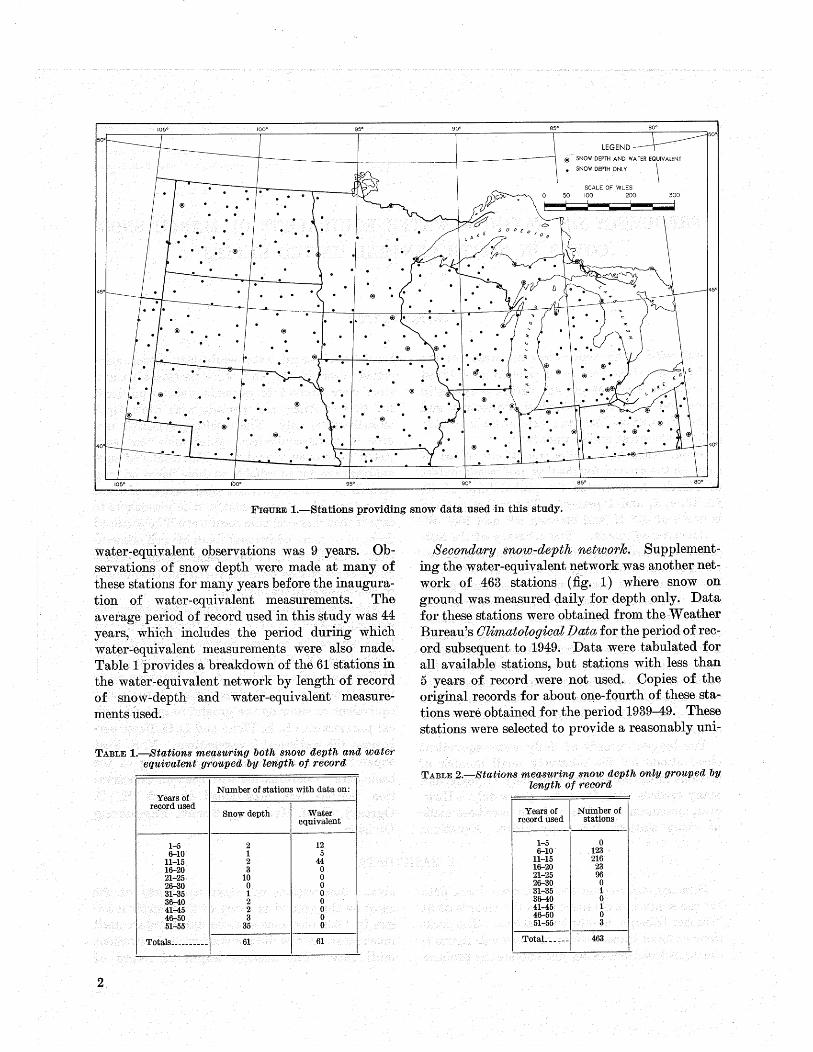
Primary water-equivalent network. Basic data for the study was obtained from the records of 61 Weather Bureau first-order stations. The locations of 52 of these stations are shown in figure 1, the other 9 stations being just outside the problem
area. Observations of water equivalent of the snow on the ground at many of these stations began in 1953, but some stations did not .. start until much later. A few .did not start such observations until 1962. The average length of record of
1
ss• so• ss•
LEGEND
~ :~~: ~:::~:~WATER EQ\IVALENT
SCALE OF MILES 50 100 200 300
ss• so• ss•
FIGURE 1.-Stations providing snow data used in this study.
water-equivalent observations was 9 years. Observations of snow depth were made at many of these stations for many years before the inauguration of water-equivalent measurements. The average period of record used in this study was 44 years, which includes the period during which water-equivalent measurements were also made. Table 1 provides a breakdown of the 61 stations in the water-equivalent network by length of record of snow-depth and water-equivalent measurementsused.
TABLE 1.-.Stations measuring both snow depth and water equivalent grouped by length of record
Number of stations with data on: Years of
re~ord used Snow depth Water
equivalent
1-5 2 12 6-10 1 5
11-15 2 44 16-20 3 0 21-25 10 0 26-30 0 0 31-35 1 0 36-40 2 0 41-45 2 0 46-50 3 0 51-55 35 0
Totals __________ 61 61
2
Secondary snow-depth network. Supplementing the water-equivalent network was another network of 463 stations (fig. 1) where snow on ground was measured daily for depth only. Data for these stations were obtained from the Weather Bureau's Climatological Data for the period of record subsequent to 1949. Data were tabulated for all available stations, but stations with less than 5 years of record were not used. Copies of the original records for about one-fourth of these stations were obtained for the period 1939-49. These stations were selected to provide a reasonably uni-
TABLE 2.-Stations measuring snow depth only grouped by length of record
Years of Number of record used stations
1-5 0 6-10 .123 .
11-15 216 16-20 23 21-25 96 26-30 0 31-35 1 36-40 0 41-45 1 46-50 0 51-55 3
TotaL _____ 463
:fqrm geographic sampling. Grouping o:f stations by length o:f record is shown in table 2.
Supplementary snow fall data. In addition to the network data, use was made o:f the "Supplementary Snowfall Data" published in Climatological Data. These data were obtained :from field snow. surveys conducted by Weather Bureau and Corps o:f Engineers personnel or by station observers acting under detailed instructions. Mea-
. surements o:f snow depth and water equivalent at designated stations were made on Tuesdays and Fridays.
Other supplementary data were obtained :from unpublished listings o:f snow-survey data maintained at some Weather. Bureau offices :for some special networks.
Quality. Accurate measurements o:f representative water-equivalent values o:f snow on ground are very difficult to make. The depth o:f snow cover may vary a great deal within short distances because o:f drifting, and, in some cases, the determination o:f a representative depth and water equivalent is practically impossible.
Measurements. o:f snow depth and water equivalent should be ·made in undisturbed snow and :from approximately the same site. Since measurements are made daily, these limitations require that a :fairly large plot o:f land be available :for the observations. Most o:f the stations measuring water
TABLE 3.-Examples of inconsistencies in water-equi-valent data
Station ___________________ _ Month, Year _____________ _ Date ______ ----------------
Max. Temp. (°F.) ________ _ Min. Temp. (°F.) ________ _ Precipitation (in.) ________ _ Snowfall (in.) ____________ _ Snow depth (in.) _________ _ Water equiv. (in.) ________ _
Minneapolis, Minn. March 1962
7 8 9 10
33 . 33 20 28 T T 0 T
23 22 3.2 3.2
36 36 21 21 0 .04 0 0.2
19 17 4. 7 4. 7
Remarks__________________ Jump in WE on 9th unexplainable.
Sioux Falls, S.Dak. Eeb.-Mar.1962
26 27 28 .. 1
5 -2 0 -12 -18 -31 .02 .01 0 0.6 0. 3 0
26 26 18 2.4 2.4 3.3
9 -16
0 0
18 3.3
Drop in snow depth and jump in WE on 28th unexplainable.
equivalent are located in cities or at airports where large observational plots are rarely available. The observer is then required to shift his measurements :from one small plot to another when it is no longer possible to obtain readings in . undisturbed snow. Such changes in observational sites may result in appreciable differences in measurements. Measurements o:f snow depth and water equivalent are also subject to observational errors; e.g.,..erroneous readings.
Table 3_.shows two examples o:f typical discrepancies :found in snow data. Such inconsistencies are not uncommon. Those shown probably resulted :from changes in observation site, but discrepancies apparently resulting :from obse·rV!ational or typographical errors were :found.
3. MAXIMUM OBSERVED VALUES
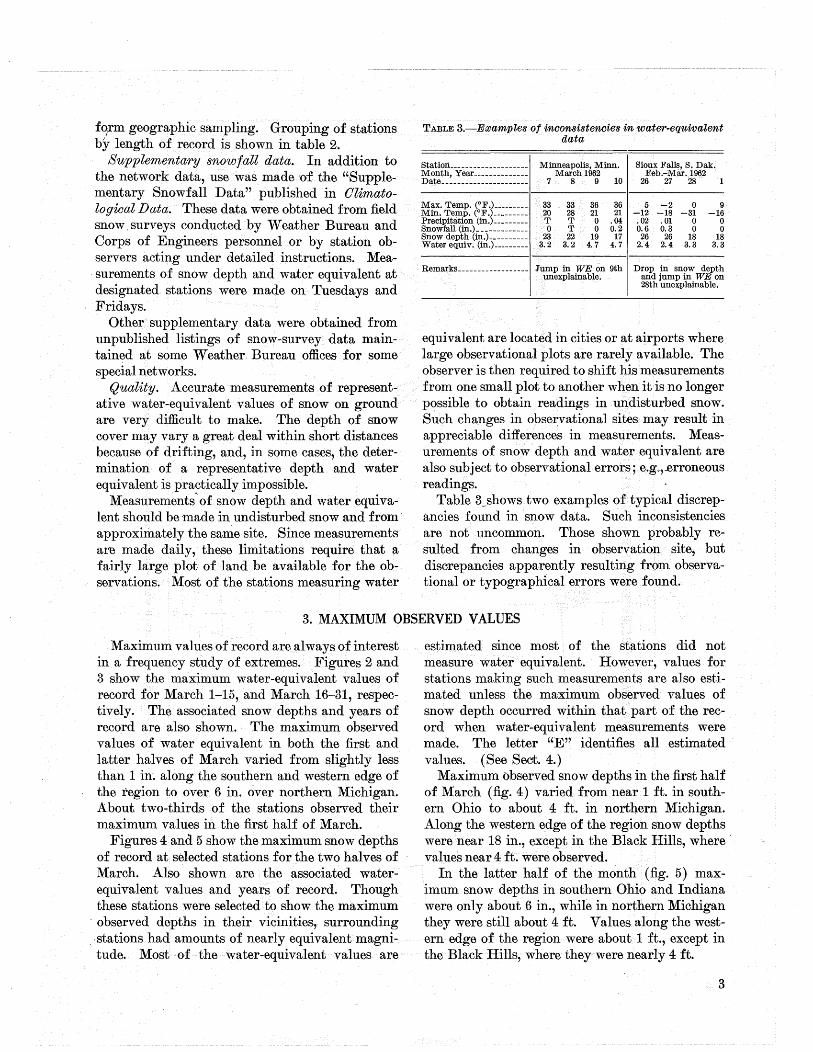
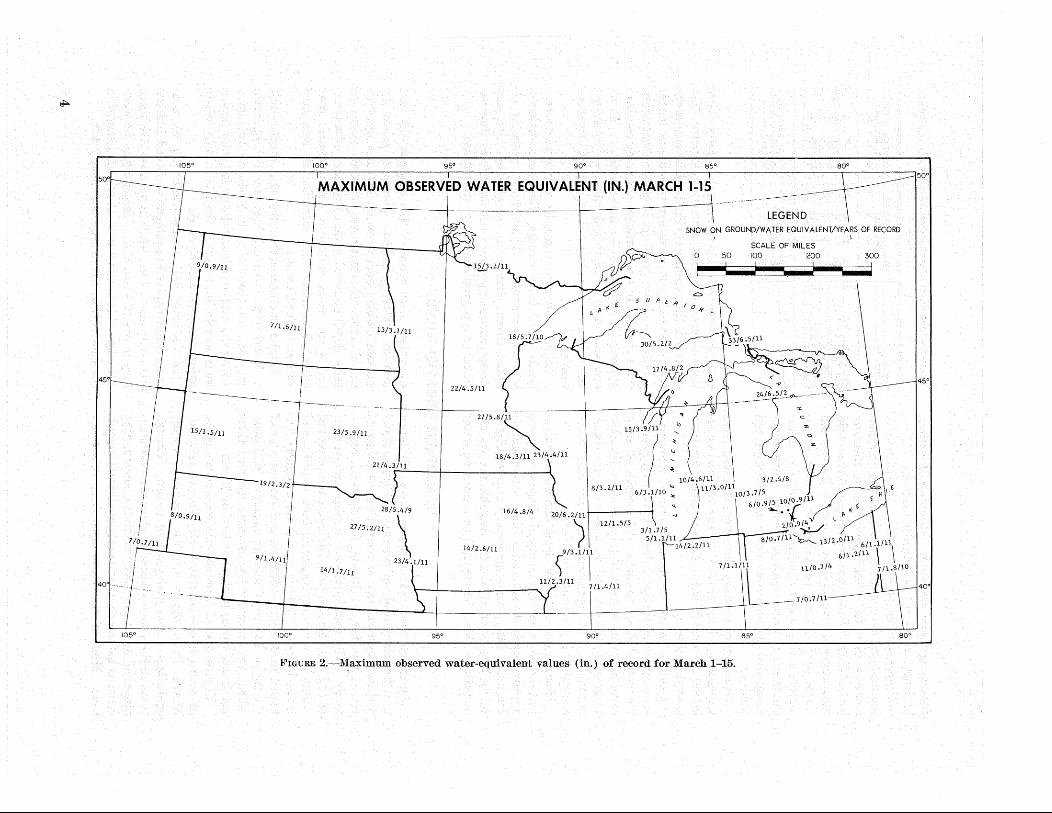
Maximum values o:f record are always o:f interest in a :frequency study o:f extremes. Figures 2 and 3 show the maximum water-equivalent values o:f record :for March 1-15, and March 16-31, respectively. The associated snow depths and years o:f record are also shown. The maximum observed values o:f water equivalent in both the first and latter halves o:f March varied :from slightly less than 1 in. along the southern and western edge o:f the region to over 6 in. over northern Michigan. About. two-thirds o:f the stations observed their maximum values in the first half o:f March.
Figures 4 and 5 show the maximum snow depths o:f record at selected stations :for the two halves o:f March. Also shown are the associated waterequivalent values and years o:f record. Though these stations were selected to show the maximum
· observed depths in their vicinities, surrounding . -stations had amounts o:f nearly equivalent magnitude. Most o:f the water-equivalent values are
estimated since most o:f the stations did not measure water equivalent. However, values :for stations making such measurements are also estimated unless the maximum observed values o:f snow depth occurred within that part o:f the record when water-equivalent measurements were made. The letter "E" identifies all estimated values. (See Sect. 4.)
Maximum observed snow depths in the first half o:f March (fig. 4) varied :from near 1 :ft. in southern Ohio to about 4 :ft. in northern Michigan. Along the western edge o:f the region snow depths were near 18 in., except in the Black Hills, where · values near 4 :ft. were observed.
In the latter half o:f the month (fig. 5) maximum snow depths in southern Ohio and Indiana were only about 6 in., while in northern Michigan they were still about 4 :ft. Values along the western edge o:f the region were about 1 :ft., except in the Black Hills, where they were nearly 4 :ft.
3
If::.
45°
40r-----
105°
105° 1000 95° 90° 85° 80°
MAXIMUM OBSERVED WATER EQUIVALENT (IN.) MARCH 1-15
'ILOJH I 13/3.1/11
22/4.5/11
----~---- - 27/5.8/11
23/5.9/11 ~ "IL'IH I '<14.,/n "/4.3/H n/4.4/H
19/2.3/2~ 8/3.2/11
/ 15/3.9/11
LEGEND SNOW ON GROUND/WATER EQUIVALENT/YEARS OF RECORD
I SCALE OF MILES
0 50 100 200 300
I ~ I 3/2.4/B 4 6/11
... 10/\.11/3.0/1110/3.7/5 10/0.9/11
9/5 .r 6/'.</W , 6/0. ~ • •'/,-.
o.9.!_4u / 21
~ 11 /11
16/4.8/4
I 28/5.4/9
r'·'IH '>!'·'In \ 20/6.2/11 /5
) 1 12/1.5
-----?711 ':t-.r"..... 13/2 .of 6/l.\1 \ 1\
B/0. 2/11
6/1· 7/1.8/10 I 11fo.7/4 7/l.l/11L
___ 7/0.7/11
23/4.1/11 9/1.4/11
14/1.7 Ill
14/2 .6/11
~/'-'/'[ 11/2.3/11 7/1.4/11
100° 95° 90° 85° 80°
IPIGURE 2.-Max:imum observed water-equivalent values (in.) of record for March 1-15.

45°
I
I 8/0.9/11
105°
Ut
105° 100° 95° 90° 85° 80°
MAXIMUM OBSERVED WATER EQUIVALENT (IN.) MARCH 16-31
SNOW ON GROUND/WATER EQUIVALENT/YEARS OF RECORD I I
SCALE OF MILES 50 100 200 300
13/3.0/11
17/4.7/11 I ------------j--------'"'·'''~
16/4.3/11 23/4.5/11
I
12/0.8/11
1 21/5 .6/ll
4/1.3/11
~' .3/11
17/2.2/2
1 23/5.4/9
'8!5.4/H \
27/4.4/11
10/3.0/11
14/1.8/11
100° 95°
8/4.7/4
'"7 : 15/2.8/11 16/4.3/11 ""
20/6.2/11 ) I 13/1.8/5
15/3.6/11
16/2)/-11 \
9/1.4/11
90°
<i
11/1.3/5 7/1.1/11
7/3.8/11 1 6/2.7/11 4/1.2/8
. 6/3.4/5
3/0.~ 6/1.2/11
:,~(/4 4/0.~~-"<~6fo.9/11 \ 1
6/0.6/11
3/0.9/11 10/1.0/11 \ \ 6/0.5/4 J . 9/0·9/10
6/0.6/11
85° 80°
FIGURE 3.-Maximum observed water-equivalent values (in.) of record for March 16-31

0\
105° IQQO 95° 90° 85°
MAXIMUM OBSERVED SNOW DEPTH (IN.) MARCH 1-15
SNOW ON GROUND/WATER EQUIVALENT/YEARS OF RECORD I I
16!2.3Ef14 I
34/6 .lE/15
22/4 .2E/12
28/5.4E/16 I 30/5.8E/24 I "-..,;' //1
22/4 J o-.OE/14 27/5.7Ej 30/4.9E/14 5 U P
15/2.4E/52 I ""·""' 23/4 .2E/51
48/10.7E/2S 1. A /?
0
I 13 / K r: E R
25/4 .7E/51 33/6 .7E/14 . )/~11.8E/17 47/10 .1E/10
2
6
/ ~ 37/8.1E/47 (I' /__,_
"' '·""" vr-,_ 2 .6E/1!- .
5.r..../ 45/8 .BE/52 45/9 .3E/10
26/4.6E/ZS 0 12.1E/24 ~ ..::.;:./ 22/3 44/10 .1E/25
181• ,,: --24/5.6E/24 I -2EI2
5 3 I L,, I "'in·""'
""T"' 17/2.4E/12
-· I ,, ·- 5 6 .6E/25 47/9 .4E/ll -, - ) I 37/8.1E/12? ~0 42/9 .OE/12
46 I I -t--I7.1E/13 I -
, Z8/6 .OE/14 30/5 .8E/25 37/7 .6E/24 __ _
L
t. 26/2.1E/20 27!5.6/52 55/12.7E/14~ I 47/9.8E/14
""·"" ""·""' (// \:>
36/6.o;z3 1
4G/11:7E/12 38 7 .OE/25 '
30/4.4E/24 ~ 29/5.1E/10 ( ::):
........._,_ 4417 .6/24 ZB/S .4/52 24/4 .4E/">2:
SCALE OF MILES 50 100 200 300
/
"'" ·'"" ,,,_ '"·- 40/7. '"'' r ,, . , ,,. "" ·"'",
I
19/2.3/52 { 33/7.6/24 34/6 .3E{ll ( .
24/3 .7E/24 t6/2.3E/24
26/5 .3E/20
13/~ .3Ef50 ,. ·- 27/5 .2E/23 \ 15/2 .6E/25
""·"'m "''·'~ I 23/4 .2E/14 16/2 .9E/12
19/2.6E/14 \\
14/l.BE/24 16/2.2E/25 \
~
L./ / tS/2.3E/14
13/t.6E/52 2113 .OE/ 2~ \
1lf1.2E/24 \ 18/1.5E/14 1 17/2 .OE/52
28/4 .4E/14
25/4 .4E/12 14/1.8E/13 9/0 i8fl25
_L___ 14/2.0E/12-12/0.7E/12 _9/0.7E/50 30/5 .OE/11
21/3 .4E/10
105° 1·)')0 95° goo 85° f!")O
l:f'IGURE 4.-Maximum observed i:!llOW devthl'-1 (in.) for ::uardt 1-1:1.
o.jQO

105° IQQO 95° 90° 85° 80°
50°
MAXIMUM OBSERVED SNOW DEPTH {IN.) MARCH 16-31
SNOW ON GROUND/WATER EQUIVALENT/YEARS OF RECORD I I
SCALE OF MILES 0 50 100 200
116/I.se;s~614.9ef12 --~"J/1 "14.9UH I I '\.1 o
23/5 .1E/16 '(i:;;l 34/6.8E/23 I f; s u p £ R
14/2 2E/ 33/7 .OE/14 p. K ~7 ., 12
21/4.0E/14 22/4.2E/14 I 48/10.7E/25 / /1 0
I 17/4.0E/51 37/6.7E/13 / t 4119~ _
20/~2.0E/14 ~ I L40/8.8E/47 ~~/!3.1/25 . ~2/11.2E/10 20/3 .4E/12- 't-49/10 .5E/25 19
//4 .4E/25 32/5 1E/14 31/6 .1E/23 50/12 .OE/25 17!2.8Ef21 • 28/4.6E/21 I ~
22/3 .9E/14 I 30/5 .6E/25 I 36/7 .8E/13 I
300
45°
35/8 .OE/14 27/4 .3E/24
32/f .4E/14 <.>
21/5.6/52 26/3.9/122
4317 .OE/
21 36/6.0/25 38/7 .8E/23
I I - I ?1/5 .lEt:
17 ; 2 21 ' ( 12io .8EI 25 L/1.8/13 •
52-20/5.6E/15 I ) \
I .........,_43/7 .6/24 13/2.0E/25
10f1.oe/14/ 2 l : 12/2.3E/25 n y 1ttz.oE/14 8/5 .4E/24 6 /54 ' \
17/l. E 7E/23 1 lB!l.9Ej23 28/4 .2E/25 29/4 .3E/25 10/l.OE/SZ 13/1 • l O/l.OE/14 17 11.2E/20 15/3.6/51
~ 15
11.9Efs2 > I /O 6E/14
I 18/2.9E/25 6/0.6E/52 9 •
. 33/5 7E/14 12/2.3E/25 \\ 1o/0.9E/21 ll!0.7E/25 • I
~5/2.6E/13
15/2.6E/20 30/5 .3E/ll 21/3 .2E/ll 12/2.4E/13 7/0 .7E/12 _6/0 .6E/51--------i-...20/3.2E/14_ \ 28/4.7E/10 ----l-------~--6/1.3E/14--
105° 100° 95° goo 85° 80°
FIGURE 5.-Maximum observed snow depths (in.) for March 16-31.
~

4. ESTIMATION OF MAXIMUM WATER EQUIVALENT
Since the number of stations making waterequivalent measurements was so small and their period of record so short, it was decided to supplement the observed water-equivalent data with values estimated from accumulated snow depth and other pertinent parameters. These parameters had to be limited to those that could be obtained from the meteorological observations made by the stations measuring the depth only of snow. The published daily data for most of these stations include only temperature (maximum and minimum), amount of precipitation, snowfall, and snow depth.
A comparison made between maximum observed water equivalent and water equivalent associated with maximum snow depth in the same halfmonth period yielded the results given in table 4. Of the 240 paired items used, 68 percent .showed no difference, and 83 percent showed differences of less than 0.2 in. On the basis of this comparison, it was assumed that estimates of water equivalent for maximum snow depths would, in general, reasonably represent maximum water-equivalent values.
Various parameters and different types of relationships were tested, and two equations were eventually selected-one for snow cover less than 10 days old and one for snow cover of. longer duration. Strangely enough, temperature, in degree-days, did not appear to be related significantly to maximum water equivalent. Various base values and durations were tested without success.
TABLE 4.-Distribution (number of cases) of differences between mawimum observed water equivalent and water equivalent observed w_ith mawimum snow depth
Difference* (in.)
Maximum observed water equivalent (in.)
G-0.9 l.G-1.9 2.G-2.9 3.o-3.9 4.G-4.9 5.o-5.9 6.o-6.9 -----1---------------------o_______________ 35 34 33 30 0,1_____________ 6 7 11 8 0.2_____________ 1 3 1 3 0.3 _____________ -------- 3 1 2 0.4 _____________ -------- 2 2 1 0.5 _____________ -------- 1 2 2 0.6-1.0 _________ -------- 1 1 1 1.1-1.5 _________ -------- -------- 1 1 1.6-2.0_ -------- -------- -------- -------- --------2.1-2.5_ -------- -------- -------- -------- --------2.6-3.0_ -------- -------- -------- -------- ·--------
11 15 6 2 2 0 1 0 0 1 1 0 0 0 1 2 0 --------3 1 --------0 -------- --------0 -------- --------0 -------- --------1 -------- --------
*Maximum observed WE minus WE observed with maximum snow depth-all differences positive.
8
Separate relations were originally developed for both new and old snow ·cover in the first and second halves of March, i.e., four relationships, but the only differences noted· were not appreciable, and it was decided to use one relation only for new snow cover and one for snow cover more than 10 days old.
The equation for estimating maximum water equivalent (WE max) of a snow cover less than 10 days old merely equated W Emaa: to the total precitation (P) falling during the period of snow accumulation leading to the maximum snow depth, or
WEmax=lP (1)
The relation between WE observed at time of maximum snow depth and WE estimated by this formula was found to have a correlation coefficient of 0.90 and a standard error of estimate of 0.1 in. The mean value of the 78 cases of observed WE was0.8in.
The equation for estimating maximum WE for a snow cover more than 10 days old was _
WE max= -0.061 +O.l72(SOGmax) +0.675(lPto) -O.l08(SOGmax-SOG_to) (2)
where SOGmaa: is maximum depth of snow on ground (in.) in the first or second half of March, lP10 is the total precipitation (in.) for the ~0 days prior to date of maximum snow depth, and SOG-1o is the snow depth 10 days prior to date of maximum depth (SO(/-maa:)· For example, a maximum snow depth of 20 in. for the second half of March, say the 19th, and a snow depth of 25 in. on the 9th would yield -5 in. for (SOGmaxSOG_to).
The relation between WE observed at time of maximum snow depth and WE estimated by equation (2) ·showed a correlation coefficient of .86 and standard error of. estimate of 0.8 in. The mean of the 240 observed values was 2.5 in.
Precipitation accumulations and differences in snow depth for various time intervals, e.g., 5, 15, 30 and more days, were tried, but the 10-day interval appeared to yield the best results. More

~7 I u z =-
::>
~ a:: w 1-<t 3::
w 1-<t ~
0 w ~ ~ ~2
2 3 ESTIMATED WATER EQUIVALENT (INCHES)
FIGURE 6.-Curve for adjusting estimates of water equiv· alent obtained from equation (2).
complicated equations.based on the same and other parameters, such as temperature and snowfall, were tested also but no appreciable improvements were noted. However, comparisons of observed WE and WE estimated by equation (2) indicated a tendency for the equation to yield WE values that were too high for small va~ues and too low for high values. A correction curve (fig. 6) was
· therefore constructed. A comparison (fig. 7) based on 112 independent paired items of observed WE and WE estimated by means of equation (2) and adjusted by means of figure 6 indicated a correlation coefficient of .85, a standard error of estimate of 0.9 in. The mean of the 112 observed items W3$3.4in.
The parameters used in equations ( 1) and ( 2) do have good physical bases. Equation (1) for example, which would be used when maximum WE is realized from one or two recent storms rather than from an a'Ccumulation of old snow, utilizes precipitation only. This is reasonable since there is relatively little time for "aging" of the snow or loss of the precipitation.
1-
~ ~
0:: w 1-<t 3: 0 w
~ 4
0
10
ADJUSTED ESTIMATES OF WATER EQUIVALENT (INCHES)
FIGURE 7.-Comparison of adjusted estimates of water equivalent with observed values.
The parameters of equation (2) appear sound also. One would naturally expect a good relationship between maximum WE and maximum depth of snow on ground. The amount of precipitation falling in the last 10 days (lPlo) is highly related to WE max, perhaps because in March snowfalls are likely to have a fairly high density and contribute a great deal to WE max· The difference in depth between the maximum snow on ground and that 10 days before is also significant. If the depth has decreased appreciably in the last 10 days, it means that some melting has taken place, and the snow cover is soggier and, for a given snow depth, has a greater water equivalent than when the di£'" ference is positive·, which would be the case for new snow in the last 10 days.
A very important point to be kept in mind is that the interest in this study was in maximum WE values in each half of March. The equations may yield unsatisfactory results for other than maximum or near-maximum WE and for regions outside the study 'areas, especially where orographic or maritime influences are involved.
9

. 5. FREQUENCY ANALYSIS
The observed and/or estimated values of maximum WE for each station . and for each half of March were subjected to various tests in order to
·determine the most appropriate frequency distribution. This was important because the obtain- . ing of WE values for the smaller probabilities of exceedance represents, in effect, an extrapolation of the observed or synthesized record. The usual procedure is to seek a. distribution function that satisfactorily describes the observed frequencies. The distribution function is then used to provide extrapolation to the smaller probabilities.
Several distribution functions were tested, and the choice finally narrowed down to two-the gamma and the lognormal. Comparison of plotted data with computed distribution curves indicated that the lognormal distribution was somewhat more representative than the gamma. This was
the diStribution ~sed although at-test [1] applied to the means of the 2-percent probability level:s for the two distributions indicated no differences significant at the 5-percent probability level.
The lognormal analysis was programmed for the computer to yield WE values for probabilities of 50, 20, 10, 4, 2, and 1 percent. Examination of the results for long-record stations indicated reasonable values for the range of probabilities used. In order to determine if the IShort-record data from recent years introduced any possible bias, data from Stations with 35 years or more of record were examined. Data for the last 10 and 25 years of record from each station were compared at the 50- and 2-percent probability levels, and no significant bias was indicated. Results for short-record stations naturally tended to be somewhat erratic for the lower probabilities.
6. CONSTRUCTION OF WE MAPS
Two 50-percent probability maps were first constructed, one for each half of March (figs. 10 and 11). These maps, based on observed and estimated WE data for all stations (tables 1 and 2) , show the n1aximum WE of snow on ground expected to be equaled or exceeded on an average of once in two years.
The next step was the construction of the 1-percent probability maps. In order to avoid inconsistencies arising from the often erratic 1-percent WE values yielded by short-record stations, ratio maps of 1-percent WE to 50-percent WE based on long-record stations were first bonstructed. These ratio maps, one for each half of March, were then applied to the corresponding 50-percent WE maps to obtain the 1-percent WE maps (figs. 20 and 21).
In ·order to obtain a consistent interpolation between the 50-percent and 1-percent maps, the probability-interpolation diagram of figure 8 was
10
- - l______
used for estimating the WE values for the. intermediate probabilities, i.e., 20, 10, 4, and 2. percent. This diagram was derived empirically from the data for long-record stations only ( 35 years or more) . Separate interpolation diagrams for the first and second halves of March were first constructed, but since there were no appreciable differences, the diagrams were combined.
In constructing the intermediate maps, the 50-and 1-percent WEvalues were first read for each grid point shown in figure 9. These two values for each grid point were then plotted on the corresponding verticals of the interpolation diagram (fig. 8) , a straightedge was laid along the two points, and WE values for intermediate probabilities were read at the intersection of the straightedge and corresponding verticals. The WE values · thus obtained were then plotted on the corresponding grid. points on the appropriate maps, and isolines were then drawn.

FIGURE B.-Probability-interpolation diagram.
95°
gso
20
1-
18
t-
16
-
14
t-(j) w i3 12 ~
1-z w _J
<t > 3 0 w 0:: w 1-<t 3
r-
10
1-
8
t-
r-
4
1-
t-
0 50
goo
goo
20 10 4 PROBABILITY (PERCENT)
SCALE OF MILES 50 100 200
FIGURE 9.-Points for which water-equivalent values were interpolated.
20
-
I
-
16
-
14
-
I
-
I
-
-
6
-
4
-
-
0
ll

7. DISCUSSION OF WE MAPS
The maps of figures 10-21 show the maximum WE· of snow on ground in the first and second halves of March for 50-, 20-, 10-, 4-, 2-, and 1-percent probabilities. In other words, the 1-percent map of figure 20 shows the maximum WE expected to be equaled or exceeded in the first half of March on an average of once in 100 years. The 2-percent map (fig. 18) shows the values expected to be equaled or exceeded on an average of once in 50 years; the 4-percent, 25 years; the 10-percent, .1 0 years; the 20-percent, 5 years; and the 50-percent, 2 years. . In general, the maps show high~r WE values
for the first half of March than for the second half. The reason may well be that appreciable melting and runoff usua.lly take place· over· most of the study area during March. This depletion was not e.vident in the colder northern Great Lakes Region, which shows higher values for the second half of March.
One very noticeable feature of the maps is the difference between the water-equivalent values on
the opposite shores of Lake Michigan. Whereas the values indicated for the western, or windward, shore tend to be about the same as those on the western shore of Lake Huron for any given latitude, much higher values are indicated for the eastern shore of Lake Michigan. This is probably a result of the warming effect of the lake in winter. The high values in extreme northwestern Michigan to the lee of the western end of Lake Superior may be another indication of this warming effect.
Good agreement was noted between the WE maps and the pattern of mean annual total snow-. fall [2] and also the snow-loads maps presented by Thorn [3] for return periods of 2, 10, 25, and 50 years. The snow loads, in general, tend to be higher than would be indicated by the WE for corresponding probabilities. H~wever, since the snow-loads study considered heaviest. snow loads
, regardless of month of occurrence, the results could be expected to be higher than the WE values presented herein, which are based on March values only.
REFERENCES
1. C. E .. P. Brooks and H. Carruthers, H andoook of Statistical Methods in Meteorology, Great Britain, Meteorological Office (M.O. 538), London, 1953, 413 pp. ( pp. 64-67).
12
2. U.S. Weather Bureau; "Mean Annual Total Snowfall," sheet of National Atlas of the United States, 1960.
3. H. C. S. Thorn; "Building Design for Wind and Snow L()ads," Agricultural Engineering, vol. 44, No.8, Aug. 1963, pp. ~26-431.

,__. ~
105•
105• 1000
100"
95• go•
MAXIMUM WATER EQUIVALENT {IN.) MARCH 1-15 50-PERCENT PROBABILITY
95• 90"
as•
as·
FIGURE 10.-Maximum March 1-15 water equivalent (in.) expected to be equaled or exceeded once in two years.
so·
so·

1--' If::>.
lOS· 100• 9S· go• as· so· 1 1 1 MAXIMUM WATER EQUIVALENT {IN.) MARCH 16-31 1 1
:::::lso-
50-PERCENT PROBABILITY
lOS• 100• gs· 90• as· so·
FIGURE 11.-Maximum March 16-31 water equivalent (in.) expected to be equaled or exceeded once in two years.
...... c.n
10s·
lOS• 100•
100"
95• go•
MAXIMUM WATER EQUIVALENT (IN.) MARCH 1-15 20-PERCENT PROBABILITY
95• 90•
as· so·
SCALE OF MILES:
50 I 00 200 300
as·
FIGURE 12.-Maximum March 1-15 water equivalent (in.) expectedto be equaled or exceeded once in five years .
so·

1-' 0\
10s·
10S· 100•
100•
9S· go•
MAXIMUM WATER EQUIVALENT (IN.) MARCH 16-31 20-PERCENT PROBABILITY
9S· 90•
as·
as·
FIGURE 13.-Maximum March 16-31 water equivalent (in.) expected to be equaled or exceeded once in five years.
so·
so·

1-' -.1
tos·
tos· too•
too·
9S· 90"
MAXIMUM WATER EQUIVALENT (IN.) MARCH 1-15 10-PERCENT PROBABILITY
9S· 90•
as· so·
SCALE OF MILES:
50 t 00 200 300
as•
FIGURE 14.-Maximum March 1-15 water equivalent (in.) expected to be equaled or exceeded once in ten years.

........ 00
105'
105• 100'
100'
95' 90'
MAXIMUM WATER EQUIVALENT {IN.) MARCH 16-31 10-PERCENT PROBABILITY
95' 90'
85'
85'
FIGURE 15.-Maximum March 16-31 water equivalent (in.) expected to be equaled or exceeded once in ten years.
so·
...... \0
10S·
10S· 100"
100"
ss· so·
MAXIMUM WATER EQUIVALENT (IN.) MARCH 1-15 4-PERCENT PROBABILITY
ss· so·
as·
as•
FIGURE 16.-Maximum March 1-15 water equivalent (in.) expected to be equaled or exceeded once in 25 years .
so·
so·

~ 0
tos·
tos· 100"
too•
9S· 90"
MAXIMUM WATER EQUIVALENT (IN.) MARCH 16-31 4-PERCENT PROBABILITY
9S· 90•
as·
as•
FIGURE 17.-Maximum March 16-31 water equivalent (in.) expected to be equaled or exceeded once in 25 years.
ao-
ao-

~ 1-'
105•
105• 1000 95• go• as· so·
MAXIMUM WATER EQUIVALENT (IN.) MARCH 1-15 I I
2-PERCENT PROBABILITY
SCALE OF MILES:
0 50 100 200 300
100• 95• 90• as• so·
FIGURE 18.-Maximum March 1-15 water equivalent (in.) expected to be equaled or exceeded once in 50 years.
l::..,j l::..,j
10s·
100•
100•
9s· go·
MAXIMUM WATER EQUIVALENT (IN.) MARCH 16-31 2-PERCENT PROBABILITY
9S· 90•
as·
as·
FIGURE 19.-Maximum March 16-31 water equivalent (in.) expected to be equaled or exceeded once in 50 years.
80"
so·

1:\:) C;.;)
lOS•
lOS• 100"
100"
95• 90"
MAXIMUM WATER EQUIVALENT (IN.) MARCH 1-15 1-PERCENT PROBABILITY
95• 90•
as· so·
SCALE OF MILES:
0 50 100 200 300
as·
FIGURE 20.-l\Iaximum March 1-15 water equivalent (in.) expected to be equaled or exceeded once in 100 years.
so·

~
tos·
!=l pl
0 0 <: l:'i
~ ~ l:'i 2: 1-j
'"d
~ 1-j
!21 0
0 t:rj
:=1 () l:'i
"' 0> >I>
0
_,
; I tos·
100"
too•
9S· go•
MAXIMUM WATER EQUIVALENT (IN.) MARCH 16-31 1-PERCENT PROBABILITY
as·
9S· go· as·
FIGURE 21.-Maximum March 16-31 water equivalent (in.) expected to be equaled or exceeded once in 100 years.
so·
so·
Copyright © 2022 FDOKUMEN