Optimization of System Maturity and Equivalent System Mass ...
Upload
sabanciunivCategory
view
0download
0
“Equivalent” Electromechanical Coefficient for IPMCActuator Design Based on Equivalent BimorphBeam Theory
H.D. Çilingir & M. Papila
Received: 24 February 2009 /Accepted: 3 November 2009 /Published online: 6 January 2010# Society for Experimental Mechanics 2009
Abstract This paper addresses an “equivalent” electrome-chanical coupling coefficient that may be used in designingIonic Polymer Metal Composite (IPMC) actuators. Thecoefficient is not a material constant and derived fromequivalent bimorph beam model. The collective effect ofthe membrane thickness and operating voltage on thecoefficient is demonstrated by using a design of experiment(DOE) of three and five levels of the two factors,respectively. Experiments and linear finite element analyseswith MD.NASTRAN at DOE points are performed. The tipdisplacement and the coupling coefficient are reported andtheir response surface (RS) approximations as function ofthe thickness and voltage are constructed. Experiments andRS predictions indicate that actuator thickness and appliedvoltage are two interacting major factors for maximum tipdisplacement. The equivalent coupling coefficient is pri-marily driven by the thickness of actuator moreover voltageappears to contribute as the thickness increases. The initialcurvature of the strips before electrical excitation is alsoshown to be a factor for “equivalent” coupling coefficient,it is not, however sufficient to explain the variation in theexperimental data. A correction factor approach is proposedand applied to the straight beam tip displacement RS thatfilters out experimental variation. A corrected RS enablesincluding the pre-imposed initial curvature as designparameter along with the actuator thickness and theoperating peak voltage when predicting the tip displace-ment and the equivalent coupling coefficient.
Keywords IPMC . Equivalent electromechanicalcoefficient . Curvature . Response surface .
Frequency response
Introduction
Ionic Polymer Metal Composites (IPMCs) along with ionicgels and conductive polymers belong to the class of ionicelectroactive polymer (EAP) systems that can be used foractuation and sensing [1]. Due to their operationalsimilarity with biological muscles, IPMCs are primarilyassociated to artificial muscle applications [1–4]. Thegeneral characteristic of IPMCs is that they contain anelectrolyte between electrodes where transport of ion/molecules occur in response to applied electric field causinginternal stress distribution and bending deformation [5, 6].
The base material of IPMCs is an ion exchange polymermembrane also used typically in proton exchange mem-brane fuel cells. There are several ionic polymer mem-branes used in IPMCs: Nafion® (E. I. Du Pont de Nemoursand Company, Inc. 0.18 mm thick, 1,100 g mol−1 ofequivalent weight) most widely used one with backboneionomer perfluoro-sulfonate, Flemion® (Asahi Glass,0.14 mm thick, 690 g mol−1 of equivalent weight) withthe perfluoro-carboxylate group, and rarely Aciplex®(Asahi Chemical) [7]. Flemion has higher ion exchangecapacity, higher stiffness, and greater water uptake thanNafion. On the other hand, Flemion based IPMCs’actuation mechanism differs because no back relaxationoccurs. Because of alkali metal cations in Flemion, itshows fast initial bending towards the anode, followedby a slow motion in the same direction whereas theNafion based IPMCs exhibit initial fast bending towardsthe anode followed by slow relaxation in the opposite
H.D. Çilingir :M. Papila (*)Sabancı University,Orhanlı Tuzla,34956 Istanbul, Turkeye-mail: [email protected]
H.D. Çilingire-mail: [email protected]
Experimental Mechanics (2010) 50:1157–1168DOI 10.1007/s11340-009-9311-0

direction [8]. In this study, Nafion based IPMC actuatorstrips are experimented.
There are several approaches in order to explain theactuation mechanism of IPMC membrane [9–15]. Both thestructure of the material and the transport mechanism of ionexchange membranes enable the actuation of IPMCs. Toexplain the ion and water transportation phenomena withinthe electrolyte membrane, a cluster network model, wasintroduced by Gierke et al. [10, 11]. The model was alsoaddressed and verified by several other researchers: Rocheet. al. (small-angle x-ray scattering) [12] and Xue et. al.(TEM analysis) [13, 14] and James et al. [15]. Themicrostructure of Nafion consists of the hydrophobicfluorocarbon backbone and hydrophilic anionic clusters ofsulfonic acid groups, resulting in the formation of aninterconnected cluster network in the hydrated membrane.In addition to hydration when the electric field is appliedthrough the membrane, unbounded cations can movethrough cluster networks towards the cathode, Nemat-Nasser [16, 17]. This transport occurs at ionic rich placesat the sides of the IPMC membrane. Depletion of cationsnear the anode formed a thin anodic layer while accumu-lation of cations near cathode formed thin cathodeboundary layer. These changes arrange the structuralvolume of the membrane and the response of the membraneby means of resting. The elastic resistance of polymermatrix produces macroscopic deformation of IPMC mem-brane as in the form of bending.
Models for predicting the behavior or performance ofIPMCs have been classified as physical models [16–18],black box models [19, 20], and gray box models [20–23].Gray box models initially proposed by Kanno et. al. [20]and DeGennes et. al. [21], are primarily for actuatorresponse and based on several physical laws combinedwith limited physical properties determined by experimen-tal or analytical methods [22]. The approach is alsoimplemented to determine models for IPMC-based sensors[23]. Such models are of interest as they are easier to applyfor general geometry and boundary conditions. An equiv-alent bimorph beam model, for instance was recentlystudied by Lee et. al. [22] and implemented in severaldesign problems [24, 25]. Nguyen et al. [26], for instance,implemented the model to calculate a blocking force-displacement diagram for an IPMC micropump designwith a flexibly supported diaphragm. The advantage oftheir approach is that although the IPMC actuation is atransport phenomenon, it is treated as response bypiezoelectric materials which is easier to model incommercial finite element analysis software such asMD.NASTRAN [27]. An “equivalent” electro-mechanicalcoupling coefficient is expressed via the equivalentbimorph beam problem, and the IPMC is modeled as if itis a piezoelectric material. In this work, we have also
employed the equivalent bimorph approach and MD.NASTRAN.
It is important to label the coupling coefficient “equiv-alent” or “effective” as it is dependent on several factors. Inother words it is not an actual “material constant”. Thecoefficient, for instance, varies with operating voltage andthickness. The thickness in particular is an actuator designparameter in various problems. In addition, the operatingvoltage, although not a typical design variable, may appearas constraint while it affects the potential objectivefunctions in design optimization. In actuator design for asynthetic jet application, for instance, although it operatesas continuous input-output, the merit or objective functionto maximize is typically the maximum volume displace-ment that is a function of actuator’s displacement at thepeak voltage level [28].
The “equivalent” electromechanical coefficient isexpressed based on a straight beam model. Lee et.al. [24,25], and Nguyen et al. [26] reported their experimental dataon the coupling coefficient, but it is for a fixed thicknessand straight beam. The validity of their approach for adifferent IPMC thickness is also addressed and reportedin a very recent article by Ji et al. [29]. Furthermore,there may be applications where the IPMC strip(s)need to have initial curvature. Rossiter et al. [28] andStoimenov et al. [30] presented IPMC applications aslinear actuator and 2D array of two-strips (strips-couples)with their ends clamped together. Such strip-coupleswith initial curvature opposite to each other can help tofacilitate two-ways linear motion with respect to thereference position.
If one wishes to use the simple equivalent bimorph beambased approach in IPMC actuator design where thethickness is a variable and the membrane is not flat, theextended data for coupling coefficient would be neededwhich motivated this work. Specifically, the aim of thepresent study is to investigate how the applied voltage,thickness, and initial curvature of the IPMC affect the“equivalent” electro-mechanical coupling coefficient inequivalent bimorph beam approach. The ResponseSurface Methodology (RSM) is utilized. Because itenables experimental investigation of the individualfactors and the interactions of the factors (variables orparameters) while filtering noise or random error in theexperimental data [31, 32]. Surrogate model or responsesurface (RS) approximation allows the evaluation ofsignificance of the parameters based on experimentalresults and provides prediction capability for design andprocess optimization [33, 34]. The output here is a semi-empirical approximation for the equivalent electromechan-ical coefficient as a function of applied voltage, IPMCthickness and the initial curvature for preliminary designpurposes.
1158 Exp Mech (2010) 50:1157–1168

Methodology
Manufacturing the IPMC Strips
The IPMC actuator strips were manufactured by followingthe process reported in [35] consisting of two main steps;compositing and surface electroding which known as theelectrochemical platinization method. The method overallcontains Pretreatment, Absorption (Ion-exchange), PrimaryPlating (Reduction), Secondary Plating, Ion-exchangeprocesses. In the present work, we used commerciallyavailable H+ form Nafion membranes of several thick-nesses, specifically 50 µm; 90 µm; 180 µm by Sigma-Aldrich. The three fabricated IPMC actuators (70 µm,110 µm and 200 µm thick actuators with platinum electro-des at each surfaces) were trimmed to dimensions50 mm × 5 mm to be subjected to actuation experiments.
Actuation Experiments
In the experiments, each of the three IPMC actuators wasrectangular in shape with dimensions of 50 mm long and5 mm wide. The actuators were clamped on 5 mm wideedge and submersed vertically into water as shown inFig. 1. Movements and displacements when the specimen issubjected to electrical load were recorded by a videocamera. Once the actuation experiment and recording isdone, the displacement is measured using freeware imageprocessing software: WinDIG 2.0 as shown in Fig. 1.
Experiments were carried out for each of the threeactuators, namely 70 µm, 110 µm, and 200 μm thick andflat IPMC actuator strips, at 10 mHz sinusoidal excitation
with peak voltage of V=Vpeak=0.0 V, 0.5 V, 1.0 V, 1.5 Vand 2.0 V. Each test was run long enough to allow numberof passes at the peak voltage and the maximum recorded tipdisplacement with respect to the initial position wasconsidered as the output of the test, as shown by Fig. 2.
The combinations of the thickness and voltage resultedin 15 test points as indicated in Table 1. Three data points atzero volts so that zero or near-zero displacements are alsoincluded. At 12 remaining test points, excitation andmeasurement of resultant tip displacement were repeated 3times. Averages of the three measurements at each testpoint were then considered as the result of the associatedcombination of thickness and applied voltage.
Modeling and Finite Element Analyses
In this paper, we utilize the equivalent bimorph beam modeldue to [22] to predict the performance of IPMC actuatorsand to obtain the electro-mechanical coupling coefficientwhich can be considered as “equivalent” or effectivematerial parameter for the finite element analyses. Theequivalent bimorph beam model, shown in Fig. 3, assumesthat IPMC having two layers of the same thickness (each ishalf the thickness of the actuator). Modeling the IPMC astwo layers produces IPMC’s bending motion. The bendingmotion is created under an applied electric field due toopposing motion of artificial layers in other words whileone layer expands, the other contracts.
According to the equivalent bimorph beam model, thetip displacement s is given by [22]:
s ¼ 3d31VL2
2H2ð1Þ
where d31 is the “equivalent” electro-mechanical couplingcoefficient with subscripts 1 and 3 standing for the x- andthe z-directions, respectively, V is the applied voltage, L isthe length, and H is the total thickness of the equivalentbeam. By manipulating the equation (1), equivalentcoupling coefficient d31 can be written as:
d31 ¼ 2sH2
3VL2ð2Þ
The “equivalent” electro-mechanical coupling coeffi-cient can be calculated from equation (2) as demonstratedin [22] by using the tip displacement values obtained fromclamped-free IPMC actuator tests. This equivalent coeffi-cient is an essential component in this study as thecoefficient enables the use of commercial Finite Elementsoftware in simulating the IPMC behavior. MSC.PATRANwas used for modeling and post-processing the results fromMD.NASTRAN when used as a solver. Since the equiva-lent bimorph beam model is the reference, IPMC strip ismodeled as a bi-layer plate for which 4-nodes QUADFig. 1 Interface of the image processing software
Exp Mech (2010) 50:1157–1168 1159

elements were used. Also, note that MD.NASTRANrequires an analogous thermo-mechanical analysis toperform coupled electro-mechanical analyses. Using ther-mal analogy technique [22–25], the equivalent electro-mechanical coupling coefficients were converted intocoefficient of thermal expansion α as follows:
a ¼ d31H=2
ð3Þ
Preliminary efforts were to duplicate the results by Leeet al. [22] for an IPMC beam of 20 mm in length, 5 mm inwidth and 300 μm in thickness. The results from our MD.NASTRAN analysis and from Lee et. al [22] are in goodagreement indicating thermal equivalent problem for elec-tromechanical loading was also simulated successfully here.
Results and Discussion
IPMC Actuators in Action
The three IPMC actuators were tested following the designof experiment summarized in the second and third columns
of Table 1. Three replications at each experiment settingsand their average are reported. The average data is alsoshown in Fig. 4.
The tip displacement data of 15 distinct test points iswell suited for fitting a polynomial response surfaceapproximation [31] with thickness and applied voltage asthe main factors. The choice of basis functions for the RSwas due to the following: it appears from the data whenconsidered as 1-D curves (via Fig. 4) each for a specifiedthickness, the tip displacement can be well fitted by a cubicfunction of the operating voltage for that particularthickness. The cubic fitting model was also reported byTang et al. [36]. That is, at a given thickness,
bsavjH ¼ "þ m1V þ m2V
2 þ m3V3 ð4Þ
where ε is an expected near zero intercept value. The curveschange significantly as the thickness changes; therefore wepresume that coefficients mi of the equation (4) can becharacterized by quadratic function of the thickness (Notethat cubic terms of thickness H are excluded since it isstudied at three levels sufficient to fit a quadratic function).This assumption along with equation (4) let’s consider the
Fig. 2 Representation of tipdisplacement measurements atsinusoidal excitation
Table 1 Measured tip displacements for various IPMC thicknesses (applied sinusoidal voltage at 10 mHz-see Fig. 2)
Data no Thickness H (mm) Applied peak voltage, Vpeak (volt) Maximum tip displacement, s (mm)
Test 1, s1 Test 2, s2 Test 3, s3 Average, sav
1 0.07 0 0
2 0.07 0.5 0.83 0.83 0.50 0.72
3 0.07 1 1.50 1.67 1.33 1.50
4 0.07 1.5 1.83 2.75 1.67 2.08
5 0.07 2 2.50 3.33 2.50 2.78
6 0.11 0 0
7 0.11 0.5 0.83 2.50 0.83 1.39
8 0.11 1 1.67 3.33 1.67 2.22
9 0.11 1.5 2.51 4.17 2.21 2.96
10 0.11 2 3.33 5.00 3.83 4.05
11 0.20 0 0
12 0.20 0.5 3.33 2.08 2.17 2.53
13 0.20 1 3.33 5.00 5.83 4.72
14 0.20 1.5 10.00 6.67 8.33 8.33
15 0.20 2 13.34 13.34 13.33 13.33
1160 Exp Mech (2010) 50:1157–1168

following polynomial basis functions of voltage and thicknessas indicated in the following surrogate or RS expression,
bsav¼ b0 þ b1 þ b2H þ b3H
2� �
V
þ b4 þ b5H þ b6H2
� �V 2
þ b7 þ b8H þ b9H2
� �V 3 ð5Þ
where βi are coefficients to be determined by the fittingprocedure on the 15 data points of Table 1. Statisticalanalysis software JMP IN 5.1 by SAS Institute wasemployed and the RS approximation was constructed bythe least square regression. Equation (6) was obtained as thepolynomial fit predicting the tip displacement (in mili-meters), a function of voltage (in volt) and actuator thickness(in milimeters):
bsav¼ 0:006þ �3:93þ 95:74H � 245:68H2
� �V
þ 6:12� 116:84H þ 389:06H2� �
V 2
þ �1:49þ 26:16H � 64:58H2� �
V 3 ð6Þ
The fitting statistics are quite good owing to higher orderterms. R2=0.999, root mean square error (RMSE) of 0.100with the mean of response based on the 15 points3.108 mm, corresponding to a coefficient of variation(RMSE/Mean of the data) of about % 3. The RSapproximation predicts near zero response Vpeak=0 V. Thefitting actually may have been realized in such a way thatzero displacement at Vpeak=0 V is strictly forced by simplyexcluding the intercept term β0 in equation (5). We,however, chose not to do this because the operating peakvoltage was not likely to be near zero values, so there is noneed for an absolute weighting of the Vpeak=0 V data pointsin favor of the zero displacement. The second column ofTable 2 summarizes the prediction of the tip displacementsby equation (6) and the last column is the relative percenterror when compared to the experimental average measure-
ments. The highest error is about % 5 among the non-zerodisplacement data points which were also used in the fittingprocedure. In addition, a new set of specimens wasprepared and additional measurements were taken atvoltages not utilized in the fitting of RS. The results, alsoindicated on Fig. 4 were compared with the predictions bythe response surface fitted on the data for the previous setof specimens. The relative error for 200 µm thick actuatorat 1.75 V is rather high, above 20%. The prediction error atthe remaining 5 points however ranges between 3% to13%. Recalling the variability in the measurements (Table 1)the predictions are considered reasonable and the compar-isons due to new set of specimens provide verification forthe outcome of the manuscript and, in addition, forrepeatability.
The “equivalent” electro-mechanical coupling coeffi-cient can now also be predicted by substituting equation(6) into equation (2). That is substituting bsav as the tipdisplacement s, resulting equation (7) which is an approx-imation for the equivalent coefficient, d31 when the beam isstraight or flat:
bd31
¼ 2H2
3VL2bsav
ð7Þ
The comparison of coupling coefficient by equation (2)(using the average measured tip displacements) andequation (7) is given in Fig. 5. The relative errors on thecoefficient are the same as for the tip displacements,because the only difference is the use of measured s asopposed to approximated tip displacement bsav.
The tip displacement and variation of “equivalent”coupling coefficient within the parameter space of voltage
V, Voltage (Volt)
s av
, ti
p di
spla
cem
ent (
mm
)
0 0.5 1 1.5 2 2.50
5
10
15H = 0.07 mm, data for RSH = 0.11 mm, data for RSH = 0.20 mm, data for RSH = 0.07 mm, verifying RSH = 0.11 mm, verifying RSH = 0.20 mm, verifying RS
Fig. 4 Tip displacement—voltage relationship for various thick-nesses, un-filled and filled symbols are for data used in the RSconstruction and data for verification, respectively. The curves are thepredictions of the RS
Fig. 3 Equivalent bimorph beam model. [22]
Exp Mech (2010) 50:1157–1168 1161

and thickness bounded in 0 V − 2 V and 70 µm − 200 µm,respectively is presented in Fig. 6. It can be concluded thatthe coefficient is greatly affected by the thickness of theIPMC. The effect of applied voltage is not significant ifthe thickness is small, but gets more pronounced as thethickness increases.
Finite Element Simulations of Straight IPMC Actuators
Based on the test results summarized in Fig. 5, the“equivalent” or “effective” electro-mechanical couplingcoefficients, d31, and equivalent thermal expansion coef-ficients α for NASTRAN linear static analysis werecalculated by using equation (2) and (3), respectively. Forinstance, experimental and simulation results for the 70 µmthick IPMC test specimen at applied voltage 1 V (Test 2column of Table 1) is compared. The tip displacementmeasurement was smeasured=1.67 mm and associated coef-ficient due to equation (2) is d31=2.178×10
−6 mm/V. Usingthis equivalent coupling coefficient, the deflected shape ofthe IPMC by the MD.NASTRAN was obtained and the tip
displacement is found as s=1.67 mm. Similar comparisonwas also presented for the IPMC strip with thickness of200 µm tested at 1 V (Test 1 column of Table 1). The tipdisplacement was smeasured=3.33 mm and associated coef-ficient was found to be d31=3.556×10
−5 mm/V. The resultsof the finite element analyses by MD.NASTRAN (s=3.33 mm) and the test results perfectly match as it shouldbe, because the “equivalent” coefficient used in the“straight” IPMC beam numerical (FE) analysis is derivedfrom the analytical/exact solution of the “straight” equiva-lent beam.
Finite Element Simulations of Curved IPMCActuators—Effect of Initial Curvature
For initially straight IPMC specimens, the displacementsmeasured in the tests and finite element results areperfectly consistent. However, while handling and im-mersing IPMC into water, deliberately or not, an initialcurvature may be imposed before the voltage is applied.Figure 7 shows an example for such a case. Newbury and
Table 2 Comparison of measured sav versus response surface (RS) predicted bsav
tip displacements for various IPMC thicknesses (appliedsinusoidal voltage at 10 mHz, see Fig. 2)
Data no ThicknessH (mm)
Applied peak voltage,Vpeak (Volt)
Maximum tip displacement,sav (mm)
RS prediction bsav
(mm)equation (6)
%Relative error
bsav�savj jsav � 100
RS fitting data
1 0.07 0 0 0.01 –
2 0.07 0.5 0.72 0.75 4.5
3 0.07 1 1.50 1.45 3.3
4 0.07 1.5 2.08 2.12 1.6
5 0.07 2 2.78 2.77 0.3
6 0.11 0 0 0.01 –
7 0.11 0.5 1.39 1.39 0.1
8 0.11 1 2.22 2.22 0.1
9 0.11 1.5 2.96 2.96 0.0
10 0.11 2 4.05 4.05 0.0
11 0.20 0 0 0.01 –
12 0.20 0.5 2.53 2.42 4.1
13 0.20 1 4.72 4.88 3.3
14 0.20 1.5 8.33 8.23 1.2
15 0.20 2 13.33 13.36 0.2
Data for verification
1 0.07 0.75 0.98 1.11 13.1
2 0.07 1.75 2.64 2.44 7.4
3 0.11 0.75 1.72 1.85 7.3
4 0.11 1.75 3.34 3.43 2.8
5 0.20 0.75 3.92 3.59 8.3
6 0.20 1.75 8.54 10.52 23.2
1162 Exp Mech (2010) 50:1157–1168
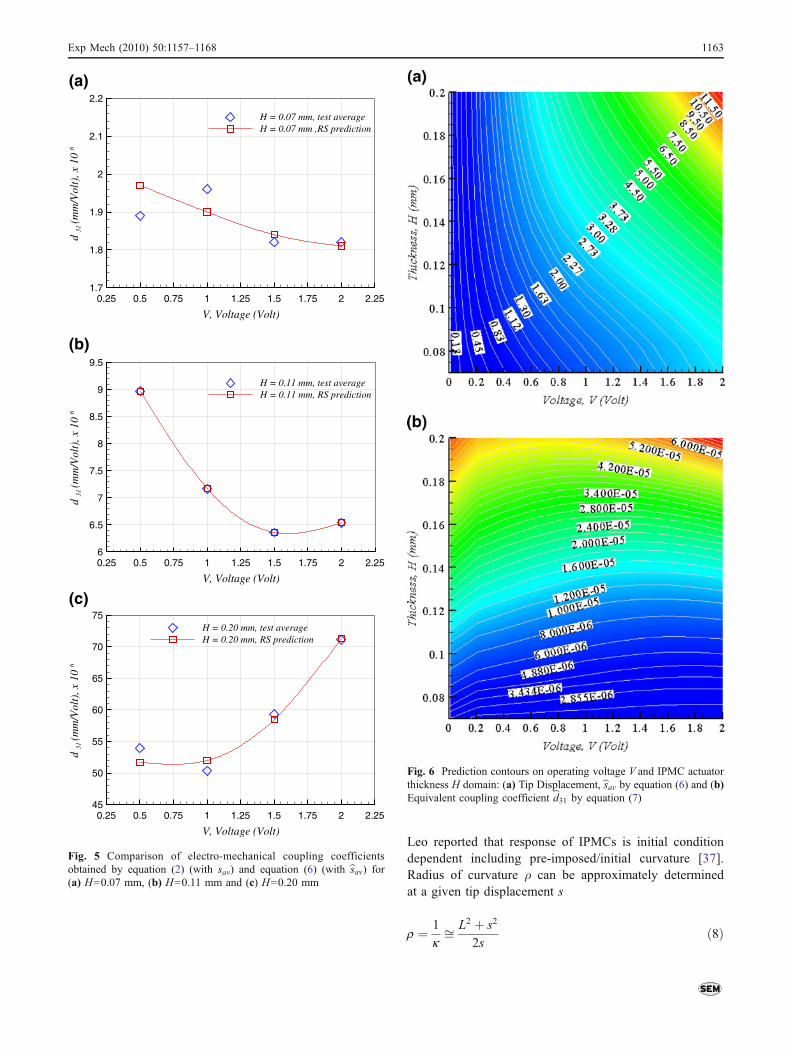
Leo reported that response of IPMCs is initial conditiondependent including pre-imposed/initial curvature [37].Radius of curvature ρ can be approximately determinedat a given tip displacement s
r ¼ 1
kffi L2 þ s2
2sð8Þ
V, Voltage (Volt)
d 31
(mm
/Vol
t), x
10
d 31
(mm
/Vol
t), x
10
0.25 0.5 0.75 1 1.25 1.5 1.75 2 2.251.7
1.8
1.9
2
2.1
2.2
H = 0.07 mm, test averageH = 0.07 mm ,RS prediction
V, Voltage (Volt)
0.25 0.5 0.75 1 1.25 1.5 1.75 2 2.256
6.5
7
7.5
8
8.5
9
9.5
H = 0.11 mm, test averageH = 0.11 mm, RS prediction
V, Voltage (Volt)
0.25 0.5 0.75 1 1.25 1.5 1.75 2 2.2545
50
55
60
65
70
75H = 0.20 mm, test averageH = 0.20 mm, RS prediction
d 31
(mm
/Vol
t), x
10
(a)
(b)
(c)
Fig. 5 Comparison of electro-mechanical coupling coefficientsobtained by equation (2) (with sav) and equation (6) (with bsav) for(a) H=0.07 mm, (b) H=0.11 mm and (c) H=0.20 mm
Fig. 6 Prediction contours on operating voltage V and IPMC actuatorthickness H domain: (a) Tip Displacement, bsav by equation (6) and (b)Equivalent coupling coefficient bd31 by equation (7)
Exp Mech (2010) 50:1157–1168 1163

where κ and L are the curvature and length of the strip,respectively [38]. For the case of initial curvature, s0 is theinitial tip displacement prior to actuation. The IPMC strip inFig. 7, for instance has initial tip displacement s0 ≈ 8 mmwhich corresponds to preset radius of curvature ρ0=157 mm.
In order to evaluate the effect of the initial or presetcurvature, test results and the finite element analyses for theinitially curved IPMC actuator were compared while thecoupling coefficient was still obtained from equivalent“straight” bimorph model of Fig. 3 and equation (2).Measurement at 1 V on the test specimen (50 mm×5mm×0.2 mm) with preset curvature (ρ0=157 mm, Fig. 7)was performed. The resultant tip displacement relative tothe initial tip position of the curved beam was measured assmeasured=4.00 mm. Then, the “equivalent” electro-mechanical coupling coefficient was computed by theequation (2) substituting smeasured in and found as(d31)straight=4.267×10
−5 mm/V. Using (d31)straight the ini-tially curved beam MD.NASTRAN analysis resulted in tipdisplacement scurved=3.89 mm. The difference betweenscurved and smeasured is due to the fact that coefficientused in the curved beam analysis is from equation (2) ofthe “straight” beam model. When we use the straightbeam NASTRAN model, 4.01 mm displacement wasobtained, but the computed deformed shape does notmatch with the experimentally observed shape as shownin Fig. 8.
In order to predict the tip displacement and thedeformed shape accurately, the “equivalent” couplingcoefficient needs also to take into account the presetcurvature when the specimen or the beam is not ini-tially straight. A simplest way to include the presetcurvature effect is to find whether a tuning or correctionfactor can be introduced to the coupling coefficientexpression,
d31ð Þk ¼ ck2H2
3VL2s ð9Þ
where cκ is the correction factor for the initial curvature.Comparing the MD.NASTRAN results for the curved andstraight beams, Fig. 9, with the equivalent coefficient by
equation (2), the tip displacements of the curved andstraight beams relate as,
scurved ¼ 0:97*sstraight ð10Þwhere sstraight ¼ smeasured (due to original equivalent“straight” bimorph beam model). That is, to tune the tipdisplacement by the initially curved model, the equivalentcoupling coefficient should be corrected by a factor of cκ=1.03 determined by the following,
ck ¼ sstraightscurved
ð11Þ
The next immediate question is whether this correctionfactor is dependent on the thickness of the membrane.Similar calculations were performed for the 70 µm and110 µm thick IPMC actuators. The comparison between thestraight and curved models resulted in the same correctionfactor provided that the preset curvature is fixed. That is,the membrane thickness does not affect the correctionfactor due to initial curvature.
The magnitude of the correction factor, on the otherhand, is for a specified curvature which is expected tochange for different preset curvature, and cκ may beexpressed as function of the initial radius of curvature, ρ0.In addition to ρ0=157 mm already studied, several other ρ0values were considered as indicated in Table 3. It issufficient to compare the tip displacements from NAS-TRAN analyses of the initially curved strips. Each analysisis based on the coupling coefficient (d31)straight=4.267×10⁻⁵ mm/V resulted from sstraight=4.01 mm, the tipdisplacement of the straight strip analysis mentioned earlier.The analyses by MD.NASTRAN for the initially curvedbeams where (d31)straight was implemented in the modelsand the resultant tip displacements scurved for 1 V wereobtained as reported in Table 3. The correction factors onthe equivalent coupling coefficient associated with the radiiof curvature were then obtained by equation (11). Figure 9shows how the correction factor varies versus the initialradius of curvature (in mm) where the data is also fit byequation (12),
bck ¼ 1:0þ 0:9r�10 þ 572r�2
0 ð12Þ
Fig. 7 The initially curvedIPMC strip used in the tests
1164 Exp Mech (2010) 50:1157–1168
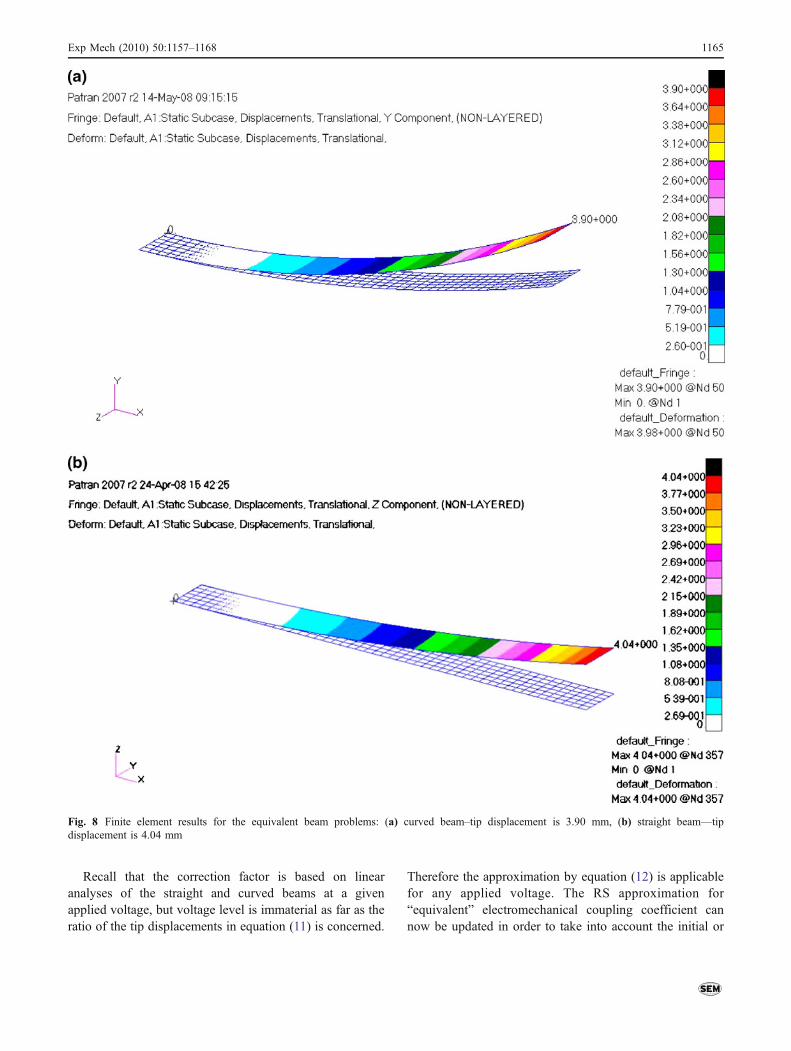
Recall that the correction factor is based on linearanalyses of the straight and curved beams at a givenapplied voltage, but voltage level is immaterial as far as theratio of the tip displacements in equation (11) is concerned.
Therefore the approximation by equation (12) is applicablefor any applied voltage. The RS approximation for“equivalent” electromechanical coupling coefficient cannow be updated in order to take into account the initial or
Fig. 8 Finite element results for the equivalent beam problems: (a) curved beam–tip displacement is 3.90 mm, (b) straight beam—tipdisplacement is 4.04 mm
Exp Mech (2010) 50:1157–1168 1165

preset curvature if any. That is equation (6) can be correctedby equation (12) and results in as follows,
bd31
¼ bcK 2H2
3VL2bsav
bd31
¼ 2H2
3VL2½0:006þ �3:93þ 95:74H � 245:68H2
� �V
þ 6:12� 116:84H þ 389:06H2� �
V 2
þ �1:49þ 26:16H � 64:58H2� �
V 3�1:0þ 0:9r�1
0 þ 572r�20
� �
ð13Þ
It should be noted, however, the variation in the experi-mental data (Table 1) is higher than the computed correctionfactors unless the radius of curvature is small. Therefore, thevariation of the data is unlikely to be due to the initialcurvature. Because the bsav RS data measurements were made
on the specimens which did not have noticeable initialcurvature, and the large radius of curvature if any for whichthe correction factor is less than 1%. On the other hand,given the fact that the determination of the correction factorrelied on finite element analyses, one can make use of thecorrection factor if the curvature is considered as a designparameter since the preliminary design computations aretypically done in deterministic setting (based on expected oraverage values).
Effect of Excitation Frequency
Another influential factor is the dynamic or frequencyresponse of the actuators [7, 39]. Figure 10 presents theoutcome of the measurements for various excitation frequen-
ρ0 (mm)
κ
0 200 400 600 800 1000 1200 14001
1.02
1.04
1.06
1.08
1.1
1.12
1.14
1.16
cκ = 1 + 0.9ρ0-1 + 572ρ0
-2
Fig. 9 Variation of the correction factor versus initial radius ofcurvature
Table 3 Initial curvature effect and correction on equivalent coefficient, the tip displacement of the straight beam analysis sstraight=4 mm, andassociated coefficient d31=4.267×10
−5 mm/V due to equation (2) when 1 V is applied
s0 initial tip disp. [mm] ρ0 initial radius of curvature, [mm] scurved tip disp. [mm] cκ Correction factor (d31)κ [mm/V]
1.0 1,251 4.001 1.002 4.268×10⁻⁵
2.0 626 4.000 1.002 4.269×10⁻⁵
3.0 417 3.980 1.007 4.290×10⁻⁵
4.0 313 3.971 1.009 4.300×10⁻⁵
5.0 251 3.955 1.013 4.317×10⁻⁵
6.1 209 3.925 1.021 4.350×10⁻⁵
8.2 157 3.900 1.028 4.378×10⁻⁵
10.3 126 3.867 1.036 4.415×10⁻⁵
13.2 101 3.780 1.060 4.516×10⁻⁵
16.5 84 3.672 1.092 4.650×10⁻⁵
x frequency (mHz)
y
tip
disp
lace
men
t, s
(mm
)
0 1000 2000 30000
2
4
6
8
10
H 0.11 mmH 0.20 mm
y 60.4x -0.58
R2 0.855
y 152.3x -0.69
R2 0.920
Fig. 10 Frequency response of the IPMC actuators of thickness0.11 mm and 0.20 mm. Measurements are at amplitude of 2 V
1166 Exp Mech (2010) 50:1157–1168

cies at driving voltage amplitude of 2 V (sinusoidal 0 V− 2 V). The results suggested that IPMC actuator displace-ment decays as the excitation frequency is increased. Thisobservation is consistent with the results presented by Nemat-Nasser and Wu [7]. Furthermore, the recorded frequencyresponse followed the power law and the fitting coefficients(see Fig. 10) appeared to be thickness dependent. We did not,however, attempt to integrate the frequency response with thepresent equivalent beam approach as the model or approachherein is limited for static linear analysis. Such an extension,that is systematic investigation of interactive effects due tofrequency, applied peak voltage and thickness on the IPMCactuator response is worthy to consider. It is, however, likelyto call for models other than the present equivalent beammodel to deal with the time constants due to transport processand relaxation during dynamic IPMC operation.
Concluding Remarks
An investigation on how the IPMC thickness, appliedvoltage and preset curvature affect the equivalent electro-mechanical coupling coefficient in equivalent bimorphbeam approach was carried out. Three and five differentthickness and driving voltages, respectively, were studiedand experiments and finite element analyses using MD.NASTRAN were performed at all fifteen combinations forthese two main factors. Particularly, a semi-empiricalapproximation of the equivalent electro-mechanical cou-pling coefficient was proposed for the IPMC thickness andvoltage ranges investigated in this study. Based on theresults following remarks can be made:
& Electro-mechanical coupling coefficient due to equiva-lent bimorph model should be treated as an “equivalent”or “effective” parameter, not an actual material constant,since it alters with the IPMC thickness and appliedvoltage.
& Experiments and predictions showed that actuatorthickness and applied voltage are interacting majorfactors for maximum tip displacement while theequivalent coupling coefficient is primarily driven bythe thickness, and the voltage appears to contribute asthe thickness increases.
& Initial curvature of the strips before electrical excitationwas also shown to be a factor for the “equivalent”coupling coefficient, but the variability in the experi-mental data seems to suppress its influence. Yet, acorrection factor approach was proposed which enablesalso to include the effect of the pre-imposed initialcurvature as design parameter in the preliminarycomputations typically done in deterministic setting(based on expected or average values).
& The RS approximation equation (13) filtered out thevariation in the experimental data and can predict the“equivalent” electromechanical coefficient accurately as afunction of actuator thickness, operating peak voltage andthe initial curvature for preliminary design purposes.
Acknowledgement We kindly acknowledge the support for thiswork from the Sabanci University Internal Research Grant Program(contract number IACF06-00418), and The Scientific and Technolog-ical Research Council of Turkey-TÜBİTAK Grant 106M364.
References
1. Bar-Cohen Y, Zhang Q (2008) Electroactive polymer actuatorsand sensors. MRS Bulletin 33:173–182
2. Shahinpoor M, Bar-Cohen Y, Simpson JO, Smith J (1998) Ionicpolymer-metal composites (IPMCs) as biomimetic sensors, actua-tors and artificial muscles. Smart Mater Struct 7:15–30
3. Shahinpoor M, Kim KJ (2001) Ionic polymer-metal composites: I.Fundamentals. Smart Mater Struct 10:819–833
4. Shahinpoor M, Kim KJ (2005) Ionic polymer-metal composites:IV. Industrial and medical applications. Smart Mater Struct14:197–214
5. Bar-Cohen Y (2000) Artificial muscles using electroactivepolymers (EAP): capabilities, challenges and potential. artificialmuscles using electroactive polymers (EAP). Available via http://hdl.handle.net/2014/18826. Accessed 05 August 2009.
6. Bar-Cohen Y (2001) Transition of EAP material from novelty topractical applications- are we there yet? In: Proceedings of SPIEEAPAD, SPIE's 8th annual ınternational symposium on smartstructures and materials. no. 4329-02.
7. Nemat-Nasser S, Wu Y (2006) Tailoring the actuation of ionicpolymer-metal composites. Smart Mater Struct 15:909–923
8. Nemat-Nasser S, Thomas C (2001) In: Bar-Cohen Y (ed)Electroactive polymer (EAP) actuators as artificial muscles—reality, potential and challenges, SPIE, Bellingham, WA, pp 139–191.
9. Lee JH, Nam JD, Choib H, Jung K, Jeon JW, Lee YK, Kim KJ,Tak Y (2005) Water uptake and migration effects of electroactiveion-exchange polymer metal composite (IPMC) actuator. SensActuators A 118:98–106
10. Gierke TD, Munn GE, Wilson FC (1981) The morphology inNafion perfluorinated membrane products, as determined by wide-and small-angle x-ray studies. J Polym Sci Polym Phys Ed19:1687–1704
11. Hsu WY, Gierke TD (1982) Elastic theory for ionic clustering inperfluorinated ionomers. Macromolecules 15:101–105
12. Roche EJ, Pineri M, Duplessix R, Levelut AM (1981) Small-anglescattering studies of Nafion membranes. J Polym Sci Polym PhysEd 19(1):1–11
13. Xue T, Trent JS, Osseo-Asare K (1989) Characterization ofNafion membranes by transmission electron microscopy. J MembrSci 45(3):261–271
14. Xue T, Longwell RB, Osseo-Asare K (1991) Mass transfer inNafion membrane systems: effects of ionic size and charge onselectivity. J Membr Sci 58(2):175–189
15. James PJ, Elliott JA, McMaster TJ, Newton JM, Elliott AMS,Hanna S, Miles MJ (2000) Hydration of Nafion studied by AFMand x-ray scattering. J Mater Sci 35(20):5111–5119
16. Nemat-Nasser S (2002) Micromechanics of actuation of ıonicpolymer-metal composites. J Appl Phys 92(5):2899–2915
Exp Mech (2010) 50:1157–1168 1167

17. Nemat-Nasser S, Li JY (2000) Electromechanical response ofionic polymer metal composites. J Appl Phys 87(7):3321–3331
18. Shahinpoor M (1995) Micro-electro-mechanics of ionic polymergels as electrically controllable artificial muscles. J Intell MaterSyst Struc 6:307–317
19. Kanno R, Kurata A, Hattori M, Tadokoro S, Takamori T, Oguro K(1994) Characteristics and modeling of ICPF actuators In: Proceed-ings of Japan–USA symp. on flexible automation 2:691–698.
20. Kanno R, Hattori M, Tadokoro S, Takamori T (1996) Linearapproximate dynamic model of ICPF actuator In: Proceedings ofIEEE ınt. conf. on robotics and automation, Piscataway, NJ, IEEE,pp 219–225.
21. DeGennes P, Okumura K, Shahinpoor M, Kim K (2000)Mechanoelectric effects in ionic gels. Europhys Lett 40:513–518
22. Lee S, Park HC, Kim KJ (2005) Equivalent modeling for ionicpolymer-metal composite actuators based on beam theories. SmartMater Struct 14:1363–1368
23. Bonomo C, Fortuna L, Giannone P, Graziani S, Strazzeri S (2006)A model for ionic polymer metal composites as sensors. SmartMater Struct 15:749–758
24. Lee S, Park HC, Kim KJ (2006) Modeling of an IPMC actuator-driven zero-net-mass-flux pump for flow control. J Intel MaterSyst Struct 17:533
25. Lee S, Kim KJ, Park IS (2007) Modeling and experiment of amuscle-like linear actuator using an ionic polymer-metal compositeand its actuation characteristics. Smart Mater Struct 16:583–588
26. Nguyen TT, Goob NS, Nguyen VK, Yoo Y, Park S (2008) Design,fabrication and experimental characterization of a flap valveIPMC micropump with a flexibly supported diaphragm. SensActuators A 141:640–648
27. MD.NASTRAN Quick Reference Guide (2006).28. Papila M, Sheplak M, Cattafesta LN (2008) Optimization of
clamped circular piezoelectric composite actuators. Sens Actua-tors A 147:310–323
29. Ji A, Park HC, Nguyen QV, Lee JW, Yoo YT (2009) Verificationof beam models for ıonic polymer-metal composite actuator.Journal of Bionic Engineering 6:232–238
30. Rossiter J, Stoimenov B, Mukai T (2007) A linear actuator from asingle ionic polymer-metal composite (IPMC) strip In: Proceed-ings of SPIE electroactive polymer actuators and devices(EAPAD), San Diego, California, USA, no. 652421-8.
31. Stoimenov B, Rossiter J, Mukai T (2007) Manufacturing of ionicpolymer metal composites (IPMCs) that can actuate into complexcurves In: Proceedings of SPIE electroactive polymer actuatorsand devices (EAPAD), San Diego, California, USA, no. 65240.
32. Montgomery MA (1997) Response surface methodology, 2nd edn.Wiley, New York
33. Papila M, Haftka RT (2000) Response surface approximations:noise, error repair, and modelling errors. AIAA Journal 38:2336–2343
34. Yördem OS, Papila M, Menceloğlu YZ (2008) Effects ofelectrospinning parameters on polyacrylonitrile nanofiber diame-ter: an investigation by response surface methodology. Mater Des26(1):33–44
35. Kim KJ, Shahinpoor M (2003) Ionic polymer-metal composites:II. Manufacturing techniques. Smart Mater Struct 12:65–79
36. Tang H-P, Nie T, Tang Y-J, Yin C-F, Tang C-X, Wang Q-Y (2008)Constitutive relationship of ıonic polymer-metal composite andstatic response character of its cantilever setup to voltage. J CentSouth Univ Technol 15:387–391
37. Newbury KM, Leo D J (2002) Electrically induced permanentstrain in ionic polymer-metal composite actuators In: Proceedingsof smart structures and materials Vol. 4695.
38. Bandopadhya D, Bhattacharya B, Dutta A (2008) Active vibrationcontrol strategy for a single-link flexible manipulator using ıonicpolymer metal composite. J Intell Mater Syst Struc 19:487–496
39. Bonomo C, Fortuna L, Giannone P, Graziani S (2005) Frequencyresponse analysis of IPMC actuators by an IR system In:Proceedings of SPIE smart structures and materials Vol. 5759.
1168 Exp Mech (2010) 50:1157–1168
Copyright © 2022 FDOKUMEN