A snapshot (2003–2005) of the 3D postseismic deformation for the 1999, M w = 7.4 İzmit earthquake...
18
Journal of Geodynamics 44 (2007) 1–18 A snapshot (2003–2005) of the 3D postseismic deformation for the 1999, M w = 7.4 ˙ Izmit earthquake in the Marmara Region, Turkey, by first results of joint gravity and GPS monitoring S. Ergintav a,∗ , U. Do ˘ gan b , C. Gerstenecker c , R. C ¸ akmak a , A. Belgen a , H. Demirel b , C. Aydın b , R. Reilinger d a TUBITAK MRC Earth and Marine Sciences Institute, Gebze, Kocaeli, Turkey b Department of Geodesy and Photogrammetry Engineering, Yıldız Technical University, ˙ Istanbul, Turkey c Darmstadt University of Technology, Institute of Physical Geodesy, Petersen Str. 13, Darmstadt, Germany d Massachusetts Institute of Technology, Cambridge, MA, USA Received 29 May 2006; received in revised form 6 December 2006; accepted 8 December 2006 Abstract Gravimetry has the potential to provide important data, in combination with GPS, for detecting vertical surface motions and sub- surface mass changes. Here, we focus on the first results of joint gravity and GPS studies in order to understand better the vertical component of the postseismic deformations of the 1999 earthquakes along the western North Anatolian Fault. We investigate the relationship between gravity changes and GPS motions during the period 2003–2005. The changes in this period constitute a snapshot of the nonlinear movements that were not studied before in the Marmara Region. The first observations evaluated here demonstrate that the joint analysis of GPS and gravity data help to constrain the 3D postseismic deformations and hence expand our knowledge of the geophysical process in the Marmara Region. We identify what appear to be different crustal properties in the western and eastern parts of the region. Furthermore, the GPS results indicate that the western extension of the 1999 ˙ Izmit rupture area presently has low strain accumulation. To the extent that this behaviour continues through the earthquake cycle, it reduces the moment release of the expected future earthquake in the eastern Marmara seismic gap. In contrast, the western part of Marmara region has important strain loading. While our results are not sufficiently accurate for detailed interpretation, the observed strain accumulation implies the poten- tial for a significant earthquake in the western Marmara region. Generally, possible fault creep extending west of the ˙ Izmit fault break following the ˙ Izmit earthquake is very important to understand the future seismic hazard in the Marmara region because it reduces the amount of strain accumulation during the earthquake cycle which will either delay the onset of future events or produce smaller future earthquakes. © 2007 Elsevier Ltd. All rights reserved. Keywords: Gravity; GPS; ˙ Izmit Earthquake; Postseismic deformations; MAGNET ∗ Corresponding author. Tel.: +90 262 641 23 00; fax: +90 262 641 23 09. E-mail address: [email protected] (S. Ergintav). 0264-3707/$ – see front matter © 2007 Elsevier Ltd. All rights reserved. doi:10.1016/j.jog.2006.12.005
Transcript of A snapshot (2003–2005) of the 3D postseismic deformation for the 1999, M w = 7.4 İzmit earthquake...

Journal of Geodynamics 44 (2007) 1–18
A snapshot (2003–2005) of the 3D postseismic deformationfor the 1999, Mw = 7.4 Izmit earthquake in the Marmara
Region, Turkey, by first results of joint gravityand GPS monitoring
S. Ergintav a,∗, U. Dogan b, C. Gerstenecker c, R. Cakmak a, A. Belgen a,H. Demirel b, C. Aydın b, R. Reilinger d
a TUBITAK MRC Earth and Marine Sciences Institute, Gebze, Kocaeli, Turkeyb Department of Geodesy and Photogrammetry Engineering, Yıldız Technical University, Istanbul, Turkey
c Darmstadt University of Technology, Institute of Physical Geodesy, Petersen Str. 13, Darmstadt, Germanyd Massachusetts Institute of Technology, Cambridge, MA, USA
Received 29 May 2006; received in revised form 6 December 2006; accepted 8 December 2006
Abstract
Gravimetry has the potential to provide important data, in combination with GPS, for detecting vertical surface motions and sub-surface mass changes. Here, we focus on the first results of joint gravity and GPS studies in order to understand better the verticalcomponent of the postseismic deformations of the 1999 earthquakes along the western North Anatolian Fault. We investigate therelationship between gravity changes and GPS motions during the period 2003–2005. The changes in this period constitute a snapshotof the nonlinear movements that were not studied before in the Marmara Region. The first observations evaluated here demonstratethat the joint analysis of GPS and gravity data help to constrain the 3D postseismic deformations and hence expand our knowledge ofthe geophysical process in the Marmara Region. We identify what appear to be different crustal properties in the western and easternparts of the region. Furthermore, the GPS results indicate that the western extension of the 1999 Izmit rupture area presently has lowstrain accumulation. To the extent that this behaviour continues through the earthquake cycle, it reduces the moment release of theexpected future earthquake in the eastern Marmara seismic gap. In contrast, the western part of Marmara region has important strainloading. While our results are not sufficiently accurate for detailed interpretation, the observed strain accumulation implies the poten-tial for a significant earthquake in the western Marmara region. Generally, possible fault creep extending west of the Izmit fault breakfollowing the Izmit earthquake is very important to understand the future seismic hazard in the Marmara region because it reduces theamount of strain accumulation during the earthquake cycle which will either delay the onset of future events or produce smaller futureearthquakes.© 2007 Elsevier Ltd. All rights reserved.
Keywords: Gravity; GPS; Izmit Earthquake; Postseismic deformations; MAGNET
∗ Corresponding author. Tel.: +90 262 641 23 00; fax: +90 262 641 23 09.E-mail address: [email protected] (S. Ergintav).
0264-3707/$ – see front matter © 2007 Elsevier Ltd. All rights reserved.doi:10.1016/j.jog.2006.12.005

2 S. Ergintav et al. / Journal of Geodynamics 44 (2007) 1–18
1. Introduction
The observation of transient postseismic ground deformations following major earthquakes is an important tool tounderstand the mechanics of the earthquake process and the mechanical behavior of the region surrounding the faultzone. Transient postseismic deformations can continue from immediately after the earthquake time to several tens ofyears as a function of time dependent stress relaxation (Thatcher, 1983; Shen et al., 1994; Yu et al., 1996; Kenner andSegall, 2000; Hudnut et al., 2002; Ergintav et al., 2002; Owen et al., 2002). While the early phase of the time dependentpostseismic motions reflects mainly the material properties of the fault zone and continued slip at depth, longer termdeformation has been explained by viscoelastic materials distributed in the crust and upper mantle (Pollitz, 1997; Hearnet al., 2002; Hearn, 2003). The separation of these different mechanisms in the postseismic motions can be difficult,and as is the case for long strike-slip earthquakes, the observed deformation field of these different mechanisms cangive similar patterns (Savage and Prescott, 1978; Thatcher, 1983; Savage, 1990). Understanding the time and spatialscale of the postseismic deformation patterns can contribute to the determination of stress loading of adjacent faultsegments—a main parameter for seismic hazard studies (Hubert-Ferrari et al., 2000; Parsons et al., 2000) and thecharacterization of crust and mantle rheology as well as the mechanical properties of the fault zone.
The postseismic time dependent motions of the 1999 Izmit and Duzce earthquake sequences (17 August 1999,Mw = 7.4 and 12 November 1999, Mw = 7.1), in the Marmara region, Turkey, provide the opportunity to improvesignificantly our understanding of the mechanical behavior of the western part of North Anatolian Fault (NAF), theresponse of the crust to coseismic and postseismic stress changes, and to assess the future seismic risk in westernTurkey.
Modern space geodetic techniques such as the Global Positioning System (GPS) and Synthetic Aperture RadarInterferometry (InSAR) provide data to measure the different phases of earthquake-related crustal motions (inter-, co-,postseismic). Following the 1999 earthquakes, numerous GPS and InSAR studies were carried out (Reilinger et al.,2000; Burgmann et al., 2002a; Feigl et al., 2002). During the 5 years following the 1999 earthquake sequence, thecontinuous GPS network in the Marmara region (MAGNET) was extended to the whole Marmara region. Every year,two GPS campaigns are carried out to observe the deformation field in more spatial detail. InSAR studies have beenfocused on the co-seismic motions (Feigl et al., 2002; Cakir et al., 2003) and only one attempt has tried to determinepostseismic motions by InSAR (Akoglu, 2001).
For the most part, researchers focused on the horizontal motions observed by GPS and InSAR. Vertical motionshave been down weighted because of the high noise components (e.g., scatters on zenith path delays, insufficientatmospheric models, and inaccurate antenna phase centers) on the signals. Furthermore, horizontal deformations havemuch larger amplitudes than vertical deformations after a strike slip event and can be identified more easily. However,time dependent vertical postseismic motions can help distinguish between different postseismic mechanisms (e.g.,afterslip versus viscoelastic relaxation), and are highly sensitive to the thickness of particular elastic and viscoelasticlayers and the distribution of viscosity in the crust (Yang and Toksoz, 1981; Hearn, 2003). Thus, the measurement ofvertical time dependent deformations are very important to understand the mechanics of postseismic deformation andthe accelerated slip and stress transfer between particular fault branches because of the dynamic long-term response ofthe viscoelastic layer. Thus, better estimates of vertical postseismic motions are a key factor in seismic hazard analyses.
In this paper, we describe the first results of an on-going study of gravity changes and the vertical component of thepostseismic deformations of 1999 earthquakes. We consider the postseismic deformations between 2003 and 2005 to bea snapshot of the long-term nonlinear movements. For the detection of accurate vertical deformations, we re-analyzedthe GPS data set following the 1999 earthquakes, and we established new GPS-sites to determine the near and far fielddeformations in more detail. Additionally we carried out at selected GPS stations repeated gravity observations with theaim to determine gravity changes in time and space related to vertical crustal movements and subsurface mass changes.
2. Data collection and processing
2.1. GPS measurements
Before the 1999 earthquakes, the Marmara Continuous GPS network (MAGNET) (Fig. 1) was established to measurethe deformations associated with strain accumulation along the western NAF system. After the 1999-earthquakes thenetwork was extended to track the postseismic deformations caused by the earthquakes and to monitor the different fault

S. Ergintav et al. / Journal of Geodynamics 44 (2007) 1–18 3
Fig. 1. The distribution of continuous (MAGNET, TUGENET) and campaign GPS sites. Thin gray lines show active faults (Saroglu et al., 1992;Le Pichon et al., 2003; Armijo et al., 2005). The black lines show the break of the 1999 earthquakes (Barka et al., 2000).
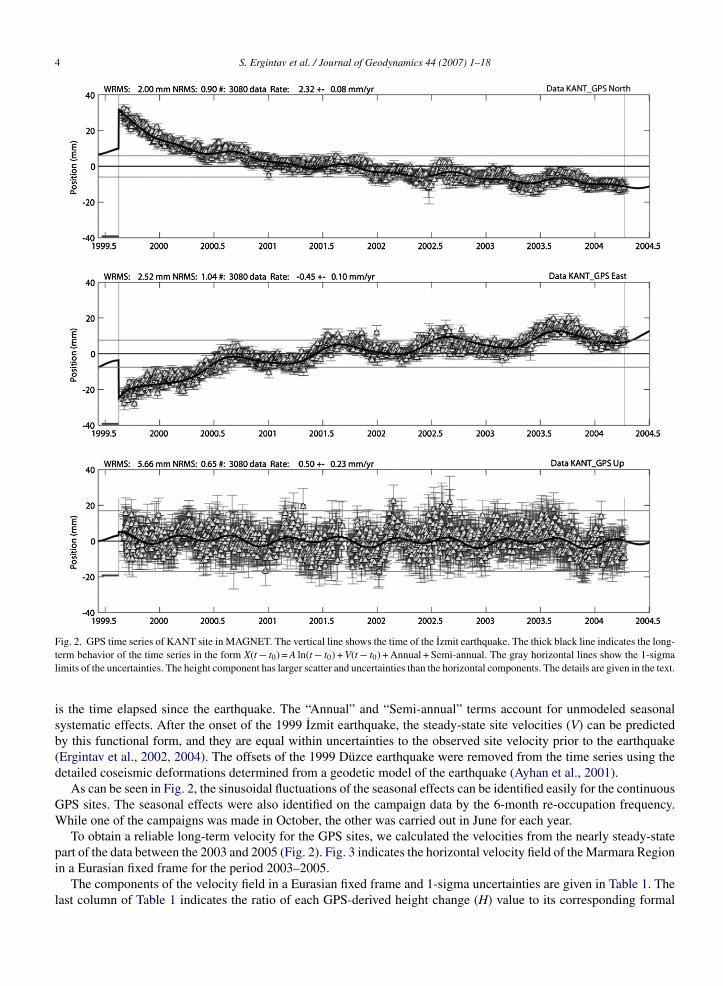
systems in the Marmara region (Reilinger et al., 2000; Burgmann et al., 2002a, 2002b; Hearn et al., 2002; Ergintav etal., 2002). It consists of 18 sites. We realized two GPS profiles perpendicular to the main branch of the North AnatolianFault (NAF) in the Marmara Region to determine the temporal and spatial deformation variations from which weestimate processes at depth. The first GPS profile crosses the Ganos fault in the western Marmara Region (B–B′ profilein Fig. 3). The second one in the Eastern Marmara traverses the western part of the 1999 Izmit earthquake rupture(A–A′ profile in Fig. 3). In addition, we established a new small network (Tuzla-Gebze GPS Net-TUGENET), whichhas four sites, in the near fault zone at the western part of the rupture of Izmit Earthquake as the possible location ofthe next hazardous earthquake in the region. We observe these sites and available campaign sites (McClusky et al.,2000; Ergintav et al., 2002) (in total 67 sites), twice a year in June and October. During each campaign at each station,two sessions of 10 h are observed. Hitherto we carried out five campaigns between June 2003 and June 2005.
To reduce the antenna phase pattern problems and the errors on the computation of the vertical components, weused the same receivers and antennas at all campaign sites (Trimble 4000 and 5700 with choke-ring and geodeticZephyr antennas).
2.2. GPS data processing
The GPS data were processed with the GAMIT/GLOBK GPS software (Herring, 2000; King and Bock, 1998). Atfirst, double differenced GPS phase observations from each day were used to estimate station coordinates, the zenithpath delay and the atmosphere gradients at each station, as well as orbital and Earth orientation parameters (EOPs)by applying loose apriori constraints to all parameters. In general, 3 or 4 International GPS Service (IGS) stationswere included within the analysis, as long as they existed. Hence, the link between regional and global networks wasestablished. In the second step, the loosely constrained estimates of these parameters and their daily covariance wereused as quasi-observations and combined with a global analysis of IGS data performed by Scripps Orbit and PermanentArray Center (SOPAC). The reference frame was constrained on each day using a reliable set of global IGS stationswith respect to the IGS00 realization of ITRF2000 no-net-rotation (NNR) frame (ITRF2000I) (Ray et al., 2004), whileestimating the translation, orientation and scale parameters for each day with the origin fixing module (GLORG) ofGLOBK. Details about the processing method are described in McClusky et al. (2000).
Fig. 2 shows an example of the GPS time series from MAGNET. It starts following the 1999 earthquake sequence andis fit well by a function of the form X(t − t0) = A ln(t − t0) + V(t − t0) + Annual + Semi-annual, where X is site position,A and V are constants (V is the steady-state velocity, and A the amplitude of the postseismic response), and (t − t0)
4 S. Ergintav et al. / Journal of Geodynamics 44 (2007) 1–18
Fig. 2. GPS time series of KANT site in MAGNET. The vertical line shows the time of the Izmit earthquake. The thick black line indicates the long-term behavior of the time series in the form X(t − t0) = A ln(t − t0) + V(t − t0) + Annual + Semi-annual. The gray horizontal lines show the 1-sigmalimits of the uncertainties. The height component has larger scatter and uncertainties than the horizontal components. The details are given in the text.
is the time elapsed since the earthquake. The “Annual” and “Semi-annual” terms account for unmodeled seasonalsystematic effects. After the onset of the 1999 Izmit earthquake, the steady-state site velocities (V) can be predictedby this functional form, and they are equal within uncertainties to the observed site velocity prior to the earthquake(Ergintav et al., 2002, 2004). The offsets of the 1999 Duzce earthquake were removed from the time series using thedetailed coseismic deformations determined from a geodetic model of the earthquake (Ayhan et al., 2001).
As can be seen in Fig. 2, the sinusoidal fluctuations of the seasonal effects can be identified easily for the continuousGPS sites. The seasonal effects were also identified on the campaign data by the 6-month re-occupation frequency.While one of the campaigns was made in October, the other was carried out in June for each year.
To obtain a reliable long-term velocity for the GPS sites, we calculated the velocities from the nearly steady-statepart of the data between the 2003 and 2005 (Fig. 2). Fig. 3 indicates the horizontal velocity field of the Marmara Regionin a Eurasian fixed frame for the period 2003–2005.
The components of the velocity field in a Eurasian fixed frame and 1-sigma uncertainties are given in Table 1. Thelast column of Table 1 indicates the ratio of each GPS-derived height change (H) value to its corresponding formal
S. Ergintav et al. / Journal of Geodynamics 44 (2007) 1–18 5
Fig. 3. Horizontal velocity field with 95% confidence ellipses of the Marmara Region in a Eurasian fixed frame. Data covers 2003–2005 timeintervals. The brackets indicate the profiles in Figs. 5 and 6. Base map as in Fig. 1.
1-sigma uncertainty. These ratios indicate that while the vertical velocities for most sites have statistically insignificantvalues, the vertical velocities for ANKR, UCG2, OLUK, TUBI, DUMT, KAMT, ERCT, YACT, DRGT, CINA, ULUT,YANT, AVCT, SELP, KART, MER1, ERDT, ALAN, ASMT, SEVK, DOKU and BGNT differ statistically from zeroat the 95% confidence level.
2.3. Gravity measurements
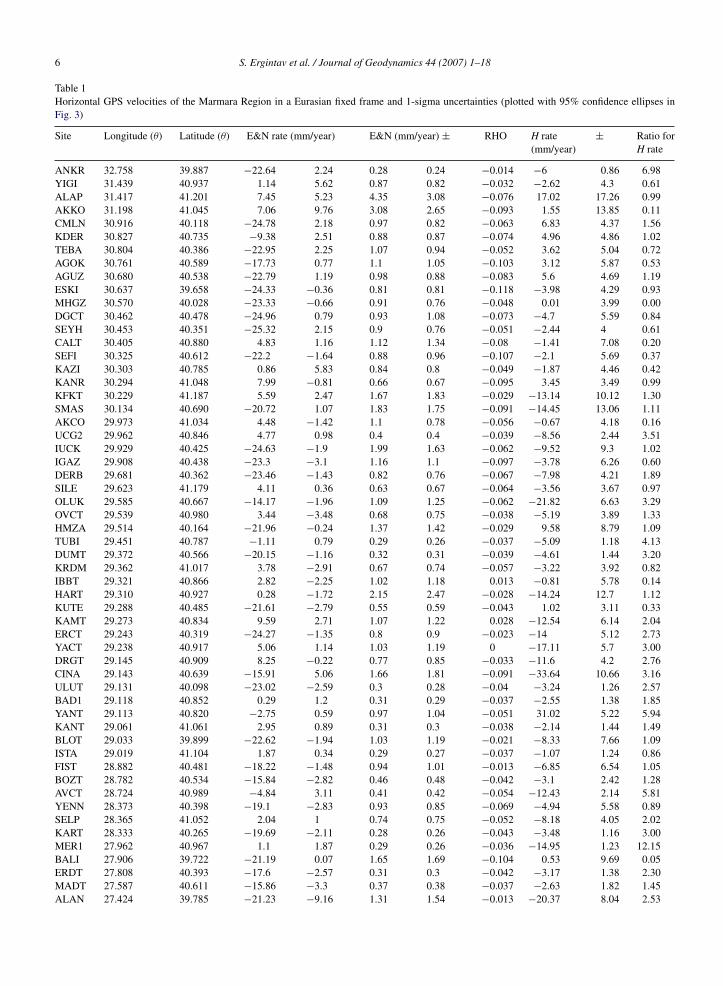
The Marmara Gravity Network (MAGRANET) consists of 25 sites (Fig. 4); it is a precise gravimetric controlnetwork for monitoring gravity changes that may be related to vertical deformations along the NAF branches in theMarmara Region due to geodynamic processes. The sites of the MAGRANET were selected from GPS sites (Fig. 1)to collect the GPS and gravity data together at the same location (Tables 2 and 3).
The main criteria for the selection of gravity sites from GPS sites is to monitor areas of high stress loading which arerelated to the end of the rupture of the previous earthquakes in the region (in the west, 9 August 1912 Ganos EarthquakeMw = 7.4; in the east 17 August 1999 Izmit Earthquake Mw = 7.4). We have also included the stations Yıgılca (YIGI)and Karadere (KDER), which have been part of former gravity networks observed between 1987 and 1994 (Akın et al.,1994; Demirel et al., 1994). The MAGRANET was re-observed five times in October and June of each year between2003 and 2005, simultaneously with the GPS campaigns. The effect of seasonal variations on both observation setsshould therefore be similar.
For the gravity observations, we have used two relative spring gravimeters LaCoste&Romberg G85 and G858. Bothinstruments are equipped with a Harrison–Sato-feedback system. A particular gravimeter readings consists of dateand time t, counter dial reading S, feedback voltage F, instrument height above bench mark h, air pressure p and airtemperature T. S is converted to the reduced gravimeter reading A in mGal (1 × 10⁻⁵ m/s2) according the followingequation:
A = S × MF + F × SC + ET(t) − 0.308 × h + 0.0003 × p (1)
6 S. Ergintav et al. / Journal of Geodynamics 44 (2007) 1–18
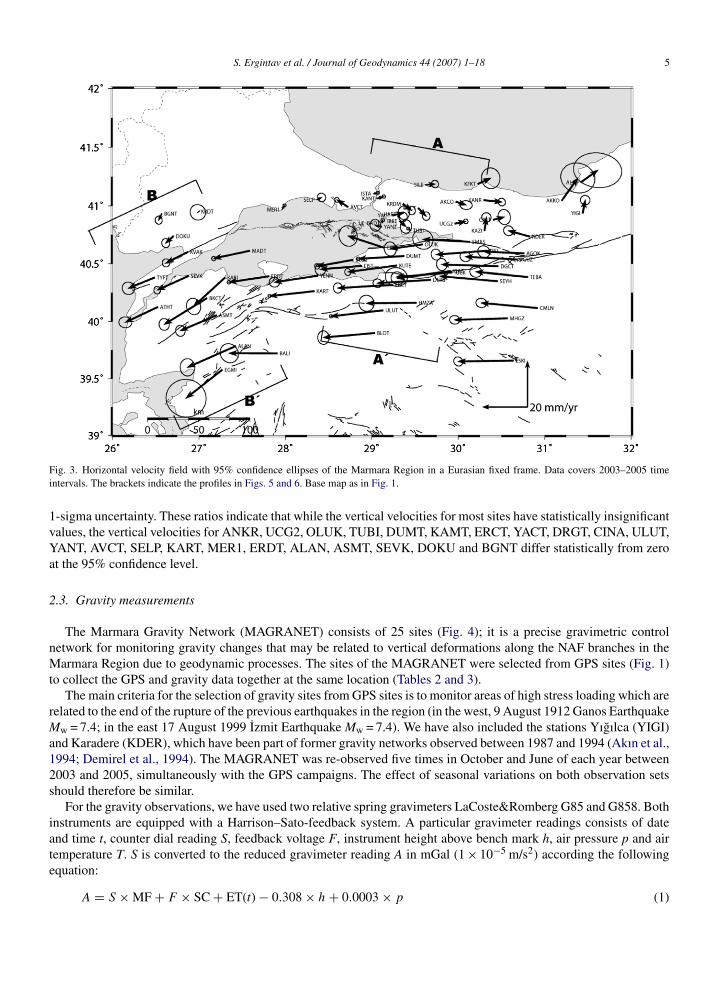
Table 1Horizontal GPS velocities of the Marmara Region in a Eurasian fixed frame and 1-sigma uncertainties (plotted with 95% confidence ellipses inFig. 3)
Site Longitude (θ) Latitude (θ) E&N rate (mm/year) E&N (mm/year) ± RHO H rate(mm/year)
± Ratio forH rate
ANKR 32.758 39.887 −22.64 2.24 0.28 0.24 −0.014 −6 0.86 6.98YIGI 31.439 40.937 1.14 5.62 0.87 0.82 −0.032 −2.62 4.3 0.61ALAP 31.417 41.201 7.45 5.23 4.35 3.08 −0.076 17.02 17.26 0.99AKKO 31.198 41.045 7.06 9.76 3.08 2.65 −0.093 1.55 13.85 0.11CMLN 30.916 40.118 −24.78 2.18 0.97 0.82 −0.063 6.83 4.37 1.56KDER 30.827 40.735 −9.38 2.51 0.88 0.87 −0.074 4.96 4.86 1.02TEBA 30.804 40.386 −22.95 2.25 1.07 0.94 −0.052 3.62 5.04 0.72AGOK 30.761 40.589 −17.73 0.77 1.1 1.05 −0.103 3.12 5.87 0.53AGUZ 30.680 40.538 −22.79 1.19 0.98 0.88 −0.083 5.6 4.69 1.19ESKI 30.637 39.658 −24.33 −0.36 0.81 0.81 −0.118 −3.98 4.29 0.93MHGZ 30.570 40.028 −23.33 −0.66 0.91 0.76 −0.048 0.01 3.99 0.00DGCT 30.462 40.478 −24.96 0.79 0.93 1.08 −0.073 −4.7 5.59 0.84SEYH 30.453 40.351 −25.32 2.15 0.9 0.76 −0.051 −2.44 4 0.61CALT 30.405 40.880 4.83 1.16 1.12 1.34 −0.08 −1.41 7.08 0.20SEFI 30.325 40.612 −22.2 −1.64 0.88 0.96 −0.107 −2.1 5.69 0.37KAZI 30.303 40.785 0.86 5.83 0.84 0.8 −0.049 −1.87 4.46 0.42KANR 30.294 41.048 7.99 −0.81 0.66 0.67 −0.095 3.45 3.49 0.99KFKT 30.229 41.187 5.59 2.47 1.67 1.83 −0.029 −13.14 10.12 1.30SMAS 30.134 40.690 −20.72 1.07 1.83 1.75 −0.091 −14.45 13.06 1.11AKCO 29.973 41.034 4.48 −1.42 1.1 0.78 −0.056 −0.67 4.18 0.16UCG2 29.962 40.846 4.77 0.98 0.4 0.4 −0.039 −8.56 2.44 3.51IUCK 29.929 40.425 −24.63 −1.9 1.99 1.63 −0.062 −9.52 9.3 1.02IGAZ 29.908 40.438 −23.3 −3.1 1.16 1.1 −0.097 −3.78 6.26 0.60DERB 29.681 40.362 −23.46 −1.43 0.82 0.76 −0.067 −7.98 4.21 1.89SILE 29.623 41.179 4.11 0.36 0.63 0.67 −0.064 −3.56 3.67 0.97OLUK 29.585 40.667 −14.17 −1.96 1.09 1.25 −0.062 −21.82 6.63 3.29OVCT 29.539 40.980 3.44 −3.48 0.68 0.75 −0.038 −5.19 3.89 1.33HMZA 29.514 40.164 −21.96 −0.24 1.37 1.42 −0.029 9.58 8.79 1.09TUBI 29.451 40.787 −1.11 0.79 0.29 0.26 −0.037 −5.09 1.18 4.13DUMT 29.372 40.566 −20.15 −1.16 0.32 0.31 −0.039 −4.61 1.44 3.20KRDM 29.362 41.017 3.78 −2.91 0.67 0.74 −0.057 −3.22 3.92 0.82IBBT 29.321 40.866 2.82 −2.25 1.02 1.18 0.013 −0.81 5.78 0.14HART 29.310 40.927 0.28 −1.72 2.15 2.47 −0.028 −14.24 12.7 1.12KUTE 29.288 40.485 −21.61 −2.79 0.55 0.59 −0.043 1.02 3.11 0.33KAMT 29.273 40.834 9.59 2.71 1.07 1.22 0.028 −12.54 6.14 2.04ERCT 29.243 40.319 −24.27 −1.35 0.8 0.9 −0.023 −14 5.12 2.73YACT 29.238 40.917 5.06 1.14 1.03 1.19 0 −17.11 5.7 3.00DRGT 29.145 40.909 8.25 −0.22 0.77 0.85 −0.033 −11.6 4.2 2.76CINA 29.143 40.639 −15.91 5.06 1.66 1.81 −0.091 −33.64 10.66 3.16ULUT 29.131 40.098 −23.02 −2.59 0.3 0.28 −0.04 −3.24 1.26 2.57BAD1 29.118 40.852 0.29 1.2 0.31 0.29 −0.037 −2.55 1.38 1.85YANT 29.113 40.820 −2.75 0.59 0.97 1.04 −0.051 31.02 5.22 5.94KANT 29.061 41.061 2.95 0.89 0.31 0.3 −0.038 −2.14 1.44 1.49BLOT 29.033 39.899 −22.62 −1.94 1.03 1.19 −0.021 −8.33 7.66 1.09ISTA 29.019 41.104 1.87 0.34 0.29 0.27 −0.037 −1.07 1.24 0.86FIST 28.882 40.481 −18.22 −1.48 0.94 1.01 −0.013 −6.85 6.54 1.05BOZT 28.782 40.534 −15.84 −2.82 0.46 0.48 −0.042 −3.1 2.42 1.28AVCT 28.724 40.989 −4.84 3.11 0.41 0.42 −0.054 −12.43 2.14 5.81YENN 28.373 40.398 −19.1 −2.83 0.93 0.85 −0.069 −4.94 5.58 0.89SELP 28.365 41.052 2.04 1 0.74 0.75 −0.052 −8.18 4.05 2.02KART 28.333 40.265 −19.69 −2.11 0.28 0.26 −0.043 −3.48 1.16 3.00MER1 27.962 40.967 1.1 1.87 0.29 0.26 −0.036 −14.95 1.23 12.15BALI 27.906 39.722 −21.19 0.07 1.65 1.69 −0.104 0.53 9.69 0.05ERDT 27.808 40.393 −17.6 −2.57 0.31 0.3 −0.042 −3.17 1.38 2.30MADT 27.587 40.611 −15.86 −3.3 0.37 0.38 −0.037 −2.63 1.82 1.45ALAN 27.424 39.785 −21.23 −9.16 1.31 1.54 −0.013 −20.37 8.04 2.53

S. Ergintav et al. / Journal of Geodynamics 44 (2007) 1–18 7
Table 1 (Continued )
Site Longitude (θ) Latitude (θ) E&N rate (mm/year) E&N (mm/year) ± RHO H rate(mm/year)
± Ratio forH rate
KABI 27.301 40.381 −13.86 −12.44 1.28 1.45 −0.106 −5.67 7.74 0.73EGMI 27.269 39.577 −15.94 −12.25 3.61 3.33 −0.02 10.58 19.87 0.53ASMT 27.204 40.054 −15.99 −6.71 0.87 0.97 −0.046 −18.34 4.96 3.70BKCT 27.091 40.203 −18.81 −11.34 0.93 1.05 −0.037 −11.53 6.07 1.90KRDT 26.999 40.951 −0.45 −0.38 1.39 1.37 −0.051 8.78 6.71 1.31SEVK 26.880 40.396 −13.84 −6.14 0.61 0.67 −0.029 −7.07 3.43 2.06KVAK 26.871 40.601 −9.59 −4.68 0.67 0.72 −0.009 −1.78 3.77 0.47DOKU 26.706 40.739 −3.43 −3 0.71 0.8 −0.048 −9.03 4.38 2.06BGNT 26.570 40.932 −1.35 −2.82 0.64 0.71 −0.036 −15 3.62 4.14ATHT 26.524 40.126 −14.32 −6.62 1.17 0.96 −0.042 9.19 4.99 1.84TYFT 26.487 40.383 −11.57 −4.68 1.12 1.1 −0.05 −6.24 14.86 0.42
RHO is the correlation coefficient between the E (east) and N (north) uncertainties. Last column indicate the statistically meaning of the H rate.Details are given in the text.
Fig. 4. Marmara Gravity Network (MAGRANET). Triangles show gravity points co-located with MAGNET continuous GPS sites, and stars withcampaign sites. Base map as in Fig. 1.
with MF is the calibration function of the maker, SC the calibration factor of the feedback system, and ET is the solidearth tides.
The real scale factors SF of the gravimeters are changing in time and deviate from the calibration functions MFof the manufacturer. Therefore the calibration factors and their time dependent changes are determined by obser-vations on the Hornisgrinde calibration line (HGCL) in Germany before and after each field campaign. The scale
Table 2Surveys of the MAGRANET
Epoch (date of survey)
October 2003 June 2004 October 2004 June 2005 October 2005
Number of gravimeters 2 2 2 2 2Number of stations 25 25 25 25 25Number of observations 434 543 477 450 466Mean point errors (�Gal) 5.93 4.26 4.04 4.19 4.53
8 S. Ergintav et al. / Journal of Geodynamics 44 (2007) 1–18
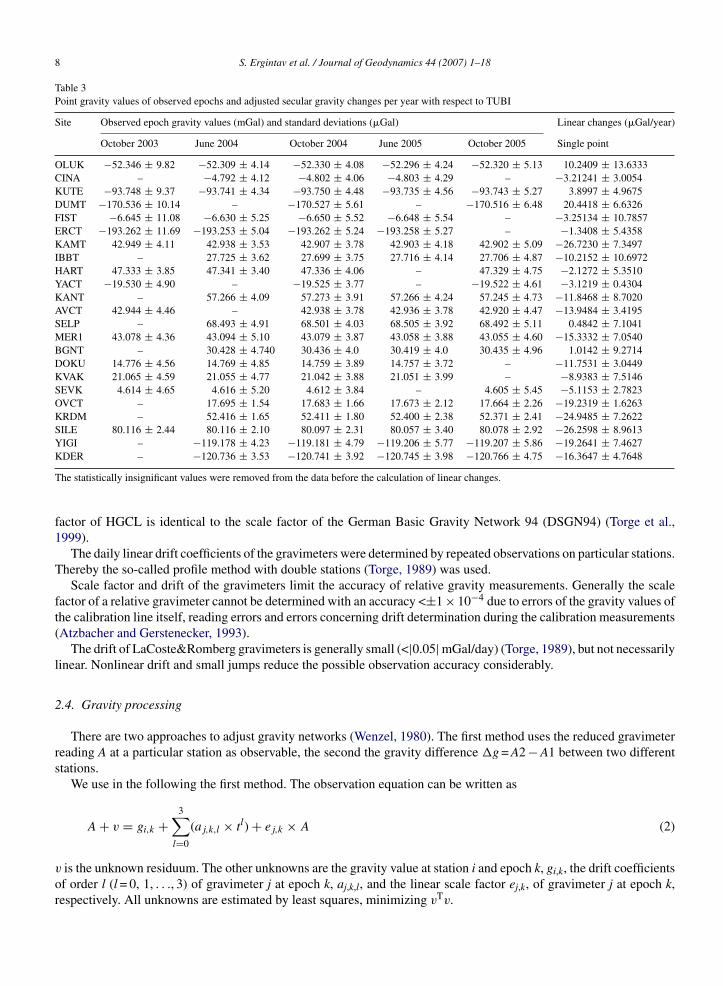
Table 3Point gravity values of observed epochs and adjusted secular gravity changes per year with respect to TUBI
Site Observed epoch gravity values (mGal) and standard deviations (�Gal) Linear changes (�Gal/year)
October 2003 June 2004 October 2004 June 2005 October 2005 Single point
OLUK −52.346 ± 9.82 −52.309 ± 4.14 −52.330 ± 4.08 −52.296 ± 4.24 −52.320 ± 5.13 10.2409 ± 13.6333CINA – −4.792 ± 4.12 −4.802 ± 4.06 −4.803 ± 4.29 – −3.21241 ± 3.0054KUTE −93.748 ± 9.37 −93.741 ± 4.34 −93.750 ± 4.48 −93.735 ± 4.56 −93.743 ± 5.27 3.8997 ± 4.9675DUMT −170.536 ± 10.14 – −170.527 ± 5.61 – −170.516 ± 6.48 20.4418 ± 6.6326FIST −6.645 ± 11.08 −6.630 ± 5.25 −6.650 ± 5.52 −6.648 ± 5.54 – −3.25134 ± 10.7857ERCT −193.262 ± 11.69 −193.253 ± 5.04 −193.262 ± 5.24 −193.258 ± 5.27 – −1.3408 ± 5.4358KAMT 42.949 ± 4.11 42.938 ± 3.53 42.907 ± 3.78 42.903 ± 4.18 42.902 ± 5.09 −26.7230 ± 7.3497IBBT – 27.725 ± 3.62 27.699 ± 3.75 27.716 ± 4.14 27.706 ± 4.87 −10.2152 ± 10.6972HART 47.333 ± 3.85 47.341 ± 3.40 47.336 ± 4.06 – 47.329 ± 4.75 −2.1272 ± 5.3510YACT −19.530 ± 4.90 – −19.525 ± 3.77 – −19.522 ± 4.61 −3.1219 ± 0.4304KANT – 57.266 ± 4.09 57.273 ± 3.91 57.266 ± 4.24 57.245 ± 4.73 −11.8468 ± 8.7020AVCT 42.944 ± 4.46 – 42.938 ± 3.78 42.936 ± 3.78 42.920 ± 4.47 −13.9484 ± 3.4195SELP – 68.493 ± 4.91 68.501 ± 4.03 68.505 ± 3.92 68.492 ± 5.11 0.4842 ± 7.1041MER1 43.078 ± 4.36 43.094 ± 5.10 43.079 ± 3.87 43.058 ± 3.88 43.055 ± 4.60 −15.3332 ± 7.0540BGNT – 30.428 ± 4.740 30.436 ± 4.0 30.419 ± 4.0 30.435 ± 4.96 1.0142 ± 9.2714DOKU 14.776 ± 4.56 14.769 ± 4.85 14.759 ± 3.89 14.757 ± 3.72 – −11.7531 ± 3.0449KVAK 21.065 ± 4.59 21.055 ± 4.77 21.042 ± 3.88 21.051 ± 3.99 – −8.9383 ± 7.5146SEVK 4.614 ± 4.65 4.616 ± 5.20 4.612 ± 3.84 – 4.605 ± 5.45 −5.1153 ± 2.7823OVCT – 17.695 ± 1.54 17.683 ± 1.66 17.673 ± 2.12 17.664 ± 2.26 −19.2319 ± 1.6263KRDM – 52.416 ± 1.65 52.411 ± 1.80 52.400 ± 2.38 52.371 ± 2.41 −24.9485 ± 7.2622SILE 80.116 ± 2.44 80.116 ± 2.10 80.097 ± 2.31 80.057 ± 3.40 80.078 ± 2.92 −26.2598 ± 8.9613YIGI – −119.178 ± 4.23 −119.181 ± 4.79 −119.206 ± 5.77 −119.207 ± 5.86 −19.2641 ± 7.4627KDER – −120.736 ± 3.53 −120.741 ± 3.92 −120.745 ± 3.98 −120.766 ± 4.75 −16.3647 ± 4.7648
The statistically insignificant values were removed from the data before the calculation of linear changes.
factor of HGCL is identical to the scale factor of the German Basic Gravity Network 94 (DSGN94) (Torge et al.,1999).
The daily linear drift coefficients of the gravimeters were determined by repeated observations on particular stations.Thereby the so-called profile method with double stations (Torge, 1989) was used.
Scale factor and drift of the gravimeters limit the accuracy of relative gravity measurements. Generally the scalefactor of a relative gravimeter cannot be determined with an accuracy <±1 × 10⁻⁴ due to errors of the gravity values ofthe calibration line itself, reading errors and errors concerning drift determination during the calibration measurements(Atzbacher and Gerstenecker, 1993).
The drift of LaCoste&Romberg gravimeters is generally small (<|0.05| mGal/day) (Torge, 1989), but not necessarilylinear. Nonlinear drift and small jumps reduce the possible observation accuracy considerably.
2.4. Gravity processing
There are two approaches to adjust gravity networks (Wenzel, 1980). The first method uses the reduced gravimeterreading A at a particular station as observable, the second the gravity difference �g = A2 − A1 between two differentstations.
We use in the following the first method. The observation equation can be written as
A + v = gi,k +3∑
l=0
(aj,k,l × tl) + ej,k × A (2)
v is the unknown residuum. The other unknowns are the gravity value at station i and epoch k, gi,k, the drift coefficientsof order l (l = 0, 1, . . ., 3) of gravimeter j at epoch k, aj,k,l, and the linear scale factor ej,k, of gravimeter j at epoch k,respectively. All unknowns are estimated by least squares, minimizing vTv.

S. Ergintav et al. / Journal of Geodynamics 44 (2007) 1–18 9
Special efforts have been made to increase the precision of the determined gravity values gi,k. For that purpose thescale factor ej,k of a so-called reference gravimeter is kept fixed at the first (reference) epoch k = 1. The scale factorsej,k of all gravimeters are fitted to this scale factor using partial spur minimization (Menke, 1984).
To avoid overparameterization the order l of particular drift polynomials are limited to lmax = 3. As an additionalconstraint the gravity value of the station TUBI was kept fixed at all epochs. The adjustment was carried out withthe software package “GRAV” developed for the least squares adjustment of absolute gravity measurements andgravimeter parameters at the Institute of Physical Geodesy, Darmstadt University of Technology. As a priori standarddeviation σ0 = ±10 �Gal for a particular observation was introduced. The most important final results are the gravityvalues gj,k and their standard deviations for each field campaign k and scale factor changes of the gravimeters ej,k.The residual changes of the gravity values at the station in time are sensitive to the vertical position (because gravitygradient is stronger vertically than horizontally) and to the mass movement and density change beneath and aroundthe measurement site. The time dependent changes of gravity, complemented by independent vertical movement (e.g.,GPS), can give important insights into geodynamical process.
We have estimated the gravity values at five observation campaigns between 2003 and 2005 in reference to the fixedstation “TUBI”. The characteristics of the five campaigns are given in Table 2. As it is shown in Tables 2 and 3, gravityvalues at a particular campaign were determined with a mean standard deviation of ±5 �Gal; the variations are in theorder of 10–40 �Gal and are statistically significant. The main limiting factor of the data accuracy is the instrumentaldrift, which can change irregularly because of the transportation of the gravimeters on the very rough roads.
3. Results
3.1. The results of the GPS analysis
General characteristics of the velocity field shown in Fig. 3 reflect two different properties for the northern andsouthern parts of NAF. In the southern part of NAF, the velocities are approximately equal to the pre-earthquakevelocities (McClusky et al., 2000; Meade et al., 2002), except a rotation component to the southwest. In contrast to thisarea, the velocities in the northern part of NAF are larger than pre-earthquake velocities, and indicate a high correlationwith the co-seismic deformation and early postseismic motions (Ergintav et al., 2002). The logarithmic behavior ofthe time series and the spatial character of observed postseismic deformation suggest that early phase of postseismicdeformation, is due to afterslip extending through the crust and perhaps into the upper mantle (Ergintav et al., 2002).
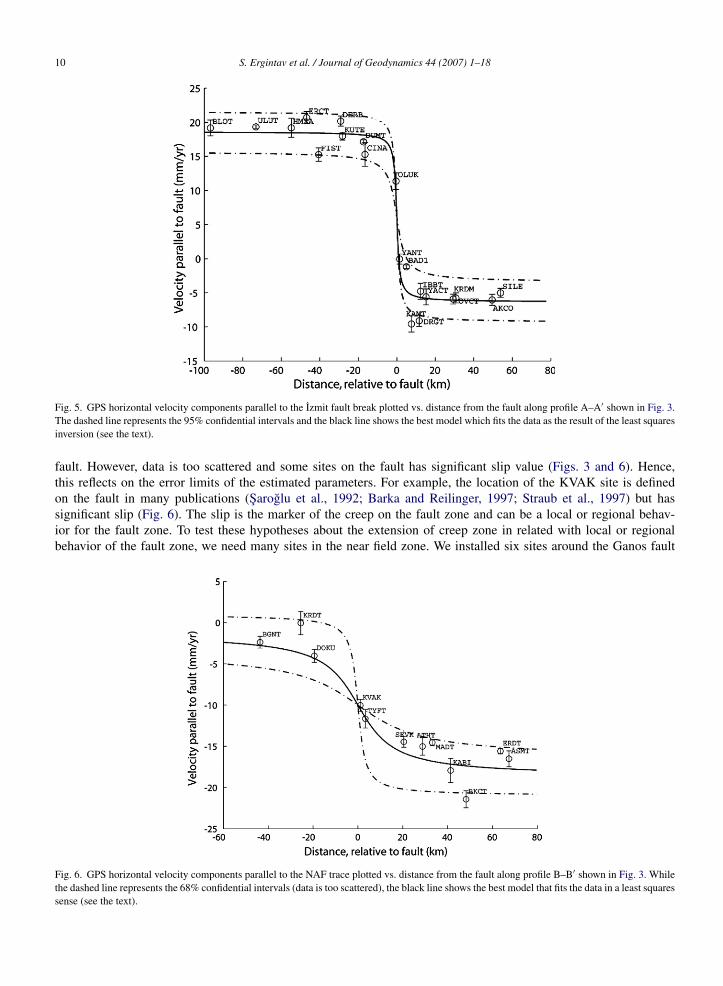
In order to understand the seismic hazard in the region and to estimate the size of future earthquakes, estimatingthe fault locking depth has crucial importance for the stress loading or release on the fault (e.g., Meade et al., 2002).Previously, efforts were made to estimate the locking depth. Different researchers agree that locking depth of the faultzone in the eastern part of the region can be defined between 10 and 15 km from seismological and geodetic data (LePichon et al., 2001; Ozalaybey et al., 2002; Flerit et al., 2003; Le Pichon et al., 2003). In contrast to these studies, Meadeet al. (2002) discussed the implications of low strains observed in the central and western Marmara Sea region witha block model that accounts for recoverable elastic strain accumulation. They find that straight-fault geometry alongthe Marmara Sea from west to east with a shallow locking depth (5–6 km) fits the observed GPS data. Unfortunately,the data set for the pre-earthquake time of Izmit Earthquake has insufficient spatial coverage near the fault zone totightly constrain the estimation of locking depth. As described earlier, we established the TUGENET to constrainbetter the locking depth. Fig. 5 shows the fault parallel velocities along the A–A′ profile in Fig. 3. Based on the screw2D dislocation model (Savage and Bedford, 1973), we made a simultaneous inversion for the depth of locking on thefault, and the fault slip velocity, under the least square approach and estimated locking depth as 3 ± 1.5 km and thevelocity as 24 ± 4 mm/year. Therefore, this area was not accumulating strain during the period 2003–2005 because ofthe shallow fault locking depth. This is the expected result due to postseismic afterslip to shallow levels of the 1999earthquake fault. However, this profile includes some sites (e.g., BAD1, YANT and TUGENET) located west of therupture area of Izmit earthquake. This area was defined as a seismic gap and is considered to be a potential source ofa large (Mw > 7.6) “gap-filling” future earthquake (Hubert-Ferrari et al., 2000; Le Pichon et al., 2003; Ergintav et al.,2004; Armijo et al., 2005). If this behavior persists through the earthquake cycle, this indicates that the moment releaseassociated with an earthquake should be smaller than expected.
In the B–B′ profile (Fig. 3), the velocity gradient is smaller than the gradient of A–A′ profile (Fig. 6). The resultsof the screw 2D dislocation model give the locking depth as 14 ± 7 km and velocity as 17 ± 5 mm/year for the Ganos
10 S. Ergintav et al. / Journal of Geodynamics 44 (2007) 1–18
Fig. 5. GPS horizontal velocity components parallel to the Izmit fault break plotted vs. distance from the fault along profile A–A′ shown in Fig. 3.The dashed line represents the 95% confidential intervals and the black line shows the best model which fits the data as the result of the least squaresinversion (see the text).
fault. However, data is too scattered and some sites on the fault has significant slip value (Figs. 3 and 6). Hence,this reflects on the error limits of the estimated parameters. For example, the location of the KVAK site is definedon the fault in many publications (Saroglu et al., 1992; Barka and Reilinger, 1997; Straub et al., 1997) but hassignificant slip (Fig. 6). The slip is the marker of the creep on the fault zone and can be a local or regional behav-ior for the fault zone. To test these hypotheses about the extension of creep zone in related with local or regionalbehavior of the fault zone, we need many sites in the near field zone. We installed six sites around the Ganos fault
Fig. 6. GPS horizontal velocity components parallel to the NAF trace plotted vs. distance from the fault along profile B–B′ shown in Fig. 3. Whilethe dashed line represents the 68% confidential intervals (data is too scattered), the black line shows the best model that fits the data in a least squaressense (see the text).
S. Ergintav et al. / Journal of Geodynamics 44 (2007) 1–18 11
and we will measure these sites with others, during future GPS campaigns. However, Fig. 6 shows that the west-ern part of the Marmara region has a different stress loading pattern (the difference of fault slip velocity is around8 mm/year between west and east of the region) than the eastern part of the region and it seems at present to beaccumulating strain to a sufficient depth to generate a large earthquake in the future. Unfortunately, due to the seawe can’t control the middle part of the Marmara region in the near field fault zone. Hence, we cannot apply anyconstraint to create a link between the two different parts of the region with the present distribution of GPS sites in theregion.
3.2. The results of the gravity analysis
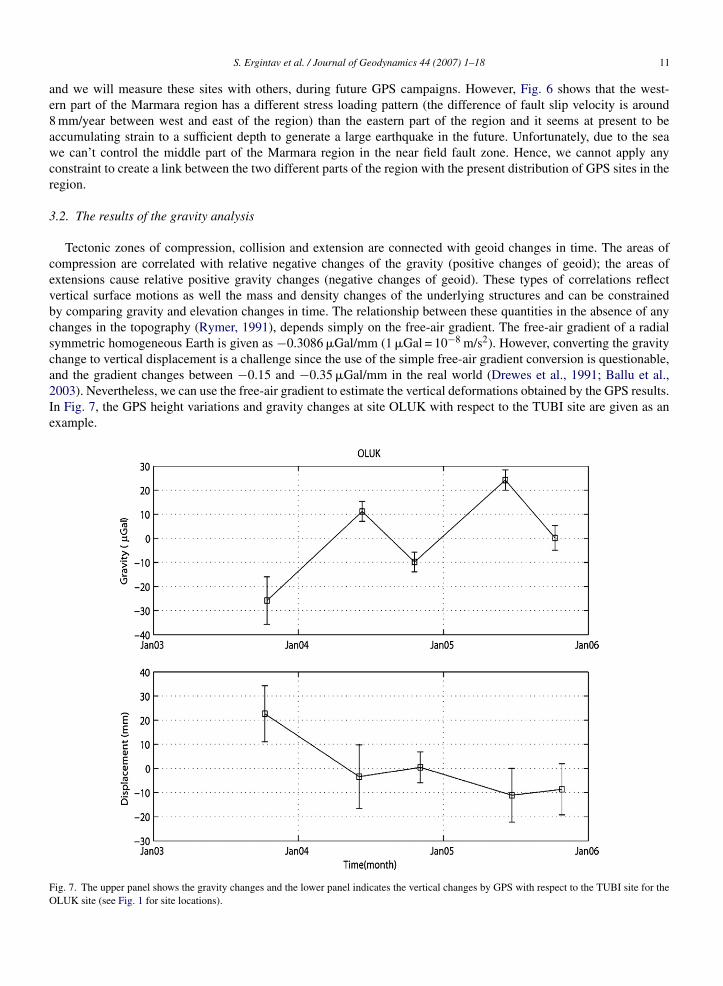
Tectonic zones of compression, collision and extension are connected with geoid changes in time. The areas ofcompression are correlated with relative negative changes of the gravity (positive changes of geoid); the areas ofextensions cause relative positive gravity changes (negative changes of geoid). These types of correlations reflectvertical surface motions as well the mass and density changes of the underlying structures and can be constrainedby comparing gravity and elevation changes in time. The relationship between these quantities in the absence of anychanges in the topography (Rymer, 1991), depends simply on the free-air gradient. The free-air gradient of a radialsymmetric homogeneous Earth is given as −0.3086 �Gal/mm (1 �Gal = 10−8 m/s2). However, converting the gravitychange to vertical displacement is a challenge since the use of the simple free-air gradient conversion is questionable,and the gradient changes between −0.15 and −0.35 �Gal/mm in the real world (Drewes et al., 1991; Ballu et al.,2003). Nevertheless, we can use the free-air gradient to estimate the vertical deformations obtained by the GPS results.In Fig. 7, the GPS height variations and gravity changes at site OLUK with respect to the TUBI site are given as anexample.
Fig. 7. The upper panel shows the gravity changes and the lower panel indicates the vertical changes by GPS with respect to the TUBI site for theOLUK site (see Fig. 1 for site locations).
12 S. Ergintav et al. / Journal of Geodynamics 44 (2007) 1–18
In Fig. 7, vertical deformations measured by GPS and gravity changes have a negative correlation as expected. Thelong-term trend also shows the negative correlation. Furthermore, the large magnitude of the gravity changes suggeststhat they represent seasonal effects—possible changes of the ground water level (Demoulin et al., 2007). The effect ofthe groundwater does not only modify the gravity but may also be a non-tectonic cause for generating vertical motionsdue to the crustal flexure (Demoulin and Collignon, 2000; van Dam et al., 2001) and/or bouyancy. In order to estimatethe amplitude of gravity changes, related with groundwater fluctuations in wet and dry seasons, the simplified Bouguerattraction model as a function of the porosity P and the water level changes dw (Battaglia et al., 2003) is used for thestation OLUK.
The possible gravity changes (dg) between dry and wet seasons for the OLUK site are
dg
dw= 42 × P (�Gal/m) (3)
To calculate the maximum expected variations of gravity changes between the wet and dry season, we assumed theporosity P as 30% for OLUK site; 1 m water table change generates a gravity change of about 12.6 �Gal. Magnitude ofgravity changes at OLUK site between the wet and dry seasons is of the same order. Normally, the effect of the groundwater variations on gravity does not change linearly and depends on the seasonal rainfall and soil humidity. Thus,we need long time series of gravity and water level monitoring to obtain reliable gravity changes due to hydrologicaleffects.
Because of the missing information about ground water changes in time, we did not use the simplified Bougerattraction model for all GPS sites. However, the sampling of different wet and dry seasons supplied some qualitativeimpressions how seasonal gravity changes superpose the long-term (Fig. 7).
From the individual point gravity values per epoch with respect to TUBI site, we isolated the seasonal fluctuationsand computed a linear regression coefficient dg/dt of the gravity variation (single point linear gravity change) withtime. The point gravity values g(tk) at epoch tk are expressed then as a linear function as
g(tk) = g(t0) + dg
dt(tk − t0) (4)
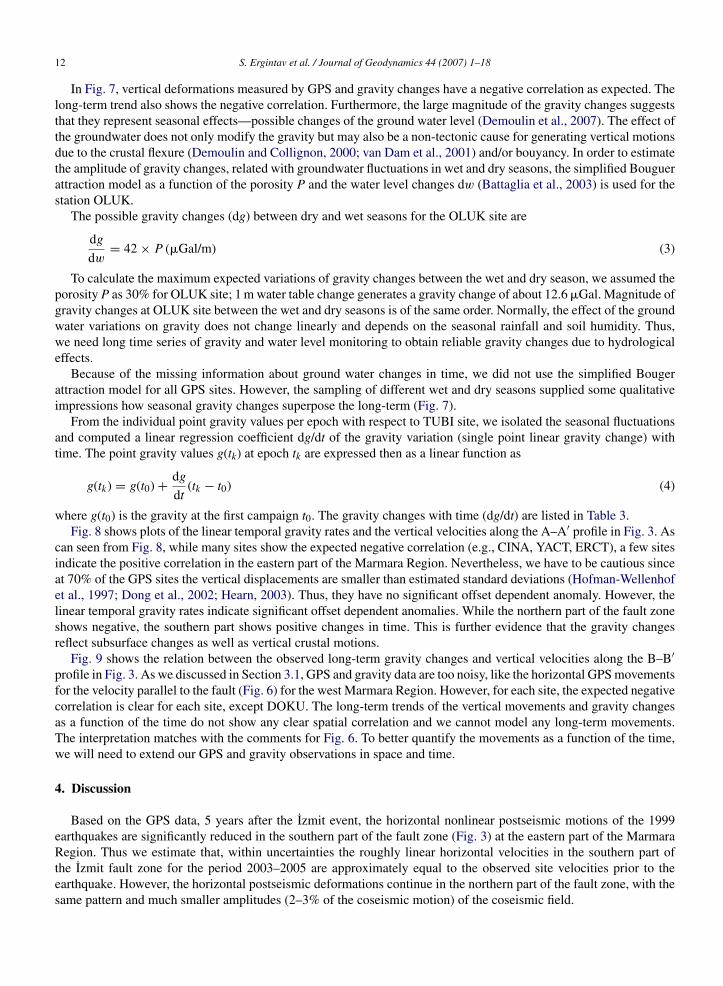
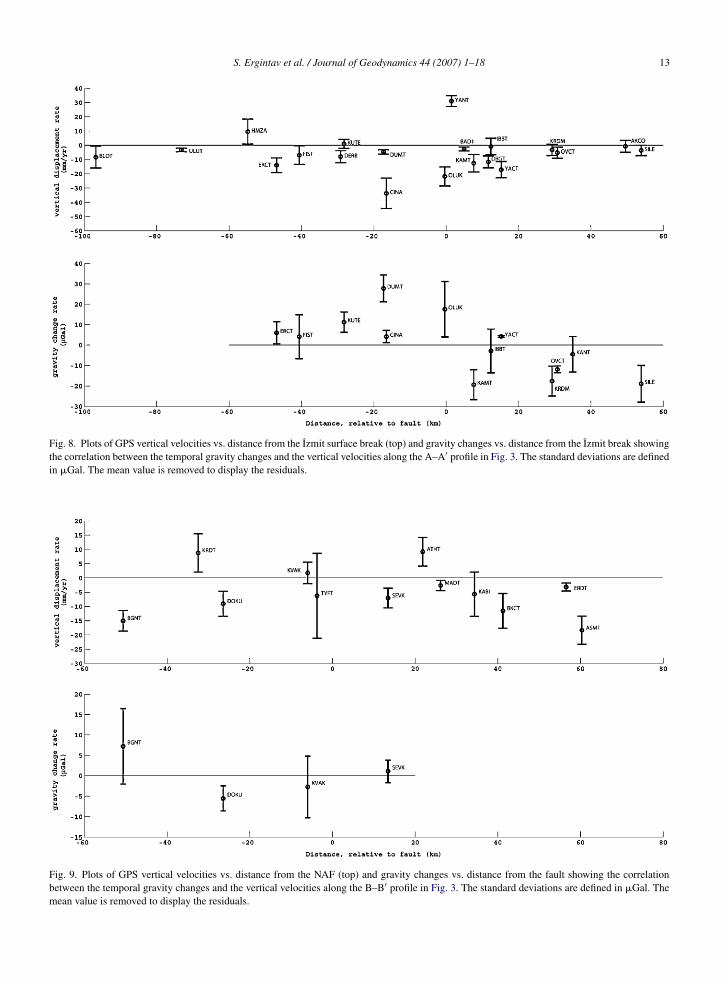
where g(t0) is the gravity at the first campaign t0. The gravity changes with time (dg/dt) are listed in Table 3.Fig. 8 shows plots of the linear temporal gravity rates and the vertical velocities along the A–A′ profile in Fig. 3. As
can seen from Fig. 8, while many sites show the expected negative correlation (e.g., CINA, YACT, ERCT), a few sitesindicate the positive correlation in the eastern part of the Marmara Region. Nevertheless, we have to be cautious sinceat 70% of the GPS sites the vertical displacements are smaller than estimated standard deviations (Hofman-Wellenhofet al., 1997; Dong et al., 2002; Hearn, 2003). Thus, they have no significant offset dependent anomaly. However, thelinear temporal gravity rates indicate significant offset dependent anomalies. While the northern part of the fault zoneshows negative, the southern part shows positive changes in time. This is further evidence that the gravity changesreflect subsurface changes as well as vertical crustal motions.
Fig. 9 shows the relation between the observed long-term gravity changes and vertical velocities along the B–B′profile in Fig. 3. As we discussed in Section 3.1, GPS and gravity data are too noisy, like the horizontal GPS movementsfor the velocity parallel to the fault (Fig. 6) for the west Marmara Region. However, for each site, the expected negativecorrelation is clear for each site, except DOKU. The long-term trends of the vertical movements and gravity changesas a function of the time do not show any clear spatial correlation and we cannot model any long-term movements.The interpretation matches with the comments for Fig. 6. To better quantify the movements as a function of the time,we will need to extend our GPS and gravity observations in space and time.
4. Discussion
Based on the GPS data, 5 years after the Izmit event, the horizontal nonlinear postseismic motions of the 1999earthquakes are significantly reduced in the southern part of the fault zone (Fig. 3) at the eastern part of the MarmaraRegion. Thus we estimate that, within uncertainties the roughly linear horizontal velocities in the southern part ofthe Izmit fault zone for the period 2003–2005 are approximately equal to the observed site velocities prior to theearthquake. However, the horizontal postseismic deformations continue in the northern part of the fault zone, with thesame pattern and much smaller amplitudes (2–3% of the coseismic motion) of the coseismic field.
S. Ergintav et al. / Journal of Geodynamics 44 (2007) 1–18 13
Fig. 8. Plots of GPS vertical velocities vs. distance from the Izmit surface break (top) and gravity changes vs. distance from the Izmit break showingthe correlation between the temporal gravity changes and the vertical velocities along the A–A′ profile in Fig. 3. The standard deviations are definedin �Gal. The mean value is removed to display the residuals.
Fig. 9. Plots of GPS vertical velocities vs. distance from the NAF (top) and gravity changes vs. distance from the fault showing the correlationbetween the temporal gravity changes and the vertical velocities along the B–B′ profile in Fig. 3. The standard deviations are defined in �Gal. Themean value is removed to display the residuals.
14 S. Ergintav et al. / Journal of Geodynamics 44 (2007) 1–18
Two different characteristics of the northern and southern part of the fault zone around the rupture of the 1999earthquakes may be related to the elastic and viscoelastic response of the layers in the crust as a function of theirthickness. When the thickness of the viscoelastic layer is greater than the thickness of the overlying elastic layer,the relaxation time of the layer can be longer than the thick elastic layer/thin viscoelastic layer model (Rundle andJackson, 1977a, 1977b; Savage and Prescott, 1978; Yang and Toksoz, 1981; Yu et al., 1996; Hearn et al., 2002;Hearn, 2003). This may account for the dominant postseismic motions, which are related to the long relaxationtime in the northern part of the fault zone as the result of the thin elastic layer in the crust. The relatively thin andstrong northern part (Ergun and Ozel, 1995; Klingele and Medici, 1997; Adatepe et al., 2002) follows the pale-otectonic boundary between the ‘Palaezoic of Istanbul’ (Sengor and Yılmaz, 1981; Le Pichon et al., 2003) andapparently rigid character of the Black Sea oceanic lithosphere (McClusky et al., 2000). In contrast, the southernpart of the fault zone, which has a relatively thick elastic layer in the crust (Ergun and Ozel, 1995; Klingele andMedici, 1997; Adatepe et al., 2002; Tirel et al., 2004), lies on a geologically young suture (Le Pichon et al., 2003) andthe postseismic motions decrease more rapidly because of the short relaxation time and the thick elastic layer in thisregion.
As discussed in Section 3.1, in the Marmara Region the horizontal velocities (velocities parallel to the fault) indicatelittle present-day strain accumulation along the Izmit coseismic surface rupture and immediately west of the rupture(Fig. 5). To the extent that this behaviour continues through the earthquake cycle, this reduces the moment releaseof the future, expected earthquake (Meade et al., 2002; Hubert-Ferrari et al., 2000; Le Pichon et al., 2003) in theeastern end of the Marmara seismic gap (to the Princess Islands in the eastern part of Marmara Sea) and decreasesthe possible seismic hazard in the region. Furthermore, the sites on the fault have significant velocities that might bedue to continuing postseismic afterslip. At present we do not have enough information about the possible extensionof this creep along the unruptured fault. Thus, we installed new sites in the near fault zone that will be measuredtogether with other sites to indicate the distribution of the creep along the fault. In contrast, for the west Marmaraprofile (Fig. 6), the velocity gradient is too low and the estimation of the locking depth and the velocities are too poorlyconstrained.
The postseismic vertical displacements are also highly sensitive to the elastic upper crust thickness and thicknessof the underlying relaxing viscoelastic layer (Yang and Toksoz, 1981; Pollitz et al., 2001; Hearn, 2003) because themeasured vertical surface deformation is the summation of the vertical strain response of the elastic and relaxingviscoelastic layer. The postseismic vertical velocities obtained from GPS are mostly within the estimated uncertaintyexcept very near the Izmit coseismic fault (OLUK, YANT). However, the gravity change rates give an importantcontribution to understanding the vertical deformations as a function of the distance from the fault (Figs. 8 and 9).While the amplitude of the observed gravity changes are too large to reflect only vertical motions, the negativecorrelation between the vertical GPS deformations and the gravity change rate for some sites indicate that a part ofgravity changes are due in part to vertical motions. Hence, the major source of gravity changes appears to be subsurfacemass redistribution and they are, fully, not reflected in vertical motion.
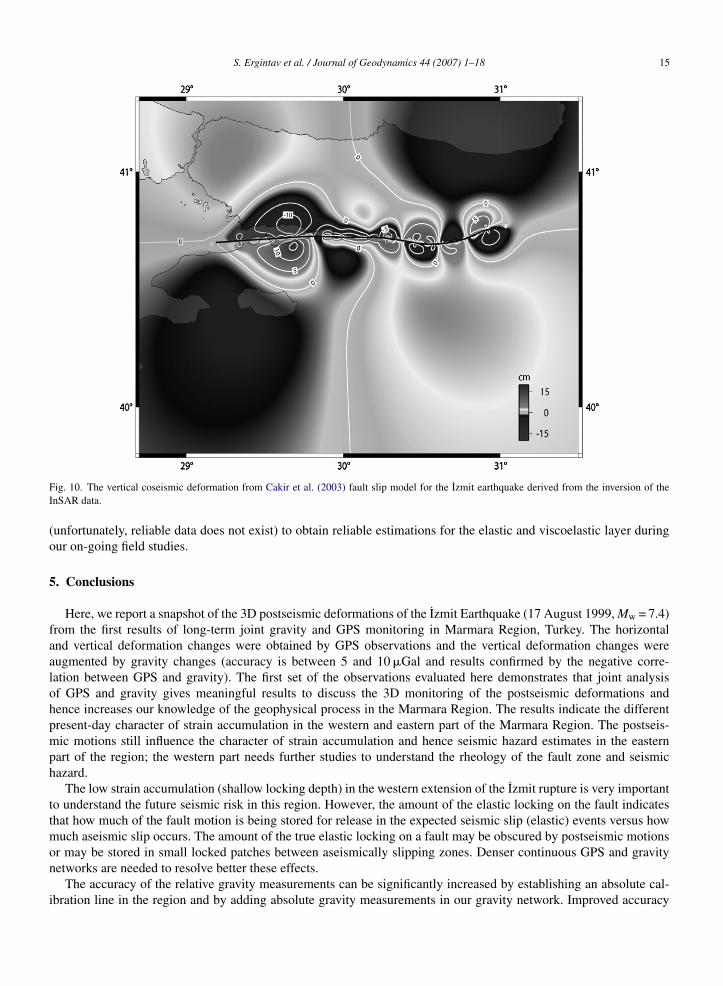
The east Marmara profile (Fig. 8) has the negative correlation between the vertical GPS deformations and gravitychanges for each site. Although the GPS data show no significant change across the fault, the gravity data suggestthat the northern part of the fault zone shows uplift while the other part indicates subsidence, during the postseismicperiod. Hence, the vertical postseismic deformations tend to be opposite in sense to the coseismic model (Fig. 10)(Pollitz et al., 2001; Hearn, 2003), in the near field. Fig. 10 shows the vertical coseismic deformation determinedfrom the Cakir et al. (2003) horizontal slip model calculated from the inversion of the InSAR data for the Izmitearthquake and the result is opposite to vertical postseismic deformations (Fig. 8) indicated by the repeated gravitymeasurements.
The polarities of the maximum vertical displacements depend on the depth of the rupture (Yang and Toksoz, 1981)and, based on modelling studies, (Yang and Toksoz, 1981; Hearn, 2003), we expect the upward (or downward) verticaldisplacements in the near field for the northern part of the fault zone (or southern part of the fault zone) and the oppositepattern in the far field. Unfortunately, while we can see the near field expected patterns, accurately, we cannot evaluatethe far fields since the profile is too short to see them.
As we discussed, while the observed horizontal component of the postseismic deformations can be omitted in thesouthern part of the east Marmara region, the vertical deformations can be displayed by the gravity changes. The resultdemonstrates that the gravity changes are a very useful tool to see the deformations as a function of time and space.However, we need to extend the length of the gravity profiles and incorporate ground water levels in our analysis
S. Ergintav et al. / Journal of Geodynamics 44 (2007) 1–18 15
Fig. 10. The vertical coseismic deformation from Cakir et al. (2003) fault slip model for the Izmit earthquake derived from the inversion of theInSAR data.
(unfortunately, reliable data does not exist) to obtain reliable estimations for the elastic and viscoelastic layer duringour on-going field studies.
5. Conclusions
Here, we report a snapshot of the 3D postseismic deformations of the Izmit Earthquake (17 August 1999, Mw = 7.4)from the first results of long-term joint gravity and GPS monitoring in Marmara Region, Turkey. The horizontaland vertical deformation changes were obtained by GPS observations and the vertical deformation changes wereaugmented by gravity changes (accuracy is between 5 and 10 �Gal and results confirmed by the negative corre-lation between GPS and gravity). The first set of the observations evaluated here demonstrates that joint analysisof GPS and gravity gives meaningful results to discuss the 3D monitoring of the postseismic deformations andhence increases our knowledge of the geophysical process in the Marmara Region. The results indicate the differentpresent-day character of strain accumulation in the western and eastern part of the Marmara Region. The postseis-mic motions still influence the character of strain accumulation and hence seismic hazard estimates in the easternpart of the region; the western part needs further studies to understand the rheology of the fault zone and seismichazard.
The low strain accumulation (shallow locking depth) in the western extension of the Izmit rupture is very importantto understand the future seismic risk in this region. However, the amount of the elastic locking on the fault indicatesthat how much of the fault motion is being stored for release in the expected seismic slip (elastic) events versus howmuch aseismic slip occurs. The amount of the true elastic locking on a fault may be obscured by postseismic motionsor may be stored in small locked patches between aseismically slipping zones. Denser continuous GPS and gravitynetworks are needed to resolve better these effects.
The accuracy of the relative gravity measurements can be significantly increased by establishing an absolute cal-ibration line in the region and by adding absolute gravity measurements in our gravity network. Improved accuracy
16 S. Ergintav et al. / Journal of Geodynamics 44 (2007) 1–18
will allow us to study better crust related gravity variations and interpret them in terms of subsurface mass redis-tribution. In addition, we need better control on water levels to identify gravity changes associated with water levelvariations. Presently we are establishing a calibration line and are extending the length of the profiles in the westand east of the region to determine better near and far field changes which may be related to the thickness andrheological properties of the elastic and underlying relaxing viscoelastic layers (Yang and Toksoz, 1981; Hearn,2003).
Acknowledgments
This study supported by TUBITAK CAYDAG Project No. 103Y100 and EU 6. Frame FORESIGHT Project (ContractNo. 511139). GPS work was supported in part by NSF Grant ERA-0310010 to MIT. We thank Prof. Dr. D. Lelgemann,TU Berlin for the possibility to use the gravimeters LCR-G 85 and LCR-G 858 during extensive fieldwork. We,also, thank E. Tari of Istanbul Technical University for the planning and establishing of MAGNET stations. We runour activities with the sharing of his project activities in the western part of Marmara Region. The authors thanktwo anonymous referees for helpful comments. Most of the figures were plotted using GMT (Wessel and Smith,1991).
References
Adatepe, F., Demirel, S., Alpar, B., 2002. Tectonic setting of the southern Marmara Sea region: based on seismic reflection data and gravity modelling.Marine Geol. 190, 383–395.
Akın, D., Demirel, H., Friedrich, J., Gerstenecker, C., 1994. Determination of vertical strain changes using repeated gravity observations. In:Proceedings of the First Turkish International Symposium on Deformation, Istanbul, pp. 380–390.
Akoglu, A.M., 2001. 17 Agustos 1999 Izmit depremi postsismik deformasyonunun sentetik acıklık radar interferometrisi yontemi ile incelenmesi.MSc Thesis, ITU, Avrasya Institute, Turkey.
Armijo, R., et al., 2005. Submarine fault scarps in the Sea of Marmara pull-apart (North Anatolian Fault): implications for seismic hazard in Istanbul.Geochem. Geophys. Geosyst. 6, 1–29.
Atzbacher, K., Gerstenecker, C., 1993. Secular gravity variations: recent crustal movements or scale factor changes? J. Geodyn. 18, 107–121.Ayhan, E., Burgmann, R., McClusky, S., Lenk, O., Aktug, B., Herece, E., Reilinger, R.E., 2001. Kinematics of the Mw = 7.2, 12 November, 1999,
Duzce, Turkey earthquake. Geophys. Res. Lett. 28, 367–370.Ballu, V., Diament, M., Briole, P., Ruegg, J.-C., 2003. 1985–1999 gravity field variations across the Asal Rift: insights on vertical movements and
mass transfer. Earth Planet Sci. Lett. 208, 41–49.Barka, A., Reilinger, R., 1997. Active tectonics of the eastern Mediterranean region: deduced from GPS, neotectonic, and seismicity data. Ann.
Geofis. 40, 587–610.Barka, A., et al., 2000. The August 17, Izmit earthquake, Mw = 7.4, Eastern Marmara region, Turkey: study of surface rupture and slip distribution.
In: The Izmit and Duzce Earthquakes: Preliminary Results. ITU, Istanbul, Turkey.Battaglia, M., Segall, P., Roberts, C., 2003. The mechanics of unrest at Long Valley Caldera, California. 2. Constraining the nature of the source
using geodetic and micro-gravity data. J. Volcanol. Geothermal. Res. 127, 219–245.Burgmann, R., Ergintav, S., Segall, S., Hearn, E.H., McClusky, S., Reilinger, R.E., Woith, H., Zschau, J., 2002a. Time-space variable afterslip on
and deep below the Izmit earthquake rupture. Bull. Seism. Soc. Am. 92, 126–137.Burgmann, R., Ayhan, M.E., Fielding, E., Wright, T.J., McClusky, S., Aktug, B., Demir, C., Lenk, O., Turkezer, A., 2002b. Deformation during the
12 November 1999 Duzce, Turkey, earthquake, from GPS and InSAR data. Bull. Seism. Soc. Am. 92, 161–171.Cakir, Z., de Chabalier, J.-B., Armijo, R., Meyer, B., Barka, A., Pelzer, G., 2003. Coseismic and early postseismic slip from the 1999 Izmit earthquake
(Turkey), from SAR interferometry and tectonic field observations. Geophys. J. Int. 155, 93–110.van Dam, T., Wahr, J., Milly, P.C.D., Shmakin, A.B., Blewitt, G., Lavallee, D., Larson, K.M., 2001. Crustal displacements due to continental water
loading. Geophys. Res. Lett. 28, 651–654.Demirel, H., Ayhan, M.E., Demir, C., 1994. Gravimetric works in Turkey for the period 1990–1994, Bureau Gravimetrique International. Bulletin
d’Information 75, 120–123.Demoulin, A., Collignon, A., 2000. Nature of the recent vertical ground movements inferred from high-precision levelling data in an intraplate
setting: NE Ardenne, Belgium. J. Geophys. Res. 105, 693–705.Demoulin, A., Ducarme, B., Everaerts, M., 2007. Seasonal height change influence in GPS and gravimetric campaign data. J. Geodyn. 43, 308–319.Dong, D., Fang, P., Bock, Y., Cheng, M.K., Miyazaki, S., 2002. Anatomy of apparent seasonal variations from GPS-derived site position time series.
J. Geophys. Res. 107, 10.1029.Drewes, H., Torge, W., Roder, R.H., Badell, C., Bravo, D., Chourio, O., 1991. Absolute and relative gravimetric surveys of national and geodynamic
networks in Venezuela. J. South Am. Earth Sci. 4, 273–286.Ergintav, S., Reilinger, R.E., Cakmak, R., McClusky, S., Hearn, E.H., Meade, B., Lenk, O., Ozener, H., 2004. Geodetic constraints on the earthquake
deformation cycle along the western North Anatolian Fault: implications for earthquake mechanics and seismic. EGU, Nice.
S. Ergintav et al. / Journal of Geodynamics 44 (2007) 1–18 17
Ergintav, S., Burgmann, R., McClusky, S., Cakmak, R., Reilinger, R.E., Lenk, O., Barka, A., Gurkan, O., 2002. Postseismic deformation near theIzmit earthquake 17 August 1999. Bull. Seism. Soc. Am. 92, 194–207.
Ergun, M., Ozel, E., 1995. Structural relationship between the Sea and Marmara Basin and the North Anatolian Fault Zone. Terra Nova 7, 278–288.Feigl, K.L., Sarti, F., Vadon, H., McClusky, S., Ergintav, S., Durand, P., Burgmann, R., Rigo, A., Massonnet, D., Reilinger, R., 2002. Estimating slip
distribution for the Izmit mainshock from coseismic GPS, ERS-1, RADARSAT, and SPOT measurements. Bull. Seism. Soc. Am. 92, 138–160.Flerit, F., Armijo, R., King, G.C.P., Meyer, B., Barka, A., 2003. Slip partitioning in the sea of Marmara pull-apart determined from GPS velocity
vectors. Geophys. J. Int. 154, 1–7.Hearn, E.H., Burgmann, R., Reilinger, R., 2002. Dynamics of Izmit earthquake postseismic deformation and loading of the Duzce earthquake
hypocenter. Bull. Seism. Soc. Am. 92, 172–193.Hearn, E.H., 2003. What can GPS data tell us about the dynamics of post-seismic deformation? J. Geophys. Res. 155, 753–777.Herring, T.A., 2000. GLOBK: Global Kalman Filter VLBI and GPS analysis program Version 10.0. MIT, Cambridge.Hofman-Wellenhof, B., Collins, J., Lichtenegger, H., 1997. Global Positioning System (GPS): Theory and Practice. Springer Wien, New York.Hubert-Ferrari, A., Barka, A.A., Jacques, E., Nalbant, S.S., Meyer, B., Armijo, R., Tapponier, P., King, G.C.P., 2000. Seismic hazard in the Marmara
Sea region following the 17 August 1999 Izmit earthquake. Nature 404, 269–273.Hudnut, K.W., King, N.E., Galetzka, J.E., Stark, K.F., Behr, J.A., Aspiotes, A., van Wyk, S., Moffitt, R., Dockter, S., Wyatt, F., 2002. Continuous
GPS observations of postseismic deformation following the 16 October 1999 Hector Mine earthquake (Mw 7.1). Bull. Seism. Soc. Am. 92,1403–1422.
Kenner, S.J., Segall, P., 2000. Postseismic deformation following the 1906 San Francisco earthquake. J. Geophys. Res. 105, 13195–13209.King, R.W., Bock, Y., 1998. Documentation for the GAMIT Analysis Software, Release 9.7. MIT, Cambridge.Klingele, E., Medici, F., 1997. Gravimetric studies of the Marmara sea region. In: Active Tectonics of Northwestern Anatolia—The Marmara
Poly-Project. ETH, Zurich, pp. 487–502.Le Pichon, X., Chamot-Rooke, N., Rangin, C., Sengor, A.M.C., 2003. The North Anatolian Fault in the sea of Marmara. J. Geophys. Res. 108,
2170–2179.Le Pichon, X., Sengor, A.M.C., Demirbag, E., Rangin, C., Imren, C., Armijo, R., Gorur, N., Cagatay, M.N., Mercier de Lepinay, B., Meyer, B.,
Saatcilar, R., Tok, B., 2001. The active main Marmara fault. Earth Planet. Sci. Lett. 192, 595–616.McClusky, S., et al., 2000. Global Positioning System constraints on plate kinematics and dynamics in the eastern Mediterranean and Caucasus. J.
Geophys. Res. 105, 5695–5719.Meade, B., Hager, B., McClusky, S., Reilinger, R.E., Ergintav, S., Lenk, O., Barka, A., Ozener, H., 2002. Estimates of seismic potential in the
Marmara Sea region from block models of secular deformation constrained by GPS measurements. Bull. Seism. Soc. Am. 92, 208–215.Menke, W., 1984. Geophysical Data Analysis: Discrete Inverse Theory. Academic Press, Orlando, 260 pp.Owen, S., et al., 2002. Early postseismic deformation from the Mw = 7.1 Hector Mine, California, earthquake as measured by survey mode GPS.
Bull. Seism. Soc. Am. 92, 1423–1432.Ozalaybey, S., Ergin, M., Aktar, M., Tapırdamaz, C., Bicmen, F., Yoruk, A., 2002. The 1999 Izmit earthquake sequence in Turkey: seismological
and tectonic aspects. Bull. Seism. Soc. Am. 92, 376–386.Parsons, T., Toda, S., Stein, R.S., Barka, A.A., Dieterich, J.H., 2000. Heightened odds of large earthquakes near Istanbul: an interaction-based
probability calculation. Science 288, 661–665.Pollitz, F.F., Peltzer, G., Burgmann, R., 2001. Mobility of continental mantle: evidence from postseismic geodetic observations following the 1992
Landers earthquake. J. Geophys. Res. 105, 8035–8054.Pollitz, F.F., 1997. Gravitational viscoelastic postseismic relaxation on a layered spherical earth. J. Geophys. Res. 102, 17 921–17 941.Ray, J., Dong, D., Altamimi, Z., 2004. IGS reference frames: status and future improvements. GPS Solutions 8, 251–266.Reilinger, R.E., Ergintav, S., Burgmann, R., et al., 2000. Coseismic and postseismic fault slip for the 17 August, 1999, M = 7.5, Izmit, Turkey
earthquake. Science 289, 1519–1524.Rundle, J.B., Jackson, D.D., 1977a. A three-dimensional viscoelastic model of a strike-slip fault. Geophys. J. R. Astron. Soc. 49, 575–591.Rundle, J.B., Jackson, D.D., 1977b. A kinematic viscoelastic model of the San Francisco earthquake of 1906. Geophys. J. R. Astron. Soc. 50,
441–458.Rymer, H., 1991. The use of microgravity for monitoring and predicting volcanic activities: Poas volcano, Costa Rica. Cahier du Centre Europeen
de Geodynamique et de Seismologie, Proceedings of the of the Workshop: Geodynamical Instrumentation Applied to Volcanic Areas, vol. 4,October 1–3, 1990, Walferdange, Luxembourg, pp. 325–331.
Savage, J.C., 1990. Equivalent strike-slip earthquake cycles in half-space and lithosphere-asthenosphere earth models. J. Geophys. Res. 95,4873–4879.
Savage, J.C., Prescott, W.A., 1978. Asthenosphere readjustment and the earthquake cycle. J. Geophys. Res. 83, 3369.Savage, J.C., Bedford, J.L., 1973. Geodetic deformation of relative plate motion in central California. J. Geophys. Res. 78, 832–845.Shen, Z.-K., Jackson, D.D., Feng, Y., Cline, M., Kim, M., Fang, P., Bock, Y., 1994. Postseismic deformation following the Landers earthquake,
California, 28 June 1992. Bull. Seism. Soc. Am. 84, 780–791.Straub, C., Kahle, H.-G., Schindler, C., 1997. GPS and geologic estimates of the tectonic activity in the Marmara sea region, NW Anatolia. J.
Geophys. Res. 102, 27587–27601.Saroglu, F., Emre, O., Kuscu, I., 1992. Turkiye diri fay haritası. MTA, Turkey.Sengor, A.M.C., Yılmaz, Y., 1981. Tethyan evolution of Turkey: a plate tectonic approach. Tectonophysics 75, 181–241.Thatcher, W., 1983. Nonlinear strain buildup and the earthquake cycle on the San Andreas Fault. J. Geophys. Res. 88, 5893–5902.Tirel, C., Gueydan, F., Tiberi, C., Brun, J.-P., 2004. Aegean crustal thickness inferred from gravity inversion. Geodynamical implications. Earth
Planet. Sci. Lett. 228, 267–280.Torge, W., 1989. Gravimetry. De Gruyter, Berlin, New York, 465 pp.

18 S. Ergintav et al. / Journal of Geodynamics 44 (2007) 1–18
Torge, W., Falk, R., Franke, A., Reinhart, E., Richter, B., Sommer, M., Wilmes, H., 1999. Das Deutsche Schweregrundnetz 1994 (DSGN94). BandI, DGK, B309, Munchen.
Wenzel, H.G., 1980. Optimierung von Schwerenetzen. In: Pelzer, H. (Ed.), Geodatische Netze in Landes- und Ingenieurvermessung. Konrad Wittwer,Stuttgart, pp. 371–383.
Wessel, P., Smith, W.H.F., 1991. Free software helps map and display data. EOS AGU 72, 445–446.Yang, M., Toksoz, N., 1981. Time-dependent deformation and stress relaxation after strike slip-earthquakes. J. Geophys. Res. 86, 2889–2901.Yu, T.-T., Rundle, J.B., Fernandez, J., 1996. Surface deformation due to a strike-slip fault in an elastic gravitational layer overlying a viscoelastic
gravitational half-space. J. Geophys. Res. 101, 3199–3214.